UNITED STATES
SECURITIES AND EXCHANGE COMMISSION
WASHINGTON, D.C. 20549
FORM 10-K
(Mark One)
☒ |
ANNUAL REPORT PURSUANT TO SECTION 13 OR 15(d) OF THE SECURITIES EXCHANGE ACT OF 1934 |
For the Fiscal Year Ended June 30, 2024
or
☐ |
TRANSITION REPORT PURSUANT TO SECTION 13 OR 15(d) OF THE SECURITIES EXCHANGE ACT OF 1934 |
For the transition period from to
Commission File Number: 001-35314
eGain Corporation
(Exact name of registrant as specified in its charter)
Delaware |
|
77-0466366 |
(State or other jurisdiction |
|
(I.R.S. Employer |
1252 Borregas Avenue
Sunnyvale, California 94089
(Address of principal executive offices, including zip code)
(408) 636-4500
(Registrant’s telephone number, including area code)
Securities registered pursuant to Section 12(b) of the Act:
Title of Each Class |
Trading Symbol |
Name of Each Exchange on Which Registered |
Common Stock, par value $0.001 per share |
EGAN |
The Nasdaq Stock Market LLC |
Securities registered pursuant to Section 12(g) of the Act: None
Indicate by check mark if the registrant is a well-known seasoned issuer, as defined in Rule 405 of the Securities Act. Yes ☐ No ☒
Indicate by check mark if the registrant is not required to file reports pursuant to Section 13 or Section 15(d) of the Act. Yes ☐ No ☒
Indicate by check mark whether the registrant (1) has filed all reports required to be filed by Section 13 or 15(d) of the Securities Exchange Act of 1934 during the preceding 12 months (or for such shorter period that the registrant was required to file such reports), and (2) has been subject to such filing requirements for the past 90 days: Yes ☒ No ☐
Indicate by check mark whether the registrant has submitted electronically every Interactive Data File required to be submitted pursuant to Rule 405 of Regulation S-T during the preceding 12 months (or for such shorter period that the registrant was required to submit such files). Yes ☒ No ☐
Indicate by check mark whether the registrant is a large accelerated filer, an accelerated filer, a non-accelerated filer, smaller reporting company, or an emerging growth company. See the definitions of “large accelerated filer,” “accelerated filer,” “smaller reporting company,” and “emerging growth company” in Rule 12b-2 of the Exchange Act.
Large accelerated filer |
|
☐ |
|
Accelerated filer |
|
☐ |
Non-accelerated filer |
|
☒ |
|
Smaller reporting company |
|
☒ |
Emerging growth company |
|
☐ |
|
|
|
|
If an emerging growth company, indicate by check mark if the registrant has elected not to use the extended transition period for complying with any new or revised financial accounting standards provided pursuant to Section 13(a) of the Exchange Act. ☐
Indicate by check mark whether the registrant has filed a report on and attestation to its management’s assessment of the effectiveness of its internal control over financial reporting under Section 404(b) of the Sarbanes-Oxley Act (15 U.S.C. 7262(b)) by the registered public accounting firm that prepared or issued its audit report. ☒
If securities are registered pursuant to Section 12(b) of the Act, indicate by check mark whether the financial statements of the registrant included in this filing reflect the correction of an error to previously issued financial statements. ☐
Indicate by check mark whether any of those error corrections are restatements that required a recovery analysis of incentive-based compensation received by any of the registrant’s executive officers during the relevant recovery period pursuant to §240.10D-1(b). ☐
Indicate by check mark whether the registrant is a shell company (as defined in Rule 12b-2 of the Exchange Act): Yes ☐ No ☒.
The aggregate market value of the voting and non-voting common equity held by non-affiliates (based on the closing price on Nasdaq) on December 31, 2023, was approximately $176.5 million.
There were 28,511,553 shares of the Registrant’s Common Stock, par value $0.001 per share, outstanding on September 9, 2024.
DOCUMENTS INCORPORATED BY REFERENCE
Items 10, 11, 12, 13 and 14 of Part III of this Annual Report on Form 10-K incorporate by reference information from the registrant’s proxy statement to be filed with the Securities and Exchange Commission in connection with the solicitation of proxies for the registrant’s 2024 Annual Meeting of Stockholders.
EGAIN CORPORATION
TABLE OF CONTENTS
2024 FORM 10-K
Item |
|
|
|
Page |
|
|
|
|
|
|
|
|
3 |
|
|
|
|
|
|
|
|
|
4 |
|
|
|
|
|
|
|
|
|
|
|
|
|
|
|
|
|
|
7 |
||
|
|
|
|
|
|
|
14 |
||
|
|
|
|
|
|
|
31 |
||
|
|
|
|
|
|
|
31 |
||
|
|
|
|
|
|
|
32 |
||
|
|
|
|
|
|
|
32 |
||
|
|
|
|
|
|
|
33 |
||
|
|
|
|
|
|
|
|
|
|
|
|
|
|
|
|
|
34 |
||
|
|
|
|
|
|
|
36 |
||
|
|
|
|
|
|
Management’s Discussion and Analysis of Financial Condition and Results of Operations |
|
36 |
|
|
|
|
|
|
|
|
50 |
||
|
|
|
|
|
|
|
51 |
||
|
|
|
|
|
|
Changes In and Disagreements With Accountants on Accounting and Financial Disclosure |
|
83 |
|
|
|
|
|
|
|
|
83 |
||
|
|
|
|
|
|
|
84 |
||
|
|
|
|
|
|
Disclosure Regarding Foreign Jurisdictions That Prevent Inspections |
|
84 |
|
|
|
|
|
|
|
|
|
|
|
|
|
|
|
|
|
|
85 |
||
|
|
|
|
|
|
|
85 |
||
|
|
|
|
|
|
Security Ownership of Certain Beneficial Owners and Management and Related Stockholder Matters |
|
85 |
|
|
|
|
|
|
|
Certain Relationships and Related Transactions and Director Independence |
|
85 |
|
|
|
|
|
|
|
|
86 |
||
|
|
|
|
|
|
|
|
|
|
|
|
|
|
|
|
|
87 |
||
|
|
|
|
|
16. |
|
|
89 |
|
|
|
|
|
|
|
|
|
90 |
2
Forward-Looking Statements
This report contains forward-looking statements that involve risks and uncertainties. These statements relate to future periods, future events or our future operating or financial plans or performance. Often, these statements include the words “believe,” “expect,” “target,” “anticipate,” “intend,” “plan,” “seek,” “estimate,” “potential,” or words of similar meaning, or future or conditional verbs such as “will,” “would,” “should,” “could,” “might,” or “may,” or the negative of these terms, and other similar expressions. These forward-looking statements include statements as to:
| ● | our belief that is useful to exclude certain non-cash charges and non-core operational charges from non-GAAP operating income; |
| ● | expected benefits of our solutions to our clients and partners; |
| ● | our value proposition; |
| ● | customer and market expectations in the market in which we operate, and our ability to meet expectations and satisfy such needs; |
| ● | our lengthy sales cycles and the difficulty in predicting timing of sales or delays; |
| ● | our expectations with respect to revenue, cost of revenue, expenses and other financial metrics; |
| ● | our business plans, strategies, targets, and outlook; |
| ● | changes in technology, including AI technology and services; |
| ● | our expectations related to our product development plan; |
| ● | competition in the markets in which we do business and our competitive advantages; |
| ● | our beliefs regarding our prospects for our business; |
| ● | changes in demand for our solutions; |
| ● | our expectations regarding the composition of our customers and the result of a loss of a significant customer; |
| ● | our reliance on strategic and third party distribution partnerships; |
| ● | the risk of unauthorized access to a customer’s data or our data or our IT systems and cybersecurity attacks; |
| ● | our ability to timely adapt and comply with changing European regulatory and political environments; |
| ● | the effect of recent changes in U.S. tax legislation; |
| ● | the effect of compliance with privacy laws and regulations on our business and our customers; |
| ● | our ability to take adequate precautions against claims or lawsuits made by third parties, including alleged infringement of proprietary rights; |
| ● | the adequacy of our capital resources and our ability to raise additional financing; |
| ● | the risks related to our international operations; |
| ● | the potential impact of foreign currency fluctuations and inflation; and |
| ● | the potential impact of health epidemics. |
These forward-looking statements reflect our current views with respect to future events, are based on assumptions and are subject to risks and uncertainties. These risks and uncertainties could cause actual results to differ materially from those projected and include, but are not limited to:
3
| ● | our ability to manage our business plans, strategies, targets, and outlooks and any business-related forecasts or projections; |
| ● | our ability to improve our current solutions; |
| ● | our ability to innovate and respond to rapid technological change and competitive challenges; |
| ● | our ability to execute our sales and marketing strategy; |
| ● | customer acceptance of our existing and future solutions; |
| ● | our ability to predict subscription renewals; |
| ● | the impact of new legislation or regulations on our business; |
| ● | the impact of accounting pronouncements and our critical accounting policies, judgments, estimates, models and assumptions on our financial results; |
| ● | our ability to compete; |
| ● | the success of our strategic and distribution partnerships; |
| ● | our ability to obtain capital when needed; |
| ● | our ability to manage future growth; |
| ● | our ability to retain key personnel and hire additional personnel; |
| ● | risks related to protection of our intellectual property; |
| ● | foreign currency fluctuations and inflation; |
| ● | the global economic environment; |
| ● | risks related to public health pandemics; and |
| ● | the risks set forth under “Risk Factors.” |
Given these risks and uncertainties, you should not place undue reliance on these forward-looking statements. Except as required by federal securities laws, we undertake no obligation to update any forward-looking statements for any reason, even if new information becomes available or other events occur in the future.
All references to “eGain”, the “Company”, “our”, “we” or “us” mean eGain Corporation and its subsidiaries, except where it is clear from the context that such terms mean only eGain and exclude its subsidiaries.
eGain and eGain® are trademarks of eGain Corporation. We also refer to trademarks of other corporations and organizations in this report
Summary Risk Factors
Our business is subject to numerous risks and uncertainties that could affect our ability to successfully implement our business strategy and affect our financial results. You should carefully consider all of the information in this report and, in particular, the following principal risks and all of the other specific factors described in Item 1A. of this report, “Risk Factors,” before deciding whether to invest in our company.
| ● | Our business is influenced by a range of factors that are beyond our control and that we have no comparative advantage in forecasting. |
| ● | Our SaaS business model is subject to certain risks. |
4
| ● | Our revenue and operating results have fluctuated in the past and are likely to fluctuate in the future, and because we recognize revenue from subscriptions over a period of time, downturns in revenue may not be immediately reflected in our operating results. |
| ● | We cannot accurately predict subscription renewal rates and the impact these rates may have on our future revenue and operating results. |
| ● | Our lengthy sales cycles and the difficulty in predicting timing of sales or delays may impair our operating results. |
| ● | Because we depend on a relatively small number of customers for a substantial portion of our revenue, the loss of any of these customers or our failure to attract new significant customers could adversely impact our revenue and harm our business. |
| ● | The market for customer engagement software, including generative AI product offerings, is competitive, and our business will be adversely affected if we are unable to successfully compete. |
| ● | If we fail to expand and improve our sales performance and marketing activities, or retain our sales and marketing personnel, we may be unable to grow our business, which could negatively impact our operating results and financial condition. |
| ● | Our failure to maintain, develop or expand strategic and third-party distribution channels would impede our revenue growth. |
| ● | Difficulties and delays in customers implementing our products could harm our revenue and margins. |
| ● | We conduct a significant portion of our business and operations outside of the United States, which exposes us to additional risks that may not exist in the United States. These risks in turn could cause our operating results and financial condition to suffer. |
| ● | Unplanned system interruptions, delays in service or inability to increase capacity, including internationally, at our third-party data center facilities could impair the use or functionality of our cloud operations and harm our business. |
| ● | Software errors could be costly and time-consuming for us to correct, and could harm our reputation and impair our ability to sell our solutions. |
| ● | The terms we agree to in our Service Level Agreements or other contracts may result in increased costs or liabilities, which would in turn affect our results of operations. |
| ● | If we are unable to increase the profitability of subscription revenue, if we experience significant customer attrition, or if we are required to delay recognition of revenue, our operating results could be adversely affected. |
| ● | We depend on broad market acceptance of our applications and of our business model. If our expectations regarding the market for our applications are not met, our business could be seriously harmed. |
| ● | We may be unable to respond to the rapid technological change and changing customer preferences in the online sales, marketing, customer service, and/or online consumer services industries and this may cause our business to suffer. |
| ● | We employ third-party technologies for use in or with our platform and the inability to license such technologies on commercially reasonable terms or the inability to maintain these licenses or errors in the software we license could result in increased costs, or reduced service levels, which could adversely affect our business. |
| ● | Our offshore product development, support and professional services may prove difficult to manage or may not allow us to realize our cost reduction goals, produce effective new solutions and provide professional services to drive growth. |
| ● | If our cybersecurity systems or the systems of our vendors, partners and suppliers are breached and unauthorized access is obtained to a customer’s data or our data or IT systems, our service may be perceived as |
5
| not being secure, customers may curtail or stop using our service and we may incur significant legal and financial exposure and liabilities. |
| ● | Changes in the European regulatory environment regarding privacy and data protection regulations, such as the GDPR, could expose us to risks of noncompliance and costs associated with compliance. |
| ● | Privacy concerns and laws, evolving regulation of cloud computing and other domestic or foreign regulations may limit the use and adoption of our solutions and adversely affect our business. |
6
PART I
ITEM 1. |
BUSINESS |
Overview
eGain automates customer engagement with an AI knowledge hub SaaS solution. We sell to enterprises who want to better serve customers at scale by delivering trusted answers across self-service, contact centers, and field staff. True to our mantra of AX + BX + CX = DX™, our AI knowledge hub orchestrates effortless Digital eXperience (DX) as it assists Agent eXperience (AX), empowers Business eXperience (BX) and assures Customer eXperience (CX). Many global brands use eGain to improve experience and reduce costs. We are headquartered in the Sunnyvale, California, United States. We also operate in the United Kingdom and India.
Industry Background
Introduction
According to Gartner Research, a majority of contact center agents are not satisfied with their desktop tools. Our assessment, based on more than two decades of serving clients is that good contact center agents ignore most information piled on their screens across multiple windows and tabs when they are interacting with customers. They focus on the customer conversation. Meanwhile, businesses expect agents to remember and refresh growing knowhow that is needed to answer customer questions across complex, expanding product portfolios and compliance-heavy processes, and then recall relevant knowhow contextually in the moment of truth – when the customer is on the line. In addition, this is expected of an entry-level workforce that is not well-paid, routinely replaced, and globally dispersed – mainly for cost reasons. This knowledge and guidance gap for agents in the flow of their work explains Gartner Research’s top technology recommendation for customer service and support leaders since 2022: invest in knowledge management tools.
AI Economy Demands Modern Knowledge Management
In a world selling commoditized, yet complex products to time-strapped customers, smart tools must automate the routine and augment the interesting across agent, business and customer support tasks. This need has been amplified by the disruption of traditional work models by COVID-19. Businesses realize that they need to invest in tools that can guide agents and customers with trusted answers, ensuring customer satisfaction and compliance. Recently we have seen the generative AI surprises pop up across businesses as businesses jumped into generative AI without solving the foundational knowledge needed to provide trusted input content to generative AI. Not surprisingly, businesses are quickly seeking modern knowledge management solutions.
AI Knowledge for Customer Engagement
To automate customer engagement, generative AI needs trusted content from a knowledge hub that ensures correct, compliant content is served with adequate controls. A knowledge hub can be built and maintained with much less time and cost using AI. It is a perfect technology intersection where AI needs knowledge and knowledge can be built easier with AI.
Contact Centers are a Brand Battleground
Contact centers offer significant opportunities to realize the transformation potential of generative AI. According to Forrester Research, there were 17 million contact center agents in 2023, with 71% of contact centers looking to hire more. Time-starved customers consuming complex products and grappling with extreme choices generate stubbornly high levels of customer contact. They need quick, correct, and assured help. The business impact of applying AI at scale on contact center operations can save the global economy hundreds of billions of dollars annually.
7
Customer Engagement Automation is a Large, Growing Market
Businesses continue to invest in digital transformation, especially in customer engagement. To further reduce cost and improve experience, businesses want to harness AI knowledge to automate customer service via omnichannel, conversational interfaces. According to McKinsey, the aggregate cost of customer operations in the global economy is $1.5 trillion. They anticipate that businesses could reduce this cost by 35% using AI. Given these potential savings, the associated market opportunity for SaaS solutions is huge. According to a recent Gartner Research prediction, by 2025, 100% of all virtual customer assistant and virtual agent assistant projects that are not integrated with a modern knowledge management system will fail to meet their experience improvement and operational cost-reduction goals.
The eGain Approach and Benefits
What Customers Want
We believe customer service queries fall into three categories: informational, transactional, and situational. Any given customer contact can morph across these categories as the conversation develops. Tools must orchestrate customer contact with context —accounting for machine-human hand-offs (mixed-initiative interaction), channel switching, multimodal interaction, and conversational pause-and-resume. During these interactions, customers increasingly want trusted answers and guidance.
The eGain Solution is Comprehensive
eGain offers a comprehensive, unified solution organized into three hubs—eGain Knowledge Hub™, eGain Conversation Hub™, and eGain Analytics Hub™, to automate, augment and orchestrate digital-first customer engagement. We believe our feature-rich portfolio of applications empowers businesses to connect, solve, and optimize agent, business, and customer experience.
Solve with eGain Knowledge Hub
Our Knowledge Hub helps businesses to centralize knowledge, policies, procedures, situational expertise, and best-practices, while delivering guided, personalized, and trusted answers to customers, agents, and field staff. We believe our guided knowledge and virtual assistance applications ensure that all agents easily resolve customer queries, regardless of product or procedure.
Connect with eGain Conversation Hub
Our Conversation Hub offers comprehensive, scalable capabilities for digital-first, omnichannel interaction management within a modern, purpose-built desktop. Rich applications, powered by our Knowledge and AI capabilities (from our Knowledge Hub), proactively guide agents to efficiently interact with customers using chatbots, messaging applications, short message service (SMS), chat, email, social media, phone, video, fax, and letter.
Optimize with eGain Analytics Hub
Our Analytics Hub enables clients to measure, manage and optimize their omnichannel service operations and knowledge. In addition, embedded AI and Machine Learning (ML) helps clients generate product improvement and customer insights, while spotting opportunities to improve experience and automate processes.
Open, Secure APIs and Third-Party Connectors Deliver Quick Value
Our open, secure platform APIs enable clients and partners to extend and enhance our solutions and to integrate with enterprise assets to enable a single view of the customer. Pre-built integrations include connectors to Adobe, Apple Business Chat, Avaya, Amazon Connect, Cisco, Five9, Google Dialogflow, Genesys, Talkdesk, IBM Watson, Microsoft Dynamics, Microsoft SharePoint, Microsoft Teams, Salesforce, SAP, ServiceNow, and Zendesk. We offer a novel “Bring Your Own” composable architecture to plug external bots, messaging channels, and third-party agent desktops to compose differentiated customer experiences.
8
Compelling Benefits
Our solution delivers quick value, easy innovation, and big business impact. Specifically, we help businesses:
| o | Enhance customer experience with digital-first, omnichannel service, powered by AI knowledge. |
| o | Reduce operating costs with self-service automation, improved agent productivity and time-to-competence. |
| o | Ensure compliance with regulations, policies, procedures, and best practices. |
| o | Deliver insights to improve service, enhance products and design new offerings. |
Competitive Strengths
Composable Platform with Rich APIs, Events, and UX Widgets
The eGain solution is a comprehensive omnichannel solution for the customer engagement market, with AI and knowledge applications at its core. We unlock the full power of our cloud platform with extensive APIs on a composable architecture, served via a developer portal to enable knowledge everywhere to power omnichannel customer and employee experiences.
Enterprise-Grade, Secure Cloud Service with Differentiated Offerings
Our cloud offering is secure, scalable, and offers unique capabilities. With respect to security and certification, we offer SOC2, PCI, HIPAA, FedRAMP, and GDPR certification. We are also approved as a supplier on Crown Commercial Service’s (CCS) G-Cloud Framework in the UK market. The Internal Revenue Service uses our solutions served from the eGain Cloud.
Transformative Value at Scale Across Diversified Customer Base
Our solution delivers transformative value at scale. We believe that our understanding of the customer need and our ability to fulfill it with enterprise-grade capability is unmatched. Our clients range from over a hundred thousand users at a healthcare client using our solution on a 24x7 basis to a Property and Casualty (P&C) insurer with fifteen thousand contact center advisors and thirty-thousand field agents.
Market-leading Innovation with a Risk-free Trial Model
To de-risk customer decisions, we offer a unique Innovation in 30 Days™ program—a 30-day guided production pilot in the eGain Cloud – at no cost and with no strings attached. Businesses can experience our product with their data, content, and process in a production setting.
Direct Go-to-market Strategy, Complemented by a Growing Partner Ecosystem
We take our solutions to market through a direct sales model, primarily in North America and Western Europe. We complement direct sales with resell partnerships. We also partner with System Integrators and boutique consultants.
Customers
We mostly sell to large enterprises, which we define as businesses with over a billion dollars in annual revenue or government organizations. Over 82% of our annual recurring cloud revenue for the fiscal year ended June 30, 2024 (which we refer to as fiscal year 2024) came from such large enterprises.
For fiscal year 2024, North America (NA) and combined Europe, Middle East, and Africa (EMEA) revenue accounted for 78% and 22% of total revenue.
9
One of our largest customers, who is also our partner, accounted for 18% of total revenue in fiscal year 2024.
Competition
We compete with application software providers, including LivePerson, Inc., NICE, Ltd., and Verint Systems Inc. In addition, we occasionally compete with some of our platform partners where some of our product capabilities overlap, including Five9, Genesys, Microsoft, Salesforce, and ServiceNow.
Our target market is highly competitive and some of our competitors may have longer operating histories, greater economies of scale, greater financial resources, greater engineering and technical resources, greater sales and marketing resources, stronger strategic partnerships and distribution channels, larger user bases, products and services with different functions, and feature sets and greater brand recognition than we have. We believe the principal competitive factors in our market include the following:
| o | proven track record of customer success; |
| o | speed and ease of implementation; |
| o | quick value realization; |
| o | rich product functionality; |
| o | strong analyst ratings; |
| o | strong customer references; |
| o | financial stability and viability of the vendor; |
| o | strong product adoption; |
| o | ease of use and rates of user adoption; |
| o | low total cost of ownership and demonstrable cost-effective benefits for customers; |
| o | performance, security, scalability, flexibility and reliability of the service; |
| o | ease of integration with existing applications; |
| o | quality of customer support; |
| o | availability and quality of implementation, consulting and training services; and |
| o | vendor reputation and brand awareness. |
Growth Strategy
We are investing in multiple programs to accelerate growth.
Advance Product and Platform Leadership
Innovation is in our DNA. We are investing actively in experimenting with, enhancing, and applying AI technologies to accelerate and automate tasks in the knowledge management and customer engagement lifecycle. In addition, we are expanding our platform connectivity to CRM, CCaaS, UCaaS, and CMS platforms with enhanced APIs and connectors.
Invest in Direct Sales and Marketing
We design and execute scalable and personalized marketing programs to boost brand awareness, based on client success, product leadership and no-risk trial offers. To complement our marketing investment, we have built and trained a field sales team to maintain high-touch presence in target accounts.
10
Develop New Partner Relationships
We are developing new partnerships with complementary platform providers (with large customer bases) to enhance their proposition with our Knowledge-powered customer engagement capabilities. At the same time, we are investing in delivery partnerships to scale our delivery capabilities.
Land and Expand in the Enterprise
With the sustained progress we have made in customer success, we see a replicable pattern emerging: land enterprise logos with a small footprint in one business unit, demonstrate business value, and then expand in the enterprise. We believe we are increasing the value of investment in eGain for our clients by deeply integrating our capabilities via our enhanced APIs with enterprise assets like enterprise collaboration platforms, CRM systems, transaction and billing, and content sources.
Selectively Pursue Acquisitions
From time to time, we pursue inorganic strategies to strengthen our product portfolio. As opportunities arise, we look for strategic acquisitions we believe will deliver compelling value faster than organic options.
Sales and Marketing
Sales Strategy
Our sales strategy is to pursue targeted accounts, mostly B2C (Business-to-Consumer) enterprises and consumer-centric government agencies, through a combination of our direct sales force and partners. These enterprises typically have thousands of customer service agents in their contact centers. Our direct sales force is organized into teams that include field sales representatives and sales consultants. Our direct sales force is complemented by lead generation representatives and sales development representatives. We also complement our direct effort with sales alliances.
Marketing and Partner Strategy
Our marketing strategy is to build our brand around the following pillars: thought leadership, product leadership, and customer advocacy. We have a long track record of thought leadership in this market. Our popular “Knowledge Management for Dummies” publication, for example, enjoys thousands of digital downloads and physical distribution in our target community. Recently, we published a revised edition of this pioneering work with generative AI updates, including relevant AI-powered product info, customer case studies, and best-practices.
Our partners help extend the breadth and depth of our product offerings, drive market awareness, and augment our professional service capabilities. We believe these relationships are important to delivering successful integrated products and services to our customers. Our partner portal, eGain Econet™, provides comprehensive sales support and services information for partners.
Subscription Services
Our subscription services provide customers with access to our software on a cloud-based platform that we manage and offer on a subscription basis. These subscription services allow our customers to easily consume our product innovation without dealing with infrastructure, installation and ongoing administration. We generally offer these services through a 36-month contract, with pricing based on the number of agents or self-service sessions.
Professional Services
Our worldwide professional services organization provides consulting, implementation, training, and managed services to deliver business value, drive customer success and build customer loyalty.
11
| o | Consulting and Implementation Services. Our offering includes rapid implementation services, platform-based solution extension, and systems integration services. Our consultants work with customers to understand their requirements, analyze their business needs, and implement effective solutions. We provide these services independently or in partnership with distribution partners who have developed expertise on our platform. |
| o | Training Services. We provide comprehensive training options to customers and partners. Training programs are offered either online (remote training) or in-person at the customer site. We also offer complementary e-learning through our eGain University education portal to our customers and partners. |
| o | Managed Services. We provide a comprehensive set of processes and activities that range from implementation to monitoring the evolution and support of eGain solutions in a company. |
Customer Support
We offer 24/7 customer support via online and phone channels worldwide under support agreements. Our customer support centers are in the United States, the United Kingdom, and India.
Research and Development
The market for our products changes rapidly and is characterized by evolving industry standards, swift changes in customer requirements, and frequent product introductions.
We continuously analyze market and customer requirements and evaluate external technology that we believe will enhance our competitiveness, increase our lifetime customer value, and expand our target market. Our product roadmap effectively combines build, partner, and buy options.
Intellectual Property
We regard our intellectual property as critical to our success. We rely on intellectual property and other laws, in addition to confidentiality procedures and licensing arrangements, to protect the proprietary aspects of our technology and business.
As of June 30, 2024, we had 17 issued patents in the United States. Our issued U.S. patents expire at various times between 2028 and 2040.
We continually assess the strength of our intellectual property protection for those aspects of our technology that we believe constitute innovations providing significant competitive advantages. Future applications may or may not receive the issuance of valid patents or registered trademarks.
We routinely require our employees, customers, and potential business partners to enter into confidentiality and nondisclosure agreements before we disclose any sensitive aspects of our products, technology, or business plans. In addition, we require employees to agree to surrender to us any proprietary information, inventions or other intellectual property they generate or come to possess while employed by us. Despite our efforts to protect our proprietary rights through confidentiality and license agreements, unauthorized parties may attempt to copy or otherwise obtain and use our products or technology. These precautions may not prevent misappropriation or infringement of our intellectual property. In addition, some of our license agreements with certain customers and partners require us to place the source code for our products into escrow. These agreements typically provide that some party will have a limited, non-exclusive right to access and use this code as authorized by the license agreement if there is a bankruptcy proceeding instituted by or against us, or if we materially breach a contractual commitment to provide support and maintenance to the party.
Human Capital
Our key human capital management objectives are to attract, retain and develop the highest quality talent. To support these objectives, our human resources programs are designed to develop talent to prepare them for critical roles and leadership positions for the future; reward and support employees through competitive pay and benefits; enhance our culture through efforts aimed at making the workplace more engaging and inclusive; acquire talent and facilitate internal talent mobility to create a high-performing and diverse workforce.
12
As of June 30, 2024, we had 544 employees, including 539 full-time employees, of which 195 were in product development, 229 in services and support, 64 in sales and marketing, and 56 in finance and administration.
None of our employees are covered by collective bargaining agreements. While we believe our relations with our employees are good, our future performance depends largely upon the continued service of our key technical, sales and marketing, and senior management personnel, none of whom are bound by employment agreements requiring service for a defined period of time.
Available Information
We were incorporated in Delaware in September 1997, and our website is located at www.egain.com. We make available free of charge on our website our annual reports on Form 10-K, quarterly reports on Form 10-Q, current reports on Form 8-K and amendments to those reports, as soon as reasonably practicable after we electronically file or furnish such materials to the Securities and Exchange Commission. Our website and the information contained therein or connected thereto are not intended to be incorporated into this Annual Report on Form 10-K.
Information About Our Executive Officers
The following table sets forth information regarding eGain’s executive officers as of September 12, 2024:
Name |
|
Age |
|
Position |
Ashutosh Roy |
|
58 |
|
Chief Executive Officer and Chairman |
Eric N. Smit |
|
62 |
|
Chief Financial Officer |
Promod Narang |
|
66 |
|
Chief Technology Officer |
Ashutosh Roy co-founded eGain and has served as Chief Executive Officer and a Director of eGain since September 1997 and as President since October 1, 2003. From May 1995 through April 1997, Mr. Roy served as Chairman of WhoWhere? Inc., an Internet-services company co-founded by Mr. Roy. From June 1994 to April 1995, Mr. Roy worked at Parsec Technologies, a call center company based in New Delhi, India, which he co-founded. From August 1988 to August 1992, Mr. Roy worked as a software engineer at Digital Equipment Corporation, a major company in the computer industry at the time. Mr. Roy holds a B.S. in Computer Science from the Indian Institute of Technology, New Delhi, a Master’s degree in Computer Science from Johns Hopkins University and a M.B.A. from Stanford University.
Eric N. Smit has served as Chief Financial Officer since August 2002. Prior to that, Mr. Smit served in a variety of roles at eGain, including Vice President, Operations from April 2001 to July 2002, Vice President, Finance and Administration from June 1999 to April 2001, and Director of Finance from June 1998 to June 1999. From December 1996 to May 1998, Mr. Smit served as Director of Finance for WhoWhere? Inc., an Internet services company. From April 1993 to November 1996, Mr. Smit served as Vice President of Operations and Chief Financial Officer of Velocity Incorporated, a software game developer and publishing company. Mr. Smit holds a Bachelor of Commerce in Accounting from Rhodes University, South Africa.
Promod Narang has served as Chief Technology Officer since November 2022. Mr. Narang joined eGain in October 1998 and served as Director of Engineering and from March 2000 to October 2022, he served as Senior Vice President of Products and Engineering prior to assuming his current position. Prior to joining eGain, Mr. Narang served as President of VMpro, a system software consulting company, from September 1987 to October 1998. Mr. Narang holds a Bachelor of Science in Computer Science from Wayne State University.
13
ITEM 1A.RISK FACTORS
The risks and uncertainties described below are not the only ones facing us. Other events that we do not currently anticipate or that we currently deem immaterial also may affect our results of operations, cash flows and financial condition.
Risks Related to Our Business and Strategy
Our business is influenced by a range of factors that are beyond our control and that we have no comparative advantage in forecasting.
Factors influencing our business include:
| ● | general economic and business conditions; |
| ● | currency exchange rate fluctuations; |
| ● | the overall demand for enterprise software and services; |
| ● | customer acceptance of cloud-based solutions; |
| ● | governmental budgetary constraints or shifts in government spending priorities; and |
| ● | general political developments. |
The global economic climate continues to influence our business. This includes items such as a general tightening in the credit markets, lower levels of liquidity, increases in the rates of default and bankruptcy, and extreme volatility in credit, equity and fixed income markets. These macroeconomic developments negatively affected, and could continue to negatively affect, our business, operating results or financial condition which, in turn, could adversely affect our stock price. A general weakening of, and related declining corporate confidence in, the global economy or the curtailment in government or corporate spending could cause current or potential customers to reduce their technology budgets or be unable to fund software or services purchases, which could cause customers to delay, decrease or cancel purchases of our products and services or cause customers to not pay us or to delay paying us for previously purchased products and services.
Our revenue and operating results have fluctuated in the past and are likely to fluctuate in the future, and because we recognize revenue from subscriptions over a period of time, downturns in revenue may not be immediately reflected in our operating results.
Because we recognize revenue when we have satisfied performance obligations to customers in connection with our sales contracts, most of our revenue each quarter results from recognition of deferred revenue related to agreements entered into during previous quarters. Consequently, declines in new or renewed subscription agreements and maintenance agreements that occur in one quarter will largely be felt in future quarters, both because we may be unable to generate sufficient new revenue to offset the decline and because we may be unable to adjust our operating costs and capital expenditures to align with the changes in revenue. In addition, our subscription model makes it more difficult for us to increase our revenue rapidly in any period, because revenue from new customers must be recognized over the applicable subscription term. It is difficult to forecast the expediency of the transition of our license customers to our cloud delivery model. Accordingly, we believe that period-to-period comparisons of our results of operations should not be relied upon as definitive indicators of future performance.
Other factors that may cause our revenue and operating results to fluctuate include:
| ● | timing of customer budget cycles; |
| ● | the priority our customers place on our products compared to other business investments; |
| ● | size, timing and contract terms of new customer contracts, and unpredictable and often lengthy sales cycles; |
| ● | reduced renewals; |
14
| ● | competitive factors, including new product introductions, upgrades and discounted pricing or special payment terms offered by our competitors, as well as strategic actions by us or our competitors, such as acquisitions, divestitures, spin-offs, joint ventures, strategic investments or changes in business strategy; |
| ● | technical difficulties, errors or service interruptions in our solutions that may cause customer dissatisfaction with our solutions; |
| ● | consolidation among our customers, which may alter their buying patterns, or business failures that may reduce demand for our solutions; |
| ● | operating expenses associated with expansion of our sales force or business, and our product development efforts; |
| ● | cost, timing and management efforts related to the introduction of new features to our solutions; |
| ● | our ability to obtain, maintain and protect our intellectual property rights and adequately safeguard the information imported to our solutions or otherwise provided to us by our customers; and |
| ● | extraordinary expenses such as impairment charges, litigation or other payments related to settlement of disputes. |
Any of these developments may adversely affect our revenue, operating results and financial condition. Furthermore, we maintain a provision for credit losses resulting from the inability of our customers to make required payments. In such cases, we may be required to defer revenue recognition on sales to affected customers. In the future, we may have to record additional reserves or write-offs, or defer revenue on sales transactions, which could negatively impact our financial results.
Our SaaS business model is subject to certain risks.
Our business is highly dependent on our ability to continue to expand our SaaS business and cloud operations, including keeping pace with the market transition to SaaS solutions. If customers choose not to renew, or reduce, their subscriptions, our operating results and financial results will suffer.
The deferral or loss of one or more significant orders can also materially adversely affect our operating results, especially in a given quarter. As with other software-focused companies, a large amount of our quarterly business tends to come in the last few weeks, or even the last few days, of each quarter. This trend complicates the process of accurately predicting revenue and other operating results, particularly on a quarterly basis. In addition, our business is subject to seasonal factors that may also cause our results to fluctuate from quarter to quarter.
If we are unable to properly manage our SaaS transition, our business may suffer.
We cannot accurately predict subscription renewal rates and the impact these rates may have on our future revenue and operating results.
We allow our customers to elect not to renew their subscriptions for our service after the expiration of their initial subscription period, which is typically 12 to 36 months, and some customers have elected not to renew. In addition, our customers may choose to renew for fewer subscriptions (in quantity or products) or renew for shorter contract lengths. We cannot accurately predict renewal rates given our varied customer base of enterprise and small and medium size business customers and the number of multiyear subscription contracts. Our renewal rates may decline or fluctuate as a result of a number of factors, including customer dissatisfaction with our service, decreases in customers’ spending levels, decreases in the number of users at our customers, pricing changes and general economic conditions. If our customers do not renew their subscriptions for our service or reduce the number of paying subscriptions at the time of renewal, our revenue will decline, and our business will suffer.
Our future success also depends in part on our ability to sell additional features and services, more subscriptions or enhanced editions of our service to our current customers. This may also require increasingly sophisticated and costly sales efforts that are targeted at senior management. Similarly, the rate at which our customers purchase new or enhanced services depends on a number of factors, including general economic conditions and our customers’ reactions to price changes related to these additional features and services.
15
If our efforts to upsell to our customers are not successful and negative reaction occurs, our business may suffer.
Our lengthy sales cycles and the difficulty in predicting timing of sales or delays may impair our operating results.
The long sales cycle for our products may cause license and subscription revenue and operating results to vary significantly from period to period. The sales cycle for our products can be six months or more and varies substantially from customer to customer. Because we sell complex and deeply integrated solutions, it can take many months of customer education to secure sales. Since our potential customers may evaluate our products before, if ever, executing definitive agreements, we may incur substantial expenses and spend significant management and legal effort in connection with a potential customer.
Our multi-product offering and the increasingly complex needs of our customers contribute to a longer and unpredictable sales cycle. Consequently, we often face difficulty predicting the quarter in which expected sales will actually occur. This contributes to the uncertainty and fluctuations in our future operating results. In particular, the corporate decision-making and approval process of our customers and potential customers has become more complicated. This has caused our average sales cycle to further increase and, in some cases, has prevented the closure of sales that we believed were likely to close.
Because we depend on a relatively small number of customers for a substantial portion of our revenue, the loss of any of these customers or our failure to attract new significant customers could adversely impact our revenue and harm our business.
We have in the past and expect in the future to derive a substantial portion of our revenue from sales to a relatively small number of customers. The composition of these customers has varied in the past, and we expect that it will continue to vary over time. The loss of any significant customer or a decline in business with any significant customer would materially and adversely affect our financial condition and results of operations.
The market for customer engagement software, including generative AI product offerings, is competitive, and our business will be adversely affected if we are unable to successfully compete.
The market for customer engagement software is intensely competitive. Other than product innovation and existing customer relationships, there are no substantial barriers to entry in this market, and established or new entities may enter this market in the future. While software internally developed by enterprises represents indirect competition, we also compete directly with packaged application software vendors, including Genesys Telecommunications Laboratories, Inc., LivePerson, Inc., NICE Ltd., and Verint Systems Inc. In addition, we face actual or potential competition from larger software companies such as Microsoft Corporation, Oracle Corporation, salesforce.com, Inc., ServiceNow, Inc., and similar companies that may attempt to sell customer engagement software to their installed base.
We believe that competition will continue to be fierce as current competitors increase the sophistication of their offerings and as new participants enter the market. Many of our current and potential competitors have longer operating histories, larger customer bases, broader brand recognition, and significantly greater financial, marketing and other resources. With more established and better-financed competitors, these companies may be able to undertake more extensive marketing campaigns, adopt more aggressive pricing policies, and make more attractive offers to businesses to induce them to use their products or services. If we are unable to compete successfully, our business will be adversely affected.
We are also investing in AI across the entire company and infusing generative AI capabilities into our product and service offerings. We expect AI technology and services to be a highly competitive and rapidly evolving market. We will bear significant development and operational costs to build and support the generative AI capabilities, products, and services necessary to meet the needs of our customers. To compete effectively, we must also be responsive to technological change, potential regulatory developments, and public scrutiny. Such competitive pressure may cause decreased sales volumes, price reductions, and/or increased operating costs, such as for research and development, marketing, and sales activities. This may lead to lower revenue, gross margins, and operating income. In addition, customers are currently assessing their AI utilization strategy, so it is difficult to estimate with any reasonable degree of precision the impact of generative AI product offerings on our future revenue or expected demand for our products.
16
If we fail to expand and improve our sales performance and marketing activities, or retain our sales and marketing personnel, we may be unable to grow our business, which could negatively impact our operating results and financial condition.
Expansion and growth of our business is dependent on our ability to expand our sales force and on the ability of our sales force to increase sales. If we are not able to effectively develop and maintain awareness of our products in a cost-effective manner, we may not achieve widespread acceptance of our existing and future products. This may result in a failure to expand and attract new customers and enhance relationships with existing customers. This may impede our efforts to improve operations in our other areas and may result in declines in the market price of our common stock.
Due to the complexity of our customer engagement hub platform and related products and services, we must utilize highly trained sales personnel to educate prospective customers regarding the use and benefits of our products and services as well as provide effective customer support. If we have turnover in our sales and marketing teams, we may not be able to successfully compete with our competitors, and our results of operations and financial condition may be harmed.
Our failure to maintain, develop, or expand strategic and third-party distribution channels would impede our revenue growth.
Our success and future growth depend in part upon the skills, experience, performance and continued service of our distribution partners, including software and hardware vendors and resellers. Our distribution partners engage with us in a number of ways, including assisting us to identify prospective customers, distributing our products and services in geographies where we do not have a physical presence and distributing our products and services where they are considered complementary to other products of the partner or third-party products distributed by the partner. We believe that our future success depends in part upon our ability to develop, maintain and expand strategic, long-term and profitable partnerships and reseller relationships. If we are unable to do so for any reason, including as a result of any change in the leadership of our distribution partners, or if any existing or future distribution partners fail to successfully market, resell, implement or support our products for their customers, or if distribution partners represent multiple providers and devote greater resources to market, resell, implement and support competing products and services, our future revenue growth could be impeded.
We sometimes rely on distribution partners to recommend our products to their customers. We likewise depend on broad market acceptance by these distribution partners of our product and service offerings. Our agreements generally do not prohibit competitive offerings and our distribution partners may develop market or recommend software applications that compete with our products. To the extent we devote resources to these relationships and the partnerships do not proceed as anticipated or provide revenue or other results as anticipated, our business may be harmed. Once partnerships are forged, there can be no guarantee that such relationships will be renewed in the future or available on acceptable terms. If we lose strategic third-party relationships, fail to renew or develop new relationships, or fail to fully exploit revenue opportunities within such relationships, our results of operations and future growth may suffer.
Difficulties and delays in customers implementing our products could harm our revenue and margins.
We generally recognize revenue upon the transfer of control of promised services to our customers in the amount that is commensurate with the consideration that we expect to receive in exchange for those services. If an arrangement requires significant customization or implementation services from us, recognition of the associated subscription and service revenue could be delayed. The timing of the commencement and completion of these services is subject to factors that may be beyond our control, as this process may require access to the customer’s facilities and coordination with the customer’s personnel after delivery of the software obligations. In addition, customers could cancel or delay product implementations. Implementation typically involves working with sophisticated software, computing, and communications systems. If we experience difficulties with implementation or do not meet project milestones in a timely manner, we could be obligated to devote more customer support, engineering, and other resources to a particular project. Some customers may also require us to develop customized features or capabilities. If new or existing customers cancel or have difficulty deploying our products or require significant amounts of our professional services, support, or customized features, revenue recognition could be cancelled or further delayed and our costs could increase, causing increased variability in our operating results.
17
Implementation services may be performed by our own staff, by a third-party partner or by a combination of the two. Our strategy is to work with partners to increase the breadth of capability and depth of capacity for delivery of these services to our customers, and we expect the number of our partner-led implementations to continue to increase over time. If a customer is not satisfied with the quality of work performed by us or a partner or with the type of professional services or functionality delivered, even if we are not contractually responsible for the partner services, then we could incur additional costs to address the situation, the profitability of that work might be impaired and the customer’s dissatisfaction with our or our partner’s services could damage our ability to expand the scope of functionality subscribed to by that customer. In addition, negative publicity related to our customer relationships, regardless of its accuracy, may further damage our business by affecting our ability to compete for new business with current and prospective customers.
We conduct a significant portion of our business and operations outside of the United States, which exposes us to additional risks that may not exist in the United States. These risks in turn could cause our operating results and financial condition to suffer.
We derived 22% of our revenue from EMEA sales during the fiscal years ended June 30, 2024 and 2023. In addition to those discussed elsewhere in this section, our EMEA sales operations are subject to a number of specific risks, such as:
| ● | general economic conditions in each country or region in which we do or plan to do business; |
| ● | foreign currency fluctuations and imposition of exchange controls; |
| ● | changes in data privacy laws including European Union’s General Data Protection Regulation (GDPR); |
| ● | difficulty and costs in staffing and managing our international operations; |
| ● | difficulties in collecting accounts receivable and longer collection periods; |
| ● | health or similar issues, such as a pandemic or epidemic; |
| ● | various trade restrictions and tax consequences; |
| ● | hostilities in various parts of the world, such as the conflict between Russia and Ukraine and the evolving events in Israel and Gaza; and |
| ● | reduced intellectual property protections in some countries. |
Any of the above risks could adversely affect our international operations, reduce our revenue from customers outside of the United States or increase our operating costs, each of which could adversely affect our business, results of operations, financial condition, and growth prospects.
As of June 30, 2024, approximately 45% of our workforce was employed in India. Of our employees in India, 46% are allocated to research and development. Although the movement of certain operations internationally was principally motivated by cost cutting, the continued management of these remote operations requires significant management attention and financial resources that could adversely affect our operating performance. In addition, with the significant increase in the numbers of foreign businesses that have established operations in India, the competition to attract and retain employees there has increased significantly. As a result of the increased competition for skilled workers, we experienced increased compensation costs and expect these costs to increase in the future. Our reliance on our workforce in India makes us particularly susceptible to disruptions in the business environment in that region. In particular, sophisticated telecommunications links, high-speed data communications with other eGain offices and customers, and overall consistency and stability of our business infrastructure are vital to our day-to-day operations, and any impairment of such infrastructure will cause our financial condition and results to suffer. In addition, the maintenance of stable political relations between the United States, the European Union (EU), and India are also of great importance to our operations.
Any of these risks could have a significant impact on our product development, customer support, or professional services. To the extent the benefit of maintaining these operations abroad does not exceed the expense of establishing and maintaining such activities, our operating results and financial condition will suffer.
18
Unplanned system interruptions, delays in service or inability to increase capacity, including internationally, at our third-party data center facilities could impair the use or functionality of our cloud operations and harm our business.
Our customers have in the past experienced some interruptions with our cloud operations. We believe that these interruptions will continue to occur from time to time. These interruptions could be due to hardware and operating system failures. As a result, our business will suffer if we experience frequent or long system interruptions that result in the unavailability or reduced performance of our hosted operations or reduce our ability to provide remote management services. We expect to experience occasional temporary capacity constraints due to sharply increased traffic or other Internet-wide disruptions, which may cause unanticipated system disruptions, slower response times, impaired quality, and degradation in levels of customer service. If this were to continue to happen, our business and reputation could be seriously harmed.
Our success largely depends on the efficient and uninterrupted operation of our computer and communications hardware and network systems. We currently serve our customers from third-party data center facilities operated by third parties in the United States and other international locations. Any damage to, or failure of, our systems generally could interrupt service or impair the use or functionality of our cloud operations. In addition, as we continue to increase the number of customers and users on our cloud operations, we will need to increase the capacity of our data center infrastructure. If we do not increase our capacity in a timely manner, customers could experience interruptions or delays in access to our cloud operations. Customer data that we store in third party data centers may also be vulnerable to damage or interruption from floods, fires, earthquake, power loss, telecommunications failures and similar events. Any damage to, or failure of, our systems, or those of our third-party data centers, could result in impairment of, or interruptions in, our service. Impairment or interruptions in our service may reduce our revenue, cause us to issue credits, pay penalties, or cause customers to terminate their subscriptions and adversely affect our renewal rate and our ability to attract new customers. Our business will also be harmed if our customers and potential customers believe our cloud operations are unreliable.
We maintain a business continuity plan for our customers in the event of an outage. We maintain other co-locations for the purpose of disaster recovery as well as maintaining backups of our customer’s information. We provide premium disaster recovery and standard disaster recovery to our customers. If a customer opts not to pay for premium disaster recovery, we will only assure that their data is available within 72 hours. This delay could cause severe disruptions to our customers’ customers and may result in customer termination of our solutions. Our premium disaster recovery service provides for an alternative data center and a return to operations within one business day.
We have entered into support obligations with our customers that require minimum performance standards, including standards regarding the response time of our support services. If we fail to meet these standards, our customers could terminate their relationships with us, and we could be subject to contractual refunds, and exposure to claims for losses by, customers.
Software errors could be costly and time-consuming for us to correct, and could harm our reputation and impair our ability to sell our solutions.
Our solutions are based on complex software that may contain errors, or “bugs,” that could be costly to correct, harm our reputation, and impair our ability to sell our solutions to new customers. Moreover, customers relying on our solutions may be more sensitive to such errors and potential security vulnerabilities and business interruptions for these applications. If we incur substantial costs to correct any errors of this nature, our operating margins could be adversely affected. Because our customers depend on our solutions for critical business functions, any service interruptions could result in lost or delayed market acceptance and lost sales, higher service-level credits and warranty costs, diversion of development resources, and product liability suits.
The terms we agree to in our Service Level Agreements or other contracts may result in increased costs or liabilities, which would in turn affect our results of operations.
Our Service Level Agreements provide for service credits for system unavailability, and in some cases, indemnities for loss, damage, or costs resulting from use of our system. If we were required to provide any of these in a material way, our results of operations would suffer.
19
If we are unable to increase the profitability of subscription revenue, if we experience significant customer attrition, or if we are required to delay recognition of revenue, our operating results could be adversely affected.
We have invested, and expect to continue to invest, substantial resources to expand, market, implement, and refine our cloud offerings. If we are unable to increase the volume of our subscription business, we may not be able to achieve sustained profitability.
Factors that could harm our ability to improve our gross margins, which may affect our operating profitability, include:
| ● | increased costs to license and maintain third party software embedded in our software applications or the cost to create or substitute such third-party software if it can no longer be licensed on commercially reasonable terms; |
| ● | our inability to maintain or increase the prices customers pay for our products and services based on competitive pricing pressures and general economic conditions limiting customer demand; |
| ● | increased cost of third-party services providers, including data centers for our cloud operations and professional services contractors performing implementation and technical support services to cloud customers; |
| ● | customer contractual requirements that delay revenue recognition until customer implementations commence production operations or customer-specific requirements are met; |
| ● | significant attrition as customers decide for their own economic or other reasons to not renew their subscription contracts when they are up for renewal negatively impacting the efficiency of our data centers and leading to the costs being spread over fewer customers negatively impacting gross margin; and |
| ● | the inability to implement, or delays in implementing, technology-based efficiencies and efforts to streamline and consolidate processes to reduce operating costs. |
We depend on broad market acceptance of our applications and of our business model. If our expectations regarding the market for our applications are not met, our business could be seriously harmed.
We depend on the widespread acceptance and use of our applications as an effective solution for businesses seeking to manage high volumes of customer interactions across multiple channels, including Web, phone, email, print and in-person. While we believe the potential to be very large, we cannot accurately estimate the size or growth rate of the potential market for such product and service offerings generally, and we do not know whether our products and services in particular will achieve broad market acceptance. The market for customer engagement software is rapidly evolving, and concerns over the security and reliability of online transactions, the privacy of users and quality of service or other issues may inhibit the growth of the Internet and commercial online services. If the market for our applications fails to grow or grows more slowly than we currently anticipate, our business will be seriously harmed.
Furthermore, our business model is premised on business assumptions that are still evolving. Our business model assumes that both customers and companies will increasingly elect to communicate through multiple channels, as well as demand integration of the online channels into the traditional telephone-based call center. If any of these assumptions is incorrect or if customers and companies do not adopt digital technology in a timely manner, our business will be seriously harmed and our stock price will decline.
We may be unable to respond to the rapid technological change and changing customer preferences in the online sales, marketing, customer service, and/or online consumer services industries and this may cause our business to suffer.
If we are unable, for technological, legal, financial or other reasons, to adapt in a timely manner to changing market conditions in the online sales, marketing, customer service and/or e-commerce industry or our customers’ or Internet users’ requirements or preferences, our business, results of operations and financial condition would be materially and adversely affected. Business on the Internet is characterized by rapid technological change. In addition, the market for online sales, marketing, customer service and expert advice solutions is relatively new. Changes in customer and Internet user requirements and preferences, frequent new product and service introductions embodying new technologies and the emergence of new industry standards and practices such as but not limited to security standards could render our services and our proprietary technology and systems obsolete. The rapid evolution of these products and services will require that we continually improve the performance, features and reliability of our services.
20
Our success will depend, in part, on our ability to:
| ● | enhance the features and performance of our services; |
| ● | develop and offer new services that are valuable to companies; and |
| ● | respond to technological advances and emerging industry standards and practices in a cost-effective and timely manner. |
If any of our new services, including upgrades to our current services, do not meet our customers’ expectations, our business may be harmed. Updating our technology may require significant additional capital expenditures and could materially and adversely affect our business, results of operations, and financial condition.
If new services require us to grow rapidly, this could place a significant strain on our managerial, operational, technical, and financial resources. In order to manage our growth, we could be required to implement new or upgraded operating and financial systems, procedures and controls. Our failure to expand our operations in an efficient manner could cause our expenses to grow, our revenue to decline or grow more slowly than expected and could otherwise have a material adverse effect on our business, results of operations and financial condition.
We employ third-party technologies for use in or with our platform and the inability to license such technologies on commercially reasonable terms or the inability to maintain these licenses or errors in the software we license could result in increased costs, or reduced service levels, which could adversely affect our business.
Our platform incorporates certain third-party software obtained under licenses from other companies, and we use third-party software development tools as we continue to develop and enhance our platform. We anticipate that we will continue to rely on such third-party software in the future. Although we believe that there are commercially reasonable alternatives to the third-party software we currently license, this may not always be the case, or it may be difficult or costly to replace such software. In addition, integration of the software used in our platform with new third-party software may require significant work and require substantial investment of our time and resources. Also, to the extent that our platform depends upon the successful operation of third-party software in conjunction with our software, any undetected errors or defects in this third-party software could prevent the deployment or impair the functionality of our platform, delay new feature introductions, result in a failure of our functionality, and injure our reputation. Our use of additional or alternative third-party software would require us to enter into license agreements with third parties. To the extent we need to license third-party technologies, we may be unable to do so on commercially reasonable terms or at all.
Third-party licenses may expose us to increased risks, including risks associated with the integration of new technology, the diversion of resources from the development of our own proprietary technology, and our inability to generate revenue from new technology sufficient to offset associated acquisition and maintenance costs. In the event that we are not able to maintain our licenses to third-party software, or cannot obtain licenses to new software as needed, or in the event third-party software used in conjunction with our platform contains errors or defects, our business, operating results, and financial condition may be adversely affected.
Our offshore product development, support and professional services may prove difficult to manage or may not allow us to realize our cost reduction goals, produce effective new solutions and provide professional services to drive growth.
We use offshore resources to perform new product and services development and provide support and professional consulting efforts, which requires detailed technical and logistical coordination. We must ensure that our international resources and personnel are aware of and understand development specifications and customer support, as well as implementation and configuration requirements and that they can meet applicable timelines. If we are unable to maintain acceptable standards of quality in support, product development and professional services, our attempts to reduce costs and drive growth through new products and margin improvements in technical support and professional services may be negatively impacted, which would adversely affect our results of operations. Outsourcing services to offshore providers may expose us to misappropriation of our intellectual property or that of our customers, or make it more difficult to defend intellectual property rights in our technology.
21
If we are unable to hire and retain key personnel, our business and results of operations would be negatively affected.
Our success will depend in large part on the skills, experience and performance of our senior management, engineering, sales, marketing and other key personnel. The loss of the services of any of our senior management or other key personnel, including our Chief Executive Officer and co-founder, Ashutosh Roy, could harm our business. Additionally, in the technology industry, there is substantial and continuous competition for highly skilled business, product development, technical and other personnel. We may also experience increased compensation costs that are not offset by either improved productivity or higher sales. Our failure to recruit new personnel and to retain and motivate existing personnel could have significant negative effects on us, including impairing our ability to expand our business, and our results of operations could suffer.
We may not be able to realize the benefits of offering the limited, free “Innovation in 30 days” version of our service.
We offer a limited version of our subscription service to customers or potential customers free of charge (known as “Innovation in 30 days”) in order to promote usage, brand and product awareness, and adoption, and we invest time and resources for such initial engagements without compensation from the customers. Some customers never enter into a definitive contract for our paid subscription service despite the time and effort we may have expended on such initiatives. To the extent that these customers do not become paying customers, we will not realize the intended benefits of this marketing effort, and our ability to grow our business and revenue may be harmed.
We may not be able to raise additional capital on acceptable terms, if at all, or without dilution to our stockholders which could limit our ability to grow our business and expand our operations.
Our working capital requirements in the foreseeable future are subject to numerous risks and will depend on a variety of factors. We may seek additional funding to finance our operations or should we make acquisitions. We may also need to secure additional financing due to unforeseen or unanticipated market conditions. We may try to raise additional funds through public or private financings, strategic relationships, or other arrangements. Such financing may be difficult to obtain on terms acceptable to us, if at all. If we raise additional funds through the issuance of equity or convertible securities, then the issuance could result in substantial dilution to existing stockholders. If we raise additional funds through the issuance of debt securities or preferred stock, these new securities would have rights, preferences, and privileges senior to those of the holders of our common stock. In addition, the terms of these securities could impose restrictions on our operations. If we are not able to raise additional funds on terms acceptable to us, if and when needed, our ability to fund our operations, take advantage of opportunities, and develop or expand our business could be significantly limited.
Our provision may be insufficient to cover accounts receivable we are unable to collect.
We assume a certain level of credit risk with our customers in order to do business. Conditions affecting any of our customers could cause them to become unable or unwilling to pay us in a timely manner, or at all, for products or services we have already provided them. In the past, we have experienced collection delays from certain customers, and we cannot predict whether we will continue to experience similar or more severe delays in the future. Although we have established provision to cover losses due to delays or inability to pay, there can be no assurance that such reserves will be sufficient to cover our losses. If losses due to delays or inability to pay are greater than our reserves, it could harm our business, operating results and financial condition.
22
If we acquire companies or technologies, we may not realize the expected business benefits, the acquisitions could prove difficult to integrate, disrupt our business and adversely affect our operations.
As part of our business strategy, we periodically make investments in, or acquisitions of, complementary businesses, joint ventures, services and technologies and intellectual property rights, and we expect that we will continue to make such investments and acquisitions in the future. Acquisitions and investments involve numerous risks, including:
| ● | the potential failure to achieve the expected benefits of the combination or acquisition; |
| ● | difficulties in and the cost of integrating operations, technologies, services and personnel; |
| ● | diversion of financial and managerial resources from existing operations; |
| ● | risks of entering new markets in which we have little or no experience or where competitors may have stronger market positions; |
| ● | potential write-offs of acquired assets or investments, and potential financial and credit risks associated with acquired customers; |
| ● | potential loss of key employees; |
| ● | inability to generate sufficient revenue to offset acquisition or investment costs; |
| ● | the inability to maintain relationships with customers and partners of the acquired business; |
| ● | the difficulty of transitioning the acquired technology onto our existing platforms and maintaining the security standards consistent with our other services for such technology; |
| ● | potential unknown liabilities associated with the acquired businesses; |
| ● | unanticipated expenses related to acquired technology and its integration into existing technology; |
| ● | negative impact to our results of operations because of the depreciation and amortization of amounts related to acquired intangible assets, fixed assets and deferred compensation, and the loss of acquired deferred revenue and unbilled deferred revenue; |
| ● | delays in customer purchases due to uncertainty related to any acquisition; |
| ● | the need to implement controls, procedures and policies at the acquired company; |
| ● | challenges caused by distance, language and cultural differences; |
| ● | in the case of foreign acquisitions, the challenges associated with integrating operations across different cultures and languages and any currency and regulatory risks associated with specific countries; and |
| ● | the tax effects of any such acquisitions. |
We may be subject to legal liability and/or negative publicity for the services provided to consumers through our technology platforms.
Our technology platforms enable representatives of our customers as well as individual service providers to communicate with consumers and other persons seeking information or advice on the Internet. The law relating to the liability of online platform providers such as us for the activities of users of their online platforms is often challenged in the U.S. and internationally. We may be unable to prevent users of our technology platforms from providing negligent, unlawful or inappropriate advice, information or content through our technology platforms, or from behaving in an unlawful manner, and we may be subject to allegations of civil or criminal liability for negligent, fraudulent, unlawful or inappropriate activities carried out by users of our technology platforms.
Claims could be made against online services companies under both U.S. and foreign law such as fraud, defamation, libel, invasion of privacy, negligence, copyright or trademark infringement, or other theories based on the nature and content of the materials disseminated by users of our technology platforms. In addition, domestic and foreign legislation has been proposed that could prohibit or impose liability for the transmission over the Internet of certain types of information. Our defense of any of these actions could be costly and involve significant time and attention of our management and other resources.
23
The Digital Millennium Copyright Act (DMCA) is intended, among other things, to reduce the liability of online service providers for listing or linking to third-party web properties that include materials that infringe copyrights or rights of others. Additionally, portions of the Communications Decency Act (CDA) are intended to provide statutory protections to online service providers who distribute third party content. A safe harbor for copyright infringement is also available under the DMCA to certain online service providers that provide specific services, if the providers take certain affirmative steps as set forth in the DMCA. Certain questions regarding the safe harbor under the DMCA and the CDA have yet to be litigated, and we cannot guarantee that we will meet the safe harbor requirements of the DMCA or of the CDA. If we are not covered by a safe harbor, for any reason, we could be exposed to claims, which could be costly and time-consuming to defend.
If our cybersecurity systems or the systems of our vendors, partners and suppliers are breached and unauthorized access is obtained to a customer’s data or our data or IT systems, our service may be perceived as not being secure, customers may curtail or stop using our service and we may incur significant legal and financial exposure and liabilities.
Security incidents have become more prevalent across industries and the methods and techniques used by threat actors continue to evolve at a rapid pace. These cyberattacks may occur on our systems and we may be unable to identify current attacks, anticipate these attacks or implement adequate security measures. Our service involves the storage and transmission of customers’ proprietary information, and security incidents could expose us to a risk of loss of this information, loss of access, litigation and possible liability. The techniques used to effect unauthorized penetration of computer systems are constantly evolving and have been increasing in sophistication. While we have security measures in place that are designed to protect customer information and prevent data loss and other security breaches, these security measures may be breached as a result of third-party action, including intentional misconduct by computer hackers (which may involve nation states and individuals sponsored by them), employee error, malfeasance or otherwise and result in someone obtaining unauthorized access to our customers’ data or our data, including our intellectual property and other confidential business information, or our IT systems. Additionally, third parties may attempt to fraudulently induce employees or customers into disclosing sensitive information such as user names, passwords or other information in order to gain access to our customers’ data or our data or IT systems.
Employees or contractors have introduced vulnerabilities in, and enabled the exploitation of, our IT environments in the past and may do so in the future. These cybersecurity attacks threaten to misappropriate our proprietary information, cause interruptions of our IT services and commit fraud. Because the techniques used to obtain unauthorized access, or to sabotage systems, change frequently and generally are not recognized until launched against a target, we may be unable to anticipate these techniques or to implement adequate preventative measures. Further, if unauthorized access or sabotage remains undetected for an extended period of time, the effects of such breach could be exacerbated. In addition, our ability to defend against and mitigate cyberattacks depends in part on prioritization decisions that we and third parties upon whom we rely make to address vulnerabilities and security defects. While we endeavor to address all identified vulnerabilities in our products, we must make determinations as to how we prioritize developing and deploying the respective fixes, and we may be unable to do so prior to an attack.
In addition, our customers may authorize third party access to their customer data located in our cloud environment. Because we do not control the transmissions between customer authorized third parties, or the processing of such data by customer authorized third parties, we cannot ensure the integrity or security of such transmissions or processing.
Cybersecurity attacks could require significant expenditures of our capital and diversion of our resources. If these attacks are successful, they could result in the theft of proprietary, personally identifiable, confidential and sensitive information of ours, our employees, our customers and our business partners, and could materially disrupt business for us, our customers and our business partners. A successful cybersecurity attack involving our data center, network or software products could also negatively impact the market perception of the effectiveness of our products or lead to contractual disputes, litigation or government regulatory action against us, any of which could materially adversely affect our business, reputation and resulting operations.
24
We may also experience disruptions, outages, and other performance problems on our systems due to service attacks, unauthorized access, or other security-related incidents. For example, third parties may conduct attacks designed to temporarily deny customers access to our services. Any successful denial of service attack could result in a loss of customer confidence in the security of our platform and damage to our brand.
Our platform involves the storage and transmission of our customers’ information, which may including their business and financial data. As a result, unauthorized access to customer data or security breaches could result in the loss, or unauthorized dissemination, of such data, which could seriously harm our or our customers’ businesses and reputations. Any of these security incidents could negatively affect our ability to attract new customers, cause existing customers to elect to not renew their subscriptions, result in reputational damage or subject us to third-party lawsuits, regulatory fines, or other action or liability, which could adversely affect our operating results. Any insurance coverage we may have related to security and privacy damages may not be adequate for liabilities actually incurred and we cannot be certain that insurance will continue to be available to us on economically reasonable terms, or at all. These risks are likely to increase as we continue to grow the scale and functionality of our platform and process, store, and transmit increasingly large amounts of our customers’ information and data, which may include proprietary or confidential data or personal or identifying information.
Changes in the European regulatory environment regarding privacy and data protection regulations, such as the GDPR, could expose us to risks of noncompliance and costs associated with compliance.
We have in the past relied on adherence to the U.S. Department of Commerce’s Safe Harbor Privacy Principles, the U.S.- EU and U.S.-Swiss Safe Harbor Frameworks, and their successors, the EU-U.S. and Swiss-U.S. Privacy Shield Frameworks, as agreed to and set forth by the U.S. Department of Commerce, and the EU and Switzerland, which established a means for legitimating the transfer of personally identifiable information (PII) by U.S. companies doing business in Europe from the European Economic Area (EEA) and Switzerland to the U.S. However, as a result of the October 6, 2015 EU Court of Justice (ECJ), opinion in Case C-362/14 (Schrems v. Data Protection Commissioner) regarding the adequacy of the U.S.-EU Safe Harbor Framework, and the July 16, 2020 ECJ judgment in Case C-311/18 (Data Protection Commissioner v Facebook Ireland Limited and Maximillian Schrems) regarding the adequacy of the Privacy Shield Framework, both frameworks are no longer deemed to constitute a valid method of compliance with restrictions set forth in European law regarding the transfer of data outside of the EEA. The EJC also noted that standard contractual clauses (approved by the European Commission as an adequate personal data transfer mechanism) may not necessarily be relied upon in all circumstances. In addition to other mechanisms, in limited circumstances we may rely on Privacy Shield certifications of third parties (for example, vendors and partners). The European Commission and the United Kingdom’s Information Commissioner’s Office have published new standard contractual clauses that are required to be implemented. Following issuance of a U.S. Executive Order, a new framework, the EU-U.S. Data Privacy Framework (“EU-U.S. DPF”) was created as a successor to the Privacy Shield. Following an adequacy decision issued by the European Commission on July 10, 2023, the DPF, along with a UK extension to the EU-U.S. DPF that allows the transfer of personal data from the UK to the U.S. (the “UK DPF Extension”), is available for companies as a lawful transfer mechanism for personal data transfers to the U.S. from the EEA and UK. The Swiss-U.S. Data Privacy Framework (“Swiss-U.S. DPF”) also has been established, but has not yet been granted an adequacy decision by the Swiss Federal Data Protection and Information Commissioner. We have self-certified to the EU-U.S. DPF, the UK DPF Extension, and the Swiss-U.S. DPF. The EU-U.S. DPF already has been the subject of legal challenge, however, and more generally, these frameworks may be subject to legal challenges from privacy advocacy groups or others. Additionally, the European Commission's adequacy decision regarding the DPF provides that the DPF will be subject to future reviews and may be subject to suspension, amendment, repeal, or limitations in scope by the European Commission. These developments regarding cross-border data transfers have created uncertainty and increased the risk around our international operations and may require us to review and amend the legal mechanisms by which we make or receive personal data transfers to the U.S. and other jurisdictions. We may, among other things, be required to implement additional contractual and technical safeguards for any personal data transferred out of the EEA, Switzerland, the United Kingdom or other regions which may increase compliance costs, lead to increased regulatory scrutiny or liability, may require additional contractual negotiations, and may adversely impact our business, financial condition and operating results.
We may also experience hesitancy, reluctance, or refusal by European or multi-national customers to continue to use our services due to the potential risk exposure to such customers as a result of the international legal developments. We and our customers are at risk of enforcement actions taken by an EU or UK data protection authority until such point in time that we ensure that all data transfers to us from the EEA and UK are legitimized.
25
We may find it necessary to establish systems to maintain EU/UK-origin data in the EEA or UK, which may involve substantial expense and distraction from other aspects of our business.
We publicly post our privacy policies and practices concerning our processing, use and disclosure of PII. Our publication of our privacy policy and other public statements that provide promises and assurances about privacy and security can subject us to potential governmental action if they are found to be deceptive or misrepresentative of our practices. Further, the costs of compliance with, and other burdens imposed by, such laws, regulations and policies that are applicable to us may limit the use and adoption of our products and solutions and could have a material adverse impact on our results of operations.
Privacy concerns and laws, evolving regulation of cloud computing and other domestic or foreign regulations may limit the use and adoption of our solutions and adversely affect our business.
Further to the above, regulation related to the provision of services on the Internet is increasing, as federal, state and foreign governments continue to adopt new laws and regulations addressing data privacy and the collection, processing, storage and use of personal information. Further, laws are increasingly aimed at the use of personal information for marketing purposes, such as the EU’s e-Privacy Directive (which is set to be replaced by a new EU e-Privacy Regulation which will have a “direct effect” in each EU Member State), and the country-specific regulations that implement that directive. These and other requirements could reduce demand for our solutions or restrict our ability to store and process data or, in some cases, impact our ability to offer our services and solutions in certain locations. Although we have implemented contracts, diligence programs, policies and procedures designed to address compliance with applicable laws and regulations, there can be no assurance that our employees, contractors, partners, suppliers, data providers or agents will not violate such laws and regulations or our contracts, policies and procedures. Additionally, public perception and standards related to the privacy of personal information can shift rapidly, in ways that may affect our reputation or influence regulators to enact regulations and laws that may limit our ability to provide certain products and services. For example, numerous jurisdictions, including the EU, are considering laws and regulations that would impose additional data privacy and other compliance requirements on the use of AI and could require us to adjust or limit our product offerings in such jurisdictions.
In the U.S., California enacted the California Consumer Privacy Act (CCPA) on June 28, 2018, which went into effect on January 1, 2020. The CCPA gives California residents expanded rights to access and delete their personal information, opt out of certain personal information sharing and receive detailed information about how their personal information is used. The CCPA provides for civil penalties for violations, as well as a private right of action for data breaches that is expected to increase data breach litigation. On November 3, 2020, California passed the California Privacy Rights Act (CPRA), which became effective on January 1, 2023 and amends and expands the CCPA, including the introduction of sensitive personal information as a new regulated dataset in California that is subject to new disclosure and purpose limitation requirements. Additionally, by July 2024, additional states had enacted numerous comprehensive state data privacy laws, requiring businesses to evaluate each law individually for specific compliance requirements and consumer rights, including the following:
| ● | The Virginia Consumer Data Protection Act (VCDPA) became effective on January 1, 2023; |
| ● | The Colorado Privacy Act and the Connecticut Data Privacy Act both become effective on July 1, 2023; |
| ● | The Utah Consumer Privacy Act became effective on December 31, 2023; |
| ● | Florida's Digital Bill of Rights, Oregon's Consumer Privacy Act, and Texas' Data Privacy and Security Act went into effect on July 1, 2024; |
| ● | Montana's Consumer Data Privacy Act will come into effect on October 1, 2024; |
| ● | Delaware’s Personal Data Privacy Act, Iowa’s Consumer Data Protection Act, Nebraska’s Online Data Privacy Act and New Hampshire’s Privacy Act will come into effect on January 1, 2025; |
| ● | New Jersey’s Privacy Act will come into effect on January 15, 2025; |
| ● | Tennessee’s Information Protection Act will come into effect on July 1, 2025; |
| ● | Minnesota’s Consumer Privacy Act will come into effect on July 31, 2025; |
| ● | Maryland’s Online Data Privacy Act will come into effect on October 1, 2025; and |
| ● | Indiana’s Consumer Data Protection Act and Kentucky’s Consumer Data Protection Act will come into effect on January 1, 2026. |
26
Furthermore, New York enacted the Stop Hacks and Improve Electronic Data Security Act (SHIELD Act), which became effective March 2020 and requires companies with data relating to New Yorkers to adopt comprehensive cybersecurity programs. Aspects of the CCPA, CPRA and other states’ privacy laws remain unclear and we may be required to modify our practices further in an effort to comply with them. These statutes may increase our compliance costs and potential liability.
Furthermore, on August 11, 2023, India’s Digital Personal Data Protection Bill (DPDP) received presidential assent after passing both houses of India’s legislature but there has been no official slated implementation date. DPDP applies to personal data processed within India and personal data outside the territory of India if such processing is in connection with any activity related to offering of goods or services to data subjects. We will continue to monitor developments related to new privacy laws which will require us to incur additional costs and expenses in an effort to monitor and comply with such laws.
In addition to government activity, privacy advocacy and other industry groups have established or may establish new self-regulatory standards that may place additional burdens on us. Our customers expect us to meet voluntary certification or other standards established by third parties, such as TRUSTe. If we are unable to maintain these certifications or meet these standards, it could adversely affect our ability to provide our solutions to certain customers and could harm our business.
The costs of compliance with and other burdens imposed by laws, regulations and standards may limit the use and adoption of our service and reduce overall demand for it, or lead to significant fines, penalties or liabilities for any noncompliance.
Furthermore, concerns regarding data privacy may cause our customers’ customers to resist providing the data necessary to allow our customers to use our service effectively. Even the perception that the privacy of personal information is not satisfactorily protected or does not meet regulatory requirements could inhibit sales of our products or services, and could limit adoption of our subscription solution. Moreover, as our customers face increased scrutiny for data privacy breaches, they may elect to transfer the risk to us through contractual provisions which may subject us to increasing levels of contractual liability for data privacy breaches.
Issues in the development and use of AI may result in reputational or competitive harm or liability.
We are integrating AI into several of our offerings, developed either by us or in collaboration with our strategic partner, OpenAI. We anticipate significant growth in this area. However, like many innovations, AI comes with risks and challenges that could impact its adoption and our business. Potential issues include flawed algorithms or training methods, inadequate or biased datasets, and harmful or illegal content generated by AI systems. Poor AI development or deployment practices could lead to incidents that hinder AI acceptance, cause harm, or result in our products not functioning as intended. Human oversight may be necessary for certain outputs. These challenges, along with other issues related to innovative technologies, could expose us to competitive harm, regulatory actions, legal liabilities (including under new AI regulations in the EU), and reputational damage. Some AI applications raise ethical concerns or have broad societal impacts. If our AI solutions lead to unintended consequences, misuse, or controversy due to their effects on human rights, privacy, employment, or other social, economic, or political issues, we may face reputational harm, negatively affecting our business and financial performance.
Anti-corruption, anti-bribery, and similar laws, and failure to comply with these laws, could subject us to criminal penalties or significant fines and harm our business and reputation.
We are subject to anti-corruption and anti-bribery and similar laws, such as the U.S. Foreign Corrupt Practices Act of 1977, as amended, the U.S. domestic bribery statute contained in 18 U.S.C. § 201, the U.S. Travel Act, the USA PATRIOT Act, the UK Bribery Act 2010, and other anti-corruption, anti-bribery, and anti-money laundering laws in countries in which we conduct activities. Anti-corruption and anti-bribery laws have been enforced aggressively in recent years and are interpreted broadly and prohibit companies and their employees and agents from promising, authorizing, making or offering improper payments, or other benefits to government officials and others in the private sector. As we increase our international sales and business, our risks under these laws may increase. Noncompliance with these laws could subject us to investigations, sanctions, settlements, prosecution, other enforcement actions, disgorgement of profits, significant fines, damages, other civil and criminal penalties or injunctions, adverse media coverage, and other consequences.
27
Any investigations, actions, or sanctions could harm our business, operating results, and financial condition.
Industry-specific regulation is evolving and unfavorable industry-specific laws, regulations or interpretive positions could limit our ability to provide services and harm our business.
Our customers and potential customers conduct business in a variety of industries, including financial services, the public sector, healthcare and telecommunications. Regulators in certain industries have adopted and may in the future adopt regulations or interpretive positions regarding the use of cloud computing and other outsourced services. The costs of compliance with, and other burdens imposed by, industry-specific laws, regulations and interpretive positions may limit customers’ use and adoption of our services and reduce overall demand for our services. For example, some financial services regulators have imposed guidelines for use of cloud computing services that mandate specific controls or require financial services enterprises to obtain regulatory approval prior to outsourcing certain functions. If we are unable to comply with these guidelines or controls, or if our customers are unable to obtain regulatory approval to use our service where required, our business may be harmed. In addition, an inability to satisfy the standards of certain voluntary third-party certification bodies that our customers may expect, such as an attestation of compliance with the PCI Data Security Standards, may have an adverse impact on our business. If we are unable to achieve or maintain these industry-specific certifications or other requirements or standards relevant to our customers, it could adversely affect our ability to provide our services to certain customers and harm our business.
In some cases, industry-specific laws, regulations or interpretive positions may also apply directly to us as a service provider. Any failure or perceived failure by us to comply with such requirements could have an adverse impact on our business.
We face risks related to pandemic and public health emergencies which could have a material adverse effect on our business, financial condition and results of operations.
Pandemics, such as the COVID-19 pandemic, and other public health emergencies, and preventative measures taken to contain or mitigate such crises have caused, and may in the future cause, business slowdown or shutdown in affected areas and significant disruption in the financial markets, both globally and in the United States. These events have led to and could again lead to adverse impacts to our business, results of operations, financial conditions, and cash flows. We cannot predict whether, and to what degree, our sales, operations and financial results could in the future be affected by the pandemic and preventative measures.
| ● | Risks presented by pandemics and other public health emergencies include, but are not limited to: the rate of information technology spending and the ability of our customers to purchase our offerings could be adversely impacted. Further, the impact of a pandemic or public health emergency could delay prospective customers’ purchasing decisions and cause them to become less inclined to trade-up from existing solutions, impact customers’ pricing expectations for our offerings, lengthen payment terms, reduce the value or duration of their subscription contracts, or adversely impact renewal rates; |
| ● | increased cyber incidents during a pandemic or public health emergency and our increased reliance on a remote workforce could increase our exposure to potential cybersecurity breaches and attacks; and/or |
| ● | our results of operations are subject to fluctuations in foreign currency exchange rates, which risks may be heightened due to increased volatility of foreign currency exchange rates as a result of a pandemic or public health emergency. Further, our forecasted revenue, operating results and cash flows could vary materially from those we provide as guidance or from those anticipated by investors and analysts if the assumptions on which we base our financial projections are inaccurate as a result of the unpredictability of the impact that a pandemic or public health emergency will have on our businesses, our customers’ and partners’ businesses and the global markets and economy or we make changes to our licensing programs or payment terms in connection with a pandemic or public health emergency. |
We cannot reasonably predict the ultimate impact of any pandemic or public health emergency, including the extent of any adverse impact on our business, results of operations and financial condition, which will depend on, among other things, the duration and spread of the pandemic or public health emergency, the impact of governmental regulations that have been, and may continue to be, imposed in response, the effectiveness of actions taken to contain or mitigate the outbreak, the availability, safety and efficacy of vaccines, including against emerging variants of the infectious disease, and global economic conditions.
28
Additionally, disruptions have in the past made it more challenging to compare our performance, including our revenue growth and overall profitability, across quarters and fiscal years, and could have this effect in the future. To the extent a pandemic or public health emergency adversely affects our business, results of operations, financial conditions, and cash flows, it may also heighten many of the other risks described in this “Risk Factors” section.
Changes to current accounting policies could have a significant effect on our reported financial results or the way in which we conduct our business.
Generally accepted accounting principles and the related accounting pronouncements, implementation guidelines and interpretations for some of our significant accounting policies are highly complex and require subjective judgments and assumptions. Some of our more significant accounting policies that could be affected by changes in the accounting rules and the related implementation guidelines and interpretations include:
| ● | recognition of revenue; |
| ● | contingencies and litigation; and |
| ● | accounting for income taxes. |
Changes in these or other rules, or scrutiny of our current accounting practices, or a determination that our judgments or assumptions in the application of these accounting principles were incorrect, could have a significant adverse effect on our reported operating results or the way in which we conduct our business.
Risks Related to Intellectual Property
We have been and may in the future be sued by third parties for various claims including alleged infringement of proprietary rights that can be time-consuming, incur substantial costs, and divert the attention of management, which could adversely affect our operations and cash flow.
We are involved in various legal matters arising from the normal course of business activities. These may include claims, suits, and other proceedings involving alleged infringement of third-party patents and other intellectual property rights, and commercial, labor and employment, and other matters.
The software and Internet industries are characterized by the existence of a large number of patents, trademarks and copyrights and by frequent litigation based on allegations of infringement or other violations of intellectual property rights. We have received and may receive in the future communications from third parties claiming that we or our customers have infringed the intellectual property rights of others. In addition, we have been, and may in the future be, sued by third parties for alleged infringement of their claimed proprietary rights. Our technologies and those of our customers may be subject to injunction if they are found to infringe the rights of a third party or we may be required to pay damages, or both. Many of our agreements require us to indemnify our customers for third-party intellectual property infringement claims, which would increase the cost to us of an adverse ruling on such a claim.
The outcome of any litigation, regardless of its merits, is inherently uncertain. Any claims and lawsuits, and the disposition of such claims and lawsuits, could be time-consuming and expensive to resolve, divert management attention from executing our business plan, lead to attempts on the part of other parties to pursue similar claims and, in the case of intellectual property claims, require us to change our technology, change our business practices or pay monetary damages, or enter into short- or long-term royalty or licensing agreements.
Any adverse determination related to intellectual property claims or other litigation could prevent us from offering our service to customers, could be material to our financial condition or cash flows, or both, or could otherwise adversely affect our operating results. In addition, depending on the nature and timing of any such dispute, a resolution of a legal matter could materially affect our future results of operation or cash flows or both.
29
We rely on trademark, copyright, trade secret laws, contractual restrictions and patent rights to protect our intellectual property and proprietary rights and, if these rights are impaired, then our ability to generate revenue will be harmed.
If we fail to protect our intellectual property rights adequately, our competitors might gain access to our technology, and our business might be harmed. In addition, defending our intellectual property rights might entail significant expense. Any of our trademarks or other intellectual property rights may be challenged by others or invalidated through administrative process or litigation. While we have some U.S. patents and pending U.S. patent applications, we may be unable to obtain patent protection for the technology covered in our patent applications. In addition, our existing patents and any patents issued in the future may not provide us with competitive advantages, or may be successfully challenged by third parties. Furthermore, legal standards relating to the validity, enforceability and scope of protection of intellectual property rights are uncertain. Effective patent, trademark, copyright and trade secret protection may not be available to us in every country in which our service is available. The laws of some foreign countries may not be as protective of intellectual property rights as those in the U.S., and mechanisms for enforcement of intellectual property rights may be inadequate. Accordingly, despite our efforts, we may be unable to prevent third parties from infringing upon or misappropriating our intellectual property.
We might be required to spend significant resources to monitor and protect our intellectual property rights. We may initiate claims or litigation against third parties for infringement of our proprietary rights or to establish the validity of our proprietary rights. Any litigation, whether or not it is resolved in our favor, could result in significant expense to us and divert the efforts of our technical and management personnel.
Our failure or inability to develop non-infringing technology or license proprietary rights on a timely basis would harm our business.
We may be subject to legal proceedings and claims from time to time in the ordinary course of our business, including claims of alleged infringement of the patents and other intellectual property rights of third parties. Our products may infringe on issued patents that may relate to our products because patent applications in the United States are not publicly disclosed until the patent is issued, and hence applications may have been filed which relate to our software products. Intellectual property litigation is expensive, time consuming, and could divert management’s attention away from running our business. Litigation could also require us to develop non-infringing technology or enter into royalty or license agreements. These royalty or license agreements, if required, may not be available on acceptable terms, if at all, in the event of a successful claim of infringement.
General Risk Factors
Our stock price has demonstrated volatility and continued market conditions may cause declines or fluctuations.
The price at which our common stock trades has been and will likely continue to be highly volatile and show wide fluctuations due to factors such as the following:
| ● | concerns related to liquidity of our stock; |
| ● | actual or anticipated fluctuations in our operating results, our ability to meet announced or anticipated profitability goals and changes in or failure to meet securities analysts’ expectations; |
| ● | announcements of technological innovations and/or the introduction of new services by us or our competitors; |
| ● | developments with respect to intellectual property rights and litigation, regulatory scrutiny and new legislation; |
| ● | conditions and trends in the Internet and other technology industries; and |
| ● | general market and economic conditions. |
Furthermore, the stock market has experienced significant price and volume fluctuations that have affected the market prices for the common stock of technology companies, regardless of the specific operating performance of the affected company. These broad market fluctuations may cause the market price of our common stock to decline.
30
Our insiders who are significant stockholders have the ability to exercise significant control over matters requiring stockholder approval, including the election of our board of directors, and may have interests that conflict with those of other stockholders.
Our directors and executive officers, together with their affiliates and members of their immediate families, beneficially owned, in the aggregate, approximately 34% of our outstanding capital stock as of June 30, 2024, of which our Chief Executive Officer, Ashutosh Roy, beneficially owned approximately 30% as of such date. As a result of these concentrated holdings, Mr. Roy individually or together with this group has the ability to exercise significant control over most matters requiring our stockholders’ approval, including the election and removal of directors and the approval of significant corporate transactions, such as a merger or sale of our company or its assets.
ITEM 1B. |
UNRESOLVED STAFF COMMENTS |
None.
ITEM 1C. CYBERSECURITY
RISK MANAGEMENT AND STRATEGY
Protecting our business information, intellectual property, customer and employee data, and technology systems is crucial for our business continuity, regulatory compliance, and stakeholder trust. We have implemented enterprise cybersecurity risk mitigation and governance processes, detailed in our Information Security Protection Program (“Security Plan”). Our strategy is guided by the Security Plan’s principles, which involve monitoring threats and vulnerabilities, assessing and monitoring related controls, and supporting the Chief Information Security Officer (CISO). Our cybersecurity policies, standards, processes, and practices are integrated into our overall risk management system to enhance our ability to protect our operations and information. This includes annual cybersecurity reporting to the board of directors by senior leadership.
We engage third-party providers to conduct evaluations of our security controls, through penetration testing, independent audits or consulting on best practices. These evaluations include testing both the design and operational effectiveness of our security controls.
Our Security Plan
Our Security Plan, developed in collaboration with third-party consultants, aligns with the National Institute of Standards and Technology (NIST) and ISO27001. This program encompasses security and privacy, risk-based controls, and integrates lessons learned from past cybersecurity incidents. Under the Security Plan, cyber risks, including threats and incidents, are continuously assessed, treated, and monitored. We incorporate insights from incident response and risk mitigation into our cyber risk management strategy to enhance overall cybersecurity. The Security Plan is led by specific management positions selected for their expertise, as detailed below.
Following best practices in cyber risk management, we have worked with recognized third-party experts to align the foundational processes, metrics, monitoring, and reporting of the Security Plan with common frameworks such as NIST.
Third-Party Cyber Risk Management
Our Third Party Cyber Risk Management Plan ensures that due diligence is carried out on third parties prior to and during engagement. Prior to engagement, third parties are assessed using a questionnaire that covers all areas of security including cyber risk and external documentation is requested such as SOC2 T2, penetration testing, and ISO27001 certification and scope. We include security and privacy clauses within our third party contracts where applicable, which cover the implementation of security controls and self reporting. During engagement, third parties are regularly reviewed, at least annually, to ensure that cyber risks are evaluated and assessed on a continual basis.
Cyber Incident Response Plan
Our Incident Response Plan outlines the processes for detecting, identifying, prioritizing, and analyzing information security events. Depending on the incident’s scope, business impact, and potential material risk, our CISO, legal counsel, and business stakeholders are engaged.
31
This cross-functional team assesses the appropriate response and mitigation pathway. Once security events are identified through our enterprise detection and monitoring ecosystem, the Incident Response Plan establishes a prioritization and decision workflow to determine the scope, business impact, and potential material risk, implemented in collaboration with the CISO, legal counsel, and business stakeholders.
Additionally, we have implemented an information security training program for employees, which includes security awareness training on cybersecurity risks, simulated phishing emails, and regular communication about cybersecurity risks.
While we occasionally experience cybersecurity threats and incidents, we are not aware of any material risks from these threats, including from past incidents, that have materially affected or are likely to materially affect our business strategy, financial condition, results of operations, or cash flows. However, there is no assurance that future cybersecurity threats will not have a material impact. For more information on our cybersecurity-related risks, please see “Item 1A. Risk Factors.”
GOVERNANCE
Protecting our customers’ data is a top priority for our board of directors and management team. Our risk management team, integrated into our CIS function, is led by our CISO. This team brings together extensive experience in information security, governance, and compliance, covering areas such as engineering, architecture, cybersecurity, and privacy. They are responsible for defining the program, overseeing cybersecurity governance, and gathering insights to assess, identify, and manage cybersecurity threats, their severity, and mitigations.
Our CISO, who reports to the Chief Financial Officer, leads the company’s technology and digital capabilities, including the overall cybersecurity strategy. Our CISO has over 25 years experience working in the commercial sector within the IT and security environments, across a variety of business verticals. Prior to this was in the Armed Forces working in an IT, telecommunications and security capacity. A member of (ISC)2 and CISSP certified, the CISO understands the security and protection requirements needed for areas such as data protection, PCI/DSS, HIPAA, FedRAMP.
The Audit Committee of our board of directors is charged with oversight of data privacy and cybersecurity risks. Our CISO provide annual updates on cybersecurity risks and related mitigating actions to the Audit Committee, meet with the full board of directors at least annually and inform the Audit Committee immediately if a cybersecurity incident is deemed material. They report to the Audit Committee and the board of directors on compliance and regulatory issues, provide updates concerning continuously-evolving threats and mitigating actions, and present a NIST Cybersecurity Framework Scorecard. Additionally, the CISO discusses and presents strategies to address technological changes, such as AI. In overseeing cybersecurity risks, the Audit Committee focuses on aggregated, thematic issues with a risk-based approach. Oversight of cybersecurity risk incorporates strategy metrics, third-party assessments, and internal audit and controls. Outside counsel advises the board of directors on best practices for cybersecurity oversight by the board of directors, and the evolution of that oversight over time. Management also reports on strategic key risk indicators, ongoing initiatives, and significant incidents and their effect.
ITEM 2. PROPERTIES
We lease all facilities used in our business as of June 30, 2024. Our corporate headquarters is located in Sunnyvale, California, and we also have corporate offices in Newbury, England, and Pune, India. We believe that our offices are adequate to meet our current and near future operating needs.
ITEM 3. |
LEGAL PROCEEDINGS |
We are not currently a party to any legal proceedings, and are not aware of any pending or threatened legal proceedings against us that we believe could have a material adverse effect on our business, consolidated operating results, or consolidated financial condition. In the ordinary course of business, we are involved in various legal proceedings and claims related to alleged infringement of third-party patents and other intellectual property rights, commercial, corporate and securities, labor and employment, wage and hour, and other claims. We have been, and may in the future be, put on notice and/or sued by third parties for alleged infringement of their proprietary rights, including patent infringement.
32
We evaluate all claims and lawsuits with respect to their potential merits, our potential defenses and counterclaims, settlement or litigation potential and the expected effect on us. Our technologies may be subject to injunction if they are found to infringe the rights of a third party. In addition, our agreements require us to indemnify our customers for third-party intellectual property infringement claims, which could increase the cost to us of an adverse ruling on such a claim.
ITEM 4. |
MINE SAFETY DISCLOSURES |
Not applicable.
33
PART II
ITEM 5. |
MARKET FOR REGISTRANT’S COMMON EQUITY, RELATED STOCKHOLDER MATTERS AND ISSUER PURCHASES OF EQUITY SECURITIES |
Market Information
Our common stock is traded on the Nasdaq Stock Market under the symbol “EGAN”.
Holders
As of June 30, 2024, there were approximately 133 stockholders of record.
Dividends
We have never declared or paid any cash dividends on our common stock. We currently anticipate that we will retain all available funds for use in the operation of our business and do not intend to pay any cash dividends in the foreseeable future.
Share Repurchases
On November 14, 2022, our board of directors authorized a stock repurchase program under which we may purchase up to $20.0 million of our outstanding common stock. On May 31, 2024, our board of directors authorized a $20.0 million increase in its stock repurchase program, bringing the aggregate amount eGain may purchase thereunder from $20.0 million to $40.0 million of its outstanding common stock. As of June 30, 2024, approximately $17.0 million remained available for stock repurchases pursuant to our stock repurchase program.
Under the stock repurchase program, we may purchase shares of common stock on a discretionary basis from time to time through open market transactions or privately negotiated transactions at prices deemed appropriate by us. In addition, at our discretion, open market repurchase of common stock may also be made under a Rule 10b5-1 plan, which would permit common stock to be repurchased when we might otherwise be precluded from doing so under insider trading laws or self-imposed trading restrictions.
The timing and number of shares repurchased will be determined based on an evaluation of market conditions and other factors, including stock price, trading volume, general business and market conditions, and the availability of capital. The stock repurchase program has been extended until the earlier of (i) the date the aggregate amount of shares that can be repurchased under the stock repurchase program have been repurchased and (ii) the date the board of directors decides to terminate the stock repurchase program. The stock repurchase program does not obligate us to acquire a specified number of shares and may be modified, suspended, or discontinued at any time at our discretion without notice. The stock repurchase program will be funded using existing cash or future cash flows.
The following table summarizes the stock repurchase activity for the three months ended June 30, 2024, and the approximate dollar value of shares that may yet be purchased pursuant to our stock repurchase program:
Period |
|
Total Number of Shares Purchased |
|
Average Price Paid per Share |
|
Total Number of Shares Purchased as Part of Publicly Announced Program |
|
Approximate Dollar Value of Shares That May Yet Be Purchased Under the Program |
||
April 1, 2024 to April 30, 2024 |
|
493,576 |
|
$ |
6.30 |
|
493,576 |
|
$ |
2,600 |
May 1, 2024 to May 31, 2024 |
|
403,511 |
|
$ |
6.29 |
|
403,511 |
|
$ |
20,060 |
June 1, 2024 to June 30, 2024 |
|
500,054 |
|
$ |
6.18 |
|
500,054 |
|
$ |
16,969 |
Total |
|
1,397,141 |
|
|
|
|
1,397,141 |
|
|
|
34
Stock Performance Graph
The following shall not be deemed incorporated by reference into any of our other filings under the Securities Exchange Act of 1934, as amended, or the Securities Act of 1933, as amended.
The graph below compares the cumulative total stockholder return on our common stock with the cumulative total return on the Standard & Poor’s 500 Index and the Nasdaq Composite Total Return Index for each of the last five fiscal years ended June 30, 2024, assuming an initial investment of $100. Data for the Standard & Poor’s 500 Index and the Nasdaq Composite Total Return Index assume no dividends.
The comparisons in the graph below are based upon historical data and are not indicative of, nor intended to forecast, future performance of our common stock.
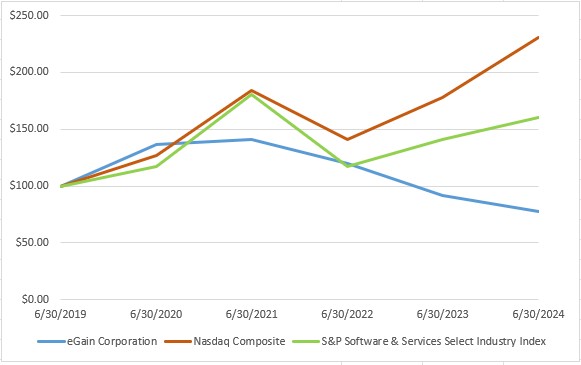
|
6/30/2019 |
6/30/2020 |
6/30/2021 |
6/30/2022 |
6/30/2023 |
6/30/2024 |
eGain Corporation |
$ 100.00 |
$ 136.49 |
$ 141.03 |
$ 119.78 |
$ 92.01 |
$ 77.52 |
Nasdaq Composite |
$ 100.00 |
$ 126.66 |
$ 184.36 |
$ 141.17 |
$ 178.08 |
$ 230.80 |
S&P Software & Services Select Industry Index |
$ 100.00 |
$ 116.76 |
$ 180.35 |
$ 117.23 |
$ 141.16 |
$ 160.31 |
Equity Compensation Plan Information
See Item 12 of Part III of this Annual Report regarding information about securities authorized for issuance under our equity compensation plan.
35
ITEM 6. |
[RESERVED] |
ITEM 7. |
MANAGEMENT’S DISCUSSION AND ANALYSIS OF FINANCIAL CONDITION AND RESULTS OF OPERATIONS |
The following discussion of eGain’s financial condition and results of operations should be read together with the consolidated financial statements and related notes in this Annual Report on Form 10-K. This discussion may contain forward-looking statements based upon current expectations that involve risks and uncertainties. These risks and uncertainties may cause actual results to differ materially from those discussed in the forward-looking statements.
Overview
eGain automates customer engagement with an AI knowledge hub SaaS solution. We sell to enterprises who want to better serve customers at scale by delivering trusted answers across self-service, contact centers, and field staff. True to our mantra of AX + BX + CX = DX™, our AI knowledge hub orchestrates effortless Digital eXperience (DX) as it assists Agent eXperience (AX), empowers Business eXperience (BX) and assures Customer eXperience (CX). Many global brands use eGain to improve experience and reduce costs. We are headquartered in the Sunnyvale, California, United States. We also operate in the United Kingdom and India.
We have transitioned from a hybrid model, where we sold both SaaS and perpetual license solutions, to a SaaS only business model. As we migrated our legacy perpetual license clients to SaaS, we expect our legacy revenue, primarily comprising annual maintenance and support fees for legacy perpetual license clients to continue to decline to a non-significant amount in our SaaS business.
We believe our go-forward SaaS business model affords us recurring revenue visibility and more predictability. Historical fiscal years affirmed our view that SaaS clients adopt our product innovation much faster than the perpetual license model and get better service levels. We believe SaaS clients enjoy up to 50% faster time to value from their eGain investment.
Key Financial Measures
We monitor the key financial performance measures set forth below as well as cash and cash equivalents and available debt capacity, which are discussed in Liquidity and Capital Resources, to help us evaluate trends, establish budgets, measure the effectiveness of our sales and marketing efforts and assess operational effectiveness and efficiencies.
SaaS Revenue
With our transition to a SaaS only business model, we believe SaaS revenue better reflects our business momentum and to analyze progress and thus, we disaggregate our subscription revenue growth between:
| ● | SaaS revenue, which is defined as revenue from cloud delivery arrangements, term licenses and embedded original equipment manufacturer (OEM) royalties and associated support; and |
| ● | Legacy revenue, which is defined as revenue, maintenance and support contracts on perpetual license arrangements that we no longer sell. |
36
The following table presents a break out of subscription revenue between SaaS and legacy revenues for each of the following periods:
|
|
Fiscal Year Ended June 30 |
|
|
|
|
|
||||
|
|
2024 |
|
2023 |
|
Change |
|||||
Revenue |
|
(in thousands, except percentages) |
|||||||||
SaaS revenue |
|
$ |
84,874 |
|
$ |
89,619 |
|
$ |
(4,745) |
(5) |
% |
Legacy revenue |
|
|
208 |
|
|
705 |
|
|
(497) |
(70) |
% |
Total subscription revenue |
|
$ |
85,082 |
|
$ |
90,324 |
|
$ |
(5,242) |
|
|
SaaS and Professional Services Revenue
As we have shifted to a SaaS only business model, substantially all of professional services revenue is now generated from our SaaS customer base. We believe the combination of SaaS and professional services revenue is a useful measure to value our business on a forward-looking basis.
The following table presents total SaaS and professional services revenue for each of the following periods:
|
|
Fiscal Year Ended June 30 |
|
|
|
|
|
||||
|
|
2024 |
|
2023 |
|
Change |
|||||
Revenue |
|
(in thousands, except percentages) |
|||||||||
SaaS revenue |
|
$ |
84,874 |
|
$ |
89,619 |
|
$ |
(4,745) |
(5) |
% |
Professional services |
|
|
7,721 |
|
|
7,687 |
|
|
34 |
0 |
% |
Total SaaS and professional services revenue |
|
$ |
92,595 |
|
$ |
97,306 |
|
$ |
(4,711) |
|
|
Non-GAAP Operating Income
Non-GAAP operating income is defined as income from operations, adjusted for the impact of stock-based compensation expense.
Management believes that it is useful to exclude certain non-cash charges and non-core operational charges from non-GAAP operating income because (i) the amount of such expenses in any specific period may not directly correlate to the underlying performance of our business operations; and (ii) such expenses can vary significantly between periods as a result of the timing of new stock-based awards. The presentation of the non-GAAP financial measures is not intended to be considered in isolation, or as a substitute for, or superior to, the financial information prepared and presented in accordance with generally accepted accounting principles in the United States of America (GAAP).
The following table presents a reconciliation of GAAP income from operations to non-GAAP income from operations for each of the following periods:
|
|
Fiscal Year Ended June 30 |
||||
|
|
2024 |
|
2023 |
||
Income from operations |
|
$ |
5,971 |
|
$ |
1,389 |
Add: |
|
|
|
|
|
|
Stock-based compensation |
|
|
4,529 |
|
|
6,246 |
Non-GAAP income from operations |
|
$ |
10,500 |
|
$ |
7,635 |
Critical Accounting Policies and Estimates
Management’s Discussion and Analysis of Financial Condition and Results of Operations discusses our consolidated financial statements, which have been prepared in accordance with GAAP in the United States.
37
The preparation of these financial statements requires management to make estimates and assumptions that affect the reported amounts of assets and liabilities and the disclosure of contingent assets and liabilities at the date of the financial statements and the reported amounts of revenue and expenses during the reporting period.
We believe that the assumptions and estimates associated with revenue recognition, stock-based compensation, provision for credit losses, the valuation of goodwill, the valuation of deferred tax allowance, and legal contingencies have the greatest potential impact on our consolidated financial statements. We evaluate these estimates on an ongoing basis. Management bases its estimates and judgments on historical experience and on various other factors that are believed to be reasonable under the circumstances, the results of which form the basis for making judgments about the carrying values of assets and liabilities that are not readily apparent from other sources. Actual results may differ from these estimates under different assumptions or conditions.
Sources of Revenues
Our revenue is comprised of two categories, subscription and professional services. Subscription includes SaaS revenue and legacy revenue. SaaS revenue includes revenue from cloud delivery arrangements, term licenses and embedded OEM royalties and associated support. Legacy revenue is associated with license, maintenance and support contracts on perpetual license arrangements that we no longer sell. Professional services include consulting, implementation, training, and managed services.
Subscription Revenue
For our cloud delivery arrangements, our maintenance and support arrangements and our term license subscriptions that incorporate substantial cloud functionality, the combined performance obligation is recognized ratably over the contract term as the obligation is delivered. For contracts involving distinct software licenses, the license performance obligation is satisfied at a point in time when control is transferred to the customer.
We typically invoice our customers in advance upon execution of the contract or subsequent renewals. Invoiced amounts are recorded in accounts receivable, deferred revenue or revenue, depending on when control is transferred to our customers based on each arrangement.
We have a royalty revenue agreement with a customer related to our embedded intellectual property. Under the terms of the agreement, the customer is to provide a combined fixed fee, per agent, for each software license sold containing the embedded software to us. These embedded OEM royalties are included as subscription revenue. Under revenue guidance, since these arrangements are for usage-based licenses of intellectual property, we estimate revenue recognized only as the performance obligation of the OEM royalties has been satisfied or partially satisfied.
Professional Services Revenue
Professional services revenue includes system implementation, consulting, training, and managed services. The transaction price is allocated to various performance obligations based on their standalone selling prices (SSP). Revenue allocated to each performance obligation is recognized as work is performed. Managed services include a comprehensive set of processes and activities that range from implementation to monitoring the evolution and support of our solutions in a company. Our consulting and implementation service contracts are bid either on a time-and-material basis or on a fixed-fee basis. Managed services contracts are bid on a time-and-material basis. Fixed fees are generally paid on milestone billing at pre-determined points in the contract. Amounts that have been invoiced are recorded in accounts receivable and in deferred revenue or revenue, depending on whether transfer of control to customers has occurred.
Training revenue that meets the criteria to be accounted for separately is recognized when training is provided.
Remaining Performance Obligations
Remaining performance obligations represent contracted revenue that have not yet been recognized, and include billed deferred revenue, consisting of amounts invoiced to customers whether collected or uncollected which have not been recognized as revenue, as well as unbilled amounts that will be invoiced and recognized as revenue in future periods.
38
The transaction price allocated to the remaining performance obligation is influenced by a variety of factors, including seasonality, timing of renewals, average contract terms and foreign currency exchange rates. As of June 30, 2024, our remaining performance obligations were $78.4 million, of which we expect to recognize $60.4 million and $18 million as revenue within one year and beyond one year, respectively.
Under Topic 606, we expect our remaining performance obligations to change quarterly for several reasons including the timing of new contracts and renewals, duration and size of our subscription and support arrangements, variable billing cycles and foreign exchange rate fluctuation. We typically issue renewal invoices in advance of the renewal service period. Depending on timing, the initial invoice and subsequent renewal invoices may occur in different quarters. This may result in an increase or decrease to our accounts receivable and deferred revenue.
Costs Capitalized to Obtain Revenue Contracts
We capitalize incremental costs to obtain non-cancelable subscription and maintenance and support revenue contracts with amortization periods that may extend longer than the non-cancelable subscription and maintenance and support revenue contract terms.
We capitalize incremental costs of obtaining a non-cancelable subscription and maintenance and support revenue contract with amortization periods of one year or more. The capitalized amounts consist primarily of sales commissions paid to our direct sales force. Capitalized amounts also include (i) amounts paid to employees other than the direct sales force who earn incentive payouts under annual compensation plans that are tied to the value of contracts acquired and (ii) the associated payroll taxes and fringe benefit costs associated with the payments to our employees.
Costs capitalized related to new revenue contracts are generally deferred and amortized on a straight-line basis over a period of benefit that we estimate to be five years. We determine the period of benefit by taking into consideration the period from initial contract through renewal, which constitutes the length of our customer relationship or customer life. Amortization of costs capitalized related to new revenue contracts is included as a component of sales and marketing expense in our operating results.
Stock-Based Compensation
We account for stock-based compensation in accordance with Accounting Standards Codification (ASC) 718, Compensation — Stock Compensation. Under the fair value recognition provisions of ASC 718, stock-based compensation cost is measured at the grant date based on the fair value of the award and is recognized as an expense over the vesting period. Determining the fair value of the stock-based awards at the grant date requires significant judgment and the use of estimates, particularly surrounding Black-Scholes valuation assumptions such as stock price volatility and expected option lives. We determine the appropriate measure of expected volatility by reviewing historic volatility in the share price of our common stock, as adjusted for certain events that management deems to be non-recurring and non-indicative of future events. We base our estimate of expected life on the historical exercise behavior, cancellations of all past option grants made by us during the time period in which our common stock has been publicly traded, the contractual term, the vesting period and the expected remaining term of the option. Based on our historical experience of option pre-vesting cancellations, we have assumed an annualized forfeiture rate for our stock options. We record additional expense if the actual forfeiture rate is lower than we estimated and record a recovery of prior expense if the actual forfeiture rate is higher than what we estimated.
Goodwill
We review goodwill annually for impairment or sooner whenever events or changes in circumstances indicate that it may be impaired. These events or circumstances could include a significant change in the business climate, legal factors, operating performance indicators, competition, or sale or disposition of a significant portion of a reporting unit. We operate under a single reporting unit and accordingly, all of our goodwill is associated with the entire company. We had no impairment for fiscal years ended June 30, 2024 and 2023.
39
Accounts Receivable and Provision for Credit Losses
We extend unsecured credit to customers on a regular basis. Our accounts receivable is derived from revenue earned from customers and are not interest bearing. We also maintain provision for credit losses to reserve for potential uncollectible trade receivables. We review our trade receivables by aging category to identify specific customers with known disputes or collectability issues. We exercise judgment when determining the adequacy of these reserves as we evaluate historical bad debt trends, general economic conditions in the U.S. and internationally, and changes in customer financial conditions. If we make different judgments or utilize different estimates, then material differences may result in additional reserves for trade receivables, which would be reflected by charges in general and administrative expenses for any period presented. We write-off a receivable after all collection efforts have been exhausted and the amount is deemed uncollectible.
As described in Note 1 of Notes to Consolidated Financial Statements included in Item 8 Financial Statements and Supplementary Data of this Annual Report, certain Company contracts have contractual billings which do not coincide with revenue recognized on the contract. Unbilled accounts receivables are recorded when revenue recognized on the contract exceeds billings, pursuant to contract provisions, and become billable at contractually specified dates.
Tax Legislation
Under the Tax Cuts and Jobs Act, enacted on December 22, 2017 (TCJA), federal Net Operating Losses (NOLs) incurred in 2018 and in future years may be carried forward indefinitely, but generally may not be carried back, and the deductibility of such NOLs is limited to 80% of taxable income.
On March 27, 2020, the Coronavirus Aid, Relief, and Economic Security Act (CARES Act), P.L. 116-136, was passed into law, amending portions of certain relevant US tax laws. The CARES Act included a number of federal income tax law changes, including, but not limited to: (i) permitting net operating loss carrybacks to offset 100% of taxable income for taxable years beginning before 2021, (ii) accelerating alternative minimum tax credit refunds, (iii) temporarily increasing the allowable business interest deduction from 30% to 50% of adjusted taxable income, and (iv) providing a technical correction for depreciation related to qualified improvement property. The CARES Act had no impact on our consolidated financial statements. Beginning in 2022, the TCJA eliminates the option to immediately deduct research and development expenditures and requires taxpayers to capitalize and amortize domestic expenditures over five years and foreign expenditures over 15 years. While the mandatory capitalization requirement increases our deferred tax assets and cash tax liabilities for 2022, the tax year in which the provision took effect, the impact will decline annually over the five-year amortization period to an immaterial amount in year six.
On August 16, 2022, the Inflation Reduction Act of 2022 (IRA) was signed into law and is effective for taxable years beginning after December 31, 2022. The IRA includes multiple incentives to promote clean energy with tax provisions primarily focused on implementing a 15% minimum tax on global adjusted financial statement income and a 1% excise tax on share repurchases. These measures may affect our consolidated financial statements and we will continue to evaluate the applicability and effect of the IRA as more guidance is issued. In 2024, California enacted legislation, with the first being S.B.167, which suspends the use of NOLs by businesses and individuals for tax years 2024 through 2026, limits the use of tax credits by businesses and individuals to $5 million for tax years 2024 through 2026, and clarifies that income not included in apportionable business income is excluded from the sales factor of the apportionment formula. The second, S.B.175, provides some relief from the $5 million credit limitation in S.B. 167 by allowing taxpayers subject to the limit to elect to later receive a refund of credits they would have otherwise used to reduce tax liabilities during the limitation period.
Fiscal Year 2024 Compared with Fiscal Year 2023
Our effective tax rate for both fiscal years 2024 and 2023 was a tax provision of $1.9 million and $1.2 million, respectively. The change in our effective tax rate for fiscal year 2024 as compared to fiscal year 2023 was primarily due to the change in valuation allowance, foreign rate differential, Section 267, stock-based compensation and the research and development tax credits.
The income before income tax provision between the U.S. and foreign countries impacted our effective tax rate as a result of the geographic distribution and customer demand related to our products and services. In fiscal year 2024, our U.S. and foreign income before our income tax provision was an income of $6.2 million and $3.5 million, respectively.
40
In fiscal year 2023, our U.S. and foreign income before our income tax was loss of $460,000 and income of $3.8 million, respectively.
Deferred Tax Valuation Allowance
When we prepare our consolidated financial statements, we estimate our income tax liability for each of the various jurisdictions where we conduct business. This requires us to estimate our actual current tax exposure and to assess temporary differences that result from differing treatment of certain items for tax and accounting purposes. The net deferred tax assets are reduced by a valuation allowance if, based upon weighted available evidence, it is more likely than not that some or all of the deferred tax assets will not be realized. We make significant judgments to determine our provision for income taxes, our deferred tax assets and liabilities and any valuation allowance to be recorded against our net deferred tax assets. As of June 30, 2024, we had a valuation allowance of approximately $35.6 million of which approximately $13.8 million was attributable to U.S. and state net operating losses and domestic research and development credit carryforwards.
We apply ASC 740, Income Taxes, in determining any uncertain tax positions. The guidance seeks to reduce the diversity in practice associated with certain aspects of measurement and recognition in accounting for income taxes and prescribes a recognition threshold and measurement attribute for the financial statement recognition and measurement of a tax position that an entity takes or expects to take in a tax return. Additionally, ASC 740 provides guidance on de-recognition, classification, interest and penalties, accounting in interim periods, disclosure and transition. Under ASC 740, an entity may only recognize or continue to recognize tax positions that meet a “more likely than not” threshold. In accordance with our accounting policy, we recognize accrued interest and penalties related to unrecognized tax benefits as a component of other (expense) income, net in the consolidated statements of operations.
We consider the earnings of certain non-U.S. subsidiaries to be indefinitely invested outside the United States, on the basis of estimates, that future domestic cash generation will be sufficient to meet future domestic cash needs and our specific plans for reinvestments of those subsidiary earnings. We have not recorded a deferred tax liability related to state income taxes and foreign withholding taxes on approximately $26.2 million of undistributed earnings of foreign subsidiaries indefinitely invested outside the United States. If we decide to repatriate the foreign earnings, we would need to adjust our income tax provision in the period we determined that the earnings will no longer be indefinitely invested outside the United States.
Fair Value of Financial Instruments
Our financial instruments consist of cash and cash equivalents, restricted cash, accounts receivable, accounts payable and accrued liabilities. We do not have any derivative financial instruments. We believe the reported carrying amounts of these financial instruments approximate fair value, based upon their short-term nature and comparable market information available at the respective balance sheet dates.
41
Results of Operations
The following table sets forth certain items reflected in our consolidated statements of operations expressed as a percent of total revenue for the periods indicated:
|
|
2024 |
|
2023 |
||
Revenue: |
|
|
|
|
|
|
Subscription |
|
92 |
% |
|
92 |
% |
Professional services |
|
8 |
|
|
8 |
|
Total revenue |
|
100 |
|
|
100 |
|
Cost of revenue: |
|
|
|
|
|
|
Cost of subscription |
|
21 |
|
|
19 |
|
Cost of professional services |
|
9 |
|
|
9 |
|
Total cost of revenue |
|
30 |
|
|
28 |
|
Gross profit |
|
70 |
|
|
72 |
|
Operating Expenses: |
|
|
|
|
|
|
Research and development |
|
29 |
|
|
28 |
|
Sales and marketing |
|
24 |
|
|
32 |
|
General and administrative |
|
11 |
|
|
11 |
|
Total operating expenses |
|
64 |
|
|
71 |
|
Income from operations |
|
6 |
% |
|
1 |
% |
Revenue
We classify our revenue into two categories; subscription and professional services revenue. We further break down subscription revenue into SaaS revenue and legacy revenue, with SaaS revenue being a key metric.
The following table presents our subscription and professional services revenue during the fiscal years indicated:
|
|
Fiscal Year Ended June 30, |
|
|
|
|
|
||||
|
|
2024 |
|
2023 |
|
Change |
|||||
Revenue |
|
(in thousands, except percentages) |
|||||||||
Subscription |
|
$ |
85,082 |
|
$ |
90,324 |
|
$ |
(5,242) |
(6) |
% |
Professional services |
|
|
7,721 |
|
|
7,687 |
|
|
34 |
0 |
% |
Total revenue |
|
$ |
92,803 |
|
$ |
98,011 |
|
$ |
(5,208) |
|
|
Total Revenue
Total revenue decreased $5.2 million during the fiscal year ended June 30, 2024, from the same period in fiscal year 2023, largely due to decreased SaaS revenue of $4.7 million and our legacy revenue of $500,000; partially offset by an increase in professional services revenue of $34,000 in fiscal year 2024.
Our revenue was impacted by foreign exchange rate fluctuation between the U.S. Dollar, Euro, and British Pound. We recalculate our current period results using the comparable prior period exchange rates to exclude the impact of foreign exchange rate fluctuation. Foreign exchange rate fluctuation resulted in an increase of $1.0 million and $2.4 million in total revenue during the fiscal years ended June 30, 2024 and 2023, respectively.
42
Subscription Revenue
SaaS Revenue
|
|
Fiscal Year Ended June 30, |
|
|
|
|
|
|
|||||
|
|
2024 |
|
2023 |
|
Change |
|||||||
Revenue |
|
(in thousands, except percentages) |
|||||||||||
SaaS revenue |
|
$ |
84,874 |
|
|
$ |
89,619 |
|
|
$ |
(4,745) |
(5) |
% |
Percentage of total revenue |
|
|
91 |
% |
|
|
91 |
% |
|
|
|
|
|
SaaS revenue includes revenue from cloud delivery arrangements, term licenses and embedded OEM royalties and associated support. Revenues from SaaS decreased by $4.7 million during the fiscal year ended June 30, 2024, from the same period in fiscal year 2023.
SaaS revenue was $84.9 million and $89.6 million during the fiscal years ended June 30, 2024 and 2023, respectively, which represented a decrease of 5% or $4.7 million. SaaS revenue represents 91% of total revenue for the fiscal years ended June 30, 2024 and 2023.
Excluding an increase of $965,000 due to foreign exchange rate fluctuation, SaaS revenue decreased by $5.7 million during the fiscal year ended June 30, 2024, from the same period in fiscal year 2023.
Legacy Revenue
|
|
Fiscal Year Ended June 30, |
|
|
|
|
|
|
|||||
|
|
2024 |
|
2023 |
|
Change |
|||||||
Revenue |
|
(in thousands, except percentages) |
|||||||||||
Legacy revenue |
|
$ |
208 |
|
|
$ |
705 |
|
|
$ |
(497) |
(70) |
% |
Percentage of total revenue |
|
|
- |
% |
|
|
1 |
% |
|
|
|
|
|
Legacy revenue is associated with license, maintenance and support contracts on perpetual license arrangements that we no longer sell. We experienced a decrease of $497,000 for the fiscal year ended June 30, 2024. This decrease was primarily due to our focus on migrating our legacy customers to SaaS.
Legacy revenue was $208,000 and $705,000 during the fiscal years ended June 30, 2024 and 2023, respectively, which represented a decrease of 70% or $497,000. Legacy revenue represents 0% and 1% of total revenue for the fiscal years ended June 30, 2024 and 2023, respectively.
Excluding an increase of $14,000 due to foreign exchange rate fluctuation, legacy revenue decreased by $511,000 during the fiscal year ended June 30, 2024, from the same period in fiscal year 2023.
Professional Services Revenue
|
|
Fiscal Year Ended June 30, |
|
|
|
|
|
||||
|
|
2024 |
|
2023 |
|
Change |
|||||
Revenue |
|
(in thousands, except percentages) |
|||||||||
Professional services revenue |
|
$ |
7,721 |
|
$ |
7,687 |
|
$ |
34 |
0 |
% |
Percentage of total revenue |
|
|
8 |
% |
|
8 |
% |
|
|
|
|
Professional services revenue includes consulting, implementation, training, and managed services. Revenues from professional services increased by $34,000 and remained flat at $7.7 million during the fiscal year ended June 30, 2024. Professional services revenue represents 8% of total revenue for the fiscal years ended June 30, 2024 and 2023.
Excluding an increase of $62,000 due to foreign exchange rate fluctuation, professional services revenues decreased by $28,000 during the fiscal year ended June 30, 2024, from the same period in fiscal year 2023.
43
Revenue by Geography
|
|
Fiscal Year Ended June 30, |
|
|
|
|
|
||||
|
|
2024 |
|
2023 |
|
Change |
|||||
Revenue |
|
(in thousands, except percentages) |
|||||||||
North America |
|
$ |
72,611 |
|
$ |
76,375 |
|
$ |
(3,764) |
(5) |
% |
Europe, Middle East, & Africa |
|
|
20,192 |
|
|
21,636 |
|
|
(1,444) |
(7) |
% |
Total revenue |
|
$ |
92,803 |
|
$ |
98,011 |
|
$ |
(5,208) |
|
|
Revenue from North America sales decreased by 5% from $76.4 million during the fiscal year ended June 30, 2023 to $72.6 million during the fiscal year ended June 30, 2024 due to decreases of (i) $3.6 million in SaaS revenue and (ii) $392,000 in legacy revenue; partially offset by the increase of $224,000 in professional service revenue.
Revenue from EMEA sales decreased by 7% from $21.6 million during the fiscal year ended June 30, 2023 to $20.2 million during the fiscal year ended June 30, 2024 due to decreases of (i) $1.1 million in SaaS revenue, (ii) $190,000 in professional services revenue, and (iii) $106,000 in legacy revenue.
Cost of Revenue
|
|
Fiscal Year Ended June 30, |
|
|
|
|
|
||||
|
|
2024 |
|
2023 |
|
Change |
|||||
Cost of revenue |
|
(in thousands, except percentages) |
|||||||||
Subscription |
|
$ |
19,514 |
|
$ |
18,677 |
|
$ |
837 |
4 |
% |
Professional services |
|
|
8,078 |
|
|
8,638 |
|
|
(560) |
(6) |
% |
Total cost of revenue |
|
$ |
27,592 |
|
$ |
27,315 |
|
$ |
277 |
|
|
Percentage of total revenue |
|
|
30 |
% |
|
28 |
% |
|
|
|
|
Gross margin |
|
|
70 |
% |
|
72 |
% |
|
|
|
|
Subscription
Cost of subscription revenues consist primarily of expenses related to our cloud services and support provided to customers. These expenses are comprised of cloud computing costs, personnel-related costs directly associated with cloud operations, and customer support, including salaries, benefits, bonuses and stock-based compensation and allocated overhead.
Cost of subscription revenues increased by $837,000 or 4% during the fiscal year ended June 30, 2024 from the same period in fiscal year 2023. The increase is primarily due to an increase in personnel related costs of $1.3 million; partially offset by a decrease in (i) outside consulting cost of $390,000 and (ii) cloud computing cost of $158,000 during the fiscal year ended June 30, 2024, from the same period in fiscal year 2023.
Excluding an increase of $45,000 due to foreign exchange rate fluctuation, cost of subscription revenues increased by $793,000 during the fiscal year ended June 30, 2024, from the same period in fiscal year 2023.
Professional Services
Cost of professional services consists primarily of personnel-related costs directly associated with our professional services and training departments, including salaries, benefits, bonuses, and stock-based compensation and allocated overhead.
Cost of professional services decreased by $560,000 or 6% during the fiscal year ended June 30, 2024 from the same period in fiscal year 2023. This decrease is due to a decrease in personnel-related costs of $560,000 from the same period in fiscal year 2023.
44
Excluding an increase of $74,000 due to foreign exchange rate fluctuation, cost of professional services revenue decreased by $634,000 for the fiscal year ended June 30, 2024, from the same period in fiscal year 2023.
Operating Expenses
Research and Development
|
|
Fiscal Year Ended June 30, |
|
|
|
|
|
||||
|
|
2024 |
|
2023 |
|
Change |
|||||
|
|
(in thousands, except percentages) |
|||||||||
Research and development |
|
$ |
26,626 |
|
$ |
27,300 |
|
$ |
(674) |
(2) |
% |
Percentage of total revenue |
|
|
29 |
% |
|
28 |
% |
|
|
|
|
Research and development expense primarily consists of personnel-related expenses directly associated with our engineering, product management and development, and quality assurance staff. Included in these costs are salaries, benefits, bonuses, stock-based compensation and allocated overhead. Research and development expense also includes outside consulting services contracted for research and development.
Research and development expense decreased by $674,000 or 2% during the fiscal year ended June 30, 2024, from the same period in fiscal year 2023. The decrease is primarily due to decreases in (i) $470,000 in personnel-related costs and (ii) $268,000 in outside consulting costs.
Excluding an increase of $64,000 due to foreign exchange rate fluctuation, research and development expense decreased by $738,000 for the fiscal year ended June 30, 2024, from the same period in fiscal year 2023.
Sales and Marketing
|
|
Fiscal Year Ended June 30, |
|
|
|
|
|
||||
|
|
2024 |
|
2023 |
|
Change |
|||||
|
|
(in thousands, except percentages) |
|||||||||
Sales and marketing |
|
$ |
22,115 |
|
$ |
31,707 |
|
$ |
(9,592) |
(30) |
% |
Percentage of total revenue |
|
|
24 |
% |
|
32 |
% |
|
|
|
|
Sales and marketing expense primarily consists of personnel-related expenses directly associated with our sales, marketing, and business development staff. Included in these costs are salaries, benefits, bonuses, and stock-based compensation and allocated overhead. Sales and marketing expenses also include amortization of commissions paid to our sales staff, lead generation activities, advertising, trade show and other promotional costs and, to a lesser extent, occupancy costs and related overhead.
Sales and marketing expenses decreased by $9.6 million or 30% during the fiscal year ended June 30, 2024 from same period in fiscal year 2023. The decrease is primarily due to a decrease of (i) $8.4 million in personnel-related costs and (ii) $1.2 million in marketing program costs.
Excluding an increase of $376,000 due to foreign exchange rate fluctuation, sales and marketing expense decreased $10.0 million for the fiscal year ended June 30, 2024, from the same period in fiscal year 2023.
General and Administrative
|
|
Fiscal Year Ended June 30, |
|
|
|
|
|
||||
|
|
2024 |
|
2023 |
|
Change |
|||||
|
|
(in thousands, except percentages) |
|||||||||
General and administrative |
|
$ |
10,499 |
|
$ |
10,300 |
|
$ |
199 |
2 |
% |
Percentage of total revenue |
|
|
11 |
% |
|
11 |
% |
|
|
|
|
45
General and administrative expense primarily consists of personnel-related expenses directly associated with our finance, human resources, administrative and legal personnel. Included in these costs are salaries, benefits, bonuses, and stock-based compensation and allocated overhead. General and administrative expenses also include fees for professional services, provision for credit losses and, to a lesser extent, occupancy costs and related overhead.
General and administrative expense increased by $199,000 or 2% during the fiscal year ended June 30, 2024, from the same period in fiscal year 2023. The increase is primarily due to an increase in (i) $829,000 in legal expenses and (ii) $154,000 in accounting, audit, and administrative expenses; partially offset by decreases of (i) $526,000 in personnel-related expenses, (ii) $175,000 in bad debt expense, (iii) $150,000 in outside consulting cost and (iv) $2,000 in investor relations expense.
Excluding an increase of $68,000 due to foreign exchange rate fluctuation, general and administrative expense increased $131,000 for the fiscal year ended June 30, 2024, from the same period in fiscal year 2023.
Stock-Based Compensation
Stock-based compensation expense is accounted for in accordance with the provisions of the accounting guidance which requires the measurement and recognition of compensation expense for all equity-based payment awards made to employees, members of our board of directors and consultants, based upon the grant-date fair value of those awards. We value our share-based payments under ASC 718, and record compensation expense for all share-based payments made to employees based on the fair value at the date of the grant.
The effect of recording stock-based compensation for fiscal year 2024 and 2023 is as follows:
|
|
Fiscal Year Ended June 30, |
||||
|
|
2024 |
|
2023 |
||
Stock-based compensation by type of award |
|
(in thousands) |
||||
Stock options |
|
$ |
3,348 |
|
$ |
5,847 |
Restricted stock units |
|
|
819 |
|
|
— |
Employee stock purchase plan |
|
|
362 |
|
|
399 |
Total stock-based compensation |
|
$ |
4,529 |
|
$ |
6,246 |
Determining the fair value of the equity-based payment awards at the grant date required significant judgment and the use of estimates, particularly surrounding the Black-Scholes valuation assumptions such as stock price volatility and expected option term.
Below is a summary of stock-based compensation included in the cost and expenses:
|
|
Fiscal Year Ended June 30, |
|
|
|
|
|
||||
|
|
2024 |
|
2023 |
|
Change |
|||||
|
|
(in thousands, except percentages) |
|||||||||
Cost of revenue |
|
$ |
1,237 |
|
$ |
1,469 |
|
$ |
(232) |
(16) |
% |
Research and development |
|
|
1,424 |
|
|
1,970 |
|
|
(546) |
(28) |
% |
Sales and marketing |
|
|
645 |
|
|
997 |
|
|
(352) |
(35) |
% |
General and administrative |
|
|
1,223 |
|
|
1,810 |
|
|
(587) |
(32) |
% |
Total stock-based compensation |
|
$ |
4,529 |
|
$ |
6,246 |
|
$ |
(1,717) |
(27) |
% |
Stock-based compensation expense includes the amortization of the fair value primarily of stock options awarded to employees, members of our board of directors and consultants. The fair value of stock options granted is recognized as an expense over their respectable vesting schedule. The decrease in our stock-based compensation expense in fiscal year 2024 compared to fiscal year 2023 was primarily due to decreases in stock option vesting over their respectable periods, company-wide headcount, and option grant activity.
We expect to review our share-based payment awards annually, as necessary.
46
Income from Operations
|
|
Fiscal Year Ended June 30, |
|
|
|
||||||
|
|
2024 |
|
2023 |
|
Change |
|||||
|
|
(in thousands, except percentages) |
|||||||||
Income from operations |
|
$ |
5,971 |
|
|
$ |
1,389 |
|
|
$ |
4,582 |
Operating margin |
|
|
6 |
% |
|
|
1 |
% |
|
|
|
Results from operations was income of $6 million in fiscal year 2024, compared to income of $1.4 million in fiscal year 2023. We recorded a positive operating margin of 6% in fiscal year 2024, and a positive operating margin of 1% in fiscal year 2023.
During the fiscal year ended June 30, 2024, SaaS revenue decreased by $4.7 million to $84.9 million compared to $89.6 million in fiscal year 2023.
The decrease in total costs and operating expenses in fiscal year ended June 30, 2024 was $10.1 million primarily due to decreases of (i) $8.6 million in personnel-related expenses, (ii) $1.2 million in outside consulting costs, (iii) $1.2 million in marketing costs, (iv) $175,000 in bad debt expenses, (v) $158,000 in cloud computing costs , and (vi) $2,000 in investor relations cost; partially offset with increases in (i) $829,000 in legal expense and (ii) $154,000 in accounting and administrative services expenses.
Excluding a decrease from foreign exchange fluctuation of $627,000, total costs and operating expenses decreased by $10.4 million for the fiscal year ended June 30, 2024, from the same period in fiscal year 2023.
Interest Income
Interest income consists primarily of interest earned on money market accounts, which have increased in rates compared to prior year. Interest income, was income of $3.8 million and $2.4 million for the fiscal years ended June 30, 2024 and 2023, respectively.
Other Expense, Net
Other expense, net primarily included foreign exchange rate fluctuations on international trade receivables. Other expense, net was $51,000 and $434,000 for the fiscal years ended June 30, 2024 and 2023, respectively.
Income Tax Provision
Provision for income taxes consists of federal, state and foreign income taxes. Due to the current economic state of the U.S. economy, expiring tax attributes and uncertainty of future profitability, we maintain a valuation allowance against U.S. deferred tax assets as of June 30, 2024. We consider all available evidence, both positive and negative, including but not limited to earnings history, expiring attributes, projected future outcomes, industry and market trends and the nature of each of the deferred tax assets. We recorded an income tax provision of $1.9 million and $1.2 million in the fiscal years ended June 30, 2024 and 2023, respectively.
New Accounting Pronouncements
For information with respect to recent accounting pronouncements and the impact of these pronouncements on our consolidated financial statements, see Note 1 of Notes to Consolidated Financial Statements included in Item 8 Financial Statements and Supplementary Data of this Annual Report.
47
Liquidity and Capital Resources
Overview
Our principal sources of liquidity were cash and cash equivalents, and accounts receivable, net. Our liquidity sources were $101.7 million compared to $104.8 million as of June 30, 2024 and 2023, respectively. Our cash, cash equivalents, and restricted cash were $70.0 million and $73.2 million as of June 30, 2024 and 2023, respectively.
Our working capital was $44.5 million and $46.1 million as of June 30, 2024 and 2023, respectively. Our deferred revenue was $49.3 million and $49.9 million as of June 30, 2024 and 2023, respectively.
Based upon our current business plan, we believe that existing capital resources will enable us to maintain current and planned operations for at least the next 12 months. From time to time, however, we may consider opportunities for raising additional capital. We can make no assurances that such opportunities will be available to us on economic terms we consider favorable, if at all.
Our expectations as to our future cash flows and our future cash balances are subject to a number of assumptions, including assumptions regarding anticipated increases in our revenue, our ability to retain existing customers and customer purchasing and payment patterns, many of which are beyond our control.
Cash Flows
For the fiscal years ended June 30, 2024 and 2023, our cash flows were as follows (in thousands):
|
Fiscal Year Ended June 30, |
||||
|
2024 |
|
2023 |
||
Net cash provided by operating activities |
$ |
12,454 |
|
$ |
4,621 |
Net cash used in investing activities |
|
(198) |
|
|
(288) |
Net cash used in financing activities |
|
(15,391) |
|
|
(4,079) |
Cash provided by operating activities mainly consists of net income adjusted for non-cash expense items such as depreciation and amortization, expense associated with stock-based awards, the timing of employee related costs including costs capitalized to obtain revenue contracts, amortization of right-of-use assets, and changes in operating assets and liabilities during the year.
Cash provided by operating activities increased by $7.8 million during the fiscal year ended June 30, 2024, driven primarily by the increase in net income and timing of accounts receivable collections and accrued compensation payments.
Net cash used in investing activities decreased by $90,000 during the fiscal year ended June 30, 2024, driven primarily by reduced activities related to the purchase of equipment for new employees and facility expenditures. Historically, cash used in investing activities has been used to purchase equipment and software to support our business and growth.
Net cash used in financing activities increased by $11.3 million during the fiscal year ended June 30, 2024. The changes consist primarily of proceeds from the exercise of employee stock options, our employee stock purchase plan, and funds used with repurchases of our common stock of approximately $11.5 million.
48
Commitments
Our principal commitments consist of obligations under leases for office space. Lease agreements are evaluated to determine whether an arrangement is or contains a lease in accordance with ASC 842, Leases.
The following table summarizes our contractual obligations as of June 30, 2024 and the effect such obligations are expected to have on its liquidity and cash flow in future periods (in thousands):
|
|
Payments Due by Period |
||||||||||
|
|
|
|
|
|
|
|
|
|
|
|
|
|
|
Total |
|
1 – 3 Years |
|
3 – 5 Years |
|
More than 5 Years |
||||
Operating leases |
|
|
4,852 |
|
|
3,044 |
|
|
556 |
|
|
1,252 |
Total |
|
$ |
4,852 |
|
$ |
3,044 |
|
$ |
556 |
|
$ |
1,252 |
Off-Balance Sheet Arrangements
As of June 30, 2024, we had no significant off-balance sheet arrangements as defined in Item 303(a)(4) of Regulation S-K.
49
ITEM 7A. |
QUANTITATIVE AND QUALITATIVE DISCLOSURES ABOUT MARKET RISK |
Foreign Currency Exchange Risk
We develop products in the United States and India and sell these products in the United States and internationally. Generally, international sales are made in local currency. As a result, our financial results could be affected by factors such as changes in foreign currency exchange rates or weak economic conditions in foreign markets. Identifiable assets denominated in foreign currency as of June 30, 2024 and 2023 totaled approximately $24.9 million and $20.8 million, respectively. A 10% increase in the value of the dollar relative to other currencies would decrease the value of these assets by $2.5 million between June 30, 2024 and our next financial reporting period. We do not currently use derivative instruments to hedge against foreign exchange risk. As such we are exposed to market risk from fluctuations in foreign currency exchange rates, principally from the exchange rate between the U.S. Dollar and the Euro, the British Pound and the Indian Rupee. An unfavorable change in the foreign currency exchange rates may cause an adverse effect on our financial position or results of operations.
Interest Rate Risk
Our exposure to market risk for changes in interest rates relates primarily to interest earned on our cash and cash equivalents. The primary objective of our investment activities is to preserve our capital to fund operations. We also seek to maximize income from our investments without assuming significant risk. Our investment policy provides for investments in short-term, low-risk, investment-grade debt instruments. These investments are subject to interest rate risk and will decrease in value if market interest rates increase.
We currently do not hedge interest rate exposure, and we do not have any foreign currency or other derivative financial instruments. To date, we have not experienced a loss of principal on any of our investments. Although we currently expect that our ability to access or liquidate these investments as needed to support our business activities will continue, we cannot ensure that this will not change. We believe that, if market interest rates were to change immediately and uniformly by 10% from levels between June 30, 2024 and our next financial reporting period, the impact on the fair value of these securities or our cash flows or income would not be material.
50
ITEM 8. |
FINANCIAL STATEMENTS AND SUPPLEMENTARY DATA |
eGain Corporation
Consolidated Financial Statements
As of June 30, 2024 and 2023 and for the years ended June 30, 2024 and 2023
Index to Consolidated Financial Statements
|
|
|
|
|---|---|---|---|
|
|
Page |
|
Report of BPM LLP, Independent Registered Public Accounting Firm (PCAOB ID: 207) |
|
52 |
|
Consolidated Financial Statements: |
|
|
|
|
54 |
|
|
Consolidated Statements of Operations for the years ended June 30, 2024 and 2023 |
|
55 |
|
Consolidated Statements of Comprehensive Income for the years ended June 30, 2024 and 2023 |
|
56 |
|
Consolidated Statements of Stockholders’ Equity for the years ended June 30, 2024 and 2023 |
|
57 |
|
Consolidated Statements of Cash Flows for the years ended June 30, 2024 and 2023 |
|
58 |
|
|
59 |
|
51
REPORT OF INDEPENDENT REGISTERED PUBLIC ACCOUNTING FIRM
Board of Directors and Stockholders
eGain Corporation
Sunnyvale, California
Opinion on the Financial Statements
We have audited the accompanying consolidated balance sheets of eGain Corporation and subsidiaries (the “Company”) as of June 30, 2024 and 2023, and the related consolidated statements of operations, comprehensive income, stockholders’ equity, and cash flows for each of the two years in the period ended June 30, 2024 and the related notes and financial statement schedule listed in the Index to this Annual Report on Form 10-K at Part IV Item 15(a)(2) (collectively referred to as the “consolidated financial statements”). In our opinion, the consolidated financial statements present fairly, in all material respects, the consolidated financial position of the Company as of June 30, 2024 and 2023, and the consolidated results of its operations and its cash flows for each of the two years in the period ended June 30, 2024, in conformity with accounting principles generally accepted in the United States of America.
Basis for Opinion
These consolidated financial statements are the responsibility of the Company’s management. Our responsibility is to express an opinion on the Company’s consolidated financial statements based on our audits. We are a public accounting firm registered with the Public Company Accounting Oversight Board (United States) (PCAOB) and are required to be independent with respect to the Company in accordance with the U.S. federal securities laws and the applicable rules and regulations of the Securities and Exchange Commission and the PCAOB.
We conducted our audits in accordance with the standards of the PCAOB. Those standards require that we plan and perform the audit to obtain reasonable assurance about whether the consolidated financial statements are free of material misstatement, whether due to error or fraud. The Company is not required to have, nor were we engaged to perform, an audit of its internal control over financial reporting. As part of our audits, we are required to obtain an understanding of internal control over financial reporting, but not for the purpose of expressing an opinion on the effectiveness of the Company’s internal control over financial reporting. Accordingly, we express no such opinion.
Our audits included performing procedures to assess the risks of material misstatement of the consolidated financial statements, whether due to error or fraud, and performing procedures that respond to those risks. Such procedures included examining, on a test basis, evidence regarding the amounts and disclosures in the consolidated financial statements. Our audits also included evaluating the accounting principles used and significant estimates made by management, as well as evaluating the overall presentation of the consolidated financial statements. We believe that our audits provide a reasonable basis for our opinion.
Critical Audit Matter
The critical audit matter communicated below is a matter arising from the current period audit of the consolidated financial statements that was communicated or required to be communicated to the audit committee and that: (1) relates to accounts or disclosures that are material to the consolidated financial statements and (2) involved our especially challenging, subjective, or complex judgments. The communication of critical audit matters does not alter in any way our opinion on the consolidated financial statements, taken as a whole, and we are not, by communicating the critical audit matters below, providing a separate opinion on the critical audit matter or on the accounts or disclosures to which it relates.
Revenue Recognition
As described in Note 1 to the consolidated financial statements, the Company recognizes revenue upon transfer of control of promised services to customers in an amount that reflects the consideration the Company expects to receive in exchange for those services. The Company enters into contracts with its customers that may include promises to transfer cloud delivery arrangements, term software licenses, support and professional services. Significant judgment may be required by the Company in determining revenue recognition for these customer agreements, including the determination of whether products and services are considered distinct performance obligations that should be accounted for separately or combined as one unit of accounting and the determination of standalone selling prices (“SSP”) for each distinct performance, particularly for services that are not sold separately.
52
The principal audit considerations for our determination that performing procedures related to the Company’s revenue recognition for customer agreements is a critical audit matter are the significant amount of judgment required by management in this process. Significant judgment is required in determining SSP, including the determination of whether services are considered distinct performance obligations that should be accounted for separately or combined as one unit of accounting and the determination of SSP for each distinct performance obligation, particularly for services that are not sold separately.
Addressing the matter involved performing procedures and evaluating audit evidence in connection with forming our overall opinion on the consolidated financial statements. These procedures included testing the effectiveness of internal controls relating to the revenue recognition process, including internal controls related to the identification of distinct performance obligations and data used to establish SSP for products and services. These procedures also included reviewing executed contracts for a sample of revenue transactions to assess management’s evaluation of significant terms, including the determination of distinct performance obligations, and testing the amounts recognized as revenue or recorded as deferred revenue. In addition, we tested management’s determination of SSP by performing audit procedures that included, among others, assessing the appropriateness of the methodology applied, testing the mathematical accuracy of the underlying data and calculations, and testing selections to corroborate the data underlying the Company’s calculations.
/s/ BPM LLP
We have served as the Company’s auditor since 2008.
San Jose, California
September 12, 2024
53
EGAIN CORPORATION
CONSOLIDATED BALANCE SHEETS
(in thousands, except per share amounts)
|
|
June 30, |
||||
|
|
2024 |
|
2023 |
||
ASSETS |
|
|
|
|
|
|
Current assets: |
|
|
|
|
|
|
Cash and cash equivalents |
|
$ |
70,003 |
|
$ |
73,201 |
Restricted cash |
|
|
8 |
|
|
7 |
Accounts receivable, less provision for credit losses of $59 and $237 as of June 30, 2024 and 2023, respectively |
|
|
31,731 |
|
|
31,569 |
Costs capitalized to obtain revenue contracts, net |
|
|
1,272 |
|
|
1,317 |
Prepaid expenses |
|
|
2,915 |
|
|
2,466 |
Other current assets |
|
|
1,195 |
|
|
1,268 |
Total current assets |
|
|
107,124 |
|
|
109,828 |
Property and equipment, net |
|
|
441 |
|
|
633 |
Operating lease right-of-use assets |
|
|
3,811 |
|
|
2,797 |
Costs capitalized to obtain revenue contracts, net of current portion |
|
|
1,779 |
|
|
2,318 |
Goodwill |
|
|
13,186 |
|
|
13,186 |
Other assets, net |
|
|
1,511 |
|
|
1,355 |
Total assets |
|
$ |
127,852 |
|
$ |
130,117 |
LIABILITIES AND STOCKHOLDERS’ EQUITY |
|
|
|
|
|
|
Current liabilities: |
|
|
|
|
|
|
Accounts payable |
|
$ |
2,725 |
|
$ |
2,044 |
Accrued compensation |
|
|
7,642 |
|
|
7,697 |
Accrued liabilities |
|
|
5,078 |
|
|
5,387 |
Operating lease liabilities |
|
|
1,179 |
|
|
832 |
Deferred revenue |
|
|
45,989 |
|
|
47,762 |
Total current liabilities |
|
|
62,613 |
|
|
63,722 |
Deferred revenue, net of current portion |
|
|
3,280 |
|
|
2,101 |
Operating lease liabilities, net of current portion |
|
|
2,592 |
|
|
1,762 |
Other long-term liabilities |
|
|
871 |
|
|
836 |
Total liabilities |
|
|
69,356 |
|
|
68,421 |
Commitments and contingencies (Note 7 and 8) |
|
|
|
|
|
|
Stockholders’ equity: |
|
|
|
|
|
|
Common stock, $0.001 par value – authorized: 60,000 shares; issued: 32,698 and 32,268 shares; outstanding: 29,160 and 31,482 shares as of June 30, 2024 and 2023, respectively |
|
|
33 |
|
|
32 |
Additional paid-in capital |
|
|
407,416 |
|
|
401,087 |
Treasury stock, at cost: 3,538 and 786 common shares as of June 30, 2024 and 2023, respectively. |
|
|
(23,031) |
|
|
(5,763) |
Notes receivable from stockholders |
|
|
(21) |
|
|
(97) |
Accumulated other comprehensive loss |
|
|
(2,240) |
|
|
(2,122) |
Accumulated deficit |
|
|
(323,661) |
|
|
(331,441) |
Total stockholders’ equity |
|
|
58,496 |
|
|
61,696 |
Total liabilities and stockholders’ equity |
|
$ |
127,852 |
|
$ |
130,117 |
The accompanying notes are an integral part of these consolidated financial statements.
54
EGAIN CORPORATION
CONSOLIDATED STATEMENTS OF OPERATIONS
(in thousands, except per share information)
|
|
Years Ended June 30, |
||||
|
|
2024 |
|
2023 |
||
Revenue: |
|
|
|
|
|
|
Subscription |
|
$ |
85,082 |
|
$ |
90,324 |
Professional services |
|
|
7,721 |
|
|
7,687 |
Total revenue |
|
|
92,803 |
|
|
98,011 |
Cost of revenue: |
|
|
|
|
|
|
Cost of subscription |
|
|
19,514 |
|
|
18,677 |
Cost of professional services |
|
|
8,078 |
|
|
8,638 |
Total cost of revenue |
|
|
27,592 |
|
|
27,315 |
Gross profit |
|
|
65,211 |
|
|
70,696 |
Operating expenses: |
|
|
|
|
|
|
Research and development |
|
|
26,626 |
|
|
27,300 |
Sales and marketing |
|
|
22,115 |
|
|
31,707 |
General and administrative |
|
|
10,499 |
|
|
10,300 |
Total operating expenses |
|
|
59,240 |
|
|
69,307 |
Income from operations |
|
|
5,971 |
|
|
1,389 |
Interest income |
|
|
3,798 |
|
|
2,401 |
Other expense, net |
|
|
(51) |
|
|
(434) |
Income before income tax provision |
|
|
9,718 |
|
|
3,356 |
Provision for income taxes |
|
|
(1,938) |
|
|
(1,247) |
Net income |
|
$ |
7,780 |
|
$ |
2,109 |
Per share information: |
|
|
|
|
|
|
Earnings per share: |
|
|
|
|
|
|
Basic |
|
$ |
0.25 |
|
$ |
0.07 |
Diluted |
|
$ |
0.25 |
|
$ |
0.06 |
Weighted-average shares used in computation: |
|
|
|
|
|
|
Basic |
|
|
30,840 |
|
|
31,959 |
Diluted |
|
|
31,468 |
|
|
32,799 |
Summary of stock-based compensation included in the costs and expenses above: |
|
|
|
|
|
|
Cost of revenue |
|
$ |
1,237 |
|
$ |
1,469 |
Research and development |
|
|
1,424 |
|
|
1,970 |
Sales and marketing |
|
|
645 |
|
|
997 |
General and administrative |
|
|
1,223 |
|
|
1,810 |
Total stock-based compensation |
|
$ |
4,529 |
|
$ |
6,246 |
The accompanying notes are an integral part of these consolidated financial statements.
55
EGAIN CORPORATION
CONSOLIDATED STATEMENTS OF COMPREHENSIVE INCOME
(in thousands)
|
|
Years Ended June 30, |
||||
|
|
2024 |
|
2023 |
||
Net income |
|
$ |
7,780 |
|
$ |
2,109 |
Other comprehensive income, net of taxes: |
|
|
|
|
|
|
Foreign currency translation adjustments |
|
|
(118) |
|
|
565 |
Total comprehensive income |
|
$ |
7,662 |
|
$ |
2,674 |
The accompanying notes are an integral part of these consolidated financial statements.
56
EGAIN CORPORATION
CONSOLIDATED STATEMENTS OF STOCKHOLDERS’ EQUITY
(in thousands)
|
|
|
|
|
|
|
|
|
|
|
|
|
|
|
Notes |
|
Accumulated |
|
|
|
|
|
|||
|
|
|
|
|
|
|
Additional |
|
|
|
|
|
|
Receivable |
|
Other |
|
|
|
Total |
|||||
|
|
Common Stock |
|
Paid-in |
|
Treasury Stock |
|
From |
|
Comprehensive |
|
Accumulated |
|
Stockholders’ |
|||||||||||
|
|
Shares |
|
Amount |
|
Capital |
|
Shares |
|
Amount |
|
Stockholders |
|
Loss |
|
Deficit |
|
Equity |
|||||||
BALANCES AS OF JULY 1, 2022 |
|
31,930 |
|
$ |
32 |
|
$ |
393,157 |
|
— |
|
$ |
— |
|
$ |
(95) |
|
$ |
(2,687) |
|
$ |
(333,550) |
|
$ |
56,857 |
Interest on stockholders’ notes |
|
— |
|
|
— |
|
|
— |
|
— |
|
|
— |
|
|
(2) |
|
|
— |
|
|
— |
|
|
(2) |
Issuance of common stock upon exercise of stock options |
|
180 |
|
|
— |
|
|
610 |
|
— |
|
|
— |
|
|
— |
|
|
— |
|
|
— |
|
|
610 |
Issuance of common stock in connection with employee stock purchase plan |
|
158 |
|
|
— |
|
|
1,074 |
|
— |
|
|
— |
|
|
— |
|
|
— |
|
|
— |
|
|
1,074 |
Repurchase of common stock |
|
(786) |
|
|
— |
|
|
— |
|
786 |
|
|
(5,763) |
|
|
|
|
|
|
|
|
|
|
|
(5,763) |
Stock-based compensation |
|
— |
|
|
— |
|
|
6,246 |
|
— |
|
|
— |
|
|
— |
|
|
— |
|
|
— |
|
|
6,246 |
Foreign currency translation adjustments |
|
— |
|
|
— |
|
|
— |
|
— |
|
|
— |
|
|
— |
|
|
565 |
|
|
— |
|
|
565 |
Net income |
|
— |
|
|
— |
|
|
— |
|
— |
|
|
— |
|
|
— |
|
|
— |
|
|
2,109 |
|
|
2,109 |
BALANCES AS OF JUNE 30, 2023 |
|
31,482 |
|
|
32 |
|
|
401,087 |
|
786 |
|
|
(5,763) |
|
|
(97) |
|
|
(2,122) |
|
|
(331,441) |
|
|
61,696 |
Interest on stockholders’ notes |
|
— |
|
|
— |
|
|
— |
|
— |
|
|
— |
|
|
(1) |
|
|
— |
|
|
— |
|
|
(1) |
Repayment on stockholders’ notes |
|
— |
|
|
— |
|
|
— |
|
— |
|
|
— |
|
|
77 |
|
|
— |
|
|
— |
|
|
77 |
Issuance of common stock upon exercise of stock options |
|
260 |
|
|
1 |
|
|
861 |
|
— |
|
|
— |
|
|
— |
|
|
— |
|
|
— |
|
|
862 |
Issuance of common stock in connection with employee stock purchase plan |
|
170 |
|
|
— |
|
|
939 |
|
— |
|
|
— |
|
|
— |
|
|
— |
|
|
— |
|
|
939 |
Repurchase of common stock |
|
(2,752) |
|
|
— |
|
|
— |
|
2,752 |
|
|
(17,268) |
|
|
|
|
|
|
|
|
|
|
|
(17,268) |
Stock-based compensation |
|
— |
|
|
— |
|
|
4,529 |
|
— |
|
|
— |
|
|
— |
|
|
— |
|
|
— |
|
|
4,529 |
Foreign currency translation adjustments |
|
— |
|
|
— |
|
|
— |
|
— |
|
|
— |
|
|
— |
|
|
(118) |
|
|
— |
|
|
(118) |
Net income |
|
— |
|
|
— |
|
|
— |
|
— |
|
|
— |
|
|
— |
|
|
— |
|
|
7,780 |
|
|
7,780 |
BALANCES AS OF JUNE 30, 2024 |
|
29,160 |
|
$ |
33 |
|
$ |
407,416 |
|
3,538 |
|
$ |
(23,031) |
|
$ |
(21) |
|
$ |
(2,240) |
|
$ |
(323,661) |
|
$ |
58,496 |
The accompanying notes are an integral part of these consolidated financial statements.
57
EGAIN CORPORATION
CONSOLIDATED STATEMENTS OF CASH FLOWS
(in thousands)
|
|
Years Ended June 30, |
||||
|
|
2024 |
|
2023 |
||
Cash flows from operating activities: |
|
|
|
|
|
|
Net income |
|
$ |
7,780 |
|
$ |
2,109 |
Adjustments to reconcile net income to net cash provided by operating activities: |
|
|
|
|
|
|
Amortization of costs capitalized to obtain revenue contracts |
|
|
1,499 |
|
|
1,529 |
Amortization of right-of-use assets |
|
|
1,098 |
|
|
1,142 |
Depreciation and amortization |
|
|
387 |
|
|
490 |
Provision for credit losses |
|
|
93 |
|
|
260 |
Deferred income taxes |
|
|
91 |
|
|
(584) |
Stock-based compensation |
|
|
4,529 |
|
|
6,246 |
Gain on disposal of property and equipment |
|
|
— |
|
|
(9) |
Changes in operating assets and liabilities: |
|
|
|
|
|
|
Accounts receivable |
|
|
(261) |
|
|
(4,508) |
Costs capitalized to obtain revenue contracts |
|
|
(917) |
|
|
(462) |
Prepaid expenses |
|
|
(453) |
|
|
164 |
Other current assets |
|
|
67 |
|
|
(384) |
Other non-current assets |
|
|
(317) |
|
|
71 |
Accounts payable |
|
|
682 |
|
|
326 |
Accrued compensation |
|
|
(46) |
|
|
(1,068) |
Accrued liabilities |
|
|
(306) |
|
|
405 |
Deferred revenue |
|
|
(578) |
|
|
(60) |
Operating lease liabilities |
|
|
(936) |
|
|
(1,075) |
Other long-term liabilities |
|
|
42 |
|
|
29 |
Net cash provided by operating activities |
|
|
12,454 |
|
|
4,621 |
Cash flows from investing activities: |
|
|
|
|
|
|
Purchases of property and equipment |
|
|
(198) |
|
|
(288) |
Net cash used in investing activities |
|
|
(198) |
|
|
(288) |
Cash flows from financing activities: |
|
|
|
|
|
|
Interest on stockholder notes |
|
|
(1) |
|
|
— |
Repayment of stockholder notes |
|
|
77 |
|
|
— |
Proceeds from exercise of stock options |
|
|
862 |
|
|
610 |
Proceeds from employee stock purchase plan |
|
|
939 |
|
|
1,074 |
Repurchases of common stock |
|
|
(17,268) |
|
|
(5,763) |
Net cash provided by (used in) financing activities |
|
|
(15,391) |
|
|
(4,079) |
Effect of exchange rate differences on cash and cash equivalents |
|
|
(62) |
|
|
774 |
Net (decrease) increase in cash, cash equivalents and restricted cash |
|
|
(3,197) |
|
|
1,028 |
Cash, cash equivalents and restricted cash at beginning of year |
|
|
73,208 |
|
|
72,180 |
Cash, cash equivalents and restricted cash at end of year |
|
$ |
70,011 |
|
$ |
73,208 |
|
|
|
|
|
|
|
Supplemental cash flow disclosures: |
|
|
|
|
|
|
Cash paid for taxes |
|
$ |
1,805 |
|
$ |
1,701 |
ROU assets and lease liabilities recognized from lease modification |
|
$ |
2,141 |
|
$ |
91 |
The accompanying notes are an integral part of these consolidated financial statements.
58
EGAIN CORPORATION
NOTES TO CONSOLIDATED FINANCIAL STATEMENTS
1. SUMMARY OF BUSINESS AND SIGNIFICANT ACCOUNTING POLICIES
Organization and Nature of Business
eGain Corporation (eGain, the Company, our, we or us) automates customer engagement with an innovative knowledge hub, powered by conversational artificial intelligence (AI) and analytics. We sell mostly to large enterprises across financial services, telecommunications, retail, government, healthcare, and utilities seeking to better serve customers at scale while coping with content silos, process complexity, and regulatory compliance. With our mantra of AX + BX + CX = DX™, we guide clients to effortless digital experience (DX) by holistically optimizing agent experience (AX), business experience (BX) and customer experience (CX). Leading brands use eGain’s cloud software to improve customer satisfaction, empower agents, reduce service cost, and boost sales. We are headquartered in the United States. We also operate in the United Kingdom and India.
Principles of Consolidation
The consolidated financial statements include the accounts of eGain and our wholly-owned subsidiaries, eGain Communications Ltd., Exony Limited (Exony), eGain Communications Pvt. Ltd., eGain Communications (SA), and eGain Deutschland GmbH. All significant intercompany balances and transactions have been eliminated.
Business Combinations
Business combinations are accounted for at fair value under the purchase method of accounting. Acquisition costs are expensed as incurred and recorded in general and administrative expenses and changes in deferred tax asset valuation allowances and income tax uncertainties after the acquisition date affect income tax expense. The accounting for business combinations requires estimates and judgment as to expectations for future cash flows of the acquired business, and the allocation of those cash flows to identifiable intangible assets, in determining the estimated fair value for assets acquired and liabilities assumed. The fair values assigned to tangible and intangible assets acquired and liabilities assumed are based on management’s estimates and assumptions, as well as other information compiled by management, including valuations that utilize customary valuation procedures and techniques. If the actual results differ from the estimates and judgments used in these estimates, the amounts recorded in the consolidated financial statements could result in a possible impairment of the intangible assets and goodwill, or require acceleration of the amortization expense of finite-lived intangible assets.
Use of Estimates
The preparation of consolidated financial statements in conformity with accounting principles generally accepted in the United States of America requires management to make estimates and assumptions that affect the reported amounts of assets and liabilities, the disclosure of contingent assets and liabilities at the date of the consolidated financial statements and the reported amounts of revenue and expenses during the reporting period. The estimates are based upon information available as of the date of the consolidated financial statements. Actual results could differ from those estimates.
We evaluate our significant estimates, including those related to revenue recognition, provision for credit losses, valuation of stock-based compensation, valuation of long-lived assets, valuation of deferred tax assets, and litigation, among others. We base our estimates on historical experience and on various other assumptions that are believed to be reasonable under the circumstances, the results of which form the basis for making judgments about the carrying values of assets and liabilities that are not readily apparent from other sources. We refer to accounting estimates of this type as “critical accounting estimates.”
59
Foreign Currency
The functional currency of each of our international subsidiaries is the local currency of the country in which it operates. Assets and liabilities of our foreign subsidiaries are translated at month-end exchange rates, and revenue and expenses are translated at the average monthly exchange rates. The resulting cumulative translation adjustments are recorded as a component of accumulated other comprehensive loss. Foreign currency transaction gains and losses are included in “other expense, net” in the consolidated statements of operations, and resulted in a loss of $98,000 and $470,000, in fiscal years ended June 30, 2024 and 2023, respectively.
Cash and Cash Equivalents, Restricted Cash and Investments
We consider all highly liquid investments with an original purchase to maturity date of three months or less to be cash equivalents. Time deposits held for investments that are not debt securities are included in short-term investments in the consolidated balance sheets. Investments in time deposits with original maturities of more than three months but remaining maturities of less than one year are considered short-term investments. Investments held with the intent to reinvest or hold for longer than a year, or with remaining maturities of one year or more, are considered long-term investments. As of June 30, 2024 and 2023, we did not have any short-term or long-term investments.
Cash earmarked for a specific purpose and therefore not available for immediate and general use by the Company is considered restricted cash. Expected usage of restricted cash within one year is classified as a current asset; expected usage more than a year is considered a non-current asset. As of June 30, 2024 and 2023, our restricted cash was nominal and expected to be used within one year.
Fair Value of Financial Instruments
Our financial instruments consist of cash and cash equivalents, restricted cash, accounts receivable, accounts payable and accrued liabilities. We do not have any derivative financial instruments. We believe the reported carrying amounts of these financial instruments approximate fair value, based upon their short-term nature and comparable market information available at the respective balance sheet dates.
Concentration of Credit Risk
Financial instruments that subject us to concentrations of credit risk consist principally of cash and cash equivalents and trade accounts receivable. Cash and cash equivalents are deposited with high credit quality institutions. We are exposed to credit risk in the event of default by these institutions to the extent of the amount recorded on the consolidated balance sheets. We invest excess cash primarily in money market funds, which are highly liquid securities that bear minimal risk. In addition, we have investment policies and procedures that are reviewed periodically to minimize credit risk. Our cash, cash equivalents and restricted cash were $70.0 million as of June 30, 2024 and exceeded the FDIC (Federal Deposit Insurance Corporation) limits.
Our customer base extends across many different industries and geographic regions. Revenue is allocated to individual countries and geographic region by customer, based on where the product is shipped to and location of services performed. One customer, who is also a partner, accounted for 18% and 20% of total revenue for the years ended June 30, 2024 and 2023, respectively.
We perform ongoing credit evaluations of our customers with outstanding receivables and generally do not require collateral. In addition, we established a provision for credit losses based upon factors surrounding the credit risk of customers, historical trends and other information. Four partners and customers accounted for a range of 12% to 22% of accounts receivable as of June 30, 2024. A set of different three partners and customers accounted for a range of 18% to 22% of accounts receivable as of June 30, 2023.
Accounts Receivable and Provision for Credit Losses
We extend unsecured credit to our customers on a regular basis. Our accounts receivable are derived from revenue earned from customers and are not interest bearing. We also maintain a provision for credit losses to reserve for potential uncollectible trade receivables.
60
We review our trade receivables by aging category to identify specific customers with known disputes or collectability issues. We exercise judgment when determining the adequacy of these reserves as we evaluate historical bad debt trends, general economic conditions in the U.S. and internationally, and changes in customer financial conditions. If we made different judgments or utilized different estimates, material differences may result in additional reserves for trade receivables, which would be reflected by charges in general and administrative expenses for any period presented. We write off a receivable after all collection efforts have been exhausted and the amount is deemed uncollectible. Recovered written off receivables are recorded as they occur.
In certain revenue contracts, contractual billings do not coincide with revenue recognized on the contract. Unbilled accounts receivables (contract assets) are recorded when revenue recognized on the contract exceeds billings, pursuant to contract provisions, and become billable upon certain criteria being met. Unbilled accounts receivables, for which the Company has the unconditional right to consideration, totaled $3.6 million and $1.7 million as of June 30, 2024 and 2023, respectively, and are included in the accounts receivable, less provision for credit losses, balance on the accompanying consolidated balance sheets.
Our accounts receivable, net balance was $31.7 million and $31.6 million as of June 30, 2024 and 2023, respectively. Our combined contract liabilities, which consist of both current and non-current deferred revenue for which we have an obligation to transfer services to customers and have received considerations in advance or the amount is due from customers, balance was $49.3 million and $49.9 million as of June 30, 2024 and 2023, respectively.
Property and Equipment, Net
Property and equipment, net, is stated at cost, net of accumulated depreciation and amortization. Depreciation is computed using the straight-line method over the estimated useful life of the respective assets, which typically is between three or five years. Leasehold improvements and leased equipment are depreciated on a straight-line basis over the shorter of the lease term or useful life of the asset, which is typically three to five years.
Goodwill
We review goodwill annually for impairment or sooner whenever events or changes in circumstances indicate that it may be impaired. These events or circumstances could include a significant change in the business climate, legal factors, operating performance indicators, competition, or sale or disposition of a significant portion of a reporting unit. We operate under a single reporting unit and accordingly, all of our goodwill is associated with the entire company. We had no indicators of impairment for fiscal years ended June 30, 2024 and 2023.
Impairment of Long-Lived Assets
We review long-lived assets for impairment, including property and equipment, whenever events or changes in business circumstances indicate that the carrying amounts of the assets may not be fully recoverable. An impairment loss is recognized when estimated undiscounted future cash flows expected to result from the use of the asset and its eventual disposition is less than its carrying amount. During fiscal years ended June 30, 2024 and 2023, we did not have any such impairment losses.
Deferred Revenue
Deferred revenue primarily consists of payments received in advance of revenue recognition from cloud, term and ratable licenses, and maintenance and support services and is recognized as the revenue recognition criteria are met. We generally invoice customers in annual or quarterly installments. The deferred revenue balance does not represent the total contract value of annual or multi-year, non-cancelable cloud or maintenance and support agreements. Deferred revenue is influenced by several factors, including seasonality, the compounding effects of renewals, invoice duration, invoice timing and new business linearity within the quarter.
Deferred revenue that will be recognized during the succeeding twelve-month period is recorded as current deferred revenue and the remaining portion is recorded as noncurrent.
61
Cost Capitalized to Obtain Revenue Contracts, Net
Under Topic 606, we capitalize incremental costs of obtaining non-cancelable subscription and support revenue contracts. The capitalized amounts consist primarily of sales commissions paid to our direct sales force. Capitalized amounts also include (i) amounts paid to employees other than the direct sales force who earn incentive payouts under annual compensation plans that are tied to the value of contracts acquired and (ii) the associated payroll taxes and fringe benefit costs associated with the payments to our employees, including stock-based compensation.
Costs capitalized related to new revenue contracts are generally deferred and amortized on a straight-line basis over a period of benefit that we estimate to be five years. We determine the period of benefit by taking into consideration the historical and expected durations of our customer contracts, the expected useful lives of our technologies, and other factors. Commissions for renewal contracts relating to our cloud-based arrangements are expensed when incurred, as we do not consider renewal contracts to be commensurate with initial customer contracts. Historically, any commission associated with renewals have been immaterial. Amortization of costs to obtain revenue contracts is included as a component of sales and marketing expenses in our consolidated statements of operations.
The Company does not adjust transaction price for the effects of a significant financing component when the period between the transfers of the promised good or service to the customer and payment for that good or service by the customer is expected to be one year or less. The Company assessed each of its revenue contracts in order to determine whether a significant financing component exists, and determined its contracts did not include a significant financing component for the years ended June 30, 2024 and 2023.
During the fiscal years ended June 30, 2024 and 2023, we capitalized $917,000 and $462,000 of costs to obtain revenue contracts, respectively, and amortized $1.5 million to sales and marketing expense each period. Capitalized costs to obtain revenue contracts, net of accumulated amortization were $3.1 million and $3.6 million as of June 30, 2024 and 2023, respectively.
Leases
Lease agreements are evaluated to determine whether an arrangement is or contains a lease in accordance with ASC 842, Leases.
Operating leases are included in operating lease right-of-use (ROU) assets, current operating lease liabilities, and noncurrent operating lease liabilities in the consolidated financial statements. ROU assets represent the Company’s right to use leased assets over the agreed upon term. Lease liabilities represent the Company’s contractual obligation to make lease payments over the lease term.
For operating leases, ROU assets and lease liabilities are recognized at the commencement date of the lease. The lease liability is measured as the present value of the lease payments over the lease term, using the rate implicit in the lease if readily determinable. If the rate implicit in the lease cannot be readily determined, the Company uses its incremental borrowing rate at lease commencement. The operating lease ROU assets are calculated as the present value of the remaining lease payments plus unamortized initial direct costs and any prepayments, less unamortized lease incentives received.
Operating leases typically include non-lease components such as common-area maintenance costs. We have elected to include non-lease components with lease payments for the purpose of calculating lease ROU assets and liabilities, to the extent that they are fixed. Non-lease component payments that are not fixed are expensed as incurred as variable lease payments.
Lease terms may include renewal or extension options to the extent they are reasonably certain to be exercised. The assessment of whether renewal or extension options are reasonably certain to be exercised is made at lease commencement. Factors considered in determining whether an option is reasonably certain of exercise include, but are not limited to, the value of any leasehold improvements, the value of renewal rates compared to market rates, and the presence of factors that would cause a significant economic penalty to the Company if the option were not exercised. Lease expense is recognized on a straight-line basis over the lease term.
62
The Company has elected not to recognize ROU assets and obligations for leases with an initial term of twelve months or less, and has applied a capitalization threshold to recognize a lease on the consolidated balance sheets. The expense associated with short-term leases and leases that do not meet the Company’s capitalization threshold are recorded to lease expense in the period it is incurred.
Software Development Costs
We account for software development costs in accordance with ASC 985, Software, for costs of the software to be sold, leased or marketed, whereby costs for the development of new software products and substantial enhancements to existing software products are included in research and development expense as incurred until technological feasibility has been established, at which time any additional costs are capitalized. Technological feasibility is established upon completion of a working model. To date, software development costs incurred in the period between achieving technological feasibility and general availability of software have not been material and have been charged to operations as incurred.
Advertising Costs
We expense advertising costs as incurred. Total advertising expenses for the fiscal years ended June 30, 2024 and 2023 were $180,000 and $686,000, respectively.
Stock-Based Compensation
We account for stock-based compensation in accordance with ASC 718, Compensation—Stock Compensation. Determining the fair value of the stock-based awards at the grant date requires significant judgment and the use of estimates, particularly surrounding Black-Scholes valuation assumptions such as stock price volatility and expected option term. Stock-based compensation expense for employee and non-employee awards is recognized as expense over the requisite service period, which is generally in line with the vesting period, net of expected forfeitures. Stock-based compensation expense consists of expenses for stock options and restricted stock units (RSUs) granted under our Amended and Restated 2005 Management Stock Option Plan, our Amended and Restated 2005 Stock Incentive Plan, and our 2017 Employee Stock Purchase Plan (ESPP).
Income Taxes
Income taxes are accounted for using the asset and liability method in accordance with ASC 740, Income Taxes. Under this method, deferred tax liabilities and assets are recognized for the estimated future tax consequences attributable to differences between the financial statement carrying amounts of existing assets and liabilities and their respective tax bases. For the legacy eGain business in the United States, based upon the weight of available evidence, which includes our historical operating performance, our future investment plans, and the uncertainty in the current market and economic environment, we have provided a full valuation allowance against our net deferred tax assets. For the legacy eGain business in the United Kingdom, based on the positive evidence, the Company has determined it would be able to utilize the deferred tax assets and does not have a valuation allowance against the deferred tax assets. The remaining eGain foreign operations as well as Exony’s business have historically been profitable and we believe it is more likely than not that those assets will be realized. Our tax provision primarily relates to foreign activities as well as state income taxes. Our income tax rate differs from the statutory tax rates primarily due to the change in valuation allowance, stock-based compensation, Section 267 inclusion, research and development tax credits, and our foreign operations.
We account for uncertain tax positions according to the provisions of ASC 740. ASC 740 contains a two-step approach for recognizing and measuring uncertain tax positions. Tax positions are evaluated for recognition by determining if the weight of available evidence indicates that it is probable that the position will be sustained on audit, including resolution of related appeals or litigation. Tax benefits are then measured as the largest amount which is more than 50% likely of being realized upon ultimate settlement. We consider many factors when evaluating and estimating tax positions and tax benefits, which may require periodic adjustments and which may not accurately anticipate actual outcomes.
As of June 30, 2024, utilization of the NOL or tax credit carryforwards to offset future taxable income and taxes, respectively, are subject to an annual limitation under the Internal Revenue Code of 1986 and similar state provisions, which is determined by first multiplying the value of the Company’s stock at the time of the ownership change by the applicable long-term, tax-exempt rate, and then could be subject to additional adjustments such as built in gain or built in loss, as required.
63
Any limitation may result in expiration of all or a portion of its NOL and or tax credit carryforwards before utilization. The Company has not identified a change in ownership as of June 30, 2024 that would significantly limit the net operating loss carryovers.
Comprehensive Income
We report comprehensive income and its components in accordance with ASC 220, Comprehensive Income. Under the accounting standards, comprehensive income includes all changes in equity during a period except those resulting from investments by or distributions to owners. Total comprehensive income for each of the two years in the year ended June 30, 2024 is shown in the accompanying consolidated statements of comprehensive income. Accumulated other comprehensive loss presented in the accompanying consolidated balance sheets as of June 30, 2024 and 2023 consists of accumulated foreign currency translation adjustments.
Earnings Per Share
Basic earnings per share is computed using the weighted-average number of shares of common stock outstanding. In periods where net income is reported, the weighted average number of shares is increased by stock options in-the-money and shares issuable for RSUs subject to service-based vesting requirements to calculate diluted earnings per share.
The following table represents the calculation of basic and diluted earnings per common share (in thousands, except per share data):
|
|
Years Ended June 30, |
||||
|
|
2024 |
|
2023 |
||
Net income |
|
$ |
7,780 |
|
$ |
2,109 |
Per share information: |
|
|
|
|
|
|
Earnings per share: |
|
|
|
|
|
|
Basic |
|
$ |
0.25 |
|
$ |
0.07 |
Diluted |
|
$ |
0.25 |
|
$ |
0.06 |
Weighted-average shares used in computation: |
|
|
|
|
|
|
Basic |
|
|
30,840 |
|
|
31,959 |
Diluted |
|
|
31,468 |
|
|
32,799 |
Weighted average options to purchase 3,479,718 and 3,582,284 shares of common stock as of June 30, 2024 and 2023, respectively, were not included in the computation of diluted net income per share due to their anti-dilutive effect. Such securities could have a dilutive effect in future periods.
Segment Information
We operate in one segment, the development, license, implementation, and support of our customer service infrastructure software solutions. Operating segments are identified as components of an enterprise for which discrete financial information is available and regularly reviewed by our chief operating decision-maker in order to make decisions about resources to be allocated to the segment and assess its performance. Our chief operating decision-makers under ASC 280, Segment Reporting, are our executive management team. Our chief operating decision-makers review financial information presented on a consolidated basis for purposes of making operating decisions and assessing financial performance.
64
Information relating to our geographic areas for the fiscal years ended June 30, 2024 and 2023 is as follows (in thousands):
|
|
|
|
|
|
|
|
|
|
|
|
Total |
|
Income |
|
Long-Lived |
|||
|
|
Revenue |
|
from Operations |
|
Assets |
|||
Year ended June 30, 2024: |
|
|
|
|
|
|
|
|
|
North America |
|
$ |
72,611 |
|
$ |
6,355 |
|
$ |
216 |
Europe, Middle East, & Africa |
|
|
20,192 |
|
|
6,050 |
|
|
81 |
Asia Pacific |
|
|
— |
|
|
(6,434) |
|
|
144 |
|
|
$ |
92,803 |
|
$ |
5,971 |
|
$ |
441 |
Year ended June 30, 2023: |
|
|
|
|
|
|
|
|
|
North America |
|
$ |
76,375 |
|
$ |
1,976 |
|
$ |
358 |
Europe, Middle East, & Africa |
|
|
21,636 |
|
|
5,830 |
|
|
131 |
Asia Pacific |
|
|
— |
|
|
(6,417) |
|
|
144 |
|
|
$ |
98,011 |
|
$ |
1,389 |
|
$ |
633 |
For the purposes of entity-wide geographic area disclosures, long-lived assets consist of computers and equipment, furniture and fixtures, and leasehold improvements, net of accumulated depreciation and amortization. These items are included in property and equipment, net, on the accompanying Company’s consolidated balance sheets.
Recent Accounting Pronouncements
Pronouncements Recently Adopted
In June 2016, the Financial Accounting Standards Board (FASB) issued Accounting Standards Update (ASU) No. 2016-13, Financial Instruments - Credit Losses (Topic 326): Measurement of Credit Losses on Financial Instruments (ASU 2016-13), which requires measurement and recognition of expected credit losses for financial assets held at the reporting date based on internal information, external information, or a combination of both relating to past events, current conditions, and reasonable and supportable forecasts. ASU No. 2016-13 replaces the existing incurred loss impairment model with a forward-looking expected credit loss model, which will result in earlier recognition of credit losses. We adopted this guidance as of our first quarter of fiscal year 2024 with no material impact on our condensed consolidated financial statements.
Revenue Recognition
Revenue Recognition Policy
Our revenue is comprised of two categories including subscription and professional services. Subscription includes SaaS revenue and legacy revenue. SaaS includes revenue from cloud delivery arrangements, term licenses and embedded OEM royalties and associated support. Legacy revenue is associated with license, maintenance, and support contracts on perpetual license arrangements that we no longer sell. Professional services includes consulting, implementation, training, and managed services.
Significant Judgment Applied in the Determination of Revenue Recognition
We enter into contractual arrangements with customers that may include promises to transfer multiple services, such as subscription, support and professional services. With respect to our business, a performance obligation is a promise to transfer a service to a customer that is distinct. Significant judgment is required to determine whether services are distinct
performance obligations that should be accounted for separately or combined as one unit of accounting. Additionally, significant judgment is required to determine the timing of revenue recognition.
65
We allocate the transaction price to each performance obligation based on relative standalone selling price basis (SSP). The SSP is the price at which we would sell a promised service separately to one of our customers. Judgment is required to determine the SSP for each distinct performance obligation.
We determine the SSP by considering our pricing objectives in relation to market demand. Consideration is placed based on our history of discounting prices, size and volume of transactions involved, customer demographics and geographic locations, price lists, contract prices and our market strategy.
Determination of Revenue Recognition
Under Topic 606, we recognize revenue upon the transfer of control of promised services to our customers in the amount that is commensurate with the consideration that we expect to receive in exchange for those services. If consideration includes a variable amount in the arrangement, such as service level credits or contingent fees, then we include an estimate of the amount that we expect to receive for the total transaction price.
The amount of revenue that we recognize is based on (i) identifying the contract with a customer; (ii) identifying the performance obligations in the contract; (iii) determining the transaction price; (iv) allocating the transaction price to the performance obligations in the contract on a relative SSP basis; and (v) recognizing revenue when, or as, we satisfy each performance obligation in the contract typically through delivery or when control is transferred to the customer.
Subscription Revenue
The following customer arrangements are recognized ratably over the contract term as the performance obligations are delivered:
| ● | Cloud delivery arrangements; |
| ● | Maintenance and support arrangements; and |
| ● | Term licenses which incorporate on-premise software licenses and a subscription to a substantial cloud functionalities. |
For contracts involving distinct software licenses, the license performance obligation is satisfied at a point in time when control is transferred to the customer.
We typically invoice our customers in advance upon execution of the contract or subsequent renewals with payment terms between 30 and 45 days. Invoiced amounts are recorded in accounts receivable, deferred revenue or revenue, depending if control transferred to our customers based on each arrangement.
The Company has a royalty revenue agreement with a customer related to the Company’s embedded intellectual property. Under the terms of the agreement, the customer is to provide a combined fixed fee, per agent, for each software license sold containing the embedded software to the Company. These embedded OEM royalties are included as subscription revenue. Under Topic 606 revenue guidance, since these arrangements are for usage-based licenses of intellectual property, for which the guidance in paragraph ASC 606-10-55-65 applies, the Company estimate revenue recognized only as the performance obligation of the OEM royalties has been satisfied or partially satisfied. Differences between actual results and estimated amounts are adjusted in the following period as such sales are reported by the customer with a quarter in arrears.
Professional Services Revenue
Professional services revenue includes system implementation, consulting, training, and managed services. The transaction price is allocated to various performance obligations based on their SSP. Revenue allocated to each performance obligation is recognized at the earlier of satisfaction of discrete performance obligations, or as work is performed on a time and material basis. Managed services include a comprehensive set of processes and activities that range from implementation to monitoring the evolution and support of eGain solutions in a company. Our consulting and implementation service contracts are bid either on a time-and-material basis or on a fixed-fee basis. Managed services contracts are bid on a time-and-material basis.
66
Fixed fees are generally paid upon milestone billing or customer acceptance at pre-determined points in the contract. Amounts that have been invoiced are recorded in accounts receivable and in deferred revenue or revenue, depending on whether transfer of control to customers has occurred.
Training revenue that meets the criteria to be accounted for separately is recognized when training is provided.
Contracts with Multiple Performance Obligations
The Company enters into contracts that can include various combinations of subscriptions, professional services and maintenance and support, which are generally distinct and accounted for as separate performance obligations. For contracts with multiple performance obligations, the Company allocates the transaction price of the contract to each performance obligation on a relative basis using the respective standalone selling prices for each performance obligation.
2. BALANCE SHEET COMPONENTS
Property and equipment, net consists of the following:
|
|
As of June 30, |
||||
|
|
2024 |
|
2023 |
||
|
|
(in thousands) |
||||
Computers and equipment |
|
$ |
3,496 |
|
$ |
3,886 |
Furniture and fixtures |
|
|
878 |
|
|
963 |
Leasehold improvements |
|
|
688 |
|
|
655 |
Total |
|
|
5,062 |
|
|
5,504 |
Accumulated depreciation and amortization |
|
|
(4,621) |
|
|
(4,871) |
Property and equipment, net |
|
$ |
441 |
|
$ |
633 |
Depreciation and amortization expense was $387,000 and $490,000 for the fiscal years ended June 30, 2024 and 2023, respectively. Disposed property and equipment, which were substantially fully-depreciated, were $625,000 and $516,000 for the fiscal years ended June 30, 2024 and June 30, 2023, respectively.
Accrued compensation consists of the following:
|
|
As of June 30, |
||||
|
|
2024 |
|
2023 |
||
|
|
(in thousands) |
||||
Accrued bonuses |
|
$ |
3,007 |
|
$ |
3,068 |
Accrued vacation |
|
|
2,804 |
|
|
2,715 |
Payroll and other employee related costs |
|
|
1,325 |
|
|
1,688 |
Accrued commissions |
|
|
506 |
|
|
226 |
Accrued compensation |
|
$ |
7,642 |
|
$ |
7,697 |
Accrued liabilities consists of the following:
|
|
As of June 30, |
||||
|
|
2024 |
|
2023 |
||
|
|
(in thousands) |
||||
VAT liability |
|
$ |
920 |
|
$ |
927 |
Sales tax payable |
|
|
425 |
|
|
1,017 |
Customer advances |
|
|
132 |
|
|
109 |
Accrued other liabilities |
|
|
3,601 |
|
|
3,334 |
Accrued liabilities |
|
$ |
5,078 |
|
$ |
5,387 |
67
3. REVENUE RECOGNITION
Disaggregation of Revenue
The following table presents our subscription and professional services revenue during the fiscal years ended June 30, 2024 and 2023, respectively:
|
|
Fiscal Year Ended June 30, |
||||
|
|
2024 |
|
2023 |
||
|
|
(in thousands) |
||||
Revenue: |
|
|
|
|
|
|
SaaS revenue |
|
$ |
84,874 |
|
$ |
89,619 |
Legacy revenue |
|
|
208 |
|
|
705 |
Total subscription |
|
|
85,082 |
|
|
90,324 |
Professional services |
|
|
7,721 |
|
|
7,687 |
Total revenue |
|
$ |
92,803 |
|
$ |
98,011 |
The following table presents our revenue recognized over-time and at a point-in-time during the fiscal years ended June 30, 2024 and 2023, respectively:
|
|
Fiscal Year Ended June 30, |
||||
|
|
2024 |
|
2023 |
||
|
|
(in thousands) |
||||
Revenue: |
|
|
|
|
|
|
Over-time |
|
$ |
81,415 |
|
$ |
86,066 |
Point-in-time |
|
|
11,388 |
|
|
11,945 |
Total revenue |
|
$ |
92,803 |
|
$ |
98,011 |
The following table presents our revenue by geography. Revenue by geography is generally determined on the region of our contracting entity rather than the region of our customer. The relative proportion of our total revenues between each geographic region as presented in the table below was materially consistent across each of our operating segments’ revenues for the periods presented.
|
|
Fiscal Year Ended June 30, |
||||
|
|
2024 |
|
2023 |
||
|
|
(in thousands) |
||||
Revenue: |
|
|
|
|
|
|
North America |
|
$ |
72,611 |
|
$ |
76,375 |
Europe, Middle East, & Africa |
|
|
20,192 |
|
|
21,636 |
Total revenue |
|
$ |
92,803 |
|
$ |
98,011 |
Contract Balances
Contract assets, if any, consist of unbilled receivables for completed performance obligations which have not been invoiced, and for which we do not have an unconditional right to consideration. Unbilled receivables are included in accounts receivable, less provision for credit losses on our consolidated balance sheets. Contract liabilities consist of deferred revenue for which we have an obligation to transfer services to customers and have received consideration in advance or the amount is due from customers.
68
Once the obligations are fulfilled, then deferred revenue is recognized to revenue in the respective period.
The following table presents the changes in contract liabilities (in thousands):
|
|
Balance as of |
|
Balance as of |
||
Contract liabilities: |
|
|
|
|
|
|
Deferred revenue |
|
|
45,989 |
|
|
47,762 |
Deferred revenue, net of current portion |
|
|
3,280 |
|
|
2,101 |
$36.2 million of deferred revenue as of June 30, 2023 was recognized as revenue during the fiscal year ended June 30, 2024. $38.2 million of deferred revenue as of June 30, 2022 was recognized as revenue during the fiscal year ended June 30, 2023.
Remaining Performance Obligations
Remaining performance obligations represent contracted revenue that had not yet been recognized, and include billed deferred revenue, consisting of amounts invoiced to customers whether collected or uncollected which have not been recognized as revenue, as well as unbilled amounts that will be invoiced and recognized as revenue in future periods. The transaction price allocated to the remaining performance obligation is influenced by a variety of factors, including seasonality, timing of renewals, average contract terms and foreign currency exchange rates. As of June 30, 2024, our remaining performance obligations were $78.4 million of which we expect to recognize $60.4 million and $18 million as revenue within one year and beyond one year, respectively.
69
4. INCOME TAXES
Income before income tax provision consisted of the following (in thousands):
|
|
Fiscal Year Ended June 30, |
||||
|
|
2024 |
|
2023 |
||
United States |
|
$ |
6,248 |
|
$ |
(460) |
Foreign |
|
|
3,470 |
|
|
3,816 |
Income before income tax provision |
|
$ |
9,718 |
|
$ |
3,356 |
The reconciliation of income tax expense at the statutory federal income tax rate and the Company’s effective tax rate is as follows (in thousands):
|
|
Fiscal Year Ended June 30, |
||||
|
|
2024 |
|
2023 |
||
|
|
|
|
|
|
|
Federal statutory income tax rate |
|
$ |
(2,041) |
|
$ |
(705) |
Current state taxes, net of federal benefit |
|
|
632 |
|
|
1,152 |
Foreign rate differential |
|
|
(292) |
|
|
559 |
Research and development credits |
|
|
599 |
|
|
747 |
Foreign withholding tax |
|
|
(23) |
|
|
(27) |
Stock-based compensation |
|
|
(410) |
|
|
(136) |
Deferred return to provision |
|
|
(175) |
|
|
(284) |
Section 267 payables |
|
|
1,294 |
|
|
— |
Other items |
|
|
(52) |
|
|
(118) |
Net change in valuation allowance |
|
|
(1,470) |
|
|
(1,726) |
Foreign income |
|
|
— |
|
|
(709) |
Income tax provision |
|
$ |
(1,938) |
|
$ |
(1,247) |
The components of the income tax provision are as follows (in thousands):
|
|
Fiscal Year Ended June 30, |
||||
|
|
2024 |
|
2023 |
||
Current provision: |
|
|
|
|
|
|
Federal |
|
$ |
— |
|
$ |
— |
State |
|
|
(897) |
|
|
(576) |
Foreign |
|
|
(951) |
|
|
(1,221) |
Total current: |
|
|
(1,848) |
|
|
(1,797) |
Deferred: |
|
|
|
|
|
|
Federal |
|
|
— |
|
|
— |
State |
|
|
— |
|
|
— |
Foreign |
|
|
(90) |
|
|
550 |
Total deferred: |
|
|
(90) |
|
|
550 |
Income tax provision |
|
$ |
(1,938) |
|
$ |
(1,247) |
As of June 30, 2024, we had federal and state net operating loss carryforwards of approximately $12.0 million and $12.3 million, respectively. The net operating loss carryforwards will expire at various dates beginning in fiscal year ending June 30, 2035, if not utilized. We also had federal research and development credit carryforwards of approximately $4.9 million as of June 30, 2024, which will expire at various dates beginning in fiscal year ending June 30, 2025, if not utilized. The California research and development credit carryforwards are approximately $6.8 million as of June 30, 2024 and have an indefinite carryover period.
70
In 2024, California enacted legislation, with the first being S.B.167, which suspends the use of NOLs by businesses and individuals for tax years 2024 through 2026, limits the use of tax credits by businesses and individuals to $5 million for tax years 2024 through 2026, and clarifies that income not included in apportionable business income is excluded from the sales factor of the apportionment formula. The second, S.B.175, provides some relief from the $5 million credit limitation in S.B. 167 by allowing taxpayers subject to the limit to elect to later receive a refund of credits they would have otherwise used to reduce tax liabilities during the limitation period.
As of June 30, 2024, utilization of the NOL or tax credit carryforwards to offset future taxable income and taxes, respectively, are subject to an annual limitation under the Internal Revenue Code of 1986 and similar state provisions, which is determined by first multiplying the value of the Company’s stock at the time of the ownership change by the applicable long-term, tax-exempt rate, and then could be subject to additional adjustments such as built in gain or built in loss, as required. Any limitation may result in expiration of all or a portion of its NOL and or tax credit carryforwards before utilization. As of June 30, 2024, the Company did not identify any ownership change that would significantly limit the net operating loss carryovers.
Deferred tax assets and liabilities reflect the net tax effects of net operating loss and credit carryforwards and of temporary differences between the carrying amounts of assets and liabilities for financial reporting and the amounts used for income tax purposes.
Significant components of our deferred tax assets and liabilities for federal, state and foreign income taxes are as follows (in thousands):
|
|
As of June 30, |
||||
|
|
2024 |
|
2023 |
||
Deferred tax assets: |
|
|
|
|
|
|
Net operating loss carryforwards |
|
$ |
3,419 |
|
$ |
9,115 |
Research credits |
|
|
10,346 |
|
|
9,404 |
Other credits |
|
|
15 |
|
|
— |
Deferred revenue |
|
|
853 |
|
|
898 |
Stock-based compensation |
|
|
4,927 |
|
|
4,500 |
Accruals and reserves |
|
|
1,231 |
|
|
1,126 |
Lease liability |
|
|
443 |
|
|
563 |
Intangibles |
|
|
4 |
|
|
— |
Other |
|
|
178 |
|
|
152 |
Section 267 payables |
|
|
1,526 |
|
|
— |
Capitalized research and development |
|
|
14,109 |
|
|
10,088 |
Gross deferred tax assets |
|
|
37,051 |
|
|
35,846 |
Less valuation allowance |
|
|
(35,608) |
|
|
(34,139) |
Net deferred tax assets |
|
|
1,443 |
|
|
1,707 |
Gross deferred tax liabilities |
|
|
|
|
|
|
Right-of-use asset |
|
|
(464) |
|
|
(601) |
Fixed assets |
|
|
(5) |
|
|
(42) |
Gross deferred tax liabilities |
|
|
(469) |
|
|
(643) |
Total deferred tax assets, net * |
|
$ |
974 |
|
$ |
1,064 |
|
|
|
|
|
|
|
*included in other assets, net, on consolidated balance sheets |
|
|
|
|
|
|
ASC 740, Income Taxes, provides for the recognition of deferred tax assets if realization of such assets is more likely than not. For the legacy eGain business in the United States, based upon the weight of available evidence, which includes our historical operating performance and the reported cumulative net losses in prior years, we have provided a full valuation allowance against our U.S. net deferred tax assets. With respect to our foreign operations, we expect to utilize the deferred tax assets and have not placed a valuation allowance against them. Our tax provision primarily relates to foreign activities as well as state income taxes. Our income tax rate differs from the statutory tax rates primarily due to the change in valuation allowance, stock-based compensation, Section 267, research and development credits, and our foreign operations.
71
The net valuation allowance increased by $1.5 million and increased by $1.7 million for the fiscal years ended June 30, 2024 and 2023, respectively.
We have not provided for taxes on $26.2 million of undistributed earnings of our foreign subsidiaries as of June 30, 2024. It is our intention to reinvest such undistributed earnings indefinitely in our foreign subsidiaries. If we distribute these earnings, in the form of dividends or otherwise, we would be subject to withholding taxes payable to the foreign jurisdiction and potential state taxes.
For the fiscal years ended June 30, 2024 and 2023, we have zero and $3.4 million of Global Intangible Low Tax Income inclusion and used our net operating losses to offset our taxable income, respectively.
Uncertain Tax Positions
The aggregate changes in the balance of our gross unrecognized tax benefits during fiscal years 2024 and 2023 were as follows (in thousands):
|
|
Fiscal Year Ended June 30, |
||||
|
|
2024 |
|
2023 |
||
Beginning balance |
|
$ |
1,551 |
|
$ |
1,556 |
Increases in balances related to tax positions taken during current periods |
|
|
161 |
|
|
130 |
Expired Attributes |
|
|
(71) |
|
|
(135) |
Ending balance |
|
$ |
1,641 |
|
$ |
1,551 |
There is $45,000 and $0 of unrecognized tax benefit, if recognized currently, that would impact the Company’s effective tax rate as of June 30, 2024 and 2023, respectively. No accrued interest and penalties have been recognized in the tax provision related to unrecognized tax benefits.
We do not anticipate the amount of existing unrecognized tax benefit to significantly increase or decrease during the next twelve months. Our policy is to record interest and penalties related to unrecognized tax benefits as income tax expense.
We file income tax returns in the United States as well as various state and foreign jurisdictions. In these jurisdictions, tax years between 2002 and 2016 remain subject to examination by the appropriate governmental agencies due to tax loss carryovers from those years. For U.S. tax purposes, tax years after 2016 are subject to a three year statute of limitations. The Company is not currently under audit with either the IRS, foreign, or any state or local jurisdictions, nor has it been notified of any other potential future income tax audit. The federal and California statute of limitations remains open for three and four years, respectively, from the date of utilization of any net operating loss or credits.
5. STOCKHOLDERS’ EQUITY
On December 8, 2021, our board of directors authorized the amended and restated Certificate of Incorporation which increased the total authorized shares of common stock from 50,000,000 to 60,000,000 shares. As of June 30, 2024 and 2023, the Company had 32,698,000 and 32,268,000 shares of common stock issued, respectively, and 29,160,000 and 31,482,000 shares of common stock outstanding, respectively.
72
Common Stock
We have reserved shares of common stock for issuance as of June 30, 2024 as follows:
|
|
Common |
|
|
Stock |
|
|
Reserves |
Stock options outstanding |
|
4,427,011 |
Restricted stock units outstanding |
|
185,427 |
Stock available for future grants or issuance: |
|
|
2005 Stock Incentive Plan |
|
1,072,051 |
2005 Management Stock Option Plan |
|
71,983 |
2017 Employee Stock Purchase Plan |
|
768,297 |
Total reserved shares of common stock for issuance |
|
6,524,769 |
Preferred Stock
We are authorized to issue 5,000,000 shares of preferred stock with a par value of $0.001 per share. As of June 30, 2024 and 2023, no shares of preferred stock are issued or outstanding. Our board of directors has the authority, without further action by our stockholders, to issue up to 5,000,000 shares of preferred stock in one or more series and to fix the rights, preferences, privileges and restrictions thereof. These rights, preferences and privileges could include dividend rights, conversion rights, voting rights, terms of redemption, liquidation preferences, sinking fund terms and the number of shares constituting any series or the designation of such series, any or all of which may be greater than the rights of the common stock.
Stock-Based Compensation
We account for stock-based compensation in accordance with ASC 718, Compensation—Stock Compensation. Under the fair value recognition provisions of ASC 718, stock-based compensation cost is measured at the grant date based on the fair value of the award and is recognized as expense over the requisite service period, which is generally the vesting period, net of expected forfeitures. Stock-based compensation expense consists of expenses for stock options, RSUs, and discounted employee common stock granted under our 2017 Employee Stock Purchase Plan (ESPP).
2005 Management Stock Option Plan
In May 2005, our board of directors adopted the 2005 Management Stock Option Plan (2005 Management Plan) which provides for the grant of non-statutory stock options to directors, officers and key employees of eGain and its subsidiaries. Our board extended the expiration date of the 2005 Management Plan to September 30, 2024. Options under the 2005 Management Plan are granted at a price not less than 100% of the fair market value of the common stock on the date of grant. Options granted under the 2005 Management Plan are subject to eGain’s right of repurchase, whose right shall lapse with respect to one-forty-eighth (1/48th) of the shares granted to a director, officer or key employee for each month of continuous service provided by such director, officer or key employee to eGain. The options granted under this plan are exercisable for up to ten years from the date of grant.
73
The following table represents the activity under the 2005 Management Plan:
|
|
Shares |
|
|
|
Weighted |
|
|
|
Available for |
|
Options |
|
Average |
|
|
|
Grant |
|
Outstanding |
|
Exercise Price |
|
Balance as of June 30, 2022 |
|
71,983 |
|
826,717 |
|
$ |
3.29 |
Balance as of June 30, 2023 |
|
71,983 |
|
826,717 |
|
$ |
3.29 |
Options Exercised |
|
— |
|
(114,200) |
|
$ |
4.16 |
Balance as of June 30, 2024 |
|
71,983 |
|
712,517 |
|
$ |
3.15 |
2005 Stock Incentive Plan
In March 2005, our board of directors adopted the 2005 Stock Incentive Plan which provides for the grant of stock options and RSUs to eGain’s employees, officers, directors and consultants. Our board extended the expiration date of the 2005 Stock Incentive Plan to October 11, 2033 and made certain other changes. Options granted under the 2005 Stock Incentive Plan are non-qualified stock options. Non-qualified stock options may be granted to employees with exercise prices of no less than the fair value of the common stock on the date of grant. The options generally vest ratably over a period of four years and expire no later than ten years from the date of grant. RSUs granted under the 2005 Stock Incentive Plan contain service-based condition and is valued at the grant date fair value; our closing stock price on the date of grant. The RSUs generally vest ratably over a period of one year.
The following table represents the activity under the 2005 Stock Incentive Plan:
|
|
Shares |
|
|
|
Weighted |
|
|
|
Available for |
|
Options |
|
Average |
|
|
|
Grant |
|
Outstanding |
|
Exercise Price |
|
Balance as of June 30, 2022 |
|
679,790 |
|
4,617,211 |
|
$ |
9.96 |
Options Granted |
|
(228,817) |
|
228,817 |
|
$ |
8.35 |
Options Exercised |
|
— |
|
(179,736) |
|
$ |
3.40 |
Options Forfeited / Expired |
|
607,010 |
|
(607,010) |
|
$ |
10.62 |
Balance as of June 30, 2023 |
|
1,057,983 |
|
4,059,282 |
|
|
10.06 |
Options Granted |
|
(120,300) |
|
120,300 |
|
$ |
6.47 |
Options Exercised |
|
— |
|
(145,293) |
|
$ |
2.66 |
Options Forfeited / Expired |
|
319,795 |
|
(319,795) |
|
$ |
9.92 |
RSUs Granted |
|
(200,821) |
|
— |
|
$ |
— |
RSUs Forfeited |
|
15,394 |
|
— |
|
$ |
— |
Balance as of June 30, 2024 |
|
1,072,051 |
|
3,714,494 |
|
$ |
10.24 |
During the fiscal year ended June 30, 2024, we granted zero stock options to consultants.
A summary of RSU activity during the year ended June 30, 2024 is as follows:
|
|
|
|
Weighted Average |
|
|
|
|
Grant Date |
||
|
|
Shares |
|
Fair Value per Share |
|
Non-vested RSUs as of June 30, 2023 |
|
— |
|
$ |
— |
RSUs granted |
|
200,821 |
|
$ |
7.55 |
RSUs forfeited |
|
(15,394) |
|
$ |
7.62 |
Non-vested RSUs as of June 30, 2024 |
|
185,427 |
|
$ |
7.55 |
During the fiscal year ended June 30, 2024, we granted 3,901 RSUs to consultants.
74
The following table summarizes information about stock options outstanding and exercisable under all stock option plans as of June 30, 2024:
|
|
|
Options Outstanding |
|
Options Exercisable |
||||||||
|
|
|
|
|
Weighted |
|
|
|
|
|
|
|
|
|
Range of |
|
|
|
Average |
|
Weighted |
|
|
|
Weighted |
||
|
Exercise |
|
Number of |
|
Remaining |
|
Average |
|
Number of |
|
Average |
||
|
Prices |
|
Shares |
|
Contractual Life |
|
Exercise Price |
|
Shares |
|
Exercise Price |
||
|
$1.8-$2.13 |
|
13,005 |
|
2.65 |
|
$ |
1.81 |
|
13,005 |
|
$ |
1.81 |
|
$2.50 |
|
709,841 |
|
3.04 |
|
$ |
2.50 |
|
709,841 |
|
$ |
2.50 |
|
$3.4-$7.32 |
|
443,126 |
|
4.09 |
|
$ |
5.65 |
|
310,684 |
|
$ |
5.28 |
|
$7.39-$9.85 |
|
456,681 |
|
5.03 |
|
$ |
8.62 |
|
354,324 |
|
$ |
8.57 |
|
$9.86-$11.23 |
|
208,819 |
|
6.66 |
|
$ |
10.54 |
|
147,725 |
|
$ |
10.53 |
|
$11.36 |
|
2,346,939 |
|
7.01 |
|
$ |
11.36 |
|
1,622,862 |
|
$ |
11.36 |
|
$11.47-$13.75 |
|
230,050 |
|
5.05 |
|
$ |
12.51 |
|
191,060 |
|
$ |
12.63 |
|
$14.28 |
|
5,000 |
|
6.21 |
|
$ |
14.28 |
|
4,687 |
|
$ |
14.28 |
|
$14.40 |
|
3,550 |
|
4.12 |
|
$ |
14.40 |
|
3,550 |
|
$ |
14.40 |
|
$19.11 |
|
10,000 |
|
6.29 |
|
$ |
19.11 |
|
9,166 |
|
$ |
19.11 |
|
$1.8-$19.11 |
|
4,427,011 |
|
5.74 |
|
$ |
9.10 |
|
3,366,904 |
|
$ |
8.66 |
The summary of options vested and exercisable as of June 30, 2024 comprised:
|
|
|
|
|
|
|
|
|
Weighted |
|
|
|
|
|
|
|
|
|
|
Average |
|
|
|
|
|
Weighted |
|
Aggregate |
|
Remaining |
||
|
|
Number of |
|
Average |
|
Intrinsic |
|
Contractual |
||
|
|
Shares |
|
Exercise Price |
|
Value |
|
Term |
||
Options outstanding |
|
4,427,011 |
|
$ |
9.10 |
|
$ |
3,116,070 |
|
5.74 |
Options fully vested and expected to vest |
|
4,348,562 |
|
$ |
9.09 |
|
$ |
3,114,689 |
|
5.71 |
Options exercisable |
|
3,366,904 |
|
$ |
8.66 |
|
$ |
3,108,203 |
|
5.28 |
The aggregate intrinsic value in the preceding table represents the total intrinsic value based on stock options with a weighted average exercise price less than our closing stock price of $6.31 as of June 30, 2024 that would have been received by the option holders, had they exercised their options on June 30, 2024. The total intrinsic value of stock options exercised was $806,000 and $866,000 during fiscal years 2024 and 2023, respectively.
2017 Employee Stock Purchase Plan
In October 2017, our board of directors adopted the ESPP which provided eligible employees the option purchase the Company’s common stock through payroll deductions at a price equal to 85% of the lower of the fair market value at the entry date of the applicable offering period or at the end of each applicable purchasing period. The offering period, meaning a period with respect to which the right to purchase shares of our common stock may be granted under the ESPP, will not exceed twenty-seven months and consist of a series of six-month purchase periods. Eligible employees may join the ESPP at the beginning of any six-month purchase period. Under the terms of the ESPP, employees can choose to have between 1% and 15% of their base earnings withheld to purchase the Company’s common stock. On December 17, 2021, our board of directors authorized an additional 600,000 shares of common stock to be available for issuance under ESPP.
75
Valuation of Stock-based Awards
Determining the fair value of the stock options and ESPP awards at the grant date requires significant judgment and the use of estimates, particularly surrounding Black-Scholes valuation assumptions such as stock price volatility and expected option term.
The table below summarizes the effect of stock-based compensation (in thousands):
|
|
Fiscal Year Ended June 30, |
||||
|
|
2024 |
|
2023 |
||
Stock-based compensation expense |
|
$ |
(4,529) |
|
$ |
(6,246) |
Income tax expense |
|
|
(97) |
|
|
(117) |
Net income effect |
|
$ |
(4,626) |
|
$ |
(6,363) |
The Company recognized $97,000 and $117,000 of tax expense related to stock-based compensation expense for eGain UK and Exony for the fiscal years ended June 30, 2024 and 2023, respectively. There is no income tax effect that has been recognized relating to the stock-based compensation expense in the US due to full valuation allowance.
Total stock-based compensation includes expense related to non-employee awards of $23,000 and $140,000 during the fiscal years ended June 30, 2024 and 2023, respectively.
We utilized the Black-Scholes valuation model for estimating the fair value of the stock-based compensation of options and ESPP stock purchase rights. All shares of our common stock issued pursuant to our stock plans are only issued out of an authorized reserve of shares of common stock, which were previously registered with the Securities and Exchange Commission on a registration statement on Form S-8.
During the fiscal years ended June 30, 2024 and 2023, there were 120,300 and 228,817 options granted, respectively, with a weighted average grant date fair value of $3.16 and $4.56, per share, respectively.
We used the following assumptions as inputs into the Black-Scholes valuation model to estimate the fair value of the options granted:
|
|
Fiscal Year Ended June 30, |
|||||
|
|
2024 |
|
2023 |
|||
Dividend yield |
|
|
— |
|
|
— |
|
Expected volatility |
|
|
54 |
% |
|
64 |
% |
Average risk-free interest rate |
|
|
4.39 |
% |
|
3.57 |
% |
Expected life (in years) |
|
|
4.56 |
|
|
4.71 |
|
We used the following assumptions as inputs into the Black-Scholes valuation model to estimate the fair value of the ESPP stock purchase right:
|
|
Fiscal Year Ended June 30, |
||||||
|
|
2024 |
|
2023 |
||||
Dividend yield |
|
|
— |
|
|
|
— |
|
Expected volatility |
|
|
57 |
% |
|
|
60 |
% |
Average risk-free interest rate |
|
|
2.16 |
% |
|
|
1.68 |
% |
Expected term (in years) |
|
|
0.50 |
|
|
|
0.50 |
|
During the fiscal years ended June 30, 2024 and 2023, employees were granted the right and purchased an aggregate of 170,106 and 158,957 shares, respectively, with a weighted average grant date fair value of $2.14 and $2.54, per share, respectively, pursuant to the ESPP. Total stock-based compensation expense related to those purchase rights was $362,000 and $399,000 for the fiscal years ended June 30, 2024 and 2023, respectively.
76
As of June 30, 2024 unrecognized compensation expense related to purchase rights that will be recognized over a weighted average period of 0.42 years was $147,000.
The dividend yield of zero is based on the fact that we have never paid cash dividends and have no present intention to pay cash dividends. We determined the appropriate measure of expected volatility by reviewing historic volatility in the share price of our common stock, as adjusted for certain events that management deemed to be non-recurring and non-indicative of future events. The risk-free interest rate is derived from the average U.S. Treasury Strips rate.
We base our estimate of expected life of a stock option on the historical exercise behavior, and cancellations of all past option grants made by the Company during the time period which its common stock has been publicly traded, the contractual term of the option, the vesting period and the expected remaining term of the outstanding options.
In accordance with Accounting Standards Updates (ASU) 2016-09, Compensation—Stock Compensation: Improvements to Employee Share-Based Accounting, we elected to continue to estimate forfeitures in the calculation of stock-based compensation expense.
The following table summarizes stock-based compensation expense relating to stock options for the years ended June 30, 2024 and 2023, respectively (in thousands):
|
|
Fiscal Year Ended June 30, |
||||
|
|
2024 |
|
2023 |
||
Cost of revenue |
|
$ |
831 |
|
$ |
1,350 |
Research and development |
|
|
1,043 |
|
|
1,833 |
Sales and marketing |
|
|
436 |
|
|
901 |
General and administrative |
|
|
1,038 |
|
|
1,763 |
Total |
|
$ |
3,348 |
|
$ |
5,847 |
Total unamortized compensation cost, net of forfeitures, for all options granted but not yet vested as of June 30, 2024 was $2.0 million which is expected to be recognized over the weighted average period of 0.83 years.
The following table summarizes stock-based compensation expense relating to RSUs for the years ended June 30, 2024 (in thousands):
|
|
Fiscal Year Ended |
|
|
|
June 30, 2024 |
|
Cost of revenue |
|
$ |
287 |
Research and development |
|
|
260 |
Sales and marketing |
|
|
147 |
General and administrative |
|
|
125 |
Total |
|
$ |
819 |
Total unamortized compensation cost, net of forfeitures, for all RSUs granted but not yet vested as of June 30, 2024 was $528,000, which is expected to be recognized over the weighted average period of 0.38 years. There were no RSUs granted during fiscal year ended June 30, 2023.
6. LEASES
During our fiscal year ended June 30, 2024, we leased our office facilities under non-cancelable operating leases that expire on various dates through the fiscal year 2033. We also modified three of our existing operating leases by extending the terms under such leases, which resulted in an increase in operating lease right-of-use assets and operating lease liabilities in the amount of approximately $2.1 million during our fiscal year ended June 30, 2024. All of our office leases are classified as operating leases with lease expense recognized on a straight-line basis over the lease term. Lease ROU assets and liabilities are recognized on the commencement date at the present value of lease payments over the lease term.
77
As our leases do not provide an implicit rate, we use our incremental borrowing rate based on information available at the commencement date to determine the present value of lease payments.
The following table presents information about the weighted average lease term and discount rate as follows:
|
|
As of June 30, 2024 |
|
As of June 30, 2023 |
||||
Weighted average remaining lease term (in years) |
|
|
5.52 |
|
|
|
3.40 |
|
Weighted average discount rate |
|
|
7.66 |
% |
|
|
4.97 |
% |
The following table presents information about leases on our consolidated statement of operations (in thousands):
|
|
Years ended June 30, |
||||
|
|
2024 |
|
2023 |
||
Operating lease expense |
|
$ |
1,345 |
|
$ |
1,284 |
The following table presents supplemental cash flow information about our leases (in thousands):
|
|
Years ended June 30, |
||||
|
|
2024 |
|
2023 |
||
Operating cash outflows from operating leases |
|
$ |
1,200 |
|
$ |
1,215 |
As of June 30, 2024, remaining maturities of lease liabilities are as follows (in thousands):
Fiscal Period: |
|
|
|
Fiscal 2025 |
|
$ |
1,181 |
Fiscal 2026 |
|
|
1,057 |
Fiscal 2027 |
|
|
806 |
Fiscal 2028 |
|
|
278 |
Fiscal 2029 |
|
|
278 |
Thereafter |
|
|
1,252 |
Total minimum lease payments |
|
|
4,852 |
Less: Imputed interest |
|
|
(1,081) |
Total operating lease liabilities |
|
|
3,771 |
Less: Current operating lease liabilities |
|
|
(1,179) |
Total operating lease liabilities, net of current portion |
|
$ |
2,592 |
7. COMMITMENTS AND CONTINGENCIES
Employee benefit plans
Defined Contribution Plans
We sponsor an employee savings and retirement plan, the 401(k) Plan, as allowed under Section 401(k) of the Internal Revenue Code. The 401(k) Plan is available to all domestic employees who meet minimum age and service requirements, and provides employees with tax deferred salary deductions and alternative investment options. Employees may contribute up to 60% of their salary, subject to certain limitations. We, at the discretion of our board of directors, may contribute to the 401(k) Plan.
78
In fiscal years 2024 and 2023, we contributed approximately $680,000 and $841,000 to the 401(k) Plan, respectively. We also have a defined contribution plan related to our foreign subsidiaries. Amounts expensed under this plan were $679,000 and $748,000, for the fiscal years ended June 30, 2024 and 2023, respectively.
Gratuity Plan—India
In accordance with Gratuity Act of 1972, we sponsor a defined benefit plan (Gratuity Plan) for all of our India employees. The Gratuity Plan is required by local law, which provides a lump sum payment to vested employees upon retirement or termination of employment in an amount based on each employee’s salary and duration of employment with the Company. The Gratuity Plan benefit cost for the year is calculated on an actuarial basis. Current service costs and actuarial gains or losses, or prior service cost, for the Gratuity Plan were $103,000 and $144,000, for the fiscal years ended June 30, 2024 and 2023, respectively.
Warranty
We generally warrant that the program portion of our software will perform substantially in accordance with certain specifications for a period up to one year from the date of delivery. Our liability for a breach of this warranty is either a return of the license fee or providing a fix, patch, work-around or replacement of the software.
We also provide standard warranties against and indemnification for the potential infringement of third party intellectual property rights to our customers relating to the use of our products, as well as indemnification agreements with certain officers and employees under which we may be required to indemnify such persons for liabilities arising out of their duties to us. The terms of such obligations vary. Generally, the maximum obligation is the amount permitted by law.
Historically, costs related to these warranties have not been significant. However, we cannot guarantee that a warranty reserve will not become necessary in the future.
Indemnification
We have agreed to indemnify our directors and executive officers for costs associated with any fees, expenses, judgments, fines and settlement amounts incurred by any of these persons in any action or proceeding to which any of those persons is, or is threatened to be, made a party by reason of the person’s service as a director or officer, including any action by us, arising out of that person’s services as our director or officer or that person’s services provided to any other company or enterprise at our request.
Transfer Pricing
We have received transfer-pricing assessments from tax authorities with regard to transfer pricing issues for certain fiscal years, which we have appealed with the appropriate authority. We review the status of each significant matter and assess its potential financial exposure. We believe that such assessments are without merit and would not have a significant impact on our consolidated financial statements.
Contractual Obligations and Commitments
Our principal contractual commitments consist of obligations under leases for office space. Lease agreements are evaluated to determine whether an arrangement is or contains a lease in accordance with ASC 842, Leases.
Contractual agreements with third parties consist of software licenses, maintenance and support for our operations. As of June 30, 2024, we have paid all non-cancelable contractual agreements related to these software licenses.
We have no significant commitments related to co-location services for cloud operations as of June 30, 2024 and 2023.
79
8. LITIGATION
In the ordinary course of business, we are involved in various legal proceedings and claims related to alleged infringement of third-party patents and other intellectual property rights, commercial, corporate and securities, labor and employment, wage and hour, and other claims that are not expected to have a material impact on our business or our consolidated financial statements. We have been, and may in the future be, put on notice and/or sued by third parties for alleged infringement of their proprietary rights, including patent infringement.
We evaluate all claims and lawsuits with respect to their potential merits, our potential defenses and counterclaims, settlement or litigation potential and the expected effect on us. Our technologies may be subject to injunction if they are found to infringe the rights of a third party. In addition, our agreements require us to indemnify our customers for third-party intellectual property infringement claims, which could increase the cost to us of an adverse ruling on such a claim.
9. FAIR VALUE MEASUREMENT
ASC 820, Fair Value Measurement, defines fair value, establishes a framework for measuring fair value of assets and liabilities, and expands disclosures about fair value measurements. Fair value is defined as the exchange price that would be received for an asset or paid to transfer a liability in the principal or most advantageous market for the assets or liabilities in an orderly transaction between market participants on the measurement date. Subsequent changes in fair value of these financial assets and liabilities are recognized in earnings or other comprehensive income when they occur. ASC 820 applies whenever other statements require or permit assets or liabilities to be measured at fair value.
ASC 820 includes a fair value hierarchy, of which the first two are considered observable and the last unobservable, that is intended to increase the consistency and comparability in fair value measurements and related disclosures. Valuation techniques used to measure fair value must maximize the use of observable inputs and minimize the use of unobservable inputs. Observable inputs reflect assumptions market participants would use in pricing an asset or liability based on market data obtained from independent sources while unobservable inputs reflect a reporting entity’s pricing based upon their own market assumptions.
The fair value hierarchy consists of the following three levels:
Level 1 – instrument valuations are obtained from real-time quotes for transactions in active exchange markets involving identical assets.
Level 2 – instrument valuations are obtained from readily-available pricing sources for comparable instruments.
Level 3 – instrument valuations are obtained without observable market value and require a high level of judgment to determine the fair value.
Our money market funds are measured at fair value on a recurring basis based on quoted market prices in active markets and are classified as level 1 within the fair value hierarchy. As of June 30, 2024 and 2023, cash equivalents classified as level 1 instruments, including money market account investments, were measured at $58.4 million and $67.3 million, respectively.
80
10. SHARE REPURCHASE PROGRAM
On November 14, 2022, the Company’s board of directors authorized a stock repurchase program under which we may purchase up to $20 million of our outstanding common stock. On May 31, 2024, our board of directors authorized a $20 million increase in its stock repurchase program, bringing the aggregate amount eGain may purchase thereunder from $20 million to $40 million of its outstanding common stock. As of June 30, 2024, approximately $17 million remained available for stock repurchases pursuant to our stock repurchase program.
Under the stock repurchase program, we may purchase shares of common stock on a discretionary basis from time to time through open market transactions or privately negotiated transactions at prices deemed appropriate by us. In addition, at our discretion, open market repurchase of common stock may also be made under a Rule 10b5-1 plan, which would permit common stock to be repurchased when the Company might otherwise be precluded from doing so under insider trading laws or self-imposed trading restrictions.
The timing and number of shares repurchased will be determined based on an evaluation of market conditions and other factors, including stock price, trading volume, general business and market conditions, and the availability of capital. The stock repurchase program has been extended until the earlier of (i) the date the aggregate amount of shares that can be repurchased under the stock repurchase program have been repurchased and (ii) the date the board of directors decides to terminate the stock repurchase program. The stock repurchase program does not obligate us to acquire a specified number of shares and may be modified, suspended, or discontinued at any time at our discretion without notice. The stock repurchase program will be funded using existing cash or future cash flows. During the year ended June 30, 2024, 2,751,608 shares have been repurchased for an average acquisition cost per share of $6.28, totaling $17.3 million. We intend to reissue repurchased shares at a later date and therefore carry the shares as treasury stock at cost.
81
11. QUARTERLY FINANCIAL DATA (Unaudited)
Following is a summary of quarterly operating results and share data for the years ended June 30, 2024 and 2023, respectively:
|
|
1st Quarter |
|
2nd Quarter |
|
3rd Quarter |
|
4th Quarter |
|
Fiscal Year |
|||||
|
|
(in thousands, except per share data) |
|||||||||||||
Fiscal Year 2024 |
|
|
|
|
|
|
|
|
|
|
|
|
|
|
|
Revenue |
|
$ |
24,176 |
|
$ |
23,815 |
|
$ |
22,350 |
|
$ |
22,462 |
|
$ |
92,803 |
Gross profit |
|
$ |
17,338 |
|
$ |
16,825 |
|
$ |
15,492 |
|
$ |
15,556 |
|
$ |
65,211 |
Income from operations |
|
$ |
1,416 |
|
$ |
2,425 |
|
$ |
938 |
|
$ |
1,192 |
|
$ |
5,971 |
Net income |
|
$ |
2,596 |
|
$ |
2,185 |
|
$ |
1,493 |
|
$ |
1,506 |
|
$ |
7,780 |
Basic net income per share |
|
$ |
0.08 |
|
$ |
0.07 |
|
$ |
0.05 |
|
$ |
0.05 |
|
$ |
0.25 |
Diluted net income per share |
|
$ |
0.08 |
|
$ |
0.07 |
|
$ |
0.05 |
|
$ |
0.05 |
|
$ |
0.25 |
|
|
|
|
|
|
|
|
|
|
|
|
|
|
|
|
Fiscal Year 2023 |
|
|
|
|
|
|
|
|
|
|
|
|
|
|
|
Revenue |
|
$ |
24,763 |
|
$ |
25,600 |
|
$ |
23,013 |
|
$ |
24,635 |
|
$ |
98,011 |
Gross profit |
|
$ |
18,481 |
|
$ |
18,848 |
|
$ |
15,418 |
|
$ |
17,949 |
|
$ |
70,696 |
Income (loss) from operations |
|
$ |
(670) |
|
$ |
213 |
|
$ |
(512) |
|
$ |
2,358 |
|
$ |
1,389 |
Net income (loss) |
|
$ |
(16) |
|
$ |
(104) |
|
$ |
(372) |
|
$ |
2,601 |
|
$ |
2,109 |
Basic net income (loss) per share |
|
$ |
(0.00) |
|
$ |
(0.00) |
|
$ |
(0.01) |
|
$ |
0.08 |
|
$ |
0.07 |
Diluted net income (loss) per share |
|
$ |
(0.00) |
|
$ |
(0.00) |
|
$ |
(0.01) |
|
$ |
0.08 |
|
$ |
0.06 |
82
ITEM 9. |
CHANGES IN AND DISAGREEMENTS WITH ACCOUNTANTS ON ACCOUNTING AND FINANCIAL DISCLOSURE |
None.
ITEM 9A. |
CONTROLS AND PROCEDURES |
Evaluation of Disclosure Controls and Procedures.
We maintain “disclosure controls and procedures,” as such term is defined in Rule 13a-15(e) under the Securities Exchange Act of 1934 (Exchange Act), that are designed to ensure that information required to be disclosed by us in reports that we file or submit under the Exchange Act is recorded, processed, summarized, and reported within the time periods specified in Securities and Exchange Commission rules and forms, and that such information is accumulated and communicated to our management, including our Chief Executive Officer and Chief Financial Officer, as appropriate, to allow timely decisions regarding required disclosure. In designing and evaluating our disclosure controls and procedures, management recognized that disclosure controls and procedures, no matter how well conceived and operated, can provide only reasonable, not absolute, assurance that the objectives of the disclosure controls and procedures are met. Our disclosure controls and procedures have been designed to meet reasonable assurance standards. Additionally, in designing disclosure controls and procedures, our management necessarily was required to apply its judgment in evaluating the cost-benefit relationship of possible disclosure controls and procedures. The design of any disclosure controls and procedures also is based in part upon certain assumptions about the likelihood of future events, and there can be no assurance that any design will succeed in achieving its stated goals under all potential future conditions.
Based on their evaluation as of the end of the period covered by this Annual Report on Form 10-K, our Chief Executive Officer and Chief Financial Officer have concluded that, as of June 30, 2024, our disclosure controls and procedures were effective at the reasonable assurance level.
Changes in Internal Controls.
There was no change in our internal control over financial reporting (as defined in Rule 13a-15(f) under the Exchange Act) that occurred during our last fiscal quarter that has materially affected, or is reasonably likely to materially affect, our internal control over financial reporting.
Management’s Annual Report on Internal Control Over Financial Reporting.
Our management is responsible for establishing and maintaining adequate internal control over financial reporting, as such term is defined in Exchange Act Rule 13a-15(f). Because of its inherent limitations, internal control over financial reporting may not prevent or detect misstatements. Projections of any evaluation of the effectiveness to future periods are subject to the risk that controls may become inadequate because of changes in conditions, or that the degree of compliance with the policies or procedures may deteriorate. Our management, with the participation of our Chief Executive Officer and Chief Financial Officer, conducted an evaluation of the effectiveness of our internal control over financial reporting based on the framework in Internal Control—Integrated Framework (2013) issued by the Committee of Sponsoring Organizations of the Treadway Commission. Based on our evaluation under the framework in Internal Control—Integrated Framework (2013), our management concluded that our internal control over financial reporting was effective as of June 30, 2024.
83
ITEM 9B. |
OTHER INFORMATION |
(c) Trading Plans
Name |
|
Title |
|
Action |
|
Adoption Date |
|
Expiration Date |
|
Aggregate # of Securities to be Purchased/Sold |
Promod Narang (1) |
|
Chief Technology Officer |
|
Adoption |
|
5/28/2024 |
|
9/11/2024 |
|
100,000 |
(1) Promod Narang, Chief Technology Officer, adopted a Rule 10b5-1 trading plan on May 28, 2024. Mr. Narang’s plan provides for the potential exercise of up to 100,000 vested stock options with the associated potential sale of up to 100,000 shares of the Company’s common stock. This trading plan expires on September 11, 2024 (unless earlier terminated pursuant to the terms of the plan or upon the date all shares under the plan are sold). This trading plan was entered into during an open window and is intended to satisfy the affirmative defense of Rule 10b5-1(c) under the Securities Exchange Act of 1934, as amended.
Other than as disclosed above, during the three months ended June 30, 2024, none of our directors or Section 16 officers adopted or terminated any Rule 10b5-1 trading arrangements or non-Rule 10b5-trading arrangements (in each case, as defined in Item 408(a) of Regulation S-K).
ITEM 9C. |
DISCLOSURE REGARDING FOREIGN JURISDICTIONS THAT PREVENT INSPECTIONS |
Not applicable.
84
PART III
ITEM 10. |
DIRECTORS, EXECUTIVE OFFICERS AND CORPORATE GOVERNANCE |
The information required by this item is incorporated by reference from the information under the headings “Election of Directors” and “Executive Compensation—Compensation Overview” contained in eGain’s definitive Proxy Statement to be filed with the Securities and Exchange Commission in connection with the solicitation of proxies for eGain’s 2024 Annual Meeting of Stockholders (Proxy Statement).
Certain information required by this item concerning executive officers is set forth in Part I, Item 1 of this report under the caption “Information About Our Executive Officers” and is incorporated herein by reference.
To the extent disclosure for delinquent reports is being made, it can be found under the caption “Delinquent Section 16(a) Reports” in the Proxy Statement and is incorporated herein by reference.
ITEM 11. |
EXECUTIVE COMPENSATION |
The information contained under the headings “Executive Compensation” and “Compensation Committee Report” and under the captions “Election of Directors—2024 Director Compensation” and “Election of Directors—Compensation Committee Interlocks and Insider Participation” in the Proxy Statement is incorporated herein by reference.
ITEM 12. |
SECURITY OWNERSHIP OF CERTAIN BENEFICIAL OWNERS AND MANAGEMENT AND RELATED STOCKHOLDER MATTERS |
The information contained under the heading “Security Ownership of Certain Beneficial Owners and Management” in the Proxy Statement is incorporated herein by reference.
The following table summarizes our equity compensation plans as of June 30, 2024:
|
|
|
|
|
|
|
Number of securities |
|
|
Number of |
|
|
|
|
remaining available for |
|
|
securities to be |
|
Weighted-average |
|
future issuance under |
|
|
|
issued upon exercise |
|
exercise price of |
|
equity compensation |
|
|
|
of outstanding |
|
outstanding options |
|
plans (excluding securities |
|
|
|
options and rights |
|
and rights |
|
reflected in column (a)) |
|
Plan Category |
|
(a) |
|
(b) |
|
(c) |
|
Equity compensation plans approved by security holders |
|
|
|
|
|
|
|
2005 Stock Incentive Plan |
|
3,714,494 |
|
$ |
10.24 |
|
1,072,051 |
Equity compensation plans not approved by security holders |
|
|
|
|
|
|
|
2005 Management Stock Option Plan |
|
712,517 |
|
$ |
3.15 |
|
71,983 |
Total |
|
4,427,011 |
|
$ |
9.10 |
|
1,144,034 |
ITEM 13. |
CERTAIN RELATIONSHIPS AND RELATED TRANSACTIONS AND DIRECTOR INDEPENDENCE |
The information contained under the headings “Related Party Transactions,” “Election of Directors—Director Independence,” and “Election of Directors—Board Meetings and Committees” in the Proxy Statement is incorporated herein by reference.
85
ITEM 14. |
PRINCIPAL ACCOUNTING FEES AND SERVICES |
The information contained under the heading “Ratification of Independent Registered Public Accounting Firm” in the Proxy Statement is incorporated herein by reference.
86
PART IV
ITEM 15. |
EXHIBIT AND FINANCIAL STATEMENT SCHEDULES |
| (a) | 1. Financial Statements |
See Index to Consolidated Financial Statements in Item 8 of this report.
2. Financial Statement Schedule
The following schedule, which is filed as part of this Form 10-K: Schedule II—Valuation and Qualifying Accounts for the fiscal years ended June 30, 2024 and 2023.
SCHEDULE II—VALUATION AND QUALIFYING ACCOUNTS
Years Ended June 30, 2024 and 2023
(in thousands)
|
|
|
|
|
|
|
|
Amounts |
|
|
|
|
|
|
Balance at |
|
Additions |
|
Written Off, |
|
|
||||
|
|
Beginning of |
|
Charged to |
|
Net of |
|
Balance at |
||||
|
|
Period |
|
Expense |
|
Recoveries |
|
End of Period |
||||
Provision for Credit Losses: |
|
|
|
|
|
|
|
|
|
|
|
|
Year ended June 30, 2024 |
|
$ |
237 |
|
$ |
93 |
|
$ |
(271) |
|
$ |
59 |
Year ended June 30, 2023 |
|
$ |
123 |
|
$ |
260 |
|
$ |
(146) |
|
$ |
237 |
All other financial statement schedules have been omitted because they are not applicable or not required or because the information in included elsewhere in the Consolidated Financial Statements or the Notes thereto.
3. Exhibits
See Item 15(b) of this report.
All other schedules have been omitted since they are either not required, not applicable or the information has been included in the consolidated financial statements or notes thereto.
| (b) | Exhibits |
The exhibits listed below are filed or incorporated by reference herein. Each management contract or compensatory plan or arrangement required to be filed has been identified.
Exhibit |
|
Description of Exhibits |
|
||
3(i).1 |
|
|
|
|
|
3(ii) |
||
|
||
4.1 |
||
|
||
4.2 |
||
|
87
10.1# |
||
|
||
10.2# |
||
|
||
10.3# |
||
|
||
10.4# |
||
|
||
10.5# |
||
|
|
|
10.6 |
||
|
|
|
10.7 |
||
|
|
|
10.8 |
|
|
|
|
|
21.1 |
||
|
|
|
23.1 |
|
Consent of BPM LLP, Independent Registered Public Accounting Firm. |
|
|
|
24.1 |
|
|
|
|
|
31.1 |
|
|
|
|
|
31.2 |
|
|
|
|
|
32.1* |
|
|
|
|
|
32.2* |
|
|
|
|
|
97.1 |
|
eGain Corporation Incentive-Based Compensation Recoupment Policy. |
|
|
|
101.INS |
|
Inline XBRL Instance Document |
|
|
|
101.SCH |
|
Inline XBRL Taxonomy Extension Schema Document |
|
|
|
101.CAL |
|
Inline XBRL Taxonomy Extension Calculation Linkbase Document |
|
|
|
101.DEF |
|
Inline XBRL Taxonomy Extension Definition Linkbase Document |
|
|
|
101.LAB |
|
Inline XBRL Taxonomy Extension Label Linkbase Document |
|
|
|
88
|
101.PRE 104 |
|
Inline XBRL Taxonomy Extension Presentation Linkbase Document Cover Page Interactive Data File (embedded within the Inline XBRL document) |
# |
Indicates management contract or compensatory plan or arrangement. |
* |
This exhibit is not deemed “filed” with the Securities and Exchange Commission and is not to be incorporated by reference into any filing of the Registrant under the Securities Act of 1933 or the Securities Exchange Act of 1934, whether made before or after date hereof and irrespective of any general incorporation language contained in such filing. |
(c) |
Financial Statements |
Reference is made to Item 15(a)(2) above.
ITEM 16. |
FORM 10-K SUMMARY |
Not applicable.
89
SIGNATURES
Pursuant to the requirements of Section 13 or 15(d) of the Securities Exchange Act of 1934, the registrant has duly caused this report to be signed on its behalf by the undersigned, thereunto duly authorized.
|
|
eGain Corporation |
||
|
|
|
|
|
Date: September 12, 2024 |
|
By: |
|
/s/ ASHUTOSH ROY |
|
|
|
|
Ashutosh Roy Chief Executive Officer |
POWER OF ATTORNEY
KNOW ALL MEN BY THESE PRESENT, that each person whose signature appears below constitutes and appoints Ashutosh Roy and Eric N. Smit, and each of them, his or her true and lawful attorneys-in-fact and agents, each with full power of substitution and resubstitution, for him or her and in his or her name, place, and stead, in any and all capacities, to sign any and all amendments to this annual report, and to file the same, with exhibits thereto and other documents in connection therewith, with the Securities and Exchange Commission, granting unto said attorneys-in-fact and agents, and each of them, full power and authority to do and perform each and every act and thing requisite and necessary to be done, as fully to all intents and purposes as he might or could do in person, hereby ratifying and confirming all that each of said attorneys-in-fact and agents or their substitute or substitutes may lawfully do or cause to be done by virtue hereof.
Pursuant to the requirements of the Securities Exchange Act of 1934, as amended, this report has been signed below by the following persons on behalf of the Registrant and in the capacities and on the dates indicated.
Name |
|
Title |
|
Date |
|---|---|---|---|---|
|
|
|
|
|
/s/ ASHUTOSH ROY |
|
Chief Executive Officer and Director |
|
September 12, 2024 |
Ashutosh Roy |
|
|
||
|
|
|
|
|
/s/ ERIC N. SMIT |
|
Chief Financial Officer |
|
September 12, 2024 |
Eric N. Smit |
|
(Principal Financial |
|
|
|
|
|
|
|
/s/ CHRISTINE RUSSELL |
|
Director |
|
September 12, 2024 |
Christine Russell |
|
|
||
|
|
|
|
|
/s/ GUNJAN SINHA |
|
Director |
|
September 12, 2024 |
Gunjan Sinha |
|
|
||
|
|
|
|
|
/s/ PHIROZ P. DARUKHANAVALA |
|
Director |
|
September 12, 2024 |
Phiroz P. Darukhanavala |
|
|
||
|
|
|
|
|
/s/ BRETT SHOCKLEY |
|
Director |
|
September 12, 2024 |
Brett Shockley |
|
|
||
|
|
|
|
|
90
Exhibit 21.1
Subsidiaries of eGain
| 1. | eGain Communications Ltd. (UK) |
| 2. | Exony Ltd. (UK) |
| 3. | eGain Communications Pvt. Ltd. (India) |
| 4. | eGain Deutschland GmbH (Germany) |
Exhibit 23.1
CONSENT OF INDEPENDENT REGISTERED PUBLIC ACCOUNTING FIRM
We hereby consent to the incorporation by reference in the Registration Statements on Form S-8 (Nos. 333-280001, 333-261722, 333-236355, 333-236354, 333-228356, 333-199720, 333-161019, 333-153763, 333-129854, 333-76688, 333-76690, 333-76692, 333-41394, and 333-32854) and on Form S-3 (Nos. 333-199639, 333-177495 and 333-48314) of eGain Corporation of our report dated September 12, 2024 relating to the consolidated financial statements and financial statement schedule which appears in this Annual Report on Form 10-K.
/s/ BPM LLP |
San Jose, California |
September 12, 2024 |
Exhibit 31.1
PRINCIPAL EXECUTIVE OFFICER’S CERTIFICATION PURSUANT TO EXCHANGE ACT RULE 13a-14(a)/15d-14(a) AS ADOPTED PURSUANT TO SECTION 302 OF THE SARBANES-OXLEY ACT OF 2002
I, Ashutosh Roy, certify that:
| 1) | I have reviewed this annual report on Form 10-K of eGain Corporation; |
| 2) | Based on my knowledge, this report does not contain any untrue statement of a material fact or omit to state a material fact necessary to make the statements made, in light of the circumstances under which such statements were made, not misleading with respect to the period covered by this report; |
| 3) | Based on my knowledge, the financial statements, and other financial information included in this report, fairly present in all material respects the financial condition, results of operations and cash flows of the registrant as of, and for, the periods presented in this report; |
| 4) | The registrant’s other certifying officer(s) and I are responsible for establishing and maintaining disclosure controls and procedures (as defined in Exchange Act Rules 13a-15(e) and 15d-15(e)) and internal control over financial reporting (as defined in Exchange Act Rules 13a-15(f) and 15d-15(f)) for the registrant and have: |
| a) | Designed such disclosure controls and procedures, or caused such disclosure controls and procedures to be designed under our supervision, to ensure that material information relating to the registrant, including its consolidated subsidiaries, is made known to us by others within those entities, particularly during the period in which this report is being prepared; |
| b) | Designed such internal control over financial reporting, or caused such internal control over financial reporting to be designed under our supervision, to provide reasonable assurance regarding the reliability of financial reporting and the preparation of financial statements for external purposes in accordance with generally accepted accounting principles; |
| c) | Evaluated the effectiveness of the registrant’s disclosure controls and procedures and presented in this report our conclusions about the effectiveness of the disclosure controls and procedures, as of the end of the period covered by this report based on such evaluation; and |
| d) | Disclosed in this report any change in the registrant’s internal control over financial reporting that occurred during the registrant’s most recent fiscal quarter (the registrant’s fourth fiscal quarter in the case of an annual report) that has materially affected, or is reasonably likely to materially affect, the registrant’s internal control over financial reporting; and |
| 5) | The registrant’s other certifying officer(s) and I have disclosed, based on our most recent evaluation of internal control over financial reporting, to the registrant’s auditors and the audit committee of the registrant’s board of directors (or persons performing the equivalent functions): |
| a) | All significant deficiencies and material weaknesses in the design or operation of internal control over financial reporting which are reasonably likely to adversely affect the registrant’s ability to record, process, summarize and report financial information; and |
| b) | Any fraud, whether or not material, that involves management or other employees who have a significant role in the registrant’s internal control over financial reporting. |
Date: September 12, 2024 | |
|
|
By: |
/s/ Ashutosh Roy |
|
Ashutosh Roy |
|
Chief Executive Officer |
Exhibit 31.2
PRINCIPAL FINANCIAL OFFICER’S CERTIFICATION PURSUANT TO EXCHANGE ACT RULE 13a-14(a)/15d-14(a) AS ADOPTED PURSUANT TO SECTION 302 OF THE SARBANES-OXLEY ACT OF 2002
I, Eric Smit, certify that:
| 1) | I have reviewed this annual report on Form 10-K of eGain Corporation; |
| 2) | Based on my knowledge, this report does not contain any untrue statement of a material fact or omit to state a material fact necessary to make the statements made, in light of the circumstances under which such statements were made, not misleading with respect to the period covered by this report; |
| 3) | Based on my knowledge, the financial statements, and other financial information included in this report, fairly present in all material respects the financial condition, results of operations and cash flows of the registrant as of, and for, the periods presented in this report; |
| 4) | The registrant’s other certifying officer(s) and I are responsible for establishing and maintaining disclosure controls and procedures (as defined in Exchange Act Rules 13a-15(e) and 15d-15(e)) and internal control over financial reporting (as defined in Exchange Act Rules 13a-15(f) and 15d-15(f)) for the registrant and have: |
| a) | Designed such disclosure controls and procedures, or caused such disclosure controls and procedures to be designed under our supervision, to ensure that material information relating to the registrant, including its consolidated subsidiaries, is made known to us by others within those entities, particularly during the period in which this report is being prepared; |
| b) | Designed such internal control over financial reporting, or caused such internal control over financial reporting to be designed under our supervision, to provide reasonable assurance regarding the reliability of financial reporting and the preparation of financial statements for external purposes in accordance with generally accepted accounting principles; |
| c) | Evaluated the effectiveness of the registrant’s disclosure controls and procedures and presented in this report our conclusions about the effectiveness of the disclosure controls and procedures, as of the end of the period covered by this report based on such evaluation; and |
| d) | Disclosed in this report any change in the registrant’s internal control over financial reporting that occurred during the registrant’s most recent fiscal quarter (the registrant’s fourth fiscal quarter in the case of an annual report) that has materially affected, or is reasonably likely to materially affect, the registrant’s internal control over financial reporting; and |
| 5) | The registrant’s other certifying officer(s) and I have disclosed, based on our most recent evaluation of internal control over financial reporting, to the registrant’s auditors and the audit committee of the registrant’s board of directors (or persons performing the equivalent functions): |
| a) | All significant deficiencies and material weaknesses in the design or operation of internal control over financial reporting which are reasonably likely to adversely affect the registrant’s ability to record, process, summarize and report financial information; and |
| b) | Any fraud, whether or not material, that involves management or other employees who have a significant role in the registrant’s internal control over financial reporting. |
Date: September 12, 2024 | |
|
|
By: |
/s/ Eric N. Smit |
|
Eric N. Smit |
|
Chief Financial Officer |
Exhibit 32.1
CERTIFICATION OF CHIEF EXECUTIVE OFFICER PURSUANT TO 18 U.S.C. § 1350 AS ADOPTED PURSUANT TO SECTION 906 OF THE SARBANES-OXLEY ACT OF 2002
I, Ashutosh Roy, the Chief Executive Officer of eGain Corporation (the “Company”), certify pursuant to 18 U.S.C. Section 1350, as adopted pursuant to Section 906 of the Sarbanes-Oxley Act of 2002, that, to my knowledge,
| (i) | the Annual Report on Form 10-K of the Company for the year ended June 30, 2024 (the “Report”), fully complies with the requirements of Section 13(a) or 15(d) of the Securities Exchange Act of 1934, and |
| (ii) | the information contained in the Report fairly presents, in all material respects, the financial condition and results of operations of the Company. |
By: |
/s/ Ashutosh Roy |
|
Ashutosh Roy |
|
Chief Executive Officer |
|
|
|
September 12, 2024 |
Exhibit 32.2
CERTIFICATION OF CHIEF FINANCIAL OFFICER PURSUANT TO 18 U.S.C. § 1350 AS ADOPTED PURSUANT TO SECTION 906 OF THE SARBANES-OXLEY ACT OF 2002
I, Eric Smit, the Chief Financial Officer of eGain Corporation (the “Company”), certify pursuant to 18 U.S.C. Section 1350, as adopted pursuant to Section 906 of the Sarbanes-Oxley Act of 2002, that, to my knowledge,
| (i) | the Annual Report on Form 10-K of the Company for the year ended June 30, 2024 (the “Report”), fully complies with the requirements of Section 13(a) or 15(d) of the Securities Exchange Act of 1934, and |
| (ii) | the information contained in the Report fairly presents, in all material respects, the financial condition and results of operations of the Company. |
By: |
/s/ Eric N. Smit |
|
Eric N. Smit |
|
Chief Financial Officer |
|
|
|
September 12, 2024 |
Exhibit 97.1
eGAIN CORPORATION
INCENTIVE-BASED COMPENSATION RECOUPMENT POLICY
Adopted: November 30, 2023
| 1. | Purpose |
eGain Corporation, a Delaware corporation (the “Company”), has adopted this Incentive-Based Compensation Recoupment Policy (this “Policy”) to comply with Section 954 of the Dodd-Frank Wall Street Reform and Consumer Protection Act of 2010, as codified by Section 10D of the Securities Exchange Act of 1934, as amended (the “Exchange Act”), and the Nasdaq Stock Exchange Listing Rule 5608. This Policy provides for the Company’s recoupment of Incentive-Based Compensation paid erroneously to Covered Executives in the event of a Restatement. Capitalized terms not otherwise defined herein will have the meanings set forth in Section 11 of this Policy.
| 2. | Administration |
This Policy will be administered by the Compensation Committee (the “Committee”) of the Board of Directors of the Company (the “Board”). The Committee is authorized to interpret and construe this Policy and to make all determinations necessary, appropriate, or advisable for the administration of this Policy. Subject to any limitation under applicable law, the Committee may authorize and empower any officer or employee of the Company to take any and all actions necessary or appropriate to carry out the purpose and intent of this Policy (other than with respect to any recovery under this Policy involving such officer or employee). This Policy will be interpreted in a manner that is consistent with the requirements of Section 10D of the Exchange Act, any applicable rules or standards adopted by the Securities and Exchange Commission (the “SEC”), and any national securities exchange on which the Company’s securities are listed. Any determinations made by the Committee will be final and binding on all affected individuals.
| 3. | Recoupment of Incentive-Based Compensation |
In the event the Company is required to prepare a Restatement, the Committee will require that the Covered Executive forfeit, promptly repay to the Company, or offset, on a pre-tax basis, the full amount of the excess of: (a) the amount of any Incentive-Based Compensation received by the Covered Executive that was calculated based on the erroneous data in the original financial statements that were subsequently restated over (b) the amount of such Incentive-Based Compensation to which the Covered Executive would have been entitled to receive based on the restated financial statements (such excess amount, the “Recoverable Incentive-Based Compensation”).
In the case of compensation based on stock price or total shareholder return, the amount subject to recoupment will be based on a reasonable estimate of the effect of the Restatement on the Company’s stock price or total shareholder return upon which the Incentive-Based Compensation was received. If any performance-based restricted stock units or other equity-based compensation is subject to recoupment, then the Recoverable Incentive-Based Compensation may be in the form of shares of Company stock, the value of such shares, based on the fair market value of such shares on the settlement date or a combination of the foregoing, in the discretion of the Committee, taking into account any sales of shares by the Covered Executive.
Such recoupment will apply on a “no-fault” basis—that is, regardless of whether any misconduct occurred or a Covered Executive officer’s responsibility for the Restatement. In addition, the Company’s obligation to recoup Recoverable Incentive-Based Compensation is not dependent on if or when restated financial statements are filed with the SEC.
| 4. | Recoupment Methods |
Subject to Section 3 of this Policy, the Committee will determine, in its sole discretion, the timing and method or methods for recouping Recoverable Incentive-Based Compensation pursuant to this Policy. The Committee will have no obligation to apply the same method of recoupment to each affected Covered Employee in connection with any Restatement.
| 5. | Exceptions to Recovery for Impracticability |
The Committee will recover any Recoverable Incentive-Based Compensation unless such recovery would be impracticable, as determined in good faith by the Committee, the Board, or a majority of the independent directors serving on the Board in accordance with Rule 10D-1 of the Exchange Act and applicable securities exchange rules.
Specifically, no recovery will be required pursuant to this Policy if: (a) the direct expense paid to a third party to assist in enforcing this Policy would exceed the amount of the Recoverable Incentive-Based Compensation and the Company (i) makes a reasonable attempt to recover the Recoverable Incentive-Based Compensation and (ii) documents such reasonable attempts, which documentation will be provided to the national securities exchange on which the Company’s securities are then listed, (b) pursuing such recovery would violate the home country law of the jurisdiction of incorporation of the Company where that law was adopted prior to November 28, 2022, and the Company provides an opinion of counsel to that effect acceptable to the national securities exchange on which the Company’s securities are then listed, or (c) recovery would likely cause an otherwise tax-qualified retirement plan, under which benefits are broadly available to employees, to fail to meet the requirements of Section 401(a)(13) or Section 411(a) of the Internal Revenue Code of 1986, as amended, and the regulations thereunder.
| 6. | Notice and Acknowledgment by Covered Executives |
The Company will provide notice of this Policy to each Covered Executive and shall solicit from each Covered Executive a signed acknowledgment of, and agreement to, this Policy in substantially the form attached hereto as Exhibit A. In addition, before the Company takes any action to seek recovery of Recoverable Incentive-Based Compensation pursuant to this Policy or any other action provided for hereunder against a Covered Executive, the Company will provide notice of such clawback or other action. Notwithstanding anything to the contrary contained herein, the Company’s failure to provide notice to or receive acknowledgment from a Covered Executive will have no impact on the applicability or enforceability of this Policy against such Covered Executive.
| 7. | Other Recoupment Rights |
Any rights or remedies under this Policy are in addition to, and not in lieu of, any other rights or remedies that the Company may have under Section 304 of the Sarbanes-Oxley Act of 2002, the Dodd-Frank Wall Street Reform and Consumer Protection Act, and other applicable laws, or pursuant to the terms of any other policy of the Company or any provision in any compensatory plan or arrangement, employment agreement, equity award agreement, or similar plan, agreement or arrangement, and any other legal rights and remedies available to the Company, or any actions that may be imposed by law enforcement agencies, regulators, administrative bodies, or other authorities.
| 8. | Amendment |
The Committee may amend this Policy from time to time in its discretion, and will amend this Policy as it deems necessary to reflect the regulations adopted by the SEC under Section 10D of the Exchange Act and to comply with any rules or standards adopted by a national securities exchange on which the Company’s securities are then listed.
| 9. | No Indemnification or Reimbursement |
Neither the Company nor any of its affiliates will: (a) indemnify any Covered Executive against the loss of any incorrectly awarded Incentive-Based Compensation or (b) pay or reimburse any Covered Executive for premiums incurred or paid for any insurance policy to fund such Covered Executive’s potential recovery obligations.
| 10. | Effective Date |
This Policy was adopted by the Company on November 30, 2023, and applies to Incentive-Based Compensation that is granted, earned, or vested by Covered Executives on or after October 2, 2023 (the “Effective Date”).
| 11. | Definitions |
For purposes of this Policy: