UNITED STATES
SECURITIES AND EXCHANGE COMMISSION
WASHINGTON, DC 20549
FORM 8-K
CURRENT REPORT
Pursuant to Section 13 or 15(d) of the
Securities Exchange Act of 1934
Date of report (Date of earliest event reported): September 5, 2024
FUELCELL ENERGY, INC.
(Exact Name of Registrant as Specified in its Charter)
Delaware |
|
1-14204 |
|
06-0853042 |
|
(State or Other Jurisdiction of Incorporation) |
|
(Commission File Number) |
|
(IRS Employer Identification No.) |
|
|
|||
|
|
3 Great Pasture Road, Danbury, Connecticut |
|
06810 |
|
|
(Address of Principal Executive Offices) |
|
(Zip Code) |
Registrant’s telephone number, including area code: (203) 825-6000
Not Applicable
(Former Name or Former Address, if Changed Since Last Report)
Check the appropriate box below if the Form 8-K filing is intended to simultaneously satisfy the filing obligation of the registrant under any of the following provisions:
☐ Written communications pursuant to Rule 425 under the Securities Act (17 CFR 230.425)
☐ Soliciting material pursuant to Rule 14a-12 under the Exchange Act (17 CFR 240.14a-12)
☐ Pre-commencement communications pursuant to Rule 14d-2(b) under the Exchange Act (17 CFR 240.14d-2(b))
☐ Pre-commencement communications pursuant to Rule 13e-4(c) under the Exchange Act (17 CFR 240.13e-4(c))
Securities registered pursuant to Section 12(b) of the Act:
Title of each class |
|
Trading Symbol(s) |
|
Name of each exchange on which registered |
Common Stock, $0.0001 par value per share |
|
FCEL |
|
The Nasdaq Stock Market LLC |
Indicate by check mark whether the registrant is an emerging growth company as defined in Rule 405 of the Securities Act of 1933 (§230.405 of this chapter) or Rule 12b-2 of the Securities Exchange Act of 1934 (§240.12b-2 of this chapter).
Emerging growth company ☐
If an emerging growth company, indicate by check mark if the registrant has elected not to use the extended transition period for complying with any new or revised financial accounting standards provided pursuant to Section 13(a) of the Exchange Act. ☐
Item 2.02. Results of Operations and Financial Condition.
On September 5, 2024, FuelCell Energy, Inc. (the “Company”) issued a press release announcing its financial results and providing a business update as of and for the three and nine months ended July 31, 2024. A copy of this press release is furnished with this report as Exhibit 99.1 and is incorporated herein by reference.
The information furnished in this Item 2.02, including Exhibit 99.1, is not deemed to be “filed” for purposes of Section 18 of the Securities Exchange Act of 1934, as amended (the “Exchange Act”), or otherwise subject to the liability of that section. This information will not be deemed to be incorporated by reference into any filing under the Securities Act of 1933, as amended (the “Securities Act”), or the Exchange Act, except to the extent that the Company specifically incorporates it by reference.
Item 7.01. Regulation FD Disclosure.
A copy of the investor presentation slides that will be used by the Company during its September 5, 2024 earnings call is furnished with this report as Exhibit 99.2.
The information furnished in this Item 7.01, including Exhibit 99.2, is not deemed to be “filed” for purposes of Section 18 of the Exchange Act, or otherwise subject to the liability of that section. This information will not be deemed to be incorporated by reference into any filing under the Securities Act or the Exchange Act, except to the extent that the Company specifically incorporates it by reference.
By furnishing the information contained herein, the Company makes no admission as to the materiality of any information in this report that is required to be disclosed solely by reason of Regulation FD. The information contained in the investor presentation furnished as Exhibit 99.2 is summary information that is intended to be considered in the context of the Company’s Securities and Exchange Commission (“SEC”) filings and other public announcements that the Company may make, by press release or otherwise, from time to time. The Company undertakes no duty or obligation to publicly update or revise the information contained in this presentation, although it may do so from time to time. Any such updating may be made through the filing of other reports or documents with the SEC, through press releases or through other public disclosure.
Item 9.01. Financial Statements and Exhibits.
(d) Exhibits:
Exhibit No. |
|
Description |
|
|
|
|
|
|
99.1 |
|
Press Release issued by FuelCell Energy, Inc. on September 5, 2024. |
|
|
|
99.2 |
|
|
|
|
|
104 |
|
Cover Page Interactive Data File (embedded within the Inline XBRL document) |
|
|
|
SIGNATURES
Pursuant to the requirements of the Securities Exchange Act of 1934, the registrant has duly caused this report to be signed on its behalf by the undersigned hereunto duly authorized.
|
FUELCELL ENERGY, INC. |
|
|
|
|
Date: September 5, 2024 |
By: |
/s/ Michael S. Bishop |
|
|
Michael S. Bishop |
|
|
Executive Vice President, Chief Financial Officer and Treasurer |
|
Exhibit 99.1 |
FuelCell Energy Reports Third Quarter of Fiscal 2024 Results
Third Quarter Fiscal 2024 Summary
(All comparisons are year-over-year unless otherwise noted)
| ● | Revenue of $23.7 million compared to $25.5 million |
| ● | Gross loss of $(6.2) million compared to $(8.2) million |
| ● | Loss from operations of $(33.6) million compared with $(41.4) million |
| ● | Net loss per share was $(0.07) compared with $(0.06) which included a $0.04 one-time debt extinguishment benefit in the third quarter of 2023 |
DANBURY, Conn., September 5, 2024 (GLOBE NEWSWIRE) -- FuelCell Energy, Inc. (NASDAQ: FCEL) today reported financial results for its third quarter ended July 31, 2024.
“In the third quarter, our team achieved solid performance and continued cost management, while advancing our Powerhouse strategy,” said Mr. Jason Few, President and Chief Executive Officer. “We continue to build upon and expand our prospective customer relationships at home and around the world, ranging from interest in our new solid oxide fuel cell and electrolysis platforms, to repowering projects in Korea, such as with Gyeonggi Green Energy Co., Ltd.’s Hwaseong Balan Industrial Complex where we are supplying 42 upgraded fuel cell modules over the next couple of years. With our recent wins, backlog grew meaningfully in the quarter. We also see meaningful potential to capture the rapidly increasing time-to-power opportunity as grids are challenged by AI data center growth.”
“While we execute on our current opportunity set, we are also focused on building our sales pipeline,” added Mr. Few. “We believe we are positioned to capitalize on market opportunities, ranging from built-in fuel diversity which supports biogas applications and hydrogen blending, similar to our work with Ameresco in Sacramento, CA, to the growing power and absorption or electrical cooling needs of edge data centers. Our goal is to generate steady, predictable results now while keeping our focus on future growth.”
Consolidated Financial Metrics
Three Months Ended July 31, |
|||||||
(Amounts in thousands) |
2024 |
2023 |
Change |
||||
Total revenues |
$23,695 |
|
$25,510 |
|
(7%) |
||
Gross loss |
(6,202) |
|
(8,215) |
|
(25%) |
||
Loss from operations |
(33,617) |
|
(41,395) |
|
(19%) |
||
Net loss |
(35,123) |
|
(23,601) |
|
49% |
||
Net loss attributable to common stockholders |
(33,460) |
|
(25,079) |
|
33% |
||
Net loss per basic and diluted share |
(0.07) |
|
(0.06) |
|
17% |
||
|
|
|
|
|
|
||
EBITDA * |
(24,379) |
|
(34,772) |
|
(30%) |
||
Adjusted EBITDA * |
($20,134) |
|
($31,606) |
|
(36%) |
||
* A reconciliation of EBITDA, Adjusted EBITDA and any other non-GAAP measures is contained in the appendix to this press release.
1
Third Quarter of Fiscal 2024 Results
(All comparisons are between third quarter of fiscal 2024 and third quarter of fiscal 2023 unless otherwise noted)
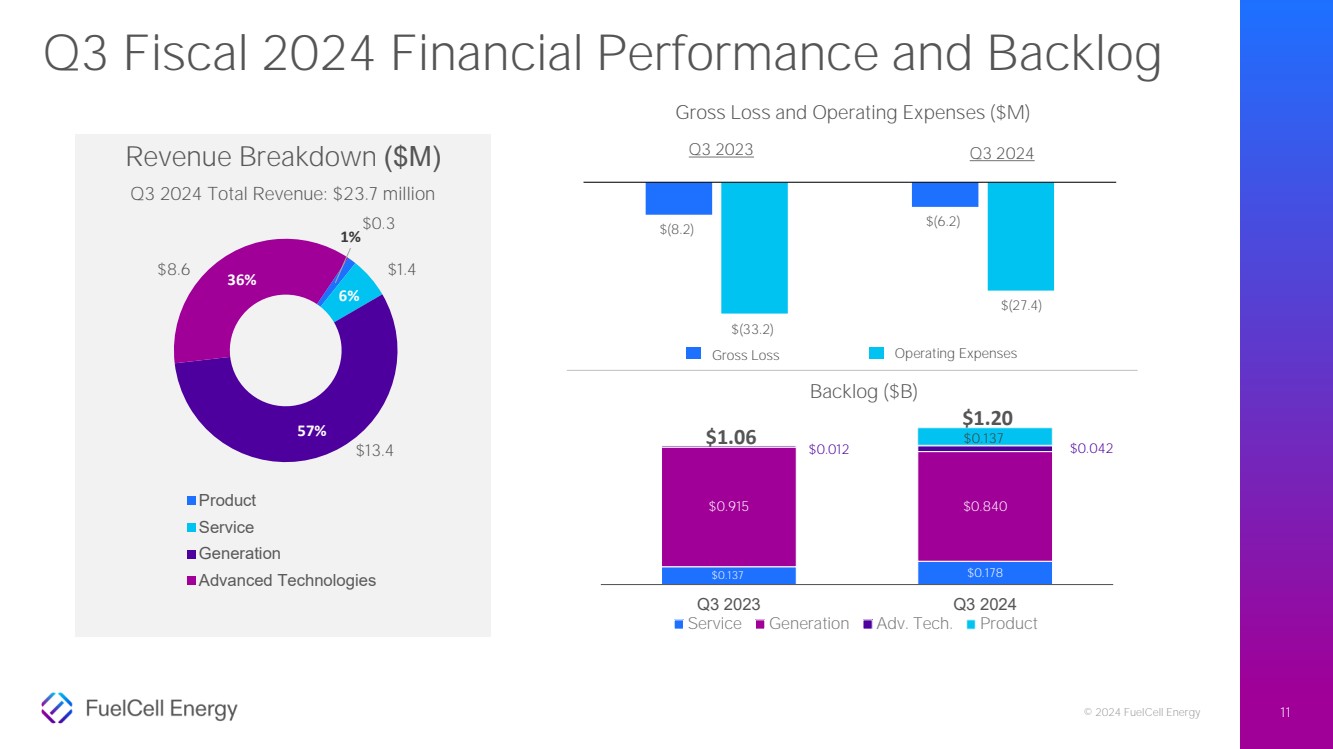
Third quarter revenue of $23.7 million represents a decrease of 7% from the comparable prior year quarter.
| ● | Product revenues were $0.3 million during the three months ended July 31, 2024, and there were no product revenues in the comparable prior year period. The product revenues during the three months ended July 31, 2024 were recognized under the Company’s new sales contract with Ameresco, Inc., which was entered into during the second quarter of fiscal 2024. |
| ● | Service agreements revenues decreased to $1.4 million from $9.8 million. The decrease in service agreements revenues during the three months ended July 31, 2024 was primarily driven by the fact that there were no module exchanges during the quarter. Service agreements revenues recognized during the third quarter of fiscal 2023 were primarily driven by module exchanges at the plants owned by Korea Southern Power Company in Korea. |
| ● | Generation revenues increased 22% to $13.4 million from $11.0 million, primarily driven by revenue generated by the Toyota and Derby projects, all of which began operations in the first quarter of fiscal 2024. |
| ● | Advanced Technologies contract revenues increased to $8.6 million from $4.7 million. Advanced Technologies contract revenues recognized under our Joint Development Agreement with ExxonMobil Technology and Engineering Company (“EMTEC”) were approximately $1.8 million, revenues arising from the purchase order received from Esso Nederland B.V. (“Esso”), an affiliate of EMTEC and Exxon Mobil Corporation, related to the Rotterdam project were approximately $3.5 million and revenue recognized under government contracts and other contracts were approximately $3.3 million for the three months ended July 31, 2024. This compares to Advanced Technologies contract revenues recognized under our Joint Development Agreement with EMTEC of approximately $2.8 million and revenue recognized under government contracts and other contracts of approximately $1.9 million the three months ended July 31, 2023. |
Gross loss for the third quarter of fiscal 2024 totaled $(6.2) million, compared to a gross loss of $(8.2) million in the comparable prior year quarter. The reduction in gross loss for the third quarter of fiscal 2024 was, in part, a result of favorable margins for Advanced Technologies of $1.9 million and Generation of $1.1 million, partially offset by higher gross losses for product of $(1.0) million. Service gross margin remained consistent quarter over quarter.
Operating expenses for the third quarter of fiscal 2024 decreased to $27.4 million from $33.2 million in the third quarter of fiscal 2023. Selling and administrative expenses decreased to $14.6 million during the third quarter of fiscal 2024 from $17.6 million during the third quarter of fiscal 2023. The decrease in selling and administrative expenses is a result of lower legal, consulting and shareholder relations expenses and lower compensation expense. Research and development expenses decreased to $12.8 million during the third quarter of fiscal 2024 compared to $15.6 million in the third quarter of fiscal 2023. The decrease in research and development expenses reflects the previously announced decrease in spending on the Company’s ongoing commercial development efforts related to our solid oxide power generation and electrolysis platforms and carbon separation and carbon recovery solutions compared to the comparable prior year period as well as a shift in engineering resource allocation toward supporting the increase in funded Advanced Technologies activities.
2
Net loss was $(35.1) million in the third quarter of fiscal 2024, compared to net loss of $(23.6) million in the third quarter of fiscal 2023. The net loss in the prior-year third quarter included the benefit of a gain on extinguishment of finance obligations and debt of $15.3 million.
Adjusted EBITDA totaled $(20.1) million in the third quarter of fiscal 2024, compared to Adjusted EBITDA of $(31.6) million in the third quarter of fiscal 2023. Please see the discussion of non-GAAP financial measures, including Adjusted EBITDA, in the appendix at the end of this release.
The net loss per share attributable to common stockholders in the third quarter of fiscal 2024 was $(0.07), compared to $(0.06) in the third quarter of fiscal 2023. The net loss per common share in the third quarter of fiscal 2024 was a result of the higher net loss offset by the benefit of the higher number of weighted average shares outstanding due to share issuances since July 31, 2023. The net loss per share attributable to common stockholders in the third quarter of fiscal 2024 included the one-time benefit of a gain on extinguishment of finance obligations and debt of approximately $0.04.
Cash, Restricted Cash and Short-Term Investments
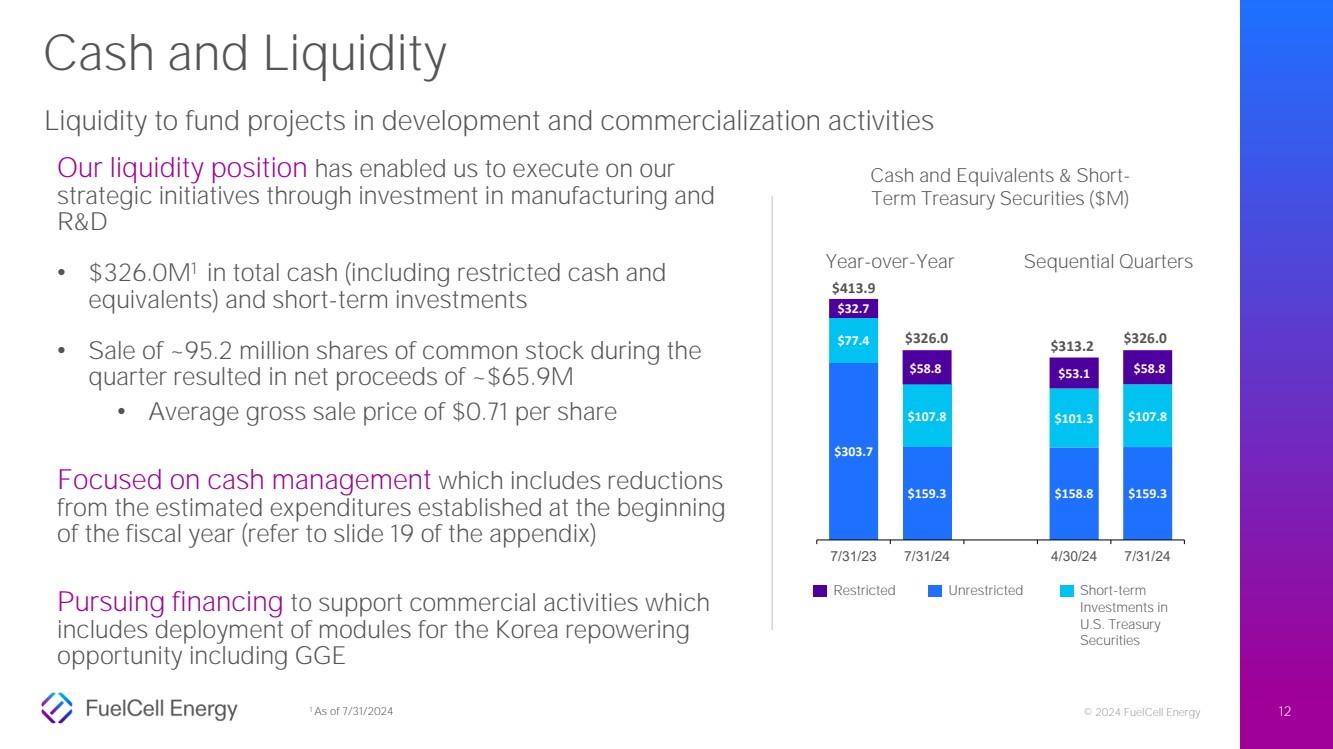
Cash and cash equivalents, restricted cash and cash equivalents, and short-term investments totaled $326.0 million as of July 31, 2024, compared to $403.3 million as of October 31, 2023. Of the $326.0 million total as of July 31, 2024, unrestricted cash and cash equivalents totaled $159.3 million, short-term investments totaled $107.8 million and restricted cash and cash equivalents totaled $58.8 million. Of the $403.3 million total as of October 31, 2023, unrestricted cash and cash equivalents totaled $250.0 million, short-term investments totaled $103.8 million, and restricted cash and cash equivalents totaled $49.6 million. Short-term investments represent the amortized cost of U.S. Treasury Securities outstanding as of July 31, 2024 and October 31, 2023 as part of the Company’s cash management optimization effort, all of which are expected to be held to maturity.
“We are taking proactive steps to help preserve balance sheet strength while continuing to execute on our growth objectives and position our platforms to capitalize on the energy transition and the growing distributed power generation opportunity,” said Mr. Michael Bishop, Executive Vice President, Chief Financial Officer and Treasurer. “We remain focused on lowering our quarterly spending and cash burn, while also pursuing financing to support commercial opportunities including our Korea repowering activities.”
During the three months ended July 31, 2024, approximately 95.2 million shares of the Company’s common stock were sold under the Company’s Amended Open Market Sale Agreement at an average sale price of $0.71 per share, resulting in gross proceeds of approximately $67.3 million before deducting sales commissions and fees, and net proceeds to the Company of approximately $65.9 million after deducting sales commissions and fees totaling approximately $1.4 million.
Backlog
As of July 31, |
|||||
(Amounts in thousands) |
2024 |
|
2023 |
|
Change |
Product |
$ 136,708 |
|
$ 26 |
|
$ 136,682 |
Service |
178,387 |
136,621 |
41,766 |
||
Generation |
839,532 |
915,062 |
(75,530) |
||
Advanced Technologies |
42,480 |
11,552 |
30,928 |
||
Total Backlog |
$1,197,107 |
$ 1,063,261 |
$ 133,846 |
||
As of July 31, 2024, backlog increased by approximately 12.6% to $1.20 billion, compared to $1.06 billion as of July 31, 2023, primarily as a result of the long-term service agreement with Gyeonggi Green Energy Co., Ltd. (the “GGE Agreement”) entered into during the third quarter of fiscal 2024. Backlog for the GGE Agreement was allocated between Product backlog of $126.0 million and service backlog of $33.6 million. Product backlog will be recognized as revenue over time as the Company completes commissioning of the replacement modules.
3
Commissioning of the first six 1.4-MW replacement fuel cell modules is expected to be completed in the fall of calendar year 2024, with an additional 30 1.4-MW replacement fuel cell modules expected to be commissioned throughout the course of calendar year 2025, and the remaining six 1.4-MW replacement fuel cell modules expected to be commissioned in the first half of calendar year 2026. Service backlog will be recognized as revenue as the Company performs service at the GGE site over the term of the GGE Agreement.
Backlog represents definitive agreements executed by the Company and our customers. Projects for which we have an executed power purchase agreement (“PPA”) or hydrogen power purchase agreement (“HPPA”) are included in generation backlog, which represents future revenue under long-term PPAs and HPPAs. The Company’s ability to recognize revenue in the future under a PPA or HPPA is subject to the Company’s completion of construction of the project covered by such PPA or HPPA. Should the Company not complete the construction of the project covered by a PPA or HPPA, it will forgo future revenues with respect to the project and may incur penalties and/or impairment charges related to the project. Projects sold to customers (and not retained by the Company) are included in product sales and service agreements backlog, and the related generation backlog is removed upon sale. Together, the service and generation portion of backlog had a weighted average term of approximately 17 years as of July 31, 2024, with weighting based on the dollar amount of backlog and utility service contracts of up to 20 years in duration at inception.
Conference Call Information
FuelCell Energy will host a conference call today beginning at 10:00 a.m. ET to discuss third quarter results for fiscal year 2024 as well as key business highlights. Participants can access the live call via webcast on the Company website or by telephone as follows:
| ● | The live webcast of the call and supporting slide presentation will be available at www.fuelcellenergy.com. To listen to the call, select “Investors” on the home page located under the “Our Company” pull-down menu, proceed to the “Events & Presentations” page and then click on the “Webcast” link listed under the September 5th earnings call event, or click here. |
| ● | Alternatively, participants can dial 888-330-3181 and state FuelCell Energy or the conference ID number 1099808. |
The replay of the conference call will be available via webcast on the Company’s Investors’ page at www.fuelcellenergy.com approximately two hours after the conclusion of the call.
Cautionary Language
This news release contains forward-looking statements within the meaning of the safe harbor provisions of the Private Securities Litigation Reform Act of 1995 regarding future events or our future financial performance that involve certain contingencies and uncertainties, including those discussed in our Annual Report on Form 10-K for the fiscal year ended October 31, 2023 in the section entitled "Management's Discussion and Analysis of Financial Condition and Results of Operations”. The forward-looking statements include, without limitation, statements with respect to the Company’s anticipated financial results and statements regarding the Company’s plans and expectations regarding the continuing development, commercialization and financing of its current and future fuel cell technologies, the expected timing of completion of the Company’s ongoing projects, the Company’s business plans and strategies, the Company’s capacity expansion, the capabilities of the Company’s products, the sales pipeline for the Company’s products, and the markets in which the Company expects to operate. Projected and estimated numbers contained herein are not forecasts and may not reflect actual results. These forward-looking statements are not guarantees of future performance, and all forward-looking statements are subject to risks and uncertainties that could cause actual results to differ materially from those projected. Factors that could cause such a difference include, without limitation: general risks associated with product development and manufacturing; general economic conditions; changes in interest rates, which may impact
4
project financing; supply chain disruptions; changes in the utility regulatory environment; changes in the utility industry and the markets for distributed generation, distributed hydrogen, and fuel cell power plants configured for carbon capture or carbon separation; potential volatility of commodity prices that may adversely affect our projects; availability of government subsidies and economic incentives for alternative energy technologies; our ability to remain in compliance with U.S. federal and state and foreign government laws and regulations; our ability to regain and maintain compliance with the listing rules of The Nasdaq Stock Market; our ability to implement a reverse stock split and the impacts of a reverse stock split, if implemented; rapid technological change; competition; the risk that our bid awards will not convert to contracts or that our contracts will not convert to revenue; market acceptance of our products; changes in accounting policies or practices adopted voluntarily or as required by accounting principles generally accepted in the United States; factors affecting our liquidity position and financial condition; government appropriations; the ability of the government and third parties to terminate their development contracts at any time; the ability of the government to exercise “march-in” rights with respect to certain of our patents; our ability to successfully market and sell our products internationally; our ability to develop new products to achieve our long-term revenue targets; our ability to implement our strategy; our ability to reduce our levelized cost of energy and deliver on our cost reduction strategy generally; our ability to protect our intellectual property; litigation and other proceedings; the risk that commercialization of our new products will not occur when anticipated or, if it does, that we will not have adequate capacity to satisfy demand; our need for and the availability of additional financing; our ability to generate positive cash flow from operations; our ability to service our long-term debt; our ability to increase the output and longevity of our platforms and to meet the performance requirements of our contracts; our ability to expand our customer base and maintain relationships with our largest customers and strategic business allies; and concerns with, threats of, or the consequences of, pandemics, contagious diseases or health epidemics, including the novel coronavirus, and resulting supply chain disruptions, shifts in clean energy demand, impacts to our customers’ capital budgets and investment plans, and impacts on the demand for our products, as well as other risks set forth in the Company’s filings with the Securities and Exchange Commission, including the Company’s Annual Report on Form 10-K for the fiscal year ended October 31, 2023 and the Company’s Quarterly Report on Form 10-Q for the fiscal quarter ended July 31, 2024. The forward-looking statements contained herein speak only as of the date of this press release. The Company expressly disclaims any obligation or undertaking to release publicly any updates or revisions to any such statement contained herein to reflect any change in the Company’s expectations or any change in events, conditions or circumstances on which any such statement is based.
About FuelCell Energy
FuelCell Energy, Inc. (NASDAQ: FCEL): FuelCell Energy is a global leader in delivering environmentally responsible distributed baseload energy platform solutions through our proprietary fuel cell technology. FuelCell Energy is focused on advancing sustainable clean energy technologies that address some of the world’s most critical challenges around energy access, security, resilience, reliability, affordability, safety and environmental stewardship. As a leading global manufacturer of proprietary fuel cell technology platforms, FuelCell Energy is uniquely positioned to serve customers worldwide with sustainable products and solutions for industrial and commercial businesses, utilities, governments, municipalities, and communities.
SureSource, SureSource 1500, SureSource 3000, SureSource 4000, SureSource Recovery, SureSource Capture, SureSource Hydrogen, SureSource Storage, SureSource Service, SureSource Capital, FuelCell Energy, and FuelCell Energy logo are all trademarks of FuelCell Energy, Inc.
Contact:
FuelCell Energy, Inc.
ir@fce.com
203.205.2491
5
FUELCELL ENERGY, INC.
Consolidated Balance Sheets
(Unaudited)
(Amounts in thousands, except share and per share amounts)
|
|
July 31, 2024 |
|
|
October 31, 2023 |
ASSETS |
|
|
|
|
|
Current assets: |
|
|
|
|
|
Cash and cash equivalents, unrestricted |
$ |
159,347 |
|
$ |
249,952 |
Restricted cash and cash equivalents – short-term |
|
9,686 |
|
|
5,159 |
Investments – short-term |
|
107,817 |
|
|
103,760 |
Accounts receivable, net |
|
11,161 |
|
|
3,809 |
Unbilled receivables |
|
30,169 |
|
|
16,296 |
Inventories |
|
129,349 |
|
|
84,456 |
Other current assets |
|
12,439 |
|
|
12,881 |
Total current assets |
|
459,968 |
|
|
476,313 |
|
|
|
|
||
Restricted cash and cash equivalents – long-term |
|
49,148 |
|
|
44,465 |
Inventories – long-term |
|
2,743 |
|
|
7,329 |
Project assets, net |
|
248,790 |
|
|
258,066 |
Property, plant and equipment, net |
|
121,382 |
|
|
89,668 |
Operating lease right-of-use assets, net |
|
7,884 |
|
|
8,352 |
Goodwill |
|
4,075 |
|
|
4,075 |
Intangible assets, net |
|
15,104 |
|
|
16,076 |
Other assets |
|
39,816 |
|
|
51,176 |
Total assets (1) |
$ |
948,910 |
|
$ |
$955,520 |
LIABILITIES AND STOCKHOLDERS’ EQUITY |
|
|
|
|
|
Current liabilities: |
|
|
|
|
|
Current portion of long-term debt |
$ |
12,232 |
|
$ |
10,067 |
Current portion of operating lease liabilities |
|
760 |
|
|
599 |
Accounts payable |
16,928 |
|
26,518 |
||
Accrued liabilities |
|
25,970 |
|
|
26,313 |
Deferred revenue |
|
10,649 |
|
|
2,406 |
Total current liabilities |
|
66,539 |
|
|
65,903 |
|
|
|
|
|
|
Long-term deferred revenue |
|
1,979 |
|
|
732 |
Long-term operating lease liabilities |
|
8,708 |
|
|
8,992 |
Long-term debt and other liabilities |
|
126,720 |
|
|
119,588 |
Total liabilities (1) |
|
203,946 |
|
|
195,215 |
Redeemable Series B preferred stock (liquidation preference of $64,020 as of July 31, 2024 and October 31, 2023) |
|
59,857 |
|
|
59,857 |
Total equity: |
|
|
|
|
|
Stockholders’ equity: |
|
55 |
|
|
45 |
Additional paid-in capital |
|
2,277,417 |
|
|
2,199,661 |
Accumulated deficit |
|
(1,600,134) |
|
|
(1,515,541) |
Accumulated other comprehensive loss |
|
(1,576) |
|
|
(1,672) |
Treasury stock, Common, at cost (376,340 and 246,468 shares as of July 31, 2024 and October 31, 2023, respectively) |
|
(1,198) |
|
|
(1,078) |
Deferred compensation |
|
1,198 |
|
|
1,078 |
Total stockholders’ equity |
|
675,762 |
|
|
682,493 |
Noncontrolling interests |
|
9,345 |
|
|
17,955 |
Total equity |
|
685,107 |
|
|
700,448 |
Total liabilities, redeemable Series B preferred stock and total equity |
$ |
948,910 |
|
$ |
955,520 |
| (1) | As of July 31, 2024 and October 31, 2023, the combined assets of the variable interest entities (“VIEs”) were $318,698 and $235,290, respectively, that can only be used to settle obligations of the VIEs. These assets include cash of $4,239, accounts receivable of $726, unbilled accounts receivable of $8,403, operating lease right of use assets of $1,667, other current assets of $137,326, restricted cash and cash equivalents of $625, project assets of $161,964 and other assets of $3,749 as of July 31, 2024, and cash of $4,797, unbilled accounts receivable of $1,876, operating lease right of use assets of $1,680, other current assets of $50,713, restricted cash and cash equivalents of $526, project assets of $170,444, derivative asset of $4,127 and other assets of $1,125 as of October 31, 2023. The combined liabilities of the VIEs as of July 31, 2024 include short-term operating lease liabilities of $203, accounts payable of $184,900, accrued liabilities of $497, deferred revenue of $132, long-term operating lease liability of $2,146, and other non-current liabilities of $2,725 and, as of October 31, 2023, include short-term operating lease liabilities of $203, accounts payable of $165,824, long-term operating lease liability of $2,159 and other non-current liabilities of $187. |
6
FUELCELL ENERGY, INC.
Consolidated Statements of Operations and Comprehensive Loss
(Unaudited)
(Amounts in thousands, except share and per share amounts)
|
|
Three Months Ended July 31, |
|
||||||
|
|
2024 |
|
|
2023 |
|
|||
Revenues: |
|
|
|
|
|
|
|
|
|
Product |
|
$ |
250 |
|
|
$ |
- |
|
|
Service |
|
|
1,411 |
|
|
|
9,841 |
|
|
Generation |
|
|
13,402 |
|
|
|
10,982 |
|
|
Advanced Technologies |
|
|
8,632 |
|
|
|
4,687 |
|
|
Total revenues |
|
|
23,695 |
|
|
|
25,510 |
|
|
|
Costs of revenues: |
|
|
|
|
|
|
|
|
|
Product |
|
|
4,181 |
|
|
|
2,910 |
|
|
Service |
|
|
1,146 |
|
|
|
9,575 |
|
|
Generation |
|
|
18,761 |
|
|
|
17,483 |
|
|
Advanced Technologies |
|
|
5,809 |
|
|
|
3,757 |
|
|
Total costs of revenues |
|
|
29,897 |
|
|
|
33,725 |
|
|
|
Gross loss |
|
|
(6,202) |
|
|
|
(8,215) |
|
|
|
Operating expenses: |
|
|
|
|
|
|
|
|
|
Administrative and selling expenses |
|
|
14,599 |
|
|
|
17,560 |
|
|
Research and development expenses |
|
|
12,816 |
|
|
|
15,620 |
|
|
Total costs and expenses |
|
|
27,415 |
|
|
|
33,180 |
|
|
|
Loss from operations |
|
|
(33,617) |
|
|
|
(41,395) |
|
|
|
Interest expense |
|
|
(2,555) |
|
|
|
(1,912) |
|
|
Interest income |
|
|
3,269 |
|
|
|
3,966 |
|
|
Gain on early extinguishment of finance obligations and debt, net |
|
|
- |
|
|
|
15,337 |
|
|
Other (expense) income, net |
|
|
(2,218) |
|
|
|
403 |
|
|
|
Loss before provision for income taxes |
|
|
(35,121) |
|
|
|
(23,601) |
|
|
Provision for income taxes |
|
|
(2) |
|
|
|
- |
|
|
|
Net loss |
|
|
(35,123) |
|
|
|
(23,601) |
|
|
Net (loss) income attributable to noncontrolling interest |
|
|
(2,463) |
|
|
|
678 |
|
|
Net loss attributable to FuelCell Energy, Inc. |
|
|
(32,660) |
|
|
|
(24,279) |
|
|
Series B preferred stock dividends |
|
|
(800) |
|
|
|
(800) |
|
|
|
Net loss attributable to common stockholders |
|
$ |
(33,460) |
|
|
$ |
(25,079) |
|
|
|
Loss per share basic and diluted: |
|
|
|
|
|
|
|
|
|
Net loss per share attributable to common stockholders |
|
$ |
(0.07) |
|
|
$ |
(0.06) |
|
|
Basic and diluted weighted average shares outstanding |
|
|
503,183,725 |
|
|
|
415,867,594 |
|
|
7
FUELCELL ENERGY, INC.
Consolidated Statements of Operations and Comprehensive Loss
(Unaudited)
(Amounts in thousands, except share and per share amounts)
|
|
Nine Months Ended July 31, |
|
|||||
|
|
2024 |
|
|
2023 |
|
||
Revenues: |
|
|
|
|
|
|
|
|
Product |
|
$ |
250 |
|
|
$ |
9,095 |
|
Service |
|
|
4,397 |
|
|
|
49,913 |
|
Generation |
|
|
38,013 |
|
|
|
28,979 |
|
Advanced Technologies |
|
|
20,146 |
|
|
|
12,945 |
|
Total revenues |
|
|
62,806 |
|
|
|
100,932 |
|
|
Costs of revenues: |
|
|
|
|
|
|
|
|
Product |
|
|
9,510 |
|
|
|
7,425 |
|
Service |
|
|
4,301 |
|
|
|
40,633 |
|
Generation |
|
|
61,079 |
|
|
|
51,166 |
|
Advanced Technologies |
|
|
12,917 |
|
|
|
10,779 |
|
Total costs of revenues |
|
|
87,807 |
|
|
|
110,003 |
|
|
Gross loss |
|
|
(25,001) |
|
|
|
(9,071) |
|
|
Operating expenses: |
|
|
|
|
|
|
|
|
Administrative and selling expenses |
|
|
48,659 |
|
|
|
47,637 |
|
Research and development expenses |
|
|
43,796 |
|
|
|
43,000 |
|
Total costs and expenses |
|
|
92,455 |
|
|
|
90,637 |
|
|
Loss from operations |
|
|
(117,456) |
|
|
|
(99,708) |
|
|
Interest expense |
|
|
(7,168) |
|
|
|
(4,926) |
|
Interest income |
|
|
10,726 |
|
|
|
11,064 |
|
Gain on early extinguishment of finance obligations and debt, net |
|
|
- |
|
|
|
15,337 |
|
Other (expense) income, net |
|
|
(3,278) |
|
|
|
216 |
|
|
Loss before provision for income taxes |
|
|
(117,176) |
|
|
|
(78,017) |
|
Provision for income taxes |
|
|
(2) |
|
|
|
(581) |
|
|
Net loss |
|
|
(117,178) |
|
|
|
(78,598) |
|
Net loss attributable to noncontrolling interest |
|
|
(32,585) |
|
|
|
(1,394) |
|
Net loss attributable to FuelCell Energy, Inc. |
|
|
(84,593) |
|
|
|
(77,204) |
|
Series B preferred stock dividends |
|
|
(2,400) |
|
|
|
(2,400) |
|
|
Net loss attributable to common stockholders |
|
$ |
(86,993) |
|
|
$ |
(79,604) |
|
|
Loss per share basic and diluted: |
|
|
|
|
|
|
|
|
Net loss per share attributable to common stockholders |
|
$ |
(0.19) |
|
|
$ |
(0.19) |
|
Basic and diluted weighted average shares outstanding |
|
|
469,387,264 |
|
|
|
409,361,826 |
|
8
Appendix
Non-GAAP Financial Measures
Financial results are presented in accordance with accounting principles generally accepted in the United States (“GAAP”). Management also uses non-GAAP measures to analyze and make operating decisions on the business. Earnings before interest, taxes, depreciation and amortization (“EBITDA”) and Adjusted EBITDA are non-GAAP measures of operations and operating performance by the Company.
These supplemental non-GAAP measures are provided to assist readers in assessing operating performance. Management believes EBITDA and Adjusted EBITDA are useful in assessing performance and highlighting trends on an overall basis. Management also believes these measures are used by companies in the fuel cell sector and by securities analysts and investors when comparing the results of the Company with those of other companies. EBITDA differs from the most comparable GAAP measure, net loss attributable to the Company, primarily because it does not include finance expense, income taxes and depreciation of property, plant and equipment and project assets. Adjusted EBITDA adjusts EBITDA for stock-based compensation, restructuring charges, non-cash (gain) loss on derivative instruments and other unusual items, which are considered either non-cash or non-recurring.
While management believes that these non-GAAP financial measures provide useful supplemental information to investors, there are limitations associated with the use of these measures. The measures are not prepared in accordance with GAAP and may not be directly comparable to similarly titled measures of other companies due to potential differences in the exact method of calculation. The Company’s non-GAAP financial measures are not meant to be considered in isolation or as a substitute for comparable GAAP financial measures and should be read only in conjunction with the Company’s consolidated financial statements prepared in accordance with GAAP.
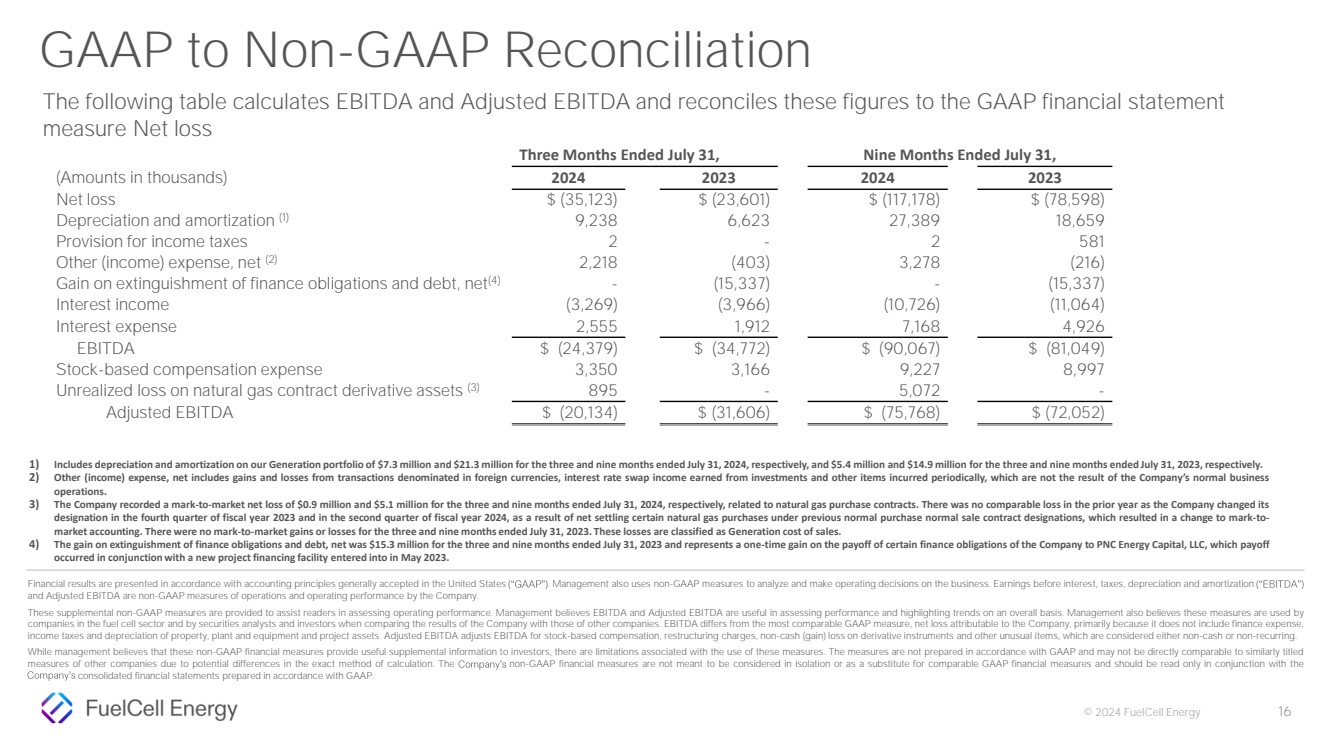
The following table calculates EBITDA and Adjusted EBITDA and reconciles these figures to the GAAP financial statement measure Net loss.
Three Months Ended July 31, |
Nine Months Ended July 31, |
|||||||
(Amounts in thousands) |
2024 |
2023 |
2024 |
2023 |
||||
Net loss |
$ (35,123) |
$ (23,601) |
(117,178) |
$ (78,598) |
||||
Depreciation and amortization (1) |
9,238 |
6,623 |
27,389 |
18,659 |
||||
Provision for income taxes |
2 |
- |
2 |
581 |
||||
Other (income) expense, net (2) |
2,218 |
(403) |
3,278 |
(216) |
||||
Gain on extinguishment of finance obligations and debt, net (4) |
- |
|
(15,337) |
|
- |
|
(15,337) |
|
Interest income |
(3,269) |
|
(3,966) |
|
(10,726) |
|
(11,064) |
|
Interest expense |
2,555 |
1,912 |
7,168 |
4,926 |
||||
EBITDA |
$ (24,379) |
$ (34,772) |
$ (90,067) |
$ (81,049) |
||||
Stock-based compensation expense |
3,350 |
3,166 |
9,227 |
8,997 |
||||
Unrealized loss on natural gas contract derivative assets (3) |
895 |
|
- |
|
5,072 |
|
- |
|
Adjusted EBITDA |
$ (20,134) |
$ (31,606) |
$ (75,768) |
$ (72,052) |
||||
| (1) | Includes depreciation and amortization on our Generation portfolio of $7.3 million and $21.3 million for the three and nine months ended July 31, 2024, respectively, and $5.4 million and $14.9 million for the three and nine months ended July 31, 2023, respectively. |
| (2) | Other (income) expense, net includes gains and losses from transactions denominated in foreign currencies, interest rate swap income earned from investments and other items incurred periodically, which are not the result of the Company’s normal business operations. |
| (3) | The Company recorded a mark-to-market net loss of $0.9 million and $5.1 million for the three and nine months ended July 31, 2024, respectively, related to natural gas purchase contracts. There was no comparable loss in the prior year as the Company changed its designation in the fourth quarter of fiscal year 2023 and in the second quarter of fiscal year 2024, as a result of net settling certain natural gas purchases under previous normal purchase normal sale contract designations, which resulted in a change to mark-to- |
9
| market accounting. There were no mark-to-market gains or losses for the three and nine months ended July 31, 2023. These losses are classified as Generation cost of sales. |
| (4) | The gain on extinguishment of finance obligations and debt, net was $15.3 million for the three and nine months ended July 31, 2023 and represents a one-time gain on the payoff of certain finance obligations of the Company to PNC Energy Capital, LLC, which payoff occurred in conjunction with a new project financing facility entered into in May 2023. |
10
|
5 September 2024 Third Quarter 2024 Financial Results & Business Update Exhibit 99.2 |
|
© 2024 FuelCell Energy 2 This presentation contains forward-looking statements within the meaning of the safe harbor provisions of the Private Securities Litigation Reform Act of 1995 regarding future events or our future financial performance that involve certain contingencies and uncertainties, including those discussed in our Annual Report on Form 10-K for the fiscal year ended October 31, 2023, in the section entitled "Management's Discussion and Analysis of Financial Condition and Results of . The forward-looking statements include, without limitation, statements with respect to the anticipated financial results and statements regarding the plans and expectations regarding the continuing development, commercialization and financing of its current and future fuel cell technologies, the expected timing of completion of the ongoing projects, the expected timing of module replacements, the business plans and strategies, the capacity expansion, the capabilities of the products, and the markets in which the Company expects to operate. Projected and estimated numbers contained herein are not forecasts and may not reflect actual results. These forward-looking statements are not guarantees of future performance, and all forward-looking statements are subject to risks and uncertainties that could cause actual results to differ materially from those projected. Factors that could cause such a difference include, without limitation: general risks associated with product development and manufacturing; general economic conditions; changes in interest rates, which may impact project financing; supply chain disruptions; changes in the utility regulatory environment; changes in the utility industry and the markets for distributed generation, distributed hydrogen, and fuel cell power plants configured for carbon capture or carbon separation; potential volatility of commodity prices that may adversely affect our projects; availability of government subsidies and economic incentives for alternative energy technologies; our ability to remain in compliance with U.S. federal and state and foreign government laws and regulations; our ability to regain and maintain compliance with the listing rules of The Nasdaq Stock Market; our ability to implement a reverse stock split and the impacts of a reverse stock split, if implemented; rapid technological change; competition; the risk that our bid awards will not convert to contracts or that our contracts will not convert to revenue; market acceptance of our products; changes in accounting policies or practices adopted voluntarily or as required by accounting principles generally accepted in the United States; factors affecting our liquidity position and financial condition; government appropriations; the ability of the government and third parties to terminate their development contracts at any time; the ability of the government to exercise - rights with respect to certain of our patents; our ability to successfully market and sell our products internationally; our ability to develop new products to achieve our long-term revenue targets; our ability to implement our strategy; our ability to reduce our levelized cost of energy and deliver on our cost reduction strategy generally; our ability to protect our intellectual property; litigation and other proceedings; the risk that commercialization of our new products will not occur when anticipated or, if it does, that we will not have adequate capacity to satisfy demand; our need for and the availability of additional financing; our ability to generate positive cash flow from operations; our ability to service our long-term debt; our ability to increase the output and longevity of our platforms and to meet the performance requirements of our contracts; our ability to expand our customer base and maintain relationships with our largest customers and strategic business allies; and concerns with, threats of, or the consequences of, pandemics, contagious diseases or health epidemics, including the novel coronavirus, and resulting supply chain disruptions, shifts in clean energy demand, impacts to our capital budgets and investment plans, and impacts on the demand for our products, as well as other risks set forth in the filings with the Securities and Exchange Commission including the Annual Report on Form 10-K for the fiscal year ended October 31, 2023 and the Quarterly Report on Form 10-Q for the fiscal quarter ended July 31, 2024. The forward-looking statements contained herein speak only as of the date of this presentation. The Company expressly disclaims any obligation or undertaking to release publicly any updates or revisions to any such statement contained herein to reflect any change in the expectations or any change in events, conditions or circumstances on which any such statement is based. The Company refers to non-GAAP financial measures in this presentation. The Company believes that this information is useful to understanding its operating results and assessing performance and highlighting trends on an overall basis. Please refer to the earnings release and the appendix to this presentation for further disclosure and reconciliation of non-GAAP financial measures. (As used herein, the term refers to generally accepted accounting principles in the U.S.) The information set forth in this presentation is qualified by reference to, and should be read in conjunction with, our Annual Report on Form 10-K for the fiscal year ended October 31, 2023, filed with the SEC on December 19, 2023, our Quarterly Report on Form 10-Q for the quarter ended July 31, 2024, filed with the SEC on September 5, 2024, and our earnings release for the third quarter of fiscal year 2024, filed as an exhibit to our Current Report on Form 8-K filed with the SEC on September 5, 2024. Safe Harbor Statement |
|
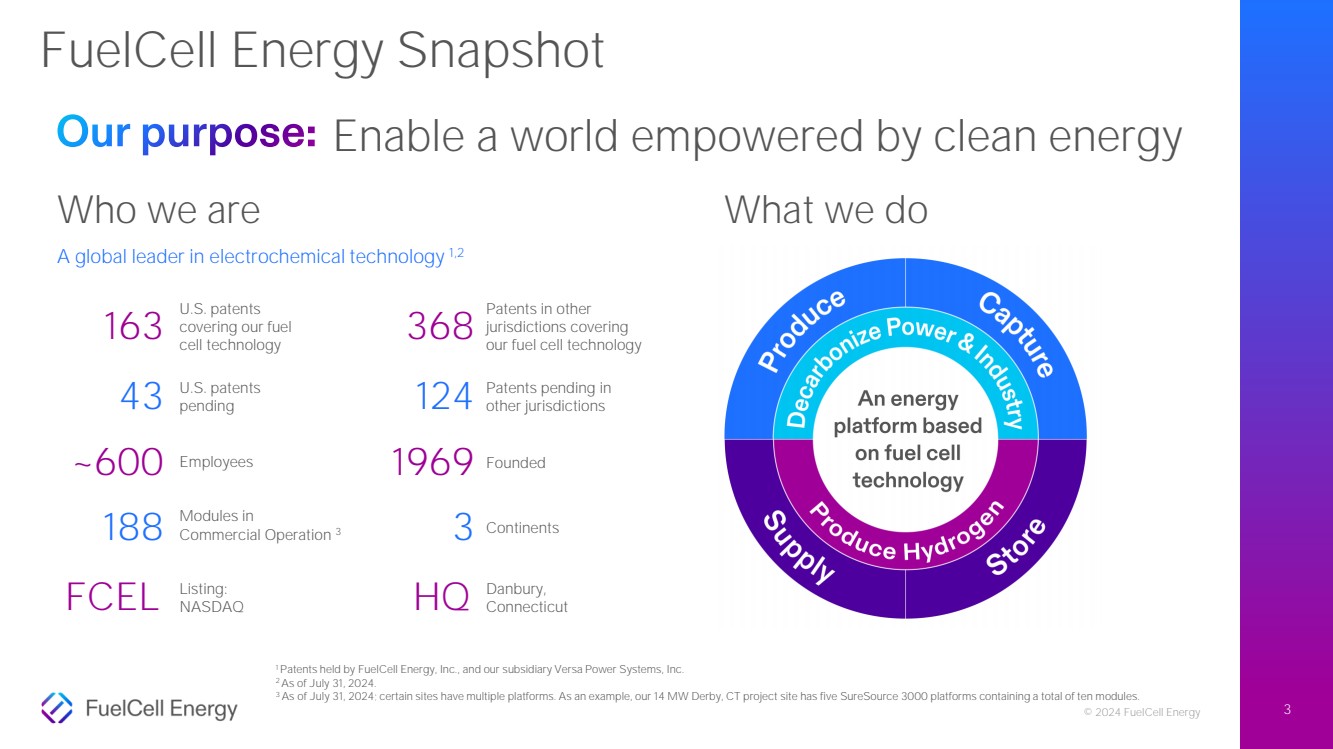
© 2024 FuelCell Energy 3 FuelCell Energy Snapshot What we do A global leader in electrochemical technology 1,2 Enable a world empowered by clean energy Who we are ~600 1969 188 3 Employees Modules in Commercial Operation 3 Founded Continents FCEL HQ 1 Patents held by FuelCell Energy, Inc., and our subsidiary Versa Power Systems, Inc. 2 As of July 31, 2024. 3 As of July 31, 2024; certain sites have multiple platforms. As an example, our 14 MW Derby, CT project site has five SureSource 3000 platforms containing a total of ten modules. U.S. patents covering our fuel cell technology U.S. patents pending 163 368 43 Patents in other jurisdictions covering our fuel cell technology Patents pending in 124 other jurisdictions Our purpose: Listing: NASDAQ Danbury, Connecticut |
|
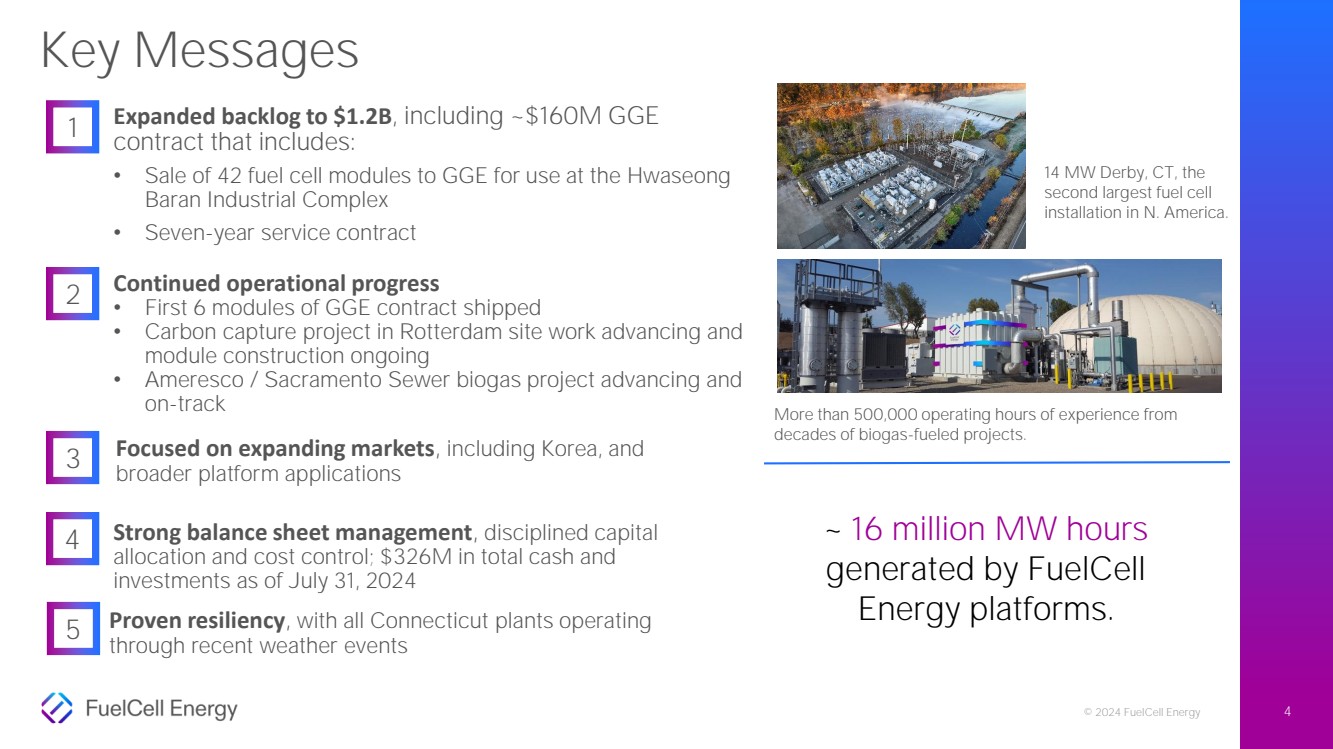
© 2024 FuelCell Energy 4 Continued operational progress • First 6 modules of GGE contract shipped • Carbon capture project in Rotterdam site work advancing and module construction ongoing • Ameresco / Sacramento Sewer biogas project advancing and on-track 2 4 3 Focused on expanding markets, including Korea, and broader platform applications 1 Strong balance sheet management, disciplined capital allocation and cost control; $326M in total cash and investments as of July 31, 2024 Key Messages Expanded backlog to $1.2B, including ~$160M GGE contract that includes: • Sale of 42 fuel cell modules to GGE for use at the Hwaseong Baran Industrial Complex • Seven-year service contract 14 MW Derby, CT, the second largest fuel cell installation in N. America. ~ 16 million MW hours generated by FuelCell Energy platforms. More than 500,000 operating hours of experience from decades of biogas-fueled projects. 5 Proven resiliency, with all Connecticut plants operating through recent weather events |
|
© 2024 FuelCell Energy Operational Update 5 |
|
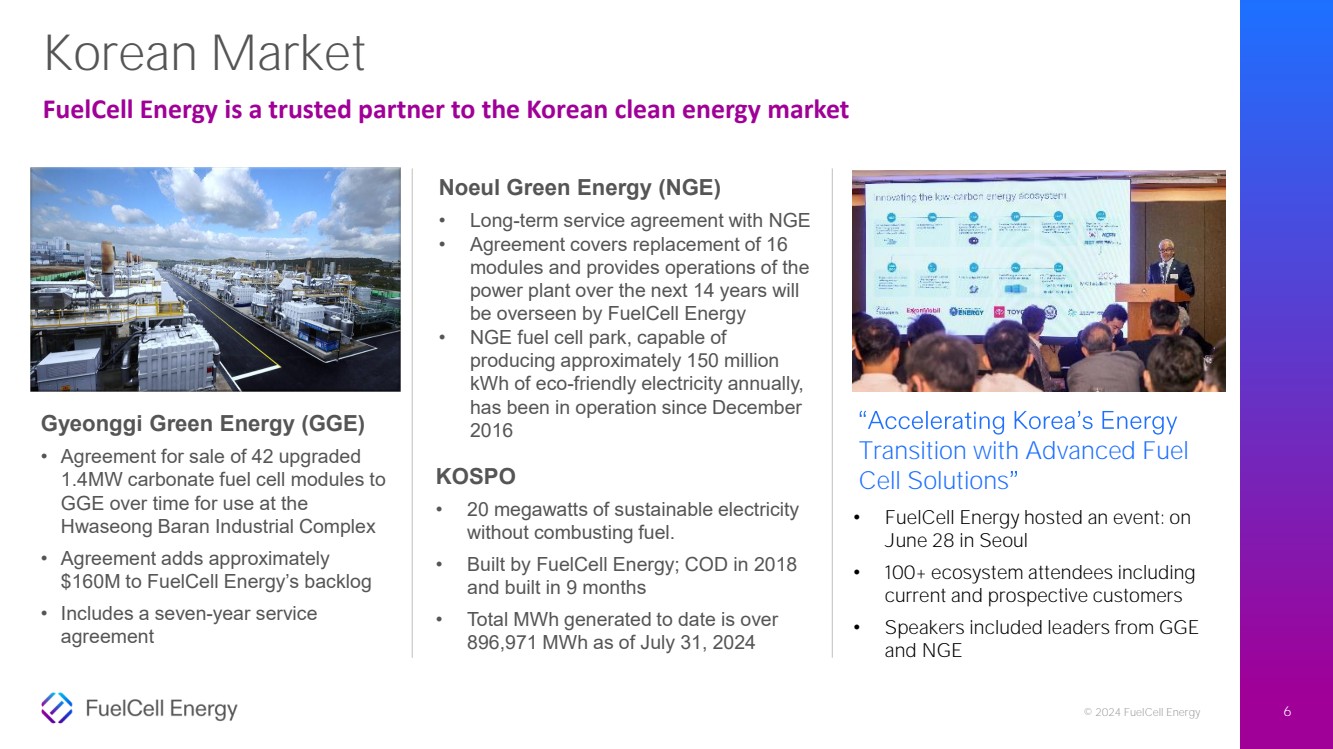
© 2024 FuelCell Energy 6 Korean Market FuelCell Energy is a trusted partner to the Korean clean energy market Noeul Green Energy (NGE) • Long-term service agreement with NGE • Agreement covers replacement of 16 modules and provides operations of the power plant over the next 14 years will be overseen by FuelCell Energy • NGE fuel cell park, capable of producing approximately 150 million kWh of eco-friendly electricity annually, has been in operation since December 2016 KOSPO • 20 megawatts of sustainable electricity without combusting fuel. • Built by FuelCell Energy; COD in 2018 and built in 9 months • Total MWh generated to date is over 896,971 MWh as of July 31, 2024 Gyeonggi Green Energy (GGE) • Agreement for sale of 42 upgraded 1.4MW carbonate fuel cell modules to GGE over time for use at the Hwaseong Baran Industrial Complex • Agreement adds approximately $160M to FuelCell Energy’s backlog • Includes a seven-year service agreement • FuelCell Energy hosted an event: on June 28 in Seoul • 100+ ecosystem attendees including current and prospective customers • Speakers included leaders from GGE and NGE Transition with Advanced Fuel Cell Solutions |
|
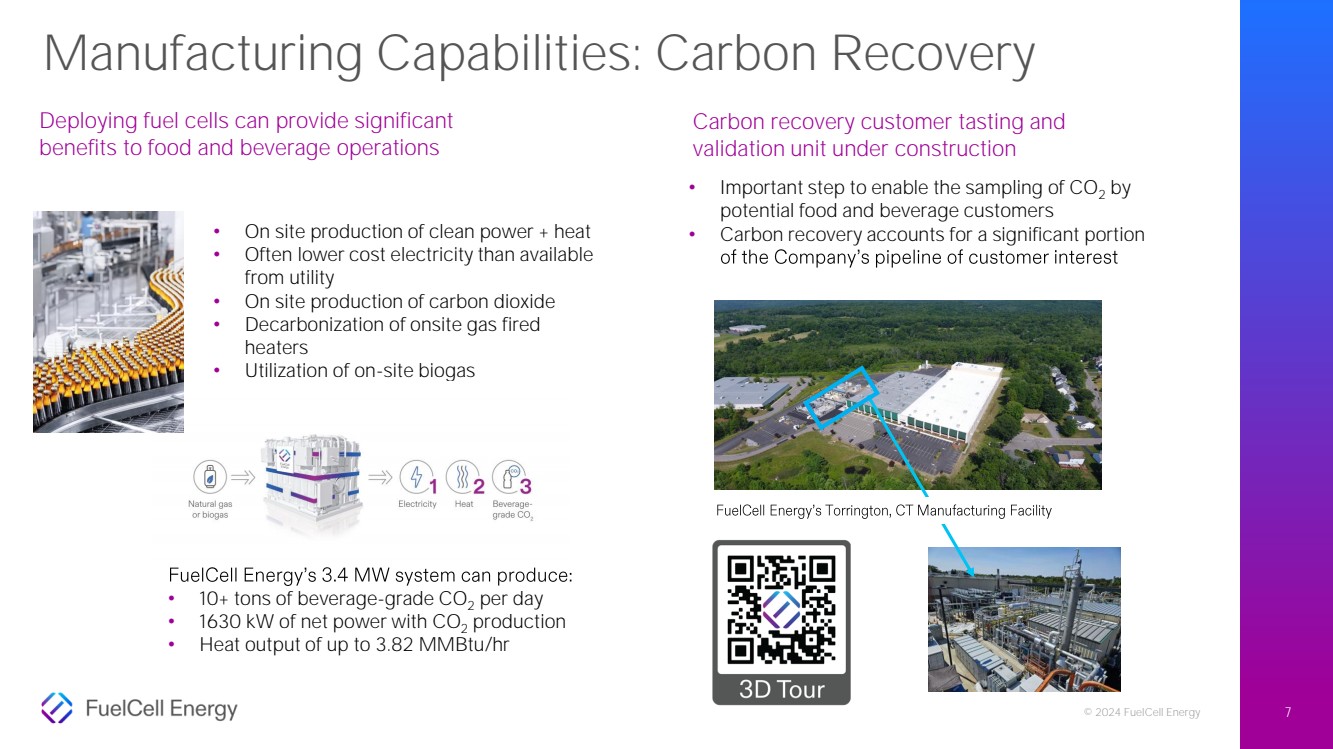
© 2024 FuelCell Energy 7 Manufacturing Capabilities: Carbon Recovery • Important step to enable the sampling of CO2 by potential food and beverage customers • Carbon recovery accounts for a significant portion Deploying fuel cells can provide significant benefits to food and beverage operations Carbon recovery customer tasting and validation unit under construction • On site production of clean power + heat • Often lower cost electricity than available from utility • On site production of carbon dioxide • Decarbonization of onsite gas fired heaters • Utilization of on-site biogas • 10+ tons of beverage-grade CO2 per day • 1630 kW of net power with CO2 production • Heat output of up to 3.82 MMBtu/hr |
|
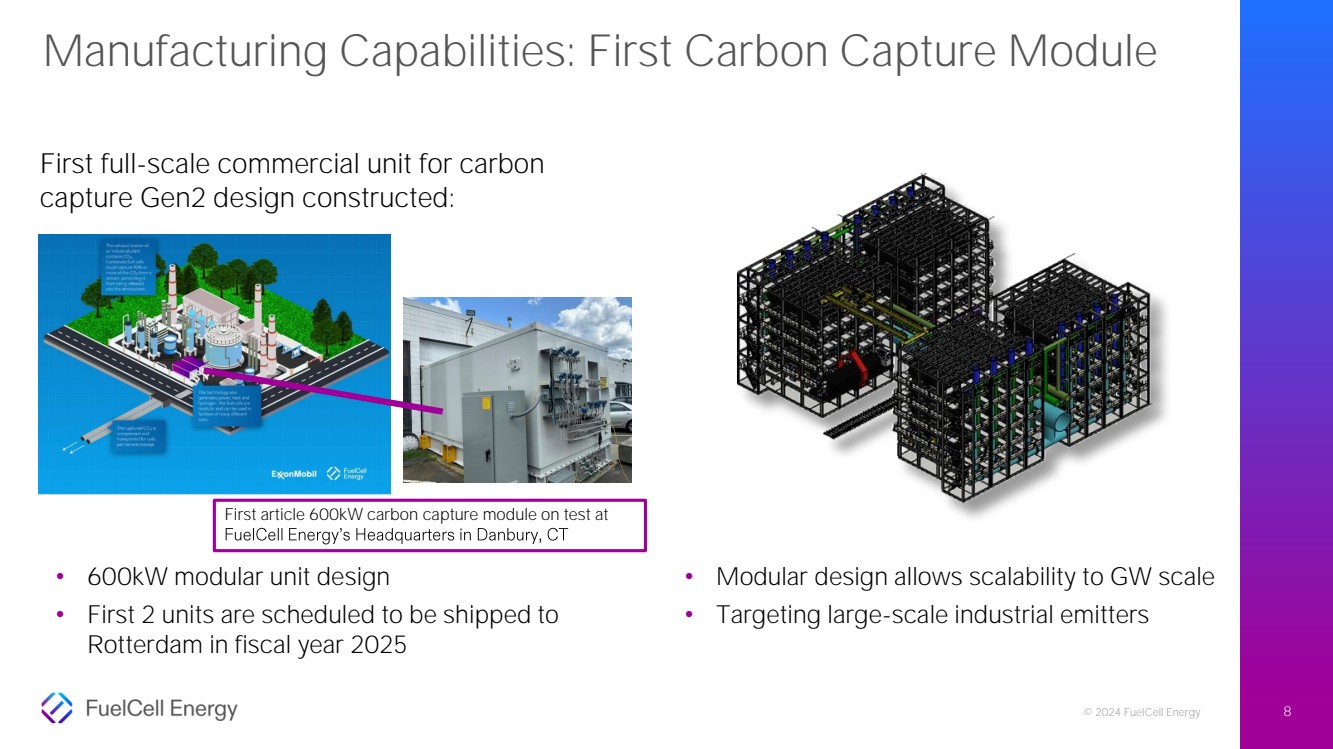
© 2024 FuelCell Energy 8 Manufacturing Capabilities: First Carbon Capture Module First full-scale commercial unit for carbon capture Gen2 design constructed: First article 600kW carbon capture module on test at • 600kW modular unit design • First 2 units are scheduled to be shipped to Rotterdam in fiscal year 2025 • Modular design allows scalability to GW scale • Targeting large-scale industrial emitters |
|
© 2024 FuelCell Energy Q3 2024 Financial Performance 9 |
|
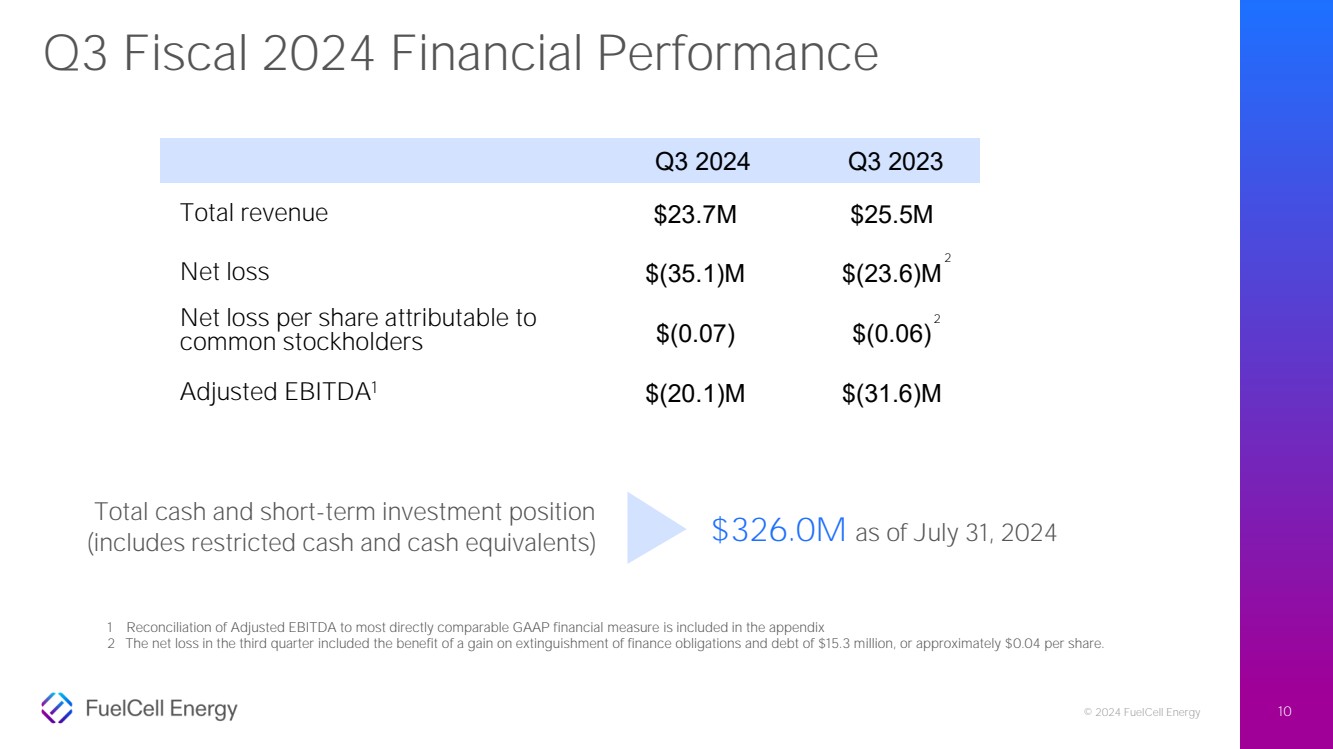
© 2024 FuelCell Energy 10 Q3 Fiscal 2024 Financial Performance 1 Reconciliation of Adjusted EBITDA to most directly comparable GAAP financial measure is included in the appendix 2 The net loss in the third quarter included the benefit of a gain on extinguishment of finance obligations and debt of $15.3 million, or approximately $0.04 per share. Total cash and short-term investment position (includes restricted cash and cash equivalents) $326.0M as of July 31, 2024 Q3 2024 Q3 2023 Total revenue $23.7M $25.5M Net loss $(35.1)M $(23.6)M Net loss per share attributable to common stockholders $(0.07) $(0.06) Adjusted EBITDA1 $(20.1)M $(31.6)M 2 2 |
|
© 2024 FuelCell Energy $0.137 $0.178 $0.915 $0.840 $0.012 $0.042 $0.137 Q3 2023 Q3 2024 Service Generation Adv. Tech. Product $1.20 $1.06 Revenue Breakdown ($M) Q3 2024 Total Revenue: $23.7 million 1% 6% 57% 36% Product Service Generation Advanced Technologies 11 Gross Loss and Operating Expenses ($M) Q3 Fiscal 2024 Financial Performance and Backlog $(8.2) $(6.2) $(33.2) $(27.4) 3Q23 3Q24 Q3 2023 Q3 2024 Backlog ($B) Gross Loss Operating Expenses 11 $1.4 $13.4 $8.6 $0.3 |
|
© 2024 FuelCell Energy 12 Our liquidity position has enabled us to execute on our strategic initiatives through investment in manufacturing and R&D • $326.0M1 in total cash (including restricted cash and equivalents) and short-term investments • Sale of ~95.2 million shares of common stock during the quarter resulted in net proceeds of ~$65.9M • Average gross sale price of $0.71 per share Focused on cash management which includes reductions from the estimated expenditures established at the beginning of the fiscal year (refer to slide 19 of the appendix) Pursuing financing to support commercial activities which includes deployment of modules for the Korea repowering opportunity including GGE Cash and Liquidity 1 As of 7/31/2024 Liquidity to fund projects in development and commercialization activities $303.7 $159.3 $158.8 $159.3 $77.4 $107.8 $101.3 $107.8 $32.7 $58.8 $53.1 $58.8 7/31/23 7/31/24 4/30/24 7/31/24 Cash and Equivalents & Short-Term Treasury Securities ($M) Restricted Short-term Investments in U.S. Treasury Securities Unrestricted $413.9 $326.0 $313.2 $326.0 Year-over-Year Sequential Quarters |
|
© 2024 FuelCell Energy 13 Thank You |
|
© 2024 FuelCell Energy Appendix 14 |
|
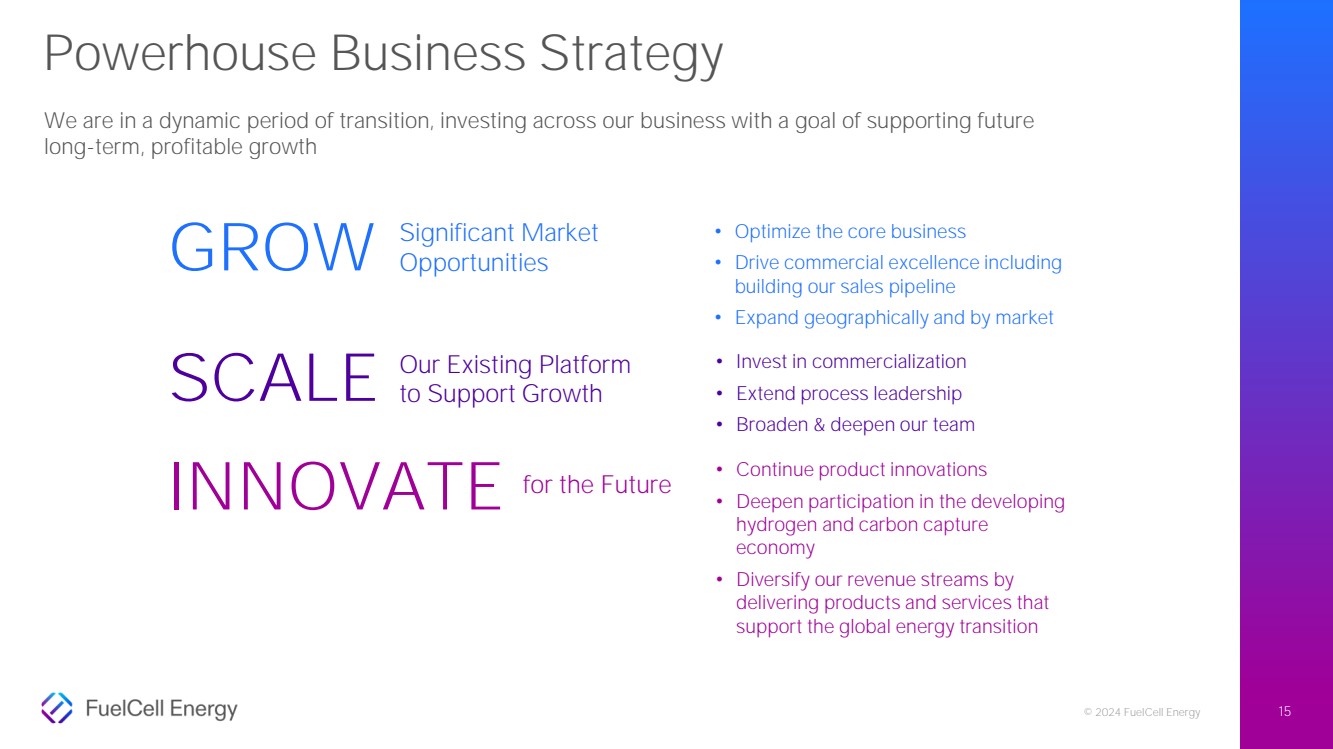
© 2024 FuelCell Energy Powerhouse Business Strategy Our Existing Platform to Support Growth for the Future Significant Market Opportunities • Invest in commercialization • Extend process leadership • Broaden & deepen our team • Continue product innovations • Deepen participation in the developing hydrogen and carbon capture economy • Diversify our revenue streams by delivering products and services that support the global energy transition • Optimize the core business • Drive commercial excellence including building our sales pipeline • Expand geographically and by market SCALE INNOVATE GROW We are in a dynamic period of transition, investing across our business with a goal of supporting future long-term, profitable growth 15 |
|
© 2024 FuelCell Energy 16 GAAP to Non-GAAP Reconciliation 1) Includes depreciation and amortization on our Generation portfolio of $7.3 million and $21.3 million for the three and nine months ended July 31, 2024,respectively, and $5.4 million and $14.9 million for the three and nine months ended July 31, 2023, respectively. 2) Other (income) expense, net includes gains and losses from transactions denominated in foreign currencies, interest rate swap income earned from investments and other items incurred periodically, which are not the result of the Company’s normal business operations. 3) The Company recorded a mark-to-market net loss of $0.9 million and $5.1 million for the three and nine months ended July 31, 2024, respectively, related to natural gas purchase contracts. There was no comparable loss in the prior year as the Company changed its designation in the fourth quarter of fiscal year 2023 and in the second quarter of fiscal year 2024, as a result of net settling certain natural gas purchases under previous normal purchase normal sale contract designations, which resulted in a change to mark-to-market accounting. There were no mark-to-market gains or losses for the three and nine months ended July 31, 2023. These losses are classified as Generation cost of sales. 4) The gain on extinguishment of finance obligations and debt, net was $15.3 million for the three and nine months ended July 31, 2023 and represents a one-time gain on the payoff of certain finance obligations of the Company to PNC Energy Capital, LLC, which payoff occurred in conjunction with a new project financing facility entered into in May 2023. The following table calculates EBITDA and Adjusted EBITDA and reconciles these figures to the GAAP financial statement measure Net loss Financial results are presented in accordance with accounting principles generally accepted in the United States . Management also uses non-GAAP measures to analyze and make operating decisions on the business. Earnings before interest, taxes, depreciation and amortization and Adjusted EBITDA are non-GAAP measures of operations and operating performance by the Company. These supplemental non-GAAP measures are provided to assist readers in assessing operating performance. Management believes EBITDA and Adjusted EBITDA are useful in assessing performance and highlighting trends on an overall basis. Management also believes these measures are used by companies in the fuel cell sector and by securities analysts and investors when comparing the results of the Company with those of other companies. EBITDA differs from the most comparable GAAP measure, net loss attributable to the Company, primarily because it does not include finance expense, income taxes and depreciation of property, plant and equipment and project assets. Adjusted EBITDA adjusts EBITDA for stock-based compensation, restructuring charges, non-cash (gain) loss on derivative instruments and other unusual items, which are considered either non-cash or non-recurring. While management believes that these non-GAAP financial measures provide useful supplemental information to investors, there are limitations associated with the use of these measures. The measures are not prepared in accordance with GAAP and may not be directly comparable to similarly titled measures of other companies due to potential differences in the exact method of calculation. The non-GAAP financial measures are not meant to be considered in isolation or as a substitute for comparable GAAP financial measures and should be read only in conjunction with the consolidated financial statements prepared in accordance with GAAP. Three Months Ended July 31, Nine Months Ended July 31, (Amounts in thousands) 2024 2023 2024 2023 Net loss $ (35,123) $ (23,601) $ (117,178) $ (78,598) Depreciation and amortization (1) 9,238 6,623 27,389 18,659 Provision for income taxes 2 - 2 581 Other (income) expense, net (2) 2,218 (403) 3,278 (216) Gain on extinguishment of finance obligations and debt, net(4) - (15,337) - (15,337) Interest income (3,269) (3,966) (10,726) (11,064) Interest expense 2,555 1,912 7,168 4,926 EBITDA $ (24,379) $ (34,772) $ (90,067) $ (81,049) Stock-based compensation expense 3,350 3,166 9,227 8,997 Unrealized loss on natural gas contract derivative assets (3) 895 - 5,072 - Adjusted EBITDA $ (20,134) $ (31,606) $ (75,768) $ (72,052) |
|
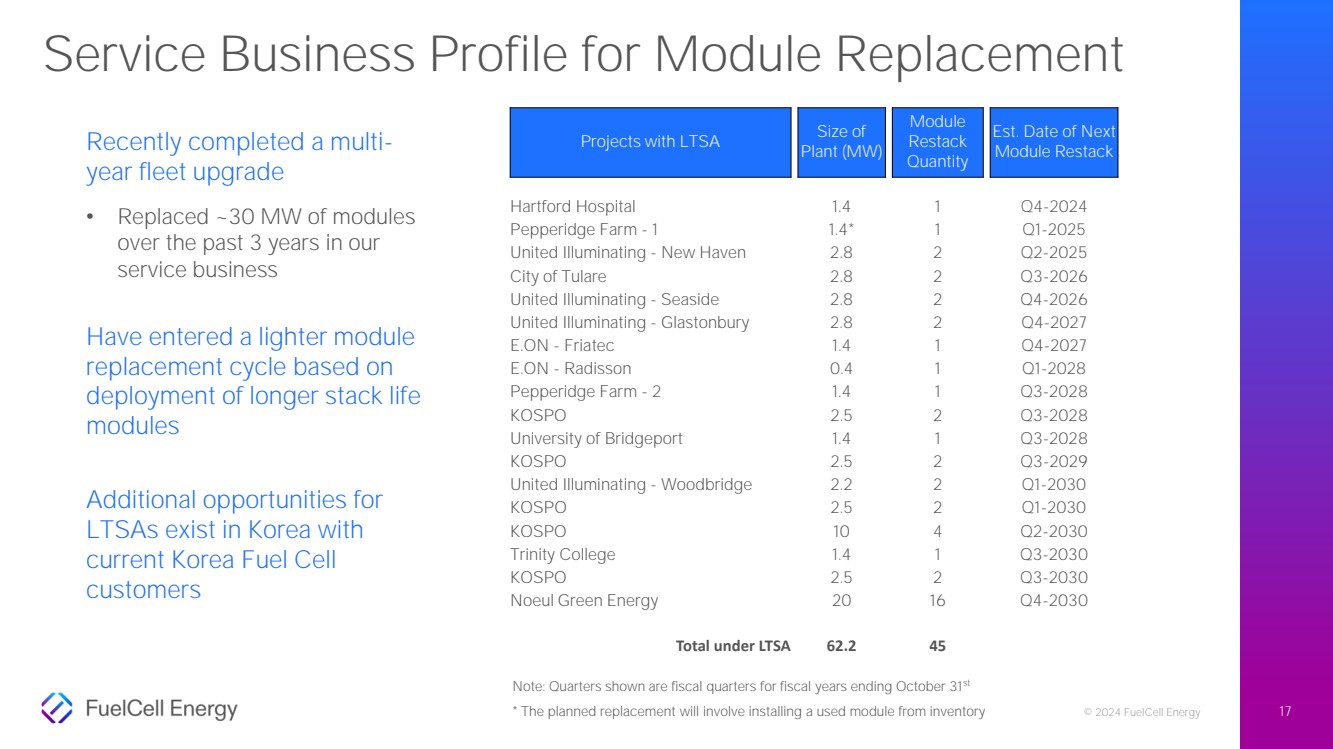
© 2024 FuelCell Energy 17 Service Business Profile for Module Replacement Recently completed a multi-year fleet upgrade • Replaced ~30 MW of modules over the past 3 years in our service business Have entered a lighter module replacement cycle based on deployment of longer stack life modules Additional opportunities for LTSAs exist in Korea with current Korea Fuel Cell customers Note: Quarters shown are fiscal quarters for fiscal years ending October 31st * The planned replacement will involve installing a used module from inventory Projects with LTSA Size of Plant (MW) Module Restack Quantity Est. Date of Next Module Restack Hartford Hospital 1.4 1 Q4-2024 Pepperidge Farm - 1 1.4* 1 Q1-2025 United Illuminating - New Haven 2.8 2 Q2-2025 City of Tulare 2.8 2 Q3-2026 United Illuminating - Seaside 2.8 2 Q4-2026 United Illuminating - Glastonbury 2.8 2 Q4-2027 E.ON - Friatec 1.4 1 Q4-2027 E.ON - Radisson 0.4 1 Q1-2028 Pepperidge Farm - 2 1.4 1 Q3-2028 KOSPO 2.5 2 Q3-2028 University of Bridgeport 1.4 1 Q3-2028 KOSPO 2.5 2 Q3-2029 United Illuminating - Woodbridge 2.2 2 Q1-2030 KOSPO 2.5 2 Q1-2030 KOSPO 10 4 Q2-2030 Trinity College 1.4 1 Q3-2030 KOSPO 2.5 2 Q3-2030 Noeul Green Energy 20 16 Q4-2030 Total under LTSA 62.2 45 |
|
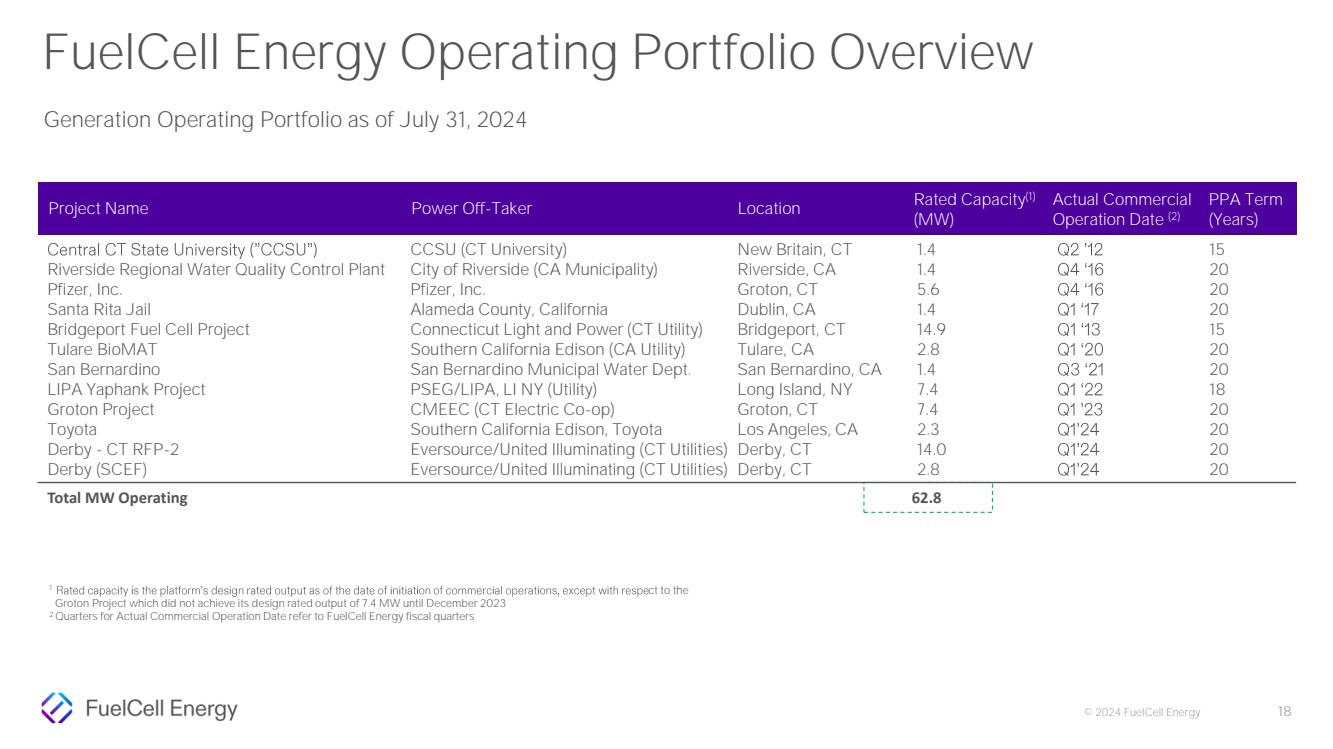
© 2024 FuelCell Energy 18 FuelCell Energy Operating Portfolio Overview Generation Operating Portfolio as of July 31, 2024 Riverside Regional Water Quality Control Plant Pfizer, Inc. Santa Rita Jail Bridgeport Fuel Cell Project Tulare BioMAT San Bernardino LIPA Yaphank Project Groton Project Toyota Derby - CT RFP-2 Derby (SCEF) CCSU (CT University) City of Riverside (CA Municipality) Pfizer, Inc. Alameda County, California Connecticut Light and Power (CT Utility) Southern California Edison (CA Utility) San Bernardino Municipal Water Dept. PSEG/LIPA, LI NY (Utility) CMEEC (CT Electric Co-op) Southern California Edison, Toyota Eversource/United Illuminating (CT Utilities) Eversource/United Illuminating (CT Utilities) New Britain, CT Riverside, CA Groton, CT Dublin, CA Bridgeport, CT Tulare, CA San Bernardino, CA Long Island, NY Groton, CT Los Angeles, CA Derby, CT Derby, CT 1.4 1.4 5.6 1.4 14.9 2.8 1.4 7.4 7.4 2.3 14.0 2.8 15 20 20 20 15 20 20 18 20 20 20 20 Project Name Power Off-Taker Location Rated Capacity(1) (MW) Actual Commercial Operation Date (2) PPA Term (Years) Total MW Operating 62.8 1 ct to the Groton Project which did not achieve its design rated output of 7.4 MW until December 2023 2 Quarters for Actual Commercial Operation Date refer to FuelCell Energy fiscal quarters |
|
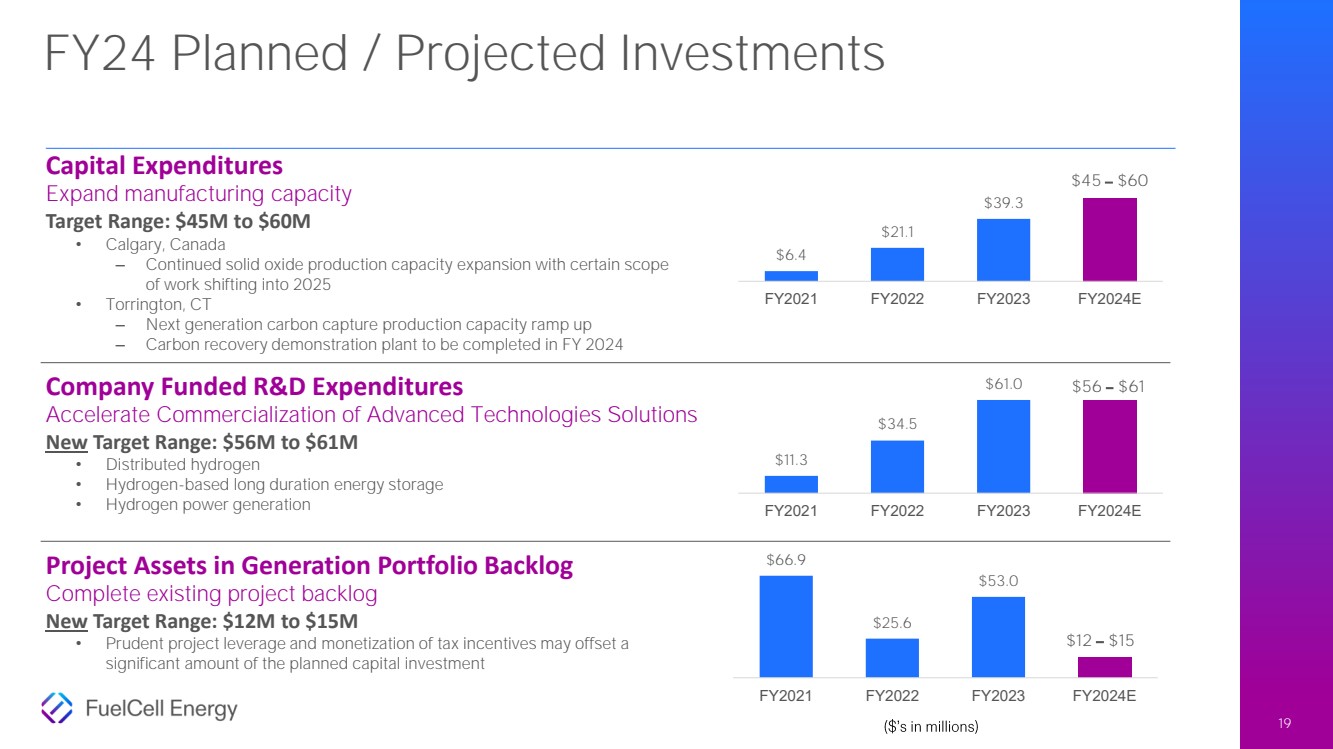
© 2024 FuelCell Energy $6.4 $21.1 $39.3 $45 $60 FY2021 FY2022 FY2023 FY2024E $11.3 $34.5 $61.0 $56 $61 FY2021 FY2022 FY2023 FY2024E $66.9 $25.6 $53.0 $12 $15 FY2021 FY2022 FY2023 FY2024E FY24 Planned / Projected Investments 19 Capital Expenditures Expand manufacturing capacity Target Range: $45M to $60M • Calgary, Canada ‒ Continued solid oxide production capacity expansion with certain scope of work shifting into 2025 • Torrington, CT ‒ Next generation carbon capture production capacity ramp up ‒ Carbon recovery demonstration plant to be completed in FY 2024 Company Funded R&D Expenditures Accelerate Commercialization of Advanced Technologies Solutions New Target Range: $56M to $61M • Distributed hydrogen • Hydrogen-based long duration energy storage • Hydrogen power generation Project Assets in Generation Portfolio Backlog Complete existing project backlog New Target Range: $12M to $15M • Prudent project leverage and monetization of tax incentives may offset a significant amount of the planned capital investment |