UNITED STATES
SECURITIES AND EXCHANGE COMMISSION
Washington, D.C. 20549
FORM 8-K
CURRENT REPORT
Pursuant to Section 13 OR 15(d) of The Securities Exchange Act of 1934
July 15, 2024
Date of Report (date of earliest event reported)
CROSSFIRST BANKSHARES, INC.
(Exact name of registrant as specified in its charter)
Kansas |
001-39028 |
26-3212879 |
|
|
|
(State or other jurisdiction of incorporation or organization) |
(Commission File Number) |
(I.R.S. Employer Identification No.) |
11440 Tomahawk Creek Parkway Leawood Kansas
(Address of Principal Executive Offices)
66211
(Zip Code)
(913) 901-4516
Registrant’s telephone number, including area code
N/A
(Former name or former address, if changed since last report.)
Check the appropriate box below if the Form 8-K filing is intended to simultaneously satisfy the filing obligation of the registrant under any of the following provisions (see General Instruction A.2. below):
☐ Written communications pursuant to Rule 425 under the Securities Act (17 CFR 230.425)
☐ Soliciting material pursuant to Rule 14a-12 under the Exchange Act (17 CFR 240.14a-12)
☐ Pre-commencement communications pursuant to Rule 14d-2(b) under the Exchange Act (17 CFR 240.14d-2(b))
☐ Pre-commencement communications pursuant to Rule 13e-4(c) under the Exchange Act (17 CFR 240.13e-4(c))
Securities registered pursuant to Section 12(b) of the Act:
Title of each class |
|
Trading Symbol(s) |
|
Name of each exchange on which registered |
Common Stock, par value $0.01 per share |
|
CFB |
|
The Nasdaq Stock Market LLC |
Indicate by check mark whether the registrant is an emerging growth company as defined in Rule 405 of the Securities Act of 1933 (§230.405 of this chapter) or Rule 12b-2 of the Securities Exchange Act of 1934 (§240.12b-2 of this chapter).
Emerging growth company ☒
If an emerging growth company, indicate by check mark if the registrant has elected not to use the extended transition period for complying with any new or revised financial accounting standards provided pursuant to Section 13(a) of the Exchange Act. ☐
Item 2.02. Results of Operations and Financial Condition.
On July 15, 2024, CrossFirst Bankshares, Inc. (the “Company”) announced the release of its financial results for the quarter ended June 30, 2024. A copy of the full text of the related press release, which is posted on the Investor Section of the Company’s website (investors.crossfirstbankshares.com) under Financials – Quarterly Reports, is attached as Exhibit 99.1 and incorporated herein by reference. The Company does not intend for information contained on its website to be part of this report.
The Company intends to hold a conference call to review second quarter 2024 financial results. The investor presentation, which will accompany the call, is furnished as Exhibit 99.2 hereto and incorporated herein by reference.
The information in Item 2.02 of this Current Report, including Exhibits 99.1 and 99.2, is being “furnished” and shall not be deemed “filed” for purposes of Section 18 of the Securities Exchange Act of 1934, as amended (the “Exchange Act”), or incorporated by reference in any filing under the Securities Act of 1933, as amended, or the Exchange Act, except as expressly stated in such a filing.
Item 9.01. Financial Statements and Exhibits.
(d)Exhibits
99.1 |
|
|
99.2 |
|
|
104 |
|
Cover Page Interactive Data File (embedded within the Inline XBRL document) |
SIGNATURE
Pursuant to the requirements of the Securities and Exchange Act of 1934, the Registrant has duly caused this report to be signed on its behalf by the undersigned hereunto duly authorized.
Date: |
July 15, 2024 |
CROSSFIRST BANKSHARES, INC. |
|
|
|
|
|
|
|
By: |
/s/ Benjamin R. Clouse |
|
|
|
Benjamin R. Clouse |
|
|
|
Chief Financial Officer |
Exhibit 99.1

CrossFirst Bankshares, Inc. Reports Second Quarter 2024 Results
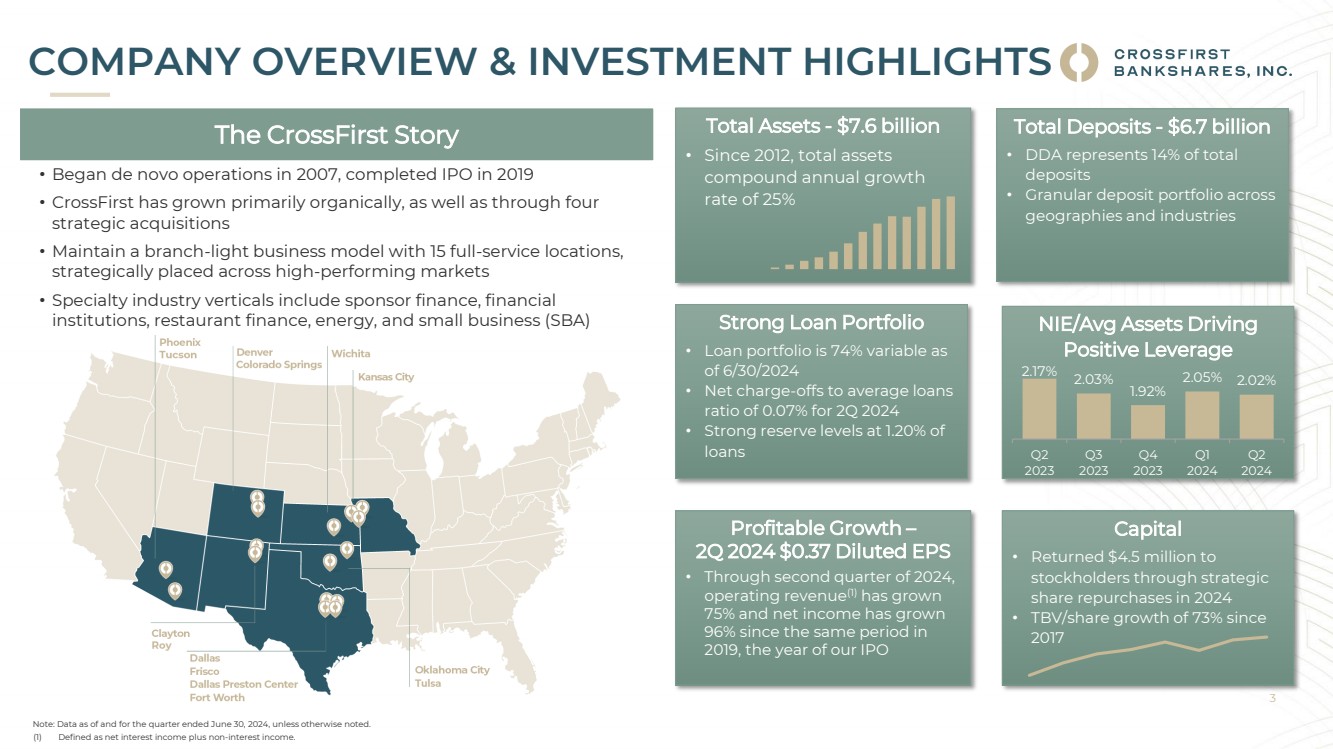
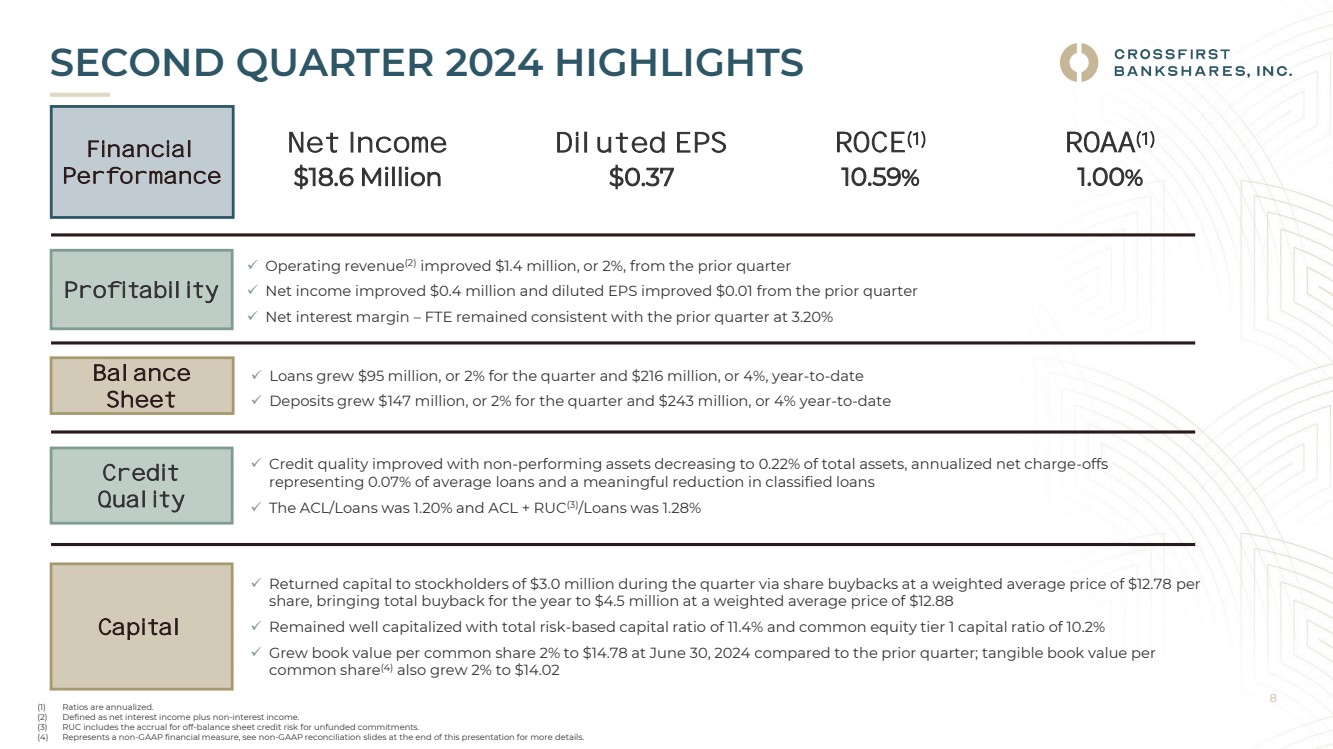
LEAWOOD, Kan., July 15, 2024 (GLOBE NEWSWIRE) -- CrossFirst Bankshares, Inc. (Nasdaq: CFB), the bank holding company for CrossFirst Bank, today reported second quarter net income of $18.6 million, or $0.37 per diluted common share.
Second Quarter 2024 Key Financial Performance Metrics |
Net Income |
|
ROAA(1) |
|
Net Interest Margin – Fully Tax Equivalent (“FTE”)(1) |
|
Diluted EPS |
|
ROCE(1) |
$18.6 million |
|
1.00% |
|
3.20% |
|
$0.37 |
|
10.59% |
CEO Commentary: |
“CrossFirst had a great quarter delivering solid earnings growth, maintaining strong credit quality, and strategically returning capital to stockholders,” said Mike Maddox, President and CEO of CrossFirst Bankshares, Inc. “Our earnings growth is a result of our focused strategy to scale our markets and verticals, driving expansion of net interest income and fee income. In turn, we increased operating leverage across our expense base.”
2024 Second Quarter Highlights: |
| ● | Operating revenue(2) improved $1.4 million, or 2%, from the prior quarter |
| ● | Net income improved $0.4 million and diluted earnings per common share improved $0.01 from the prior quarter |
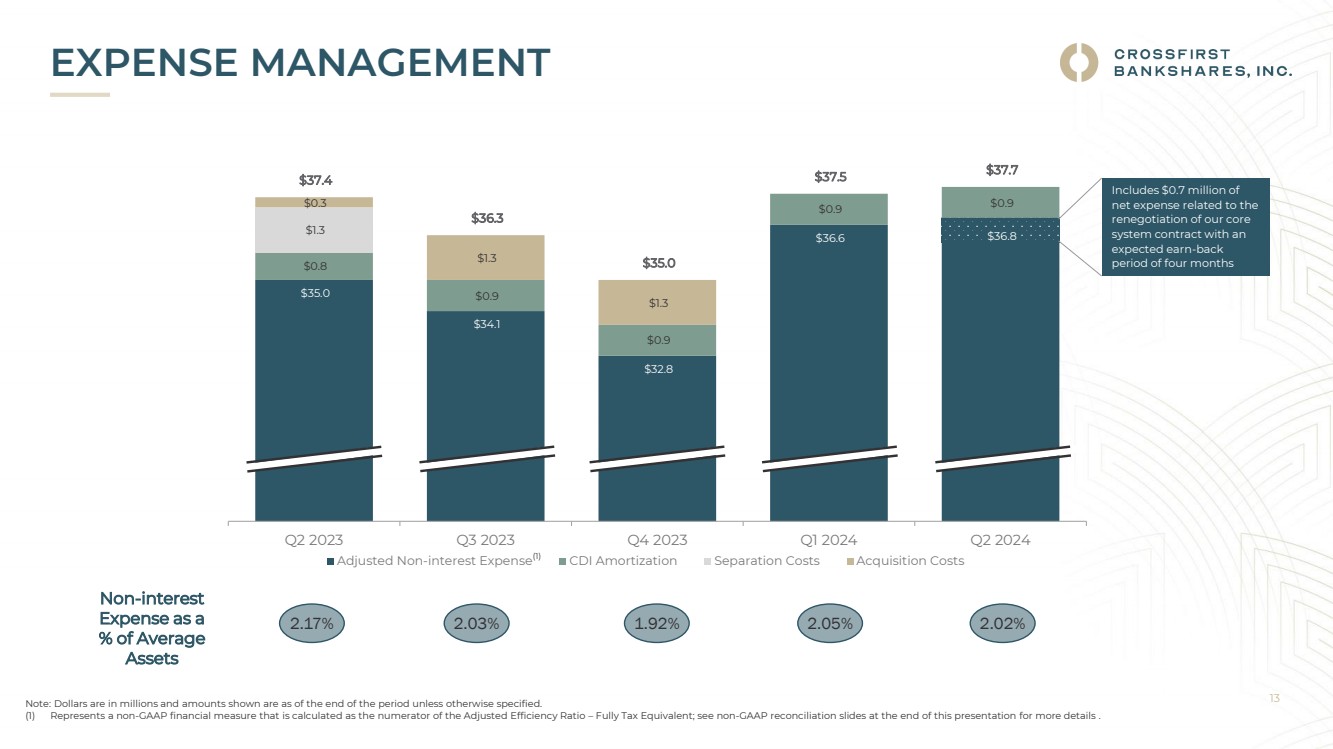
| o | Incurred $0.7 million of expense, net related to the renegotiation of our core system contract with an expected earn-back period of four months |
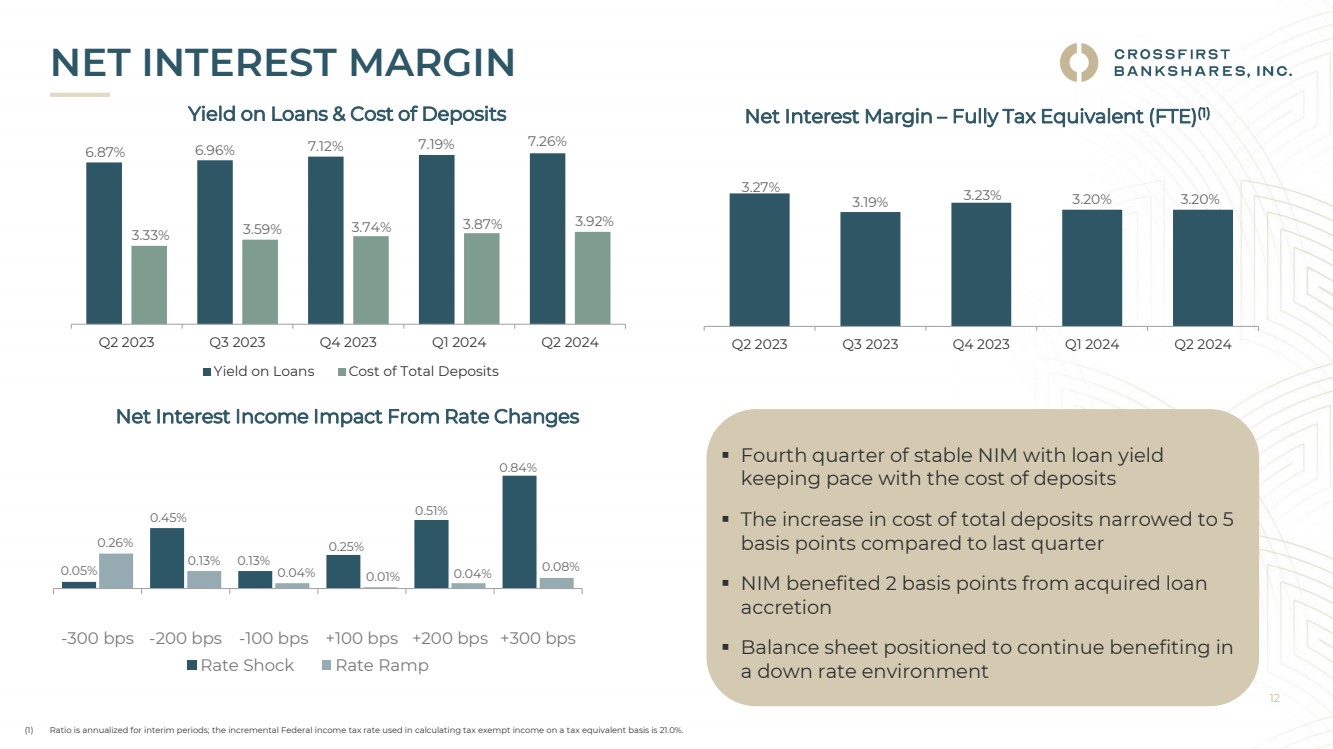
| ● | Net interest margin – FTE remained consistent with the prior quarter at 3.20% |
| ● | Grew loans $95 million, or 2%, for the quarter and $216 million, or 4%, year-to-date |
| ● | Grew deposits $147 million, or 2%, for the quarter and $243 million, or 4%, year-to-date |
| ● | Credit quality improved with non-performing assets decreasing to 0.22% of total assets, annualized net charge-offs representing 0.07% of average loans and classified loans declining meaningfully |
| ● | Returned capital to stockholders of $3.0 million during the quarter via share buybacks at a weighted average price of $12.78 per share |
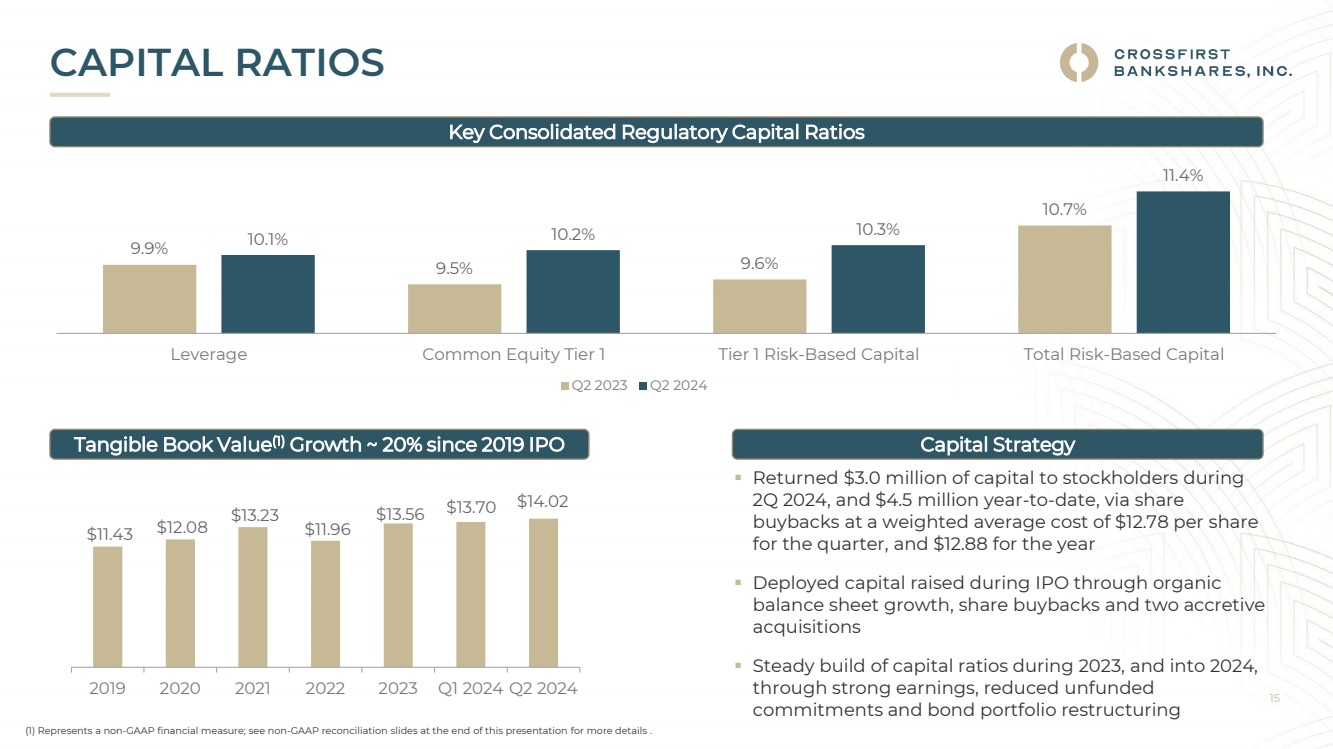
| ● | Remained well capitalized with total risk-based capital of 11.4% and common equity Tier 1 capital of 10.2% |
| ● | Grew book value per common share 2% to $14.78 at June 30, 2024 compared to the prior quarter; tangible book value per common share(3) also grew 2% to $14.02 |
| (1) | Ratios are annualized. |
| (2) | Net interest income plus non-interest income. |
| (3) | Represents a non-GAAP financial measure. See “Table 5. Non-GAAP Financial Measures” for a reconciliation to the most directly comparable financial measure calculated and presented in accordance with GAAP. |
CROSSFIRST BANKSHARES, INC.
|
|
Three Months Ended |
|
Six Months Ended |
|
|||||||||||
(Dollars in millions except per share data) |
|
June 30, 2024 |
|
March 31, 2024 |
|
June 30, 2023 |
|
June 30, 2024 |
|
June 30, 2023 |
|
|||||
Operating revenue(1) |
|
$ |
63.6 |
|
$ |
62.2 |
|
$ |
60.3 |
|
$ |
125.8 |
|
$ |
123.0 |
|
Net income |
|
$ |
18.6 |
|
$ |
18.2 |
|
$ |
16.0 |
|
$ |
36.8 |
|
$ |
32.2 |
|
Adjusted net income(2) |
|
$ |
18.6 |
|
$ |
18.2 |
|
$ |
17.3 |
|
$ |
36.8 |
|
$ |
34.6 |
|
Diluted earnings per common share |
|
$ |
0.37 |
|
$ |
0.36 |
|
$ |
0.33 |
|
$ |
0.73 |
|
$ |
0.65 |
|
Adjusted diluted earnings per common share(2) |
|
$ |
0.37 |
|
$ |
0.36 |
|
$ |
0.35 |
|
$ |
0.73 |
|
$ |
0.70 |
|
Return on average assets |
|
|
1.00 |
% |
|
1.00 |
% |
|
0.93 |
% |
|
1.00 |
% |
|
0.95 |
% |
Adjusted return on average assets(2) |
|
|
1.00 |
% |
|
1.00 |
% |
|
1.00 |
% |
|
1.00 |
% |
|
1.02 |
% |
Return on average common equity |
|
|
10.59 |
% |
|
10.36 |
% |
|
10.00 |
% |
|
10.47 |
% |
|
10.26 |
% |
Adjusted return on average common equity(2) |
|
|
10.59 |
% |
|
10.36 |
% |
|
10.81 |
% |
|
10.47 |
% |
|
11.05 |
% |
Net interest margin |
|
|
3.18 |
% |
|
3.17 |
% |
|
3.23 |
% |
|
3.17 |
% |
|
3.41 |
% |
Net interest margin - FTE(3) |
|
|
3.20 |
% |
|
3.20 |
% |
|
3.27 |
% |
|
3.20 |
% |
|
3.46 |
% |
Efficiency ratio |
|
|
59.32 |
% |
|
60.31 |
% |
|
62.02 |
% |
|
59.81 |
% |
|
61.41 |
% |
Adjusted efficiency ratio - FTE(2)(3) |
|
|
57.41 |
% |
|
58.31 |
% |
|
57.27 |
% |
|
57.86 |
% |
|
56.84 |
% |
| (1) | Net interest income plus non-interest income. |
| (2) | Represents a non-GAAP financial measure. See “Table 5. Non-GAAP Financial Measures” for a reconciliation to the most directly comparable financial measure calculated and presented in accordance with GAAP. |
| (3) | Tax exempt income is calculated on a tax-equivalent basis. Tax-free municipal securities are exempt from federal income taxes. The incremental federal income tax rate used is 21.0%. |
Income from Operations
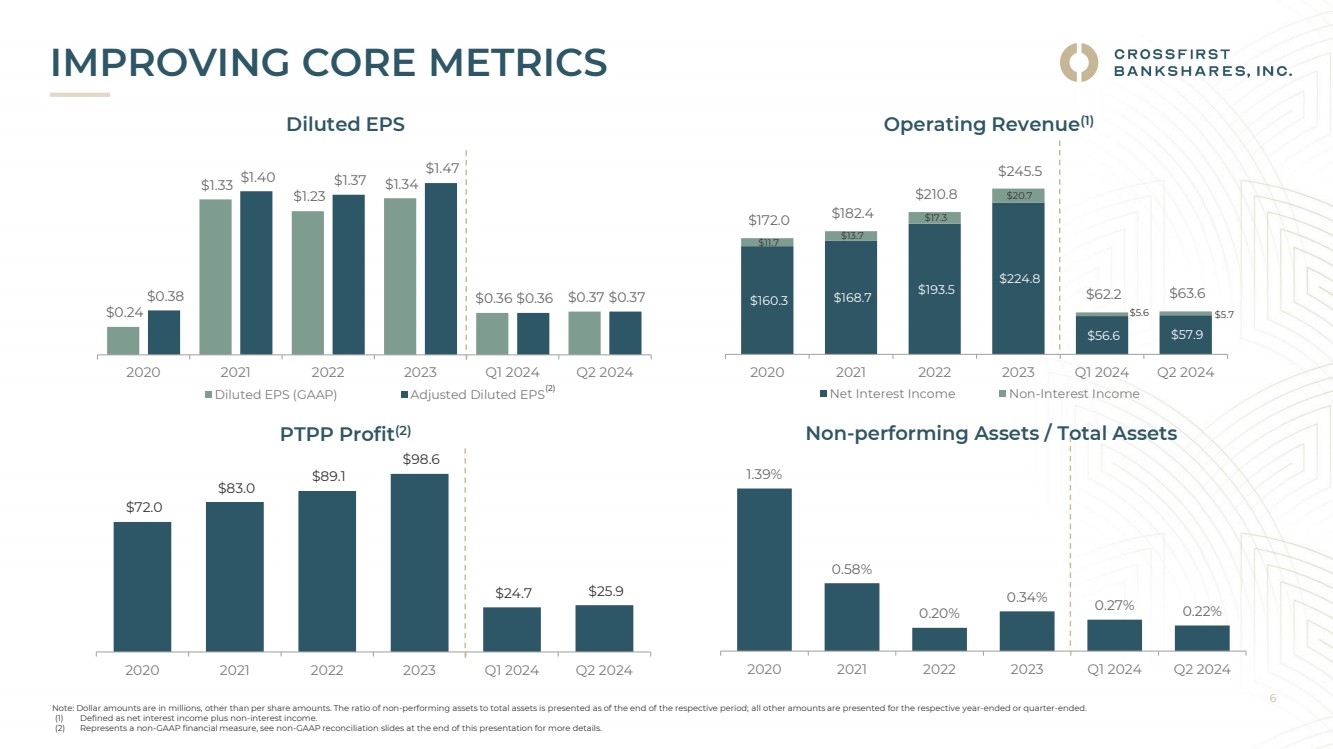
Net income totaled $18.6 million, or $0.37 per diluted common share, for the second quarter of 2024, compared to $18.2 million, or $0.36 per diluted common share, for the first quarter of 2024 and $16.0 million, or $0.33 per diluted common share, for the second quarter of 2023. On a linked quarter basis, net income was higher due to increases in net interest income and non-interest income, partially offset by higher provision expense and non-interest expense. Compared to the same period in the prior year, the quarter’s results reflect higher net interest income, as well as lower provision expense, partially offset by lower non-interest income and higher non-interest expense.
Net Interest Income
Net interest income – FTE increased $1.3 million compared to the first quarter of 2024 entirely due to higher average earning assets as the net interest margin – FTE was 3.20% in both periods. The yield on earning assets increased six basis points due to stronger yields on both loans and taxable securities. The cost of funds also increased six basis points due to continued pricing pressure on interest-bearing deposits, as well as higher rates on Federal Home Loan Bank advances due to higher intra-quarter utilization. Average earning assets increased $161 million compared to the prior quarter primarily due to higher average loan balances and higher average taxable securities balances.
Compared to the second quarter of 2023, net interest income – FTE increased $3.1 million as the benefit from higher average earning assets was partially offset by a seven basis point reduction in net interest margin - FTE. The yield on earning assets increased 39 basis points due to stronger loan yields and higher yields on securities. The cost of a rate hedge also lowered the earning asset yield by eight basis points. The cost of funds increased 51 basis points compared to the second quarter of 2023 due to pricing pressure on deposits, client migration into higher cost deposit products and a reduction in average non-interest-bearing deposits compared to the prior year. The increase in average earning assets was driven by higher average loan and securities balances as well as higher average cash balances.
Non-Interest Income
Non-interest income increased $0.1 million compared to the first quarter of 2024 and decreased $0.1 million compared to the same quarter in 2023. The increase compared to the linked quarter was primarily due to increases in client service charges and fees, partially offset by lower gains on sale of loans. Compared to the same quarter in the prior year, the decrease was primarily due to lower gains on sale of loans, partially offset by increases in client service charges and fees and stronger credit card interchange income.
Non-Interest Expense
Non-interest expense increased $0.2 million from the first quarter of 2024 and increased $0.3 million from the second quarter of 2023. Salaries and employee benefits were lower compared to the first quarter of 2024 primarily due to lower payroll taxes and benefits costs, partially offset by merit increases. Salaries and employee benefits were lower compared to the second quarter of 2023 primarily due to a decrease in severance expenses and lower benefits costs, partially offset by merit increases and higher equity compensation expense.
CROSSFIRST BANKSHARES, INC.
Data processing expense increased compared to both comparative periods due to $0.7 million of net cost incurred in the first quarter of 2024 related to the renegotiation of our core systems contract, which is expected to be earned back over the next four months. Additionally, foreclosed assets, net decreased compared to the first quarter of 2024 due to expense in the prior quarter related to a commercial construction credit that was moved to foreclosed assets held for sale.
The Company’s effective tax rate for the second quarter of 2024 was 20.7%, compared to 20.8% in the first quarter of 2024 and the second quarter of 2023.
Statement of Financial Condition Performance & Analysis
During the second quarter of 2024, total assets increased $159 million, or 2%, compared to the end of the prior quarter and increased $518 million, or 7%, compared to June 30, 2023. Total assets increased for both comparative periods primarily due to an increase in loans, which included acquired loans when compared to June 30, 2023. Compared to the end of the prior quarter, the asset increase also included an increase in cash. Deposits increased $147 million compared to March 31, 2024, and increased $634 million, including $165 million in acquired deposits, compared to June 30, 2023.
Loan Results
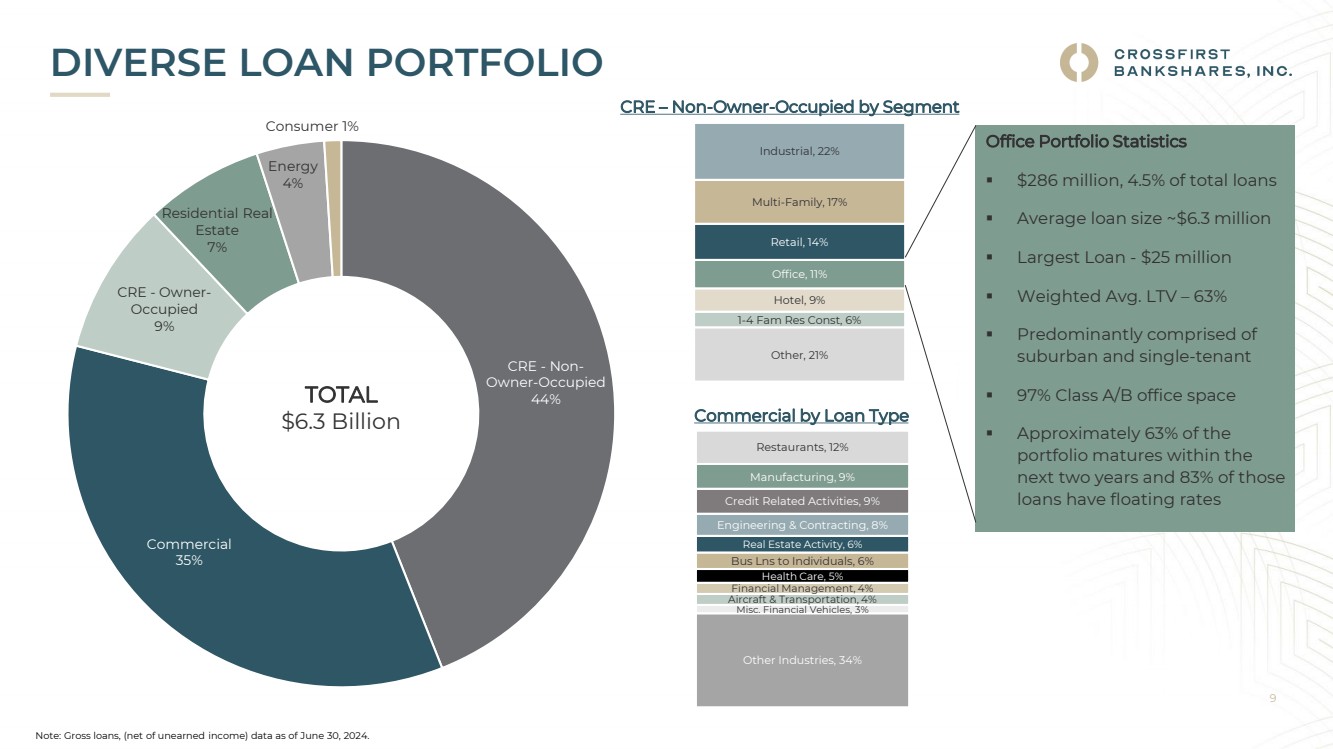
During the second quarter of 2024, loans increased $95 million, or 2%, compared to March 31, 2024. Loans increased $547 million, or 9%, compared to June 30, 2023, including $106 million, net, of acquired loans. The loan increase for both comparative periods was primarily due to growth in the commercial and industrial and the commercial real estate – non-owner-occupied portfolios. The increases in the commercial real estate portfolio were primarily due to funding of prior commitments, as well as the addition of acquired loans compared to June 30, 2023.
|
|
|
|
|
|
|
|
|
|
|
|
|
|
|
|
|
|
|
|
|
|
|
|
|
|
|
|
|
|
|
|
|
|
|
|
|
|
|
|
|
|
|
|
|
|
|
|
QoQ |
|
QoQ |
|
YoY |
|
YoY |
|
||
|
|
|
|
|
|
|
|
|
|
|
|
|
|
|
|
|
% of |
|
Growth |
|
Growth |
|
Growth |
|
Growth |
|
||
|
|
6/30/2024 |
|
3/31/2024 |
|
12/31/2023 |
|
9/30/2023 |
|
6/30/2023 |
|
Total |
|
($) |
|
(%) |
|
($) |
|
(%) |
|
|||||||
|
|
(Dollars in millions) |
|
|||||||||||||||||||||||||
Period-end loans (gross) |
|
|
|
|
|
|
|
|
|
|
|
|
|
|
|
|
|
|
|
|
|
|
|
|
|
|
|
|
Commercial and industrial |
|
$ |
2,207 |
|
$ |
2,179 |
|
$ |
2,160 |
|
$ |
2,056 |
|
$ |
2,058 |
|
35 |
% |
$ |
28 |
|
1 |
% |
$ |
149 |
|
7 |
% |
Energy |
|
|
234 |
|
|
221 |
|
|
214 |
|
|
214 |
|
|
233 |
|
4 |
|
|
13 |
|
6 |
|
|
1 |
|
— |
|
Commercial real estate - owner-occupied |
|
|
592 |
|
|
578 |
|
|
567 |
|
|
584 |
|
|
543 |
|
9 |
|
|
14 |
|
2 |
|
|
49 |
|
9 |
|
Commercial real estate - non-owner-occupied |
|
|
2,812 |
|
|
2,770 |
|
|
2,686 |
|
|
2,593 |
|
|
2,480 |
|
44 |
|
|
42 |
|
2 |
|
|
332 |
|
13 |
|
Residential real estate |
|
|
474 |
|
|
469 |
|
|
464 |
|
|
456 |
|
|
440 |
|
7 |
|
|
5 |
|
1 |
|
|
34 |
|
8 |
|
Consumer |
|
|
25 |
|
|
32 |
|
|
37 |
|
|
43 |
|
|
43 |
|
1 |
|
|
(7) |
|
(22) |
|
|
(18) |
|
(42) |
|
Total |
|
$ |
6,344 |
|
$ |
6,249 |
|
$ |
6,128 |
|
$ |
5,946 |
|
$ |
5,797 |
|
100 |
% |
$ |
95 |
|
2 |
% |
$ |
547 |
|
9 |
% |
Deposit & Other Borrowing Results
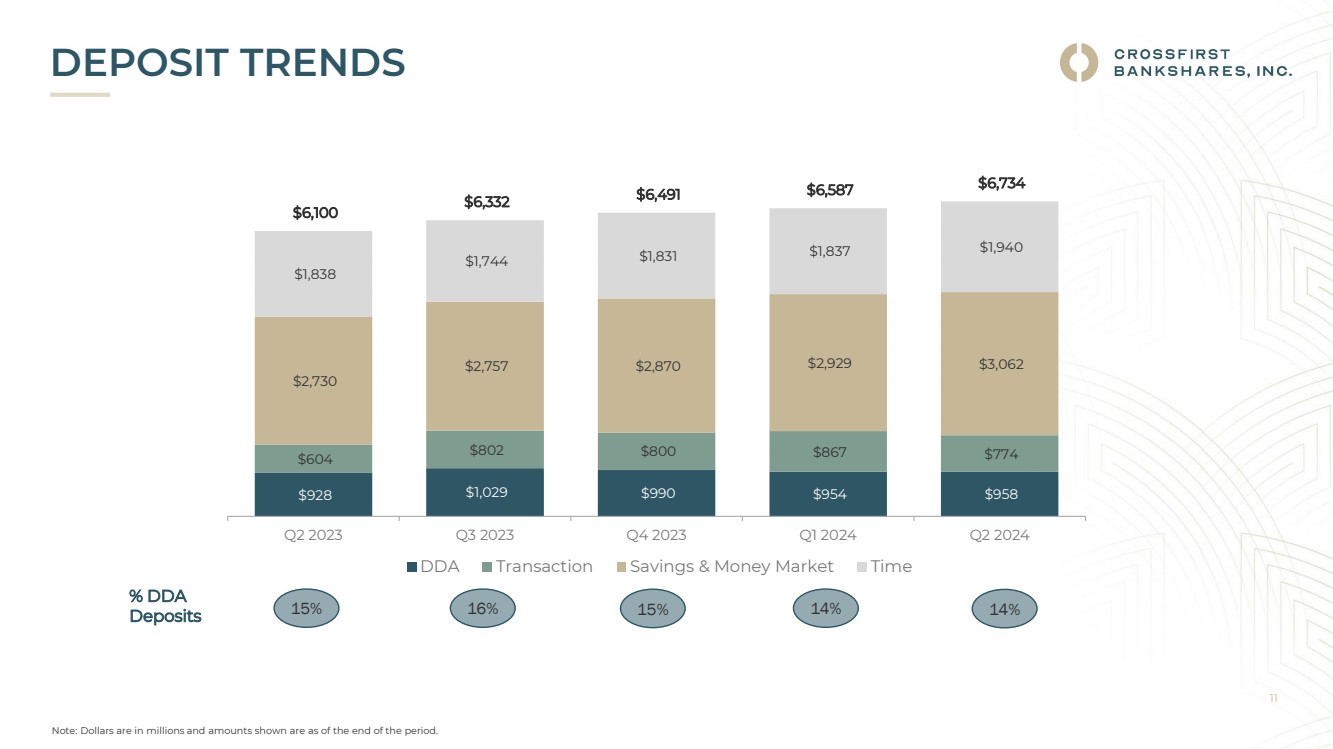
During the second quarter of 2024, deposits increased 2%, compared to March 31, 2024, and increased 10%, compared to June 30, 2023. The deposit increase compared to March 31, 2024 was due to increases in non-interest-bearing deposits, savings and money market deposits and time deposits, partially offset by decreases in transaction deposits. The total deposit increase compared to June 30, 2023 was due to increases in non-interest-bearing deposits, transaction deposits, savings and money market deposits and time deposits, including $165 million of acquired deposits.
CROSSFIRST BANKSHARES, INC.
|
|
|
|
|
|
|
|
|
|
|
|
|
|
|
|
|
QoQ |
|
QoQ |
|
YoY |
|
YoY |
|
||
|
|
|
|
|
|
|
|
|
|
|
|
|
|
|
|
|
Growth |
|
Growth |
|
Growth |
|
Growth |
|
||
|
|
6/30/2024 |
|
3/31/2024 |
|
12/31/2023 |
|
9/30/2023 |
|
6/30/2023 |
|
($) |
|
(%) |
|
($) |
|
(%) |
|
|||||||
|
|
(Dollars in millions) |
|
|||||||||||||||||||||||
Period-end deposits |
|
|
|
|
|
|
|
|
|
|
|
|
|
|
|
|
|
|
|
|
|
|
|
|
|
|
Non-interest-bearing deposits |
|
$ |
958 |
|
$ |
954 |
|
$ |
990 |
|
$ |
1,029 |
|
$ |
928 |
|
$ |
4 |
|
— |
% |
$ |
30 |
|
3 |
% |
Transaction deposits |
|
|
774 |
|
|
867 |
|
|
800 |
|
|
802 |
|
|
604 |
|
|
(93) |
|
(11) |
|
|
170 |
|
28 |
|
Savings and money market deposits |
|
|
3,062 |
|
|
2,929 |
|
|
2,870 |
|
|
2,757 |
|
|
2,730 |
|
|
133 |
|
5 |
|
|
332 |
|
12 |
|
Time deposits |
|
|
1,940 |
|
|
1,837 |
|
|
1,831 |
|
|
1,744 |
|
|
1,838 |
|
|
103 |
|
6 |
|
|
102 |
|
6 |
|
Total |
|
$ |
6,734 |
|
$ |
6,587 |
|
$ |
6,491 |
|
$ |
6,332 |
|
$ |
6,100 |
|
$ |
147 |
|
2 |
% |
$ |
634 |
|
10 |
% |
FHLB and Other borrowings ended the quarter at $85.1 million compared to $86.8 million at March 31, 2024 and $277 million at June 30, 2023. The average borrowings balance was higher this quarter as we utilized borrowings during the quarter due to seasonal client cash outflows which resolved by the end of the quarter leaving the ending balance flat compared to the end of the prior quarter. Compared to the same period in the prior year, borrowings were reduced due to client deposit growth, including acquired deposits.
Asset Quality and Provision for Credit Losses
The Company recorded $2.4 million of provision expense, compared to $1.7 million in the prior quarter and $2.6 million in the prior year second quarter. The current quarter’s provision expense was primarily driven by loan growth and economic factors.
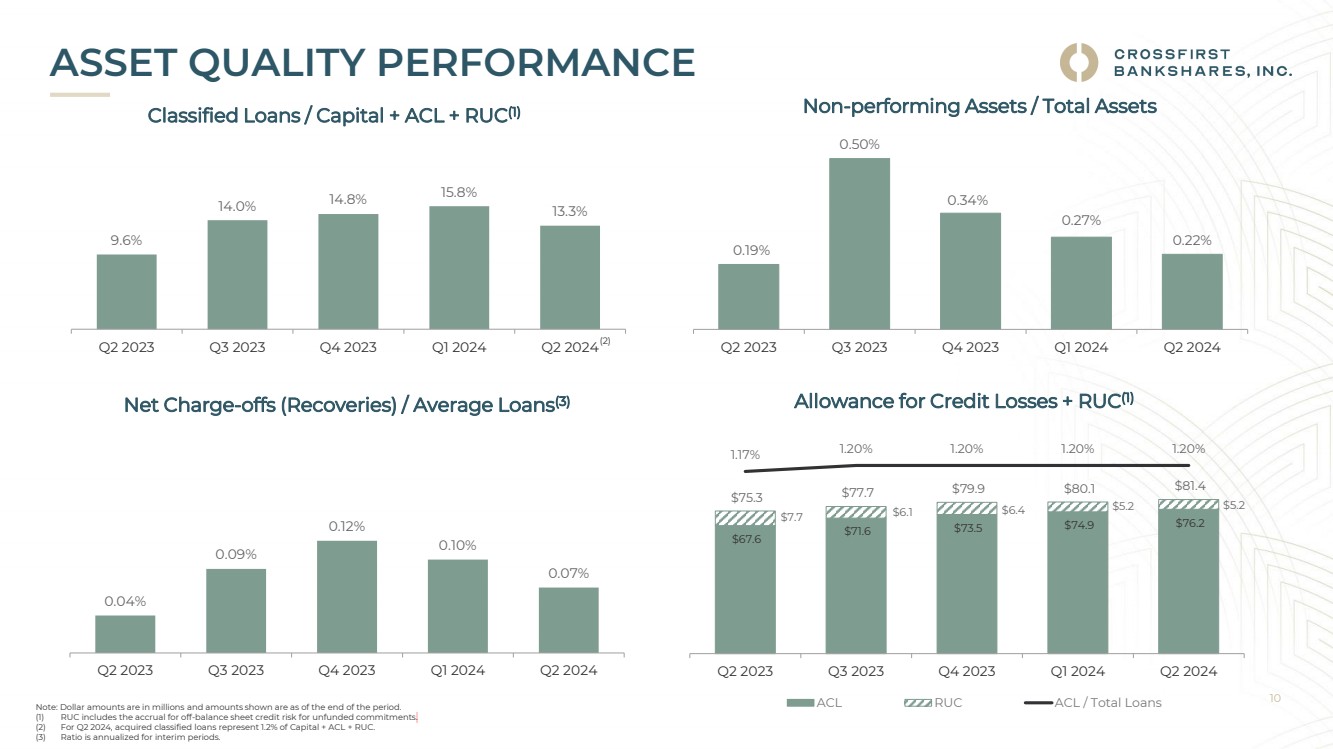
Non-performing assets decreased $3.7 million to $16.7 million, or 0.22% of total assets, at June 30, 2024. The decrease was due to a reduction in loans 90+ days past due and still accruing, client principal payments and partial charge-offs. Annualized net charge-offs were 0.07% for the quarter compared to 0.10% in the prior quarter and 0.04% in the prior year second quarter. Classified loans also decreased meaningfully in the quarter with the ratio of classified loans to total capital and ACL improving to 13.3%.
The allowance for credit losses was $76.2 million as of June 30, 2024 and was consistent with the prior quarter at 1.20% of outstanding loans. The combined allowance for credit losses and accrual for off-balance sheet credit risk from unfunded commitments (“RUC”) was $81.4 million or 1.28% of outstanding loans.
The following table provides information regarding asset quality.
Asset quality (Dollars in millions) |
|
6/30/2024 |
|
3/31/2024 |
|
12/31/2023 |
|
9/30/2023 |
|
6/30/2023 |
|||||
Non-accrual loans |
|
$ |
10.1 |
|
$ |
12.1 |
|
$ |
18.5 |
|
$ |
20.4 |
|
$ |
12.9 |
Foreclosed asset held for sale |
|
|
4.8 |
|
|
5.4 |
|
|
— |
|
|
— |
|
|
— |
Loans 90+ days past due and still accruing |
|
|
1.8 |
|
|
2.9 |
|
|
6.3 |
|
|
15.7 |
|
|
0.4 |
Non-performing assets |
|
$ |
16.7 |
|
$ |
20.4 |
|
$ |
24.8 |
|
$ |
36.1 |
|
$ |
13.3 |
|
|
|
|
|
|
|
|
|
|
|
|
|
|
|
|
Loans 30 - 89 days past due |
|
|
16.0 |
|
|
46.4 |
|
|
2.0 |
|
|
29.5 |
|
|
13.3 |
Net charge-offs (recoveries) |
|
|
1.0 |
|
|
1.5 |
|
|
1.9 |
|
|
1.3 |
|
|
0.6 |
Asset quality metrics (%) |
|
6/30/2024 |
|
3/31/2024 |
|
12/31/2023 |
|
9/30/2023 |
|
6/30/2023 |
|
Nonperforming assets to total assets |
|
0.22 |
% |
0.27 |
% |
0.34 |
% |
0.50 |
% |
0.19 |
% |
Allowance for credit losses to total loans |
|
1.20 |
|
1.20 |
|
1.20 |
|
1.20 |
|
1.17 |
|
Allowance for credit losses + RUC to total loans(1) |
|
1.28 |
|
1.28 |
|
1.30 |
|
1.31 |
|
1.30 |
|
Allowance for credit losses to non-performing loans |
|
640 |
|
499 |
|
296 |
|
198 |
|
508 |
|
Net charge-offs (recoveries) to average loans(2) |
|
0.07 |
|
0.10 |
|
0.12 |
|
0.09 |
|
0.04 |
|
Classified Loans / (Total Capital + ACL) |
|
13.3 |
|
15.9 |
|
14.9 |
|
14.2 |
|
9.7 |
|
Classified Loans / (Total Capital + ACL + RUC)(1) |
|
13.3 |
|
15.8 |
|
14.8 |
|
14.0 |
|
9.6 |
|
| (1) | Includes the accrual for off-balance sheet credit risk from unfunded commitments. |
| (2) | Interim periods annualized. |
CROSSFIRST BANKSHARES, INC.
Capital Position
At June 30, 2024, stockholders’ equity totaled $728 million, or $14.78 of book value per common share, compared to $715 million, or $14.47 of book value per common share, at March 31, 2024.
Tangible book value per common share(1) was $14.02 at June 30, 2024, an increase of $0.32, or 2%, from March 31, 2024. The increase was primarily due to net income, partially offset by the change in other comprehensive loss and share repurchases. The ratio of common equity Tier 1 capital to risk-weighted assets was approximately 10.2%, and the ratio of total capital to risk-weighted assets was approximately 11.4% at June 30, 2024.
| (1) | Represents a non-GAAP financial measure. See “Table 5. Non-GAAP Financial Measures” for a reconciliation to the most directly comparable financial measure calculated and presented in accordance with GAAP. |
CROSSFIRST BANKSHARES, INC.
Conference Call and Webcast
Management will host a conference call to review second quarter results on Tuesday, July 16, 2024, at 10 a.m. CT / 11 a.m. ET. The conference call and webcast may also include discussion of Company developments, forward-looking statements and other material information about business and financial matters. To access the event by telephone, please dial (844) 481-2831 at least fifteen minutes prior to the start of the call and request access to the CrossFirst Bankshares call. International callers should dial +1 (412) 317-1851 and request access as directed above. The call will also be broadcast live over the internet and can be accessed via the following link: https://edge.media-server.com/mmc/p/uorjsgvq. Please visit the site at least 15 minutes prior to the call to allow time for registration. For those unable to join the presentation, a replay of the call will be available two hours after the conclusion of the live call. To access the replay, dial (877) 344-7529 and enter the replay access code 4103192. International callers should dial +1 (412) 317-0088 and enter the same access code. A replay of the webcast will also be available for 90 days on the Company’s website https://investors.crossfirstbankshares.com/.
Cautionary Note Regarding Forward-Looking Information
The financial results in this press release reflect preliminary, unaudited results, which are not final until the Company’s Quarterly Report on Form 10-Q is filed. This earnings release contains forward-looking statements regarding, among other things, our business plans; growth opportunities; expense control initiatives; anticipated expenses, cash requirements and sources of liquidity; capital allocation strategies and plans; and future financial performance. These statements are often, but not always, made through the use of words or phrases such as “growth,” “plan,” “guidance,” “believe,” “future,” “opportunities,” “anticipate,” “expect,” “expected,” “will,” “goal,” “focused,” “intend,” “position,” “initiatives,” “could,” “estimated,” “assume” and similar words or phrases of a future or forward-looking nature. The inclusion of forward-looking information herein should not be regarded as a representation by us or any other person that the future plans, estimates or expectations contemplated by us will be achieved. These forward-looking statements are not historical facts, and are based on current expectations, estimates and projections about our industry, management’s beliefs, certain assumptions made by management, and financial trends that may affect our financial condition, results of operations, business strategy or financial needs, many of which, by their nature, are inherently uncertain and beyond our control. Our actual results could differ materially from those anticipated in such forward-looking statements.
Accordingly, we caution you that any such forward-looking statements are not guarantees of future performance and are subject to risks, assumptions, estimates and uncertainties that are difficult to predict. Although we believe that the expectations reflected in these forward-looking statements are reasonable as of the date made, actual results may prove to be materially different from the results expressed or implied by the forward-looking statements due to a number of factors, including, without limitation, the following: uncertain or unfavorable business or economic conditions and any regulatory responses thereto, including uncertainty and volatility in the financial markets, possible slowing or recessionary economic conditions and continuing or increasing inflation; geographic concentration of our markets; changes in market interest rates that affect the pricing of our products and our net interest income; our ability to effectively execute our growth strategy and manage our growth, including identifying, consummating and integrating suitable mergers and acquisitions, entering new lines of business or offering new or enhanced services or products; fluctuations in the fair value of our investments; our ability to successfully manage our credit risk, particularly in our commercial real estate, energy and commercial-based loan portfolios, and the sufficiency of our allowance for credit losses; declines in the values of the real estate and other collateral securing loans in our portfolio; an increase in non-performing assets; borrower and depositor concentration risks; risks associated with originating Small Business Administration loans; our dependence on our management team, including our ability to attract, hire and retain key employees and their client and community relationships; our ability to raise and maintain sufficient liquidity and capital; competition from banks, credit unions, FinTech companies and other financial services providers; the effectiveness of our risk management framework; accounting estimates; our ability to maintain effective internal control over financial reporting; our ability to keep pace with technological changes; system failures, service denials, cyber incidents or other failures, disruptions or security breaches; employee error, employee or client misconduct, fraud committed against the Company or our clients, or incomplete or inaccurate information about clients and counterparties; disruptions to our business caused by our third-party service providers; our ability to maintain our reputation; environmental liability or failure to comply with regulatory requirements affecting foreclosed properties; costs and effects of litigation, investigations or similar matters to which we may be subject; risk exposure from transactions with financial counterparties; severe weather, natural disasters, pandemics or other health crises, acts of war or terrorism, climate change and responses thereto, or other external events; compliance with (and changes in) laws, rules, regulations, interpretations or policies relating to or affecting financial institutions, including stringent capital requirements, higher FDIC insurance premiums and assessments, consumer protection laws and privacy laws and accounting, tax, trade, monetary and fiscal matters, including the policies of the Federal Reserve and as a result of government initiatives; systemic risks across the banking industry associated with the soundness of other financial institutions; volatility in our stock price and other risks associated with our common stock; changes in our dividend or share repurchase policies and practices or other external events. These and other factors that could cause results to differ materially from those described in the forward-looking statements, as well as a discussion of the risks and uncertainties that may affect our business, can be found in our Annual Report on Form 10-K, our Quarterly Reports on Form 10-Q and in other filings we make with the Securities and Exchange Commission. These forward-looking statements are made as of the date hereof, and we disclaim any obligation to update any forward-looking statement or to publicly announce the results of any revisions to any of the forward-looking statements included herein, except as required by law.
CROSSFIRST BANKSHARES, INC.
About CrossFirst Bankshares, Inc.
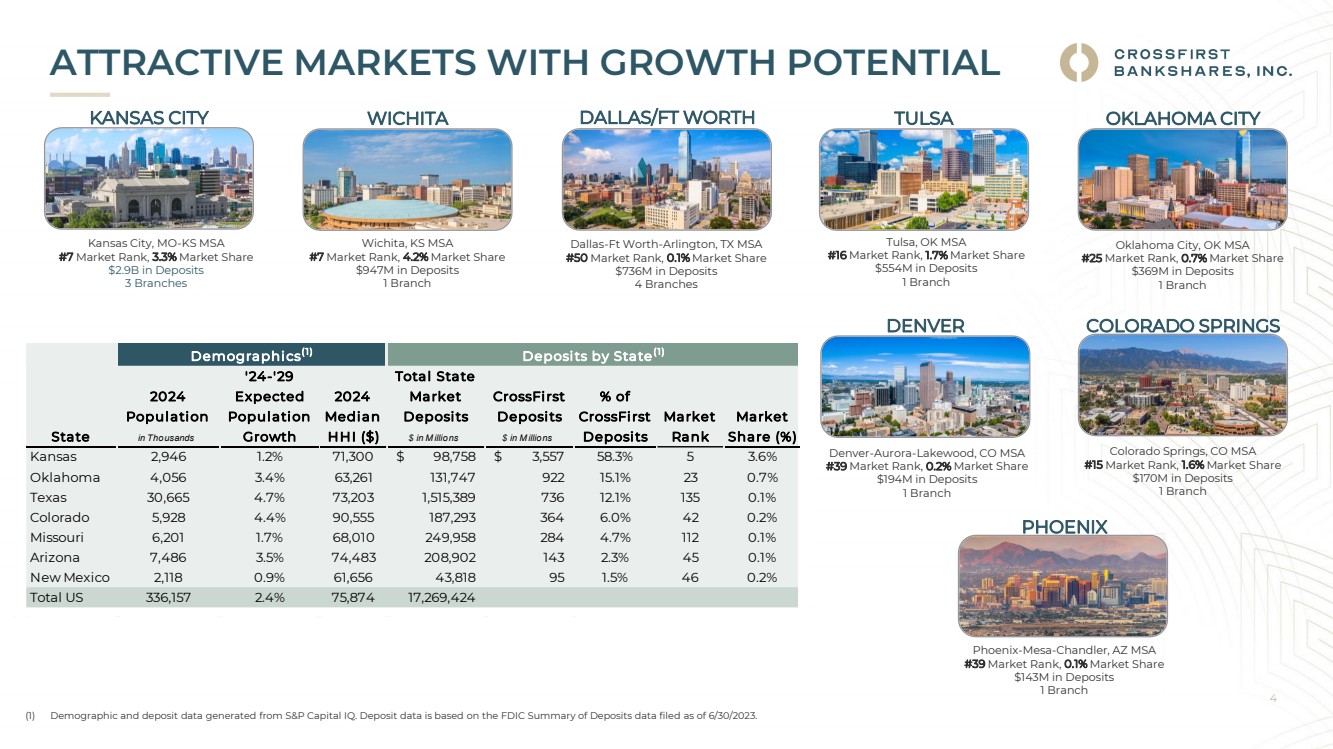
CrossFirst Bankshares, Inc. (Nasdaq: CFB) is a Kansas corporation and a registered bank holding company for its wholly owned subsidiary, CrossFirst Bank, a full-service financial institution that offers products and services to businesses, professionals, individuals, and families. CrossFirst Bank, headquartered in Leawood, Kansas, has locations in Kansas, Missouri, Oklahoma, Texas, Arizona, Colorado, and New Mexico.
INVESTOR CONTACT
Mike Daley, Chief Accounting Officer and Head of Investor Relations
mike.daley@crossfirstbank.com
(913) 754-9707
https://investors.crossfirstbankshares.com
CROSSFIRST BANKSHARES, INC.
TABLE 1. CONSOLIDATED STATEMENTS OF FINANCIAL CONDITION (UNAUDITED)
|
|
June 30, 2024 |
|
March 31, 2024 |
|
December 31, 2023 |
|||
|
|
(Dollars in thousands) |
|||||||
Assets |
|
|
|
|
|
|
|
|
|
Cash and cash equivalents |
|
$ |
250,364 |
|
$ |
206,773 |
|
$ |
255,229 |
Available-for-sale securities - taxable |
|
|
461,018 |
|
|
441,157 |
|
|
413,217 |
Available-for-sale securities - tax-exempt |
|
|
341,331 |
|
|
345,446 |
|
|
353,436 |
Loans, net of unearned fees |
|
|
6,344,407 |
|
|
6,249,187 |
|
|
6,127,690 |
Allowance for credit losses on loans |
|
|
76,218 |
|
|
74,856 |
|
|
73,462 |
Loans, net of the allowance for credit losses on loans |
|
|
6,268,189 |
|
|
6,174,331 |
|
|
6,054,228 |
Premises and equipment, net |
|
|
69,898 |
|
|
70,580 |
|
|
70,869 |
Restricted equity securities |
|
|
3,768 |
|
|
3,752 |
|
|
3,950 |
Interest receivable |
|
|
39,497 |
|
|
37,833 |
|
|
37,294 |
Foreclosed assets held for sale |
|
|
4,818 |
|
|
5,377 |
|
|
— |
Goodwill and other intangible assets, net |
|
|
29,499 |
|
|
30,404 |
|
|
31,335 |
Bank-owned life insurance |
|
|
71,766 |
|
|
71,266 |
|
|
70,810 |
Other |
|
|
98,403 |
|
|
92,813 |
|
|
90,312 |
Total assets |
|
$ |
7,638,551 |
|
$ |
7,479,732 |
|
$ |
7,380,680 |
Liabilities and stockholders’ equity |
|
|
|
|
|
|
|
|
|
Deposits |
|
|
|
|
|
|
|
|
|
Non-interest-bearing |
|
$ |
957,584 |
|
$ |
954,240 |
|
$ |
990,458 |
Savings, NOW and money market |
|
|
3,836,070 |
|
|
3,795,770 |
|
|
3,669,726 |
Time |
|
|
1,939,972 |
|
|
1,837,136 |
|
|
1,831,092 |
Total deposits |
|
|
6,733,626 |
|
|
6,587,146 |
|
|
6,491,276 |
Federal Home Loan Bank advances |
|
|
76,256 |
|
|
77,840 |
|
|
77,889 |
Other borrowings |
|
|
8,875 |
|
|
8,911 |
|
|
8,950 |
Interest payable and other liabilities |
|
|
91,916 |
|
|
90,864 |
|
|
94,422 |
Total liabilities |
|
|
6,910,673 |
|
|
6,764,761 |
|
|
6,672,537 |
Stockholders’ equity |
|
|
|
|
|
|
|
|
|
Preferred Stock, $0.01 par value: Authorized - 5,000,000 shares, issued - 7,750 at June 30, 2024, March 31, 2024 and December 31, 2023 |
|
|
— |
|
|
— |
|
|
— |
Common Stock, $0.01 par value: Authorized - 200,000,000 shares, issued - 53,590,173, 53,503,391 and 53,326,641 at June 30, 2024, March 31, 2024 and December 31, 2023, respectively |
|
|
536 |
|
|
535 |
|
|
533 |
Treasury stock, at cost: 4,340,033, 4,102,925 and 3,990,753 shares held at June 30, 2024, March 31, 2024 and December 31, 2023, respectively |
|
|
(62,761) |
|
|
(59,720) |
|
|
(58,251) |
Additional paid-in capital |
|
|
545,716 |
|
|
544,206 |
|
|
543,556 |
Retained earnings |
|
|
308,886 |
|
|
290,419 |
|
|
272,351 |
Accumulated other comprehensive loss |
|
|
(64,499) |
|
|
(60,469) |
|
|
(50,046) |
Total stockholders’ equity |
|
|
727,878 |
|
|
714,971 |
|
|
708,143 |
Total liabilities and stockholders’ equity |
|
$ |
7,638,551 |
|
$ |
7,479,732 |
|
$ |
7,380,680 |
CROSSFIRST BANKSHARES, INC.
TABLE 2. CONSOLIDATED STATEMENTS OF OPERATIONS (UNAUDITED)
|
|
Three Months Ended |
|
Six Months Ended |
|||||||||||
|
|
June 30, |
|
March 31, |
|
June 30, |
|
June 30, |
|
June 30, |
|||||
|
|
2024 |
|
2024 |
|
2023 |
|
2024 |
|
2023 |
|||||
|
|
(Dollars in thousands except per share data) |
|||||||||||||
Interest Income |
|
|
|
|
|
|
|
|
|
|
|
|
|
|
|
Loans, including fees |
|
$ |
113,346 |
|
$ |
110,099 |
|
$ |
98,982 |
|
$ |
223,445 |
|
$ |
188,600 |
Available-for-sale securities - taxable |
|
|
5,052 |
|
|
4,528 |
|
|
2,622 |
|
|
9,580 |
|
|
4,471 |
Available-for-sale securities - tax-exempt |
|
|
2,554 |
|
|
2,553 |
|
|
3,571 |
|
|
5,107 |
|
|
7,365 |
Deposits with financial institutions |
|
|
1,985 |
|
|
1,981 |
|
|
1,609 |
|
|
3,966 |
|
|
3,623 |
Dividends on bank stocks |
|
|
161 |
|
|
78 |
|
|
364 |
|
|
239 |
|
|
626 |
Total interest income |
|
|
123,098 |
|
|
119,239 |
|
|
107,148 |
|
|
242,337 |
|
|
204,685 |
Interest Expense |
|
|
|
|
|
|
|
|
|
|
|
|
|
|
|
Deposits |
|
|
63,700 |
|
|
62,111 |
|
|
48,663 |
|
|
125,811 |
|
|
85,388 |
Fed funds purchased and repurchase agreements |
|
|
— |
|
|
— |
|
|
— |
|
|
— |
|
|
46 |
Federal Home Loan Bank advances |
|
|
1,442 |
|
|
471 |
|
|
3,734 |
|
|
1,913 |
|
|
6,125 |
Other borrowings |
|
|
64 |
|
|
63 |
|
|
212 |
|
|
127 |
|
|
366 |
Total interest expense |
|
|
65,206 |
|
|
62,645 |
|
|
52,609 |
|
|
127,851 |
|
|
91,925 |
Net Interest Income |
|
|
57,892 |
|
|
56,594 |
|
|
54,539 |
|
|
114,486 |
|
|
112,760 |
Provision for Credit Losses |
|
|
2,383 |
|
|
1,655 |
|
|
2,640 |
|
|
4,038 |
|
|
7,061 |
Net Interest Income after Provision for Credit Losses |
|
|
55,509 |
|
|
54,939 |
|
|
51,899 |
|
|
110,448 |
|
|
105,699 |
Non-Interest Income |
|
|
|
|
|
|
|
|
|
|
|
|
|
|
|
Service charges and fees on client accounts |
|
|
2,333 |
|
|
2,104 |
|
|
2,110 |
|
|
4,437 |
|
|
3,939 |
ATM and credit card interchange income |
|
|
1,568 |
|
|
1,487 |
|
|
1,213 |
|
|
3,055 |
|
|
2,477 |
Gain on sale of loans |
|
|
440 |
|
|
537 |
|
|
1,205 |
|
|
977 |
|
|
1,392 |
Income from bank-owned life insurance |
|
|
501 |
|
|
456 |
|
|
418 |
|
|
957 |
|
|
829 |
Swap fees and credit valuation adjustments, net |
|
|
88 |
|
|
158 |
|
|
84 |
|
|
246 |
|
|
174 |
Other non-interest income |
|
|
771 |
|
|
847 |
|
|
749 |
|
|
1,618 |
|
|
1,389 |
Total non-interest income |
|
|
5,701 |
|
|
5,589 |
|
|
5,779 |
|
|
11,290 |
|
|
10,200 |
Non-Interest Expense |
|
|
|
|
|
|
|
|
|
|
|
|
|
|
|
Salaries and employee benefits |
|
|
23,162 |
|
|
23,585 |
|
|
24,061 |
|
|
46,747 |
|
|
46,683 |
Occupancy |
|
|
3,181 |
|
|
3,206 |
|
|
3,054 |
|
|
6,387 |
|
|
6,028 |
Professional fees |
|
|
1,083 |
|
|
972 |
|
|
970 |
|
|
2,055 |
|
|
3,588 |
Deposit insurance premiums |
|
|
1,851 |
|
|
1,906 |
|
|
1,881 |
|
|
3,757 |
|
|
3,412 |
Data processing |
|
|
1,719 |
|
|
970 |
|
|
1,057 |
|
|
2,689 |
|
|
2,299 |
Advertising |
|
|
491 |
|
|
558 |
|
|
649 |
|
|
1,049 |
|
|
1,401 |
Software and communication |
|
|
1,833 |
|
|
1,824 |
|
|
1,655 |
|
|
3,657 |
|
|
3,306 |
Foreclosed assets, net |
|
|
24 |
|
|
229 |
|
|
(21) |
|
|
253 |
|
|
128 |
Core deposit intangible amortization |
|
|
906 |
|
|
931 |
|
|
802 |
|
|
1,837 |
|
|
1,624 |
Other non-interest expense |
|
|
3,475 |
|
|
3,324 |
|
|
3,304 |
|
|
6,799 |
|
|
7,035 |
Total non-interest expense |
|
|
37,725 |
|
|
37,505 |
|
|
37,412 |
|
|
75,230 |
|
|
75,504 |
Net Income Before Taxes |
|
|
23,485 |
|
|
23,023 |
|
|
20,266 |
|
|
46,508 |
|
|
40,395 |
Income tax expense |
|
|
4,863 |
|
|
4,800 |
|
|
4,219 |
|
|
9,663 |
|
|
8,240 |
Net Income |
|
$ |
18,622 |
|
$ |
18,223 |
|
$ |
16,047 |
|
$ |
36,845 |
|
$ |
32,155 |
Basic Earnings Per Common Share |
|
$ |
0.37 |
|
$ |
0.36 |
|
$ |
0.33 |
|
$ |
0.74 |
|
$ |
0.66 |
Diluted Earnings Per Common Share |
|
$ |
0.37 |
|
$ |
0.36 |
|
$ |
0.33 |
|
$ |
0.73 |
|
$ |
0.65 |
CROSSFIRST BANKSHARES, INC.
TABLE 3. YEAR-TO-DATE ANALYSIS OF CHANGES IN NET INTEREST INCOME – FTE (UNAUDITED)
|
|
Six Months Ended |
|
||||||||||||||
|
|
June 30, |
|
||||||||||||||
|
|
2024 |
|
2023 |
|
||||||||||||
|
|
|
|
|
Interest |
|
Average |
|
|
|
|
Interest |
|
Average |
|
||
|
|
Average |
|
Income / |
|
Yield / |
|
Average |
|
Income / |
|
Yield / |
|
||||
|
|
Balance |
|
Expense |
|
Rate(3) |
|
Balance |
|
Expense |
|
Rate(3) |
|
||||
|
|
(Dollars in thousands) |
|
||||||||||||||
Interest-earning assets: |
|
|
|
|
|
|
|
|
|
|
|
|
|
|
|
|
|
Securities - taxable |
|
$ |
466,010 |
|
$ |
9,819 |
|
4.21 |
% |
$ |
302,763 |
|
$ |
5,097 |
|
3.37 |
% |
Securities - tax-exempt - FTE(1) |
|
|
392,077 |
|
|
6,179 |
|
3.15 |
|
|
527,047 |
|
|
8,912 |
|
3.38 |
|
Federal funds sold |
|
|
— |
|
|
— |
|
— |
|
|
873 |
|
|
6 |
|
1.39 |
|
Interest-bearing deposits in other banks |
|
|
167,826 |
|
|
3,966 |
|
4.75 |
|
|
170,287 |
|
|
3,617 |
|
4.28 |
|
Gross loans, net of unearned income(2) |
|
|
6,221,388 |
|
|
223,445 |
|
7.22 |
|
|
5,658,698 |
|
|
188,600 |
|
6.72 |
|
Total interest-earning assets - FTE(1) |
|
|
7,247,301 |
|
$ |
243,409 |
|
6.75 |
% |
|
6,659,668 |
|
$ |
206,232 |
|
6.24 |
% |
Allowance for loan losses |
|
|
(74,864) |
|
|
|
|
|
|
|
(64,664) |
|
|
|
|
|
|
Other non-interest-earning assets |
|
|
247,501 |
|
|
|
|
|
|
|
226,983 |
|
|
|
|
|
|
Total assets |
|
$ |
7,419,938 |
|
|
|
|
|
|
$ |
6,821,987 |
|
|
|
|
|
|
Interest-bearing liabilities |
|
|
|
|
|
|
|
|
|
|
|
|
|
|
|
|
|
Transaction deposits |
|
$ |
839,363 |
|
$ |
15,287 |
|
3.66 |
% |
$ |
570,661 |
|
$ |
7,839 |
|
2.77 |
% |
Savings and money market deposits |
|
|
2,878,339 |
|
|
63,623 |
|
4.45 |
|
|
2,794,201 |
|
|
50,496 |
|
3.64 |
|
Time deposits |
|
|
1,869,375 |
|
|
46,901 |
|
5.05 |
|
|
1,357,688 |
|
|
27,053 |
|
4.02 |
|
Total interest-bearing deposits |
|
|
5,587,077 |
|
|
125,811 |
|
4.53 |
|
|
4,722,550 |
|
|
85,388 |
|
3.65 |
|
FHLB and short-term borrowings |
|
|
113,038 |
|
|
1,913 |
|
3.40 |
|
|
311,471 |
|
|
6,423 |
|
4.16 |
|
Trust preferred securities, net of fair value adjustments |
|
|
1,128 |
|
|
127 |
|
22.64 |
|
|
1,070 |
|
|
114 |
|
21.49 |
|
Non-interest-bearing deposits |
|
|
904,850 |
|
|
— |
|
— |
|
|
1,057,268 |
|
|
— |
|
— |
|
Cost of funds |
|
|
6,606,093 |
|
$ |
127,851 |
|
3.89 |
% |
|
6,092,359 |
|
$ |
91,925 |
|
3.04 |
% |
Other liabilities |
|
|
104,555 |
|
|
|
|
|
|
|
95,702 |
|
|
|
|
|
|
Stockholders’ equity |
|
|
709,290 |
|
|
|
|
|
|
|
633,926 |
|
|
|
|
|
|
Total liabilities and stockholders’ equity |
|
$ |
7,419,938 |
|
|
|
|
|
|
$ |
6,821,987 |
|
|
|
|
|
|
Net interest income - FTE(1) |
|
|
|
|
$ |
115,558 |
|
|
|
|
|
|
$ |
114,307 |
|
|
|
Net interest spread - FTE(1) |
|
|
|
|
|
|
|
2.86 |
% |
|
|
|
|
|
|
3.20 |
% |
Net interest margin - FTE(1) |
|
|
|
|
|
|
|
3.20 |
% |
|
|
|
|
|
|
3.46 |
% |
| (1) | Tax exempt income is calculated on a tax-equivalent basis. Tax-free municipal securities are exempt from federal income taxes. The incremental income tax rate used is 21.0%. |
| (2) | Average loan balances include non-accrual loans. |
| (3) | Actual unrounded values are used to calculate the reported yield or rate disclosed. Accordingly, recalculations using the amounts in thousands as disclosed in this |
release may not produce the same amounts.
CROSSFIRST BANKSHARES, INC.
TABLE 4. QUARTERLY ANALYSIS OF CHANGES IN NET INTEREST INCOME – FTE (UNAUDITED)
|
|
|
|
|
|
|
|
|
|
|
|
|
|
|
|
|
|
|
|
|
|
|
|
|
|
|
|
Three Months Ended |
|
||||||||||||||||||||||
|
|
June 30, 2024 |
|
March 31, 2024 |
|
June 30, 2023 |
|
||||||||||||||||||
|
|
|
|
|
Interest |
|
Average |
|
|
|
|
Interest |
|
Average |
|
|
|
|
Interest |
|
Average |
|
|||
|
|
Average |
|
Income / |
|
Yield / |
|
Average |
|
Income / |
|
Yield / |
|
Average |
|
Income / |
|
Yield / |
|
||||||
|
|
Balance |
|
Expense |
|
Rate(3) |
|
Balance |
|
Expense |
|
Rate(3) |
|
Balance |
|
Expense |
|
Rate(3) |
|
||||||
|
|
(Dollars in thousands) |
|
||||||||||||||||||||||
Interest-earning assets: |
|
|
|
|
|
|
|
|
|
|
|
|
|
|
|
|
|
|
|
|
|
|
|
|
|
Securities - taxable |
|
$ |
485,849 |
|
$ |
5,213 |
|
4.29 |
% |
$ |
445,952 |
|
$ |
4,606 |
|
4.13 |
% |
$ |
336,446 |
|
$ |
2,986 |
|
3.55 |
% |
Securities - tax-exempt - FTE(1) |
|
|
391,655 |
|
|
3,090 |
|
3.16 |
|
|
392,505 |
|
|
3,089 |
|
3.15 |
|
|
511,993 |
|
|
4,321 |
|
3.38 |
|
Interest-bearing deposits in other banks |
|
|
167,007 |
|
|
1,985 |
|
4.78 |
|
|
168,653 |
|
|
1,981 |
|
4.72 |
|
|
145,559 |
|
|
1,609 |
|
4.43 |
|
Gross loans, net of unearned income(2) |
|
|
6,282,649 |
|
|
113,346 |
|
7.26 |
|
|
6,159,447 |
|
|
110,099 |
|
7.19 |
|
|
5,776,137 |
|
|
98,982 |
|
6.87 |
|
Total interest-earning assets - FTE(1) |
|
|
7,327,160 |
|
$ |
123,634 |
|
6.78 |
% |
|
7,166,557 |
|
$ |
119,775 |
|
6.72 |
% |
|
6,770,135 |
|
$ |
107,898 |
|
6.39 |
% |
Allowance for loan losses |
|
|
(76,032) |
|
|
|
|
|
|
|
(73,683) |
|
|
|
|
|
|
|
(66,078) |
|
|
|
|
|
|
Other non-interest-earning assets |
|
|
243,813 |
|
|
|
|
|
|
|
251,228 |
|
|
|
|
|
|
|
225,915 |
|
|
|
|
|
|
Total assets |
|
$ |
7,494,941 |
|
|
|
|
|
|
$ |
7,344,102 |
|
|
|
|
|
|
$ |
6,929,972 |
|
|
|
|
|
|
Interest-bearing liabilities |
|
|
|
|
|
|
|
|
|
|
|
|
|
|
|
|
|
|
|
|
|
|
|
|
|
Transaction deposits |
|
$ |
800,709 |
|
$ |
7,357 |
|
3.70 |
% |
$ |
878,446 |
|
$ |
7,930 |
|
3.63 |
% |
$ |
598,646 |
|
$ |
4,339 |
|
2.91 |
% |
Savings and money market deposits |
|
|
2,907,375 |
|
|
31,948 |
|
4.42 |
|
|
2,848,979 |
|
|
31,675 |
|
4.47 |
|
|
2,707,637 |
|
|
26,927 |
|
3.99 |
|
Time deposits |
|
|
1,918,195 |
|
|
24,395 |
|
5.12 |
|
|
1,820,013 |
|
|
22,506 |
|
4.97 |
|
|
1,612,105 |
|
|
17,397 |
|
4.33 |
|
Total interest-bearing deposits |
|
|
5,626,279 |
|
|
63,700 |
|
4.55 |
|
|
5,547,438 |
|
|
62,111 |
|
4.50 |
|
|
4,918,388 |
|
|
48,663 |
|
3.97 |
|
FHLB and short-term borrowings |
|
|
147,816 |
|
|
1,442 |
|
3.92 |
|
|
77,874 |
|
|
471 |
|
2.43 |
|
|
349,763 |
|
|
3,888 |
|
4.46 |
|
Trust preferred securities, net of fair value adjustments |
|
|
1,135 |
|
|
64 |
|
22.68 |
|
|
1,121 |
|
|
63 |
|
22.60 |
|
|
1,077 |
|
|
58 |
|
21.60 |
|
Non-interest-bearing deposits |
|
|
909,434 |
|
|
— |
|
— |
|
|
900,216 |
|
|
— |
|
— |
|
|
921,259 |
|
|
— |
|
— |
|
Cost of funds |
|
|
6,684,664 |
|
$ |
65,206 |
|
3.92 |
% |
|
6,526,649 |
|
$ |
62,645 |
|
3.86 |
% |
|
6,190,487 |
|
$ |
52,609 |
|
3.41 |
% |
Other liabilities |
|
|
101,044 |
|
|
|
|
|
|
|
108,105 |
|
|
|
|
|
|
|
91,994 |
|
|
|
|
|
|
Stockholders’ equity |
|
|
709,233 |
|
|
|
|
|
|
|
709,348 |
|
|
|
|
|
|
|
647,491 |
|
|
|
|
|
|
Total liabilities and stockholders’ equity |
|
$ |
7,494,941 |
|
|
|
|
|
|
$ |
7,344,102 |
|
|
|
|
|
|
$ |
6,929,972 |
|
|
|
|
|
|
Net interest income - FTE(1) |
|
|
|
|
$ |
58,428 |
|
|
|
|
|
|
$ |
57,130 |
|
|
|
|
|
|
$ |
55,289 |
|
|
|
Net interest spread - FTE(1) |
|
|
|
|
|
|
|
2.86 |
% |
|
|
|
|
|
|
2.86 |
% |
|
|
|
|
|
|
2.98 |
% |
Net interest margin - FTE(1) |
|
|
|
|
|
|
|
3.20 |
% |
|
|
|
|
|
|
3.20 |
% |
|
|
|
|
|
|
3.27 |
% |
| (1) | Tax exempt income is calculated on a tax-equivalent basis. Tax-free municipal securities are exempt from federal income taxes. The incremental income tax rate used is 21.0%. |
| (2) | Average loan balances include non-accrual loans. |
| (3) | Actual unrounded values are used to calculate the reported yield or rate disclosed. Accordingly, recalculations using the amounts in thousands as disclosed in this release may not produce the same amounts. |
CROSSFIRST BANKSHARES, INC.
TABLE 5. NON-GAAP FINANCIAL MEASURES
Non-GAAP Financial Measures
In addition to disclosing financial measures determined in accordance with U.S. generally accepted accounting principles (GAAP), the Company discloses non-GAAP financial measures in this release including “tangible common stockholders’ equity,” “tangible book value per common share,” “adjusted efficiency ratio – fully tax equivalent (FTE),” “adjusted net income,” “adjusted diluted earnings per common share,” “adjusted return on average assets (ROAA),” and “adjusted return on average common equity (ROCE).” We consider the use of select non-GAAP financial measures and ratios to be useful for financial and operational decision making and useful in evaluating period-to-period comparisons. We believe that these non-GAAP financial measures provide meaningful supplemental information regarding our performance by excluding certain expenditures or gains that we believe are not indicative of our primary business operating results. We believe that management and investors benefit from referring to these non-GAAP financial measures in assessing our performance and when planning, forecasting, analyzing and comparing past, present and future periods.
These non-GAAP financial measures should not be considered a substitute for financial information presented in accordance with GAAP and you should not rely on non-GAAP financial measures alone as measures of our performance. The non-GAAP financial measures we present may differ from non-GAAP financial measures used by our peers or other companies. We compensate for these limitations by providing the equivalent GAAP measures whenever we present the non-GAAP financial measures and by including a reconciliation of the impact of the components adjusted for in the non-GAAP financial measure so that both measures and the individual components may be considered when analyzing our performance.
A reconciliation of non-GAAP financial measures to the comparable GAAP financial measures follows.
|
|
|
|
|
|
|
|
|
|
|
|
|
|
|
|
|
|
|
|
|
|
|
|
Three Months Ended |
|
Six Months Ended |
|||||||||||||||||
|
|
6/30/2024 |
|
3/31/2024 |
|
12/31/2023 |
|
9/30/2023 |
|
6/30/2023 |
|
6/30/2024 |
|
6/30/2023 |
|||||||
|
|
(Dollars in thousands, except per share data) |
|||||||||||||||||||
Adjusted net income: |
|
|
|
|
|
|
|
|
|
|
|
|
|
|
|
|
|
|
|
|
|
Net income |
|
$ |
18,622 |
|
$ |
18,223 |
|
$ |
17,651 |
|
$ |
16,863 |
|
$ |
16,047 |
|
$ |
36,845 |
|
$ |
32,155 |
Add: Acquisition costs |
|
|
— |
|
|
— |
|
|
1,300 |
|
|
1,328 |
|
|
338 |
|
|
— |
|
|
1,815 |
Add: Acquisition - Day 1 CECL provision |
|
|
— |
|
|
— |
|
|
— |
|
|
900 |
|
|
— |
|
|
— |
|
|
— |
Add: Employee separation |
|
|
— |
|
|
— |
|
|
— |
|
|
— |
|
|
1,300 |
|
|
— |
|
|
1,300 |
Add: Loss on bond repositioning |
|
|
— |
|
|
— |
|
|
1,130 |
|
|
— |
|
|
— |
|
|
— |
|
|
— |
Less: Tax effect(1) |
|
|
— |
|
|
— |
|
|
(510) |
|
|
(468) |
|
|
(344) |
|
|
— |
|
|
(654) |
Adjusted net income |
|
$ |
18,622 |
|
$ |
18,223 |
|
$ |
19,571 |
|
$ |
18,623 |
|
$ |
17,341 |
|
$ |
36,845 |
|
$ |
34,616 |
Preferred stock dividends |
|
$ |
155 |
|
$ |
155 |
|
$ |
155 |
|
$ |
155 |
|
$ |
103 |
|
$ |
310 |
|
$ |
103 |
Diluted weighted average common shares outstanding |
|
|
49,784,067 |
|
|
49,967,638 |
|
|
49,788,962 |
|
|
49,480,107 |
|
|
48,943,325 |
|
|
49,882,653 |
|
|
48,994,807 |
Diluted earnings per common share (GAAP) |
|
$ |
0.37 |
|
$ |
0.36 |
|
$ |
0.35 |
|
$ |
0.34 |
|
$ |
0.33 |
|
$ |
0.73 |
|
$ |
0.65 |
Adjusted diluted earnings per common share |
|
$ |
0.37 |
|
$ |
0.36 |
|
$ |
0.39 |
|
$ |
0.37 |
|
$ |
0.35 |
|
$ |
0.73 |
|
$ |
0.70 |
| (1) | Represents the tax impact of the adjustments at a tax rate of 21.0%, plus permanent tax expense associated with merger related transactions. |
|
|
|
|
|
|
|
|
|
|
|
|
|
|
|
|
|
|
|
|
|
|
|
|
|
Three Months Ended |
|
Six Months Ended |
|
|||||||||||||||||
|
|
6/30/2024 |
|
3/31/2024 |
|
12/31/2023 |
|
9/30/2023 |
|
6/30/2023 |
|
6/30/2024 |
|
6/30/2023 |
|
|||||||
|
|
(Dollars in thousands) |
|
|||||||||||||||||||
Adjusted return on average assets: |
|
|
|
|
|
|
|
|
|
|
|
|
|
|
|
|
|
|
|
|
|
|
Net income |
|
$ |
18,622 |
|
$ |
18,223 |
|
$ |
17,651 |
|
$ |
16,863 |
|
$ |
16,047 |
|
$ |
36,845 |
|
$ |
32,155 |
|
Adjusted net income |
|
|
18,622 |
|
|
18,223 |
|
|
19,571 |
|
|
18,623 |
|
|
17,341 |
|
|
36,845 |
|
|
34,616 |
|
Average assets |
|
$ |
7,494,941 |
|
$ |
7,344,102 |
|
$ |
7,231,611 |
|
$ |
7,114,228 |
|
$ |
6,929,972 |
|
$ |
7,419,938 |
|
$ |
6,821,987 |
|
Return on average assets (GAAP) |
|
|
1.00 |
% |
|
1.00 |
% |
|
0.97 |
% |
|
0.94 |
% |
|
0.93 |
% |
|
1.00 |
% |
|
0.95 |
% |
Adjusted return on average assets |
|
|
1.00 |
% |
|
1.00 |
% |
|
1.07 |
% |
|
1.04 |
% |
|
1.00 |
% |
|
1.00 |
% |
|
1.02 |
% |
CROSSFIRST BANKSHARES, INC.
|
|
|
|
|
|
|
|
|
|
|
|
|
|
|
|
|
|
|
|
|
|
|
|
|
Three Months Ended |
|
Six Months Ended |
|
|||||||||||||||||
|
|
6/30/2024 |
|
3/31/2024 |
|
12/31/2023 |
|
9/30/2023 |
|
6/30/2023 |
|
6/30/2024 |
|
6/30/2023 |
|
|||||||
|
|
(Dollars in thousands) |
|
|||||||||||||||||||
Adjusted return on average common equity: |
|
|
|
|
|
|
|
|
|
|
|
|
|
|
|
|
|
|
|
|
|
|
Net income |
|
$ |
18,622 |
|
$ |
18,223 |
|
$ |
17,651 |
|
$ |
16,863 |
|
$ |
16,047 |
|
$ |
36,845 |
|
$ |
32,155 |
|
Preferred stock dividends |
|
|
155 |
|
|
155 |
|
|
155 |
|
|
155 |
|
|
103 |
|
|
310 |
|
|
103 |
|
Net income attributable to common stockholders |
|
$ |
18,467 |
|
$ |
18,068 |
|
$ |
17,496 |
|
$ |
16,708 |
|
$ |
15,944 |
|
$ |
36,535 |
|
$ |
32,052 |
|
|
|
|
|
|
|
|
|
|
|
|
|
|
|
|
|
|
|
|
|
|
|
|
Adjusted net income |
|
$ |
18,622 |
|
$ |
18,223 |
|
$ |
19,571 |
|
$ |
18,623 |
|
$ |
17,341 |
|
$ |
36,845 |
|
$ |
34,616 |
|
Preferred stock dividends |
|
|
155 |
|
|
155 |
|
|
155 |
|
|
155 |
|
|
103 |
|
|
310 |
|
|
103 |
|
Adjusted net income attributable to common stockholders |
|
$ |
18,467 |
|
$ |
18,068 |
|
$ |
19,416 |
|
$ |
18,468 |
|
$ |
17,238 |
|
$ |
36,535 |
|
$ |
34,513 |
|
Average common equity |
|
$ |
701,483 |
|
$ |
701,598 |
|
$ |
647,882 |
|
$ |
650,494 |
|
$ |
639,741 |
|
$ |
701,540 |
|
$ |
629,901 |
|
Return on average common equity (GAAP) |
|
|
10.59 |
% |
|
10.36 |
% |
|
10.71 |
% |
|
10.19 |
% |
|
10.00 |
% |
|
10.47 |
% |
|
10.26 |
% |
Adjusted return on average common equity |
|
|
10.59 |
% |
|
10.36 |
% |
|
11.89 |
% |
|
11.26 |
% |
|
10.81 |
% |
|
10.47 |
% |
|
11.05 |
% |
|
|
Three Months Ended |
|||||||||||||
|
|
6/30/2024 |
|
3/31/2024 |
|
12/31/2023 |
|
9/30/2023 |
|
6/30/2023 |
|||||
|
|
(Dollars in thousands, except per share data) |
|||||||||||||
Tangible common stockholders’ equity: |
|
|
|
|
|
|
|
|
|
|
|
|
|
|
|
Total stockholders’ equity |
|
$ |
727,878 |
|
$ |
714,971 |
|
$ |
708,143 |
|
$ |
643,051 |
|
$ |
651,483 |
Less: goodwill and other intangible assets |
|
|
29,499 |
|
|
30,404 |
|
|
31,335 |
|
|
32,293 |
|
|
27,457 |
Less: preferred stock |
|
|
7,750 |
|
|
7,750 |
|
|
7,750 |
|
|
7,750 |
|
|
7,750 |
Tangible common stockholders’ equity |
|
$ |
690,629 |
|
$ |
676,817 |
|
$ |
669,058 |
|
$ |
603,008 |
|
$ |
616,276 |
Common shares outstanding at end of period |
|
|
49,250,140 |
|
|
49,400,466 |
|
|
49,335,888 |
|
|
49,295,036 |
|
|
48,653,487 |
Book value per common share (GAAP) |
|
$ |
14.78 |
|
$ |
14.47 |
|
$ |
14.35 |
|
$ |
13.04 |
|
$ |
13.39 |
Tangible book value per common share |
|
$ |
14.02 |
|
$ |
13.70 |
|
$ |
13.56 |
|
$ |
12.23 |
|
$ |
12.67 |
|
|
|
|
|
|
|
|
|
|
|
|
|
|
|
|
|
|
|
|
|
|
|
|
|
Three Months Ended |
|
Six Months Ended |
|
|||||||||||||||||
|
|
6/30/2024 |
|
3/31/2024 |
|
12/31/2023 |
|
9/30/2023 |
|
6/30/2023 |
|
6/30/2024 |
|
6/30/2023 |
|
|||||||
|
|
(Dollars in thousands) |
|
|||||||||||||||||||
Adjusted Efficiency Ratio - Fully Tax Equivalent (FTE)(1) |
|
|
|
|
|
|
|
|
|
|
|
|
|
|
|
|
|
|
|
|
|
|
Non-interest expense |
|
$ |
37,725 |
|
$ |
37,505 |
|
$ |
35,049 |
|
$ |
36,354 |
|
$ |
37,412 |
|
$ |
75,230 |
|
$ |
75,504 |
|
Less: Acquisition costs |
|
|
— |
|
|
— |
|
|
(1,300) |
|
|
(1,328) |
|
|
(338) |
|
|
— |
|
|
(1,815) |
|
Less: Core deposit intangible amortization |
|
|
(906) |
|
|
(931) |
|
|
(957) |
|
|
(922) |
|
|
(802) |
|
|
(1,837) |
|
|
(1,624) |
|
Less: Employee separation |
|
|
— |
|
|
— |
|
|
— |
|
|
— |
|
|
(1,300) |
|
|
— |
|
|
(1,300) |
|
Adjusted Non-interest expense (numerator) |
|
$ |
36,819 |
|
$ |
36,574 |
|
$ |
32,792 |
|
$ |
34,104 |
|
$ |
34,972 |
|
$ |
73,393 |
|
$ |
70,765 |
|
Net interest income |
|
|
57,892 |
|
|
56,594 |
|
|
56,954 |
|
|
55,127 |
|
|
54,539 |
|
|
114,486 |
|
|
112,760 |
|
Tax equivalent interest income(1) |
|
|
536 |
|
|
536 |
|
|
654 |
|
|
707 |
|
|
750 |
|
|
1,072 |
|
|
1,547 |
|
Non-interest income |
|
|
5,701 |
|
|
5,589 |
|
|
4,483 |
|
|
5,981 |
|
|
5,779 |
|
|
11,290 |
|
|
10,200 |
|
Add: Loss on bond repositioning |
|
|
— |
|
|
— |
|
|
1,130 |
|
|
— |
|
|
— |
|
|
— |
|
|
— |
|
Total adjusted tax-equivalent income (denominator) |
|
$ |
64,129 |
|
$ |
62,719 |
|
$ |
63,221 |
|
$ |
61,815 |
|
$ |
61,068 |
|
$ |
126,848 |
|
$ |
124,507 |
|
Efficiency Ratio (GAAP) |
|
|
59.32 |
% |
|
60.31 |
% |
|
57.05 |
% |
|
59.49 |
% |
|
62.02 |
% |
|
59.81 |
% |
|
61.41 |
% |
Adjusted Efficiency Ratio - Fully Tax Equivalent (FTE)(1) |
|
|
57.41 |
% |
|
58.31 |
% |
|
51.87 |
% |
|
55.17 |
% |
|
57.27 |
% |
|
57.86 |
% |
|
56.84 |
% |
| (1) | Tax exempt income (tax-free municipal securities) is calculated on a tax equivalent basis. The incremental tax rate used is 21.0%. |
|
1 Second Quarter 2024 Results July 15, 2024 |
|
2 LEGAL DISCLAIMER FORWARD-LOOKING STATEMENTS. The financial results in this presentation reflect preliminary, unaudited results, which are not final until the Company’s quarterly report on Form 10-Q is filed. This presentation and oral statements made relating to this presentation contain forward-looking statements regarding, among other things, our business plans; growth opportunities; expense control initiatives; anticipated expenses, cash requirements and sources of liquidity; capital allocation strategies and plans; and future financial performance. These statements are often, but not always, made through the use of words or phrases such as “positioned,” “growth,” “estimate,” “believe,” “plan,” “future,” “opportunity,” “optimistic,” “anticipate,” “target,” “expectations,” “expect,” “will,” “strategy,” “goal, “focused,” “guidance,” “foresee” and similar words or phrases of a future or forward-looking nature. The inclusion of forward-looking information herein should not be regarded as a representation by us or any other person that the future plans, estimates or expectations contemplated by us will be achieved. These forward-looking statements are not historical facts, and are based on current expectations, estimates and projections about our industry, management’s beliefs, certain assumptions made by management, and financial trends that may affect our financial condition, results of operations, business strategy or financial needs, many of which, by their nature, are inherently uncertain and beyond our control. Our actual results could differ materially from those anticipated in such forward-looking statements. Accordingly, we caution you that any such forward-looking statements are not guarantees of future performance and are subject to risks, assumptions, estimates and uncertainties that are difficult to predict. Although we believe that the expectations reflected in these forward-looking statements are reasonable as of the date made, actual results may prove to be materially different from the results expressed or implied by the forward-looking statements due to a number of factors, including without limitation, the following: uncertain or unfavorable business or economic conditions and any regulatory responses thereto, including uncertainty and volatility in the financial markets; possible slowing or recessionary economic conditions and continuing or increasing inflation; geographic concentration of our markets; changes in market interest rates that affect the pricing of our products and our net interest income; our ability to effectively execute our growth strategy and manage our growth, including identifying, consummating and integrating suitable mergers and acquisitions, entering new lines of business or offering new or enhanced services or products; fluctuations in the fair value of our investments; our ability to successfully manage our credit risk, particularly in our commercial real estate, energy and commercial-based loan portfolios, and the sufficiency of our allowance for credit losses; declines in the values of the real estate and other collateral securing loans in our portfolio; an increase in non-performing assets; borrower and depositor concentration risks; risks associated with originating Small Business Administration loans; our dependence on our management team, including our ability to attract, hire and retain key employees and their client and community relationships; our ability to raise and maintain sufficient liquidity and capital; competition from banks, credit unions, FinTech companies and other financial services providers; the effectiveness of our risk management framework; accounting estimates; our ability to maintain effective internal control over financial reporting; our ability to keep pace with technological changes; system failures, service denials, cyber incidents or other failures, disruptions or security breaches; employee error, employee or client misconduct, fraud committed against the Company or our clients, or incomplete or inaccurate information about clients and counterparties; disruptions to our business caused by our third-party service providers; our ability to maintain our reputation; environmental liability or failure to comply with regulatory requirements affecting foreclosed properties; costs and effects of litigation, investigations or similar matters to which we may be subject; risk exposure from transactions with financial counterparties; severe weather, natural disasters, pandemics or other health crises, acts of war or terrorism, climate change and responses thereto, or other external events; compliance with (and changes in) laws, rules, regulations, interpretations or policies relating to or affecting financial institutions, including stringent capital requirements, higher FDIC insurance premiums and assessments, consumer protection laws and privacy laws and accounting, tax, trade, monetary and fiscal matters, including the policies of the Federal Reserve and as a result of government initiatives; systemic risks across the banking industry associated with the soundness of other financial institutions; volatility in our stock price and other risks associated with our common stock; changes in our dividend or share repurchase policies and practices or other external events. These and other factors that could cause results to differ materially from those described in the forward-looking statements, as well as a discussion of the risks and uncertainties that may affect our business, can be found in our Annual Report on Form 10-K, our Quarterly Reports on Form 10-Q and in other filings we make with the Securities and Exchange Commission. These forward-looking statements are made as of the date hereof, and we disclaim any obligation to update any forward-looking statement or to publicly announce the results of any revisions to any of the forward-looking statements included herein, except as required by law. MARKET AND INDUSTRY DATA. This presentation references certain market, industry and demographic data, forecasts and other statistical information. We have obtained this data, forecasts and information from various independent, third party industry sources and publications. Nothing in the data, forecasts or information used or derived from third party sources should be construed as advice. Some data and other information are also based on our good faith estimates, which are derived from our review of industry publications and surveys and independent sources. We believe that these sources and estimates are reliable but have not independently verified them. Statements as to our market position are based on market data currently available to us. Although we are not aware of any misstatements regarding the economic, employment, industry and other market data presented herein, these estimates involve inherent risks and uncertainties and are based on assumptions that are subject to change. ABOUT NON-GAAP FINANCIAL MEASURES. In addition to disclosing financial measures determined in accordance with U.S. generally accepted accounting principles (GAAP), we disclose non-GAAP financial measures, including “adjusted net income”, “adjusted diluted earnings per common share”, “tangible common stockholders’ equity”, “tangible book value per common share”, “adjusted return on average assets (ROAA)”, “adjusted return on average common equity (ROCE)”, “adjusted efficiency ratio – fully tax equivalent (FTE),” “pre-tax pre-provision (PTPP) profit” and “adjusted non-interest expense.” We consider the use of select non-GAAP financial measures and ratios to be useful for financial and operational decision making and useful in evaluating period-to-period comparisons. We believe that these non-GAAP financial measures provide meaningful supplemental information regarding our performance by excluding certain expenditures or gains that we believe are not indicative of our primary business operating results. We believe that management and investors benefit from referring to these non-GAAP financial measures in assessing our performance and when planning, forecasting, analyzing and comparing past, present and future periods. These non-GAAP financial measures should not be considered a substitute for financial information presented in accordance with GAAP and should not be relied on alone as measures of our performance. The non-GAAP financial measures we present may differ from non-GAAP financial measures used by our peers or other companies. We compensate for these limitations by providing the equivalent GAAP measures whenever we present the non-GAAP financial measures and by including a reconciliation of the impact of the components adjusted for in the non-GAAP financial measure so that both measures and the individual components may be considered when analyzing our performance. A reconciliation of non-GAAP financial measures to the comparable GAAP financial measures is provided at the end of this presentation. |
|
3 COMPANY OVERVIEW & INVESTMENT HIGHLIGHTS The CrossFirst Story • Began de novo operations in 2007, completed IPO in 2019 • CrossFirst has grown primarily organically, as well as through four strategic acquisitions • Maintain a branch-light business model with 15 full-service locations, strategically placed across high-performing markets • Specialty industry verticals include sponsor finance, financial institutions, restaurant finance, energy, and small business (SBA) Total Assets - $7.6 billion • Since 2012, total assets compound annual growth rate of 25% Total Deposits - $6.7 billion • DDA represents 14% of total deposits • Granular deposit portfolio across geographies and industries Strong Loan Portfolio • Loan portfolio is 74% variable as of 6/30/2024 • Net charge-offs to average loans ratio of 0.07% for 2Q 2024 • Strong reserve levels at 1.20% of loans NIE/Avg Assets Driving Positive Leverage Profitable Growth – 2Q 2024 $0.37 Diluted EPS • Through second quarter of 2024, operating revenue(1) has grown 75% and net income has grown 96% since the same period in 2019, the year of our IPO Capital • Returned $4.5 million to stockholders through strategic share repurchases in 2024 • TBV/share growth of 73% since 2017 2.17% 2.03% 1.92% 2.05% 2.02% Q2 2023 Q3 2023 Q4 2023 Q1 2024 Q2 2024 Note: Data as of and for the quarter ended June 30, 2024, unless otherwise noted. (1) Defined as net interest income plus non-interest income. |
|
4 KANSAS CITY Kansas City, MO-KS MSA #7 Market Rank, 3.3% Market Share $2.9B in Deposits 3 Branches TULSA Tulsa, OK MSA #16 Market Rank, 1.7% Market Share $554M in Deposits 1 Branch OKLAHOMA CITY Oklahoma City, OK MSA #25 Market Rank, 0.7% Market Share $369M in Deposits 1 Branch ATTRACTIVE MARKETS WITH GROWTH POTENTIAL DALLAS/FT WORTH Dallas-Ft Worth-Arlington, TX MSA #50 Market Rank, 0.1% Market Share $736M in Deposits 4 Branches DENVER Denver-Aurora-Lakewood, CO MSA #39 Market Rank, 0.2% Market Share $194M in Deposits 1 Branch COLORADO SPRINGS Colorado Springs, CO MSA #15 Market Rank, 1.6% Market Share $170M in Deposits 1 Branch (1) Demographic and deposit data generated from S&P Capital IQ. Deposit data is based on the FDIC Summary of Deposits data filed as of 6/30/2023. 2024 Population '24-'29 Expected Population 2024 Median Total State Market Deposits CrossFirst Deposits % of CrossFirst Market Market State in Thousands Growth HHI ($) $ in M illions $ in M illions Deposits Rank Share (%) Kansas 2,946 1.2% 71,300 $ 98,758 $ 3,557 58.3% 5 3.6% Oklahoma 4,056 3.4% 63,261 131,747 922 15.1% 23 0.7% Texas 30,665 4.7% 73,203 1,515,389 736 12.1% 135 0.1% Colorado 5,928 4.4% 90,555 187,293 364 6.0% 4 2 0.2% Missouri 6,201 1.7% 68,010 249,958 284 4.7% 112 0.1% Arizona 7,486 3.5% 74,483 208,902 143 2.3% 4 5 0.1% New Mexico 2,118 0.9% 61,656 43,818 95 1.5% 4 6 0.2% Total US 336,157 2.4% 75,874 17,269,424 Demographics(1) Deposits by State(1) WICHITA Wichita, KS MSA #7 Market Rank, 4.2% Market Share $947M in Deposits 1 Branch PHOENIX Phoenix-Mesa-Chandler, AZ MSA #39 Market Rank, 0.1% Market Share $143M in Deposits 1 Branch |
|
5 $565 $847 $1,220 $1,574 $2,133 $2,961 $4,107 $4,931 $5,659 $5,621 $6,601 $7,381 $7,639 2012 2013 2014 2015 2016 2017 2018 2019 2020 2021 2022 2023 6/30/2024 OUR GROWTH Total Assets Compound Annual Growth Rate Since 2012 Total Assets 25.4% Note: Dollars in chart are in millions. 2012 Expanded into Wichita & Oklahoma City markets 2013 Expanded into Tulsa market through acquisition of Tulsa National Bancshares, Inc. (~$160mm in Total Assets) 2016 Expanded into Dallas market 2021 Expanded into Phoenix market 2019 CrossFirst Bankshares, Inc. Initial Public Offering; Nasdaq listed: CFB 2022 Expanded into Colorado and New Mexico markets through acquisition of Farmers & Stockmens Bank (aka Central Bank & Trust) (~$648mm in Total Assets) 2023 Expanded into Tucson market through acquisition of Canyon Bancorporation (~$106mm in Total Assets) 2007 Began de novo operations |
|
6 IMPROVING CORE METRICS (1) Defined as net interest income plus non-interest income. (2) Represents a non-GAAP financial measure, see non-GAAP reconciliation slides at the end of this presentation for more details. Note: Dollar amounts are in millions, other than per share amounts. The ratio of non-performing assets to total assets is presented as of the end of the respective period; all other amounts are presented for the respective year-ended or quarter-ended. $0.24 $1.33 $1.23 $1.34 $0.38 $0.36 $0.37 $1.40 $1.37 $1.47 $0.36 $0.37 2020 2021 2022 2023 Q1 2024 Q2 2024 Diluted EPS (GAAP) Adjusted Diluted EPS Diluted EPS $160.3 $168.7 $193.5 $224.8 $56.6 $57.9 $11.7 $13.7 $17.3 $20.7 $5.6 $5.7 $172.0 $182.4 $210.8 $245.5 $62.2 $63.6 2020 2021 2022 2023 Q1 2024 Q2 2024 Net Interest Income Non-Interest Income Operating Revenue(1) $72.0 $83.0 $89.1 $98.6 $24.7 $25.9 2020 2021 2022 2023 Q1 2024 Q2 2024 PTPP Profit(2) 1.39% 0.58% 0.20% 0.34% 0.27% 0.22% 2020 2021 2022 2023 Q1 2024 Q2 2024 Non-performing Assets / Total Assets (2) |
|
7 DRIVEN BY EXTRAORDINARY CULTURE FOCUSING ON OUR CORE VALUES INVESTING IN OUR PEOPLE & CLIENTS POSITIONING FOR SUCCESS At CrossFirst Bank, extraordinary service is the unifying purpose at the very heart of our organization. To deliver on our purpose, each of our employees operates with four values that define our approach to banking: character, competence, commitment, and connection. These are not just words at CrossFirst. They are core values that guide our actions, decisions, and vision. CHARACTER Who You Are COMPETENCE What You Can Do COMMITMENT What You Want To Do CONNECTION What Others See In You We prioritize and invest in creating opportunities to help employees grow and build their careers using a variety of training and development programs. These include online, classroom, and on-the-job learning formats. Our CrossFirst training programs include: An immersive, multi-day culture and leadership-driven onboarding program for all new hires to advance and preserve our values and operating standards A development program designed for emerging leaders that explores core leadership concepts and the foundations of the banking industry We strive to build an equitable and inclusive environment with diverse teams who support our core values and strategic initiatives. We strive to hire and retain top-tier talent to drive growth and extraordinary service. 57% 64% As a GALLUP® Strengths-Based organization, our very first commitment to every new employee is that we will value them and provide access to Top 5 their unique CliftonStrengths® CliftonStrengths® Engaged employees as measured by GALLUP® Q12 Survey; 89% employee response rate of workforce is female as of 6/30/2024 21% of current year new hires were ethnically diverse through 6/30/2024 Recognized as a GALLUP® Don Clifton Strengths-Based Culture award winner, a worldwide honor, for the second year in a row |
|
8 SECOND QUARTER 2024 HIGHLIGHTS ✓ Returned capital to stockholders of $3.0 million during the quarter via share buybacks at a weighted average price of $12.78 per share, bringing total buyback for the year to $4.5 million at a weighted average price of $12.88 ✓ Remained well capitalized with total risk-based capital ratio of 11.4% and common equity tier 1 capital ratio of 10.2% ✓ Grew book value per common share 2% to $14.78 at June 30, 2024 compared to the prior quarter; tangible book value per common share(4) also grew 2% to $14.02 Net Income $18.6 Million (1) Ratios are annualized. (2) Defined as net interest income plus non-interest income. (3) RUC includes the accrual for off-balance sheet credit risk for unfunded commitments. (4) Represents a non-GAAP financial measure, see non-GAAP reconciliation slides at the end of this presentation for more details. ✓ Operating revenue(2) improved $1.4 million, or 2%, from the prior quarter ✓ Net income improved $0.4 million and diluted EPS improved $0.01 from the prior quarter ✓ Net interest margin – FTE remained consistent with the prior quarter at 3.20% Diluted EPS $0.37 ROCE(1) 10.59% ROAA(1) 1.00% ✓ Credit quality improved with non-performing assets decreasing to 0.22% of total assets, annualized net charge-offs representing 0.07% of average loans and a meaningful reduction in classified loans ✓ The ACL/Loans was 1.20% and ACL + RUC(3)/Loans was 1.28% Financial Performance Profitability Balance Sheet Credit Quality Capital ✓ Loans grew $95 million, or 2% for the quarter and $216 million, or 4%, year-to-date ✓ Deposits grew $147 million, or 2% for the quarter and $243 million, or 4% year-to-date |
|
9 DIVERSE LOAN PORTFOLIO Note: Gross loans, (net of unearned income) data as of June 30, 2024. CRE - Non-Owner-Occupied 44% Commercial 35% CRE - Owner-Occupied 9% Residential Real Estate 7% Energy 4% Consumer 1% Other, 21% 1-4 Fam Res Const, 6% Hotel, 9% Office, 11% Retail, 14% Multi-Family, 17% Industrial, 22% Other Industries, 34% Misc. Financial Vehicles, 3% Aircraft & Transportation, 4% Financial Management, 4% Health Care, 5% Bus Lns to Individuals, 6% Real Estate Activity, 6% Engineering & Contracting, 8% Credit Related Activities, 9% Manufacturing, 9% Restaurants, 12% TOTAL $6.3 Billion CRE – Non-Owner-Occupied by Segment Commercial by Loan Type Update Office Portfolio Statistics ▪ $286 million, 4.5% of total loans ▪ Average loan size ~$6.3 million ▪ Largest Loan - $25 million ▪ Weighted Avg. LTV – 63% ▪ Predominantly comprised of suburban and single-tenant ▪ 97% Class A/B office space ▪ Approximately 63% of the portfolio matures within the next two years and 83% of those loans have floating rates |
|
10 ASSET QUALITY PERFORMANCE Note: Dollar amounts are in millions and amounts shown are as of the end of the period. (1) RUC includes the accrual for off-balance sheet credit risk for unfunded commitments. (2) For Q2 2024, acquired classified loans represent 1.2% of Capital + ACL + RUC. (3) Ratio is annualized for interim periods. 9.6% 14.0% 14.8% 15.8% 13.3% Q2 2023 Q3 2023 Q4 2023 Q1 2024 Q2 2024 0.19% 0.50% 0.34% 0.27% 0.22% Q2 2023 Q3 2023 Q4 2023 Q1 2024 Q2 2024 Classified Loans / Capital + ACL + RUC(1) Non-performing Assets / Total Assets 0.04% 0.09% 0.12% 0.10% 0.07% Q2 2023 Q3 2023 Q4 2023 Q1 2024 Q2 2024 Net Charge-offs (Recoveries) / Average Loans(3) $67.6 $71.6 $73.5 $74.9 $76.2 $7.7 $6.1 $6.4 $5.2 $5.2 $75.3 $77.7 $79.9 $80.1 $81.4 1.17% 1.20% 1.20% 1.20% 1.20% Q2 2023 Q3 2023 Q4 2023 Q1 2024 Q2 2024 ACL RUC ACL / Total Loans Allowance for Credit Losses + RUC(1) (2) |
|
11 DEPOSIT TRENDS 15% % DDA Deposits 16% 15% 14% 14% $928 $1,029 $990 $954 $958 $604 $802 $800 $867 $774 $2,730 $2,757 $2,870 $2,929 $3,062 $1,838 $1,744 $1,831 $1,837 $1,940 $6,100 $6,332 $6,491 $6,587 $6,734 Q2 2023 Q3 2023 Q4 2023 Q1 2024 Q2 2024 DDA Transaction Savings & Money Market Time Note: Dollars are in millions and amounts shown are as of the end of the period. |
|
12 NET INTEREST MARGIN (1) Ratio is annualized for interim periods; the incremental Federal income tax rate used in calculating tax exempt income on a tax equivalent basis is 21.0%. Yield on Loans & Cost of Deposits 6.87% 6.96% 7.12% 7.19% 7.26% 3.33% 3.59% 3.74% 3.87% 3.92% Q2 2023 Q3 2023 Q4 2023 Q1 2024 Q2 2024 Yield on Loans Cost of Total Deposits 3.27% 3.19% 3.23% 3.20% 3.20% Q2 2023 Q3 2023 Q4 2023 Q1 2024 Q2 2024 0.05% 0.45% 0.13% 0.25% 0.51% 0.84% 0.26% 0.13% 0.04% 0.01% 0.04% 0.08% -300 bps -200 bps -100 bps +100 bps +200 bps +300 bps Rate Shock Rate Ramp Net Interest Income Impact From Rate Changes Net Interest Margin – Fully Tax Equivalent (FTE)(1) ▪ Fourth quarter of stable NIM with loan yield keeping pace with the cost of deposits ▪ The increase in cost of total deposits narrowed to 5 basis points compared to last quarter ▪ NIM benefited 2 basis points from acquired loan accretion ▪ Balance sheet positioned to continue benefiting in a down rate environment |
|
13 $35.0 $34.1 $32.8 $36.6 $36.8 $0.8 $0.9 $0.9 $0.9 $0.9 $1.3 $0.3 $1.3 $1.3 $37.4 $36.3 $35.0 $37.5 $37.7 Q2 2023 Q3 2023 Q4 2023 Q1 2024 Q2 2024 Adjusted Non-interest Expense CDI Amortization Separation Costs Acquisition Costs EXPENSE MANAGEMENT Note: Dollars are in millions and amounts shown are as of the end of the period unless otherwise specified. (1) Represents a non-GAAP financial measure that is calculated as the numerator of the Adjusted Efficiency Ratio – Fully Tax Equivalent; see non-GAAP reconciliation slides at the end of this presentation for more details . 2.17% Non-interest Expense as a % of Average Assets 2.03% 1.92% 2.05% 2.02% (1) Includes $0.7 million of net expense related to the renegotiation of our core system contract with an expected earn-back period of four months |
|
14 INVESTMENT PORTFOLIO AND LIQUIDITY Investment Strategy ▪ Improving performance in tax-equivalent yield, with a 18bps increase to 3.78% from fourth quarter 2023 ▪ Reducing municipal concentration and focusing reinvestment in lower risk-weighted assets ▪ Repositioning portfolio to increase liquidity and provide more balanced cash flow Evolution of Investment Portfolio Municipal - Tax-Exempt, 71% Mortgage Securities, 25% SBA + Agencies, 1% Other,3% Gross $769 Million Net $686 Million Municipal - Tax-Exempt, 43% Mortgage Securities, 40% SBA + Agencies, 16% Other,1% Gross $881 Million Net $802 Million December 31, 2022 June 30, 2024 Portfolio Strategy Shift Liquidity – 34% of Total Assets On-balance Sheet Liquidity Securities Portfolio $802M Cash & Equivalents $250M $1.052B Off-balance Sheet Liquidity $1.533B Total Liquidity $2.585B Duration: 5.2 years Duration: 5.2 years Municipal - Tax-Exempt, 35% Mortgage Securities, 40% SBA + Agencies, 20% Treasuries + Other, 5% Future Portfolio Strategy Shift Targeted Future Portfolio |
|
15 9.9% 9.5% 9.6% 10.7% 10.1% 10.2% 10.3% 11.4% Leverage Common Equity Tier 1 Tier 1 Risk-Based Capital Total Risk-Based Capital Q2 2023 Q2 2024 CAPITAL RATIOS ▪ Returned $3.0 million of capital to stockholders during 2Q 2024, and $4.5 million year-to-date, via share buybacks at a weighted average cost of $12.78 per share for the quarter, and $12.88 for the year ▪ Deployed capital raised during IPO through organic balance sheet growth, share buybacks and two accretive acquisitions ▪ Steady build of capital ratios during 2023, and into 2024, through strong earnings, reduced unfunded commitments and bond portfolio restructuring Key Consolidated Regulatory Capital Ratios Tangible Book Value(1) Growth ~ 20% since 2019 IPO Capital Strategy $11.43 $12.08 $13.23 $11.96 $13.56 $13.70 $14.02 2019 2020 2021 2022 2023 Q1 2024 Q2 2024 (1) Represents a non-GAAP financial measure; see non-GAAP reconciliation slides at the end of this presentation for more details . |
|
16 2024 GUIDANCE Business Driver Prior Current Loans 8-10% core loan growth 6-8% core loan growth Net Interest Margin (NIM) 3.20% to 3.25% No change Adjusted Non-interest Expense $36-37 million quarterly $37 million quarterly Combined ACL / Loans 1.25% to 1.35% No change Effective Tax Rate 20-22% No change |
|
17 NON-GAAP RECONCILIATIONS (1) Represents the tax impact of the adjustments at a tax rate of 21.0%, plus permanent tax expense associated with merger related transactions and permanent tax benefit associated with stock-based grants. (2) No tax effect. 6/30/2024 6/30/2023 Adjusted net income: Net income (GAAP) $ 18,622 $ 18,223 $ 17,651 $ 16,863 $ 16,047 $ 36,845 $ 32,155 Add: Acquisition costs - - 1,300 1,328 338 - 1,815 Add: Acquisition - Day 1 CECL provision - - - 900 - - - Add: Employee separation - - - - 1,300 - 1,300 Add: Loss on bond repositioning - - 1,130 - - - - Less: Tax effect(1) - - (510) (468) (344) - (654) Adjusted net income $ 18,622 $ 18,223 $ 19,571 $ 18,623 $ 17,341 $ 36,845 $ 34,616 Preferred stock dividends $ 155 $ 155 $ 155 $ 155 $ 103 $ 310 $ 103 Diluted weighted average common shares outstanding 49,784,067 49,967,638 49,788,962 49,480,107 48,943,325 49,882,653 48,994,807 Earnings per common share - diluted (GAAP) $ 0.37 $ 0.36 $ 0.35 $ 0.34 $ 0.33 $ 0.73 $ 0.65 Adjusted earnings per common share - diluted $ 0.37 $ 0.36 $ 0.39 $ 0.37 $ 0.35 $ 0.73 $ 0.70 Adjusted net income: Net income $ 66,669 $ 61,599 $ 69,413 $ 12,601 Add: Acquisition costs 4,443 3,890 - - Add: Acquisition - Day 1 CECL provision 900 4,400 - - Add: Employee separation 1,300 1,063 - - Add: Unrealized loss on equity security - - 6,200 - Add: Accelerated employee benefits - - 719 - Add: Goodwill impairment(2) - - - 7,397 Add: Loss on bond repositioning 1,130 - - - Less: BOLI settlement benefits(2) - - (1,841) - Less: Tax effect(1) (1,632) (2,335) (1,512) - Adjusted net income $ 72,810 $ 68,617 $ 72,979 $ 19,998 Preferred stock dividends $ 413 $ - $ - $ - Diluted weighted average common shares outstanding 49,340,066 50,002,054 52,030,582 52,548,547 Earnings per common share - diluted (GAAP) $ 1.34 $ 1.23 $ 1.33 $ 0.24 Adjusted earnings per common share - diluted $ 1.47 $ 1.37 $ 1.40 $ 0.38 Three Months Ended 6/30/2024 3/31/2024 12/31/2023 9/30/2023 12/31/2022 12/31/2020 Year Ended (Dollars in thousands, except per share data) 12/31/2023 12/31/2021 (Dollars in thousands, except per share data) 6/30/2023 Six Months Ended |
|
18 NON-GAAP RECONCILIATIONS 6/30/2024 3/31/2024 12/31/2023 9/30/2023 6/30/2023 6/30/2024 6/30/2023 Adjusted return on average assets: Net income (GAAP) $ 18,622 $ 18,223 $ 17,651 $ 16,863 $ 16,047 $ 36,845 $ 32,155 Adjusted net income 18,622 18,223 19,571 18,623 17,341 36,845 34,616 Average assets $ 7,494,941 $ 7,344,102 $ 7,231,611 $ 7,114,228 $ 6,929,972 $ 7,419,938 $ 6,821,987 Return on average assets (GAAP) 1.00 % 1.00 % 0.97 % 0.94 % 0.93 % 1.00 % 0.95 % Adjusted return on average assets 1.00 % 1.00 % 1.07 % 1.04 % 1.00 % 1.00 % 1.02 % 6/30/2024 3/31/2024 12/31/2023 9/30/2023 6/30/2023 6/30/2024 6/30/2023 Adjusted return on average common equity: Net income (GAAP) $ 18,622 $ 18,223 $ 17,651 $ 16,863 $ 16,047 $ 36,845 $ 32,155 Preferred stock dividends 155 155 155 155 103 310 103 Net income attributable to common stockholders (GAAP) $ 18,467 $ 18,068 $ 17,496 $ 16,708 $ 15,944 $ 36,535 $ 32,052 Adjusted net income 18,622 18,223 19,571 18,623 17,341 36,845 34,616 Preferred stock dividends 155 155 155 155 103 310 103 Adjusted net income attributable to common stockholders (GAAP) $ 18,467 $ 18,068 $ 19,416 $ 18,468 $ 17,238 $ 36,535 $ 34,513 Average common equity $ 701,483 $ 701,598 $ 647,882 $ 650,494 $ 639,741 $ 701,540 $ 629,901 Return on average common equity (GAAP) 10.59 % 10.36 % 10.71 % 10.19 % 10.00 % 10.47 % 10.26 % Adjusted return on average common equity 10.59 % 10.36 % 11.89 % 11.26 % 10.81 % 10.47 % 11.05 % 6/30/2024 12/31/2022 12/31/2021 12/31/2020 Pre-tax pre-provision profit: Net income before taxes $ 23,485 $ 23,023 $ 84,109 $ 77,572 $ 86,969 $ 15,314 Add: Provision for credit losses 2,383 1,655 14,489 11,501 (4,000) 56,700 Pre-tax pre-provision profit $ 25,868 $ 24,678 $ 98,598 $ 89,073 $ 82,969 $ 72,014 3/31/2024 Three Months Ended 12/31/2023 (Dollars in thousands) Six Months Ended (Dollars in thousands) Three Months Ended Year Ended Three Months Ended Six Months Ended (Dollars in thousands) |
|
19 NON-GAAP RECONCILIATIONS (1) Tax exempt income (tax-free municipal securities) is calculated on a tax equivalent basis. The incremental rate used is 21.0%. Tangible common stockholders' equity: Total stockholders' equity (GAAP) $ 727,878 $ 714,971 $ 708,143 $ 643,051 $ 651,483 Less: goodwill and other intangible assets 29,499 30,404 31,335 32,293 27,457 Less: preferred stock 7,750 7,750 7,750 7,750 7,750 Tangible common stockholders' equity $ 690,629 $ 676,817 $ 669,058 $ 603,008 $ 616,276 Common shares outstanding at end of period 49,250,140 49,400,466 49,335,888 49,295,036 48,653,487 Book value per common share (GAAP) $ 14.78 $ 14.47 $ 14.35 $ 13.04 $ 13.39 Tangible book value per common share $ 14.02 $ 13.70 $ 13.56 $ 12.23 $ 12.67 9/30/2023 6/30/2023 Tangible common stockholders' equity: Total stockholders' equity (GAAP) $ 708,143 $ 608,599 $ 667,573 $ 624,428 $ 601,644 Less: goodwill and other intangible assets 31,335 29,081 130 208 7,694 Less: preferred stock 7,750 - - - - Tangible common stockholders' equity $ 669,058 $ 579,518 $ 667,443 $ 624,220 $ 593,950 Common shares outstanding at end of period 49,335,888 48,448,215 50,450,045 51,679,516 51,969,203 Book value per common share (GAAP) $ 14.35 $ 12.56 $ 13.23 $ 12.08 $ 11.58 Tangible book value per common share $ 13.56 $ 11.96 $ 13.23 $ 12.08 $ 11.43 6/30/2024 3/31/2024 12/31/2023 9/30/2023 6/30/2023 6/30/2024 6/30/2023 Adjusted efficiency ratio - fully tax equivalent (FTE)(1 ) Non-interest expense (GAAP) $ 37,725 $ 37,505 $ 35,049 $ 36,354 $ 37,412 $ 75,230 $ 75,504 Less: Acquisition costs - - (1,300) (1,328) (338) - (1,815) Less: Core deposit intangible amortization (906) (931) (957) (922) (802) (1,837) (1,624) Less: Employee separation - - - - (1,300) - (1,300) Adjusted non-interest expense (numerator) $ 36,819 $ 36,574 $ 32,792 $ 34,104 $ 34,972 $ 73,393 $ 70,765 Net interest income 57,892 56,594 56,954 55,127 54,539 114,486 112,760 Tax equivalent interest income(1) 536 536 654 707 750 1,072 1,547 Non-interest income 5,701 5,589 4,483 5,981 5,779 11,290 10,200 Add: Loss on bond repositioning - - 1,130 - - - - Total tax-equivalent income (denominator) $ 64,129 $ 62,719 $ 63,221 $ 61,815 $ 61,068 $ 126,848 $ 124,507 Efficiency ratio (GAAP) 59.32 % 60.31 % 57.05 % 59.49 % 62.02 % 59.81 % 61.41 % Adjusted efficiency ratio - fully tax equivalent (FTE)(1 ) 57.41 % 58.31 % 51.87 % 55.17 % 57.27 % 57.86 % 56.84 % 12/31/2023 9/30/2023 6/30/2023 Six Months Ended Three Months Ended (Dollars in thousands, except per share data) (Dollars in thousands, except per share data) Three Months Ended 6/30/2024 3/31/2024 Year Ended 12/31/2023 12/31/2022 12/31/2021 (Dollars in thousands) |