UNITED STATES
SECURITIES AND EXCHANGE COMMISSION
Washington, D.C. 20549
FORM 8-K
CURRENT REPORT
Pursuant to Section 13 or 15(d) of the Securities Exchange Act of 1934
Date of Report (Date of earliest event reported): June 26, 2024
AEROVIRONMENT, INC.
(Exact name of registrant as specified in its charter)
Delaware |
|
001-33261 |
|
95-2705790 |
(State or other jurisdiction of |
|
(Commission File Number) |
|
(I.R.S. Employer Identification No.) |
incorporation or organization) |
|
|
|
|
241 18th Street South, Suite 415 |
|
|
Arlington, Virginia |
|
22202 |
(Address of Principal Executive Offices) |
|
(Zip Code) |
Registrant’s telephone number, including area code: (805) 520-8350
Securities registered pursuant to Section 12(b) of the Act:
Title of each class |
|
Trading Symbol(s) |
Name of each exchange on which registered |
Common Stock, par value $0.0001 per share |
|
AVAV |
The NASDAQ Stock Market LLC |
Check the appropriate box below if the Form 8-K filing is intended to simultaneously satisfy the filing obligation of the registrant under any of the following provisions (see General Instruction A.2. below):
☐ Written communications pursuant to Rule 425 under the Securities Act (17 CFR 230.425)
☐ Soliciting material pursuant to Rule 14a-12 under the Exchange Act (17 CFR 240.14a-12)
☐ Pre-commencement communications pursuant to Rule 14d-2(b) under the Exchange Act (17 CFR 240.14d-2(b))
☐ Pre-commencement communications pursuant to Rule 13e-4(c) under the Exchange Act (17 CFR 240.13e-4(c))
Indicate by check mark whether the registrant is an emerging growth company as defined in Rule 405 of the Securities Act of 1933 (§230.405 of this chapter) or Rule 12b-2 of the Securities Exchange Act of 1934 (§240.12b-2 of this chapter).
Emerging growth company ☐
If an emerging growth company, indicate by check mark if the registrant has elected not to use the extended transition period for complying with any new or revised financial accounting standards provided pursuant to Section 13(a) of the Exchange Act. ☐
Item 2.02. Results of Operations and Financial Condition
On June 26, 2024, AeroVironment, Inc. (the “Company”) issued a press release announcing fourth quarter financial results for the period ended April 30, 2024, a copy of which is attached hereto as Exhibit 99.1.
Item 7.01. Regulation FD Disclosure
The information under Item 2.02 above is incorporated herein by reference.
Attached as Exhibit 99.2 hereto is a presentation containing additional information regarding the Company’s fourth quarter fiscal 2024 financial results for the period ended April 30, 2024. A copy of the presentation is also available on the investor relations section of the Company’s website at https://investor.avinc.com/events-and-presentations. The information contained on the Company’s website is not incorporated by reference into, and does not form a part of, this Current Report on Form 8-K.
In addition to historic information, this report, including the exhibits, contains forward-looking statements regarding events, performance and financial trends. Various factors could affect future results and could cause actual results to differ materially from those expressed in or implied by the forward-looking statements. Some of those factors are identified in the exhibits, and in our periodic reports filed with the Securities and Exchange Commission.
The information in this Current Report on Form 8-K, including the exhibits, is furnished pursuant to Items 2.02 and 7.01 and shall not be deemed “filed” for purposes of Section 18 of the Securities Exchange Act of 1934, as amended (the “Exchange Act”), or otherwise subject to the liabilities of that section, nor shall it be deemed incorporated by reference in any filing of AeroVironment, Inc. under the Securities Act of 1933, as amended, or the Exchange Act, whether made before or after the date hereof, except as shall be expressly set forth by specific reference in such filing.
Item 9.01. Financial Statements and Exhibits
(d) Exhibits.
Exhibit |
|
|
Number |
|
Description |
99.1 |
|
Press release issued by AeroVironment, Inc., dated June 26, 2024. |
99.2 |
|
|
104 |
|
Cover Page Interactive Data File (embedded within the Inline XBRL document). |
2
SIGNATURE
Pursuant to the requirements of the Securities Exchange Act of 1934, the Registrant has duly caused this report to be signed on its behalf by the undersigned hereunto duly authorized.
|
AEROVIRONMENT, INC. |
|
|
|
|
|
|
|
Date: June 26, 2024 |
By: |
/s/ Wahid Nawabi |
|
|
Wahid Nawabi |
|
|
Chairman, President and Chief Executive Officer |
3
Exhibit 99.1

AeroVironment Announces Fiscal 2024 Fourth Quarter and Fiscal Year Results
ARLINGTON, VA, June 26, 2024 — AeroVironment, Inc. (“AeroVironment” or the “Company”) reported today financial results for the fiscal fourth quarter and year ended April 30, 2024.
Fourth Quarter and Fiscal Year Highlights:
| ● | Record fourth quarter revenue of $197.0 million and fiscal year revenue of $716.7 million, up 6% and 33%, year-over-year, respectively |
| ● | Fourth quarter net income of $6.0 million and adjusted EBITDA of $22.2 million and fiscal year net income of $60.0 million and adjusted EBITDA of $127.8 million |
| ● | Company on track for nearly 12% top line growth in fiscal year 2025 with expected revenue of between $790 million and $820 million |
“AeroVironment has yet again delivered exceptional results this past quarter resulting in record revenue and full year profitability for the company,” said Wahid Nawabi, AeroVironment chairman, president and chief executive officer. “We are pleased to also announce our full year revenue increased 33% from last year’s results. Our Loitering Munitions Segment continues to be a key growth driver for our company, and we have expanded capacity to deliver these much-needed systems to keep up with increasing customer demand.
As the need for our autonomous systems continues to rapidly increase worldwide, AeroVironment stands ready to meet our customer’s needs while delivering solid bottom-line results for our shareholders. We are therefore issuing fiscal year 2025 revenue guidance of between $790 million and $820 million, another record year and double-digit revenue increase from fiscal year 2024.”
FISCAL 2024 FOURTH QUARTER RESULTS
Revenue for the fourth quarter of fiscal 2024 was $197.0 million, an increase of 6% as compared to $186.0 million for the fourth quarter of fiscal 2023, reflecting higher product sales of $23.1 million, partially offset by a decrease in service revenue of $12.1 million. From a segment standpoint, the year-over-year increase was due to revenue growth in Loitering Munitions Systems (“LMS”) of 74%, partially offset by decreases in UnCrewed Systems (“UxS”), the renamed Unmanned Systems segment, of 15% and MacCready Works (“MW”) of 9%.
Gross margin for the fourth quarter of fiscal 2024 was $75.6 million, an increase of 11% as compared to $68.4 million for the fourth quarter of fiscal 2023, reflecting higher service margin of $8.0 million, partially offset by lower product gross margin of $0.8 million. As a percentage of revenue, gross margin increased to 38% from 37%, primarily due to a decrease in the proportion of service revenue to total revenue driven by the closure of COCO site locations, partially offset by product mix. Gross margin was favorably impacted by a decrease in depreciation charges for in-service assets of $4.4 million related to the closure of COCO site locations during fiscal year 2023. Gross margin was negatively impacted by $3.9 million of intangible amortization expense and other related non-cash purchase accounting expenses in the fourth quarter of fiscal 2024 as compared to $3.6 million in the fourth quarter of fiscal 2023.
Income from operations for the fourth quarter of fiscal 2024 was $5.9 million as compared to loss from operations of $(165.7) million for the fourth quarter of last fiscal year. The increase year-over-year was primarily due to the MUAS goodwill impairment of $156.0 million recorded during the fourth quarter of fiscal 2023, lower selling, general and administrative (“SG&A”) expense of $27.0 million inclusive of $34.1 million of accelerated intangible amortization expenses associated with the closure of all of the Company’s MUAS COCO sites during the fourth quarter of fiscal 2023, and higher gross margin of $7.2 million, partially offset by an increase in research and development (“R&D”) expense of $18.6 million.
1
Other loss, net, for the fourth quarter of fiscal 2024 was $1.5 million, as compared to $0.8 million for the fourth quarter of last fiscal year. The increase in other loss, net was primarily due to increases in net unrealized losses on investment holdings, partially offset by a decrease in interest expense.
Provision for (benefit from) income taxes for the fourth quarter of fiscal 2024 was $1.8 million, as compared to $(6.3) million for the fourth quarter of last fiscal year. The increase in provision for income taxes was primarily attributable to the increase in net income before income taxes.
Net income attributable to AeroVironment for the fourth quarter of fiscal 2024 was $6.0 million, or $0.22 per diluted share, as compared to net loss of $(160.5) million, or $(6.31) per diluted share, in the prior-year period, respectively.
Non-GAAP adjusted EBITDA for the fourth quarter of fiscal 2024 was $22.2 million and non-GAAP earnings per diluted share were $0.43, as compared to $46.4 million and $0.99, respectively, for the fourth quarter of fiscal 2023.
BACKLOG
As of April 30, 2024, funded backlog (defined as remaining performance obligations under firm orders for which funding is currently appropriated to us under a customer contract) was $400.2 million, as compared to $424.1 million as of April 30, 2023. Funded backlog as of April 30, 2024 does not include new orders related to recently announced program wins such as the Low Altitude Stalking and Strike Ordnance or “LASSO” program, Organic Precision Fires-Light or “OPF-L” program, the Replicator Initiative and the Ukraine Aid Initiative as well as our first Lithuanian order for Switchblade 300 and 600.
FISCAL 2025 — OUTLOOK FOR THE FULL YEAR
For fiscal year 2025, the Company expects revenue of between $790 million and $820 million, net income of between $74 million and $83 million, Non-GAAP adjusted EBITDA of between $143 million and $153 million, earnings per diluted share of between $2.61 and $2.92 and non-GAAP earnings per diluted share, which excludes amortization of intangible assets, other non-cash purchase accounting expenses and equity securities investments gains or losses, of between $3.18 and $3.49.
The foregoing estimates are forward-looking and reflect management’s view of current and future market conditions, subject to certain risks and uncertainties, including certain assumptions with respect to our ability to efficiently and on a timely basis integrate acquisitions, obtain and retain government contracts, changes in the timing and/or amount of government spending, react to changes in the demand for our products and services, activities of competitors, changes in the regulatory environment, and general economic and business conditions in the United States and elsewhere in the world. Investors are reminded that actual results may differ materially from these estimates.
CONFERENCE CALL AND PRESENTATION
In conjunction with this release, AeroVironment, Inc. will host a conference call today, Wednesday, June 26, 2024, at 4:30 pm Eastern Time that will be webcast live. Wahid Nawabi, chairman, president and chief executive officer, Kevin P. McDonnell, chief financial officer and Jonah Teeter-Balin, senior director corporate development and investor relations, will host the call.
Investors may access the call by registering via the following participant registration link up to ten minutes prior to the start time.
Participant registration URL: https://register.vevent.com/register/BIda168288195747ed8cf612e20a3e0343
Investors may also listen to the live audio webcast via the Investor Relations page of the AeroVironment, Inc. website, http://investor.avinc.com. Please allow 15 minutes prior to the call to download and install any necessary audio software.
2
A supplementary investor presentation for the fourth quarter fiscal year 2024 can be accessed at https://investor.avinc.com/events-and-presentations.
Audio Replay
An audio replay of the event will be archived on the Investor Relations section of the Company's website at http://investor.avinc.com.
ABOUT AEROVIRONMENT, INC.
AeroVironment (NASDAQ: AVAV) provides technology solutions at the intersection of robotics, sensors, software analytics and connectivity that deliver more actionable intelligence so you can Proceed with Certainty. Headquartered in Virginia, AeroVironment is a global leader in intelligent, multi-domain robotic systems, and serves defense, government and commercial customers. For more information, visit www.avinc.com.
FORWARD-LOOKING STATEMENTS
This press release contains "forward-looking statements" as that term is defined in the Private Securities Litigation Reform Act of 1995. Forward-looking statements include, without limitation, any statement that may predict, forecast, indicate or imply future results, performance or achievements, and may contain words such as “believe,” “anticipate,” “expect,” “estimate,” “intend,” “project,” “plan,” or words or phrases with similar meaning. Forward-looking statements are based on current expectations, forecasts and assumptions that involve risks and uncertainties, including, but not limited to, economic, competitive, governmental and technological factors outside of our control, that may cause our business, strategy or actual results to differ materially from the forward-looking statements.
Factors that could cause actual results to differ materially from the forward-looking statements include, but are not limited to, the impact of our ability to successfully close and integrate acquisitions into our operations and avoid disruptions from acquisition transactions that will harm our business; the recording of goodwill and other intangible assets as part of acquisitions that are subject to potential impairments in the future and any realization of such impairments; any actual or threatened disruptions to our relationships with our distributors, suppliers, customers and employees, including shortages in components for our products; the ability to timely and sufficiently integrate international operations into our ongoing business and compliance programs; reliance on sales to the U.S. government, including uncertainties in classification, pricing or potentially burdensome imposed terms for certain types of government contracts; availability of U.S. government funding for defense procurement and R&D programs; our ability to win U.S. and international government R&D and procurement programs; changes in the timing and/or amount of government spending, including due to continuing resolutions; adverse impacts of a U.S. government shutdown; our reliance on limited relationships to fund our development of HAPS UAS; our ability to execute contracts for anticipated sales, perform under such contracts and other existing contracts and obtain new contracts; risks related to our international business, including compliance with export control laws; the extensive and increasing regulatory requirements governing our contracts with the U.S. government and international customers; the consequences to our financial position, business and reputation that could result from failing to comply with such regulatory requirements; unexpected technical and marketing difficulties inherent in major research and product development efforts; the impact of potential security and cyber threats or the risk of unauthorized access to and resulting misuse of our, our customers’ and/or our suppliers’ information and systems; failure to remain a market innovator, to create new market opportunities or to expand into new markets; our ability to increase production capacity to support anticipated growth; unexpected changes in significant operating expenses, including components and raw materials; failure to develop new products or integrate new technology into current products; any increase in litigation activity or unfavorable results in legal proceedings, including pending class actions; our ability to respond and adapt to legal, regulatory and government budgetary changes, including those resulting from the impact of pandemics and similar outbreaks; our ability to comply with the covenants in our loan documents; our ability to attract and retain skilled employees; the impact of inflation; and general economic and business conditions in the United States and elsewhere in the world; and the failure to establish and maintain effective internal control over financial reporting. For a further list and description of such risks and uncertainties, see the reports we file with the Securities and Exchange Commission. We do not intend, and undertake no obligation, to update any forward-looking statements, whether as a result of new information, future events or otherwise.
NON-GAAP MEASURES
In addition to the financial measures prepared in accordance with generally accepted accounting principles (GAAP), this earnings release also contains non-GAAP financial measures. See in the financial tables below the calculation of these measures, the reasons why we believe these measures provide useful information to investors, and a reconciliation of these measures to the most directly comparable GAAP measures.
3
– Financial Tables Follow –
4
AeroVironment, Inc.
Consolidated Statements of Operations
(In thousands except share and per share data)
|
|
Three Months Ended |
|
Year Ended |
|
||||||||
|
|
April 30, |
|
April 30, |
|
April 30, |
|
April 30, |
|
||||
|
|
2024 |
|
2023 |
|
2024 |
|
2023 |
|
||||
|
|
(Unaudited) |
|
(Unaudited) |
|
||||||||
Revenue: |
|
|
|
|
|
|
|
|
|
|
|
|
|
Product sales |
|
$ |
164,598 |
|
$ |
141,529 |
|
$ |
585,771 |
|
$ |
353,062 |
|
Contract services |
|
|
32,381 |
|
|
44,512 |
|
|
130,949 |
|
|
187,474 |
|
|
|
|
196,979 |
|
|
186,041 |
|
|
716,720 |
|
|
540,536 |
|
Cost of sales: |
|
|
|
|
|
|
|
|
|
|
|
|
|
Product sales |
|
|
100,048 |
|
|
76,209 |
|
|
340,174 |
|
|
203,419 |
|
Contract services |
|
|
21,297 |
|
|
41,432 |
|
|
92,615 |
|
|
163,603 |
|
|
|
|
121,345 |
|
|
117,641 |
|
|
432,789 |
|
|
367,022 |
|
Gross margin: |
|
|
|
|
|
|
|
|
|
|
|
|
|
Product sales |
|
|
64,550 |
|
|
65,320 |
|
|
245,597 |
|
|
149,643 |
|
Contract services |
|
|
11,084 |
|
|
3,080 |
|
|
38,334 |
|
|
23,871 |
|
|
|
|
75,634 |
|
|
68,400 |
|
|
283,931 |
|
|
173,514 |
|
Selling, general and administrative |
|
|
34,620 |
|
|
61,603 |
|
|
114,420 |
|
|
131,905 |
|
Research and development |
|
|
35,069 |
|
|
16,462 |
|
|
97,687 |
|
|
64,255 |
|
Impairment of goodwill |
|
|
— |
|
|
156,017 |
|
|
— |
|
|
156,017 |
|
Income (loss) from operations |
|
|
5,945 |
|
|
(165,682) |
|
|
71,824 |
|
|
(178,663) |
|
Other (loss) income: |
|
|
|
|
|
|
|
|
|
|
|
|
|
Interest expense, net |
|
|
(148) |
|
|
(2,646) |
|
|
(4,220) |
|
|
(9,368) |
|
Other (expense) income, net |
|
|
(1,390) |
|
|
1,837 |
|
|
(4,373) |
|
|
(346) |
|
Income (loss) before income taxes |
|
|
4,407 |
|
|
(166,491) |
|
|
63,231 |
|
|
(188,377) |
|
Provision for (benefit from) income taxes |
|
|
(1,819) |
|
|
(6,281) |
|
|
1,891 |
|
|
(14,663) |
|
Equity method investment loss, net of tax |
|
|
(180) |
|
|
(263) |
|
|
(1,674) |
|
|
(2,453) |
|
Net income (loss) |
|
|
6,046 |
|
|
(160,473) |
|
|
59,666 |
|
|
(176,167) |
|
Net income attributable to noncontrolling interest |
|
|
— |
|
|
— |
|
|
— |
|
|
(45) |
|
Net income (loss) attributable to AeroVironment, Inc. |
|
$ |
6,046 |
|
$ |
(160,473) |
|
$ |
59,666 |
|
$ |
(176,212) |
|
Net income (loss) per share attributable to AeroVironment, Inc. |
|
|
|
|
|
|
|
|
|
|
|
|
|
Basic |
|
$ |
0.22 |
|
$ |
(6.31) |
|
$ |
2.19 |
|
$ |
(7.04) |
|
Diluted |
|
$ |
0.22 |
|
$ |
(6.31) |
|
$ |
2.18 |
|
$ |
(7.04) |
|
Weighted-average shares outstanding: |
|
|
|
|
|
|
|
|
|
|
|
|
|
Basic |
|
|
27,916,276 |
|
|
25,451,034 |
|
|
27,203,417 |
|
|
25,044,881 |
|
Diluted |
|
|
28,096,737 |
|
|
25,451,034 |
|
|
27,327,993 |
|
|
25,044,881 |
|
5
AeroVironment, Inc.
Consolidated Balance Sheets
(In thousands except share data)
|
|
April 30, |
|
||||
|
|
2024 |
|
2023 |
|
||
|
|
|
|
|
|
|
|
Assets |
|
(Unaudited) |
|
|
|
|
|
Current assets: |
|
|
|
|
|
|
|
Cash and cash equivalents |
|
$ |
73,301 |
|
$ |
132,859 |
|
Accounts receivable, net of allowance for doubtful accounts of $159 at April 30, 2024 and $156 at April 30, 2023 |
|
|
70,305 |
|
|
87,633 |
|
Unbilled receivables and retentions |
|
|
199,474 |
|
|
105,653 |
|
Inventories, net |
|
|
150,168 |
|
|
138,814 |
|
Prepaid expenses and other current assets |
|
|
22,333 |
|
|
12,043 |
|
Total current assets |
|
|
515,581 |
|
|
477,002 |
|
Long-term investments |
|
|
20,960 |
|
|
23,613 |
|
Property and equipment, net |
|
|
46,602 |
|
|
39,795 |
|
Operating lease right-of-use assets |
|
|
30,033 |
|
|
27,363 |
|
Deferred income taxes |
|
|
41,303 |
|
|
27,206 |
|
Intangibles, net |
|
|
72,224 |
|
|
43,577 |
|
Goodwill |
|
|
275,652 |
|
|
180,801 |
|
Other assets |
|
|
13,505 |
|
|
5,220 |
|
Total assets |
|
$ |
1,015,860 |
|
$ |
824,577 |
|
Liabilities and stockholders’ equity |
|
|
|
|
|
|
|
Current liabilities: |
|
|
|
|
|
|
|
Accounts payable |
|
$ |
48,298 |
|
$ |
31,355 |
|
Wages and related accruals |
|
|
44,312 |
|
|
35,637 |
|
Customer advances |
|
|
11,192 |
|
|
16,645 |
|
Current portion of long-term debt |
|
|
10,000 |
|
|
7,500 |
|
Current operating lease liabilities |
|
|
9,841 |
|
|
8,229 |
|
Income taxes payable |
|
|
4,162 |
|
|
2,342 |
|
Other current liabilities |
|
|
17,074 |
|
|
19,626 |
|
Total current liabilities |
|
|
144,879 |
|
|
121,334 |
|
Long-term debt, net of current portion |
|
|
17,092 |
|
|
125,904 |
|
Non-current operating lease liabilities |
|
|
22,745 |
|
|
21,189 |
|
Other non-current liabilities |
|
|
2,132 |
|
|
746 |
|
Liability for uncertain tax positions |
|
|
5,603 |
|
|
2,705 |
|
Deferred income taxes |
|
|
664 |
|
|
1,729 |
|
Commitments and contingencies |
|
|
|
|
|
|
|
Stockholders’ equity: |
|
|
|
|
|
|
|
Preferred stock, $0.0001 par value: |
|
|
|
|
|
|
|
Authorized shares—10,000,000; none issued or outstanding at April 30, 2024 and April 30, 2023 |
|
|
— |
|
|
— |
|
Common stock, $0.0001 par value: |
|
|
|
|
|
|
|
Authorized shares—100,000,000 |
|
|
|
|
|
|
|
Issued and outstanding shares—28,134,438 shares at April 30, 2024 and 26,216,897 shares at April 30, 2023 |
|
|
4 |
|
|
4 |
|
Additional paid-in capital |
|
|
597,646 |
|
|
384,397 |
|
Accumulated other comprehensive loss |
|
|
(5,592) |
|
|
(4,452) |
|
Retained earnings |
|
|
230,687 |
|
|
171,021 |
|
Total stockholders’ equity |
|
|
822,745 |
|
|
550,970 |
|
Total liabilities and stockholders’ equity |
|
$ |
1,015,860 |
|
$ |
824,577 |
|
6
AeroVironment, Inc.
Consolidated Statements of Cash Flows
(In thousands)
|
|
Year Ended April 30, |
|||||||
|
|
2024 |
|
2023 |
|
2022 |
|||
Operating activities |
|
|
|
|
|
|
|
||
Net income (loss) |
|
$ |
59,666 |
|
$ |
(176,167) |
|
$ |
(4,185) |
Adjustments to reconcile net income (loss) to cash provided by (used in) operating activities: |
|
|
|
|
|
|
|
|
|
Depreciation and amortization |
|
|
35,749 |
|
|
99,999 |
|
|
60,825 |
Impairment of goodwill |
|
|
— |
|
|
156,017 |
|
|
— |
Loss (gain) from equity method investments |
|
|
1,674 |
|
|
2,453 |
|
|
(5,889) |
Loss on deconsolidation of previously controlled subsidiary |
|
|
— |
|
|
189 |
|
|
— |
Amortization of debt issuance costs |
|
|
1,009 |
|
|
845 |
|
|
789 |
Provision for doubtful accounts |
|
|
4 |
|
|
99 |
|
|
(6) |
Reserve for inventory excess and obsolescence |
|
|
13,937 |
|
|
8,136 |
|
|
2,271 |
Other non-cash expense, net |
|
|
1,316 |
|
|
1,995 |
|
|
649 |
Non-cash lease expense |
|
|
10,400 |
|
|
8,048 |
|
|
6,814 |
Loss on foreign currency transactions |
|
|
22 |
|
|
119 |
|
|
233 |
Unrealized loss on available-for-sale equity securities, net |
|
|
3,945 |
|
|
132 |
|
|
— |
Deferred income taxes |
|
|
(23,290) |
|
|
(18,661) |
|
|
(7,282) |
Stock-based compensation |
|
|
17,069 |
|
|
10,765 |
|
|
5,390 |
Loss on disposal of property and equipment |
|
|
621 |
|
|
1,497 |
|
|
8,277 |
Amortization of debt securities discount |
|
|
— |
|
|
125 |
|
|
242 |
Changes in operating assets and liabilities, net of acquisitions: |
|
|
|
|
|
|
|
|
|
Accounts receivable |
|
|
19,208 |
|
|
(27,423) |
|
|
3,084 |
Unbilled receivables and retentions |
|
|
(92,850) |
|
|
(1,446) |
|
|
(31,883) |
Inventories |
|
|
(23,045) |
|
|
(61,846) |
|
|
(29,431) |
Income taxes receivable |
|
|
— |
|
|
442 |
|
|
(442) |
Prepaid expenses and other assets |
|
|
(20,279) |
|
|
(3,821) |
|
|
(4,534) |
Accounts payable |
|
|
12,968 |
|
|
12,538 |
|
|
(7,044) |
Other liabilities |
|
|
(2,832) |
|
|
(2,635) |
|
|
(7,496) |
Net cash provided by (used in) operating activities |
|
|
15,292 |
|
|
11,400 |
|
|
(9,618) |
Investing activities |
|
|
|
|
|
|
|
|
|
Acquisition of property and equipment |
|
|
(22,983) |
|
|
(14,868) |
|
|
(22,289) |
Equity method investments |
|
|
(3,074) |
|
|
(5,778) |
|
|
(6,884) |
Equity security investments |
|
|
— |
|
|
(5,100) |
|
|
— |
Business acquisitions, net of cash acquired |
|
|
(24,157) |
|
|
(5,105) |
|
|
(46,150) |
Acquisition of intangibles |
|
|
(1,500) |
|
|
— |
|
|
— |
Proceeds from sale of ownership in equity method investment |
|
|
— |
|
|
— |
|
|
6,497 |
Proceeds from loan repayment |
|
|
— |
|
|
— |
|
|
4,345 |
Proceeds from deconsolidation of previously controlled subsidiary, net of cash deconsolidated |
|
|
— |
|
|
(635) |
|
|
— |
Redemptions of available-for-sale investments |
|
|
— |
|
|
26,059 |
|
|
35,851 |
Purchases of available-for-sale investments |
|
|
— |
|
|
(1,326) |
|
|
(23,882) |
Other |
|
|
— |
|
|
(250) |
|
|
224 |
Net cash used in investing activities |
|
|
(51,714) |
|
|
(7,003) |
|
|
(52,288) |
Financing activities |
|
|
|
|
|
|
|
|
|
Principal payments of term loan |
|
|
(107,000) |
|
|
(55,000) |
|
|
(10,000) |
Holdback and retention payments for business acquisition |
|
|
(500) |
|
|
— |
|
|
(7,814) |
Payment of contingent consideration |
|
|
(2,132) |
|
|
— |
|
|
— |
Proceeds from shares issued, net of issuance costs |
|
|
88,437 |
|
|
104,649 |
|
|
— |
Payment of debt issuance costs |
|
|
(37) |
|
|
— |
|
|
(293) |
Tax withholding payment related to net settlement of equity awards |
|
|
(1,596) |
|
|
(1,065) |
|
|
(1,245) |
Exercise of stock options |
|
|
— |
|
|
2,278 |
|
|
2,776 |
Other |
|
|
(24) |
|
|
(28) |
|
|
(31) |
Net cash (used in) provided by financing activities |
|
|
(22,852) |
|
|
50,834 |
|
|
(16,607) |
Effects of currency translation on cash and cash equivalents |
|
|
(284) |
|
|
397 |
|
|
(1,319) |
Net (decrease) increase in cash, cash equivalents, and restricted cash |
|
|
(59,558) |
|
|
55,628 |
|
|
(79,832) |
Cash, cash equivalents and restricted cash at beginning of period |
|
|
132,859 |
|
|
77,231 |
|
|
157,063 |
Cash, cash equivalents and restricted cash at end of period |
|
$ |
73,301 |
|
$ |
132,859 |
|
$ |
77,231 |
Supplemental disclosures of cash flow information |
|
|
|
|
|
|
|
|
|
Cash paid, net during the period for: |
|
|
|
|
|
|
|
|
|
Income taxes |
|
$ |
20,438 |
|
$ |
2,911 |
|
$ |
1,879 |
Interest |
|
$ |
6,823 |
|
$ |
10,229 |
|
$ |
5,025 |
Non-cash activities |
|
|
|
|
|
|
|
|
|
Issuance of common stock for business acquisition |
|
$ |
109,820 |
|
$ |
— |
|
$ |
— |
Unrealized gain (loss) on available-for-sale investments, net of deferred tax expense of $0, $0 and $8 for the fiscal years ended April 30, 2024, 2023 and 2022, respectively |
|
$ |
— |
|
$ |
53 |
|
$ |
(43) |
Change in foreign currency translation adjustments |
|
$ |
(1,140) |
|
$ |
2,009 |
|
$ |
6,814 |
Issuances of inventory to property and equipment, ISR in-service assets |
|
$ |
— |
|
$ |
6,306 |
|
$ |
17,481 |
Acquisitions of property and equipment included in accounts payable |
|
$ |
986 |
|
$ |
721 |
|
$ |
1,117 |
7
AeroVironment, Inc.
Reportable Segment Results (Unaudited)
(In thousands)
|
|
Three Months Ended April 30, 2024 |
||||||||||
|
|
UxS |
|
LMS |
|
MW |
|
Total |
||||
Revenue: |
|
|
|
|
|
|
|
|
|
|
|
|
Product sales |
|
$ |
96,365 |
|
$ |
68,218 |
|
$ |
15 |
|
$ |
164,598 |
Contract services |
|
|
7,371 |
|
|
5,545 |
|
|
19,465 |
|
|
32,381 |
|
|
$ |
103,736 |
|
$ |
73,763 |
|
$ |
19,480 |
|
$ |
196,979 |
|
|
|
|
|
|
|
|
|
|
|
|
|
Segment adjusted income (loss) from operations |
|
$ |
9,074 |
|
$ |
12,717 |
|
$ |
(10,079) |
|
|
|
|
|
Three Months Ended April 30, 2023 |
||||||||||
|
|
UxS |
|
LMS |
|
MW |
|
Total |
||||
Revenue: |
|
|
|
|
|
|
|
|
|
|
|
|
Product sales |
|
$ |
107,572 |
|
$ |
33,911 |
|
$ |
46 |
|
$ |
141,529 |
Contract services |
|
|
14,600 |
|
|
8,586 |
|
|
21,326 |
|
|
44,512 |
|
|
$ |
122,172 |
|
$ |
42,497 |
|
$ |
21,372 |
|
$ |
186,041 |
|
|
|
|
|
|
|
|
|
|
|
|
|
Segment adjusted income (loss) from operations |
|
$ |
25,354 |
|
$ |
7,230 |
|
$ |
(435) |
|
|
|
8
AeroVironment, Inc.
Reconciliation of non-GAAP Earnings per Diluted Share (Unaudited)
|
|
|
|
|
|
|
|
|
|
|
||
|
|
Three Months Ended |
|
Three Months Ended |
|
Year Ended |
|
Year Ended |
||||
|
|
April 30, 2024 |
|
April 30, 2023 |
|
April 30, 2024 |
|
April 30, 2023 |
||||
|
|
|
|
|
|
|
|
|
|
|
|
|
Earnings (loss) per diluted share |
|
$ |
0.22 |
|
$ |
(6.31) |
|
$ |
2.18 |
|
$ |
(7.04) |
Acquisition-related expenses |
|
|
0.01 |
|
|
0.01 |
|
|
0.06 |
|
|
0.05 |
Amortization of acquired intangible assets and other purchase accounting adjustments |
|
|
0.15 |
|
|
0.23 |
|
|
0.54 |
|
|
0.92 |
Equity method and equity securities investments activity, net |
|
|
0.05 |
|
|
(0.06) |
|
|
0.21 |
|
|
0.10 |
Goodwill impairment |
|
|
— |
|
|
6.10 |
|
|
— |
|
|
6.19 |
Accelerated intangible amortization |
|
|
— |
|
|
1.02 |
|
|
— |
|
|
1.04 |
Earnings per diluted share as adjusted (Non-GAAP) |
|
$ |
0.43 |
|
$ |
0.99 |
|
$ |
2.99 |
|
$ |
1.26 |
Reconciliation of non-GAAP adjusted EBITDA (Unaudited)
|
|
|
|
|
|
|
|
|
|
|
|
|
|
|
Three Months Ended |
|
Three Months Ended |
|
Year Ended |
|
Year Ended |
||||
(in millions) |
|
April 30, 2024 |
|
April 30, 2023 |
|
April 30, 2024 |
|
April 30, 2023 |
||||
Net income (loss) |
|
$ |
6.0 |
|
$ |
(160.5) |
|
$ |
59.7 |
|
$ |
(176.2) |
Interest expense, net |
|
|
0.1 |
|
|
2.6 |
|
|
4.2 |
|
|
9.4 |
Provision for (benefit from) income taxes |
|
|
(1.8) |
|
|
(6.3) |
|
|
1.9 |
|
|
(14.7) |
Depreciation and amortization |
|
|
10.9 |
|
|
52.0 |
|
|
35.7 |
|
|
100.0 |
EBITDA (Non-GAAP) |
|
|
15.2 |
|
|
(112.2) |
|
|
101.5 |
|
|
(81.5) |
Stock-based compensation |
|
|
4.6 |
|
|
3.7 |
|
|
17.1 |
|
|
10.8 |
Equity method and equity securities investments activity, net |
|
|
1.4 |
|
|
(1.5) |
|
|
5.6 |
|
|
2.6 |
Amortization of cloud computing arrangement implementation |
|
|
0.6 |
|
|
0.1 |
|
|
1.5 |
|
|
0.7 |
Acquisition-related expenses |
|
|
0.4 |
|
|
0.3 |
|
|
2.1 |
|
|
1.4 |
Goodwill impairment |
|
|
— |
|
|
156.0 |
|
|
— |
|
|
156.0 |
Adjusted EBITDA (Non-GAAP) |
|
$ |
22.2 |
|
$ |
46.4 |
|
$ |
127.8 |
|
$ |
90.0 |
9
Reconciliation of Forecast Earnings per Diluted Share (Unaudited)
|
|
|
|
|
|
Fiscal year ending |
|
|
|
April 30, 2025 |
|
Forecast earnings per diluted share |
|
$ |
2.61 - 2.92 |
Amortization of acquired intangible assets and other purchase accounting adjustments |
|
|
0.51 |
Equity method and equity securities investments activity, net |
|
|
0.06 |
Forecast earnings per diluted share as adjusted (Non-GAAP) |
|
$ |
3.18 - 3.49 |
Reconciliation of 2025 Forecast and Fiscal Year 2024 Actual Non-GAAP adjusted EBITDA (Unaudited)
|
|
|
|
|
|
|
|
|
Fiscal year ending |
|
Fiscal year ended |
||
(in millions) |
|
April 30, 2025 |
|
April 30, 2024 |
||
Net income |
|
$ |
74 - 83 |
|
$ |
60 |
Interest expense, net |
|
|
2 |
|
|
4 |
Provision for income taxes |
|
|
7 |
|
|
2 |
Depreciation and amortization |
|
|
36 |
|
|
36 |
EBITDA (Non-GAAP) |
|
|
119 - 129 |
|
|
102 |
Stock-based compensation |
|
|
20 |
|
|
17 |
Equity method and equity securities investments activity, net |
|
|
2 |
|
|
6 |
Amortization of cloud computing arrangement implementation |
|
|
2 |
|
|
2 |
Acquisition-related expenses |
|
|
— |
|
|
2 |
Adjusted EBITDA (Non-GAAP) |
|
$ |
143 - 153 |
|
$ |
128 |
10
Statement Regarding Non-GAAP Measures
The non-GAAP measures set forth above should be considered in addition to, and not as a replacement for or superior to, the comparable GAAP measures, and may not be comparable to similarly titled measures reported by other companies. Management believes that these measures provide useful information to investors by offering additional ways of viewing our results that, when reconciled to the corresponding GAAP measures, help our investors to understand the long-term profitability trends of our business and compare our profitability to prior and future periods and to our peers. In addition, management uses these non-GAAP measures to evaluate our operating and financial performance.
Non-GAAP Adjusted Operating Income
Adjusted operating income is defined as operating income before intangible amortization, amortization of non-cash purchase accounting adjustments, goodwill impairment and acquisition related expenses.
Non-GAAP Earnings per Diluted Share
We exclude the acquisition-related expenses, amortization of acquisition-related intangible assets, equity securities investments gains or losses, goodwill impairment and one-time non-operating items because we believe this facilitates more consistent comparisons of operating results over time between our newly acquired and existing businesses, and with our peer companies. We believe, however, that it is important for investors to understand that such intangible assets contribute to revenue generation and that intangible asset amortization will recur in future periods until such intangible assets have been fully amortized.
Adjusted EBITDA (Non-GAAP)
Adjusted EBITDA is defined as net income before interest income, interest expense, income tax expense (benefit) and depreciation and amortization including amortization of purchase accounting adjustments, adjusted for the impact of certain other non-cash items, including amortization of implementation of cloud computing arrangements, stock-based compensation, acquisition related expenses, equity method investment gains or losses, equity securities investments gains or losses, goodwill impairment and one-time non-operating gains or losses. We present Adjusted EBITDA, which is not a recognized financial measure under U.S. GAAP, because we believe it is frequently used by analysts, investors and other interested parties to evaluate companies in our industry. We believe this facilitates more consistent comparisons of operating results over time between our newly acquired and existing businesses, and with our peer companies. We believe, however, that it is important for investors to understand that such intangible assets contribute to revenue generation, intangible asset amortization will recur in future periods until such intangible assets have been fully amortized and that interest and income tax expenses will recur in future periods. In addition, Adjusted EBITDA may not be comparable to similarly titled measures used by other companies in our industry or across different industries.
11
/////////////////////////////////////////////////////////////////////////////////////////////////////////////////////////////////////
For additional media and information, please follow us


CONTACT
Jonah Teeter-Balin
+1 (805) 520-8350 x4278
https://investor.avinc.com/contact-and-faq/contact-us
12
|
Slide 1 | © 2024 AeroVironment, Inc. Fourth Quarter Fiscal Year 2024 Earnings Presentation June 26, 2024 |
|
Slide 2 052620 | © 2024 AeroVironment, Inc. Safe Harbor Statement Factors that could cause actual results to differ materially from the forward-looking statements include, but are not limited to, the impact of our ability to successfully close and integrate acquisitions into our operations and avoid disruptions from acquisition transactions that will harm our business; the recording of goodwill and other intangible assets as part of acquisitions that are subject to potential impairments in the future and any realization of such impairments; any actual or threatened disruptions to our relationships with our distributors, suppliers, customers and employees, including shortages in components for our products; the ability to timely and sufficiently integrate international operations into our ongoing business and compliance programs; reliance on sales to the U.S. government, including uncertainties in classification, pricing or potentially burdensome imposed terms for certain types of government contracts; availability of U.S. government funding for defense procurement and R&D programs; our ability to win U.S. and international government R&D and procurement programs; changes in the timing and/or amount of government spending, including due to continuing resolutions; adverse impacts of a U.S. government shutdown; our reliance on limited relationships to fund our development of HAPS UAS; our ability to execute contracts for anticipated sales, perform under such contracts and other existing contracts and obtain new contracts; risks related to our international business, including compliance with export control laws; the extensive and increasing regulatory requirements governing our contracts with the U.S. government and international customers; the consequences to our financial position, business and reputation that could result from failing to comply with such regulatory requirements; unexpected technical and marketing difficulties inherent in major research and product development efforts; the impact of potential security and cyber threats or the risk of unauthorized access to and resulting misuse of our, our customers’ and/or our suppliers’ information and systems;; failure to remain a market innovator, to create new market opportunities or to expand into new markets; our ability to increase production capacity to support anticipated growth; unexpected changes in significant operating expenses, including components and raw materials; failure to develop new products or integrate new technology into current products; any increase in litigation activity or unfavorable results in legal proceedings, including pending class actions; our ability to respond and adapt to legal, regulatory and government budgetary changes, including those resulting from the impact of pandemics and similar outbreaks; our ability to comply with the covenants in our loan documents; our ability to attract and retain skilled employees; the impact of inflation; and general economic and business conditions in the United States and elsewhere in the world; and the failure to establish and maintain effective internal control over financial reporting. For a further list and description of such risks and uncertainties, see the reports we file with the Securities and Exchange Commission. We do not intend, and undertake no obligation, to update any forward-looking statements, whether as a result of new information, future events or otherwise. |
|
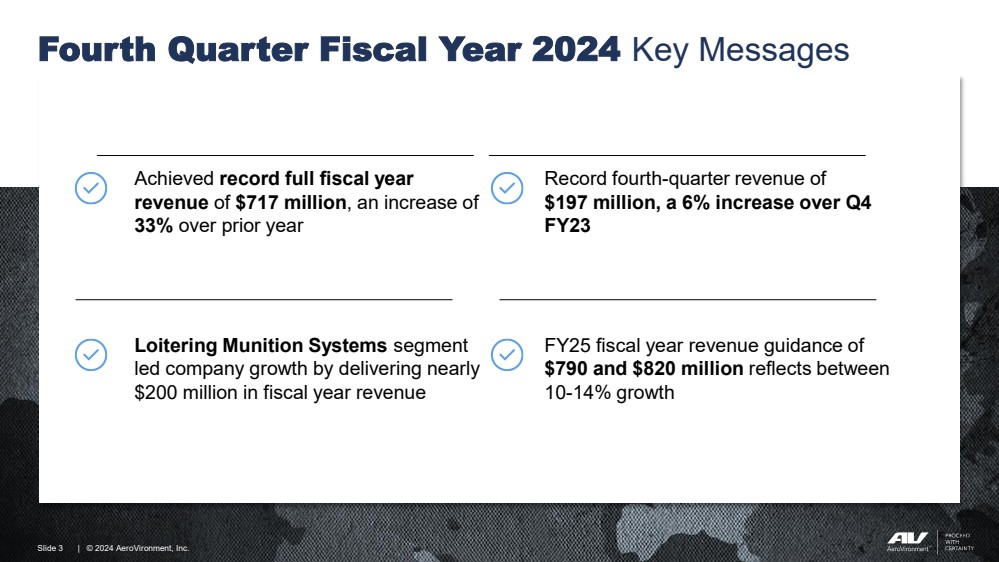
Slide 3 052620 | © 2024 AeroVironment, Inc. Fourth Quarter Fiscal Year 2024 Key Messages Achieved record full fiscal year revenue of $717 million, an increase of 33% over prior year Record fourth-quarter revenue of $197 million, a 6% increase over Q4 FY23 Loitering Munition Systems segment led company growth by delivering nearly $200 million in fiscal year revenue FY25 fiscal year revenue guidance of $790 and $820 million reflects between 10-14% growth |
|
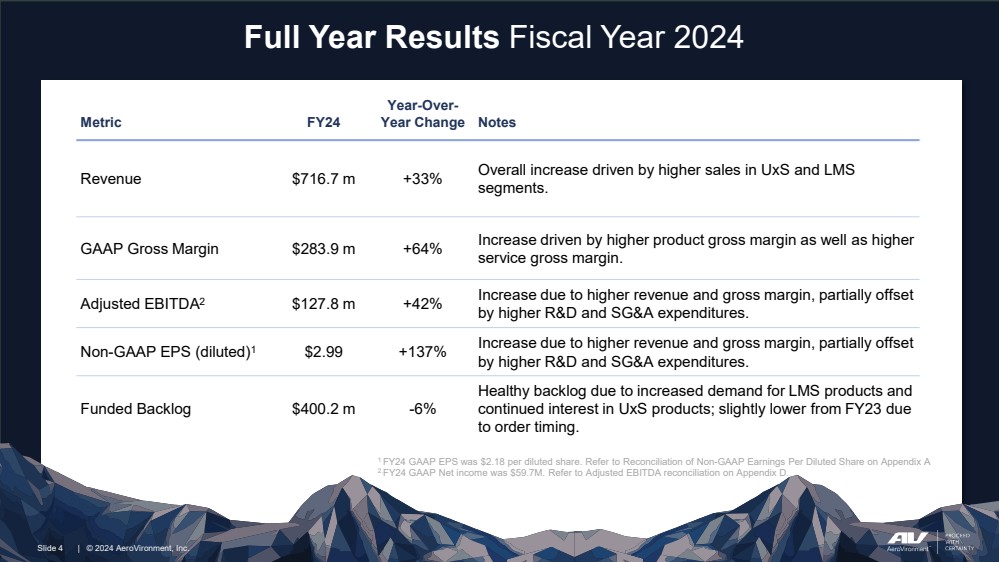
Slide 4 052620 | © 2024 AeroVironment, Inc. Full Year Results Fiscal Year 2024 1 FY24 GAAP EPS was $2.18 per diluted share. Refer to Reconciliation of Non-GAAP Earnings Per Diluted Share on Appendix A 2.FY24 GAAP Net income was $59.7M. Refer to Adjusted EBITDA reconciliation on Appendix D. Slide 4 | © 2024 AeroVironment, Inc. Metric FY24 Year-Over-Year Change Notes Revenue $716.7 m +33% Overall increase driven by higher sales in UxS and LMS segments. GAAP Gross Margin $283.9 m +64% Increase driven by higher product gross margin as well as higher service gross margin. Adjusted EBITDA2 $127.8 m +42% Increase due to higher revenue and gross margin, partially offset by higher R&D and SG&A expenditures. Non-GAAP EPS (diluted)1 $2.99 +137% Increase due to higher revenue and gross margin, partially offset by higher R&D and SG&A expenditures. Funded Backlog $400.2 m -6% Healthy backlog due to increased demand for LMS products and continued interest in UxS products; slightly lower from FY23 due to order timing. |
|
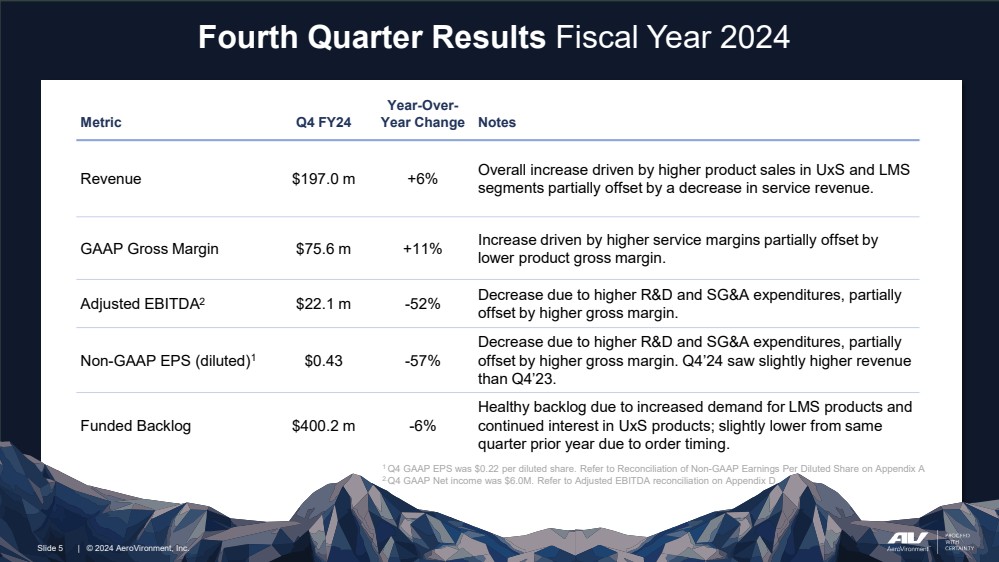
Slide 5 052620 | © 2024 AeroVironment, Inc. Fourth Quarter Results Fiscal Year 2024 1 Q4 GAAP EPS was $0.22 per diluted share. Refer to Reconciliation of Non-GAAP Earnings Per Diluted Share on Appendix A 2.Q4 GAAP Net income was $6.0M. Refer to Adjusted EBITDA reconciliation on Appendix D. Slide 5 | © 2024 AeroVironment, Inc. Metric Q4 FY24 Year-Over-Year Change Notes Revenue $197.0 m +6% Overall increase driven by higher product sales in UxS and LMS segments partially offset by a decrease in service revenue. GAAP Gross Margin $75.6 m +11% Increase driven by higher service margins partially offset by lower product gross margin. Adjusted EBITDA2 $22.1 m -52% Decrease due to higher R&D and SG&A expenditures, partially offset by higher gross margin. Non-GAAP EPS (diluted)1 $0.43 -57% Decrease due to higher R&D and SG&A expenditures, partially offset by higher gross margin. Q4’24 saw slightly higher revenue than Q4’23. Funded Backlog $400.2 m -6% Healthy backlog due to increased demand for LMS products and continued interest in UxS products; slightly lower from same quarter prior year due to order timing. |
|
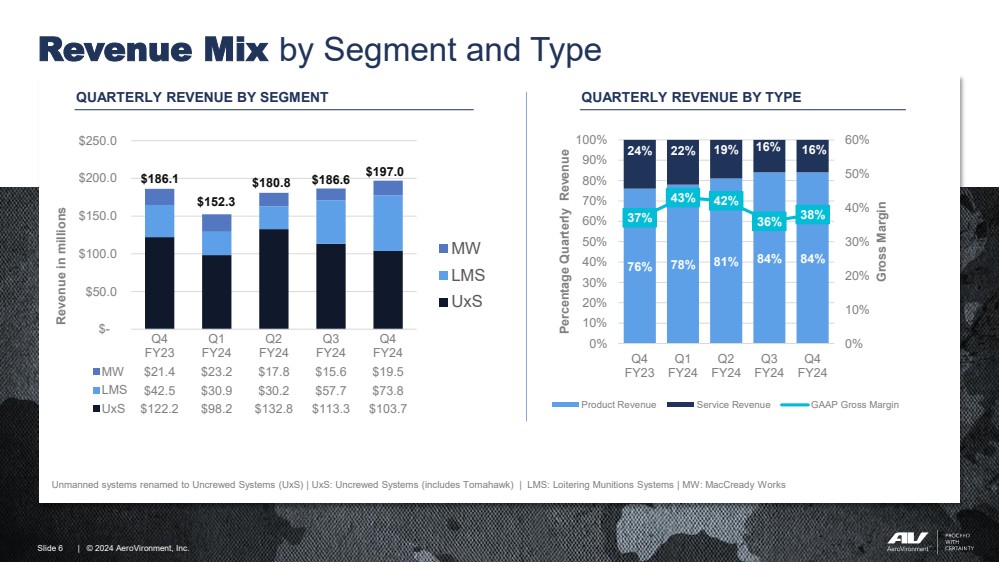
Slide 6 052620 | © 2024 AeroVironment, Inc. backlog of Slide 6 QUARTERLY REVENUE BY SEGMENT QUARTERLY REVENUE BY TYPE Revenue Mix by Segment and Type 76% 78% 81% 84% 84% 24% 22% 19% 16% 16% 37% 43% 42% 36% 38% 0% 10% 20% 30% 40% 50% 60% 0% 10% 20% 30% 40% 50% 60% 70% 80% 90% 100% Q4 FY23 Q1 FY24 Q2 FY24 Q3 FY24 Q4 FY24 Gross Margin Percentage Quarterly Revenue Product Revenue Service Revenue GAAP Gross Margin Q4 FY23 Q1 FY24 Q2 FY24 Q3 FY24 Q4 FY24 MW $21.4 $23.2 $17.8 $15.6 $19.5 LMS $42.5 $30.9 $30.2 $57.7 $73.8 UxS $122.2 $98.2 $132.8 $113.3 $103.7 $- $50.0 $100.0 $150.0 $200.0 $250.0 Revenue in millions MW LMS UxS $186.6 $152.3 $186.1 $180.8 Unmanned systems renamed to Uncrewed Systems (UxS) | UxS: Uncrewed Systems (includes Tomahawk) | LMS: Loitering Munitions Systems | MW: MacCready Works $197.0 |
|
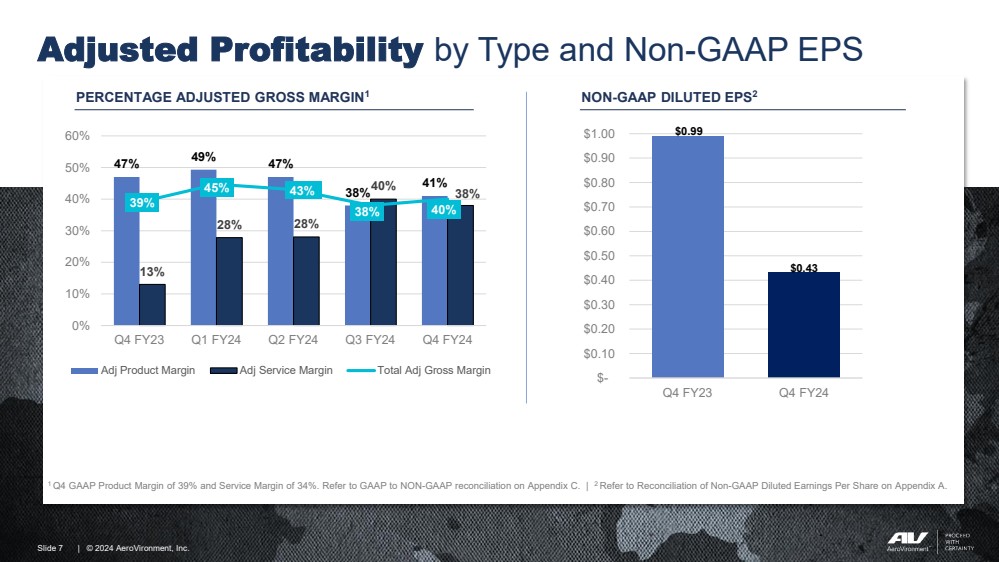
Slide 7 052620 | © 2024 AeroVironment, Inc. Adjusted Profitability by Type and Non-GAAP EPS 47% 49% 47% 38% 41% 13% 28% 28% 40% 38% 39% 45% 43% 38% 40% 0% 10% 20% 30% 40% 50% 60% Q4 FY23 Q1 FY24 Q2 FY24 Q3 FY24 Q4 FY24 Adj Product Margin Adj Service Margin Total Adj Gross Margin 1 Q4 GAAP Product Margin of 39% and Service Margin of 34%. Refer to GAAP to NON-GAAP reconciliation on Appendix C. | 2 Refer to Reconciliation of Non-GAAP Diluted Earnings Per Share on Appendix A. $0.99 $0.43 $- $0.10 $0.20 $0.30 $0.40 $0.50 $0.60 $0.70 $0.80 $0.90 $1.00 Q4 FY23 Q4 FY24 Slide 7 | © 2024 AeroVironment, Inc. NON-GAAP DILUTED EPS2 PERCENTAGE ADJUSTED GROSS MARGIN1 |
|
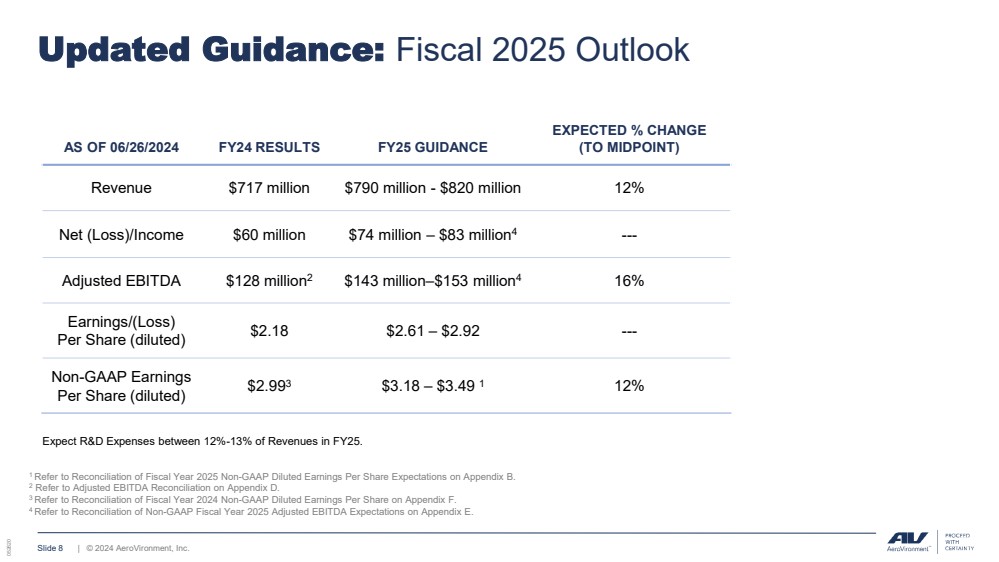
Slide 8 052620 | © 2024 AeroVironment, Inc. Updated Guidance: Fiscal 2025 Outlook AS OF 06/26/2024 FY24 RESULTS FY25 GUIDANCE EXPECTED % CHANGE (TO MIDPOINT) Revenue $717 million $790 million - $820 million 12% Net (Loss)/Income $60 million $74 million – $83 million4 --- Adjusted EBITDA $128 million2 $143 million–$153 million4 16% Earnings/(Loss) Per Share (diluted) $2.18 $2.61 – $2.92 --- Non-GAAP Earnings Per Share (diluted) $2.993 $3.18 – $3.49 1 12% 1 Refer to Reconciliation of Fiscal Year 2025 Non-GAAP Diluted Earnings Per Share Expectations on Appendix B. 2 Refer to Adjusted EBITDA Reconciliation on Appendix D. 3 Refer to Reconciliation of Fiscal Year 2024 Non-GAAP Diluted Earnings Per Share on Appendix F. 4 Refer to Reconciliation of Non-GAAP Fiscal Year 2025 Adjusted EBITDA Expectations on Appendix E. Expect R&D Expenses between 12%-13% of Revenues in FY25. |
|
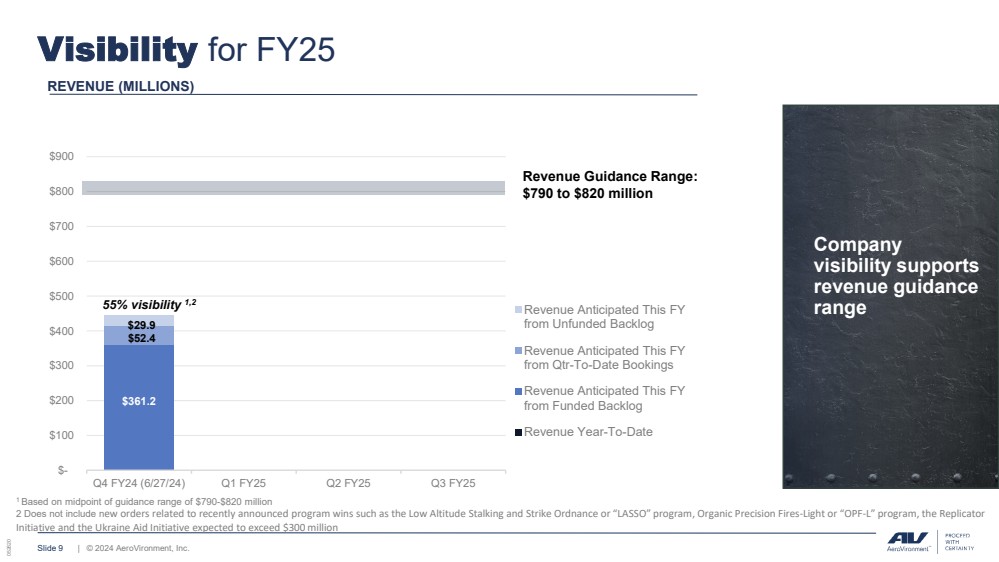
Slide 9 052620 | © 2024 AeroVironment, Inc. Visibility for FY25 $361.2 $29.9 $52.4 $- $100 $200 $300 $400 $500 $600 $700 $800 $900 Q4 FY24 (6/27/24) Q1 FY25 Q2 FY25 Q3 FY25 Revenue Anticipated This FY from Unfunded Backlog Revenue Anticipated This FY from Qtr-To-Date Bookings Revenue Anticipated This FY from Funded Backlog Revenue Year-To-Date 1 Based on midpoint of guidance range of $790-$820 million 2 Does not include new orders related to recently announced program wins such as the Low Altitude Stalking and Strike Ordnance or “LASSO” program, Organic Precision Fires-Light or “OPF-L” program, the Replicator Initiative and the Ukraine Aid Initiative expected to exceed $300 million Revenue Guidance Range: $790 to $820 million Company visibility supports revenue guidance range REVENUE (MILLIONS) 55% visibility 1,2 |
|
Slide 10 © 2024 AeroVironment, Inc. Financial Tables |
|
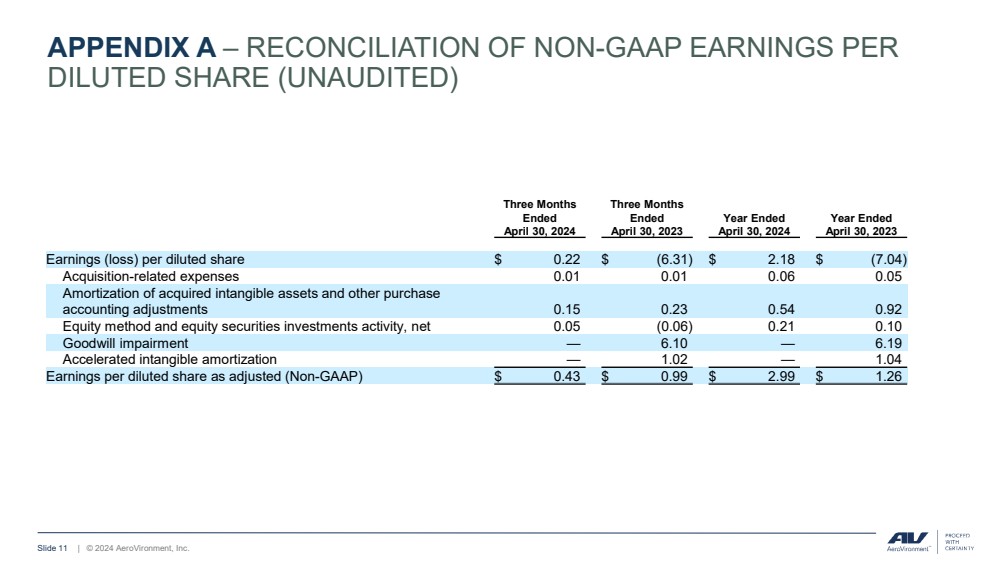
Slide 11 | © 2024 AeroVironment, Inc. APPENDIX A – RECONCILIATION OF NON-GAAP EARNINGS PER DILUTED SHARE (UNAUDITED) Three Months Ended Three Months Ended Year Ended Year Ended April 30, 2024 April 30, 2023 April 30, 2024 April 30, 2023 Earnings (loss) per diluted share $ 0.22 $ (6.31) $ 2.18 $ (7.04) Acquisition-related expenses 0.01 0.01 0.06 0.05 Amortization of acquired intangible assets and other purchase accounting adjustments 0.15 0.23 0.54 0.92 Equity method and equity securities investments activity, net 0.05 (0.06) 0.21 0.10 Goodwill impairment — 6.10 — 6.19 Accelerated intangible amortization — 1.02 — 1.04 Earnings per diluted share as adjusted (Non-GAAP) $ 0.43 $ 0.99 $ 2.99 $ 1.26 |
|
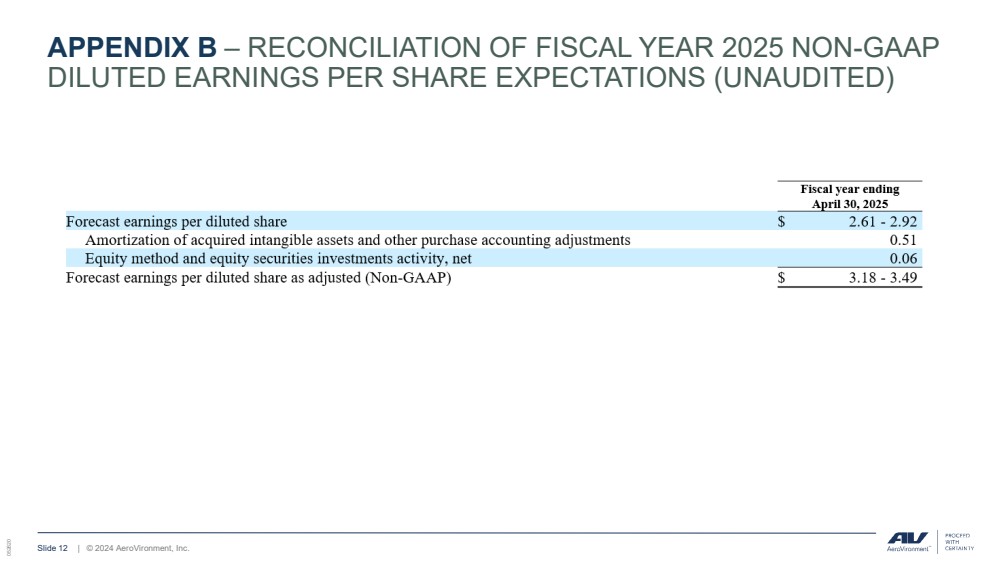
Slide 12 052620 | © 2024 AeroVironment, Inc. APPENDIX B – RECONCILIATION OF FISCAL YEAR 2025 NON-GAAP DILUTED EARNINGS PER SHARE EXPECTATIONS (UNAUDITED) |
|
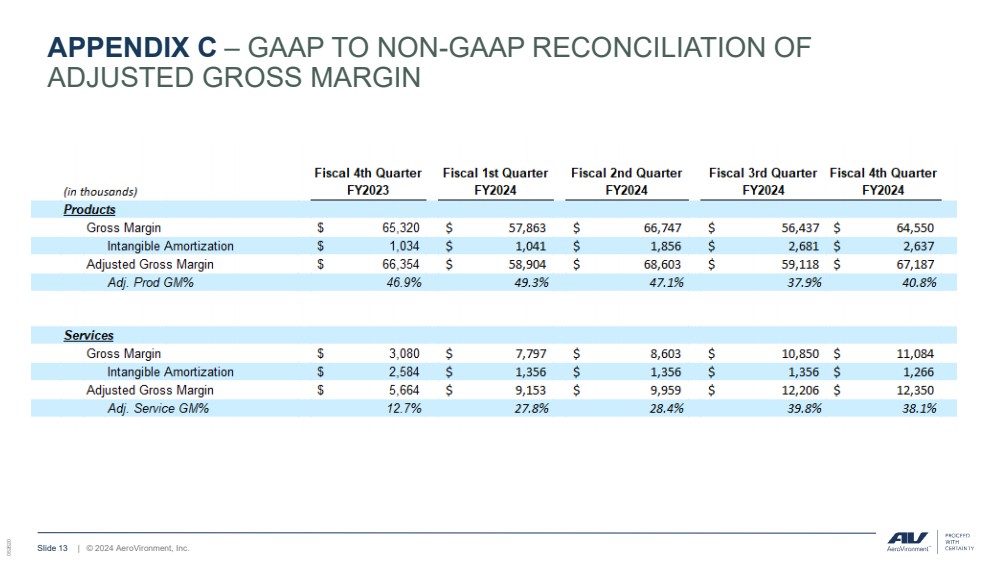
Slide 13 052620 | © 2024 AeroVironment, Inc. APPENDIX C – GAAP TO NON-GAAP RECONCILIATION OF ADJUSTED GROSS MARGIN |
|
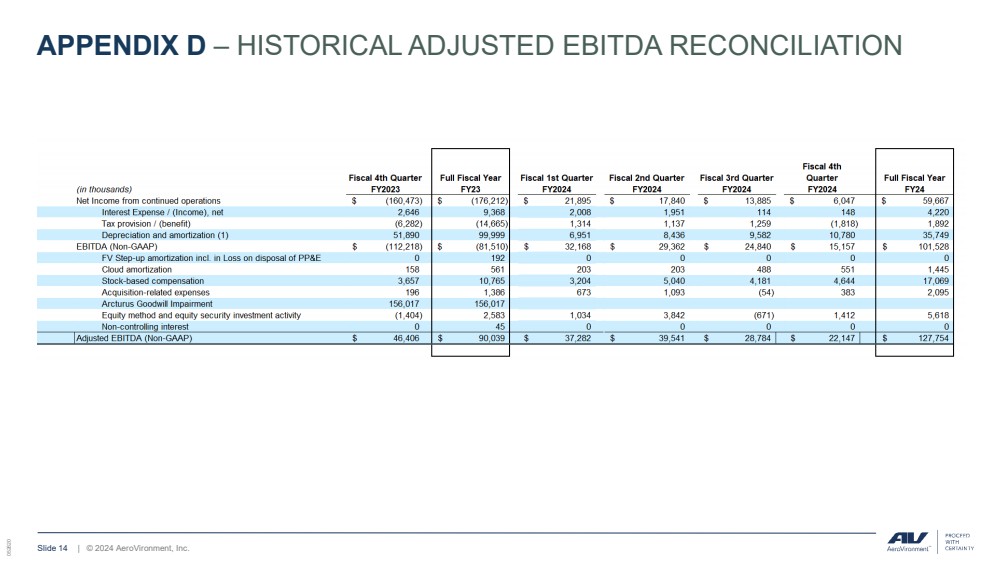
Slide 14 052620 | © 2024 AeroVironment, Inc. APPENDIX D – HISTORICAL ADJUSTED EBITDA RECONCILIATION |
|
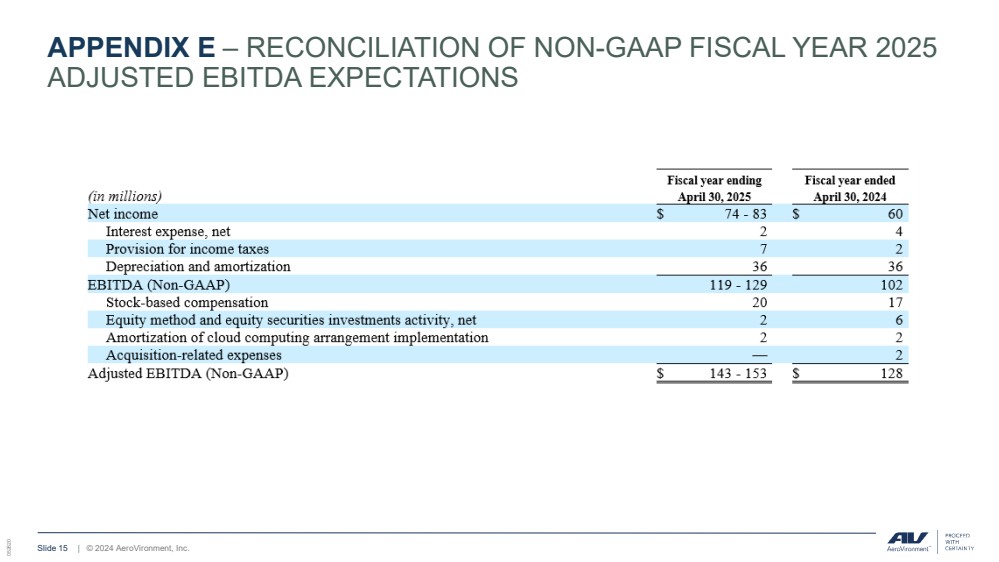
Slide 15 052620 | © 2024 AeroVironment, Inc. APPENDIX E – RECONCILIATION OF NON-GAAP FISCAL YEAR 2025 ADJUSTED EBITDA EXPECTATIONS |
|
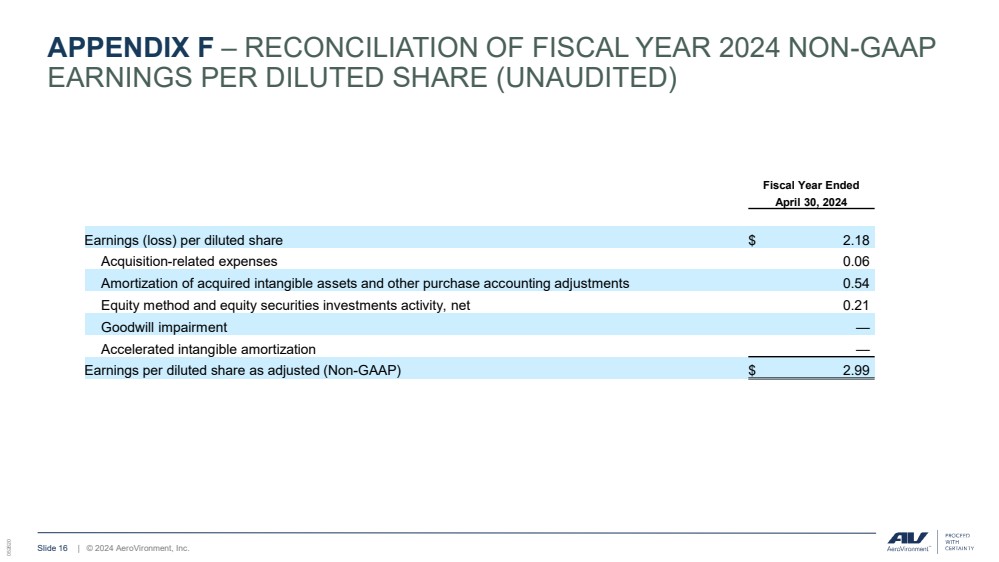
Slide 16 052620 | © 2024 AeroVironment, Inc. APPENDIX F – RECONCILIATION OF FISCAL YEAR 2024 NON-GAAP EARNINGS PER DILUTED SHARE (UNAUDITED) Fiscal Year Ended April 30, 2024 Earnings (loss) per diluted share $ 2.18 Acquisition-related expenses 0.06 Amortization of acquired intangible assets and other purchase accounting adjustments 0.54 Equity method and equity securities investments activity, net 0.21 Goodwill impairment — Accelerated intangible amortization — Earnings per diluted share as adjusted (Non-GAAP) $ 2.99 |