UNITED STATES
SECURITIES AND EXCHANGE COMMISSION
Washington, D.C. 20549
FORM 8-K
CURRENT REPORT
Pursuant to Section 13 OR 15(d)
of The Securities Exchange Act of 1934
Date of Report (Date of earliest event reported): May 2, 2024
DIGITAL REALTY TRUST, INC.
(Exact name of registrant as specified in its charter)
|
|
|
Maryland |
001-32336 |
26-0081711 |
(State or other jurisdiction |
(Commission |
(IRS Employer |
|
|
5707 Southwest Parkway, Building 1, Suite 275 |
78735 |
(Address of principal executive offices) |
(Zip Code) |
(737) 281-0101
(Registrant’s telephone number, including area code)
N/A
(Former name or former address, if changed since last report)
Check the appropriate box below if the Form 8-K filing is intended to simultaneously satisfy the filing obligation of the registrant under any of the following provisions:
☐ Written communications pursuant to Rule 425 under the Securities Act (17 CFR 230.425)
☐ Soliciting material pursuant to Rule 14a-12 under the Exchange Act (17 CFR 240.14a-12)
☐ Pre-commencement communications pursuant to Rule 14d-2(b) under the Exchange Act (17 CFR 240.14d-2(b))
☐ Pre-commencement communications pursuant to Rule 13e-4(c) under the Exchange Act (17 CFR 240.13e-4(c))
Securities registered pursuant to Section 12(b) of the Act:
|
|
|
Title of each class |
Trading |
Name of each exchange on |
Common Stock |
DLR |
New York Stock Exchange |
Series J Cumulative Redeemable Preferred Stock |
DLR Pr J |
New York Stock Exchange |
Series K Cumulative Redeemable Preferred Stock |
DLR Pr K |
New York Stock Exchange |
Series L Cumulative Redeemable Preferred Stock |
DLR Pr L |
New York Stock Exchange |
Indicate by check mark whether the registrant is an emerging growth company as defined in Rule 405 of the Securities Act of 1933 (§230.405 of this chapter) or Rule 12b-2 of the Securities Exchange Act of 1934 (§240.12b-2 of this chapter).
|
Emerging growth company ☐ |
|
If an emerging growth company, indicate by check mark if the registrant has elected not to use the extended transition period for complying with any new or revised financial accounting standards provided pursuant to Section 13(a) of the Exchange Act. ◻ The information in this Item 2.02 of this Current Report on Form 8-K is also being furnished under Item 7.01 “Regulation FD Disclosure” of Form 8-K.
Item 2.02 Results of Operations and Financial Condition.
Such information, including the exhibits attached hereto, is furnished pursuant to Item 2.02 and shall not be deemed “filed” for any purpose, including for the purposes of Section 18 of the Securities Exchange Act of 1934, as amended (Exchange Act), or otherwise subject to the liabilities of that Section. The information in this Current Report on Form 8-K shall not be deemed incorporated by reference into any filing under the Securities Act of 1933, as amended (Securities Act), or the Exchange Act regardless of any general incorporation language in such filing.
On May 2, 2024, we issued a press release announcing our financial results for the quarter ended March 31, 2024. The press release referred to certain supplemental information that is available on the Company’s website at www.digitalrealty.com. A copy of the press release and supplemental information is attached hereto as Exhibit 99.1 and incorporated by reference herein.
On May 2, 2024, we also posted presentation materials to our website at www.digitalrealty.com. The presentation materials are attached hereto as Exhibit 99.2 and incorporated by reference herein.
Item 7.01 Regulation FD Disclosure.
The information in this Item 7.01 of this Current Report on Form 8-K is also being furnished under Item 2.02 “Results of Operations and Financial Condition” of Form 8-K. Such information, including the exhibits attached hereto, is furnished pursuant to Item 7.01 and shall not be deemed “filed” for any purpose, including for the purposes of Section 18 of the Exchange Act, or otherwise subject to the liabilities of that Section. The information in this Current Report on Form 8-K shall not be deemed incorporated by reference into any filing under the Securities Act or the Exchange Act regardless of any general incorporation language in such filing.
On May 2, 2024, we issued a press release announcing our financial results for the quarter ended March 31, 2024. The press release referred to certain supplemental information that is available on the Company’s website at www.digitalrealty.com. A copy of the press release and supplemental information is attached hereto as Exhibit 99.1 and incorporated by reference herein.
On May 2, 2024, we also posted presentation materials to our website at www.digitalrealty.com. The presentation materials are attached hereto as Exhibit 99.2 and incorporated by reference herein.
Item 9.01 Financial Statements and Exhibits.
(d) Exhibits.
|
|
|
Exhibit No. |
|
Description |
|
|
|
99.1 |
|
Earnings Press Release and Supplemental Information for the Quarter Ended March 31, 2024. |
99.2 |
|
|
104 |
|
Cover Page Interactive Data File (embedded within the Inline XBRL document) |
SIGNATURES
Pursuant to the requirements of the Securities Exchange Act of 1934, the registrant has duly caused this report to be signed on its behalf by the undersigned hereunto duly authorized.
|
|
Digital Realty Trust, Inc. |
|
By: |
/s/ JEANNIE LEE |
|
|
Jeannie Lee |
|
|
Executive Vice President, General Counsel and Secretary |
Date: May 2, 2024
\
Overview |
PAGE |
|
|
3 |
|
|
|
5 |
|
|
|
Consolidated Statements of Operations |
|
|
|
7 |
|
|
|
10 |
|
|
|
12 |
|
|
|
13 |
|
|
|
14 |
|
|
|
Balance Sheet Information |
|
|
|
15 |
|
|
|
16 |
|
|
|
17 |
|
|
|
18 |
|
|
|
Internal Growth |
|
|
|
19 |
|
|
|
20 |
|
|
|
21 |
|
|
|
22 |
|
|
|
23 |
|
|
|
24 |
|
|
|
External Growth |
|
|
|
25 |
|
|
|
26 |
|
|
|
Historical Capital Expenditures and Investments in Real Estate |
27 |
|
|
28 |
|
|
|
29 |
|
|
|
Additional Information |
|
|
|
Reconciliation of Earnings Before Interest, Taxes, Depreciation & Amortization and Financial Ratios |
30 |
|
|
31 |
|
|
|
33 |
Corporate Profile
Digital Realty Trust, Inc. (“Digital Realty” or the “company”) owns, acquires, develops, and operates data centers through its operating partnership subsidiary, Digital Realty Trust, L.P. (the “operating partnership”). The company is focused on providing data center, colocation, and interconnection solutions for domestic and international customers across a variety of industry verticals ranging from cloud and information technology services, communications and social networking to financial services, manufacturing, energy, healthcare, and consumer products. As of March 31, 2024, the company’s 309 data centers, including 72 data centers held as investments in unconsolidated joint ventures, contain applications and operations critical to the day-to-day operations of technology industry and corporate enterprise data center customers. Digital Realty’s portfolio is comprised of approximately 39.8 million square feet, excluding approximately 8.2 million square feet of space under active development and 4.1 million square feet of space held for future development, located throughout North America, Europe, South America, Asia, Australia, and Africa. For additional information, please visit the company’s website at digitalrealty.com.
|
Corporate Headquarters 5707 Southwest Parkway, Building 1, Suite 275 Austin, TX 78735 |
Senior Management President & Chief Executive Officer: Andrew P. Power |
Investor Relations
To request more information or to be added to our e-mail distribution list, please visit the Investor Relations section of our website at https://investor.digitalrealty.com.
Analyst Coverage
|
Bank of America |
|
BMO Capital |
BNP Paribas |
|
|||||||
Argus Research |
|
Merrill Lynch |
|
Barclays |
|
Markets |
|
Exane |
|
Citigroup |
|
Deutsche Bank |
Marie Ferguson |
|
David Barden |
|
Brendan Lynch |
|
Ari Klein |
|
Nate Crossett |
|
Michael Rollins |
|
Matthew Niknam |
(212) 425-7500 |
|
(646) 855-1320 |
|
(212) 526-9428 |
|
(212) 885-4103 |
|
(646) 725-3716 |
|
(212) 816-1116 |
|
(212) 250-4711 |
|
|
|
|
|
|
|
|
|
|
|
|
|
Edward Jones |
|
Evercore ISI |
|
Green Street Advisors |
|
HSBC |
|
Jefferies |
|
J.P. Morgan |
|
MoffettNathanson |
Kyle Sanders |
|
Irvin Liu |
|
David Guarino |
|
Phani Kanumuri |
|
Jonathan Petersen |
|
Richard Choe |
|
Nick Del Deo |
(314) 515-0198 |
|
(415) 800-0183 |
|
(949) 640-8780 |
|
+52 (551) 782-7350 |
|
(212) 284 1705 |
|
(212) 662 6708 |
|
(212) 519-0025 |
|
|
|
|
|
|
|
|
|
|
|
|
|
Morgan Stanley |
|
Morningstar |
|
Raymond James |
|
RBC Capital Markets |
|
Scotiabank |
|
Stifel |
|
TD Cowen |
Simon Flannery |
|
Matthew Dolgin |
|
Frank Louthan |
|
Jonathan Atkin |
|
Maher Yaghi |
|
Erik Rasmussen |
|
Michael Elias |
(212) 761-6432 |
|
(312) 696-6783 |
|
(404) 442-5867 |
|
(415) 633-8589 |
|
(437) 995-5548 |
|
(212) 271-3461 |
|
(646) 562-1358 |
|
|
|
|
|
|
|
|
|
|
|
|
|
Truist Securities |
|
UBS |
|
Wells Fargo |
|
Wolfe Research |
|
|
|
|
|
|
Anthony Hau |
|
John Hodulik |
|
Eric Luebchow |
|
Andrew Rosivach |
|
|
|
|
|
|
(212) 303-4176 |
|
(212) 713-4226 |
|
(312) 630-2386 |
|
(646) 582-9250 |
|
|
|
|
|
This Earnings Press Release and Supplemental Information package supplements the information provided in our quarterly and annual reports filed with the U.S. Securities and Exchange Commission. Additional information about Digital Realty and our business is also available on our website at digitalrealty.com.
Upcoming Conference Schedule
June 4 – 6, 2024 |
NAREIT REITweek 2024 |
New York City, NY |
|
|
|
|
|
|
Webcasts for these events are available through the Digital Realty Investor Relations website when possible. Please check our website for additional information.
3
Stock Listing Information
The stock of Digital Realty Trust, Inc. is traded primarily on the New York Stock Exchange under the following symbols:
Common Stock: |
|
DLR |
Series J Preferred Stock: |
|
DLRPRJ |
Series K Preferred Stock: |
|
DLRPRK |
Series L Preferred Stock: |
|
DLRPRL |
Symbols may vary by stock quote provider.
Credit Ratings
Standard & Poor’s |
|
|
|
Corporate Credit Rating: |
|
BBB |
(Stable Outlook) |
Preferred Stock: |
|
BB+ |
|
|
|
|
|
Moody’s |
|
|
|
Issuer Rating: |
|
Baa2 |
(Stable Outlook) |
Preferred Stock: |
|
Baa3 |
|
|
|
|
|
Fitch |
|
|
|
Issuer Default Rating: |
|
BBB |
(Stable Outlook) |
Preferred Stock: |
|
BB+ |
|
These credit ratings may not reflect the potential impact of risks relating to the structure or trading of the company’s securities and are provided solely for informational purposes. Credit ratings are not recommendations to buy, hold or sell any security, and may be revised or withdrawn at any time by the issuing rating agency at its sole discretion. The company does not undertake any obligation to maintain the ratings or to advise of any change in ratings. Each agency’s rating should be evaluated independently of any other agency’s rating. An explanation of the significance of the ratings may be obtained from each of the rating agencies.
Common Stock Price Performance
The following summarizes recent activity of Digital Realty’s common stock (DLR):
|
|
Three Months Ended |
|
|||||||||||||
|
|
31-Mar-24 |
|
31-Dec-23 |
|
30-Sep-23 |
|
30-Jun-23 |
|
31-Mar-23 |
|
|||||
High price |
|
|
$154.18 |
|
|
$139.35 |
|
|
$133.39 |
|
|
$114.43 |
|
|
$122.43 |
|
Low price |
|
|
$130.00 |
|
|
$113.94 |
|
|
$112.38 |
|
|
$86.33 |
|
|
$90.72 |
|
Closing price, end of quarter |
|
|
$144.04 |
|
|
$134.58 |
|
|
$121.02 |
|
|
$113.87 |
|
|
$98.31 |
|
Average daily trading volume (1) |
|
|
2,108 |
|
|
1,932 |
|
|
2,301 |
|
|
3,113 |
|
|
2,232 |
|
Indicated dividend per common share (2) |
|
|
$4.88 |
|
|
$4.88 |
|
|
$4.88 |
|
|
$4.88 |
|
|
$4.88 |
|
Closing annual dividend yield, end of quarter |
|
|
3.4% |
|
|
3.6% |
|
|
4.0% |
|
|
4.3% |
|
|
5.0% |
|
Shares and units outstanding, end of quarter (1) (3) |
|
|
319,009 |
|
|
318,057 |
|
|
309,325 |
|
|
305,723 |
|
|
297,761 |
|
Closing market value of shares and units outstanding (4) |
|
|
$45,950,001 |
|
|
$42,804,053 |
|
|
$37,434,562 |
|
|
$34,812,727 |
|
|
$29,272,861 |
|
| (1) | Shares or shares and units in thousands. |
| (2) | On an annualized basis. |
| (3) | As of March 31, 2024, the total number of shares and units includes 312,421 shares of common stock, 4,343 common units held by third parties and 2,245 common units and vested and unvested long-term incentive units held by directors, officers and others and excludes all shares of common stock potentially issuable upon conversion of our series J, series K and series L cumulative redeemable preferred stock upon certain change of control transactions. |
| (4) | Dollars in thousands as of the end of the quarter. |
This Earnings Press Release and Supplemental Information package supplements the information provided in our quarterly and annual reports filed with the U.S. Securities and Exchange Commission. Additional information about us and our data centers is also available on our website at digitalrealty.com.
4
|
Financial Supplement |
|
|---|---|---|
Unaudited, Dollars (except per share data) and Square Feet in Thousands |
First Quarter 2024 |
Shares and Units at End of Quarter |
|
31-Mar-24 |
|
31-Dec-23 |
|
30-Sep-23 |
|
30-Jun-23 |
|
31-Mar-23 |
|||||
Common shares outstanding |
|
|
312,421 |
|
|
311,608 |
|
|
302,846 |
|
|
299,240 |
|
|
291,299 |
Common partnership units outstanding |
|
|
6,588 |
|
|
6,449 |
|
|
6,479 |
|
|
6,483 |
|
|
6,462 |
Total Shares and Units |
|
|
319,009 |
|
|
318,057 |
|
|
309,325 |
|
|
305,723 |
|
|
297,761 |
|
|
|
|
|
|
|
|
|
|
|
|
|
|
|
|
Enterprise Value |
|
|
|
|
|
|
|
|
|
|
|
|
|
|
|
Market value of common equity (1) |
|
|
$45,950,001 |
|
|
$42,804,053 |
|
|
$37,434,562 |
|
|
$34,812,727 |
|
|
$29,272,861 |
Liquidation value of preferred equity |
|
|
755,000 |
|
|
755,000 |
|
|
755,000 |
|
|
755,000 |
|
|
755,000 |
Total debt at balance sheet carrying value |
|
|
17,020,340 |
|
|
17,425,908 |
|
|
16,869,776 |
|
|
17,729,452 |
|
|
17,875,511 |
Total Enterprise Value |
|
|
$63,725,341 |
|
|
$60,984,961 |
|
|
$55,059,338 |
|
|
$53,297,179 |
|
|
$47,903,372 |
Total debt / total enterprise value |
|
|
26.7% |
|
|
28.6% |
|
|
30.6% |
|
|
33.3% |
|
|
37.3% |
Debt-plus-preferred-to-total-enterprise-value |
|
|
27.9% |
|
|
29.8% |
|
|
32.0% |
|
|
34.7% |
|
|
38.9% |
|
|
|
|
|
|
|
|
|
|
|
|
|
|
|
|
Selected Balance Sheet Data |
|
|
|
|
|
|
|
|
|
|
|
|
|
|
|
Investments in real estate (before depreciation) |
|
|
$34,099,698 |
|
|
$34,355,662 |
|
|
$33,267,766 |
|
|
$33,958,096 |
|
|
$33,805,740 |
Total Assets |
|
|
42,633,089 |
|
|
44,113,257 |
|
|
41,932,515 |
|
|
42,388,735 |
|
|
41,953,068 |
Total Liabilities |
|
|
21,792,866 |
|
|
23,116,936 |
|
|
21,895,634 |
|
|
22,916,155 |
|
|
22,799,620 |
|
|
|
|
|
|
|
|
|
|
|
|
|
|
|
|
Selected Operating Data |
|
|
|
|
|
|
|
|
|
|
|
|
|
|
|
Total operating revenues |
|
|
$1,331,143 |
|
|
$1,369,633 |
|
|
$1,402,437 |
|
|
$1,366,267 |
|
|
$1,338,724 |
Total operating expenses |
|
|
1,181,776 |
|
|
1,235,598 |
|
|
1,344,206 |
|
|
1,211,407 |
|
|
1,161,388 |
Net income |
|
|
287,837 |
|
|
19,884 |
|
|
745,941 |
|
|
115,647 |
|
|
68,839 |
Net income / (loss) available to common stockholders |
|
|
271,327 |
|
|
18,122 |
|
|
723,440 |
|
|
108,003 |
|
|
58,547 |
|
|
|
|
|
|
|
|
|
|
|
|
|
|
|
|
Financial Ratios |
|
|
|
|
|
|
|
|
|
|
|
|
|
|
|
EBITDA (2) |
|
|
$835,446 |
|
|
$572,958 |
|
|
$1,272,048 |
|
|
$667,866 |
|
|
$603,419 |
Adjusted EBITDA (3) |
|
|
710,556 |
|
|
699,509 |
|
|
685,943 |
|
|
696,604 |
|
|
667,804 |
Net Debt-to-Adjusted EBITDA (4) |
|
|
6.1x |
|
|
6.2x |
|
|
6.3x |
|
|
6.8x |
|
|
7.1x |
Interest expense |
|
|
109,535 |
|
|
113,638 |
|
|
110,767 |
|
|
111,116 |
|
|
102,220 |
Fixed charges (5) |
|
|
148,239 |
|
|
156,851 |
|
|
150,079 |
|
|
149,181 |
|
|
139,172 |
Interest coverage ratio (6) |
|
|
4.3x |
|
|
4.0x |
|
|
4.3x |
|
|
4.5x |
|
|
4.7x |
Fixed charge coverage ratio (7) |
|
|
4.0x |
|
|
3.8x |
|
|
4.1x |
|
|
4.2x |
|
|
4.4x |
|
|
|
|
|
|
|
|
|
|
|
|
|
|
|
|
Profitability Measures |
|
|
|
|
|
|
|
|
|
|
|
|
|
|
|
Net income / (loss) per common share - basic |
|
|
$0.87 |
|
|
$0.06 |
|
|
$2.40 |
|
|
$0.37 |
|
|
$0.20 |
Net income / (loss) per common share - diluted |
|
|
$0.82 |
|
|
$0.08 |
|
|
$2.33 |
|
|
$0.37 |
|
|
$0.20 |
Funds from operations (FFO) / diluted share and unit (8) |
|
|
$1.41 |
|
|
$1.53 |
|
|
$1.55 |
|
|
$1.52 |
|
|
$1.60 |
Core funds from operations (Core FFO) / diluted share and unit (8) |
|
|
$1.67 |
|
|
$1.63 |
|
|
$1.62 |
|
|
$1.68 |
|
|
$1.66 |
Adjusted funds from operations (AFFO) / diluted share and unit (9) |
|
|
$1.68 |
|
|
$1.30 |
|
|
$1.40 |
|
|
$1.59 |
|
|
$1.56 |
Dividends per share and common unit |
|
|
$1.22 |
|
|
$1.22 |
|
|
$1.22 |
|
|
$1.22 |
|
|
$1.22 |
Diluted FFO payout ratio (8) (10) |
|
|
86.5% |
|
|
79.8% |
|
|
78.6% |
|
|
80.3% |
|
|
76.0% |
Diluted Core FFO payout ratio (8) (11) |
|
|
73.2% |
|
|
75.0% |
|
|
75.2% |
|
|
72.6% |
|
|
73.5% |
Diluted AFFO payout ratio (9) (12) |
|
|
72.8% |
|
|
93.6% |
|
|
87.3% |
|
|
76.7% |
|
|
78.2% |
|
|
|
|
|
|
|
|
|
|
|
|
|
|
|
|
Portfolio Statistics |
|
|
|
|
|
|
|
|
|
|
|
|
|
|
|
Buildings (13) |
|
|
323 |
|
|
323 |
|
|
326 |
|
|
330 |
|
|
328 |
Data Centers (13) |
|
|
309 |
|
|
309 |
|
|
312 |
|
|
316 |
|
|
314 |
Cross-connects (13) (14) |
|
|
221,500 |
|
|
220,000 |
|
|
218,000 |
|
|
216,000 |
|
|
214,000 |
Net rentable square feet, excluding development space (13) |
|
|
39,839 |
|
|
39,688 |
|
|
39,542 |
|
|
39,310 |
|
|
38,804 |
Occupancy at end of quarter (15) |
|
|
82.1% |
|
|
81.7% |
|
|
82.8% |
|
|
82.9% |
|
|
83.5% |
Occupied square footage (13) |
|
|
32,727 |
|
|
32,407 |
|
|
32,727 |
|
|
32,603 |
|
|
32,394 |
Space under active development (16) |
|
|
8,238 |
|
|
8,470 |
|
|
9,205 |
|
|
8,841 |
|
|
9,243 |
Space held for development (17) |
|
|
4,141 |
|
|
4,130 |
|
|
3,937 |
|
|
3,941 |
|
|
3,742 |
Weighted average remaining lease term (years) (18) |
|
|
4.5 |
|
|
4.6 |
|
|
4.8 |
|
|
4.9 |
|
|
4.8 |
Same-capital occupancy at end of quarter (15) (19) |
|
|
82.6% |
|
|
82.9% |
|
|
82.8% |
|
|
83.1% |
|
|
83.0% |
5
|
Financial Supplement |
|
|---|---|---|
Unaudited, Dollars (except per share data) and Square Feet in Thousands |
First Quarter 2024 |
| (1) | The market value of common equity is based on the closing stock price at the end of the quarter and assumes 100% redemption of the limited partnership units in our operating partnership, including common units and vested and unvested long-term incentive units, for shares of our common stock on a one-for-one basis. Excludes shares of common stock potentially issuable upon conversion of our series J, series K and series L cumulative redeemable preferred stock upon certain change of control transactions, as applicable. |
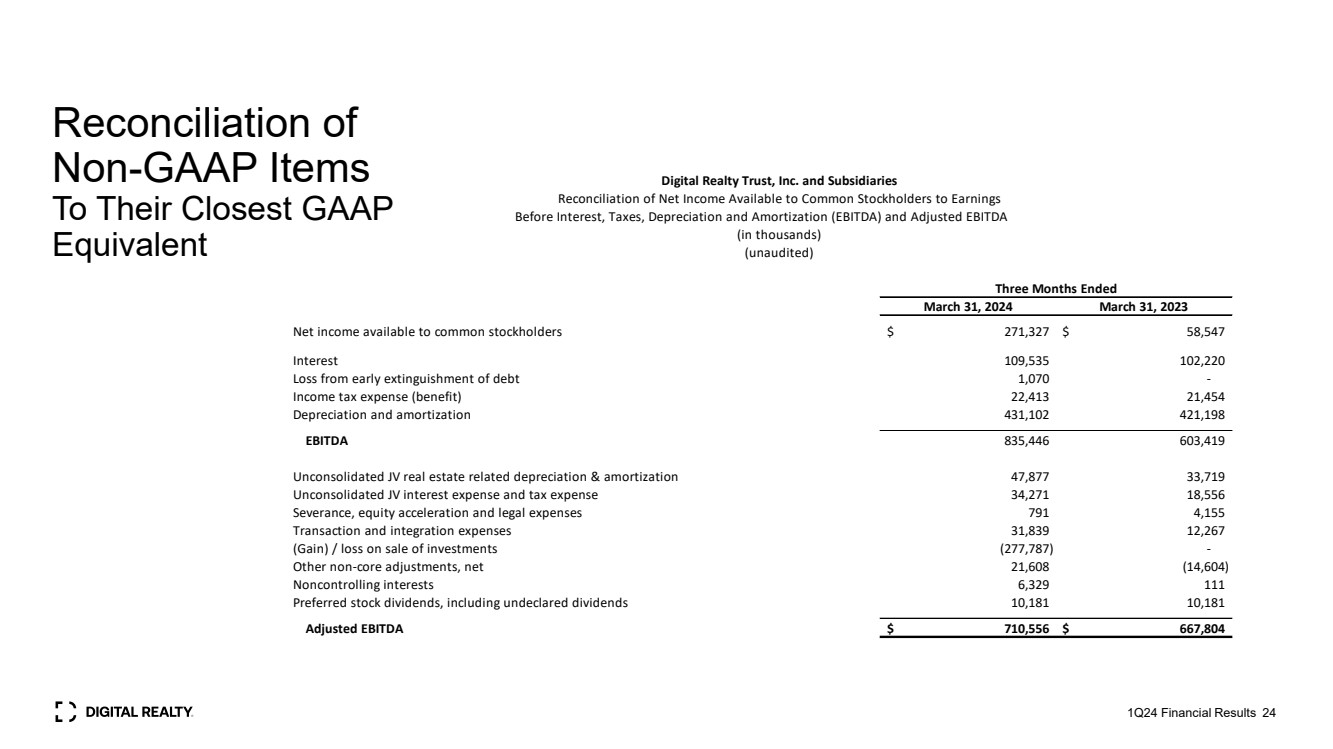
| (2) | EBITDA is calculated as earnings before interest expense, loss from early extinguishment of debt, tax expense, and depreciation and amortization. For a discussion of EBITDA, see page 31. For a reconciliation of net income available to common stockholders to EBITDA, see page 30. |
| (3) | Adjusted EBITDA is EBITDA excluding (i) unconsolidated joint venture real estate related depreciation & amortization, (ii) unconsolidated joint venture interest and tax expense, (iii) severance, equity acceleration and legal expenses, (iv) transaction and integration expenses, (v) gain (loss) on sale / deconsolidation, (vi) provision for impairment, (vii) other non-core adjustments, net, (viii) non-controlling interests, (ix) preferred stock dividends, and (x) issuance costs associated with redeemed preferred stock. For a discussion of Adjusted EBITDA, see page 31. For a reconciliation of net income available to common stockholders to Adjusted EBITDA, see page 30. |
| (4) | Net Debt to Adjusted EBITDA is calculated as total debt at balance sheet carrying value (see page 5), plus capital lease obligations, plus our share of unconsolidated joint venture debt at carrying value, less cash and cash equivalents (including our share of unconsolidated joint venture cash), divided by the product of Adjusted EBITDA (including our share of unconsolidated joint venture EBITDA), multiplied by four. |
| (5) | Fixed charges consist of GAAP interest expense, capitalized interest, scheduled debt principal payments and preferred stock dividends. |
| (6) | Interest coverage ratio is Adjusted EBITDA divided by GAAP interest expense plus capitalized interest (including our share of unconsolidated joint venture interest expense). |
| (7) | Fixed charge coverage ratio is Adjusted EBITDA divided by fixed charges (including our share of unconsolidated joint venture fixed charges). |
| (8) | For definitions and discussion of FFO and Core FFO, see page 31. For reconciliations of net income available to common stockholders to FFO and Core FFO, see page 13. |
| (9) | For a definition and discussion of AFFO, see page 31. For a reconciliation of Core FFO to AFFO, see page 14. |
| (10) | Diluted FFO payout ratio is dividends declared per common share and unit divided by diluted FFO per share and unit. |
| (11) | Diluted Core FFO payout ratio is dividends declared per common share and unit divided by diluted Core FFO per share and unit. |
| (12) | Diluted AFFO payout ratio is dividends declared per common share and unit divided by diluted AFFO per share and unit. |
| (13) | Includes buildings held as investments in unconsolidated entities. Excludes buildings held-for-sale. |
| (14) | Represents approximate amounts. |
| (15) | Occupancy and same-capital occupancy exclude space under active development and space held for development. Occupancy represents our consolidated portfolio in addition to our managed portfolio of unconsolidated joint ventures and non-managed unconsolidated joint ventures. For some of our buildings, we calculate occupancy based on factors in addition to contractually leased square feet, including available power, required support space and common area. Excludes buildings held for sale. |
| (16) | Space under active development includes current Base Building and Data Centers projects in progress. Excludes buildings held-for-sale. |
| (17) | Space held for development includes space held for future Data Center development and excludes space under active development. Excludes buildings held for sale. |
| (18) | Weighted average remaining lease term excludes renewal options and is weighted by net rentable square feet. |
| (19) | Represents buildings owned as of December 31, 2022, with less than 5% of total rentable square feet under development. Excludes buildings that were undergoing, or were expected to undergo, development activities in 2023-2024, buildings classified as held-for-sale, and buildings sold or contributed to joint ventures for all periods presented. Prior period results have been adjusted to reflect current same-capital pool. |
6
Digital Realty Reports First Quarter 2024 Results
Austin, TX — May 2, 2024 — Digital Realty (NYSE: DLR), the largest global provider of cloud- and carrier-neutral data center, colocation, and interconnection solutions, announced today financial results for the first quarter of 2024. All per share results are presented on a fully diluted basis.
Highlights
| ◾ | Reported net income available to common stockholders of $0.82 per share in 1Q24, compared to $0.20 in 1Q23 |
| ◾ | Reported FFO per share of $1.41 in 1Q24, compared to $1.60 in 1Q23 |
| ◾ | Reported Core FFO per share of $1.67 in 1Q24, compared to $1.66 in 1Q23 |
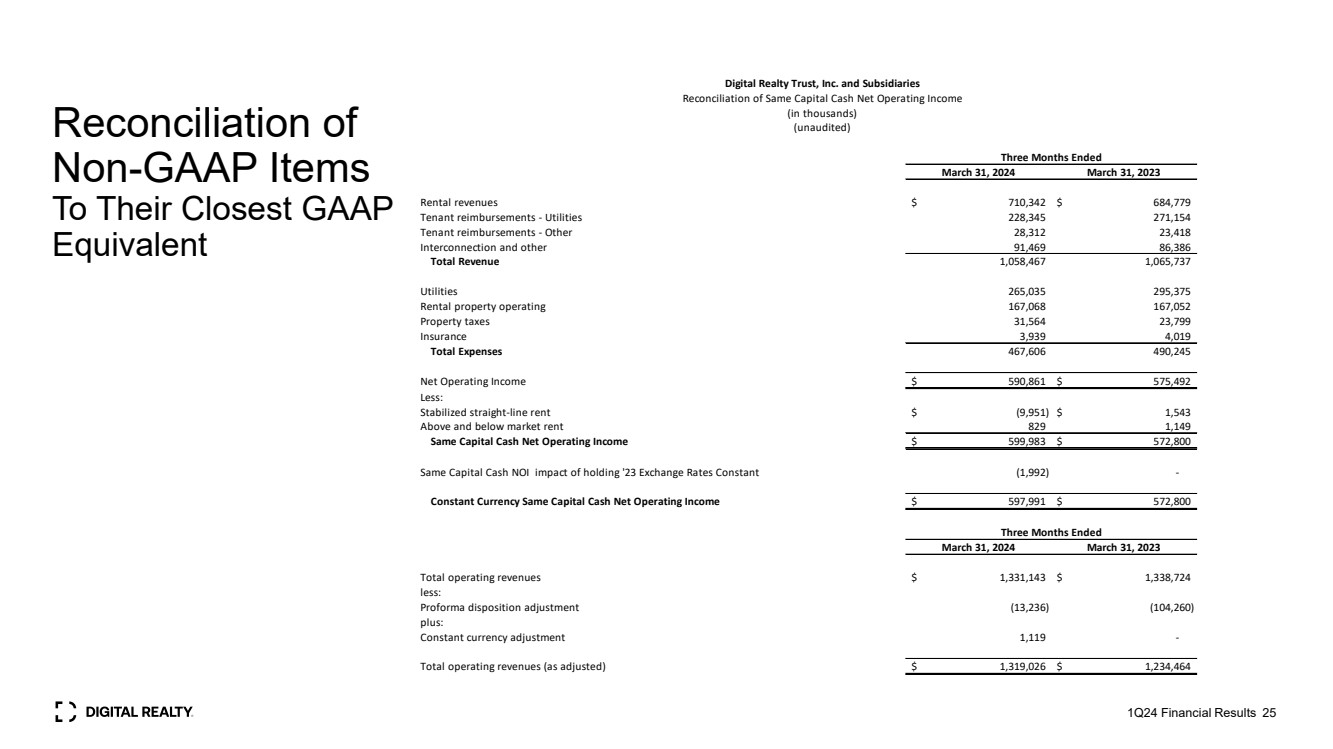
| ◾ | Reported “Same-Capital” cash NOI growth of 4.7% in 1Q24 |
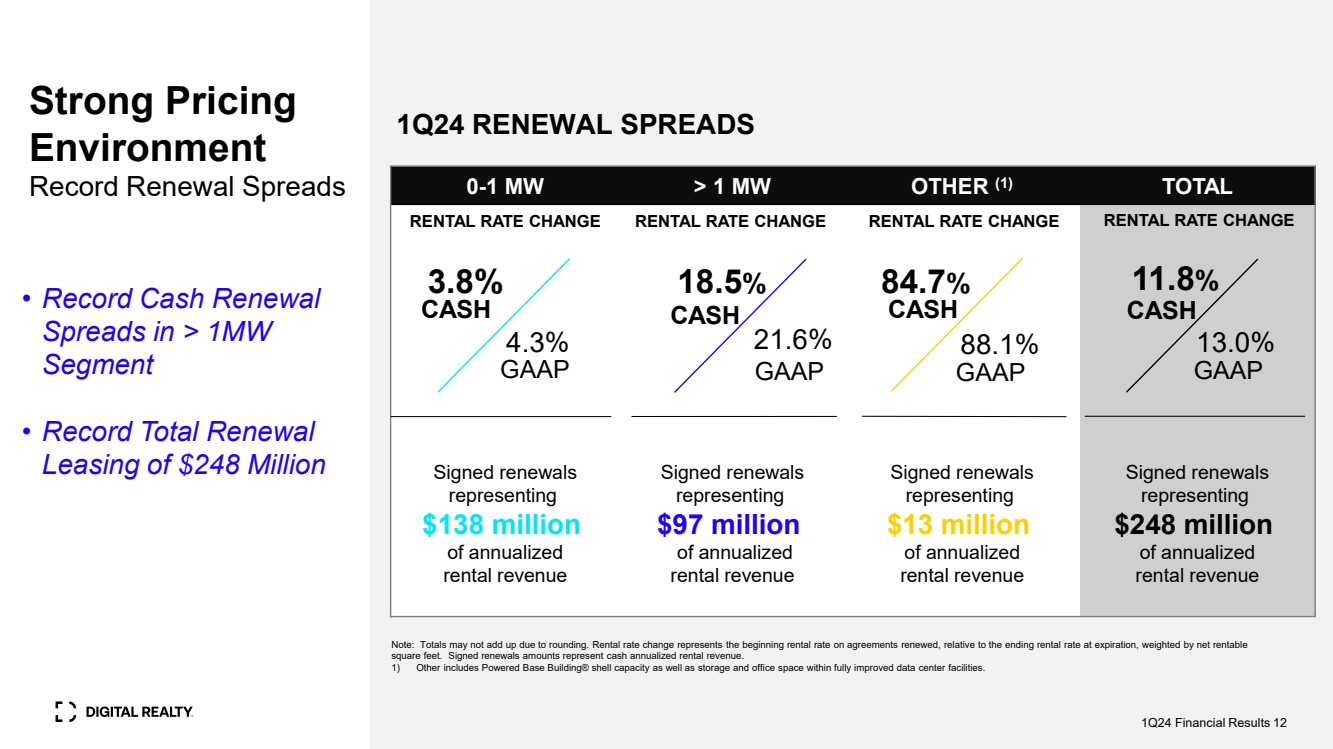
| ◾ | Reported rental rate increases on renewal leases of 11.8% on a cash basis in 1Q24 |
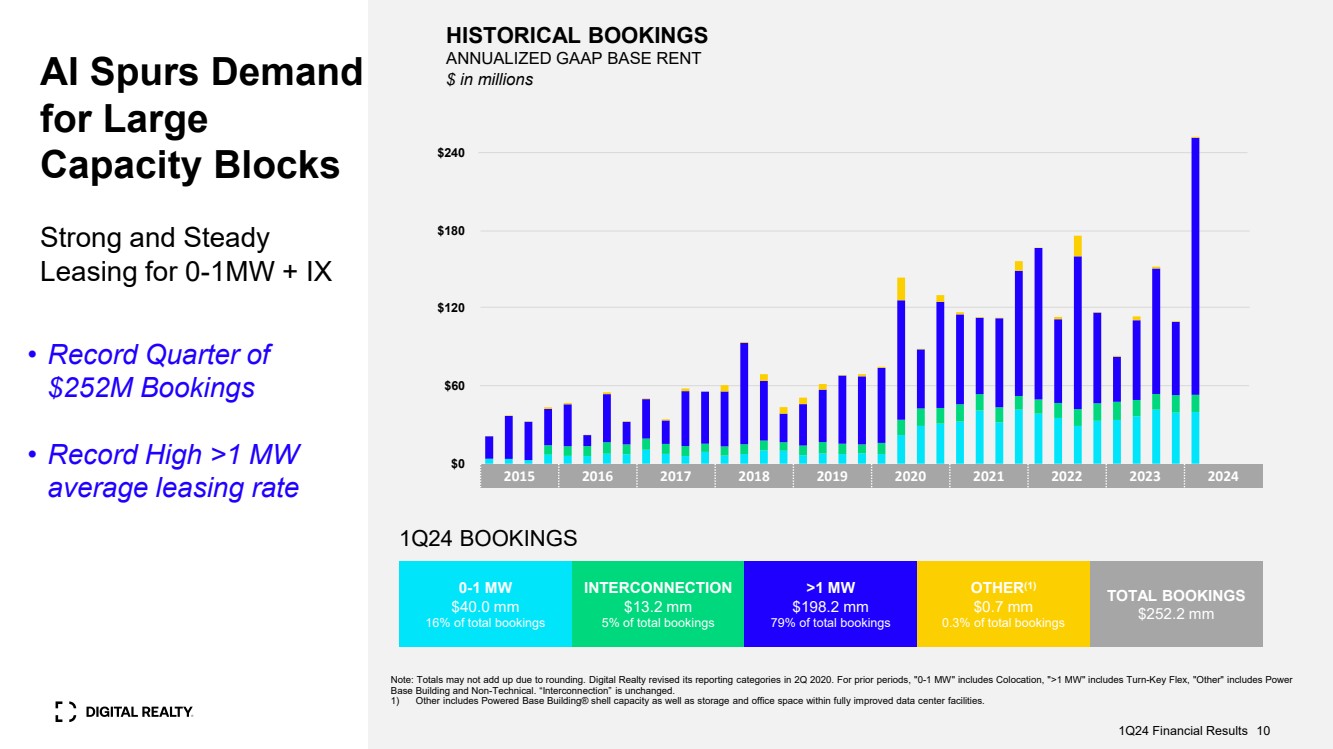
| ◾ | Signed total bookings during 1Q24 that are expected to generate $252 million of annualized GAAP rental revenue, including a $40 million contribution from the 0–1 megawatt category and $13 million contribution from interconnection |
| ◾ | Maintained 2024 Core FFO per share outlook of $6.60 - $6.75 |
Financial Results
Digital Realty reported revenues of $1.3 billion in the first quarter of 2024, a 3% decrease from the previous quarter and an 1% decrease from the same quarter last year.
The company delivered net income of $288 million in the first quarter of 2024, and net income available to common stockholders of $271 million, or $0.82 per diluted share, compared to $0.08 per diluted share in the previous quarter and $0.20 per diluted share in the same quarter last year.
Digital Realty generated Adjusted EBITDA of $711 million in the first quarter of 2024, a 2% increase from the previous quarter and 6% increase over the same quarter last year.
The company reported Funds From Operations (FFO) of $451 million in the first quarter of 2024, or $1.41 per share, compared to $1.53 per share in the previous quarter and $1.60 per share in the same quarter last year.
Excluding certain items that do not represent core expenses or revenue streams, Digital Realty delivered Core FFO per share of $1.67 in the first quarter of 2024, compared to $1.63 per share in the previous quarter and $1.66 per share in the same quarter last year. Digital Realty delivered Constant-Currency Core FFO per share of $1.67 for the first quarter of 2024.
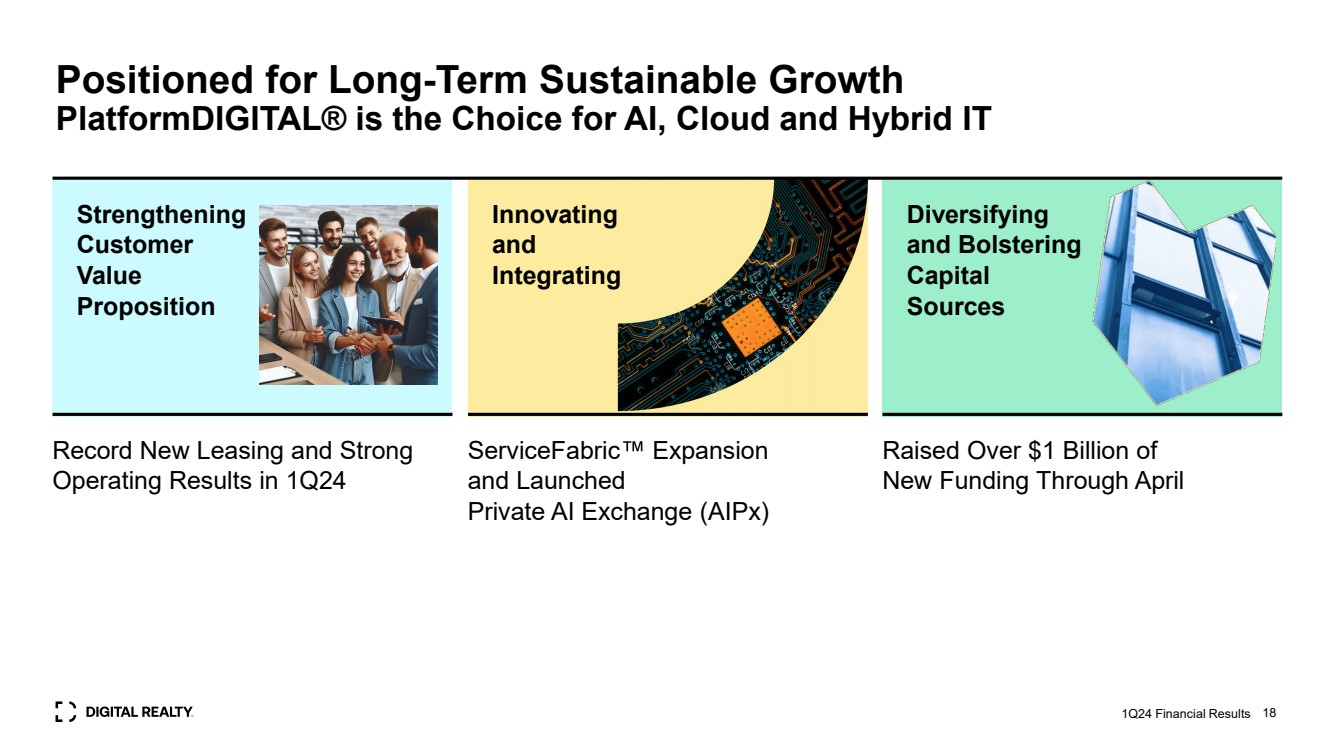
“Digital Realty saw accelerating demand in the first quarter, executing on a number of multifaceted AI-oriented opportunities, while continuing to support hybrid multi-cloud requirements. Strong demand supported a new leasing record, driven by large footprint deals,” said Digital Realty President & Chief Executive Officer Andy Power. “In support of this demand, we sourced over $1 billion of fresh capital through asset sales and joint ventures, further reducing our reported leverage while positioning the company to meet our customers' growing needs.”
Leasing Activity
In the first quarter, Digital Realty signed total bookings that are expected to generate $252 million of annualized GAAP rental revenue, including a $40 million contribution from the 0–1 megawatt category and a $13 million contribution from interconnection.
The weighted-average lag between new leases signed during the first quarter of 2024 and the contractual commencement date was 7 months.
In addition to new leases signed, Digital Realty also signed renewal leases representing $248 million of annualized cash rental revenue during the quarter. Rental rates on renewal leases signed during the first quarter of 2024 increased 11.8% on a cash basis and 13.0% on a GAAP basis.
7
New leases signed during the first quarter of 2024 are summarized by region and product as follows:
|
|
Annualized GAAP |
|
|
|
|
|
|
|
|
|
|
|
|
|
Base Rent |
|
Square Feet |
|
GAAP Base Rent |
|
|
|
GAAP Base Rent |
|||
Americas |
|
(in thousands) |
|
(in thousands) |
|
per Square Foot |
|
Megawatts |
|
per Kilowatt |
|||
0-1 MW |
|
|
$19,050 |
|
67 |
|
|
$283 |
|
6.5 |
|
|
$243 |
> 1 MW |
|
|
175,200 |
|
636 |
|
|
275 |
|
84.0 |
|
|
174 |
Other (1) |
|
|
495 |
|
10 |
|
|
51 |
|
— |
|
|
— |
Total |
|
|
$194,746 |
|
713 |
|
|
$273 |
|
90.5 |
|
|
$179 |
|
|
|
|
|
|
|
|
|
|
|
|
|
|
EMEA (2) |
|
|
|
|
|
|
|
|
|
|
|
|
|
0-1 MW |
|
|
$14,754 |
|
60 |
|
|
$246 |
|
5.5 |
|
|
$224 |
> 1 MW |
|
|
23,020 |
|
112 |
|
|
206 |
|
13.7 |
|
|
140 |
Other (1) |
|
|
72 |
|
1 |
|
|
117 |
|
— |
|
|
— |
Total |
|
|
$37,846 |
|
173 |
|
|
$219 |
|
19.2 |
|
|
$164 |
|
|
|
|
|
|
|
|
|
|
|
|
|
|
Asia Pacific (2) |
|
|
|
|
|
|
|
|
|
|
|
|
|
0-1 MW |
|
|
$6,192 |
|
18 |
|
|
$343 |
|
1.5 |
|
|
$333 |
> 1 MW |
|
|
— |
|
— |
|
|
— |
|
— |
|
|
— |
Other (1) |
|
|
159 |
|
3 |
|
|
56 |
|
— |
|
|
— |
Total |
|
|
$6,351 |
|
21 |
|
|
$304 |
|
1.5 |
|
|
$333 |
|
|
|
|
|
|
|
|
|
|
|
|
|
|
All Regions (2) |
|
|
|
|
|
|
|
|
|
|
|
|
|
0-1 MW |
|
|
$39,996 |
|
145 |
|
|
$275 |
|
13.6 |
|
|
$246 |
> 1 MW |
|
|
198,220 |
|
748 |
|
|
265 |
|
97.7 |
|
|
169 |
Other (1) |
|
|
726 |
|
13 |
|
|
55 |
|
— |
|
|
— |
Total |
|
|
$238,942 |
|
907 |
|
|
$264 |
|
111.2 |
|
|
$178 |
|
|
|
|
|
|
|
|
|
|
|
|
|
|
Interconnection |
|
|
$13,240 |
|
N/A |
|
|
N/A |
|
N/A |
|
|
N/A |
|
|
|
|
|
|
|
|
|
|
|
|
|
|
Grand Total |
|
|
$252,182 |
|
907 |
|
|
$264 |
|
111.2 |
|
|
$178 |
Note: Totals may not foot due to rounding differences.
| (1) | Other includes Powered Base Building® shell capacity as well as storage and office space within fully improved data center facilities. |
| (2) | Based on quarterly average exchange rates during the three months ended March 31, 2024. |
Investment Activity
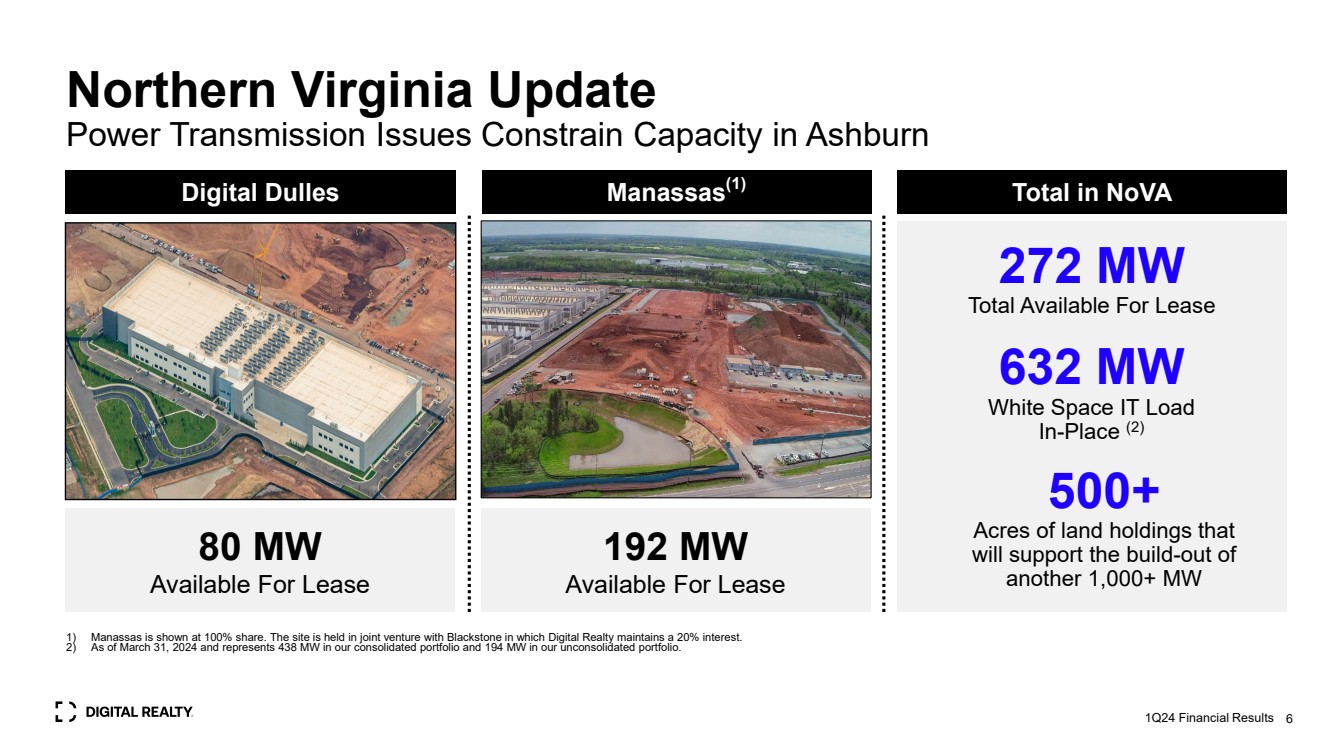
As previously disclosed, in the first quarter, Digital Realty successfully resolved its relationship with Cyxtera, with the closing of a series of transactions with Brookfield Infrastructure Partners L.P., Cyxtera Technologies and Digital Core REIT. Digital Realty received $277 million for its interest in four data centers and redeployed $55 million to buy out Cyxtera’s leases in Digital Realty’s Frankfurt and Singapore data centers. Digital Realty also exercised its option to purchase a data center outside of London, UK, which is expected to close in the second quarter.
Also previously disclosed, in January, Digital Realty and Blackstone Inc. established the first phase of their $7 billion hyperscale data center development joint venture, which includes campuses in Paris and Northern Virginia. The second phase is scheduled to close later this year, upon obtaining the required approvals.
As announced in early March, Digital Realty and Mitsubishi Corporation established a joint venture to support the development of two build-to-suit data centers in the Dallas metro area. The two data centers commenced construction in the fourth quarter of 2022 and can deliver up to 48 megawatts of IT load. Mitsubishi initially invested approximately $200 million to acquire a 65% equity interest in the venture, while Digital Realty maintains a 35% interest. Each partner will fund its pro rata share of the remaining development costs for the two facilities, which are slated for initial completion and commencement in late 2024.
Additionally, as previously disclosed, during the quarter, Digital Realty closed on the purchase of approximately 19 acres of land in Paris, France for approximately €70 million or $76 million. The parcel of land, which was previously leased to Digital Realty, is currently under development to support up to 77 megawatts of IT load.
During the quarter, Digital Realty closed on the sale of 19 acres of vacant land in Sydney, Australia for approximately AU$96 million or $63 million.
Digital Realty also received approximately $92 million of proceeds during the first quarter, pursuant to an agreement to grant land easements for the use of substations on its Digital Dulles campus.
8
During the first quarter, MC Digital Realty closed on the acquisition of five acres of land in Osaka, Japan which could support the development of up to 18 megawatts of IT load, for approximately JPY1 billion or $7 million.
Subsequent to quarter end, Digital Realty and GI Partners expanded their existing joint venture in Chicago, with the sale to GI Partners of a 75% interest in a stabilized hyperscale data center that is situated on the same campus as two stabilized hyperscale data centers that were previously contributed to a joint venture with GI Partners in July 2023. Digital Realty received approximately $388 million of gross proceeds and will maintain a 25% interest in the joint venture. Based on annualized in‐place cash NOI as of March 31, 2024, adjusted for a customary vacancy allowance, the transaction values the facility at a 6.5% cap rate. As previously disclosed, in January, GI Partners executed its option to increase its stake from 65% to 80% in the two original stabilized hyperscale data centers within the Chicago joint venture.
Subsequent to quarter end, Digital Realty closed on the sale to Digital Core REIT (SGX: DCRU) of an additional 24.9% interest in a data center facility located in Frankfurt, Germany for €117 million, or approximately $129 million. The transaction valued the Frankfurt facility at €470 million, or approximately $517 million (at 100% share). Digital Core REIT has an option to acquire up to an 89.9% total ownership interest in the facility.
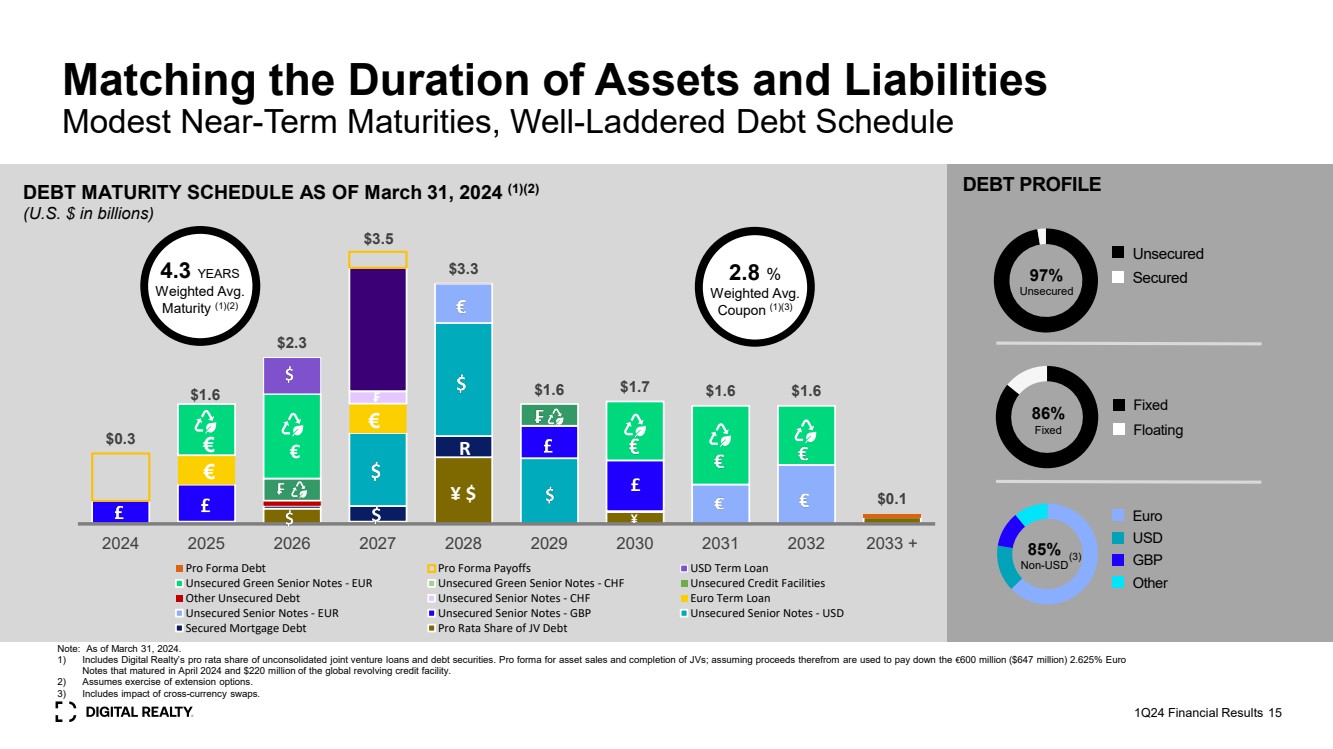
Balance Sheet
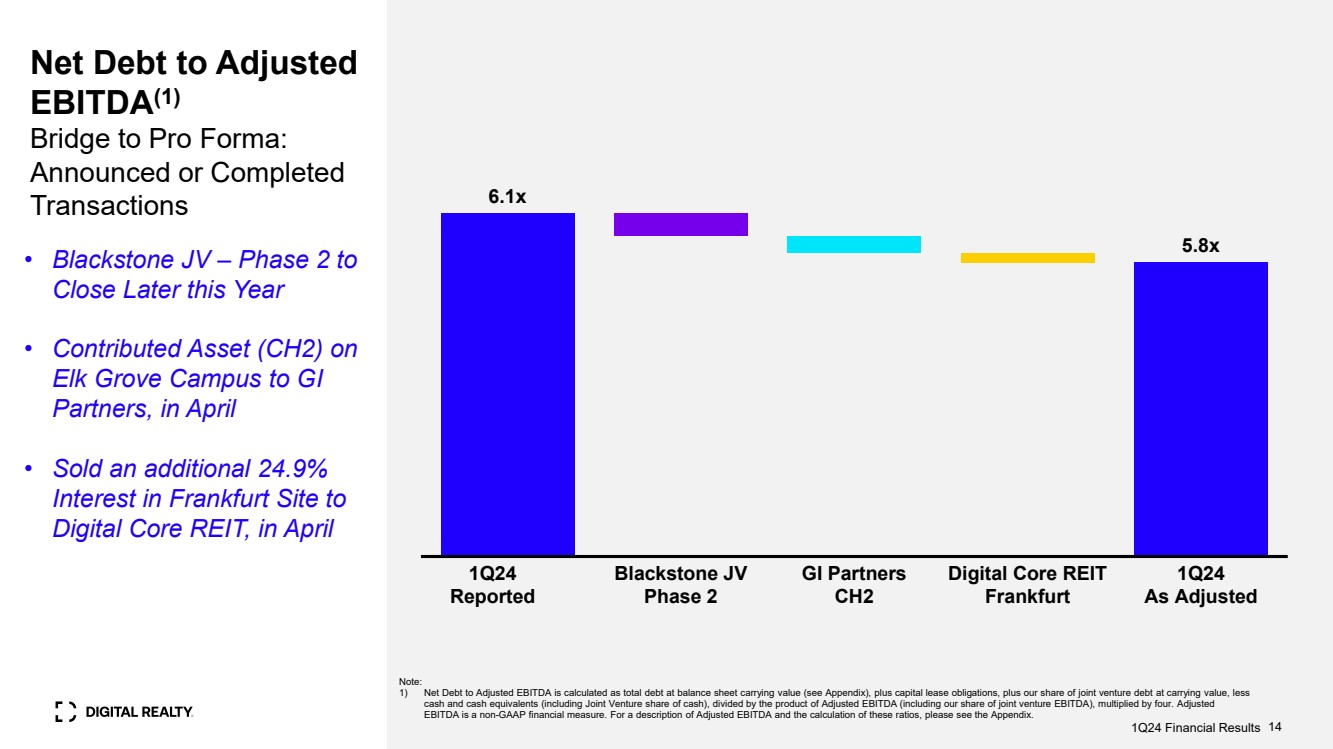
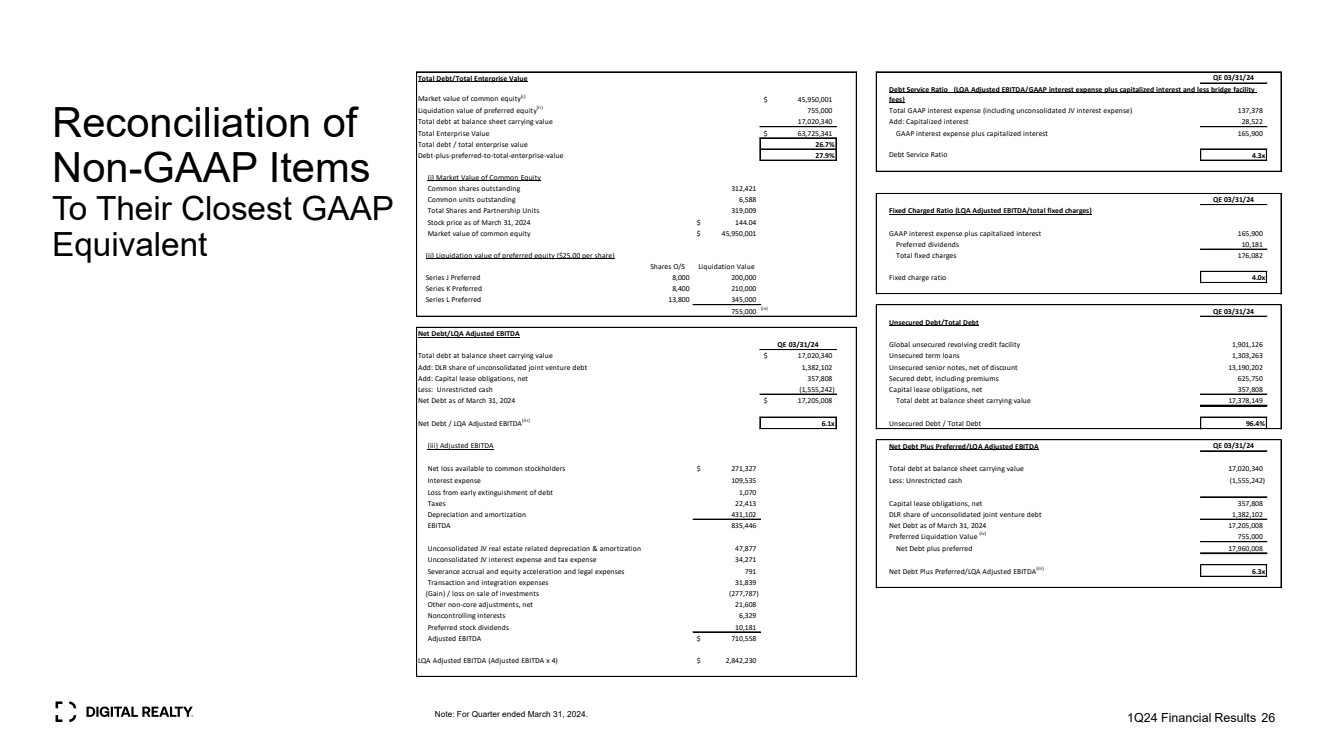
Digital Realty had approximately $17.0 billion of total debt outstanding as of March 31, 2024, comprised of $16.4 billion of unsecured debt and approximately $0.6 billion of secured debt and other. At the end of the first quarter of 2024, net debt-to-Adjusted EBITDA was 6.1x, debt-plus-preferred-to-total enterprise value was 27.9% and fixed charge coverage was 4.0x. Pro forma for the completion of the second phase of the Blackstone development joint ventures announced in December 2023, as well as the expansion of the joint venture with GI Partners and the sale of an interest in an asset to Digital Core REIT subsequent to quarter end, net debt-to-Adjusted EBITDA was 5.8x.
As previously disclosed, in January, Digital Realty sold 0.6 million shares of its common stock at a weighted average price of $133.43 per share for net proceeds of approximately $84 million.
Subsequent to quarter end, the company repaid €600 million ($647 million) aggregate principal amount of its 2.625% notes.
9
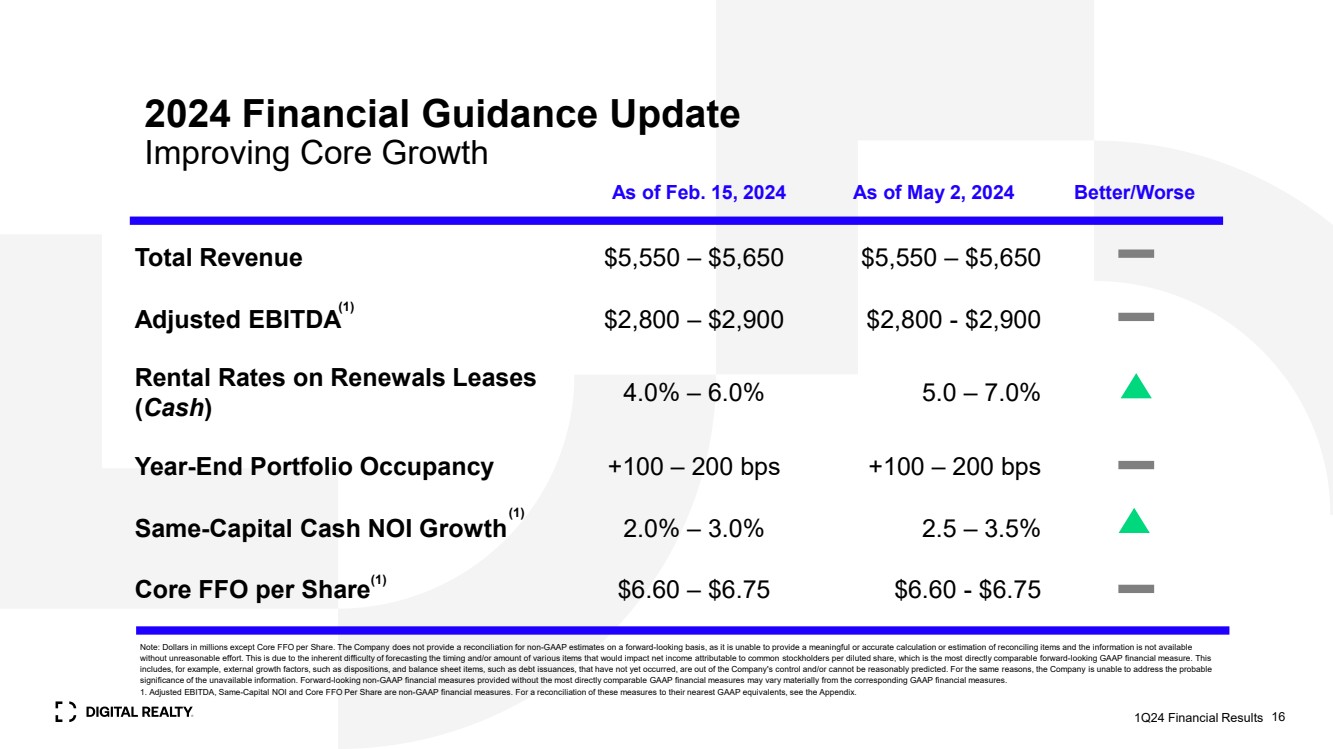
Digital Realty maintained its 2024 Core FFO per share and Constant-Currency Core FFO per share outlook of $6.60 - $6.75. The assumptions underlying the outlook are summarized in the following table.
|
|
As of |
|
As of |
|
Top-Line and Cost Structure |
|
February 15, 2024 |
|
May 2, 2024 |
|
Total revenue |
|
$5.550 - $5.650 billion |
|
$5.550 - $5.650 billion |
|
Net non-cash rent adjustments (1) |
|
($35 - $40 million) |
|
($35 - $40 million) |
|
Adjusted EBITDA |
|
$2.800 - $2.900 billion |
|
$2.800 - $2.900 billion |
|
G&A |
|
$450 - $460 million |
|
$450 - $460 million |
|
|
|
|
|
|
|
Internal Growth |
|
|
|
|
|
Rental rates on renewal leases |
|
|
|
|
|
Cash basis |
|
4.0% - 6.0% |
|
5.0% - 7.0% |
|
GAAP basis |
|
6.0% - 8.0% |
|
7.0% - 9.0% |
|
Year-end portfolio occupancy |
|
+100 - 200 bps |
|
+100 - 200 bps |
|
"Same-Capital" cash NOI growth (2) |
|
2.0% - 3.0% |
|
2.5% - 3.5% |
|
|
|
|
|
|
|
Foreign Exchange Rates |
|
|
|
|
|
U.S. Dollar / Pound Sterling |
|
$1.25 - $1.30 |
|
$1.25 - $1.30 |
|
U.S. Dollar / Euro |
|
$1.05 - $1.10 |
|
$1.05 - $1.10 |
|
|
|
|
|
|
|
External Growth |
|
|
|
|
|
Dispositions / Joint Venture Capital |
|
|
|
|
|
Dollar volume |
|
$1,000 - $1,500 million |
|
$1,000 - $1,500 million |
|
Cap rate |
|
6.0% - 8.0% |
|
6.0% - 8.0% |
|
Development |
|
|
|
|
|
CapEx (Net of Partner Contributions) (3) |
|
$2,000 - $2,500 million |
|
$2,000 - $2,500 million |
|
Average stabilized yields |
|
10.0%+ |
|
10.0%+ |
|
Enhancements and other non-recurring CapEx (4) |
|
$15 - $20 million |
|
$15 - $20 million |
|
Recurring CapEx + capitalized leasing costs (5) |
|
$260 - $275 million |
|
$260 - $275 million |
|
|
|
|
|
|
|
Balance Sheet |
|
|
|
|
|
Long-term debt issuance |
|
|
|
|
|
Dollar amount |
|
$0 - $1,000 million |
|
$0 - $1,000 million |
|
Pricing |
|
5.0% - 5.5% |
|
5.0% - 5.5% |
|
Timing |
|
Mid-Year |
|
Mid-Year |
|
|
|
|
|
|
|
Net income per diluted share |
|
$1.80 - $1.95 |
|
$1.80 - $1.95 |
|
Real estate depreciation and (gain) / loss on sale |
|
$4.40 - $4.40 |
|
$4.40 - $4.40 |
|
Funds From Operations / share (NAREIT-Defined) |
|
$6.20 - $6.35 |
|
$6.20 - $6.35 |
|
Non-core expenses and revenue streams |
|
$0.40 - $0.40 |
|
$0.40 - $0.40 |
|
Core Funds From Operations / share |
|
$6.60 - $6.75 |
|
$6.60 - $6.75 |
|
Foreign currency translation adjustments |
|
$0.00 - $0.00 |
|
$0.00 - $0.00 |
|
Constant-Currency Core Funds From Operations / share |
|
$6.60 - $6.75 |
|
$6.60 - $6.75 |
|
| (1) | Net non-cash rent adjustments represent the sum of straight-line rental revenue and straight-line rental expense, as well as the amortization of above- and below-market leases (i.e., ASC 805 adjustments). |
| (2) | The “Same-Capital” pool includes properties owned as of December 31, 2022 with less than 5% of total rentable square feet under development. It excludes properties that were undergoing, or were expected to undergo, development activities in 2023-2024, properties classified as held for sale, and properties sold or contributed to joint ventures for all periods presented. |
| (3) | Excludes land acquisitions and includes Digital Realty’s share of JV contributions. Figure is net of JV partner contributions. |
| (4) | Other non-recurring CapEx represents costs incurred to enhance the capacity or marketability of operating properties, such as network fiber initiatives and software development costs. |
| (5) | Recurring CapEx represents non-incremental improvements required to maintain current revenues, including second-generation tenant improvements and leasing commissions. |
Note: The Company does not provide a reconciliation for non-GAAP estimates on a forward-looking basis, where it is unable to provide a meaningful or accurate calculation or estimation of reconciling items and the information is not available without unreasonable effort. Please see Non-GAAP Financial Measures in this document for further discussion.
10
Non-GAAP Financial Measures
This document contains non-GAAP financial measures, including FFO, Core FFO, Adjusted FFO, Net Operating Income (NOI), “Same-Capital” Cash NOI and Adjusted EBITDA. A reconciliation from U.S. GAAP net income available to common stockholders to FFO, a reconciliation from FFO to Core FFO, a reconciliation from Core FFO to Adjusted FFO, reconciliation from NOI to Cash NOI, and definitions of FFO, Core FFO, Adjusted FFO, NOI and “Same-Capital” Cash NOI are included as an attachment to this document. A reconciliation from U.S. GAAP net income available to common stockholders to Adjusted EBITDA, a definition of Adjusted EBITDA and definitions of net debt-to-Adjusted EBITDA, debt-plus-preferred-to-total enterprise value, cash NOI, and fixed charge coverage ratio are included as an attachment to this document.
The Company does not provide a reconciliation for non-GAAP estimates on a forward-looking basis, where it is unable to provide a meaningful or accurate calculation or estimation of reconciling items and the information is not available without unreasonable effort. This is due to the inherent difficulty of forecasting the timing and/or amount of various items that would impact net income attributable to common stockholders per diluted share, which is the most directly comparable forward-looking GAAP financial measure. This includes, for example, external growth factors, such as dispositions, and balance sheet items such as debt issuances, that have not yet occurred, are out of the Company's control and/or cannot be reasonably predicted. For the same reasons, the Company is unable to address the probable significance of the unavailable information. Forward-looking non-GAAP financial measures provided without the most directly comparable GAAP financial measures may vary materially from the corresponding GAAP financial measures.
Investor Conference Call
Prior to Digital Realty’s investor conference call at 5:00 p.m. ET / 4:00 p.m. CT on May 2, 2024, a presentation will be posted to the Investors section of the company’s website at https://investor.digitalrealty.com. The presentation is designed to accompany the discussion of the company’s first quarter 2024 financial results and operating performance. The conference call will feature President & Chief Executive Officer Andy Power and Chief Financial Officer Matt Mercier.
To participate in the live call, investors are invited to dial +1 (888) 317-6003 (for domestic callers) or +1 (412) 317-6061 (for international callers) and reference the conference ID# 1322262 at least five minutes prior to start time. A live webcast of the call will be available via the Investors section of Digital Realty’s website at https://investor.digitalrealty.com.
Telephone and webcast replays will be available after the call until June 2, 2024. The telephone replay can be accessed by dialing +1 (877) 344-7529 (for domestic callers) or +1 (412) 317-0088 (for international callers) and providing the conference ID# 7673278. The webcast replay can be accessed on Digital Realty’s website.
About Digital Realty
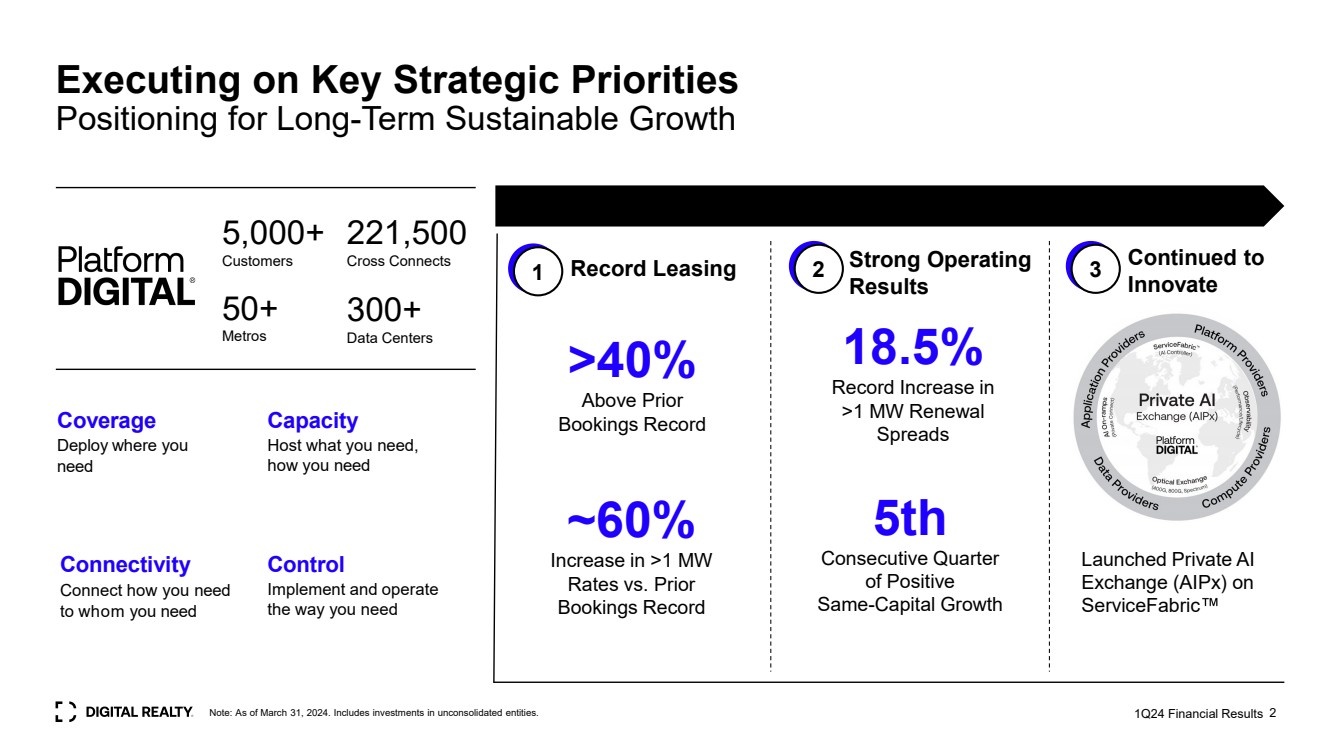
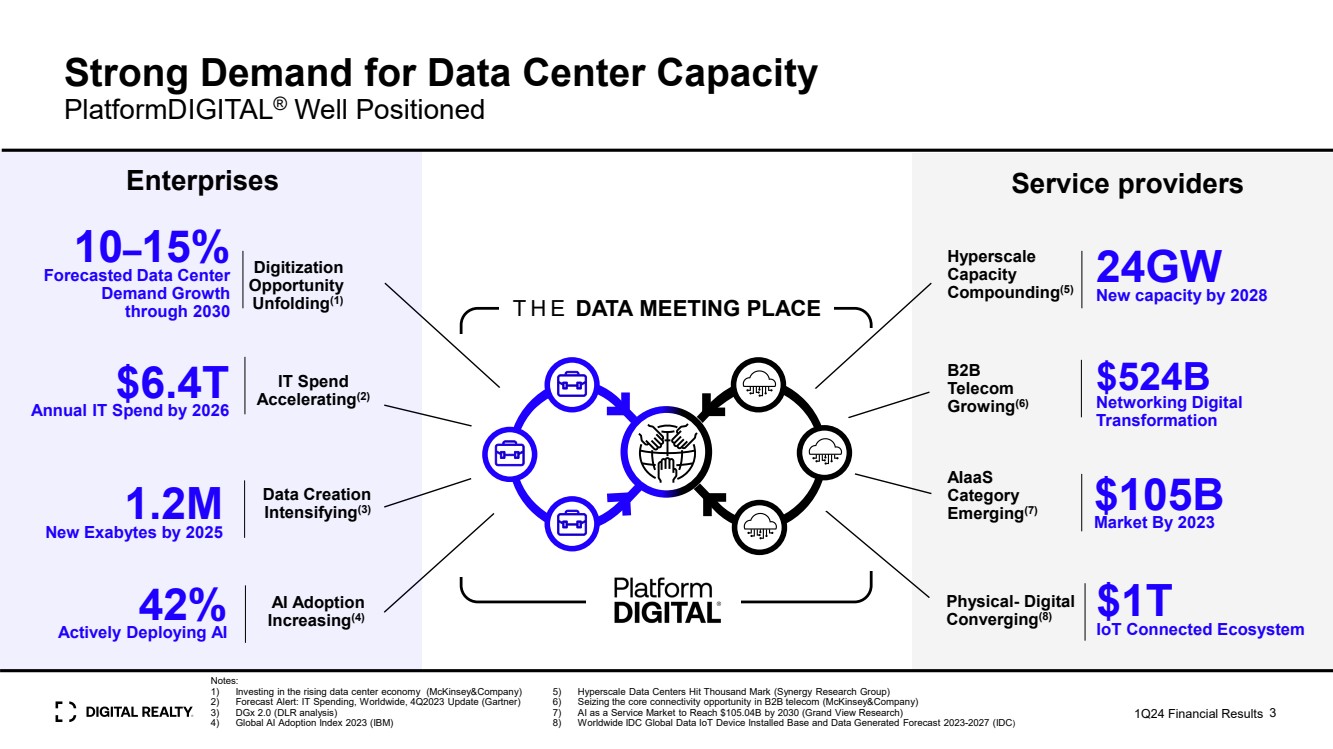
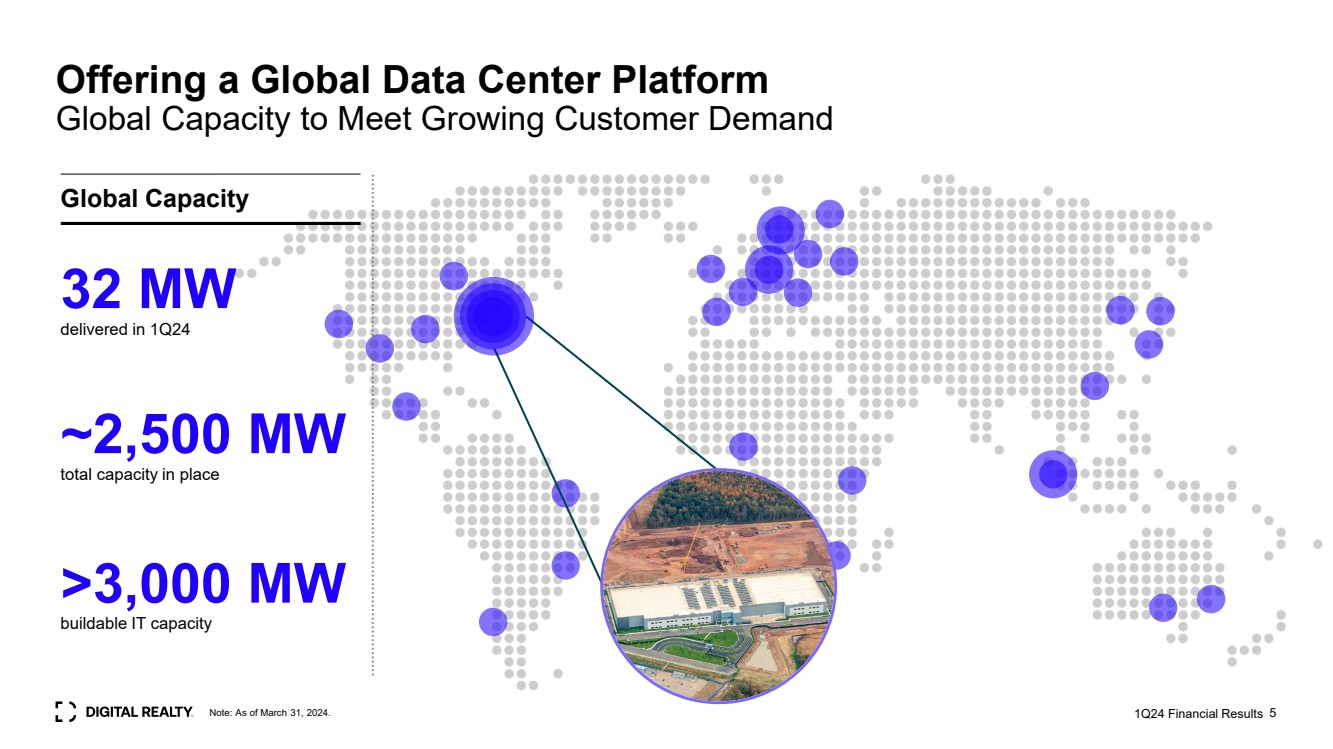
Digital Realty brings companies and data together by delivering the full spectrum of data center, colocation, and interconnection solutions. PlatformDIGITAL®, the company’s global data center platform, provides customers with a secure data meeting place and a proven Pervasive Datacenter Architecture (PDx®) solution methodology for powering innovation and efficiently managing Data Gravity challenges. Digital Realty gives its customers access to the connected data communities that matter to them with a global data center footprint of 300+ facilities in 50+ metros across 25+ countries on six continents. To learn more about Digital Realty, please visit digitalrealty.com or follow us on LinkedIn and X.
Contact Information
Matt Mercier
Chief Financial Officer
Digital Realty
(737) 281-0101
Jordan Sadler / Jim Huseby
Investor Relations
Digital Realty
(737) 281-0101
11
|
Financial Supplement |
|
|---|---|---|
Unaudited and in Thousands, Except Per Share Data |
First Quarter 2024 |
|
|
|
Three Months Ended |
||||||||||||
|
|
|
31-Mar-24 |
|
|
31-Dec-23 |
|
|
30-Sep-23 |
|
|
30-Jun-23 |
|
|
31-Mar-23 |
Rental revenues |
|
|
$894,409 |
|
|
$885,694 |
|
|
$886,960 |
|
|
$869,298 |
|
|
$870,975 |
Tenant reimbursements - Utilities |
|
|
276,357 |
|
|
316,634 |
|
|
335,477 |
|
|
330,416 |
|
|
317,148 |
Tenant reimbursements - Other |
|
|
38,434 |
|
|
46,418 |
|
|
64,876 |
|
|
46,192 |
|
|
40,150 |
Interconnection & other |
|
|
108,071 |
|
|
106,413 |
|
|
107,305 |
|
|
104,521 |
|
|
101,695 |
Fee income |
|
|
13,010 |
|
|
14,330 |
|
|
7,819 |
|
|
14,908 |
|
|
7,868 |
Other |
|
|
862 |
|
|
144 |
|
|
— |
|
|
932 |
|
|
887 |
Total Operating Revenues |
|
|
$1,331,143 |
|
|
$1,369,633 |
|
|
$1,402,437 |
|
|
$1,366,267 |
|
|
$1,338,724 |
|
|
|
|
|
|
|
|
|
|
|
|
|
|
|
|
Utilities |
|
|
$324,571 |
|
|
$366,083 |
|
|
$384,455 |
|
|
$374,934 |
|
|
$346,364 |
Rental property operating |
|
|
224,369 |
|
|
237,118 |
|
|
223,089 |
|
|
224,762 |
|
|
224,861 |
Property taxes |
|
|
41,156 |
|
|
40,161 |
|
|
72,279 |
|
|
46,718 |
|
|
40,424 |
Insurance |
|
|
2,694 |
|
|
3,794 |
|
|
4,289 |
|
|
4,385 |
|
|
4,355 |
Depreciation & amortization |
|
|
431,102 |
|
|
420,475 |
|
|
420,613 |
|
|
432,573 |
|
|
421,198 |
General & administration |
|
|
114,419 |
|
|
109,235 |
|
|
108,039 |
|
|
105,964 |
|
|
107,766 |
Severance, equity acceleration and legal expenses |
|
|
791 |
|
|
7,565 |
|
|
2,682 |
|
|
3,652 |
|
|
4,155 |
Transaction and integration expenses |
|
|
31,839 |
|
|
40,226 |
|
|
14,465 |
|
|
17,764 |
|
|
12,267 |
Provision for impairment |
|
|
— |
|
|
5,363 |
|
|
113,000 |
|
|
— |
|
|
— |
Other expenses |
|
|
10,836 |
|
|
5,580 |
|
|
1,295 |
|
|
655 |
|
|
— |
Total Operating Expenses |
|
|
$1,181,776 |
|
|
$1,235,598 |
|
|
$1,344,206 |
|
|
$1,211,407 |
|
|
$1,161,388 |
|
|
|
|
|
|
|
|
|
|
|
|
|
|
|
|
Operating Income |
|
|
$149,367 |
|
|
$134,035 |
|
|
$58,231 |
|
|
$154,860 |
|
|
$177,335 |
|
|
|
|
|
|
|
|
|
|
|
|
|
|
|
|
Equity in earnings / (loss) of unconsolidated joint ventures |
|
|
(16,008) |
|
|
(29,955) |
|
|
(19,793) |
|
|
5,059 |
|
|
14,897 |
Gain / (loss) on sale of investments |
|
|
277,787 |
|
|
(103) |
|
|
810,688 |
|
|
89,946 |
|
|
— |
Interest and other income / (expense), net |
|
|
9,709 |
|
|
50,269 |
|
|
24,812 |
|
|
(6,930) |
|
|
280 |
Interest (expense) |
|
|
(109,535) |
|
|
(113,638) |
|
|
(110,767) |
|
|
(111,116) |
|
|
(102,220) |
Income tax benefit / (expense) |
|
|
(22,413) |
|
|
(20,724) |
|
|
(17,228) |
|
|
(16,173) |
|
|
(21,454) |
Loss from early extinguishment of debt |
|
|
(1,070) |
|
|
— |
|
|
— |
|
|
— |
|
|
— |
Net Income |
|
|
$287,837 |
|
|
$19,884 |
|
|
$745,941 |
|
|
$115,647 |
|
|
$68,839 |
|
|
|
|
|
|
|
|
|
|
|
|
|
|
|
|
Net income / (loss) attributable to noncontrolling interests |
|
|
(6,329) |
|
|
8,419 |
|
|
(12,320) |
|
|
2,538 |
|
|
(111) |
Net Income Attributable to Digital Realty Trust, Inc. |
|
|
$281,508 |
|
|
$28,304 |
|
|
$733,621 |
|
|
$118,185 |
|
|
$68,728 |
|
|
|
|
|
|
|
|
|
|
|
|
|
|
|
|
Preferred stock dividends |
|
|
(10,181) |
|
|
(10,181) |
|
|
(10,181) |
|
|
(10,181) |
|
|
(10,181) |
Net Income / (Loss) Available to Common Stockholders |
|
|
$271,327 |
|
|
$18,122 |
|
|
$723,440 |
|
|
$108,003 |
|
|
$58,547 |
|
|
|
|
|
|
|
|
|
|
|
|
|
|
|
|
Weighted-average shares outstanding - basic |
|
|
312,292 |
|
|
305,781 |
|
|
301,827 |
|
|
295,390 |
|
|
291,219 |
Weighted-average shares outstanding - diluted |
|
|
320,798 |
|
|
314,995 |
|
|
311,341 |
|
|
306,819 |
|
|
303,065 |
Weighted-average fully diluted shares and units |
|
|
326,975 |
|
|
321,173 |
|
|
317,539 |
|
|
313,021 |
|
|
309,026 |
|
|
|
|
|
|
|
|
|
|
|
|
|
|
|
|
Net income / (loss) per share - basic |
|
|
$0.87 |
|
|
$0.06 |
|
|
$2.40 |
|
|
$0.37 |
|
|
$0.20 |
Net income / (loss) per share - diluted |
|
|
$0.82 |
|
|
$0.08 |
|
|
$2.34 |
|
|
$0.35 |
|
|
$0.20 |
12
|
Financial Supplement |
|
|---|---|---|
Unaudited and in Thousands, Except Per Share Data |
First Quarter 2024 |
|
|
Three Months Ended |
|||||||||||||
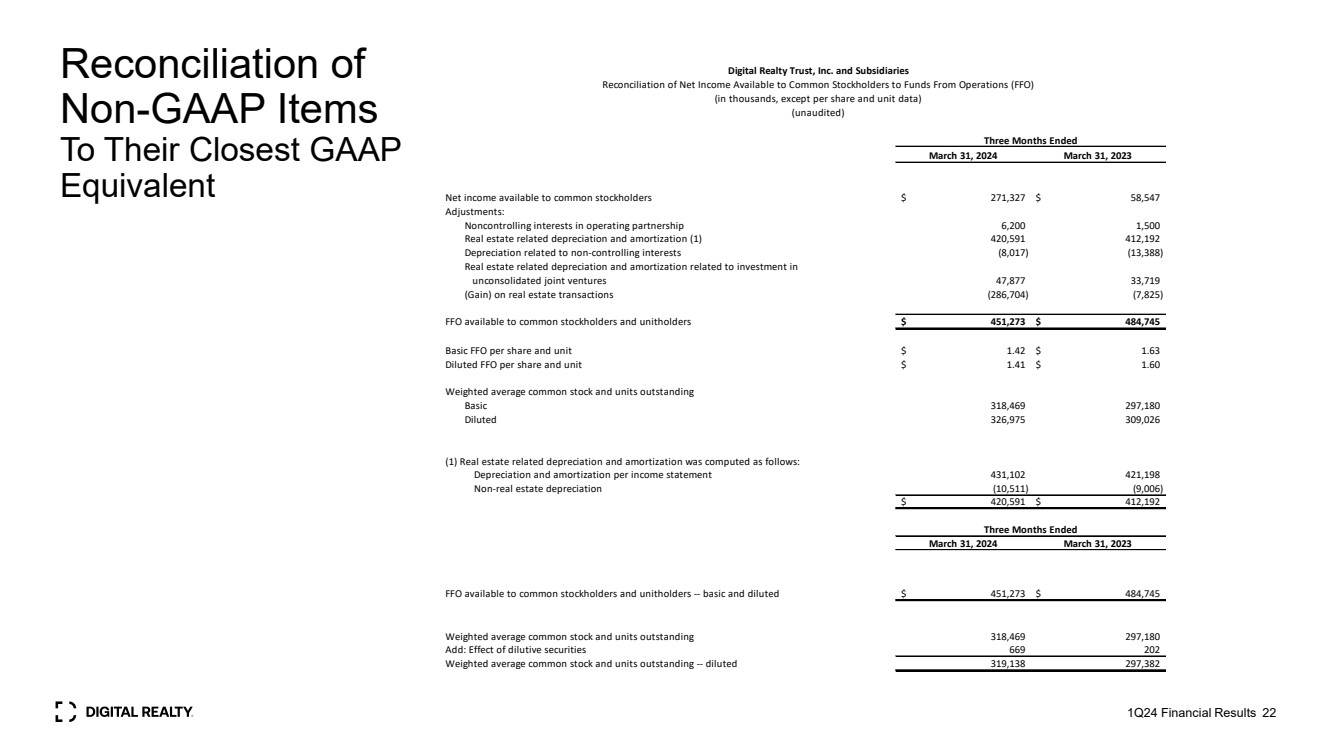
Reconciliation of Net Income to Funds From Operations (FFO) |
|
|
31-Mar-24 |
|
|
31-Dec-23 |
|
|
30-Sep-23 |
|
|
30-Jun-23 |
|
|
31-Mar-23 |
|
|
|
|
|
|
|
|
|
|
|
|
|
|
|
|
Net Income / (Loss) Available to Common Stockholders |
|
|
$271,327 |
|
|
$18,122 |
|
|
$723,440 |
|
|
$108,003 |
|
|
$58,547 |
Adjustments: |
|
|
|
|
|
|
|
|
|
|
|
|
|
|
|
Non-controlling interest in operating partnership |
|
|
6,200 |
|
|
410 |
|
|
16,300 |
|
|
2,500 |
|
|
1,500 |
Real estate related depreciation & amortization (1) |
|
|
420,591 |
|
|
410,167 |
|
|
410,836 |
|
|
424,044 |
|
|
412,192 |
Reconciling items related to non-controlling interests |
|
|
(8,017) |
|
|
(15,377) |
|
|
(14,569) |
|
|
(14,144) |
|
|
(13,388) |
Unconsolidated JV real estate related depreciation & amortization |
|
|
47,877 |
|
|
64,833 |
|
|
43,215 |
|
|
35,386 |
|
|
33,719 |
(Gain) / loss on real estate transactions |
|
|
(286,704) |
|
|
103 |
|
|
(810,688) |
|
|
(89,946) |
|
|
(7,825) |
Provision for impairment |
|
|
— |
|
|
5,363 |
|
|
113,000 |
|
|
— |
|
|
— |
Funds From Operations |
|
|
$451,273 |
|
|
$483,621 |
|
|
$481,535 |
|
|
$465,844 |
|
|
$484,745 |
|
|
|
|
|
|
|
|
|
|
|
|
|
|
|
|
Weighted-average shares and units outstanding - basic |
|
|
318,469 |
|
|
311,960 |
|
|
308,024 |
|
|
301,593 |
|
|
297,180 |
Weighted-average shares and units outstanding - diluted (2) (3) |
|
|
326,975 |
|
|
321,173 |
|
|
317,539 |
|
|
313,021 |
|
|
309,026 |
|
|
|
|
|
|
|
|
|
|
|
|
|
|
|
|
Funds From Operations per share - basic |
|
|
$1.42 |
|
|
$1.55 |
|
|
$1.56 |
|
|
$1.54 |
|
|
$1.63 |
|
|
|
|
|
|
|
|
|
|
|
|
|
|
|
|
Funds From Operations per share - diluted (2) (3) |
|
|
$1.41 |
|
|
$1.53 |
|
|
$1.55 |
|
|
$1.52 |
|
|
$1.60 |
|
|
Three Months Ended |
|||||||||||||
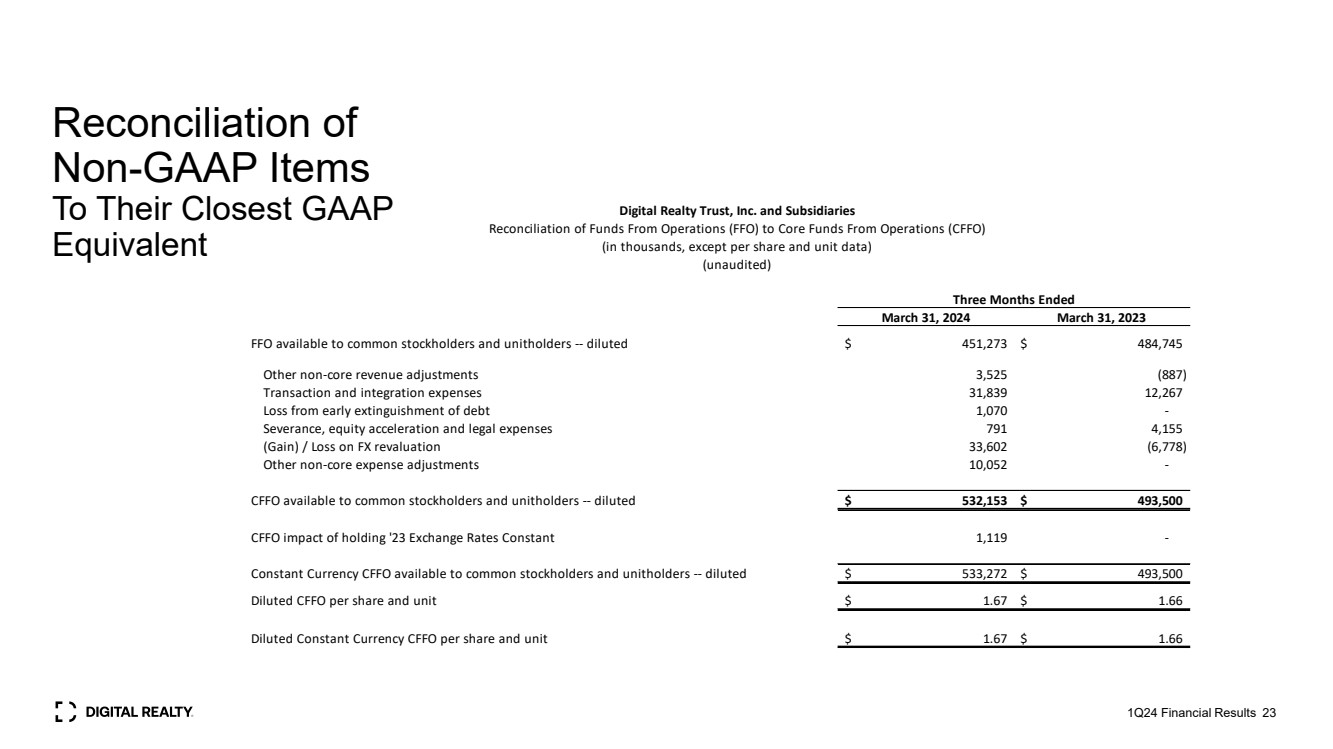
Reconciliation of FFO to Core FFO |
|
|
31-Mar-24 |
|
|
31-Dec-23 |
|
|
30-Sep-23 |
|
|
30-Jun-23 |
|
|
31-Mar-23 |
|
|
|
|
|
|
|
|
|
|
|
|
|
|
|
|
Funds From Operations |
|
|
$451,273 |
|
|
$483,621 |
|
|
$481,535 |
|
|
$465,844 |
|
|
$484,745 |
Other non-core revenue adjustments |
|
|
3,525 |
|
|
(146) |
|
|
(27) |
|
|
27,454 |
|
|
(887) |
Transaction and integration expenses |
|
|
31,839 |
|
|
40,226 |
|
|
14,465 |
|
|
17,764 |
|
|
12,267 |
Loss from early extinguishment of debt |
|
|
1,070 |
|
|
— |
|
|
— |
|
|
— |
|
|
— |
Severance, equity acceleration and legal expenses (4) |
|
|
791 |
|
|
7,565 |
|
|
2,682 |
|
|
3,652 |
|
|
4,155 |
(Gain) / Loss on FX revaluation |
|
|
33,602 |
|
|
(24,804) |
|
|
451 |
|
|
(7,868) |
|
|
(6,778) |
Other non-core expense adjustments |
|
|
10,052 |
|
|
1,956 |
|
|
1,295 |
|
|
655 |
|
|
— |
Core Funds From Operations |
|
|
$532,153 |
|
|
$508,417 |
|
|
$500,402 |
|
|
$507,501 |
|
|
$493,500 |
|
|
|
|
|
|
|
|
|
|
|
|
|
|
|
|
Weighted-average shares and units outstanding - diluted (2) (3) |
|
|
319,138 |
|
|
312,356 |
|
|
308,539 |
|
|
301,806 |
|
|
297,382 |
|
|
|
|
|
|
|
|
|
|
|
|
|
|
|
|
Core Funds From Operations per share - diluted (2) |
|
|
$1.67 |
|
|
$1.63 |
|
|
$1.62 |
|
|
$1.68 |
|
|
$1.66 |
(1) Real Estate Related Depreciation & Amortization |
|
Three Months Ended |
|||||||||||||
|
|
|
31-Mar-24 |
|
|
31-Dec-23 |
|
|
30-Sep-23 |
|
|
30-Jun-23 |
|
|
31-Mar-23 |
|
|
|
|
|
|
|
|
|
|
|
|
|
|
|
|
Depreciation & amortization per income statement |
|
|
$431,102 |
|
|
$420,475 |
|
|
$420,613 |
|
|
$432,573 |
|
|
$421,198 |
Non-real estate depreciation |
|
|
(10,511) |
|
|
(10,308) |
|
|
(9,777) |
|
|
(8,529) |
|
|
(9,006) |
Real Estate Related Depreciation & Amortization |
|
|
$420,591 |
|
|
$410,167 |
|
|
$410,836 |
|
|
$424,044 |
|
|
$412,192 |
| (2) | Certain of Teraco's minority indirect shareholders have the right to put their shares in an upstream parent company of Teraco to Digital Realty in exchange for cash or the equivalent value of shares of Digital Realty common stock, or a combination thereof. US GAAP requires Digital Realty to assume the put right is settled in shares for purposes of calculating diluted EPS. This same approach was utilized to calculate FFO/share. The potential future dilutive impact associated with this put right will be excluded from Core FFO and AFFO until settlement occurs – causing diluted share count to be higher for FFO than for Core FFO and AFFO. When calculating diluted FFO, Teraco related minority interest is added back to the FFO numerator as the denominator assumes all shares have been put back to Digital Realty. |
|
|
Three Months Ended |
|||||||||||||
|
|
|
31-Mar-24 |
|
|
31-Dec-23 |
|
|
30-Sep-23 |
|
|
30-Jun-23 |
|
|
31-Mar-23 |
Teraco noncontrolling share of FFO |
|
|
$9,768 |
|
|
$7,135 |
|
|
$11,537 |
|
|
$9,645 |
|
|
$11,069 |
Teraco related minority interest |
|
|
$9,768 |
|
|
$7,135 |
|
|
$11,537 |
|
|
$9,645 |
|
|
$11,069 |
| (3) | For all periods presented, we have excluded the effect of dilutive series J, series K and series L preferred stock, as applicable, that may be converted into common stock upon the occurrence of specified change in control transactions as described in the articles supplementary governing the series J, series K and series L preferred stock, as applicable, which we consider highly improbable. See above for calculations of FFO and the share count detail section that follows the reconciliation of Core FFO to AFFO for calculations of weighted average common stock and units outstanding. For definitions and discussion of FFO and Core FFO, see the Definitions section. |
| (4) | Relates to severance and other charges related to the departure of company executives and integration-related severance. |
13
|
Financial Supplement |
|
|---|---|---|
Unaudited and in Thousands, Except Per Share Data |
First Quarter 2024 |
|
|
Three Months Ended |
|||||||||||||
Reconciliation of Core FFO to AFFO |
|
|
31-Mar-24 |
|
|
31-Dec-23 |
|
|
30-Sep-23 |
|
|
30-Jun-23 |
|
|
31-Mar-23 |
|
|
|
|
|
|
|
|
|
|
|
|
|
|
|
|
Core FFO available to common stockholders and unitholders |
|
|
$532,153 |
|
|
$508,417 |
|
|
$500,402 |
|
|
$507,501 |
|
|
$493,500 |
Adjustments: |
|
|
|
|
|
|
|
|
|
|
|
|
|
|
|
Non-real estate depreciation |
|
|
10,511 |
|
|
10,308 |
|
|
9,777 |
|
|
8,529 |
|
|
9,006 |
Amortization of deferred financing costs |
|
|
5,576 |
|
|
5,744 |
|
|
5,776 |
|
|
5,984 |
|
|
4,072 |
Amortization of debt discount/premium |
|
|
1,832 |
|
|
973 |
|
|
1,360 |
|
|
1,339 |
|
|
1,301 |
Non-cash stock-based compensation expense |
|
|
12,592 |
|
|
9,226 |
|
|
14,062 |
|
|
13,893 |
|
|
13,056 |
Straight-line rental revenue |
|
|
9,976 |
|
|
(21,992) |
|
|
(14,080) |
|
|
(16,151) |
|
|
(16,194) |
Straight-line rental expense |
|
|
1,111 |
|
|
(4,999) |
|
|
1,427 |
|
|
520 |
|
|
(515) |
Above- and below-market rent amortization |
|
|
(854) |
|
|
(856) |
|
|
(1,127) |
|
|
(1,195) |
|
|
(1,226) |
Deferred tax (benefit) / expense |
|
|
(3,437) |
|
|
33,448 |
|
|
(8,539) |
|
|
1,339 |
|
|
(9,795) |
Leasing compensation & internal lease commissions |
|
|
13,291 |
|
|
9,848 |
|
|
12,515 |
|
|
11,611 |
|
|
11,067 |
Recurring capital expenditures (1) |
|
|
(47,676) |
|
|
(142,808) |
|
|
(90,251) |
|
|
(53,498) |
|
|
(40,465) |
|
|
|
|
|
|
|
|
|
|
|
|
|
|
|
|
AFFO available to common stockholders and unitholders (2) |
|
|
$535,073 |
|
|
$407,306 |
|
|
$431,322 |
|
|
$479,873 |
|
|
$463,807 |
|
|
|
|
|
|
|
|
|
|
|
|
|
|
|
|
Weighted-average shares and units outstanding - basic |
|
|
318,469 |
|
|
311,960 |
|
|
308,024 |
|
|
301,593 |
|
|
297,180 |
Weighted-average shares and units outstanding - diluted (3) |
|
|
319,138 |
|
|
312,356 |
|
|
308,539 |
|
|
301,806 |
|
|
297,382 |
|
|
|
|
|
|
|
|
|
|
|
|
|
|
|
|
AFFO per share - diluted (3) |
|
|
$1.68 |
|
|
$1.30 |
|
|
$1.40 |
|
|
$1.59 |
|
|
$1.56 |
|
|
|
|
|
|
|
|
|
|
|
|
|
|
|
|
Dividends per share and common unit |
|
|
$1.22 |
|
|
$1.22 |
|
|
$1.22 |
|
|
$1.22 |
|
|
$1.22 |
|
|
|
|
|
|
|
|
|
|
|
|
|
|
|
|
Diluted AFFO Payout Ratio |
|
|
72.8% |
|
|
93.6% |
|
|
87.3% |
|
|
76.7% |
|
|
78.2% |
|
|
Three Months Ended |
|||||||||||||
Share Count Detail |
|
|
31-Mar-24 |
|
|
31-Dec-23 |
|
|
30-Sep-23 |
|
|
30-Jun-23 |
|
|
31-Mar-23 |
|
|
|
|
|
|
|
|
|
|
|
|
|
|
|
|
Weighted Average Common Stock and Units Outstanding |
|
|
318,469 |
|
|
311,960 |
|
|
308,024 |
|
|
301,593 |
|
|
297,180 |
Add: Effect of dilutive securities |
|
|
669 |
|
|
396 |
|
|
515 |
|
|
213 |
|
|
202 |
Weighted Avg. Common Stock and Units Outstanding - diluted |
|
|
319,138 |
|
|
312,356 |
|
|
308,539 |
|
|
301,806 |
|
|
297,382 |
| (1) | Recurring capital expenditures represent non-incremental building improvements required to maintain current revenues, including second-generation tenant improvements and external leasing commissions. Recurring capital expenditures do not include acquisition costs contemplated when underwriting the purchase of a building, costs which are incurred to bring a building up to Digital Realty’s operating standards, or internal leasing commissions. |
| (2) | For a definition and discussion of AFFO, see the Definitions section. For a reconciliation of net income available to common stockholders to FFO and Core FFO, see above. |
| (3) | For all periods presented, we have excluded the effect of dilutive series J, series K and series L preferred stock, as applicable, that may be converted into common stock upon the occurrence of specified change in control transactions as described in the articles supplementary governing the series J, series K and series L preferred stock, as applicable, which we consider highly improbable. See above for calculations of FFO and for calculations of weighted average common stock and units outstanding. |
14
|
Financial Supplement |
|
|---|---|---|
Unaudited and in Thousands, Except Per Share Data |
First Quarter 2024 |
|
|
31-Mar-24 |
|
31-Dec-23 |
|
30-Sep-23 |
|
30-Jun-23 |
|
31-Mar-23 |
|||||
Assets |
|
|
|
|
|
|
|
|
|
|
|
|
|
|
|
Investments in real estate: |
|
|
|
|
|
|
|
|
|
|
|
|
|
|
|
Real estate |
|
$27,122,796 |
|
|
$27,306,369 |
|
|
$25,887,031 |
|
|
$27,087,769 |
|
|
$27,052,022 |
|
Construction in progress |
|
4,496,840 |
|
|
4,635,215 |
|
|
5,020,464 |
|
|
4,635,939 |
|
|
4,563,578 |
|
Land held for future development |
|
114,240 |
|
|
118,190 |
|
|
179,959 |
|
|
193,936 |
|
|
194,564 |
|
Investments in Real Estate |
|
$31,733,877 |
|
|
$32,059,773 |
|
|
$31,087,453 |
|
|
$31,917,644 |
|
|
$31,810,164 |
|
Accumulated depreciation and amortization |
|
(7,976,093) |
|
|
(7,823,685) |
|
|
(7,489,193) |
|
|
(7,739,462) |
|
|
(7,600,559) |
|
Net Investments in Properties |
|
$23,757,784 |
|
|
$24,236,089 |
|
|
$23,598,260 |
|
|
$24,178,182 |
|
|
$24,209,605 |
|
Investment in unconsolidated joint ventures |
|
2,365,821 |
|
|
2,295,889 |
|
|
2,180,313 |
|
|
2,040,452 |
|
|
1,995,576 |
|
Net Investments in Real Estate |
|
$26,123,605 |
|
|
$26,531,977 |
|
|
$25,778,573 |
|
|
$26,218,634 |
|
|
$26,205,180 |
|
|
|
|
|
|
|
|
|
|
|
|
|
|
|
|
|
Operating lease right-of-use assets, net |
|
$1,233,410 |
|
|
$1,414,256 |
|
|
$1,274,410 |
|
|
$1,291,233 |
|
|
$1,317,293 |
|
Cash and cash equivalents |
|
1,193,784 |
|
|
1,625,495 |
|
|
1,062,050 |
|
|
124,519 |
|
|
131,406 |
|
Accounts and other receivables, net (1) |
|
1,217,276 |
|
|
1,278,110 |
|
|
1,325,725 |
|
|
1,158,383 |
|
|
1,070,066 |
|
Deferred rent, net |
|
611,670 |
|
|
624,427 |
|
|
586,418 |
|
|
613,796 |
|
|
627,700 |
|
Goodwill |
|
9,105,026 |
|
|
9,239,871 |
|
|
8,998,074 |
|
|
9,148,603 |
|
|
9,199,636 |
|
Customer relationship value, deferred leasing costs & other intangibles, net |
|
2,359,380 |
|
|
2,500,237 |
|
|
2,506,198 |
|
|
2,825,596 |
|
|
3,015,291 |
|
Assets held for sale |
|
|
287,064 |
|
|
478,503 |
|
|
— |
|
|
593,892 |
|
|
— |
Other assets |
|
501,875 |
|
|
420,382 |
|
|
401,068 |
|
|
414,078 |
|
|
386,495 |
|
Total Assets |
|
$42,633,089 |
|
|
$44,113,257 |
|
|
$41,932,515 |
|
|
$42,388,735 |
|
|
$41,953,068 |
|
|
|
|
|
|
|
|
|
|
|
|
|
|
|
|
|
Liabilities and Equity |
|
|
|
|
|
|
|
|
|
|
|
|
|
|
|
Global unsecured revolving credit facilities, net |
|
$1,901,126 |
|
|
$1,812,287 |
|
|
$1,698,780 |
|
|
$2,242,258 |
|
|
$2,514,202 |
|
Unsecured term loans, net |
|
1,303,263 |
|
|
1,560,305 |
|
|
1,524,663 |
|
|
1,548,780 |
|
|
1,542,275 |
|
Unsecured senior notes, net of discount |
|
13,190,202 |
|
|
13,422,342 |
|
|
13,072,102 |
|
|
13,383,819 |
|
|
13,258,079 |
|
Secured and other debt, net of discount |
|
625,750 |
|
|
630,973 |
|
|
574,231 |
|
|
554,594 |
|
|
560,955 |
|
Operating lease liabilities |
|
1,357,751 |
|
|
1,542,094 |
|
|
1,404,510 |
|
|
1,420,239 |
|
|
1,443,994 |
|
Accounts payable and other accrued liabilities |
|
1,870,344 |
|
|
2,168,983 |
|
|
2,147,103 |
|
|
2,214,820 |
|
|
1,923,819 |
|
Deferred tax liabilities, net |
|
1,121,224 |
|
|
1,151,096 |
|
|
1,088,724 |
|
|
1,128,961 |
|
|
1,164,276 |
|
Accrued dividends and distributions |
|
— |
|
|
387,988 |
|
|
— |
|
|
— |
|
|
— |
|
Security deposits and prepaid rents |
|
413,225 |
|
|
401,867 |
|
|
385,521 |
|
|
417,693 |
|
|
392,021 |
|
Obligations associated with assets held for sale |
|
|
9,981 |
|
|
39,001 |
|
|
— |
|
|
4,990 |
|
|
— |
Total Liabilities |
|
$21,792,866 |
|
|
$23,116,936 |
|
|
$21,895,634 |
|
|
$22,916,155 |
|
|
$22,799,620 |
|
|
|
|
|
|
|
|
|
|
|
|
|
|
|
|
|
Redeemable non-controlling interests |
|
1,350,736 |
|
|
1,394,814 |
|
|
1,360,308 |
|
|
1,367,422 |
|
|
1,448,772 |
|
|
|
|
|
|
|
|
|
|
|
|
|
|
|
|
|
Equity |
|
|
|
|
|
|
|
|
|
|
|
|
|
|
|
Preferred Stock: $0.01 par value per share, 110,000 shares authorized: |
|
|
|
|
|
|
|
|
|
|
|
|
|
|
|
Series J Cumulative Redeemable Preferred Stock (2) |
|
$193,540 |
|
|
$193,540 |
|
|
$193,540 |
|
|
$193,540 |
|
|
$193,540 |
|
Series K Cumulative Redeemable Preferred Stock (3) |
|
203,264 |
|
|
203,264 |
|
|
203,264 |
|
|
203,264 |
|
|
203,264 |
|
Series L Cumulative Redeemable Preferred Stock (4) |
|
334,886 |
|
|
334,886 |
|
|
334,886 |
|
|
334,886 |
|
|
334,886 |
|
Common Stock: $0.01 par value per share, 392,000 shares authorized (5) |
|
3,097 |
|
|
3,088 |
|
|
3,002 |
|
|
2,967 |
|
|
2,888 |
|
Additional paid-in capital |
|
24,508,683 |
|
|
24,396,797 |
|
|
23,239,088 |
|
|
22,882,200 |
|
|
22,126,379 |
|
Dividends in excess of earnings |
|
(5,373,529) |
|
|
(5,262,648) |
|
|
(4,900,757) |
|
|
(5,253,915) |
|
|
(4,995,982) |
|
Accumulated other comprehensive (loss), net |
|
(850,091) |
|
|
(751,393) |
|
|
(882,996) |
|
|
(741,484) |
|
|
(652,486) |
|
Total Stockholders' Equity |
|
$19,019,850 |
|
|
$19,117,535 |
|
|
$18,190,026 |
|
|
$17,621,456 |
|
|
$17,212,490 |
|
|
|
|
|
|
|
|
|
|
|
|
|
|
|
|
|
Noncontrolling Interests |
|
|
|
|
|
|
|
|
|
|
|
|
|
|
|
Noncontrolling interest in operating partnership |
|
$438,422 |
|
|
$438,081 |
|
|
$441,366 |
|
|
$436,099 |
|
|
$444,843 |
|
Noncontrolling interest in consolidated joint ventures |
|
31,215 |
|
|
45,892 |
|
|
45,182 |
|
|
47,603 |
|
|
47,342 |
|
|
|
|
|
|
|
|
|
|
|
|
|
|
|
|
|
Total Noncontrolling Interests |
|
$469,637 |
|
|
$483,972 |
|
|
$486,547 |
|
|
$483,702 |
|
|
$492,185 |
|
|
|
|
|
|
|
|
|
|
|
|
|
|
|
|
|
Total Equity |
|
$19,489,487 |
|
|
$19,601,507 |
|
|
$18,676,573 |
|
|
$18,105,158 |
|
|
$17,704,675 |
|
|
|
|
|
|
|
|
|
|
|
|
|
|
|
|
|
Total Liabilities and Equity |
|
$42,633,089 |
|
|
$44,113,257 |
|
|
$41,932,515 |
|
|
$42,388,735 |
|
|
$41,953,068 |
|
| (1) | Net of allowance for doubtful accounts of $43,873 and $36,240 as of March 31, 2024 and March 31, 2023, respectively. |
| (2) | Series J Cumulative Redeemable Preferred Stock, 5.250%, $200,000 liquidation preference ($25.00 per share), 8,000 shares issued and outstanding as of March 31, 2024 and March 31, 2023. |
| (3) | Series K Cumulative Redeemable Preferred Stock, 5.850%, $210,000 liquidation preference ($25.00 per share), 8,400 shares issued and outstanding as of March 31, 2024 and March 31, 2023. |
| (4) | Series L Cumulative Redeemable Preferred Stock, 5.200%, $345,000 liquidation preference ($25.00 per share), 13,800 shares issued and outstanding as of March 31, 2024 and March 31, 2023. |
| (5) | Common Stock: 312,421 and 291,299 shares issued and outstanding as of March 31, 2024 and March 31, 2023, respectively. |
15
|
Financial Supplement |
|
|---|---|---|
Unaudited and in Thousands |
First Quarter 2024 |
44
Consolidated Properties Cash Net Operating Income (NOI)(2), Annualized (3) |
|
|
|
Network-Dense |
|
|
$1,124,737 |
Campus |
|
|
1,590,934 |
Other (4) |
|
|
174,226 |
Total Cash NOI, Annualized |
|
|
$2,889,897 |
less: Partners' share of consolidated JVs |
|
|
(62,120) |
Acquisitions / dispositions / expirations |
|
|
(72,292) |
FY 2024 backlog cash NOI and 1Q24 carry-over (stabilized) (5) |
|
|
190,849 |
Total Consolidated Cash NOI, Annualized |
|
|
$2,946,334 |
|
|
|
|
Digital Realty's Pro Rata Share of Unconsolidated Joint Venture Cash NOI (3) (6) |
|
|
$223,132 |
|
|
|
|
Other Income |
|
|
|
Development and Management Fees (net), Annualized |
|
|
$52,042 |
|
|
|
|
Other Assets |
|
|
|
Pre-stabilized inventory, at cost (7) |
|
|
$88,245 |
Land held for development |
|
|
114,240 |
Development CIP (8) |
|
|
4,496,840 |
less: Investment associated with FY24 Backlog NOI (9) |
|
|
(651,274) |
Cash and cash equivalents |
|
|
1,193,784 |
Accounts and other receivables, net |
|
|
1,217,276 |
Other assets |
|
|
501,875 |
less: Partners' share of consolidated JV assets |
|
|
(84,559) |
Total Other Assets |
|
|
$6,876,427 |
|
|
|
|
Liabilities |
|
|
|
Global unsecured revolving credit facilities |
|
|
$1,912,492 |
Unsecured term loans |
|
|
1,309,250 |
Unsecured senior notes |
|
|
13,271,592 |
Secured and other debt |
|
|
631,469 |
Accounts payable and other accrued liabilities |
|
|
1,870,344 |
Deferred tax liabilities, net |
|
|
1,121,224 |
Security deposits and prepaid rents |
|
|
413,225 |
Obligations associated with assets held for sale |
|
|
9,981 |
Backlog NOI cost to complete (9) |
|
|
333,573 |
Preferred stock |
|
|
755,000 |
Digital Realty's share of unconsolidated JV debt |
|
|
1,382,102 |
less: Partners' share of consolidated JV liabilities |
|
|
(387,367) |
Total Liabilities |
|
|
$22,622,886 |
|
|
|
|
| (1) | Backlog and associated financial line items include activity related to unconsolidated joint venture properties. |
| (2) | For definitions and discussion of NOI and cash NOI and a reconciliation of operating income to NOI and cash NOI, see page 32. |
| (3) | Annualized cash NOI is calculated by multiplying results for the most recent quarter by four. Annualized results may not be indicative of any four-quarter period and do not take into account scheduled lease expirations, among other things. Annualized data is presented for illustrative purposes only. Reflects annualized 1Q24 Cash NOI of $2.9 billion. NOI is allocated based on management’s estimates derived using contractual ABR and stabilized margins. |
| (4) | Other includes Powered Base Building shell capacity as well as storage and office space within fully improved data center facilities. |
| (5) | Estimated cash NOI related to signed leases that are expected to commence through December 31, 2024. Includes Digital Realty’s share of signed leases at unconsolidated joint venture properties. |
| (6) | For a reconciliation of Digital Realty’s pro rata share of unconsolidated joint venture operating income to cash NOI, see page 29. |
| (7) | Excludes Digital Realty’s share of cost at unconsolidated joint venture properties. |
| (8) | See page 26 for further details on the breakdown of the construction in progress balance. |
| (9) | Includes Digital Realty’s share of construction in progress and expected cost to complete at unconsolidated joint venture properties. |
16
4
|
|
As of March 31, 2024 |
||||||||||||||||||||||||
|
|
|
|
Interest Rate |
|
|
|
|
|
|
|
|
|
|
|
|
|
|
|
|
|
|
|
|
|
|
|
|
Interest |
|
Including |
|
|
|
|
|
|
|
|
|
|
|
|
|
|
|
|
|
|
|
|
|
|
|
|
Rate |
|
Swaps |
|
|
|
2024 |
|
|
2025 |
|
|
2026 |
|
|
2027 |
|
|
2028 |
|
|
Thereafter |
|
|
Total |
Global Unsecured Revolving Credit Facilities (1) |
|
|
|
|
|
|
|
|
|
|
|
|
|
|
|
|
|
|
|
|
|
|
|
|
|
|
Global unsecured revolving credit facility |
|
4.488% |
|
4.488% |
|
|
|
— |
|
|
— |
|
|
— |
|
|
$1,825,412 |
|
|
— |
|
|
— |
|
|
$1,825,412 |
Yen revolving credit facility |
|
0.615% |
|
0.615% |
|
|
|
— |
|
|
— |
|
|
— |
|
|
87,080 |
|
|
— |
|
|
— |
|
|
87,080 |
Deferred financing costs, net |
|
— |
|
— |
|
|
|
— |
|
|
— |
|
|
— |
|
|
— |
|
|
— |
|
|
— |
|
|
(11,366) |
Total Global Unsecured Revolving Credit Facilities |
|
4.311% |
|
4.311% |
|
|
|
— |
|
|
— |
|
|
— |
|
|
$1,912,492 |
|
|
— |
|
|
— |
|
|
$1,901,126 |
|
|
|
|
|
|
|
|
|
|
|
|
|
|
|
|
|
|
|
|
|
|
|
|
|
|
|
Unsecured Term Loans |
|
|
|
|
|
|
|
|
|
|
|
|
|
|
|
|
|
|
|
|
|
|
|
|
|
|
Euro term loan facility |
|
4.780% |
|
4.005% |
|
|
|
— |
|
|
$404,625 |
|
|
— |
|
|
$404,625 |
|
|
— |
|
|
— |
|
|
$809,250 |
USD term loan facility |
|
6.368% |
|
5.180% |
|
|
|
— |
|
|
— |
|
|
$500,000 |
|
|
— |
|
|
— |
|
|
— |
|
|
500,000 |
Deferred financing costs, net |
|
— |
|
— |
|
|
|
— |
|
|
— |
|
|
— |
|
|
— |
|
|
— |
|
|
— |
|
|
(5,987) |
Total Unsecured Term Loans |
|
5.386% |
|
4.453% |
|
|
|
— |
|
|
$404,625 |
|
|
$500,000 |
|
|
$404,625 |
|
|
— |
|
|
— |
|
|
$1,303,263 |
|
|
|
|
|
|
|
|
|
|
|
|
|
|
|
|
|
|
|
|
|
|
|
|
|
|
|
Senior Notes |
|
|
|
|
|
|
|
|
|
|
|
|
|
|
|
|
|
|
|
|
|
|
|
|
|
|
€600 million 2.625% Notes due 2024 (2) |
|
2.625% |
|
2.625% |
|
|
|
$647,400 |
|
|
— |
|
|
— |
|
|
— |
|
|
— |
|
|
— |
|
|
$647,400 |
£250 million 2.750% Notes due 2024 |
|
2.750% |
|
2.750% |
|
|
|
315,575 |
|
|
— |
|
|
— |
|
|
— |
|
|
— |
|
|
— |
|
|
315,575 |
£400 million 4.250% Notes due 2025 |
|
4.250% |
|
4.250% |
|
|
|
— |
|
|
$504,920 |
|
|
— |
|
|
— |
|
|
— |
|
|
— |
|
|
504,920 |
€650 million 0.625% Notes due 2025 |
|
0.625% |
|
0.625% |
|
|
|
— |
|
|
701,350 |
|
|
— |
|
|
— |
|
|
— |
|
|
— |
|
|
701,350 |
€1.08 billion 2.500% Notes due 2026 |
|
2.500% |
|
2.500% |
|
|
|
— |
|
|
— |
|
|
$1,159,925 |
|
|
— |
|
|
— |
|
|
— |
|
|
1,159,925 |
₣275 million 0.200% Notes due 2026 |
|
0.200% |
|
0.200% |
|
|
|
— |
|
|
— |
|
|
304,915 |
|
|
— |
|
|
— |
|
|
— |
|
|
304,915 |
₣150 million 1.700% Notes due 2027 |
|
1.700% |
|
1.700% |
|
|
|
— |
|
|
— |
|
|
— |
|
|
$166,317 |
|
|
— |
|
|
— |
|
|
166,317 |
$1.00 billion 3.700% Notes due 2027 (3) |
|
3.700% |
|
2.485% |
|
|
|
— |
|
|
— |
|
|
— |
|
|
1,000,000 |
|
|
— |
|
|
— |
|
|
1,000,000 |
€500 million 1.125% Notes due 2028 |
|
1.125% |
|
1.125% |
|
|
|
— |
|
|
— |
|
|
— |
|
|
— |
|
|
$539,500 |
|
|
— |
|
|
539,500 |
$900 million 5.550% Notes due 2028 (3) |
|
5.550% |
|
3.996% |
|
|
|
— |
|
|
— |
|
|
— |
|
|
— |
|
|
900,000 |
|
|
— |
|
|
900,000 |
$650 million 4.450% Notes due 2028 |
|
4.450% |
|
4.450% |
|
|
|
— |
|
|
— |
|
|
— |
|
|
— |
|
|
650,000 |
|
|
— |
|
|
650,000 |
₣270 million 0.550% Notes due 2029 |
|
0.550% |
|
0.550% |
|
|
|
— |
|
|
— |
|
|
— |
|
|
— |
|
|
— |
|
|
$299,371 |
|
|
299,371 |
$900 million 3.600% Notes due 2029 |
|
3.600% |
|
3.600% |
|
|
|
— |
|
|
— |
|
|
— |
|
|
— |
|
|
— |
|
|
900,000 |
|
|
900,000 |
£350 million 3.300% Notes due 2029 |
|
3.300% |
|
3.300% |
|
|
|
— |
|
|
— |
|
|
— |
|
|
— |
|
|
— |
|
|
441,805 |
|
|
441,805 |
€750 million 1.500% Notes due 2030 |
|
1.500% |
|
1.500% |
|
|
|
— |
|
|
— |
|
|
— |
|
|
— |
|
|
— |
|
|
809,250 |
|
|
809,250 |
£550 million 3.750% Notes due 2030 |
|
3.750% |
|
3.750% |
|
|
|
— |
|
|
— |
|
|
— |
|
|
— |
|
|
— |
|
|
694,265 |
|
|
694,265 |
€500 million 1.250% Notes due 2031 |
|
1.250% |
|
1.250% |
|
|
|
— |
|
|
— |
|
|
— |
|
|
— |
|
|
— |
|
|
539,500 |
|
|
539,500 |
€1.00 billion 0.625% Notes due 2031 |
|
0.625% |
|
0.625% |
|
|
|
— |
|
|
— |
|
|
— |
|
|
— |
|
|
— |
|
|
1,079,000 |
|
|
1,079,000 |
€750 million 1.000% Notes due 2032 |
|
1.000% |
|
1.000% |
|
|
|
— |
|
|
— |
|
|
— |
|
|
— |
|
|
— |
|
|
809,250 |
|
|
809,250 |
€750 million 1.375% Notes due 2032 |
|
1.375% |
|
1.375% |
|
|
|
— |
|
|
— |
|
|
— |
|
|
— |
|
|
— |
|
|
809,250 |
|
|
809,250 |
Unamortized discounts |
|
— |
|
— |
|
|
|
— |
|
|
— |
|
|
— |
|
|
— |
|
|
— |
|
|
— |
|
|
(30,928) |
Deferred financing costs |
|
— |
|
— |
|
|
|
— |
|
|
— |
|
|
— |
|
|
— |
|
|
— |
|
|
— |
|
|
(50,463) |
Total Senior Notes |
|
2.452% |
|
2.255% |
|
|
|
$962,975 |
|
|
$1,206,270 |
|
|
$1,464,840 |
|
|
$1,166,317 |
|
|
$2,089,500 |
|
|
$6,381,691 |
|
|
$13,190,202 |
|
|
|
|
|
|
|
|
|
|
|
|
|
|
|
|
|
|
|
|
|
|
|
|
|
|
|
Secured Debt |
|
|
|
|
|
|
|
|
|
|
|
|
|
|
|
|
|
|
|
|
|
|
|
|
|
|
ICN10 Facilities |
|
5.980% |
|
3.614% |
|
|
|
— |
|
|
— |
|
|
— |
|
|
— |
|
|
— |
|
|
$12,543 |
|
|
$12,543 |
Westin |
|
3.290% |
|
3.290% |
|
|
|
— |
|
|
— |
|
|
— |
|
|
$135,000 |
|
|
— |
|
|
— |
|
|
135,000 |
Teraco Loans |
|
10.665% |
|
9.438% |
|
|
|
$234 |
|
|
$568 |
|
|
$39,322 |
|
|
78,064 |
|
|
$289,592 |
|
|
— |
|
|
407,780 |
Deferred financing costs |
|
— |
|
— |
|
|
|
— |
|
|
— |
|
|
— |
|
|
— |
|
|
— |
|
|
— |
|
|
(2,068) |
Total Secured Debt |
|
8.766% |
|
7.812% |
|
|
|
$234 |
|
|
$568 |
|
|
$39,322 |
|
|
$213,064 |
|
|
$289,592 |
|
|
$12,543 |
|
|
$553,255 |
|
|
|
|
|
|
|
|
|
|
|
|
|
|
|
|
|
|
|
|
|
|
|
|
|
|
|
Other Debt |
|
|
|
|
|
|
|
|
|
|
|
|
|
|
|
|
|
|
|
|
|
|
|
|
|
|
Icolo loans |
|
11.650% |
|
11.650% |
|
|
|
— |
|
|
— |
|
|
$5,298 |
|
|
$4,035 |
|
|
$924 |
|
|
$2,332 |
|
|
$12,589 |
Total Other Debt |
|
11.650% |
|
11.650% |
|
|
|
— |
|
|
— |
|
|
$5,298 |
|
|
$4,035 |
|
|
924 |
|
|
2,332 |
|
|
$12,589 |
|
|
|
|
|
|
|
|
|
|
|
|
|
|
|
|
|
|
|
|
|
|
|
|
|
|
|
Mandatorily Redeemable Preferred Shares (Teraco) |
|
|
|
|
|
|
|
|
|
|
|
|
|
|
|
|
|
|
|
|
|
|
|
|
|
|
Mandatorily Redeemable Preferred Shares (Teraco) |
|
10.105% |
|
10.105% |
|
|
|
— |
|
|
— |
|
|
$63,557 |
|
|
— |
|
|
— |
|
|
— |
|
|
$63,557 |
Unamortized discounts |
|
— |
|
— |
|
|
|
— |
|
|
— |
|
|
— |
|
|
— |
|
|
— |
|
|
— |
|
|
(3,651) |
Total Redeemable Preferred Shares |
|
10.105% |
|
10.105% |
|
|
|
— |
|
|
— |
|
|
$63,557 |
|
|
— |
|
|
— |
|
|
— |
|
|
$59,906 |
|
|
|
|
|
|
|
|
|
|
|
|
|
|
|
|
|
|
|
|
|
|
|
|
|
|
|
Total unhedged variable rate debt |
|
— |
|
— |
|
|
|
$47 |
|
|
$114 |
|
|
$66,803 |
|
|
$2,323,492 |
|
|
$24,841 |
|
|
$4,795 |
|
|
$2,420,091 |
Total fixed rate / hedged variable rate debt |
|
— |
|
— |
|
|
|
963,162 |
|
|
1,611,349 |
|
|
2,006,214 |
|
|
1,377,041 |
|
|
2,355,175 |
|
|
6,391,771 |
|
|
14,704,712 |
Total Debt |
|
3.123% |
|
2.868% |
|
|
|
$963,209 |
|
|
$1,611,463 |
|
|
$2,073,017 |
|
|
$3,700,533 |
|
|
$2,380,016 |
|
|
$6,396,566 |
|
|
$17,124,803 |
|
|
|
|
|
|
|
|
|
|
|
|
|
|
|
|
|
|
|
|
|
|
|
|
|
|
|
Weighted Average Interest Rate |
|
|
|
|
|
|
|
2.668% |
|
|
2.613% |
|
|
3.196% |
|
|
3.746% |
|
|
4.134% |
|
|
1.880% |
|
|
2.868% |
|
|
|
|
|
|
|
|
|
|
|
|
|
|
|
|
|
|
|
|
|
|
|
|
|
|
|
Summary |
|
|
|
|
|
|
|
|
|
|
|
|
|
|
|
|
|
|
|
|
|
|
|
|
|
|
|
|
|
|
|
|
|
|
|
|
|
|
|
|
|
|
|
|
|
|
|
|
|
|
|
|
|
Weighted Average Term to Initial Maturity |
|
|
|
|
|
|
|
|
|
|
|
|
|
|
|
|
|
|
|
|
|
|
|
|
|
3.9 Years |
|
|
|
|
|
|
|
|
|
|
|
|
|
|
|
|
|
|
|
|
|
|
|
|
|
|
|
Weighted Average Maturity (assuming exercise of extension options) |
|
|
|
|
|
|
|
|
|
|
|
|
|
|
|
|
|
|
|
|
|
|
|
|
|
4.1 Years |
Global Unsecured Revolving Credit Facilities Detail As of March 31, 2024 |
|
|
|
|
|
|
|
|
|
|
|
|
|
|
|
|
|
|
|
|
|
|
|
|
|
|
|
|
Maximum Available |
|
Existing Capacity (4) |
|
Currently Drawn |
|||||
|
|
|
|
|
|
|
|
|
|
|
|
|
Global Unsecured Revolving Credit Facilities |
$3,885,870 |
|
$1,885,762 |
|
$1,910,936 |
|||||||
| (1) | Assumes all extensions will be exercised. |
| (2) | Repaid in full on April 15, 2024. |
| (3) | Subject to cross-currency swaps. |
| (4) | Net of letters of credit issued of $89.2 million. |
17
|
|
As of March 31, 2024 |
||||||||
|
|
|
|
|
|
|
|
|
|
|
|
|
|
|
|
|
|
|
Global Unsecured |
||
|
|
Unsecured Senior Notes |
|
Credit Facilities |
||||||
Debt Covenant Ratios (1) |
|
Required |
|
Actual (2) |
|
Actual (3) |
|
Required |
|
Actual |
Total outstanding debt / total assets (4) |
|
Less than 60% |
|
44% |
|
37% |
|
Less than 60% (5) |
|
38% |
Secured debt / total assets (6) |
|
Less than 40% |
|
5% |
|
1% |
|
Less than 40% |
|
3% |
Total unencumbered assets / unsecured debt |
|
Greater than 150% |
|
245% |
|
271% |
|
N/A |
|
N/A |
Consolidated EBITDA / interest expense (7) |
|
Greater than 1.50x |
|
4.6x |
|
4.6x |
|
N/A |
|
N/A |
Fixed charge coverage |
|
|
|
N/A |
|
N/A |
|
Greater than 1.50x |
|
4.4x |
Unsecured debt / total unencumbered asset value (8) |
|
|
|
N/A |
|
N/A |
|
Less than 60% |
|
39% |
Unencumbered assets debt service coverage ratio (8) |
|
|
|
N/A |
|
N/A |
|
Greater than 1.50x |
|
5.3x |
| (1) | For definitions of the terms used in the table above and related footnotes, please refer to the indentures which govern the notes, the Second Amended and Restated Global Senior Credit Agreement dated as of November 18, 2021 and the Amended and Restated Yen facility Credit Agreement dated as of November 18, 2021, each as amended and which are filed as exhibits to our reports filed with the U.S. Securities and Exchange Commission. |
| (2) | Ratios for the Unsecured Senior Notes listed on page 17 except for the 0.20% notes due 2026, 1.70% notes due 2027, 5.550% notes due 2028, 0.55% notes due 2029, 1.250% notes due 2031, 0.625% notes due 2031, 1.00% notes due 2032 and 1.375% notes due 2032. |
| (3) | Ratios for the 0.20% notes due 2026, 1.70% notes due 2027, 5.550% notes due 2028, 0.55% notes due 2029, 1.250% notes due 2031, 0.625% notes due 2031, 1.00% notes due 2032 and 1.375% notes due 2032. |
| (4) | This ratio is referred to as the Leverage Ratio, defined as Consolidated Debt / Total Asset Value, under the global unsecured revolving credit facility and the Yen facility. For the calculation of Total Assets, please refer to the indentures which govern the notes, the Second Amended and Restated Global Senior Credit Agreement dated as of November 18, 2021 and the Amended and Restated Yen facility Credit Agreement dated as of November 18, 2021, each as amended and which are filed as exhibits to our reports filed with the U.S. Securities and Exchange Commission. |
| (5) | The company has the right to maintain a Leverage Ratio of greater than 60.0% but less than or equal to 65.0% for up to four consecutive fiscal quarters during the term of the facility following an acquisition of one or more Assets. |
| (6) | This ratio is referred to as the Secured Debt Leverage Ratio, defined as Secured Debt / Total Asset Value, under the global unsecured revolving credit facility and the Yen facility. |
| (7) | Calculated as current quarter annualized consolidated EBITDA to current quarter annualized Interest Expense (including capitalized interest and debt discounts). |
| (8) | Assets must satisfy certain conditions to qualify for inclusion as an Unencumbered Asset under the global unsecured revolving credit facility and the Yen facility. |
18
|
Financial Supplement |
|
|---|---|---|
Unaudited and in Thousands |
First Quarter 2024 |
Stabilized (“Same-Capital”) Portfolio (1)
|
|
Three Months Ended |
|
|||||||||||||
|
|
31-Mar-24 |
|
31-Mar-23 |
|
% Change |
|
31-Dec-23 |
|
% Change |
|
|||||
Rental revenues |
|
|
$710,342 |
|
|
$684,779 |
|
|
3.7% |
|
|
$709,266 |
|
|
0.2% |
|
Tenant reimbursements - Utilities |
|
|
228,345 |
|
|
271,154 |
|
|
(15.8%) |
|
|
272,007 |
|
|
(16.1%) |
|
Tenant reimbursements - Other |
|
|
28,312 |
|
|
23,418 |
|
|
20.9% |
|
|
34,936 |
|
|
(19.0%) |
|
Interconnection & other |
|
|
91,469 |
|
|
86,386 |
|
|
5.9% |
|
|
90,901 |
|
|
0.6% |
|
Total Revenue |
|
|
$1,058,467 |
|
|
$1,065,737 |
|
|
(0.7%) |
|
|
$1,107,110 |
|
|
(4.4%) |
|
|
|
|
|
|
|
|
|
|
|
|
|
|
|
|
|
|
Utilities |
|
|
$265,035 |
|
|
$295,375 |
|
|
(10.3%) |
|
|
$314,101 |
|
|
(15.6%) |
|
Rental property operating |
|
|
167,068 |
|
|
167,052 |
|
|
0.0% |
|
|
181,528 |
|
|
(8.0%) |
|
Property taxes |
|
|
31,564 |
|
|
23,799 |
|
|
32.6% |
|
|
28,736 |
|
|
9.8% |
|
Insurance |
|
|
3,939 |
|
|
4,019 |
|
|
(2.0%) |
|
|
3,595 |
|
|
9.6% |
|
Total Expenses |
|
|
$467,606 |
|
|
$490,245 |
|
|
(4.6%) |
|
|
$527,960 |
|
|
(11.4%) |
|
|
|
|
|
|
|
|
|
|
|
|
|
|
|
|
|
|
Net Operating Income (2) |
|
|
$590,861 |
|
|
$575,492 |
|
|
2.7% |
|
|
$579,150 |
|
|
2.0% |
|
Less: |
|
|
|
|
|
|
|
|
|
|
|
|
|
|
|
|
Stabilized straight-line rent |
|
|
($9,951) |
|
|
$1,543 |
|
|
(744.9%) |
|
|
$17,204 |
|
|
(157.8%) |
|
Above- and below-market rent |
|
|
829 |
|
|
1,149 |
|
|
(27.9%) |
|
|
828 |
|
|
0.1% |
|
Cash Net Operating Income (3) |
|
|
$599,983 |
|
|
$572,800 |
|
|
4.7% |
|
|
$561,118 |
|
|
6.9% |
|
|
|
|
|
|
|
|
|
|
|
|
|
|
|
|
|
|
Stabilized Portfolio occupancy at period end (4) |
|
|
82.6% |
|
|
83.0% |
|
|
(0.4%) |
|
|
82.9% |
|
|
(0.4%) |
|
| (1) | Represents buildings owned as of December 31, 2022 with less than 5% of total rentable square feet under development. Excludes buildings that were undergoing, or were expected to undergo, development activities in 2023-2024, buildings classified as held for sale, and buildings sold or contributed to joint ventures for all periods presented. Prior period numbers adjusted to reflect current same-capital pool. |
| (2) | For a definition and discussion of net operating income and a reconciliation of operating income to NOI, see page 32. |
| (3) | For a definition and discussion of cash net operating income and a reconciliation of operating income to cash NOI, see page 32. |
| (4) | Occupancy excludes space under active development and space held for development. For some of our buildings, we calculate occupancy based on factors in addition to contractually leased square feet, including available power, required support space and common areas. |
19
Summary of Leasing Activity |
Financial Supplement |
|
|---|---|---|
Leases Signed in the Quarter End March 31, 2024 |
First Quarter 2024 |
|
|
0-1 MW |
|
> 1 MW (3) |
|
Other (4) |
|
Total |
||||||||||||||||
Leasing Activity - New (1) (2) |
|
1Q24 |
|
LTM |
|
1Q24 |
|
LTM |
|
1Q24 |
|
LTM |
|
1Q24 |
|
LTM |
||||||||
|
|
|
|
|
|
|
|
|
|
|
|
|
|
|
|
|
|
|
|
|
|
|
|
|
Annualized GAAP Rent (in thousands) |
|
|
$39,996 |
|
|
$158,070 |
|
|
$198,220 |
|
|
$413,346 |
|
|
$726 |
|
|
$5,593 |
|
|
$238,942 |
|
|
$577,009 |
|
|
|
|
|
|
|
|
|
|
|
|
|
|
|
|
|
|
|
|
|
|
|
|
|
Kilowatt leased |
|
|
13,565 |
|
|
52,254 |
|
|
97,660 |
|
|
222,651 |
|
|
— |
|
|
— |
|
|
111,225 |
|
|
274,905 |
NRSF (in thousands) |
|
|
145 |
|
|
609 |
|
|
748 |
|
|
2,149 |
|
|
13 |
|
|
83 |
|
|
907 |
|
|
2,841 |
|
|
|
|
|
|
|
|
|
|
|
|
|
|
|
|
|
|
|
|
|
|
|
|
|
Weighted Average Lease Term (years) |
|
|
4.1 |
|
|
4.1 |
|
|
10.5 |
|
|
13.0 |
|
|
6.7 |
|
|
6.0 |
|
|
9.5 |
|
|
10.4 |
|
|
|
|
|
|
|
|
|
|
|
|
|
|
|
|
|
|
|
|
|
|
|
|
|
Initial stabilized cash rent per Kilowatt |
|
|
$240 |
|
|
$240 |
|
|
$142 |
|
|
$133 |
|
|
— |
|
|
— |
|
|
$154 |
|
|
$153 |
GAAP rent per Kilowatt |
|
|
$246 |
|
|
$252 |
|
|
$169 |
|
|
$155 |
|
|
— |
|
|
— |
|
|
$178 |
|
|
$173 |
Leasing cost per Kilowatt |
|
|
$17 |
|
|
$25 |
|
|
— |
|
|
$1 |
|
|
— |
|
|
— |
|
|
$3 |
|
|
$5 |
|
|
|
|
|
|
|
|
|
|
|
|
|
|
|
|
|
|
|
|
|
|
|
|
|
Net Effective Economics by Kilowatt (5) |
|
|
|
|
|
|
|
|
|
|
|
|
|
|
|
|
|
|
|
|
|
|
|
|
|
|
|
|
|
|
|
|
|
|
|
|
|
|
|
|
|
|
|
|
|
|
|
|
|
Base rent by Kilowatt |
|
|
$251 |
|
|
$255 |
|
|
$169 |
|
|
$156 |
|
|
— |
|
|
— |
|
|
$179 |
|
|
$175 |
Rental concessions by Kilowatt |
|
|
$5 |
|
|
$3 |
|
|
— |
|
|
$1 |
|
|
— |
|
|
— |
|
|
$1 |
|
|
$2 |
Estimated operating expense by Kilowatt |
|
|
$78 |
|
|
$75 |
|
|
$42 |
|
|
$39 |
|
|
— |
|
|
— |
|
|
$46 |
|
|
$45 |
|
|
|
|
|
|
|
|
|
|
|
|
|
|
|
|
|
|
|
|
|
|
|
|
|
Net rent per Kilowatt |
|
|
$168 |
|
|
$178 |
|
|
$127 |
|
|
$116 |
|
|
— |
|
|
— |
|
|
$132 |
|
|
$128 |
|
|
|
|
|
|
|
|
|
|
|
|
|
|
|
|
|
|
|
|
|
|
|
|
|
Tenant improvements by Kilowatt |
|
|
— |
|
|
— |
|
|
$1 |
|
|
$1 |
|
|
— |
|
|
— |
|
|
$1 |
|
|
— |
Leasing commissions by Kilowatt |
|
|
$8 |
|
|
$8 |
|
|
— |
|
|
— |
|
|
— |
|
|
— |
|
|
$1 |
|
|
$2 |
|
|
|
|
|
|
|
|
|
|
|
|
|
|
|
|
|
|
|
|
|
|
|
|
|
Net effective rent per Kilowatt |
|
|
$160 |
|
|
$169 |
|
|
$126 |
|
|
$115 |
|
|
— |
|
|
— |
|
|
$130 |
|
|
$126 |
|
|
|
|
|
|
|
|
|
|
|
|
|
|
|
|
|
|
|
|
|
|
|
|
|
Initial stabilized cash rent per NRSF |
|
|
$269 |
|
|
$247 |
|
|
$222 |
|
|
$165 |
|
|
$53 |
|
|
$65 |
|
|
$227 |
|
|
$180 |
GAAP rent per NRSF |
|
|
$275 |
|
|
$259 |
|
|
$265 |
|
|
$192 |
|
|
$55 |
|
|
$68 |
|
|
$264 |
|
|
$203 |
Leasing cost per NRSF |
|
|
$19 |
|
|
$26 |
|
|
$1 |
|
|
$1 |
|
|
$2 |
|
|
$147 |
|
|
$4 |
|
|
$11 |
|
|
|
|
|
|
|
|
|
|
|
|
|
|
|
|
|
|
|
|
|
|
|
|
|
Net Effective Economics by NRSF (5) |
|
|
|
|
|
|
|
|
|
|
|
|
|
|
|
|
|
|
|
|
|
|
|
|
|
|
|
|
|
|
|
|
|
|
|
|
|
|
|
|
|
|
|
|
|
|
|
|
|
Base rent by NRSF |
|
|
$281 |
|
|
$263 |
|
|
$253 |
|
|
$194 |
|
|
$56 |
|
|
$71 |
|
|
$255 |
|
|
$205 |
Rental concessions by NRSF |
|
|
$6 |
|
|
$3 |
|
|
— |
|
|
$2 |
|
|
$1 |
|
|
$4 |
|
|
$1 |
|
|
$2 |
Estimated operating expense by NRSF |
|
|
$59 |
|
|
$68 |
|
|
$68 |
|
|
$56 |
|
|
$8 |
|
|
$9 |
|
|
$66 |
|
|
$57 |
|
|
|
|
|
|
|
|
|
|
|
|
|
|
|
|
|
|
|
|
|
|
|
|
|
Net rent per NRSF |
|
|
$216 |
|
|
$191 |
|
|
$185 |
|
|
$136 |
|
|
$47 |
|
|
$59 |
|
|
$188 |
|
|
$146 |
|
|
|
|
|
|
|
|
|
|
|
|
|
|
|
|
|
|
|
|
|
|
|
|
|
Tenant improvements by NRSF |
|
|
— |
|
|
— |
|
|
— |
|
|
— |
|
|
— |
|
|
$14 |
|
|
— |
|
|
$1 |
Leasing commissions by NRSF |
|
|
$8 |
|
|
$8 |
|
|
— |
|
|
— |
|
|
— |
|
|
$1 |
|
|
$1 |
|
|
$2 |
|
|
|
|
|
|
|
|
|
|
|
|
|
|
|
|
|
|
|
|
|
|
|
|
|
Net effective rent per NRSF |
|
|
$207 |
|
|
$183 |
|
|
$185 |
|
|
$136 |
|
|
$47 |
|
|
$44 |
|
|
$187 |
|
|
$143 |
| (1) | Excludes short-term, roof, storage, and garage leases. |
| (2) | Includes leases for new and re-leased space. |
| (3) | >1 MW Base Rent for the LTM includes the net uplift related to an eight-megawatt lease replacement which resulted in an increased rate for the same capacity. GAAP Base Rent for the LTM per Square Foot and per Kilowatt metrics reflect the incremental additional Base Rent with no incremental capacity added. |
| (4) | Other includes Powered Base Building shell capacity as well as storage and office space within fully improved data center facilities. |
| (5) | All dollar amounts are per square foot averaged over lease term. Per Kilowatt amounts are presented in monthly values. Per NRSF amounts are presented in yearly values. |
Note: LTM is last twelve months, including current quarter. Weighted average lease term excludes renewal options and is weighted by net rentable square feet.
20
Summary of Leasing Activity |
Financial Supplement |
|
|---|---|---|
Leases Renewed in the Quarter Ended March 31, 2024 |
First Quarter 2024 |
|
|
0-1 MW |
|
> 1 MW |
|
Other (4) |
|
Total |
||||||||||||||||
Leasing Activity - Renewals (1) (2) (3) |
|
1Q24 |
|
LTM |
|
1Q24 |
|
LTM |
|
1Q24 |
|
LTM |
|
1Q24 |
|
LTM |
||||||||
|
|
|
|
|
|
|
|
|
|
|
|
|
|
|
|
|
|
|
|
|
|
|
|
|
Leases renewed (Kilowatt) |
|
|
37,976 |
|
|
141,706 |
|
|
60,812 |
|
|
148,768 |
|
|
— |
|
|
— |
|
|
98,787 |
|
|
290,474 |
Leases renewed (NRSF in thousands) |
|
|
551 |
|
|
2,006 |
|
|
739 |
|
|
1,840 |
|
|
182 |
|
|
562 |
|
|
1,472 |
|
|
4,408 |
Leasing cost per Kilowatt |
|
|
$1 |
|
|
$1 |
|
|
$2 |
|
|
$3 |
|
|
— |
|
|
— |
|
|
$1 |
|
|
$1 |
Leasing cost per NRSF |
|
|
$1 |
|
|
$1 |
|
|
$2 |
|
|
$2 |
|
|
— |
|
|
$6 |
|
|
$1 |
|
|
$2 |
|
|
|
|
|
|
|
|
|
|
|
|
|
|
|
|
|
|
|
|
|
|
|
|
|
Weighted Term (years) |
|
|
1.4 |
|
|
1.6 |
|
|
5.9 |
|
|
4.5 |
|
|
5.9 |
|
|
5.1 |
|
|
4.2 |
|
|
3.0 |
|
|
|
|
|
|
|
|
|
|
|
|
|
|
|
|
|
|
|
|
|
|
|
|
|
Cash Rent |
|
|
|
|
|
|
|
|
|
|
|
|
|
|
|
|
|
|
|
|
|
|
|
|
|
|
|
|
|
|
|
|
|
|
|
|
|
|
|
|
|
|
|
|
|
|
|
|
|
Expiring cash rent per Kilowatt |
|
|
$293 |
|
|
$296 |
|
|
$112 |
|
|
$129 |
|
|
— |
|
|
— |
|
|
$181 |
|
|
$210 |
Renewed cash rent per Kilowatt |
|
|
$304 |
|
|
$310 |
|
|
$133 |
|
|
$146 |
|
|
— |
|
|
— |
|
|
$198 |
|
|
$226 |
|
|
|
|
|
|
|
|
|
|
|
|
|
|
|
|
|
|
|
|
|
|
|
|
|
% Change Cash Rent Per Kilowatt |
|
|
3.8% |
|
|
4.7% |
|
|
18.5% |
|
|
13.1% |
|
|
— |
|
|
— |
|
|
9.4% |
|
|
7.3% |
|
|
|
|
|
|
|
|
|
|
|
|
|
|
|
|
|
|
|
|
|
|
|
|
|
Expiring cash rent per NRSF |
|
|
$242 |
|
|
$251 |
|
|
$111 |
|
|
$125 |
|
|
$39 |
|
|
$35 |
|
|
$151 |
|
|
$171 |
Renewed cash rent per NRSF |
|
|
$251 |
|
|
$263 |
|
|
$131 |
|
|
$141 |
|
|
$72 |
|
|
$56 |
|
|
$169 |
|
|
$186 |
|
|
|
|
|
|
|
|
|
|
|
|
|
|
|
|
|
|
|
|
|
|
|
|
|
% Change Cash Rent Per NRSF |
|
|
3.8% |
|
|
4.7% |
|
|
18.5% |
|
|
13.1% |
|
|
84.7% |
|
|
63.5% |
|
|
11.8% |
|
|
8.8% |
|
|
|
|
|
|
|
|
|
|
|
|
|
|
|
|
|
|
|
|
|
|
|
|
|
GAAP Rent |
|
|
|
|
|
|
|
|
|
|
|
|
|
|
|
|
|
|
|
|
|
|
|
|
|
|
|
|
|
|
|
|
|
|
|
|
|
|
|
|
|
|
|
|
|
|
|
|
|
Expiring GAAP rent per Kilowatt |
|
|
$292 |
|
|
$295 |
|
|
$108 |
|
|
$120 |
|
|
— |
|
|
— |
|
|
$179 |
|
|
$206 |
Renewed GAAP rent per Kilowatt |
|
|
$305 |
|
|
$311 |
|
|
$131 |
|
|
$147 |
|
|
— |
|
|
— |
|
|
$198 |
|
|
$227 |
|
|
|
|
|
|
|
|
|
|
|
|
|
|
|
|
|
|
|
|
|
|
|
|
|
% Change GAAP Rent Per Kilowatt |
|
|
4.3% |
|
|
5.5% |
|
|
21.6% |
|
|
22.3% |
|
|
— |
|
|
— |
|
|
10.7% |
|
|
10.5% |
|
|
|
|
|
|
|
|
|
|
|
|
|
|
|
|
|
|
|
|
|
|
|
|
|
Expiring GAAP rent per NRSF |
|
|
$242 |
|
|
$250 |
|
|
$106 |
|
|
$117 |
|
|
$36 |
|
|
$33 |
|
|
$148 |
|
|
$167 |
Renewed GAAP rent per NRSF |
|
|
$252 |
|
|
$264 |
|
|
$129 |
|
|
$143 |
|
|
$67 |
|
|
$56 |
|
|
$168 |
|
|
$187 |
|
|
|
|
|
|
|
|
|
|
|
|
|
|
|
|
|
|
|
|
|
|
|
|
|
% Change GAAP Rent Per NRSF |
|
|
4.3% |
|
|
5.5% |
|
|
21.6% |
|
|
22.3% |
|
|
88.1% |
|
|
73.3% |
|
|
13.0% |
|
|
12.1% |
|
|
|
|
|
|
|
|
|
|
|
|
|
|
|
|
|
|
|
|
|
|
|
|
|
Retention ratio (5) |
|
|
88.8% |
|
|
83.9% |
|
|
76.4% |
|
|
77.0% |
|
|
80.0% |
|
|
83.1% |
|
|
81.1% |
|
|
80.8% |
|
|
|
|
|
|
|
|
|
|
|
|
|
|
|
|
|
|
|
|
|
|
|
|
|
Churn (6) |
|
|
1.5% |
|
|
6.0% |
|
|
2.0% |
|
|
4.5% |
|
|
0.5% |
|
|
2.8% |
|
|
1.7% |
|
|
5.1% |
| (1) | Excludes short-term, roof, storage, and garage leases. |
| (2) | Rental rates represent annual estimated cash rent per kilowatt and net rentable square feet, adjusted for straight-line rents in accordance with GAAP. |
| (3) | Per Kilowatt amounts are presented in monthly values. Per NRSF amounts are presented in yearly values. |
| (4) | Other includes Powered Base Building shell capacity as well as storage and office space within fully improved data center facilities. |
| (5) | Based on square feet. |
| (6) | Churn is defined as recurring revenue lost during the period due to leases terminated or not renewed, divided by recurring revenue at the beginning of the period. |
Note: LTM is last twelve months, including current quarter. Weighted average lease term excludes renewal options and is weighted by net rentable square feet.
21
|
Financial Supplement |
|
|---|---|---|
Dollars and Square Feet in Thousands (except per square foot and per KW data) |
First Quarter 2024 |
|
|
|
|
|
|
|
% of |
|
Annualized Rent Per |
|
Annualized Rent Per |
|
|
|
|
|
|
|
|
Rent Per kW |
|
|||||
|
|
Square Footage of |
|
Annualized |
|
Annualized |
|
Occupied |
|
Occupied Square |
|
Annualized Rent |
|
kW of Expiring |
|
Rent per kW |
|
Per Month at |
|
|||||||
Year |
|
Expiring Leases (1) |
|
Rent (2) |
|
Rent |
|
Square Foot |
|
Foot at Expiration |
|
at Expiration |
|
Leases |
|
Per Month |
|
Expiration |
|
|||||||
0-1 MW |
|
|
|
|
|
|
|
|
|
|
|
|
|
|
|
|
|
|
|
|
|
|
|
|
|
|
Available |
|
2,773 |
|
|
— |
|
— |
|
|
— |
|
|
— |
|
|
— |
|
|
— |
|
|
— |
|
|
— |
|
Month to Month (3) |
|
197 |
|
|
$48,017 |
|
1.4% |
|
|
$243 |
|
|
$243 |
|
|
$47,837 |
|
|
10,266 |
|
|
$390 |
|
|
$388 |
|
2024 |
|
1,802 |
|
|
536,030 |
|
15.5% |
|
|
297 |
|
|
296 |
|
|
533,801 |
|
|
128,582 |
|
|
347 |
|
|
346 |
|
2025 |
|
1,226 |
|
|
315,829 |
|
9.1% |
|
|
258 |
|
|
261 |
|
|
319,584 |
|
|
86,905 |
|
|
303 |
|
|
306 |
|
2026 |
|
557 |
|
|
139,734 |
|
4.0% |
|
|
251 |
|
|
261 |
|
|
145,486 |
|
|
42,431 |
|
|
274 |
|
|
286 |
|
2027 |
|
523 |
|
|
98,630 |
|
2.9% |
|
|
189 |
|
|
201 |
|
|
105,347 |
|
|
38,629 |
|
|
213 |
|
|
227 |
|
2028 |
|
322 |
|
|
51,912 |
|
1.5% |
|
|
161 |
|
|
176 |
|
|
56,910 |
|
|
20,789 |
|
|
208 |
|
|
228 |
|
2029 |
|
176 |
|
|
24,178 |
|
0.7% |
|
|
138 |
|
|
171 |
|
|
30,117 |
|
|
11,894 |
|
|
169 |
|
|
211 |
|
2030 |
|
70 |
|
|
23,256 |
|
0.7% |
|
|
333 |
|
|
341 |
|
|
23,782 |
|
|
5,986 |
|
|
324 |
|
|
331 |
|
2031 |
|
79 |
|
|
12,087 |
|
0.3% |
|
|
153 |
|
|
242 |
|
|
19,133 |
|
|
4,827 |
|
|
209 |
|
|
330 |
|
2032 |
|
62 |
|
|
5,564 |
|
0.2% |
|
|
90 |
|
|
100 |
|
|
6,201 |
|
|
1,982 |
|
|
234 |
|
|
261 |
|
2033 |
|
32 |
|
|
9,145 |
|
0.3% |
|
|
290 |
|
|
361 |
|
|
11,372 |
|
|
2,809 |
|
|
271 |
|
|
337 |
|
Thereafter |
|
10 |
|
|
1,852 |
|
0.1% |
|
|
176 |
|
|
174 |
|
|
1,829 |
|
|
478 |
|
|
323 |
|
|
319 |
|
|
|
|
|
|
|
|
|
|
|
|
|
|
|
|
|
|
|
|
|
|
|
|
|
|
|
|
Total / Wtd. Avg. |
|
7,830 |
|
|
$1,266,234 |
|
36.6% |
|
|
$250 |
|
|
$257 |
|
|
$1,301,399 |
|
|
355,577 |
|
|
$297 |
|
|
$305 |
|
|
|
|
|
|
|
|
|
|
|
|
|
|
|
|
|
|
|
|
|
|
|
|
|
|
|
|
> 1 MW |
|
Expiring Leases (1) |
|
Annualized |
|
Annualized |
Annualized Rent Per |
|
Annualized Rent Per |
|
Annualized Rent Per |
|
kW of Expiring |
|
Annualized |
|
Rent Per kW |
|
||||||||
Available |
|
1,722 |
|
|
— |
|
— |
|
|
— |
|
|
— |
|
|
— |
|
|
— |
|
|
— |
|
|
— |
|
Month to Month (3) |
|
222 |
|
|
$30,424 |
|
0.9% |
|
|
$137 |
|
|
$137 |
|
|
$30,424 |
|
|
16,935 |
|
|
$150 |
|
|
$150 |
|
2024 |
|
837 |
|
|
134,709 |
|
3.9% |
|
|
161 |
|
|
162 |
|
|
135,248 |
|
|
76,419 |
|
|
147 |
|
|
147 |
|
2025 |
|
1,815 |
|
|
270,488 |
|
7.8% |
|
|
149 |
|
|
152 |
|
|
275,232 |
|
|
160,749 |
|
|
140 |
|
|
143 |
|
2026 |
|
1,705 |
|
|
248,046 |
|
7.2% |
|
|
145 |
|
|
153 |
|
|
260,113 |
|
|
158,731 |
|
|
130 |
|
|
137 |
|
2027 |
|
1,466 |
|
|
212,695 |
|
6.2% |
|
|
145 |
|
|
156 |
|
|
228,028 |
|
|
141,240 |
|
|
125 |
|
|
135 |
|
2028 |
|
1,040 |
|
|
133,006 |
|
3.8% |
|
|
128 |
|
|
139 |
|
|
144,540 |
|
|
100,083 |
|
|
111 |
|
|
120 |
|
2029 |
|
1,116 |
|
|
144,969 |
|
4.2% |
|
|
130 |
|
|
141 |
|
|
157,089 |
|
|
130,405 |
|
|
93 |
|
|
100 |
|
2030 |
|
1,064 |
|
|
164,016 |
|
4.7% |
|
|
154 |
|
|
152 |
|
|
161,835 |
|
|
109,519 |
|
|
125 |
|
|
123 |
|
2031 |
|
1,035 |
|
|
163,476 |
|
4.7% |
|
|
158 |
|
|
154 |
|
|
159,852 |
|
|
103,189 |
|
|
132 |
|
|
129 |
|
2032 |
|
920 |
|
|
137,017 |
|
4.0% |
|
|
149 |
|
|
149 |
|
|
137,041 |
|
|
97,150 |
|
|
118 |
|
|
118 |
|
2033 |
|
478 |
|
|
71,744 |
|
2.1% |
|
|
150 |
|
|
182 |
|
|
86,882 |
|
|
48,440 |
|
|
123 |
|
|
149 |
|
Thereafter |
|
2,003 |
|
|
209,068 |
|
6.0% |
|
|
104 |
|
|
120 |
|
|
240,979 |
|
|
189,298 |
|
|
92 |
|
|
106 |
|
|
|
|
|
|
|
|
|
|
|
|
|
|
|
|
|
|
|
|
|
|
|
|
|
|
|
|
Total / Wtd. Avg. |
|
15,422 |
|
|
$1,919,657 |
|
55.5% |
|
|
$140 |
|
|
$147 |
|
|
$2,017,264 |
|
|
1,332,158 |
|
|
$120 |
|
|
$126 |
|
|
|
|
|
|
|
|
|
|
|
|
|
|
|
|
|
|
|
|
|
|
|
|
|
|
|
|
Other (4) |
|
Expiring Leases (1) |
|
Annualized |
|
Annualized |
Annualized Rent Per |
|
Annualized Rent Per |
|
Annualized Rent Per |
|
kW of Expiring |
|
Annualized |
|
Rent Per kW |
|
||||||||
Available |
|
1,767 |
|
|
— |
|
— |
|
|
— |
|
|
— |
|
|
— |
|
|
— |
|
|
— |
|
|
— |
|
Month to Month (3) |
|
91 |
|
|
$3,367 |
|
0.1% |
|
|
$37 |
|
|
$37 |
|
|
$3,367 |
|
|
— |
|
|
— |
|
|
— |
|
2024 |
|
506 |
|
|
22,309 |
|
0.6% |
|
|
44 |
|
|
44 |
|
|
22,233 |
|
|
— |
|
|
— |
|
|
— |
|
2025 |
|
536 |
|
|
25,135 |
|
0.7% |
|
|
47 |
|
|
48 |
|
|
25,576 |
|
|
— |
|
|
— |
|
|
— |
|
2026 |
|
722 |
|
|
25,336 |
|
0.7% |
|
|
35 |
|
|
37 |
|
|
26,635 |
|
|
— |
|
|
— |
|
|
— |
|
2027 |
|
318 |
|
|
9,910 |
|
0.3% |
|
|
31 |
|
|
33 |
|
|
10,593 |
|
|
— |
|
|
— |
|
|
— |
|
2028 |
|
442 |
|
|
12,934 |
|
0.4% |
|
|
29 |
|
|
32 |
|
|
14,079 |
|
|
— |
|
|
— |
|
|
— |
|
2029 |
|
757 |
|
|
43,931 |
|
1.3% |
|
|
58 |
|
|
66 |
|
|
49,606 |
|
|
— |
|
|
— |
|
|
— |
|
2030 |
|
921 |
|
|
54,835 |
|
1.6% |
|
|
60 |
|
|
75 |
|
|
69,480 |
|
|
— |
|
|
— |
|
|
— |
|
2031 |
|
60 |
|
|
2,295 |
|
0.1% |
|
|
39 |
|
|
45 |
|
|
2,707 |
|
|
— |
|
|
— |
|
|
— |
|
2032 |
|
108 |
|
|
6,268 |
|
0.2% |
|
|
58 |
|
|
66 |
|
|
7,148 |
|
|
— |
|
|
— |
|
|
— |
|
2033 |
|
142 |
|
|
5,208 |
|
0.2% |
|
|
37 |
|
|
44 |
|
|
6,245 |
|
|
— |
|
|
— |
|
|
— |
|
Thereafter |
|
2,882 |
|
|
60,431 |
|
1.7% |
|
|
21 |
|
|
27 |
|
|
77,221 |
|
|
— |
|
|
— |
|
|
— |
|
|
|
|
|
|
|
|
|
|
|
|
|
|
|
|
|
|
|
|
|
|
|
|
|
|
|
|
Total / Wtd. Avg. |
|
9,251 |
|
|
$271,958 |
|
7.9% |
|
|
$36 |
|
|
$42 |
|
|
$314,890 |
|
|
— |
|
|
— |
|
|
— |
|
|
|
|
|
|
|
|
|
|
|
|
|
|
|
|
|
|
|
|
|
|
|
|
|
|
|
|
Total |
|
Expiring Leases (1) |
|
Annualized |
|
Annualized |
Annualized Rent Per |
|
Annualized Rent Per |
|
Annualized Rent Per |
|
kW of Expiring |
|
Annualized |
|
Rent Per kW |
|
||||||||
Available |
|
6,262 |
|
|
— |
|
— |
|
|
— |
|
|
— |
|
|
— |
|
|
— |
|
|
— |
|
|
— |
|
Month to Month (3) |
|
587 |
|
|
$81,808 |
|
2.4% |
|
|
$139 |
|
|
$139 |
|
|
$81,628 |
|
|
— |
|
|
— |
|
|
— |
|
2024 |
|
3,145 |
|
|
693,048 |
|
20.0% |
|
|
220 |
|
|
220 |
|
|
691,282 |
|
|
— |
|
|
— |
|
|
— |
|
2025 |
|
3,577 |
|
|
611,451 |
|
17.7% |
|
|
171 |
|
|
173 |
|
|
620,392 |
|
|
— |
|
|
— |
|
|
— |
|
2026 |
|
2,983 |
|
|
413,116 |
|
11.9% |
|
|
138 |
|
|
145 |
|
|
432,233 |
|
|
— |
|
|
— |
|
|
— |
|
2027 |
|
2,307 |
|
|
321,235 |
|
9.3% |
|
|
139 |
|
|
149 |
|
|
343,968 |
|
|
— |
|
|
— |
|
|
— |
|
2028 |
|
1,804 |
|
|
197,852 |
|
5.7% |
|
|
110 |
|
|
119 |
|
|
215,529 |
|
|
— |
|
|
— |
|
|
— |
|
2029 |
|
2,049 |
|
|
213,078 |
|
6.2% |
|
|
104 |
|
|
116 |
|
|
236,812 |
|
|
— |
|
|
— |
|
|
— |
|
2030 |
|
2,055 |
|
|
242,107 |
|
7.0% |
|
|
118 |
|
|
124 |
|
|
255,097 |
|
|
— |
|
|
— |
|
|
— |
|
2031 |
|
1,174 |
|
|
177,858 |
|
5.1% |
|
|
152 |
|
|
155 |
|
|
181,692 |
|
|
— |
|
|
— |
|
|
— |
|
2032 |
|
1,090 |
|
|
148,848 |
|
4.3% |
|
|
137 |
|
|
138 |
|
|
150,390 |
|
|
— |
|
|
— |
|
|
— |
|
2033 |
|
651 |
|
|
86,097 |
|
2.5% |
|
|
132 |
|
|
161 |
|
|
104,499 |
|
|
— |
|
|
— |
|
|
— |
|
Thereafter |
|
4,896 |
|
|
271,351 |
|
7.8% |
|
|
55 |
|
|
65 |
|
|
320,029 |
|
|
— |
|
|
— |
|
|
— |
|
|
|
|
|
|
|
|
|
|
|
|
|
|
|
|
|
|
|
|
|
|
|
|
|
|
|
|
Total / Wtd. Avg. |
|
32,579 |
|
|
$3,457,849 |
|
100.0% |
|
|
$131 |
|
|
$138 |
|
|
$3,633,553 |
|
|
— |
|
|
— |
|
|
— |
|
| (1) | For some buildings, we calculate square footage based on factors in addition to contractually leased square feet, including available power, required support space and common areas. We estimate the total net rentable square feet available for lease based on a number of factors in addition to contractually leased square feet, including available power, required support space and common areas. |
| (2) | Annualized rent represents the monthly contractual base rent (defined as cash base rent before abatements) under existing leases as of March 31, 2024, multiplied by 12. |
| (3) | Includes leases, licenses, and similar agreements that upon expiration have been automatically renewed on a month-to-month basis. |
| (4) | Other includes unimproved building shell capacity as well as storage and office space within fully improved data center facilities. |
Note: Represents consolidated portfolio in addition to our managed portfolio of unconsolidated joint ventures based on our ownership percentage.
22
|
|
|
|
|
|
|
|
|
|
|
Weighted |
|
|
|
|
|
|
|
|
|
|
|
Average |
|
|
|
|
|
|
Annualized |
|
% of Annualized |
|
Remaining |
|
|
|
|
|
Number of |
|
Recurring |
|
Recurring |
|
Lease Term in |
|
|
|
Customer |
|
Locations |
|
Revenue (1) |
|
Revenue |
|
Years |
|
1 |
|
Fortune 50 Software Company |
|
71 |
|
|
$441,626 |
|
11.6% |
|
7.6 |
2 |
|
Social Content Platform |
|
25 |
|
|
217,400 |
|
5.7% |
|
4.4 |
3 |
|
Oracle Corporation |
|
38 |
|
|
169,947 |
|
4.5% |
|
7.1 |
4 |
|
Global Cloud Provider |
|
61 |
|
|
158,267 |
|
4.1% |
|
4.8 |
5 |
|
IBM |
|
37 |
|
|
129,322 |
|
3.4% |
|
2.0 |
6 |
|
Equinix |
|
15 |
|
|
92,767 |
|
2.4% |
|
5.7 |
7 |
|
LinkedIn Corporation |
|
7 |
|
|
81,524 |
|
2.1% |
|
1.0 |
8 |
|
Fortune 25 Investment Grade-Rated Company |
|
29 |
|
|
77,104 |
|
2.0% |
|
2.6 |
9 |
|
Fortune 25 Tech Company |
|
53 |
|
|
64,718 |
|
1.7% |
|
3.5 |
10 |
|
Social Media Platform |
|
8 |
|
|
62,557 |
|
1.6% |
|
7.1 |
11 |
|
Meta Platforms, Inc. |
|
48 |
|
|
61,820 |
|
1.6% |
|
3.6 |
12 |
|
Fortune 500 SaaS Provider |
|
12 |
|
|
56,076 |
|
1.5% |
|
2.9 |
13 |
|
Lumen Technologies, Inc. |
|
123 |
|
|
47,636 |
|
1.2% |
|
9.4 |
14 |
|
AT&T |
|
75 |
|
|
43,665 |
|
1.1% |
|
3.0 |
15 |
|
Comcast Corporation |
|
43 |
|
|
41,927 |
|
1.1% |
|
4.0 |
16 |
|
JPMorgan Chase & Co. |
|
16 |
|
|
40,031 |
|
1.0% |
|
3.3 |
17 |
|
Rackspace |
|
24 |
|
|
38,367 |
|
1.0% |
|
9.2 |
18 |
|
Centersquare (2) |
|
9 |
|
|
35,059 |
|
0.9% |
|
7.6 |
19 |
|
Verizon |
|
89 |
|
|
34,255 |
|
0.9% |
|
10.9 |
20 |
|
Zayo |
|
115 |
|
|
33,681 |
|
0.9% |
|
2.0 |
|
|
Total / Weighted Average |
|
|
|
|
$1,927,749 |
|
50.3% |
|
5.6 |
| (1) | Annualized recurring revenue represents the monthly contractual base rent (defined as cash base rent before abatements) and interconnection revenue under existing leases as of March 31, 2024, multiplied by 12. |
| (2) | In April 2024, Cyxtera announced a combination with Evoque and the combined company is named Centersquare. |
Note: Represents consolidated portfolio in addition to our managed portfolio of unconsolidated joint ventures based on ownership percentage. Our direct customers may be the entities named in the table above or their subsidiaries or affiliates.
23
|
|
Net Rentable |
|
Space Under Active |
|
Space Held for |
|
Annualized |
|
Occupancy (5) |
|
White Space |
|
Data Center |
|||
Metropolitan Area |
|
Square Feet (1) |
|
Development (2) |
|
Development (3) |
|
Rent (4) |
|
31-Mar-24 |
|
31-Dec-23 |
|
IT Load (6) |
|
Count |
|
North America |
|
|
|
|
|
|
|
|
|
|
|
|
|
|
|
|
|
|
|
|
|
|
|
|
|
|
|
|
|
|
|
|
|
|
|
Northern Virginia |
|
5,050 |
|
1,100 |
|
263 |
|
|
$506,360 |
|
91.2% |
|
88.8% |
|
438.5 |
|
18 |
Chicago |
|
2,344 |
|
— |
|
113 |
|
|
225,325 |
|
90.0% |
|
90.0% |
|
81.0 |
|
7 |
Dallas |
|
3,065 |
|
— |
|
77 |
|
|
204,410 |
|
83.0% |
|
83.6% |
|
111.2 |
|
19 |
New York |
|
1,786 |
|
94 |
|
107 |
|
|
202,997 |
|
70.5% |
|
71.4% |
|
65.5 |
|
12 |
Portland |
|
942 |
|
221 |
|
— |
|
|
179,026 |
|
98.9% |
|
99.9% |
|
99.6 |
|
3 |
Silicon Valley |
|
1,524 |
|
— |
|
131 |
|
|
168,912 |
|
90.1% |
|
90.5% |
|
94.6 |
|
14 |
Phoenix |
|
796 |
|
— |
|
— |
|
|
70,614 |
|
75.1% |
|
71.0% |
|
42.5 |
|
2 |
San Francisco |
|
844 |
|
— |
|
— |
|
|
63,323 |
|
64.2% |
|
64.3% |
|
31.5 |
|
4 |
Atlanta |
|
557 |
|
20 |
|
314 |
|
|
60,651 |
|
96.5% |
|
96.5% |
|
9.1 |
|
4 |
Toronto |
|
509 |
|
218 |
|
— |
|
|
55,015 |
|
95.1% |
|
87.0% |
|
47.8 |
|
2 |
Los Angeles |
|
591 |
|
31 |
|
— |
|
|
43,133 |
|
85.5% |
|
85.4% |
|
16.2 |
|
2 |
Seattle |
|
397 |
|
— |
|
— |
|
|
42,383 |
|
77.8% |
|
77.8% |
|
5.9 |
|
1 |
Boston |
|
437 |
|
— |
|
51 |
|
|
17,246 |
|
41.7% |
|
42.1% |
|
19.0 |
|
3 |
Houston |
|
393 |
|
— |
|
14 |
|
|
16,801 |
|
69.6% |
|
63.9% |
|
12.0 |
|
6 |
Miami |
|
226 |
|
— |
|
— |
|
|
9,491 |
|
86.1% |
|
85.5% |
|
1.3 |
|
2 |
Austin |
|
86 |
|
— |
|
— |
|
|
7,590 |
|
56.3% |
|
56.3% |
|
4.3 |
|
1 |
Charlotte |
|
95 |
|
— |
|
— |
|
|
5,699 |
|
91.1% |
|
90.7% |
|
1.5 |
|
3 |
North America Total/Weighted Average |
|
19,642 |
|
1,684 |
|
1,069 |
|
|
$1,878,975 |
|
84.4% |
|
83.5% |
|
1,081.5 |
|
103 |
|
|
|
|
|
|
|
|
|
|
|
|
|
|
|
|
|
|
EMEA |
|
|
|
|
|
|
|
|
|
|
|
|
|
|
|
|
|
|
|
|
|
|
|
|
|
|
|
|
|
|
|
|
|
|
|
Frankfurt |
|
2,185 |
|
1,539 |
|
— |
|
|
$246,727 |
|
84.4% |
|
87.1% |
|
144.3 |
|
29 |
London |
|
1,365 |
|
— |
|
77 |
|
|
197,444 |
|
54.8% |
|
57.2% |
|
94.4 |
|
14 |
Amsterdam |
|
1,332 |
|
222 |
|
92 |
|
|
178,343 |
|
84.2% |
|
83.2% |
|
116.3 |
|
13 |
Paris |
|
918 |
|
344 |
|
— |
|
|
121,201 |
|
83.5% |
|
71.9% |
|
85.5 |
|
12 |
Johannesburg |
|
1,103 |
|
1,104 |
|
— |
|
|
110,206 |
|
78.7% |
|
71.1% |
|
57.2 |
|
5 |
Marseille |
|
520 |
|
— |
|
38 |
|
|
69,360 |
|
78.1% |
|
76.8% |
|
45.4 |
|
4 |
Dublin |
|
553 |
|
— |
|
— |
|
|
59,653 |
|
76.0% |
|
76.0% |
|
39.3 |
|
9 |
Zurich |
|
444 |
|
152 |
|
— |
|
|
57,681 |
|
77.5% |
|
79.5% |
|
29.0 |
|
3 |
Vienna |
|
356 |
|
133 |
|
— |
|
|
52,392 |
|
81.9% |
|
84.0% |
|
25.6 |
|
3 |
Madrid |
|
304 |
|
105 |
|
— |
|
|
42,509 |
|
70.9% |
|
76.3% |
|
16.8 |
|
4 |
Brussels |
|
290 |
|
47 |
|
— |
|
|
37,718 |
|
72.9% |
|
66.8% |
|
17.3 |
|
3 |
Cape Town |
|
326 |
|
402 |
|
— |
|
|
36,830 |
|
75.4% |
|
74.6% |
|
21.1 |
|
2 |
Stockholm |
|
190 |
|
108 |
|
— |
|
|
24,129 |
|
70.4% |
|
70.0% |
|
16.8 |
|
6 |
Copenhagen |
|
226 |
|
— |
|
99 |
|
|
21,285 |
|
66.3% |
|
66.6% |
|
12.9 |
|
3 |
Dusseldorf |
|
142 |
|
— |
|
71 |
|
|
18,820 |
|
55.1% |
|
58.7% |
|
7.7 |
|
3 |
Athens |
|
55 |
|
159 |
|
— |
|
|
9,343 |
|
79.1% |
|
92.8% |
|
2.2 |
|
4 |
Durban |
|
45 |
|
— |
|
— |
|
|
5,968 |
|
86.9% |
|
84.4% |
|
1.1 |
|
1 |
Mombasa |
|
37 |
|
— |
|
21 |
|
|
4,081 |
|
38.1% |
|
17.3% |
|
3.5 |
|
2 |
Zagreb |
|
22 |
|
— |
|
13 |
|
|
2,809 |
|
85.7% |
|
85.7% |
|
0.9 |
|
1 |
Nairobi |
|
16 |
|
75 |
|
— |
|
|
2,674 |
|
61.9% |
|
61.9% |
|
0.5 |
|
1 |
Maputo |
|
3 |
|
— |
|
— |
|
|
487 |
|
41.6% |
|
41.6% |
|
0.2 |
|
1 |
Crete |
|
— |
|
11 |
|
— |
|
|
— |
|
— |
|
— |
|
— |
|
— |
EMEA Total/Weighted Average |
|
10,431 |
|
4,403 |
|
411 |
|
|
$1,299,662 |
|
76.4% |
|
75.3% |
|
737.8 |
|
123 |
|
|
|
|
|
|
|
|
|
|
|
|
|
|
|
|
|
|
Asia Pacific |
|
|
|
|
|
|
|
|
|
|
|
|
|
|
|
|
|
|
|
|
|
|
|
|
|
|
|
|
|
|
|
|
|
|
|
Singapore |
|
873 |
|
17 |
|
— |
|
|
$203,323 |
|
95.2% |
|
93.8% |
|
84.3 |
|
3 |
Sydney |
|
361 |
|
— |
|
88 |
|
|
31,663 |
|
90.8% |
|
92.2% |
|
22.8 |
|
4 |
Melbourne |
|
147 |
|
— |
|
— |
|
|
15,012 |
|
62.3% |
|
62.3% |
|
9.6 |
|
2 |
Seoul |
|
162 |
|
— |
|
— |
|
|
1,966 |
|
7.6% |
|
7.6% |
|
12.0 |
|
1 |
Hong Kong |
|
99 |
|
66 |
|
120 |
|
|
503 |
|
2.2% |
|
2.2% |
|
7.5 |
|
1 |
Asia Pacific Total/Weighted Average |
|
1,642 |
|
83 |
|
207 |
|
|
$252,468 |
|
77.0% |
|
76.7% |
|
136.1 |
|
11 |
|
|
|
|
|
|
|
|
|
|
|
|
|
|
|
|
|
|
Non-Data Center Properties |
|
329 |
|
— |
|
264 |
|
|
— |
|
— |
|
— |
|
— |
|
— |
|
|
|
|
|
|
|
|
|
|
|
|
|
|
|
|
|
|
Consolidated Portfolio Total/Weighted Average |
|
32,043 |
|
6,170 |
|
1,951 |
|
|
$3,431,105 |
|
80.6% |
|
79.6% |
|
1,955.4 |
|
237 |
|
|
|
|
|
|
|
|
|
|
|
|
|
|
|
|
|
|
Held For Sale (7) |
|
328 |
|
— |
|
— |
|
|
$34,830 |
|
99.5% |
|
99.5% |
|
26.8 |
|
1 |
|
|
|
|
|
|
|
|
|
|
|
|
|
|
|
|
|
|
Unconsolidated Joint Ventures |
|
|
|
|
|
|
|
|
|
|
|
|
|
|
|
|
|
|
|
|
|
|
|
|
|
|
|
|
|
|
|
|
|
|
|
Northern Virginia |
|
2,418 |
|
805 |
|
— |
|
|
$221,253 |
|
98.8% |
|
97.9% |
|
193.7 |
|
12 |
Chicago |
|
790 |
|
— |
|
— |
|
|
77,274 |
|
91.8% |
|
91.3% |
|
67.4 |
|
2 |
Silicon Valley |
|
142 |
|
— |
|
— |
|
|
18,498 |
|
100.0% |
|
100.0% |
|
10.9 |
|
2 |
Toronto |
|
104 |
|
— |
|
— |
|
|
12,742 |
|
55.7% |
|
55.7% |
|
6.8 |
|
1 |
Hong Kong |
|
186 |
|
— |
|
— |
|
|
11,394 |
|
48.2% |
|
48.2% |
|
11.0 |
|
1 |
Paris |
|
90 |
|
180 |
|
— |
|
|
7,270 |
|
61.5% |
|
— |
|
10.0 |
|
1 |
Los Angeles |
|
197 |
|
— |
|
— |
|
|
5,446 |
|
100.0% |
|
100.0% |
|
— |
|
2 |
Lagos |
|
4 |
|
— |
|
— |
|
|
514 |
|
100.0% |
|
100.0% |
|
0.2 |
|
1 |
Abuja |
|
1 |
|
— |
|
— |
|
|
42 |
|
73.0% |
|
73.0% |
|
0.1 |
|
1 |
Chennai |
|
52 |
|
— |
|
— |
|
|
— |
|
— |
|
— |
|
7.2 |
|
1 |
Dallas |
|
— |
|
327 |
|
— |
|
|
— |
|
— |
|
— |
|
— |
|
2 |
Managed Unconsolidated Portfolio Total/Weighted Average |
|
3,985 |
|
1,313 |
|
— |
|
|
$354,434 |
|
91.9% |
|
93.7% |
|
307.1 |
|
26 |
|
|
|
|
|
|
|
|
|
|
|
|
|
|
|
|
|
|
Managed Portfolio Total/Weighted Average |
|
36,029 |
|
7,482 |
|
1,951 |
|
|
$3,785,539 |
|
81.8% |
|
81.2% |
|
2,262.6 |
|
263 |
|
|
|
|
|
|
|
|
|
|
|
|
|
|
|
|
|
|
Digital Realty Share Total/Weighted Average (8) |
|
32,579 |
|
6,170 |
|
1,951 |
|
|
$3,457,849 |
|
80.8% |
|
80.3% |
|
2,020.8 |
|
— |
|
|
|
|
|
|
|
|
|
|
|
|
|
|
|
|
|
|
Non-Managed Unconsolidated Joint Ventures |
|
|
|
|
|
|
|
|
|
|
|
|
|
|
|
|
|
|
|
|
|
|
|
|
|
|
|
|
|
|
|
|
|
|
|
Sao Paulo |
|
1,393 |
|
97 |
|
1,198 |
|
|
$183,568 |
|
91.9% |
|
91.8% |
|
117.6 |
|
25 |
Tokyo |
|
1,352 |
|
484 |
|
— |
|
|
80,324 |
|
75.6% |
|
76.2% |
|
64.9 |
|
5 |
Osaka |
|
583 |
|
56 |
|
140 |
|
|
74,347 |
|
83.3% |
|
81.4% |
|
58.9 |
|
4 |
Queretaro |
|
105 |
|
— |
|
583 |
|
|
16,891 |
|
100.0% |
|
100.0% |
|
8.0 |
|
3 |
Santiago |
|
119 |
|
118 |
|
71 |
|
|
16,363 |
|
90.1% |
|
90.1% |
|
10.2 |
|
3 |
Rio De Janeiro |
|
112 |
|
— |
|
— |
|
|
11,630 |
|
100.0% |
|
100.0% |
|
8.0 |
|
2 |
Fortaleza |
|
94 |
|
— |
|
— |
|
|
9,543 |
|
87.0% |
|
87.0% |
|
6.2 |
|
1 |
Seattle |
|
51 |
|
— |
|
— |
|
|
7,770 |
|
100.0% |
|
100.0% |
|
9.0 |
|
1 |
Bogota |
|
— |
|
— |
|
197 |
|
|
— |
|
— |
|
— |
|
— |
|
2 |
Non-Managed Portfolio Total/Weighted Average |
|
3,810 |
|
756 |
|
2,190 |
|
|
$400,435 |
|
85.2% |
|
85.3% |
|
282.8 |
|
46 |
|
|
|
|
|
|
|
|
|
|
|
|
|
|
|
|
|
|
Portfolio Total/Weighted Average |
|
39,839 |
|
8,238 |
|
4,141 |
|
|
$4,185,973 |
|
82.1% |
|
81.5% |
|
2,545.3 |
|
309 |
| (1) | We estimate the total net rentable square feet available for lease based on a number of factors in addition to contractually leased square feet, including available power, required support space and common areas. |
| (2) | Space under active development includes current Base Building and Data Center projects in progress. |
| (3) | Space held for development includes space held for future Data Center development and excludes space under active development. |
| (4) | Annualized base rent represents the monthly contractual base rent (defined as cash base rent before abatements) under existing leases as of March 31, 2024, multiplied by 12. |
| (5) | Occupancy excludes space under active development and space held for development. For some of our buildings, we calculate occupancy based on factors in addition to contractually leased square feet, including available power, required support space and common areas. |
| (6) | White Space IT Load represents UPS-backed utility power dedicated to Digital Realty’s operated data center space. |
| (7) | Held for Sale represents the assets being sold in the CH2 transaction which closed in April 2024. |
| (8) | Represents consolidated portfolio plus our managed portfolio of unconsolidated joint ventures based on our ownership percentage. |
24
|
|
Future Development Capacity |
|
Data Center Construction |
|||||||||||||||||||||||||||||||||
|
|
|
|
|
|
|
|
|
|
|
|
|
|
|
|
|
|
|
|
|
|
|
|
|
|
|
|
|
|
|
|
|
|
|
|
|
|
|
|
IT Capacity (100% Share) (2) |
|
Total Investment (3) |
|
Project Summary (4) |
|
100% Share (4) |
|
DLR Share (5) |
|||||||||||||||||||||||||||
|
|
|
|
|
|
|
|
|
|
|
|
|
|
|
|
|
|
|
|
|
|
|
|
|
|
|
|
|
|
|
|
|
|
|
|
|
|
|
|
|
|
|
|
|
|
|
|
Under |
|
|
|
Average |
|
Current |
|
Future |
|
Total |
|
Current |
|
Future |
|
Total |
|
|
|
||||||||
|
|
|
|
|
|
100% Share |
|
DLR Share |
|
Construction |
|
|
|
Expected |
|
Investment |
|
Investment |
|
Investment |
|
Investment |
|
Investment |
|
Investment |
|
|
Yields |
||||||||
Region |
|
Land (MW) |
|
Shell (MW) |
|
|
(4) |
(5) |
|
(MW) |
|
% Leased |
|
Completion |
|
|
(6) |
|
|
(7) |
|
|
(8) |
|
(6) |
|
(7) |
|
|
(8) |
|
|
(9) |
||||
Northern Virginia |
|
1,100 |
|
170 |
|
|
$1,025,225 |
|
|
$761,322 |
|
104 |
|
69% |
|
4Q24 |
|
|
$469,663 |
|
|
$623,677 |
|
|
$1,093,340 |
|
|
$270,954 |
|
|
$461,993 |
|
|
$732,946 |
|
|
|
Dallas |
|
230 |
|
30 |
|
|
198,135 |
|
|
130,146 |
|
16 |
|
100% |
|
3Q24 |
|
|
224,638 |
|
|
79,962 |
|
|
304,600 |
|
|
78,623 |
|
|
27,987 |
|
|
106,610 |
|
|
|
Portland |
|
— |
|
— |
|
|
— |
|
|
— |
|
24 |
|
100% |
|
3Q24 |
|
|
194,129 |
|
|
81,691 |
|
|
275,820 |
|
|
194,129 |
|
|
81,691 |
|
|
275,820 |
|
|
|
Other |
|
360 |
|
100 |
|
|
748,561 |
|
|
644,635 |
|
34 |
|
91% |
|
3Q24-1Q25 |
|
|
215,709 |
|
|
190,940 |
|
|
406,649 |
|
|
171,541 |
|
|
155,118 |
|
|
326,659 |
|
|
|
Americas |
|
1,690 |
|
300 |
|
|
$1,971,922 |
|
|
$1,536,104 |
|
178 |
|
80% |
|
|
|
|
$1,104,139 |
|
|
$976,270 |
|
|
$2,080,409 |
|
|
$715,247 |
|
|
$726,788 |
|
|
$1,442,035 |
|
|
12.3% |
|
|
|
|
|
|
|
|
|
|
|
|
|
|
|
|
|
|
|
|
|
|
|
|
|
|
|
|
|
|
|
|
|
|
|
|
|
|
Frankfurt |
|
120 |
|
60 |
|
|
$728,342 |
|
|
$728,342 |
|
56 |
|
55% |
|
2Q25 |
|
|
$599,493 |
|
|
$399,246 |
|
|
$998,739 |
|
|
$599,493 |
|
|
$399,246 |
|
|
$998,739 |
|
|
|
Paris |
|
220 |
|
10 |
|
|
114,871 |
|
|
41,025 |
|
48 |
|
44% |
|
4Q24 |
|
|
453,985 |
|
|
301,098 |
|
|
755,083 |
|
|
375,560 |
|
|
285,263 |
|
|
660,823 |
|
|
|
Zurich |
|
10 |
|
— |
|
|
32,866 |
|
|
32,866 |
|
13 |
|
82% |
|
3Q25 |
|
|
151,406 |
|
|
110,688 |
|
|
262,094 |
|
|
151,406 |
|
|
110,688 |
|
|
262,094 |
|
|
|
Other |
|
360 |
|
160 |
|
|
671,131 |
|
|
633,710 |
|
104 |
|
48% |
|
2Q24-1Q26 |
|
|
383,890 |
|
|
700,481 |
|
|
1,084,372 |
|
|
328,871 |
|
|
597,151 |
|
|
926,022 |
|
|
|
EMEA |
|
710 |
|
230 |
|
|
$1,547,209 |
|
|
$1,435,943 |
|
222 |
|
51% |
|
|
|
|
$1,588,774 |
|
|
$1,511,514 |
|
|
$3,100,288 |
|
|
$1,455,330 |
|
|
$1,392,349 |
|
|
$2,847,679 |
|
|
9.7% |
|
|
|
|
|
|
|
|
|
|
|
|
|
|
|
|
|
|
|
|
|
|
|
|
|
|
|
|
|
|
|
|
|
|
|
|
|
|
Tokyo |
|
30 |
|
20 |
|
|
$134,008 |
|
|
$67,004 |
|
24 |
|
63% |
|
1Q25 |
|
|
$93,135 |
|
|
$160,153 |
|
|
$253,288 |
|
|
$46,567 |
|
|
$80,077 |
|
|
$126,644 |
|
|
|
Hong Kong |
|
— |
|
— |
|
|
25,807 |
|
|
25,807 |
|
6 |
|
100% |
|
3Q25 |
|
|
22,293 |
|
|
48,505 |
|
|
70,798 |
|
|
22,293 |
|
|
48,505 |
|
|
70,798 |
|
|
|
Osaka |
|
40 |
|
10 |
|
|
51,523 |
|
|
25,762 |
|
6 |
|
100% |
|
2Q25 |
|
|
18,630 |
|
|
34,106 |
|
|
52,736 |
|
|
9,315 |
|
|
17,053 |
|
|
26,368 |
|
|
|
Other |
|
200 |
|
20 |
|
|
190,427 |
|
|
144,842 |
|
1 |
|
100% |
|
2Q24 |
|
|
1,195 |
|
|
7,728 |
|
|
8,924 |
|
|
1,195 |
|
|
7,728 |
|
|
8,924 |
|
|
|
APAC |
|
270 |
|
50 |
|
|
$401,765 |
|
|
$263,414 |
|
37 |
|
76% |
|
|
|
|
$135,253 |
|
|
$250,493 |
|
|
$385,746 |
|
|
$79,371 |
|
|
$153,363 |
|
|
$232,734 |
|
|
10.4% |
|
|
|
|
|
|
|
|
|
|
|
|
|
|
|
|
|
|
|
|
|
|
|
|
|
|
|
|
|
|
|
|
|
|
|
|
|
|
Total |
|
2,670 |
|
580 |
|
|
$3,920,896 |
|
|
$3,235,461 |
|
437 |
|
65% |
|
|
|
|
$2,828,166 |
|
|
$2,738,277 |
|
|
$5,566,443 |
|
|
$2,249,948 |
|
|
$2,272,500 |
|
|
$4,522,448 |
|
|
10.6% |
| (1) | Includes development projects in consolidated and unconsolidated joint ventures. |
| (2) | Represents the expected megawatt capacity to be developed based on our current plans and estimates; actual megawatt capacity developed may differ. Includes land and space held or actively under construction in preparation for future data center fit-out. |
| (3) | Represents cost incurred through March 31, 2024, plus remaining cost to complete on approved phases in preparation for future data center fit-out, including pro-rata share of acquisition, shell, and infrastructure costs. |
| (4) | Includes Digital Realty's and partners' shares in development joint venture projects. |
| (5) | Includes only Digital Realty's share in development joint venture projects. |
| (6) | Represents cost incurred through March 31, 2024. |
| (7) | Represents estimated cost to complete scope of work pursuant to approved development budget. |
| (8) | Represents total cost to develop a data center, including pro-rata share of acquisition, infrastructure, and shell space, plus the direct investment in the data center fit-out. |
| (9) | Estimated yields are based on total expected investment amounts and anticipated net operating income from leases signed or other assumptions based on market conditions. |
25
|
|
|
100% Share (2) |
|
DLR Share (3) |
|||||||||||||||
|
|
Current |
|
Future |
|
Total |
|
Current |
|
Future |
|
Total |
|
|
||||||
Construction Projects in Progress |
|
Investment (4) |
|
Investment (5) |
|
Investment |
|
Investment (4) (6) |
|
Investment (5) |
|
Investment |
|
|
||||||
Future Development Capacity (7) |
|
|
$2,966,878 |
|
|
$954,017 |
|
|
$3,920,896 |
|
|
$2,527,178 |
|
|
$708,283 |
|
|
$3,235,461 |
|
|
Data Center Construction |
|
|
2,828,166 |
|
|
2,738,277 |
|
|
5,566,443 |
|
|
2,249,948 |
|
|
2,272,500 |
|
|
4,522,448 |
|
|
Equipment Pool & Other Inventory (8) |
|
|
184,706 |
|
|
— |
|
|
184,706 |
|
|
184,706 |
|
|
— |
|
|
184,706 |
|
|
Campus, Tenant Improvements & Other (9) |
|
|
232,389 |
|
|
107,835 |
|
|
340,224 |
|
|
232,389 |
|
|
107,835 |
|
|
340,224 |
|
|
Total Land Held and Development CIP |
|
|
$6,212,140 |
|
|
$3,800,129 |
|
|
$10,012,269 |
|
|
$5,194,222 |
|
|
$3,088,617 |
|
|
$8,282,839 |
|
|
|
|
|
|
|
|
|
|
|
|
|
|
|
|
|
|
|
|
|
|
|
Enhancement & Other |
|
|
$24,064 |
|
|
$6,363 |
|
|
$30,427 |
|
|
$24,064 |
|
|
$6,363 |
|
|
$30,427 |
|
|
Recurring |
|
|
26,549 |
|
|
36,587 |
|
|
63,136 |
|
|
26,549 |
|
|
36,587 |
|
|
63,136 |
|
|
Total Land Held and Construction in Progress |
|
|
$6,262,753 |
|
|
$3,843,079 |
|
|
$10,105,832 |
|
|
$5,244,835 |
|
|
$3,131,567 |
|
|
$8,376,403 |
|
|
| (1) | Includes development projects in consolidated and unconsolidated joint ventures. |
| (2) | Includes Digital Realty's and partners' shares in development joint venture projects. |
| (3) | Includes only Digital Realty's share in development joint venture projects. |
| (4) | Represents cost incurred through March 31, 2024. |
| (5) | Represents estimated cost to complete scope of work pursuant to approved development budget. |
| (6) | Excludes $67.8 million representing our partners' shares in consolidated joint ventures included in Construction in Progress or Land Held for Future Development in our Consolidated Balance Sheet; includes $651.0 million representing Digital Realty's share in development projects classified as Investments in Unconsolidated Joint Ventures in our Consolidated Balance Sheet. |
| (7) | Includes land and space held or actively under construction in preparation for future data center fit-out. |
| (8) | Represents long-lead equipment and materials required for timely deployment and delivery of data center fit-out. |
| (9) | Represents improvements in progress as of March 31, 2024, which benefit space recently converted to our operating portfolio and is composed primarily of shared infrastructure projects and first-generation tenant improvements. Includes $3.0 million included in our Consolidated Balance Sheet related to fair value adjustments on Teraco portfolio projects that were partially constructed as of August 1, 2022. |
26
Historical Capital Expenditures and Investments in Real Estate |
|
Financial Supplement |
|---|---|---|
Dollars and Square Feet in Thousands |
First Quarter 2024 |
|
|
Three Months Ended |
|||||||||||||
|
|
31-Mar-24 |
|
|
31-Dec-23 |
30-Sep-23 |
|
30-Jun-23 |
|
31-Mar-23 |
|||||
|
|
|
|
|
|
|
|
|
|
|
|
|
|
|
|
Non-Recurring Capital Expenditures (1) |
|
|
|
|
|
|
|
|
|
|
|
|
|
|
|
|
|
|
|
|
|
|
|
|
|
|
|
|
|
|
|
Development (2) |
|
|
$549,522 |
|
|
$845,315 |
|
|
$953,267 |
|
|
$523,406 |
|
|
$644,910 |
|
|
|
|
|
|
|
|
|
|
|
|
|
|
|
|
Enhancements and Other Non-Recurring |
|
|
7,738 |
|
|
10,113 |
|
|
1,317 |
|
|
1,479 |
|
|
2,796 |
|
|
|
|
|
|
|
|
|
|
|
|
|
|
|
|
Total Non-Recurring Capital Expenditures |
|
|
$557,260 |
|
|
$855,428 |
|
|
$954,584 |
|
|
$524,885 |
|
|
$647,706 |
|
|
|
|
|
|
|
|
|
|
|
|
|
|
|
|
Recurring Capital Expenditures (3) |
|
|
$47,676 |
|
|
$142,808 |
|
|
$90,251 |
|
|
$53,498 |
|
|
$40,465 |
|
|
|
|
|
|
|
|
|
|
|
|
|
|
|
|
Total Direct Capital Expenditures |
|
|
$604,936 |
|
|
$998,236 |
|
|
$1,044,835 |
|
|
$578,383 |
|
|
$688,171 |
|
|
|
|
|
|
|
|
|
|
|
|
|
|
|
|
Indirect Capital Expenditures |
|
|
|
|
|
|
|
|
|
|
|
|
|
|
|
|
|
|
|
|
|
|
|
|
|
|
|
|
|
|
|
Capitalized Interest |
|
|
$28,522 |
|
|
$33,032 |
|
|
$29,130 |
|
|
$27,883 |
|
|
$26,771 |
|
|
|
|
|
|
|
|
|
|
|
|
|
|
|
|
Capitalized Overhead |
|
|
25,857 |
|
|
27,867 |
|
|
23,837 |
|
|
23,717 |
|
|
23,735 |
|
|
|
|
|
|
|
|
|
|
|
|
|
|
|
|
Total Indirect Capital Expenditures |
|
|
$54,379 |
|
|
$60,899 |
|
|
$52,967 |
|
|
$51,600 |
|
|
$50,506 |
|
|
|
|
|
|
|
|
|
|
|
|
|
|
|
|
Total Improvements to and Advances for Investment in Real Estate |
|
|
$659,315 |
|
|
$1,059,135 |
|
|
$1,097,802 |
|
|
$629,983 |
|
|
$738,677 |
|
|
|
|
|
|
|
|
|
|
|
|
|
|
|
|
Consolidated Portfolio Net Rentable Square Feet (4) |
|
|
32,579 |
|
|
32,670 |
|
|
32,603 |
|
|
33,858 |
|
|
33,511 |
| (1) | Non-recurring capital expenditures are primarily for development of space and land, excluding acquisition costs. |
| (2) | Amount reflects the total capital expenditures on consolidated development projects during the quarter. The total includes 100% of spending on projects contributed to joint ventures during the quarter, prior to their contribution. |
| (3) | Recurring capital expenditures represent non-incremental building improvements required to maintain current revenues, including second-generation tenant improvements and external leasing commissions. Recurring capital expenditures do not include acquisition costs contemplated when underwriting the purchase of a building, costs which are incurred to bring a building up to Digital Realty’s operating standards, or internal leasing commissions. |
| (4) | For some of our buildings, we calculate square footage based on factors in addition to contractually leased square feet, including available power, required support space and common areas. |
27
|
Financial Supplement |
|
|---|---|---|
Dollars and Square Feet in Thousands |
First Quarter 2024 |
Closed Acquisitions:
|
|
|
|
|
|
|
|
|
|
|
|
Net |
|
|
|
|
|
|
|
|
|
|
|
|
|
|
|
|
|
|
Rentable |
|
Square Feet |
|
Square Feet |
|
% of Total Net |
|
|
Acquisition |
|
Metropolitan |
|
Date |
|
Purchase |
|
Cap |
|
Square |
|
Under |
|
Held For |
|
Rentable Square |
Property |
|
Type |
|
Area |
|
Acquired |
|
Price (1) |
|
Rate (2) |
|
Feet (3) |
|
Development |
|
Development |
|
Feet Occupied (4) |
PAR8-11 |
|
Land |
|
Paris, France |
|
1/11/2024 |
|
$75,675 |
|
NA |
|
— |
|
— |
|
— |
|
— |
Cyxtera- Various |
|
Leasehold |
|
Frankfurt, Singapore |
|
1/12/2024 |
|
55,000 |
|
NA |
|
— |
|
— |
|
— |
|
— |
KIX10 Annex (MC Digital Realty) |
|
Land |
|
Osaka, Japan |
|
2/5/2024 |
|
6,608 |
|
NA |
|
— |
|
— |
|
— |
|
— |
Total |
|
|
|
|
|
|
|
$137,283 |
|
— |
|
— |
|
— |
|
— |
|
— |
Closed Dispositions:
|
|
|
|
|
|
|
|
|
|
|
|
Net |
|
|
|
|
|
|
|
|
|
|
|
|
|
|
|
|
|
|
Rentable |
|
Square Feet |
|
Square Feet |
|
% of Total Net |
|
|
Disposition |
|
Metropolitan |
|
Date |
|
Sale |
|
Cap |
|
Square |
|
Under |
|
Held For |
|
Rentable Square |
Property |
|
Type |
|
Area |
|
Disposed |
|
Price (1) |
|
Rate (2) |
|
Feet (3) |
|
Development |
|
Development |
|
Feet Occupied (4) |
Cyxtera- Various |
|
Buildings |
|
Santa Clara, New Jersey |
|
1/12/2024 |
|
$277,399 |
|
6.1% |
|
— |
|
— |
|
— |
|
— |
SYD15 |
|
Land |
|
Sydney, Australia |
|
3/28/2024 |
|
62,837 |
|
NA |
|
— |
|
— |
|
— |
|
— |
Total |
|
|
|
|
|
|
|
$340,236 |
|
— |
|
— |
|
— |
|
— |
|
— |
Closed Joint Venture Contributions:
|
|
|
|
|
|
|
|
|
|
Net |
|
|
|
|
|
|
|
|
|
|
|
|
|
|
|
|
Rentable |
|
Square Feet |
|
Square Feet |
|
% of Total Net |
|
|
Metropolitan |
|
|
|
Contribution |
|
Cap |
|
Square |
|
Under |
|
Held For |
|
Rentable Square |
Property |
|
Area |
|
Date |
|
Price |
|
Rate (2) |
|
Feet (3) |
|
Development |
|
Development |
|
Feet Occupied (4) |
Blackstone JV - Phase I (5) |
|
NoVa, Paris |
|
1/11/2024 |
|
$367,746 |
|
NA |
|
— |
|
— |
|
— |
|
— |
GI Partners JV - CH1 and CH3 (6) |
|
Chicago, IL |
|
1/12/2024 |
|
900,000 |
|
6.5% |
|
— |
|
— |
|
— |
|
— |
Mitsubishi JV (7) |
|
Dallas, TX |
|
3/4/2024 |
|
307,896 |
|
NA |
|
— |
|
— |
|
— |
|
— |
Total |
|
|
|
|
|
$1,575,642 |
|
— |
|
— |
|
— |
|
— |
|
— |
| (1) | Represents the purchase price or sale price, as applicable before contractual price adjustments, transaction expenses, taxes, and potential currency fluctuations. All prices converted to USD based on FX rate as of March 31,2024. |
| (2) | We calculate the cash capitalization rate on acquisitions, dispositions, and joint venture contributions by dividing anticipated annual net operating income by the purchase/sale/contribution price, including assumed debt and related pre-payment penalties. Net operating income represents rental revenue and tenant reimbursement revenue from in-place leases, less rental property operating and maintenance expenses, property taxes and insurance expenses, and is not a financial measure calculated in accordance with GAAP. We caution you not to place undue reliance on our cash capitalization rates because they are based solely on data made available to us in the diligence process in connection with the relevant acquisitions and are calculated on a non-GAAP basis. Our calculation of the cash capitalization rate on acquisitions may change, based on our experience operating the data centers subsequent to closing of the acquisitions. In addition, the actual cash capitalization rates may differ from our expectations based on numerous other factors, including the results of our final purchase price allocation, difficulties collecting anticipated rental revenues, tenant bankruptcies, property tax reassessments and unanticipated expenses at the data centers that we cannot pass on to tenants. |
| (3) | We estimate the total net rentable square feet available for lease based on a number of factors in addition to contractually leased square feet, including available power, required support space and common area. |
| (4) | Occupancy excludes space under active development and space held for development. |
| (5) | Blackstone acquired an 80% interest, while Digital Realty maintains a 20% interest and will manage the development and day-to-day operations of the JV. Contribution price is shown at 100%. |
| (6) | GI Partners acquired an additional 15% equity interest in two stabilized hyperscale data center buildings in the Chicago metro area, increasing their stake from 65% to 80%, for approximately $68 million. Contribution price is shown at 100%. |
| (7) | Mitsubishi invested approximately $200 million to acquire a 65% interest while Digital Realty maintains a 35% interest in the joint venture for the development of two build-to-suit hyperscale data centers in the Dallas metro area. Each partner will fund its pro rata share of the remaining development costs of the projects. Contribution price is shown at 100%. |
28
Summary Balance Sheet - |
|
As of March 31, 2024 |
|||||||||||||
at the JV's 100% Share |
|
|
Americas (1) |
|
|
APAC (2) |
|
|
EMEA (3) |
|
|
Global (4) |
|
|
Total |
|
|
|
|
|
|
|
|
|
|
|
|
|
|
|
|
Gross cost of operating real estate |
|
|
$5,684,399 |
|
|
$1,728,633 |
|
|
$320,288 |
|
|
$1,293,417 |
|
|
$9,026,737 |
Accumulated depreciation & amortization |
|
|
(742,961) |
|
|
(225,285) |
|
|
— |
|
|
(77,253) |
|
|
(1,045,499) |
Net Book Value of Operating Real Estate |
|
|
$4,941,438 |
|
|
$1,503,348 |
|
|
$320,288 |
|
|
$1,216,164 |
|
|
$7,981,239 |
Cash |
|
|
361,349 |
|
|
286,539 |
|
|
76,859 |
|
|
119,316 |
|
|
844,063 |
Other assets |
|
|
1,839,898 |
|
|
178,238 |
|
|
47,462 |
|
|
179,398 |
|
|
2,244,996 |
Total Assets |
|
|
$7,142,684 |
|
|
$1,968,125 |
|
|
$444,609 |
|
|
$1,514,878 |
|
|
$11,070,298 |
|
|
|
|
|
|
|
|
|
|
|
|
|
|
|
|
Debt |
|
|
2,604,657 |
|
|
654,680 |
|
|
— |
|
|
444,853 |
|
|
3,704,190 |
Other liabilities |
|
|
586,997 |
|
|
157,491 |
|
|
395,554 |
|
|
34,291 |
|
|
1,174,333 |
Equity / (deficit) |
|
|
3,951,032 |
|
|
1,155,954 |
|
|
49,055 |
|
|
1,035,735 |
|
|
6,191,775 |
Total Liabilities and Equity |
|
|
$7,142,686 |
|
|
$1,968,125 |
|
|
$444,609 |
|
|
$1,514,878 |
|
|
$11,070,298 |
|
|
|
|
|
|
|
|
|
|
|
|
|
|
|
|
Digital Realty's Pro Rata Share of Unconsolidated JV Debt |
|
|
$886,171 |
|
|
$327,340 |
|
|
— |
|
|
$168,591 |
|
|
$1,382,102 |
Summary Statement of Operations - |
|
Three Months Ended March 31, 2024 |
|||||||||||||
at the JV's 100% Share |
|
|
Americas (1) |
|
|
APAC (2) |
|
|
EMEA (3) |
|
|
Global (4) |
|
|
Total |
|
|
|
|
|
|
|
|
|
|
|
|
|
|
|
|
Total revenues |
|
|
$188,283 |
|
|
$63,557 |
|
|
$556 |
|
|
$24,247 |
|
|
$276,643 |
Operating expenses |
|
|
(83,577) |
|
|
(30,384) |
|
|
(725) |
|
|
(8,798) |
|
|
(123,485) |
Net Operating Income (NOI) |
|
|
$104,706 |
|
|
$33,173 |
|
|
($169) |
|
|
$15,449 |
|
|
$153,159 |
|
|
|
|
|
|
|
|
|
|
|
|
|
|
|
|
Straight-line rent |
|
|
(1,913) |
|
|
(1,182) |
|
|
— |
|
|
279 |
|
|
(2,816) |
Above and below market rent |
|
|
1,573 |
|
|
— |
|
|
— |
|
|
(775) |
|
|
798 |
Cash Net Operating Income (NOI) |
|
|
$104,366 |
|
|
$31,991 |
|
|
($169) |
|
|
$14,953 |
|
|
$151,140 |
|
|
|
|
|
|
|
|
|
|
|
|
|
|
|
|
Interest expense |
|
|
($59,240) |
|
|
($1,091) |
|
|
($1,615) |
|
|
($6,899) |
|
|
($68,845) |
Depreciation & amortization |
|
|
(97,617) |
|
|
(15,612) |
|
|
— |
|
|
(15,180) |
|
|
(128,409) |
Other income / (expense) |
|
|
(2,593) |
|
|
(4,118) |
|
|
105 |
|
|
31,910 |
|
|
25,303 |
FX remeasurement on USD debt |
|
|
(31,784) |
|
|
— |
|
|
— |
|
|
4,110 |
|
|
(27,674) |
Total Non-Operating Expenses |
|
|
($191,234) |
|
|
($20,821) |
|
|
($1,510) |
|
|
$13,940 |
|
|
($199,624) |
|
|
|
|
|
|
|
|
|
|
|
|
|
|
|
|
Net Income / (Loss) |
|
|
($86,528) |
|
|
$12,352 |
|
|
($1,678) |
|
|
$29,389 |
|
|
($46,466) |
|
|
|
|
|
|
|
|
|
|
|
|
|
|
|
|
|
|
|
|
|
|
|
|
|
|
|
|
|
|
|
|
Digital Realty's Pro Rata Share of Unconsolidated JV NOI |
|
|
$34,172 |
|
|
$16,587 |
|
|
$17 |
|
|
$5,855 |
|
|
$56,630 |
|
|
|
|
|
|
|
|
|
|
|
|
|
|
|
|
Digital Realty's Pro Rata Share of Unconsolidated JV Cash NOI |
|
|
$34,104 |
|
|
$15,996 |
|
|
$17 |
|
|
$5,667 |
|
|
$55,783 |
|
|
|
|
|
|
|
|
|
|
|
|
|
|
|
|
Digital Realty's Earnings (loss) income from unconsolidated joint ventures |
|
|
($33,511) |
|
|
$6,176 |
|
|
($1,278) |
|
|
$12,606 |
|
|
($16,008) |
|
|
|
|
|
|
|
|
|
|
|
|
|
|
|
|
Digital Realty's Pro Rata Share of Core FFO (5) |
|
|
$17,580 |
|
|
$14,337 |
|
|
($1,280) |
|
|
$8,648 |
|
|
$39,285 |
|
|
|
|
|
|
|
|
|
|
|
|
|
|
|
|
Digital Realty's Fee Income from Joint Ventures |
|
|
$5,096 |
|
|
$178 |
|
|
— |
|
|
$3,388 |
|
|
$8,661 |
| (1) | Includes Ascenty, Blackstone Nova, Clise, Colovore, GI Partners, Mapletree, Menlo, Mitsubishi, Realty Income, TPG Real Estate, and Walsh. |
| (2) | Includes Digital Connexion, Lumen, and MC Digital Realty. |
| (3) | Includes Blackstone Paris, Medallion, and Mivne. |
| (4) | Includes Digital Core REIT. |
| (5) | For a definition of Core FFO, see page 31. |
Note: Digital Realty’s ownership percentages in the Joint Ventures vary.
29
Reconciliation of Earnings Before Interest, Taxes, Depreciation & Amortization and Financial Ratios |
|
Financial Supplement |
|---|---|---|
Unaudited and Dollars in Thousands |
First Quarter 2024 |
|
|
Three Months Ended |
|||||||||||||
Reconciliation of Earnings Before Interest, Taxes, Depreciation & Amortization (EBITDA) (1) |
|
|
31-Mar-24 |
|
|
31-Dec-23 |
|
|
30-Sep-23 |
|
|
30-Jun-23 |
|
|
31-Mar-23 |
|
|
|
|
|
|
|
|
|
|
|
|
|
|
|
|
Net Income / (Loss) Available to Common Stockholders |
|
|
$271,327 |
|
|
$18,122 |
|
|
$723,440 |
|
|
$108,003 |
|
|
$58,547 |
Interest |
|
|
109,535 |
|
|
113,638 |
|
|
110,767 |
|
|
111,116 |
|
|
102,220 |
Loss from early extinguishment of debt |
|
|
1,070 |
|
|
— |
|
|
— |
|
|
— |
|
|
— |
Income tax expense (benefit) |
|
|
22,413 |
|
|
20,724 |
|
|
17,228 |
|
|
16,173 |
|
|
21,454 |
Depreciation & amortization |
|
|
431,102 |
|
|
420,475 |
|
|
420,613 |
|
|
432,573 |
|
|
421,198 |
EBITDA |
|
|
$835,446 |
|
|
$572,958 |
|
|
$1,272,048 |
|
|
$667,866 |
|
|
$603,420 |
Unconsolidated JV real estate related depreciation & amortization |
|
|
47,877 |
|
|
64,833 |
|
|
43,214 |
|
|
35,386 |
|
|
33,719 |
Unconsolidated JV interest expense and tax expense |
|
|
34,271 |
|
|
42,140 |
|
|
27,000 |
|
|
32,105 |
|
|
18,556 |
Severance, equity acceleration and legal expenses |
|
|
791 |
|
|
7,565 |
|
|
2,682 |
|
|
3,652 |
|
|
4,155 |
Transaction and integration expenses |
|
|
31,839 |
|
|
40,226 |
|
|
14,465 |
|
|
17,764 |
|
|
12,267 |
(Gain) / loss on sale of investments |
|
|
(277,787) |
|
|
103 |
|
|
(810,688) |
|
|
(89,946) |
|
|
— |
Provision for impairment |
|
|
— |
|
|
5,363 |
|
|
113,000 |
|
|
— |
|
|
— |
Other non-core adjustments, net |
|
|
21,608 |
|
|
(35,439) |
|
|
1,719 |
|
|
22,132 |
|
|
(14,604) |
Non-controlling interests |
|
|
6,329 |
|
|
(8,419) |
|
|
12,320 |
|
|
(2,538) |
|
|
111 |
Preferred stock dividends |
|
|
10,181 |
|
|
10,181 |
|
|
10,181 |
|
|
10,181 |
|
|
10,181 |
Adjusted EBITDA |
|
|
$710,556 |
|
|
$699,509 |
|
|
$685,943 |
|
|
$696,604 |
|
|
$667,804 |
| (1) | For definitions and discussion of EBITDA and Adjusted EBITDA, see the Definitions section. |
|
|
Three Months Ended |
|||||||||||||
Financial Ratios |
|
|
31-Mar-24 |
|
|
31-Dec-23 |
|
|
30-Sep-23 |
|
|
30-Jun-23 |
|
|
31-Mar-23 |
|
|
|
|
|
|
|
|
|
|
|
|
|
|
|
|
Total GAAP interest expense |
|
|
$109,535 |
|
|
$113,638 |
|
|
$110,767 |
|
|
$111,116 |
|
|
$102,220 |
Capitalized interest |
|
|
28,522 |
|
|
33,032 |
|
|
29,130 |
|
|
27,883 |
|
|
26,771 |
Change in accrued interest and other non-cash amounts |
|
|
55,421 |
|
|
(66,013) |
|
|
44,183 |
|
|
(60,612) |
|
|
38,137 |
Cash Interest Expense (2) |
|
|
$193,479 |
|
|
$80,657 |
|
|
$184,081 |
|
|
$78,387 |
|
|
$167,128 |
|
|
|
|
|
|
|
|
|
|
|
|
|
|
|
|
Preferred stock dividends |
|
|
10,181 |
|
|
10,181 |
|
|
10,181 |
|
|
10,181 |
|
|
10,181 |
Total Fixed Charges (3) |
|
|
$148,239 |
|
|
$156,851 |
|
|
$150,079 |
|
|
$149,181 |
|
|
$139,172 |
|
|
|
|
|
|
|
|
|
|
|
|
|
|
|
|
|
|
|
|
|
|
|
|
|
|
|
|
|
|
|
|
Coverage |
|
|
|
|
|
|
|
|
|
|
|
|
|
|
|
Interest coverage ratio (4) |
|
|
4.3x |
|
|
4.0x |
|
|
4.3x |
|
|
4.5x |
|
|
4.7x |
Cash interest coverage ratio (5) |
|
|
3.2x |
|
|
6.4x |
|
|
3.4x |
|
|
7.4x |
|
|
3.7x |
Fixed charge coverage ratio (6) |
|
|
4.0x |
|
|
3.8x |
|
|
4.1x |
|
|
4.2x |
|
|
4.4x |
Cash fixed charge coverage ratio (7) |
|
|
3.1x |
|
|
5.8x |
|
|
3.2x |
|
|
6.6x |
|
|
3.5x |
|
|
|
|
|
|
|
|
|
|
|
|
|
|
|
|
Leverage |
|
|
|
|
|
|
|
|
|
|
|
|
|
|
|
Debt to total enterprise value (8)(9) |
|
|
26.7% |
|
|
28.6% |
|
|
30.6% |
|
|
33.3% |
|
|
37.3% |
Debt-plus-preferred-stock-to-total-enterprise-value (9)(10) |
|
|
27.9% |
|
|
29.8% |
|
|
32.0% |
|
|
34.7% |
|
|
38.9% |
Pre-tax income to interest expense (11) |
|
|
3.6x |
|
|
1.2x |
|
|
7.7x |
|
|
2.0x |
|
|
1.7x |
Net Debt-to-Adjusted EBITDA (12) |
|
|
6.1x |
|
|
6.2x |
|
|
6.3x |
|
|
6.8x |
|
|
7.1x |
| (2) | Cash interest expense is interest expense less amortization of debt discount and deferred financing fees and includes interest that we capitalized. We consider cash interest expense to be a useful measure of interest as it excludes non-cash-based interest expense. |
| (3) | Fixed charges consist of GAAP interest expense, capitalized interest, and preferred stock dividends. |
| (4) | Adjusted EBITDA divided by GAAP interest expense plus capitalized interest (including our pro rata share of unconsolidated joint venture interest expense). |
| (5) | Adjusted EBITDA divided by cash interest expense (including our pro rata share of unconsolidated joint venture interest expense). |
| (6) | Adjusted EBITDA divided by fixed charges (including our pro rata share of unconsolidated joint venture fixed charges). |
| (7) | Adjusted EBITDA divided by the sum of cash interest expense and preferred stock dividends (including our pro rata share of unconsolidated joint venture cash fixed charges). |
| (8) | Total debt divided by market value of common equity plus debt plus preferred stock. |
| (9) | Total enterprise value defined as market value of common equity plus debt plus preferred stock. |
| (10) | Same as (8), except numerator includes preferred stock. |
| (11) | Calculated as net income plus interest expense divided by GAAP interest expense. |
| (12) | Calculated as total debt at balance sheet carrying value, plus capital lease obligations, plus Digital Realty’s pro rata share of unconsolidated joint venture debt, less cash and cash equivalents (including Digital Realty’s pro rata share of unconsolidated joint venture cash) divided by the product of Adjusted EBITDA (including Digital Realty’s pro rata share of unconsolidated joint venture EBITDA), multiplied by four. |
30
Definitions
Funds From Operations (FFO):
We calculate funds from operations, or FFO, in accordance with the standards established by the National Association of Real Estate Investment Trusts (Nareit) in the Nareit Funds From Operations White Paper - 2018 Restatement. FFO is a non-GAAP financial measure and represents net income (loss) (computed in accordance with GAAP), excluding gain (loss) from the disposition of real estate assets, provision for impairment, real estate related depreciation and amortization (excluding amortization of deferred financing costs), our share of unconsolidated JV real estate related depreciation & amortization, net income attributable to non-controlling interests in operating partnership and, depreciation related to non-controlling interests. Management uses FFO as a supplemental performance measure because, in excluding real estate related depreciation and amortization and gains and losses from property dispositions and after adjustments for unconsolidated partnerships and joint ventures, it provides a performance measure that, when compared year over year, captures trends in occupancy rates, rental rates and operating costs. We also believe that, as a widely recognized measure of the performance of REITs, FFO will be used by investors as a basis to compare our operating performance with that of other REITs. However, because FFO excludes depreciation and amortization and captures neither the changes in the value of our data centers that result from use or market conditions, nor the level of capital expenditures and capitalized leasing commissions necessary to maintain the operating performance of our data centers, all of which have real economic effect and could materially impact our financial condition and results from operations, the utility of FFO as a measure of our performance is limited. Other REITs may not calculate FFO in accordance with the Nareit definition and, accordingly, our FFO may not be comparable to other REITs’ FFO. FFO should be considered only as a supplement to net income computed in accordance with GAAP as a measure of our performance.
Core Funds from Operations (Core FFO):
We present core funds from operations, or Core FFO, as a supplemental operating measure because, in excluding certain items that do not reflect core revenue or expense streams, it provides a performance measure that, when compared year over year, captures trends in our core business operating performance. We calculate Core FFO by adding to or subtracting from FFO (i) other non-core revenue adjustments, (ii) transaction and integration expenses, (iii) loss from early extinguishment of debt, (iv) gain on / issuance costs associated with redeemed preferred stock, (v) severance, equity acceleration and legal expenses, (vi) gain/loss on FX revaluation, and (vii) other non-core expense adjustments. Because certain of these adjustments have a real economic impact on our financial condition and results from operations, the utility of Core FFO as a measure of our performance is limited. Other REITs may calculate Core FFO differently than we do and accordingly, our Core FFO may not be comparable to other REITs’ Core FFO. Core FFO should be considered only as a supplement to net income computed in accordance with GAAP as a measure of our performance.
Adjusted Funds from Operations (AFFO):
We present adjusted funds from operations, or AFFO, as a supplemental operating measure because, when compared year over year, it assesses our ability to fund dividend and distribution requirements from our operating activities. We also believe that, as a widely recognized measure of the operations of REITs, AFFO will be used by investors as a basis to assess our ability to fund dividend payments in comparison to other REITs, including on a per share and unit basis. We calculate AFFO by adding to or subtracting from Core FFO (i) non-real estate depreciation, (ii) amortization of deferred financing costs, (iii) amortization of debt discount/premium, (iv) non-cash stock-based compensation expense, (v) straight-line rental revenue, (vi) straight-line rental expense, (vii) above- and below-market rent amortization, (viii) deferred tax expense / (benefit), (ix) leasing compensation and internal lease commissions, and (x) recurring capital expenditures. Other REITs may calculate AFFO differently than we do and, accordingly, our AFFO may not be comparable to other REITs’ AFFO. AFFO should be considered only as a supplement to net income computed in accordance with GAAP as a measure of our performance.
EBITDA and Adjusted EBITDA:
We believe that earnings before interest, loss from early extinguishment of debt, income taxes, and depreciation and amortization, or EBITDA, and Adjusted EBITDA (as defined below), are useful supplemental performance measures because they allow investors to view our performance without the impact of non-cash depreciation and amortization or the cost of debt and, with respect to Adjusted EBITDA, (i) unconsolidated joint venture real estate related depreciation & amortization, (ii) unconsolidated joint venture interest expense and tax, (iii) severance, equity acceleration and legal expenses, (iv) transaction and integration expenses, (v) gain (loss) on sale / deconsolidation, (vi) provision for impairment, (vii) other non-core adjustments, net, (viii) non-controlling interests, (ix) preferred stock dividends, and (x) issuance costs associated with redeemed preferred stock. Adjusted EBITDA is EBITDA excluding (i) unconsolidated joint venture real estate related depreciation & amortization, (ii) unconsolidated joint venture interest expense and tax, (iii) severance, equity acceleration and legal expenses, (iv) transaction and integration expenses, (v) gain (loss) on sale / deconsolidation, (vi) provision for impairment, (vii) other non-core adjustments, net, (vii) non-controlling interests, (ix) preferred stock dividends, and (x) gain on / issuance costs associated with redeemed preferred stock. In addition, we believe EBITDA and Adjusted EBITDA are frequently used by securities analysts, investors, and other interested parties in the evaluation of REITs. Because EBITDA and Adjusted EBITDA are calculated before recurring cash charges including interest expense and income taxes, exclude capitalized costs, such as leasing commissions, and are not adjusted for capital expenditures or other recurring cash requirements of our business, their utility as a measure of our performance is limited. Other REITs may calculate EBITDA and Adjusted EBITDA differently than we do and, accordingly, our EBITDA and Adjusted EBITDA may not be comparable to other REITs’ EBITDA and Adjusted EBITDA. Accordingly, EBITDA and Adjusted EBITDA should be considered only as supplements to net income computed in accordance with GAAP as a measure of our financial performance.
31
Net Operating Income (NOI) and Cash NOI:
Net operating income, or NOI, represents rental revenue, tenant reimbursement revenue and interconnection revenue less utilities expense, rental property operating expenses, property taxes and insurance expenses (as reflected in the statement of operations). NOI is commonly used by stockholders, company management and industry analysts as a measurement of operating performance of the company’s rental portfolio. Cash NOI is NOI less straight-line rents and above- and below-market rent amortization. Cash NOI is commonly used by stockholders, company management and industry analysts as a measure of property operating performance on a cash basis. Same-Capital Cash NOI represents buildings owned as of December 31, 2022 of the prior year with less than 5% of total rentable square feet under development and excludes buildings that were undergoing, or were expected to undergo, development activities in 2023-2024, buildings classified as held for sale, and buildings sold or contributed to joint ventures for all periods presented (prior period numbers adjusted to reflect current same-capital pool). However, because NOI and cash NOI exclude depreciation and amortization and capture neither the changes in the value of our data centers that result from use or market conditions, nor the level of capital expenditures and capitalized leasing commissions necessary to maintain the operating performance of our data centers, all of which have real economic effect and could materially impact our results from operations, the utility of NOI and cash NOI as measures of our performance is limited. Other REITs may calculate NOI and cash NOI differently than we do and, accordingly, our NOI and cash NOI may not be comparable to other REITs’ NOI and cash NOI. NOI and cash NOI should be considered only as supplements to net income computed in accordance with GAAP as measures of our performance.
Additional Definitions
Net debt-to-Adjusted EBITDA ratio is calculated as total debt at balance sheet carrying value, plus capital lease obligations, plus Digital Realty’s pro rata share of unconsolidated joint venture debt, less cash and cash equivalents (including Digital Realty’s pro rata share of unconsolidated joint venture cash) divided by the product of Adjusted EBITDA (including Digital Realty’s pro rata share of unconsolidated joint venture EBITDA), multiplied by four.
Debt-plus-preferred-to-total enterprise value is total debt plus preferred stock divided by total debt plus the liquidation value of preferred stock and the market value of outstanding Digital Realty Trust, Inc. common stock and Digital Realty Trust, L.P. units, assuming the redemption of Digital Realty Trust, L.P. units for shares of Digital Realty Trust, Inc. common stock.
Fixed charge coverage ratio is Adjusted EBITDA divided by the sum of GAAP interest expense, capitalized interest and preferred stock dividends. For the quarter ended March 31, 2024, GAAP interest expense was $110 million, capitalized interest was $29 million and preferred stock dividends was $10 million.
Reconciliation of Net Operating Income (NOI) |
|
Three Months Ended |
|||||||
(in thousands) |
|
31-Mar-24 |
|
31-Dec-23 |
|
31-Mar-23 |
|||
|
|
|
|
|
|
|
|
|
|
Operating income |
|
|
$149,367 |
|
|
$134,035 |
|
|
$177,335 |
|
|
|
|
|
|
|
|
|
|
Fee income |
|
|
(13,010) |
|
|
(14,330) |
|
|
(7,868) |
Other income |
|
|
(862) |
|
|
(144) |
|
|
(887) |
Depreciation and amortization |
|
|
431,102 |
|
|
420,475 |
|
|
421,198 |
General and administrative |
|
|
114,419 |
|
|
109,235 |
|
|
107,766 |
Severance, equity acceleration and legal expenses |
|
|
791 |
|
|
7,565 |
|
|
4,155 |
Transaction expenses |
|
|
31,839 |
|
|
40,226 |
|
|
12,267 |
Provision for impairment |
|
|
— |
|
|
5,363 |
|
|
— |
Other expenses |
|
|
10,836 |
|
|
5,580 |
|
|
— |
|
|
|
|
|
|
|
|
|
|
Net Operating Income |
|
|
$724,482 |
|
|
$708,003 |
|
|
$713,965 |
|
|
|
|
|
|
|
|
|
|
|
|
|
|
|
|
|
|
|
|
Cash Net Operating Income (Cash NOI) |
|
|
|
|
|
|
|
|
|
|
|
|
|
|
|
|
|
|
|
Net Operating Income |
|
|
$724,482 |
|
|
$708,003 |
|
|
$713,965 |
|
|
|
|
|
|
|
|
|
|
Straight-line rental revenue |
|
|
(2,522) |
|
|
(22,085) |
|
|
(16,327) |
Straight-line rental expense |
|
|
1,369 |
|
|
(4,745) |
|
|
(510) |
Above- and below-market rent amortization |
|
|
(854) |
|
|
(856) |
|
|
(1,226) |
|
|
|
|
|
|
|
|
|
|
Cash Net Operating Income |
|
|
$722,474 |
|
|
$680,317 |
|
|
$695,902 |
|
|
|
|
|
|
|
|
|
|
|
|
|
|
|
|
|
|
|
|
|
|
|
|
|
|
|
|
|
|
Constant Currency CFFO Reconciliation |
|
Three Months Ended |
|||||||
(in thousands, except per share data) |
|
31-Mar-24 |
|
|
|
31-Mar-23 |
|||
|
|
|
|
|
|
|
|
|
|
Core FFO (1) |
|
|
$532,153 |
|
|
|
|
|
$493,500 |
Core FFO impact of holding '23 Exchange Rates Constant (2) |
|
|
1,119 |
|
|
|
|
|
— |
|
|
|
|
|
|
|
|
|
|
Constant Currency Core FFO |
|
|
$533,272 |
|
|
|
|
|
$493,500 |
Weighted-average shares and units outstanding - diluted |
|
|
319,138 |
|
|
|
|
|
297,382 |
Constant Currency CFFO Per Share |
|
|
$1.67 |
|
|
|
|
|
$1.66 |
| 1) | As reconciled to net income above. |
| 2) | Adjustment calculated by holding currency translation rates for 2024 constant with average currency translation rates that were applicable to the same periods in 2023. |
32
This document contains forward-looking statements within the meaning of the federal securities laws, which are based on current expectations, forecasts and assumptions that involve risks and uncertainties that could cause actual outcomes and results to differ materially. Such forward-looking statements include statements relating to: our economic outlook, our expected investment and expansion activity, anticipated continued demand for our products and service, our liquidity, our joint ventures, supply and demand for data center and colocation space, our acquisition and disposition activity, pricing and net effective leasing economics, market dynamics and data center fundamentals, our strategic priorities, our product offerings, available inventory, rent from leases that have been signed but have not yet commenced and other contracted rent to be received in future periods, rental rates on future leases, lag between signing and commencement, cap rates and yields, investment activity, the company’s FFO, Core FFO, constant currency Core FFO, adjusted FFO, and net income, 2024 outlook and underlying assumptions, information related to trends, our strategy and plans, leasing expectations, weighted average lease terms, the exercise of lease extensions, lease expirations, debt maturities, annualized rent at expiration of leases, the effect new leases and increases in rental rates will have on our rental revenue, our credit ratings, construction and development activity and plans, projected construction costs, estimated yields on investment, expected occupancy, expected square footage and IT load capacity upon completion of development projects, backlog NOI, NAV components, and other forward-looking financial data. Such statements are based on management’s beliefs and assumptions made based on information currently available to management. Such statements are subject to risks, uncertainties and assumptions and are not guarantees of future performance and may be affected by known and unknown risks, trends, uncertainties, and factors that are beyond our control. Should one or more of these risks or uncertainties materialize, or should underlying assumptions prove incorrect, actual results may vary materially from those anticipated, estimated, or projected. Some of the risks and uncertainties that may cause our actual results, performance, or achievements to differ materially from those expressed or implied by forward-looking statements include, among others, the following:
| ● | reduced demand for data centers or decreases in information technology spending; |
| ● | decreased rental rates, increased operating costs, or increased vacancy rates; |
| ● | increased competition or available supply of data center space; |
| ● | the suitability of our data centers and data center infrastructure, delays or disruptions in connectivity or availability of power, or failures or breaches of our physical and information security infrastructure or services; |
| ● | our dependence upon significant customers, bankruptcy or insolvency of a major customer or a significant number of smaller customers, or defaults on or non-renewal of leases by customers; |
| ● | our ability to attract and retain customers; |
| ● | breaches of our obligations or restrictions under our contracts with our customers; |
| ● | our inability to successfully develop and lease new properties and development space, and delays or unexpected costs in development of properties; |
| ● | the impact of current global and local economic, credit and market conditions; |
| ● | our inability to retain data center space that we lease or sublease from third parties; |
| ● | global supply chain or procurement disruptions, or increased supply chain costs; |
| ● | information security and data privacy breaches; |
| ● | difficulty managing an international business and acquiring or operating properties in foreign jurisdictions and unfamiliar metropolitan areas; |
| ● | our failure to realize the intended benefits from, or disruptions to our plans and operations or unknown or contingent liabilities related to, our recent acquisitions; |
| ● | our failure to successfully integrate and operate acquired or developed properties or businesses; |
| ● | difficulties in identifying properties to acquire and completing acquisitions; |
| ● | risks related to joint venture investments, including as a result of our lack of control of such investments; |
| ● | risks associated with using debt to fund our business activities, including re-financing and interest rate risks, our failure to repay debt when due, adverse changes in our credit ratings or our breach of covenants or other terms contained in our loan facilities and agreements; |
| ● | our failure to obtain necessary debt and equity financing, and our dependence on external sources of capital; |
| ● | financial market fluctuations and changes in foreign currency exchange rates; |
| ● | adverse economic or real estate developments in our industry or the industry sectors that we sell to, including risks relating to decreasing real estate valuations and impairment charges and goodwill and other intangible asset impairment charges; |
| ● | our inability to manage our growth effectively; |
| ● | losses in excess of our insurance coverage; |
| ● | our inability to attract and retain talent; |
| ● | impact on our operations and on the operations of our customers, suppliers, and business partners during a pandemic, such as COVID-19; |
| ● | the expected operating performance of anticipated near-term acquisitions and descriptions relating to these expectations; |
| ● | environmental liabilities, risks related to natural disasters and our inability to achieve our sustainability goals; |
| ● | our inability to comply with rules and regulations applicable to our company; |
| ● | Digital Realty Trust, Inc.’s failure to maintain its status as a REIT for federal income tax purposes; |
| ● | Digital Realty Trust, L.P.’s failure to qualify as a partnership for federal income tax purposes; |
| ● | restrictions on our ability to engage in certain business activities; |
| ● | changes in local, state, federal and international laws, and regulations, including related to taxation, real estate, and zoning laws, and increases in real property tax rates; and |
| ● | the impact of any financial, accounting, legal or regulatory issues or litigation that may affect us. |
The risks included here are not exhaustive, and additional factors could adversely affect our business and financial performance. Several additional material risks are discussed in our annual report on Form 10-K for the year ended December 31, 2023, and other filings with the U.S. Securities and Exchange Commission. Those risks continue to be relevant to our performance and financial condition. Moreover, we operate in a competitive and rapidly changing environment. New risk factors emerge from time to time and it is not possible for management to predict all such risk factors, nor can it assess the impact of all such risk factors on the business or the extent to which any factor, or combination of factors, may cause actual results to differ materially from those contained in any forward-looking statements. We expressly disclaim any responsibility to update forward-looking statements, whether as a result of new information, future events or otherwise. Digital Realty, Digital Realty Trust, the Digital Realty logo, Interxion, Turn-Key Flex, Powered Base Building, ServiceFabric, AnyScale Colo, Pervasive Data Center Architecture, PlatformDIGITAL, PDx, Data Gravity Index and Data Gravity Index DGx are registered trademarks and service marks of Digital Realty Trust, Inc. in the United States and/or other countries. All other names, trademarks and service marks are the property of their respective owners.
33
|
Global. Connected. Sustainable. 1Q24 FINANCIAL RESULTS May 2, 2024 The meeting place for companies, technologies and data |
|
5,000+ Customers 221,500 Cross Connects 50+ Metros 300+ Data Centers Capacity Host what you need, how you need Coverage Deploy where you need Connectivity Connect how you need to whom you need Control Implement and operate the way you need 1Q24 Financial Results 2 Executing on Key Strategic Priorities Positioning for Long-Term Sustainable Growth Note: As of March 31, 2024. Includes investments in unconsolidated entities. 1 Record Leasing 2 3 Strong Operating Results Continued to Innovate ~60% Increase in >1 MW Rates vs. Prior Bookings Record >40% Above Prior Bookings Record 18.5% Record Increase in >1 MW Renewal Spreads 5th Consecutive Quarter of Positive Same-Capital Growth Launched Private AI Exchange (AIPx) on ServiceFabric |
|
Enterprises Service providers THE DATA MEETING PLACE Strong Demand for Data Center Capacity PlatformDIGITAL® Well Positioned IT Spend Accelerating(2) Data Creation Intensifying(3) AI Adoption Increasing(4) Hyperscale Capacity Compounding(5) B2B Telecom $6.4T Growing(6) Annual IT Spend by 2026 1.2M New Exabytes by 2025 42% Actively Deploying AI Digitization Opportunity Unfolding(1) Forecasted Data Center 10–15% Demand Growth through 2030 AIaaS Category Emerging(7) Physical- Digital Converging(8) 24GW New capacity by 2028 $524B Networking Digital Transformation $105B Market By 2023 $1T IoT Connected Ecosystem Notes: 1) Investing in the rising data center economy (McKinsey&Company) 2) Forecast Alert: IT Spending, Worldwide, 4Q2023 Update (Gartner) 3) DGx 2.0 (DLR analysis) 4) Global AI Adoption Index 2023 (IBM) 1Q24 Financial Results 3 5) Hyperscale Data Centers Hit Thousand Mark (Synergy Research Group) 6) Seizing the core connectivity opportunity in B2B telecom (McKinsey&Company) 7) AI as a Service Market to Reach $105.04B by 2030 (Grand View Research) 8) Worldwide IDC Global Data IoT Device Installed Base and Data Generated Forecast 2023-2027 (IDC) |
|
1Q24 Financial Results 4 Connected Data Communities Strong 0-1MW + IX Revenue 128 new logos $53M total 1Q bookings from 0-1 MW + Interconnection #3 Highest 0-1MW + IX Bookings in History 1Q24 Results |
|
Note: As of March 31, 2024. 1Q24 Financial Results 5 32 MW delivered in 1Q24 Offering a Global Data Center Platform Global Capacity to Meet Growing Customer Demand Global Capacity ~2,500 MW total capacity in place >3,000 MW buildable IT capacity |
|
272 MW Total Available For Lease 632 MW White Space IT Load In-Place (2) Northern Virginia Update Power Transmission Issues Constrain Capacity in Ashburn Digital Dulles Manassas Total in NoVA (1) 80 MW Available For Lease 192 MW Available For Lease 500+ Acres of land holdings that will support the build-out of another 1,000+ MW 1Q24 Financial Results 6 1) Manassas is shown at 100% share. The site is held in joint venture with Blackstone in which Digital Realty maintains a 20% interest. 2) As of March 31, 2024 and represents 438 MW in our consolidated portfolio and 194 MW in our unconsolidated portfolio. |
|
Note: As of March 31, 2024. 1Q24 Financial Results 7 Leading Data Center Partner for Sustainability Science-Based Target Commitment to Reduce Global Emissions by 68% by 2030 • 1.4 GW contracted renewable capacity • 100% renewable for European properties and N. Am. productized colocation portfolio • 126+ sites 100% renewable including New Jersey, Texas, San Francisco, and Sydney markets More green building certified IT capacity than any other data center provider • ENERGY STAR Partner of the Year; 64% of U.S. operating portfolio ENERGY STAR certified • Awarded SEAA’s “Green Innovations: Water Solutions” in Singapore • Top 10 in the U.S. EPA Green Power Partnership • 7% reduction in water use intensity since 2020 • Expanded HVO diesel to 20 Global Sites and 15% of our global portfolio by IT capacity Leading the data center industry in green bonds Renewable Energy Leading data center purchaser of renewable energy • 1.1 GW-IT global operating portfolio has a sustainable building certification • 59% of certifications are gold level and above • 158 MW-IT certified in the past year Green Buildings Energy Efficiency Green Bonds More energy star certifications than any other data center provider • $6.4B in aggregate principal amount of green bonds issued • Fully allocated all green bond funds to sustainable projects • Executed first data center industry green bond |
|
Social Demonstrated commitment to Diversity, Equity & Inclusion: established five employee resource groups & signed CEO Action Pledge for Diversity and Inclusion 12 philanthropic organizations supported as part of ‘Giving Tuesday’ campaign Newsweek’s America’s Most Responsible Companies of 2023 2024 Serving a Social Purpose Delivering Growth for All Stakeholders 1Q24 Financial Results 8 Top 100 ranking on JUST Capital America’s Most JUST Companies Governance Susan Swanezy added to the Board of Directors Enhanced Board diversity to 44% female or ethnically diverse 2021 2022 2023 Formalized oversight of ESG by the Nominating & Corporate Governance Committee; Signatory to the UN Global Compact Appointed Mary Hogan Preusse as Chair of the Board, which aligns with our commitment to strong governance Aligned ownership requirements to amend bylaws consistent with SEC standard |
|
1Q24 Financial Results 1Q24 Financial Results 9 |
|
Note: Totals may not add up due to rounding. Digital Realty revised its reporting categories in 2Q 2020. For prior periods, "0-1 MW" includes Colocation, ">1 MW" includes Turn-Key Flex, "Other" includes Power Base Building and Non-Technical. “Interconnection” is unchanged. 1) Other includes Powered Base Building® shell capacity as well as storage and office space within fully improved data center facilities. 1Q24 BOOKINGS HISTORICAL BOOKINGS ANNUALIZED GAAP BASE RENT AI Spurs Demand $ in millions for Large Capacity Blocks Strong and Steady Leasing for 0-1MW + IX 0-1 MW $40.0 mm 16% of total bookings INTERCONNECTION $13.2 mm 5% of total bookings >1 MW $198.2 mm 79% of total bookings OTHER(1) $0.7 mm 0.3% of total bookings TOTAL BOOKINGS $252.2 mm 2015 2016 2017 2018 2019 2020 2021 2022 2023 2024 • Record Quarter of $252M Bookings • Record High >1 MW average leasing rate $0 $60 $120 $180 $240 1Q24 Financial Results 10 |
|
2024 2025 2026+ 1Q24 Backlog Note: Totals may not add up due to rounding. 1) Amounts shown represent GAAP annualized base rent from leases signed. 2) 4Q23 backlog total was revised to reflect leases at share for data centers contributed to the Blackstone JV (Ashburn and Paris metros) and Mitsubishi JV (Dallas Metro). 3) Amounts shown represent GAAP annualized base rent from leases signed, but not yet commenced, based on estimated future commencement date at time of signing. Actual commencement dates may vary. Record Backlog Bodes Well for Future Growth BACKLOG ROLL-FORWARD (1) $ in millions Digital Realty Backlog Unconsolidated Joint Venture Backlog COMMENCEMENT TIMING (3) $ in millions • Record Backlog of $541 Million • Record $156 Million of Commencements, Including IX in 1Q24 • 51% of Backlog to Commence in 2024 1Q24 Financial Results11 $193M $40M $495M $277M $218M 4Q23 Backlog Signed Commenced 1Q24 Backlog $46M $541M $392M $446M (2) $239M $144M $235M $131M $541M $495M $263M |
|
Strong Pricing Environment Record Renewal Spreads 1Q24 RENEWAL SPREADS 0-1 MW > 1 MW OTHER (1) TOTAL Signed renewals representing $138 million of annualized rental revenue Signed renewals representing $97 million of annualized rental revenue Signed renewals representing $13 million of annualized rental revenue Signed renewals representing $248 million of annualized rental revenue RENTAL RATE CHANGE RENTAL RATE CHANGE RENTAL RATE CHANGE RENTAL RATE CHANGE 4.3% 18.5% GAAP Note: Totals may not add up due to rounding. Rental rate change represents the beginning rental rate on agreements renewed, relative to the ending rental rate at expiration, weighted by net rentable square feet. Signed renewals amounts represent cash annualized rental revenue. 1) Other includes Powered Base Building® shell capacity as well as storage and office space within fully improved data center facilities. • Record Cash Renewal Spreads in > 1MW Segment • Record Total Renewal Leasing of $248 Million 3.8% CASH GAAP CASH 21.6% 84.7% CASH 88.1% GAAP 11.8% CASH 13.0% GAAP 1Q24 Financial Results 12 |
|
Revenue Exposure by Currency FX Slight Tailwind in the First Quarter 51% 1% 6% 23% 5% 1% <1% 2% 4% 2024E $6.68 / Sh 1.0% SOFR +/- 100bps 0.1% GBP +/- 10% 2.0% EUR +/- 10% CORE FFO/SHARE EXPOSURE (2) EXPOSURE BY REVENUE (1) Note: Totals may not add up due to rounding. 1) As of March 31, 2024. Includes Digital Realty’s share of revenue from unconsolidated joint ventures. 2) Core FFO is a non-GAAP financial measure. For a definition of Core FFO and reconciliation to its nearest GAAP equivalent, see the Appendix. 1Q24 Financial Results 13 3% <1% • Local Operations Funded in Local Currencies act as a Natural Hedge Apr-24 <1% <1% 1Q23 U.S. DOLLAR INDEX 1Q24 ZAR 4% USD EURO GBP SGD AUD 23% 6% 5% 1% OTHER <1% CHF 51% 2% 1% JPY CAD 2% BRL 3% <1% <1% <1% 85 90 95 100 105 110 115 Jan-23 Apr-23 Jul-23 Oct-23 Jan-24 2% |
|
Net Debt to Adjusted EBITDA(1) Bridge to Pro Forma: Announced or Completed Transactions Note: 1) Net Debt to Adjusted EBITDA is calculated as total debt at balance sheet carrying value (see Appendix), plus capital lease obligations, plus our share of joint venture debt at carrying value, less cash and cash equivalents (including Joint Venture share of cash), divided by the product of Adjusted EBITDA (including our share of joint venture EBITDA), multiplied by four. Adjusted EBITDA is a non-GAAP financial measure. For a description of Adjusted EBITDA and the calculation of these ratios, please see the Appendix. • Blackstone JV – Phase 2 to Close Later this Year • Contributed Asset (CH2) on Elk Grove Campus to GI Partners, in April • Sold an additional 24.9% Interest in Frankfurt Site to Digital Core REIT, in April 14 6.1x 5.8x 1Q24 Reported Blackstone JV Phase 2 GI Partners CH2 Digital Core REIT Frankfurt 1Q24 As Adjusted 1Q24 Financial Results |
|
Matching the Duration of Assets and Liabilities Modest Near-Term Maturities, Well-Laddered Debt Schedule DEBT MATURITY SCHEDULE AS OF March 31, 2024 (1)(2) (U.S. $ in billions) Note: As of March 31, 2024. 1) Includes Digital Realty’s pro rata share of unconsolidated joint venture loans and debt securities. Pro forma for asset sales and completion of JVs; assuming proceeds therefrom are used to pay down the €600 million ($647 million) 2.625% Euro Notes that matured in April 2024 and $220 million of the global revolving credit facility. 2) Assumes exercise of extension options. 3) Includes impact of cross-currency swaps. 4.3 YEARS Weighted Avg. Maturity (1)(2) DEBT PROFILE 97% Unsecured Unsecured Secured 85% Non-USD Euro USD GBP Other 86% Fixed Fixed Floating 2.8 % Weighted Avg. Coupon (1)(3) 1Q24 Financial Results (3) 15 $0.3 $1.6 $2.3 $3.5 $3.3 $1.6 $1.7 $1.6 $1.6 $0.1 2024 2025 2026 2027 2028 2029 2030 2031 2032 2033 + Pro Forma Debt Pro Forma Payoffs USD Term Loan Unsecured Green Senior Notes - EUR Unsecured Green Senior Notes - CHF Unsecured Credit Facilities Other Unsecured Debt Unsecured Senior Notes - CHF Euro Term Loan Unsecured Senior Notes - EUR Unsecured Senior Notes - GBP Unsecured Senior Notes - USD Secured Mortgage Debt Pro Rata Share of JV Debt € € € R € € ₣ ¥ ¥ $ |
|
2024 Financial Guidance Update Improving Core Growth 16 As of Feb. 15, 2024 As of May 2, 2024 Better/Worse Total Revenue $5,550 – $5,650 $5,550 – $5,650 Adjusted EBITDA $2,800 – $2,900 $2,800 - $2,900 Rental Rates on Renewals Leases (Cash) 4.0% – 6.0% 5.0 – 7.0% Year-End Portfolio Occupancy +100 – 200 bps +100 – 200 bps Same-Capital Cash NOI Growth 2.0% – 3.0% 2.5 – 3.5% Core FFO per Share $6.60 – $6.75 $6.60 - $6.75 Note: Dollars in millions except Core FFO per Share. The Company does not provide a reconciliation for non-GAAP estimates on a forward-looking basis, as it is unable to provide a meaningful or accurate calculation or estimation of reconciling items and the information is not available without unreasonable effort. This is due to the inherent difficulty of forecasting the timing and/or amount of various items that would impact net income attributable to common stockholders per diluted share, which is the most directly comparable forward-looking GAAP financial measure. This includes, for example, external growth factors, such as dispositions, and balance sheet items, such as debt issuances, that have not yet occurred, are out of the Company's control and/or cannot be reasonably predicted. For the same reasons, the Company is unable to address the probable significance of the unavailable information. Forward-looking non-GAAP financial measures provided without the most directly comparable GAAP financial measures may vary materially from the corresponding GAAP financial measures. 1. Adjusted EBITDA, Same-Capital NOI and Core FFO Per Share are non-GAAP financial measures. For a reconciliation of these measures to their nearest GAAP equivalents, see the Appendix. 1Q24 Financial Results (1) (1) (1) |
|
Q&A Global. Connected. Sustainable. 1Q24 Financial Results 17 |
|
18 Diversifying and Bolstering Capital Sources Strengthening Customer Value Proposition Innovating and Integrating Positioned for Long-Term Sustainable Growth PlatformDIGITAL® is the Choice for AI, Cloud and Hybrid IT Record New Leasing and Strong Operating Results in 1Q24 ServiceFabric Expansion and Launched Private AI Exchange (AIPx) Raised Over $1 Billion of New Funding Through April 1Q24 Financial Results |
|
Appendix 1Q24 Financial Results 19 |
|
Appendix Management Statements on Non-GAAP Measures The information included in this presentation contains certain non-GAAP financial measures that management believes are helpful in understanding our business, as further described below. Our definition and calculation of non-GAAP financial measures may differ from those of other REITs, and, therefore, may not be comparable. The non-GAAP financial measures should not be considered alternatives to net income or any other GAAP measurement of performance and should not be considered an alternative to cash flows from operating, investing or financing activities as a measure of liquidity. Funds From Operations (FFO): We calculate funds from operations, or FFO, in accordance with the standards established by the National Association of Real Estate Investment Trusts, or Nareit, in the Nareit Funds From Operations White Paper - 2018 Restatement. FFO represents net income (loss) (computed in accordance with GAAP), excluding gains (or losses) from real estate transactions, provision for impairment, real estate related depreciation and amortization (excluding amortization of deferred financing costs), unconsolidated JV real estate related depreciation & amortization, non-controlling interest in operating-partnership reconciling items related to non-controlling interests and after adjustments for unconsolidated partnerships and joint ventures. Management uses FFO as a supplemental performance measure because, in excluding real estate related depreciation and amortization and gains and losses from property dispositions and after adjustments for unconsolidated partnerships and joint ventures, it provides a performance measure that, when compared year over year, captures trends in occupancy rates, rental rates and operating costs. We also believe that, as a widely recognized measure of the performance of REITs, FFO will be used by investors as a basis to compare our operating performance with that of other REITs. However, because FFO excludes depreciation and amortization and captures neither the changes in the value of our data centers that result from use or market conditions, nor the level of capital expenditures and capitalized leasing commissions necessary to maintain the operating performance of our data centers, all of which have real economic effect and could materially impact our financial condition and results from operations, the utility of FFO as a measure of our performance is limited. Other REITs may not calculate FFO in accordance with the Nareit definition and, accordingly, our FFO may not be comparable to other REITs’ FFO. FFO should be considered only as a supplement to net income computed in accordance with GAAP as a measure of our performance. Core Funds from Operations (Core FFO): We present core funds from operations, or Core FFO, as a supplemental operating measure because, in excluding certain items that do not reflect core revenue or expense streams, it provides a performance measure that, when compared year over year, captures trends in our core business operating performance. We calculate Core FFO by adding to or subtracting from FFO (i) other non-core revenues adjustments, (ii) transaction and integration expenses, (iii) loss from early extinguishment of debt, (iv) gain on / issuance costs associated with redeemed preferred stock, (v) severance, equity acceleration, and legal expenses, (vi) gain/loss on FX revaluation, and (vii) other non-core expense adjustments. Because certain of these adjustments have a real economic impact on our financial condition and results from operations, the utility of Core FFO as a measure of our performance is limited. Other REITs may calculate core FFO differently than we do and accordingly, our Core FFO may not be comparable to other REITs’ core FFO. Core FFO should be considered only as a supplement to net income computed in accordance with GAAP as a measure of our performance. EBITDA and Adjusted EBITDA: We believe that earnings before interest, loss from early extinguishment of debt, income taxes, and depreciation and amortization, or EBITDA, and Adjusted EBITDA (as defined below), are useful supplemental performance measures because they allow investors to view our performance without the impact of non-cash depreciation and amortization or the cost of debt and, with respect to Adjusted EBITDA, unconsolidated joint venture real estate related depreciation & amortization, unconsolidated joint venture interest expense and tax expense, severance, equity acceleration, and legal expenses, transaction and integration expenses, gain on sale / deconsolidation, provision for impairment, other non-core adjustments, net, non-controlling interests, preferred stock dividends, and issuance costs associated with redeemed preferred stock. Adjusted EBITDA is EBITDA excluding unconsolidated joint venture real estate related depreciation & amortization, unconsolidated joint venture interest expense and tax, severance, equity acceleration, and legal expenses, transaction and integration expenses, gain on sale / deconsolidation, provision for impairment, other non-core adjustments, net, non-controlling interests, preferred stock dividends, and gain on / issuance costs associated with redeemed preferred stock. In addition, we believe EBITDA and Adjusted EBITDA are frequently used by securities analysts, investors and other interested parties in the evaluation of REITs. Because EBITDA and Adjusted EBITDA are calculated before recurring cash charges including interest expense and income taxes, exclude capitalized costs, such as leasing commissions, and are not adjusted for capital expenditures or other recurring cash requirements of our business, their utility as a measure of our performance is limited. Other REITs may calculate EBITDA and Adjusted EBITDA differently than we do and, accordingly, our EBITDA and Adjusted EBITDA may not be comparable to other REITs’ EBITDA and Adjusted EBITDA. Accordingly, EBITDA and Adjusted EBITDA should be considered only as supplements to net income computed in accordance with GAAP as a measure of our financial performance. Net Operating Income (NOI) and Cash NOI: Net operating income, or NOI, represents rental revenue, tenant reimbursement revenue and interconnection revenue less utilities expense, rental property operating expenses, property taxes and insurance expenses (as reflected in the statement of operations). NOI is commonly used by stockholders, company management and industry analysts as a measurement of operating performance of the company’s rental portfolio. Cash NOI is NOI less straight-line rents and above- and below-market rent amortization. Cash NOI is commonly used by stockholders, company management and industry analysts as a measure of property operating performance on a cash basis. However, because NOI and cash NOI exclude depreciation and amortization and capture neither the changes in the value of our data centers that result from use or market conditions, nor the level of capital expenditures and capitalized leasing commissions necessary to maintain the operating performance of our data centers, all of which have real economic effect and could materially impact our results from operations, the utility of NOI and cash NOI as measures of our performance is limited. Other REITs may calculate NOI and cash NOI differently than we do and, accordingly, our NOI and cash NOI may not be comparable to other REITs’ NOI and cash NOI. NOI and cash NOI should be considered only as supplements to net income computed in accordance with GAAP as measures of our performance. Same–Capital Cash NOI: Same-Capital Cash NOI represents buildings owned as of December 31, 2022 of the prior year with less than 5% of total rentable square feet under development excludes buildings that were undergoing, or were expected to undergo, development activities in 2023-2024, buildings classified as held for sale, and buildings sold or contributed to joint ventures for all periods presented (prior period numbers adjusted to reflect current same-capital pool). 1Q24 Financial Results 20 |
|
Appendix Forward-Looking Statements This information in this presentation contains forward-looking statements within the meaning of the federal securities laws, which are based on current expectations, forecasts and assumptions that involve risks and uncertainties that could cause actual outcomes and results to differ materially. Such forward-looking statements include statements relating to: our economic outlook; our expected investment and expansion activity; our joint ventures; the expected benefits and timing of PlatformDIGITAL®; the Data Gravity Index ; Data Gravity Index DGx ; public cloud services spending; the potential impact of artificial intelligence and data regulations; our sustainability initiatives; the expected effect of foreign currency translation adjustments on our financials; anticipated continued demand for our products and services; our liquidity; demand drivers and economic growth outlook; business drivers; our expected development plans and completions, including timing, total square footage, IT capacity and raised floor space upon completion; expected availability for leasing efforts and colocation initiatives; organizational initiatives; our product offerings; our connected data communities; joint venture opportunities; occupancy and total investment; our expected investment in our properties; our estimated time to stabilization and targeted returns at stabilization of our properties; our expected future acquisitions; acquisitions strategy; available inventory and development strategy; the signing and commencement of leases, and related rental revenue; lag between signing and commencement of leases; our 2023 backlog; future rents; our expected same store portfolio growth; our expected growth and stabilization of development completions and acquisitions; lease rollovers and expected rental rate changes; our re-leasing spreads; our expected yields on investments; our expectations with respect to capital investments at lease expiration on existing data center or colocation space; debt maturities; lease maturities; our other expected future financial and other results including guidance, and the assumptions underlying such results; our customers’ capital investments; our plans and intentions; future data center utilization, utilization rates, growth rates, trends, supply and demand; datacenter expansion plans; estimated kW/MW requirements; capital expenditures; the effect new leases and increases in rental rates will have on our rental revenues and results of operations; estimates of the value of our development portfolio; our ability to meet our liquidity needs, including the ability to raise additional capital; market forecasts; projected financial information and covenant metrics; Core FFO run rate and NOI growth; other forward looking financial data; leasing expectations; our exposure to tenants in certain industries; our expectations and underlying assumptions regarding our sensitivity to fluctuations in foreign exchange rates; and the sufficiency of our capital to fund future requirements. You can identify forward-looking statements by the use of forward-looking terminology such as “believes,” “expects,” “may,” “will,” “should,” “seeks,” “approximately,” “intends,” “plans,” “pro forma,” “estimates” or “anticipates” or the negative of these words and phrases or similar words or phrases which are predictions of or indicate future events or trends and discussions which do not relate solely to historical matters. Such statements are based on management’s beliefs and assumptions made based on information currently available to management. Such statements are subject to risks, uncertainties and assumptions and are not guarantees of future performance and may be affected by known and unknown risks, trends, uncertainties and factors that are beyond our control. Should one or more of these risks or uncertainties materialize, or should underlying assumptions prove incorrect, actual results may vary materially from those anticipated, estimated or projected. Some of the risks and uncertainties that may cause our actual results, performance or achievements to differ materially from those expressed the suitability of our data centers and data center infrastructure, delays or disruptions in connectivity or availability of power, or failures or breaches of our physical and information security infrastructure or services; or implied by forward-looking statements include, among others, the following: reduced demand for data centers or decreases in information technology spending; decreased rental rates, increased operating costs or increased vacancy rates; increased competition or available supply of data center space; the suitability of our data centers and data center infrastructure, delays or disruptions in connectivity or availability of power, or failures or breaches of our physical and information security infrastructure or services; breaches of our obligations or restrictions under our contracts with our customers; our dependence upon significant customers, bankruptcy or insolvency of a major customer or a significant number of smaller customers, or defaults on or non-renewal of leases by customers; our inability to successfully develop and lease new properties and development space, and delays or unexpected costs in development of properties; the impact of current global and local economic, credit and market conditions; global supply chain or procurement disruptions, or increased supply chain costs; the impact from periods of heightened inflation on our costs, such as operating and general and administrative expenses, interest expense and real estate acquisition and construction costs; information security and data privacy breaches; difficulties managing an international business and acquiring or operating properties in foreign jurisdictions and unfamiliar metropolitan areas; our failure to realize the intended benefits from, or disruptions to our plans and operations or unknown or contingent liabilities related to, our recent acquisitions; our failure to successfully integrate and operate acquired or developed properties or businesses; difficulties in identifying properties to acquire and completing acquisitions; risks related to joint venture investments, including as a result of our lack of control of such investments; risks associated with using debt to fund our business activities, including re-financing and interest rate risks, our failure to repay debt when due, adverse changes in our credit ratings or our breach of covenants or other terms contained in our loan facilities and agreements; our failure to obtain necessary debt and equity financing, and our dependence on external sources of capital; financial market fluctuations and changes in foreign currency exchange rates; adverse economic or real estate developments in our industry or the industry sectors that we sell to, including risks relating to decreasing real estate valuations and impairment charges and goodwill and other intangible asset an epidemic, pandemic, or other global event impairment charges; our inability to manage our growth effectively; losses in excess of our insurance coverage; our inability to attract and retain talent; impact on our operations and on the operations of our customers, suppliers, and business partners; the expected operating performance of anticipated near-term acquisitions and descriptions relating to these expectations; environmental liabilities, risks related to natural disasters and our inability to achieve our sustainability goals; our inability to comply with rules and regulations applicable to our company; Digital Realty Trust, Inc.’s failure to maintain its status as a REIT for federal income tax purposes; Digital Realty Trust, L.P.’s failure to qualify as a partnership for federal income tax purposes; restrictions on our ability to engage in certain business activities; and changes in local, state, federal and international laws and regulations, including related to taxation, real estate and zoning laws and increases in real property tax rates; the impact of any financial, accounting, legal or regulatory issues or litigation that may affect us. The risks included here are not exhaustive, and additional factors could adversely affect our business and financial performance. We discussed a number of additional material risks in our annual report on Form 10-K for the year ended December 31, 2023, and other filings with the Securities and Exchange Commission. Those risks continue to be relevant to our performance and financial condition. Moreover, we operate in a very competitive and rapidly changing environment. New risk factors emerge from time to time and it is not possible for management to predict all such risk factors, nor can it assess the impact of all such risk factors on the business or the extent to which any factor, or combination of factors, may cause actual results to differ materially from those contained in any forward-looking statements. We expressly disclaim any responsibility to update forward-looking statements, whether as a result of new information, future events or otherwise. Digital Realty, Digital Realty Trust, the Digital Realty logo, Interxion, Turn-Key Flex, Powered Base Building, PlatformDIGITAL, Data Gravity Index, Data Gravity Index DGx, ServiceFabric, AnyScale Colo, and Pervasive Data Center Architecture (PDx),among others, are registered trademarks and service marks of Digital Realty Trust, Inc. in the United States and/or other countries. All other names, trademarks and service marks are the property of their respective owners. 1Q24 Financial Results 21 |
|
Reconciliation of Non-GAAP Items To Their Closest GAAP Equivalent 1Q24 Financial Results 22 March 31, 2024 March 31, 2023 Net income available to common stockholders $ 271,327 $ 58,547 Adjustments: Noncontrolling interests in operating partnership 6,200 1,500 Real estate related depreciation and amortization (1) 420,591 412,192 Depreciation related to non-controlling interests (8,017) (13,388) Real estate related depreciation and amortization related to investment in unconsolidated joint ventures 47,877 33,719 (Gain) on real estate transactions (286,704) (7,825) FFO available to common stockholders and unitholders $ 451,273 $ 484,745 Basic FFO per share and unit $ 1.42 $ 1.63 Diluted FFO per share and unit $ 1.41 $ 1.60 Weighted average common stock and units outstanding Basic 318,469 297,180 Diluted 326,975 309,026 (1) Real estate related depreciation and amortization was computed as follows: Depreciation and amortization per income statement 431,102 421,198 Non-real estate depreciation (10,511) (9,006) $ 420,591 $ 412,192 March 31, 2024 March 31, 2023 FFO available to common stockholders and unitholders -- basic and diluted $ 451,273 $ 484,745 Weighted average common stock and units outstanding 318,469 297,180 Add: Effect of dilutive securities 669 202 Weighted average common stock and units outstanding -- diluted 319,138 297,382 Three Months Ended Digital Realty Trust, Inc. and Subsidiaries Reconciliation of Net Income Available to Common Stockholders to Funds From Operations (FFO) (in thousands, except per share and unit data) (unaudited) Three Months Ended |
|
Reconciliation of Non-GAAP Items To Their Closest GAAP Equivalent 1Q24 Financial Results 23 March 31, 2024 March 31, 2023 FFO available to common stockholders and unitholders -- diluted $ 451,273 $ 484,745 Other non-core revenue adjustments 3,525 (887) Transaction and integration expenses 31,839 12,267 Loss from early extinguishment of debt 1,070 - Severance, equity acceleration and legal expenses 791 4,155 (Gain) / Loss on FX revaluation 33,602 (6,778) Other non-core expense adjustments 10,052 - CFFO available to common stockholders and unitholders -- diluted $ 532,153 $ 493,500 CFFO impact of holding '23 Exchange Rates Constant 1,119 - Constant Currency CFFO available to common stockholders and unitholders -- diluted $ 533,272 $ 493,500 Diluted CFFO per share and unit $ 1.67 $ 1.66 Diluted Constant Currency CFFO per share and unit $ 1.67 $ 1.66 Digital Realty Trust, Inc. and Subsidiaries Reconciliation of Funds From Operations (FFO) to Core Funds From Operations (CFFO) (in thousands, except per share and unit data) (unaudited) Three Months Ended |
|
Reconciliation of Non-GAAP Items To Their Closest GAAP Equivalent 1Q24 Financial Results 24 March 31, 2024 March 31, 2023 Net income available to common stockholders $ 271,327 $ 58,547 Interest 109,535 102,220 Loss from early extinguishment of debt 1,070 - Income tax expense (benefit) 22,413 21,454 Depreciation and amortization 431,102 421,198 EBITDA 835,446 603,419 Unconsolidated JV real estate related depreciation & amortization 47,877 33,719 Unconsolidated JV interest expense and tax expense 34,271 18,556 Severance, equity acceleration and legal expenses 791 4,155 Transaction and integration expenses 31,839 12,267 (Gain) / loss on sale of investments (277,787) - Other non-core adjustments, net 21,608 (14,604) Noncontrolling interests 6,329 111 Preferred stock dividends, including undeclared dividends 10,181 10,181 Adjusted EBITDA $ 710,556 $ 667,804 Digital Realty Trust, Inc. and Subsidiaries Reconciliation of Net Income Available to Common Stockholders to Earnings (in thousands) (unaudited) Three Months Ended Before Interest, Taxes, Depreciation and Amortization (EBITDA) and Adjusted EBITDA |
|
Reconciliation of Non-GAAP Items To Their Closest GAAP Equivalent 1Q24 Financial Results 25 March 31, 2024 March 31, 2023 Rental revenues $ 710,342 $ 684,779 Tenant reimbursements - Utilities 228,345 271,154 Tenant reimbursements - Other 28,312 23,418 Interconnection and other 91,469 86,386 Total Revenue 1,058,467 1,065,737 Utilities 265,035 295,375 Rental property operating 167,068 167,052 Property taxes 31,564 23,799 Insurance 3,939 4,019 Total Expenses 467,606 490,245 Net Operating Income $ 590,861 $ 575,492 Less: Stabilized straight-line rent $ (9,951) $ 1,543 Above and below market rent 829 1,149 Same Capital Cash Net Operating Income $ 599,983 $ 572,800 Same Capital Cash NOI impact of holding '23 Exchange Rates Constant (1,992) - Constant Currency Same Capital Cash Net Operating Income $ 597,991 $ 572,800 March 31, 2024 March 31, 2023 Total operating revenues $ 1,331,143 $ 1,338,724 less: Proforma disposition adjustment (13,236) (104,260) plus: Constant currency adjustment 1,119 - Total operating revenues (as adjusted) $ 1,319,026 $ 1,234,464 Three Months Ended Three Months Ended Digital Realty Trust, Inc. and Subsidiaries Reconciliation of Same Capital Cash Net Operating Income (in thousands) (unaudited) |
|
Reconciliation of Non-GAAP Items To Their Closest GAAP Equivalent 26 Note: For Quarter ended March 31, 2024. 1Q24 Financial Results Total Debt/Total Enterprise Value QE 03/31/24 Market value of common equity(i) $ 45,950,001 Liquidation value of preferred equity(ii) 755,000 Total GAAP interest expense (including unconsolidated JV interest expense) 137,378 Total debt at balance sheet carrying value 17,020,340 Add: Capitalized interest 28,522 Total Enterprise Value $ 63,725,341 GAAP interest expense plus capitalized interest 165,900 Total debt / total enterprise value 26.7% Debt-plus-preferred-to-total-enterprise-value 27.9% Debt Service Ratio 4.3x (i) Market Value of Common Equity Common shares outstanding 312,421 Common units outstanding 6,588 QE 03/31/24 Total Shares and Partnership Units 319,009 Fixed Charged Ratio (LQA Adjusted EBITDA/total fixed charges) Stock price as of March 31, 2024 $ 144.04 Market value of common equity $ 45,950,001 GAAP interest expense plus capitalized interest 165,900 Preferred dividends 10,181 (ii) Liquidation value of preferred equity ($25.00 per share) Total fixed charges 176,082 Shares O/S Liquidation Value Series J Preferred 8,000 200,000 Fixed charge ratio 4.0x Series K Preferred 8,400 210,000 Series L Preferred 13,800 345,000 755,000 (iv) QE 03/31/24 Unsecured Debt/Total Debt Net Debt/LQA Adjusted EBITDA QE 03/31/24 Global unsecured revolving credit facility 1,901,126 Total debt at balance sheet carrying value $ 17,020,340 Unsecured term loans 1,303,263 Add: DLR share of unconsolidated joint venture debt 1,382,102 Unsecured senior notes, net of discount 13,190,202 Add: Capital lease obligations, net 357,808 Secured debt, including premiums 625,750 Less: Unrestricted cash (1,555,242) Capital lease obligations, net 357,808 Net Debt as of March 31, 2024 $ 17,205,008 Total debt at balance sheet carrying value 17,378,149 Net Debt / LQA Adjusted EBITDA(iii) 6.1x Unsecured Debt / Total Debt 96.4% (iii) Adjusted EBITDA Net Debt Plus Preferred/LQA Adjusted EBITDA QE 03/31/24 Net loss available to common stockholders $ 271,327 Total debt at balance sheet carrying value 17,020,340 Interest expense 109,535 Less: Unrestricted cash (1,555,242) Loss from early extinguishment of debt 1,070 Taxes 22,413 Capital lease obligations, net 357,808 Depreciation and amortization 431,102 DLR share of unconsolidated joint venture debt 1,382,102 EBITDA 835,446 Net Debt as of March 31, 2024 17,205,008 Preferred Liquidation Value (iv) 755,000 Unconsolidated JV real estate related depreciation & amortization 47,877 Net Debt plus preferred 17,960,008 Unconsolidated JV interest expense and tax expense 34,271 Severance accrual and equity acceleration and legal expenses 791 Net Debt Plus Preferred/LQA Adjusted EBITDA(iii) 6.3x Transaction and integration expenses 31,839 (Gain) / loss on sale of investments (277,787) Other non-core adjustments, net 21,608 Noncontrolling interests 6,329 Preferred stock dividends 10,181 Adjusted EBITDA $ 710,558 LQA Adjusted EBITDA (Adjusted EBITDA x 4) $ 2,842,230 Debt Service Ratio (LQA Adjusted EBITDA/GAAP interest expense plus capitalized interest and less bridge facility fees) |
|
Reconciliation of Non-GAAP Items To Their Closest GAAP Equivalent 27 Total Debt/Total Enterprise Value QE 06/30/23 Market value of common equity(i) $ 34,812,727 Liquidation value of preferred equity(ii) 755,000 Total GAAP interest expense (including unconsolidated JV interest expense) 127,468 Total debt at balance sheet carrying value 17,729,452 Add: Capitalized interest 27,883 Total Enterprise Value $ 53,297,179 GAAP interest expense plus capitalized interest 155,351 Total debt / total enterprise value 33.3% Debt-plus-preferred-to-total-enterprise-value 34.7% Debt Service Ratio 4.5x (i) Market Value of Common Equity Common shares outstanding 299,240 Common units outstanding 6,483 QE 06/30/23 Total Shares and Partnership Units 305,723 Fixed Charged Ratio (LQA Adjusted EBITDA/total fixed charges) Stock price as of June 30, 2023 $ 113.87 Market value of common equity $ 34,812,727 GAAP interest expense plus capitalized interest 155,351 Preferred dividends 10,181 (ii) Liquidation value of preferred equity ($25.00 per share) Total fixed charges 165,533 Shares O/S Liquidation Value Series J Preferred 8,000 200,000 Fixed charge ratio 4.2x Series K Preferred 8,400 210,000 Series L Preferred 13,800 345,000 755,000 (iv) QE 06/30/23 Unsecured Debt/Total Debt Net Debt/LQA Adjusted EBITDA QE 06/30/23 Global unsecured revolving credit facility 2,242,258 Total debt at balance sheet carrying value $ 17,729,452 Unsecured term loans 1,548,780 Add: DLR share of unconsolidated joint venture debt 1,118,743 Unsecured senior notes, net of discount 13,383,819 Add: Capital lease obligations, net 319,635 Secured debt, including premiums 554,594 Less: Unrestricted cash (324,938) Capital lease obligations, net 319,635 Net Debt as of June 30, 2023 $ 18,842,893 Total debt at balance sheet carrying value 18,049,086 Net Debt / LQA Adjusted EBITDA(iii) 6.8x Unsecured Debt / Total Debt 96.9% (iii) Adjusted EBITDA Net Debt Plus Preferred/LQA Adjusted EBITDA QE 06/30/23 Net loss available to common stockholders $ 108,003 Total debt at balance sheet carrying value 17,729,452 Interest expense 111,116 Less: Unrestricted cash (324,938) Taxes 16,173 Capital lease obligations, net 319,635 Depreciation and amortization 432,573 DLR share of unconsolidated joint venture debt 1,118,743 EBITDA 667,866 Net Debt as of June 30, 2023 18,842,893 Preferred Liquidation Value (iv) 755,000 Unconsolidated JV real estate related depreciation & amortization 35,386 Net Debt plus preferred 19,597,893 Unconsolidated JV interest expense and tax expense 32,105 Severance accrual and equity acceleration and legal expenses 3,652 Net Debt Plus Preferred/LQA Adjusted EBITDA(iii) 7.0x Transaction and integration expenses 17,764 (Gain) / loss on sale of investments (89,946) Other non-core adjustments, net 22,132 Impairment of investments in real estate - Noncontrolling interests (2,538) Preferred stock dividends, including undeclared dividends 10,181 Adjusted EBITDA $ 696,604 LQA Adjusted EBITDA (Adjusted EBITDA x 4) $ 2,786,415 Debt Service Ratio (LQA Adjusted EBITDA/GAAP interest expense plus capitalized interest and less bridge facility fees) Note: For Quarter ended June 30, 2023. 1Q24 Financial Results |
|
Reconciliation of Non-GAAP Items To Their Closest GAAP Equivalent Note: For Quarter ended September 30, 2023. 1Q24 Financial Results 28 Total Debt/Total Enterprise Value QE 09/30/23 Market value of common equity(i) $ 37,434,562 Liquidation value of preferred equity(ii) 755,000 Total GAAP interest expense (including unconsolidated JV interest expense) 129,948 Total debt at balance sheet carrying value 16,869,776 Add: Capitalized interest 29,130 Total Enterprise Value $ 55,059,338 GAAP interest expense plus capitalized interest 159,078 Total debt / total enterprise value 30.6% Debt-plus-preferred-to-total-enterprise-value 32.0% Debt Service Ratio 4.3x (i) Market Value of Common Equity Common shares outstanding 302,846 Common units outstanding 6,479 QE 09/30/23 Total Shares and Partnership Units 309,325 Fixed Charged Ratio (LQA Adjusted EBITDA/total fixed charges) Stock price as of September 30, 2023 $ 121.02 Market value of common equity $ 37,434,562 GAAP interest expense plus capitalized interest 159,078 Preferred dividends 10,181 (ii) Liquidation value of preferred equity ($25.00 per share) Total fixed charges 169,259 Shares O/S Liquidation Value Series J Preferred 8,000 200,000 Fixed charge ratio 4.1x Series K Preferred 8,400 210,000 Series L Preferred 13,800 345,000 755,000 (iv) QE 09/30/23 Unsecured Debt/Total Debt Net Debt/LQA Adjusted EBITDA QE 09/30/23 Global unsecured revolving credit facility 1,698,780 Total debt at balance sheet carrying value $ 16,869,776 Unsecured term loans 1,524,663 Add: DLR share of unconsolidated joint venture debt 1,463,211 Unsecured senior notes, net of discount 13,072,102 Add: Capital lease obligations, net 306,538 Secured debt, including premiums 574,231 Less: Unrestricted cash (1,275,978) Capital lease obligations, net 306,538 Net Debt as of September 30, 2023 $ 17,363,548 Total debt at balance sheet carrying value 17,176,314 Net Debt / LQA Adjusted EBITDA(iii) 6.3x Unsecured Debt / Total Debt 96.7% (iii) Adjusted EBITDA Net Debt Plus Preferred/LQA Adjusted EBITDA QE 09/30/23 Net loss available to common stockholders $ 723,440 Total debt at balance sheet carrying value 16,869,776 Interest expense 110,767 Less: Unrestricted cash (1,275,978) Taxes 17,228 Capital lease obligations, net 306,538 Depreciation and amortization 420,613 DLR share of unconsolidated joint venture debt 1,463,211 EBITDA 1,272,048 Net Debt as of September 30, 2023 17,363,548 Preferred Liquidation Value (iv) 755,000 Unconsolidated JV real estate related depreciation & amortization 43,214 Net Debt plus preferred 18,118,548 Unconsolidated JV interest expense and tax expense 27,000 Severance accrual and equity acceleration and legal expenses 2,682 Net Debt Plus Preferred/LQA Adjusted EBITDA(iii) 6.6x Transaction and integration expenses 14,465 (Gain) / loss on sale of investments (810,688) Other non-core adjustments, net 1,719 Provision for impairment 113,000 Noncontrolling interests 12,320 Preferred stock dividends 10,181 Adjusted EBITDA $ 685,943 LQA Adjusted EBITDA (Adjusted EBITDA x 4) $ 2,743,770 Debt Service Ratio (LQA Adjusted EBITDA/GAAP interest expense plus capitalized interest and less bridge facility fees) |
|
Reconciliation of Non-GAAP Items To Their Closest GAAP Equivalent Note: For Quarter ended December 31, 2023. 1Q24 Financial Results 29 Total Debt/Total Enterprise Value QE 12/31/23 Market value of common equity(i) $ 42,804,053 Liquidation value of preferred equity(ii) 755,000 Total GAAP interest expense (including unconsolidated JV interest expense) 143,052 Total debt at balance sheet carrying value 17,425,908 Add: Capitalized interest 33,032 Total Enterprise Value $ 60,984,961 GAAP interest expense plus capitalized interest 176,084 Total debt / total enterprise value 28.6% Debt-plus-preferred-to-total-enterprise-value 29.8% Debt Service Ratio 4.0x (i) Market Value of Common Equity Common shares outstanding 311,608 Common units outstanding 6,449 QE 12/31/23 Total Shares and Partnership Units 318,057 Fixed Charged Ratio (LQA Adjusted EBITDA/total fixed charges) Stock price as of December 31, 2023 $ 134.58 Market value of common equity $ 42,804,053 GAAP interest expense plus capitalized interest 176,084 Preferred dividends 10,181 (ii) Liquidation value of preferred equity ($25.00 per share) Total fixed charges 186,265 Shares O/S Liquidation Value Series J Preferred 8,000 200,000 Fixed charge ratio 3.8x Series K Preferred 8,400 210,000 Series L Preferred 13,800 345,000 755,000 (iv) QE 12/31/23 Unsecured Debt/Total Debt Net Debt/LQA Adjusted EBITDA QE 12/31/23 Global unsecured revolving credit facility 1,812,287 Total debt at balance sheet carrying value $ 17,425,908 Unsecured term loans 1,560,305 Add: DLR share of unconsolidated joint venture debt 1,534,744 Unsecured senior notes, net of discount 13,422,342 Add: Capital lease obligations, net 315,178 Secured debt, including premiums 630,973 Less: Unrestricted cash (1,898,342) Capital lease obligations, net 315,178 Net Debt as of September 30, 2023 $ 17,377,488 Total debt at balance sheet carrying value 17,741,085 Net Debt / LQA Adjusted EBITDA(iii) 6.2x Unsecured Debt / Total Debt 96.4% (iii) Adjusted EBITDA Net Debt Plus Preferred/LQA Adjusted EBITDA QE 12/31/23 Net loss available to common stockholders $ 18,122 Total debt at balance sheet carrying value 17,425,908 Interest expense 113,638 Less: Unrestricted cash (1,898,342) Taxes 20,724 Capital lease obligations, net 315,178 Depreciation and amortization 420,475 DLR share of unconsolidated joint venture debt 1,534,744 EBITDA 572,958 Net Debt as of September 30, 2023 17,377,488 Preferred Liquidation Value (iv) 755,000 Unconsolidated JV real estate related depreciation & amortization 64,833 Net Debt plus preferred 18,132,488 Unconsolidated JV interest expense and tax expense 42,140 Severance accrual and equity acceleration and legal expenses 7,565 Net Debt Plus Preferred/LQA Adjusted EBITDA(iii) 6.5x Transaction and integration expenses 40,226 (Gain) / loss on sale of investments 103 Other non-core adjustments, net (35,439) Impairment of investments in real estate 5,363 Noncontrolling interests (8,419) Preferred stock dividends 10,181 Adjusted EBITDA $ 699,509 LQA Adjusted EBITDA (Adjusted EBITDA x 4) $ 2,798,037 Debt Service Ratio (LQA Adjusted EBITDA/GAAP interest expense plus capitalized interest and less bridge facility fees) |
|
Thank you |
 .
.