UNITED STATES
SECURITIES AND EXCHANGE COMMISSION
Washington, D.C. 20549
FORM 8-K
CURRENT REPORT
PURSUANT TO SECTION 13 OR 15(D) OF
THE SECURITIES EXCHANGE ACT OF 1934
Date of Report (Date of earliest event reported): May 1, 2024
Riot Platforms, Inc.
(Exact name of registrant as specified in its charter)
Nevada |
|
001-33675 |
|
84-1553387 |
(State or other jurisdiction of incorporation) |
|
(Commission File Number) |
|
(I.R.S. Employer Identification No.) |
3855 Ambrosia Street, Suite 301
Castle Rock, CO 80109
(Address of principal executive offices)
(303) 794-2000
(Registrant’s telephone number, including area code)
(Former name, former address, and former fiscal year, if changed since last report.)
Check the appropriate box below if the Form 8-K filing is intended to simultaneously satisfy the filing obligation of the registrant under any of the following provisions:
☐ Written communications pursuant to Rule 425 under the Securities Act (17 CFR 230.425)
☐ Soliciting material pursuant to Rule 14a-12 under the Exchange Act (17 CFR 240.14a-12)
☐ Pre-commencement communications pursuant to Rule 14d-2(b) under the Exchange Act (17 CFR 240.14d-2(b))
☐ Pre-commencement communications pursuant to Rule 13e-4(c) under the Exchange Act (17 CFR 240.13e-4(c))
Title of each class |
|
Trading Symbol(s) |
|
Name of each exchange on which registered |
Common Stock, no par value per share |
|
RIOT |
|
Nasdaq Capital Market |
Indicate by check mark whether the registrant is an emerging growth company as defined in Rule 405 of the Securities Act of 1933 (§230.405 of this chapter) or Rule 12b-2 of the Securities Exchange Act of 1934 (§240.12b-2 of this chapter).
Emerging growth company ☐
If an emerging growth company, indicate by check mark if the registrant has elected not to use the extended transition period for complying with any new or revised financial accounting standards provided pursuant to Section 13(a) of the Exchange Act. ☐
Item 2.02 – Results of Operations and Financial Condition.
On May 1, 2024, Riot Platforms, Inc. (together with its consolidated subsidiaries, “Riot”) issued a press release (the “Press Release”) and an update on Riot’s business and quarterly financial results and results of operation for the three months ended March 31, 2024 (the “Q1 2024 Earnings Deck”) on its website, riotplatforms.com, under the “Investor Relations” tab. The full text of the Press Release and the Q1 2024 Earnings Deck are attached to this Current Report on Form 8-K (this “Report”) as Exhibits 99.1 and 99.2, respectively.
The information under this Item 2.02 of this Report, including the Press Release and the Q1 2024 Earnings Deck attached as Exhibits 99.1 and 99.2 hereto, is furnished pursuant to this Item 2.02 and shall not be deemed “filed” for purposes of Section 18 of the Securities Exchange Act of 1934, as amended, (the “Exchange Act”) or incorporated by reference in any filing under the Securities Act of 1933, as amended, or the Exchange Act, except as shall be expressly set forth by specific reference in such a filing.
Item 9.01 – Regulation FD Disclosure.
(d)Exhibits.
EXHIBIT INDEX
The following exhibits are filed or furnished herewith:
Exhibit No. |
|
Description |
99.1 |
|
|
99.2 |
|
|
104 |
|
Cover Page Interactive Data File (embedded within the Inline XBRL document) |
S I G N A T U R E
Pursuant to the requirements of the Securities Exchange Act of 1934, as amended, the registrant has duly caused this report to be signed on its behalf by the undersigned hereunto duly authorized.
|
RIOT PLATFORMS, INC. |
|
|
|
|
|
|
|
|
|
|
|
By: |
/s/ Colin Yee |
|
|
Name: |
Colin Yee |
|
|
Title: |
Chief Financial Officer |
|
Date: May 1, 2024
Exhibit 99.1
RIOT PLATFORMS REPORTS FIRST QUARTER 2024 FINANCIAL RESULTS, CURRENT
OPERATIONAL AND FINANCIAL HIGHLIGHTS
Riot Reports $79.3 Million in Total Revenue and Successful Energization of New Corsicana Facility
CASTLE ROCK, Colo., May 1, 2024 (GLOBE NEWSWIRE) -- Riot Platforms, Inc. (NASDAQ: RIOT) (“Riot” or “the Company”), an industry leader in vertically integrated Bitcoin mining, reported financial results for the three-month period ended March 31, 2024. The unaudited financial statements and accompanying presentation materials are available on Riot’s website.
“I am excited to present results for Riot for the first quarter of 2024, during which we achieved a number of significant milestones which further solidify our growth path,” said Jason Les, CEO of Riot. “This quarter, Riot reported net income of $211.8 million and earnings per share of $0.82 which are new record highs for our quarterly results. Additionally, we reported $245.7 million in adjusted EBITDA for the quarter, another record high for Riot, rounding out strong financial performance for the quarter.
“Last month, Riot also announced the energization of our Corsicana Facility, which we believe will be the largest dedicated Bitcoin mining facility in the world once fully developed. Miners deployed at our Corsicana Facility are already hashing, and we remain on track to increase our self-mining hash rate capacity to 31 EH/s by the end of the year, which will nearly triple our existing hash rate capacity. With up to 1 GW of total capacity when fully developed, the Corsicana Facility provides Riot with a clear growth pipeline unrivalled in our industry and gives us a strong foundation upon which we will continue scaling our Bitcoin mining business in the future.”
First Quarter 2024 Financial and Operational Highlights
Key financial and operational highlights for the first quarter include:
| ● | Total revenue of $79.3 million, as compared to $73.2 million for the same three-month period in 2023. The increase was primarily driven by a 131% increase in Bitcoin prices as compared to the same three-month period in 2023, partially offset by lower Bitcoin production. |
| ● | Produced 1,364 Bitcoin during the quarter, which represented a decrease of 36% from the 2,115 Bitcoin mined during the three months ended March 31, 2023, due primarily to the significant increase in the Bitcoin network difficulty, which has more than doubled since January 2023. |
| ● | The average cost to mine Bitcoin was $23,034 in the quarter, as compared to $9,438 per Bitcoin for the same three-month period in 2023. The increase was primarily driven by an |
increase of 89% in global network hash rate as compared to the same three-month period in 2023.
| ● | Earned $5.1 million in power curtailment credits during the quarter, as compared to $3.1 million in power curtailment credits earned for the same three-month period in 2023. |
| ● | Following the termination of the legacy Data Center Hosting business, reportable segments have changed to reflect the two primary business segments of Riot: Bitcoin Mining and Engineering. |
| ● | Bitcoin Mining revenue of $74.6 million for the quarter, as compared to $48.0 million for the same three-month period in 2023, primarily driven by higher average Bitcoin prices. |
| ● | Engineering revenue of $4.7 million for the quarter, as compared to $16.1 million for the same three-month period in 2023. |
| ● | Maintained industry-leading financial position, with $692.5 million in working capital, including $688.5 million in cash on hand, and 8,490 in unencumbered Bitcoin (equating to $605.6 million assuming a market price for one Bitcoin on March 31, 2024 of approximately $71,333), all of which were produced by the Company’s self-mining operations, as of March 31, 2024. |
First Quarter 2024 Financial Results
Total revenue for the three-month period ended March 31, 2024 was $79.3 million, and consisted of $74.6 million in Bitcoin Mining revenue and $4.7 million in Engineering revenue.
Bitcoin Mining revenue in excess of Bitcoin Mining cost of revenue for the quarter was $33.5 million (45% of mining revenue), as compared to $26.1 million (54% of mining revenue) for the same three-month period in 2023, an increase of $7.4 million driven by higher Bitcoin prices during the quarter and an increase in revenues from the expansion of Bitcoin mining capacity at the Rockdale Facility. Bitcoin Mining cost of revenue consists primarily of direct production costs of mining operations, including electricity, labor, and insurance, but excludes depreciation and amortization.
Engineering cost of revenue in excess of Engineering revenue for the quarter was $1.3 million, as compared to Engineering revenue in excess of Engineering cost of revenue of $0.5 million (3% of Engineering revenue) for the same three-month period in 2023. This decrease was primarily due to decreased receipts of materials resulting from increased competition for direct materials due to supply chain constraints.
Power curtailment credits received totaled approximately $5.1 million for the quarter, as compared to $3.1 million during the same three-month period in 2023 and equates to approximately 98 Bitcoin for the 2024 period as computed by using average daily closing Bitcoin prices on a monthly basis.
If power credits were directly allocated to Bitcoin Mining cost of revenue, Bitcoin Mining cost of revenue would have decreased by $5.1 million, increasing Bitcoin Mining revenue in excess of cost of revenue to $38.6 million (52% of Bitcoin Mining revenue) on a non-GAAP basis.
Selling, general and administrative expenses during the quarter totaled $57.7 million, an increase of $12.7 million relative to the same period in 2023. The increase was primarily due to increases in stock compensation expenses of $34.3 million related to new grants under our long-term incentive program, compensation expenses of $4.4 million as a result of hiring additional employees to support our ongoing growth, increased legal and professional fees of $2.5 million primarily related to ongoing litigation and public company compliance, and $3.6 million for other costs primarily attributable to ongoing growth.
Net income for the quarter was $211.8 million, or $0.82 per share, compared to net income of $18.5 million, or $0.11 per share, for the same period in 2023. The net income for the quarter included a change in fair value of Bitcoin equal to $234.1 million, non-cash stock-based compensation expense of $32.0 million, and depreciation and amortization of $32.3 million.
Non-GAAP Adjusted EBITDA for the quarter was $245.7 million, as compared to $81.7 million for the same three-month period in 2023.
Hash Rate Growth
Riot anticipates achieving a total self-mining hash rate capacity of 31 EH/s by the end of 2024.
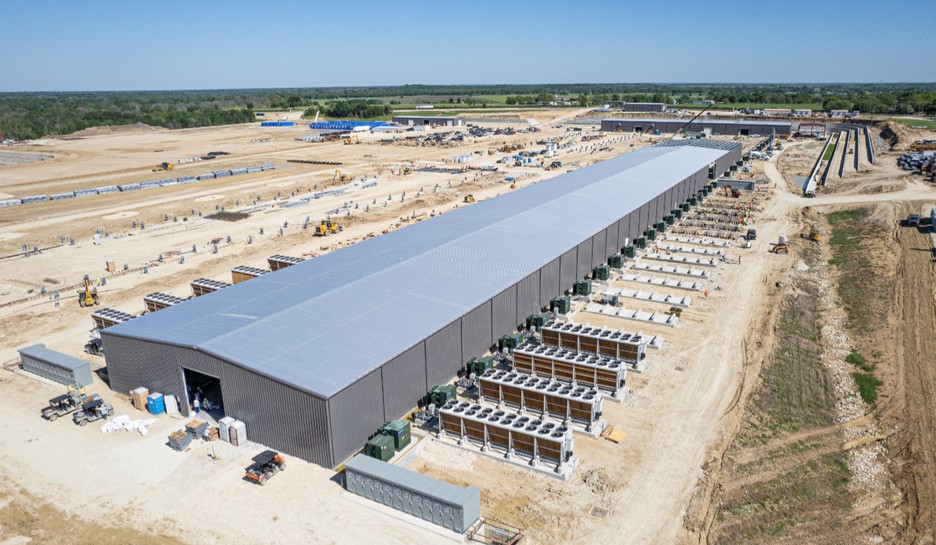
On April 18th, Riot announced the successful energization of the Corsicana Facility substation. The Corsicana Facility will have a total capacity of 1 GW when fully developed, at which point it is expected to be the largest known Bitcoin mining facility in the world by developed capacity. The recently energized substation will power the initial 400 MW phase of development of the Corsicana Facility. This initial phase is expected to add 16 EH/s to Riot’s self-mining capacity by the end of 2024. The first batch of miners in the first 100 MW building, Building A1, have been installed and are already hashing, and miners will continue to be deployed in Building A1 until a total capacity of 3.7 EH/s is reached.
As previously disclosed in June 2023, Riot entered into a long-term master purchase agreement with MicroBT, which included an initial order of 33,280 immersion miners for the Corsicana Facility. Effective December 1, 2023, Riot executed a second order under the MicroBT master agreement for an additional 66,560 immersion miners, primarily for the Corsicana Facility. In February 2024, Riot entered into a third order with MicroBT, for 31,500 air-cooled miners for the Rockdale Facility. Approximately 17,000 miners in the order are expected to replace underperforming machines currently operating in the facility, and the deployment of the remaining 14,500 miners will contribute additional hash rate capacity to our self-mining operations at the Rockdale Facility.
Collectively, the three purchase orders will add an anticipated 28 EH/s to Riot’s self-mining capacity. Deployment of these miners intended for the Corsicana Facility has begun and is estimated to be completed by the second half of 2025. Deployment of the miners intended for the Rockdale Facility is expected to begin in Q2 2024 and be completed in Q3 2024.
Upon full deployment in 2025, Riot anticipates a total self-mining hash rate capacity of 41 EH/s.
ATM Offerings
In February 2024, the Company registered an offering under its at-the-market equity offering program, under which it could offer and sell up to $750.0 million in shares of the Company’s common stock.
During the three months ended March 31, 2024, the Company received net proceeds of approximately $345.7 million ($353.2 million of gross proceeds, net of $7.5 million in commissions and expenses) from the sale of 26,169,300 shares of its common stock at a weighted average fair value of $13.50 per share under its at-the-market equity offering program.
Subsequent to March 31, 2024, and through April 30, 2024, the Company received net proceeds of approximately $154.1 million from the sale of 14,789,000 shares of its common stock at a weighted average fair value of $10.63 per share under its at-the-market equity offering program.
About Riot Platforms, Inc.
Riot’s (NASDAQ: RIOT) vision is to be the world’s leading Bitcoin-driven infrastructure platform.
Our mission is to positively impact the sectors, networks and communities that we touch. We believe that the combination of an innovative spirit and strong community partnership allows the Company to achieve best-in-class execution and create successful outcomes.
Riot is a Bitcoin mining and digital infrastructure company focused on a vertically integrated strategy. The Company has Bitcoin mining operations in central Texas and electrical switchgear engineering and fabrication operations in Denver, Colorado.
For more information, visit www.riotplatforms.com.
Safe Harbor
Statements in this press release that are not historical facts are forward-looking statements that reflect management’s current expectations, assumptions, and estimates of future performance and economic conditions. Such statements rely on the safe harbor provisions of Section 27A of the Securities Act of 1933 and Section 21E of the Securities Exchange Act of 1934. Because such statements are subject to risks and uncertainties, actual results may differ materially from those expressed or implied by such forward-looking statements. Words such as “anticipates,” “believes,” “plans,” “expects,” “intends,” “will,” “potential,” “hope,” and similar expressions are intended to identify forward-looking statements. These forward-looking statements may include, but are not limited to, statements about the Company’s plans, objectives, expectations, and intentions. The risks and uncertainties that could cause actual results to differ from those expressed in forward-looking statements include, but are not limited to: unaudited estimates of Bitcoin production; our future hash rate growth (EH/s); the anticipated benefits, construction schedule, and costs associated with the Corsicana site expansion; our expected schedule of new miner deliveries; the impact of weather events on our operations and results; our ability to successfully deploy new miners; potential negative impacts on our results of Bitcoin production due to the variance in our mining pool rewards; megawatt (“MW”) capacity under development; our potential inability to realize the anticipated benefits from immersion cooling; our ability to access sufficient additional capital for future strategic growth initiatives; the possibility that the integration of acquired businesses may not be successful, or such integration may take longer or be more difficult, time-consuming or costly to accomplish than anticipated; failure to otherwise realize anticipated efficiencies and strategic and financial benefits from our acquisitions; the anticipated impacts of the Bitcoin “halving”; and the impact of COVID-19 on our suppliers in connection with our estimated timelines. Detailed information regarding the factors identified by the Company’s management which they believe may cause actual results to differ materially from those expressed or implied by such forward-looking statements in this press release may be found in the Company’s filings with the U.S. Securities and Exchange Commission (the “SEC”), including the risks, uncertainties and other factors discussed under the sections entitled “Risk Factors” and “Cautionary Note Regarding Forward-Looking Statements” of the Company’s Annual Report on Form 10-K for the fiscal year ended December 31, 2023, as amended, and the other filings the Company makes with the SEC, copies of which may be obtained from the SEC’s website, www.sec.gov.
All forward-looking statements included in this press release are made only as of the date of this press release, and the Company disclaims any intention or obligation to update or revise any such forward-looking statements to reflect events or circumstances that subsequently occur, or of which the Company hereafter becomes aware, except as required by law. Persons reading this press release are cautioned not to place undue reliance on such forward-looking statements.
For further information, please contact:
Investor Contact:
Phil McPherson
IR@Riot.Inc
303-794-2000 ext. 110
Media Contact:
Alexis Brock
303-794-2000 ext. 118
PR@Riot.Inc
Non-U.S. GAAP Measures of Financial Performance
In addition to financial measures presented under generally accepted accounting principles in the United States of America (“GAAP”), we consistently evaluate our use of and calculation of non-GAAP financial measures such as “Adjusted EBITDA.” EBITDA is computed as net income before interest, taxes, depreciation, and amortization. Adjusted EBITDA is a financial measure defined as EBITDA, adjusted to eliminate the effects of certain non-cash and/or non-recurring items that do not reflect our ongoing strategic business operations, which management believes results in a performance measurement that represents a key indicator of the Company’s core business operations of Bitcoin mining. The adjustments include fair value adjustments such as derivative power contract adjustments, equity securities value changes, and non-cash stock-based compensation expense, in addition to financing and legacy business income and expense items. We exclude impairments and gains or losses on sales or exchanges of Bitcoin from our calculation of Adjusted EBITDA for all periods presented.
We believe Adjusted EBITDA can be an important financial measure because it allows management, investors, and our board of directors to evaluate and compare our operating results, including our return on capital and operating efficiency from period-to-period by making such adjustments. Additionally, Adjusted EBITDA is used as a performance metric for share-based compensation.
Adjusted EBITDA is provided in addition to, and should not be considered to be a substitute for, or superior to, net income, the most comparable measure under GAAP for Adjusted EBITDA. Further, Adjusted EBITDA should not be considered as an alternative to revenue growth, net income, diluted earnings per share or any other performance measure derived in accordance with GAAP, or as an alternative to cash flow from operating activities as a measure of our liquidity. Adjusted EBITDA has limitations as an analytical tool, and you should not consider such measures either in isolation or as substitutes for analyzing our results as reported under GAAP.
The following table reconciles Adjusted EBITDA to Net income (loss), the most comparable GAAP financial metric:
|
|
Three Months Ended |
||||
|
|
March 31, |
||||
|
|
2024 |
|
2023 |
||
Net income (loss) |
|
$ |
211,814 |
|
$ |
18,513 |
Interest (income) expense |
|
|
(7,805) |
|
|
3,830 |
Income tax expense (benefit) |
|
|
(102) |
|
|
(4,969) |
Depreciation and amortization |
|
|
32,343 |
|
|
59,340 |
EBITDA |
|
|
236,250 |
|
|
76,714 |
|
|
|
|
|
|
|
Adjustments: |
|
|
|
|
|
|
Stock-based compensation expense |
|
|
32,000 |
|
|
(2,296) |
Change in fair value of derivative asset |
|
|
(20,232) |
|
|
5,778 |
Casualty-related charges (recoveries), net |
|
|
(2,300) |
|
|
1,526 |
Other (income) expense |
|
|
(8) |
|
|
— |
License fees |
|
|
(24) |
|
|
(24) |
Adjusted EBITDA |
|
$ |
245,686 |
|
$ |
81,698 |
|
Riot Platforms (NASDAQ: RIOT) Q1 2024 Update May 1, 2024 NASDAQ: RIOT |
|
Statements in this presentation that are not statements of historical fact are forward-looking statements that reflect management’s current expectations, assumptions, and estimates of future performance and economic conditions, and are not guarantees of future performance or actual results. Such statements are made in reliance on the safe harbor provisions of Section 27A of the Securities Act of 1933, as amended, and Section 21E of the Securities Exchange Act of 1934, as amended. These forward-looking statements may include, but are not limited to, statements about the benefits of acquisitions, including potential future financial and operating results, as well as the Company’s plans, objectives, expectations, and intentions. Words such as “anticipates,” “believes,” “plans,” “expects,” “intends,” “will,” “potential,” “hope,” and similar expressions are intended to identify forward-looking statements; however, forward-looking statements may be made without such signifying expressions. Because such forward-looking statements reflect management’s current expectations, assumptions and estimates of future performance and economic conditions, they are subject to risks and uncertainties that may cause actual results to differ materially from those expressed or implied by such forward-looking statements. These risks and uncertainties include, but are not limited to: unaudited estimates of Bitcoin production; our future hash rate growth (EH/s); the anticipated benefits, construction schedule, and costs associated with the Corsicana Facility; our expected schedule of new miner deliveries; our ability to successfully deploy new miners; MW capacity under development; risks related to our realization of the benefits we anticipate from immersion-cooling; risks related to the success, schedule, cost and difficulty of integrating businesses we acquire; our failure to realize anticipated efficiencies and strategic and financial benefits from our acquisitions; and the impact that COVID-19 and other global events may have on us, our customers, our suppliers, and on economic conditions in connection with our estimated timelines, future performance and operations. Detailed information regarding the factors identified by the Company’s management which they believe may cause actual results to differ materially from those expressed or implied by the forward-looking statements contained in this presentation may be found in the Company’s filings with the U.S. Securities and Exchange Commission (the “SEC”), including the risks, uncertainties and other factors discussed under the sections entitled “Risk Factors” and “Cautionary Note Regarding Forward-Looking Statements” of the Company’s Annual Report on Form 10-K for the fiscal year ended December 31, 2023, as amended, and the other filings the Company makes with the SEC, copies of which may be obtained from the SEC’s website, www.sec.gov. In addition to these risks and those identified by the Company’s management and disclosed in the Company’s filings with the SEC, other risks, factors and uncertainties not identified by management, or which management does not presently believe to be material to the Company, its business or prospects, may also materially affect the Company’s actual future results, including in ways adverse to the Company’s business. All forward-looking statements included in this presentation are made only as of the date of this presentation, and the Company disclaims any intention or obligation to update or revise any such forward-looking statements to reflect events or circumstances that subsequently occur, or of which the Company hereafter becomes aware, except as required by law. Persons reading this presentation are cautioned not to place undue reliance on such forward-looking statements. 2 Forward Looking Statements |
|
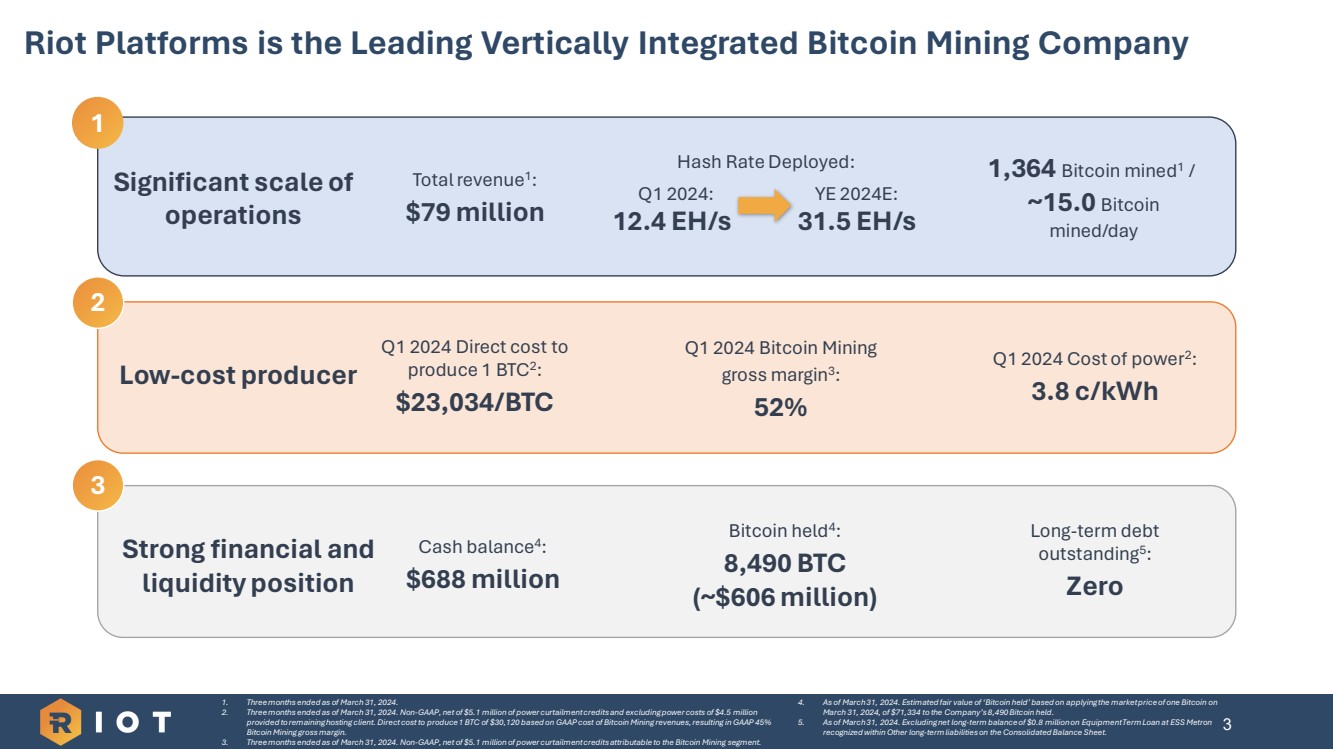
Riot Platforms is the Leading Vertically Integrated Bitcoin Mining Company Significant scale of operations Total revenue1 : $79 million Low-cost producer 1 2 Q1 2024 Direct cost to produce 1 BTC2 : $23,034/BTC Q1 2024 Bitcoin Mining gross margin3 : 52% Cash balance4 : $290 million Strong financial and liquidity position 3 Bitcoin held4 : 8,490 BTC (~$606 million) Long-term debt outstanding5 : Zero 3 4. As of March 31, 2024. Estimated fair value of ‘Bitcoin held’ based on applying the market price of one Bitcoin on March 31, 2024, of $71,334 to the Company’s 8,490 Bitcoin held. 5. As of March31, 2024. Excluding net long-term balance of $0.8 million on Equipment Term Loan at ESS Metron recognized within Other long-term liabilities on the Consolidated Balance Sheet. 1. Three months ended as of March 31, 2024. 2. Three months ended as of March 31, 2024. Non-GAAP, net of $5.1 million of power curtailment credits and excluding power costs of $4.5 million provided to remaining hosting client. Direct cost to produce 1 BTC of $30,120 based on GAAP cost of Bitcoin Mining revenues, resulting in GAAP 45% Bitcoin Mining gross margin. 3. Three months ended as of March 31, 2024. Non-GAAP, net of $5.1 million of power curtailment credits attributable to the Bitcoin Mining segment. 1,364 Bitcoin mined1 / ~15.0 Bitcoin mined/day Q1 2024 Cost of power2 : 3.8 c/kWh Cash balance4 : $688 million 12.4 EH/s Hash Rate Deployed: Q1 2024: YE 2024E: 31.5 EH/s |
|
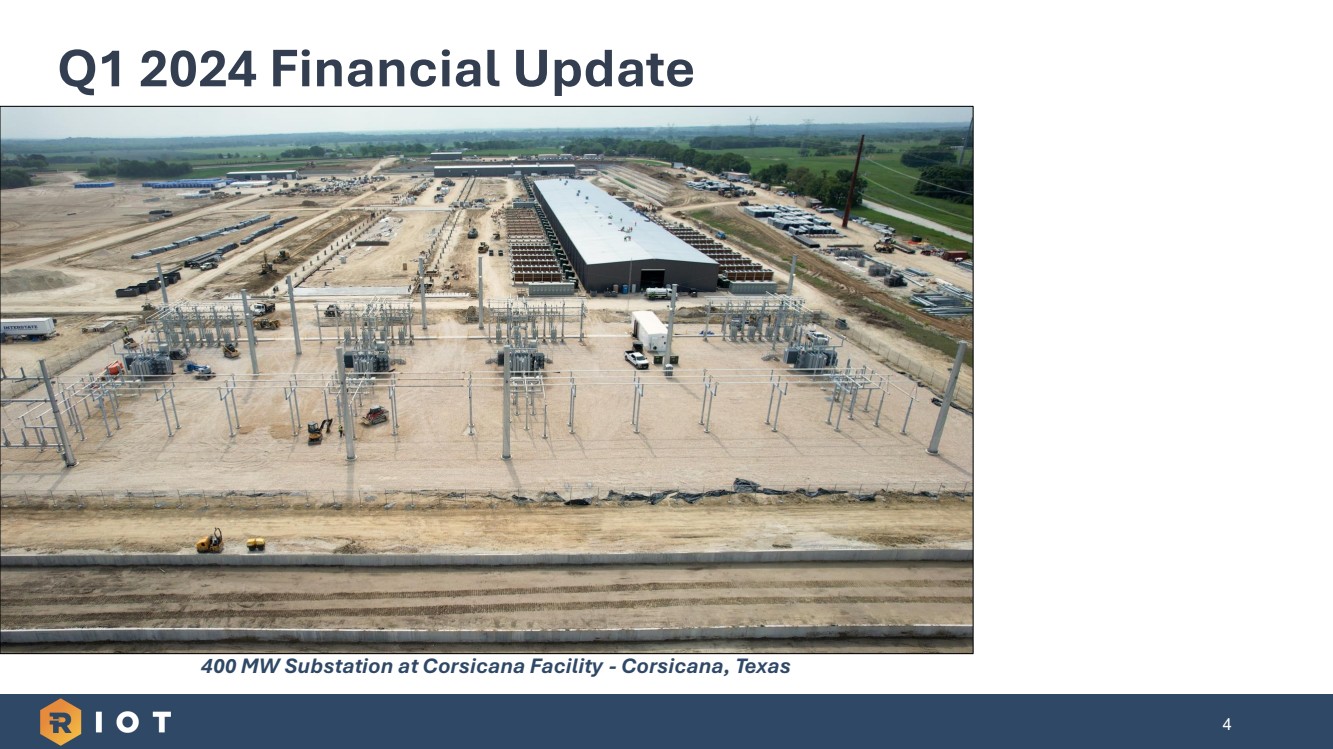
FY 2023 Financial Update 4 Q1 2024 Financial Update 400 MW Substation at Corsicana Facility - Corsicana, Texas |
|
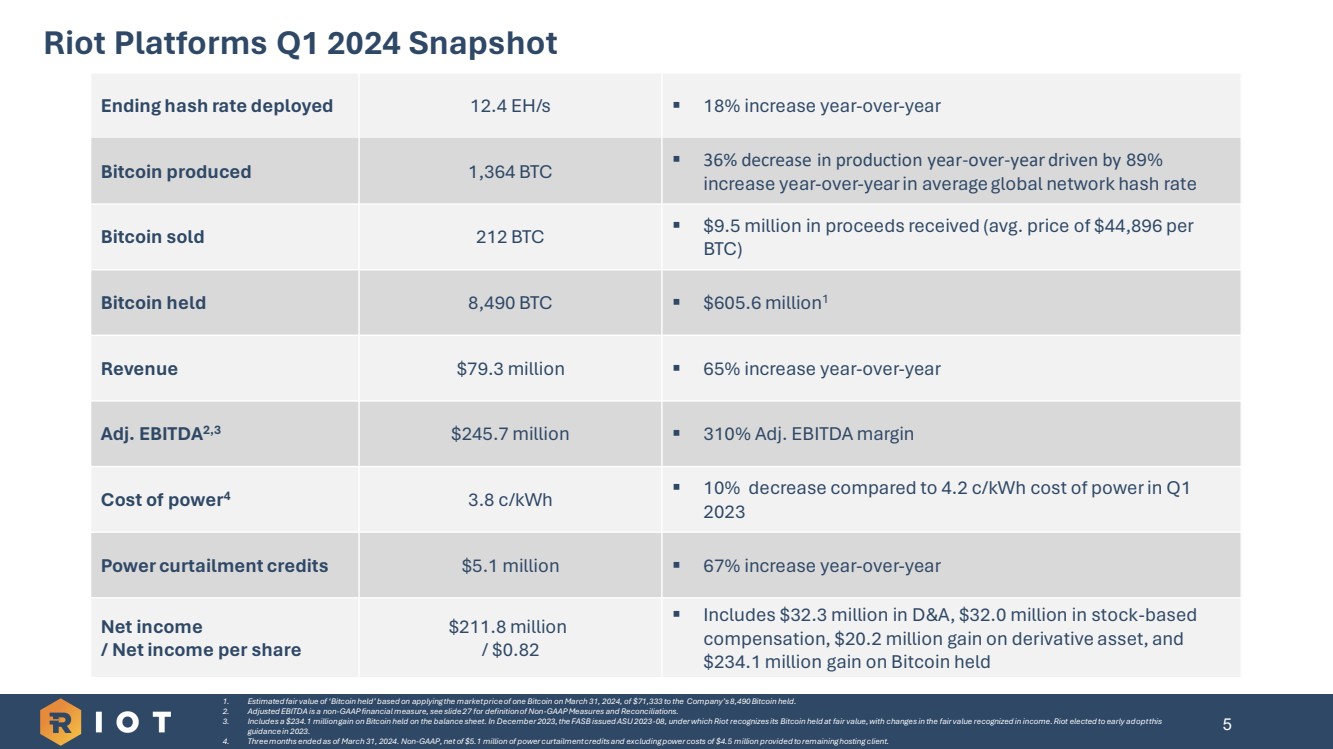
5 Ending hash rate deployed 12.4 EH/s ▪ 18% increase year-over-year Bitcoin produced 1,364 BTC ▪ 36% decrease in production year-over-year driven by 89% increase year-over-year in average global network hash rate Bitcoin sold 212 BTC ▪ $9.5 million in proceeds received (avg. price of $44,896 per BTC) Bitcoin held 8,490 BTC ▪ $605.6 million1 Revenue $79.3 million ▪ 65% increase year-over-year Adj. EBITDA2,3 $245.7 million ▪ 310% Adj. EBITDA margin Cost of power4 3.8 c/kWh ▪ 10% decrease compared to 4.2 c/kWh cost of power in Q1 2023 Power curtailment credits $5.1 million ▪ 67% increase year-over-year Net income / Net income per share $211.8 million / $0.82 ▪ Includes $32.3 million in D&A, $32.0 million in stock-based compensation, $20.2 million gain on derivative asset, and $234.1 million gain on Bitcoin held 1. Estimated fair value of ‘Bitcoin held’ based on applying the market price of one Bitcoin on March 31, 2024, of $71,333 to the Company’s 8,490 Bitcoin held. 2. Adjusted EBITDA is a non-GAAP financial measure, see slide 27 for definition of Non-GAAP Measures and Reconciliations. 3. Includes a $234.1 million gain on Bitcoin held on the balance sheet. In December 2023, the FASB issued ASU 2023-08, under which Riot recognizes its Bitcoin held at fair value, with changes in the fair value recognized in income. Riot elected to early adoptthis guidance in 2023. 4. Three months ended as of March 31, 2024. Non-GAAP, net of $5.1 million of power curtailment credits and excluding power costs of $4.5 million provided to remaining hosting client. Riot Platforms Q1 2024 Snapshot |
|
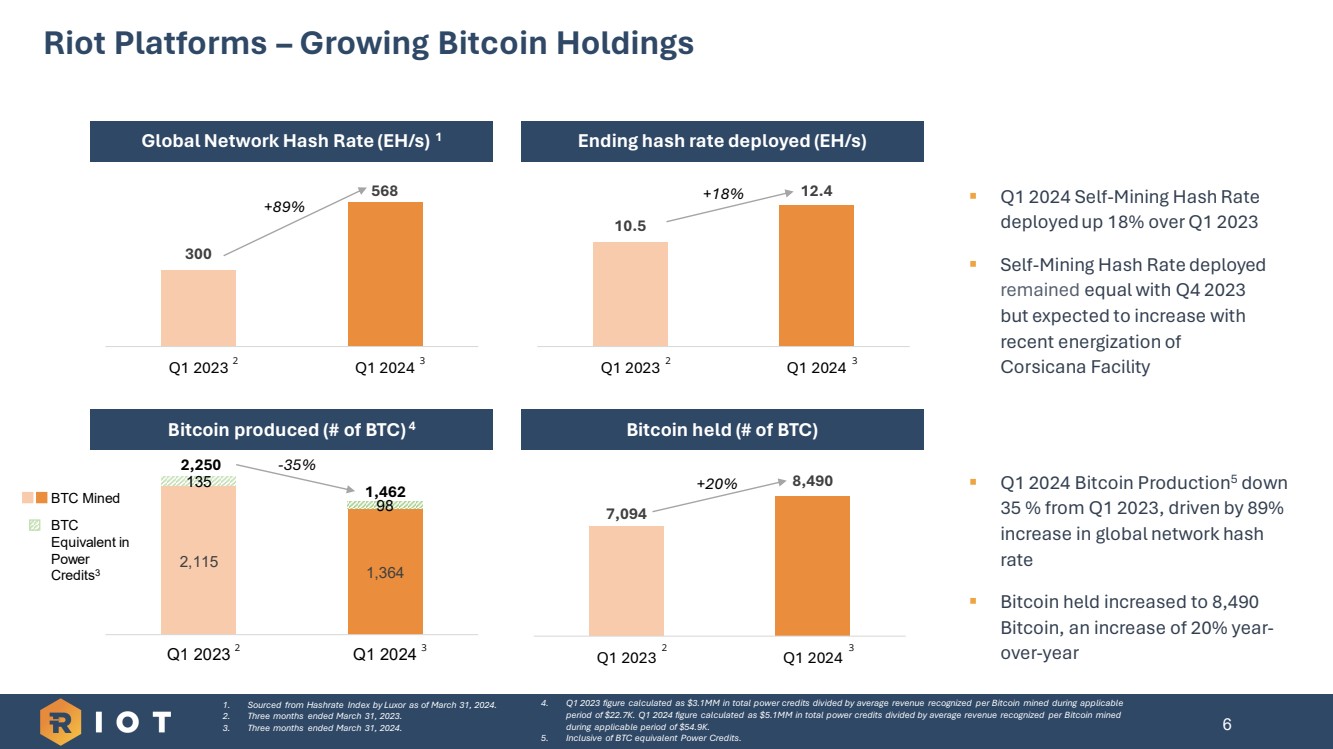
2,115 1,364 135 98 Q1 2023 Q1 2024 Riot Platforms – Growing Bitcoin Holdings 6 Global Network Hash Rate (EH/s) 1 Ending hash rate deployed (EH/s) Bitcoin produced (# of BTC) 4 Bitcoin held (# of BTC) 10.5 12.4 Q1 2023 Q1 2024 +18% 7,094 8,490 Q1 2023 Q1 2024 300 568 Q1 2023 Q1 2024 +89% +20% 2 3 2 3 2 3 2 3 ▪ Q1 2024 Self-Mining Hash Rate deployed up 18% over Q1 2023 ▪ Self-Mining Hash Rate deployed remained equal with Q4 2023 but expected to increase with recent energization of Corsicana Facility ▪ Q1 2024 Bitcoin Production5 down 35 % from Q1 2023, driven by 89% increase in global network hash rate ▪ Bitcoin held increased to 8,490 Bitcoin, an increase of 20% year-over-year 2,250 1,462 BTC Mined BTC Equivalent in Power Credits3 -35% 1. Sourced from Hashrate Index by Luxor as of March 31, 2024. 2. Three months ended March 31, 2023. 3. Three months ended March 31, 2024. 4. Q1 2023 figure calculated as $3.1MM in total power credits divided by average revenue recognized per Bitcoin mined during applicable period of $22.7K. Q1 2024 figure calculated as $5.1MM in total power credits divided by average revenue recognized per Bitcoin mined during applicable period of $54.9K. 5. Inclusive of BTC equivalent Power Credits. |
|
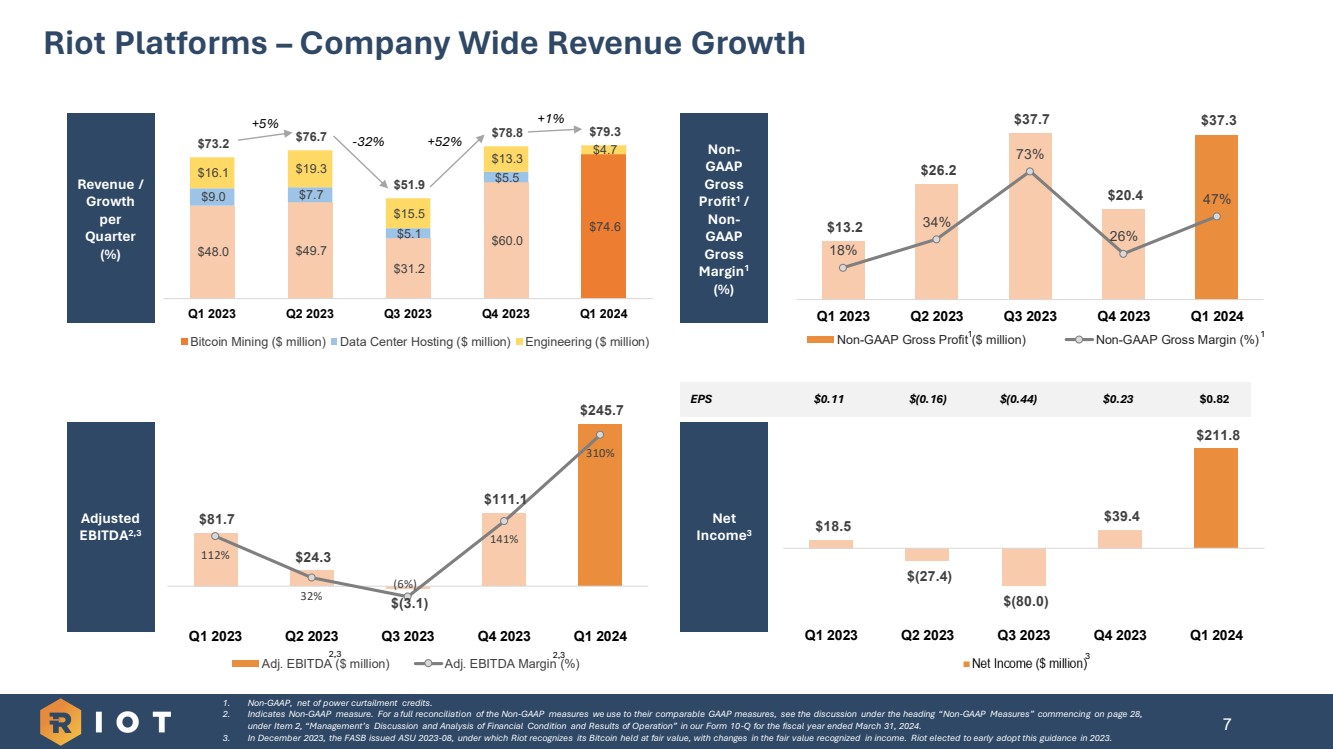
$48.0 $49.7 $31.2 $60.0 $74.6 $9.0 $7.7 $5.1 $5.5 $16.1 $19.3 $15.5 $13.3 $4.7 $73.2 $76.7 $51.9 $78.8 $79.3 Q1 2023 Q2 2023 Q3 2023 Q4 2023 Q1 2024 Bitcoin Mining ($ million) Data Center Hosting ($ million) Engineering ($ million) $81.7 $24.3 $(3.1) $111.1 $245.7 112% 32% (6%) 141% 310% (50%) 0% 50% 100% 150% 200% 250% 300% 350% 400% -$50 m $0 m $50 m $100 m $150 m $200 m $250 m $300 m Q1 2023 Q2 2023 Q3 2023 Q4 2023 Q1 2024 Adj. EBITDA ($ million) Adj. EBITDA Margin (%) $13.2 $26.2 $37.7 $20.4 $37.3 18% 34% 73% 26% 47% 0% 10% 20% 30% 40% 50% 60% 70% 80% 90% 100% $0 m $5 m $10 m $15 m $20 m $25 m $30 m $35 m $40 m Q1 2023 Q2 2023 Q3 2023 Q4 2023 Q1 2024 Non-GAAP Gross Profit ($ million) Non-GAAP Gross Margin (%) Riot Platforms – Company Wide Revenue Growth 7 1. Non-GAAP, net of power curtailment credits. 2. Indicates Non-GAAP measure. For a full reconciliation of the Non-GAAP measures we use to their comparable GAAP measures, see the discussion under the heading “Non-GAAP Measures” commencing on page 28, under Item 2, “Management’s Discussion and Analysis of Financial Condition and Results of Operation” in our Form 10-Q for the fiscal year ended March 31, 2024. 3. In December 2023, the FASB issued ASU 2023-08, under which Riot recognizes its Bitcoin held at fair value, with changes in the fair value recognized in income. Riot elected to early adopt this guidance in 2023. Adjusted EBITDA2,3 Revenue / Growth per Quarter (%) -32% +5% +52% 2,3 +1% Net Income3 Non-GAAP Gross Profit1 / Non-GAAP Gross Margin1 (%) $18.5 $(27.4) $(80.0) $39.4 $211.8 Q1 2023 Q2 2023 Q3 2023 Q4 2023 Q1 2024 EPS $0.11 $(0.16) $(0.44) $0.23 $0.82 1 1 2,3 3 |
|
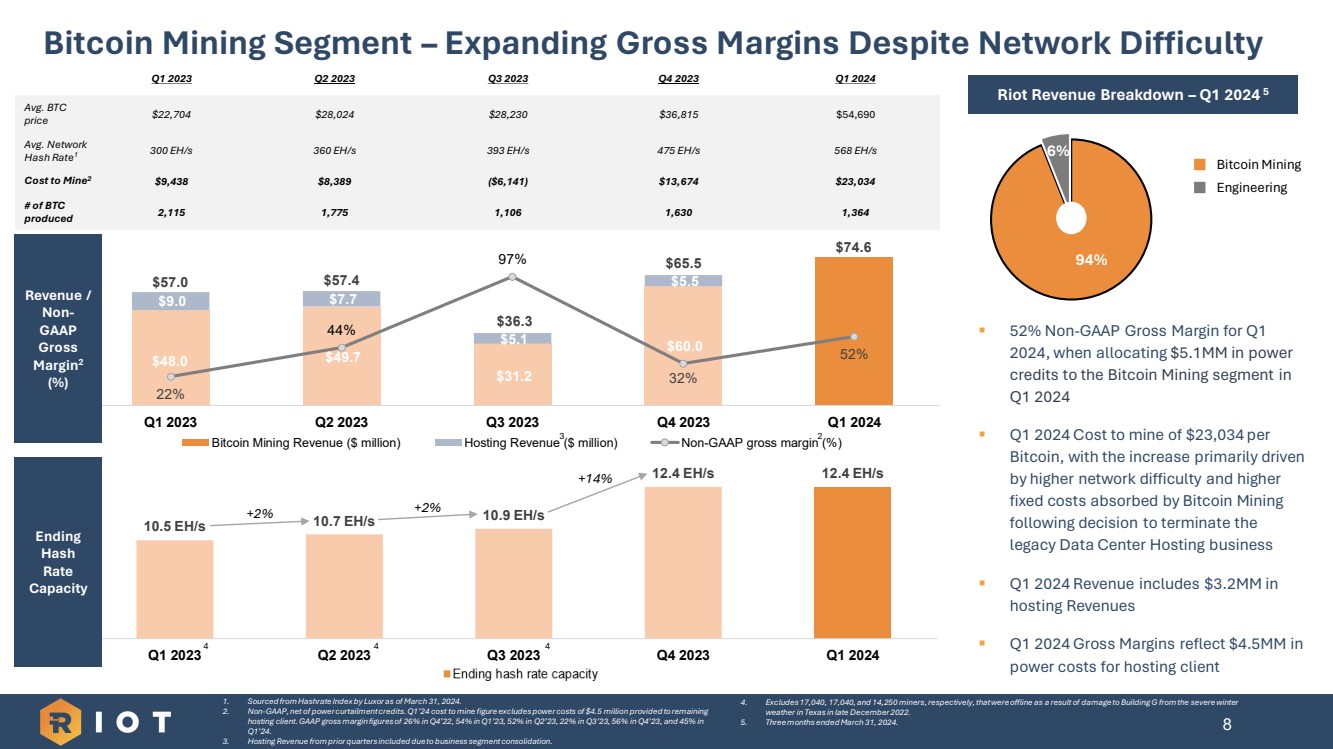
$48.0 $49.7 $31.2 $60.0 $74.6 $9.0 $7.7 $5.1 $5.5 22% 44% 97% 32% 52% 0% 20% 40% 60% 80% 100% 120% Q1 2023 Q2 2023 Q3 2023 Q4 2023 Q1 2024 Bitcoin Mining Revenue ($ million) Hosting Revenue ($ million) Non-GAAP gross margin (%) 10.5 EH/s 10.7 EH/s 10.9 EH/s 12.4 EH/s 12.4 EH/s Q1 2023 Q2 2023 Q3 2023 Q4 2023 Q1 2024 Bitcoin Mining Segment – Expanding Gross Margins Despite Network Difficulty 8 ▪ 52% Non-GAAP Gross Margin for Q1 2024, when allocating $5.1MM in power credits to the Bitcoin Mining segment in Q1 2024 ▪ Q1 2024 Cost to mine of $23,034 per Bitcoin, with the increase primarily driven by higher network difficulty and higher fixed costs absorbed by Bitcoin Mining following decision to terminate the legacy Data Center Hosting business ▪ Q1 2024 Revenue includes $3.2MM in hosting Revenues ▪ Q1 2024 Gross Margins reflect $4.5MM in power costs for hosting client 1. Sourced from HashrateIndex by Luxor as of March 31, 2024. 2. Non-GAAP, net of power curtailment credits. Q1’24 cost to mine figure excludes power costs of $4.5 million provided to remaining hosting client. GAAP gross margin figures of 26% in Q4’22, 54% in Q1’23, 52% in Q2’23, 22% in Q3’23, 56% in Q4’23, and 45% in Q1’24. 3. Hosting Revenue from prior quarters included due to business segment consolidation. Q1 2023 Q2 2023 Q3 2023 Q4 2023 Q1 2024 Avg. BTC price $22,704 $28,024 $28,230 $36,815 $54,690 Avg. Network Hash Rate1 300 EH/s 360 EH/s 393 EH/s 475 EH/s 568 EH/s Cost to Mine2 $9,438 $8,389 ($6,141) $13,674 $23,034 # of BTC produced 2,115 1,775 1,106 1,630 1,364 Riot Revenue Breakdown – Q1 2024 5 Revenue / Non-GAAP Gross Margin2 (%) Ending Hash Rate Capacity 94% 6% 2 4 4 4 +2% Bitcoin Mining Engineering +2% +14% $57.0 $57.4 $36.3 $65.5 3 $74.6 4. Excludes 17,040, 17,040, and 14,250 miners, respectively,that wereoffline as a result of damage to Building G from the severe winter weather in Texas in late December 2022. 5. Three months ended March 31, 2024. |
|
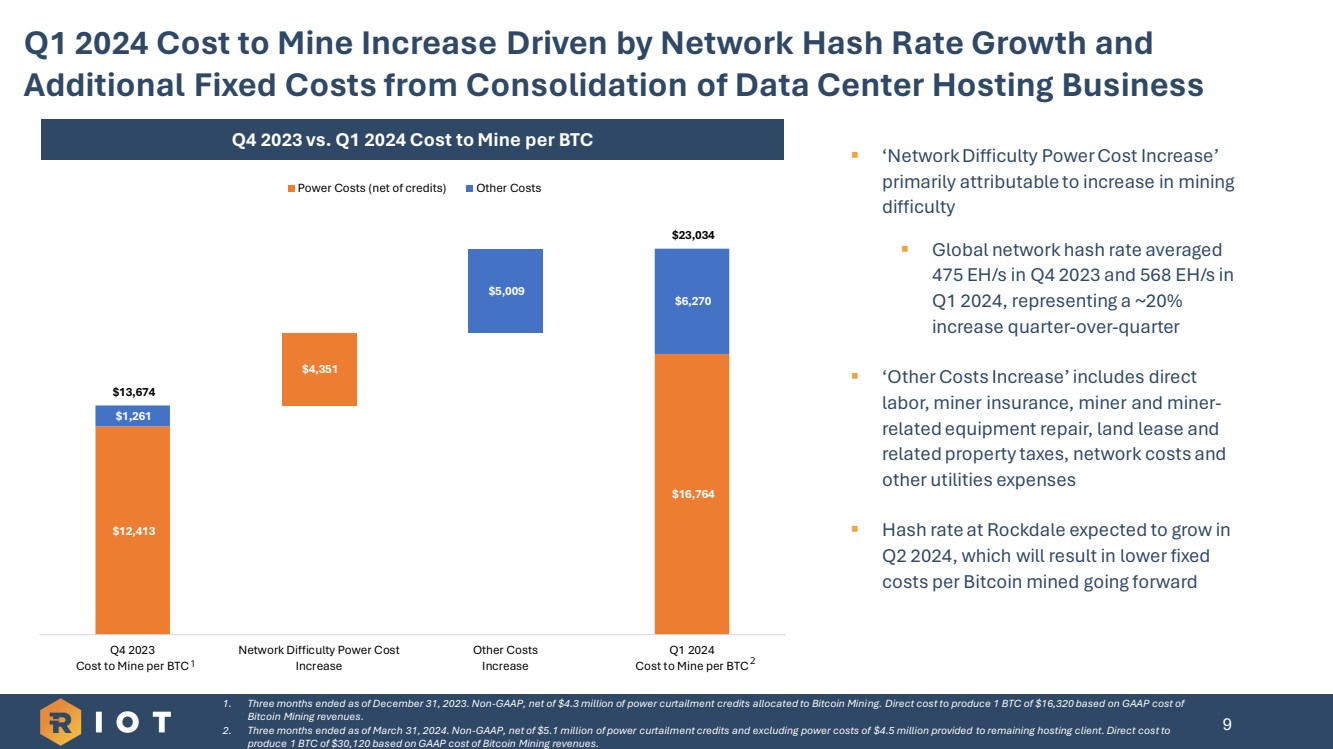
9 Q1 2024 Cost to Mine Increase Driven by Network Hash Rate Growth and Additional Fixed Costs from Consolidation of Data Center Hosting Business $12,413 $16,764 $1,261 $6,270 $13,674 $4,351 $5,009 $23,034 Q4 2023 Cost to Mine per BTC Network Difficulty Power Cost Increase Other Costs Increase Q1 2024 Cost to Mine per BTC Power Costs (net of credits) Other Costs Q4 2023 vs. Q1 2024 Cost to Mine per BTC 1 2 1. Three months ended as of December 31, 2023. Non-GAAP, net of $4.3 million of power curtailment credits allocated to Bitcoin Mining. Direct cost to produce 1 BTC of $16,320 based on GAAP cost of Bitcoin Mining revenues. 2. Three months ended as of March 31, 2024. Non-GAAP, net of $5.1 million of power curtailment credits and excluding power costs of $4.5 million provided to remaining hosting client. Direct cost to produce 1 BTC of $30,120 based on GAAP cost of Bitcoin Mining revenues. ▪ ‘Network Difficulty Power Cost Increase’ primarily attributable to increase in mining difficulty ▪ Global network hash rate averaged 475 EH/s in Q4 2023 and 568 EH/s in Q1 2024, representing a ~20% increase quarter-over-quarter ▪ ‘Other Costs Increase’ includes direct labor, miner insurance, miner and miner-related equipment repair, land lease and related property taxes, network costs and other utilities expenses ▪ Hash rate at Rockdale expected to grow in Q2 2024, which will result in lower fixed costs per Bitcoin mined going forward |
|
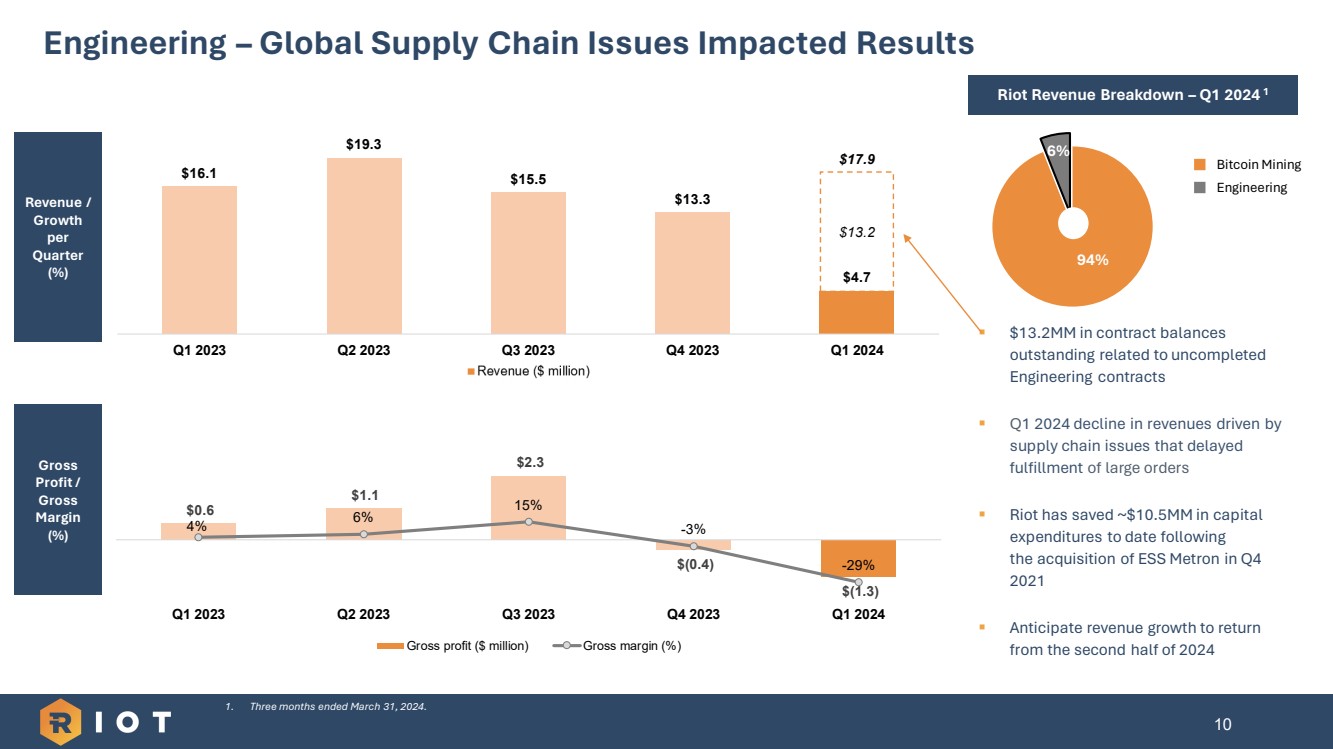
$16.1 $19.3 $15.5 $13.3 $4.7 Q1 2023 Q2 2023 Q3 2023 Q4 2023 Q1 2024 Engineering – Global Supply Chain Issues Impacted Results 10 ▪ $13.2MM in contract balances outstanding related to uncompleted Engineering contracts ▪ Q1 2024 decline in revenues driven by supply chain issues that delayed fulfillment of large orders ▪ Riot has saved ~$10.5MM in capital expenditures to date following the acquisition of ESS Metron in Q4 2021 ▪ Anticipate revenue growth to return from the second half of 2024 Riot Revenue Breakdown – Q4 20231 1. Three months ended March 31, 2024. Revenue / Growth per Quarter (%) Gross Profit / Gross Margin (%) $0.6 $1.1 $2.3 $(0.4) $(1.3) 4% 6% 15% -3% -29% Q1 2023 Q2 2023 Q3 2023 Q4 2023 Q1 2024 Gross profit ($ million) Gross margin (%) Riot Revenue Breakdown – Q1 2024 1 94% 6% Bitcoin Mining Engineering $13.2 $17.9 |
|
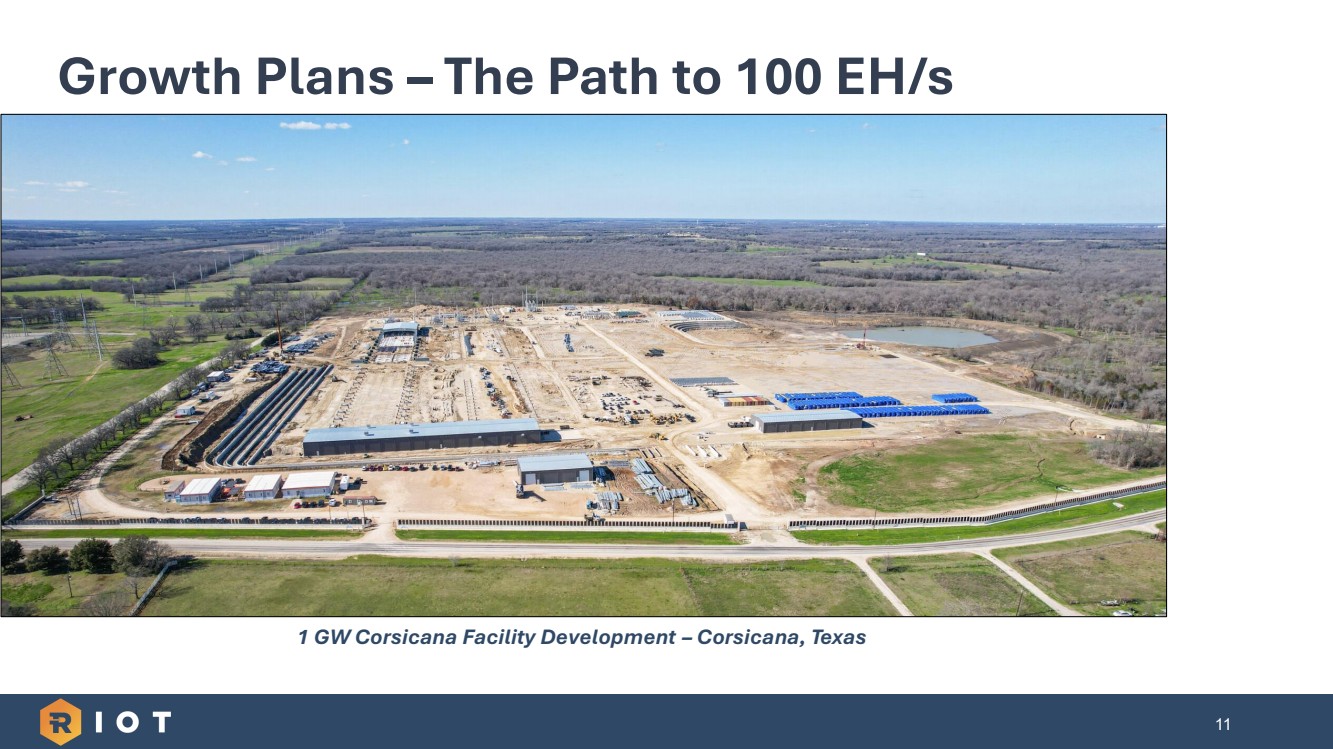
11 Growth Plans – The Path to 100 EH/s 1 GW Corsicana Facility Development – Corsicana, Texas |
|
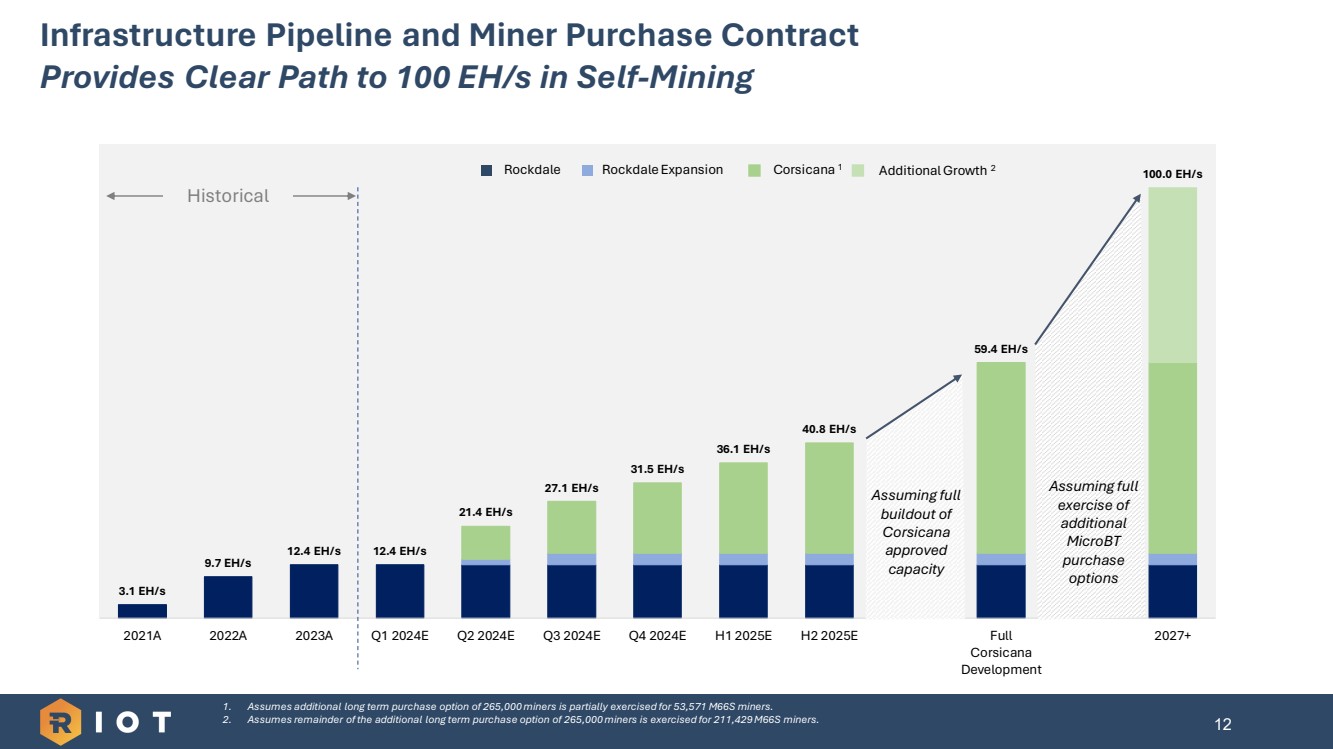
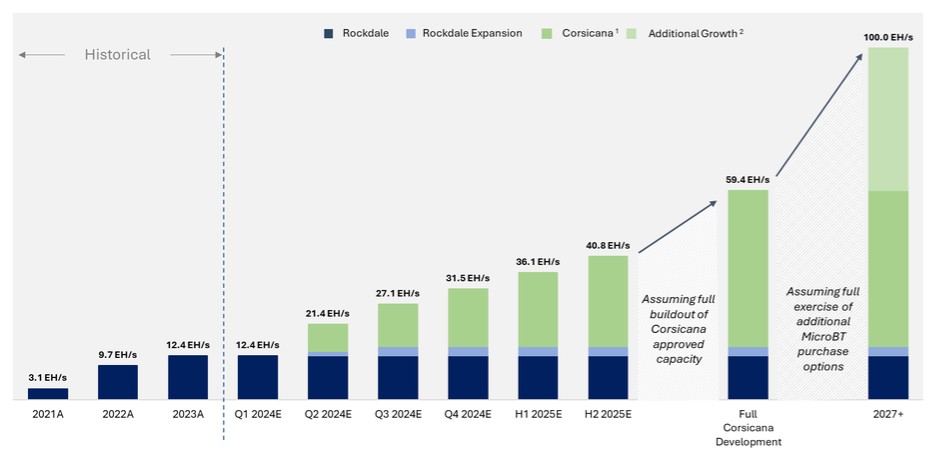
12 Infrastructure Pipeline and Miner Purchase Contract Provides Clear Path to 100 EH/s in Self-Mining 1. Assumes additional long term purchase option of 265,000 miners is partially exercised for 53,571 M66S miners. 2. Assumes remainder of the additional long term purchase option of 265,000 miners is exercised for 211,429 M66S miners. 3.1 EH/s 9.7 EH/s 12.4 EH/s 12.4 EH/s 21.4 EH/s 27.1 EH/s 31.5 EH/s 36.1 EH/s 40.8 EH/s 59.4 EH/s 100.0 EH/s 2021A 2022A 2023A Q1 2024E Q2 2024E Q3 2024E Q4 2024E H1 2025E H2 2025E Full Corsicana Development 2027+ Assuming full exercise of additional MicroBT purchase options Rockdale Rockdale Expansion Historical Corsicana 1 Assuming full buildout of Corsicana approved capacity Additional Growth 2 |
|
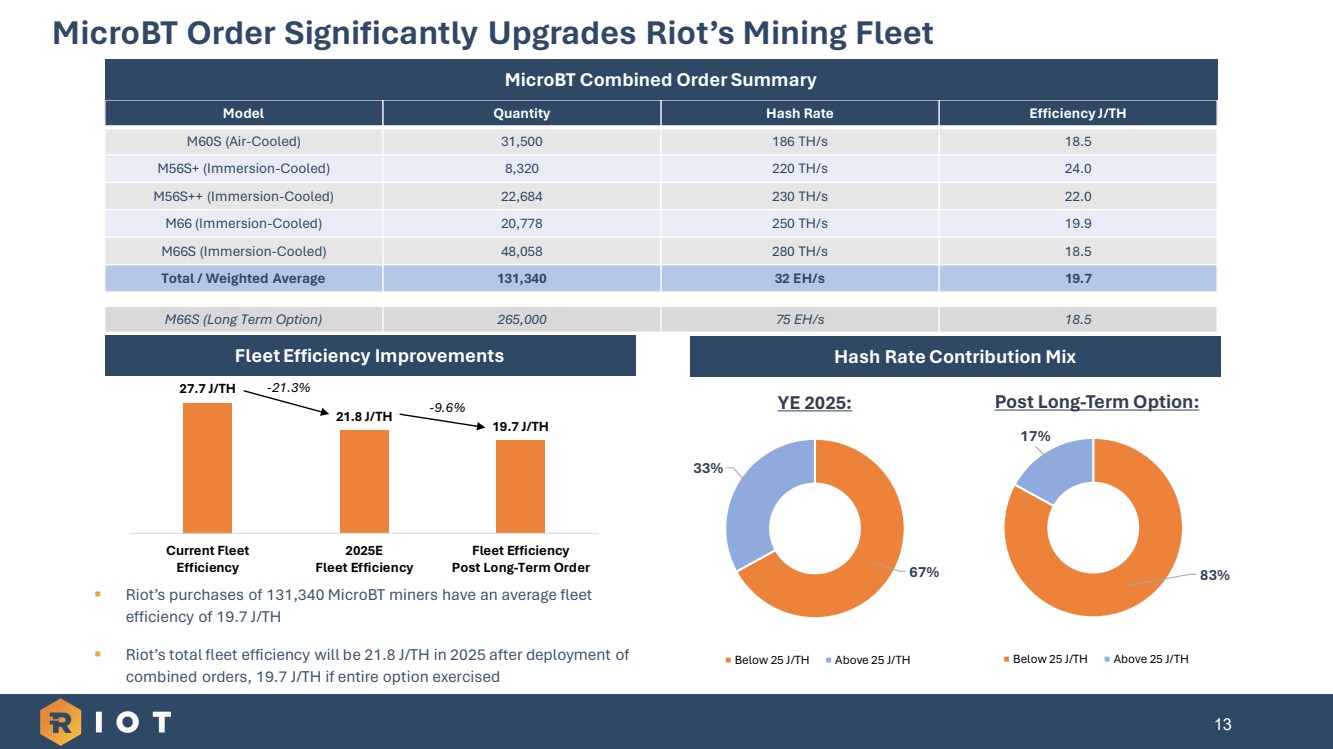
13 MicroBT Order Significantly Upgrades Riot’s Mining Fleet ▪ Riot’s purchases of 131,340 MicroBT miners have an average fleet efficiency of 19.7 J/TH ▪ Riot’s total fleet efficiency will be 21.8 J/TH in 2025 after deployment of combined orders, 19.7 J/TH if entire option exercised Model Quantity Hash Rate Efficiency J/TH M60S (Air-Cooled) 31,500 186 TH/s 18.5 M56S+ (Immersion-Cooled) 8,320 220 TH/s 24.0 M56S++ (Immersion-Cooled) 22,684 230 TH/s 22.0 M66 (Immersion-Cooled) 20,778 250 TH/s 19.9 M66S (Immersion-Cooled) 48,058 280 TH/s 18.5 Total / Weighted Average 131,340 32 EH/s 19.7 M66S (Long Term Option) 265,000 75 EH/s 18.5 Fleet Efficiency Improvements Hash Rate Contribution Mix MicroBT Combined Order Summary 27.7 J/TH 21.8 J/TH 19.7 J/TH Current Fleet Efficiency 2025E Fleet Efficiency Fleet Efficiency Post Long-Term Order -21.3% -9.6% YE 2025: Post Long-Term Option: 83% 17% Below 25 J/TH Above 25 J/TH 67% 33% Below 25 J/TH Above 25 J/TH |
|
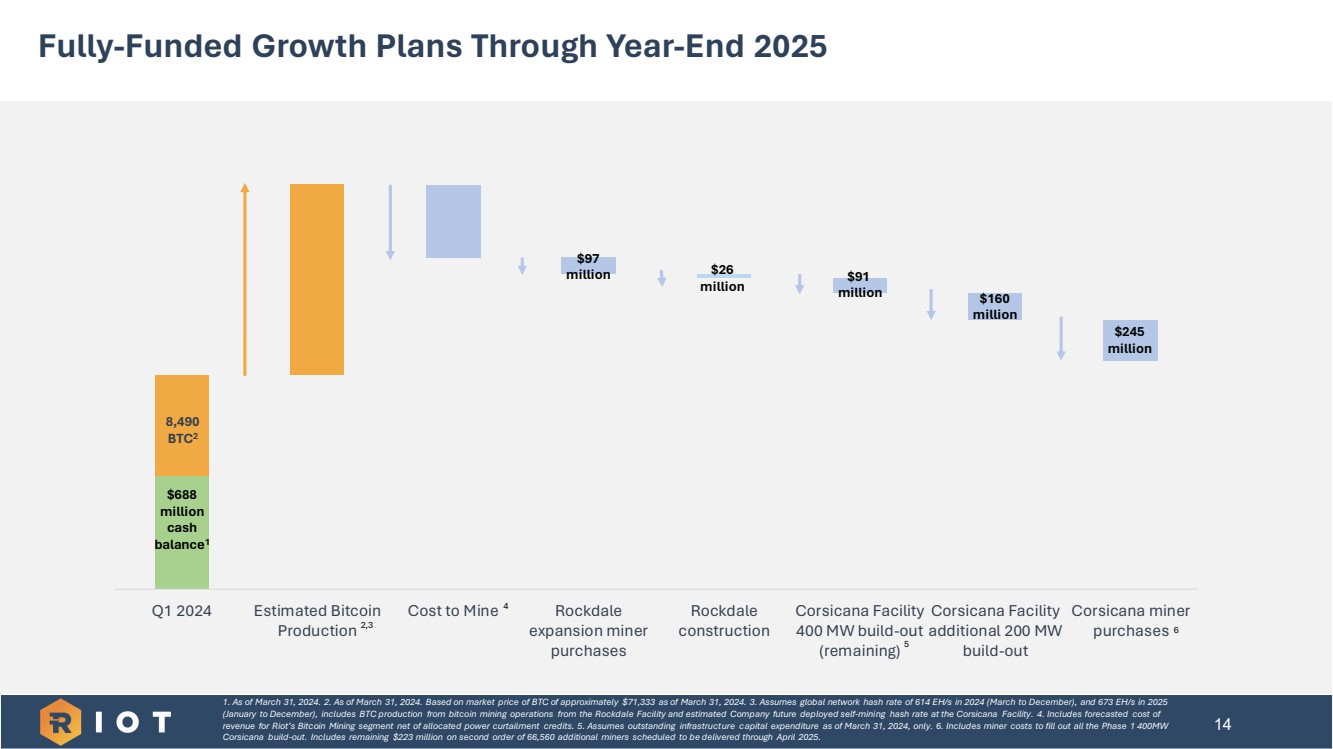
Q1 2024 Estimated Bitcoin Production Cost to Mine Rockdale expansion miner purchases Rockdale construction Corsicana Facility 400 MW build-out (remaining) Corsicana Facility additional 200 MW build-out Corsicana miner purchases 14 1. As of March 31, 2024. 2. As of March 31, 2024. Based on market price of BTC of approximately $71,333 as of March 31, 2024. 3. Assumes global network hash rate of 614 EH/s in 2024 (March to December), and 673 EH/s in 2025 (January to December), includes BTC production from bitcoin mining operations from the Rockdale Facility and estimated Company future deployed self-mining hash rate at the Corsicana Facility. 4. Includes forecasted cost of revenue for Riot’s Bitcoin Mining segment net of allocated power curtailment credits. 5. Assumes outstanding infrastructure capital expenditure as of March 31, 2024, only. 6. Includes miner costs to fill out all the Phase 1 400MW Corsicana build-out. Includes remaining $223 million on second order of 66,560 additional miners scheduled to be delivered through April 2025. $688 million cash balance1 5 6 8,490 BTC2 2,3 $97 million $91 million Fully-Funded Growth Plans Through Year-End 2025 $26 million 4 $160 million $245 million |
|
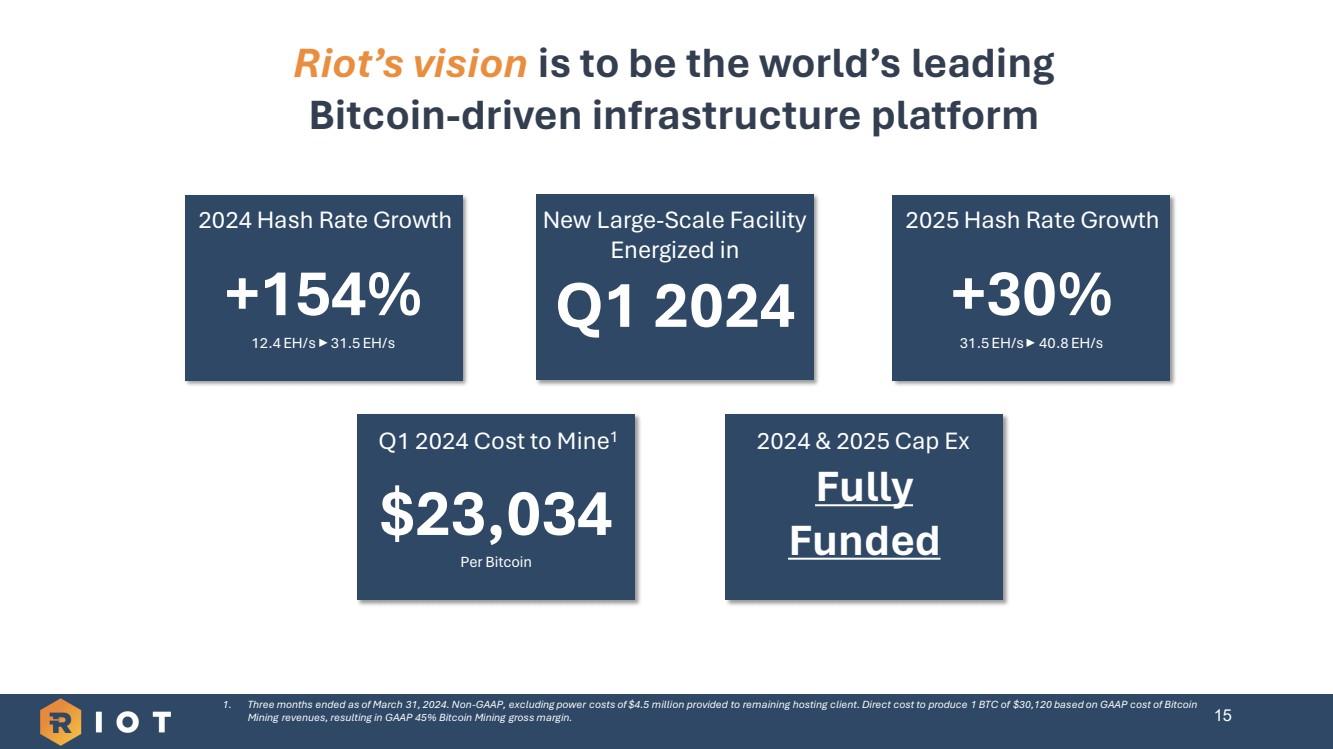
+154% 12.4 EH/s 31.5 EH/s Riot’s vision is to be the world’s leading Bitcoin-driven infrastructure platform 15 2024 Hash Rate Growth +30% 31.5 EH/s 40.8 EH/s 2025 Hash Rate Growth $23,034 Per Bitcoin Q1 2024 Cost to Mine1 Fully Funded 2024 & 2025 Cap Ex New Large-Scale Facility Energized in Q1 2024 1. Three months ended as of March 31, 2024. Non-GAAP, excluding power costs of $4.5 million provided to remaining hosting client. Direct cost to produce 1 BTC of $30,120 based on GAAP cost of Bitcoin Mining revenues, resulting in GAAP 45% Bitcoin Mining gross margin. |
|
Appendix 16 |
|
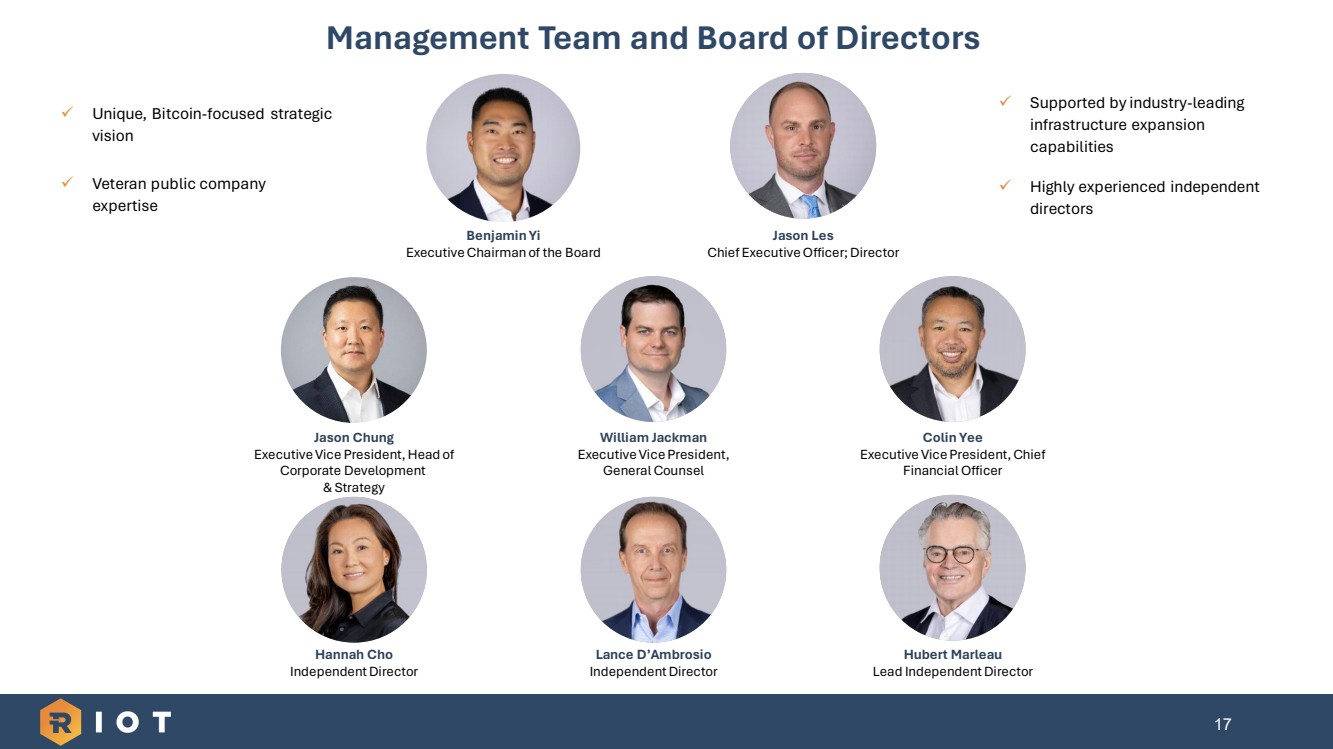
17 Management Team and Board of Directors ✓ Unique, Bitcoin-focused strategic vision ✓ Veteran public company expertise Jason Les Chief Executive Officer; Director Benjamin Yi Executive Chairman of the Board William Jackman Executive Vice President, General Counsel Colin Yee Executive Vice President, Chief Financial Officer Hannah Cho Independent Director Lance D’Ambrosio Independent Director Hubert Marleau Lead Independent Director Jason Chung Executive Vice President, Head of Corporate Development & Strategy ✓ Supported by industry-leading infrastructure expansion capabilities ✓ Highly experienced independent directors |
|
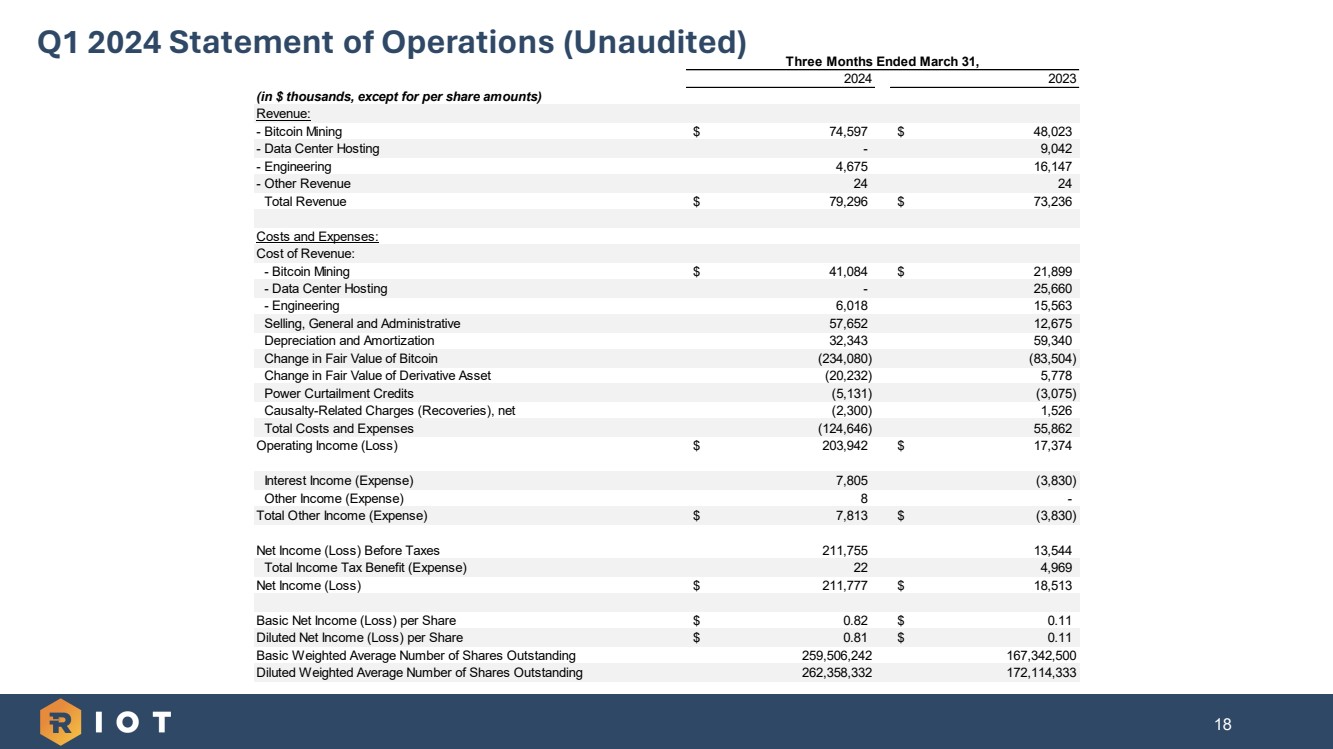
18 Q1 2024 Statement of Operations (Unaudited) 2024 2023 (in $ thousands, except for per share amounts) Revenue: - Bitcoin Mining $ 74,597 $ 48,023 - Data Center Hosting - 9,042 - Engineering 4,675 16,147 - Other Revenue 24 24 Total Revenue $ 79,296 $ 73,236 Costs and Expenses: Cost of Revenue: - Bitcoin Mining $ 41,084 $ 21,899 - Data Center Hosting - 25,660 - Engineering 6,018 15,563 Selling, General and Administrative 57,652 12,675 Depreciation and Amortization 32,343 59,340 Change in Fair Value of Bitcoin (234,080) (83,504) Change in Fair Value of Derivative Asset (20,232) 5,778 Power Curtailment Credits (5,131) (3,075) Causalty-Related Charges (Recoveries), net (2,300) 1,526 Total Costs and Expenses (124,646) 55,862 Operating Income (Loss) $ 203,942 $ 17,374 Interest Income (Expense) 7,805 (3,830) Other Income (Expense) 8 - Total Other Income (Expense) $ 7,813 $ (3,830) Net Income (Loss) Before Taxes 211,755 13,544 Total Income Tax Benefit (Expense) 22 4,969 Net Income (Loss) $ 211,777 $ 18,513 Basic Net Income (Loss) per Share $ 0.82 $ 0.11 Diluted Net Income (Loss) per Share $ 0.81 $ 0.11 Basic Weighted Average Number of Shares Outstanding 259,506,242 167,342,500 Diluted Weighted Average Number of Shares Outstanding 262,358,332 172,114,333 Three Months Ended March 31, |
|
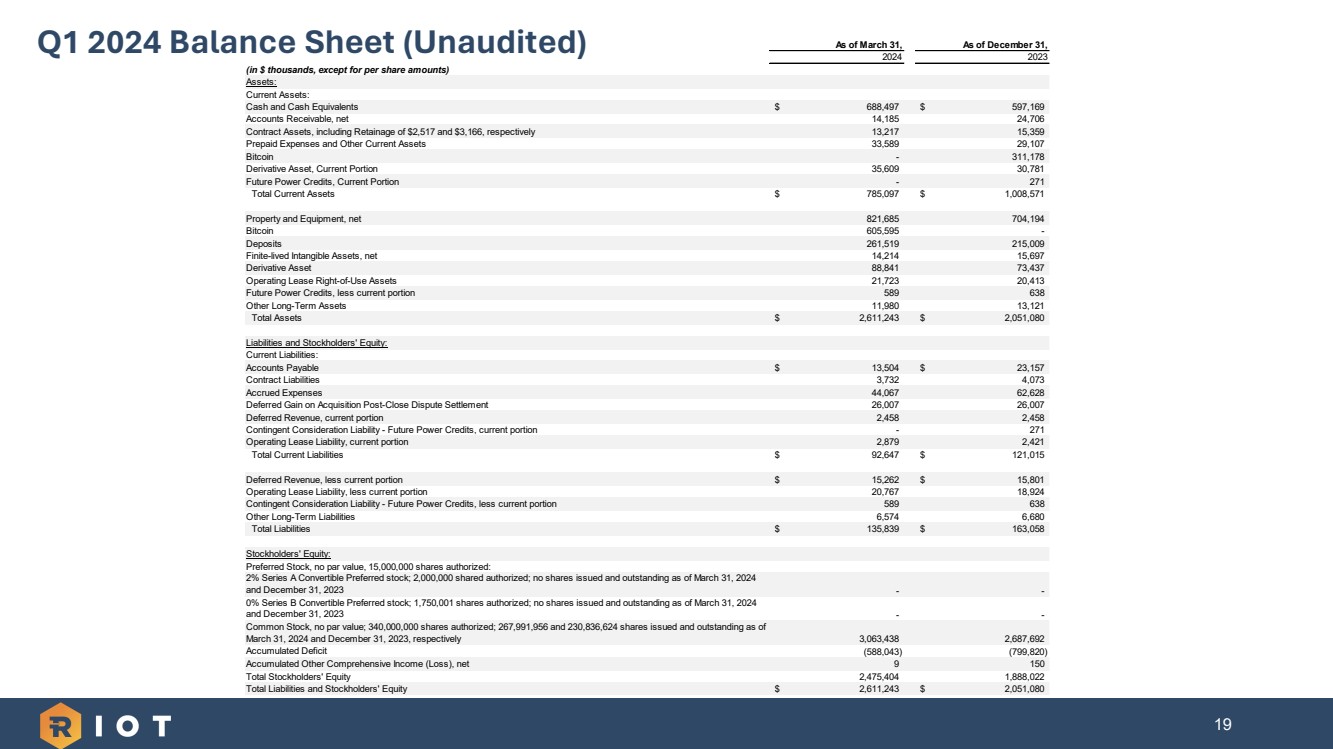
19 Q1 2024 Balance Sheet (Unaudited) As of March 31, As of December 31, 2024 2023 (in $ thousands, except for per share amounts) Assets: Current Assets: Cash and Cash Equivalents $ 688,497 $ 597,169 Accounts Receivable, net 14,185 24,706 Contract Assets, including Retainage of $2,517 and $3,166, respectively 13,217 15,359 Prepaid Expenses and Other Current Assets 33,589 29,107 Bitcoin - 311,178 Derivative Asset, Current Portion 35,609 30,781 Future Power Credits, Current Portion - 271 Total Current Assets $ 785,097 $ 1,008,571 Property and Equipment, net 821,685 704,194 Bitcoin 605,595 - Deposits 261,519 215,009 Finite-lived Intangible Assets, net 14,214 15,697 Derivative Asset 88,841 73,437 Operating Lease Right-of-Use Assets 21,723 20,413 Future Power Credits, less current portion 589 638 Other Long-Term Assets 11,980 13,121 Total Assets $ 2,611,243 $ 2,051,080 Liabilities and Stockholders' Equity: Current Liabilities: Accounts Payable $ 13,504 $ 23,157 Contract Liabilities 3,732 4,073 Accrued Expenses 44,067 62,628 Deferred Gain on Acquisition Post-Close Dispute Settlement 26,007 26,007 Deferred Revenue, current portion 2,458 2,458 Contingent Consideration Liability - Future Power Credits, current portion - 271 Operating Lease Liability, current portion 2,879 2,421 Total Current Liabilities $ 92,647 $ 121,015 Deferred Revenue, less current portion $ 15,262 $ 15,801 Operating Lease Liability, less current portion 20,767 18,924 Contingent Consideration Liability - Future Power Credits, less current portion 589 638 Other Long-Term Liabilities 6,574 6,680 Total Liabilities $ 135,839 $ 163,058 Stockholders' Equity: Preferred Stock, no par value, 15,000,000 shares authorized: 2% Series A Convertible Preferred stock; 2,000,000 shared authorized; no shares issued and outstanding as of March 31, 2024 and December 31, 2023 - - 0% Series B Convertible Preferred stock; 1,750,001 shares authorized; no shares issued and outstanding as of March 31, 2024 and December 31, 2023 - - Common Stock, no par value; 340,000,000 shares authorized; 267,991,956 and 230,836,624 shares issued and outstanding as of March 31, 2024 and December 31, 2023, respectively 3,063,438 2,687,692 Accumulated Deficit (588,043) (799,820) Accumulated Other Comprehensive Income (Loss), net 9 150 Total Stockholders' Equity 2,475,404 1,888,022 Total Liabilities and Stockholders' Equity $ 2,611,243 $ 2,051,080 |
|
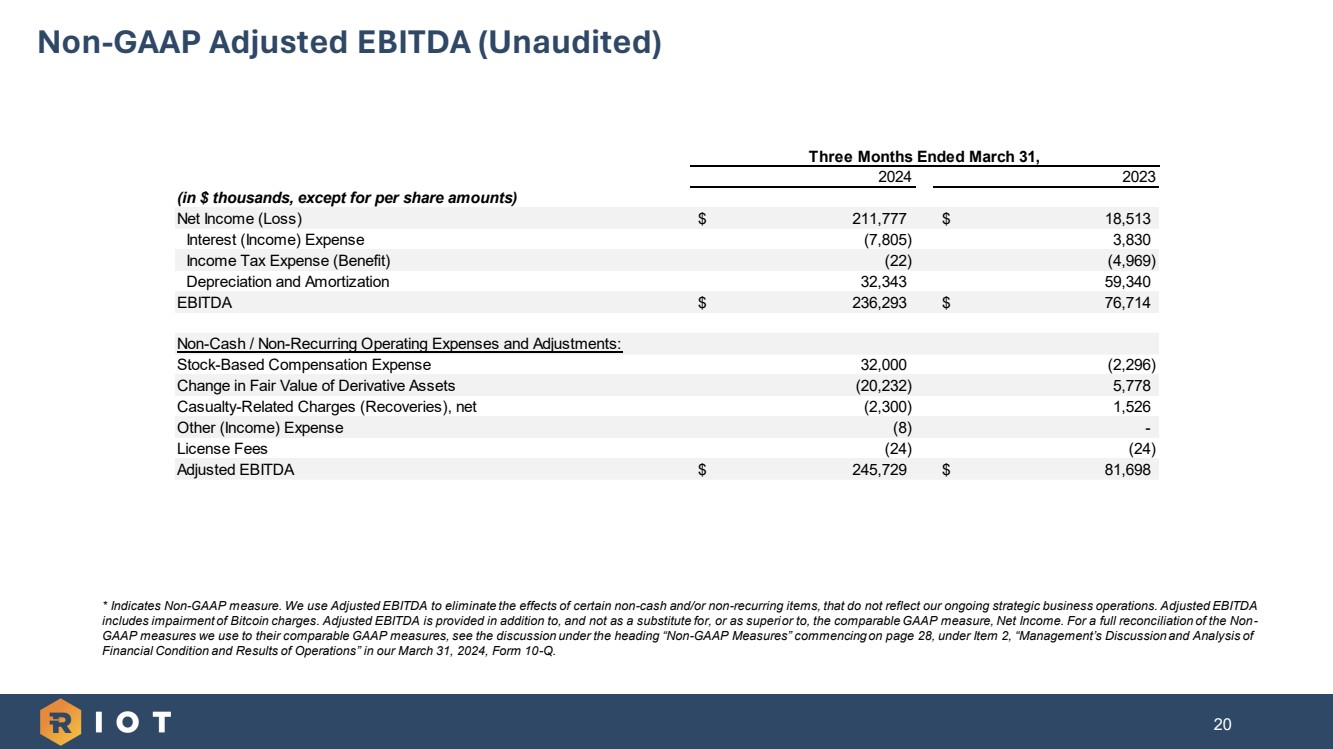
20 * Indicates Non-GAAP measure. We use Adjusted EBITDA to eliminate the effects of certain non-cash and/or non-recurring items, that do not reflect our ongoing strategic business operations. Adjusted EBITDA includes impairment of Bitcoin charges. Adjusted EBITDA is provided in addition to, and not as a substitute for, or as superior to, the comparable GAAP measure, Net Income. For a full reconciliation of the Non-GAAP measures we use to their comparable GAAP measures, see the discussion under the heading “Non-GAAP Measures” commencing on page 28, under Item 2, “Management’s Discussion and Analysis of Financial Condition and Results of Operations” in our March 31, 2024, Form 10-Q. Non-GAAP Adjusted EBITDA (Unaudited) 2024 2023 (in $ thousands, except for per share amounts) Net Income (Loss) $ 211,777 $ 18,513 Interest (Income) Expense (7,805) 3,830 Income Tax Expense (Benefit) (22) (4,969) Depreciation and Amortization 32,343 59,340 EBITDA $ 236,293 $ 76,714 Non-Cash / Non-Recurring Operating Expenses and Adjustments: Stock-Based Compensation Expense 32,000 (2,296) Change in Fair Value of Derivative Assets (20,232) 5,778 Casualty-Related Charges (Recoveries), net (2,300) 1,526 Other (Income) Expense (8) - License Fees (24) (24) Adjusted EBITDA $ 245,729 $ 81,698 Three Months Ended March 31, |