UNITED STATES
SECURITIES AND EXCHANGE COMMISSION
Washington, D.C. 20549
FORM 6-K
REPORT OF FOREIGN PRIVATE ISSUER PURSUANT TO RULE 13a-16 OR 15d-16 UNDER THE SECURITIES EXCHANGE ACT OF 1934
For the month of May 2024
Commission File Number: 001-41411
Haleon plc
(Translation of registrant’s name into English)
Building 5, First Floor, The Heights,
Weybridge, Surrey, KT13 0NY
(Address of principal executive offices)
Indicate by check mark whether the registrant files or will file annual reports under cover of Form 20-F or Form 40-F:
Form 20-F |
Form 40-F |
☒ |
☐ |
INCORPORATION BY REFERENCE
This report on Form 6-K shall be deemed to be filed and incorporated by reference in the registration statement on Form F-3 (No. 333-273103) and the registration statement on Form S-8 (No. 333-267647) of Haleon plc and to be a part thereof from the date on which this report is furnished, to the extent not superseded by documents or reports subsequently filed or furnished.
EXHIBIT INDEX
Exhibit Number |
Description |
99.1 |
2024 Q1 Trading Statement dated May 1, 2024 |
SIGNATURE
Pursuant to the requirements of the Securities Exchange Act of 1934, the registrant has duly caused this report to be signed on its behalf by the undersigned, thereunto duly authorized.
|
HALEON PLC |
||
|
(Registrant) |
||
|
|
||
Date: May 1, 2024 |
By: |
/s/ Amanda Mellor |
|
|
|
Name: |
Amanda Mellor |
|
|
Title: |
Company Secretary |
|
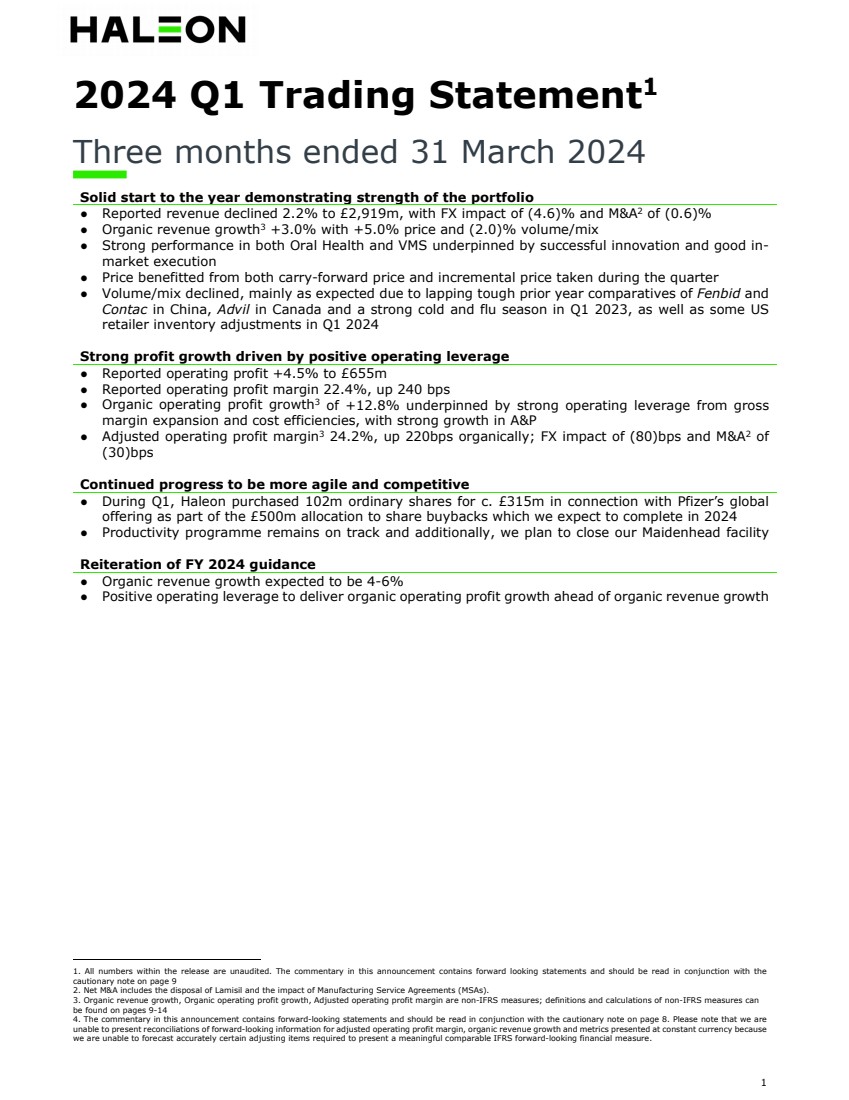
1 2024 Q1 Trading Statement1 Three months ended 31 March 2024 Solid start to the year demonstrating strength of the portfolio ● Reported revenue declined 2.2% to £2,919m, with FX impact of (4.6)% and M&A2 of (0.6)% ● Organic revenue growth3 +3.0% with +5.0% price and (2.0)% volume/mix ● Strong performance in both Oral Health and VMS underpinned by successful innovation and good in-market execution ● Price benefitted from both carry-forward price and incremental price taken during the quarter ● Volume/mix declined, mainly as expected due to lapping tough prior year comparatives of Fenbid and Contac in China, Advil in Canada and a strong cold and flu season in Q1 2023, as well as some US retailer inventory adjustments in Q1 2024 Strong profit growth driven by positive operating leverage ● Reported operating profit +4.5% to £655m ● Reported operating profit margin 22.4%, up 240 bps ● Organic operating profit growth3 of +12.8% underpinned by strong operating leverage from gross margin expansion and cost efficiencies, with strong growth in A&P ● Adjusted operating profit margin3 24.2%, up 220bps organically; FX impact of (80)bps and M&A2 of (30)bps Continued progress to be more agile and competitive ● During Q1, Haleon purchased 102m ordinary shares for c. £315m in connection with Pfizer’s global offering as part of the £500m allocation to share buybacks which we expect to complete in 2024 ● Productivity programme remains on track and additionally, we plan to close our Maidenhead facility Reiteration of FY 2024 guidance ● Organic revenue growth expected to be 4-6% ● Positive operating leverage to deliver organic operating profit growth ahead of organic revenue growth 1. All numbers within the release are unaudited. The commentary in this announcement contains forward looking statements and should be read in conjunction with the cautionary note on page 9 2. Net M&A includes the disposal of Lamisil and the impact of Manufacturing Service Agreements (MSAs). 3. Organic revenue growth, Organic operating profit growth, Adjusted operating profit margin are non-IFRS measures; definitions and calculations of non-IFRS measures can be found on pages 9-14 4. The commentary in this announcement contains forward-looking statements and should be read in conjunction with the cautionary note on page 8. Please note that we are unable to present reconciliations of forward-looking information for adjusted operating profit margin, organic revenue growth and metrics presented at constant currency because we are unable to forecast accurately certain adjusting items required to present a meaningful comparable IFRS forward-looking financial measure. |
|
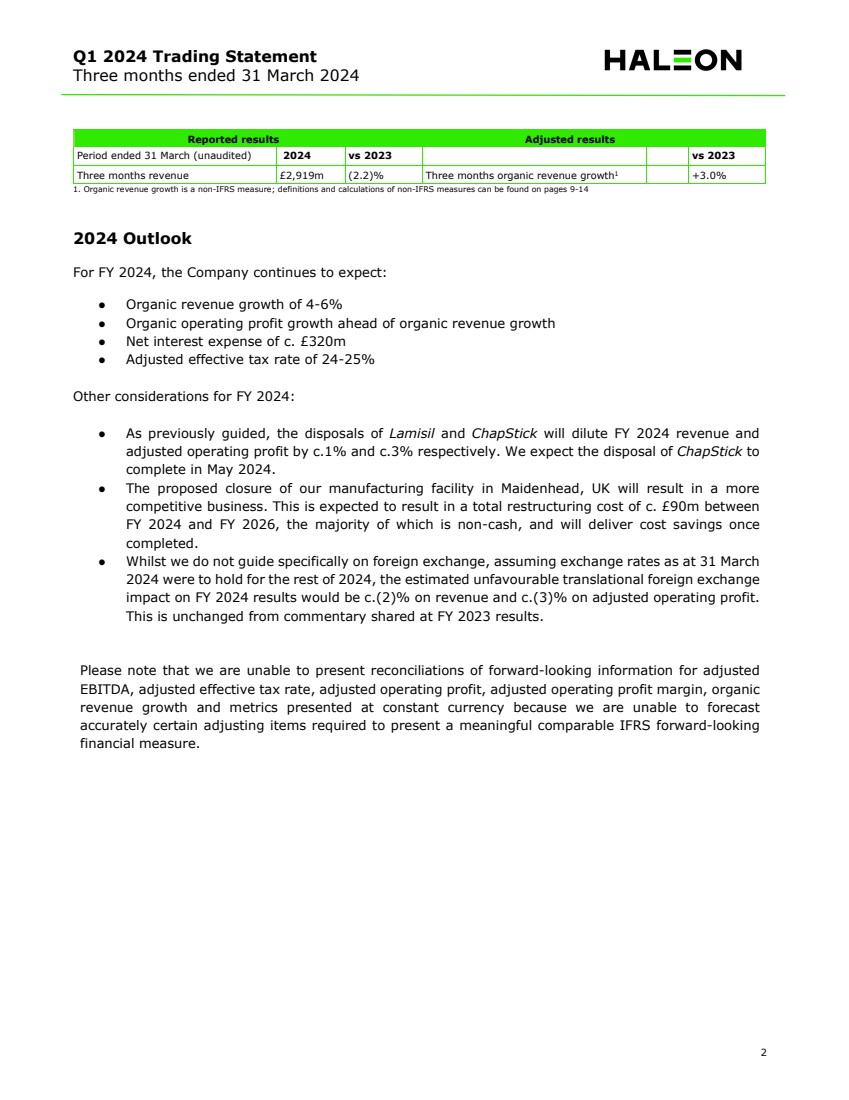
Q1 2024 Trading Statement Three months ended 31 March 2024 2 1. Organic revenue growth is a non-IFRS measure; definitions and calculations of non-IFRS measures can be found on pages 9-14 2024 Outlook For FY 2024, the Company continues to expect: ● Organic revenue growth of 4-6% ● Organic operating profit growth ahead of organic revenue growth ● Net interest expense of c. £320m ● Adjusted effective tax rate of 24-25% Other considerations for FY 2024: ● As previously guided, the disposals of Lamisil and ChapStick will dilute FY 2024 revenue and adjusted operating profit by c.1% and c.3% respectively. We expect the disposal of ChapStick to complete in May 2024. ● The proposed closure of our manufacturing facility in Maidenhead, UK will result in a more competitive business. This is expected to result in a total restructuring cost of c. £90m between FY 2024 and FY 2026, the majority of which is non-cash, and will deliver cost savings once completed. ● Whilst we do not guide specifically on foreign exchange, assuming exchange rates as at 31 March 2024 were to hold for the rest of 2024, the estimated unfavourable translational foreign exchange impact on FY 2024 results would be c.(2)% on revenue and c.(3)% on adjusted operating profit. This is unchanged from commentary shared at FY 2023 results. Please note that we are unable to present reconciliations of forward-looking information for adjusted EBITDA, adjusted effective tax rate, adjusted operating profit, adjusted operating profit margin, organic revenue growth and metrics presented at constant currency because we are unable to forecast accurately certain adjusting items required to present a meaningful comparable IFRS forward-looking financial measure. Reported results Adjusted results Period ended 31 March (unaudited) 2024 vs 2023 vs 2023 Three months revenue £2,919m (2.2)% Three months organic revenue growth1 +3.0% |
|
Q1 2024 Trading Statement Three months ended 31 March 2024 3 Presentation for analysts and shareholders: A short presentation followed by Q&A will be hosted by Tobias Hestler, Chief Financial Officer and Sonya Ghobrial, Head of Investor Relations at 9:00am BST (10:00am CEST) on 1 May 2024, which can be accessed at www.haleon.com/investors. For analysts and shareholders wishing to ask questions on the Q&A call, please use the dial-in details below which will have a Q&A facility: UK: +44 800 279 3956 US: +1 866 291 4166 All other: +44 (0) 207 107 0613 Passcode: 43700369 An archived webcast of the Q&A call will be available later on the day of the results and can be accessed at www.haleon.com/investors. Financial reporting calendar 2024 Annual General Meeting 8 May 2024 HY 2024 Results 1 August 2024 Q3 2024 Trading Statement 31 October 2024 Enquiries Investors Media Sonya Ghobrial +44 7392 784784 Zoe Bird +44 7736 746167 Rakesh Patel +44 7552 484646 Nidaa Lone +44 7841 400607 Emma White +44 7823 523562 Email: investor-relations@haleon.com Email: corporate.media@haleon.com About Haleon plc Haleon (LSE/NYSE: HLN) is a global leader in consumer health, with a purpose to deliver better everyday health with humanity. Haleon’s product portfolio spans five major categories – Oral Health, Pain Relief, Respiratory Health, Digestive Health and Other, and Vitamins, Minerals and Supplements (VMS). Its long-standing brands – such as Advil, Sensodyne, Panadol, Voltaren, Theraflu, Otrivin, Polident, parodontax and Centrum – are built on trusted science, innovation and deep human understanding. For more information please visit www.haleon.com |
|
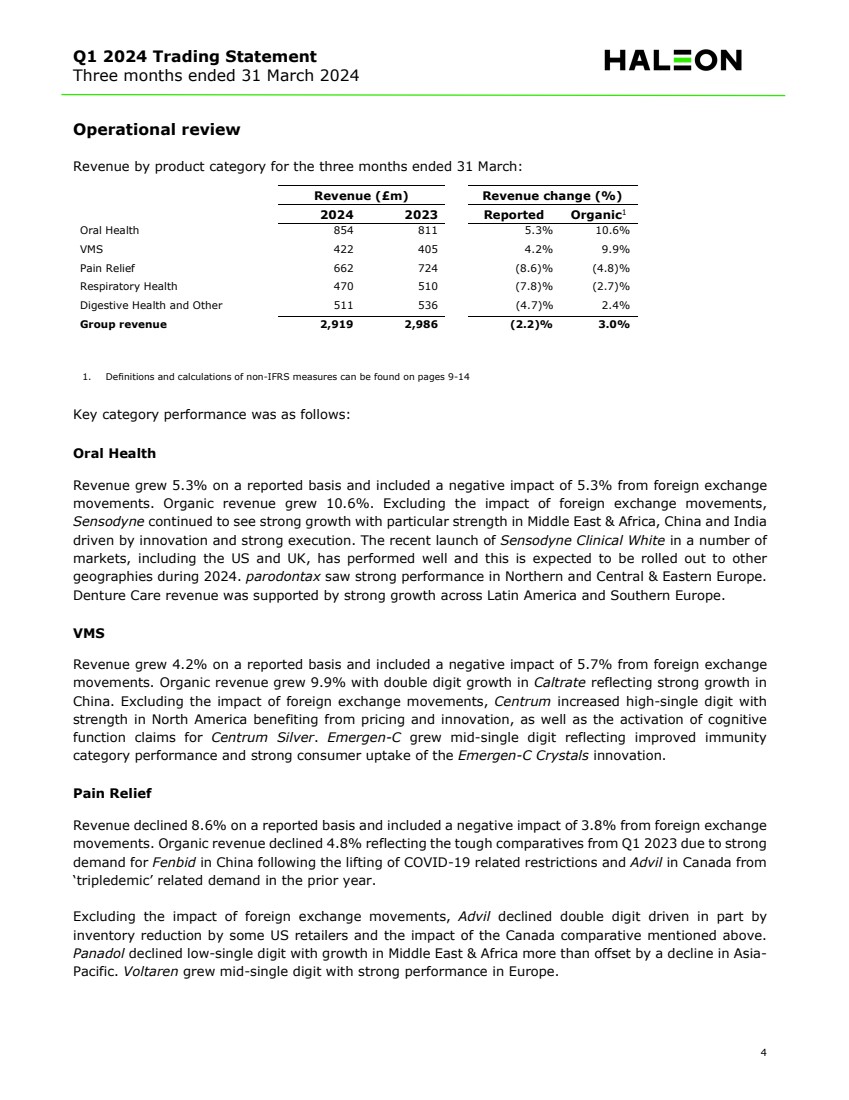
Q1 2024 Trading Statement Three months ended 31 March 2024 4 Operational review Revenue by product category for the three months ended 31 March: Revenue (£m) Revenue change (%) 2024 2023 Reported Organic1 Oral Health 854 811 5.3% 10.6% VMS 422 405 4.2% 9.9% Pain Relief 662 724 (8.6)% (4.8)% Respiratory Health 470 510 (7.8)% (2.7)% Digestive Health and Other 511 536 (4.7)% 2.4% Group revenue 2,919 2,986 (2.2)% 3.0% 1. Definitions and calculations of non-IFRS measures can be found on pages 9-14 Key category performance was as follows: Oral Health Revenue grew 5.3% on a reported basis and included a negative impact of 5.3% from foreign exchange movements. Organic revenue grew 10.6%. Excluding the impact of foreign exchange movements, Sensodyne continued to see strong growth with particular strength in Middle East & Africa, China and India driven by innovation and strong execution. The recent launch of Sensodyne Clinical White in a number of markets, including the US and UK, has performed well and this is expected to be rolled out to other geographies during 2024. parodontax saw strong performance in Northern and Central & Eastern Europe. Denture Care revenue was supported by strong growth across Latin America and Southern Europe. VMS Revenue grew 4.2% on a reported basis and included a negative impact of 5.7% from foreign exchange movements. Organic revenue grew 9.9% with double digit growth in Caltrate reflecting strong growth in China. Excluding the impact of foreign exchange movements, Centrum increased high-single digit with strength in North America benefiting from pricing and innovation, as well as the activation of cognitive function claims for Centrum Silver. Emergen-C grew mid-single digit reflecting improved immunity category performance and strong consumer uptake of the Emergen-C Crystals innovation. Pain Relief Revenue declined 8.6% on a reported basis and included a negative impact of 3.8% from foreign exchange movements. Organic revenue declined 4.8% reflecting the tough comparatives from Q1 2023 due to strong demand for Fenbid in China following the lifting of COVID-19 related restrictions and Advil in Canada from ‘tripledemic’ related demand in the prior year. Excluding the impact of foreign exchange movements, Advil declined double digit driven in part by inventory reduction by some US retailers and the impact of the Canada comparative mentioned above. Panadol declined low-single digit with growth in Middle East & Africa more than offset by a decline in Asia-Pacific. Voltaren grew mid-single digit with strong performance in Europe. |
|
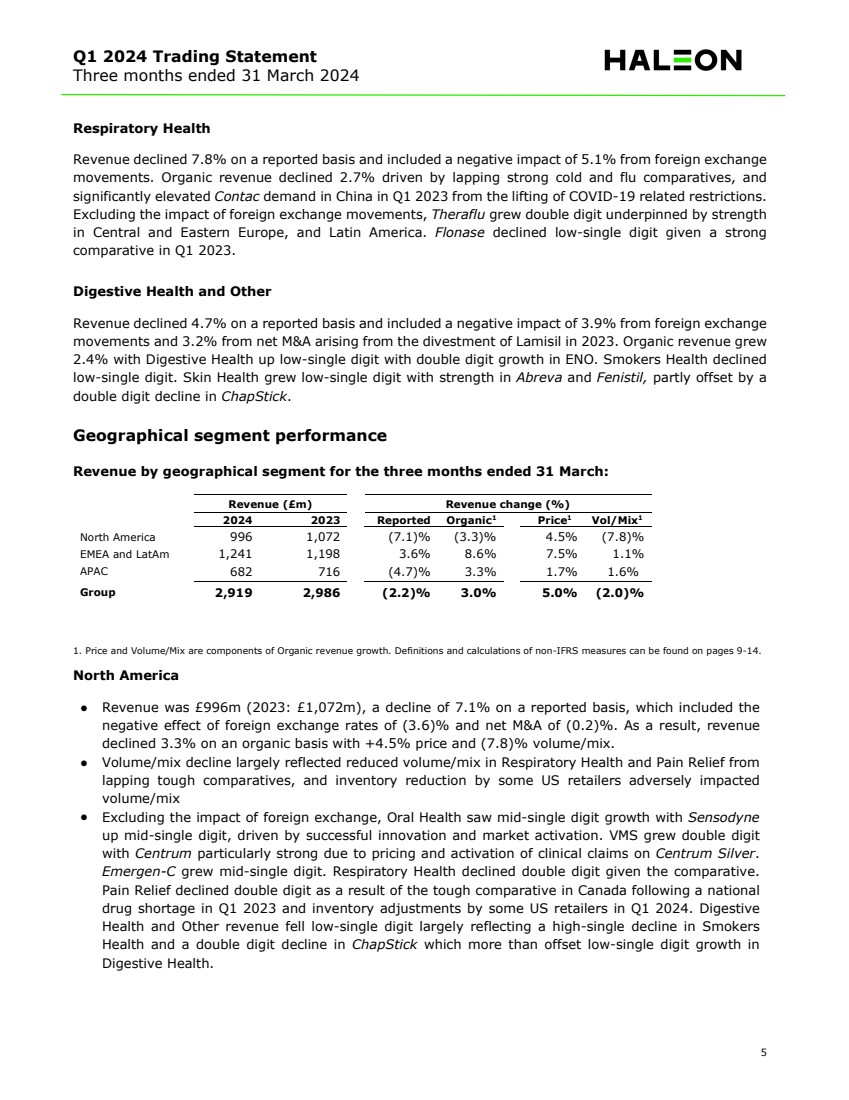
Q1 2024 Trading Statement Three months ended 31 March 2024 5 Respiratory Health Revenue declined 7.8% on a reported basis and included a negative impact of 5.1% from foreign exchange movements. Organic revenue declined 2.7% driven by lapping strong cold and flu comparatives, and significantly elevated Contac demand in China in Q1 2023 from the lifting of COVID-19 related restrictions. Excluding the impact of foreign exchange movements, Theraflu grew double digit underpinned by strength in Central and Eastern Europe, and Latin America. Flonase declined low-single digit given a strong comparative in Q1 2023. Digestive Health and Other Revenue declined 4.7% on a reported basis and included a negative impact of 3.9% from foreign exchange movements and 3.2% from net M&A arising from the divestment of Lamisil in 2023. Organic revenue grew 2.4% with Digestive Health up low-single digit with double digit growth in ENO. Smokers Health declined low-single digit. Skin Health grew low-single digit with strength in Abreva and Fenistil, partly offset by a double digit decline in ChapStick. Geographical segment performance Revenue by geographical segment for the three months ended 31 March: Revenue (£m) Revenue change (%) 2024 2023 Reported Organic1 Price1 Vol/Mix1 North America 996 1,072 (7.1)% (3.3)% 4.5% (7.8)% EMEA and LatAm 1,241 1,198 3.6% 8.6% 7.5% 1.1% APAC 682 716 (4.7)% 3.3% 1.7% 1.6% Group 2,919 2,986 (2.2)% 3.0% 5.0% (2.0)% 1. Price and Volume/Mix are components of Organic revenue growth. Definitions and calculations of non-IFRS measures can be found on pages 9-14. North America ● Revenue was £996m (2023: £1,072m), a decline of 7.1% on a reported basis, which included the negative effect of foreign exchange rates of (3.6)% and net M&A of (0.2)%. As a result, revenue declined 3.3% on an organic basis with +4.5% price and (7.8)% volume/mix. ● Volume/mix decline largely reflected reduced volume/mix in Respiratory Health and Pain Relief from lapping tough comparatives, and inventory reduction by some US retailers adversely impacted volume/mix ● Excluding the impact of foreign exchange, Oral Health saw mid-single digit growth with Sensodyne up mid-single digit, driven by successful innovation and market activation. VMS grew double digit with Centrum particularly strong due to pricing and activation of clinical claims on Centrum Silver. Emergen-C grew mid-single digit. Respiratory Health declined double digit given the comparative. Pain Relief declined double digit as a result of the tough comparative in Canada following a national drug shortage in Q1 2023 and inventory adjustments by some US retailers in Q1 2024. Digestive Health and Other revenue fell low-single digit largely reflecting a high-single decline in Smokers Health and a double digit decline in ChapStick which more than offset low-single digit growth in Digestive Health. |
|
Q1 2024 Trading Statement Three months ended 31 March 2024 6 Europe, Middle East & Africa (EMEA) and Latin America (LatAm) ● Revenue was £1,241m (2023: £1,198m), a growth of 3.6% on a reported basis which included the negative impact of foreign exchange rates of (4.0)% and net M&A of (1.0)%. As a result, organic revenue growth in EMEA and LatAm was 8.6%, with +7.5% price and +1.1% volume/mix. Pricing in this region partly benefitted from carry-forward pricing taken in 2023 along with incremental pricing taken in the region. The impact of carry-forward pricing from 2023 is expected to reduce going forward. The region saw broad based volume/mix growth which was held back by a decline in Middle East and Africa. ● As previously noted in the FY 2023 results announcement, the benefit of pricing in high inflation economies, Turkey and Argentina is capped at 26% from one period to the next. ● Excluding the impact of foreign exchange, Oral Health and Digestive Health and Other both grew double digit. In Oral Health, there was double digit growth across all three Power Brands particularly across Europe and Latin America. VMS revenue grew mid-single digit with Centrum up mid-single digit and a good performance across local brands. In Pain Relief, revenue increased mid-single digit with high-single digit growth in Voltaren and low-single digit growth in Panadol. Respiratory Health revenue was up mid-single digit driven by a good cold and flu season across Central and Eastern Europe. In Digestive Health and Other revenue ENO grew double digit, Smokers Health was up mid-single digit and Skin Health grew double digit driven by Fenistil. ● Geographically, and excluding the impact of foreign exchange, Latin America, and Central & Eastern Europe were up double digit. Northern and Southern Europe, Germany and Middle East and Africa all grew mid-single digit. Asia-Pacific (APAC) ● Revenue was £682m (2023: £716m), a decline of 4.7% on a reported basis which included the negative impact of foreign exchange rates of (7.4)% and net M&A of (0.6)%. As a result, organic revenue growth in APAC was 3.3%, with +1.7% price and +1.6% volume/mix. ● Revenue was impacted by the high comparative from Fenbid and Contac in China during Q1 2023. ● Excluding the impact of foreign exchange, double digit growth in Oral Health was driven by continued momentum in Sensodyne with strong performance in China and India. VMS grew high-single digit with strength in Caltrate from increased consumption in China. Respiratory Health grew high-single digit despite the tough comparative from Contac in Q1 2023 following the lifting of COVID-19 related restrictions. Pain Relief declined double digit driven by a double digit decline in Fenbid due to tough comparatives following the easing of COVID-19 related restrictions in China in Q1 2023. Panadol declined mid-single digit due to Australia. Digestive Health and Other was up low-single digit with mid-single digit growth in Digestive Health underpinned by high-single digit growth in ENO. Smokers Health grew double digit and there was a high-single digit decline in Skin Health revenues. ● Geographically and excluding the impact of foreign exchange, India grew double digit helped by continued strength in Sensodyne. China declined low-single digit due to lapping the tough prior year comparative. North Asia was up mid-single digit, South East Asia & Taiwan grew high-single digit and Australia/New Zealand was down mid-single digit. |
|
Q1 2024 Trading Statement Three months ended 31 March 2024 7 Operating profit and margin Operating profit increased by 4.5% to £655m (Q1 2023: £627m), and operating profit margin increased by 140bps to 22.4% (Q1 2023: 21.0%). Adjusted operating profit increased +2.3% at actual exchange rates to £707m (Q1 2023: £691m). FX reduced adjusted operating profit by £59m (8.6%) and net M&A reduced it by £12m (1.9%). Organic operating profit growth was +12.8% driven by good operating leverage, particularly through price as well as efficiencies, which were only partially offset by volume/mix decline. Adjusted operating profit margin increased to 24.2% (up 100bps and 220bps organically). |
|
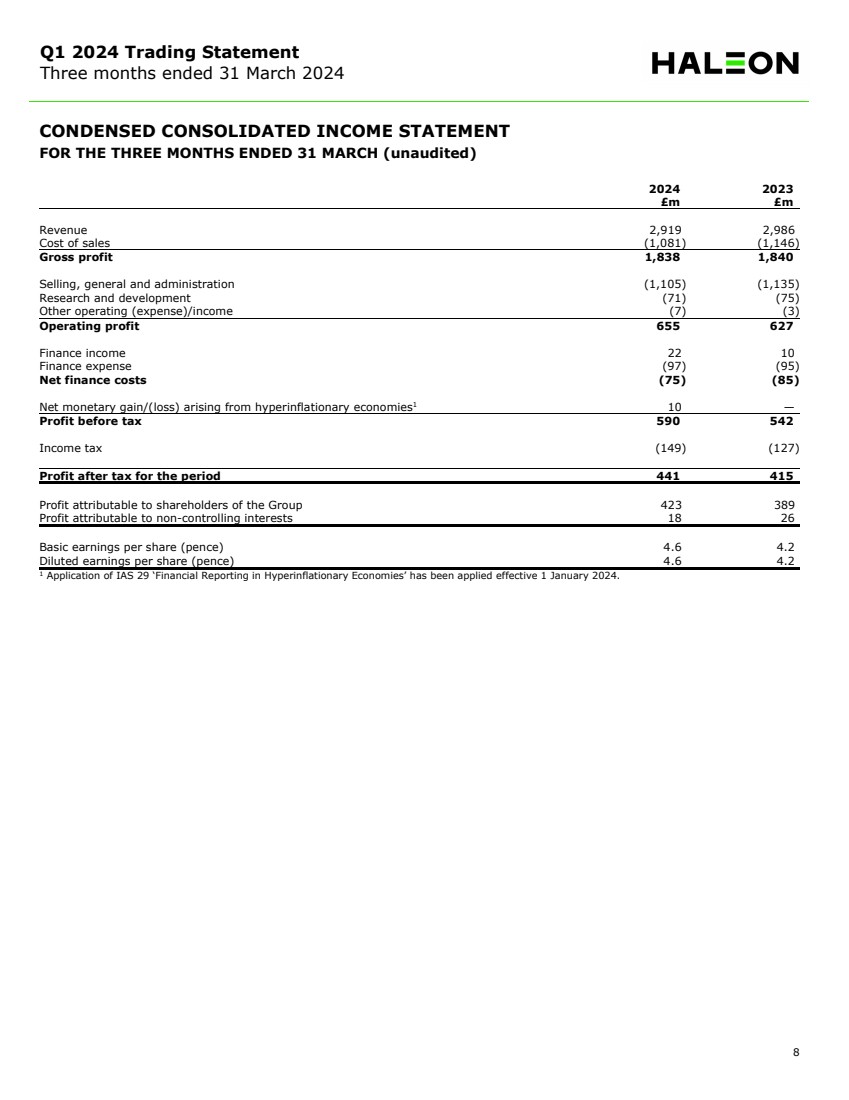
Q1 2024 Trading Statement Three months ended 31 March 2024 8 CONDENSED CONSOLIDATED INCOME STATEMENT FOR THE THREE MONTHS ENDED 31 MARCH (unaudited) 2024 2023 £m £m Revenue 2,919 2,986 Cost of sales (1,081) (1,146) Gross profit 1,838 1,840 Selling, general and administration (1,105) (1,135) Research and development (71) (75) Other operating (expense)/income (7) (3) Operating profit 655 627 Finance income 22 10 Finance expense (97) (95) Net finance costs (75) (85) Net monetary gain/(loss) arising from hyperinflationary economies1 10 — Profit before tax 590 542 Income tax (149) (127) Profit after tax for the period 441 415 Profit attributable to shareholders of the Group 423 389 Profit attributable to non-controlling interests 18 26 Basic earnings per share (pence) 4.6 4.2 Diluted earnings per share (pence) 4.6 4.2 1 Application of IAS 29 ‘Financial Reporting in Hyperinflationary Economies’ has been applied effective 1 January 2024. |
|
Q1 2024 Trading Statement Three months ended 31 March 2024 9 Appendix Cautionary note regarding forward-looking statements This document contains certain statements that are, or may be deemed to be, "forward-looking statements“ (including for purposes of the safe harbor provisions for forward-looking statements contained in Section 27A of the Securities Act of 1933 and Section 21E of the Securities Exchange Act of 1934). Forward-looking statements give Haleon’s current expectations and projections about future events, including strategic initiatives and future financial condition and performance, and so Haleon’s actual results may differ materially from what is expressed or implied by such forward-looking statements. Forward-looking statements sometimes use words such as "expects“, "anticipates“, "believes“, "targets“, "plans", "intends“, “aims”, "projects“, "indicates", "may", “might”, "will", "should“, “potential”, “could” and words of similar meaning (or the negative thereof). All statements, other than statements of historical facts, included in this presentation are forward-looking statements. Such forward-looking statements include, but are not limited to, statements relating to future actions, prospective products or product approvals, delivery on strategic initiatives (including but not limited to acquisitions and dispositions, realisations of efficiencies and responsible business goals), future performance or results of current and anticipated products, sales efforts, expenses, the outcome of contingencies such as legal proceedings, dividend payments and financial results. Any forward-looking statements made by or on behalf of Haleon speak only as of the date they are made and are based upon the knowledge and information available to Haleon on the date of this document. These forward-looking statements and views may be based on a number of assumptions and, by their nature, involve known and unknown risks, uncertainties and other factors because they relate to events and depend on circumstances that may or may not occur in the future and/or are beyond Haleon’s control or precise estimate. Such risks, uncertainties and other factors that could cause Haleon’s actual results, performance or achievements to differ materially from those in the forward-looking statements include, but are not limited to, those discussed under “Risk Factors” on pages 193 to 201 in Haleon’s Annual Report and Form 20-F 2023. Forward-looking statements should, therefore, be construed in light of such risk factors and undue reliance should not be placed on forward-looking statements. Subject to our obligations under English and U.S. law in relation to disclosure and ongoing information (including under the Market Abuse Regulations, the UK Listing Rules and the Disclosure and Transparency Rules of the Financial Conduct Authority ("FCA")), we undertake no obligation to update publicly or revise any forward-looking statements, whether as a result of new information, future events or otherwise. You should, however, consult any additional disclosures that Haleon may make in any documents which it publishes and/or files with the SEC and take note of these disclosures, wherever you are located. No statement in this document is or is intended to be a profit forecast or profit estimate. Use of non-IFRS measures (unaudited) We use certain alternative performance measures to make financial, operating, and planning decisions and to evaluate and report performance. We believe these measures provide useful information to investors and as such, where clearly identified, we have included certain alternative performance measures in this document to allow investors to better analyse our business performance and allow greater comparability. To do so, we have excluded items affecting the comparability of period-over-period financial performance. Adjusted Results and other non-IFRS measures may be considered in addition to, but not as a substitute for or superior to, information presented in accordance with IFRS. |
|
Q1 2024 Trading Statement Three months ended 31 March 2024 10 Adjusted results Adjusted results comprise adjusted cost of sales, adjusted gross profit, adjusted gross profit margin, adjusted selling, general and administration (SG&A), adjusted research and development (R&D), adjusted other operating income/(expense), adjusted operating expenses, adjusted operating profit, adjusted operating profit margin, adjusted net finance costs, adjusted profit before tax, adjusted income tax, adjusted effective tax rate, adjusted profit after tax, adjusted profit attributable to shareholders, adjusted diluted earnings per share. Adjusted results exclude net amortisation and impairment of intangible assets, restructuring costs, transaction-related costs, separation and admission costs, and disposals and others, in each case net of the impact of taxes (where applicable) (collectively the adjusting items). Management believes that adjusted results, when considered together with the Group’s operating results as reported under IFRS, provide investors, analysts and other stakeholders with helpful complementary information to understand the financial performance and position of the Group from period to period and allow the Group’s performance to be more easily comparable. Adjusting items Adjusted results exclude the following items (net of the impact of taxes, where applicable): Net amortisation and impairment of intangible assets Net impairment of intangibles, impairment of goodwill and amortisation of acquired intangibles excluding computer software. These adjustments are made to reflect the performance of the business excluding the effect of acquisitions. Restructuring costs From time to time, the Group may undertake business restructuring programmes that are structural in nature and significant in scale. The cost associated with such programmes includes severance and other personnel costs, professional fees, impairments of assets, and other related items. Transaction-related costs Transaction related accounting or other adjustments related to significant acquisitions including deal costs and other pre-acquisition costs when there is certainty that an acquisition will complete. It also includes costs of registering and issuing debt and equity securities and the effect of inventory revaluations on acquisitions. Separation and admission costs Costs incurred in relation to and in connection with separation, UK Admission and registration of the Company’s Ordinary Shares represented by the Company’s American Depositary Shares (ADSs) under the Securities Exchange Act of 1934 and listing of ADSs on the NYSE. These costs are not directly attributable to the sale of the Group’s products and specifically relate to the foregoing activities, affecting comparability of the Group’s financial results in historical and future reporting periods. Disposals and others Includes gains and losses on disposals of assets, businesses and tax indemnities related to business combinations, legal settlement and judgements, impact of changes in tax rates and tax laws on deferred tax assets and liabilities, retained or uninsured losses related to acts of terrorism, significant product recalls, natural disasters and other items. These gains and losses are not directly attributable to the sale of the |
|
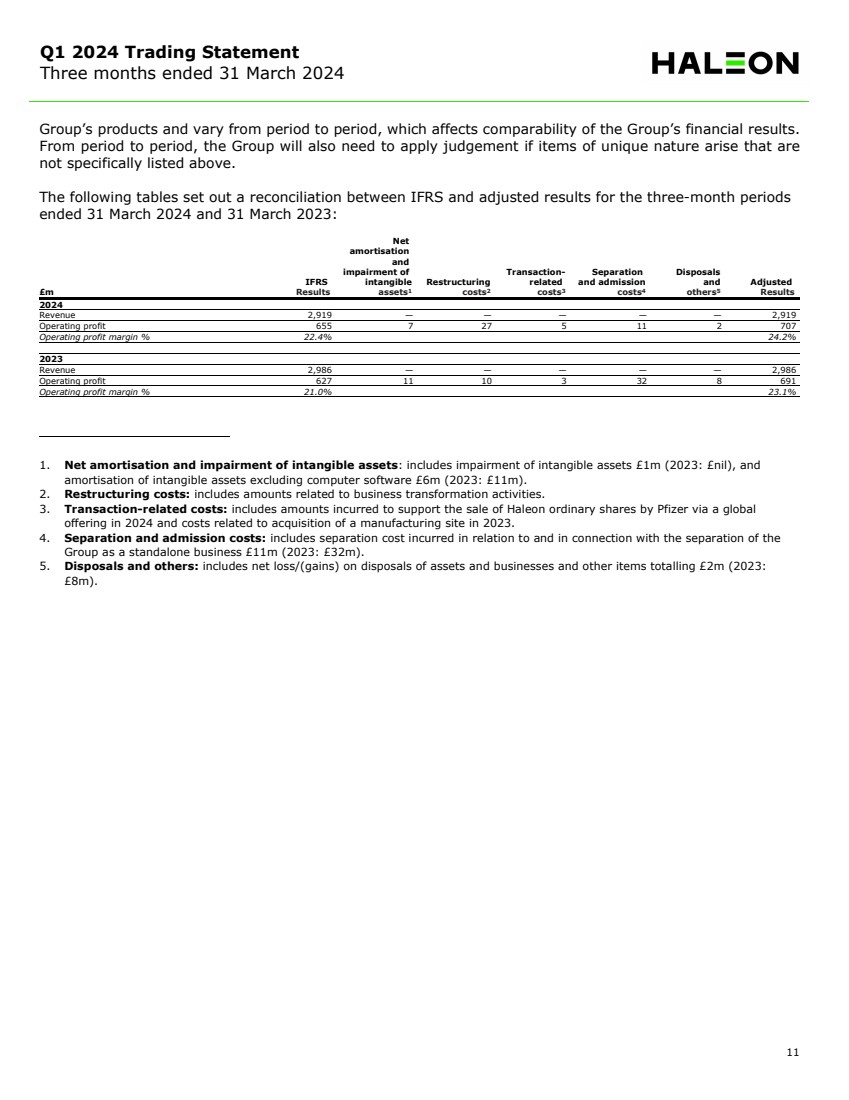
Q1 2024 Trading Statement Three months ended 31 March 2024 11 Group’s products and vary from period to period, which affects comparability of the Group’s financial results. From period to period, the Group will also need to apply judgement if items of unique nature arise that are not specifically listed above. The following tables set out a reconciliation between IFRS and adjusted results for the three-month periods ended 31 March 2024 and 31 March 2023: Net amortisation and impairment of Transaction- Separation Disposals IFRS intangible Restructuring related and admission and Adjusted £m Results assets1 costs2 costs3 costs4 others5 Results 2024 Revenue 2,919 — — — — — 2,919 Operating profit 655 7 27 5 11 2 707 Operating profit margin % 22.4% 24.2% 2023 Revenue 2,986 — — — — — 2,986 Operating profit 627 11 10 3 32 8 691 Operating profit margin % 21.0% 23.1% 1. Net amortisation and impairment of intangible assets: includes impairment of intangible assets £1m (2023: £nil), and amortisation of intangible assets excluding computer software £6m (2023: £11m). 2. Restructuring costs: includes amounts related to business transformation activities. 3. Transaction-related costs: includes amounts incurred to support the sale of Haleon ordinary shares by Pfizer via a global offering in 2024 and costs related to acquisition of a manufacturing site in 2023. 4. Separation and admission costs: includes separation cost incurred in relation to and in connection with the separation of the Group as a standalone business £11m (2023: £32m). 5. Disposals and others: includes net loss/(gains) on disposals of assets and businesses and other items totalling £2m (2023: £8m). |
|
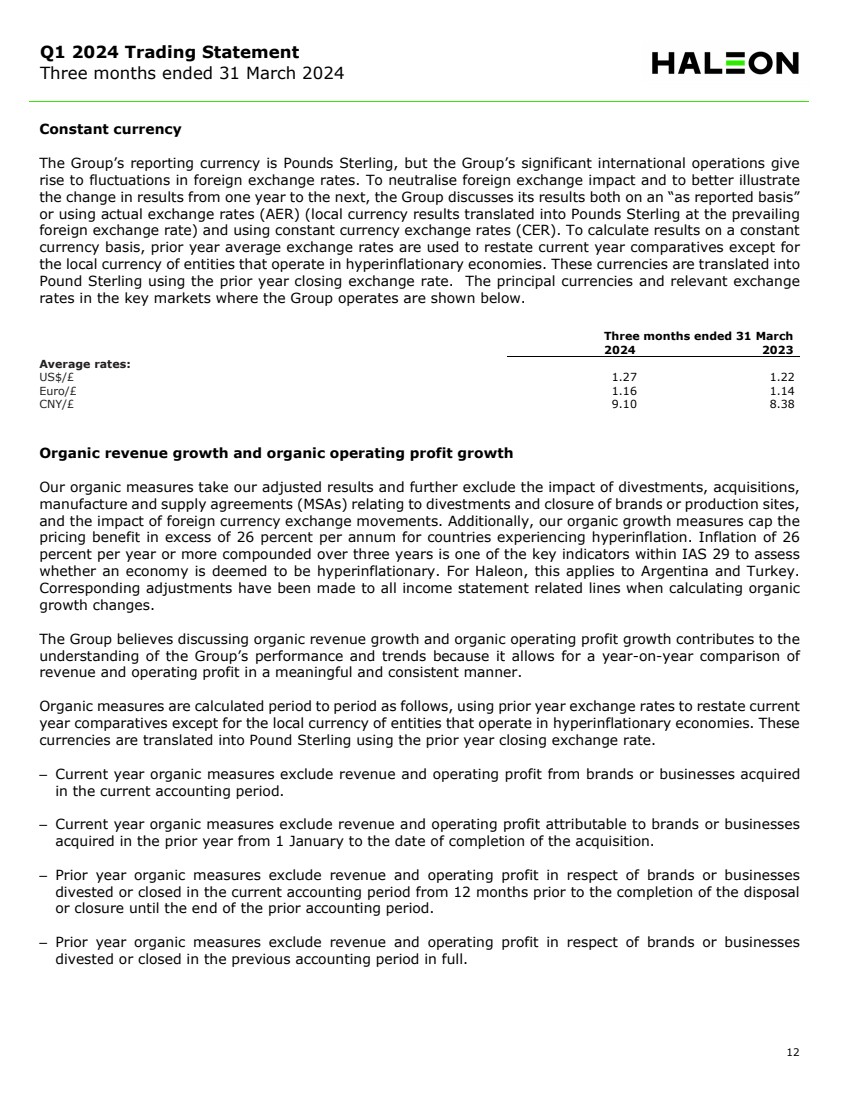
Q1 2024 Trading Statement Three months ended 31 March 2024 12 Constant currency The Group’s reporting currency is Pounds Sterling, but the Group’s significant international operations give rise to fluctuations in foreign exchange rates. To neutralise foreign exchange impact and to better illustrate the change in results from one year to the next, the Group discusses its results both on an “as reported basis” or using actual exchange rates (AER) (local currency results translated into Pounds Sterling at the prevailing foreign exchange rate) and using constant currency exchange rates (CER). To calculate results on a constant currency basis, prior year average exchange rates are used to restate current year comparatives except for the local currency of entities that operate in hyperinflationary economies. These currencies are translated into Pound Sterling using the prior year closing exchange rate. The principal currencies and relevant exchange rates in the key markets where the Group operates are shown below. Three months ended 31 March 2024 2023 Average rates: US$/£ 1.27 1.22 Euro/£ 1.16 1.14 CNY/£ 9.10 8.38 Organic revenue growth and organic operating profit growth Our organic measures take our adjusted results and further exclude the impact of divestments, acquisitions, manufacture and supply agreements (MSAs) relating to divestments and closure of brands or production sites, and the impact of foreign currency exchange movements. Additionally, our organic growth measures cap the pricing benefit in excess of 26 percent per annum for countries experiencing hyperinflation. Inflation of 26 percent per year or more compounded over three years is one of the key indicators within IAS 29 to assess whether an economy is deemed to be hyperinflationary. For Haleon, this applies to Argentina and Turkey. Corresponding adjustments have been made to all income statement related lines when calculating organic growth changes. The Group believes discussing organic revenue growth and organic operating profit growth contributes to the understanding of the Group’s performance and trends because it allows for a year-on-year comparison of revenue and operating profit in a meaningful and consistent manner. Organic measures are calculated period to period as follows, using prior year exchange rates to restate current year comparatives except for the local currency of entities that operate in hyperinflationary economies. These currencies are translated into Pound Sterling using the prior year closing exchange rate. – Current year organic measures exclude revenue and operating profit from brands or businesses acquired in the current accounting period. – Current year organic measures exclude revenue and operating profit attributable to brands or businesses acquired in the prior year from 1 January to the date of completion of the acquisition. – Prior year organic measures exclude revenue and operating profit in respect of brands or businesses divested or closed in the current accounting period from 12 months prior to the completion of the disposal or closure until the end of the prior accounting period. – Prior year organic measures exclude revenue and operating profit in respect of brands or businesses divested or closed in the previous accounting period in full. |
|
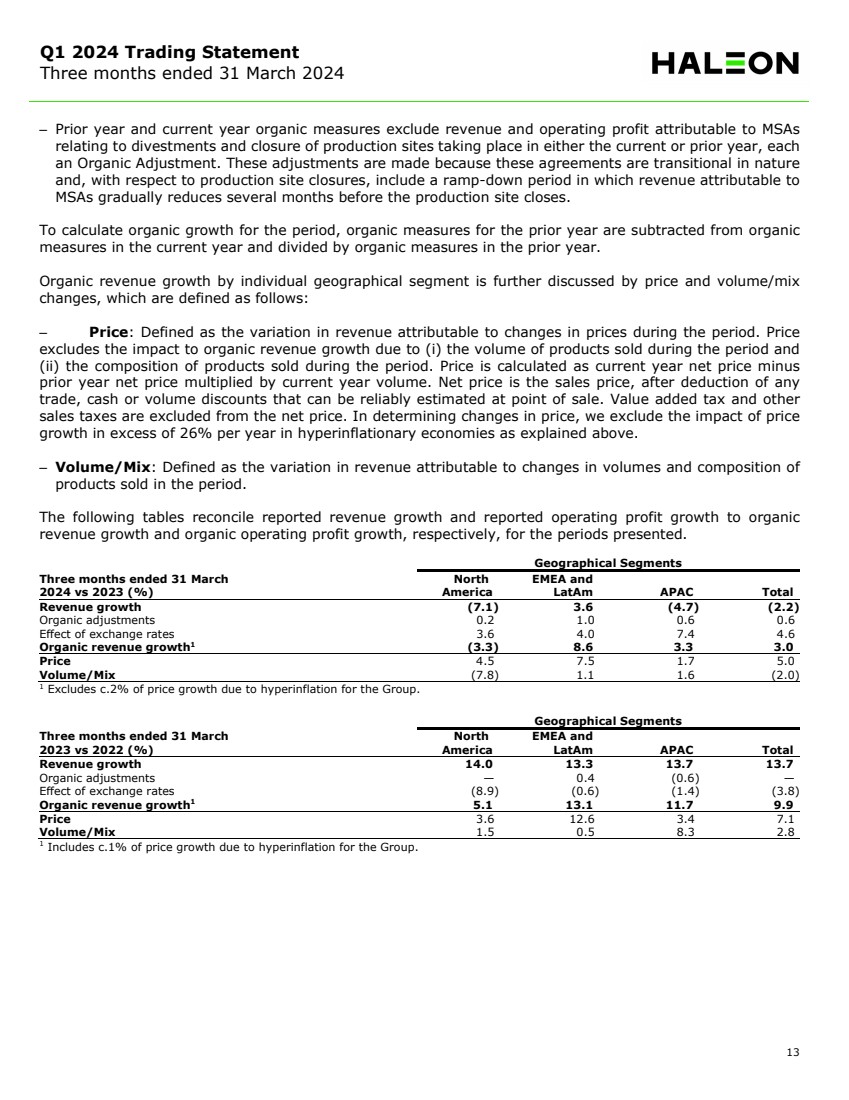
Q1 2024 Trading Statement Three months ended 31 March 2024 13 – Prior year and current year organic measures exclude revenue and operating profit attributable to MSAs relating to divestments and closure of production sites taking place in either the current or prior year, each an Organic Adjustment. These adjustments are made because these agreements are transitional in nature and, with respect to production site closures, include a ramp-down period in which revenue attributable to MSAs gradually reduces several months before the production site closes. To calculate organic growth for the period, organic measures for the prior year are subtracted from organic measures in the current year and divided by organic measures in the prior year. Organic revenue growth by individual geographical segment is further discussed by price and volume/mix changes, which are defined as follows: – Price: Defined as the variation in revenue attributable to changes in prices during the period. Price excludes the impact to organic revenue growth due to (i) the volume of products sold during the period and (ii) the composition of products sold during the period. Price is calculated as current year net price minus prior year net price multiplied by current year volume. Net price is the sales price, after deduction of any trade, cash or volume discounts that can be reliably estimated at point of sale. Value added tax and other sales taxes are excluded from the net price. In determining changes in price, we exclude the impact of price growth in excess of 26% per year in hyperinflationary economies as explained above. – Volume/Mix: Defined as the variation in revenue attributable to changes in volumes and composition of products sold in the period. The following tables reconcile reported revenue growth and reported operating profit growth to organic revenue growth and organic operating profit growth, respectively, for the periods presented. Geographical Segments Three months ended 31 March North EMEA and 2024 vs 2023 (%) America LatAm APAC Total Revenue growth (7.1) 3.6 (4.7) (2.2) Organic adjustments 0.2 1.0 0.6 0.6 Effect of exchange rates 3.6 4.0 7.4 4.6 Organic revenue growth1 (3.3) 8.6 3.3 3.0 Price 4.5 7.5 1.7 5.0 Volume/Mix (7.8) 1.1 1.6 (2.0) 1 Excludes c.2% of price growth due to hyperinflation for the Group. Geographical Segments Three months ended 31 March North EMEA and 2023 vs 2022 (%) America LatAm APAC Total Revenue growth 14.0 13.3 13.7 13.7 Organic adjustments — 0.4 (0.6) — Effect of exchange rates (8.9) (0.6) (1.4) (3.8) Organic revenue growth1 5.1 13.1 11.7 9.9 Price 3.6 12.6 3.4 7.1 Volume/Mix 1.5 0.5 8.3 2.8 1 Includes c.1% of price growth due to hyperinflation for the Group. |
|
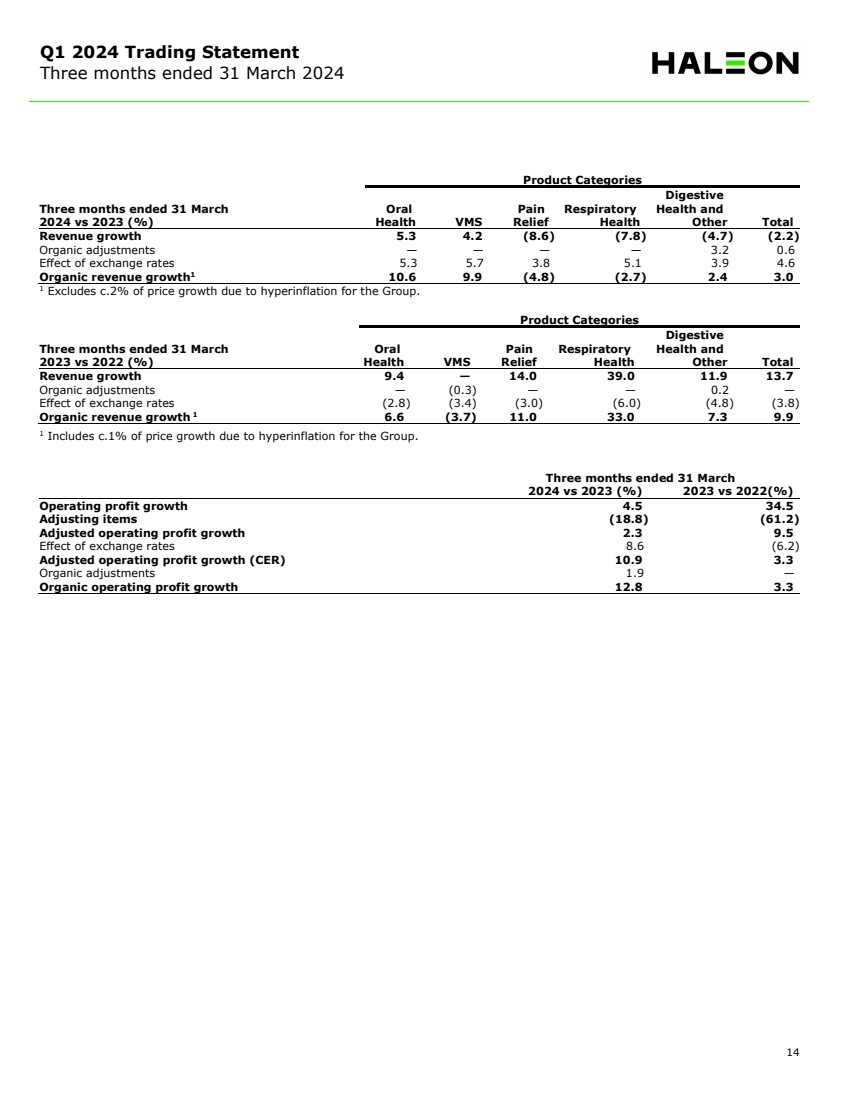
Q1 2024 Trading Statement Three months ended 31 March 2024 14 Product Categories Digestive Three months ended 31 March Oral Pain Respiratory Health and 2024 vs 2023 (%) Health VMS Relief Health Other Total Revenue growth 5.3 4.2 (8.6) (7.8) (4.7) (2.2) Organic adjustments — — — — 3.2 0.6 Effect of exchange rates 5.3 5.7 3.8 5.1 3.9 4.6 Organic revenue growth1 10.6 9.9 (4.8) (2.7) 2.4 3.0 1 Excludes c.2% of price growth due to hyperinflation for the Group. Product Categories Digestive Three months ended 31 March Oral Pain Respiratory Health and 2023 vs 2022 (%) Health VMS Relief Health Other Total Revenue growth 9.4 — 14.0 39.0 11.9 13.7 Organic adjustments — (0.3) — — 0.2 — Effect of exchange rates (2.8) (3.4) (3.0) (6.0) (4.8) (3.8) Organic revenue growth 1 6.6 (3.7) 11.0 33.0 7.3 9.9 1 Includes c.1% of price growth due to hyperinflation for the Group. Three months ended 31 March 2024 vs 2023 (%) 2023 vs 2022(%) Operating profit growth 4.5 34.5 Adjusting items (18.8) (61.2) Adjusted operating profit growth 2.3 9.5 Effect of exchange rates 8.6 (6.2) Adjusted operating profit growth (CER) 10.9 3.3 Organic adjustments 1.9 — Organic operating profit growth 12.8 3.3 |