UNITED STATES
SECURITIES AND EXCHANGE COMMISSION
WASHINGTON, D.C. 20549
FORM 8-K
CURRENT REPORT
PURSUANT TO SECTION 13 OR 15(d) OF THE SECURITIES EXCHANGE ACT OF 1934
Date of Report (Date of Earliest Event Reported): April 25, 2024
HarborOne Bancorp, Inc.
(Exact Name of Registrant as Specified in its Charter)
Massachusetts |
001-38955 |
81-1607465 |
(State or other jurisdiction |
(Commission |
(IRS Employer |
of incorporation) |
File Number) |
Identification Number |
770 Oak Street, Brockton, Massachusetts 02301
(Address of principal executive offices)
(508) 895-1000
(Registrant’s telephone number, including area code)
Check the appropriate box below if the Form 8-K filing is intended to simultaneously satisfy the filing obligation of the registrant under any of the following provisions:
☐Written communications pursuant to Rule 425 under the Securities Act (17 CFR 230.425)
☐Soliciting material pursuant to Rule 14a-12 under the Exchange Act (17 CFR 240.14a-12)
☐Pre-commencement communications pursuant to Rule 14d-2(b) under the Exchange Act (17 CFR 240.14d-2(b))
☐Pre-commencement communications pursuant to Rule 13e-4(c) under the Exchange Act (17 CFR 240.13e-4(c))
Indicate by check mark whether the registrant is an emerging growth company as defined in Rule 405 of the Securities Act of 1933 (§230.405 of this chapter) or Rule 12b-2 of the Securities Exchange Act of 1934 (§240.12b-2 of this chapter).
Emerging growth company ☐
If an emerging growth company, indicate by check mark if the registrant has elected not to use the extended transition period for complying with any new or revised financial accounting standards provided pursuant to Section 13(a) of the Exchange Act. ☐
Title of each Class |
Trading Symbol |
Name of each exchange on which registered |
Common Stock, $0.01 par value |
HONE |
The NASDAQ Stock Market, LLC |
Item 2.02 |
Results of Operations and Financial Condition |
On April 25, 2024, HarborOne Bancorp, Inc. (the “Company”), the holding company for HarborOne Bank, issued a press release announcing its financial results for the quarter ended March 31, 2024. The Company’s press release is included as Exhibit 99.1 to this report.
The information set forth in this Item 2.02 and in the attached Exhibit 99.1 is deemed to be “furnished” and shall not be deemed to be “filed” for purposes of Section 18 of the Securities Exchange Act of 1934, as amended (the “Exchange Act”), or otherwise subject to the liabilities of that Section.
Item 7.01 |
Regulation FD Disclosure |
The Company has prepared an investor presentation about the Company’s operations and performance that management intends to use from time to time on and after April 25, 2024. The investor presentation is attached as Exhibit 99.2 to this report.
The information set forth in this Item 7.01 and in the attached Exhibit 99.2 shall not be deemed “filed” for purposes of Section 18 of the Exchange Act, or otherwise subject to the liabilities under that Section.
Item 9.01Financial Statements and Exhibits
(d)Exhibits
Number |
|
Description |
|
|
|
99.1 |
|
|
99.2 |
|
|
104 |
|
Cover Page Interactive Data File (formatted as inline XBRL) |
EXHIBIT INDEX
Number |
|
Description |
|
|
|
99.1 |
|
|
99.2 |
|
|
104 |
|
Cover Page Interactive Data File (formatted as inline XBRL) |
SIGNATURE
Pursuant to the requirements of the Securities Exchange Act of 1934, as amended, the registrant has duly caused this report to be signed on its behalf by the undersigned hereunder duly authorized.
|
HARBORONE BANCORP, INC. |
||
|
|
||
By: |
/s/ Joseph F. Casey |
|
|
|
Name: |
Joseph F. Casey |
|
|
Title: |
President and |
|
|
|
Chief Executive Officer |
|
|
|
|
|
Date: April 25, 2024 |
|
|
|
Exhibit 99.1

HarborOne Bancorp, Inc. Announces 2024 First Quarter Results
Contact: Joseph F. Casey, President and CEO
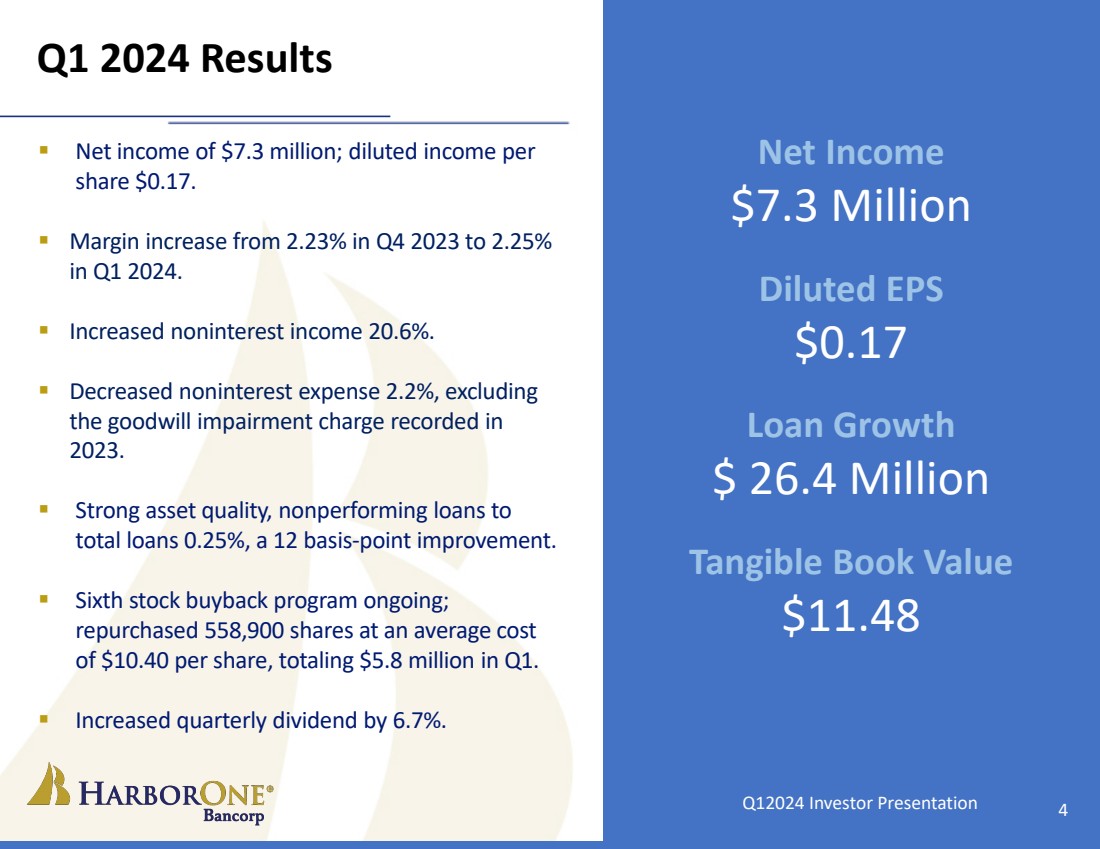
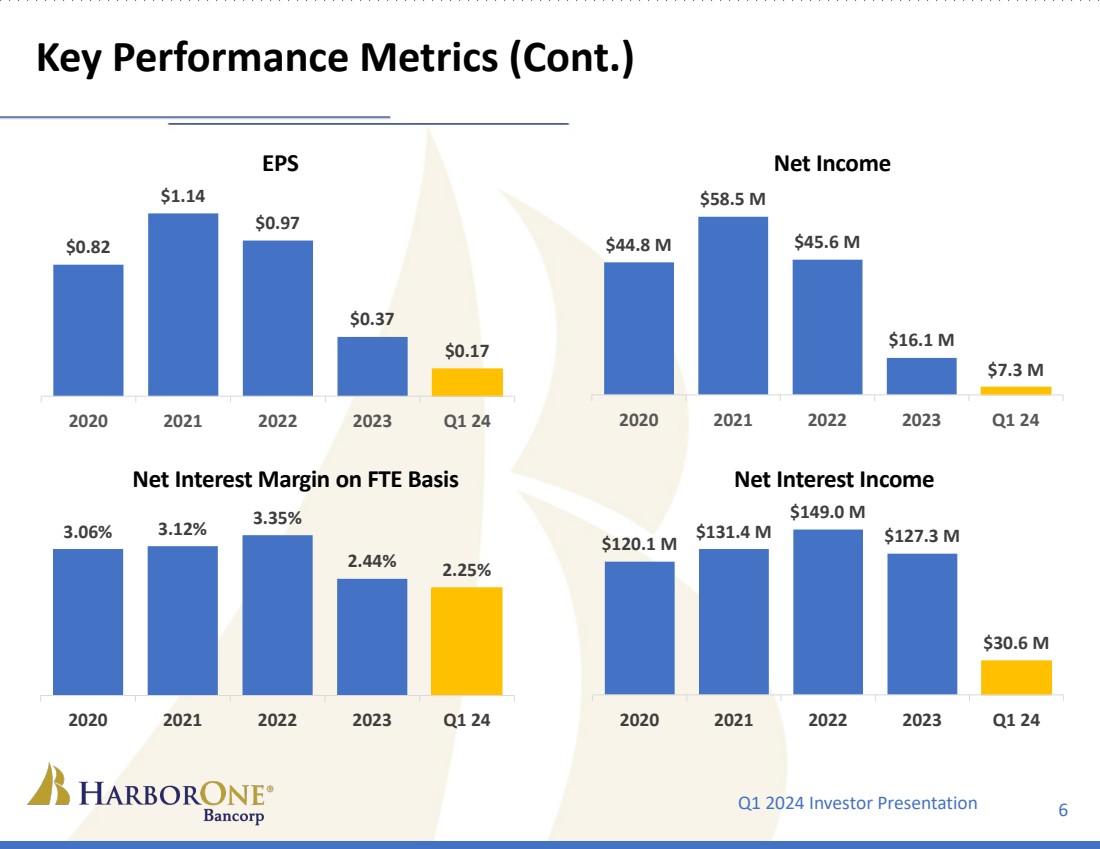
Brockton, Massachusetts (April 25, 2024): HarborOne Bancorp, Inc. (the “Company” or “HarborOne”) (NASDAQ: HONE), the holding company for HarborOne Bank (the “Bank”), announced net income of $7.3 million, or $0.17 per diluted share, for the first quarter of 2024, compared to a net loss of $7.1 million, or $0.17 per diluted share for the preceding quarter, and net income of $7.3 million, or $0.16 per diluted share for the same period last year. Excluding the HarborOne Mortgage, LLC (“HarborOne Mortgage”) goodwill impairment charge of $10.8 million recorded in the fourth quarter of 2023, included in noninterest expense, net income and diluted earnings per share for the quarter ended December 31, 2023 were $3.7 million and $0.09, respectively.(1)
Selected Financial Highlights:
| ● | Strong asset quality; nonperforming loans as a percentage of total loans were 0.25% compared to 0.37% last quarter. |
| ● | Increased noninterest income 20.6% on a linked-quarter basis. |
| ● | Reduced noninterest expense 2.2% on a linked-quarter basis, excluding the goodwill impairment recorded in 2023. |
| ● | Loan growth of $26.4 million, or 2.2% annualized. |
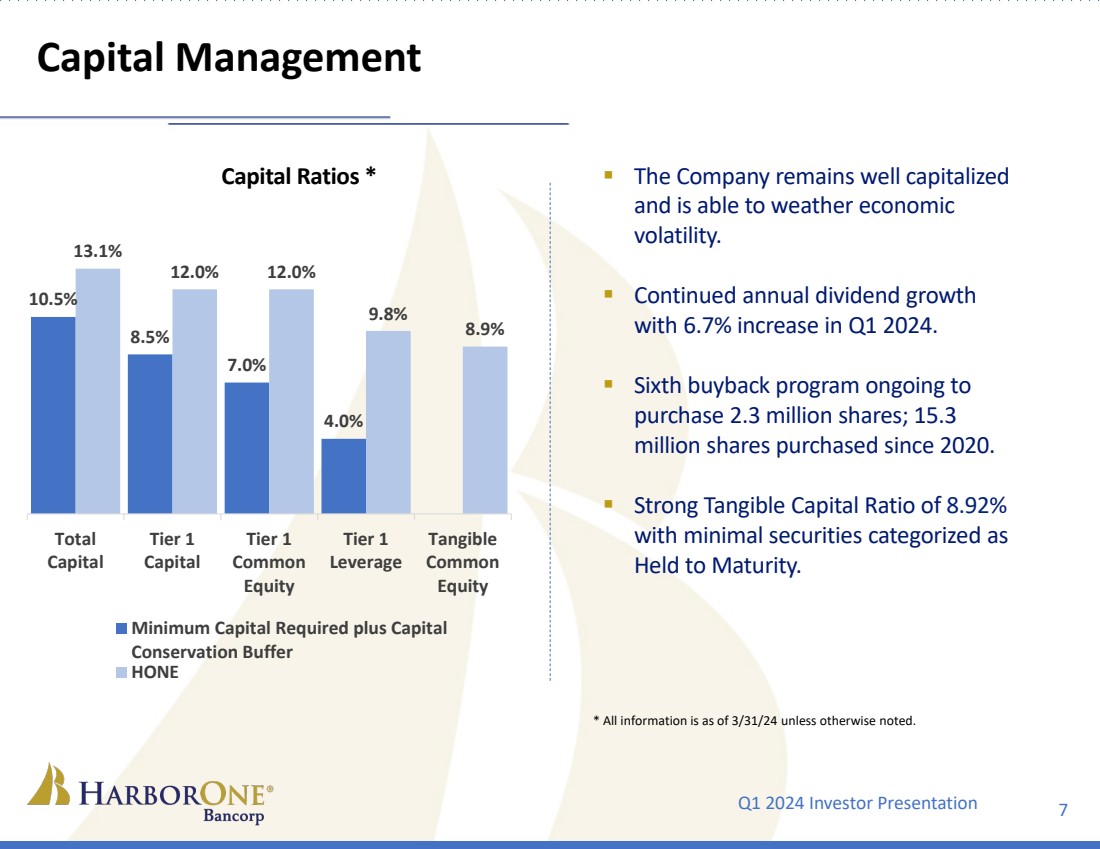
| ● | Continued share repurchase program, repurchasing 558,900 shares at an average cost of $10.40 per share, totaling $5.8 million. |
| ● | Returned $3.4 million of capital to shareholders via dividends and increased quarterly dividend by 6.7%. |
“In this uncertain interest rate environment, our team remains laser focused on expense management and moderate commercial loan growth that brings operational deposits to the Bank,” said Joseph F. Casey, President and CEO. “This quarter was the first quarter since the second quarter of 2022 where the yield on interest-earning assets increased more than the cost of interest-bearing liabilities. I am pleased with our improved earnings this quarter and with our ability to return $9.2 million to shareholders through the cash dividend, which increased 6.7%, and through the continuation of our stock buybacks.”
Net Interest Income
The Company’s net interest and dividend income was $30.6 million for the quarter ended March 31, 2024, compared to $29.7 million for the quarter ended December 31, 2023, and $34.4 million for the quarter ended March 31, 2023. The tax equivalent interest rate spread and net interest margin were 1.62% and 2.25%, respectively, for the quarter ended March 31, 2024, compared to 1.56% and 2.23%, respectively, for the quarter ended December 31, 2023, and 2.28% and 2.78%, respectively, for the quarter ended March 31, 2023. The fourth quarter results included interest expense of $620,000 for the remaining unamortized issuance cost on the Company’s $35 million subordinated notes redeemed in the fourth quarter of 2023.
On a linked-quarter basis, the increase in the margin, spread and net interest and dividend income reflects average interest-earning assets increasing $172.8 million and the yield on interest-earning assets increasing 10 basis points while average interest-bearing liabilities increased $207.6 million and the cost of these liabilities increased 4 basis points. The cost of interest-bearing deposits, excluding brokered, decreased 2 basis points, driven by disciplined pricing in a competitive deposit market.
The $3.8 million decrease in net interest and dividend income from the prior year quarter reflects an increase of $14.8 million, or 68.6%, in total interest expense, partially offset by an increase of $11.0 million, or 19.6%, in total interest and dividend income. The cost of interest-bearing liabilities increased 106 basis points, while the average balance increased $521.3 million, and the yield on interest-earning assets increased 40 basis points, while the average balance increased $451.9 million.
Noninterest Income
Total noninterest income improved $1.8 million, or 20.6%, to $10.7 million for the quarter ended March 31, 2024, from $8.9 million for the quarter ended December 31, 2023. The change was primarily driven by an increase in the mortgage servicing rights (“MSR”) valuation for the three months ended March 31, 2024 of $628,000, compared to a decrease of $3.1 million in the MSR valuation for the three months ended December 31, 2023. The MSR valuation was positively impacted by key benchmark interest rates used in the valuation model, which increased from the prior quarter. The impact on the MSR valuation of principal payments on the underlying mortgages was $353,000 and $487,000 for the quarters ended, March 31, 2024 and December 31, 2023, respectively. During the first quarter of 2024, HarborOne Mortgage executed a hedge to partially mitigate potential MSR valuation losses in a declining rate environment. As a result, the MSR valuation gain was partially offset by a $221,000 hedging loss in the quarter.
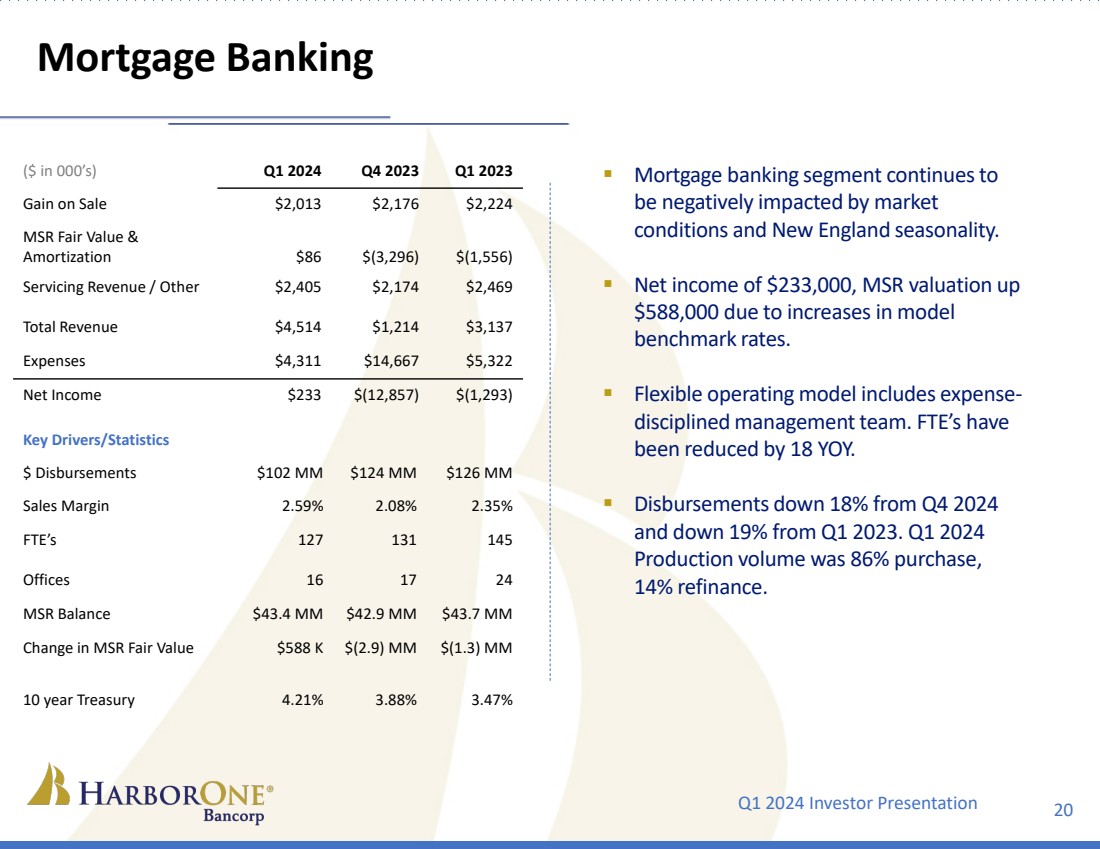
Persistent low inventory of for-sale residential real estate and elevated mortgage interest rates continued to impact the results of HarborOne Mortgage, with gain on loan sales of $2.0 million from mortgage loan closings of $102.1 million for the quarter ended March 31, 2024, compared to $2.2 million from mortgage loan closings of $124.2 million on a linked-quarter basis. Slightly higher gain-on-sale margins partially offset seasonally lower production volume. Mortgage loan closings for the quarter ended March 31, 2023 were $125.6 million with a gain on loan sales of $2.2 million.
Total noninterest income for the quarter ended December 31, 2023 included a $305,000 gain on sale of a former bank branch, and $582,000 recognized on a Bank-owned life insurance (“BOLI”) surrender and exchange strategy. BOLI income was offset by a $464,000 corresponding tax impact included in the provision for income taxes and a modified endowment contract charge included in noninterest expense. The quarter ended March 31, 2024 had no such income.
Total noninterest income increased $2.1 million, or 23.6%, compared to the quarter ended March 31, 2023, primarily due to a $1.6 million, or 58.0%, increase in mortgage banking income. The prior year quarter reflected a $1.3 million decrease in the MSR valuation.
Noninterest Expense
Total noninterest expense decreased $11.5 million, or 26.5%, to $31.8 million for the quarter ended March 31, 2024, from $43.2 million for the quarter ended December 31, 2023. Excluding the one-time $10.8 million goodwill impairment charge from the fourth quarter results, noninterest expenses decreased $704,000 on a linked-quarter basis. Compensation and benefits expenses decreased $1.6 million as the fourth quarter of 2023 included catch-up accrual adjustments for incentives and certain benefits. The fourth quarter of 2023 also included $118,000 in severance expense for a reduction in force at HarborOne Mortgage. Loan expense increased $688,000, as the fourth quarter of 2023 included a $629,000 reversal of repurchase reserve at HarborOne Mortgage based on updated assumptions used to determine the estimate.
Total noninterest expense increased $241,000, or 0.8%, compared to the prior year quarter of $31.5 million. Deposit insurance expense increased $654,000 partially offset by a $365,000 decrease in marketing expense.
Asset Quality and Allowance for Credit Losses
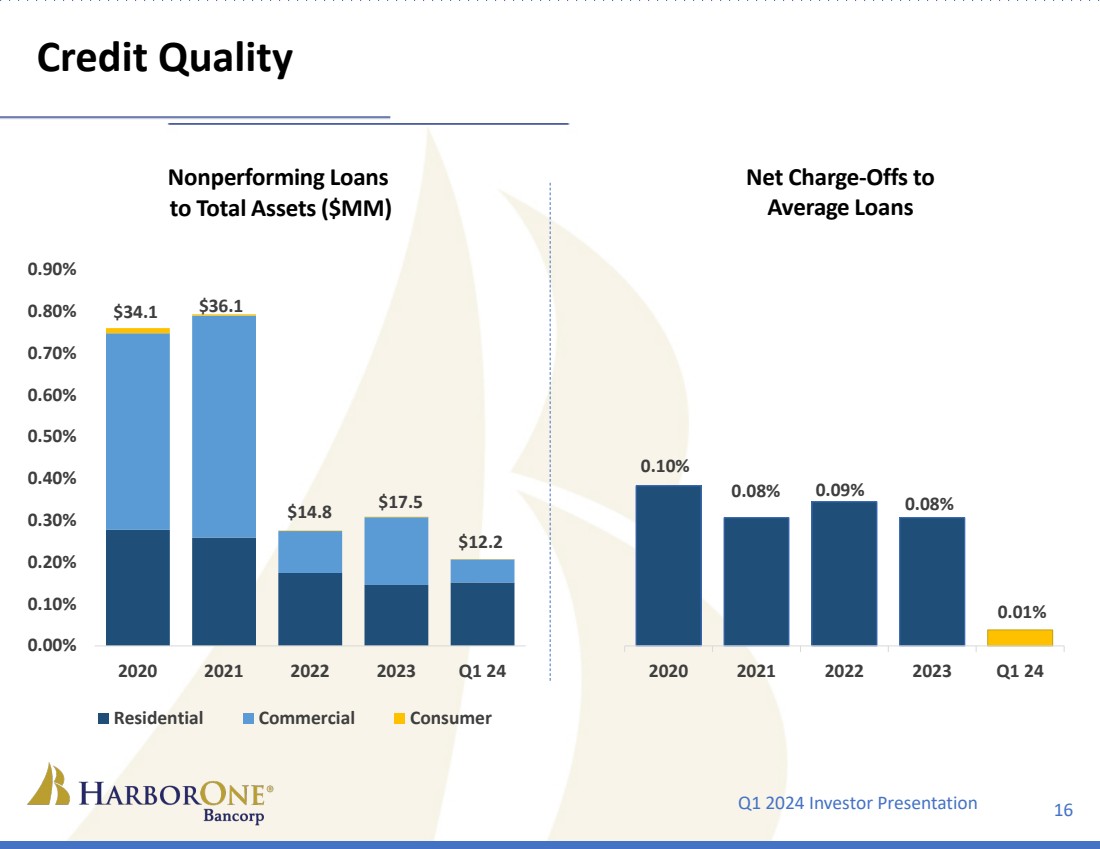
Total nonperforming assets were $12.2 million at March 31, 2024, compared to $17.6 million at December 31, 2023 and $12.3 million at March 31, 2023. Nonperforming assets as a percentage of total assets were 0.21% at March 31, 2024, 0.31% at December 31, 2023, and 0.22% at March 31, 2023. During the first quarter of 2024, a single credit included in the metro office space loan segment with a carrying value of $5.7 million, considered nonperforming in the prior quarter, was paid with a partial recovery of $99,000.
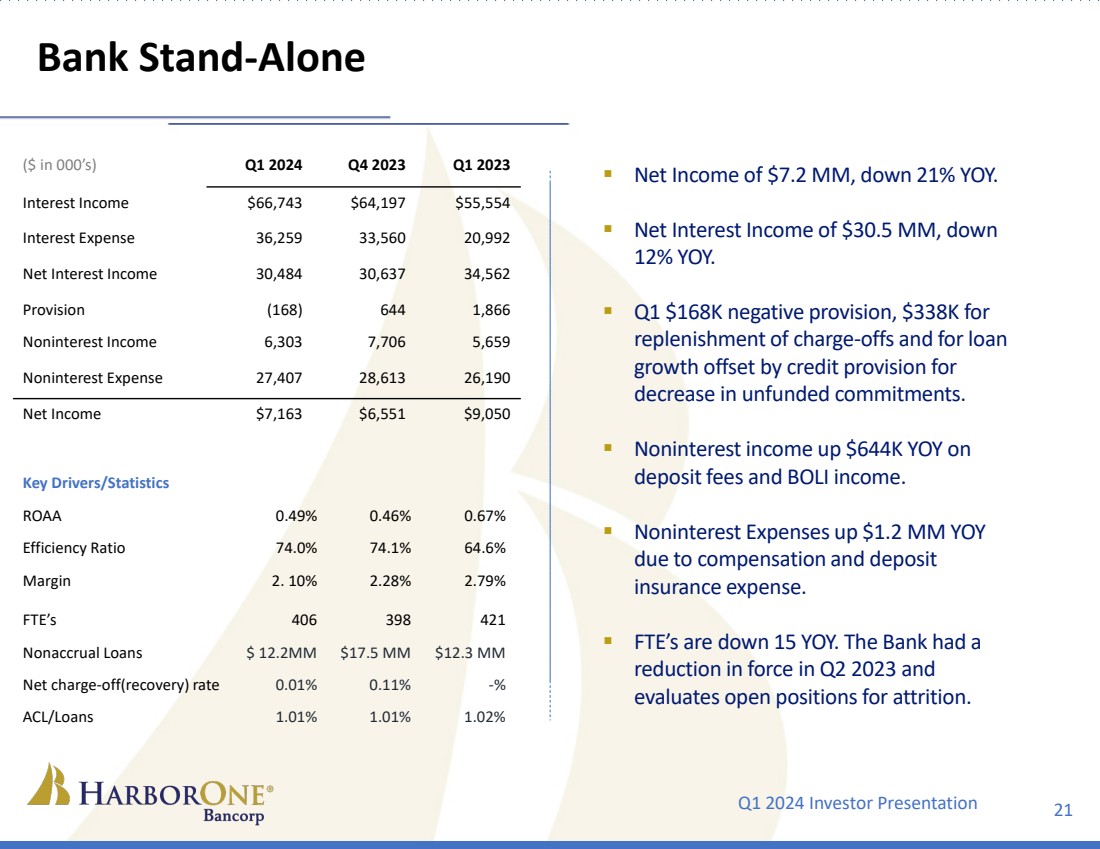
The Company recorded a $168,000 negative provision for credit losses for the quarter ended March 31, 2024. The provision for loan credit losses was $338,000, offset by a negative provision of $506,000 for unfunded commitments. The provision for credit losses for the quarter ended December 31, 2023 was $644,000, a result of a provision for loan credit losses of $970,000 partially offset by a $326,000 negative provision for unfunded commitments. The Company recorded a provision for credit losses of $1.9 million for the quarter ended March 31, 2023, a result of a provision for loan credit losses of $1.7 million and a $119,000 provision for unfunded commitments. Net charge-offs totaled $125,000, or 0.01%, of average loans outstanding on an annualized basis, for the quarter ended March 31, 2024. Net charge-offs totaled $1.3 million, or 0.11%, of average loans outstanding on an annualized basis, for the quarter ended December 31, 2023, and net recoveries totaled $11,000 for the quarter ended March 31, 2023. Loan credit loss provisioning primarily reflects replenishment of the allowance for credit losses (“ACL”) on loans due to charge-offs and loan growth.
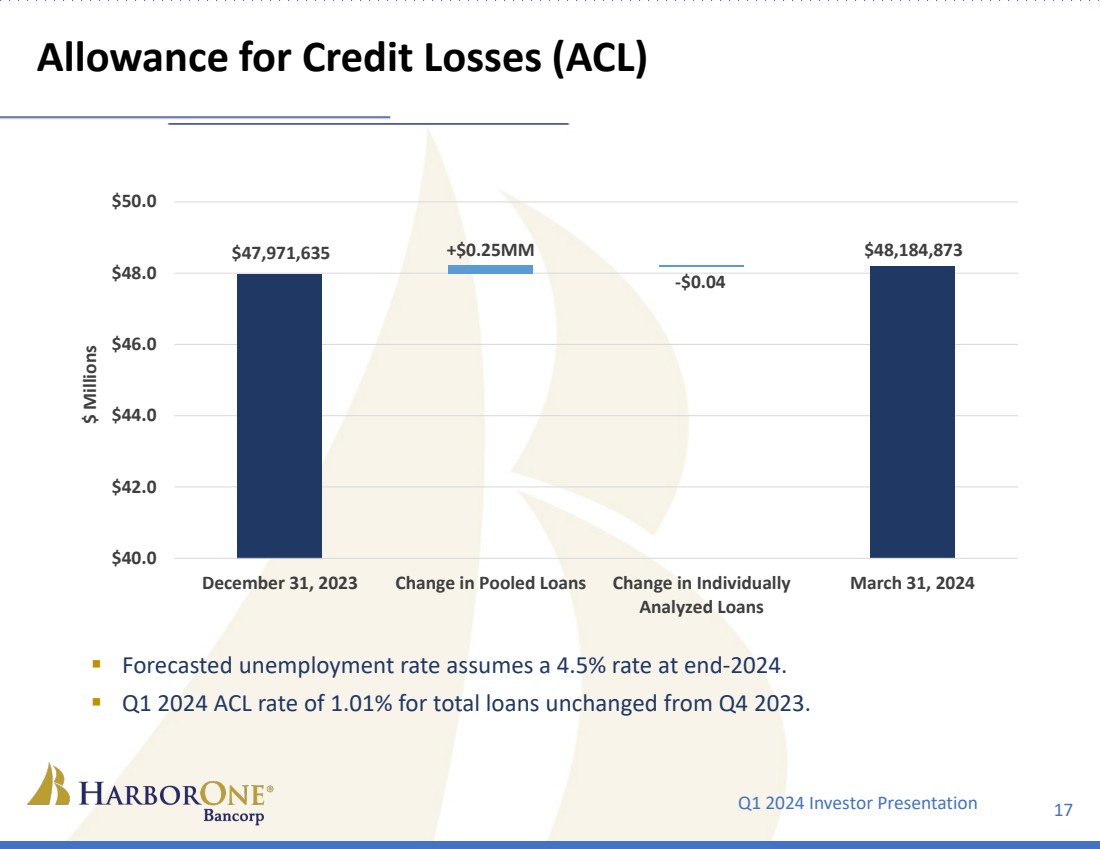
The ACL on loans was $48.2 million, or 1.01% of total loans, at March 31, 2024, compared to $48.0 million, or 1.01% of total loans, at December 31, 2023 and $47.0 million, or 1.02% of total loans, at March 31, 2023. The ACL on unfunded commitments, included in other liabilities on the unaudited Consolidated Balance Sheets, amounted to $3.4 million at March 31, 2024, compared to $3.9 million at December 31, 2023 and $5.0 million at March 31, 2023.
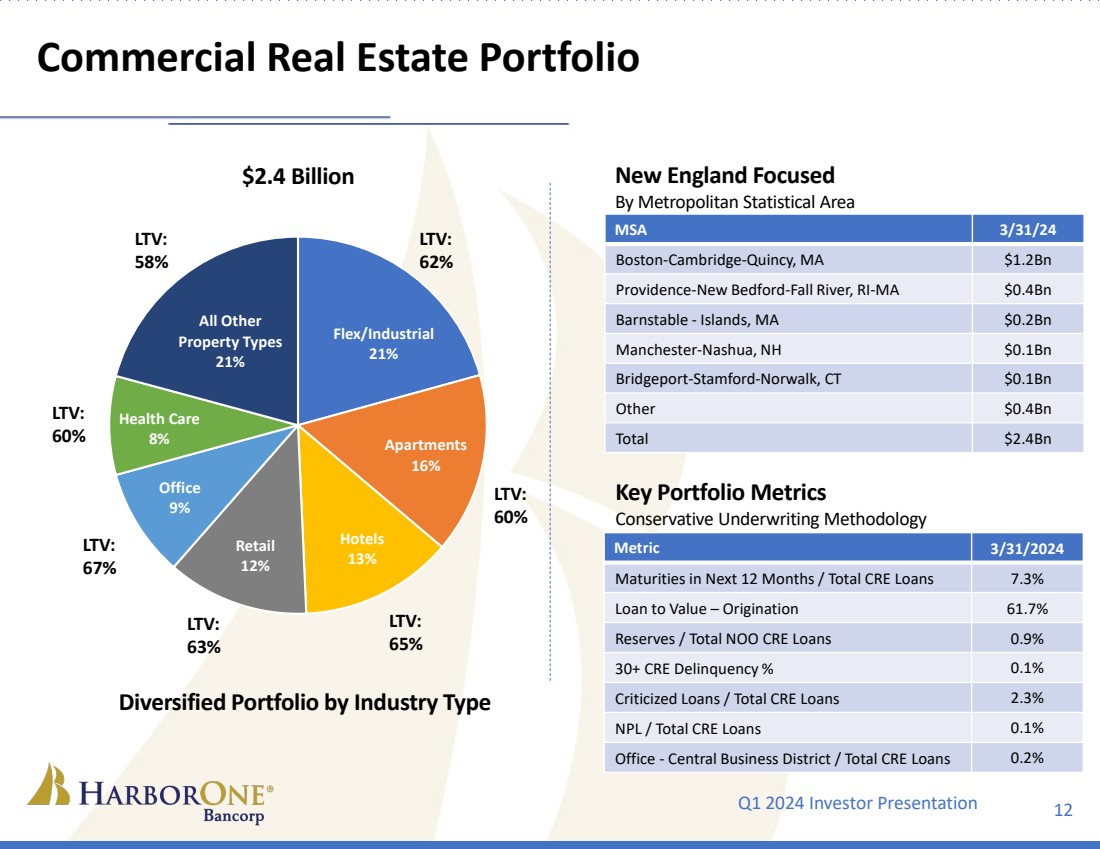
Management continues to closely monitor the loan portfolio for signs of deterioration in light of speculation that commercial real estate values may deteriorate as the market adjusts to higher vacancies and interest rates. The commercial real estate portfolio is centered in New England, with approximately 75% of the portfolio secured by property located in Massachusetts and Rhode Island. Approximately 60% of the commercial real estate loans are fixed-rate loans with, in the opinion of management, limited near-term maturity risk. As of March 31, 2024 commercial loans rated “watch” amounted to $67.9 million, compared to $30.6 million at December 31, 2023. Loans are rated “watch” at the point when there are signs of potential weakness. Approximately 41% of the increase is due to one credit included in the office category. Management performs comprehensive reviews and works proactively with creditworthy borrowers facing financial distress and implements prudent workouts and accommodations to improve the Bank’s prospects of contractual repayment.
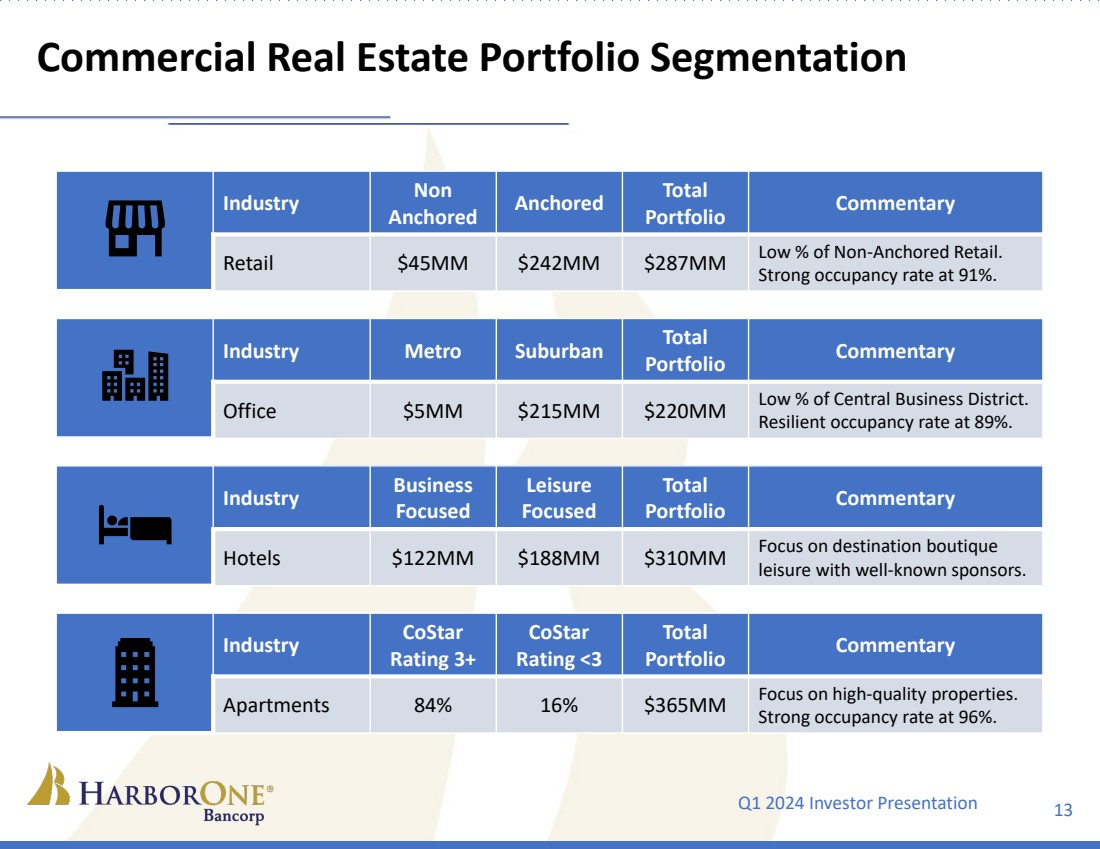
Three sub-sectors that Management identified as potentially more susceptible to weakness includes business-oriented hotels, non-anchored retail space, and metro office space. As of March 31, 2024, business-oriented hotels loans included 14 loans with a total outstanding balance of $122.0 million, non-anchored retail space loans included 28 loans with a total outstanding balance of $44.6 million, and metro office space loans included one loan with a total outstanding balance of $5.1 million. There is one business-oriented hotel credit with a carrying value of $1.8 million that was rated substandard and on nonaccrual.
The other loans in these groups were performing in accordance with their terms.
Balance Sheet
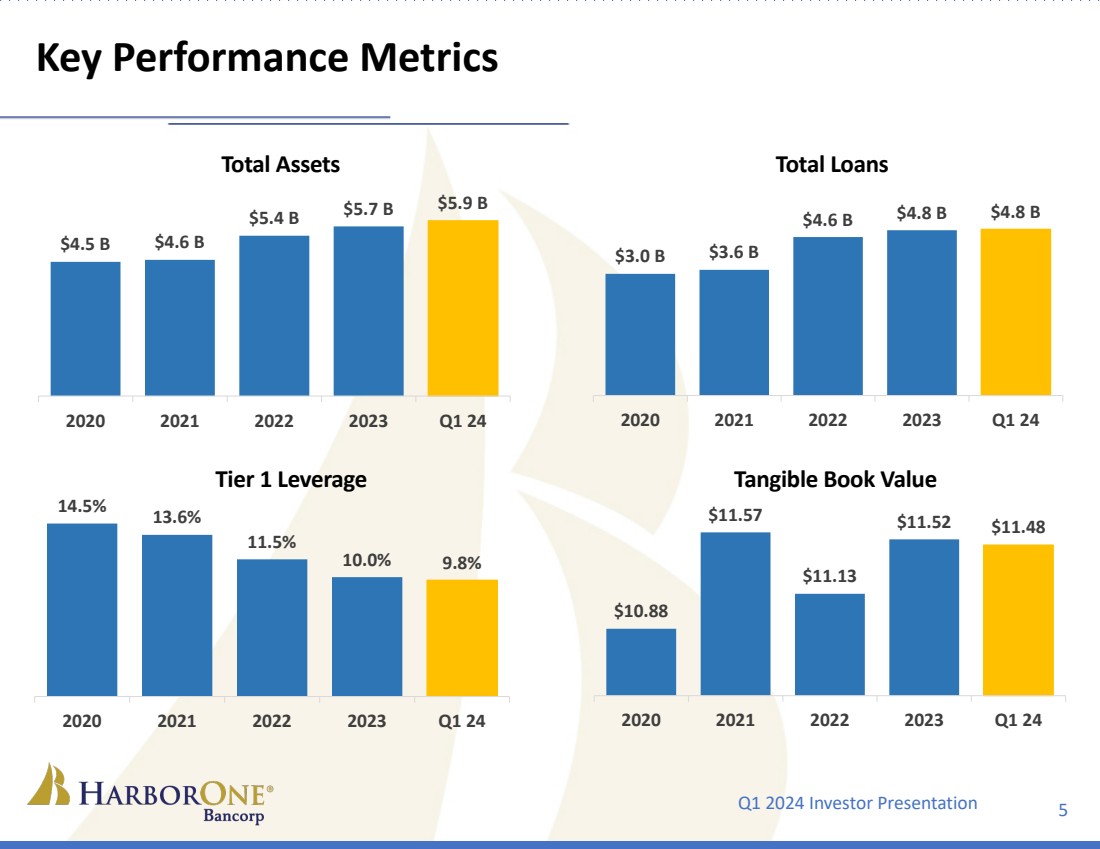
Total assets increased $194.3 million, or 3.4%, to $5.86 billion at March 31, 2024, from $5.67 billion at December 31, 2023. The linked-quarter increase primarily reflects an increase in cash and cash equivalents.
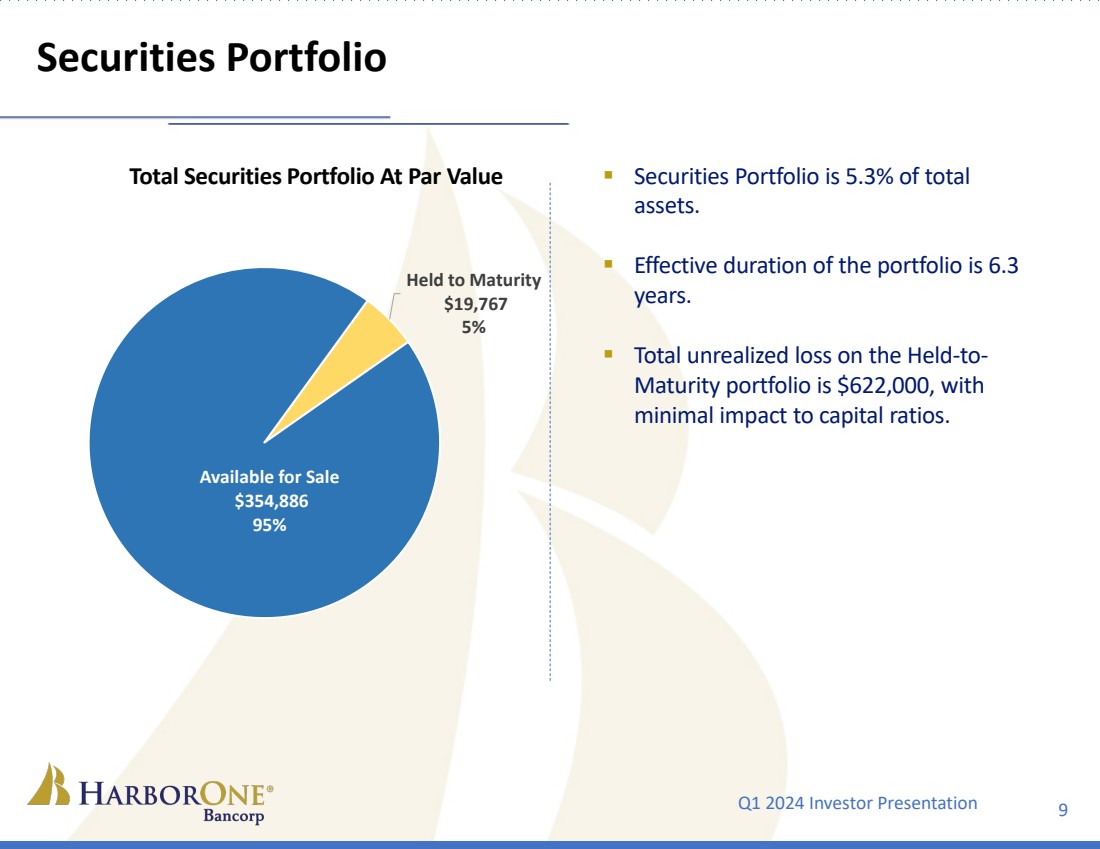
Available-for-sale securities were $291.0 million and $290.2 million at March 31, 2024 and December 31, 2023, respectively. The unrealized loss on securities available for sale increased to $66.9 million as of March 31, 2024, as compared to $62.0 million of unrealized losses as of December 31, 2023. Securities held to maturity were flat at $19.7 million, or 0.3% of total assets, at March 31, 2024.
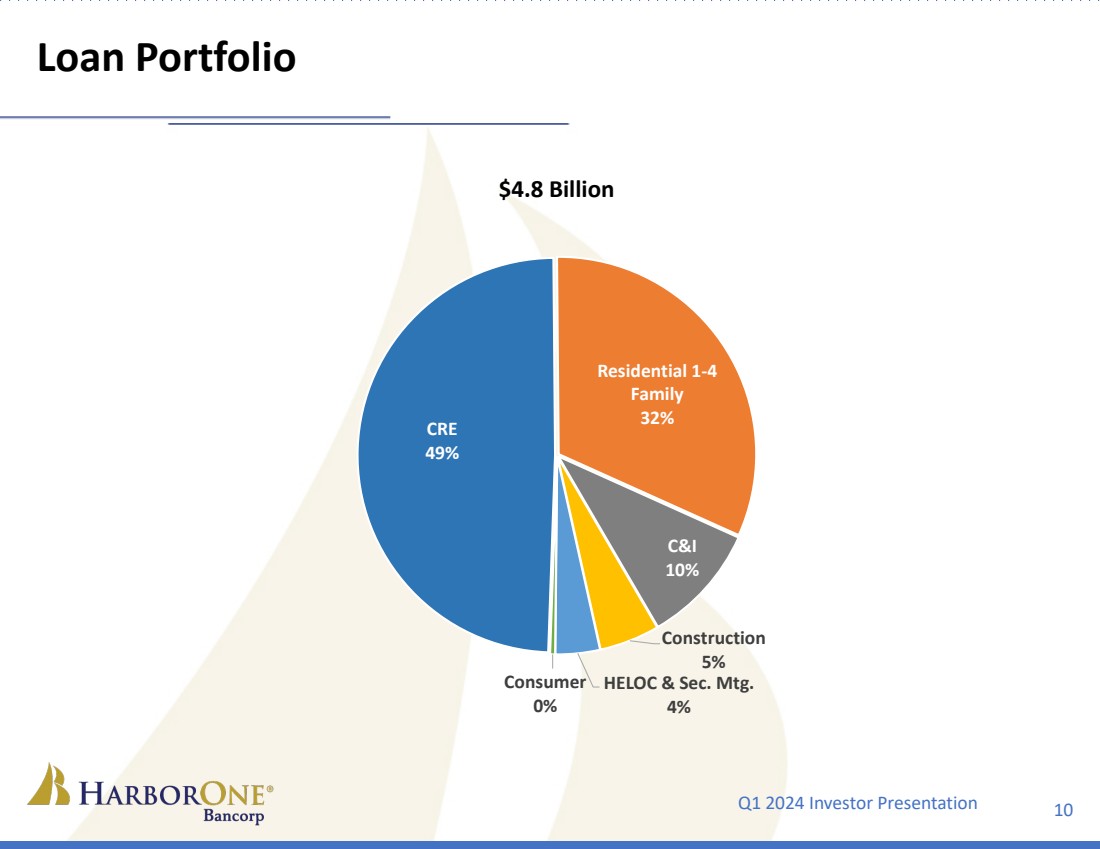
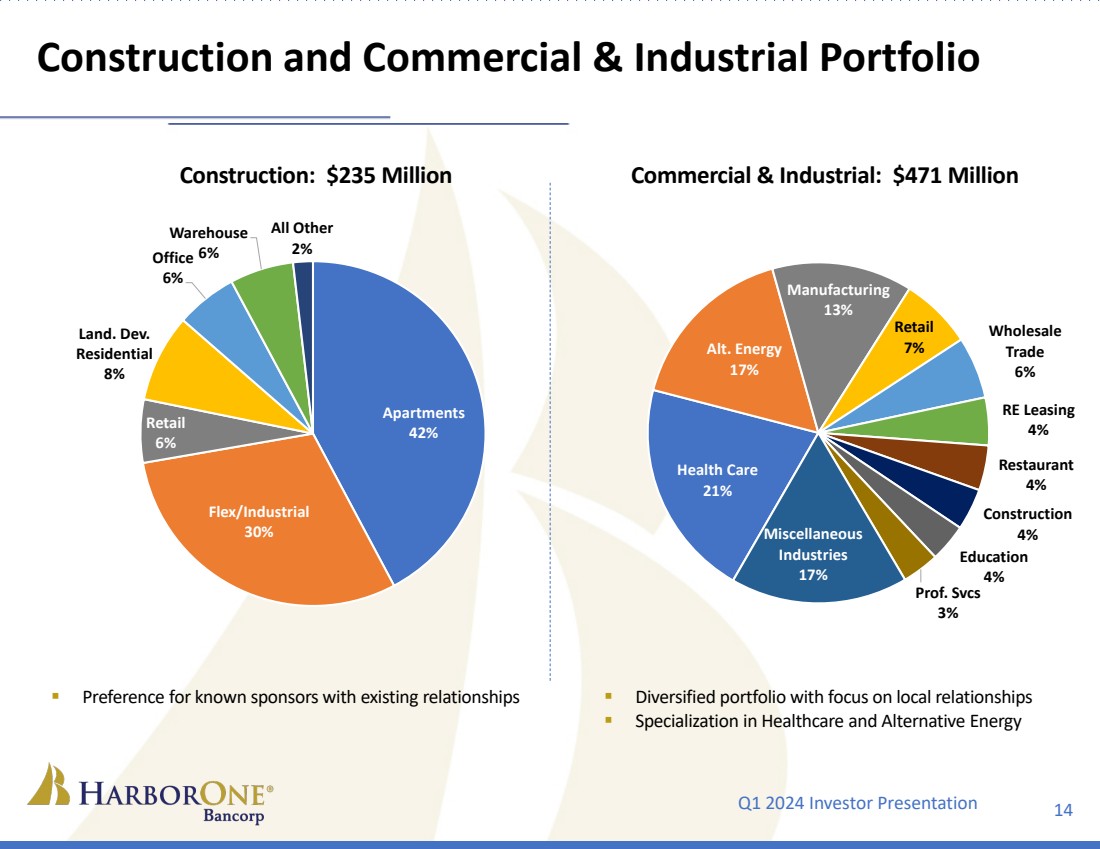
Loans increased $26.4 million, or 0.6%, to $4.78 billion at March 31, 2024, from $4.75 billion at December 31, 2023. The linked-quarter increase was primarily due to increases in commercial construction loans of $26.4 million, commercial real estate loans of $12.0 million, and commercial and industrial loans of $4.8 million, partially offset by decreases in residential mortgage loans of $14.0 million and consumer loans of $2.7 million.
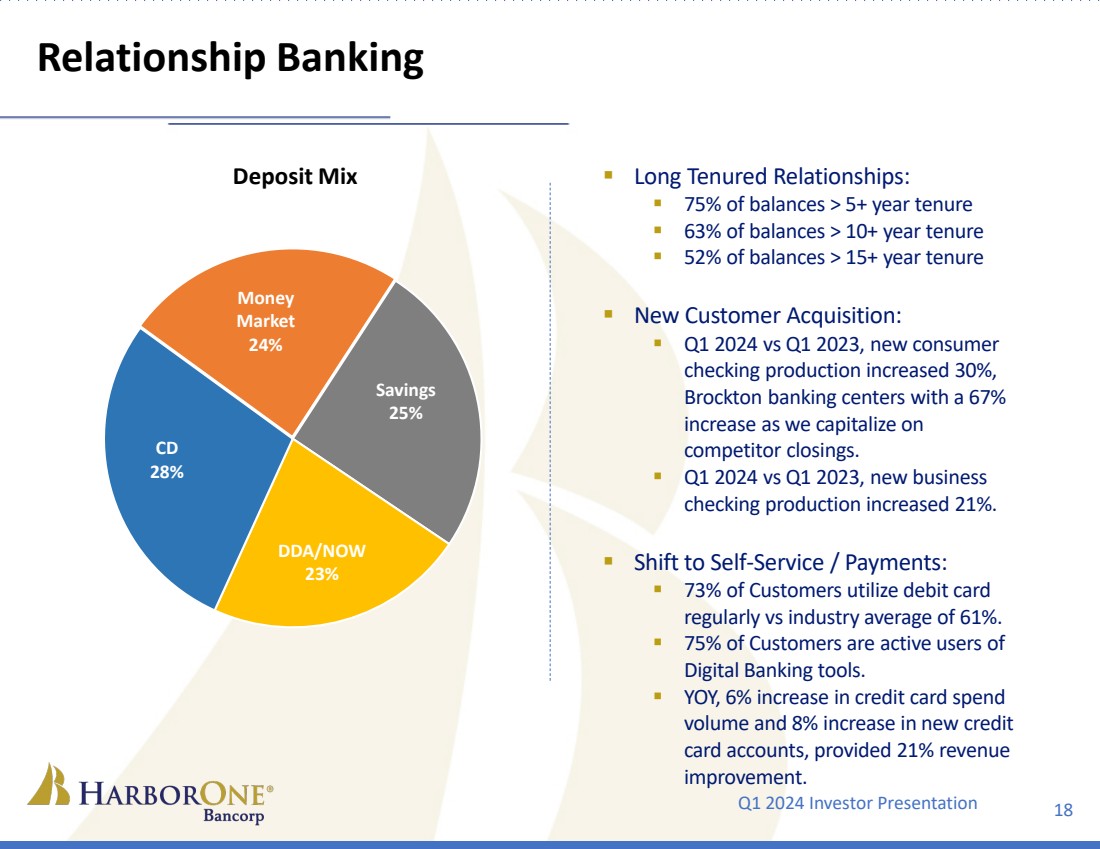
Total deposits were $4.39 billion at March 31, 2024 and December 31, 2023. Compared to the prior quarter, non-certificate accounts decreased $43.5 million and term certificate accounts decreased $11.1 million, as a competitive rate environment continued to pressure deposit growth. Brokered deposits increased $61.3 million. As of March 31, 2024, FDIC-insured deposits were approximately 73% of total deposits, including Bank subsidiary deposits.
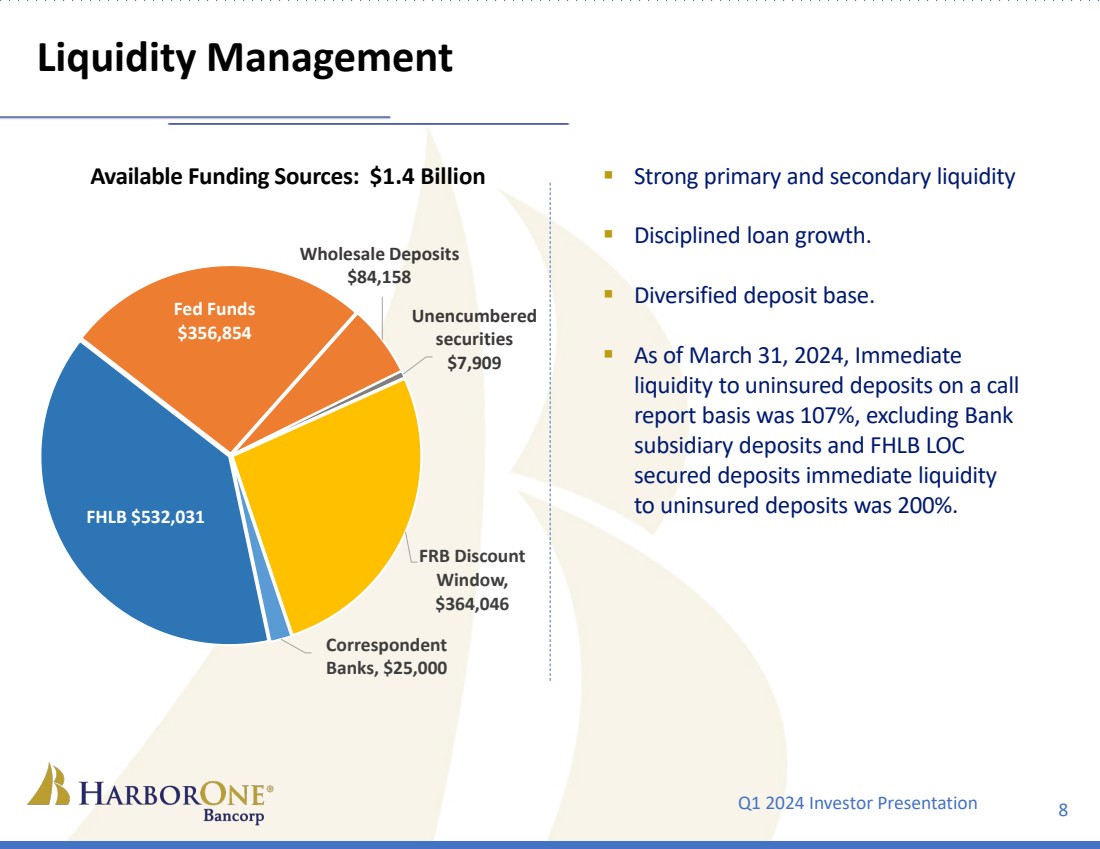
FHLB borrowings increased $10.9 million to $579.4 million at March 31, 2024 from $568.5 million at December 31, 2023. The Bank borrowed $175.0 million under the Bank Term Funding Program during the first quarter of 2024. As of March 31, 2024, the Bank had $921.1 million in available borrowing capacity across multiple relationships.
Total stockholders’ equity was $577.7 million at March 31, 2024, compared to $583.8 million at December 31, 2023. Stockholders’ equity decreased 1.0% when compared to the prior quarter, as net income was offset by share repurchases and an increase in unrealized loss on available-for-sale securities. As of March 31, 2024, the Company’s sixth share repurchase program, commenced in the third quarter of 2023, is ongoing with 1,781,950 shares repurchased since commencement, at an average price of $10.15, including $0.10 per share of excise tax. The tangible-common-equity-to-tangible-assets ratio(2) was 8.92% at March 31, 2024, 9.33% at December 31, 2023, and 9.60% at March 31, 2023. At March 31, 2024, the Company and the Bank had strong capital positions, exceeding all regulatory capital requirements, and are considered well-capitalized.
(1) These non-GAAP measures are net loss less goodwill impairment and net loss less goodwill impairment to weighted average shares outstanding on a diluted basis.
(2) This non-GAAP ratio is total stockholders’ equity less goodwill and intangible assets to total assets less goodwill and intangible assets.
About HarborOne Bancorp, Inc.
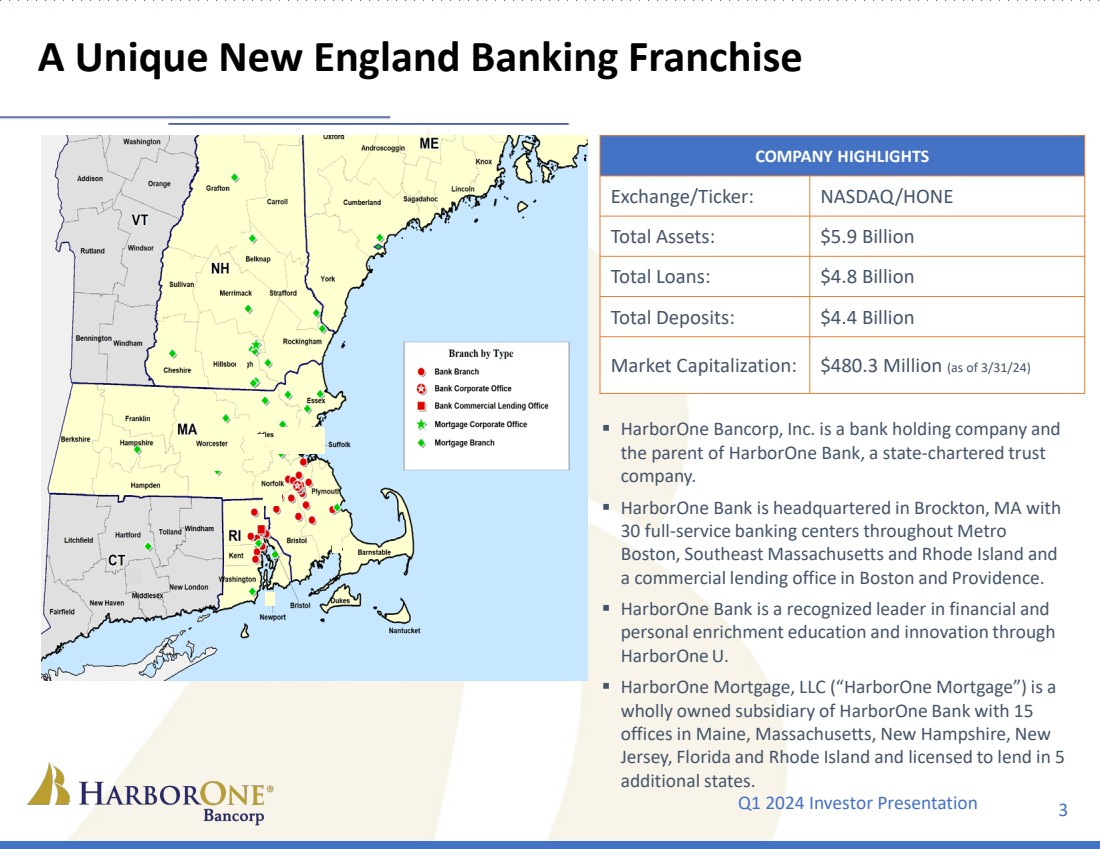
HarborOne Bancorp, Inc. is the holding company for HarborOne Bank, a Massachusetts-chartered trust company. HarborOne Bank serves the financial needs of consumers, businesses, and municipalities throughout Eastern Massachusetts and Rhode Island through a network of 30 full-service banking centers located in Massachusetts and Rhode Island, and commercial lending offices in Boston, Massachusetts and Providence, Rhode Island. HarborOne Bank also provides a range of educational resources through “HarborOne U,” with free digital content, webinars, and recordings for small business and personal financial education. HarborOne Mortgage, LLC, a subsidiary of HarborOne Bank, provides mortgage lending services throughout New England and other states.
Forward Looking Statements
Certain statements herein constitute forward-looking statements within the meaning of Section 27A of the Securities Act of 1933, as amended, and Section 21E of the Exchange Act and are intended to be covered by the safe harbor provisions of the Private Securities Litigation Reform Act of 1995. We may also make forward-looking statements in other documents we file with the Securities and Exchange Commission (“SEC”), in our annual reports to shareholders, in press releases and other written materials, and in oral statements made by our officers, directors or employees. Such statements may be identified by words such as “believes,” “will,” “would,” “expects,” “project,” “may,” “could,” “developments,” “strategic,” “launching,” “opportunities,” “anticipates,” “estimates,” “intends,” “plans,” “targets” and similar expressions. These statements are based upon the current beliefs and expectations of the Company’s management and are subject to significant risks and uncertainties. Actual results may differ materially from those set forth in the forward-looking statements as a result of numerous factors.
Factors that could cause such differences to exist include, but are not limited to, changes in general business and economic conditions (including inflation and concerns about inflation) on a national basis and in the local markets in which the Company operates, including changes that adversely affect borrowers’ ability to service and repay the Company’s loans; changes in interest rates; changes in customer behavior; ongoing turbulence in the capital and debt markets and the impact of such conditions on the Company’s business activities; increases in loan default and charge-off rates; decreases in the value of securities in the Company’s investment portfolio; fluctuations in real estate values; the possibility that future credit losses may be higher than currently expected due to changes in economic assumptions, customer behavior or adverse economic developments; the adequacy of loan loss reserves; decreases in deposit levels necessitating increased borrowing to fund loans and investments; competitive pressures from other financial institutions; acquisitions may not produce results at levels or within time frames originally anticipated; cybersecurity incidents, fraud, natural disasters, war, terrorism, civil unrest, and pandemics; changes in regulation; changes in accounting standards and practices; the risk that goodwill and intangibles recorded in the Company’s financial statements will become impaired; demand for loans in the Company’s market area; the Company’s ability to attract and maintain deposits; risks related to the implementation of acquisitions, dispositions, and restructurings; the risk that the Company may not be successful in the implementation of its business strategy; changes in assumptions used in making such forward-looking statements and the risk factors described in the Annual Report on Form 10-K and Quarterly Reports on Form 10-Q as filed with the SEC, which are available at the SEC’s website, www.sec.gov. Should one or more of these risks materialize or should underlying beliefs or assumptions prove incorrect, HarborOne’s actual results could differ materially from those discussed. Readers are cautioned not to place undue reliance on these forward-looking statements, which speak only as of the date of this release. The Company disclaims any obligation to publicly update or revise any forward-looking statements to reflect changes in underlying assumptions or factors, new information, future events or other changes, except as required by law.
Use of Non-GAAP Measures
In addition to results presented in accordance with generally accepted accounting principles (“GAAP”), this press release contains certain non-GAAP financial measures. The Company’s management believes that the supplemental non-GAAP information, which consists of income statement results excluding the goodwill impairment charge, total adjusted noninterest expense excluding the goodwill impairment charge, diluted earnings per share excluding the goodwill impairment charge, Return on average assets (ROAA), excluding the goodwill impairment charge, Return on average equity (ROAE), excluding goodwill impairment charge, the efficiency ratio, efficiency ratio excluding the goodwill impairment charge, tangible common equity to tangible assets ratio and tangible book value per share, is utilized by regulators and market analysts to evaluate a company’s financial condition and therefore, such information is useful to investors. These disclosures should not be viewed as a substitute for financial results determined in accordance with GAAP, nor are they necessarily comparable to non-GAAP performance measures which may be presented by other companies. Because non-GAAP financial measures are not standardized, it may not be possible to compare these financial measures with other companies’ non-GAAP financial measures having the same or similar names.
HarborOne Bancorp, Inc.
Consolidated Balance Sheet Trend
(Unaudited)
|
|
March 31, |
|
December 31, |
|
September 30, |
|
June 30, |
|
March 31, |
|||||
(in thousands) |
|
2024 |
|
2023 |
|
2023 |
|
2023 |
|
2023 |
|||||
|
|
|
|
|
|
|
|
|
|
|
|
|
|
|
|
Assets |
|
|
|
|
|
|
|
|
|
|
|
|
|
|
|
|
|
|
|
|
|
|
|
|
|
|
|
|
|
|
|
Cash and due from banks |
|
$ |
36,340 |
|
$ |
38,876 |
|
$ |
38,573 |
|
$ |
43,525 |
|
$ |
38,989 |
Short-term investments |
|
|
357,101 |
|
|
188,474 |
|
|
208,211 |
|
|
209,326 |
|
|
210,765 |
Total cash and cash equivalents |
|
|
393,441 |
|
|
227,350 |
|
|
246,784 |
|
|
252,851 |
|
|
249,754 |
|
|
|
|
|
|
|
|
|
|
|
|
|
|
|
|
Securities available for sale, at fair value |
|
|
291,008 |
|
|
290,151 |
|
|
271,078 |
|
|
292,012 |
|
|
303,059 |
Securities held to maturity, at amortized cost |
|
|
19,724 |
|
|
19,796 |
|
|
19,795 |
|
|
19,839 |
|
|
19,838 |
Federal Home Loan Bank stock, at cost |
|
|
26,565 |
|
|
27,098 |
|
|
23,378 |
|
|
27,123 |
|
|
23,589 |
Asset held for sale |
|
|
348 |
|
|
348 |
|
|
966 |
|
|
966 |
|
|
— |
Loans held for sale, at fair value |
|
|
16,434 |
|
|
19,686 |
|
|
17,796 |
|
|
20,949 |
|
|
13,956 |
Loans: |
|
|
|
|
|
|
|
|
|
|
|
|
|
|
|
Commercial real estate |
|
|
2,355,672 |
|
|
2,343,675 |
|
|
2,349,886 |
|
|
2,286,688 |
|
|
2,286,727 |
Commercial construction |
|
|
234,811 |
|
|
208,443 |
|
|
191,224 |
|
|
228,902 |
|
|
212,689 |
Commercial and industrial |
|
|
471,215 |
|
|
466,443 |
|
|
450,547 |
|
|
453,422 |
|
|
423,036 |
Total commercial loans |
|
|
3,061,698 |
|
|
3,018,561 |
|
|
2,991,657 |
|
|
2,969,012 |
|
|
2,922,452 |
Residential real estate |
|
|
1,695,686 |
|
|
1,709,714 |
|
|
1,706,950 |
|
|
1,701,766 |
|
|
1,667,934 |
Consumer |
|
|
19,301 |
|
|
22,036 |
|
|
24,247 |
|
|
27,425 |
|
|
32,246 |
Loans |
|
|
4,776,685 |
|
|
4,750,311 |
|
|
4,722,854 |
|
|
4,698,203 |
|
|
4,622,632 |
Less: Allowance for credit losses on loans |
|
|
(48,185) |
|
|
(47,972) |
|
|
(48,312) |
|
|
(47,821) |
|
|
(46,994) |
Net loans |
|
|
4,728,500 |
|
|
4,702,339 |
|
|
4,674,542 |
|
|
4,650,382 |
|
|
4,575,638 |
Mortgage servicing rights, at fair value |
|
|
46,597 |
|
|
46,111 |
|
|
49,201 |
|
|
48,176 |
|
|
47,080 |
Goodwill |
|
|
59,042 |
|
|
59,042 |
|
|
69,802 |
|
|
69,802 |
|
|
69,802 |
Other intangible assets |
|
|
1,326 |
|
|
1,515 |
|
|
1,704 |
|
|
1,893 |
|
|
2,082 |
Other assets |
|
|
279,237 |
|
|
274,460 |
|
|
289,341 |
|
|
275,261 |
|
|
268,060 |
Total assets |
|
$ |
5,862,222 |
|
$ |
5,667,896 |
|
$ |
5,664,387 |
|
$ |
5,659,254 |
|
$ |
5,572,858 |
|
|
|
|
|
|
|
|
|
|
|
|
|
|
|
|
Liabilities and Stockholders' Equity |
|
|
|
|
|
|
|
|
|
|
|
|
|
|
|
|
|
|
|
|
|
|
|
|
|
|
|
|
|
|
|
Deposits: |
|
|
|
|
|
|
|
|
|
|
|
|
|
|
|
Demand deposit accounts |
|
$ |
677,152 |
|
$ |
659,973 |
|
$ |
708,847 |
|
$ |
717,572 |
|
$ |
726,548 |
NOW accounts |
|
|
305,071 |
|
|
305,825 |
|
|
289,141 |
|
|
286,956 |
|
|
287,376 |
Regular savings and club accounts |
|
|
1,110,404 |
|
|
1,265,315 |
|
|
1,324,635 |
|
|
1,390,906 |
|
|
1,455,318 |
Money market deposit accounts |
|
|
1,061,145 |
|
|
966,201 |
|
|
951,128 |
|
|
834,120 |
|
|
796,008 |
Term certificate accounts |
|
|
852,326 |
|
|
863,457 |
|
|
859,266 |
|
|
742,931 |
|
|
653,553 |
Brokered deposits |
|
|
387,926 |
|
|
326,638 |
|
|
276,941 |
|
|
315,003 |
|
|
322,927 |
Total deposits |
|
|
4,394,024 |
|
|
4,387,409 |
|
|
4,409,958 |
|
|
4,287,488 |
|
|
4,241,730 |
Borrowings |
|
|
754,380 |
|
|
568,462 |
|
|
475,470 |
|
|
604,568 |
|
|
590,665 |
Subordinated debt |
|
|
— |
|
|
— |
|
|
34,380 |
|
|
34,348 |
|
|
34,317 |
Other liabilities and accrued expenses |
|
|
136,135 |
|
|
128,266 |
|
|
159,945 |
|
|
137,318 |
|
|
106,352 |
Total liabilities |
|
|
5,284,539 |
|
|
5,084,137 |
|
|
5,079,753 |
|
|
5,063,722 |
|
|
4,973,064 |
|
|
|
|
|
|
|
|
|
|
|
|
|
|
|
|
Common stock |
|
|
598 |
|
|
598 |
|
|
597 |
|
|
597 |
|
|
597 |
Additional paid-in capital |
|
|
487,277 |
|
|
486,502 |
|
|
485,144 |
|
|
484,544 |
|
|
483,831 |
Unearned compensation - ESOP |
|
|
(25,326) |
|
|
(25,785) |
|
|
(26,245) |
|
|
(26,704) |
|
|
(27,164) |
Retained earnings |
|
|
363,591 |
|
|
359,656 |
|
|
369,930 |
|
|
364,709 |
|
|
360,454 |
Treasury stock |
|
|
(199,853) |
|
|
(193,590) |
|
|
(187,803) |
|
|
(181,324) |
|
|
(175,514) |
Accumulated other comprehensive loss |
|
|
(48,604) |
|
|
(43,622) |
|
|
(56,989) |
|
|
(46,290) |
|
|
(42,410) |
Total stockholders' equity |
|
|
577,683 |
|
|
583,759 |
|
|
584,634 |
|
|
595,532 |
|
|
599,794 |
|
|
|
|
|
|
|
|
|
|
|
|
|
|
|
|
Total liabilities and stockholders' equity |
|
$ |
5,862,222 |
|
$ |
5,667,896 |
|
$ |
5,664,387 |
|
$ |
5,659,254 |
|
$ |
5,572,858 |
HarborOne Bancorp, Inc.
Consolidated Statements of Net Income - Trend
(Unaudited)
|
|
Quarters Ended |
|||||||||||||
|
|
March 31, |
|
December 31, |
|
September 30, |
|
June 30, |
|
March 31, |
|||||
(in thousands, except share data) |
|
2024 |
|
2023 |
|
2023 |
|
2023 |
|
2023 |
|||||
|
|
|
|
|
|
|
|
|
|
|
|
|
|
|
|
Interest and dividend income: |
|
|
|
|
|
|
|
|
|
|
|
|
|
|
|
Interest and fees on loans |
|
$ |
59,937 |
|
$ |
59,499 |
|
$ |
58,124 |
|
$ |
55,504 |
|
$ |
52,771 |
Interest on loans held for sale |
|
|
243 |
|
|
369 |
|
|
370 |
|
|
326 |
|
|
286 |
Interest on securities |
|
|
2,065 |
|
|
2,001 |
|
|
2,003 |
|
|
2,035 |
|
|
2,079 |
Other interest and dividend income |
|
|
4,659 |
|
|
2,516 |
|
|
2,667 |
|
|
2,935 |
|
|
803 |
Total interest and dividend income |
|
|
66,904 |
|
|
64,385 |
|
|
63,164 |
|
|
60,800 |
|
|
55,939 |
|
|
|
|
|
|
|
|
|
|
|
|
|
|
|
|
Interest expense: |
|
|
|
|
|
|
|
|
|
|
|
|
|
|
|
Interest on deposits |
|
|
26,899 |
|
|
27,310 |
|
|
25,039 |
|
|
20,062 |
|
|
15,913 |
Interest on borrowings |
|
|
9,423 |
|
|
6,260 |
|
|
6,439 |
|
|
8,114 |
|
|
5,105 |
Interest on subordinated debentures |
|
|
— |
|
|
1,122 |
|
|
606 |
|
|
524 |
|
|
523 |
Total interest expense |
|
|
36,322 |
|
|
34,692 |
|
|
32,084 |
|
|
28,700 |
|
|
21,541 |
|
|
|
|
|
|
|
|
|
|
|
|
|
|
|
|
Net interest and dividend income |
|
|
30,582 |
|
|
29,693 |
|
|
31,080 |
|
|
32,100 |
|
|
34,398 |
|
|
|
|
|
|
|
|
|
|
|
|
|
|
|
|
Provision (benefit) for credit losses |
|
|
(168) |
|
|
644 |
|
|
(113) |
|
|
3,283 |
|
|
1,866 |
|
|
|
|
|
|
|
|
|
|
|
|
|
|
|
|
Net interest and dividend income, after provision for credit losses |
|
|
30,750 |
|
|
29,049 |
|
|
31,193 |
|
|
28,817 |
|
|
32,532 |
|
|
|
|
|
|
|
|
|
|
|
|
|
|
|
|
Noninterest income: |
|
|
|
|
|
|
|
|
|
|
|
|
|
|
|
Mortgage banking income: |
|
|
|
|
|
|
|
|
|
|
|
|
|
|
|
Gain on sale of mortgage loans |
|
|
2,013 |
|
|
2,176 |
|
|
2,704 |
|
|
3,300 |
|
|
2,224 |
Changes in mortgage servicing rights fair value |
|
|
54 |
|
|
(3,553) |
|
|
125 |
|
|
436 |
|
|
(1,692) |
Other |
|
|
2,276 |
|
|
2,301 |
|
|
2,270 |
|
|
2,312 |
|
|
2,216 |
Total mortgage banking income |
|
|
4,343 |
|
|
924 |
|
|
5,099 |
|
|
6,048 |
|
|
2,748 |
|
|
|
|
|
|
|
|
|
|
|
|
|
|
|
|
Deposit account fees |
|
|
4,983 |
|
|
5,178 |
|
|
5,133 |
|
|
5,012 |
|
|
4,733 |
Income on retirement plan annuities |
|
|
145 |
|
|
147 |
|
|
146 |
|
|
128 |
|
|
119 |
Bank-owned life insurance income |
|
|
746 |
|
|
1,207 |
|
|
531 |
|
|
511 |
|
|
500 |
Other income |
|
|
524 |
|
|
1,448 |
|
|
689 |
|
|
963 |
|
|
590 |
Total noninterest income |
|
|
10,741 |
|
|
8,904 |
|
|
11,598 |
|
|
12,662 |
|
|
8,690 |
|
|
|
|
|
|
|
|
|
|
|
|
|
|
|
|
Noninterest expenses: |
|
|
|
|
|
|
|
|
|
|
|
|
|
|
|
Compensation and benefits |
|
|
17,636 |
|
|
19,199 |
|
|
18,699 |
|
|
18,220 |
|
|
17,799 |
Occupancy and equipment |
|
|
4,781 |
|
|
4,670 |
|
|
4,430 |
|
|
4,633 |
|
|
5,040 |
Data processing |
|
|
2,479 |
|
|
2,474 |
|
|
2,548 |
|
|
2,403 |
|
|
2,346 |
Loan (income) expense |
|
|
371 |
|
|
(317) |
|
|
385 |
|
|
417 |
|
|
313 |
Marketing |
|
|
816 |
|
|
811 |
|
|
794 |
|
|
925 |
|
|
1,181 |
Professional fees |
|
|
1,457 |
|
|
1,690 |
|
|
1,374 |
|
|
1,114 |
|
|
1,501 |
Deposit insurance |
|
|
1,164 |
|
|
795 |
|
|
1,004 |
|
|
1,176 |
|
|
510 |
Goodwill impairment |
|
|
— |
|
|
10,760 |
|
|
— |
|
|
— |
|
|
— |
Other expenses |
|
|
3,046 |
|
|
3,132 |
|
|
2,638 |
|
|
2,837 |
|
|
2,819 |
Total noninterest expenses |
|
|
31,750 |
|
|
43,214 |
|
|
31,872 |
|
|
31,725 |
|
|
31,509 |
|
|
|
|
|
|
|
|
|
|
|
|
|
|
|
|
Income (loss) before income taxes |
|
|
9,741 |
|
|
(5,261) |
|
|
10,919 |
|
|
9,754 |
|
|
9,713 |
|
|
|
|
|
|
|
|
|
|
|
|
|
|
|
|
Income tax provision |
|
|
2,441 |
|
|
1,850 |
|
|
2,507 |
|
|
2,275 |
|
|
2,416 |
|
|
|
|
|
|
|
|
|
|
|
|
|
|
|
|
Net income (loss) |
|
$ |
7,300 |
|
$ |
(7,111) |
|
$ |
8,412 |
|
$ |
7,479 |
|
$ |
7,297 |
|
|
|
|
|
|
|
|
|
|
|
|
|
|
|
|
Earnings (losses) per common share: |
|
|
|
|
|
|
|
|
|
|
|
|
|
|
|
Basic |
|
$ |
0.17 |
|
$ |
(0.17) |
|
$ |
0.20 |
|
$ |
0.17 |
|
$ |
0.16 |
Diluted |
|
$ |
0.17 |
|
$ |
(0.17) |
|
$ |
0.20 |
|
$ |
0.17 |
|
$ |
0.16 |
Weighted average shares outstanding: |
|
|
|
|
|
|
|
|
|
|
|
|
|
|
|
Basic |
|
|
41,912,421 |
|
|
42,111,872 |
|
|
42,876,893 |
|
|
43,063,507 |
|
|
44,857,224 |
Diluted |
|
|
42,127,037 |
|
|
42,299,858 |
|
|
42,983,477 |
|
|
43,133,455 |
|
|
45,284,240 |
|
|
|
|
|
|
|
|
|
|
|
|
|
|
|
|
HarborOne Bancorp, Inc.
Average Balances and Yield Trend
(Unaudited)
|
|
Quarters Ended |
|
||||||||||||||||||||||
|
|
March 31, 2024 |
|
December 31, 2023 |
|
March 31, 2023 |
|
||||||||||||||||||
|
|
Average |
|
|
|
|
|
Average |
|
|
|
|
|
Average |
|
|
|
|
|
||||||
|
|
Outstanding |
|
|
|
Yield/ |
|
Outstanding |
|
|
|
Yield/ |
|
Outstanding |
|
|
|
Yield/ |
|
||||||
|
|
Balance |
|
Interest |
|
Cost (8) |
|
Balance |
|
Interest |
|
Cost (8) |
|
Balance |
|
Interest |
|
Cost (8) |
|
||||||
|
|
(dollars in thousands) |
|
||||||||||||||||||||||
Interest-earning assets: |
|
|
|
|
|
|
|
|
|
|
|
|
|
|
|
|
|
|
|
|
|
|
|
|
|
Investment securities (1) |
|
$ |
372,787 |
|
$ |
2,065 |
|
2.23 |
% |
$ |
370,683 |
|
$ |
2,001 |
|
2.14 |
% |
$ |
387,303 |
|
$ |
2,079 |
|
2.18 |
% |
Other interest-earning assets |
|
|
356,470 |
|
|
4,659 |
|
5.26 |
|
|
205,929 |
|
|
2,516 |
|
4.85 |
|
|
63,426 |
|
|
803 |
|
5.13 |
|
Loans held for sale |
|
|
14,260 |
|
|
243 |
|
6.85 |
|
|
20,010 |
|
|
369 |
|
7.32 |
|
|
18,108 |
|
|
286 |
|
6.41 |
|
Loans |
|
|
|
|
|
|
|
|
|
|
|
|
|
|
|
|
|
|
|
|
|
|
|
|
|
Commercial loans (2)(3) |
|
|
3,040,835 |
|
|
41,653 |
|
5.51 |
|
|
3,005,840 |
|
|
41,263 |
|
5.45 |
|
|
2,901,464 |
|
|
36,837 |
|
5.15 |
|
Residential real estate loans (3)(4) |
|
|
1,700,694 |
|
|
18,175 |
|
4.30 |
|
|
1,707,978 |
|
|
18,103 |
|
4.21 |
|
|
1,647,109 |
|
|
15,616 |
|
3.85 |
|
Consumer loans (3) |
|
|
20,539 |
|
|
358 |
|
7.01 |
|
|
22,324 |
|
|
384 |
|
6.82 |
|
|
36,310 |
|
|
519 |
|
5.80 |
|
Total loans |
|
|
4,762,068 |
|
|
60,186 |
|
5.08 |
|
|
4,736,142 |
|
|
59,750 |
|
5.01 |
|
|
4,584,883 |
|
|
52,972 |
|
4.69 |
|
Total interest-earning assets |
|
|
5,505,585 |
|
|
67,153 |
|
4.91 |
|
|
5,332,764 |
|
|
64,636 |
|
4.81 |
|
|
5,053,720 |
|
|
56,140 |
|
4.51 |
|
Noninterest-earning assets |
|
|
299,153 |
|
|
|
|
|
|
|
313,729 |
|
|
|
|
|
|
|
313,309 |
|
|
|
|
|
|
Total assets |
|
$ |
5,804,738 |
|
|
|
|
|
|
$ |
5,646,493 |
|
|
|
|
|
|
$ |
5,367,029 |
|
|
|
|
|
|
Interest-bearing liabilities: |
|
|
|
|
|
|
|
|
|
|
|
|
|
|
|
|
|
|
|
|
|
|
|
|
|
Savings accounts |
|
$ |
1,186,201 |
|
|
5,523 |
|
1.87 |
|
$ |
1,307,774 |
|
|
6,875 |
|
2.09 |
|
$ |
1,459,392 |
|
|
5,445 |
|
1.51 |
|
NOW accounts |
|
|
289,902 |
|
|
75 |
|
0.10 |
|
|
290,147 |
|
|
122 |
|
0.17 |
|
|
275,801 |
|
|
36 |
|
0.05 |
|
Money market accounts |
|
|
994,353 |
|
|
9,313 |
|
3.77 |
|
|
963,223 |
|
|
9,288 |
|
3.83 |
|
|
824,694 |
|
|
5,238 |
|
2.58 |
|
Certificates of deposit |
|
|
855,070 |
|
|
8,554 |
|
4.02 |
|
|
859,274 |
|
|
8,329 |
|
3.85 |
|
|
552,636 |
|
|
2,685 |
|
1.97 |
|
Brokered deposits |
|
|
356,459 |
|
|
3,434 |
|
3.87 |
|
|
288,449 |
|
|
2,696 |
|
3.71 |
|
|
330,426 |
|
|
2,509 |
|
3.08 |
|
Total interest-bearing deposits |
|
|
3,681,985 |
|
|
26,899 |
|
2.94 |
|
|
3,708,867 |
|
|
27,310 |
|
2.92 |
|
|
3,442,949 |
|
|
15,913 |
|
1.87 |
|
Borrowings |
|
|
764,623 |
|
|
9,423 |
|
4.96 |
|
|
507,520 |
|
|
6,260 |
|
4.89 |
|
|
448,096 |
|
|
5,105 |
|
4.62 |
|
Subordinated debentures |
|
|
— |
|
|
— |
|
- |
|
|
22,614 |
|
|
1,122 |
|
19.68 |
|
|
34,298 |
|
|
523 |
|
6.18 |
|
Total borrowings |
|
|
764,623 |
|
|
9,423 |
|
4.96 |
|
|
530,134 |
|
|
7,382 |
|
5.52 |
|
|
482,394 |
|
|
5,628 |
|
4.73 |
|
Total interest-bearing liabilities |
|
|
4,446,608 |
|
|
36,322 |
|
3.29 |
|
|
4,239,001 |
|
|
34,692 |
|
3.25 |
|
|
3,925,343 |
|
|
21,541 |
|
2.23 |
|
Noninterest-bearing liabilities: |
|
|
|
|
|
|
|
|
|
|
|
|
|
|
|
|
|
|
|
|
|
|
|
|
|
Noninterest-bearing deposits |
|
|
654,436 |
|
|
|
|
|
|
|
683,548 |
|
|
|
|
|
|
|
721,536 |
|
|
|
|
|
|
Other noninterest-bearing liabilities |
|
|
119,289 |
|
|
|
|
|
|
|
137,239 |
|
|
|
|
|
|
|
101,820 |
|
|
|
|
|
|
Total liabilities |
|
|
5,220,333 |
|
|
|
|
|
|
|
5,059,788 |
|
|
|
|
|
|
|
4,748,699 |
|
|
|
|
|
|
Total stockholders' equity |
|
|
584,405 |
|
|
|
|
|
|
|
586,705 |
|
|
|
|
|
|
|
618,330 |
|
|
|
|
|
|
Total liabilities and stockholders' equity |
|
$ |
5,804,738 |
|
|
|
|
|
|
$ |
5,646,493 |
|
|
|
|
|
|
$ |
5,367,029 |
|
|
|
|
|
|
Tax equivalent net interest income |
|
|
|
|
|
30,831 |
|
|
|
|
|
|
|
29,944 |
|
|
|
|
|
|
|
34,599 |
|
|
|
Tax equivalent interest rate spread (5) |
|
|
|
|
|
|
|
1.62 |
% |
|
|
|
|
|
|
1.56 |
% |
|
|
|
|
|
|
2.28 |
% |
Less: tax equivalent adjustment |
|
|
|
|
|
249 |
|
|
|
|
|
|
|
251 |
|
|
|
|
|
|
|
201 |
|
|
|
Net interest income as reported |
|
|
|
|
$ |
30,582 |
|
|
|
|
|
|
$ |
29,693 |
|
|
|
|
|
|
$ |
34,398 |
|
|
|
Net interest-earning assets (6) |
|
$ |
1,058,977 |
|
|
|
|
|
|
$ |
1,093,763 |
|
|
|
|
|
|
$ |
1,128,377 |
|
|
|
|
|
|
Net interest margin (7) |
|
|
|
|
|
|
|
2.23 |
% |
|
|
|
|
|
|
2.21 |
% |
|
|
|
|
|
|
2.76 |
% |
Tax equivalent effect |
|
|
|
|
|
|
|
0.02 |
|
|
|
|
|
|
|
0.02 |
|
|
|
|
|
|
|
0.02 |
|
Net interest margin on a fully tax equivalent basis |
|
|
|
|
|
|
|
2.25 |
% |
|
|
|
|
|
|
2.23 |
% |
|
|
|
|
|
|
2.78 |
% |
Ratio of interest-earning assets to interest-bearing liabilities |
|
|
123.82 |
% |
|
|
|
|
|
|
125.80 |
% |
|
|
|
|
|
|
128.75 |
% |
|
|
|
|
|
|
|
|
|
|
|
|
|
|
|
|
|
|
|
|
|
|
|
|
|
|
|
|
|
|
|
Supplemental information: |
|
|
|
|
|
|
|
|
|
|
|
|
|
|
|
|
|
|
|
|
|
|
|
|
|
Total deposits, including demand deposits |
|
$ |
4,336,421 |
|
$ |
26,899 |
|
|
|
$ |
4,392,415 |
|
$ |
27,310 |
|
|
|
$ |
4,164,485 |
|
$ |
15,913 |
|
|
|
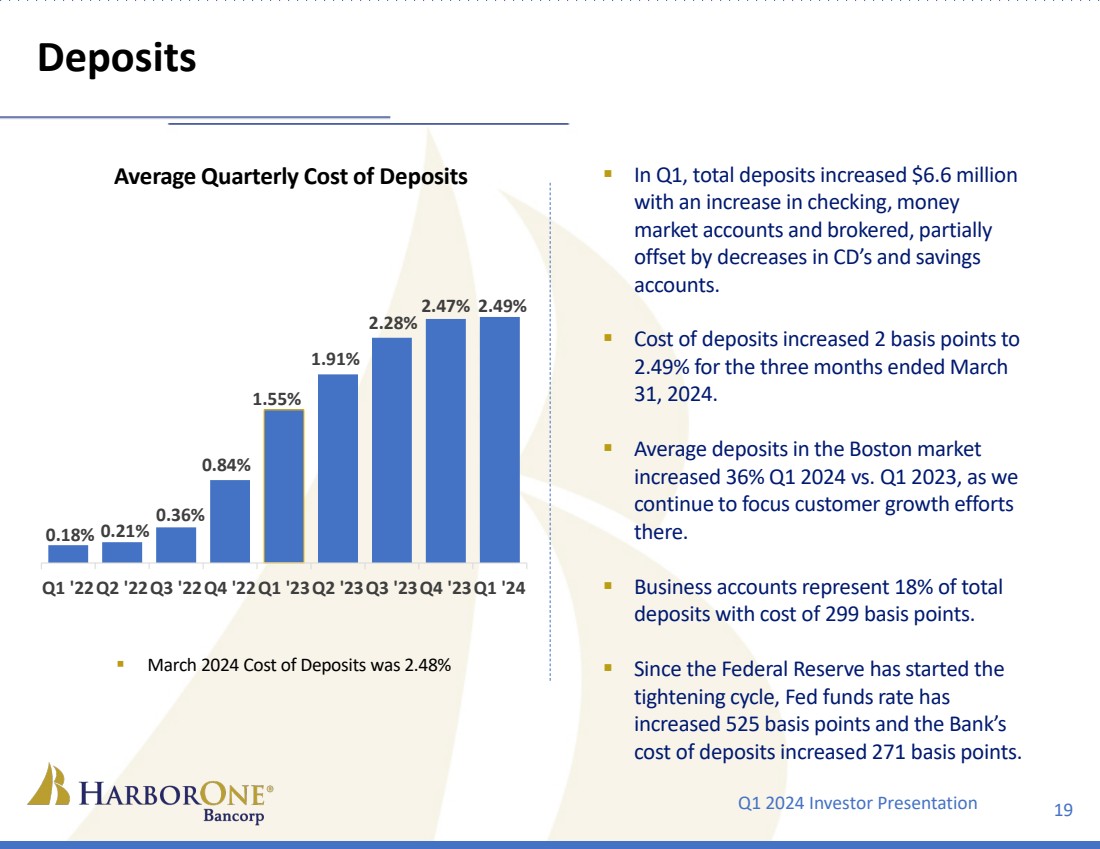
Cost of total deposits |
|
|
|
|
|
|
|
2.49 |
% |
|
|
|
|
|
|
2.47 |
% |
|
|
|
|
|
|
1.55 |
% |
Total funding liabilities, including demand deposits |
|
$ |
5,101,044 |
|
$ |
36,322 |
|
|
|
$ |
4,922,549 |
|
$ |
34,692 |
|
|
|
$ |
4,646,879 |
|
$ |
21,541 |
|
|
|
Cost of total funding liabilities |
|
|
|
|
|
|
|
2.86 |
% |
|
|
|
|
|
|
2.80 |
% |
|
|
|
|
|
|
1.88 |
% |
|
|
|
|
|
|
|
|
|
|
|
|
|
|
|
|
|
|
|
|
|
|
|
|
|
|
(1) Includes securities available for sale and securities held to maturity. |
|
||||||||||||||||||||||||
(2) Tax-exempt income on industrial revenue bonds is included in commercial loans on a tax-equivalent basis. |
|
||||||||||||||||||||||||
(3) Includes nonaccruing loan balances and interest received on such loans. |
|
||||||||||||||||||||||||
(4) Includes the basis adjustments of certain loans included in fair value hedging relationships. |
|
||||||||||||||||||||||||
(5) Net interest rate spread represents the difference between the yield on average interest-earning assets and the cost of average interest-bearing liabilities. |
|
||||||||||||||||||||||||
(6) Net interest-earning assets represents total interest-earning assets less total interest-bearing liabilities. |
|
||||||||||||||||||||||||
(7) Net interest margin represents net interest income divided by average total interest-earning assets. |
|
||||||||||||||||||||||||
(8) Annualized. |
|
||||||||||||||||||||||||
|
|
Average Balances - Trend - Quarters Ended |
||||||||||||||
|
|
|
March 31, |
|
December 31, |
|
September 30, |
|
June 30, |
|
March 31 |
|||||
|
|
|
2024 |
|
2023 |
|
2023 |
|
2023 |
|
2023 |
|||||
|
|
(in thousands) |
|
|||||||||||||
|
|
|
|
|
|
|
|
|
|
|
|
|
|
|
|
|
Interest-earning assets: |
|
|
|
|
|
|
|
|
|
|
|
|
|
|
|
|
Investment securities (1) |
|
$ |
372,787 |
|
$ |
370,683 |
|
$ |
375,779 |
|
$ |
381,762 |
|
$ |
387,303 |
|
Other interest-earning assets |
|
|
356,470 |
|
|
205,929 |
|
|
207,234 |
|
|
238,891 |
|
|
63,426 |
|
Loans held for sale |
|
|
14,260 |
|
|
20,010 |
|
|
20,919 |
|
|
19,614 |
|
|
18,108 |
|
Loans |
|
|
|
|
|
|
|
|
|
|
|
|
|
|
|
|
Commercial loans (2)(3) |
|
|
3,040,835 |
|
|
3,005,840 |
|
|
2,980,817 |
|
|
2,938,292 |
|
|
2,901,464 |
|
Residential real estate loans (3)(4) |
|
|
1,700,694 |
|
|
1,707,978 |
|
|
1,700,383 |
|
|
1,682,860 |
|
|
1,647,109 |
|
Consumer loans (3) |
|
|
20,539 |
|
|
22,324 |
|
|
25,126 |
|
|
29,025 |
|
|
36,310 |
|
Total loans |
|
|
4,762,068 |
|
|
4,736,142 |
|
|
4,706,326 |
|
|
4,650,177 |
|
|
4,584,883 |
|
Total interest-earning assets |
|
|
5,505,585 |
|
|
5,332,764 |
|
|
5,310,258 |
|
|
5,290,444 |
|
|
5,053,720 |
|
Noninterest-earning assets |
|
|
299,153 |
|
|
313,729 |
|
|
314,030 |
|
|
305,132 |
|
|
313,309 |
|
Total assets |
|
$ |
5,804,738 |
|
$ |
5,646,493 |
|
$ |
5,624,288 |
|
$ |
5,595,576 |
|
$ |
5,367,029 |
|
Interest-bearing liabilities: |
|
|
|
|
|
|
|
|
|
|
|
|
|
|
|
|
Savings accounts |
|
$ |
1,186,201 |
|
$ |
1,307,774 |
|
$ |
1,360,728 |
|
$ |
1,421,622 |
|
$ |
1,459,392 |
|
NOW accounts |
|
|
289,902 |
|
|
290,147 |
|
|
274,329 |
|
|
280,501 |
|
|
275,801 |
|
Money market accounts |
|
|
994,353 |
|
|
963,223 |
|
|
910,694 |
|
|
802,373 |
|
|
824,694 |
|
Certificates of deposit |
|
|
855,070 |
|
|
859,274 |
|
|
818,182 |
|
|
708,087 |
|
|
552,636 |
|
Brokered deposits |
|
|
356,459 |
|
|
288,449 |
|
|
287,428 |
|
|
281,614 |
|
|
330,426 |
|
Total interest-bearing deposits |
|
|
3,681,985 |
|
|
3,708,867 |
|
|
3,651,361 |
|
|
3,494,197 |
|
|
3,442,949 |
|
Borrowings |
|
|
764,623 |
|
|
507,520 |
|
|
508,001 |
|
|
666,345 |
|
|
448,096 |
|
Subordinated debentures |
|
|
— |
|
|
22,614 |
|
|
34,364 |
|
|
34,331 |
|
|
34,298 |
|
Total borrowings |
|
|
764,623 |
|
|
530,134 |
|
|
542,365 |
|
|
700,676 |
|
|
482,394 |
|
Total interest-bearing liabilities |
|
|
4,446,608 |
|
|
4,239,001 |
|
|
4,193,726 |
|
|
4,194,873 |
|
|
3,925,343 |
|
Noninterest-bearing liabilities: |
|
|
|
|
|
|
|
|
|
|
|
|
|
|
|
|
Noninterest-bearing deposits |
|
|
654,436 |
|
|
683,548 |
|
|
705,009 |
|
|
712,081 |
|
|
721,536 |
|
Other noninterest-bearing liabilities |
|
|
119,289 |
|
|
137,239 |
|
|
126,742 |
|
|
88,363 |
|
|
101,820 |
|
Total liabilities |
|
|
5,220,333 |
|
|
5,059,788 |
|
|
5,025,477 |
|
|
4,995,317 |
|
|
4,748,699 |
|
Total stockholders' equity |
|
|
584,405 |
|
|
586,705 |
|
|
598,811 |
|
|
600,259 |
|
|
618,330 |
|
Total liabilities and stockholders' equity |
|
$ |
5,804,738 |
|
$ |
5,646,493 |
|
$ |
5,624,288 |
|
$ |
5,595,576 |
|
$ |
5,367,029 |
|
|
|
|
|
|
|
|
|
|
|
|
|
|
|
|
|
|
|
|
Annualized Yield Trend - Quarters Ended |
|
|||||||||||||
|
|
|
March 31, |
|
December 31, |
|
September 30, |
|
June 30, |
|
March 31, |
|||||
|
|
|
2024 |
|
2023 |
|
2023 |
|
2023 |
|
2023 |
|||||
|
|
|
|
|
|
|
|
|
|
|
|
|
|
|
|
|
Interest-earning assets: |
|
|
|
|
|
|
|
|
|
|
|
|
|
|
|
|
Investment securities (1) |
|
|
2.23 |
% |
|
2.14 |
% |
|
2.11 |
% |
|
2.14 |
% |
|
2.18 |
% |
Other interest-earning assets |
|
|
5.26 |
% |
|
4.85 |
% |
|
5.11 |
% |
|
4.93 |
% |
|
5.13 |
% |
Loans held for sale |
|
|
6.85 |
% |
|
7.32 |
% |
|
7.02 |
% |
|
6.67 |
% |
|
6.41 |
% |
Commercial loans (2)(3) |
|
|
5.51 |
% |
|
5.45 |
% |
|
5.38 |
% |
|
5.30 |
% |
|
5.15 |
% |
Residential real estate loans (3)(4) |
|
|
4.30 |
% |
|
4.21 |
% |
|
4.09 |
% |
|
3.92 |
% |
|
3.85 |
% |
Consumer loans (3) |
|
|
7.01 |
% |
|
6.82 |
% |
|
6.51 |
% |
|
5.79 |
% |
|
5.80 |
% |
Total loans |
|
|
5.08 |
% |
|
5.01 |
% |
|
4.92 |
% |
|
4.81 |
% |
|
4.69 |
% |
Total interest-earning assets |
|
|
4.91 |
% |
|
4.81 |
% |
|
4.74 |
% |
|
4.63 |
% |
|
4.51 |
% |
|
|
|
|
|
|
|
|
|
|
|
|
|
|
|
|
|
Interest-bearing liabilities: |
|
|
|
|
|
|
|
|
|
|
|
|
|
|
|
|
Savings accounts |
|
|
1.87 |
% |
|
2.09 |
% |
|
1.98 |
% |
|
1.74 |
% |
|
1.51 |
% |
NOW accounts |
|
|
0.10 |
% |
|
0.17 |
% |
|
0.11 |
% |
|
0.08 |
% |
|
0.05 |
% |
Money market accounts |
|
|
3.77 |
% |
|
3.83 |
% |
|
3.64 |
% |
|
3.13 |
% |
|
2.58 |
% |
Certificates of deposit |
|
|
4.02 |
% |
|
3.85 |
% |
|
3.50 |
% |
|
2.99 |
% |
|
1.97 |
% |
Brokered deposits |
|
|
3.87 |
% |
|
3.71 |
% |
|
3.60 |
% |
|
3.29 |
% |
|
3.08 |
% |
Total interest-bearing deposits |
|
|
2.94 |
% |
|
2.92 |
% |
|
2.72 |
% |
|
2.30 |
% |
|
1.87 |
% |
Borrowings |
|
|
4.96 |
% |
|
4.89 |
% |
|
5.03 |
% |
|
4.88 |
% |
|
4.62 |
% |
Subordinated debentures |
|
|
- |
% |
|
19.68 |
% |
|
7.00 |
% |
|
6.12 |
% |
|
6.18 |
% |
Total borrowings |
|
|
4.96 |
% |
|
5.52 |
% |
|
5.15 |
% |
|
4.94 |
% |
|
4.73 |
% |
Total interest-bearing liabilities |
|
|
3.29 |
% |
|
3.25 |
% |
|
3.04 |
% |
|
2.74 |
% |
|
2.23 |
% |
|
|
|
|
|
|
|
|
|
|
|
|
|
|
|
|
|
(1) Includes securities available for sale and securities held to maturity. |
|
|||||||||||||||
(2) Tax-exempt income on industrial revenue bonds is included in commercial loans on a tax-equivalent basis. |
|
|||||||||||||||
(3) Includes nonaccruing loan balances and interest received on such loans. |
|
|||||||||||||||
(4) Includes the basis adjustments of certain loans included in fair value hedging relationships. |
|
|||||||||||||||
HarborOne Bancorp, Inc.
Selected Financial Highlights
(Unaudited)
|
|
Quarters Ended |
|
|||||||||||||
|
|
March 31, |
|
December 31, |
|
September 30, |
|
June 30, |
|
March 31, |
|
|||||
Performance Ratios (annualized): |
|
2024 |
|
2023 |
|
2023 |
|
2023 |
|
2023 |
|
|||||
(dollars in thousands) |
|
|
|
|
|
|
|
|
|
|
|
|
|
|
|
|
Net income (loss) |
|
$ |
7,300 |
|
$ |
(7,111) |
|
$ |
8,411 |
|
$ |
7,450 |
|
$ |
7,297 |
|
Less: Goodwill impairment charge |
|
|
— |
|
|
10,760 |
|
|
— |
|
|
— |
|
|
— |
|
Net income, excluding goodwill impairment charge(1) |
|
$ |
7,300 |
|
$ |
3,649 |
|
$ |
8,411 |
|
$ |
7,450 |
|
$ |
7,297 |
|
Average Assets |
|
$ |
5,804,738 |
|
$ |
5,646,493 |
|
$ |
5,624,288 |
|
$ |
5,595,576 |
|
$ |
5,367,029 |
|
Average Equity |
|
$ |
584,405 |
|
$ |
586,705 |
|
$ |
598,811 |
|
$ |
600,258 |
|
$ |
618,330 |
|
|
|
|
|
|
|
|
|
|
|
|
|
|
|
|
|
|
Return on average assets (ROAA) |
|
|
0.50 |
% |
|
(0.50) |
% |
|
0.60 |
% |
|
0.54 |
% |
|
0.54 |
% |
Return on average assets (ROAA), excluding goodwill impairment charge(2) |
|
|
0.50 |
% |
|
0.26 |
% |
|
0.60 |
% |
|
0.54 |
% |
|
0.54 |
% |
Return on average equity (ROAE) |
|
|
5.00 |
% |
|
(4.85) |
% |
|
5.62 |
% |
|
4.98 |
% |
|
4.72 |
% |
Return on average equity (ROAE), excluding goodwill impairment charge(3) |
|
|
5.00 |
% |
|
2.49 |
% |
|
5.62 |
% |
|
4.98 |
% |
|
4.72 |
% |
|
|
|
|
|
|
|
|
|
|
|
|
|
|
|
|
|
Total noninterest expense |
|
$ |
31,750 |
|
$ |
43,214 |
|
$ |
31,872 |
|
$ |
31,725 |
|
$ |
31,509 |
|
Less: Amortization of other intangible assets |
|
|
189 |
|
|
189 |
|
|
189 |
|
|
189 |
|
|
189 |
|
Total adjusted noninterest expense |
|
|
31,561 |
|
|
43,025 |
|
|
31,683 |
|
|
31,536 |
|
|
31,320 |
|
Less: Goodwill impairment charge |
|
|
— |
|
|
10,760 |
|
|
— |
|
|
— |
|
|
— |
|
Total adjusted noninterest expense, excluding goodwill impairment(4) |
|
$ |
31,561 |
|
$ |
32,265 |
|
$ |
31,683 |
|
$ |
31,536 |
|
$ |
31,320 |
|
|
|
|
|
|
|
|
|
|
|
|
|
|
|
|
|
|
Net interest and dividend income |
|
$ |
30,582 |
|
$ |
29,693 |
|
$ |
31,080 |
|
$ |
32,100 |
|
$ |
34,398 |
|
Total noninterest income |
|
|
10,741 |
|
|
8,904 |
|
|
11,598 |
|
|
12,662 |
|
|
8,690 |
|
Total revenue |
|
$ |
41,323 |
|
$ |
38,597 |
|
$ |
42,678 |
|
$ |
44,762 |
|
$ |
43,088 |
|
|
|
|
|
|
|
|
|
|
|
|
|
|
|
|
|
|
Efficiency ratio (5) |
|
|
76.38 |
% |
|
111.47 |
% |
|
74.24 |
% |
|
70.45 |
% |
|
72.69 |
% |
Efficiency ratio, excluding goodwill impairment charge(6) |
|
|
76.38 |
% |
|
83.59 |
% |
|
74.24 |
% |
|
70.45 |
% |
|
72.69 |
% |
|
|
|
|
|
|
|
|
|
|
|
|
|
|
|
|
|
(1) This non-GAAP measure represents net income, excluding goodwill impairment charge |
|
|||||||||||||||
(2) This non-GAAP measure represents net income, excluding goodwill impairment charge to average assets |
|
|||||||||||||||
(3) This non-GAAP measure represents net income, excluding goodwill impairment charge to average equity |
|
|||||||||||||||
(4) This non-GAAP measure represents adjusted noninterest expense, excluding goodwill impairment charge |
|
|||||||||||||||
(5) This non-GAAP measure represents adjusted noninterest expense divided by total revenue |
|
|||||||||||||||
(6) This non-GAAP measure represents adjusted noninterest expense, excluding goodwill impairment divided by total revenue |
|
|||||||||||||||
|
|
At or for the Quarters Ended |
|
|||||||||||||
|
|
March 31, |
|
December 31, |
|
September 30, |
|
June 30, |
|
March 31, |
|
|||||
Asset Quality |
|
2024 |
|
2023 |
|
2023 |
|
2023 |
|
2023 |
|
|||||
(dollars in thousands) |
|
|
|
|
|
|
|
|
|
|
|
|
|
|
|
|
|
|
|
|
|
|
|
|
|
|
|
|
|
|
|
|
|
Total nonperforming assets |
|
$ |
12,160 |
|
$ |
17,582 |
|
$ |
18,795 |
|
$ |
20,234 |
|
$ |
12,300 |
|
|
|
|
|
|
|
|
|
|
|
|
|
|
|
|
|
|
Nonperforming assets to total assets |
|
|
0.21 |
% |
|
0.31 |
% |
|
0.33 |
% |
|
0.36 |
% |
|
0.22 |
% |
|
|
|
|
|
|
|
|
|
|
|
|
|
|
|
|
|
Allowance for credit losses on loans to total loans |
|
|
1.01 |
% |
|
1.01 |
% |
|
1.02 |
% |
|
1.02 |
% |
|
1.02 |
% |
|
|
|
|
|
|
|
|
|
|
|
|
|
|
|
|
|
Net charge-offs (recoveries) |
|
$ |
125 |
|
$ |
1,311 |
|
$ |
(18) |
|
$ |
2,671 |
|
$ |
(11) |
|
|
|
|
|
|
|
|
|
|
|
|
|
|
|
|
|
|
Annualized net charge-offs (recoveries)/average loans |
|
|
0.01 |
% |
|
0.11 |
% |
|
— |
% |
|
0.23 |
% |
|
— |
% |
|
|
|
|
|
|
|
|
|
|
|
|
|
|
|
|
|
Allowance for credit losses on loans to nonperforming loans |
|
|
396.27 |
% |
|
273.92 |
% |
|
257.21 |
% |
|
236.62 |
% |
|
383.50 |
% |
HarborOne Bancorp, Inc.
Selected Financial Highlights
(Unaudited)
|
|
Quarters Ended |
|
|||||||||||||
|
|
March 31, |
|
December 31, |
|
September 30, |
|
June 30, |
|
March 31, |
|
|||||
Capital and Share Related |
|
2024 |
|
2023 |
|
2023 |
|
2023 |
|
2023 |
|
|||||
(dollars in thousands, except share data) |
|
|
|
|
|
|
|
|
|
|
|
|
|
|
|
|
|
|
|
|
|
|
|
|
|
|
|
|
|
|
|
|
|
Common stock outstanding |
|
|
45,055,006 |
|
|
45,401,224 |
|
|
45,915,364 |
|
|
46,575,478 |
|
|
47,063,087 |
|
|
|
|
|
|
|
|
|
|
|
|
|
|
|
|
|
|
Book value per share |
|
$ |
12.82 |
|
$ |
12.86 |
|
$ |
12.73 |
|
$ |
12.79 |
|
$ |
12.74 |
|
|
|
|
|
|
|
|
|
|
|
|
|
|
|
|
|
|
Tangible common equity: |
|
|
|
|
|
|
|
|
|
|
|
|
|
|
|
|
Total stockholders' equity |
|
$ |
577,683 |
|
$ |
583,759 |
|
$ |
584,634 |
|
$ |
595,532 |
|
$ |
599,794 |
|
Less: Goodwill |
|
|
59,042 |
|
|
59,042 |
|
|
69,802 |
|
|
69,802 |
|
|
69,802 |
|
Less: Other intangible assets (1) |
|
|
1,326 |
|
|
1,515 |
|
|
1,704 |
|
|
1,893 |
|
|
2,082 |
|
Tangible common equity |
|
$ |
517,315 |
|
$ |
523,202 |
|
$ |
513,128 |
|
$ |
523,837 |
|
$ |
527,910 |
|
|
|
|
|
|
|
|
|
|
|
|
|
|
|
|
|
|
Tangible book value per share (2) |
|
$ |
11.48 |
|
$ |
11.52 |
|
$ |
11.18 |
|
$ |
11.25 |
|
$ |
11.22 |
|
|
|
|
|
|
|
|
|
|
|
|
|
|
|
|
|
|
Tangible assets: |
|
|
|
|
|
|
|
|
|
|
|
|
|
|
|
|
Total assets |
|
$ |
5,862,222 |
|
$ |
5,667,896 |
|
$ |
5,664,387 |
|
$ |
5,659,254 |
|
$ |
5,572,858 |
|
Less: Goodwill |
|
|
59,042 |
|
|
59,042 |
|
|
69,802 |
|
|
69,802 |
|
|
69,802 |
|
Less: Other intangible assets |
|
|
1,326 |
|
|
1,515 |
|
|
1,704 |
|
|
1,893 |
|
|
2,082 |
|
Tangible assets |
|
$ |
5,801,854 |
|
$ |
5,607,339 |
|
$ |
5,592,881 |
|
$ |
5,587,559 |
|
$ |
5,500,974 |
|
|
|
|
|
|
|
|
|
|
|
|
|
|
|
|
|
|
Tangible common equity / tangible assets (3) |
|
|
8.92 |
% |
|
9.33 |
% |
|
9.17 |
% |
|
9.38 |
% |
|
9.60 |
% |
|
|
|
|
|
|
|
|
|
|
|
|
|
|
|
|
|
(1) Other intangible assets are core deposit intangibles. | ||||||||||||||||
(2) This non-GAAP ratio is total stockholders' equity less goodwill and intangible assets divided by common stock outstanding. | ||||||||||||||||
(3) This non-GAAP ratio is total stockholders' equity less goodwill and intangible assets to total assets less goodwill and intangible assets. | ||||||||||||||||
HarborOne Bancorp, Inc.
Segments Key Financial Data
(Unaudited)
|
|
Quarters Ended |
|
|
|||||||||||||
|
|
March 31, |
|
December 31, |
|
September 30, |
|
June 30, |
|
March 31, |
|
|
|||||
Statements of Net Income for HarborOne Bank Segment: |
|
2024 |
|
2023 |
|
2023 |
|
2023 |
|
2023 |
|
|
|||||
|
|
(Dollars in thousands) |
|
|
|||||||||||||
|
|
|
|
|
|
|
|
|
|
|
|
|
|
|
|
|
|
Net interest and dividend income |
|
$ |
30,485 |
|
$ |
30,637 |
|
$ |
31,468 |
|
$ |
32,490 |
|
$ |
34,562 |
|
|
Provision (benefit) for credit losses |
|
|
(168) |
|
|
644 |
|
|
(113) |
|
|
3,283 |
|
|
1,866 |
|
|
Net interest and dividend income, after provision for credit losses |
|
|
30,653 |
|
|
29,993 |
|
|
31,581 |
|
|
29,207 |
|
|
32,696 |
|
|
Mortgage banking income: |
|
|
|
|
|
|
|
|
|
|
|
|
|
|
|
|
|
Intersegment loss |
|
|
(236) |
|
|
(159) |
|
|
(198) |
|
|
(358) |
|
|
(348) |
|
|
Changes in mortgage servicing rights fair value |
|
|
(32) |
|
|
(257) |
|
|
18 |
|
|
29 |
|
|
(136) |
|
|
Other |
|
|
180 |
|
|
185 |
|
|
188 |
|
|
195 |
|
|
201 |
|
|
Total mortgage banking (loss) income |
|
|
(88) |
|
|
(231) |
|
|
8 |
|
|
(134) |
|
|
(283) |
|
|
Other noninterest income: |
|
|
|
|
|
|
|
|
|
|
|
|
|
|
|
|
|
Deposit account fees |
|
|
4,983 |
|
|
5,178 |
|
|
5,132 |
|
|
5,013 |
|
|
4,733 |
|
|
Income on retirement plan annuities |
|
|
145 |
|
|
147 |
|
|
146 |
|
|
128 |
|
|
119 |
|
|
Bank-owned life insurance income |
|
|
746 |
|
|
1,207 |
|
|
531 |
|
|
511 |
|
|
500 |
|
|
Other income |
|
|
517 |
|
|
1,405 |
|
|
694 |
|
|
962 |
|
|
590 |
|
|
Total noninterest income |
|
|
6,303 |
|
|
7,706 |
|
|
6,511 |
|
|
6,480 |
|
|
5,659 |
|
|
Noninterest expenses: |
|
|
|
|
|
|
|
|
|
|
|
|
|
|
|
|
|
Compensation and benefits |
|
|
15,307 |
|
|
16,535 |
|
|
15,238 |
|
|
15,067 |
|
|
14,764 |
|
|
Occupancy and equipment |
|
|
4,150 |
|
|
4,038 |
|
|
3,828 |
|
|
3,910 |
|
|
4,295 |
|
|
Data processing |
|
|
2,470 |
|
|
2,462 |
|
|
2,527 |
|
|
2,355 |
|
|
2,305 |
|
|
Loan expense |
|
|
71 |
|
|
153 |
|
|
128 |
|
|
96 |
|
|
87 |
|
|
Marketing |
|
|
783 |
|
|
751 |
|
|
709 |
|
|
787 |
|
|
1,063 |
|
|
Professional fees |
|
|
1,056 |
|
|
1,404 |
|
|
914 |
|
|
699 |
|
|
996 |
|
|
Deposit insurance |
|
|
1,164 |
|
|
794 |
|
|
1,004 |
|
|
1,176 |
|
|
510 |
|
|
Other expenses |
|
|
2,406 |
|
|
2,476 |
|
|
1,924 |
|
|
2,103 |
|
|
2,170 |
|
|
Total noninterest expenses |
|
|
27,407 |
|
|
28,613 |
|
|
26,272 |
|
|
26,193 |
|
|
26,190 |
|
|
Less: Amortization of other intangible assets |
|
|
189 |
|
|
189 |
|
|
190 |
|
|
189 |
|
|
189 |
|
|
Total adjusted noninterest expense |
|
|
27,218 |
|
|
28,424 |
|
|
26,082 |
|
|
26,004 |
|
|
26,001 |
|
|
|
|
|
|
|
|
|
|
|
|
|
|
|
|
|
|
|
|
Income before income taxes |
|
|
9,549 |
|
|
9,086 |
|
|
11,820 |
|
|
9,494 |
|
|
12,165 |
|
|
Provision for income taxes |
|
|
2,386 |
|
|
2,535 |
|
|
2,716 |
|
|
2,193 |
|
|
3,115 |
|
|
Net income |
|
$ |
7,163 |
|
$ |
6,551 |
|
$ |
9,104 |
|
$ |
7,301 |
|
$ |
9,050 |
|
|
|
|
|
|
|
|
|
|
|
|
|
|
|
|
|
|
|
|
Efficiency ratio (1) - QTD |
|
|
73.99 |
% |
|
74.13 |
% |
|
68.67 |
% |
|
66.73 |
% |
|
64.65 |
% |
|
Efficiency ratio (1) - YTD |
|
|
73.99 |
% |
|
68.49 |
% |
|
66.64 |
% |
|
65.67 |
% |
|
64.65 |
% |
|
|
|
|
|
|
|
|
|
|
|
|
|
|
|
|
|
|
|
(1) This non-GAAP measure represents adjusted noninterest expense divided by total revenue |
|
|
|||||||||||||||
|
|
|
|
|
|
|
|
|
|
|
|
|
|
|
|
|
|
HarborOne Bancorp, Inc.
Segments Key Financial Data
(Unaudited)
|
|
Quarters Ended |
|
|
|||||||||||||
|
|
March 31, |
|
December 31, |
|
September 30, |
|
June 30, |
|
March 31, |
|
|
|||||
Statements of Net Income for HarborOne Mortgage Segment: |
|
2024 |
|
2023 |
|
2023 |
|
2023 |
|
2023 |
|
|
|||||
|
|
(Dollars in thousands) |
|
|
|||||||||||||
|
|
|
|
|
|
|
|
|
|
|
|
|
|
|
|
|
|
Net interest and dividend income |
|
$ |
80 |
|
$ |
160 |
|
$ |
199 |
|
$ |
120 |
|
$ |
327 |
|
|
Mortgage banking income: |
|
|
|
|
|
|
|
|
|
|
|
|
|
|
|
|
|
Gain on sale of mortgage loans |
|
|
2,013 |
|
|
2,176 |
|
|
2,704 |
|
|
3,300 |
|
|
2,224 |
|
|
Intersegment gain |
|
|
308 |
|
|
56 |
|
|
249 |
|
|
90 |
|
|
454 |
|
|
Changes in mortgage servicing rights fair value |
|
|
86 |
|
|
(3,296) |
|
|
107 |
|
|
407 |
|
|
(1,556) |
|
|
Other |
|
|
2,097 |
|
|
2,116 |
|
|
2,082 |
|
|
2,117 |
|
|
2,015 |
|
|
Total mortgage banking income |
|
|
4,504 |
|
|
1,052 |
|
|
5,142 |
|
|
5,914 |
|
|
3,137 |
|
|
Other noninterest income (loss) |
|
|
10 |
|
|
2 |
|
|
(4) |
|
|
— |
|
|
— |
|
|
Total noninterest income |
|
|
4,514 |
|
|
1,054 |
|
|
5,138 |
|
|
5,914 |
|
|
3,137 |
|
|
Noninterest expenses: |
|
|
|
|
|
|
|
|
|
|
|
|
|
|
|
|
|
Compensation and benefits |
|
|
2,919 |
|
|
3,217 |
|
|
4,014 |
|
|
3,700 |
|
|
3,575 |
|
|
Occupancy and equipment |
|
|
604 |
|
|
596 |
|
|
567 |
|
|
688 |
|
|
701 |
|
|
Data processing |
|
|
9 |
|
|
13 |
|
|
21 |
|
|
48 |
|
|
41 |
|
|
Loan expense |
|
|
304 |
|
|
(470) |
|
|
258 |
|
|
321 |
|
|
226 |
|
|
Marketing |
|
|
33 |
|
|
60 |
|
|
85 |
|
|
138 |
|
|
118 |
|
|
Professional fees |
|
|
132 |
|
|
120 |
|
|
155 |
|
|
180 |
|
|
257 |
|
|
Goodwill impairment |
|
|
— |
|
|
10,760 |
|
|
— |
|
|
— |
|
|
— |
|
|
Other expenses |
|
|
310 |
|
|
371 |
|
|
390 |
|
|
418 |
|
|
404 |
|
|
Total noninterest expenses |
|
|
4,311 |
|
|
14,667 |
|
|
5,490 |
|
|
5,493 |
|
|
5,322 |
|
|
|
|
|
|
|
|
|
|
|
|
|
|
|
|
|
|
|
|
Income (loss) before income taxes |
|
|
283 |
|
|
(13,453) |
|
|
(153) |
|
|
541 |
|
|
(1,858) |
|
|
Income tax (benefit) provision |
|
|
60 |
|
|
(596) |
|
|
(15) |
|
|
232 |
|
|
(565) |
|
|
Net income (loss) |
|
$ |
223 |
|
$ |
(12,857) |
|
$ |
(138) |
|
$ |
309 |
|
$ |
(1,293) |
|
|
|
|
|
|
|
|
|
|
|
|
|
|
|
|
|
|
|
|
Efficiency ratio (1) - QTD |
|
|
93.84 |
% |
|
1,208.15 |
% |
|
102.87 |
% |
|
91.03 |
% |
|
153.64 |
% |
|
Efficiency ratio, excluding goodwill impairment (2) - QTD |
|
|
93.84 |
% |
|
321.83 |
% |
|
102.87 |
% |
|
91.03 |
% |
|
153.64 |
% |
|
Efficiency ratio (1) - YTD |
|
|
93.84 |
% |
|
192.98 |
% |
|
109.91 |
% |
|
113.87 |
% |
|
153.64 |
% |
|
Efficiency ratio, excluding goodwill impairment (2) - YTD |
|
|
93.84 |
% |
|
125.94 |
% |
|
109.91 |
% |
|
113.87 |
% |
|
153.64 |
% |
|
|
|
|
|
|
|
|
|
|
|
|
|
|
|
|
|
|
|
(1) This non-GAAP measure represents noninterest expense divided by total revenue |
|
|
|||||||||||||||
(2) This non-GAAP measure represents noninterest expense, excluding goodwill impairment divided by total revenue |
|
|
|||||||||||||||
|
|
|
|
|
|
|
|
|
|
|
|
|
|
|
|
|
|
|
Investor Presentation April 2024 |
|
2 Q1 2024 Investor Presentation Forward-Looking Statements Certain statements herein constitute forward-looking statements within the meaning of Section 27A of the Securities Act of 1933, as amended, and Section 21E of the Exchange Act and are intended to be covered by the safe harbor provisions of the Private Securities Litigation Reform Act of 1995. We may also make forward-looking statements in other documents we file with the Securities and Exchange Commission (“SEC”), in our annual reports to shareholders, in press releases and other written materials, and in oral statements made by our officers, directors or employees. Such statements may be identified by words such as “believes,” “will,” “would,” “expects,” “project,” “may,” “could,” “developments,” “strategic,” “launching,” “opportunities,” “anticipates,” “estimates,” “intends,” “plans,” “targets” and similar expressions. These statements are based upon the current beliefs and expectations of the Company’s management and are subject to significant risks and uncertainties. Actual results may differ materially from those set forth in the forward-looking statements as a result of numerous factors. Factors that could cause such differences to exist include, but are not limited to, changes in general business and economic conditions (including inflation and concerns about inflation) on a national basis and in the local markets in which the Company operates, including changes that adversely affect borrowers’ ability to service and repay the Company’s loans; changes in interest rates; changes in customer behavior; ongoing turbulence in the capital and debt markets and the impact of such conditions on the Company’s business activities; increases in loan default and charge-off rates; decreases in the value of securities in the Company’s investment portfolio; fluctuations in real estate values; the possibility that future credit losses may be higher than currently expected due to changes in economic assumptions, customer behavior or adverse economic developments; the adequacy of loan loss reserves; decreases in deposit levels necessitating increased borrowing to fund loans and investments; competitive pressures from other financial institutions; acquisitions may not produce results at levels or within time frames originally anticipated; cybersecurity incidents, fraud, natural disasters, war, terrorism, civil unrest, and pandemics; changes in regulation; changes in accounting standards and practices; the risk that goodwill and intangibles recorded in the Company’s financial statements will become impaired; demand for loans in the Company’s market area; the Company’s ability to attract and maintain deposits; risks related to the implementation of acquisitions, dispositions, and restructurings; the risk that the Company may not be successful in the implementation of its business strategy; changes in assumptions used in making such forward-looking statements and the risk factors described in the Annual Report on Form 10 K and Quarterly Reports on Form 10 Q as filed with the SEC, which are available at the SEC’s website, www.sec.gov. Should one or more of these risks materialize or should underlying beliefs or assumptions prove incorrect, HarborOne’s actual results could differ materially from those discussed. Readers are cautioned not to place undue reliance on these forward-looking statements, which speak only as of the date of this release. The Company disclaims any obligation to publicly update or revise any forward-looking statements to reflect changes in underlying assumptions or factors, new information, future events or other changes, except as required by law. |
|
3 Q1 2024 Investor Presentation COMPANY HIGHLIGHTS Exchange/Ticker: NASDAQ/HONE Total Assets: $5.9 Billion Total Loans: $4.8 Billion Total Deposits: $4.4 Billion Market Capitalization: $480.3 Million (as of 3/31/24) HarborOne Bancorp, Inc. is a bank holding company and the parent of HarborOne Bank, a state-chartered trust company. HarborOne Bank is headquartered in Brockton, MA with 30 full-service banking centers throughout Metro Boston, Southeast Massachusetts and Rhode Island and a commercial lending office in Boston and Providence. HarborOne Bank is a recognized leader in financial and personal enrichment education and innovation through HarborOneU. HarborOne Mortgage, LLC (“HarborOne Mortgage”) is a wholly owned subsidiary of HarborOne Bank with 15 offices in Maine, Massachusetts, New Hampshire, New Jersey, Florida and Rhode Island and licensed to lend in 5 additional states. A Unique New England Banking Franchise |
|
2023 Investor Report 4 Q12024 Investor Presentation Net income of $7.3 million; diluted income per share $0.17. Margin increase from 2.23% in Q4 2023 to 2.25% in Q1 2024. Increased noninterest income 20.6%. Decreased noninterest expense 2.2%, excluding the goodwill impairment charge recorded in 2023. Strong asset quality, nonperforming loans to total loans 0.25%, a 12 basis-point improvement. Sixth stock buyback program ongoing; repurchased 558,900 shares at an average cost of $10.40 per share, totaling $5.8 million in Q1. Increased quarterly dividend by 6.7%. Q1 2024 Results Net Income $7.3 Million Diluted EPS $0.17 Loan Growth $ 26.4 Million Tangible Book Value $11.48 |
|
5 Q1 2024 Investor Presentation $4.5 B $4.6 B $5.4 B $5.7 B $5.9 B 2020 2021 2022 2023 Q1 24 14.5% 13.6% 11.5% 10.0% 9.8% 2020 2021 2022 2023 Q1 24 $3.0 B $3.6 B $4.6 B $4.8 B $4.8 B 2020 2021 2022 2023 Q1 24 $10.88 $11.57 $11.13 $11.52 $11.48 2020 2021 2022 2023 Q1 24 Key Performance Metrics Total Assets Total Loans Tier 1 Leverage Tangible Book Value |
|
6 Q1 2024 Investor Presentation Key Performance Metrics (Cont.) EPS Net Income Net Interest Margin on FTE Basis Net Interest Income $0.82 $1.14 $0.97 $0.37 $0.17 2020 2021 2022 2023 Q1 24 $44.8 M $58.5 M $45.6 M $16.1 M $7.3 M 2020 2021 2022 2023 Q1 24 3.06% 3.12% 3.35% 2.44% 2.25% 2020 2021 2022 2023 Q1 24 $120.1 M $131.4 M $149.0 M $127.3 M $30.6 M 2020 2021 2022 2023 Q1 24 |
|
7 Q1 2024 Investor Presentation Capital Management The Company remains well capitalized and is able to weather economic volatility. Continued annual dividend growth with 6.7% increase in Q1 2024. Sixth buyback program ongoing to purchase 2.3 million shares; 15.3 million shares purchased since 2020. Strong Tangible Capital Ratio of 8.92% with minimal securities categorized as Held to Maturity. 10.5% 8.5% 7.0% 4.0% 13.1% 12.0% 12.0% 9.8% 8.9% Total Capital Tier 1 Capital Tier 1 Common Equity Tier 1 Leverage Tangible Common Equity Minimum Capital Required plus Capital Conservation Buffer HONE Capital Ratios * * All information is as of 3/31/24 unless otherwise noted. |
|
8 Q1 2024 Investor Presentation FHLB $532,031 Fed Funds $356,854 Wholesale Deposits $84,158 Unencumbered securities $7,909 FRB Discount Window, $364,046 Correspondent Banks, $25,000 Liquidity Management Available Funding Sources: $1.4 Billion Strong primary and secondary liquidity Disciplined loan growth. Diversified deposit base. As of March 31, 2024, Immediate liquidity to uninsured deposits on a call report basis was 107%, excluding Bank subsidiary deposits and FHLB LOC secured deposits immediate liquidity to uninsured deposits was 200%. |
|
9 Q1 2024 Investor Presentation Securities Portfolio Total Securities Portfolio At Par Value Held to Maturity $19,767 5% Available for Sale $354,886 95% Securities Portfolio is 5.3% of total assets. Effective duration of the portfolio is 6.3 years. Total unrealized loss on the Held-to-Maturity portfolio is $622,000, with minimal impact to capital ratios. |
|
10 Q1 2024 Investor Presentation CRE 49% Residential 1-4 Family 32% C&I 10% Construction 5% HELOC & Sec. Mtg. 4% Consumer 0% Loan Portfolio $4.8 Billion |
|
11 Q1 2024 Investor Presentation Commercial Lending $2.1 B $2.3 B $2.9 B $3.0 B $- $500 $1,000 $1,500 $2,000 $2,500 $3,000 $3,500 2020 2021 2022 2023 Q1 2024 Construction Commercial Commercial Real Estate Total Commercial Loans Commercial loans grew from $2.1 billion in 2020 to $3.1 billion as of Q1 2024, transforming the balance sheet while maintaining strong credit quality. #1 in volume U.S. Small Business Administration (SBA) Lender in Rhode Island in 2023. Continued investment in people and technology to promote C&I and Small Business growth within Boston and Providence metro. 2024 growth focused on high-quality, deep-relationship lending within footprint. $3.1 B |
|
12 Q1 2024 Investor Presentation Flex/Industrial 21% Apartments 16% Hotels 13% Retail 12% Office 9% Health Care 8% All Other Property Types 21% Commercial Real Estate Portfolio $2.4 Billion LTV: 58% LTV: 62% LTV: 60% LTV: 60% LTV: 67% LTV: 63% LTV: 65% New England Focused By Metropolitan Statistical Area MSA 3/31/24 Boston-Cambridge-Quincy, MA $1.2Bn Providence-New Bedford-Fall River, RI-MA $0.4Bn Barnstable - Islands, MA $0.2Bn Manchester-Nashua, NH $0.1Bn Bridgeport-Stamford-Norwalk, CT $0.1Bn Other $0.4Bn Total $2.4Bn Key Portfolio Metrics Conservative Underwriting Methodology Metric 3/31/2024 Maturities in Next 12 Months / Total CRE Loans 7.3% Loan to Value – Origination 61.7% Reserves / Total NOO CRE Loans 0.9% 30+ CRE Delinquency % 0.1% Criticized Loans / Total CRE Loans 2.3% NPL / Total CRE Loans 0.1% Office - Central Business District / Total CRE Loans 0.2% Diversified Portfolio by Industry Type |
|
13 Q1 2024 Investor Presentation Commercial Real Estate Portfolio Segmentation Industry Non Anchored Anchored Total Portfolio Commentary Retail $45MM $242MM $287MM Low % of Non-Anchored Retail. Strong occupancy rate at 91%. Industry Metro Suburban Total Portfolio Commentary Office $5MM $215MM $220MM Low % of Central Business District. Resilient occupancy rate at 89%. Industry Business Focused Leisure Focused Total Portfolio Commentary Hotels $122MM $188MM $310MM Focus on destination boutique leisure with well-known sponsors. Industry CoStar Rating 3+ CoStar Rating <3 Total Portfolio Commentary Apartments 84% 16% $365MM Focus on high-quality properties. Strong occupancy rate at 96%. |
|
14 Q1 2024 Investor Presentation Construction and Commercial & Industrial Portfolio Construction: $235 Million Commercial & Industrial: $471 Million Preference for known sponsors with existing relationships Diversified portfolio with focus on local relationships Specialization in Healthcare and Alternative Energy Apartments 42% Flex/Industrial 30% Retail 6% Land. Dev. Residential 8% Office 6% Warehouse 6% All Other 2% Health Care 21% Alt. Energy 17% Manufacturing 13% Retail 7% Wholesale Trade 6% RE Leasing 4% Restaurant 4% Construction 4% Education 4% Prof. Svcs 3% Miscellaneous Industries 17% |
|
15 Q1 2024 Investor Presentation Residential 88% HELOC 10% Consumer 1% Construction 1% Residential and Consumer Lending Portfolio $1.7 Billion Key Portfolio Metrics: Residential Conservative Underwriting Methodology Metric 3/31/24 Weighted Average FICO 771 Weighted Average LTV (Origination) 66% Second Home and Investment % 13% Cash-out Refinanced %1 1.9% 30+ Delinquency % 0.4% Key Portfolio Metrics: HELOC Conservative Underwriting Methodology Metric 3/31/24 Weighted Average FICO (as of 9/2023) 748 Weighted Average CLTV 60% Utilization 38% Second Home and Investment % 2.8% 30+ Delinquency % 0.6% 1 Cash-out Refinanced % represents population of loans booked since March 15, 2021 |
|
16 Q1 2024 Investor Presentation Credit Quality Nonperforming Loans to Total Assets ($MM) Net Charge-Offs to Average Loans $34.1 $36.1 $14.8 $17.5 $12.2 0.00% 0.10% 0.20% 0.30% 0.40% 0.50% 0.60% 0.70% 0.80% 0.90% 2020 2021 2022 2023 Q1 24 Residential Commercial Consumer 0.10% 0.08% 0.09% 0.08% 0.01% 2020 2021 2022 2023 Q1 24 |
|
17 Q1 2024 Investor Presentation Allowance for Credit Losses (ACL) Forecasted unemployment rate assumes a 4.5% rate at end-2024. Q1 2024 ACL rate of 1.01% for total loans unchanged from Q4 2023. $47,971,635 +$0.25MM $48,184,873 -$0.04 $40.0 $42.0 $44.0 $46.0 $48.0 $50.0 December 31, 2023 Change in Pooled Loans Change in Individually Analyzed Loans March 31, 2024 $ Millions |
|
18 Q1 2024 Investor Presentation Savings 25% DDA/NOW 23% CD 28% Money Market 24% Relationship Banking Deposit Mix Long Tenured Relationships: 75% of balances > 5+ year tenure 63% of balances > 10+ year tenure 52% of balances > 15+ year tenure New Customer Acquisition: Q1 2024 vs Q1 2023, new consumer checking production increased 30%, Brockton banking centers with a 67% increase as we capitalize on competitor closings. Q1 2024 vs Q1 2023, new business checking production increased 21%. Shift to Self-Service / Payments: 73% of Customers utilize debit card regularly vs industry average of 61%. 75% of Customers are active users of Digital Banking tools. YOY, 6% increase in credit card spend volume and 8% increase in new credit card accounts, provided 21% revenue improvement. |
|
19 Q1 2024 Investor Presentation Deposits Average Quarterly Cost of Deposits 0.18% 0.21% 0.36% 0.84% 1.55% 1.91% 2.28% 2.47% 2.49% Q1 '22Q2 '22Q3 '22Q4 '22Q1 '23Q2 '23Q3 '23Q4 '23Q1 '24 March 2024 Cost of Deposits was 2.48% In Q1, total deposits increased $6.6 million with an increase in checking, money market accounts and brokered, partially offset by decreases in CD’s and savings accounts. Cost of deposits increased 2 basis points to 2.49% for the three months ended March 31, 2024. Average deposits in the Boston market increased 36% Q1 2024 vs. Q1 2023, as we continue to focus customer growth efforts there. Business accounts represent 18% of total deposits with cost of 299 basis points. Since the Federal Reserve has started the tightening cycle, Fed funds rate has increased 525 basis points and the Bank’s cost of deposits increased 271 basis points. |
|
20 Q1 2024 Investor Presentation Mortgage Banking ($ in 000’s) Q1 2024 Q4 2023 Q1 2023 Gain on Sale $2,013 $2,176 $2,224 MSR Fair Value & Amortization $86 $(3,296) $(1,556) Servicing Revenue / Other $2,405 $2,174 $2,469 Total Revenue $4,514 $1,214 $3,137 Expenses $4,311 $14,667 $5,322 Net Income $233 $(12,857) $(1,293) Key Drivers/Statistics $ Disbursements $102 MM $124 MM $126 MM Sales Margin 2.59% 2.08% 2.35% FTE’s 127 131 145 Offices 16 17 24 MSR Balance $43.4 MM $42.9 MM $43.7 MM Change in MSR Fair Value $588 K $(2.9) MM $(1.3) MM 10 year Treasury 4.21% 3.88% 3.47% Mortgage banking segment continues to be negatively impacted by market conditions and New England seasonality. Net income of $233,000, MSR valuation up $588,000 due to increases in model benchmark rates. Flexible operating model includes expense-disciplined management team. FTE’s have been reduced by 18 YOY. Disbursements down 18% from Q4 2024 and down 19% from Q1 2023. Q1 2024 Production volume was 86% purchase, 14% refinance. |
|
21 Q1 2024 Investor Presentation Bank Stand-Alone ($ in 000’s) Q1 2024 Q4 2023 Q1 2023 Interest Income $66,743 $64,197 $55,554 Interest Expense 36,259 33,560 20,992 Net Interest Income 30,484 30,637 34,562 Provision (168) 644 1,866 Noninterest Income 6,303 7,706 5,659 Noninterest Expense 27,407 28,613 26,190 Net Income $7,163 $6,551 $9,050 Key Drivers/Statistics ROAA 0.49% 0.46% 0.67% Efficiency Ratio 74.0% 74.1% 64.6% Margin 2. 10% 2.28% 2.79% FTE’s 406 398 421 Nonaccrual Loans $ 12.2MM $17.5 MM $12.3 MM Net charge-off(recovery) rate 0.01% 0.11% -% ACL/Loans 1.01% 1.01% 1.02% Net Income of $7.2 MM, down 21% YOY. Net Interest Income of $30.5 MM, down 12% YOY. Q1 $168K negative provision, $338K for replenishment of charge-offs and for loan growth offset by credit provision for decrease in unfunded commitments. Noninterest income up $644K YOY on deposit fees and BOLI income. Noninterest Expenses up $1.2 MM YOY due to compensation and deposit insurance expense. FTE’s are down 15 YOY. The Bank had a reduction in force in Q2 2023 and evaluates open positions for attrition. |
|
22 Q1 2024 Investor Presentation Why HarborOne Clear Strategic Focus Drive organic growth with a focus on Customer Primacy. Ensure diverse and low cost funding base with significant available liquidity. Foster customer-centric mission that earns total long-term banking relationships. Continued rationalization and modernization of Banking Centers. Unique Franchise and Culture Attractive New England (metro Boston & Providence) footprint. Focus on retaining and attracting top talent in the communities we serve. Deep community engagement - 2023 Boston Business Journal Most Charitable Companies list (7th consecutive year), Providence Business News Giving Guide ranked HarborOne Bank #5 in the state of Rhode Island in 2023 for total charitable donations. Proven Track Record Seasoned management team and Board. Excess capital to manage economic headwinds. Increasing quarterly dividend with continued stock buybacks. Prudent cost management with commitment to continuous process enhancement. |
|
23 Q1 2024 Investor Presentation HarborOne U - “Enriching lives through education” Original content, tools, templates, case studies, and calculators to help small businesses achieve financial success. A personalized education platform that helps individuals and families gain skills and build confidence in their financial choices. Consumer Small Business |
|
24 Q1 2024 Investor Presentation A Commitment to Doing What’s Right Mission Statement We provide a personalized experience while caring about every customer. We focus on understanding their financial goals for today and dreams for tomorrow. We are unwavering in our commitment to the communities that we serve. Vision Statement To be our customers’ most trusted financial partner. Our Values Integrity. Teamwork. Trust. Respect. Accountability. |