UNITED STATES
SECURITIES AND EXCHANGE COMMISSION
WASHINGTON, DC 20549
FORM 8-K
CURRENT REPORTPURSUANT TO
SECTION 13 OR 15(d) OF THE
SECURITIES EXCHANGE ACT OF 1934
Date of report (Date of earliest event reported): April 24, 2024
Alerus Financial Corporation
(Exact Name of Registrant as Specified in Charter)
Delaware |
001-39036 |
45-0375407 |
(State or Other Jurisdiction of Incorporation) |
(Commission File Number) |
(IRS Employer Identification No.) |
401 Demers Avenue
Grand Forks, North Dakota 58201
(Address of Principal Executive Offices) (Zip Code)
Registrant's telephone number, including area code: (701) 795-3200
N/A
(Former Name or Former Address, if Changed Since Last Report.)
Check the appropriate box below if the Form 8-K filing is intended to simultaneously satisfy the filing obligation of the registrant under any of the following provisions (see General Instruction A.2. below):
☐Written communications pursuant to Rule 425 under the Securities Act (17 CFR 230.425)
☐Soliciting material pursuant to Rule 14a-12 under the Exchange Act (17 CFR 240.14a-12)
☐Pre-commencement communications pursuant to Rule 14d-2(b) under the Exchange
Act (17 CFR 240.14d-2(b))
☐Pre-commencement communications pursuant to Rule 13e-4(c) under the Exchange
Act (17 CFR 240.13e-4(c))
Securities registered pursuant to Section 12(b) of the Act:
Title of each class |
|
Trading symbol |
|
Name of each exchange on which registered |
Common Stock, $1.00 par value per share |
|
ALRS |
|
The Nasdaq Stock Market LLC |
Indicate by check mark whether the registrant is an emerging growth company as defined in Rule 405 of the Securities Act of 1933 (§ 230.405 of this chapter) or Rule 12b–2 of the Securities Exchange Act of 1934 (§ 240.12b–2 of this chapter).
Emerging growth company ☒
If an emerging growth company, indicate by check mark if the registrant has elected not to use the extended transition period for complying with any new or revised financial accounting standards provided pursuant to Section 13(a) of the Exchange Act. ☐
Item 2.02. Results of Operations and Financial Condition.
On April 24, 2024, Alerus Financial Corporation (the “Company”) issued a press release announcing its financial results for the three months ended March 31, 2024. A copy of the press release is attached as Exhibit 99.1 to this Form 8-K and is incorporated herein by reference.
The information in Item 2.02 of this Current Report on Form 8-K, and the related Exhibit 99.1, attached hereto is being “furnished” and will not, except to the extent required by applicable law or regulation, be deemed “filed” by the Company for purposes of Section 18 of the Securities Exchange Act of 1934, as amended (the “Exchange Act”), or otherwise subject to the liabilities of that section, nor will any of such information or exhibits be deemed incorporated by reference to any filing under the Securities Act of 1933, as amended, or the Exchange Act, except as may be expressly set forth by specific reference in such filing.
Item 7.01. Regulation FD Disclosure.
On April 24, 2024, the Company posted a presentation to the Company’s investor relations website, located at investors.alerus.com. The presentation is also attached hereto as Exhibit 99.2.
The information in Item 7.01 of this Current Report on Form 8-K, and the related Exhibit 99.2, attached hereto is being “furnished” and will not, except to the extent required by applicable law or regulation, be deemed “filed” by the Company for purposes of Section 18 of the Exchange Act, or otherwise subject to the liabilities of that section, nor will any of such information or exhibits be deemed incorporated by reference to any filing under the Securities Act of 1933, as amended, or the Exchange Act, except as may be expressly set forth by specific reference in such filing.
Item 9.01. Financial Statements and Exhibits.
(d) Exhibits
Exhibit No. |
|
Description |
99.1 |
|
Press Release of Alerus Financial Corporation, dated April 24, 2024 |
|
99.2 104 |
|
Investor Presentation of Alerus Financial Corporation Cover Page Interactive Data File (embedded within the Inline XBRL document) |
SIGNATURES
Pursuant to the requirements of the Securities Exchange Act of 1934, the registrant has duly caused this report to be signed on its behalf by the undersigned hereunto duly authorized.
Date: April 24, 2024 |
Alerus Financial Corporation |
|
|
|
|
|
|
|
|
By: |
/s/ Katie A. Lorenson |
|
Name: |
Katie A. Lorenson |
|
Title: |
President and Chief Executive Officer |
|
|
|
Exhibit 99.1
|
FOR RELEASE (04.24.2024) |
Alan A. Villalon, Chief Financial Officer 952.417.3733 (Office) |
ALERUS FINANCIAL CORPORATION REPORTS
FIRST QUARTER 2024 NET INCOME OF $6.4 MILLION
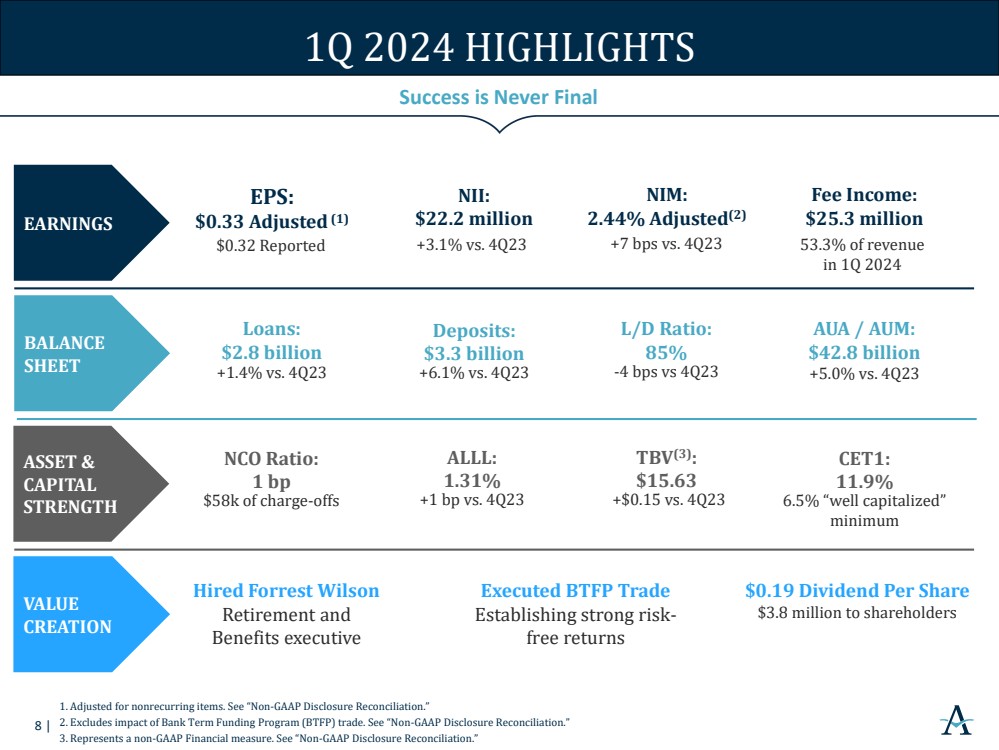
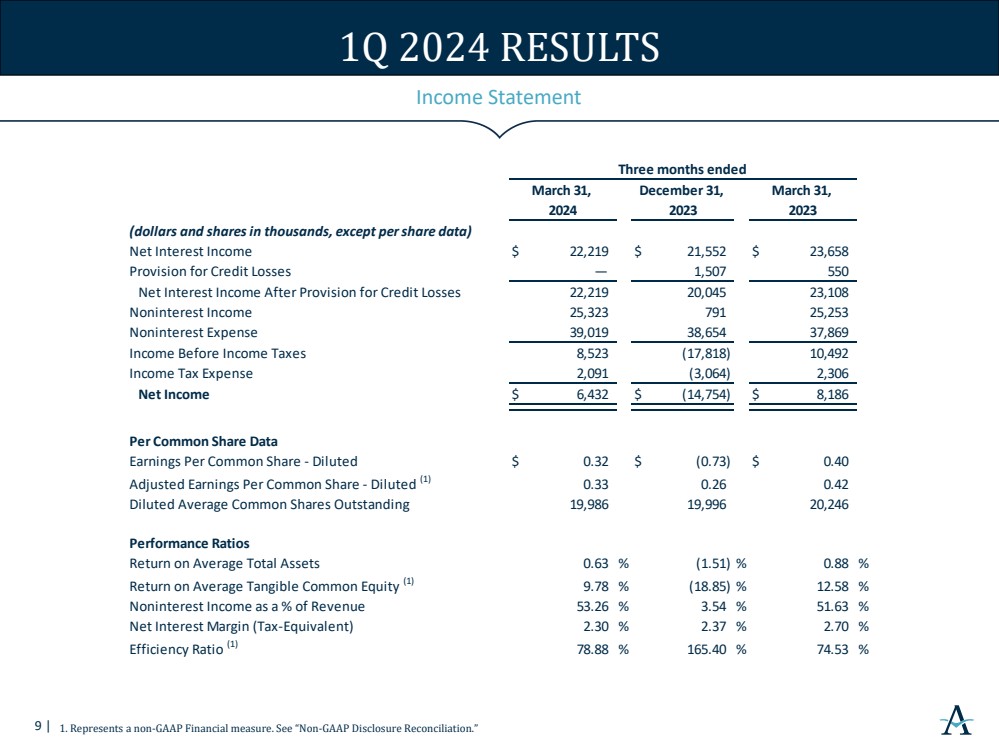
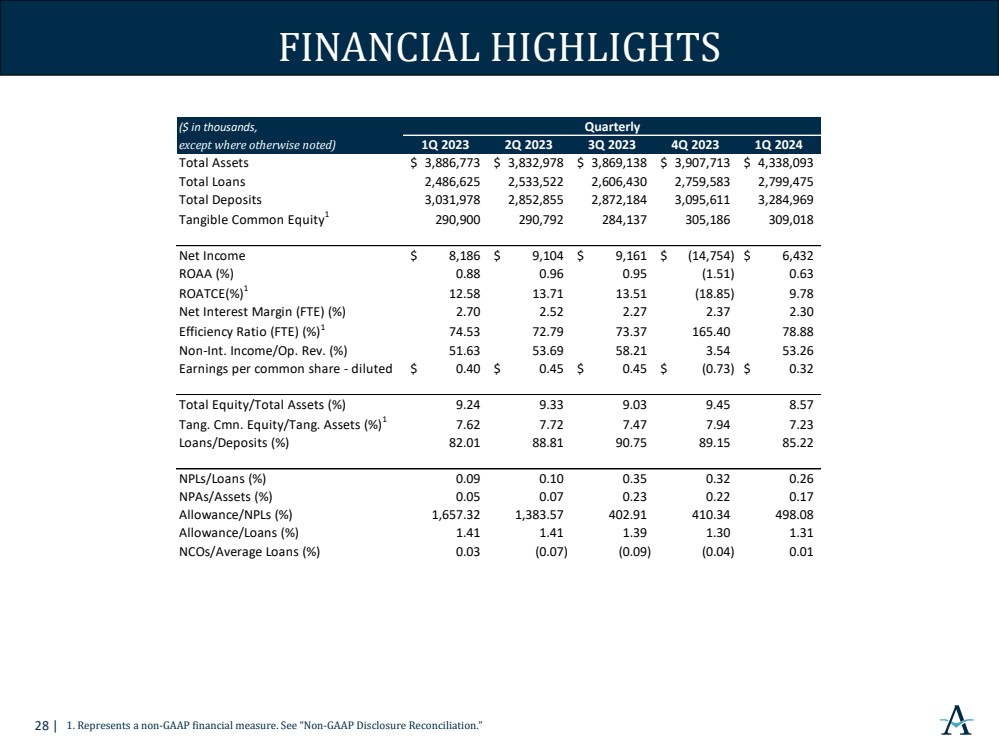
MINNEAPOLIS, MN (April 24, 2024) – Alerus Financial Corporation (Nasdaq: ALRS), or the Company, reported net income of $6.4 million for the first quarter of 2024, or $0.32 per diluted common share, compared to a net loss of $14.8 million, or ($0.73) per diluted common share, for the fourth quarter of 2023, and net income of $8.2 million, or $0.40 per diluted common share, for the first quarter of 2023.
CEO Comments
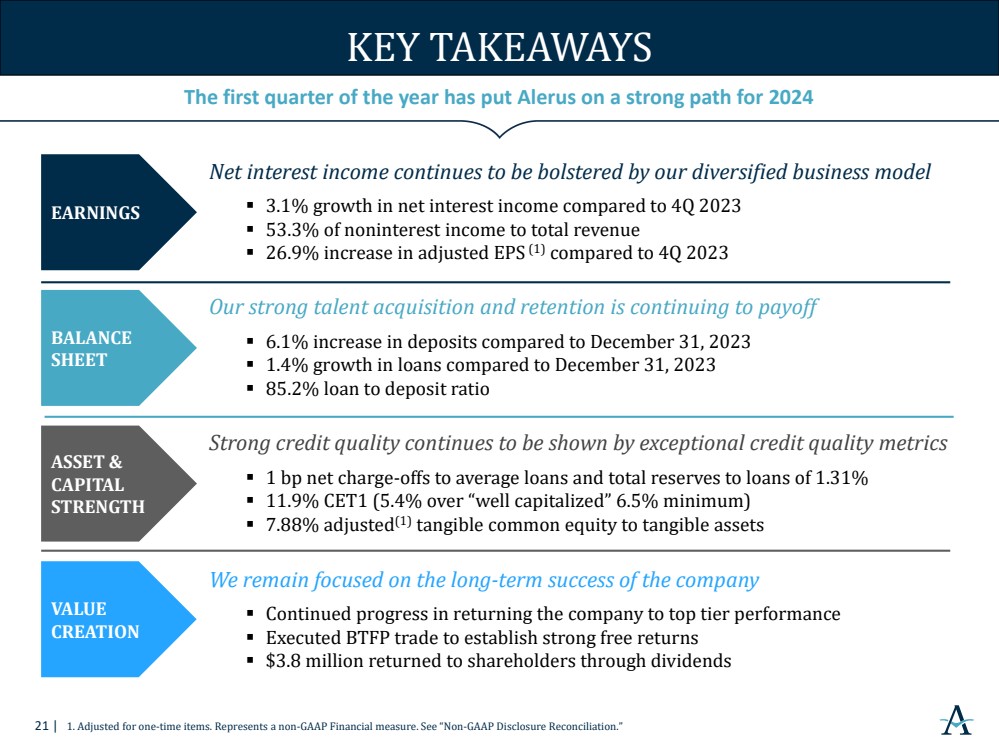
President and Chief Executive Officer Katie Lorenson said, “Our momentum continues into 2024 as we started the year with strong production and client acquisition in our commercial wealth bank and national retirement businesses. Deposit growth and inflows were robust at over 6%, adjusted net interest margin expanded another 7 basis points and our loan to deposit ratio trended down to 85.2%. We leveraged the Bank Term Funding Program as a strategic arbitrage which was additive to net interest income during the quarter and helped drive over 3% sequential growth. The company’s fee income, which accounted for 53.3% of total revenues, increased across each diversified business line. Our adjusted efficiency ratio decreased slightly, despite the inflationary headwinds, as we continue to manage expenses prudently. Maintaining our fortress balance sheet remained a priority and we ended the quarter with an allowance for credit losses to total loans of 1.31%, a CET1 capital ratio of 11.86%, and growth in tangible book value per common share of 7.8% over the prior year. We continue to make progress in returning the company to top tier performance and remain focused on the long-term success of the company. I would like to thank our team members for all they do to create value for our clients, our communities, and our shareholders.”
First Quarter Highlights
| ◾ | Total deposits were $3.3 billion as of March 31, 2024, an increase of $189.4 million, or 6.1%, from December 31, 2023 |
| ◾ | Total loans were $2.8 billion as of March 31, 2024, an increase of $39.9 million, or 1.4%, from December 31, 2023 |
| ◾ | The loan to deposit ratio as of December 31, 2024 was 85.2%, compared to 89.1% as of December 31, 2023; brokered deposits remained at $0 |
| ◾ | Net interest margin (on a tax equivalent basis) was 2.30% in the first quarter of 2024, compared to 2.37% in the fourth quarter of 2023. Adjusted net interest margin (on a tax-equivalent basis) (non-GAAP) increased 7 basis points from 2.37% in the fourth quarter of 2023 to 2.44% in the first quarter of 2024 |
| ◾ | Net interest income increased 3.1%, from $21.6 million in the fourth quarter of 2023 to $22.2 million in the first quarter of 2024 |
| ◾ | Total assets under administration/management at March 31, 2024 were $42.7 billion, a 5.0% increase from December 31, 2023 |
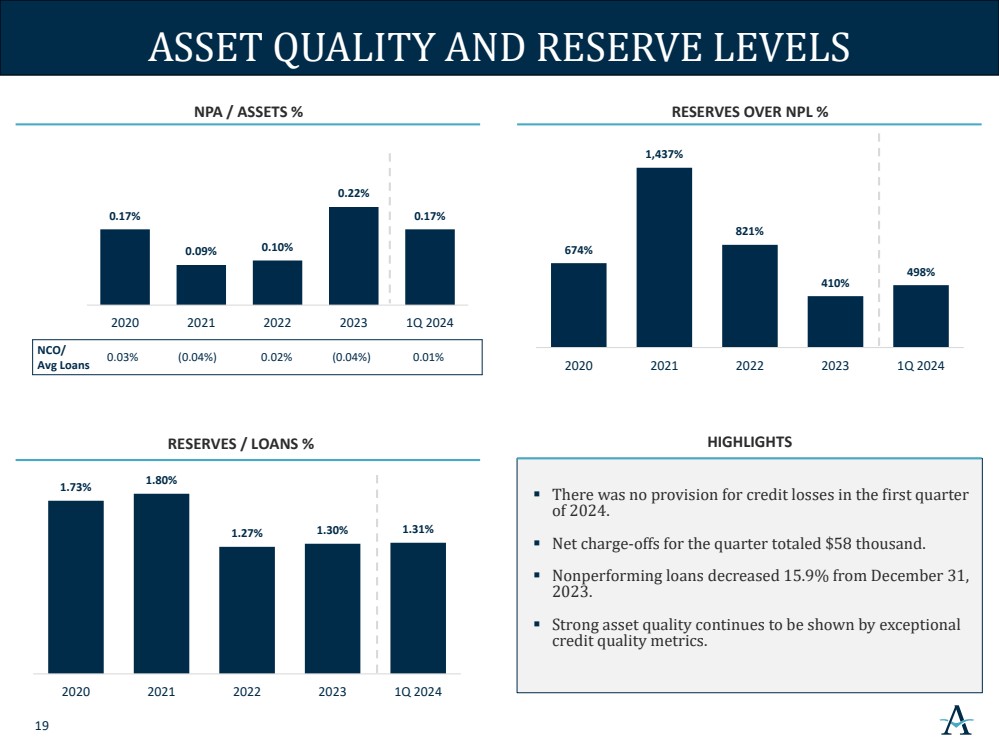
| ◾ | Net charge-offs to average loans of 0.01% for the first quarter of 2024, compared to net recoveries to average loans of 0.04% for the fourth quarter of 2023 |
| ◾ | Total nonperforming assets were $7.3 million as of March 31, 2024, a decrease of $1.4 million, or 16.2%, from December 31, 2023 |
| ◾ | Allowance for credit losses to nonperforming loans increased from 410% as of December 31, 2023 to 498% as of March 31, 2024 |
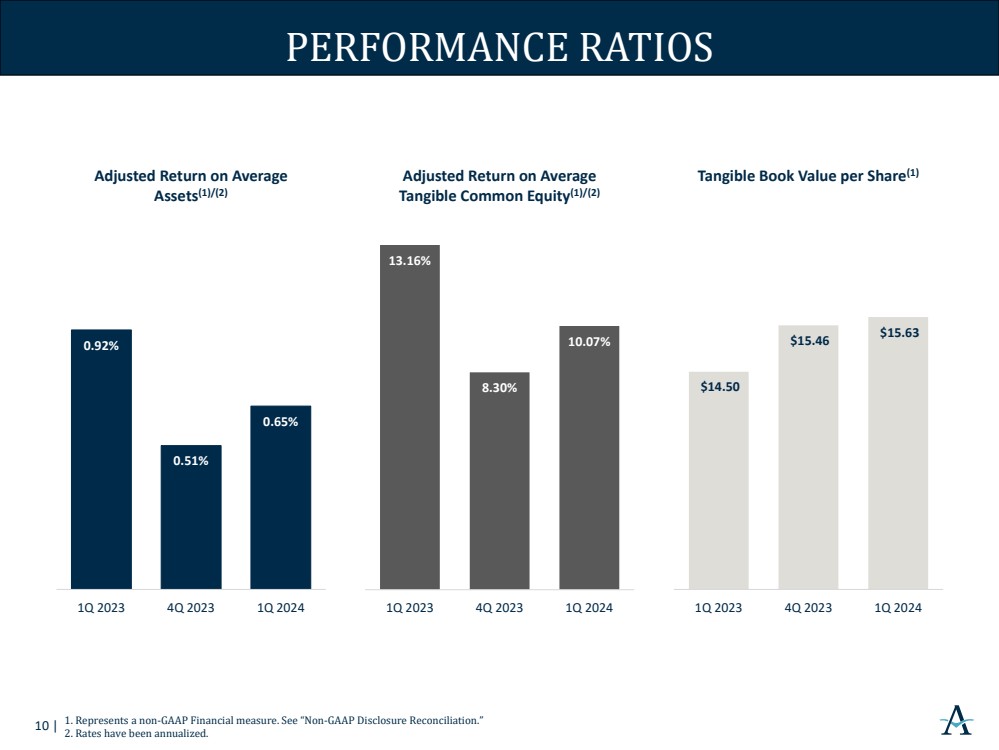
| ◾ | Tangible book value per common share (non-GAAP) was $15.63 as of March 31, 2024, a 1.1% increase from December 31, 2023 |
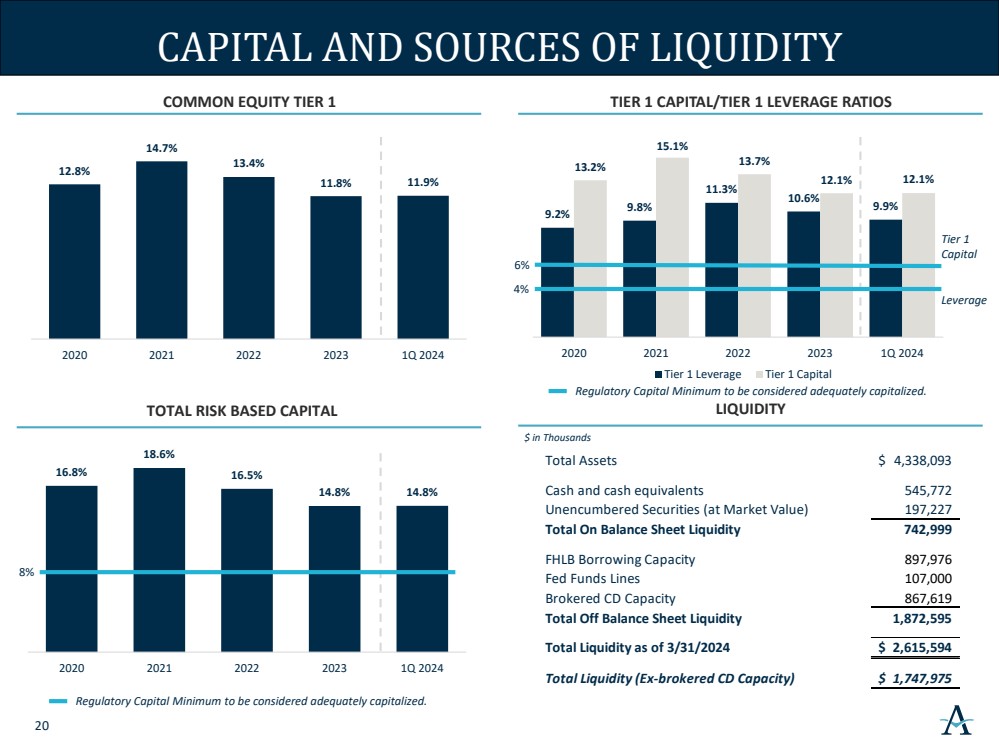
| ◾ | Common equity tier 1 capital to risk weighted assets as of March 31, 2024 was 11.86%, compared to 11.82% as of December 31, 2023, and continues to be well above the minimum threshold to be “well capitalized” of 6.50% |
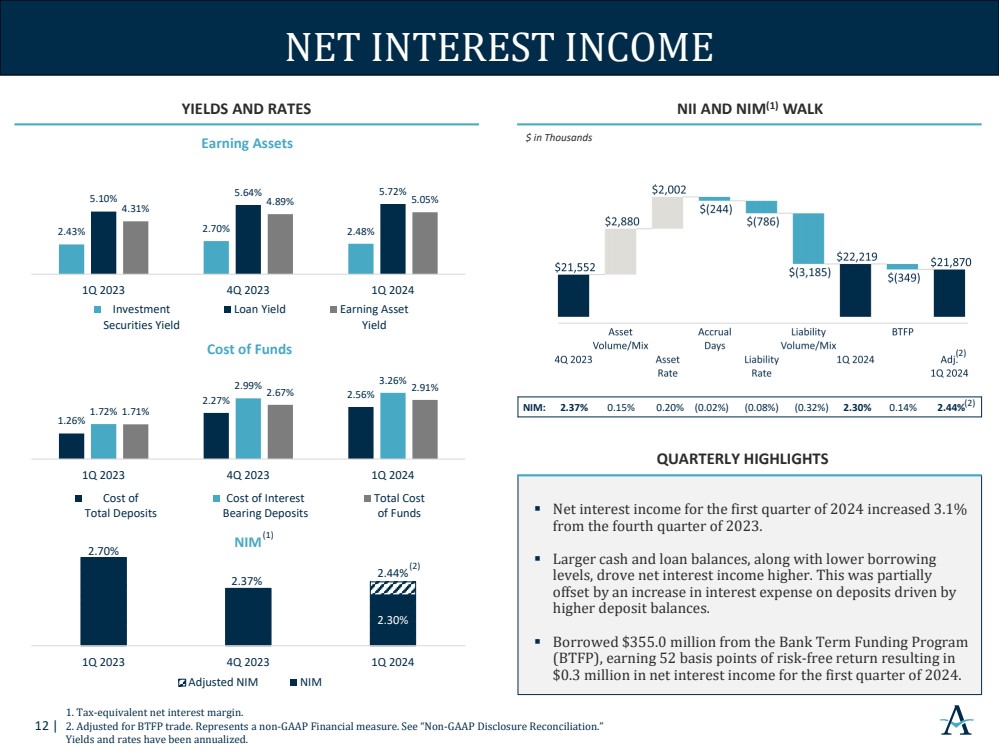
| ◾ | Borrowed $355.0 million from the Bank Term Funding Program (“BTFP”), earning 52 basis points of risk free return resulting in $0.3 million in net interest income for the first quarter of 2024 |
Selected Financial Data (unaudited)
|
|
As of and for the |
|
|||||||
|
|
Three months ended |
|
|||||||
|
|
March 31, |
|
December 31, |
|
March 31, |
|
|||
(dollars and shares in thousands, except per share data) |
|
2024 |
|
2023 |
|
2023 |
|
|||
Performance Ratios |
|
|
|
|
|
|
|
|
|
|
Return on average total assets |
|
|
0.63 |
% |
|
(1.51) |
% |
|
0.88 |
% |
Return on average common equity |
|
|
7.04 |
% |
|
(16.75) |
% |
|
9.17 |
% |
Return on average tangible common equity (1) |
|
|
9.78 |
% |
|
(18.85) |
% |
|
12.58 |
% |
Noninterest income as a % of revenue |
|
|
53.26 |
% |
|
3.54 |
% |
|
51.63 |
% |
Net interest margin (tax-equivalent) |
|
|
2.30 |
% |
|
2.37 |
% |
|
2.70 |
% |
Adjusted net interest margin (tax-equivalent) (1) |
|
|
2.44 |
% |
|
2.37 |
% |
|
2.70 |
% |
Efficiency ratio (1) |
|
|
78.88 |
% |
|
165.40 |
% |
|
74.53 |
% |
Adjusted efficiency ratio (1) |
|
|
78.88 |
% |
|
79.07 |
% |
|
74.53 |
% |
Net charge-offs/(recoveries) to average loans |
|
|
0.01 |
% |
|
(0.04) |
% |
|
0.03 |
% |
Dividend payout ratio |
|
|
59.38 |
% |
|
(26.03) |
% |
|
45.00 |
% |
Per Common Share |
|
|
|
|
|
|
|
|
|
|
Earnings per common share - basic |
|
$ |
0.32 |
|
$ |
(0.74) |
|
$ |
0.41 |
|
Earnings per common share - diluted |
|
$ |
0.32 |
|
$ |
(0.73) |
|
$ |
0.40 |
|
Dividends declared per common share |
|
$ |
0.19 |
|
$ |
0.19 |
|
$ |
0.18 |
|
Book value per common share |
|
$ |
18.79 |
|
$ |
18.71 |
|
$ |
17.90 |
|
Tangible book value per common share (1) |
|
$ |
15.63 |
|
$ |
15.46 |
|
$ |
14.50 |
|
Average common shares outstanding - basic |
|
|
19,739 |
|
|
19,761 |
|
|
20,028 |
|
Average common shares outstanding - diluted |
|
|
19,986 |
|
|
19,996 |
|
|
20,246 |
|
Other Data |
|
|
|
|
|
|
|
|
|
|
Retirement and benefit services assets under administration/management |
|
$ |
38,488,523 |
|
$ |
36,682,425 |
|
$ |
33,404,342 |
|
Wealth management assets under administration/management |
|
$ |
4,242,408 |
|
$ |
4,018,846 |
|
$ |
3,675,684 |
|
Mortgage originations |
|
$ |
54,101 |
|
$ |
65,488 |
|
$ |
77,728 |
|
Results of Operations
Net Interest Income
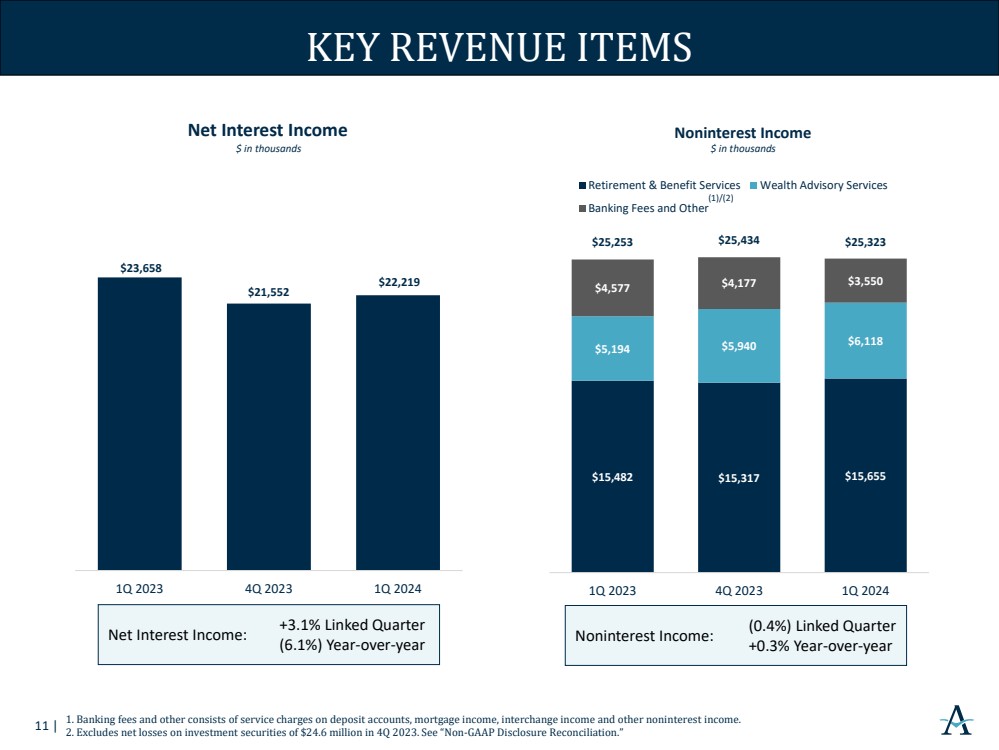
Net interest income for the first quarter of 2024 was $22.2 million, a $667.0 thousand, or 3.1%, increase from the fourth quarter of 2023. The increase was due to interest income on increased cash balances from deposit growth and BTFP borrowings, as well as increased loan balances and lower interest expense on borrowings due to lower borrowing balances. The increase was partially offset by an increase in interest expense on deposits, driven by higher deposit balances.
Net interest income decreased $1.4 million, or 6.1%, from $23.7 million for the first quarter of 2023 due to heightened deposit competition, the impact of higher short-term interest rates on indexed money market deposits, and clients moving deposits out of noninterest bearing products into interest-bearing products. Interest income increased $11.2 million, or 29.7%, from the first quarter of 2023, primarily driven by higher yields on new loans and strong organic loan growth, in addition to interest income on higher cash balances due to the Company’s excess cash position. The increase in interest income was offset by a $12.7 million, or 89.5%, increase in interest expense, primarily due to an increase in rates paid on interest-bearing deposits and higher short-term borrowing balances.
Net interest margin (on a tax-equivalent basis), was 2.30% for the first quarter of 2024, a 7 basis point decrease from 2.37% for the fourth quarter of 2023, and a 40 basis point decrease from 2.70% for the first quarter of 2023. The decrease in net interest margin (on a tax-equivalent basis) was mainly attributable to higher earning assets at lower yields resulting from the BTFP opportunity. Adjusted net interest margin (on a tax-equivalent basis) (non-GAAP), which excludes BTFP borrowings, was 2.44% for the first quarter of 2024, a 7 basis point increase from 2.37% for the fourth quarter of 2023, and a 26 basis point decrease from 2.70% for the first quarter of 2023. The increase in adjusted net interest margin (on a tax-equivalent basis) (non-GAAP) from the prior quarter reflected higher yields on new loans, partially offset by higher cost of funds from continued growth on interest-bearing deposits.
2
Noninterest Income
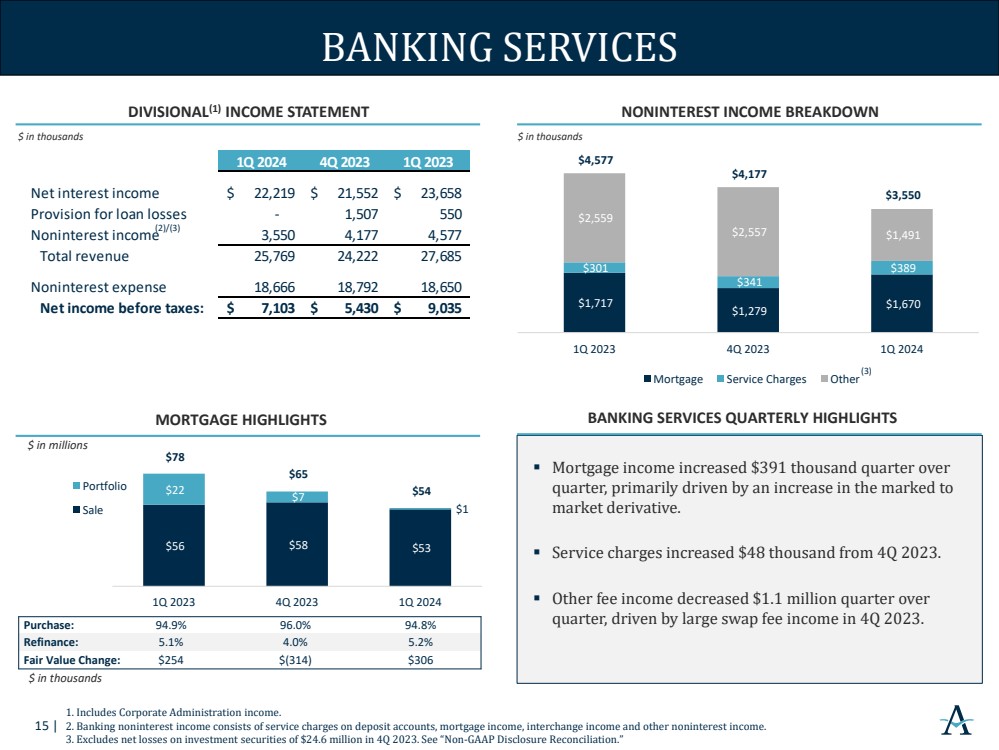
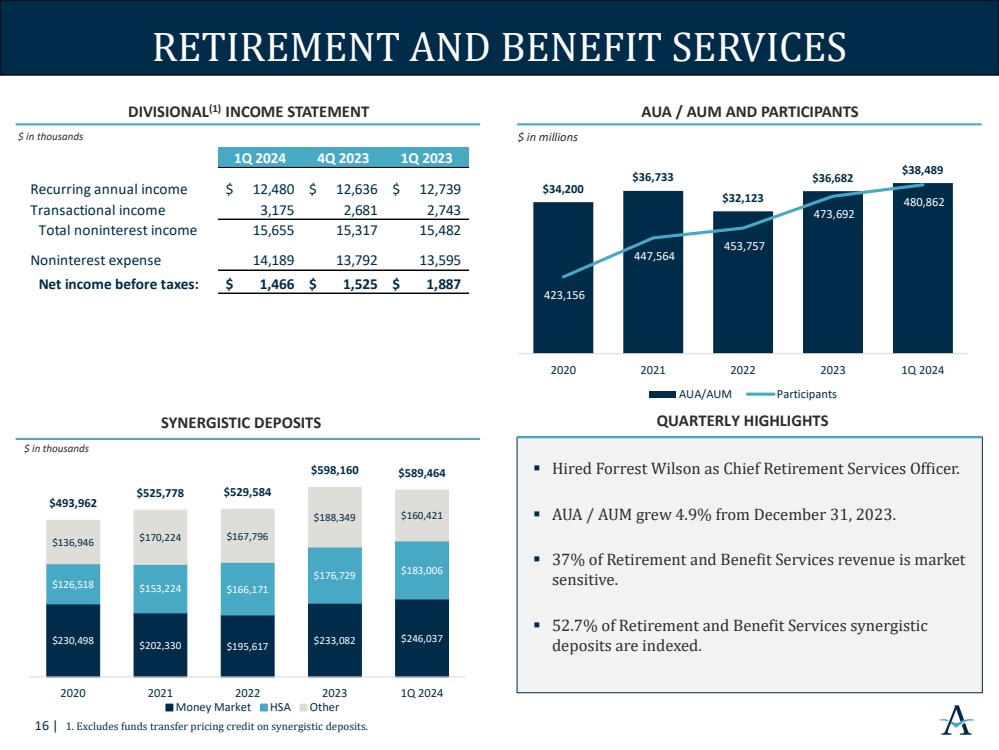
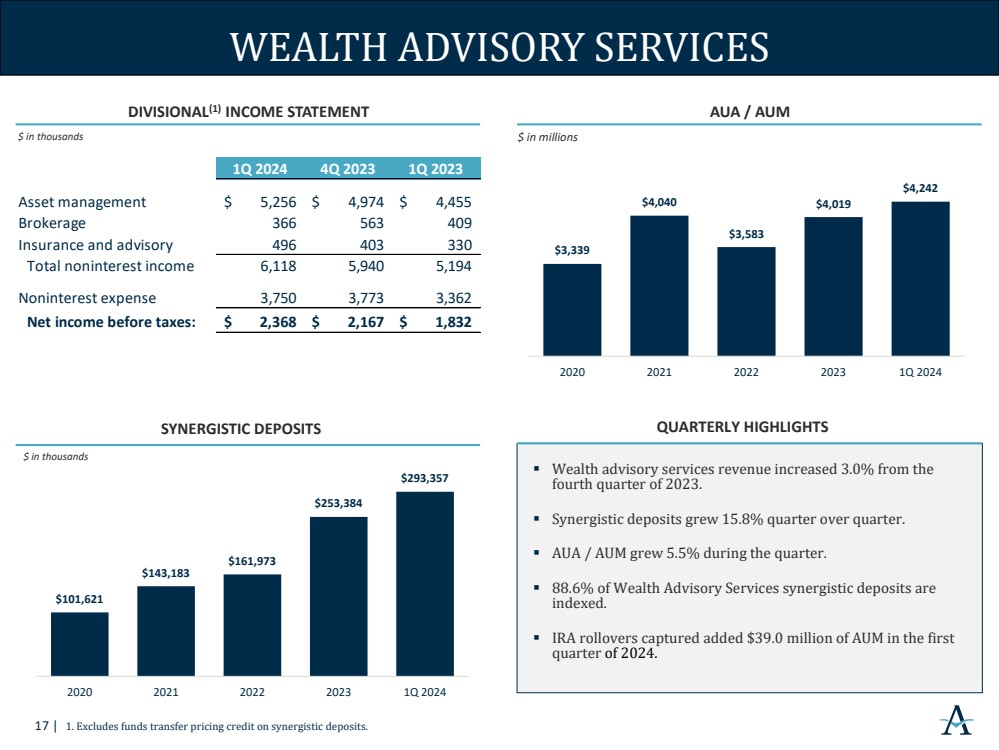
Noninterest income for the first quarter of 2024 was $25.3 million, a $24.5 million increase from the fourth quarter of 2023. The quarter over quarter increase was primarily driven by the balance sheet repositioning in the fourth quarter of 2023. Adjusted noninterest income (non-GAAP) for the first quarter of 2024 was $25.3 million, a 0.4% decrease from the fourth quarter of 2023. Retirement and benefit services revenue increased $0.3 million, a 2.2% increase from fourth quarter of 2023 results, primarily due to the growth in both asset-based revenue and transaction-based revenue. Assets under administration/management in retirement and benefit services increased 4.9% from December 31, 2023, due to improved equity and bond markets. Wealth management revenues increased $0.2 million during the first quarter of 2024, a 3.0% increase from the fourth quarter of 2023, as assets under administration/management increased 5.6% during that same period. Mortgage saw a $0.4 million increase in mortgage banking revenue with mortgage originations of $54.1 million for the first quarter of 2024, compared to originations of $65.5 million in the fourth quarter of 2023, primarily driven by an increase in the marked to market derivative.
Noninterest income for the first quarter of 2024 was $25.3 million, an increase of $71 thousand, or 0.3%, from the first quarter of 2023. While overall noninterest income was stable year over year, wealth management revenues increased $0.9 million, or 17.8%, in the first quarter of 2024 as assets under administration/management increased 15.4% during that same period. Offsetting this increase, other revenue decreased $1.1 million, or 41.7%, from $2.6 million in the first quarter of 2023, primarily due to $1.2 million in proceeds received on a bank-owned life insurance claim in the first quarter of 2023.
Noninterest Expense
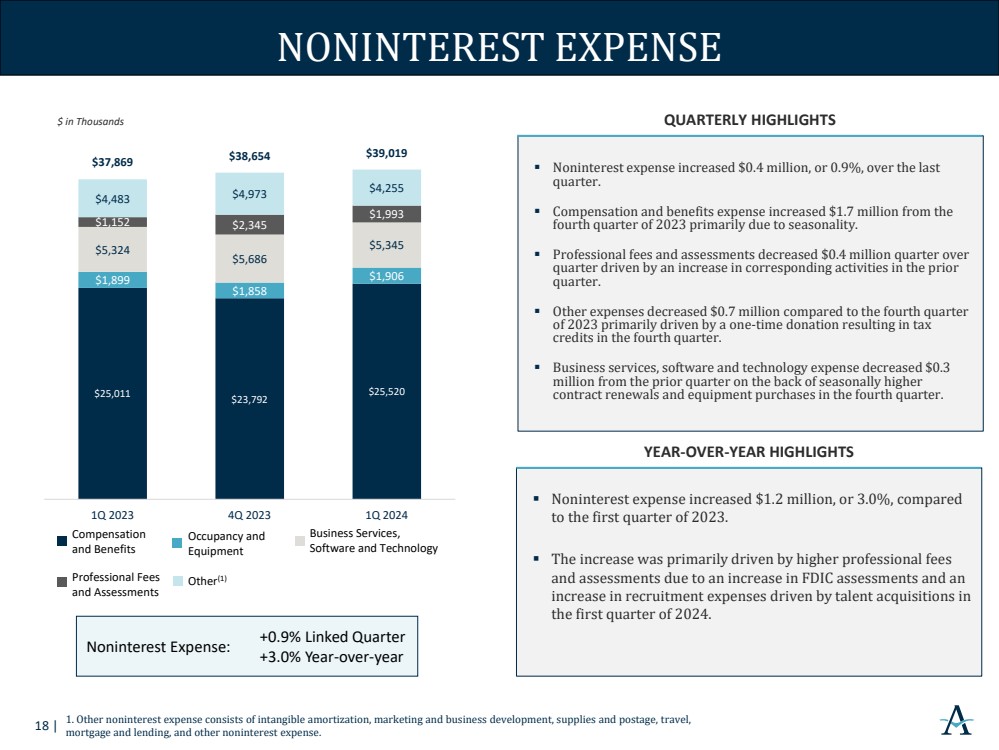
Noninterest expense for the fourth quarter of 2024 was $39.0 million, a $0.4 million, or 0.9%, increase from the fourth quarter of 2023. Employee taxes and benefits expense increased $1.6 million, a 35.2% increase from the fourth quarter of 2023, primarily due to seasonality. This was partially offset by decreases in professional fees and assessments, business services, software and technology expense, and marketing and business development expense totaling $1.0 million compared to the fourth quarter of 2023. Professional fees and assessments expense decreased $0.4 million, or 15.0%, from the fourth quarter of 2023, primarily driven by higher fees resulting from increased audit, examination, and other professional fees in the fourth quarter of 2023. Business services, software and technology expense decreased $0.3 million, or 6.0%, from the fourth quarter of 2023, primarily driven by seasonally higher contract renewals due to inflationary pressures and equipment purchases in the fourth quarter of 2023. Marketing and business development expense decreased $0.3 million, or 31.6%, from the fourth quarter of 2023 due to a one-time donation resulting in tax credits in the fourth quarter of 2023.
Noninterest expense for the first quarter of 2024 increased $1.2 million, or 3.0%, from $37.9 million in the first quarter of 2023. The increase was primarily driven by higher professional fees and assessments due to an increase in Federal Deposit Insurance Corporation (“FDIC”) assessments and an increase in recruitment expense driven by talent acquisitions in the first quarter of 2024.
Financial Condition
Total assets were $4.3 billion as of March 31, 2024, an increase of $430.4 million, or 11.0%, from December 31, 2023. The increase was primarily due to a $415.9 million increase in cash and cash equivalents and a $39.9 million increase in loans, partially offset by a decrease of $17.5 million in investment securities. The increase in cash and cash equivalents was primarily driven by the proceeds from BTFP borrowings.
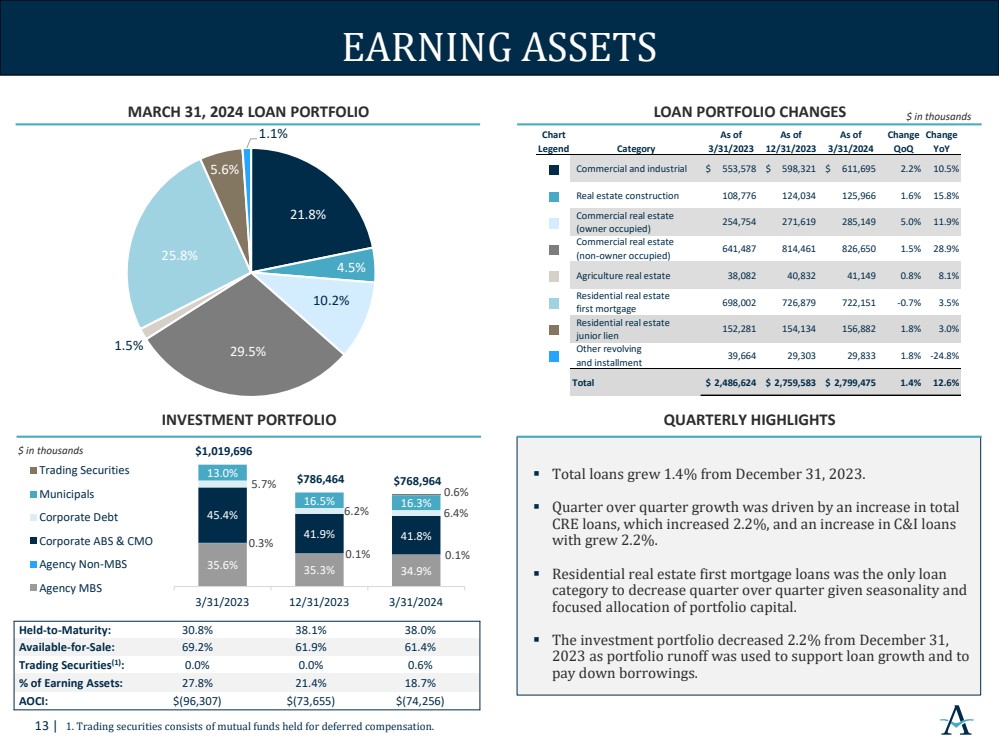
Loans
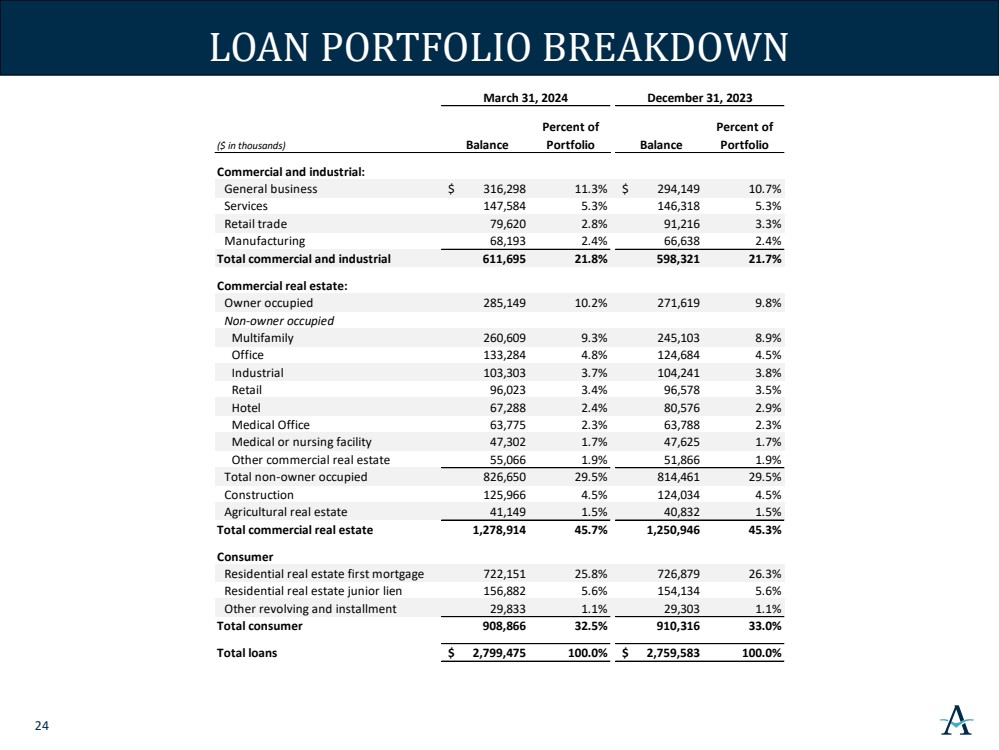
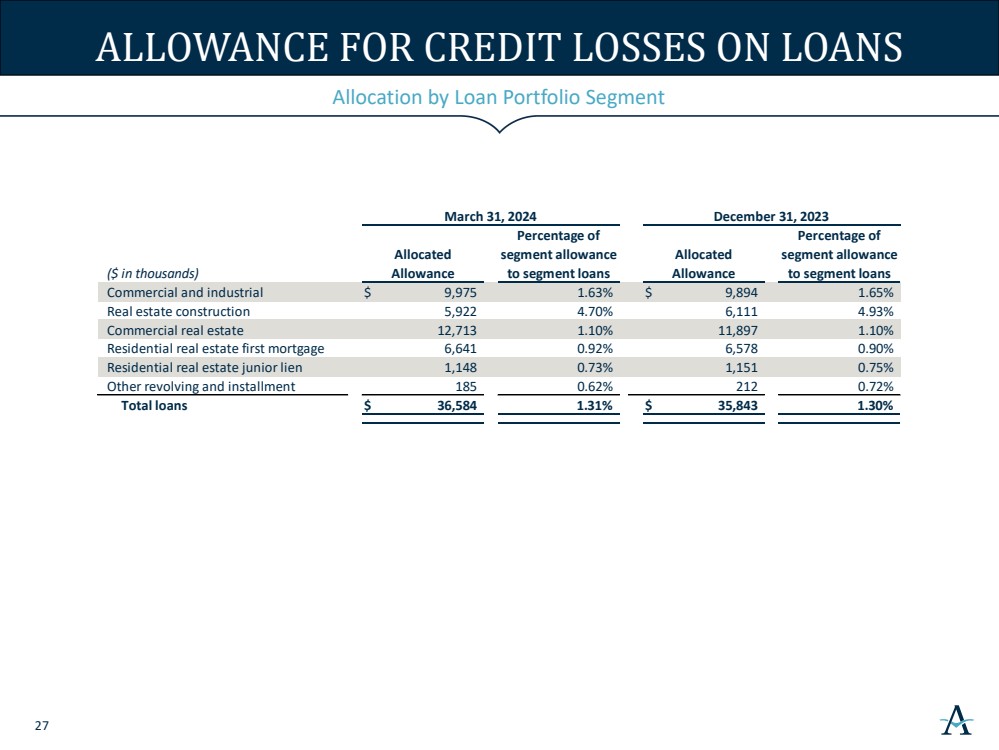
Total loans were $2.8 billion as of March 31, 2024, an increase of $39.9 million, or 1.4%, from December 31, 2023. The increase was primarily driven by a $26.0 million increase in commercial real estate loans, a $13.4 million increase commercial and industrial loans, a $2.7 million increase in residential real estate junior lien loans, and a $1.9 million increase in real estate construction loans, partially offset by a $4.7 million decrease in residential real estate first mortgage loans.
3
The following table presents the composition of our loan portfolio as of the dates indicated:
|
|
|
|
|
|
|
|
|
|
|
|||||
|
|
March 31, |
|
December 31, |
|
September 30, |
|
June 30, |
|
March 31, |
|||||
(dollars in thousands) |
|
2024 |
|
2023 |
|
2023 |
|
2023 |
|
2023 |
|||||
Commercial |
|
|
|
|
|
|
|
|
|
|
|
|
|
|
|
Commercial and industrial |
|
$ |
611,695 |
|
$ |
598,321 |
|
$ |
582,387 |
|
$ |
551,860 |
|
$ |
553,578 |
Real estate construction |
|
|
125,966 |
|
|
124,034 |
|
|
97,742 |
|
|
78,428 |
|
|
108,776 |
Commercial real estate |
|
|
1,152,948 |
|
|
1,126,912 |
|
|
1,025,014 |
|
|
1,003,821 |
|
|
934,324 |
Total commercial |
|
|
1,890,609 |
|
|
1,849,267 |
|
|
1,705,143 |
|
|
1,634,109 |
|
|
1,596,678 |
Consumer |
|
|
|
|
|
|
|
|
|
|
|
|
|
|
|
Residential real estate first mortgage |
|
|
722,151 |
|
|
726,879 |
|
|
717,793 |
|
|
707,630 |
|
|
698,002 |
Residential real estate junior lien |
|
|
156,882 |
|
|
154,134 |
|
|
152,677 |
|
|
157,231 |
|
|
152,281 |
Other revolving and installment |
|
|
29,833 |
|
|
29,303 |
|
|
30,817 |
|
|
34,552 |
|
|
39,664 |
Total consumer |
|
|
908,866 |
|
|
910,316 |
|
|
901,287 |
|
|
899,413 |
|
|
889,947 |
Total loans |
|
$ |
2,799,475 |
|
$ |
2,759,583 |
|
$ |
2,606,430 |
|
$ |
2,533,522 |
|
$ |
2,486,625 |
Deposits
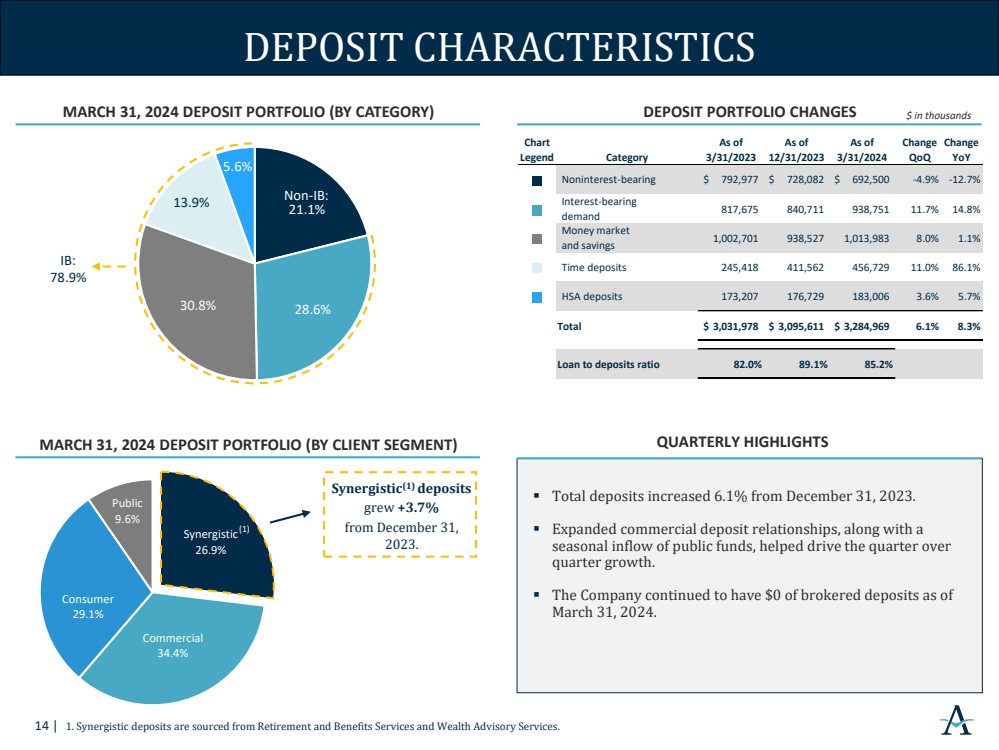
Total deposits were $3.3 billion as of March 31, 2024, an increase of $189.4 million, or 6.1%, from December 31, 2023. Interest-bearing deposits increased $224.9 million, while noninterest-bearing deposits decreased $35.6 million, from December 31, 2023. The increase in total deposits was due to both seasonal inflows of public funds deposit balances and expanded commercial deposit relationships, along with time deposit and synergistic deposit growth. Synergistic deposits were $882.8 million as of March 31, 2024, an increase of $31.3 million, or 3.7%, from December 31, 2023. The Company continued to have $0 of brokered deposits as of March 31, 2024.
The following table presents the composition of our deposit portfolio as of the dates indicated:
|
|
March 31, |
|
December 31, |
|
September 30, |
|
June 30, |
|
March 31, |
|||||
(dollars in thousands) |
|
2024 |
|
2023 |
|
2023 |
|
2023 |
|
2023 |
|||||
Noninterest-bearing demand |
|
$ |
692,500 |
|
$ |
728,082 |
|
$ |
717,990 |
|
$ |
715,534 |
|
$ |
792,977 |
Interest-bearing |
|
|
|
|
|
|
|
|
|
|
|
|
|
|
|
Interest-bearing demand |
|
|
938,751 |
|
|
840,711 |
|
|
759,812 |
|
|
753,194 |
|
|
817,675 |
Savings accounts |
|
|
82,727 |
|
|
82,485 |
|
|
88,341 |
|
|
93,557 |
|
|
99,742 |
Money market savings |
|
|
1,114,262 |
|
|
1,032,771 |
|
|
959,106 |
|
|
986,403 |
|
|
1,076,166 |
Time deposits |
|
|
456,729 |
|
|
411,562 |
|
|
346,935 |
|
|
304,167 |
|
|
245,418 |
Total interest-bearing |
|
|
2,592,469 |
|
|
2,367,529 |
|
|
2,154,194 |
|
|
2,137,321 |
|
|
2,239,001 |
Total deposits |
|
$ |
3,284,969 |
|
$ |
3,095,611 |
|
$ |
2,872,184 |
|
$ |
2,852,855 |
|
$ |
3,031,978 |
Asset Quality
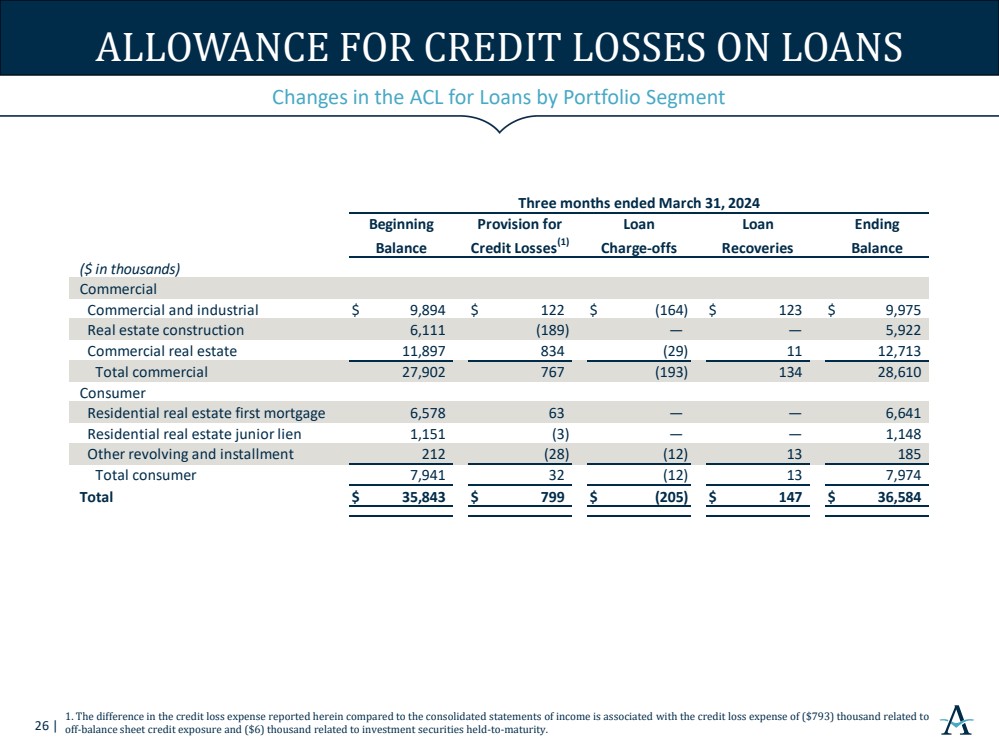
Total nonperforming assets were $7.3 million as of March 31, 2024, a decrease of $1.4 million, or 16.2%, from December 31, 2023. As of March 31, 2024, the allowance for credit losses on loans was $36.6 million, or 1.31% of total loans, compared to $35.8 million, or 1.30% of total loans, as of December 31, 2023.
4
The following table presents selected asset quality data as of and for the periods indicated:
|
|
As of and for the three months ended |
|
|||||||||||||
|
|
March 31, |
|
December 31, |
|
September 30, |
|
June 30, |
|
March 31, |
|
|||||
(dollars in thousands) |
|
2024 |
|
2023 |
|
2023 |
|
2023 |
|
2023 |
|
|||||
Nonaccrual loans |
|
$ |
7,345 |
|
$ |
8,596 |
|
$ |
9,007 |
|
$ |
2,233 |
|
$ |
2,118 |
|
Accruing loans 90+ days past due |
|
|
— |
|
|
139 |
|
|
— |
|
|
347 |
|
|
— |
|
Total nonperforming loans |
|
|
7,345 |
|
|
8,735 |
|
|
9,007 |
|
|
2,580 |
|
|
2,118 |
|
OREO and repossessed assets |
|
|
3 |
|
|
32 |
|
|
3 |
|
|
— |
|
|
— |
|
Total nonperforming assets |
|
$ |
7,348 |
|
$ |
8,767 |
|
$ |
9,010 |
|
$ |
2,580 |
|
$ |
2,118 |
|
Net charge-offs/(recoveries) |
|
|
58 |
|
|
(238) |
|
|
(594) |
|
|
(403) |
|
|
170 |
|
Net charge-offs/(recoveries) to average loans |
|
|
0.01 |
% |
|
(0.04) |
% |
|
(0.09) |
% |
|
(0.07) |
% |
|
0.03 |
% |
Nonperforming loans to total loans |
|
|
0.26 |
% |
|
0.32 |
% |
|
0.35 |
% |
|
0.10 |
% |
|
0.09 |
% |
Nonperforming assets to total assets |
|
|
0.17 |
% |
|
0.22 |
% |
|
0.23 |
% |
|
0.07 |
% |
|
0.05 |
% |
Allowance for credit losses on loans to total loans |
|
|
1.31 |
% |
|
1.30 |
% |
|
1.39 |
% |
|
1.41 |
% |
|
1.41 |
% |
Allowance for credit losses on loans to nonperforming loans |
|
|
498 |
% |
|
410 |
% |
|
403 |
% |
|
1,384 |
% |
|
1,657 |
% |
For the first quarter of 2024, the Company had net charge-offs of $58 thousand, compared to net recoveries of $238 thousand for the fourth quarter of 2023 and net charge-offs of $170 thousand for the first quarter of 2023.
The Company recorded no provision for credit losses for the first quarter of 2024, compared to a provision of $1.5 million for the fourth quarter of 2023 and a provision of $550 thousand for the first quarter of 2023. The unearned fair value adjustments on the acquired Metro Phoenix Bank loan portfolio were $4.7 million as of March 31, 2024, $5.2 million as of December 31, 2023, and $6.9 million as of March 31, 2023.
Capital
Total stockholders’ equity was $371.6 million as of March 31, 2024, an increase of $2.5 million from December 31, 2023. This change was primarily driven by an increase in retained earnings of $2.7 million. Tangible book value per common share (non-GAAP) increased to $15.63 as of March 31, 2024, from $15.46 as of December 31, 2023. Tangible common equity to tangible assets (non-GAAP) decreased to 7.23% as of March 31, 2024, from 7.94% as of December 31, 2023. Common equity tier 1 capital to risk weighted assets increased to 11.86% as of March 31, 2024, from 11.82% as of December 31, 2023.
The following table presents our capital ratios as of the dates indicated:
|
|
March 31, |
|
December 31, |
|
March 31, |
|
|||
|
|
2024 |
|
2023 |
|
2023 |
|
|||
Capital Ratios(1) |
|
|
|
|
|
|
|
|
|
|
Alerus Financial Corporation Consolidated |
|
|
|
|
|
|
|
|
|
|
Common equity tier 1 capital to risk weighted assets |
|
|
11.86 |
% |
|
11.82 |
% |
|
13.30 |
% |
Tier 1 capital to risk weighted assets |
|
|
12.13 |
% |
|
12.10 |
% |
|
13.60 |
% |
Total capital to risk weighted assets |
|
|
14.79 |
% |
|
14.76 |
% |
|
16.51 |
% |
Tier 1 capital to average assets |
|
|
9.89 |
% |
|
10.57 |
% |
|
11.00 |
% |
Tangible common equity / tangible assets (2) |
|
|
7.23 |
% |
|
7.96 |
% |
|
7.62 |
% |
|
|
|
|
|
|
|
|
|
|
|
Alerus Financial, N.A. |
|
|
|
|
|
|
|
|
|
|
Common equity tier 1 capital to risk weighted assets |
|
|
11.71 |
% |
|
11.40 |
% |
|
12.67 |
% |
Tier 1 capital to risk weighted assets |
|
|
11.71 |
% |
|
11.40 |
% |
|
12.67 |
% |
Total capital to risk weighted assets |
|
|
12.87 |
% |
|
12.51 |
% |
|
13.87 |
% |
Tier 1 capital to average assets |
|
|
9.30 |
% |
|
9.92 |
% |
|
10.24 |
% |
| (1) | Capital ratios for the current quarter are to be considered preliminary until the Call Report for Alerus Financial, N.A. is filed. |
| (2) | Represents a non-GAAP financial measure. See “Non-GAAP to GAAP Reconciliations and Calculation of Non-GAAP Financial Measures.” |
5
Conference Call
The Company will host a conference call at 11:00 a.m. Central Time on Thursday, April 25, 2024, to discuss its financial results. The call can be accessed via telephone at 1-(833)-470-1428, using access code 557480. A recording of the call and transcript will be available on the Company’s investor relations website at investors.alerus.com following the call.
About Alerus Financial Corporation
Alerus Financial Corporation (Nasdaq: ALRS) is a commercial wealth bank and national retirement services provider with corporate offices in Grand Forks, North Dakota, and the Minneapolis-St. Paul, Minnesota metropolitan area. Through its subsidiary, Alerus Financial, National Association, Alerus provides diversified and comprehensive financial solutions to business and consumer clients, including banking, wealth services, and retirement and benefits plans and services. Alerus provides clients with a primary point of contact to help fully understand the unique needs and delivery channel preferences of each client. Clients are provided with competitive products, valuable insight, and sound advice supported by digital solutions designed to meet the clients’ needs. Alerus has banking and wealth offices in Grand Forks and Fargo, North Dakota, the Minneapolis-St. Paul, Minnesota metropolitan area, and Phoenix and Scottsdale, Arizona. Alerus Retirement and Benefits serves advisors, brokers, employers, and plan participants across the United States.
Non-GAAP Financial Measures
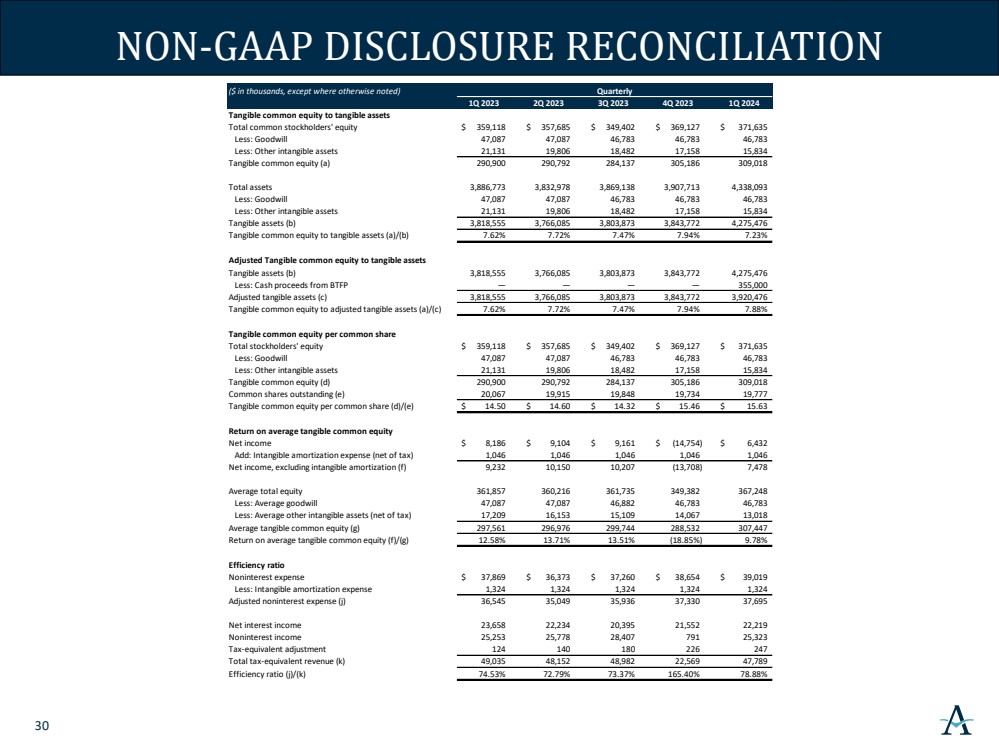
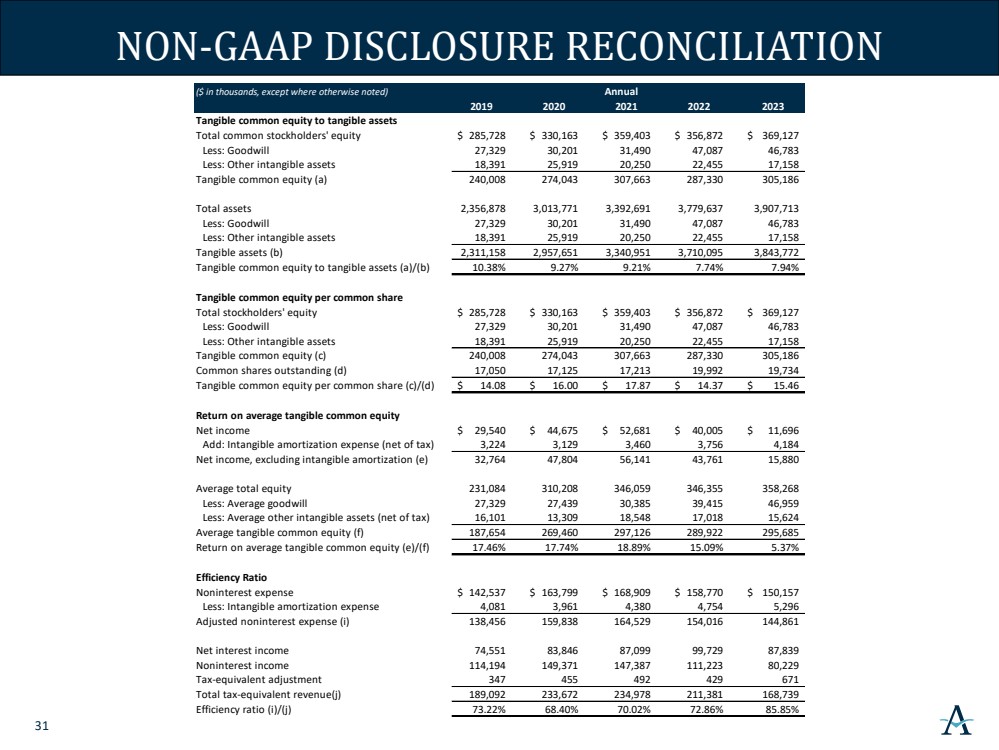
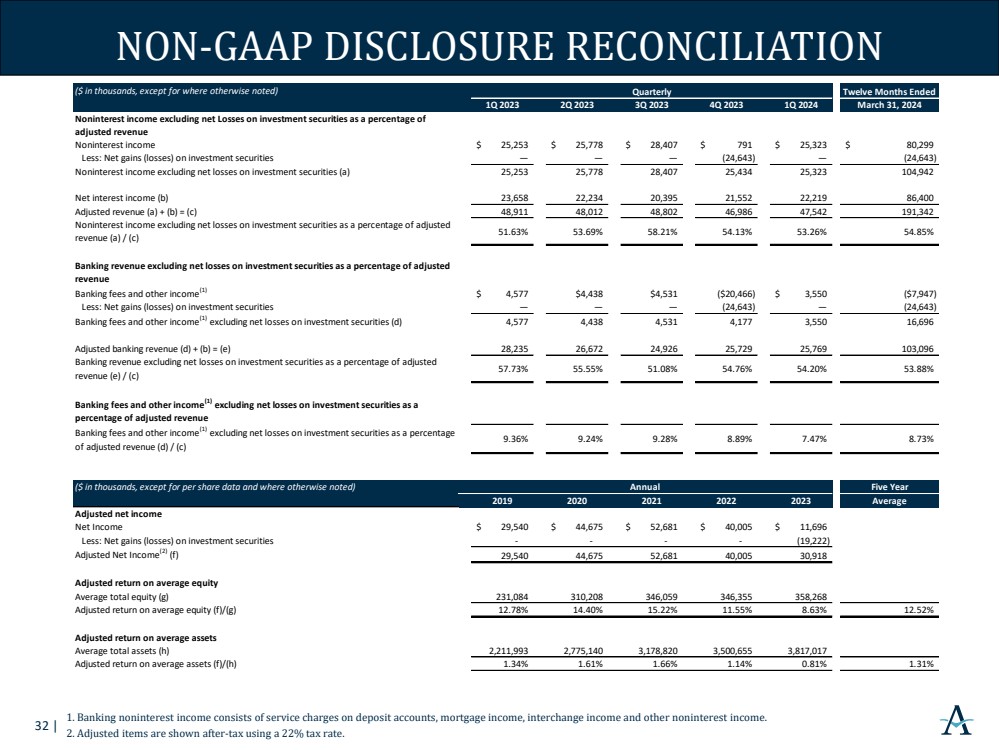
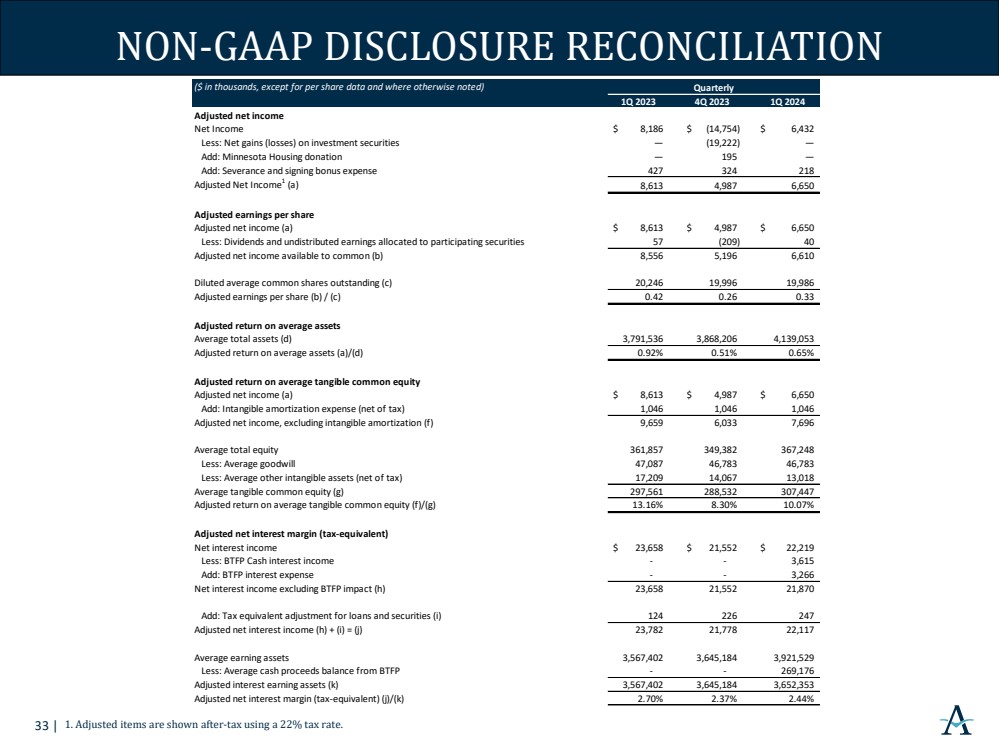
Some of the financial measures included in this press release are not measures of financial performance recognized by U.S. Generally Accepted Accounting Principles, or GAAP. These non-GAAP financial measures include the ratio of tangible common equity to tangible assets, adjusted tangible common equity to tangible assets, tangible book value per common share, return on average tangible common equity, efficiency ratio, adjusted efficiency ratio, adjusted noninterest income, net interest margin (tax-equivalent), and adjusted net interest margin (tax-equivalent). Management uses these non-GAAP financial measures in its analysis of its performance, and believes financial analysts and investors frequently use these measures, and other similar measures, to evaluate capital adequacy and financial performance. Reconciliations of non-GAAP disclosures used in this press release to the comparable GAAP measures are provided in the accompanying tables. Management, banking regulators, many financial analysts and other investors use these measures in conjunction with more traditional bank capital ratios to compare the capital adequacy of banking organizations with significant amounts of goodwill or other intangible assets, which typically stem from the use of the purchase accounting method of accounting for mergers and acquisitions.
These non-GAAP financial measures should not be considered in isolation or as a substitute for total stockholders’ equity, total assets, book value per share, return on average assets, return on average equity, or any other measure calculated in accordance with GAAP. Moreover, the manner in which the Company calculates these non-GAAP financial measures may differ from that of other companies reporting measures with similar names.
Forward-Looking Statements
This press release contains “forward-looking statements” within the meaning of the safe harbor provisions of the U.S. Private Securities Litigation Reform Act of 1995. Forward-looking statements include, without limitation, statements concerning plans, estimates, calculations, forecasts and projections with respect to the anticipated future performance of Alerus Financial Corporation. These statements are often, but not always, identified by words such as “may”, “might”, “should”, “could”, “predict”, “potential”, “believe”, “expect”, “continue”, “will”, “anticipate”, “seek”, “estimate”, “intend”, “plan”, “projection”, “would”, “annualized”, “target” and “outlook”, or the negative version of those words or other comparable words of a future or forward-looking nature. Examples of forward-looking statements include, among others, statements the Company makes regarding our projected growth, anticipated future financial performance, financial condition, credit quality, management’s long-term performance goals and the future plans and prospects of Alerus Financial Corporation.
6
Forward-looking statements are neither historical facts nor assurances of future performance. Instead, they are based only on our current beliefs, expectations and assumptions regarding our business, future plans and strategies, projections, anticipated events and trends, the economy and other future conditions. Because forward-looking statements relate to the future, they are subject to inherent uncertainties, risks and changes in circumstances that are difficult to predict and many of which are outside of our control. Our actual results and financial condition may differ materially from those indicated in forward-looking statements. Therefore, you should not rely on any of these forward-looking statements. Important factors that could cause our actual results and financial condition to differ materially from those indicated in forward-looking statements include, among others, the following: interest rate risk, including the effects of significant rate increases by the Federal Reserve since 2020; our ability to successfully manage credit risk and maintain an adequate level of allowance for credit losses; new or revised accounting standards; business and economic conditions generally and in the financial services industry, nationally and within our market areas, including high rates of inflation and possible recession; the effects of recent developments and events in the financial services industry, including the large-scale deposit withdrawals over a short-period of time that resulted in recent bank failures; the overall health of the local and national real estate market; concentrations within our loan portfolio; the level of nonperforming assets on our balance sheet; our ability to implement our organic and acquisition growth strategies, including the integration of Metro Phoenix Bank which the Company acquired in 2022; the impact of economic or market conditions on our fee-based services; our ability to continue to grow our retirement and benefit services business; our ability to continue to originate a sufficient volume of residential mortgages; the occurrence of fraudulent activity, breaches or failures of our or our third party vendors’ information security controls or cybersecurity-related incidents, including as a result of sophisticated attacks using artificial intelligence and similar tools; interruptions involving our information technology and telecommunications systems or third-party servicers; potential losses incurred in connection with mortgage loan repurchases; the composition of our executive management team and our ability to attract and retain key personnel; rapid technological change in the financial services industry; increased competition in the financial services industry from non-banks such as credit unions and Fintech companies, including digital asset service providers; our ability to successfully manage liquidity risk, including our need to access higher cost sources of funds such as fed funds purchased and short-term borrowings; the concentration of large deposits from certain clients, who have balances above current FDIC insurance limits; the effectiveness of our risk management framework; the commencement and outcome of litigation and other legal proceedings and regulatory actions against us or to which the Company may become subject; potential impairment to the goodwill the Company recorded in connection with our past acquisitions, including the acquisition of Metro Phoenix Bank; the extensive regulatory framework that applies to us; the impact of recent and future legislative and regulatory changes, including in response to recent bank failures; fluctuations in the values of the securities held in our securities portfolio, including as a result of changes in interest rates; governmental monetary, trade and fiscal policies; risks related to climate change and the negative impact it may have on our customers and their businesses; severe weather, natural disasters, widespread disease or pandemics; acts of war or terrorism, including the ongoing Israeli-Palestinian conflict and the Russian invasion of Ukraine, or other adverse external events; any material weaknesses in our internal control over financial reporting; changes to U.S. or state tax laws, regulations and guidance, including the 1.0% excise tax on stock buybacks by publicly traded companies; potential changes in federal policy and at regulatory agencies as a result of the upcoming 2024 presidential election; talent and labor shortages and employee turnover; our success at managing the risks involved in the foregoing items; and any other risks described in the “Risk Factors” sections of the reports filed by Alerus Financial Corporation with the Securities and Exchange Commission.
Any forward-looking statement made by us in this press release is based only on information currently available to us and speaks only as of the date on which it is made. The Company undertakes no obligation to publicly update any forward-looking statement, whether written or oral, that may be made from time to time, whether as a result of new information, future developments or otherwise.
7
Alerus Financial Corporation and Subsidiaries
Consolidated Balance Sheets
(dollars in thousands, except share and per share data)
|
|
March 31, |
|
December 31, |
||
|
|
2024 |
|
2023 |
||
Assets |
|
(Unaudited) |
|
(Audited) |
||
Cash and cash equivalents |
|
$ |
545,772 |
|
$ |
129,893 |
Investment securities |
|
|
|
|
|
|
Trading, at fair value |
|
|
4,553 |
|
|
— |
Available-for-sale, at fair value |
|
|
472,272 |
|
|
486,736 |
Held-to-maturity, at amortized cost (with an allowance for credit losses on investments of $207 and $213, respectively) |
|
|
291,932 |
|
|
299,515 |
Loans held for sale |
|
|
10,625 |
|
|
11,497 |
Loans |
|
|
2,799,475 |
|
|
2,759,583 |
Allowance for credit losses on loans |
|
|
(36,584) |
|
|
(35,843) |
Net loans |
|
|
2,762,891 |
|
|
2,723,740 |
Land, premises and equipment, net |
|
|
18,162 |
|
|
17,940 |
Operating lease right-of-use assets |
|
|
5,112 |
|
|
5,436 |
Accrued interest receivable |
|
|
16,149 |
|
|
15,700 |
Bank-owned life insurance |
|
|
33,396 |
|
|
33,236 |
Goodwill |
|
|
46,783 |
|
|
46,783 |
Other intangible assets |
|
|
15,834 |
|
|
17,158 |
Servicing rights |
|
|
1,983 |
|
|
2,052 |
Deferred income taxes, net |
|
|
34,796 |
|
|
34,595 |
Other assets |
|
|
77,833 |
|
|
83,432 |
Total assets |
|
$ |
4,338,093 |
|
$ |
3,907,713 |
Liabilities and Stockholders’ Equity |
|
|
|
|
|
|
Deposits |
|
|
|
|
|
|
Noninterest-bearing |
|
$ |
692,500 |
|
$ |
728,082 |
Interest-bearing |
|
|
2,592,469 |
|
|
2,367,529 |
Total deposits |
|
|
3,284,969 |
|
|
3,095,611 |
Short-term borrowings |
|
|
555,000 |
|
|
314,170 |
Long-term debt |
|
|
58,985 |
|
|
58,956 |
Operating lease liabilities |
|
|
5,420 |
|
|
5,751 |
Accrued expenses and other liabilities |
|
|
62,084 |
|
|
64,098 |
Total liabilities |
|
|
3,966,458 |
|
|
3,538,586 |
Stockholders’ equity |
|
|
|
|
|
|
Preferred stock, $1 par value, 2,000,000 shares authorized: 0 issued and outstanding |
|
|
— |
|
|
— |
Common stock, $1 par value, 30,000,000 shares authorized: 19,776,786 and 19,734,077 issued and outstanding |
|
|
19,777 |
|
|
19,734 |
Additional paid-in capital |
|
|
150,740 |
|
|
150,343 |
Retained earnings |
|
|
275,374 |
|
|
272,705 |
Accumulated other comprehensive loss |
|
|
(74,256) |
|
|
(73,655) |
Total stockholders’ equity |
|
|
371,635 |
|
|
369,127 |
Total liabilities and stockholders’ equity |
|
$ |
4,338,093 |
|
$ |
3,907,713 |
8
Alerus Financial Corporation and Subsidiaries
Consolidated Statements of Income
(dollars and shares in thousands, except per share data)
|
|
Three months ended |
|||||||
|
|
March 31, |
|
December 31, |
|
March 31, |
|||
|
|
2024 |
|
2023 |
|
2023 |
|||
Interest Income |
|
(Unaudited) |
|
(Unaudited) |
|
(Unaudited) |
|||
Loans, including fees |
|
$ |
39,294 |
|
$ |
37,731 |
|
$ |
30,933 |
Investment securities |
|
|
|
|
|
|
|
|
|
Taxable |
|
|
4,568 |
|
|
6,040 |
|
|
5,951 |
Exempt from federal income taxes |
|
|
174 |
|
|
182 |
|
|
190 |
Other |
|
|
5,002 |
|
|
742 |
|
|
735 |
Total interest income |
|
|
49,038 |
|
|
44,695 |
|
|
37,809 |
Interest Expense |
|
|
|
|
|
|
|
|
|
Deposits |
|
|
20,152 |
|
|
17,169 |
|
|
9,104 |
Short-term borrowings |
|
|
5,989 |
|
|
5,292 |
|
|
4,393 |
Long-term debt |
|
|
678 |
|
|
682 |
|
|
654 |
Total interest expense |
|
|
26,819 |
|
|
23,143 |
|
|
14,151 |
Net interest income |
|
|
22,219 |
|
|
21,552 |
|
|
23,658 |
Provision for credit losses |
|
|
— |
|
|
1,507 |
|
|
550 |
Net interest income after provision for credit losses |
|
|
22,219 |
|
|
20,045 |
|
|
23,108 |
Noninterest Income |
|
|
|
|
|
|
|
|
|
Retirement and benefit services |
|
|
15,655 |
|
|
15,317 |
|
|
15,482 |
Wealth management |
|
|
6,118 |
|
|
5,940 |
|
|
5,194 |
Mortgage banking |
|
|
1,670 |
|
|
1,279 |
|
|
1,717 |
Service charges on deposit accounts |
|
|
389 |
|
|
341 |
|
|
301 |
Net gains (losses) on investment securities |
|
|
— |
|
|
(24,643) |
|
|
— |
Other |
|
|
1,491 |
|
|
2,557 |
|
|
2,559 |
Total noninterest income |
|
|
25,323 |
|
|
791 |
|
|
25,253 |
Noninterest Expense |
|
|
|
|
|
|
|
|
|
Compensation |
|
|
19,332 |
|
|
19,214 |
|
|
19,158 |
Employee taxes and benefits |
|
|
6,188 |
|
|
4,578 |
|
|
5,853 |
Occupancy and equipment expense |
|
|
1,906 |
|
|
1,858 |
|
|
1,899 |
Business services, software and technology expense |
|
|
5,345 |
|
|
5,686 |
|
|
5,324 |
Intangible amortization expense |
|
|
1,324 |
|
|
1,324 |
|
|
1,324 |
Professional fees and assessments |
|
|
1,993 |
|
|
2,345 |
|
|
1,152 |
Marketing and business development |
|
|
685 |
|
|
1,002 |
|
|
686 |
Supplies and postage |
|
|
528 |
|
|
521 |
|
|
460 |
Travel |
|
|
292 |
|
|
313 |
|
|
248 |
Mortgage and lending expenses |
|
|
441 |
|
|
501 |
|
|
497 |
Other |
|
|
985 |
|
|
1,312 |
|
|
1,268 |
Total noninterest expense |
|
|
39,019 |
|
|
38,654 |
|
|
37,869 |
Income (loss) before income tax expense (benefit) |
|
|
8,523 |
|
|
(17,818) |
|
|
10,492 |
Income tax expense (benefit) |
|
|
2,091 |
|
|
(3,064) |
|
|
2,306 |
Net income (loss) |
|
$ |
6,432 |
|
$ |
(14,754) |
|
$ |
8,186 |
Per Common Share Data |
|
|
|
|
|
|
|
|
|
Earnings (loss) per common share |
|
$ |
0.32 |
|
$ |
(0.74) |
|
$ |
0.41 |
Diluted earnings (loss) per common share |
|
$ |
0.32 |
|
$ |
(0.73) |
|
$ |
0.40 |
Dividends declared per common share |
|
$ |
0.19 |
|
$ |
0.19 |
|
$ |
0.18 |
Average common shares outstanding |
|
|
19,739 |
|
|
19,761 |
|
|
20,028 |
Diluted average common shares outstanding |
|
|
19,986 |
|
|
19,996 |
|
|
20,246 |
9
Alerus Financial Corporation and Subsidiaries
Non-GAAP to GAAP Reconciliations and Calculation of Non-GAAP Financial Measures (unaudited)
(dollars and shares in thousands, except per share data)
|
|
March 31, |
|
December 31, |
|
March 31, |
|
|||
|
|
2024 |
|
2023 |
|
2023 |
|
|||
Tangible Common Equity to Tangible Assets |
|
|
|
|
|
|
|
|
|
|
Total common stockholders’ equity |
|
$ |
371,635 |
|
$ |
369,127 |
|
$ |
359,118 |
|
Less: Goodwill |
|
|
46,783 |
|
|
46,783 |
|
|
47,087 |
|
Less: Other intangible assets |
|
|
15,834 |
|
|
17,158 |
|
|
21,131 |
|
Tangible common equity (a) |
|
|
309,018 |
|
|
305,186 |
|
|
290,900 |
|
Total assets |
|
|
4,338,093 |
|
|
3,907,713 |
|
|
3,886,773 |
|
Less: Goodwill |
|
|
46,783 |
|
|
46,783 |
|
|
47,087 |
|
Less: Other intangible assets |
|
|
15,834 |
|
|
17,158 |
|
|
21,131 |
|
Tangible assets (b) |
|
|
4,275,476 |
|
|
3,843,772 |
|
|
3,818,555 |
|
Tangible common equity to tangible assets (a)/(b) |
|
|
7.23 |
% |
|
7.94 |
% |
|
7.62 |
% |
Adjusted Tangible Common Equity to Tangible Assets |
|
|
|
|
|
|
|
|
|
|
Tangible assets (b) |
|
$ |
4,275,476 |
|
$ |
3,843,772 |
|
$ |
3,818,555 |
|
Less: Cash proceeds from BTFP |
|
|
355,000 |
|
|
— |
|
|
— |
|
Adjusted tangible assets (c) |
|
|
3,920,476 |
|
|
3,843,772 |
|
|
3,818,555 |
|
Adjusted tangible common equity to tangible assets (a)/(c) |
|
|
7.88 |
% |
|
7.94 |
% |
|
7.62 |
% |
Tangible Book Value Per Common Share |
|
|
|
|
|
|
|
|
|
|
Total common stockholders’ equity |
|
$ |
371,635 |
|
$ |
369,127 |
|
$ |
359,118 |
|
Less: Goodwill |
|
|
46,783 |
|
|
46,783 |
|
|
47,087 |
|
Less: Other intangible assets |
|
|
15,834 |
|
|
17,158 |
|
|
21,131 |
|
Tangible common equity (d) |
|
|
309,018 |
|
|
305,186 |
|
|
290,900 |
|
Total common shares issued and outstanding (e) |
|
|
19,777 |
|
|
19,734 |
|
|
20,067 |
|
Tangible book value per common share (d)/(e) |
|
$ |
15.63 |
|
$ |
15.46 |
|
$ |
14.50 |
|
|
|
Three months ended |
|
|||||||
|
|
March 31, |
|
December 31, |
|
March 31, |
|
|||
|
|
2024 |
|
2023 |
|
2023 |
|
|||
Return on Average Tangible Common Equity |
|
|
|
|
|
|
|
|
|
|
Net income (loss) |
|
$ |
6,432 |
|
$ |
(14,754) |
|
$ |
8,186 |
|
Add: Intangible amortization expense (net of tax) |
|
|
1,046 |
|
|
1,046 |
|
|
1,046 |
|
Net income (loss), excluding intangible amortization (f) |
|
|
7,478 |
|
|
(13,708) |
|
|
9,232 |
|
Average total equity |
|
|
367,248 |
|
|
349,382 |
|
|
361,857 |
|
Less: Average goodwill |
|
|
46,783 |
|
|
46,783 |
|
|
47,087 |
|
Less: Average other intangible assets (net of tax) |
|
|
13,018 |
|
|
14,067 |
|
|
17,209 |
|
Average tangible common equity (g) |
|
|
307,447 |
|
|
288,532 |
|
|
297,561 |
|
Return on average tangible common equity (f)/(g) |
|
|
9.78 |
% |
|
(18.85) |
% |
|
12.58 |
% |
Efficiency Ratio |
|
|
|
|
|
|
|
|
|
|
Noninterest expense |
|
$ |
39,019 |
|
$ |
38,654 |
|
$ |
37,869 |
|
Less: Intangible amortization expense |
|
|
1,324 |
|
|
1,324 |
|
|
1,324 |
|
Adjusted noninterest expense (h) |
|
|
37,695 |
|
|
37,330 |
|
|
36,545 |
|
Net interest income |
|
|
22,219 |
|
|
21,552 |
|
|
23,658 |
|
Noninterest income |
|
|
25,323 |
|
|
791 |
|
|
25,253 |
|
Tax-equivalent adjustment |
|
|
247 |
|
|
226 |
|
|
123 |
|
Total tax-equivalent revenue (i) |
|
|
47,789 |
|
|
22,569 |
|
|
49,034 |
|
Efficiency ratio (h)/(i) |
|
|
78.88 |
% |
|
165.40 |
% |
|
74.53 |
% |
Adjusted Efficiency Ratio |
|
|
|
|
|
|
|
|
|
|
Noninterest expense |
|
$ |
39,019 |
|
$ |
38,654 |
|
$ |
37,869 |
|
Less: Intangible amortization expense |
|
|
1,324 |
|
|
1,324 |
|
|
1,324 |
|
Adjusted noninterest expense (j) |
|
|
37,695 |
|
|
37,330 |
|
|
36,545 |
|
Net interest income |
|
|
22,219 |
|
|
21,552 |
|
|
23,658 |
|
Noninterest income |
|
|
25,323 |
|
|
791 |
|
|
25,253 |
|
Tax-equivalent adjustment |
|
|
247 |
|
|
226 |
|
|
123 |
|
Less: Net gains (losses) on investment securities |
|
|
— |
|
|
(24,643) |
|
|
— |
|
Total tax-equivalent revenue (k) |
|
|
47,789 |
|
|
47,212 |
|
|
49,034 |
|
Adjusted efficiency ratio (j)/(k) |
|
|
78.88 |
% |
|
79.07 |
% |
|
74.53 |
% |
10
Alerus Financial Corporation and Subsidiaries
Non-GAAP to GAAP Reconciliations and Calculation of Non-GAAP Financial Measures (unaudited)
(dollars and shares in thousands, except per share data)
|
|
Three months ended |
|
|||||||
|
|
March 31, |
|
December 31, |
|
March 31, |
|
|||
|
|
2024 |
|
2023 |
|
2023 |
|
|||
Adjusted Noninterest Income |
|
|
|
|
|
|
|
|
|
|
Noninterest income |
|
$ |
25,323 |
|
$ |
791 |
|
$ |
25,253 |
|
Add: Net gains (losses) on investment securities |
|
|
— |
|
|
(24,643) |
|
|
— |
|
Adjusted noninterest income |
|
$ |
25,323 |
|
$ |
25,434 |
|
$ |
25,253 |
|
Adjusted Net Interest Margin (Tax-Equivalent) |
|
|
|
|
|
|
|
|
|
|
Net interest income |
|
$ |
22,219 |
|
$ |
21,552 |
|
$ |
23,658 |
|
Less: BTFP cash interest income |
|
|
3,615 |
|
|
— |
|
|
— |
|
Add: BTFP interest expense |
|
|
3,266 |
|
|
— |
|
|
— |
|
Net interest income excluding BTFP impact |
|
|
21,870 |
|
|
21,552 |
|
|
23,658 |
|
Add: Tax equivalent adjustment for loans and securities |
|
|
247 |
|
|
226 |
|
|
124 |
|
Adjusted net interest income (l) |
|
$ |
22,117 |
|
$ |
21,778 |
|
$ |
23,782 |
|
Interest earning assets |
|
|
3,921,529 |
|
|
3,645,184 |
|
|
3,567,402 |
|
Less: Average cash proceeds balance from BTFP |
|
|
269,176 |
|
|
— |
|
|
— |
|
Adjusted interest earning assets (m) |
|
$ |
3,652,353 |
|
$ |
3,645,184 |
|
$ |
3,567,402 |
|
Adjusted net interest margin (tax-equivalent) (l)/(m) |
|
|
2.44 |
% |
|
2.37 |
% |
|
2.70 |
% |
|
|
|
|
|
|
|
|
|
|
|
11
Alerus Financial Corporation and Subsidiaries
Analysis of Average Balances, Yields, and Rates (unaudited)
(dollars in thousands)
|
|
Three months ended |
||||||||||||||||
|
|
March 31, 2024 |
|
December 31, 2023 |
|
March 31, 2023 |
||||||||||||
|
|
|
|
|
Average |
|
|
|
|
Average |
|
|
|
|
Average |
|||
|
|
Average |
|
Yield/ |
|
Average |
|
Yield/ |
|
Average |
|
Yield/ |
||||||
|
|
Balance |
|
Rate |
|
Balance |
|
Rate |
|
Balance |
|
Rate |
||||||
Interest Earning Assets |
|
|
|
|
|
|
|
|
|
|
|
|
|
|
|
|
|
|
Interest-bearing deposits with banks |
|
$ |
352,038 |
|
5.33 |
% |
|
$ |
33,920 |
|
3.22 |
% |
|
$ |
41,947 |
|
3.23 |
% |
Investment securities (1) |
|
|
775,305 |
|
2.48 |
|
|
|
921,555 |
|
2.70 |
|
|
|
1,034,288 |
|
2.43 |
|
Loans held for sale |
|
|
9,014 |
|
5.67 |
|
|
|
11,421 |
|
6.01 |
|
|
|
10,345 |
|
4.98 |
|
Loans |
|
|
|
|
|
|
|
|
|
|
|
|
|
|
|
|
|
|
Commercial: |
|
|
|
|
|
|
|
|
|
|
|
|
|
|
|
|
|
|
Commercial and industrial |
|
|
599,456 |
|
6.93 |
|
|
|
573,174 |
|
6.89 |
|
|
|
559,416 |
|
6.09 |
|
Real estate construction |
|
|
127,587 |
|
8.04 |
|
|
|
117,765 |
|
8.12 |
|
|
|
103,099 |
|
6.56 |
|
Commercial real estate |
|
|
1,134,540 |
|
5.58 |
|
|
|
1,053,812 |
|
5.47 |
|
|
|
911,634 |
|
4.95 |
|
Total commercial |
|
|
1,861,583 |
|
6.18 |
|
|
|
1,744,751 |
|
6.12 |
|
|
|
1,574,149 |
|
5.46 |
|
Consumer |
|
|
|
|
|
|
|
|
|
|
|
|
|
|
|
|
|
|
Residential real estate first mortgage |
|
|
723,315 |
|
4.05 |
|
|
|
724,110 |
|
4.00 |
|
|
|
688,754 |
|
3.76 |
|
Residential real estate junior lien |
|
|
154,781 |
|
7.86 |
|
|
|
155,137 |
|
7.86 |
|
|
|
149,720 |
|
7.21 |
|
Other revolving and installment |
|
|
28,835 |
|
6.43 |
|
|
|
29,510 |
|
6.33 |
|
|
|
44,531 |
|
5.86 |
|
Total consumer |
|
|
906,931 |
|
4.77 |
|
|
|
908,757 |
|
4.73 |
|
|
|
883,005 |
|
4.45 |
|
Total loans (1) |
|
|
2,768,514 |
|
5.72 |
|
|
|
2,653,508 |
|
5.64 |
|
|
|
2,457,154 |
|
5.10 |
|
Federal Reserve/FHLB stock |
|
|
16,658 |
|
8.14 |
|
|
|
24,780 |
|
7.48 |
|
|
|
23,668 |
|
6.87 |
|
Total interest earning assets |
|
|
3,921,529 |
|
5.05 |
|
|
|
3,645,184 |
|
4.89 |
|
|
|
3,567,402 |
|
4.31 |
|
Noninterest earning assets |
|
|
217,524 |
|
|
|
|
|
223,022 |
|
|
|
|
|
224,134 |
|
|
|
Total assets |
|
$ |
4,139,053 |
|
|
|
|
$ |
3,868,206 |
|
|
|
|
$ |
3,791,536 |
|
|
|
Interest-Bearing Liabilities |
|
|
|
|
|
|
|
|
|
|
|
|
|
|
|
|
|
|
Interest-bearing demand deposits |
|
$ |
869,060 |
|
1.97 |
% |
|
$ |
798,634 |
|
1.65 |
% |
|
$ |
746,660 |
|
0.87 |
% |
Money market and savings deposits |
|
|
1,186,900 |
|
3.77 |
|
|
|
1,092,656 |
|
3.53 |
|
|
|
1,165,269 |
|
2.17 |
|
Time deposits |
|
|
431,679 |
|
4.46 |
|
|
|
383,715 |
|
4.27 |
|
|
|
231,959 |
|
2.23 |
|
Fed funds purchased and Bank Term Funding Program |
|
|
282,614 |
|
4.99 |
|
|
|
189,568 |
|
5.71 |
|
|
|
290,187 |
|
4.85 |
|
Short-term borrowings |
|
|
200,000 |
|
4.99 |
|
|
|
200,000 |
|
5.09 |
|
|
|
80,000 |
|
4.69 |
|
Long-term debt |
|
|
58,971 |
|
4.62 |
|
|
|
58,943 |
|
4.59 |
|
|
|
58,858 |
|
4.51 |
|
Total interest-bearing liabilities |
|
|
3,029,224 |
|
3.56 |
|
|
|
2,723,516 |
|
3.37 |
|
|
|
2,572,933 |
|
2.23 |
|
Noninterest-Bearing Liabilities and Stockholders' Equity |
|
|
|
|
|
|
|
|
|
|
|
|
|
|
|
|
|
|
Noninterest-bearing deposits |
|
|
675,926 |
|
|
|
|
|
719,895 |
|
|
|
|
|
789,134 |
|
|
|
Other noninterest-bearing liabilities |
|
|
66,655 |
|
|
|
|
|
75,413 |
|
|
|
|
|
67,612 |
|
|
|
Stockholders’ equity |
|
|
367,248 |
|
|
|
|
|
349,382 |
|
|
|
|
|
361,857 |
|
|
|
Total liabilities and stockholders’ equity |
|
$ |
4,139,053 |
|
|
|
|
$ |
3,868,206 |
|
|
|
|
$ |
3,791,536 |
|
|
|
Net interest income (1) |
|
|
|
|
|
|
|
|
|
|
|
|
|
|
|
|
|
|
Net interest rate spread |
|
|
|
|
1.49 |
% |
|
|
|
|
1.52 |
% |
|
|
|
|
2.08 |
% |
Net interest margin, tax-equivalent (1) |
|
|
|
|
2.30 |
% |
|
|
|
|
2.37 |
% |
|
|
|
|
2.70 |
% |
| (1) | Taxable-equivalent adjustment was calculated utilizing a marginal income tax rate of 21.0%. |
12
|
INVESTOR PRESENTATION 1Q 2024 NASDAQ: ALRS |
|
DISCLAIMERS Forward-Looking Statements This presentation contains “forward-looking statements” within the meaning of the safe harbor provisions of the U.S. Private Securities Litigation Reform Act of 1995. Forward-looking statements include, without limitation, statements concerning plans, estimates, calculations, forecasts and projections with respect to the anticipated future performance of Alerus Financial Corporation. These statements are often, but not always, identified by words such as “may”, “might”, “should”, “could”, “predict”, “potential”, “believe”, “expect”, “continue”, “will”, “anticipate”, “seek”, “estimate”, “intend”, “plan”, “projection”, “would”, “annualized”, “target” and “outlook”, or the negative version of those words or other comparable words of a future or forward-looking nature. Examples of forward-looking statements include, among others, statements we make regarding our projected growth, anticipated future financial performance, financial condition, credit quality, management’s long-term performance goals and the future plans and prospects of Alerus Financial Corporation. Forward-looking statements are neither historical facts nor assurances of future performance. Instead, they are based only on our current beliefs, expectations and assumptions regarding our business, future plans and strategies, projections, anticipated events and trends, the economy and other future conditions. Because forward-looking statements relate to the future, they are subject to inherent uncertainties, risks and changes in circumstances that are difficult to predict and many of which are outside of our control. Our actual results and financial condition may differ materially from those indicated in forward-looking statements. Therefore, you should not rely on any of these forward-looking statements. Important factors that could cause our actual results and financial condition to differ materially from those indicated in forward-looking statements include, among others, the following: interest rate risk, including the effects of significant rate increases by the Federal Reserve since 2020; our ability to successfully manage credit risk and maintain an adequate level of allowance for credit losses; new or revised accounting standards; business and economic conditions generally and in the financial services industry, nationally and within our market areas, including high rates of inflation and possible recession; the effects of recent developments and events in the financial services industry, including the large-scale deposit withdrawals over a short-period of time that resulted in recent bank failures of those institutions; the overall health of the local and national real estate market; concentrations within our loan portfolio; the level of nonperforming assets on our balance sheet; our ability to implement our organic and acquisition growth strategies, including the integration of Metro Phoenix Bank which we acquired in 2022; the impact of economic or market conditions on our fee-based services; our ability to continue to grow our retirement and benefit services business; our ability to continue to originate a sufficient volume of residential mortgages; the occurrence of fraudulent activity, breaches or failures of our or our third-party vendors’ information security controls or cybersecurity-related incidents, including as a result of sophisticated attacks using artificial intelligence and similar tools; interruptions involving our information technology and telecommunications systems or third-party servicers; potential losses incurred in connection with mortgage loan repurchases; the composition of our executive management team and our ability to attract and retain key personnel; rapid technological change in the financial services industry; increased competition in the financial services industry from non-banks such as credit unions and Fintech companies, including digital asset service providers; our ability to successfully manage liquidity risk, including our need to access higher cost sources of funds such as fed funds purchased and short-term borrowings; the concentration of large deposits from certain clients, who have balances above current Federal Deposit Insurance Corporation (“FDIC”) insurance limits; the effectiveness of our risk management framework; the commencement and outcome of litigation and other legal proceedings and regulatory actions against us or to which we may become subject; potential impairment to the goodwill we recorded in connection with our past acquisitions, including the acquisition of Metro Phoenix Bank; the extensive regulatory framework that applies to us; the impact of recent and future legislative and regulatory changes, including in response to the recent bank failures; fluctuations in the values of the securities held in our securities portfolio, including as a result of changes in interest rates; governmental monetary, trade and fiscal policies; risks related to climate change and the negative impact it may have on our customers and their businesses; severe weather, natural disasters, widespread disease or pandemics; acts of war or terrorism, including the ongoing Israeli-Palestinian conflict and the Russian invasion of Ukraine, or other adverse external events; any material weaknesses in our internal control over financial reporting; changes to U.S. or state tax laws, regulations and guidance, including the 1.0% excise tax on stock buybacks by publicly traded companies; potential changes in federal policy and at regulatory agencies as a result of the upcoming 2024 presidential election; talent and labor shortages and employee turnover; our success at managing the risks involved in the foregoing items; and any other risks described in the “Risk Factors” sections of the reports filed by Alerus Financial Corporation with the Securities and Exchange Commission. Any forward-looking statement made by us in this presentation is based only on information currently available to us and speaks only as of the date on which it is made. We undertake no obligation to publicly update any forward-looking statement, whether written or oral, that may be made from time to time, whether as a result of new information, future developments or otherwise. Non-GAAP Financial Measures This presentation includes certain ratios and amounts that do not conform to U.S. Generally Accepted Accounting Principles, or GAAP. Management uses certain non-GAAP financial measures to evaluate financial performance and business trends from period to period and believes that disclosure of these non-GAAP financial measures will help investors, rating agencies and analysts evaluate the financial performance and condition of Alerus Financial Corporation. This presentation includes a reconciliation of each non-GAAP financial measure to the most comparable GAAP equivalent. Miscellaneous Except as otherwise indicated, this presentation speaks as of the date hereof. The delivery of this presentation shall not, under any circumstances, create any implication that there has been no change in the affairs of Alerus Financial Corporation after the date hereof. Certain of the information contained herein may be derived from information provided by industry sources. We believe that such information is accurate and that the sources from which it has been obtained are reliable. We cannot guarantee the accuracy of such information, however, and we have not independently verified such information. 1 |
|
Retirement & Benefits Revenue 34.2% Wealth Advisory Revenue Banking Fees & 11.9% Other Revenue 8.7% Net Interest Income 45.2% COMPANY PROFILE Alerus is a commercial wealth bank and a national retirement plan provider DIVERSIFIED REVENUE(1) Net Interest Income: $86.4 million 45.2% of revenue Noninterest Income: $104.9 million 54.8% of revenue BANKING Business Services ▪ Commercial and small business offerings ▪ Treasury Management services ▪ SBA & CRE Lending Consumer Services ▪ Private banking ▪ Savings, money markets, CDs ▪ Mortgage services Assets: $ in billions WEALTH ADVISORY RETIREMENT AND BENEFITS AUA / AUM: $ in billions Retirement ▪ Plan administration ▪ Trust and custodial offerings ▪ Record keeping Benefits ▪ Health savings accounts ▪ Flexible spending accounts ▪ COBRA ▪ Financial Planning: Retirement | Tax | Estate planning ▪ Investment Management: Managed investments | Brokerage ▪ Trust and Fiduciary: Estate Administration | Corporate Trusteeship AUA / AUM: $ in billions 2 | 1. Excludes net losses on investment securities of $24.6 million in 4Q 2023. See “Non-GAAP Disclosure Reconciliation.” 2. Banking and other revenue consists of service charges on deposit accounts, mortgage income, interchange income and other noninterest income. Last Twelve Months Ended March 31, 2024 (2) $3.1 $3.3 $4.0 $3.6 $4.0 $4.2 2019 2020 2021 2022 2023 1Q 2024 $2.4 $3.0 $3.4 $3.8 $3.9 $4.3 2019 2020 2021 2022 2023 1Q 2024 $31.9 $34.2 $36.7 $32.1 $36.7 $38.5 2019 2020 2021 2022 2023 1Q 2024 |
|
41.8% 21.8% 9.5% 26.9% Market Distribution and Client Base FRANCHISE FOOTPRINT FULL-SERVICE BANKING ▪ Grand Forks, ND: 4 offices ▪ Fargo, ND: 3 offices ▪ Twin Cities, MN: 6 offices ▪ Phoenix, AZ: 2 offices RETIREMENT AND BENEFITS SERVICES ▪ Offices in Minnesota, North Dakota, Michigan, and Colorado ▪ Retirement plan service clients in all 50 states BANKING LEGEND: North Dakota Minnesota Arizona National Synergistic WEALTH ADVISORY RETIREMENT AND BENEFITS | ($ in millions) 3 | ▪ 481,000 Employer-sponsored retirement and benefit plan participants and health savings account participants ▪ 34,600 Flexible spending account and health reimbursement arrangement participants ▪ 37,600 Consumer banking clients ▪ 16,700 Commercial banking clients ▪ 8,400 Employer-sponsored retirement plans ▪ 10,800 Wealth clients 28.0% 57.4% 14.6% 74.2% 10.7% 4.1% 11.0% 9.5% 13.2% 77.3% Data as of 3/31/2024. LOANS: $2,799 DEPOSITS: $3,285 AUA / AUM: $4,243 AUA / AUM: $38,489 |
|
STRATEGIC GROWTH To supplement our organic growth, we have executed 25 acquisitions throughout the history of our company including: 15 in Banking, 10 in Retirement and Benefits 1879 2022 2019 2009 2007 2000 Began as the Bank of Grand Forks Rebranded to Alerus Expanded to Minnesota Market Expanded to Arizona Market Completed Initial Public Offering (IPO) Acquired Metro Phoenix Bank 4 | 1. Source S&P Capital IQ. 2. Excludes net losses on investment securities (after-tax) of $19.2 million in 4Q 2023. See “Non-GAAP Disclosure Reconciliation.” (2) (2) 1.08% 1.28% 1.31% KBW Regional Bank Index (Average) KBW Regional Bank Index (Top Quartile) Alerus Financial ROA(1) (5 Year History: 2019 - 2023) 9.2% 11.2% 12.5% KBW Regional Bank Index (Average) KBW Regional Bank Index (Top Quartile) Alerus Financial ROE(1) (5 Year History: 2019 - 2023) |
|
▪ Provide secure and reliable technology that meets evolving client expectations ▪ Integrate our full product and service offerings through our fast-follower technology strategy STRATEGIC INITIATIVES One Alerus = Working Better Together to Grow ORGANIC GROWTH TALENT ACQUISITIONS STRATEGIC ACQUISITION PRODUCTIVITY AND EFFICIENCY ▪ Collaborative leadership team focused on new client acquisition, retention, and deepening relationships with existing clients ▪ Diversified business model focused on bringing value to the client through advice and specialty solutions to help clients grow ▪ Leveraging product synergies unavailable to traditional banking organizations ▪ Recruiting top talent in mid-market C&I banking and specialty niches to accelerate growth in our existing markets ▪ Jumpstart our entrance into new markets with new talent ▪ Proactively positioning ourselves as an acquirer and employer of choice ▪ Capitalize on strategic opportunities to grow in our existing markets or new markets ▪ Acquisition targets include banks and nationwide fee income companies with complementary business models, cultural similarities, and synergy and growth opportunities 5 Our Purpose Powers our Culture Do the Right Thing Lead with integrity and provide valued advice and guidance One Alerus Work together to provide purpose-driven products and services for our clients Passion for Excellence Act with accountability and sense of urgency to best serve clients and achieve exceptional results Success is Never Final Embrace opportunities to adapt and growth with our industry and our clients One Alerus Client Oriented Diversified Services Synergistic Growth Tailored Advice Technology Investment Reinvention of Processes |
|
OFFICERS AND DIRECTORS DAN COUGHLIN Since 2016 Chairman, Alerus Financial Corp. Former MD & Co-Head – Fin’l Services Inv. Banking, Raymond James; Former Chairman & CEO, Howe Barnes Hoefer & Arnett MARY ZIMMER Since 2021 Former Director of Diverse Client Segments and Former Northern Regional President, Wells Fargo Advisors Former Head of Intl. Wealth USA, Royal Bank of Canada U.S. Wealth Mgmt. JANET ESTEP Since 2021 Former President and CEO, Nacha Former EVP, US Bank Transaction Division Former VP, Pace Analytical Services RANDY NEWMAN Since 1987 Former President and CEO, Alerus JON HENDRY Executive Vice President and Chief Technology Officer 40 years with Alerus KARIN TAYLOR Executive Vice President and Chief Risk Officer and Operating Officer 6 years with Alerus KEVIN LEMKE Since 1994 President Virtual Systems, Inc. GALEN VETTER Since 2013 Former Global CFO, Franklin Templeton Investments; Former Partner-in-Charge, Upper Midwest Region, RSM EXECUTIVE MANAGEMENT BOARD OF DIRECTORS KATIE LORENSON Director, President and Chief Executive Officer 7 years with Alerus MISSY KENEY Executive Vice President and Chief Engagement Officer 19 years with Alerus AL VILLALON Executive Vice President and Chief Financial Officer 2 years with Alerus JIM COLLINS Executive Vice President and Chief Banking and Revenue Officer 2 years with Alerus NIKKI SORUM Since 2023 Former Head of Sales and Distribution, Thrivent Former SVP, Private Client Group, RBC Wealth Management JOHN URIBE Since 2023 Chief Financial Officer Blue Cross and Blue Shield of Minnesota 6 FORREST WILSON Executive Vice President and Chief Retirement Services Officer Joined Alerus in 2024 |
|
FIRST QUARTER HIGHLIGHTS Office in Excelsior, Minnesota |
|
1Q 2024 HIGHLIGHTS Success is Never Final EPS: $0.33 Adjusted(1) $0.32 Reported NII: $22.2 million +3.1% vs. 4Q23 NIM: 2.44% Adjusted(2) +7 bps vs. 4Q23 Fee Income: $25.3 million 53.3% of revenue in 1Q 2024 1. Adjusted for nonrecurring items. See “Non-GAAP Disclosure Reconciliation.” 2. Excludes impact of Bank Term Funding Program (BTFP) trade. See “Non-GAAP Disclosure Reconciliation.” 3. Represents a non-GAAP Financial measure. See “Non-GAAP Disclosure Reconciliation.” EARNINGS BALANCE SHEET ASSET & CAPITAL STRENGTH VALUE CREATION AUA / AUM: $42.8 billion +5.0% vs. 4Q23 Loans: $2.8 billion +1.4% vs. 4Q23 Deposits: $3.3 billion +6.1% vs. 4Q23 L/D Ratio: 85% -4 bps vs 4Q23 CET1: 11.9% 6.5% “well capitalized” minimum NCO Ratio: 1 bp $58k of charge-offs ALLL: 1.31% +1 bp vs. 4Q23 TBV(3): $15.63 +$0.15 vs. 4Q23 Executed BTFP Trade Establishing strong risk-free returns $0.19 Dividend Per Share $3.8 million to shareholders Hired Forrest Wilson Retirement and Benefits executive 8 | |
|
1Q 2024 RESULTS 1. Represents a non-GAAP Financial measure. See “Non-GAAP Disclosure Reconciliation.” Income Statement 9 | (dollars and shares in thousands, except per share data) Net Interest Income $ 22,219 $ 21,552 $ 23,658 Provision for Credit Losses — 1,507 550 Net Interest Income After Provision for Credit Losses 22,219 20,045 23,108 Noninterest Income 25,323 791 25,253 Noninterest Expense 39,019 38,654 37,869 Income Before Income Taxes 8,523 (17,818) 10,492 Income Tax Expense 2,091 (3,064) 2,306 Net Income $ 6,432 $ (14,754) $ 8,186 Per Common Share Data Earnings Per Common Share - Diluted $ 0.32 $ (0.73) $ 0.40 Adjusted Earnings Per Common Share - Diluted (1) 0.33 0.26 0.42 Diluted Average Common Shares Outstanding 19,986 19,996 20,246 Performance Ratios Return on Average Total Assets 0.63 % (1.51) % 0.88 % Return on Average Tangible Common Equity (1) 9.78 % (18.85) % 12.58 % Noninterest Income as a % of Revenue 53.26 % 3.54 % 51.63 % Net Interest Margin (Tax-Equivalent) 2.30 % 2.37 % 2.70 % Efficiency Ratio (1) 78.88 % 165.40 % 74.53 % Three months ended 2024 March 31, December 31, 2023 March 31, 2023 |
|
PERFORMANCE RATIOS 1. Represents a non-GAAP Financial measure. See “Non-GAAP Disclosure Reconciliation.” 2. Rates have been annualized. 10 | 0.92% 0.51% 0.65% 1Q 2023 4Q 2023 1Q 2024 Adjusted Return on Average Assets(1)/(2) 13.16% 8.30% 10.07% 1Q 2023 4Q 2023 1Q 2024 Adjusted Return on Average Tangible Common Equity(1)/(2) $14.50 $15.46 $15.63 1Q 2023 4Q 2023 1Q 2024 Tangible Book Value per Share(1) |
|
$23,658 $21,552 $22,219 1Q 2023 4Q 2023 1Q 2024 Net Interest Income KEY REVENUE ITEMS 1. Banking fees and other consists of service charges on deposit accounts, mortgage income, interchange income and other noninterest income. 2. Excludes net losses on investment securities of $24.6 million in 4Q 2023. See “Non-GAAP Disclosure Reconciliation.” (1)/(2) 11 | $ in thousands $ in thousands Net Interest Income: +3.1% Linked Quarter (6.1%) Year-over-year Noninterest Income: (0.4%) Linked Quarter +0.3% Year-over-year $15,482 $15,317 $15,655 $5,194 $5,940 $6,118 $4,577 $4,177 $3,550 $25,253 $25,434 $25,323 1Q 2023 4Q 2023 1Q 2024 Noninterest Income Retirement & Benefit Services Wealth Advisory Services Banking Fees and Other |
|
NET INTEREST INCOME $ in Thousands NIM: 2.37% 0.15% 0.20% (0.02%) (0.08%) (0.32%) 2.30% 0.14% 2.44% QUARTERLY HIGHLIGHTS ▪ Net interest income for the first quarter of 2024 increased 3.1% from the fourth quarter of 2023. ▪ Larger cash and loan balances, along with lower borrowing levels, drove net interest income higher. This was partially offset by an increase in interest expense on deposits driven by higher deposit balances. ▪ Borrowed $355.0 million from the Bank Term Funding Program (BTFP), earning 52 basis points of risk-free return resulting in $0.3 million in net interest income for the first quarter of 2024. YIELDS AND RATES NII AND NIM(1) WALK 12 | 1.26% 2.27% 2.56% 1.72% 2.99% 3.26% 1.71% 2.67% 2.91% 1Q 2023 4Q 2023 1Q 2024 Cost of Funds Cost of Total Deposits Cost of Interest Bearing Deposits Total Cost of Funds 1. Tax-equivalent net interest margin. 2. Adjusted for BTFP trade. Represents a non-GAAP Financial measure. See “Non-GAAP Disclosure Reconciliation.” Yields and rates have been annualized. 2.44% 2.70% 2.37% 2.30% 1Q 2023 4Q 2023 1Q 2024 NIM Adjusted NIM NIM (2) 2.43% 2.70% 2.48% 5.10% 5.64% 5.72% 4.31% 4.89% 5.05% 1Q 2023 4Q 2023 1Q 2024 Earning Assets Investment Securities Yield Loan Yield Earning Asset Yield (2) (2) (1) |
|
Chart As of As of As of Change Change Legend Category 3/31/2023 12/31/2023 3/31/2024 QoQ YoY Commercial and industrial $ 553,578 $ 598,321 $ 611,695 2.2% 10.5% Real estate construction 108,776 124,034 125,966 1.6% 15.8% Commercial real estate (owner occupied) 254,754 271,619 285,149 5.0% 11.9% Commercial real estate (non-owner occupied) 641,487 814,461 826,650 1.5% 28.9% Agriculture real estate 38,082 40,832 41,149 0.8% 8.1% Residential real estate first mortgage 698,002 726,879 722,151 -0.7% 3.5% Residential real estate junior lien 152,281 154,134 156,882 1.8% 3.0% Other revolving and installment 39,664 29,303 29,833 1.8% -24.8% Total $ 2,486,624 $ 2,759,583 $ 2,799,475 1.4% 12.6% EARNING ASSETS QUARTERLY HIGHLIGHTS ▪ Total loans grew 1.4% from December 31, 2023. ▪ Quarter over quarter growth was driven by an increase in total CRE loans, which increased 2.2%, and an increase in C&I loans with grew 2.2%. ▪ Residential real estate first mortgage loans was the only loan category to decrease quarter over quarter given seasonality and focused allocation of portfolio capital. ▪ The investment portfolio decreased 2.2% from December 31, 2023 as portfolio runoff was used to support loan growth and to pay down borrowings. LOAN PORTFOLIO CHANGES INVESTMENT PORTFOLIO MARCH 31, 2024 LOAN PORTFOLIO Held-to-Maturity: 30.8% 38.1% 38.0% Available-for-Sale: 69.2% 61.9% 61.4% Trading Securities(1): 0.0% 0.0% 0.6% % of Earning Assets: 27.8% 21.4% 18.7% AOCI: $(96,307) $(73,655) $(74,256) 13 | $ in thousands $ in thousands 1. Trading securities consists of mutual funds held for deferred compensation. 21.8% 4.5% 10.2% 29.5% 1.5% 25.8% 5.6% 1.1% 35.6% 35.3% 34.9% 0.3% 0.1% 0.1% 45.4% 41.9% 41.8% 5.7% 6.2% 6.4% 13.0% 16.5% 16.3% 0.6% $1,019,696 $786,464 $768,964 3/31/2023 12/31/2023 3/31/2024 Trading Securities Municipals Corporate Debt Corporate ABS & CMO Agency Non-MBS Agency MBS |
|
Chart As of As of As of Change Change Legend Category 3/31/2023 12/31/2023 3/31/2024 QoQ YoY Noninterest-bearing $ 792,977 $ 728,082 $ 692,500 -4.9% -12.7% Interest-bearing demand 817,675 840,711 938,751 11.7% 14.8% Money market and savings 1,002,701 938,527 1,013,983 8.0% 1.1% Time deposits 245,418 411,562 456,729 11.0% 86.1% HSA deposits 173,207 176,729 183,006 3.6% 5.7% Total $ 3,031,978 $ 3,095,611 $ 3,284,969 6.1% 8.3% Loan to deposits ratio 82.0% 89.1% 85.2% 21.1% 30.8% 28.6% 13.9% 5.6% DEPOSIT CHARACTERISTICS QUARTERLY HIGHLIGHTS ▪ Total deposits increased 6.1% from December 31, 2023. ▪ Expanded commercial deposit relationships, along with a seasonal inflow of public funds, helped drive the quarter over quarter growth. ▪ The Company continued to have $0 of brokered deposits as of March 31, 2024. MARCH 31, 2024 DEPOSIT PORTFOLIO (BY CATEGORY) DEPOSIT PORTFOLIO CHANGES MARCH 31, 2024 DEPOSIT PORTFOLIO (BY CLIENT SEGMENT) Synergistic(1) deposits grew +3.7% from December 31, 2023. 14 | $ in thousands IB: 78.9% Synergistic 26.9% Commercial 34.4% Consumer 29.1% Public 9.6% 1. Synergistic deposits are sourced from Retirement and Benefits Services and Wealth Advisory Services. (1) Non-IB: |
|
$1,717 $1,279 $1,670 $301 $341 $389 $2,559 $2,557 $1,491 $4,577 $4,177 $3,550 1Q 2023 4Q 2023 1Q 2024 Mortgage Service Charges Other BANKING SERVICES BANKING SERVICES QUARTERLY HIGHLIGHTS ▪ Mortgage income increased $391 thousand quarter over quarter, primarily driven by an increase in the marked to market derivative. ▪ Service charges increased $48 thousand from 4Q 2023. ▪ Other fee income decreased $1.1 million quarter over quarter, driven by large swap fee income in 4Q 2023. DIVISIONAL(1) INCOME STATEMENT NONINTEREST INCOME BREAKDOWN MORTGAGE HIGHLIGHTS $ in millions $ in thousands 15 | $ in thousands Purchase: 94.9% 96.0% 94.8% Refinance: 5.1% 4.0% 5.2% Fair Value Change: $254 $(314) $306 1. Includes Corporate Administration income. 2. Banking noninterest income consists of service charges on deposit accounts, mortgage income, interchange income and other noninterest income. 3. Excludes net losses on investment securities of $24.6 million in 4Q 2023. See “Non-GAAP Disclosure Reconciliation.” (2)/(3) (3) $56 $58 $53 $22 $7 $1 $78 $65 $54 1Q 2023 4Q 2023 1Q 2024 Portfolio Sale $ in thousands 1Q 2024 4Q 2023 1Q 2023 Net interest income $ 22,219 $ 21,552 $ 23,658 Provision for loan losses - 1,507 550 Noninterest income 3,550 4,177 4,577 Total revenue 25,769 24,222 27,685 Noninterest expense 18,666 18,792 18,650 Net income before taxes: $ 7,103 $ 5,430 $ 9,035 |
|
1Q 2024 4Q 2023 1Q 2023 Recurring annual income $ 12,480 $ 12,636 $ 12,739 Transactional income 3,175 2,681 2,743 Total noninterest income 15,655 15,317 15,482 Noninterest expense 14,189 13,792 13,595 Net income before taxes: $ 1,466 $ 1,525 $ 1,887 $230,498 $202,330 $195,617 $233,082 $246,037 $126,518 $153,224 $166,171 $176,729 $183,006 $136,946 $170,224 $167,796 $188,349 $160,421 $493,962 $525,778 $529,584 $598,160 $589,464 2020 2021 2022 2023 1Q 2024 Money Market HSA Other RETIREMENT AND BENEFIT SERVICES QUARTERLY HIGHLIGHTS ▪ Hired Forrest Wilson as Chief Retirement Services Officer. ▪ AUA / AUM grew 4.9% from December 31, 2023. ▪ 37% of Retirement and Benefit Services revenue is market sensitive. ▪ 52.7% of Retirement and Benefit Services synergistic deposits are indexed. DIVISIONAL(1) INCOME STATEMENT AUA / AUM AND PARTICIPANTS SYNERGISTIC DEPOSITS 16 | $ in thousands $ in millions $ in thousands $34,200 $36,733 $32,123 $36,682 $38,489 423,156 447,564 453,757 473,692 480,862 2020 2021 2022 2023 1Q 2024 AUA/AUM Participants 1. Excludes funds transfer pricing credit on synergistic deposits. |
|
1Q 2024 4Q 2023 1Q 2023 Asset management $ 5,256 $ 4,974 $ 4,455 Brokerage 366 563 409 Insurance and advisory 496 403 330 Total noninterest income 6,118 5,940 5,194 Noninterest expense 3,750 3,773 3,362 Net income before taxes: $ 2,368 $ 2,167 $ 1,832 WEALTH ADVISORY SERVICES QUARTERLY HIGHLIGHTS ▪ Wealth advisory services revenue increased 3.0% from the fourth quarter of 2023. ▪ Synergistic deposits grew 15.8% quarter over quarter. ▪ AUA / AUM grew 5.5% during the quarter. ▪ 88.6% of Wealth Advisory Services synergistic deposits are indexed. ▪ IRA rollovers captured added $39.0 million of AUM in the first quarter of 2024. DIVISIONAL(1) INCOME STATEMENT AUA / AUM SYNERGISTIC DEPOSITS 17 | $ in thousands $ in millions $ in thousands $101,621 $143,183 $161,973 $253,384 $293,357 2020 2021 2022 2023 1Q 2024 $3,339 $4,040 $3,583 $4,019 $4,242 2020 2021 2022 2023 1Q 2024 1. Excludes funds transfer pricing credit on synergistic deposits. |
|
NONINTEREST EXPENSE $ in Thousands YEAR-OVER-YEAR HIGHLIGHTS ▪ Noninterest expense increased $1.2 million, or 3.0%, compared to the first quarter of 2023. ▪ The increase was primarily driven by higher professional fees and assessments due to an increase in FDIC assessments and an increase in recruitment expenses driven by talent acquisitions in the first quarter of 2024. QUARTERLY HIGHLIGHTS ▪ Noninterest expense increased $0.4 million, or 0.9%, over the last quarter. ▪ Compensation and benefits expense increased $1.7 million from the fourth quarter of 2023 primarily due to seasonality. ▪ Professional fees and assessments decreased $0.4 million quarter over quarter driven by an increase in corresponding activities in the prior quarter. ▪ Other expenses decreased $0.7 million compared to the fourth quarter of 2023 primarily driven by a one-time donation resulting in tax credits in the fourth quarter. ▪ Business services, software and technology expense decreased $0.3 million from the prior quarter on the back of seasonally higher contract renewals and equipment purchases in the fourth quarter. 18 | Compensation and Benefits Professional Fees and Assessments Other(1) Occupancy and Equipment Business Services, Software and Technology Noninterest Expense: +0.9% Linked Quarter +3.0% Year-over-year 1. Other noninterest expense consists of intangible amortization, marketing and business development, supplies and postage, travel, mortgage and lending, and other noninterest expense. $25,011 $23,792 $25,520 $1,899 $1,858 $1,906 $5,324 $5,686 $5,345 $1,152 $2,345 $1,993 $4,483 $4,973 $4,255 $37,869 $38,654 $39,019 1Q 2023 4Q 2023 1Q 2024 |
|
ASSET QUALITY AND RESERVE LEVELS HIGHLIGHTS ▪ There was no provision for credit losses in the first quarter of 2024. ▪ Net charge-offs for the quarter totaled $58 thousand. ▪ Nonperforming loans decreased 15.9% from December 31, 2023. ▪ Strong asset quality continues to be shown by exceptional credit quality metrics. NCO/ Avg Loans 0.03% (0.04%) 0.02% (0.04%) 0.01% NPA / ASSETS % RESERVES OVER NPL % RESERVES / LOANS % 19 0.17% 0.09% 0.10% 0.22% 0.17% 2020 2021 2022 2023 1Q 2024 674% 1,437% 821% 410% 498% 2020 2021 2022 2023 1Q 2024 1.73% 1.80% 1.27% 1.30% 1.31% 2020 2021 2022 2023 1Q 2024 |
|
9.2% 9.8% 11.3% 10.6% 9.9% 13.2% 15.1% 13.7% 12.1% 12.1% 2020 2021 2022 2023 1Q 2024 Tier 1 Leverage Tier 1 Capital 16.8% 18.6% 16.5% 14.8% 14.8% 2020 2021 2022 2023 1Q 2024 12.8% 14.7% 13.4% 11.8% 11.9% 2020 2021 2022 2023 1Q 2024 CAPITAL AND SOURCES OF LIQUIDITY LIQUIDITY COMMON EQUITY TIER 1 TIER 1 CAPITAL/TIER 1 LEVERAGE RATIOS TOTAL RISK BASED CAPITAL 20 $ in Thousands 8% Regulatory Capital Minimum to be considered adequately capitalized. 6% Regulatory Capital Minimum to be considered adequately capitalized. 4% Tier 1 Capital Leverage Total Assets $ 4,338,093 Cash and cash equivalents 545,772 Unencumbered Securities (at Market Value) 197,227 Total On Balance Sheet Liquidity 742,999 FHLB Borrowing Capacity 897,976 Fed Funds Lines 107,000 Brokered CD Capacity 867,619 Total Off Balance Sheet Liquidity 1,872,595 Total Liquidity as of 3/31/2024 $ 2,615,594 Total Liquidity (Ex-brokered CD Capacity) $ 1,747,975 |
|
KEY TAKEAWAYS The first quarter of the year has put Alerus on a strong path for 2024 EARNINGS BALANCE SHEET ASSET & CAPITAL STRENGTH VALUE CREATION Net interest income continues to be bolstered by our diversified business model ▪ 3.1% growth in net interest income compared to 4Q 2023 ▪ 53.3% of noninterest income to total revenue ▪ 26.9% increase in adjusted EPS (1) compared to 4Q 2023 Our strong talent acquisition and retention is continuing to payoff ▪ 6.1% increase in deposits compared to December 31, 2023 ▪ 1.4% growth in loans compared to December 31, 2023 ▪ 85.2% loan to deposit ratio Strong credit quality continues to be shown by exceptional credit quality metrics ▪ 1 bp net charge-offs to average loans and total reserves to loans of 1.31% ▪ 11.9% CET1 (5.4% over “well capitalized” 6.5% minimum) ▪ 7.88% adjusted(1) tangible common equity to tangible assets We remain focused on the long-term success of the company ▪ Continued progress in returning the company to top tier performance ▪ Executed BTFP trade to establish strong free returns ▪ $3.8 million returned to shareholders through dividends 21 | 1. Adjusted for one-time items. Represents a non-GAAP Financial measure. See “Non-GAAP Disclosure Reconciliation.” |
|
APPENDIX Office in Downtown Minneapolis, Minnesota |
|
DIVISIONAL INCOME STATEMENT 23 | 1. Banking noninterest income consists of service charges on deposit accounts, mortgage income, interchange income and other noninterest income. 2. Excludes net losses on investment securities of $24.6 million in 4Q 2023 which represents a non-GAAP Financial measure. See “Non-GAAP Disclosure Reconciliation.” ($ dollars in thousands) Banking Services Retirement and Benefit Services Wealth Advisory Services Corporate Administration Consolidated Net interest income $ 22,897 $ - $ - $ (678) $ 22,219 Provision for loan losses - - - - - Noninterest income(1) 3,490 15,655 6,118 60 25,323 Noninterest expense 18,666 14,189 3,750 2,414 39,019 Net income before taxes $ 7,721 $ 1,466 $ 2,368 $ (3,031) $ 8,523 Banking Services Retirement and Benefit Services Wealth Advisory Services Corporate Administration Consolidated Net interest income $ 22,234 $ - $ - $ (682) $ 21,552 Provision for loan losses 1,507 - - - 1,507 Noninterest income(1)/(2) 4,186 15,317 5,940 (9) 25,434 Noninterest expense 18,792 13,792 3,773 2,297 38,654 Net income before taxes $ 6,121 $ 1,525 $ 2,167 $ (2,988) $ 6,825 Banking Services Retirement and Benefit Services Wealth Advisory Services Corporate Administration Consolidated Net interest income $ 24,312 $ - $ - $ (654) $ 23,658 Provision for loan losses 550 - - - 550 Noninterest income(1) 4,539 15,482 5,194 38 25,253 Noninterest expense 18,650 13,595 3,362 2,262 37,869 Net income before taxes $ 9,651 $ 1,887 $ 1,832 $ (2,878) $ 10,492 Quarter ended March 31, 2024 Quarter ended March 31, 2023 Quarter ended December 31, 2023 |
|
LOAN PORTFOLIO BREAKDOWN 24 ($ in thousands) Balance Percent of Portfolio Balance Percent of Portfolio Commercial and industrial: General business $ 316,298 11.3% $ 294,149 10.7% Services 147,584 5.3% 146,318 5.3% Retail trade 79,620 2.8% 91,216 3.3% Manufacturing 68,193 2.4% 66,638 2.4% Total commercial and industrial 611,695 21.8% 598,321 21.7% Commercial real estate: Owner occupied 285,149 10.2% 271,619 9.8% Non-owner occupied Multifamily 260,609 9.3% 245,103 8.9% Office 133,284 4.8% 124,684 4.5% Industrial 103,303 3.7% 104,241 3.8% Retail 96,023 3.4% 96,578 3.5% Hotel 67,288 2.4% 80,576 2.9% Medical Office 63,775 2.3% 63,788 2.3% Medical or nursing facility 47,302 1.7% 47,625 1.7% Other commercial real estate 55,066 1.9% 51,866 1.9% Total non-owner occupied 826,650 29.5% 814,461 29.5% Construction 125,966 4.5% 124,034 4.5% Agricultural real estate 41,149 1.5% 40,832 1.5% Total commercial real estate 1,278,914 45.7% 1,250,946 45.3% Consumer Residential real estate first mortgage 722,151 25.8% 726,879 26.3% Residential real estate junior lien 156,882 5.6% 154,134 5.6% Other revolving and installment 29,833 1.1% 29,303 1.1% Total consumer 908,866 32.5% 910,316 33.0% Total loans $ 2,799,475 100.0% $ 2,759,583 100.0% March 31, 2024 December 31, 2023 |
|
0% 10% 20% 30% 40% 50% 60% - 50,000 100,000 150,000 200,000 250,000 300,000 350,000 400,000 2019 2020 2021 2022 2023 1Q 2023 2Q 2023 3Q 2023 4Q 2023 1Q 2024 Home Equity Lines of Credit Funded Unfunded Funded % 0% 10% 20% 30% 40% 50% 60% - 50,000 100,000 150,000 200,000 250,000 300,000 350,000 400,000 450,000 2019 2020 2021 2022 2023 1Q 2023 2Q 2023 3Q 2023 4Q 2023 1Q 2024 C&I Funded Unfunded Funded % LINE OF CREDIT UTILIZATION 25 | Commercial and industrial loans includes revolving C&I loans and other loans. It excludes non-revolving C&I loans, ag production, and loans to public entities. |
|
ALLOWANCE FOR CREDIT LOSSES ON LOANS Changes in the ACL for Loans by Portfolio Segment 1. The difference in the credit loss expense reported herein compared to the consolidated statements of income is associated with the credit loss expense of ($793) thousand related to 26 off-balance sheet credit exposure and ($6) thousand related to investment securities held-to-maturity. | ($ in thousands) Commercial Commercial and industrial $ 9,894 $ 122 $ (164) $ 123 $ 9,975 Real estate construction 6,111 (189) — — 5,922 Commercial real estate 11,897 834 (29) 11 12,713 Total commercial 27,902 767 (193) 134 28,610 Consumer Residential real estate first mortgage 6,578 63 — — 6,641 Residential real estate junior lien 1,151 (3) — — 1,148 Other revolving and installment 212 (28) (12) 13 185 Total consumer 7,941 32 (12) 13 7,974 Total $ 35,843 $ 799 $ (205) $ 147 $ 36,584 Ending Balance Three months ended March 31, 2024 Loan Charge-offs Loan Recoveries Beginning Balance Provision for Credit Losses(1) |
|
ALLOWANCE FOR CREDIT LOSSES ON LOANS Allocation by Loan Portfolio Segment 27 ($ in thousands) Commercial and industrial $ 9,975 1.63% $ 9,894 1.65% Real estate construction 5,922 4.70% 6,111 4.93% Commercial real estate 12,713 1.10% 11,897 1.10% Residential real estate first mortgage 6,641 0.92% 6,578 0.90% Residential real estate junior lien 1,148 0.73% 1,151 0.75% Other revolving and installment 185 0.62% 212 0.72% Total loans $ 36,584 1.31% $ 35,843 1.30% to segment loans March 31, 2024 December 31, 2023 Allocated segment allowance Allowance to segment loans Allocated Allowance segment allowance Percentage of Percentage of |
|
($ in thousands, except where otherwise noted) 1Q 2023 2Q 2023 3Q 2023 4Q 2023 1Q 2024 Total Assets $ 3,886,773 $ 3,832,978 $ 3,869,138 $ 3,907,713 $ 4,338,093 Total Loans 2,486,625 2,533,522 2,606,430 2,759,583 2,799,475 Total Deposits 3,031,978 2,852,855 2,872,184 3,095,611 3,284,969 Tangible Common Equity1 290,900 290,792 284,137 305,186 309,018 Net Income $ 8,186 $ 9,104 $ 9,161 $ (14,754) $ 6,432 ROAA (%) 0.88 0.96 0.95 (1.51) 0.63 ROATCE(%)1 12.58 13.71 13.51 (18.85) 9.78 Net Interest Margin (FTE) (%) 2.70 2.52 2.27 2.37 2.30 Efficiency Ratio (FTE) (%)1 74.53 72.79 73.37 165.40 78.88 Non-Int. Income/Op. Rev. (%) 51.63 53.69 58.21 3.54 53.26 Earnings per common share - diluted $ 0.40 $ 0.45 $ 0.45 $ (0.73) $ 0.32 Total Equity/Total Assets (%) 9.24 9.33 9.03 9.45 8.57 Tang. Cmn. Equity/Tang. Assets (%)1 7.62 7.72 7.47 7.94 7.23 Loans/Deposits (%) 82.01 88.81 90.75 89.15 85.22 NPLs/Loans (%) 0.09 0.10 0.35 0.32 0.26 NPAs/Assets (%) 0.05 0.07 0.23 0.22 0.17 Allowance/NPLs (%) 1,657.32 1,383.57 402.91 410.34 498.08 Allowance/Loans (%) 1.41 1.41 1.39 1.30 1.31 NCOs/Average Loans (%) 0.03 (0.07) (0.09) (0.04) 0.01 Quarterly FINANCIAL HIGHLIGHTS 28 | 1. Represents a non-GAAP financial measure. See “Non-GAAP Disclosure Reconciliation.” |
|
FINANCIAL HIGHLIGHTS 29 | 1. Represents a non-GAAP financial measure. See “Non-GAAP Disclosure Reconciliation.” ($ in thousands, 19-'23 except where otherwise noted) 2019 2020 2021 2022 2023 CAGR Total Assets $ 2,356,878 $ 3,013,771 $ 3,392,691 $ 3,779,637 $ 3,907,713 13.5% Total Loans 1,721,279 1,979,375 1,758,020 2,443,994 2,759,583 12.5% Total Deposits 1,971,316 2,571,993 2,920,551 2,915,484 3,095,611 11.9% Tangible Common Equity1 240,008 274,043 307,663 287,330 305,186 6.2% Net Income $ 29,540 $ 44,675 $ 52,681 $ 40,005 $ 11,696 ROAA (%) 1.34 1.61 1.66 1.14 0.31 ROATCE(%)1 17.46 17.74 18.89 15.09 5.37 Net Interest Margin (FTE) (%) 3.65 3.22 2.90 3.04 2.46 Efficiency Ratio (FTE) (%)1 73.22 68.40 70.02 72.86 85.85 Non-Int. Income/Op. Rev. (%) 60.50 64.05 62.86 52.72 47.74 Earnings per common share - diluted 1.91 2.52 2.97 2.10 0.58 Total Equity/Total Assets (%) 12.12 10.96 10.59 9.44 9.45 Tang. Cmn. Equity/Tang. Assets (%)1 10.38 9.27 9.21 7.74 7.94 Loans/Deposits (%) 87.32 76.96 60.19 83.83 89.15 NPLs/Loans (%) 0.45 0.26 0.12 0.16 0.32 NPAs/Assets (%) 0.33 0.17 0.09 0.10 0.22 Allowance/NPLs (%) 305.66 674.13 1,437.05 820.93 410.34 Allowance/Loans (%) 1.39 1.73 1.80 1.27 1.30 NCOs/Average Loans (%) 0.33 0.03 (0.04) 0.02 (0.04) Annual |
|
NON-GAAP DISCLOSURE RECONCILIATION 30 ($ in thousands, except where otherwise noted) 1Q 2023 2Q 2023 3Q 2023 4Q 2023 1Q 2024 Tangible common equity to tangible assets Total common stockholders' equity $ 359,118 $ 357,685 $ 349,402 $ 369,127 $ 371,635 Less: Goodwill 47,087 47,087 46,783 46,783 46,783 Less: Other intangible assets 21,131 19,806 18,482 17,158 15,834 Tangible common equity (a) 290,900 290,792 284,137 305,186 309,018 Total assets 3,886,773 3,832,978 3,869,138 3,907,713 4,338,093 Less: Goodwill 47,087 47,087 46,783 46,783 46,783 Less: Other intangible assets 21,131 19,806 18,482 17,158 15,834 Tangible assets (b) 3,818,555 3,766,085 3,803,873 3,843,772 4,275,476 Tangible common equity to tangible assets (a)/(b) 7.62% 7.72% 7.47% 7.94% 7.23% Adjusted Tangible common equity to tangible assets Tangible assets (b) 3,818,555 3,766,085 3,803,873 3,843,772 4,275,476 Less: Cash proceeds from BTFP — — — — 355,000 Adjusted tangible assets (c) 3,818,555 3,766,085 3,803,873 3,843,772 3,920,476 Tangible common equity to adjusted tangible assets (a)/(c) 7.62% 7.72% 7.47% 7.94% 7.88% Tangible common equity per common share Total stockholders' equity $ 359,118 $ 357,685 $ 349,402 $ 369,127 $ 371,635 Less: Goodwill 47,087 47,087 46,783 46,783 46,783 Less: Other intangible assets 21,131 19,806 18,482 17,158 15,834 Tangible common equity (d) 290,900 290,792 284,137 305,186 309,018 Common shares outstanding (e) 20,067 19,915 19,848 19,734 19,777 Tangible common equity per common share (d)/(e) $ 14.50 $ 14.60 $ 14.32 $ 15.46 $ 15.63 Return on average tangible common equity Net income $ 8,186 $ 9,104 $ 9,161 $ (14,754) $ 6,432 Add: Intangible amortization expense (net of tax) 1,046 1,046 1,046 1,046 1,046 Net income, excluding intangible amortization (f) 9,232 10,150 10,207 (13,708) 7,478 Average total equity 361,857 360,216 361,735 349,382 367,248 Less: Average goodwill 47,087 47,087 46,882 46,783 46,783 Less: Average other intangible assets (net of tax) 17,209 16,153 15,109 14,067 13,018 Average tangible common equity (g) 297,561 296,976 299,744 288,532 307,447 Return on average tangible common equity (f)/(g) 12.58% 13.71% 13.51% (18.85%) 9.78% Efficiency ratio Noninterest expense $ 37,869 $ 36,373 $ 37,260 $ 38,654 $ 39,019 Less: Intangible amortization expense 1,324 1,324 1,324 1,324 1,324 Adjusted noninterest expense (j) 36,545 35,049 35,936 37,330 37,695 Net interest income 23,658 22,234 20,395 21,552 22,219 Noninterest income 25,253 25,778 28,407 791 25,323 Tax-equivalent adjustment 124 140 180 226 247 Total tax-equivalent revenue (k) 49,035 48,152 48,982 22,569 47,789 Efficiency ratio (j)/(k) 74.53% 72.79% 73.37% 165.40% 78.88% Quarterly |
|
NON-GAAP DISCLOSURE RECONCILIATION 31 ($ in thousands, except where otherwise noted) 2019 2020 2021 2022 2023 Tangible common equity to tangible assets Total common stockholders' equity $ 285,728 $ 330,163 $ 359,403 $ 356,872 $ 369,127 Less: Goodwill 27,329 30,201 31,490 47,087 46,783 Less: Other intangible assets 18,391 25,919 20,250 22,455 17,158 Tangible common equity (a) 240,008 274,043 307,663 287,330 305,186 Total assets 2,356,878 3,013,771 3,392,691 3,779,637 3,907,713 Less: Goodwill 27,329 30,201 31,490 47,087 46,783 Less: Other intangible assets 18,391 25,919 20,250 22,455 17,158 Tangible assets (b) 2,311,158 2,957,651 3,340,951 3,710,095 3,843,772 Tangible common equity to tangible assets (a)/(b) 10.38% 9.27% 9.21% 7.74% 7.94% Tangible common equity per common share Total stockholders' equity $ 285,728 $ 330,163 $ 359,403 $ 356,872 $ 369,127 Less: Goodwill 27,329 30,201 31,490 47,087 46,783 Less: Other intangible assets 18,391 25,919 20,250 22,455 17,158 Tangible common equity (c) 240,008 274,043 307,663 287,330 305,186 Common shares outstanding (d) 17,050 17,125 17,213 19,992 19,734 Tangible common equity per common share (c)/(d) $ 14.08 $ 16.00 $ 17.87 $ 14.37 $ 15.46 Return on average tangible common equity Net income $ 29,540 $ 44,675 $ 52,681 $ 40,005 $ 11,696 Add: Intangible amortization expense (net of tax) 3,224 3,129 3,460 3,756 4,184 Net income, excluding intangible amortization (e) 32,764 47,804 56,141 43,761 15,880 Average total equity 231,084 310,208 346,059 346,355 358,268 Less: Average goodwill 27,329 27,439 30,385 39,415 46,959 Less: Average other intangible assets (net of tax) 16,101 13,309 18,548 17,018 15,624 Average tangible common equity (f) 187,654 269,460 297,126 289,922 295,685 Return on average tangible common equity (e)/(f) 17.46% 17.74% 18.89% 15.09% 5.37% Efficiency Ratio Noninterest expense $ 142,537 $ 163,799 $ 168,909 $ 158,770 $ 150,157 Less: Intangible amortization expense 4,081 3,961 4,380 4,754 5,296 Adjusted noninterest expense (i) 138,456 159,838 164,529 154,016 144,861 Net interest income 74,551 83,846 87,099 99,729 87,839 Noninterest income 114,194 149,371 147,387 111,223 80,229 Tax-equivalent adjustment 347 455 492 429 671 Total tax-equivalent revenue(j) 189,092 233,672 234,978 211,381 168,739 Efficiency ratio (i)/(j) 73.22% 68.40% 70.02% 72.86% 85.85% Annual |
|
NON-GAAP DISCLOSURE RECONCILIATION 1. Banking noninterest income consists of service charges on deposit accounts, mortgage income, interchange income and other noninterest income. 2. Adjusted items are shown after-tax using a 22% tax rate. 32 | Twelve Months Ended 1Q 2023 2Q 2023 3Q 2023 4Q 2023 1Q 2024 March 31, 2024 Noninterest income excluding net Losses on investment securities as a percentage of adjusted revenue Noninterest income $ 25,253 $ 25,778 $ 28,407 $ 791 $ 25,323 $ 80,299 Less: Net gains (losses) on investment securities — — — (24,643) — (24,643) Noninterest income excluding net losses on investment securities (a) 25,253 25,778 28,407 25,434 25,323 104,942 Net interest income (b) 23,658 22,234 20,395 21,552 22,219 86,400 Adjusted revenue (a) + (b) = (c) 48,911 48,012 48,802 46,986 47,542 191,342 Noninterest income excluding net losses on investment securities as a percentage of adjusted revenue (a) / (c) 51.63% 53.69% 58.21% 54.13% 53.26% 54.85% Banking revenue excluding net losses on investment securities as a percentage of adjusted revenue Banking fees and other income(1) $ 4,577 $4,438 $4,531 ($20,466) $ 3,550 ($7,947) Less: Net gains (losses) on investment securities — — — (24,643) — (24,643) Banking fees and other income(1) excluding net losses on investment securities (d) 4,577 4,438 4,531 4,177 3,550 16,696 Adjusted banking revenue (d) + (b) = (e) 28,235 26,672 24,926 25,729 25,769 103,096 Banking revenue excluding net losses on investment securities as a percentage of adjusted revenue (e) / (c) 57.73% 55.55% 51.08% 54.76% 54.20% 53.88% Banking fees and other income(1) excluding net losses on investment securities as a percentage of adjusted revenue Banking fees and other income(1) excluding net losses on investment securities as a percentage of adjusted revenue (d) / (c) 9.36% 9.24% 9.28% 8.89% 7.47% 8.73% ($ in thousands, except for per share data and where otherwise noted) Five Year 2019 2020 2021 2022 2023 Average Adjusted net income Net Income $ 29,540 $ 44,675 $ 52,681 $ 40,005 $ 11,696 Less: Net gains (losses) on investment securities - - - - (19,222) Adjusted Net Income(2) (f) 29,540 44,675 52,681 40,005 30,918 Adjusted return on average equity Average total equity (g) 231,084 310,208 346,059 346,355 358,268 Adjusted return on average equity (f)/(g) 12.78% 14.40% 15.22% 11.55% 8.63% 12.52% Adjusted return on average assets Average total assets (h) 2,211,993 2,775,140 3,178,820 3,500,655 3,817,017 Adjusted return on average assets (f)/(h) 1.34% 1.61% 1.66% 1.14% 0.81% 1.31% Annual ($ in thousands, except for where otherwise noted) Quarterly |
|
NON-GAAP DISCLOSURE RECONCILIATION 33 | 1. Adjusted items are shown after-tax using a 22% tax rate. 1Q 2023 4Q 2023 1Q 2024 Adjusted net income Net Income $ 8,186 $ (14,754) $ 6,432 Less: Net gains (losses) on investment securities — (19,222) — Add: Minnesota Housing donation — 195 — Add: Severance and signing bonus expense 427 324 218 Adjusted Net Income1 (a) 8,613 4,987 6,650 Adjusted earnings per share Adjusted net income (a) $ 8,613 $ 4,987 $ 6,650 Less: Dividends and undistributed earnings allocated to participating securities 57 (209) 40 Adjusted net income available to common (b) 8,556 5,196 6,610 Diluted average common shares outstanding (c) 20,246 19,996 19,986 Adjusted earnings per share (b) / (c) 0.42 0.26 0.33 Adjusted return on average assets Average total assets (d) 3,791,536 3,868,206 4,139,053 Adjusted return on average assets (a)/(d) 0.92% 0.51% 0.65% Adjusted return on average tangible common equity Adjusted net income (a) $ 8,613 $ 4,987 $ 6,650 Add: Intangible amortization expense (net of tax) 1,046 1,046 1,046 Adjusted net income, excluding intangible amortization (f) 9,659 6,033 7,696 Average total equity 361,857 349,382 367,248 Less: Average goodwill 47,087 46,783 46,783 Less: Average other intangible assets (net of tax) 17,209 14,067 13,018 Average tangible common equity (g) 297,561 288,532 307,447 Adjusted return on average tangible common equity (f)/(g) 13.16% 8.30% 10.07% Adjusted net interest margin (tax-equivalent) Net interest income $ 23,658 $ 21,552 $ 22,219 Less: BTFP Cash interest income - - 3,615 Add: BTFP interest expense - - 3,266 Net interest income excluding BTFP impact (h) 23,658 21,552 21,870 Add: Tax equivalent adjustment for loans and securities (i) 124 226 247 Adjusted net interest income (h) + (i) = (j) 23,782 21,778 22,117 Average earning assets 3,567,402 3,645,184 3,921,529 Less: Average cash proceeds balance from BTFP - - 269,176 Adjusted interest earning assets (k) 3,567,402 3,645,184 3,652,353 Adjusted net interest margin (tax-equivalent) (j)/(k) 2.70% 2.37% 2.44% ($ in thousands, except for per share data and where otherwise noted) Quarterly |