UNITED STATES
SECURITIES AND EXCHANGE COMMISSION
Washington, D.C. 20549
FORM 8-K
CURRENT REPORT
Pursuant to Section 13 or 15(d)
of the Securities Exchange Act of 1934
Date of Report (Date of earliest event reported): April 23, 2024
FLUSHING FINANCIAL CORPORATION
(Exact name of registrant as specified in its charter)
001-33013
(Commission File Number)
Delaware
(State or Other Jurisdiction of Incorporation)
11-3209278
(I.R.S. Employer Identification No.)
220 RXR Plaza, Uniondale, NY 11556
(Address of principal executive offices)
(718) 961-5400
(Registrant's telephone number, including area code)
Check the appropriate box below if the Form 8-K filing is intended to simultaneously satisfy the filing obligation of the registrant under any of the following provisions:
☐ Written communications pursuant to Rule 425 under the Securities Act (17 CFR 230.425)
☐ Soliciting material pursuant to Rule 14a-12 under the Exchange Act (17 CFR 240.14a-12)
☐ Pre-commencement communications pursuant to Rule 14d-2(b) under the Exchange Act (17 CFR 240.14d-2(b))
☐ Pre-commencement communications pursuant to Rule 13e-4(c) under the Exchange Act (17 CFR 240.13e-4(c))
Securities registered pursuant to Section 12(b) of the Act:
Common Stock, $0.01 par value |
FFIC |
The Nasdaq Stock Market LLC |
Indicate by check mark whether the registrant is an emerging growth company as defined in Rule 405 of the Securities Act of 1933 (§230.405 of this chapter) or Rule 12b-2 of the Securities Exchange Act of 1934 (§240.12b-2 of this chapter).
Emerging growth company ☐
If an emerging growth company, indicate by check mark if the registrant has elected not to use the extended transition period for complying with any new or revised financial accounting standards provided pursuant to Section 13(a) of the Exchange Act. ☐
Item 7.01. Regulation FD Disclosure.
On April 23, 2024 Flushing Financial Corp. (the “Company”) made available to investors, and to post on this website, the earnings presentation for the 2024 first quarter earnings, the presentation attached hereto as Exhibit 99.1.
Item 9.01. Financial Statements and Exhibits.
104 Cover Page Interactive Data File (embedded within the Inline XBRL document) |
SIGNATURE
Pursuant to the requirements of the Securities Exchange Act of 1934, the registrant has duly caused this report to be signed on its behalf by the undersigned hereunto duly authorized.
|
FLUSHING FINANCIAL CORPORATION |
|
|
|
|
|
|
|
Date: April 23, 2024 |
By: |
/s/ SUSAN K. CULLEN |
|
|
Susan K. Cullen |
|
|
Senior Executive Vice President, Chief Financial Officer and Treasurer |
|
|
|
|
1Q24 Earnings Conference Call April 24, 2024 |
|
Safe Harbor Statement 2 “Safe Harbor” Statement under the Private Securities Litigation Reform Act of 1995: Statements in this Presentation relating to plans, strategies, economic performance and trends, projections of results of specific activities or investments and other statements that are not descriptions of historical facts may be forward-looking statements within the meaning of the Private Securities Litigation Reform Act of 1995, Section 27A of the Securities Act of 1933 and Section 21E of the Securities Exchange Act of 1934. Forward-looking information is inherently subject to risks and uncertainties, and actual results could differ materially from those currently anticipated due to a number of factors, which include, but are not limited to, risk factors discussed in the Company’s Annual Report on Form 10-K for the fiscal year ended December 31, 2023, and in other documents filed by the Company with the Securities and Exchange Commission from time to time. Forward-looking statements may be identified by terms such as “may”, “will”, “should”, “could”, “expects”, “plans”, “intends”, “anticipates”, “believes”, “estimates”, “predicts”, “forecasts”, “goals”, “potential” or “continue” or similar terms or the negative of these terms. Although we believe that the expectations reflected in the forward-looking statements are reasonable, we cannot guarantee future results, levels of activity, performance or achievements. The Company has no obligation to update these forward-looking statements. |
|
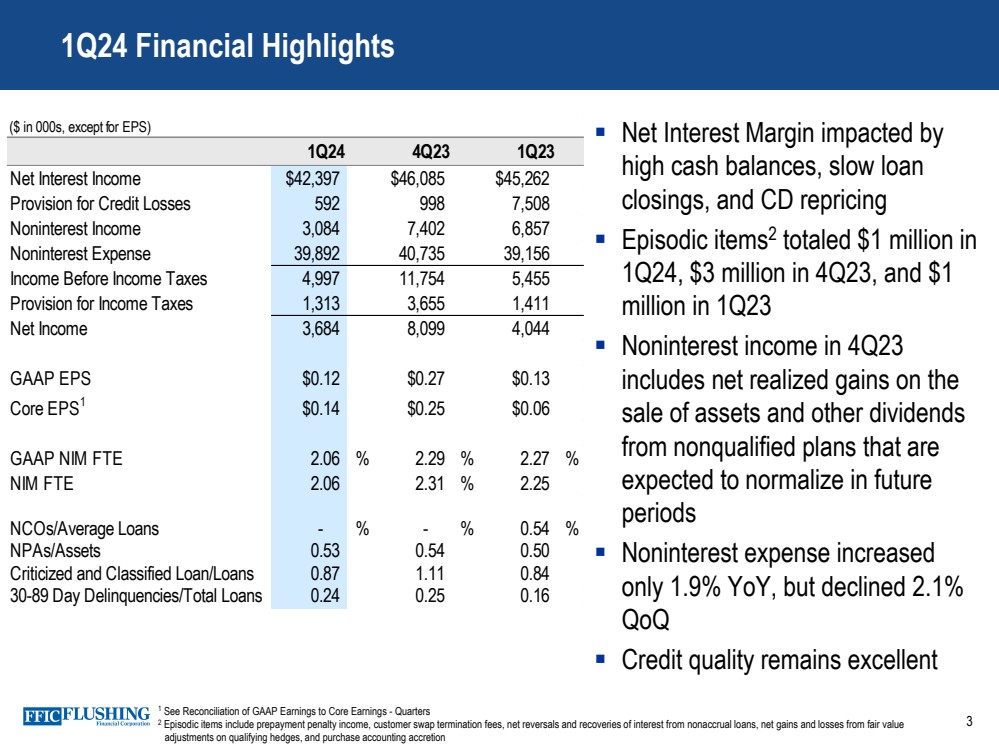
▪ Net Interest Margin impacted by high cash balances, slow loan closings, and CD repricing ▪ Episodic items2 totaled $1 million in 1Q24, $3 million in 4Q23, and $1 million in 1Q23 ▪ Noninterest income in 4Q23 includes net realized gains on the sale of assets and other dividends from nonqualified plans that are expected to normalize in future periods ▪ Noninterest expense increased only 1.9% YoY, but declined 2.1% QoQ ▪ Credit quality remains excellent 3 1Q24 Financial Highlights 1 See Reconciliation of GAAP Earnings to Core Earnings - Quarters 2 Episodic items include prepayment penalty income, customer swap termination fees, net reversals and recoveries of interest from nonaccrual loans, net gains and losses from fair value adjustments on qualifying hedges, and purchase accounting accretion ($ in 000s, except for EPS) 1Q24 4Q23 1Q23 Net Interest Income $42,397 $46,085 $45,262 Provision for Credit Losses 592 998 7,508 Noninterest Income 3,084 7,402 6,857 Noninterest Expense 39,892 40,735 39,156 Income Before Income Taxes 4,997 11,754 5,455 Provision for Income Taxes 1,313 3,655 1,411 Net Income 3,684 8,099 4,044 GAAP EPS $0.12 $0.27 $0.13 Core EPS1 $0.14 $0.25 $0.06 GAAP NIM FTE 2.06 % 2.29 % 2.27 % NIM FTE 2.06 2.31 % 2.25 NCOs/Average Loans - % - % 0.54 % NPAs/Assets 0.53 0.54 0.50 Criticized and Classified Loan/Loans 0.87 1.11 0.84 30-89 Day Delinquencies/Total Loans 0.24 0.25 0.16 |
|
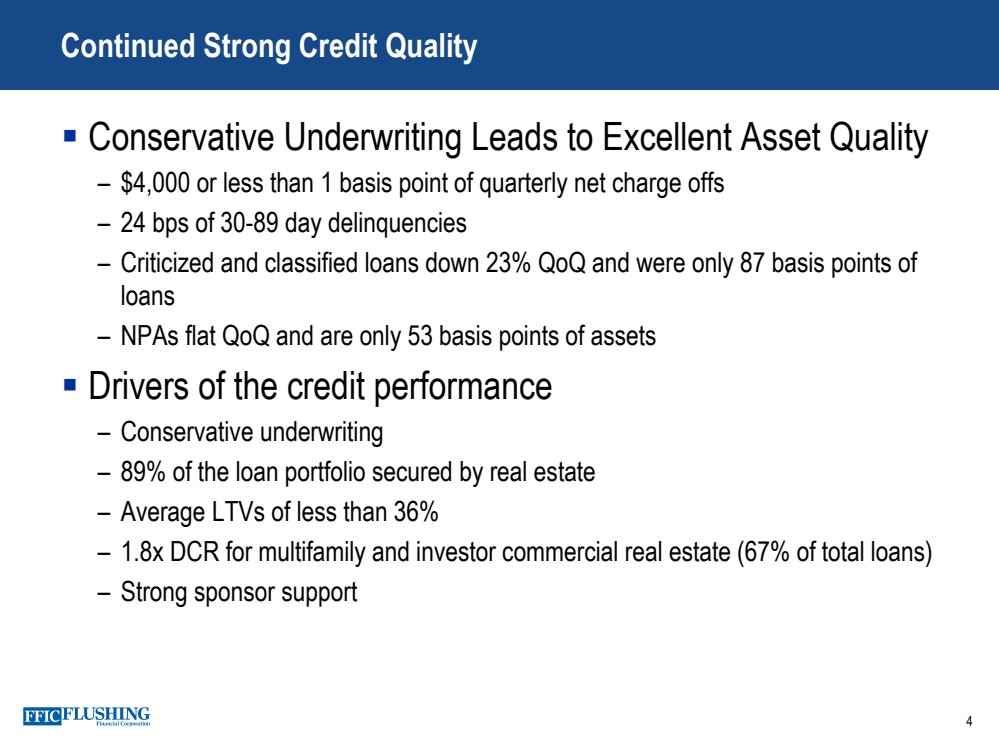
▪ Conservative Underwriting Leads to Excellent Asset Quality – $4,000 or less than 1 basis point of quarterly net charge offs – 24 bps of 30-89 day delinquencies – Criticized and classified loans down 23% QoQ and were only 87 basis points of loans – NPAs flat QoQ and are only 53 basis points of assets ▪ Drivers of the credit performance – Conservative underwriting – 89% of the loan portfolio secured by real estate – Average LTVs of less than 36% – 1.8x DCR for multifamily and investor commercial real estate (67% of total loans) – Strong sponsor support 4 Continued Strong Credit Quality |
|
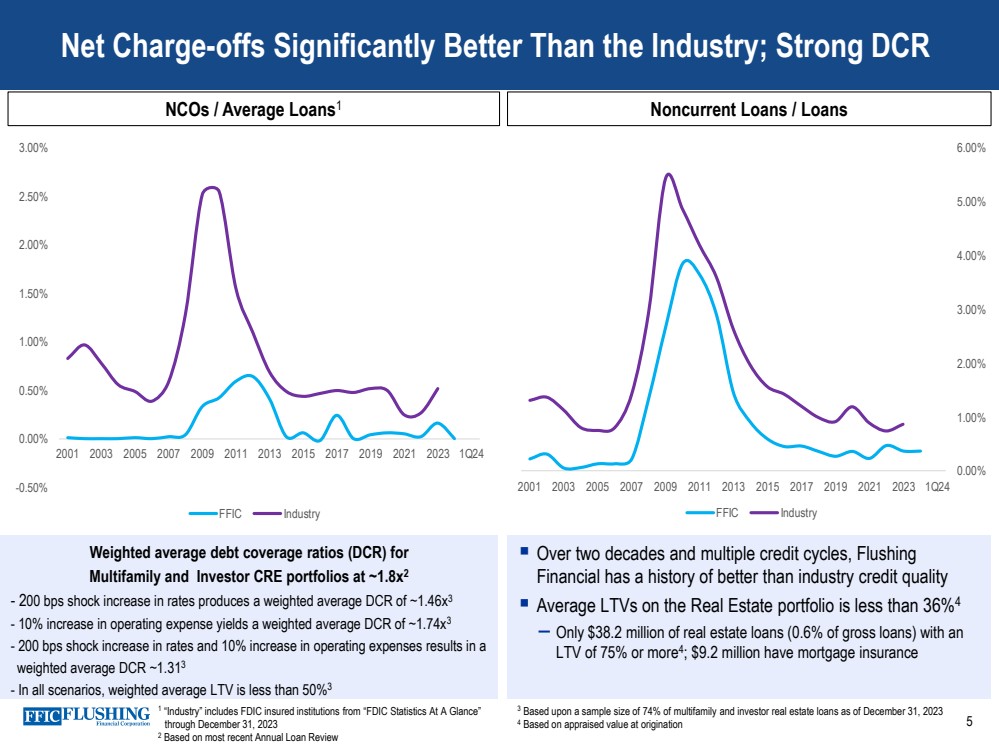
▪ Over two decades and multiple credit cycles, Flushing Financial has a history of better than industry credit quality ▪ Average LTVs on the Real Estate portfolio is less than 36%4 – Only $38.2 million of real estate loans (0.6% of gross loans) with an LTV of 75% or more4 ; $9.2 million have mortgage insurance Net Charge-offs Significantly Better Than the Industry; Strong DCR NCOs / Average Loans1 1 “Industry” includes FDIC insured institutions from “FDIC Statistics At A Glance” through December 31, 2023 2 Based on most recent Annual Loan Review 3 Based upon a sample size of 74% of multifamily and investor real estate loans as of December 31, 2023 4 Based on appraised value at origination 5 Noncurrent Loans / Loans -0.50% 0.00% 0.50% 1.00% 1.50% 2.00% 2.50% 3.00% 2001 2003 2005 2007 2009 2011 2013 2015 2017 2019 2021 2023 1Q24 FFIC Industry 0.00% 1.00% 2.00% 3.00% 4.00% 5.00% 6.00% 0.00% 20.00% 40.00% 60.00% 80.00% 100. 0% 120. 0% 2001 2003 2005 2007 2009 2011 2013 2015 2017 2019 2021 2023 1Q24 FFIC Industry Weighted average debt coverage ratios (DCR) for Multifamily and Investor CRE portfolios at ~1.8x2 - 200 bps shock increase in rates produces a weighted average DCR of ~1.46x3 - 10% increase in operating expense yields a weighted average DCR of ~1.74x3 - 200 bps shock increase in rates and 10% increase in operating expenses results in a weighted average DCR ~1.313 - In all scenarios, weighted average LTV is less than 50%3 |
|
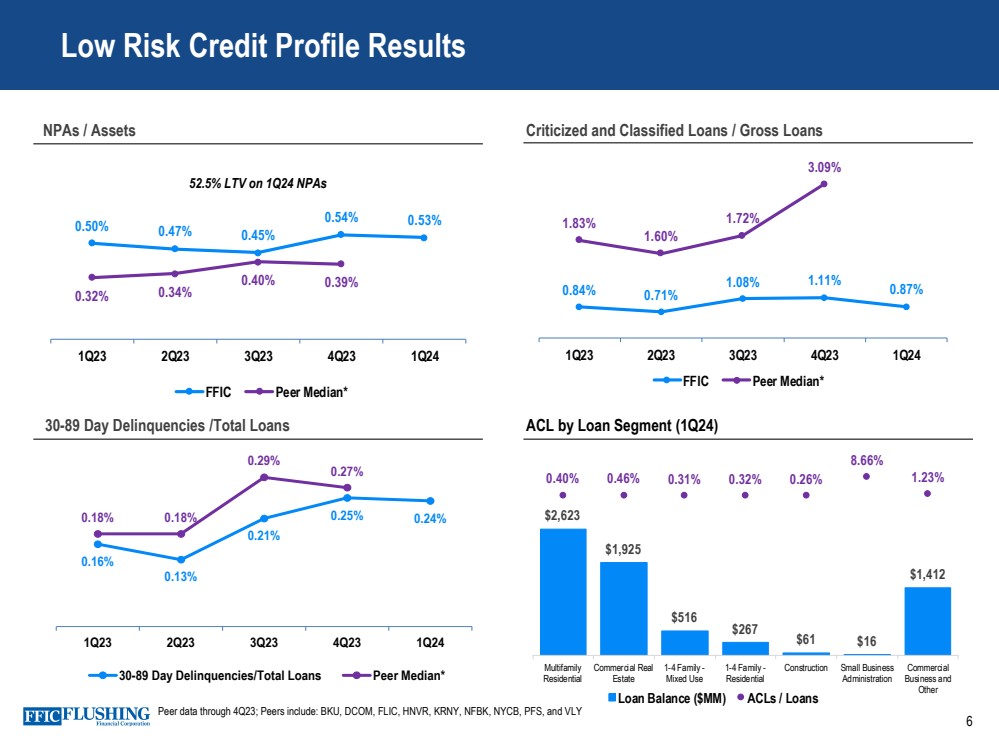
0.50% 0.47% 0.45% 0.54% 0.53% 0.32% 0.34% 0.40% 0.39% 0 .0 0% 0 .1 0% 0 .2 0% 0 .3 0% 0 .4 0% 0 .5 0% 0 .6 0% 0 .7 0% 0 .8 0% 0 .9 0% 1 .0 0% 1Q23 2Q23 3Q23 4Q23 1Q24 FFIC Peer Median* 6 Low Risk Credit Profile Results NPAs / Assets Criticized and Classified Loans / Gross Loans 30-89 Day Delinquencies /Total Loans ACL by Loan Segment (1Q24) $2,623 $1,925 $516 $267 $61 $16 $1,412 0.40% 0.46% 0.31% 0.32% 0.26% 8.66% 1.23% -70.00 % -60.00 % -50.00 % -40.00 % -30.00 % -20.00 % -10.00 % 0.00% 10.00% Multifamily Residential Commercial Real Estate 1-4 Family - Mixed Use 1-4 Family - Residential Construction Small Business Administration Commercial Business and Other Loan Balance ($MM) ACLs / Loans 52.5% LTV on 1Q24 NPAs Peer data through 4Q23; Peers include: BKU, DCOM, FLIC, HNVR, KRNY, NFBK, NYCB, PFS, and VLY 0.84% 0.71% 1.08% 1.11% 0.87% 1.83% 1.60% 1.72% 3.09% 0.00% 0.50% 1.00% 1.50% 2.00% 2.50% 3.00% 3.50% 4.00% 4.50% 5.00% 1Q23 2Q23 3Q23 4Q23 1Q24 FFIC Peer Median* 0.16% 0.13% 0.21% 0.18% 0.18% 0.25% 0.24% 0.29% 0.27% 0.00% 0.05% 0.10% 0.15% 0.20% 0.25% 0.30% 0.35% 1Q23 2Q23 3Q23 4Q23 1Q24 30-89 Day Delinquencies/Total Loans Peer Median* |
|
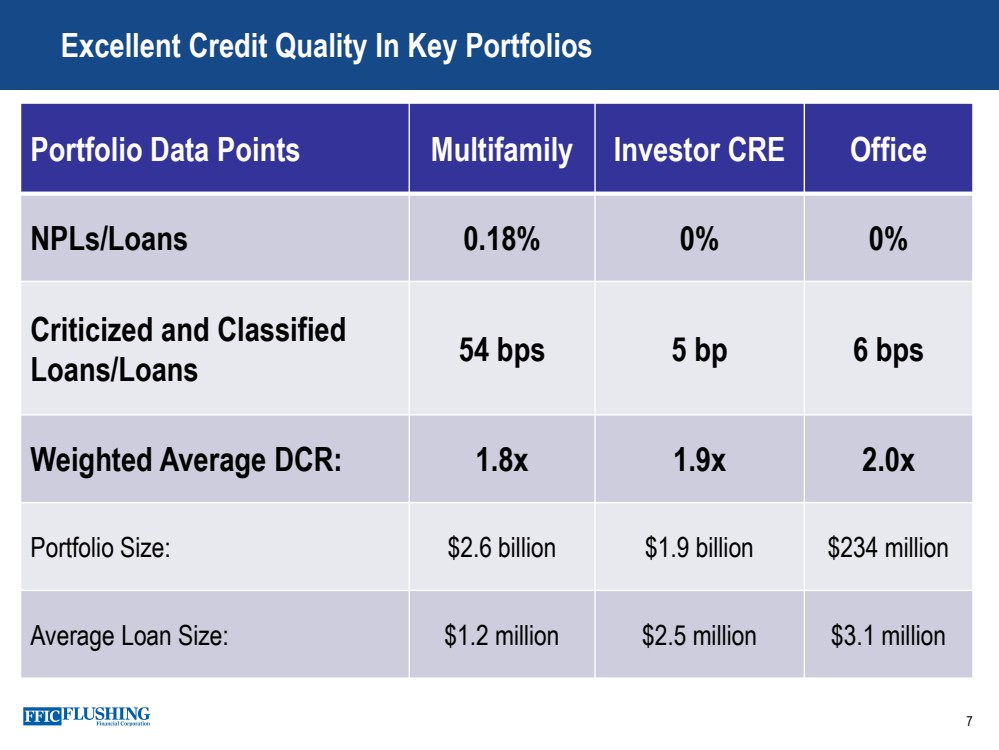
7 Excellent Credit Quality In Key Portfolios Portfolio Data Points Multifamily Investor CRE Office NPLs/Loans 0.18% 0% 0% Criticized and Classified Loans/Loans 54 bps 5 bp 6 bps Weighted Average DCR: 1.8x 1.9x 2.0x Portfolio Size: $2.6 billion $1.9 billion $234 million Average Loan Size: $1.2 million $2.5 million $3.1 million |
|
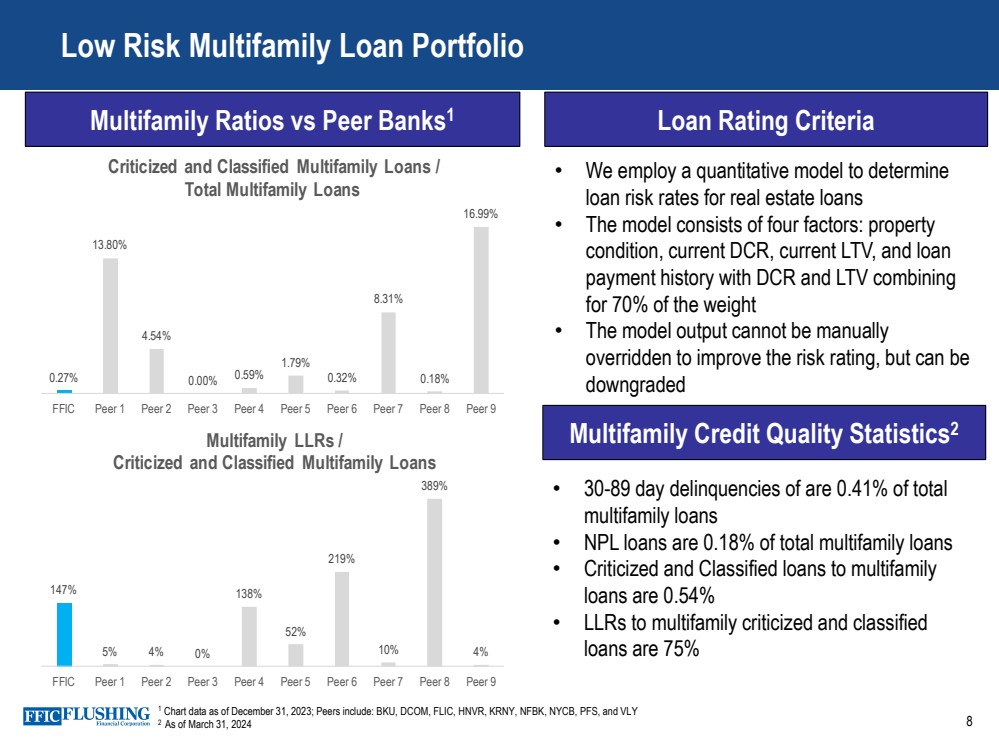
8 Low Risk Multifamily Loan Portfolio • We employ a quantitative model to determine loan risk rates for real estate loans • The model consists of four factors: property condition, current DCR, current LTV, and loan payment history with DCR and LTV combining for 70% of the weight • The model output cannot be manually overridden to improve the risk rating, but can be downgraded 0.27% 13.80% 4.54% 0.00% 0.59% 1.79% 0.32% 8.31% 0.18% 16.99% FFIC Peer 1 Peer 2 Peer 3 Peer 4 Peer 5 Peer 6 Peer 7 Peer 8 Peer 9 Criticized and Classified Multifamily Loans / Total Multifamily Loans 147% 5% 4% 0% 138% 52% 219% 10% 389% 4% FFIC Peer 1 Peer 2 Peer 3 Peer 4 Peer 5 Peer 6 Peer 7 Peer 8 Peer 9 Multifamily LLRs / Criticized and Classified Multifamily Loans 1 Chart data as of December 31, 2023; Peers include: BKU, DCOM, FLIC, HNVR, KRNY, NFBK, NYCB, PFS, and VLY 2 As of March 31, 2024 Loan Rating Criteria • 30-89 day delinquencies of are 0.41% of total multifamily loans • NPL loans are 0.18% of total multifamily loans • Criticized and Classified loans to multifamily loans are 0.54% • LLRs to multifamily criticized and classified loans are 75% Multifamily Credit Quality Statistics2 Multifamily Ratios vs Peer Banks1 |
|
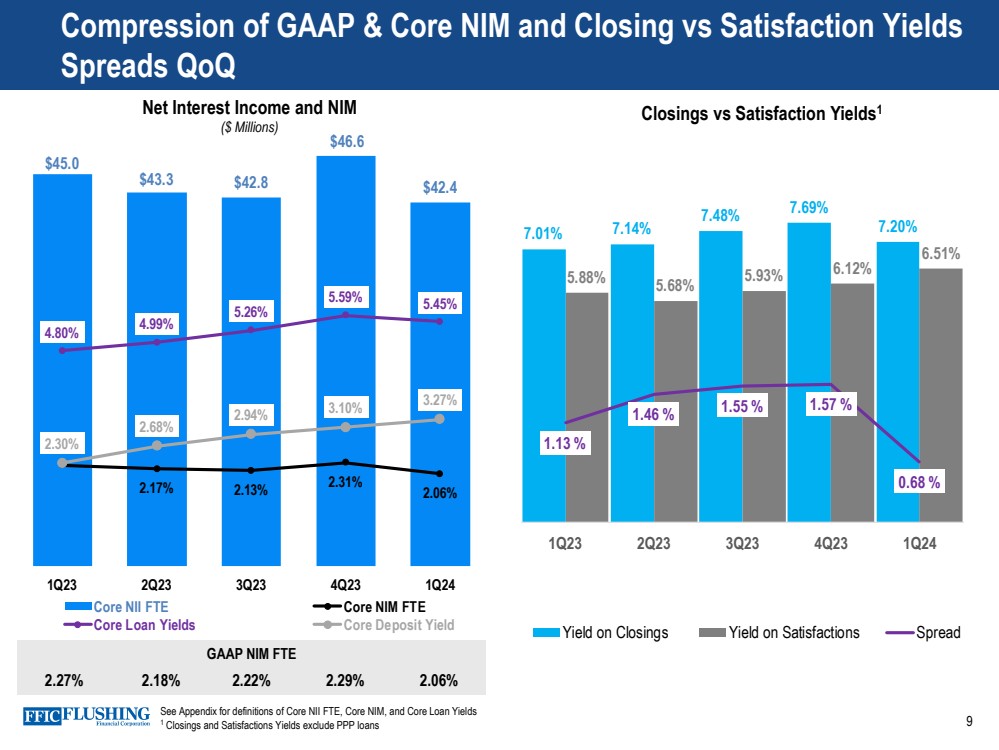
Compression of GAAP & Core NIM and Closing vs Satisfaction Yields Spreads QoQ 9 GAAP NIM FTE 2.27% 2.18% 2.22% 2.29% 2.06% See Appendix for definitions of Core NII FTE, Core NIM, and Core Loan Yields 1 Closings and Satisfactions Yields exclude PPP loans Closings vs Satisfaction Yields1 7.01% 7.14% 7.48% 7.69% 7.20% 5.88% 5.68% 5.93% 6.12% 6.51% 1.13 % 1.46 % 1.55 % 1.57 % 0.68 % 0.00 % 0.50 % 1.00 % 1.50 % 2.00 % 2.50 % 3.00 % 3.50 % 4.00 % 0.00% 1.00% 2.00% 3.00% 4.00% 5.00% 6.00% 7.00% 8.00% 9.00% 1Q23 2Q23 3Q23 4Q23 1Q24 Yield on Closings Yield on Satisfactions Spread $45.0 $43.3 $42.8 $46.6 $42.4 2.25% 2.17% 2.13% 2.31% 2.06% 4.80% 4.99% 5.26% 5.59% 5.45% 2.30% 2.68% 2.94% 3.10% 3.27% 0.00% 1.00% 2.00% 3.00% 4.00% 5.00% 6.00% 7.00% 8.00% 9.00% 10.00% $10.0 $15.0 $20.0 $25.0 $30.0 $35.0 $40.0 $45.0 $50.0 1Q23 2Q23 3Q23 4Q23 1Q24 Core NII FTE Core NIM FTE Core Loan Yields Core Deposit Yield Net Interest Income and NIM ($ Millions) |
|
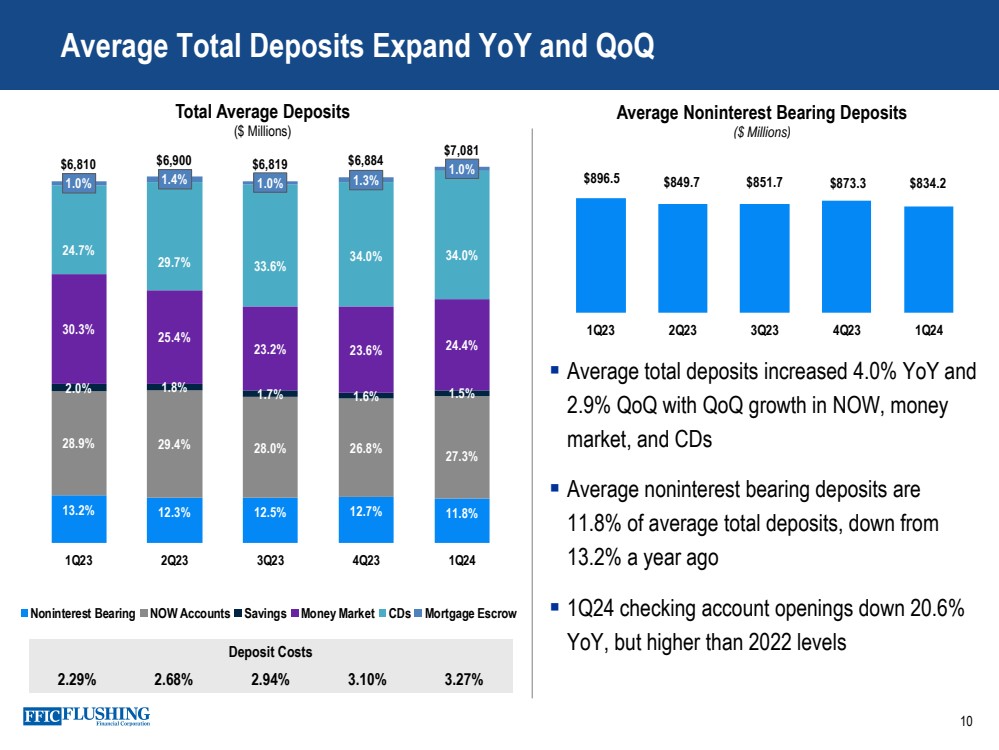
13.2% 12.3% 12.5% 12.7% 11.8% 28.9% 29.4% 28.0% 26.8% 27.3% 2.0% 1.8% 1.7% 1.6% 1.5% 30.3% 25.4% 23.2% 23.6% 24.4% 24.7% 29.7% 33.6% 34.0% 34.0% 1.0% 1.4% 1.0% 1.3% $6,810 1.0% $6,900 $6,819 $6,884 $7,081 0 1 00 0 2 00 0 3 00 0 4 00 0 5 00 0 6 00 0 7 00 0 8 00 0 1Q23 2Q23 3Q23 4Q23 1Q24 Noninterest Bearing NOW Accounts Savings Money Market CDs Mortgage Escrow Average Total Deposits Expand YoY and QoQ 10 Total Average Deposits ($ Millions) ▪ Average total deposits increased 4.0% YoY and 2.9% QoQ with QoQ growth in NOW, money market, and CDs ▪ Average noninterest bearing deposits are 11.8% of average total deposits, down from 13.2% a year ago ▪ 1Q24 checking account openings down 20.6% YoY, but higher than 2022 levels Average Noninterest Bearing Deposits ($ Millions) Deposit Costs 2.29% 2.68% 2.94% 3.10% 3.27% $896.5 $849.7 $851.7 $873.3 $834.2 - 100 100 300 500 700 900 1100 1300 1Q23 2Q23 3Q23 4Q23 1Q24 |
|
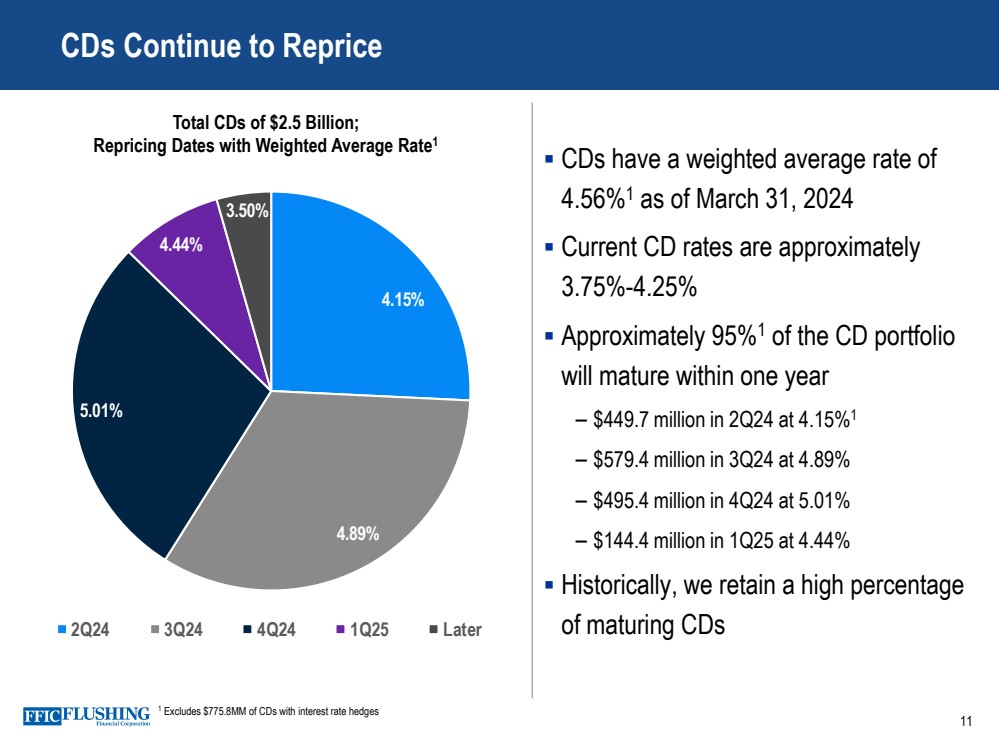
11 CDs Continue to Reprice ▪ CDs have a weighted average rate of 4.56%1 as of March 31, 2024 ▪ Current CD rates are approximately 3.75%-4.25% ▪ Approximately 95%1 of the CD portfolio will mature within one year – $449.7 million in 2Q24 at 4.15%1 – $579.4 million in 3Q24 at 4.89% – $495.4 million in 4Q24 at 5.01% – $144.4 million in 1Q25 at 4.44% ▪ Historically, we retain a high percentage of maturing CDs Total CDs of $2.5 Billion; Repricing Dates with Weighted Average Rate1 1 Excludes $775.8MM of CDs with interest rate hedges 4.15% 4.89% 5.01% 4.44% 3.50% 2Q24 3Q24 4Q24 1Q25 Later |
|
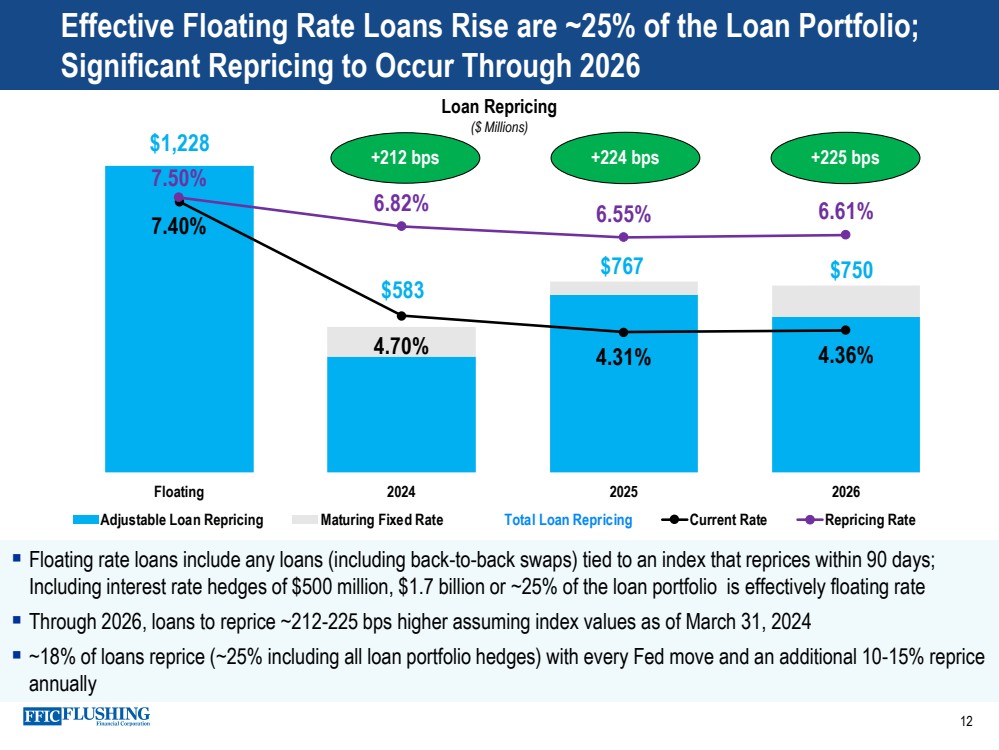
▪ Floating rate loans include any loans (including back-to-back swaps) tied to an index that reprices within 90 days; Including interest rate hedges of $500 million, $1.7 billion or ~25% of the loan portfolio is effectively floating rate ▪ Through 2026, loans to reprice ~212-225 bps higher assuming index values as of March 31, 2024 ▪ ~18% of loans reprice (~25% including all loan portfolio hedges) with every Fed move and an additional 10-15% reprice annually $1,228 $583 $767 $750 7.40% 4.70% 4.31% 4.36% 7.50% 6.82% 6.55% 6.61% - 20 0 40 0 60 0 80 0 1,0 00 1,2 00 1,4 00 Floating 2024 2025 2026 Adjustable Loan Repricing Maturing Fixed Rate Total Loan Repricing Current Rate Repricing Rate Effective Floating Rate Loans Rise are ~25% of the Loan Portfolio; Significant Repricing to Occur Through 2026 12 Loan Repricing ($ Millions) +212 bps +224 bps +225 bps |
|
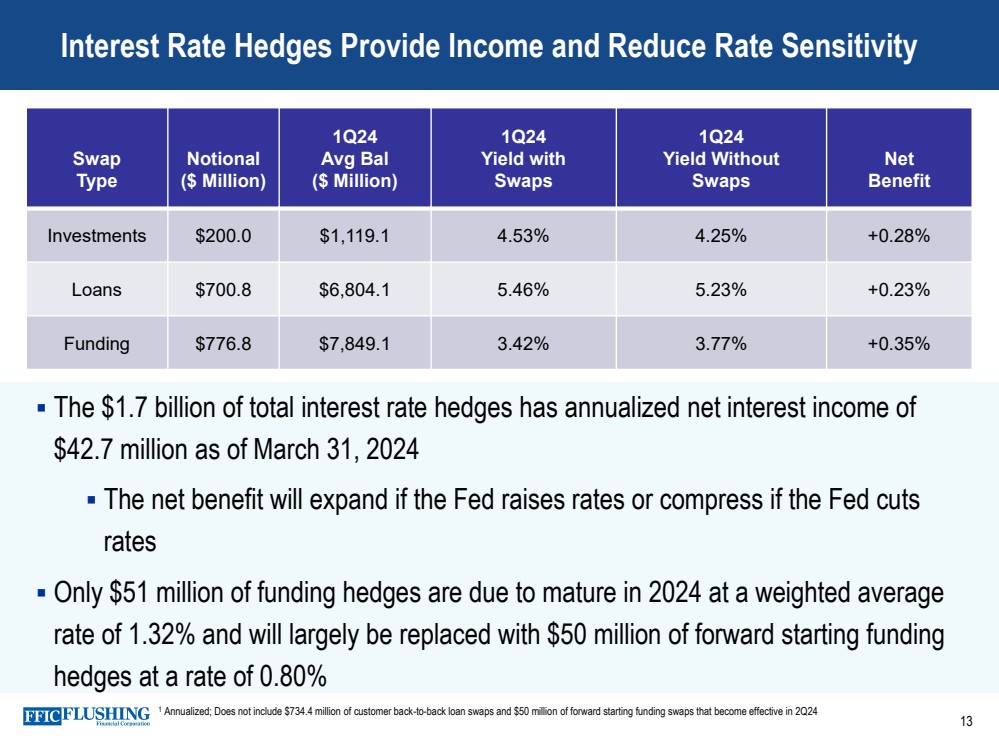
13 Interest Rate Hedges Provide Income and Reduce Rate Sensitivity Swap Type Notional ($ Million) 1Q24 Avg Bal ($ Million) 1Q24 Yield with Swaps 1Q24 Yield Without Swaps Net Benefit Investments $200.0 $1,119.1 4.53% 4.25% +0.28% Loans $700.8 $6,804.1 5.46% 5.23% +0.23% Funding $776.8 $7,849.1 3.42% 3.77% +0.35% ▪ The $1.7 billion of total interest rate hedges has annualized net interest income of $42.7 million as of March 31, 2024 ▪ The net benefit will expand if the Fed raises rates or compress if the Fed cuts rates ▪ Only $51 million of funding hedges are due to mature in 2024 at a weighted average rate of 1.32% and will largely be replaced with $50 million of forward starting funding hedges at a rate of 0.80% 1 Annualized; Does not include $734.4 million of customer back-to-back loan swaps and $50 million of forward starting funding swaps that become effective in 2Q24 |
|
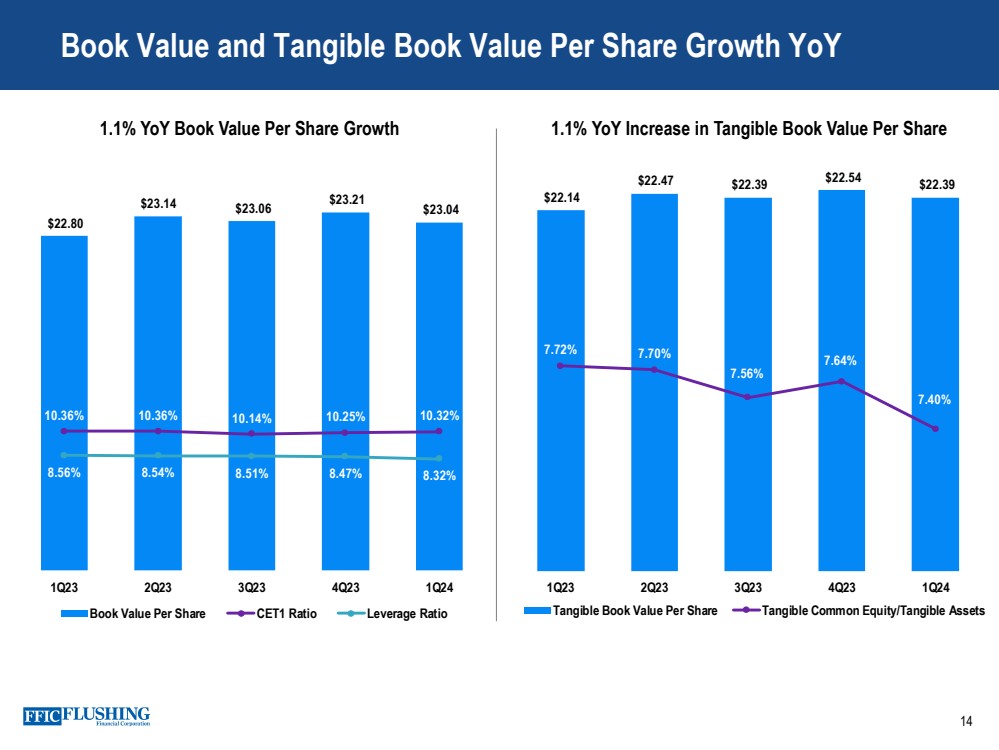
$22.80 $23.14 $23.06 $23.21 $23.04 10.36% 10.36% 10.14% 10.25% 10.32% 8.56% 8.54% 8.51% 8.47% 8.32% 0.00% 5.00% 10.00% 15.00% 20.00% 25.00% 30.00% $17. 00 $18. 00 $19. 00 $20. 00 $21. 00 $22. 00 $23. 00 $24. 00 1Q23 2Q23 3Q23 4Q23 1Q24 Book Value Per Share CET1 Ratio Leverage Ratio Book Value and Tangible Book Value Per Share Growth YoY 14 1.1% YoY Book Value Per Share Growth 1.1% YoY Increase in Tangible Book Value Per Share $22.14 $22.47 $22.39 $22.54 $22.39 7.72% 7.70% 7.56% 7.64% 7.40% 6.70% 6.90% 7.10% 7.30% 7.50% 7.70% 7.90% 8.10% 8.30% 8.50% 8.70% $15. 00 $16. 00 $17. 00 $18. 00 $19. 00 $20. 00 $21. 00 $22. 00 $23. 00 1Q23 2Q23 3Q23 4Q23 1Q24 Tangible Book Value Per Share Tangible Common Equity/Tangible Assets |
|
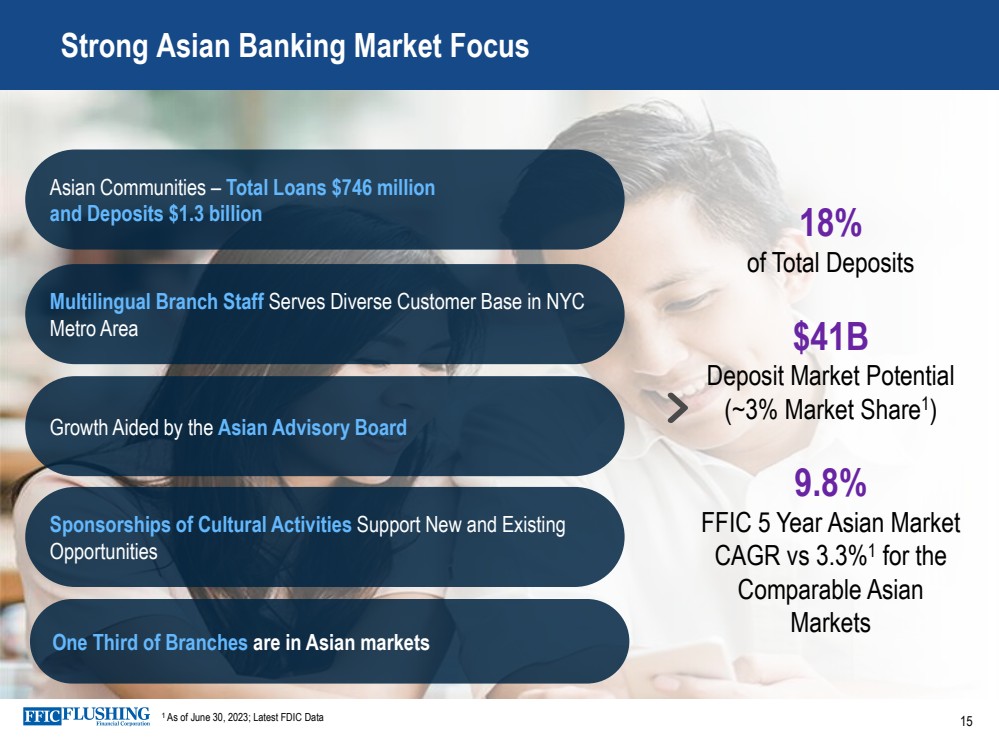
Strong Asian Banking Market Focus 18% of Total Deposits $41B Deposit Market Potential (~3% Market Share1 ) 9.8% FFIC 5 Year Asian Market CAGR vs 3.3%1 for the Comparable Asian Markets Asian Communities – Total Loans $746 million and Deposits $1.3 billion Multilingual Branch Staff Serves Diverse Customer Base in NYC Metro Area Growth Aided by the Asian Advisory Board Sponsorships of Cultural Activities Support New and Existing Opportunities 1 As of June 30, 2023; Latest FDIC Data One Third of Branches are in Asian markets 15 |
|
▪ Lunar New Year Parade in Flushing ▪ Tangram Mall Lunar New Year with Tote Bag 16 Key Community Events During 1Q24 |
|
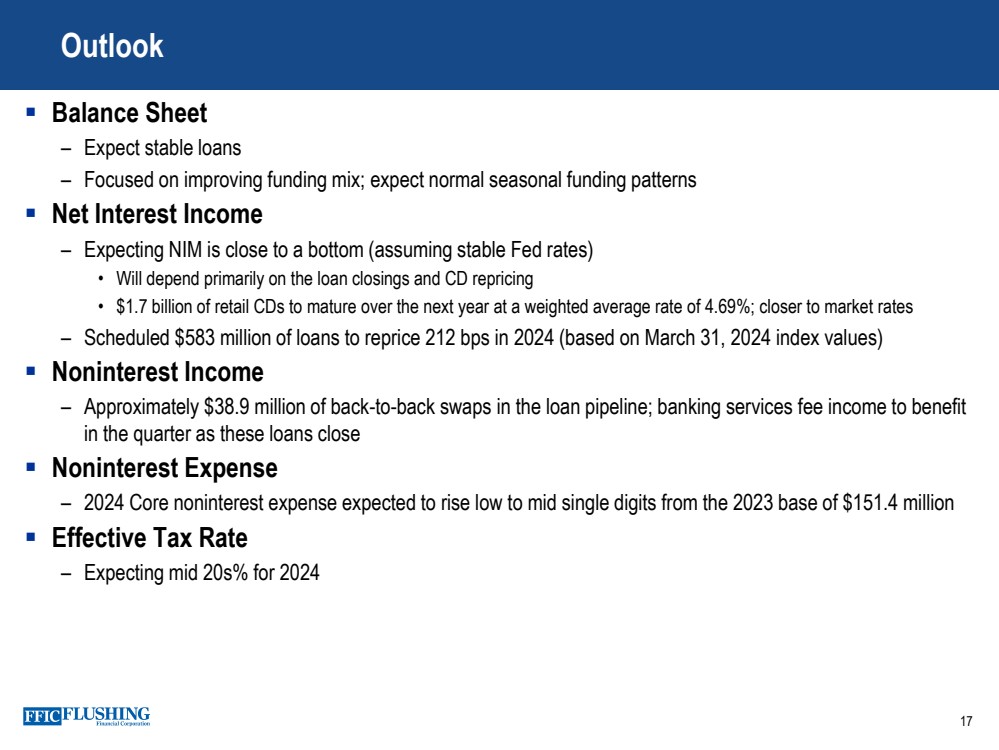
▪ Balance Sheet – Expect stable loans – Focused on improving funding mix; expect normal seasonal funding patterns ▪ Net Interest Income – Expecting NIM is close to a bottom (assuming stable Fed rates) • Will depend primarily on the loan closings and CD repricing • $1.7 billion of retail CDs to mature over the next year at a weighted average rate of 4.69%; closer to market rates – Scheduled $583 million of loans to reprice 212 bps in 2024 (based on March 31, 2024 index values) ▪ Noninterest Income – Approximately $38.9 million of back-to-back swaps in the loan pipeline; banking services fee income to benefit in the quarter as these loans close ▪ Noninterest Expense – 2024 Core noninterest expense expected to rise low to mid single digits from the 2023 base of $151.4 million ▪ Effective Tax Rate – Expecting mid 20s% for 2024 17 Outlook |
|
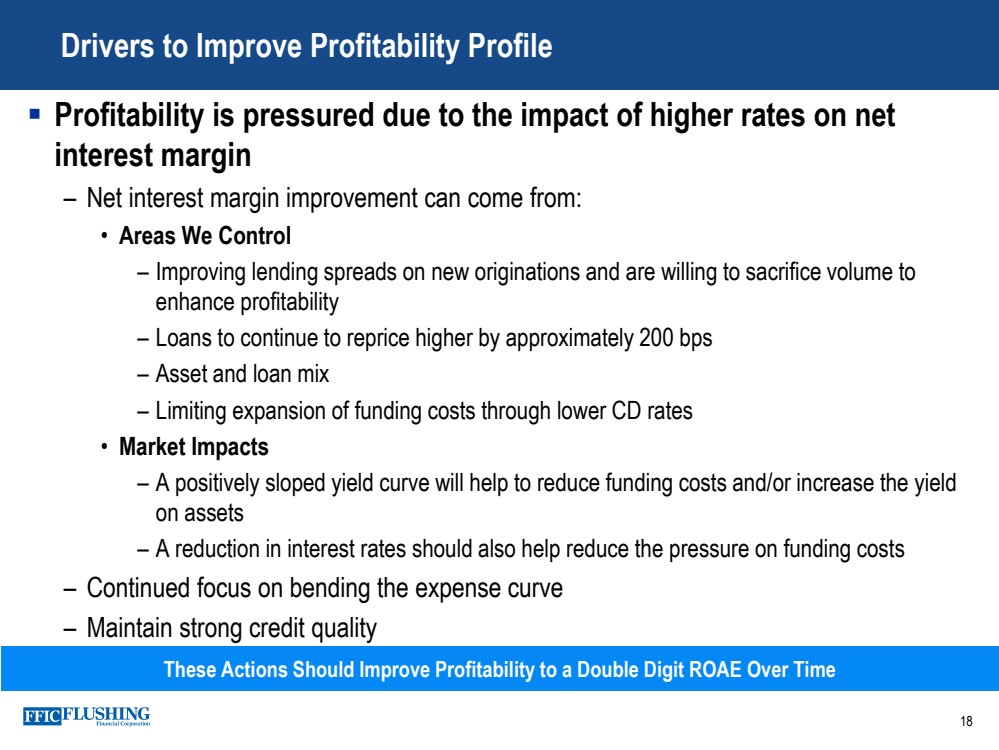
Drivers to Improve Profitability Profile 18 These Actions Should Improve Profitability to a Double Digit ROAE Over Time ▪ Profitability is pressured due to the impact of higher rates on net interest margin – Net interest margin improvement can come from: • Areas We Control – Improving lending spreads on new originations and are willing to sacrifice volume to enhance profitability – Loans to continue to reprice higher by approximately 200 bps – Asset and loan mix – Limiting expansion of funding costs through lower CD rates • Market Impacts – A positively sloped yield curve will help to reduce funding costs and/or increase the yield on assets – A reduction in interest rates should also help reduce the pressure on funding costs – Continued focus on bending the expense curve – Maintain strong credit quality |
|
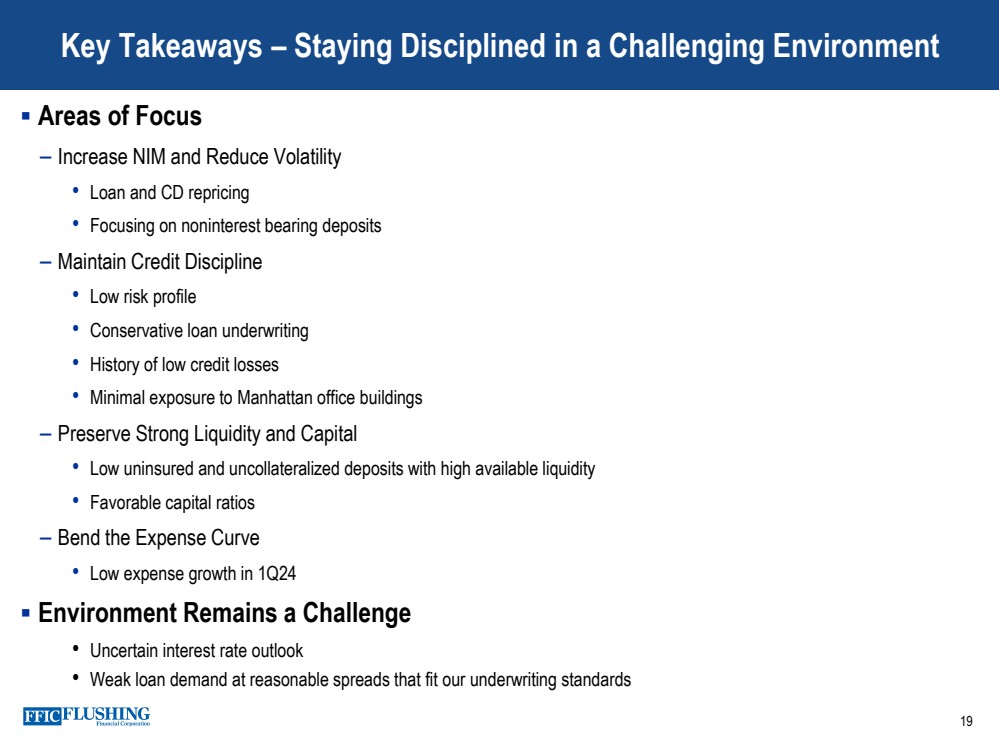
19 ▪ Areas of Focus – Increase NIM and Reduce Volatility • Loan and CD repricing • Focusing on noninterest bearing deposits – Maintain Credit Discipline • Low risk profile • Conservative loan underwriting • History of low credit losses • Minimal exposure to Manhattan office buildings – Preserve Strong Liquidity and Capital • Low uninsured and uncollateralized deposits with high available liquidity • Favorable capital ratios – Bend the Expense Curve • Low expense growth in 1Q24 ▪ Environment Remains a Challenge • Uncertain interest rate outlook • Weak loan demand at reasonable spreads that fit our underwriting standards Key Takeaways – Staying Disciplined in a Challenging Environment |
|
Appendix 20 |
|
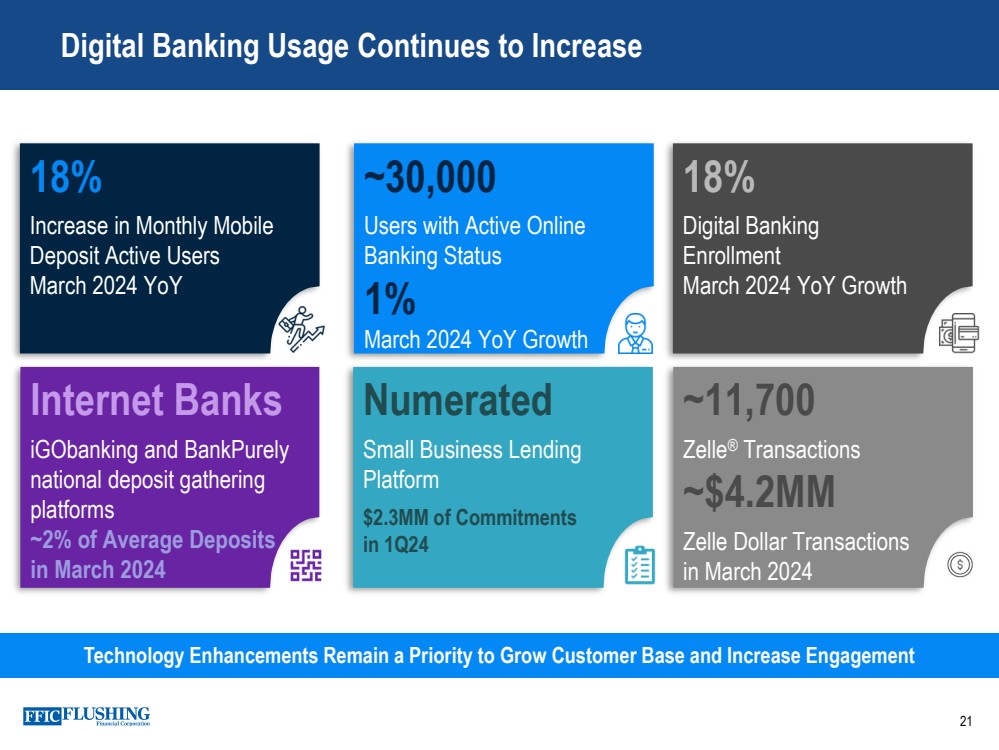
Digital Banking Usage Continues to Increase 21 Technology Enhancements Remain a Priority to Grow Customer Base and Increase Engagement 18% Increase in Monthly Mobile Deposit Active Users March 2024 YoY ~30,000 Users with Active Online Banking Status 1% March 2024 YoY Growth 18% Digital Banking Enrollment March 2024 YoY Growth Numerated Small Business Lending Platform $2.3MM of Commitments in 1Q24 Internet Banks iGObanking and BankPurely national deposit gathering platforms ~2% of Average Deposits in March 2024 ~11,700 Zelle® Transactions ~$4.2MM Zelle Dollar Transactions in March 2024 |
|
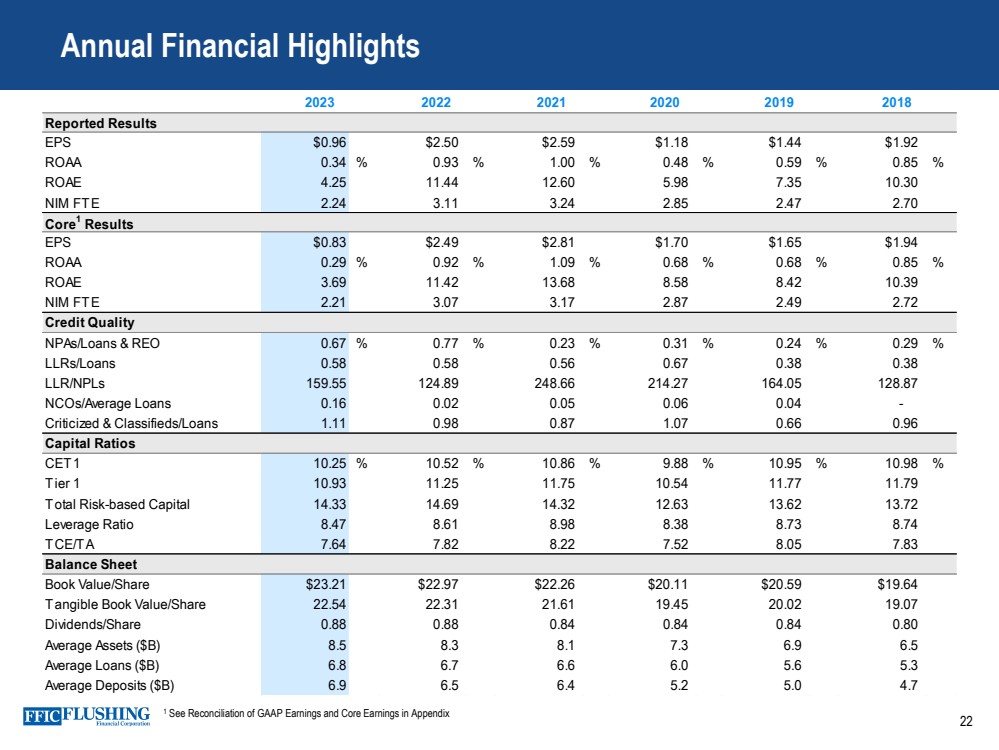
Reported Results EPS $0.96 $2.50 $2.59 $1.18 $1.44 $1.92 ROAA 0.34 % 0.93 % 1.00 % 0.48 % 0.59 % 0.85 % ROAE 4.25 11.44 12.60 5.98 7.35 10.30 NIM FTE 2.24 3.11 3.24 2.85 2.47 2.70 Core1 Results EPS $0.83 $2.49 $2.81 $1.70 $1.65 $1.94 ROAA 0.29 % 0.92 % 1.09 % 0.68 % 0.68 % 0.85 % ROAE 3.69 11.42 13.68 8.58 8.42 10.39 NIM FTE 2.21 3.07 3.17 2.87 2.49 2.72 Credit Quality NPAs/Loans & REO 0.67 % 0.77 % 0.23 % 0.31 % 0.24 % 0.29 % LLRs/Loans 0.58 0.58 0.56 0.67 0.38 0.38 LLR/NPLs 159.55 124.89 248.66 214.27 164.05 128.87 NCOs/Average Loans 0.16 0.02 0.05 0.06 0.04 - Criticized & Classifieds/Loans 1.11 0.98 0.87 1.07 0.66 0.96 Capital Ratios CET1 10.25 % 10.52 % 10.86 % 9.88 % 10.95 % 10.98 % Tier 1 10.93 11.25 11.75 10.54 11.77 11.79 Total Risk-based Capital 14.33 14.69 14.32 12.63 13.62 13.72 Leverage Ratio 8.47 8.61 8.98 8.38 8.73 8.74 TCE/TA 7.64 7.82 8.22 7.52 8.05 7.83 Balance Sheet Book Value/Share $23.21 $22.97 $22.26 $20.11 $20.59 $19.64 Tangible Book Value/Share 22.54 22.31 21.61 19.45 20.02 19.07 Dividends/Share 0.88 0.88 0.84 0.84 0.84 0.80 Average Assets ($B) 8.5 8.3 8.1 7.3 6.9 6.5 Average Loans ($B) 6.8 6.7 6.6 6.0 5.6 5.3 Average Deposits ($B) 6.9 6.5 6.4 5.2 5.0 4.7 2023 2022 2021 2020 2019 2018 22 Annual Financial Highlights 1 See Reconciliation of GAAP Earnings and Core Earnings in Appendix |
|
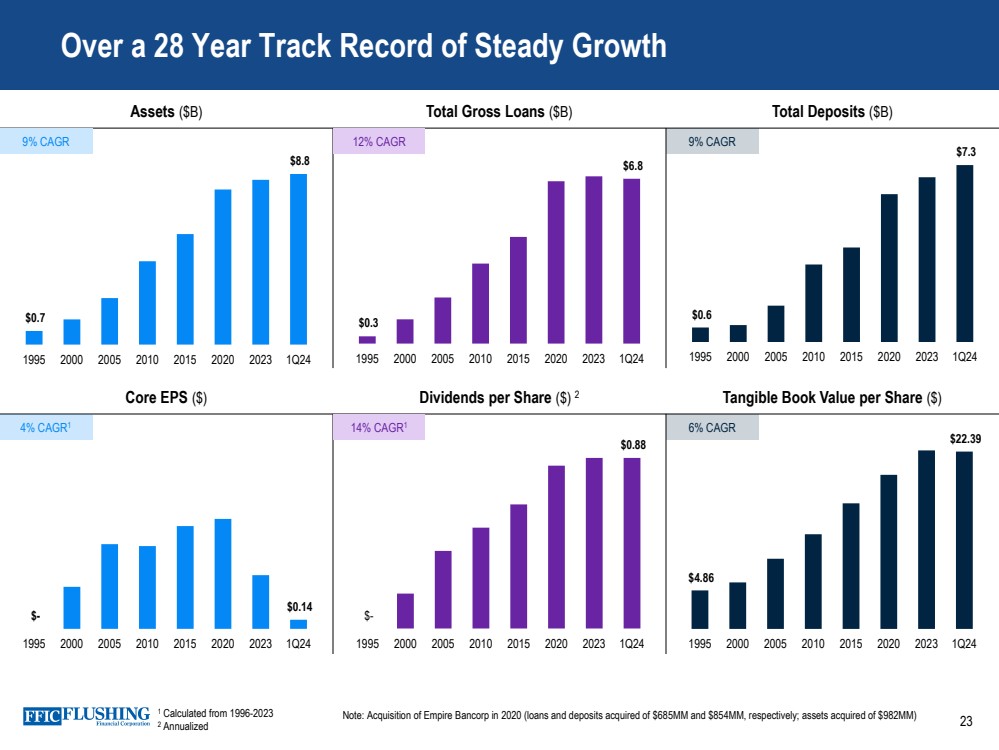
Over a 28 Year Track Record of Steady Growth Core EPS ($) Dividends per Share ($) 2 Tangible Book Value per Share ($) Assets ($B) Total Gross Loans ($B) Total Deposits ($B) $- $0.88 1995 2000 2005 2010 2015 2020 2023 1Q24 $- $0.14 1995 2000 2005 2010 2015 2020 2023 1Q24 $0.6 $7.3 1995 2000 2005 2010 2015 2020 2023 1Q24 $0.3 $6.8 1995 2000 2005 2010 2015 2020 2023 1Q24 $0.7 $8.8 1995 2000 2005 2010 2015 2020 2023 1Q24 9% CAGR 12% CAGR 9% CAGR 4% CAGR1 14% CAGR1 $4.86 $22.39 1995 2000 2005 2010 2015 2020 2023 1Q24 6% CAGR Note: Acquisition of Empire Bancorp in 2020 (loans and deposits acquired of $685MM and $854MM, respectively; assets acquired of $982MM) 23 1 Calculated from 1996-2023 2 Annualized |
|
Approach to Real Estate Lending: Low Leverage & Shared Philosophy 24 Our Conservative Lending Profile Has Served Us Well Over Many Cycles ▪ Since 1929, we have a long history of lending in metro New York City – Historically, credit quality has outperformed the industry and peers • From 2001-2023, median NCOs to average loans has been 4 bps compared to 52 bps for the industry • Median noncurrent loans to total loans has been 37 bps compared to 130 bps for the industry over the same period ▪ The key to our success is shared client philosophy – Our clients tend to have low leverage (average LTV is <36%) and strong cash flows (DCR is 1.8x for multifamily and CRE1 ) – Multigenerational– our clients tend to build portfolio of properties; generally, buy and hold – Borrowers are not transaction oriented – average real estate loan seasoning is over 8 years, which is generally passed the 5-year reset for multifamily and investor CRE loans – We do not attract clients who are short term borrowers, who want funds on future cash flows, or who are aggressively trying to convert rent regulated units into market rents 1 Based on annual loan reviews |
|
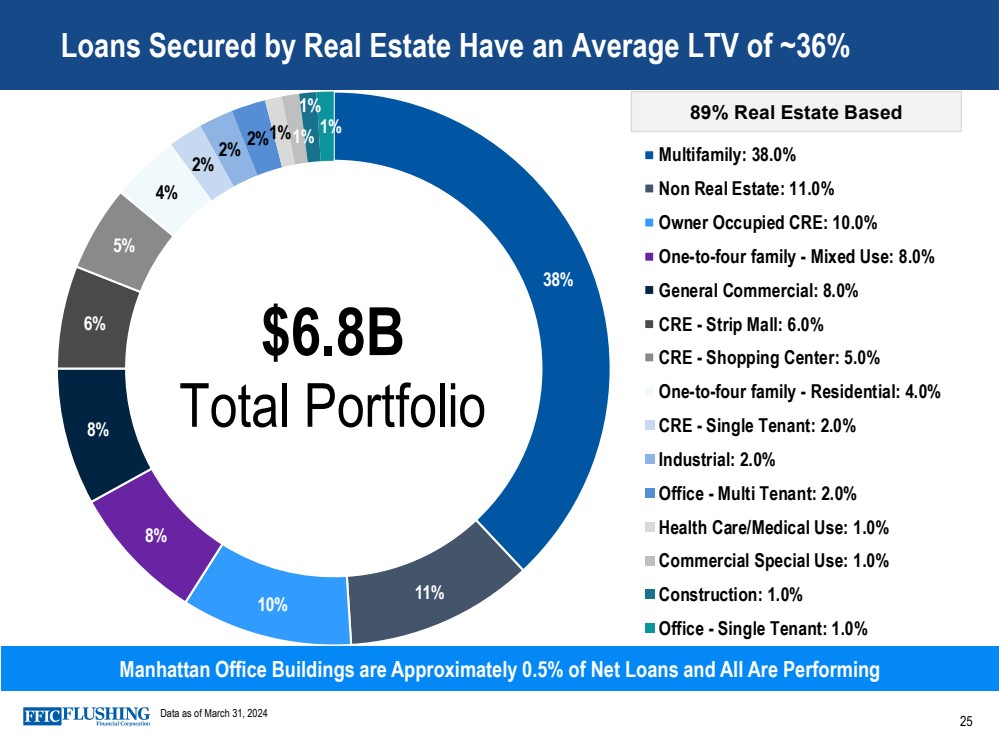
Loans Secured by Real Estate Have an Average LTV of ~36% Manhattan Office Buildings are Approximately 0.5% of Net Loans and All Are Performing Data as of March 31, 2024 38% 11% 10% 8% 8% 6% 5% 4% 2% 2% 2%1%1% 1% 1% Multifamily: 38.0% Non Real Estate: 11.0% Owner Occupied CRE: 10.0% One-to-four family - Mixed Use: 8.0% General Commercial: 8.0% CRE - Strip Mall: 6.0% CRE - Shopping Center: 5.0% One-to-four family - Residential: 4.0% CRE - Single Tenant: 2.0% Industrial: 2.0% Office - Multi Tenant: 2.0% Health Care/Medical Use: 1.0% Commercial Special Use: 1.0% Construction: 1.0% Office - Single Tenant: 1.0% $6.8B Total Portfolio 89% Real Estate Based 25 |
|
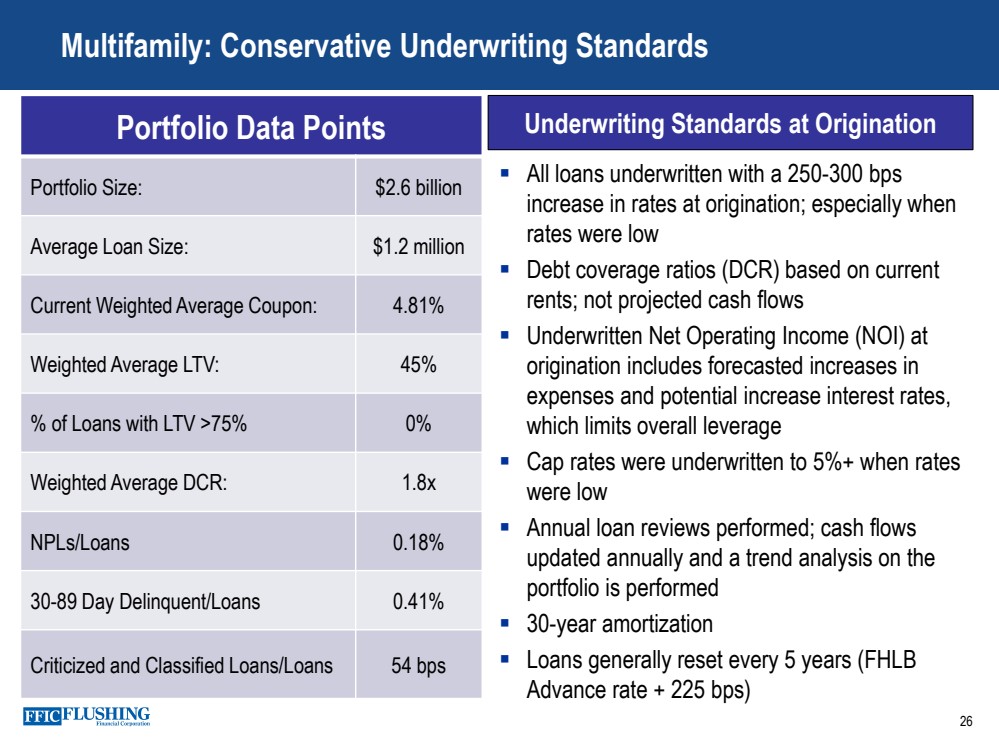
▪ All loans underwritten with a 250-300 bps increase in rates at origination; especially when rates were low ▪ Debt coverage ratios (DCR) based on current rents; not projected cash flows ▪ Underwritten Net Operating Income (NOI) at origination includes forecasted increases in expenses and potential increase interest rates, which limits overall leverage ▪ Cap rates were underwritten to 5%+ when rates were low ▪ Annual loan reviews performed; cash flows updated annually and a trend analysis on the portfolio is performed ▪ 30-year amortization ▪ Loans generally reset every 5 years (FHLB Advance rate + 225 bps) 26 Multifamily: Conservative Underwriting Standards Portfolio Data Points Portfolio Size: $2.6 billion Average Loan Size: $1.2 million Current Weighted Average Coupon: 4.81% Weighted Average LTV: 45% % of Loans with LTV >75% 0% Weighted Average DCR: 1.8x NPLs/Loans 0.18% 30-89 Day Delinquent/Loans 0.41% Criticized and Classified Loans/Loans 54 bps Underwriting Standards at Origination |
|
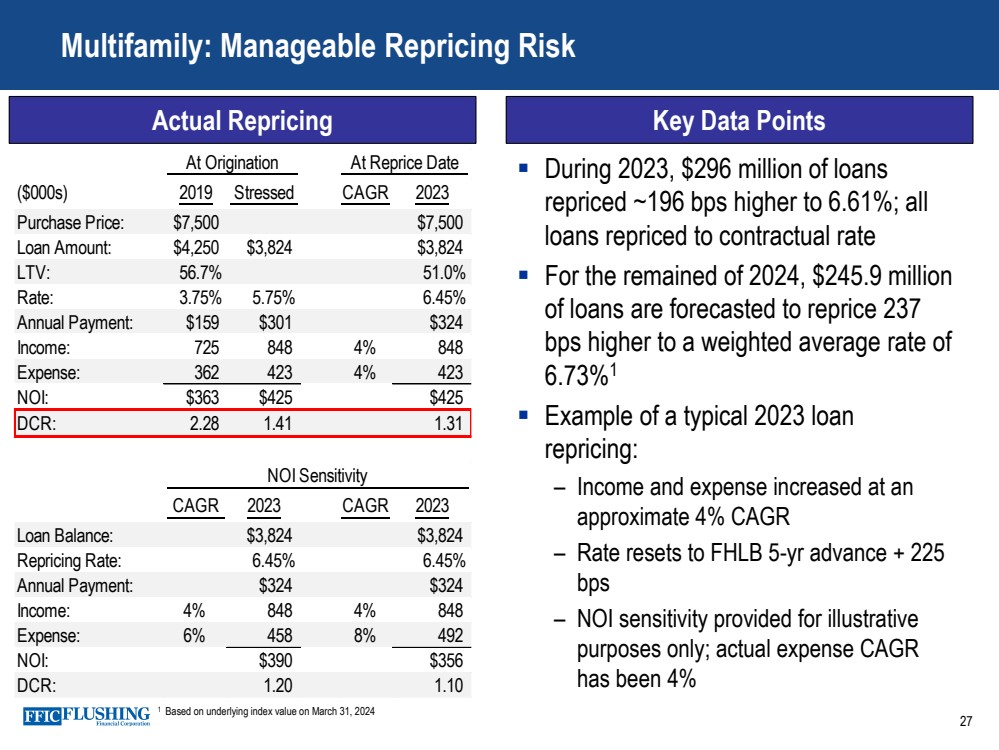
Actual Repricing 27 Multifamily: Manageable Repricing Risk ▪ During 2023, $296 million of loans repriced ~196 bps higher to 6.61%; all loans repriced to contractual rate ▪ For the remained of 2024, $245.9 million of loans are forecasted to reprice 237 bps higher to a weighted average rate of 6.73%1 ▪ Example of a typical 2023 loan repricing: – Income and expense increased at an approximate 4% CAGR – Rate resets to FHLB 5-yr advance + 225 bps – NOI sensitivity provided for illustrative purposes only; actual expense CAGR has been 4% 1 Based on underlying index value on March 31, 2024 Key Data Points At Origination At Reprice Date ($000s) 2019 Stressed CAGR 2023 Purchase Price: $7,500 $7,500 Loan Amount: $4,250 $3,824 $3,824 LTV: 56.7% 51.0% Rate: 3.75% 5.75% 6.45% Annual Payment: $159 $301 $324 Income: 725 848 4% 848 Expense: 362 423 4% 423 NOI: $363 $425 $425 DCR: 2.28 1.41 1.31 NOI Sensitivity CAGR 2023 CAGR 2023 Loan Balance: $3,824 $3,824 Repricing Rate: 6.45% 6.45% Annual Payment: $324 $324 Income: 4% 848 4% 848 Expense: 6% 458 8% 492 NOI: $390 $356 DCR: 1.20 1.10 |
|
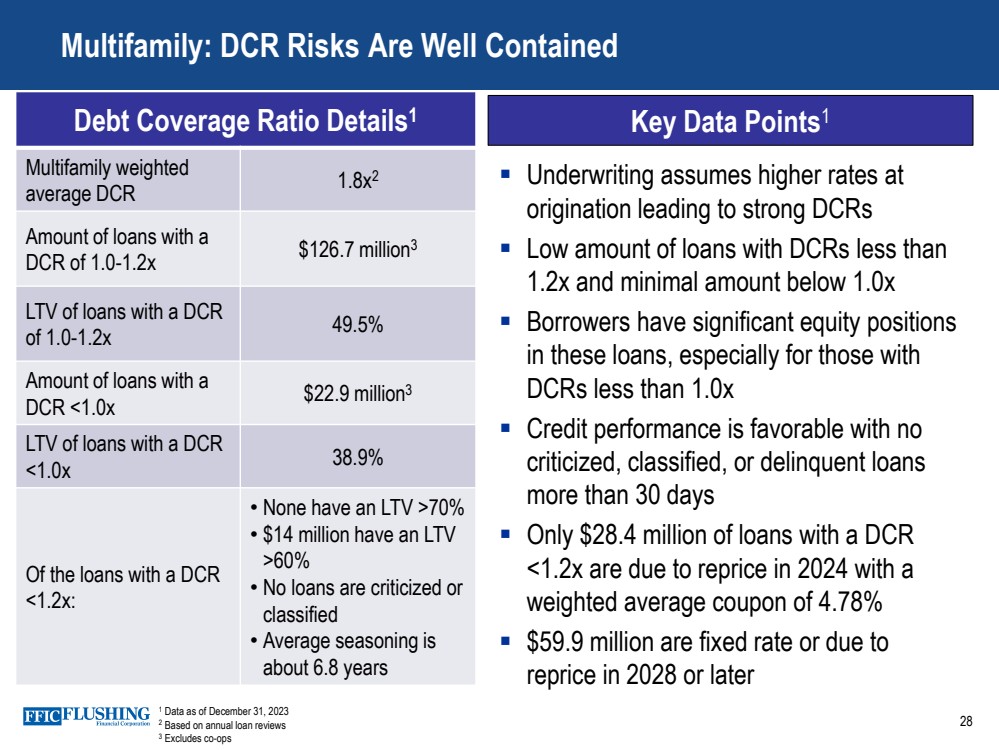
Debt Coverage Ratio Details1 Multifamily weighted average DCR 1.8x2 Amount of loans with a DCR of 1.0-1.2x $126.7 million3 LTV of loans with a DCR of 1.0-1.2x 49.5% Amount of loans with a DCR <1.0x $22.9 million3 LTV of loans with a DCR <1.0x 38.9% Of the loans with a DCR <1.2x: • None have an LTV >70% • $14 million have an LTV >60% • No loans are criticized or classified • Average seasoning is about 6.8 years 28 Multifamily: DCR Risks Are Well Contained 1 Data as of December 31, 2023 2 Based on annual loan reviews 3 Excludes co-ops ▪ Underwriting assumes higher rates at origination leading to strong DCRs ▪ Low amount of loans with DCRs less than 1.2x and minimal amount below 1.0x ▪ Borrowers have significant equity positions in these loans, especially for those with DCRs less than 1.0x ▪ Credit performance is favorable with no criticized, classified, or delinquent loans more than 30 days ▪ Only $28.4 million of loans with a DCR <1.2x are due to reprice in 2024 with a weighted average coupon of 4.78% ▪ $59.9 million are fixed rate or due to reprice in 2028 or later Key Data Points1 |
|
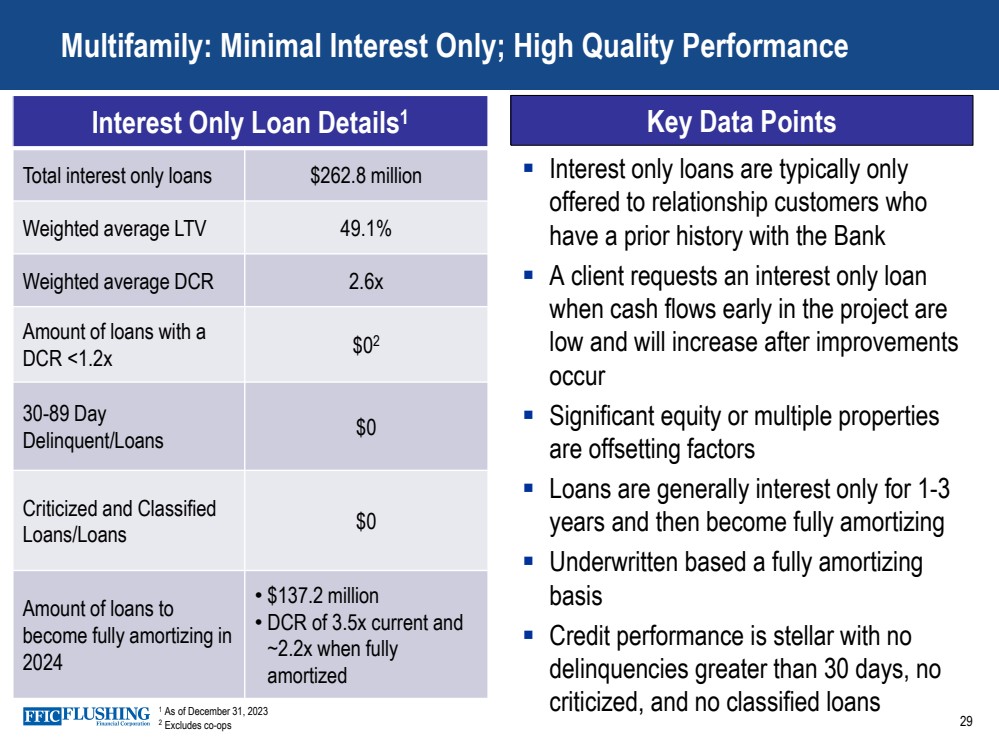
29 Multifamily: Minimal Interest Only; High Quality Performance 1 As of December 31, 2023 2 Excludes co-ops ▪ Interest only loans are typically only offered to relationship customers who have a prior history with the Bank ▪ A client requests an interest only loan when cash flows early in the project are low and will increase after improvements occur ▪ Significant equity or multiple properties are offsetting factors ▪ Loans are generally interest only for 1-3 years and then become fully amortizing ▪ Underwritten based a fully amortizing basis ▪ Credit performance is stellar with no delinquencies greater than 30 days, no criticized, and no classified loans Interest Only Loan Details Key Data Points 1 Total interest only loans $262.8 million Weighted average LTV 49.1% Weighted average DCR 2.6x Amount of loans with a DCR <1.2x $02 30-89 Day Delinquent/Loans $0 Criticized and Classified Loans/Loans $0 Amount of loans to become fully amortizing in 2024 • $137.2 million • DCR of 3.5x current and ~2.2x when fully amortized |
|
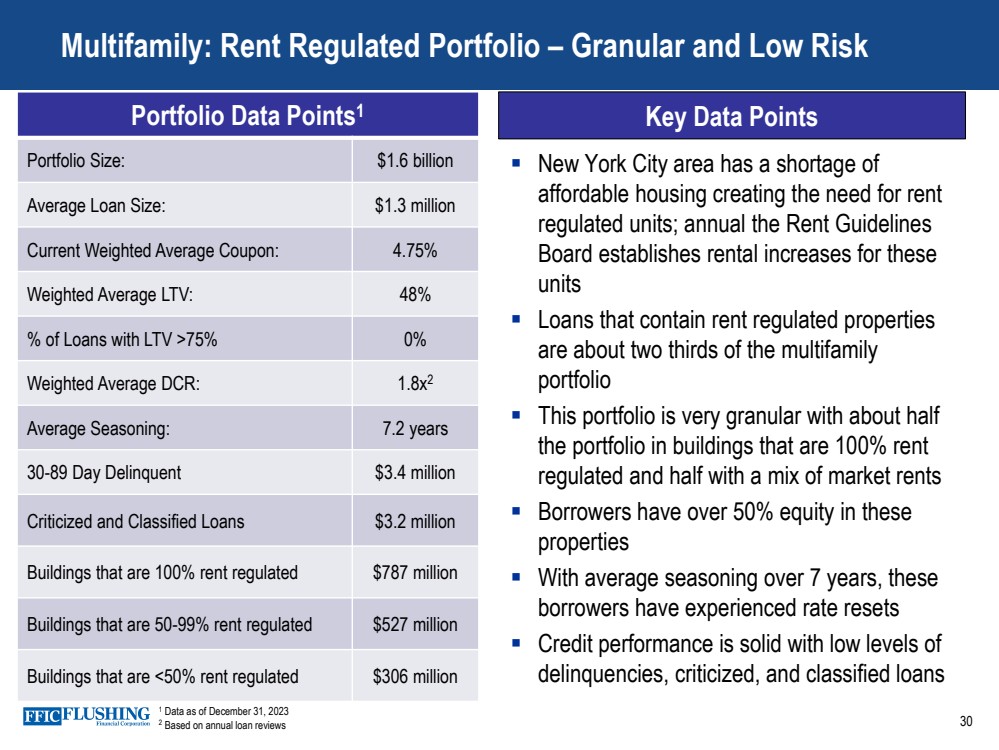
Key Data Points 30 Multifamily: Rent Regulated Portfolio – Granular and Low Risk Portfolio Data Points1 Portfolio Size: $1.6 billion Average Loan Size: $1.3 million Current Weighted Average Coupon: 4.75% Weighted Average LTV: 48% % of Loans with LTV >75% 0% Weighted Average DCR: 1.8x2 Average Seasoning: 7.2 years 30-89 Day Delinquent $3.4 million Criticized and Classified Loans $3.2 million Buildings that are 100% rent regulated $787 million Buildings that are 50-99% rent regulated $527 million Buildings that are <50% rent regulated $306 million ▪ New York City area has a shortage of affordable housing creating the need for rent regulated units; annual the Rent Guidelines Board establishes rental increases for these units ▪ Loans that contain rent regulated properties are about two thirds of the multifamily portfolio ▪ This portfolio is very granular with about half the portfolio in buildings that are 100% rent regulated and half with a mix of market rents ▪ Borrowers have over 50% equity in these properties ▪ With average seasoning over 7 years, these borrowers have experienced rate resets ▪ Credit performance is solid with low levels of delinquencies, criticized, and classified loans 1 Data as of December 31, 2023 2 Based on annual loan reviews |
|
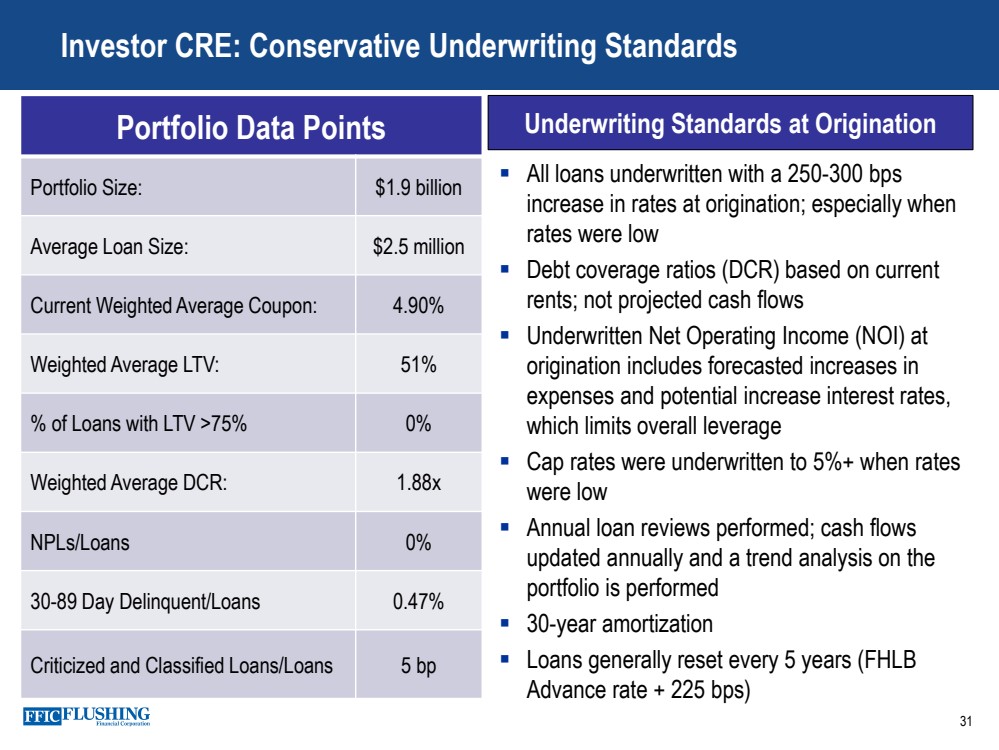
▪ All loans underwritten with a 250-300 bps increase in rates at origination; especially when rates were low ▪ Debt coverage ratios (DCR) based on current rents; not projected cash flows ▪ Underwritten Net Operating Income (NOI) at origination includes forecasted increases in expenses and potential increase interest rates, which limits overall leverage ▪ Cap rates were underwritten to 5%+ when rates were low ▪ Annual loan reviews performed; cash flows updated annually and a trend analysis on the portfolio is performed ▪ 30-year amortization ▪ Loans generally reset every 5 years (FHLB Advance rate + 225 bps) 31 Investor CRE: Conservative Underwriting Standards Portfolio Data Points Portfolio Size: $1.9 billion Average Loan Size: $2.5 million Current Weighted Average Coupon: 4.90% Weighted Average LTV: 51% % of Loans with LTV >75% 0% Weighted Average DCR: 1.88x NPLs/Loans 0% 30-89 Day Delinquent/Loans 0.47% Criticized and Classified Loans/Loans 5 bp Underwriting Standards at Origination |
|
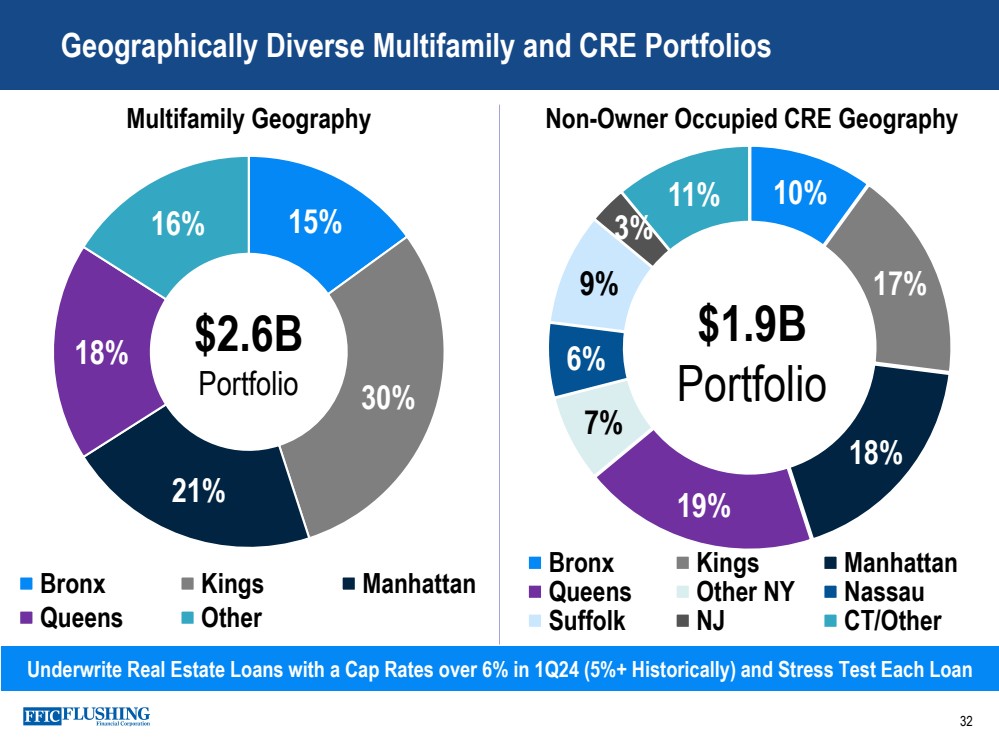
15% 30% 21% 18% 16% Bronx Kings Manhattan Queens Other 10% 17% 18% 19% 7% 6% 9% 3% 11% Bronx Kings Manhattan Queens Other NY Nassau Suffolk NJ CT/Other Multifamily Geography Geographically Diverse Multifamily and CRE Portfolios 32 Underwrite Real Estate Loans with a Cap Rates over 6% in 1Q24 (5%+ Historically) and Stress Test Each Loan $2.6B Portfolio Non-Owner Occupied CRE Geography $1.9B Portfolio |
|
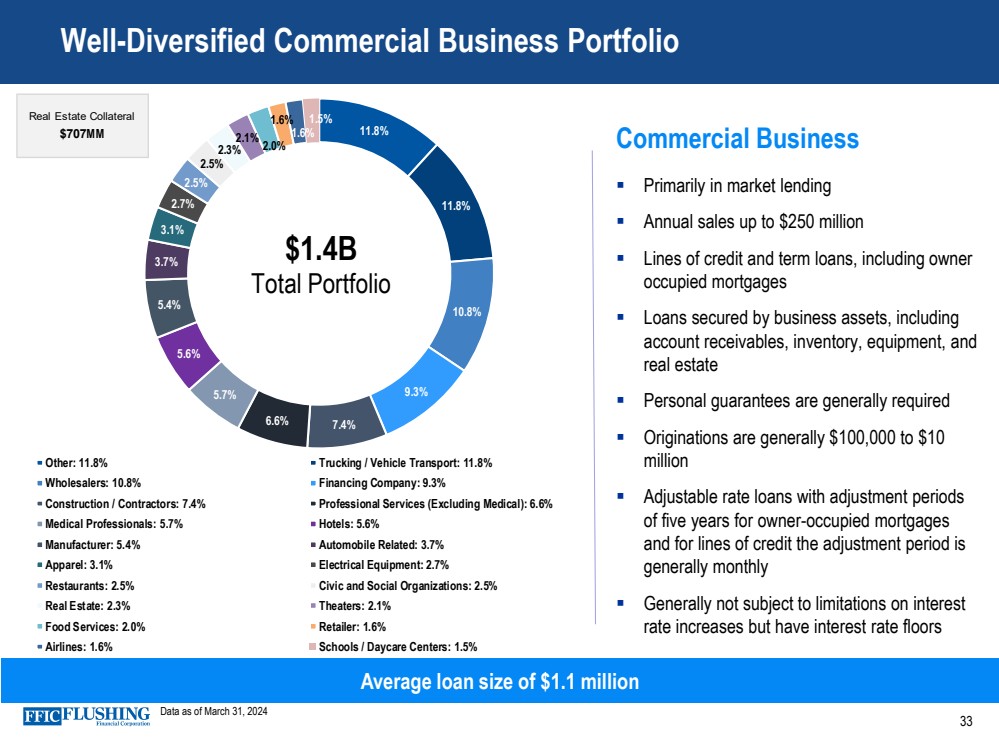
33 Well-Diversified Commercial Business Portfolio Commercial Business ▪ Primarily in market lending ▪ Annual sales up to $250 million ▪ Lines of credit and term loans, including owner occupied mortgages ▪ Loans secured by business assets, including account receivables, inventory, equipment, and real estate ▪ Personal guarantees are generally required ▪ Originations are generally $100,000 to $10 million ▪ Adjustable rate loans with adjustment periods of five years for owner-occupied mortgages and for lines of credit the adjustment period is generally monthly ▪ Generally not subject to limitations on interest rate increases but have interest rate floors Average loan size of $1.1 million Data as of March 31, 2024 11.8% 11.8% 10.8% 9.3% 6.6% 7.4% 5.7% 5.6% 5.4% 3.7% 3.1% 2.7% 2.5% 2.5% 2.3% 2.1% 2.0% 1.6% 1.6% 1.5% Other: 11.8% Trucking / Vehicle Transport: 11.8% Wholesalers: 10.8% Financing Company: 9.3% Construction / Contractors: 7.4% Professional Services (Excluding Medical): 6.6% Medical Professionals: 5.7% Hotels: 5.6% Manufacturer: 5.4% Automobile Related: 3.7% Apparel: 3.1% Electrical Equipment: 2.7% Restaurants: 2.5% Civic and Social Organizations: 2.5% Real Estate: 2.3% Theaters: 2.1% Food Services: 2.0% Retailer: 1.6% Airlines: 1.6% Schools / Daycare Centers: 1.5% $1.4B Total Portfolio Real Estate Collateral $707M M |
|
Reconciliation of GAAP Earnings and Core Earnings 34 Non-cash Fair Value Adjustments to GAAP Earnings The variance in GAAP and core earnings is partly driven by the impact of non-cash net gains and losses from fair value adjustments. These fair value adjustments relate primarily to borrowings carried at fair value under the fair value option. Core Net Income, Core Diluted EPS, Core ROAE, Core ROAA, Pre-provision, Pre-tax Net Revenue, Core Net Interest Income FTE, Core Net Interest Margin FTE, Core Interest Income and Yield on Total Loans, Core Noninterest Income, Core Noninterest Expense and Tangible Book Value per common share are each non-GAAP measures used in this presentation. A reconciliation to the most directly comparable GAAP financial measures appears below in tabular form. The Company believes that these measures are useful for both investors and management to understand the effects of certain interest and noninterest items and provide an alternative view of the Company's performance over time and in comparison, to the Company's competitors. These measures should not be viewed as a substitute for net income. The Company believes that tangible book value per common share is useful for both investors and management as this measure is commonly used by financial institutions, regulators and investors to measure the capital adequacy of financial institutions. The Company believes this measure facilitates comparison of the quality and composition of the Company's capital over time and in comparison, to its competitors. This measure should not be viewed as a substitute for total shareholders' equity. These non-GAAP measures have inherent limitations, are not required to be uniformly applied and are not audited. They should not be considered in isolation or as a substitute for analysis of results reported under GAAP. These non-GAAP measures may not be comparable to similarly titled measures reported by other companies. |
|
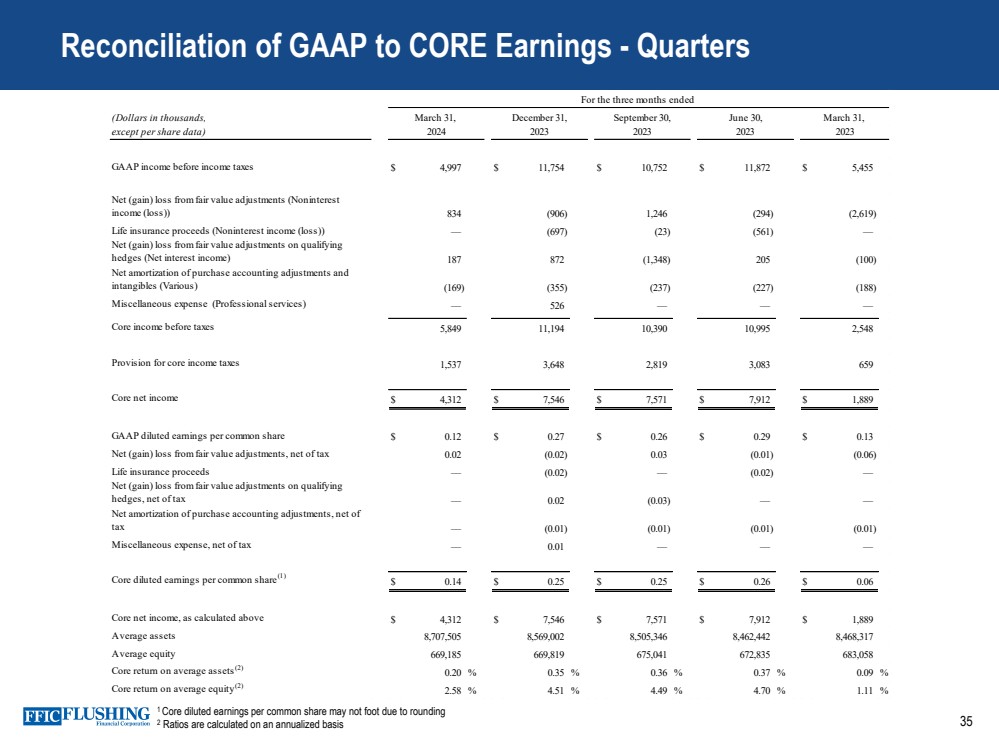
35 1 Core diluted earnings per common share may not foot due to rounding 2 Ratios are calculated on an annualized basis Reconciliation of GAAP to CORE Earnings - Quarters (Dollars in thousands, except per share data) GAAP income before income taxes $ 4,997 $ 11,754 $ 10,752 $ 11,872 $ 5,455 Net (gain) loss from fair value adjustments (Noninterest income (loss)) 834 (906) 1,246 (294) (2,619) Life insurance proceeds (Noninterest income (loss)) — (697) (23) (561) — Net (gain) loss from fair value adjustments on qualifying hedges (Net interest income) 187 872 (1,348) 205 (100) Net amortization of purchase accounting adjustments and intangibles (Various) (169) (355) (237) (227) (188) Miscellaneous expense (Professional services) — 526 — — — Core income before taxes 5,849 11,194 10,390 10,995 2,548 Provision for core income taxes 1,537 3,648 2,819 3,083 659 Core net income $ 4,312 $ 7,546 $ 7,571 $ 7,912 $ 1,889 GAAP diluted earnings per common share $ 0.12 $ 0.27 $ 0.26 $ 0.29 $ 0.13 Net (gain) loss from fair value adjustments, net of tax 0.02 (0.02) 0.03 (0.01) (0.06) Life insurance proceeds — (0.02) — (0.02) — Net (gain) loss from fair value adjustments on qualifying hedges, net of tax — 0.02 (0.03) — — Net amortization of purchase accounting adjustments, net of tax — (0.01) (0.01) (0.01) (0.01) Miscellaneous expense, net of tax — 0.01 — — — Core diluted earnings per common share(1) $ 0.14 $ 0.25 $ 0.25 $ 0.26 $ 0.06 Core net income, as calculated above $ 4,312 $ 7,546 $ 7,571 $ 7,912 $ 1,889 Average assets 8,707,505 8,569,002 8,505,346 8,462,442 8,468,317 Average equity 669,185 669,819 675,041 672,835 683,058 Core return on average assets(2) 0.20 % 0.35 % 0.36 % 0.37 % 0.09 % Core return on average equity(2) 2.58 % 4.51 % 4.49 % 4.70 % 1.11 % For the three months ended September 30, June 30, 2023 2023 March 31, 2024 March 31, December 31, 2023 2023 |
|
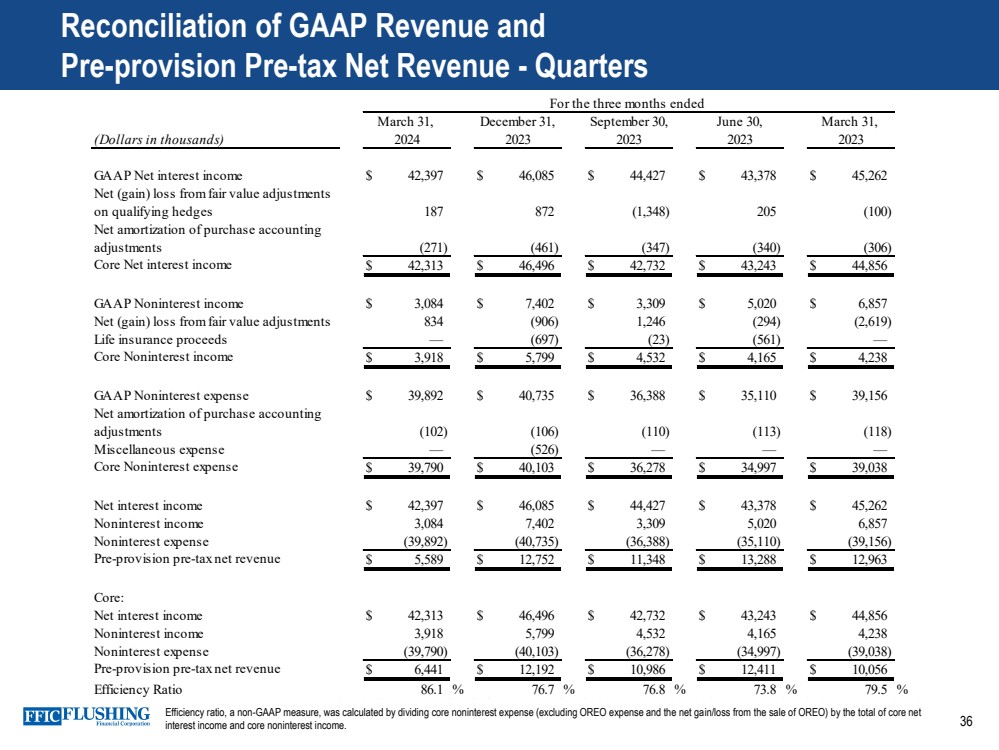
36 Reconciliation of GAAP Revenue and Pre-provision Pre-tax Net Revenue - Quarters Efficiency ratio, a non-GAAP measure, was calculated by dividing core noninterest expense (excluding OREO expense and the net gain/loss from the sale of OREO) by the total of core net interest income and core noninterest income. (Dollars in thousands) GAAP Net interest income $ 42,397 $ 46,085 $ 44,427 $ 43,378 $ 45,262 Net (gain) loss from fair value adjustments on qualifying hedges 187 872 (1,348) 205 (100) Net amortization of purchase accounting adjustments (271) (461) (347) (340) (306) Core Net interest income $ 42,313 $ 46,496 $ 42,732 $ 43,243 $ 44,856 GAAP Noninterest income $ 3,084 $ 7,402 $ 3,309 $ 5,020 $ 6,857 Net (gain) loss from fair value adjustments 834 (906) 1,246 (294) (2,619) Life insurance proceeds — (697) (23) (561) — Core Noninterest income $ 3,918 $ 5,799 $ 4,532 $ 4,165 $ 4,238 GAAP Noninterest expense $ 39,892 $ 40,735 $ 36,388 $ 35,110 $ 39,156 Net amortization of purchase accounting adjustments (102) (106) (110) (113) (118) Miscellaneous expense — (526) — — — Core Noninterest expense $ 39,790 $ 40,103 $ 36,278 $ 34,997 $ 39,038 Net interest income $ 42,397 $ 46,085 $ 44,427 $ 43,378 $ 45,262 Noninterest income 3,084 7,402 3,309 5,020 6,857 Noninterest expense (39,892) (40,735) (36,388) (35,110) (39,156) Pre-provision pre-tax net revenue $ 5,589 $ 12,752 $ 11,348 $ 13,288 $ 12,963 Core: Net interest income $ 42,313 $ 46,496 $ 42,732 $ 43,243 $ 44,856 Noninterest income 3,918 5,799 4,532 4,165 4,238 Noninterest expense (39,790) (40,103) (36,278) (34,997) (39,038) Pre-provision pre-tax net revenue $ 6,441 $ 12,192 $ 10,986 $ 12,411 $ 10,056 Efficiency Ratio 86.1 % 76.7 % 76.8 % 73.8 % 79.5 % June 30, 2023 March 31, 2023 For the three months ended March 31, 2024 December 31, 2023 September 30, 2023 |
|
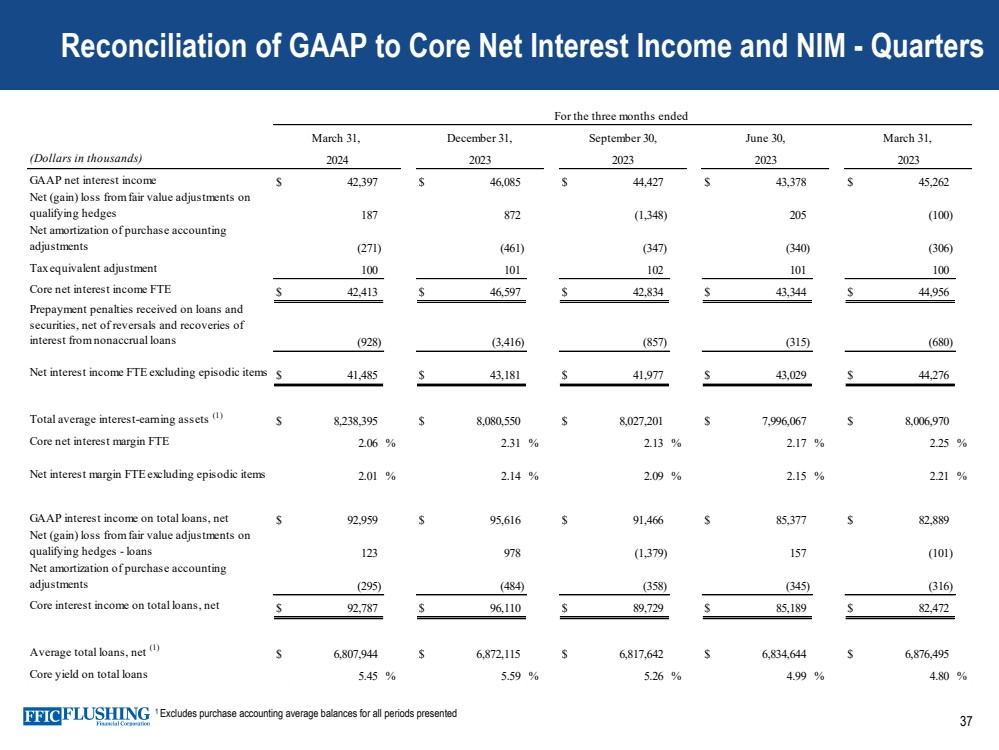
37 1 Excludes purchase accounting average balances for all periods presented Reconciliation of GAAP to Core Net Interest Income and NIM - Quarters (Dollars in thousands) GAAP net interest income $ 42,397 $ 46,085 $ 44,427 $ 43,378 $ 45,262 Net (gain) loss from fair value adjustments on qualifying hedges 187 872 (1,348) 205 (100) Net amortization of purchase accounting adjustments (271) (461) (347) (340) (306) Tax equivalent adjustment 100 101 102 101 100 Core net interest income FTE $ 42,413 $ 46,597 $ 42,834 $ 43,344 $ 44,956 Prepayment penalties received on loans and securities, net of reversals and recoveries of interest from nonaccrual loans (928) (3,416) (857) (315) (680) Net interest income FTE excluding episodic items $ 41,485 $ 43,181 $ 41,977 $ 43,029 $ 44,276 Total average interest-earning assets (1) $ 8,238,395 $ 8,080,550 $ 8,027,201 $ 7,996,067 $ 8,006,970 Core net interest margin FTE 2.06 % 2.31 % 2.13 % 2.17 % 2.25 % Net interest margin FTE excluding episodic items 2.01 % 2.14 % 2.09 % 2.15 % 2.21 % GAAP interest income on total loans, net $ 92,959 $ 95,616 $ 91,466 $ 85,377 $ 82,889 Net (gain) loss from fair value adjustments on qualifying hedges - loans 123 978 (1,379) 157 (101) Net amortization of purchase accounting adjustments (295) (484) (358) (345) (316) Core interest income on total loans, net $ 92,787 $ 96,110 $ 89,729 $ 85,189 $ 82,472 Average total loans, net (1) $ 6,807,944 $ 6,872,115 $ 6,817,642 $ 6,834,644 $ 6,876,495 Core yield on total loans 5.45 % 5.59 % 5.26 % 4.99 % 4.80 % For the three months ended March 31, December 31, September 30, June 30, March 31, 2024 2023 2023 2023 2023 |
|
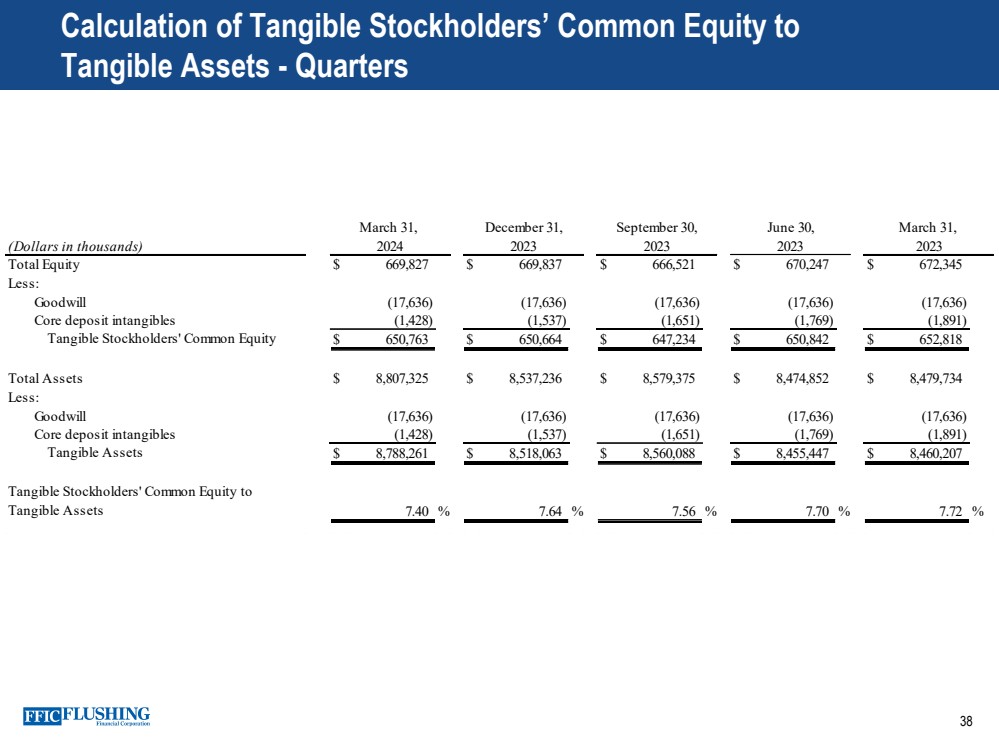
38 Calculation of Tangible Stockholders’ Common Equity to Tangible Assets - Quarters (Dollars in thousands) Total Equity $ 669,827 $ 669,837 $ 666,521 $ 670,247 $ 672,345 Less: Goodwill (17,636) (17,636) (17,636) (17,636) (17,636) Core deposit intangibles (1,428) (1,537) (1,651) (1,769) (1,891) Tangible Stockholders' Common Equity $ 650,763 $ 650,664 $ 647,234 $ 650,842 $ 652,818 Total Assets $ 8,807,325 $ 8,537,236 $ 8,579,375 $ 8,474,852 $ 8,479,734 Less: Goodwill (17,636) (17,636) (17,636) (17,636) (17,636) Core deposit intangibles (1,428) (1,537) (1,651) (1,769) (1,891) Tangible Assets $ 8,788,261 $ 8,518,063 $ 8,560,088 $ 8,455,447 $ 8,460,207 Tangible Stockholders' Common Equity to Tangible Assets 7.40 % 7.64 % 7.56 % 7.70 % 7.72 % 2023 December 31, 2024 March 31, 2023 June 30, March 31, 2023 September 30, 2023 |
|
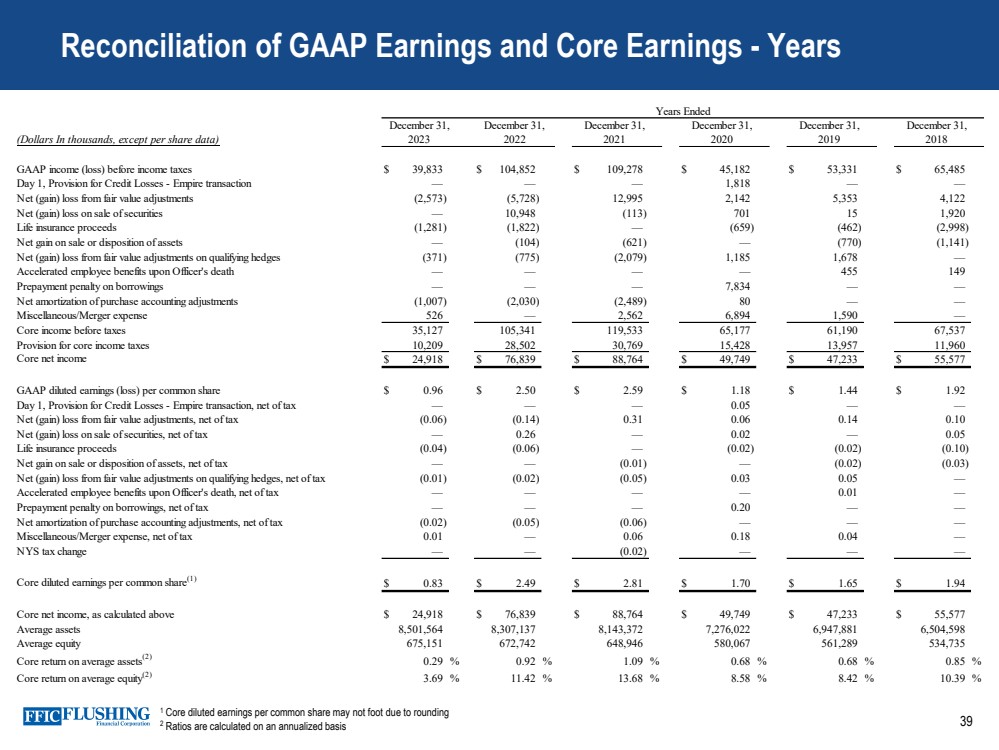
39 Reconciliation of GAAP Earnings and Core Earnings - Years 1 Core diluted earnings per common share may not foot due to rounding 2 Ratios are calculated on an annualized basis December 31, December 31, December 31, December 31, (Dollars In thousands, except per share data) 2021 2020 2019 2018 GAAP income (loss) before income taxes $ 39,833 $ 104,852 $ 109,278 $ 45,182 $ 53,331 $ 65,485 Day 1, Provision for Credit Losses - Empire transaction — — — 1,818 — — Net (gain) loss from fair value adjustments (2,573) (5,728) 12,995 2,142 5,353 4,122 Net (gain) loss on sale of securities — 10,948 (113) 701 15 1,920 Life insurance proceeds (1,281) (1,822) — (659) (462) (2,998) Net gain on sale or disposition of assets — (104) (621) — (770) (1,141) Net (gain) loss from fair value adjustments on qualifying hedges (371) (775) (2,079) 1,185 1,678 — Accelerated employee benefits upon Officer's death — — — — 455 149 Prepayment penalty on borrowings — — — 7,834 — — Net amortization of purchase accounting adjustments (1,007) (2,030) (2,489) 80 — — Miscellaneous/Merger expense 526 — 2,562 6,894 1,590 — Core income before taxes 35,127 105,341 119,533 65,177 61,190 67,537 Provision for core income taxes 10,209 28,502 30,769 15,428 13,957 11,960 Core net income $ 24,918 $ 76,839 $ 88,764 $ 49,749 $ 47,233 $ 55,577 GAAP diluted earnings (loss) per common share $ 0.96 $ 2.50 $ 2.59 $ 1.18 $ 1.44 $ 1.92 Day 1, Provision for Credit Losses - Empire transaction, net of tax — — — 0.05 — — Net (gain) loss from fair value adjustments, net of tax (0.06) (0.14) 0.31 0.06 0.14 0.10 Net (gain) loss on sale of securities, net of tax — 0.26 — 0.02 — 0.05 Life insurance proceeds (0.04) (0.06) — (0.02) (0.02) (0.10) Net gain on sale or disposition of assets, net of tax — — (0.01) — (0.02) (0.03) Net (gain) loss from fair value adjustments on qualifying hedges, net of tax (0.01) (0.02) (0.05) 0.03 0.05 — Accelerated employee benefits upon Officer's death, net of tax — — — — 0.01 — Prepayment penalty on borrowings, net of tax — — — 0.20 — — Net amortization of purchase accounting adjustments, net of tax (0.02) (0.05) (0.06) — — — Miscellaneous/Merger expense, net of tax 0.01 — 0.06 0.18 0.04 — NYS tax change — — (0.02) — — — Core diluted earnings per common share(1) $ 0.83 $ 2.49 $ 2.81 $ 1.70 $ 1.65 $ 1.94 Core net income, as calculated above $ 24,918 $ 76,839 $ 88,764 $ 49,749 $ 47,233 $ 55,577 Average assets 8,501,564 8,307,137 8,143,372 7,276,022 6,947,881 6,504,598 Average equity 675,151 672,742 648,946 580,067 561,289 534,735 Core return on average assets(2) 0.29 % 0.92 % 1.09 % 0.68 % 0.68 % 0.85 % Core return on average equity(2) 3.69 % 11.42 % 13.68 % 8.58 % 8.42 % 10.39 % December 31, 2023 December 31, 2022 Years Ended |
|
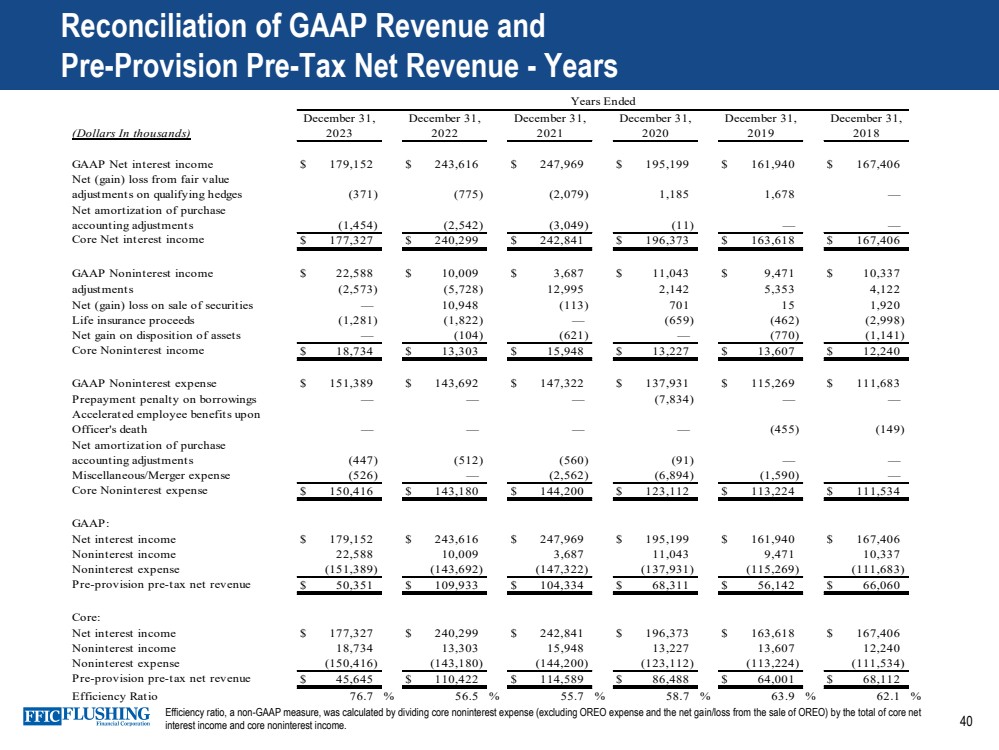
40 Reconciliation of GAAP Revenue and Pre-Provision Pre-Tax Net Revenue - Years Efficiency ratio, a non-GAAP measure, was calculated by dividing core noninterest expense (excluding OREO expense and the net gain/loss from the sale of OREO) by the total of core net interest income and core noninterest income. (Dollars In thousands) GAAP Net interest income $ 179,152 $ 243,616 $ 247,969 $ 195,199 $ 161,940 $ 167,406 Net (gain) loss from fair value adjustments on qualifying hedges (371) (775) (2,079) 1,185 1,678 — Net amortization of purchase accounting adjustments (1,454) (2,542) (3,049) (11) — — Core Net interest income $ 177,327 $ 240,299 $ 242,841 $ 196,373 $ 163,618 $ 167,406 GAAP Noninterest income Net (gain) loss from fair value $ 22,588 $ 10,009 $ 3,687 $ 11,043 $ 9,471 $ 10,337 adjustments (2,573) (5,728) 12,995 2,142 5,353 4,122 Net (gain) loss on sale of securities — 10,948 (113) 701 1 5 1,920 Life insurance proceeds (1,281) (1,822) — (659) (462) (2,998) Net gain on disposition of assets — (104) (621) — (770) (1,141) Core Noninterest income $ 18,734 $ 13,303 $ 15,948 $ 13,227 $ 13,607 $ 12,240 GAAP Noninterest expense $ 151,389 $ 143,692 $ 147,322 $ 137,931 $ 115,269 $ 111,683 Prepayment penalty on borrowings — — — (7,834) — — Accelerated employee benefits upon Officer's death — — — — (455) (149) Net amortization of purchase accounting adjustments (447) (512) (560) (91) — — Miscellaneous/Merger expense (526) — (2,562) (6,894) (1,590) — Core Noninterest expense $ 150,416 $ 143,180 $ 144,200 $ 123,112 $ 113,224 $ 111,534 GAAP: Net interest income $ 179,152 $ 243,616 $ 247,969 $ 195,199 $ 161,940 $ 167,406 Noninterest income 22,588 10,009 3,687 11,043 9,471 10,337 Noninterest expense (151,389) (143,692) (147,322) (137,931) (115,269) (111,683) Pre-provision pre-tax net revenue $ 50,351 $ 109,933 $ 104,334 $ 68,311 $ 56,142 $ 66,060 Core: Net interest income $ 177,327 $ 240,299 $ 242,841 $ 196,373 $ 163,618 $ 167,406 Noninterest income 18,734 13,303 15,948 13,227 13,607 12,240 Noninterest expense (150,416) (143,180) (144,200) (123,112) (113,224) (111,534) Pre-provision pre-tax net revenue $ 45,645 $ 110,422 $ 114,589 $ 86,488 $ 64,001 $ 68,112 Efficiency Ratio 76.7 % 56.5 % 55.7 % 58.7 % 63.9 % 62.1 % 2020 December 31, 2023 December 31, 2022 December 31, 2021 December 31, 2019 December 31, 2018 Years Ended December 31, |
|
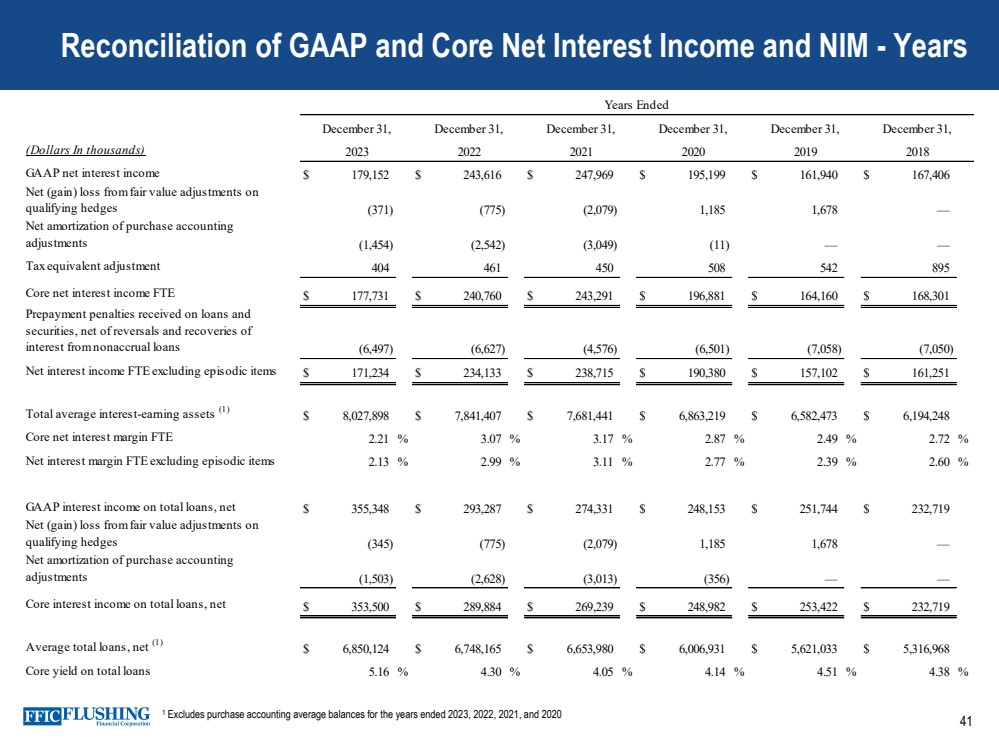
41 Reconciliation of GAAP and Core Net Interest Income and NIM - Years 1 Excludes purchase accounting average balances for the years ended 2023, 2022, 2021, and 2020 (Dollars In thousands) GAAP net interest income $ 179,152 $ 243,616 $ 247,969 $ 195,199 $ 161,940 $ 167,406 Net (gain) loss from fair value adjustments on qualifying hedges (371) (775) (2,079) 1,185 1,678 — Net amortization of purchase accounting adjustments (1,454) (2,542) (3,049) (11) — — Tax equivalent adjustment 404 461 450 508 542 895 Core net interest income FTE $ 177,731 $ 240,760 $ 243,291 $ 196,881 $ 164,160 $ 168,301 Prepayment penalties received on loans and securities, net of reversals and recoveries of interest from nonaccrual loans (6,497) (6,627) (4,576) (6,501) (7,058) (7,050) Net interest income FTE excluding episodic items $ 171,234 $ 234,133 $ 238,715 $ 190,380 $ 157,102 $ 161,251 Total average interest-earning assets (1) $ 8,027,898 $ 7,841,407 $ 7,681,441 $ 6,863,219 $ 6,582,473 $ 6,194,248 Core net interest margin FTE 2.21 % 3.07 % 3.17 % 2.87 % 2.49 % 2.72 % Net interest margin FTE excluding episodic items 2.13 % 2.99 % 3.11 % 2.77 % 2.39 % 2.60 % GAAP interest income on total loans, net $ 355,348 $ 293,287 $ 274,331 $ 248,153 $ 251,744 $ 232,719 Net (gain) loss from fair value adjustments on qualifying hedges (345) (775) (2,079) 1,185 1,678 — Net amortization of purchase accounting adjustments (1,503) (2,628) (3,013) (356) — — Core interest income on total loans, net $ 353,500 $ 289,884 $ 269,239 $ 248,982 $ 253,422 $ 232,719 Average total loans, net (1) $ 6,850,124 $ 6,748,165 $ 6,653,980 $ 6,006,931 $ 5,621,033 $ 5,316,968 Core yield on total loans 5.16 % 4.30 % 4.05 % 4.14 % 4.51 % 4.38 % 2019 December 31, Years Ended December 31, 2020 December 31, 2023 December 31, 2022 December 31, 2021 December 31, 2018 |
|
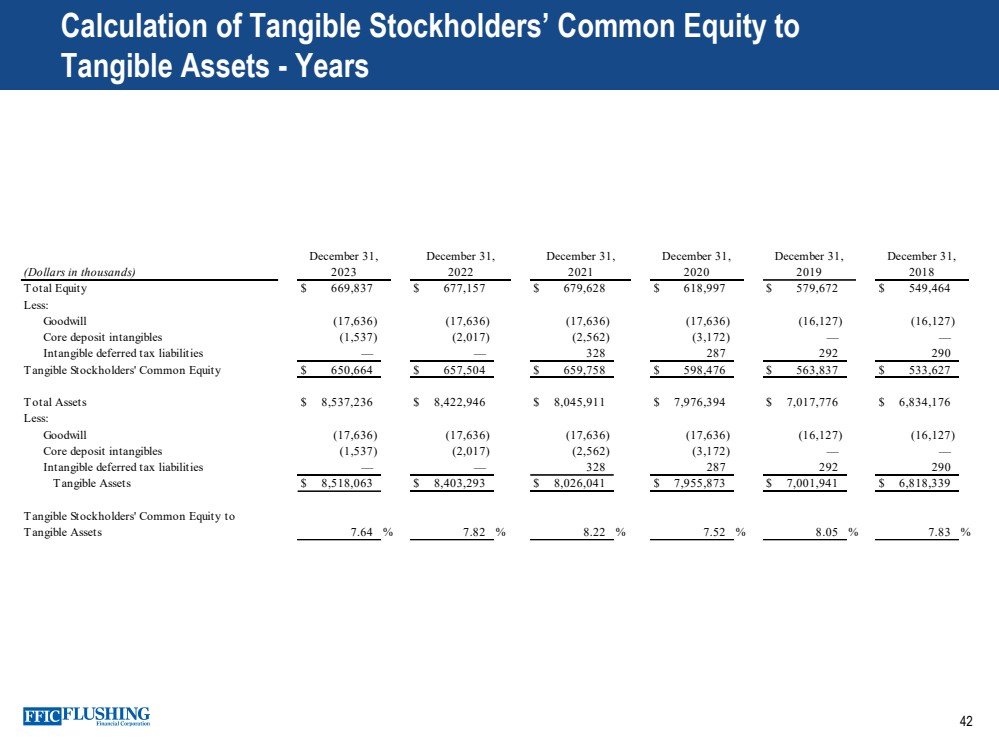
42 Calculation of Tangible Stockholders’ Common Equity to Tangible Assets - Years (Dollars in thousands) Total Equity $ 669,837 $ 677,157 $ 679,628 $ 618,997 $ 579,672 $ 549,464 Less: Goodwill (17,636) (17,636) (17,636) (17,636) (16,127) (16,127) Core deposit intangibles (1,537) (2,017) (2,562) (3,172) — — Intangible deferred tax liabilities — — 328 287 292 290 Tangible Stockholders' Common Equity $ 650,664 $ 657,504 $ 659,758 $ 598,476 $ 563,837 $ 533,627 Total Assets $ 8,537,236 $ 8,422,946 $ 8,045,911 $ 7,976,394 $ 7,017,776 $ 6,834,176 Less: Goodwill (17,636) (17,636) (17,636) (17,636) (16,127) (16,127) Core deposit intangibles (1,537) (2,017) (2,562) (3,172) — — Intangible deferred tax liabilities — — 328 287 292 290 Tangible Assets $ 8,518,063 $ 8,403,293 $ 8,026,041 $ 7,955,873 $ 7,001,941 $ 6,818,339 Tangible Stockholders' Common Equity to Tangible Assets 7.64 % 7.82 % 8.22 % 7.52 % 8.05 % 7.83 % 2021 2020 2019 2018 December 31, December 31, December 31, December 31, December 31, 2023 December 31, 2022 |
|
43 Contact Details Susan K. Cullen SEVP, CFO & Treasurer Phone: (718) 961-5400 Email: scullen@flushingbank.com Al Savastano, CFA Director of Investor Relations Phone: (516) 820-1146 Email: asavastano@flushingbank.com |
|