UNITED STATES SECURITIES AND EXCHANGE COMMISSION
WASHINGTON, D.C. 20549
FORM 40-F
|
|
|
☐ |
|
REGISTRATION STATEMENT PURSUANT TO SECTION 12 OF THE SECURITIES EXCHANGE ACT OF 1934 |
OR
|
|
|
☑ |
|
ANNUAL REPORT PURSUANT TO SECTION 13(a) OR 15(d) OF THE SECURITIES EXCHANGE ACT OF 1934 |
For the fiscal year ended: December 31, 2023 Commission File Number: 001-35297
FORTUNA SILVER MINES INC.
(Exact name of Registrant as specified in its charter)
N/A
(Translation of Registrant’s name into English (if applicable))
British Columbia, Canada
(Province or other jurisdiction of incorporation or organization)
|
|
|
|
|
|
1040 |
|
N/A |
|
(Primary Standard Industrial Classification Code Number (if applicable)) |
|
(I.R.S. Employer Identification Number (if applicable)) |
200 Burrard Street, Suite 650
Vancouver, British Columbia V6C 3L6, Canada
604-484-4085
(Address and telephone number of Registrant’s principal executive offices)
National Corporate Research, Ltd.
10 East 40th Street, 10th Floor
New York, New York 10016
212-947-7200
(Name, address (including zip code) and telephone number (including area code)
of agent for service in the United States)
Securities registered or to be registered pursuant to Section 12(b) of the Act.
|
|
|
Title of each class |
Trading Symbol(s) |
Name of each exchange on which registered |
Common Shares |
FSM |
New York Stock Exchange |
Securities registered or to be registered pursuant to Section 12(g) of the Act.
None
(Title of Class)
Securities for which there is a reporting obligation pursuant to Section 15(d) of the Act.
None
(Title of Class)
For annual reports, indicate by check mark the information filed with this Form:
☑ Annual information form ☑ Audited annual financial statements
Indicate the number of outstanding shares of each of the issuer’s classes of capital or common stock as of the close of the period covered by the annual report:
There were 306,587,630 common shares with no par value outstanding as of December 31, 2023.
Indicate by check mark whether the Registrant: (1) has filed all reports to be filed by Section 13 or 15(d) of the Exchange Act during the preceding 12 months (or for such shorter period that the Registrant was required to file such reports); and (2) has been subject to such filing requirements for the past 90 days.
Yes ☑ No ◻
Indicate by check mark whether the Registrant has submitted electronically every Interactive Data File required to be submitted pursuant to Rule 405 of Regulation S-T (§ 232.405 of this chapter) during the preceding 12 months (or for such shorter period that the Registrant was required to submit such files).
Yes ☑ No ◻
Indicate by check mark whether the Registrant is an emerging growth company as defined in Rule 12b-2 of the Exchange Act.
Emerging growth company ☐
If an emerging growth company that prepares its financial statements in accordance with U.S. GAAP, indicate by check mark if the Registrant has elected not to use the extended transition period for complying with any new or revised financial accounting standards† provided pursuant Section 13(a) of the Exchange Act.
◻
† The term “new or revised financial accounting standard” refers to any update issued by the Financial Accounting Standards Board to its Accounting Standards Codification after April 5, 2012.
Indicate by check mark whether the Registrant has filed a report on and attestation to its management’s assessment of the effectiveness of its internal control over financial reporting under Section 404(b) of the Sarbanes-Oxley Act (15 U.S.C. 7262(b)) by the registered public accounting firm that prepared or issued its audit report.
☑
If securities are registered pursuant to Section 12(b) of the Act, indicate by check mark whether the financial statements of the registrant included in the filing reflect the correction of an error to previously issued financial statements.
☐
Indicate by check mark whether any of those error corrections are restatements that required a recovery analysis of incentive-based compensation received by any of the registrant’s executive officers during the relevant recovery period pursuant to §240.10D-1(b).
☐
DISCLOSURE REGARDING CONTROLS AND PROCEDURES
Disclosure Controls and Procedures.
Disclosure controls and procedures are defined in Rule 13a-15(e) and Rule 15d-15(e) of the Securities Exchange Act of 1934, as amended (the “Exchange Act”) as those controls and procedures designed to ensure that information required to be disclosed in the annual filings and interim filings and other reports filed or submitted by Fortuna Silver Mines Inc. (the “Company”) under the Exchange Act is duly recorded, processed, summarized and reported, within the time periods specified in rules and forms of the United States Securities and Exchange Commission (the “SEC”). Disclosure controls and procedures include, without limitation, controls and procedures designed to ensure that information required to be disclosed in the Company’s reports and filings is accumulated and communicated to management, including the Chief Executive Officer (“CEO”) and Chief Financial Officer (“CFO”) as appropriate, to allow timely decisions regarding required disclosure.
The Company evaluated, with the participation of its CEO and CFO, the effectiveness of its disclosure controls and procedures as of December 31, 2023. Based on that evaluation, the CEO and the CFO have concluded that, as of the end of the period covered by this Annual Report on Form 40-F, the disclosure controls and procedures were effective to provide reasonable assurance that information required to be disclosed in the Company’s annual filings and interim filings and other reports filed or submitted under the Exchange Act, is recorded, processed, summarized and reported within time periods specified in SEC rules and forms and is accumulated and communicated to management, including the CEO and CFO, as appropriate to allow timely decisions regarding required disclosure.
Notwithstanding the foregoing, because of the inherent limitations in all control systems, no evaluation of controls can provide absolute assurance that the Company’s disclosure controls and procedures will detect or uncover every situation involving the failure of persons within the Company and its subsidiaries to disclose material information otherwise required to be set forth in the Company’s periodic reports. The Company’s disclosure controls and procedures are designed to provide reasonable assurance of achieving their objective of ensuring that information required to be disclosed in the reports that the Company files or submits under the Exchange Act is communicated to management to allow timely decisions regarding required disclosure.
Management’s Annual Report on Internal Control Over Financial Reporting.
Management is responsible for establishing and maintaining adequate internal control over financial reporting (as such term is defined in Rule 13a-15(f) and Rule 15d-15(f) under the Exchange Act) and has designed such internal controls over financial reporting to provide reasonable assurance regarding the reliability of financial reporting and preparation of financial statements for external purposes in accordance with International Financial Reporting Standards, as issued by the International Accounting Standards Board.
In designing and evaluating the Company’s internal control over financial reporting, the Company’s management recognizes that any controls and procedures, no matter how well designed and operated, can provide only reasonable assurance of achieving their objectives and management necessarily applies its reasonable judgment in evaluating the cost-benefit relationship of possible controls and procedures. Because of its inherent limitations, internal controls over financial reporting may not prevent or detect misstatements. Projections of any evaluation of effectiveness to future periods are subject to the risks that controls may become inadequate because of changes in conditions, or that the degree of compliance with the policies and procedures may deteriorate.
Management assessed the effectiveness of the Company’s internal control over financial reporting as of December 31, 2023. In making this assessment, management used the Internal Control – Integrated Framework (2013) issued by the Committee of Sponsoring Organizations of the Treadway Commission. Based on this assessment, management concluded that the Company’s internal control over financial reporting was effective as of December 31, 2023.
See “Management’s Report on Internal Control Over Financial Reporting” in the Management’s Discussion and Analysis for the fiscal years ended December 31, 2023 and 2022, included as Exhibit 99.3 to this Annual Report on Form 40-F. The Company’s auditors have issued an attestation report on management’s assessment of the Company’s internal control over financial reporting. See “Attestation Report of the Registered Public Accounting Firm” below.
Attestation Report of the Independent Registered Public Accounting Firm. The Company’s internal control over financial reporting as of December 31, 2023 has been audited by KPMG LLP, Independent Registered Public Accounting Firm, Vancouver, BC, Canada, Audit Firm ID 85. The required report is included in the “Report of Independent Registered Public Accounting Firm,” that accompanies the Company’s audited consolidated financial statements as at and for the fiscal years ended December 31, 2023 and 2022, filed as part of this Annual Report on Form 40-F in Exhibit 99.2.
Changes in Internal Control Over Financial Reporting. During the fiscal year ended December 31, 2023, there were no changes in the Company’s internal control over financial reporting that have materially affected, or are reasonably likely to materially affect, the Company’s internal control over financial reporting.
NOTICES PURSUANT TO REGULATION BTR
None.
IDENTIFICATION OF THE AUDIT COMMITTEE
The Company has a separately-designated standing audit committee established in accordance with Section 3(a)(58)(A) of the Exchange Act. The members of the audit committee are Kylie Dickson, Alfredo Sillau and David Farrell. The board of directors has determined that each of Kylie Dickson, Alfredo Sillau and David Farrell is independent, as that term is defined in Rule 10A-3 under the Exchange Act and the Listed Company Manual of the New York Stock Exchange.
AUDIT COMMITTEE FINANCIAL EXPERT
The board of directors of the Company has determined that Kylie Dickson, a member of the Company’s audit committee, qualifies as an audit committee financial expert for purposes of paragraph (8) of General Instruction B to Form 40-F. The SEC has indicated that the designation of Kylie Dickson as an audit committee financial expert does not: (i) make her an “expert” for any purpose, (ii) impose any duties, obligations or liabilities on her that are greater than those imposed on members of the audit committee and the board of directors who do not carry this designation, and (iii) or affect the duties, obligations or liabilities of any other member of the audit committee or the board of directors.
CODE OF ETHICS
The Company has adopted a “code of ethics” (as that term is defined in Form 40-F), entitled the “Code of Business Conduct and Ethics and Whistle-Blower Policy”, that applies to all of its directors, officers, employees, and consultants including its principal executive officer, principal financial officer, principal accounting officer or controller, and persons performing similar functions.
The Code of Business Conduct and Ethics and Whistle-Blower Policy is available for viewing on the Company’s website at www.fortunasilver.com under “About Company / Corporate Governance”.
PRINCIPAL ACCOUNTANT FEES AND SERVICES
The required disclosure is included under the heading “Audit Committee” in the Company’s Annual Information Form for the fiscal year ended December 31, 2023, filed as part of this Annual Report on Form 40-F in Exhibit 99.1.
PRE-APPROVAL POLICIES AND PROCEDURES
The auditors of the Company obtain, as necessary, the pre-approval of the Audit Committee for any anticipated additional services required of the auditors for the coming fiscal year. If other service requirements arise during the year, the Audit Committee will pre-approve such services at that time, prior to the commencement of such services. During the fiscal year ended December 31, 2023, the Audit Committee did not approve any audit-related, tax or other services pursuant to paragraph (c) (7) (i) (C) of Rule 2-01 of Regulation S-X, with the exception of certain financial statement preparation services relating to the statutory audits of certain of the Company's subsidiaries, the fees for which represented less than 5% of total fees for the fiscal year ended December 31, 2023.
OFF-BALANCE SHEET ARRANGEMENTS
The Company does not have any off-balance sheet arrangements required to be disclosed in this Annual Report on Form 40-F.
MINE SAFETY DISCLOSURE
The Company is currently not required to disclose the information required by Section 1503(a) of the Dodd-Frank Wall Street Reform and Consumer Protection Act.
NEW YORK STOCK EXCHANGE CORPORATE GOVERNANCE
The Company is a “foreign private issuer” as defined in Rule 3b-4 under the Exchange Act and Rule 405 under the United States Securities Act of 1933, as amended, and the Company’s common shares are listed on the New York Stock Exchange (the “NYSE”). Sections 103.00, 303A.00 and 303A.11 of the NYSE Listed Company Manual permit foreign private issuers to follow home country practices in lieu of certain provisions of the NYSE Listed Company Manual. A foreign private issuer that follows home country practices in lieu of certain provisions of the NYSE Listed Company Manual must disclose any significant ways in which its corporate governance practices differ from those followed by domestic companies either on its website or in the annual report that it distributes to shareholders in the United States. A description of the significant ways in which the Company’s governance practices differ from those followed by domestic companies pursuant to NYSE standards is disclosed on the Company’s website at www.fortunasilver.com under “Company / Corporate Governance / New York Stock Exchange”.
The Company’s corporate governance practices, as described on its website, are consistent with the laws, customs and practices in Canada.
INCORPORATION BY REFERENCE
Exhibits 99.1, 99.2 and 99.3 to this Annual Report on Form 40-F for the year ended December 31, 2023 are incorporated by reference into the Registration Statement on Form F-10 (Commission File No. 333-237897) of the Company.
UNDERTAKING
The Company undertakes to make available, in person or by telephone, representatives to respond to inquiries made by the SEC staff, and to furnish promptly, when requested to do so by the SEC staff, information relating to: the securities registered pursuant to Form 40-F; the securities in relation to which the obligation to file an annual report on Form 40-F arises; or transactions in said securities.
CONSENT TO SERVICE OF PROCESS
A Form F-X signed by the Company and its agent for service of process has been previously filed with the SEC together with the Company’s Registration Statement on Form 40-F (File No. 001-35297) in connection with its securities registered on such form.
Any changes to the name or address of the agent for service of process of the Company shall be communicated promptly to the SEC by an amendment to the Form F-X referencing the file number of the Company.
SIGNATURE
Pursuant to the requirements of the Exchange Act, the Company certifies that it meets all of the requirements for filing on Form 40-F and has duly caused this annual report to be signed on its behalf by the undersigned, thereto duly authorized.
|
|
|
|
|
Date: March 28, 2024 |
FORTUNA SILVER MINES INC. |
|
||
|
By: |
“Jorge Ganoza Durant” |
|
|
|
|
Name: Jorge Ganoza Durant |
|
|
|
|
Title:President, Chief Executive Officer & Director |
||
| ||||
EXHIBIT INDEX
Exhibit |
|
Description |
|
|
|
|
||
|
|
|
|
Annual Information Form for the year ended December 31, 2023 |
|
|
|
|
|
||
|
|
|
|
Management’s Discussion and Analysis for the years ended December 31, 2023 and 2022 |
|
|
|
|
|
Consent of KPMG LLP (PCAOB ID 85) |
|
|
|
|
|
||
|
|
|
|
||
|
|
|
|
||
|
|
|
|
||
|
|
|
|
||
|
|
|
|
||
|
|
|
|
||
|
|
|
|
||
|
|
|
|
Certification of Chief Executive Officer pursuant to Section 302 of the Sarbanes-Oxley Act of 2002 |
|
|
|
|
|
Certification of Chief Financial Officer pursuant to Section 302 of the Sarbanes-Oxley Act of 2002 |
|
|
|
|
|
Certification of Chief Executive Officer pursuant to Section 906 of the Sarbanes-Oxley Act of 2002 |
|
|
|
|
|
Certification of Chief Financial Officer pursuant to Section 906 of the Sarbanes-Oxley Act of 2002 |
|
|
|
|
101.INS |
|
XBRL Instance |
|
|
|
101.SCH |
|
XBRL Taxonomy Extension Schema |
|
|
|
101.CAL |
|
XBRL Taxonomy Extension Calculation Linkbase |
|
|
|
101.DEF |
|
XBRL Taxonomy Extension Definition Linkbase |
|
|
|
101.LAB |
|
XBRL Taxonomy Extension Label Linkbase |
|
|
|
101.PRE |
|
XBRL Taxonomy Extension Presentation Linkbase |
|
|
|
104 |
|
Cover Page Interactive Data File (formatted as Inline XBRL and contained in Exhibit 101) |
EXHIBIT 97
INCENTIVE COMPENSATION RECOVERY POLICY
FORTUNA SILVER MINES INC.
(the "Company")
INCENTIVE COMPENSATION RECOVERY POLICY
Purpose
The Board of Directors of the Company (“Board”) has adopted this Incentive Compensation Recovery Policy (“Policy”) in order to provide a measure of accountability by ensuring that Incentive-Based Compensation (as defined below) paid to its Executive Officers (as defined below) and employees is based on accurate Financial Reporting Measures (as defined below). This Policy complies with the listing requirements of the New York Stock Exchange (“NYSE Requirements”) and the Sarbanes-Oxley Act of 2002 (“SOX Requirements”) regarding the clawback of incentive-based compensation.
This Policy shall apply to Incentive-Based Compensation received on or after October 2, 2023 and which has been determined by the Board to be Erroneously Awarded Compensation (as defined below).
Definitions
“Clawback Period” means the three completed fiscal years immediately preceding the earlier of:
(1) |
the date the Board (or a committee thereof) or the officer or officers of the Company authorized to take such action if Board action is not required, concludes, or reasonably should have concluded, that the Company is required to prepare a Restatement (as defined below), or |
(2) |
the date that a court, regulator, or other legally authorized body directs the Company to prepare a Restatement. |
In addition, the Clawback Period includes any transition period that results from a change in the Company’s fiscal year within or immediately following those three completed fiscal years. However, a transition period between the last day of the Company’s previous fiscal year end and the first day of its new fiscal year that comprises a period of nine to twelve months would be deemed a completed fiscal year.
“Executive Officer” means the Company’s current or former:
(1) |
President, |
(2) |
Chief Executive Officer, |
(3) |
Chief Financial Officer, |
(4) |
Vice-President of Accounting and Finance, or if there is no such officer, then any principal accounting officer, or if there is no such officer, then the Controller, |
(5) |
any Senior Vice-President, and |
any other persons who currently perform or formerly performed a significant policy-making function for the Company, including executive officers of Company subsidiaries.
“Erroneously Awarded Compensation” means the amount of Incentive-Based Compensation received by a current or former Executive Officer or employee that exceeds the amount of Incentive-Based Compensation that otherwise would have been received had it been determined based on the Restatement, which shall be calculated without regard to any taxes paid. For Incentive-Based Compensation based on stock price or total shareholder return, where the amount of Erroneously Awarded Compensation is not subject to mathematical recalculation directly from the information in an accounting restatement:
(1) |
the amount shall be based on a reasonable estimate of the effect of the accounting restatement on the stock price or total shareholder return upon which the Incentive-Based Compensation was received; and |
(2) |
the Company shall maintain and provide documentation of the determination of that reasonable estimate to the NYSE. |
“Financial Reporting Measure” means a measure that is determined and presented in accordance with the accounting principles used in preparing the Company’s financial statements, and any measures that are derived wholly or in part from such measures. For the avoidance of doubt, a Financial Reporting Measure need not be presented within the financial statements, and stock price and total shareholder return are Financial Reporting Measures.
“Incentive-Based Compensation” means any compensation (including cash and equity compensation) that is granted, earned or vested based wholly or in part upon the attainment of any Financial Reporting Measure.
“Restatement” means any accounting restatement of the Company’s financial results due to material non-compliance of the Company with any financial reporting requirement under applicable securities laws, including any required accounting restatement to correct an error to previously issued financial statements:
(1) |
that is material to the previously issued financial statements, or |
(2) |
that would result in a material misstatement if the error were corrected in the current period or left uncorrected in the current period, |
and which requires the Company to file an amended financial statement, management’s discussion and analysis or other financial report (including for the current period) to correct such Restatement.
Recovery of Erroneously Awarded Compensation upon Restatement
In the event that the Company is required to prepare a Restatement, the Board shall require each Executive Officer and, if such Restatement was caused or contributed to by the fraud, theft, embezzlement, serious misconduct or negligence of an employee who is not an Executive Officer, each applicable employee, to repay and/or forfeit the Erroneously Awarded Compensation received by such person during the Clawback Period.
Incentive-Based Compensation shall be deemed “received” in the fiscal period during which the applicable Financial Reporting Measure specified in the Incentive-Based Compensation award is attained, even if the payment or grant occurs after the end of that fiscal period.
This Policy applies to all Incentive-Based Compensation received by a person:
(1) |
after beginning service as an Executive Officer or employee (including Incentive-Based Compensation derived from an award authorized before the individual is newly hired as an Executive Officer or employee, e.g. inducement grants), |
(2) |
who served as an Executive Officer or employee at any time during the performance period for that Incentive-Based Compensation, |
(3) |
while the Company has a class of securities listed on a national securities exchange or a national securities association, and |
(4) |
during the Clawback Period. |
To the extent the Erroneously Awarded Compensation represents an award which has previously been deferred, such deferred compensation award shall be forfeited. Without otherwise limiting the Company’s authority to recover the Erroneously Awarded Compensation hereunder, the Company shall have the authority to unilaterally forfeit deferred compensation, subject to compliance with Section 409A of the U.S. Internal Revenue Code or any other applicable local employment or tax law.
Clawback of Erroneously Awarded Compensation shall be without regard to any fault, misconduct, responsibility or involvement of the Executive Officer in the material non-compliance with Financial Reporting Measures that resulted in the Restatement. The Company’s obligation to recover Erroneously Awarded Compensation is not dependent on if or when the restated financial report is filed.
Where Incentive-Based Compensation is based only in part on the achievement of a Financial Reporting Measure performance goal, the Company will determine the portion of the original Incentive-Based Compensation based on or derived from the Financial Reporting Measure which was restated and will recalculate the affected portion based on the Financial Reporting Measure as restated to determine the difference between the greater amount based on the original financial report and the lesser amount that would have been received based on the Restatement. The Erroneously Awarded Compensation will be calculated on a pre-tax basis.
Recovery Mechanisms
In the event a Restatement is required, each person subject to clawback will be given the opportunity to elect how to repay his or her Erroneously Awarded Compensation to the Company, subject to approval of the Board and compliance with this Policy.
Failing such an election, the Board shall have the discretion to cancel scheduled but not granted awards, withhold payments of vested but unpaid awards, or take such other action as it deems appropriate to recoup all Erroneously Awarded Compensation from the Executive Officers. Where the Erroneously Awarded Compensation consists of equity compensation, the Board will recover the excess portion of the equity award that would not have been vested and/or paid based on the Restatement, as follows:
(1) |
if the vested portion of the equity award has been determined but has not been paid, the excess portion of the vested portion of the award will be forfeited; |
(2) |
if the equity award has been exercised or settled into shares (the “Underlying Shares”), and the person still holds the Underlying Shares, the Company will recover and return to treasury the number of Underlying Shares relating to the excess portion of the award (less any exercise price paid for the Underlying Shares); and |
(3) |
if the Underlying Shares have been sold by person, the Company will recover the proceeds received by the person from the sale of the Underlying Shares relating to the excess portion of the award (less any exercise price paid for the Underlying Shares). |
The Board will take such action as it deems appropriate, in its sole and absolute discretion, to reasonably promptly clawback the Erroneously Awarded Compensation, unless the Company’s committee of independent directors responsible for executive compensation decisions, or in the absence of such a committee, a majority of the independent directors serving on the Board, determines that it would be impracticable to recover such amount because:
(1) |
subsequent to making a reasonable and documented attempt at recovery, the direct costs of enforcing recovery would exceed the Erroneously Awarded Compensation amount to be recovered, documentation of which shall be provided to the NYSE; or |
(2) |
recovery would likely cause an otherwise tax-qualified retirement plan, under which benefits are broadly available to employees of the Company, to fail to meet the requirements of 26 U.S.C. 401(a)(13) or 26 U.S.C. 411(a) and regulations thereunder, based on an opinion of legal counsel; or (3) if the recovery of the incentive-based compensation would violate the employment or other home-country laws applicable to the Company based on an opinion of home country counsel, which opinion shall be provided to the NYSE. |
Additional Recovery as a Result of Misconduct pursuant to SOX Requirements
In addition to the provisions in this Policy which comply with the NYSE Requirements, if the Company is required to prepare a Restatement as a result of misconduct, then in accordance with the SOX Requirements, the Chief Executive Officer and Chief Financial Officer who were in office at the time the financial document embodying such financial reporting requirement was originally issued shall reimburse the Company for:
(1) |
any bonus or other incentive-based or equity-based compensation received from the Company during the 12-month period following the first public issuance or filing with the U.S. Securities and Exchange Commission (whichever first occurs) of such financial document; and |
(2) |
any profits realized from the sale of securities of the Company during that 12-month period. |
Such repayment shall be without regard to the knowledge, engagement or involvement of the Chief Executive Officer or Chief Financial Officer in the misconduct.
Limit of Amount Recoverable from any one Person
To the extent that the provisions of this Policy require recovery of Erroneously Awarded Compensation by the Company in compliance with both the NYSE Requirements and SOX Requirements, the amount recoverable from any one person shall be the greater of: (i) the amount required under the NYSE Requirements, and (ii) the amount required under the SOX Requirements as determined by the Board.
Changes to this Policy
The Board reserves the right, at its absolute discretion, to change this Policy from time to time as it considers necessary. Changes to this Policy will be communicated to all persons to whom this Policy applies.
General
The Board shall have full authority to interpret, amend and enforce this Policy on behalf of the Company. All determinations and decisions made by the Board (or any committee thereof) pursuant to the provisions of this Policy shall be final, conclusive and binding on the Company, its subsidiaries and the persons to whom this Policy applies.
The provisions of this Policy apply to the fullest extent of the law; provided however, to the extent that any provisions of this Policy are found to be unenforceable or invalid under any applicable law, such provision will be applied to the maximum extent permitted, and shall automatically be deemed amended in a manner consistent with its objectives to the extent necessary to conform to any limitations required under applicable law.
The Company will not indemnify or provide insurance to cover any repayment of Incentive-Based Compensation in accordance with this Policy.
This Policy is in addition to (and not in lieu of) any right of repayment, forfeiture or right of offset against any Executive Officer that is required pursuant to any other statutory repayment requirement, regardless of whether implemented at any time prior to or following the adoption of this Policy.
This Incentive Compensation Recovery Policy was adopted by the Board on November 22, 2023.
Exhibit 99.1
ANNUAL INFORMATION FORM
For the Fiscal Year Ended December 31, 2023
DATED: March 22, 2024
CORPORATE OFFICE: |
MANAGEMENT HEAD OFFICE: |
|
|
Suite 650, 200 Burrard Street |
Piso 5, Av. Jorge Chávez #154 |
Vancouver, BC V6C 3L6, Canada |
Miraflores, Lima, Peru |
Tel: 604.484.4085 |
Tel: 511.616.6060, ext. 2 |
Fax: 604.484.4029 |
|
TABLE OF CONTENTS
PRELIMINARY NOTES |
1 |
Cautionary Statement – Forward Looking Statements |
1 |
Notice Regarding Non-IFRS Measures |
5 |
Cautionary Note to United States Investors Concerning Estimates of Reserves and Resources |
6 |
Documents Incorporated by Reference |
7 |
Scientific and Technical Information |
7 |
Currency |
7 |
|
|
CORPORATE STRUCTURE |
7 |
Name, Address and Incorporation |
7 |
Intercorporate Relationships |
8 |
|
|
GENERAL DEVELOPMENT OF THE BUSINESS |
8 |
Business of the Company |
8 |
Three-Year History and Recent Developments |
9 |
|
|
DESCRIPTION OF THE BUSINESS |
27 |
General |
27 |
Sustainability Governance |
29 |
Risk Factors |
36 |
Material Mineral Properties (see Schedules “A”, “B”, “C”, “D” and “E”) |
67 |
Non-Material Mineral Properties |
67 |
|
|
DIVIDENDS |
67 |
|
|
DESCRIPTION OF CAPITAL STRUCTURE |
68 |
|
|
MARKET FOR SECURITIES |
70 |
Common Shares |
70 |
Debentures |
71 |
Prior Sales |
71 |
|
|
DIRECTORS AND EXECUTIVE OFFICERS |
71 |
Name, Occupation and Shareholding |
71 |
Cease Trade Orders or Bankruptcies |
73 |
Penalties or Sanctions |
74 |
Conflicts of Interest |
75 |
|
|
AUDIT COMMITTEE |
75 |
|
|
LEGAL PROCEEDINGS |
76 |
|
|
TRANSFER AGENT AND REGISTRAR |
76 |
|
|
MATERIAL CONTRACTS |
76 |
|
|
INTERESTS OF EXPERTS |
77 |
|
|
ADDITIONAL INFORMATION |
78 |
|
|
Material Mineral Properties: |
|
Séguéla Mine, Côte d’Ivoire |
Schedule “A” |
Yaramoko Mine, Burkina Faso |
Schedule “B” |
Lindero Mine, Argentina |
Schedule “C” |
San Jose Mine, Mexico |
Schedule “D” |
Caylloma Mine, Peru |
Schedule “E” |
Audit Committee Charter |
Schedule “F” |
FORTUNA SILVER MINES INC.
PRELIMINARY NOTES
This Annual Information Form (“AIF”) is dated March 22, 2024 and presents information about Fortuna Silver Mines Inc. (referred to herein as the “Company” or “Fortuna”). Except as otherwise indicated, the information contained herein is presented as at December 31, 2023, being the date of the Company’s most recently completed financial year end.
Fortuna has a number of direct and indirect subsidiaries which own and operate assets and conduct activities in different jurisdictions. The terms "Fortuna" or the "Company" are use in this AIF for simplicity of the discussion provided herein and may include references to subsidiaries that have an affiliation with Fortuna, without necessarily identifying the specific nature of such affiliation.
Cautionary Statement – Forward-Looking Statements
Certain statements contained in this AIF and the documents incorporated by reference into this AIF constitute forward-looking statements within the meaning of the United States Private Securities Litigation Reform Act of 1995 and Section 21E of the United States Securities Exchange Act of 1934, as amended (the “Exchange Act”) and Section 27A of the U.S. Securities Act of 1933, as amended (the “Securities Act”), and forward-looking information within the meaning of applicable Canadian securities legislation (collectively, “forward-looking statements”). All statements included herein, other than statements of historical fact, are forward-looking statements and are subject to a variety of known and unknown risks and uncertainties which could cause actual events or results to differ materially from those reflected in the forward-looking statements. The forward-looking statements in this AIF include, without limitation, statements relating to:
| ● | Mineral Reserves (as defined herein) and Mineral Resources (as defined herein) at the Caylloma, Lindero, San Jose, Séguéla and Yaramoko mines and at the Arizaro Project, as they involve implied assessment, based on estimates and assumptions that the Mineral Reserves and Mineral Resources described exist in the quantities predicted or estimated and can be profitably produced in the future; |
| ● | estimated rates of production for gold silver and the other metals that we produce, timing of production and the cash costs and all-in sustaining cash costs (“AISC”) estimates; |
| ● | expectations with respect to metal grade estimates and the impact of any variations relative to metal grades experienced; |
| ● | the Company's plans and expectations for its material properties and future Brownfields and Greenfields exploration, development and operating activities including, without limitation, capital expenditures, exploration activities and budgets, forecasts and schedule estimates, as well as their impact on the results of operations or financial condition of the Company; |
| ● | results from the feasibility and optimization work at the Séguéla Mine to realize the opportunity to incorporate underground mineable resources at the Sunbird, Ancien and Koula deposits; |
| ● | life of mine estimates for the Caylloma, Lindero, San Jose, Séguéla and Yaramoko Mines, including the exhaustion of Mineral Reserves at the San Jose Mine, the timing of the closure of the San Jose Mine, and the estimated costs of associated with such closure; |
| ● | the proposed expansion of ore processing at the Séguéla Mine above the target prepared and estimated in 2021 and the initiatives to de-bottleneck the processing plant to be put in place in 2024; |
| ● | timing for delivery of materials and equipment for the Company’s properties; |
| ● | timing and cost of sustaining capital projects at the Company’s mines, including the one-time phase II expansion of the leach pad at the Lindero Mine; the replacement and overhaul of heavy equipment and purchase of critical spare parts at the Lindero Mine; the expansion of the tailings storage facility at the Séguéla Mine; and the enhancement of the power grid substation and the completion of phase II of the plant power substation at the Caylloma Mine; |
| ● | the sufficiency of the Company’s cash on hand and available credit lines and estimated cash flows to fund planned capital and exploration programs at its properties; |
| ● | the Company’s financial performance being closely linked to the prices of silver and gold and other metals; |
| ● | rising costs caused by the effect of the Ukraine - Russian conflict and the Israel - Hamas war, causing increased rates of inflation and pressures on the global supply chain; |
|
ANNUAL INFORMATION FORM |
Page | 1 |
FORTUNA SILVER MINES INC.
| ● | the anticipated rates of returns from mining projects, as reflected in preliminary economic assessments, pre-feasibility and feasibility studies or other reports prepared in relation to development of projects; |
| ● | future sales of the metals and concentrates or other products that the Company produces, the availability and location of refineries and sales counterparts, and any plans and expectations with respect to hedging; |
| ● | the Company’s intentions with respect to the exploration of the Diamba Sud gold project (“Diamba Sud Project”); the results and anticipated timing of the 42,700 meter drill program at the Diamba Sud Project which is intended to confirm and to expand the historical mineral resource prepared under the JORC Code, and support the development of the project towards the preparation of a resource model in late 2024; |
| ● | undisclosed risks and liabilities relating to the acquisition of Chesser Resources Limited; |
| ● | restrictions on the ability of employees to travel and restrictions on supply chains as a result of epidemics, pandemics, and health crises may adversely affect the Company’s business and operations, and financial condition; |
| ● | the appeal by the Secretaria de Medio Ambiente y Recursos Naturales (“SEMARNAT”) to the reinstatement of the 12-year environmental impact authorization (“EIA”) for the San Jose Mine; |
| ● | the payments due under, and the maturity dates of the Company’s financial liabilities, lease obligations and other contractual commitments, including the Company’s outstanding convertible debentures in the aggregate amount of $45.7 million which mature in October 2024 and its senior secured credit facility of which an aggregate of $165 million was outstanding as at December 31, 2023 and which matures in November 2025; |
| ● | the expiry dates of bank letters of guarantee; |
| ● | compliance with environmental, health, safety and other regulations; |
| ● | the Company’s commitment to sustainable development, by conducting its operations in an environmentally and socially responsible manner, including complying with its Sustainability Framework, its environmental, social and governance (“ESG”) policies and targets and other operational and governance policies, such as the Company’s commitment to implementing standards and ensuring compliance with applicable requirements of Global Industry Standard on Tailings Management for its tailings storage facilities by 2027; |
| ● | the ability of the Company to reduce its greenhouse gas (“GHG”) emissions to transition to a lower carbon economy and lessen the impact of its operations on climate change, through projects such as solar power plants at the Lindero and Séguéla Mines; and changing to an energy supplier at its Caylloma Mine which provides energy from 100% renewable energy sources; |
| ● | the Company’s commitment to mitigating the physical risks of climate change at its mine sites and to minimize its operational water consumption as well as to reduce its exposure to climate-related transition risks; |
| ● | complying with anti-corruption laws; |
| ● | litigation matters; |
| ● | estimated mine closure costs, including remediation and reclamation and timing thereof; and |
| ● | future income tax rate. |
Often, but not always, these forward-looking statements can be identified by the use of words such as “anticipates”, “believes”, “plans”, “estimates”, “expects”, “forecasts”, “scheduled”, “targets”, “possible”, “strategy”, “potential”, “intends”, “advance”, “goal”, “objective”, “projects”, “budget”, “calculates” or statements that events, “will”, “may”, “could” or “should” occur or be achieved and similar expressions, including negative variations.
The forward-looking statements in this AIF also include financial outlooks and other forward-looking metrics relating to Fortuna and its business, including references to financial and business prospects and future results of operations, including production, and cost guidance and anticipated future financial performance. Such information, which may be considered future oriented financial information or financial outlooks within the meaning of applicable Canadian securities legislation (collectively, “FOFI”), has been approved by management of the Company and is based on assumptions which management believes were reasonable on the date such FOFI was prepared, having regard to the industry, business, financial conditions, plans and prospects of Fortuna and its business and properties. These projections are provided to describe the prospective performance of the Company’s business. Nevertheless, readers are cautioned that such information is highly subjective and should not be relied on as necessarily indicative of future
|
ANNUAL INFORMATION FORM |
Page | 2 |
FORTUNA SILVER MINES INC.
results and that actual results may differ significantly from such projections. FOFI constitutes forward-looking statements and is subject to the same assumptions, uncertainties, risk factors and qualifications as set forth below.
Material Risks and Assumptions
Forward-looking statements involve known and unknown risks, uncertainties and other factors which may cause the actual events, results, performance or achievements of the Company to be materially different from any events, results, performance or achievements expressed or implied by the forward-looking statements. Such risks, uncertainties and factors include, among others:
| ● | operational risks associated with mining and mineral processing; |
| ● | uncertainty relating to Mineral Resource and Mineral Reserve estimates; |
| ● | uncertainty relating to capital and operating costs, production schedules and economic returns; |
| ● | uncertainties related to new operations such as the Séguéla Mine, including the possibility that actual capital and operating costs and economic returns will differ significantly from those estimated for such projects prior to production; |
| ● | uncertainty relating to the financing and timing of the Company’s sustaining capital projects at its mines due to the increased costs and rising rates of inflation; |
| ● | risks relating to the Company’s ability to replace its Mineral Reserves; |
| ● | risks associated with mineral exploration and project development; |
| ● | risk related to the exploration of projects such as the Diamba Sud Project, including whether a mineral resource estimate prepared under NI 43-101 (as defined herein) will be confirmed, and if confirmed will be in an amount satisfactory to the Company; |
| ● | risks associated with political instability and changes to the regulations governing the Company’s business operations; |
| ● | uncertainty relating to the repatriation of funds as a result of currency controls; |
| ● | environmental matters including obtaining or renewing environmental permits and potential liability claims; |
| ● | uncertainties related to the timing of the closure of the San Jose Mine; |
| ● | changes in national and local government legislation, taxation, controls, regulations and political or economic developments in countries in which the Company does or may carry on business, including potential changes by the new Argentine Government to national macroeconomic policies, the taxation system and import and export duties; |
| ● | risks associated with war, hostilities or other conflicts, such as the Ukrainian – Russian conflict and the Israel – Hamas war, and the possible impact of such conflicts on global economic activity; |
| ● | risks relating to the termination of the Company’s mining concessions in certain circumstances; |
| ● | risks related to International Labour Organization (“ILO”) Convention 169 compliance; |
| ● | developing and maintaining relationships with local communities and stakeholders; |
| ● | risks associated with losing control of public perception as a result of social media and other web-based applications; |
| ● | potential opposition to the Company’s exploration, development and operational activities; |
| ● | risks related to the Company’s ability to obtain adequate financing for planned exploration and development activities; |
| ● | substantial reliance on the Séguéla Mine, the Lindero Mine, the Yaramoko Mine and the Caylloma Mine for revenues; |
| ● | property title matters; |
| ● | risks relating to the integration of businesses and assets acquired by the Company; |
| ● | failure to meet covenants under the 2021 Credit Facility (as defined herein), or an event of default which may reduce the Company’s liquidity and adversely affect its business; |
| ● | impairments; |
| ● | restrictions on the 2021 Credit Facility being temporary in nature; |
| ● | reliance on key personnel; |
| ● | uncertainty relating to potential conflicts of interest involving the Company’s directors and officers; |
|
ANNUAL INFORMATION FORM |
Page | 3 |
FORTUNA SILVER MINES INC.
| ● | risks associated with the Company’s reliance on local counsel and advisors and its management and Board (as defined herein) in foreign jurisdictions; |
| ● | adequacy of insurance coverage; |
| ● | operational safety and security risks; |
| ● | risks related to the Company’s compliance with the Sarbanes-Oxley Act; |
| ● | risks related to the foreign corrupt practices regulations and anti-bribery laws; |
| ● | uncertainties regarding the outcome of the appeal of the reinstatement of the Company’s 12 year EIA at the San Jose Mine; |
| ● | legal proceedings and potential legal proceedings; |
| ● | uncertainties relating to general economic conditions; |
| ● | competition; |
| ● | fluctuations in metal prices; |
| ● | risks associated with entering into commodity forward and option contracts for base metals production; |
| ● | fluctuations in currency exchange rates; |
| ● | tax audits and reassessments; |
| ● | risks related to hedging; |
| ● | uncertainty relating to concentrate treatment charges and transportation costs; |
| ● | sufficiency of monies allotted by the Company for land reclamation; |
| ● | risks associated with dependence upon information technology systems, which are subject to disruption, damage, failure and risks with implementation and integration; |
| ● | the possibility of an outbreak of a communicable disease, epidemic or pandemic in areas in which Fortuna operates, which could affect global economic growth and impact the Company’s business, operations, financial condition and share price; |
| ● | uncertainty relating to nature and climate conditions; |
| ● | risks associated with climate change legislation; |
| ● | our ability to manage physical and transition risks related to climate change and successfully adapt our business strategy to a low carbon global economy; |
| ● | the anticipated nature and effect of climate related risks; |
| ● | risks related to the volatility of the trading price of the Company’s common shares (“Common Shares”) and the Company’s senior subordinated unsecured convertible debentures in the aggregate principal amount of US$45.7 million (the “Debentures”); |
| ● | dilution from future equity or convertible debt financings; |
| ● | risks related to future insufficient liquidity resulting from a decline in the price of the Common Shares or Debentures; |
| ● | uncertainty relating to the Company’s ability to pay dividends in the future; |
| ● | risks relating to the market for the Company’s securities; |
| ● | risks relating to the Debentures of the Company; |
| ● | uncertainty relating to the enforcement of U.S. judgments against the Company; and |
| ● | risk factors referred to in the “Risk Factors” section in this AIF, and the documents incorporated by reference herein (if any). |
Forward-looking statements contained in this AIF are based on the assumptions, beliefs, expectations and opinions of management, including but not limited to:
| ● | that all required third party contractual, regulatory and governmental approvals will be obtained and maintained for the exploration, development, construction and production of its properties; |
| ● | there being no significant disruptions affecting operations, whether relating to labor, supply, power, damage to equipment or any other matter; |
| ● | there being no material and negative impact to the various contractors, suppliers and subcontractors at the Company’s mine sites as a result of the Ukrainian – Russian conflict and the Isarael – Hamas war or otherwise that would impair their ability to provide goods and services; |
| ● | permitting, construction, development and expansion proceeding on a basis consistent with the Company’s current expectations; |
|
ANNUAL INFORMATION FORM |
Page | 4 |
FORTUNA SILVER MINES INC.
| ● | expected trends and specific assumptions regarding metal prices and currency exchange rates; |
| ● | prices for and availability of fuel, electricity, parts and equipment and other key supplies remaining consistent with current levels; |
| ● | production forecasts meeting expectations; |
| ● | any investigations, claims, and legal, labor and tax proceedings arising in the ordinary course of business will not have a material effect on the results of operations or financial condition of the Company; and |
| ● | the accuracy of the Company’s current Mineral Resource and Mineral Reserve estimates. |
Although the Company has attempted to identify important factors that could cause actual actions, events or results to differ materially from those described in forward-looking statements, there may be other factors that cause actions, events or results not to be as anticipated, estimated or intended. These forward-looking statements are made as of the date of this AIF. There can be no assurance that forward-looking statements will prove to be accurate, as actual results and future events could differ materially from those anticipated in such statements. Accordingly, readers are cautioned not to place undue reliance on forward-looking statements. Except as required by law, the Company does not assume the obligation to revise or update these forward looking-statements after the date of this document or to revise them to reflect the occurrence of future unanticipated events.
Notice Regarding Non-IFRS Measures
Fortuna’s audited consolidated financial statements for the years ended December 31, 2023 and 2022 (the “2023 Financial Statements”) which are referred to in this AIF have been prepared in accordance with International Financial Reporting Standards (“IFRS”), as issued by the International Accounting Standards Board. However, this AIF includes certain financial measures and ratios that are not defined under IFRS and are not disclosed in the 2023 Financial Statements, including but not limited to: cash cost per ounce of gold sold; cash cost per tonne of processed ore; cash cost per ounce of silver equivalent; consolidated cash cost per ounce of gold equivalent sold; AISC per ounce of gold sold; AISC per ounce of silver equivalent; and consolidated AISC per ounce of gold equivalent.
These non-IFRS financial measures and non-IFRS ratios are widely reported in the mining industry as benchmarks for performance and are used by management to monitor and evaluate the Company’s operating performance and ability to generate cash. The Company believes that, in addition to financial measures and ratios prepared in accordance with IFRS, certain investors use these non-IFRS financial measures and ratios to evaluate the Company’s performance. However, the measures do not have a standardized meaning under IFRS and may not be comparable to similar financial measures disclosed by other companies. Accordingly, non-IFRS financial measures and non-IFRS ratios should not be considered in isolation or as a substitute for measures and ratios of the Company's performance prepared in accordance with IFRS.
Except as otherwise described below, the Company has calculated these non-IFRS financial measures and non-IFRS ratios consistently for all periods presented.
To facilitate a better understanding of these measures and ratios as calculated by the Company, descriptions are provided below. In addition, see “Non-IFRS Financial Measures” in the Company’s management’s discussion and analysis for the fiscal year ended December 31, 2023 (“2023 MD&A”), which section is incorporated by reference in this AIF, for additional information regarding each non-IFRS financial measure and non-IFRS ratio disclosed in this AIF, including an explanation of their composition; an explanation of how such measures and ratios provide useful information to an investor and the additional purposes, if any, for which management of Fortuna uses such measures and ratios; and a qualitative reconciliation of each non-IFRS financial measure to the most directly comparable financial measure that is disclosed in the Company’s 2023 Financial Statements. The 2023 MD&A may be accessed on SEDAR+ at www.sedarplus.ca and on EDGAR at www.sec.gov under the Company’s profile, Fortuna Silver Mines Inc.
Equivalent Ounces
At our San Jose and Caylloma Mines, production and sales of other metals are treated as a silver equivalent in determining a combined precious metal production or sales unit, commonly referred to as silver equivalent ounces. Silver equivalent ounces are calculated by converting other metal production to its silver equivalent using relative
|
ANNUAL INFORMATION FORM |
Page | 5 |
FORTUNA SILVER MINES INC.
metal/silver metal prices at realized prices and adding the converted metal production expressed in silver ounces to the ounces of silver production. The Lindero, Yaramoko and Séguéla Mines do not make use of an equivalent ounce measure as all material production is gold.
However, consolidated cash costs for production of all mines is provided on a gold equivalent basis. Gold equivalent ounces are calculated by converting other metal production to its gold equivalent using relative metal/gold metal prices at realized prices and adding the converted metal production expressed in gold ounces to the ounces of gold production.
Cash Cost and AISC
In this AIF, the Company has disclosed certain cash cost and AISC figures on a per unit basis, with each such per unit measure being a non-IFRS ratio.
Cash cost is a non-IFRS measure that is an industry-standard method of comparing certain costs on a per unit basis. Cash costs include all direct and indirect operating cash costs related directly to the physical activities of producing metals, including mining and processing costs, third-party refining and treatment charges, on-site general and administrative expenses, applicable production taxes and royalties which are not based on sales or taxable income calculations , net of by-product credits, but are exclusive of the impact of non-cash items that are included as part of the cost of sales that is calculated in the consolidated Income Statement including depreciation and depletion, reclamation, capital, development and exploration costs.
The most directly comparable financial measure to cash cost that is defined in IFRS and disclosed in the Company’s 2023 Financial Statements is cost of sales. Unit based cash cost ratios contained in this AIF include:
| ● | cash cost per ounce of gold sold; |
| ● | cash cost per tonne of processed ore; |
| ● | cash cost per ounce of silver equivalent; and |
| ● | consolidated cash cost per ounce of gold equivalent sold |
AISC: The Company, in conjunction with an initiative undertaken within the gold mining industry, has adopted AISC and all-in sustaining cost measures based on guidance published by World Gold Council. The Company conforms its AISC and all-in cash cost definitions to that set out in the guidance and the Company presents the cash cost figures on a sold ounce basis.
AISC is a non-IFRS measure that includes total production cash costs incurred at the applicable mining operation but excludes mining royalty recognized as income tax within the scope of IAS-12, as well as non-sustaining capital expenditures. Sustaining capital expenditures, corporate selling, general and administrative expenses, and Brownfields exploration expenditures are added to the cash cost. AISC is estimated at realized metal prices.
The most directly comparable financial measure to AISC that is defined in IFRS and disclosed in the Company's 2023 Financial Statements is cost of sales. Unit based AISC ratios contained in this AIF include:
| ● | all-in sustaining cash cost per ounce of gold sold; |
| ● | all-in sustaining cash cost per ounce of silver equivalent; and |
| ● | consolidated all-in sustaining cash cost per ounce of gold equivalent sold |
Cautionary Note to United States Investors Concerning Estimates of Reserves and Resources
The Company is a Canadian “foreign private issuer” as defined in Rule 3b-4 under the Exchange Act and is permitted to prepare the technical information contained herein in accordance with the requirements of the securities laws in effect in Canada, which differ from the requirements of the securities laws currently in effect in the United States.
|
ANNUAL INFORMATION FORM |
Page | 6 |
FORTUNA SILVER MINES INC.
Technical disclosure regarding our properties included herein and, in the documents, incorporated herein by reference, if applicable, was prepared in accordance with National Instrument 43-101 — Standards of Disclosure for Mineral Projects (“NI 43-101”). NI 43-101 is a rule developed by the Canadian Securities Administrators that establishes standards for all public disclosure an issuer makes of scientific and technical information concerning mineral projects. NI 43-101 differs significantly from the disclosure requirements of the Securities and Exchange Commission (the “SEC”) generally applicable to U.S. companies. Accordingly, information contained herein is not comparable to similar information made public by U.S. companies reporting pursuant to SEC disclosure requirements.
Documents Incorporated by Reference
The information provided in this AIF is supplemented by disclosure contained in the documents listed below which are incorporated by reference into this AIF. These documents must be read together with the AIF in order to provide full, true and plain disclosure of all material facts relating to Fortuna. The documents listed below are not contained within or attached to this document. The documents may be accessed on SEDAR+ at www.sedarplus.ca and on EDGAR at www.sec.gov under the Company’s profile for Fortuna Silver Mines Inc.
Document |
Effective Date |
Date Filed on |
Document |
Technical Report, Séguéla Gold Mine, Côte d’Ivoire |
December 31, 2023 |
February 16, 2024 |
Technical Report(s) |
Technical Report, Yaramoko Gold Mine, Burkina Faso |
December 31, 2022 |
March 24, 2023 |
Technical Report(s) |
Technical Report, Lindero Mine and Arizaro Project, Argentina |
December 31, 2022 |
March 28, 2023 |
Technical Report(s) |
Technical Report, San Jose Mine, Mexico |
December 31, 2023 |
March 8, 2024 |
Technical Report(s) |
Technical Report, Caylloma Mine, Peru |
December 31, 2023 |
February 16, 2024 |
Technical Report(s) |
Scientific and Technical Information
Eric Chapman, Senior Vice President of Technical Services of the Company, is a “Qualified Person” as defined by NI 43-101. Mr. Chapman is responsible for ensuring that the technical information contained in this AIF is an accurate summary of the original reports and data provided to or developed by the Company and he has reviewed and approved the scientific and technical information contained in this AIF.
Currency
Unless otherwise noted, all dollar amounts in this AIF are expressed in United States dollars. References to “$” or “US$” in this AIF are to United States dollars and references to CAD$ are to Canadian dollars.
CORPORATE STRUCTURE
Name, Address and Incorporation
The Company was incorporated on September 4, 1990 pursuant to the Company Act (British Columbia) under the name Jopec Resources Ltd. and subsequently transitioned under the Business Corporations Act (British Columbia). On February 3, 1999, the Company changed its name to Fortuna Ventures Inc. and on June 28, 2005 to Fortuna Silver Mines Inc.
|
ANNUAL INFORMATION FORM |
Page | 7 |
FORTUNA SILVER MINES INC.
The management head office of the Company is located at Piso 5, Av. Jorge Chávez #154, Miraflores, Lima, Peru. The corporate head and registered office of the Company is located at 200 Burrard Street, Suite 650, Vancouver, BC V6C 3L6.
Intercorporate Relationships
The chart below illustrates the Company’s intercorporate relationships with its subsidiaries including the name, jurisdiction of incorporation and the Company’s respective percentage ownership of each subsidiary:
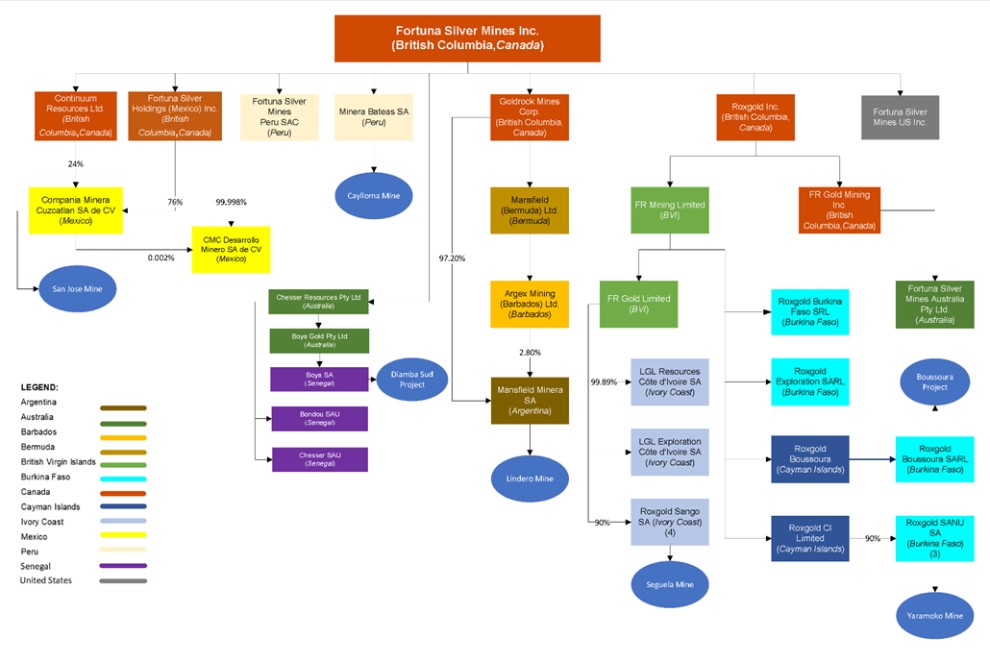
Notes:
1. |
In some jurisdictions where the Company operates, laws require that a company operating mineral properties must have more than one shareholder. For those jurisdictions, a nominal interest may be held by an individual or other affiliated entity and this may not be represented on the above chart. |
2. |
All ownership of subsidiaries is 100% unless otherwise indicated. |
3. |
10% of the issued and outstanding shares of Roxgold Sanu S.A. are held by the State of Burkina Faso |
4. |
10% of the issued and outstanding shares of Roxgold Sango S.A. are held by the State of Côte d’Ivoire. |
GENERAL DEVELOPMENT OF THE BUSINESS
Business of the Company
Fortuna is engaged in precious and base metals mining and related activities in Latin America and West Africa, including exploration, extraction, and processing. The Company’s principal products are gold and silver, although it also produces and sells lead and zinc.
|
ANNUAL INFORMATION FORM |
Page | 8 |
FORTUNA SILVER MINES INC.
As at December 31, 2023, Fortuna:
| ● | operates the underground San Jose silver and gold mine (the “San Jose Mine”) (100% ownership) in southern Mexico; |
| ● | operates the Lindero open pit gold mine (the “Lindero Mine”) (100% ownership) in northern Argentina; |
| ● | operates the Yaramoko open pit gold mine (the “Yaramoko Mine”) (90% ownership) in southwestern Burkina Faso; |
| ● | operates the underground Caylloma silver, lead and zinc mine (the “Caylloma Mine”) (100% ownership) in southern Peru, and |
| ● | operates the Séguéla open pit gold mine (the “Séguéla Mine”) (90% ownership) in northwestern Côte d’Ivoire. |
The Company also has various Greenfields exploration properties at different stages of development in Côte d’Ivoire, Mexico, and Senegal.
Three-Year History and Recent Developments
Over the three most recently completed financial years, the significant events described below contributed to the development of the Company’s business.
2021 Developments
The Company reported full year production results for 2021 from its four operating mines: the San Jose Mine in Mexico, the Lindero Mine in Argentina, the Yaramoko Mine in Burkina Faso, and the Caylloma Mine in Peru. In 2021, the Company produced 207,192 ounces of gold (274% increase over 2020), 7,498,701 ounces of silver (5% increase over 2020), 32,989,973 pounds of lead (11% increase over 2020) and 47,549,301 pounds of zinc (4% increase 2020). Production results for each mine in 2021 compared to 2020 are as follows:
Yaramoko Mine: as a result of the Roxgold Acquisition completed in July 2021, the Company acquired the Yaramoko Mine. From July 2, 2021, the Company produced 57,538 ounces of gold with an average gold head grade of 7.13 g/t. Cash cost per ounce of gold sold1 for the second semester of 2021 was $739.
Lindero Mine: in 2021, the Company produced 104,161 ounces of gold, comprised of 99,313 ounces in doré, 730 ounces of gold contained in precipitate/sludge and 4,118 ounces of gold-in-carbon (GIC) inventory, an increase of 675% over the 13,435 ounces produced in 2020. Cash cost per ounce of gold sold2 for the first full year of production in 2021 was $617.
San Jose Mine: in 2021, the Company produced 6,425,029 ounces of silver, an increase over 2020 of 4%, and 39,406 ounces of gold, an increase over 2020 of 4%. Average head grades for silver and gold for the year were 209 g/t and 1.29 g/t, respectively, both a decrease of 7% over the respective head grades in 2020. Cash cost per tonne of processed ore3 for 2021 increased to $75.80 compared to $68.79 for 2020 due to higher mine preparation and support and higher indirect costs.
Caylloma Mine: in 2021, the Company produced 1,073,62 ounces of silver, an increase over 2020 of 11%. Annual average head grade for silver was 76 g/t. Base metal production at the Caylloma Mine in 2021 totaled 33.0 million pounds of lead, an increase of 11% over 2020, and 47.5 million pounds of zinc, an increase of 4% over 2020. Average head grades for lead and zinc were 3.16% and 4.56%, respectively, for the year. Gold production for 2021 totaled 6,086 ounces, an increase of 48% over 2020, with an average head grade of 0.49 g/t. Cash cost
1 |
Cash cost per ounce of gold sold is a non-IFRS measure. Refer to “Notice Regarding Non-IFRS Measures” section above. |
2 |
Refer to footnote 1, above. |
3 |
Cash cost per tonne of processed ore is a non-IFRS measure. Refer to “Notice Regarding Non-IFRS Measures” section above. |
|
ANNUAL INFORMATION FORM |
Page | 9 |
FORTUNA SILVER MINES INC.
per tonne of processed ore4 for the full year 2021 increased to $88.41 compared to $77.19 for 2020 due to higher mine preparation and support and higher indirect costs related to administration and energy.
On February 8, 2021, the Company announced the resignation of Simon Ridgway as a director and Chairman of the Board. David Laing was appointed as an independent Chair of the board of directors of the Company (the “Board”).
On March 29, 2021, the Company announced the results from a successful 4,670 meters of step-out and infill drilling over 22 drill holes at the San Jose Mine which established continuity of high-grade mineralization in the upper levels of the Trinidad Footwall structures.
In 2009, SEMARNAT granted an EIA to Fortuna’s Mexican subsidiary, Companía Minera Cuzcatlan (“Minera Cuzcatlan”), which authorized the construction, execution and maintenance of the San Jose Mine for a period of 12 years effective until October 23, 2021. In May 2021, Minera Cuzcatlan filed an application to extend the term of the EIA for an additional period of 10 years. On November 10, 2021 Minera Cuzcatlan received written notification from SEMARNAT that the application to extend the EIA had been denied. Minera Cuzcatlan appealed the decision of SEMARNAT and obtained the protection of the Mexican courts to continue to operate the San Jose Mine beyond the expiry date of the EIA. On December 20, 2021, the Company announced that SEMARNAT had granted a 12 year extension to the EIA at the San Jose Mine. On February 4, 2022, the Company announced that it had received a notice from SEMARNAT which advised that SEMARNAT had made a typographical error in the extension to the term of the EIA for the San Jose Mine and that the correct extension term is two years. Minera Cuzcatlan initiated legal proceedings to challenge and revoke the allegation of the typographical error and to reconfirm the 12 year extension granted by SEMARNAT in December 2021. The Mexican Federal Administrative Court admitted the Company’s legal proceedings and granted an injunction in favour of the Company, which suspended the reduction of the term of the EIA from 12 years to two years during the course of the legal proceedings. See “2022 Developments” and “2023 Developments” below for further updates on this matter.
On July 2, 2021, the Company completed its acquisition of all of the issued and outstanding common shares (“Roxgold Shares”) of Roxgold Inc. (“Roxgold”) by way of a court-approved plan of arrangement under the Business Corporations Act (British Columbia) pursuant to an arrangement agreement between the Company and Roxgold dated effective April 26, 2021 (the “Arrangement Agreement”). Under the terms of the Arrangement Agreement, holders of Roxgold Shares received 0.283 of a Common Share and CAD$0.01 in cash for each Roxgold Share held. Upon completion of the Roxgold Acquisition, Fortuna issued an aggregate of 106,106,225 Common Shares and CAD$374,934 in cash and Roxgold became a wholly-owned subsidiary of Fortuna. As a result of the Roxgold Acquisition, the Company acquired the producing Yaramoko mine in Burkina Faso, the Séguéla advanced gold project in Côte d’Ivoire and certain exploration projects in Burkina Faso and Côte d’Ivoire. See “Business of the Company”.
In connection with the Roxgold Acquisition, Kate Harcourt was appointed a director of the Company and a member of the Sustainability Committee of the Company (the “Sustainability Committee”) on July 2, 2021. Additionally, various changes in the Company’s executive officers were made during the second half of 2021 to reflect the expansion of the Company’s operations into West Africa.
On September 7, 2021, the Company announced continued high grade results from extension and scout drilling at the Séguéla Project in Côte d’Ivoire and the Boussoura project in Burkina Faso. Exploration activities at the Séguéla Project included a 7,115 meter step-out drilling program at the Koula deposit; a 1,774 meter 11 hole program at the Sunbird prospect and a 2,070 meter 11 hole program at the Gabbro North prospect. Exploration activities at the Boussoura project included a 5,958 meter 47 hole program at the Fofora Main prospect and a 3,419 meter 12 hole program at the Galgouli prospect.
On September 29, 2021, the Company announced the decision to proceed with the construction of an open pit mine at the Séguéla Project in Côte d’Ivoire with long lead items procured and development teams established on the ground. The updated Séguéla Project budgeted total capital investment is $173.5 million. The anticipated construction schedule is approximately 20 months, with ramp-up to design capacity expected in the third quarter of 2023.
4 |
Refer to footnote 3. |
|
ANNUAL INFORMATION FORM |
Page | 10 |
FORTUNA SILVER MINES INC.
On October 7, 2021, the Company and the Mexican Geological Service (“SGM”) entered into a settlement agreement related to a disputed royalty on one of the mining concessions at the San Jose mine in Mexico. Pursuant to the settlement agreement, the Company paid to the SGM the amount of $9.6 million plus value added tax to end any prior dispute and agreed to pay to the SGM a three percent royalty on the billing value of minerals obtained from the concession from May 1, 2021 on an ongoing basis. The terms of the royalty are set out in a royalty agreement between the parties dated March 18, 2022. The remaining terms of the settlement are confidential, and the Company has not admitted any liability.
In November 2021, the Company entered into a fourth amended and restated credit agreement (the “2021 Credit Facility”) with a syndicate of banks led by BNP Paribas, and including the Bank of Nova Scotia, Bank of Montreal and Societe Generale which converted the Company’s non-revolving and revolving facility into a revolving credit facility and increased the amount of the facility from $120 million to $200 million, subject to certain terms and conditions. The 2021 Credit Facility has a term of four years maturing in November 2025 and steps down to $150 million after three years. Interest initially accrued on LIBOR loans under the 2021 Credit Facility at LIBOR plus an applicable margin (now SOFR loans plus an applicable margin) of between two and three percent, which varied according to the consolidated leverage levels of the Company. The Company’s principal operating subsidiaries in Mexico, Peru, Côte d’Ivoire and Burkina Faso, and their respective direct and indirect holding companies, have pledged all of their respective assets to secure their respective guarantees of such payment, including the shares of the Company’s principal operating subsidiaries in Mexico and Peru. The Company’s principal operating subsidiary in Burkina Faso has pledged its bank accounts to secure the obligations under its guarantee and the holding companies of the Company’s principal operating subsidiaries in Burkina Faso and Côte d’Ivoire and Burkina Faso have pledged the shares of those principal operating subsidiaries to secure the obligations under their guarantees. The 2021 Credit Facility was amended in 2022. See “2022 Developments” below for further details.
On December 9, 2021, the Company announced results from the exploration programs at the Séguéla Project, the San Jose Mine, the Arizaro project in Argentina, and the Caylloma Mine.
In 2021, the Company made significant progress on the development of its corporate climate change strategy. It conducted gap assessments to analyze how its then climate change practices compared to climate change best practices and the practices of its peers in the areas of governance, strategy, risk management, metrics and targets, and reporting and disclosure. The Company developed a multi-year climate change strategy implementation roadmap which focuses on addressing gaps between our existing practices and climate change best practices. A key milestone on this roadmap was to disclose a credible and achievable GHG emissions reduction target, supported by clear reduction pathways.
2022 Developments
The Company reported full year production results for 2022 from its four operating mines: the San Jose Mine in Mexico, the Lindero Mine in Argentina, the Yaramoko Mine in Burkina Faso, and the Caylloma Mine in Peru. In 2022, the Company produced 259,427 ounces of gold (25% increase over 2021), 6,907,275 ounces of silver (8% decrease over 2021), 34,588,324 pounds of lead (5% increase over 2021) and 46,175,821 pounds of zinc (3% decrease over 2021). Production results for each mine in 2022 compared to 2021 are as follows:
Yaramoko Mine: in 2022, the Company produced 106,108 ounces of gold achieving the mid-point of the annual guidance range. The average gold head grade for the year was 6.37 g/t in line with the planned estimate for the year. Cash cost per ounce of gold sold5 for 2022 was $840 compared to $739 from the date of acquisition on July 2, 2021 to December 31, 2021, primarily due to higher mining service costs related to inflation and variation in orebody sequence.
Lindero Mine: in 2022, the Company produced 118,418 ounces of gold, comprised of 116,191 ounces in doré and 2,227 ounces of gold-in-carbon (GIC), an increase of 14% over the 104,161 ounces produced in 2021. Cash
5 |
Refer to footnote 1. |
|
ANNUAL INFORMATION FORM |
Page | 11 |
FORTUNA SILVER MINES INC.
cost per ounce of gold sold6 for 2022 increased to $740 compared to $617 in 2021, due to higher operating costs primarily due to inflation and lower stripping capitalization.
San Jose Mine: in 2022, the Company produced 5,762,562 ounces of silver, a decrease over 2021 of 10%, and 34,124 ounces of gold, a decrease over 2021 of 13%. Average head grades for silver and gold for the year were 191 g/t and 1.14 g/t, respectively, a decrease of 9% and 12% over the respective head grades in 2021. Cash cost per tonne of processed ore7 for 2022 increased to $81.33 compared to $75.80 for 2021, due to higher mine preparation, support and indirect costs.
Caylloma Mine: in 2022, the Company produced 1,144,713 ounces of silver, an increase over 2021 of 7%. Average head silver head grade was 80 g/t, an increase over 2021 of 5%. Base metal production at the Caylloma Mine in 2022 totaled 46.2 million pounds of zinc and 34.6 million pounds of lead, both exceeding the upper range of annual guidance. Average head grades for zinc and lead were 4.32% and 3.27%, respectively, for the year. Cash cost per tonne of processed ore8 for 2022 increased to $92.96 compared to $88.41 in 2021 mainly due to higher mine costs caused by inflation.
One of the Company’s main focuses for 2022 was the construction of the mine at Séguéla. Construction at the Séguéla Project advanced during 2022 in accordance with the project timeline and budget, despite worldwide supply chain challenges. The Séguéla Project was 29% complete at the end of 2021 and by the end of January 2023 it was approximately 90% complete.
On February 4, 2022, the Company announced that Minera Cuzcatlan had received a notice from SEMARNAT which advised that SEMARNAT had made a typographical error in the extension to the term of the EIA for the San Jose Mine and that the correct extension term is two years. Minera Cuzcatlan initiated legal proceedings to challenge and revoke the allegation of the typographical error and to reconfirm the 12 year extension granted by SEMARNAT in December 2021. The Mexican Federal Administrative Court admitted Minera Cuzcatlan’s legal proceedings and granted an injunction in favour of the Company, which suspended the reduction of the term of the EIA from 12 years to two years during the course of the legal proceedings. On November 7, 2022, the Company received notice that the Mexican Federal Administrative Court had issued a judgment in favour of the Company, which re-confirmed that the extension of the term of the EIA for the San Jose Mine is for a period of 12 years. See “2023 Developments” below for further updates on this matter.
On March 15, 2022, the Company announced a maiden inferred mineral resource estimate for the Sunbird discovery located at the Séguéla Project. It was estimated that the Sunbird deposit contains an inferred mineral resource of 3.4 million tonnes at an average grade of 3.16 g/t gold containing 350,000 gold ounces. The inferred mineral resource does not materially change the existing mineral resource estimate at Séguéla.
On May 2, 2022, the Company initiated a share repurchase program to purchase up to five percent of its issued and outstanding Common Shares, expiring on the earlier of May 1, 2023 and the date on which Fortuna has acquired the maximum number of Common Shares allowable under the Normal Course Issuer Bid (“NCIB”) or the date on which Fortuna otherwise decides not to make any further repurchases under the NCIB. From the commencement of the share repurchase program to December 31, 2022, in accordance with the Company’s NCIB, the Company re-purchased an aggregate of 2,201,404 common shares at a weighted average price of $2.69 per share via open market purchases through the facilities of the New York Stock Exchange (“NYSE”) for a total repurchase value of approximately $5.9 million, all of which shares were subsequently returned to treasury and cancelled. No share repurchases under the NCIB were made in 2023. See “General Development of the Business - 2024 Recent Developments” regarding share repurchases made in 2024 under the NCIB. The Company will continue to evaluate further share purchases with respect to this program when it believes the share price undervalues the Company and based on cash requirements.
6 |
Refer to footnote 1. |
7 |
Refer to footnote 3. |
8 |
Refer to footnote 3. |
|
ANNUAL INFORMATION FORM |
Page | 12 |
FORTUNA SILVER MINES INC.
Effective June 27, 2022, the Board approved the appointment of Ms. Salma Seetaroo as an additional director of the Company. Ms. Seetaroo brings her skills and experience in commodities, financing, investment banking, and project development in West Africa. She has spent the last 17 years working on debt, equity, and special situations investments in Africa as an investment banker.
On August 17, 2022, the Company announced the voluntary resignation of Paul Criddle from the position of Chief Operating Officer – West Africa effective September 30, 2022. David Whittle, formerly the Vice-President Operations – West Africa, assumed the role of Chief Operating Officer – West Africa effective October 1, 2022.
On December 5, 2022, the Company announced that additional exploration drilling at the Sunbird deposit has resulted in an upgraded mineral resource estimate, including a maiden indicated mineral resource of 3.2 million tonnes at an average grade of 2.66 g/t gold containing 279,000 ounces and an inferred mineral resource of 4.2 million tonnes at an average grade of 3.73 g/t gold containing 506,000 ounces. The indicated mineral resource and increased inferred mineral resource do not materially change the existing mineral resource estimate at Séguéla.
On December 15, 2022, the Company announced that it had entered into an amendment to the 2021 Credit Facility which increased the maximum facility amount by US$50 million to US$250 million. The maturity date of the 2021 Credit Facility remained unchanged and matures in November 2025. The 2021 Credit Facility was further amended in 2023. See “2023 Developments” below for further details.
Key amendments to the 2021 Credit Facility include:
| ● | Addition of an uncommitted US$50 million accordion option which can increase the aggregate principal amount under the credit facility to US$300 million, exercisable on or after June 1, 2023 and before October 2024; |
| ● | An increase in the step-down level of the facility from US$150 million to US$175 million in November 2024; |
| ● | Potential annual extensions of both the maturity date and the step-down date |
| ● | Replacement of discontinued LIBOR based interest rates by secured overnight financing rate based rates published by the Federal Reserve Bank of New York and the inclusion of market standard benchmark interest rate replacement provisions; and |
| ● | 25 basis points increase in the benchmark loan interest rate margins and 9 to 12 basis points increase in the commitment fee rate; the actual margin and rate will be determined based on the Company’s net senior secured leverage ratio. |
In April 2022, the Company disclosed its commitments towards the reduction of GHG emissions and the transition to a lower carbon economy under a formal Climate Change Position Statement. In addition, the Company:
| ● | included climate change into its Enterprise Risk Management system and the mapping of its climate risks; and |
| ● | launched a study to define the Company’s GHG baseline and reduction opportunities as well as a decarbonization roadmap and targets. |
2023 Developments
Construction of the Séguéla Mine was completed in mid-2023, on time and on budget, and its first gold pour took place on May 24, 2023, making it the Company’s fifth operating mine. The mine produced 78,617 ounces of gold in 2023 which was in accordance with the production guidance for 2023.
The Company reported full year production results for 2023 from its five operating mines: the Séguéla Mine in Côte d’Ivoire, the Yaramoko Mine in Burkina Faso, the Lindero Mine in Argentina, the San Jose Mine in Mexico, and the Caylloma Mine in Peru. In 2023, the Company produced 326,638 ounces of gold (26% increase over 2022), 5,883,691 ounces of silver (15% decrease over 2022), 40,851,657 pounds of lead (18% increase over 2022) and 55,060,450 pounds of zinc (19% decrease over 2022).
|
ANNUAL INFORMATION FORM |
Page | 13 |
FORTUNA SILVER MINES INC.
Production results for each mine in 2023 compared to 2022 are as follows:
Séguéla Mine, Côte d’Ivoire
Exceeded annual production guidance by 5%; operated 20% above nameplate capacity
In 2023, the Séguéla Mine produced 78,617 ounces of gold, since its first gold pour in May 2023. The average gold head grade for the year was 3.42 g/t. Cash cost per ounce of gold sold9 for 2023 was $357.
Yaramoko Mine, Burkina Faso
Strong performance, achieved higher end of annual production guidance
In 2023, the Company produced 117,711 ounces of gold, achieving the higher end of annual production guidance and an 11% increase over the 106,108 ounces produced in 2022. The average gold head grade for the year was 6.81 g/t, a 7% increase over 2022. Cash cost per ounce of gold sold10 decreased in 2023 to $809 compared to $840 in 2022, primarily due to increased production and lower mining costs during the year.
Lindero Mine, Argentina
Achieved midpoint of annual production guidance
In 2023, the Lindero Mine produced 101,238 ounces of gold, comprised of 94,905 ounces in doré bars, 6,015 ounces in gold contained in fine carbon, and 319 ounces contained in copper concentrate, a 15% decrease over the 118,418 ounces produced in 2022. Cash cost per ounce of gold sold11 for 2023 increased to $920 compared to $739 in 2022, due to lower processed gold grades in accordance with the mine plan.
San Jose Mine, Mexico
Illegal blockade and operational challenges led to shortfall in annual production guidance
In 2023, the San Jose Mine produced 4,656,631 ounces of silver, a 19% decrease over 2022, and 28,559 ounces of gold, a 16% decrease over 2022. Average head grades for silver and gold for the year were 171 g/t and 1.06 g/t, respectively, a decrease of 10% and 7% over the respective head grades in 2022. Cash cost per tonne of processed ore12 for 2023 increased to $98.98 compared to $81.33 for 2022, mainly influenced by the appreciation of the Mexican Peso and 10% lower tonnes processed.
Caylloma Mine
Outperformer, exceeded annual production guidance for all metals
In 2023, the Caylloma Mine produced 1,227,060 ounces of silver, a 7% increase over 2022. Average head silver head grade was 85 g/t, a 6% increase over 2022. Base metal production at the Caylloma Mine in 2023 totaled 55,060,450 pounds of zinc and 40,851,657 pounds of lead, both exceeding the upper range of annual guidance. Average head grades for zinc and lead were 5.11% and 3.74%, respectively, for the year, an increase of 18% and 14% over the respective head grades in 2022. Cash cost per tonne of processed ore13 for 2023 increased to $100.40 compared to $92.96 in 2022 mainly due to higher capital costs.
On January 5, 2023, the Company announced that Minera Cuzcatlan had received notice of a resolution (the “SEMARNAT Resolution”) issued by SEMARNAT which provides that SEMARNAT has annulled and is re-assessing the 12 year extension to the EIA for the San Jose Mine that it granted to Minera Cuzcatlan in December 2021.
9 |
Refer to footnote 1. |
10 |
Refer to footnote 1. |
11 |
Refer to footnote 1. |
12 |
Refer to footnote 3. |
13 |
Refer to footnote 3. |
|
ANNUAL INFORMATION FORM |
Page | 14 |
FORTUNA SILVER MINES INC.
Management of the Company believed that the SEMARNAT Resolution was unfounded and had no merits. Accordingly, Minera Cuzcatlan initiated legal proceedings (the “Mexican Legal Proceedings”) in the Mexican Federal Administrative Court (the “Court”) to contest and revoke the annulment of the San Jose EIA. The Court admitted the Mexican Legal Proceedings, and on March 14, 2023, the Company announced that Court granted a permanent injunction which allows the San Jose Mine to continue to operate under the terms of the 12-year EIA until the determination of the Mexican Legal Proceedings.
On October 30, 2023, the Company announced that the Court had ruled in favour of Minera Cuzcatlan and reinstated the 12-year EIA for the San Jose Mine. The decision of the Court has been appealed and was admitted by the Mexican Collegiate Court (the “Appeals Court”) in January 2024. Minera Cuzcatlan filed a response with the Appeals Court in February 2024. A decision of the Appeals Court is expected within the next six to 12 months. The permanent injunction previously granted to Minera Cuzcatlan remains in effect.
See “Risk Factors – The Company is subject to extensive government regulations and permit requirements”. Until the determination of the Mexican Legal Proceedings, the Company has agreed with its lenders to certain temporary restrictions under the 2021 Credit Facility. See “Risk Factors – Temporary restrictions on the 2021 Credit Facility”.
In August 2023, the Company published (refer to Fortuna news release dated August 8, 2023) an update on exploration activities at the Yaramoko Mine. The Company had completed a drilling program of 29 holes for a total of 7,011 meters, testing the strike and vertical extent of high grade extensions to the Zone 55 mineralization to the west, and limited strike extent testing to the lower east levels of the underground operation.
Zone 55 drilling highlights:
| ● | YRM-22-GCDD-184: 9.6 g/t Au over an estimated true width of 5.5 meters from 254.10 meters |
| ● | YRM-23-GCDD-203: 32.8 g/t Au over an estimated true width of 3.1 meters from 287.90 meters |
| ● | YRM-23-GCDD-205: 13.2 g/t Au over an estimated true width of 4.6 meters from 302.28 meters |
| ● | YRM-23-GCDD-224: 8.9 g/t Au over an estimated true width of 8.2 meters from 120.95 meters |
| ● | YRM-23-GCDD-227: 8.8 g/t Au over an estimated true width of 8.6 meters from 140.10 meters |
Drilling to the west intersected new high grade mineralization beyond the boundary of the 2022 Mineral Resource at Yaramoko, with recent mine development extending approximately 130 meters beyond the previous design. Drilling continued in the second half of 2023 to test the depth potential.
Step-out drilling to the east and at depth also continued to identify the Zone 55 mineralized structure beyond the limits of the 2022 Mineral Resource boundary, with results including drill hole GCDD-224 returning 8.9 g/t Au over a true width of 8.2 meters. Drilling continued in the second half of 2023.
In September 2023, the Company expanded its presence in West Africa with the acquisition (the “Chesser Acquisition”) of all of the issued and outstanding common shares (“Chesser Shares”) of Chesser Resources Limited (“Chesser”) by way of a court-approved scheme of arrangement pursuant to the Australian Corporations Act 2001. Under the terms of the Chesser Acquisition, holders of Chesser Shares received 0.0248 of a common share of Fortuna for each Chesser Share held. Upon completion of the Chesser Acquisition, Fortuna issued an aggregate of 15,545,368 common shares of Fortuna and Chesser became a wholly-owned subsidiary of Fortuna. As a result of the Chesser Acquisition, the Company acquired the preliminary economic assessment stage Diamba Sud Gold Project (“Diamba Sud Project”) in Senegal, one of the new and emerging gold discoveries in the region. See “Non-Material Mineral Properties” herein.
In December 2023, the 2021 Credit Facility was further amended to include additional security to the lenders in the form of guarantees and share pledges from the Company’s subsidiaries which indirectly own the Diamba Sud Project in Senegal, acquired pursuant to the Chesser Acquisition. These guarantees are in addition to the guarantees already provided by Fortuna’s operating subsidiaries in Burkina Faso, Côte d’Ivoire, Mexico and Peru.
In 2023, the Company's main climate-related focus was to conduct the required analysis on energy consumption and GHG emissions to enable the Company to set a GHG emissions reduction target. In addition, the Company conducted
|
ANNUAL INFORMATION FORM |
Page | 15 |
FORTUNA SILVER MINES INC.
an initial climate-related scenario analysis to enhance its understanding of its exposure to climate-related risks and opportunities and the resilience of its business strategy. The results of this analysis are to be included in the Company’s first Climate Change Report which is anticipated to be published in the second quarter of 2024.
2024 Recent Developments
On February 8, 2024, the Company announced its target to reduce Scope 1 and Scope 2 GHG emissions by 15% in 2030 compared to “business as usual” forecast GHG emissions if no intervention measures were taken. See “ Sustainability Governance – Climate Change” below for further details.
On March 11, 2024, the Company announced the results of its exploration programs at the Séguéla Mine. Following on the Barana, Badior and Kestrel discoveries made during 2022 and 2023, the Company has completed a 2,040-meter, 20-hole program at the newly discovered Kingfisher prospect identifying three lodes along a 1.9-kilometer strike, all of which remain open along strike and at depth. Results include drill hole SGRC1762 intersecting 2.9 g/t Au over an estimated true width of 19.6 meters from 106 meters downhole, and drill hole SGRC1763 intersecting 2.9 g/t Au over an estimated true width of 16.1 meters from 136 meters downhole.
The Kingfisher prospect is hosted in a set of quartz veins along a moderately sheared contact between a series of basalt-dolerite units which also hosts the Boulder and Agouti deposits, one and three kilometers, respectively, to the north, with a steep easterly dip consistent with the majority of other deposits at Séguéla. Additional drilling at Kingfisher is scheduled in the second quarter of 2024 to further test its strike and depth potential.
The Company completed a 3,106-meter, 12-hole program at the Koula deposit in December 2023. As part of the support for potential underground mining, the program was designed to infill and further improve the understanding of the structural controls on the central and hanging wall high-grade lodes. Results such as 22.5 g/t Au over an estimated true width of 9.8 meters from 208 meters downhole, including 68.0 g/t Au over an estimated true width of 2.1 meters from 215 meters downhole in drillhole SGRD1783, highlight the potential of Koula. Drilling continues to expand Koula’s underground potential and the further delineation of the hanging wall lodes. Please refer to the Company’s news release dated March 11, 2024 for full details of the Séguéla drill holes and assay results.
Subsequent to December 31, 2023 and up to March 22, 2024, in accordance with the Company’s NCIB the Company repurchased an aggregate of 790,589 Common Shares at a weighted average price of $3.40 per share via open market purchases through the facilities of the NYSE for a total repurchase value of approximately $2.69 million, all of which shares were or will be returned to treasury and cancelled.
Outlook for 2024
2024 Production and Cost Guidance
The Company’s production and cost guidance for 2024 is set out below.
Mine |
Silver (Moz) |
Gold (koz) |
Lead (Mlbs) |
Zinc (Mlbs) |
Cash Cost1,23,5 |
AISC1,2,3,5 |
Silver |
($/oz Ag Eq) |
($/oz Ag Eq) |
||||
San Jose, Mexico |
3.1 - 3.6 |
19 - 23 |
- |
- |
20.3 - 22.3 |
22.8 - 24.0 |
Caylloma, Peru |
0.9 - 1.1 |
- |
29 - 34 |
36 - 39 |
12.7 - 14.0 |
18.0 - 21.0 |
Gold |
($/oz Au) |
($/oz Au) |
||||
Lindero, Argentina4 |
- |
93 - 105 |
- |
- |
850 - 950 |
1,730 - 1,950 |
Yaramoko, Burkina Faso |
- |
105 - 119 |
- |
- |
865 - 965 |
1,220 - 1,320 |
Séguéla, Côte d´Ivoire |
- |
126 - 138 |
- |
- |
630 - 730 |
1,110 - 1,230 |
Consolidated Total |
4.0 - 4.7 |
343 - 385 |
29 - 34 |
36 - 39 |
$935 - 1,0556 |
$1,485 - 1,6406 |
Notes:
1. |
Cash Cost and AISC are non-IFRS financial measures which are not standardized financial measures under the financial reporting framework used to prepare the financial statements of the Company and might not be comparable to similar financial measures disclosed by other issuers. Refer to the note under “Non-IFRS Financial Measures” below. |
|
ANNUAL INFORMATION FORM |
Page | 16 |
FORTUNA SILVER MINES INC.
2. |
Cash cost includes production cash cost and for Lindero, is net of copper by-product credit. AISC includes sustaining capital expenditures, worker’s participation (as applicable) commercial and government royalties mining tax, export duties (as applicable), subsidiary G&A and Brownfields exploration and is estimated at metal prices of $1,800/oz Au, $22/oz Ag, $2,000/t Pb, and $2,500/t Zn. AISC excludes government mining royalty recognized as income tax within the scope of IAS-12. |
3. |
Silver equivalent is calculated at metal prices of $1,800/oz Au, $22/oz Ag, $2,000/t Pb and $2,500/t Zn. |
4. |
The cost guidance for the Lindero Mine does not take into account potential changes by the new Argentine Government to national macroeconomic policies, the taxation system and import and export duties which, if implemented, may have a material impact on costs. |
5. |
Historical non-IFRS measure cost comparatives: The following table provides the historical cash costs and historical AISC for the Company’s four mines which were operating during the year ended December 31, 2022, as follows: |
Mine |
Cash Costa,b,c |
AISCa,b,c |
Silver |
($/oz Ag Eq) |
($/oz Ag Eq) |
San Jose, Mexico |
10.56 |
15.11 |
Caylloma, Peru |
12.34 |
17.97 |
Gold |
($/oz Au) |
($/oz Au) |
Lindero, Argentina |
740 |
1,142 |
Yaramoko, Burkina Faso |
840 |
1,529 |
(a) |
Cash cost and AISC are non-IFRS financial measures; refer to “Notice Regarding Non-IFRS Financial Measures” section above. |
(b) |
Silver equivalent was calculated at metal prices of $1,802/oz Au, $21.75/oz Ag, $2,161/t Pb and $3,468/t Zn for the year ended December 31, 2022. |
(c) |
Further details on the cash costs and AISC for the year ended December 31, 2022 are disclosed on pages 38, 40, and 41 (with respect to cash costs) and pages 39 and 42 (with respect to AISC) of the Company’s management discussion and analysis for the year ended December 31, 2022 dated as of March 15, 2023 (“2022 MD&A”) which is available under Fortuna’s SEDAR+ profile at www.sedarplus.ca, and the note under “Non-IFRS Financial Measures” below. |
6. |
2024 cash cost and consolidated AISC guidance: |
AISC Guidance |
2024 Guidance ($/oz Au Eq) |
||
Note:
(a) Cash cost includes production cash cost and for Lindero, is net of copper by-product credit. AISC includes sustaining capital expenditures, worker’s participation (as applicable) commercial and government royalties mining tax, export duties (as applicable), subsidiary G&A and Brownfields exploration and is estimated at metal prices of $1,800/oz Au, $22/oz Ag, $2,000/t Pb, and $2,500/t Zn. AISC excludes government mining royalty recognized as income tax within the scope of IAS-12.
Séguéla Mine, Côte d’Ivoire – production guidance for 2024
Mill throughput expanded to 1.46 Mta, achieving 70% of mill expansion scheduled for 2026
The 2024 Séguéla mine plan considers mining in the Antenna, Ancien, and Koula pits, with plans to process 1.46 million tonnes of ore averaging 3.0 g/t Au, and capital investments estimated at $39.8 million, including $32 million for sustaining capital expenditures and $7.8 million for Brownfields exploration programs.
Feasibility and optimization work is underway to realize the opportunity to incorporate underground mineable resources at the Sunbird, Ancien, and Koula deposits.
|
ANNUAL INFORMATION FORM |
Page | 17 |
FORTUNA SILVER MINES INC.
Major sustaining capital investments include:
· |
Capitalized stripping |
$17.1 million |
· |
Tailings storage facility (TSF) lift |
$4.8 million |
· |
Other miscellaneous |
$10.1 million |
Capitalized stripping at Séguéla corresponds to further mining of the Antenna pit and development and mining of the Ancien and Koula pits. The overall stripping ratio for 2024 is planned to be 8.2:1. AISC for 2024 reflects the ongoing TSF expansion project, which will add tailings holding capacity for the next two years and is expected to be completed in the first half of 2024.
In 2024, annual ore processing is expanded to 1.46 million tonnes, 17 percent above tonnage originally estimated and scheduled in 2021 for year 1, and close to the expansion target of 1.57 million tonnes originally estimated and scheduled in 2021 for year 3. Process plant de-bottlenecking initiatives in 2024 still present upside opportunities for throughput capacity.
Cash cost and AISC:
· |
The Company expects a 2024 cash cost between $630 and $730 per ounce of gold14, an increase of approximately 113 percent over 2023 at the upper range, and 84 percent at the lower range of guidance. The increase is mainly due to the mine’s stripping ratio rising from 3.7:1 to 8.2:1, in accordance with the mine plan. In addition, higher costs are anticipated for processing, which include milling, energy consumption, freight, transportation, and overheads. |
· |
The Company expects a 2024 AISC between $1,110 and $1,230 per ounce of gold15, an increase of approximately 54 percent over 2023 at the upper range, and 39 percent at the lower range of guidance. The increase is explained by higher cash cost per ounce and higher capex per ounce of approximately $120 related to capitalized stripping costs. |
Yaramoko Mine, Burkina Faso – production guidance for 2024
Grade and tonnages benefit from exploration success in 2023
At the Yaramoko Mine, the Company plans to process 435,000 tonnes of ore averaging 8.3 g/t Au. Capital investment decreases substantially compared to previous years and in 2024 mainly comprises of development and exploration activities.
Major sustaining capital investment projects include:
· |
Mine development |
$13.9 million |
· |
Brownfields exploration |
$6.1 million |
Cash cost and AISC:
· |
The Company expects a 2024 cash cost between $865 and $965 per ounce of gold16, an increase of approximately 29 percent over 2023 at the upper range, and 16 percent at the lower range of guidance. The increase is due primarily to the reallocation of fixed mining costs from capex to opex and lower processed ore. |
· |
The Company expects a 2024 AISC between $1,220 and $1,320 per ounce of gold17, a decrease of approximately 7 percent under 2023 at the upper range, and 14 percent at the lower range of guidance. The decrease is explained by lower capex year over year of approximately $250 per ounce of gold. |
14 |
Refer to footnote 1. |
15 |
AISC per ounce of gold is a non-IFRS measure. Refer to “Notice Regarding Non-IFRS Measures” section above. |
16 |
Refer to footnote 1. |
17 |
Refer to footnote 15. |
|
ANNUAL INFORMATION FORM |
Page | 18 |
FORTUNA SILVER MINES INC.
Lindero Mine, Argentina – production guidance for 2024
Sustaining capital intensive year, including a one-time leach pad expansion of $41.7 million
The Lindero Mine is expected to place 6.6 million tonnes of ore on the leach pad averaging 0.62 g/t Au, containing an estimated 131,000 ounces of gold. Capital investments are estimated at $64.0 million, including $51.5 million in capital projects, and $12.5 million in capitalized stripping costs.
Major sustaining capital investments include:
· |
Capitalized stripping |
$12.5 million |
· |
Leach pad phase II expansion |
$41.7 million |
· |
Heavy equipment replacement and overhaul |
$6.6 million |
· |
Plant critical spare parts |
$3.2 million |
Cash cost and AISC:
· |
The Company expects a 2024 cash cost between $850 and $950 per ounce of gold18, mostly in line with 2023. |
· |
The Company expects a 2024 AISC between $1,730 and $1,950 per ounce of gold19, an increase of approximately 22 percent over 2023 at the upper range, and 9 percent at the lower range of guidance. 2024 is a particularly capital intensive year for Lindero, including a one-time leach pad phase II expansion project which is planned to be completed in the second half of 2024, with a capital estimate of $41.7 million. |
While the Lindero Mine continues delivering on cost savings from operational efficiency programs, the economics of Lindero are exposed to potential significant impacts in changes to macro-economic and taxation policies, derived from emergency announcements made by the newly elected national Government in its attempt to eliminate the national fiscal deficit. Cash cost per ounce does not include any potential changes to the Argentine taxation regime on imports and export duties, as these are still being discussed by the Government and Congress. However, if passed as advertised, these represent additional risks to higher cash cost per ounce and AISC estimates.
San Jose Mine, Mexico – production guidance for 2024
Cost increments lead to exhaustion of reserves by year end 2024
At the San Jose Mine, the Company plans to process 0.90 million tonnes of ore averaging 142 g/t Ag and 0.9 g/t Au. Silver and gold production reflect the declining grade profile of the tail end of the Mineral Reserves.
The updated mine plan for 2024 is scheduled to exhaust Mineral Reserves by the end of 2024, compared to mid-2025 as previously planned. Over the past 12 months, the operation has experienced significant cost increments, of which the main drivers are:
| ● | Mexican Peso appreciation; representing approximately 35 percent of cost increment. |
| ● | Higher contractor costs for transportation, distribution, shotcrete, maintenance, and mining services; representing approximately 16 percent of cost increment. |
| ● | Higher labor costs and new labor reform mandates, which took effect on January 1, 2024; representing approximately 21 percent of cost increment. |
| ● | Change from owner’s mining fleet to contractor for mine development; representing approximately 6 percent of cost increment. |
| ● | Higher costs in fuel, energy, materials, and consumables related to 2023 inflation; representing approximately 5 percent of cost increment. |
As a result of the cost increments described above, the mine plan has been reduced by approximately six months, leading to an anticipated closure in late 2024 from the previous estimation of closure in mid-2025, which is subject to further review and consideration upon the exhaustion of Mineral Reserves and an updated mine closure plan.
18 |
Refer to footnote 1. |
19 |
Refer to footnote 15. |
|
ANNUAL INFORMATION FORM |
Page | 19 |
FORTUNA SILVER MINES INC.
The Company has assigned a dedicated team to review and update a multiyear progressive mine closure and monitoring plan with a current budget of approximately $27 million, which will begin its implementation during 2024. Multiple considerations are being included such as closure-related technical studies and designs, remediation of affected areas, decommissioning and removal of infrastructure, landform reshaping, revegetation, and value-added activities for the communities associated with progressive closure, repurposing, and where appropriate, long-term monitoring and maintenance, whilst adhering to strict compliance with mine closure governmental regulations and high international standards.
The Company is engaged in an intensive exploration program to delineate the newly discovered Yessi vein.
Cash cost and AISC:
· |
The Company expects a 2024 cash cost between $20.3 and $22.3 per ounce of silver equivalent20, an increase of approximately 70 percent over 2023 at the upper range, and 54 percent at the lower range of guidance. The increase is mainly explained by lower production related to the grade profile as per the remaining life of mine plan, and the impact of higher projected operational expenditures, reflecting incremental costs throughout 2023. In addition, cash cost includes remaining lateral and vertical development and infill drilling required to complete final stoping and mining, as well as mining equipment overhauling, totaling $10.7 million. |
· |
The Company expects a 2024 AISC between $22.8 and $24.0 per ounce of silver equivalent21, an increase of approximately 31 percent over 2023 at the upper range, and 24 percent at the lower range of guidance. The increase is mainly explained by lower volume and higher cash cost, partially offset by no capital expenditures in 2024. |
Caylloma Mine, Peru – production guidance for 2024
Consistent performer
At the Caylloma Mine, the Company plans to process 0.5 million tonnes of ore averaging 78 g/t Ag, 3.12 % Pb, and 4.20 % Zn. Capital investments are estimated at $21.0 million, including $19.0 million for sustaining capital expenditures and $2.0 million for Brownfields exploration programs.
Sustaining capital investments include:
· |
Mine development |
$5.1 million |
· |
Caylloma Mine substation power grid enhancement |
$2.9 million |
· |
Plant power sub-station, phase II |
$1.4 million |
· |
New paste backfill system |
$4.7 million |
· |
Operating permits and GISTM(as defined below) |
$1.2 million |
· |
Maintenance |
$3.7 million |
Cash cost and AISC:
· |
The Company expects a 2024 cash cost between $12.7 and $14.0 per ounce of silver equivalent22, a decrease of approximately 6 percent under 2023 at the upper range, and 14 percent at the lower range of guidance. The decrease is mainly due to lower treatment and refining charges in 2024. |
· |
The Company expects a 2024 AISC between $18.0 and $21.0 per ounce of silver equivalent23, in line with 2023 at the upper range, and a decrease of 14 percent at the lower range of guidance. The decrease is explained mainly by lower cash costs and slightly lower capital expenditures. |
20 |
Cash cost per ounce of silver is a non-IFRS measure. Refer to “Notice Regarding Non-IFRS Measures” section above. |
21 |
AISC per ounce of silver is a non-IFRS measure. Refer to “Notice Regarding Non-IFRS Measures” section above. |
22 |
Refer to footnote 20. |
23 |
Refer to footnote 21. |
|
ANNUAL INFORMATION FORM |
Page | 20 |
FORTUNA SILVER MINES INC.
2024 Exploration Outlook
Fortuna continues to advance its robust pipeline of Brownfields and Greenfields exploration projects in West Africa and the Americas, building on the success of the exploration programs carried out in 2023.
Brownfields Exploration
Fortuna´s consolidated Brownfields exploration budget for 2024 for its five mines and the Diamba Sud Project totals $30.8 million, which includes 192,500 meters of reverse circulation, diamond core, and air core exploration drilling.
Séguéla Mine, Côte d’Ivoire
The Brownfields exploration program budget for 2024 at Séguéla is $7.8 million, which includes 41,750 meters of exploration drilling, focused on testing and extending underground targets associated with the Sunbird, Ancien, and Koula deposits, as well as advancing emerging deposits such as Barana, Badior, Kestral, and the newly discovered Kingfisher prospect, and continuing to explore for additional prospects.
Yaramoko Mine, Burkina Faso
The Brownfields exploration program budget for 2024 at Yaramoko is $6.1 million, which includes 41,450 meters of exploration drilling, with underground drilling testing western and depth extensions to the Zone 55 deposit, surface drilling testing several anomalies along the Boni Shear, Bagassi South surface extensions, and other surface targets.
San Jose Mine, Mexico
The Brownfields exploration program budget for 2024 at San Jose is $4.9 million, which includes 13,900 meters of diamond drilling, focused on testing and extending the Yessi vein as well as exploring additional targets within the mine area.
Caylloma Mine, Peru
The Brownfields exploration program budget for 2024 at Caylloma is $2.0 million, supporting field exploration, regional geophysics, and ongoing studies of the structural controls to mineralization on the Animas vein.
Diamba Sud Project, Senegal
The Brownfields exploration program budget for 2024 at the Diamba Sud Project is $9.9 million, which includes 42,700 meters of drilling, including extension and resource development, in addition to the testing and advancement of previously identified geochemistry anomalies. Additional geochemical and geophysical surveys at Diamba Sud will be conducted in support of advancing the project.
Subject to the successful completion of this exploration program, the Company plans to prepare a Mineral Resource estimate in accordance with the disclosure requirements of NI 43-101. The program is expected to finish by the end of August 2024 with the updated evaluation planned for completion by the end of 2024.
Greenfields Exploration
Greenfields exploration will continue in Mexico, Argentina, Senegal, and Côte d’Ivoire advancing generative programs across several projects supported by a budget of $7.5 million, including continuing active corporate development.
|
ANNUAL INFORMATION FORM |
Page | 21 |
FORTUNA SILVER MINES INC.
Updated Mineral Reserve and Mineral Resource Estimates
A summary of the current Mineral Reserve and Mineral Resource estimates for the Company’s five mines and the Arizaro Project, Argentina as at December 31, 2023 is as follows:
Highlights of Mineral Reserve and Mineral Resource Update
| ● | Consolidated Proven and Probable Mineral Reserves are reported containing 3.1 Moz Au Eq24 representing a year-over-year decrease of 11 percent. |
| ● | Consolidated Measured and Indicated Resources exclusive of Mineral Reserves are reported containing 1.1 Moz Au Eq25 representing a year-over-year decrease of 19 percent. |
| ● | Consolidated Inferred Mineral Resources are reported containing 1.7 Moz Au Eq26 representing a year-over-year decrease of 22 percent. |
| ● | Primary drivers for changes in Mineral Reserves and Mineral Resources are production related depletion in 2023 of 452 koz Au Eq27 and the application of higher cut-off values as a result of increased operational costs. |
2023 Mineral Reserves and Mineral Resources
Mineral Reserves – Proven and Probable |
Contained Metal |
||||||||
Property |
Classification |
Tonnes (000) |
Ag (g/t) |
Au (g/t) |
Pb (%) |
Zn (%) |
Ag (Moz) |
Au (koz) |
|
|
Silver Mines |
Caylloma, |
Proven |
20 |
261 |
0.94 |
2.23 |
2.62 |
0.2 |
1 |
Probable |
2,269 |
81 |
0.13 |
2.79 |
4.06 |
5.9 |
9 |
||
Proven + Probable |
2,288 |
83 |
0.13 |
2.78 |
4.04 |
6.1 |
10 |
||
San Jose, Mexico |
Proven |
37 |
172 |
1.23 |
N/A |
N/A |
0.2 |
2 |
|
Probable |
695 |
155 |
0.97 |
N/A |
N/A |
3.5 |
22 |
||
Proven + Probable |
733 |
156 |
0.98 |
N/A |
N/A |
3.7 |
23 |
||
Total |
Proven + Probable |
3,021 |
101 |
0.34 |
N/A |
N/A |
9.8 |
33 |
|
|
Gold Mines |
Lindero, Argentina |
Proven |
24,295 |
N/A |
0.60 |
N/A |
N/A |
0.0 |
468 |
Probable |
47,210 |
N/A |
0.54 |
N/A |
N/A |
0.0 |
816 |
||
Proven + Probable |
71,505 |
N/A |
0.56 |
N/A |
N/A |
0.0 |
1,284 |
||
Yaramoko, Burkina Faso |
Proven |
21 |
N/A |
5.44 |
N/A |
N/A |
0.0 |
4 |
|
Probable |
842 |
N/A |
7.96 |
N/A |
N/A |
0.0 |
216 |
||
Proven + Probable |
863 |
N/A |
7.90 |
N/A |
N/A |
0.0 |
219 |
||
|
Séguéla, Côte d’Ivoire |
Proven |
436 |
N/A |
2.06 |
N/A |
N/A |
0.0 |
29 |
|
Probable |
11,327 |
N/A |
3.09 |
N/A |
N/A |
0.0 |
1,125 |
||
Proven + Probable |
11,763 |
N/A |
3.05 |
N/A |
N/A |
0.0 |
1,154 |
||
Total |
Proven + Probable |
84,131 |
N/A |
0.98 |
N/A |
N/A |
0.0 |
2,658 |
|
Total |
Proven + Probable |
9.8 |
2,691 |
||||||
24 |
Gold equivalent is a non-IFRS measure and is calculated using metal prices of $1,600/oz for Au, $21/oz for Ag, $2,000/t for Pb, and $2,600/t for Zn. Refer to “Notice Regarding Non-IFRS Measures” section above. |
25 |
Refer to footnote 24. |
26 |
Refer to footnote 24. |
27 |
Refer to footnote 24. |
|
ANNUAL INFORMATION FORM |
Page | 22 |
FORTUNA SILVER MINES INC.
Mineral Resources – Measured and Indicated |
Contained Metal |
||||||||
Property |
Classification |
Tonnes (000) |
Ag (g/t) |
Au (g/t) |
Pb (%) |
Zn (%) |
Ag (Moz) |
Au (koz) |
|
|
Silver Mines |
Caylloma, |
Measured |
524 |
98 |
0.30 |
2.09 |
3.16 |
1.6 |
5 |
Indicated |
1,262 |
82 |
0.21 |
1.47 |
2.54 |
3.3 |
9 |
||
Measured + Indicated |
1,786 |
87 |
0.24 |
1.65 |
2.72 |
5.0 |
14 |
||
San Jose, Mexico |
Measured |
45 |
141 |
1.09 |
N/A |
N/A |
0.2 |
2 |
|
Indicated |
1,001 |
148 |
1.11 |
N/A |
N/A |
4.7 |
35 |
||
Measured + Indicated |
1,046 |
147 |
1.11 |
N/A |
N/A |
5.0 |
37 |
||
Total |
Measured + Indicated |
2,832 |
109 |
0.56 |
N/A |
N/A |
9.9 |
51 |
|
|
Gold Mines |
Lindero, Argentina |
Measured |
1,981 |
N/A |
0.48 |
N/A |
N/A |
0.0 |
30 |
Indicated |
28,482 |
N/A |
0.42 |
N/A |
N/A |
0.0 |
382 |
||
Measured + Indicated |
30,464 |
N/A |
0.42 |
N/A |
N/A |
0.0 |
412 |
||
Yaramoko, Burkina Faso |
Measured |
18 |
N/A |
4.33 |
N/A |
N/A |
0.0 |
2 |
|
Indicated |
452 |
N/A |
2.82 |
N/A |
N/A |
0.0 |
41 |
||
Measured + Indicated |
469 |
N/A |
2.87 |
N/A |
N/A |
0.0 |
43 |
||
|
Séguéla, Côte d’Ivoire |
Measured |
0 |
N/A |
- |
N/A |
N/A |
0.0 |
0 |
|
Indicated |
4,659 |
N/A |
2.54 |
N/A |
N/A |
0.0 |
381 |
||
Measured + Indicated |
4,659 |
N/A |
2.54 |
N/A |
N/A |
0.0 |
381 |
||
Total |
Measured + Indicated |
35,592 |
N/A |
0.73 |
N/A |
N/A |
0.0 |
837 |
|
Total |
Measured + Indicated |
9.9 |
888 |
||||||
Mineral Resources – Inferred |
Contained Metal |
||||||||
Property |
Classification |
Tonnes (000) |
Ag (g/t) |
Au (g/t) |
Pb (%) |
Zn (%) |
Ag (Moz) |
Au (koz) |
|
|
Silver Mines |
Caylloma, |
Inferred |
4,505 |
99 |
0.43 |
2.43 |
3.70 |
14.4 |
63 |
|
San Jose, Mexico |
Inferred |
1,029 |
147 |
1.04 |
N/A |
N/A |
4.9 |
35 |
|
Total |
Inferred |
5,534 |
108 |
0.55 |
N/A |
N/A |
19.3 |
97 |
|
|
Gold Mines |
Lindero, Argentina |
Inferred |
25,325 |
N/A |
0.47 |
N/A |
N/A |
0.0 |
386 |
|
Yaramoko, Burkina Faso |
Inferred |
159 |
N/A |
3.52 |
N/A |
N/A |
0.0 |
18 |
|
Séguéla, |
Inferred |
3,059 |
N/A |
2.50 |
N/A |
N/A |
0.0 |
245 |
|
Total |
Inferred |
28,543 |
N/A |
0.71 |
N/A |
N/A |
0.0 |
649 |
|
|
Gold Project |
Arizaro, Argentina |
Inferred |
24,131 |
N/A |
0.40 |
N/A |
N/A |
0.0 |
310 |
Total |
Inferred |
19.3 |
1,056 |
||||||
Notes:
1. |
Mineral Reserves and Mineral Resources are as defined by the 2014 CIM Definition Standards for Mineral Resources and Mineral Reserves. |
2. |
Mineral Resources are exclusive of Mineral Reserves. |
3. |
Mineral Resources that are not Mineral Reserves do not have demonstrated economic viability. |
4. |
Factors that could materially affect the reported Mineral Resources or Mineral Reserves include changes in metal price and exchange rate assumptions; changes in local interpretations of mineralization; changes to assumed metallurgical recoveries, mining dilution and recovery; and assumptions as to the continued ability to access the site, retain mineral and surface rights titles, maintain environmental and other regulatory permits, and maintain the social license to operate. |
5. |
Mineral Resources and Mineral Reserves are reported as of December 31, 2023. |
6. |
Mineral Reserves for the Caylloma Mine are reported above NSR breakeven cut-off values based on underground mining methods including: mechanized (breasting) that represents 91 % of Mineral Reserves planned for mining at $89.78/t, mechanized (uppers) at $79.70/t, semi-mechanized at $93.27/t, sub-level stoping at $88.81/t, and a conventional method at $170/t; using assumed metal prices of $21/oz Ag, $1,600/oz Au, $2,000/t Pb, and $2,600/t Zn; metallurgical recovery rates of 82 or 85 % for Ag, 22 or 55 % for Au, 87 or 89 % for Pb and 89 % for Zn. Mining, processing, and administrative costs used to determine NSR cut-off values were estimated based on actual operating costs incurred from July 2022 through June 2023. Mining recovery is estimated to average 94 % with average mining dilution of 17 % depending on the mining methodology. Mineral Resources are reported at an NSR cut-off grade of $75/t for veins classified as wide (Animas, Animas NE, Nancy, and San Cristobal) and $135/t for veins classified as narrow (all other veins) based on the same parameters used for Mineral Reserves, and a 15 % upside in metal prices. |
7. |
Mineral Reserves for the San Jose Mine are based on underground mining within optimized stope designs using an estimated NSR break-even cut-off grade of $96.54/t to $85.02/t equivalent to 154 to 132 g/t Ag Eq based on assumed metal prices of $23.90/oz Ag and $1,880/oz Au; estimated metallurgical recovery rates of 91 % for Ag and 90 % for Au and mining costs of |
|
ANNUAL INFORMATION FORM |
Page | 23 |
FORTUNA SILVER MINES INC.
$49.83/t (C&F) - $38.31/t (SLS); processing costs of $20.79/t; and other costs including distribution, general service costs of $25.92/t based on actual operating costs. Average mining recovery is estimated to 94 % (C&F) and 92 % (SLS) and average mining dilution 10 % (C&F) and 14 % (SLS). Mineral Resources are reported at a 130 g/t Ag Eq cut-off grade based on the same parameters used for Mineral Reserves.
8. |
Mineral Reserves for the Lindero Mine are reported based on open pit mining within a designed pit shell based on variable gold cut-off grades and gold recoveries by metallurgical type: Met type 1 cut-off 0.28 g/t Au, recovery 75.4 %; Met type 2 cut-off 0.27 g/t Au, recovery 78.2 %; Met type 3 cut-off 0.27 g/t Au, recovery 78.5 %; and Met type 4 cut-off 0.31 g/t Au, recovery 68.5 %. Mining recovery and mining dilution have been accounted for during block regularization to 10-meter x 10-meter x 8-meter size. The cut-off grades and pit designs are considered appropriate for long term gold prices of $1,600/oz, estimated base mining costs of $1.36 per tonne of material, total processing and G&A costs of $9.78 per tonne of ore, and refinery costs net of pay factor of $12.20 per ounce gold. Reported Proven Reserves include 8.3 Mt averaging 0.44 g/t Au of stockpiled material. Mineral Resources are reported within a conceptual pit shell above a 0.24 g/t Au cut-off grade based on the same parameters used for Mineral Reserves and a 15 % upside in metal prices. Mineral Resources for Arizaro are reported within a conceptual pit shell above a 0.26 g/t Au cut-off grade using the same gold price and costs as Lindero with an additional $0.52 per tonne of ore to account for haulage costs between the deposit and plant. A slope angle of 47° was used for defining the pit. |
9. |
Mineral Reserves for the Yaramoko Mine are reported on a 100 % ownership basis at a cut-off grade of 1.57 g/t Au for the Zone 55 open pit, 0.86 g/t Au for the Zone 109 open pit, 4.5 g/t Au for Zone 55 underground, 3.8 g/t Au for Bagassi South QV Prime and Bagassi South underground based on an assumed gold price of $1,600/oz, metallurgical recovery rates of 96.8 %, underground mining costs of $154/t, processing cost of $28/t and G&A costs of $27/t, surface mining costs of $4.95/t, processing cost of $27/t, and G&A costs of $33/t. Underground average mining recovery is estimated at 90 % for Bagassi South QV Prime and Bagassi South underground, 93 % for Zone 55 SLS stopes, and 86 % for sill drift stopes. A mining dilution factor of 10 % has been applied for sill drift stopes, 0.7-meter and 0.4-meter dilution skin has been applied for sub-level stopes and shrinkage mining respectively. Surface mining recovery and mining dilution have been accounted for during block regularization to 5-meter x 5-meter x 5-meter size within an optimized pit shell and only Proven and Probable categories reported within the final pit designs. Yaramoko Mineral Resources are reported at a gold grade cut-off grade of 0.9 g/t Au for the Zone 55 open pit, 0.5 g/t Au for the Zone 109 open pit, and 2.7 g/t Au and 2.5 g/t Au for underground Zone 55 and Bagassi South respectively, based on an assumed gold price of $1,840/oz and the same costs, metallurgical recovery and constrained within an optimized pit shell. The Yaramoko Mine is subject to a 10 % carried interest held by the State of Burkina Faso. |
10. |
Mineral Reserves for the Séguéla Mine are reported on a 100 % ownership basis at an incremental gold grade cut-off of 0.65 g/t Au for Antenna, 0.72 g/t Au for Agouti, 0.69 g/t Au for Boulder, 0.66 g/t Au for Koula, 0.73 g/t Au for Ancien, and 0.66 g/t Au for Sunbird deposits based on a gold price of $1,600/ounce, metallurgical recovery rates of 94.5 %, surface mining costs of $3.12/t, processing cost of $15.42/t and G&A cost of $8.83/t, and only Proven and Probable categories reported within the final pit designs. The Mineral Reserves pit designs were completed based on overall slope angle recommendations of between 37° and 57° for Antenna, Koula, and Agouti deposits from oxide to fresh weathering profiles, between 34° and 56° for Ancien deposit from oxide to fresh weathering profiles, 37° and 60° for Boulder deposit from oxide to fresh weathering profiles and 37° and 58° for Sunbird deposit from oxide to fresh weathering profiles. The Mineral Reserves are reported with modifying factors of mining dilution and mining recovery represented by regularizing the block models to an appropriate selective mining unit block size. Mineral Resources for Séguéla are reported at a cut-off grade of 0.55 g/t Au for Antenna, 0.55 g/t Au for Sunbird, 0.60 g/t Au for Koula and Boulder, and 0.65 g/t Au for Ancien and Agouti deposits, based on an assumed gold price of $1,840/oz and constrained within preliminary pit shells. The Séguéla Mine is subject to a 10 % carried interest held by the State of Côte d’Ivoire. |
11. |
Eric Chapman, P. Geo. (EGBC #36328), is the Qualified Person responsible for Mineral Resources; Raul Espinoza (FAUSIMM (CP) #309581) is the Qualified Person responsible for Mineral Reserves; both being employees of Fortuna Silver Mines Inc. |
12. |
N/A = Not applicable. |
13. |
Totals may not add due to rounding. |
Caylloma Mine, Peru
As of December 31, 2023, the Caylloma Mine has Proven and Probable Mineral Reserves of 2.3 Mt containing 6.1 Moz Ag, 10 koz Au, 64 kt Pb, and 93 kt Zn in addition to Inferred Resources of 4.5 Mt containing 14.4 Moz Ag, 63 koz Au, 110 kt Pb, and 162 kt Zn.
Year-over-year, Mineral Reserve tonnes decreased by 28 percent, while silver grade increased 2 percent to 83 g/t, lead grade increased 5 percent to 2.78 %, and zinc grade increased 4 percent to 4.04 %. Changes are due to mining related depletion of 544,000 tonnes, a decrease by 51,000 tonnes due to higher cut-off values related to increases in operating costs, a decrease of 188,000 tonnes as a result of changes in commercial terms and metal price, a decrease of 218,000 tonnes due to adjustments in the estimation parameters and geologic interpretation, and conversion of 23,000 tonnes of Inferred Resources to Mineral Reserves.
|
ANNUAL INFORMATION FORM |
Page | 24 |
FORTUNA SILVER MINES INC.
Measured and Indicated Resource tonnes, exclusive of Mineral Reserves, decreased by 37 percent year-over-year to 1.8 Mt with silver and lead grades increasing slightly by 9 and 1 percent, respectively, and zinc grades decreasing by 12 percent, due to an increase in cut-off value as a result of higher operating costs and the application of operational dilution based on mineable shape optimizer evaluation to remove isolated and narrow mineralized structures from the inventory.
Inferred Resource tonnes decreased by 10 percent year-over-year. Silver grades decreased 6 percent, whereas lead and zinc grades increased by 9 and 8 percent, respectively. The decrease in Inferred Mineral Resources is a result of an increase in cut-off values used for reporting Mineral Resources from $65/t to $75/t resulting in a decrease of 416,000 tonnes and adjustments in the geologic interpretation, changes in commercial terms, and sterilization of material associated with isolated or narrow mineralization resulting in a decrease of 929,000 tonnes, offset by the discovery of 900,000 tonnes through exploration drilling of the Animas and Animas NE veins.
The Brownfields exploration program budget for 2024 at Caylloma is $2.0 million, supporting field exploration, regional geophysics, and ongoing studies of the structural controls to mineralization on the Animas vein (refer to Fortuna news release dated January 18, 2024).
San Jose Mine, Mexico
As of December 31, 2023, the San Jose Mine has Proven and Probable Mineral Reserves of 0.7 Mt containing 3.7 Moz Ag and 23 koz Au, in addition to Inferred Resources of 1.0 Mt containing a further 4.9 Moz Ag and 35 koz Au.
Year-over-year, Mineral Reserves decreased 66 percent in terms of tonnes, while silver grade decreased 9 percent and gold grade decreased 16 percent after net changes of minus 1 Mt resulting from production-related depletion, and a further decrease of 0.4 Mt due to the application of higher cut-off grades as a result of significant cost increments related to the appreciation of the Mexican Peso, higher contractor costs for transportation, distribution, shotcrete, maintenance, and mining services, higher labor costs and new labor reform mandates, change from owner’s mining fleet to contractor fleet for mine development, and higher costs in fuel, energy, materials, and consumables related to 2023 inflation.
Measured and Indicated Resource tonnes exclusive of Mineral Reserves increased by 15 percent year-over-year, while silver and gold grades increased 35 and 54 percent, respectively. The change is due to an increase in cut-off grade from 110 g/t to 130 g/t Ag Eq due to cost increases as detailed above combined with the upgrading of Inferred Resources to Indicated Resources in the Victoria mineralized zone. An evaluation is ongoing as to whether sufficient tonnage at a high enough grade is located in localized areas of the Victoria mineralized zone to cover development and infrastructure costs allowing conversion of Inferred Resources to Mineral Reserves and inclusion in the mine plan.
Year-over-year, Inferred Resources decreased 59 percent in terms of tonnes, with grades increasing for silver and gold by 25 percent. The net variation is due primarily to the increase in cut-off grade used for reporting, as described above, the upgrading of Inferred Resources to Indicated Resources through infill drilling of the Victoria mineralized zone and changes in the geologic interpretation and removal of isolated mineralization through the application of a mineable stope optimizer.
The Brownfields exploration program budget for 2024 at San Jose is $4.9 million, which includes 13,900 meters of diamond drilling, focused on testing and extending the Yessi vein as well as exploring additional targets within the mine area (refer to Fortuna news release dated January 18, 2024).
Lindero Mine, Argentina
As of December 31, 2023, the Lindero Mine has Proven and Probable Mineral Reserves of 71.5 Mt containing 1.3 Moz Au, in addition to Measured and Indicated Resources, exclusive of Mineral Reserves, of 30.5 Mt containing 412 koz Au, and Inferred Resources of 25.3 Mt containing 386 koz Au.
|
ANNUAL INFORMATION FORM |
Page | 25 |
FORTUNA SILVER MINES INC.
Since December 31, 2022, Mineral Reserve tonnes decreased by 10 percent, while gold grade remained relatively unchanged at 0.56 g/t Au. Changes are primarily due to mining related depletion and sterilization of 6.5 Mt of material containing 122 koz Au delivered to the heap leach pad in 2023 and an increase in the reporting cut-off grade due to higher operating costs resulting in a decrease of 2.3 Mt containing 21 koz Au.
Measured and Indicated Resource gold ounces, exclusive of Mineral Reserves, remained relatively unchanged year-over-year.
Inferred Resource tonnes increased by 1.1 Mt or 5 percent, to 25.3 Mt since December 31, 2022 with the gold grade remaining unchanged at 0.47 g/t. The slight increase in Inferred Resources is due to minor adjustments in the optimization of the pit shell.
Yaramoko Mine, Burkina Faso
As of December 31, 2023, the Yaramoko Mine has Proven and Probable Mineral Reserves of 0.9 Mt containing 219 koz Au, in addition to Measured and Indicated Resources, exclusive of Mineral Reserves, of 0.5 Mt containing 43 koz Au, and Inferred Resources of 0.16 Mt containing 18 koz Au.
Year over year, Mineral Reserve tonnes decreased 26 percent, while gold grades increased 34 percent to 7.90 g/t Au. The changes are due to mining related depletion in 2023 of 0.5 Mt of material containing 118 koz Au offset by successful underground exploration and delineation drilling of the Zone 55 and Bagassi South QV Prime veins that, after the application of modifying factors, resulted in an increase of 0.3 Mt containing 124 koz Au of new Probable Reserves.
Measured and Indicated Resource gold ounces, exclusive of Mineral Reserves, decreased by 46 koz and Inferred Resources by 7 koz as a result of the application of updated cut-off grades and operational dilution based on mineable stope optimizer evaluation to remove isolated non-economic mineralization.
The Brownfields exploration program budget for 2024 at Yaramoko is $6.1 million, which includes 41,450 meters of exploration drilling, with underground drilling testing western and depth extensions to the Zone 55 deposit, surface drilling testing several anomalies along the Boni Shear, Bagassi South surface extensions, and other surface targets (refer to Fortuna news release dated January 18, 2024).
Séguéla Mine, Côte d’Ivoire
As of December 31, 2023, the Séguéla Mine has Proven and Probable Mineral Reserves of 11.8 Mt containing 1.2 Moz Au, in addition to Indicated Resources of 4.7 Mt containing 381 koz Au and Inferred Resources of 3.1 Mt containing 245 koz Au.
Since December 31, 2022, Mineral Reserve tonnes decreased by 3 percent, while gold grade increased by 9 percent to 3.05 g/t Au. Changes are primarily due to mining related depletion of 0.8 Mt of material containing 79 koz Au since operations commenced in May 2023, an increase in the reporting cut-off grade due to higher processing and service costs resulting in a decrease of 1.6 Mt containing 53 koz Au offset by the reclassification of 2.1 Mt containing 206 koz from Indicated Resources to Probable Reserves related to delineation drilling and definition of the updated pit shell at the Sunbird deposit.
Measured and Indicated Resource gold ounces, exclusive of Mineral Reserves, decreased 34 percent, by 142 koz, year-over-year, in relation to the reclassification of the Sunbird deposit open pit resources from Indicated Resources to Probable Reserves and a reduction in pit size based on updated contractor costs and geologic interpretation, a decrease of 339 koz Au. This reduction was offset by the inclusion of underground Indicated Resources for the Koula, Ancien and Sunbird deposits totaling 233 koz Au. The application of higher cut-off grades in relation to an increase in processing and service costs accounted for a further decrease of 36 koz Au.
Inferred Resources decreased 2.6 Mt or 365 koz Au in relation to the reduction in the size of the Sunbird pit shell due to the results of the infill drilling and increased costs as described above resulting in a decrease of 203 koz, and
|
ANNUAL INFORMATION FORM |
Page | 26 |
FORTUNA SILVER MINES INC.
upgrading to Indicated Resources of underground mineralization, previously planned for open pit mining of 233 koz Au. These decreases were offset by the inclusion of underground Inferred Resources for the Koula, Ancien and Sunbird deposits totaling 98 koz Au. Adjustments to the estimation parameters and pit optimization for the other deposits resulted in a further decrease of 27 koz Au.
The Brownfields exploration program budget for 2024 at Séguéla is $7.8 million, which includes 41,750 meters of exploration drilling, focused on testing and extending underground targets associated with the Sunbird, Ancien, and Koula deposits, as well as advancing emerging prospects such as Barana, Badior, and Kestral, and continuing to explore for additional prospects (refer to Fortuna news release dated January 18, 2024).
Arizaro Gold Project, Lindero Property, Argentina
As of December 31, 2023, the Arizaro Gold Project has Inferred Mineral Resources of 24.1 Mt averaging 0.40 g/t Au containing 310 koz Au, remaining relatively unchanged from last year other than minor adjustments in the pit shell. Mineralization remains open at depth and along the trend of the northeast to southwest striking porphyry.
DESCRIPTION OF THE BUSINESS
General
Summary. The Company is engaged in the mining of silver, gold and base metals and related activities in Latin America and West Africa, including exploration, extraction, and processing. The Company operates the San Jose Mine located in southern Mexico, the Lindero Mine located in northern Argentina, the Yaramoko Mine located in southwestern Burkina Faso, the Caylloma Mine located in southern Peru, and the Séguéla Mine located in northwestern Côte d’Ivoire. Each of the Company’s producing mines is generally considered to be a reportable segment.
The Company’s gold production at the Lindero, Yaramoko and Séguéla Mines is in the form of gold doré bars. It has entered into non-exclusive precious metals purchase agreements with Auramet International LLC, a precious metals merchant headquartered in New Jersey, USA and Stonex Commodities DMCC, a precious metals trader headquartered in Dubai, United Arab Emirates. Refining arrangements are provided by Metalor USA Refining Corporation and Metalor Technologies SA. Gold doré is delivered to refineries in Switzerland and the United States, and subsequently transferred to the accounts of the buyers.
The silver-lead, zinc, and silver-gold concentrates produced by the Company at its San Jose Mine and its Caylloma Mine are sold to international metals traders who in turn deliver the products to different clients around the world.
The material sources of revenue for 2023 and 2022 are as follows:
|
|
2023 |
|
2022 |
Gold doré |
|
69%(1) |
|
60% |
|
|
|
|
|
By type of concentrate: |
|
|
|
|
Silver-lead concentrate |
|
7% |
|
8% |
Zinc concentrate |
|
5% |
|
7% |
Silver-gold concentrate |
|
19% |
|
25% |
|
|
|
|
|
By metal contained in concentrate: |
|
|
|
|
Silver |
|
50% |
|
50% |
Lead |
|
14% |
|
11% |
Zinc |
|
16% |
|
18% |
Gold |
|
20% |
|
21% |
Note:
1. |
Includes gold doré produced at the Séguéla Mine from May 24, 2023, being the date of the first gold pour at the mine. |
|
ANNUAL INFORMATION FORM |
Page | 27 |
FORTUNA SILVER MINES INC.
Production Methods. The Séguéla Mine is an open pit operation with six deposits currently identified and scheduled for mining in the life of mine plan. Mining activities use conventional drill, blast, load, and haul mining methods. The mined ore is fed to a traditional gold processing facility where the ore is crushed, milled and subject to carbon-in-leach (“CIL”) extraction processes, prior to electrowinning and refining where gold is poured to doré bars.
The Yaramoko Mine complex is an underground project with feed ore from two underground portals at the 55 Zone and Bagassi South mines, where long hole open stoping and cemented rock backfill is the mining method. The mined ore is fed to a traditional gold processing facility where the ore is crushed, milled and subject to CIL extraction processes, prior to electrowinning and refining where gold is poured to doré bars.
The Lindero Mine is an open pit heap leach operation. Crushed ore is placed on a leach pad with the pregnant solution pumped to a sulphidization-acidification-recycle-thickening plant and an adsorption, desorption and recovery plant prior to electrowinning and refining where gold is poured to doré bars.
The method of production both at the Caylloma Mine and the San Jose Mine consists of underground mining principally through cut and fill and longhole stoping mechanized operations. Extracted ore is trucked to a conventional crushing, milling and flotation processing plant which consists of zinc, and lead-silver flotation circuits for the Caylloma Mine, and a gold-silver circuit for the San Jose Mine.
Research and Development. The Company conducts feasibility work and operational enhancement evaluations in order to improve production processes and exploration and mining operations. The Company does not, in the normal course of business, conduct research and development activities in relation to products or services.
Specialized Skill and Knowledge. All aspects of the Company’s business require specialized skills and knowledge. Such skills and knowledge include the areas of geology, mining, metallurgy, engineering, environment issues, permitting, social issues, and accounting. While competition in the resource mining industry can make it difficult to locate and retain competent employees in such fields, the Company has been successful in finding and retaining personnel for the majority of its key processes. Management considers training and re-training of its staff to be a priority.
Competitive Conditions. The exploration and mining of precious metals and base metals is competitive. Competition relates to: the acquisition of mineral property interests that can be explored, developed and operated; technical experts that can find, develop and mine such mineral properties and interests; workers to operate the mineral properties; and capital to finance, exploration, development and operations, and customers to purchase products.
The Company competes with other mining companies, some of which have greater financial resources and technical facilities, for the acquisition of mineral property interests, the recruitment and retention of qualified employees; and for investment capital with which to fund its projects, and in the sale of its products.
Cycles.
The mining business is subject to global economic cycles which affect the marketability of products derived from mining. In addition to commodity price cycles, business activity may also be affected by seasonal and irregular weather conditions in the areas where the Company has property interests.
Environmental Protection. The Company is required to reclaim certain lands it disturbs during mining operations and exploration and development activities. Significant reclamation and closure activities include land rehabilitation, decommissioning of buildings and mine facilities, and ongoing care and maintenance. During the financial year ended December 31, 2023, the Company’s environmental expenditures for reclamation were approximately $1.2 million. After taking into account the application of asset retirement obligation rules for accounting purposes, the Company currently estimates the present value of the reclamation costs for its five operating mines to total approximately US$65.8 million over the life of the mines, with the majority of the expenditures to be incurred at the end of production, as more particularly described in Note 16 to the 2023 Financial Statements. The Company is expecting to incur progressive reclamation costs throughout the life of its mines.
|
ANNUAL INFORMATION FORM |
Page | 28 |
FORTUNA SILVER MINES INC.
Employees. The Company and its subsidiaries had 2,490 direct employees and 2,695 indirect employees through contractors as at December 31, 2023.
Foreign Operations. The Company’s material mineral resource properties are located in Argentina, Burkina Faso, Côte d’Ivoire, Mexico and Peru. Through the Company’s history of successfully developing and operating mines in foreign jurisdictions, Fortuna has developed various corporate governance policies, practices and frameworks to manage the social, economic and political risks and challenges associated with operating in foreign jurisdictions. See “Risk Factors” section for a detailed description of such risks.
Members of the Board and senior officers of the Company periodically visit the Company’s operations in Latin America and West Africa. In 2023, members of the Board travelled to Côte d’Ivoire and in January 2024 travelled to Argentina and Mexico. During these visits, members of the Board met with local employees, government officials and businesspersons; such interactions enhance the visiting directors’ or officers’ knowledge of local culture and business practices.
Additionally, in accordance with the Company’s corporate governance practices, the Board regularly receives management and technical updates, risk assessment and progress reports in connection with the Company’s operations, and in doing so, maintains effective oversight over its business and operations. For example, the Sustainability Committee meets at least quarterly and obtains such updates from management which is then reported by the Committee to the Board. Through these updates, assessments and reports, the Board gains familiarity with the conditions, laws and risks associated with the Company’s foreign operations.
Sustainability Governance
Policies
The Company’s business involves the exploration, design, development, operation and closure of mines that produce precious and base metals in Latin America and West Africa. Our vision is to be valued by our stakeholders as a sustainable company and a leader in the precious metals industry and our mission is to create sustainable value through growth of our mineral reserves, metals production and the efficient operation of our assets, while remaining firmly committed to safety, and to social and environmental responsibility. To do so, we value:
| ● | the health and safety of our employees. We do not tolerate unsafe actions or conditions. |
| ● | the environment. We adhere to strict environmental standards and mitigate our impact. |
| ● | our communities. We show respect for cultural diversity, and work as a strategic partner to enable the sustainable development of our neighboring communities. |
| ● | a commitment to excellence. We achieve high standards and the best practices. |
| ● | integrity. We act in accordance with our philosophy. |
The Company’s objective is to generate sustainable prosperity through its business operations which means protecting the environment, providing a safe workplace for our employees and contractors, supporting the local communities in the areas in which the Company operates through education, employment, and infrastructure investment. The Company has built strong relationships with the stakeholders where it operates, in particular with local communities and institutions where we are dedicated to innovative, sustainable projects and partnerships that build trust in local communities while respecting their values, customs and traditions. The Company’s operating practices are governed by the principles set out in its Code of Business Conduct and Ethics and Whistle-Blower Policy, which was adopted by the Board in order to promote integrity and honest and ethical conduct of the Company’s business. It applies to all directors, officers, employees and consultants of the Company and its subsidiaries. In terms of Board oversight, a Sustainability Committee composed of members of the Board of Directors was created to assist in fulfilling the Board’s oversight responsibilities related to health, safety, security, environmental, sustainable development and social responsibility obligations and corporate objectives.
As sustainability includes factors which affect all aspects of the Company’s business, instead of isolating sustainability into a single, stand-alone policy, the Company created a Sustainability Framework that is integrated into its overall corporate strategy and which is supported through a range of corporate policies and standards. To support the
|
ANNUAL INFORMATION FORM |
Page | 29 |
FORTUNA SILVER MINES INC.
implementation of the Company’s Sustainability Framework, we have developed policies and position statements listed below, relating to environmental, social and governance (ESG) related matters:
| ● | Human Rights Policy |
| ● | Diversity, Equity and Inclusion Policy |
| ● | Board and Management Diversity Policy |
| ● | Anti-corruption Policy |
| ● | Health and Safety Policy |
| ● | Environmental Policy |
| ● | Employee Relations Policy |
| ● | Community Relations Policy |
| ● | Code of Business Code and Ethics and Whistle-blower Policy |
| ● | Supplier Code of Business Conduct and Ethics |
| ● | Climate Change Position Statement |
| ● | Global Industry Standard on Tailings Management Position Statement |
All of the Company’s corporate governance policies and position statements are reviewed on an annual basis. Copies of the Company’s above mentioned ESG policies and position statements can be found on the Company’s website. We provide awareness and/or training sessions to our workforce on our ESG policies to enhance their engagement in our sustainability objectives.
Sustainability Report
On July 2, 2023, the Company announced the publication of its fifth annual sustainability report, which details the Company´s performance on key ESG indicators during 2022. The 2022 Sustainability Report highlights Fortuna´s sustainability management and initiatives at each operating mine as well as our contributions within our host countries. The Report also includes a dedicated ESG data section containing disclosure under SASB Metals and Mining Industry Standard, Task Force on Climate-related Financial Disclosures (TCFD) Recommendations, and the Global Reporting Initiative (GRI) standard. The Company anticipates that it will publish its Sustainability Report for fiscal 2023 during the second quarter of 2024.
2023 ESG Performance
Environment
The Company is committed to ensuring that the highest possible standards of environmental management are followed in all areas of its business activities. Environment protection is one of Fortuna’s core values and is a pillar of our Sustainability Framework. Our Environmental Policy aims to prevent, avoid, minimize, mitigate, and, when appropriate, offset our negative impacts on ecosystems, and to proactively manage environmental risks associated with our activities, with the primary goal of attaining zero harm.
All phases of the Company’s operations are subject to environmental laws and regulations in the jurisdictions in which it operates, in addition to its own operational and corporate level policies and standards. These environmental regulations and internal policies and standards provide directives and guidelines to avoid and/or limit spills, releases and emission of various substances related to industrial mining operations that could result in environmental contamination.
The Company conducts regular environmental risk assessments and internal audits of its operations. The overall objective is to assess key environmental risks and their associated controls and to assess regulatory compliance. Environmental statistics are collected from each of our operations on a monthly and annual basis. To the best of management’s knowledge, the Company is in compliance in all material respects with all environmental laws and regulations applicable to its exploration, development, construction and operating activities, including the renewal of environmental permits where applicable. Refer to the section “Risk Factors” below for additional information in respect of the financial and operational effects of such environmental laws and regulations on the Company, and for a discussion on the litigation related to the environmental impact authorization for the San Jose Mine.
|
ANNUAL INFORMATION FORM |
Page | 30 |
FORTUNA SILVER MINES INC.
In terms of performance, the Company’s environmental management highlights for 2023 are:
| ● | Zero significant environmental fines |
| ● | Zero tailings dam incidents |
| ● | Zero significant spills |
| ● | Yaramoko Mine achieved ISO 14001 certification of its environmental management system, and the San Jose and Caylloma Mines maintained the same certifications |
| ● | Energy use per ton of processed ore (GJ/t) was 0.22 GJ/t in 2023, the same intensity as in 2022 |
| ● | GHG emissions intensity per thousand tonnes of processed ore in 2023 was 16.65 tons of carbon dioxide equivalent (“tCO2eq”) per kt which was 7.2% lower than the 17.94 tCO2eq/kt in 2022 |
| ● | Freshwater consumption intensity per ton of processed ore was 0.20 m3/t in 2023, which was 20% lower than the 0.25 m3/t in 2022 |
Tailings management
In 2022, the Company published its Global Industry Standard on Tailings Management (”GISTM”) position statement, which articulates Fortuna’s approach to tailings management along with its implementation commitments. Under the Company’s tailings management approach, the Company commits to adopt GISTM and achieve compliance with applicable GISTM requirements for all new tailings storage facilities (“TSFs”) during their first year of operation. The Company will continue to conduct the necessary studies to assess and fulfill GISTM applicable requirements for all existing TSFs owned and operated by the Company, in order to implement the standards and ensure compliance of all applicable requirements of GISTM for all company owned TSFs by 2027.
In 2023, the Company continued its implementation of its commitments under GISTM by implementing the following actions, among others:
| ● | Finalized the implementation of its TSF Governance Standard and integration of the Standard into Fortuna’s HSSEC Management Systems; |
| ● | Approved a TSF Technical Standard and in early 2024 developed a Water Management Standard to support GISTM compliance; |
| ● | Established and arranged meetings of the Independent Tailings Review Board (ITRB) to review and refine technologies, TSF design, risk management, and impact management for certain active TSFs; |
| ● | Initiated third-party Dam Safety Reviews (DSRs) for certain active TSFs; |
| ● | Created or reviewed key documents, such as TSF site characterization, Design Basis Report, and Deviance Accountability Report; and |
| ● | Updated Fortuna’s Community Relations, Health and Safety and Environmental Policies. |
Mine closure
The environmental permits under which the Company’s mines operate require the reclamation of certain lands that it disturbs during mining operations. Reclamation and closure activities can be significant and include land rehabilitation, decommissioning of mine facilities, environmental monitoring and sometimes ongoing care and maintenance. Costs of mine closures and reclamation of mine sites vary considerably due to factors such as quantity of material to reclaim and land to rehabilitate, location, climate, environmental vulnerability, mining method, minerals being mined, waste characteristics, and labor costs. Closure cost estimates are reviewed regularly to reflect changing circumstances and adjusted according to inflation and work requirements. See "Description of the Business – Environmental Protection” above for further details.
Regulatory environmental requirements and best practices require the Company to establish mine closure plans and to review and update same periodically when required. There have been no significant changes in laws, regulations and governmental reclamation obligations in respect of the Company’s five operating mines during the financial year ended December 31, 2023.
|
ANNUAL INFORMATION FORM |
Page | 31 |
FORTUNA SILVER MINES INC.
Climate Change
The Company recognizes that climate change is a major global challenge that could have significant impacts on operations, host communities, the resources used in production, the economy and society in general. Climate change is a systemic risk with the potential to affect our mine infrastructure and operations; the regulatory frameworks under which we operate; and the demand for the minerals we produce.
Since the disclosure of the Company’s commitments towards the reduction of GHG emissions in April 2022, the Company has continued to advance the implementation of its corporate climate change strategy. Fortuna is committed to analyzing the risks and opportunities of climate change on its business activities, to integrating climate change factors into its long-term strategic planning and developing short-term tactical climate change action plans. Its approach to climate change management is guided by three key pillars, which align to the climate change factors that were identified as having the greatest potential to influence company value in the Climate Change Materiality Assessment conducted in 2021. These key pillars include:
| ● | Reducing GHG emissions by promoting resource efficiency and increasing the use of renewable energy sources. |
| ● | Building resilience to the physical risks of climate change at our operations and projects. |
| ● | Continuously improving the performance of our governance and climate change action plans based on climate change science, regulatory and voluntary frameworks, and international standards. |
In 2023, the Company's main climate-related focus was to conduct the required analysis on energy consumption and GHG emissions to enable the Company to set a GHG emissions reduction target. In addition, the Company conducted an initial climate-related scenario analysis to enhance its understanding of its exposure to climate-related risks and opportunities and the resilience of its business strategy. The results of this analysis are to be included in the Company’s first Climate Change Report which is anticipated to be published in the second quarter of 2024.
On February 8, 2024, the Company announced its GHG emissions reduction target for 2030 and long-term objectives for 2050. The Company:
| ● | has set a target to reduce Scope 1 and Scope 2 GHG emissions by 15 percent in 2030, compared to “business as usual” (“BAU”) forecast GHG emissions in 2030 if no intervention measures were taken. |
| ● | is committed to supporting the global ambition of net-zero GHG emissions by 2050 through investing in technology, energy efficiency initiatives, and renewable energy over the long-term, where such investments are reliable, affordable, and competitive. |
Based on an assessment of existing activities, Fortuna has determined that a significant portion of its current GHG emissions is attributable to the use of diesel to power its operations. Accordingly, Fortuna’s biggest opportunities for reducing GHG emissions are related to electrification, and increased use of renewable energy.
Fortuna expects to achieve its GHG emissions reduction target through the implementation of the following projects:
|
ANNUAL INFORMATION FORM |
Page | 32 |
FORTUNA SILVER MINES INC.
Mine |
Initiative |
Outcome |
|
Séguéla, Côte d’Ivoire |
Provide renewable energy to the operation |
· Construction and implementation of a solar power plant by 2025 · GHG emissions expected to decrease by approximately 3,700 tCO2 per year over the 8-year LoM1 |
Lindero, |
Provide renewable energy to the operation |
· Construction and implementation of a solar power plant by 2025 · GHG emissions expected to decrease by approximately 10,820 tCO2 per year over the 11-year LoM |
Caylloma, |
Provide low-carbon electricity to the operation |
· In 2022, Caylloma switched to an energy supplier that provides electricity from 100 percent renewable energy sources · GHG emissions expected to decrease by ~ 8,860 tCO2 per year over the 5-year LoM |
Caylloma, |
Optimization of mine paste fill plant |
· Construction and modernization of new paste fill plant will avoid use of truck haulage of tailings for plant feed · GHG emissions expected to decrease by ~ 420 tCO2 per year over the 5-year LoM |
Note:
1. |
LoM: Life of mine based on Mineral Reserves |
Climate Change Mitigation Efforts
The Company has implemented a range of mitigation efforts, both company-wide and site-specific, in an effort to reduce exposure to climate-related risks and capture opportunities. These efforts include among others:
| ● | Fortuna has set a company-wide GHG emissions reduction target (see above), with the objective to mitigate risks associated with climate-related transition risks. |
| ● | Fortuna has developed a company-wide climate change strategy, published a Climate Change Position Statement and continues to enhance the alignment of its climate change disclosure frameworks for reporting on climate change factors. |
| ● | Fortuna’s mines produce silver, gold, lead and zinc, all metals used in daily life and in many industries that contribute to sustainable development. Demand for these metals is growing with an increasing global population and higher living standards. The Company seeks to satisfy this need through responsible mineral production. Fortuna is focused on improving the resource efficiency of its operations to reduce risks related to changing input prices of raw materials. |
| ● | Fortuna has implemented initiatives at its mine sites that are designed to enhance resiliency to the acute and chronic physical impacts of climate change. |
| ● | The Company aims to minimize its operational water consumption and make effective use of water in its processes. Water management systems have been developed at site level and the Company seeks to improve its water governance based on current industry practices. |
| ● | Fortuna is committed to the ongoing monitoring of evolving technology and other opportunities to improve the resource efficiency of operations and capitalizing on advances in renewable energy technologies. The Company will continue to focus on capturing climate-related opportunities where such solutions are proven to be reliable, affordable and competitive. |
Social
Health and Safety
The Company is committed to ensuring the highest possible standards of health and safety management and to provide safe and healthy working conditions in all areas of our operations. We believe that work-related accidents, injuries and diseases are preventable. We do not tolerate unsafe acts or conditions. Occupational health and safety is one of Fortuna’s core values and is a pillar of our Sustainability Framework. The Company’s Health and Safety Policy aims to support the attainment of a safe, healthy working environment, as well as a zero harm workplace for our employees, contractors, and visitors, at all of our mining operations, exploration sites, and offices.
|
ANNUAL INFORMATION FORM |
Page | 33 |
FORTUNA SILVER MINES INC.
Health and safety statistics are collected from each of our operations on a monthly and annual basis. Targets for health and safety KPIs are set each year considering lagging and leading indicators, and are used in determining annual performance incentives as part of management’s compensation for 2023, including the total recordable injury frequency rate (“TRIFR”) and fatal incidents.
The Company’s health and safety management performance highlights for 2023 are:
| ● | Zero cases of work-related illnesses. |
| ● | TRIFR of 1.22 in 2023 which is a 47% reduction of the TRIFR of 2.67 in 2022. In 2023, an aggregate of 17 events were registered compared to 30 in 2022. |
| ● | The Company incurred five lost time injury incidents (using the Occupational Safety and Health Administration (“OSHA”) definition) in 2023 which was the same as in 2022. The lost time incident frequency rate (LTIFR) was 0.36 in 2023 compared to 0.39 in 2022. |
| ● | Yaramoko Mine achieved ISO 45001 certification of its occupational health and safety management system, and the San Jose and Caylloma Mines maintained their certifications. |
| ● | The improvements in workplace safety achieved in 2023 were overshadowed by a fatality at the Caylloma Mine in June 2023. No other personnel were injured in the accident. Please refer to the Company’s news release dated June 5, 2023 for details. |
Based on past events, the safety programs have been optimized, taking into account the lessons learned from incident investigations. In particular, the Company has advanced the implementation of its Critical Risk Management program and developed a Contractor Management Standard to improve oversight and risk management of contractors on site. In addition, a risk-based leadership training program is being implemented company-wide to reinforce the health and safety culture of our organization.
The following statistics are for employees and contractors at the individual mine sites and on a consolidated basis. The terms set out below have the following meanings:
“FI” means fatal incidents
“LTI” means lost time injury
“RWI” means restricted work injury (Occupational Health and Safety Administration (“OHSA”) definition)
“MTI” means medical treatment injury
“TRI” means total recordable injuries (FI+LTI+RWI+MTI)
“TRIFR” means total recordable frequency incident rate = (number of FI+LTI+RWI+MTI) x 1,000,000/ worked-hours
“LTIFR” means lost time incident frequency rate = (number of LTI x 1,000,000) / worked-hours
“LTISR” means lost time incident severity rate = (number of days lost x 1,000,000/ worked-hours)
|
LTIFR3 |
TRIFR |
LTISR3 |
|||
|
2022 |
2023 |
2022 |
2023 |
2022 |
2023 |
Lindero Mine |
0.50 |
0.51 |
3,03 |
1.53 |
94.32 |
83.39 |
San Jose Mine |
0.74 |
0.77 |
3.68 |
2.68 |
56.98 |
21.85 |
Caylloma Mine |
0.00 |
0.00 |
1.78 |
1.03 |
0.00 |
62.07 |
Yaramoko Mine |
0.00 |
0.00 |
2.45 |
0.38 |
0.00 |
0.00 |
Séguéla Mine1 |
0.71 |
0.54 |
1.07 |
0.81 |
18.93 |
34.08 |
All mining operations2 |
0.30 |
0.36 |
2.71 |
1.23 |
34.32 |
38.21 |
Consolidated4 |
0.39 |
0.36 |
2.32 |
1.22 |
30.60 |
37.78 |
Notes:
1. |
The information provided for the Séguéla Mine in 2023 is for the full year, including both the project and operational phases. |
2. |
In 2022, Séguéla Mine was considered as a project, and was not included in the calculation of all mining operation safety performance. In 2023, the calculation includes the Company’s five operating mines. |
3. |
LTIFR and LTISR reporting is based on OHSA classification. |
4. |
Includes all operations, offices and other activities. |
|
ANNUAL INFORMATION FORM |
Page | 34 |
FORTUNA SILVER MINES INC.
Community relations
The Company is committed to ensuring the highest possible standards of social management in all areas of its business activities, in order to maintain its social license to operate and create value for its stakeholders. Community relations is one of Fortuna’s core values and is a pillar of its Sustainability Framework. The Company’s Community Relations Policy aims to foster a participative approach to community relations through respectful dialogue that builds trust, genuine collaboration and mutually beneficial relationships. In addition, it seeks to formulate strategies and procedures to manage social risks and the impacts and opportunities associated with our operations in consultation with local communities, while enhancing our contributions to local socio-economic development.
Highlights of the Company’s community relations management performance for 2023 are:
| ● | Zero significant disputes with local communities. |
| ● | Development of software to manage community grievances at the corporate level. |
| ● | 43.4% of employees were hired directly from local communities (communities nearby our mining operations) |
| ● | Caylloma Mine received the “Company with Sustainable Management” recognition from the local institution “Peru Sostenible”, and recognition from the National Mining Safety Institute for good practices in occupational health and safety. |
| ● | Launch of a new Sustainability Partnership Program in Côte d’Ivoire which aims to contribute to the achievement of the United Nations Sustainable Development Goals and to the sustainable development of the countries in which we operate, while reinforcing Fortuna's reputation as a partner of choice and a responsible mining operator. |
Human rights
The Company is committed to respecting human rights, which is understood as the fundamental rights and freedoms in the International Bill of Human Rights and the ILO Declaration on Fundamental Principles and Rights at Work. We recognize that mining activities and business relationships could create potential risks and impacts to human rights. We therefore strive to manage risks, maximize positive impacts, and reduce negative impacts. Human Rights and Ethics is a pillar of our Sustainability Framework. The Company’s Human Rights Policy aims to ensure that we respect human rights and prevent or mitigate any violations, in alignment with the UN Guiding Principles on Business and Human Rights.
Highlights of the Company’s human rights management performance for 2023 are:
| ● | Zero confirmed cases of human rights violations. |
| ● | Creation of a Human Rights Steering Committee, chaired by our CEO, to oversee the continuous improvement of company practices. |
| ● | Development of a Human Rights action plan at the operation level, to enhance our performance and risk management. |
| ● | Preparation for reporting in accordance with the Fighting Against Forced Labour and Child Labour in Supply Chains Act enacted in Canada in 2023 and effective as of January 1, 2024. |
2024 ESG Outlook
The Company continuously updates its Sustainability framework, governance, strategy, risk management, and metrics and targets taking into account internal and external factors and material issues in order to adapt its management of opportunities and stakeholders’ expectations.
In 2024, the Company’s objectives from an ESG perspective are to continue the implementation of ESG initiatives and enhance their performance at the subsidiary level. The main initiatives for 2024 include:
|
ANNUAL INFORMATION FORM |
Page | 35 |
FORTUNA SILVER MINES INC.
| ● | Finalize the implementation of the Company’s Critical Risk Management system and to accelerate its application and level of compliance at operational level. |
| ● | Publish its Climate Change 2030 GHG emissions reduction target and 2050 long-term objectives – completed in February 2024. |
| ● | Advance the level of implementation of the GISTM. |
| ● | Prepare and disclose the Company’s first report under the Canadian Fighting Against Forced Labour and Child Labour in Supply Chains Act. |
| ● | Continue to improve the Company’s ESG reputation in the precious metal sector according to major ESG ratings agencies. |
| ● | Conduct climate-related water studies for the Company’s higher risk operations. |
| ● | Evaluate additional opportunities to implement energy efficiency initiatives, adopt new technology and/or increase the Company’s use of renewable energy to further reduce energy consumption and GHG emissions. |
Risk Factors
The Company’s ability to generate revenues and profits from its natural resource properties is subject to a number of risks and uncertainties including those listed below, any of which, individually or together could cause actual events or results to differ materially from those described in forward-looking statements and forward-looking information.
The risks described below are a summary only and are not exhaustive of the risks relating to Fortuna and its business and operations. There may be additional risks not presently known to the Company, or that the Company currently considers immaterial, which may also impair its business and operations.
Risks Relating to the Company’s Business Operations
The Company’s operations are subject to operating hazards and risks incidental to mining activities.
The operations of the Company are subject to all of the hazards and risks normally incidental to mining exploration, development and operational activities, including fire, explosions, floods, structural collapses, industrial accidents, unusual or unexpected geological conditions, ground control problems, power outages, pollution, industrial water shortages, inclement weather, cave-ins and mechanical equipment failure. Any such hazards could result in work stoppages, damage to or destruction of mines and other facilities, damage to life and property, environmental damage and possible legal liability for any or all damages. While the Company maintains insurance against certain risks, potential claims could exceed policy limits or be excluded from coverage. There are also risks against which Fortuna cannot or may elect not to insure. The potential costs which could be associated with any liabilities not covered by insurance or in excess of insurance coverage may have a material adverse effect on the Company’s business, financial condition or results of operations.
Mineral Resources, Mineral Reserves and precious metal recoveries are estimated.
There is a degree of uncertainty attributable to the estimation of Mineral Resources, Mineral Reserves and expected mineral grades. The Mineral Resource and Mineral Reserve estimates included or incorporated by reference in this AIF have been determined and valued based on assumed or estimated future prices, cut-off grades and operating costs. However, until mineral deposits are actually mined and processed, Mineral Resources and Mineral Reserves must be considered as estimates only. Any such estimates are expressions of judgment based on knowledge, mining experience, analysis of drilling results and industry practices.
Mineral Resources and Mineral Reserves may require revision based on actual production experience. Market fluctuations in the price of metals, as well as increased production costs, results of metallurgical testing and reduced recovery rates, may render certain Mineral Reserves uneconomic and may ultimately result in a restatement of Mineral Resources and/or Mineral Reserves. Short-term operating factors relating to the Mineral Resources and Mineral Reserves, such as the need for sequential development of ore bodies, may adversely affect the Company’s profitability in any accounting period. Estimates of operating costs are based on assumptions including those relating to inflation and currency exchange, which may prove incorrect. Estimates of mineralization can be imprecise and depend upon geometallurgical assumptions, geological interpretation and statistical inferences drawn from drilling
|
ANNUAL INFORMATION FORM |
Page | 36 |
FORTUNA SILVER MINES INC.
and sampling analysis, which may prove to be unreliable. In addition, the grade and/or quantity of precious metals ultimately recovered may differ from that indicated by drilling results. There can be no assurance that precious metals recovered in small scale tests will be duplicated in large scale tests under onsite conditions or at production scale. Amendments to mine plans and production profiles may be required as the amount of Mineral Resources changes or upon receipt of further information during the implementation phase of the particular project. Extended declines in market prices for gold, silver and other metals may render portions of the Company’s mineralization uneconomic and result in reduced reported mineralization. Any material reduction in estimates of mineralization, or in the Company’s ability to develop its properties and extract and sell such minerals, could have a material adverse effect on the Company’s business, financial condition or results of operations.
The Company’s capital and operating costs, production schedules and economic returns are based on certain assumptions which may prove to be inaccurate.
The Company’s expected capital and operating costs, production schedules and estimates, anticipated economic returns and other projections, estimates and forecasts for its mineral properties that are included or incorporated by reference in this AIF or included in any technical reports, scoping studies, pre-feasibility studies and feasibility studies prepared for or by the Company are based on assumed or estimated future metals prices, cut-off grades, operating costs, capital costs, metallurgical recoveries, that the actual ore mined is amenable to mining or treatment, environmental considerations, labour volumes, permitting and other factors, any of which may prove to be inaccurate. As a result, technical reports, scoping studies, pre-feasibility studies and feasibility studies prepared for or by the Company may prove to be unreliable.
The Company’s capital and operating costs are affected by the cost and availability of commodities and goods such as steel, cement, explosives, fuel, electrical power and supplies, including reagents. Significant declines in market prices for gold, silver and other metals could have an adverse effect on the Company’s economic projections. Management assumes that the materials and supplies required for operations will be available for purchase and that the Company will have access to the required amount of sufficiently skilled labour. As the Company relies on certain third-party suppliers and contractors, these factors can be outside its control and an increase in the costs of, or a lack of availability of, commodities, goods and labour may have an adverse impact on the Company’s financial condition. The Company may experience difficulty in obtaining the necessary permits for its exploration, development or operational activities, if such permits are obtained at all, and may face penalties as a result of violations of permits or other environmental laws, which may cause delays and increases to projected budgets. Any of these discrepancies from the Company’s expected capital and operating costs, production schedules and economic returns could cause a material adverse effect on the Company’s business, financial condition or results of operations.
The Company has in the past, and may in the future, provide estimates and projections of its future production, costs and financial results. Any such information is forward looking. Neither the Company’s auditors nor any other independent expert or outside party compiles or examines these forward looking statements. Accordingly, no such person expresses any opinion or any other form of assurance with respect thereto. Such estimates are made by the Company’s management and technical personnel and are qualified by, and subject to the assumptions, contained or referred to in the filing, release or presentation in which they are made, including assumptions about the availability, accessibility, sufficiency and quality of mineralized material, the Company’s costs of production, the market prices of silver, gold and other metals, the Company’s ability to sustain and increase production levels, the ability to produce and sell marketable concentrates, the sufficiency of its infrastructure, the performance of its personnel and equipment, its ability to maintain and obtain mining interests and permits, the state of governments and community relations, and its compliance with existing and future laws and regulations. Actual results and experience may differ materially from these assumptions. Failure to achieve estimates or material increases to costs could have a material adverse impact on the Company’s future cashflows, profitability, results of operations and financial condition. Any such production, cost, or financial results estimates speak only as of the date on which they are made, and the Company disclaims any intent or obligation to update such estimates, whether as a result of new information, future events or otherwise. Accordingly, such forward-looking statements should be considered in the context in which they are made and undue reliance should not be placed on them.
Uncertainties related to new mining operations.
It is not unusual in the mining industry for new mining operations to experience unexpected difficulties during the start-up phase or the subsequent ramp up in production to design capacity. The transition from construction to
|
ANNUAL INFORMATION FORM |
Page | 37 |
FORTUNA SILVER MINES INC.
operations at the Séguéla Mine could be impacted by unexpected delays, operational issues or costs in achieving planned production levels thereby affecting the Company’s cashflows and profitability. Any unexpected complications and delays in the completion and successful functioning of these operational elements may result in additional costs being incurred by the Company beyond those already incurred and budgeted.
As part of its strategy, the Company will continue to develop new mineral projects. A number of risks and uncertainties are associated with the exploration and development of these types of projects, including: political, regulatory, design, construction, labour, operating, technical and technological risks, uncertainties relating to capital and other costs and financing risks.
The level of production and capital and operating cost estimates relating to the expanded portfolio of growth projects are based on certain assumptions and are inherently subject to significant uncertainties. It is likely that actual results of the Company’s projects will differ from its current estimates and assumptions, and these differences may be material. In addition, experience from actual mining or processing operations may identify new or unexpected conditions which could reduce production below, and/or increase capital and/or operating costs above, current estimates. If actual results are less favourable than current estimates, the Company’s business, results of operations, financial condition and liquidity could be adversely impacted.
Any new mining project will face a number of risks inherent in new mining operations. It is not unusual in the mining industry for new mining operations to experience unexpected difficulties during the start-up phase or the initial production phase, resulting in production suspensions, delays and requiring more capital than anticipated. It is also common in new mining operations to experience unexpected problems, delays and costs during mine development and ramp-up to full production capacity. Such factors can add to the costs of the mine development, production and operations and/or impair production and mining activities, thereby affecting Fortuna’s cashflows and profitability. Any unexpected complications and delays in the completion and successful functioning of these operational elements may result in additional costs being incurred by Fortuna beyond those already incurred and budgeted. There can be no assurance that current or future development and expansion plans in respect of the Séguéla Mine and any of the Company’s other mines will be successful or completed on time or on budget.
Exploration projects such as the Diamba Sud Project are uncertain.
The Company’s mineral production is dependent in part on the success of its exploration projects, such as the Diamba Sud Project. The decision as to whether a property contains a commercial mineral deposit and should be brought into production will depend upon market conditions, as well as the results of exploration and evaluation programs and/or feasibility studies, and the recommendations of duly qualified engineers and/or geologists, all of which involves significant expense and risk. It is impossible to ensure that the Company’s current exploration and development programs, at the Diamba Sud Project or elsewhere, will result in profitable commercial mining operations.
Additionally, the historical Mineral Resource estimates for the Diamba Sud Project were prepared in accordance with the Australasian Code for Reporting of Exploration Results, Mineral Resources and Ore Reserves (2012 edition) published by the Joint Ore Reserves Committee of the Australian Institute of Mining and Metallurgy, the Australian Institute of Geoscientists and the Minerals Council of Australia. Confirmatory drilling to update the historical resources is on-going and planned for completion later in 2024. A detailed study of the drill results, technical data and economic parameters relating to the property, together with the preparation of an updated development plan, is required to be conducted in order to update the historical estimates at the Diamba Sud Project as a current Mineral Resource. The Company has not done sufficient work to classify the historical estimates as current Mineral Resources or current Mineral Reserves and the Company is not treating the historical estimate as a current Mineral Resource.
Projects being considered for development are subject to the completion of successful preliminary economic assessments, feasibility studies, engineering studies and environmental assessments, the issuance of necessary governmental permits and the availability of adequate financing, the completion or attainment of which are subject to their own risks and uncertainties. The inability to complete necessary tasks or obtain required inputs, or any delays in the achievement of any key project tasks or inputs, could cause significant delays in timing, cost or results of the assessment of feasibility and/or the process to advance a project to a development decision. The economic feasibility of development projects is based upon many factors, including, among others: the accuracy of mineral reserve and resource estimates; metallurgical recoveries; capital and operating costs of such projects; government regulations relating to prices, taxes, royalties, infrastructure, land tenure, land use, importing and exporting, and
|
ANNUAL INFORMATION FORM |
Page | 38 |
FORTUNA SILVER MINES INC.
environmental protection; political and economic climate; and metal prices, which are historically volatile and cyclical.
Many of these factors are beyond the control of a mining company and therefore development projects, such as the Diamba Sud Project, are uncertain. See risk factor “The Company’s operations are subject to political and other risks in the regions in which it operates” below for further discussion of risks relating to the Diamba Sud Project.
The Company may be unable to replace its Mineral Reserves.
The Company must continually replace its Mineral Reserves depleted by production to maintain production levels over the long term. Mineral Reserves can be replaced by expanding known ore bodies, locating new deposits or making acquisitions. Exploration is highly speculative in nature and involves many risks and is frequently unsuccessful. Substantial expenditures are required to complete drilling programs which may take several years to complete in order to establish Mineral Reserves. As a result, there is no assurance that current or future exploration programs will be successful. There is a risk that depletion of the Company’s Mineral Reserves will not be offset by discoveries or acquisitions. The Company’s mineral base may decline if Mineral Reserves are mined without adequate replacement and the Company may not be able to sustain production beyond the current mine lives, based on current production rates. If the Company’s Mineral Reserves are not replaced either by the development of additional Mineral Reserves and/or additions to Mineral Reserves, there may be an adverse impact on the Company’s future cash flows, earnings, results of operations and financial condition, and this may be compounded by requirements to expend funds for reclamation and decommissioning. As at December 31 2023, the life of the Mineral Reserves at the Yaramoko Mine is two years, and one year at the San Jose Mine. It is anticipated that the San Jose mine will close at the end of 2024, and that the Yaramoko Mine will close at the end of its mine life currently estimated to be in the second half of 2026, in the event that the Company’s exploration programs are unsuccessful in expanding existing reserves or locating new deposits at these mines.
At the San Jose Mine, the Company’s exploration continues to pursue the discovery of new resources with the aim of extending production beyond 2024, but there is no certainty of success. In the case of a maturing mine nearing the end of its life such as the San Jose Mine, the risk of the extraction of Mineral Reserves becoming uneconomic increases. As a result, the Company’s ability to maintain its current production or increase its annual production of precious metals and generate revenues therefrom will depend significantly upon the Company’s ability to discover or acquire new deposits, to successfully bring new mines into production and to expand mineral reserves at existing mines. Exploration and development of mineral properties involves significant financial risk. Very few properties that are explored are later developed into operating mines.
The development of the Company’s properties requires substantial exploration, expenditures and the development of infrastructure.
Development of the Company’s non-producing properties, including the Diamba Sud Project, and the expansion of existing producing projects will only follow upon obtaining satisfactory exploration and engineering results that confirm economically recoverable and saleable volumes of minerals and metal as well as the legality of such development. The business of mineral exploration and development is speculative in nature and involves a high degree of risk, as few properties which are explored are ultimately developed into producing mines. Even with a combination of careful evaluation, experience and knowledge, there is no assurance that the Company’s mineral exploration and development activities will result in any discoveries of Mineral Reserves. The long-term profitability of the Company’s operations will be in part directly related to the cost and success of its exploration programs, which may be affected by a number of factors.
Substantial expenditures are required to establish Mineral Resources and Mineral Reserves through drilling and development and for mining and processing facilities and infrastructure. No assurance can be given that minerals will be discovered in sufficient quantities to justify commercial operations or that the funds required for development can be obtained on a timely basis. The economic feasibility of developing a mineral property is based on several other factors including anticipated metallurgical recoveries, the cost of operations, environmental considerations and permitting, future metal prices, and timely completion of the development plan.
In addition, completion of the development of the Company’s advanced projects is subject to various requirements, including the availability and timing of acceptable arrangements for power, water, transportation, access and facilities. The lack of, or delay in, availability of any one or more of these items could prevent or delay development of the Company’s advanced projects. There can be no assurance that adequate infrastructure, including road access,
|
ANNUAL INFORMATION FORM |
Page | 39 |
FORTUNA SILVER MINES INC.
will be built, that it will be built in a timely manner or that the cost of such infrastructure will be reasonable or that it will sufficiently satisfy the requirements of the advanced projects. As well, accidents or sabotage could affect the provision or maintenance of adequate infrastructure.
The Company’s operations are subject to extensive environmental regulation.
All phases of the Company’s operations are subject to environmental regulation in the various jurisdictions in which it operates. These laws address emissions into the air, discharges into water, management of waste, management of hazardous substances, protection of natural resources, vulnerable, threatened and endangered species and habitats and reclamation of lands disturbed by mining operations. The Company’s ability to obtain, maintain and renew permits and approvals and to successfully develop and operate mines may be adversely affected by real or perceived impacts associated with the Company’s activities or of other mining companies that affect the environment, human health and safety. Environmental hazards may exist on the Company’s properties which are unknown to the Company at present and were caused by previous or existing owners or operators of the properties, for which the Company could be held liable.
Tailings Facilities
There are ten tailings storage facilities under management of the Company’s subsidiaries. This includes four operating tailings storage facilities (TSF): one TSF at the Caylloma Mine, one dry stack TSF at the San Jose Mine, one TSF at Yaramoko Mine and one TSF at Séguéla Mine. In addition, the Company has a six partially closed or closed TSFs: two at the Caylloma Mine, and four at the San Joe Mine including three small legacy dry tailings deposits recently added into the management system from older mining facilities that existed within the mining concession. All of these TSFs are subject to the Company’s tailings governance standards which is based on GISTM. As part of the Company’s risk management protocols, the Company continually assesses its tailings facility management systems. Since 2019, the Company has executed comprehensive annual reviews and inspections of all of its TSF. At the end of 2023, no significant tailings incidents were recorded and no seepage, movement or instabilities have been observed at the TSFs under the Company’s management. Fortuna is committed to ensure public safety and recognizes the GISTM as the leading global guidance for the mining industry, alongside standards and guidelines issued by the Canadian Dam Association (CDA), the Australian National Committee on Large Dams (ANCOLD) and the Mining Association of Canada’s (MAC) Towards Sustainable Mining® standard (TSM). While the Company believes that appropriate steps have been taken to prevent TSF incidents, there are inherent risks involved with tailings facilities, including among other things, seismic activity, particularly in seismically active regions such as Peru and Mexico, and the ability of field investigations completed prior to construction of old TSFs to detect weak foundation materials. There can be no assurance that a tailings dam or other tailings facility safety incident will not occur in the case of an extreme natural event. Such an incident could have a material adverse effect on the Company’s business, results of operations and financial condition.
Use of Cyanide
As part of their industrial process, operations at the Lindero, Caylloma, Séguéla and Yaramoko Mines involve the use of sodium cyanide, a hazardous material, to leach metal bearing ore and then collect the resulting metal-bearing solution. Although ore treatment plants are designed to be effluent-free with no industrial wastewater released into the environment, there is an inherent risk of an unintended discharge of hazardous materials for example from a heap leach or tailings facility. If sodium cyanide escapes from industrial infrastructure or is detected in surface and groundwater downstream, the Company could be subject to liability for remediation costs, which could be significant and may not be insured against. In addition, metal production could be delayed or halted to prevent further discharges and to allow for remediation. Such delays or cessations in production could be long-term or, in some cases, permanent, and any interference with production could result in a significant reduction in, or loss of, cash flow and value for the Company. While appropriate steps may be taken to prevent discharges of sodium cyanide and other hazardous materials into the ground water, surface water, and the downstream environment, there is inherent risk in the operation and there can be no assurance that a release of hazardous materials will not occur.
Whether it is during transport, storage or its use, cyanide management systems have been implemented outlining the responsibilities and procedures to be followed to ensure that a safe environment is maintained for all employees, nearby communities and the environment. This includes risk assessment, appropriate infrastructure design, training, audits, inspections, stakeholder consultation and emergency preparedness.
|
ANNUAL INFORMATION FORM |
Page | 40 |
FORTUNA SILVER MINES INC.
The Company’s operations are subject to political and other risks in the regions in which it operates.
The Company currently conducts, or plans to conduct, exploration, development and production activity in a number of regions, including Peru, Mexico, Argentina and West Africa (including Burkina Faso, Côte d’Ivoire and Senegal). The Company's mining investments and operations are subject to various political, economic and social risks normally associated with the conduct of business in foreign jurisdictions, which include:
| ● | cancellation or renegotiation of contracts by government authorities; |
| ● | changes in foreign laws or regulations, including those relating to taxation, royalties, mineral title, imports and/or exports, environmental controls and permitting; |
| ● | expropriation or nationalization of property; |
| ● | inflationary risks, including the inflation of costs that are not off-set by a currency devaluation; |
| ● | restrictions on the ability of local operating companies to sell gold, silver or other minerals offshore for U.S. dollars, and on the ability of companies to hold U.S. dollars or other foreign currencies; |
| ● | restrictions on the purchase of foreign currencies and on the remittance of dividend and interest payments offshore; |
| ● | limitations on the repatriation of earnings; |
| ● | opposition to mining development projects from governments, non-governmental organizations, environmental groups, local groups or other stakeholders; |
| ● | mining companies are increasingly required to consider and provide benefits to the communities and countries in which they operate; |
| ● | requirements to provide employment and procure from local suppliers; |
| ● | governmental restrictions in response to pandemics; |
| ● | uncertain political and economic environments, including increased risk of civil strife, social unrest, acts of war, guerrilla activities, insurrection and terrorism; |
| ● | lack of certainty with respect to foreign legal systems, corruption and other factors that are inconsistent with the rule of law; |
| ● | reliance on advisors, consultants and employees in foreign jurisdictions to carry out the Company’s planned exploration, operations, development and exploration activities, including in connection planned with regulatory, permitting and other governmental requirements; and |
| ● | other risks arising out of foreign sovereignty over the areas in which the Company’s operations are conducted. |
Such risks could potentially arise in any country in which the Company operates. These risks may limit or disrupt operating mines or projects, restrict the movement of funds, cause the Company to have to expend more funds than previously expected or required, and may materially adversely affect the Company’s business, financial condition or results of operations. The Company may also evaluate business opportunities in other jurisdictions where such risks may exist.
Challenges also exist with respect to inconsistent application of the rule of law in certain of the jurisdictions in which the Company operates, as court systems in regions such as West Africa may offer less certainty as to the judicial outcome or a more protracted judicial process than is the case in more established economies. Businesses can become involved in lengthy court cases over simple issues when rulings are not clearly defined, and any inconsistencies in the drafting of laws and excessive delays in the legal process for resolving issues or disputes compound such problems. In addition, enforcement of laws may depend on and be subject to the interpretation placed upon such laws by the relevant local authority, and such authority may adopt an interpretation of an aspect of local law which differs from the advice that has been given to the Company by local lawyers or even previously by the relevant local authority itself. Furthermore, there is limited relevant case law providing guidance on how courts would interpret such laws and the application of such laws to the Company’s contracts, joint ventures, licenses, license applications or other arrangements. Thus, there can be no assurance that contracts, joint ventures, licenses, license applications or other legal arrangements will not be adversely affected by the actions of government authorities.
Accordingly, the Company could face risks such as: (i) effective legal redress in the courts of certain jurisdictions in which the Company operates being more difficult to obtain, whether in respect of a breach of law or regulation, or
|
ANNUAL INFORMATION FORM |
Page | 41 |
FORTUNA SILVER MINES INC.
in a contract or an ownership dispute, (ii) a higher degree of discretion on the part of governmental authorities and therefore less certainty, (iii) the lack of judicial or administrative guidance on interpreting applicable rules and regulations, (iv) inconsistencies or conflicts between and within various laws, regulations, decrees, orders and resolutions, or (v) relative inexperience of the judiciary and courts in such matters.
Additionally, the introduction of new tax laws, regulations or rules, or changes to, or differing interpretation of, or application of, existing tax laws, regulations or rules in any of the countries in which the Company operates, could result in an increase in the Company’s taxes, or other governmental charges, duties or impositions. No assurance can be given that new tax laws, rules or regulations will not be enacted or that existing tax laws will not be changed, interpreted or applied in a manner that could result in the Company’s profits being subject to additional taxation or that could otherwise have an adverse material effect on the Company.
On August 16, 2022, the Argentine Tax Authority (“AFIP”) published General Resolution No.5248/2022 (the “Resolution”) which established a one-time “windfall income tax prepayment” for companies that have obtained extraordinary income derived from the general increase in international prices. The Resolution was published by AFIP without prior notice.
The windfall income tax prepayment applies to companies that meet certain income tax or net income tax (before the deduction of accumulated tax losses) thresholds for 2021 or 2022. The aggregate amount of the windfall income tax prepayment payable by Fortuna’s subsidiary Mansfield calculated in accordance with the Resolution was approximately $1.0 million, (810 million Argentine Pesos), excluding related accrued interest of approximately $0.3 million (277 million Argentine Pesos).
The windfall income tax prepayment was to be paid in three equal and consecutive monthly instalments, starting on October 22, 2022, and was payable in addition to income tax instalments currently being paid by corporate taxpayers on account of their income tax obligations. The windfall income tax prepayment is an advance payment of income taxes which were due to be paid in 2022.
Based on the historical accumulated losses of Mansfield for fiscal 2021 which can be carried forward for 2022, Mansfield was not liable for income tax for fiscal 2022.
To protect Mansfield’s position from having to pay the windfall income tax prepayment as an advance income tax for 2022, which based on management’s projections is not payable, Mansfield applied to the Federal Court of Salta Province for a preliminary injunction to prevent the AFIP from issuing a demand or other similar measure for the collection of the windfall income tax prepayment. On October 3, 2022, Mansfield was notified that the Court had granted the preliminary injunction. As a result, Mansfield did not pay any of the instalments. Mansfield also filed an administrative claim with the AFIP to challenge the constitutionality of the Resolution, which was rejected by AFIP on November 2, 2022.
Mansfield has challenged the rejection of its administrative claim, by filing legal proceedings against the AFIP with the Federal Court. On February 15, 2023, the Federal Court granted a preliminary injunction to Mansfield.
In these legal proceedings, Mansfield has subsequently presented additional documentation to AFIP which has resulted in the windfall tax prepayment installments being eliminated from Mansfield’s account in AFIP’s system. The legal proceedings to determine the unconstitutionality of the Resolution and whether interest is payable to AFIP continue under the protection of a preliminary injunction.
Argentina
The Company’s operations at the Lindero Mine are subject to the payment of government taxes, fees and duties. This includes a 3% provincial royalty “boca mina” which is payable on revenue after deduction of direct processing, commercial, general and administrative costs. Under Argentina’s federal laws exports of bullion, doré and unrefined gold were subject to an 8 percent export tax until December 31, 2023.
Effective December 23, 2019, changes to Argentina’s tax laws proposed by the new Argentine Government were implemented. The changes ratified and extended legislation which was to expire on December 31, 2019 and allow
|
ANNUAL INFORMATION FORM |
Page | 42 |
FORTUNA SILVER MINES INC.
the Argentine Central Bank to regulate funds coming into and flowing out of Argentina in order to maintain stability and support the economic recovery of the country. The Argentine Government has not set an expiry date for these restrictions, and they currently remain in place. These capital controls together with additional temporary controls enacted on May 29, 2020, have the effect of: requiring exporters to convert the equivalent value of foreign currency received from the export into Argentine Pesos; requiring the prior consent of the Argentine Central Bank to the payment of cash dividends and distributions of currency out of Argentina; requiring Argentine companies to convert foreign currency loans received from abroad into Argentine Pesos; and restricting the sale of Argentine Pesos for foreign currency. These provisions restrict the Company from holding funds in Argentina in United States dollars. Accordingly, the Company is required to convert the equivalent value of proceeds received in foreign currency from the export of all gold doré from the Lindero Mine, into Argentine Pesos. In addition, the Company is required to obtain the prior consent of the Argentine Central Bank to the payment of cash dividends and distributions of profits out of Argentina.
Further, effective December 12, 2023 additional capital controls were imposed on the import of goods and services in Argentina. Currently, most import permits for goods are approved subject to payment being deferred for 120 days (four equal monthly instalments of 25 percent), with the exception of pre-financing of exports, which are paid at the time of the nationalization of the goods. In the case of services, the payment is deferred for 30 days after the service is provided.
Certain of the costs and expenses to fund the construction at the Lindero Mine were advanced by way of intercompany loans. Under the terms of the Argentine Central Bank regulation, any funds in foreign currency which were advanced by the Company as a loan to its Argentine subsidiary in connection with the payment of construction costs and expenses at the Lindero Mine, are to the extent that the funds were advanced in foreign currency, required to be converted into Argentine Pesos at a conversion rate negotiated at the foreign exchange market within five business days from the date of the receipt of the funds in Argentina. When the loan is to be repaid, the regulation requires proof that the loan was advanced in foreign currency and converted into local currency in order to repay the loan in foreign currency. Due to the volatility of the exchange rate for Argentine Pesos, the Company will apply additional measures in cash management to minimize potential gains or losses arising from the conversion of funds. In addition, the Argentine Central Bank has also issued a temporary measure in effect until June 30, 2024, which requires the consent of the Argentine Central Bank to the repayment of certain types of intercompany loans. There can be no assurance that the temporary measure will not be extended.
As part of the structure used to fund the construction of the Lindero project and the operation of the Lindero Mine, Fortuna has implemented a series of intercompany revolving pre-export financing facilities. This allows exporters to apply the proceeds of sales directly towards payment of principal and interest under the facility. The facilities are not impacted by the regulations described above, and the Company could repatriate up to $20 million through this mechanism.
There are also risks relating to an uncertain or unpredictable political and economic environment in Argentina, and there may be material adverse consequences with respect to the Company and its operations as a result of such political or economic instability. After the presidential election in Argentina in November 2023, the new President announced broad economic changes shortly after taking office on December 10, 2023, including, but not limited to, changes in import and export tariffs, labour and tax reforms, the privatization of major state-owned companies, capital control reforms, and the dollarization of the economy. These and other policy changes, if implemented, may cause significant volatility in the political, regulatory and economic environment and may adversely impact the Company’s operations and financial condition and accuracy of cost estimates and economic analysis of the Lindero Mine.
Mexico
The Company’s operations at the San Jose Mine are subject to the payment of government taxes, fees and duties. Under Mexican federal corporate income tax law, titleholders of mining concessions are required to pay an annual 7.5% duty on their mining related profits and a 0.5% duty on revenues obtained from the sale of gold, silver and platinum.
Additionally, the State of Oaxaca in Mexico has a history of social conflicts and political agitation which can lead to public demonstrations and blockades that can from time to time affect the Company’s operations.
|
ANNUAL INFORMATION FORM |
Page | 43 |
FORTUNA SILVER MINES INC.
In 2015, the Mexican Government introduced a mining fund (the “Mining Fund”) which was funded from taxes paid by mining companies operating in Mexico. The Mining Fund distributed monies to local communities where the activities of mining companies take place to promote infrastructure and social development and to mitigate environmental impacts. Effective January 1, 2020, 85% of the funds of the Mining Fund were reallocated to the Public Education Ministry, and 5% are to be distributed among the municipalities where the mining activities take place. The local communities where the Company operates may be affected by the cut-back in these funds. It is not yet known if this may have an impact on the business and operations of the Company.
In January 2020, the Oaxacan Congress approved a Previous, Free and Informed Consultation Law for the Indigenous and Afromexican Communities in the State of Oaxaca (the “Consultation Law”), which is now in full force and effect.
The Consultation Law settles the procedure that the authority, in this case any public administration sector or the legislative power of Oaxaca, must follow to acquire the prior and informed consent of the indigenous or Afromexican communities that may be affected or jeopardized by the approval of a specific law, or by the authorization of an administrative procedure or act. The Consultation Law is only applicable locally in the State of Oaxaca and specifically to state matters. The mining operations at the San Jose Mine, including the granting of mining concessions and the corresponding environmental impact authorizations are regulated federally and should not be affected by the recently published Consultation Law.
The Consultation Law has no impact on the ongoing business of the Company at the San Jose Mine, as it has no effect on the permits and authorizations already granted for the operations at the San Jose Mine. However, the new law may be applicable in the case of a new local license or permit that is needed. The Company is unable to predict how this new legislation may affect the business and operations of the Company at this time.
In June 2020, the Mexican Supreme Court of Justice mandated the Federal Congress to issue a Federal Consultation Law to regulate the previous, free and informed consent rights of the Indigenous and Afromexican Communities in compliance with Mexico´s obligations under ILO Convention 169. In April 2021, the House of Representatives approved a General Consultation Law for the Indigenous and Afromexican Communities. Currently the Senate is analyzing the House of Representative´s proposal and (i) may approve and send it to the Executive Branch for its enactment; or (ii) modify it and send it back to the House of Representatives for further analysis. The General Consultation Law settles the procedure that the authority, in this case the federal legislative and executive branches of government, must follow to acquire the prior and informed consent of the Indigenous or Afromexican Communities that may be affected or jeopardized by new legislation or by an administrative procedure or administrative act. The Company is unable to predict at this time how this new legislation, if enacted, may affect the business and operations of the Company at this time.
On April 28, 2023, the Mexican Government reformed its mining code which significantly changed the current legal environment for mining including shortening the length of concessions from 50 years to 30 years, requiring all new mining concessions to be granted pursuant to a public tendering process; imposing new indigenous consultation requirements and new environmental safeguards; tightening the requirements for water, and other reforms. The impact to Fortuna’s operations is currently under review. The Mining Code has brought significant uncertainty for foreign investors in Mexico and companies operating in the mining sector, including the Company. As a result of the new Mining Code, the Company expects that it will be more difficult to access and maintain rights to land and water, thereby negatively impacting the Company’s mining activities within Mexico and raising concerns around exploration programs. Challenges have been filed in country against the new Mining Code. If the challenges to the new Mining Code are unsuccessful, and the current trend of political and regulatory anti-mining sentiment continues, this may have an adverse impact on the Company’s operations and financial results.
Peru
The Company’s operations at the Caylloma Mine are subject to the payment of government taxes, fees and duties. Holders of mineral concessions are obliged to pay a mining royalty to the Peruvian Government, as a consideration for the exploitation of metallic and non-metallic natural resources, which is calculated based on the quarterly sales revenues from metallic and non-metallic mineral resources at a minimum rate of 1% and up to 12%.
|
ANNUAL INFORMATION FORM |
Page | 44 |
FORTUNA SILVER MINES INC.
In addition, an additional tax called the “Special Mining Tax” is payable to the Peruvian Government which imposes a tax on the operating profit of metallic resources at a tax rate that ranges from between 2% to 8.4%.
In some areas of Peru, the development of infrastructure projects and extractive industries have met with strong rejection from the local population. Such social conflict may lead to public demonstrations and blockades which could affect the Company’s operations.
In early December 2022, Pedro Castillo, the former President of Peru, was removed from office and replaced by Dina Boluarte, Peru's former Vice President. The new President, Ms. Boluarte, has adopted a more business-friendly stance, albeit on a fragile coalition government. Security related issues have severely impacted some northern areas of Peru, specifically the Pataz region, where significant illegal gold mining takes place. There is no impact to Minera Bateas’ operations nor its sales distribution process, as the Caylloma Mine is located in the Arequipa region in southern Peru. Despite this, Peru’s business environment remains relatively strong, supported by the recent change of Peru’s Prime Minister and a new Mining and Energy Minister.
West Africa
The Company’s operations at the Yaramoko Mine, the Séguéla Mine and the Diamba Sud Project are subject to the payment of government taxes, fees and duties in Burkina Faso, Côte d’Ivoire and Senegal, respectively.
Operations in Burkina Faso are subject to the royalty regime set forth in the Burkina Faso 2015 Mining Code (“Burkina Faso Mining Code”). Pursuant to the Burkina Faso Mining Code, the granting of an exploitation permit entails the allocation to the State of 10% of the share capital of the exploitation company, free of charge. This 10% State participation must be maintained when there is an increase in the capital of the company. Any form of additional participation by the State in the share capital of a company shall be in accordance with the provisions of the Uniform Act of the Organization for the Harmonization of Business Law in Africa relating to commercial companies and economic interest groups.
In addition, there is a gold price based sliding scale 3% to 5% royalty, which in late 2023 was increased to a maximum of 7%, payable to the State, on all gold production.
Operations in Côte d’Ivoire are subject to a similar royalty regime as in Burkina Faso, as set forth in the Côte d’Ivoire 2014 Mining Code (“Côte d’Ivoire Mining Code”). Pursuant to the Côte d’Ivoire Mining Code, the granting of an exploitation permit entails the allocation to the State of 10% of the share capital of the exploitation company, free of charge. This 10% State participation must be maintained regardless of any increase in the capital of the company. Any additional participation of the State in the share capital of the company must be agreed among the parties following negotiation and based on market prices. The said participation is contributory and shall not exceed 15% of the capital of the company at the date of its acquisition.
Production from the Séguéla Mine is subject to a gold price based sliding scale 3% to 6% royalty, payable to the State, which is calculated on the gross revenue from gold produced after deduction of transportation and refining costs.
Operations in Senegal are subject to a similar royalty regime as in Burkina Faso and Côte d’Ivoire as set forth in the Senegal 2016 Mining Code (“Senegal Mining Code”). Pursuant to the Senegal Mining Code, the granting of an exploitation permit entails the allocation to the State of 10% of the share capital of the exploitation company, free of charge. This 10% State participation must be maintained regardless of any increase in the capital of the company. Any additional participation of the State in the share capital of the company must be agreed among the parties following negotiation and based on market prices. The said participation is contributory and shall not exceed 25% of the capital of the company at the date of its acquisition.
Production from gold mines in Senegal is subject to a 5% royalty on gold production, payable to the State.
While the Company believes that the governments of Burkina Faso, Côte d’Ivoire and Senegal support the development of their natural resources by foreign companies, the Company’s West African operations may face a heightened level of political and social risk, such as civil and ethnic unrest, war (including in neighbouring countries),
|
ANNUAL INFORMATION FORM |
Page | 45 |
FORTUNA SILVER MINES INC.
terrorist actions, hostage taking or detainment of personnel, military repression, criminal activity, nationalization, invalidation of governmental orders, corruption and political instability.
Following instability in recent years in several West African countries, the prevailing security environment in these countries has deteriorated due to the presence of various militant secessionist and Islamist paramilitary groups, as well as a result of military coups in Burkina Faso in January and September 2022. On January 28, 2024, the government of Burkina Faso, along with Mali and Niger, announced its intention to withdraw from the Economic Community of West Africa States (ECOWAS). The protocol to withdraw from ECOWAS takes up to one year to complete and there is significant uncertainty on how this will impact the economic and political situation in Burkina Faso. In February 2024, the decision of the Senegalese National Assembly to postpone the presidential election from February 25, 2024 to December 15, 2024 caused weeks of protests and violence in country. The Senegalese Constitutional Council subsequently ruled that the presidential election must take place before April 2024. There can be no assurances that political unrest and protests will not continue once the election has been held. While the Company has implemented additional measures in response to ensure the security of its various assets, personnel and contractors, and continues to cooperate with regional governments, their security forces and applicable third parties, there can be no assurance that these measures will be successful. Any failure to maintain the security of its assets, personnel and contractors may have a material adverse effect on Company’s business, prospects, financial condition and results of operations. To date, neither our employees nor our operations have been impacted by the security situation in Burkina Faso.
While there is no reason to believe that Fortuna’s employees or operations will be targeted by criminal and/or terrorist activities in West Africa, risks associated with conducting business in the region, along with the increased perception that such incidents are likely to occur, may disrupt the Company’s operations, limit its ability to hire and keep qualified personnel, and impair its access to sources of capital or insurance on terms and at rates that are commercially viable. Further, although the Company has developed procedures regarding the mitigation of such risks, due to the unpredictable nature of criminal and/or terrorist activities, there is no assurance that its efforts will be able to effectively mitigate such risks and safeguard the Company’s personnel and assets.
As African governments continue to struggle with deficits and depressed economies, the strength of commodity prices has resulted in the gold mining sector being targeted as a source of revenue. Governments in West Africa are continually assessing the terms for a mining company to exploit resources in their country. This has in the past resulted in governments repudiating or renegotiating contracts with, and expropriating assets from, companies that are producing in such countries. Although the Company believes it has good relations with the governments of Burkina Faso, Côte d’Ivoire and Senegal, there can be no assurance that the actions of present or future governments will not materially adversely affect the business or financial condition of the Company.
Any of the above events could delay or prevent the Company from operating, developing or exploring its properties located in Burkina Faso, Côte d’Ivoire and Senegal, even if economic quantities of minerals are found and could have a material adverse impact upon the Company’s operations.
The Company is subject to global geopolitical risks.
In addition to the risks specific to the countries in which the Company operates, global events such as war and occupation, terrorism and related geopolitical risks may lead to increased market volatility and may have adverse short-term and long-term effects on world economies and markets generally. For example, in response to the current conflict between Russia and Ukraine, countries in which Fortuna operates have implemented economic sanctions against Russia and/or certain Russian individuals or organizations, and may impose further sanctions or other restrictive actions against governmental or other individuals or organizations in Russia or elsewhere. The effects of disruptive events, including the Israel - Hamas war, could affect the global economy and financial and commodities markets in ways that cannot necessarily be foreseen at the present time. These events could also exacerbate other pre-existing political, social and economic risks, including those described elsewhere in this AIF.
The Company is subject to risks relating to the repatriation of funds.
The ability of the Company to repatriate funds from any foreign country may be hindered by the legal restriction of the countries in which it operates. The Company currently generates cash flow and profits at its foreign subsidiaries,
|
ANNUAL INFORMATION FORM |
Page | 46 |
FORTUNA SILVER MINES INC.
and repatriates funds from those subsidiaries to fulfill its business plan. The Company may not be able to repatriate funds or may incur tax payments or other costs when doing so, due to legal restrictions or tax requirements at local subsidiary levels or at the parent company level, which could be material. In light of the foregoing factors, the amount of cash that appears on the balance sheet of the Company from time to time may overstate the amount of liquidity it has available to meet its business or debt obligations. Although the Company has not historically experienced difficulties in repatriating capital, there is no assurance that the government of any foreign country in which it operates, or may operate in the future, will not impose additional restrictions on the repatriation of earnings to foreign entities. Any inability to repatriate funds could have a material adverse effect on the liquidity of the Company. Existing foreign exchange controls in Argentina may impact the ability to repay intercompany debt and to repatriate funds by way of the payment of dividends. See “Risk Factors – The Company’s operations are subject to political and other risks in the regions in which it operates – Argentina”.
The Company is subject to extensive government regulations and permit requirements.
Operations, development and exploration on the Company’s properties are affected to varying degrees by political stability and government regulations relating to such matters as environmental protection, health, safety and labor, mining law reform, restrictions on production, price controls, tax increases, maintenance of claims, tenure, and expropriation of property. Failure to comply with applicable laws and regulations may result in fines or administrative penalties or enforcement actions, including orders issued by regulatory or judicial authorities enjoining or curtailing operations or requiring corrective measures, installation of additional equipment or remedial actions, any of which could result in the Company incurring significant expenditures.
The activities of the Company require licenses and permits from various governmental authorities. The Company has been granted the requisite licenses and permits to enable it to carry on its existing business and operations. On December 20, 2021, the Company announced that SEMARNAT had granted a 12-year extension to the EIA for the San Jose Mine. Subsequently on January 28, 2022, the Company announced that it had received a notice from SEMARNAT which advised that SEMARNAT had made a typographical error in the extension to the term of the EIA for the San Jose Mine and that the correct extension term is two years.
On November 7, 2022, the Company received notice that the Mexican Federal Administrative Court had issued a judgment in favour of the Company, which re-confirms that the extension of the term of the EIA for the San Jose Mine is for a period of 12 years. On January 5, 2023, the Company announced that it had received the SEMARNAT Resolution which provides that SEMARNAT has annulled and is re-assessing the 12-year extension to the EIA for the San Jose Mine that it granted to Minera Cuzcatlan in December 2021.
Minera Cuzcatlan initiated legal proceedings in the Federal Administrative Court in Mexico City to contest and revoke the annulment of the San Jose EIA. Minera Cuzcatlan obtained provisional and permanent injunctions from the Court which allowed the San Jose Mine to continue to operate under the terms of the 12-year EIA. On October 30, 2023, Fortuna announced that the Federal Administrative Court had ruled in favor of Minera Cuzcatlan and re-instated the 12-year EIA for the San Jose Mine. The decision of the Mexican Administrative Court has been appealed and was admitted by the Mexican Collegiate Court in January 2024. Minera Cuzcatlan filed a response with the Mexican Collegiate Court in February 2024. A decision of the Mexican Collegiate Court is expected within the next six to 12 months. The permanent injunction that Minera Cuzcatlan currently has remains in effect.
The results of these legal proceedings cannot be predicted with certainty due to the uncertainty inherent in litigation, including the difficulty of predicting decisions and the timing required to render decisions. The legal proceedings could take away from the time and effort of the Company’s management and could force the Company to pay substantial legal fees or penalties. Further, there can be no assurances that the resolutions of any such matters will not have a material adverse effect on the Company’s business, financial condition and results of operations.
In addition, there can be no assurance that the Company will be able to obtain all the necessary licenses and permits which may be required to carry out exploration, development and mining operations for its projects in the future. The Company might find itself in situations where the state of compliance with regulation and permits can be subject to interpretation and challenge from authorities that could carry risk of fines or temporary stoppage.
The Company operates in countries with developing mining laws and regulations, and changes in such laws or regulations could materially impact Fortuna’s rights or interests in its properties. For example, the recently elected Peruvian government has raised the prospect of implementing changes to the Peruvian constitution, imposing
|
ANNUAL INFORMATION FORM |
Page | 47 |
FORTUNA SILVER MINES INC.
increased mining taxes and royalties, in addition to changes to mine closure requirements, and formalization of small-scale miners and artisanal miners. In addition, previous regional and local governments and other political parties have actively opposed mining projects in the Arequipa area. The Company is unable to predict the positions that will be taken in the future on foreign investment, mining concessions, land tenure or other regulations, or whether such positions will affect the Caylloma Mine. In addition, in May 2023, the Mexican government published several amendments to laws relating to the country's mining industry, which have added significant uncertainty for foreign investors in Mexico and companies operating in the mining sector, including the Company. See “Risk Factors – The Company’s operations are subject to political and other risks in the regions in which it operates – Mexico”.
Future Environmental Legislation.
Environmental legislation is evolving in a manner which is imposing stricter standards and enforcement, increased fines and penalties for non-compliance, in addition to more stringent environmental assessments of proposed projects and a heightened degree of responsibility for companies and their officers, directors and employees. New environmental laws and regulations or more stringent enforcement of existing laws and regulations could have a material adverse effect on the Company, both financially and operationally, by potentially increasing capital or operating costs and delaying or preventing development activities at our mineral properties. Compliance with environmental laws and regulations may require significant capital outlays on behalf of the Company and may cause material changes or delays in the Company’s intended activities. Failure to comply with applicable environmental laws, regulations and permitting requirements may result in enforcement actions thereunder, including orders issued by regulatory or judicial authorities, causing operations to cease or be curtailed. Such enforcement actions may include the imposition of corrective measures requiring capital expenditure, installation of new equipment or remedial action. There is no assurance that future changes in environmental regulation, if any, will not adversely affect the Company’s operations.
The Company intends to, and attempts to, fully comply with all applicable environmental regulations. While the health and safety of its people and responsible environmental stewardship are top priorities for the Company, there can be no assurance that the Company has been or will be at all times in complete compliance with such laws, regulations and permits, or that the costs of complying with current and future environmental and health and safety laws and permits will not materially and adversely affect the Company’s business, results of operations or financial condition.
Abnormal or extreme natural events.
The Company and the mining industry are facing continued physical challenges, which could adversely impact the Company’s production and profitability. Unanticipated adverse geotechnical and hydrological conditions, such as landslides, floods, seismic activity, droughts and pit wall failures, may occur in the future and such events may not be accurately predicted or detected in advance. Such risks could impact the structural integrity of our mines, stockpiles, leach pads and tailings storage facilities. Geotechnical instabilities and adverse climatic conditions can be difficult to predict and are often affected by risks and hazards outside of the Company’s control, such as severe weather, droughts and considerable rainfall.
The Company’s operations require water, and the Lindero Mine and the San Jose Mine are located in regions where water is scarce. While the Company believes it holds sufficient water rights to support its current operations, future developments could limit the amount of water available to the Company. New water development projects, or climatic conditions such as extended drought, could adversely affect the Company's operations. There can be no guarantee that extreme weather events such as a prolonged drought will not affect the operations at these mines, or that the Company will be successful in maintaining adequate supplies of water for its operations. In addition, too much precipitation can pose a risk to the Company's operations, such as at the San Jose Mine which in the past experienced abnormally high rainfall which disrupted operations. Increased precipitation, either due to normal variances in weather or due to global climate change, could result in flooding that may adversely impact operations and could damage the Company’s facilities, plant and operating equipment.
Abnormal or extreme natural events may adversely impact the Company’s operations. These risks may include extreme weather events, resource shortages, changes in rainfall and storm patterns and intensities, water shortages, changing sea levels and changing temperatures, leading to geotechnical failures that could result in limited or restricted access to mine sites, suspension of operations, government investigations, increased monitoring costs, remediation costs, loss of ore and other impacts, which could cause one or more of the Company’s projects to be
|
ANNUAL INFORMATION FORM |
Page | 48 |
FORTUNA SILVER MINES INC.
less profitable than currently anticipated and could result in a material adverse effect on the Company’s business results of operations and financial position.
The Company is subject to risks relating to labour relations.
While the Company has good relations with its employees, there can be no assurance that it will be able to maintain positive relationships with its employees or that new collective agreements will be entered into without interruptions to the Company’s operations. In addition, relations between the Company and its employees may be impacted by regulatory or governmental changes introduced by the relevant authorities in the jurisdictions that the Company operates. Adverse changes in such legislation or in the relationship between the Company and its employees could have a material adverse impact on the Company’s business, financial condition and results of operations.
In the second quarter of 2023, a small group of union employees at the San Jose Mine, representing 15 percent of the mine and plant workforce, illegally blockaded access to the mine for 15 days resulting in suspension of operations, which negatively impacted production and revenue. The illegal blockade arose after the group of workers failed to agree with the estimated amount the Company was to distribute among the workforce as part of the worker´s profit sharing entitlement. Profit sharing is a transparent calculation and is payable in accordance with Mexican legislation. The blockaders demanded that the Company increase profit sharing participation beyond what was stipulated by law. The Company engaged in dialogue with the union leadership such that the employees returned to work and operations at the San Jose Mine resumed. Any failure to successfully resolve future union complaints could result in additional work stoppages and/or other future disruptions in production and labour issues, which could adversely affect the Company’s operations and financial performance and the Company’s ability to achieve expected results and guidance.
The Company is subject to risks relating to the use of outside contractors.
The underground mining operations at the Yaramoko Mine and the open pit mining operations at the Séguéla Mine are conducted by outside contractors pursuant to mining services contracts. As a result, the Company’s operations in Burkina Faso and Côte d’Ivoire are subject to risks, some of which are outside of the Company’s control, including: (i) the inability to replace a contractor and its operating equipment in the event that either party terminates the agreement; (ii) reduced control over such aspects of operations that are the responsibility of the contractor; (iii) failure of a contractor to perform under the related mining services contract; (iv) interruption of operations in the event that a contractor ceases its business due to insolvency or other events; (v) failure of a contractor to comply with applicable legal and regulatory requirements, to the extent that it is responsible for such compliance, and; (vi) problems of a contractor with managing its workforce, labour unrest or other employment issues. In addition, the Company may incur liability to third parties as a result of the actions of a contractor. Although the mining contractors involved with the Company’s projects are well-known and reputable, the occurrence of one or more of these risks could materially adversely affect the Company’s business, financial condition and results of operations.
Informal and artisanal mining occurs on or adjacent to certain of our properties exposing such sites to security risks.
Informal and artisanal miners have been active on, or adjacent to, some of the Company’s properties, including concession areas of the Caylloma Mine and the Company’s properties in Burkina Faso, Côte d’Ivoire and Senegal. No such activities currently occur in the area where the Mineral Resources and Mineral Reserves are located. Informal or artisanal mining is associated with a number of potentially negative impacts, such as exposure to security risks, environmental degradation, and in certain cases, it could accelerate the depletion of our Mineral Resources and Mineral Reserves. In coordination with the Peruvian government and the Peruvian police, during 2023 and 2024, the Company closed the majority of the concession areas adjacent to the Caylloma Mine where informal miners were active. The activities of artisanal miners are largely unregulated and work conditions are often unsafe and present health risks to the artisanal miners and local communities, which while unrelated to our operations, may have an impact on them.
At the Caylloma Mine, artisanal miners are in dialogue with the Peruvian government to formalize their operation. Pursuant to Law No. 31388 published on December 31, 2021, artisanal miners have a deadline of December 31, 2024 to conclude the formalization process. While the Company believes it is unlikely that the
|
ANNUAL INFORMATION FORM |
Page | 49 |
FORTUNA SILVER MINES INC.
artisanal miners will be successful in obtaining approval to formalize their operations, there can be no assurance of same.
In Burkina Faso and Côte d’Ivoire, the Company is aware that small scale unauthorized artisanal mining activities are being conducted on land within the boundaries of its exploration and exploitation permits at the Yaramoko Mine and the Séguéla Mine, but not within the respective areas of defined Mineral Resources and Mineral Reserves. No approval to conduct such activities has been granted by either the Company or the Mines Administrations in Burkina Faso or Côte d’Ivoire.
In May 2023, one of the Company’s Senegalese subsidiaries entered into a temporary agreement allowing artisanal miners to access a small area of the Diamba Sud Project to carry out artisanal mining activities, subject to certain terms and conditions. The agreement has a term of 12 months and will not be renewed by the Company. Except for the foregoing, artisanal miners have no rights to access the land and no rights to conduct artisanal mining activities on the Diamba Sud Project.
The Company’s mining concessions may be terminated in certain circumstances.
Under the laws of the jurisdictions where the Company’s operations, exploration and development projects and prospects are located, Mineral Resources belong to the state and governmental concessions are required to explore for, and exploit, Mineral Reserves. The Company holds mining, exploration and other related concessions in these jurisdictions. The concessions held by the Company in respect of its operations, exploration and development projects and prospects may be terminated under certain circumstances, including where minimum production levels are not achieved by the Company (or a corresponding penalty is not paid), if certain fees and/or royalties are not paid or if environmental and safety standards are not met. Termination of any of the Company’s concessions could have a material adverse effect on the Company’s business, financial condition or results of operations.
The Company is subject to risks related to ILO Convention 169 compliance.
The Company may, or may in the future, operate in areas presently or previously inhabited or used by indigenous peoples. As a result, the Company’s operations are subject to national and international laws, codes, resolutions, conventions, guidelines and other similar rules respecting the rights of indigenous peoples, including the provisions of ILO Convention 169. ILO Convention 169 mandates, among other things, that governments consult with indigenous peoples who may be impacted by mining projects prior to granting rights, permits or approvals in respect of such projects.
ILO Convention 169 has been ratified by most Latin American countries including Argentina, Peru and Mexico. It is possible however that these governments may not (i) have implemented procedures to ensure their compliance with ILO Convention 169 or (ii) have complied with the requirements of ILO Convention 169 despite implementing such procedures.
Government compliance with ILO Convention 169 can result in delays and significant additional expenses to the Company arising from the consultation process with indigenous peoples in relation to the Company’s exploration, mining or development projects. Moreover, any actual or perceived past contraventions, or potential future actual or perceived contraventions, of ILO Convention 169 by ratifying governments in the countries in which the Company operates create a risk that the permits, rights, approvals, and other governmental authorizations that the Company has relied upon, or may in the future rely upon, to carry out its operations or plans in such countries could be challenged by or on behalf of indigenous peoples in such countries.
Such challenges may result in, without limitation, additional expenses with respect to the Company’s operations, the suspension, revocation or amendment of the Company’s rights or mining, environmental or export permits, a delay or stoppage of the Company’s development, exploration or mining operations, the refusal by governmental authorities to grant new permits or approvals required for the Company’s continuing operations until the settlement of such challenges, or the requirement for the responsible government to undertake the requisite consultation process in accordance with ILO Convention 169.
As a result of the inherent uncertainty in respect of such proceedings, the Company is unable to predict what the results of any such challenges would be; however, any ILO Convention 169 proceedings relating to the Company’s mining and exploration operations in Mexico or Peru, or its development of the Lindero Mine and exploration of
|
ANNUAL INFORMATION FORM |
Page | 50 |
FORTUNA SILVER MINES INC.
other properties in Argentina, may have a material adverse effect on the business, operations, and financial condition of the Company.
On March 1, 2022, the Constitutional Court of Peru through Verdict N° 27/2022, declared the that the right to prior consultation is not a fundamental right, therefore it is not possible to claim protection of ILO Convention 169 through a constitutional process.
The Company’s success depends on developing and maintaining relationships with local communities and stakeholders.
The Company’s ongoing and future success depends on developing and maintaining productive relationships with the communities surrounding its operations, including indigenous peoples who may have rights or may assert rights to certain of the Company’s properties, and other stakeholders in its operating locations. The Company believes its operations can provide valuable benefits to surrounding communities, in terms of direct employment, training and skills development and other benefits associated with ongoing payment of taxes. In addition, the Company seeks to maintain its partnerships and relationships with local communities, including indigenous peoples, and stakeholders in a variety of ways, including in-kind contributions, local procurement of goods and services, volunteer time, sponsorships and donations. Notwithstanding the Company’s ongoing efforts, local communities and stakeholders can become dissatisfied with its activities or the level of benefits provided, which may result in civil unrest, protests, direct action or campaigns against it. Any such occurrence could materially and adversely affect the Company’s business, financial condition or results of operations.
As a result of social media and other web-based applications, companies today are at much greater risk of losing control over how they are perceived.
Damage to the Company’s reputation can be the result of the actual or perceived occurrence of any number of events, and could include any negative publicity, whether true or not. Although the Company places a great emphasis on protecting its image and reputation, it does not ultimately have direct control over how it is perceived by others. Reputation loss may lead to increased challenges in developing and maintaining community relations, decreased investor confidence and act as an impediment to the Company’s overall ability to advance its projects, thereby having a material adverse impact on the Company’s business, financial condition or results of operations.
Opposition of the Company’s exploration, development and operational activities may adversely affect the Company’s reputation, its ability to receive mining rights or permits and its current or future activities.
Maintaining a positive relationship with the communities in which the Company operates is critical to continuing successful exploration and development. Community support for operations is a key component of a successful exploration or development project. Various international and national laws, codes, resolutions, conventions, guidelines and other materials relating to corporate social responsibility (including rights with respect to health and safety and the environment) may also require government and or company consultation with communities on a variety of issues affecting local stakeholders, including the approval of mining rights or permits.
The Company may come under pressure in the jurisdictions in which it explores or develops to demonstrate that other stakeholders benefit and will continue to benefit from its commercial activities. Local stakeholders and other groups may oppose the Company’s current and future exploration, development and operational activities through legal or administrative proceedings, protests, roadblocks or other forms of public expression against the Company’s activities. Opposition by such groups may have a negative impact on the Company’s reputation and its ability to receive necessary mining rights or permits. Opposition may also require the Company to modify its exploration, development or operational plans or enter into agreements with local stakeholders or governments with respect to its projects, in some cases causing considerable project delays. Any of these outcomes could have a material adverse effect on the Company’s business, financial condition, results of operations and Common Share price.
The Company is faced with uncertainty of funding for exploration and development.
The Company’s ability to continue production, development and exploration activities, if any, will depend on its ability to generate sufficient operating cash flows from the Lindero Mine, the Yaramoko Mine, the Séguéla Mine, the Caylloma Mine and the San Jose Mine, and to obtain additional external financing where necessary. Any unexpected costs, problems or delays at the Lindero Mine, the Yaramoko Mine, the Séguéla Mine, the San Jose Mine, or the Caylloma Mine could severely impact the Company’s ability to generate sufficient cash flows and require
|
ANNUAL INFORMATION FORM |
Page | 51 |
FORTUNA SILVER MINES INC.
greater reliance on alternative sources of financing, including but not limited to: project or bank financing, or public or private offerings of equity and debt, joint ventures, or utilize one or a combination of all of these alternatives. There can be no assurance that the Company will be able to obtain additional financing or that the terms of such financing will be favorable. Failure to obtain such additional financing could result in delay or indefinite postponement of further exploration and development of some of its projects.
The Company is substantially reliant on its producing mines.
Prior to the exhaustion of Mineral Reserves at the San Jose Mine anticipated to be at the end of 2024, until the Company develops additional properties or projects, it remains largely dependent upon the operation of the Lindero Mine, the Yaramoko Mine, the Séguéla Mine, the Caylloma Mine and the San Jose Mine as its primary source of cashflows, future revenue and profits, if any. If for any reason production at any of these mines was reduced or stopped, the Company’s revenues and profits would decrease significantly. In addition, existing foreign exchange controls in Argentina may impact the ability to repay intercompany debt and to repatriate funds by way of the payment of dividends.
The title to the Company’s properties could be challenged or impugned.
Although the Company has or will receive title opinions for any properties in which it has a material interest, there is no guarantee that title to such properties will not be challenged or impugned. The Company has not conducted surveys of the claims in which it holds direct or indirect interests and, therefore the precise area and location of the properties may be in doubt. The Company’s properties may be subject to prior unregistered agreements or transfers or indigenous land claims and title may be affected by unidentified or unknown defects. Title insurance is generally not available for mineral properties and the Company’s ability to ensure that it has obtained secure claims to individual mineral properties or mining concessions may be constrained. A successful challenge to the Company’s title to a property or to the precise area and location of a property could cause delays or stoppages to the Company’s exploration, development or operating activities without reimbursement to the Company. Any such delays or stoppages could have a material adverse effect on the Company’s business, financial condition and results of operations.
Additional businesses and assets that the Company acquires may not be successfully integrated.
The Company undertakes evaluations from time to time of opportunities to acquire additional mining assets and businesses. For example, the Company recently completed the Chesser Acquisition in September 2023, and the Company spent time and effort integrating Chesser’s operations and workforce during the remainder of 2023. Fortuna expects to continue to evaluate acquisition opportunities from time to time and to pursue opportunities the Company deems to be in its long-term best interest. Any such acquisitions may be significant in size, may change the scale of the Company’s business, may require additional capital, and/or may expose the Company to new geographic, political, operating, financial and geological risks. The Company’s success in its acquisition activities depends on its ability to identify suitable acquisition candidates, acquire them on acceptable terms, and integrate their operations successfully. Any acquisitions would be accompanied by risks such as:
There can be no assurance that any assets or business acquired will prove to be profitable or that the Company will be able to integrate the required businesses successfully, which could slow the Company’s rate of expansion and cause the Company’s business, results of operations and financial condition to suffer.
|
ANNUAL INFORMATION FORM |
Page | 52 |
FORTUNA SILVER MINES INC.
The Company may need additional capital to finance future acquisitions. There can be no assurance that such financing would be available, on favourable terms or at all. If the Company obtains further debt financing, it will be exposed to the risk of leverage and its operations could become subject to restrictive loan and lease covenants and undertakings. If the Company obtains equity financing, existing shareholders may suffer dilution. There can be no assurance that the Company would be successful in overcoming these risks or any other problems encountered in connection with such financings.
The 2021 Credit Facility contains financial covenants which the Company could fail to meet.
Under the terms of the 2021 Credit Facility, the Company is required to satisfy various affirmative and negative covenants and to meet certain financial ratios and tests. There is no assurance that in the future the Company will continue to satisfy these covenants. Furthermore, a breach of these covenants, including a failure to meet the financial tests or ratios, would likely result in an event of default under the 2021 Credit Facility unless the Company is able to obtain a waiver or consent in respect of any such breach. The Company cannot provide any assurance that a waiver or consent would be granted. A breach of any of these covenants or the inability to comply with the required financial tests or ratios could result in a default under the 2021 Credit Facility. In the event of any default under the 2021 Credit Facility, the lenders could elect to declare all outstanding borrowings, together with accrued interest, fees and other amounts due thereunder, to be immediately due and payable, which may have a material adverse impact on the Company’s business, profitability or financial condition.
Temporary Restrictions on the 2021 Credit Facility
Until the determination of the Mexican Legal Proceedings (See “Three Year History and Recent Developments – 2023 Developments”), the Company has agreed with its lenders to certain temporary restrictions under the 2021 Credit Facility as follows:
Until the date that the Company receives a “positive” decision in the Mexican Legal Proceedings, the following conditions will apply:
| ● | The Company may not exercise the $50 million accordion feature. |
| ● | The Company must maintain a minimum liquidity balance of $70 million. In the event that the Company fails to maintain this minimum requirement over a period of 30 days, the availability of the credit under the facility will be reduced to $200 million. The credit availability will revert to $250 million once the Company re-establishes the minimum liquidity balance requirement over a period of 30 days. |
| ● | The Company cannot make any cash-based permitted acquisition and investments, nor any discretionary expansionary capital expenditures. |
| ● | The Company may not make investments in or provide financial assistance to non-guaranteeing subsidiaries in excess of $3,000,000. |
In the event that: (1) the permanent injunction ceases to be in effect; (2) the Court upholds the SEMARNAT Resolution, (3) an administrative authority issues a resolution to cease operations at the San Jose Mine, or (4) a positive unappealable decision in the Mexican Legal Proceedings is not received before December 31, 2024, the availability under the 2021 Credit Facility will be reduced to nil, and an event of default will occur thereunder.
The results of the Mexican Legal Proceedings cannot be predicted with certainty due to the uncertainty inherent in litigation, including the difficulty of predicting decisions and the timing required to render decisions. Further, there can be no assurances given that a “positive” unappealable decision will be obtained by the Company in the Mexican Legal Proceedings. There can also be no assurances that the restrictions imposed by the lenders on the 2021 Credit Facility will only be temporary, which may have a material adverse impact on the Company’s business, financial condition and results of operations or otherwise negatively impact the activities of the Company.
Fortuna may record impairment charges which will adversely affect financial results.
At the end of each reporting period, the Company assesses mineral properties and equipment for impairment indicators and if there are such indicators, then the Company performs a test of impairment. For the purpose of assessing impairment, assets are grouped at the lowest level for which there are separately identifiable cash inflows or cash generating units (CGUs). These are typically individual mines or development projects. Brownfields exploration projects, located close to existing mine infrastructure, are assessed for impairment as part of the
|
ANNUAL INFORMATION FORM |
Page | 53 |
FORTUNA SILVER MINES INC.
associated mine cash generating unit. An impairment loss is recognized for the amount by which the asset’s carrying amount exceeds its recoverable amount.
Where an impairment loss subsequently reverses, the carrying amount of the asset or cash-generating unit is increased to the revised estimate of recoverable amount but not beyond the carrying amount, net of depreciation and amortization, that would have been determined had no impairment loss been recognized for the asset or cash generating unit in prior years.
The recoverable amounts, or fair values, of the Company’s CGUs are based, in part, on certain factors that may be partially or totally outside of the Company’s control. Impairment estimates are based on management’s assumptions and sensitivity analyses and future outcomes may differ from these estimates.
The Company is dependent on key personnel.
The Company is dependent on a number of key management and employee personnel. The Company’s ability to manage its exploration, development, construction and operating activities, and hence its success, will depend in large part on the ability to retain current personnel and attract and retain new personnel, including management, technical and skilled employees. The loss of the services of one or more key management personnel, as well as a prolonged labour disruption, could have a material adverse effect on the Company’s ability to successfully manage and expand its affairs.
The Company will be required to recruit additional personnel and to train, motivate and manage its employees. The international mining industry is very active and the Company is facing increased competition for personnel in all disciplines and areas of operation, including geology and project management. In addition, as a result of pandemics or health crises, technological improvements, and the growth in work from home or hybrid employment arrangements, employees have become more mobile and available to a wider pool of employers and industries, presenting further challenges in retaining key personnel. There can be no assurance that the Company will be able to retain current personnel and attract and retain new personnel.
Incentive provisions for the Company’s key executives include the granting of stock options and various share units that vest over time, which are designed to encourage such individuals to stay with the Company. However, a low Common Share price, whether as a result of disappointing progress in the Company’s exploration, development, construction or operating activities or as a result of market conditions generally, could render such agreements of little value to the Company’s key executives. In such event, the Company’s key executives could be susceptible to being hired away by the Company's competitors who could offer a better compensation package. If the Company is unable to attract and retain key personnel, its business, financial conditions and results of operations may be adversely affected.
The Company relies on local counsel and advisors and the experience of its management and Board in foreign jurisdictions.
The Company’s material mining or exploration property interests are located in Argentina, Burkina Faso, Côte d’Ivoire, Mexico, Peru and Senegal. The legal and regulatory requirements in certain of these countries with respect to mineral exploration and mining activities, as well as local business customs and practices, are different from those in Canada. The officers and directors of the Company must rely, to a great extent, on the Company’s local legal counsel and local consultants retained by the Company in order to keep abreast of material legal, regulatory and governmental developments as they pertain to and affect the Company’s business operations, and to assist the Company with its governmental relations. The Company must rely, to some extent, on those members of management and the Board who have previous experience working and conducting business in these countries in order to enhance its understanding of and appreciation for the local business customs and practices. The Company also relies on the advice of local experts and professionals in connection with current and new regulations that develop in respect of banking, financing, labour, litigation and tax matters in these countries. There can be no guarantee that reliance on such local counsel and advisors and the Company’s management and the Board will result in compliance at all times with such legal and regulatory requirements and business customs and practices. Any such violations could result in a material adverse effect on the Company’s business, financial condition and results of operations.
|
ANNUAL INFORMATION FORM |
Page | 54 |
FORTUNA SILVER MINES INC.
Certain of the Company’s directors and officers may have conflicts of interest.
Certain of the directors and officers of the Company also serve as directors and/or officers of other companies involved in natural resource exploration and development and consequently there exists the possibility for such directors and officers to be in a position of conflict. To the extent that such other companies may participate in ventures that the Company may also participate in, or in ventures that the Company may seek to participate in, the Company’s directors and officers may have a conflict of interest in negotiating and concluding terms respecting the extent of such participation. As a result of these potential conflicts of interests, the Company may miss the opportunity to participate in certain transactions. In all cases where the Company’s directors and officers have an interest in other companies, such other companies may also compete with the Company for the acquisition of mineral property investments. Such conflicts of the Company’s directors and officers may result in a material and adverse effect on its business, financial condition and results of operations.
The insurance coverage on the Company’s operations may be inadequate.
The mining industry is subject to significant risks that could result in damage to, or destruction of, mineral properties or producing facilities, personal injury or death, environmental damage, delays in mining, monetary losses and possible legal liability. The Company’s policies of insurance may not provide sufficient coverage for losses related to these or other risks. The Company’s insurance does not cover all risks that may result in loss or damages and may not be adequate to reimburse the Company for all losses sustained. The occurrence of losses or damage not covered by insurance could have a material and adverse effect on the Company’s business, operations and financial condition.
Insurance against certain environmental risks, including potential liability for pollution and other hazards as a result of the disposal of waste products occurring from production, is not generally available to companies within the mining industry. There is no assurance that the Company’s insurance will be adequate to cover all liabilities or that it will continue to be available and at terms that are economically acceptable. Losses from un-insured or under-insured events may cause the Company to incur significant costs that could have a material adverse effect on its business and financial condition.
Compliance with Listing Standards.
The Company must meet continuing listing standards to maintain the listing of the Common Shares on the Toronto Stock Exchange (the “TSX”) and the NYSE, including minimum trading price of such Common Shares. If the Company fails to comply with listing standards and the TSX or NYSE delists the Common Shares, the Company and its shareholders could face significant material adverse consequences, including: a limited availability of market quotations for the Common Shares; reduced liquidity for the Common Shares; a determination that the Common Shares are “penny stock,” which would require brokers trading in the Common Shares to adhere to more stringent rules and possibly result in a reduced level of trading activity in the secondary trading market for the Common Shares; a limited amount of news about the Company and analyst coverage; and a decreased ability for the Company to issue additional equity securities or obtain additional equity or debt financing in the future.
Foreign Private Issuer.
The Company is a “foreign private issuer” as such term is defined in Rule 405 under the Securities Act and is permitted, under a multijurisdictional disclosure system adopted by the United States and Canada, to prepare its disclosure documents filed under the Exchange Act, in accordance with Canadian disclosure requirements. Under the Exchange Act, the Company is subject to reporting obligations that, in certain respects, are less detailed and less frequent than those of U.S. domestic reporting companies. As a result, the Company will not file the same reports that a U.S. domestic issuer would file with the SEC, although it will be required to file or furnish to the SEC the continuous disclosure documents that we are required to file in Canada under Canadian securities laws. In addition, the Company’s officers, directors, and principal shareholders are exempt from the reporting and “short swing“ profit recovery provisions of Section 16 of the Exchange Act. Therefore, the Company’s shareholders may not know on a timely basis when the Company’s officers, directors and principal shareholders purchase or sell shares, as the reporting deadlines under the corresponding Canadian insider reporting requirements are longer.
As a foreign private issuer, the Company is exempt from the rules and regulations under the Exchange Act related to the furnishing and content of proxy statements. The Company is also exempt from Regulation FD, which prohibits issuers from making selective disclosures of material non-public information. While the Company expects to comply
|
ANNUAL INFORMATION FORM |
Page | 55 |
FORTUNA SILVER MINES INC.
with the corresponding requirements relating to proxy statements and disclosure of material non-public information under Canadian securities laws, these requirements differ from those under the Exchange Act and Regulation FD and shareholders should not expect to receive in every case the same information at the same time as such information is provided by U.S. domestic companies.
In addition, as a foreign private issuer, the Company has the option to follow certain Canadian corporate governance practices, except to the extent that such laws would be contrary to U.S. securities laws, and provided that the Company discloses the requirements we are not following and describe the Canadian practices the Company follows instead. For example, the Company does not intend to follow the minimum quorum requirements for shareholder meetings as well as certain shareholder approval requirements prior to the issuance of securities under NYSE listing standards, as permitted for foreign private issuers. As a result, the Company's shareholders may not have the same protections afforded to shareholders of U.S. domestic companies that are subject to all U.S. corporate governance requirements.
The Company may lose its foreign private issuer status if a majority of the Common Shares are owned of record in the United States and the Company fails to meet the additional requirements necessary to avoid loss of foreign private issuer status, which require that the majority of both its directors and executive officers are not U.S. citizens or residents, a majority of the Company’s assets are located outside the United States, and that its business be principally administered outside the United States. The regulatory and compliance costs to the Company under U.S. federal securities laws as a U.S. domestic issuer may be significantly more than the costs the Company incurs as a Canadian foreign private issuer eligible to use the multijurisdictional disclosure system. If the Company is not a foreign private issuer, it would not be eligible to use the multijurisdictional disclosure system or other foreign issuer forms and would be required to file periodic and current reports and registration statements on U.S. domestic issuer forms with the SEC, which are more detailed and extensive than the forms available to a foreign private issuer. Loss of status as a foreign private issuer could result in significant additional costs and expenses to the Company.
The Company must comply with the Sarbanes-Oxley Act.
The Sarbanes-Oxley Act (“SOX”) requires an annual assessment by management of the effectiveness of the Company’s internal control over financial reporting. Beginning with the Company’s 2016 fiscal year, its auditor is also required to attest to the effectiveness of the Company’s internal control over financial reporting. The Company may fail to maintain the adequacy of its internal control over financial reporting as such standards are modified, supplemented or amended from time to time. If this occurs, the Company may not be able to conclude, on an ongoing basis, that it has effective internal control over financial reporting in accordance with Section 404 of SOX and the Company’s auditor may issue an adverse opinion on the effectiveness of its internal control over financial reporting. The Company’s failure to satisfy the requirements of Section 404 of SOX on an ongoing, timely basis could result in the loss of investor confidence in the reliability of the Company’s financial statements, which in turn could harm its business and negatively impact the trading price or the market value of its securities. In addition, any failure to implement required new or improved controls, or difficulties encountered in their implementation, could harm the Company’s operating results or cause it to fail to meet its reporting obligations. Future acquisitions of companies, if any, may provide the Company with challenges in implementing the required processes, procedures and controls in its acquired operations. No evaluation can provide complete assurance that the Company’s internal control over financial reporting will detect or uncover all failures of persons within the Company to disclose material information otherwise required to be reported. The effectiveness of the Company’s processes, procedures and controls could also be limited by simple errors or faulty judgments. As the Company continues to expand, the challenges involved in implementing appropriate internal control over financial reporting will increase and will require that the Company continue to monitor its internal control over financial reporting. Although the Company intends to expend substantial time and incur substantial costs, as necessary, to ensure ongoing compliance, it cannot be certain that it will be successful in complying with Section 404 of SOX.
The Company may be responsible for corruption and anti-bribery law violations.
The Company’s business is subject to the Foreign Corrupt Practices Act (the “FCPA”) and the Corrupt Foreign Public Officials Act (Canada) (the “CFPOA”), which generally prohibit companies and company employees from engaging in bribery or other prohibited payments to foreign officials for the purpose of obtaining or retaining business. The FCPA also requires companies to maintain accurate books and records and internal controls, including at foreign-controlled subsidiaries. Since all of the Company’s presently held interests are located in Argentina, Burkina Faso, Côte d’Ivoire, Mexico, Peru and Senegal, there is a risk of potential FCPA violations. In addition, the Company is
|
ANNUAL INFORMATION FORM |
Page | 56 |
FORTUNA SILVER MINES INC.
subject to the anti-bribery laws of Argentina, Burkina Faso, Côte d’Ivoire, Mexico, Peru and Senegal and of any other countries in which it conducts business in the future. The Company’s employees or other agents may, without its knowledge and despite its efforts, engage in prohibited conduct under the Company’s policies and procedures and the FCPA, the CFPOA or other anti-bribery laws for which the Company may be held responsible. If the Company’s employees or other agents are found to have engaged in such practices, the Company could suffer severe penalties and other consequences that may have a material adverse effect on its business, financial condition and results of operations. The Company’s Anti-Corruption Policy and other corporate policies mandate compliance with these anti-bribery laws; however, there can be no assurance that the Company’s internal control policies and procedures will always protect it from fraudulent behavior or dishonesty and other inappropriate acts committed by the Company’s employees and agents. As such, the Company’s corporate policies and processes may not prevent all potential breaches of law or other governance practices.
The Company may be subject to legal proceedings that arise in the ordinary course of business.
Due to the nature of its business, the Company is at the date of this AIF subject to litigation and claims covering a wide range of matters that arise in the ordinary course of business and may, from time to time, be subject to regulatory investigations, claims, lawsuits and other proceedings in the ordinary course of its business. The Company’s operations are subject to the risk of legal claims by employees, unions, contractors, lenders, suppliers, joint venture partners, shareholders, governmental agencies or others through private actions, class actions, administrative proceedings, regulatory actions or other litigation. Plaintiffs may seek recovery of very large or indeterminate amounts, and the magnitude of the potential loss relating to such lawsuits may remain unknown for substantial periods of time. Defense and settlement costs can be substantial, even with respect to claims that have no merit. The results of these legal proceedings cannot be predicted with certainty due to the uncertainty inherent in litigation, including the effects of discovery of new evidence or advancement of new legal theories, the difficulty of predicting decisions of judges and juries and the possibility that decisions may be reversed on appeal. The litigation process could, as a result, take away from the time and effort of the Company’s management and could force the Company to pay substantial legal fees or penalties. There can be no assurances that the resolutions of any such matters will not have a material adverse effect on the Company’s business, financial condition and results of operations.
General economic conditions could impact the Company’s business.
Turmoil in global financial markets have at times caused a loss of confidence in global financial and credit markets. Many industries, including the precious and base metals mining industry, have been impacted by these market conditions. Some of the key impacts have included contraction in credit markets resulting in a widening of credit risk, devaluations and high volatility in global equity, commodity, foreign exchange and precious metal markets, and a lack of market liquidity. The global economic slowdown is an example of a visible risk to world financial stability. A continued or worsened slowdown in economic conditions, including, but not limited to, consumer spending, employment rates, business conditions, inflation, increasing government debt, fuel and energy costs, consumer debt levels, lack of available credit, the state of the financial markets, interest rates, and tax rates may adversely affect the Company’s growth and profitability. Specifically:
·a new global credit/liquidity crisis could impact the cost and availability of financing and the Company’s overall market liquidity;
·the volatility of metal prices could impact the Company’s revenues, profits, losses and cash flow;
·volatile energy prices, commodity and consumables prices and currency exchange rates could impact the Company’s production costs or projected economic returns; and
·the devaluation and volatility of global stock markets, which are not related to the Company’s operations or assets, could impact the valuation of the Company’s equity and other securities.
Restrictions and controls imposed by Governments relating to exchange rates impact the Company’s operations. For example, in Argentina, the government has at times established official exchange rates that were significantly different from the unofficial exchange rates more readily utilized locally to determine process and value. The Company’s investments in Argentina are primarily funded from outside of the country, and therefore conversion of foreign currencies such as the United States dollar at the official exchange rate has had the effect of reducing purchasing power and substantially increasing relative costs in an already high inflationary market. Maintaining
|
ANNUAL INFORMATION FORM |
Page | 57 |
FORTUNA SILVER MINES INC.
monetary assets in Argentine pesos exposes the Company to the risks of devaluation of the peso and high rates of inflation in Argentina.
These factors are beyond the control of the Company and could have a material adverse effect on the Company’s financial condition and results of operations.
The Company may be adversely affected by operating expense exchange rate fluctuations.
The Company’s activities and operations in Argentina, Burkina Faso, Côte d’Ivoire, Mexico, Peru and Senegal make it subject to foreign currency fluctuations. Although the Company uses U.S. dollars as the currency for the presentation of its financial statements, the Company’s operating expenses are incurred in Mexican and Argentine Pesos, Peruvian Sol and West African CFA francs in proportions that will typically range between 30% and 45% of total expenses, depending on the country. The fluctuation of these currencies in relation to the U.S. dollar will consequently have an impact upon the profitability of the Company’s mineral properties and therefore its ability to continue to finance its exploration, development and operations. Such fluctuations may also affect the value of the Company’s assets and shareholders’ equity. Future exploration, development and operational plans may need to be altered or abandoned if actual exchange rates for these currencies are less than or more than the rates estimated in any such future plans.
During the year ended December 31, 2023, the Company recognized an unrealized/realized foreign exchange loss of $10.9 million primarily as a result of the devaluation of the Argentine Peso relative to the U.S. dollar. The Argentine Peso was devalued significantly in the fourth quarter, a 356% decrease compared to the beginning of the year resulting in an unrealized/realized foreign exchange loss of $8.7 million. These losses were offset by the Company’s utilization of blue-chip swaps resulting in a gain of $12.4 million. During the year ended December 31, 2023, the Company recognized an unrealized/realized foreign exchange loss of $1.8 million as a result of the 13% appreciation of the Mexican Peso relative to the U.S. dollar during the year. If significant changes in the relative value of the U.S. dollar compared to the Argentine Peso or the Mexican Peso continue, there can be no assurance that further losses will not be incurred.
During the year ended December 31, 2023, the Company was impacted negatively with higher costs to access foreign currency within the West Africa region. In the event that the higher costs to access foreign currency continue or increase, there can be no assurance that this will not negatively impact the Company’s financial condition. .
Due to the volatility of the exchange rate for the Argentine Peso, the Company is applying additional measures in cash management to minimize potential losses arising from the conversion of funds. There can be no assurance that the Company will be successful in its cash management measures. With the capital controls currently in effect in Argentina, the Company is required to convert the equivalent value into Argentine Peso from the export sale of all gold doré from the Lindero Mine. In addition, the Company is required to obtain the prior consent of the Argentine Central Bank for the payment of cash dividends and distributions of profits out of Argentina. There can be no assurance that these capital controls will not have an adverse effect on the financial condition of the Company.
The Company faces intense competition.
The mining industry is intensely competitive in all of its phases. Much of the Company’s competition is from larger mining companies with greater liquidity, greater access to credit and other financial resources, and that may have newer or more efficient equipment, lower cost structures, more effective risk management policies and procedures and/or greater ability than the Company to withstand losses. The Company’s competitors may be able to respond more quickly to new laws, regulations or emerging technologies, or devote greater resources to the expansion of their operations, than the Company can. In addition, current and potential competitors may make strategic acquisitions or establish cooperative relationships among themselves or with third parties. Competition could adversely affect the Company’s ability to acquire suitable new producing properties or properties for exploration and development in the future. Competition could also affect the Company’s ability to raise financing to fund the exploration and development of its properties or to hire qualified personnel. The Company may not be able to compete successfully against current and future competitors, and any failure to do so could have a material adverse effect on the Company’s business, financial condition or results of operations.
|
ANNUAL INFORMATION FORM |
Page | 58 |
FORTUNA SILVER MINES INC.
The Company is subject to supply chain disruptions.
The Company’s ability to mine, process and sell products is critical to its operations. The Company’s operations depend on the continued availability and delivery of supplies of consumables and capital items to operate efficiently. In addition to consumables, continuous supplies of energy, water, equipment and spare parts, and labour are critical to the Company’s operations, the costs of which are subject to worldwide supply and demand as well as other factors beyond the Company’s control. Supply chain disruptions; power outages; labour disputes and/or strikes; geopolitical activity, such as the changes to import and export tariffs in Argentina between 2020 and 2023; health emergencies in the regions where the Company operates; weather events and natural disasters could seriously harm the Company’s operations as well as the operations of the Company’s customers and suppliers. Further, the Company’s suppliers may experience capacity limitations in their own operations or may elect to reduce or eliminate certain product lines, all of which is beyond the Company’s control but could have a material adverse effect on the Company’s operations and revenue. See “Risk Factors – The Company’s operations are subject to political and other risks in the regions in which it operates”.
Metal prices and the marketability of metals acquired or discovered by the Company may be affected by factors beyond the Company’s control.
The marketability of metals acquired or discovered by the Company may be affected by numerous factors which are beyond the Company’s control and which cannot be accurately foreseen or predicted, such as market fluctuations, the global marketing conditions for precious and base metals, the proximity and capacity of milling facilities, metal markets and processing equipment and government regulations, including regulations relating to royalties, allowable production, importing and exporting metals and environmental protection.
The price of silver, gold or other metals fluctuates widely and is affected by numerous factors beyond the Company’s control, such as the sale or purchase of metals by various central banks and financial institutions, interest rates, exchange rates, inflation or deflation, fluctuation in the value of the United States dollar and foreign currencies, global and regional supply and demand, the political and economic conditions of major metal-producing countries throughout the world, and the cost of substitutes, inventory levels and carrying charges.
The price of the Common Shares and the Company’s financial condition and exploration, development and mining activities may in the future be significantly adversely affected by declines in the price of silver, gold or other metals. Declining metal prices can impact operations by requiring a reassessment of the feasibility of a particular project. Such a reassessment may be the result of a management decision or may be required under financing arrangements related to a particular project. The continued exploration and development of or commercial production from the Company’s properties may no longer be economically viable if serious price declines in the market value of silver, gold or other metals occur. Even if exploration, development or production is ultimately determined to be economically viable, the need to conduct such a reassessment may cause substantial delays or may interrupt operations until the reassessment can be completed. Depending on the price of silver, gold and other metals, cash flow from mining operations may not be sufficient and the Company’s financial condition and results of operations may be adversely affected. The Company may lose its interest in, or may be forced to sell, some of its properties as a result. If any such circumstances occur, the price of the Common Shares may be significantly adversely affected.
The Company’s use of derivative contracts to protect against market volatility exposes the Company to risk of opportunity loss and mark to market fair value adjustments.
The profitability of the Company’s operations depends, in large part, upon gold and other commodity prices. Gold and other commodity prices can fluctuate widely and can be influenced by many factors beyond its control, including but not limited to: industrial demand; political and economic events (global and regional); gold and financial market volatility and other market factors, the popularity of cryptocurrencies as an alternative investment to gold, and central bank purchases and sales of gold and gold lending. The global supply of gold is made up of new production from mining, and existing stocks of bullion, scrap and fabricated gold held by governments, public and private financial institutions, industrial organizations and private individuals.
From time to time the Company may enter into price risk management contracts to protect against fluctuations in the prices of zinc, lead and precious metals, and changes in the prices of fuel and other input costs. These contracts could include forward sales or purchase contracts, futures contracts, purchased or sold put and call options and other derivative instruments.
|
ANNUAL INFORMATION FORM |
Page | 59 |
FORTUNA SILVER MINES INC.
There is no assurance that any hedging program or transactions which may be adopted or utilized by the Company designed to reduce the risk associated with changes in the prices of precious metals, lead, zinc or commodities will be successful.
In February 2023, the Company entered into hedging contracts equivalent to 25% of forecasted consolidated gold production for the period from February 14 to June 15, 2023. This was a requirement the Company agreed to with its lenders as part of the temporary restrictions until the Mexican Legal Proceedings are resolved. Zero cost collars were completed on 22,355 ounces of consolidated gold production with a weighted average of $1,800 put and $1,921 call. Although hedging may protect the Company from an adverse price change, certain hedging strategies may also prevent the Company from benefiting fully from a positive price change. The temporary hedge program resulted in a loss on derivatives of $0.9 million.
Except as discussed above, during 2023, the Company did not enter into any new hedging contracts related to precious metals, lead, zinc or commodities.
The use of derivative instruments can expose the Company to risk of opportunity loss and may also result in significant mark-to-market fair value adjustments, which may have a material adverse effect on the Company’s financial results.
Tax Audits and Reassessments.
In the normal course of business, the Company is subject to assessment by taxation authorities in various jurisdictions. Any reassessment by applicable tax authorities of the Company’s tax filings and the continuation or timing of any such process is outside of the Company’s control. There is a risk that applicable tax authorities may audit the Company or its subsidiaries and issue a notice of reassessment for material amounts. In the event that applicable tax authorities issue one or more additional notices of reassessment for material amounts of tax, interest and penalties, the Company is prepared to vigorously defend its position. If the Company is unable to resolve any of these matters favourably, or if applicable tax authorities issue one or more additional notices of reassessment for material amounts of tax, interest and penalties, this could have a material and adverse effect on the Company’s business and its financial condition.
The Company is subject to credit risk through its VAT receivables.
The timing of the collection of Value-added tax (“VAT”) receivables is uncertain as VAT refund procedures require a significant amount of information and follow-up. The Company assesses the recoverability of the amounts receivable at each reporting date which is impacted by several factors, including the status of discussions with the tax authorities, outcome of court proceedings relating to VAT claims and current interpretation of relevant tax legislation. Changes in these estimates can materially affect the amount recognized as VAT receivable and could result in an increase in other expenses recognized in the Consolidated Income Statements and Comprehensive Income. Significant judgment is required to determine the presentation of current and non-current VAT receivable. The Company is subject to credit risk through its current VAT receivables in Mexico and Burkina Faso that are collectible from the respective national governments. There can be no assurance that when VAT refunds are payable by the Authorities that they will be in the amounts that have been claimed, and that they will paid in a regular and timely manner. As a result, this may lead to significant amounts outstanding which remain to be paid to the Company.
The Company is subject to fluctuating concentrate treatment charges and transportation costs.
The Company has entered into agreements to sell its concentrate production from the Caylloma Mine and San Jose Mine for 2024. Treatment and refinery charges for the Caylloma Mine have shown a decrease compared to 2023. At the San Jose Mine, treatment charges have shown a slight increase compared to 2023, and refinery charges have remained stable.
There is no assurance that the Company will be able to enter into smelting and refining contracts at competitive terms beyond the terms of the current applicable agreements due to economic and market conditions. The cost of transporting concentrate from both mines to off-takers is dependent on, among other things, the concentrate destination. Transportation-related costs at both the Caylloma and San Jose mines increased during 2022 and are expected to remain high in the mid-to-near term due to a number of factors, including changes in the prices of oil
|
ANNUAL INFORMATION FORM |
Page | 60 |
FORTUNA SILVER MINES INC.
and truck spare parts, and a shortage in shipping availability. Increases in rates costs would have an adverse impact on the Company’s results of operations and financial condition.
The Company may not have reserved sufficient monies to cover the costs associated with reclamation.
Natural resource companies are required to close their operations and rehabilitate the lands that they mine in accordance with a variety of environmental laws and regulations. Land reclamation requirements are generally imposed on companies with mineral exploration, development and operations activity in order to minimize long-term effects of land disturbance. Reclamation may include requirements to treat ground and surface water to drinking water standards, control dispersion of potentially deleterious effluent and reasonably re-establish pre-disturbance land forms and vegetation.
In order to carry out reclamation obligations imposed on the Company in connection with exploration, development and production activities, the Company must allocate financial resources that might otherwise be spent on further exploration and development programs. The actual costs of mine closure and reclamation are uncertain and planned expenditures may differ from the actual expenditures required. There is a risk that monies allotted for mine closure land reclamation may not be sufficient to cover all risks, due to changes in the nature of the waste rock or tailings and/or revisions to government regulations. Therefore, additional funds, or reclamation bonds or other forms of financial assurance, may be required over the tenure of any of the Company’s projects to cover potential risks. These additional costs may have material adverse impact on the Company’s business, financial condition and results of operations. It is anticipated that Mineral Reserves at the San Jose Mine will be exhausted at the end of 2024. The Company has assigned a dedicated team to review and update a multiyear progressive mine closure and monitoring plan, which will begin its implementation during 2024. Multiple considerations are being included such as closure-related technical studies and designs, remediation of affected areas, decommissioning and removal of infrastructure, landform reshaping, revegetation, and value-added activities for the communities associated with progressive closure, repurposing, and where appropriate, long-term monitoring and maintenance, whilst adhering to strict compliance with mine closure governmental regulations and high international standards. Estimates of the total ultimate closure and rehabilitation costs for mining operations can be significant and are based principally on current legal and regulatory requirements and mine closure plans that may change materially.
The Company is dependent upon information technology systems, which are subject to disruption, damage, failure and risks with implementation and integration.
The Company’s information technology systems used in its operations are subject to disruption, damage or failure from a variety of sources including without limitation, computer viruses, security breaches, cyberattacks, natural disasters and defects in design. For example, damage to computer cables can cause disruption to networks. This has occurred in recent years, and more recently in March 2024 when damage to underwater cables off the coast of Côte d’Ivoire caused disruption to internet service in western and central Africa, including Côte d’Ivoire and Burkina Faso. Cybersecurity incidents, in particular, are evolving and include, but are not limited to, malicious software, attempts to gain unauthorized access to data or machines and equipment, and other electronic security breaches that could lead to disruptions in systems, unauthorized release of confidential or otherwise protected information, the corruption of data or the disabling, misuse or malfunction or machines and equipment. Various measures have been implemented to manage the Company’s risks related to information technology systems and network disruptions. However, given the unpredictability of the timing, nature and scope of information or operational technology disruptions, the Company could potentially be subject to production downtimes, operational delays, operating accidents, the compromising of confidential or otherwise protected information, destruction or corruption of data, security breaches, other manipulation or improper use of our systems and networks or financial losses from remedial actions, any of which would have a material and adverse effect on the Company’s business, financial condition or results of operations.
The Company could also be adversely affected by system or network disruptions if new or upgraded information technology systems are defective, not installed properly or not properly integrated into operations. Various measures have been implemented to manage the risks related to the system implementation and modification, but system modification failures could have a material and adverse effect on the Company’s business, financial condition or results of operations.
|
ANNUAL INFORMATION FORM |
Page | 61 |
FORTUNA SILVER MINES INC.
Infectious Diseases, epidemics and pandemics may adversely impact the Company’s operations, financial condition and share price.
Global markets may be adversely impacted by infectious diseases, epidemic or pandemic, as was seen in relation to the COVID 19 pandemic during 2020 and 2021. That pandemic led to significant restrictions on travel, temporary business closures, mandatory quarantines, global stock market volatility, operating and supply chain delays and disruptions, and a general reduction in consumer activity.
The possibility of a new pandemic or spread of other communicable disease in areas in which Fortuna operates may result in the re-imposition of certain restrictions. For example, infectious diseases (including malaria, HIV/AIDS, tuberculosis, and the Ebola virus) are major health care issues in African countries. Workforce training and health programs are undertaken to maximize prevention awareness and minimize the impact of infectious diseases in our West Africa operations, however, there can be no assurance that this will be sufficient to adequately address these serious issues. It is difficult to predict the extent of the impact of a disease , epidemic or pandemic on the Company and its business, which will depend on future developments, including: the duration, severity and geographic spread of the communicable disease; further actions that may be taken by governmental authorities, which could include travel restrictions and the suspension of business activities, including mining; the effectiveness and timing of actions taken to contain and treat the disease, including the effectiveness and uptake of vaccines; and how quickly and to what extent normal economic conditions and operating conditions can resume. Any such widespread pandemic is likely to have material impacts on the Company’s business, financial condition and results of operations.
Climate change impacts.
There is significant evidence of the negative effects of climate change on our planet and public support for climate change action has grown in recent years, as has the impetus to pursue new technologies to mitigate the effects of climate change. Governments around the world, including those in countries in which the Company operates, have responded by adopting emissions reduction targets and supporting legislation, including measures such as carbon pricing, emissions reduction initiatives and alternative energy incentives and mandates, and in some cases by requiring companies to disclose business risks and opportunities related to climate change.
Regulations relating to emission levels and energy efficiency and the disclosure related to same are becoming more stringent. Some of the costs associated with reducing emissions can be offset by changing to lower carbon emission energy source and increased energy efficiency using technological innovation. If the current regulatory trend continues, the impact of the regulations may result in increased taxes and costs at some of our operations.
In 2021, we conducted a corporate-level climate change materiality assessment where we assessed the materiality of the TCFD’s climate-related risks based on the potential and likelihood for the climate change factor to impact company value over the short (0 to 1 year), medium (1 to 10 years) or long term (10+ years). During 2023, Fortuna conducted an assessment of the Company’s exposure to key climate-related risks under a range of potential future climate-related scenarios. This work was designed to enhance the Company’s understanding of its exposure to the Company’s most significant climate-related risks and opportunities. The assessment was conducted at a high-level and is subject to certain limitations based on the quality and range of data available to the Company and other third-party sources. The assessment was focused on assessing the Company’s resilience based on potential growth and considered estimated values for future production and future GHG emissions. While there is uncertainty regarding how the Company’s GHG emissions, production and profits will evolve over time as we are targeting continued operational and business growth, the climate-related scenarios analysis informs the company on future potential risks.
Fortuna has grouped its risks related to climate change into two main categories: (i) physical risks; and (ii) transition risks.
Physical Risks
The physical impacts of climate change are expected to increase over time as the planet warms. There is uncertainty regarding how successful we will be as a society in mitigating global GHG emissions and accordingly how much global temperatures will increase. The physical impacts of climate change will be location-specific.
|
ANNUAL INFORMATION FORM |
Page | 62 |
FORTUNA SILVER MINES INC.
The table below provides an overview of potential impacts of climate-related physical risks to the Company and the time horizon over which they may impact the business. Our scenario analysis work in 2023 focused on developing a more detailed understanding of exposure to physical climate risks under different scenarios, with a focus on potential financial impact of a set of climate hazards on the business by considering asset value at risk.
Climate-related Risk |
Time Horizon |
Description of Potential Impact |
Acute Physical Risk |
Short Medium Long Term |
· Climate change is expected to continue to cause an increase in the frequency and intensity of extreme weather events. · Potential for decreased revenue and increased operational costs due to shutdowns from extreme weather events. · Potential for decreased revenue and increased capital expenditures due to damage to facilities, infrastructure and/or critical elements of the supply chain. |
Chronic Physical Risk |
Medium Long Term |
· Climate change is expected to continue to cause an increase in average global temperatures and cause changes to weather patterns. · Potential for decreased revenue and increased costs due to ongoing and/or worsening drought conditions. · Potential for increased capital expenditures to build new infrastructure to address resource shortages. |
The analysis of physical climate risks considered the following key climate hazards: coastal flood; river flood; pluvial flood; extreme heat; tropical cyclone; wildfire; water stress and drought. The vast majority of the potential financial impact to assets is driven by drought, temperature extremes and pluvial flooding. Drought is expected to present the highest relative risk to the Company’s assets, followed by temperature extremes, indicating that Fortuna’s exposure is primarily to chronic physical risks.
The physical risk analysis conducted as part of Fortuna’s scenario analysis work found that in the 2030s, all of Fortuna’s five current mine sites have a low level of exposure to physical risk under both the medium and high emissions scenarios. The Séguéla Mine has the highest risk of physical climate risk, driven by exposure to drought and potential impacts to water expenses and production. However, overall risk exposure is still characterized as low.
The Company has implemented initiatives at its mine sites that are designed to enhance resiliency to the acute and chronic physical impacts of climate change, and the Company aims to minimize its operational water consumption and make effective use of water in its processes. Water management systems have been developed at site level and we seek to improve our water governance based on current industry practices. See “2023 ESG Performance – Climate Change and 2024 ESG Outlook”.
The Company is committed to making efforts to mitigate the physical risks of climate change at its sites. However, the Company can provide no assurances that its efforts to mitigate the risks of climate change at its sites will be effective, and that the physical risks of climate change will not have an adverse impact on the Company’s business, results of operations and financial condition.
Transition Risks
Carbon prices and other climate-related policies are expected to increase over time as governments take action to reduce GHG emissions aligned with commitments under the Paris Agreement. There is uncertainty regarding the speed and level of adoption and there is expected to be a variety of actions taken by different countries.
The table below provides an overview of potential impacts of climate-related transition risks to the Company and the time horizon over which they may impact the business.
|
ANNUAL INFORMATION FORM |
Page | 63 |
FORTUNA SILVER MINES INC.
Climate-related Risk |
Time Horizon |
Description of Potential Impact |
Policy and Legal Risk |
Short Medium Long Term |
· Mining operations can be energy-intensive and generate significant direct GHG emissions. · Potential for increased costs due to carbon pricing, increased expenditures and impacts to earnings due to regulatory efforts to reduce GHG emissions in response to the risks posed by climate change. |
Reputational Risk |
Medium Long Term |
· Public sentiment related to climate change is evolving and causing perceptions of certain industries to be impacted according to their perceived contribution to climate change/negative environmental impacts. In extreme circumstances, this could result in impacts to a company’s social license to operate. · Potential for additional costs required to increase engagement efforts with stakeholders. · Potential for decreased revenue and increased costs associated with delays due to community protests. · Potential for increased human capital-related costs due to decreased ability to attract and retain employees. · Potential challenges accessing capital and/or adequate insurance. |
Technology Risk |
Medium Long Term |
· Mining companies are increasingly developing and using emerging technologies (e.g., renewable energy, battery storage, data and analytics, energy-efficient technologies, advanced processes). · Potential for increased capital expenditures and costs to pilot, adopt and deploy new technologies. · Potential for decreased competitiveness if adoption of technology lags industry peers. |
Market Risk |
Long Term |
· Changing consumer preferences and reduced demand for high-emitting products and services. · Potential for increased operational costs due to changing input prices of raw materials (e.g., fuel, water). |
Fortuna operates in Mexico, Peru, Argentina, Burkina Faso and Côte d’Ivoire which have all ratified the Paris Agreement and have established various commitments to reduce GHG emissions. Peru, Argentina, Burkina Faso, Côte d’Ivoire are not OECD countries or major emerging market economies. Carbon prices in these countries are not expected to increase as rapidly or as significantly as they are in OECD countries, which is expected to reduce overall risk and exposure to carbon pricing to the Company.
Overall, management determined that the results of its scenario analysis do not suggest that the Company faces climate related risks that are significantly greater than the broader mining industry.
The Company has implemented a range of mitigation efforts, both company-wide and site-specific, in an effort to reduce exposure to climate-related risks and capture opportunities. Fortuna has set a company-wide GHG emissions reduction target, is focused on the continued development and implementation of a company-wide climate change strategy, seeks to continue to enhance the alignment of climate change disclosure investor-preferred frameworks for reporting on climate change factors, and is committed to the ongoing monitoring of evolving technology and other opportunities to improve the resource efficiency of operations and capitalizing on advances in renewable energy technologies.
The Company is committed to making efforts to mitigate the risks of climate change and to reduce its exposure to transition risks as demonstrated through the establishment of its 2030 GHG emissions reduction target. See “Sustainability Governance – Climate Change”. However, there can be no assurance that the Company’s efforts will
|
ANNUAL INFORMATION FORM |
Page | 64 |
FORTUNA SILVER MINES INC.
be effective or that the risks of climate change will not have an adverse impact on the Company’s business, results of operations or financial condition.
Risks Relating to the Securities of the Company
The market price of the Company’s Common Shares and Debentures is volatile.
In recent years, the securities markets in the United States and Canada have experienced a high level of price and volume volatility, and the market prices of securities of many mining companies have experienced wide fluctuations in price which have not necessarily been related to the operating performance, underlying asset values or prospects of such companies. In particular, the price of the Common Shares on the TSX and NYSE fluctuated significantly during the past 12 months. Additionally, the price of the Debentures on the TSX has fluctuated significantly since being listed for trading in October 2019. There can be no assurance that continual fluctuations in price will not occur prior to the maturity date on October 31, 2024.
There are many factors that may influence such volatility. Macroeconomic conditions in North America, Peru, Mexico, Argentina or West Africa and changes in the laws and regulations of these regions may have a negative effect on the development prospects, timelines or relationships for the Company’s properties. Negative changes in the public’s perception of the Company’s prospects or of mining companies in general could cause the price of the Company’s securities, including the price of the Common Shares and Debentures, to decrease dramatically. The price of the Common Shares and Debentures is also likely to be affected by short-term changes in precious metal prices or other mineral prices, currency exchange fluctuations, the Company’s financial condition or results of operations and the extent of research analyst coverage of its securities.
Securities class action litigation often has been brought against companies following periods of volatility in the market price of their securities. The Company may in the future be the target of similar litigation. Securities litigation could result in substantial costs and damages and divert management’s attention and resources.
Shareholders may suffer dilution as a result of future offerings of the Common Shares or securities convertible into Common Shares.
The Company may sell equity securities in future offerings (including through the sale of securities convertible into equity securities) and may issue additional equity securities to finance operations, exploration, development, acquisitions or other projects. The Company may also issue Common Shares as a result of exercises of the Company’s outstanding stock options, the vesting of the Company’s outstanding share units, or the conversion of the Company’s Debentures. Any such convertible securities are more likely to be exercised when the market price of the Company’s Common Shares exceeds the exercise price of such instruments. The Company cannot predict the size of future issuances of equity securities or the size and terms of future issuances of debt instruments or other securities convertible into equity securities. The Board has the authority to authorize certain offers and sales of additional securities without the vote of, or prior notice to, shareholders. It is likely that the Company will issue additional securities to provide capital to fund expected expenditures and growth. Any transaction involving the issuance of previously authorized but unissued Common Shares, or securities convertible into Common Shares, would result in potentially substantial dilution to shareholders.
The market price of the Common Shares and Debentures could decline as a result of future issuances or sales of the Company’s securities, which could result in insufficient liquidity.
The market price of the Common Shares and Debentures could decline as a result of issuances of securities by the Company or sales by its existing shareholders of Common Shares or Debentures in the market, or the perception that these sales could occur. The issuance of Common Shares upon the exercise of the Company’s outstanding stock options and Common Share purchase warrants or the vesting of the Company’s outstanding share units may also reduce the market price of the Common Shares. Additional Common Shares, Debentures, stock options, Common Share purchase warrants and share units may be issued in the future. A decrease in the market price of the Common Shares could adversely affect the liquidity of the Common Shares on the TSX and the NYSE. Additionally, a decrease in the market price of the Debentures could adversely affect the liquidity of the Common Shares on the TSX. The Company’s shareholders may be unable, as a result, to sell significant quantities of the Common Shares or Debentures into the public trading markets. The Company may not, as a result, have sufficient liquidity to meet the continued listing requirements of the TSX and the NYSE. Sales of the Common Shares or Debentures by shareholders
|
ANNUAL INFORMATION FORM |
Page | 65 |
FORTUNA SILVER MINES INC.
might also make it more difficult for the Company to sell equity or debt securities at a time and price that it deems appropriate, which may have a material adverse effect on the Company’s business, financial conditions and results of operations.
The Company has never paid, and does not currently anticipate paying, dividends.
The Company has paid no dividends on the Common Shares since incorporation and does not anticipate paying dividends in the immediate future. The payment of future dividends, if any, will be reviewed periodically by the Board and will depend upon, among other things, conditions then existing including earnings, financial conditions, cash on hand, financial requirements to fund its commercial activities, development and growth, and other factors that the Board may consider appropriate in the circumstances.
Risks related to the Debentures of the Company.
The terms of the Debentures are governed by the terms and conditions set out in the Debenture indenture between the Company and Computershare Trust Company of Canada entered into on October 2, 2019 (the “Indenture”). The Debentures mature on October 31, 2024. The Indenture provides, among other things, for the repurchase, conversion and redemption of the Debentures in certain circumstances and the Company agrees to certain restrictive and affirmative covenants which are set out in the Indenture. Under the terms of the Indenture, there is a risk that the Company may choose to redeem the outstanding Debentures for Common Shares or to repay outstanding principal amounts thereunder at maturity of the Debentures by issuing additional Common Shares. Additionally, the Debentures are subordinate to all senior indebtedness of the Company. If the Company becomes bankrupt, liquidates its assets, reorganizes or enters into certain other transactions, the Company will be able to pay its obligations with respect to the Debentures only after it has paid senior indebtedness and any other secured indebtedness in full. There may be insufficient assets remaining following such payments to pay amounts due on any or all of the Debentures then outstanding. The Indenture does not restrict the Company from incurring additional indebtedness for borrowed money or otherwise from mortgaging, pledging or charging its real or personal property or properties to secure any indebtedness or other financing. A holder of a Debenture will be subject to such terms and conditions, as further described in the Indenture. A full copy of the Indenture is available under the Company’s SEDAR+ profile at www.sedarplus.ca.
Foreign investors may find it difficult to enforce judgments against the Company.
The Company is incorporated under the laws of British Columbia, Canada and the majority of the Company’s directors and officers are not residents of the United States. Because all or a substantial portion of the Company’s assets and the assets of these persons are located outside of the United States, it may be difficult for U.S. investors to effect service of process within the United States upon the Company or upon such persons who are not residents of the United States, or to realize in the United States upon judgments of U.S. courts predicated upon civil liabilities under U.S. securities laws. A judgment of a U.S. court predicated solely upon such civil liabilities may be enforceable in Canada by a Canadian court if the U.S. court in which the judgment was obtained had jurisdiction, as determined by the Canadian court, in the matter. Investors should not assume that Canadian courts: (i) would enforce judgments of U.S. courts obtained in actions against the Company or such persons predicated upon the civil liability provisions of the U.S. federal securities laws or the securities or blue-sky laws of any state within the United States, or (ii) would enforce, in original actions, liabilities against the Company or such persons predicated upon the U.S. federal securities laws or any such state securities or blue-sky laws. There is substantial doubt whether an original action could be brought successfully in Canada against any of such persons or the Company predicated solely upon such civil liabilities.
Furthermore, many of the subsidiaries of the Company and its assets are located outside of Canada. Accordingly, it may be difficult for investors to enforce within Canada any judgments obtained against the Company, including judgments predicated upon the civil liability provisions of applicable Canadian securities laws. Consequently, investors may be effectively prevented from pursuing remedies against the Company under Canadian securities laws or otherwise.
|
ANNUAL INFORMATION FORM |
Page | 66 |
FORTUNA SILVER MINES INC.
Material Mineral Properties
The Company has five material mineral properties:
Séguéla Mine: The mine produces gold and is located in the Region of Worodougou in northwestern Côte d’Ivoire. In 2023, the mine produced 78,617 ounces of gold since its first gold pour in May 2023. The Company filed a technical report on this property in February 2024, effective December 31, 2023. The executive summary of the technical report is attached as Schedule “A” to this AIF. See also “2024 Recent Developments” for a description of exploration work conducted subsequent to the date of the technical report.
Yaramoko Mine: The mine produces gold and is located in the Province of Balé in southwestern Burkina Faso. The mine produced 117,711 ounces of gold in 2023. The Company filed a technical report on this property in March 2023, effective December 31, 2022. The executive summary of the technical report is attached as Schedule “B” to this AIF. See also “2023 Developments” for a description of exploration work conducted subsequent to the date of the technical report.
Lindero Mine: The mine produces gold and is located in the Province of Salta, northern Argentina. The mine produced 101,238 ounces of gold in 2023. The Company filed a technical report on this property in March 2023, effective December 31, 2022. The executive summary of the technical report is attached as Schedule “C” to this AIF.
San Jose Mine: The mine produces silver and gold and is located in the State of Oaxaca, southern Mexico. The mine produced 4,656,631 ounces of silver and 28,559 ounces of gold in 2023. The Company filed a technical report on this property in March 2024, effective December 31, 2023. The executive summary of the technical report is attached as Schedule “D” to this AIF.
Caylloma Mine: The mine produces silver, zinc and lead and is located in the Caylloma District of Arequipa in southern Peru. The mine produced 1,227,060 ounces of silver, 55,060,450 million pounds of zinc and 40,851,657 million pounds of lead in 2023. The Company filed a technical report on this property in February 2024, effective December 31, 2023. The executive summary of the technical report is attached as Schedule “E” to this AIF.
See also “Three Year History and Recent Developments – Mineral Reserve and Mineral Resource Estimates” herein for further information regarding the Company’s material properties.
Non-Material Mineral Properties
Diamba Sud Project
The 53.4 km2 Diamba Sud Project is situated within the highly prospective Senegal-Mali Shear Zone orogenic belt in Senegal and is associated with north north-east trending fertile splays. The Diamba Sud Project is owned by Boya SA, which is an indirect wholly-owned subsidiary of Fortuna that was acquired in September 2023 pursuant to the Chesser Acquisition. Drilling commenced on the property in October 2023 with an initial 10,945 meter three-drill rig program, which has since been extended to a 42,700 meter reverse circulation and diamond drilling campaign. The program is intended to confirm the historical estimate for the Diamba Sud Project (which was prepared in accordance with the Australasian Code for Reporting of Exploration Results, Mineral Resources and Ore Reserves (2012 edition) published by the Joint Ore Reserves Committee of the Australian Institute of Mining and Metallurgy, the Australian Institute of Geoscientists and the Minerals Council of Australia), and to test for extensions to the existing historic resource in support of project development and advancing further economic studies on the project and incorporating same into a resource model to be prepared towards the end of 2024.
DIVIDENDS
The Company has not to date paid any dividends on its Common Shares nor does it intend to pay any dividends on its shares in the immediate future as management anticipates that all available funds will be invested to finance
|
ANNUAL INFORMATION FORM |
Page | 67 |
FORTUNA SILVER MINES INC.
further acquisition, exploration and development of its mineral properties and to repay outstanding debt obligations.
The Company initiated an NCIB in 2022, and from the commencement of the share repurchase program to December 31, 2023, in accordance with the Company’s NCIB, the Company repurchased an aggregate of 2,201,404 Common Shares at a weighted average price of $2.69 per share via open market purchases through the facilities of the NYSE for a total repurchase value of approximately $5.9 million, all of which shares were subsequently returned to treasury and cancelled. See “General Developments of the Business – 2022 Developments”. Subsequent to December 31, 2023, the Company repurchased additional Common Shares - see “General Developments of the Business – 2024 Recent Developments”.
DESCRIPTION OF CAPITAL STRUCTURE
Common Shares
The Company’s authorized share capital is an unlimited number of Common Shares without par value. All Common Shares of the Company rank equally as to dividends, voting powers and participation in assets and in all other respects.
Voting
The holders of Common Shares are entitled to receive notice of, attend and vote at any meeting of the shareholders of the Company. Each Common Share carries one vote per share. There are no voting right ceilings attached to the Common Shares.
Dividends
The holders of Common Shares are entitled to receive on a pro-rata basis such dividends as the Board from time to time may declare, out of funds legally available therefor.
Rights on Dissolution
In the event of a liquidation, winding-up or dissolution of the Company, whether voluntary or involuntary or for the purpose of a reorganization or otherwise or upon any distribution of capital, the holders of the Common Shares have the right to receive on a pro-rata basis all of the assets of the Company remaining after payment of all of the Company’s liabilities.
Pre-emptive, Conversion and Other Rights
No pre-emptive, redemption, retraction, exchange, sinking fund or conversion rights are attached to the Common Shares, and the Common Shares, when fully paid, will not be liable to further call or assessment. No other class of shares may be created without the approval of the holders of the Common Shares.
Debentures
In October 2019, the Company issued $46 million aggregate principal amount of Debentures by way of a public offering at a price of $1,000 per Debenture. The Debentures are senior subordinated unsecured convertible securities of the Company. Refer to “Three- Year History- Recent Developments and Financings”.
The Debentures mature on October 31, 2024 and bear interest at a rate of 4.65% per annum, payable semi-annually in arrears on the last business day of April and October in each year, commencing on April 30, 2020. The Debentures are convertible at the holder’s option into Common Shares at a conversion price of US$5.00 per share, representing a conversion rate of 200 Common Shares per US$1,000 principal amount of Debentures, subject to adjustment in certain circumstances. The Debentures are governed by way of a debenture indenture (the “Indenture”) between
|
ANNUAL INFORMATION FORM |
Page | 68 |
FORTUNA SILVER MINES INC.
the Company and Computershare Trust Company of Canada dated October 2, 2019. The Debentures are transferable and are listed for trading on the TSX.
Adjustment of Conversion Price
The Indenture provides for the adjustment of the conversion price upon certain events including: (i) the subdivision or consolidation of the outstanding Common Shares; (ii) the issue of Common Shares or securities convertible into Common Shares by way of stock dividend or other distribution to all or substantially all holders of Common Shares; (iii) the issue of rights, options or warrants to all or substantially all of the holders of Common Shares entitling them to acquire Common Shares or other securities convertible into Common Shares in certain circumstances and (iv) the distribution to all or substantially all holders of Common Shares of any other class of shares, rights, options or warrants, evidences of indebtedness or assets, at less than 95% of the then Current Market Price (as defined below) of the Common Shares.
Redemption
The Debentures were not redeemable (a “Redemption”) by the Company prior to October 31, 2022, unless certain conditions were satisfied following a Change of Control (as defined below). Between November 1, 2022 and prior to October 31, 2023, the Debentures were redeemable by the Company, in whole or in part from time to time, on not more than 60 days and not less than 30 days prior notice (a “Redemption Notice”), at a redemption price equal to the principal amount thereof plus accrued and unpaid interest, if any, up to but excluding the date set for Redemption, provided that the arithmetic average of the volume weighted average trading price of the Common Shares (as defined herein) on the NYSE for the 20 consecutive trading days ending five trading days prior to the date on which the Redemption Notice is provided (the “Current Market Price”) is at least 125% of the conversion price, subject to regulatory approval. On or after October 31, 2023 and prior to the maturity date, the Debentures may be redeemed in whole or in part at the option of the Company on not more than 60 days and not less than 30 days prior notice, at a price equal to their principal amount plus accrued and unpaid interest, if any, up to but excluding the date set for Redemption.
Change of Control
Within 30 days of the Company giving notice of the occurrence of: (i) the acquisition by any person or group of persons acting jointly or in concert (within the meaning of National Instrument 62-104 – Take-Over Bids and Issuer Bids as at the date of the Indenture) of ownership of, or voting control or direction over, 50% or more of the then outstanding Common Shares; or (ii) the sale or other transfer of all or substantially all of the consolidated assets of the Company (each, a “Change of Control”), the holders of the Debentures (the “Debentureholders”) may require the Company to repurchase their Debentures then outstanding at a price equal to 100% of the principal amount of the Debentures plus accrued and unpaid interest thereon, from and including the last Interest Payment Date (as defined in the Indenture) to, but not including the purchase date. If holders of 90% of the aggregate then outstanding principal amount of Debentures tender to the Change of Control offer, the Company will have the option to call the remaining Debentures. A Change of Control will not include a sale, merger, reorganization, arrangement or similar transaction if the previous holders of the Common Shares hold at least 50% of the voting control or direction in such merged, reorganized, arranged or other continuing entity.
In the event of an acquisition of the Company where the consideration includes 10% or more in cash or assets or shares (other than publicly traded shares), then, subject to regulatory approval, Debentureholders will be entitled to convert their Debentures within a specified timeframe, in whole or in part, and receive, in addition to the number of Common Shares that such holders are otherwise entitled to receive upon such conversion, an additional number of Common Shares per $1,000 principal amount of Debentures converted as set forth in the Indenture.
Payment of Principal Upon Redemption of Maturity
Subject to applicable securities laws and regulatory approval and provided that no Event of Default (as defined in the Indenture) has occurred and is continuing, the Company may, at its option, elect to satisfy its obligation to pay the principal amount of the Debentures and accrued and unpaid interest on redemption or at maturity, in whole or
|
ANNUAL INFORMATION FORM |
Page | 69 |
FORTUNA SILVER MINES INC.
in part, through the issuance of freely tradable Common Shares upon at least 30 days and not more than 60 days prior notice, by issuing and delivering that number of Common Shares, as applicable, obtained by dividing the principal amount of the Debentures and all accrued and unpaid interest thereon by 95% of the Current Market Price on the date of redemption or maturity, as applicable.
MARKET FOR SECURITIES
Common Shares
The Company’s Common Shares were listed and posted for trading on the TSX Venture Exchange until January 18, 2010 when the Company graduated to the TSX. On September 19, 2011, the Company’s Common Shares were listed and posted for trading on the NYSE. The Company’s shares currently trade on the NYSE under the symbol “FSM” and on the TSX under the symbol “FVI”.
Trading Prices and Volume
The following table sets forth the monthly high and low sale prices and trading volumes of the Common Shares on the TSX and the NYSE during the fiscal year ended December 31, 2023:
|
Toronto Stock Exchange |
|
New York Stock Exchange |
||||
|---|---|---|---|---|---|---|---|
Month |
High (CAD$) |
Low (CAD$) |
Volume |
|
High (US$) |
Low (US$) |
Volume |
December |
5.485 |
4.77 |
11,673,882 |
|
4.14 |
3.52 |
14,723,268 |
November |
5.40 |
3.80 |
18,587,472 |
|
3.97 |
2.73 |
18,881,098 |
October |
4.32 |
3.56 |
14,403,806 |
|
3.16 |
2.58 |
14,629,082 |
September |
4.28 |
3.56 |
8,248,730 |
|
3.165 |
2.635 |
8,028,265 |
August |
4.63 |
3.81 |
9,309,167 |
|
3.48 |
2.81 |
10,808,816 |
July |
5.13 |
4.075 |
7,958,496 |
|
3.89 |
3.07 |
10,256,080 |
June |
4.89 |
4.02 |
8,880,596 |
|
3.655 |
3.051 |
11,061,082 |
May |
5.36 |
4.37 |
12,323,066 |
|
3.97 |
3.21 |
12,047,945 |
April |
5.61 |
4.92 |
13,235,523 |
|
4.19 |
3.615 |
11,779,859 |
March |
5.265 |
4.29 |
17,343,686 |
|
3.89 |
3.10 |
18,693,181 |
February |
5.49 |
4.28 |
10,063,280 |
|
4.13 |
3.13 |
11,083,956 |
January |
5.59 |
4.575 |
19,029,745 |
|
4.20 |
3.37 |
14,118,876 |
Source: Bloomberg
Debentures
The Debentures are listed for trading on the TSX under the trading symbol “FVI.DB.U.”
Trading Prices and Volume
The following table sets forth the monthly high and low sale prices and trading volumes of the Debentures on the TSX during the fiscal year ended December 31, 2023:
|
ANNUAL INFORMATION FORM |
Page | 70 |
FORTUNA SILVER MINES INC.
Toronto Stock Exchange
Month |
High (CAD$) |
Low (CAD$) |
Volume(1) |
|---|---|---|---|
December |
98.00 |
96.50 |
260 |
November |
98.00 |
92.50 |
370 |
October |
- |
- |
- |
September |
94.00 |
91.01 |
310 |
August |
- |
- |
- |
July |
- |
- |
- |
June |
95.00 |
95.00 |
30 |
May |
98.55 |
98.10 |
60 |
April |
102.50 |
97.04 |
4,950 |
March |
99.55 |
95.08 |
110 |
February |
99.50 |
97.00 |
200 |
January |
101.00 |
101.00 |
10 |
Source: TMX Datalinx
(1)Represents the total quantity of Debentures traded on the TSX for the applicable month.
Prior Sales
The following table summarizes the issuances of share-settled performance share units (“PSUs”) by the Company during the financial year ended December 31, 2023, which securities are not listed or quoted on a marketplace, and the issuances of Common Shares upon the settlement of restricted share units (“RSUs”), PSUs and stock options during the aforementioned year.
Date Issued |
|
Issue/Exercise Price |
|
Number and Type of Security Issued |
|
Reason for Issuance |
|---|---|---|---|---|---|---|
Feb. 28, 2023 |
|
CAD$3.32 |
|
42,851 Common Shares |
|
Settlement of RSUs |
March 20, 2023 |
|
CAD$4.69 |
|
844,187 PSUs |
|
Grant |
March 27, 2023 |
|
CAD$4.88 |
|
127,388 Common Shares |
|
Settlement of PSUs |
April 19, 2023 |
|
US$5.00 |
|
45,000 Common Shares |
|
Debenture Conversion |
April 20, 2023 |
|
CAD$3.32 |
|
254,424 Common Shares |
|
Settlement of RSUs |
April 27, 2023 |
|
CAD$7.90 |
|
191,015 Common Shares |
|
Settlement of PSUs |
July 10, 2023 |
|
CAD$6.91 |
|
32,263 Common Shares |
|
Settlement of PSUs |
Sept. 20, 2023 |
|
US$2.93 |
|
15,545,368 Common Shares |
|
Chesser Acquisition |
Nov. 24, 2023 |
|
CAD$3.22 |
|
127,350 Common Shares |
|
Stock Option Exercise |
DIRECTORS AND EXECUTIVE OFFICERS
Name, Occupation and Shareholding
The Board presently consists of eight directors. The directors will hold office until the next annual general meeting of the Company or until their successor is elected or appointed, unless their office is earlier vacated in accordance with the Articles of the Company, or with the provisions of the Business Corporations Act (British Columbia).
The following are the full name, place of residence, position with the Company, and principal occupation within the preceding five years of each of the directors and executive officers of the Company as at the date of this AIF:
|
ANNUAL INFORMATION FORM |
Page | 71 |
FORTUNA SILVER MINES INC.
Name, Position and Residency (1) |
Principal Occupation or Employment (1) |
Period as a Director of the Company |
|---|---|---|
JORGE GANOZA DURANT |
President & CEO of the Company. |
December 2, 2004 to present |
|
DAVID LAING (3) (5) Chair of the Board and Director British Columbia, Canada |
Mining Engineer; Independent Mining Consultant. |
September 26, 2016 to present |
|
MARIO SZOTLENDER (5) Director Caracas, Venezuela |
Self-Employed Consultant and Director of several public mineral exploration or mining companies. |
June 16, 2008 to present |
|
DAVID FARRELL (2) (3) (4) Director British Columbia, Canada |
President of Davisa Consulting (a private consulting company). |
July 15, 2013 to present |
|
ALFREDO SILLAU (2) (3) Director Lima, Peru |
Managing Partner and Director of Faro Capital (investment management). |
November 29, 2016 to present |
|
KYLIE DICKSON (2) (4) Director British Columbia, Canada |
Financial Consultant and Director of several public companies, March 2020 to present; Vice-President, Business Development of Equinox Gold Corp. and predecessors (mining), April 2017 to March 2020. |
August 16, 2017 to present |
|
KATE HARCOURT (5) Director Monmouthshire, Wales |
Chartered Environmentalist; Independent Environmental and Social Advisor to the mining industry; Director of Condor Gold plc from Mar 2015 to Sep 2023, Director of Orezone Gold Corporation since 2018; Director of Atalaya Mining plc since May 2022; and ESG Officer for Cornish Lithium since Jan 2021. |
July 2, 2021 to present |
|
SALMA SEETAROO (4) (5) Director Abidjan, Côte d’Ivoire |
Chief Executive Officer, Cashew Coast, since June 2021 and Ivoirienne de Noix de Cajou SA, December 2018 to March 2024 (Cashew Coast is a group of agri-processing companies including Ivoirienne de Noix de Cajou SA located in Côte d’Ivoire); non-executive director of Goviex Uranium Inc. (mining), February 2021 to present; non-executive director Algold Resources Inc. (mining) – June 2013 to June 2021; director Great Quest Fertilizer Ltd. (mining), September 2018 to March 2020. |
June 27, 2022 to present |
|
LUIS GANOZA DURANT Chief Financial Officer Lima, Peru |
Chief Financial Officer of the Company. |
N/A |
|
ANNUAL INFORMATION FORM |
Page | 72 |
FORTUNA SILVER MINES INC.
Name, Position and Residency (1) |
Principal Occupation or Employment (1) |
Period as a Director of the Company |
|
CESAR VELASCO Chief Operating Officer – Latin America Lima, Peru |
Chief Operating Officer – Latin America of the Company, Sept 2021 to present; General Manager, Minera Bateas S.A. (subsidiary of Fortuna), Nov 2018 to Aug 2021. |
N/A |
|
DAVID WHITTLE Chief Operating Officer – West Africa Faro, Portugal |
Chief Operating Officer – West Africa of the Company, Oct 2022 to present; VP Operations – West Africa of the Company, Oct 2021 to Sept 2022; General Manager, Yaramoko Mine of Roxgold Inc., May 2019 to July 2021; Deputy General Manager Kupol Mine of Kinross Gold Corporation, 2017 to May 2019. |
N/A |
|
ERIC CHAPMAN Senior Vice-President, Technical Services British Columbia, Canada |
Senior Vice-President, Technical Services of the Company, Oct 2021 to present; Vice-President, Technical Services of the Company, Jan 2017 to Sept 2021. |
N/A |
|
PAUL WEEDON Senior Vice-President, Exploration Western Australia, Australia |
Senior Vice-President, Exploration of the Company, Oct 2021 to present; Vice-President, Exploration, West Africa of the Company, July 2021 to Sept 2021; Vice-President, Exploration of Roxgold Inc., Oct 2018 to July 2021. |
N/A |
|
JULIEN BAUDRAND Senior Vice-President, Sustainability Utah, USA |
Senior Vice-President, Sustainability of the Company, Dec 2021 to present; Vice-President Sustainability, West Africa of the Company, Sept 2021 to Nov 2021; Vice-President Sustainability of Roxgold Inc., June 2019 to Sept 2021. |
N/A |
Notes:
(1) |
The information as to country of residence, principal occupation, and Common Shares held is not within the knowledge of the management of the Company and has been furnished by the respective individuals. |
(2) |
Member of the Audit Committee of the Company. |
(3) |
Member of the Compensation Committee of the Company. |
(4) |
Member of the Corporate Governance and Nominating Committee of the Company. |
(5) |
Member of the Sustainability Committee of the Company. |
As at December 31, 2023, the directors and executive officers of the Company beneficially owned or had control or direction over, directly or indirectly, an aggregate of 3,127,922 Common Shares, representing approximately 1.0% of the issued Common Shares of the Company.
Cease Trade Orders or Bankruptcies
On April 3, 2017, a management cease trade order (“MCTO”) was issued by the British Columbia Securities Commission and other Canadian provincial securities regulatory authorities pursuant to National Policy 12-203 Management Cease Trade Orders in connection with the late filing of the Company’s annual audited financial statements and related management’s discussion and analysis for the years ended December 31, 2016 and 2015 and the AIF for the year ended December 31, 2016 (the “Annual Documents”). The MCTO prohibited the Chief Executive Officer and the Chief Financial Officer of the Company from trading in securities of the Company until the Company completed the required filing of the Annual Documents as well as its Interim Financial Documents (as defined below) for the first quarter of 2017, and the regulator revokes the MCTO.
|
ANNUAL INFORMATION FORM |
Page | 73 |
FORTUNA SILVER MINES INC.
The Annual Documents were filed on May 15, 2017. Due to the delay in finalizing the Annual Financial Documents, the Company was delayed in filing its interim financial statements and related management’s discussion and analysis for the three months ended March 31, 2017 and 2016 (together, the “Interim Financial Documents”). The Company filed the Interim Financial Documents on May 24, 2017, and the MCTO was revoked by the British Columbia Securities Commission on May 25, 2017.
On June 22, 2020, the Autorité des marches financiers and the Ontario Securities Commission each issued a cease-trade order against Algold Resources Inc. (“Algold”) for having failed to file its annual statements for the fiscal year ended December 31, 2019. The cease trade order came into effect automatically in every jurisdiction in Canada that the company was reporting pursuant to automatic reciprocity legislation. In addition, Algold filed under the Bankruptcy and Insolvency Act in February 2021. A proposal made in the context of a notice of intention was approved by the creditors and homologated by the court on March 26, 2021. Under such proposal, Algold became a wholly-owned subsidiary of Aya Gold & Silver Inc. and ceased to be a reporting issuer, effective as of June 11, 2021. Ms. Seetaroo was a director of Algold at the time the cease trade order was issued, and at the time of the bankruptcy filing.
Other than as set forth above, as at the date of the AIF and during the 10 years prior to the date of the AIF, none of the directors or executive officers of the Company or a shareholder holding a sufficient number of securities of the Company to affect materially the control of the Company:
(a) |
is or has been a director or executive officer of any company (including the Company), that while that person was acting in that capacity: |
(i) |
was the subject of a cease trade order or similar order or an order that denied the relevant company access to any exemption under securities legislation, for a period of more than 30 consecutive days, other than as disclosed above; |
(ii) |
was subject to an event that resulted, after the director or executive officer ceased to be a director or executive officer, in the company being the subject of a cease trade or similar order or an order that denied the relevant company access to any exemption under securities legislation, for a period of more than 30 consecutive days; or |
(iii) |
within a year of that person ceasing to act in that capacity, became bankrupt, made a proposal under any legislation relating to bankruptcy or insolvency or was subject to or instituted any proceedings, arrangement or compromise with creditors or had a receiver, receiver manager or trustee appointed to hold its assets; or |
(b) |
has become bankrupt, made a proposal under any legislation relating to bankruptcy or insolvency, or become subject to or instituted any proceedings, arrangement or compromise with creditors, or had a receiver, receiver manager or trustee appointed to hold the assets of the director, officer and shareholder. |
Penalties or Sanctions
As at the date of the AIF and during the 10 years prior to the date of the AIF, none of the directors or officers of the Company or a shareholder holding a sufficient number of securities of the Company to affect materially the control of the Company has been subject to:
(a) |
any penalties or sanctions imposed by a court relating to securities legislation or by a securities regulatory authority or has entered into a settlement agreement with a securities regulatory authority; or |
(b) |
any other penalties or sanctions imposed by a court or regulatory body that would likely be considered important to a reasonable investor making an investment decision. |
|
ANNUAL INFORMATION FORM |
Page | 74 |
FORTUNA SILVER MINES INC.
Conflicts of Interest
There are no existing or potential material conflicts of interest between the Company or any of its subsidiaries and a director or officer of the Company or any subsidiary.
AUDIT COMMITTEE
Pursuant to the provisions of National Instrument 52-110 Audit Committees (“NI 52-110”), the Company’s Audit Committee has adopted a written charter (the “Charter”) that sets out its mandate and responsibilities. The Charter is attached as Schedule “F” to this AIF.
The Audit Committee is presently comprised of Kylie Dickson, Alfredo Sillau and David Farrell. All members of the Audit Committee are “independent” and “financially literate”, within the meanings given to those terms in NI 52-110.
The education and experience of the Audit Committee members that is relevant to the performance of their responsibilities as Audit Committee members is as follows:
Audit Committee Member |
Education and Experience |
|---|---|
Kylie Dickson |
Ms. Dickson is a Canadian Chartered Professional Accountant, Chartered Accountant (CPA,CA) with more than 15 years’ experience working with publicly traded resource companies. She received her Bachelor of Business Administration degree in Accounting from Simon Fraser University. She is the Audit Committee Chair of Hillcrest Energy Technologies Ltd. and Star Royalties Ltd., and she previously held the positions of Vice-President, Business Development of Equinox Gold Corp. and Chief Financial Officer of several mineral exploration and mining companies. Prior to her work with public companies, Ms. Dickson was an audit manager in the mining group of a major audit firm. |
Alfredo Sillau |
Mr. Sillau is Managing Partner and Director of Faro Capital, an investment management firm that manages private equity and real estate funds. Previously, he headed the business development in Peru for Compass Group, a regional investment management firm, until late 2011. As CEO of Compass, Mr. Sillau actively took part in the structuring, promoting and management of investment funds with approximately US$500 million in assets under management. Mr. Sillau is a graduate of Harvard Business School. His background has given him the required experience to understand and assess the general application of the accounting principles used by the Company and to understand internal controls and procedures for financial reporting. |
David Farrell |
Mr. Farrell is President of Davisa Consulting, a private consulting firm working with junior to mid-tier global mining companies. He formerly was Managing Director of Mergers & Acquisitions at Endeavour Financial where he successfully closed over $25 billion worth of M&A transactions for junior and mid-tier natural resource companies. Before his 12 years at Endeavour Financial, David was a lawyer at Stikeman Elliott LLP, working in Vancouver, Budapest and London. Mr. Farrell graduated from the University of British Columbia with a B.Comm. (Honours, Finance) and an LL.B and was called to the bar in both British Columbia and England. In addition, he has completed the ICD-Rotman Directors Education Program and been awarded the ICD.D designation. His background has given him the required experience to understand and assess the general application of the accounting principles used by the Company and to understand internal controls and procedures for financial reporting. |
|
ANNUAL INFORMATION FORM |
Page | 75 |
FORTUNA SILVER MINES INC.
The auditor of the Company obtains, as necessary, the pre-approval of the Audit Committee for any anticipated additional services required of the auditor for the coming fiscal year. If other service requirements arise during the year, the Audit Committee pre-approves such services at that time, prior to the commencement of such services.
During the Company’s most recently completed fiscal year, no services were performed by the Company’s auditor pursuant to the De-Minimus Non-audit Services exemption contained in NI 52-110.
During the Company’s most recently completed fiscal year, the Company’s auditor performed certain non-audit services. Fees and out-of-pocket costs charged by the auditor during the last two fiscal years are as follows:
|
2023 |
2022 |
Audit Fees |
$2,023,738 |
$1,654,987 |
Audit-Related Fees |
$6,570 |
6,380 |
Tax Fees |
$2,634 |
47,547 |
All Other Fees |
$500 |
Nil |
|
$2,033,442 |
$1,708,914 |
“Audit Fees” are the aggregate amounts billed for the audit of the Company’s consolidated annual financial statements, and review of the interim financial statements.
“Audit-Related Fees” are amounts charged for assurance and related services that are reasonably related to the performance of the audit or review of the Company’s financial statements and are not reported under “Audit Fees”. The amounts charged include services for attestation engagements.
“Tax Fees” are amounts for professional services rendered for tax compliance and tax advice on actual or contemplated transactions.
“All Other Fees” are amounts not included in the categories above.
LEGAL PROCEEDINGS
There are no known legal proceedings involving an amount exceeding 10% of the current assets of the Company to which the Company is a party or which any of its properties is the subject during the most recently completed financial year, or any such proceedings known to the Company to be contemplated. The Company has not been subject to any regulatory penalties or sanctions during the most recently completed financial year related to securities legislation or imposed by a court or regulatory body, nor has Fortuna entered into any settlement agreements relating to securities legislation during the most recently completed financial year.
TRANSFER AGENT AND REGISTRAR
The Common Shares are listed for trading on the TSX in Canada and on the NYSE in the United States. The Debentures are only listed for trading on the TSX. The Company’s transfer agent and registrar for its Common Shares and Debentures is Computershare Trust Company, at its offices in Vancouver, BC and Toronto, ON. The Company’s co-transfer agent and registrar for its Common Shares in the United States is Computershare Trust Company, N.A. at its office in Golden, Colorado.
MATERIAL CONTRACTS
Other than as disclosed in this AIF and other than those entered into in the ordinary course of the Company’s business, there are no contracts that are material to the Company and that were entered into during the most
|
ANNUAL INFORMATION FORM |
Page | 76 |
FORTUNA SILVER MINES INC.
recently completed fiscal year ended December 31, 2023 or before the most recently completed financial year, but are still in effect as of the date of this AIF.
INTERESTS OF EXPERTS
Auditors
The 2023 Financial Statements have been audited by KPMG LLP, as set forth in their report of independent registered public accounting firm thereon. KPMG LLP is the independent registered public accounting firm of the Company and they have confirmed with respect to the Company that they are independent within the meaning of the relevant rules and related interpretations prescribed by the relevant professional bodies in Canada and any applicable legislation or regulations and also that they are independent accountants with respect to the Company under all relevant U.S. professional and regulatory standards.
Qualified Persons
Séguéla Technical Report
Paul Weedon, Eric Chapman, Raul Espinoza, Mathieu F. Veillette and Paul Criddle (the “Séguéla Technical Report Authors”), each a Qualified Person as defined by NI 43-101, prepared the Séguéla Technical Report which was filed by the Company on SEDAR+ on February 16, 2024. See “Schedule “A” – Material Mineral Properties – Séguéla Mine, Côte d’Ivoire”.
To the knowledge of the Company, as at the date of the Séguéla Technical Report and as of the date hereof, each of the Séguéla Technical Report Authors owns, directly or indirectly, less than 1% of the outstanding Common Shares. None of the Séguéla Technical Report Authors has received a direct or indirect interest in the property of the Company.
Yaramoko Technical Report
Paul Weedon, Matthew Cobb, Raul Espinoza and Paul Criddle (the “Yaramoko Technical Report Authors”), each a Qualified Person as defined by NI 43-101, prepared the Yaramoko Technical Report which was filed by the Company on SEDAR+ on March 24, 2023. See “Schedule “B” – Material Mineral Properties – Yaramoko Mine, Burkina Faso”.
To the knowledge of the Company, as at the date of the Yaramoko Technical Report and as of the date hereof, each of the Yaramoko Technical Report Authors owns, directly or indirectly, less than 1% of the outstanding Common Shares. None of the Yaramoko Technical Report Authors has received a direct or indirect interest in the property of the Company.
Lindero and Arizaro Technical Report
Eric Chapman, Raul Espinoza, Mathieu Veillette and Dmitry Tolstov (the “Lindero and Arizaro Technical Report Authors”), each a Qualified Person as defined by NI 43-101, prepared the Lindero and Arizaro Technical Report which was filed by the Company on SEDAR+ on March 28, 2023. See “Schedule “C” – Material Mineral Properties – Lindero Mine, Argentina”.
To the knowledge of the Company, as at the date of the Lindero and Arizaro Technical Report and as of the date hereof, each of the Lindero and Arizaro Technical Report Authors owns, directly or indirectly, less than 1% of the outstanding Common Shares. None of the Lindero and Arizaro Technical Report Authors has received a direct or indirect interest in the property of the Company.
|
ANNUAL INFORMATION FORM |
Page | 77 |
FORTUNA SILVER MINES INC.
San Jose Technical Report
Eric Chapman, Paul Weedon, Raul Espinoza, Mathieu F. Veillette and Patricia Gonzalez (the “San Jose Technical Report Authors”), each a Qualified Person as defined by NI 43-101, prepared the San Jose Technical Report which was filed by the Company on SEDAR+ on March 8, 2024. See “Schedule “D” – Material Mineral Properties – San Jose Mine, Mexico”.
To the knowledge of the Company, as at the date of the San Jose Technical Report and as of the date hereof, each of the San Jose Technical Report Authors owns, directly or indirectly, less than 1% of the outstanding Common Shares. None of the San Jose Technical Report Authors has received a direct or indirect interest in the property of the Company.
Caylloma Technical Report
Eric Chapman, Paul Weedon, Raul Espinoza, Mathieu F. Veillette and Patricia Gonzalez (the “Caylloma Technical Report Authors”), each a Qualified Person as defined by NI 43-101, prepared the Caylloma Technical Report which was filed by the Company on SEDAR+ on February 16, 2024. See “Schedule “E” – Material Mineral Properties – Caylloma Mine, Peru”.
To the knowledge of the Company, as at the date of the Caylloma Technical Report and as of the date hereof, each of the Caylloma Technical Report Authors owns, directly or indirectly, less than 1% of the outstanding Common Shares. None of the Caylloma Technical Report Authors has received a direct or indirect interest in the property of the Company.
Annual Information Form
Eric Chapman, Senior Vice President of Technical Services of the Company is a Qualified Person as defined by NI 43-101. To the knowledge of the Company, as of the date hereof, Eric Chapman owns, directly or indirectly, less than one percent of the outstanding Common Shares. Eric Chapman has not received a direct or indirect interest in the property of the Company.
ADDITIONAL INFORMATION
Additional information, including directors’ and officers’ remuneration and indebtedness, principal holders of the Company’s securities and securities authorized for issuance under equity compensation plans, is contained in the Company’s Management Information Circular for the most recent annual meeting of shareholders. Additional financial information is provided in the 2023 Financial Statements and the 2023 MD&A. The foregoing disclosure documents, along with additional information relating to the Company are available for viewing on SEDAR+ at www.sedarplus.ca and on EDGAR at www.sec.gov.
|
ANNUAL INFORMATION FORM |
Page | 78 |
FORTUNA SILVER MINES INC.
SCHEDULE “A”
MATERIAL PROPERTIES
Séguéla Mine, Côte d’Ivoire
The following is the Summary from the technical report (the “Séguéla Technical Report”) entitled “Séguéla Gold Mine, Côte d’Ivoire”, with an effective date of December 31, 2023 prepared by Paul Weedon, MAIG, Eric Chapman, P.Geo., Raul Espinoza, FAusIMM (CP), Mathieu F. Veillette, P.Eng., and Paul Criddle, FAusIMM. This Summary is subject to certain assumptions, qualifications and procedures described in the Séguéla Technical Report and is qualified in its entirety by the full text of the Séguéla Technical Report which is available for viewing on SEDAR+ at www.sedarplus.ca and is incorporated by reference in this AIF, and is also filed with the SEC on EDGAR (available at www.sec.gov). Defined terms and abbreviations used herein and not otherwise defined shall have the meanings ascribed to such terms in the Séguéla Technical Report.
1.1 |
Introduction |
Fortuna Silver Mines Inc. (Fortuna) has compiled a Technical Report (the Report) on the Séguéla Gold Mine (the “Séguéla Mine or the Séguéla Project) located in the Worodougou Region of the Woroba District, Côte d’Ivoire.
The Séguéla open pit gold mine is operated by Roxgold Sango S.A. (Roxgold Sango), a 90 % indirectly-owned Fortuna subsidiary, with the remaining 10 % interest held by the government of Côte d’Ivoire.
The Report discloses updated Mineral Resource and Mineral Reserve estimates for the Project.
Costs are in US dollars (US$) unless otherwise indicated.
1.2 |
Property Description, Location and Access |
The Séguéla Mine is located approximately 500 km from Abidjan, via major highways to the town of Séguéla. The open pit mine is managed by Roxgold Sango. The operation has a relatively small surface infrastructure consisting primarily of the concentration plant, electrical power station, water storage facilities, tailings storage facility (TSF), waste dumps, stockpiles, and workshop facilities. The open pits at the Antenna, Ancien, Agouti, Boulder, Koula and Sunbird deposits are connected by unsealed roads. Additional structures located in the mine area include offices, dining hall, laboratory, core logging and core storage warehouses.
Roxgold Sango holds an exploration permit (Permis de Recherche Miniére No. 638) and an exploitation permit (Permis d’Exploitation Minière No.56).
Permis de Recherche Miniére No. 638, which surrounds Permis d’Exploitation Minière No.56, is a three‐year permit that Roxgold Sango has exercised for a second renewal, having submitted the application on July 20, 2023, and awaiting Ministerial signature. The permit covers an area of 270.1 km2.
Provided minimum expenditure requirements are met, exploration permits in Côte d’Ivoire are subject to automatic grants of renewal applications for two terms of three years each, and a special third term of no more than two years.
In addition to the Environmental Permit obtained on September 22, 2020, the exploitation permit (Permis d’Exploitation No. 56) was granted by the Council of Ministers on December 9, 2020, and signed as a decree by the President of Côte d’Ivoire (Decree No.2020‐960). This permit covers an area of 353.6 km2 and is valid for 10 years. The permit is thereafter renewable for successive 10-year periods. All the deposits are located on this permit.
The Séguéla Mine is accessible year‐round by road vehicle. Bituminized national highways facilitate transport between Abidjan, Yamoussoukro, and the nearest major town, Séguéla (population c. 65,000). From Séguéla, unsealed roads provide access to the mine through the village of Fouio (population c. 3,000).
The Project is located within a tropical savannah climatic region on the southern margin of the Sahel savannah. This climatic zone is typified by high average temperatures, and a distinct wet season and dry season. The average annual temperature for the Séguéla Mine area is 25.3°C, with an annual average rainfall of 1,268 mm. August and September are the wettest months of the year. Mining operations are conducted year‐round.
|
ANNUAL INFORMATION FORM |
Séguéla Technical Report Page |A-1 |
FORTUNA SILVER MINES INC.
The Séguéla Project occurs in a region of low forested hills, with elevations averaging 347 m above sea level. The vegetation of the region is tropical savannah woodland. The area surrounding the Séguéla Project is extensively cropped for cashews, and to a lesser extent, cacao.
1.3 |
History |
The Séguéla permit (Permis de Recherche Miniére No. 252) was granted to a local Ivorian company, Geoservices CI in February 2012. The Project was subsequently transferred to a local Ivorian joint venture company, Mont Fouimba Resource (Mont Fouimba) in late 2012. In 2013 the permit was transferred to Apollo Consolidated Ltd (Apollo), which was the 51 % shareholder in Mont Fouimba, with Geoservices CI holding the remaining 49 % interest. In February 2016, Apollo announced the signing of an Option to Purchase Agreement by Newcrest Mining Ltd (Newcrest), for the Séguéla Project. Newcrest acquired the adjacent permit (Permis de Recherche Miniére No. 638) on 19 October 2016. In February 2017, the permit was transferred to LGL Exploration CI S.A; a wholly-owned Newcrest subsidiary. In April 2019, Roxgold Inc. (Roxgold) acquired the Séguéla Project from Newcrest through the acquisition of LGL Exploration CI S.A. In July 2021 Roxgold was acquired by Fortuna.
On 23 July 2020, Roxgold through its wholly-owned local entity LGL Exploration CI SA, lodged an application for an exploitation permit (Permis d’Exploitation No. 56). Permis d’Exploitation No. 56 effectively replaced Permis de Recherche Miniére No. 252. LGL Exploration CI SA subsequently transferred Permis d’Exploitation No. 56 to Roxgold Sango by Ministerial Order dated May 25, 2021.
Prior to this period, there is evidence to suggest that the ground contained within permit no. 252 was held by Randgold Resources (Randgold), with press releases from Apollo referring to trenching completed by Randgold over the Gabbro, Porphyry and Agouti prospects within the current permit limits.
Roxgold Sango commenced construction of the mine in September 2021 with commissioning activities starting in April 2023 and the first gold doré pour occurring on May 24, 2023.
1.4 |
Geology Setting, Mineralization and Deposit Types |
The Séguéla Project is situated within the Paleoproterozoic (Birimian) Baoule‐Mossi Domain of the West African Craton. Two cycles of volcanism/sedimentation are recognized within the Birimian rocks of the Baoule‐Mossi Domain; each followed by a period of orogenesis, and together described as the Eburnian Orogeny which is dated c. 2.19–2.08 Ga. Rocks of the Baoule‐Mossi Domain are primarily polyphase granitoids, and volcano‐sedimentary sequences forming granite‐greenstone terranes. The first cycle of sedimentation and orogenesis (Eburnian 1) is described by the accumulation of volcanic and volcaniclastic rocks; then subsequently intruded by early stage granitoids. Following a period of uplift and erosion, the Eburnian 2 cycle is described by the filling of intra‐montaine basins with predominantly arenaceous sediments of the Tarkwaian Series.
The Antenna deposit occurs within a greenstone package deposited during Eburnian 1, that comprises (west to east) an ultramafic hangingwall, which is in presumed fault contact with an interlayered package of felsic volcaniclastic rocks and flow banded rhyolitic units, which are then in contact with a mafic (basaltic) footwall unit. The faulted contacts between the mafic/ultramafic units and the felsic assemblage converge to the south of the deposit forming a wedge shape to the felsic package.
The Antenna deposit is considered to be an example of an orogenic lode‐style gold system, hosted by a brittle‐ductile quartz‐albite vein stockwork predominantly contained within flow banded rhyolite units. The stockwork lode varies in width roughly in proportion with the widths of the rhyolitic units that host it (approximately 3–40 m) and extends over a strike length of approximately 1,350 m. Stockwork veins that host mineralization show two principal orientations: steep east‐dipping and steep west‐dipping. Veins in the steep west‐dipping orientation range from ptygmatically folded to undeformed, while veins in the east‐dipping direction may be variably boudinaged to undeformed. This evidence suggests syn‐deformational emplacement of the vein sets during west and east movement along the main fault structures within the region. Mineralization occurs as free gold, associated with pyrite and pyrrhotite. Alteration assemblages associated with this mineralization assemblage vary from proximal intense silica–albite ± biotite ± chlorite alteration, through medial silica–albite‐sericite ± chlorite assemblages, to more distal sericite‐carbonate (ankerite/calcite) and carbonate‐magnetite assemblages. Pyrite is the dominant sulfide associated with higher‐grade mineralization within proximal alteration zones, while sulfide mineralogy is pyrrhotite-dominated in medial and distal assemblages and is associated with lower-grade gold mineralization.
|
ANNUAL INFORMATION FORM |
Séguéla Technical Report Page |A-2 |
FORTUNA SILVER MINES INC.
The Ancien deposit is associated with an interpreted D2 sinistral shear zone, informally referred to as the Ancien shear, within the east domain. The host lithologies comprise (from west to east) a chloritic pillow basalt footwall overlain by a foliated/sheared tholeiitic basalt unit, which is in turn overlain by a second chloritic pillow basalt hanging wall unit that is gradational into a coarser grained porphyritic basalt unit. Generally narrow quartz‐feldspar–biotite porphyries crosscut and intrude all other lithologies and are interpreted as late-stage intrusions.
Both the Koula and Sunbird deposits are situated within the same package of mafic rocks as the Ancien deposit, which is informally referred to as the Ancien–Koula corridor. Similar to Ancien, both Koula and Sunbird are hosted within a strongly foliated/sheared thoeliitic basalt unit within a broader sequence of pillow basalt.
At the Ancien, Koula, and Sunbird deposits, significant mineralization is restricted to the more reactive and competent tholeiitic basalt unit and is best developed in zones of strong brittle–ductile brecciation and shearing, with selective sericite ± silica alteration and intense quartz and quartz–carbonate veining. Mineralization occurs as free gold, predominantly as small grains within microfractured milky‐white quartz veins and associated with pyrite and lesser pyrrhotite at Ancien, that trends to being more pyrrhotite dominant at Koula. Generally lower-grade mineralization is also developed at the margins of felsic porphyries that intrude the tholeiitic basalt, and in zones of increased brecciation and veining within these porphyries.
The Boulder and Agouti deposits are both located within a distinct northerly‐trending litho‐structural corridor that extends from Boulder in the south to the Gabbro prospect in the north. Regional mapping has defined a broad package of pillow basalts and intercalated basaltic sediments, flanked to the west by a discontinuous gabbro unit and regionally extensive doleritic sequence. The basaltic units are extensively intruded by quartz–feldspar–biotite porphyritic felsic intrusions.
Gold mineralization at the Boulder and Agouti prospects is associated with strongly foliated or mylonitized, quartz/quartz–carbonate veined basalt and the margins of the felsic intrusions. Generally lower-grade mineralization occurs internal to the felsic intrusions where they are brecciated or extensively veined. The highest gold grades generally correlate with the intersection of north–northeast- and northwest‐trending structures. Mineralization occurs as free gold within a network of milky white quartz veins and associated with foliation or quartz/quartz–carbonate vein‐controlled pyrite and minor pyrrhotite.
1.5 |
Exploration, Drilling and Sampling |
Exploration has been undertaken by Randgold (pre‐2012), Apollo (2012–2016), Newcrest (2016–2017) and Roxgold Sango (2019 onwards).
Exploration activity included construction of a 40‐person exploration camp and core storage/logging facilities, geological mapping, purchase and interpretation of aeromagnetic data, soil, trench, and artisanal dump sampling, and aircore (AC) and reverse circulation (RC) drilling. Xcalibur Airborne Geophysics Pty Ltd of South Africa conducted an aeromagnetic survey across the Project area in December 2019 and January 2020, with the results used to further enhance the prospectivity mapping and structural understanding of the mineralization controls.
As of the effective date of the Report, Roxgold Sango has completed 248,483 m of RC and core drilling (DD) since Roxgold Inc.’s acquisition of the Séguéla Project in April 2019 from Newcrest. Roxgold Sango has an ongoing program of reconnaissance AC and RC drilling across the Project area as new prospects are identified. Those prospects that demonstrate suitable mineral continuity and grade are advanced with additional drilling to improve confidence and to provide suitable samples for metallurgical and geotechnical testing. Projects that have advanced to resource definition (RC and DD) drilling include the Antenna, Ancien, Agouti, Boulder, Koula and Sunbird deposits. Core drilling typically used HQ sized core (63.5 mm diameter) until the final hole depth is reached. A reduction to NQ (47.6 mm diameter) may rarely be required if poor ground conditions are encountered. Down‐hole deviation was monitored using a Reflex Instruments device at 12-m intervals and then at 30-mintervals thereafter. Core recoveries are high, averaging 99 %, reflecting the competent nature of the host lithologies.
Drill collar surveys were carried out using a site based differential global positioning system (DGPS) instrument that was calibrated with the regional geodesic system.
Downhole surveys generally used Reflex EZ‐GYRO downhole camera, with the Reflex EZ‐SHOT retained for backup and survey check purposes. Instruments were provided by the drilling contractor and calibrated prior to use on site.
DD holes were generally drilled on patterns of 25 to 30 m centers to support potential classification as Indicated Mineral Resources and approximately 50 m centers for Inferred Mineral Resources.
|
ANNUAL INFORMATION FORM |
Séguéla Technical Report Page |A-3 |
FORTUNA SILVER MINES INC.
Sampling of core was performed by Roxgold Sango personnel. From the drill site, core was transported by truck to a secure logging facility at the Roxgold field office where it was photographed and logged by a geologist. Selective sampling was employed where, at the discretion of the geologist, samples were collected from visible alteration or vein zones outside of the expected intercepts. All core was sampled at 1.0 m intervals, except where a significant geological change occurred. Core was cut in half lengthwise using an electrical rock saw. Half of the sample was placed inside a labelled plastic sample bag. The remaining half was returned to the core box for archiving. Samples were then inserted into woven polypropylene bags prior to being transported by truck to the preparation and assay laboratory.
Roxgold Sango implemented logging onto Maxwell LogChief data capture software in 2019, enabling the direct capture and traceability of logging data via dropdown menus and pre‐set codes to promote data hygiene. Prior to 2019, all logging was onto pre‐set excel spreadsheets before importation into the database. Reviews of the logging data and associated model interpretation are carried out on a regular basis by the site senior geological team and on each QP site visit.
Samples were submitted to ALS Laboratories (ALS) in Yamoussoukro for preparation and analysis. Core samples received by ALS are passed through a primary crush via oscillating jaw crushers to a >70% pass through a <2 mm size. The AC, RC and DD samples are then passed through a riffle splitter to achieve a 250 g split. This split material is pulverized in its entirety to a >85% pass through 75 µm. This pulp is then rolled on a plastic sheet for homogenization, and an aliquot is taken to fill a paper Geochem bag (approximately 200 g).
Prepared samples from the Yamoussoukro laboratory were then shipped via commercial courier to ALS’s analytical facility in either Ouagadougou, Burkina Faso, or Kumasi, Ghana.
Samples submitted for assay were analyzed by ALS by fire assay of a 50 g charge using an atomic absorption spectroscopy (AAS) finish (ALS code Au‐AA24). Samples returning >10,000 ppb Au were reanalyzed by fire assay of a 50 g charge with a gravimetric finish (ALS code Au‐GRA22). From December 2019, all samples with visible gold noted in drill hole logging, or returning >50,000 ppb Au from the routine fire assay analysis, were also analyzed by the screen fire assay technique (ALS code Au_SCR24 – 106 µm metal screen) to determine the percentage of gold present in the coarse fraction versus the fine fraction. These analytical techniques are considered total and appropriate for the style of mineralization. Results of the screen fire analysis as of the effective report date indicate a reasonable correlation with the primary fire assay analysis.
ALS laboratories are independent of Roxgold Sango. ALS maintain certification in accordance with the most relevant quality certification standards for the activities which they undertake, namely ISO9001:2015 for survey/inspection activity and ISO 17025:2005 UKAS ref 4028 for laboratory analysis. Other than initial sample collection splitting and bagging at the Séguéla Mine, Roxgold Sango personnel and its consultants and contractors were not involved in the laboratory sample preparation and analysis.
Assay data are electronically reported from the laboratory in Microsoft Excel and pdf format and imported into the database after validation, along with the corresponding assay certificates.
The quality assurance/quality control (QAQC) program involves establishing appropriate procedures and the routine insertion of certified reference material (CRMs), blanks, and duplicates to monitor the sampling, sample preparation and analytical process. Evaluation of the QAQC data indicates that the analytical data are sufficiently accurate and precise to support the Mineral Resource and Mineral Reserve estimation.
1.6 |
Data Verification |
Roxgold Sango staff follow a stringent set of procedures for data storage and validation, performing verification of data on a monthly basis. The operation employs a Database Administrator who is responsible for overseeing data entry, verification and database maintenance. A separate Database Auditor is responsible for performing a detailed independent review of the database on a quarterly basis and submitting a report to Fortuna management detailing the findings. Any issues identified are immediately resolved by the administrator.
Data used for the Mineral Resource estimation are stored in the commercial SQL database system Datashed, which hosts both mine-related data and drilling related results (exploration and infill drilling).
As a component of the 2023 Mineral Resource estimate, a preliminary validation of the database was performed by the Database Administrator in June 2023. The database has a series of automated import, export, and validation
|
ANNUAL INFORMATION FORM |
Séguéla Technical Report Page |A-4 |
FORTUNA SILVER MINES INC.
tools to minimize potential errors. Any inconsistencies identified were corrected during the analysis with the database then handed over in Microsoft Access format to the QP for final review on June 30, 2023.
In addition, data verification by the QP was also conducted through the inspection of selected drill core to assess the nature of the mineralization and to confirm geological descriptions as well as the inspection of geology and mineralization in open pit workings of the Antenna deposit.
A series of plan and cross sections were generated displaying the lithologic and mineralization interpretation by the Roxgold Sango geology and exploration departments and reviewed by the QP.
Mr. Veillette has performed an internal audit on the TSF, water management, waste dump and open pit geotechnical/hydrological aspects. Mr. Veillette is of the opinion that geotechnical and hydrogeology studies are of a sufficient level to support the estimation of Mineral Reserves and Mineral Resources.
Mr. Criddle has reviewed the extensive body of metallurgical investigation comprising several phases of testwork and, in addition, has been personally involved in the development and construction of the Séguéla Mine. In the opinion of the Mr. Criddle, the Séguéla metallurgical samples tested, and the ore that is presently treated in the plant are representative of the orebody as a whole in respect to grade and metallurgical response. Differences between deposits are minimal with regard to metallurgical recovery.
The QPs are of the opinion that the data verification programs performed on the data collected by Roxgold Sango are adequate to support the geological interpretations, the analytical and database quality, and Mineral Resource and Mineral Reserve estimation at the Séguéla Gold Mine.
1.7 |
Mineral Processing and Metallurgical Testing |
Previous owner, Newcrest, conducted a round of Leachwell assay test work on 61 samples from drill hole SGDD001 in 2018. Comparison of the Leachwell tests to fire assays for the samples set (four‐hour bottle roll used for leach testing of a nominal 1 kg sample) demonstrated a near 1:1 correlation of results. This was used to conclude that the material is non‐refractory, and therefore amenable to standard carbon‐in‐leach (CIL) treatment for extraction.
Roxgold supervised the metallurgical testing work completed by the ALS Metallurgy assay lab in Perth, Australia on representative samples from the Antenna, Agouti, Boulder, Ancien, Koula and Sunbird deposits between 2019 to 2023. Seven test work programs were performed.
As the Antenna deposit hosts the majority of the estimated Mineral Reserves and this ore will be the majority of mill feed ore projected for the life-of-mine plan (LOMP). As a result, this mineralization was examined more comprehensively and represents the basis for the mineral processing design criteria. Satellite deposits in the form of the Agouti, Boulder, Ancien, Koula and Sunbird were also tested throughout the seven programs for confirmation purposes and in support of Mineral Resource and Mineral Reserve estimation. Test work included comminution test work, head assays, mineralogical analysis, grind establishment test work, gravity gold recovery and cyanide leach test work, flotation test work, carbon adsorption test work, oxygen uptake test work, preg‐robbing test work, cyanide detox test work, sedimentation and rheology test work, and acid mine drainage test work.
Samples tested were reasonably competent with average Bond rod and ball mill work indices of 21.8kWh/t and 19.7 kWh/t respectively. The results showed the mineralization was amenable to a simple comminution circuit design.
The test work showed that leaching is substantially complete within 24 hours and there is no apparent preg‐robbing or refractory characteristics in the ores tested. Furthermore, it showed a fast‐initial leaching rate with more than 80% of the stage extraction completed within the first two hours of cyanidation. The highest gold recovery was achieved for tests incorporating gravity recovery and elevated dissolved oxygen levels for the duration of the leach.
The ore tested across all deposits exhibited a degree of grind sensitivity with an optimal grind size of 75 µm selected for all extraction test work. The results of that program were very encouraging, indicating free milling of the ore with good leach kinetics and overall recoveries averaging 94.5 %.
A single stage semi-autogenous grind (SAG) circuit followed by gravity concentration and cyanidation of the gravity tailings was the configuration adopted for the process plant.
It is the opinion of the QP that an average gold recovery of 94.5 % can be expected, based on the life‐of‐mine average gold grade of 3.06 g/t.
|
ANNUAL INFORMATION FORM |
Séguéla Technical Report Page |A-5 |
FORTUNA SILVER MINES INC.
1.8 |
Mineral Resource Estimates |
Roxgold Sango, under the supervision of the QP, has completed Mineral Resource estimates for the Antenna, Ancien, Agouti, Boulder, Koula and Sunbird deposits based on the drill hole data available to June 30, 2023 and reported as of December 31, 2023, taking into account production related depletion to this date.
The Mineral Resources are reported insitu, using the 2014 CIM Definition Standards, exclusive of those Mineral Resources converted to Mineral Reserves. Mineral Resources that are not Mineral Reserves do not have demonstrated economic viability. A summary of the Mineral Resources is presented in Table 1.
Table 1:Mineral Resources as of December 31, 2023
Indicated Mineral Resources |
COG (g/t Au) |
Tonnes (Mt) |
Au (g/t) |
Au (koz) |
|
Open pit |
Antenna |
0.55 |
1.33 |
1.32 |
57 |
Agouti |
0.65 |
0.30 |
1.69 |
16 |
|
Ancien |
0.65 |
0.19 |
2.79 |
17 |
|
Koula |
0.60 |
0.05 |
5.84 |
10 |
|
Boulder |
0.60 |
0.43 |
1.13 |
16 |
|
Sunbird |
0.55 |
0.55 |
1.77 |
31 |
|
Total |
0.55–0.65 |
2.86 |
1.60 |
147 |
|
Underground |
Ancien |
2.40 |
0.19 |
3.79 |
23 |
Koula |
2.40 |
0.04 |
4.54 |
7 |
|
Sunbird |
2.40 |
1.56 |
4.05 |
203 |
|
Total |
2.40 |
1.80 |
4.03 |
233 |
|
Total Indicated Mineral Resources |
4.66 |
2.54 |
381 |
||
|
|
||||
Inferred Mineral Resources |
COG (g/t Au) |
Tonnes (Mt) |
Au (g/t) |
Au (koz) |
|
Open pit |
Antenna |
0.55 |
1.73 |
1.61 |
90 |
Agouti |
0.65 |
0.05 |
1.53 |
2 |
|
Ancien |
0.65 |
0.02 |
0.89 |
1 |
|
Koula |
0.60 |
0.37 |
4.44 |
53 |
|
Boulder |
0.60 |
0 |
- |
- |
|
Sunbird |
0.55 |
0.02 |
2.29 |
2 |
|
Total |
0.55–0.65 |
2.19 |
2.09 |
147 |
|
Underground |
Ancien |
2.40 |
0.15 |
3.82 |
19 |
Koula |
2.40 |
0.29 |
3.24 |
30 |
|
Sunbird |
2.40 |
0.42 |
3.62 |
49 |
|
Total |
2.40 |
0.86 |
3.53 |
98 |
|
Total Inferred Mineral Resources |
|
3.05 |
2.50 |
245 |
|
Notes:
| ● | Mineral Resources are reported insitu, using the 2014 CIM Definition Standards. |
| ● | Mr. Eric Chapman, P.Geo., is the Qualified Person responsible for Mineral Resources and is a full time employee of Fortuna Silver Mines Inc. |
| ● | Mineral Resources are reported as of December 31, 2023. |
| ● | Mineral Resources are reported on a 100 % basis. Fortuna holds a 90 % interest in the Séguéla Gold Mine. The remaining 10 % interest is held by the State of Côte d’Ivoire. |
| ● | Mineral Resources are reported exclusive of those Mineral Resources modified to produce Mineral Reserves. Mineral Resources that are not Mineral Reserves do not have demonstrated economic viability. |
| ● | Mineral Resources potentially amenable to open pit mining methods are reported at a gold cut-off grade of 0.55 g/t Au for Antenna and Sunbird, 0.60 g/t Au for Koula and Boulder, and 0.65 g/t Au for Ancien and Agouti. Mineral resources are constrained within optimized pit shells. |
|
ANNUAL INFORMATION FORM |
Séguéla Technical Report Page |A-6 |
FORTUNA SILVER MINES INC.
| ● | Mineral Resources potentially amenable to underground mining methods are reported inside MSO shapes at a gold cut-off grade of 2.4 g/t Au based on sublevel stoping mining method. |
| ● | Mineral Resources are based on a gold price of US$1,840/oz. |
| ● | All figures have been rounded to reflect the relative accuracy of the estimates and totals may not add due to rounding. |
Factors which may affect the Mineral Resource estimates include:
| ● | Metal price and exchange rate assumptions. |
| ● | Changes to the technical inputs used to estimate gold content (e.g. bulk density estimation, grade interpolation methodology). |
| ● | Changes to the geological interpretation (e.g. post‐mineralization dykes and structural offsets such as faults and shear zones). |
| ● | Additional depletion due to artisanal mining activities beyond those already identified and excluded from the estimate. |
| ● | Changes to geotechnical and mining assumptions, including the minimum mining thickness; or the application of alternative mining methods. |
| ● | Changes to process plant recovery estimates if the metallurgical recovery in certain domains is lesser or greater than currently assumed. |
| ● | Final negotiated terms of the Mining Convention. |
| ● | Changes to governmental regulations. |
| ● | Changes to environmental, permitting and social license assumptions. |
The Mineral Resource estimates for the Antenna, Ancien, Agouti, Boulder, Koula and Sunbird deposits incorporate data from RC and DD holes to date comprising 130,566.75 m of drilling from 925 holes. Drill hole spacings range nominally from 50 x 50 m to 25 x 25 m within the modelled areas.
The Antenna, Ancien, Koula and Sunbird models were built using Datamine Studio RM software. The Agouti and Boulder models were developed using Leapfrog Geo and Datamine Studio RM software. All gold assays from drill holes were composited to 1 m intervals within the mineralized wireframes. Top‐cuts were applied to individual domains based on an analysis of gold grade outliers within the statistical data populations.
Geostatistical exploratory data analysis, variogram modelling and Mineral Resource model validation was conducted using Snowden Supervisor software.
The Mineral Resource model gold grades were estimated using a combination of ordinary kriging and inverse distance weighting methods using a multiple pass approach to inform the models. Grade estimates were validated visually by sectional comparison and through statistical approaches that encompass traditional validation methods, such as swath plots comparing composite and block model values for each deposit.
Models and drill hole data use the WGS84 (Zone 29N) coordinate system. The Antenna, Ancien, Koula and Sunbird block models used parent cell sizes of 5 x 5 x 5 m, oriented variously along the ordinate axes to best align with the strike of the mineralization, with subcelling used to ensure exact filling of the domain wireframes. The Agouti and Boulder deposits used a parent cell of 2.5 x 5 x 5 m and 3.5 x 5 x 5 m, respectively in the respective XYZ axis to provide sufficient volume resolution to the modelled mineralization lodes. After gold grades had been estimated and densities assigned to the subcelled model the blocks were regularized to the parent cell size to represent the planned selective mining unit (SMU) size.
Density values were assigned to the Mineral Resource models based on ascribed oxidization state and lithological unit, with mineralization being assigned the density of its predominant host. A density of 1.8 t/m3 was assigned to transported and alluvial sediments, with a range of 1.8–2.5 t/m3 assigned to the oxidized weathered profile and a range of 2.7–3.2 t/m3 assigned to fresh rock lithologies.
The Mineral Resource estimates are reported constrained by pit optimizations generated in Deswik, and are based on the following parameters:
| ● | Assumed gold price of $1,840/oz. |
| ● | Processing recovery of 94.5 %. |
|
ANNUAL INFORMATION FORM |
Séguéla Technical Report Page |A-7 |
FORTUNA SILVER MINES INC.
| ● | Overall slope angles of 36.8° for oxide material, 44.2° for transitional material and 51° for fresh material except for Sunbird that used slope angles of 36.8° for oxide material, 36.5° for transitional material and 50° for fresh material. |
| ● | Average mining cost of $3.12/t mined, based on distance from pit to processing facility. |
| ● | Average total processing costs (including G&A) of $24.25/t processed. |
| ● | Selling costs which include: |
| o | 6% royalty on revenue. |
| o | Refining and transport costs of $7.00/oz with a payability of 99%. |
The Mineral Resource models were classified into Indicated and Inferred Mineral Resource categories based on analysis of the following criteria: number of samples informing the estimate, sample spacing, average sample distance, kriging efficiency and slope of regression outputs, drill hole and sample QAQC thresholds, geological confidence in modelled interpretations, grade continuity, and level of geological understanding at each deposit.
1.9 |
Mineral Reserve Estimates |
The Mineral Reserve estimate has an effective date of December 31, 2023, and reported using the 2014 CIM Definition Standards.
Mineral Reserves are based on conversion of Indicated Mineral Resources to Probable Mineral Reserves within the final pit designs guided by the ultimate pit shells generated from open pit optimizations at a gold price of $1,600/oz Au. Each deposit has undergone pit optimization, detailed mine design, mine scheduling, and cashflow analysis, demonstrating a technically achievable and economically viable mine plan supporting the Mineral Reserve estimate. The Mineral Reserves are reported inclusive of mining dilution and mining recovery represented by regularizing the block models to an appropriate SMU size.
Proven Mineral Reserves are estimated for stockpiled material. All Inferred Mineral Resources are treated as non-revenue generating waste rock. Mineral Resources potentially amenable to underground mining methods have not been converted to Mineral Reserves as additional evaluation is required to confirm reasonable confidence in the modifying factors applied for reporting.
Mineral Reserves are reported in Table 2 at the point of delivery to the process plant, using the 2014 CIM Definition Standards.
Table 2: Mineral Reserves as of December 31, 2023
Location |
Proven |
Probable |
Proven & Probable |
||||||
|---|---|---|---|---|---|---|---|---|---|
|
Tonnes (Mt) |
Grade (g/t Au) |
Metal (000 oz) |
Tonnes (Mt) |
Grade (g/t Au) |
Metal (000 oz) |
Tonnes (Mt) |
Grade (g/t Au) |
Metal (000 oz) |
|
Stockpile |
0.44 |
2.06 |
29 |
- |
- |
- |
0.44 |
2.06 |
29 |
Antenna |
‐ |
‐ |
‐ |
4.35 |
2.30 |
321 |
4.35 |
2.30 |
321 |
Koula |
‐ |
‐ |
‐ |
1.45 |
5.77 |
268 |
1.45 |
5.77 |
268 |
Ancien |
‐ |
‐ |
‐ |
1.81 |
3.80 |
221 |
1.81 |
3.80 |
221 |
Agouti |
‐ |
‐ |
‐ |
0.90 |
2.39 |
70 |
0.90 |
2.39 |
70 |
Boulder |
‐ |
‐ |
‐ |
0.71 |
1.73 |
39 |
0.71 |
1.73 |
39 |
Sunbird |
- |
- |
- |
2.10 |
3.04 |
206 |
2.10 |
3.04 |
206 |
Total |
0.44 |
2.06 |
29 |
11.33 |
3.09 |
1,125 |
11.76 |
3.05 |
1,154 |
Notes:
· |
Mineral Reserves are reported at the point of delivery to the process plant, using the 2014 CIM Definition Standards. |
· |
Mr. Raul Espinoza, P.Eng., is the Qualified Person responsible for Mineral Reserves and is a full time employee of Fortuna Silver Mines Inc. |
· |
Mineral Reserves are reported as of December 31, 2023. |
|
ANNUAL INFORMATION FORM |
Séguéla Technical Report Page |A-8 |
FORTUNA SILVER MINES INC.
· |
Mineral Reserves are reported on a 100 % basis. Fortuna holds a 90 % interest in the Séguéla Gold Mine. The remaining 10 % interest is held by the State of Côte d’Ivoire. |
· |
Mineral Reserves are reported at an incremental gold grade cut-off of 0.65 g/t Au for Antenna, 0.72 g/t Au for Agouti, 0.69 g/t Au for Boulder, 0.66 g/t Au for Koula, 0.73 g/t Au for Ancien, and 0.66 g/t Au for Sunbird deposit. The estimate is based on a gold price of US$1,600/oz, metallurgical recovery of 94.5%, surface mining costs of $3.12/t, processing costs of $15.42/t and G&A costs of 8.83/t. |
· |
Overall slope angles applied are 36.8° for oxide material, 44.2° for transitional material and 51° for fresh material except for Sunbird that uses slope angles of 36.8° for oxide material, 36.5° for transitional material and 50° for fresh material. |
· |
The Mineral Reserves are reported with modifying factors of mining dilution and mining recovery represented by regularizing the block models to an appropriate selective mining unit (SMU) block size. |
· |
Each deposit has undergone pit optimization, detailed mine design, mine scheduling, and cashflow analysis, demonstrating a technically achievable and economically viable mine plan supporting this Mineral Reserve. |
· |
All figures have been rounded to reflect the relative accuracy of the estimates and totals may not add due to rounding. |
Factors which may affect the Mineral Reserve estimates include:
· |
Metal price and exchange rate assumptions. |
· |
Changes to metallurgical recovery assumptions. |
· |
Changes to the input assumptions used to derive the mineable shapes applicable to the open pit mining methods used to constrain the estimates. |
· |
Changes to the forecast dilution and mining recovery assumptions. |
· |
Changes to the cut-off values applied to the estimates. |
· |
Variations in geotechnical, hydrogeological and mining method assumptions. |
· |
Final negotiated terms of the Mining Convention. |
· |
Changes to environmental, permitting and social license assumptions. |
1.10 |
Mining Methods |
Six deposits: Antenna, Ancien, Agouti, Boulder, Koula, and Sunbird are scheduled for mining in the LOMP. The overall mining and production strategy is to maintain ore tonnes to achieve an annual production throughput of 1.46 Mtpa, increasing to 1.57 Mtpa by 2026, by sequencing pit stages and processing feed based on grade, operational requirements, plant throughput and material characteristics for the plant. The mine schedule delivers 12 Mt averaging 3.06 g/t Au to the mill over the remaining 7.5-year mine life.
Mining activities are conducted using a mining contractor and use conventional drill, blast, load, and haul mining methods. Drilling and blasting are used for oxide, transitional and fresh ROM ore material and waste, followed by conventional truck and excavator operations within the pits for the movement of ore and waste. Some free digging has been assumed for some of the oxide material, but generally drilling and blasting is applied. Bench height assumption for extraction of ore and waste material is 5 m taken in two digging flitches of 2.5 m in accordance with the capabilities of the mining equipment. Where possible in high waste stripping pit stages, 10 m bench heights will be used at an appropriate standoff distance from known mineralization.
Mining costs and equipment requirements are based on the existing mining contract with the mining contractor Mota-Engil. The mining schedule consists of a lower mining rate for 2024 moving a total material mined of 5.9 million BCM/annum, with a ramp up in total mining movement in 2025 onwards in line with mill feed requirements and stripping ratios. The initial mining equipment required to meet the mining schedule for 2024 is one 200 t excavator, one to two 120 t excavator, and one 80 t excavator, and eight to ten 90 t haul trucks. Additional mining equipment required to meet the mining schedule for 2025 to 2031 includes an additional 200 t excavator and an additional six to eight 90 t haul trucks. The annual mining rate after 2024 peaks in 2026 at 10.0 million BCM. A common pool of equipment will be used and scheduled across all active pits so that movement between the pits is minimized.
Roxgold Sango will use a mining contractor for the initial 5.5 years of operations. Afterward, and depending on the extension of the life of mine, mining operations will transition to an owner-operation model, or the contractor will be retained as the operator.
Detailed pit stage designs were prepared based on the results of the pit optimizations and incorporating appropriate wall angles, geotechnical berms, minimum mining widths, and access ramps with sufficient width for the equipment
|
ANNUAL INFORMATION FORM |
Séguéla Technical Report Page |A-9 |
FORTUNA SILVER MINES INC.
selected. Waste dumps were designed for each individual open pit, with the intention of minimizing haulage distance for the movement of waste material from the open pit to the adjacent surface waste dump, taking into consideration surface water drainage, as well as existing and planned infrastructure locations. The dumps were designed using a 37º rill, and a 15‐m berm every 10 vertical meters to achieve a footprint consistent with the requirements of rehabilitated waste dumps at closure.
A total of 15 mining stages were designed and scheduled, consisting of individual pits or pit stages within a final pit design. The mining schedule sequences pit stages such that ROM ore material within the Mineral Reserve is mined, when practical, to target higher grade ore and lower strip ratios early and balance plant feed requirements and material characteristic types.
1.11 |
Processing and Recovery Methods |
The processing facilities comprise a single stage primary crush/SAG milling comminution circuit where the mineralized material is drawn from the ROM ore bin via an apron feeder, scalped via a vibrating grizzly with the undersize reporting directly to the discharge conveyor and the oversize reporting to a primary jaw crusher for further size reduction. All crushed and scalped material is conveyed to a surge bin. Crushed ore and water is fed to the mill.
The mill operates in closed circuit with hydrocyclones, with cyclone underflow reporting to the mill feed. A portion of the cyclone underflow slurry is fed to the gravity circuit for recovery of gravity gold. The gravity concentrator tailings flow to the cyclone feed hopper, while the gravity concentrate report to an intensive leach circuit. Gold in solution is recovered in a dedicated electrowinning system.
Screened cyclone overflow is thickened prior to the CIL circuit. Loaded carbon drawn from the CIL circuit is stripped by the split AARL method. The resultant gold in solution is recovered by electrowinning. Recovered gold from the cathodes is filtered, dried, and smelted in a furnace to doré bars.
A forecast gold recovery rate of 94.5 % is estimated for the LOMP.
The QP considers process requirements to be well understood, and consistent based on the actual observed conditions in the operating plant. There is no indication that the characteristics of the material planned for mining will change and therefore the recovery assumptions applied for future mining are considered as reasonable for the LOMP.
1.12 |
Infrastructure |
The infrastructure and services adequately support the current operations and planned open pit operations, as well as the processing plant. This infrastructure consists of a process plant, a mine service area (offices, workshops, and a warehouse), a TSF, a water storage facility, waste dumps, mine access and haulage roads, an explosives magazine, an electrical grid connection, and an accommodation camp.
The tailings system consists of two parallel tailings lines and associated tailings pumps. The TSF is a side‐valley storage formed by two multi‐zoned earth‐fill embankments, designed to accommodate 13.0 Mt of tailings, and built using the downstream construction methodology. The TSF was designed to comply to ANCOLD (2019) guidelines, is currently transitioning to comply with the Global Industry Standard of Tailings Management criteria, and includes a HDPE geomembrane liner.
A water storage dam supplied with runoff water, mine dewatering and underground water is the main collection and storage pond for clean raw and process water.
Power supply is through a connection to the Côte d’Ivoire electricity grid by a 2,400 m tee into the 90 kV powerline from the Laboa to Séguéla substation. The Séguéla substation is fed via an existing 90 kV transmission line from the 225/90 kV Laboa substation. The Laboa substation is part of a 225 kV ring main system around the country where various sources of generation are connected and, being a large ring main, offers a great deal of redundancy at 225 kV. The grid supply from Côte d’Ivoire is, by world standards, economically priced and much more financially favorable than other options including self‐generation as the tariff is based on a mix of hydro and thermal generation with a large portion of hydro.
The QP is confident that all mine and process infrastructure and supporting facilities are included in the present general layout to ensure that they meet the needs of the mine plan and production rate.
|
ANNUAL INFORMATION FORM |
Séguéla Technical Report Page |A-10 |
FORTUNA SILVER MINES INC.
1.13 |
Market Studies |
Gold is a freely traded commodity on the world market for which there is a steady demand from numerous buyers.
The Fortuna financial department provides the mine with gold price projections for inclusion in budget and business plan preparations. Pricing is based on long‐term analyst and bank forecasts, with a gold price of $ 1,600/oz used for estimating Mineral Reserves and cash flow analysis and $ 1,840/oz for estimating Mineral Resources.
A contract is in place with METALOR Technologies S.A. for the receipt of gold doré from Roxgold Sango, to process/refine and either to buy or transfer the precious metal to a metal account designated by Roxgold Sango.
A contract is in place with Mota-Engil Cote d'Ivoire mining to conduct mining services on behalf of Roxgold Sango and consists of ROM feed, mine development, grade control drilling, drill and blast, and load and haul activities.
Contracts are in place with Tseebo Solutions Group Proprietary Limited, Total Energies, Cote d’Ivoire Energies, Group 4 Securities and SGS laboratory testing services to provide catering services, fuel supply, power supply, security services, and metallurgical assaying and testing for the project on behalf of the client.
1.14 |
Environmental Studies and Permitting |
Roxgold Sango contracted the consulting firm CECAF to undertake the project baseline studies and compile the environmental and social impact assessment (ESIA) required to obtain the environmental decree. The ESIA identifies the potential social and environmental impacts of the development of the project and proposed mitigation measures. Part of the ESIA included the development of a conceptual resettlement action plan which was necessary for any physical or economic displacement of people or communities as a result of the project’s development as well as a conceptual mine closure plan.
Following environmental and social studies, public consultations, and governmental examination, the ESIA for the Séguéla Mine was approved by the Ministry of Environment and Sustainable Development by decree signed on September 22, 2020 (Decree No.00261 dated September 22, 2020, on ESIA approval for the exploitation of a gold mine in Séguéla department). This decree allowed the mine to be built and exploited in accordance with the conditions listed in the environmental permit application file and the decree.
Artisanal and small-scale mining (ASM) activities in the Séguéla area and its surroundings can be characterized as unauthorized, dispersed, intermittent and not mechanized. Currently, there is no permanent illegal or authorized ASM settlements on the identified deposits of the Séguéla Mine or nearby, with only a few hundred ASM miners present from time to time in the Project area outside of the mining operation areas.
The implementation of a stakeholder management plan has ensured good relationships between Roxgold Sango and the local authorities, village leaders and landowners. In addition, regular monitoring of the occupancy of the land around the deposits and prospects and the intervention of the authorities to avoid the establishment of organized ASM has led to an effective control of the ASM activities in the Séguéla mining area.
As at the effective date of this Report, the projected total cost required to close present and future infrastructure is US$ 11.9 million as developed from the conceptual mine closure plan prepared by Roxgold Sango with the assistance of specialized consultants CECAF International and Trajectory.
The peak total greenhouse gas emission is projected at 67,676 tCO2e. Based on fuel and energy consumption and the total production of gold, the energy and GHG emission intensities are estimated at 4.39 GJ/oz and 0.58 tCO2e/oz, respectively.
1.15 |
Sustaining Capital and Operating Costs |
Sustaining capital and operating cost estimates are based on the established cost experience gained from the operation, projected budgets, and quotes from manufacturers and suppliers. Overall, the cost estimation is of sufficient detail, that, with the current experience of operating at the Séguéla mine, Mineral Reserves can be declared. All costs are US dollar (US$). The total sustaining capital cost through the LOMP is estimated to be US$188.5 million, respectively, over the 7.5-year mine life.
Sustaining capital cost requirements over the LOMP include mainly mine development requirements for each deposit, waste capitalized stripping, subsequent lifts required for the TSF and related studies, purchase of minor mining equipment and plant equipment, permitting and environmental.
|
ANNUAL INFORMATION FORM |
Séguéla Technical Report Page |A-11 |
FORTUNA SILVER MINES INC.
The total LOMP operating cost for the Séguéla mine is estimated at US$ 80 per tonne of ore processed.
Long-term projected operating costs are derived from the mining and processing needs throughout the life of mine, outlined in the executed contract between Roxgold Sango and Mota-Engil Cote d’Ivoire. These costs consider site-related expenses and operating costs essential for the operation and are analyzed based on a cost structure may not correspond to the operating costs reported by financial statements of Fortuna. Site costs pertain to activities conducted on the property including mine, plant and indirect costs related to general services and administrative on-site. Additionally, other operating expenses cover costs associated with gold transportation (distribution), community support activities and management fee from Fortuna corporate.
1.16 |
Economic Analysis |
Fortuna is using the provision for producing issuers, whereby producing issuers may exclude the information required under Item 22 of Form 43‐101F1 ‐Technical Reports for technical reports on properties currently in production and where no material production expansion is planned.
The Mineral Reserve declaration in this Report is supported by a positive cashflow for the period set out in the LOMP.
1.17 |
Conclusions |
The conversion of Mineral Resources to Mineral Reserves was undertaken using industry‐recognized methods, and estimated operational costs, capital costs, and plant performance data.
1.18 |
Risks and Opportunities |
Analysis of the results of the investigations has identified a series of risks and opportunities associated with each of the technical aspects considered for the development of the mining operation.
The key risks include:
| ● | Changes to metal price assumptions. |
| ● | Changes to the technical inputs used to estimate gold content (e.g. bulk density estimation, grade interpolation methodology). |
| ● | Geological interpretation (e.g. dykes and structural offsets such as faults and shear zones). |
| ● | Depletion due to artisanal mining activities. |
| ● | Changes to geotechnical, hydrogeological, and mining assumptions, including the minimum mining thickness; or the application of alternative mining methods. |
| ● | Changes to process plant recovery estimates if the metallurgical recovery in certain domains is lesser or greater than currently assumed. |
| ● | Changes in the characteristics and/or throughput of the tailings could result in changes to the achieved densities in the TSF, requiring adjustments to the design. |
| ● | Geochemical testing of the tailings should be continued at points throughout the life of the facility to ensure that initial testing remains valid. |
| ● | The LOMP assumes that all requisite approvals and permits for the relocation of the communications antenna adjacent to the Sunbird deposit and those required for the plant expansion in 2026 will be obtained. It is believed that such approvals and permits can be obtained but there is no certainty that this will be the case. A delay in permitting would require adjustments to the LOMP that could reduce cash flows in 2026 onwards, however any change would not be regarded as material based on the current performance of the processing plant and the multiple deposits available to mine at the Séguéla Project. |
| ● | The most recent wet season proved to be disruptive causing some delays to deliveries and personnel to site. The road to the Project requires upgrading to an all-weather road including culverts and crowing and erosion protection. |
| ● | Rip rap armoring was not completed during construction since no waste rock was available. Rip rap armoring as per design is required for the TSF spillway, water storage dam spillway, and diversion ditch to prevent downstream sedimentation and improve dam safety (limit erosion of water retaining structures). |
|
ANNUAL INFORMATION FORM |
Séguéla Technical Report Page |A-12 |
FORTUNA SILVER MINES INC.
| ● | Any changes to the LOMP or throughput will impact upon the tailings management requirements for the site. Any significant increases in total throughput may require an expansion review of the current TSF (in particular, the proximity to the plant site) and reconsideration of the closure plan. |
| ● | The availability and reliability of grid power supply presents a risk. The extended use of diesel generation will have an impact on power costs. |
| ● | The nearby communities have expectations relating to job creation, community development and improvement in services and infrastructure. Meeting these expectations and minimizing impacts to regional infrastructure and community livelihood is a challenge resulting in possible dissatisfaction with Roxgold Sango and the associated risks of community action against the project and loss of social license to operate. |
The key opportunities include:
| ● | The Séguéla Project covers the entire greenstone belt exposure that hosts the Antenna, Ancien, Agouti, Boulder, Koula and Sunbird deposits. Exploration over the Séguéla Project has the potential to expand known mineralization, advance known prospects to drill stage, and discover new prospects. |
| ● | Optimization of the open pit and underground mining transition of the Koula, Ancien and Sunbird deposits. Optimal transition point from open pit to underground, lifting the pit floor up, reducing strip ratio and waste movement yielding an increase in the overall project NPV. |
| ● | Optimization in geotechnical pit slope angles for mine design improvements and reduction in the overall strip ratio. |
| ● | Optimization of plant throughput and investigation on the potential for future expansion. |
| ● | Investigations into installing a solar farm. Subject to the successful completion of an economic study, a solar farm should result in lower electricity prices and provide some level of security around continuous supply to essential services. |
| ● | Potential to implement a system whereby the supernatant pond is decanted via a barge equipped with submersible pump. This system is reliant on numerous factors, including the resultant beach slope, and the level of control required over the supernatant pond location. |
| ● | Maximize the benefit of the operation for local communities as an opportunity for social and economic development, including social infrastructures, professional skills and all the other aspects of the Sustainability Development Goals (SDGs) where possible. |
| ● | A good working relationship with local government, state services, traditional authorities, communities and other stakeholders such as the artisanal miners, is in place due to the quality of the early stakeholder’s engagement at the project. The opportunity to strengthen these existing relationships will help mitigate the risks associated with unmet expectations amongst the community and other stakeholders. |
1.19 |
Recommendations |
Analysis of the results and findings from each major area of investigation suggests several recommendations for further investigations to mitigate risks and improve the base case designs to be considered during the operation of the mine. Each recommendation is not contingent on the results of other recommendations and can be completed in a single phase, concurrently. A summary of the recommendations as provided is as follows:
1.19.1 |
Exploration |
| ● | Additional definition drilling (infill and extension) where applicable, in order to support potential upgrade of some or all of the Inferred Mineral Resources and extend the known mineralization at an estimated drill cost of $2,000,000. |
| ● | Routine collection of density measurements should be maintained for core and included for in pit sampling to better establish densities in the block model. This recommendation will be completed in-house with existing personnel and will not incur an additional cost above regular mine operating costs. |
| ● | Target down‐dip underground potential at each deposit, in particular Ancien, Koula and Sunbird at an estimated drilling cost of $2,000,000. |
|
ANNUAL INFORMATION FORM |
Séguéla Technical Report Page |A-13 |
FORTUNA SILVER MINES INC.
| ● | Review and re‐rank existing regional exploration results and prospects followed by selective drill testing of those proximal to the defined Mineral Resource estimates with a drill program estimated at $2,000,000. |
| ● | Detailed structural analysis of all deposits, based on high‐quality oriented drill core, with a view to developing exploration models for analogue or related systems elsewhere within the Séguéla Project. This recommendation will be completed in-house with existing personnel and will not incur an additional cost above regular mine operating costs. |
1.19.2 |
Mining |
| ● | Revising pit optimization parameters, cost estimates, scheduling, and cashflow forecasts with actual operational data as it is collected. This recommendation will be completed in-house annually with existing personnel and will not incur an additional cost above regular company operating costs. |
| ● | Conducting a geotechnical investigation into steeper batter angles of 90˚ and wider berm widths of 10 m in fresh rock. This recommendation will cost approximately $30,000. |
| ● | Ongoing collection of geotechnical data is required to further refine the geotechnical model, to confirm assumptions made as inputs in this assessment, and to review performance of slopes, batters, and spill berm widths during operations. This recommendation will be completed in-house annually with existing personnel and will not incur an additional cost above regular mine operating costs. |
| ● | Ongoing assessment of slope, batter and spill berm width performance. This recommendation will be completed in-house annually with existing personnel and will not incur an additional cost above regular mine operating costs. |
| ● | Conducting detailed waste rock dump sequencing to increase discounted cashflow. This recommendation will be completed in-house with existing personnel and will not incur an additional cost above regular mine operating costs. |
| ● | Reviewing drill and blast parameters in consultation with the mining contractor to identify potential areas of improvement. This recommendation will be completed in-house with existing personnel and will not incur an additional cost above regular mine operating costs. |
| ● | Preparing drill and blast designs and procedures to achieve acceptable blasting impacts when blasting close to the TSF. This recommendation will cost approximately $30,000. |
| ● | Further optimizations of the mining strategy as well as optimized mine designs and scheduling resulting in a reduction in stripping ratio and overall project waste movement requirements to improve mine economics. This recommendation will be completed in-house with existing personnel and will not incur an additional cost above regular mine operating costs. |
| ● | Optimization on the open pit and potential underground mining transition of the Koula, Ancien and Sunbird deposits. Review the optimal transition point from open pit to underground. This recommendation will be completed in-house with existing personnel with assistance of outside consultants to complete the study. This recommendation will cost approximately $150,000. |
| ● | Study the modifying factors applicable to underground mining at the Ancien, Koula, and Sunbird deposits to investigate the potential for converting underground Mineral Resources to Mineral Reserves, including metallurgical test work, geotechnical drilling and study and hydrogeology study. Activities will be completed in-house with existing personnel with assistance from outside consultants to complete the study. This recommendation will cost approximately $700,000. |
| ● | Operations should improve pit slope monitoring systems (2 x TM50, prisms and monitoring platform), by providing one system for Antenna and another portable system for the other pits as required at an estimated cost of $150,000. |
| ● | Perform a cost analysis and obtain the necessary permits for relocating the telecommunication antenna currently situated at the edge of the Sunbird pit design. It is recommended the relocation study is performed in 2024 to ensure appropriate capital expenditure and time is assigned to the activity to prevent potential delays in mining the Sunbird deposit, planned to commence in the fourth quarter of 2025. This study will be completed using the internal resources and will be part of normal operating costs. |
|
ANNUAL INFORMATION FORM |
Séguéla Technical Report Page |A-14 |
FORTUNA SILVER MINES INC.
1.19.3 |
Processing |
| ● | Carbon adsorption modelling for various combinations of carbon movement rates and concentration profiles should be considered. The test results from the FS indicate that gold adsorption is below average for this slurry which was unexpected given the ‘clean’ nature of the ores. Confirmatory test work is recommended but not essential as the impact on the CIL / elution circuit design will be modest. This will be completed using the internal resources and will be part of normal operating costs. |
| ● | Installation of a substantial filter system to improve the raw water quality. This recommendation will cost approximately $100,000. |
| ● | Installation of a reverse osmosis plant to improve elution performance by utilizing potable water rather than filtered raw water, at an estimated budget of approximately $200,000. |
| ● | Install a rock breaker at the jaw crusher to improve throughput at an approximate cost of $1.0 M. |
1.19.4 |
Tailings Management |
| ● | A TSF conceptual study should be completed to investigate the maximum capacity of the current TSF location and any other new potential locations such as open pit co-disposal if no additional area is available for some pits to accommodate future growth. This will require a budget of about $50,000. |
| ● | Determine the required TSF buttress size for the West and East dams to decrease the consequence classification as per Global Industry Standard of Tailings Management guidelines. This will require moving the tailings delivery and return pipeline trench, powerline and fence alignments along the western area of the TSF. An estimated cost of $1.0 M will be required during LOMP to execute these activities. |
| ● | Further Global Industry Standard of Tailings Management work is recommended, such as revising the dam break analysis once the TSF design is updated as per above and updating of the Operation, Monitoring and Surveillance manual, Trigger Action Response Plan and Emergency Preparedness Response Plan documents is required at an estimated cost of $100,000. |
| ● | As per Global Industry Standard of Tailings Management requirements, ongoing visits by the Independent Tailings Review Board and Dam Safety Review are recommended at an estimated cost of $80,000. |
1.19.5 |
Environmental and Social |
| ● | Continue climate data collection on site to establish variation between the mine site and other long‐term monitoring data sources. This will be completed using existing resources and is part of the normal operating cost. |
| ● | Continue to engage effectively with all the stakeholders as the mine develops including those concerned by the impact on regional infrastructure. This will be completed using Séguéla’s resources as part of normal operating costs. |
| ● | Undertake further studies to investigate the impacts of the Mine on water quality and the long‐term potential impacts of the TSF on surface and ground water quality, including the refinement of a transient state model at an estimated cost of US$50,000 and the creation and updating of a site wide water balance at an estimated cost of US$75,000. |
| ● | The diversion ditch crossing the main public road is currently undersized, with two additional 2m x 2m culverts required. This work has an estimated cost of US$100,000. |
| ● | Rip rap armoring was not completed during initial construction since no waste rock was available. Rip rap armoring as per design is required for the TSF spillway, water storage dam spillway, and diversion ditch to prevent downstream sedimentation and improve dam safety. The work has an estimated cost of US$600,000. |
| ● | Locate additional air quality and noise monitoring points at the boundary between the project infrastructure and the closest villages to provide a more robust baseline. This will be completed utilizing Séguéla’s resources as part of normal operating cost. |
|
ANNUAL INFORMATION FORM |
Séguéla Technical Report Page |A-15 |
FORTUNA SILVER MINES INC.
| ● | Cover designs or dust suppression trails be considered for the waste rock dumps and tailings facilities to minimize the generation of windblown dust from the surface of these facilities. This will be completed utilizing the projects resources and part of normal operating cost. |
[End of Extract of Summary from Séguéla Technical Report]
See “General Development of the Business - Business of the Company – 2024 Recent Developments” for a description of exploration activities conducted subsequent to the Séguéla Report.
|
ANNUAL INFORMATION FORM |
Séguéla Technical Report Page |A-16 |
FORTUNA SILVER MINES INC.
SCHEDULE “B”
MATERIAL PROPERTIES
Yaramoko Mine, Burkina Faso
The following is the Summary from the technical report (the “Yaramoko Technical Report”) entitled “Fortuna Silver Mines Inc.: Yaramoko Gold Mine, Burkina Faso Technical Report” with an effective date of December 31, 2022 prepared by Paul Criddle, FAusIMM, Paul Weedon, MAIG, Matthew Cobb, MAIG and Raul Espinoza, FAusIMM (CP). This Summary is subject to certain assumptions, qualifications and procedures described in the Yaramoko Technical Report and is qualified in its entirety by the full text of the Yaramoko Technical Report which is available for viewing on SEDAR+ at www.sedarplus.ca and is incorporated by reference in this AIF, and is also filed with the SEC on EDGAR (available at www.sec.gov). Defined terms and abbreviations used herein and not otherwise defined shall have the meanings ascribed to such terms in the Yaramoko Technical Report.
1.1 |
Introduction |
The Yaramoko gold mine (Yaramoko Gold Mine or Yaramoko) is a mining operation that commenced production in 2016 and, as of the effective date of this Report, consists of the operating 55 Zone underground mine, the Bagassi South underground mine (which includes the QV’ lode, consisting of QV QV’ and QV1), and planned open pit mining operations at the 109 Zone and the 55 Zone.
Recent exploration drilling and a review of mine engineering designs supports an updated 55 Zone open pit mining inventory and the development of an open pit deposit at the 109 Zone. In addition, a technical review of mining methods for Bagassi South QV’ lode identified a preferred underground mining method and the ongoing underground mining of 55 Zone deposit.
The 55 Zone open pit is to be mined at the completion of the 55 Zone underground mine, which includes the mining of near surface mineralization remaining in the crown pillar and remnant mineralization from underground. The 109 Zone open pit mine, located 1.2 km north of the current Yaramoko processing plant, is to be mined concurrently with the 55 Zone and Bagassi South underground with production planned to commence in the first quarter of 2024 with mine development works to be completed throughout 2023. Mining of the 55 Zone open pit will only commence at the conclusion of underground mining due to the need to remove certain key surface infrastructure associated with the underground mine.
Bagassi South QV’ lode is a parallel splay 200 m north of the QV1 lode, with QV1 mined as part of the Bagassi South underground mine. Previous technical reports contemplated extraction of the QV’ lode utilising conventional longhole open stoping methods under the African Underground Mining Services (AUMS) mining contract. Outcomes of a recent mining method technical review reconsidered mining options and selected handheld shrinkage stoping as the preferred mining method for the Bagassi South QV’ lode.
This updated technical report (Technical Report or Report) discloses the methodology for estimating the Mineral Resources and Mineral Reserves reported as of December 31, 2022 and summarizes the scientific and technical information that supports the current underground mine and proposed open pit operations. It presents the assumptions and designs at a level of accuracy that is required to demonstrate the economic viability of the Mineral Resources defined for the underground and open pit mining of the Yaramoko Gold Mine. The opinions contained herein and effective as of December 31, 2022, are based on information collected by the company throughout the course of its investigations.
1.2 |
Property Description, Location and Access |
The Yaramoko Gold Mine is located approximately 200 kilometers (km) southwest of Ouagadougou in the Balé Province in western Burkina Faso. The centre of the 55 Zone gold deposit in the Yaramoko Gold Mine is located at 3 degrees and 16 minutes longitude west (3.28 degrees west) and 11 degrees and 45 minutes latitude north (11.75 degrees north).
|
ANNUAL INFORMATION FORM |
Yaramoko Technical Report Page |B-1 |
FORTUNA SILVER MINES INC.
The QV1 Zone, which is the main deposit of the Bagassi South underground mine with the QV’ deposit being 200 m north of QV1 and accessed from the same capital infrastructure, is geologically similar to the 55 Zone and is located about 1.8 km south of the 55 Zone.
The 109 Zone deposit is a satellite deposit located approximately 1.2 km from the Yaramoko processing plant and also hosted in similar geology.
The Yaramoko Gold Mine is operated by Roxgold Sanu S.A. (Roxgold Sanu), a company incorporated, registered and subsisting in accordance with the laws of Burkina Faso and which is a 90 percent directly owned subsidiary of Roxgold Inc. (Roxgold) with the remaining 10 percent interest held by the State of Burkina Faso. Roxgold was a Canadian public company listed on the Toronto Stock Exchange until July 2, 2021, when Fortuna Silver Mines Inc. (Fortuna or the Company) acquired all of the issued and outstanding shares of Roxgold resulting in Roxgold becoming a wholly-owned subsidiary of Fortuna. Fortuna is a Canadian public company with its shares listed on the Toronto Stock Exchange under the symbol FVI and on the New York Stock Exchange under the symbol FSM.
The Government of Burkina Faso receives a 3 percent royalty on the revenues from mineral production if the gold price is lower than US$1,000 per ounce, 4 percent if the gold price is between US$1,000 and US$1,300 per ounce and 5 percent if the gold price is higher than US$1,300 per ounce. The Government also collects various taxes and duties on the imports of fuels, supplies, equipment and outside services, as specified by the Burkina Faso Mining Code.
Roxgold Sanu was awarded a Permis d’exploitation industrielle, the Burkina Faso equivalent of a Mining Permit, through Decree 2015-074 PRES-TRANS/PM/MME/MEF/ MERH for Yaramoko on January 30, 2015. This was followed by the approval of the National Mines Commission meeting held on May 24, 2015.
An extension to the Mining Permit to incorporate the Bagassi South project into the Mining Permit was awarded through Decree 2018-0656/PRES/PM/MMC/MINEFID/MEEVCC for Yaramoko dated July 30, 2018. This extension (Bagassi South Zone) adds 7.2 square kilometers (km2) to the permit, for a total of 22.9 km2. The extension decree only defines the geographic scope of the original mining license which thus stays under the Mining Code which granted it (2003 in this case), and the dates of grant or renewal remain unchanged. No geographical extension of the Mining Permit is required to accommodate the Zone 109 open pit project, as it fits entirely within the existing permit boundaries.
1.3 |
History |
Between 1974 and 1995, le Programme des Nations Unies pour le Développement (PNUD) and the Bureau des Mines et de la Géologie du Burkina (BUMIGEB) conducted intermittent exploration work in and around the current permit area, with significant results reported by Willemyns of PNUD in 1982 (as cited in Riverstone, 2008) from two quartz vein core samples collected in the area of Bagassi East that returned 2.9 grams per tonne of gold (g/t Au) over a core length interval of 1.45 meters (m), and 6.36 g/t Au over a core length interval of 0.30 m.
In 1995, Placer Outokumpu Exploration Limited conducted soil sampling in the area of Bagassi-Yaramoko returning a small number of isolated values greater than 100 parts per billion (ppb) gold. A single sample returned a value of 760 ppb gold and was reported to have been collected in an area underlain by Tarkwaian sedimentary rocks (Riverstone, 2008).
In 1996, S.à.r.l. Shield Resources of Burkina Faso conducted exploration work in the Bagassi area with a few anomalous points returned; however, no follow-up work was conducted (Riverstone, 2008).
Other than small scale orpaillage (artisanal mining) conducted on a few areas of the property there has not been any known production from the Yaramoko Gold Mine prior to the start of operations in 2016. Gold production since 2016 to the end of December 2022 is 0.84 million ounces (Moz).
1.4 |
Accessibility, Climate, Local Resources, Infrastructure, and Physiography |
The closest major town to the Yaramoko Gold Mine is Boromo, located 50 km away. It is serviced by the national power grid and it hosts a hospital and additional suppliers. However, major purchases and procurements come from Ouagadougou. Yaramoko can be reached via the highway system by traveling west from Ouagadougou on paved highway for approximately 200 km, or alternatively traveling east from Bobo-Dioulasso for approximately 150 km to the village of Ouahabou, and then north-northwest by laterite road for approximately 20 km to the village of Bagassi.
|
ANNUAL INFORMATION FORM |
Yaramoko Technical Report Page |B-2 |
FORTUNA SILVER MINES INC.
Roxgold’s Sabarya camp is a purpose built 306-person accommodation camp built in 2015 with associated recreational and messing facilities. Adjacent to the accommodation camp are the exploration offices and associated secure area for logging and processing drill core and for storing exploration equipment. The milling complex, administrative and mining contractor offices, warehouses and associated maintenance and back-up power facilities, are accessed by a 1 km laterite road constructed by Roxgold. The 55 Zone mine portal is also located in this complex, the Bagassi South mine portal is located 1.8 km to the south, while the 109 Zone open pit access will be located 1.2 km north of the processing plant facility.
The closest village is Bagassi which has a population of approximately 3,000 people. Agriculture is the main industry in the region with production of millet, groundnut, and cotton.
The climate is semi-arid with a rainy season from April to October and a warm dry season from November to February and hot from March to June. Temperatures range from a night-time low of about 15 degrees Celsius (°C) in December to day-time highs of about 45 °C in March and April. Annual total rainfall in the area averages 800 millimeters (mm).
1.5 |
Geology and Mineralization |
The north-northeast-trending Boni shear zone divides the Yaramoko Gold Mine between the predominantly Houndé volcanic and volcaniclastic rock to the west and the Diébougou granitoid domain composed predominantly of granitic rock with minor volcanic rock to the east. The main lithological units are mafic volcanic rocks, felsic intrusions, and late dolerite dikes. This region is considered prospective for orogenic gold deposits, which typically exhibit a strong relationship with regional arrays of major shear zones.
The largest granitic intrusion found on the Yaramoko concession is host to both the 55 Zone, Bagassi South and 109 Zone gold deposits. Each deposit is set on the eastern margin of the intrusive in the footwall of the Yaramoko shear along conjugate dextral faults located in extensional position to the regional shear zone. The bulk of the gold mineralization occurs in dilatational segments of the shear zones where quartz veins are thicker and exhibit greater continuity. The Bagassi South deposit is located 1.8 km south of the 55 Zone and the surface definition of the veins can be traced over a strike length of some 800 m and dips to the northeast. The 109 Zone deposit is located 900 m to the north of the 55 Zone and is traceable at surface over 1 km; dipping steeply to the north-northeast. Gold typically occurs as coarse free grain in quartz and is associated with pyrite.
1.6 |
Exploration Drilling and Sampling |
Riverstone started exploration work on the Yaramoko property in 2005 before Roxgold became involved in late 2010. The exploration programs comprised soil and rock sampling, airborne and ground geophysics, rotary air blast, auger, reverse circulation, and core drilling.
Rotary air blast drilling was used to follow up soil anomalies in 2011 and 2012 (1,887 rotary air blast boreholes) while auger drilling was used for collecting soil samples under the transported cover in 2012 and 2013 (2,669 auger boreholes totalling 13,480 m). Rotary air blast and reverse circulation drilling was then used to trace gold in soil anomalies to bedrock, positive results from reverse circulation drilling were followed with core drilling to confirm the geological setting of each target. This method successfully identified the 55 Zone, and thereafter other gold mineralized zones on the property including Bagassi South.
From 2015 to 2021, Roxgold drilled a total of 417 core holes (77,964 m) from surface and underground at Bagassi South on the QV1 and QV’ structures to infill and extend mineralization up and down dip, with increasing focus on resource conversion and infill. In 2020-21 a final stage of extension drilling was completed.
A deep drilling program from surface was carried out at the 55 Zone during 2018-2019, following on from an earlier 2017 surface drilling program. This program was designed to infill mineralization previously intersected during the 2017 surface drilling campaigns between 700 m and 1,000 m below surface. A second phase of this program in 2019 saw additional drilling from surface testing further down-plunge extensions to approximately 1,300 m below surface. In 2021 and 2022, additional diamond drilling from dedicated underground platforms was carried out at the 55 Zone, focusing on infilling and mineral resource conversion, and testing for strike and down-plunge extensions. A total of 127 diamond drill holes totalling 72,503 m was drilled during the 2021-2022 campaigns.
Core drilling from surface typically utilized HQ sized core (63.5 mm diameter) from the top of the borehole to the point where the rock showed no signs of oxidation; typically, 20 to 30 m in depth. At that point, the core size was reduced to NQ (47.6 mm diameter). Down-hole deviation was monitored using a Reflex Instruments device at 15, 25, and 50 m intervals, and then approximately every 50 m thereafter. Core drilling from underground stations
|
ANNUAL INFORMATION FORM |
Yaramoko Technical Report Page |B-3 |
FORTUNA SILVER MINES INC.
utilized NQ core. Core recoveries are high, averaging 99 percent, reflecting the competent nature of the host lithologies.
Surface drill collar surveys were carried out using a site based Differential Global Positioning System (DGPS) which has been calibrated with the regional geodesic system. Underground drill collar surveys were carried out using a total station operated and managed by the mining contractor surveyors AUMS.
Downhole surveys generally used Reflex cameras, either single-shot or multi-shot provided by the drilling contractor and calibrated prior to use on site.
Core boreholes considered for mineral resource modelling in the 55 Zone were drilled on centers of 12.5 m to a vertical depth of 75 m, 25 to 30 m centers from 75 to 400 m vertical depth, 25 to 50 m centers from 400 to 800 m vertical depth, and wider spacings at deeper depths. At Bagassi South, the QV1 structure was drilled to approximately 30 to 35 m centers.
Standardized sampling protocols were used for core sampling by Riverstone in 2011 and by Roxgold between 2011 and 2021. Sample preparation and analyses were conducted by Activation Laboratories Ltd. (Actlabs), ALS Chemex (ALS), BIGS Global S.A.R.L. (BIGS), and SGS Laboratories (SGS) located in Ouagadougou, as well as by SGS in Tarkwa and TSL Laboratories (TSL) in Saskatoon. Seventy one percent of the core samples informing the mineral resource (49,675 out of 69,548 samples) were prepared and assayed by Actlabs in Ouagadougou at 55 Zone, and ninety two percent of the core samples informing the mineral resource (23,368 out of 25,419 samples) were prepared and assayed by Actlabs in Ouagadougou for Bagassi South.
Actlabs, ALS, BIGS, SGS, and TSL are commercial laboratories independent of Roxgold and Riverstone. Actlabs is not accredited to ISO/IEC 17025, but received ISO 9001:2008 certification for its quality management system in April 2013. The ALS Ouagadougou laboratory is also not accredited under recognized accreditation; however, it is part of the ALS Group of laboratories that operates under a global quality management system accredited to ISO 9001:2008 and participates in international proficiency testing programs such as those managed by Geostats Pty Ltd. The SGS Ouagadougou, Yaramoko and Tarkwa laboratories are not accredited under recognized accreditation, but are part of the SGS Group of laboratories that operates under a global quality management system accredited to ISO 9001:2008 and participates in international proficiency testing programs such as those managed by Geostats Pty Ltd. TSL has received ISO/IEC 17025:2005 certification by the Standards Council of Canada for numerous specific test procedures, including the method used to assay samples submitted by Roxgold.
Sampling of core was performed by Roxgold personnel. From the drill site, core was transported by truck to a secure logging facility at the Roxgold field office where it was photographed and logged by a geologist. Selective sampling was employed where, at the discretion of the geologist, samples were collected from visible alteration or vein zones outside of the expected intercepts. All core was sampled 100 m above and below the 55 Zone in boreholes drilled prior to 2014, and thereafter were generally sampled starting from approximately 20 m above the main mineralized zone.
Waste intervals were sampled at 2.0 m intervals, except where a significant geological change occurred and/or in mineralized zones where the sampling intervals averaged between 1.0 m to 1.5 m. The core was then cut in half lengthwise using an electrical rock saw. Half of the sample was placed inside a labelled plastic sample bag. The remaining half was returned to the core box for archiving. Samples were then inserted into woven polypropylene bags prior to being transported by truck to the preparation and assay laboratory.
Roxgold implemented logging onto Maxwell LogChief data capture software in 2019, enabling the direct capture and traceability of logging data via dropdown menus and pre-set codes to promote data hygiene. Prior to 2019, all logging was onto pre-set excel spreadsheets before importation into the database. Reviews of the logging data and associated model interpretation are carried out on a regular basis by the site senior geological team and on each site visit by the qualified person (QP).
Assay data are electronically reported from the laboratory in Microsoft Excel and pdf format and imported into the database after validation, along with the corresponding assay certificates.
Samples received at Actlabs in Ouagadougou were first crushed to 90 percent under 2 mm grain size. A 300 g split was then pulverized to 95 percent, passing 150 mesh (preparation code RX1). For samples marked as mineralized, a 1,000 g split is pulverized (preparation code RX1+1.3). All samples were assayed using a 30 g fire assay procedure
|
ANNUAL INFORMATION FORM |
Yaramoko Technical Report Page |B-4 |
FORTUNA SILVER MINES INC.
with atomic absorption spectroscopy (AAS) finish with a detection limit of 5 ppb gold (procedure code 1A2) prior to 2014. A 50 g fire assay procedure was used subsequently.
All samples grading over 5.0 g/t Au were re-assayed with a gravimetric finish. Selected samples within the mineralized zones were re-assayed using a 1,000 g screen metallic fire assay procedure with gravimetric finish (procedure code 1A4-1000). With this procedure, a representative 500 g or 1,000 g sample spilt is sieved at 100 mesh (150 micrometers) with fire assay performed on the entire +100 mesh fraction and two splits of the 100 mesh fraction. The final assay result is calculated based on the results and the weight of each fraction. A total of 99,683 samples have been analyzed using fire assay at the 55 Zone and Bagassi South Zone, including 1,174 via screen fire assay methods.
Implementation of a quality assurance/quality control (QAQC) program is current industry best practice and involves establishing appropriate procedures and the routine insertion of certified reference material (CRMs), blanks, and duplicates to monitor the sampling, sample preparation and analytical process. Roxgold implemented a full QAQC program to monitor the sampling, sample preparation and analytical process for all drilling campaigns in accordance with its companywide procedures. The program involved the routine insertion of CRMs, blanks, and duplicates. Evaluation of the QAQC data indicates that it is sufficiently accurate and precise to support Mineral Resource estimation.
1.7 |
Data Verification |
Prior to March 2019, the database was managed by an external consultancy, Taiga Consultants Ltd. (Taiga) of Calgary, Alberta. Exploration data was recorded digitally to minimize data entry errors. Core logging, surveying, and sampling was monitored by qualified geologists and routinely verified for consistency. Electronic data was captured and managed using an electronic database.
Assay results were delivered by the primary laboratories electronically to Roxgold and Taiga. Analytical data was examined for consistency and completeness prior to being entered into the database. Sampling intervals that did not meet analytical quality control standards were re-assayed where necessary.
In March 2019, Roxgold transitioned to Maxwell Geoservice Datashed SQL database system. The database has been set up with a series of automated import, export and validation processes to minimize potential errors and inconsistencies.
Data verification by the QP was conducted through the inspection of selected drill core to assess the nature of the mineralization and to confirm geological descriptions as well as the inspection of geology and mineralization in underground workings of the Zone 55 and Bagassi South veins in addition to reviews of production data.
A series of plan and cross sections were generated displaying the lithologic and mineralization interpretation by the Roxgold geology and exploration departments and reviewed by the QP, while three-dimensional viewing for data interpretation consistency was carried out on screen.
The QP is of the opinion that the data verification programs performed on the data collected by Roxgold are adequate to support the geological interpretations, the analytical and database quality, and Mineral Resource estimation at the Yaramoko Gold Mine.
1.8 |
Mineral Processing and Metallurgical Testing |
In June 2013, Roxgold commissioned SRK Consulting (Canada) Inc. (SRK) to provide certain technical engineering services and to prepare a feasibility study in accordance with the disclosure requirements of Canadian Securities Administrators’ National Instrument 43-101 (NI 43-101) for the gold mineralization contained in the 55 Zone of the Yaramoko Gold Mine. The study was documented in a technical report published on June 4, 2014.
Since 2014, there have been no further metallurgical test campaigns carried out for the 55 Zone deposit.
The testwork conducted on the 55 Zone samples are considered to be representative of the material intended to be processed from the 55 Zone open pit, given it is the extension of the same deposit.
Additional testwork carried out in support of the processing plant expansion and development of the Bagassi South mine was performed in September 2015, for the 109 Zone deposit testwork was carried out in September 2022, with both testwork program completed at the ALS metallurgy assay laboratory in Perth, Western Australia, Australia under the supervision of Roxgold and demonstrated very similar characteristics.
|
ANNUAL INFORMATION FORM |
Yaramoko Technical Report Page |B-5 |
FORTUNA SILVER MINES INC.
It is the opinion of the QP that operational experience since 2016 has demonstrated a consistent metallurgical performance with recoveries between 98 to 99.3 percent supporting the historical test work and is representative of the material remaining to be processed in the life of mine plan (LOMP), including material expected to be sourced from the 109 Zone and 55 Zone open pit mining operations.
1.9 |
Mineral Resource and Reserve Estimates |
Since 2014, Roxgold has completed numerous near-mine exploration and resource definition drilling campaigns, both from surface and underground and on a near continual basis, to support the extension of the Yaramoko Gold Mine life at the 55 Zone and Bagassi South. Between June 30, 2021 and June 30, 2022, Roxgold continued exploration and resource definition drilling campaigns and internally prepared updated resource models for the Yaramoko Gold Mine using drilling information to June 30, 2022. The Mineral Resources reported herein have been estimated using a geostatistical block modelling approach informed from gold assay data collected in core boreholes. This updated resource model formed the basis of the 2022 year-end Mineral Resources and Mineral Reserves of the Yaramoko Gold Mine. The consolidated Mineral Resources (excluding the Mineral Reserves) for the 55 Zone underground and open pit, Bagassi South underground and 109 Zone open pit are presented in Table 1.
Table 1:Mineral Resources for the Yaramoko Gold Mine, as of December 31, 2022
Classification |
Tonnes (000) |
Grade Au (g/t) |
Contained Gold (000’ oz) |
Measured |
86 |
6.41 |
18 |
Indicated |
374 |
5.97 |
71 |
Measured & Indicated |
460 |
6.05 |
89 |
Inferred |
141 |
5.51 |
25 |
Notes:
| ● | Mineral Resources are as defined by the 2014 CIM Definition Standards for Mineral Resources and Mineral Reserves. |
| ● | Mineral Resources are exclusive of Mineral Reserves. |
| ● | Mineral Resources that are not Mineral Reserves do not have demonstrated economic viability. |
| ● | Factors that could materially affect the reported Mineral Resources include; changes in metal price and exchange rate assumptions; changes in local interpretations of mineralization; changes to assumed metallurgical recoveries, mining dilution and recovery; and assumptions as to the continued ability to access the site, retain mineral and surface rights titles, maintain environmental and other regulatory permits, and maintain the social license to operate. |
| ● | Mineral Resources for the Yaramoko Gold Mine are estimated as of June 30, 2022, for underground and open pit, and reported as of December 31, 2022, taking into account production related depletion for the period through December 31, 2022 for the underground mine as no open pit mining was active in 2022. |
| ● | Yaramoko Mineral Resources are reported in situ at a gold grade cut-off grade of 0.9 g/t Au for the 55 Zone open pit, 0.5 g/t Au for the 109 Zone open pit, and 2.9 g/t Au for underground (Zone 55 and Bagassi South), based on an assumed gold price of US$1,700/oz and the same costs, metallurgical recovery and constrained within an optimized pit shell. The Yaramoko Mine is subject to a 10% carried interest held by the government of Burkina Faso. |
| ● | Dr. Matthew Cobb is the Qualified Person responsible for Mineral Resources, and is an employee of Roxgold (a wholly-owned subsidiary of Fortuna). |
| ● | Totals may not add due to rounding procedures. |
The 55 Zone and Bagassi South Mineral Resource block models was used to estimate underground Mineral Reserves using modifying factors. Mining shapes were designed targeting the Measured and Indicated Mineral Resources only, using an in-situ mining cut-off grade of 4.1 g/t Au for 55 Zone and Bagassi South (QV), and 3.1 g/t Au for Bagassi South (QV’) based on a gold price of $1,600 per ounce (oz), an estimated site operating cost of $194 per tonne (t) for 55 Zone and Bagassi South (QV), and $145 per tonne for Bagassi South (QV’), and a metallurgical gold recovery of 98.0 percent.
The mining shapes follow the mineralization wireframes without attempting to trim off any areas below the cut-off grade. Mining recovery and dilution parameters are based on the selected mining method and geotechnical considerations. External dilution applied to the mining shapes, with grades from wall rock dilution directly extracted from the block model and null grade from backfill, with dilution defined as waste/ore tonnes.
Development dilution factor of 10 percent was included in the selected development drive profiles with reported physicals being the diluted tonnes and grades. Mining recoveries vary from 86 to 92 percent, dependent on stope type, category and mining method.
|
ANNUAL INFORMATION FORM |
Yaramoko Technical Report Page |B-6 |
FORTUNA SILVER MINES INC.
The 55 Zone and 109 Zone open pit mineral reserve was estimated using a marginal cut-off grade of 1.26 g/t Au and 0.74 g/t Au respectively, with a gold price of US$1,600/oz, and a combination of existing relevant operating costs and recoveries, as well as mining contractor rates provided by a reputable and experienced mining contractor operating within the region. Probable Mineral Reserves were estimated from the Indicated Mineral Resource, for both 55 Zone and 109 Zone open pits within the ultimate pit design based on optimisation pit shell run with an SMU block model re-blocked to 5m x 5m x5m.
The Mineral Reserves for the Yaramoko Gold Mine are presented in Table 2.
Table 2:Mineral Reserves for the Yaramoko Gold Mine, as of December 31, 2022
Classification |
Tonnes (000) |
Grade Au (g/t) |
Contained Gold (000’ oz) |
Proven |
123 |
3.42 |
13 |
Probable |
1,039 |
6.19 |
207 |
Proven & Probable |
1,161 |
5.89 |
220 |
Notes:
| ● | Mineral Reserves are as defined by the 2014 CIM Definition Standards for Mineral Resources and Mineral Reserves. |
| ● | Factors that could materially affect the reported Mineral Reserves include: changes in metal price and exchange rate assumptions; changes in local interpretations of mineralization; changes to assumed metallurgical recoveries, mining dilution and recovery; and assumptions as to the continued ability to access the site, retain mineral and surface rights titles, maintain environmental and other regulatory permits, and maintain the social license to operate. |
| ● | Mineral Reserves for the Yaramoko Gold Mine are estimated as of June 30, 2022 for underground, and reported as of December 31, 2022, taking into account production related depletion for the period through December 31, 2022. |
| ● | Mineral Reserves for the Yaramoko open pit are estimated as of December 31, 2022, no production related depletion was applied as there were no active open pit mining in 2022. |
| ● | Mineral Reserves for Yaramoko are reported at a cut-off grade of 1.26 g/t Au and 0.74 g/t Au for the 55 Zone and 109 Zone open pit respectively based on an assumed gold price of US$1,600/oz, 4.1 g/t Au for 55 Zone and Bagassi South (QV) underground and 3.1 g/t Au for Bagassi South (QV’) underground, based on an assumed gold price of US$1,600/oz, metallurgical recovery rates of 98.0%, Surface mining costs of US$3.49/t, Processing costs of US$27/t, and G&A cost of US$25/t for 55 Zone, surface mining costs of US$3.66/t and processing cost of US$27/t for 109 Zone. 55 Zone and Bagassi South (QV) underground mining costs of US$135/t, G&A costs of US$28/t, and processing cost of US$31/t and Bagassi South (QV’) underground mining costs of US$115/t, and processing cost of US$30/t. Underground mining recovery is estimated at 86% (QV) and 90% (QV’) for Bagassi South, 92% for 55 Zone stopes, and 100% for sill drifts. |
| ● | A mining dilution factor of 10% has been applied for sill drifts, 0.6m dilution skin has been applied for 55 Zone and Bagassi South (QV) stopes and 0.4m dilution skin has been applied for Bagassi South (QV’) stopes. Surface Mineral Reserves are reported with modifying factors of mining dilution and mining recovery represented by regularizing the block models to an appropriate selective mining unit (SMU) block size Each open pit deposit has undergone pit optimization, detailed mine design, mine scheduling, and cashflow analysis, demonstrating a technically achievable and economic viable mine plan supporting this Mineral Reserve. Reported proven reserves includes surface stockpile material. |
| ● | Raul Espinoza is the Qualified Person responsible for the underground and open pit Mineral Reserves reported for the Yaramoko Gold Mine, being an employee of Fortuna |
| ● | Totals may not add due to rounding procedures. |
1.10 |
Mining Methods |
Planned mining operations for the Yaramoko Gold Mine are comprised of the existing 55 Zone and Bagassi South underground mines, and the 55 Zone and 109 Zone open pit mines.
55 Zone and Bagassi South underground mines are a combined 1,280 tonne-per-day (tpd) underground operation which utilizes longhole stoping with cemented rock fill as its primary mining method. As of the second quarter of 2022, mining of the QV1 lode at the Bagassi South underground mine ceased with only remnant stopes remaining to be mined at the end of mine life and the 55 Zone became the main source of ore for the operation.
Following completion of mining at the QV1 lode, activities at the Bagassi South underground mine were limited to capital infrastructure development in preparation for mining the QV’ lode based on the handheld shrinkage stoping mining method with unconsolidated waste rockfill. As of the effective date of the Report no production activities have occurred for the QV’ lode.
Stoping at 55 Zone and for the remnant stopes of Bagassi South QV1 utilize 20 m and 17 m sublevel spacing respectively, with longitudinal stope sequencing, retreating towards centralized access declines. Mine development and stoping operations are conducted for Roxgold by AUMS under a mining services agreement which extends
|
ANNUAL INFORMATION FORM |
Yaramoko Technical Report Page |B-7 |
FORTUNA SILVER MINES INC.
through to the end of 2023, with negotiations to be made on whether an extension will be provided through to the end of the first quarter 2025, the completion of the 55 Zone underground mine. The 55 Zone and Bagassi South operations benefit from shared infrastructure, management, and support services.
Stoping at Bagassi South QV’ is proposed to utilize a transverse handheld stope sequencing, providing production flexibility and selectivity to preserve ground conditions with 25 m sublevel spacing. Mineralized material reports to multiple draw points along the drives and is mucked to dedicated level ore passes prior to being hauled out of the mine from the extraction level. Mine capital development for QV’ is conducted for Roxgold by AUMS, with operating development and stoping activities completed through a combination of Paramina (mining supervision and operators labour hire) and DeSimone for haulage activities (trucks) under a mining services agreement. Roxgold will provide equipment and consumables for Bagassi South QV’ production activities.
The 55 Zone underground mine has Proven and Probable Mineral Reserves to a depth of 1,100 m below surface with 0.60 million tonnes (Mt) grading 7.42 g/t Au. Mine life for underground mining of the 55 Zone at the planned production rate is currently to the end of the first quarter 2025.
The Bagassi South mine has Proven and Probable Mineral Reserves to a depth of 235 m below surface with 0.15 Mt grading 6.62 g/t Au comprising of the Bagassi South QV1 and QV′ deposits. The QV′ deposit is parallel to the main QV1, accessed through the same decline utilizing the AUMS underground mining contractors for capital development and production activities completed by Paramina and Desimone for stoping and haulage respectively. Baggasi South main QV1 deposit mining activities have ceased with remaining remnant stopes to be mined following completion of the Bagassi South QV’ deposit during the first quarter of 2025.
As of December 31, 2022, the 55 Zone underground mine sublevels have been developed in advance of stoping to the 4,410 level, 900 m below surface and the access decline has reached a depth of 940 m. All development for the QV1 deposit at the Bagassi South underground mine has been completed with the QV′ capital development planned completion at the end of the first quarter 2023 with remaining development at the end of the first quarter 2024. Development for the 55 Zone and Bagassi South underground mines are well-advanced ahead of production to support the required mine plan.
As of the effective date of the Report, there has been no open pit mining or underground handheld shrinkage stoping mining at the Yaramoko Gold Mine.
In September 2020, a geotechnical study was completed for the 55 Zone open pit by geotechnical consultancy MineGeoTech Pty Ltd (MineGeoTech). The outcome of the geotechnical study (MineGeoTech, 2020) was a technically justifiable pit design for the 55 Zone appropriate to support Mineral Reserves. In June 2022, a geotechnical study was completed for the 109 Zone open pit by MineGeoTech. The outcome of the geotechnical study (MineGeoTech, 2022) was a technically justifiable pit design for the 109 Zone appropriate to support the Mineral Reserves. In February 2021, a mining study of the 55 Zone open pit was completed by independent international mining consultancy Entech Pty Ltd. (Entech). The Entech (2021) mining study consisted of pit optimization guiding a detailed pit design, mining schedule, and cashflow assessment.
In 2022, the Mineral Resource estimate was reviewed and updated, following an update of the open pit mining study for the 55 Zone to maximise cashflow and reduce project risk. The 2022 mining study also included a mining study of the 109 Zone. The 2022 mining study demonstrates a technically achievable and economically viable open pit mining operation and is used to justify the Mineral Reserve estimate shown in this report. The QP regards the study work completed on the 55 Zone open pit and the 109 Zone open pit to be at a preliminary feasibility study (PFS) level of confidence and of sufficient accuracy to support the 55 Zone open pit Mineral Reserve estimate.
The 55 Zone open pit optimization work and 109 Zone mining study supports mining the 55 Zone and 109 Zone open pits via conventional drill, blast, load and haul open pit mining methods. Mining is proposed to be via a contract miner, with mining costs estimated from rates received from an experienced mining contractor operating within the region. Open pit mining of the 55 Zone deposit is proposed to commence upon completion of underground mining operations of the 55 Zone deposit and 109 Zone.
Run of mine (ROM) ore for the 55 Zone open pit will be extracted from the pit via a 14.5 m wide dual lane haul road from the surface down to approximately 30 vertical meters to the 5,270 m reduced level (RL), then a 10 m wide single lane haul road down to approximately 20 vertical meters to the final truck floor at the 5,250 mRL. The ultimate pit is approximately 655 m long, 115 m wide, and 50 m in depth. All pit haul road gradients have been designed at a 1:9 slope. All pit stage designs utilize a minimum mining width of 15 m and 5 m goodbye cuts.
|
ANNUAL INFORMATION FORM |
Yaramoko Technical Report Page |B-8 |
FORTUNA SILVER MINES INC.
ROM ore for the 109 Zone comprising the north and south pits will be extracted from the pit via a 9.3 m wide haul road from the surface down to approximately 60 vertical meters for both pits. The southern ultimate pit is approximately 285 m long, 140 m wide, and 60 m in depth and the northern ultimate pit is approximately 190 m long, 100 m wide, and 60 m in depth. All pit haul road gradients have been designed at a 1:9 slope. The 109 Zone pits contain a 5 m goodbye cut.
1.11 |
Recovery Methods |
The mineral processing and metallurgical test work conducted on the Yaramoko gold deposits by ALS Metallurgy confirmed the coarse free gold nature of the deposit. Gold extraction using gravity and leaching processes yields excellent gold recoveries for both deposits. As a result, the Yaramoko gold processing plant has exhibited high rates of metallurgical performance in treating the 55 Zone and Bagassi South ore since commencing operations in 2016.
In 2019, an expansion of the plant was undertaken to increase the nameplate capacity of the project from 270,000 tonnes per annum to 400,000 tonnes per annum (1,100 tpd) and was designed and constructed by DRA (Pty.) Ltd in Johannesburg, South Africa.
The design of the Yaramoko plant is a simplistic flowsheet that incorporates secondary crushing, single stage SAG milling, carbon in leach (CIL) and gravity recovery circuits, elution and smelting circuits to produce gold doré.
Water is sourced primarily from the water storage facility and supplemented from the underground mining dewatering activities and a bore field network. The water storage dam is located approximately 2 km from the plant, adjacent to the tailings storage facility.
1.12 |
Project Infrastructure |
The infrastructure and services at the Yaramoko Gold Mine adequately support the current operations being the 55 Zone and Bagassi South underground mines, the proposed 109 Zone open pit, as well as the processing plant. This infrastructure consists of a process plant, a mine service area (offices, workshops, and a warehouse), mine refrigeration and ventilation facilities, a tailings storage facility, a water storage facility, mine access and haulage roads, an explosives magazine, a gendarmerie, an electrical grid connection, and an accommodation camp. The site is also serviced by a laterite airstrip, utilized to transport the operations personnel to and from the mine site, via contract aircraft services.
In 2017, the site was connected to the Burkina Faso electricity grid by teeing into the 90-kilovolt powerline from the Pa substation to the Mana mine site. The capacity of the 90/11-kilovolt substation is 13 megavolt amperes (MVA). In the event of a power outage, there is an emergency diesel generator power station, which is sized to power the entire site operations (except the accommodation camp which has a dedicated emergency generator).
For the development of the 55 Zone open pit phase of the mine, some key underground mine infrastructure associated with the 55 Zone will need to be decommissioned as it will fall within the blast radius of the open pit plan. The underground operations workshop and offices, ventilation and refrigeration facilities as well as above ground power reticulation in that area, would need to be decommissioned and removed before the ultimate pit outline is developed.
For the development of the 109 Zone open pit mine, additional infrastructure is required to accommodate mining of the deposit including; road deviation of the current national highway, haul road to access the deposit, extension of perimeter fencing and additional security personnel, systems and posts.
The entire Yaramoko Gold Mine, with the exception of the 109 Zone open pit, is contained within a security fence, with key infrastructures secured with double fences.
1.13 |
Market Studies |
Gold is a freely traded commodity on the world market for which there is a steady demand from numerous buyers. The Fortuna financial department provides the Yaramoko Gold Mine with gold price projections for inclusion in budget and business plan preparations. Pricing is based on long-term analyst and bank forecasts for gold.
For the current Yaramoko Gold Mine, a contract is in place with METALOR Technologies S.A. for the receipt of gold doré from Roxgold Sanu, to process/refine and either to buy or transfer the precious metal to a metal account designated by Roxgold Sanu.
|
ANNUAL INFORMATION FORM |
Yaramoko Technical Report Page |B-9 |
FORTUNA SILVER MINES INC.
The QP has reviewed the information provided by Fortuna on metal price projections and exchange rate forecasts and note that the information provided is consistent with what is publicly available for industry norms.
1.14 |
Environmental Studies, Permitting, and Social or Community Impact |
The Mining Code (Loi No. 036-2015/CNT du 16 juin 2015) and the Environmental Code (Loi N°006-2013/AN du 2 avril 2013) of Burkina Faso outline the legal framework for social and environmental impacts from mining activities in Burkina Faso. The primary environmental approval required by Roxgold Sanu to develop a mining project is an Avis de Conformité et de Faisabilité Environmentale, which is issued by the Ministry of Environment and Sustainable Development (MEDD) through its environmental agency named Agence National des Evaluations Environnementales (ANEVE, ex BUNEE). The ANEVE has the mandate to promote, monitor and manage all the environmental assessment process in the country. Such an Avis de Conformité et de Faisabilité Environmentale indicates a positive decision of the Minister of Environment on the submitted ESIA.
Avis de Conformité et de Faisabilité Environmentale were received in 2014 for the first phase of the Yaramoko Gold Mine (55 Zone mine) and in 2017 for the expansion (Bagassi South mine). The respective Avis are: (1) Decree N°2014-155/MEDD/CAB and (2) Decree n°2017-431/MEEVCC/CAB. An ESIA for Zone 109 project has been submitted in August 2022, with validation and Avis de Conformité et de Faisabilité Environmentale expected on track for finalization in the first quarter of 2023. Any further development of the Yaramoko Gold Mine will follow the same process.
This framework will guide the requirements for future permit modifications to support the 55 Zone open pit development, in a similar way to which the Bagassi South extension was granted in 2017. The Zone 109 open pit project is undergoing permitting.
At present, the main potential environmental issues identified concern water quality due to seepage or runoff from mine infrastructure; reduced groundwater supply due to the impact of a potential drawdown cone around the mine; and dust from waste rock dumps and the tailings storage facility. The main social issues identified concern livelihood changes due to the loss of farmland and loss of income from artisanal mining. Roxgold has been able to manage these aspects through a comprehensive ESMS based on ISO 14001 and International Financial Corporation (IFC) Performance Standards.
Since 2014, Roxgold Sanu has engaged with its local stakeholders through a stakeholder engagement management plan. A specific stakeholder engagement strategy and plan based on the community analysis (stakeholder mapping), the existing tools and the experience of the community relations team, including presentations of the expansion projects, community representatives’ meetings, special committee, public enquiries, billboard and/or broadcasting is in place.
The closure plan for the Yaramoko Gold Mine will be updated to incorporate plans for the development of the 109 Zone open pit project once its ESIA is formally validated, and eventually for the 55 Zone open pit at the appropriate time. It currently assumes the preferred final post-closure land use will be a savannah landscape commensurate with the existing small-scale agriculture and livestock grazing land uses. The plan assumes no salvage value. The mine areas will be reclaimed to a safe and environmentally sound condition consistent with closure commitments developed during the LOMP.
1.15 |
Capital and Operating Costs |
Cost estimates are derived from activity-based life of mine scheduling. Underground mining costs are estimated using the schedule of rates within the existing mining contract with AUMS and contracts for mining and haulage activities of the Bagassi South QV’ deposit with Paramina and DeSimone respectively. Open pit mining costs are based on estimated mining rates provided by a reputable and experienced mining contractor operating within the region.
Processing, sustaining capital, general and administrative, and selling cost estimates are prepared using realized costs from recent operating years, with forecast labour and consumables from activity-based scheduling aligned with the LOMP schedule.
The QP considers the capital and operating costs estimated for the operation as reasonable based on industry-standard practices and actual costs observed for 2022.
|
ANNUAL INFORMATION FORM |
Yaramoko Technical Report Page |B-10 |
FORTUNA SILVER MINES INC.
1.16 |
Economic Analysis |
Fortuna is using the provision for producing issuers, whereby producing issuers may exclude the information required under Item 22 of Form 43-101F1 -Technical Reports for technical reports on properties currently in production and where no material production expansion is planned.
The Mineral Reserve declaration in this Report is supported by a positive cashflow for the period set out in the LOMP.
1.17 |
Conclusions, Risks, and Opportunities |
This Report represents the most accurate interpretation of the Mineral Reserve and Mineral Resource available as of the effective date of this Report. The conversion of Mineral Resources to Mineral Reserves was undertaken using industry-recognized methods, and estimated operational costs, capital costs, and plant performance data. This Report also supports the development of the 55 Zone open pit at the completion of the 55 Zone underground mine, the 109 Zone open pit mine and the Bagassi South QV’ handheld shrinkage stoping mining methodology. Thus, it is considered to be representative of future operational plans. This Report has been prepared with the latest information regarding environmental and closure cost requirements.
A number of opportunities and risks were identified by the QPs during the evaluation of the Yaramoko Gold Mine.
Opportunities include:
| ● | Exploration potential to increase the Mineral Resources of the Yaramoko Gold Mine deposits. |
| ● | Upside potential in the QV’ deposit upon realisation of actual operating costs. |
| ● | 55 Zone and 109 Zone open pit design and scheduling optimization for contract negotiations. |
| ● | Further optimized mining methods resulting in operating cost savings and lower total mining dilution, thus increased head grade. |
| ● | Further optimize mine scheduling. |
Risks include:
| ● | Ground conditions at depth for the 55 Zone underground mine resulting in delayed extraction of stopes due to increased re-work requirements. |
| ● | Operating conditions associated with mining the Bagassi South QV’ deposit. |
| ● | Change of management with the adoption of a new mining method with alternative contractors. |
| ● | Unforeseen increases in costs due to inflation could impact the outcome of the mining study as well as future open pit to underground transition studies. Contractor costs will need to be revalidated during development plans. |
| ● | Further geotechnical work prior to the commencement of mining will be required to further assess the impact of underground voids on pit wall stability. |
| ● | Open pit mining will occur adjacent to the processing facility and key project infrastructure. Drill and blast designs and processes will need to ensure vibration and fly rock is controlled such that any impact to key project infrastructure is minimized. |
| ● | Unmet community expectations leading to potential for loss of social license to operate. Roxgold Sanu expects to minimize this risk with its experience, positive reputation, and social management plans relating to community development, stakeholder engagement and artisanal miners. |
| ● | Preparation for open pit mining activities delayed due to schedule extension of the 55 Zone underground mine, contract negotiations for preferred contractor and mine development preparations. These are mitigated through optimisation of the underground mine plan, negotiations for preferred contractor and project planning for mine development commencing in the first half of 2023. |
| ● | Long term impact of groundwater movement away from mine workings after closure. |
1.18 |
Recommendations |
Recommendations for the next phase of work have been broken down into those related to ongoing exploration activities at the Yaramoko Gold Mine; underground mining activities and studies related to operational
|
ANNUAL INFORMATION FORM |
Yaramoko Technical Report Page |B-11 |
FORTUNA SILVER MINES INC.
improvements; exploration activities and development studies related to the development of the 55 Zone and 109 Zone open pits at Yaramoko; processing and infrastructure improvements; and environmental, permitting and social activities as set out below.
Underground Mining:
| ● | Continued monitoring of ground conditions along with the implementation of a recommended ground support regime in line with the increase in depth at the 55 Zone underground mine. Costs are included in the operating costs for the mine. |
| ● | Infill and step out drilling program. Expenditure of US$ 2.8 million is budgeted in 2023 for this program. |
| ● | Further review of the mining contract and its cost reduction opportunity through contract negotiations during the fourth quarter of 2023, cost is included in the operating costs for the mine. |
| ● | Review of actual productivity and realised cost with mining of the Bagassi QV’ mineralization and update the mining inventory inline with the realised parameters. Costs are included in operating costs of the mine. |
| ● | Continued monitoring and operational improvements for safety and productivity in mining the Bagassi South QV’ lode. Costs are included in operating costs of the mine. |
Open Pit Mining:
| ● | Prior to mining 55 Zone Open Pit commencing, a void management plan will be prepared to define the mining methods to safely mine mineralization adjacent to underground workings while minimizing mining dilution and maximizing mining recovery. The void management plan will be undertaken predominantly with Roxgold technical staff, with such costs included in the operating costs for the mine. An external geotechnical consultants will be utilised to assist with this study with costs included as part of the budgeted geotechnical site support. |
| ● | Prior to mining 55 Zone Open Pit commencing, a drill and blast study will be completed to define the drill and blast designs that protect key project infrastructure from ground vibrations and fly rock within the blast perimeter. Drill and blast studies will be undertaken by Roxgold technical staff, with such costs included in the operating costs for the mine. |
| ● | Evaluate and choose a preferred mining contract for the open pit scope of work. Prepare a workable mining contract for the open pit mining scope of work. Contractor evaluation and preparation of the mining contract will be undertaken by Roxgold technical staff, with such costs included in the operating costs for the mine. |
| ● | Data gap existing in the north-eastern wall of the northern pit for 109 Zone to be assessed and altered as required prior to mining of the sector commencing. Such costs will be included in the operating cost of the mine. |
Processing and Infrastructure:
| ● | As processing feed begins to reduce over the next couple of years, there is the potential at times for the mill load to fluctuate and potentially run low. The lifter angle of the SAG mill should be reviewed to ensure that it is not overly aggressive with the reduced total load. The cost of such a review will be assessed internally by Roxgold technical staff. |
| ● | Metallurgical behavior should continue to be monitored especially when there are major changes to the proposed mine plan and mine development. Additional on-site testing should be completed from time to time in accordance with an updated mine plan during production, to identify any potential issues, especially in the comminution circuit. This testwork should be completed during operations. Such costs will be included in the operating costs for the mine. |
Environmental, Permitting, and Social:
| ● | Continue the implementation of the environmental management plan as required under applicable environmental regulations and according to the Company’s ESIA, internal standards and applicable international best practices. This includes the implementation of the monitoring and prevention programs to avoid or mitigate our impacts, the regular update of the closure plan and the continuous improvement of the Company’s environmental management system. Such costs will be included in the operating costs for the mine. |
| ● | Ensure the performance of the stakeholders’ engagement plan and continue to support the local stakeholders in their social and economic development as part of the social corporate responsibility and license to operate. Such costs will be included in the operating costs for the mine. |
|
ANNUAL INFORMATION FORM |
Yaramoko Technical Report Page |B-12 |
FORTUNA SILVER MINES INC.
| ● | Continue the implementation of a rigorous health and safety management system to protect employees from injury and health issues, including preventative activities such as risk assessments, inspections, audits, employee safety and competences training, leadership programs and the continuous improvement of the health and safety management system. Such costs will be included in the operating costs for the mine. |
[End of Extract of Summary from Yaramoko Technical Report]
See “General Development of the Business - Business of the Company – 2023 Developments” for a description of exploration activities conducted subsequent to the Yaramoko Report.
|
ANNUAL INFORMATION FORM |
Yaramoko Technical Report Page |B-13 |
FORTUNA SILVER MINES INC.
SCHEDULE “C”
MATERIAL PROPERTIES
Lindero Mine, Argentina
The following is the Summary from the technical report (the “Lindero and Arizaro Technical Report”) entitled “Fortuna Silver Mines Inc.: Lindero Mine and Arizaro Project, Salta Province, Argentina” with an effective date of December 31, 2022 prepared by Eric Chapman, P.Geo., Raul Espinoza, FAusIMM (CP), Mathieu Veillette, P.Eng., P.E., and Dmitry Tolstov, MMSA(QP). This Summary is subject to certain assumptions, qualifications and procedures described in the Lindero and Arizaro Technical Report and is qualified in its entirety by the full text of the Lindero and Arizaro Technical Report which is available for viewing on SEDAR+ at www.sedarplus.ca and is incorporated by reference in this AIF, and is also filed with the SEC on EDGAR (available at www.sec.gov). Defined terms and abbreviations used herein and not otherwise defined shall have the meanings ascribed to such terms in the Lindero and Arizaro Technical Report.
1.1Introduction
This Technical Report (the Report) on the Lindero Mine and Arizaro Project in Salta, Argentina (the Property or the Lindero Property), has been prepared by Mr. Eric Chapman, P.Geo, Mr. Raul Espinoza, FAusIMM, Mathieu Veillette, P.Eng, and Dr. Dmitry Tolstov, MMSA QP, for Fortuna Silver Mines Inc. (Fortuna) in accordance with the disclosure requirements of Canadian National Instrument 43-101 – Standards of Disclosure for Mineral Projects (NI 43-101). The Report discloses updated Mineral Resource and Mineral Reserve estimates, including the maiden estimation of Inferred Resources for the Arizaro Project, as well as details on the start of operations at the Lindero Mine.
1.2 |
Property description, location and ownership |
The Property is located in the Argentine puna, a cool, arid zone with a minimum elevation of approximately 3,500 to 4,000 m. The climate is generally dry and windy; it can be cold and snowy during storms.
The Lindero Property is located 260 km due west of Salta, Argentina, the main service center of the region, at latitude 25° 05’ south and longitude 67° 47’ west. Drive time from Salta to the Property is approximately 7 to 7.5 hours, over a road distance of 420 km. The nearest town to the Property is Tolar Grande (population 250) located 75 km to the northeast.
The Property can be accessed via either road or by airplane. Access by road is via National Route 51, which passes through the towns of San Antonio de Los Cobres and Olacapato; and Provincial Route 27, via Pocitos and Tolar Grande. Access by plane is via charter flights that are scheduled three times a week from Salta to a runway strip located at the Salar de Arizaro, less than 10 kilometers from the mine. The flight takes approximately 35 minutes.
The Lindero Property contains two known porphyry gold-copper deposits. The Lindero Deposit which is the focus of current mining activities described in this report (the Lindero Mine); and the Arizaro Deposit which is located 3.2 km southeast of the Lindero Mine.
The mineral tenement holdings cover 3,500 ha, and comprise 35 pertenencias, each of 100 ha, which are constrained by Gauss Kruger Posgar co-ordinates generated by survey. Tenure is held in the name of Mansfield Minera S.A. (Mansfield), an indirectly wholly-owned subsidiary of Fortuna. There is no expiry date on the pertenencias, providing Mansfield meets expenditure and environmental requirements, and pays the appropriate annual mining fees.
A three percent provincial royalty “boca mina” is payable on revenue after deduction of direct processing, commercial, general and administrative costs. There are no royalties payable to any other third party.
Surface rights are owned by the provincial state (Propiedad Fiscal) of Salta. There are no reservations, restrictions, rights-of-way or easements on the Property to any third-party. Mansfield holds a registered camp concession, and a granted and surveyed access right-of-way. Water permits and rights of access to the Property are guaranteed through water and access licenses granted by the Mining Court of Salta.
|
ANNUAL INFORMATION FORM |
Lindero and Arizaro Technical Report Page |C-1 |
FORTUNA SILVER MINES INC.
In addition, Mansfield holds one mining concession and eight easements that cover the mine infrastructure (including the camp, plant, open pit, leach pad, and waste dump).
1.3 |
History |
Gold–copper mineralization associated with potassic alteration was first discovered at the Property by Goldrock Mines Corp. (Goldrock) geologists in November 1999, and led to claim staking.
The area was explored using reconnaissance and detailed geological mapping, soil geochemistry (talus fines), trench sampling and mapping during 2000 and early 2001. As a result of this work, mineralization at what is now the Lindero and Arizaro deposits was identified in September 2000.
From April 2002 to March 2003, Rio Tinto had an option on the Property with Goldrock, during which time additional exploration including drilling was conducted at both Lindero and Arizaro with follow-up metallurgical testwork undertaken using Lindero core samples. An in-house preliminary Mineral Resource estimate for the Lindero Deposit was performed. As the tonnage and grade estimate did not meet Rio Tinto’s corporate targets, the option was not exercised.
Goldrock resumed as project operator, and between 2005 and 2013 completed additional exploration and drilling at both the Lindero and Arizero deposits, but with a focus on progressing the technical potential of mining Lindero. Based on this, a Pre-Feasibility Study for the Lindero Deposit was completed by AMEC in 2010, assuming a production throughput of 30,000 tonnes of ore per day (AMEC Americas Ltd., 2010a; 2010b). In 2012, Goldrock commissioned Kappes, Cassiday & Associates (KCA) to complete a Feasibility Study using a reduced throughput of 18,750 tpd.
In 2015, Goldrock commissioned KCA to work with local engineering firms in advancing the engineering design for the Lindero Project to a basic engineering level and update the 2013 Feasibility Study. A new Feasibility Study incorporating these design changes, additional metallurgical testwork, and updated costs and gold price assumptions was filed by KCA in 2016 (KCA, 2016a).
In July 2016, Fortuna acquired all of the issued and outstanding shares of Goldrock, making Mansfield a wholly-owned subsidiary of Fortuna (Fortuna, 2016). Upon completion of the transaction, Fortuna continued to advance the optimization of the 2016 Feasibility Study through additional drilling as well as conducting tradeoff metallurgical tests and detailed engineering revisions with the objective of reaching a construction decision for the Lindero Project (Fortuna, 2017).
Fortuna continued the exploration of the Arizaro Deposit while progressing the technical studies and construction activities at Lindero with diamond drill programs executed in 2018, 2021 and 2022 culminating in the estimation of Mineral Resources as detailed in this Report.
Mining activities commenced at Lindero in September 2019 (Fortuna, 2019) with first placement of ore on the leach pad in July 2020 (Fortuna, 2020a) and doré production in October 2020 (Fortuna, 2020b). Total production since October 2020 through December 31, 2022 is estimated as 228,939 oz of gold doré bars.
1.4 |
Geology and mineralization |
In the Central Andes, the altiplano or puna is a high plateau of more subdued relief between the Eastern Cordillera, a rugged region usually rising to between 3 km and 4.5 km, and the Western Cordillera, which is a high spine of mountains that may reach as much as 5 km in height. The Arizaro Volcanic Complex consists of two superimposed concentric volcanic centers, the Arizaro and the Lindero cones, located in the Archibarca volcanic arc at the southern margin of the Salar de Arizaro basin. Basement rocks crop out to the north of the Lindero Deposit and consist of coarse-grained Ordovician granites uncomformably overlain by Early Tertiary red bed sandstones. The Lindero–Arizaro complex, a series of diorite to monzonite porphyritic stocks, intrudes these units.
Lindero and Arizaro are examples of gold-rich porphyry copper deposits as described by Sillitoe (2000). More specifically, they show affinities with the porphyry gold deposit model (Rytuba and Cox, 1991; also termed dioritic porphyry gold deposits by Seedorff et al., 2005). These are exemplified by the Refugio, Cerro Casale, Marte, and Lobo gold deposits of the Miocene-age Maricunga belt, Chile, approximately 200 km south of Lindero. Vila and Sillitoe (1991) and Muntean and Einaudi (2000, 2001) described those deposits in detail.
|
ANNUAL INFORMATION FORM |
Lindero and Arizaro Technical Report Page |C-2 |
FORTUNA SILVER MINES INC.
The deposits of the Property area are considered to be examples of porphyry-style deposits, in particular gold-rich porphyries based on the following:
| ● | High level (epizonal) stock emplacement levels in magmatic arc. |
| ● | High-level stocks and related dikes intrude their coeval and cogenetic volcanic piles. Intrusions range from fine through coarse-grained, equigranular to coarsely porphyritic. |
| ● | Mineralization in or adjoining porphyritic intrusions of quartz diorite/monzonite composition. |
| ● | Mineralization is spatially, temporally, and genetically associated with hydrothermal alteration of the intrusive bodies and host rocks. |
| ● | Gold–copper mineralization formed during intrusion of multiple phases of similar composition intrusive rocks. |
| ● | Large zones of quartz veining, stockwork mineralization, and disseminated pyrite. |
| ● | Tenor of gold and copper grades, i.e., large tonnage but low grade. |
The weathered oxidation zone at Lindero is generally poorly developed and averages 44 m in thickness, while at Arizaro the oxidation zone is even less pronounced being just a few meters in thickness.
1.4.1Lindero Deposit
Mineralized zones at the Lindero Deposit form a semi-circular shape about 600 m in diameter which extends to a depth of 600 m, consisting of four different zones at the surface. The distribution of gold–copper mineralization at Lindero shows a strong relationship to lithology, stockwork veinlets, and alteration assemblages. Higher grades of gold–copper (approximately 1 g/t Au and 0.1 % Cu) are commonly associated with sigmoidal quartz, quartz–magnetite–sulfide, biotite-magnetite–chalcopyrite, magnetite–chalcopyrite and quartz–limonite–hematite stockworks that are strongly associated with K-feldspar alteration. This association is very common in the east zone of the deposit, where the highest gold grades occur. At other locations where one or more stockwork types are missing or the intensity of fracturing is lower, mineralization tends to be weaker and the grades of gold tends to be lower (approximately 0.4 g/t Au).
At the Lindero Deposit, native gold and electrum are finely disseminated in subparallel to stockwork quartz + sulfide ± magnetite ± anhydrite veins and in some cases in matrices of hydrothermal breccias. Magnetite is common to abundant in mineralized zones. These mineralized stockworks and potassic alteration are interpreted to have formed as the result of degassing of the early intrusive bodies. Fluid pressures during degassing triggered fracturing of the intrusions and wall rock, allowing gold-rich fluids to circulate and precipitate, forming a gold–copper orebody. Later intrusions resulted in weak to moderate gold–copper mineralization forming mostly along and immediately fringing these intrusive contacts. Finally, post mineralized intrusives were overprinted onto the north and west of the deposit.
Gold mineralization at Lindero is characterized by native, free-milling gold associated with chalcopyrite and/or magnetite grains with rare interstitial quartz.
1.4.2Arizaro Deposit
The Arizaro volcanic center is characterized by fine- to medium-grained hornblende diorite to monzonite porphyritic stocks. The Arizaro Deposit is dominated by a main, moderately to strongly mineralized intrusive unit that crops out in the central part of the prospect area. It consists of fine hornblende porphyritic diorite intruded by several stocks, dikes, igneous-cemented breccias and hydrothermal breccias. Smaller stocks are exposed in a few areas. Dikes of andesitic and dacitic composition are generally distributed radially to the main intrusive unit.
Several alteration assemblages are noted in the Arizaro Deposit area. Alteration patterns are semi-concentric and asymmetric, with a core of moderate to strong potassic alteration including zones of K-feldspar-rich magnetite–silica alteration. An incomplete rim of chloritic alteration is developed outboard of the potassic alteration. In the southeast part of the deposit, intermediate argillic alteration has formed and overprints potassic alteration. Sericitic and very weak argillic alteration (hydrolytic alteration) has developed in the
|
ANNUAL INFORMATION FORM |
Lindero and Arizaro Technical Report Page |C-3 |
FORTUNA SILVER MINES INC.
volcanic tuffs. To the south and west of the deposit, chloritic alteration passes directly to propylitic alteration. An actinolite–magnetite alteration assemblage forms in the eastern part of the deposit area.
The Arizaro Deposit has mineralization styles with copper–gold grades that are strongly correlated with different alteration assemblages. Mineralization is mainly associated with potassic alteration. This occurs generally in multi-directional veins, vein stockworks and disseminations. In some areas, the vein density is high, forming vein stockworks in the intrusive rocks. These vein stockworks are limited to magnetite–biotite veinlets, quartz–magnetite–chalcopyrite veinlets, late magnetite breccias and in late-stage mineralization events, anhydrite–sulfide veinlets. Chalcopyrite and bornite are the main copper minerals. Gold is mainly associated with chalcopyrite, quartz, and anhydrite veinlets. Coarse gold was observed and confirmed with X-ray diffraction analysis in the University of Neuquen, Argentina, laboratory.
Understanding of the geological setting and model concepts for Lindero and Arizaro is adequate to provide guidance for exploration and development of the deposits.
1.5 |
Exploration, drilling and sampling |
Multiple exploration programs have been conducted by Rio Tinto, Goldrock and Fortuna on the Lindero Property all under the management of Mansfield.
Exploration drilling comprises 233 diamond drill holes totaling 46,987 m at the Lindero Deposit, as well as 65 diamond drill holes totaling 16,165 m at the Arizaro Deposit that has been conducted over the last twenty years. Ground conditions are good with core recovery generally above 90 percent. Collars for all holes drilled since 2005 have been surveyed using differential GPS. Coordinates are projected on the WGS 84 Datum ellipsoid and calibrated according to the position of Geodetic point IGM N° PR-02-015, located a few kilometers from the Property. The results are available in geographic co-ordinates and in metric co-ordinates (UTM and Gauss Kruger), using the WGS 84 datum.
During Rio Tinto’s exploration drilling campaign in 2002, undertaken by Connors Drilling, no downhole surveys were completed despite the fact that many of the holes extended beyond 300 m in depth. Holes drilled during the first Goldrock campaign were not originally downhole surveyed either. In June 2006, GEC-Geophysical Exploration & Consulting S.A. (GEC) was contracted by Goldrock to perform borehole surveying services with a Reflex Maxibor II System 3™ Probe (Maxibor™), which is not affected by magnetism. In 2008, Goldrock detected that the Maxibor™ surveys showed an unacceptably large deviation in the drill holes and a decision was made to re-survey all holes that showed a deviation of more than 5 percent. Comprobe Chile Ltd. (Comprobe) was contracted to re-survey the holes considered by Goldrock as having incorrect downhole deviations. A surface-recording gyroscopic instrument was used, and orientation and dip parameters were recorded every 10 m. For the 2016 to 2022 drilling campaigns, downhole surveys were conducted by the drilling contractor using Reflex™ gyroscopic equipment with readings taken at 5 to 10 m intervals.
All core was logged for geology and geotechnical characteristics. All logging was digital and has been incorporated into the Maxwell DataShed™ database system. Data was recorded initially with Excel™ templates, and later with Maxwell LogChief™ application using essentially the same structure. Separate pages were designed to capture metadata, lithology, alteration, veins, sulfide–oxide zones, sulfide–oxide surfaces, minerals (sulfides, oxides, and limonite), sulfates, structures (contacts, fractures, veins, and faults with attitudes to core axis), magnetic susceptibility, and special data (samples collected for geochemistry, thin section examinations, the core library, skeleton core, etc.). Intensity of alteration phases was recorded using a numeric 1 to 4 scale (weak, moderate, strong, complete); abundance of veins and most other minerals were estimated in volume percent.
Core samples are marked and collected on 2 m intervals that honor lithological boundaries. Samples weigh between 4 and 8 kg depending on core diameter and recovery. Channel samples were collected using a rock saw to cut a 2 x 3 cm channel in exposed bedrock in trenches and road cuts. The material was removed from the channel with a chisel. Sample preparation for most samples consisted of crushing to 70 percent passing 10 mesh and pulverization to 95 percent passing 150 mesh. Density samples are routinely collected by Mansfield personnel from drill core on approximate 10-m intervals. Samples consist of pieces of core approximately 7 cm in length and weighing between 93 g and 408 g.
|
ANNUAL INFORMATION FORM |
Lindero and Arizaro Technical Report Page |C-4 |
FORTUNA SILVER MINES INC.
All samples collected by Mansfield personnel were assayed for gold using a 30 g fire assay–atomic absorption (FA-AA) finish and a second aliquot was selected for copper analysis using aqua regia digestion and AA analyses. For the drill samples only, a full suite of trace elements was analyzed using an aqua regia digestion followed by inductively-coupled plasma (ICP) analysis. Assay results and certificates were reported electronically by e-mail.
Fortuna samples were sent to the ALS Global sample preparation facility in Mendoza, Argentina. Following drying at 55°C, the samples were weighed and the entire sample crushed using a two-stage method, first with a jaw crusher to 1 cm, and then by cone crusher to 70 percent passing 10 mesh. The entire crushed sample was then pulverized to a minimum of 95 percent passing 80 mesh. Pulverized samples were then split using a riffle splitter to generate a 300 g subsample that was pulverized to 95 percent passing 150 mesh. This subsample was then split again using a riffle splitter to generate three 100 g samples.
All samples were sent to accredited laboratories independent of Rio Tinto, Goldrock and Fortuna.
Implementation of a quality assurance/quality control (QAQC) program is current industry best practice and involves establishing appropriate procedures and the routine insertion of standard reference material (SRMs), blanks, and duplicates to monitor the sampling, sample preparation and analytical process. Fortuna implemented a full QAQC program to monitor the sampling, sample preparation and analytical process since 2016 in accordance with its companywide procedures. The program involves the routine insertion of SRMs, blanks, and duplicates. Evaluation of the QAQC data indicate that the data at both deposits are sufficiently accurate and precise to support Mineral Resource estimation.
The Arizaro and Lindero deposits were discovered in 1999 and 2000, respectively, as a result of a regional program of exploration. Major exploration programs conducted since discovery at the Property include:
| ● | Goldrock campaign: August 2000 to October 2001, which included geologic mapping, soil sampling, and trench sampling. |
| ● | Rio Tinto campaign: May 2002 to February 2003, which included road sampling, geophysics (43 km of ground magnetics and 11 km of induced polarization (IP)), and drilling (10 holes for a total of 3,279 m at Lindero and 2 holes for a total of 629 m at Arizaro). |
| ● | Goldrock campaign: October 2005 to January 2008, which included geologic mapping and modeling, trenching, and a significant drilling program and metallurgical testwork at Lindero (106 holes for a total of 30,024 m). |
| ● | Goldrock campaign: September 2008 and August 2010 to November 2010, which consisted of additional drilling and metallurgical testwork at Lindero (23 holes) for the Pre-Feasibility Study. |
| ● | Goldrock campaign: May 2010 and February 2013 consisting of a drilling program and bottle roll tests at Arizaro (27 holes for a total of 8,225 m). |
| ● | Fortuna campaign: September 2016 to December 2016 consisting of 8 holes for metallurgical samples, 2 holes for geologic interpretation and 2 twin holes, all targeting the Lindero Deposit. |
| ● | Fortuna campaign: May to July 2018 consisting of 61 vertical holes for improved geological and grade estimation of material proposed for mining at Lindero, and from 2019 to 2021 to obtain fresh material for metallurgical samples. |
| ● | Fortuna campaign: July to September 2018 consisting of 12 holes to define the geology and mineralization characteristics of the magnetite breccias at the Arizaro Deposit. |
| ● | Fortuna campaign: March to April 2021, consisting of 18 holes focused on the areas planned for mining at Lindero in 2022. The purpose for the drilling campaign was similar to that for 2018, with 5 holes drilled to source samples for metallurgical column testing. |
| ● | Fortuna campaigns: October to December 2021 and April to July 2022 consisting of additional exploration drilling at Arizaro (24 holes for a total of 5,133 m). |
|
ANNUAL INFORMATION FORM |
Lindero and Arizaro Technical Report Page |C-5 |
FORTUNA SILVER MINES INC.
| ● | Fortuna campaign: March to April 2022, consisting of 10 holes for improved geological understanding focused on areas planned for mining at Lindero in 2023. The campaign included 3 holes drilled to source samples for metallurgical column testing. |
The Lindero Deposit is a gold-rich porphyry with low-grade mineralization permeating throughout the deposit, making the calculation of true thickness impossible as no definitive across strike direction exists. The mineralization appears to be annular in shape at surface due to the intrusion of barren to low-grade intrusive rocks into the core of the system, but this circular shape is not representative of true thickness.
Gold–copper mineralization at Arizaro is associated with two different mineralizing events. The strongest is a non-outcropping intrusive which occurs in the north part of the porphyry with an elongated shape trending northeast to southwest for more than 400 m with an estimated average width of 60 m. The other mineralizing event is in the center of the system and is related to breccias and micro-breccias which have a semi-oval shape at surface. In the center, there is a higher-grade core with a semi-ellipsoidal form, extending north–south for 480 m with an estimated average width of 50 m.
1.6 |
Data verification |
Fortuna conducted audits and verification of historical information as well as verifying new data generated since 2016 to support assumptions for the Mineral Resource and Mineral Reserve estimates reported in Section 14 and Section 15 of this Report. The verification process focused on the database; collars and downhole surveys; lithologic logs; assays; metallurgical results; and geotechnical parameters. Fortuna checked all collar and downhole survey information for each campaign against source documentation and completed a hand-held GPS survey of randomly selected drill hole collars. The results showed a good agreement with locations in the database. In August 2016, Fortuna initiated a comprehensive program of relogging Lindero and Arizaro core to verify the original lithologic descriptions. An additional relogging program was conducted on Arizaro historical drill core in 2021 due to geological reinterpretation based on results from the 2018 and 2021 drill campaigns.
Fortuna contracted Call & Nicholas Inc. (CNI) to validate all geotechnical data, data collection methods, slope stability analysis methods, and slope angle recommendations presented previously by other consultants to determine feasibility-level slope angle recommendations for design of the planned Lindero final pit.
The QP is of the opinion that the data verification programs performed on the data collected are adequate to support the geological interpretations, the analytical and database quality, and Mineral Resource estimation for the Lindero and Arizaro deposits.
1.7 |
Mineral processing and metallurgical testing |
Mansfield has used commercial laboratories to execute multiple and extensive testing campaigns that have progressively optimized the metallurgical and process conditions for its permanent gold heap leach pad facility. Two initial campaigns conducted by Goldrock between 2004 and 2007 were followed by Fortuna’s four major testing campaigns between 2016 and 2018 that supported the design of the industrial scale operation. Since the first ore was place on the leach pad in July 2020, Mansfield has been using its in-house laboratory to continuously support metallurgical parameters used in the LOM.
The metallurgical testing was initially focused on leaching conditions and included bottle rolls and leaching columns of various sizes under varying conditions of leaching and agglomeration. Additional testing, particularly for the crushing plant, was performed with major technology suppliers and concluded that using high-pressure-grinding-rolls (HPGR) in the tertiary crushing stage translated in faster leaching kinetics and ultimately higher gold extraction.
The pervasive presence of copper in the Lindero Deposit reflects in the dissolution of copper during the leaching of gold. Testing of the sulfidization-acidification-recycling-thickening (SART) process was successful in removing sufficient copper quantities (59 to 74 percent) from the pregnant leach solution (PLS) to guarantee the optimal performance of the adsorption-desorption-recovery (ADR) process downstream and quality of the doré. The copper precipitate also recovered silver at a rate of more than 90 percent.
A limited, preliminary metallurgical testing of the satellite Arizaro Deposit achieved comparable results to those observed for the Lindero Deposit.
|
ANNUAL INFORMATION FORM |
Lindero and Arizaro Technical Report Page |C-6 |
FORTUNA SILVER MINES INC.
1.8 |
Mineral Resources |
Mineral Resource estimation for the Lindero and Arizaro deposits involved the use of drill hole data in conjunction with surface mapping to construct three-dimensional (3-D) wireframes to define individual lithologic structures and oxide–mixed–sulfide horizons if present. Drill hole samples were selected inside these wireframes, coded, composited and grade top cuts applied if applicable. Boundaries were treated as either soft, firm or hard with statistical and geostatistical analysis conducted on composites identified in individual lithologic units. Gold and copper grades were estimated into a geological block model consisting of 10 m x 10 m x 8 m selective mining units (SMUs). Grades were estimated by ordinary kriging (OK) and constrained within an ultimate pit shell based on estimated metal prices, actual costs as experienced at the Lindero Mine in 2022, geotechnical constraints, and metallurgical recoveries to fulfill the ‘reasonable prospects for eventual economic extraction’. Estimated grades were validated globally, locally, and visually prior to tabulation of the Mineral Resources.
Resource confidence classification considers a number of aspects affecting confidence in the resource estimation including; geological continuity and complexity; data density and orientation; data accuracy and precision; grade continuity; and in the case of the Lindero Mine, simulated grade variability by mining period.
Mineral Resources exclusive of Mineral Reserves as of December 31, 2022 are reported in Table 1.1.
Table 1.1 Mineral Resources as of December 31, 2022
Deposit |
Classification |
Tonnes (000) |
Au (g/t) |
Cu (%) |
Contained Au (koz) |
Lindero |
Measured |
1,855 |
0.50 |
0.12 |
30 |
Indicated |
27,594 |
0.42 |
0.10 |
369 |
|
Measured + Indicated |
29,448 |
0.42 |
0.10 |
399 |
|
Inferred |
24,087 |
0.47 |
0.11 |
364 |
|
Arizaro |
Inferred |
22,146 |
0.39 |
0.15 |
280 |
Notes:
| ● | Mineral Resources are as defined by the 2014 CIM Definition Standards for Mineral Resources and Mineral Reserves. |
| ● | Mineral Resources are exclusive of Mineral Reserves. |
| ● | Mineral Resources for the Lindero Deposit are estimated as of August 31, 2022 and reported as of December 31, 2022 taking into account production related depletion between September 1 to December 31, 2022. Mineral Resources for the Arizaro Deposit are estimated and reported as of December 31, 2022. |
| ● | Eric Chapman, P.Geo. (EGBC #36328) is the Qualified Person for mineral resources being an employee of Fortuna Silver Mines Inc. |
| ● | Lindero Mineral Resources are reported within a conceptual pit shell above a 0.23 g/t Au cut-off grade using a long-term gold price of US$1,840/oz, average mining costs at US$1.67 per tonne of material, with total processing and G&A costs of US$10.32 per tonne of ore and an average process recovery of 75 %. The refinery costs net of pay factor were estimated to be US$8.52 per ounce gold. Slope angles are based on 3 sectors (39°, 42°, and 47°) consistent with geotechnical consultant recommendations. Arizaro Mineral Resources are reported within a conceptual pit shell above a 0.25 g/t Au cut-off grade using the same gold price and costs as Lindero with an additional US$0.52 per tonne of ore to account for haulage costs between the deposit and plant. A slope angle of 47° was used for defining the pit. |
| ● | Mineral Resource tonnes are rounded to the nearest thousand. |
| ● | Totals may not add due to rounding. |
Factors that may affect the estimates include metal price and exchange rate assumptions; changes to the assumptions used to generate the cut-off grade; changes in local interpretations of mineralization geometry and continuity of mineralized zones; changes to geological and mineralization shape and geological and grade continuity assumptions; variations in density and domain assignments; geometallurgical assumptions; changes to geotechnical, mining, dilution, and metallurgical recovery assumptions; change to the input and
|
ANNUAL INFORMATION FORM |
Lindero and Arizaro Technical Report Page |C-7 |
FORTUNA SILVER MINES INC.
design parameter assumptions that pertain to the conceptual slope designs constraining the estimates; and assumptions as to the continued ability to access the site, retain mineral and surface rights titles, maintain environment and other regulatory permits, and maintain the social license to operate.
There are no other known environmental, legal, title, taxation, socioeconomic, marketing, political or other relevant factors that would materially affect the estimation of Mineral Resources or Mineral Reserves that are not discussed in this Report.
1.9 |
Mineral Reserves |
Mineral Reserve estimates follow standard industry practices, considering only Measured and Indicated Mineral Resources as only these categories have sufficient geological confidence to be considered Mineral Reserves (CIM, 2014). Subject to the application of modifying factors, Measured Resources may become Proven Reserves and Indicated Resources may become Probable Reserves. Mineral Reserves are reconciled monthly against production to validate the estimates.
Metal prices used for Mineral Reserve estimation were determined as of June 2022 by the corporate finance department of Fortuna from market consensus. Metallurgical recoveries are based on metallurgical test work conducted on samples obtained since 2017.
A breakeven cut-off grade was determined based on all variable and fixed costs applicable to the operation. These include exploitation and treatment costs, general expenses and administrative and commercialization costs (including doré transportation).
Mineral Reserves for the Lindero Deposit as of December 31, 2022 are reported in Table 1.2. Mineral Reserves are not estimated for the Arizaro Deposit.
Table 1.2Mineral Reserves as of December 31, 2022
Deposit |
Classification |
Tonnes (000) |
Au (g/t) |
Cu (%) |
Contained Metal |
Au (koz) |
|||||
Lindero |
Proven |
25,505 |
0.61 |
0.08 |
504 |
Probable |
53,713 |
0.54 |
0.11 |
937 |
|
Proven + Probable |
79,218 |
0.57 |
0.10 |
1,441 |
Notes:
| ● | Mineral Reserves are as defined by the 2014 CIM Definition Standards for Mineral Resources and Mineral Reserves. |
| ● | Factors that could materially affect the reported Mineral Reserves include; changes in metal price and exchange rate assumptions; changes in local interpretations of mineralization; changes to assumed metallurgical recoveries, mining dilution and recovery; and assumptions as to the continued ability to access the site, retain mineral and surface rights titles, maintain environmental and other regulatory permits, and maintain the social license to operate. |
| ● | Mineral Reserves for the Lindero Deposit are reported based on open pit mining within designed pit shells based on variable gold internal cut-off grades and gold recoveries by metallurgical type. Met type 1 cut-off 0.27 g/t Au, recovery 75.4%; Met type 2 cut-off 0.26 g/t Au, recovery 78.2%; Met type 3 cut-off 0.26 g/t Au, recovery 78.5%; and Met type 4 cut-off 0.30 g/t Au, recovery 68.5%. The cut-off grades and pit designs are considered appropriate for long term gold prices of US$1,600/oz. Assumptions used in the pit design are the same as those for the resources. |
| ● | Mineral Reserves are estimated as of August 31, 2022 and reported as of December 31, 2022 taking into account production related depletion between September 1 and December 31, 2022 |
| ● | Mining recovery and dilution is accounted for during block regularization to 10 x 10 x 8 meter selective mining units. |
| ● | Raul Espinoza, FAusIMM Chartered Professional #309581 is the Qualified Person for mineral reserves, being an employee of Fortuna Silver Mines Inc. |
| ● | Mineral Reserve tonnes are rounded to the nearest thousand. |
|
ANNUAL INFORMATION FORM |
Lindero and Arizaro Technical Report Page |C-8 |
FORTUNA SILVER MINES INC.
| ● | Totals may not add due to rounding. |
1.10 |
Mining methods |
The mine at the Lindero Property is an owner-operated conventional open pit mining operation. The key mining fleet equipment is composed of six trucks with an operational capacity of 96 tonnes per unit and two 17 cubic yard wheel loaders.
Mining costs benefit from short haul distances from the pit to the primary crusher and waste dump. Maximum travel distance is in the range of 4.2 km to deliver waste to the dump at the end of the mine life. The LOM direct base mining cost is estimated at US$ 1.65 per tonne mined.
Mineral Reserves are estimated at 79.2 million tonnes as of December 31, 2022 which is sufficient for a 12 year life-of-mine (LOM) as of January 1, 2023, consisting of an annual average mill throughput rate of 18,493 tpd. The LOM annual average production will be approximately 100 koz of gold based on an average head grade of 0.56 g/t Au. The ratio of waste to ore over the LOM is 1.36 to 1.
The QP is of the opinion that:
| ● | The mining method being used is appropriate for the Lindero Deposit being mined. |
| ● | The open pit, stockpile, waste dump designs, and equipment fleet selection are appropriate to reach production targets. |
| ● | The mine plan is based on successful mining philosophy and planning, and presents low risk. |
| ● | Inferred Mineral Resources have not been included in the mine plan and are considered as waste. |
| ● | The mobile equipment fleet presented is based on simulations and productivity data from the current operations. |
| ● | All mine infrastructure and supporting facilities meet the needs of the current mine plan and production rate. |
| ● | Major planned maintenance of the main equipment, such as loaders and trucks, have been covered in sustaining capital by purchasing additional equipment that can replace any possible lost production hours and not impact production targets. |
1.11 |
Recovery methods |
The Lindero Mine’s recovery process includes a multi-stage crushing plant, an agglomerator, a permanent leach pad, a SART plant, an ADR plant, and smelting plant to produce doré bars. Additionally, the SART plant produces a precipitate containing large fractions of copper and silver from the PLS solution.
Water is obtained from multiple wells located in the vicinity of the mine site. Electrical power is sourced though diesel generators under a rental contract. The crushing plant consists of three stages with a target final product of 80 percent passing size (P80) of minus 6-8 mm. A primary jaw crusher operating in open circuit, a secondary stage using three parallel-operating cone crushers in inverse close-circuit with its own classification screen, and a tertiary stage using a single high pressure grinding roll operating in open circuit with a recirculation of its discharge.
The agglomeration stage mixes crushed ore with cement, concentrate cyanide solution and barren solution to produce a glomer with enough mechanical competence to allow percolation of the leaching solution during the entire life of the permanent multi-lift leach pad.
A permanent multi-lift leach pad is loaded using a series of grasshoppers and a radial stacker into, typically, 60 x 60 x 10 m cells that are irrigated for a total of 75 days. Initially the cells are irrigated with intermediate leach solution (ILS) for 30 days to produce a PLS from which the gold is later recovered, followed by a further 45 days of irrigation with barren solution to produce the ILS.
|
ANNUAL INFORMATION FORM |
Lindero and Arizaro Technical Report Page |C-9 |
FORTUNA SILVER MINES INC.
Low grade-cyanide soluble copper is pervasive throughput the deposit. To guarantee the efficiency of the downstream recovery processes, as well as the quality of the doré, a SART plant removes the vast majority of the copper and silver contained in the PLS to a precipitate. The copper precipitate is sold to the open market.
The PLS solution is then processed using activated carbon in the ADR plant to produce a high gold concentrate solution (eluate) that for security reasons is transferred to the smelter area. At the smelter, gold is converted to a solid using electrowinning then smelted into a doré bar using a propane furnace.
The Lindero Mine’s operational metallurgical performance is progressively improving since first ore was loaded on the leach pad in July 2020. Throughput levels have increased as the operation has improved the mechanical availability of the crushing and stacking facilities.
The Lindero Mine’s accumulated gold recovery as of December 31, 2022, reached 58.03 percent, which is line with management’s expectations based on the loading of coarse size ore during the first 11 months of operation. This coarse ore accounts for 31.8 percent of the total ore tonnes and 31.1 percent of the total gold metal loaded on the leach pad as of yearend 2022. The accumulated gold recovery curve shows a consistent upward trend that will continue to increase provided Mansfield continue optimizing the performance of the crushing circuit.
1.12 |
Project infrastructure |
The QP is confident that all mine and process infrastructure and supporting facilities have been included in the general layout to ensure that they meet the needs of the mine plan and production rate and notes that:
| ● | The mine has good year-round access with significant road improvements undertaken for stretches of the road between Tolar Grande and the operation. |
| ● | The mine infrastructure has a compact layout footprint of approximately 60 ha. |
| ● | Major processing and support facilities located at the Lindero Mine include: primary, secondary and tertiary crushers; agglomerators; stacking system; leach pad; solution ponds; SART plant; ADR plant; power plant; truck shop; administrative offices; waste dump; warehouses; logging facility; chemical and metallurgical laboratories; and accommodation camp. |
| ● | Power is being generated on-site by a contractor through diesel-fuel generators with a hired capacity of 7.64 MW. |
| ● | Total water requirements vary between 90 and 100 m3/hr and are primarily sourced from three existing wells located approximately 13 km southeast of the Mine. |
1.13 |
Market studies and contracts |
No market studies are currently relevant as the Lindero Mine will produce a readily-saleable commodity in the form of doré.
Mansfield has 14 major contracts for services relating to operations at the mine including mining activities, drilling, civil works, transportation, electrical installations, plant and mine maintenance, and the supply of reagents, cement and explosives. Mansfield also has agreed to contracts for its main services including power generation, catering, security, personnel transportation and product sales.
A long-term price estimate of US$1,600/oz has been applied, based on the mean consensus prices from 2022 to 2025 of US$1,719/oz weighted at 40 percent and the 10-year historical average of US$1,435/oz weighted at 60 percent.
The Lindero Mine product consists of doré bars containing an average of approximately 84 percent gold content for the mine life. Overall gold extraction in respect to ore placed on the heap leach is estimated to be approximately 75 percent.
The QP has reviewed the information provided by Fortuna on marketing, contracts, metal price projections and exchange rate forecasts, and notes that the information provided support the assumptions used in this Report and are consistent with the source documents, and that the information is consistent with what is publicly available within industry norms.
|
ANNUAL INFORMATION FORM |
Lindero and Arizaro Technical Report Page |C-10 |
FORTUNA SILVER MINES INC.
1.14 |
Environmental studies and permitting |
In November 2011, the Salta Provincial government granted the principal environmental Declaración de Impacto Ambiental (DIA) permit, which is the primary mining permit required for development of a mine, enabling a project operator to start construction and proceed to full mine operating status. The Salta Provincial government has approved the three Environmental Impact Assessment (EIA) renewals submitted by Mansfield since November 2011, granting in each case a new DIA permit with the same faculties. The last update submitted in February 2021, is under evaluation by the authority of the Mining Secretary of Salta. During the evaluation of the renewals, the last approved EIA and the DIA permits remain valid and in force until renewal approval, which is expected later in 2023.
Specific approvals and permits are required for many aspects of the Mine. All necessary permits regarding mining operations were granted in a timely manner.
Since the discovery of gold mineralization at the Property in 2000, Mansfield has provided more than 20 environmental reports describing various activities such as extraction of samples at initial stages, soil sampling, a program of geophysical surveys, and details of access roads, drilling programs, camp installation, and runways. These reports each consist of a brief description of the environmental baseline, the Lindero Mine, environmental impact, and ways to prevent and mitigate that impact.
In December 2007, Mansfield presented an extensive environmental baseline report (EBL), completed by Vector Argentina, to the Secretariat of Mining for Salta Province.
That report included sections on geology, geomorphology, hydrology, sociology, archaeology, local flora and fauna, soil types, and climate and air quality. The EBL was accepted by the Mining Judge of Salta after being examined by environmental technicians of the Secretariat of Mining and the Provincial Secretariat of Environment. There are no known current environmental liabilities for this Project.
In September 2007, Mansfield installed a weather station at the site to record temperature, humidity, wind speed and direction, precipitation, atmospheric pressure, solar radiation, and evaporation. All of these parameters are recorded on a daily basis in a database at the camp. The weather station allows the analysis of updated data daily and analysis of the data across time.
It is important to note that Mansfield has filed an advance activity report every six months since 2012, as established by DIA requirements. The last semi-annual report was submitted to the mining authorities in August 2022.
Mansfield received a mine permit to build a heap-leach gold mine for up to 30,000 tpd as detailed in the Pre-Feasibility Study (AMEC, 2010b).
Electrical, structural, building and seismic plans for the construction of the mine were reviewed and approved by COPAIPA (Dec 2013), the professional engineering institution that overlooks all construction in Salta Province. In 2017, COPAIPA approved additional permits for the construction of the agglomeration and SART plants that were added to the process design. Mansfield has obtained all necessary permits for the infrastructure that is required to support mining operations at the Lindero Mine.
Environmental risks during the closure stage will be reduced by remediation and monitoring work. At the closure stage, soil will be contoured by heavy machinery to minimize the long-term impact of mining activity and return the topography of the land to resemble prior conditions. However, the movement of soil, and thus the risk, will be significantly less than in the mining operations stage.
In November 2022, Mansfield filed a detailed closure plan report with the Secretary of Mining. This is the first detailed mine closure study presented in the Province of Salta.
One social-environmental risk will be the impact of closure on employment, directly and indirectly, to the surrounding communities. It will be imperative to implement measures to mitigate this impact during the mine’s operation.
A significant environmental risk will also be present during the closure of facilities, which will cause significant production of non-hazardous industrial waste and hazardous products from the movement of heavy
|
ANNUAL INFORMATION FORM |
Lindero and Arizaro Technical Report Page |C-11 |
FORTUNA SILVER MINES INC.
machinery. It will be essential to establish clear environmental policies with the contractors during this process.
One of the priorities of Mansfield is the care and protection of the environment. During the exploration and construction phases, an attempt was made to control to the greatest extent possible any potential environmental impacts on the area. The same effort is being made in the operational stage and will be made in the closure stages of the mine. Mansfield has defined environmental principles that will enable the development of mining operations efficiently from a productivity standpoint and from an environmental perspective.
It is the opinion of the QPs that the appropriate environmental, social and community impact studies have been conducted to date for the Lindero Mine. Mansfield has maintained all necessary environmental permits that are the prerequisites for the granting of mining permits.
1.15 |
Capital and operating costs |
Capital and operating cost estimates are based on the established cost experience gained from the operation, projected budgets, and quotes from manufacturers and suppliers. Overall, the cost estimation is of sufficient detail that, with the current experience at the Lindero Mine, Mineral Reserves can be declared. All costs are US dollars (US$). No escalation factors have been applied to any costs, present or future capital. The total mine sustaining capital cost through the LOM is estimated to be US$ 196.4 million.
Major sustaining capital projects planned for 2023 include leach pad phase 2 expansion (US$ 17.5 million), heavy equipment replacement and overhaul (US$ 7.6 million) and plant spare parts (US$ 1.2 million).
The total LOM operating cost for the Lindero Mine is estimated at US$ 12.90 per tonne of ore processed.
Long-term projected operating costs are based on the LOM plan, mining and processing requirements, as well as historical information regarding performance, operational and administrative support demands. Operating costs include site costs and operating expenses to maintain the operation.
1.16 |
Economic analysis |
Fortuna is using the provision for producing issuers, whereby producing issuers may exclude the information required under Item 22 of Form 43-101F1 - Technical Reports for technical reports on properties currently in production and where no material production expansion is planned.
The Mineral Reserve declaration in this Report is supported by a positive cashflow for the period set out in the LOMP based on the assumptions detailed in this Report.
1.17 |
Other relevant data and information |
Goldrock commissioned Vector Argentina SA (Ausenco; 2010) and Conhidro (2013) to conduct a hydrologic study of the Property area, during the detailing of the environment base line map and EIA study. As part of the study, the Rio Grande hydrologic basin was defined through the evaluation of various field parameters and review of satellite images. The basin was determined to be 1,687 km2 in size. Exploration for groundwater resources was undertaken, and successfully identified possible sources.
A number of geotechnical studies were performed at the Lindero Deposit and reviewed by CNI from 2017 to 2022. Those studies form the basis for the pit slope estimates used in the mining model for the Lindero Mine. Included in the studies were geotechnical surveys for heap leach and waste dumps. These studies are considered by the QP to be consistent with industry practices and adequate to support mine design.
1.18Conclusions, risks, and opportunities
This Report represents the most accurate interpretation of the Mineral Reserve and Mineral Resource available as of the effective date of this report. The conversion of Mineral Resources to Mineral Reserves for the Lindero Deposit estimate was undertaken using industry-recognized methods, and estimated operational costs, capital costs, and plant performance data. Thus, it is considered to be representative of future operational conditions. This Report has been prepared with the latest information regarding environmental and closure cost requirements.
|
ANNUAL INFORMATION FORM |
Lindero and Arizaro Technical Report Page |C-12 |
FORTUNA SILVER MINES INC.
A number of opportunities and risks were identified by the QPs during the evaluation of the Lindero Mine and Arizaro Project.
Opportunities include:
| ● | As mining has commenced at the Lindero Deposit, additional geotechnical data is being collected from the open pit that could support an increase in final pit slope angles, potentially decreasing stripping ratios and/or increasing Mineral Reserves. |
| ● | The Arizaro Deposit is not included in the current mine plan. However, it represents upside opportunity if a satellite mine can be developed on the Property that could supplement the Lindero operation. |
| ● | Infill drilling at both the Lindero and Arizaro deposits could support the conversion of Inferred Resources to Measured or Indicated Resources and, with the appropriate studies, to Mineral Reserves. This represents additional upside potential for the planned operation. |
| ● | The Lindero Deposit remains open at depth below the pit shell constrained reported reserves and resources. An area of interest has been identified by Fortuna during the drilling campaign carried out in 2016 with drill hole LDH-126 encountering 0.97 g/t Au over a 38 m interval (refer to discussion in Section 10). This is supported by historical drilling from 2007 including drill hole LDH-86 averaging 1.06 g/t Au over a 52 m interval which bottomed in mineralization. These intercepts warrant follow-up drill testing. |
| ● | There are several local exploration targets within the concession boundary, that with further work, represent upside opportunity to identify mineralization that can potentially add to the resource base. |
| ● | As mining has commenced, blasting fragmentation analysis is being conducted on an ongoing basis to optimize mining and processing productivity and reduce costs. |
| ● | Blasting trials on interim walls could result in the steepening of bench face angles and determine if pre-splitting final walls is required. |
| ● | Usage of 50-tonne capacity civil trucks instead of 96-tonne mining trucks could reduce both acquisition capital and maintenance costs. |
| ● | Mansfield plan to execute multiple projects in 2023 in the crushing and agglomeration areas that are intended to improve the long-term mechanical availability of those facilities. |
| ● | Improvements to the radial stackers traction system will increase its mechanical availability. |
Risks include:
| ● | Vibrations are impacting infrastructure associated with the primary crusher and agglomerator, which could potentially lead to damage to the supporting structure. Mansfield has strengthened the equipment and incorporated monitoring procedures to the primary crusher to help early identification of potential issues. External consultants have been engaged to assess the vibrations to ascertain if further remediation is required. |
| ● | Failure of strategic components of critical equipment in the processing plant could have a detrimental impact on planned throughput resulting in a reduction in gold production for a specific period of the year. Mansfield monitors critical components and maintains an inventory of spare parts to reduce the potential impact of any such failure. |
| ● | Despite collection of data relating to soluble copper from blast holes since operations commenced, local behavior of cyanide-soluble copper is not fully understood and cannot be modeled due to insufficient assays from historical core. Levels of soluble copper could be higher than anticipated in certain areas of the deposit requiring adjustments to mine plans and schedules to reduce the impact in the plant. The presence of a SART plant greatly reduces the potential impact of soluble copper at the mine. |
|
ANNUAL INFORMATION FORM |
Lindero and Arizaro Technical Report Page |C-13 |
FORTUNA SILVER MINES INC.
| ● | Considerable new lithium projects are being proposed in the Salta province and there is a minor risk that one of these projects could access water from the same aquifer that the Lindero Mine uses for its supply. In addition, new projects could have an adverse impact on procurement, transportation and social conditions in the local area while increasing competition for skilled workers. |
| ● | Capital controls and duties on goods and services imported into Argentina are impacting the delivery of spare parts for mining and processing equipment, which can result in reduced equipment productivity and mechanical availability. To ensure smooth operations, the logistics area should continue to monitor and maintain a well-stocked inventory to resolve potential issues promptly. In addition, Mansfield has engaged with local suppliers to obtain spare parts to mitigate potential future mechanical problems that may arise. |
1.19Recommendations
Recommended work programs at the Lindero Mine and Arizaro Project are independent of each other and can be conducted concurrently unless otherwise stated and include:
| ● | Continued work at the Arizaro Deposit that focuses on the controls of lithology, structure, and alteration on mineralization so as to determine the suitability of material as a potential feed for the Lindero Mine’s processing facility and to support the estimation of Mineral Resources. It is recommended that a 3,000-m diamond drill program (approximately 15 holes at a 50 m spacing) is conducted as the next phase of work at a cost of approximately US$ 670,000. |
| ● | An infill drill program at the Lindero Deposit involving the drilling of approximately 2,000-m of diamond drill holes is recommended in 2023 to improve the geological understanding of material planned for extraction in 2024. The cost of such a drill program is estimated at approximately US$ 500,000. |
| ● | Exploration work to date on the Lindero concession has been focused on outcropping porphyry mineralization. It is recommended that Mansfield evaluate the property for mineralization beyond the two known porphyry systems at Lindero and Arizaro. For example, alteration zones and silica structures located within the concession, 2.5 km due south of the Lindero Mine, remain open for evaluation. Exploration work would primarily involve mapping and carry no additional cost to the operation. |
| ● | The cement in each lift on the heap will cure for several months before another lift is placed. It may be several years before any block of agglomerated ore receives 110 m of loading. It is recommended that a long-term stacking test be conducted to see if ageing will improve the ability of the ore to support the 110-m height with less cement. The estimated cost of the testwork is US$ 20,000. |
| ● | A lysimeter test on site is recommended to obtain better data on evaporation and soil moisture content for improved pad water balance understanding. The estimated cost for tanks, piping, strain-gage loadcells, construction and installation is approximately US$ 10,000. |
| ● | Field scale permeability testing of ore with design cement content versus less to no cement content is recommended to determine if the site cement requirements could be decreased. The estimated cost for a tank, flow meter, construction and installation is approximately US$ 10,000. |
| ● | The extents of the Lindero Deposit rock quality designation (RQD) block model fails to reach the upper parts of the slope in a limited area in the southwest and north of the pit. It is recommended that new drill holes be planned to get information for the areas not covered by the RQD block model. An update of the RQD block model should be performed when this new information becomes available. The cost of a 2,000-meter geotechnical drill program to collect sufficient data is estimated at approximately US$ 500,000. |
|
ANNUAL INFORMATION FORM |
Lindero and Arizaro Technical Report Page |C-14 |
FORTUNA SILVER MINES INC.
| ● | Geotechnical drilling at the Arizaro Deposit to verify appropriate pit slope angles. The cost of a 3,000-meter geotechnical drill program to collect sufficient data for such an analysis is estimated at approximately US$ 750,000. |
| ● | It is recommended that Mansfield create a sulfide (pyrite) block model to proactively manage pockets of sulfide-rich waste rock (i.e. encapsulate potentially acid generating waste rock). This study can be conducted inhouse at no additional cost. |
| ● | A trade-off study is recommended to assess the option to excavate 16 m high benches without pre-splitting versus pre-splitting to excavate 8 m high benches, to steepen the pit walls. This study can be conducted inhouse at no additional cost. |
| ● | Drill and install additional piezometers (monitoring wells) to help verify aquifer adequacy and supply at approximately US$ 100,000. |
| ● | Conduct an overall site water balance and hydrogeology study with known supply and demand parameters. The cost of this study is estimated at approximately US$ 75,000. |
In addition, it is recommended that Mansfield focus its metallurgical development on optimization initiatives including:
| ● | The crushing and agglomeration plants may need additional reinforcement to their supporting structures. Once completed, the mechanical availability could improve along with throughput levels. |
| ● | The crushing plant’s metallurgical performance is undergoing several infrastructure upgrades to consistently achieve the desired target particle size of 6-8 mm. In addition to the usual evaluation of alternative crushing chambers for the jaw and cone crushers, the HPGR’s control logic should be reviewed to ensure minimal deviation from the roll’s opening target set point. |
| ● | Mansfield need to continue improving the leach pad stacking system mechanical availability to increase the equipment utilization time of the agglomeration-stacking circuit. Particular attention should be paid to, the radial stacker’s driving system that may need reinforcement or replacement. |
| ● | The leach pad operating practices must be supported in the metallurgical development of the in-house laboratory. The design parameters defined during the development stage of the project are to be used as a starting point and continuous internal investigations used for updating and improving the operating parameters for all unit processes to support the Lindero Mine’s LOM. |
| ● | It is recommended that the metallurgical laboratory facilities be carefully monitored and continuously upgraded to meet the requirements of the operation in a timely manner. |
| ● | The Lindero Mine’s electrical power supply relies 100 percent on diesel generation under a rental contract. During 2022 the average energy cost was US$ 0.40/kWh which is high when compared to typical values in the industry but not unreasonable considering the remote nature of the operation in the Argentine puna. Mansfield are in the process of tendering bids for the installation of a solar power plant that will help provide supplementary power to the camp and other remote facilities. |
All the above optimization recommendations can be conducted inhouse with associated costs incorporated into ongoing operational costs.
[End of Extract of Summary from Lindero and Arizaro Technical Report]
|
ANNUAL INFORMATION FORM |
Lindero and Arizaro Technical Report Page |C-15 |
FORTUNA SILVER MINES INC.
SCHEDULE “D”
MATERIAL PROPERTIES
San Jose Mine, Mexico
The following is the Summary from the technical report (the “San Jose Technical Report”) entitled “Fortuna Silver Mines Inc.: San Jose Mine, Oaxaca, Mexico” with an effective date of December 31, 2023 prepared by Eric Chapman, P.Geo., Paul Weedon, MAIG, Raul Espinoza, FAusIMM(CP), Mathieu F. Veillette, P.Eng. and Patricia Gonzalez, MMSA(QP). This Summary is subject to certain assumptions, qualifications and procedures described in the San Jose Technical Report and is qualified in its entirety by the full text of the San Jose Technical Report which is available for viewing on SEDAR+ at www.sedarplus.ca and is incorporated by reference in this AIF, and is also filed with the SEC on EDGAR (available at www.sec.gov). Defined terms and abbreviations used herein and not otherwise defined shall have the meanings ascribed to such terms in the San Jose Technical Report.
1.1 |
Introduction |
Fortuna Silver Mines Inc. (Fortuna) has compiled a Technical Report (the Report) on the San Jose Mine (the San Jose Project or the Project) located in Oaxaca, Mexico
The mineral rights of the San Jose Mine are held by Compania Minera Cuzcatlan S.A. de C.V. (Cuzcatlan). Cuzcatlan is a Mexican subsidiary that is 100 % indirectly owned by Fortuna and is responsible for running the underground silver-gold mine.
The Report discloses updated Mineral Resource and Mineral Reserve estimates for the Project.
Costs are in US dollars (US$) unless otherwise indicated.
1.2 |
Property description, location and access |
The mine is located in the central portion of the state of Oaxaca, Mexico.
The San Jose Mine area is characterized by gently sloping hills and adjoining colluvial- covered plains. Elevations above mean sea level range from approximately 1,540 m to 1,675 m. The vegetation is grasslands and thornbush that are typical of dry savannah climates being temperate in nature with an average annual temperature of 19.5ºC. Mining operations are conducted on a year-round basis.
The mine site is 47 km by road south of the city of Oaxaca, which provides access to an international airport, and 0.8 km east of federal highway 175, the major highway between Oaxaca and Puerto Angel on the Pacific coast. The village of San Jose del Progreso is located 2 km to the southeast of the mine site.
1.3 |
Mineral tenure, surface rights and royalties |
The Project consists of mineral rights for 22 mining concessions all located in the state of Oaxaca for a total surface area of approximately 47,844 hectares (ha). Tenure is held in the name of Cuzcatlan with all mining concessions having an expiry date beyond the expected mine life.
Cuzcatlan has signed 45 usufruct contracts, which have been registered before the National Agrarian Registry, with landowners to cover the surface area needed for the operation and tailings facilities.
The San Jose Mine is not subject to any back-in rights, liens, payments or encumbrances.
There are royalties attached to the mineral concessions, however, the only royalties that affect the Mineral Reserves and have been considered in the economic analysis are:
| ● | A 1.5 % royalty to Maverix on the Reduccion Taviche Oeste concession. |
| ● | A 3 % royalty on the Progreso concession and a 1 % royalty the Reduccion Taviche Oeste concession payable to SGM. |
|
ANNUAL INFORMATION FORM |
San Jose Technical Report Page |D-1 |
FORTUNA SILVER MINES INC.
1.4 |
History |
The Project has a long history of small mining operations, dating from the 1850s.
Companies with involvement in the Project prior to Fortuna’s interest include Pan American Silver, Minerales de Oaxaca S.A., and Continuum Resources Ltd. (Continuum). Work completed included surface and underground mapping, chip-channel sampling of the surface and underground workings, core drilling, and mining activities.
In November 2005, Fortuna reached an agreement with Continuum to earn a 70 % interest in Continuum’s interests. Fortuna acquired a 100 % interest in the Project in 2009.
Work completed by Fortuna and Cuzcatlan since 2009 has included geological mapping, a remote-sensing-based geological study, airborne geophysical surveys (airborne magnetometric and gamma-ray spectrometry), fluid inclusion and petrographic studies, core and RC drilling, metallurgical testwork, mining studies, environmental baseline and supporting studies, social outreach, and underground mining activities.
Total production from the mine from September 2011 through December 31, 2023, is estimated as 66.8 Moz of silver and 457 koz of gold.
1.5 |
Geology and mineralization |
The silver-gold deposit at the San Jose Mine is a typical low-sulfidation epithermal deposit.
The San Jose Mine area is underlain by a thick sequence of sub-horizontal andesitic to dacitic volcanic and volcaniclastic rocks of presumed Paleogene age. These units have been significantly displaced along major north and northwest-trending extensional fault systems with the precious metal mineralization being hosted in hydrothermal breccias, crackle breccias, and sheeted stockwork-like zones of quartz/carbonate veins emplaced within zones of high paleo permeability associated with the extensional structures.
The mineralized structural corridor extends for more than 3 km in a north-south direction and has been subdivided into the Trinidad deposit, San Ignacio and Victoria areas. The Mineral Resource and Mineral Reserve estimates discussed in this Report are located in the Trinidad deposit and Victoria areas.
The major mineralized structure in the Trinidad deposit area consists of a sheeted and stockwork quartz–carbonate vein system referred to as the main Stockwork Zone located between the primary Trinidad and Bonanza structures. In addition, several secondary vein systems are present locally in the hanging wall and footwall of the Trinidad and Bonanza structures.
The Victoria mineralized zone is located approximately 350 m east of the Trinidad vein and north of the current underground operations of the San Jose Mine. It is structurally related to the same extensional behavior that dominates the Trinidad deposit with a similar style of mineralization, corresponding to a low sulfidation epithermal deposit formed in a shallow crustal environment with a relatively low temperature resulting in the precipitation of silver and gold mineralization.
1.6 |
Drilling and sampling |
As of June 30, 2023, the data cut-off date for estimation of Mineral Resources, a total of 1,460 drill holes totaling 463,774.55 m have been completed at the San Jose Mine, with the drilling being concentrated in the Trinidad deposit area and extensions to the south of the mineralized structural system.
Wide-spaced exploration drilling has also been completed in the San Ignacio area along the southern extension of the structurally controlled mineralized corridor and to the far north of the Trinidad deposit, as well as in the Victoria mineralized zone, Los Diaz, Maria and Taviche projects. All of the drilling was conducted using core drilling methods with the exception of 1,476 m of reverse circulation (RC) pre-collars in six of the 1,460 diamond drill holes.
A total of 1,110 core holes totaling 330,951.55 m have been drilled in the Trinidad deposit area and 205 holes totaling 75,229.25 m in the Victoria mineralized zone. In Trinidad, the majority of the holes have been drilled from east to west to crosscut the steeply east-dipping mineralized zone at high angles, whereas in the Victoria mineralized zone, the holes have been drilled from west to east from underground to intersect the subvertical Victoria main structure. Of the 1,315 holes, 320 have been drilled from the surface and the remainder from underground.
The core drilling typically commences with HQ-(63.5 mm diameter) core and continues to the maximum depth allowable based on the mechanical capabilities of the drill equipment. Once this point is reached or poor ground
|
ANNUAL INFORMATION FORM |
San Jose Technical Report Page |D-2 |
FORTUNA SILVER MINES INC.
conditions are encountered the hole is cased and further drilling undertaken with smaller diameter drilling tools with the core diameter being reduced to NQ2 (50.6 mm) or NQ-size (47.6 mm) to completion of the hole. In the Trinidad deposit, five of the drill holes were further reduced to BQ-size (36.5 mm) diameter to complete the drill holes to the target depths. All the drilling completed in the project area has been carried out by contract drilling service companies. Ground conditions are generally good with core recovery averaging 99 %.
Surface drill hole collars were surveyed using differential global positioning system (GPS) and total station survey methods. Concrete monuments are constructed at each collar location recording the drill hole name, azimuth, inclination and total depth. At locations where the drill hole collar is located in a cultivated field, the collar monument is constructed approximately 50 cm below the actual surface.
Underground drill hole collars were surveyed using total station survey methods. Concrete monuments similar to those used for surface collars are constructed to mark the location with the drill hole name, azimuth, inclination and total depth recorded.
Down-hole surveys have been completed for 1,443 of the 1,460 drill holes completed as of the data cut-off date. For the 17 holes where downhole surveys are not recorded, all of which were drilled prior to 2007 with only three being drilled in the Trinidad deposit. The azimuth and dip orientation of these holes was recorded at the collar to account for drilling direction. The absence of downhole surveys in three of the 1,315 holes drilled at Trinidad and Victoria is not regarded as material to the Mineral Resource estimate.
Downhole surveys are typically completed at 50 m intervals although recent drill holes include downhole surveys at 10 m intervals until reaching 50 m depth and then at 50 m intervals thereafter. All downhole surveys have been carried out by the drilling contractor using Reflex electronic downhole survey tools.
As of the effective date of this Report, drilling has been conducted at the Trinidad deposit over a strike length of approximately 2,500 m and to depths exceeding 1,000 m from surface. Exploration drilling has generally increased in depth to the north. Drilling of the Victoria mineralized zone has been conducted over a strike length of approximately 1,700 m and covers a vertical extent of approximately 550 m, with upper holes intersecting the structure approximately 250 m below the surface.
The relationship between the sample intercept lengths and the true width of the mineralization varies in relation to the intersect angle between the steeply dipping zone of mineralized veins and the inclined nature of the diamond core holes. Calculated estimated true widths are always reported together with actual sample lengths by taking into account the angle of intersection between drill hole and the mineralized structure.
In 2018, all logging became digital, being incorporated daily into the Maxwell Datashed database system. Data were initially recorded using Excel templates, and later with the Maxwell LogChief application using essentially the same structure. Both input methods used picklists and data validation rules to ensure consistency between loggers. Separate pages were designed to capture metadata, lithology, alteration, minerals (sulfides, oxides, and limonite), structure (contacts, fractures, veins, and faults with attitudes to core axis). Intensity of alteration phases was recorded using a numeric 1 to 4 scale (weak, moderate, strong, complete).
Geotechnical logging consists of the collection of specified data fields including recovery percentage and rock quality designation (RQD) length. Joint filling and joint weathering were described. A tablet-based data entry program was developed by Cuzcatlan using the Maxwell LogChief software. Data checks are implemented into this program to prevent entry of erroneous data.
The sampling methodology, preparation, and analyses differ depending on whether it is drill core or a channel sample. All samples are collected by Cuzcatlan geological staff with sample preparation and analysis being conducted either at the onsite Cuzcatlan Laboratory or transported to the ALS Global preparation facility in Guadalajara prior to being sent on for analysis at their laboratory in Vancouver.
The Cuzcatlan Laboratory used since 2012 for assaying channel samples was accredited as a testing laboratory with the requirements of ISO/IEC 17025:2005 for sample preparation and assaying of silver and gold on March 2, 2018. Prior to this date, the laboratory was not certified. The Cuzcatlan Laboratory is not independent of Fortuna/Cuzcatlan.
The ALS Global Laboratory is an independent, privately-owned analytical laboratory group. The Vancouver laboratory holds ISO 17025 accreditation. The Mexican laboratory holds ISO 9001:2000 certification.
|
ANNUAL INFORMATION FORM |
San Jose Technical Report Page |D-3 |
FORTUNA SILVER MINES INC.
The SGS Laboratory used by Cuzcatlan as an umpire laboratory is an independent privately-owned analytical laboratory located in Durango, Mexico and holds ISO/IEC 17025:2005 accreditation for sample preparation and assaying.
Channel chip samples are generally collected from the face of newly exposed underground workings. The entire process is carried out under the mine geology department’s supervision. Sampling is carried out at 3 m intervals within the drifts and stopes of all veins. The channel’s length and orientation are identified using paint in the underground working and by painting the channel number on the footwall. The channel is typically approximately 20 cm wide and approximately 1 to 2 cm deep, with each individual sample preferably being no smaller than 0.4 m and no longer than 1.5 m.
Drill core is laid out for sampling and logging at the core logging facility at the camp. Sample intervals are marked on the core and depths recorded on the appropriate box. A geologist is responsible for determining and marking the drill core intervals to be sampled, selecting them based on geological and structural logging. The sample length must not exceed 2 m or be less than 20 cm.
All samples collected by Cuzcatlan are assayed by atomic absorption (AA) spectroscopy and by fire assay (FA) with gravimetric finish. For drill samples only, a full suite of trace elements is analyzed using an aqua regia digestion followed by inductively-coupled plasma (ICP) analysis. Assay results and certificates are reported electronically by e-mail. Since mid- 2018, the onsite laboratory has also assayed channel samples and selected composites for fluorine using a selective ion electrode technique.
Bulk density samples have been primarily sourced from drill core with a limited number being sampled from underground workings. Bulk density measurements are performed at the ALS Global Laboratory in Vancouver using an industry-standard wax coated water immersion technique.
Sample collection and transportation of drill core and channel samples is the responsibility of and the Cuzcatlan mine geology and brownfields exploration departments and must follow strict security and chain of custody requirements established by Fortuna. Samples are retained in accordance with the Fortuna corporate quality assurance/quality control (QAQC) procedures.
Fortuna implemented a full QAQC program to monitor the sampling, sample preparation and analytical process for all drilling campaigns in accordance with its companywide procedures. The program involved the routine insertion of certified reference materials, blanks, and duplicates. Evaluation of the QAQC data indicates that the data are sufficiently accurate and precise to support Mineral Resource estimation.
1.7 |
Data verification |
Data verification programs performed by the QPs on the data collected by Cuzcatlan are adequate to support Mineral Resource and Mineral Reserve estimation.
1.8 |
Mineral processing and metallurgical testing |
Initial metallurgical test work was completed in support of pre-feasibility studies with Cuzcatlan continuing to build on this original work with additional tests to support operational requirements.
Work completed included whole rock analysis, Bond ball mill work index, grind calibration. rougher flotation test work with three stages of cleaning, locked cycle flotation test work and rougher kinetics flotation. Data was used to design the process plant, which has been in operation for 12 years, since 2011.
It is the opinion of the QP that the San Jose Mine has an extensive body of metallurgical investigation comprising several phases of testwork as well as an extensive history of treating ore at the operation since 2011. In the opinion of the QP, the San Jose metallurgical samples tested and the ore that is presently treated in the plant is representative of the material included in the life-of-mine plan (LOMP) in respect to grade and metallurgical response. In 2022, the geology department provided 25 samples from the Victoria mineralized zone for testing. The metallurgical recoveries obtained for silver head grades in the range of 120-160 g/t were 87.7-90.1% for gold (Au) and 88.1-89.7% for silver (Ag). Therefore, the samples exhibit a metallurgical recovery trend similar to the current operation within that range of Ag head grades. Additionally, mineralogy did not detect any mineral types different from those currently being processed at the Trinidad deposit.
|
ANNUAL INFORMATION FORM |
San Jose Technical Report Page |D-4 |
FORTUNA SILVER MINES INC.
Metallurgical recovery is estimated to be constant for the LOMP at 90.54 % for silver and 89.82 % for gold. Differences between vein systems are minimal with regard to recovery.
There is no indication that the characteristics of the material planned for mining will change and therefore the recovery assumptions applied for future mining are considered as reasonable for the LOMP.
Deleterious elements detected in ore in specific parts of the deposit have the potential to affect economics due to potential smelting penalties, including elevated levels of fluorine (>1,000 ppm). These levels have been considered in the financial analysis.
Iron-oxide minerals (hematite) have been identified in ore processed from mineralization associated with the highest levels of the mine. Elevated iron-oxide has been found to lower metallurgical recovery in the plant by approximately 5 %. Testwork is ongoing to optimize the plant to maximize recovery from this material that will potentially be processed in batches so as not to impact the recovery of sulfide ore.
1.9 |
Mineral Resources |
Mineral Resource estimation involved the usage of drill hole and channel samples in conjunction with underground mapping to construct three-dimensional wireframes to define individual vein structures. Samples were selected inside these wireframes, coded, composited and top cuts applied if applicable. Boundaries were treated as hard with statistical and geostatistical analysis conducted on composites identified in individual veins. Silver and gold grades were estimated into a geological block model consisting of 4 m x 4 m x 4 m selective mining units (SMUs) representing each vein. All veins were estimated by ordinary kriging (OK) with risk analysis conducted by sequential Gaussian simulation. Estimated grades were validated globally, locally, visually, and (where possible) through production reconciliation prior to tabulation of Mineral Resources.
Resource confidence classification considers a number of aspects affecting confidence in the resource estimation including: geological continuity and complexity; data density and orientation; data accuracy and precision; grade continuity; and simulated grade variability. Mineral Resources were classified as Measured, Indicated and Inferred on a combination of the distance to the nearest sample, kriging efficiencies, and the slope of regression.
Mineral Resources are reported based on underground mining within mineable stope shapes based on actual operational costs and mining equipment sizes using silver equivalent grades in the block model calculated based on the projected long term metal prices and actual metallurgical recoveries experienced in the plant using the following formula:
Ag Eq (g/t) = Ag (g/t) + (Au (g/t)*((1,880/23.90)*(91/90)).
Mineral Resources are reported above a cut-off grade of 130 g/t Ag Eq based on operating costs of US$ 84.94/t comprised of US$ 38.31/t for mining, US$ 20.79/t for plant, and US$ 25.92 for all other costs including general services and administration, distribution, community and social relations.
By the application of a silver equivalent value taking into consideration the average metallurgical recovery and long-term metal prices for each metal, and the determination of a reasonable cut-off grade using actual operating costs, as well as the exclusion of Mineral Resources identified as being isolated or economically unviable using a floating stope optimizer, the Mineral Resources have ‘reasonable prospects for eventual economic extraction’.
Mineral Resources exclusive of Mineral Reserves as of December 31, 2023, are reported in Table 1.1. Mineral Resources that are not Mineral Reserves do not have demonstrated economic viability. Mineral Resources are reported insitu, using the 2014 CIM Definition Standards. Eric Chapman P. Geo, a Fortuna employee, is the Qualified Person for the estimate.
Table 1.1 Mineral Resources as of December 31, 2023
Classification |
Tonnes (000) |
Ag (g/t) |
Au (g/t) |
Contained Metal |
|
Ag (Moz) |
Au (koz) |
||||
Measured |
45 |
141 |
1.09 |
0.2 |
2 |
Indicated |
1,001 |
148 |
1.11 |
4.7 |
36 |
Measured + Indicated |
1,046 |
147 |
1.11 |
5.0 |
37 |
Inferred |
1,029 |
147 |
1.04 |
4.9 |
35 |
|
ANNUAL INFORMATION FORM |
San Jose Technical Report Page |D-5 |
FORTUNA SILVER MINES INC.
Notes:
| ● | Mineral Resources are reported insitu, using the 2014 CIM Definition Standards for Mineral Resources and Mineral Reserves. |
| ● | Mineral Resources are exclusive of Mineral Reserves. Mineral Resources that are not Mineral Reserves, do not have demonstrated economic viability. |
| ● | Mineral Resources are reported as of December 31, 2023. |
| ● | Mr. Eric Chapman, P. Geo., a Fortuna employee, is the Qualified Person for the estimate. |
| ● | Mineral Resources are reported based on underground mining within optimized stope designs using a cut-off grade of 130 g/t Ag Eq based on assumed metal prices of US$ 23.90/oz Ag and US$ 1,880/oz Au, estimated metallurgical recovery rates of 91 % for Ag and 90 % for Au (Ag Eq (g/t) = Ag (g/t) + (Au (g/t)*((1,880/23.90)*(91/90)), and an average mining cost of US$ 38.31/t, processing cost of US$ 20.79/t and other costs including general administrative & services and distribution of US$ 25.92. |
| ● | Mineral Resource tonnes are rounded to the nearest thousand. |
| ● | Totals may not add due to rounding. |
Factors that may affect the estimates include metal price and exchange rate assumptions; changes to the assumptions used to generate the cut-off grade; changes in local interpretations of mineralization geometry and continuity of mineralized zones; changes to geological and mineralization shape and geological and grade continuity assumptions; variations in density and domain assignments; geometallurgical assumptions; changes to geotechnical, mining, dilution, and metallurgical recovery assumptions; changes to input and design parameter assumptions that pertain to the conceptual stope designs constraining the estimates; and assumptions as to the continued ability to access the site, retain mineral and surface rights titles, maintain environment and other regulatory permits, and maintain the social license to operate.
1.10 |
Mineral Reserves |
Mineral Reserves were converted from Measured and Indicated Mineral Resources. Inferred Mineral Resources were set to waste.
Mineral Reserves assume overhand cut and fill (OCF) or sublevel stoping (SLS) mining methods.
The overall mining recovery is approximately 92 % which takes into account the presence of pillars in wide veins and crown pillars for each main level of the mine.
Two sources of dilution were considered, operational dilution and mucking dilution. Operational dilution for OCF averages 13.4 % if a zero grade for the waste material is applied. In the case of SLS, the operation dilution averages 16.7 %. Mucking dilution was estimated as 1 % and applied to both mining methods.
Metal prices used for Mineral Reserve estimation were determined as of June 2023 by the corporate financial department of Fortuna based on market consensus.
Metallurgical recoveries were based on metallurgical testwork and operational results at the plant from July 2022 to June 2023.
Net smelter return (NSR) values were dependent on various parameters including metal prices, metallurgical recovery, price deductions, refining charges and penalties.
A breakeven cut-off grade was determined based on all variable and fixed costs applicable to the operation. These include exploitation and treatment costs, general expenses and administrative and commercialization costs (including concentrate transportation). The cut-off grade determination does not include costs associated with management fees, community support activities, institutional relations, capital expenditures, SG&A expenses, Brownfields exploration or closure costs., with the expectation that these costs will be covered by the operations cash flow or by Fortuna. The breakeven cut-off grade was determined to be 150 g/t Ag Eq for OCF and 132 g/t Ag Eq for SLS. For the Reduccion Taviche Oeste concession where an additional 2.5 % royalty is payable, the cutoff was 153 g/t Ag Eq cut-off for OCF and 135 g/t Ag Eq for SLS. For the Progreso mineral concession where a 3% royalty may be payable, the break-even cut-off grade would be increased to 154 g/t Ag Eq in OCF and 136 g/t Ag Eq in SLS.
SLS mining will be used for 82 % of the total Mineral Reserves with OCF mining representing the remainder.
Mineral Reserves as of December 31, 2023, are reported in Table 1.2. Mineral Reserves are reported at the point of delivery to the process plant, using the 2014 CIM Definition Standards. The Qualified Person for the estimate is Mr. Raul Espinoza, FAusIMM (CP), a Fortuna employee.
|
ANNUAL INFORMATION FORM |
San Jose Technical Report Page |D-6 |
FORTUNA SILVER MINES INC.
Table 1.2 Mineral Reserves as of December 31, 2023
Classification |
Tonnes (000) |
Ag (g/t) |
Au (g/t) |
Contained Metal |
|
Ag (Moz) |
Au (koz) |
||||
Proven |
37 |
172 |
1.23 |
0.2 |
1.5 |
Probable |
695 |
155 |
0.97 |
3.5 |
21.7 |
Proven + Probable |
733 |
156 |
0.98 |
3.7 |
23.1 |
Notes:
| ● | Mineral Reserves are reported at the point of delivery to the process plant using the 2014 CIM Definition Standards. |
| ● | Mineral Reserves are reported as of December 31, 2023. |
| ● | Mr. Raul Espinoza, FAusIMM (CP), a Fortuna employee, is the Qualified Person for the estimate. |
| ● | Mineral Reserves are reported based on underground mining within optimized stope designs using an NSR breakeven cut-off for cut and fill mining methods of US$ 96.54/t, equivalent to 150 g/t Ag Eq and an NSR breakeven cut-off for sublevel stoping mining methods of US$ 85.02/t, equivalent to 132 g/t Ag Eq. An additional 2.5 % royalty is applied to the cut-off for Mineral Reserves mined from the Reduccion Taviche Oeste concession and a 3.0 % royalty is applied to the cut-off for Mineral Reserves mined from the Progreso concession. |
| ● | Metal prices used in the NSR evaluation are US$ 23.90/oz for silver and US$ 1,880/oz for gold. |
| ● | Metallurgical recovery values used in the NSR evaluation are 90.5 % for silver and 89.8 % for gold based on actual plant recoveries. |
| ● | NSR values taking into account refining charges used in the estimation are US$ 20.08/oz for silver and US$ 1,586.16/oz for gold with the exception of material located in the Reduccion Taviche Oeste concession where NSR values are US$ 19.57/oz for silver and US$ 1,546.31/oz for gold and Progreso concession where NSR values are US$ 19.47/oz for silver and US$ 1,538.34/oz for gold. |
| ● | Costs used in NSR breakeven cut-off determination are US$ 49.83/t for cut and fill mining method; US$ 38.31/t for sublevel stoping mining method; US$ 20.79/t for processing; and US$ 25.92/t for other costs including distribution, general service and administration. |
| ● | Mining recovery is estimated to average 92 % and mining dilution is estimated at 17 %. |
| ● | Mineral Reserve tonnes are rounded to the nearest thousand. |
| ● | Totals may not add due to rounding. |
1.11 |
Mining methods |
Mining uses conventional underground methods, consisting of OCF and SLS.
Geotechnical recommendations used in the mine design are based on a combination of rock mass rating and geotechnical strength index data.
Water inflows are currently managed using five pumping stations installed at different levels of the mine. One future pumping station is planned for construction in 2024, in accordance with the LOMP requirements.
Mineral Reserves are estimated at 0.7 million tonnes as of December 31, 2023, which is sufficient for a one-year LOMP consisting of 350 days at an average mill throughput rate of 2,100 tonnes per day (tpd). Production in 2024 is estimated to be approximately 3.2 Moz of silver and 20 koz of gold based on an average head grade of 156 g/t Ag and 0.98 g/t Au. Mine life will be complete by the end of 2024 unless additional Mineral Reserves are discovered through exploration drilling or reduction in costs.
Access to the San Jose underground mine is from surface through a main ramp. The San Jose Mine has been designed with a separation of 100 m between levels primarily to limit blast vibration but also to assist with hanging wall and footwall stability.
Transportation of ore and waste is performed via trucks with a 14 m3 and 7 m3 of capacity through the main and secondary ramps.
The ventilation requirements for the mine to produce 2,100 tpd is 615,593 cfm. The ventilation system brings all the intake air through the main ramp and three main airway networks. Exhaust air is forced to the surface from inside the mine by three principal fans, two operating at 250,000 cfm and one at 120,000 cfm.
The mine uses two kinds of backfill; waste rock backfill generated during underground mining and paste fill.
|
ANNUAL INFORMATION FORM |
San Jose Technical Report Page |D-7 |
FORTUNA SILVER MINES INC.
The mobile equipment fleet is based on the current mining operations, which is known to achieve the production targets set out in the LOMP.
Mine infrastructure and supporting facilities are sufficient for the remaining LOMP.
1.12 |
Recovery methods |
The process design is based on metallurgical testwork completed on samples from the deposit. The design and equipment are conventional.
The process plant design is split into four principal stages including: crushing; milling; flotation; and thickening, filtering and shipping. The plant has a 3,000 tpd throughput rate.
Energy requirements at the operation are provided by a State power line of 115 kV which supplies two power transformers of 7 to 8 MVA capacity.
The plant requires 2.7 m3 of water to process one tonne of ore, of which 92 % comes from the recirculation process, and the remaining 8 % from the waste-water treatment plant in Ocotlan.
The plant uses conventional reagents, including a frother, collectors, flocculant and a depressor.
1.13 |
Project infrastructure |
The mine has a relatively small surface footprint with the property boundary split into two parts, a north area covering the operational footprint, and a south area covering the area of the tailings storage facility.
Infrastructure consists primarily of the concentration plant, electrical power station, water storage facilities, filtered dry stack tailings facility, tailings dam, stockpiles, and workshop facilities, all connected by unsealed roads.
Additional facilities include offices, dining hall, laboratory, core logging and core storage warehouses.
All process buildings and offices for operating the mine have been constructed, with camp facilities not required due to the proximity of the site to urban areas.
The tailings facility is located approximately 1,500 m to the southwest of the concentration plant. The current dry stack tailings facility has a total capacity to 4,033,000 m3, which is sufficient for the LOMP.
The mine currently has one waste stockpile used for storing waste material that could not be effectively disposed of underground. There is sufficient remaining capacity for LOMP requirements.
The mine currently has two ore stockpiles which store low-grade silver ore, or material pending evaluation (due to mixing of different ore types).
Tractor trailers that can transport two 25 t containers each are used to transport concentrate by road to the port of Veracruz in the State of Veracruz for subsequent shipping to purchasers in 400 to 600 t lots.
Power is provided to the mine from the main grid via a 115,000-volt circuit, as well as a secondary reserve power supply line, all managed by Federal Electricity Commission (CFE).
1.14 |
Market studies and contracts |
Since the operation commenced commercial production in September 2011, a corporate decision was made to sell the concentrate on the open market. In order to get the best commercial terms for the concentrates, it is Fortuna’s policy to sign contracts for periods no longer than one year. In 2023 Cuzcatlan agreed a short-term contract to sell concentrate to Trafigura PTE LTD (15,000 t) and Arrow Metals (15,000 t) for 12 months.
All commercial terms entered between the buyer and Cuzcatlan are regarded confidential but are considered to be within standard industry norms.
The QPs have reviewed the key input information and consider that the data reflect a range of analyst predictions that are consistent with those used by industry peers. Based on these sources, price projections are considered acceptable as consensus prices for use in mine planning and financial analyses for the San Jose Mine in the context of this Report.
A price estimate of US$23.90/oz for silver and US$1,880/oz for gold has been applied, based on mean consensus prices projected for 2024.
|
ANNUAL INFORMATION FORM |
San Jose Technical Report Page |D-8 |
FORTUNA SILVER MINES INC.
Cuzcatlan has used a Mexican peso exchange rate of 19 pesos to the US dollar for financial analysis purposes, which conforms with general industry-consensus.
Cuzcatlan has 14 major contracts for services relating to operations at the mine regarding: mining activities, ground support, raise boring, drilling, transportation, electrical installations, plant and mine maintenance, explosives and civil works. The costs of such contracts are accounted for in the capital and operating expenditure depending on work performed. Contracts are negotiated and renewed as needed. Contract terms are typical of similar contracts in Mexico that Fortuna is familiar with.
The QP has reviewed the information provided by Fortuna on marketing, contracts, metal price projections and exchange rate forecasts and notes that the information provided supports the assumptions used in this Report and is consistent with the source documents, and that the information is consistent with what is publicly available within industry norms.
1.15 |
Environmental studies and permitting |
Numerous baseline and supporting studies were completed, covering areas including climate, air and water quality, hydrology, soil, flora, fauna, ecosystem characterization, identification of protected areas and archaeology.
No significant environmental risks were identified in the environmental baseline studies. During the operation stage, environmental risks and mitigation measures for the operation stage are determined on an annual basis.
Cuzcatlan has an environmental management and monitoring plan that includes follow-up on environmental programs for flora and fauna management, management of urban solid waste, special waste, hazardous waste, and mining waste, as well as a surface and groundwater monitoring plans, environmental noise monitoring, monitoring of the survival rate of flora included in reforestation programs, and a wildlife monitoring plan. Sustainability indicators have also been defined and their performance monitored monthly.
The mining operation has been developed in strict compliance with the Mexican regulations and permits required by the government agencies involved in the mining sector. In addition, all work follows the international quality and safety standards set forth under standards ISO 14001 and OHSAS 18000.
To the extent known, all permits that are required by Mexican law for the mining operation have been obtained. The tailings facility has sufficient storage capacity to support the currently reported Mineral Reserves and LOMP.
Cuzcatlan continues developing sustainable annual programs for the benefit of local communities, including educational, nutritional and economic programs. The social and environmental responsibilities support a good relationship between the company and local communities. This will aid the development and continuity of the mining operation and improve the standard of living and economies of local communities.
The mine plan anticipates closure of the operation in late 2024. The Company has assigned a dedicated team to review and update a multiyear progressive mine closure and monitoring plan with a current estimated budget of US$ 27 million, which will begin its implementation during 2024. Multiple considerations are being included such as closure-related technical studies and designs, remediation of affected areas, decommissioning and removal of infrastructure, landform reshaping, revegetation, and value-added activities for the communities associated with progressive closure, repurposing, and where appropriate, long-term monitoring and maintenance, whilst adhering to strict compliance with mine closure governmental regulations and high international standards.
1.16 |
Capital and operating costs |
As the mine has entered its last planned year of operation, sustaining capital expenses such as mine development meters, infill drilling, mine equipment and other necessary expenses have been considered as part of operating costs and covered by the projected cash flow generation in 2024.
The projected operating costs are based on the LOMP mining and processing requirements for 2024, as well as historical information regarding performance, operational and administrative support demands.
Operating costs include site costs and operating expenses to maintain the operation. These operating costs are analyzed on a functional basis and the cost structure is not similar to the operating costs reported by the financial statements published by Fortuna Silver Mines Inc.
|
ANNUAL INFORMATION FORM |
San Jose Technical Report Page |D-9 |
FORTUNA SILVER MINES INC.
Site costs relate to activities performed on the property including mine, plant, indirect and distribution of the commercial products. Community relations and capital expenditure costs are projected to be covered by Cuzcatlan’s cash flows in 2024. Brownfields explorations costs and closure costs sustained after mining activities have ceased are planned to be paid by Fortuna’s cash flow from its four other operating mines.
Projected operating costs for the LOMP are detailed in Table 1.3.
Table 1.3 Summary of projected operating costs in 2024
Area |
Units |
Q1 |
Q2 |
Q3 |
Q4 |
Total |
Mine |
US$/t |
60 |
56 |
43 |
39 |
48 |
Plant |
US$/t |
29 |
29 |
20 |
19 |
23 |
Indirect |
US$/t |
31 |
31 |
21 |
19 |
24 |
Distribution |
US$/t |
8 |
9 |
7 |
7 |
8 |
Community Relations |
US$/t |
5 |
6 |
4 |
3 |
4 |
Capital expenditure |
US$/t |
15 |
24 |
10 |
6 |
12 |
Total |
US$/t |
148 |
155 |
104 |
93 |
120 |
1.17 |
Economic analysis |
Fortuna is using the provision for producing issuers, whereby producing issuers may exclude the information required under Item 22 for technical reports on properties currently in production and where no material production expansion is planned.
The global after-tax financial results exhibit a negative outcome when factoring in exploration costs and the total mine closure cost. However, the projected financial outcome for 2024, considering only operational costs, shows a positive result. Fortuna expresses its commitment to covering Brownfields exploration costs for 2024 and the subsequent expenses upon cessation of mining operations using funds derived from corporate profits. Given this, the QP believes it is reasonable to continue mining operations throughout the planned operational period in 2024 to alleviate the negative financial and social results of mine closure and support the current Mineral Reserve declaration under two assumptions:
1.18 |
Conclusions |
An economic analysis was performed in support of the estimation of Mineral Reserves that, when costs associated with Brownfields exploration and closure were excluded, demonstrated a positive cash flow that provides the QP reasonability to continue mining operations through the planned operational period in 2024 while a more detailed closure plan for the mine is prepared.
1.19 |
Risks and opportunities |
Opportunities include:
| ● | Improvements in mining productivity through optimizing the mining cycle. As shotcreting comprises a significant component of the mining cycle, tests are being done to reduce the curing time from three to two hours which would improve the mining cycle. |
| ● | Completing the raise bore initiatives currently underway in the central and northern zones of the Trinidad deposit. This will ensure 100 % air coverage throughout the remainder of the mine life. |
| ● | Definition of Mineral Reserves associated with higher-grade mineralization identified in the Victoria mineralized structure. |
| ● | Exploration potential exists for the Yessi vein, a new blind zone of alteration and brecciation that has been interpreted as striking northwest to southeast and intersecting the Victoria mineralized zone, where drilling has intercepted some high-grade gold and silver mineralization. |
|
ANNUAL INFORMATION FORM |
San Jose Technical Report Page |D-10 |
FORTUNA SILVER MINES INC.
Risks include:
| ● | On January 2, 2023, SEMARNAT served Cuzcatlan a resolution confirming the nullity of the previously granted 12-year EIA extension. Cuzcatlan challenged the annulment of the EIA via a nullity trial presented before the Federal Administrative Court in Mexico City on January 10, 2023. On October 30, 2023, the Mexican Federal Administrative Court ruled in favor of Cuzcatlan and re- instated the 12-year EIA. The decision of the Mexican Federal Administrative Court has been appealed and was admitted by the Collegiate Court in January 2024. |
Cuzcatlan filed a response with the Collegiate Court in February 2024. A decision of the Collegiate Court is expected within the next six to 12 months. The permanent injunction that Cuzcatlan already has remains in effect.
| ● | Metallurgical recovery could be lower than estimated in ore that is estimated to have an elevated iron oxide content, which represents approximately 30 % of the plant feed in the LOMP. |
1.20 |
Recommendations |
Recommendations for the next phase of work have been broken into those related to ongoing exploration activities and those related to additional technical and operational studies. Recommended work programs are independent of each other and can be conducted concurrently unless otherwise stated. The exploration-related programs are estimated at a total cost of US$3.94 million. The operational improvement studies are recommended to be conducted in-house and therefore do not involve a direct cost.
1.20.1 |
Exploration activities |
1.20.2 Technical and operational studies
| ● | Delineation (infill) drilling. It is recommended that Cuzcatlan continue the delineation drilling from underground of the Trinidad deposit and Victoria mineralized zone. A total of 20,600 m of core drilling is recommended at a budgeted cost of US$ 2,200,000. |
|
ANNUAL INFORMATION FORM |
San Jose Technical Report Page |D-11 |
FORTUNA SILVER MINES INC.
| ● | Assess the mining potential of the Victoria mineralized zone. A detailed evaluation is recommended to determine the economic viability of accessing and mining the higher-grade zones of the Victoria mineralized structure. This will be completed utilizing the operations resources and part of normal operating cost. |
| ● | Bulk density measurements. It is recommended that the number of bulk density measurements be increased in secondary veins. If sufficient measurements are obtained, bulk density can be estimated rather than the presently used density assignment methodology. |
| ● | Mining method. As part of the continuous improvement initiatives to reduce mining cost and to increase mine productivity, it is recommended to continue with the mining evaluation and geomechanical conditions for each stope, considering the possibility of increasing the mining height using the SLS method from 20 m to 25 m where possible. |
| ● | Mining dilution. The mine should continue enhancing its blasting practices to minimize excessive host rock over breaking, which can lead to increased unplanned dilution. |
| ● | Optimization of plant based on metallurgical testwork results for mineralization located in the upper levels of the mine. The operation has identified a decrease in metallurgical recovery by approximately 5 % associated with mineralization from the upper levels of the mine, which recent mineralogical analysis indicates is related to the presence of hematite (iron-oxide). Additional metallurgical testwork has been initiated with results expected by the end of March 2024. Based on these results, it is recommended that the processing methodology is optimized to maximize metallurgical recovery by processing this mineralized material in batches. The budgeted cost of these tests is US$ 10,000. |
[End of Extract of Summary from San Jose Technical Report]
|
ANNUAL INFORMATION FORM |
San Jose Technical Report Page |D-12 |
FORTUNA SILVER MINES INC.
SCHEDULE “E”
MATERIAL PROPERTIES
Caylloma Mine, Peru
The following is the Summary from the technical report (the “Caylloma Technical Report”) entitled “Fortuna Silver Mines Inc.: Caylloma Mine, Caylloma District, Peru” with an effective date of December 31, 2023 prepared by Eric Chapman, P.Geo., Paul Weedon, MAIG, Raul Espinoza, FAusIMM (CP), Mathieu F. Veillette, P.Eng. and Patricia Gonzalez, MMSA QP. This Summary is subject to certain assumptions, qualifications and procedures described in the Caylloma Technical Report and is qualified in its entirety by the full text of the Caylloma Technical Report which is available for viewing on SEDAR+ at www.sedarplus.ca and is incorporated by reference in this AIF, and is also filed with the SEC on EDGAR (available at www.sec.gov). Defined terms and abbreviations used herein and not otherwise defined shall have the meanings ascribed to such terms in the Caylloma Technical Report.
1.1 |
Introduction |
Fortuna Silver Mines Inc. (Fortuna) has compiled a Technical Report (the Report) on the Caylloma Mine (the Caylloma Project or Project) located in the Caylloma District, Peru.
The Caylloma Mine ownership is 100 % held by Fortuna.
The mineral rights of the Caylloma Mine are held by Compania Minera Bateas S.A.C. (Bateas). Bateas is a Peruvian subsidiary that is 100 % indirectly owned by Fortuna and is responsible for running the underground silver-lead-zinc mine.
The Report discloses updated Mineral Resource and Mineral Reserve estimates for the Project.
Costs are in US dollars (US$) unless otherwise indicated.
1.2 |
Property description, location and access |
The Caylloma Mine is located in the Puna region of Peru at an altitude of between 4,300 and 5,000 meters above sea level (masl). Surface topography is generally steep with vegetation being primarily comprised of grasses and small shrubs common at high altitudes. The mine facilities are located at approximately 4,400 masl.
Access to the Caylloma Mine is by a combination of sealed and gravel road. The mine is located 225 road kilometers from Arequipa, a city of approximately a million people that includes an international airport and requires a trip of approximately five hours by vehicle. Access is available to all concessions via a network of unsealed roads.
The Caylloma Mine is an operating underground mine located in the Caylloma Mining District, 14 km northwest of the town of Caylloma at the UTM grid location of 8192263E, 8321387N, (WGS84, UTM Zone 19S).
1.3 |
Mineral tenure, surface rights and royalties |
The Caylloma Project consists of mineral rights for 74 mining concessions for a total surface area of 35,622 hectares (ha) and one beneficiation concession comprising 91.12 ha. Tenure is held in the name of Bateas with all mining concessions having an expiry date beyond the expected mine life.
Bateas has signed 22 surface right or easement contracts covering a total of 8,311 ha with landowners to cover the surface area needed for the operation and tailings facilities.
The Caylloma Mine is not subject to any back-in rights, liens, payments or encumbrances.
There are royalties attached to the mineral concessions, however, the only royalties that affect the Mineral Reserves and have been considered in the economic analysis are:
|
ANNUAL INFORMATION FORM |
Caylloma Technical Report Page |E-1 |
FORTUNA SILVER MINES INC.
| ● | A 2 % royalty on silver production to Nueva Granada Gold Ltd. (formerly Lemuria Royalties Corp.). |
| ● | A 1 % royalty or an effective rate based on operating profit (whichever is greater) to the Peruvian Government has been taken into account in predicting cash flows. |
| ● | A Special Tax on Mining based on the quarterly operating profit of the mining concession holder. |
1.4 |
History |
The earliest documented mining activity in the Caylloma District dates back to that of Spanish miners in 1620. English miners carried out activities in the late 1800s and early 1900s. Numerous companies have been involved in mining the district of Caylloma but limited records are available to detail these activities.
The Caylloma Mine was acquired by Compania Minera Arcata S.A. (CMA), a wholly owned subsidiary of Hochschild Mining plc in 1981. Fortuna acquired the mine from CMA in 2005.
CMA focused exploration on identifying high-grade silver vein structures. Exploration was concentrated in the northern portion of the district and focused on veins including Bateas, El Toro, Paralela, San Pedro, San Cristobal, San Carlos, Don Luis, La Plata, and Apostles.
Production prior to 2005 came primarily from the San Cristobal vein, as well as from the Bateas, Santa Catalina and the northern silver veins (including Paralela, San Pedro, and San Carlos) with production focused on silver ores and no payable credits for base metals. While under CMA management production parameters fluctuated during the late 1990s, as reserves were depleted. Owing to low metal prices, funds were not available to develop the Mineral Resources at depth or extend along the strike of the veins. Ultimately this resulted in production being halted in 2002.
Production under Bateas management focused on the development of polymetallic veins producing lead and zinc concentrates with silver and gold credits. Total production since October 2006 through December 31, 2023, is estimated at 23.4 Moz of silver, 36 koz of gold, 193 kt of lead, and 272 kt of zinc.
1.5 |
Geology and mineralization |
The mine is within the historical mining district of Caylloma, northwest of the Caylloma caldera complex and southwest of the Chonta caldera complex. Host rocks at the Caylloma Mine are volcanic in nature, belonging to the Tacaza Group. Mineralization is in the form of low to intermediate sulfidation epithermal vein systems.
Epithermal veins at the Caylloma Mine are characterized by minerals such as pyrite, sphalerite, galena, chalcopyrite, marcasite, native gold, stibnite, argentopyrite, and silver-bearing sulfosalts (tetrahedrite, polybasite, pyrargyrite, stephanite, stromeyerite, jalpite, miargyrite and bournonite). These are accompanied by gangue minerals, such as quartz, rhodonite, rhodochrosite, johannsenite (manganese-pyroxene) and calcite.
There are two different types of mineralization at Caylloma; the first is comprised of silver-rich veins with low concentrations of base metals and includes the Bateas, Bateas Piso, Bateas Techo, La Plata, Cimoide La Plata, San Cristobal, Pilar, Patricia, San Pedro, San Carlos, Paralela, Ramal Piso Carolina, and Don Luis II veins. The second type of vein is polymetallic in nature with elevated lead, zinc, copper, silver and gold grades and includes the Animas, Animas NE, Comoide ASNE, Ramal Techo ASNE, Rosita, Nancy Santa Catalina, Silvia and Soledad veins.
Underground operations are presently focused on mining the Animas, Animas NE, Nancy and associated splay veins.
1.6 |
Exploration, drilling and sampling |
CMA implemented a series of exploration programs to complement their mining activities prior to the closure of the operation in 2002. There is no reliable information available to detail the exploration conducted by CMA at the Caylloma Mine. Bateas were able to recover and validate information on 47 diamond drill holes totaling 8,177.67 m drilled by CMA between 1981 and 2003 at the Caylloma Mine.
Since Fortuna took ownership of the property in 2005, the principal exploration conducted at the deposit has been surface and underground drilling, to explore the numerous vein structures identified through surface
|
ANNUAL INFORMATION FORM |
Caylloma Technical Report Page |E-2 |
FORTUNA SILVER MINES INC.
mapping or geophysical surveys conducted by Bateas, or for infill purposes to increase the confidence level of the Mineral Resource estimates.
As of June 30, 2023, Bateas had completed 1,658 drill holes on the Caylloma Project totaling 283,593.30 m since the company took ownership in 2005 and represents all data compiled as of the data cut-off date used for Mineral Resource estimation. All holes are diamond drill holes and include 565 from the surface totaling 160,521.80 m, and 1,093 from underground totaling 123,071.50 m. It is important to note that not all the holes presented encountered mineralization and only drill holes in areas where reasonable geological continuity of mineralized structures could be established were used in defining and ultimately estimating Mineral Resources.
Bateas has used a number of different drilling contractors to carry out exploration and definition drilling since it took ownership of the mine in 2005. Both HQ (63.5 mm) and NQ (47.6 mm) diameter core were obtained, depending on the depth of the hole. Ground conditions are generally good with core recovery averaging 94 % and higher in mineralized zones.
Proposed surface and underground drill hole collar coordinates, azimuths and inclinations were designed based on the known orientation of the veins and the planned depth of vein intersection using geological plan maps and sections as a guide. For surface holes, the location of the collar is located in the field using differential global positioning system (GPS) instruments. The drill pad is then prepared at this marked location. Upon completion of the drill hole, a survey of the collar is performed using Total Station equipment, with results reported in the collar coordinates using reference Datum WGS84, UTM Zone 19S. For underground drill holes, once the drill station has been established, the location of the collar is located using Total Station instruments based on previously surveyed control points.
The geologist in charge of drilling is responsible for orienting the azimuth and inclination of the hole at the collar using a compass clinometer. Downhole surveys are completed by the drilling contractor using survey equipment such as a Flexit or Reflex tool at approximately 50 m intervals for all surface drill holes and for underground drill holes greater than 100 m in length. Bateas assesses the downhole survey measurements as a component of data validation.
Drill holes are typically drilled on sections spaced 40 to 60 m apart along the strike of the vein with surface drilling focusing on exploring the extents of the Animas, Animas NE, Bateas and Nancy veins and underground drilling used for a mix of exploration and resource definition. The extent of drilling varies for each vein with those having the greatest coverage having drill holes extending over 3 km of the vein’s strike length (Animas/Animas NE), to exploration prospects having only a few drill holes extending over just 50 m (Antimonio).
The relationship between the sample intercept lengths and the true width of the mineralization varies in relation to the intersect angle between the steeply dipping zone of mineralized veins and the inclined nature of the diamond core holes. Calculated estimated true widths (ETWs) are always reported together with actual sample lengths by taking into account the angle of intersection between drill hole and the mineralized structure.
In 2018, all logging became digital, being incorporated daily into the Maxwell Datashed database system. Data were recorded initially with Excel templates, and later with the Maxwell LogChief application using essentially the same structure. Both input methods used picklists and data validation rules to ensure consistency between loggers. Separate pages were designed to capture, lithology, alteration, veins, sulfide-oxide zones, minerals, structure (contacts, fractures, veins, and faults with attitudes to core axis), magnetic susceptibility, and special data (samples collected for geochemistry, thin section examinations, the core library, density, etc.). Intensity of alteration phases was recorded using a numeric 1 to 4 scale (weak, moderate, strong, very strong); abundance of veins and most other minerals were estimated in volume percent.
Geotechnical logging is conducted prior to cutting of the core and involves the collection of drill core recovery and rock-quality designation (RQD) data. Information is recorded in the field using the Maxwell LogChief application.
The sampling methodology, preparation, and analyses differ depending on whether it is drill core or a channel sample. All samples are collected by geological staff of Bateas with sample preparation and analysis being
|
ANNUAL INFORMATION FORM |
Caylloma Technical Report Page |E-3 |
FORTUNA SILVER MINES INC.
conducted either at the onsite Bateas Laboratory or transported to the ALS Global preparation facility in Arequipa prior to being sent on for analysis at their laboratory in Lima.
The Bateas Laboratory operated by Bateas is not independent and does not hold an internationally recognized accreditation.
ALS Global is an independent, privately-owned analytical laboratory group. The preparation laboratory in Arequipa and the analytical laboratory in Lima are supported by a Quality Management System (QMS) framework which is designed to highlight data inconsistencies sufficiently early in the process to enable corrective action to be taken in time to meet reporting deadlines. The QMS framework follows the most appropriate ISO Standard for the service at hand i.e. ISO 9001:2015 for survey/inspection activity and ISO 17025:2005 UKAS ref 4028 for laboratory analysis.
Channel samples are collected from the faces of underground workings. The entire process is carried out under the geology department’s supervision. Sampling is carried out at 2 m intervals within the drifts of all veins and 3 m intervals in stopes (except for Bateas and Soledad, where due to the thickness of the vein, sampling is carried out every 2 m in stopes). The channel lengths and orientations are identified using paint in the underground working and by painting the channel number on the footwall. The channel is between 20 cm to 30 cm wide and approximately 2 cm deep, with each individual sample being no longer than 1.5 m.
Drill core is laid out for sampling and logging at the core logging facility at the camp. Sample intervals are marked on the core and depths recorded on the appropriate box. A geologist is responsible for determining and marking the drill core intervals to be sampled, selecting them based on geological and structural logging. The sample length must not exceed 1.2 m or be less than 30 cm.
The elements of silver, copper, lead and zinc are assayed using either; atomic absorption (AA); inductively coupled plasma atomic emission spectroscopy (ICP-AES); or for high lead and zinc grades volumetric/titration techniques (VOL); or for high silver grades gravimetric techniques (GRAV) depending on the laboratory and assay value. Assay results and certificates are reported electronically by e-mail.
Bulk density samples have been primarily sourced from drill core with a limited number being sampled from underground workings. Bulk density measurements are performed at the ALS Global Laboratory in Lima using the OA-GRA09A methodology.
Sample collection and transportation of drill core and channel samples is the responsibility of Brownfields exploration and the Bateas mine geology departments and must follow strict security and chain of custody requirements established by Fortuna. Samples are retained in accordance with the Fortuna corporate sample retention policy.
Implementation of a quality assurance/quality control (QAQC) program is current industry best practice and involves establishing appropriate procedures and the routine insertion of certified reference material (CRMs), blanks, and duplicates to monitor the sampling, sample preparation and analytical process. Fortuna implemented a full QAQC program to monitor the sampling, sample preparation and analytical process for all drilling campaigns in accordance with its companywide procedures. The program involved the routine insertion of CRMs, blanks, and duplicates. Evaluation of the QAQC data indicates that the data are sufficiently accurate and precise to support Mineral Resource estimation.
1.7 |
Data verification |
Data verification programs performed by the QPs on the data collected by Bateas are adequate to support Mineral Resource and Mineral Reserve estimation.
1.8 |
Mineral processing and metallurgical testing |
It is the opinion of the QP that the Caylloma Mine has an extensive body of metallurgical investigation comprising several phases of testwork as well as an extensive history of treating ore at the operation since 2006. In the opinion of the QP, the Caylloma metallurgical samples tested and the ore that is presently treated in the plant is representative of the material included in the life-of-mine (LOM) in respect to grade and metallurgical response.
|
ANNUAL INFORMATION FORM |
Caylloma Technical Report Page |E-4 |
FORTUNA SILVER MINES INC.
Metallurgical recovery values forecast in the LOM for sulfide material averages 82 % for silver, 22 % for gold, 89 % for lead, and 89 % for zinc with the exception of gold rich veins (> 1 g/t Au) where testwork has demonstrated that minor adjustments in the processing plant can achieve metallurgical recovery rates of 85 % for silver, 55 % for gold, 87 % for lead and 89 % for zinc.
Until 2012, ore identified as containing high zinc oxide content was classified as not amenable for flotation. Laboratory and plant tests conducted since 2013 include metallurgical testing of material from the different levels of the Animas vein. The main conclusion was that zinc oxide contents greater than 0.20 % within the ore were related to lower metallurgical recoveries. In order to include this type of material without affecting the metallurgical recoveries blending has to be performed to limit the oxide material content to no more than 11 % of the plant feed. This has been considered in the LOM plan.
Beyond the blending consideration for oxide material, as described above, there are no additional deleterious elements that require special treatment in the plant as of the effective date of this Report.
1.9 |
Mineral Resources |
The 2023 Mineral Resource update has relied on channel and drill hole sample information obtained by Bateas since 2005. Mineralized domains identifying potentially economically extractable material were modeled for each vein and used to code drill holes and channel samples for geostatistical analysis, block modeling and grade interpolation by ordinary kriging or inverse distance weighting.
Resource confidence classification considers a number of aspects affecting confidence in the resource estimation including; geological continuity and complexity; data density and orientation; data accuracy and precision; and grade continuity. Mineral Resources are categorized as Measured, Indicated or Inferred. The criteria used for classification includes the number of samples, spatial distribution, distance to block centroid, kriging efficiency (KE) and slope of regression (ZZ).
Mineral Resources are reported based on underground mining within mineable stope shapes based on actual operational costs and mining equipment sizes using net smelter return (NSR) values in the block model calculated based on the projected long-term metal prices, commercial terms, and actual metallurgical recoveries experienced in the plant.
Veins classified as wide, being on average greater than two meters, are amenable to extraction by semi-mechanized mining methods with a mine to mill cost reported as US$ 89.78/t. Taking into account a 15% upside in metal prices for the evaluation of long-term resources a US$ 75/t NSR cut-off value is applied to the wide veins including Animas, Animas NE, Ramal Techo ASNE, Cimoide ASNE, Nancy, Rosita, and San Cristobal.
Veins classified as narrow, being on average less than 2 m, are amenable to extraction by conventional mining methods with a mine to mill cost estimated as US$ 170/t. Taking into account a 15% upside in metal prices for the evaluation of long term resources a US$135 /t NSR cut-off value is applied to the narrow veins including Bateas, Bateas Piso, Bateas Techo, La Plata, Cimoide La Plata, Soledad, Santa Catalina, Silvia, Ramal Piso Carolina, Paralela, San Carlos, San Pedro, Patricia, Pilar, and Don Luis II.
By the application of a NSR value taking into consideration the average metallurgical recovery and long-term metal prices for each metal, and the determination of a reasonable cut-off value using actual operating costs, as well as the exclusion of Mineral Resources identified as being isolated or economically unviable using a floating stope optimizer, the Mineral Resources have ‘reasonable prospects for eventual economic extraction’.
Mineral Resources exclusive of Mineral Reserves for the Caylloma Mine are reported as of December 31, 2023, and detailed in Table 1.1
|
ANNUAL INFORMATION FORM |
Caylloma Technical Report Page |E-5 |
FORTUNA SILVER MINES INC.
Table 1.1 Mineral Resources as of December 31, 2023
Category |
Tonnes (000) |
Ag (g/t) |
Au (g/t) |
Pb (%) |
Zn (%) |
Contained Metal |
|||
Ag (koz) |
Au (koz) |
Pb (kt) |
Zn (kt) |
||||||
Measured |
524 |
98 |
0.30 |
2.09 |
3.16 |
1,646 |
5 |
11 |
17 |
Indicated |
1,262 |
82 |
0.21 |
1.47 |
2.54 |
3,338 |
9 |
19 |
32 |
Measured + Indicated |
1,786 |
87 |
0.24 |
1.65 |
2.72 |
4,983 |
14 |
29 |
49 |
Inferred |
4,505 |
99 |
0.43 |
2.43 |
3.70 |
14,382 |
63 |
110 |
167 |
Notes on Mineral Resources
| ● | Mineral Resources are reported in situ, as defined by the 2014 CIM Definition Standards for Mineral Resources and Mineral Reserves. |
| ● | Mineral Resources as reported exclusive of Mineral Reserves. Mineral Resources that are not Mineral Reserves do not have demonstrated economic viability. |
| ● | Mineral Resources are reported as of December 31, 2023. |
| ● | Mr. Eric Chapman P.Geo., a Fortuna employee, is the Qualified Person for the estimate. |
| ● | Point metal values (taking into account metal price, concentrate recovery, smelter cost, metallurgical recovery) used for NSR evaluation are US$ 0.49/g for silver, US$ 15.40/% for lead, and US$ 15.58/% for zinc with the exception of gold rich veins that used US$ 0.51/g for silver, US$ 24.69/g for gold, US$ 14.88/% for lead, and US$ 15.48/% for zinc, based on metal prices of US$ 21/oz for silver, US$ 1,600/oz for gold, US$ 2,000/t for lead and US $2,600/t for zinc, and metallurgical recovery values of 82 % for silver, 22 % for gold, 89 % for lead, and 89 % for zinc, with the exception of gold rich veins that used 85 % for silver, 55 % for gold, 87 % for lead, and 89 % for zinc. |
| ● | Mineral Resources for veins classified as wide (Anima, Animas NE, Cimoide ASNE, Nancy, Rosita, and San Cristobal) are reported above an NSR cut-off value of US$ 75/t. Mineral Resources for veins classified as narrow (all other veins) are reported above an NSR cut-off value of US$ 135/t based on actual and projected mining costs and a 15% upside in metal prices. |
| ● | Mineral Resource tonnes are rounded to the nearest thousand. |
| ● | Totals may not add due to rounding. |
Factors that may affect the Mineral Resource estimates include metal price and exchange rate assumptions; changes to the assumptions used to generate the cut-off grade; changes in local interpretations of mineralization geometry and continuity of mineralized zones; changes to geological and mineralization shape and geological and grade continuity assumptions; variations in density and domain assignments; geometallurgical assumptions; changes to geotechnical, mining, dilution, and metallurgical recovery assumptions; change to the input and design parameter assumptions that pertain to the conceptual stope designs constraining the estimates; and assumptions as to the continued ability to access the site, retain mineral and surface rights titles, maintain environment and other regulatory permits, and maintain the social license to operate.
1.10 |
Mineral Reserves |
Mineral Reserves were converted from Measured and Indicated Mineral Resources. Inferred Mineral Resources were set to waste.
Mineral Reserves assume overhand cut and fill or sublevel stoping mining methods.
The overall mining recovery is approximately 94 % which takes into account the presence of pillars in wide veins and crown pillars for each main level of the mine.
Two sources of dilution were considered, operational dilution and mucking dilution. Operational dilution for cut and fill (mechanized – breasting) averages 17 % if a zero grade for the waste material is applied and this represents 91 % of the total reserves estimated. Other mining methods applied in less tonnage are cut and fill (mechanized – enhanced) averages 21 %, cut and fill (semi-mechanized) average 22 % and conventional cut and fill averages 34 %. For Sublevel longhole stoping, the calculation of the mining width estimated is 0.8 m (0.6 m for hangingwall and 0.2 m for footwall) with a minimum mining width of 0.8, then minimum stope shape dimension of 1.6m.
Metal prices used for Mineral Reserve estimation were determined as of June 2023 by the corporate financial department of Fortuna based on market consensus.
|
ANNUAL INFORMATION FORM |
Caylloma Technical Report Page |E-6 |
FORTUNA SILVER MINES INC.
Metallurgical recoveries were based on metallurgical test work and operational results at the plant from July 2022 to June 2023.
Net smelter return (NSR) values were dependent on various parameters including metal prices, metallurgical recovery, price deductions, refining charges and penalties.
A breakeven cut-off grade was determined based on all variable and fixed costs applicable to the operation. These include exploitation and treatment costs, general expenses and administrative and commercialization costs (including concentrate transportation). The breakeven cut-off grade was determined to be US$ 89.78/t for mechanized (breasting); US$ 79.70/t for mechanized (enhanced); US$ 88.81/t for sub-level stoping (SLS); US$ 93.27/t for semi-mechanized; and US$ 170/t conventional.
Mechanized (breasting) cut and fill mining will be used for 91 % of the total Mineral Reserves, with the other methods representing the remainder.
Mineral Reserves as of December 31, 2023, are reported in Table 1.2.
Table 1.2 Mineral Reserves as of December 31, 2023
Category |
Tonnes (000) |
Ag (g/t) |
Au (g/t) |
Pb (%) |
Zn (%) |
Contained Metal |
|||
Ag (koz) |
Au (koz) |
Pb (kt) |
Zn (kt) |
||||||
Proven |
20 |
261 |
0.94 |
2.23 |
2.62 |
165 |
0.6 |
0.4 |
0.5 |
Probable |
2,269 |
81 |
0.13 |
2.79 |
4.06 |
5,924 |
9.3 |
63.2 |
92.0 |
Proven +Probable |
2,288 |
83 |
0.13 |
2.78 |
4.04 |
6,089 |
9.9 |
63.6 |
92.5 |
Notes on Mineral Reserves
| ● | Mineral Reserves are reported at the point of delivery to the process plant using the 2014 CIM Definition Standards. |
| ● | Mineral Reserves are reported as of December 31, 2023. |
| ● | Raul Espinoza, FAusIMM (CP), a Fortuna employee, is the Qualified Person for the estimate. |
| ● | Mineral Reserves are reported based on underground mining within optimized stope designs using an NSR breakeven cut-off for extraction including; mechanized (breasting) at US$ 89.78/t; mechanized (enhanced) at US$ 79.70/t; sub-level stoping (SLS) at US$88.81/t; semi-mechanized at US$ 93.27/t; and conventional at US$ 170/t. |
| ● | Metal prices used in the NSR evaluation are US$ 21/oz for silver, US$ 1,600/oz for gold, US$ 2,000/t for lead, and US$ 2,600/t for zinc. |
| ● | Metallurgical recovery rates used for NSR values are 82% for Ag, 22% for Au, 89% for Pb and 89% for Zn except for gold rich veins (>1 g/t Au) that use 85% for Ag, 55% for Au, 87% for Pb and 89% for Zn and include the Soledad, Cimoide La Plata, La Plata, Pilar, San Pedro, and Ramal Piso Carolina veins. |
| ● | Mining, processing and administrative costs used to determine NSR cut-off values were estimated based on second half of 2022 and first half of 2023 actual operating costs. |
| ● | Mining recovery is estimated to average 94 % with mining dilution ranging from 10 % to 34 % depending on the mining methodology. |
| ● | Tonnes are rounded to the nearest thousand. |
| ● | Totals may not add due to rounding. |
1.11 |
Mining methods |
The mining method employed at the Caylloma Mine is primarily cut-and-fill, which is commonly used in the mining of steeply dipping orebodies in stable rock masses. Cut-and-fill is a bottom-up mining method that consists of removing ore in horizontal slices, starting from a bottom undercut and advancing upwards. The operation bases its mining plan on a mix of mechanized, semi-mechanized, and conventional extraction methods based on vein width and rock quality.
Geotechnical recommendations used in mine design are based on a combination of rock mass rating and geotechnical strength index data.
Water inflows are currently managed using three pumping stations installed at different levels of the mine. Main pumping station at level 17 is under construction and expected to be completed in January 2024 with testing and commissioning in February 2024.
The mining production period extends from 2024 to 2028, almost 5 years. At full production the planned mining rate is 1,500 tpd (543,000 tonnes per annum). Planned LOM production is 2.3 Mt at an average silver grade of 83 g/t, gold grade of 0.14 g/t, lead grade of 2.79 %, and zinc grade of 4.03 %.
|
ANNUAL INFORMATION FORM |
Caylloma Technical Report Page |E-7 |
FORTUNA SILVER MINES INC.
Access to the Caylloma underground mine is from surface through a main ramp. The Caylloma Mine has been designed with a separation of 100 m between levels primarily to limit blast vibration but also to assist with hanging wall and footwall stability.
Transportation of ore and waste is done via trucks with a 15 m3 of capacity through the main and secondary ramps.
The ventilation requirements for the Animas underground mine to produce 1,500 tpd is 345,100 cfm based on the utilization of the planned mining equipment. Air intake is through the RB 509 N and the main access ramp for levels 7 (NE), 8, 9 and 12 which represents an estimated 356,855 cfm. Ventilation is controlled by three principal fans, two operating at 120,000 cfm and one at 100,000 cfm.
The mine uses two kinds of backfill; waste rock backfill generated during underground mining and hydraulic backfill.
The mobile equipment fleet is based on the current mining operations, which are known to achieve the production targets set out in the LOM.
Mine infrastructure and supporting facilities are sufficient for the remaining LOM.
1.12 |
Processing and recovery methods |
The process design is based on metallurgical testwork completed on samples from the deposit. The design and equipment are conventional.
The process plant design is split into four principal stages including: crushing; milling; flotation; and thickening, filtering and shipping. The plant has a 1,500 tpd throughput rate.
Energy requirements at the operation are provided by a state power line of 15 kV. The maximum power demand for the plant is 2300 kW.
The processing plant water consumption is 2.45 m3/t to process one tonne of ore. Approximately 74 % (1.82 m3/t) is recovered from the tailings facility and pumped back to the plant to be re-used in the process along with 26 % (0.63 m3/t) fresh water collected from the mine and pumped to Level 9 to send it to the plant.
The plant uses conventional reagents, including a frother, collectors, flocculant and a depressor.
1.13 |
Project infrastructure |
All mine and process infrastructure and supporting facilities are in place at the operation with only an increase in tailings storage facility in 2026 and designation of underground waste disposal area required to meet the needs of the mine plan and production rate beyond 2025.
The Caylloma Mine has infrastructure consisting primarily of the concentration plant, electrical power station, water storage facilities, tailings facilities, stockpiles, and workshop facilities, all connected by unsealed roads. Additional structures located at the mine include offices, dining hall, laboratory, core logging and core storage warehouses. The mine site infrastructure has a footprint of 91.12 ha associated with the Huayllacho beneficiation concession.
All process buildings, offices, and camp facilities for operating the mine have been constructed.
The current tailings storage facility (TSF N° 3) is located approximately 4 km to the south of the concentration plant. The tailings facility has a current incremental capacity of 921,000 m3, sufficient to handle tailings until the end of 2026 based on current production levels, with an expansion required for completion in 2026 to provide sufficient capacity for the LOM.
The mine currently has a single surface waste stockpile used for storing waste material that could not be effectively disposed of underground. There is sufficient remaining capacity for LOM requirements based on the currently defined underground waste disposal areas that are sufficient to the end of 2025 and the identification of an additional waste storage area on Level 8 of the Animas vein.
The mine currently has one ore stockpile which is used for blending or plant feed if underground mining is temporarily stopped.
|
ANNUAL INFORMATION FORM |
Caylloma Technical Report Page |E-8 |
FORTUNA SILVER MINES INC.
The maximum power demand for the operation is 7800 kW provided mainly through the national power grid and three diesel generators on site to cover the shortfall and provide backup.
Water demand at the Caylloma Mine is 60 l/s, including 10 l/s for the camp. Approximately 70 % of the processing plant total water consumption is recovered from tailings facility N° 3 with the other 30 % from fresh water provided by the Santiago River.
1.14 |
Market studies and contracts |
Since the operation commenced production in October 2006, a corporate decision was made to sell the concentrate on the open market. In order to get the best commercial terms for the concentrates, it is Fortuna’s policy to sign contracts for periods no longer than one year. All commercial terms entered between the buyer and Bateas are regarded confidential, but are considered to be within standard industry norms.
Fortuna established the metal pricing for Mineral Resources and Mineral Reserves using a consensus approach based on long-term analyst and bank forecasts prepared in May 2023. A long-term price estimate of US$ 21/oz for silver and US$ 1,600/oz for gold has been applied, based on the mean consensus prices from 2024 to 2026 of US$ 24.00/oz of silver and US$ 1,788/oz for gold weighted at 40 % and the 10-year historical average of US$ 19.1/oz for silver and US$ 1,452/oz for gold weighted at 60 %.
Bateas has used a Peruvian sol exchange rate of 3.6 soles to the US dollar for financial analysis purposes, which conforms with general industry-consensus.
Bateas has eight major contracts for services relating to operations at the mine regarding: mining activities, ground support, raise boring, drilling, transportation, electrical installations, plant and mine maintenance, explosives and civil works. The costs of such contracts are accounted for in the capital and operating expenditures depending on work performed. Contracts are negotiated and renewed as needed. Contract terms are typical of similar contracts in Peru that Fortuna is familiar with.
The QP has reviewed the information provided by Fortuna on marketing, contracts, metal price projections and exchange rate forecasts and notes that the information provided support for the assumptions used in this Report and are consistent with the source documents, and that the information is consistent with what is publicly available within industry norms.
1.15 |
Environmental studies and permitting |
The mining operation has been developed under strict compliance of norms and permits required by public institutions associated with the mining sector. Furthermore, all work follows quality and safety international norms as set out in ISO 14001 and OHSAS 18000.
In addition to these norms and permits obtained from the environmental department, the operation also ensures that all environmental activities are regularly monitored and recorded as part of the quality control measures that are presented to the Ministry of Energy and Mining (MEM) and other legal regulatory organizations.
Of particular importance is monitoring of the quality of river water in the area. This activity involves monitoring the Santiago River, being the main river that passes through the property, employing people from the local communities to verify the results.
Bateas has a very strong commitment to the development of neighboring communities of the Caylloma Mine. In this respect, Bateas is committed to sustainable projects, direct support and partnerships that build company engagement in local communities while respecting local values, customs and traditions. The company aims to develop projects or programs based on respect for ethno-cultural diversity, open communication and effective interaction with local stakeholders that improve education, health and infrastructure.
Mine closure is included in the environmental program. For 2024 a total of US$ 471,000 has been budgeted for the ongoing closure plan and environmental liabilities. The closure plan is performed to ensure compliance with the programs and plans submitted to the MEM. Budgeted mine closure costs for the LOM total US$ 16.1 million.
|
ANNUAL INFORMATION FORM |
Caylloma Technical Report Page |E-9 |
FORTUNA SILVER MINES INC.
1.16 |
Sustaining capital and operating costs |
Capital and operating cost estimates are based on established cost experience gained from current operations, projected budget data and quotes from manufacturers and suppliers.
The capital and operating cost provisions for the LOM plan that supports Mineral Reserves have been reviewed. The basis for the estimates is appropriate for the known mineralization, mining and production schedules, marketing plans, and equipment replacement and maintenance requirements.
The QP considers the capital and operating costs estimated for the Caylloma Mine as reasonable based on industry-standard practices and actual costs observed for 2023.
All remaining capital costs are considered to be sustaining capital costs.
Capital costs include all investments in ongoing mine development, infill drilling, mine equipment overhaul and components, infrastructure necessary to sustain the continuity of the operation. The capital costs are split into three areas: mine development; equipment and infrastructure; and mine closure and site rehabilitation.
Mine development includes the main development and infrastructure of the mine through the generation of ramps, ventilation raises, and extraction levels. Infill delineation drilling is included under mine development costs as this activity has the objective of increasing the confidence in currently defined Mineral Resources, and Brownfields exploration drilling is included regarding planned activities for the coming year.
Equipment and infrastructure costs are attributed to mine infrastructure in the Animas NE vein and energy capacity expansion for the plant and other minor equipment acquisition and spare parts.
Mine closure costs are attributed to site rehabilitation costs required to remediate the area where the mine is located and to meet mine closure requirements.
The capital cost estimate is summarized in Table 1.3.
Table 1.3 Summary of projected major capital costs for the LOM
Capital Cost Item (MUS$) |
2024 |
2025 |
2026 |
2027 |
2028 |
Development |
3.61 |
5.89 |
2.52 |
2.87 |
0.00 |
Brownfields |
0.24 |
0.00 |
0.00 |
0.00 |
0.00 |
Infill drilling |
0.74 |
0.50 |
0.50 |
0.50 |
0.50 |
Mine Development & Brownfields |
4.59 |
6.39 |
3.02 |
3.37 |
0.50 |
| |||||
Mine |
6.07 |
0.98 |
1.32 |
4.08 |
0.00 |
Plant |
0.36 |
0.13 |
0.09 |
0.03 |
0.00 |
Tailings dam |
0.44 |
3.61 |
5.41 |
0.31 |
0.00 |
Maintenance and Energy |
6.18 |
1.68 |
0.23 |
0.00 |
0.00 |
General services |
1.07 |
2.89 |
0.15 |
0.23 |
0.00 |
Equipment and Infrastructure |
14.11 |
9.29 |
7.20 |
4.64 |
0.00 |
| |||||
Mine Closure & Site Rehabilitation |
0.47 |
0.07 |
2.10 |
1.90 |
11.52 |
| |||||
Total Capital Expenditure* |
19.17 |
15.75 |
12.32 |
9.91 |
12.02 |
*Numbers may not add due to rounding | |||||
Long-term projected operating costs are based on the LOM mining and processing requirements, as well as historical information regarding performance, operational and administrative support demands.
Operating costs include site costs and operating expenses to maintain the operation. These operating costs are analyzed on a functional basis and the cost structure is not similar to the operating costs reported by the financial statements published by Fortuna.
Site costs relate to activities performed on the property including mine, plant, general services, and administrative service costs. Other operating expenses include costs associated with concentrate transportation and community support activities.
|
ANNUAL INFORMATION FORM |
Caylloma Technical Report Page |E-10 |
FORTUNA SILVER MINES INC.
Projected operating costs for the LOM are detailed in Table 1.4.
Table 1.4 Life-of-mine operating costs
Area |
Units |
2024 |
2025 |
2026 |
2027 |
2028 |
Mine |
US$/t |
45.3 |
44.1 |
42.4 |
41.9 |
43.2 |
Plant |
US$/t |
15.7 |
12.2 |
12.2 |
12.2 |
12.2 |
General Services |
US$/t |
16.4 |
16.4 |
16.4 |
16.4 |
16.4 |
Administrative Services |
US$/t |
12.0 |
12.1 |
12.1 |
12.1 |
12.0 |
Management Fee |
US$/t |
1.7 |
1.8 |
1.8 |
1.8 |
1.7 |
Distribution |
US$/t |
7.4 |
7.1 |
7.3 |
7.1 |
7.2 |
Community Support Activities |
US$/t |
1.2 |
1.2 |
1.2 |
1.2 |
1.2 |
Total |
US$/t |
99.8 |
94.8 |
93.3 |
92.6 |
93.9 |
1.17 |
Economic analysis |
Fortuna is using the provision for producing issuers, whereby producing issuers may exclude the information required under Item 22 for technical reports on properties currently in production and where no material expansion in production is planned.
Mineral Reserve declaration is supported by a positive cashflow for the period set out in the LOM based on the assumptions detailed in this Report.
1.18 |
Conclusions |
An economic analysis was performed in support of the estimation of Mineral Reserves. This indicated a positive cash flow using the assumptions and parameters detailed in this Report.
1.19 |
Risks, and opportunities |
Opportunities include:
| ● | Reduction in overall pumping costs through improvements to the mine dewatering system resulting in reduced power consumption and maintenance requirements. |
| ● | Potential to expand the ore processing capacity at the plant. The conceptual study indicates a possible business case to increase production to 2,200 tpd and requires further studies to confirm its feasibility. |
| ● | Potential to expand current resources through exploration of the Animas NE vein with mineralization remaining open to the northeast and at depth. |
Risks include:
| ● | An expansion of the current tailings storage facility TSF N° 3 will be required for stage (3C) to cover the current production levels up to LOM requirements. A permit will be required for the expansion, and although there is no guarantee this will be granted, Bateas is confident that if the application is submitted in a timely manner, the permit should be granted based on previous permit applications. |
| ● | Bateas management occasionally receives requests from local authorities and/or civil organizations regarding unrealistic social expectations. Bateas are mitigating the risk of conflict regarding these demands by working with local authorities, landowners, and communities to address expectation levels and to take requests into account in preparing its annual community relations work program and budget. |
| ● | TSF N° 2 provides a small capacity (two months) as a contingency plan for tailings storage. It is currently being used as a temporary cyclone / tailings classification facility. TSF N° 2 is planned for decommissioning in 2025 when a new cyclone plant is planned to be operational adjacent to the mill. A site investigation study was conducted in the third quarter of 2023 to sample foundation materials and laboratory testing is planned for January 2024. Engineering trade off analysis is expected to be completed by the end of the second quarter 2024 to determine closure costs associated with this facility. TSF N° 2 closure costs are currently unknown. |
|
ANNUAL INFORMATION FORM |
Caylloma Technical Report Page |E-11 |
FORTUNA SILVER MINES INC.
1.20 |
Recommendations |
Recommendations for the next phase of work have been broken into those related to ongoing exploration activities and those related to additional technical and operational studies. Recommended work programs are independent of each other and can be conducted concurrently unless otherwise stated. The exploration phase is estimated to cost $ 980,000 with an additional technical studies phase estimated to cost $ 180,000. Depending on results from these phases a plant expansion pre-feasibility study phase may be executed at an estimated cost of approximately $ 1,000,000.
1.20.1 Exploration
| ● | Exploration. It is recommended that Bateas continue surface mapping of key areas of interest including Antacollo, Condorcoto, Santa Rosa and Antimonio, as well as geophysical surveys at Llocococha to identify potential future drill targets. The budgeted cost of the surface mapping activities is $ 244,000 (excluding personnel costs). |
| ● | Delineation (infill) drilling. Bateas is planning to continue the delineation drilling from underground in 2024 focusing on the lower levels of ore shoot 3 in the Animas NE vein. A total of 20 drill holes totaling 4,027 m is planned at a budgeted total cost of $ 736,000. |
| ◾ | Technical and operational studies |
| ● | Review of mining methodology. The width of mineralization and rock quality varies greatly throughout the deposit. It is recommended that an evaluation of mining method be conducted to assess potential implementation of the SLS mining method applied to high grade Au-Ag veins, additionally to review an increment on the bench height of the SLS stopes from 13.5 m to 20 m. The study could be conducted in-house or externally, with an external cost estimated at $ 80,000. |
| ● | Review of mine cost optimization. It is proposed to do a cost optimization study in order to identify operational bottlenecks where savings can be found both in mine, auxiliary services and plant. The estimated cost of the study is $ 100,000. |
| ● | Plant expansion pre-feasibility study. A pre-feasibility study is recommended to assess if the production rate at the Caylloma plant could be increased to 2,200 tpd. The estimated cost of the study is approximately $ 1,000,000. |
| ● | Density estimation. It is recommended that the number of bulk density measurements be increased in veins that lack sufficient values for meaningful statistical analysis. This will be completed utilizing the operations resources and part of normal operating cost. |
[End of Extract of Summary from Caylloma Technical Report]
|
ANNUAL INFORMATION FORM |
Caylloma Technical Report Page |E-12 |
FORTUNA SILVER MINES INC.
SCHEDULE “F”
FORTUNA SILVER MINES INC.
(the “Company”)
Audit Committee Charter
PURPOSE
The primary function of the Audit Committee is to assist the Board of Directors of the Company (the “Board”) in fulfilling its oversight responsibilities by reviewing the financial information to be provided to the shareholders and others, the systems of internal controls and management information systems established by the senior officers of the Company (“Management”) and the Company’s internal and external audit process and monitoring compliance with the Company's legal and regulatory requirements with respect to its financial statements.
The Audit Committee is accountable to the Board. In the course of fulfilling its specific responsibilities hereunder, the Audit Committee is expected to maintain an open communication between the Company’s external auditors and the Board.
The Audit Committee does not plan or perform audits or warrant the accuracy or completeness of the Company's financial statements or financial disclosure or compliance with generally accepted accounting procedures as these are the responsibility of Management.
RESPONSIBILITIES
Subject to the powers and duties of the Board, the Board hereby delegates to the Audit Committee the following powers and duties to be performed by the Audit Committee on behalf of and for the Board. Nothing in this Charter is intended to or does confer on any member a higher standard of care or diligence than that which applies to the directors as a whole.
External Auditors
The Audit Committee has primary responsibility for the selection, appointment, dismissal, compensation and oversight of the external auditors, subject to the overall approval of the Board. For this purpose, the Audit Committee may consult with Management.
The external auditors shall report directly to the Audit Committee.
Also, the Audit Committee:
a. |
recommends to the Board: |
i. |
whether the current external auditors should be nominated for reappointment for the ensuing year and if applicable, select and recommend a suitable alternative for nomination; and |
ii. |
the amount of compensation payable to the external auditors; |
b. |
resolves disagreements, if any, between Management and the external auditors regarding financial reporting; |
c. |
provides the Board with such recommendations and reports with respect to the financial statements of the Company as it deems advisable; |
|
ANNUAL INFORMATION FORM |
Audit Committee Charter Page |F-1 |
FORTUNA SILVER MINES INC.
d. |
takes reasonable steps to confirm the independence of the external auditors, including but not limited to pre-approving any non-audit related services provided by the external auditors to the Company or the Company's subsidiaries, if any; |
e. |
confirms that the external auditors are a 'participating audit' firm for the purpose of National Instrument 52-108 Auditor Oversight and are in compliance with governing regulations; |
f. |
reviews the plan and scope of the audit to be conducted by the external auditors of the Company; |
g. |
reviews and evaluates the performance of the external auditors; and |
h. |
reviews and approves the Company’s hiring policy regarding partners, employees and former partners and employees of the Company’s present and former external auditors. |
Audit and Review Process and Results
The Audit Committee has a duty to receive, review and make any inquiry regarding the completeness, accuracy and presentation of the Company’s financial statements to ensure that the financial statements fairly present the financial position and risks of the organization and that they are prepared in accordance with generally accepted accounting principles. To accomplish this, the Audit Committee:
a. |
considers the scope and general extent of the external auditors' review, including their engagement letter and major changes to the Company’s auditing and accounting principles and practices; |
b. |
consults with management regarding the sufficiency of the Company's internal system of audit and financial controls, internal audit procedures and results of such audits; |
c. |
ensures the external auditors have full, unrestricted access to required information and have the cooperation of management; |
d. |
reviews with the external auditors the audit process and standards, as well as regulatory or Company-initiated changes in accounting practices and policies and the financial impact thereof, and selection or application of appropriate accounting principles; |
e. |
reviews with the external auditors and, if necessary, legal counsel, any litigation, claim or contingency, including tax assessments, that could have a material effect upon the financial position of the Company and the manner in which these matters are being disclosed in the financial statements; |
f. |
reviews the appropriateness and disclosure of any off-balance sheet matters; |
g. |
reviews disclosure of related-party transactions; |
h. |
receives and reviews with the external auditors, the external auditors' audit report and the audited financial statements; |
i. |
makes recommendations to the Board respecting approval of the audited financial statements; |
j. |
meets with the external auditors separately from management to review the integrity of the Company’s financial reporting, including the clarity of financial disclosure and the degree of conservatism or aggressiveness of the accounting policies and estimates, any significant disagreements or difficulties in obtaining information, adequacy of internal controls over financial reporting, adequacy of disclosure controls and procedures, and the degree of compliance by the Company with prior recommendations of the external auditors; |
|
ANNUAL INFORMATION FORM |
Audit Committee Charter Page |F-2 |
FORTUNA SILVER MINES INC.
k. |
directs management to implement such changes as the Audit Committee considers appropriate, subject to any required approvals of the Board arising out of the review; and |
l. |
meets at least annually with the external auditors, independent of management, and reports to the Board on such meetings. |
Interim Financial Statements
The Audit Committee:
a. |
reviews and determines the Company's practice with respect to review of interim financial statements by the external auditors; |
b. |
conducts all such reviews and discussions with the external auditors and Management as it deems appropriate; and |
c. |
makes recommendations to the Board respecting approval of the interim financial statements. |
Involvement with Management
The Audit Committee has primary responsibility for overseeing the actions of management in all aspects of financial management and reporting. The Audit Committee:
a. |
reviews the Company’s annual and interim financial statements, Management’s Discussion and Analysis and earnings press releases, if any, before the Company publicly discloses this information; |
b. |
reviews all of the Company’s public disclosure of financial information extracted from the Company's financial statements, if such financial statements have not previously been reviewed by the Committee, prior to such information being made public by the Company and for such purpose, the CFO assumes responsibility for providing the information to the Audit Committee for its review; |
c. |
reviews material financial risks with Management, the plan that Management has implemented to monitor and deal with such risks and the success of Management in following the plan; |
d. |
consults annually and otherwise as required with the Company's CEO and CFO respecting the adequacy of the internal controls over financial reporting and disclosure controls and procedures and reviews any breaches or deficiencies; |
e. |
obtains such certifications of annual and interim filings by the CEO and CFO attesting to internal controls over financial reporting and disclosure controls and procedures as deemed advisable; |
f. |
reviews Management's response to significant written reports and recommendations issued by the external auditors and the extent to which such recommendations have been implemented by Management; |
g. |
reviews with Management the Company's compliance with applicable laws and regulations respecting financial reporting matters, and any proposed regulatory changes and their impact on the Company; and |
h. |
reviews as required with Management and approves disclosure of the Audit Committee Charter, and Audit Committee disclosure required in the Company's Annual Information Form, Information Circular and on the Company's website. |
|
ANNUAL INFORMATION FORM |
Audit Committee Charter Page |F-3 |
FORTUNA SILVER MINES INC.
PROCEDURAL MATTERS
The Audit Committee:
a. |
invites the Company’s external auditors, the CFO, and such other persons as deemed appropriate by the Audit Committee to attend meetings of the Audit Committee; |
b. |
reports material decisions and actions of the Audit Committee to the Board, together with such recommendations as the Audit Committee may deem appropriate; |
c. |
has the power to conduct or authorize investigations into any matter within the scope of its responsibilities; |
d. |
has the right to engage independent counsel and other advisors as it determines necessary to carry out its duties and the right to set the compensation for any advisors employed by the Audit Committee; |
e. |
has the right to communicate directly with the CFO and other members of Management who have responsibility for the internal and external audit process, as well as to communicate directly with the internal and external auditors; and |
f. |
pre-approves non-audit services to be performed by the external auditors, in accordance with the provisions of National Instrument 52-110 – Audit Committees (“NI 52-110”). |
COMPOSITION
The Audit Committee is composed of a minimum of three directors, all of whom are independent, subject to any exemptions or relief that may be granted from such requirements under NI 52-110, and have relevant skills and/or experience in the Audit Committee's areas of responsibility as may be required by the securities laws applicable to the Company, including those of any stock exchange on which the Company’s securities are traded. No member shall have served as the CEO of the Company, or an affiliate, within the past five years, or as the CFO of the Company, or an affiliate, within the past three years.
The members of the Audit Committee shall not be members of more than three public company audit committees (including the Company), except for a member with a demonstrable financial expertise such as a former CFO, who shall not be a member of more than four audit committees (including the Company).
Appointment of Committee Members and Vacancies
Members of the Audit Committee are appointed or confirmed by the Board annually and hold office at the pleasure of the Board. The Board fills any vacancy on, and may appoint any additional members to, the Audit Committee.
Committee Chair
The Board appoints a Chair for the Audit Committee.
STRUCTURE AND OPERATIONS
Meetings
The Chair of the Audit Committee or the Chair of the Board or any two of its members may call a meeting of the Audit Committee. The Audit Committee meets at least four times each fiscal year, and at such other times during each year as it deems appropriate.
Quorum
A majority of the members appointed to the Audit Committee constitutes a quorum.
|
ANNUAL INFORMATION FORM |
Audit Committee Charter Page |F-4 |
FORTUNA SILVER MINES INC.
Notice of Meetings
The Chair of the Audit Committee arranges to provide notice of the time and place of every meeting in writing (including by electronic means) to each member of the Audit Committee at least two (2) business days prior to the time fixed for such meeting, provided, however, that a member may in any manner waive a notice of a meeting. Attendance of a member at a meeting constitutes a waiver of notice of the meeting, except where a member attends a meeting for the express purpose of objecting to the transaction of any business on the grounds that the meeting is not lawfully called. The Chair also ensures that an agenda for the meeting and all required materials for review by the members of the Audit Committee are delivered to the members with sufficient time for their review, or that such requirement is waived.
Absence of Committee Chair
If the Chair of the Audit Committee is not present at any meeting of the Audit Committee, the other members of the Audit Committee will choose a Chair to preside at the meeting.
Secretary of Committee
At each meeting the Audit Committee appoints a secretary who need not be a director of the Company.
Attendance of the Company's Officers at Meetings
The Chair of the Audit Committee or any two members of the Audit Committee may invite one or more officers of the Company to attend any meeting of the Audit Committee.
Delegation
The Audit Committee may, in its discretion and where permitted by NI 52-110, delegate all or a portion of its duties and responsibilities to a subcommittee, management or, to the extent otherwise permitted by applicable plans, laws or regulations, to any other body or individual.
Procedure and Records
Subject to any statute or constating documents of the Company, the Audit Committee determines its own procedures at meetings and may conduct meetings by telephone and keeps records of its proceedings.
COMPLAINTS
The Audit Committee has established a whistle-blower policy as detailed in the Code of Business Conduct and Ethics and Whistle-Blower Policy, which sets out the procedures for:
a. |
the receipt, retention and treatment of complaints received by the Company regarding accounting, internal accounting controls, or auditing matters; and |
b. |
the confidential, anonymous submission to the Company of concerns regarding questionable accounting or auditing matters. |
The Audit Committee reviews the whistle-blower policy annually.
REPORTING AND ASSESSMENT
The Audit Committee reports to the Board of Directors, and on an annual basis, presents to the Board a Committee Annual Report consisting of the Audit Committee’s review of its charter, the Committee’s and its Chair’s performance over the past year, and any recommendations the Audit Committee makes in respect thereto.
Approved by the Board: March 11, 2021
|
ANNUAL INFORMATION FORM |
Audit Committee Charter Page |F-5 |
CONSOLIDATED FINANCIAL STATEMENTS
For the years ended
December 31, 2023 and 2022
MANAGEMENT’S RESPONSIBILITY FOR THE FINANCIAL STATEMENTS
Management of Fortuna Silver Mines Inc. (the “Company”) (“we”, “us” or “our”) have prepared the consolidated financial statements in accordance with International Financial Reporting Standards (“IFRS”) and the accompanying Management’s Discussion and Analysis (“MD&A”) and are responsible for their content. The financial information presented in the MD&A is consistent with the information that is contained in the consolidated financial statements. The consolidated financial statements include, where necessary, amounts based on our estimates and judgement.
In order to discharge our responsibility for the integrity of the financial statements, the Company maintains a system of Internal Control over Financial Reporting and Disclosure Controls and Procedures. These controls are designed to provide reasonable assurance that the Company’s assets are safeguarded, transactions are executed and recorded in accordance with our authorization, proper records are maintained and relevant and reliable financial information is produced. These controls include maintaining quality standards in the hiring and training of employees, policies and procedures manuals, a corporate code of conduct and ensuring that there is proper accountability for performance within appropriate and well defined areas of responsibility.
The Board of Directors is responsible for overseeing the performance of our responsibilities for financial reporting and internal control over Financial Reporting and Disclosure Controls and Procedures. The Audit Committee, which is composed of independent directors, meets with us as well as the external auditors to ensure that we are properly fulfilling our financial reporting responsibilities to the Directors who approve the consolidated financial statements. The external auditors have full and unrestricted access to the Audit Committee to discuss the scope of their audits, and the adequacy of the system of internal controls, and to review financial reporting issues.
The consolidated financial statements have been audited by KPMG LLP, the Company’s independent registered public accounting firm, in accordance with the standards of the Public Company Accounting Oversight Board (United States).
|
|
/s/ Jorge Ganoza Durant |
/s /Luis Ganoza Durant |
President and Chief Executive Officer |
Chief Financial Officer |
Vancouver, Canada
March 06, 2024
Report of Independent Registered Public Accounting Firm
To the Shareholders and Board of Directors
Fortuna Silver Mines Inc.
Opinion on the Consolidated Financial Statements
We have audited the accompanying consolidated statements of financial position of Fortuna Silver Mines Inc. (the Company) as of December 31, 2023 and 2022, the related consolidated statements of income (loss), comprehensive income (loss), cash flows, and changes in equity for each of the years then ended, and the related notes (collectively, the consolidated financial statements). In our opinion, the consolidated financial statements present fairly, in all material respects, the financial position of the Company as of December 31, 2023 and 2022, and its financial performance and its cash flows for each of the years then ended, in conformity with International Financial Reporting Standards as issued by the International Accounting Standards Board.
We also have audited, in accordance with the standards of the Public Company Accounting Oversight Board (United States) (PCAOB), the Company’s internal control over financial reporting as of December 31, 2023, based on criteria established in Internal Control – Integrated Framework (2013) issued by the Committee of Sponsoring Organizations of the Treadway Commission, and our report dated March 6, 2024 expressed an unqualified opinion on the effectiveness of the Company’s internal control over financial reporting.
Basis for Opinion
These consolidated financial statements are the responsibility of the Company’s management. Our responsibility is to express an opinion on these consolidated financial statements based on our audits. We are a public accounting firm registered with the PCAOB and are required to be independent with respect to the Company in accordance with the U.S. federal securities laws and the applicable rules and regulations of the Securities and Exchange Commission and the PCAOB.
We conducted our audits in accordance with the standards of the PCAOB. Those standards require that we plan and perform the audit to obtain reasonable assurance about whether the consolidated financial statements are free of material misstatement, whether due to error or fraud. Our audits included performing procedures to assess the risks of material misstatement of the consolidated financial statements, whether due to error or fraud, and performing procedures that respond to those risks. Such procedures included examining, on a test basis, evidence regarding the amounts and disclosures in the consolidated financial statements. Our audits also included evaluating the accounting principles used and significant estimates made by management, as well as evaluating the overall presentation of the consolidated financial statements. We believe that our audits provide a reasonable basis for our opinion.
Critical Audit Matter
The critical audit matter communicated below is a matter arising from the current period audit of the consolidated financial statements that was communicated or required to be communicated to the Audit Committee and that: (1) relates to accounts or disclosures that are material to the consolidated financial statements and (2) involved our especially challenging, subjective, or complex judgments. The communication of a critical audit matter does not alter in any way our opinion on the consolidated financial statements, taken as a whole, and we are not, by communicating the critical audit matter below, providing a separate opinion on the critical audit matter or on the accounts or disclosures to which it relates.
Assessment of the recoverable amount of the Lindero cash-generating unit
As discussed in Note 9 to the consolidated financial statements, the carrying value of the Company’s mineral properties, plant, and equipment was $1,574,212 thousand as of December 31, 2023. As discussed in Note 32 to the consolidated financial statements, the Company determined that there were indicators of impairment at the Lindero cash-generating unit (CGU) due to an increase in capital costs for the heap leach expansion project and an increase in operating costs as a result of macro-economic factors. The Company estimated the recoverable amount of the Lindero CGU, determined on a fair value less cost of disposal basis, and concluded no impairment charge was required.
We identified the assessment of the recoverable amount of the Lindero CGU as a critical audit matter. A high degree of auditor judgment was required to evaluate the inputs used to estimate the recoverable amount. Significant assumptions used in the determination of the recoverable amount included the quantities of mineral reserves and mineral resources that form the basis for the life of mine plan, metal prices, expected future production costs and capital expenditures, and the discount rate. Changes in any of these assumptions could have had a significant effect on the determination of the estimated recoverable amount.
The following are the primary procedures we performed to address this critical audit matter. We evaluated the design and tested the operating effectiveness of certain internal controls over the Company's process to determine the recoverable amount of the Lindero CGU. This included controls over the Company’s development of the significant assumptions used to estimate the recoverable amount of the Lindero CGU. We assessed the competence, capabilities and objectivity of the Company’s personnel who determined the quantities of mineral reserves and mineral resources that form the basis for the life of mine plan for the Lindero CGU. We compared the amount of mineral reserves and mineral resources in the discounted cash flow model to the life of mine plan and to the mineral reserve and mineral resource information. We compared the Company’s historical mineral reserve and resource information, life of mine plan and operating results to actual results to assess the accuracy of the Company’s forecasting process. We compared expected future production costs and capital expenditures in the discounted cash flow model to the life of mine plan and to historical expenditures. We involved valuations professionals with specialized skills and knowledge, who assisted in (1) assessing the metal prices by comparing to third party data; and (2) evaluating the discount rate by comparing it to an independently calculated range of discount rates using internal and external independent sources.
/s/ KPMG LLP
Chartered Professional Accountants
We have served as the Company’s auditor since 2017.
Vancouver, Canada
March 6, 2024
Report of Independent Registered Public Accounting Firm
To the Shareholders and Board of Directors
Fortuna Silver Mines Inc.
Opinion on Internal Control Over Financial Reporting
We have audited Fortuna Silver Mines Inc.’s (the Company) internal control over financial reporting as of December 31, 2023, based on criteria established in Internal Control – Integrated Framework (2013) issued by the Committee of Sponsoring Organizations of the Treadway Commission. In our opinion, the Company maintained, in all material respects, effective internal control over financial reporting as of December 31, 2023, based on criteria established in Internal Control – Integrated Framework (2013) issued by the Committee of Sponsoring Organizations of the Treadway Commission.
We also have audited, in accordance with the standards of the Public Company Accounting Oversight Board (United States) (PCAOB), the consolidated statements of financial position of the Company as of December 31, 2023 and 2022, the related consolidated statements of income (loss), comprehensive income (loss), cash flows, and changes in equity for each of the years then ended, and the related notes (collectively, the consolidated financial statements), and our report dated March 6, 2024 expressed an unqualified opinion on those consolidated financial statements.
Basis for Opinion
The Company’s management is responsible for maintaining effective internal control over financial reporting and for its assessment of the effectiveness of internal control over financial reporting, which appears under the heading Management’s Report on Internal Control Over Financial Reporting in the accompanying Management’s Discussion and Analysis. Our responsibility is to express an opinion on the Company’s internal control over financial reporting based on our audit. We are a public accounting firm registered with the PCAOB and are required to be independent with respect to the Company in accordance with the U.S. federal securities laws and the applicable rules and regulations of the Securities and Exchange Commission and the PCAOB.
We conducted our audit in accordance with the standards of the PCAOB. Those standards require that we plan and perform the audit to obtain reasonable assurance about whether effective internal control over financial reporting was maintained in all material respects. Our audit of internal control over financial reporting included obtaining an understanding of internal control over financial reporting, assessing the risk that a material weakness exists, and testing and evaluating the design and operating effectiveness of internal control based on the assessed risk. Our audit also included performing such other procedures as we considered necessary in the circumstances. We believe that our audit provides a reasonable basis for our opinion.
Definition and Limitations of Internal Control Over Financial Reporting
A company’s internal control over financial reporting is a process designed to provide reasonable assurance regarding the reliability of financial reporting and the preparation of financial statements for external purposes in accordance with generally accepted accounting principles. A company’s internal control over financial reporting includes those policies and procedures that (1) pertain to the maintenance of records that, in reasonable detail, accurately and fairly reflect the transactions and dispositions of the assets of the company; (2) provide reasonable assurance that transactions are recorded as necessary to permit preparation of financial statements in accordance with generally accepted accounting principles, and that receipts and expenditures of the company are being made only in accordance with authorizations of management and directors of the company; and (3) provide reasonable assurance regarding prevention or timely detection of unauthorized acquisition, use, or disposition of the company’s assets that could have a material effect on the financial statements.
Because of its inherent limitations, internal control over financial reporting may not prevent or detect misstatements. Also, projections of any evaluation of effectiveness to future periods are subject to the risk that controls may become inadequate because of changes in conditions, or that the degree of compliance with the policies or procedures may deteriorate.
/s/ KPMG LLP
Chartered Professional Accountants
Vancouver, Canada
March 6, 2024
Fortuna Silver Mines Inc.
Consolidated Statements of Income (Loss)
(Tabular amounts presented in thousands of US dollars, except share and per share amounts)
|
|
|
|
Years ended December 31, |
|||
|
Note |
|
2023 |
|
2022 |
||
Sales |
20 |
|
$ |
842,428 |
|
$ |
681,491 |
Cost of sales |
21 |
|
|
652,403 |
|
|
534,695 |
Mine operating income |
|
|
|
190,025 |
|
|
146,796 |
|
|
|
|
|
|
|
|
General and administration |
22 |
|
|
64,073 |
|
|
61,456 |
Foreign exchange loss |
|
|
|
10,885 |
|
|
8,866 |
Impairment of mineral properties, plant and equipment |
32 |
|
|
90,615 |
|
|
182,842 |
Write-off of mineral properties |
|
|
|
5,985 |
|
|
5,874 |
Other (income) expenses |
23 |
|
|
18,874 |
|
|
1,310 |
|
|
|
|
190,432 |
|
|
260,348 |
|
|
|
|
|
|
|
|
Operating loss |
|
|
|
(407) |
|
|
(113,552) |
|
|
|
|
|
|
|
|
Investment gains |
5 |
|
|
12,395 |
|
|
- |
Interest and finance costs, net |
24 |
|
|
(21,790) |
|
|
(12,057) |
(Loss) gain on derivatives |
20 |
|
|
(1,249) |
|
|
500 |
|
|
|
|
(10,644) |
|
|
(11,557) |
|
|
|
|
|
|
|
|
Loss before income taxes |
|
|
|
(11,051) |
|
|
(125,109) |
|
|
|
|
|
|
|
|
Income taxes |
|
|
|
|
|
|
|
Current income tax expense |
25 |
|
|
42,636 |
|
|
35,783 |
Deferred income tax expense (recovery) |
25 |
|
|
(10,057) |
|
|
(24,986) |
|
|
|
|
32,579 |
|
|
10,797 |
Net loss for the year |
|
|
$ |
(43,630) |
|
$ |
(135,906) |
|
|
|
|
|
|
|
|
Net loss attributable to: |
|
|
|
|
|
|
|
Fortuna shareholders |
|
|
$ |
(50,836) |
|
$ |
(128,132) |
Non-controlling interest |
30 |
|
|
7,206 |
|
|
(7,774) |
|
|
|
$ |
(43,630) |
|
$ |
(135,906) |
|
|
|
|
|
|
|
|
Loss per share |
19 |
|
|
|
|
|
|
Basic |
|
|
$ |
(0.17) |
|
$ |
(0.44) |
Diluted |
|
|
$ |
(0.17) |
|
$ |
(0.44) |
|
|
|
|
|
|
|
|
Weighted average number of common shares outstanding (000's) |
|
|
|
|
|
|
|
Basic |
|
|
|
295,067 |
|
|
291,281 |
Diluted |
|
|
|
295,067 |
|
|
291,281 |
The accompanying notes are an integral part of these financial statements.
Page | 1
Fortuna Silver Mines Inc.
Consolidated Statements of Comprehensive Income (Loss)
(Tabular amounts presented in thousands of US dollars, except share and per share amounts)
|
|
|
Years ended December 31, |
||||
|
Note |
|
2023 |
|
2022 |
||
Net loss for the year |
|
|
$ |
(43,630) |
|
$ |
(135,906) |
|
|
|
|
|
|
|
|
Items that will remain permanently in other comprehensive income (loss): |
|
|
|
|
|
|
|
Changes in fair value of investments in equity securities, net of $nil tax |
|
|
|
(22) |
|
|
(280) |
Items that may in the future be reclassified to profit or loss: |
|
|
|
|
|
|
|
Currency translation adjustment, net of tax1 |
|
|
|
(1,859) |
|
|
(61) |
Changes in fair value of hedging instruments, net of $nil tax |
|
|
|
- |
|
|
70 |
Total other comprehensive income (loss) for the year |
|
|
|
(1,881) |
|
|
(271) |
Comprehensive loss for the year |
|
|
$ |
(45,511) |
|
$ |
(136,177) |
|
|
|
|
|
|
|
|
Comprehensive income (loss) attributable to: |
|
|
|
|
|
|
|
Fortuna shareholders |
|
|
|
(52,717) |
|
|
(128,403) |
Non-controlling interest |
30 |
|
|
7,206 |
|
|
(7,774) |
|
|
|
$ |
(45,511) |
|
$ |
(136,177) |
1 For the year ended December 31, 2023, the currency translation adjustment is net of tax recovery of $2.2 million (2022 - $1.1 million expense).
The accompanying notes are an integral part of these financial statements.
Page | 2
Fortuna Silver Mines Inc.
Consolidated Statements of Financial Position
(Tabular amounts presented in thousands of US dollars, except share and per share amounts)
Balance at |
Note |
|
December 31, 2023 |
|
December 31, 2022 |
||
ASSETS |
|
|
|
|
|
|
|
CURRENT ASSETS |
|
|
|
|
|
|
|
Cash and cash equivalents |
|
|
$ |
128,148 |
|
$ |
80,493 |
Trade and other receivables |
5 |
|
|
69,529 |
|
|
68,165 |
Inventories |
6 |
|
|
115,825 |
|
|
92,033 |
Other current assets |
7 |
|
|
19,823 |
|
|
12,021 |
|
|
|
|
333,325 |
|
|
252,712 |
NON-CURRENT ASSETS |
|
|
|
|
|
|
|
Restricted cash |
|
|
|
910 |
|
|
3,967 |
Mineral properties and property, plant and equipment |
9 |
|
|
1,574,212 |
|
|
1,567,622 |
Other non-current assets |
10 |
|
|
59,416 |
|
|
51,923 |
Total assets |
|
|
$ |
1,967,863 |
|
$ |
1,876,224 |
|
|
|
|
|
|
|
|
LIABILITIES |
|
|
|
|
|
|
|
CURRENT LIABILITIES |
|
|
|
|
|
|
|
Trade and other payables |
11 |
|
$ |
148,084 |
|
$ |
111,896 |
Current portion of debt |
14 |
|
|
43,901 |
|
|
- |
Income taxes payable |
25 |
|
|
31,779 |
|
|
11,591 |
Current portion of lease obligations |
13 |
|
|
14,941 |
|
|
9,416 |
Current portion of closure and reclamation provisions |
16 |
|
|
5,065 |
|
|
2,177 |
|
|
|
|
243,770 |
|
|
135,080 |
NON-CURRENT LIABILITIES |
|
|
|
|
|
|
|
Debt |
14 |
|
|
162,946 |
|
|
219,175 |
Deferred tax liabilities |
25 |
|
|
159,855 |
|
|
167,619 |
Closure and reclamation provisions |
16 |
|
|
60,738 |
|
|
51,128 |
Lease obligations |
13 |
|
|
42,460 |
|
|
11,930 |
Other non-current liabilities |
15 |
|
|
9,973 |
|
|
2,596 |
Total liabilities |
|
|
|
679,742 |
|
|
587,528 |
|
|
|
|
|
|
|
|
SHAREHOLDERS' EQUITY |
|
|
|
|
|
|
|
Share capital |
18 |
|
|
1,125,376 |
|
|
1,076,342 |
Reserves |
|
|
|
25,342 |
|
|
29,929 |
Retained earnings |
|
|
|
87,649 |
|
|
138,485 |
Equity attributable to Fortuna shareholders |
|
|
|
1,238,367 |
|
|
1,244,756 |
Equity attributable to non-controlling interest |
30 |
|
|
49,754 |
|
|
43,940 |
Total equity |
|
|
|
1,288,121 |
|
|
1,288,696 |
|
|
|
|
|
|
|
|
Total liabilities and shareholders' equity |
|
|
$ |
1,967,863 |
|
$ |
1,876,224 |
Contingencies and Capital Commitments (Note 31)
/s/ Jorge Ganoza Durant |
|
/s/ Kylie Dickson |
Jorge Ganoza Durant |
|
Kylie Dickson |
Director |
|
Director |
The accompanying notes are an integral part of these financial statements.
Page | 3
Fortuna Silver Mines Inc.
Consolidated Statements of Cash Flows
(Tabular amounts presented in thousands of US dollars, except share and per share amounts)
|
|
|
Years ended December 31, |
||||
|
Note |
|
2023 |
|
2022 |
||
|
|
|
|
|
|
|
|
Operating activities: |
|
|
|
|
|
|
|
Net loss for the year |
|
|
$ |
(43,630) |
|
$ |
(135,906) |
Items not involving cash |
|
|
|
|
|
|
|
Depletion and depreciation |
|
|
|
219,688 |
|
|
172,809 |
Accretion expense |
24 |
|
|
6,773 |
|
|
4,830 |
Income taxes |
|
|
|
32,579 |
|
|
10,797 |
Interest expense, net |
24 |
|
|
15,017 |
|
|
7,227 |
Share-based payments, net of cash settlements |
|
|
|
2,017 |
|
|
(1) |
Impairment of mineral properties, plant and equipment |
32 |
|
|
90,615 |
|
|
182,841 |
Inventory net realizable value adjustments |
6 |
|
|
6,188 |
|
|
8,898 |
Inventory obsolescence adjustments |
6 |
|
|
10,097 |
|
|
- |
Write-off of mineral properties |
9 |
|
|
5,985 |
|
|
5,874 |
Unrealized foreign exchange loss |
|
|
|
5,706 |
|
|
4,554 |
Investment gains |
5 |
|
|
(12,395) |
|
|
- |
Unrealized gains on derivatives |
|
|
|
(170) |
|
|
(1,194) |
Other |
23 |
|
|
5,142 |
|
|
- |
Closure and reclamation payments |
16 |
|
|
(1,203) |
|
|
(623) |
Changes in working capital |
29 |
|
|
(9,737) |
|
|
(18,021) |
Cash provided by operating activities |
|
|
|
332,672 |
|
|
242,085 |
Income taxes paid |
|
|
|
(25,872) |
|
|
(42,222) |
Interest paid |
|
|
|
(13,545) |
|
|
(7,465) |
Interest received |
|
|
|
3,654 |
|
|
1,851 |
Net cash provided by operating activities |
|
|
|
296,909 |
|
|
194,249 |
|
|
|
|
|
|
|
|
Investing activities: |
|
|
|
|
|
|
|
Costs related to Chesser acquisition, net of cash acquired |
8 |
|
|
(13,321) |
|
|
- |
Restricted cash |
|
|
|
- |
|
|
(1,911) |
Additions to mineral properties and property, plant and equipment |
|
|
|
(217,314) |
|
|
(251,236) |
Contractor advances on Séguéla construction |
|
|
|
(8) |
|
|
(2,186) |
Purchases of investments |
5 |
|
|
(9,359) |
|
|
- |
Proceeds from sale of investments |
5 |
|
|
21,754 |
|
|
- |
Other investing activities |
|
|
|
1,364 |
|
|
- |
Cash used in investing activities |
|
|
|
(216,884) |
|
|
(255,333) |
|
|
|
|
|
|
|
|
Financing activities: |
|
|
|
|
|
|
|
Transaction costs on credit facility |
14 |
|
|
- |
|
|
(688) |
Proceeds from credit facility |
14 |
|
|
75,500 |
|
|
80,000 |
Repayment of credit facility |
14 |
|
|
(90,500) |
|
|
(20,000) |
Repurchase of common shares |
18 |
|
|
- |
|
|
(5,929) |
Issuance of common shares from option exercise |
|
|
|
301 |
|
|
- |
Payments of lease obligations |
|
|
|
(16,625) |
|
|
(12,209) |
Dividend payment to non-controlling interest |
|
|
|
(1,392) |
|
|
(2,708) |
Cash (used in) provided by financing activities |
|
|
|
(32,716) |
|
|
38,466 |
Effect of exchange rate changes on cash and cash equivalents |
|
|
|
346 |
|
|
(3,986) |
Increase (decrease) in cash and cash equivalents during the year |
|
|
|
47,655 |
|
|
(26,604) |
Cash and cash equivalents, beginning of the year |
|
|
|
80,493 |
|
|
107,097 |
Cash and cash equivalents, end of the year |
|
|
$ |
128,148 |
|
$ |
80,493 |
|
|
|
|
|
|
|
|
Cash and cash equivalents consist of: |
|
|
|
|
|
|
|
Cash |
|
|
$ |
106,135 |
|
$ |
65,140 |
Cash equivalents |
|
|
|
22,013 |
|
|
15,353 |
Cash and cash equivalents, end of the year |
|
|
$ |
128,148 |
|
$ |
80,493 |
Supplemental cash flow information (Note 29) |
|
|
|
|
|
|
|
The accompanying notes are an integral part of these financial statements.
Page | 4
Fortuna Silver Mines Inc.
Consolidated Statements of Changes in Equity
(Tabular amounts presented in thousands of US dollars, except share and per share amounts)
|
|
|
Share capital |
|
|
Reserves |
|
|
|
|
|
|
|
|
|
|||||||||||||||
|
Note |
|
Number of common shares |
|
Amount |
|
Equity |
|
Hedging |
|
Fair value |
|
|
Equity component of convertible debentures |
|
Foreign |
|
Retained |
|
Non-controlling interest |
|
Total equity |
||||||||
Balance at January 1, 2023 |
|
|
290,221,971 |
|
$ |
1,076,342 |
|
$ |
28,850 |
|
$ |
198 |
|
$ |
(976) |
|
$ |
4,825 |
|
$ |
(2,968) |
|
$ |
138,485 |
|
$ |
43,940 |
|
$ |
1,288,696 |
Total comprehensive loss for the year |
|
|
|
|
|
|
|
|
|
|
|
|
|
|
|
|
|
|
|
|
|
|
|
|
|
|
|
|
|
|
Net loss for the year |
|
|
- |
|
|
- |
|
|
- |
|
|
- |
|
|
- |
|
|
- |
|
|
- |
|
|
(50,836) |
|
|
7,206 |
|
|
(43,630) |
Other comprehensive loss for the year |
|
|
- |
|
|
- |
|
|
- |
|
|
- |
|
|
(22) |
|
|
- |
|
|
(1,859) |
|
|
- |
|
|
- |
|
|
(1,881) |
Total comprehensive loss for the year |
|
|
- |
|
|
- |
|
|
- |
|
|
- |
|
|
(22) |
|
|
- |
|
|
(1,859) |
|
|
(50,836) |
|
|
7,206 |
|
|
(45,511) |
|
|
|
|
|
|
|
|
|
|
|
|
|
|
|
|
|
|
|
|
|
|
|
|
|
|
|
|
|
|
|
Transactions with owners of the Company |
|
|
|
|
|
|
|
|
|
|
|
|
|
|
|
|
|
|
|
|
|
|
|
|
|
|
|
|
|
|
Acquisition of Chesser |
8 |
|
15,545,368 |
|
|
45,548 |
|
|
- |
|
|
- |
|
|
- |
|
|
- |
|
|
- |
|
|
- |
|
|
- |
|
|
45,548 |
Dividend payment to non-controlling interest |
|
|
- |
|
|
- |
|
|
- |
|
|
- |
|
|
- |
|
|
- |
|
|
- |
|
|
- |
|
|
(1,392) |
|
|
(1,392) |
Exercise of stock options |
|
|
127,350 |
|
|
397 |
|
|
(96) |
|
|
- |
|
|
- |
|
|
- |
|
|
- |
|
|
- |
|
|
- |
|
|
301 |
Shares issued on vesting of share units |
|
|
647,941 |
|
|
2,864 |
|
|
(2,864) |
|
|
- |
|
|
- |
|
|
- |
|
|
- |
|
|
- |
|
|
- |
|
|
- |
Convertible debenture conversion |
|
|
45,000 |
|
|
225 |
|
|
- |
|
|
- |
|
|
- |
|
|
- |
|
|
- |
|
|
- |
|
|
- |
|
|
225 |
Share-based payments |
17 |
|
- |
|
|
- |
|
|
254 |
|
|
- |
|
|
- |
|
|
- |
|
|
- |
|
|
- |
|
|
- |
|
|
254 |
|
|
|
16,365,659 |
|
|
49,034 |
|
|
(2,706) |
|
|
- |
|
|
- |
|
|
- |
|
|
- |
|
|
- |
|
|
(1,392) |
|
|
44,936 |
|
|
|
|
|
|
|
|
|
|
|
|
|
|
|
|
|
|
|
|
|
|
|
|
|
|
|
|
|
|
|
Balance at December 31, 2023 |
|
|
306,587,630 |
|
$ |
1,125,376 |
|
$ |
26,144 |
|
$ |
198 |
|
$ |
(998) |
|
$ |
4,825 |
|
$ |
(4,827) |
|
$ |
87,649 |
|
$ |
49,754 |
|
$ |
1,288,121 |
|
|
|
|
|
|
|
|
|
|
|
|
|
|
|
|
|
|
|
|
|
|
|
|
|
|
|
|
|
|
|
Balance at January 1, 2022 |
|
|
291,529,330 |
|
$ |
1,079,746 |
|
$ |
27,435 |
|
$ |
128 |
|
$ |
(696) |
|
$ |
4,825 |
|
$ |
(2,907) |
|
$ |
266,617 |
|
$ |
54,422 |
|
$ |
1,429,570 |
Total comprehensive loss for the year |
|
|
|
|
|
|
|
|
|
|
|
|
|
|
|
|
|
|
|
|
|
|
|
|
|
|
|
|
|
|
Net loss for the year |
|
|
- |
|
|
- |
|
|
- |
|
|
- |
|
|
- |
|
|
- |
|
|
- |
|
|
(128,132) |
|
|
(7,774) |
|
|
(135,906) |
Other comprehensive loss for the year |
|
|
- |
|
|
- |
|
|
- |
|
|
70 |
|
|
(280) |
|
|
- |
|
|
(61) |
|
|
- |
|
|
- |
|
|
(271) |
Total comprehensive loss for the year |
|
|
- |
|
|
- |
|
|
- |
|
|
70 |
|
|
(280) |
|
|
- |
|
|
(61) |
|
|
(128,132) |
|
|
(7,774) |
|
|
(136,177) |
|
|
|
|
|
|
|
|
|
|
|
|
|
|
|
|
|
|
|
|
|
|
|
|
|
|
|
|
|
|
|
Transactions with owners of the Company |
|
|
|
|
|
|
|
|
|
|
|
|
|
|
|
|
|
|
|
|
|
|
|
|
|
|
|
|
|
|
Dividend payment to non-controlling interest |
|
|
- |
|
|
- |
|
|
- |
|
|
- |
|
|
- |
|
|
- |
|
|
- |
|
|
- |
|
|
(2,708) |
|
|
(2,708) |
Repurchase of common shares |
|
|
(2,201,404) |
|
|
(5,929) |
|
|
- |
|
|
- |
|
|
- |
|
|
- |
|
|
- |
|
|
- |
|
|
- |
|
|
(5,929) |
Shares issued on vesting of share units |
|
|
894,045 |
|
|
2,525 |
|
|
(2,006) |
|
|
- |
|
|
- |
|
|
- |
|
|
- |
|
|
- |
|
|
- |
|
|
519 |
Share-based payments |
17 |
|
- |
|
|
- |
|
|
3,421 |
|
|
- |
|
|
- |
|
|
- |
|
|
- |
|
|
- |
|
|
- |
|
|
3,421 |
|
|
|
(1,307,359) |
|
|
(3,404) |
|
|
1,415 |
|
|
- |
|
|
- |
|
|
- |
|
|
- |
|
|
- |
|
|
(2,708) |
|
|
(4,697) |
|
|
|
|
|
|
|
|
|
|
|
|
|
|
|
|
|
|
|
|
|
|
|
|
|
|
|
|
|
|
|
Balance at December 31, 2022 |
|
|
290,221,971 |
|
$ |
1,076,342 |
|
$ |
28,850 |
|
$ |
198 |
|
$ |
(976) |
|
$ |
4,825 |
|
$ |
(2,968) |
|
$ |
138,485 |
|
$ |
43,940 |
|
$ |
1,288,696 |
The accompanying notes are an integral part of these financial statements.
Page | 5
Fortuna Silver Mines Inc.
Notes to Consolidated Financial Statements
For the years ended December 31, 2023 and 2022
(Tabular amounts presented in thousands of US dollars, except share and per share amounts)
1. NATURE OF OPERATIONS
Fortuna Silver Mines Inc. (the “Company”) is a publicly traded company incorporated and domiciled in British Columbia, Canada.
The Company is engaged in precious and base metal mining and related activities in Argentina, Burkina Faso, Côte d’Ivoire, Mexico, and Peru. The Company operates the open pit Lindero gold mine (“Lindero”) in northern Argentina, the underground Yaramoko gold mine (“Yaramoko”) in southwestern Burkina Faso, the open pit Séguéla gold mine (“Séguéla”) in southwestern Côte d’Ivoire, the underground San Jose silver and gold mine (“San Jose”) in southern Mexico, and the underground Caylloma silver, lead, and zinc mine (“Caylloma”) in southern Peru.
The Company’s common shares are listed on the New York Stock Exchange (the “NYSE”) under the trading symbol FSM and on the Toronto Stock Exchange (the “TSX”) under the trading symbol FVI.
The Company’s registered office is located at Suite 650 - 200 Burrard Street, Vancouver, British Columbia, V6C 3L6, Canada.
2. BASIS OF PRESENTATION
Statement of Compliance
These consolidated financial statements (“financial statements”) have been prepared by management of the Company in accordance with International Financial Reporting Standards (“IFRS”) as issued by the International Accounting Standards Board (“IASB”) effective as of December 31, 2023.
On March 6, 2024, the Company's Board of Directors approved these financial statements for issuance.
Basis of Measurement
These financial statements have been prepared on a going concern basis under the historical cost basis, except for those assets and liabilities that are measured at fair value (Note 27) at the end of each reporting period.
3. MATERIAL ACCOUNTING POLICIES
The Company has consistently applied the following accounting policies to all periods presented in these financial statements.
(a) Basis of Consolidation
These financial statements include the accounts of the Company. All significant intercompany transactions, balances, revenues, and expenses have been eliminated upon consolidation.
Subsidiaries are included in the consolidated financial results of the Company from the effective date of acquisition or control and up to the effective date of disposition or loss of control. Control is achieved when the Company has power over the investee, is exposed to or has rights to variable returns from its involvement with an investee, and had the ability to affect those returns through its power over the investee.
Page | 6
Fortuna Silver Mines Inc.
Notes to Consolidated Financial Statements
For the years ended December 31, 2023 and 2022
(Tabular amounts presented in thousands of US dollars, except share and per share amounts)
Fortuna Silver Mines Inc. is the ultimate parent entity of the group. At December 31, 2023, the principal subsidiaries of the Company, their geographic locations, and the ownership interests held by the Company, were as follows:
|
|
|
|
|
|
|
Name |
|
Location |
|
Ownership |
|
Principal Activity |
Minera Bateas S.A.C. ("Bateas") |
|
Peru |
|
100% |
|
Caylloma Mine |
Compania Minera Cuzcatlan S.A. de C.V. ("Cuzcatlan") |
|
Mexico |
|
100% |
|
San Jose Mine |
Mansfield Minera S.A. ("Mansfield") |
|
Argentina |
|
100% |
|
Lindero Mine |
Roxgold SANU S.A. (“Sanu”) |
|
Burkina Faso |
|
90% |
|
Yaramoko Mine |
Roxgold SANGO S.A. (“Sango”) |
|
Côte d’Ivoire |
|
90% |
|
Séguéla Mine |
(b) Business Combination
A business combination is an acquisition of assets and liabilities that constitute a business. A business is an integrated set of activities and assets that consist of inputs and processes, including operational processes that, when applied to those inputs, have the ability to create outputs that provide a return to the Company and its shareholders. A business also includes those assets and liabilities that do not necessarily have all the inputs and processes required to produce outputs, but can be integrated with the inputs and processes of the Company to create outputs.
When acquiring a set of activities or assets in the exploration and development stage, which may not have outputs, the Company considers other factors to determine whether the set of activities or assets is a business.
Acquisitions of businesses are accounted for using the acquisition method. The consideration transferred in a business combination is measured at fair value, which is allocated to the identifiable assets acquired and liabilities assumed based on the acquisition-date fair value. The excess of the cost of acquisition over the fair value of the Company’s share of the identifiable net assets acquired is recorded as goodwill. If the cost of acquisition is less than the fair value of the net assets acquired, the difference, or gain, is recognized directly in the consolidated statement of operations. The results of businesses acquired during the period are included in the financial statements from the date of acquisition. Acquisition-related costs are expensed as incurred. Provisional fair values are finalized within 12 months of the acquisition date. Measurement period adjustments are adjustments that arise from additional information obtained during the measurement period about facts and circumstances that existed at the acquisition date.
(c) Non-Controlling Interests
Non-controlling interests represents equity interests in subsidiaries owned by outside parties. Non-controlling interests are recorded at their proportionate share of the fair value of identifiable net assets acquired on initial recognition. The share of net assets of subsidiaries attributable to non-controlling interests is presented as a component of equity. Their share of net income and other comprehensive income is recognized directly in equity even if the results of the non-controlling interest have a deficit balance.
The Company recognizes transactions with non-controlling interest as transactions with equity shareholders. Changes in the Company’s ownership interest in subsidiaries that do not result in loss of control are accounted for as equity transactions.
Page | 7
Fortuna Silver Mines Inc.
Notes to Consolidated Financial Statements
For the years ended December 31, 2023 and 2022
(Tabular amounts presented in thousands of US dollars, except share and per share amounts)
(d) Consolidation, Functional and Presentation Currency
These financial statements are presented in United States Dollars (“$” or “US$” or “US dollars”), which is the functional currency of the Company. Reference to C$ are to Canadian dollars. All amounts in these financial statements have been rounded to the nearest thousand US dollars, unless otherwise stated.
The functional currency for each entity consolidated within the Company's financial statements is determined by the currency of the primary economic environment in which it operates. The functional currency of all subsidiaries is US dollars except for those outlined in the table below.
Name of Subsidiary |
Place of Incorporation |
Beneficial Common Share Ownership Interest |
Principal Activity |
Functional Currency |
Roxgold Inc. |
Canada |
100% |
Holding |
CAD |
FR Gold Mining Inc. |
Canada |
100% |
Holding |
CAD |
Fortuna Silver Mines Australia Pty Ltd. |
Australia |
100% |
Corporate |
AUD |
LGL Exploration Côte d’Ivoire SA |
Côte d’Ivoire |
100% |
Exploration |
XOF |
LGL Resources Côte d’Ivoire SA |
Côte d’Ivoire |
100% |
Exploration |
XOF |
Assets and liabilities of the subsidiaries that have a functional currency other than US dollar are translated into US dollars at the exchange rate in effect on the consolidated statements of financial position date and revenues and expenses are translated at the average rate over the reporting period. Gains and losses from these translations are recognized in other comprehensive income.
Transactions in foreign currencies are initially recorded in the functional currency at the exchange rate at the date of the transaction. Monetary assets and liabilities denominated in foreign currencies are translated at the rate of exchange at each financial position date. Foreign exchange gains or losses on translation to the functional currency of an entity are recorded in profit or loss. Non-monetary items that are measured in terms of historical cost in a foreign currency are translated using the exchange rate as at the date of the initial transaction.
(e) Inventories
Inventories include mineral concentrates, doré, leach pad, gold in-circuit, stockpiled ore, materials and supplies, which are valued at the lower of average production cost and estimated net realizable value. Production costs allocated to metal inventories include direct mining costs, direct labour costs, direct material costs, mine site overhead, depletion and amortization. Stockpiled ore that is not expected to be processed within the next twelve months is classified as non-current. Costs allocated to materials and supplies are based on weighted average costs and include all costs of purchase and other costs in bringing these inventories to their existing location and condition.
In the heap leaching process, ore is stacked on the leach pad and treated with a chemical solution that dissolves the gold contained within the ore. The resulting pregnant solution is further processed in a plant where the gold is recovered. The cost of leach pad inventory is based on cost of mining, crushing, and leaching, including applicable depletion and amortization, and is removed as ounces of gold are recovered at the weighted average cost per recoverable ounce of gold on the leach pad. Estimates of recoverable gold in the leach pad are calculated based on the quantities of ore placed on the leach pad (measured tonnes added to the leach pad), the estimated grade of ore placed on the leach pad (based on assay data), and an estimated recovery percentage (based on estimated recovery assumptions from metallurgical testing). The nature of the leaching process inherently limits the ability to precisely monitor inventory levels. As a result, estimates are refined based on actual results and engineering studies over a period of time.
Page | 8
Fortuna Silver Mines Inc.
Notes to Consolidated Financial Statements
For the years ended December 31, 2023 and 2022
(Tabular amounts presented in thousands of US dollars, except share and per share amounts)
The final recovery of gold from leach pad will not be known until the leaching process is concluded at the end of the mine life.
If the carrying value exceeds the net realizable amount, a write-down is recognized. The write-down may be reversed in a subsequent period if the circumstances which caused the write-down no longer exist, to the extent that the related inventory has not been sold. Net realizable value is calculated as the estimated price at the time of sale based on prevailing metal prices less estimated future costs to convert the inventories into saleable form and estimated costs to sell.
(f) Exploration and Evaluation Assets
Exploration expenditures on properties for which the Company does not have title or rights to are expensed when incurred. Significant payments related to the acquisition of land and mineral rights and the costs to conduct a preliminary evaluation to determine that the property has potential to develop an economic ore body are capitalized as incurred. The time between initial acquisition and a full evaluation of a property’s potential is dependent on many factors including, but not limited to, location relative to existing infrastructure, the property’s stage of development, geological controls and metal prices.
The Company capitalizes the cost of acquiring, maintaining its interest, and exploring mineral properties as exploration and evaluation assets until such time as the properties are placed into development, abandoned, sold, or considered to be impaired in value.
If a mineable ore body is discovered, exploration and evaluation costs are reclassified to mining properties. The Company uses the following criteria in its assessment:
| ● | the property has mineral reserves as referred to in Canadian National Instrument 43-101 Standards of Disclosure for Mineral Projects (“NI 43-101”), and |
| ● | when legal, permitting, and social matters have been resolved sufficiently to allow mining of the ore body. |
Exploration and evaluation assets are tested for impairment when an indicator of impairment is identified and upon reclassification to mining properties.
If no mineable ore body is discovered, all previously capitalized costs are expensed in the period in which it is determined the property has no economic value.
Proceeds received from the sale of interests in exploration and evaluation assets are credited to the carrying value of the mineral properties, plant and equipment. Exploration costs that do not relate to any specific property are expensed as incurred.
(g) Mineral Properties, and Property, Plant and Equipment
i. Mineral Properties and Development Costs
For operating mines, all mineral property expenditures are capitalized and amortized based on a unit-of-production method considering the expected production to be obtained over the life of the mineral property. The expected production includes proven and probable reserves, and for the Caylloma, Yaramoko, and Séguéla mines the portion of inferred resources expected to be extracted economically as part of the production cost.
Page | 9
Fortuna Silver Mines Inc.
Notes to Consolidated Financial Statements
For the years ended December 31, 2023 and 2022
(Tabular amounts presented in thousands of US dollars, except share and per share amounts)
Capitalized costs of producing properties are amortized on a unit-of-production basis over proven and probable reserves and the portion of inferred resources where it is considered highly probable that those resources are expected to be extracted economically.
The expected production to be obtained over the life of the mineral property is based on our life-of-mine production plans which for Caylloma, Yaramoko and Séguéla include a portion of inferred resources, and therefore differ from the life-of-mine plans the Company publishes as part of our NI 43-101 compliant technical reports which are based on reserves only. The decision to use inferred resources, and the portion of inferred resources to be included varies for each operation and is based on the geological characteristics of the ore body, the quality and predictability of inferred resources, and the conversion of inferred resources into measured and indicated (“M&I”) that the Company has historically achieved in the past.
As part of the process to include inferred resources into our life-of-mine production plans, the Company applies an economic cut-off to identify only the material that can be considered profitable to mine within our mine designs, and at this time we apply a conversion or “risk” factor to the mining blocks comprised of inferred resources that we include in such mine production plans. This conversion factor is based on the predictability of conversion derived from statistical estimates of confidence as described above and the support from historic conversion rates of inferred resources into M&I at each of our mines. The conversion factors used in our 2023 life-of-mine plans were 0% (2022: 90%) at San Jose, 90% (2022: 90%) at Caylloma, 100% (2022: 100%) at Yaramoko, and 100% at Séguéla.
The percentage of inferred resources included as a component of the total mineable inventory (reserve and resource) considered in the 2023 life-of-mine evaluation for each operation as of December 31, 2023, was San Jose 0% (2022: 31%), Caylloma 50% (2022: 41%), Yaramoko 5% (2022: 8%), Séguéla 1%, and Lindero 0% (2022: 0%).
The Company reviews the conversion factors including past experience in assessing the future expected conversion of inferred resources to be used in the life-of-mine plans for inclusion of inferred resources once a year in light of new geologic information and conversion data and when events or circumstances indicate that a review should be made. The Company continually monitors expected conversion and any changes in estimates that arise from this review are accounted for prospectively.
ii. Property, Plant and Equipment
Property, plant and equipment are recorded at cost, net of accumulated depreciation and impairments. Costs directly related to construction projects are capitalized to work in progress until the asset is available for use in the manner intended by management. Assets, other than capital works in progress, are depreciated to their residual values over their estimated useful lives as follows:
Page | 10
Fortuna Silver Mines Inc.
Notes to Consolidated Financial Statements
For the years ended December 31, 2023 and 2022
(Tabular amounts presented in thousands of US dollars, except share and per share amounts)
|
|
|
|
|
|
|
|
|
|
Land and buildings |
|
|
|
|
Land |
|
Not depreciated |
|
|
Mineral properties |
|
Units of production |
|
Declining balance |
Buildings, located at the mine |
|
Units of production |
|
Declining balance |
Buildings, others (1) |
|
6-10 years |
|
Straight line |
Leasehold improvements (1) |
|
4-8 years |
|
Straight line |
Plant and equipment |
|
|
|
|
Processing plant |
|
Units of production |
|
Declining balance |
Machinery and equipment (1) |
|
3-12 years |
|
Straight line |
Furniture and other equipment (1) |
|
2-12 years |
|
Straight line |
Transport units |
|
4-5 years |
|
Straight line |
Capital work in progress |
|
Not depreciated |
|
|
| (1) | The lesser of useful life or life of mine. |
Equipment under finance lease is initially recorded at the present value of minimum lease payments at the inception of the lease and depreciated over the shorter of the lease term or useful life.
Spare parts and components included in machinery and equipment are depreciated over the shorter of the useful life of the component or the related machinery and equipment.
Borrowing costs attributed to the construction of qualifying assets are capitalized to mineral properties, plant and equipment, and are included in the carrying amounts of related assets until the asset is available for use in the manner intended by management.
The sales proceeds and associated production costs incurred during commissioning of qualifying assets under capital works in progress are recognized in profit or loss.
On an annual basis, the depreciation method, useful economic life, and residual value of each component asset is reviewed with any changes recognized prospectively over its remaining useful economic life.
iii. Stripping cost
Pre-production stripping costs are generally capitalized and amortized over the production life of the mine using the unit-of-production method.
Stripping costs incurred during the production stage are incurred in order to produce inventory or to improve access to ore which will be mined in the future. Where the costs are incurred to produce inventory, the production stripping costs are accounted for as a cost of producing those inventories. Where the costs are incurred to improve access to ore which will be mined in the future, the costs are deferred and capitalized to the statement of financial position as a stripping activity asset (included in mining interest) if the following criteria are met:
| ● | improved access to the ore body is probable; |
| ● | the component of the ore body can be accurately identified; and |
| ● | the costs relating to the stripping activity associated with the component can be reliably measured. |
If these criteria are not met, the costs are expensed in the period in which they are incurred.
The stripping activity asset is subsequently depleted using the units-of-production depletion method over the life of the identified component of the ore body to which access has been improved as a result of the stripping activity.
Page | 11
Fortuna Silver Mines Inc.
Notes to Consolidated Financial Statements
For the years ended December 31, 2023 and 2022
(Tabular amounts presented in thousands of US dollars, except share and per share amounts)
(h) Asset Impairment
At the end of each reporting period, the Company assesses for impairment indicators and if there are such indicators, then the Company performs a test of impairment.
For the purpose of assessing impairment, assets are grouped at the lowest level for which there are separately identifiable cash inflows or cash generating units. These are typically individual mines or development projects. Brownfields exploration projects, located close to existing mine infrastructure, are assessed for impairment as part of the associated mine cash generating unit.
An impairment loss is recognized for the amount by which the asset’s carrying amount exceeds its recoverable amount. The recoverable amount is the higher of an asset’s fair value less cost of disposal (“FVLCD”) and value in use.
When the recoverable amount is assessed using discounted cash flow techniques, the resulting estimates are based on detailed mine and/or production plans. For value in use, recent cost levels are considered, together with expected changes in costs compatible with the current condition of the business. The cash flow forecasts are based on best estimates of the expected future revenues and costs, including the future cash costs of production, sustaining capital expenditures, and reclamation and closure costs.
Where a FVLCD model is used, the cash flow forecast includes net cash flows expected to be realized from extraction, processing, and sale of mineral resources that do not currently qualify for inclusion in proven or probable reserves and the portion of resources expected to be extracted economically.
Where an impairment loss subsequently reverses, the carrying amount of the asset or cash-generating unit is increased to the revised estimate of recoverable amount but not beyond the carrying amount, net of depreciation and amortization, that would have been determined had no impairment loss been recognized for the asset or cash-generating unit in prior years. A reversal of an impairment loss is recognized into earnings immediately.
(i) Borrowing Costs
Interest and other financing costs incurred that are attributable to acquiring and developing exploration and development stage mining properties and constructing new facilities (“qualifying assets”), are capitalized and included in the carrying amounts of qualifying assets until those qualifying assets are capable of operating in the manner intended by management.
The capitalization of borrowing costs incurred commences on the date when the following three conditions are met:
| ● | expenditures for the qualifying asset are being incurred; |
| ● | borrowing costs are being incurred; and, |
| ● | activities that are necessary to prepare the qualifying asset for its intended use are being undertaken. |
Borrowing costs incurred after the qualifying assets are substantially complete are expensed.
Transaction costs, including legal, upfront commitment fees and other costs of issuance, associated with debt are recorded against the debt and are amortized over the term of the credit facility using the effective interest rate method.
All other borrowing costs are expensed in the period in which they are incurred.
Page | 12
Fortuna Silver Mines Inc.
Notes to Consolidated Financial Statements
For the years ended December 31, 2023 and 2022
(Tabular amounts presented in thousands of US dollars, except share and per share amounts)
(j) Income Taxes
Income tax expense consists of current and deferred tax expense.
Current tax expense is the expected tax payable on the taxable income for the year using tax rates enacted or substantively enacted at period end adjusted for amendments to tax payable with regards to previous years.
Deferred tax assets and liabilities are recognized for deferred tax consequences attributable to unused tax loss carry forwards, unused tax credits, and differences between the financial statement carrying amounts of existing assets and liabilities and their respective tax basis (“temporary differences”). Deferred tax assets and liabilities are measured using the enacted or substantively enacted tax rates expected to apply when the asset is realized, or the liability is settled.
The effect on deferred tax assets and liabilities of a change in tax rates is recognized in profit or loss in the period that substantive enactment occurs.
A deferred tax asset is recognized to the extent that it is probable that future taxable income will be available against which the asset can be utilized. To the extent that the Company does not consider it probable that a deferred tax asset will be recovered, the deferred tax asset is reduced.
The following temporary differences do not result in deferred tax assets or liabilities:
| ● | the initial recognition of assets or liabilities, not arising in a business combination, that does not affect accounting or taxable income; |
| ● | goodwill; and |
| ● | investments in subsidiaries, associates and jointly controlled entities where the timing of reversal of the temporary differences can be controlled and reversal in the foreseeable future is not probable. |
Deferred tax assets and liabilities are offset when there is a legally enforceable right to offset current tax assets against current tax liabilities, and when they relate to income taxes levied by the same taxation authority and the Company intends to settle its current tax assets and liabilities on a net basis.
(k) Provisions
i. Closure and Reclamation Provisions
Future obligations to retire an asset, including dismantling, remediation and ongoing treatment and monitoring of the site related to normal operation are initially recognized and recorded as a liability based on estimated future cash flows discounted at the risk-free rate.
The closure and reclamation provision (“CRP”) is adjusted at each reporting period for changes to the expected amount of cash flows required to discharge the liability, the timing of such cash flows and the risk-free discount rate.
The liability is accreted to full value over time through periodic charges to profit or loss.
The amount of the CRP initially recognized is capitalized as part of the related asset’s carrying value and amortized to profit or loss. The method of amortization follows that of the underlying asset. The costs related to a CRP are only capitalized to the extent that the amount meets the definition of an asset and can bring about future economic benefit. For a closed site or where the asset which generated a CRP no longer exists, there is no longer a future benefit related to the costs and as such, the amounts are expensed. Revisions in estimates or new disturbances result in an adjustment to the CRP with an offsetting adjustment to the asset, unless there is no future benefit, in which case they are expensed.
Page | 13
Fortuna Silver Mines Inc.
Notes to Consolidated Financial Statements
For the years ended December 31, 2023 and 2022
(Tabular amounts presented in thousands of US dollars, except share and per share amounts)
Due to uncertainties inherent in environmental remediation, the ultimate cost of future site closure and reclamation could differ from the amounts provided. The estimate of future site closure and reclamation costs is subject to change based on amendments to laws and regulations, changes in technologies, price increases and changes in interest rates, and as new information concerning the Company’s closure and reclamation obligations becomes available. Such changes are reflected prospectively in the determination of the provision.
ii. Environmental Disturbance Restoration Provisions
During the operating life of an asset, events such as infractions of environmental laws or regulations may occur. These events are not related to the normal operation of the asset and are referred to as environmental disturbance restoration provisions (“EDRP”). The costs associated with an EDRP are accrued and charged to earnings in the period in which the event giving rise to the liability occurs. Any subsequent adjustments to an EDRP due to changes in estimates are also charged to earnings in the period of adjustment. These costs are not capitalized as part of the long-lived asset’s carrying value.
(l) Share-Based Payments
The fair value method of accounting is used for share-based payment transactions. Under this method, the cost of stock options and other equity-settled share-based payment arrangements are recorded based on the estimated fair value at the grant date and charged to earnings over the vesting period. Where awards are forfeited because non-market based vesting conditions were not satisfied, the expense previously recognized is reversed in the period the forfeiture occurs.
Share-based payment expenses relating to cash-settled awards, including deferred share units, restricted share units, and performance share units, are accrued and expensed over the vesting period based on the quoted market value of the Company’s common shares. As these awards will be settled in cash, the expense and liability are adjusted at each reporting period for any changes in the underlying share price.
Equity settled share-based payment transactions with parties other than employees are measured at the fair value of the goods or services received, except where that fair value cannot be estimated reliably, in which case they are measured at the fair value of the equity instruments granted, measured at the date the Company obtains the goods or the counter party renders the services.
i. Stock Option Plan
The Company applies the fair value method of accounting for all stock option awards. Under this method, the Company recognizes a compensation expense for all stock options awarded to employees, based on the fair value of the options on the date of grant which is determined by using the Black-Scholes option pricing model. The fair value of the options is expensed over the graded vesting period of the options.
ii. Deferred Share Unit Plan
Deferred share units (“DSU”) are typically granted to non-executive directors of the Company. They are payable in cash upon resignation, retirement, removal, failure to achieve re-election, or upon a change of control of the Company. The DSU compensation liability is accounted for based on the number of DSUs outstanding and the quoted market value of the Company’s common shares at the financial position date.
Page | 14
Fortuna Silver Mines Inc.
Notes to Consolidated Financial Statements
For the years ended December 31, 2023 and 2022
(Tabular amounts presented in thousands of US dollars, except share and per share amounts)
The year-over-year change in the DSU compensation liability is recognized in profit or loss.
iii. Share Unit Plans
The Company’s share unit plan covers all restricted share units (“RSUs”) and performance share units (“PSUs”) granted by the Company.
Restricted Share Units
The Company’s RSUs are settled in either cash or equity, as determined by the Company’s Board of Directors at the grant date and typically vest over three years.
For cash settled RSUs, the share-based payment expense is adjusted at each reporting period to reflect any change in the quoted market price of the Company’s common shares and the vesting of each RSU grant, with a corresponding amount recorded in Trade and Other Payables, and Other Non-Current Liabilities.
For equity-settled RSUs, the fair value is determined based on the quoted market price of the Company’s common shares at the date of grant, and the fair value is recognized as a share-based payment expense over the vesting period with a corresponding amount recorded in equity reserves.
Performance Share Units
The Company’s PSUs are performance-based awards for the achievement of specified performance metrics by specified deadlines and are settled in either cash or equity, as determined by the Company’s Board of Directors at the grant date and typically vest over three years.
For cash settled PSUs, the share-based payment expense is adjusted at each reporting period to reflect any change in the quoted market price of the Company’s common shares, the vesting of each PSU grant and the expected performance factors with a corresponding amount recorded in Trade and Other Payables.
For equity-settled PSUs, the fair value is determined based on the quoted market price of the Company’s common shares at the date of grant and the number of PSUs expected to vest based on the performance factors. The fair value is recognized as a share-based payment expense over the vesting period with a corresponding amount recorded in equity reserves.
(m) Financial Instruments
Classification and measurement of financial assets and financial liabilities
Financial assets are measured as either: amortized cost; fair value through other comprehensive income (“FVOCI”) or fair value through profit or loss (“FVTPL”). All non-derivative financial liabilities are measured at amortized cost. The classification of financial assets is generally based on the business model in which a financial asset is managed and its contractual cash flow characteristics. Derivatives embedded in contracts where the host is a financial asset in the scope of the standard are never separated, and instead the hybrid financial instrument is assessed for classification.
Page | 15
Fortuna Silver Mines Inc.
Notes to Consolidated Financial Statements
For the years ended December 31, 2023 and 2022
(Tabular amounts presented in thousands of US dollars, except share and per share amounts)
A financial asset is measured at amortized cost if it meets both of the following conditions and is not designated as at FVTPL:
| ● | it is held within a business model whose objective is to hold assets to collect contractual cash flows; and |
| ● | its contractual terms give rise on specified dates to cash flows that are solely payments of principal and interest on the principal amount outstanding. |
A debt investment is measured at FVOCI if it meets both of the following conditions and is not designated as at FVTPL:
| ● | it is held within a business model whose objective is achieved by both collecting contractual cash flows and selling financial assets; and |
| ● | its contractual terms give rise on specified dates to cash flows that are solely payments of principal and interest on the principal amount outstanding. |
On initial recognition of an equity investment that is not held for trading, the Company may irrevocably elect to present subsequent changes in the investment’s fair value in other comprehensive income (OCI). This election is made on an investment-by-investment basis. All financial assets not classified as measured at amortized cost or FVOCI as described above are measured at FVTPL.
Components of compound financial instruments are separately classified as either financial liabilities or as equity in accordance with the substance of the contractual arrangements and the definitions of a financial liability and an equity instrument. The financial liability is initially recognized at fair value, net of an allocation of issuance costs, and is subsequently measured at amortized cost. The equity component is initially measured based on the residual amount, net of an allocation of issuance costs, and is not subsequently remeasured.
Equity instruments issued by the Company are recognized at the proceeds received, net of direct issue costs. Repurchase of the Company’s own equity instruments is recognized and deducted directly in equity. No gain or loss is recognized in profit or loss on the purchase, sale, or cancellation of our own equity instruments. No gain or loss is recognized on the issue of our own equity instruments, unless the equity is issued to settle a liability.
Financial Liabilities at Amortized Cost – Financial liabilities are measured at amortized cost using the effective interest method, unless they are required to be measured at fair value through profit or loss, or the Company has opted to measure them at FVTPL. Debt and accounts payable and accrued liabilities are recognized initially at fair value, net of any transaction costs incurred, and subsequently at amortized cost using the effective interest method.
The following accounting policies apply to the subsequent measurement of financial assets:
| ● | Financial assets at FVTPL - These assets are subsequently measured at fair value. Net gains and losses, including any interest or dividend income, are recognized in profit or loss. |
| ● | Financial assets at amortized cost - These assets are subsequently measured at amortized cost using the effective interest method. The amortized cost is reduced by impairment losses. Interest income, foreign exchange gains and losses and impairment are recognized in profit or loss. Any gain or loss on derecognition is recognized in profit or loss. |
| ● | Equity investments at FVOCI - These assets are subsequently measured at fair value. Dividends are recognized as income in profit or loss unless the dividend clearly represents a recovery of part of the cost of the investment. Gains or losses recognized on the sale of the equity investment are recognized in OCI and are never reclassified to profit or loss. |
Page | 16
Fortuna Silver Mines Inc.
Notes to Consolidated Financial Statements
For the years ended December 31, 2023 and 2022
(Tabular amounts presented in thousands of US dollars, except share and per share amounts)
(n) Revenue Recognition
The Company earns revenue from contracts with customers related to its concentrate and doré sales. Revenue from contracts with customers is recognized when a customer obtains control of the concentrate or the doré and the Company satisfies its performance obligation. The Company considers the terms of the contract in determining the transaction price, which is the amount the entity expects to be entitled to in exchange for the transferring of the concentrates. The transaction price of a contract is allocated to each performance obligation based on its stand-alone selling price.
The Company satisfies its performance obligations for its concentrate sales based upon specified contract terms which are generally upon delivery to the customer at a specified warehouse or upon loading of the concentrate onto a vessel. The Company typically receives payment within one to four weeks of delivery.
Doré sales are recognized when the Company satisfies its performance obligation and control is transferred to the customer upon payment. Final weights and assays are adjusted on final settlement which is approximately one month after delivery.
Revenue from concentrate sales is recorded based upon forward market price of the expected final sales price date. IFRS 15 Revenue from Contracts with Customers (“IFRS 15”) does not consider provisional price adjustments associated with concentrate sales to be revenue from contracts with customers as they arise from changes in market pricing for silver, gold, lead and zinc between the delivery date and settlement date. As such, the provisional price adjustments are accounted for as derivatives and presented separately in Note 20 of these financial statements.
(o) Adoption of New Accounting Standards, Interpretation or Amendments
The Company adopted Disclosure of Accounting Policies (Amendments to IAS 1 and IFRS Practice Statement 2) from January 1, 2023. The amendments require the disclosure of 'material', rather than 'significant', accounting policies. Although the amendments did not result in any changes to the accounting policies themselves, they impacted the accounting policy information disclosed in Note 3 in certain instances.
(p) New Accounting Standards Issued but not yet Effective
A number of new standards are effective for annual periods beginning on or after January 1, 2024 and earlier application is permitted; however, the Company has not early adopted any new or amended standards in preparing these financial statements. The Company is currently evaluating the impact of the following amended standard on its financial statements:
| ● | Classification of Liabilities as Current or Non-Current (Amendments to IAS 1) |
These amendments clarify that the classification of liabilities as current or non-current is based on the right to defer settlement in existence at the end of the reporting period, which is unaffected by management’s intentions or expectation. These amendments also introduce a definition of “settlement” to make clear that settlement refers to the transfer to the counterparty of cash, equity instruments, other assets or services.
In addition, the amendments specify that only covenants that a company is required to comply with on or before the reporting date affect the company’s right to defer settlement of a liability, and therefore the classification of current or non-current. Such covenants affect whether the right exists at the end of the reporting period, even if compliance with the covenant is assessed only after the reporting date.
The amendments are applied retrospectively for annual periods beginning on or after 1 January 2024, with early application permitted.
Page | 17
Fortuna Silver Mines Inc.
Notes to Consolidated Financial Statements
For the years ended December 31, 2023 and 2022
(Tabular amounts presented in thousands of US dollars, except share and per share amounts)
The following new standards or amendments are effective for annual periods beginning on or after January 1, 2024 and are expected to have no impact on the Company’s financial statements:
| ● | Lease Liability in a Sale and Leaseback (Amendments to IFRS 16) |
| ● | Supplier Finance Arrangements (Amendments to IAS 7 and IFRS 7) |
| ● | Sale or Contribution of Assets between an Investor and its Associate or Joint Venture (Amendments to IFRS 10 and IAS 28) |
The Company is currently evaluating the impact of the following amended standard, effective January 1, 2025, and interpretations on its consolidated financial statements:
| ● | Lack of Exchangeability (Amendments to IAS 21) |
4. USE OF ESTIMATES, ASSUMPTIONS, AND JUDGEMENTS
The preparation of these financial statements requires management to make estimates and judgements that affect the reported amounts of assets and liabilities at the period end date and reported amounts of expenses during the reporting period. Such judgements and estimates are, by their nature, uncertain. Actual outcomes could differ from these estimates.
The impact of such judgements and estimates are pervasive throughout the financial statements, and may require accounting adjustments based on future occurrences. These judgements and estimates are continuously evaluated and are based on management’s experience and knowledge of the relevant facts and circumstances. Revisions to accounting estimates are recognized in the period in which the estimate is revised and are accounted for prospectively.
In preparing these consolidated financial statements for the year ended December 31, 2023, the Company applied the critical estimates, assumptions and judgements as disclosed below.
(a) Critical Accounting Estimates and Assumptions
Areas where critical accounting estimates and assumptions have the most significant effect on the amounts recognized in the consolidated financial statements include:
i. Mineral Reserves and Resources and the Life of Mine Plan
The Company estimates its mineral reserves and mineral resources in accordance with the requirements of NI 43-101. Estimates of the quantities of the mineral reserves and mineral resources form the basis for the Company’s life of mine plans, which are used for the calculation of depletion expense under the units of production method, impairment tests, and forecasting the timing of the payments related to the environmental reclamation provision.
Significant estimation is involved in determining the reserves and resources included within the Company’s life of mine plans. Changes in forecast prices of commodities, exchange rates, production costs or recovery rates may result in the Company’s life-of-mine plan being revised and such changes could impact depletion rates, asset carrying values and the environmental reclamation provision. As at December 31, 2023, the Company used the following long-term prices for the reserve and resource estimations: gold $1,600/oz, silver $21/oz, lead $2,000/t and zinc $2,600/t, except at the San Jose mine which used $1,880/oz gold and $23.90/oz silver.
In addition to the estimates above, estimation is involved in determining the percentage of resources ultimately expected to be converted to reserves and hence included in the Company’s life of mine plans. The Company’s life of mine plans include a portion of inferred resources as the Company believes this provides a better estimate of the expected life of mine for certain types of deposits, in particular for vein type structures. The percentage of inferred resources out of the total tonnage included in the life of mine plans is based on site specific geological, technical, and economic considerations.
Page | 18
Fortuna Silver Mines Inc.
Notes to Consolidated Financial Statements
For the years ended December 31, 2023 and 2022
(Tabular amounts presented in thousands of US dollars, except share and per share amounts)
Estimation of future conversion of resources is inherently uncertain and involves judgement, and actual outcomes may vary from these judgements and estimates and such changes could have a material impact on the financial results. Some of the key assumptions in the estimation process include geological continuity, stationarity in the grades within defined domains, reasonable geotechnical and metallurgical conditions, treatment of outlier (extreme) values, cut-off grade determination and the establishment of geostatistical and search parameters. Revisions to these estimates are accounted for prospectively in the period in which the change in estimate arises.
ii. Valuation of Mineral Properties and Exploration Properties
The Company carries its mineral properties at cost less accumulated depletion and any accumulated impairment. The costs of each property and related capitalized expenditures are depleted over the economic life of the property on a units-of-production basis. When a property is abandoned or when there is an impairment, costs are charged to profit or loss.
The Company undertakes a review of the carrying values of mining properties and related expenditures whenever events or changes in circumstances indicate that their carrying values may exceed their estimated recoverable amounts determined by reference to estimated future operating results and discounted net cash flows. Where previous impairment has been recorded, the Company analyzes any impairment reversal indicators. An impairment loss is recognized when the carrying value of those assets is not recoverable.
In undertaking this review, management of the Company is required to make significant estimates of, amongst other things, future production and sales volumes, metal prices, discount rates, mineral resource and reserve quantities, future operating and capital costs to the end of the mine’s life, and reclamation costs. These estimates are subject to various risks and uncertainties which may ultimately have an effect on the expected recoverability of the carrying values of the mining properties and related expenditures.
The Company, from time to time, acquires exploration and development properties. When properties are acquired, the Company must determine the fair value attributable to each of the properties. When the Company conducts exploration on a mineral property and the results from the exploration do not support the carrying value, the property is written down to its new fair value which could have a material effect on the consolidated statement of financial position and the consolidated income statement.
iii. Deferred stripping costs
In determining whether stripping costs incurred during the production phase of a mining property relate to mineral reserves that will be mined in a future period and therefore should be capitalized, the Company makes estimates of the proportion of stripping activity which relates to extracting ore in the current period versus the proportion which relates to obtaining access to ore reserves which will be mined in the future.
iv. Inventory
Finished goods, work-in-process, heap leach ore, and stockpile ore are valued at the lower of the average production costs or net realizable value. The assumptions used in the valuation of work-in process inventories include estimates of gold contained in the ore stacked on leach pads, assumptions of the amount of gold stacked that is expected to be recovered from the leach pads, the amount of gold in the mill circuits and assumption of the gold price expected to be realized when the gold is recovered. If these estimates or assumptions prove to be inaccurate, the Company could be required to write-down the recorded value of its work-in-process inventories, which would reduce the Company's earnings and working capital.
Page | 19
Fortuna Silver Mines Inc.
Notes to Consolidated Financial Statements
For the years ended December 31, 2023 and 2022
(Tabular amounts presented in thousands of US dollars, except share and per share amounts)
v. Reclamation and Other Closure Provisions
The Company has obligations for reclamation and other closure activities related to its mining properties. The future obligations for mine closure activities are estimated by the Company using mine closure plans or other similar studies which outline the requirements that will be carried out to meet the obligations.
Because the obligations are dependent on the laws and regulations of the countries in which the mines operate, the requirements could change as a result of amendments in the laws and regulations relating to environmental protection and other legislation affecting resource companies. As the estimate of the obligations is based on future expectations, a number of estimates and assumptions are made by management in the determination of closure provisions.
vi. Revenue from metal in concentrate
The Company’s sales of metal in concentrates allow for price adjustments based on the market price at the end of the relevant quotational period (“QP”) stipulated in the contract. These are referred to as provisional pricing arrangements and are such that the selling price for metal in concentrate is based on the prevailing spot price on a specified future date. At each balance sheet date, the Company estimates the value of the trade receivable using forward metal prices.
Adjustments to the sale price occur based on movements in quoted market prices up to the end of the QP. The period between provisional invoicing and the end of the QP is generally between one and three months. Any future changes over the QP are embedded within the provisionally priced trade receivables and are, therefore, within the scope of IFRS 9 and not within the scope of IFRS 15. As such, the provisional price adjustments are accounted for as derivatives and presented separately in Note 20 of these financial statements.
vii. Contingencies
Contingencies can be either possible assets or possible liabilities arising from past events which, by their nature, will only be resolved when one or more future events not within our control occur or fail to occur. The assessment of such contingencies inherently involves the exercise of significant judgement and estimates of the outcome of future events. In assessing loss contingencies related to legal proceedings that are pending against the Company or unasserted claims that may result in such proceedings or regulatory or government actions that may negatively impact our business or operations, the Company with assistance from its legal counsel evaluates the perceived merits of any legal proceedings or unasserted claims or actions.
A liability is recognized in the consolidated financial statements when the outcome of the legal proceedings is probable and the estimated settlement amount can be estimated reliably. Contingent assets are not recognized in the consolidated financial statements until virtually certain.
(b) Critical Accounting Judgements in Applying the Entity’s Accounting Policies
Judgements that have the most significant effect on the amounts recognized in the Company’s consolidated financial statements are as follows:
i. Income Taxes
Deferred tax assets and liabilities are determined based on differences between the financial statement carrying values of assets and liabilities and their respective income tax bases and losses carried forward. The determination of the ability of the Company to utilize tax loss carryforwards to offset deferred tax liabilities requires management to exercise judgement and make certain assumptions about the future performance of the Company.
Page | 20
Fortuna Silver Mines Inc.
Notes to Consolidated Financial Statements
For the years ended December 31, 2023 and 2022
(Tabular amounts presented in thousands of US dollars, except share and per share amounts)
Management is required to assess whether it is “probable” that the Company will benefit from these prior losses and other deferred tax assets. Changes in economic conditions, metal prices and other factors could result in revisions to the estimates of the benefits to be realized or the timing of utilization of the losses.
ii. Assessment of Impairment and Reversal of Impairment Indicators
Management applies significant judgement in assessing whether indicators of impairment or impairment reversal exist for an asset or a group of assets. External sources of information the Company considers include changes in the market, economic and legal environment in which the Company operates that are not within its control and affect the recoverable amount of mining interests. Internal sources of information the Company considers include the manner in which mining properties and plant and equipment are being used or are expected to be used, and indicators of economic performance of the assets.
iii. Functional Currency
The functional currency for the Company and its subsidiaries is the currency of the primary economic environment in which each operates. The determination of functional currency may require certain judgements to determine the primary economic environment. The Company reconsiders the functional currency used when there is a change in the events and conditions which determined the primary economic environment.
iv. Leases
Significant judgements made by management in the accounting for leases primarily included whether the lease conveys the right to use a specific asset, whether the Company obtains substantially all of the economic benefits from the use of the asset, whether the Company has the right to direct the use of the asset, evaluating the appropriate discount rate to use to discount the lease liability for each lease or groups of assets, and to determine the lease term where a contract includes renewal options. Significant judgements over these factors would affect the present value of the lease liabilities, as well as the associated amount of the right-of-use (“ROU”) asset.
v. Value-added tax (“VAT”) receivable
Timing of collection of VAT receivables is uncertain as VAT refund procedures require a significant amount of information and follow-up. The Company assesses the recoverability of the amounts receivable at each reporting date and the expected timing of the recovery, which are impacted by several factors, including the status of discussions with the tax authorities, and current interpretation of relevant VAT legislation and regulation. Changes in these judgements can materially affect the amount recognized as VAT receivable and could result in an increase in other expenses recognized in profit or loss and the presentation of current and non-current VAT receivable.
5. TRADE AND OTHER RECEIVABLES
As at |
|
December 31, 2023 |
|
December 31, 2022 |
||
Trade receivables from doré and concentrate sales |
|
$ |
19,970 |
|
$ |
23,977 |
Advances and other receivables |
|
|
5,189 |
|
|
7,443 |
Value added tax receivables |
|
|
44,370 |
|
|
36,745 |
Trade and other receivables |
|
$ |
69,529 |
|
$ |
68,165 |
Page | 21
Fortuna Silver Mines Inc.
Notes to Consolidated Financial Statements
For the years ended December 31, 2023 and 2022
(Tabular amounts presented in thousands of US dollars, except share and per share amounts)
The Company’s trade receivables from concentrate and doré sales are expected to be collected in accordance with the terms of the existing concentrate and doré sales contracts with its customers. No amounts were past due as at December 31, 2023 and December 31, 2022.
As at December 31, 2023, current VAT receivables included $7.5 million (December 31, 2022 - $8.8 million) for Argentina, $7.4 million (December 31, 2022 - $4.7 million) for Mexico, $5.1 million (December 31, 2022 - $1.0 million) for Côte d’Ivoire, and $22.7 million (December 31, 2022 - $20.9 million) for Burkina Faso.
During the year ended December 31, 2023, the Company sold VAT receivables in the amount of $10.4 million at a factor rate of 5% to a commercial bank in Burkina Faso.
In the fourth quarter of 2023, the Company recognized foreign exchange losses incurred during the devaluation of the Argentine Peso in December 2023, primarily impacting VAT receivables. As of December 2023, the Company has unrealized FX losses of $7.6 million related to Argentine VAT receivables. The Company had already implemented an investment strategy, utilizing Argentine export promotions, to address its local currency requirements in Argentina. This strategy enabled the Company to achieve gains of $12.4 million from trades in Argentine Peso denominated cross-border securities, which helped offset foreign exchange losses.
6. INVENTORIES
As at |
Note |
|
December 31, 2023 |
|
December 31, 2022 |
||
Concentrate stockpiles |
|
|
$ |
1,328 |
|
$ |
2,161 |
Doré bars |
|
|
|
273 |
|
|
4,494 |
Leach pad and gold-in-circuit |
|
|
|
27,527 |
|
|
31,649 |
Ore stockpiles |
|
|
|
73,015 |
|
|
52,692 |
Materials and supplies |
|
|
|
53,235 |
|
|
44,476 |
Total inventories |
|
|
$ |
155,378 |
|
$ |
135,472 |
Less: non-current portion |
10 |
|
|
(39,553) |
|
|
(43,439) |
Current inventories |
|
|
$ |
115,825 |
|
$ |
92,033 |
During the year ended December 31, 2023, the Company expensed $584.6 million of inventories to cost of sales (December 31, 2022 - $481.5 million).
During the year ended December 31, 2023, a charge of $6.2 million (December 31, 2022 – charge of $8.9 million) was recognized to reduce low grade stockpiles at Lindero and Yaramoko to net realizable value. This includes a charge of $2.3 million (December 31, 2022 – charge of $3.4 million) related to depletion and depreciation.
During the year ended December 31, 2023, the Company completed an assessment of its consumption plan for the materials in the warehouse and set up a provision of $10.1 million ($3.0 million Yaramoko, $4.6 million San Jose and $2.5 million at Lindero) related to inventory obsolescence.
7. OTHER CURRENT ASSETS
As at |
|
December 31, 2023 |
|
December 31, 2022 |
||
Prepaid expenses |
|
$ |
14,604 |
|
$ |
11,180 |
Income tax recoverable |
|
|
5,113 |
|
|
718 |
Other |
|
|
106 |
|
|
123 |
Other current assets |
|
$ |
19,823 |
|
$ |
12,021 |
Page | 22
Fortuna Silver Mines Inc.
Notes to Consolidated Financial Statements
For the years ended December 31, 2023 and 2022
(Tabular amounts presented in thousands of US dollars, except share and per share amounts)
8. ACQUISITION OF CHESSER RESOURCES
On September 20, 2023, the Company acquired a portfolio of exploration projects in eastern Senegal, including the flagship Diambu Sud project, through the acquisition of Chesser Resources Limited ("Chesser").
The transaction did not qualify as a business combination under IFRS 3, Business Combinations, as significant inputs and processes that together constitute a business were not identified, given the early stage of exploration and evaluation of the projects acquired. The acquisition was therefore accounted for as an asset acquisition, and the purchase price was allocated to the assets acquired and liabilities assumed, based on their relative fair values at the date of acquisition. Acquisition costs were capitalized as part of the cost of assets acquired.
The cost of acquisition includes the fair value of the Fortuna shares issued to acquire Chesser, based on the issuance of 15,545,368 Fortuna shares at $2.93 per share, the Fortuna acquisition costs related to the acquisition, and the settlement of taxes related to the transaction. These taxes relate to the capital gain on the indirect disposition of the exploration projects in Senegal, and related registration fees.
The Company advanced interest-bearing loans of $3.4 million Australian dollars ($2.2 million) to Chesser in advance of closing of the transaction. The loans, and related interest, were effectively settled upon closing of the transaction.
The consideration and allocation of purchase price to assets acquired and liabilities assumed are as follows:
Consideration transferred |
|
|
Shares issued |
$ |
45,548 |
Acquisition costs |
|
2,182 |
Settlement of loan facility from Fortuna |
|
2,212 |
Capital gains taxes and registration fees |
|
9,371 |
|
$ |
59,313 |
|
|
|
Assets acquired and liabilities assumed |
|
|
Cash and cash equivalents |
$ |
420 |
Other current assets |
|
300 |
Property, plant and equipment |
|
282 |
Exploration and evaluation assets |
|
58,862 |
Current liabilities |
|
(551) |
|
$ |
59,313 |
Page | 23
Fortuna Silver Mines Inc.
Notes to Consolidated Financial Statements
For the years ended December 31, 2023 and 2022
(Tabular amounts presented in thousands of US dollars, except share and per share amounts)
9. MINERAL PROPERTIES AND PROPERTY, PLANT AND EQUIPMENT
|
|
|
|
Mineral |
|
|
Mineral |
|
|
Construction in Progress |
|
|
Property, Plant & Equipment |
|
|
Total |
COST |
|
|
|
|
|
|
|
|
|
|
|
|
|
|
|
|
Balance as at December 31, 2022 |
|
|
$ |
866,999 |
|
$ |
712,269 |
|
$ |
154,647 |
|
$ |
704,781 |
|
$ |
2,438,696 |
Acquisition of Chesser |
|
|
|
- |
|
|
58,862 |
|
|
- |
|
|
282 |
|
|
59,144 |
Additions |
|
|
|
100,366 |
|
|
39,835 |
|
|
111,690 |
|
|
23,930 |
|
|
275,821 |
Changes in closure and reclamation provision |
|
|
|
9,407 |
|
|
- |
|
|
- |
|
|
152 |
|
|
9,559 |
Disposals and write-offs |
|
|
|
(142) |
|
|
(5,883) |
|
|
- |
|
|
(6,872) |
|
|
(12,897) |
Transfers |
|
|
|
534,991 |
|
|
(532,127) |
|
|
(222,119) |
|
|
219,255 |
|
|
- |
Balance as at December 31, 2023 |
|
|
$ |
1,511,621 |
|
$ |
272,956 |
|
$ |
44,218 |
|
$ |
941,528 |
|
$ |
2,770,323 |
ACCUMULATED DEPLETION AND IMPAIRMENT |
|
|
|
|
|
|
|
|
|
|
|
|
|
|
|
|
Balance as at December 31, 2022 |
|
|
$ |
506,268 |
|
$ |
- |
|
$ |
- |
|
$ |
364,807 |
|
$ |
871,075 |
Disposals and write-offs |
|
|
|
(40) |
|
|
- |
|
|
- |
|
|
(6,610) |
|
|
(6,650) |
Impairment |
|
|
|
60,602 |
|
|
- |
|
|
49 |
|
|
29,964 |
|
|
90,615 |
Depletion and depreciation |
|
|
|
156,425 |
|
|
- |
|
|
- |
|
|
84,646 |
|
|
241,071 |
Balance as at December 31, 2023 |
|
|
$ |
723,255 |
|
$ |
- |
|
$ |
49 |
|
$ |
472,807 |
|
$ |
1,196,111 |
Net Book Value as at December 31, 2023 |
|
|
$ |
788,366 |
|
$ |
272,956 |
|
$ |
44,169 |
|
$ |
468,721 |
|
$ |
1,574,212 |
Following the first gold pour on May 24, 2023, and the subsequent ramp-up of operations, the Séguéla project was evaluated to determine if it was ready for its intended use. Determining when a mine under construction is substantially complete and ready for its intended use involves significant judgement. Some of the criteria used to make the determination for the Séguéla mine included:
| ● | Completion of all major capital expenditures to prepare the mine for steady state operations. |
| ● | The mine and plant achieving a predetermined percentage of design capacity. |
| ● | Metallurgical recoveries aligning with expectations. |
| ● | Ability to sustain ongoing metal production. |
| ● | Availability and utilization of key infrastructure aligned with the intended design. |
No single factor was more important than any other factor. Management considered these factors collectively and determined that commercial production was achieved, and assets were ready for their intended use on July 1, 2023, for the open pit mine and August 1, 2023, for the processing plant and supporting infrastructure. Upon reaching commercial production, the related assets started depreciating, and the Company stopped capitalizing interest expenses associated with the project on July 1, 2023.
During the year ended December 31, 2023, the Company capitalized $6.5 million of interest related to the construction of the Séguéla mine (year ended December 31, 2022 - $3.3 million).
As at December 31, 2023, non-depletable mineral properties include $88.5 million of exploration and evaluation assets (December 31, 2022 - $26.4 million).
During the year ended December 31, 2023, mining equipment arrived at site and was placed into use at the Séguéla mine as part of a mining services contract. As a result, the Company recognized right-of-use assets with a cost of $35.8 million.
As at December 31, 2023, property, plant and equipment includes right-of-use assets with a net book value of $56.1 million (December 31, 2022 - $21.5 million). Related depletion and depreciation for the year ended December 31, 2023, was $16.2 million (year ended December 31, 2022 - $9.5 million).
Page | 24
Fortuna Silver Mines Inc.
Notes to Consolidated Financial Statements
For the years ended December 31, 2023 and 2022
(Tabular amounts presented in thousands of US dollars, except share and per share amounts)
|
|
|
|
Mineral |
|
|
Mineral |
|
|
Construction in Progress |
|
|
Property, Plant & Equipment |
|
|
Total |
COST |
|
|
|
|
|
|
|
|
|
|
|
|
|
|
|
|
Balance as at December 31, 2021 |
|
|
$ |
758,112 |
|
$ |
719,663 |
|
$ |
57,759 |
|
$ |
675,486 |
|
$ |
2,211,020 |
Additions |
|
|
|
74,301 |
|
|
35,468 |
|
|
117,860 |
|
|
14,255 |
|
|
241,884 |
Changes in closure and reclamation provision |
|
|
|
(10,024) |
|
|
5,238 |
|
|
- |
|
|
(235) |
|
|
(5,021) |
Disposals and write-offs |
|
|
|
(372) |
|
|
(5,502) |
|
|
- |
|
|
(3,313) |
|
|
(9,187) |
Transfers |
|
|
|
44,982 |
|
|
(42,598) |
|
|
(20,972) |
|
|
18,588 |
|
|
- |
Balance as at December 31, 2022 |
|
|
$ |
866,999 |
|
$ |
712,269 |
|
$ |
154,647 |
|
$ |
704,781 |
|
$ |
2,438,696 |
ACCUMULATED DEPLETION AND IMPAIRMENT |
|
|
|
|
|
|
|
|
|
|
|
|
|
|
|
|
Balance as at December 31, 2021 |
|
|
$ |
275,460 |
|
$ |
- |
|
$ |
- |
|
$ |
223,206 |
|
$ |
498,666 |
Disposals and write-offs |
|
|
|
- |
|
|
- |
|
|
- |
|
|
(1,970) |
|
|
(1,970) |
Impairment |
|
|
|
117,237 |
|
|
- |
|
|
- |
|
|
65,605 |
|
|
182,842 |
Depletion and depreciation |
|
|
|
113,571 |
|
|
- |
|
|
- |
|
|
77,966 |
|
|
191,537 |
Balance as at December 31, 2022 |
|
|
$ |
506,268 |
|
$ |
- |
|
$ |
- |
|
$ |
364,807 |
|
$ |
871,075 |
Net Book Value as at December 31, 2022 |
|
|
$ |
360,731 |
|
$ |
712,269 |
|
$ |
154,647 |
|
$ |
339,975 |
|
$ |
1,567,622 |
10. OTHER NON-CURRENT ASSETS
As at |
Note |
|
December 31, 2023 |
|
December 31, 2022 |
||
Ore stockpiles |
6 |
|
$ |
39,553 |
|
$ |
43,439 |
Value added tax receivables |
|
|
|
13,172 |
|
|
3,642 |
Income tax recoverable |
|
|
|
1,170 |
|
|
1,137 |
Other |
|
|
|
5,521 |
|
|
3,705 |
Total other non-current assets |
|
|
$ |
59,416 |
|
$ |
51,923 |
As at December 31, 2023, non-current VAT receivables included $3.8 million (December 31, 2022 - $3.6 million) for Mexico and $9.4 million (December 31, 2022 - nil) for Burkina Faso.
11. TRADE AND OTHER PAYABLES
As at |
Note |
|
December 31, 2023 |
|
December 31, 2022 |
||
Trade accounts payable |
|
|
$ |
100,387 |
|
$ |
72,571 |
Payroll and related payables |
|
|
|
21,896 |
|
|
22,967 |
Mining royalty payable |
|
|
|
3,997 |
|
|
2,476 |
Other payables |
|
|
|
15,112 |
|
|
7,794 |
Derivative liabilities |
|
|
|
81 |
|
|
270 |
Share units payable |
17(a)(b)(c) |
|
|
6,611 |
|
|
5,818 |
Total trade and other payables |
|
|
$ |
148,084 |
|
$ |
111,896 |
12. RELATED PARTY TRANSACTIONS
In addition to the related party transactions and balances disclosed elsewhere in these financial statements, the Company entered into the following related party transactions during the year ended December 31, 2023, and 2022:
Page | 25
Fortuna Silver Mines Inc.
Notes to Consolidated Financial Statements
For the years ended December 31, 2023 and 2022
(Tabular amounts presented in thousands of US dollars, except share and per share amounts)
Key Management Personnel
Amounts paid to key management personnel were as follows:
|
|
|
Years ended December 31, |
|||
|
|
2023 |
|
2022 |
||
Salaries and benefits |
|
$ |
8,450 |
|
$ |
11,532 |
Directors fees |
|
|
830 |
|
|
934 |
Consulting fees |
|
|
66 |
|
|
69 |
Share-based payments |
|
|
4,874 |
|
|
7,042 |
|
|
$ |
14,220 |
|
$ |
19,577 |
During the year ended December 31, 2023, and 2022, the Company was charged for consulting services by Mario Szotlender, a director of the Company.
13. LEASE OBLIGATIONS
|
|
Minimum lease payments |
||||
As at |
|
December 31, 2023 |
|
December 31, 2022 |
||
Less than one year |
|
$ |
20,339 |
|
$ |
11,343 |
Between one and five years |
|
|
44,677 |
|
|
14,044 |
More than five years |
|
|
6,457 |
|
|
5,806 |
|
|
|
71,473 |
|
|
31,193 |
Less: future finance charges |
|
|
(14,072) |
|
|
(9,847) |
Present value of lease obligations |
|
|
57,401 |
|
|
21,346 |
Less: Current portion |
|
|
(14,941) |
|
|
(9,416) |
Non-current portion |
|
$ |
42,460 |
|
$ |
11,930 |
14. DEBT
The following table summarizes the changes in debt:
|
|
|
|
Credit |
|
|
Convertible debentures |
|
|
Total |
Balance at December 31, 2021 |
|
|
$ |
117,082 |
|
$ |
40,407 |
|
$ |
157,489 |
Convertible debenture conversion |
|
|
|
- |
|
|
(60) |
|
|
(60) |
Drawdown |
|
|
|
80,000 |
|
|
- |
|
|
80,000 |
Transaction costs |
|
|
|
(688) |
|
|
- |
|
|
(688) |
Amortization of discount |
|
|
|
626 |
|
|
1,808 |
|
|
2,434 |
Payments |
|
|
|
(20,000) |
|
|
- |
|
|
(20,000) |
Balance at December 31, 2022 |
|
|
|
177,020 |
|
|
42,155 |
|
|
219,175 |
Convertible debenture conversion |
|
|
|
- |
|
|
(225) |
|
|
(225) |
Drawdown |
|
|
|
75,500 |
|
|
- |
|
|
75,500 |
Amortization of discount |
|
|
|
926 |
|
|
1,971 |
|
|
2,897 |
Payments |
|
|
|
(90,500) |
|
|
- |
|
|
(90,500) |
Balance at December 31, 2023 |
|
|
$ |
162,946 |
|
$ |
43,901 |
|
$ |
206,847 |
Less: Current portion |
|
|
|
– |
|
|
(43,901) |
|
|
(43,901) |
Non-current portion |
|
|
$ |
162,946 |
|
$ |
- |
|
$ |
162,946 |
Page | 26
Fortuna Silver Mines Inc.
Notes to Consolidated Financial Statements
For the years ended December 31, 2023 and 2022
(Tabular amounts presented in thousands of US dollars, except share and per share amounts)
| (a) | Credit Facilities |
On November 4, 2021, the Company entered into a fourth amended and restated credit agreement (the “Amended Credit Facility”) effective November 5, 2021, with a syndicate of banks led by BNP Paribas, and including The Bank of Nova Scotia, Bank of Montreal and Société Générale, which converted the Company’s prior non-revolving and revolving facilities with the Bank of Nova Scotia and BNP Paribas (the “Scotiabank Facility”) into a revolving term credit facility and increased the amount of the Amended Credit Facility from $120.0 million to $200.0 million, subject to the conditions described below. The Amended Credit Facility has a term of four years, maturing in November 2025, and steps down to $150.0 million after three years. Interest initially accrued on LIBOR loans under the Amended Credit Facility at LIBOR plus an applicable margin of between two and three percent per annum, which varied according to the consolidated leverage levels of the Company, as defined in the Amended Credit Facility.
Effective December 15, 2022, the Company executed a second amendment to the fourth Amended Credit Facility. The second amendment increased the amount of the Amended Credit Facility from $200.0 million to $250.0 million and increased the level of the step down of the Amended Credit Facility from $150.0 million to $175.0 million in November 2024. The amendment also introduced an uncommitted $50.0 million accordion option, exercisable from June 1, 2023, to October 2024. LIBOR loans under the Amended Credit Facility were converted to Term Benchmark loans, with the interest base rate on these loans converting from LIBOR to an Adjusted Term SOFR. The applicable loan margins on Term Benchmark loans increased by 25 basis points across all levels of the margin grid, and the commitment fee rate increased by 9 to 12 basis points across the margin grid. The counterparties, guarantors, covenants, step down date and maturity date of the Amended Credit Facility were unchanged.
The Company’s principal operating subsidiaries in Mexico, Peru, Côte d’Ivoire and Burkina Faso, and their respective direct and indirect holding companies, have guaranteed the obligations of the Company contemplated under the Amended Credit Facility. The Company has pledged all its assets to secure the payment of its obligations contemplated by the Amended Credit Facility. The Company’s principal operating subsidiaries in Mexico and Peru, as well as their direct and indirect holding companies, have pledged substantially all their respective assets to secure their respective guarantees of such payment, including the shares of the Company’s principal operating subsidiaries in Mexico and Peru. The Company’s principal operating subsidiary in Burkina Faso has pledged its bank accounts to secure the obligations under its guarantee of the obligations of the Company under the Amended Credit Facility and the holding companies of the Company’s principal operating subsidiaries in Burkina Faso and Côte d’Ivoire have pledged the shares of those principal operating subsidiaries to secure the payment of their obligations under their respective guarantees.
In December 2023, the Amended Credit Facility was further amended to include additional security to the lenders in the form of guarantees and share pledges from the Company’s subsidiaries which indirectly own the Diamba Sud project in Senegal, acquired pursuant to the acquisition of Chesser.
The Amended Credit Facility includes covenants customary for a facility of this nature, including, among other matters, reporting requirements, and positive, negative, and financial covenants set out therein. As at December 31, 2023, the Company was in compliance with all of the covenants under the Amended Credit Facility.
| (b) | Convertible Debentures |
On October 2 and 6, 2019, the Company completed a bought deal public offering of senior subordinated unsecured convertible debentures with an aggregate principal amount of $46.0 million (the “Debentures”).
Page | 27
Fortuna Silver Mines Inc.
Notes to Consolidated Financial Statements
For the years ended December 31, 2023 and 2022
(Tabular amounts presented in thousands of US dollars, except share and per share amounts)
The Debentures mature on October 31, 2024, and bear interest at a rate of 4.65% per annum, payable semi-annually in arrears on the last business day of April and October, commencing on April 30, 2020. For the year ended December 31, 2023, the Company paid $2.1 million in interest on the Debentures.
The Debentures are convertible at the holder’s option into common shares in the capital of the Company at a conversion price of $5.00 per share (the “Conversion Price”), representing a conversion rate of 200 Common Shares per $1 thousand principal amount of Debentures, subject to adjustment in certain circumstances.
On and after October 31, 2023, the Debentures may be redeemed in whole or in part from time to time at the Company’s option at a price equal to their principal amount plus accrued and unpaid interest regardless of the trading price of the Common Shares.
Subject to applicable securities laws and regulatory approval and provided that no event of default has occurred and is continuing, the Company may, at its option, elect to satisfy its obligation to pay the principal amount of the Debentures and accrued and unpaid interest on the redemption date and the maturity date, in whole or in part, through the issuance of Common Shares, by issuing and delivering that number of Common Shares, obtained by dividing the principal amount of the Debentures and all accrued and unpaid interest thereon by 95% of the current market price (as defined in the Debenture Indenture) on such redemption date or maturity date, as applicable.
15. OTHER NON-CURRENT LIABILITIES
As at |
Note |
|
December 31, 2023 |
|
December 31, 2022 |
||
Restricted share units |
17(b) |
|
$ |
2,648 |
|
$ |
1,490 |
Other |
|
|
|
7,325 |
|
|
1,106 |
Total other non-current liabilities |
|
|
$ |
9,973 |
|
$ |
2,596 |
Other non-current liabilities include $6.4 million of severance provisions for the anticipated San Jose mine closure at the end of 2024.
Page | 28
Fortuna Silver Mines Inc.
Notes to Consolidated Financial Statements
For the years ended December 31, 2023 and 2022
(Tabular amounts presented in thousands of US dollars, except share and per share amounts)
16. CLOSURE AND RECLAMATION PROVISIONS
The following table summarizes the changes in closure and reclamation provisions:
|
|
|
Closure and Reclamation Provisions |
||||||||||||||||
|
|
|
Caylloma |
|
San Jose |
|
Lindero |
|
|
Yaramoko |
|
|
Séguéla |
|
|
Total |
|||
Balance as at December 31, 2022 |
|
|
$ |
13,956 |
|
$ |
7,670 |
|
$ |
11,514 |
|
$ |
13,375 |
|
$ |
6,790 |
|
$ |
53,305 |
Changes in estimate |
|
|
|
2,215 |
|
|
949 |
|
|
2,442 |
|
|
261 |
|
|
3,692 |
|
|
9,559 |
Reclamation expenditures |
|
|
|
(1,011) |
|
|
(192) |
|
|
- |
|
|
- |
|
|
- |
|
|
(1,203) |
Accretion |
|
|
|
790 |
|
|
777 |
|
|
529 |
|
|
597 |
|
|
295 |
|
|
2,988 |
Effect of changes in foreign exchange rates |
|
|
|
- |
|
|
1,154 |
|
|
- |
|
|
- |
|
|
- |
|
|
1,154 |
Balance as at December 31, 2023 |
|
|
|
15,950 |
|
|
10,358 |
|
|
14,485 |
|
|
14,233 |
|
|
10,777 |
|
|
65,803 |
Less: Current portion |
|
|
|
(3,804) |
|
|
(1,261) |
|
|
- |
|
|
- |
|
|
- |
|
|
(5,065) |
Non-current portion |
|
|
$ |
12,146 |
|
$ |
9,097 |
|
$ |
14,485 |
|
$ |
14,233 |
|
$ |
10,777 |
|
$ |
60,738 |
|
|
|
|
|
|
|
|
|
|
|
|
|
|
|
|
|
|
|
|
|
|
|
Closure and Reclamation Provisions |
||||||||||||||||
|
|
|
Caylloma |
|
San Jose |
|
Lindero |
|
|
Yaramoko Mine |
|
|
Séguéla |
|
|
Total |
|||
Balance as at December 31, 2021 |
|
|
$ |
14,898 |
|
$ |
7,128 |
|
$ |
19,639 |
|
$ |
12,895 |
|
$ |
1,552 |
|
$ |
56,112 |
Changes in estimate |
|
|
|
(1,235) |
|
|
(493) |
|
|
(8,666) |
|
|
135 |
|
|
5,238 |
|
|
(5,021) |
Reclamation expenditures |
|
|
|
(503) |
|
|
(120) |
|
|
- |
|
|
- |
|
|
- |
|
|
(623) |
Accretion |
|
|
|
796 |
|
|
682 |
|
|
541 |
|
|
345 |
|
|
- |
|
|
2,364 |
Effect of changes in foreign exchange rates |
|
|
|
- |
|
|
473 |
|
|
- |
|
|
- |
|
|
- |
|
|
473 |
Balance as at December 31, 2022 |
|
|
|
13,956 |
|
|
7,670 |
|
|
11,514 |
|
|
13,375 |
|
|
6,790 |
|
|
53,305 |
Less: Current portion |
|
|
|
(1,577) |
|
|
(600) |
|
|
- |
|
|
- |
|
|
- |
|
|
(2,177) |
Non-current portion |
|
|
$ |
12,379 |
|
$ |
7,070 |
|
$ |
11,514 |
|
$ |
13,375 |
|
$ |
6,790 |
|
$ |
51,128 |
The following table summarizes certain key inputs used in determining the present value of reclamation costs related to mine and development sites:
|
|
|
Closure and Reclamation Provisions |
||||||||||||||||
|
|
|
Caylloma |
|
San Jose |
|
Lindero |
|
|
Yaramoko |
|
|
Séguéla |
|
|
Total |
|||
Undiscounted uninflated estimated cash flows |
|
|
$ |
17,036 |
|
$ |
11,972 |
|
$ |
24,507 |
|
$ |
14,805 |
|
$ |
11,003 |
|
$ |
79,323 |
Discount rate |
|
|
|
6.30% |
|
|
9.29% |
|
|
4.19% |
|
|
4.23% |
|
|
3.88% |
|
|
|
Inflation rate |
|
|
|
3.20% |
|
|
4.85% |
|
|
2.26% |
|
|
2.20% |
|
|
2.61% |
|
|
|
The Company is expecting to incur progressive reclamation costs throughout the life of its mines.
17. SHARE BASED PAYMENTS
During the year ended December 31, 2023, the Company recognized share-based payments of $8.1 million, (December 31, 2022 – $10.2 million) related to the amortization of deferred, restricted and performance share units and $nil (December 31, 2022 – $0.1 million) related to amortization of stock options.
Page | 29
Fortuna Silver Mines Inc.
Notes to Consolidated Financial Statements
For the years ended December 31, 2023 and 2022
(Tabular amounts presented in thousands of US dollars, except share and per share amounts)
| (a) | Deferred Share Units (DSUs) |
|
|
Cash Settled |
|||
|
Number of DSUs |
|
Fair Value |
||
Outstanding, December 31, 2021 |
|
805,055 |
|
$ |
3,137 |
Granted |
|
117,643 |
|
|
452 |
Changes in fair value |
|
- |
|
|
(121) |
Outstanding, December 31, 2022 |
|
922,698 |
|
|
3,468 |
Granted |
|
125,802 |
|
|
431 |
Changes in fair value |
|
- |
|
|
144 |
Outstanding, December 31, 2023 |
|
1,048,500 |
|
$ |
4,043 |
| (b) | Restricted Share Units (RSUs) |
|
|
Cash Settled |
|
Equity Settled |
|||
|
Number of RSUs |
|
Fair Value |
Number of RSUs |
|||
Outstanding, December 31, 2021 |
|
1,859,139 |
|
$ |
5,503 |
|
1,644,461 |
Granted |
|
1,348,538 |
|
|
5,264 |
|
- |
Units paid out in cash |
|
(1,256,288) |
|
|
(5,737) |
|
- |
Vested and paid out in shares |
|
- |
|
|
- |
|
(665,305) |
Transferred from equity to cash settled |
|
413,864 |
|
|
- |
|
(413,864) |
Transferred from cash to equity settled |
|
(155,674) |
|
|
- |
|
155,674 |
Forfeited or cancelled |
|
(260,870) |
|
|
- |
|
(15,111) |
Changes in fair value and vesting |
|
- |
|
|
(1,190) |
|
- |
Outstanding, December 31, 2022 |
|
1,948,709 |
|
|
3,840 |
|
705,855 |
Granted |
|
1,716,286 |
|
|
5,887 |
|
- |
Units paid out in cash |
|
(1,214,393) |
|
|
(4,812) |
|
- |
Vested and paid out in shares |
|
- |
|
|
- |
|
(297,275) |
Transferred from equity to cash settled |
|
406,487 |
|
|
- |
|
(406,487) |
Forfeited or cancelled |
|
(188,892) |
|
|
- |
|
(2,093) |
Changes in fair value and vesting |
|
- |
|
|
301 |
|
- |
Outstanding, December 31, 2023 |
|
2,668,197 |
|
|
5,216 |
|
- |
Less: current portion |
|
|
|
|
(2,568) |
|
|
Non-current portion |
|
|
|
$ |
2,648 |
|
|
Page | 30
Fortuna Silver Mines Inc.
Notes to Consolidated Financial Statements
For the years ended December 31, 2023 and 2022
(Tabular amounts presented in thousands of US dollars, except share and per share amounts)
(c) Performance Share Units
|
|
Cash Settled |
|
Equity Settled |
|||
|
Number of PSUs |
|
Fair Value |
|
Number of PSUs |
||
Outstanding, December 31, 2021 |
|
515,008 |
|
$ |
3,104 |
|
1,845,887 |
Granted |
|
- |
|
|
- |
|
824,768 |
Forfeited or cancelled |
|
- |
|
|
- |
|
(434,007) |
Transferred from equity to cash settled |
|
168,452 |
|
|
- |
|
(168,452) |
Units paid out in cash |
|
(683,460) |
|
|
(3,882) |
|
- |
Vested and paid out in shares |
|
- |
|
|
- |
|
(228,740) |
Changes in fair value and vesting |
|
- |
|
|
778 |
|
- |
Outstanding, December 31, 2022 |
|
- |
|
|
- |
|
1,839,456 |
Granted |
|
- |
|
|
- |
|
844,187 |
Forfeited or cancelled |
|
- |
|
|
- |
|
(152,729) |
Transferred from equity to cash settled |
|
340,236 |
|
|
- |
|
(340,236) |
Units paid out in cash |
|
(340,236) |
|
|
(1,240) |
|
- |
Vested and paid out in shares |
|
- |
|
|
- |
|
(350,666) |
Change in fair value and vesting |
|
- |
|
|
1,240 |
|
- |
Outstanding, December 31, 2023 |
|
- |
|
$ |
- |
|
1,840,012 |
(d) Stock Options
The Company’s Stock Option Plan, as amended and approved from time to time, permits the Company to issue up to 12,200,000 stock options. As at December 31, 2023, a total of 2,950,529 stock options are available for issuance under the plan.
|
|
Number of stock options |
|
Weighted average |
|
|
|
|
|
Canadian dollars |
|
Outstanding, December 31, 2021 |
|
1,249,383 |
|
$ |
5.88 |
Expired unexercised |
|
(612,565) |
|
|
6.16 |
Outstanding, December 31, 2022 |
|
636,818 |
|
|
5.62 |
Exercised |
|
(127,350) |
|
|
3.22 |
Expired unexercised |
|
(509,468) |
|
|
6.21 |
Outstanding, December 31, 2023 |
|
- |
|
$ |
- |
Vested and exercisable, December 31, 2022 |
|
636,818 |
|
$ |
5.62 |
Vested and exercisable, December 31, 2023 |
|
- |
|
$ |
- |
18. SHARE CAPITAL
Authorized Share Capital
The Company has an unlimited number of common shares without par value authorized for issue.
On April 28, 2023, the Company announced a renewal of its Normal Course Issuer Bid Program (“NCIB”) pursuant to which the Company can purchase up to five percent of its outstanding common shares. Under the NCIB, purchases of common shares may be made through the facilities of the TSX, the NYSE and/or alternative Canadian trading systems. The share repurchase program started on May 2, 2023 and will expire on the earlier of: (i) May 1, 2024; (ii) the date the Company acquires the maximum number of common shares allowable under the NCIB; or (iii) the date the Company otherwise decides not to make any further repurchases under the NCIB.
Page | 31
Fortuna Silver Mines Inc.
Notes to Consolidated Financial Statements
For the years ended December 31, 2023 and 2022
(Tabular amounts presented in thousands of US dollars, except share and per share amounts)
During the year ended December 31, 2023, the Company did not purchase any of its outstanding common shares. During the year ended December 31, 2022, the Company acquired and cancelled 2,201,404 common shares through its previous program at an average cost of $2.69 per share for a total cost of $5.9 million.
19. EARNINGS PER SHARE
|
|
|
Years ended December 31, |
|||
|
|
2023 |
|
2022 |
||
Basic: |
|
|
|
|
|
|
Net loss attributable to Fortuna shareholders |
|
$ |
(50,836) |
|
$ |
(128,132) |
Weighted average number of shares (000's) |
|
|
295,067 |
|
|
291,281 |
Loss per share - basic |
|
$ |
(0.17) |
|
$ |
(0.44) |
|
|
|
Years ended December 31, |
|||
|
|
2023 |
|
2022 |
||
Diluted: |
|
|
|
|
|
|
Net loss attributable to Fortuna shareholders |
|
$ |
(50,836) |
|
$ |
(128,132) |
Diluted net loss for the period |
|
$ |
(50,836) |
|
$ |
(128,132) |
|
|
|
|
|
|
|
Weighted average number of shares (000's) |
|
|
295,067 |
|
|
291,281 |
Weighted average diluted number of shares (000's) |
|
|
295,067 |
|
|
291,281 |
Loss per share - diluted |
|
$ |
(0.17) |
|
$ |
(0.44) |
For the year ended December 31, 2023, nil (December 31, 2022 – 509,468) out of the money options, 1,657,298 (December 31, 2022 – 2,380,857) share units, and 9,143,000 (December 31, 2022 – 9,176,000) potential shares issuable on conversion of the debentures were excluded from the diluted earnings per share calculation. These items were excluded from the diluted earnings per share calculations as their effect would have been anti-dilutive.
Page | 32
Fortuna Silver Mines Inc.
Notes to Consolidated Financial Statements
For the years ended December 31, 2023 and 2022
(Tabular amounts presented in thousands of US dollars, except share and per share amounts)
20. SALES
The Company’s geographical analysis of revenue from contracts with customers attributed to the location of the products produced, is as follows:
|
|
Years ended December 31, 2023 |
|||||||||||||||
|
|
|
Peru |
|
|
Mexico |
|
|
Argentina |
|
Burkina Faso |
|
|
Côte d'Ivoire |
|
|
Total |
Silver-gold concentrates |
|
$ |
- |
|
$ |
148,828 |
|
$ |
- |
$ |
- |
|
$ |
- |
|
$ |
148,828 |
Silver-lead concentrates |
|
|
60,813 |
|
|
- |
|
|
- |
|
- |
|
|
- |
|
|
60,813 |
Zinc concentrates |
|
|
42,989 |
|
|
- |
|
|
- |
|
- |
|
|
- |
|
|
42,989 |
Gold doré |
|
|
- |
|
|
- |
|
|
207,509 |
|
228,846 |
|
|
154,165 |
|
|
590,520 |
Provisional pricing adjustments |
|
|
(1,600) |
|
|
878 |
|
|
- |
|
- |
|
|
- |
|
|
(722) |
Sales to external customers |
|
$ |
102,202 |
|
$ |
149,706 |
|
$ |
207,509 |
$ |
228,846 |
|
$ |
154,165 |
|
$ |
842,428 |
|
|
|
|
|
|
|
|
|
|
|
|
|
|
|
|
|
|
|
|
Years ended December 31, 2022 |
|||||||||||||||
|
|
|
Peru |
|
|
Mexico |
|
|
Argentina |
|
Burkina Faso |
|
|
Côte d'Ivoire |
|
|
Total |
Silver-gold concentrates |
|
$ |
- |
|
$ |
173,871 |
|
$ |
- |
$ |
- |
|
$ |
- |
|
$ |
173,871 |
Silver-lead concentrates |
|
|
50,300 |
|
|
- |
|
|
- |
|
- |
|
|
- |
|
|
50,300 |
Zinc concentrates |
|
|
53,147 |
|
|
- |
|
|
- |
|
- |
|
|
- |
|
|
53,147 |
Gold doré |
|
|
- |
|
|
- |
|
|
212,092 |
|
193,541 |
|
|
- |
|
|
405,633 |
Provisional pricing adjustments |
|
|
(1,116) |
|
|
(344) |
|
|
- |
|
- |
|
|
- |
|
|
(1,460) |
Sales to external customers |
|
$ |
102,331 |
|
$ |
173,527 |
|
$ |
212,092 |
$ |
193,541 |
|
$ |
- |
|
$ |
681,491 |
|
|
Years ended December 31, |
||||
|
|
2023 |
|
2022 |
||
Customer 1 |
|
$ |
228,846 |
|
$ |
193,541 |
Customer 2 |
|
|
207,505 |
|
|
212,092 |
Customer 3 |
|
|
154,165 |
|
|
- |
Customer 4 |
|
|
102,206 |
|
|
102,332 |
Customer 5 |
|
|
78,519 |
|
|
76,851 |
Customer 6 |
|
|
71,187 |
|
|
70,584 |
Customer 7 |
|
|
- |
|
|
26,091 |
|
|
$ |
842,428 |
|
$ |
681,491 |
From time to time, the Company enters into forward sale and collar contracts to mitigate the price risk for some of its forecasted base and precious metals production, and non-metal commodities.
During the year ended December 31, 2023, the Company recognized $1.5 million of realized losses on the settlement of forward sale and collar contracts (December 31, 2022 - $0.7 million realized losses), and $0.3 million unrealized gains from changes in the fair value of the open positions (December 31, 2022 - $1.2 million unrealized gains).
Page | 33
Fortuna Silver Mines Inc.
Notes to Consolidated Financial Statements
For the years ended December 31, 2023 and 2022
(Tabular amounts presented in thousands of US dollars, except share and per share amounts)
21. COST OF SALES
|
|
Years ended December 31, |
||||
|
|
2023 |
|
2022 |
||
Direct mining costs |
|
$ |
297,322 |
|
$ |
272,329 |
Salaries and benefits |
|
|
75,088 |
|
|
44,432 |
Workers' participation |
|
|
1,422 |
|
|
4,285 |
Depletion and depreciation |
|
|
216,250 |
|
|
171,447 |
Royalties and other taxes |
|
|
46,036 |
|
|
33,304 |
Other |
|
|
16,285 |
|
|
8,898 |
Cost of sales |
|
$ |
652,403 |
|
$ |
534,695 |
For the year ended December 31, 2023, depletion and depreciation includes $13.9 million of depreciation related to right-of-use assets (December 31, 2022 - $9.0 million).
22. GENERAL AND ADMINISTRATION
|
|
Years ended December 31, |
||||
|
|
2023 |
|
2022 |
||
General and administration |
|
$ |
55,769 |
|
$ |
50,191 |
Workers' participation |
|
|
241 |
|
|
954 |
|
|
|
56,010 |
|
|
51,145 |
Share-based payments |
|
|
8,063 |
|
|
10,311 |
General and administration |
|
$ |
64,073 |
|
$ |
61,456 |
23. OTHER (INCOME) EXPENSES
|
|
Years ended December 31, |
||||
|
|
2023 |
|
2022 |
||
Loss on disposal of property, plant, and equipment |
|
$ |
209 |
|
$ |
789 |
Other (income) expenses |
|
|
18,665 |
|
|
521 |
|
|
$ |
18,874 |
|
$ |
1,310 |
Other expenses include payments made and provisions raised during the year ended December 31, 2023:
| ● | $2.8 million related to a new agreement with the workers’ union at San Jose, |
| ● | $1.5 million for stand-by and maintenance costs during the work stoppage at San Jose, |
| ● | $6.4 million severance provisions for the anticipated San Jose mine closure at the end of 2024, |
| ● | $1.4 million penalty provision related to a customs dispute at Séguéla, |
| ● | $2.0 million at Yaramoko for stand-by and maintenance costs during the underground work stoppage, and |
| ● | $3.7 million in administrative penalties incurred by Yaramoko, payable to the Ministry of Mines. |
24. INTEREST AND FINANCE COSTS, NET
|
|
Years ended December 31, |
||||
|
|
2023 |
|
2022 |
||
Interest income |
|
$ |
3,654 |
|
$ |
1,851 |
Interest expense |
|
|
(18,367) |
|
|
(8,885) |
Bank stand-by and commitment fees |
|
|
(304) |
|
|
(193) |
Accretion expense |
|
|
(2,988) |
|
|
(2,364) |
Lease liabilities |
|
|
(3,785) |
|
|
(2,466) |
|
|
$ |
(21,790) |
|
$ |
(12,057) |
Page | 34
Fortuna Silver Mines Inc.
Notes to Consolidated Financial Statements
For the years ended December 31, 2023 and 2022
(Tabular amounts presented in thousands of US dollars, except share and per share amounts)
25. INCOME TAX
| (a) | Reconciliation of Effective Tax Rate |
Income tax expense differs from the amount that would be computed by applying the applicable Canadian statutory
income tax rate to income before income taxes. The significant reasons for the differences are as follows:
|
|
Years ended December 31, |
||||
|
|
2023 |
|
2022 |
||
Net loss before tax |
|
$ |
(11,051) |
|
$ |
(125,109) |
Statutory tax rate |
|
|
27.0% |
|
|
27.0% |
Anticipated income tax at statutory rates |
|
|
(2,984) |
|
|
(33,779) |
Non-deductible expenditures (deductible expenditures) |
|
|
2,443 |
|
|
(3,513) |
Differences between Canadian and foreign tax rates |
|
|
(729) |
|
|
10,448 |
Changes in estimate |
|
|
7,419 |
|
|
(4,492) |
Inflation adjustment |
|
|
(63,095) |
|
|
(57,403) |
Impact of foreign exchange |
|
|
70,014 |
|
|
17,336 |
Change in deferred tax assets not recognized |
|
|
11,489 |
|
|
70,178 |
Mining taxes |
|
|
2,714 |
|
|
5,629 |
Withholding taxes |
|
|
5,629 |
|
|
7,720 |
Other items |
|
|
(321) |
|
|
(1,327) |
Total income tax expense |
|
$ |
32,579 |
|
$ |
10,797 |
|
|
|
|
|
|
|
Total income tax represented by: |
|
|
|
|
|
|
Current income tax expense |
|
$ |
42,636 |
|
$ |
35,783 |
Deferred tax recovery |
|
|
(10,057) |
|
|
(24,986) |
|
|
$ |
32,579 |
|
$ |
10,797 |
| (b) | Tax Amounts Recognized in Profit or Loss |
|
|
Years ended December 31, |
||||
|
|
2023 |
|
2022 |
||
Current tax expense |
|
|
|
|
|
|
Current taxes on profit for the year |
|
$ |
42,096 |
|
$ |
35,884 |
Changes in estimates related to prior years |
|
|
540 |
|
|
(101) |
|
|
$ |
42,636 |
|
$ |
35,783 |
|
|
|
|
|
|
|
Deferred tax expense |
|
|
|
|
|
|
Origination and reversal of temporary differences and foreign exchange rate |
|
$ |
(16,899) |
|
$ |
(20,826) |
Changes in estimates related to prior years |
|
|
6,879 |
|
|
(4,392) |
Effect of differences in tax rates |
|
|
(37) |
|
|
232 |
Effect of changes in tax rates |
|
|
- |
|
|
- |
|
|
$ |
(10,057) |
|
$ |
(24,986) |
|
|
|
|
|
|
|
Total tax expense |
|
$ |
32,579 |
|
$ |
10,797 |
Page | 35
Fortuna Silver Mines Inc.
Notes to Consolidated Financial Statements
For the years ended December 31, 2023 and 2022
(Tabular amounts presented in thousands of US dollars, except share and per share amounts)
| (c) | Deferred Tax Balances |
The significant components of the recognized deferred tax assets and liabilities are:
|
|
December 31, |
|
December 31, |
||
|
|
2023 |
|
2022 |
||
Deferred tax assets: |
|
|
|
|
|
|
Reclamation and closure cost obligation |
|
$ |
15,011 |
|
$ |
14,942 |
Carried forward tax loss |
|
|
16,043 |
|
|
3,552 |
Equipment and buildings |
|
|
- |
|
|
11,976 |
Accounts payable and accrued liabilities |
|
|
16,747 |
|
|
13,286 |
Deductibility of resource taxes |
|
|
154 |
|
|
2,406 |
Lease obligations |
|
|
7,972 |
|
|
8,374 |
Other |
|
|
- |
|
|
86 |
Total deferred tax assets |
|
$ |
55,927 |
|
$ |
54,622 |
|
|
|
|
|
|
|
Deferred tax liabilities: |
|
|
|
|
|
|
Mineral properties |
|
$ |
(193,646) |
|
$ |
(202,087) |
Mining and foreign withholding taxes |
|
|
(1,124) |
|
|
(3,524) |
Equipment and buildings |
|
|
(5,941) |
|
|
- |
Convertible debenture |
|
|
(406) |
|
|
(831) |
Inflation |
|
|
(598) |
|
|
(4,306) |
Inventory and other |
|
|
(14,067) |
|
|
(11,493) |
Total deferred tax liabilities |
|
$ |
(215,782) |
|
$ |
(222,241) |
|
|
|
|
|
|
|
Net deferred tax liabilities |
|
$ |
(159,855) |
|
$ |
(167,619) |
|
|
|
|
|
|
|
|
|
2023 |
|
2022 |
||
Classification: |
|
|
|
|
|
|
Deferred tax assets |
|
$ |
- |
|
$ |
- |
Deferred tax liabilities |
|
|
(159,855) |
|
|
(167,619) |
Net deferred tax liabilities |
|
$ |
(159,855) |
|
$ |
(167,619) |
The Company's movement of net deferred tax liabilities is described below:
|
|
2023 |
|
2022 |
||
At January 1 |
|
$ |
167,619 |
|
$ |
191,668 |
Deferred income tax (recovery) expense through income statement |
|
|
(10,057) |
|
|
(24,831) |
Deferred income tax expense through equity |
|
|
2,293 |
|
|
782 |
At December 31 |
|
$ |
159,855 |
|
$ |
167,619 |
Page | 36
Fortuna Silver Mines Inc.
Notes to Consolidated Financial Statements
For the years ended December 31, 2023 and 2022
(Tabular amounts presented in thousands of US dollars, except share and per share amounts)
| (d) | Unrecognized Deferred Tax Assets and Liabilities |
The Company recognizes tax benefits on losses or other deductible amounts where it is more likely than not that the deferred tax asset will be realized. The Company’s unrecognized deductible temporary differences and unused tax losses for which no deferred tax asset is recognized consist of the following amounts:
|
|
December 31, |
|
December 31, |
||
|
|
2023 |
|
2022 |
||
Unrecognized deductible temporary differences and unused tax losses: |
|
|
|
|
|
|
Non-capital losses |
|
$ |
138,736 |
|
$ |
164,427 |
Provisions |
|
|
19,335 |
|
|
7,215 |
Share issue costs |
|
|
- |
|
|
306 |
Mineral properties, plant and equipment |
|
|
163,508 |
|
|
184,970 |
Lease obligation |
|
|
1,729 |
|
|
578 |
Derivative liabilities |
|
|
23,395 |
|
|
335 |
Investments in equity securities and associates |
|
|
1,069 |
|
|
1,070 |
Unrecognized deductible temporary differences |
|
$ |
347,772 |
|
$ |
358,901 |
As at December 31, 2023, the Company has temporary differences associated with investments in subsidiaries for which an income tax liability has not been recognized as the Company can control the timing of the reversal of the temporary differences and the Company plans to reinvest in its foreign subsidiaries. The temporary difference associated with investments in subsidiaries aggregate as follows:
|
|
December 31, |
|
December 31, |
||
|
|
2023 |
|
2022 |
||
Mexico |
|
$ |
27,491 |
|
$ |
150,379 |
Peru |
|
|
96,467 |
|
|
78,505 |
West Africa |
|
|
- |
|
|
18,122 |
| (e) | Tax Loss Carry Forwards |
Tax losses have the following expiry dates:
|
|
|
|
|
December 31, |
|
|
|
|
December 31, |
||
|
|
|
Year of expiry |
|
2023 |
|
|
Year of expiry |
|
2022 |
||
Canada |
|
|
2025 - 2042 |
|
$ |
210,847 |
|
|
2025 - 2042 |
|
$ |
184,717 |
Mexico |
|
|
2024 - 2031 |
|
|
6,623 |
|
|
2023 - 2031 |
|
|
20 |
In addition, as at December 31, 2023, the Company has accumulated Canadian resource related expenses of $8.2 million (December 31, 2022- $8.0 million) for which the deferred tax benefit has not been recognized.
26. SEGMENTED INFORMATION
The Company’s operating segments are based on the reports reviewed by the senior management group that are used to make strategic decisions. The Chief Executive Officer, as chief operating decision maker, considers the business from a geographic perspective when considering the performance of the Company’s business units.
Page | 37
Fortuna Silver Mines Inc.
Notes to Consolidated Financial Statements
For the years ended December 31, 2023 and 2022
(Tabular amounts presented in thousands of US dollars, except share and per share amounts)
The following summary describes the operations of each reportable segment:
| ● | Mansfield – operates the Lindero gold mine |
| ● | Sanu – operates the Yaramoko gold mine |
| ● | Sango – operates the Séguéla gold mine |
| ● | Cuzcatlan – operates the San Jose silver-gold mine |
| ● | Bateas – operates the Caylloma silver, lead, and zinc mine |
| ● | Corporate – corporate stewardship |
|
|
Year ended December 31, 2023 |
|||||||||||||||||||
|
|
|
Mansfield |
|
|
Sanu |
|
|
Sango |
|
|
Cuzcatlan |
|
|
Bateas |
|
|
Corporate |
|
|
Total |
Revenues from external customers |
|
$ |
207,509 |
|
$ |
228,846 |
|
$ |
154,165 |
|
$ |
149,706 |
|
$ |
102,202 |
|
$ |
- |
|
$ |
842,428 |
Cost of sales before depreciation and depletion |
|
|
(125,438) |
|
|
(113,693) |
|
|
(38,948) |
|
|
(100,040) |
|
|
(58,034) |
|
|
- |
|
|
(436,153) |
Depreciation and depletion in cost of sales |
|
|
(51,258) |
|
|
(73,064) |
|
|
(40,524) |
|
|
(40,028) |
|
|
(11,376) |
|
|
- |
|
|
(216,250) |
General and administration |
|
|
(9,697) |
|
|
(919) |
|
|
(4,930) |
|
|
(7,304) |
|
|
(5,157) |
|
|
(36,066) |
|
|
(64,073) |
Impairment of mineral properties, plant and equipment |
|
|
- |
|
|
- |
|
|
- |
|
|
(90,615) |
|
|
- |
|
|
- |
|
|
(90,615) |
Other (expenses) income |
|
|
(10,601) |
|
|
(4,998) |
|
|
(1,136) |
|
|
(17,428) |
|
|
108 |
|
|
(1,689) |
|
|
(35,744) |
Finance items |
|
|
9,685 |
|
|
(1,045) |
|
|
(3,039) |
|
|
(707) |
|
|
296 |
|
|
(15,834) |
|
|
(10,644) |
Segment income (loss) before taxes |
|
|
20,200 |
|
|
35,127 |
|
|
65,588 |
|
|
(106,416) |
|
|
28,039 |
|
|
(53,589) |
|
|
(11,051) |
Income taxes |
|
|
(2,096) |
|
|
(7,423) |
|
|
(8,472) |
|
|
(910) |
|
|
(8,862) |
|
|
(4,816) |
|
|
(32,579) |
Segment income (loss) after taxes |
|
$ |
18,104 |
|
$ |
27,704 |
|
$ |
57,116 |
|
$ |
(107,326) |
|
$ |
19,177 |
|
$ |
(58,405) |
|
$ |
(43,630) |
|
|
|
|
|
|
|
|
|
|
|
|
|
|
|
|
|
|
|
|
|
|
|
|
Year ended December 31, 2022 |
|||||||||||||||||||
|
|
|
Mansfield |
|
|
Sanu |
|
|
Sango |
|
|
Cuzcatlan |
|
|
Bateas |
|
|
Corporate |
|
|
Total |
Revenues from external customers |
|
$ |
212,092 |
|
$ |
193,541 |
|
$ |
- |
|
$ |
173,527 |
|
$ |
102,331 |
|
$ |
- |
|
$ |
681,491 |
Cost of sales before depreciation and depletion |
|
|
(111,625) |
|
|
(106,953) |
|
|
- |
|
|
(91,312) |
|
|
(53,358) |
|
|
- |
|
|
(363,248) |
Depreciation and depletion in cost of sales |
|
|
(54,644) |
|
|
(64,893) |
|
|
- |
|
|
(37,776) |
|
|
(14,134) |
|
|
- |
|
|
(171,447) |
General and administration |
|
|
(8,698) |
|
|
(2,101) |
|
|
(366) |
|
|
(8,150) |
|
|
(4,478) |
|
|
(37,663) |
|
|
(61,456) |
Impairment of mineral properties, plant and equipment |
|
|
(70,156) |
|
|
(103,457) |
|
|
- |
|
|
(9,229) |
|
|
- |
|
|
- |
|
|
(182,842) |
Other (expenses) income |
|
|
(3,239) |
|
|
2,570 |
|
|
(1,175) |
|
|
(5,026) |
|
|
(208) |
|
|
(8,972) |
|
|
(16,050) |
Finance items |
|
|
(1,695) |
|
|
(760) |
|
|
(360) |
|
|
(660) |
|
|
(1,167) |
|
|
(6,915) |
|
|
(11,557) |
Segment income (loss) before taxes |
|
|
(37,965) |
|
|
(82,053) |
|
|
(1,901) |
|
|
21,374 |
|
|
28,986 |
|
|
(53,550) |
|
|
(125,109) |
Income taxes |
|
|
(3,529) |
|
|
13,056 |
|
|
405 |
|
|
(4,855) |
|
|
(8,915) |
|
|
(6,959) |
|
|
(10,797) |
Segment income (loss) after taxes |
|
$ |
(41,494) |
|
$ |
(68,997) |
|
$ |
(1,496) |
|
$ |
16,519 |
|
$ |
20,071 |
|
$ |
(60,509) |
|
$ |
(135,906) |
|
|
|
|
|
|
|
|
|
|
|
|
|
|
|
|
|
|
|
|
|
|
As at December 31, 2023 |
|
|
Mansfield |
|
|
Sanu |
|
|
Sango |
|
|
Cuzcatlan |
|
|
Bateas |
|
|
Corporate |
|
|
Total |
Total assets |
|
$ |
491,213 |
|
$ |
228,335 |
|
$ |
976,169 |
|
$ |
58,501 |
|
$ |
139,161 |
|
$ |
74,484 |
|
$ |
1,967,863 |
Total liabilities |
|
$ |
53,175 |
|
$ |
59,043 |
|
$ |
243,532 |
|
$ |
36,955 |
|
$ |
49,944 |
|
$ |
237,093 |
|
$ |
679,742 |
Capital expenditures1 |
|
$ |
44,667 |
|
$ |
63,833 |
|
$ |
118,693 |
|
$ |
22,260 |
|
$ |
22,394 |
|
$ |
3,974 |
|
$ |
275,821 |
1 Capital expenditures are on an accrual basis for the year ended December 31, 2023 | |||||||||||||||||||||
|
|
|
|
|
|
|
|
|
|
|
|
|
|
|
|
|
|
|
|
|
|
As at December 31, 2022 |
|
|
Mansfield |
|
|
Sanu |
|
|
Sango |
|
|
Cuzcatlan |
|
|
Bateas |
|
|
Corporate |
|
|
Total |
Total assets |
|
$ |
499,937 |
|
$ |
182,621 |
|
$ |
833,179 |
|
$ |
187,898 |
|
$ |
142,385 |
|
$ |
30,204 |
|
$ |
1,876,224 |
Total liabilities |
|
$ |
44,152 |
|
$ |
47,122 |
|
$ |
173,082 |
|
$ |
30,381 |
|
$ |
49,143 |
|
$ |
243,648 |
|
$ |
587,528 |
Capital expenditures1 |
|
$ |
23,048 |
|
$ |
54,137 |
|
$ |
118,645 |
|
$ |
24,397 |
|
$ |
19,610 |
|
$ |
2,047 |
|
$ |
241,884 |
1 Capital expenditures are on an accrual basis for the year ended December 31, 2022 | |||||||||||||||||||||
27. FAIR VALUE MEASUREMENTS
Fair value is the price that would be received to sell an asset or paid to transfer a liability in an orderly transaction in the principal (or most advantageous) market at the measurement date under current market conditions (an exit price) regardless of whether that price is directly observable or estimated using another valuation technique.
Page | 38
Fortuna Silver Mines Inc.
Notes to Consolidated Financial Statements
For the years ended December 31, 2023 and 2022
(Tabular amounts presented in thousands of US dollars, except share and per share amounts)
The fair value hierarchy establishes three levels to classify the inputs to valuation techniques used to measure fair value. Level 1 inputs are quoted prices (unadjusted) in active markets for identical assets or liabilities. Level 2 inputs are quoted prices in markets that are not active, quoted prices for similar assets or liabilities in active markets, inputs other than quoted prices that are observable for the asset or liability (interest rate, yield curves), or inputs that are derived principally from or corroborated observable market data or other means. Level 3 inputs are unobservable (supported by little or no market activity). The fair value hierarchy gives the highest priority to Level 1 inputs and the lowest priority to Level 3 inputs.
The following sets up the methods and assumptions used to estimate the fair value of financial instruments.
Financial asset or liability |
Methods and assumptions used to estimate fair value |
Trade receivables |
Trade receivables arising from the sales of metal concentrates are subject to provisional pricing, and the final selling price is adjusted at the end of a quotational period. These are marked to market at each reporting date based on the forward price corresponding to the expected settlement date. |
Investments in equity securities |
Investments in equity securities are recorded at fair value based on the quoted market price at the end of each reporting period with changes in fair value through other comprehensive income. |
Interest rate swap, metal, fuel and foreign exchange contracts |
Fair value is calculated as the present value of the estimated contractual cash flows. Estimates of future cash flows are based on quoted swap rates, futures prices and interbank borrowing rates. These are discounted using a yield curve, and adjusted for credit risk of the Company or the counterparty. |
Convertible Debentures |
The fair value of the convertible debentures represents both the debt and equity components of the convertible debentures and has been determined with reference to the quoted market price of the convertible debentures. |
During the years ended December 31, 2023, and 2022, there were no transfers of amounts between Level 1, Level 2, and Level 3 of the fair value hierarchy. The following tables show the carrying amounts and fair values of financial assets and financial liabilities, including their levels in the fair value hierarchy. Fair value information for financial assets and financial liabilities not measured at fair value is not presented if the carrying amount is a reasonable approximation of fair value.
Page | 39
Fortuna Silver Mines Inc.
Notes to Consolidated Financial Statements
For the years ended December 31, 2023 and 2022
(Tabular amounts presented in thousands of US dollars, except share and per share amounts)
|
|
Carrying value |
|
Fair value |
|
|
|
|||||||||||||||||
December 31, 2023 |
|
Fair Value through OCI |
|
Fair value |
|
Amortized |
|
Total |
|
Level 1 |
|
Level 2 |
|
Level 3 |
|
Carrying value |
||||||||
Financial assets measured at Fair Value |
|
|
|
|
|
|
|
|
|
|
|
|
|
|
|
|
|
|
|
|
|
|
|
|
Investments in equity securities |
|
$ |
80 |
|
$ |
- |
|
$ |
- |
|
$ |
80 |
|
$ |
80 |
|
$ |
- |
|
$ |
- |
|
$ |
- |
Trade receivables concentrate sales |
|
|
- |
|
|
16,819 |
|
|
- |
|
|
16,819 |
|
|
- |
|
|
16,819 |
|
|
- |
|
|
- |
|
|
$ |
80 |
|
$ |
16,819 |
|
$ |
- |
|
$ |
16,899 |
|
$ |
80 |
|
$ |
16,819 |
|
$ |
- |
|
$ |
- |
|
|
|
|
|
|
|
|
|
|
|
|
|
|
|
|
|
|
|
|
|
|
|
|
|
Financial assets not measured at Fair Value |
|
|
|
|
|
|
|
|
|
|
|
|
|
|
|
|
|
|
|
|
|
|
|
|
Cash and cash equivalents |
|
$ |
- |
|
$ |
- |
|
$ |
128,148 |
|
$ |
128,148 |
|
$ |
- |
|
$ |
- |
|
$ |
- |
|
$ |
128,148 |
Trade receivables doré sales |
|
|
- |
|
|
- |
|
|
3,151 |
|
|
3,151 |
|
|
- |
|
|
- |
|
|
- |
|
|
3,151 |
Other receivables |
|
|
- |
|
|
- |
|
|
5,189 |
|
|
5,189 |
|
|
- |
|
|
- |
|
|
- |
|
|
5,189 |
|
|
$ |
- |
|
$ |
- |
|
$ |
136,488 |
|
$ |
136,488 |
|
$ |
- |
|
$ |
- |
|
$ |
- |
|
$ |
136,488 |
|
|
|
|
|
|
|
|
|
|
|
|
|
|
|
|
|
|
|
|
|
|
|
|
|
Financial liabilities measured at Fair Value |
|
|
|
|
|
|
|
|
|
|
|
|
|
|
|
|
|
|
|
|
|
|
|
|
Metal forward sale and collar contracts liability |
|
$ |
- |
|
$ |
(81) |
|
$ |
- |
|
$ |
(81) |
|
$ |
- |
|
$ |
(81) |
|
$ |
- |
|
$ |
- |
Share units payable |
|
|
- |
|
|
(9,259) |
|
|
- |
|
|
(9,259) |
|
|
- |
|
|
(9,259) |
|
|
- |
|
|
- |
|
|
$ |
- |
|
$ |
(9,340) |
|
$ |
- |
|
$ |
(9,340) |
|
$ |
- |
|
$ |
(9,340) |
|
$ |
- |
|
$ |
- |
|
|
|
|
|
|
|
|
|
|
|
|
|
|
|
|
|
|
|
|
|
|
|
|
|
Financial liabilities not measured at Fair Value |
|
|
|
|
|
|
|
|
|
|
|
|
|
|
|
|
|
|
|
|
|
|
|
|
Trade payables |
|
$ |
- |
|
$ |
- |
|
$ |
(100,387) |
|
$ |
(100,387) |
|
$ |
- |
|
$ |
- |
|
$ |
- |
|
$ |
(100,387) |
Payroll payable |
|
|
- |
|
|
- |
|
|
(21,896) |
|
|
(21,896) |
|
|
- |
|
|
- |
|
|
- |
|
|
(21,896) |
Credit facilities |
|
|
- |
|
|
- |
|
|
(162,946) |
|
|
(162,946) |
|
|
- |
|
|
(165,000) |
|
|
- |
|
|
- |
Convertible debentures |
|
|
- |
|
|
- |
|
|
(43,901) |
|
|
(43,901) |
|
|
- |
|
|
(44,344) |
|
|
- |
|
|
- |
Other payables |
|
|
- |
|
|
- |
|
|
(82,807) |
|
|
(82,807) |
|
|
- |
|
|
- |
|
|
- |
|
|
(82,807) |
|
|
$ |
- |
|
$ |
- |
|
$ |
(411,937) |
|
$ |
(411,937) |
|
$ |
- |
|
$ |
(209,344) |
|
$ |
- |
|
$ |
(205,090) |
Page | 40
Fortuna Silver Mines Inc.
Notes to Consolidated Financial Statements
For the years ended December 31, 2023 and 2022
(Tabular amounts presented in thousands of US dollars, except share and per share amounts)
|
|
Carrying value |
|
Fair value |
|
|
|
|||||||||||||||||
December 31, 2022 |
|
Fair Value through OCI |
|
Fair value |
|
Amortized |
|
Total |
|
Level 1 |
|
Level 2 |
|
Level 3 |
|
Carrying value |
||||||||
Financial assets measured at Fair Value |
|
|
|
|
|
|
|
|
|
|
|
|
|
|
|
|
|
|
|
|
|
|
|
|
Investments in equity securities |
|
$ |
78 |
|
$ |
- |
|
$ |
- |
|
$ |
78 |
|
$ |
78 |
|
$ |
- |
|
$ |
- |
|
$ |
- |
Trade receivables concentrate sales |
|
|
- |
|
|
21,455 |
|
|
- |
|
|
21,455 |
|
|
- |
|
|
21,455 |
|
|
- |
|
|
- |
Fuel hedge contracts asset |
|
|
- |
|
|
18 |
|
|
- |
|
|
18 |
|
|
- |
|
|
18 |
|
|
- |
|
|
- |
|
|
$ |
78 |
|
$ |
21,473 |
|
$ |
- |
|
$ |
21,551 |
|
$ |
78 |
|
$ |
21,473 |
|
$ |
- |
|
$ |
- |
|
|
|
|
|
|
|
|
|
|
|
|
|
|
|
|
|
|
|
|
|
|
|
|
|
Financial assets not measured at Fair Value |
|
|
|
|
|
|
|
|
|
|
|
|
|
|
|
|
|
|
|
|
|
|
|
|
Cash and cash equivalents |
|
$ |
- |
|
$ |
- |
|
$ |
80,493 |
|
$ |
80,493 |
|
$ |
- |
|
$ |
- |
|
$ |
- |
|
$ |
80,493 |
Trade receivables doré sales |
|
|
- |
|
|
- |
|
|
2,522 |
|
|
2,522 |
|
|
- |
|
|
- |
|
|
- |
|
|
2,522 |
Other receivables |
|
|
- |
|
|
- |
|
|
7,443 |
|
|
7,443 |
|
|
- |
|
|
- |
|
|
- |
|
|
7,443 |
|
|
$ |
- |
|
$ |
- |
|
$ |
90,458 |
|
$ |
90,458 |
|
$ |
- |
|
$ |
- |
|
$ |
- |
|
$ |
90,458 |
|
|
|
|
|
|
|
|
|
|
|
|
|
|
|
|
|
|
|
|
|
|
|
|
|
Financial liabilities measured at Fair Value |
|
|
|
|
|
|
|
|
|
|
|
|
|
|
|
|
|
|
|
|
|
|
|
|
Foreign exchange forward contracts liability |
|
$ |
- |
|
$ |
(270) |
|
$ |
- |
|
$ |
(270) |
|
$ |
- |
|
$ |
(270) |
|
$ |
- |
|
$ |
- |
Share units payable |
|
|
- |
|
|
(7,308) |
|
|
- |
|
|
(7,308) |
|
|
- |
|
|
(7,308) |
|
|
- |
|
|
- |
|
|
$ |
- |
|
$ |
(7,578) |
|
$ |
- |
|
$ |
(7,578) |
|
$ |
- |
|
$ |
(7,578) |
|
$ |
- |
|
$ |
- |
|
|
|
|
|
|
|
|
|
|
|
|
|
|
|
|
|
|
|
|
|
|
|
|
|
Financial liabilities not measured at Fair Value |
|
|
|
|
|
|
|
|
|
|
|
|
|
|
|
|
|
|
|
|
|
|
|
|
Trade payables |
|
$ |
- |
|
$ |
- |
|
$ |
(72,571) |
|
$ |
(72,571) |
|
$ |
- |
|
$ |
- |
|
$ |
- |
|
$ |
(72,571) |
Payroll payable |
|
|
- |
|
|
- |
|
|
(22,967) |
|
|
(22,967) |
|
|
- |
|
|
- |
|
|
- |
|
|
(22,967) |
Credit facilities |
|
|
- |
|
|
- |
|
|
(177,020) |
|
|
(177,020) |
|
|
- |
|
|
(180,000) |
|
|
- |
|
|
- |
Convertible debentures |
|
|
- |
|
|
- |
|
|
(42,155) |
|
|
(42,155) |
|
|
- |
|
|
(46,138) |
|
|
- |
|
|
- |
Other payables |
|
|
- |
|
|
- |
|
|
(31,519) |
|
|
(31,519) |
|
|
- |
|
|
- |
|
|
- |
|
|
(31,519) |
|
|
$ |
- |
|
$ |
- |
|
$ |
(346,232) |
|
$ |
(346,232) |
|
$ |
- |
|
$ |
(226,138) |
|
$ |
- |
|
$ |
(127,057) |
Page | 41
Fortuna Silver Mines Inc.
Notes to Consolidated Financial Statements
For the years ended December 31, 2023 and 2022
(Tabular amounts presented in thousands of US dollars, except share and per share amounts)
28. MANAGEMENT OF FINANCIAL RISK
The Board of Directors has overall responsibility for the establishment and oversight of the Company’s risk management framework and reviews the Company’s policies on an ongoing basis.
The Company is exposed to certain financial risks, including credit risk, liquidity risk, currency risk, metal price risk, and interest rate risk.
| (a) | Credit Risk |
Credit risk is the risk of an unexpected loss if a customer or third party to a financial instrument fails to meet its contractual obligations. All our trade accounts receivables from concentrate sales are held with large international metals trading companies.
The Company’s cash and cash equivalents and short-term investments are held through large financial institutions.
These investments mature at various dates within three months.
The Company’s maximum exposure to credit risk as at December 31, 2023 and 2022 is as follows:
|
|
|
|
|
||
As at |
|
December 31, 2023 |
|
December 31, 2022 |
||
Cash and cash equivalents |
|
$ |
128,148 |
|
$ |
80,493 |
Trade and other receivables |
|
|
69,529 |
|
|
68,165 |
Income tax receivable |
|
|
6,283 |
|
|
718 |
Other non-current receivables |
|
|
18,693 |
|
|
8,503 |
|
|
$ |
222,653 |
|
$ |
157,879 |
The carrying amount of financial assets recorded in the financial statements represents the Company’s maximum exposure to credit risk. We limit our exposure to counterparty credit risk on cash and term deposits by only dealing with financial institutions with high credit ratings and through our investment policy of purchasing only instruments with a high credit rating. Materially all of the Company’s concentrates are sold to large, well-known concentrate buyers.
| (b) | Liquidity Risk |
Liquidity risk is the risk that the Company will not be able to meet its financial obligations as they come due. The Company manages its liquidity risk by continually monitoring forecasted and actual cash flows. The Company has in place a planning and budgeting process to help determine the funds required to support its normal operating requirements and its development plans. The Company aims to maintain sufficient liquidity to meet its short term business requirements, taking into account its anticipated cash flows from operations, its holdings of cash and cash equivalents, and its committed and anticipated liabilities.
The Company had $213.1 million of liquidity comprised of cash and cash equivalents and undrawn credit facilities as at December 31, 2023. The Company believes that it has sufficient liquidity to meet the Company’s minimum obligations for at least the next 12 months from December 31, 2023.
Compania Minera Cuzcatlan S.A. de C.V. (“Minera Cuzcatlan”), the wholly owned subsidiary that operates the San Jose mine, has an ongoing legal proceeding (the “Mexican Legal Proceedings") over the 12-year extension of its Environmental Impact Authorization (“EIA”) with the Secretaría de Medio Ambiente y Recursos Naturales (“SEMARNAT”) after it annulled the mine’s EIA on January 5, 2023. Until there is a determination in the Mexican Legal Proceedings, the San Jose mine continues to operate under the terms of the 12-year EIA due to a permanent injunction granted by the Mexican Federal Administrative Court (see Note 33).
Page | 42
Fortuna Silver Mines Inc.
Notes to Consolidated Financial Statements
For the years ended December 31, 2023 and 2022
(Tabular amounts presented in thousands of US dollars, except share and per share amounts)
Until the determination of the Mexican Legal Proceedings, the Company has agreed to certain temporary restrictions on its Amended Credit Facility and is required to have a positive unappealable decision in such proceedings prior to December 31, 2024. In the event such a decision is not received before December 31, 2024, an event of default would occur and the availability under the Amended Credit Facility would be reduced to nil. Management expects to receive either a positive unappealable decision or an additional extension from its lenders prior to December 31, 2024. In the event that the Company does not receive either a positive unappealable decision or an extension and an event of default occurs, the Company anticipates having sufficient liquidity to fulfill its financial obligations and settle any outstanding debt.
The Company manages its liquidity risk by continuously monitoring forecasted and actual cashflows. A rigorous reporting, planning and budgeting process is in place to help facilitate forecasting funding requirements, to support operations on an ongoing basis and expansion plans, if any.
As at December 31, 2023, the Company expects the following maturities of its financial liabilities, lease obligations, and other contractual commitments, excluding payments relating to interest:
|
|
Expected payments due by year as at December 31, 2023 |
|||||||||||||
|
|
|
Less than |
|
|
|
|
|
|
After |
|
|
|||
|
|
|
1 year |
|
|
1 - 3 years |
|
|
4 - 5 years |
|
|
5 years |
|
|
Total |
Trade and other payables |
|
$ |
148,084 |
|
$ |
- |
|
$ |
- |
|
$ |
- |
|
$ |
148,084 |
Debt |
|
|
45,715 |
|
|
165,000 |
|
|
- |
|
|
- |
|
|
210,715 |
Income taxes payable |
|
|
31,779 |
|
|
- |
|
|
- |
|
|
- |
|
|
31,779 |
Lease obligations |
|
|
20,339 |
|
|
39,775 |
|
|
4,902 |
|
|
6,457 |
|
|
71,473 |
Other liabilities |
|
|
- |
|
|
9,973 |
|
|
- |
|
|
- |
|
|
9,973 |
Closure and reclamation provisions |
|
|
5,527 |
|
|
27,157 |
|
|
8,219 |
|
|
38,420 |
|
|
79,323 |
|
|
$ |
251,444 |
|
$ |
241,905 |
|
$ |
13,121 |
|
$ |
44,877 |
|
$ |
551,347 |
|
|
|
|
|
|
|
|
|
|
|
|
|
|
|
|
|
|
Expected payments due by year as at December 31, 2022 |
|||||||||||||
|
|
|
Less than |
|
|
|
|
|
|
|
|
After |
|
|
|
|
|
|
1 year |
|
|
1 - 3 years |
|
|
4 - 5 years |
|
|
5 years |
|
|
Total |
Trade and other payables |
|
$ |
111,896 |
|
$ |
- |
|
$ |
- |
|
$ |
- |
|
$ |
111,896 |
Debt |
|
|
- |
|
|
225,940 |
|
|
- |
|
|
- |
|
|
225,940 |
Income taxes payable |
|
|
11,589 |
|
|
- |
|
|
- |
|
|
- |
|
|
11,589 |
Lease obligations |
|
|
11,343 |
|
|
8,308 |
|
|
5,736 |
|
|
5,806 |
|
|
31,193 |
Other liabilities |
|
|
- |
|
|
2,596 |
|
|
- |
|
|
- |
|
|
2,596 |
Capital commitments, Séguéla |
|
|
13,923 |
|
|
380 |
|
|
- |
|
|
- |
|
|
14,303 |
Closure and reclamation provisions |
|
|
3,227 |
|
|
24,635 |
|
|
9,110 |
|
|
23,040 |
|
|
60,012 |
|
|
$ |
151,978 |
|
$ |
261,859 |
|
$ |
14,846 |
|
$ |
28,846 |
|
$ |
457,529 |
| (c) | Currency risk |
The Company is exposed to fluctuations in foreign exchange rates as a portion of our expenses are incurred in Canadian dollars, Peruvian soles, Argentine pesos, Mexican pesos, West Africa CFA francs, Australian dollars, and Euros. A significant change in the foreign exchange rates between the United States dollar relative to the other currencies could have a material effect on the Company’s profit or loss, financial position, or cash flows.
Page | 43
Fortuna Silver Mines Inc.
Notes to Consolidated Financial Statements
For the years ended December 31, 2023 and 2022
(Tabular amounts presented in thousands of US dollars, except share and per share amounts)
As at December 31, 2023 and 2022, the Company was exposed to currency risk through the following assets and liabilities denominated in foreign currencies:
|
|
December 31, 2023 |
||||||||||||
|
|
Canadian |
|
Peruvian |
|
Mexican |
|
Argentine |
|
West |
|
Australian |
|
Euros |
Cash and cash equivalents |
|
480 |
|
6,871 |
|
8,798 |
|
1,092,738 |
|
39,898,039 |
|
48 |
|
- |
Marketable securities |
|
105 |
|
- |
|
- |
|
- |
|
- |
|
- |
|
- |
Restricted cash |
|
- |
|
- |
|
- |
|
- |
|
573,830 |
|
- |
|
- |
Trade and VAT receivables |
|
388 |
|
1,730 |
|
114,189 |
|
9,554,183 |
|
16,584,783 |
|
(117) |
|
- |
Income tax receivable |
|
- |
|
28,052 |
|
84,050 |
|
- |
|
- |
|
- |
|
- |
VAT - long term receivable |
|
- |
|
- |
|
64,265 |
|
- |
|
5,582,765 |
|
- |
|
- |
Trade and other payables |
|
(18,669) |
|
(51,327) |
|
(174,021) |
|
(6,605,563) |
|
(18,465,087) |
|
(1,259) |
|
(2,535) |
Provisions, current |
|
- |
|
(5,905) |
|
(21,420) |
|
(1,334,105) |
|
- |
|
- |
|
- |
Income tax payable |
|
- |
|
- |
|
(28,094) |
|
- |
|
(2,136,164) |
|
- |
|
- |
Other liabilities |
|
(184) |
|
- |
|
(121,249) |
|
- |
|
- |
|
- |
|
- |
Provisions, non-current |
|
- |
|
(13,879) |
|
(107,576) |
|
- |
|
- |
|
- |
|
- |
Total foreign currency exposure |
|
(17,880) |
|
(34,458) |
|
(181,058) |
|
2,707,253 |
|
42,038,166 |
|
(1,328) |
|
(2,535) |
US$ equivalent of foreign currency exposure |
|
(13,516) |
|
(9,280) |
|
(10,718) |
|
3,350 |
|
70,851 |
|
(905) |
|
(2,802) |
|
|
December 31, 2022 |
||||||||||||
|
|
Canadian |
|
Peruvian |
|
Mexican |
|
Argentine |
|
West |
|
Australian |
|
Euros |
Cash and cash equivalents |
|
587 |
|
6,237 |
|
73,868 |
|
11,845 |
|
6,057,885 |
|
250 |
|
0 |
Marketable securities |
|
105 |
|
- |
|
- |
|
- |
|
- |
|
- |
|
- |
Restricted cash |
|
- |
|
- |
|
- |
|
- |
|
2,338,983 |
|
- |
|
- |
Trade and VAT receivables |
|
215 |
|
3,317 |
|
73,868 |
|
2,062,918 |
|
12,979,116 |
|
(115) |
|
- |
Income tax receivable |
|
- |
|
28,137 |
|
13,900 |
|
- |
|
- |
|
- |
|
- |
VAT - long term receivable |
|
- |
|
- |
|
70,520 |
|
- |
|
- |
|
- |
|
- |
Trade and other payables |
|
(13,374) |
|
(16,966) |
|
(218,288) |
|
(1,429,416) |
|
(15,346,471) |
|
(1,285) |
|
(274) |
Provisions, current |
|
- |
|
(8,123) |
|
(11,729) |
|
(387,883) |
|
- |
|
- |
|
- |
Income tax payable |
|
51 |
|
- |
|
(84,393) |
|
- |
|
(1,353,215) |
|
- |
|
- |
Other liabilities |
|
(177) |
|
- |
|
(9,708) |
|
- |
|
- |
|
- |
|
- |
Provisions, non-current |
|
- |
|
(12,611) |
|
(90,797) |
|
- |
|
- |
|
- |
|
- |
Total foreign currency exposure |
|
(12,593) |
|
(9) |
|
(182,759) |
|
257,464 |
|
4,676,298 |
|
(1,150) |
|
(274) |
US$ equivalent of foreign currency exposure |
|
(9,297) |
|
(2) |
|
(9,439) |
|
1,436 |
|
7,416 |
|
(793) |
|
(287) |
Page | 44
Fortuna Silver Mines Inc.
Notes to Consolidated Financial Statements
For the years ended December 31, 2023 and 2022
(Tabular amounts presented in thousands of US dollars, except share and per share amounts)
Sensitivity as to change in foreign currency exchange rates on our foreign currency exposure as at December 31, 2023 is provided below:
|
|
|
|
Effect on foreign |
|
|
|
|
|
denominated |
|
Currency |
|
Change |
|
items |
|
Mexican pesos |
|
+/- 10% |
|
$ |
974 |
Peruvian soles |
|
+/- 10% |
|
$ |
844 |
Argentine pesos |
|
+/- 10% |
|
$ |
305 |
Canadian dollars |
|
+/- 10% |
|
$ |
1,229 |
West African CFA francs |
|
+/- 10% |
|
$ |
6,441 |
Australian dollars |
|
+/- 10% |
|
$ |
82 |
Euros |
|
+/- 10% |
|
$ |
255 |
Due to the volatility of the exchange rate for Argentine Peso, the Company is applying additional measures in cash management to minimize potential losses arising from the conversion of funds. As discussed in Note 28(f), with the capital controls in effect, the Company is required to convert the equivalent value of foreign currency received from the proceeds of the sale of all gold doré from the Lindero Mine.
| (d) | Metal Price Risk |
The Company is exposed to metal price risk with respect to the sales of silver, gold, lead, and zinc concentrates. The following table summarizes the effect on provisionally priced sales and accounts receivables of a 10% change in metal prices from the prices used at December 31, 2023:
Metal |
|
Change |
|
Effect on Sales |
|
Silver |
|
+/- 10% |
|
$ |
433 |
Gold |
|
+/- 10% |
|
$ |
246 |
Lead |
|
+/- 10% |
|
$ |
488 |
Zinc |
|
+/- 10% |
|
$ |
449 |
During the year ended December 31, 2023, the Company recognized negative sales adjustments of $0.7 million
(December 31, 2022 – negative $1.5 million) as a result of changes in metal prices on the final settlement or during the quotational period.
From time to time, the Company mitigates the price risk associated with its base metal production by entering into forward sale and collar contracts for some of its forecasted base metal production and non-metal commodities (see Note 20).
| (e) | Interest Rate Risk |
Interest rate risk is the risk that the fair value or future cash flows of a financial instrument will fluctuate because of changes in market interest rates. Currently, the Company’s interest rate exposure mainly relates to interest earned on its cash, cash equivalent, and short-term investment balances, interest paid on its SOFR-based debt and the mark-to-market value of derivative instruments which depend on interest rates.
| (f) | Capital Management |
The Company’s objective when managing its capital is to maintain its ability to continue as a going concern while at the same time maximizing the growth of its business and providing returns to its shareholders. The Company manages its capital structure and makes adjustments based on changes to its economic environment and the risk characteristics of the Company’s assets.
Page | 45
Fortuna Silver Mines Inc.
Notes to Consolidated Financial Statements
For the years ended December 31, 2023 and 2022
(Tabular amounts presented in thousands of US dollars, except share and per share amounts)
Effective December 23, 2019, changes to Argentina’s tax laws proposed by the new Argentine Government were implemented. The changes ratified and extended legislation which was to expire on December 31, 2019 and allow the Argentine Central Bank to regulate funds coming into and flowing out of Argentina in order to maintain stability and support the economic recovery of the country. These capital controls, together with additional temporary controls enacted on May 29, 2020, have the effect of requiring exporters to convert the equivalent value of foreign currency received from the export into Argentine Pesos; requiring the prior consent of the Argentine Central Bank to the payment of cash dividends and distributions of currency out of Argentina; requiring Argentine companies to convert foreign currency loans received from abroad into Argentine Pesos; and restricting the sale of Argentine Pesos for foreign currency. These changes have since been ratified and extended legislation to December 31, 2025.
The Company’s capital requirement is effectively managed based on the Company having a thorough reporting, planning and forecasting process to help identify the funds required to ensure the Company is able to meet its operating and growth objectives.
The Company’s capital structure consists of equity comprising of share capital, reserves and retained earnings as well as debt facilities, equipment financing obligations less cash, cash equivalents and short-term investments.
|
|
|
|
|
|
|
|
|
December 31, 2023 |
|
December 31, 2022 |
||
Equity |
|
$ |
1,238,367 |
|
$ |
1,244,756 |
Debt |
|
|
206,847 |
|
|
219,175 |
Lease obligations |
|
|
57,401 |
|
|
21,346 |
Less: cash and cash equivalents |
|
|
(128,148) |
|
|
(80,493) |
|
|
$ |
1,374,467 |
|
$ |
1,404,784 |
Other than the restrictions related to capital controls, and complying with the debt covenants under the Company’s Amended Credit Facility, the Company is not subject to any externally imposed capital requirements. As at December 31, 2023 and 2022, the Company was in compliance with its debt covenants.
29. SUPPLEMENTAL CASH FLOW INFORMATION
Changes in working capital for the years ended December 31, 2023 and 2022 are as follows:
|
|
Years ended December 31, |
||||
|
|
2023 |
|
2022 |
||
Trade and other receivables |
|
$ |
(17,111) |
|
$ |
7,315 |
Prepaid expenses |
|
|
(3,242) |
|
|
(1,643) |
Inventories |
|
|
(21,020) |
|
|
(20,415) |
Trade and other payables |
|
|
31,636 |
|
|
(3,278) |
Total changes in working capital |
|
$ |
(9,737) |
|
$ |
(18,021) |
Page | 46
Fortuna Silver Mines Inc.
Notes to Consolidated Financial Statements
For the years ended December 31, 2023 and 2022
(Tabular amounts presented in thousands of US dollars, except share and per share amounts)
The changes in liabilities arising from financing activities, including both changes arising from cash flows and non-cash changes for the periods as set out below are as follows:
|
|
|
Bank loan |
|
Convertible debentures |
|
Lease |
|||
As at December 31, 2021 |
|
|
$ |
117,082 |
|
$ |
40,407 |
|
$ |
29,405 |
Loss on debt modifications |
|
|
|
— |
|
|
— |
|
|
(729) |
Additions |
|
|
|
80,000 |
|
|
— |
|
|
2,774 |
Terminations |
|
|
|
— |
|
|
— |
|
|
(661) |
Conversion of debenture |
|
|
|
— |
|
|
(60) |
|
|
— |
Interest |
|
|
|
626 |
|
|
1,808 |
|
|
2,623 |
Payments |
|
|
|
(20,000) |
|
|
— |
|
|
(12,209) |
Transaction costs |
|
|
|
(688) |
|
|
— |
|
|
— |
Foreign exchange |
|
|
|
— |
|
|
— |
|
|
143 |
As at December 31, 2022 |
|
|
|
177,020 |
|
|
42,155 |
|
|
21,346 |
Additions |
|
|
|
75,500 |
|
|
— |
|
|
48,805 |
Terminations |
|
|
|
— |
|
|
— |
|
|
(21) |
Conversion of debenture |
|
|
|
— |
|
|
(225) |
|
|
— |
Interest |
|
|
|
926 |
|
|
1,971 |
|
|
3,658 |
Payments |
|
|
|
(90,500) |
|
|
— |
|
|
(16,625) |
Foreign exchange |
|
|
|
— |
|
|
— |
|
|
238 |
As at December 31, 2023 |
|
|
$ |
162,946 |
|
$ |
43,901 |
|
$ |
57,401 |
The significant non-cash financing and investing transactions during the years ended December 31, 2023 and 2022 are as follows:
|
|
|
|
|
|
|
|
|
|
|
Years ended December 31, |
||||
|
|
|
2023 |
|
2022 |
||
Acquisition of Chesser |
|
|
$ |
45,548 |
|
$ |
- |
Mineral properties, plant and equipment changes in closure and reclamation provision |
|
|
$ |
(9,559) |
|
$ |
5,021 |
Stock options allocated to share capital upon exercise |
|
|
$ |
96 |
|
$ |
- |
Additions to right of use assets |
|
|
$ |
48,805 |
|
$ |
2,774 |
Share units allocated to share capital upon settlement |
|
|
$ |
2,864 |
|
$ |
2,525 |
30. NON-CONTROLLING INTEREST
As at December 31, 2023, the non-controlling interest (“NCI”) of the State of Burkina Faso, which represents a 10% interest in Roxgold SANU S.A., totaled $3.4 million. The income attributable to the NCI for the year ended December 31, 2023, totaling $2.6 million, is based on the net income for Yaramoko.
Page | 47
Fortuna Silver Mines Inc.
Notes to Consolidated Financial Statements
For the years ended December 31, 2023 and 2022
(Tabular amounts presented in thousands of US dollars, except share and per share amounts)
As at December 31, 2023, the NCI of the State of Côte d’Ivoire, which represents a 10% interest in Roxgold Sango S.A., totaled $46.4 million. The income attributable to the NCI for the year ended December 31, 2023, totaling $4.7 million, is based on the net income for Séguéla.
Summarized statement of financial position |
|
|
|
|
|
|
|
|
|
|
|
|
|
As of December 31, 2023 |
|
Yaramoko |
|
Séguéla |
||
Non-controlling interest percentage |
|
|
10% |
|
|
10% |
Current assets |
|
$ |
53,002 |
|
$ |
82,462 |
Non-current assets |
|
|
153,037 |
|
|
318,912 |
Current liabilities |
|
|
(30,356) |
|
|
(63,515) |
Non-current liabilities |
|
|
(100,919) |
|
|
(228,553) |
Net assets |
|
$ |
74,764 |
|
$ |
109,306 |
|
|
|
|
|
|
|
Non-controlling interest |
|
$ |
3,379 |
|
$ |
46,376 |
|
|
|
|
|
|
|
Summarized income statement |
|
|
|
|
|
|
|
|
|
|
|
|
|
For the period ended December 31, 2023 |
|
Yaramoko |
|
Séguéla |
||
Revenue |
|
$ |
228,846 |
|
$ |
154,165 |
Net income (loss) and comprehensive income (loss) |
|
$ |
(2,881) |
|
$ |
66,915 |
|
|
|
|
|
|
|
Summarized cash flows |
|
|
|
|
|
|
|
|
|
|
|
|
|
For the period ended December 31, 2023 |
|
Yaramoko |
|
Séguéla |
||
Cash flows provided by operating activities |
|
$ |
101,193 |
|
$ |
109,264 |
Cash flows used in investing activities |
|
$ |
(51,057) |
|
$ |
(59,022) |
Cash flows (used in) provided by financing activities |
|
$ |
(43,025) |
|
$ |
79 |
31. CONTINGENCIES AND CAPITAL COMMITMENTS
(a) Caylloma Letter of Guarantee
The Caylloma mine closure plan, as amended, that was in effect in January 2021, included total undiscounted closure costs of $18.2 million, which consisted of progressive closure activities of $6.2 million, final closure activities of $9.8 million, and post closure activities of $2.3 million pursuant to the terms of the Mine Closing Law.
Under the terms of the current Mine Closing Law, the Company is required to provide the Peruvian Government with a guarantee in respect of the Caylloma mine closure plan as it relates to final closure activities and post-closure activities and related taxes. In 2024, the Company provided a bank letter of guarantee of $12.9 million to the Peruvian Government in respect of such closure costs and taxes.
(b) San Jose Letter of Guarantee
The Company has established three letters of guarantee in the aggregate amount of $0.8 million to fulfill its environmental obligations under the terms and conditions of the Environmental Impact Statements issued by the Secretaria de Medio Ambiente y Recursos Naturales (“SEMARNAT”) in 2009 in respect of the construction of the San Jose mine, and in 2017 and 2020 with respect to the expansion of the dry stack tailings facility at the San Jose mine. The letters of guarantee expire on March 5, 2024, September 17, 2024 and December 31, 2024, respectively. The letter expiring on March 5, 2024 is in the process of being extended for a further 12 months.
Page | 48
Fortuna Silver Mines Inc.
Notes to Consolidated Financial Statements
For the years ended December 31, 2023 and 2022
(Tabular amounts presented in thousands of US dollars, except share and per share amounts)
(c) Other Commitments
As at December 31, 2023, the Company had capital commitments of $5.8 million, for civil work, equipment purchases and other services at the Lindero mine, which are expected to be expended within one year.
Côte d’Ivoire
The Company entered into an agreement with a service provider at the Séguéla mine wherein if the Company terminates the agreement prior to the end of its term, in November 2026, the Company would be required to make an early termination payment, which is reduced monthly over 48 months. If the Company had terminated the agreement on December 31, 2023, and elected not to purchase the service provider’s equipment, it would have been subject to an early termination payment of $16.7 million. If the Company had terminated the agreement on December 31, 2023, and elected to purchase the service provider’s equipment, the early termination amount would be adjusted to exclude equipment depreciation and demobilization of equipment, and only include portion of the monthly management fee and demobilization of personnel.
(d) Tax Contingencies
The Company is, from time to time, involved in various tax assessments arising in the ordinary course of business. The Company cannot reasonably predict the likelihood or outcome of these actions. The Company has recognized tax provisions with respect to current assessments received from the tax authorities in the various jurisdictions in which the Company operates, and from any uncertain tax positions identified. For those amounts recognized related to current tax assessments received, the provision is based on management's best estimate of the outcome of those assessments, based on the validity of the issues in the assessment, management's support for their position, and the expectation with respect to any negotiations to settle the assessment. Management re-evaluates the outstanding tax assessments regularly to update their estimates related to the outcome for those assessments taking into account the criteria above.
Peru
The Company was assessed $1.2 million (4.3 million Peruvian soles), including interest and penalties of $0.8 million (2.9 million Peruvian soles), for the 2010 tax year by SUNAT, the Peruvian tax authority, with respect to the deduction of certain losses arising from derivative instruments. The Company applied to the Peruvian tax court to appeal the assessment. On January 22, 2019, the Peruvian tax court reaffirmed SUNAT’s position and denied the deduction. The Company believes the assessment is inconsistent with Peruvian tax law and that it is probable the Company will succeed on appeal through the Peruvian legal system. The Company has paid the disputed amount in full and has initiated proceedings through the Peruvian legal system to appeal the decision of the Peruvian tax court.
As at December 31, 2023, the Company has recorded the amount paid of $1.2 million (4.3 million Peruvian soles) in other long-term assets, as the Company believes it is probable that the appeal will be successful (Note 10).
The Company was assessed $0.7 million (2.8 million Peruvian soles), including interest and penalties of $0.5 million (1.7 million Peruvian soles), for the 2011 tax year by SUNAT, the Peruvian tax authority, with respect to the deduction of certain losses arising from intercompany transactions. The Company applied to the Peruvian tax court to appeal the assessment. On May 14, 2019, the Peruvian tax court reaffirmed SUNAT’s position and denied the deduction. The Company believes the assessment is inconsistent with Peruvian tax law and that it is probable the Company will succeed on appeal through the Peruvian legal system. The Company has paid the disputed amount in full and has initiated proceedings through the Peruvian legal system to appeal the decision of the Peruvian tax court.
Page | 49
Fortuna Silver Mines Inc.
Notes to Consolidated Financial Statements
For the years ended December 31, 2023 and 2022
(Tabular amounts presented in thousands of US dollars, except share and per share amounts)
Argentina
On August 16, 2022, the Argentine Tax Authority (“AFIP”) published General Resolution No.5248/2022 (the “Resolution”) which established a one-time “windfall income tax prepayment” for companies that have obtained extraordinary income derived from the general increase in international prices. The Resolution was published by AFIP without prior notice.
The windfall income tax prepayment applies to companies that meet certain income tax or net income tax (before the deduction of accumulated tax losses) thresholds for 2021 or 2022. The aggregate amount of the windfall income tax prepayment payable by Mansfield calculated in accordance with the Resolution was approximately $1.0 million (810 million Argentine Pesos), excluding related accrued interest of approximately $0.3 million (277 million Argentine Pesos).
The windfall income tax prepayment was to be paid in three equal and consecutive monthly instalments, starting on October 22, 2022, and was payable in addition to income tax instalments currently being paid by corporate taxpayers on account of their income tax obligations. The windfall income tax prepayment is an advance payment of income taxes which were due to be paid in 2022.
Based on the historical accumulated losses of Mansfield for fiscal 2021, which can be carried forward for 2022, Mansfield was not liable for income tax, and based upon current corporate income tax laws and the ability of the Company to deduct historical accumulated losses, income tax will not be required to be paid for fiscal 2022.
To protect Mansfield’s position from having to pay the windfall income tax prepayment as an advance income tax for 2022, which based on management’s projections is not payable, Mansfield applied to the Federal Court of Salta Province for a preliminary injunction to prevent the AFIP from issuing a demand or other similar measure for the collection of the windfall income tax prepayment. On October 3, 2022, Mansfield was notified that the Court had granted the preliminary injunction. As a result, Mansfield did not pay any of the instalments.
Mansfield also filed an administrative claim with the AFIP to challenge the constitutionality of the Resolution, which was rejected by AFIP on November 2, 2022. Mansfield has challenged the rejection of its administrative claim, by filing legal proceedings against the AFIP with the Federal Court. On February 15, 2023, the Federal Court granted Mansfield a preliminary injunction in these legal proceedings. Mansfield has subsequently presented additional documentation to AFIP which has resulted in the windfall tax prepayment installments being eliminated from Mansfield’s account in AFIP’s system. The legal proceedings to determine the unconstitutionality of the Resolution and whether interest is payable to AFIP continue under the protection of a preliminary injunction.
(e) Other Contingencies
The Company is subject to various investigations and other claims; and legal, labour, and tax proceedings covering matters that arise in the ordinary course of business activities. Each of these matters is subject to various uncertainties, and it is possible that some of these matters may be resolved unfavourably for the Company. Certain conditions may exist as of the date these financial statements are issued that may result in a loss to the Company. None of these matters is expected to have a material effect on the results of operations or financial conditions of the Company.
Page | 50
Fortuna Silver Mines Inc.
Notes to Consolidated Financial Statements
For the years ended December 31, 2023 and 2022
(Tabular amounts presented in thousands of US dollars, except share and per share amounts)
32. IMPAIRMENT
Impairment Testing
In accordance with the Company’s accounting policies each cash-generating unit (CGU) is assessed for indicators of impairment from both internal and external sources at the end of each reporting period. If such indicators of impairment exist for any CGU, those CGUs are tested for impairment. Based on this assessment, the Company determined that the San Jose and Lindero CGUs had indicators of impairment.
The recoverable amounts of the CGUs are determined based on the discounted cash flows expected to be derived from the Company’s mining properties, which is a Level 3 fair value estimate. Due to its short mine life, the recoverable amount of the San Jose mine was calculated based on its Value in Use (VIU). The recoverable amount of the Lindero CGU was calculated based on its Fair Value Less Cost of Disposal (FVLCD).
San Jose
During the fourth quarter of 2023, the life of mine plan for the San Jose mine was updated and indicated that the Mineral Reserves will be exhausted at the end of 2024, compared to mid-2025 as previously planned. The decrease in the life of mine was the result of significant cost increases over the last 12 months, which resulted from:
•Appreciation of the Mexican Peso.
• |
Higher labour costs as a result of new labour reform mandates which either took effect on January 1, 2024, or are expected to take place in 2024. |
• |
Higher contractor costs for transportation, distribution, shotcrete, maintenance and mine services. |
• |
Higher costs for fuel, energy and materials related to inflation. |
In addition to the reduction in Mineral Reserves in the Trinidad Zone, planned expansion areas such as the Victoria Zone failed to convert from Mineral Resources to Mineral Reserves as a result of the higher costs noted above.
As a result, the Company determined that the recoverable amount of the San Jose CGU was $10.0 million, and recorded an impairment charge of $90.6 million to reduce the carrying amount of the CGU to its recoverable amount.
Lindero
As of December 31, 2023, the Company determined that there were indicators of impairment at the Lindero mine due to an increase in capital costs for the heap leach expansion project and an increase in operating costs as a result of macro-economic factors, in particular the pace of inflation relative to the devaluation of the Argentine Peso. As a result, management estimated the recoverable amount of the Lindero mine as at December 31, 2023, determined on a fair value less cost of disposal basis, and concluded that no impairment charge was required. However, adverse changes in any of the assumptions used to determine the recoverable amount in future periods may result in an impairment.
Key Assumptions
The projected cash flows used in impairment testing are significantly affected by changes in the assumptions of metal prices, estimated quantities of mineral reserves and mineral resources that form the basis for the life of mine plans, production cost estimates, capital requirements, and discount rates. The Company’s impairment testing incorporated the following key assumptions.
Page | 51
Fortuna Silver Mines Inc.
Notes to Consolidated Financial Statements
For the years ended December 31, 2023 and 2022
(Tabular amounts presented in thousands of US dollars, except share and per share amounts)
Weighted Average Cost of Capital
Projected cash flows were discounted using an after-tax discount rate that reflects the weighted average cost of capital for each CGU when considering estimates for risk free interest rates, market value of the Company’s equity, market return on equity, share volatility, debt-to-equity financing ratio and a country risk premium. Discount rates used in each impairment assessment were as follows:
Cash Generating Unit |
Discount Rate |
Lindero, after-tax |
7.7% |
San Jose, after-tax |
6.6% |
San Jose, pre-tax |
6.9% |
Pricing Assumptions
Metal pricing including in the cash flow projects beyond five years is based on historical volatility and consensus analyst pricing. The metal price assumptions used in the Company’s impairment assessments were as follows:
Metal |
2024 |
2025 |
2026 |
2027 |
Long Term |
Gold (Per Once) |
$2,000 |
$2,000 |
$1,925 |
$1,875 |
$1,800 |
Silver (Per Ounce) |
$24.50 |
$24.50 |
$24.00 |
$23.25 |
$23.00 |
Production and Costs
The Company’s estimates of future cash costs of production and capital expenditures are based on the life of mine (LOM) plan for each cash generating unit. The LOM plans for each CGU are based on detailed research and analysis and consider the optimal level of capital investment, overall production levels and mine sequence, commodity prices, export and corporate taxes, historical performance, and other factors to maximize the value of the CGU. Adverse changes in any of the assumptions made in future periods may result in an impairment.
Projected future revenues reflect the forecasted production at each CGU as detailed in their LOM plans. The LOM may include mineralized material that does not qualify for inclusion as a mineral reserve or a mineral resource. This is consistent with the methodology used to measure value beyond proven and probable reserves when allocating the purchase price of a business combination to acquired mining assets. The Company’s estimate of recoverable amount for accounting purposes is not a “preliminary assessment”, as defined in Canadian Securities Administrators’ National Instrument 43- 101 “Standards of Disclosure for Mineral Projects”.
33. SUBSEQUENT EVENTS
On October 30, 2023, the Company announced that the Mexican Federal Administrative Court (the “Court”) had ruled in favour of Cuzcatlan (Fortuna’s Mexican subsidiary), and reinstated the 12 year environmental impact authorization for the San Jose mine. The decision of the Court has been appealed and was admitted by the Mexican Collegiate Court (the “Appeals Court”) in January 2024. Cuzcatlan filed a response in February 2024. A decision of the Appeals Court is expected within the next six to 12 months. The permanent injunction that Cuzcatlan already has allowing the San Jose ine to continue to operate, remains in effect. If a positive unappealable decision in these proceedings is not received by Cuzcatlan before December 31, 2024, the availability under the Amended Credit Facility will be reduced to nil, and an event of default will occur.
Page | 52
MANAGEMENT’S DISCUSSION AND ANALYSIS
For the year ended December 31, 2023
As of March 6, 2024
Fortuna Silver Mines Inc.
Management’s Discussion and Analysis
For the year ended December 31, 2023
This Management’s Discussion and Analysis (“MD&A”) of the financial position and results of operations for Fortuna Silver Mines Inc. (the “Company” or “Fortuna”) (TSX: FVI and NYSE: FSM) should be read in conjunction with the audited consolidated financial statements of the Company for the years ended December 31, 2023 and 2022 (the “2023 Financial Statements”) and the related notes thereto which have been prepared in accordance with International Financial Reporting Standards (“IFRS”) as issued by the International Accounting Standards Board. For further information on the Company, reference should be made to its public filings, including its annual information form, on SEDAR+ at www.sedarplus.ca and on EDGAR at www.sec.gov/edgar.
This MD&A is prepared by management and approved by the Board of Directors as of March 6, 2024. The information and discussion provided in this MD&A covers the year December 31, 2023, and where applicable, the subsequent period up to the date of issuance of this MD&A. Unless otherwise noted, all dollar amounts in this MD&A are expressed in United States (“US”) dollars. References to "$" or "US$" in this MD&A are to US dollars and references to C$ are to Canadian dollars.
Fortuna has a number of direct and indirect subsidiaries which own and operate assets and conduct activities in different jurisdictions. The terms "Fortuna" or the "Company" are used in this MD&A for simplicity of the discussion provided herein and may include references to subsidiaries that have an affiliation with Fortuna, without necessarily identifying the specific nature of such affiliation.
This MD&A contains forward-looking statements. Readers are cautioned as to the risks and uncertainties related to the forward-looking statements, the risks and uncertainties associated with investing in the Company’s securities and the technical and scientific information under National Instrument 43-101 – Standards for Disclosure of Mineral Projects (“NI 43-101”) concerning the Company’s material properties, including information about mineral reserves and resources, which classifications differ significantly from the requirements required by the U.S. Securities and Exchange Commission (“SEC”) as set out in the cautionary note 57 of this MD&A. All forward-looking statements are qualified by cautionary notes in this MD&A as well as risks and uncertainties discussed in the Company’s Annual Information Form for fiscal 2022 dated March 28, 2023 and its Management Information Circular dated May 8, 2023, which are available on SEDAR+ and EDGAR.
This MD&A uses certain Non-IFRS financial measures and ratios that are not defined under IFRS, including but not limited to: cash cost per ounce of gold; all-in sustaining cash cost per ounce of gold sold; all-in sustaining cash cost per ounce of gold equivalent sold; total production cash cost per tonne; cash cost per payable ounce of silver equivalent; all-in sustaining cash cost per payable ounce of silver equivalent sold; all-in cash cost per payable ounce of silver equivalent sold; free cashflow and free cashflow from ongoing operations; adjusted net income; adjusted attributable net income, adjusted EBITDA, net debt and working capital which are used by the Company to manage and evaluate operating performance at each of the Company’s mines and are widely reported in the mining industry as benchmarks for performance. Non-IFRS financial measures and non-IFRS ratios do not have a standard meaning under IFRS, and may not be comparable to similar financial measures disclosed by other issuers. Non-IFRS measures are further discussed in the “Non-IFRS Measures” section 30 of this MD&A.
Fortuna | 2
Fortuna Silver Mines Inc.
Management’s Discussion and Analysis
For the year ended December 31, 2023 (in US Dollars, tabular amounts in millions, except where noted)
CONTENTS
|
|
4 |
|
4 |
|
5 |
|
8 |
|
18 |
|
25 |
|
26 |
|
29 |
|
Share Position & Outstanding Options & Equity Based Share Units |
29 |
30 |
|
30 |
|
44 |
|
53 |
|
54 |
|
55 |
|
Cautionary Note to United States Investors Concerning Estimates of Reserves and Resources |
57 |
Fortuna | 3
Fortuna Silver Mines Inc.
Management’s Discussion and Analysis
For the year ended December 31, 2023 (in US Dollars, tabular amounts in millions, except where noted)
Fortuna is a growth focused Canadian precious metals mining company with operations and projects in Argentina, Burkina Faso, Côte d’Ivoire, Mexico, Peru, and Senegal. The Company produces silver, gold, and base metals and generates shared value over the long-term through efficient production, environmental protection, and social responsibility.
The Company operates the open pit Lindero gold mine (“Lindero” or the “Lindero Mine”) located in northern Argentina, the underground Yaramoko gold mine (“Yaramoko” or the “Yaramoko Mine”) located in southwestern Burkina Faso, the underground San Jose silver and gold mine (“San Jose” or the “San Jose Mine”) located in southern Mexico, the underground Caylloma silver, lead, and zinc mine (“Caylloma” or the “Caylloma Mine”) located in southern Peru, and the open pit Séguéla gold mine (“Séguéla”, or the “Séguéla Mine”) located in southwestern Côte d’Ivoire. Each of the Company's producing mines is generally considered to be a separate reportable segment, along with the Company's corporate stewardship segment.
Fortuna is a publicly traded company incorporated and domiciled in British Columbia, Canada. Its common shares are listed on the New York Stock Exchange (“NYSE”) under the trading symbol FSM and on the Toronto Stock Exchange (“TSX”) under the trading symbol FVI.
San Jose EIA
On October 30, 2023 the Company announced that the Mexican Federal Administrative Court (the “Court”) had ruled in favour of Compañia Minera Cuzcatlan S.A. de C.V (“Minera Cuzcatlan”), Fortuna’s Mexican subsidiary, and reinstated the 12-year environmental impact authorization (“EIA”) for the San Jose Mine.
The decision of the Court has been appealed and was admitted by the Mexican Collegiate Court (the “Appeals Court”) in January 2024. Minera Cuzcatlan filed a response in February 2024. A decision of the Appeals Court is expected within the next six to 12 months. The permanent injunction that Minera Cuzcatlan already has remains in effect which allows the San Jose Mine to continue to operate.
Until the determination of the legal proceedings, the Company has agreed to certain temporary restrictions under the credit facility as disclosed in the Liquidity and Capital Resources section below.
IMPAIRMENT EXPENSE RECORDED IN THE FOURTH QUARTER OF 2023
In the fourth quarter of 2023 the Company recorded an impairment of mining interests and property plant and equipment of $90.6 million ($90.6 million net of tax). The impairment expense recognized against the carrying values of the mining interests is as follows:
|
|
Impairment Expense |
|
Impairment Expense |
||
|
|
|
|
Net of Tax |
||
San Jose |
|
$ |
90.6 |
|
$ |
90.6 |
Impairment expense |
|
$ |
90.6 |
|
$ |
90.6 |
Figures may not add due to rounding |
|
|
|
|
|
|
Fortuna | 4
Fortuna Silver Mines Inc.
Management’s Discussion and Analysis
For the year ended December 31, 2023 (in US Dollars, tabular amounts in millions, except where noted)
San Jose
During the fourth quarter of 2023, the life of mine plan for the San Jose Mine was updated and indicated that the Mineral Reserves will be exhausted at the end of 2024, compared to mid-2025 as previously planned. The decrease in the life of mine was the result of significant cost increases over the last 12 months, which resulted from:
| ● | Appreciation of the Mexican Peso |
| ● | Higher labour costs as a result of new labour reform mandates which either took effect on January 1, 2024 or are expected to take effect in 2024 |
| ● | Higher contractor costs for transportation, distribution, shotcrete, maintenance and mine services |
| ● | Higher costs for fuel, energy and materials related to inflation |
In addition to the reduction in Mineral Reserves in the Trinidad Zone, planned expansion areas such as the Victoria Zone failed to convert Mineral Resources to Mineral Reserves as a result of the higher costs noted above.
The external factors increasing San Jose’s cost structure were not anticipated in the impairment assessment completed in 2022 along with the corresponding impact on the mines ability to replace Mineral Reserves. The change in circumstances and costs were integrated into a new impairment assessment with the result being an impairment charge of $90.6 million.
Lindero
As of December 31, 2023, the Company determined that there were indicators of impairment at the Lindero Mine due to an increase in capital costs for the heap leach expansion project and an increase in operating costs as a result of macro-economic factors; particularly in the pace of inflation relative to the devaluation of the Argentine Peso. In determining the recoverable value of the Lindero Cash Generating Unit (CGU), the Company made estimates of discounted after-tax cash flows expected to be derived from the Company’s mining properties, costs to sell the mining properties and the appropriate discount rate. The projected cash flows are significantly affected by changes in assumptions related to metal selling prices, changes in the amount of recoverable reserves, resources, and exploration potential, production cost estimates, export taxes, future capital expenditures, discount rates and exchange rates. The Company performed a test of impairment using a discount rate of 7.7% and a long term gold price of $1,750/oz to determine the fair value less cost of disposal (FVLCD) of the CGU and concluded that no impairment charge was required as of December 31, 2023. However, any adverse changes in any of the assumptions above in future periods may result in an impairment.
HIGHLIGHTS FOR THE YEAR ENDED DECEMBER 31, 2023
Financial
| ● | Sales were $842.4 million, an increase of 24% from the $681.5 million reported in the year ended December 31, 2022 (“2022”) |
| ● | Mine operating income was $190.0 million, an increase of 29% from the $146.8 million reported in 2022 |
| ● | Operating loss was $0.4 million, a decrease of 100% from the $113.6 million in operating loss reported in 2022 |
| ● | Net loss was $43.6 million or $0.17 per share, a decrease from a net loss of $135.9 million or $0.44 per share reported in 2022 |
| ● | Adjusted net income (refer to Non-IFRS Financial Measures) was $72.6 million compared to $42.6 million in 2022, representing a 70% year-over-year increase |
| ● | Adjusted EBITDA (refer to Non-IFRS Financial Measures) was $335.1 million compared to $245.5 million reported in 2022, representing a 36% year-over-year increase |
| ● | Free cash flow from ongoing operations (refer to Non-IFRS Financial Measures) was $153.5 million compared to $69.2 million reported in 2022, representing a 122% year-over-year increase |
Fortuna | 5
Fortuna Silver Mines Inc.
Management’s Discussion and Analysis
For the year ended December 31, 2023 (in US Dollars, tabular amounts in millions, except where noted)
| ● | Net cash provided by operating activities was $296.9 million, an increase of 53% from the $194.2 million reported in 2022 |
Operating
| ● | Gold production of 326,638 ounces, a 26% increase from 2022 |
| ● | Silver production of 5,883,691 ounces, a decrease of 15% from 2022 |
| ● | Lead production of 40,851,657 pounds, an increase of 18% from 2022 |
| ● | Zinc production of 55,060,450 pounds, an increase of 19% from 2022 |
| ● | Consolidated All-in Sustaining Costs (“AISC”) of $1,508 per ounce on a gold equivalent sold basis compared to $1,431 per ounce for 2022. See “Non-IFRS Measures - All-in Sustaining Cash Cost per Ounce of Gold Equivalent Sold” for additional information |
Health & Safety
For the fourth quarter of 2023, the Company recorded one lost time injury (“LTI”), three restricted work injuries and four medical treatment injuries (“MTI”) over 3.47 million hours worked. The year-to-date LTI frequency rate (“LTIFR”) at the end of this quarter was 0.36 (0.39 in 2022) lost time injuries per million hours worked while the year-to-date total recordable injury frequency rate (“TRIFR”) was 1.22 (2.32 in 2022) total recordable injuries per million hours worked.
Environment
No significant incidents were recorded during the fourth quarter of 2023, and no instances of environmental non-compliance were identified by authorities, nor were any fines related to environmental permits and regulations recorded.
Community Engagement
During the fourth quarter of 2023, there were no significant disputes at any of our sites. We also recorded 219 local stakeholder engagement activities during the period. These included consultation meetings with local administration and community leaders, participation in ceremonies and courtesy visits.
Climate Change
In the fourth quarter of 2023, the Company continued to pursue its climate change action plan, which aims to reduce its greenhouse gas emissions and strengthen its resilience to climate-related risks. The Company completed a climate-related scenario risk analysis in line with the guidelines set forth in the Task Force on Climate-Related Financial Disclosures Framework while finalizing its process of defining climate-related metrics and targets.
Fortuna | 6
Fortuna Silver Mines Inc.
Management’s Discussion and Analysis
For the year ended December 31, 2023 (in US Dollars, tabular amounts in millions, except where noted)
Operating and Financial Highlights
A summary of the Company’s consolidated financial and operating results for the three and twelve months ended December 31, 2023 are presented below:
|
|
Three months ended December 31, |
|
Years ended December 31, |
||||||||
Consolidated Metrics |
|
2023 |
|
2022 |
|
% Change |
|
2023 |
|
2022 |
|
% Change |
Selected highlights |
|
|
|
|
|
|
|
|
|
|
|
|
Silver |
|
|
|
|
|
|
|
|
|
|
|
|
Metal produced (oz) |
|
1,354,003 |
|
1,746,746 |
|
(22%) |
|
5,883,691 |
|
6,907,275 |
|
(15%) |
Metal sold (oz) |
|
1,398,553 |
|
1,775,019 |
|
(21%) |
|
5,899,186 |
|
6,924,640 |
|
(15%) |
Realized price ($/oz) |
|
23.27 |
|
21.35 |
|
9% |
|
23.37 |
|
21.75 |
|
7% |
Gold |
|
|
|
|
|
|
|
|
|
|
|
|
Metal produced (oz) |
|
107,376 |
|
64,112 |
|
67% |
|
326,638 |
|
259,427 |
|
26% |
Metal sold (oz) |
|
106,961 |
|
62,718 |
|
71% |
|
328,264 |
|
259,313 |
|
27% |
Realized price ($/oz) |
|
1,990 |
|
1,737 |
|
15% |
|
1,948 |
|
1,802 |
|
8% |
Lead |
|
|
|
|
|
|
|
|
|
|
|
|
Metal produced (000's lbs) |
|
10,798 |
|
8,735 |
|
24% |
|
40,852 |
|
34,588 |
|
18% |
Metal sold (000's lbs) |
|
11,641 |
|
9,118 |
|
28% |
|
41,074 |
|
34,869 |
|
18% |
Zinc |
|
|
|
|
|
|
|
|
|
|
|
|
Metal produced (000's lbs) |
|
13,933 |
|
12,575 |
|
11% |
|
55,060 |
|
46,176 |
|
19% |
Metal sold (000's lbs) |
|
14,407 |
|
11,027 |
|
31% |
|
56,166 |
|
44,770 |
|
25% |
Unit Costs |
|
|
|
|
|
|
|
|
|
|
|
|
Production cash cost ($/oz Au Eq) |
|
840 |
|
873 |
|
(4%) |
|
874 |
|
849 |
|
3% |
All-in sustaining cash cost ($/oz Au Eq) |
|
1,509 |
|
1,579 |
|
(4%) |
|
1,508 |
|
1,431 |
|
5% |
|
|
|
|
|
|
|
|
|
|
|
|
|
Mine operating income |
|
51.9 |
|
26.0 |
|
100% |
|
190.0 |
|
146.8 |
|
29% |
Operating loss |
|
(77.4) |
|
(173.1) |
|
55% |
|
(0.4) |
|
(113.6) |
|
100% |
Attributable net loss |
|
(92.3) |
|
(152.8) |
|
40% |
|
(50.8) |
|
(128.1) |
|
60% |
Attributable loss per share - basic |
|
(0.30) |
|
(0.52) |
|
42% |
|
(0.17) |
|
(0.44) |
|
61% |
Adjusted attributable net income1 |
|
20.6 |
|
6.4 |
|
222% |
|
64.9 |
|
41.4 |
|
57% |
Adjusted EBITDA1 |
|
120.3 |
|
55.8 |
|
116% |
|
335.1 |
|
245.5 |
|
36% |
Net cash provided by operating activities |
|
105.1 |
|
49.6 |
|
112% |
|
296.9 |
|
194.2 |
|
53% |
Free cash flow from ongoing operations1 |
|
66.2 |
|
4.4 |
|
1,405% |
|
153.5 |
|
69.2 |
|
122% |
Capital Expenditures2 |
|
|
|
|
|
|
|
|
|
|
|
|
Sustaining |
|
46.8 |
|
33.9 |
|
38% |
|
136.1 |
|
98.1 |
|
39% |
Non-sustaining3 |
|
1.8 |
|
(2.3) |
|
178% |
|
5.2 |
|
8.2 |
|
(37%) |
Séguéla construction |
|
— |
|
23.5 |
|
(100%) |
|
50.0 |
|
107.7 |
|
(54%) |
Brownfields |
|
5.5 |
|
6.5 |
|
(15%) |
|
16.1 |
|
23.3 |
|
(31%) |
1 Refer to Non-IFRS financial measures |
|
|
|
|
|
|
|
|
|
|
|
|
2 Capital expenditures are presented on a cash basis |
|
|
|
|
|
|
|
|
|
|
|
|
3 Non-sustaining expenditures include greenfields exploration | ||||||||||||
Figures may not add due to rounding |
|
|
|
|
|
|
|
|
|
|
|
|
Fortuna | 7
Fortuna Silver Mines Inc.
Management’s Discussion and Analysis
For the year ended December 31, 2023 (in US Dollars, tabular amounts in millions, except where noted)
The following table presents a summary of certain selected financial information for the three years ended December 31, 2023, 2022 and 2021:
|
|
Three months ended December 31, |
Years ended December 31, |
|||||||||||||
|
|
2023 |
|
2022 |
|
% Change |
|
2023 |
|
2022 |
|
2021 |
||||
Sales |
|
|
265.3 |
|
|
164.7 |
|
61% |
|
|
842.4 |
|
|
681.5 |
|
599.9 |
Mine operating income |
|
|
51.9 |
|
|
26.0 |
|
100% |
|
|
190.0 |
|
|
146.8 |
|
205.5 |
Operating (loss) income |
|
|
(77.4) |
|
|
(173.1) |
|
55% |
|
|
(0.4) |
|
|
(113.6) |
|
136.9 |
Net (loss) income |
|
|
(89.8) |
|
|
(160.4) |
|
44% |
|
|
(43.6) |
|
|
(135.9) |
|
59.4 |
Attributable net (loss) Income |
|
|
(92.3) |
|
|
(152.8) |
|
40% |
|
|
(50.8) |
|
|
(128.1) |
|
57.9 |
(Loss) earnings per share - basic |
|
|
(0.30) |
|
|
(0.52) |
|
42% |
|
|
(0.17) |
|
|
(0.44) |
|
0.24 |
Attributable (loss) earnings per share - basic |
|
|
(0.30) |
|
|
(0.52) |
|
43% |
|
|
(0.17) |
|
|
(0.44) |
|
0.24 |
|
|
|
|
|
|
|
|
|
|
|
|
|
|
|
|
|
As at |
|
|
|
|
|
|
|
|
|
|
December 31, 2023 |
|
|
December 31, 2022 |
|
December 31, 2021 |
Cash and cash equivalents |
|
|
|
|
|
|
|
|
|
|
128.1 |
|
|
80.5 |
|
107.1 |
Total assets |
|
|
|
|
|
|
|
|
|
|
1,967.9 |
|
|
1,876.2 |
|
2,021.9 |
Debt |
|
|
|
|
|
|
|
|
|
|
206.8 |
|
|
219.2 |
|
157.5 |
Shareholder's equity attributable to Fortuna shareholders |
|
|
1,238.4 |
|
|
1,244.8 |
|
1,375.1 |
||||||||
| ||||||||||||||||
Sales
|
|
Three months ended December 31, |
|
Years ended December 31, |
||||||||
|
|
2023 |
|
2022 |
|
% Change |
|
2023 |
|
2022 |
|
% Change |
Provisional sales $ |
|
|
|
|
|
|
|
|
|
|
|
|
Lindero |
|
61.4 |
|
48.8 |
|
26% |
|
207.5 |
|
212.1 |
|
(2%) |
Yaramoko |
|
56.0 |
|
45.7 |
|
23% |
|
228.8 |
|
193.5 |
|
18% |
Séguéla |
|
85.8 |
|
- |
|
100% |
|
154.2 |
|
- |
|
100% |
San Jose |
|
33.6 |
|
43.8 |
|
(23%) |
|
152.2 |
|
175.6 |
|
(13%) |
Caylloma |
|
28.0 |
|
24.7 |
|
13% |
|
103.6 |
|
103.7 |
|
(0%) |
Adjustments1 |
|
0.5 |
|
1.7 |
|
(71%) |
|
(3.9) |
|
(3.4) |
|
(15%) |
Total sales $ |
|
265.3 |
|
164.7 |
|
61% |
|
842.4 |
|
681.5 |
|
24% |
1 Adjustments consists of mark to market, final price and assay adjustments | ||||||||||||
Based on provisional sales before final price adjustments. Net after payable metal deductions, treatment, and refining charges | ||||||||||||
Treatment charges are allocated to base metals at Caylloma and to gold at San Jose | ||||||||||||
| ||||||||||||
Fourth Quarter 2023 vs Fourth Quarter 2022
Consolidated sales for the three months ended December 31, 2023 were $265.3 million, a 61% increase from the $164.7 million reported in the same period in 2022. Sales by reportable segment for the three months ended December 31, 2023 were as follows:
| ● | Lindero recognized adjusted sales of $61.4 million from the sale of 29,308 ounces of gold, a 26% increase from the same period in 2022. Sales increased at Lindero as a result of higher realized metal prices of $1,993 per gold ounce compared to $1,732 in the previous period and higher ounces sold. See "Results of Operations – Lindero Mine, Argentina" for additional information. |
| ● | Yaramoko recognized adjusted sales of $56.0 million from the sale of 28,229 ounces of gold which was 23% higher than the same period in 2022. Higher gold sales at Yaramoko were primarily driven by higher metal prices of $1,984 per gold ounce compared to $1,742 in the comparable period and higher ounces sold. See "Results of Operations – Yaramoko Mine, Burkina Faso" for additional information. |
Fortuna | 8
Fortuna Silver Mines Inc.
Management’s Discussion and Analysis
For the year ended December 31, 2023 (in US Dollars, tabular amounts in millions, except where noted)
| ● | Séguéla recognized adjusted sales of $85.8 million from the sale of 43,018 ounces of gold. The mine was under construction in the same period for 2022. See "Results of Operations – Séguéla Mine, Côte d’Ivoire" for additional information. |
| ● | San Jose recognized adjusted sales of $34.1 million, a 26% decrease from the $45.9 million reported in the same period in 2022. The decrease in sales was primarily driven by lower production from lower grades as well as lower tonnes mined as a result of operational challenges. This was partially offset by higher metal prices. See "Results of Operations – San Jose Mine, Mexico" for additional information. |
| ● | Caylloma recognized adjusted sales of $28.1 million compared to $24.3 million reported in the same period in 2022. The increase in sales was primarily the result of higher increased production from higher grades and higher metal prices. See "Results of Operations – Caylloma Mine, Peru" for additional information. |
Twelve Months of 2023 vs Twelve Months of 2022
Consolidated sales for the twelve months ended December 31, 2023 were $842.4 million, a 24% increase from the $681.4 million reported in the same period in 2022. Sales by reportable segment for the twelve months ended December 31, 2023 were as follows:
| ● | Lindero recognized adjusted sales of $207.5 million from the sale of 103,503 ounces of gold, a 2% decrease from the same period in 2022. Lower gold sales were the result of lower production due to lower gold grades delivered to the leach pad which was in line with the mining sequence, partially offset by higher metal prices. See "Results of Operations – Lindero Mine, Argentina" for additional information. |
| ● | Yaramoko recognized adjusted sales of $228.8 million from the sale of 117,676 ounces of gold which was an 18% increase from the previous period. Higher sales were mainly due to higher metal prices as well as increased production from higher processed tonnes and higher grades. See "Results of Operations – Yaramoko Mine, Burkina Faso" for additional information. |
| ● | Séguéla recognized adjusted sales of $154.2 million from the sale of 78,521 ounces of gold. See "Results of Operations – Séguéla Mine, Côte d’Ivoire " for additional information. |
| ● | San Jose recognized adjusted sales of $149.7 million, a 14% decrease from the $173.5 million reported in the same period in 2022. Sales for the year were lower at San Jose primarily due to the illegal blockade of the mine in the second quarter and lower production from lower grades which is in line with the reserve model and partially offset by higher realized prices. See "Results of Operations – San Jose Mine, Mexico" for additional information. |
| ● | Caylloma recognized adjusted sales of $102.2 million which were in line with the $102.3 million reported in the same period in 2022. See "Results of Operations – Caylloma Mine, Peru" for additional information. |
Fortuna | 9
Fortuna Silver Mines Inc.
Management’s Discussion and Analysis
For the year ended December 31, 2023 (in US Dollars, tabular amounts in millions, except where noted)
Operating Income (Loss) and Adjusted EBITDA
|
|
Three months ended December 31, |
|
Years ended December 31, |
||||||||||||||||
|
|
2023 |
|
%1 |
|
2022 |
|
%1 |
|
2023 |
|
%1 |
|
2022 |
|
%1 |
||||
Operating income (loss) |
|
|
|
|
|
|
|
|
|
|
|
|
|
|
|
|
|
|
|
|
Lindero |
|
|
(5.8) |
|
(9%) |
|
|
(69.6) |
|
(142%) |
|
|
10.5 |
|
5% |
|
|
(36.3) |
|
(17%) |
Séguéla |
|
|
38.0 |
|
44% |
|
|
1.4 |
|
0% |
|
|
68.6 |
|
45% |
|
|
(1.5) |
|
0% |
Yaramoko |
|
|
2.2 |
|
4% |
|
|
(95.0) |
|
(208%) |
|
|
36.2 |
|
5% |
|
|
(81.3) |
|
(42%) |
San Jose |
|
|
(110.6) |
|
(325%) |
|
|
(1.6) |
|
(3%) |
|
|
(105.7) |
|
(71%) |
|
|
22.0 |
|
13% |
Caylloma |
|
|
8.4 |
|
30% |
|
|
6.8 |
|
28% |
|
|
27.7 |
|
27% |
|
|
30.2 |
|
29% |
Corporate |
|
|
(9.6) |
|
|
|
|
(15.1) |
|
|
|
|
(37.7) |
|
|
|
|
(46.6) |
|
|
Total |
|
|
(77.4) |
|
(29%) |
|
|
(173.1) |
|
(105%) |
|
|
(0.4) |
|
(0%) |
|
|
(113.5) |
|
(17%) |
|
|
|
|
|
|
|
|
|
|
|
|
|
|
|
|
|
|
|
|
|
Adjusted EBITDA2 |
|
|
|
|
|
|
|
|
|
|
|
|
|
|
|
|
|
|
|
|
Lindero |
|
|
30.1 |
|
49% |
|
|
17.3 |
|
35% |
|
|
80.9 |
|
39% |
|
|
90.2 |
|
43% |
Séguéla |
|
|
63.0 |
|
73% |
|
|
1.1 |
|
0% |
|
|
106.3 |
|
69% |
|
|
(0.3) |
|
0% |
Yaramoko |
|
|
19.5 |
|
35% |
|
|
24.0 |
|
53% |
|
|
108.3 |
|
47% |
|
|
85.6 |
|
44% |
San Jose |
|
|
6.4 |
|
19% |
|
|
18.4 |
|
40% |
|
|
40.4 |
|
27% |
|
|
71.6 |
|
41% |
Caylloma |
|
|
11.1 |
|
39% |
|
|
9.8 |
|
40% |
|
|
38.7 |
|
38% |
|
|
39.3 |
|
38% |
Corporate |
|
|
(9.8) |
|
|
|
|
(14.8) |
|
|
|
|
(39.5) |
|
|
|
|
(40.9) |
|
|
Total |
|
|
120.3 |
|
45% |
|
|
55.8 |
|
34% |
|
|
335.1 |
|
40% |
|
|
245.5 |
|
36% |
1 As a Percentage of Sales | ||||||||||||||||||||
2 Refer to Non-IFRS Financial Measures | ||||||||||||||||||||
Figures may not add due to rounding | ||||||||||||||||||||
Fourth Quarter 2023 vs Fourth Quarter 2022
Operating loss for the three months ended December 31, 2023 was $77.4 million, a decrease of $95.7 million over the same period in 2022 which was primarily due to:
| ● | Higher operating income at the Lindero Mine was the result of an impairment charge of $70.2 million in the comparable period of 2022. Operating income for the fourth quarter of 2023 was impacted by several one time charges including: |
| o | A write-down of long-term low grade stockpiles to net realizable value of $5.4 million due to an increase in the expected costs to complete. The write-down was calculated based on an average cost per tonne including cash and non-cash costs as required under IFRS where as low grade stockpiles at Lindero are accumulated based on incremental cash costs. On a cash only basis, the low grade stockpiles remain profitable. |
| o | In the fourth quarter of 2023 the site completed a detailed review of inventory in warehouse and identified $2.5 million in inventory that was obsolete. The materials were written-off. |
| o | In December of 2023 the new Argentine government allowed a rapid devaluation of the Argentine Peso which resulted in a foreign exchange loss of $5.0 million primarily driven by the devaluation of VAT receivables |
| ● | Yaramoko saw an increase in operating income of $97.2 million as a result of the mine recognizing an impairment charge of $103.5 million in the fourth quarter of 2022. Operating results at Yaramoko in the fourth quarter of 2023 were impacted by a write-down of materials in warehouse of $3.0 million as the site completed a detailed review of what will be consumed prior to the end of the current mine life and an administrative penalty of $2.7 million imposed by the government of Burkina Faso. |
| ● | Séguéla recognized operating income of $38.0 million in the fourth quarter as the site completed its production ramp-up. In the comparable period the mine was still under construction. |
Fortuna | 10
Fortuna Silver Mines Inc.
Management’s Discussion and Analysis
For the year ended December 31, 2023 (in US Dollars, tabular amounts in millions, except where noted)
| ● | Operating loss at the San Jose Mine for the fourth quarter of 2023 was $110.6 million compared to operating income of $1.6 million in the same period of 2022. The decrease in operating income was primarily due to: |
| o | An impairment of mineral properties of $90.6 million related to an impairment charge for the San Jose cash generating unit. Refer “Impairment Expense Recorded in the Fourth Quarter of 2023” above. |
| o | A provision for $6.4 million related to employee severance costs as the mine is currently expected to close at the end of 2024 when Mineral Reserves are exhausted |
| o | A write-down of materials in warehouse of $4.4 million as a result of the shorter mine life and a revision in the inventory consumption plan |
| o | A write-off of $4.1 million of mineral properties related to exploration programs that will no longer be continued |
| ● | Operating income at the Caylloma Mine for the fourth quarter of 2023 was $1.6 million higher than the comparable period of 2022 as a result of higher sales. |
After adjusting for items that are not indicative of future operating earnings, adjusted EBITDA (refer to Non-IFRS Financial Measures) was $120.3 million for the three months ended December 31, 2023, an increase of $64.5 million over the same period in 2022. Higher adjusted EBITDA was primarily the result of contributions from the Séguéla Mine which was still under construction in the comparable period of 2022.
The most comparable IFRS measure to the Non-IFRS measure adjusted EBITDA is net income. Net loss for the three months ended December 31, 2023 was $89.8 million. Refer to the discussion above and to the section entitled “Non-IFRS Measures” for more detailed information.
Twelve months of 2023 vs Twelve months of 2022
Operating loss for the twelve months ended December 31, 2023 was $0.4 million, a decrease of $113.2 million over the same period in 2022 which was primarily due to:
| ● | Operating loss for the year ending December 31, 2022 included an impairment charge of $182.8 million related to impairments at the San Jose, Lindero and Yaramoko CGUs. |
| ● | Contributions from the Séguéla Mine in the second half of 2023. The mine was under construction during 2022. |
| ● | Lower operating income at the Lindero Mine was driven by the same factors above that influenced results for the quarter as well as higher distribution costs from the sale of copper concentrate during the year. |
| ● | An operating loss at San Jose of $105.7 million for 2023 compared to an operating income of $22.0 million in the comparable period. The reduction in operating income was primarily the result of an impairment charge of $90.6 million that was recognized in the fourth quarter. |
| ● | Operating income at Yaramoko was higher by $117.5 million as a result of the mine recognizing an impairment charge of $103.5 million in the previous year. |
| ● | Operating income at Caylloma decreased by $2.4 million primarily as a result of higher operating costs. |
After adjusting for items that are not indicative of future operating earnings, adjusted EBITDA (refer to Non-IFRS Financial Measures) was $335.1 million for the twelve months ended December 31, 2023, an increase of $89.6 million over the same period in 2022. Higher adjusted EBITDA was primarily the result of contributions from the Séguéla Mine which was still under construction in the previous period.
The most comparable IFRS measure to the Non-IFRS measure adjusted EBITDA is net loss. Net loss for the twelve months ended December 31, 2023 was $43.6 million. Refer to the discussion above and to the section entitled “Non-IFRS Measures” for more detailed information.
Fortuna | 11
Fortuna Silver Mines Inc.
Management’s Discussion and Analysis
For the year ended December 31, 2023 (in US Dollars, tabular amounts in millions, except where noted)
All-in Sustaining Cost (“AISC”)
Fourth Quarter 2023 vs Fourth Quarter 2022
Consolidated AISC per gold equivalent ounce sold for the fourth quarter of 2023 was $1,509 per ounce compared to $1,579 per ounce for the comparable quarter. The decrease in AISC was primarily the result of:
| ● | Cash costs per ounce of $840 per gold equivalent ounces were lower than the $873 per gold equivalent ounce reported in Q4 2022 due to lower cost ounces from the Séguéla Mine, partially offset by a higher cost per ounce at the San Jose Mine due to lower production and higher costs |
| ● | Higher gold equivalent ounces (“GEO”) sold primarily due to low contributions from the Séguéla Mine that was under construction in the comparable period. |
| ● | The previous period benefited from the impact of the gain on a forward contract for diesel of $1.1 million. |
Twelve Months of 2023 vs Twelve Months of 2022
Consolidated AISC per gold equivalent ounce sold for the twelve months ended December 31, 2023 was $1,508 per ounce compared to $1,431 per ounce for the comparable period. The increase in AISC was primarily the result of:
| ● | Cash cost per gold equivalent ounce was $874 compared to the $849 reported in 2022 as the contribution of lower cost production in the second half of the year from Séguéla was offset higher costs per ounce at Lindero mainly due to lower planned head grades in 2023 and higher costs at San Jose due to lower processed ore and lower head grades |
| ● | Higher sustaining capital at the Lindero Mine as a result of Phase 2 of the leach pad expansion and higher capitalized stripping |
| ● | The previous period benefited from the impact of the gain on a forward contract for diesel of $4.6 million. |
General and Administrative (“G&A”) Expenses
|
|
Three months ended December 31, |
|
Years ended December 31, |
||||||||||||
(Expressed in millions) |
|
2023 |
|
2022 |
|
% Change |
|
2023 |
|
2022 |
|
% Change |
||||
Mine G&A |
|
|
7.2 |
|
|
6.1 |
|
18% |
|
|
27.5 |
|
|
22.5 |
|
22% |
Corporate G&A |
|
|
8.4 |
|
|
5.9 |
|
42% |
|
|
28.3 |
|
|
27.7 |
|
2% |
Share-based payments |
|
|
4.3 |
|
|
4.4 |
|
(2%) |
|
|
8.1 |
|
|
10.3 |
|
(21%) |
Workers' participation |
|
|
— |
|
|
0.2 |
|
(100%) |
|
|
0.2 |
|
|
1.0 |
|
(80%) |
Total |
|
|
19.9 |
|
|
16.6 |
|
20% |
|
|
64.1 |
|
|
61.5 |
|
4% |
G&A expenses for the three months ended December 31, 2023 increased 20% to $19.9 million compared to $16.6 million reported in the same period in 2022. The increase was the result of the Séguéla project entering production and timing of expenses.
G&A expenses for the twelve months ended December 31, 2023 of $64.1 million were in line with the $61.5 million reported in the same period in 2022 with higher mine G&A being offset by lower share based compensation.
Fortuna | 12
Fortuna Silver Mines Inc.
Management’s Discussion and Analysis
For the year ended December 31, 2023 (in US Dollars, tabular amounts in millions, except where noted)
Foreign Exchange Loss
Foreign exchange loss for the three months ended December 31, 2023 increased $2.0 million to $2.4 million compared to $0.4 million reported in the same period in 2022. Foreign exchange losses for the quarter were primarily driven by a $5.0 million loss in Argentina as the government allowed a rapid devaluation of the Argentine Peso in December which reduced the value of Peso denominated VAT balances.
Foreign exchange loss for the twelve months ended December 31, 2023 increased $2.0 million to $10.9 million compared to $8.9 million reported in the same period in 2022. Losses for the year were primarily driven by the December devaluation of the Argentine Peso in both August and December as well as devaluations of the West African Franc and the impact on VAT and cash balances.
Income Tax Expense
The Company is subject to tax in various jurisdictions, including Peru, Mexico, Argentina, Côte d’Ivoire, Burkina Faso, Australia, and Canada. There are a number of factors that can significantly impact the Company’s effective tax rate (“ETR”) including the geographic distribution of income, variations in our income before income taxes, varying rates in different jurisdictions, the non-recognition of tax assets, local inflation rates, fluctuation in the value of the United States dollar and foreign currencies, changes in tax laws, and the impact of specific transactions and assessments. As a result of the number of factors that can potentially impact the ETR and the sensitivity of the tax provision to these factors, the ETR will fluctuate, sometimes significantly. This trend is expected to continue in future periods.
Income tax expense for the three months ended December 31, 2023 was $17.0 million compared to an income tax recovery of $15.3 million reported in the same period in 2022. The $32.3 million increase in the income tax expense was a result of Séguéla starting to accrue income taxes in the fourth quarter of 2023 as well as there not being a deferred tax recovery associated with the impairment charge at San Jose as it only has a year of mine life left. The fourth quarter of 2022 also had a large deferred tax recovery associated with the impairment charges realized in the quarter.
Income tax expense for the twelve months ended December 31, 2023 was $32.6 million compared to an income tax expense of $10.8 million reported in the same period in 2022. The increase of $21.8 million is primarily attributable to the Séguéla Mine starting to accrue for income tax expenses in the fourth quarter of 2024 and the impact of a deferred tax recoveries in 2022 related to the impairment charge of $182.8 million.
The ETR for the three months ended December 31, 2023 was (23%) compared to 9% for the same period in 2022. The decrease of 33% is primarily a result of the impairment charge at San Jose in the fourth quarter of 2023.
The ETR for the twelve months ended December 31, 2023 was (295%) compared to (9%) for the same period in 2022. The change in the ETR was the result of the impairment charge recognized at San Jose in the fourth quarter of 2023 and there not being a deferred tax recovery associated with the impairment charge as a result of the short mine life.
2024 GUIDANCE AND OUTLOOK
Séguéla Mine, Côte d’Ivoire
Mill throughput expanded to 1.46 Mta, achieving 70% of mill expansion scheduled for 2026
The 2024 mine plan considers mining in the Antenna, Ancien, and Koula pits, with plans to process
1.46 million tonnes of ore averaging 3.0 g/t Au, and capital investments estimated at $39.8 million, including $32 million for sustaining capital expenditures and $7.8 million for Brownfields exploration programs.
Fortuna | 13
Fortuna Silver Mines Inc.
Management’s Discussion and Analysis
For the year ended December 31, 2023 (in US Dollars, tabular amounts in millions, except where noted)
Feasibility and optimization work is underway to realize the opportunity to incorporate underground mineable resources at the Sunbird, Ancien, and Koula deposits.
Major sustaining capital investments include:
| ● | Capitalized stripping$17.1 million |
| ● | Tailings storage facility (TSF) lift$4.8 million |
| ● | Other miscellaneous $10.1 million |
Capitalized stripping at Séguéla corresponds to further mining of the Antenna pit and development and mining of the Ancien and Koula pits. The overall stripping ratio for 2024 is planned to be 8.2:1. AISC for 2024 reflects the ongoing TSF expansion project, which will add tailings holding capacity for the next two years and is expected to be completed in the first half of 2024.
In 2024, annual ore processing is expanded to 1.46 million tonnes, 17 percent above tonnage scheduled for year 1 in the 2021 Technical Report, and close to the expansion target of 1.57 million tonnes scheduled for year 3. Process plant de-bottlenecking initiatives in 2024 still present upside opportunities for throughput capacity.
Cash cost and AISC:
| ● | The Company expects a 2024 cash cost between $630 and $730 per ounce of gold, an increase of approximately 113 percent over 2023 at the upper range, and 84 percent at the lower range of guidance. The increase is mainly due to the mine’s stripping ratio rising from 3.7:1 to 8.2:1, in accordance with the mine plan. In addition, higher costs are anticipated for processing, which include milling, energy consumption, freight, transportation, and overhead. |
| ● | The Company expects a 2024 AISC between $1,110 and $1,230 per ounce of gold, an increase of approximately 54 percent over 2023 at the upper range, and 39 percent at the lower range of guidance. The increase is explained by higher cash cost per ounce and higher capex per ounce of approximately $120 related to capitalized stripping costs. |
Yaramoko Mine, Burkina Faso
Grade and tonnages benefit from exploration success in 2023
At the Yaramoko Mine, the Company plans to process 435,000 tonnes of ore averaging 8.3 g/t Au. Capital investment decreases substantially compared to previous years and in 2024 mainly comprises of development and exploration activities.
Major sustaining capital investment projects include:
| ● | Mine development$13.9 million |
| ● | Brownfields exploration $6.1 million |
Cash cost and AISC:
| ● | The Company expects a 2024 cash cost between $865 and $965 per ounce of gold, an increase of approximately 29 percent over 2023 at the upper range, and 16 percent at the lower range of guidance. The increase is due primarily to the reallocation of fixed mining costs from capex to opex and lower processed ore. |
| ● | The Company expects a 2024 AISC between $1,220 and $1,320 per ounce of gold, a decrease of approximately 7 percent under 2023 at the upper range, and 14 percent at the lower range of guidance. The decrease is explained by lower capex year over year of approximately $250 per ounce of gold. |
Fortuna | 14
Fortuna Silver Mines Inc.
Management’s Discussion and Analysis
For the year ended December 31, 2023 (in US Dollars, tabular amounts in millions, except where noted)
Lindero Mine, Argentina
Sustaining capital intensive year, including a one-time leach pad expansion of $41.7 million
The Lindero Mine is expected to place 6.6 million tonnes of ore on the leach pad averaging 0.62 g/t Au, containing an estimated 131,000 ounces of gold. Capital investments are estimated at $64.0 million, including $51.5 million in capital projects, and $12.5 million in capitalized stripping costs.
Major sustaining capital investments include:
| ● | Capitalized stripping $12.5 million |
| ● | Leach pad phase II expansion$41.7 million |
| ● | Heavy equipment replacement and overhaul$6.6 million |
| ● | Plant critical spare parts$3.2 million |
Cash cost and AISC:
| ● | The Company expects a 2024 cash cost between $850 and $950 per ounce of gold, mostly in line with 2023. |
| ● | The Company expects a 2024 AISC between $1,730 and $1,950 per ounce of gold, an increase of approximately 22 percent over 2023 at the upper range, and 9 percent at the lower range of guidance. 2024 is a particularly capital intensive year for Lindero, including a one-time leach pad phase II expansion project which is planned to be completed in the second half of 2024, with a capital estimate of $41.7 million. |
While the mine continues delivering on cost savings from operational efficiency programs, the economics of Lindero are exposed to potential significant impacts in changes to macro-economic and taxation policies, derived from emergency announcements made by the newly elected Government in its attempt to eliminate the national fiscal deficit. Cash cost per ounce does not include any potential changes to the Argentine taxation regime on imports and export duties, as these are still being discussed by the Government and Congress. However, if passed as advertised, these represent additional risks to higher cash cost per ounce and AISC estimates.
San Jose Mine, Mexico
Cost increments lead to exhaustion of reserves by year end 2024
At the San Jose Mine, the Company plans to process 0.90 million tonnes of ore averaging 142 g/t Ag and 0.9 g/t Au. Silver and gold production reflect the declining grade profile of the tail end of the Mineral Reserves.
The updated mine plan for 2024 is scheduled to exhaust Mineral Reserves by the end of 2024, compared to mid-2025 as previously planned. Over the past 12 months, the operation has experienced significant cost increments, of which the main drivers are:
| ● | Mexican Peso appreciation; representing approximately 35 percent of cost increment. |
| ● | Higher contractor costs for transportation, distribution, shotcrete, maintenance, and mining services; representing approximately 16 percent of cost increment. |
| ● | Higher labour costs and new labour reform mandates, which took effect on January 1, 2024; representing approximately 21 percent of cost increment. |
| ● | Change from owner’s mining fleet to contractor for mine development; representing approximately 6 percent of cost increment. |
| ● | Higher costs in fuel, energy, materials, and consumables related to 2023 inflation; representing approximately 5 percent of cost increment. |
Fortuna | 15
Fortuna Silver Mines Inc.
Management’s Discussion and Analysis
For the year ended December 31, 2023 (in US Dollars, tabular amounts in millions, except where noted)
As a result of the cost increments described above, the mine plan has been reduced by approximately
six months, leading to an anticipated closure in late 2024 from the previous estimation of closure in mid-2025. The Company has assigned a dedicated team to review and update a multiyear progressive mine closure and monitoring plan with a current budget of approximately $27.0 million, which will begin its implementation during 2024. Multiple considerations are being included such as closure-related technical studies and designs, remediation of affected areas, decommissioning and removal of infrastructure, landform reshaping, revegetation, and value-added activities for the communities associated with progressive closure, repurposing, and where appropriate, long-term monitoring and maintenance, whilst adhering to strict compliance with mine closure governmental regulations and high international standards.
The Company is engaged in an intensive exploration program to delineate the newly discovered Yessi vein.
Cash cost and AISC:
| ● | The Company expects a 2024 cash cost between $20.3 and $22.3 per ounce of silver, an increase of approximately 70 percent over 2023 at the upper range, and 54 percent at the lower range of guidance. The increase is mainly explained by lower production related to the grade profile as per the remaining life of mine plan, and the impact of higher projected operational expenditures, reflecting incremental costs throughout 2023. In addition, cash cost includes remaining lateral and vertical development and infill drilling required to complete final stoping and mining, as well as mining equipment overhauling, totaling $10.7 million. |
| ● | The Company expects a 2024 AISC between $22.8 and $24.0 per ounce of silver, an increase of approximately 31 percent over 2023 at the upper range, and 24 percent at the lower range of guidance. The increase is mainly explained by lower volume and higher cash cost, partially offset by no capital expenditures in 2024. |
Caylloma Mine, Peru
Consistent performer
At the Caylloma Mine, the Company plans to process 0.5 million tonnes of ore averaging 78 g/t Ag, 3.12% Pb, and 4.20% Zn. Capital investments are estimated at $21.0 million, including $19.0 million for sustaining capital expenditures and $2.0 million for Brownfields exploration programs.
Sustaining capital investments include:
| ● | Mine development$5.1 million |
| ● | Caylloma Mine substation power grid enhancement$2.9 million |
| ● | Plant power sub-station, phase II$1.4 million |
| ● | New paste backfill system $4.7 million |
| ● | Operating permits and |
Global Industry Standard on Tailings Management (GISTM) $1.2 million
| ● | Maintenance $3.7 million |
Cash cost and AISC:
| ● | The Company expects a 2024 cash cost between $12.7 and $14.0 per ounce of silver, a decrease of approximately 6 percent under 2023 at the upper range, and 14 percent at the lower range of guidance. The decrease is mainly due to lower treatment and refining charges in 2024. |
| ● | The Company expects a 2024 AISC between $18.0 and $21.0 per ounce of silver, in line with 2023 at the upper range, and a decrease of 14 percent at the lower range of guidance. The decrease is explained mainly by lower cash costs and slightly lower capital expenditures. |
Fortuna | 16
Fortuna Silver Mines Inc.
Management’s Discussion and Analysis
For the year ended December 31, 2023 (in US Dollars, tabular amounts in millions, except where noted)
2024 Exploration Outlook
Fortuna continues to advance its robust pipeline of Brownfields and Greenfields exploration projects in West Africa and the Americas, building on the success of the exploration programs carried out in 2023.
Brownfields Exploration
Fortuna´s consolidated Brownfields exploration budget for 2024 for its five mines and the Diamba Sud Gold Project totals $30.8 million, which includes 192,500 meters of reverse circulation, diamond core, and air core exploration drilling.
Séguéla Mine, Côte d’Ivoire
The Brownfields exploration program budget for 2024 at Séguéla is $7.8 million, which includes 41,750 meters of exploration drilling, focused on testing and extending underground targets associated with the Sunbird, Ancien, and Koula deposits, as well as advancing emerging deposits such as Barana, Badior, and Kestral, and continuing to explore for additional prospects.
San Jose Mine, Mexico
The Brownfields exploration program budget for 2024 at San Jose is $4.9 million, which includes 13,900 meters of diamond drilling, focused on testing and extending the Yessi vein as well as exploring additional targets within the mine area.
Yaramoko Mine, Burkina Faso
The Brownfields exploration program budget for 2024 at Yaramoko is $6.1 million, which includes 41,450 meters of exploration drilling, with underground drilling testing western and depth extensions to the Zone 55 deposit, surface drilling testing several anomalies along the Boni Shear, Bagassi South surface extensions, and other surface targets.
Caylloma Mine, Peru
The Brownfields exploration program budget for 2024 at Caylloma is $2.0 million, supporting field exploration, regional geophysics, and ongoing studies of the structural controls to mineralization on the Animas vein.
Diamba Sud Gold Project, Senegal
The Brownfields exploration program budget for 2024 at the Diamba Sud Gold Project is $9.9 million, which includes 42,700 meters of drilling, including extension and resource development, in addition to the testing and advancement of previously identified geochemistry anomalies. Additional geochemical and geophysical surveys at Diamba Sud will be conducted in support of advancing the project.
Greenfields Exploration
Greenfields exploration will continue in Mexico, Argentina, Senegal, and Côte d'Ivoire advancing generative programs across several projects supported by a budget of $7.5 million, including continuing active corporate development.
Fortuna | 17
Fortuna Silver Mines Inc.
Management’s Discussion and Analysis
For the year ended December 31, 2023 (in US Dollars, tabular amounts in millions, except where noted)
Lindero Mine, Argentina
The Lindero Mine is an open pit gold mine located in Salta Province in northern Argentina. Its commercial product is gold doré. The table below shows the key metrics used to measure the operating performance of the mine: tonnes placed on the leach pad, grade, production, and unit costs:
|
|
|
Three months ended December 31, |
|
|
Years ended December 31, |
||||||
|
|
|
2023 |
|
|
2022 |
|
|
2023 |
|
|
2022 |
Mine Production |
|
|
|
|
|
|
|
|
|
|
|
|
Tonnes placed on the leach pad |
|
|
1,556,000 |
|
|
1,334,509 |
|
|
6,005,049 |
|
|
5,498,064 |
|
|
|
|
|
|
|
|
|
|
|
|
|
Gold |
|
|
|
|
|
|
|
|
|
|
|
|
Grade (g/t) |
|
|
0.63 |
|
|
0.80 |
|
|
0.64 |
|
|
0.81 |
Production (oz) |
|
|
29,591 |
|
|
29,301 |
|
|
101,238 |
|
|
118,418 |
Metal sold (oz) |
|
|
29,308 |
|
|
27,847 |
|
|
103,503 |
|
|
117,076 |
Realized price ($/oz) |
|
|
1,993 |
|
|
1,732 |
|
|
1,942 |
|
|
1,803 |
|
|
|
|
|
|
|
|
|
|
|
|
|
Unit Costs |
|
|
|
|
|
|
|
|
|
|
|
|
Cash cost ($/oz Au)1 |
|
|
934 |
|
|
814 |
|
|
920 |
|
|
739 |
All-in sustaining cash cost ($/oz Au)1 |
|
|
1,557 |
|
|
1,219 |
|
|
1,565 |
|
|
1,140 |
|
|
|
|
|
|
|
|
|
|
|
|
|
Capital Expenditures ($000's) 2 |
|
|
|
|
|
|
|
|
|
|
|
|
Sustaining |
|
|
10,607 |
|
|
3,973 |
|
|
39,358 |
|
|
18,035 |
Sustaining leases |
|
|
598 |
|
|
567 |
|
|
2,393 |
|
|
2,398 |
Non-sustaining |
|
|
1,302 |
|
|
– |
|
|
1,978 |
|
|
169 |
Brownfields |
|
|
– |
|
|
184 |
|
|
– |
|
|
1,288 |
1 Cash cost and All-in sustaining cash cost are non-IFRS financial measures. Refer to Non-IFRS Financial Measures. |
|
|
|
|
|
|
|
|
|
|
|
|
2 Capital expenditures are presented on a cash basis
Quarterly and Annual Operating and Financial Highlights
In the fourth quarter of 2023, a total of 1,556,000 tonnes of ore were placed on the heap leach pad, with an average gold grade of 0.63 g/t, containing an estimated 31,665 ounces of gold. Gold production for Q4 2023 totaled 29,591 ounces. This represents a 1% increase in total ounces, from the previous quarter. Gold production was comprised of 24,977 ounces in doré bars, 4,443 ounces of gold contained in fine carbon, and 171 ounces contained in copper concentrate. Ore mined was 2.1 million tonnes, with a stripping ratio of 0.6:1. The stripping ratio in the fourth quarter was 45 percent lower than the third quarter of 2023.
For the full year 2023 gold production totaled 101,238 ounces, achieving midpoint of annual production guidance. Gold production comprised of 94,905 ounces in doré bars, 6,015 ounces in gold contained in fine carbon, and 319 ounces contained in copper concentrate. The stripping ratio for 2023 was 1.14:1, aligned with the mining plan for the year.
The cash cost per ounce of gold for the quarter ending December 31, 2023, was $934 compared to $814 in the same period of 2022. For the year ending December 31, 2023, the cash cost per ounce was $920, an increase from $739 in 2022. The increase in cash cost per ounce of gold for both the quarter and for the full year was primarily due to lower processed gold grades in accordance with the mine plan.
The all-in sustaining cash cost per gold ounce sold during Q4 2023 was $1,557, up from $1,219 in the fourth quarter of 2022. For the full year of 2023, the all-in sustaining cash cost was $1,565, compared to $1,140 in 2022. The increase in both the quarter and the year was primarily due to higher cash costs, along with increased sustaining capital expenditures related to the heap leach expansion.
Fortuna | 18
Fortuna Silver Mines Inc.
Management’s Discussion and Analysis
For the year ended December 31, 2023 (in US Dollars, tabular amounts in millions, except where noted)
This was partially mitigated by higher copper by-product credits.
As of December 31, 2023, the leach pad expansion project is approximately 23% complete. Mobilization of the civil contractor’s personnel and equipment has advanced with earth moving activities having commenced in January. Deliveries of geomembrane and geosynthetic clay liner are on-track, with the remaining materials expected to arrive on site in the first quarter of 2024. The leach pad expansion remains on schedule for completion during the second half of 2024.
Yaramoko Mine, Burkina Faso
The Yaramoko Mine is located in south-western Burkina Faso, and began commercial production in 2016. The operation consists of two underground mines feeding ore to a traditional gold processing facility where the ore is crushed, milled and subject to carbon-in-leach extraction processes, prior to electrowinning and refining where gold is poured to doré bars. The table below shows the key metrics used to measure the operating performance of the mine: tonnes milled, grade, production, and unit costs:
|
|
|
Three months ended December 31, |
|
|
Years ended December 31, |
||||||
|
|
|
2023 |
|
|
2022 |
|
|
2023 |
|
|
2022 |
Mine Production |
|
|
|
|
|
|
|
|
|
|
|
|
Tonnes milled |
|
|
110,445 |
|
|
142,694 |
|
|
531,578 |
|
|
546,651 |
|
|
|
|
|
|
|
|
|
|
|
|
|
Gold |
|
|
|
|
|
|
|
|
|
|
|
|
Grade (g/t) |
|
|
7.16 |
|
|
6.45 |
|
|
6.81 |
|
|
6.37 |
Recovery (%) |
|
|
98 |
|
|
98 |
|
|
98 |
|
|
98 |
Production (oz) |
|
|
28,235 |
|
|
26,190 |
|
|
117,711 |
|
|
106,108 |
Metal sold (oz) |
|
|
28,229 |
|
|
26,250 |
|
|
117,676 |
|
|
107,433 |
Realized price ($/oz) |
|
|
1,984 |
|
|
1,742 |
|
|
1,945 |
|
|
1,802 |
|
|
|
|
|
|
|
|
|
|
|
|
|
Unit Costs |
|
|
|
|
|
|
|
|
|
|
|
|
Cash cost ($/oz Au)1 |
|
|
949 |
|
|
818 |
|
|
809 |
|
|
840 |
All-in sustaining cash cost ($/oz Au)1 |
|
|
1,720 |
|
|
1,829 |
|
|
1,499 |
|
|
1,529 |
|
|
|
|
|
|
|
|
|
|
|
|
|
Capital Expenditures ($000's) 2 |
|
|
|
|
|
|
|
|
|
|
|
|
Sustaining |
|
|
12,620 |
|
|
18,994 |
|
|
49,938 |
|
|
45,665 |
Sustaining leases |
|
|
1,077 |
|
|
1,419 |
|
|
4,758 |
|
|
5,692 |
Brownfields |
|
|
1,261 |
|
|
2,855 |
|
|
4,917 |
|
|
5,873 |
1 Cash cost and All-in sustaining cash cost are non-IFRS financial measures. Refer to Non-IFRS Financial Measures. | ||||||||||||
2 Capital expenditures are presented on a cash basis | ||||||||||||
Quarterly and Annual Operating and Financial Highlights
The Yaramoko Mine produced 28,235 ounces of gold in the fourth quarter of 2023 with an average gold head grade of 7.16g/t, 8% and 11% increases when compared to the same period in 2022. Higher production was due to higher grades partially offset by lower mill throughput in the fourth quarter and a planned maintenance shutdown in December.
Gold production in 2023 totaled 117,711 ounces, achieving the higher end of the annual guidance range.
The cash cost per ounce of gold sold for the quarter ended December 31, 2023, was $949 compared to $818 in the same period in 2022. The increase for the quarter is mainly attributed to higher mining costs, particularly due to equipment, energy, and overhead expenses, but was partially offset by higher gold production. For the year ending December 31, 2023, the cash cost per ounce of gold sold was $809, a decrease from $840 in 2022. The full year decrease is mainly due to increased production and lower mining costs during prior quarters.
Fortuna | 19
Fortuna Silver Mines Inc.
Management’s Discussion and Analysis
For the year ended December 31, 2023 (in US Dollars, tabular amounts in millions, except where noted)
The all-in sustaining cash cost per gold ounce sold was $1,720 for the quarter ended December 31, 2023, compared to $1,829 in the same period of 2022. The change in the quarter was primarily due to the increased cash cost described above, increased royalties and an administrative penalty in Q4, offset by reduced capital expenditures. For the full year, the all-in sustaining cash cost was $1,499 in 2023, compared to $1,529 in 2022. The increased royalies and administrative penalty costs in Q4 were offset by increased production and decreased costs earlier in the year.
Exploration and grade control drilling success in conjunction with underground development extended mineralization on the western side of the Zone 55 mineralized structure. This provided additional mining areas which demonstrated wider and higher-grade extensions of mineralization within and beyond the existing resource boundary.
Séguéla Mine, Côte d’Ivoire
The Séguéla Mine is located in the Woroba District of Côte d’Ivoire, and began commercial production on July 1, 2023. The operation consists of an open pit mine, feeding ore to a single stage crushing circuit, with crushed ore being fed to a SAG mill followed by conventional carbon-in-leach and gravity recovery circuits prior to electro winning and smelting of gold doré. The table below shows the key metrics used to measure the operating performance of the mine: tonnes milled, grade, production, and unit costs:
|
|
|
Three months ended December 31, |
|
|
Years ended December 31, |
||||||
|
|
|
2023 |
|
|
2022 |
|
|
2023 |
|
|
2022 |
Mine Production |
|
|
|
|
|
|
|
|
|
|
|
|
Tonnes milled |
|
|
387,624 |
|
|
- |
|
|
807,616 |
|
|
- |
Average tonnes crushed per day |
|
|
4,123 |
|
|
- |
|
|
3,282 |
|
|
- |
|
|
|
|
|
|
|
|
|
|
|
|
|
Gold |
|
|
|
|
|
|
|
|
|
|
|
|
Grade (g/t) |
|
|
3.62 |
|
|
- |
|
|
3.42 |
|
|
- |
Recovery (%) |
|
|
95 |
|
|
- |
|
|
94 |
|
|
- |
Production (oz) |
|
|
43,096 |
|
|
- |
|
|
78,617 |
|
|
- |
Metal sold (oz) |
|
|
43,018 |
|
|
- |
|
|
78,521 |
|
|
- |
Realized price ($/oz) |
|
|
1,994 |
|
|
- |
|
|
1,963 |
|
|
- |
|
|
|
|
|
|
|
|
|
|
|
|
|
Unit Costs |
|
|
|
|
|
|
|
|
|
|
|
|
Cash cost ($/oz Au)1 |
|
|
323 |
|
|
- |
|
|
357 |
|
|
- |
All-in sustaining cash cost ($/oz Au)1 |
|
|
737 |
|
|
- |
|
|
760 |
|
|
- |
|
|
|
|
|
|
|
|
|
|
|
|
|
Capital Expenditures ($000's) 2 |
|
|
|
|
|
|
|
|
|
|
|
|
Sustaining |
|
|
7,765 |
|
|
- |
|
|
10,912 |
|
|
- |
Sustaining leases |
|
|
2,285 |
|
|
- |
|
|
5,329 |
|
|
- |
1 Cash cost and All-in sustaining cash cost are non-IFRS financial measures. Refer to Non-IFRS Financial Measures. | ||||||||||||
2 Capital expenditures are presented on a cash basis | ||||||||||||
Quarterly and Annual Operating and Financial Highlights
In the fourth quarter of 2023, mined material totaled 387,624 tonnes of ore, averaging 3.62 g/t Au, and containing an estimated 43,096 ounces of gold from the Antenna Pit. Movement of waste during the quarter totaled 2,110,209 tonnes, for a strip ratio of 5.4:1. Séguéla produced 43,096 ounces of gold at an average head grade of 3.62 g/t Au, a 37% increase and a 5% decrease, respectively, compared to the previous quarter. The increase in gold production is directly related to the mill achieving consistently higher throughput, processing 387,624 tonnes, a 25% increase over the previous quarter.
Gold production in 2023 totaled 78,617 ounces, exceeding the higher end of the annual guidance range.
Fortuna | 20
Fortuna Silver Mines Inc.
Management’s Discussion and Analysis
For the year ended December 31, 2023 (in US Dollars, tabular amounts in millions, except where noted)
Reconciliation of tonnes, grade, and gold ounces mined for the fourth quarter from Antenna show a positive correlation when compared to the long-term reserve model with 6% higher ore tonnes mined at 16% higher grades resulting in 24% more gold ounces extracted than predicted in the model.
Process plant performance continued to improve as feed characteristics were stabilized and initial bottlenecks addressed. Recovery in the fourth quarter increased to 94.9%, ahead of feasibility study assumptions. Plant productivity also continued to improve with throughput in the fourth quarter being 186 tonnes/hour, a 20% increase on the 154 tonnes/hour nameplate capacity.
Cash cost per gold ounce sold was $323 for Q4 2023 and $357 for the full year, which was below plan and guidance, primarily due to higher production, higher head grades, lower consumable consumption, and lower service costs.
All-in sustaining cash cost per gold ounce sold was $737 for Q4 2023 and $760 for the full year, which was below plan and guidance, primarily due to lower cash cost and higher sales volume, partially offset by higher capital expenditures.
Fortuna | 21
Fortuna Silver Mines Inc.
Management’s Discussion and Analysis
For the year ended December 31, 2023 (in US Dollars, tabular amounts in millions, except where noted)
San Jose Mine, Mexico
The San Jose Mine is an underground silver-gold mine located in the state of Oaxaca in southern Mexico. The following table shows the key metrics used to measure the operating performance of the mine: tonnes milled, grade, recovery, gold and silver production, and unit costs:
|
|
|
Three months ended December 31, |
|
|
Years ended December 31, |
||||||
|
|
|
2023 |
|
|
2022 |
|
|
2023 |
|
|
2022 |
Mine Production |
|
|
|
|
|
|
|
|
|
|
|
|
Tonnes milled |
|
|
241,035 |
|
|
259,500 |
|
|
930,200 |
|
|
1,029,590 |
Average tonnes milled per day |
|
|
2,678 |
|
|
2,883 |
|
|
2,643 |
|
|
2,925 |
|
|
|
|
|
|
|
|
|
|
|
|
|
Silver |
|
|
|
|
|
|
|
|
|
|
|
|
Grade (g/t) |
|
|
145 |
|
|
194 |
|
|
171 |
|
|
191 |
Recovery (%) |
|
|
91 |
|
|
91 |
|
|
91 |
|
|
91 |
Production (oz) |
|
|
1,023,525 |
|
|
1,473,627 |
|
|
4,656,631 |
|
|
5,762,563 |
Metal sold (oz) |
|
|
1,040,888 |
|
|
1,482,452 |
|
|
4,659,611 |
|
|
5,755,330 |
Realized price ($/oz) |
|
|
23.35 |
|
|
21.37 |
|
|
23.36 |
|
|
21.73 |
|
|
|
|
|
|
|
|
|
|
|
|
|
Gold |
|
|
|
|
|
|
|
|
|
|
|
|
Grade (g/t) |
|
|
0.91 |
|
|
1.13 |
|
|
1.06 |
|
|
1.14 |
Recovery (%) |
|
|
90 |
|
|
90 |
|
|
90 |
|
|
90 |
Production (oz) |
|
|
6,345 |
|
|
8,499 |
|
|
28,559 |
|
|
34,124 |
Metal sold (oz) |
|
|
6,406 |
|
|
8,621 |
|
|
28,524 |
|
|
34,201 |
Realized price ($/oz) |
|
|
1,983 |
|
|
1,734 |
|
|
1,942 |
|
|
1,802 |
|
|
|
|
|
|
|
|
|
|
|
|
|
Unit Costs |
|
|
|
|
|
|
|
|
|
|
|
|
Production cash cost ($/t)2 |
|
|
103.89 |
|
|
86.26 |
|
|
98.98 |
|
|
81.33 |
Production cash cost ($/oz Ag Eq)1,2 |
|
|
17.57 |
|
|
11.16 |
|
|
14.40 |
|
|
10.56 |
All-in sustaining cash cost ($/oz Ag Eq)1,2 |
|
|
21.98 |
|
|
15.53 |
|
|
19.40 |
|
|
15.11 |
|
|
|
|
|
|
|
|
|
|
|
|
|
Capital Expenditures ($000's) 3 |
|
|
|
|
|
|
|
|
|
|
|
|
Sustaining |
|
|
3,190 |
|
|
3,695 |
|
|
14,018 |
|
|
15,731 |
Sustaining leases |
|
|
246 |
|
|
169 |
|
|
878 |
|
|
658 |
Non-sustaining |
|
|
505 |
|
|
– |
|
|
1,682 |
|
|
869 |
Brownfields |
|
|
1,257 |
|
|
961 |
|
|
4,215 |
|
|
5,606 |
1 Production cash cost silver equivalent and All-in sustaining cash cost silver equivalent are calculated using realized metal prices for each period respectively | ||||||||||||
2 Production cash cost, Production cash cost silver equivalent, and All-in sustaining cash cost silver equivalent are Non-IFRS Financial Measures, refer to Non-IFRS Financial Measures | ||||||||||||
3 Capital expenditures are presented on a cash basis | ||||||||||||
Fortuna | 22
Fortuna Silver Mines Inc.
Management’s Discussion and Analysis
For the year ended December 31, 2023 (in US Dollars, tabular amounts in millions, except where noted)
Quarterly and Annual Operating and Financial Highlights
In the fourth quarter of 2023, San Jose produced 1,023,525 ounces of silver and 6,345 ounces of gold, 31% and 25% decreases respectively, at average head grades for silver and gold of 145 g/t and 0.91 g/t, 25% and 20% decreases respectively, when compared to the same period in 2022. The decrease in silver and gold production for the quarter is explained by the declining grade profile of Mineral Reserves in the mine plan, as well as lower tonnage extracted from the mine. The reduction in tonnage is due to operational challenges leading to delays in backfilling and blasting operations in stopes P and Q during December 2023. During the fourth quarter, the processing plant milled 241,035 tonnes at an average of 2,678 tonnes per day.
Production in 2023 totaled 4,656,631 ounces of silver and 28,559 ounces of gold, 12% and 16% below annual guidance range, respectively. The decrease in production is attributed primarily to the 15-day illegal union blockade in the second quarter, the associated disruption to operations thereafter, and a silver and gold head grade reconciliation to reserves at the lower end of guidance range.
The cash cost per silver equivalent ounce for the three months ending December 31, 2023, was $17.57, an increase from $11.16 in the same period of 2022. This increase was primarily attributed to lower head grades, as discussed above, and higher cash costs per tonne primarily related to the appreciation of the Mexican Peso, higher mining contractor tariffs, and a 7% decrease in processed ore. For the year ending December 31, 2023 the cash cost per silver equivalent ounce sold was $14.40 compared to $10.56. The full year increase was driven by lower head grades, and higher cash cost per tonne, which was similarly influenced by the appreciation of the Mexican Peso and 10% lower tonnes processed.
The all-in sustaining cash cost of payable silver equivalent ounce for the three months ended December 31, 2023 increased by 42% to $21.98, and full year 2023 increased 28% to $19.40. This compares to $15.53 per ounce and $15.11 per ounce for the same periods in 2022. These increases were mainly driven by higher cash costs and lower production, slightly mitigated by lower workers' participation costs.
The decrease in Brownfields expenditures is primarily attributable to reduced drilling activity in 2023. Drilling in 2023 was however higher than initially anticipated, owing to the emergent drilling campaign at the Yessi vein, discovered in the third quarter of the year. Exploration at the Yessi vein is ongoing.
Fortuna | 23
Fortuna Silver Mines Inc.
Management’s Discussion and Analysis
For the year ended December 31, 2023 (in US Dollars, tabular amounts in millions, except where noted)
Caylloma Mine, Peru
Caylloma is an underground silver, lead, and zinc mine located in the Arequipa Department in southern Peru. Its commercial products are silver-lead and zinc concentrates. The table below shows the key metrics used to measure the operating performance of the mine: tonnes milled, grade, recovery, silver, gold, lead, and zinc production and unit costs:
|
|
|
Three months ended December 31, |
|
|
Years ended December 31, |
||||||
|
|
|
2023 |
|
|
2022 |
|
|
2023 |
|
|
2022 |
Mine Production |
|
|
|
|
|
|
|
|
|
|
|
|
Tonnes milled |
|
|
140,800 |
|
|
138,491 |
|
|
543,876 |
|
|
546,186 |
Average tonnes milled per day |
|
|
1,564 |
|
|
1,556 |
|
|
1,528 |
|
|
1,539 |
|
|
|
|
|
|
|
|
|
|
|
|
|
Silver |
|
|
|
|
|
|
|
|
|
|
|
|
Grade (g/t) |
|
|
88 |
|
|
75 |
|
|
85 |
|
|
80 |
Recovery (%) |
|
|
83 |
|
|
81 |
|
|
83 |
|
|
81 |
Production (oz) |
|
|
330,478 |
|
|
273,119 |
|
|
1,227,060 |
|
|
1,144,714 |
Metal sold (oz) |
|
|
353,935 |
|
|
289,870 |
|
|
1,229,298 |
|
|
1,156,381 |
Realized price ($/oz) |
|
|
23.06 |
|
|
21.28 |
|
|
23.37 |
|
|
21.81 |
|
|
|
|
|
|
|
|
|
|
|
|
|
Gold |
|
|
|
|
|
|
|
|
|
|
|
|
Grade (g/t) |
|
|
0.11 |
|
|
0.12 |
|
|
0.14 |
|
|
0.14 |
Recovery (%) |
|
|
21 |
|
|
22 |
|
|
22 |
|
|
32 |
Production (oz) |
|
|
109 |
|
|
122 |
|
|
513 |
|
|
777 |
Metal sold (oz) |
|
|
— |
|
|
— |
|
|
40 |
|
|
603 |
Realized price ($/oz) |
|
|
— |
|
|
— |
|
|
1,902 |
|
|
1,864 |
|
|
|
|
|
|
|
|
|
|
|
|
|
Lead |
|
|
|
|
|
|
|
|
|
|
|
|
Grade (%) |
|
|
3.84 |
|
|
3.22 |
|
|
3.74 |
|
|
3.27 |
Recovery (%) |
|
|
91 |
|
|
89 |
|
|
91 |
|
|
88 |
Production (000's lbs) |
|
|
10,798 |
|
|
8,735 |
|
|
40,852 |
|
|
34,588 |
Metal sold (000's lbs) |
|
|
11,641 |
|
|
9,118 |
|
|
41,074 |
|
|
34,869 |
Realized price ($/lb) |
|
|
0.97 |
|
|
0.96 |
|
|
0.98 |
|
|
0.98 |
|
|
|
|
|
|
|
|
|
|
|
|
|
Zinc |
|
|
|
|
|
|
|
|
|
|
|
|
Grade (%) |
|
|
5.00 |
|
|
4.63 |
|
|
5.11 |
|
|
4.32 |
Recovery (%) |
|
|
90 |
|
|
89 |
|
|
90 |
|
|
89 |
Production (000's lbs) |
|
|
13,933 |
|
|
12,575 |
|
|
55,060 |
|
|
46,176 |
Metal sold (000's lbs) |
|
|
14,407 |
|
|
11,027 |
|
|
56,166 |
|
|
44,770 |
Realized price ($/lb) |
|
|
1.13 |
|
|
1.35 |
|
|
1.23 |
|
|
1.57 |
|
|
|
|
|
|
|
|
|
|
|
|
|
Unit Costs |
|
|
|
|
|
|
|
|
|
|
|
|
Production cash cost ($/t)2 |
|
|
100.71 |
|
|
95.70 |
|
|
100.40 |
|
|
92.96 |
Production cash cost ($/oz Ag Eq)1,2 |
|
|
13.67 |
|
|
12.46 |
|
|
14.28 |
|
|
12.34 |
All-in sustaining cash cost ($/oz Ag Eq)1,2 |
|
|
22.34 |
|
|
20.30 |
|
|
19.90 |
|
|
17.97 |
|
|
|
|
|
|
|
|
|
|
|
|
|
Capital Expenditures ($000's) 3 |
|
|
|
|
|
|
|
|
|
|
|
|
Sustaining |
|
|
8,635 |
|
|
7,188 |
|
|
17,903 |
|
|
18,694 |
Sustaining leases |
|
|
912 |
|
|
845 |
|
|
3,538 |
|
|
3,350 |
Brownfields |
|
|
966 |
|
|
473 |
|
|
2,302 |
|
|
1,202 |
1 Production cash cost silver equivalent and All-in sustaining cash cost silver equivalent are calculated using realized metal prices for each period respectively | ||||||||||||
2 Production cash cost, Production cash cost silver equivalent, and All-in sustaining cash cost silver equivalent are Non-IFRS Financial Measures, refer to Non-IFRS Financial Measures | ||||||||||||
3 Capital expenditures are presented on a cash basis | ||||||||||||
Fortuna | 24
Fortuna Silver Mines Inc.
Management’s Discussion and Analysis
For the year ended December 31, 2023 (in US Dollars, tabular amounts in millions, except where noted)
Quarterly and Annual Operating and Financial Highlights
In the fourth quarter, the Caylloma Mine produced 330,478 ounces of silver at an average head grade of 88 g/t, a21% and 17% increase, respectively, when compared to the previous quarter. Silver production for 2023 totaled 1,227,060 ounces, exceeding the upper end of annual guidance range by 10 percent.
Lead and zinc production for the quarter was 10.8 million pounds of lead, and 13.9 million pounds of zinc. Lead and zinc production rose by 24% and 11%, respectively, compared to the same period in 2022. Head grades averaged 3.84%, and 5.00%, a 19% and 8% increase, respectively, when compared to the previous quarter. Record lead and zinc production for 2023 totaled 40.9 and 55.1 million pounds, respectively. Increased production is the result of positive grade reconciliation to the reserve model in levels 16 and 18 of the Animas vein. Gold production totaled 109 ounces with an average head grade of 0.11 g/t.
The cash cost per silver equivalent ounce sold for the quarter ended December 31, 2023, was $13.67 compared to $12.46 in the same period in 2022. The increase for the quarter is attributed primarily due to higher cash cost per tonne, higher treatment charges and the impact of higher silver prices on the calculation of silver equivalent ounces . For the year ended December 31, 2023, the cash cost per ounce of silver equivalent sold was $14.28, compared to $12.34 in 2022. The full year increase was driven mainly by the same factors explained above for the quarter.
The all-in sustaining cash cost per ounce of payable silver equivalent for the three months ended December 31, 2023, increased 10% to $22.34, compared to $20.30 for the same period in 2022. The all-in sustaining cash cost per ounce of payable silver equivalent for the full year 2023 increased 11% to $19.90, compared to $17.97 in 2022. The increases were mainly driven by the impact of increasing silver prices on the calculation of silver equivalent ounces, and higher capital costs.
Underground development for the quarter was mainly focused on mine levels 15, 16, and 18. The increase in Brownfields expenditures is primarily attributable to greater footage and additional diamond drilling.
The following table provides information for the last eight fiscal quarters up to December 31, 2023:
|
|
Q4 2023 |
|
Q3 2023 |
|
Q2 2023 |
|
Q1 2023 |
|
Q4 2022 |
|
Q3 2022 |
|
Q2 2022 |
|
Q1 2022 |
Sales |
|
265.3 |
|
243.1 |
|
158.4 |
|
175.7 |
|
164.7 |
|
166.6 |
|
167.9 |
|
182.3 |
Mine operating income |
|
51.9 |
|
65.9 |
|
31.9 |
|
40.4 |
|
26.0 |
|
24.7 |
|
32.5 |
|
63.5 |
Operating income (loss) |
|
(77.4) |
|
45.4 |
|
7.7 |
|
23.9 |
|
(173.1) |
|
5.7 |
|
13.1 |
|
40.7 |
Net income (loss) |
|
(89.8) |
|
30.9 |
|
3.5 |
|
11.9 |
|
(160.4) |
|
(4.1) |
|
1.7 |
|
27.0 |
|
|
|
|
|
|
|
|
|
|
|
|
|
|
|
|
|
Basic (loss) earnings per share |
|
(0.30) |
|
0.09 |
|
0.01 |
|
0.04 |
|
(0.52) |
|
(0.01) |
|
0.01 |
|
0.09 |
Diluted (loss) earnings per share |
|
(0.30) |
|
0.09 |
|
0.01 |
|
0.04 |
|
(0.52) |
|
(0.01) |
|
0.01 |
|
0.09 |
|
|
|
|
|
|
|
|
|
|
|
|
|
|
|
|
|
Total assets |
|
1,967.9 |
|
2,046.6 |
|
1,991.5 |
|
1,946.1 |
|
1,876.2 |
|
2,032.6 |
|
2,060.0 |
|
2,060.4 |
Debt |
|
206.8 |
|
246.6 |
|
285.9 |
|
244.9 |
|
219.2 |
|
204.2 |
|
218.6 |
|
198.0 |
Figures may not add due to rounding
Sales increased 9% in the fourth quarter of 2023 to $265.3 million compared to $243.1 million in the third quarter of 2023 due to higher production. Net income decreased by $120.7 million compared to the third quarter of 2023 as a result of an impairment charge at San Jose and a number of onetime charges.
Fortuna | 25
Fortuna Silver Mines Inc.
Management’s Discussion and Analysis
For the year ended December 31, 2023 (in US Dollars, tabular amounts in millions, except where noted)
Sales increased 53% in the third quarter of 2023 to $243.1 million compared to $158.4 million in the second quarter of 2023. Sales in the quarter were impacted by the addition of Séguéla as an operating mine. Net income increased by $27.4 million compared to the second quarter of 2023 as a result of contributions from Séguéla which was in ramp-up during the previous quarter and the return to full operations at San Jose following an illegal blockade.
Sales decreased 10% in the second quarter of 2023 to $158.4 million compared to $175.7 million in the first quarter of 2023. Sales in the quarter were impacted by the illegal blockade at San Jose. Net income decreased by $8.4 million compared to the first quarter of 2023 as a result of lower sales and $7.3 million of other operating expenses related to care and maintenance, stand-by charges, and one-time payments associated with the work stoppages at Yaramoko and San Jose.
Sales increased 7% in the first quarter of 2023 to $175.7 million compared to $164.7 million in the fourth quarter of 2022 as higher gold sales and realized prices offset lower silver production. Net income increased by $172.3 million compared to the fourth quarter of 2022 as a result of an impairment charge of $182.8 million ($164.5 million net of tax) in the previous quarter.
Sales decreased 1% in the fourth quarter of 2022 to $164.7 million compared to $166.6 million in the third quarter of 2022 as lower production was offset by higher metal prices. Net loss increased by $156.3 million compared to the third quarter of 2022 as a result of an impairment charge of $182.8 million ($164.5 million net of tax) related to write-downs in the carrying values of the San Jose, Yaramoko, and Lindero cash generating units.
Sales decreased 1% in the third quarter of 2022 to $166.6 million compared to $167.9 million in the second quarter of 2022 as higher production was offset by lower realized metal prices. Mine operating income was impacted by higher processing costs and a $1.0 million write down of inventory to net realizable value at Yaramoko. Net income decreased $5.8 million compared to the second quarter of 2022 primarily due to the factors described above as well the write-off of the Tlamino property for $3.4 million.
Sales decreased 8% in the second quarter of 2022 to $167.9 million compared to $182.3 million in the first quarter of 2022 due primarily to lower sales at Yaramoko as mining finished in the QV zone and mill feed was supplemented by stockpiles reducing head grade delivered to the mill and lower head grades at San Jose. Mine operating income was lower as a result of lower sales as well as a $4.0 million write-down of inventory to net realizable value and an increase in costs due to inflationary pressures. Net income decreased $25.3 million compared to the first quarter of 2022 primarily due to the factors described above as well as higher current taxes from the recognition of withholding taxes.
Sales decreased 8% in the first quarter of 2022 to $182.3 million compared to $198.9 million in the fourth quarter of 2021 due primarily to lower sales at Lindero as a result of the impacts of COVID-19 at the mine and due to lower head grades at San Jose. Operating income was in line with the previous quarter as higher mine operating income was offset by the $2.1 million write-off due to the termination of a property agreement for the Santa Fe Property in Mexico and an increase in foreign exchange losses in the quarter. Net income increased $10.4 million compared to the fourth quarter of 2021 primarily due to lower current and deferred taxes.
LIQUIDITY AND CAPITAL RESOURCES
Cash and Cash Equivalents
The Company has cash and cash equivalents of $128.1 million at December 31, 2023 compared to $80.5 million at the end of 2022. The increase in cash and cash equivalents was primarily the result of the completion of construction at Séguéla and the mine starting to generate free cash flow. Significant cash movements are described below.
Fortuna | 26
Fortuna Silver Mines Inc.
Management’s Discussion and Analysis
For the year ended December 31, 2023 (in US Dollars, tabular amounts in millions, except where noted)
Working Capital
Working capital decreased to $89.6 million at the end of 2023 compared to $117.6 million at the end of 2022. The decrease in working capital was primarily a result of the convertible debentures moving from long term to current liabilities as they will mature on October 31, 2024 and an increase in accounts payable with the Séguéla Mine moving into operations.
Operating Activities
Cash flow generated from operating activities for the year ending December 31, 2023 increased to $296.9 million compared to $194.2 million in 2022. The increase in operating cash flow was primarily due to the addition of Séguéla as an operating mine in the second half of 2023 and higher realized gold prices. Negative working capital movements for 2023 were lower than the previous year due to an increase in payables at Séguéla as the mine shifted to operations. Interest paid in the year was higher due to an increase in interest rates and the Company stopped capitalizing interest costs when the Séguéla Mine transitioned to commercial production.
Investing Activities
For the year ending December 31, 2023 the Company invested $217.3 million in capital expenditures on a cash basis consisting of $143.6 million in sustaining capital and $73.7 million in expansionary capital. Capital investments consisted primarily of the following:
Sustaining
| ● | $39.4 million invested at the Lindero Mine to support both capitalized stripping and the Phase 2 expansion of the leach pad |
| ● | $54.9 million at Yaramoko which consisted primarily of underground development |
| ● | $20.2 million at Bateas and $18.2 million at San Jose primarily for capitalized development costs |
| ● | $10.9 million in capitalized stripping and mine development at Séguéla |
Expansionary
| ● | $3.9 million related to exploration and study work at the Diamba Sud project |
| ● | $10.0 million to Newcrest West Africa Holdings Pty Ltd. paid on the achievement of the first gold pour at Séguéla under a contractual obligation |
| ● | $50.0 million to complete the construction of Séguéla |
| ● | $6.5 million in capitalized interest related to the Séguéla project |
During the period the Company also realized an investment gain of $12.4 million related to blue chip swaps at Lindero to access a foreign exchange window opened by the government and paid $12.8 million related to the acquisition of Chesser Resources for capitalized acquisition and transaction costs.
Financing Activities
Financing activities for the year primarily consisted of a $75.5 million draw down on the credit facility to complete the construction of Séguéla and a subsequent repayment of $90.5 million after Séguéla transitioned to operations. The Company also spent $16.6 million related to payments on lease obligations.
Capital Resources
The Company maintains a $250.0 million revolving credit facility (“Credit Facility”). As at December 31, 2023, the Company had drawn down $165.0 million of the available credit (excluding letters of credit). The Credit Facility has a term of four years and matures on November 4, 2025. The amount available under the Credit Facility steps down to $175.0 million on November 4, 2024. Interest accrues on SOFR loans under the Credit Facility at SOFR plus an applicable margin of 2.25% to 3.25% which varies depending on the consolidated leverage levels of the Company.
Fortuna | 27
Fortuna Silver Mines Inc.
Management’s Discussion and Analysis
For the year ended December 31, 2023 (in US Dollars, tabular amounts in millions, except where noted)
The Credit Facility includes covenants customary for a facility of this nature including, among other matters, reporting requirements, and positive, negative, and financial covenants set out therein. As at December 31, 2023, the Company was in compliance with all of the covenants under the Credit Facility.
As at |
|
December 31, 2023 |
|
December 31, 2022 |
|
Change |
|||
Cash and cash equivalents |
|
|
128.1 |
|
|
80.5 |
|
|
47.6 |
Credit facility |
|
|
250.0 |
|
|
250.0 |
|
|
- |
Total liquidity available |
|
|
378.1 |
|
|
330.5 |
|
|
47.6 |
Amount drawn on credit facility1 |
|
|
(165.0) |
|
|
(180.0) |
|
|
15.0 |
Net liquidity position |
|
|
213.1 |
|
|
150.5 |
|
|
62.6 |
1Excluding letters of credit |
|
|
|
|
|
|
|
|
|
Figures may not add due to rounding
As of the date of this MD&A, the Company has the following debt coming due within the next 12 months:
| ● | The maturity of $45.7 million in outstanding convertible debentures on October 31, 2024 |
On January 5, 2023, the Company announced that it had received notice of a resolution (“SEMARNAT Resolution”) from the Secretaría de Medio Ambiente y Recursos Naturales (“SEMARNAT”) which provides that SEMARNAT has annulled and is re-assessing the 12-year extension to the environmental impact authorization (“EIA”) for the San Jose Mine that it had granted to Fortuna’s wholly-owned subsidiary, Compania Minera Cuzcatlan S.A. de C.V. (“Minera Cuzcatlan”) in December 2022.
Minera Cuzcatlan initiated legal proceedings in the Mexican Federal Administrative Court (the “Court”) to contest and revoke the annulment of the EIA, and also obtained a permanent injunction which allows the San Jose Mine to continue to operate under the terms of the 12-year EIA until the determination of these legal proceedings.
On October 30, 2023, the Company announced that the Court had ruled in favour of Minera Cuzcatlan and reinstated the 12-year EIA. The decision of the Court has been appealed and was admitted by the Mexican Collegiate Court (the “Appeals Court”) in January 2024. Minera Cuzcatlan filed a response with the Appeals Court in February 2024. A decision of the Appeals Court is expected within the next six to 12 months. The permanent injunction that Minera Cuzcatlan already has remains in effect.
Until the determination of these legal proceedings, the Company has agreed with its lenders to certain temporary restrictions under the Credit Facility (which restrictions have been reduced from those imposed by the lenders in 2023) as follows:
| ● | The Company may not exercise the $50.0 million accordion feature. |
| ● | The Company must maintain a minimum liquidity balance of $70.0 million. In the event that the Company fails to maintain this minimum requirement over a period of 30 days, the availability of the credit under the facility will be reduced to $200.0 million. The credit availability will revert to $250.0 million once the Company re-establishes the minimum liquidity balance requirement over a period of 30 days. |
| ● | The Company cannot make any cash-based permitted acquisition and investments, nor any discretionary expansionary capital expenditures. |
| ● | The Company may not make investments in or provide financial assistance to non-guaranteeing subsidiaries in excess of $3,000,000. |
Fortuna | 28
Fortuna Silver Mines Inc.
Management’s Discussion and Analysis
For the year ended December 31, 2023 (in US Dollars, tabular amounts in millions, except where noted)
In the event that: (1) the permanent injunction ceases to be in effect; (2) the Court upholds the SEMARNAT Resolution, (3) an Administrative Authority issues a resolution to cease operations at the San Jose Mine, or (4) a positive unappealable decision in the Mexican Legal Proceedings is not received before December 31, 2024, the availability under the Credit Facility will be reduced to nil, and an event of default will occur thereunder.
Off-Balance Sheet Arrangements
The Company does not have any off-balance sheet arrangements or commitments that are expected to have a current or future effect on the financial condition, results of operations, liquidity, capital expenditures, or capital resources that are material to investors.
The Company does not utilize complex financial instruments in hedging foreign exchange or interest exposure. Any hedging activity requires approval of the Company’s Board of Directors. The Company will not hold or issue derivative instruments for speculative or trading purposes.
Provisional priced trade receivables of $16.8 million are the Company’s only level 2 fair valued instruments and no level 3 instruments are held.
Provisionally priced trade receivables are valued using forward London Metal Exchange prices until final prices are settled at a future date. The forward sales, and forward foreign exchange contracts liabilities are valued based on the present value of the estimated contractual cash flows. Estimates of future cash flows are based on quoted swap rates, futures prices and interbank borrowing rates. These are discounted using a yield curve, and adjusted for credit risk of the Company or the counterparty.
See note 3 (section m) and Note 28 of the 2023 Financial Statements for a discussion of the Company’s use of financial instruments, including a description of liquidity risks associated with such instruments.
SHARE POSITION & OUTSTANDING OPTIONS & EQUITY BASED SHARE UNITS
The Company has 306,587,630 common shares outstanding as at March 6, 2024. In addition, there were 1,840,012 outstanding equity-settled share-based awards as follows:
Performance share units |
1,840,012 |
An aggregate of 1,807,223 share-settled performance units issued by the Company are subject to a multiplier ranging from 50% to 200% depending on the achievement level of certain performance targets.
As at December 31, 2023, the Company has $45.7 million of senior subordinated unsecured convertible debentures outstanding. The debentures mature on October 31, 2024 and bear interest at a rate of 4.65% per annum, payable semi-annually in arrears on the last business day of April and October. The debentures are convertible at the holder’s option into common shares in the capital of the Company at a conversion price of $5.00 per share, resulting in the issuance of up to 9,143,000 common shares subject to adjustments in certain circumstances. Refer to Note 14 of the 2023 Financial Statements for additional details.
Normal Course Issuer Bid
On April 28, 2023 the Company announced a renewal of its Normal Course Issuer Bid Program (“NCIB”) pursuant to which the Company may purchase up to five percent of its outstanding common shares. Under the NCIB, purchases of common shares may be made through the facilities of the TSX, the NYSE and/or alternative Canadian trading systems.
Fortuna | 29
Fortuna Silver Mines Inc.
Management’s Discussion and Analysis
For the year ended December 31, 2023 (in US Dollars, tabular amounts in millions, except where noted)
The share repurchase program started on May 2, 2023 and will expire on the earlier of May 1, 2024; the date Fortuna acquires the maximum number of common shares allowable under the NCIB; or the date Fortuna otherwise decides not to make any further repurchases under the NCIB.
The Company has entered into the following related party transactions during the three and twelve months ended December 31, 2023 and 2022:
(a) Key Management Personnel
During the three and twelve months ended December 31, 2023 and 2022, the Company was charged for consulting services by Mario Szotlender, a director of the Company.
Amounts paid to key management personnel were as follows:
|
|
Three months ended December 31, |
|
Years ended December 31, |
||||||||
(Expressed in $ thousands) |
|
2023 |
|
2022 |
|
2023 |
|
2022 |
||||
Salaries and benefits |
|
|
1,564 |
|
|
2,475 |
|
|
8,450 |
|
|
11,532 |
Directors fees |
|
|
208 |
|
|
197 |
|
|
830 |
|
|
934 |
Consulting fees |
|
|
16 |
|
|
16 |
|
|
66 |
|
|
69 |
Share-based payments |
|
|
2,682 |
|
|
2,626 |
|
|
4,874 |
|
|
7,042 |
|
|
|
4,470 |
|
|
5,314 |
|
|
14,220 |
|
|
19,577 |
ACQUISITION OF CHESSER RESOURCES
On September 20, 2023, the Company completed, by way of a Scheme Implementation Deed, the acquisition of Chesser Resources (ASX: CHZ) (the “Chesser Acquisition”). Under the terms of the Chesser Acquisition, Fortuna acquired all of the shares of Chesser Resources in consideration for 0.0248 of one common share of Fortuna for each Chesser share held, and Chesser became a wholly-owned subsidiary of the Company. The Company issued 15,545,368 common shares as consideration for the transaction, representing approximately 5.1% of the outstanding common shares of Fortuna on an undiluted basis.
The acquisition of Chesser represents a relatively small transaction for Fortuna and the Company expects the ongoing integration to be efficient and effective. In addition to closing and transaction related costs, the acquisition triggered a capital gains tax on the indirect acquisition of a Senegalese entity and associated registration fees. A payment of $9.4 million was made to the Senegalese tax authority on October 20, 2023 to settle these obligations based on the final valuation of the consideration exchanged.
The Company has disclosed certain financial measures and ratios in this MD&A which are not defined under IFRS and are not disclosed in the Financial Statements, including but not limited to: cash cost per ounce of gold; all-in sustaining cash cost per ounce of gold sold; all-in sustaining costs per ounce of gold equivalent sold; all-in cash cost per ounce of gold sold; total production cash cost per tonne; cash cost per payable ounce of silver equivalent; all-in sustaining cash cost per payable ounce of silver equivalent sold; all-in cash cost per payable ounce of silver equivalent sold; free cash flow and free cashflow from ongoing operations; adjusted net income; adjusted attributable net income; adjusted EBITDA; net debt and working capital.
Fortuna | 30
Fortuna Silver Mines Inc.
Management’s Discussion and Analysis
For the year ended December 31, 2023 (in US Dollars, tabular amounts in millions, except where noted)
These non-IFRS financial measures and non-IFRS ratios are widely reported in the mining industry as benchmarks for performance and are used by Management to monitor and evaluate the Company's operating performance and ability to generate cash. The Company believes that, in addition to financial measures and ratios prepared in accordance with IFRS, certain investors use these non-IFRS financial measures and ratios to evaluate the Company’s performance. However, the measures do not have a standardized meaning under IFRS and may not be comparable to similar financial measures disclosed by other companies. Accordingly, non-IFRS financial measures and non-IFRS ratios should not be considered in isolation or as a substitute for measures and ratios of the Company’s performance prepared in accordance with IFRS. The Company has calculated these measures consistently for all periods presented.
The following table outlines the non-IFRS financial measures and ratios, their definitions, the most directly comparable IFRS measures and why we use these measures.
Non-IFRS |
Definition |
Most Directly |
Why we use this measure and |
|---|---|---|---|
Silver Equivalent Ounces Sold |
Silver equivalent ounces are calculated by converting other metal production to its silver equivalent using relative metal/silver metal prices at realized prices and adding the converted metal production expressed in silver ounces to the ounces of silver production. |
Silver Ounces Sold |
Management believes this provides a consistent way to measure costs and performance. |
Gold Equivalent Ounces Sold |
Gold equivalent ounces are calculated by converting other metal production to its gold equivalent using relative metal/gold metal prices at realized prices and adding the converted metal production expressed in gold ounces to the ounces of gold production. |
Silver Ounces Sold |
|
Cash Costs |
Cash costs include all direct and indirect operating cash costs related directly to the physical activities of producing metals, including mining and processing costs, third-party refining and treatment charges, on-site general and administrative expenses, applicable production taxes and royalties which are not based on sales or taxable income calculations , net of by-product credits, but are exclusive of the impact of non-cash items that are included as part of the cost of sales that is calculated in the consolidated Income Statement including depreciation and depletion, reclamation, capital, development and exploration costs. |
Cost of Sales |
Management believes that cash cost and AISC measures provide useful information regarding the Company's ability to generate operating earnings and cash flows from its mining operations, and uses such measures to monitor the performance of the Company's mining operations. In addition, the Company believes that each measure provides useful information to investors in comparing, on a mine-by-mine basis, our operations relative performance on a period-by-period basis, against our competitors operations. |
Cash Cost Per Tonne |
This ratio is calculated by dividing Cash Costs by the number of tonnes milled in the period. |
|
|
Cash Cost Per Ounce |
This ratio is calculated by dividing cash costs by gold or silver equivalent ounces sold in the period. |
|
Fortuna | 31
Fortuna Silver Mines Inc.
Management’s Discussion and Analysis
For the year ended December 31, 2023 (in US Dollars, tabular amounts in millions, except where noted)
Non-IFRS |
Definition |
Most Directly |
Why we use this measure and |
|---|---|---|---|
All-In Sustaining Costs (AISC) |
The Company, in conjunction with an initiative undertaken within the gold mining industry, has adopted AISC and all-in sustaining cost measures based on guidance published by World Gold Council ("WGC"). The Company conforms its AISC and all-in cash cost definitions to that set out in the guidance and the Company has presented the cash cost figures on a sold ounce basis. We define All-in Sustaining Costs as total production cash costs incurred at the applicable mining operation but excludes mining royalty recognized as income tax within the scope of IAS-12, as well as non-sustaining capital expenditures. Sustaining capital expenditures, corporate selling, general and administrative expenses, and brownfield exploration expenditures are added to the cash cost. AISC is estimated at realized metal prices. |
|
|
AISC per Ounce Sold |
This ratio is calculated by dividing AISC by gold or silver equivalent ounces sold in the period. |
|
|
All-In Costs |
All-In Costs is calculated consistently with AISC but is inclusive of non-sustaining capital. |
|
|
Free cash Flow From Ongoing Operations |
Free cash flow from ongoing operations is defined as net cash provided by operating activities, including Lindero commissioning, less sustaining capital expenditures and current income tax expense and adding back income taxes paid, changes in long-term receivable sustaining capital expenditures, one time transaction costs, payments of lease liabilities and other non-recurring items. |
Net Cash Provided by Operating Activities |
This non-IFRS measure is used by the Company and investors to measure the cash flow available to fund the Company’s growth through investments and capital expenditures. |
|
Adjusted Net Income and Adjusted Attributable Net Income |
Adjusted net income and adjusted attributable net income excludes the after-tax impact of specific items that are significant, which the Company believes are not reflective of the Company’s underlying performance for the reporting period, such as foreign exchange gains (losses) related to the construction of the Séguéla Mine, gains and losses and other one-time costs related to acquisitions, impairment charges (reversals), and certain non-recurring items. Although some of the items are recurring, such as; loss on disposal of assets and non-hedge derivative gains and losses, the Company believes that they are not reflective of the underlying operating performance of its current business and are not necessarily indicative of future operating results. |
Net Income |
Management believes that in addition to conventional measures prepared in accordance with IFRS, the Company and certain investors and analysts use this information and information obtained from conventional IFRS measures to evaluate the Company’s performance. |
Fortuna | 32
Fortuna Silver Mines Inc.
Management’s Discussion and Analysis
For the year ended December 31, 2023 (in US Dollars, tabular amounts in millions, except where noted)
Non-IFRS |
Definition |
Most Directly |
Why we use this measure and |
|---|---|---|---|
Adjusted EBITDA |
Adjusted EBITDA is a non-IFRS measure which is calculated as net income before interest, taxes, depreciation, and amortization, adjusted to exclude specific items that are significant, but not reflective of the Company's underlying operations, such as foreign exchange gains (losses) related to the construction of the Séguéla Mine, gains and losses and other one-time costs related to acquisitions, impairment charges (reversals), unrealized gains (losses) on derivatives and certain non-recurring items, included in “Other expenses” on the Consolidated Income Statement. Other companies may calculate Adjusted EBITDA differently. |
Net Income |
Management believes that adjusted EBITDA provides valuable information as an indicator of the Company’s ability to generate operating cash flow to fund working capital needs, service debt obligations and fund capital expenditures. Adjusted EBITDA is also a common metric that provides additional information used by investors and analysts for valuation purposes based on an observed or inferred relationship between adjusted EBITDA and market value. |
Working Capital |
Working capital is non-IFRS measure which is calculated by subtracting current liabilities from current assets. |
Current Assets, Current Liabilities |
Management believes that working capital is a useful indicator of the liquidity of the Company. |
Net Debt |
Net debt is a Non-IFRS measure which is calculated by adding together current and long term debt and then subtracting cash and cash equivalents. |
Current Debt, Long Term Debt, Cash and Cash Equivalents |
Management believes that net debt is a useful indicator of the liquidity of the Company. |
Cash Cost per Ounce of Gold Equivalent Sold
The following tables presents a reconciliation of cash cost per ounce of gold equivalent sold to the cost of sales in the 2023 Financial Statements for the three and twelve months ended December 31, 2023 and 2022:
Cash Cost Per Gold Equivalent Ounce Sold - Q4 2023 |
|
Lindero |
|
Yaramoko |
|
Séguéla |
|
San Jose |
|
Caylloma |
|
GEO Cash Costs |
Cost of sales |
|
57,913 |
|
49,598 |
|
46,239 |
|
41,108 |
|
18,599 |
|
213,457 |
Inventory adjustment |
|
(7,884) |
|
(3,033) |
|
— |
|
(4,407) |
|
(683) |
|
(16,007) |
Depletion, depreciation, and amortization |
|
(15,061) |
|
(15,345) |
|
(25,972) |
|
(11,407) |
|
(3,476) |
|
(71,261) |
Royalties and taxes |
|
(3,916) |
|
(4,437) |
|
(6,364) |
|
(815) |
|
(227) |
|
(15,759) |
By-product credits |
|
(4,183) |
|
— |
|
— |
|
— |
|
— |
|
(4,183) |
Right of use |
|
— |
|
— |
|
— |
|
219 |
|
365 |
|
584 |
Other |
|
— |
|
— |
|
— |
|
344 |
|
(397) |
|
(53) |
Production cash costs |
|
26,869 |
|
26,783 |
|
13,903 |
|
25,042 |
|
14,181 |
|
106,778 |
Inventory adjustment |
|
— |
|
— |
|
— |
|
(147) |
|
683 |
|
536 |
Right of use |
|
— |
|
— |
|
— |
|
(219) |
|
(365) |
|
(584) |
Depletion and depreciation in concentrate inventory |
|
— |
|
— |
|
— |
|
56 |
|
10 |
|
66 |
Realized gain on diesel hedge |
|
— |
|
— |
|
— |
|
— |
|
— |
|
— |
Treatment and refining charges |
|
— |
|
— |
|
— |
|
1,505 |
|
4,241 |
|
5,746 |
Cash cost applicable per gold equivalent ounce sold |
|
26,869 |
|
26,783 |
|
13,903 |
|
26,237 |
|
18,750 |
|
112,542 |
Ounces of gold equivalent sold |
|
28,779 |
|
28,229 |
|
43,018 |
|
17,650 |
|
16,236 |
|
133,912 |
Cash cost per ounce of gold equivalent sold ($/oz) |
|
934 |
|
949 |
|
323 |
|
1,487 |
|
1,155 |
|
840 |
Gold equivalent was calculated using the realized prices for gold of $1,990/oz Au, $23.3/oz Ag, $2,137/t Pb, and $2,499/t Zn for Q4 2023. | ||||||||||||
| ||||||||||||
Fortuna | 33
Fortuna Silver Mines Inc.
Management’s Discussion and Analysis
For the year ended December 31, 2023 (in US Dollars, tabular amounts in millions, except where noted)
Cash Cost Per Gold Equivalent Ounce Sold - Q4 2022 |
|
Lindero |
|
Yaramoko |
|
Séguéla |
|
San Jose |
|
Caylloma |
|
GEO Cash Costs |
Cost of sales |
|
43,057 |
|
42,084 |
|
— |
|
34,775 |
|
16,676 |
|
136,592 |
Inventory adjustment |
|
(312) |
|
— |
|
— |
|
27 |
|
216 |
|
(69) |
Depletion, depreciation, and amortization |
|
(13,441) |
|
(17,884) |
|
— |
|
(10,557) |
|
(2,960) |
|
(44,842) |
Royalties and taxes |
|
(3,353) |
|
(2,732) |
|
— |
|
(1,260) |
|
(181) |
|
(7,526) |
By-product credits |
|
(982) |
|
— |
|
— |
|
— |
|
— |
|
(982) |
Right of use |
|
— |
|
— |
|
— |
|
— |
|
— |
|
— |
Other |
|
— |
|
— |
|
— |
|
(601) |
|
(497) |
|
(1,098) |
Production cash costs |
|
24,969 |
|
21,468 |
|
— |
|
22,384 |
|
13,254 |
|
82,075 |
Inventory adjustment |
|
(1,379) |
|
— |
|
— |
|
(27) |
|
(216) |
|
(1,622) |
Right of use |
|
— |
|
— |
|
— |
|
— |
|
— |
|
— |
Depletion and depreciation in concentrate inventory |
|
— |
|
— |
|
— |
|
47 |
|
(120) |
|
(73) |
Realized gain on diesel hedge |
|
(1,105) |
|
— |
|
— |
|
— |
|
— |
|
(1,105) |
Treatment and refining charges |
|
— |
|
— |
|
— |
|
947 |
|
3,128 |
|
4,075 |
Cash cost applicable per gold equivalent ounce sold |
|
22,485 |
|
21,468 |
|
— |
|
23,351 |
|
16,046 |
|
83,350 |
Ounces of gold equivalent sold |
|
27,634 |
|
26,250 |
|
— |
|
25,747 |
|
15,795 |
|
95,426 |
Cash cost per ounce of gold equivalent sold ($/oz) |
|
814 |
|
818 |
|
— |
|
907 |
|
1,016 |
|
873 |
Gold equivalent was calculated using the realized prices for gold of $1,737/oz Au, $21.4/oz Ag, $2,106/t Pb, and $2,986/t Zn for Q4 2022. | ||||||||||||
| ||||||||||||
Cash Cost Per Gold Equivalent Ounce Sold - Year 2023 |
|
Lindero |
|
Yaramoko |
|
Séguéla |
|
San Jose |
|
Caylloma |
|
GEO Cash Costs |
Cost of sales |
|
176,696 |
|
186,757 |
|
79,472 |
|
140,068 |
|
69,408 |
|
652,401 |
Inventory adjustment |
|
(10,693) |
|
(3,859) |
|
— |
|
(4,564) |
|
(576) |
|
(19,692) |
Depletion, depreciation, and amortization |
|
(51,258) |
|
(73,064) |
|
(40,529) |
|
(40,058) |
|
(13,390) |
|
(218,299) |
Royalties and taxes |
|
(14,958) |
|
(14,678) |
|
(10,932) |
|
(4,390) |
|
(1,078) |
|
(46,036) |
By-product credits |
|
(7,921) |
|
— |
|
— |
|
— |
|
— |
|
(7,921) |
Right of use |
|
— |
|
— |
|
— |
|
758 |
|
1,933 |
|
2,691 |
Other |
|
— |
|
— |
|
— |
|
253 |
|
(1,692) |
|
(1,439) |
Production cash costs |
|
91,866 |
|
95,156 |
|
28,011 |
|
92,067 |
|
54,605 |
|
361,705 |
Inventory adjustment |
|
2,823 |
|
— |
|
— |
|
10 |
|
576 |
|
3,409 |
Right of use |
|
— |
|
— |
|
— |
|
(758) |
|
(1,933) |
|
(2,691) |
Depletion and depreciation in concentrate inventory |
|
— |
|
— |
|
— |
|
30 |
|
76 |
|
106 |
Realized gain on diesel hedge |
|
— |
|
— |
|
— |
|
— |
|
— |
|
— |
Treatment and refining charges |
|
— |
|
— |
|
— |
|
4,352 |
|
19,974 |
|
24,326 |
Cash cost applicable per gold equivalent ounce sold |
|
94,689 |
|
95,156 |
|
28,011 |
|
95,701 |
|
73,298 |
|
386,855 |
Ounces of gold equivalent sold |
|
102,896 |
|
117,676 |
|
78,521 |
|
80,458 |
|
63,229 |
|
442,780 |
Cash cost per ounce of gold equivalent sold ($/oz) |
|
920 |
|
809 |
|
357 |
|
1,189 |
|
1,159 |
|
874 |
Gold equivalent was calculated using the realized prices for gold of $1,948/oz Au, $23.4/oz Ag, $2,155/t Pb, and $2,706/t Zn for YTD 2023. | ||||||||||||
| ||||||||||||
Fortuna | 34
Fortuna Silver Mines Inc.
Management’s Discussion and Analysis
For the year ended December 31, 2023 (in US Dollars, tabular amounts in millions, except where noted)
Cash Cost Per Gold Equivalent Ounce Sold - Year 2022 |
|
Lindero |
|
Yaramoko |
|
Séguéla |
|
San Jose |
|
Caylloma |
|
GEO Cash Costs |
Cost of sales |
|
164,179 |
|
171,846 |
|
— |
|
129,088 |
|
67,491 |
|
532,604 |
Inventory adjustment |
|
293 |
|
(6,397) |
|
— |
|
156 |
|
48 |
|
(5,900) |
Depletion, depreciation, and amortization |
|
(54,644) |
|
(64,894) |
|
— |
|
(37,773) |
|
(14,108) |
|
(171,419) |
Royalties and taxes |
|
(15,545) |
|
(11,630) |
|
— |
|
(5,262) |
|
(867) |
|
(33,304) |
By-product credits |
|
(1,214) |
|
(25) |
|
— |
|
— |
|
— |
|
(1,239) |
Right of use |
|
— |
|
— |
|
— |
|
— |
|
— |
|
— |
Other |
|
— |
|
(329) |
|
— |
|
(2,477) |
|
(1,789) |
|
(4,595) |
Production cash costs |
|
93,069 |
|
88,571 |
|
— |
|
83,732 |
|
50,775 |
|
316,147 |
Inventory adjustment |
|
(1,984) |
|
1,320 |
|
— |
|
(156) |
|
(48) |
|
(868) |
Right of use |
|
— |
|
— |
|
— |
|
— |
|
— |
|
— |
Depletion and depreciation in concentrate inventory |
|
— |
|
— |
|
— |
|
(2) |
|
76 |
|
74 |
Realized gain on diesel hedge |
|
(4,620) |
|
— |
|
— |
|
— |
|
— |
|
(4,620) |
Treatment and refining charges |
|
— |
|
329 |
|
— |
|
3,508 |
|
15,476 |
|
19,313 |
Cash cost applicable per gold equivalent ounce sold |
|
86,465 |
|
90,220 |
|
— |
|
87,082 |
|
66,279 |
|
330,046 |
Ounces of gold equivalent sold |
|
116,950 |
|
107,433 |
|
— |
|
99,439 |
|
64,952 |
|
388,774 |
Cash cost per ounce of gold equivalent sold ($/oz) |
|
739 |
|
840 |
|
— |
|
876 |
|
1,020 |
|
849 |
Gold equivalent was calculated using the realized prices for gold of $1,802/oz Au, $21.8/oz Ag, $2,161/t Pb, and $3,468/t Zn for YTD 2022. | ||||||||||||
| ||||||||||||
Fortuna | 35
Fortuna Silver Mines Inc.
Management’s Discussion and Analysis
For the year ended December 31, 2023 (in US Dollars, tabular amounts in millions, except where noted)
All-in Sustaining Cash Cost and All-in Cash Cost per Ounce of Gold Equivalent Sold
The following tables shows a breakdown of the all-in sustaining cash cost per ounce of gold equivalent sold for the three and twelve months ended December 31, 2023 and 2022:
AISC Per Gold Equivalent Ounce Sold - Q4 2023 |
|
Lindero |
|
Yaramoko |
|
Séguéla |
|
San Jose |
|
Caylloma |
|
Corporate |
|
GEO AISC |
Cash cost applicable per gold equivalent ounce sold |
|
26,869 |
|
26,783 |
|
13,903 |
|
26,237 |
|
18,750 |
|
— |
|
112,542 |
Inventory net realizable value adjustment |
|
— |
|
— |
|
— |
|
— |
|
— |
|
— |
|
— |
Royalties and taxes |
|
3,916 |
|
4,437 |
|
6,364 |
|
815 |
|
227 |
|
— |
|
15,759 |
Worker's participation |
|
— |
|
— |
|
— |
|
(430) |
|
399 |
|
— |
|
(31) |
General and administration |
|
2,833 |
|
(336) |
|
1,398 |
|
1,789 |
|
1,344 |
|
12,603 |
|
19,631 |
Stand-by |
|
— |
|
2,700 |
|
— |
|
— |
|
— |
|
— |
|
2,700 |
Total cash costs |
|
33,618 |
|
33,584 |
|
21,665 |
|
28,411 |
|
20,720 |
|
12,603 |
|
150,601 |
Sustaining capital1 |
|
11,205 |
|
14,958 |
|
10,050 |
|
4,693 |
|
10,513 |
|
— |
|
51,419 |
All-in sustaining costs |
|
44,823 |
|
48,542 |
|
31,715 |
|
33,104 |
|
31,233 |
|
12,603 |
|
202,020 |
Gold equivalent ounces sold |
|
28,779 |
|
28,229 |
|
43,018 |
|
17,650 |
|
16,236 |
|
— |
|
133,912 |
All-in sustaining costs per ounce |
|
1,557 |
|
1,720 |
|
737 |
|
1,876 |
|
1,924 |
|
— |
|
1,509 |
Gold equivalent was calculated using the realized prices for gold of $1,990/oz Au, $23.3/oz Ag, $2,137/t Pb, and $2,499/t Zn for Q4 2023. | ||||||||||||||
1 Presented on a cash basis | ||||||||||||||
|
|
|
|
|
|
|
|
|
|
|
|
|
|
|
AISC Per Gold Equivalent Ounce Sold - Q4 2022 |
|
Lindero |
|
Yaramoko |
|
Séguéla |
|
San Jose |
|
Caylloma |
|
Corporate |
|
GEO AISC |
Cash cost applicable per gold equivalent ounce sold |
|
22,485 |
|
21,468 |
|
— |
|
23,351 |
|
16,046 |
|
— |
|
83,350 |
Inventory net realizable value adjustment |
|
1,052 |
|
— |
|
— |
|
— |
|
— |
|
— |
|
1,052 |
Royalties and taxes |
|
3,353 |
|
2,732 |
|
— |
|
1,260 |
|
181 |
|
— |
|
7,526 |
Worker's participation |
|
— |
|
— |
|
— |
|
751 |
|
480 |
|
— |
|
1,231 |
General and administration |
|
2,081 |
|
531 |
|
— |
|
2,319 |
|
928 |
|
10,329 |
|
16,188 |
Stand-by |
|
— |
|
— |
|
— |
|
— |
|
— |
|
— |
|
— |
Total cash costs |
|
28,971 |
|
24,731 |
|
— |
|
27,681 |
|
17,635 |
|
10,329 |
|
109,347 |
Sustaining capital3 |
|
4,724 |
|
23,268 |
|
— |
|
4,825 |
|
8,506 |
|
— |
|
41,323 |
All-in sustaining costs |
|
33,695 |
|
47,999 |
|
— |
|
32,506 |
|
26,141 |
|
10,329 |
|
150,670 |
Gold equivalent ounces sold |
|
27,634 |
|
26,250 |
|
— |
|
25,747 |
|
15,795 |
|
— |
|
95,426 |
All-in sustaining costs per ounce |
|
1,219 |
|
1,829 |
|
— |
|
1,263 |
|
1,655 |
|
— |
|
1,579 |
Gold equivalent was calculated using the realized prices for gold of $1,737/oz Au, $21.4/oz Ag, $2,106/t Pb, and $2,986/t Zn for Q4 2022. | ||||||||||||||
1 Presented on a cash basis | ||||||||||||||
|
|
|
|
|
|
|
|
|
|
|
|
|
|
|
AISC Per Gold Equivalent Ounce Sold - Year 2023 |
|
Lindero |
|
Yaramoko |
|
Séguéla |
|
San Jose |
|
Caylloma |
|
Corporate |
|
GEO AISC |
Cash cost applicable per gold equivalent ounce sold |
|
94,689 |
|
95,156 |
|
28,011 |
|
95,701 |
|
73,298 |
|
— |
|
386,855 |
Inventory net realizable value adjustment |
|
— |
|
334 |
|
— |
|
— |
|
— |
|
— |
|
334 |
Royalties and taxes |
|
14,958 |
|
14,678 |
|
10,932 |
|
4,390 |
|
1,078 |
|
— |
|
46,036 |
Worker's participation |
|
— |
|
— |
|
— |
|
(316) |
|
1,927 |
|
— |
|
1,611 |
General and administration |
|
9,624 |
|
919 |
|
4,510 |
|
7,040 |
|
4,810 |
|
35,903 |
|
62,806 |
Stand-by |
|
— |
|
5,699 |
|
— |
|
4,084 |
|
— |
|
— |
|
9,783 |
Total cash costs |
|
119,271 |
|
116,786 |
|
43,453 |
|
110,899 |
|
81,113 |
|
35,903 |
|
507,425 |
Sustaining capital3 |
|
41,751 |
|
59,613 |
|
16,241 |
|
19,111 |
|
23,743 |
|
— |
|
160,459 |
Fortuna | 36
Fortuna Silver Mines Inc.
Management’s Discussion and Analysis
For the year ended December 31, 2023 (in US Dollars, tabular amounts in millions, except where noted)
All-in sustaining costs |
|
161,022 |
|
176,399 |
|
59,694 |
|
130,010 |
|
104,856 |
|
35,903 |
|
667,884 |
Gold equivalent ounces sold |
|
102,896 |
|
117,676 |
|
78,521 |
|
80,458 |
|
63,229 |
|
— |
|
442,780 |
All-in sustaining costs per ounce |
|
1,565 |
|
1,499 |
|
760 |
|
1,616 |
|
1,658 |
|
— |
|
1,508 |
Gold equivalent was calculated using the realized prices for gold of $1,948/oz Au, $23.4/oz Ag, $2,155/t Pb, and $2,706/t Zn for YTD 2023. | ||||||||||||||
1 Presented on a cash basis | ||||||||||||||
|
|
|
|
|
|
|
|
|
|
|
|
|
|
|
AISC Per Gold Equivalent Ounce Sold - Year 2022 |
|
Lindero |
|
Yaramoko |
|
Séguéla |
|
San Jose |
|
Caylloma |
|
Corporate |
|
GEO AISC |
Cash cost applicable per gold equivalent ounce sold |
|
86,465 |
|
90,220 |
|
— |
|
87,082 |
|
66,279 |
|
— |
|
330,046 |
Inventory net realizable value adjustment |
|
1,052 |
|
3,125 |
|
— |
|
— |
|
— |
|
— |
|
4,177 |
Royalties and taxes |
|
15,545 |
|
11,630 |
|
— |
|
5,262 |
|
867 |
|
— |
|
33,304 |
Worker's participation |
|
— |
|
— |
|
— |
|
3,096 |
|
2,087 |
|
— |
|
5,183 |
General and administration |
|
8,578 |
|
2,101 |
|
— |
|
7,164 |
|
4,063 |
|
37,661 |
|
59,567 |
Stand-by |
|
— |
|
— |
|
— |
|
— |
|
— |
|
— |
|
— |
Total cash costs |
|
111,640 |
|
107,076 |
|
— |
|
102,604 |
|
73,296 |
|
37,661 |
|
432,277 |
Sustaining capital3 |
|
21,721 |
|
57,230 |
|
— |
|
21,995 |
|
23,246 |
|
— |
|
124,192 |
All-in sustaining costs |
|
133,361 |
|
164,306 |
|
— |
|
124,599 |
|
96,542 |
|
37,661 |
|
556,469 |
Gold equivalent ounces sold |
|
116,950 |
|
107,433 |
|
— |
|
99,439 |
|
64,952 |
|
— |
|
388,774 |
All-in sustaining costs per ounce |
|
1,140 |
|
1,529 |
|
— |
|
1,253 |
|
1,486 |
|
— |
|
1,431 |
Gold equivalent was calculated using the realized prices for gold of $1,802/oz Au, $21.8/oz Ag, $2,161/t Pb, and $3,468/t Zn for YTD 2022. | ||||||||||||||
1 Presented on a cash basis | ||||||||||||||
|
|
|
|
|
|
|
|
|
|
|
|
|
|
|
Fortuna | 37
Fortuna Silver Mines Inc.
Management’s Discussion and Analysis
For the year ended December 31, 2023 (in US Dollars, tabular amounts in millions, except where noted)
Production Cash Cost per Tonne and Cash Cost per Payable Ounce of Silver Equivalent Sold
The following tables present a reconciliation of production cash cost per tonne and cash cost per payable ounce of silver equivalent sold to the cost of sales in the 2023 Financial Statements for the three and twelve months ended December 31, 2023 and 2022:
Cash Cost Per Equivalent Silver Ounce Sold - Q4 2023 |
|
San Jose |
|
Caylloma |
|
SEO Cash Costs |
Cost of sales |
|
41,108 |
|
18,599 |
|
59,707 |
Inventory adjustment |
|
(4,407) |
|
(683) |
|
(5,090) |
Depletion, depreciation, and amortization |
|
(11,407) |
|
(3,476) |
|
(14,883) |
Royalties and taxes |
|
(815) |
|
(227) |
|
(1,042) |
By-product credits |
|
— |
|
— |
|
— |
Right of use |
|
219 |
|
365 |
|
584 |
Other |
|
344 |
|
(397) |
|
(53) |
Production cash costs |
|
25,042 |
|
14,181 |
|
39,223 |
Total tonnes |
|
241,035 |
|
140,800 |
|
381,835 |
Production cash cost per tonne |
|
104 |
|
101 |
|
103 |
|
|
|
|
|
|
|
|
|
|
|
|
|
|
Cash Costs |
|
25,042 |
|
14,181 |
|
39,223 |
Inventory adjustment |
|
(147) |
|
683 |
|
536 |
Depletion and depreciation in concentrate inventory |
|
56 |
|
10 |
|
66 |
Treatment and refining charges |
|
1,505 |
|
4,241 |
|
5,746 |
Cash cost applicable per silver equivalent sold |
|
26,456 |
|
19,115 |
|
45,571 |
Ounces of silver equivalent sold1 |
|
1,505,763 |
|
1,398,062 |
|
2,903,825 |
Cash cost per ounce of silver equivalent sold ($/oz) |
|
17.57 |
|
13.67 |
|
15.69 |
1 Silver equivalent sold for Q4 2023 for San Jose is calculated using a silver to gold ratio of 84.9:1. Silver equivalent sold for Q4 2023 for Caylloma is calculated using a silver to gold ratio of 0.0:1, silver to lead ratio of 1:23.8 pounds, and silver to zinc ratio of 1:20.3 pounds. | ||||||
2 Silver equivalent is calculated using the realized prices for gold, silver, lead, and zinc. Refer to Financial Results - Sales and Realized Prices | ||||||
|
|
|
|
|
|
|
Cash Cost Per Silver Equivalent Ounce Sold - Q4 2022 |
|
San Jose |
|
Caylloma |
|
SEO Cash Costs |
Cost of sales |
|
34,775 |
|
16,676 |
|
51,451 |
Inventory adjustment |
|
27 |
|
216 |
|
243 |
Depletion, depreciation, and amortization |
|
(10,557) |
|
(2,960) |
|
(13,517) |
Royalties and taxes |
|
(1,260) |
|
(181) |
|
(1,441) |
By-product credits |
|
— |
|
— |
|
— |
Right of use |
|
— |
|
— |
|
— |
Other |
|
(601) |
|
(497) |
|
(1,098) |
Production cash costs |
|
22,384 |
|
13,254 |
|
35,638 |
Total tonnes |
|
259,500 |
|
138,491 |
|
397,991 |
Production cash cost per tonne |
|
86 |
|
96 |
|
90 |
|
|
|
|
|
|
|
|
|
|
|
|
|
|
Cash Costs |
|
22,384 |
|
13,254 |
|
35,638 |
Inventory adjustment |
|
(27) |
|
(216) |
|
(243) |
Depletion and depreciation in concentrate inventory |
|
47 |
|
(120) |
|
(73) |
Treatment and refining charges |
|
947 |
|
3,128 |
|
4,075 |
Cash cost applicable per silver equivalent sold |
|
23,351 |
|
16,046 |
|
39,397 |
Ounces of silver equivalent sold1 |
|
2,092,500 |
|
1,287,998 |
|
3,380,498 |
Cash cost per ounce of silver equivalent sold ($/oz) |
|
11.16 |
|
12.46 |
|
11.65 |
1 Silver equivalent sold for San Jose for Q4 2022 is 81.2:1.Silver equivalent sold for Caylloma for Q4 2022 is calculated using a silver to gold ratio of 0.0:1, silver to lead ratio of 1:22.3 pounds, and silver to zinc ratio 1:15.7. | ||||||
2 Silver equivalent is calculated using the realized prices for gold, silver, lead, and zinc. Refer to Financial Results - Sales and Realized Prices | ||||||
|
|
|
|
|
|
|
Fortuna | 38
Fortuna Silver Mines Inc.
Management’s Discussion and Analysis
For the year ended December 31, 2023 (in US Dollars, tabular amounts in millions, except where noted)
Cash Cost Per Silver Ounce Sold - Year 2023 |
|
San Jose |
|
Caylloma |
|
SEO Cash Costs |
Cost of sales |
|
140,068 |
|
69,408 |
|
209,476 |
Inventory adjustment |
|
(4,564) |
|
(576) |
|
(5,140) |
Depletion, depreciation, and amortization |
|
(40,058) |
|
(13,390) |
|
(53,448) |
Royalties and taxes |
|
(4,390) |
|
(1,078) |
|
(5,468) |
By-product credits |
|
— |
|
— |
|
— |
Right of use |
|
758 |
|
1,933 |
|
2,691 |
Other |
|
253 |
|
(1,692) |
|
(1,439) |
Production cash costs |
|
92,067 |
|
54,605 |
|
146,672 |
Total tonnes |
|
930,200 |
|
543,877 |
|
1,474,077 |
Production cash cost per tonne |
|
99 |
|
100 |
|
100 |
|
|
|
|
|
|
|
|
|
|
|
|
|
|
Cash Costs |
|
92,067 |
|
54,605 |
|
146,672 |
Inventory adjustment |
|
10 |
|
576 |
|
586 |
Depletion and depreciation in concentrate inventory |
|
30 |
|
76 |
|
106 |
Treatment and refining charges |
|
4,352 |
|
19,974 |
|
24,326 |
Cash cost applicable per silver equivalent sold |
|
96,459 |
|
75,231 |
|
171,690 |
Ounces of silver equivalent sold1 |
|
6,700,419 |
|
5,269,540 |
|
11,969,959 |
Cash cost per ounce of silver equivalent sold ($/oz) |
|
14.40 |
|
14.28 |
|
14.34 |
1 Silver equivalent sold for YTD 2023 for San Jose is calculated using a silver to gold ratio of 83.1:1. Silver equivalent sold for YTD 2023 for Caylloma is calculated using a silver to gold ratio of 81.4:1, silver to lead ratio of 1:23.9 pounds, and silver to zinc ratio of 1:19.0 pounds. | ||||||
2 Silver equivalent is calculated using the realized prices for gold, silver, lead, and zinc. Refer to Financial Results - Sales and Realized Prices | ||||||
|
|
|
|
|
|
|
Cash Cost Per Silver Ounce Sold - Year 2022 |
|
San Jose |
|
Caylloma |
|
SEO Cash Costs |
Cost of sales |
|
129,088 |
|
67,491 |
|
196,579 |
Inventory adjustment |
|
156 |
|
48 |
|
204 |
Depletion, depreciation, and amortization |
|
(37,773) |
|
(14,108) |
|
(51,881) |
Royalties and taxes |
|
(5,262) |
|
(867) |
|
(6,129) |
By-product credits |
|
— |
|
— |
|
— |
Right of use |
|
— |
|
— |
|
— |
Other |
|
(2,477) |
|
(1,789) |
|
(4,266) |
Production cash costs |
|
83,732 |
|
50,775 |
|
134,507 |
Total tonnes |
|
1,029,590 |
|
546,186 |
|
1,575,776 |
Production cash cost per tonne |
|
81 |
|
93 |
|
85 |
|
|
|
|
|
|
|
|
|
|
|
|
|
|
Cash Costs |
|
83,732 |
|
50,775 |
|
134,507 |
Inventory adjustment |
|
(156) |
|
(48) |
|
(204) |
Depletion and depreciation in concentrate inventory |
|
(2) |
|
76 |
|
74 |
Treatment and refining charges |
|
3,508 |
|
15,476 |
|
18,984 |
Cash cost applicable per silver equivalent sold |
|
87,082 |
|
66,279 |
|
153,361 |
Ounces of silver equivalent sold1 |
|
8,243,436 |
|
5,372,277 |
|
13,615,713 |
Cash cost per ounce of silver equivalent sold ($/oz) |
|
10.56 |
|
12.34 |
|
11.26 |
1 Silver equivalent sold for YTD 2022 for San Jose is calculated using a silver to gold ratio of 82.9:1. Silver equivalent sold for YTD 2022 for Caylloma is calculated using a silver to gold ratio of 85.5:1, silver to lead ratio of 1:22.9 pounds, and silver to zinc ratio of 1:13.9 pounds. | ||||||
2 Silver equivalent is calculated using the realized prices for gold, silver, lead, and zinc. Refer to Financial Results - Sales and Realized Prices | ||||||
|
|
|
|
|
|
|
Fortuna | 39
Fortuna Silver Mines Inc.
Management’s Discussion and Analysis
For the year ended December 31, 2023 (in US Dollars, tabular amounts in millions, except where noted)
All-in Sustaining Cash Cost and All-in Cash Cost per Payable Ounce of Silver Equivalent Sold
The following tables show a breakdown of the all-in sustaining cash cost per payable ounce of silver equivalent sold for the three and twelve months ended December 31, 2023 and 2022:
AISC Per Silver Equivalent Ounce Sold - Q4 2023 |
|
San Jose |
|
Caylloma |
|
SEO AISC |
Cash cost applicable per silver equivalent ounce sold |
|
26,237 |
|
18,750 |
|
44,987 |
Royalties and taxes |
|
815 |
|
227 |
|
1,042 |
Worker's participation |
|
(430) |
|
399 |
|
(31) |
General and administration |
|
1,789 |
|
1,344 |
|
3,133 |
Stand-by |
|
— |
|
— |
|
— |
Total cash costs |
|
28,411 |
|
20,720 |
|
49,131 |
Sustaining capital3 |
|
4,693 |
|
10,513 |
|
15,206 |
All-in sustaining costs |
|
33,104 |
|
31,233 |
|
64,337 |
Silver equivalent ounces sold1 |
|
1,505,763 |
|
1,398,062 |
|
2,903,825 |
All-in sustaining costs per ounce2 |
|
21.98 |
|
22.34 |
|
22.16 |
1 Silver equivalent sold for Q4 2023 for San Jose is calculated using a silver to gold ratio of 84.9:1. Silver equivalent sold for Q4 2023 for Caylloma is calculated using a silver to gold ratio of 0.0:1, silver to lead ratio of 1:23.8 pounds, and silver to zinc ratio of 1:20.3 pounds. | ||||||
2 Silver equivalent is calculated using the realized prices for gold, silver, lead, and zinc. Refer to Financial Results - Sales and Realized Prices | ||||||
3 Presented on a cash basis | ||||||
|
|
|
|
|
|
|
AISC Per Silver Equivalent Ounce Sold - Q4 2022 |
|
San Jose |
|
Caylloma |
|
SEO AISC |
Cash cost applicable per silver equivalent ounce sold |
|
23,351 |
|
16,046 |
|
39,397 |
Royalties and taxes |
|
1,260 |
|
181 |
|
1,441 |
Worker's participation |
|
751 |
|
480 |
|
1,231 |
General and administration |
|
2,319 |
|
928 |
|
3,247 |
Stand-by |
|
— |
|
— |
|
— |
Total cash costs |
|
27,681 |
|
17,635 |
|
45,316 |
Sustaining capital3 |
|
4,825 |
|
8,506 |
|
13,331 |
All-in sustaining costs |
|
32,506 |
|
26,141 |
|
58,647 |
Silver equivalent ounces sold1 |
|
2,092,500 |
|
1,287,998 |
|
3,380,498 |
All-in sustaining costs per ounce2 |
|
15.53 |
|
20.30 |
|
17.35 |
1 Silver equivalent sold for San Jose for Q4 2022 is 81.2:1.Silver equivalent sold for Caylloma for Q4 2022 is calculated using a silver to gold ratio of 0.0:1, silver to lead ratio of 1:22.3 pounds, and silver to zinc ratio 1:15.7. | ||||||
2 Silver equivalent is calculated using the realized prices for gold, silver, lead, and zinc. Refer to Financial Results - Sales and Realized Prices | ||||||
3 Presented on a cash basis | ||||||
|
|
|
|
|
|
|
AISC Per Silver Equivalent Ounce Sold - Year 2023 |
|
San Jose |
|
Caylloma |
|
SEO AISC |
Cash cost applicable per silver equivalent ounce sold |
|
95,701 |
|
73,298 |
|
168,999 |
Royalties and taxes |
|
4,390 |
|
1,078 |
|
5,468 |
Worker's participation |
|
(316) |
|
1,927 |
|
1,611 |
General and administration |
|
7,040 |
|
4,810 |
|
11,850 |
Stand-by |
|
4,084 |
|
— |
|
4,084 |
Total cash costs |
|
110,899 |
|
81,113 |
|
192,012 |
Sustaining capital3 |
|
19,111 |
|
23,743 |
|
42,854 |
All-in sustaining costs |
|
130,010 |
|
104,856 |
|
234,866 |
Silver equivalent ounces sold1 |
|
6,700,419 |
|
5,269,540 |
|
11,969,959 |
All-in sustaining costs per ounce2 |
|
19.40 |
|
19.90 |
|
19.62 |
1 Silver equivalent sold for YTD 2023 for San Jose is calculated using a silver to gold ratio of 83.1:1. Silver equivalent sold for YTD 2023 for Caylloma is calculated using a silver to gold ratio of 81.4:1, silver to lead ratio of 1:23.9 pounds, and silver to zinc ratio of 1:19.0 pounds. | ||||||
2 Silver equivalent is calculated using the realized prices for gold, silver, lead, and zinc. Refer to Financial Results - Sales and Realized Prices | ||||||
3 Presented on a cash basis | ||||||
|
|
|
|
|
|
|
Fortuna | 40
Fortuna Silver Mines Inc.
Management’s Discussion and Analysis
For the year ended December 31, 2023 (in US Dollars, tabular amounts in millions, except where noted)
AISC Per Silver Equivalent Ounce Sold - Year 2022 |
|
San Jose |
|
Caylloma |
|
SEO AISC |
Cash cost applicable per silver equivalent ounce sold |
|
87,082 |
|
66,279 |
|
153,361 |
Royalties and taxes |
|
5,262 |
|
867 |
|
6,129 |
Worker's participation |
|
3,096 |
|
2,087 |
|
5,183 |
General and administration |
|
7,164 |
|
4,063 |
|
11,227 |
Stand-by |
|
— |
|
— |
|
— |
Total cash costs |
|
102,604 |
|
73,296 |
|
175,900 |
Sustaining capital3 |
|
21,995 |
|
23,246 |
|
45,241 |
All-in sustaining costs |
|
124,599 |
|
96,542 |
|
221,141 |
Silver equivalent ounces sold1 |
|
8,243,436 |
|
5,372,277 |
|
13,615,713 |
All-in sustaining costs per ounce2 |
|
15.11 |
|
17.97 |
|
16.24 |
1 Silver equivalent sold for YTD 2022 for San Jose is calculated using a silver to gold ratio of 82.9:1. Silver equivalent sold for YTD 2022 for Caylloma is calculated using a silver to gold ratio of 85.5:1, silver to lead ratio of 1:22.9 pounds, and silver to zinc ratio of 1:13.9 pounds. | ||||||
2 Silver equivalent is calculated using the realized prices for gold, silver, lead, and zinc. Refer to Financial Results - Sales and Realized Prices | ||||||
3 Presented on a cash basis | ||||||
|
|
|
|
|
|
|
Free Cash Flow from Ongoing Operations
The following table presents a reconciliation of free cash flow from ongoing operations to net cash provided by operating activities, the most directly comparable IFRS measure, for the three and twelve months ended December 31, 2023 and 2022:
|
|
Three months ended December 31, |
|
|
Years ended December 31, |
||||||
(Expressed in millions) |
2023 |
|
2022 |
|
2023 |
|
2022 |
||||
|
|
|
|
|
|
|
|
|
|
|
|
Net cash provided by operating activities |
|
105.1 |
|
|
49.6 |
|
|
296.9 |
|
|
194.2 |
Adjustments |
|
|
|
|
|
|
|
|
|
|
|
Séguéla, working capital |
|
- |
|
|
- |
|
|
4.4 |
|
|
- |
Additions to mineral properties, plant and equipment |
|
(46.3) |
|
|
(39.6) |
|
|
(143.6) |
|
|
(113.4) |
Gain on blue chip swap investments |
|
12.4 |
|
|
- |
|
|
12.4 |
|
|
- |
Mexican royalty payment |
|
- |
|
|
- |
|
|
- |
|
|
3.0 |
Other adjustments |
|
(5.0) |
|
|
(5.6) |
|
|
(16.6) |
|
|
(14.6) |
Free cash flow from ongoing operations |
|
66.2 |
|
|
4.4 |
|
|
153.5 |
|
|
69.2 |
Figures may not add due to rounding
Fortuna | 41
Fortuna Silver Mines Inc.
Management’s Discussion and Analysis
For the year ended December 31, 2023 (in US Dollars, tabular amounts in millions, except where noted)
Adjusted Net Income
The following table presents a reconciliation of the adjusted net income from net income, the most directly comparable IFRS measure, for the three and twelve months ended December 31, 2023 and 2022:
|
|
|
Three months ended December 31, |
|
|
Years ended December 31, |
||||||
(Expressed in millions) |
|
2023 |
|
2022 |
|
2023 |
|
2022 |
||||
Net income |
|
|
(89.8) |
|
|
(160.4) |
|
|
(43.6) |
|
|
(135.9) |
Adjustments, net of tax: |
|
|
|
|
|
|
|
|
|
|
|
|
Community support provision and accruals1 |
|
|
(0.4) |
|
|
(0.1) |
|
|
(0.5) |
|
|
(0.1) |
Foreign exchange loss, Séguéla Mine |
|
|
- |
|
|
(0.4) |
|
|
- |
|
|
0.8 |
Write off of mineral properties |
|
|
4.0 |
|
|
0.3 |
|
|
4.5 |
|
|
5.1 |
Unrealized loss (gain) on derivatives |
|
|
0.1 |
|
|
0.1 |
|
|
(0.3) |
|
|
(0.4) |
Impairment of mineral properties, plant and equipment |
|
|
90.6 |
|
|
164.5 |
|
|
90.6 |
|
|
164.5 |
Inventory adjustment |
|
|
13.5 |
|
|
3.8 |
|
|
14.2 |
|
|
8.0 |
Accretion on right of use assets |
|
|
0.5 |
|
|
0.5 |
|
|
3.3 |
|
|
2.3 |
Other non-cash/non-recurring items |
|
|
4.9 |
|
|
(1.1) |
|
|
4.4 |
|
|
(1.7) |
Adjusted net income |
|
|
23.4 |
|
|
7.2 |
|
|
72.6 |
|
|
42.6 |
1 Amounts are recorded in Cost of sales |
|
|
|
|
|
|
|
|
|
|
|
|
Figures may not add due to rounding
Adjusted EBITDA
The following table presents a reconciliation of Adjusted EBITDA from net income, the most directly comparable IFRS measure, for the three and twelve months ended December 31, 2023 and 2022:
|
|
Three months ended December 31, |
|
|
Years ended December 31, |
|||||||
(Expressed in millions) |
|
2023 |
|
2022 |
|
2023 |
|
2022 |
||||
Net income |
|
|
(89.8) |
|
|
(160.4) |
|
|
(43.6) |
|
|
(135.9) |
Adjustments: |
|
|
|
|
|
|
|
|
|
|
|
|
Community support provision and accruals |
|
|
(0.5) |
|
|
(0.1) |
|
|
(0.7) |
|
|
(0.1) |
Inventory adjustment |
|
|
15.4 |
|
|
3.8 |
|
|
16.3 |
|
|
8.9 |
Foreign exchange loss, Séguéla Mine |
|
|
- |
|
|
(0.4) |
|
|
0.8 |
|
|
0.8 |
Net finance items |
|
|
7.5 |
|
|
3.1 |
|
|
21.8 |
|
|
12.1 |
Depreciation, depletion, and amortization |
|
|
71.6 |
|
|
45.3 |
|
|
219.6 |
|
|
172.8 |
Income taxes |
|
|
17.0 |
|
|
(15.3) |
|
|
32.6 |
|
|
10.8 |
Impairment of mineral properties, plant and equipment |
|
|
90.6 |
|
|
182.8 |
|
|
90.6 |
|
|
182.8 |
Investment income |
|
|
- |
|
|
- |
|
|
- |
|
|
- |
Other non-cash/non-recurring items |
|
|
8.5 |
|
|
(3.0) |
|
|
(2.3) |
|
|
(6.7) |
Adjusted EBITDA |
|
|
120.3 |
|
|
55.8 |
|
|
335.1 |
|
|
245.5 |
Figures may not add due to rounding
Fortuna | 42
Fortuna Silver Mines Inc.
Management’s Discussion and Analysis
For the year ended December 31, 2023 (in US Dollars, tabular amounts in millions, except where noted)
Adjusted Attributable Net Income
The following table presents a reconciliation of Adjusted Attributable Net Income from attributable net income, the most directly comparable IFRS measure, for the three and twelve months ended December 31, 2023 and 2022:
|
|
|
Three months ended December 31, |
|
|
Years ended December 31, |
||||||
(Expressed in millions) |
|
2023 |
|
2022 |
|
2023 |
|
2022 |
||||
Net loss attributable to shareholders |
|
|
(92.3) |
|
|
(152.8) |
|
|
(50.8) |
|
|
(128.1) |
Adjustments, net of tax: |
|
|
|
|
|
|
|
|
|
|
|
|
Community support provision and accruals1 |
|
|
(0.4) |
|
|
(0.1) |
|
|
(0.5) |
|
|
(0.1) |
Foreign exchange loss, Séguéla Mine2 |
|
|
- |
|
|
(0.4) |
|
|
- |
|
|
1.1 |
Write off of mineral properties |
|
|
4.0 |
|
|
0.3 |
|
|
4.5 |
|
|
5.1 |
Unrealized loss (gain) on derivatives |
|
|
0.1 |
|
|
0.1 |
|
|
(0.3) |
|
|
(0.4) |
Impairment of mineral properties, plant and equipment |
|
|
90.6 |
|
|
155.9 |
|
|
90.6 |
|
|
155.9 |
Inventory adjustment |
|
|
13.2 |
|
|
3.8 |
|
|
13.9 |
|
|
7.6 |
Accretion on right of use assets |
|
|
0.5 |
|
|
0.5 |
|
|
3.1 |
|
|
2.3 |
Other non-cash/non-recurring items |
|
|
4.9 |
|
|
(0.9) |
|
|
4.4 |
|
|
(2.0) |
Adjusted attributable net income |
|
|
20.6 |
|
|
6.4 |
|
|
64.9 |
|
|
41.4 |
1 Amounts are recorded in Cost of sales |
|
|
|
|
|
|
|
|
|
|
|
|
Net Debt
The following table presents a calculation of net debt for the twelve months ended December 31, 2023 and 2022:
|
|
|
|
|
|
|
||||||
(Expressed in millions except Total net debt to Adjusted EBITDA ratio) |
|
|
|
|
|
As at December 31, 2023 |
||||||
Credit facility |
|
|
|
|
|
|
|
|
|
$ |
|
165.0 |
Convertible debenture |
|
|
|
|
|
|
|
|
|
|
|
45.7 |
Debt |
|
|
|
|
|
|
|
|
|
|
|
210.7 |
Less: Cash and Cash Equivalents |
|
|
|
|
|
|
|
|
|
|
|
(128.1) |
Total net debt1 |
|
|
|
|
|
|
|
|
|
$ |
|
82.6 |
Adjusted EBITDA (last four quarters) |
|
|
|
|
|
|
|
|
|
$ |
|
335.1 |
Total net debt to adjusted EBITDA ratio |
|
|
|
|
|
|
|
|
|
|
|
0.2:1 |
1 Excluding letters of credit |
|
|
|
|
|
|
|
|
|
|
|
|
Working Capital
The following table presents a calculation of working capital for the twelve months ended December 31, 2023 and 2022:
|
|
Years ended December 31, |
||||
|
|
2023 |
|
2022 |
||
Current Assets |
|
$ |
333,325 |
|
$ |
252,712 |
Current Liabilities |
|
|
243,770 |
|
|
135,080 |
Working Capital |
|
$ |
89,555 |
|
$ |
117,632 |
Fortuna | 43
Fortuna Silver Mines Inc.
Management’s Discussion and Analysis
For the year ended December 31, 2023 (in US Dollars, tabular amounts in millions, except where noted)
Qualified Person
Eric Chapman, Senior Vice-President of Technical Services, is a Professional Geoscientist of the Engineers and Geoscientists of British Columbia (Registration Number 36328), and is the Company’s Qualified Person (as defined by National Instrument 43-101). Mr. Chapman has reviewed and approved the scientific and technical information contained in this MD&A and has verified the underlying data.
Other Information, Risks and Uncertainties
For further information regarding the Company’s operational risks, please refer to the section entitled “Description of the Business - Risk Factors” in the Company’s most recent Annual Information Form that is available on SEDAR+ at www.sedarplus.ca and on EDGAR at www.sec.gov/edgar.shtml.
The following is a discussion of risk factors relevant to the Company’s operations and future financial performance. Additional risks not currently known by the Company, or that the Company currently deems immaterial, may also impair the Company’s operations. You should carefully consider the risks and uncertainties described below as well as the other information contained and incorporated by reference in this MD&A.
The Company is exposed to many risks in conducting its business, including, but not limited, to metal price risk as the Company derives its revenue from the sale of silver, gold, lead and zinc; credit risk in the normal course of business; foreign exchange risk as the Company reports its financial statements in U.S. dollars, whereas the Company operates in jurisdictions that conducts its business in other currencies; the inherent risks of uncertainties in estimating mineral reserves and mineral resources; rising rates of inflation which impact the costs of production; political risks, capital controls risk and the limitations on the repatriation of operating cash flows, environmental risks; risks related to the ability of the Company to obtain permits for its operations, including risks related to the legal proceedings in respect of the reinstatement of the 12 year extension of the EIA at the San Jose Mine; and risks related to its relations with employees. Before deciding to invest in securities of the Company, investors should consider carefully such risks and uncertainties.
As at the date of the MD&A, the Company conducts its operations in Argentina, Burkina Faso, Côte d'Ivoire, Mexico, Peru, and Senegal. All these jurisdictions are potentially subject to a number of political and economic risks as described below, including risk specific to operating in West Africa. The Company is unable to determine the impact of these risks on its future financial position or results of operations, and the Company’s exploration, development, and production activities may be substantially affected by factors outside of the Company’s control. These potential factors include but are not limited to royalty and tax increases or claims by governmental bodies, expropriation or nationalization, lack of an independent judiciary, foreign exchange controls, capital and currency controls, import and export regulations, cancellation or renegotiation of contracts, and environmental and permitting regulations. The Company has no political risk insurance coverage against these risks.
The majority of the Company’s production and revenue to December 31, 2023 was derived from its operations in Argentina, Mexico, Burkina Faso, Côte d'Ivoire, and Peru. As the Company’s business is carried on in a number of developing countries, it is exposed to a number of risks and uncertainties, including the following: expropriation or nationalization without adequate compensation, especially in Argentina which has a history of expropriation where the Company operates the Lindero Mine; changing political and fiscal regime, and economic and regulatory instability; unanticipated changes to royalty and tax regulations; unreliable and undeveloped infrastructure, labor unrest, and labor scarcity; difficulty procuring key equipment and components for equipment; import and export regulation and restrictions; the imposition of capital controls which may affect the repatriation of funds; high rates of inflation; extreme fluctuations in foreign exchange rates and the imposition of currency controls; inability to obtain fair dispute resolution or judicial determination because of bias, corruption or abuse of power; difficulties enforcing judgments; difficulties understanding and complying with regulatory and legal framework with respect to ownership and maintenance of mineral properties, mines and mining operations; local opposition to mine development projects, which include the potential for violence, property damage and frivolous or vexatious claims; terrorism and hostage taking; military repression and increased likelihood of international conflicts or aggression; increased public health concerns.
Fortuna | 44
Fortuna Silver Mines Inc.
Management’s Discussion and Analysis
For the year ended December 31, 2023 (in US Dollars, tabular amounts in millions, except where noted)
Certain of the risks and uncertainties described above are prevalent in the jurisdictions where the Company operates. In particular, on April 28, 2023, the Mexican Government reformed its mining code which significantly changed the current legal environment including shortening the length of concessions from 50 years to 30 years, requiring all new mining concession to be granted pursuant to a public tendering process; imposing new indigenous consultation requirements and new environmental safeguards; tightening the requirements for water, and other reforms. The impact to Fortuna’s operations is currently under review.
On December 10, 2023, the Milei government came to power in Argentina and began wide-spread change to the country’s economic and taxation policies. This included a significant devaluation of the Peso in December 2023. It is unclear how the change in government and macro-economic policies will impact Argentina and the economic environment and management will continue to monitor the situation.
On January 28, 2024, the government of Burkina Faso, along with Mali and Niger, announced its intention to withdraw from the Economic Community of West Africa States (ECOWAS). The protocol to withdraw from ECOWAS takes up to one year to complete and there is significant uncertainty on how this will impact the economic and political situation in Burkina Faso. Burkina Faso has not yet announced an intention to withdraw from the West African Monetary Union (WAMU) which dictates free trade and the currency within the economic zone. Management will continue to monitor the situation and take the appropriate actions to limit risk as a result of the announcement.
Risks of Operating in West Africa
Certain of the Company’s operations are currently conducted in West Africa, with the Séguéla Mine in Côte d’Ivoire, the Yaramoko Mine in Burkina Faso, and the Diamba Sud Exploration project in Senegal, and, as such is common in other mining jurisdictions, the Company’s operations are exposed to various political, economic, and other risks and uncertainties. These risks and uncertainties include, but are not limited to: civil and ethnic unrest, war (including in neighboring countries), terrorist actions, hostage taking or detainment of personnel, military repression, criminal activity, nationalization, illegal mining, invalidation of governmental orders, failure to enforce existing laws, labor disputes, corruption, sovereign risk, political instability, the failure of foreign parties, courts or governments to honor or enforce contractual relations or uphold property rights, changing government regulations with respect to mining (including royalties, environmental requirements, labor, taxation, land tenure, foreign investments, income repatriation, and capital recovery), fluctuations in currency exchange and inflation rates, import and export restrictions, the expropriation of assets and property interests, currency controls and government regulations that favor or require the Company to award contracts in, employ citizens of, or purchase supplies from, a particular jurisdiction; as well as by laws and policies of Canada affecting foreign trade, investment and taxation.
As African governments continue to grapple with challenges in their public finance management systems, the strength of commodity prices has resulted in the gold mining sector being targeted as a source of revenue for the Governments, by enhancing tax collection from the extractive sector in particular. Governments are assessing the terms for mining company to exploit resources in their countries
Operations may also be impacted to varying degrees by the lack of certainty with respect to foreign legal systems, which may not be immune from the influence of political pressure, corruption, or other factors that are inconsistent with the rule of law. Businesses can become involved in lengthy court cases over simple issues when rulings are not clearly defined, and the poor drafting of laws and excessive delays in the legal process for resolving issues or disputes compound such problems.
Fortuna | 45
Fortuna Silver Mines Inc.
Management’s Discussion and Analysis
For the year ended December 31, 2023 (in US Dollars, tabular amounts in millions, except where noted)
Failure to comply strictly with applicable laws, regulations and local practices relating to mineral right applications and tenure could result in loss, reduction, or expropriation of entitlements. In addition, changes in government laws and regulations, including taxation, royalties, the repatriation of capital and profits, restrictions on production, export controls, changes in taxation policies, environmental and ecological compliance, expropriation of property and shifts in the political stability of the country, could adversely affect the Company’s exploration, development and production initiatives in these countries and their profitability.
Different economic and social issues exist in emerging markets which may affect the Company’s operating and financial results. For example, infectious diseases (including malaria, HIV/AIDS, tuberculosis, and the Ebola virus) are major health care issues in African countries. Workforce training and health programs to maximize prevention awareness and minimize the impact of infectious diseases in Africa may prove insufficient to adequately address these serious issues. Operations in some emerging countries of West Africa may also be subject to civil disturbances and criminal activities such as trespass, illegal mining, sabotage, theft, and vandalism. Any disturbances and criminal activities may cause disruptions at the Company’s operations, increase operating costs, result in harm to employees or trespassers, cause damage to production facilities or otherwise decrease operational efficiency, increase community tensions or result in criminal and/or civil liability for the Company or its respective employees and/or financial damages or penalties. In particular, the risks associated with civil unrest in the foreign jurisdictions and local communities in which the Company operates may lead to critical supply chain interruptions.
Any of the above events could delay or prevent the Company from exploring, permitting, developing operating, or its properties even if economic quantities of minerals are found and could have a material adverse impact upon the Company’s operations.
There is a degree of uncertainty attributable to the estimation of Mineral Resources, Mineral Reserves, and expected mineral grades. Until mineral deposits are actually mined and processed, Mineral Resources and Mineral Reserves must be considered as estimates only. Any such estimates are expressions of judgment based on knowledge, mining experience, analysis of drilling results and industry practices.
Mineral Resources and Mineral Reserves may require revision based on actual production experience. Market fluctuations in the price of metals, as well as increased production costs and reduced metallurgical recovery rates, may render certain Mineral Reserves uneconomic and may ultimately result in a restatement of Mineral Resources and/or Mineral Reserves. Short-term operating factors relating to the Mineral Resources and Mineral Reserves, such as the need for sequential development of ore bodies, may adversely affect the Company’s profitability in any accounting period. Estimates of operating costs are based on assumptions including those relating to inflation and currency exchange, which may prove incorrect. Estimates of mineralization can be imprecise and depend upon geological interpretation and statistical inferences drawn from drilling and sampling analysis, which may prove to be unreliable. In addition, the grade and/or quantity of precious metals ultimately recovered may differ from that indicated by drilling results. There can be no assurance that precious metals recovered in small scale tests will be duplicated in large scale tests under onsite conditions or in production scale. Amendments to mine plans and production profiles may be required as the amount of Mineral Resources changes or upon receipt of further information during the implementation phase of the project. Extended declines in market prices for gold, silver, and other metals may render portions of the Company’s mineralization uneconomic and result in reduced reported mineralization. Any material reduction in estimates of mineralization, or in the Company’s ability to develop its properties and extract and sell such minerals, could have a material adverse effect on the Company's results of operations or financial condition.
During the fourth quarter of 2023, the life of mine plan for the San Jose Mine was updated which indicated that the Mineral Reserves will be exhausted at the end of 2024, compared to mid-2025 as previously planned, unless the Company replaces planned depletion of reserves through its exploration program. Upon the closure of the San Jose Mine, the Company will become more heavily reliant on a reduced number of operating projects.
Fortuna | 46
Fortuna Silver Mines Inc.
Management’s Discussion and Analysis
For the year ended December 31, 2023 (in US Dollars, tabular amounts in millions, except where noted)
As a result, the Company’s ability to maintain its current production or to increase its annual production of precious metals and generate revenue therefrom will depend significantly upon the Company’s ability to discover or acquire new deposits, bring new mines into production successfully and to expand mineral reserves at existing mines. Exploration and development of mineral properties involve significant financial risk. Very few properties that are explored are later developed into operating mines.
The capital costs required by the Company’s projects may be significantly higher than anticipated. Capital and operating costs, production and economic returns, and other estimates contained in the Company’s current technical reports may differ significantly from those provided for in future studies and estimates and from management guidance, and there can be no assurance that the Company’s actual capital and operating costs will not be higher than currently anticipated. In addition, delays to construction and exploration schedules may negatively impact the net present value and internal rates of return of the Company’s mineral properties as set forth in the applicable technical report. Similarly, there can be no assurance that historical rates of production, grades of ore processed, rates of recoveries or mining cash costs will not experience fluctuations or differ significantly from current levels over the course of the mining operations. In addition, there can be no assurance that the Company will be able to continue to extend the production from its current operations through exploration and drilling programs.
The operations of the Company are subject to all of the hazards and risks normally incidental to mining exploration, development and operational activities, including fire, explosions, floods, structural collapses, industrial accidents, unusual or unexpected geological conditions, ground control problems, power outages, pollution, industrial water shortages, inclement weather, cave-ins and mechanical equipment failure. Any such hazards could result in work stoppages, damage to or destruction of mines and other facilities, damage to life and property, environmental damage, and possible legal liability for any or all damages. While the Company maintains insurance against certain risks, potential claims could exceed policy limits or be excluded from coverage. There are also risks against which the Company cannot or may elect not to insure. The potential costs which could be associated with any liabilities not covered by insurance or in excess of insurance coverage may have a material adverse effect on the Company’s business, financial condition or results of operations.
It is not unusual in the mining industry for new mining operations to experience unexpected difficulties during the start-up phase or the subsequent ramp up in production to design capacity. The transition from construction to operations at the Séguéla Mine could be impacted by unexpected delays, operational issues or costs in achieving planned production levels thereby affecting the Company’s cashflows and profitability. Any unexpected complications and delays in the completion and successful functioning of these operational elements may result in additional costs being incurred by the Company beyond those already incurred and budgeted.
All phases of the Company’s operations are subject to environmental regulation in the various jurisdictions in which it operates. These laws address emissions into the air, discharges into water, management of waste, management of hazardous substances, protection of natural resources, antiquities and endangered species, and reclamation of lands disturbed by mining operations. The Company’s operations generate chemical and metals depositions in the form of tailings. The Company’s ability to obtain, maintain and renew permits and approvals, and to successfully develop and operate mines may be adversely affected by real or perceived impacts associated with the Company’s activities or of other mining companies that affect the environment, human health and safety. Environmental hazards may exist on the Company’s properties which are unknown to the Company at present and were caused by previous or existing owners or operators of the properties, for which the Company could be held liable.
Fortuna | 47
Fortuna Silver Mines Inc.
Management’s Discussion and Analysis
For the year ended December 31, 2023 (in US Dollars, tabular amounts in millions, except where noted)
Environmental legislation is evolving in a manner which is imposing stricter standards and enforcement, increased fines and penalties for non-compliance, in addition to more stringent environmental assessments of proposed projects and a heightened degree of responsibility for companies and their officers, directors and employees. Compliance with environmental laws and regulations may require significant capital outlays on behalf of the Company and may cause material changes or delays in the Company’s intended activities. Failure to comply with applicable environmental laws, regulations and permitting requirements may result in enforcement actions thereunder, including orders issued by regulatory or judicial authorities, causing operations to cease or be curtailed. Such enforcement actions may include the imposition of corrective measures requiring capital expenditure, installation of new equipment, or remedial action. There is no assurance that future changes in environmental regulation, if any, will not adversely affect the Company’s operations.
The activities of the Company require licenses and permits from various governmental authorities. The Company currently has been granted the requisite licenses and permits to enable it to carry on its existing business and operations. However, there can be no assurance that the Company will be able to obtain all the necessary licenses and permits which may be required to carry out exploration, development and mining operations for its projects in the future. The Company might find itself in situations where the state of compliance with regulation and permits can be subject to interpretation and challenge from authorities that could carry risk of fines or temporary stoppage.
On January 5, 2023, the Company announced that it had received the SEMARNAT Resolution which provides that SEMARNAT has annulled and is re-assessing the 12-year extension to the EIA for the San Jose Mine that it granted to Minera Cuzcatlan in December 2021. Management of the Company believes that the SEMARNAT resolution is unfounded and has no merits. Minera Cuzcatlan initiated the Mexican Legal Proceedings to contest and revoke the annulment of the San Jose EIA. On March 10, 2023, the Court granted Cuzcatlan a permanent injunction which allows the San Jose Mine to continue to operate under the terms of the 12-year EIA until the determination of the Mexican Legal Proceedings. On October 30, 2023, the Company announced that the Court had ruled in favour of Minera Cuzcatlan and reinstated the 12-year EIA. The decision of the Court has been appealed and was admitted by the Appeals Court in January 2024. Minera Cuzcatlan filed a response with the Appeals Court in February 2024. A decision of the Appeals Court is expected within the next six to 12 months; the results cannot be predicted with certainty due to the uncertainty inherent in litigation. The permanent injunction that Minera Cuzcatlan already has remains in effect which allows the mine to continue to operate.
The Company’s Yaramoko Mine is located in Burkina Faso and the Séguéla Mine is located in in Côte d’Ivoire. Following instability in recent years in several West African countries, the prevailing security environment in certain West African countries has deteriorated due to the presence of various militant secessionist and Islamist paramilitary groups, including the 2022 military coups in Burkina Faso and the coup in Niger in July of 2023. While additional measures have been implemented in response to ensure the security of its various assets, personnel, and contractors, and while the Company continues to cooperate with regional governments, their security forces, and third parties, there can be no assurance that these measures will be successful. Any failure to maintain the security of its assets, personnel, and contractors may have a material adverse effect on the Company’s business, prospects, financial condition, and results of operations. To date, neither employees nor operations have been impacted by the security situation in Burkina Faso.
While there is no reason to believe that the Company’s employees or operations will be targeted by criminal and/or terrorist activities in the countries in which we operate, risks associated with conducting business in the region, along with the increased perception that such incidents are likely to occur, may disrupt the Company’s operations, limit its ability to hire and keep qualified personnel, and impair its access to sources of capital or insurance on terms and at rates that are commercially viable. Furthermore, although the Company has developed procedures regarding the mitigation of such risks, due to the unpredictable nature of criminal and/or terrorist activities, there is no assurance that its efforts will be able to effectively mitigate such risks and safeguard the Company’s personnel and assets.
Fortuna | 48
Fortuna Silver Mines Inc.
Management’s Discussion and Analysis
For the year ended December 31, 2023 (in US Dollars, tabular amounts in millions, except where noted)
Credit risk is the risk of an unexpected loss if a customer or third party to a financial instrument fails to meet its contractual obligations. All of our trade receivables from concentrate sales are held with large international metals trading companies.
The Company’s cash and cash equivalents and short-term investments are held through large financial institutions. These investments mature at various dates within one year.
The Company’s maximum exposure to credit risk as at December 31, 2023 and 2022 is as follows:
As at |
|
December 31, 2023 |
|
December 31, 2022 |
||
Cash and cash equivalents |
|
$ |
128.1 |
|
$ |
80.5 |
Trade and other receivables |
|
|
69.5 |
|
|
68.2 |
Income tax receivable |
|
|
6.3 |
|
|
0.7 |
Other non-current receivables |
|
|
18.7 |
|
|
8.5 |
|
|
$ |
222.6 |
|
$ |
157.9 |
Figures may not add due to rounding
The carrying amount of financial assets recorded in the financial statements represents the Company’s maximum exposure to credit risk. We limit our exposure to counterparty credit risk on cash and term deposits by only dealing with financial institutions with high credit ratings and through our investment policy of purchasing only instruments with a high credit rating. Almost all of our concentrate is sold to large well-known concentrate buyers.
The Company derives its revenue from the sale of silver, gold, lead, and zinc. The Company’s sales are directly dependent on metal prices, and metal prices have historically shown significant volatility that is beyond the Company’s control.
The following table illustrates the sensitivity to a +/-10% change in metal prices on the Company’s outstanding trade receivables as at December 31, 2023:
Metal |
|
Change |
|
|
Effect on Sales |
Silver |
|
+/- 10% |
|
|
0.4 |
Gold |
|
+/- 10% |
|
|
0.2 |
Lead |
|
+/- 10% |
|
|
0.5 |
Zinc |
|
+/- 10% |
|
|
0.4 |
Changes in the market prices of the precious metals that the Company produces affects the Company’s profitability and cashflow. Metals prices can fluctuate due to many factors including, demand, the strength of the United States dollar, currency exchange rates, inflation, global mine production levels, other general price instability. Decrease in the market price of metals can also significantly affect the value of the Company’s metal inventory, stockpiles and leach pads, and it may be necessary to record a write-down to the net realizable value as well as significantly impact the carrying value of Company’s assets.
From time to time, the Company mitigates the price risk associated with its base metal production by entering into forward sale and collar contracts for some of its forecasted base metal production and non-metal commodities.
Fortuna | 49
Fortuna Silver Mines Inc.
Management’s Discussion and Analysis
For the year ended December 31, 2023 (in US Dollars, tabular amounts in millions, except where noted)
The zinc and lead contracts are derivative financial instruments and are not accounted for as designated hedges. They were initially recognized at fair value on the date on which the related derivative contracts were entered into and are subsequently re-measured to estimated fair value. Any gains or losses arising from changes in the fair value of the derivatives are credited or charged to profit or loss.
The Company is exposed to fluctuations in foreign exchange rates as a portion of our expenses are incurred in Canadian Dollars, Peruvian Soles, Argentine Pesos, Mexican Pesos, Euros, Australian dollars, and West African CFA Francs. A significant change in the foreign exchange rates between the United States dollar relative to the other currencies could have a material effect on the Company’s profit or loss, financial position, or cash flows.
The following table summarizes the sensitivity to a +/-10% change in foreign currency exchange rates on the Company’s foreign currency exposure as at December 31, 2023:
Currency of foreign denominated items |
|
Change |
|
|
Effect |
Mexican pesos |
|
+/- 10% |
|
|
1.0 |
Peruvian soles |
|
+/- 10% |
|
|
0.8 |
Argentine pesos |
|
+/- 10% |
|
|
0.3 |
Canadian dollars |
|
+/- 10% |
|
|
1.2 |
West African CFA francs |
|
+/- 10% |
|
|
6.4 |
Australian dollar |
|
+/- 10% |
|
|
0.1 |
Euros |
|
+/- 10% |
|
|
0.3 |
Due to the volatility of the exchange rate for Argentine Peso, the Company is applying additional measures in cash management to minimize potential losses arising from the conversion of funds. As discussed below in the capital management section, the Company is required to convert the equivalent value into Argentine Pesos from the export sale of all gold doré from the Lindero Mine. In addition, the Company would be required to obtain the prior consent of the Argentine Central Bank for the payment of cash dividends and distributions of profits out of Argentina.
The following tables summarize the Company’s exposure to currency risk through the following assets and liabilities denominated in foreign currencies:
As at December 31, 2023 (In millions of local currency) |
|
Canadian |
|
Peruvian |
|
Mexican |
|
Argentine |
|
West African CFA Francs |
|
Australian |
|
Euro |
Cash and cash equivalents |
|
0.5 |
|
6.9 |
|
8.8 |
|
1,092.7 |
|
39,898.0 |
|
- |
|
- |
Marketable securities |
|
0.1 |
|
- |
|
- |
|
- |
|
- |
|
- |
|
- |
Restricted cash |
|
- |
|
- |
|
- |
|
- |
|
573.8 |
|
- |
|
- |
Trade and VAT receivables |
|
0.4 |
|
1.7 |
|
114.2 |
|
9,554.2 |
|
16,584.8 |
|
(0.1) |
|
- |
Income tax receivable |
|
- |
|
28.1 |
|
84.1 |
|
- |
|
- |
|
- |
|
- |
VAT - long term receivable |
|
- |
|
- |
|
64.3 |
|
- |
|
5,582.8 |
|
- |
|
- |
Trade and other payables |
|
(18.7) |
|
(51.3) |
|
(174.0) |
|
(6,605.6) |
|
(18,465.1) |
|
(1.3) |
|
(2.5) |
Provisions, current |
|
- |
|
(5.9) |
|
(21.4) |
|
(1,334.1) |
|
- |
|
- |
|
- |
Income tax payable |
|
- |
|
- |
|
(28.1) |
|
- |
|
(2,136.2) |
|
- |
|
- |
Other liabilities |
|
(0.2) |
|
- |
|
(121.2) |
|
- |
|
- |
|
- |
|
- |
Provisions, non-current |
|
- |
|
(13.9) |
|
(107.6) |
|
- |
|
- |
|
- |
|
- |
Total foreign currency exposure |
|
(17.9) |
|
(34.4) |
|
(180.9) |
|
2,707.2 |
|
42,038.1 |
|
(1.4) |
|
(2.5) |
US$ equivalent of foreign currency exposure |
|
(13.5) |
|
(9.3) |
|
(10.7) |
|
3.4 |
|
70.9 |
|
(0.9) |
|
(2.8) |
Figures may not add due to rounding |
|
|
|
|
|
|
|
|
|
|
|
|
|
|
Fortuna | 50
Fortuna Silver Mines Inc.
Management’s Discussion and Analysis
For the year ended December 31, 2023 (in US Dollars, tabular amounts in millions, except where noted)
As at December 31, 2022 (In millions of local currency) |
|
Canadian |
|
Peruvian |
|
Mexican |
|
Argentine |
|
West African CFA Francs |
|
Australian |
|
Euro |
Cash and cash equivalents |
|
0.6 |
|
6.2 |
|
73.9 |
|
11.8 |
|
6,057.9 |
|
0.3 |
|
- |
Marketable securities |
|
0.1 |
|
- |
|
- |
|
- |
|
- |
|
- |
|
- |
Restricted cash |
|
- |
|
- |
|
- |
|
- |
|
2,339.0 |
|
- |
|
- |
Trade and VAT receivables |
|
0.2 |
|
3.3 |
|
73.9 |
|
2,062.9 |
|
12,979.1 |
|
(0.1) |
|
- |
Income tax receivable |
|
- |
|
28.1 |
|
13.9 |
|
- |
|
- |
|
- |
|
- |
VAT - long term receivable |
|
- |
|
- |
|
70.5 |
|
- |
|
- |
|
- |
|
- |
Trade and other payables |
|
(13.4) |
|
(17.0) |
|
(218.3) |
|
(1,429.4) |
|
(15,346.5) |
|
(1.3) |
|
(0.3) |
Provisions, current |
|
- |
|
(8.1) |
|
(11.7) |
|
(387.9) |
|
- |
|
- |
|
- |
Income tax payable |
|
0.1 |
|
- |
|
(84.4) |
|
- |
|
(1,353.2) |
|
- |
|
- |
Other liabilities |
|
(0.2) |
|
- |
|
(9.7) |
|
- |
|
- |
|
- |
|
- |
Provisions, non-current |
|
- |
|
(12.6) |
|
(90.8) |
|
- |
|
- |
|
- |
|
- |
Total foreign currency exposure |
|
(12.6) |
|
(0.1) |
|
(182.7) |
|
257.4 |
|
4,676.3 |
|
(1.1) |
|
(0.3) |
US$ equivalent of foreign currency exposure |
|
(9.3) |
|
(0.0) |
|
(9.4) |
|
1.4 |
|
7.4 |
|
(0.8) |
|
(0.3) |
Figures may not add due to rounding |
|
|
|
|
|
|
|
|
|
|
|
|
|
|
Liquidity risk is the risk that we will not be able to meet our financial obligations as they come due. We manage our liquidity risk by continually monitoring forecasted and actual cash flows. We have in place a planning and budgeting process to help determine the funds required to support our normal operating requirements and our development plans. We aim to maintain sufficient liquidity to meet our short term business requirements, taking into account our anticipated cash flows from operations, our holdings of cash and cash equivalents, and our committed and anticipated liabilities.
The Company manages its liquidity risk by continuously monitoring forecasted and actual cashflows. A rigorous reporting, planning, and budgeting process is in place to help facilitate forecasting funding requirements, to support operations on an ongoing basis and with expansion plans, if any. See also “Liquidity and Capital Resources”.
As at December 31, 2023, the Company expects the following maturities of its financial liabilities, lease obligations, and other contractual commitments, excluding payments relating to interest:
|
|
|
Expected payments due by year as at December 31, 2023 |
||||||||||||
|
|
|
Less than |
|
|
|
|
|
|
|
|
After |
|
|
|
|
|
|
1 year |
|
|
1 - 3 years |
|
|
4 - 5 years |
|
|
5 years |
|
|
Total |
Trade and other payables |
|
|
148.1 |
|
|
- |
|
|
- |
|
|
- |
|
|
148.1 |
Debt |
|
|
45.7 |
|
|
165.0 |
|
|
- |
|
|
- |
|
|
210.7 |
Income taxes payable |
|
|
31.8 |
|
|
- |
|
|
- |
|
|
- |
|
|
31.8 |
Lease obligations |
|
|
20.3 |
|
|
39.8 |
|
|
4.9 |
|
|
6.5 |
|
|
71.5 |
Other liabilities |
|
|
- |
|
|
10.0 |
|
|
- |
|
|
- |
|
|
10.0 |
Closure and reclamation provisions |
|
|
5.5 |
|
|
27.2 |
|
|
8.2 |
|
|
38.4 |
|
|
79.3 |
Total |
|
|
251.4 |
|
|
242.0 |
|
|
13.1 |
|
|
44.9 |
|
|
551.4 |
Figures may not add due to rounding |
|
|
|
|
|
|
|
|
|
|
|
|
|
|
|
Fortuna | 51
Fortuna Silver Mines Inc.
Management’s Discussion and Analysis
For the year ended December 31, 2023 (in US Dollars, tabular amounts in millions, except where noted)
The Company’s objective when managing its capital is to maintain its ability to continue as a going concern while at the same time maximizing the growth of its business and providing returns to its shareholders. The Company manages its capital structure and makes adjustments based on changes to its economic environment and the risk characteristics of the Company’s assets.
Effective December 23, 2019, changes to Argentina’s tax laws proposed by the new Argentine Government were implemented. The changes ratified and extended legislation which was to expire on December 31, 2019 and allow the Argentine Central Bank to regulate funds coming into and flowing out of Argentina in order to maintain stability and support the economic recovery of the country. These capital controls, together with additional temporary controls enacted on May 29, 2020, have the effect of requiring exporters to convert the equivalent value of foreign currency received from the export into Argentine Pesos; requiring the prior consent of the Argentine Central Bank to the payment of cash dividends and distributions of currency out of Argentina; requiring Argentine companies to convert foreign currency loans received from abroad into Argentine Pesos; and restricting the sale of Argentine Pesos for foreign currency. These changes have since ratified and extended legislation to December 31, 2025.
The Company’s capital requirement is effectively managed based on the Company having a thorough reporting, planning and forecasting process to help identify the funds required to ensure the Company is able to meet its operating and growth objectives.
The Company’s capital structure consists of equity comprising of share capital, reserves and retained earnings as well as debt facilities, equipment financing obligations less cash, cash equivalents and short-term investments.
As at |
|
December 31, 2023 |
|
December 31, 2022 |
||
Equity |
|
|
1,238.4 |
|
|
1,244.8 |
Debt |
|
|
206.8 |
|
|
219.2 |
Lease obligations |
|
|
57.4 |
|
|
21.3 |
Less: cash and cash equivalents |
|
|
(128.1) |
|
|
(80.5) |
|
|
|
1,374.5 |
|
|
1,404.8 |
Figures may not add due to rounding |
|
|
|
|
|
|
Other than the restrictions related to capital controls, and complying with the debt covenants under the Company’s credit facility, the Company is not subject to any externally imposed capital requirements. As at December 31, 2023, the Company was in compliance with its debt covenants.
Interest rate risk is the risk that the fair value or future cash flows of a financial instrument will fluctuate because of changes in market interest rates. Currently, the Company’s interest rate exposure mainly relates to interest earned on its cash, cash equivalent, and short-term investment balances, interest paid on its SOFR-based debt and the mark-to-market value of derivative instruments which depend on interest rates.
The Company is dependent on a number of key management and employee personnel. The Company’s ability to manage its exploration, development, construction, and operating activities, and hence its success, will depend in large part on the ability to retain current personnel and attract and retain new personnel, including management, technical, and unskilled employees. The loss of the services of one or more key management personnel, as well as a prolonged labor disruption, could have a material adverse effect on the Company’s ability to successfully manage and expand its affairs.
Fortuna | 52
Fortuna Silver Mines Inc.
Management’s Discussion and Analysis
For the year ended December 31, 2023 (in US Dollars, tabular amounts in millions, except where noted)
The Company is subject to various claims and legal proceedings covering a wide range of matters that arise in the normal course of business. The Company may be subject to claims by local communities, indigenous groups, or private landowners relating to land and mineral rights, and such claimants may seek sizable monetary damages or seek the return of surface or mineral rights that may be valuable to the Company which may significantly impact operations and profitability, if lost. These matters are subject to various uncertainties and it is possible that some of these matters may be resolved with an unfavorable outcome to the Company. The Company does carry liability insurance coverage, but such coverage does not cover all risks to which the Company may be exposed to.
On August 16, 2022, the Argentine Tax Authority (“AFIP”) published General Resolution No.5248/2022 (the “Resolution”) which established a one-time “windfall income tax prepayment” for companies that have obtained extraordinary income derived from the general increase in international prices. The Resolution was published by AFIP without prior notice. The windfall income tax prepayment applies to companies that meet certain income tax or net income tax (before the deduction of accumulated tax losses) thresholds for 2021 or 2022. The aggregate amount of the windfall income tax prepayment payable by Mansfield calculated in accordance with the Resolution was approximately $1.0 million (810 million Argentine Pesos), excluding related accrued interest of approximately $0.3 million (277 million Argentine Pesos). The windfall income tax prepayment was to be paid in three equal and consecutive monthly instalments, starting on October 22, 2022, and was payable in addition to income tax instalments currently being paid by corporate taxpayers on account of their income tax obligations. The windfall income tax prepayment is an advance payment of income taxes which were due to be paid in 2022.
Based on the historical accumulated losses of Mansfield for fiscal 2021, which can be carried forward for 2022, Mansfield was not liable for income tax for fiscal 2022. To protect Mansfield’s position from having to pay the windfall income tax prepayment as an advance income tax for 2022, which based on management’s projections was not payable, Mansfield applied to the Federal Court of Salta Province for a preliminary injunction to prevent the AFIP from issuing a demand or other similar measure for the collection of the windfall income tax prepayment. On October 3, 2022, Mansfield was notified that the Court had granted the preliminary injunction. As a result, Mansfield did not pay any of the instalments.
Mansfield also filed an administrative claim with the AFIP to challenge the constitutionality of the Resolution, which was rejected by AFIP on November 2, 2022. Mansfield has challenged the rejection of its administrative claim, by filing legal proceedings against the AFIP with the Federal Court. On February 15, 2023, the Federal Court granted Mansfield a preliminary injunction in these legal proceedings. Mansfield has subsequently presented additional documentation to AFIP which has resulted in the windfall tax prepayment installments being eliminated from Mansfield’s account in AFIP’s system. The legal proceedings to determine the unconstitutionality of the Resolution and whether interest is payable to AFIP continue under the protection of a preliminary injunction.
CRITICAL ACCOUNTING ESTIMATES, ASSUMPTIONS AND JUDGEMENTS
The preparation of consolidated financial statements in conformity with IFRS requires management to make judgements, estimates and assumptions that affect the application of accounting policies and the reported amounts of assets, liabilities, income and expenses. Actual results may differ from these estimates. Estimates and underlying assumptions are reviewed at each period end. Revisions to accounting estimates are recognized in the period in which the estimates are revised and in any future periods affected.
For further information on our significant judgements and accounting estimates, refer to note 4 of our 2023 Financial Statements. There have been no subsequent material changes to these significant judgements and accounting estimates.
Fortuna | 53
Fortuna Silver Mines Inc.
Management’s Discussion and Analysis
For the year ended December 31, 2023 (in US Dollars, tabular amounts in millions, except where noted)
Changes in Accounting Policies
The Company adopted various amendments to IFRS, which were effective for accounting periods beginning on or after January 1, 2023. These include amendments to IAS 1 (Presentation of Financial Statements) and IFRS Practice Statement 2 (Making Materiality Judgements), IAS 8 (Definition of Accounting Estimates) and IAS 12 (Deferred tax related to assets and liabilities arising from a single transaction). The impact of adoption was not significant to the Company's financial statements.
Evaluation of Disclosure Controls and Procedures
Disclosure controls and procedures have been designed to provide reasonable assurance that all material information related to the Company is identified and communicated to management on a timely basis. Management of the Company, under the supervision of the President and Chief Executive Officer and the Chief Financial Officer, is responsible for the design and operation of disclosure controls and procedures in accordance with the requirements of National Instrument 52-109 of the Canadian Securities Administrators and as defined in Rules 13a-15(e) and 15d-15(e) under the Securities Exchange Act of 1934, as amended.
The Company evaluated, with the participation of its CEO and CFO, the effectiveness of its disclosure controls and procedures as of December 31, 2023 and concluded that they are effective.
Management’s Report on Internal Control over Financial Reporting
The Company’s internal control over financial reporting (“ICFR”) is designed to provide reasonable assurance regarding the
reliability of financial reporting and preparation of financial statements for external reporting purposes in accordance with
IFRS as issued by the International Accounting Standards Board. However, due to its inherent limitations, internal control
over financial reporting may not prevent or detect all misstatements and fraud.
Management assesses the effectiveness of the Company’s internal control over financial reporting using the Internal
Control – Integrated Framework (2013) issued by the Committee of Sponsoring Organization of the Treadway Commission
(“COSO”). Management conducted an evaluation of the effectiveness of ICFR and concluded that it was effective as of
December 31, 2023.
There have been no changes in the Company’s internal control over financial reporting during the year ended December
31, 2023 that have materially affected, or are reasonably likely to materially affect, the Company’s internal control over
financial reporting.
The Company’s internal control over financial reporting as of December 31, 2023 has been audited by KPMG LLP, Independent Registered Public Accounting Firm, Vancouver, BC, Canada. The required report is included in the “Report of Independent Registered Public Accounting Firm,” that accompanies the Company’s audited consolidated financial statements as of and for the fiscal years ended December 31, 2023 and 2022.
Fortuna | 54
Fortuna Silver Mines Inc.
Management’s Discussion and Analysis
For the year ended December 31, 2023 (in US Dollars, tabular amounts in millions, except where noted)
CAUTIONARY STATEMENT ON FORWARD-LOOKING STATEMENTS
This MD&A and any documents incorporated by reference into this MD&A includes certain “forward-looking statements” within the meaning of the U.S. Private Securities Litigation Reform Act of 1995 and Section 21E of the United States Securities Exchange Act of 1934, as amended, and “forward-looking information” within the meaning of applicable Canadian securities legislation (collectively, “Forward-looking Statements”). All statements included herein, other than statements of historical fact, are Forward-looking Statements and are often, but not always, identified by the use of words such as “anticipates”, “believes”, “plans”, “estimates”, “expects”, “forecasts”, “targets”, “possible”, “potential”, “intends”, “advance”, “goal”, “objective”, “projects”, “budget”, “calculates” or statements that events, “will”, “may”, “could” or “should” occur or be achieved and similar expressions, including negative variations. The Forward-looking Statements in this MD&A include, without limitation, statements relating to: Mineral Resource and Mineral Reserve estimates as they involve the implied assessment, based on estimates and assumptions that the resources and reserves described exist in the quantities predicted or estimated and can be profitably produced in the future; the Company's plans and expectations for its material properties and future exploration, development and operating activities including, without limitation, capital expenditure, production and cash cost and AISC estimates, exploration activities and budgets, forecasts and schedule estimates, as well as their impact on the results of operations or financial condition of the Company; estimated production forecasts for 2024; estimated costs; estimated cash costs and all-in sustaining cash costs and expenditures for 2024; estimated capital expenditures in 2024; estimated Brownfields and Greenfields expenditures in 2024; exploration plans; the future results of exploration activities; the timing of the implementation and completion of sustaining capital investment projects at the Company’s mines; statements relating to the anticipated closure of the San Jose Mine and the possibility of extending production beyond 2024; statements regarding the ongoing exploration at the Yessi vein at the San Jose MIne; the current budget for the San Jose Mine closure and monitoring plan; the Company’s expectation that there are no changes in internal controls during the year ended December 31, 2023 that are reasonably likely to materially affect the Company’s internal control over financing reporting; property permitting and litigation matters; the Company’s expectation that the leach pad expansion project at the Lindero Mine will be completed during the second half of 2024; the fluctuation of its effective tax rate in the jurisdictions where the Company does business; statements that management will continue to monitor the political and regulatory environments in Argentina and in Burkina Faso and will take appropriate actions to mitigate the risks to the Company’s operations; and the Company’s expectations regarding the timeline for providing updated Mineral Resource and Mineral Reserve estimates.
The forward-looking statements in this MD&A also include financial outlooks and other forward-looking metrics relating to Fortuna and its business, including references to financial and business prospects and future results of operations, including production, and cost guidance and anticipated future financial performance. Such information, which may be considered future oriented financial information or financial outlooks within the meaning of applicable Canadian securities legislation (collectively, “FOFI”), has been approved by management of the Company and is based on assumptions which management believes were reasonable on the date such FOFI was prepared, having regard to the industry, business, financial conditions, plans and prospects of Fortuna and its business and properties. These projections are provided to describe the prospective performance of the Company's business. Nevertheless, readers are cautioned that such information is highly subjective and should not be relied on as necessarily indicative of future results and that actual results may differ significantly from such projections. FOFI constitutes forward-looking statements and is subject to the same assumptions, uncertainties, risk factors and qualifications as set forth below.
Forward-looking Statements involve known and unknown risks, uncertainties and other factors which may cause the actual results, performance or achievements of the Company to be materially different from any results, performance or achievements expressed or implied by the Forward-looking Statements.
Fortuna | 55
Fortuna Silver Mines Inc.
Management’s Discussion and Analysis
For the year ended December 31, 2023 (in US Dollars, tabular amounts in millions, except where noted)
Such uncertainties and factors include, among others: operational risks relating to mining and mineral processing; uncertainty relating to Mineral Resource and Mineral Reserve estimates; uncertainty relating to capital and operating costs, production schedules and economic returns; uncertainty relating to new mining operations such as the Séguéla Mine; that the appeal in respect of the ruling in favor of Minera Cuzcatlan reinstating the environmental impact authorization at the San Jose Mine (the “EIA”) will be successful; risks relating to the Company’s ability to replace its Mineral Reserves; risks associated with mineral exploration and project development; uncertainty relating to the repatriation of funds as a result of currency controls; environmental matters including maintaining, obtaining or renewing environmental permits and potential liability claims; risks associated with political instability and changes to the regulations governing the Company’s business operations; changes in national and local government legislation, taxation, controls, regulations and political or economic developments in countries in which the Company does or may carry on business; risks associated with war, hostilities or other conflicts, such as the Ukrainian – Russian conflict, and the impact it may have on global economic activity; risks relating to the termination of the Company’s mining concessions in certain circumstances; risks related to International Labor Organization (“ILO”) Convention 169 compliance; developing and maintaining good relationships with local communities and stakeholders; risks associated with losing control of public perception as a result of social media and other web-based applications; potential opposition to the Company’s exploration, development and operational activities; risks related to the Company’s ability to obtain adequate financing for planned exploration and development activities; substantial reliance on the Lindero Mine, the Yaramoko Mine, the Séguéla Mine, and the San Jose Mine for revenues; property title matters; risks relating to the integration of businesses and assets acquired by the Company; impairments; reliance on key personnel; uncertainty relating to potential conflicts of interest involving the Company’s directors and officers; risks associated with the Company’s reliance on local counsel and advisors and the experience of its management and board of directors in foreign jurisdictions; adequacy of insurance coverage; operational safety and security risks; risks related to the Company’s compliance with the United States Sarbanes-Oxley Act; risks related to the foreign corrupt practices regulations and anti-bribery laws; legal proceedings and potential legal proceedings; uncertainties relating to general economic conditions; risks relating to pandemics, epidemics and public health crises; and the impact they might have on the Company’s business, operations and financial condition; the Company’s ability to access its supply chain; the ability of the Company to transport its products; and impacts on the Company’s employees and local communities all of which may affect the Company’s ability operate; competition; fluctuations in metal prices; regulations and restrictions with respect to imports; high rates of inflation; risks associated with entering into commodity forward and option contracts for base metals production; fluctuations in currency exchange rates and restrictions on foreign exchange and currencies; failure to meet covenants under its Credit Facilities, or an event of default which may reduce the Company’s liquidity and adversely affect its business; tax audits and reassessments; risks relating to hedging; uncertainty relating to concentrate treatment charges and transportation costs; sufficiency of monies allotted by the Company for land reclamation; risks associated with dependence upon information technology systems, which are subject to disruption, damage, failure and risks with implementation and integration; uncertainty relating to nature and climate change conditions; risks associated with climate change legislation; our ability to manage physical and transition risks related to climate change and successfully adapt our business strategy to a low carbon global economy; risks related to the volatility of the trading price of the Company’s common shares and the Company’s debentures; dilution from further equity or convertible debenture financings; risks related to future insufficient liquidity resulting from a decline in the price of the Company’s common shares or debentures; uncertainty relating to the Company’s ability to pay dividends in the future; risks relating to the market for the Company’s securities; risks relating to the debentures of the Company; and uncertainty relating to the enforcement of any U.S. judgments which may be brought against the Company; as well as those factors referred to in the “Risks and Uncertainties” section in this MD&A and in the “Risk Factors” section in our Annual Information Form for the financial year ended December 31, 2022 filed with the Canadian Securities Administrators and available at www.sedarplus.ca and filed with the U.S. Securities and Exchange Commission as part of the Company’s Form 40-F and available at www.sec.gov/edgar.shtml. Although the Company has attempted to identify important factors that could cause actual actions, events or results to differ materially from those described in Forward-looking Statements, there may be other factors that cause actions, events or results not to be as anticipated, estimated or intended.
Forward-looking Statements contained in this MD&A are based on the assumptions and factors management considers reasonable as at the date of this MD&A, including but not limited to: all required third party contractual, regulatory and governmental approvals will be obtained and maintained for the exploration, development, construction and production of its properties; there being no significant disruptions affecting operations, whether relating to labor, supply, power, blockades, damage to equipment or other matter; there being no material and negative impact to the various contractors, suppliers and subcontractors at the Company’s mine sites as a result of the Ukrainian – Russian conflict or otherwise that would impair their ability to provide goods and services; permitting, construction, development, expansion, and production continuing on a basis consistent with the Company’s current expectations; that the appeal filed in the Mexican Collegiate Court challenging the reinstatement of the EIA will be unsuccessful; expected trends and specific assumptions regarding metal prices and currency exchange rates; prices for and availability of fuel, electricity, parts and equipment and other key supplies remaining consistent with current levels; production forecasts meeting expectations; any investigations, claims, and legal, labor and tax proceedings arising in the ordinary course of business will not have a material effect on the results of operations or financial condition of the Company; and the accuracy of the Company’s current Mineral Resource and Mineral Reserve estimates.
Fortuna | 56
Fortuna Silver Mines Inc.
Management’s Discussion and Analysis
For the year ended December 31, 2023 (in US Dollars, tabular amounts in millions, except where noted)
These Forward-looking Statements are made as of the date of this MD&A. There can be no assurance that Forward-looking Statements will prove to be accurate, as actual results and future events could differ materially from those anticipated in such statements. Accordingly, readers are cautioned not to place undue reliance on Forward-looking Statements. Except as required by law, the Company does not assume the obligation to revise or update these Forward-looking Statements after the date of this document or to revise them to reflect the occurrence of future unanticipated events.
CAUTIONARY NOTE TO UNITED STATES INVESTORS CONCERNING ESTIMATES OF RESERVES AND RESOURCES
The Company is a Canadian “foreign private issuer” as defined in Rule 3b-4 under the United States Securities Exchange Act of 1934, as amended, and is permitted to prepare the technical information contained herein in accordance with the requirements of the securities laws in effect in Canada, which differ from the requirements of the securities laws currently in effect in the United States.
Technical disclosure regarding the Company’s properties included herein was prepared in accordance with NI 43-101. NI 43-101 is a rule developed by the Canadian Securities Administrators that establishes standards for all public disclosure an issuer makes of scientific and technical information concerning mineral projects. NI 43-101 differs significantly from the disclosure requirements of the SEC generally applicable to U.S. companies. Accordingly, information contained herein is not comparable to similar information made public by U.S. companies reporting pursuant to SEC disclosure requirements.
Fortuna | 57
EXHIBIT 99.4
Consent of Independent Registered Public Accounting Firm
The Board of Directors
Fortuna Silver Mines Inc.
We consent to the use of:
| ● | our report dated March 6, 2024 on the consolidated financial statements of Fortuna Silver Mines Inc. (the “Entity”) which comprise the consolidated statements of financial position as of December 31, 2023 and 2022, the related consolidated statements of income (loss), comprehensive income (loss), cash flows, and changes in equity for each of the years then ended, and the related notes (collectively the “consolidated financial statements”), and |
| ● | our report dated March 6, 2024 on the effectiveness of the Entity’s internal control over financial reporting as of December 31, 2023 |
each of which is included in the Annual Report on Form 40-F of the Entity for the fiscal year ended December 31, 2023.
/s/ KPMG LLP
Chartered Professional Accountants
March 28, 2024
Vancouver, Canada
EXHIBIT 99.5
CONSENT OF AUTHOR / EXPERT
ERIC CHAPMAN
I hereby consent to:
| 1. | the use of my name, Eric Chapman, and reference to my name, the technical report entitled “Fortuna Silver Mines Inc.: Séguéla Gold Mine, Côte d’Ivoire” dated effective December 31, 2023 evaluating the Séguéla Mine of Fortuna Silver Mines Inc. (the “Company”), the technical report entitled “Fortuna Silver Mines Inc.: Lindero Mine and Arizaro Project, Salta Province, Argentina” dated effective December 31, 2022 evaluating the Lindero property of the Company, the technical report entitled “Fortuna Silver Mines Inc.: San Jose Mine, Oaxaca, Mexico” dated effective December 31, 2023 evaluating the San Jose Mine of the Company, and the technical report entitled “Fortuna Silver Mines Inc.: Caylloma Mine, Caylloma District, Peru” dated effective December 31, 2023 evaluating the Caylloma Mine of the Company, and the information contained in said technical reports described or incorporated by reference in the Company’s Annual Report on Form 40-F for the year ended December 31, 2023 filed with the United States Securities and Exchange Commission; |
| 2. | the use of my name, Eric Chapman, and reference to my name, and the technical information relating to the updated Mineral Resource estimates for the Company’s properties contained under the heading “General Development of the Business – Three-Year History and Recent Developments” in the Annual Information Form of the Company for the year ended December 31, 2023 included in the Company’s Annual Report on Form 40-F for the year ended December 31, 2023 filed with the United States Securities and Exchange Commission; and |
| 3. | the use of my name, Eric Chapman, and reference to my name, and the technical information contained in the Annual Information Form of the Company for the year ended December 31, 2023 included in the Company’s Annual Report on Form 40-F for the year ended December 31, 2023 filed with the United States Securities and Exchange Commission. |
Dated: March 28, 2024
“Eric Chapman”
Eric Chapman, P.Geo.
EXHIBIT 99.6
CONSENT OF AUTHOR / EXPERT
PAUL WEEDOON
I hereby consent to the use of my name, Paul Weedon, and reference to my name, the technical report entitled “Fortuna Silver Mines Inc.: Séguéla Gold Mine, Côte d’Ivoire” dated effective December 31, 2023 evaluating the Séguéla Mine of Fortuna Silver Mines Inc. (the “Company”), the technical report entitled “Fortuna Silver Mines Inc.: San Jose Mine, Oaxaca, Mexico” dated effective December 31, 2023 evaluating the San Jose Mine of the Company, the technical report entitled “Fortuna Silver Mines Inc.: Caylloma Mine, Caylloma District, Peru” dated effective December 31, 2023 evaluating the Caylloma Mine of the Company, the technical report entitled “Fortuna Silver Mines Inc: Yaramoko Gold Mine, Burkina Faso” dated effective December 31, 2022, evaluating the Yaramoko Mine of the Company, and the information contained in said technical reports described or incorporated by reference in the Company’s Annual Report on Form 40-F for the year ended December 31, 2023 filed with the United States Securities and Exchange Commission.
Dated: March 28, 2024
“Paul Weedon”
Paul Weedon, MAIG
EXHIBIT 99.7
CONSENT OF AUTHOR / EXPERT
RAUL ESPINOZA
I hereby consent to:
| 1. | the use of my name, Raul Espinoza, and reference to my name, the technical report entitled “Fortuna Silver Mines Inc.: Séguéla Gold Mine, Côte d’Ivoire” dated effective December 31, 2023 evaluating the Séguéla Mine of Fortuna Silver Mines Inc. (the “Company”), the technical report entitled “Fortuna Silver Mines Inc: Yaramoko Gold Mine, Burkina Faso” dated effective December 31, 2022 evaluating the Yaramoko Mine of the Company, the technical report entitled “Fortuna Silver Mines Inc.: Lindero Mine and Arizaro Project, Salta Province, Argentina” dated effective December 31, 2022 evaluating the Lindero property of the Company, the technical report entitled “Fortuna Silver Mines Inc.: San Jose Mine, Oaxaca, Mexico” dated effective December 31, 2023 evaluating the San Jose Mine of the Company, the technical report entitled “Fortuna Silver Mines Inc.: Caylloma Mine, Caylloma District, Peru” dated effective December 31, 2023 evaluating the Caylloma Mine of the Company, and the information contained in said technical reports described or incorporated by reference in the Company’s Annual Report on Form 40-F for the year ended December 31, 2023 filed with the United States Securities and Exchange Commission; and |
| 2. | the use of my name, Raul Espinoza, and reference to my name, and the technical information relating to the updated Mineral Reserves estimates for the Company’s properties contained under the heading “General Development of the Business – Three-Year History and Recent Developments” in the Annual Information Form of the Company for the year ended December 31, 2023 included in the Company’s Annual Report on Form 40-F for the year ended December 31, 2023 filed with the United States Securities and Exchange Commission. |
Dated: March 28, 2024
“Raul Espinoza”
Raul Espinoza, FAusIMM (CP)
EXHIBIT 99.8
CONSENT OF AUTHOR / EXPERT
MATHIEU VEILLETTE
I hereby consent to the use of my name, Mathieu Veillette, and reference to my name, the technical report entitled “Fortuna Silver Mines Inc.: Séguéla Gold Mine, Côte d’Ivoire” dated effective December 31, 2023 evaluating the Séguéla Mine of Fortuna Silver Mines Inc. (the “Company”), the technical report entitled “Fortuna Silver Mines Inc.: Lindero Mine and Arizaro Project, Salta Province, Argentina” dated effective December 31, 2022 evaluating the Lindero property of the Company, the technical report entitled “Fortuna Silver Mines Inc.: San Jose Mine, Oaxaca, Mexico” dated effective December 31, 2023 evaluating the San Jose Mine of the Company, the technical report entitled “Fortuna Silver Mines Inc.: Caylloma Mine, Caylloma District, Peru” dated effective December 31, 2023 evaluating the Caylloma Mine of the Company, and the information contained in said technical reports described or incorporated by reference in the Company’s Annual Report on Form 40-F for the year ended December 31, 2023 filed with the United States Securities and Exchange Commission.
Dated: March 28, 2024
“Mathieu Veillette”
Mathieu Veillette, P.Eng.
EXHIBIT 99.9
CONSENT OF AUTHOR / EXPERT
PATRICIA GONZALEZ
I hereby consent to the use of my name, Patricia Gonzalez, and reference to my name, the technical report entitled “Fortuna Silver Mines Inc.: San Jose Mine, Oaxaca, Mexico” dated effective December 31, 2023 evaluating the San Jose Mine of Fortuna Silver Mines Inc. (the “Company”), the technical report entitled “Fortuna Silver Mines Inc.: Caylloma Mine, Caylloma District, Peru” dated effective December 31, 2023 evaluating the Caylloma Mine of the Company, and the information contained in said technical reports described or incorporated by reference in the Company’s Annual Report on Form 40-F for the year ended December 31, 2023 filed with the United States Securities and Exchange Commission.
Dated: March 28, 2024
“Patricia Gonzalez”
Patricia Gonzalez, MMSA (QP)
EXHIBIT 99.10
CONSENT OF AUTHOR / EXPERT
DMITRY TOLSTOV
I hereby consent to the use of my name, Dmitry Tolstov, and reference to my name, the technical report entitled “Fortuna Silver Mines Inc.: Lindero Mine and Arizaro Project, Salta Province, Argentina” dated effective December 31, 2022 evaluating the Lindero property of Fortuna Silver Mines Inc. (the “Company”), and the information contained in said technical report described or incorporated by reference in the Company’s Annual Report on Form 40-F for the year ended December 31, 2023 filed with the United States Securities and Exchange Commission.
Dated: March 28, 2024
“Dmitry Tolstov”
Dmitry Tolstov, MMSA (QP)
EXHIBIT 99.11
CONSENT OF AUTHOR / EXPERT
MATTHEW COBB
I hereby consent to the use of my name, Matthew Cobb, and reference to my name, the technical report entitled “Fortuna Silver Mines Inc: Yaramoko Gold Mine, Burkina Faso” dated effective December 31, 2022 evaluating the Yaramoko Mine of Fortuna Silver Mines Inc. (the “Company”), and the information contained in said technical report described or incorporated by reference in the Company’s Annual Report on Form 40-F for the year ended December 31, 2023 filed with the United States Securities and Exchange Commission.
Dated: March 28, 2024
“Matthew Cobb”
Matthew Cobb, MAIG
EXHIBIT 99.12
CONSENT OF AUTHOR / EXPERT
PAUL CRIDDLE
I hereby consent to the use of my name, Paul Criddle, and reference to my name, the technical report entitled “Fortuna Silver Mines Inc.: Séguéla Gold Mine, Côte d’Ivoire” dated effective December 31, 2023 evaluating the Séguéla Mine of Fortuna Silver Mines Inc. (the “Company”), the technical report entitled “Fortuna Silver Mines Inc: Yaramoko Gold Mine, Burkina Faso” dated effective December 31, 2022 evaluating the Yaramoko Mine of the Company, and the information contained in said technical reports described or incorporated by reference in the Company’s Annual Report on Form 40-F for the year ended December 31, 2023 filed with the United States Securities and Exchange Commission.
Dated: March 28, 2024
“Paul Criddle”
Paul Criddle, FAusIMM
EXHIBIT 99.13
CERTIFICATION PURSUANT TO RULE 13a-14 OR 15d-14 OF THE SECURITIES
EXCHANGE ACT OF 1934, AS ADOPTED PURSUANT TO SECTION 302 OF THE
SARBANES-OXLEY ACT OF 2002
I, Jorge Ganoza Durant, certify that:
|
|
|
1. |
|
I have reviewed this annual report on Form 40-F of Fortuna Silver Mines Inc. (the “issuer”); |
| ||
2. |
|
Based on my knowledge, this report does not contain any untrue statement of a material fact or omit to state a material fact necessary to make the statements made, in light of the circumstances under which such statements were made, not misleading with respect to the period covered by this report; |
| ||
3. |
|
Based on my knowledge, the financial statements, and other financial information included in this report, fairly present in all material respects the financial condition, results of operations and cash flows of the issuer as of, and for, the periods presented in this report; |
| ||
4. |
|
The issuer’s other certifying officer(s) and I are responsible for establishing and maintaining disclosure controls and procedures (as defined in Exchange Act Rules 13a-15(e) and 15d-15(e)) and internal control over financial reporting (as defined in Exchange Act Rules 13a-15(f) and 15d-15(f)) for the issuer and have: |
|
(a) |
|
Designed such disclosure controls and procedures, or caused such disclosure controls and procedures to be designed under our supervision, to ensure that material information relating to the issuer, including its consolidated subsidiaries, is made known to us by others within those entities, particularly during the period in which this report is being prepared; |
| |||
|
(b) |
|
Designed such internal control over financial reporting, or caused such internal control over financial reporting to be designed under our supervision, to provide reasonable assurance regarding the reliability of financial reporting and the preparation of financial statements for external purposes in accordance with generally accepted accounting principles; |
| |||
|
(c) |
|
Evaluated the effectiveness of the issuer’s disclosure controls and procedures and presented in this report our conclusions about the effectiveness of the disclosure controls and procedures, as of the end of the period covered by this report based on such evaluation; and |
| |||
|
(d) |
|
Disclosed in this report any change in the issuer’s internal control over financial reporting that occurred during the period covered by the annual report that has materially affected, or is reasonably likely to materially affect, the issuer’s internal control over financial reporting; and |
5. |
|
The issuer’s other certifying officer(s) and I have disclosed, based on our most recent evaluation of internal control over financial reporting, to the issuer’s auditors and the audit committee of the issuer’s board of directors (or persons performing the equivalent functions): |
|
(a) |
|
All significant deficiencies and material weaknesses in the design or operation of internal control over financial reporting which are reasonably likely to adversely affect the issuer’s ability to record, process, summarize and report financial information; and |
| |||
|
(b) |
|
Any fraud, whether or not material, that involves management or other employees who have a significant role in the issuer’s internal control over financial reporting. |
Dated: March 28, 2024
|
|
“Jorge Ganoza Durant” |
|
|
|
|
Name:Jorge Ganoza Durant |
|
|
|
|
Title:President, Chief Executive Officer & Director |
||
|
|
(principal executive officer) |
|
|
EXHIBIT 99.14
CERTIFICATION PURSUANT TO RULE 13a-14 OR 15d-14 OF THE SECURITIES
EXCHANGE ACT OF 1934, AS ADOPTED PURSUANT TO SECTION 302 OF THE
SARBANES-OXLEY ACT OF 2002
I, Luis Ganoza Durant, certify that:
|
|
|
1. |
|
I have reviewed this annual report on Form 40-F of Fortuna Silver Mines Inc. (the “issuer”); |
| ||
2. |
|
Based on my knowledge, this report does not contain any untrue statement of a material fact or omit to state a material fact necessary to make the statements made, in light of the circumstances under which such statements were made, not misleading with respect to the period covered by this report; |
| ||
3. |
|
Based on my knowledge, the financial statements, and other financial information included in this report, fairly present in all material respects the financial condition, results of operations and cash flows of the issuer as of, and for, the periods presented in this report; |
| ||
4. |
|
The issuer’s other certifying officer(s) and I are responsible for establishing and maintaining disclosure controls and procedures (as defined in Exchange Act Rules 13a-15(e) and 15d-15(e)) and internal control over financial reporting (as defined in Exchange Act Rules 13a-15(f) and 15d-15(f)) for the issuer and have: |
|
(a) |
|
Designed such disclosure controls and procedures, or caused such disclosure controls and procedures to be designed under our supervision, to ensure that material information relating to the issuer, including its consolidated subsidiaries, is made known to us by others within those entities, particularly during the period in which this report is being prepared; |
||
| |||||
|
(b) |
|
Designed such internal control over financial reporting, or caused such internal control over financial reporting to be designed under our supervision, to provide reasonable assurance regarding the reliability of financial reporting and the preparation of financial statements for external purposes in accordance with generally accepted accounting principles; |
||
| |||||
|
(c) |
|
Evaluated the effectiveness of the issuer’s disclosure controls and procedures and presented in this report our conclusions about the effectiveness of the disclosure controls and procedures, as of the end of the period covered by this report based on such evaluation; and |
||
| |||||
|
(d) |
|
Disclosed in this report any change in the issuer’s internal control over financial reporting that occurred during the period covered by the annual report that has materially affected, or is reasonably likely to materially affect, the issuer’s internal control over financial reporting; and |
||
5. |
|
The issuer’s other certifying officer(s) and I have disclosed, based on our most recent evaluation of internal control over financial reporting, to the issuer’s auditors and the audit committee of the issuer’s board of directors (or persons performing the equivalent functions): |
|||
(a) |
|
All significant deficiencies and material weaknesses in the design or operation of internal control over financial reporting which are reasonably likely to adversely affect the issuer’s ability to record, process, summarize and report financial information; and |
|
| |||
|
(b) |
|
Any fraud, whether or not material, that involves management or other employees who have a significant role in the issuer’s internal control over financial reporting. |
Dated: March 28, 2024
|
“Luis Ganoza Durant” |
|
|
|
|
|
Name:Luis Ganoza Durant |
|
|
|
|
Title: Chief Financial Officer |
|
|
|
|
(principal financial officer) |
|
|
EXHIBIT 99.15
CERTIFICATION PURSUANT TO 18 U.S.C. SECTION 1350, AS ADOPTED
PURSUANT TO SECTION 906 OF THE SARBANES-OXLEY ACT OF 2002
In connection with the annual report of Fortuna Silver Mines Inc. (the “Company”) on Form 40-F for the fiscal year ended December 31, 2023, as filed with the Securities and Exchange Commission on the date hereof (the “Report”), I, Jorge Ganoza Durant, President, Chief Executive Officer & Director of the Company, certify, pursuant to 18 U.S.C. section 1350, as adopted pursuant to Section 906 of the Sarbanes-Oxley Act of 2002, that to the best of my knowledge:
|
|
|
1. |
|
The Report fully complies with the requirements of section 13(a) or 15(d) of the Securities Exchange Act of 1934, as amended; and |
2. |
|
The information contained in the Report fairly presents, in all material respects, the financial condition and results of operations of the Company. |
Dated: March 28, 2024
|
“Jorge Ganoza Durant” |
|
|
|
|
|
Name:Jorge Ganoza Durant |
|
|
|
|
Title: President, Chief Executive Officer & Director |
||
|
|
(principal executive officer) |
|
|
This certification accompanies the Report pursuant to Section 906 of the Sarbanes-Oxley Act of 2002 and shall not, except to the extent required by the Sarbanes-Oxley Act of 2002, be deemed filed by the Company for purposes of Section 18 of the Securities Exchange Act of 1934, as amended.
EXHIBIT 99.16
CERTIFICATION PURSUANT TO 18 U.S.C. SECTION 1350, AS ADOPTED
PURSUANT TO SECTION 906 OF THE SARBANES-OXLEY ACT OF 2002
In connection with the annual report of Fortuna Silver Mines Inc. (the “Company”) on Form 40-F for the fiscal year ended December 31, 2023, as filed with the Securities and Exchange Commission on the date hereof (the “Report”), I, Luis Ganoza Durant, Chief Financial Officer of the Company, certify, pursuant to 18 U.S.C. section 1350, as adopted pursuant to Section 906 of the Sarbanes-Oxley Act of 2002, that to the best of my knowledge:
|
|
|
1. |
|
The Report fully complies with the requirements of section 13(a) or 15(d) of the Securities Exchange Act of 1934, as amended; and |
| ||
2. |
|
The information contained in the Report fairly presents, in all material respects, the financial condition and results of operations of the Company. |
Dated: March 28, 2024
|
|
“Luis Ganoza Durant” |
|
|
|
|
Name:Luis Ganoza Durant |
|
|
|
|
Title:Chief Financial Officer |
|
|
|
|
(principal financial officer) |
|
|
This certification accompanies the Report pursuant to Section 906 of the Sarbanes-Oxley Act of 2002 and shall not, except to the extent required by the Sarbanes-Oxley Act of 2002, be deemed filed by the Company for purposes of Section 18 of the Securities Exchange Act of 1934, as amended.