UNITED STATES
SECURITIES AND EXCHANGE COMMISSION
Washington, D.C. 20549
FORM 10-K
(Mark One)
⌧ |
ANNUAL REPORT PURSUANT TO SECTION 13 OR 15(d) OF THE SECURITIES EXCHANGE ACT OF 1934 |
For the fiscal year ended December 31, 2023
◻ |
TRANSITION REPORT PURSUANT TO SECTION 13 OR 15(d) OF THE SECURITIES EXCHANGE ACT OF 1934 |
For the transition period from __________ to ___________
Commission File Number: 001-34857

Gold Resource Corporation
(Exact name of registrant as specified in its charter)
|
|
Colorado |
84-1473173 |
(State or other jurisdiction of |
(I.R.S. Employer |
7900 E. Union Ave, Suite 320, Denver, Colorado 80237
(Address of Principal Executive Offices) (Zip Code)
(303) 320-7708
(Registrant’s telephone number including area code)
Securities registered pursuant to Section 12(b) of the Act:
|
||
|---|---|---|
|
||
Title of each class |
Trading Symbol |
Name of each exchange on which registered |
Common Stock, $0.001 par value |
GORO |
NYSE American |
Securities registered pursuant to Section 12(g) of the Act:
None
Indicate by check mark if the registrant is a well-known seasoned issuer, as defined in Rule 405 of the Securities Act. Yes ◻ No ⌧
Indicate by check mark if the registrant is not required to file reports pursuant to Section 13 or Section 15(d) of the Act. Yes ◻ No ⌧
Indicate by check mark whether the registrant (1) has filed all reports required to be filed by Section 13 or 15(d) of the Securities Exchange Act of 1934 during the preceding 12 months (or for such shorter period that the registrant was required to file such reports), and (2) has been subject to such filing requirements for the past 90 days. Yes ⌧ No ◻
Indicate by check mark whether the registrant has submitted electronically every Interactive Data File required to be submitted pursuant to Rule 405 of Regulation S-T (§232.405 of this chapter) during the preceding 12 months (or for such shorter period that the registrant was required to submit such files). Yes ⌧ No ◻
Indicate by check mark whether the registrant is a large accelerated filer, an accelerated filer, a non-accelerated filer, smaller reporting company, or an emerging growth company. See definition of “large accelerated filer,” “accelerated filer”, “smaller reporting company”, and “emerging growth company” in Rule 12b-2 of the Exchange Act.
Large accelerated filer |
◻ |
Accelerated filer |
◻ |
|
|
|
|
Non-accelerated filer |
⌧ |
Smaller reporting company |
⌧ |
|
|
|
|
|
|
Emerging growth company |
☐ |
If an emerging growth company, indicate by check mark if the registrant has elected not to use the extended transition period for complying with any new or revised financial accounting standards provided pursuant to Section 13(a) of the Exchange Act ◻
Indicate by check mark whether the registrant has filed a report on and attestation to its management’s assessment of the effectiveness of its internal control over financial reporting under Section 404(b) of the Sarbanes-Oxley Act (15 U.S.C.7262(b)) by the registered public accounting firm that prepared or issued its audit report. ◻
If securities are registered pursuant to Section 12(b) of the Act, indicate by check mark whether the financial statements of the registrant included in the filing reflect the correction of an error to previously issued financial statements. ☒
Indicate by check mark whether any of those error corrections are restatements that required a recovery analysis of incentive-based compensation received by any of the registrant’s executive officers during the relevant recovery period pursuant to §240.10D-1(b). ☐
Indicate by check mark whether registrant is a shell company (as defined in Rule 12b-2 of the Exchange Act). Yes ◻ No ⌧
The aggregate market value of the common stock of Gold Resource Corporation held by non-affiliates as of June 30, 2023, the last business day of the registrant’s most recently completed second fiscal quarter, was $55,611,099 based on the closing price of the common stock of $0.63 as reported on the NYSE American.
As of March 20, 2024, there were 88,757,610 shares of the registrant’s common stock outstanding.
DOCUMENTS INCORPORATED BY REFERENCE:
Portions of the Definitive Proxy Statement to be filed pursuant to Regulation 14A for the registrant’s 2024 annual meeting of shareholders will be filed no later than 120 days after the close of Registrant’s fiscal year ended December 31, 2023, and are incorporated by reference into Part III of this Form 10-K.
TABLE OF CONTENTS
|
|
|
Page |
|
|
2 |
|
|
|
|
|
|
|
|
|
|
5 |
||
|
12 |
||
|
25 |
||
|
25 |
||
|
26 |
||
|
40 |
||
|
40 |
||
|
|
|
|
|
|
|
|
|
|
|
|
Market For Common Equity, Related Stockholder Matters and Issuer Purchases of Equity Securities |
|
41 |
|
|
41 |
||
Management’s Discussion and Analysis of Financial Condition and Results of Operations |
|
42 |
|
|
62 |
||
|
64 |
||
Changes in and Disagreements with Accountants on Accounting and Financial Disclosure |
|
99 |
|
|
99 |
||
|
99 |
||
Disclosures Regarding Foreign Jurisdictions that Prevent Inspections |
|
99 |
|
|
|
|
|
|
|
|
|
|
|
|
|
|
100 |
||
|
100 |
||
Security Ownership of Certain Beneficial Owners and Management and Related Stockholder Matters |
|
100 |
|
Certain Relationships and Related Transactions, and Director Independence |
|
100 |
|
|
100 |
||
|
|
|
|
|
|
|
|
|
|
|
|
|
101 |
||
|
103 |
||
|
|
103 |
Gold Resource Corporation
1
2023 HIGHLIGHTS
Highlights for the full-year ended December 31, 2023 are summarized below and discussed further in our Management’s Discussion and Analysis:
Corporate and Financial:
| ● | The Company closed the year with a $6.3 million cash balance as at December 31, 2023. The decrease of $17.4 million from December 31, 2022 is mainly attributable to a cash outflow of $12.5 million for capital investments and a cash outflow of $5.2 million from operating activities for 2023, which included $7.8 million of income tax payments for the tax years 2022 and 2023, exploration investment of $4.2 million at the Don David Gold Mine (“DDGM”), and $1.6 million in spending on the Back Forty Project optimization work, offset by a $0.2 million increase in the value of cash due to the strengthening of the peso. |
| ● | Working capital at December 31, 2023, was $15.2 million, a 29% decrease from the December 31, 2022, working capital of $21.4 million. The decrease is primarily driven by the decline in cash balance discussed above. |
| ● | DDGM total cash costs (after co-product credits) and total all-in sustaining cost per gold equivalent (“AuEq”)1 ounce sold were $1,250 and $1,630, respectively. See Item 7. Management’s Discussion and Analysis of Financial Condition and Results of Operations—Non-GAAP Measures below for a reconciliation of non-GAAP measures to applicable GAAP measures. |
| ● | The Company’s At-The-Market Offering Agreement with H.C. Wainwright & Co., LLC (the “Agent”), which was entered into in November 2019 (the “ATM Agreement”), pursuant to which the Agent agreed to act as the Company’s sales agent with respect to the offer and sale from time to time of the Company’s common stock having an aggregate gross sales price of up to $75.0 million, was renewed in June 2023. |
| ● | On February 13, 2023, the Company announced the suspension of future quarterly dividends to protect the balance sheet and to focus capital resources on exploration and resource and reserve development. |
| ● | In November 2023, the Company’s Board of Directors decided to initiate a formal review process, with the assistance of outside financial and legal advisors, to evaluate strategic alternatives for the Company. The comprehensive process, which is ongoing, is evaluating a broad range of options to maximize shareholder value, including a potential sale or merger of the Company. |
Don David Gold Mine:
| ● | The DDGM safety program aims to bolster the overall health and safety culture of our employees. |
| ● | In 2023, two incidents resulting in lost time were recorded. Despite their low potential for harm, comprehensive investigations were conducted, and requisite measures were implemented accordingly. |
| ● | The full-year lost time injury frequency rate per million hours was 0.96, which is substantially below the 3.95 Camimex (Mexican Chamber of Mines) benchmark.2 |
| ● | DDGM received the Mexican Empresa Socialmente Responsable (“ESR”) award in 2023 for the ninth consecutive year. |
| ● | DDGM produced and sold a total of 31,085 gold equivalent ounces, comprising of 18,534 gold ounces and 1,036,229 silver ounces, sold at an average price per ounce of $1,955 and $23.68, respectively. |
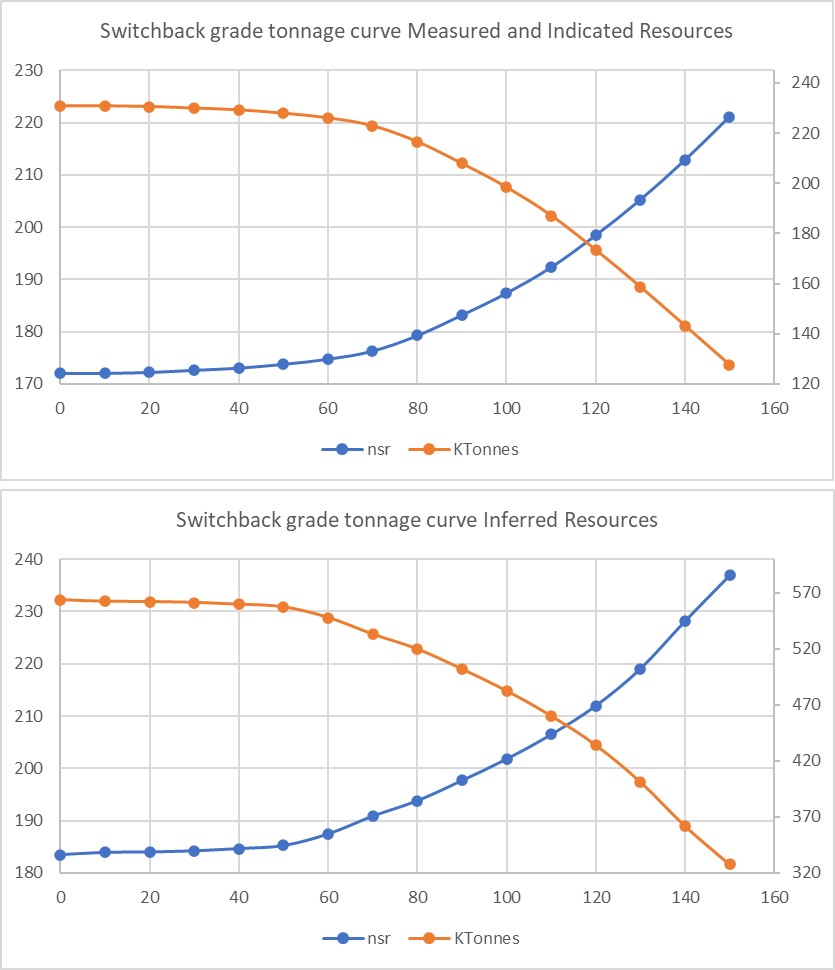
| ● | During the year, our exploration program was executed as planned, maintaining a dual focus on both infill and expansion drilling, with encouraging results from targets in the Switchback, Arista, and Three Sisters vein systems. The 2023 expansion (step-out) drilling program proved highly successful, culminating in the discovery of the Gloria vein system, located immediately north of the Three Sisters system, as well as successfully testing the projected northern extensions of the Splay 31 and Marena North veins of the Arista system. |
| ● | The Company purchased over two thousand tonnes of tailings material for $0.3 million from a third-party mining operation as a collaborative initiative with the local community at the end of 2022. Some of this material was processed in early 2023 to ensure the proper environmental treatment and storage of the material. |
| ● | During the fourth quarter of 2023, negotiations were successfully undertaken to decrease the royalty fee from 5% to 3% for the mining claims at La Tehuana, El Aguila, and Mina El Aire. |
Back Forty Project:
| ● | Optimization work related to the metallurgy and the economic model for the Back Forty Project in Michigan, USA was completed, and the Company filed the Back Forty Project Technical Report Summary, which was prepared in accordance with subpart 1300 of Regulation S-K (“S-K 1300”), as Exhibit 96.1 to the Form 8-K filed on October 26, 2023 (the “Back Forty Project Technical Report Summary”). Results of the work indicate a more robust economic project with no planned impacts to wetlands that is more protective of the environment, which should facilitate a successful mine permitting process. |
1 Gold equivalent is determined by taking gold ounces produced and sold, plus silver ounces produced and sold, converted to gold equivalent ounces using the gold to silver average realized price ratio for the period.
2 Further information regarding the Mexican Chamber of Mines benchmark can be found at https://camimex.org.mx/sostenibilidad2023/indicadores.html. Information contained therein is not a part of this report and is not incorporated by reference herein.
Gold Resource Corporation
2
FORWARD-LOOKING STATEMENTS
This report contains “forward-looking statements” within the meaning of Section 27A of the Securities Act of 1933 and Section 21E of the Securities Exchange Act of 1934. We use the words “anticipate,” “continue,” “likely,” “estimate,” “expect,” “may,” “could,” “will,” “project,” “should,” “believe” and similar expressions (including negative and grammatical variations) to identify forward looking statements. Such forward-looking statements include, without limitation, statements regarding:
| ● | Our strategy for significant future investment in exploration and development activities in Oaxaca, Mexico; |
| ● | The anticipated beneficial impacts of the dry stack tailings facility; |
| ● | Our 2024 guidance for payable production, cash costs per ounce after co-product credits, and all-in sustaining costs per ounce after co-product credits; |
| ● | Expectations regarding 2024 DDGM and Back Forty investment; |
| ● | Expectations regarding 2024 general and administrative costs; |
| ● | The expected timing for the Back Forty Project, permitting, detailed engineering, and project financing; |
| ● | Expectations regarding the likelihood of a successful mine permitting process at the Back Forty Project; |
| ● | Expectations regarding sources and uses of cash during the twelve months ending December 31, 2024; |
| ● | Future exploration plans at DDGM; |
| ● | Compliance with existing legal and regulatory requirements, including future asset reclamation costs; |
| ● | Estimates of Mineral Resources (“Mineral Resources”) and Mineral Reserves (“Mineral Reserves”); |
| ● | The sufficiency of our water rights; |
| ● | Our expectations regarding the future payment of dividends; |
| ● | Our expectation for the outcome of the 2015 DDGM tax audit; |
| ● | Anticipated grades from future production at DDGM; |
| ● | Our ability to locate another customer to purchase our products if the relationship with our existing customers is interrupted; and |
| ● | Our ability to satisfy our obligations and other potential cash requirements over the next twelve months. |
Forward-looking statements are neither historical facts nor assurances of future performance. Rather, they are based only on our current beliefs, expectations, and assumptions regarding the future of our business, future plans and strategies, projections, anticipated events and trends, the economy, and other future conditions. Because forward-looking statements relate to the future, they are subject to inherent uncertainties, risks, and changes in circumstances that are difficult to predict, and many of which are outside of our control. Our actual results and financial condition may differ materially from those indicated in the forward-looking statements. Therefore, you should not rely on any of these forward-looking statements. Important factors that could cause our actual results and financial condition to differ materially from those indicated in the forward-looking statements include, among others, the following:
| ● | The extent of the impact of any pandemic, including the duration, spread, severity, and any repeated resurgence of a pandemic, the duration and scope of related government orders and restrictions, the impact on our employees, and the extent of the impact of a pandemic on our mining operations; |
| ● | Commodity price fluctuations; |
| ● | Mine protests and work stoppages; |
| ● | Rock formations, faults and fractures, water flow, possible CO2 gas exhalation, or other unanticipated geological challenges; |
| ● | Unexpected changes in business and economic conditions, including supply chain challenges, the rate of inflation, and their impact on operating and capital costs; |
| ● | Changes in interest rates and currency exchange rates; |
| ● | The Company’s inability to secure financing when needed; |
| ● | Adverse technological changes and cybersecurity threats; |
| ● | Unanticipated increases in our operating costs and other costs of doing business; |
| ● | Access to land and availability of materials, equipment, supplies, labor and supervision, power, and water; |
Gold Resource Corporation
3
| ● | Results of current and future feasibility studies; |
| ● | Interpretation of drill hole results and the geology, grade, and continuity of mineralization; |
| ● | Litigation by private parties or regulatory action by governmental entities; |
| ● | Acts of God, such as floods, earthquakes, and any other natural disasters; |
| ● | The uncertainty of Mineral Resource and Mineral Reserve estimates; and |
| ● | Such other factors are discussed below under “Risk Factors”. |
Many of these factors are beyond our ability to control or predict. Although we believe that the expectations reflected in our forward-looking statements are based on reasonable assumptions, such expectations may prove to be materially incorrect due to known and unknown risks and uncertainties. You should not unduly rely on any of our forward-looking statements. These statements speak only as of the date of this annual report on Form 10-K. Except as required by law, we are not obligated to publicly release any revisions to these forward-looking statements to reflect future events or developments. All subsequent written and oral forward-looking statements attributable to us and persons acting on our behalf are qualified in their entirety by the cautionary statements contained in this section and elsewhere in this annual report on Form 10-K.
Gold Resource Corporation
4
PART I
ITEM 1. |
BUSINESS |
History and Organization
In this report, “Company,” “GRC,” “our,” “us,” and “we” refer to Gold Resource Corporation together with its subsidiaries, unless the context otherwise requires. See Item 2. Properties—Glossary for additional definitions.
Gold Resource Corporation was organized under the laws of Colorado, USA on August 24, 1998. Since 2010, GRC has produced gold and silver doré and copper, lead, and zinc concentrates in Oaxaca, Mexico at our subsidiary, Don David Gold Mexico S.A. de C.V. (“Don David Gold Mine” or “DDGM”). The Don David Gold Mine holds six (6) properties which are all located in what is known as the San Jose structural corridor. Our properties span 55 continuous kilometers of this structural corridor, which include three historic mining districts in Oaxaca.
On December 10, 2021, the Company successfully completed the acquisition of all the issued and outstanding common shares of Aquila Resources Inc (the “Aquila Transaction”). Aquila’s principal asset is its 100% interest in the Back Forty Project located in Menominee County, Michigan, USA. The Back Forty Project has a polymetallic (gold, silver, copper, lead, and zinc) Volcanogenic Massive Sulfide deposit. The Back Forty Project controls surface and mineral rights through ownership and leases with the State of Michigan. Optimization work related to metallurgy and the economic model was completed during the third quarter of 2023, and the Company filed the Back Forty Project Technical Report Summary on October 26, 2023. Results of the work indicate a more robust economic project with no planned impacts to wetlands that is more protective of the environment, which should facilitate a successful mine permitting process. The Board continues to evaluate options that could lead to the development of the Project.
Review of Strategic Alternatives
Notwithstanding the technical successes noted above, in light of the continued challenges facing the Company, the Company’s Board of Directors has decided to initiate a formal review process, with the assistance of outside financial and legal advisors, to evaluate strategic alternatives for the Company. The comprehensive process is evaluating a broad range of options to maximize shareholder value, including a potential sale of the Company.
There is no deadline or definitive timetable for completion of the strategic alternatives review process, and there can be no assurance regarding the results or outcome of this review. The Company does not intend to comment further on this strategic review process until it has been completed or the Company determines that a disclosure is required by law or otherwise deemed appropriate.
Gold Resource Corporation
5
Mexico Production Stage Properties:
The primary production stage properties at DDGM commenced operations in 2010. The current operations include the Arista underground mine and the DDGM processing facility. The DDGM processing facility currently produces doré and metal concentrates from ore mined at the Arista Mine. The Arista Mine was expanded in 2016 with the development of the Switchback vein system. The Arista Mine portal is located approximately two kilometers from the processing facility. Additionally, underground mining at the Alta Gracia mine was conducted from 2017 to 2019. Alta Gracia is approximately 32 kilometers from the processing facilities.
The Arista and Alta Gracia mines include a total of approximately 30,000 hectares of mining concessions, access roads from a major highway, haul roads, a processing facility and adjoining buildings, an assay lab, a now depleted open pit, underground mines, tailings facilities, and other infrastructure. Please see Item 2. Properties for additional information.
Mexico Exploration Prospects:
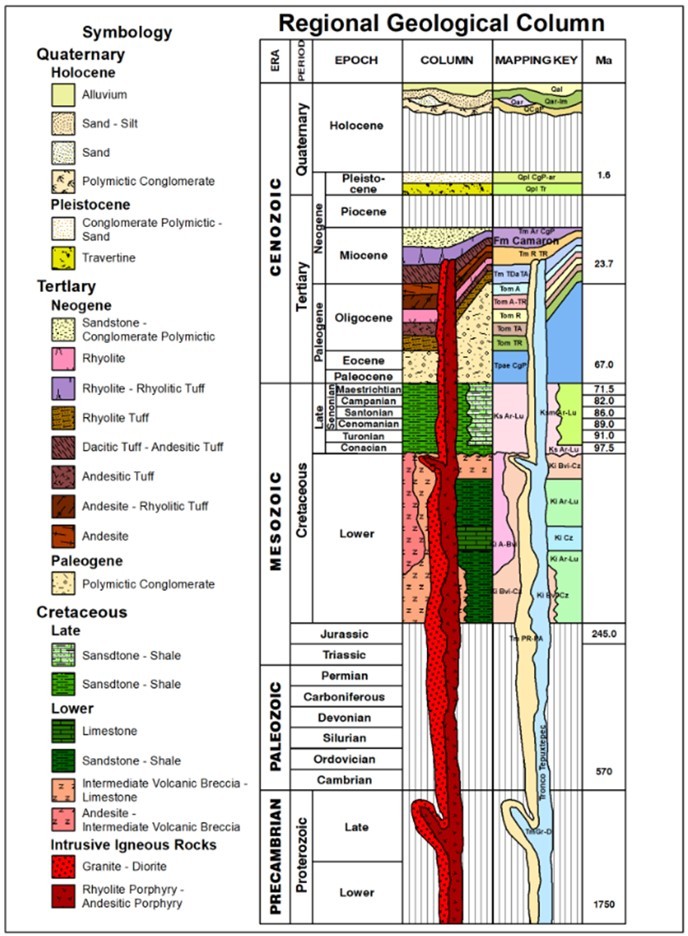
The current company land package sits within the highly prospective 55-kilometer-long San Jose structural corridor, in Oaxaca, Mexico. Multiple volcanic domes of various scales, and likely non-vented intrusive domes, dominate the district geology. These volcanogenic features are imposed on a pre-volcanic basement of sedimentary rocks. Gold and silver, as well as base metal mineralization in this district is related to the manifestations of this classic volcanogenic system and is considered epithermal in character. The Company intends to advance organic growth and to unlock the value of the mine, existing infrastructure, and our large property position by continuing to invest in exploration and development. Please see Item 2. Properties for additional information.
Gold Resource Corporation
6
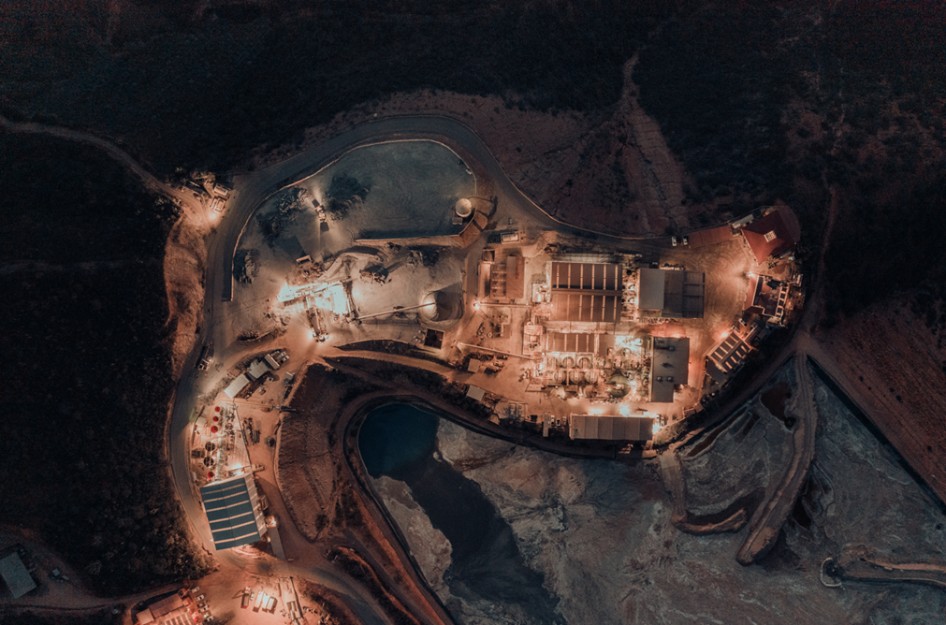
|
Processing Plant at Night |
Back Forty Project:
There is a long history of exploration at the Back Forty Project. After acquisition of Aquila and the Back Forty Project by the Company in 2021, optimization work was initiated to address the mine’s footprint, potential for an underground mine, wetland mitigation, and other key construction and design decisions. This optimization work related to a change in mine design, tailings relocation, metallurgy, and the economic model was completed, and the Company filed the Back Forty Project Technical Report Summary on October 26, 2023. Results of the work indicate a more robust economic project with no planned impacts to wetlands that is more protective of the environment, which should facilitate a successful mine permitting process. The Board continues to evaluate options that could lead to the development of the Project. Please see Item 2. Properties for additional information.
Before the Aquila Transaction, Aquila’s common shares were traded on the Toronto Stock Exchange (“TSX”) under the ticker symbol AQA. Effective December 10, 2021, Aquila ceased to be a reporting issuer in British Columbia, Alberta, Saskatchewan, Ontario, and Nova Scotia. At the same time, GRC became a reporting issuer in British Columbia, Alberta, Saskatchewan, Ontario, and Nova Scotia by virtue of the completion of the acquisition. As a Canadian Issuer, GRC is now required to file reports on the System for Electronic Document Analysis and Retrieval (“SEDAR”) in Canada. All financial statements filed on SEDAR will conform to United States Generally Accepted Accounting Principles (“U.S. GAAP”).
Administrative Offices:
Our principal executive offices are located at 7900 E. Union Ave, Suite 320, Denver, Colorado 80237, and our telephone number is (303) 320-7708. The Company maintains a website at www.goldresourcecorp.com. Information on our website is not incorporated into this annual report on Form 10-K and is not a part of this report. The U.S. Securities and Exchange Commission (“SEC”) maintains an internet site (www.sec.gov) on which the reports that we file with the SEC are available to review.
Gold Resource Corporation
7
The SEC filings can also be accessed through our website.
2023 Developments
For the year ended December 31, 2023, the Company reported a net loss of $16.0 million. The loss is mainly attributable to a high inflationary environment and the strengthening of the Mexican Peso, which resulted in higher production and capital costs (including but not limited to energy, payroll, services, and equipment costs). Financial results for 2023 include revenue of $97.7 million and mine gross loss of $5.3 million. The Company achieved solid production results for the year totaling 20,328 gold ounces, 1,142,138 silver ounces, 1,287 copper tonnes, 5,068 lead tonnes, and 13,513 zinc tonnes, as planned, despite achieving lower production than in 2022 due to mine planning.
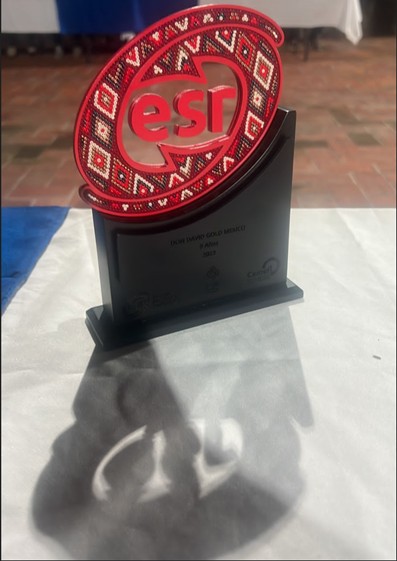
|
Ninth consecutive ESR award |
For the ninth consecutive year, the DDGM received the prestigious ESR award from the Mexican Center for Philanthropy (“CEMEFI”). Awards are given to organizations that demonstrate a commitment to supporting social and environmental protection programs within their local communities.
Our 2023 exploration activities were focused on drilling at the Arista and Switchback vein systems in the Arista Mine. During the year, we completed 168 underground diamond drill holes totaling 36,350 meters, including 18 expansion drill holes totaling 10,293 meters and 150 infill drill holes totaling 26,057 meters in the Arista mine. In addition to exploration drilling, 520 meters of drift development was completed to support the expansion and infill drilling programs.
During 2023, exploration was strategically directed towards infill and expansion drilling of multiple high-grade, polymetallic epithermal veins within the Switchback vein system, both up- and down-dip and along strike of existing workings, as well as in the Three Sisters and newly discovered Gloria vein systems to define additional Mineral Reserves and Mineral Resources. The Gloria vein system, located near existing mine infrastructure and comprised of no fewer than three distinct veins, is located between and north of the Arista and Switchback vein systems. Both the Gloria and Three Sisters vein systems will be a primary focus of the 2024 drilling program. The 2023 drilling program successfully targeted the expansion of the Arista vein system along strike to the north-west, with particular focus on the Splay 31 and Marena North veins, to define additional Mineral Resources. Surface exploration activity during 2023 focused on the Alta Gracia property with the interpretation of surface mapping and soil geochemistry results received late 2022. This work has identified several targets for future follow-up exploration activity. Our continued investment in exploration efforts demonstrate our commitment to long-term investment in Oaxaca, Mexico.
For the Back Forty Project, work in 2023 focused on the optimization of the mine design, project layout, metallurgy, and the economic model which was completed and filed by the Company in a Technical Report Summary on October 26, 2023. Results of the work indicate a more robust economic project with no planned impacts to wetlands that is more protective of the environment, which should facilitate a successful mine permitting process. The Board continues to evaluate options that could lead to the development of the Project.
In June 2023, the petition by the Menominee Indian Tribe of Wisconsin (“MITW”) to have an area along the Menominee River registered as a cultural landscape with the Keeper of the National Register of Historic Places was approved. Anaem Omot is an area around the Menominee River known as the Sixty Islands. This area is known to have culturally significant archeological findings. The Company helped identify these artifacts to ensure that proper procedures are deployed to protect cultural resources and to avoid and mitigate intrusions to the cultural landscape, as required. In addition to identifying these culturally significant resources, the Company has incorporated them into the Back Forty Project designs and permitting strategy.
We are also monitoring the U.S. Army Corps of Engineers’ review of a petition by the MITW to have the Menominee River designated as Navigable under Section 10 of the Rivers and Harbor Act. The MITW asked the Environmental Protection Agency and the U.S. Army Corps of Engineers’ to revisit whether they—as opposed to the state of Michigan—should exercise authority over Aquila’s Back Forty permit applications. In response to a petition from the MITW, the U.S. Army Corps of Engineers is updating its navigability study on the Menominee River, which is expected to be completed in 2025.
Gold Resource Corporation
8
2024 Guidance
The Company’s focus continues to be on unlocking the value of the Arista mine, existing infrastructure, and large property position in Oaxaca, Mexico.
Measure |
2024 Guidance |
Metals Produced & Sold |
13,000 to 15,000 Gold Ounces 1,250,000 to 1,400,000 Silver Ounces 29,500 to 31,500 Gold Equivalent Ounces |
Cash Costs after co-product credits per gold equivalent AuEq ounce (1) |
$1,100 to $1,300 |
All-in Sustaining Costs after co-product credits per AuEq ounce (1) (2) |
DDGM: $1,450 to $1,650 |
Capital Investment |
$6.8 to $8.0 million (Sustaining Capital) $2.0 to $3.0 million (Sustaining Capitalized Exploration) $0.5 to $0.8 million (Non-Sustaining Capitalized Exploration) |
Exploration Investment |
DDGM: $2.0 to $3.5 million (Non-Sustaining Exploration Expense) |
General and Administrative Costs (“G & A”) |
$5.0 to $6.0 million, excluding Stock-based Compensation |
| (1) | Calculations of cash cost after co-product credits per gold equivalent ounce and all-in sustaining cost after co-product credits per gold equivalent ounce are non-GAAP financial measures. Please see Item 7. Management’s Discussion and Analysis of Financial Condition and Results of Operations—Non-GAAP Measures below for a complete reconciliation of the non-GAAP measures to U.S. GAAP. |
| (2) | Co-product credits directly impact the Cash Costs and AISC per AuEq ounce calculation. Guidance is based on approximately 3,600 tonnes of lead sold at a $0.95 per pound metal price, approximately 1,000 tonnes of copper sold at a $3.80 per pound metal prices, and approximately 10,200 tonnes of zinc sold at a $1.15 per pound metal price. |
The table above contains forward-looking projections about our financial condition, results of operations, and business. These projections are subject to numerous assumptions, risks, and uncertainties, which are discussed in Item 1A. Risk Factors. Because these projections are subject to risks and uncertainties, actual results may differ materially from those expressed or implied. See Item 7. Management’s Discussion and Analysis of Financial Condition and Results of Operations—Non-GAAP Measures below for a discussion of the calculation of Cash Costs per Ounce and All-in Sustaining Costs per Ounce, which are non-GAAP measures.
Dividends
In February 2023, we announced the suspension of our quarterly dividend until such time that it may become practicable to reinstate. Please see Item 5. Market for Registrant’s Common Equity, Related Stockholder Matters and Issuer Purchase of Equity Securities for additional information regarding our Dividend Policy.
Insurance
Our business is capital intensive and requires ongoing investment for the replacement, modernization, or expansion of equipment and facilities. For more information, please see Item 7. Management’s Discussion and Analysis of Financial Condition and Results of Operations—Liquidity and Capital Resources below. We maintain insurance policies against property loss and business interruption and insure against most risks that are typical in the operation of our business in amounts that we believe to be reasonable. Such insurance, however, contains exclusions and limitations on coverage, particularly with respect to property loss, environmental liability, and political risk. There can be no assurance that claims would be paid under such insurance policies in connection with a particular event.
Gold Resource Corporation
9
Please see Item 1A. Risk Factors below for additional information.
Competitive Business Conditions
The acquisition of gold and silver properties is subject to intense competition. Identifying and evaluating potential mining prospects is a costly and time-consuming endeavor. In 2021, we successfully acquired the Back Forty Project as discussed above. We expect to continue our significant investment in exploration and growth activities in the future; however, competition for acquiring mineral prospects will continue to be intense.
Government Regulations and Permits
In connection with mining, milling, and exploration activities in Mexico, we are subject to Mexican federal, state, and local laws and regulations governing the protection of the environment, including laws and regulations relating to the protection of air and water quality, hazardous waste management, mine reclamation, as well as the protection of endangered or threatened species. The government department responsible for environmental protection in Mexico is Secretaria de Medio Ambiente y Recursos Naturales (“SEMARNAT”). SEMARNAT has broad authority over environmental regulations and standards. Potential areas of environmental consideration for mining companies, such as ours, include but are not limited to acid rock drainage, cyanide containment and handling, contamination of water sources, dust, and noise.
For operations at our Don David Gold Mine, we have secured and continue to maintain various regulatory permits from federal, state, and local agencies. These governmental and regulatory permits generally govern the processes being used to operate, the stipulations concerning air quality, water issues, hazardous and waste management, and the plans and obligations for reclamation of the properties at the conclusion of operations. These laws and regulations are continually changing and are generally becoming more restrictive.
Our production stage mines in Mexico have reclamation plans in place that we believe meet all applicable legal and regulatory requirements. As of December 31, 2023, $11.4 million has been accrued on our Consolidated Balance Sheets for reclamation costs relating to our production and exploration stage properties in Mexico. In addition, we accrued $0.4 million for drill-hole capping in Michigan.
The State of Michigan has been delegated authority under federal environmental law to issue all necessary environmental permits required for the Back Forty project. The State of Michigan’s “Natural Resource Environmental Protection Act” provides rules and regulations for the State Department of Environment, Great Lakes and Energy (EGLE) to issue permits for mining, treated wastewater discharge, air emissions, and related environmental permits necessary for the project.
Customers
During the year ended December 31, 2023, three customers accounted for 98% of our revenue from DDGM. In the event that our relationship with any of the customers is interrupted for any reason, we believe that we would be able to locate another entity to purchase our products in a timely manner on substantially similar terms. However, any interruption could temporarily disrupt the sale of our principal products and materially adversely affect our operating results. We periodically review our options for alternative sales outlets to mitigate the concentration of risk in case of any unforeseen disruptions.
Human Capital Resources
We value excellence and recognize that embracing the diverse backgrounds, skills, and perspectives of the local workforce will lead to a competitive advantage. We are committed to leading by example and maintaining a fair and inclusive work environment built on mutual respect and integrity. Diversity means understanding, accepting, respecting, and valuing differences among people regardless of age, gender, race, ethnicity, culture, religion or spiritual practices, disabilities, sexual orientation, gender identity, family status, or veteran status.
Gold Resource Corporation
10
We believe we have good morale and a dedicated workforce. Our human capital resources objectives include, as applicable, identifying, recruiting, retaining, incentivizing, and integrating our existing employees and new hires. The principal purposes of our equity incentive plans are to attract, retain, and motivate selected employees and directors by granting stock-based compensation awards that align employee compensation with shareholder returns.
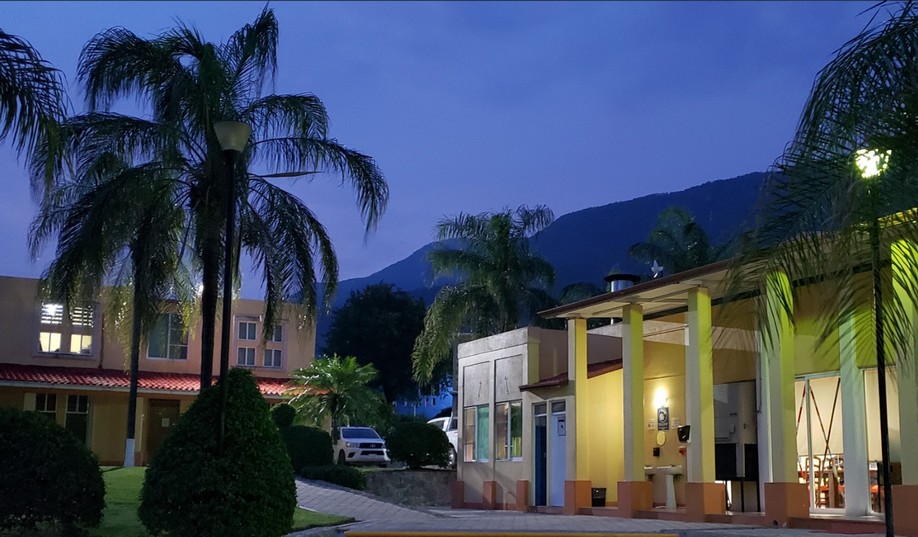
|
DDGM Employee Housing |
As of December 31, 2023, the Company had 488 employees at DDGM. There were 16 full-time corporate employees, three of whom serve as executive officers, and three full-time employees in Michigan who are fully dedicated to progressing the Back Forty Project.
Gold Resource Corporation
11
ITEM 1A. |
RISK FACTORS |
Our business, and the mining industry in general, is influenced by significant risks and uncertainties. These risks include those described below and may include additional risks and uncertainties not presently known to us or that we currently deem immaterial. Our business, financial condition, and results of operations could be materially adversely affected by any of these risks, and the trading price of our common stock could decline by virtue of these risks. These risks should be read in conjunction with the other information in this annual report on Form 10-K.
Financial Risks
Our results of operations, cash flows, and the value of our properties are highly dependent on the market prices of gold, silver, and certain base metals, and these prices can be volatile.
The profitability of our mining operations and the value of our mining properties are directly related to the market price of gold, silver, copper, lead, and zinc. The price of gold and silver may also significantly influence the market price of our common stock. The market prices of these metals historically have fluctuated significantly and are affected by numerous factors beyond our control, including (i) global or regional consumption patterns; (ii) supply of and demand for silver and gold on a worldwide basis; (iii) speculative and hedging activities; (iv) expectations for inflation; (v) political and economic conditions; (vi) supply of, and demand for, consumables required for extraction and processing of metals, and (vii) general economic conditions worldwide. Over the last five years (as reported on the London Bullion Market Association using the London PM Fix for gold and silver), gold prices have fluctuated from a low of $1,270 per ounce to a high of $2,078 per ounce, and silver prices have fluctuated from a low of $12.01 per ounce to a high of $29.59 per ounce. On December 28, 2023, The London PM Fix gold price was $2,078 per ounce and on December 29, 2023, the London PM silver price was $23.79 per ounce.
Currently, we do not use hedging transactions with respect to any of our metal production. Accordingly, we are fully exposed to price fluctuations in precious metals. In the event metal prices decline or remain low for prolonged periods of time, we might be unable to develop our exploration properties, which may materially adversely affect our results of operations, financial performance, and cash flows. An asset impairment charge may result from the occurrence of unexpected adverse events that impact our estimates of expected cash flows generated from our mining operations or the market value of our non-producing properties, including a material diminution in the price of metals.
We may not achieve profitability.
Our DDGM property is the only property we own that produces revenue, and it may not generate sufficient cash flow to cover our operating, development, exploration, general and administrative, and other costs due to certain risk factors. Unexpected interruptions in our mining business may cause us to incur losses, or the revenue that we generate from extraction may not be sufficient to fund continuing operations, including exploration and mine development costs. Our failure to generate future profits may materially adversely affect the price of our common stock, and stockholders may lose all or part of their investment. Metal prices and foreign currency rates have a significant impact on our profit margin, and there is no assurance that we will be profitable in the future. Please see Item 1A. Risk Factors—General Risks – Our results of operations, cash flows, and the value of our properties are highly dependent on the market prices of gold, silver, and certain base metals and these prices can be volatile.
We may not have access to sufficient future capital.
We may be required to expend significant funds to develop, access, and determine if Mineral Reserves exist at any of our non-producing properties, continue exploration, and if warranted, develop our existing properties and identify and acquire additional properties to diversify our property portfolio.
Our ability to obtain necessary funding for these purposes, in turn, depends upon several factors, including our historical and prospective results of operations, the status of the national and worldwide economy, the price of gold, silver, and other metals, the condition of the debt and equity markets, the costs associated with extracting and acquiring minerals, and the market value for our common stock.
Gold Resource Corporation
12
We may not be successful in generating or obtaining the required financing, or if we can obtain such financing, such financing may not be on terms that are favorable to us and our shareholders. We also may be unable to obtain funding by monetizing additional non-core exploration or other assets at an acceptable price.
We cannot provide assurance we will be able to obtain financing to fund our general and administrative costs and other working capital needs to fund our continuing business activities in the future on favorable terms or at all. Failure to obtain financing could result in delay or indefinite postponement of further mining operations, exploration, and construction, as well as the possible partial or total loss of our interest in our properties.
Our ability to recognize the benefits of deferred tax assets is dependent on future cash flows and taxable income.
We recognize deferred tax assets when the tax benefit is more likely than not to be realized; otherwise, a valuation allowance is applied against deferred tax assets. Assessing the recoverability of deferred tax assets requires management to make significant estimates related to expectations of future taxable income. Estimates of future taxable income are based on forecasted cash flows from operations and the application of existing tax laws in each jurisdiction. To the extent that future cash flows and taxable income differ significantly from estimates, our ability to realize the deferred tax assets could be impacted. Additionally, future changes in tax laws could limit our ability to realize the future tax benefits represented by our deferred tax assets.
Our accounting and other estimates may be imprecise.
Preparing financial statements requires management to make estimates and assumptions that affect the reported amounts and related disclosure of assets, liabilities, revenue, and expenses at the date of the consolidated financial statements and reporting periods. The more significant areas requiring the use of management assumptions and estimates relate to:
| ● | Mineral Resources that are the basis for future income and cash flow estimates; |
| ● | Mineral Reserves that are the basis for units-of-production depreciation, depletion, and amortization calculations; |
| ● | Future ore grades, throughput, and recoveries; |
| ● | Future metals prices; |
| ● | Future capital and operating costs; |
| ● | Environmental, reclamation, and closure obligations; |
| ● | Gold and Silver Stream Agreements; |
| ● | Contingent Consideration Liabilities; |
| ● | Permitting and other regulatory considerations; |
| ● | Asset impairments; |
| ● | The valuation of our investments in equity securities; |
| ● | Asset acquisition accounting, including the valuation of the transaction and related instruments; |
| ● | Future foreign exchange rates, inflation rates, and applicable tax rates; and |
| ● | Deferred tax asset valuation allowance. |
Future estimates and actual results may differ materially from these estimates as a result of using different assumptions or conditions. For additional information, see Item 7. Management’s Discussion and Analysis of Financial Condition and Results of Operations.
We may be required to repay a significant amount if we default under certain gold and silver stream agreements.
In connection with the Aquila Transaction, the Company assumed substantial liabilities related to the gold and silver stream agreements with Osisko Bermuda Limited (“Osisko”). Under the agreements, Osisko deposited a total of $37.2 million upfront in exchange for a portion of the future gold and silver production from the Back Forty Project. The stream agreements contain customary provisions regarding default and security.
Gold Resource Corporation
13
In the event that our subsidiary defaults under the stream agreements, including by failing to achieve commercial production by an agreed upon date, it may be required to repay the deposit plus accumulated interest at a rate agreed with Osisko. If the Company fails to do so, Osisko may elect to enforce its remedies as a secured party and take possession of the assets that comprise the Back Forty Project.
Operational Risks
Our production is derived from a single operating unit, and any interruptions or stoppages in our mining activities at that operating unit would materially adversely affect our revenue.
We are dependent on revenues from a single operating unit to fund our operations. Any interruption in our ability to mine this location, such as a labor strike, natural disaster, or loss of permits would negatively impact our ability to generate revenue following such interruption. Additionally, if we are unable to develop additional mines economically, we will eventually deplete the body of mineralized material and will no longer generate cash flow sufficient to fund our operations. A decrease in, or cessation of, our mining operations at this operating unit would materially adversely affect our financial performance and may eventually cause us to cease operations.
Since our current property portfolio is limited to one operating unit, our ability to be profitable over the long-term will depend on our ability to (1) expand the known Arista and Switchback vein systems and /or identify, explore, and develop additional properties in Mexico, (2) successfully develop the Back Forty Project in Michigan, USA, or (3) acquire and develop an alternative project.
Gold and silver producers must continually replace reserves depleted by production to maintain production levels over the long-term and provide a return on invested capital. Depleted reserves can be replaced in several ways, including expanding known ore bodies, locating new deposits, or acquiring interests in reserves from third parties. Exploration is highly speculative in nature, capital intensive, involves many risks, and frequently unproductive. Our current or future exploration programs may not result in new mineralization. Even if significant mineralization is discovered, it will likely take many years from the initial phases of exploration until commencement of production, during which time the economic feasibility of production may change.
From time to time, we may acquire mineral interests from other parties. Such acquisitions are based on an analysis of a variety of factors, including historical exploration results, estimates and assumptions regarding the extent of mineralized material and/or reserves, the timing of production from such reserves, and cash and other operating costs. In addition, we may rely on data and reports prepared by third parties, which may contain information or data that we are unable to independently verify or confirm. All of these factors are uncertain and may impact our ability to develop the mineral interests.
As a result of these uncertainties, our exploration programs and any acquisitions which we may pursue may not result in the expansion or replacement of our current production with new ore reserves or operations, which could have a material adverse effect on our business, prospects, results of operations, and financial position.
Gold Resource Corporation
14
Increased operating and capital costs could materially adversely affect our results of operations.
Costs at our mining properties are subject to fluctuation due to a number of factors, such as variable ore grade, changing metallurgy, and revisions to mine plans in response to the physical shape and location of the ore body, as well as the age and utilization rates for the mining and processing-related facilities and equipment. In addition, costs are affected by the price and availability of input commodities, such as fuel, electricity, labor, chemical reagents, explosives, steel, concrete, and mining and processing related equipment and facilities. Commodity costs are often subject to volatile price movements, including increases that could make mineral extraction less profitable. Further, changes in laws and regulations can affect commodity prices, uses, and transport. Reported costs may also be affected by changes in accounting standards. A material increase in costs could significantly affect our results of operations and operating cash flow.
We could have significant increases in capital and operating costs over the next several years in connection with developing new projects in challenging jurisdictions and sustaining and/or expanding existing mining and processing operations. Costs associated with capital expenditures may increase in the future as a result of factors beyond our control, such as inflation. Increased capital expenditures may have an adverse effect on the results of operations and cash flow generated from existing operations, as well as the economic returns anticipated from new projects, or may make the development of future projects uneconomic.
Competition in the mining industry is intense, and we have limited financial and personnel resources with which to compete.
In the mining industry, competition for desirable properties, investment capital, and human capital is intense. Numerous companies headquartered in the United States, Canada, and worldwide compete for properties and human capital on a global basis. We are a small participant in the mining industry due to our limited financial and human capital resources. We presently operate with a limited number of people, and we anticipate operating in the same manner going forward. We compete with other companies in our industry to hire qualified employees and consultants when needed to operate our mines successfully and to advance our exploration properties. We may be unable to attract the necessary human capital to fully explore, and if warranted, develop our properties and be unable to acquire other desirable properties. We believe that competition for acquiring mineral properties, as well as the competition to attract and retain qualified human capital, will continue to be intense in the future.
Estimates of proven and probable Mineral Reserves and measured and indicated Mineral Resources are uncertain, and the volume and grade of ore actually recovered may vary from our estimates.
The proven and probable Mineral Reserves stated in this report represent the amount of gold, silver, copper, lead, and zinc that we estimated at December 31, 2023, that could be economically and legally extracted or produced at the time of the reserve determination. Estimates of proven and probable Mineral Reserves and measured and indicated Mineral Resources are subject to considerable uncertainty. Such estimates are largely based on the prices of gold, silver, copper, lead, and zinc, as well as interpretations of geologic data obtained from drill holes and other exploration techniques. These prices and interpretations are subject to change. If we determine that certain of our estimated Mineral Reserves or Mineral Resources have become uneconomic, we may be forced to reduce our estimates. Actual production from proven and probable Mineral Reserves may be significantly less than we expect. There can be no assurance that estimates of Mineral Resources will be upgraded to Mineral Reserves or may ultimately be extracted.
Any material changes in Mineral Reserve or Mineral Resource estimates and grades of mineralization may affect the economic viability of our current operations, our decision to place a new property into production, and/or such property’s return on capital. There can be no assurance that mineral recoveries in small-scale laboratory tests will be duplicated in a large-scale on-site operation in a production environment. Declines in market prices for contained metals may render portions of our Mineral Reserve or Mineral Resource estimates uneconomic and result in reduced reported mineralization or materially adversely affect the commercial viability of one or more of our properties. Any material reductions in estimates of mineralization, or of our ability to extract this mineralization, could have a material adverse effect on our results of operations or financial condition.
Gold Resource Corporation
15
Products processed from our operating mines or other mines in the future could contain higher than expected contaminants, thereby negatively impacting our financial condition.
Contracts for treatment charges paid to smelters and refineries include penalties for certain deleterious elements that exceed contract limits. If the material mined from our operating mines includes higher than expected contaminants, this will result in higher treatment expenses and penalty charges that could increase our costs and negatively impact our business, financial condition, and results of operations. This could occur due to unexpected variations in the occurrence of these elements in the material mined, problems that occur during blending of material from various locations in the mine prior to processing, and other unanticipated events.
Continuation of our mining and processing activities is dependent on the availability of sufficient water supplies to support our mining activities.
Water is critical to our business, and the increasing pressure on water resources requires us to consider both current and future conditions in our management approach. Across the globe, water is a shared and regulated resource. Mining operations require significant quantities of water for mining, ore processing, and related support facilities. Many of our properties in Mexico are in areas where water is scarce, and competition among users for continuing access to water is significant. Continuous production and mine development depend on our ability to acquire and maintain water rights and defeat claims adverse to current water use in legal proceedings. Although we believe that our operations currently have sufficient water rights and claims to cover operating demands, we cannot predict the potential outcome of future legal proceedings relating to water rights, claims, and uses. Water shortages may also result from weather or environmental and climate impacts beyond our control. Shortages in water supply could result in production and processing interruptions. In addition, the scarcity of water in certain regions could result in increased costs to obtain sufficient quantities of water to conduct our operations. The loss of some or all water rights, in whole or in part, ongoing shortages of water to which we have rights, or significantly higher costs to obtain sufficient quantities of water (or the failure to procure sufficient quantities of water) could result in our inability to maintain mineral extraction at current or expected levels, require us to curtail or shut down mining operations, and prevent us from pursuing expansion or any development opportunities. Laws and regulations may be introduced in some jurisdictions where we operate, which could also limit access to sufficient water resources, thus materially adversely affecting our operations.
The nature of mineral exploration, mining, and processing activities involves significant hazards, a high degree of risk, and the possibility of uninsured losses.
Exploration for and the production of minerals is highly speculative and involves greater risk than many other businesses. Many exploration programs do not result in the discovery of mineralization, and any mineralization discovered may not be of sufficient quantity or quality to be profitably mined. Our operations are, and any future mining operations or construction we may conduct will be, subject to all of the operating hazards and risks normally incident to exploring for and mining of mineral properties, such as, but not limited to:
| ● | Fluctuation in production costs that make mining uneconomic; |
| ● | Fluctuation in commodity prices; |
| ● | Social, community, or labor force disputes resulting in work stoppages or delays, or related loss of social acceptance of community support; |
| ● | Changes to legal and regulatory requirements; |
| ● | Unanticipated variations in grade and other geologic problems; |
| ● | Environmental hazards, noxious fumes, and gases; |
| ● | Ground and water conditions; |
| ● | Difficult surface or underground conditions; |
| ● | Industrial accidents; |
| ● | Security incidents; |
| ● | Failure of unproven or evolving technologies or loss of information integrity or data; |
| ● | Metallurgical and other processing problems; |
Gold Resource Corporation
16
| ● | Mechanical and equipment performance problems; |
| ● | Failure of pit walls, dams, declines, drifts, and shafts; |
| ● | Unusual or unexpected rock formations; |
| ● | Personal injury; |
| ● | Pandemics; |
| ● | Fire, flooding, cave-ins, seismic activity, landslides, or other inclement weather conditions, including those impacting operations or the ability to access and supply sites; and |
| ● | Decrease in the value of mineralized material due to lower gold, silver, and metal prices. |
These occurrences could result in damage to—or destruction of—mineral properties, processing facilities, and equipment; personal injury or death; environmental damage; reduced extraction and processing; delays in mining; asset write-downs; monetary losses; and possible legal liability. Although we maintain insurance in amounts that we consider reasonable for general commercial liability claims, physical assets at our Arista and Alta Gracia mines, and risks inherent in the conduct of our business, this insurance contains exclusions and limitations on coverage and will not cover all potential risks associated with mining and exploration activities. As such, the related liabilities might exceed policy limits. As a result of any or all of the foregoing, we could incur significant liabilities and costs that may exceed the limits of our insurance coverage or that we may elect not to insure against because of premium costs or other reasons, which could materially adversely affect our results of operations and financial condition. We may also not be insured against all interruptions to our operations. Losses from these or other events may cause us to incur significant costs which could materially adversely affect our financial condition and our ability to fund activities on our properties. A significant loss could force us to reduce or suspend our operations and development.
Revenue from the sale of metal concentrate may be materially adversely affected by loss or damage during shipment and storage at our buyer’s facilities.
We rely on third-party transportation companies to transport our metal concentrate to the buyer’s facilities for processing and further refining. The terms of our sales contracts with the buyers require us to rely, in part, on assay results from samples of our metal concentrate that are obtained at the buyer’s warehouse to determine the final sales value for our metals. Once the metal concentrate leaves our processing facility, we no longer have direct custody and control of these products. Theft, loss, road accidents, improper storage, fire, natural disasters, tampering, or other unexpected events while in transit or at the buyer’s location may lead to the loss of all or a portion of our metal concentrate products. Such losses may not be covered by insurance and may lead to a delay or interruption in our revenue, and as a result, our operating results may be materially adversely affected.
A significant delay or disruption in sales of doré or concentrates as a result of the unexpected disruption in services provided by smelters or refiners could have a material adverse effect on results of operations.
We rely on third-party smelters and refiners to refine and process and, in some cases, purchase, the gold and silver doré and copper, lead, and zinc concentrate produced from our mines. Access to smelters and refiners on economic terms is critical to our ability to sell our products to buyers and generate revenues. We periodically enter into agreements with smelters and refiners, some of which operate their smelting or refining facilities outside the United States, and we believe we currently have contractual arrangements with a sufficient number of smelters and refiners so that the loss of any one refiner or smelter would not significantly or materially impact our operations or our ability to generate revenues. Nevertheless, services provided by a refiner or smelter may be disrupted by operational issues, new or increased tariffs, duties or other cross-border trade barriers, the bankruptcy or insolvency of one or more smelters, or refiners or the inability to agree on acceptable commercial or legal terms with a refiner or smelter. Such an event or events may disrupt an existing relationship with a refiner or smelter, or result in the inability to create a contractual relationship with a refiner or smelter, which may leave us with limited, uneconomical, or no access to smelting or refining services for short or long periods of time. Any such delay or loss of access may significantly impact our ability to sell doré and concentrate products. We cannot ensure that alternative smelters or refiners would be available or offer comparable terms if the need for them arose or that we would not experience delays or disruptions in sales that would materially adversely affect the results of operations.
Gold Resource Corporation
17
We rely on contractors to conduct a significant portion of our exploration, development, and construction projects.
A significant portion of our development and construction projects are currently conducted in whole or in part by contractors. As a result, our operations are subject to a number of risks, some of which are outside our control, including:
| ● | Negotiating agreements with contractors on acceptable terms; |
| ● | New foreign or domestic legislation limiting or altering the ability to utilize contractors or outsourced resources; |
| ● | The difficulty and inherent delay in replacing a contractor and its equipment in the event that either party terminates the agreement; |
| ● | Reduced control and oversight over those aspects of the work which are the responsibility of the contractor; |
| ● | Failure of a contractor to perform under its agreement; |
| ● | Interruption of development and construction or increased costs in the event that a contractor ceases its business due to insolvency or other unforeseen events; |
| ● | Injuries or fatalities on the job as a result of the failure to implement or follow adequate safety measures; |
| ● | Failure of a contractor to comply with applicable legal and regulatory requirements, to the extent it is responsible for such compliance; and |
| ● | Problems of a contractor managing its workforce, labor unrest, or other related employment issues. |
In addition, we may incur liability to third parties as a result of the actions of our contractors. The occurrence of one or more of these risks could materially adversely affect our results of operations and financial position.
Risks Related to our Exploration Activities
The exploration of our mineral properties is highly speculative in nature, involves substantial expenditures, and is frequently non-productive.
Gold Resource Corporation
18
| ● | Identifying suitable candidates for acquisition and negotiating acceptable terms; |
| ● | Obtaining approval from regulatory authorities and potentially our shareholders; |
| ● | Implementing our standards, controls, procedures, and policies at the acquired business and addressing any pre-existing liabilities or claims involving the acquired business; and |
| ● | To the extent the acquired operations are in a country where we have not operated historically, understanding the regulations and challenges of operating in that new jurisdiction. |
Regulatory Risks
Our operations are subject to ongoing permitting requirements, which could result in the delay, suspension, or termination of our operations.
Our operations, including our ongoing exploration drilling programs and mining, require ongoing permits from governmental and local authorities. We may also be required to obtain certain property rights to access or use our properties. Obtaining or renewing licenses and permits, and acquiring property rights, can be complex and time-consuming processes. There can be no assurance that we will be able to acquire all required licenses, permits, or property rights on reasonable terms or in a timely manner, or at all, and that such terms will not be adversely changed; that required extensions will be granted; or that the issuance of such licenses, permits or property rights will not be challenged by third parties. If we cannot obtain or maintain the necessary permits, or if there is a delay in receiving future permits, our timetable and business plan will be materially adversely affected.
Our operating properties located in Mexico are subject to changes in political or economic conditions and regulations in that country.
The risks with respect to operating in Mexico or other developing countries include, but are not limited to: nationalization of properties, military repression, extreme fluctuations in currency exchange rates, increased security risks, labor instability or militancy, mineral title irregularities, and high rates of inflation. In addition, changes in mining or investment policies or shifts in political attitudes in Mexico may materially adversely affect our business. We may be affected in varying degrees by government regulation concerning restrictions on production, price controls, export controls, income taxes, expropriation of property, maintenance of claims, environmental legislation, land use, land claims of local people, opposition from non-governmental organizations, labor legislation, water use, and mine safety. The effect of these factors cannot be accurately predicted and may adversely impact our operations.
Most of our properties are subject to extensive environmental laws and regulations, which could materially adversely affect our business.
Our exploration and mining operations are subject to extensive laws and regulations governing land use and the protection of the environment, which control the exploration and mining of mineral properties and their effects on the environment, including air and water quality, mine reclamation, waste generation, handling and disposal, the protection of different species of flora and fauna, and the preservation of lands. These laws and regulations require us to acquire permits and other authorizations for conducting certain activities. In many countries, there is relatively new comprehensive environmental legislation, and the permitting and the authorization process may not be established or predictable.
Gold Resource Corporation
19
We may not be able to acquire necessary permits or authorizations on a timely basis, if at all. Delays in acquiring any permit or authorization could increase the cost of our projects and could suspend or delay the commencement of extraction and processing of mineralized material.
Environmental legislation in Mexico and in many other countries is evolving in a manner that will require stricter standards and enforcement, increased fines and penalties for non-compliance, more stringent environmental assessments of proposed projects, and a heightened degree of responsibility for companies and their officers, directors, and employees. Future changes in environmental regulation in the jurisdictions where our properties are located may materially adversely affect our business, make our business prohibitively expensive, or prohibit it altogether. We cannot predict what environmental legislation or regulations will be enacted or adopted in the future or how future laws and regulations will be administered or interpreted. Compliance with more stringent laws and regulations, as well as potentially more vigorous enforcement policies or regulatory agencies or stricter interpretation of existing laws, may (i) necessitate significant capital outlays, (ii) cause us to delay, terminate, or otherwise change our intended activities with respect to one or more projects, or (iii) materially adversely affect our future exploration activities.
Climate change and climate change legislation or regulations could impact our business.
We are subject to physical risks associated with climate change, which could seriously harm our results of operations and increase our costs and expenses. The occurrence of severe adverse weather conditions, including increased temperatures and droughts, fires, longer wet or dry seasons, increased precipitation, floods, hail, snow, or more severe storms may have a potentially devastating impact on our operations. Adverse weather may result in physical damage to our operations, instability of our infrastructure and equipment, washed-out roads to our properties, and altered water and electricity supply to our projects. Increased temperatures may also decrease worker productivity at our projects and raise ventilation and cooling costs. Should the impacts of climate change be material in nature or occur for lengthy periods of time in the areas in which we operate, our financial condition or results of operations could be materially adversely affected.
Changes in the quantity of water, whether in excess or deficient amounts, may impact exploration and development activities, mining and processing operations, water storage and treatment facilities, tailings storage facilities, closure and reclamation efforts, and may increase levels of dust in dry conditions, and land erosion and slope stability in case of prolonged wet conditions. Increased precipitation and extreme rainfall events may potentially impact tailings storage facilities by flooding the water management infrastructure, exceeding surface water runoff network capacity, overtopping the facility, or undermining the slope stability of the structure. Further, increased amounts of water may result in extended periods of flooding to the mine pits and site infrastructure or may exceed the current water treatment facility capacity to store and treat water physical conditions, resulting in an unintended overflow either on or off the mine site property.
U.S. and international legislative and regulatory actions intended to ensure the protection of the environment are constantly changing and evolving in a manner expected to result in stricter standards and enforcement, larger fines and liability, and potentially increased capital expenditures and operating costs. Transitioning our business to meet regulatory, societal, and investor expectations may cause us to incur higher costs and lower economic returns than originally estimated for new exploration projects and development plans of existing operations.
Our continuing reclamation obligations at our operations could require significant additional expenditures.
We are responsible for the reclamation obligations related to disturbances located on all of our properties and have recorded a liability on our Consolidated Balance Sheets to cover the estimated reclamation obligation. However, there is a risk that any reserve could be inadequate to cover the actual costs of reclamation when carried out. Continuing reclamation obligations will require a significant amount of capital. There is a risk that we will be unable to fund these obligations and that the regulatory authorities may increase reclamation requirements to such a degree that it would not be commercially reasonable to continue mining and exploration activities, which may materially adversely affect our results of operations, financial performance, and cash flows.
Gold Resource Corporation
20
Title to mineral properties can be uncertain, and in the event of a dispute regarding the title to our Mexican properties, it will likely be necessary for us to resolve the dispute in Mexico, where we would be faced with unfamiliar laws and procedures.
Our ability to explore and operate our properties depends on the validity of our title to that property. Uncertainties inherent in mineral properties relate to such things as the sufficiency of mineral discovery, proper posting and marking of boundaries, assessment work and possible conflicts with other claims not determinable from public record. There may be valid challenges to the title to our properties which, if successful, could impair development and/or operations. The resolution of disputes in foreign countries can be costly and time consuming. In a foreign country, we face the additional burden of understanding unfamiliar laws and procedures. Not like in the U.S., we may not be entitled to a jury trial. Further, to litigate in any foreign country, we would be faced with the necessity of hiring lawyers and other professionals who are familiar with the foreign laws. For these reasons, we may incur unforeseen costs if we are forced to resolve a dispute in Mexico or any other foreign country.
In most of the countries where we operate, failure to comply with applicable laws and regulations relating to mineral right applications and tenure could result in loss, reduction or expropriation of entitlements, or the imposition of additional local or foreign parties as joint venture partners. Any such loss, reduction, or imposition of partners could have a material adverse effect on our financial condition, results of operations, and prospects.
Under the laws of Mexico, Mineral Resources belong to the United States of Mexico, and government concessions are required to explore for or exploit Mineral Reserves. Mineral rights derive from concessions granted, on a discretionary basis, by the Ministry of Economy, pursuant to the Mexican mining law and regulations thereunder. Our concessions in Mexico are subject to continuing government regulation, and failure to adhere to such regulations will result in the termination of the concession. A title defect could result in losing all or a portion of our right, title, and interest in and to the properties to which the title defect relates.
Additionally, in 2014, new mining concessions became subject to additional review and approval by the Mexico Ministry of Energy, and in recent years, the federal government has been reluctant to issue new mining concessions.
Mining concessions in Mexico give exclusive exploration and exploitation rights to the minerals located in the concessions but do not include surface rights to the real property, which requires that we negotiate the necessary agreements with surface landowners. Many of our mining properties are subject to the Mexican Ejido system, requiring us to contract with the local communities surrounding the properties in order to obtain surface rights to land needed in connection with our mining exploration activities. Please see Item 1A. Risk Factors—Regulatory Risks—Our ability to develop our Mexican properties is subject to the rights of the Ejido (agrarian cooperatives) who use or own the surface for agricultural purposes.
Our ability to develop our Mexican properties is subject to the rights of the Ejido (agrarian cooperatives), who use or own the surface for agricultural purposes.
Our ability to mine minerals is subject to maintaining satisfactory arrangements and relationships with the Ejido for access and surface disturbances. Ejidos are groups of local inhabitants who were granted rights to conduct agricultural activities on the property. We must negotiate and maintain a satisfactory arrangement with these residents in order to disturb or discontinue their rights to farm. While we have successfully negotiated and signed such agreements related to the DDGM operations, our inability to maintain these agreements or consummate similar agreements for new projects could impair or impede our ability to successfully explore, develop, and mine the properties, which in turn could materially adversely affect our future cash flow.
A significant amount of our mining properties are subject to exchange control policies, the effects of inflation, and currency fluctuations between the U.S. dollar and the Mexican peso.
Our revenue and external funding are primarily denominated in U.S. dollars. However, certain mining, processing, maintenance, and exploration costs are denominated in Mexican pesos. These costs principally include electricity, labor, water, maintenance, local contractors, and fuel. The appreciation of the peso against the U.S. dollar increases expenses and the cost of purchasing capital assets in U.S. dollar terms in Mexico, which can adversely impact our operating results and cash flows.
Gold Resource Corporation
21
Conversely, the depreciation of the Mexican peso decreases operating costs and capital asset purchases in U.S. dollar terms. When inflation in Mexico increases without a corresponding devaluation of the Mexican peso, our financial position, results of operations, and cash flows could be materially adversely affected. The annual average inflation rate in Mexico was approximately 5.55% in 2023 and 7.89% in 2022. Current and future inflationary effects may be driven by, among other things, supply chain disruptions, governmental stimulus or fiscal policies, and geopolitical instability, including the ongoing conflicts between Ukraine and Russia and in Gaza. For additional information, please see Item 1A. Risk Factors—General Risks—The Israel-Palestinian conflict in Gaza, the conflict in Ukraine, and the related price volatility and geopolitical instability could negatively impact our business. Continuing increases in inflation could increase our costs of labor and other costs related to our business, which could have an adverse impact on our business, financial position, results of operations, and cash flows.
At the same time, the peso has been subject to fluctuation, which may not have been proportionate to the inflation rate and may not be proportional to the inflation rate in the future. The value of the peso increased by 14.6% in 2023 and increased by 6.3% in 2022. In addition, fluctuations in currency exchange rates may have a significant impact on our financial results. There can be no assurance that the Mexican government will maintain its current policies with regard to the peso or that the peso's value will not fluctuate significantly in the future. We cannot assure you that currency fluctuations, inflation, and exchange control policies will not have an adverse impact on our financial condition, results of operations, earnings, and cash flows.
Lack of infrastructure could forestall or prevent further exploration and advancement.
Exploration activities, as well as any advancement activities, depend on adequate infrastructure. Reliable roads, bridges, power sources, and water supply are important factors that affect capital and operating costs and the feasibility and economic viability of a project. Unanticipated or higher than expected costs and unusual or infrequent weather phenomena, or government or other interference in the maintenance or provision of such infrastructure, could materially adversely affect our business, financial condition, and results of operations.
Risks Related to our Common Stock
Our stock price may be volatile, and as a result, shareholders could lose part or all of their investment.
In addition to other risk factors identified in this annual report on Form 10-K, and due to volatility associated with equity securities in general, the value of a shareholder’s investment could decline due to the impact of numerous factors upon the market price of our common stock, including:
| ● | Changes in the worldwide price for the metals we mine; |
| ● | Adverse results from our exploration, development, or production efforts; |
| ● | Changes to the dividend program, including suspensions; |
| ● | Producing at rates lower than those targeted; |
| ● | Political and regulatory risks and social unrest, including the conflicts between Ukraine and Russia and in Gaza; |
| ● | Weather conditions and extreme weather events, including unusually heavy rains; |
| ● | Failure to meet our revenue or profit goals or operating budget; |
| ● | Decline in demand for our common stock; |
| ● | Downward revisions in securities analysts’ estimates or changes in global financial markets, global economies, and general market conditions; |
| ● | Technological innovations by competitors or in competing technologies; |
| ● | Investor perception of our industry or our prospects; |
| ● | Lawsuits; |
| ● | Economic impact from the spread of any disease; |
| ● | Our ability to integrate and operate the companies and the businesses that we acquire; |
| ● | Actions by government or central banks; and |
| ● | General economic trends. |
Gold Resource Corporation
22
Stock markets in general have experienced extreme price and volume fluctuations, and the market prices of individual securities have been highly volatile. These fluctuations are often unrelated to operating performance and may materially adversely affect the market price of our common stock. As a result, shareholders may be unable to sell their shares at a desired price.
Past payments of dividends on our common stock are not a guaranty of future payments of dividends.
In 2010, we began paying cash dividends to the holders of our common stock. However, our ability to pay dividends in the future will depend on a number of factors, including free cash flow, expected operational performance, mine construction requirements and strategies, other acquisition and/or construction projects, spot metal prices, taxation, government-imposed royalties, and general market conditions. Further, a portion of our cash flow is expected to be retained to finance our operations, explorations, and development of mineral properties. In February 2023, we announced the suspension of our quarterly dividends. There is no assurance that the Board will elect to re-institute a dividend payment in the near-term or at all.
Issuances of our stock in the future could dilute existing shareholders and materially adversely affect the market price of our common stock.
We have the authority to issue up to 200,000,000 shares of common stock, 5,000,000 shares of preferred stock, and to issue options and warrants to purchase shares of our common stock, in some cases without shareholder approval. As of March 20, 2024, there were 88,757,610 shares of common stock outstanding. Future issuances of our securities could be at prices substantially below the price paid for our common stock by our current shareholders. We can issue significant blocks of our common stock without further shareholder approval. Because we have issued less common stock than many of our larger peers, the issuance of a significant amount of our common stock may have a disproportionately large impact on our share price compared to larger companies.
General Risks
Our operations may be disrupted, and our financial results may be materially adversely affected by any future pandemic.
Any pandemic may pose a risk to our business and operations. If a significant portion of our workforce becomes unable to work or travel to our operations due to illness or state or federal government restrictions (including travel restrictions and “shelter-in-place” and similar orders restricting certain activities that may be issued or extended by authorities), we may be forced to reduce or suspend exploration activities and/or development projects, which may impact liquidity and financial results. These restrictions have significantly disrupted economic activity in both the world, national and local economies and have caused volatility in capital markets.
To the extent any pandemic materially adversely affects our business and financial results, as discussed above, it may also have the effect of heightening many of the other risks described in this “Risk Factors” section, such as those relating to our operation, indebtedness, and financing. We are unable to predict the ultimate adverse impact of any pandemic on our business, which will depend on numerous evolving factors and future developments, including the pandemic’s ongoing effect on the demand for silver and gold, as well as the response of the overall economy and the financial markets after the pandemic and response measures come to an end, the timing of which remains highly unpredictable.
The Israel-Palestinian conflict in Gaza, the conflict in Ukraine, and the related price volatility and geopolitical instability could negatively impact our business.
On October 7, 2023, the Palestinian Sunni Islamist group, Hamas, led surprise attacks against Israel from the Gaza Strip. In response to the attacks, Israel’s cabinet formally declared war on Hamas. Although we do not have operations in the region, the extent and duration of the military action and resulting market disruptions could be significant and could potentially have a substantial negative impact on the global economy and/or our business.
Gold Resource Corporation
23
The magnitude of these risks cannot be predicted, including the extent to which these conflicts may heighten other risks disclosed herein.
In late February 2022, Russia launched significant military action against Ukraine, and the war remains ongoing. The extent and duration of the military action, sanctions, and resulting market disruptions could be significant and could potentially have a substantial negative impact on the global economy and/or our business for an unknown period of time. The ramifications of the hostilities and sanctions may not be limited to Russia, Ukraine, and Russian or Ukrainian companies, and may spill over to and negatively impact other regional and global economic markets (including in Europe and in the United States), companies in other countries (particularly those that have done business with Russia and Ukraine), and various sectors, industries, and markets for securities and commodities globally. Any such volatility and disruptions may also magnify the impact of other risks described in this “Risk Factors” section.
We may not be able to operate successfully if we are unable to recruit, hire, retain, and develop key personnel and maintain a qualified and diverse workforce. In addition, we are dependent upon our employees being able to safely perform their jobs, but there is risk of physical injuries or illness.
We depend upon the services of a number of key executives and management personnel. These individuals include our executive officers and other key employees. If any of these individuals were to die, become disabled, or leave our company, we would be forced to identify and retain individuals to replace them. We may be unable to hire a suitable replacement on favorable terms should that become necessary.
Our success is also dependent on the contributions of our highly skilled and experienced workforce. Our ability to achieve our operating goals depend upon our ability to recruit, hire, retain, and develop qualified and diverse personnel to execute on our strategy. There continues to be competition over highly skilled personnel in our industry. If we lose key personnel or one or more members of our senior management team; or if we fail to develop adequate succession plans; or if we fail to hire, retain, and develop qualified and diverse employees; our business, financial condition, results of operations, and cash flows could be harmed.
We are dependent on information technology systems, which are subject to certain risks, including cybersecurity risks, data leakage risks, and risks associated with implementation and integration.
We are dependent upon information technology systems in the conduct of our business. Any significant breakdown, invasion, virus, cyberattack, security breach, destruction, or interruption of these systems by employees, others with authorized access to our systems, or unauthorized persons could negatively impact our business. To the extent any invasion, cyberattack, or security breach results in disruption to our business; such as loss or disclosure of, or damage to our data or confidential information; our reputation, business, results of operations, and financial condition could be materially adversely affected. We have implemented various measures to manage our risks related to information technology systems and network disruptions. However, given the unpredictability of the timing, nature, and scope of information technology disruptions, we could potentially be subject to production downtimes, operational delays, the compromising of confidential or otherwise protected information, destruction or corruption of data, security breaches, other manipulation or improper use of our systems, and networks or financial losses from remedial actions, any of which could have a material adverse effect on our cash flows, competitive position, financial condition, or results of operations. Our systems and insurance coverage for protecting against cyber security risks may not be sufficient. Although to date we have not experienced any material losses relating to cyberattacks, we may suffer such losses in the future. We may be required to expend significant additional resources to continue to modify or enhance our protective measures. We also may be subject to significant litigation, regulatory investigation, and remediation costs associated with any information security vulnerabilities, cyberattacks, or security breaches.
We may also be materially adversely affected by system or network disruptions if new or upgraded information technology systems are defective, not installed properly, or not properly integrated into our operations. If we are unable to successfully implement system upgrades or modifications, we may have to rely on manual reporting processes and controls over financial reporting that have not been planned, designed, or tested.
Gold Resource Corporation
24
Various measures have been implemented to manage our risks related to the system upgrades and modifications, but system upgrades and modification failures could have a material adverse effect on our business, financial condition, and results of operations and could, if not successfully implemented, adversely impact the effectiveness of our internal controls over financial reporting.
Our business is subject to the U.S. Foreign Corrupt Practices Act and similar worldwide anti-bribery laws, a breach or violation of which could lead to civil and criminal fines and penalties, loss of licenses or permits, and reputational harm.
We operate in certain jurisdictions that have experienced some degree of governmental and private sector corruption, and in certain circumstances, strict compliance with anti-bribery laws may conflict with certain local customs and practices. The U.S. Foreign Corrupt Practices Act and anti-bribery laws in other jurisdictions generally prohibit companies and their intermediaries from making improper payments for the purpose of obtaining or retaining business or other commercial advantages. Our Code of Ethics and other corporate governance mandate compliance with these anti-bribery laws, which often carry substantial penalties. However, there can be no assurance that our internal control policies and procedures will always protect us from recklessness, fraudulent behavior, dishonesty, or other inappropriate acts committed by our affiliates, employees, contractors, or agents. As such, our corporate policies and processes may not prevent all potential breaches of law or other governance practices. Violations of these laws, or allegations of such violations, could lead to civil and criminal fines and penalties, litigation, loss of operating licenses or permits, and may damage our reputation, which could have a material adverse effect on our business, financial position, and results of operations, or cause the market value of our common stock to decline.
ITEM 1B. |
UNRESOLVED STAFF COMMENTS |
None.
ITEM 1C. |
CYBERSECURITY |
Risk Management and Strategy
We have established policies and processes for assessing, identifying, and managing material risk from cybersecurity threats and have integrated these processes into our overall risk management systems and processes. We routinely assess material risks from cybersecurity threats, including any potential unauthorized occurrence on or conducted through our information systems that may result in adverse effects on the confidentiality, integrity, or availability of our information systems or any information residing therein.
We conduct periodic risk assessments to identify cybersecurity threats, as well as assessments in the event of a material change in our business practices that may affect information systems that are vulnerable to such cybersecurity threats. These risk assessments include identification of reasonably foreseeable internal and external risks, the likelihood and potential damage that could result from such risks, and the sufficiency of existing policies, procedures, systems, and safeguards in place to manage such risks.
Governance
One of the key functions of our Board of Directors is informed oversight of our risk management process, including risks from cybersecurity threats. Our Board is responsible for monitoring and assessing strategic risk exposure, and management is responsible for the day-to-day management of any material risks that may arise. The Board receives periodic updates from management regarding cybersecurity matters and is notified between such updates regarding any significant new cybersecurity threats or incidents. We do not believe that there are currently any known risks from cybersecurity threats that are reasonably likely to materially affect us or our business strategy, results of operations, or financial condition.
Management is responsible for the operational oversight of company-wide cybersecurity strategy, policy, and standards across relevant departments to assess and help prepare us to address cybersecurity risks. As part of our overall risk management system, we monitor and test our safeguards and train our employees on these safeguards.
Gold Resource Corporation
25
Personnel at all levels and departments are made aware of our cybersecurity policies through trainings.
Cybersecurity Threats
As of December 31, 2023, we have not identified an indication of a cybersecurity incident that would have a material impact on our business and consolidated financial statements. For further discussion of cybersecurity risks, please refer to Item 1A. Risk Factors.
ITEM 2. |
PROPERTIES |
Glossary
The following terms used in this report shall have the following meanings:
Andesite: |
An extrusive igneous, volcanic rock, of intermediate composition, with aphanitic to porphyritic texture characteristic of subduction zones, such as the western margin of South America. |
|
|
Concentrate: |
A product from a mineral processing facility, such as gravity separation or flotation, in which the valuable constituents have been upgraded and unwanted gangue materials rejected as waste. |
|
|
Doré: |
Composite gold and silver bullion, usually consisting of approximately 90% precious metals that will be further refined to separate pure metals. |
|
|
Drift: |
A horizontal tunnel generally driven within or alongside an ore body and aligned parallel to the long dimension of the ore. |
|
|
Epithermal: |
Used to describe gold deposits found on or just below the surface close to vents or volcanoes, formed at low temperature and pressure. |
|
|
Exploration: |
Prospecting, sampling, mapping, diamond-drilling, and other work involved in locating the presence of economic deposits and establishing their nature, shape, and grade. |
|
|
Grade: |
The concentration of an element of interest expressed as relative mass units (percentage, ounces per ton, grams per tonne (“g/t”), etc.). |
|
|
Hectare: |
A metric unit of measurement, for surface area. One hectare equals 1/200th of a square kilometer, 10,000 square meters, or 2.47 acres. A hectare is approximately the size of a soccer field. |
|
|
Long-hole Stoping: |
Mining method which uses holes drilled by a production drill to a predetermined pattern by a mining engineer. Long-hole stoping is a highly selective and productive method of mining and can cater for varying ore thicknesses and dips (0 - 90 degree). Blasted rock is designed to fall into a supported drawpoint or be removed with remote control LHD (load, haul, dump machine). |
|
|
|
Net Smelter Return (“NSR”): |
The net revenue that the owner of a mining property receives from the sale of the mine's metal products, less transportation and refining costs. As a royalty, it refers to the fraction of net smelter return that a mine operator is obligated to pay the owner of the royalty agreement. |
|
|
Mineral Deposit: |
Rocks that contain economic amounts of minerals in them and that are expected to be profitably mined. |
Gold Resource Corporation
26
|
|
Tonne: |
A metric ton. One tonne equals 1000 kg. It is equal to approximately 2,204.62 pounds. |
|
|
Volcanogenic: |
Of volcanic origin. |
|
|
Volcanic domes: |
These are mounds that form when viscous lava is erupted slowly and piles up over the vent, rather than moving away as lava flow. The sides of most domes are very steep and typically are mantled with unstable rock debris formed during or shortly after dome emplacement. Most domes are composed of silica-rich lava, which may contain enough pressurized gas to cause explosions during dome extrusion. |
Overview
We classify our mineral properties into three categories: “Production Stage Properties,” “Development Stage Properties,” and “Exploration Stage Properties.” Production Properties are properties for which we operate a producing mine.
At our Don David Gold Mine, we currently have 100% interest in six properties, including two Production Stage Properties and four Exploration Stage Properties, located in Oaxaca, Mexico, along the San Jose structural corridor. Because of their proximity and relatively integrated operations, we collectively refer to the six properties as the Don David Gold Mine. The two Production Stage Properties are the only two of the six properties that make up the Don David Gold Mine that we consider to be independently material at this time. Please see Item 2. Properties – Don David Gold Mine for further discussion of the properties.
The Company also has 100% interest in the Back Forty Project, an advanced Exploration Stage Property, located in Menominee County, Michigan, USA. We do not consider the Back Forty Project to be independently material to the Company at this time. Please see Item 2. Properties – Back Forty Project for further discussion of the property.
Mineral Resources
Under S-K 1300, a Mineral Resource is defined as “a concentration or occurrence of material of economic interest in or on the Earth’s crust in such form, grade or quality, and quantity that there are reasonable prospects for economic extraction.” A Mineral Resource is a “reasonable estimate of mineralization, taking into account relevant factors such as cut-off grade, likely mining dimensions, location or continuity, that, with the assumed and justifiable technical and economic conditions, is likely to, in whole or in part, become economically extractable. It is not merely an inventory of all mineralization drilled or sampled.”
Gold Resource Corporation
27
The following tables summarize the estimated Mineral Resources at DDGM and at Back Forty:
Don David Gold Mine – Summary of Gold, Silver, and Base Metal Mineral Resources
at December 31, 2023(1)(2)(3)(4)
Description |
|
KTonnes |
|
Gold |
|
Silver |
|
Copper % |
|
Lead % |
|
|
Zinc % |
|
Cut-off grade |
|
Metallurgical Recovery (%) |
||||||||
Arista |
|
|
|
|
|
|
|
|
|
|
|
|
|
|
$/Tonne |
|
Au |
|
Ag |
|
Cu |
|
Pb |
|
Zn |
Measured Mineral Resources |
|
68 |
|
1.49 |
|
109.69 |
|
0.42 |
|
1.42 |
|
|
4.39 |
|
100 |
|
80 |
|
91 |
|
77 |
|
74 |
|
84 |
Indicated Mineral Resources |
|
489 |
|
1.10 |
|
131.89 |
|
0.28 |
|
1.33 |
|
|
4.25 |
|
100 |
|
80 |
|
91 |
|
77 |
|
74 |
|
84 |
Measured + Indicated |
|
557 |
|
1.15 |
|
129.16 |
|
0.29 |
|
1.34 |
|
|
4.26 |
|
100 |
|
80 |
|
91 |
|
77 |
|
74 |
|
84 |
Inferred Mineral Resources |
|
1,418 |
|
1.01 |
|
107.87 |
|
0.21 |
|
1.31 |
|
|
3.68 |
|
100 |
|
80 |
|
91 |
|
77 |
|
74 |
|
84 |
Alta Gracia |
|
|
|
|
|
|
|
|
|
|
|
|
|
|
AuEq/tonne |
|
|
|
|
|
|
|
|
|
|
Measured Mineral Resources |
|
27 |
|
0.81 |
|
370.58 |
|
|
|
|
|
|
|
|
2.35 |
|
85 |
|
72 |
|
- |
|
- |
|
- |
Indicated Mineral Resources |
|
141 |
|
0.49 |
|
269.96 |
|
|
|
|
|
|
|
|
2.35 |
|
85 |
|
72 |
|
- |
|
- |
|
- |
Measured + Indicated |
|
168 |
|
0.54 |
|
286.13 |
|
|
|
|
|
|
|
|
2.35 |
|
85 |
|
72 |
|
- |
|
- |
|
- |
Inferred Mineral Resources |
|
148 |
|
0.62 |
|
259.61 |
|
|
|
|
|
|
|
|
2.35 |
|
85 |
|
72 |
|
- |
|
- |
|
- |
Notes on Mineral Resources:
1. |
Mineral Resources estimated at December 31, 2023 are based on $1,800/oz for Gold, $23.30/oz for Silver, $3.90/pound Copper, $0.95/pound Lead and $1.25/pound Zinc. The metal prices used are based on the average median consensus prices for years 2024 through 2028 as provided by the Bank of Montreal in June 2023. The median price was based on the price estimates contributed by 38 participating financial institutions. These prices are also very similar to the three-year average. |
2. |
The definitions for Mineral Resources in S-K 1300 were followed which are consistent with CIM (2014) definitions and are exclusive of Mineral Reserves. |
3. |
Mineral Resources that are not Mineral Reserves are materials of economic interest with reasonable prospects for economic extraction. |
4. |
Rounding of tonnes, average grades, and contained ounces may result in apparent discrepancies with total rounded tonnes, average grades, and total contained ounces. |
For comparison, as at December 31, 2022, DDGM’s estimates of Mineral Resources, exclusive of Mineral Reserves, are provided in the below table.
Don David Gold Mine – Summary of Gold, Silver, and Base Metal Mineral Resources
at December 31, 2022(1)(2)(3)(4)
Description |
|
KTonnes |
|
Gold |
|
Silver |
|
Copper % |
|
Lead % |
|
Zinc % |
|
Cut-off grade |
|
Metallurgical Recovery (%) |
||||||||
Arista |
|
|
|
|
|
|
|
|
|
|
|
|
|
$/Tonne |
|
Au |
|
Ag |
|
Cu |
|
Pb |
|
Zn |
Measured Mineral Resources |
|
259 |
|
1.70 |
|
152.58 |
|
0.38 |
|
1.36 |
|
3.95 |
|
80 |
|
82 |
|
91 |
|
71 |
|
70 |
|
84 |
Indicated Mineral Resources |
|
1,240 |
|
1.19 |
|
120.74 |
|
0.29 |
|
1.14 |
|
3.17 |
|
80 |
|
82 |
|
91 |
|
71 |
|
70 |
|
84 |
Measured + Indicated |
|
1,499 |
|
1.27 |
|
126.26 |
|
0.31 |
|
1.18 |
|
3.30 |
|
80 |
|
82 |
|
91 |
|
71 |
|
70 |
|
84 |
Inferred Mineral Resources |
|
1,916 |
|
0.80 |
|
110.98 |
|
0.25 |
|
1.18 |
|
3.03 |
|
80 |
|
82 |
|
91 |
|
71 |
|
70 |
|
84 |
Alta Gracia |
|
|
|
|
|
|
|
|
|
|
|
|
|
AuEq/tonne |
|
|
|
|
|
|
|
|
|
|
Measured Mineral Resources |
|
24 |
|
0.81 |
|
367.95 |
|
- |
|
- |
|
- |
|
2.35 |
|
85 |
|
72 |
|
- |
|
- |
|
- |
Indicated Mineral Resources |
|
90 |
|
0.61 |
|
327.18 |
|
- |
|
- |
|
- |
|
2.35 |
|
85 |
|
72 |
|
- |
|
- |
|
- |
Measured + Indicated |
|
114 |
|
0.65 |
|
335.82 |
|
- |
|
- |
|
- |
|
2.35 |
|
85 |
|
72 |
|
- |
|
- |
|
- |
Inferred Mineral Resources |
|
148 |
|
0.62 |
|
295.61 |
|
- |
|
- |
|
- |
|
2.35 |
|
85 |
|
72 |
|
- |
|
- |
|
- |
Notes on Mineral Resources:
1. |
Mineral Resources estimated at December 31, 2022 are based on $1,650/oz for Gold, $20.00/oz for Silver, $3.40/pound Copper, $0.90/pound Lead and $1.35/pound Zinc. As a result of market volatility in 2022, these prices are based on conservative estimates which closely approximate the 12-month low for Gold ($1,620/oz), Silver ($18/oz), Copper ($3.35/pound), Lead ($0.80/pound), and Zinc ($1.25/pound). |
2. |
The definitions for Mineral Resources in S-K 1300 were followed which are consistent with CIM (2014) definitions and are exclusive of Mineral Reserves. |
3. |
Mineral Resources that are not Mineral Reserves are materials of economic interest with reasonable prospects for economic extraction. |
4. |
Rounding of tonnes, average grades, and contained ounces may result in apparent discrepancies with total rounded tonnes, average grades, and total contained ounces. |
During 2023, we performed a comprehensive review of our geological database and interpretation of the mineralization, the block models derived from them, and ultimately the mine plan to ensure more reliable and accurate mine planning and forecasting. In addition, metallurgy, mining methods, ground control, and other parameters were reviewed.
Gold Resource Corporation
28
As a result of this review, Measured and Indicated Mineral Resources decreased from approximately 1.6 million tonnes at December 31, 2022 to approximately 0.7 million tonnes at December 31, 2023. The contributing factors to this decrease was the reclassification of Measured and Indicated Mineral Resource to Proven and Probable Reserves resulting in a decrease of 0.7 million tonnes, the application of economic constraining parameters (engineering) resulting in a decrease of 1.4 million tonnes, and change in the NSR cutoff grade from $80/tonne to $100/tonne resulting in a decrease of 0.6 million tonnes. These reductions were partially offset by the addition of 1.8 million tonnes related to the 2023 infill and step-out drilling program. The total Inferred Mineral Resources decreased from approximately 2.1 million tonnes at December 31, 2022 to approximately 1.6 million tonnes at December 31, 2023. The decrease in Inferred Mineral Resources was mainly due to infill drilling and the reclassification of Inferred Mineral Resources to Measured and Indicated Mineral Resources along with optimized mine planning.
More information regarding the assumptions, methodologies, and procedures utilized in the estimation of Mineral Resources at DDGM can be found in the updated Don David Gold Mine Technical Report Summary filed as Exhibit 96.2 to this Form 10-K (the “DDGM Technical Report Summary”).
Back Forty Project – Summary of Gold, Silver, and Base Metal Mineral Resources
at December 31, 2023(1)(2)(3)(4)
|
|
|
|
|
|
|
|
|
|
|
|
|
|
|
Description |
|
KTonnes |
|
Gold |
|
Silver |
|
Copper % |
|
Lead % |
|
Zinc % |
|
Cut-off grade |
Back Forty - Open Pit |
|
|
|
|
|
|
|
|
|
|
|
|
|
$/Tonne |
Measured Mineral Resources |
|
- |
|
- |
|
- |
|
- |
|
- |
|
- |
|
- |
Indicated Mineral Resources |
|
9,360 |
|
2.41 |
|
28.06 |
|
0.36 |
|
- |
|
3.74 |
|
33 |
Measured + Indicated |
|
9,360 |
|
2.41 |
|
28.06 |
|
0.36 |
|
- |
|
3.74 |
|
33 |
Inferred Mineral Resources |
|
566 |
|
2.70 |
|
48.84 |
|
0.35 |
|
- |
|
1.31 |
|
33 |
Back Forty - Underground |
|
|
|
|
|
|
|
|
|
|
|
|
|
AuEq/tonne |
Measured Mineral Resources |
|
- |
|
- |
|
- |
|
- |
|
- |
|
- |
|
- |
Indicated Mineral Resources |
|
5,137 |
|
1.86 |
|
24.05 |
|
0.41 |
|
- |
|
2.65 |
|
73 |
Measured + Indicated |
|
5,137 |
|
1.86 |
|
24.05 |
|
0.41 |
|
- |
|
2.65 |
|
73 |
Inferred Mineral Resources |
|
627 |
|
2.00 |
|
26.10 |
|
0.37 |
|
- |
|
2.89 |
|
73 |
Notes on Mineral Resources:
1. |
Mineral Resources estimated at December 31, 2023 are based on $1,800/oz for Gold, $23.30/oz for Silver, $3.90/pound Copper, $0.95/pound Lead and $1.25/pound Zinc. The metal prices used are based on the average median consensus prices for years 2024 through 2028 as provided by the Bank of Montreal in June 2023. The median price was based on the price estimates contributed by 38 participating financial institutions. These prices are also very similar to the three-year average. |
2. |
The definitions for Mineral Resources in S-K 1300 were followed which are consistent with CIM (2014) definitions and are exclusive of Mineral Reserves. |
3. |
Mineral Resources that are not Mineral Reserves are materials of economic interest with reasonable prospects for economic extraction. |
4. |
Rounding of tonnes, average grades, and contained ounces may result in apparent discrepancies with total rounded tonnes, average grades, and total contained ounces. |
Following the completion of the optimization work for the Back Forty Project, the Company published an update on Indicated and Inferred Mineral Resources in the Back Forty S-K1300 Technical Report filed on October 26, 2023. A Measured Mineral Resource estimate or a Mineral Reserve estimate have yet to be established for the Back Forty Project.
More information regarding the assumptions, methodologies, and procedures utilized in the estimation of Mineral Resources at Back Forty can be found in the Back Forty Technical Report Summary incorporated by reference as Exhibit 96.1 to this Form 10-K.
Mineral Reserves
Under S-K 1300, a Mineral Reserve is defined as “an estimate of tonnage and grade or quality of indicated and measured Mineral Resources that, in the opinion of the qualified person, can be the basis of an economically viable project.”
Gold Resource Corporation
29
The following tables summarize the estimated Mineral Reserves at DDGM:
Don David Gold Mine – Summary of Gold, Silver and Base Metal Mineral Reserves
at December 31, 2023 (1) (2) (3) (4)
|
|
|
|
|
|
|
|
|
|
|
|
|
|
|
|
Recovery |
||||||||
Description |
|
Tonnes |
|
Gold |
|
Silver |
|
Cu (%) |
|
Pb (%) |
|
Zn (%) |
|
Cut-off Grade |
|
% Au |
|
% Ag |
|
% Cu |
|
% Pb |
|
% Zn |
Don David Gold Mine |
|
|
|
|
|
|
|
|
|
|
|
|
|
|
|
|
|
|
|
|
|
|
|
|
Arista Mine (2) |
|
|
|
|
|
|
|
|
|
|
|
|
|
$/Tonne |
|
|
|
|
|
|
|
|
|
|
Proven Mineral Reserves |
|
90,000 |
|
2.91 |
|
176 |
|
0.50 |
|
1.65 |
|
5.02 |
|
120 |
|
79.5 |
|
91.1 |
|
76.6 |
|
73.9 |
|
83.9 |
Probable Mineral Reserves |
|
973,000 |
|
1.14 |
|
126 |
|
0.23 |
|
0.84 |
|
2.50 |
|
120 |
|
79.5 |
|
91.1 |
|
76.6 |
|
73.9 |
|
83.9 |
Arista Mine Total |
|
1,063,000 |
|
1.29 |
|
131 |
|
0.26 |
|
0.91 |
|
2.71 |
|
|
|
|
|
|
|
|
|
|
|
|
Alta Gracia Mine (3) |
|
|
|
|
|
|
|
|
|
|
|
|
|
AuEq/tonne |
|
|
|
|
|
|
|
|
|
|
Proven Mineral Reserves |
|
- |
|
- |
|
- |
|
- |
|
- |
|
- |
|
- |
|
- |
|
- |
|
|
|
|
|
|
Probable Mineral Reserves |
|
- |
|
- |
|
- |
|
- |
|
- |
|
- |
|
- |
|
- |
|
- |
|
|
|
|
|
|
Alta Gracia Mine Total |
|
- |
|
|
|
|
|
|
|
|
|
|
|
|
|
|
|
|
|
|
|
|
|
|
Don David Gold Mine Total |
|
1,063,000 |
|
1.29 |
|
131 |
|
|
|
|
|
|
|
|
|
|
|
|
|
|
|
|
|
|
Notes on Mineral Reserves:
| 1. | Mineral Resources estimated at December 31, 2023 are based on $1,800/oz for Gold, $23.30/oz for Silver, $3.90/pound Copper, $0.95/pound Lead and $1.25/pound Zinc. The metal prices used are based on the average median consensus prices for years 2024 through 2028 as provided by the Bank of Montreal in June 2023. The median price was based on the price estimates contributed by 38 participating financial institutions. These prices are also very similar to the three-year average. |
| 2. | The Arista Mine cut-off grades for Mineral Reserves are $120/tonne NSR. |
| 3. | Alta Gracia reserves reported December 31, 2022 have been downgraded to resources for the December 31, 2023 estimate. |
| 4. | Rounding of tonnes, average grades, and contained ounces may result in apparent discrepancies with total rounded tonnes, average grades, and total contained ounces. |
For comparison, as at December 31, 2022, DDGM’s estimates of Mineral Reserves are presented in the table below.
Don David Gold Mine – Summary of Gold, Silver and Base Metal Mineral Reserves
at December 31, 2022 (1) (2) (3) (4)
|
|
|
|
|
|
|
|
|
|
|
|
|
|
|
|
Recovery |
||||||||
Description |
|
Tonnes |
|
Gold |
|
Silver |
|
Cu (%) |
|
Pb (%) |
|
Zn (%) |
|
Cut-off Grade |
|
% Au |
|
% Ag |
|
% Cu |
|
% Pb |
|
% Zn |
Don David Gold Mine |
|
|
|
|
|
|
|
|
|
|
|
|
|
|
|
|
|
|
|
|
|
|
|
|
Arista Mine (2) |
|
|
|
|
|
|
|
|
|
|
|
|
|
$/Tonne |
|
|
|
|
|
|
|
|
|
|
Proven Mineral Reserves |
|
236,800 |
|
2.34 |
|
146 |
|
0.37 |
|
1.60 |
|
4.12 |
|
80 |
|
81.6 |
|
90.8 |
|
71.2 |
|
70.4 |
|
84.2 |
Probable Mineral Reserves |
|
1,120,300 |
|
0.92 |
|
83 |
|
0.24 |
|
0.84 |
|
2.75 |
|
80 |
|
81.6 |
|
90.8 |
|
71.2 |
|
70.4 |
|
84.2 |
Arista Mine Total |
|
1,357,100 |
|
1.17 |
|
94 |
|
0.26 |
|
0.97 |
|
2.99 |
|
|
|
|
|
|
|
|
|
|
|
|
Alta Gracia Mine (3) |
|
|
|
|
|
|
|
|
|
|
|
|
|
AuEq/tonne |
|
|
|
|
|
|
|
|
|
|
Proven Mineral Reserves |
|
3,000 |
|
0.85 |
|
392 |
|
0.01 |
|
0.12 |
|
0.25 |
|
2.35 |
|
85.0 |
|
72.0 |
|
|
|
|
|
|
Probable Mineral Reserves |
|
50,800 |
|
0.27 |
|
169 |
|
0.00 |
|
0.03 |
|
0.05 |
|
2.35 |
|
85.0 |
|
72.0 |
|
|
|
|
|
|
Alta Gracia Mine Total |
|
53,800 |
|
0.30 |
|
181 |
|
0.00 |
|
0.04 |
|
0.06 |
|
|
|
|
|
|
|
|
|
|
|
|
Don David Gold Mine Total |
|
1,410,900 |
|
1.14 |
|
97 |
|
|
|
|
|
|
|
|
|
|
|
|
|
|
|
|
|
|
Notes on Mineral Reserves:
| 1. | Mineral Reserves estimated at December 31, 2022 are based on $1,650/oz for Gold, $20.00/oz for Silver, $3.40/pound Copper, $0.90/pound Lead and $1.35/pound Zinc. As a result of market volatility in 2022, these prices are based on conservative estimates which closely approximate the 12-month low for Gold ($1,620/oz), Silver ($18/oz), Copper ($3.35/pound), Lead ($0.80/pound), and Zinc ($1.25/pound). |
| 2. | The Arista Mine cut-off grades for Mineral Reserves are $80/tonne NSR. |
| 3. | No appreciable amounts of base metals are present in the Alta Gracia veins identified to-date. A breakeven cut-off grade of 2.35 g/t AuEq was used for Mineral Reserves using gold and silver only to calculate gold equivalencies. |
| 4. | Rounding of tonnes, average grades, and contained ounces may result in apparent discrepancies with total rounded tonnes, average grades, and total contained ounces. |
Gold Resource Corporation
30
Proven and Probable Mineral Reserves decreased from 1.4 million tonnes at December 31, 2022 to 1.1 million tonnes at December 31, 2023. The largest contributing factors for this decrease were the depletion of reserves by 0.5 million tonnes related to 2023 mining activities, the reduction of 0.6 million tonnes due to the increase of the NSR cutoff grade from $80/tonne to $120/tonne. The deductions were partially offset by the reclassification of 0.7 million tonnes from Measured and Indicated Mineral Resources to Proven and Probable Mineral Reserves as a result of detailed engineering for the Arista Mine.
More information regarding the assumptions, methodologies, and procedures utilized in the estimation of Mineral Reserves can be found in the DDGM Technical Report Summary filed as Exhibit 96.2 to this Form 10-K.
Don David Gold Mine
All of the properties that make up our Don David Gold Mine are located in Oaxaca, Mexico, in what is known as the San Jose structural corridor, which runs 70 degrees north-west. Our properties comprise 55 continuous kilometers along this structural corridor, which spans three historic mining districts in Oaxaca. The map below shows the general location of our properties:
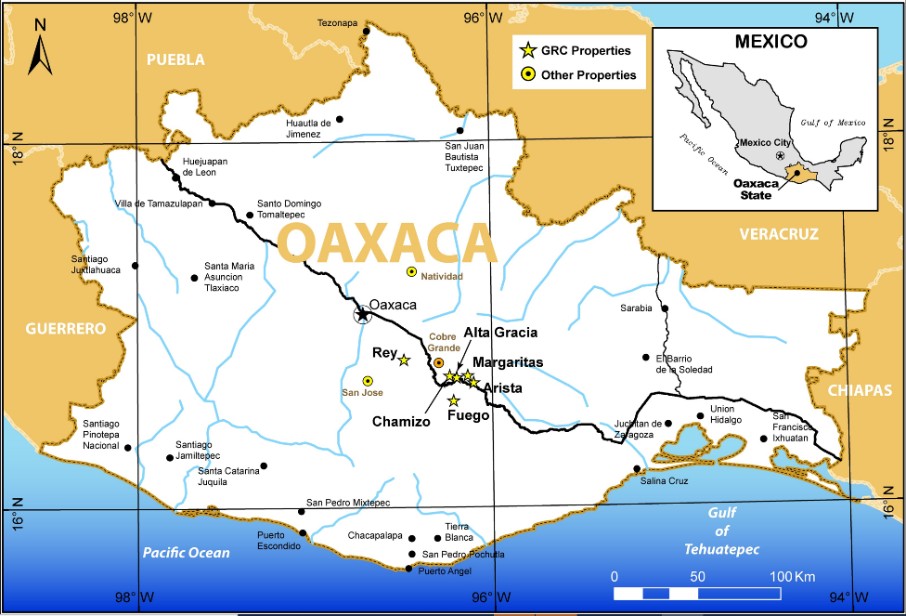
The Company was granted concessions from the Mexican federal government to explore and mine our properties in Mexico. Please see below Item 2. Properties—Mining Concessions and Regulations in Mexico below for additional information. We hold certain properties as the concession holder and lease other properties from third-parties. We are required to pay concession fees to the Mexican government to maintain our interest in these concessions, and we pay concession fees for all our mineral properties, including those which are subject to the third-party lease.
Gold Resource Corporation
31
The table below details information related to the mining concessions that comprise our properties in Oaxaca, Mexico:
|
|
Total Number of Concessions |
|
Total Size |
|
Acquisition Date Range |
|
|
2023 Maintenance Fees Paid |
|
|
|
|
(in hectares) |
|
|
|
|
|
||
Production Stage Properties: |
|
|
|
|
|
|
|
|
||
Arista |
|
18 |
|
24,372 |
|
2002 to 2016 |
|
$ |
556,090 |
|
Alta Gracia |
|
3 |
|
5,175 |
|
2008 |
|
|
118,289 |
|
Total Production Stage Properties: |
|
|
|
29,547 |
|
|
|
$ |
674,379 |
|
Exploration Stage Properties: |
|
|
|
|
|
|
|
|
||
Rey |
|
4 |
|
2,335 |
|
2002 to 2009 |
|
$ |
53,368 |
|
Chamizo |
|
2 |
|
19,758 |
|
2011 to 2013 |
|
|
451,601 |
|
Margaritas |
|
1 |
|
925 |
|
2002 |
|
|
21,143 |
|
Fuego |
|
1 |
|
2,554 |
|
2013 |
|
|
58,377 |
|
Total Exploration Stage Properties: |
|
|
|
25,572 |
|
|
|
$ |
584,489 |
|
|
|
|
|
|
|
|
|
|
|
|
Total: |
|
29 |
|
55,119 |
|
|
|
$ |
1,258,868 |
|
Production Stage Properties
Arista & Alta Gracia Mines
History: The Arista and Alta Gracia mines are in the regional Tlacolula mining district within Oaxaca State, in southern Mexico. According to the Mexican Geological Survey, the Servicio Geologico Mexicano (“SGM”) mining activity was initiated in the early 1880s in the Tlacolula mining district, producing some 300,000 ounces of gold and silver from an ore shoot in the La Leona mine. However, no separate amounts of production were reported for each metal. According to the SGM, in 1892 two smelters were built and operated (Magdalena Teitipac and O'Kelly) near the village of Tlacolula for processing ores from the Alta Gracia La Soledad, San Ignacio y Anexas, La Leona, La Victoria, and San Rafael silver mines. Subsequently, in 1911, Mr. Sken Sanders investigated the Totolapam mining region with a particular interest in the Margaritas mine. Most of these historical mines are within DDGM's mining concessions.
While the DDGM Arista Mine and Alta Gracia Mine are in the smaller mining subdistricts of San Jose de Gracia and Alta Gracia, respectively, only small-scale artisanal mining was historically conducted in these areas’ subdistricts. No reliable production records exist for the historic production performed in the Arista and Alta Gracia Project areas.
Arista Mine
Background: The Arista Mine currently holds 18 mining concessions aggregating 24,372 hectares.
In 2002, the initial three concessions were leased from a third-party. Two of the concessions are part of the Arista Mine, and the third concession comprises the Margaritas property. The lease agreement is subject to a 4% net smelter return royalty where production is sold in the form of gold/silver doré and 5% for production sold in concentrate form. Subject to meeting minimum exploration requirements, there is no expiration term for the lease. We may terminate it at any time upon written notice to the lessor, and the lessor may terminate it if we fail to fulfill any of our obligations, which primarily consist of paying the appropriate royalty to the lessor.
In August 2003, initial drilling and exploration program commenced at the Arista mine. Through the end of 2023, we have drilled a total of 1,794 core holes (both surface and underground) totaling 482,271 meters and 166 reverse circulation holes equaling 14,367 meters, for a total of 1,960 holes totaling 496,638 meters.
Gold Resource Corporation
32
|
DDGM Ore Terminal |
In 2010, additional concessions were acquired from a third-party at no additional cost, which are subject to a 2% royalty. We filed for and received additional concessions from the Mexican government which are also not part of the concessions leased or acquired from the third-party. Two concessions are considered within the Arista mine.
Location and Access: The Arista mine is located in the Sierra Madre del Sur Mountains of southern Mexico in the central part of the State of Oaxaca. The property is located along a major paved highway approximately 120 kilometers southeast of Oaxaca City, the state’s capital city. The property is approximately four kilometers northwest from the village of San Jose de Gracia. We have constructed gravel and paved roads from the village to the mine and processing facility, which provide adequate access to the property.
The climate of the Arista mine area is dry and warm to very warm with most rainfall occurring in June through September, and annual precipitation averaging 423.7 mm. The average yearly temperature is 26.6 degrees centigrade. The area is very rocky with arid vegetation. Subsistence farming occurs, and the main agricultural crop is agave cactus that is cultivated for the production of mescal.
Gold Resource Corporation
33
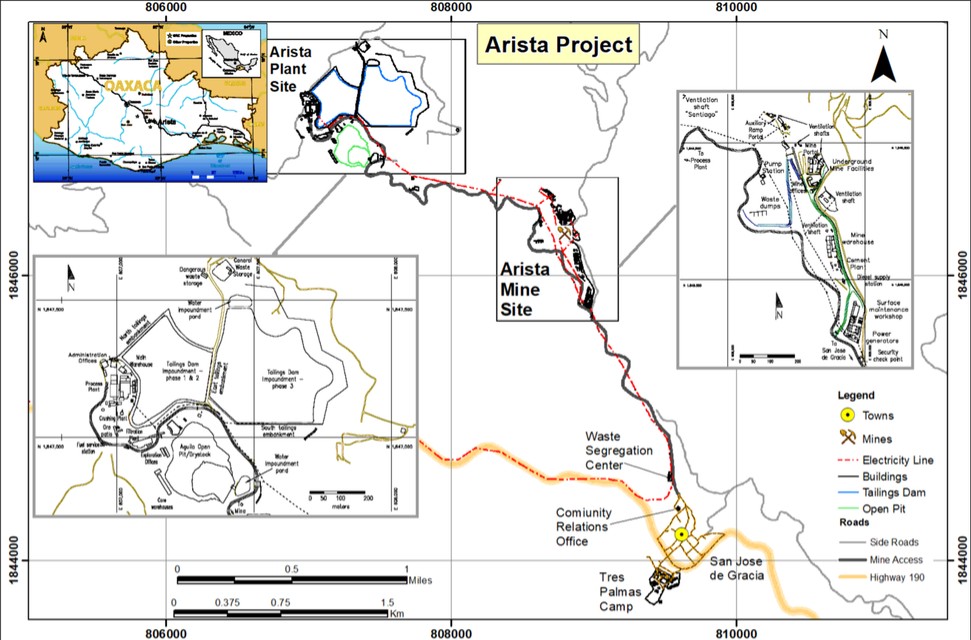
Geology and Mineralization: The Arista mine is located in the San Jose de Gracia Mining District in Oaxaca. Multiple volcanic domes of various scales, and likely non-vented intrusive domes, dominate the district geology. These volcanogenic features are imposed on a pre-volcanic basement of sedimentary rocks. Gold and silver mineralization in this district is related to the manifestations of this classic volcanogenic system and is considered epithermal in character.
Historically, we have produced ore from two locations on the Arista mine, the open pit mine and the underground mine. The open pit mineralization is considered low sulfidation epithermal-type with consisting primarily of gold with some silver and no base metals. In 2021, mining activities were completed in the open pit, and it is now being backfilled and reclaimed by filtered dry stack tailings deposition. The Arista underground mine mineralization is considered intermediate epithermal-type consisting of gold, silver, copper, lead, and zinc. The host rock in the Arista vein system is primarily andesite.
Facilities: The processing facility and other infrastructure at the Arista mine was constructed for approximately $35 million in 2009, and the processing facility was expanded in 2012 and 2013 for additional $23 million. The flotation mill expansion, completed at the end of 2013, increased the number of flotation cells, added a second ball mill to allow for additional processing capacity, and added a Knelson gravity concentrator. In 2014, a doré processing facility was completed. In 2019, an increase in pumping capacity to the cyclones in the plant resulted in plant capacity increasing to nominal 2,000 tonnes per day. The DDGM processing facility is flexible in its ability to process several types of mineralization. It has a differential flotation section capable of processing polymetallic ore and producing up to three separate concentrate products. The facility also has an agitated leach circuit capable of producing gold and silver doré.
We obtained water rights from the Mexican government for an amount of water that we believe is sufficient to meet our operating requirements and pump it approximately five kilometers to the site from a permitted well located near the Totolapam River.
Gold Resource Corporation
34
Additional improvements at the site include electrical power lines connecting to the Mexican national power grid, installation of backup diesel generation power plants and switch gear, paving a three-kilometer section of the road from the mine to the processing facility, construction of a surface maintenance garage and fuel station, construction of haul roads from the mine site to the processing facility, office space at the processing facility, an assay lab, an exploration office, tailings impoundment facilities and lift, a paste fill plant, mine camp facilities, the filtration plant, the dry stack facility, and other infrastructure.
Exploration Activities: In 2023, an extensive underground drilling campaign at the Arista mine was successfully executed, completing 168 diamond drill holes totaling 36,350 meters. This program included a total of 150 underground infill drill holes, totaling 26,057 meters, with a specific emphasis on upgrading Mineral Resources to Mineral Reserves and delineating the multiple sub-parallel veins within the Switchback system. Drilling here identified a number of high-grade zones up- and down-dip of existing workings, both within and peripheral to existing Mineral Resources. In late 2023, infill drilling also got underway in the Three Sisters vein system to begin converting Inferred Mineral Resources, identified earlier in the year during expansion drilling, to Mineral Reserves.
Underground expansion drilling activities were also completed at the Arista mine during 2023, encompassing a total of 18 drill holes totaling 10,293 meters. Expansion drilling focused on the Three Sisters and North Arista vein systems, as well as on the newly discovered Gloria vein system identified through expansion drilling during the first quarter of 2023. The objective of expansion drilling is to delineate additional Mineral Resources. Both the Arista and Switchback vein systems extend for over 1.5 kilometers in strike length, and both systems remain open along strike and in the vertical extent. The Gloria vein system, a new discovery, is located between and north of the Arista and Switchback vein systems, near existing mine infrastructure. Expansion drilling of the Gloria vein system in 2023 has defined a minimum of three new veins with true widths locally in excess of six meters. The Three Sisters vein system lies at the northern limit of the Arista mine underground workings and also between the Switchback and Arista vein systems. The Tree Sisters drilling during 2023 focused on the Sandy veins, which are open to the northwest and up- and down-dip. Both the Gloria and Three Sisters vein systems will be a primary focus of continued infill and expansion drilling in 2024.
Surface exploration activity during 2023 focused on the Alta Gracia property with the interpretation of surface mapping and soil geochemistry results generated in late 2022. This work has identified several targets for future follow-up exploration activity. Our exploration efforts on the Arista, Alta Gracia, and other properties demonstrate our commitment to long-term investment and the potential to extend our operations into the future in Oaxaca, Mexico.
Please see Item 7. Management’s Discussion and Analysis of Financial Condition and Results of Operations for additional information concerning our mining operations at the Alta Gracia project.
Alta Gracia Mine
Background: In 2008, we were granted claims adjacent to the Margaritas property in the Alta Gracia Mining District by filing three mining concessions known as the David Fracción I, the David Fracción II, and La Herradura, totaling 5,175 hectares.
As of December 31, 2016, proven and probable reserves had been established for the Mirador Underground Mine on our Alta Gracia property. In July 2017, mine development reached the economic ore zone of the Mirador vein, and mining began.
Location and Access: The Alta Gracia project is approximately 20 kilometers northeast of the village of San Pedro Totalapam, in the Municipality of San Pedro Totolapam. Access to the project is by a gravel road that departs the paved highway approximately 13 kilometers east of the village of San Pedro Totalapam. The haulage distance by road from Alta Gracia to the DDGM processing facility is approximately 32 kilometers.
Gold Resource Corporation
35
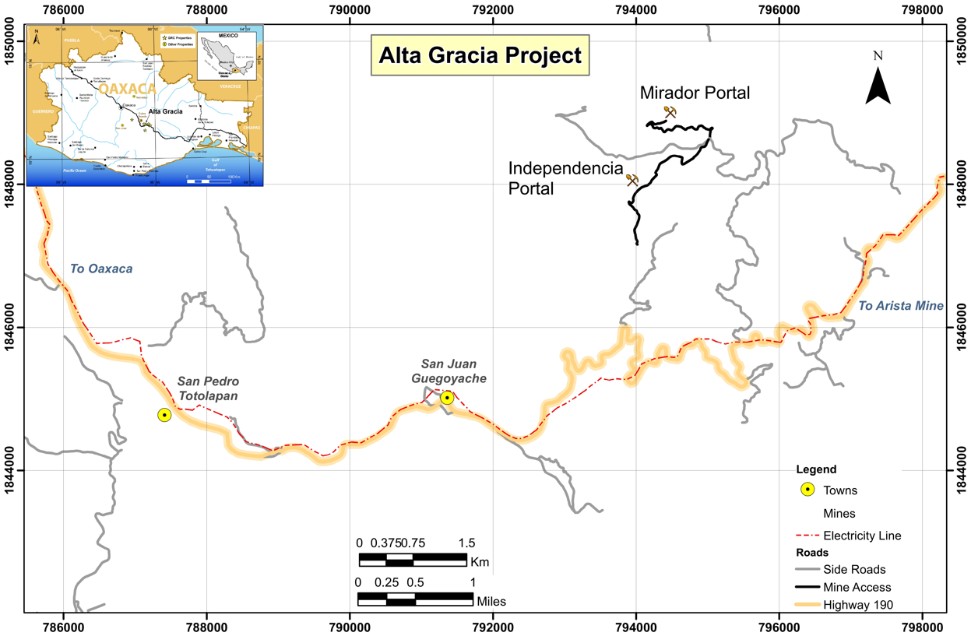
Geology and Mineralization: The sedimentary and volcanic units mapped at Alta Gracia are similar to those observed at the Arista mine. The district is dominated by tertiary-age rhyolite flows and tuffs, which are underlain by andesite flows and tuffs. Granodiorite and felsic intrusives are observed to crop out to the north and east of the Mirador mine. Known vein occurrences at Alta Gracia are mainly hosted in andesite and rhyolite. The veins at Alta Gracia are considered low sulfidation epithermal mineralization with economic values only for gold and silver.
Facilities: During 2016, we received our operating permit for the Mirador Mine. In 2017, two mine portals were developed to provide access to the Mirador vein. Mine site offices and a mobile equipment maintenance shop were established. Additionally, a diesel power generation plant, a compressed air system, and a mine water pumping station were developed and put into service. In 2018, old workings were improved to create a second access to the vein system called Independencia. The portal for this access is located approximately 500 meters southwest of the Mirador portal. Development was established to access the mineralization, delineated by drill campaigns completed during 2018 and 2019 on the Mirador’s Independencia vein.
Ore from the Mirador Mine, primarily silver ore, was transported by contracted haul trucks to and processed at our agitated leach plant at the DDGM processing facility, with the final product being doré.
Exploration Activities: In 2023, surface exploration activity was centered around the Alta Gracia property area. In late 2022 and continuing into early 2023, a surface mapping and soil geochemical program was carried out in the Aguacatillo prospect over an area to the south-west, west, and north-west of the Independencia and Mirador mines. The objective of this work was to test for possible westerly extensions of mineralization extending from the Independencia and Mirador mines. The program was successful in identifying several anomalous zones, which will be used to target follow-up detailed mapping to identify additional potential targets for future surface drilling. In addition, analysis and interpretation was completed in 2023 of the geochemical results generated from a regional soil sampling program completed in late 2022 in the La Fundicion prospect area located immediately south-southeast of the Independencia and Mirador mines.
Gold Resource Corporation
36
This interpretation was successful in identifying three distinct clusters of anomalous gold- and silver-in-soil anomalies, which will be followed up with detailed geologic mapping and rock chip sampling.
Exploration Properties
Margaritas Property
The Margaritas property is made up of the La Tehuana concession, which is approximately 925 hectares, located within the 55-kilometer San Jose structural corridor and adjacent to the Arista mine.
In 2023, we continued to review results from previous surface drilling, surveying, detailed geological mapping, and rock chip channel sampling for the Margaritas property. We completed the work required to maintain the claims during 2023, with work focused on analysis of spectral and geophysical information to identify new targets of interest. We expect to target a similar amount of work in 2024, along with identifying opportunities to strengthen our relationship in the local communities.
Chamizo Property
In June 2011, we acquired an exploration concession from the Mexican government of approximately 17,898 hectares referred to as Chamizo. In March 2013, we acquired a property known as Cerro Colorado from Almaden Minerals, Ltd. (“Almaden”) consisting of approximately 1,860 hectares. The Cerro Colorado property is surrounded by our Chamizo concession, and we include it as part of the Chamizo property. The Chamizo Property is adjacent to the Alta Gracia property. Any future production from the Cerro Colorado concession is subject to a 2% net smelter return royalty in favor of Almaden.
During 2022, surface mapping and geochemical sampling were begun in the Jabali prospect area. Results of this work were reviewed and analyzed in 2023 in order to plan additional detailed follow up geologic mapping and target evaluation. Different targets within the Chamizo property will continue to be evaluated in 2024, while also looking to identify opportunities to strengthen our relationship in the local communities to facilitate future work.
Fuego Property
In March 2013, we acquired the Fuego property from Almaden subject to a 2% net smelter return royalty. The Fuego property consists of approximately 2,554 hectares and is located south of our Alta Gracia and Chamizo properties. In 2013, Fuego was included in the property-wide airborne geophysical survey. Geologic mapping and surface sampling have been conducted on the Fuego property, which allows us to meet the acceptable amount of work required to maintain the claims. We do not anticipate any significant exploration activities at Fuego in 2024. However, we do plan to conduct the work required to maintain the claims.
Rey Property
The Rey property consists of concessions on the far north-west end of our 55-kilometer structural corridor in the State of Oaxaca known as El Rey, El Virrey, La Reyna, and El Marquez, totaling 2,335 hectares. We acquired the El Virrey concession from a third-party, and it is subject to a 2% net smelter return royalty. We obtained the remaining concessions by staking claims and filing for concessions with the Mexican government.
The Rey property is located approximately 64 kilometers by road from the Arista mine. There is no plant or equipment on the Rey property. If exploration is successful, any mining would probably require an underground mine where ore could be trucked to the DDGM processing facility for processing. To date, we have drilled 48 core holes for a total of 5,273 meters at the Rey property. Early in 2012, we completed a small amount of work to finish refurbishing and extending an existing shaft on the property to permit underground exploratory drilling. We ceased work at the Rey property during 2012, following a request to obtain additional approvals from local community agencies. In 2024, we plan to continue working with the local agencies to understand and address any concerns the community may have, but we have no assurance that we will be able to resume our exploration activities in the near term.
Gold Resource Corporation
37
Once community support is obtained, we plan to conduct follow-up drilling and exploration based on the drilling done in 2007 and 2008. While negotiations continue, we will complete enough work to maintain the claims in good standing.
Mining Concessions and Regulations in Mexico
Mineral rights in Mexico belong to the Mexican federal government and are administered pursuant to Article 27 of the Mexican Constitution. All of our mining concessions are exploitation concessions, which may be granted or transferred to Mexican citizens and corporations. Our leases or concessions are held by our Mexican subsidiary DDGM. Exploitation concessions have a term of 50 years and can be renewed for another 50 years. Concessions grant us the right to explore and exploit all minerals found in the ground. Maintenance of concessions requires the semi-annual payment of mining duties (due in January and July) and the performance of assessment work, on a calendar year basis, with assessment work reports required to be filed in the month of May for the preceding calendar year. The amount of mining duties and annual assessments are set by regulation, may increase over the life of the concession, and include periodic adjustments for inflation. Failure to pay the mining duties can lead to the cancelation of the relevant concession.
Mexican mining law does not require payment of finder’s fees to the government, except for a discovery premium in connection with national Mineral Reserves, concessions and claims, or allotments contracted directly from the Mexican Geological Survey. None of the claims held by DDGM are under such a discovery premium regime.
Ejido Lands and Surface Right Acquisitions in Mexico
Surface lands within DDGM are Ejido lands (agrarian cooperative lands granted by the federal government to groups of Campesinos pursuant to Article 27 of the Mexican Constitution of 1917). Prior to January 1, 1994, Ejidos could not transfer Ejido lands into private ownership. Amendments to Article 27 of the Mexican Constitution in 1994 now allow individual property ownership within Ejidos and allow Ejidos to enter into commercial ventures with individuals or entities, including foreign corporations. We have an agreement with the local San Pedro Totolapam Ejido, allowing exploration and exploitation of mineralization at the Arista mine and some of our surrounding properties.
Mexican law recognizes mining as a land use generally superior to agriculture. However, the law also recognizes the rights of the Ejidos to compensation in the event mining activity interrupts or discontinues their use of the agricultural lands. Compensation is typically made in the form of a cash payment to the holder of the agricultural rights. The amount of such compensation is generally related to the perceived value of the agricultural rights as negotiated in the first instance between the Ejidos and the owner of the mineral rights. If the parties are unable to reach an agreement on the amount of the compensation, the decision can be referred to the government.
We have established surface rights agreements with the San Pedro Totolapam Ejido and the individuals impacted by our proposed operations which allow disturbance of the surface where necessary for our exploration activities and mining operations.
Office Facilities
We constructed an administrative office building adjacent to the DDGM processing facility and a mine office adjacent to the Arista Mine portal. We also lease approximately 3,000 square feet of office space in Oaxaca City, Oaxaca. The lease commenced in 2012 and was renewed in December 2021 through the end of 2024.
Gold Resource Corporation
38
Back Forty Project
The Back Forty Project is an advanced Exploration Stage Property located in Menominee County, Michigan, USA in the mineral rich Penokean Volcanic Belt. Our property is made up of approximately 1,304 hectares (3,222 acres) of private and public (State of Michigan) mineral lands. The project is centered at latitude 46 degrees 27 North and longitude 87 degrees 51 West. Because of the exploratory nature of the property, we do not currently consider the Back Forty Project to be independently material to the Company.
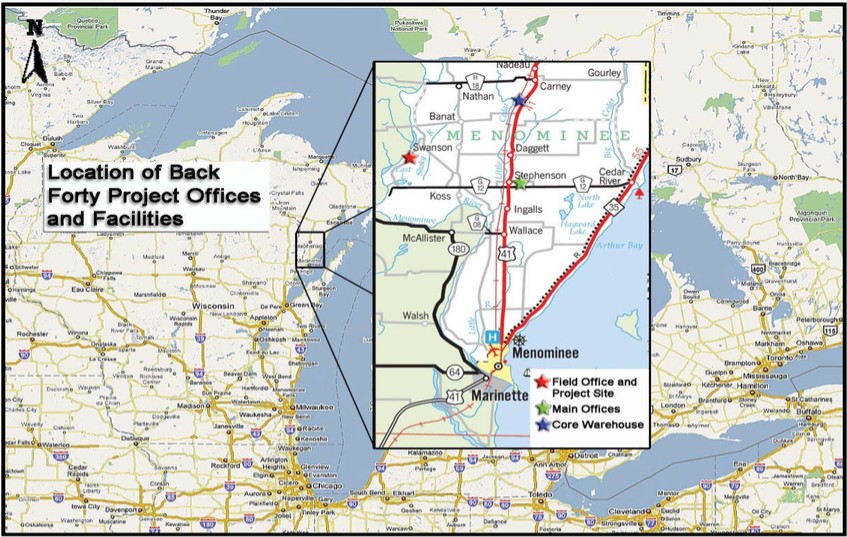
Background: On December 10, 2021, the Company successfully completed the acquisition of all the issued and outstanding common shares of Aquila Resources Inc. Aquila’s principal asset is its 100% interest in the Back Forty Project located in Menominee County, Michigan, USA. The Back Forty Project has a polymetallic (gold, silver, copper, lead, and zinc) Volcanogenic Massive Sulfide deposit. The Back Forty Project controls surface and mineral rights through ownership, leases with the State of Michigan, and royalties with private parties.
Optimization work related to the metallurgy and the economic model for the Back Forty Project was completed, and the Company released the Back Forty Project Technical Report Summary, which is incorporated by reference as Exhibit 96.1 to this Form 10-K. Results of the work indicate a more robust economic project with no planned impacts to wetlands that is more protective of the environment, which should facilitate a successful mine permitting process. The Board continues to evaluate options that could lead to the development of the Project. Please see Item 2. Properties for additional information.
Permitting: The State of Michigan governs and regulates the permitting process as it relates to the Back Forty Project.
Community: Tribal engagement has been very important to the Project, especially considering the cultural resources near the site. Outreach to local Tribes, including the Menominee Indian Tribe of Wisconsin, began as early as June of 2010.
Gold Resource Corporation
39
Aquila conducted extensive archeological studies throughout the affected and unaffected areas. As agreed with the authorities, Aquila identified areas for permanent protection and established appropriate buffers.
Office Facilities: In Michigan, we own and operate an administrative office building in Stephenson, MI and another field office close to the location of the potential future mine facilities.
ITEM 3. |
LEGAL PROCEEDINGS |
In February 2020, a local Ejido community (who claim to be an indigenous community) filed an injunction against the Mexican federal government through which they demanded the cancelation of several concession titles, including concessions currently granted to DDGM. The federal government ordered a suspension to prevent work related to excavating, drilling, opening tunnels, and exploiting the Mineral Resources on the surface and subsoil of the concessions named in the injunction in the lands of the indigenous community. Presently, DDGM does not perform such works in the named concessions in lands of the indigenous community. The lawsuit filed in February 2020 at the First District Courthouse in the state of Oaxaca remains under review by the courts.
ITEM 4. |
MINE SAFETY DISCLOSURES |
Not applicable.
Gold Resource Corporation
40
PART II
ITEM 5. |
MARKET FOR REGISTRANT’S COMMON EQUITY, RELATED STOCKHOLDER MATTERS, AND ISSUER PURCHASES OF EQUITY SECURITIES |
Market Information
Our common stock trades on the New York Stock Exchange American (“NYSE”) under the symbol “GORO”.
On March 20, 2024, there were 88,757,610 shares of Gold Resource Corporation, which were held by approximately 200 holders of record.
Transfer Agent
Computershare Trust Company, N.A. is the transfer agent for our common stock. The principal office of Computershare is located at 6200 S. Quebec St., Greenwood Village, CO 80111, and its telephone number is (303) 262-0600. Correspondence should be mailed to P.O. Box 43078, Providence, RI 02940-3078 or couriered to 150 Royall St., Suite 101, Canton, MA 0202.
Dividend Policy
Approximately $123 million in dividends have been returned to our shareholders since commercial production began at DDGM in July 2010. As of February 13, 2023, to protect our balance sheet and to focus our capital resources on exploration and growth opportunities, thus to maximize shareholder value, the company suspended the quarterly dividend payments until such time that it may become practicable to reinstate.
ITEM 6.RESERVED
Gold Resource Corporation
41
ITEM 7. |
MANAGEMENT’S DISCUSSION AND ANALYSIS OF FINANCIAL CONDITION AND RESULTS OF OPERATIONS |
Except for the historical information, the following discussion contains forward-looking statements that are subject to risks and uncertainties. We caution you not to put undue reliance on any forward-looking statements, which speak only as of the date of this report. See “Forward-Looking Statements” above. Our actual future results or actions may differ materially from these forward-looking statements for many reasons, including but not limited to the risks described in “Item 1A. Risk Factors” and elsewhere in this annual report and other reports filed by us with the SEC. This discussion and analysis of our financial condition and results of operations should be read in conjunction with the audited consolidated financial statements and related notes included in this report and with the understanding that our actual future results may be materially different from what we currently expect.
Introduction
We are a mining company that pursues gold and silver projects that are expected to achieve both low operating costs and high returns on capital. DDGM holds six properties and includes mineral production primarily from the Arista underground mine. We produce gold and silver doré and metal concentrates which contain precious metals of gold and silver and base metals of copper, lead, and zinc.
The following discussion summarizes our results of operations for the two fiscal years ended December 31, 2023 and 2022 and our financial condition as of December 31, 2023 and 2022, with a particular emphasis on the year ended December 31, 2023.
The discussion also presents certain non-GAAP financial measures that are important to management in its evaluation of our operating results and which are used by management to compare our performance with what we perceive to be peer group mining companies and are relied on as part of management’s decision-making process. Management believes these measures may also be important to investors in evaluating our performance. For a detailed description of each of the non-GAAP financial measures, please see the discussion under Item 7. Management’s Discussion and Analysis of Financial Condition and Results of Operations below.
In our financial statements, we report the sale of all precious and base metals as revenue, and we periodically review our revenue streams to ensure that this treatment remains appropriate. We consider precious metals to be the long-term primary driver of our economic decisions and believe that base metals are secondary products for non-GAAP financial measures.
Gold equivalent is determined by taking gold ounces produced and sold, plus silver ounces produced and sold, converted to gold equivalent ounces using the gold to silver average realized price ratio for the period.
Gold Resource Corporation—Management’s Discussion and Analysis of Financial Condition and Results of Operations
42
Results of Operations
Don David Gold Mine
Production Statistics
Mine activities during 2023 included development and ore extraction from the Arista mine. The following table summarizes certain production statistics about our Don David Gold Mine for the periods indicated:
|
|
For the year ended December 31, |
||||
|
|
2023 |
|
2022 |
||
Arista Mine |
|
|
|
|
|
|
Milled |
|
|
|
|
|
|
Tonnes Milled |
|
|
458,111 |
|
|
491,983 |
Grade |
|
|
|
|
|
|
Average Gold Grade (g/t) |
|
|
1.73 |
|
|
2.56 |
Average Silver Grade (g/t) |
|
|
85 |
|
|
83 |
Average Copper Grade (%) |
|
|
0.36 |
|
|
0.39 |
Average Lead Grade (%) |
|
|
1.52 |
|
|
1.80 |
Average Zinc Grade (%) |
|
|
3.45 |
|
|
4.36 |
Recoveries |
|
|
|
|
|
|
Average Gold Recovery (%) |
|
|
79.6 |
|
|
83.9 |
Average Silver Recovery (%) |
|
|
91.6 |
|
|
92.0 |
Average Copper Recovery (%) |
|
|
77.5 |
|
|
75.6 |
Average Lead Recovery (%) |
|
|
73.0 |
|
|
75.4 |
Average Zinc Recovery (%) |
|
|
85.4 |
|
|
83.7 |
Combined |
|
|
|
|
|
|
Tonnes Milled (1) |
|
|
459,171 |
|
|
493,241 |
Tonnes Milled per Day (2) |
|
|
1,436 |
|
|
1,466 |
Metal production (3) |
|
|
|
|
|
|
Gold (ozs.) |
|
|
20,328 |
|
|
34,122 |
Silver (ozs.) |
|
|
1,142,138 |
|
|
1,213,404 |
Copper (tonnes) |
|
|
1,287 |
|
|
1,436 |
Lead (tonnes) |
|
|
5,068 |
|
|
6,665 |
Zinc (tonnes) |
|
|
13,513 |
|
|
17,943 |
Metal produced and sold (3) |
|
|
|
|
|
|
Gold (ozs.) |
|
|
18,534 |
|
|
30,119 |
Silver (ozs.) |
|
|
1,036,229 |
|
|
1,057,209 |
Copper (tonnes) |
|
|
1,231 |
|
|
1,348 |
Lead (tonnes) |
|
|
4,501 |
|
|
5,391 |
Zinc (tonnes) |
|
|
10,954 |
|
|
14,157 |
Percentage payable metal (3) |
|
|
|
|
|
|
Gold (%) |
|
|
91 |
|
|
88 |
Silver (%) |
|
|
91 |
|
|
87 |
Copper (%) |
|
|
96 |
|
|
94 |
Lead (%) |
|
|
89 |
|
|
81 |
Zinc (%) |
|
|
81 |
|
|
79 |
| (1) | During the first and second quarter of 2022 and during the first quarter of 2023, tonnes milled includes 1,043, 215, and 1,060 purchased tonnes, respectively, related to a collaborative initiative with a local community to ensure the proper environmental treatment and storage of the material. |
| (2) | Based on actual days the mill operated during the period. |
| (3) | The difference between what we report as "ounces/tonnes produced" and "payable ounces/tonnes sold" is attributable to the difference between the quantities of metals contained in the concentrates we produce versus the portion of those metals actually paid for according to the terms of our sales contracts. Differences can also arise from inventory changes incidental to shipping schedules, or variances in ore grades and recoveries, which impact the amount of metals contained in concentrates produced and sold. |
Gold Resource Corporation—Management’s Discussion and Analysis of Financial Condition and Results of Operations
43
Full-year 2023 compared to full-year 2022
Key drivers in the production and financial results for the twelve months ended December 31, 2023, as compared to the same period in 2022, relate to the lower tonnes mined and changes in metal grades. These results align with the 2023 mine plan and were considered in the 2023 guidance disclosed in the 2022 Annual Report. Financial results have also been impacted unfavorably by the strengthening Mexican peso and the lower zinc price realized in 2023.
Grades & Recoveries
During the twelve months ended December 31, 2023, we processed ore with an average gold grade of 1.73 g/t, as compared to 2.56 g/t for the same period in 2022. Full-year average gold grade was approximately 32% lower than the prior year, in line with our mine sequencing plan. The average silver grade for the year ending 2023 increased 2% to 85 g/t. While silver grade and recovery were similar to prior year, recovery for gold declined 5% in 2023 and is in line as per mine plan. As shown in the DDGM Technical Report Summary filed as Exhibit 96.2 to this Form 10-K, gold and silver grades are expected to decline over time, in line with the life of mine average shown in the Mineral Reserve and Mineral Resource tables. As grades decline, recoveries are expected to decline as well; however, there are other factors that may influence this general assumption.
Our base metal average grades for the twelve months ended December 31, 2023 were 0.36% for copper, 1.52% for lead, and 3.45% for zinc, compared to 0.39% for copper, 1.80% for lead, and 4.36% for zinc in 2022. Copper, Lead and zinc grades for the 12 months ending December 31, 2023 declined by 8%, 16% and 21%, respectively, in line with our mine sequencing plan. As shown in the DDGM Technical Report Summary filed as Exhibit 96.2 to this Form 10-K, future recoveries and grades are expected to be in line with the life of mine average shown in the Mineral Reserve and Mineral Resource tables.
Production
For the year ended December 31, 2023, the Oaxaca operations processed 459,171 tonnes of ore, at an average rate of 1,436 daily tonnes, a decrease of 7% in material processed and a decrease of 2% in tonnes milled per day from prior year. 20,328 gold ounces and 1,142,138 silver ounces were produced, reflecting a decrease of 40% and 6%, respectively, from the same period in 2022. The production decrease for gold is directly related to the decrease in gold grade and recovery in 2023 as compared to the same periods in 2022. Production for copper, lead, and zinc decreased by 10%, 24%, and 25%, respectively, for the three months ending December 31, 2023, compared the same period in 2022. Production decreases are mostly related to the decrease in base metal grades in 2023 compared to the same periods in 2022, as well as a result of lower tonnes processed, as expected and in line with the 2023 mine plan.
Metals produced and sold is less than the amount of metals produced because a portion of the metals present in the materials shipped is withheld by the purchaser of our doré and concentrates under the terms of the Company’s sales contracts, as explained above. The percentage payable metal—the amount of metal sold as a percent of the metal produced—were higher for all metals for the twelve months ended December 31, 2023, compared to same period in 2022, due to the minerology of the material mined.
Gold Resource Corporation—Management’s Discussion and Analysis of Financial Condition and Results of Operations
44
Sales Statistics
The following table summarizes certain sales statistics about the Don David Gold Mine operations for the periods indicated:
|
|
For the year ended December 31, |
||||
|
|
2023 |
|
2022 |
||
Net sales |
|
|
|
|
|
|
Gold |
|
$ |
35,944 |
|
$ |
54,319 |
Silver |
|
|
24,205 |
|
|
22,757 |
Copper |
|
|
10,472 |
|
|
11,987 |
Lead |
|
|
9,540 |
|
|
11,626 |
Zinc |
|
|
29,225 |
|
|
50,470 |
Less: Treatment and refining charges |
|
|
(11,630) |
|
|
(12,072) |
Realized and unrealized gain (loss) - embedded derivative, net |
|
|
(28) |
|
|
(363) |
Total sales, net |
|
$ |
97,728 |
|
$ |
138,724 |
Metal produced and sold |
|
|
|
|
|
|
Gold (ozs.) |
|
|
18,534 |
|
|
30,119 |
Silver (ozs.) |
|
|
1,036,229 |
|
|
1,057,209 |
Copper (tonnes) |
|
|
1,231 |
|
|
1,348 |
Lead (tonnes) |
|
|
4,501 |
|
|
5,391 |
Zinc (tonnes) |
|
|
10,954 |
|
|
14,157 |
Average metal prices realized (1) |
|
|
|
|
|
|
Gold ($ per oz.) |
|
$ |
1,955 |
|
$ |
1,801 |
Silver ($ per oz.) |
|
$ |
23.68 |
|
$ |
21.53 |
Copper ($ per tonne) |
|
$ |
8,513 |
|
$ |
8,795 |
Lead ($ per tonne) |
|
$ |
2,158 |
|
$ |
2,129 |
Zinc ($ per tonne) |
|
$ |
2,621 |
|
$ |
3,539 |
Gold equivalent ounces sold |
|
|
|
|
|
|
Gold Ounces |
|
|
18,534 |
|
|
30,119 |
Gold Equivalent Ounces from Silver |
|
|
12,551 |
|
|
12,638 |
Total AuEq oz |
|
|
31,085 |
|
|
42,757 |
| (1) | Average metal prices realized vary from the market metal prices due to final settlement adjustments from our provisional invoices when they are settled. Our average metal prices realized will therefore differ from the market average metal prices in most cases. |
Full-year 2023 compared to full-year 2022
Metal Sold
During the twelve months ended December 31, 2023, gold sales of 18,534 ounces, silver sales of 1,036,229 ounces, copper sales of 1,231 tonnes, lead sales of 4,501 tonnes, and zinc sales of 10,954 tonnes decreased by 38%, 2%, 9%, 17%, and 23%, respectively, as compared to the same period in 2022. These decreases were expected due to mine sequencing.
Average metal prices realized
During the twelve months ended December 31, 2023, the average metal prices were $1,955 per ounce for gold, $23.68 per ounce for silver, $8,513 per tonne for copper, $2,158 per tonne for lead, and $2,621 per tonne for zinc. Compared to the same period in 2022, the average metal price for gold, silver, and lead increased by 9%, 10%, and 1%, respectively, while the average metal price for copper and zinc decreased by 3% and 26%, respectively.
Gold Resource Corporation—Management’s Discussion and Analysis of Financial Condition and Results of Operations
45
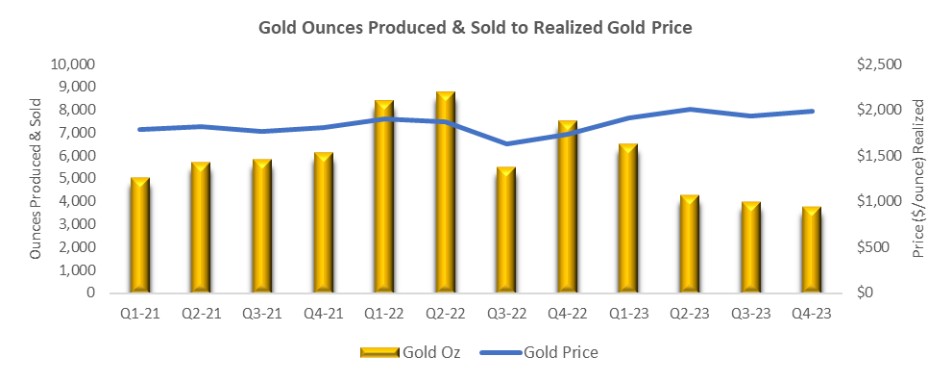
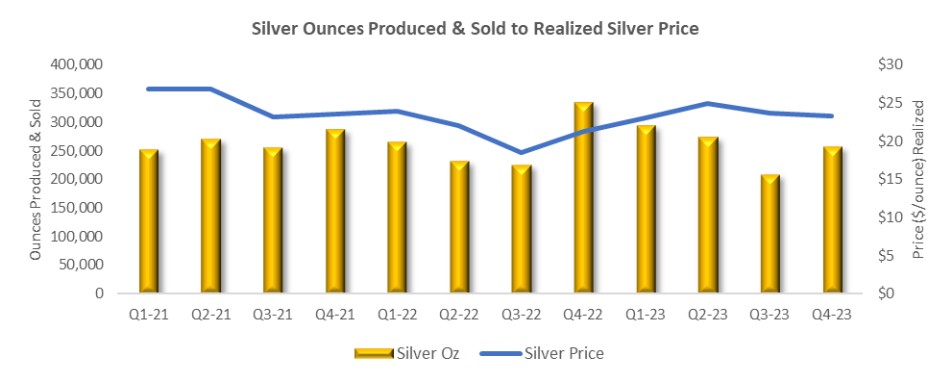
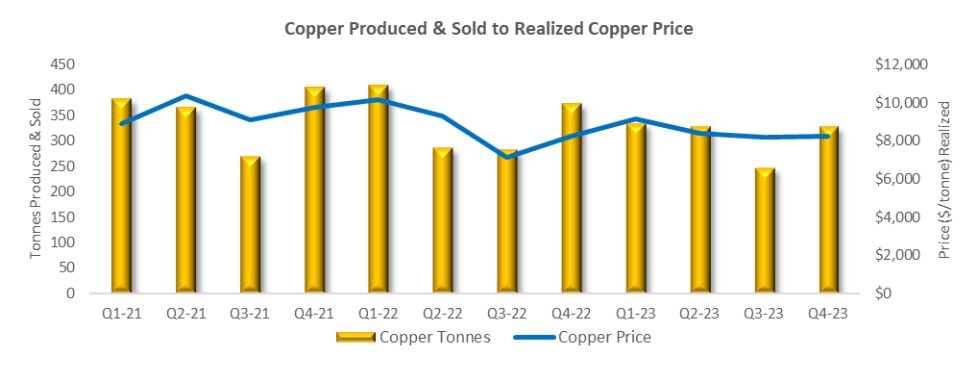
Gold Resource Corporation—Management’s Discussion and Analysis of Financial Condition and Results of Operations
46
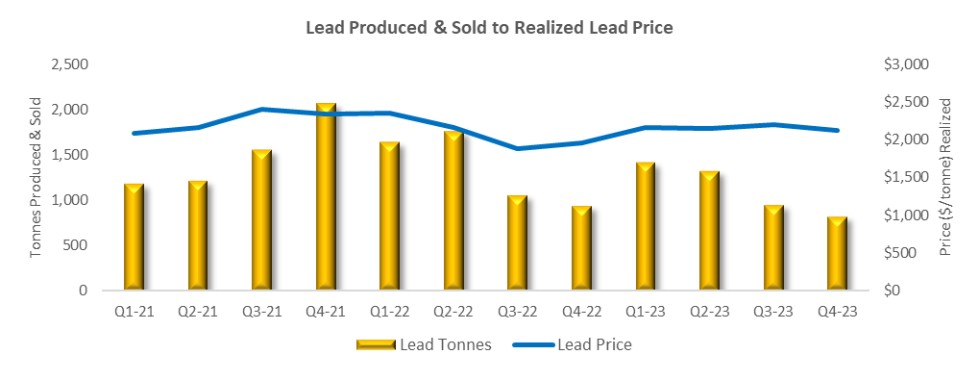
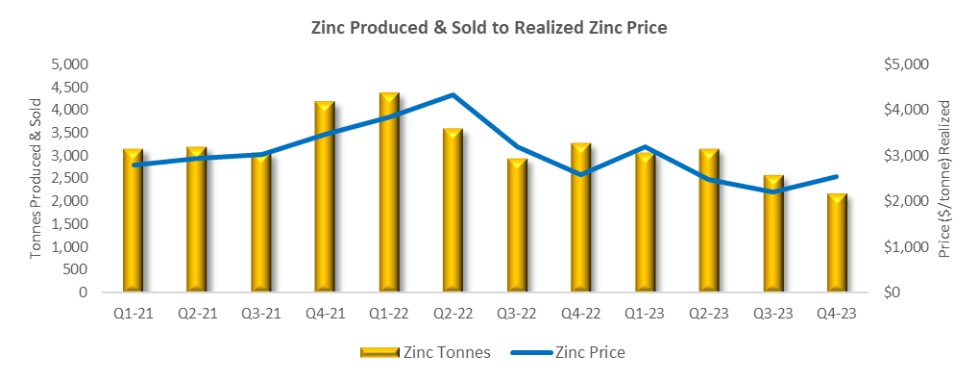
Gold Resource Corporation—Management’s Discussion and Analysis of Financial Condition and Results of Operations
47
Financial Measures
The following table summarizes certain financial data of the Company for the periods indicated:
|
|
For the year ended December 31, |
||||
|
|
2023 |
|
2022 |
||
|
|
(in thousands) |
||||
Doré and concentrate sales |
|
$ |
109,386 |
|
$ |
151,159 |
Less: Treatment and refining charges |
|
|
(11,630) |
|
|
(12,072) |
Realized/unrealized derivatives, net |
|
|
(28) |
|
|
(363) |
Sales, net |
|
|
97,728 |
|
|
138,724 |
Total cost of sales |
|
|
103,043 |
|
|
108,976 |
Mine gross (loss) profit |
|
|
(5,315) |
|
|
29,748 |
Other costs and expenses, including tax: |
|
|
10,702 |
|
|
36,069 |
Net loss |
|
$ |
(16,017) |
|
$ |
(6,321) |
|
|
|
|
|
|
|
Other Non-GAAP Financial Measures: |
|
|
|
|
|
|
Total cash cost after co-product credits per AuEq oz sold (1) |
|
$ |
1,250 |
|
$ |
458 |
Total consolidated all-in sustaining cost after co-product credits per AuEq oz sold (1) |
|
$ |
1,864 |
|
$ |
1,093 |
Total all-in cost after co-product credits per AuEq oz sold (1) |
|
$ |
2,062 |
|
$ |
1,442 |
| (1) | For a detailed description of each of the non-GAAP financial measures and a reconciliation to GAAP financial measures, please see the discussion under Item 7. Management’s Discussion and Analysis of Financial Condition and Results of Operations——Non-GAAP Measures below. |
Full-year 2023 compared to full-year 2022
Sales, net
DDGM net sales of $97.7 million for the year ended December 31, 2023 decreased by $41.0 million, or 30%, when compared to 2022. The decrease in 2023 sales is the result of lower tonnes processed and lower grades for gold and base metals.
Treatment charges
Treatment charges for the twelve months ended December 31, 2023, were $11.6 million, or $697 per tonne of base metal produced and sold, as compared to $12.1 million, or $578 per tonne of base metal produced and sold for the same period in 2022. This 21% cost increase in treatment charge per metal tonne sold due to a 32% increased contractual rate for copper treatment charges and for a 21% increase in zinc treatment charges which are based on spot and benchmark rates. These are slightly offset by a 30% decrease in contractual rate for lead treatment charges.
Total cost of sales
Total cost of sales of $103.0 million in 2023 decreased by $5.9 million, or 5%, compared to 2022. The primary driver is the $4.8 million, or 6% decrease in production costs from $80.9 million in 2022 to $76.1 million in 2023, and a $1.1 million, or 4% decrease in depreciation expense. The decrease in production costs is related to lower production in 2023.
Gold Resource Corporation—Management’s Discussion and Analysis of Financial Condition and Results of Operations
48
Mine gross (loss) profit
For the year ended December 31, 2023, mine gross loss and mine gross loss percent totaled $5.3 million and 5% respectively, as compared to a mine gross profit and mine gross profit percent of $29.7 million and 21% for the same period in 2022. The decrease in mine gross profit and loss and mine gross profit and loss percent of $35.1 million and 27%, respectively, when compared to the same period in 2022, primarily resulted from the $41.0 million decrease in net sales year-over-year.
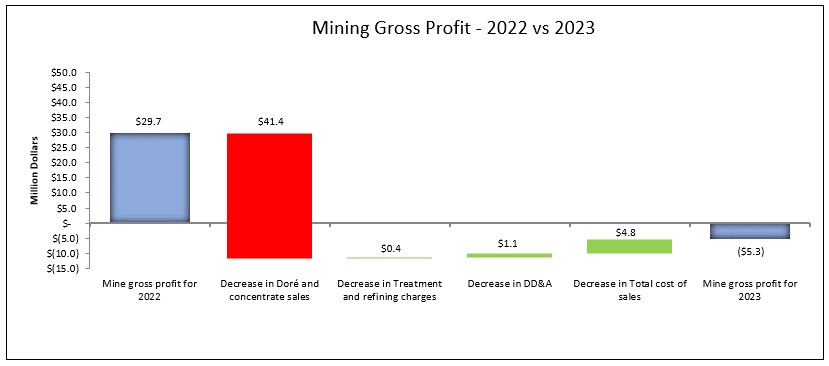
The relationship between sales and operating costs, and therefore mine gross profit or loss, is not perfectly correlated to the tonnes of ore processed. While both sales and operating costs are impacted by the tonnes of ore processed, other factors—the grade of ore processed, metal commodity prices, and operating cost unit prices—tend to have a greater impact on the relationship to mine gross profit. For example, in 2023, the volume of ore processed decreased 7% compared to 2022, with net sales also decreasing by 30% and operating costs decreasing by 40%. The decrease in 2023 net sales when compared to 2022 is explained by the 32% decrease in gold grade and the base metal grade decreases for copper, lead, and zinc of 8%, 16%, and 21%, respectively. The decrease in operating costs is explained chiefly by the targeted decreases in exploration and general and administrative expenses.
We expect grades to vary from period to period based on the annual mine plan. The gold grades are expected to trend downwards over time, toward the average grade of 1.29 g/t (exclusive of silver, copper, lead, and zinc contained grades), reflected in our Mineral Reserves estimate. However, as capital intensive mine development progresses and infill drilling occurs, opportunities to refine mining methods and eliminate dilution may have a favorable impact on future mined grades.
One component of gross profit or loss is concentrate treatment charges, which are netted against concentrate sales. These treatment charge agreements are negotiated on an annual basis with the spot rate adjusted quarterly on zinc. The decrease in treatment charges in 2023 compared to 2022 was the result of lower metals production and therefor decreased revenue as compared to 2022 due to both reduced tonnes mined and processed, and lower grades realized on the tonnage.
Net loss
For the year ended December 31, 2023, we recorded a net loss from operations of $16.0 million, as compared to $6.3 million net loss during the same period in 2022. The change was attributable to the factors noted above.
Gold Resource Corporation—Management’s Discussion and Analysis of Financial Condition and Results of Operations
49
Other Costs and Expenses, Including Taxes
|
|
For the year ended December 31, |
|
||||
|
|
2023 |
|
2022 |
|
||
|
|
(in thousands) |
|
||||
Other costs and expenses: |
|
|
|
|
|
|
|
General and administrative expenses |
|
$ |
6,583 |
|
$ |
8,048 |
|
Mexico exploration expenses |
|
|
4,167 |
|
|
4,244 |
|
Michigan Back Forty Project expenses |
|
|
1,642 |
|
|
8,805 |
|
Stock-based compensation |
|
|
681 |
|
|
1,955 |
|
Realized and unrealized loss on zinc zero cost collar |
|
|
- |
|
|
170 |
|
Other (income) expense, net |
|
|
3,364 |
|
|
4,288 |
|
Total other costs and expenses |
|
|
16,437 |
|
|
27,510 |
|
(Benefit) provision for income taxes |
|
|
(5,735) |
|
|
8,559 |
|
Total other costs, including taxes |
|
$ |
10,702 |
|
$ |
36,069 |
|
Full-year 2023 compared to full-year 2022
General and administrative expenses: For the year ended December 31, 2023, general and administrative expenses totaled $6.6 million compared to $8.0 million for the same period of 2022. The $1.4 million decrease in the twelve months ended December 31, 2023, as compared to the same period in 2022, is due allocating more job duties directly related to production at DDGM from corporate employees in 2023.
DDGM Exploration expenses: For the years ended December 31, 2023 and 2022 DDGM exploration expenses remained flat at $4.2 million.
Back Forty Project expenses: For the year ended December 31, 2023, the Back Forty Project expenses totaled $1.6 million as compared to $8.8 million for the year ended December 31, 2022. Costs were lower in 2023, as the optimization work was completed in October 2023.
Stock-based compensation: For the year ended December 31, 2023, stock-based compensation expense totaled $0.7 million as compared to $2.0 million for the year ended December 31, 2022. This decrease is due to personnel changes and lower share price in 2023.
Other expense, net: For the year ended December 31, 2023, we recorded other expense of $3.4 million compared to $4.3 million during the year ended December 31, 2022. The $0.9 million decrease from 2022 was due to $0.7 million lower realized and unrealized currency gains and losses and lower other expense that includes $0.7 million lower expense related to the contingent consideration, offset by $0.6 million higher interest on the streaming liabilities and $0.9 million higher severance payments in 2023 due to planned reduction of work force. Please see Item 8. Financial Statements and Supplementary Data—Note 17. Other (Income) Expense, Net for additional information.
Provision for income taxes. For the year ended December 31, 2023, income tax benefit increased to $5.7 million from an $8.6 million income tax expense for the same period in 2022. The 2023 income tax benefit is primarily driven by the decrease in pre-tax income at DDGM. Please see Item 8. Financial Statements and Supplementary Data—Note 4. Income Taxes for additional information.
Gold Resource Corporation—Management’s Discussion and Analysis of Financial Condition and Results of Operations
50
Other Non-GAAP Financial Measures
Certain Non-GAAP financial measures are discussed below. For a detailed description of each of these measures and a reconciliation to GAAP financial measures, please see the discussion under Item 7. Management’s Discussion and Analysis of Financial Condition and Results of Operations—Non-GAAP Measures below.
Full-year 2023 compared to full-year 2022
Total cash cost after co-product credits per AuEq oz sold: For the twelve months ended December 31, 2023, the total cash cost after co-product credits per AuEq oz sold was $1,250 compared to $458 for the same period in 2022. The increase is due to the lower amount of co-product credits we received during the twelve months ended December 31, 2023, the 27% decrease in total number of AuEq ounces sold, and the 4% decrease in treatment and refining charges as a result of an increase in the zinc treatment charge benchmark and spot price. Although production costs were lower for the twelve months ended December 31, 2023 compared to the same period last year, the strengthening peso and increased energy costs negatively impacted production costs and, therefore, the cost per tonne processed and the total cash cost after co-product credits per AuEq oz sold.
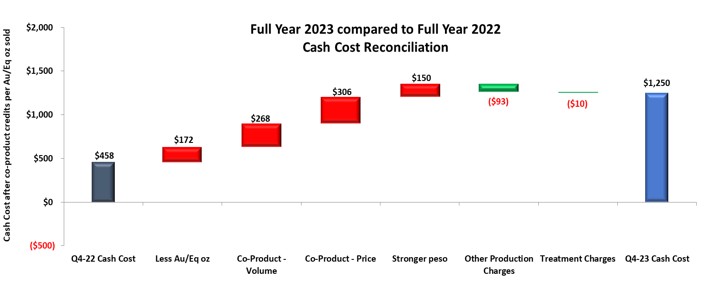
Total consolidated all-in sustaining cost after co-product credits per AuEq oz sold: For the twelve months ended December 31, 2023, the total consolidated all-in sustaining cost after co-product credits per AuEq oz sold was $1,864 compared to $1,093 for the same period in 2022. The increase is directly related to the higher cash costs per ounce discussed above, partially offset by lower sustaining capital expenditures.
Total all-in cost after co-product credits per AuEq oz sold: For the twelve months ended December 31, 2023, the total all-in cost after co-product credits per AuEq oz sold was $2,062 compared to $1,442 for the same period in 2022. The increase is due to the higher all-in sustaining costs discussed above, offset by lower Back Forty costs due to completion of the optimization work in October 2023.
For a detailed description of each of the non-GAAP financial measures and a reconciliation to GAAP financial measures, please see the discussion below under Item 7. Management’s Discussion and Analysis of Financial Condition and Results of Operations—Non-GAAP Measures.
Gold Resource Corporation—Management’s Discussion and Analysis of Financial Condition and Results of Operations
51
2023 Capital and Exploration Investment Summary
|
|
For the year ended December 31, 2023 |
|
2023 full-year guidance |
||
|
|
(in thousands) |
||||
Sustaining Investments: |
|
|
|
|
|
|
Underground Development |
Capital |
$ |
4,386 |
|
|
|
Infill Drilling |
Capitalized Exploration |
|
4,096 |
|
|
|
Other Sustaining Capital |
Capital |
|
1,420 |
|
|
|
Surface and Underground Exploration Development & Other |
Capitalized Exploration |
|
1,139 |
|
|
|
Subtotal of Sustaining Investments: |
|
|
11,041 |
|
$ |
9 - 11 million |
Growth Investments: |
|
|
|
|
|
|
DDGM growth: |
|
|
|
|
|
|
Surface Exploration / Other |
Exploration |
|
2,240 |
|
|
|
Underground Exploration Drilling |
Exploration |
|
1,927 |
|
|
|
Underground Exploration Development |
Capitalized Exploration |
|
357 |
|
|
|
Back Forty growth: |
|
|
|
|
|
|
Back Forty Project Optimization & Permitting |
Exploration |
|
1,642 |
|
|
|
Subtotal of Growth Investments: |
|
|
6,166 |
|
$ |
6 - 7 million |
Total Capital and Exploration: |
|
$ |
17,207 |
|
$ |
15 - 18 million |
The Company’s investment in Mexico totaled $15.1 million in 2023. Our investment in Mexico is focused on favorably impacting our environmental, social, and governance programs while creating operational efficiencies and longevity. At the Back Forty Project, $1.6 million was spent to wrap up the optimization work and to release the Back Forty Project Technical Report Summary, which was filed as Exhibit 96.1 to the Form 8-K filed on October 26, 2023.
Gold Resource Corporation—Management’s Discussion and Analysis of Financial Condition and Results of Operations
52
|
DDGM Ore Transportation |
Underground and Exploration Development: Mine development during the quarter included ramps and accesses to different areas of the deposit, vertical shafts, and exploration development drifts. A total of 2,420 meters of underground development and exploration development, at a cost of $5.9 million, was completed during the year, including access to new exploration drill stations for both infill and expansion programs.
Back Forty Feasibility and Permitting: Work on optimizing the Back Forty Project was completed during the third quarter of 2023. Mine planning, process plant design, site layout, and infrastructure were largely completed during 2022. As a result, the Company filed the Back Forty Project Technical Report Summary on October 26, 2023. Results of the work indicate a more robust economic project with no planned impacts to wetlands that is more protective of the environment, which should facilitate a successful mine permitting process. The Board continues to evaluate options that could lead to the development of the Project.
Gold Resource Corporation—Management’s Discussion and Analysis of Financial Condition and Results of Operations
53
Non-GAAP Measures
Throughout this report, we have provided information prepared or calculated according to U.S. GAAP and have referenced some non-GAAP performance measures which we believe will assist with understanding the performance of our business. These measures are based on precious metal gold equivalent ounces sold and include cash cost before co-product credits per ounce, total cash cost after co-product credits per ounce, and total all-in sustaining cost per ounce (“AISC”). Because the non-GAAP performance measures do not have any standardized meaning prescribed by U.S. GAAP, they may not be comparable to similar measures presented by other companies. Accordingly, these measures should not be considered in isolation or as a substitute for measures of performance prepared in accordance with U.S. GAAP. These non-GAAP measures are not necessarily indicative of operating profit or cash flow from operations as determined under GAAP.
For financial reporting purposes, we report the sale of base metals as part of our revenue. Revenue generated from the sale of base metals in our concentrates is considered a co-product of our gold and silver production for the purpose of our total cash cost after co-product credits for our Don David Gold Mine. We periodically review our revenues to ensure that our reporting of primary products and co-products remains appropriate. Because we consider copper, lead, and zinc to be co-products of our precious metal production, the value of these metals continues to be applied as a reduction to total cash costs in our calculation of total cash cost after co-product credits per gold equivalent ounce sold. Gold equivalent is determined by taking gold ounces produced and sold, plus silver ounces produced and sold, converted to gold equivalent ounces using the gold to silver average realized price ratio for the period. We believe the identification of copper, lead, and zinc as co-product credits is appropriate because of their lower individual economic value compared to gold and silver and due to the fact that gold and silver are the primary products we intend to produce.
Total cash cost, after co-product credits, is a measure developed by the Gold Institute in an effort to provide a uniform standard for comparison purposes. AISC is calculated based on the current guidance from the World Gold Council.
Total cash cost before co-product credits includes all direct and indirect production costs related to our production of metals (including mining, milling, and other plant facility costs, royalties, and site general and administrative costs) less stock-based compensation allocated to production costs plus treatment and refining costs.
Total cash cost after co-product credits includes total cash cost before co-product credits, less co-product credits (revenues earned from base metals).
AISC includes total cash cost after co-product credits plus other costs related to sustaining production, including sustaining allocated general and administrative expenses and sustaining capital expenditures. We determined sustaining capital expenditures as those capital expenditures that are necessary to maintain current production and execute the current mine plan.
Cash cost before co-product credits per ounce, total cash cost after co-product credits per ounce, and AISC are calculated by dividing the relevant costs, as determined using the cost elements noted above, by precious metal gold equivalent ounces sold for the periods presented.
Gold Resource Corporation—Management’s Discussion and Analysis of Financial Condition and Results of Operations
54
Reconciliations to U.S. GAAP
The table below present reconciliations between the most comparable GAAP measure of Total cost of sales to the non-GAAP measures of Cash cost after co-product credits , All-in sustaining cost after co-product credits for DDGM and for the Company, and All-in Cost after co-product credits for the years ended December 31, 2023 and 2022:
|
Note |
|
For the year ended December 31, |
||||
|
|
|
2023 |
|
2022 |
||
|
|
|
|
|
|
|
|
|
|
|
|
|
|
|
|
Total cost of sales (1) |
|
|
$ |
103,043 |
|
$ |
108,976 |
Less: Depreciation and amortization (1) |
|
|
|
(26,126) |
|
|
(27,226) |
Less: Reclamation and remediation (1) |
|
|
|
(774) |
|
|
(801) |
Refining charges for Doré sales |
2 |
|
|
52 |
|
|
59 |
Treatment and refining charges for Concentrate sales |
2 |
|
|
11,578 |
|
|
12,013 |
Co-product credits: |
|
|
|
|
|
|
|
Concentrate sales - Copper |
2 |
|
|
(10,472) |
|
|
(11,987) |
Concentrate sales - Lead |
2 |
|
|
(9,540) |
|
|
(11,626) |
Concentrate sales - Zinc |
2 |
|
|
(29,225) |
|
|
(50,470) |
Realized (loss) gain for embedded derivatives - Copper |
19 |
|
|
(6) |
|
|
127 |
Realized (loss) gain for embedded derivatives - Lead |
19 |
|
|
(174) |
|
|
150 |
Realized gain for embedded derivatives - Zinc |
19 |
|
|
511 |
|
|
364 |
Total cash cost after co-product credits |
|
|
$ |
38,867 |
|
$ |
19,579 |
Gold equivalent (AuEq) ounces sold (oz) |
|
|
|
31,085 |
|
|
42,757 |
Total cash cost after co-product credits per AuEq oz sold |
|
|
$ |
1,250 |
|
$ |
458 |
|
|
|
|
|
|
|
|
Total cash cost after co-product credits from above |
|
|
$ |
38,867 |
|
$ |
19,579 |
Sustaining Investments - Capital: |
|
|
|
|
|
|
|
Underground Development (2) |
|
|
|
4,386 |
|
|
6,619 |
Other Sustaining Capital (2) |
|
|
|
1,420 |
|
|
3,227 |
Sustaining Investments - Capitalized Exploration: |
|
|
|
|
|
|
|
Infill Drilling (2) |
|
|
|
4,096 |
|
|
3,459 |
Surface and Underground Exploration Development & Other (2) |
|
|
|
1,139 |
|
|
3,034 |
Reclamation and remediation (1) |
|
|
|
774 |
|
|
801 |
DDGM all-in sustaining cost after co-product credits |
|
|
$ |
50,682 |
|
$ |
36,719 |
AuEq ounces sold (oz) |
|
|
|
31,085 |
|
|
42,757 |
DDGM all-in sustaining cost after co-product credits per AuEq oz sold |
|
|
$ |
1,630 |
|
$ |
859 |
|
|
|
|
|
|
|
|
DDGM all-in sustaining cost after co-product credits from above |
|
|
$ |
50,682 |
|
$ |
36,719 |
Corporate Sustaining Expenses: |
|
|
|
|
|
|
|
General and administrative expenses (1) |
|
|
|
6,583 |
|
|
8,048 |
Stock-based compensation (1) |
|
|
|
681 |
|
|
1,955 |
Consolidated all-in sustaining cost after co-product credits |
|
|
$ |
57,946 |
|
$ |
46,722 |
AuEq ounces sold (oz) |
|
|
|
31,085 |
|
|
42,757 |
Total consolidated all-in sustaining cost after co-product credits per AuEq oz sold |
|
|
$ |
1,864 |
|
$ |
1,093 |
|
|
|
|
|
|
|
|
Consolidated all-in sustaining cost after co-product credits from above |
|
|
$ |
57,946 |
|
$ |
46,722 |
Growth Investments - Capital: |
|
|
|
|
|
|
|
Gold Regrind (2) |
|
|
|
- |
|
|
745 |
Dry Stack Completion (2) |
|
|
|
- |
|
|
1,149 |
Growth Investments - Capitalized Exploration: |
|
|
|
|
|
|
|
Underground Exploration Development (2) |
|
|
|
357 |
|
|
- |
Growth Investments - Exploration: |
|
|
|
|
|
|
|
Mexico exploration expenses (1) |
|
|
|
4,167 |
|
|
4,244 |
Michigan Back Forty Project expenses (1) |
|
|
|
1,642 |
|
|
8,805 |
Total all-in cost after co-product credits |
|
|
$ |
64,112 |
|
$ |
61,665 |
AuEq ounces sold (oz) |
|
|
|
31,085 |
|
|
42,757 |
Total all-in cost after co-product credits per AuEq oz sold |
|
|
$ |
2,062 |
|
$ |
1,442 |
| (1) | Refer to Item 8—Financial Statements and Supplementary Data: Consolidated Statements of Operations. |
| (2) | Refer to Item 7—Management’s Discussion and Analysis of Financial Condition and Results of Operations—2023 Capital and Exploration Investment Summary and the 2022 Annual Report Item 7—Management’s Discussion and Analysis of Financial Condition and Results of Operations—2022 Capital and Exploration Investment Summary. |
Gold Resource Corporation—Management’s Discussion and Analysis of Financial Condition and Results of Operations
55
Trending Highlights
|
2022 |
|
2023 |
||||||
|
Q1 |
Q2 |
Q3 |
Q4 |
|
Q1 |
Q2 |
Q3 |
Q4 |
Operating Data |
|
|
|
|
|
|
|
|
|
Total tonnes milled |
136,844 |
129,099 |
110,682 |
116,616 |
|
117,781 |
113,510 |
116,626 |
111,255 |
Average Grade |
|
|
|
|
|
- |
|
|
|
Gold (g/t) |
3.00 |
2.63 |
1.98 |
2.51 |
|
2.33 |
1.59 |
1.52 |
1.44 |
Silver (g/t) |
81 |
64 |
80 |
109 |
|
94 |
86 |
73 |
85 |
Copper (%) |
0.41 |
0.32 |
0.37 |
0.45 |
|
0.37 |
0.37 |
0.32 |
0.39 |
Lead (%) |
1.97 |
1.99 |
1.59 |
1.58 |
|
1.73 |
1.64 |
1.29 |
1.39 |
Zinc (%) |
4.89 |
4.00 |
4.21 |
4.27 |
|
3.88 |
3.72 |
3.24 |
2.95 |
Metal production (before payable metal deductions) |
|
|
|
|
|
|
|
|
|
Gold (ozs.) |
11,187 |
9,317 |
5,851 |
7,767 |
|
7,171 |
4,637 |
4,443 |
4,077 |
Silver (ozs.) |
332,292 |
249,088 |
261,256 |
370,768 |
|
322,676 |
289,816 |
247,159 |
282,488 |
Copper (tonnes) |
431 |
303 |
296 |
406 |
|
336 |
334 |
276 |
341 |
Lead (tonnes) |
2,073 |
2,020 |
1,249 |
1,323 |
|
1,559 |
1,389 |
1,048 |
1,072 |
Zinc (tonnes) |
5,562 |
4,282 |
3,901 |
4,198 |
|
3,837 |
3,569 |
3,223 |
2,884 |
Metal produced and sold |
|
|
|
|
|
|
|
|
|
Gold (ozs.) |
8,381 |
8,746 |
5,478 |
7,514 |
|
6,508 |
4,287 |
3,982 |
3,757 |
Silver (ozs.) |
265,407 |
231,622 |
225,012 |
335,168 |
|
294,815 |
274,257 |
208,905 |
258,252 |
Copper (tonnes) |
408 |
286 |
282 |
372 |
|
332 |
327 |
245 |
327 |
Lead (tonnes) |
1,639 |
1,755 |
1,056 |
941 |
|
1,417 |
1,317 |
947 |
820 |
Zinc (tonnes) |
4,359 |
3,590 |
2,943 |
3,265 |
|
3,060 |
3,141 |
2,571 |
2,182 |
Average metal prices realized |
|
|
|
|
|
|
|
|
|
Gold ($ per oz.) |
$ 1,898 |
$ 1,874 |
$ 1,627 |
$ 1,734 |
|
$ 1,915 |
$ 2,010 |
$ 1,934 |
$ 1,985 |
Silver ($ per oz.) |
$ 23.94 |
$ 22.05 |
$ 18.54 |
$ 21.25 |
|
$ 23.04 |
$ 24.93 |
$ 23.61 |
$ 23.14 |
Copper ($ per tonne) |
$ 10,144 |
$ 9,275 |
$ 7,115 |
$ 8,221 |
|
$ 9,172 |
$ 8,397 |
$ 8,185 |
$ 8,205 |
Lead ($ per tonne) |
$ 2,347 |
$ 2,168 |
$ 1,882 |
$ 1,954 |
|
$ 2,158 |
$ 2,153 |
$ 2,196 |
$ 2,122 |
Zinc ($ per tonne) |
$ 3,842 |
$ 4,338 |
$ 3,186 |
$ 2,577 |
|
$ 3,195 |
$ 2,485 |
$ 2,195 |
$ 2,516 |
Gold equivalent ounces sold |
|
|
|
|
|
|
|
|
|
Gold Ounces |
8,381 |
8,746 |
5,478 |
7,514 |
|
6,508 |
4,287 |
3,982 |
3,757 |
Gold Equivalent Ounces from Silver |
3,348 |
2,729 |
2,564 |
4,107 |
|
3,547 |
3,402 |
2,550 |
3,011 |
Total AuEq oz |
11,729 |
11,475 |
8,042 |
11,621 |
|
10,055 |
7,689 |
6,532 |
6,768 |
Financial Data |
|
|
|
|
|
|
|
|
|
Total sales, net (in thousands) |
$ 45,417 |
$ 37,064 |
$ 23,869 |
$ 32,374 |
|
$ 31,228 |
$ 24,807 |
$ 20,552 |
$ 21,141 |
Production Costs (in thousands) |
$ 20,074 |
$ 21,722 |
$ 19,380 |
$ 19,773 |
|
$ 19,850 |
$ 20,302 |
$ 18,957 |
$ 17,034 |
Production Costs/Tonnes Milled |
$ 147 |
$ 168 |
$ 175 |
$ 170 |
|
$ 169 |
$ 179 |
$ 163 |
$ 153 |
Operating Cash Flows (in thousands) |
$ 4,230 |
$ 7,976 |
($ 4,292) |
$ 6,243 |
|
$ 1,024 |
($ 551) |
($ 7,475) |
$ 1,783 |
Net income (loss) (in thousands) |
$ 4,019 |
$ 2,673 |
($ 9,730) |
($ 3,283) |
|
($ 1,035) |
($ 4,584) |
($ 7,341) |
($ 3,057) |
Earnings (loss) per share - basic |
$ 0.05 |
$ 0.03 |
($ 0.11) |
($ 0.04) |
|
($ 0.01) |
($ 0.05) |
($ 0.08) |
($ 0.03) |
Gold Resource Corporation—Management’s Discussion and Analysis of Financial Condition and Results of Operations
56
Liquidity and Capital Resources
As of December 31, 2023, our working capital was $15.2 million, a decrease of $6.2 million from $21.4 million at December 31, 2022. Our working capital balance at December 31, 2023 reflects a decrease in cash, partially offset by a decrease in current liabilities related to income tax payable, accounts payable, and the contingent consideration. The decrease of $17.4 million of cash and cash equivalents from December 31, 2022 is attributable to a cash outflow of $12.5 million for capital investments, as well as a cash outflow of $5.2 million from operating activities for 2023 that includes $7.8 million of income tax payments for the tax years 2022 and 2023, exploration investment of $4.2 million in DDGM, and $1.6 million of spending on the Back Forty Project optimization work. The cash outflow from operating activities is partially the result of higher energy prices due to inflation and the strengthening of the Mexican Peso. Our working capital balance fluctuates as we use cash to fund our operations, financing, and investing activities, including exploration and mine development. We believe that as a result of our cash balances, the performance of our current and expected operations, and current metals prices, we will be able to meet our obligations and other potential cash requirements during the next 12 months from the date of this report.
The actual amount of cash receipts that we receive during the period from operations may vary significantly from the planned amounts due to, among other things: (i) unanticipated variations in grade, (ii) unexpected challenges associated with our proposed mining plan, (iii) decreases in commodity prices below those used in calculating the estimates shown above, (iv) variations in expected recoveries, or (v) interruptions in mining at DDGM. The actual amount of cash expenditures that we incur during the twelve-month period ending December 31, 2024 may vary significantly from the planned amounts and will depend on a number of factors, including, among other things: (i) unexpected challenges in operations, including exploration and development, (ii) increases in operating costs above those used in calculating the estimates shown above, (iii) possible strategic transactions, and (iv) continued inflationary pressure. Likewise, if cash expenditures are greater than anticipated or if cash receipts are less than anticipated, we may need to take certain actions to adjust our spending over the next twelve months. Although it is not likely, given the current share price, we may also utilize the At-The-Market Offering Agreement (“ATM”) program, if necessary. Please see Item 8. Financial Statements and Supplementary Data—Note 12. Shareholders’ Equity in for additional information about the ATM.
Long-term liabilities assumed with the Aquila acquisition, capital requirements to develop the Back Forty Project, and potential project financing may have an impact on liquidity in the long term. These long-term liabilities are contingent upon the Back Forty Project securing project financing and achieving commercial production. Project financing requirements will not be determined until the Company Board of Directors approves a decision to proceed on the Project. The Board continues to evaluate options that could lead to the development of the Project.
Cash and cash equivalents as of December 31, 2023 decreased to $6.3 million from $23.7 million as of December 31, 2022, a net decrease in cash of $17.4 million. The decrease is primarily due to the $5.2 million cash outflows from operations and the $12.5 million cash spent on investing activities for capital investments, offset by $0.2 million increase in value due to the strengthening of the peso.
Net cash used in operating activities for the years ended December 31, 2023 was $5.2 million, compared to net cash provided by operating activities of $14.2 million in 2022. The decrease is mainly attributable to reduced net sales resulting from lower mined and processed tonnages, lower grades realized on said tonnages, and lower realized metal prices for copper and zinc. Other attributable impacts to production costs included higher inflation and a stronger average Mexican Peso in 2023 as compared to 2022 that resulted in increased costs offset by lower mining and processing related costs resulting from lower tonnage.
Net cash used in investing activities for the year ended December 31, 2023 was $12.5 million compared to $19.4 million during the same period in 2022. The decrease in investing activities is primarily attributable to non-recurring capital projects undertaken in 2022 (including efforts to improve stabilization and ventilation of the Don David mine and the completion of the filtration plant) and in addition, the lower Back Forty expenses related to the optimization work in 2023, as compared to 2022.
Gold Resource Corporation—Management’s Discussion and Analysis of Financial Condition and Results of Operations
57
Net cash used in financing activities for the year ended December 31, 2023 was a net outflow of $0.1 million compared to a net outflow of $3.9 million in 2022. The lower financing costs are attributable to the suspension of the dividend program in 2023.
Off-Balance Sheet Arrangements
As of December 31, 2023, we have off-balance sheet arrangements related to equipment purchase obligations of $0.8 million.
Accounting Developments
Recent accounting pronouncements issued have been evaluated and do not presently impact our financial statements and supplemental data.
Critical Accounting Estimates
The preparation of financial statements in conformity with U.S. GAAP requires management to make estimates and assumptions that affect the reported amount of assets, liabilities, and contingencies at the date of the financial statements, as well as the reported amounts of revenues and expenses during the reporting period. As a result, management is required to routinely make judgments and estimates about the effects of matters that are inherently uncertain. Actual results may differ from these estimates under different conditions or assumptions. The following discussion pertains to accounting estimates management believes are most critical to the presentation of our financial position and results of operations that require management’s most difficult, subjective, or complex judgments.
Future Metals Prices
Metals prices are key components in estimates that determine the valuation of some of our significant assets and liabilities, including properties, plant and equipment, deferred tax assets, and certain accounts receivable. Metals prices are also an important component in the estimation of reserves. As shown above in Item 1. – Business, metals prices have historically been volatile. Gold demand arises primarily from investment and consumer demand. Silver demand arises from investment demand, particularly in exchange-traded funds, industrial demand, and consumer demand. Investment demand for gold and silver can be influenced by several factors, including: the value of the U.S. dollar and other currencies, changing U.S. budget deficits, widening availability of exchange-traded funds, interest rate levels, the health of credit markets, and inflationary expectations. The investments in the construction industry, rising electrical and electronics production, and demand for industrial equipment are some of the major factors driving the demand for base metals and their prices.
Mineral Resources and Mineral Reserves
Critical estimates are inherent in the process of determining our Mineral Resources and Mineral Reserves. Our Mineral Resources and Mineral Reserves are affected largely by our assessment of future metals prices, as well as by engineering and geological estimates of ore grade, accessibility, and production costs. Metals prices used in estimating our Mineral Resources and Mineral Reserves closely approximate the average median consensus prices from analysts as at June 2023 for each of the five years starting 2024 through 2028. The consensus prices were based on estimates of 38 financial institutions compiled by the Company. These consensus prices were subsequently compared to the actual 2023 closing spot price as at September 29, 2023 and the 36-month average as at August 28, 2023 and as per published exchanges (Comex for precious metals and London Metal Exchange (“LME”) for base metals) to ensure the prices used for the Mineral Resources and Mineral Reserves were still considered to be reasonably conservative estimates. Of note, the metal price estimates are applied to both the Back Forty Mine Project Technical Report Summary and the DDGM Technical Report Summary. Our assessment of Mineral Resources and Mineral Reserves occurs at least annually. Mineral Reserves are a key component in the valuation of our property, equipment, mine development, and related depletion and depreciation rates.
Gold Resource Corporation—Management’s Discussion and Analysis of Financial Condition and Results of Operations
58
Mineral Reserve estimates are used in determining appropriate rates of units-of-production depreciation, with net book value of many assets depreciated over remaining estimated reserves. Mineral Resources and Mineral Reserves are also key components in forecasts of estimated future cash flows, which we compare to current asset values in an effort to ensure that carrying values are reported appropriately, as well as assessment of the recoverability of deferred tax assets related to expectations of future taxable income. Mineral Resources and Mineral Reserves are a culmination of many estimates and are not guarantees that we will recover the indicated quantities of metals or that we will do so at a profitable level.
Revenue
Concentrate sales are initially recorded based on 100% of the provisional sales prices, net of treatment and refining charges, at the time of delivery to the customer, at which point the performance obligations are satisfied and control of the product is transferred to the customer. Adjustments to the provisional sales prices are made to take into account the mark-to-market changes based on the forward prices of metals until final settlement occurs. The changes in price between the provisional sales price and final sales price are considered an embedded derivative that is required to be separated from the host contract for accounting purposes. The host contract is the receivable from the sale of the concentrates at the quoted metal prices at the time of delivery. The embedded derivative, which does not qualify for hedge accounting, is adjusted to market through revenue each period prior to final settlement. Market changes in the prices of metals between the delivery and final settlement dates will result in adjustments to revenues related to previously recorded sales of concentrate. Sales are recorded net of charges for treatment, refining, smelting losses, and other charges negotiated with the buyer. These charges are estimated upon delivery of concentrates based on contractual terms and adjusted to reflect actual charges at final settlement. Historically, actual charges have not varied materially from the Company’s initial estimates.
Doré sales are recognized upon the satisfaction of performance obligations, which occurs when price and quantity are agreed upon with the customer. Doré sales are recorded using quoted metal prices, net of refining charges.
Depreciation and Amortization
Capitalized costs are depreciated or amortized using the straight-line method or unit-of-production (“UOP”) method at rates sufficient to depreciate such costs over the shorter of estimated productive lives of such assets or the useful life of the individual assets. Significant judgment is involved in the determination of the estimated life of the assets. The Company’s estimates for Mineral Reserves is used in determining our UOP rates. The Company’s estimates of proven and probable ore reserves may change, possibly in the near term, resulting in changes to depreciation, depletion, and amortization rates in future reporting periods. Productive lives of the assets range from 1 to 10 years, but do not exceed the useful life of the individual asset. Please see Item 8. Financial Statements and Supplementary Data—Note 1. Nature of Operations and Summary of Significant Accounting Policies for depreciation rates of major asset categories.
Gold Resource Corporation—Management’s Discussion and Analysis of Financial Condition and Results of Operations
59
Carrying Value of Stockpiles
Stockpiles represent ore that has been extracted from the mine and is available for further processing. Mine sequencing may result in mining material at a faster rate than can be processed. We generally process the highest ore grade material first to maximize metal production; however, a blend of gold ore stockpiles may be processed to balance hardness and/or metallurgy in order to maximize throughput and recovery. Processing of lower grade stockpiled ore may continue after mining operations are completed. Stockpiles are measured by estimating the number of tonnes added and removed from the stockpile, the number of contained ounces (based on assay data), and the estimated metallurgical recovery rates. Stockpile ore tonnages are verified by periodic surveys. Costs are added to stockpiles based on current mining costs, including applicable overhead, depreciation, and amortization relating to mining operations and removed at each stockpile’s average cost per recoverable unit as material is processed.
We record stockpiles at the lower of average cost or net realizable value, and carrying values are evaluated at least quarterly. Net realizable value represents the estimated future sales price based on short-term and long-term metals price assumptions that are applied to expected short-term (12 months or less) and long-term sales from stockpiles, less estimated costs to complete production and bring the product to sale. The primary factors that influence the need to record write-downs of stockpiles include declines in short-term or long-term metals prices, increases in costs of production inputs such as labor, fuel and energy, materials and supplies, as well as realized ore grades and recovery rates.
Other assumptions include future operating and capital costs, metal recoveries, production levels, commodity prices, Mineral Resource and Mineral Reserve quantities, engineering data, and other factors unique to each operation based on the life of mine plans. If short-term and long-term commodity prices decrease, estimated future processing costs increase, or other negative factors occur, it may be necessary to record a write-down of ore on stockpiles. A high degree of judgment is involved in determining such assumptions and estimates and no assurance can be given that actual results will not differ significantly from those estimates and assumptions.
Impairment of Long-Lived Assets
We evaluate the carrying value of long-lived assets to be held and used using a fair-value based approach when events and circumstances indicate that the related carrying amount of our assets may not be recoverable. The economic environment and commodity prices may be considered as impairment indicators for the purposes of these impairment assessments. In accordance with U.S. GAAP, the carrying value of a long-lived asset or asset group is considered impaired when the anticipated undiscounted cash flows from such asset or asset group are less than its carrying value. In that event, a loss will be recorded in our Consolidated Statements of Operations based on the difference between book value and the estimated fair value of the asset or asset group computed using discounted estimated future cash flows, or the application of an expected fair value technique in the absence of an observable market price. Future cash flows include estimates of recoverable quantities to be produced from estimated Mineral Resources and Mineral Reserves, commodity prices (considering current and historical prices, price trends, and related factors), production quantities, production costs, and capital expenditures, all based on life-of-mine plans and projections. In estimating future cash flows, assets are grouped at the lowest level for which identifiable cash flows exist that are largely independent of cash flows from other asset groups. It is possible that actual future cash flows will be significantly different than the estimates, as actual future quantities of recoverable minerals, gold and other commodity prices, production levels and costs, and capital are each subject to significant risks and uncertainties.
Asset Retirement Obligation/Reclamation and Remediation Costs
Our mining and exploration activities are subject to various laws and regulations, including legal and contractual obligations to reclaim, remediate, or otherwise restore properties at the time the property is removed from service. Accounting for reclamation and remediation obligations requires management to make estimates of the future costs that we will incur to complete the work required to comply with existing laws and regulations. Actual costs may differ from the amounts estimated. Reclamation costs are allocated to expense over the life of the related assets and are periodically adjusted to reflect changes in the estimated present value resulting from the passage of time and revisions to the estimates of either the timing or amount of the reclamation and remediation costs.
Gold Resource Corporation—Management’s Discussion and Analysis of Financial Condition and Results of Operations
60
Also, future changes to environmental laws and regulations could increase the extent of reclamation and remediation work required.
Stock-based Compensation
The Company accounts for stock-based employee compensation plans under the fair value recognition and measurement provisions in accordance with applicable accounting standards, which require all stock-based payments to employees, including grants of stock options, restricted stock units (“RSUs”), performance share units (“PSUs”), and deferred share units (“DSUs”) to be measured based on the grant date fair value of the awards. The resulting expense is generally recognized on a straight-line basis over the period during which the employee is required to perform service in exchange for the award. For stock-based employee compensation that is expected to be settled in cash, a liability is established, and a quarterly mark-to-market adjustment is applied based on current stock price.
Stock-based compensation expense is recorded net of estimated forfeitures in our Consolidated Statements of Operations, and it is recorded for only those stock-based awards that we expect to vest. We estimate the forfeiture rate based on historical forfeitures of equity awards and adjust the rate to reflect changes in facts and circumstances, if any. We will revise our estimated forfeiture rate if actual forfeitures differ from our initial estimates.
Income Taxes
In preparing our consolidated financial statements, we estimate the actual amount of taxes currently payable or receivable, as well as deferred tax assets and liabilities attributable to temporary differences between the financial statement carrying amounts of existing assets and liabilities and their respective tax bases. Deferred income tax assets and liabilities are measured using enacted tax rates expected to apply to taxable income in the years in which these temporary differences are expected to be recovered or settled. Changes in deferred tax assets and liabilities generally have a direct impact on earnings in the period of the changes. Mining taxes represent federal and state taxes levied on mining operations. As the mining taxes are calculated as a percentage of mining profits, we classify them as income taxes. Where applicable tax laws and regulations are either unclear or subject to varying interpretations, it is possible that changes in these estimates could occur that materially affect the amounts of deferred income tax assets and liabilities recorded in the consolidated financial statements.
Each period, we evaluate the likelihood of whether some portion or all of each deferred tax asset will be realized and provide a valuation allowance for those deferred tax assets for which it is more likely than not that the related benefits will not be realized. When evaluating our valuation allowance, we consider historical and future expected levels of taxable income, the pattern and timing of reversals of taxable temporary timing differences that give rise to deferred tax liabilities, and tax planning initiatives. Levels of future taxable income are affected by, among other things, market gold and silver prices, production costs, quantities of Mineral Resources and Mineral Reserves, interest rates, federal and local legislation, and foreign currency exchange rates. If we determine that all or a portion of the deferred tax assets will not be realized, a valuation allowance will be recorded with a charge to income tax expense. Conversely, if we determine that we will ultimately be able to realize all or a portion of the related benefits for which a valuation allowance has been provided, all or a portion of the related valuation allowance will be reduced with a credit to income tax expense.
In addition, the calculation of income tax expense involves significant management estimation and judgment involving a number of assumptions. In determining these amounts, management interprets tax legislation in each of the jurisdictions in which we operate and makes estimates of the expected timing of the reversal of future tax assets and liabilities. We make assumptions about future earnings, tax planning strategies, and the extent to which potential future tax benefits will be used. We are also subject to assessments by various taxation authorities, which may interpret tax legislation differently, which could affect the final amount or the timing of tax payments.
In October 2023, the Company received a notification from the Mexican Tax Administration Services (“SAT”) with a sanction of 331 million pesos (approximately $19.5 million) as the result of a 2015 tax audit that began in 2021. The 2015 tax audit performed by SAT encompassed various tax aspects, including but not limited to intercompany transactions, mining royalty tax, and extraordinary mining tax.
Gold Resource Corporation—Management’s Discussion and Analysis of Financial Condition and Results of Operations
61
Management is in process of disputing this tax notification and sent a letter of protest to the tax authorities along with providing all requested documentation. Management intends to use all legal avenues of protest, including filing a lawsuit with the Mexico court system if needed, to see that these adjustments are removed. Management believes the 2015 tax return was prepared correctly, and that as of December 31, 2023, the Company has no liability. Please also see Item 8. Financial Statements and Supplementary Data—Note 4. Income Taxes.
ITEM 7A. |
QUANTITATIVE AND QUALITATIVE DISCLOSURES ABOUT MARKET RISK |
Our exposure to market risks includes, but is not limited to, the following risks: changes in commodity prices, foreign currency exchange rates, provisional sales contract risks, changes in interest rates, and equity price risks. We do not use derivative financial instruments as part of an overall strategy to manage market risk; however, we may consider such arrangements in the future as we evaluate our business and financial strategy.
Commodity Price Risk
The results of our operations depend in large part upon the market prices of gold, silver, and base metal prices of copper, lead, and zinc. Gold and silver prices fluctuate widely and are affected by numerous factors beyond our control. The level of interest rates, the rate of inflation, the state of the global or national economies, the stability of exchange rates, the world supply of and demand for gold, silver, and other metals, among other factors, can all cause significant fluctuations in commodity prices. Such external economic factors are in turn influenced by changes in international investment patterns, monetary systems, and political developments. The price of gold and silver has fluctuated widely in recent years, and future price declines could cause a mineral project to become uneconomic, thereby having a material adverse effect on our business and financial condition. We have not entered into derivative contracts to protect the selling price for gold or silver. We may in the future more actively manage our exposure through derivative contracts or other commodity price risk management programs.
Effective May 18, 2021, the Company entered into a Trading Agreement with Auramet International LLC that govern non-exchange traded, over-the-counter, spot, forward, and option transactions on both a deliverable and non-deliverable basis involving various metals and currencies. Subsequently, the Company entered into zinc zero cost collars. These derivatives are not designated as hedges. The zero cost collars were used to manage the Company’s near-term exposure to cash flow variability from zinc price risks; however, the current zinc program concluded on December 21, 2022. We do not currently use financial instruments with respect to any of the other base metal production either.
In addition to materially adversely affecting our reserve estimates, results of operations, and our financial condition, declining gold and silver prices could require a reassessment of the feasibility of a project. Even if a project is ultimately determined to be economically viable, the need to conduct such a reassessment may cause delays in the implementation of a project.
Foreign Currency Risk
Foreign currency exchange rate fluctuations can increase or decrease our costs to the extent that we pay costs in currencies other than the U.S. dollar. We are primarily impacted by Mexican peso rate changes relative to the U.S. Dollar, as we incur approximately 55-60% of costs in peso in Mexico. When the value of the peso rises in relation to the U.S. Dollar, some of our costs in Mexico may increase, thus affecting our operating results. Alternatively, when the value of the peso drops in relation to the U.S. Dollar, peso-denominated costs in Mexico will decrease in U.S. Dollar terms. These fluctuations do not impact our revenues since we sell our metals in U.S. dollars. Future fluctuations may give rise to foreign currency exposure, which may affect our financial results.
As of December 31, 2023, we held 0.9 million Mexican Pesos ($0.1 million) and 0.2 million Canadian Dollars ($0.1 million). We have not utilized market-risk sensitive instruments to manage our exposure to foreign currency exchange rates but may in the future actively manage our exposure to foreign currency exchange rate risk.
Gold Resource Corporation—Management’s Discussion and Analysis of Financial Condition and Results of Operations
62
Provisional Sales Contract Risk
We enter into concentrate sales contracts which, in general, provide for a provisional payment to us based upon provisional assays and prices. The provisionally priced sales contracts contain an embedded derivative that is required to be separated from the host contract for accounting purposes. The host contract is the receivable from the sale of concentrates determined at the quoted metal prices at the time of shipment. The embedded derivative, which does not qualify for hedge accounting, is adjusted to market through revenue each period prior to settlement. Changes in the prices of metals between the shipment and the final settlement date will result in adjustments to revenues related to the sales of concentrate previously recorded upon shipment. Please see Item 8. Financial Statements and Supplementary Data—Note 13. Derivatives for additional information.
Interest Rate Risk
None.
Equity Price Risk
We have in the past, and may in the future, seek to acquire additional funding by sale of common stock and other equity. The price of our common stock has been volatile in the past and may also be volatile in the future. As a result, there is a risk that we may not be able to sell our common stock at an acceptable price should the need for new equity funding arise.
Gold Resource Corporation—Management’s Discussion and Analysis of Financial Condition and Results of Operations
63
ITEM 8. |
FINANCIAL STATEMENTS AND SUPPLEMENTARY DATA |
|
Page |
||
|---|---|---|---|
|
Index to Financial Statements: |
|
||
|
Report of Independent Registered Public Accounting Firm (BDO USA, P.C.; Spokane, Washington; PCAOB ID#243) |
|
65 |
|
|
67 |
|
|
Consolidated Statements of Operations for the years ended December 31, 2023 and 2022 |
|
68 |
|
|
69 |
|
|
Consolidated Statements of Cash Flows for the years ended December 31, 2023 and 2022 |
|
70 |
|
|
70 |
|
Gold Resource Corporation—Audited Consolidated Financial Statements and Notes
64
Report of Independent Registered Public Accounting Firm
Shareholders and Board of Directors
Gold Resource Corporation
Denver, Colorado
Opinion on the Consolidated Financial Statements
We have audited the accompanying consolidated balance sheets of Gold Resource Corporation (the “Company”) as of December 31, 2023 and 2022, the related consolidated statements of operations, changes in shareholders’ equity, and cash flows for each of the years then ended, and the related notes (collectively referred to as the “consolidated financial statements”). In our opinion, the consolidated financial statements present fairly, in all material respects, the financial position of the Company at December 31, 2023 and 2022, and the results of its operations and its cash flows for the years then ended, in conformity with accounting principles generally accepted in the United States of America.
Basis for Opinion
These consolidated financial statements are the responsibility of the Company’s management. Our responsibility is to express an opinion on the Company’s consolidated financial statements based on our audits. We are a public accounting firm registered with the Public Company Accounting Oversight Board (United States) (“PCAOB”) and are required to be independent with respect to the Company in accordance with the U.S. federal securities laws and the applicable rules and regulations of the Securities and Exchange Commission and the PCAOB.
We conducted our audits in accordance with the standards of the PCAOB. Those standards require that we plan and perform the audit to obtain reasonable assurance about whether the consolidated financial statements are free of material misstatement, whether due to error or fraud. The Company is not required to have, nor were we engaged to perform, an audit of its internal control over financial reporting. As part of our audits, we are required to obtain an understanding of internal control over financial reporting but not for the purpose of expressing an opinion on the effectiveness of the Company’s internal control over financial reporting. Accordingly, we express no such opinion.
Our audits included performing procedures to assess the risks of material misstatement of the consolidated financial statements, whether due to error or fraud, and performing procedures that respond to those risks. Such procedures included examining, on a test basis, evidence regarding the amounts and disclosures in the consolidated financial statements. Our audits also included evaluating the accounting principles used and significant estimates made by management, as well as evaluating the overall presentation of the consolidated financial statements. We believe that our audits provide a reasonable basis for our opinion.
Critical Audit Matter
The critical audit matter communicated below is a matter arising from the current period audit of the consolidated financial statements that was communicated or required to be communicated to the audit committee and that: (1) relates to accounts or disclosures that are material to the consolidated financial statements and (2) involved our especially challenging, subjective, or complex judgments. The communication of the critical audit matter does not alter in any way our opinion on the consolidated financial statements, taken as a whole, and we are not, by communicating the critical audit matter below, providing separate opinions on the critical audit matter or on the accounts or disclosures to which it relates.
Gold Resource Corporation—Audited Consolidated Financial Statements and Notes
65
Evaluation of Going Concern
As described in Note 9 of the Company’s consolidated financial statements, the Company’s liabilities under its gold and silver stream agreements were approximately $21 million and $24 million, respectively, as of December 31, 2023. The stream agreements contain certain customary provisions regarding default and security, including certain operational covenants. In the event that the Company’s subsidiary defaults under the stream agreements, it may be required to repay the deposit plus accumulated interest. The Company obtained deferral to 2026 of certain operational covenants that were previously due in 2024, as more fully described in Note 9. Additionally, the Company’s revenues declined by $41 million in 2023 as compared to 2022. Should the Company default under the terms of these operational covenants or otherwise be unable to fund its obligations as they become due, these conditions could raise substantial doubt regarding its ability to continue as a going concern.
We identified management’s evaluation regarding the Company’s ability to continue as a going concern as a critical audit matter due to the significant judgments and assumptions used by management in (i) forecasting compliance with operational covenants in stream agreements, (ii) preparing its forecast of sources of cash and expenditures, and (iii) expectations of future metals prices. Auditing these estimates and assumptions involved especially challenging auditor judgment due to the nature and extent of audit evidence and effort required to address these matters.
The primary procedures we performed to address this critical audit matter included:
| ● | Obtaining the amendments to the Company’s stream agreements which deferred the compliance date of certain operational covenants. |
| ● | Testing compliance with covenants in the stream agreements for a period of one year after the date the consolidated financial statements are issued. |
| ● | Evaluating the appropriateness of management’s forecast of sources of cash and expenditures by comparing to historical forecasts and actual results, and certain planned operational activities. |
| ● | Evaluating the appropriateness of expected future metals prices by comparing to historical results and published forecasted industry data. |
/s/ BDO USA, P.C.
We have served as the Company's auditor since 2022.
Spokane, Washington
March 27, 2024
Gold Resource Corporation—Audited Consolidated Financial Statements and Notes
66
GOLD RESOURCE CORPORATION
CONSOLIDATED BALANCE SHEETS
(U.S. dollars in thousands, except share and per share amounts)
|
|
As of |
|
As of |
||
|
|
December 31, |
|
December 31, |
||
|
Note |
2023 |
|
2022 |
||
ASSETS |
|
|
|
|
|
|
Current assets: |
|
|
|
|
|
|
Cash and cash equivalents |
|
$ |
6,254 |
|
$ |
23,675 |
Accounts receivable, net |
|
|
4,335 |
|
|
5,085 |
Inventories, net |
3 |
|
9,294 |
|
|
13,500 |
Prepaid expenses and other current assets |
5 |
|
6,612 |
|
|
3,839 |
Total current assets |
|
|
26,495 |
|
|
46,099 |
Property, plant, and mine development, net |
6 |
|
138,626 |
|
|
152,563 |
Deferred tax assets, net |
4 |
|
13,301 |
|
|
5,927 |
Other non-current assets |
7 |
|
5,464 |
|
|
5,509 |
Total assets |
|
$ |
183,886 |
|
$ |
210,098 |
LIABILITIES AND SHAREHOLDERS' EQUITY |
|
|
|
|
|
|
Current liabilities: |
|
|
|
|
|
|
Accounts payable |
|
$ |
8,378 |
|
$ |
13,329 |
Mining royalty taxes payable, net |
|
|
1,199 |
|
|
3,945 |
Contingent consideration |
11 |
|
- |
|
|
2,211 |
Accrued expenses and other current liabilities |
8 |
|
1,748 |
|
|
5,197 |
Total current liabilities |
|
|
11,325 |
|
|
24,682 |
Reclamation and remediation liabilities |
10 |
|
11,795 |
|
|
10,366 |
Gold and silver stream agreements liability |
9 |
|
44,932 |
|
|
43,466 |
Deferred tax liabilities, net |
4 |
|
14,077 |
|
|
15,151 |
Contingent consideration |
11 |
|
3,548 |
|
|
2,179 |
Other non-current liabilities |
8 |
|
1,516 |
|
|
2,490 |
Total liabilities |
|
|
87,193 |
|
|
98,334 |
|
|
|
|
|
|
|
Commitments and contingencies |
11 |
|
|
|
|
|
|
|
|
|
|
|
|
Shareholders' equity: |
|
|
|
|
|
|
Common stock - $0.001 par value, 200,000,000 shares authorized: |
|
|
|
|
|
|
88,694,038 and 88,398,109 shares outstanding at December 31, 2023 and December 31, 2022, respectively |
|
|
89 |
|
|
89 |
Additional paid-in capital |
|
|
111,970 |
|
|
111,024 |
(Accumulated deficit) retained earnings |
|
|
(8,311) |
|
|
7,706 |
Treasury stock at cost, 336,398 shares |
|
|
(5,884) |
|
|
(5,884) |
Accumulated other comprehensive loss |
|
|
(1,171) |
|
|
(1,171) |
Total shareholders' equity |
|
|
96,693 |
|
|
111,764 |
Total liabilities and shareholders' equity |
|
$ |
183,886 |
|
$ |
210,098 |
The accompanying notes are an integral part of these consolidated financial statements.
Gold Resource Corporation—Audited Consolidated Financial Statements and Notes
67
GOLD RESOURCE CORPORATION
CONSOLIDATED STATEMENTS OF OPERATIONS
for the years ended December 31, 2023 and 2022
(U.S. dollars in thousands, except share and per share amounts)
|
|
|
For the year ended |
||||
|
|
|
December 31, |
||||
|
Note |
|
2023 |
|
2022 |
||
|
|
|
|
|
|
|
|
Sales, net |
2 |
|
$ |
97,728 |
|
$ |
138,724 |
Cost of sales: |
|
|
|
|
|
|
|
Production costs |
|
|
|
76,143 |
|
|
80,949 |
Depreciation and amortization |
|
|
|
26,126 |
|
|
27,226 |
Reclamation and remediation |
|
|
|
774 |
|
|
801 |
Total cost of sales |
|
|
|
103,043 |
|
|
108,976 |
Mine gross (loss) profit |
|
|
|
(5,315) |
|
|
29,748 |
Costs and expenses: |
|
|
|
|
|
|
|
General and administrative expenses |
|
|
|
6,583 |
|
|
8,048 |
Mexico exploration expenses |
|
|
|
4,167 |
|
|
4,244 |
Michigan Back Forty Project expenses |
|
|
|
1,642 |
|
|
8,805 |
Stock-based compensation |
15 |
|
|
681 |
|
|
1,955 |
Realized and unrealized loss on zinc zero cost collar |
16 |
|
|
- |
|
|
170 |
Other expense, net |
17 |
|
|
3,364 |
|
|
4,288 |
Total costs and expenses |
|
|
|
16,437 |
|
|
27,510 |
(Loss) income before income taxes |
|
|
|
(21,752) |
|
|
2,238 |
(Benefit) provision for income taxes |
4 |
|
|
(5,735) |
|
|
8,559 |
Net loss |
|
|
$ |
(16,017) |
|
$ |
(6,321) |
Net loss per common share: |
|
|
|
|
|
|
|
Basic and diluted net loss per common share |
18 |
|
$ |
(0.18) |
|
$ |
(0.07) |
|
|
|
|
|
|
|
|
Weighted average shares outstanding: |
|
|
|
|
|
|
|
Basic and diluted |
18 |
|
|
88,514,243 |
|
|
88,368,250 |
The accompanying notes are an integral part of these consolidated financial statements.
Gold Resource Corporation—Audited Consolidated Financial Statements and Notes
68
GOLD RESOURCE CORPORATION
CONSOLIDATED STATEMENTS OF CHANGES IN SHAREHOLDERS' EQUITY
for the years ended December 31, 2023 and 2022
(U.S. dollars in thousands, except share and per share amounts)
|
|
|
|
|
|
|
|
|
|
|
|
|
|
|
|
|
|
|
|
|
||
|
|
Number of |
|
Par Value of |
|
Additional Paid- |
|
Retained Earnings (Accumulated Deficit) |
|
Treasury |
|
Accumulated |
|
Total |
||||||||
Balance, December 31, 2021 |
|
88,675,172 |
|
$ |
89 |
|
$ |
110,153 |
|
$ |
17,563 |
|
$ |
(5,884) |
|
$ |
(1,171) |
|
$ |
120,750 |
||
Stock-based compensation |
|
- |
|
|
- |
|
|
1,240 |
|
|
- |
|
|
- |
|
|
- |
|
|
1,240 |
||
Net stock options exercised |
|
- |
|
|
- |
|
|
(331) |
|
|
- |
|
|
- |
|
|
- |
|
|
(331) |
||
Common stock issued for vested restricted stock units |
|
80,169 |
|
|
- |
|
|
- |
|
|
- |
|
|
- |
|
|
- |
|
|
- |
||
Dividends declared (1) |
|
- |
|
|
- |
|
|
- |
|
|
(3,536) |
|
|
- |
|
|
- |
|
|
(3,536) |
||
Unclaimed shares related to the Aquila acquisition (2) |
|
(16,249) |
|
|
- |
|
|
(29) |
|
|
- |
|
|
- |
|
|
- |
|
|
(29) |
||
Surrender of stock for taxes due on vesting |
|
(4,585) |
|
|
- |
|
|
(9) |
|
|
- |
|
|
- |
|
|
- |
|
|
(9) |
||
Net loss |
|
- |
|
|
- |
|
|
- |
|
|
(6,321) |
|
|
- |
|
|
- |
|
|
(6,321) |
||
Balance, December 31, 2022 |
|
88,734,507 |
|
$ |
89 |
|
$ |
111,024 |
|
$ |
7,706 |
|
$ |
(5,884) |
|
$ |
(1,171) |
|
$ |
111,764 |
||
Stock-based compensation |
|
- |
|
|
- |
|
|
879 |
|
|
- |
|
|
- |
|
|
- |
|
|
879 |
||
Common stock issued for vested restricted stock units |
|
130,238 |
|
|
- |
|
|
- |
|
|
- |
|
|
- |
|
|
- |
|
|
- |
||
Issuance of stock, net of issuance costs |
|
195,872 |
|
|
- |
|
|
85 |
|
|
- |
|
|
- |
|
|
- |
|
|
85 |
||
Surrender of stock for taxes due on vesting |
|
(30,181) |
|
|
- |
|
|
(18) |
|
|
- |
|
|
- |
|
|
- |
|
|
(18) |
||
Net loss |
|
- |
|
|
- |
|
|
- |
|
|
(16,017) |
|
|
- |
|
|
- |
|
|
(16,017) |
||
Balance, December 31, 2023 |
|
89,030,436 |
|
$ |
89 |
|
$ |
111,970 |
|
$ |
(8,311) |
|
$ |
(5,884) |
|
$ |
(1,171) |
|
$ |
96,693 |
||
| (1) | Cash dividends declared and paid per share was $0.04 for 2022. On February 13, 2023, the Company announced the suspension of future quarterly dividends, thus no cash dividends were declared and paid in 2023. |
| (2) | Aquila formerly issued shares related to RebGold/BacTech Mining Arrangement Agreement that expired in 2020. As these shares were not redeemed prior to expiration, the shares should have been struck by Aquila’s transfer agent prior to issuing GRC shares on December 10, 2021 in connection with the acquisition by GRC. |
The accompanying notes are an integral part of these consolidated financial statements.
Gold Resource Corporation—Audited Consolidated Financial Statements and Notes
69
GOLD RESOURCE CORPORATION
CONSOLIDATED STATEMENTS OF CASH FLOWS
for the years ended December 31, 2023 and 2022
(U.S. dollars in thousands)
|
|
For the year ended December 31, |
||||
|
Note |
2023 |
|
2022 |
||
Cash flows from operating activities: |
|
|
|
|
|
|
Net loss |
|
$ |
(16,017) |
|
$ |
(6,321) |
Adjustments to reconcile net loss to net cash (used in) provided by operating activities: |
|
|
|
|
|
|
Deferred income tax benefit |
|
|
(6,638) |
|
|
(3,545) |
Depreciation and amortization |
|
|
26,217 |
|
|
27,364 |
Stock-based compensation |
|
|
681 |
|
|
1,955 |
Other operating adjustments |
20 |
|
591 |
|
|
44 |
Changes in operating assets and liabilities: |
|
|
|
|
|
|
Accounts receivable |
|
|
750 |
|
|
3,587 |
Inventories |
|
|
2,611 |
|
|
(2,550) |
Prepaid expenses and other current assets |
|
|
1,568 |
|
|
(724) |
Other non-current assets |
|
|
(863) |
|
|
249 |
Accounts payable and other accrued liabilities |
|
|
(7,113) |
|
|
284 |
Mining royalty and income taxes payable, net |
|
|
(7,006) |
|
|
(6,186) |
Net cash (used in) provided by operating activities |
|
|
(5,219) |
|
|
14,157 |
|
|
|
|
|
|
|
Cash flows from investing activities: |
|
|
|
|
|
|
Capital expenditures |
|
|
(12,487) |
|
|
(18,233) |
Equity investment |
|
|
- |
|
|
(1,743) |
Proceeds from the sale of gold and silver rounds |
|
|
- |
|
|
533 |
Net cash used in investing activities |
|
|
(12,487) |
|
|
(19,443) |
|
|
|
|
|
|
|
Cash flows from financing activities: |
|
|
|
|
|
|
Cash settlement of options exercise |
|
|
- |
|
|
(376) |
Dividends paid |
|
|
- |
|
|
(3,536) |
Proceeds from the ATM sales |
|
|
85 |
|
|
- |
Other financing activities |
|
|
(23) |
|
|
- |
Net cash provided by (used in) financing activities |
|
|
62 |
|
|
(3,912) |
Effect of exchange rate changes on cash and cash equivalents |
|
|
223 |
|
|
(839) |
|
|
|
|
|
|
|
Net decrease in cash and cash equivalents |
|
|
(17,421) |
|
|
(10,037) |
Cash and cash equivalents at beginning of period |
|
|
23,675 |
|
|
33,712 |
Cash and cash equivalents at end of period |
|
$ |
6,254 |
|
$ |
23,675 |
|
|
|
|
|
|
|
|
|
|
|
|
|
|
Supplemental Cash Flow Information |
|
|
|
|
|
|
Income and mining taxes paid |
|
$ |
7,751 |
|
$ |
18,594 |
Non-cash investing or financing activities |
|
|
|
|
|
|
Balance of capital expenditures in accounts payable |
|
$ |
214 |
|
$ |
1,303 |
Change in estimate for asset retirement costs |
|
$ |
(1,221) |
|
$ |
6,384 |
Green Light Metals shares received for promissory note |
|
$ |
- |
|
$ |
3,611 |
Issuance (cancellation) of shares related to the Aquila acquisition |
|
$ |
- |
|
$ |
(29) |
The accompanying notes are an integral part of these consolidated financial statements.
Gold Resource Corporation
70
GOLD RESOURCE CORPORATION
NOTES TO CONSOLIDATED FINANCIAL STATEMENTS
December 31, 2023 and 2022
1. Nature of Operations and Summary of Significant Accounting Policies
Nature of Operations
Gold Resource Corporation (the “Company”) was organized under the laws of the State of Colorado on August 24, 1998. The Company is a producer of doré containing gold and silver and metal concentrates that contain gold, silver, copper, lead, and zinc in Oaxaca, Mexico. The Company also has 100% interest in the Back Forty Project, an advanced Exploration Stage Property, located in Menominee County, Michigan, USA.
Significant Accounting Policies
Basis of Presentation
The consolidated financial statements included herein are expressed in United States dollars and conform to accounting principles generally accepted in the United States of America (“U.S. GAAP”). The consolidated financial statements include the accounts of the Company, its Mexican subsidiary, Don David Gold Mexico S.A. de C.V., and Aquila Resources Inc (“Aquila) and its subsidiaries. Intercompany accounts and transactions have been eliminated in consolidation.
Segment Reporting
The Company has organized its operations into three geographic regions. The geographic regions include Oaxaca, Mexico, Michigan, U.S.A., and Corporate and Other. Oaxaca, Mexico represents the Company’s only production stage property. Michigan, U.S.A. is an advanced exploration stage property. The Company’s business activities that are not considered production stage or advanced exploration stage properties are included in Corporate and Other. Please see Note 21—Segment Reporting below for additional information.
Use of Estimates
The preparation of financial statements in conformity with U.S. GAAP requires management to make estimates and assumptions that affect the reported amount of assets and liabilities, the disclosure of contingent assets and liabilities at the date of the financial statements, and the reported amounts of revenues and expenses during the reporting periods. The more significant areas requiring the use of management estimates and assumptions relate to Mineral Resources and Mineral Reserves that are the basis for future cash flow estimates utilized in impairment calculations and units-of-production depreciation calculations; future metal prices; environmental remediation, reclamation and closure obligations; estimates of recoverable gold and other minerals in stockpiles; write-downs of inventory stockpiles to net realizable value; valuation allowances for deferred tax assets and liabilities; valuation of contingent considerations and gold and silver stream agreements; provisional amounts related to income tax effects of newly enacted tax laws; and stock-based compensation. Management routinely makes judgments and estimates about the effects of matters that are inherently uncertain and bases its estimates and judgments on historical experience and on various other factors that are believed to be reasonable under the circumstances. Actual results could differ from these estimates.
Revisions of Previously Issued Financial Statements for Correction of Immaterial Errors
In connection with the preparation of the Company’s financial statements for the period ended September 30, 2023, the Company’s management identified an immaterial error in prior period financial statements, whereby deferred tax liabilities and deferred tax assets attributable to different tax-paying components of the entity or to different tax jurisdictions were incorrectly offset.
Gold Resource Corporation
71
The Company has corrected the consolidated balance sheets as of December 31, 2022, for this immaterial error. The effects of these revisions are as follows.
Revision to the Consolidated Balance Sheet as of December 31, 2022:
|
As filed as of |
|
|
|
Revised as of |
|||
|
December 31, |
|
Adjustments |
|
December 31, |
|||
|
2022 |
|
|
|
2022 |
|||
ASSETS |
|
|
|
|
|
|
|
|
Current assets: |
|
|
|
|
|
|
|
|
Total current assets |
$ |
46,099 |
|
$ |
- |
|
$ |
46,099 |
Property, plant, and mine development, net |
|
152,563 |
|
|
- |
|
|
152,563 |
Deferred tax assets, net |
|
- |
|
|
5,927 |
|
|
5,927 |
Other non-current assets |
|
5,509 |
|
|
- |
|
|
5,509 |
Total assets |
$ |
204,171 |
|
$ |
5,927 |
|
$ |
210,098 |
LIABILITIES AND SHAREHOLDERS' EQUITY |
|
|
|
|
|
|
|
|
Current liabilities: |
|
|
|
|
|
|
|
|
Total current liabilities |
$ |
24,682 |
|
$ |
- |
|
$ |
24,682 |
Reclamation and remediation liabilities |
|
10,366 |
|
|
- |
|
|
10,366 |
Gold and silver stream agreements liability |
|
43,466 |
|
|
- |
|
|
43,466 |
Deferred tax liabilities, net |
|
9,224 |
|
|
5,927 |
|
|
15,151 |
Contingent consideration |
|
2,179 |
|
|
- |
|
|
2,179 |
Other non-current liabilities |
|
2,490 |
|
|
- |
|
|
2,490 |
Total liabilities |
|
92,407 |
|
|
5,927 |
|
|
98,334 |
Shareholders' equity: |
|
|
|
|
|
|
|
|
Total shareholders' equity |
|
111,764 |
|
|
- |
|
|
111,764 |
Total liabilities and shareholders' equity |
$ |
204,171 |
|
$ |
5,927 |
|
$ |
210,098 |
Cash and Cash Equivalents
Cash and cash equivalents consist of all cash balances and highly liquid investments with a remaining maturity of three months or less when purchased. Cash held in Mexican Pesos or Canadian Dollars is converted to U.S. Dollars at the closing exchange rate at year end.
Accounts Receivable, net
Accounts receivable consists of trade receivables, which are recorded net of allowance for credit losses from the sale of doré and metals concentrates, as well as net of an embedded derivative based on mark-to-market adjustments for outstanding provisional invoices based on forward metal prices. Please see Item 8. Financial Statements and Supplementary Data—Note 13. Derivatives and Item 8. Financial Statements and Supplementary Data—Note 19. Fair Value Measurement for additional information related to the embedded derivative. As of both December 31, 2023 and 2022, the allowance for credit losses was nil.
Gold Resource Corporation
72
Inventories
The major inventory categories are set forth below:
Stockpile Inventories: Stockpile inventories represent ore that has been mined and is available for further processing. Stockpiles are measured by estimating the number of tonnes added and removed from the stockpile, an estimate of the contained metals (based on assay data), and the estimated metallurgical recovery rates. Costs are allocated to stockpiles based on relative values of material stockpiled and processed using current mining costs incurred, including applicable overhead, depreciation, and amortization relating to mining operations. Material is removed at each stockpile’s average cost per tonne. Stockpiles are carried at the lower of average cost or net realizable value. Net realizable value represents the estimated future sales price of the product based on current and long-term metals prices, less the estimated costs to complete production and to bring the product to sale.
Concentrate Inventories: Concentrate inventories include metal concentrates located either at the Company’s facilities or in transit to its customer’s port. Inventories consist of copper, lead, and zinc metal concentrates, which also contain gold and silver mineralization. Concentrate inventories are carried at the lower of cost of production or net realizable value based on current metals prices.
Doré Inventory: Doré includes gold and silver doré bars held at the Company’s facility. Doré inventories are carried at the lower of cost of production or net realizable value based on current metals prices.
Materials and Supplies Inventories: Materials and supplies inventories consist of chemical reagents, parts, fuels, and other materials and supplies. Cost includes applicable taxes and freight. Materials and supplies inventory is carried at the lower of average cost or net realizable value.
Write-downs of inventory, when needed, are charged to production costs on the Consolidated Statements of Operations.
Property, Plant, and Mine Development
Land and Mineral Interests: The costs of acquiring land, mineral rights, and mineral interests are considered tangible assets. Administrative and holding costs to maintain an exploration property are expensed as incurred. If a mineable mineral deposit is discovered, such capitalized costs are amortized when production begins using the units of production (“UOP”) method. If no mineable mineral deposit is discovered, or such rights are otherwise determined to have diminished value, costs are expensed in the period in which this determination is made.
Mine Development: This includes the cost of engineering and metallurgical studies; drilling and other related costs to delineate an ore body; and the cost of building access ways, shafts, lateral access, drifts, ramps, and other infrastructure. Costs incurred before mineralization is classified as Mineral Resources are expensed and classified as exploration expenses. Capitalization of mine development project costs that meet the definition of an asset begins once mineralization is classified as Mineral Resources.
Drilling costs incurred during the production phase for operational ore control are recorded as mine development and amortized using UOP. All other drilling and related costs are expensed as incurred.
Mine development costs are amortized using the UOP method based on estimated recoverable ounces in Mineral Reserves.
Property and Equipment: All items of property and equipment are carried at cost. Normal maintenance and repairs are expensed as incurred, while expenditures for major maintenance and improvements are capitalized. Gains or losses on disposition are recognized in other expense, net.
Gold Resource Corporation
73
Construction in Progress: Expenditures for new facilities or equipment are capitalized and recorded at cost. Once completed and ready for its intended use, the asset is transferred to property and equipment to be depreciated or amortized.
Depreciation and Amortization: Capitalized costs are depreciated or amortized using the straight-line or UOP method at rates sufficient to depreciate such costs over the shorter of estimated productive lives of such assets or the useful life of the individual assets. The estimates for Mineral Reserves are a key component in determining the UOP depreciation rates. The estimates of Mineral Reserves may change, possibly in the near term, resulting in significant changes to depreciation and amortization rates in future reporting periods. The following are the estimated economic lives of depreciable assets:
|
|
|
|
|
Range of Lives |
|
|
Asset retirement costs |
|
UOP |
|
Furniture, computer and office equipment |
|
3 to 10 years |
|
Light vehicles and other mobile equipment |
|
4 years |
|
Machinery and equipment |
|
UOP to 8 years |
|
Mill facilities and related infrastructure |
|
UOP |
|
Mine development and mineral interests |
|
UOP |
|
Buildings and infrastructure |
|
UOP to 4 years |
|
Impairment of Long-Lived Assets
The Company evaluates its long-lived assets for impairment when events or changes in circumstances indicate that the related carrying amounts may not be recoverable. Asset impairment is considered to exist if the total estimated future cash flows on an undiscounted basis are less than the carrying amount of the asset. If an impairment is indicated, a determination is made whether an impairment has occurred. Impairment losses are measured either 1) as the excess of carrying value over the total discounted estimated future cash flows, or 2) as the excess of carrying value over the fair value, using the expected fair value technique in the absence of an observable market price. Losses are charged to expense on the Company’s Consolidated Statements of Operations. In estimating future cash flows, assets are grouped at the lowest level for which there are identifiable cash flows that are largely independent of future cash flows from other asset groups.
Existing Mineral Resources and Mineral Reserves are included when estimating the fair value in determining whether the assets are impaired. The Company’s estimates of future cash flows are based on numerous assumptions, including expected gold and other commodity prices, production levels and costs, processing recoveries, capital requirements, and estimated salvage values. It is possible that actual future cash flows will be significantly different from the estimates, as actual future quantities of recoverable minerals, gold and other commodity prices, production levels and costs, and capital requirements are each subject to significant risks and uncertainties.
Fair Value of Financial Instruments
The recorded amounts of cash and cash equivalents, receivables from provisional concentrate sales, and accounts payable approximate fair value because of the short maturity of those instruments. The recorded amount for the equity investment in the common shares of Maritime is based on the closing share price of MAE.V on TSX-V. The company elected the fair value measurement option as the measurement basis for the equity investment in the common shares of Green Light Metals.
Gold Resource Corporation
74
Treasury Stock
Treasury stock represents shares of the Company’s common stock which have been repurchased on the open market at the prevailing market price at the time of purchase and have not been canceled. Treasury stock is shown at cost as a separate component of shareholders’ equity.
Revenue Recognition
The Company recognizes revenue from doré and concentrate sales.
Doré sales: Doré sales are recognized upon the satisfaction of performance obligations, which occurs upon delivery of doré and when the price and quantity are agreed with the customer. Doré sales are recorded using quoted metal prices, net of refining charges.
Concentrate sales: Concentrate sales are initially recorded based on 100% of the provisional sales prices, net of treatment and refining charges, at the time of delivery to the customer, at which point the performance obligations are satisfied and control of the product is transferred to the customer. Adjustments to the provisional sales prices are made to take into account the mark-to-market changes based on the forward prices of metals until final settlement occurs. The changes in price between the provisional sales price and final sales price are considered an embedded derivative that is required to be separated from the host contract for accounting purposes. The host contract is the receivable from the sale of the concentrates at the quoted metal prices at the time of delivery. The embedded derivative, which does not qualify for hedge accounting, is adjusted to market through revenue each period prior to final settlement. Market changes in the prices of metals between the delivery and final settlement dates will result in adjustments to revenues related to previously recorded sales of concentrate. Sales are recorded net of charges for treatment, refining, smelting losses, and other charges negotiated with the buyer. These charges are estimated upon delivery of concentrates based on contractual terms and adjusted to reflect actual charges at final settlement, which normally occurs within three months. Historically, actual charges have not varied materially from the Company’s initial estimates.
Production Costs
Production costs include labor and benefits, royalties, concentrate and doré shipping costs, mining costs, fuel and lubricants, legal and professional fees related to mine operations, stock-based compensation attributable to mine workers, materials and supplies, repairs and maintenance, explosives, site support, housing and food, insurance, reagents, travel, medical services, security equipment, office rent, tools, and other costs that support mining operations.
Exploration Costs
Exploration costs are charged to expense as incurred. Costs to identify new Mineral Resources and to evaluate potential Mineral Resources are considered exploration costs. Exploration activities conducted within the defined Mineral Resources are capitalized.
Stock-Based Compensation
The Company accounts for stock-based compensation under the fair value recognition and measurement provisions of U.S. GAAP. Those provisions require all stock-based payments, including grants of stock options, restricted stock units (“RSUs”), performance share units (“PSUs”), and deferred share units (“DSUs”) to be measured based on the grant date fair value of the awards, with the resulting expense generally recognized on a straight-line basis in the Consolidated Statements of Operations over the period during which services are performed in exchange for the award. The majority of the awards are earned over a service period of three years. DSUs are earned immediately at grant and are expected to be paid out in cash in the future. PSUs and DSUs are considered liability instruments and marked-to-market each reporting period. The Company's estimates may be impacted by certain variables including, but not limited to, stock price volatility, employee stock option exercise behaviors, additional stock option grants, and estimates of forfeitures.
Gold Resource Corporation
75
Reclamation and Remediation Costs
Reclamation costs are allocated to expense over the life of the related assets and are periodically adjusted to reflect changes in the estimated present value resulting from the passage of time and revisions to the estimates of either the timing or amount of the reclamation and remediation costs. Reclamation obligations are based in part on when the spending for an existing environmental disturbance will occur. The Company reviews the reclamation obligation at least on an annual basis.
In 2014, the Company became a production stage company and therefore, started capitalizing asset retirement costs along with the asset retirement obligation. Please see Item 8. Financial Statements and Supplementary Data—Note 10. Reclamation and Remediation in for additional information.
Accounting for reclamation and remediation obligations requires management to make estimates unique to each mining operation of the future costs expected to be incurred to complete the reclamation and remediation work required to comply with existing laws and regulations. Actual costs incurred in future periods could differ from the amounts estimated. Additionally, future changes to environmental laws and regulations could increase the extent of reclamation and remediation work required. Any such increases in future costs could materially impact the amounts charged to operations for reclamation and remediation.
Accumulated Other Comprehensive Loss
Accumulated other comprehensive loss is presented in the Consolidated Statements of Changes in Shareholders’ Equity. Accumulated other comprehensive loss is composed of foreign currency translation adjustment effects related to the historical adjustment when the functional currency was the Mexican peso for our Mexico subsidiary. This loss will remain on our Consolidated Balance Sheets until the sale or dissolution of our Mexico subsidiary.
Income and Mining Royalty Taxes
Income and Mining Royalty Taxes are computed using the asset and liability method. Deferred income taxes reflect the net tax effects of temporary differences between the carrying amounts of assets and liabilities for financial and tax reporting purposes and the effect of net operating loss and foreign tax credit carryforwards using enacted tax rates in effect in the years in which the differences are expected to reverse. Deferred tax assets and liabilities are evaluated to determine if it is more likely than not that they will be realized. Deferred tax liabilities and deferred tax assets attributable to different tax-paying components of the entity or to different tax jurisdictions are not netted against each other. Please see Item 8. Financial Statements and Supplementary Data—Note 4. Income Taxes for additional information.
Net Loss Per Share
Basic loss per share is calculated based on the weighted average number of common shares outstanding for the period. Diluted loss per share reflects the dilution that could occur if potentially dilutive securities, as determined using the treasury stock method, are converted into common stock. Potentially dilutive securities are excluded from the calculation when their inclusion would be anti-dilutive, such as periods when a net loss is reported or when the exercise price of the instrument exceeds the average fair market value of the underlying common stock.
Foreign Currency
The functional currency for all of the Company’s subsidiaries is the United States dollar (“U.S. dollar”).
Gold Resource Corporation
76
Concentration of Credit Risk
The Company has considered and assessed the credit risk resulting from its concentrate sales and doré sales arrangements with its customers. In the event that the Company’s relationships with its customers are interrupted for any reason, the Company believes that it would be able to locate another entity to purchase its metals concentrates and doré bars; however, any interruption could temporarily disrupt the Company’s sale of its products and materially adversely affect operating results.
Currently 100% of the Company’s total net sales from operations are coming from the Arista and Alta Gracia mines at DDGM, the Company’s Oaxaca, Mexico business segment. Sales from significant customers as a percentage of sales for the years ended December 31, 2023 and 2022 were the following:
|
|
For the year ended |
||||
|
|
December 31, |
||||
|
|
2023 |
|
2022 |
||
Customer A |
|
48 |
% |
|
38 |
% |
Customer B |
|
24 |
% |
|
33 |
% |
Customer C |
|
25 |
% |
|
- |
% |
Customer D |
|
- |
% |
|
24 |
% |
The following table shows accounts receivable from significant customers as a percentage of total accounts receivable as of December 31, 2023 and 2022:
|
|
As of |
|
As of |
||
|
|
December 31, |
|
December 31, |
||
|
|
2023 |
|
2022 |
||
Customer A |
|
46 |
% |
|
47 |
% |
Customer B |
|
33 |
% |
|
33 |
% |
Customer C |
|
21 |
% |
|
- |
% |
Customer D |
|
- |
% |
|
20 |
% |
Some of the Company’s operating cash balances are maintained in accounts that currently exceed federally insured limits. The Company believes that the financial strength of the depositing institutions mitigates the underlying risk of loss. To date, these concentrations of credit risk have not had a significant impact on the Company’s financial position or results of operations.
Streaming Liabilities
The Company presents the gold and silver streaming liabilities initially at fair value and subsequently accreted using a discount rate and risk factor probabilities. The discount rate is the Company’s estimated borrowing rate, and the probabilities consider the completion of the feasibility study, obtaining necessary permits, and the completion of the mine facilities. The adjustment in the value is the accretion of interest, which is included in other expense, net.
Gold Resource Corporation
77
New Accounting Pronouncements and Accounting Standards Updates to Become Effective in Future Periods
The FASB issued ASU 2023-07, Segment Reporting (Topic 280): Improvements to Reportable Segment Disclosures in November 2023, amending reportable segment disclosure requirements to include disclosure of incremental segment information on an annual and interim basis. Among the disclosure enhancements are new disclosures regarding significant segment expenses that are regularly provided to the chief operating decision-maker and included within each reported measure of segment profit or loss, as well as other segment items bridging segment revenue to each reported measure of segment profit or loss. The amendments in ASU 2023-07 are effective for fiscal years beginning after December 15, 2023, and for interim periods within fiscal years beginning after December 15, 2024, and are applied retrospectively. Early adoption is permitted. We are currently evaluating the impact of this update on our consolidated financial statements and disclosures.
The FASB issued ASU 2023-09, Income Taxes (Topic 740): Improvement to Income Tax Disclosures in December 2023, amending income tax disclosure requirements for the effective tax rate reconciliation and income taxes paid. The amendments in ASU 2023-09 are effective for fiscal years beginning after December 15, 2024, and are applied prospectively. Early adoption and retrospective application of the amendments are permitted. We are currently evaluating the impact of this update on our consolidated financial statements and disclosures.
2. Revenue
The Company derives its revenue from the sale of doré and concentrates. The following table presents the Company’s net sales disaggregated by source:
|
|
For the year ended December 31, |
||||
|
|
2023 |
|
2022 |
||
|
|
(in thousands) |
||||
Doré sales, net |
|
|
|
|
|
|
Gold |
|
$ |
3,079 |
|
$ |
7,997 |
Silver |
|
|
139 |
|
|
230 |
Less: Refining charges |
|
|
(52) |
|
|
(59) |
Total doré sales, net |
|
|
3,166 |
|
|
8,168 |
Concentrate sales |
|
|
|
|
|
|
Gold |
|
|
32,865 |
|
|
46,322 |
Silver |
|
|
24,066 |
|
|
22,527 |
Copper |
|
|
10,472 |
|
|
11,987 |
Lead |
|
|
9,540 |
|
|
11,626 |
Zinc |
|
|
29,225 |
|
|
50,470 |
Less: Treatment and refining charges |
|
|
(11,578) |
|
|
(12,013) |
Total concentrate sales, net |
|
|
94,590 |
|
|
130,919 |
Realized gain (loss) - embedded derivative, net (1) |
|
|
298 |
|
|
(720) |
Unrealized (loss) gain - embedded derivative, net |
|
|
(326) |
|
|
357 |
Total sales, net |
|
$ |
97,728 |
|
$ |
138,724 |
| (1) | Copper, lead, and zinc are co-products. In the realized (loss) gain - embedded derivative, net, there are $0.3 million gain and $0.7 million gain, respectively, related to these co-products for the years ended December 31, 2023 and 2022. |
Gold Resource Corporation
78
3. Inventories
At December 31, 2023 and 2022, inventories consisted of the following:
|
|
As of |
|
As of |
||
|
|
December 31, |
|
December 31, |
||
|
|
2023 |
|
2022 |
||
|
|
(in thousands) |
||||
Stockpiles - underground mine |
|
$ |
534 |
|
$ |
597 |
Concentrates |
|
|
1,768 |
|
|
3,271 |
Doré, net |
|
|
169 |
|
|
653 |
Subtotal - product inventories |
|
|
2,471 |
|
|
4,521 |
Materials and supplies (1) |
|
|
6,823 |
|
|
8,979 |
Total |
|
$ |
9,294 |
|
$ |
13,500 |
| (1) | Net of reserve for obsolescence of $0.5 million and $0.1 million as of December 31, 2023 and 2022, respectively. |
4. Income Taxes
The Company accounts for income taxes in accordance with the provisions of ASC 740, "Income Taxes" ("ASC 740") on a tax jurisdictional basis. The Company and its U.S. subsidiaries file U.S. tax returns and the Company’s foreign subsidiaries file tax returns in Mexico and Canada. For financial reporting purposes, total (loss) income before income taxes includes the following components.
|
|
Years Ended December 31, |
||||
|
|
2023 |
|
2022 |
||
|
|
(in thousands) |
||||
U.S. Operations |
|
$ |
(8,958) |
|
$ |
(18,317) |
Foreign Operations (1) |
|
|
(12,794) |
|
|
20,555 |
Total (loss) income before income taxes |
|
$ |
(21,752) |
|
$ |
2,238 |
| (1) | Foreign operations are predominantly in Mexico, as activities in Canada are minimal. |
The Company's total income tax (benefit) provision consists of the following:
|
|
Years ended December 31, |
||||
|
|
2023 |
|
2022 |
||
|
|
(in thousands) |
||||
Current taxes: |
|
|
||||
State |
|
$ |
(3) |
|
$ |
(254) |
Foreign |
|
|
906 |
|
|
12,358 |
Total current taxes |
|
$ |
903 |
|
$ |
12,104 |
|
|
|
|
|
|
|
Deferred taxes: |
|
|
|
|
|
|
Federal |
|
$ |
(691) |
|
$ |
(895) |
State |
|
|
- |
|
|
25 |
Foreign |
|
|
(5,947) |
|
|
(2,675) |
Total deferred tax benefits |
|
$ |
(6,638) |
|
$ |
(3,545) |
Total income tax (benefit) provision |
|
$ |
(5,735) |
|
$ |
8,559 |
Gold Resource Corporation
79
The (benefit) provision for income taxes for the years ended December 31, 2023 and 2022 differs from the amount of income tax determined by applying the applicable United States statutory federal income tax rate to pre-tax income from operations as a result of the following differences:
|
|
For the year ended December 31, |
||||
|
|
2023 |
|
2022 |
||
|
|
(in thousands) |
||||
Tax at statutory rates |
|
$ |
(4,568) |
|
$ |
470 |
Foreign rate differential |
|
|
(1,006) |
|
|
1,867 |
Changes in valuation allowance |
|
|
(3,521) |
|
|
(5,115) |
Tax losses subject to limitation |
|
|
2,708 |
|
|
8,306 |
Mexico mining tax |
|
|
301 |
|
|
2,168 |
Foreign exchange |
|
|
(904) |
|
|
311 |
Stock option expiration |
|
|
237 |
|
|
519 |
Mexico withholding tax |
|
|
102 |
|
|
1,328 |
Deduction for inflation in Mexico |
|
|
(1,043) |
|
|
(1,083) |
U.S. state income tax |
|
|
(288) |
|
|
(786) |
Foreign tax credit expirations |
|
|
2,118 |
|
|
- |
Other |
|
|
129 |
|
|
574 |
Tax (benefit) provision |
|
$ |
(5,735) |
|
$ |
8,559 |
In the fourth quarter of 2023, the Company completed a study of the Internal Revenue Code section 382 (“382”) net operating loss limitations related to ownership changes in connection with the Back Forty Project acquisition. The study found that approximately $45.1 million of federal net operating losses and $12.3 million of Michigan net operating losses would be subject to potential limitation under 382. The study also concluded that, of those losses, $30.8 million of federal losses and $35.9 million of Michigan losses would be unable to offset future taxable income by the Company due to loss limitations under 382 and loss carryforward expirations. The annual limitation for the Company under 382 is $1.3 million.
The following table sets forth deferred tax assets and liabilities:
|
|
As of December 31, |
||||
|
|
2023 |
|
2022 |
||
|
|
|
(in thousands) |
|||
Deferred tax assets: |
|
|
|
|
|
|
Tax loss carryforward |
|
$ |
28,888 |
|
$ |
25,626 |
Property, plant, and mine development |
|
|
5,880 |
|
|
1,429 |
Share-based compensation |
|
|
131 |
|
|
511 |
Foreign tax credits |
|
|
1,971 |
|
|
4,089 |
Inventory |
|
|
197 |
|
|
45 |
Foreign Mining Tax |
|
|
264 |
|
|
1,106 |
Accrued Expenses |
|
|
5,529 |
|
|
5,606 |
Gold and silver stream agreements liability |
|
|
3,472 |
|
|
2,144 |
Employee profit sharing obligation |
|
|
20 |
|
|
663 |
Other |
|
|
300 |
|
|
1,344 |
Total deferred tax assets |
|
$ |
46,652 |
|
$ |
42,563 |
Valuation allowance |
|
|
(28,297) |
|
|
(31,818) |
Deferred tax assets after valuation allowance |
|
$ |
18,355 |
|
$ |
10,745 |
Deferred tax liability – Property, plant and mine development |
|
|
(17,713) |
|
|
(17,724) |
Deferred tax liability – Other |
|
|
(1,418) |
|
|
(2,245) |
Total deferred tax liabilities |
|
$ |
(19,131) |
|
$ |
(19,969) |
Net deferred tax liability |
|
$ |
(776) |
|
$ |
(9,224) |
In accordance with ASC 740, the Company presents deferred tax assets net of its deferred tax liabilities on its Consolidated Balance Sheets on a jurisdictional basis. The net deferred tax liability of $0.8 million as of December 31, 2023 shown in the table above is comprised of a $14.1 million deferred tax liability related to the US entities and a $13.3 million deferred tax asset related to Don David Gold Mine S.A. de C.V. (“DDGM”) in Mexico. No net deferred tax balances exist in Canada due to the existence of a full valuation allowance.
Gold Resource Corporation
80
The Company evaluates the evidence available to determine whether a valuation allowance is required on deferred tax assets. As of December 31, 2023, the Company determined that a valuation allowance of $28.3 million was necessary due to the uncertain utilization of specific deferred tax assets, primarily net operating loss carryforwards, with $18.8 million in U.S. and $9.5 million in Canada; $19.5 million of the total valuation allowance of $28.3 million is related to Aquila in the U.S. and Canada. As of December 31, 2022, the Company determined that a valuation allowance of $31.8 million was necessary due to the uncertain utilization of specific deferred tax assets, primarily net operating loss carryforwards, with $21.2 million in U.S. and $10.6 million in Canada; $21.8 million of the valuation allowance is related to Aquila. The net change in the Company’s valuation allowance was a decrease of $3.5 million for the year ended December 31, 2023. The decrease in valuation allowance is primarily explained by expiration of foreign tax credits and the write-off of net operating losses now expected to expire unutilized under 382 on a tax-effected basis as discussed above.
At December 31, 2023, the Company has available U.S. federal loss carryforwards of $76.8 million, of which $56.2 million have no expiration date, and $20.6 million that expire at various dates between 2027 and 2037; U.S. Foreign Tax Credits of $2.0 million that expire at various dates between 2024 and 2026; state of Colorado tax loss carryforwards of $53.0 million, of which $29.8 million expire at various dates between 2024 and 2037 and $23.1 million that have no expiration; available state of Michigan tax loss carryforwards of $16.8 million expiring at various dates between 2024 and 2033; Wisconsin tax loss carryforwards of $4.0 million expiring in 2042; and Canadian tax loss carryforwards of $23.0 million that expire between 2026 and 2043.
Mexico Mining Taxation
Mining entities in Mexico are subject to two mining duties, in addition to the 30% Mexico corporate income tax: (i) a “special” mining duty of 7.5% of taxable income as defined under Mexican tax law (also referred to as “mining royalty tax”) on extraction activities performed by concession holders, and (ii) the “extraordinary” mining duty of 0.5% on gross revenue from the sale of gold, silver, and platinum. The mining royalty tax is generally applicable to earnings before income tax, depreciation, depletion, amortization, and interest. In calculating the mining royalty tax, there are no deductions related to depreciable costs from operational fixed assets, but prospecting and exploration expenses are amortized at 10% rate in a straight line. Both duties are tax deductible for income tax purposes. As a result, our effective tax rate applicable to the Company’s Mexican operations is substantially higher than Mexico’s statutory rate.
The Company periodically transfers funds from its Mexican wholly-owned subsidiary to the U.S. in the form of dividends. Mexico requires a 10% withholding tax on dividends on all post-2013 earnings. The Company began distributing post-2013 earnings from Mexico in 2018. According to the existing U.S. – Mexico tax treaty, the dividend withholding tax between these countries is reduced to 5% if certain requirements are met. The Company determined that it had met such requirements and paid a 5% withholding tax on dividends received from Mexico, and as a result, paid $0.1 million and $1.3 million for years ending December 31, 2023 and 2022, respectively.
Other Tax Disclosures
The Company files U.S. and various state income tax returns, as well as foreign income tax returns in Canada and Mexico, with varying statutes of limitations. In general, the statute of limitations is three years in the United States and in Canada. However, the Company has net operating loss and tax credit carryforward balances beginning in the tax year ended December 31, 2007 for the United States and in the tax year ended December 31, 2006 for Canada. As a result, all tax years since 2007 remain open to examination in the United States and all tax years since 2006 remain open to examination in Canada. In Mexico, the statute of limitations is generally five years, which currently is 2018 and forward. The Company is under audit for the tax year ended December 31, 2015. All other years are closed to inspection outside of the standard statute of limitations window in Mexico.
Gold Resource Corporation
81
The U.S. Treasury Department issued final regulations in July 2020 concerning global intangible low-taxed income, commonly referred to as GILTI tax, which was introduced by the Tax Act of 2017. The GILTI provisions impose a tax on foreign income in excess of a deemed return on tangible assets of foreign corporations. The final tax regulations allow income to be excluded from GILTI tax that are subject to an effective tax rate higher than 90% of the U.S. tax rate. The Company determined that it is not subject to GILTI tax due to this high tax exception rule.
In October 2023, the Company received a notification from the Mexican Tax Administration Services (“SAT”) with a sanction of 331 million pesos (approximately $19.5 million) as the result of a 2015 tax audit that began in 2021. The 2015 tax audit performed by SAT encompassed various tax aspects, including but not limited to intercompany transactions, mining royalty tax, and extraordinary mining tax. Management is in process of disputing this tax notification and sent a letter of protest to the tax authorities along with providing all requested documentation. Management intends to pursue legal avenues of protest, including filing a lawsuit with the Mexico court system if necessary, to ensure that these adjustments are removed. Management believes the position taken on the 2015 income tax return meets the more likely than not threshold and that as of the years ended December 31, 2023 and 2022, the Company has no liability for uncertain tax positions. If the Company were to determine there was an unrecognized tax benefit, the Company would recognize the liability and related interest and penalties within income tax (benefit) provision.
5. Prepaid Expenses and Other Current Assets
At December 31, 2023 and 2022, prepaid expenses and other current assets consisted of the following:
|
|
As of |
|
As of |
||
|
|
December 31, |
|
December 31, |
||
|
|
2023 |
|
2022 |
||
|
|
(in thousands) |
||||
Advances to suppliers |
|
$ |
266 |
|
$ |
867 |
Prepaid insurance |
|
|
1,103 |
|
|
1,298 |
Prepaid income tax |
|
|
4,589 |
|
|
432 |
Other current assets |
|
|
654 |
|
|
1,242 |
Total |
|
$ |
6,612 |
|
$ |
3,839 |
IVA taxes receivable, net is a value added (“IVA”) tax in Mexico assessed on purchases of materials and services and sales of products. Likewise, businesses owe IVA taxes as the business sells a product and collects IVA taxes from its customers. Businesses are generally entitled to recover the taxes they have paid related to purchases of materials and services, either as a refund or credit to IVA tax payable. Amounts recorded as IVA taxes in the consolidated financial statements represent the net estimated IVA tax receivable or payable, since there is a legal right of offset of IVA taxes. As of December 31, 2023 and 2022, this resulted in an asset balance of $0.4 million and $0.8 million, respectively, which is included in other current assets above.
Gold Resource Corporation
82
6. Property, Plant and Mine Development, net
At December 31, 2023 and 2022, property, plant and mine development consisted of the following:
|
|
As of |
|
As of |
||
|
|
December 31, |
|
December 31, |
||
|
|
2023 |
|
2022 |
||
|
|
(in thousands) |
||||
Asset retirement costs ("ARO asset") |
|
$ |
6,227 |
|
$ |
7,449 |
Construction-in-progress |
|
|
243 |
|
|
351 |
Furniture and office equipment |
|
|
1,781 |
|
|
1,732 |
Land |
|
|
9,033 |
|
|
9,033 |
Mineral interest |
|
|
79,543 |
|
|
79,543 |
Light vehicles and other mobile equipment |
|
|
2,126 |
|
|
2,327 |
Machinery and equipment |
|
|
42,887 |
|
|
41,343 |
Mill facilities and infrastructure |
|
|
36,396 |
|
|
35,917 |
Mine development |
|
|
115,230 |
|
|
105,263 |
Software and licenses |
|
|
1,554 |
|
|
1,552 |
Subtotal |
|
|
295,020 |
|
|
284,510 |
Accumulated depreciation and amortization |
|
|
(156,394) |
|
|
(131,947) |
Total |
|
$ |
138,626 |
|
$ |
152,563 |
Asset retirement credits of $1.2 million were recognized on December 31, 2023 due to changes in estimates in the reclamation model, also decreasing the asset retirement obligations. Please see Item 8. Financial Statements and Supplementary Data—Note 10. Reclamation and Remediation for additional information.
Gold Resource Corporation
83
7. Other Non-current Assets
At December 31, 2023 and 2022, other non-current assets consisted of the following:
|
|
As of |
|
As of |
||
|
|
December 31, |
|
December 31, |
||
|
|
2023 |
|
2022 |
||
|
|
(in thousands) |
||||
Investment in Maritime |
|
$ |
1,596 |
|
$ |
1,559 |
Investment in Green Light Metals |
|
|
3,698 |
|
|
3,611 |
Other non-current assets |
|
|
170 |
|
|
339 |
Total |
|
$ |
5,464 |
|
$ |
5,509 |
On September 22, 2022, the Company invested C$2.4 million (or $1.7 million) in the common shares of Maritime Resources Corp. The 47 million shares purchased represented 9.9% of the issued and outstanding shares of Maritime at the time of purchase. As of both December 31, 2023, and December 31, 2022, the fair value of this investment was $1.6 million.
On December 28, 2022, Gold Resource Corporation received 12.25 million common shares of Green Light Metals as a settlement for a promissory note receivable acquired with the Aquila acquisition. This represented approximately 28.5% ownership in Green Light Metals at the time. As of December 31, 2022, the fair value of this equity investment was $3.6 million. The contract included a top-up provision that would result in additional common shares being issued to the Company if any Green Light Metals financing was raised at less than C$0.40 per share before March 31, 2023. After this settlement and before March 31, 2023, additional financing was raised by Green Light Metals at C$0.40 per share. Therefore, the top-up provision was not triggered, and no additional shares were received. As of December 31, 2023, and December 31, 2022, the fair value of this equity investment was $3.7 million and $3.6 million, respectively.
8. Accrued Expenses and Other Liabilities
At December 31, 2023 and 2022, accrued expenses and other current and non-current liabilities consisted of the following:
|
|
As of |
|
As of |
||
|
|
December 31, |
|
December 31, |
||
|
|
2023 |
|
2022 |
||
|
|
(in thousands) |
||||
Accrued royalty payments |
|
$ |
726 |
|
$ |
1,787 |
Share-based compensation liability - current |
|
|
67 |
|
|
- |
Employee profit sharing obligation |
|
|
67 |
|
|
2,206 |
Other payables |
|
|
888 |
|
|
1,204 |
Total accrued expenses and other current liabilities |
|
$ |
1,748 |
|
$ |
5,197 |
|
|
|
|
|
|
|
Accrued non-current labor obligation |
|
$ |
1,167 |
|
$ |
1,050 |
Share-based compensation liability |
|
|
320 |
|
|
884 |
Other long-term liabilities |
|
|
29 |
|
|
556 |
Total other non-current liabilities |
|
$ |
1,516 |
|
$ |
2,490 |
Under Mexican law, employees are entitled to receive statutory profit sharing (Participacion a los Trabajadores de las Utilidades or “PTU”) payments. The required cash payment to employees in the aggregate is equal to 10% of their employer’s profit subject to PTU, which differs from profit determined under U.S. GAAP.
In 2023, $0.1 million for PTU was recorded in current liabilities and production costs, as well as $1.2 million for statutory employee severance benefits recorded in other long-term liabilities and other expenses. In 2022, $2.2 million for PTU was recorded in current liabilities and production costs, as well as $1.1 million for statutory employee severance benefits recorded in other long-term liabilities and other expenses.
Gold Resource Corporation
84
PSU and DSU awards contain a cash settlement feature and are therefore classified as liability instruments and are marked to fair value each reporting period. Please see Item 8. Financial Statements and Supplementary Data—Note 15. Stock-Based Compensation for additional information.
9. Gold and Silver Stream Agreements
The following table presents the Company’s liabilities related to the Gold and Silver Stream Agreements as of December 31, 2023 and 2022:
|
|
|
|
|
|
|
|
|
As of |
|
As of |
||
|
|
December 31, |
|
December 31, |
||
|
|
2023 |
|
2022 |
||
|
|
(in thousands) |
||||
Liability related to the Gold Stream Agreement |
|
$ |
21,002 |
|
$ |
20,881 |
Liability related to the Silver Stream Agreement |
|
|
23,930 |
|
|
22,585 |
Total liability |
|
$ |
44,932 |
|
$ |
43,466 |
Periodic interest expense incurred based on an implied interest rate. The implied interest rate is determined based on the timing and probability of future production and a 6% discount rate. Interest expense is recorded to the Consolidated Statements of Operations and the gold and silver stream agreement liability on the Consolidated Balance Sheet.
The stream agreements contain customary provisions regarding default and security. In the event that our subsidiary defaults under the stream agreements, including by failing to achieve commercial production by an agreed upon date, it may be required to repay the deposit plus accumulated interest at a rate agreed with Osisko. If the Company fails to do so, Osisko may elect to enforce its remedies as a secured party and take possession of the assets that comprise the Back Forty Project.
Gold Streaming Agreement
In November 2017, Aquila entered into a stream agreement with Osisko Bermuda Limited (“OBL”), a wholly-owned subsidiary of Osisko Gold Royalties Ltd (TSX & NYSE: OR), pursuant to which OBL agreed to commit approximately $55 million to Aquila through a gold stream purchase agreement. In June 2020, Aquila amended its agreement with Osisko, reducing the total committed amount to $50 million, as well as adjusting certain milestone dates under the gold stream to align with the current project development timeline. Aquila had received a total of $20 million of the committed funds at the time of the Gold Resource Corporation acquisition. Remaining deposits from OBL are $5 million upon receipt of permits required for the development and operation of the Back Forty Project and $25 million upon the first drawdown of an appropriate project debt finance facility. OBL has been provided a general security agreement over the Back Forty Project, which consists of the subsidiaries of Gold Resource Acquisition Sub. Inc., a 100% owned subsidiary of Gold Resource Corporation. The initial term of the agreement is for 40 years, automatically renewable for successive ten-year periods. The agreement is subject to certain operating and financial covenants, which are in good standing as of December 31, 2023. Subsequent to year end, the Company secured an amendment to the stream agreement that deferred the required completion of certain operational milestones related to permitting from 2024 to 2026.
The $20 million received from OBL through December 31, 2023 is shown as a long-term liability on the Consolidated Balance Sheet, along with an implied interest. The implied interest rate is applied on the OBL advance payments and calculated on the total expected life-of-mine production to be deliverable using an estimated gold price and a discount rate of 6%. As the remaining $30 million deposit is subject to the completion of specific milestones and the satisfaction of certain other conditions, this amount is not reflected on the Consolidated Balance Sheet.
Gold Resource Corporation
85
Per the terms of the gold stream agreement, OBL will purchase 18.5% of the refined gold from Back Forty (the “Threshold Stream Percentage”) until the Company has delivered 105,000 ounces of gold (the “Production Threshold”). Upon satisfaction of the Production Threshold, the Threshold Stream Percentage will be reduced to 9.25% of the refined gold (the “Tail Stream”). In exchange for the refined gold delivered under the Stream Agreement, OBL will pay the Company ongoing payments equal to 30% of the spot price of gold on the day of delivery, subject to a maximum payment of $600 per ounce. Where the market price of gold is greater than the price paid, the difference realized from the sale of the gold will be applied against the deposit received from Osisko. Please see Item 8. Financial Statements and Supplementary Data—Note 11. Commitments and Contingencies for additional information.
Silver Stream Agreement
Through a series of contracts, Aquila executed a silver stream agreement with OBL to purchase 85% of the silver produced and sold at the Back Forty Project. A total of $17.2 million has been advanced under the agreement as of December 31, 2023. There are no future deposits remaining under the agreement. The initial term of the agreement is for 40 years, automatically renewable for successive ten-year periods. The agreement is subject to certain operating and financial covenants, which are in good standing as of December 31, 2023. Subsequent to year end, the Company secured an amendment to the stream agreement that deferred the required completion of certain operational milestones related to permitting from 2024 to 2026.
Per the terms of the silver stream agreement, OBL will purchase 85% of the silver produced from the Back Forty Project at a fixed price of $4 per ounce of silver. Where the market price of silver is greater than $4 per ounce, the difference realized from the sale of the silver will be applied against the deposit received from Osisko.
The $17.2 million received from OBL through December 31, 2023 is shown as a long-term liability on the Consolidated Balance Sheet and includes an implied interest rate. The implied interest rate is applied on the OBL advance payments and calculated on the total expected life-of-mine production to be deliverable using an estimated silver price and a discount rate of 6%. Please see Item 8. Financial Statements and Supplementary Data—Note 11. Commitments and Contingencies for additional information.
10. Reclamation and Remediation
The following table presents the changes in the Company’s reclamation and remediation obligations for the years ended December 31, 2023 and 2022:
|
|
2023 |
|
2022 |
||
|
|
(in thousands) |
||||
Reclamation liabilities – balance at beginning of period |
|
$ |
1,949 |
|
$ |
1,833 |
Foreign currency exchange loss |
|
|
284 |
|
|
116 |
Reclamation liabilities – balance at end of period |
|
|
2,233 |
|
|
1,949 |
|
|
|
|
|
|
|
Asset retirement obligation – balance at beginning of period (1) |
|
|
8,417 |
|
|
1,279 |
Changes in estimate (1) |
|
|
(1,221) |
|
|
6,384 |
Liability for Aquila drillhole capping (2) |
|
|
404 |
|
|
- |
Accretion |
|
|
689 |
|
|
668 |
Foreign currency exchange loss |
|
|
1,273 |
|
|
86 |
Asset retirement obligation – balance at end of period |
|
|
9,562 |
|
|
8,417 |
Total period end balance |
|
$ |
11,795 |
|
$ |
10,366 |
| (1) | In 2022, the Company updated its closure plan study, which resulted in a $6.4 million increase in the estimated liability and ARO asset. This increase is a result of formalizing a tailings storage facility closure plan, the addition of the dry stack facility and the filtration plant, and the increase of inflation in Mexico. In 2023, the Company updated its closure plan study to include current disturbances, which resulted in a $1.2 million decrease in the estimated liability and ARO asset. |
Gold Resource Corporation
86
| (2) | As of December 31, 2022, the Company reported the liability of $0.4 million to remediate exploration drill holes at the Back Forty Project in Michigan, USA in other non-current liabilities. As of March 31, 2023, this liability of $0.4 million was reclassified to non-current reclamation and remediation liabilities. |
The Company’s undiscounted reclamation liabilities of $2.2 million and $1.9 million as of December 31, 2023 and 2022, respectively, are related to DDGM in Mexico. These represent reclamation liabilities that were expensed through 2013 before proven and probable Mineral Reserves were established and the Company was considered to be a development stage entity; therefore, most of the costs, including asset retirement costs, were not allowed to be capitalized as part of our property, plant, and mine development.
The Company’s asset retirement obligations reflect the additions to the asset for reclamation and remediation costs in property, plant & mine development, post 2013 development stage status, which were discounted using a credit adjusted risk-free rate of 8%. As of December 31, 2023 and 2022, the Company’s asset retirement obligation related to the Don David Gold Mine in Mexico was $9.6 million and $8.4 million, respectively.
11. Commitments and Contingencies
As of December 31, 2023 and 2022, the Company had equipment purchase commitments aggregating approximately $0.8 million and $1.2 million, respectively.
Contingent Consideration
With the Aquila acquisition, the Company assumed a contingent consideration. On December 30, 2013, Aquila’s shareholders approved the acquisition of 100% of the shares of HudBay Michigan Inc. (“HMI”), a subsidiary of HudBay Minerals Inc. (“HudBay”), effectively giving Aquila 100% ownership in the Back Forty Project (the “HMI Acquisition”). Pursuant to the HMI Acquisition, HudBay’s 51% interest in the Back Forty Project was acquired in consideration for the issuance of common shares of Aquila, future milestone payments tied to the development of the Back Forty Project and a 1% net smelter return royalty on production from certain land parcels in the project. The issuance of shares and 1% net smelter obligations were settled before the Company acquired Aquila.
The contingent consideration is composed of the following:
The value of future installments is based on C$9 million tied to the development of the Back Forty project as follows:
| a. | C$3 million payable on completion of any form of financing for purposes including the commencement of construction of Back Forty, up to 50% of the C$3 million can be paid, at the Company’s option in Gold Resource Corporation shares with the balance payable in cash; |
| b. | C$2 million payable in cash 90 days after the commencement of commercial production; |
| c. | C$2 million payable in cash 270 days after the commencement of commercial production, and; |
| d. | C$2 million payable in cash 450 days after the commencement of commercial production. |
Initially, the company intended to pay the first C$3 million in 2023 to prevent HudBay’s 51% buy-back option in the Back Forty Project. Management later decided that it was more likely than not that HudBay would not exercise its buy-back option, and consequently, this amount was not paid. Additionally, since financing of the project is not expected in 2024, this liability was moved to long-term. As of the end of January 2024, by the contractual deadline, HudBay did not exercise its buy-back option, and thus, it is forfeited.
The total value of the contingent consideration at December 31, 2023 and 2022 was $3.5 million and $4.4 million, respectively. The contingent consideration is adjusted for the time value of money and the likelihood of the milestone payments. Any future changes in the value of the contingent consideration is recognized in other expense, net, in the Consolidated Statements of Operations.
Gold Resource Corporation
87
The following table shows the change in the balance of the contingent consideration:
|
|
2023 |
|
2022 |
||
|
|
(in thousands) |
||||
Beginning Balance of contingent consideration: |
|
|
|
|
|
|
Current contingent consideration |
|
$ |
2,211 |
|
$ |
- |
Non-current contingent consideration |
|
|
2,179 |
|
|
4,603 |
|
|
$ |
4,390 |
|
$ |
4,603 |
|
|
|
|
|
|
|
Change in value of contingent consideration |
|
|
(842) |
|
|
(213) |
|
|
|
|
|
|
|
Ending Balance of contingent consideration: |
|
|
|
|
|
|
Current contingent consideration |
|
$ |
- |
|
$ |
2,211 |
Non-current contingent consideration |
|
|
3,548 |
|
|
2,179 |
|
|
$ |
3,548 |
|
$ |
4,390 |
Other Contingencies
The Company has certain other contingencies resulting from litigation, claims, and other commitments and is subject to a variety of environmental and safety laws and regulations incident to the ordinary course of business. The Company currently has no basis to conclude that any or all of such contingencies will materially affect its financial position, results of operations, or cash flows. However, in the future, there may be changes to these contingencies, or additional contingencies may occur, any of which might result in an accrual or a change in current accruals recorded by the Company, and there can be no assurance that their ultimate disposition will not have a material adverse effect on the Company’s financial position, results of operations or cash flow.
With the acquisition of Aquila Resources Inc. on December 10, 2021, the Company assumed substantial liabilities that relate to the gold and silver stream agreements with Osisko Bermuda Limited. Under the agreements, Osisko deposited a total of $37.2 million upfront in exchange for a portion of the future gold and silver production from the Back Forty Project. The stream agreements contain customary provisions regarding default and security. In the event that our subsidiary defaults under the stream agreements, including failing to achieve commercial production at a future date, it may be required to repay the deposit plus accumulated interest at a rate agreed with Osisko. If it fails to do so, Osisko may be entitled to enforce its remedies as a secured party and take possession of the assets that comprise the Back Forty Project.
12. Shareholders’ Equity
On February 13, 2023, the Company announced the suspension of future quarterly dividends to protect our balance sheet and to focus capital resources on exploration and growth opportunities. Therefore, in the year ended December 31, 2023, the Company neither declared nor paid dividends. The Company declared and paid dividends of $3.5 million, or $0.04 per share, for the year ended December 31, 2022.
The Company’s At-The-Market Offering Agreement with H.C. Wainwright & Co., LLC (the “Agent”), which was entered into in November 2019 (the “ATM Agreement”), pursuant to which the Agent agreed to act as the Company’s sales agent with respect to the offer and sale from time to time of the Company’s common stock having an aggregate gross sales price of up to $75.0 million, was renewed in June 2023. During the year ended December 31, 2023, an aggregate of 195,872 shares of the Company’s common stock were sold through the ATM Agreement, for net proceeds to the Company, after deducting the Agent’s commissions and other expenses, of $0.1 million.
Gold Resource Corporation
88
13. Derivatives
Embedded Derivatives
Concentrate Sales
Concentrate sales contracts contain embedded derivatives due to the provisional pricing terms for shipments pending final settlement. At the end of each reporting period, the Company records an adjustment to accounts receivable and revenue to reflect the mark-to-market adjustments for outstanding provisional invoices based on forward metal prices. Please see Item 8. Financial Statements and Supplementary Data—Note 19. Fair Value Measurement for additional information.
The following table summarizes the Company’s unsettled sales contracts at December 31, 2023, with the quantities of metals under contract subject to final pricing occurring through February 2023:
|
|
|
|
|
|
|
|
|
|
|
|
|
|
|
|
|
|
|
|
|
Gold |
|
Silver |
|
Copper |
|
Lead |
|
Zinc |
|
|
Total |
|||||
|
|
(ounces) |
|
(ounces) |
|
(tonnes) |
|
(tonnes) |
|
(tonnes) |
|
|
|
|||||
Under contract |
|
|
2,908 |
|
|
252,324 |
|
|
217 |
|
|
1,678 |
|
|
2,236 |
|
|
|
Average forward price (per ounce or tonne) |
|
$ |
1,983 |
|
|
23.45 |
|
|
8,337 |
|
|
2,151 |
|
|
2,499 |
|
|
|
Unsettled sales contracts value (in thousands) |
|
$ |
5,767 |
|
$ |
5,917 |
|
$ |
1,809 |
|
$ |
3,609 |
|
$ |
5,588 |
|
$ |
22,690 |
Other Derivatives
Zinc zero cost collar
Derivative instruments that are not designated as hedging instruments are required to be recorded on the balance sheet at fair value. Changes in fair value impact the Company’s earnings through mark-to-market adjustments until the physical commodity is delivered or the financial instrument is settled. As of December 31, 2022, the hedge program concluded, but the Company may utilize similar programs in the future to manage near-term exposure to cash flow variability from metal prices.
Effective May 18, 2021, GRC entered into a Trading Agreement with Auramet International LLC that governs nonexchange traded, over-the-counter, spot, forward, and option transactions on both a deliverable and non-deliverable basis involving various metals and currencies, and these contracts are not designated as hedging instruments. Due to the conclusion of the current program, in 2023, the Company had neither realized nor unrealized gains or losses, compared to a realized loss of $2.0 million and an unrealized gain of $1.8 million in 2022.
The Company manages credit risk by selecting counterparties that it believes to be financially strong, by entering into netting arrangements with counterparties, and by requiring other credit risk mitigants, as appropriate. The Company actively evaluates the creditworthiness of its counterparties, assigns appropriate credit limits, and monitors credit exposures against those assigned limits.
14. Employee Benefits
Effective October 2012, the Company adopted a profit-sharing plan (the “Plan”) which covers all U.S. employees. The Plan meets the requirements of a qualified retirement plan pursuant to the provisions of Section 401(k) of the Internal Revenue Code. The Plan also provides eligible employees the opportunity to make tax deferred contributions to a retirement trust account up to 90% of their qualified wages, subject to the IRS annual maximums.
On April 23, 2021, a decree that reforms labor outsourcing in Mexico was published in the Federation’s Official Gazette. This decree amended the outsourcing provisions, whereby operating companies can no longer source their labor resources used to carry out the core business functions from service entities or third-party providers. Under Mexican law, employees are entitled to receive statutory profit sharing (Participacion a los Trabajadores de las Utilidades or “PTU”) payments.
Gold Resource Corporation
89
The required cash payment to employees in the aggregate is equal to 10% of their employer’s profit subject to PTU, which differs from profit determined under U.S. GAAP. Please see Item 8. Financial Statements and Supplementary Data—Note 8. Accrued Expenses and Other Liabilities for additional information.
15. Stock-Based Compensation
The Company’s compensation program comprises three main elements: base salary, an annual short-term incentive plan (“STIP”) cash award, and long-term equity-based incentive compensation (“LTIP”) in the form of stock options, restricted stock units (“RSUs”), performance stock units (“PSUs”), and deferred stock units (“DSUs”).
The Gold Resource Corporation 2016 Equity Incentive Plan (the “Incentive Plan”) allows for the issuance of up to 5 million shares of common stock in the form of incentive and non-qualified stock options, stock appreciation rights, RSUs, stock grants, stock units, performance shares, PSUs, and performance cash. Effective January 1, 2021, the Company’s Board of Directors, on the recommendation of the Compensation Committee, implemented a program to issue DSUs, which are qualifying instruments under the terms of the Company’s Incentive Plan, to eligible directors. Additionally, pursuant to the terms of the Incentive Plan, any award outstanding under the prior plan that is terminated, expired, forfeited, or canceled for any reason, will be available for grant under the Incentive Plan.
The Company’s STIP provides for an annual cash bonus payable upon achievement of specified performance metrics for its management team. As of December 31, 2023, we accrued $0.8 million payable in cash related to the STIP program. As of December 31, 2022, we accrued $1.0 million related to the program.
Stock-Based Compensation Expense
Stock-based compensation expense for stock options, RSUs, PSUs, and DSUs is as follows:
|
For the year ended December 31, |
||||
|
2023 |
|
2022 |
||
|
(in thousands) |
||||
Stock options |
$ |
342 |
|
$ |
646 |
Restricted stock units |
|
537 |
|
|
631 |
Performance stock units |
|
(168) |
|
|
332 |
Deferred stock units |
|
(30) |
|
|
346 |
Total |
$ |
681 |
|
$ |
1,955 |
The estimated unrecognized stock-based compensation expense from unvested options and RSUs, as of December 31, 2023, was nil and $0.7 million, respectively, and is expected to be recognized over the weighted average remaining periods of nil and 1.93 year, respectively. As DSUs are vested immediately at grant, the full amount of fair value is recognized as expense at the time of grant. In addition, a mark-to-market adjustment due to fluctuation of share price is recognized at the end of each period related to the DSUs. The fair value of the PSUs is recognized over their vesting period of three years, and similarly to the DSUs, a mark-to-market adjustment due to fluctuation of the share price, as well as due to changes in the performance, is recognized at the end of each period related to the proportionate number of units based on passage of time.
Gold Resource Corporation
90
Stock Options
A summary of stock option activity under the Incentive Plan for the years ended December 31, 2023 and 2022 is presented below:
|
|
Stock |
|
Weighted |
|
Weighted Average |
|
Aggregate Intrinsic Value (in thousands) |
||
Outstanding as of December 31, 2021 |
|
2,454,700 |
|
$ |
4.62 |
|
4.58 |
|
$ |
109 |
Granted |
|
320,816 |
|
|
2.41 |
|
|
|
|
|
Exercised |
|
(355,000) |
|
|
1.31 |
|
|
|
|
|
Expired or Forfeited |
|
(945,200) |
|
|
7.78 |
|
|
|
|
|
Outstanding as of December 31, 2022 |
|
1,475,316 |
|
$ |
2.90 |
|
7.38 |
|
$ |
18 |
Expired or Forfeited |
|
(634,704) |
|
|
2.79 |
|
|
|
|
|
Outstanding as of December 31, 2023 |
|
840,612 |
|
$ |
2.99 |
|
7.38 |
|
$ |
- |
|
|
|
|
|
|
|
|
|
|
|
Vested and exercisable as of December 31, 2023 |
|
593,740 |
|
$ |
2.98 |
|
7.36 |
|
$ |
- |
During the years ended December 31, 2023 and 2022 stock options of nil and 320,816, respectively, were granted. The weighted-average fair value of options per share granted during the years ended December 31, 2023 and 2022 was nil and $1.06, respectively. The total intrinsic value of options exercised during the years ended December 31, 2023 and 2022, was nil and $0.1 million, respectively. The total fair value of options vested during the years ended December 31, 2023 and 2022 was nil and $1.0 million, respectively.
Stock options of nil and 355,000 were exercised during the years ended December 31, 2023 and December 31, 2022, respectively. The 2022 exercises were settled in cash.
The following table summarizes information about stock options outstanding at December 31, 2023:
|
|
Outstanding |
|
Exercisable |
||||||||
Range of Exercise Prices |
|
Number of |
|
Weighted Average |
|
Weighted |
|
Number of |
|
Weighted |
||
$0.00 - $2.50 |
|
240,612 |
|
8.22 |
|
$ |
2.41 |
|
160,407 |
|
$ |
2.41 |
$2.51 -$5.00 |
|
600,000 |
|
7.04 |
|
$ |
3.22 |
|
433,333 |
|
$ |
3.19 |
|
|
840,612 |
|
7.38 |
|
$ |
2.99 |
|
593,740 |
|
$ |
2.98 |
The assumptions used to determine the value of stock-based awards granted in 2022 under the Black-Scholes method are summarized below:
|
|
|
|
|
|
2022 |
|
Risk-free interest rate |
|
2.13 |
% |
Dividend yield |
|
1.66 |
% |
Expected volatility |
|
56.39 |
% |
Expected life in years |
|
5 |
|
Gold Resource Corporation
91
Restricted Stock Units
A summary of RSU activity under the Incentive Plan for the years ended December 31, 2023 and 2022 is presented below:
|
|
Restricted |
|
Aggregate |
|
Weighted Average |
|
Nonvested as of December 31, 2021 |
|
105,799 |
|
$ |
165 |
|
1.07 |
Granted |
|
611,681 |
|
|
|
|
|
Vested but not redeemed (deferred) |
|
(39,298) |
|
|
|
|
|
Vested and redeemed |
|
(80,169) |
|
|
|
|
|
Forfeited |
|
(22,465) |
|
|
|
|
|
Nonvested as of December 31, 2022 |
|
575,548 |
|
$ |
881 |
|
1.04 |
Granted |
|
779,192 |
|
|
|
|
|
Vested but not redeemed (deferred) |
|
(106,955) |
|
|
|
|
|
Vested and redeemed |
|
(100,057) |
|
|
|
|
|
Vested and forfeited for net settlement |
|
(30,181) |
|
|
|
|
|
Forfeited |
|
(270,292) |
|
|
|
|
|
Nonvested as of December 31, 2023 |
|
847,255 |
|
$ |
319 |
|
1.93 |
RSUs of 779,192 and 611,681 respectively, were granted during the years ended December 31, 2023 and 2022. The weighted-average fair value per share of RSUs granted during the years ended December 31, 2023 and 2022 was $0.92 and $1.97, respectively. The grant date fair value of RSUs is determined by the 20-day volume weighted average price of the Company’s common shares at grant date. The total intrinsic value of RSUs vested during the years ended December 31, 2023 and 2022 was $0.6 million and $0.3 million, respectively. During the years ended December 31, 2023 and 2022, 0.1 million and 39 thousand RSUs were deferred, respectively.
Performance Stock Units
A summary of PSU activity under the Incentive Plan for the years ended December 31, 2023 presented below:
|
|
Performance |
|
|
Liability Balance (in thousands) |
Outstanding as of December 31, 2021 |
|
- |
|
|
- |
Granted |
|
695,041 |
|
|
|
Outstanding as of December 31, 2022 |
|
695,041 |
|
|
332 |
Granted |
|
534,890 |
|
|
|
Forfeited |
|
(349,005) |
|
|
|
Outstanding as of December 31, 2023 |
|
880,926 |
|
|
164 |
Starting in 2022, the Company’s Board of Directors approved granting performance share units to the Company’s management team. PSUs cliff vest in three years based on the relative total shareholder return of a predetermined peer group and are expected to be settled in cash. These awards contain a cash settlement feature and are therefore classified as liability and are marked to fair value each reporting period based on the relative total shareholder return of a predetermined peer group and the Company’s stock price. As of December 31, 2023 and 2022, the Company has liability of $0.2 million and $0.3 million, respectively, related to PSUs. As of December 31, 2023, of the $0.2 million liability, $0.1 million is short-term and expected to be paid out in 2024 according to the terms of the grant agreements.
PSUs of 534,890 and 695,041, respectively, were granted during the years ended December 31, 2023 and 2022, with weighted-average fair value of $0.90 and $1.99 per unit, respectively. The grant date fair value of PSUs is determined by the 20-day volume weighted average price of the Company’s common shares at grant date.
Gold Resource Corporation
92
No PSUs were vested nor redeemed during the years ended December 31, 2023 and 2022. and PSUs of 349,005 and nil, respectively, were forfeited during the years ended December 31, 2023 and 2022.
Deferred Stock Units
A summary of DSU activity under the Incentive Plan for the years ended December 31, 2023 is presented below:
|
|
|
|
|
|
|
|
Deferred |
|
|
Liability Balance (in thousands) |
Outstanding as of December 31, 2021 |
|
131,960 |
|
|
206 |
Granted |
|
214,357 |
|
|
|
Granted in lieu of board fees |
|
14,382 |
|
|
|
Outstanding as of December 31, 2022 |
|
360,699 |
|
|
552 |
Granted |
|
278,663 |
|
|
|
Granted in lieu of board fees |
|
108,011 |
|
|
|
Granted in lieu of executive bonus |
|
212,407 |
|
|
|
Redeemed |
|
(373,489) |
|
|
|
Outstanding as of December 31, 2023 |
|
586,291 |
|
|
223 |
Effective January 1, 2021, the Company’s Board of Directors, on the recommendation of the Compensation Committee, implemented a program to issue deferred stock units to members of the Company’s Board of Directors. Additionally, members of the Board may elect, at the beginning of each year, that a portion of their board fees be paid in DSUs rather than in cash. DSUs are qualifying instruments under the terms of the Company’s Incentive Plan, and therefore, do not require additional shareholder approval. The vesting and settlement terms of the DSUs are determined by the Compensation Committee at the time the DSUs are awarded.
DSUs are vested immediately at grant and are redeemable in cash or shares—at the discretion of the Company—at the earlier of 10 years or upon the eligible directors’ termination and expected to be paid in cash. Termination is deemed to occur on the earliest of (1) the date of voluntary resignation or retirement of the director from the Board; (2) the date of death of the director; or (3) the date of removal of the director from the Board whether by shareholder resolution, failure to achieve re-election, or otherwise; and on which date the director is not a director or employee of the Company or any of its affiliates. These awards contain a cash settlement feature and are therefore classified as a liability and are marked to fair value each reporting period. As of December 31, 2023 and 2022, the Company has $0.2 million and $0.6 million, respectively, of other non-current liability related to the DSUs, based on the fair value of the Company’s stock price.
DSUs of 278,663 and 214,357 were granted to the Board of Directors during the years ended December 31, 2023 and 2022, respectively. Additionally, DSUs of 108,011 and 14,382 were granted to the Board of Directors in lieu of board fees at their request during the years ended December 31, 2023 and 2022, respectively. DSUs of 212,407 and nil, respectively, were granted in lieu of executive bonuses during the years ended December 31, 2023 and 2022. The weighted-average grant date fair value per share of DSUs granted during the years ended December 31, 2023 and 2022 was $0.83 and $2.93, respectively. The grant date fair value of DSUs is determined by the 20-day volume weighted average price of the Company’s common shares at grant date. During the year ended December 31, 2022, no DSUs were redeemed or forfeited, and 373,489 and nil DSUs, respectively, were redeemed and forfeited during the year ended December 31, 2023.
Gold Resource Corporation
93
16. Zinc Zero Cost Collar
During the years ended December 31, 2023 and 2022, the realized and unrealized losses related to the Company’s Zinc Zero Cost Collar are the following:
|
|
|
|
|
|
|
|
|
For the year ended December 31, |
||||
|
|
2023 |
|
2022 |
||
|
|
(in thousands) |
||||
Realized (gain) loss on zinc zero cost collar |
|
$ |
- |
|
$ |
2,014 |
Unrealized gain on zinc zero cost collar (1) |
|
|
- |
|
|
(1,844) |
Total |
|
$ |
- |
|
$ |
170 |
| (1) | Gains and losses due to changes in fair value are non-cash in nature until such time that they are realized through cash transactions. |
Effective May 18, 2021, GRC entered into Trading Agreement with Auramet International LLC that govern nonexchange traded, over-the-counter, spot, forward and option transactions on both a deliverable and non-deliverable basis involving various metals and currencies. In 2022, the Company had a realized loss of $2.0 million and an unrealized gain of $1.8 million related to the program. As of December 31, 2022, the current program concluded; therefore, in 2023, the Company had neither realized nor unrealized gains or losses related to the program. However, the Company may enter into similar zinc zero cost collar call and put options in the future. Please see Item 8. Financial Statements and Supplementary Data—Note 13. Derivatives in for additional information.
17. Other Expense, Net
During the years ended December 31, 2023 and 2022, other expense, net consisted of the following:
|
|
For the year ended December 31, |
||||
|
|
2023 |
|
2022 |
||
|
|
(in thousands) |
||||
Unrealized currency exchange (gain) loss (1) |
|
$ |
(174) |
|
$ |
1,286 |
Realized currency exchange loss |
|
|
860 |
|
|
121 |
Realized and unrealized loss (gain) from gold and silver rounds, net |
|
|
(12) |
|
|
(28) |
Loss on disposal of fixed assets |
|
|
13 |
|
|
330 |
Interest on streaming liabilities |
|
|
1,466 |
|
|
906 |
Severance |
|
|
1,619 |
|
|
688 |
Other expense (income) |
|
|
(408) |
|
|
985 |
Total |
|
$ |
3,364 |
|
$ |
4,288 |
| (1) | Gains and losses due to changes in fair value are non-cash in nature until such time that they are realized through cash transactions. |
18. Net Loss per Common Share
Basic loss per common share is calculated based on the weighted average number of shares of common stock outstanding for the period. Diluted Loss per common share is calculated based on the assumption that stock options outstanding, which have an exercise price less than the average market price of the Company’s common stock during the period, would have been exercised on the later of the beginning of the period or the date granted and that the funds obtained from the exercise were used to purchase common shares at the average market price during the period. All of the Company’s restricted stock units are considered to be dilutive.
The effect of the Company’s dilutive securities is calculated using the treasury stock method, and only those instruments that result in a reduction in net income per common share are included in the calculation. Options to purchase 0.8 million shares of common stock at weighted average exercise prices of $2.99 were outstanding as of December 31, 2023 but had no dilutive effect due to the net loss. Options to purchase 1.5 million shares of common stock at weighted average exercise prices of $2.90 were outstanding as of December 31, 2022 but had no dilutive effect due to the net loss.
Gold Resource Corporation
94
Basic and diluted net loss per common share is calculated as follows:
|
For the year ended |
||||
|
December 31, |
||||
|
2023 |
|
2022 |
||
Numerator: |
|
|
|
|
|
Net loss (in thousands) |
$ |
(16,017) |
|
$ |
(6,321) |
|
|
|
|
|
|
Denominator: |
|
|
|
|
|
Basic and diluted weighted average common shares outstanding |
|
88,514,243 |
|
|
88,368,250 |
|
|
|
|
|
|
Basic and diluted net loss per common share |
$ |
(0.18) |
|
$ |
(0.07) |
19. Fair Value Measurement
Fair value accounting establishes a fair value hierarchy that prioritizes the inputs to valuation techniques used to measure fair value. The hierarchy gives the highest priority to unadjusted quoted prices in active markets for identical assets or liabilities (Level 1 measurements) and the lowest priority to unobservable inputs (Level 3 measurements). The three levels of the fair value hierarchy are described below:
Level 1 |
Unadjusted quoted prices in active markets that are accessible at the measurement date for identical, unrestricted assets or liabilities; |
Level 2 |
Quoted prices in markets that are not active, or inputs that are observable, either directly or indirectly, for substantially the full term of the asset or liability; and |
Level 3 |
Prices or valuation techniques that require inputs that are both significant to the fair value measurement and unobservable (supported by little or no market activity.) |
As required by accounting guidance, assets and liabilities are classified in their entirety based on the lowest level of input that is significant to the fair value measurement. These assets and liabilities are remeasured for each reporting period. The following tables set forth certain of the Company’s assets and liabilities measured at fair value by level within the fair value hierarchy as of December 31, 2023 and 2022:
|
|
As of |
|
As of |
|
|
||
|
|
December 31, |
|
December 31, |
|
Input Hierarchy Level |
||
|
|
2023 |
|
2022 |
|
|
||
|
|
(in thousands) |
|
|
||||
Cash and cash equivalents |
|
$ |
6,254 |
|
$ |
23,675 |
|
Level 1 |
Accounts receivable, net |
|
$ |
4,335 |
|
$ |
5,085 |
|
Level 2 |
Investment in equity securities-Maritime |
|
$ |
1,596 |
|
$ |
1,559 |
|
Level 1 |
Investment in equity securities-Green Light Metals |
|
$ |
3,698 |
|
$ |
3,611 |
|
Level 3 |
The following methods and assumptions were used to estimate the fair value of each class of financial instrument:
Cash and cash equivalents: Cash and cash equivalents consist primarily of cash deposits and are valued at cost, which approximates fair value.
Accounts receivable, net: Accounts receivable, net include amounts due to the Company for deliveries of concentrates and doré sold to customers. Concentrate sales contracts provide for provisional pricing as specified in such contracts. These sales contain an embedded derivative related to the provisional pricing mechanism which is bifurcated and accounted for as a derivative. At the end of each reporting period, the Company records an adjustment to sales to reflect the mark-to-market of outstanding provisional invoices based on the forward price curve. Because these provisionally priced sales have not yet settled as of the reporting date, the mark-to-market adjustment related to these invoices is included in accounts receivable as of each reporting date.
Gold Resource Corporation
95
At December 31, 2023 and 2022, the Company had an unrealized gain of $0.3 million and $0.6 million, respectively, included in its accounts receivable on the accompanying Consolidated Balance Sheets related to mark-to-market adjustments. Please see Item 8. Financial Statements and Supplementary Data—Note 13. Derivatives for additional information.
Investment in equity securities—Maritime: On September 22, 2022, Gold Resource Corporation invested C$2.4 million (or $1.7 million) in the common shares of Maritime Resources Corp., ticker symbol MAE.V on TSX-V, in a private placement. The 47 million shares purchased represent less than 10% of the issued and outstanding shares of Maritime. As of both December 31, 2023 and 2022, the share price of Maritime was C$0.045.
Investment in equity securities—Green Light Metals: Upon maturity on December 28, 2022, the Company received 12,250,000 private shares of Green Light Metals, which settled the promissory note receivable from Green Light Metals. The shares received represented approximately 28.5% ownership. Management chose to account for this investment using the fair value option; therefore, these securities are carried at fair value. As of December 31, 2023, the value of this equity investment was C$4.9 million (or $3.7 million). The value of the issued shares was determined to be C$0.40 per share, which was based on the significant unobservable input of recent Green Light Metals equity transactions. Through December 31, 2023, there have been no gains or losses on the value of the shares the Company received, other than some foreign exchange gain.
Gains and losses related to changes in the fair value of these financial instruments were included in the Company’s Consolidated Statements of Operations as shown in the following:
|
|
|
For the year ended December 31, |
|
Statements of Operations Classification |
||||
|
|
|
2023 |
|
2022 |
|
|
||
|
Note |
|
|
|
|
|
|
|
|
Realized and unrealized derivative gain (loss), net |
13 |
|
$ |
(28) |
|
$ |
(363) |
|
Sales, net |
Realized gain (loss) on zinc zero cost collar |
16 |
|
$ |
- |
|
$ |
(2,014) |
|
Realized and unrealized loss on zinc zero cost collar |
Unrealized gain on zinc zero cost collar |
16 |
|
$ |
- |
|
$ |
1,844 |
|
Realized and unrealized loss on zinc zero cost collar |
Realized/Unrealized Derivatives, net
The following tables summarize the Company’s realized/unrealized derivatives, net (in thousands):
|
|
|
|
|
|
|
|
|
|
|
|
|
|
|
|
|
|
|
|
|
Gold |
|
Silver |
|
Copper |
|
Lead |
|
Zinc |
|
Total |
||||||
For the year ended December 31, 2023 |
|
|
|
|
|
|
|
|
|
|
|
|
|
|
|
|
|
|
Realized gain (loss) |
|
$ |
295 |
|
$ |
334 |
|
$ |
6 |
|
$ |
174 |
|
$ |
(511) |
|
$ |
298 |
Unrealized (loss) gain |
|
|
(40) |
|
|
(241) |
|
|
4 |
|
|
(186) |
|
|
137 |
|
|
(326) |
Total realized/unrealized derivatives, net |
|
$ |
255 |
|
$ |
93 |
|
$ |
10 |
|
$ |
(12) |
|
$ |
(374) |
|
$ |
(28) |
|
|
|
|
|
|
|
|
|
|
|
|
|
|
|
|
|
|
|
|
|
Gold |
|
Silver |
|
Copper |
|
Lead |
|
Zinc |
|
Total |
||||||
For the year ended December 31, 2022 |
|
|
|
|
|
|
|
|
|
|
|
|
|
|
|
|
|
|
Realized loss |
|
$ |
(79) |
|
$ |
- |
|
$ |
(127) |
|
$ |
(150) |
|
$ |
(364) |
|
$ |
(720) |
Unrealized gain (loss) |
|
|
136 |
|
$ |
433 |
|
$ |
7 |
|
$ |
153 |
|
$ |
(372) |
|
|
357 |
Total realized/unrealized derivatives, net |
|
$ |
57 |
|
$ |
433 |
|
$ |
(120) |
|
$ |
3 |
|
$ |
(736) |
|
$ |
(363) |
Gold Resource Corporation
96
20. Supplementary Cash Flow Information
During the years ended December 31, 2023 and 2022, other operating adjustments and write-downs within the net cash provided by operations on the Consolidated Statements of Cash Flows consisted of the following:
|
|
For the year ended December 31, |
||||
|
|
2023 |
|
2022 |
||
|
|
(in thousands) |
||||
Unrealized gain on gold and silver rounds |
|
$ |
(14) |
|
$ |
(63) |
Unrealized foreign currency exchange (gain) loss |
|
|
(174) |
|
|
1,286 |
Loss on disposition of fixed assets |
|
|
13 |
|
|
408 |
Increase (decrease) in reserve for inventory |
|
|
382 |
|
|
(264) |
Unrealized gain on zinc zero cost collar |
|
|
- |
|
|
(1,844) |
Other |
|
|
384 |
|
|
521 |
Total other operating adjustments |
|
$ |
591 |
|
$ |
44 |
21. Segment Reporting
As of December 31, 2023, the Company has organized its operations into three geographic regions. The geographic regions include Oaxaca, Mexico, Michigan, U.S.A. and Corporate and Other. Oaxaca, Mexico represents the Company’s only production stage property. Michigan, U.S.A. is an advanced exploration stage property. Intercompany revenue and expense amounts have been eliminated within each segment in order to report the net income (loss) on the basis that management uses internally for evaluating segment performance. The Company’s business activities that are not considered production stage or advanced exploration stage properties are included in Corporate and Other.
The following table shows selected information from the Consolidated Balance Sheets relating to the Company’s segments (in thousands):
|
|
Oaxaca, |
|
Michigan, |
|
Corporate |
|
Consolidated |
||||
As of December 31, 2023 |
|
|
|
|
|
|
|
|
|
|
|
|
Total current assets |
|
$ |
25,155 |
|
$ |
116 |
|
$ |
1,224 |
|
$ |
26,495 |
Total non-current assets (1) |
|
|
62,368 |
|
|
93,287 |
|
|
1,736 |
|
|
157,391 |
Total assets |
|
$ |
87,523 |
|
$ |
93,403 |
|
$ |
2,960 |
|
$ |
183,886 |
Total current liabilities |
|
$ |
10,029 |
|
|
59 |
|
|
1,237 |
|
$ |
11,325 |
Total non-current liabilities |
|
|
12,559 |
|
|
62,792 |
|
|
517 |
|
|
75,868 |
Total shareholders' equity |
|
|
64,935 |
|
|
30,552 |
|
|
1,206 |
|
|
96,693 |
Total liabilities and shareholders' equity |
|
$ |
87,523 |
|
$ |
93,403 |
|
$ |
2,960 |
|
$ |
183,886 |
|
|
|
|
|
|
|
|
|
|
|
|
|
As of December 31, 2022 |
|
|
|
|
|
|
|
|
|
|
|
|
Total current assets |
|
$ |
38,032 |
|
$ |
272 |
|
$ |
7,795 |
|
$ |
46,099 |
Total non-current assets (1) |
|
|
69,269 |
|
|
92,927 |
|
|
1,803 |
|
|
163,999 |
Total assets |
|
$ |
107,301 |
|
$ |
93,199 |
|
$ |
9,598 |
|
$ |
210,098 |
Total current liabilities |
|
$ |
20,035 |
|
$ |
3,352 |
|
$ |
1,295 |
|
$ |
24,682 |
Total non-current liabilities |
|
|
11,460 |
|
|
60,648 |
|
|
1,544 |
|
|
73,652 |
Total shareholders' equity |
|
|
75,806 |
|
|
29,199 |
|
|
6,759 |
|
|
111,764 |
Total liabilities and shareholders' equity |
|
$ |
107,301 |
|
$ |
93,199 |
|
$ |
9,598 |
|
$ |
210,098 |
| (1) | In 2023, the total non-current assets included capital investments of $11.0 million in Oaxaca, Mexico, $0.4 million in Michigan, USA, and nil in Corporate and Other. In 2022, the total non-current assets included capital investments of $18.1 million in Oaxaca, Mexico, $0.1 million in Michigan, USA, and nil in Corporate and Other. |
Gold Resource Corporation
97
The following table shows selected information from the Consolidated Statements of Operations relating to the Company’s segments (in thousands):
|
|
Oaxaca, |
|
Michigan, |
|
Corporate |
|
Consolidated |
||||
For the year ended December 31, 2023 |
|
|
|
|
|
|
|
|
|
|
|
|
Sales, net |
|
$ |
97,728 |
|
|
- |
|
|
|
|
$ |
97,728 |
Total mine cost of sales, including depreciation |
|
|
102,913 |
|
|
92 |
|
|
38 |
|
|
103,043 |
Exploration expense |
|
|
4,167 |
|
|
1,642 |
|
|
- |
|
|
5,809 |
Total other costs and expenses, including G&A |
|
|
2,693 |
|
|
529 |
|
|
7,406 |
|
|
10,628 |
Income tax benefit |
|
|
(4,767) |
|
|
(695) |
|
|
(273) |
|
|
(5,735) |
Net loss |
|
$ |
(7,278) |
|
$ |
(1,568) |
|
$ |
(7,171) |
|
$ |
(16,017) |
|
|
|
|
|
|
|
|
|
|
|
|
|
For the year ended December 31, 2022 |
|
|
|
|
|
|
|
|
|
|
|
|
Sales, net |
|
$ |
138,724 |
|
$ |
- |
|
$ |
- |
|
$ |
138,724 |
Total mine cost of sales, including depreciation |
|
|
108,863 |
|
|
75 |
|
|
38 |
|
|
108,976 |
Exploration expense |
|
|
4,244 |
|
|
8,805 |
|
|
- |
|
|
13,049 |
Total other costs and expenses, including G&A |
|
|
2,741 |
|
|
1,415 |
|
|
10,305 |
|
|
14,461 |
Income tax provision (benefit) |
|
|
8,061 |
|
|
(1,123) |
|
|
1,621 |
|
|
8,559 |
Net income (loss) |
|
$ |
14,815 |
|
$ |
(9,172) |
|
$ |
(11,964) |
|
$ |
(6,321) |
Gold Resource Corporation
98
ITEM 9. |
CHANGES IN AND DISAGREEMENTS WITH ACCOUNTANTS ON ACCOUNTING AND FINANCIAL DISCLOSURE |
None.
ITEM 9A.CONTROLS AND PROCEDURES
Evaluation of Disclosure Controls and Procedures
Our disclosure controls and procedures are designed to ensure that information required to be disclosed in the reports that we file under the Securities Exchange Act of 1934, as amended (the "Exchange Act"), is recorded, processed, summarized, and reported within the time periods specified in the rules and forms of the Securities and Exchange Commission, and that such information is accumulated and communicated to our management, including our Chief Executive Officer and Chief Financial Officer, as appropriate, to allow timely decisions regarding required disclosure. The Chief Executive Officer and the Chief Financial Officer, with assistance from management, have evaluated the effectiveness of disclosure controls and procedures as of December 31, 2023. Based on that evaluation, the Chief Executive Officer and the Chief Financial Officer have concluded that our disclosure controls and procedures were effective as of December 31, 2023.
Management's Report on Internal Control over Financial Reporting
Management is responsible for establishing and maintaining adequate internal control over financial reporting and for the assessment of the effectiveness of internal control over financial reporting as defined in Rules 13a-15(f) and 15d-15(f) under the Exchange Act. Because of its inherent limitations, any system of internal control over financial reporting, no matter how well designed, may not prevent or detect misstatements due to the possibility that a control can be circumvented or overridden or that misstatements due to error or fraud may occur that are not detected. Also, because of changes in conditions, internal control effectiveness may vary over time. Management assessed the effectiveness of the Company’s internal control over financial reporting as of December 31, 2023 based on the framework set forth by the Committee of Sponsoring Organizations of the Treadway Commission (“COSO”) in Internal Control-Integrated Framework (2013) and concluded that the Company has maintained effective internal control over financial reporting as of December 31, 2023 based on the COSO criteria.
Changes in Internal Control over Financial Reporting
There have been no changes in our internal control over financial reporting (as defined in Rule 13a-15(f) under the Exchange Act) which occurred during the fourth quarter of our year ended December 31, 2023 that have materially affected, or are reasonably likely to materially affect, our internal control over financial reporting.
ITEM 9B. |
OTHER INFORMATION |
None.
ITEM 9C. |
DISCLOSURE REGARDING FOREIGN JURISDICTIONS THAT PREVENT INSPECTIONS |
None.
Gold Resource Corporation
99
PART III
Item 10. Directors, Executive Officers, and Corporate Governance
The information required by this item is incorporated by reference from the information to be contained in our Proxy Statement for the 2024 Annual Meeting of Shareholders (“2024 Proxy Statement”), which we will file within 120 days after the end of our fiscal year ended December 31, 2023.
We have adopted a code of ethics that applies to all of our employees, including the principal executive officer, principal financial officer, principal accounting officer, and those of our officers performing similar functions. The full text of our code of ethics can be found on the Corporate Governance page on our website. In the event our Board of Directors approves an amendment to or waiver from any provision of our code of ethics, we will disclose the required information pertaining to such amendment or waiver on our website.
Item 11.Executive Compensation
The information required by this item is incorporated by reference from the information to be contained in our 2024 Proxy Statement.
Item 12. |
Security Ownership of Certain Beneficial Owners and Management and Related Stockholder Matters |
The information required by this item is incorporated by reference from the information to be contained in our 2024 Proxy Statement.
Item 13. |
Certain Relationships and Related Transactions, and Director Independence |
The information required by this item is incorporated by reference from the information to be contained in our 2024 Proxy Statement.
Item 14. |
Principal Accounting Fees and Services |
The information required by this item is incorporated by reference from the information to be contained in our 2024 Proxy Statement.
Gold Resource Corporation
100
PART IV
ITEM 15. |
EXHIBITS AND FINANCIAL STATEMENT SCHEDULES |
|
|
The following exhibits are filed with or incorporated by referenced in this report: | |
|
|
Item No. |
Description |
|
|
3.1 |
|
|
|
3.1.1 |
|
|
|
3.1.2 |
|
|
|
3.1.3 |
|
|
|
3.2 |
|
|
|
3.2.1 |
|
|
|
3.2.2 |
|
|
|
4.1 |
|
|
|
10.1 |
|
|
|
10.2 |
|
|
|
10.3 |
|
|
|
10.4 |
|
|
|
Gold Resource Corporation
101
10.5 |
|
|
|
10.6 |
|
|
|
10.7 |
|
|
|
10.8 |
|
|
|
10.9 |
|
|
|
10.10 |
|
|
|
10.11 |
|
|
|
10.12* |
Employment Agreement dated August 2, 2023 between Gold Resource Canada Corporation and Chet Holyoak. |
|
|
10.13 |
|
|
|
10.14 |
|
|
|
10.15 |
|
|
|
21* |
|
|
|
23.1* |
Consent of BDO USA, P.C., Independent Registered Public Accounting Firm. |
|
|
23.2* |
|
|
|
23.3* |
|
|
|
23.4* |
|
|
|
23.5* |
|
|
|
23.6* |
|
|
|
31.1* |
Certification pursuant to Section 302 of the Sarbanes-Oxley Act of 2002 of Chief Executive Officer. |
|
|
Gold Resource Corporation
102
31.2* |
Certification pursuant to Section 302 of the Sarbanes-Oxley Act of 2002 of Chief Financial Officer. |
|
|
32* |
|
96.1 |
|
|
|
96.2* |
Technical Report Summary for the Don David Gold Mine dated December 31, 2023. |
|
|
97.1* |
Policy for Recoupment of Executive Compensation effective July 26, 2023. |
101* |
The following financial statements from the Annual Report on Form 10-K for the year ended December 31, 2023 are furnished herewith, formatted in inline XBRL: (i) the Consolidated Balance Sheets, (ii) the Consolidated Statements of Operations, (iii) the Consolidated Statements of Changes in Shareholders’ Equity, (iv) the Consolidated Statements of Cash Flows, and (v) the Notes to the Consolidated Financial Statements. |
|
|
104 |
Cover Page Interactive Data File (embedded within the XBRL document). |
* |
filed herewith |
ITEM 16. |
FORM 10-K SUMMARY |
None.
SIGNATURES
Pursuant to the requirements of Section 13 or 15(d) of the Securities Exchange Act of 1934, the registrant has duly caused this report to be signed on its behalf by the undersigned, thereunto duly authorized.
|
|
|
GOLD RESOURCE CORPORATION |
|
|
|
|
|
Date: March 27, 2024 |
/s/ Allen Palmiere |
|
By: Allen Palmiere, Chief Executive Officer, |
|
Gold Resource Corporation
103
Pursuant to the requirements of the Securities Exchange Act of 1934, this report has been signed below by the following persons on behalf of the registrant and in the capacities and on the dates indicated.
/s/ Allen Palmiere |
|
Chief Executive Officer, President and Director |
|
March 27, 2024 |
|
Allen Palmiere |
|
(Principal Executive Officer) |
|
|
|
|
|
|
|
|
|
/s/ Chet Holyoak |
|
Chief Financial Officer |
|
March 27, 2024 |
|
Chet Holyoak |
|
(Principal Financial and Accounting Officer) |
|
|
|
|
|
|
|
|
|
/s/ Ron Little |
|
Director |
|
March 27, 2024 |
|
Ron Little |
|
|
|
|
|
|
|
|
|
|
|
/s/ Lila Murphy |
|
Director |
|
March 27, 2024 |
|
Lila Murphy |
|
|
|
|
|
|
|
|
|
|
|
|
|
|
|
|
|
|
|
|
|
|
|
|
|
|
|
|
|
|
|
|
|
|
|
|
|
|
|
|
|
|
|
|
|
|
|
|
|
|
|
|
|
|
|
|
|
|
|
Gold Resource Corporation
104
Exhibit 10.12
EMPLOYMENT AGREEMENT
This Employment Agreement (the “Agreement”) is entered into as of the 2nd day of August, 2023, between Chet Holyoak (the “Executive”) and Gold Resource Corporation, a Colorado Corporation (the “Company”).
WHEREAS the Company desires to retain the services of Executive and Executive desires to render such services to the Company in accordance with the terms, conditions, and provisions of this Agreement.
NOW THEREFORE, in consideration of the mutual covenants contained herein and other valid consideration, the sufficiency of which is acknowledged, the Company and Executive herby agree as follows:
| a. | General. The Company will employ the Executive as its Chief Financial Officer (interim) reporting to the Company’s Chief Executive Officer and the Company’s Board of Directors (the “Board”), and the Executive accepts employment to serve in this capacity, all upon the terms and considerations in this Agreement. The Executive will have those duties and responsibilities that are consistent with the Executive’s position as Chief Financial Officer (interim), as determined by the Chief Executive Officer and the Board. The Company reserves the right, in its sole discretion, to change or modify Executive’s position, title and duties during the term of this Agreement. |
| b. | Devotion to Duties. During the Term, the Executive (i) will devote all of their business time and efforts to the performance of their duties on the Company’s behalf, and (ii) will not at any time or place or to any extent whatsoever, either directly or indirectly, without the express written consent of the Company, engage in any outside employment, or in any activity competitive with or adverse to the Company’s business, practice or affairs, whether alone or as partner, manager, officer, director, employee, shareholder of any corporation or as a trustee, fiduciary, consultant or other representative. This is not intended to prohibit Executive from engaging in nonprofessional activities such as personal investments of conducting to a reasonable extent private business affairs which may include other boards of directors’ activity, as long as they do not conflict with the Company and, in the case of positions on boards or directors or similar bodies, receive the prior written approval of the CEO or the Board. Participation to a reasonable extent in civic, social or community activities is encouraged. Notwithstanding anything herein to the contrary, any non-Company activities will be conducted in compliance with the Company’s corporate governance policies and other policies and procedures as in effect from time to time. |
| a. | Effective Date and Term. Subject to the termination provisions set out in this Agreement, this Agreement will be for an indefinite term (the “Term”) and commencing August 2, 2023 (the “Effective Date”). |
| 3. | Location. The location of the Executive’s principal place of employment will be at the Company’s offices; but the Executive understands that they may be required to travel and perform services outside of this area as reasonable required to properly perform their duties under this Agreement. |
| 4. | Base Salary. The Company will pay Executive an annual base salary (“Base Salary”) in the amount of $240,000, subject to the future modification in accordance with the Company’s executive compensation review policies and practices. The Base Salary will be paid in accordance with the Company’s payroll practices in effect from time to time. |
| a. | Short-term Incentive Compensation. The Executive will be entitled to receive short-term incentive compensation as described below. The Board will establish, after consultation with Executive, bonus terms under which the Executive shall have the opportunity to earn a target bonus based on 40% of base salary (the “Target STIP”). There is protentional to earn a higher amount if Executive materially exceeds defined targets. Unless deferred pursuant to a plan that complies with section 409A of the Internal Revenue Code of 1986, as amended (“Code”), this bonus, if any, will be paid to the Executive no later than two and one-half months following the end of the relevant fiscal year in which the services are performed. |
| b. | Long-term Incentive Compensation. The Executive will be entitled to receive a discretionary long-term equity-based incentive plan based on 80% of base salary (the “Target LTIP). The Target LTIP composition is of Stock Options, RSUs, PSUs and any other long-term equity performance instrument the Board decides to implement at a future date. |
| c. | Clawback. The compensation and benefits provided pursuant to this Agreement may be subject to the company’s compensation recoupment policy or policies (and related Company practices) that may be adopted by the company and in effect from time-to-time, including, but not limited to, any policy or policies that may be adopted in response to applicable law (each, a “Clawback Policy”). By signing this Agreement Executive agrees to fully cooperate with the Company in assuring compliance with such policies and the provisions of applicable law, including, but not limited to, promptly returning any compensation subject to recovery by the Company pursuant to such Clawback Polices and applicable law. |
| a. | Fringe Benefits: Paid Time Off. The Company will provide the Executive with those fringe benefits and other executive benefits on the same terms and conditions as generally available to senior management from time to time (e.g. health and other insurance programs, etc.); provided, however, that the Company reserves the right to amend or terminate any employee or executive benefits plan or program. The Executive is entitled to paid time off (PTO) during each calendar year, with the amount to scheduling of vacation to be determined under the Company’s PTO policies as in effect from time to time. |
| b. | Reimbursement of Expenses. The Executive is entitled to be reimbursed by the Company for reasonable business expenses incurred in performing their duties under the Company’s expense reimbursement policies as in effect from time to time or as otherwise approved by the CEO or the Board. |
| 7. | Termination of Employment During the Term of the Agreement. Upon, and as of, the date of the Executive’s termination of employment with the Company for any reason, the Executive will be deemed to have resigned from all positions then held as an officer or employee of the Company. The Executive’s employment may be terminated during the Term of this Agreement pursuant to the following terms and conditions: |
| a. | Company Terminates Executive’s Employment for Cause. |
| i. | Definition. For purposes of this Agreement, Cause means (A) the Executive’s failure to substantially perform reasonably assigned duties (other than on account of Disability); (B) the Executive is convicted of criminal conduct having the effect of materially adversely affecting the Company, after all rights of appeal have expired or such appeals have been exhausted; (C) the Executive engages in the use of alcohol or narcotics to the extent that the performance of duties is materially impaired; (D) the Executive materially breaches the terms of this Agreement; (E) the Executive engages in willful misconduct that is materially injurious to the Company, other than business decisions made in good faith; or (F) the Executive commits any act or omission not described above that constitutes material and willful misfeasance, malfeasance, fraud or gross negligence in the performance of their duties to the Company. |
| ii. | Effective Date of Termination. The Executive’s employment will terminate immediately upon written notice by the Company to the Executive stating that the Executive’s employment is being terminated for Cause. |
| iii. | Compensation and Benefits. If the Company terminates the Executive’s employment for Cause, the Company will pay the Executive (A) any earned but unpaid Base Salary through the effective date of termination, and (B) any other unpaid benefits to which they have earned under the applicable terms of any applicable plan, program, agreement or arrangement of the company or its affiliates (the amount in (A) and (B) above are referred to elsewhere in this Agreement as “Accrued Amounts”). |
| b. | Company Terminates Executive’s Employment without Cause. |
| i. | Effective Date of Termination. Executives’ employment will terminate |
(A) on the 30th day after the company gives written notice to the Executive stating that Executive’s employment is being terminated without Cause. The Company may, at its discretion, place the Executive on paid administrative leave during all or any part of the notice period.
During the administrative leave, the Company may bar the Executive’s access to its offices or facilities or may provide the Executive with the access subject to such terms and conditions as the Company chooses to impose.
| ii. | Compensation and Benefits. If the Company terminates Executive’s employment without Cause (subject to all of the terms and conditions of this Agreement, including without limitation Section 7(h) and Section 10)), Company will pay or provide Executive the Sum of: |
| 1. | Accrued Amounts: |
| 2. | 12 months of Executive’s then current Base Salary, payable in a lump sum no later than the 60th day following the termination date (unless otherwise delayed under Section 7(h) below), provided that the revocation period set froth in the Release Agreement in Section 7(b)(iii) has expired on or before that date; |
| 3. | To the extent permissible under the terms of the Company’s welfare benefit plans, the continuations of all Company welfare benefits, including medical, dental, vision, life and disability benefits pursuant to plans maintained by the Company under which the Executive and/or the Executive’s family were receiving benefits and/or coverage, or otherwise reimburse Executive for the cost of continuation of state health coverage for the Executive and/or the Executive’s family, for the 12- month period following the date of the Executive’s termination, and the Executive shall pay any portion of such cost as was required to be borne by key executives of the Company generally on the date of termination; provided, however, that, the coverage for any plan subject to COBRA or state continuation of coverage will discontinue if such coverage terminates under Section 4980B of the Code; and |
| iii. | Release Agreement. The Company will not make any payment to the Executive or furnish any benefit under this Section 7(b) unless Executive signs (and does not revoke) a legal release (“Release Agreement”), in the form and substance reasonably requested by the Company. The Release Agreement will require Executive to release the Company, directors, officers, employee, agents, and other affiliates with the Company from any and all claims, including claims related to Executive’s employment with the Company and the termination of Executive’s employment. The Release Agreement must be executed and returned to the Company within the 21- or 45-day (as applicable) period described in the Release Agreement, and it must not be revoked by Executive within the seven-day revocation period described in the Release Agreement. Notwithstanding anything in this Agreement to the contrary, (A) the Company will provide the Release Agreement to the signs (and does not revoke) a legal release (“Release Agreement”), in the form and substance reasonably requested by the Company. The Release Agreement will require Executive to release the Company, directors, officers, employee, agents, and other affiliates with the Company from any and all claims, including claims related to Executive’s employment with the Company and the termination of Executive’s employment. The Release Agreement must be executed and returned to the Company within the 21- or 45-day (as applicable) period described in the Release Agreement, and it must not be revoked by Executive within the seven-day revocation period described in the Release Agreement. Notwithstanding anything in this Agreement to the contrary, (A) the Company will provide the Release Agreement to the |
Executive in a timely manner to comply with the provisions under Code Section 409A, and (B) if the company concludes, in the exercise of its discretion, that the payments due pursuant to this Agreement are subject to Section 409A of the Code, and if the consideration period, plus the revocation period described in the Release Agreement, spans two calendar years, the payments will be made in the second calendar year.
| c. | Executive Voluntarily Resigns. |
| i. | Effective Date of Termination. Executive’s employment will terminate on the 30th day after Executive gives written notice to the Company stating that Executive is resigning employment with the company for any reason, unless the Company waives in writing all or part of this notice period (in which case the termination of employment is effective as of the date of the waiver). |
| ii. | Compensation and Benefits. If the Executive voluntarily resigns, the Company will pay the Executive the Accrued Amount. |
| d. | Disability. |
| i. | Definition. For the purposes of this Agreement, Disability or Disabled means the Executive (A) is unable to engage in any substantial gainful activity by reason of any medically determinable physical or mental impairment that can be expected to result in death or can be expected to last for a continuous period of not lass than 12 months, or (B) is, by reason of medically determinable physical or mental impairment that can be expected to result in death or can be expected to last for a continuous period of not less than 12 months, is receiving income replacement benefits for a period of not less than three months under an accident and health plan covering the Company’s employees. |
| ii. | Effective Date of Termination. Executive’s employment will terminate on the first day the Company makes a determination that the Executive is Disabled. |
| iii. | Compensation and Benefits. Upon a determination that the Executive is Disabled, the company will pay to the Executive a lump sum equal to 6 months of the Executive’s then Base Salary, reduced by any disability insurance maintained by the Company to be received by Executive for 6 months following termination of employment, payable within 30 days following the date of Executive’s termination of employment. |
| e. | Death. |

| i. | Effective Date of Termination. Executive’s employment will terminate immediately upon the Executive’s death. |
| ii. | Compensation and Benefits. If the Executive dies during the Term, the Company will pay the Executive’s designated beneficiary, or estate if there is not designated beneficiary, the Accrued Amounts. Any amounts payable under this Section 7(e)(ii) are in addition to any payments which the Executive’s designated beneficiary or estate may be entitled to |
receive pursuant to any pension plan, profit sharing plan, employee benefit plan, or life insurance policy maintained by the Company.
| f. | Change in Control. |
| i. | Definition. For the purposes of this Agreement, the term Change in Control means (A) the sale of 50% or more of the outstanding voting securities of the Company in a single transaction or series of transaction occurring during a 12-month period; (B) A majority of the members of the board of Directors s replace during any 12-month period by directors whose appointment or elections is not endorsed by a majority f the Company’s Board or Directors prior to the date of the appointment or election; (C) the Company is merged or consolidated with another corporation and as a result of such merger or consolidation less than 50% of the outstanding securities of the surviving or resulting corporation is owned in the aggregate by the shareholders of the Company that existed immediately prior the merger or consolidation; or |
(D) the Company sells more than 40% of the fair market value of its assets to another corporation that is not wholly owned subsidiary of the Company during a 12-month period.
| ii. | Compensation and Benefits. If the Company terminates the Executive’s employment or Executive resigns with Good Reason in connection with or within a period of 12 months following a Change in Control, the Company will pay to Executive 24 months of the Executive’s then current Base Salary plus an amount equal to the greater of actual short-term incentive compensation received or the Executive’s targeted cash bonus for two full fiscal years prior to the Change in Control. For purposes of determining the bonus amount to be included in compensation, the Company shall use the value of all short-term incentive compensation received during the two full fiscal years prior to the change o f control or the current targeted cash bonus amount pursuant to the short-term incentive compensation plane in effect at the time of Change of Control applied to the two full fiscal years prior to the Change in Control. The total compensation pursuant to this section 7(f)(ii) is payable to the Executive in a lump sum no later than the 60th day following the termination date (unless otherwise delayed under Section 7(h) below). For purposes of this Agreement, “Good Reason” means assigning the Executive to any duties that are materially inconsistent with the position as described in Section 1, a reduction of the Executive’s Base Salary without the prior written consent of the Executive, or a relocation of the Executive’s primary job duties to a location more than 50 miles from the location described in Section 3. The foregoing notwithstanding, a condition is not considered “Good Reason” unless (A) Executive gives the Company written notice of such condition within 30 days after the condition comes into existence; (B) |
the Company fails to cure the condition within 30 days after receiving Executive’s written notice; and (C) Executive terminates their employment within 12 months following a Change in Control.
| iii. | Change in Control Payment/Section 280G Limitation. |
| 1. | General Rules. Code Sections 280G and 4999 may place significant tax burdens on both Executive and the Company if the total payments made to Executive dues to certain change in control events described in Code Section 280G (the “Total Change in Control Payments”) equal or exceed the 280G Cap (three times the Executive’s “Base Amount” as defined in Code Section 280G). If the Total Change in Control Payments equal or exceed the 280G Cap, Section 4999 or the Code imposes a 20% excise tax (the “Excise Tax”) on all amounts in excess of one time Executive’s Base Period Income Amount. The Excise Tax is imposed on Executive, rather than the Company, and will be withheld by the Company from any amounts payable to Executive pursuant to this Agreement. In determining whether the Total Change in Control Payments will exceed the 280G Cap and result in an Excise Tax becoming due, and for the purposes of calculating the 280G Cap itself, the provisions of Code Sections 280G and 4999 and the applicable regulations will control over the general provisions of this Section 7(f)(iii). |
| 2. | Limitation on Payments. Subject to the “best net” exception descried in Section 7(f)(iii)(3) below, in order to avoid the imposition of the Excise Tax, the total payments to which Executive is entitled under this Agreement or otherwise will be reduced to the extent necessary to avoid exceeding the 280G Cap minus $1.00. |
| 3. | “Best Net” Exception. If Executive’s Total Change in Control Payments minus the Excise Tax payable on all such payments exceeds the 280G Cap minus $1.00, then the total payment to which the Executive is entitled under this Agreement or otherwise will not be reduced pursuant to Section 7(f)(iii)(2). If the “best net” exception applies, Executive shall be responsible for paying any Excise Tax (and income or other taxes) that may be imposed on Executive pursuant to Code Section 4999 or otherwise. |
| 4. | Calculating the 280G Cap. If the Company believes that the provisions of Section 7(f)(iii)(2) may apply to reduce the total payments to which the Executive is entitled under this Agreement or otherwise, it will notify Executive as soon as possible. The Company then will engage a “Consultant” (a law firm, a certified public accounting firm, and/or a firm of |
recognized executive compensation consultants) to make any necessary determinations and to perform any necessary calculations required in order to implement the rules set forth in this Section 7(f)(iii). The Consultant shall provide detailed supporting calculations to both the Company and Executive and all fees and expenses of the Consultant shall be borne by the Company. If the Consultant determines that the limitations of Section 7(f)(iii)(2) apply, then the total payments to which the Executive is entitled under this Agreement or otherwise will be reduced to the extent necessary to eliminate the amount in excess of the 280G Cap. Such payments will be made at the times specified herein, in the maximum amount that may be paid without exceeding the 280G Cap. The balance, if any, will then be paid, if due, after the opinions called for by Section 7(f)(iii)(4) have been received. If the amount paid to the Executive by the Company is ultimately determined by the Internal Revenue Service to have exceeded the limitations of Section 7(f)(ii)(2), the Executive must repay the excess promptly on demand of the Company. If it is ultimately determined by the Consultant or the Internal Revenue Service that a greater payment should have been made to the Executive, the Company shall pay Executive the amount of the deficiency within 30 days of such determination. As a general rule, the Consultant’s determination shall be binding on the Executive and the Company. Section 280G and the Excise Tax rules of Section 4999, however, are complex and uncertain and, as a result, the Internal Revenue Service may disagree wit the Consultant’s conclusions. If the Internal Revenue Service determines that the 280G Cap is actually lower than calculated by the Consultant, the 280G Cap will be recalculated by the consultant. Any payment in excess of the revised 280G Cap then will be repaid by the Executive to the Company. If the Internal Revenue Service determines that the actual 280G Cap exceeds the amount calculated by the consultant, the Company shall pay the Executive any shortage. The Company has the right to challenge any determinations made by the Internal Revenue Service. If the Company agrees to indemnify the Executive from any taxes, interest and penalties that may be imposed on the Executive in connection with such a challenge, then the Executive must cooperate fully with the Company. The Company shall bear all costs associated with the challenge of any determination made by the Internal Revenue Service and the Company shall control all such challenges. The Executive must notify the Company in writing of any claim or determination by the Internal Revenue Service that, if upheld, would result in the payment of Excise Taxes.
Such notice shall be given as soon as possible but in no event later than 15 days following the Executive’s receipt of the notice of the Internal Revenue Service’s position.
| 5. | Effect of Repeal. If the provisions of Code Sections 280G and 4999 are repealed without succession, this Section 7(f)(ii) will not apply. In addition, if this provision does not apply to the Executive for whatever reason (e.g., because Executive is not a “disqualified individual” for purposes of Code Section 280G), this Section will not apply. |
| g. | Leave of Absence. At the Company’s sole discretion, Executive may be placed on a paid administrative leave of absence for a reasonable period of time (not to exceed 60 days unless otherwise reasonably required to resolve matters under investigation) should the Board believe it necessary for any reason, including, but not limited to confirm that reasonable grounds exist for a termination for Cause, for example pending the outcome of any internal or other investigation or any criminal charges. Durning this leave, the Company may bar Executive’s access to the Company’s or any affiliate’s offices or facilities or may provide Executive with access subject to terms and conditions as the Company choses to impose. |
| h. | Compliance with Code Section 409A. Any payment under this Section 7 is subject to the provisions of this Section 7(h) (except for a payment pursuant to Disability or death under Section 7(d) or (e)). If Executive is a "Specified Employee" of the Company for purposes of Code Section 409A at the time of a payment event in Section 7(b) and if no exception from Code Section 409A applies in whole or in part, the severance or other payments will be made to Executive by the Company on the first day of the seventh month following the date of the Executive's Separation from Service (the "409A Payment Date"). Should this Section 7(h) result in a delay of payments to Executive, the Company will begin to make the payments as described in this Section 7, provided that any amounts that would have been payable earlier but for the application of this Section 7(h)_ will be paid in lump-sum on the 409A Payment Date along with accrued interest at the rate of interest announced by the Company's primary bank from time to time as its prime rate from the date that payments would otherwise have been made under this Agreement. The balance of the severance payments will be payable in accordance with regular payroll timing and the COBRA premiums will be paid monthly. For purposes of the provision, the term Specified Employee has the meaning in Code Section 409A(a)(2)(B)(i), or any successor provision and the issued treasury regulations and rulings. "Separation from Service" or "Termination of Employment" means, with respect to any payment that is subject to Code Section 409A, either |
| (a) | termination of Executive's employment with Company and all affiliates, or |
| i. | Mitigation/Offset. The Executive is under no obligation to seek other Employment or to otherwise mitigate the obligations of the Company under this Agreement, and the Company may not offset against amounts or benefits due Executive under this Agreement or otherwise on account of any claim (other than any preexisting debts then due in accordance with their terms) the Company or its affiliates may have against the Executive or any remuneration or other benefit earned or received by the Executive after such termination. |
| 8. | Executive’s Post-Termination Obligations. |
| a. | Ownership of Work, Materials and Documents. The Executive will disclose promptly to the Company any and all inventions, discoveries, and improvements (whether or not patentable or registrable under copyright or similar statutes), and all patentable or copyrightable works, initiated, conceived, discovered, reduced to practice, or made by the Executive, either alone or in conjunction with others, during the Executive's employment with the Company and related to the business or activities of the Company and its affiliates (the "Developments"). Except to the extent any rights in any Developments constitute a work made for hire under the U.S. Copyright Act, which the patties acknowledge are owned by the Company and/or its applicable affiliate, the Executive assigns all of her right, title and interest in all Developments (including all intellectual prope1ty rights) to the Company or its nominee without further compensation, including all rights or benefits, including, without limitation, the right to sue and recover for past and future infringement. Whenever requested by the Company, the Executive will execute any and all applications, assignments or other instruments which the Company deems |
necessary to apply for and obtain trademarks, patents or copyrights of the United States or any foreign country or otherwise protect its interests. These obligations continue beyond the end of the Executive's employment with the Company with respect to inventions, discoveries, improvements, or copyrightable works initiated, conceived, or made by the Executive while employed by the Company, and are binding upon the Executive's employers, assigns, executors, administrators and other legal representatives. If the Company is unable for any reason, after reasonable effort, to obtain the Executive's signature on any document needed in connection with the actions described in this Section 8(a). the Executive irrevocably designates and appoints the Company and its duly authorized officers and agents as the Executive's agent and attorney in fact to act for and in the Executive's behalf to execute, verify and file any such documents and to do all other lawfully permitted acts to further the purposes of this Section 8(a) with the same legal force and effect as if executed by the Executive. Immediately upon the Company's request at any time during or following the Term, Executive is required to return to the Company any and all Confidential and Proprietary Information and any other property of the Company then within Executive's possession, custody and/or control. Failure to return this property, whether during the term of this Agreement or after its termination, is a breach of this Agreement.
| b. | Interest to be Protected. During the course of the Executive’s employment, Executive will be exposed to a substantial amount of confidential and proprietary information, including, but not limited to, financial information, annual reports, audited and unaudited financial reports, operational budgets and strategies, methods of operation, customer lists, strategic plans, business plans, marketing plans and strategies, new business strategies, merger and acquisition strategies, management systems programs, computer systems, personnel and compensation information and payroll data, and other such reports, documents or information (collectively the "Confidential and Proprietary Information"). Due to Executive's senior position with the Company and its affiliates, Executive acknowledges that they regularly receive Confidential and Proprietary Info1mation with respect to the Company and/or its affiliates; for the avoidance of doubt, all such information is expressly included in the defined term "Confidential and Proprietary Information." If Executive's employment is terminated by either party for any reason, Executive promises that Executive will not retain, take with Executive or make any copies of such Confidential and Proprietary Information in any form, format, or manner whatsoever (including paper, digital or other storage in any form) nor will Executive disclose the same in whole or in part to any person or entity, in any manner either directly or indirectly. Excluded from this Agreement is information that |
(i) is or becomes publicly known through no violation of this Agreement; (ii) is lawfully received by the Executive from any third party without restriction on disclosure or use; (iii) is required to be disclosed by law, or (iv) is expressly approved in writing by the Company for release or other use by the Executive.
Executive and the Company also acknowledge that because Executive is a senior executive will have access to information (some of which is Confidential Information and some of which is not), employees and knowledge about the Company that is extremely valuable to the Company and which it needs to protect for a period of time after Executive terminates employment. Additionally, they agree that the covenants in this Section 8 are reasonable and necessary to protect the Company's legitimate business interests. The Executive and the Company agree that the following restrictive covenants (which together are referred to as the "Executive's Post-Termination Obligations") are fair and reasonable and are freely, voluntarily, and knowingly entered into. Further, each party has been given the opportunity to consult with legal counsel before entering into this Agreement.
| c. | Judicial Amendment. If the scope of any provision of Section 8 of this Agreement is found by a court to be too broad to permit enforcement to its full extent, then that provision will be enforced to the maximum extent permitted by law. The parties agree that, if legally permissible, the scope of any provision of this Agreement may be modified by a judge in any proceeding to enforce Section 8 of this Agreement, so that the provision can be enforced to the maximum extent permitted by law. If any provision of this Agreement is found to be invalid or unenforceable for any reason, the parties agree that it will not affect the validity and enforceability of the remaining provisions of this Agreement. |
| d. | Injunctive Relief, Damages and Forfeiture. Due to the nature of the Executive's position with the Company, and with full realization that a violation of Section 8 may cause immediate and irreparable injury and damage, which is not readily measurable, and to protect the parties' interests, the parties understand and agree that in addition to instituting arbitration proceedings pursuant to Section 10 to recover damages resulting from a breach of this Agreement, either party may also seek injunctive relief to enforce this Agreement in a court of competent jurisdiction to cease or prevent any actual or threatened violation of this Agreement. In any action brought pursuant to this Section 8(d). the prevailing party will be entitled to an award of attorney's fees and costs. |
| e. | Survival. The provisions of this Section 8 survive the termination of this Agreement. |
| f. | Cooperation: No Disparagement. Durning the Period of Executive’s Post- Termination Obligations, Executive agrees to provide reasonable assistance to the Company (including assistance with litigation matters), upon the Company's request, concerning the Executive's previous employment responsibilities and functions with the Company. In consideration for such cooperation, but only if the Executive is not receiving severance pursuant to |
Section 7, Company will compensate Executive for the time Executive spends on such cooperative effo1ts (at an hourly rate based on Executive's Base Salary during the year preceding the date of termination) and Company will reimburse Executive for her reasonable out-of-pocket expenses Executive incurs in connection with such cooperative efforts. Additionally, at all times after the Executive's employment with the Company has terminated, Company (defined for this purpose only as any Company press release and the Board, the CEO and the CEO's direct reports, and no other employees) and Executive agree to refrain from making any disparaging or derogato1y remarks, statements and/or publications regarding the other, its employees or its services.
| 9. | General Provisions |
| a. | Severability. If any provision of this Agreement is held to be illegal, invalid, or unenforceable under any applicable law, then, if legally permissible, such provision will be deemed to be modified to the extent necessary to render it legal, valid and enforceable, and if no modification will make the provision legal, valid and enforceable, then this Agreement will be construed as if not containing the provision held to be invalid, and the rights and obligations of the parties will be construed and enforced accordingly. |
| b. | Assignment by Company. Nothing in this Agreement precludes the Company from consolidating or merging into or with or transferring all or substantially all of its assets to, another corporation or entity that assumes this Agreement and all obligations and undertakings hereunder. Upon any consolidation, merger or transfer of assets and assumption, the term "Company" means any other corporation or entity, as appropriate, and this Agreement will continue in full force and effect. |
| c. | Entire Agreement. This Agreement and any agreements concerning equity compensation or other benefits, embody the parties' complete agreement with respect to the subject matter in this Agreement and supersede any prior written or contemporaneous oral, understandings or agreements between the parties that may have related in any way to the subject matter in this Agreement, including but not limited to any offer letter provided to or signed by Executive. This Agreement may be amended only in writing executed by the Company and Executive. |
| d. | Governing Law. Because the Company is a Colorado corporation, and because it is mutually agreed that it is in the best interests of the Company and all of its employees that a uniform body of law consistently interpreted be applied to the employment agreements to which the Company is a party, this Agreement will be deemed entered into by the Company and Executive in Colorado. The law of the State of Colorado will govern the interpretation and application of all of the provisions of this Agreement. |
| e. | Notice. Any notice required or permitted under this Agreement must be in writing and will be deemed to have been given when delivered personally or by overnight courier service or three days after being sent by mail, postage prepaid, |


at the address indicated below or to such changed address as such person may subsequently give such notice of:
if to the Company:Gold Resource Corporation
7900 E Union Ave. Suite 320
Denver, CO 80222
Attention: Chief Executive Officer
if to Executive: |
Chet Holyoak Address on File |
| f. | Withholding: Release. All of the Executive’s compensation under this Agreement will be subject to deduction and withholding authorized or required by applicable law. The Company's obligation to make any post-termination payments hereunder (other than salary payments and expense reimbursements through a date of termination), is subject to Company receiving from Executive a mutually agreeable release, and compliance by Executive with the covenants set forth in Section 8 above. |
| g. | Non-Waiver: Construction: Counterparts. The failure in any one or more instances of a party to insist upon performance of any of the terms, covenants or conditions of this Agreement, to exercise any right or privilege conferred in this Agreement, or the waiver by that party of any breach of any of the terms, covenants or conditions of this Agreement, will not be construed as a subsequent waiver of any such terms, covenants, conditions, rights or privileges, but the waiver will continue and remain in full force and effect as if no such forbearance or waiver had occurred. No waiver is effective unless it is in writing and signed by an authorized representative of the waiving party. This Agreement will be construed fairly as to both parties and not in favor of, or against, either party, regardless of which party prepared the Agreement. This Agreement may be executed in multiple counterparts, each of which will be deemed to be an original, and all such counterparts will constitute but one instrument. |
| h. | Successors and Assigns. This Agreement is solely for the benefit of the parties and their respective successors, assigns, heirs and legatees. Nothing in this Agreement will be construed to provide any right to any other entity or individual. |
| i. | Indemnification. The company agrees to indemnify the Executive to the fullest extent provided under the Company's limited liability company agreement and By-Laws, on the same terms and conditions as indemnification is generally provided to the Company's officers and directors, in the event that the Executive was or is a party or is threatened to be made a party to any threatened, pending or completed action, suit or proceeding, by reason of the fact that the Executive |


is or was a director, officer, employee or agent of the Company or any of its affiliates; provided, however, that the Executive is not entitled to indemnification under this Section 8(i) relating to any claims, actions, suits or proceedings arising from her breach of this Agreement.
| 10. | Dispute Resolution. Any dispute, controversy, or claim, whether contractual or non- contractual, including without limitation any federal or state statutory claim, common law or tort claim, or claim for attorneys' fees, between the parties arising directly or indirectly out of or connected with this Agreement and/or the parties' employment relationship, unless mutually settled by the parties hereto, must be resolved by binding arbitration conducted pursuant to the Federal Arbitration Act and in accordance with the Employment Arbitration Rules of the American Arbitration Association (the "AAA") in effect at the time. The parties agree that before proceeding to arbitration, they will mediate their dispute(s) before a mutually selected mediator. If the parties are unable to mutually select a mediator within thirty (30) days (or as otherwise agreed), then either party may request the AAA's assistance in appointing a mediator. Any arbitration will be conducted by an arbitrator mutually selected by the parties. If the parties are unable to mutually select an arbitrator within thirty (30) days (or as otherwise agreed), then either party may request the AAA's assistance in selecting an arbitrator. All such disputes, controversies or claims will be conducted by a single arbitrator, unless the pa1ties mutually agree that the arbitration will be conducted by a panel of three arbitrators. The arbitration shall be conducted pursuant to the Employment Arbitration Rules of the AAA in effect at the time, or as otherwise agreed. The arbitrator(s) may award any relief available in a court of competent jurisdiction. The resolution of the dispute by the arbitrator(s) will be final, binding, non-appealable (except as provided by the Federal Arbitration Act) and fully enforceable by a court of competent jurisdiction pursuant to the Federal Arbitration Act. The arbitration award will. be in writing and will include a statement of the reasons for the award. The arbitration will be held at the principal place of employment of the Executive, or as otherwise agreed to by the parties. The Company will initially pay all AAA, mediation, and arbitrator's fees and costs. The arbitrator(s) may award reasonable attorneys' fees and/or costs to the prevailing party. The Company and the Executive agree that each may bring claims against the other in an individual capacity only, and not as a class representative or class member in any purported collective, class or representative proceeding. Further, unless both the Company and the Executive agree otherwise, the Arbitrator may not consolidate more than one party's claims into a single arbitration proceeding and may not otherwise preside over any form of a collective, class or representative proceeding. |
[SIGNATURE PAGE FOLLOWS]
IN WITNESS WHEROF, the parties have executed and delivered this Agreement as of the date first above written.
GOLD RESOURCE CORPORATION, a
Colorado corporation
By: [s] Allen Palmiere
Name: Allen Palmiere
Title: President and Chief Executive Officer
EXECUTIVE
By: [s] Chet Holyoak
Name: Chet Holyoak
Exhibit 21
Gold Resource Corporation and Subsidiaries
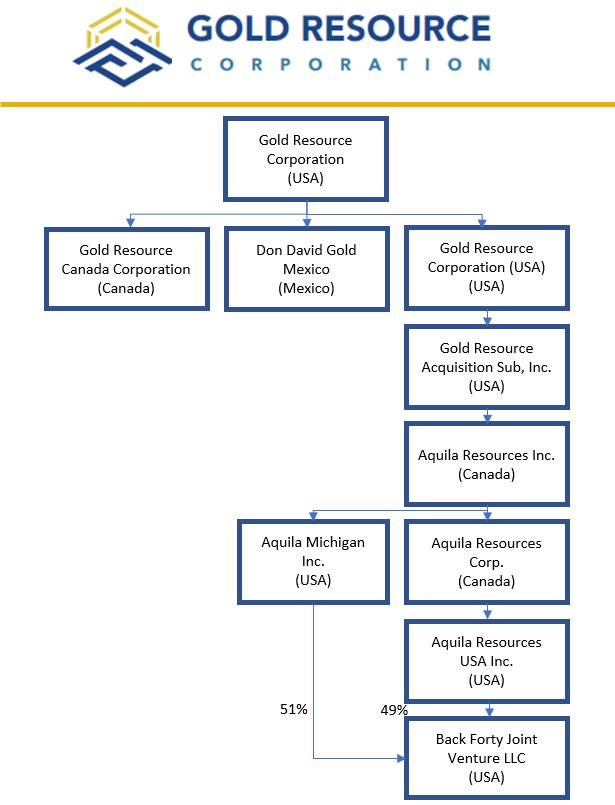
Exhibit 23.1
Consent of Independent Registered Public Accounting Firm
We hereby consent to the incorporation by reference in the Registration Statements on Form S-3 (No. 333-271913) and Form S-8 (No. 333-214958 and 333-171779) of Gold Resource Corporation of our report dated March 27, 2024, relating to the consolidated financial statements, which appears in this Annual Report on Form 10-K.
/s/ BDO USA, P.C.
Spokane, Washington
March 27, 2024
Exhibit 23.2
CONSENT OF QUALIFIED PERSON
I, David Turner, P. Geo., in connection with the Annual Report on Form 10-K for the year ended December 31, 2023 and any amendments or supplements and/or exhibits thereto (collectively, the Form 10-K), consent to:
| ● | the filing and use of the Technical Report Summary for the Don David Gold Mine with an effective date of December 31, 2023, as an exhibit to the Form 10-K; |
| ● | the use of and references to my name, including my status as an expert or “qualified person” (as defined in Subpart 1300 of Regulation S-K promulgated by the U.S. Securities and Exchange Commission), in connection with the Form 10-K and the Technical Report Summary; and |
| ● | the use of information derived, summarized, quoted, or referenced from the Technical Report Summary, or portions thereof, that was prepared by me, that I supervised the preparation of and/or that was reviewed and approved by me, that is included or incorporated by reference in the Form 10-K. |
I am the qualified person responsible for authoring the following sections of the Technical Report Summary: 1, 3, 5, 6, 7, 8, 9, 20, 21, 22, and 23.
I also consent to the incorporation by reference of the above items in the registration statements of Gold Resource Corporation filed on Form S-3 (No. 333-235312) and Form S-8 (Nos. 333-214958 and 333-171779).
Dated March 27, 2024
By: |
/s/ David Turner |
Name: |
David Turner, P. Geo. |
Title: |
Director of Geology |
Exhibit 23.3
CONSENT OF QUALIFIED PERSON
I, Rodrigo Simidu, in connection with the Annual Report on Form 10-K for the year ended December 31, 2023 and any amendments or supplements and/or exhibits thereto (collectively, the Form 10-K), consent to:
| ● | the filing and use of the Technical Report Summary for the Don David Gold Mine with an effective date of December 31, 2023, as an exhibit to the Form 10-K; |
| ● | the use of and references to my name, including my status as an expert or “qualified person” (as defined in Subpart 1300 of Regulation S-K promulgated by the U.S. Securities and Exchange Commission), in connection with the Form 10-K and the Technical Report Summary; and |
| ● | the use of information derived, summarized, quoted, or referenced from the Technical Report Summary, or portions thereof, that was prepared by me, that I supervised the preparation of and/or that was reviewed and approved by me, that is included or incorporated by reference in the Form 10-K. |
I am the qualified person responsible for authoring the following sections of the Technical Report Summary: 1, 4, 5, 12, 13, 15, 16, 17, 22, and 23.
I also consent to the incorporation by reference of the above items in the registration statements of Gold Resource Corporation filed on Form S-3 (No. 333-235312) and Form S-8 (Nos. 333-214958 and 333-171779).
Dated March 27, 2024
By: |
/s/ Rodrigo Simidu |
Name: |
Rodrigo Simidu, P.Eng. |
Title: |
Principal Mining Engineer |
Exhibit 23.4
CONSENT OF QUALIFIED PERSON
I, Marcelo Zangrandi, in connection with the Annual Report on Form 10-K for the year ended December 31, 2023 and any amendments or supplements and/or exhibits thereto (collectively, the Form 10-K), consent to:
| ● | the filing and use of the Technical Report Summary for the Don David Gold Mine with an effective date of December 31, 2023, as an exhibit to the Form 10-K; |
| ● | the use of and references to my name, including my status as an expert or “qualified person” (as defined in Subpart 1300 of Regulation S-K promulgated by the U.S. Securities and Exchange Commission), in connection with the Form 10-K and the Technical Report Summary; and |
| ● | the use of information derived, summarized, quoted, or referenced from the Technical Report Summary, or portions thereof, that was prepared by me, that I supervised the preparation of and/or that was reviewed and approved by me, that is included or incorporated by reference in the Form 10-K. |
I am the qualified person responsible for authoring the following sections of the Technical Report Summary: 1, 8, 9, 11, 22, and 23.
I also consent to the incorporation by reference of the above items in the registration statements of Gold Resource Corporation filed on Form S-3 (No. 333-235312) and Form S-8 (Nos. 333-214958 and 333-171779).
Dated March 27, 2024
By: |
/s/ AMBA Consultoria do Brasil Ltda. |
/s/ Marcelo Zangrandi |
|
Name: |
AMBA Consultoria do Brasil Ltda. |
Marcelo Zangrandi, AIG Member |
|
Title: |
|
B.Geologist |
|
Exhibit 23.5
CONSENT OF QUALIFIED PERSON
I, Patrick Frenette, P. Eng., in connection with the Annual Report on Form 10-K for the year ended December 31, 2023 and any amendments or supplements and/or exhibits thereto (collectively, the Form 10-K), consent to:
| ● | the filing and use of the Technical Report Summary for the Don David Gold Mine with an effective date of December 31, 2023, as an exhibit to the Form 10-K; |
| ● | the use of and references to my name, including my status as an expert or “qualified person” (as defined in Subpart 1300 of Regulation S-K promulgated by the U.S. Securities and Exchange Commission), in connection with the Form 10-K and the Technical Report Summary; and |
| ● | the use of information derived, summarized, quoted, or referenced from the Technical Report Summary, or portions thereof, that was prepared by me, that I supervised the preparation of and/or that was reviewed and approved by me, that is included or incorporated by reference in the Form 10-K. |
I am the qualified person responsible for authoring the following sections of the Technical Report Summary: 1, 2, 18, 19, 22, 23, 24, and 25.
I also consent to the incorporation by reference of the above items in the registration statements of Gold Resource Corporation filed on Form S-3 (No. 333-235312) and Form S-8 (Nos. 333-214958 and 333-171779).
Dated March 27, 2024
By: |
/s/ Patrick Frenette |
Name: |
Patrick Frenette, P. Eng. |
Title: |
VP Technical Services |
Exhibit 23.6
CONSENT OF QUALIFIED PERSON
I, Christian Laroche, P. Eng., in connection with the Annual Report on Form 10-K for the year ended December 31, 2023 and any amendments or supplements and/or exhibits thereto (collectively, the Form 10-K), consent to:
| ● | the filing and use of the Technical Report Summary for the Don David Gold Mine with an effective date of December 31, 2023, as an exhibit to the Form 10-K; |
| ● | the use of and references to my name, including my status as an expert or “qualified person” (as defined in Subpart 1300 of Regulation S-K promulgated by the U.S. Securities and Exchange Commission), in connection with the Form 10-K and the Technical Report Summary; and |
| ● | the use of information derived, summarized, quoted, or referenced from the Technical Report Summary, or portions thereof, that was prepared by me, that I supervised the preparation of and/or that was reviewed and approved by me, that is included or incorporated by reference in the Form 10-K. |
I am the qualified person responsible for authoring the following sections of the Technical Report Summary: 1, 10, 14, 22, and 23.
I also consent to the incorporation by reference of the above items in the registration statements of Gold Resource Corporation filed on Form S-3 (No. 333-235312) and Form S-8 (Nos. 333-214958 and 333-171779).
Dated March 27, 2024
By: |
/s/ Christian Laroche |
Name: |
Christian Laroche, P. Eng. |
Title: |
Metallurgist |
Exhibit 31.1
CERTIFICATION
PURSUANT TO SECTION 302 OF THE SARBANES-OXLEY ACT OF 2002
I, Allen Palmiere, certify that:
1. I have reviewed this Form 10-K of Gold Resource Corporation;
2. Based on my knowledge, this report does not contain any untrue statement of a material fact or omit to state a material fact necessary to make the statements made, in light of the circumstances under which such statements were made, not misleading with respect to the period covered by this report;
3. Based on my knowledge, the financial statements, and other financial information included in this report, fairly present in all material respects the financial condition, results of operations and cash flows of the registrant as of, and for, the periods presented in this report;
4. The registrant’s other certifying officer(s) and I are responsible for establishing and maintaining disclosure controls and procedures (as defined in Exchange Act Rules 13a-15(e) and 15d-15(e)) and internal control over financial reporting (as defined in Exchange Act Rules 13a-15(f) and 15d-15(f)) for the registrant and have:
a. Designed such disclosure controls and procedures, or caused such disclosure controls and procedures to be designed under our supervision, to ensure that material information relating to the registrant, including its consolidated subsidiaries, is made known to us by others within those entities, particularly during the period in which this report is being prepared;
b. Designed such internal control over financial reporting, or caused such internal control over financial reporting to be designed under our supervision, to provide reasonable assurance regarding the reliability of financial reporting and the preparation of financial statements for external purposes in accordance with generally accepted accounting principles;
c. Evaluated the effectiveness of the registrant’s disclosure controls and procedures and presented in this report our conclusions about the effectiveness of the disclosure controls and procedures, as of the end of the period covered by this report based on such evaluation; and
d. Disclosed in this report any change in the registrant’s internal control over financial reporting that occurred during the registrant’s most recent fiscal quarter (the registrant’s fourth fiscal quarter in the case of an annual report) that has materially affected, or is reasonably likely to materially affect, the registrant’s internal control over financial reporting; and
5. The registrant’s other certifying officer(s) and I have disclosed, based on our most recent evaluation of internal control over financial reporting, to the registrant’s auditors and the audit committee of the registrant’s board of directors (or persons performing the equivalent functions):
a. All significant deficiencies and material weaknesses in the design or operation of internal control over financial reporting which are reasonably likely to adversely affect the registrant’s ability to record, process, summarize and report financial information; and
b. Any fraud, whether or not material, that involves management or other employees who have a significant role in the registrant’s internal control over financial reporting.
|
|
Date: March 27, 2024 |
/s/ Allen Palmiere |
Allen Palmiere |
Chief Executive Officer, President and Director I, Chet Holyoak, certify that:
(Principal Executive Officer)
Exhibit 31.2
CERTIFICATION
PURSUANT TO SECTION 302 OF THE SARBANES-OXLEY ACT OF 2002
1. I have reviewed this Form 10-K of Gold Resource Corporation;
2. Based on my knowledge, this report does not contain any untrue statement of a material fact or omit to state a material fact necessary to make the statements made, in light of the circumstances under which such statements were made, not misleading with respect to the period covered by this report;
3. Based on my knowledge, the financial statements, and other financial information included in this report, fairly present in all material respects the financial condition, results of operations and cash flows of the registrant as of, and for, the periods presented in this report;
4. The registrant’s other certifying officer(s) and I are responsible for establishing and maintaining disclosure controls and procedures (as defined in Exchange Act Rules 13a-15(e) and 15d-15(e)) and internal control over financial reporting (as defined in Exchange Act Rules 13a-15(f) and 15d-15(f)) for the registrant and have:
a. Designed such disclosure controls and procedures, or caused such disclosure controls and procedures to be designed under our supervision, to ensure that material information relating to the registrant, including its consolidated subsidiaries, is made known to us by others within those entities, particularly during the period in which this report is being prepared;
b. Designed such internal control over financial reporting, or caused such internal control over financial reporting to be designed under our supervision, to provide reasonable assurance regarding the reliability of financial reporting and the preparation of financial statements for external purposes in accordance with generally accepted accounting principles;
c. Evaluated the effectiveness of the registrant’s disclosure controls and procedures and presented in this report our conclusions about the effectiveness of the disclosure controls and procedures, as of the end of the period covered by this report based on such evaluation; and
d. Disclosed in this report any change in the registrant’s internal control over financial reporting that occurred during the registrant’s most recent fiscal quarter (the registrant’s fourth fiscal quarter in the case of an annual report) that has materially affected, or is reasonably likely to materially affect, the registrant’s internal control over financial reporting; and
5. The registrant’s other certifying officer(s) and I have disclosed, based on our most recent evaluation of internal control over financial reporting, to the registrant’s auditors and the audit committee of the registrant’s board of directors (or persons performing the equivalent functions):
a. All significant deficiencies and material weaknesses in the design or operation of internal control over financial reporting which could adversely affect the registrant’s ability to record, process, summarize and report financial information; and
b. Any fraud, whether or not material, that involves management or other employees who have a significant role in the registrant’s internal control over financial reporting.
|
Date: March 27, 2024 |
/s/ Chet Holyoak |
Chet Holyoak |
Chief Financial Officer
(Principal Financial and Accounting Officer)
Exhibit 32
CERTIFICATION
PURSUANT TO SECTION 906 OF THE SARBANES-OXLEY ACT OF 2002
I, Allen Palmiere, Chief Executive Officer, President and Director, and I, Chet Holyoak, Chief Financial Officer of Gold Resource Corporation (the “Company”) certify that:
1. The Report complies fully with the requirements of Section 13(e) or 15(d) of the Securities Exchange Act of 1934; and
2. Based on my knowledge, the financial statements, and other financial information included in this annual report, fairly present in all material respects the financial condition, results of operations and cash flows of the Company as of, and for, the period presented in this amended annual report.
|
|
Date: March 27, 2024 |
|
/s/ Allen Palmiere |
Allen Palmiere |
|
Chief Executive Officer, President and Director (Principal Executive Officer) |
|
Date: March 27, 2024 |
|
/s/ Chet Holyoak |
Chet Holyoak |
Chief Financial Officer
(Principal Financial and Accounting Officer)
S-K 1300 Technical Report Summary on the
Don David Gold Mine Project, Oaxaca, Mexico
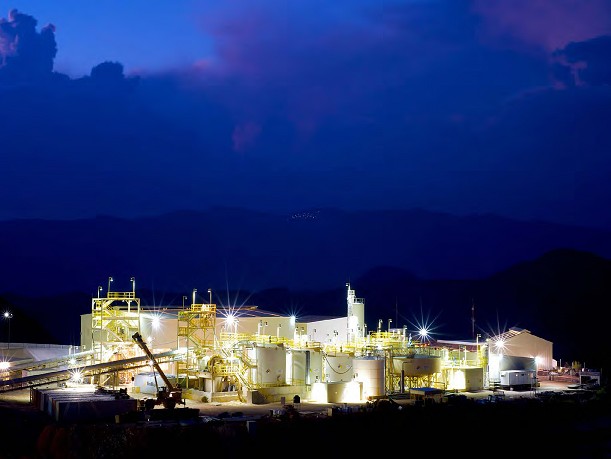
|
Report prepared for: |
|
Report Date: |
GOLD RESOURCE CORPORATION |
|
March 27, 2024 |
|
|
|
|
Report prepared by: |
|
Effective Date: |
Rodrigo Simidu, P. Eng. |
|
December 31, 2023 |
|
Marcelo Zangrandi, P. Geo Patrick Frenette, P. Eng. Christian Laroche, P. Eng. |
|
|
David Turner, P. Geo |
|
|
|
|
|
|
|
|
Page No |
|---|---|---|---|
Executive Summary |
1 |
||
|
1 |
||
|
1 |
||
|
3 |
||
|
4 |
||
|
4 |
||
|
4 |
||
|
5 |
||
|
6 |
||
|
6 |
||
|
7 |
||
|
8 |
||
|
9 |
||
|
10 |
||
|
10 |
||
|
11 |
||
|
11 |
||
|
11 |
||
|
11 |
||
|
12 |
||
|
12 |
||
13 |
|||
|
13 |
||
|
13 |
||
|
13 |
||
|
13 |
||
|
14 |
||
15 |
|||
|
15 |
||
|
18 |
||
|
18 |
||
|
19 |
||
|
19 |
||
|
19 |
||
|
19 |
||
Accessibility, Climate, Local Resources, Infrastructure and Physiography |
19 |
||
|
20 |
||
|
20 |
||
|
20 |
||
|
20 |
||
|
21 |
||
|
21 |
||
22 |
|||
|
22 |
||
|
22 |
||
|
22 |
||
|
22 |
||
24 |
|||
|
24 |
||
|
|
|
Page No |
|---|---|---|---|
|
26 |
||
|
28 |
||
|
35 |
||
|
41 |
||
|
42 |
||
43 |
|||
|
43 |
||
|
43 |
||
|
49 |
||
|
50 |
||
|
76 |
||
|
76 |
||
|
76 |
||
77 |
|||
|
77 |
||
|
77 |
||
|
78 |
||
|
80 |
||
|
81 |
||
|
83 |
||
84 |
|||
|
84 |
||
|
84 |
||
|
84 |
||
85 |
|||
|
85 |
||
|
86 |
||
|
86 |
||
|
86 |
||
|
87 |
||
|
94 |
||
|
95 |
||
|
95 |
||
|
96 |
||
97 |
|||
|
97 |
||
|
98 |
||
|
99 |
||
|
129 |
||
|
133 |
||
|
143 |
||
144 |
|||
|
144 |
||
|
144 |
||
|
144 |
||
|
144 |
||
|
146 |
||
|
147 |
||
|
147 |
||
|
150 |
||
|
151 |
||
|
153 |
||
|
|
|
Page No |
|---|---|---|---|
|
153 |
||
154 |
|||
|
154 |
||
|
154 |
||
|
155 |
||
|
156 |
||
|
162 |
||
|
163 |
||
171 |
|||
|
171 |
||
|
173 |
||
|
173 |
||
|
175 |
||
|
176 |
||
|
178 |
||
188 |
|||
|
188 |
||
|
188 |
||
|
189 |
||
|
189 |
||
|
189 |
||
|
189 |
||
|
190 |
||
|
191 |
||
|
192 |
||
|
193 |
||
|
193 |
||
194 |
|||
|
194 |
||
|
194 |
||
|
194 |
||
|
194 |
||
|
195 |
||
196 |
|||
|
196 |
||
|
199 |
||
|
199 |
||
|
200 |
||
|
202 |
||
|
203 |
||
|
204 |
||
|
205 |
||
206 |
|||
|
206 |
||
|
206 |
||
208 |
|||
|
208 |
||
|
210 |
||
211 |
|||
|
211 |
||
|
211 |
||
211 |
|||
|
|
|
Page No |
|---|---|---|---|
212 |
|||
|
212 |
||
|
212 |
||
|
213 |
||
|
215 |
||
|
215 |
||
|
216 |
||
|
216 |
||
|
217 |
||
|
218 |
||
|
218 |
||
|
219 |
||
|
Environmental studies, permitting, social and community impact |
219 |
|
|
219 |
||
|
220 |
||
|
220 |
||
221 |
|||
|
221 |
||
|
221 |
||
|
221 |
||
|
221 |
||
|
223 |
||
|
223 |
||
223 |
|||
225 |
|||
List of Tables
List of Figures
138 |
||
140 |
||
Comparison of 12/31/2022 to 12/31/2023 Arista Measured and Indicated Mineral Resources |
141 |
|
Comparison of 12/31/2022 to 12/31/2023 Arista Inferred Mineral Resources |
142 |
|
Comparison of 12/31/2021 to 12/31/2022 Alta Gracia Mineral Resources |
142 |
|
145 |
||
147 |
||
147 |
||
152 |
||
153 |
||
156 |
||
Three-Dimensional Schematic of the Overhand Mechanized Cut-and-Fill (CAF) Mining Method |
159 |
|
Longitudinal View of Cut-and-fill (CAF) Mining Method Using a Jumbo |
160 |
|
Schematic Vertical Longitudinal Projection of Typical Long-hole stope Design |
161 |
|
162 |
||
Ventilation Fans and Raise Bore Holes Installed at the Arista Underground Mine |
166 |
|
Three-Dimensional View of the Arista Mine Ventilation System |
167 |
|
167 |
||
168 |
||
169 |
||
171 |
||
172 |
||
173 |
||
175 |
||
176 |
||
177 |
||
177 |
||
178 |
||
178 |
||
180 |
||
180 |
||
181 |
||
181 |
||
182 |
||
182 |
||
183 |
||
183 |
||
184 |
||
184 |
||
185 |
||
185 |
||
186 |
||
186 |
||
187 |
||
188 |
||
191 |
||
192 |
||
193 |
GOLD RESOURCE CORPORATION (NYSE American: GORO) is a registrant with the United States Securities and Exchange Commission (“SEC”). GORO must report its exploration results, Mineral Resources, and Mineral Reserves using the mining disclosure standards of Subpart 229.1300 of Regulation S-K Disclosure by Registrants Engaged in Mining Operations (“S-K 1300”).
This report is a Technical Report Summary (“Technical Report”) in accordance with the SEC S-K 1300 for Don David Gold Mexico S.A. de C.V. (“DDGM” or “Don David Gold Mine” or “Don David Mine” or the “Project”), a wholly owned subsidiary of Gold Resource Corporation (“GRC”). DDGM is an underground gold, silver, and base-metal production stage property with exploration prospects in Oaxaca, Mexico. This report supports the historical, scientific, and technical information concerning the Project, effective as of December 31, 2023. This report does not purport to reflect new information regarding the Project arising after such date.
DDGM adopted S-K 1300 standards for the December 31, 2021 Technical Report. The adoption applied a new methodology focused on geological interpretations, improved grade estimation, better variable anisotropy, channel sampling, and improved ore control models. This approach creates greater confidence in the reliability of the Mineral Resources and Mineral Reserves. Gold and silver ounces are reported in troy ounces converted using 31.1035 grams per troy ounce. Unless otherwise stated, all currency is in U.S. dollars (“$”).
The Qualified Persons (“QPs”) preparing this report are mining industry professionals and specialists trained in diverse technical backgrounds, including but not limited to geology, exploration, environmental, cost estimation, and mineral economics. A QP, defined under SEC S-K 1300 instructions, is a mineral industry professional with at least five years of relevant work experience in the type of mineralization and deposit like DDGM and an eligible member or licensee in good standing of a recognized professional organization.
By their education, experience, and professional association, the following individuals are considered QPs for this report and are members in good standing of relevant professional institutions/organizations. As noted below, four of the QPs are GRC employees; and therefore, such individuals are not independent of DDGM.
1
Table 1.1 Summary of QP Qualifications.
QP NAME & BIOGRAPHY |
SITE VISIT |
RESPONSIBLE SECTIONS |
Rodrigo Simidu, P. Eng. (GRC employee) | ||
Mr. Rodrigo Simidu graduated with a degree in Mining Engineering from the University of Sao Paulo, Brazil, in 2008. He is a Professional Engineer (P. Eng.) registered with Engineers & Geoscientists British Columbia (EGBC). Mr. Simidu has over 15 years of practical experience as a mining engineer in several mining methods for hard rock mines, with a strong background in mine planning. He is currently the principal Mining Engineer for GRC, and his relevant experience includes operational, planning, corporate technical support, and consulting in Canada, USA, Mexico, Australia, South Africa, and Ghana. Prior to joining GRC, Mr. Simidu was a Manager, Mine Planning at Worley, a global engineering company. |
Multiple times in 2023; most recently from November 7 to 15, 2023. |
1, 4, 5, 12, 13, 15, 16, 17, 22, and 23 |
Marcelo Zangrandi, B. Geo (AMBA employee) | ||
Mr. Marcelo Zangrandi holds a Bachelor´s degree in Geology from Universidad Nacional de San Juan (1998) and a Graduate’s degree in Geostatistical Evaluation of Ore Deposits from Universidad de Chile (2012). He is a Professional Geologist (P.Geologist) registered with the Australian Institute of Geoscientists (AIG). Mr. Zangrandi has over 24 years of practical experience in the mining industry and related research (geostatistics), mainly in exploration projects, open pit and underground mines, with gold, silver and copper, among other commodities. He is a senior geologist of AMBA Consultoria Ltda. (“AMBA”), a Brazilian consulting company. He has held various roles in geological exploration and mine operations, from the greenfield exploration to the resource estimation, mainly at Snowden Consulting (Brazil) and Barrick Gold (Argentina, Chile and Dominican Republic). |
May 18 to 25 and October 16 to 27, 2023 |
1, 8, 9, 11, 22, and 23 |
Patrick Frenette, P. Eng. (GRC employee) | ||
Mr. Patrick Frenette graduated with a degree in Mining Engineering from Ecole Polytechnique de Montreal in 2001. He also holds a Master’s in Rock Mechanics (2003) and a Master’s in Business Administration (2021). Mr. Frenette has over 20 years of experience in open pit and underground operations as well as in consulting where he worked on different projects in Canada, the USA and Mexico for companies such as Cambior, Agnico Eagle, Osisko, Canadian Malartic, InnovExplo and Wesdome. He is currently the Vice-President of Technical Services for GRC. Prior to joining GRC, he was Director of Operational Support for Osisko Development. He is a Professional Engineer and a member in good standing of the Ordre des Ingénieurs du Québec (OIQ) and Professional Engineers of Ontario (PEO). |
May 18 to 25 and December 5 to 11, 2023 |
1, 2, 18, 19, 22, 23, 24, and 25 |
Christian Laroche, P. Eng. (GRC employee) | ||
Mr. Christian Laroche graduated from Laval University with a degree in Metallurgical Engineering. He is registered at Ordre Ingénieur du Québec (OIQ). Mr. Laroche worked as a Process Engineer for BBA an engineering consultant and as Corporate Director of Metallurgy for Compagnie Minière Osisko. He spent 8 years as Director of Metallurgy at Osisko Gold Royalty and 3 years as Vice-President Metallurgy at Falco Resources. He is currently the GRC Technical Service Director of Metallurgy since 2022. |
Multiple times in 2023 and most recently December 5 to 11, 2023 |
1, 10, 14, 22, and 23 |
2
David Turner P. Geo (GRC employee) | ||
Mr. David R. Turner graduated from Colorado State University, Fort Collins, Colorado where he earned his Bachelor of Science degree in Geology in 1992. He is a Professional Geologist (P. Geo.) accredited by the Australian Institute of Geoscientists (AIG). Mr. Turner has been working continuously for over 30 years in the exploration and mining industry with a focus on precious and base metal exploration and development, on projects ranging from grass roots to advanced stage exploration and in operations at both underground and open pit mines in the USA, Mexico, El Salvador, Honduras, Nicaragua, Brazil and Bolivia for companies including BHP, Kinross, Yamana Gold, Mineros, Electrum Group and New Pacific Metals, amongst others. He is currently the Director of Geology for GRC. |
Multiple times in 2023 and most recently October 16 to 27, 2023 |
1, 3, 5, 6, 7, 8, 9, 20, 21, 22, and 23 |
Technical data and information used in preparing this report also included documents from third-party contractors. The authors sourced information from referenced documents as cited in the text and listed in the References section of this report.
1.3Property Description, Location, and Ownership
At our Don David Gold Mine, we currently have 100% interest in six properties, including two Production Stage Properties and four Exploration Stage Properties, located in Oaxaca, Mexico, along the San Jose structural corridor. The Project is in the Sierra Madre Sur Mountains of southern Mexico, in the southwestern part of the State of Oaxaca. The Project is a significant precious and base metals epithermal deposit positioned along a major paved highway approximately 120 kilometers (km) southeast of Oaxaca City, the capital city of the State of Oaxaca. Because of their proximity and relatively integrated operations, we refer collectively to the six properties as the Don David Gold Mine. The two Production Stage Properties are the only two of the six properties that make up the Don David Gold Mine that we consider to be independently material at this time. As of December 31, 2023, DDGM controlled twenty-nine (29) mining concessions in Oaxaca State totaling 55,119 hectares and permits necessary to sustain mining operations. Expiration dates associated with the Project concessions range from August 30, 2049, to March 4, 2073.
Table 1-2: Summary of DDGM Properties.
DDGM PROJECTS |
SEC STAGE |
DEPOSITS |
VEIN SYSTEMS |
Arista Project |
Producing |
Arista |
Arista Three Sisters Gloria |
Alta Gracia Project |
Producing |
Alta Gracia |
Mirador |
Rey |
Exploration |
||
Chamizo |
Exploration |
||
Margaritas |
Exploration |
||
Fuego |
Exploration |
|
The Arista Project is a production stage property with a relatively small surface infrastructure consisting of a processing plant made up of an 1,800 tonnes per day (“tpd”) flotation plant, 250 tpd leaching plant, electrical power station (connected to the national electric power grid), water storage facilities, paste plant, filtration plant and dry stack facilities, stockpiles, and workshop facilities, all connected by sealed and unsealed roads. Additional structures located at the property include offices, dining halls, a laboratory, core logging, and core storage warehouses. The tailings facilities are located approximately 500 meters (m) northeast of the flotation plant.
DDGM must pay surface rights for concessions to the Mexican government to maintain its interest in the DDGM concessions. In 2023, DDGM satisfied these concessions' investment and assessment work requirements based on its work programs and past work completed. The annual concession tax paid for the mining concessions controlled by DDGM in 2023 was $1.26 million. DDGM concession payments are in good standing.
3
DDGM has established surface rights agreements with several neighboring communities. The most significant agreement is with the San Pedro Totolapam Ejido, and the individuals impacted by current and proposed operations, which allow surface disturbance, where necessary, for DDGM's exploration activities and mining operations.
The Arista and Alta Gracia Projects are in the regional Tlacolula mining district in the State of Oaxaca, in south-west Mexico. According to the Mexican Geological Survey, the Servicio Geologico Mexicano (“SGM”) mining activity was initiated in the early 1880s in the Tlacolula mining district, producing some 300,000 ounces of gold and silver from an ore shoot of the La Leona mine. However, no separate reported amounts of production were reported for each metal. SGM says that in 1892 two smelters were built and operated (Magdalena Teitipac and O'Kelly) near the village of Tlacolula for processing ores from the Alta Gracia, La Soledad, San Ignacio y Anexas, La Leona, La Victoria, and San Rafael silver mines. Subsequently, in 1911, Mr. Sken Sanders investigated the Totolapam mining region with a particular interest in the Margaritas mine. Most of these historical mines are within DDGM's mining concessions.
While the DDGM Arista and Alta Gracia Projects are in the smaller mining subdistricts of San Jose de Gracia and Alta Gracia, respectively, only small-scale artisanal mining was historically conducted in these areas' subdistricts. No reliable production records exist for the historic production performed in the area.
In 1998 and 1999, Arista Project concessions were leased to Apex Silver Corporation (“Apex”). Apex carried out an exploration program involving geologic mapping, surface sampling, and an eleven (11) hole reverse circulation (RC) drilling program (1,242 m) into the flat-lying vein, manto-style deposit (“Manto Vein”).
GRC has carried out a continuous exploration program since 2003. This exploration has included an aggressive program of surface and underground drilling. Mining of the Arista Project began in 2010, underground mining commenced in 2011, and underground Switchback vein system mining began in 2017.
Since the commencement of production from the Don David Gold Mine in 2010, DDGM has produced 379,013 ounces of gold and 25,895,756 ounces of silver from the 5,992,068 tonnes shipped to the DDGM Processing Facility. In addition, 16,605 tonnes of copper, 69,583 tonnes of lead, and 190,334 tonnes of zinc have been produced from the plant.
1.5Geology Setting, Mineralization, and Deposit
The DDGM area is predominantly comprised of volcanic rocks of presumed Miocene age, which overlay and intrude into basement rocks consisting of Cretaceous marine sediments. This district's gold and silver mineralization is related to a volcanogenic system and is considered epithermal in character. The DDGM mineralization occurs as structurally controlled epithermal deposits in veins and stockwork zones. It consists of concentrations of sulfides containing gold, silver, lead, copper, and zinc. Primary sulfide mineralization consists of pyrite, galena, sphalerite, chalcopyrite, and different minor amounts of argentite and silver sulfosalts. The mineralization is associated with gangue minerals such as quartz, calcite, and other minor elements.
DDGM exploration efforts have been mainly focused on the Arista Project, which contains the Manto vein, Arista, and Switchback vein deposits, and includes the significant Arista, Baja, and Soledad veins and multiple ancillary structures. The principal hosts of mineralization are the Arista and Switchback vein systems, known from drilling and underground workings in the Arista underground mine. The Switchback deposit is approximately 500 m northeast of the Arista deposit. Both vein systems are hosted in andesitic rocks, rhyolite dikes, and structural contacts with the basement sedimentary rocks. The mineralization in these systems is intermediate sulfidation with precious and base metals at economic grades. Both vein systems trend north-westerly; although locally, vein orientations can range from north-south to east-west.
The second zone of interest is the Alta Gracia property, where low sulfidation epithermal, predominantly silver mineralized, veins are hosted in andesitic and rhyolitic rocks. This property has been investigated by drilling as well as surface and underground mapping of historical and recent workings. The Mirador and Independencia vein systems, which DDGM has mined, are one of several predominantly north-east trending vein systems on the property.
Other mineralized zones and properties have been investigated, including preliminary drilling in areas such as Escondida, Chacal, and Salina Blanca on the Arista Project and the Margaritas and Rey properties. The Margaritas and Rey properties host low sulfidation epithermal veins with volcanic associations.
The Don David Gold Mine properties include several mining sub-districts that had minimal exploration by modern methods before DDGM activity. DDGM acquired its Oaxaca mining concessions in 2003 and began exploring the Manto Vein at the Arista Project, including drilling.
4
Commencing in 2005, DDGM has carried out a continuous drilling program on other historical mine targets. The 2007 drill program included the discovery of the Arista vein and was the last RC drilling used. Since 2007 the continuous drilling programs have used wireline core drilling with 2.5 inches or 63.5-millimeter (mm) and 1.875 inches or 47.6 mm (“HQ” and “NQ”) core diameters. Underground drilling began in 2011. In 2013 step-out drilling from underground stations in the Arista underground mine identified the first intersections of the Switchback vein system. Drill programs have targeted other zones of interest in the Arista mine and epithermal vein systems on the Alta Gracia, Margaritas, and Rey projects. The Arista mine is located near the south-eastern limit of the 55 km long San Jose structural corridor.
DDGM continues the development of an aggressive exploration program along the 55 km corridor that includes extensive surface and underground drilling, along with underground mine development, such as access ramps, drifts, and crosscuts into the Arista, Switchback, and Alta Gracia vein systems. Exploration techniques include geophysics (airborne and ground), stream, soil and rock geochemistry, mapping, petrographic and fluid inclusion studies, and drilling. These activities have identified multiple exploration targets. Exploration has focused on the Arista and Alta Gracia zones due to proximity and ease of access to the DDGM processing facilities. Exploration drilling (core and RC) by DDGM through the end of December 2023 amounts to 1,960 drill holes totaling 496,638 meters. The 2023 district exploration work program included 168 underground drill holes with 36,350 meters of diamond drill core produced, requiring an expenditure of $6.0 million. Exploration mine development in 2023 totaled 520 meters at a total cost of $1.5 million. Other district surface exploration work required an expenditure of $1.3 million.
The drill core is logged, sampled, and stored at the on-site exploration facilities within the DDGM operational site, using standard industry practices. All pulps, and selected coarse reject material, are recovered from an external laboratory and also stored in the DDGM exploration storage facilities.
Since 2006 exploration samples have been analyzed by ALS Global (“ALS”) at their ISO/IEC 17025:2017 and ISO 9001:2015 accredited laboratory in Vancouver, Canada, with sample preparation at their Guadalajara laboratory in Mexico. Beginning in 2023 sample preparation was completed at the ALS laboratory in Santiago de Queretaro in Mexico.
All exploration samples are subject to strict quality assurance and quality control (“QAQC”) protocols that include inserting certified reference materials (standards and blanks) and duplicate sampling. Mine channel samples and narrow diameter production core are assayed at the laboratory located at the DDGM processing facilities.
The DDGM staff follow stringent data storage and validation procedures and performs data verification continuously. The DDGM database manager last performed preliminary database validation in October 2023. The on-site database has a series of automated import, export, and validation tools to minimize potential errors. Any inconsistencies are corrected during the validation process before being handed over for final review and validation. The QP visited the site on numerous occasions in 2023 and most recently in October 2023 to review data collection storage and undertake validation. The data verification procedures performed by the QP involved the following:
| ● | Inspection of selected drill core to assess the nature of the mineralization and to confirm geological descriptions. |
| ● | Inspection of geology and mineralization in underground workings of the Arista and Switchback veins. |
| ● | Verification that the collar coordinates coincide with underground workings or the topographic surface. |
| ● | Verification that downhole survey bearing, and inclination values display consistency. |
| ● | Evaluation of minimum and maximum grade values. |
| ● | Investigation of minimum and maximum sample lengths. |
| ● | Randomly selecting assay data from the databases and comparing the stored grades to the original assay certificates. |
| ● | Assessing for spelling or coding inconsistences (typographic and case sensitivity errors). |
| ● | Ensuring full data entry and that a specific data type (collar, survey, lithology, and assay) is present. |
| ● | Assessing for sample gaps or overlaps. |
5
1.8Mineral Processing and Metallurgical Testing
ALS's metallurgical testing in 2014, 2018, and more recently in 2020 and 2022 supports the DDGM processing methodology. As exploration continues, additional metallurgical testing will be required to determine if the constituents of the ore should change.
Deleterious elements in the concentrate products are predominantly non-liberated sulfide and non-sulfide gangue, apart from Cadmium and Silica within the Zinc concentrate.
Metallurgical recoveries at the DDGM processing facility for ore produced from the Arista mine averaged 79.6% during 2023 for gold, 91.6% for silver, 77.3% for copper, 73.0% for lead, and 85.4% for zinc.
The DDGM processing facility has a good body of metallurgical information comprising historic testing supported by the studies completed by ALS. The metallurgical samples tested and the ore presently treated in the plant represent the material included in the life-of-mine (“LOM”) plan regarding grade and metallurgical response.
1.9Commodity Price Projections
To estimate the Mineral Reserves and Mineral Resources in this report, the QP utilized prices based on conservative estimates (“Resource & Reserve Price Deck”) which closely approximate to the average median consensus prices for each of the five years starting 2024 through 2028 as provided by the Bank of Montreal in June 2023. The median price was based on the price estimates contributed by 38 participating financial institutions.
The prices were subsequently compared to the actual 2023 closing spot price as at September 29, 2023 and the 36-month average as at August 28, 2023 and as per published exchanges (Comex for precious metals and London Metal Exchange (“LME”) for base metals) to ensure the prices used for the Mineral Resources and Mineral Reserves were still considered to be reasonably conservative estimates.
Table 1-3: Mineral estimation Commodity Price Projections
Metal |
Measure |
Base Case |
36-month average (as of August 28, 2023) |
Spot Price (As of September 29, 2023) |
Au |
$/oz |
1,800 |
1,841 |
1,850 |
Ag |
$/oz |
23.30 |
23.70 |
22.20 |
Cu |
$/lb |
3.90 |
3.95 |
3.70 |
Zn |
$/lb |
1.25 |
1.39 |
1.18 |
Pb |
$/lb |
0.95 |
0.97 |
1.02 |
For the Economic Analysis, the QP utilized the median consensus prices for each of the four years starting from 2024 through 2027 as provided by Bloomberg’s consensus commodity price forecast as at February 27, 2024. The 2027 consensus was used for the remaining life of mine. The Economic Analysis Price Deck is set forth in the below table:
Table 1-4: Economic Analysis Commodity Price Projections
Metal |
Measure |
2024 |
2025 |
2026 |
2027 |
Au |
$/oz |
2,040 |
2,050 |
1,900 |
1,800 |
Ag |
$/oz |
24.25 |
24.40 |
25.00 |
24.25 |
Cu |
$/lb |
3.90 |
4.10 |
4.20 |
4.30 |
Zn |
$/lb |
0.96 |
0.97 |
0.98 |
1.00 |
Pb |
$/lb |
1.15 |
1.20 |
1.20 |
1.25 |
The actual metal prices can change, either positively or negatively, from the assumptions above. If the assumed metal prices are not realized, this could have a negative impact on the operation’s financial outcome. At the same time, higher than predicted metal prices could have a positive impact. Gold equivalencies are determined by taking the price for gold and silver and converting them to gold equivalent ratio for the respective remaining life of mine periods (average is 82.5 silver: 1 gold).
6
1.10Mineral Resources Estimates
The modeling and estimation of Mineral Resources presented herein are based on technical data and information available as of December 31, 2023 (Drilling database close October 15, 2023). DDGM models and estimates Mineral Resources from available technical details before generating Mineral Reserves.
Marcelo Zangrandi, from AMBA Consultoria Ltda. (“AMBA”) completed the Mineral Resource estimate using Vulcan software. Wireframes for geology and mineralization were constructed by DDGM geology staff using Leapfrog Geo, based on underground mappings, assay results, lithological information from drill holes, and structural data. The model incorporates all significant vein systems identified to date: a total of 35 veins were interpreted and modelled for the Switchback system, 41 veins for the Arista system, and 14 veins for the Alta Gracia system. Assays were composited to 1 m lengths and capped to various levels based on exploratory data analysis for each vein. Wireframes were filled with blocks of 10 m by 1 m by 10 m (x,y,z),, which were sub-celled at wireframe boundaries (minimum sub-celling size 2.5 by 0.5 m by 2.5 m, x,y,z). Block grades were interpolated using the ordinary kriging (“OK”) interpolation algorithm. Block estimates were validated using industry-standard validation techniques. Classification of blocks used information distance-based criteria related to the spatial continuity of mineralization. Satisfying adequate minimum mining size continuity criteria and using a breakeven net smelter return (“NSR”) cutoff grade of $100 per tonne for the Arista mine (Arista and Switchback vein systems) and a gold equivalent (“AuEq”) of 2.35 grams per tonne (g/t) for the Alta Gracia deposit (See Section 12.7 for more discussion on cutoff grade).
A summary of the Don David Gold Mine Mineral Resources, exclusive of Mineral Reserves, for the Arista mine, is shown in Table 15. Table 16 shows the Mineral Resources for the Alta Gracia deposit. NSR cutoff values for the Mineral Resources were established using a zinc price of $1.25/pound (lb), a lead price of $0.95/lb, a copper price of $3.90/lb, a silver price of $23.30/ounce (oz) and a gold price of $1,800/oz.
Mineral Resources have been classified under the definitions for Mineral Resources in S-K 1300, which are consistent with the Canadian Institute of Mining, Metallurgy and Petroleum (CIM) Definition Standards for Mineral Resources and Mineral Reserves (CIM (2014) definitions).
7
Table 1-5: Don David Gold Mine (Arista Mine) - Summary of Gold, Silver and Base Metal Mineral Resources, exclusive of Mineral Reserves at December 31, 2023.
Amount |
Grades |
Cut off grade |
|||||
Arista |
Ktonne |
Au (g/t) |
Ag (g/t) |
Cu (%) |
Pb (%) |
Zn (%) |
$/tonne |
Measured mineral resources |
68 |
1.49 |
109.69 |
0.42 |
1.42 |
4.39 |
100 |
Indicated mineral resources |
489 |
1.10 |
131.89 |
0.28 |
1.33 |
4.25 |
100 |
Measured + Indicated mineral resources |
557 |
1.15 |
129.16 |
0.29 |
1.34 |
4.26 |
100 |
Inferred mineral resources |
1,906 |
1.08 |
104.78 |
0.23 |
1.22 |
3.40 |
100 |
Table 1-6: Don David Gold Mine (Alta Gracia Mine) - Summary of Gold, Silver and Base Metal Mineral Resources, exclusive of Mineral Reserves at December 31, 2023.
Amount |
Grades |
Cut off grade |
||
Altagracia |
Ktonne |
Au (g/t) |
Ag (g/t) |
Au_Eq/tonne |
Measured mineral resources |
27 |
0.81 |
370.6 |
2.35 |
Indicated mineral resources |
141 |
0.49 |
270.0 |
2.35 |
Measured + Indicated mineral resources |
168 |
0.54 |
286.1 |
2.35 |
Inferred mineral resources |
148 |
0.62 |
295.6 |
2.35 |
Notes on Mineral Resources:
| 1. | Mineral Resource estimated at December 31, 2023. |
| 2. | The definitions for Mineral Resources in S-K 1300 were followed for Mineral Resources, which are consistent with CIM (2014) definitions. |
| 3. | Metal prices used in the estimate were $1,800/oz Au, $23.30/oz Ag, $3.90/lb Cu, $0.95/lb Pb, and $1.25/lb Zn. See Section 1.9 for a discussion of the metal prices used. |
| 4. | Mineral Resources are exclusive of Mineral Reserves. |
| 5. | Mineral Resources that are not Mineral Reserves are materials of economic interest with reasonable prospects for economic extraction. |
| 6. | Mining, processing, and overhead costs were based on 2023 actual costs for the Don David Gold Mine and consider cost improvements made in the fourth quarter of 2023. |
| 7. | An exchange rate of 17 Mexican Pesos (“MXP”) to 1 U.S. dollar is applied to peso-denominated costs. |
| 8. | Rounding of tonnes, average grades, and contained ounces may result in discrepancies with total rounded tonnes, average grades, and total contained ounces. |
| 9. | Metallurgical recoveries are based on historical milling results and are 79.0% for Au, 91.2% for Ag, 78.0% for Cu, 75.4% for Pb, and 84.6% for Zn for Arista. For Altagracia, recoveries are 85.0% for Au and 72.0% for Ag. |
1.11Mineral Reserves Estimates
The Arista and Alta Gracia underground mine Mineral Reserve estimates follow standard industry practices, considering Measured and Indicated Mineral Resources. Only these categories have sufficient geological confidence to be considered Mineral Reserves. Subject to the application of modifying factors, Measured Resources may become Proven Reserves, and Indicated Resources may become Probable Reserves. Mineral Reserves are reconciled quarterly against production to validate dilution and recovery factors. The reserve estimate is based on technical data and information available as of December 31, 2023.
Mineral Reserve are classified as Proven and Probable (“P&P”). The mine designs include all modifying factors and must meet cutoff grade requirements to be deemed feasible and economical for extraction.
DDGM uses a breakeven NSR cutoff grade, considering actual metal prices, total mining, milling, general administration, smelting/refining costs, and plant recoveries for P&P Reserve estimations. The cutoff grade calculation does not include either exploration or capital costs, and the average operating costs used for reserve calculations are net of base metal credits and royalty payments.
8
Plant recoveries used are the average of actual recoveries reported by the plant during the twelve months of 2023.
The 2023 breakeven NSR cutoff grade for the Arista underground mine is based on a $120/t NSR. Gold, silver, copper, lead, and zinc metal price assumptions established in Section 1.9 were utilized to calculate the NSR value.
The P&P Mineral Reserves for the Don David Gold Mine as of December 31, 2023, are summarized in Table 17.
Table 1-7: Don David Gold Mine – Summary of Gold, Silver and Base Metal Mineral Reserves at December 31, 2023(1)(4).
Description |
Amount |
Grades |
Cutoff Grade |
Metallurgical Recovery (%) |
||||||||||||||||
Arista |
KTonne |
Au (g/t) |
Ag (g/t) |
Cu (%) |
Pb (%) |
Zn (%) |
$/tonne |
Au |
Ag |
Cu |
Pb |
Zn |
||||||||
Proven Mineral Reserves |
90 |
2.91 |
176 |
0.50 |
1.65 |
5.02 |
120 |
79.5 |
91.1 |
76.6 |
73.9 |
83.9 |
||||||||
Probable Mineral Reserves |
973 |
1.14 |
126 |
0.23 |
0.84 |
2.50 |
120 |
79.5 |
91.1 |
76.6 |
73.9 |
83.9 |
||||||||
Arista Mine Total |
1,063 |
1.29 |
131 |
0.26 |
0.91 |
2.71 |
|
|
|
|
|
|||||||||
Notes on Mineral Reserves in Tables 1.7:
| 1. | Metal prices used for P & P reserves were $1,800 per ounce of gold, $23.30 per ounce of silver, $3.90 per pound of copper, $0.95 per pound of lead and $1.25 per pound of zinc. See Section 1.9 for a discussion of metal prices used. |
| 2. | A breakeven NSR cutoff grade of $120/t was used for estimations of P & P reserves at the Arista Underground Mine. The term “cutoff grade” means the lowest NSR value considered economic to process. |
| 3. | Mining, processing, and overheads were based on 2023 actual costs for the Don David Gold Mine and consider cost improvements made in the fourth quarter of 2023. |
| 4. | P & P reserves are diluted and factored for expected mining recovery. |
| 5. | An exchange rate of 17 Mexican Pesos (“MXP”) to 1 U.S. dollar is applied to peso-denominated costs |
| 6. | Rounding of tonnes, average grades, and contained ounces may result in apparent discrepancies with total rounded tonnes, average grades, and total contained ounces. |
In 2010, DDGM began developing an underground mine to access the Arista and Baja veins, part of the Arista vein system. The underground mine is approximately three km from the DDGM processing facilities. In March 2011, DDGM began transitioning to processing the underground mineralization. Conventional drill and blast methods are currently used to extract ore from the Arista underground mine. Currently, the main mining method used in the Arista underground mine is long-hole open stopping (“LHOS”) with delayed fill.
Since commercial production was declared at the Don David Gold Mine on July 1, 2010, through December 31, 2023, the plant has processed a total of 5,992,068 tonnes of open pit and underground ore to recover 379,013 ounces of gold and 25,789,847 ounces of silver.
This Technical Report concludes that:
| ● | The mining methods being used are appropriate for the deposit being mined. The underground mine design, stockpiles, tailings facilities, and equipment fleet selection are appropriate for the operation. |
| ● | The mine plan is based on historical mining and planning methods practiced at the operation for the previous years and presents a low risk. |
| ● | Inferred Mineral Resources are not included in the mine plan and were sent to waste. |
| ● | The mobile equipment fleet presented is based on the actual present-day mining operations, which is known to achieve the production targets set out in the LOM. |
| ● | All mine infrastructure and supporting facilities meet the needs of the current mine plan and production rate. |
9
| ● | Production from the Don David Gold Mine has proven that the Project has the grade and continuity required to justify continued development and mining. The known veins and other Don David Gold Mine targets are underexplored by drilling. If DDGM maintains its exploration programs, excellent potential exists for reserves to maintain or grow. |
1.13Processing and Recovery Methods
During 2009 and 2010, DDGM constructed a processing plant and infrastructure at the Arista mine. The processing plant has a differential flotation section capable of processing polymetallic ores and producing up to three (3) separate concentrate products for sale and an agitated leach circuit capable of producing gold and silver doré for purchase. The DDGM mill's flotation circuit has undergone modifications in the circuit, higher capacity pumps and extra floatation cells that increased name plate capacity to 2,000 tpd (1,800 sulfides and 200 oxides). There is no indication that the characteristics of the material planned for mining will change, and therefore the recovery assumptions applied for future mining are considered reasonable for the LOM.
All material mine and process infrastructure and supporting facilities are included in the current general layout to ensure that they meet the needs of the mine plan and production rate and notes that:
| ● | The Don David Gold Mine is 114 km, or two hours by road from Oaxaca City, the main service center for the operation, with good year-round access. |
| ● | A flotation tailings impoundment was constructed in a valley just below the process plant site. The impoundment is double lined with the first liner made of clay and synthetic material that acts as a leak prevention system with an effective absorption equal to ~ 3 m of clay. The second liner is 1.5 mm Linear Low-Density Polyethylene (“LLDPE”), a permitting requirement. The method of subsequent embankment construction to obtain total capacity was downstream. |
| ● | Construction of a filtration plant and dry stack facility commenced in September 2020 and was commissioned in March 2022. The filtration plant and existing paste plant (commissioned in October 2019) handle 100% of current tailings production. |
| ● | Up until 2018, the site was powered by diesel generators. In 2019, DDGM successfully connected a power line to its Arista project from the Mexican Federal Electricity Commission's (Comisión Federal de Electricidad or CFE) power grid. Before this connection, the DDGM project operated 100% from electricity generated from more expensive and higher emission diesel fuel. In 2021, there was an increase in power consumption due to ventilation and dewatering pumps requiring the installation of capacitors that improved and stabilized the power supply. In 2021, DDGM also initiated conversations with CFE to expand further the load delivered to stabilize the energy supply. |
| ● | Water requirements to process ore are primarily sourced from water pumped to the surface from the underground dewatering system. Water in the tailings facility is recycled to the DDGM processing plant, and the excess water pumped from the underground workings is discharged at the surface into decantation ponds. DDGM has the necessary permits to discharge underground mine water at the surface. Water sampling from rivers and creeks is conducted regularly and sent to an external laboratory for analysis. |
| ● | All process buildings and offices for operating the mine have been constructed. Camp facilities in San Jose de Gracia were built with recycled materials. |
10
1.15Market Studies and Contracts
Since the operation commenced commercial production in July 2010, a corporate decision was made to sell the concentrate on the open market. All commercial terms entered between the buyer and DDGM are confidential but are considered within standard industry norms.
The information provided by GRC on marketing, contracts, metal price projections, and exchange rate forecasts is consistent with the information publicly available and within industry norms.
1.16 |
Environmental Studies, Permitting and Plans, Negotiations, or Agreements with Local Individuals or Groups. |
In connection with mining, milling, and exploration activities, DDGM is subject to all Mexican federal, state, and local laws and regulations governing the protection of the environment. Laws and regulations include the protection of air and water quality, hazardous waste management, mine reclamation and protection of endangered or threatened species. Additional areas of environmental consideration for mining companies, including DDGM, include but are not limited to, acid rock drainage, cyanide containment and handling, contamination of water sources, dust, and noise.
All mining and environmental activities in México are regulated by the Dirección General de Minas (“DGM”) and by the Secretaría de Medio Ambiente y Recursos Naturales (“SEMARNAT”) from México City, under the corresponding laws and regulations. The environmental impact and risk relating to atmosphere emissions and hazardous waste produced and treated operate under a unique environmental license (“Licencia Ambiental Unica” or “LAU”). This environmental license is issued after approval by the Evaluación del Impacto Ambiental (“EIA”). Special permits are also required for new developments such as expansions, tailings dams, etc. DDGM must also obtain various permits for surface and underground water use including waste-water discharge. The permissions are granted by the Comisión Nacional del Agua (“CONAGUA”), the administrative, technical advisory commission of SEMARNAT. CONAGUA administers national waters, manages and controls the country's hydrological system, and promotes social development.
DDGM is required to prepare a mine closure plan for the possible future abandonment of the Arista and Alta Gracia Mines. Golder has prepared a mine closure plan and reclamation budgets. The total estimated closure and reclamation cost for the Arista and Alta Gracia Mines according to the information provided in 2023 amounts to $11.95 million (excluding taxes). This amount was calculated with the assumptions of the technical information available during the assessment.
1.17Capital and Operating Costs
The support for capital and operating costs is based on realized costs, quotations, and estimates in 2023 dollars. The estimated capital and operating costs are to a feasibility level of accuracy (15%) and include a contingency of 3%. No inflation factors or changes to exchange rates have been used in the economic projections.
Total Don David Gold Mine LOM capital expenditures, including mine closure costs, are estimated to be $39.7 million, before contingency and $40.5 million after 3% contingency applied.
Operating costs are estimated based on an evaluation of actual historical and current expenditures for labor, consumables, and established DDGM contracts. The operating costs have a fixed and variable component and are estimated at $172/t before contingency and $175/t after contingency. The total operating costs are based on applying the estimated unit costs to the estimated total ore tonnes of 1.1 million tonnes to be processed over the four (4) year remaining life of mine (“LOM”).
The capital and operating costs estimated for the Don David Gold Mine are reasonable based on industry-standard practices and actual costs observed for 2023.
The Don David Gold Mine has a four-year LOM given the Mineral Reserves as described in this Report. Assumptions underlying the determination of Free Cash Flow and Net Present Value (“NPV”) include:
| ● | Capital and operating costs as summarized above and in Section 1.17 and below in Section 18. Of note, mine closure costs of $12.0 million are included in the Economic Analysis. |
| ● | Metals prices over the remaining LOM are based on the Economic Analysis Price Deck summarized above in Section 1.9 and below in Section 16. |
11
| ● | No inflation factors have been used in economic projections; however, a 3% contingency has been incorporated and an 5% discount rate applied for NPV. |
| ● | An exchange rate of 17.5 Mexican Pesos (“MXP”) exchange rate to 1 U.S. dollar is applied to peso-denominated costs. |
| ● | Revenues are estimates based on the Economic Analysis Price Deck mentioned earlier and the terms established in the doré and concentrate contracts discussed in Section 16. |
| ● | Only material in the Reserves has been considered in the life of mine plan. |
| ● | Optimized mine that assumes full depletion of the Arista Reserves through 2027. |
Based on Mineral Reserves, the free cash flow is estimated at $1.6 million, and the NPV is estimated at $2.8 million.
1.19Interpretations and Conclusions
This Technical Report represents the most accurate interpretation of the available Mineral Resource and Mineral Reserve as of the effective date. The conversion of Mineral Resources to Mineral Reserves was undertaken using industry-recognized methods and estimated operational costs, capital costs, and plant performance data. Likewise, the processing facilities and related infrastructure are appropriately designed to convert the minerals into a saleable product. Thus, it is considered to be representative of future operating conditions. This Technical Report has been prepared with the latest environmental and closure cost requirements. DDGM has obtained, or is in the process of applying for, the required Environmental Impact Studies and permits to continue operating in accordance with Mexican Laws and Regulations.
Recommendations for the next phase of work have been broken into those related to ongoing exploration activities and those related to additional technical studies focused on operational improvements. A detailed list of recommendations is described in the "Recommendations" section. Recommended work programs are independent and can be conducted concurrently unless otherwise stated.
12
This Report was prepared for Gold Resource Corporation (GRC) as a Technical Report in accordance with SEC S-K 1300 for the Don David Gold Mine, a wholly owned subsidiary of GRC. DDGM is an underground gold, silver, and base-metal production and exploration stage property in Oaxaca, Mexico.
The Report contains estimates of Mineral Reserves and Mineral Resources for the Project, effective as of December 31, 2023, prepared following S-K 1300 guidelines, which estimates supersede and replace the corresponding estimates of Mineral Reserves and Mineral Resources for the Project contained in the DDGM Technical Report in accordance with SEC S-K 1300 and the GRC Form 10-K on December 31, 2023. The quality of information, conclusions, and calculations contained herein are consistent with the level of effort by the QPs, based on:
A QP defined by SEC S-K 1300 instructions is a mineral industry professional with at least five years of relevant work experience in the type of mineralization and deposit like DDGM and is an eligible member or licensee in good standing of a recognized professional organization. The QPs preparing this Technical Report are specialists in geology, exploration, mineral resource, mineral reserve estimation and classification, underground and surface mining, geotechnical, environmental, permitting, metallurgical testing, mineral processing, processing design, capital and operating cost estimation, and mineral economics. See section 1.2 for additional details on the QPs for this Technical Report. Technical data and information used in this Report's preparation include documents prepared by third-party contractors. The authors sourced information from referenced documents as cited in the text and listed in the References section of this Technical Report.
The effective date of this Report is December 31, 2023.
DDGM has previously filed technical reports on the Don David Gold Mine, listed in chronological order:
| ● | Lopez, Noble, Jaacks, 2012. NI 43-101 Technical Report for Mineral Resources for the El Arista project, Oaxaca State, Mexico, prepared by Pincock, Allen & Holt, effective date July 10, 2012 |
| ● | Devlin & Alvarado, 2013. Report on the Reserve Estimate for the La Arista Underground Mine at the El Arista project, Oaxaca, Mexico, prepared by Gold Resource Corp., effective date October 1, 2013 |
| ● | Devlin & Alvarado, 2014. Report on the Reserve Estimate for the La Arista Underground Mine at the El Arista project, Oaxaca, Mexico, prepared by Gold Resource Corp., effective date December 1, 2013 |
| ● | Devlin, 2015. Report on Estimates of Reserves and Measured and Indicated Mineralized Material at the El Arista project, Oaxaca, Mexico, prepared by Gold Resource Corp., effective date December 31, 2014 |
| ● | Devlin, 2016. Report on Estimates of Reserves and Mineralized Material at the Arista project, Oaxaca, Mexico, prepared by Gold Resource Corp., effective date December 31, 2015 |
| ● | Devlin, 2017. Report on Estimates of Reserves and Mineralized Material at the Oaxaca Mining Unit, Oaxaca, Mexico, prepared by Gold Resource Corp., effective date December 31, 2016 |
| ● | Brown & Devlin, 2018. Report on Estimates of Reserves and Mineralized Material at the Oaxaca Mining Unit, Oaxaca, Mexico, prepared by Gold Resource Corp., effective date December 31, 2017 |
| ● | Brown, Garcia, Devlin & Lester, 2019. Report on the Estimate of Mineral Resources and Mineral Reserves for the Oaxaca Mining Unit, Oaxaca, Mexico, prepared by Gold Resource Corp., effective date December 31, 2018 |
| ● | Brown, Garcia, Devlin & Lester, 2020. Report on the Estimate of Mineral Resources and Mineral Reserves for the Oaxaca Mining Unit, Oaxaca, Mexico, prepared by Gold Resource Corp., effective date December 31, 2019 |
| ● | Brown, Garcia & Devlin, 2021. Report on the Estimates of Mineral Resources and Mineral Reserves for the Don David Mine, Oaxaca, Mexico, prepared by Gold Resource Corp., effective date December 31, 2020 |
| ● | Brown, Garcia, Zangrandi, Lachapelle & Reyes 2021. NI 43-101 Technical Report for Mineral Resources, Oaxaca |
13
| State, Mexico, prepared by Gold Resource Corp., effective date December 31, 2020 |
| ● | Simidu, Zangrandi & Lachapelle 2022. S-K 1300 Technical Report for Mineral Resources, Oaxaca State, Mexico, prepared by Gold Resource Corp., effective date December 31, 2021 |
| ● | Simidu, Zangrandi, Frenette & Laroche 2023. S-K 1300 Technical Report for Mineral Resources, Oaxaca State, Mexico, prepared by Gold Resource Corp., effective date December 31, 2022 |
2.5Information Sources and References
The primary information source referenced in this Report is the 2023 Technical Report:
| ● | Simidu, Zangrandi, Frenette & Laroche 2023. S-K 1300 Technical Report for Mineral Resources, Oaxaca State, Mexico, prepared by Gold Resource Corp., effective date December 31, 2022 |
The QPs also used the other reports and documents noted in Section 24 "References" in preparing this Report.
The metric system for weights and units has been used throughout this Report. Mass is reported in metric tons (“tonnes or t”) consisting of 1,000 kilograms per tonne. Gold and silver are reported as grams per tonne (“g/t”). Copper, lead, and zinc are reported as percentages (“%”).
Gold and silver ounces are reported in troy ounces converted using 31.1035 grams per troy ounce. Unless otherwise stated, all currency is in U.S. dollars (“$”).
14
3.PROPERTY DESCRIPTION AND LOCATION
The Project is comprised of six properties. The Arista and Alta Gracia Projects are located in southern Mexico’s Sierra Madre del Sur Mountains, in the central part of the State of Oaxaca (Figure 31). The projects are along a paved highway approximately 90 to 120 km southeast of the capital city of Oaxaca. Oaxaca has daily passenger airline service to Mexico City, Guadalajara, and Houston, Texas, USA. They are serviced by Xoxocotlan International airport. The approximate center of the project area is N16.68°, W96.17° (Figure 3.1). The Rey, Chamizo, Margaritas and Fuego properties are exploration-stage properties within the Project.
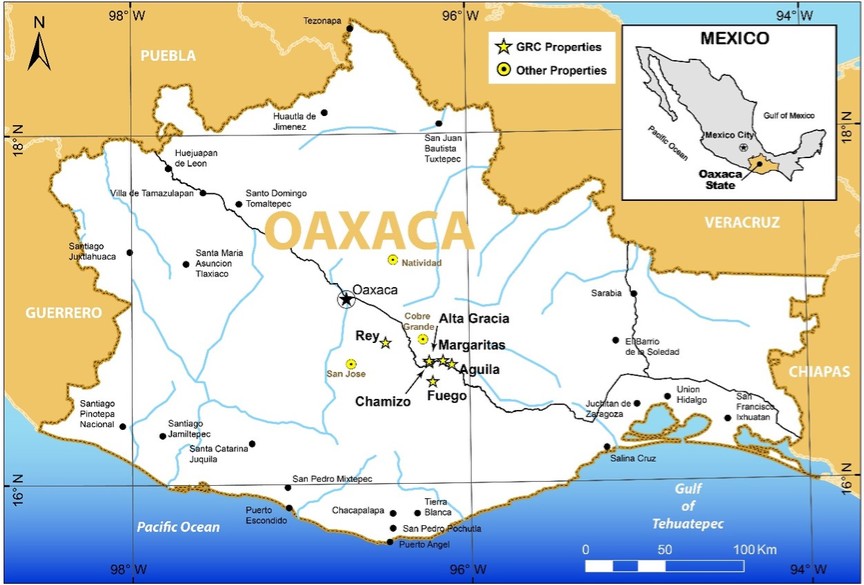
Figure 3-1: General Location of the six Properties Comprising the Don David Mine.
DDGM currently holds an interest in twenty-nine (29) mining concessions in Oaxaca State totaling 55,119 hectares (Table 31, Figure 32). Expiration dates associated with the Don David Mine mining concessions range from August 30, 2049 to February 22, 2073.
15
Table 3-1: Mining Concessions Owned by Don David Gold Mexico, S.A. de C.V.
Number |
Concession Name |
Title Number |
Hectares |
Term of Mining Concession |
|
From |
To |
||||
1 |
MINA DEL AIRE |
158272 |
72.00 |
2/23/1973 |
2/22/2073 |
2 |
EL AGUILA |
222844 |
899.06 |
9/9/2004 |
9/8/2054 |
3 |
LA TEHUANA |
210029 |
925.00 |
8/31/1999 |
8/30/2049 |
4 |
EL CHACAL |
232628 |
375.00 |
9/26/2008 |
9/25/2058 |
5 |
EL PILON |
232629 |
1,070.35 |
9/26/2008 |
9/25/2058 |
6 |
PITAYO FRACCIÓN 1 |
231124 |
429.63 |
1/17/2008 |
1/16/2058 |
7 |
PITAYO FRACCIÓN 2 |
231125 |
22.05 |
1/17/2008 |
1/16/2058 |
8 |
PITAYO FRACCIÓN 3 |
231126 |
113.31 |
1/17/2008 |
1/16/2058 |
9 |
PITAYO FRACCIÓN 4 |
231127 |
2.82 |
1/17/2008 |
1/16/2058 |
10 |
EL TALAJE |
231128 |
1,015.95 |
1/17/2008 |
1/16/2058 |
11 |
LA HERRADURA |
231129 |
3,628.85 |
1/17/2008 |
1/16/2058 |
12 |
DAVID FRACCIÓN 1 |
232851 |
625.59 |
10/30/2008 |
10/29/2052 |
13 |
DAVID FRACCIÓN 2 |
232852 |
920.76 |
10/30/2008 |
10/29/2052 |
14 |
SAN LUIS |
246866 |
2,820.07 |
12/12/2008 |
12/11/2052 |
15 |
EL COYOTE |
246864 |
2,799.55 |
3/12/2010 |
2/11/2060 |
16 |
EL ZORRITO |
246922 |
8,836.42 |
11/12/2009 |
11/11/2059 |
17 |
LA CURVA |
246825 |
1,940.28 |
3/12/2010 |
2/11/2060 |
18 |
EL CHAMIZO |
246865 |
17,897.54 |
9/23/2011 |
9/22/2061 |
19 |
ZOPI |
246934 |
504.00 |
11/8/2011 |
11/7/2061 |
20 |
LA REYNA |
225401 |
692.00 |
8/31/2005 |
8/30/2055 |
21 |
EL REY |
225373 |
172.00 |
8/26/2005 |
8/25/2055 |
22 |
EL VIRREY |
226269 |
36.00 |
12/2/2005 |
12/1/2055 |
23 |
EL MARQUEZ |
246863 |
1,434.89 |
6/5/2009 |
6/4/2059 |
24 |
SAN MIGUEL FRACCIÓN 2 |
241818 |
1,122.84 |
3/27/2013 |
3/26/2063 |
25 |
SAN PEDRO FRACCIÓN 1 |
233694 |
2,554.00 |
3/30/2009 |
2/23/2054 |
26 |
SAN PEDRO FRACCIÓN 2 |
233693 |
1,860.21 |
3/30/2009 |
2/23/2054 |
27 |
EL AGUILA III |
246842 |
2,250.00 |
12/16/2013 |
12/16/2063 |
28 |
CORRECAMINOS |
246834 |
97.81 |
8/25/2015 |
8/24/2065 |
29 |
TLACUACHE |
245147 |
1.04 |
11/8/2016 |
11/7/2066 |
Total |
55,119.02 |
|
|
||
16
Figure 3-2: Don David Mine Concessions (concession numbers are listed in Table 3.1).
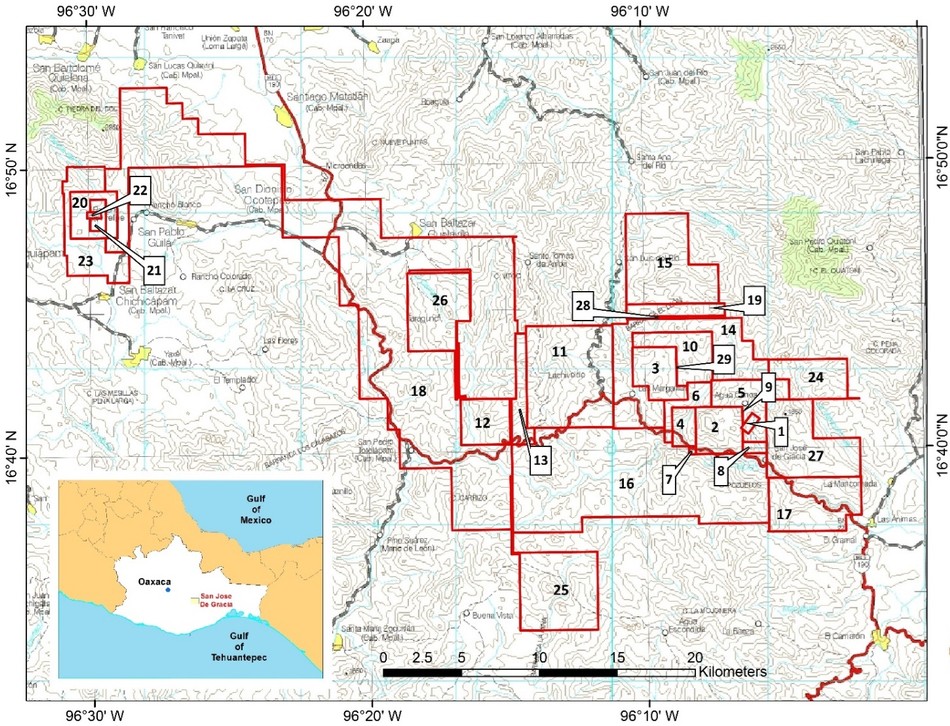
Mineral rights in Mexico belong to the Mexican federal government and are administered according to Article 27 of the Mexican Constitution. Concessions grant the right to explore and exploit all minerals found in the ground. All mining concessions comprising the Don David Gold Mine are exploitation concessions, which may be granted or transferred to Mexican citizens and corporations. Mexican subsidiaries of GRC hold the leases or concessions. Exploitation concessions have a term of 50 years and can be renewed for another 50 years. Maintenance of concessions requires the semi-annual payment of mining duties (due in January and July). The submission of confirmation of work reports on a calendar year basis. The confirmation of work reports is required to be filed in May for the preceding calendar year. The number of mining duties and annual assessment are set by regulation and may increase over the life of the concession and include periodic adjustments for inflation. Mining concessions are registered at the Public Registry of Mining in Mexico City and regional offices in Mexico.
Mexican mining law does not require payment of finder’s fees or royalties to the government, except for a discovery premium connected with national mineral reserves, concessions, and claims or allotments contracted directly from the Mexican Geological Survey. None of the claims held by DDGM’s subsidiaries are under any such discovery premium regime.
DDGM must pay surface rights for concessions to the Mexican government to maintain its interest in the DDGM mining concessions, which are paid twice annually (January and July). The annual 2023 concession surface rights tax paid for the mining concessions controlled by DDGM was $1.3 million; all payments have been met and are current.
In 2023, DDGM satisfied the investment and assessment work requirements based on its annual work programs and past work completed. DDGM concession payments are in good standing.
17
Table 3-2: Don David Gold Mine Concession Maintenance Fees by Property.
TOTAL NUMBER OF CONCESSIONS |
TOTAL SIZE |
ACQUISITION DATE RANGE |
2023 MAINTENANCE FEES PAID |
||||||
|
|
|
(in hectares) * |
|
|
|
|
||
Production Stage Properties: |
|
|
|
|
|
|
|
||
Arista |
|
18 |
|
24,372 |
|
2002 to 2016 |
|
$ |
556,090 |
Alta Gracia |
|
3 |
|
5,175 |
|
2008 |
|
|
118,289 |
Subtotal |
|
|
|
29,547 |
|
|
|
$ |
674,379 |
Exploration Stage Properties: |
|
|
|
|
|
|
|
||
Rey |
|
4 |
|
2,335 |
|
2002 to 2009 |
|
$ |
53,368 |
Chamizo |
|
2 |
|
19,758 |
|
2011 to 2013 |
|
|
451,601 |
Margaritas |
|
1 |
|
925 |
|
2002 |
|
|
21,143 |
Fuego |
|
1 |
|
2,554 |
|
2013 |
|
|
58,377 |
Subtotal |
|
|
|
25,572 |
|
|
|
|
584,488 |
Total: |
|
29 |
|
55,119 |
|
|
|
$ |
1,258,867 |
In 2013, the Mexican federal government enacted a tax reform package effective January 1, 2014. There were several significant changes in the Mexican tax reform package. The planned corporate income tax rate reductions (29% in 2014, 28% thereafter) were repealed. The corporate tax rate remains at 30%. The tax base for income tax was amplified, considering certain limitations on deductions. The business flat tax (“IETU”) that was effective from 2008 to 2013 was repealed in 2014. A special mining royalty tax of 7.5% was applied to net profits from a property concession holder from the sale or transfer of extraction-related activities. Net profits for this royalty are determined, including the calculation of general taxable income with the exceptions for deductions for investments in fixed assets and interest. Effective in 2021, deductions of amounts paid for surface right mining concession were no longer allowed. In addition, owners of mining concessions are now required to pay an additional extraordinary 0.5% royalty fee on gross revenue derived from the sale of gold, silver, and/or platinum. A further 10% withholding tax on dividend distributions was introduced. However, the tax treaty between the US and Mexico to avoid double taxation reduces this withholding tax to 5%.
In this Technical Report, all Mineral Resources and Mineral Reserves mining concessions are controlled by DDGM. Further, DDGM has secured and maintained the necessary permits for the Don David Gold Mine’s exploration, development, and production.
On October 14, 2002, DDGM leased its first three mining concessions from a former consultant to the company. These concessions are El Aguila, Mina Del Aire, and La Tehuana, totaling approximately 1,896 hectares. The El Aguila and Mina Del Aire concessions are now part of DDGM's Arista Mine, and the La Tehuana concession comprises the Margaritas property.
The initial lease agreement with the former consultant was subject to a 4% net smelter return royalty where production is sold in the form of gold/silver doré and 5% for production sold in concentrate form. These royalty terms were renegotiated with a new agreement signed on November 9, 2023, reducing the net smelter return royalty for producing gold/silver doré and production sold in concentrate form to 3%. Subject to meeting minimum exploration requirements, the lease has no expiration term. DDGM may terminate the lease at any time upon written notice to the lessor, and the lessor may terminate it if DDGM fails to fulfill any of its obligations, primarily of paying the appropriate royalty to the lessor.
In 2010, DDGM subsequently acquired, at no additional cost, two additional concessions from the former consultant: El Chacal and El Pilon, totaling approximately 1,445 hectares, each is subject to a 2% royalty to the consultant but is not subject to the lease.
DDGM has since filed for and received additional concessions for the Project that total approximately 45,029 hectares referred to as: El Pitayo Fracción 1 to 4, El Talaje, El Coyote, El Zorrito, San Luis, La Curva, La Herradura, David Fracción 1 and 2, El Chamizo, Zopi, San Miguel Fracción 2, El Aguila III, Correcaminos and Tlacuache. These additional concessions are not part of the concessions leased or acquired from DDGM’s former consultant.
18
The Don David Gold Mine also includes the Rey property, which adjoins DDGM's El Chamizo concession on the west side. These concessions are Rey, El Virrey, La Reyna, and El Marquez. DDGM acquired the El Virrey concession from the former consultant, and it is subject to a 2% net smelter return royalty payable to the consultant. DDGM obtained the remaining concessions by staking claims and filing for concessions with the Mexican government. These concessions total approximately 2,335 hectares.
In March 2013, DDGM acquired the San Pedro Fracción 1 and San Pedro Fracción 2 concessions from Almaden Minerals Ltd. (Almaden), subject to a 2% net smelter return royalty. The San Pedro Fracción 1 concession consists of 2,554 hectares and is located south of DDGM’s Alta Gracia and El Chamizo properties. The San Pedro Fracción 2 concession consists of approximately 1,860 hectares and is surrounded by DDGM's El Chamizo concession and will be included as part of the El Chamizo property. Any future production from the San Pedro Fracción 1 and San Pedro Fracción 2 concession is subject to Almaden's 2% net smelter return royalty.
3.4.1Mine Closure
DDGM is required to prepare a mine closure plan for the possible future abandonment of the Arista and Alta Gracia Projects. Golder has prepared a Mine Closure Plan and Reclamation Budgets for the Arista Mine. The closure cost estimate includes funds covering the tailings ponds, waste rock stockpiles ("tepetateras"), and securing and cleaning up the other surface and underground mine facilities. The total estimated closure and reclamation cost for the Arista and Alta Gracia Mines is estimated to be $12.0 million. Golder prepared its report in December 2023.
See Section 17 (Environmental Studies, Permitting and Social or Community Impact) for additional information on the environmental regulation of the Project.
DDGM has obtained, or is in the process of applying for, the required Environmental Impact Studies and permits to continue operating in accordance with Mexican Laws and Regulations.
3.6Other Significant Factors and Risks
We are not aware of other significant factors and risks that may affect access, title or right, or ability to perform work at the mine.
In the opinion of the QPs:
| ● | GRC was provided with a legal opinion that supported that the mining concessions held by DDGM for the Don David Gold Mine are valid and that GRC has a legal right to mine the deposit. |
| ● | GRC was provided with a legal opinion that supported that the surface rights held by DDGM for the Don David Gold Mine are in good standing. The surface rights are sufficient in the area for the mining operation infrastructure and tailings facilities. |
| ● | GRC was provided with a legal opinion that outlined royalties’ payable for the concessions held by DDGM. |
The information discussed in this section supports the declaration of Mineral Resources, Mineral Reserves and the development of a mine plan with accompanying financial analysis.
19
4ACCESSIBILITY, CLIMATE, LOCAL RESOURCES, INFRASTRUCTURE AND, PHYSIOGRAPHY
DDGM’s primary operations are located near San José de Gracia village, within the Municipality of San Pedro Totolapam. The Municipality of San Pedro Totolapam is located in the Region of the Central Valleys, 89 km southeast of the city of Oaxaca, and is part of the District of Tlacolula. Access to the project area from the city of Oaxaca is by the paved federal Highway 190, which passes through the village of San José de Gracia.
The Don David Gold Mine is approximately 4 km northwest of the village of San José de Gracia. Gravel and paved roads have been constructed from the village to the mine and mill sites, supporting adequate property access by small and large vehicles.
The Alta Gracia Project is approximately 20 km northeast of San Pedro Totolapam, the seat of the municipal government. The project is accessible by a gravel road that departs the paved highway approximately 13 km east of San Pedro Totolapam. The haulage distance by road from Alta Gracia to the DDGM Processing Facility, where the ore is processed, is about 32 km.
The climate of the DDGM area is temperate, semi-dry, and warm to hot. Most rainfall occurs in the summer months (June – August), and the annual average precipitation in the project area is approximately 400 mm, with significant fluctuations occurring. The recent average yearly temperature on the mine site is 22 degrees centigrade (°C); measurements at the Totolapam station from 1975 to 2008 showed an annual average of 24.2°C. Minimum yearly temperatures generally occur in January, while maximum temperatures typically occur in March through May; the yearly temperature range is generally between 9°C and 33°C. Mining operations are conducted on a year-round basis.
4.3Topography, Elevation, And Vegetation
The Don David Gold Mine is in the state of Oaxaca in southern Mexico, which is bordered by the states of Puebla, Veracruz, Chiapas, and Guerrero, with the Pacific Ocean to the south. The DDGM project areas are in the physiographic sub-province of Tierras Altas de Oaxaca, part of the Sierra Madre del Sur physiographic province, in the south-western part of Mexico.
Oaxaca has one of the most rugged terrains in Mexico, with mountain ranges that abruptly transition into the sea. Oaxaca has several mountain chains with elevations varying from sea level to more than 3,700 meters above sea level (masl). Between these mountains are primarily narrow valleys, canyons, and ravines. The mountains are formed mainly by the convergence of the Sierra Madre del Sur, Sierra Madre de Oaxaca and Sierra Atravesada into what is referred to as the Oaxaca Complex (Complejo Oaxaqueño).
The Arista and Alta Gracia projects of the Don David Gold Mine are located within the municipality of San Pedro Totolapam. The municipality's surface is irrigated by the Rio Grande River, with many tributary rivers also irrigating other project areas; most watercourses (arroyos) are dry throughout most of the year. The elevations range from 660 to 2,480 masl in GSRs project areas; somewhat lower in the Arista and Alta Gracia projects (up to 1,680 masl). The area is rugged with generally steep slopes, up to 30°, although more vertical cliffs are also present. The area is very rocky with thorn bushes and stunted deciduous temperate vegetation typical of dry savannah climates; locally, cacti, both columnar and candlestick types, are a prominent vegetation feature. Subsistence farming occurs in the area, and the main agricultural crop is agave cacti, which are cultivated to produce mezcal.
The current general layout includes all mine, process infrastructure, and supporting facilities to ensure that they meet the needs of the mine plan and production rate.
The Don David Gold Mine is 114 km, or two hours by road from Oaxaca City, the main service center for the operation, with good year-round access. A workforce familiar with mining and the necessary support facilities is present in the region. The company provides transportation to and from their local home bases. The San Jose de Gracia village supplies some of the crew for the mine, while other workers come from Oaxaca City or nearby villages.
The processing plant has a differential flotation circuit capable of processing polymetallic ores and producing up to three separate concentrate products for sale and an agitated leach circuit capable of producing gold and silver doré for purchase. The DDGM mill flotation circuit and agitated leach processing capacities provide for a nominal 2,000 tpd.
A flotation tailings impoundment was constructed in a valley just below the process plant site.
20
The impoundment is double lined with the first liner made of clay and synthetic material that acts as a leak prevention system with an effective absorption equal to ~3 meters of clay.
The second liner is a welded High-Density Polyethylene (HDPE), which was a permitting requirement. The method of subsequent embankment construction to obtain total capacity was upstream.
Construction of a filtration plant and dry stack facility commenced in September 2020 and was completed in early 2022. The filtration plant and existing paste plant (commissioned in October 2019) handle 100% of current tailings production.
DDGM has several permitted waste-rock disposal areas at the Arista and Alta Gracia projects. These waste disposal areas were designed mainly as valley fill sites.
Up until 2018, diesel generators mainly provided power at the site. In 2019, DDGM successfully connected a power line to its Arista Mine from the Mexican Federal Electricity Commission’s (Comisión Federal de Electricidad or “CFE”) power grid. Before this connection, the project operated 100% from electricity generated from more expensive, higher-emission diesel fuel. The mine and plant can remain operational using the diesel generators maintained for backup use. In 2021, there was an increase in power consumption due to ventilation and dewatering pumps requiring the installation of capacitors that improved and stabilized the power supply. In 2021, DDGM also initiated conversations with CFE to expand the load delivered to stabilize the energy supply. In 2022, the capacitors were installed and commissioned, and CFE expanded the load delivered to attend to the higher demand on site.
Water requirements to process ore are primarily sourced from water pumped to the surface from the underground mine dewatering system. Previously, some water was sourced from the local river for which payment was made to the National Water Commission (Comisión Nacional del Agua, or “CONAGUA”); however, this consumption is now minimal, and river water is only used for the camp facilities. DDGM has the necessary permits to discharge underground mine water at the surface. Water in the tailings facility is recycled to the DDGM processing plant, and the excess water pumped from the underground workings is discharged at the surface into decantation ponds. Water sampling from rivers and creeks is conducted regularly and sent to an external laboratory for analysis.
All process buildings and offices for operating the mine have been constructed. Camp facilities are in the village of San Jose de Gracia.
Plan drawings and more detailed information regarding the property infrastructure are provided in the Project Infrastructure section of this report.
4.5Sufficiency of Surface Rights
This report's mineral resources and mineral reserves are located on mining concessions controlled by DDGM. The mine's processing facility and supporting infrastructure are within the area of surface rights and mineral tenure owned by the Don David Gold Mine.
It is the opinion of the QPs that there are sufficient mineral tenure and surface rights to support the LOM mining operations due to the following:
21
The Arista and Alta Gracia Projects are in the regional Tlacolula mining district in the state of Oaxaca, in south-west Mexico. According to the Mexican Geological Survey, the Servicio Geologico Mexicano (“SGM”) mining activity was initiated in the early 1880s in the Tlacolula mining district, producing some 300,000 ounces of gold and silver from an ore shoot in the La Leona mine. However, no separate amounts of production were reported for each metal. SGM states that in 1892 two smelters were built and operated (Magdalena Teitipac and O’Kelly) near the village of Tlacolula for processing ores from the Alta Gracia La Soledad, San Ignacio y Anexas, La Leona, La Victoria, and San Rafael silver mines. Subsequently, in 1911, Mr. Sken Sanders investigated the Totolapam mining region with a particular interest in the Margaritas mine. Most of these historical mines are situated within DDGM’s mining concessions.
The Arista and Alta Gracia projects are in the smaller mining sub-districts of San Jose de Gracia and Alta Gracia, respectively. Only small-scale artisanal mining has been historically conducted in these sub-districts. No reliable production records exist for the historic production performed in the Arista and Alta Gracia Project areas.
The Arista Project mining district had been inactive since the 1950s and the Alta Gracia Project mining district since the 1980s until Apex Silver Corporation (Apex) began exploration work in the 1990s. Subsequently, GRC initiated geologic reconnaissance through its Mexican subsidiaries in search of precious metal deposits.
DDGM currently holds an interest in twenty-nine (29) mining concessions in Oaxaca State, totaling 55,119 hectares. Expiration dates associated with the DDGM mining concessions range from August 30, 2049 to February 22, 2073.
GRC has carried out a continuous drilling program since 2003 when the company took control of the Arista project mining concessions, now part of GRC’s Don David Gold Mine. GRC continues the development of an aggressive exploration program that includes underground mine development, such as access ramps, drifts, and crosscuts into the Arista, Switchback, and Alta Gracia vein systems.
In the 1940s, exploration adits were mined into the Manto Vein, but the results of this activity were not reported. In the 1980s, mining took place on the Alta Gracia property; again, no information on exploration activity is available.
In 1998 - 1999, before GRC’s involvement, several DDGM concessions were leased to Apex. Apex conducted an exploration program involving geologic mapping, surface sampling, and an 11-hole RC drilling program (1,242 m) into the shallow dipping vein, manto-style deposit (Manto Vein).
GRC exploration and drilling activities are discussed in the relevant sections of this document.
5.3.Prior Mineral Resources and Mineral Reserves
All previously reported Mineral Resource and Mineral Reserve estimates are regarded as prior estimates and are superseded by the current Mineral Resources and Mineral Reserves presented in this Report.
The Arista and Alta Gracia Projects are in the smaller mining sub-districts of San Jose de Gracia and Alta Gracia, respectively. Historically, only small-scale artisanal mining has been conducted in these sub-districts. No reliable production records exist for the historic production conducted in the Arista and Alta Gracia Project areas. Mining of the Arista deposit was initiated in 2010. The mining of the Switchback deposit began in 2017.
Since the commencement of production from the Don David Gold Mine in 2010, DDGM has produced 379,013 ounces of gold and 25,895,756 ounces of silver from the 5,992,068 tonnes shipped to the DDGM Processing Facility (Table 51). In addition, 16,605 tonnes of copper, 69,583 tonnes of lead, and 190,334 tonnes of zinc have been produced from the plant.
22
Table 5-1: Don David Mine Production 2010 through 2023.
YEAR |
MILLED |
GOLD |
SILVER |
COPPER |
LEAD |
ZINC |
TONNES |
OZ |
OZ |
TONNES |
TONNES |
TONNES |
|
2010 |
166,237 |
10,493 |
111,316 |
|||
2011 |
214,215 |
21,586 |
2,180,309 |
620 |
1,840 |
3,730 |
2012 |
282,120 |
34,417 |
2,996,743 |
986 |
3,374 |
9,115 |
2013 |
316,270 |
33,942 |
3,032,841 |
926 |
2,742 |
7,452 |
2014 |
375,623 |
35,552 |
3,297,204 |
1,254 |
4,555 |
13,195 |
2015 |
413,626 |
29,644 |
2,506,337 |
1,310 |
4,174 |
13,900 |
2016 |
450,221 |
27,628 |
1,857,658 |
1,035 |
4,049 |
14,302 |
2017 |
449,177 |
28,117 |
1,773,263 |
1,141 |
5,365 |
16,301 |
2018 |
611,670 |
26,838 |
1,672,034 |
1,652 |
7,280 |
19,808 |
2019 |
693,173 |
29,435 |
1,722,852 |
1,859 |
9,202 |
23,683 |
2020 |
565,346 |
20,473 |
1,189,366 |
1,593 |
7,725 |
19,696 |
2021 |
501,978 |
26,438 |
1,200,291 |
1,506 |
7,544 |
17,696 |
2022 |
493,241 |
34,122 |
1,213,404 |
1,436 |
6,665 |
17,943 |
2023 |
459,171 |
20,328 |
1,142,138 |
1,287 |
5,068 |
13,513 |
Totals |
5,992,068 |
379,013 |
25,895,756 |
16,605 |
69,583 |
190,334 |
23
6.GEOLOGICAL SETTING AND MINERALIZATION AND DEPOSIT
The regional geology of the Don David Mine is dominated by volcanic rocks of presumed Miocene age that vary in composition from rhyolitic to andesitic, which occur as flows, tuffs, agglomerates, and ignimbrites, as well as intrusive units. These units overly and intrude basement rocks consisting of Cretaceous marine sediments.
The Don David Mine includes mineral deposits over a 55-km NW–SE mineralized trend, which is hosted by volcanic, sedimentary, igneous, and metamorphic rocks ranging in age from Cenozoic to Cretaceous. The regional geology is contained within the Cuicateco, or Juarez, tectonostratigraphic terrane. The Juarez terrane is a west-dipping, fault-bounded prism of variably deformed Jurassic and Cretaceous arc-volcanic and oceanic rocks. The Cenozoic volcanism and subsequent structural overprint are interpreted to be related to subduction along the predominantly convergent southern Mexico plate boundary (Figure 61)
Figure 62 shows the DDGM concession boundaries and regional geology for the Don David Mine area taken from SGM (formerly the CRM; Sánchez Rojas et al., 2000).
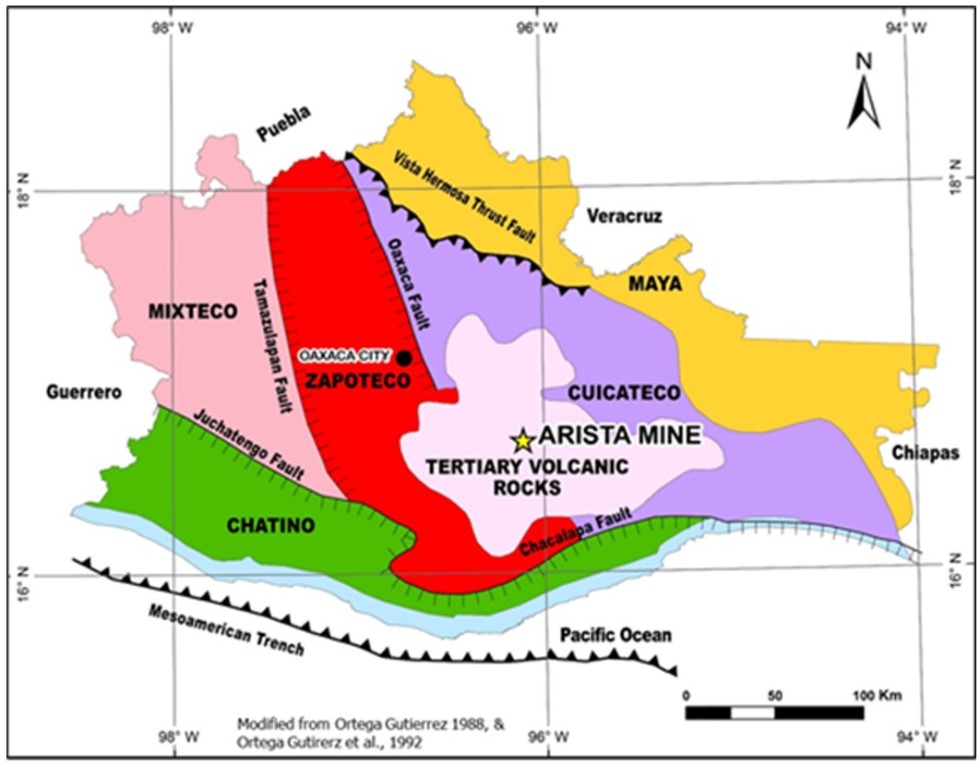
Figure 6-1: Map of Oaxaca State showing tectonostratigraphic terranes.
24
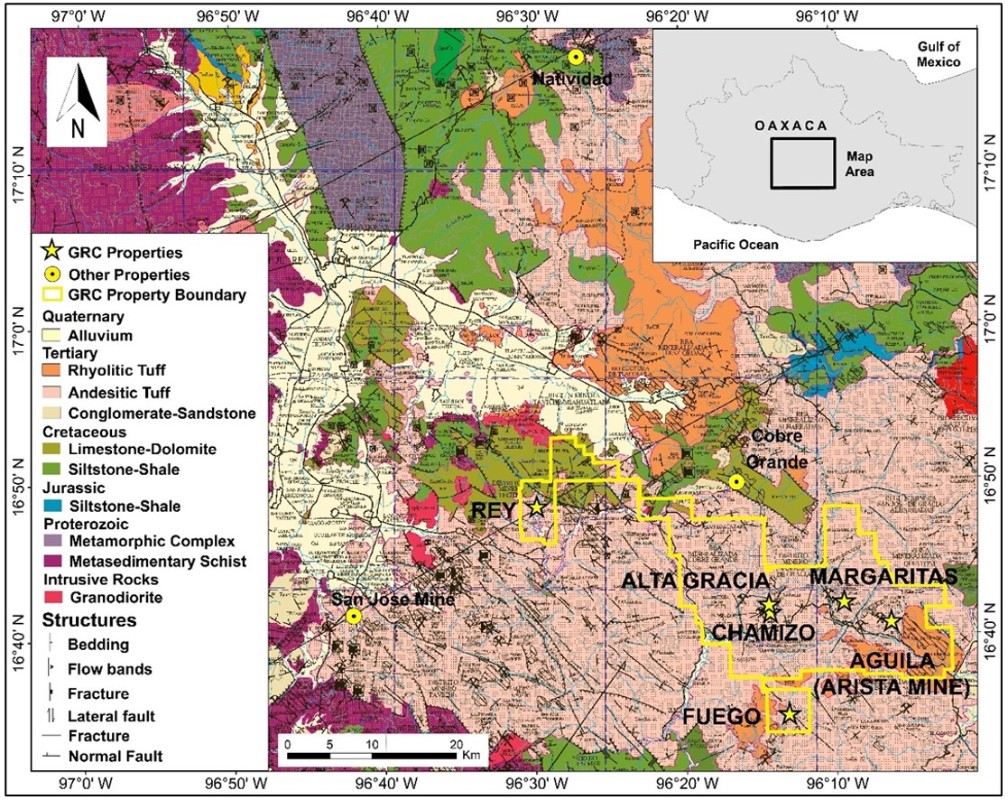
Figure 6-2: Concession boundaries in yellow (Geology after Sánchez Rojas et al., 2000; map insert from INEGI 2019).
25
The Don David Mine is underlain by thick sequences of andesitic to rhyolitic volcanic and volcaniclastic rocks, with intercalated minor sedimentary units, of presumed Miocene age (Ferrusquía-Villafranca and McDowell, 1991). The youngest volcanic units may be of Pliocene age. Multiple, predominantly rhyolitic volcanic domes at various scales have been identified within the district. It is suspected that non-vented domes also occur. These units are unconformably underlain by a basement of Cretaceous marine, locally calcareous sediments.
Figure 64 shows the stratigraphic column for rock units shown in Figure 63, corresponding to DDGM’s local geologic investigations.
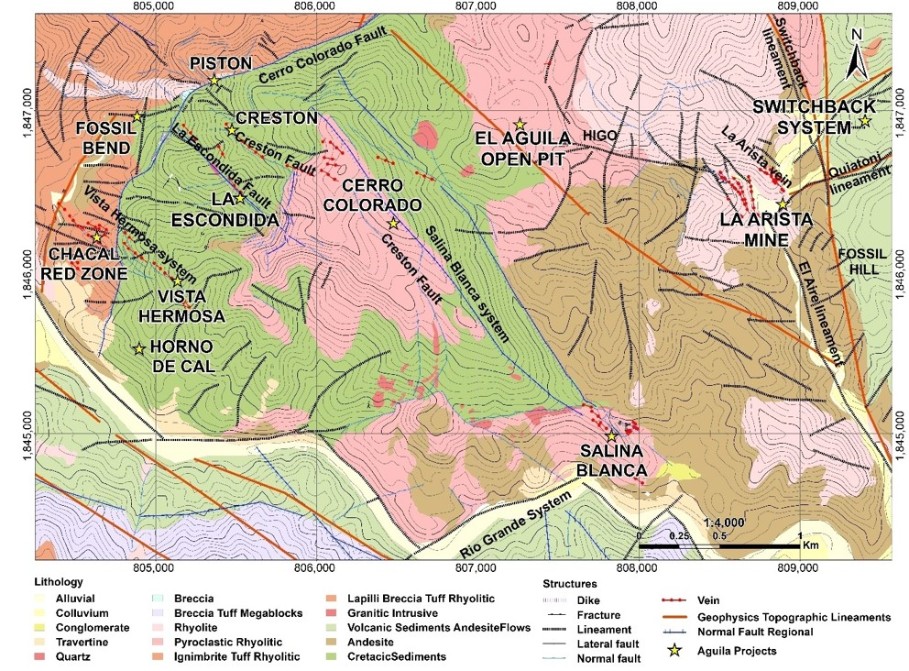
Figure 6-3: Geologic Map of the Arista Project and Arista Underground Mine Area.
26
Multiple volcanic domes of various scales dominate the Don David Mine area, and it is suspected that non-vented intrusive domes are also present. These volcanogenic features overly, and are intruded into, a pre-volcanic basement of sedimentary rocks. Gold, silver, and base metal mineralization in this district is related to the volcanogenic system and is considered epithermal in character.
6.3.1Arista Project
A semi-detailed regional geologic map of the area at a scale of 1:5000 was initiated in 2007 by DDGM’s on-site geologic staff (Figure 63). The information recorded includes lithology, structural, alteration zone features, and hand sample locations. Data based on aerial photographic interpretation and field data were incorporated into the geologic map, continually updated based on new observations.
The Don David Mine Arista property is underlain by a Cretaceous sedimentary lithic sequence, composed of fine-grained sandstones intercalated with shale, siltstone, and calcareous rocks; these have been identified in outcrops on the central part of the Arista Project area surrounding the Cerro Colorado peak and in drill hole intercepts (Figure 63). Younger andesitic to rhyolitic volcanic and volcaniclastic units, intrusive dikes, and small stocks of granitic to granodiorite composition crop out within the area and have been intercepted in drill holes. The intrusive rocks may be associated with structural conditions favorable for subsequent deposition of mineralization along dikes, faults, and breccia zones and be related to possible replacement and skarn deposits in good contact zones with the sedimentary sequence.
The mineralized structures appear to be associated with a trans-tensional structural system intersecting an interpreted Cenozoic-aged volcanic “caldera.”
6.3.1.1 Stratigraphy
The stratigraphy of the Arista Project area can be divided into a Cretaceous basement and overlying Tertiary units, as shown in Figure 64. The Cretaceous units are composed of rocks of sedimentary origin, weakly to moderately metamorphosed and often intensely deformed. These rocks are unconformably overlain by the Cenozoic units comprised mainly of subaerial volcanic rocks. The rocks of the Cenozoic cover have experienced only extensional deformation and, in some places, are gently tilted. The Cenozoic-aged rocks correspond to a period of tectonism accompanied by volcanism, sedimentation, and intrusive magmatic activity associated with the north north-east subduction of the Guadalupe plate under southern Mexico (Morán-Zenteno et al., 1999). According to geologic investigations by DDGM’s on-site staff and numerous consultants, the predominant rocks identified within the Arista Project area include volcanic rocks of intermediate to acid composition (andesite to rhyolite).
Below is a summary of the central stratigraphic units determined by the GRC geologists.
Rocks of Cretaceous Age:
Black Breccia (Ksm Ar-Lu) - The basement rocks within the Arista Project area consist of the Late Cretaceous formation locally referred to as "Black Breccia". This formation consists of lithic sedimentary rocks composed of carbonaceous shale, fine-grained sandstone, siltstone, and calcareous rocks, including some layers of argillaceous limestone. The Black Breccia strata occur in thicknesses that vary from 2 - 80 cm, while sandstone beds may reach 1.0 m in thickness. The formation hosts rounded to sub-rounded lithic fragments of a few millimeters up to 1.0 m in diameter, composed of the same host formation that may have originated due to tectonic events. This formation occurs in the area surrounding Cerro Colorado peak. According to the SGM (Carta Geológico Minera Totolapan E14-D69, 2003), its thickness is about 300 to 400 m, and it is of Albian–Maastrichtian age (Mid–Late Cretaceous) based on fossil identification.
Rocks of Cenozoic Age:
The Cenozoic units consist of a series of volcanoclastic deposits interbedded with volcanic rocks of andesitic composition (volcano-sedimentary series) overlain by a succession of andesitic to rhyolitic volcanic rocks occurring as flows, tuffs, ignimbrites, and agglomerates; the units have been classified as follows:
Volcanic Sediments with Andesites (Tm An-Sed) - consists of intercalated sandstones, tuffaceous sandstones, siltstones, and andesite flows and tuffs. The andesitic flow units occur near the base of the sequence associated with volcaniclastics. This is considered to be grouped within the Laollaga formation and is differentiated from the Tm Tan-An unit by sediments. While currently distinguished, this and the following unit may prove to be a single more diverse unit.
28
Andesite (Tm Tan-An) - This unit was dated by Petróleos Mexicanos (Murillo and Torres, 1987) as Late Oligocene – Early Miocene age (26.4 ± 1.3 million years, Ma to 19.0 ± 0.95 Ma); while SGM dated this unit as Middle to Late Miocene (15.3 to 17.32 Ma). This unit is classified as a member of the Laollaga Formation and consists of a series of andesite flows, tuffs, and breccia zones with complex contacts between occurrences. The unit crops out in about 60 percent of the Arista Project area proximal to and capping Cerro Colorado Peak.
Rhyolite (Tm Ry) - Consists of rhyolite flows with some pyroclastic phases hosting abundant phenocrysts of plagioclase and quartz crystals (“eyes”). Outcrops are noted in the northeastern and southeastern parts of the project area and overlie the andesite with discordant and structural contacts. In drill holes, it can appear as lithic tuff (e.g., DH-107021). SGM dated this unit as Middle Miocene (16.57 to 15.82 Ma). This rock unit constitutes the core of the Cerro Pilón dome.
Pyroclastic Rhyolite (Tm PclRy – Ry) - This unit crops out within the open pit, around the western slope of Cerro Pilón, and on the slopes and top of Cerro Colorado. The unit consists of a sequence of strata with 10 - 30 cm thick beds, exhibiting clastic textures enclosing rock fragments composed of shale and coarse-grained sandstone within a fine-grained matrix. The unit indicates substantial alteration, including silicification, argillization, and oxidation. This unit may be part of an underlying breccia unit. It has been identified in drill holes 105023, 106005, and 106009 with a thickness of 70 to 135 m, dated to the Middle Miocene age.
Rhyolite Tuff – Ignimbrite (Tm Try – Ig) - This unit occurs on the north-western part of the Arista underground mine area. It consists of pyroclastic units occurring as lithic tuffs with different degrees of consolidation. Typically, outcrops are present in the Chacal Creek area, appearing as thin to massive strata 25 to 30 cm thick. The unit contains abundant lithoclasts enclosed by fine-grained matrix hosting quartz “eyes.” It has been considered to be of the Middle Miocene age. According to Lipman (2011), this rock unit may be regarded as an intra-caldera unit due to its significant thickness (260 m) intercepted on the southwestern slope of Cerro Pilón (drill hole 111001).
Rhyolitic Tuff – Agglomerate (Tm Try – Agl) - This unit occurs as a mesa on the Tablón mountain to the northeast of San José de Gracia, consisting of a sequence of stratified lithic tuffs with intercalated ignimbrite beds of up to 5 m in thickness. These rocks contain quartz crystals, feldspars, and abundant rounded and sub-rounded, poorly classified, slightly consolidated fragments of ignimbrites. The unit has a thickness of about 200 m at the top of the Tablón Mountain. This unit’s physical characteristics, such as stratification including cross-stratification and rounded to sub-rounded fragments, indicate a volcano-sedimentary sequence where the deposition was interrupted by volcanic events that caused deposition of intercalated beds of ignimbrites, rhyolites, and tuffs. It has been defined as of Late Miocene age.
Andesite (TPl An) - This unit consists of massive dark-grey aphanitic andesite with occasional plagioclase crystals. The thickness is estimated at 100 m and is believed to be Pliocene age. Some dikes and sills of this unit intrude the Rhyolite Tuff – Ignimbrite unit at Chacal creek.
Intrusive Rocks:
Granite – Porphyry Rhyolite – Felsic Rhyolite (Tm Gr, Tm PR, Tm Ry-Fel) - A few small outcrops of this unit have been observed within the Arista Project area; notably on the eastern side of the Arista underground mine, and on the upper parts of the Cerro Colorado peak. These rocks are thought to be from the Middle Miocene age. In outcrop form, they appear as granular holocrystalline rocks composed of white feldspar with quartz. These units have been intercepted as dikes in some Arista mine area drill holes. The unit appears to be related to other regional rhyolite intrusions and may have played a role in the uplift of the Cerro Colorado dome.
Other Rocks of Quaternary Age:
The youngest rocks identified in the Arista Project area include surficial deposits of alluvium, colluvium, and gravel as products of weathering of the surrounding pre-existing units. Locally and particularly near Salina Blanca, active travertine deposition occurs due to infiltration and deposition of carbonate-bearing water, which may indicate a dynamic hydrothermal system and dissolution of carbonate sedimentary rocks.
6.3.1.2 Structural Geology
The Arista Project shows a complex structural system with numerous lineaments and geologic structures; many were first identified on satellite images and aerial photographs and later verified during field observations and drilling. Figure 63 highlights the prominent structures discussed below.
29
The identified structures have been used to define a possible regional transtensional wrench-fault system determined by relative movements and inter-relations between the various individual structures. A transpressional system has also been proposed. The most significant regional structures within the Arista Project area are summarized as follows:
Río Grande System - Identified along the valley of the Río Grande River in the southern part of the area and is represented by a series of sub-parallel faults, oriented ENE - WSW with a complementary or conjugate sub-perpendicular system with an NW-SE orientation. This fault system seems to represent the regional trace of a right-lateral strike-slip fault.
Aire Lineament - Occurs as strong quartz vein (Aire vein) within the Arista mine, along the Aire creek and adjacent to the Arista mine road, striking N25˚W cutting the local andesite and rhyolite units. In the Arista mine area, this lineament changes orientation to the north and appears to intersect two other lineaments, Quiatoni and Higo.
Quiatoni Lineament - This lineament is oriented N60˚E and is located at the eastern side of the Arista mine. It cuts through andesite and a lithic agglomerate tuff unit. Other sub-parallel structures have been identified to the north of the Quiatoni structure, indicating a solid and broad structural system.
Switchback Lineament - Occurs as a sub-parallel structure to the Aire Lineament oriented at N17˚W. It is enclosed by pyroclastic volcanic rocks and rhyolite that constitute the Pilón dome. This lineament was intersected in drill hole 108030 as a significant fault zone.
Higo Lineament - Occurs along the Higo creek oriented N78˚W and is projected from the Arista underground mine to the Arista open pit mine. Outcrops exhibit quartz veins and veinlets along with fractures within the lineament system.
Arista Vein System - Consists of up to 40 cm thick vein exposed along Arista ridge oriented N45°W, 70°NE. Drilling has defined this significant vein system to a depth of more than 500 m and extending at least 650 m along strike with a thickness varying from 3 to 5 m. The vein corresponds to high-grade mineralization in the Arista underground mine workings.
Salina Blanca System - Composed of two parallel faults oriented N39°W with fault surfaces dipping to the NE bound sub-parallel structures. These are exposed on the northeast side of Cerro Colorado peak. The structure exhibits lateral and vertical movement, solid silicification, and stockwork quartz veins and often shows disseminated oxidation.
Crestón Fault - Exposed as a sub-vertical structure on the NW flank of Cerro Colorado, it strikes between N55°W to N70°W, with fault surface dipping to the SW. This structure is subparallel to the Escondida and Vista Hermosa fault systems, all of which define the SW flank of a horst structure defined by Cerro Colorado peak.
Escondida Fault - Occurs on the western side of Cerro Colorado peak as a normal fault-oriented N40˚W, dipping to the SW. At the Escondida mine area, where several small mine workings follow narrow veins, this fault is associated with a quartz vein and a rhyolitic dike and base metal mineralization.
Vista Hermosa System - Consists of a group of sub-parallel normal faults with an average strike of N40˚W, dipping to the SW. It is considered part of the “en echelon” fault system that includes Creston and Escondida in the southwestern area of Cerro Colorado peak. This system shows vertical movement and hosts quartz veining with associated mineralization.
Cerro Colorado Fault - Occurs as a curvilinear normal fault orientation N7˚E, N30˚E, and N70˚E on the western and north-western sides of Cerro Colorado peak, respectively. Quartz veins and mineralization are associated with the fault zone, an area nominated as the “Red Zone.”
Chacal Fault - Occurs on the northern side of the Chacal creek oriented N25˚E and exhibits evidence of lateral movement. This fault appears to have been displaced by the Escondida and Vista Hermosa structural systems.
30
6.3.1.3 Local Structures
A detailed structural examination from underground mine workings, surface exposures, and drill core intercepts (in the regional regime context) provides evidence of transtensional-wrench faulting as the dominant structural control at the Arista Project. Consultants of SRK (Canada) performed site visits and subsequent desktop studies at the mine project in 2012 and 2013, examining the kinematics and overall structural system (Vos et al., 2012; Couture, 2012; Kramer and Couture 2013). Their conclusions support previous conceptual models and are summarized below (Figure 65 and Figure 66):
| ● | The Arista Fault is a northwest-striking, steeply northeast-dipping fault zone that comprises breccia and colloform veins and exhibits evidence for sinistral strike-slip fault movement. It comprises two main segments oriented at 305° and 280° (100°). |
| ● | The Alta Vein and Vein 3 are northwest-striking, sub-vertical fault zones comprising breccia and colloform veins and exhibit evidence for sinistral strike-slip fault movement with minor components dip-slip movement; additional post mineralization offset is oriented at 345°. |
| ● | The 100 Vein, renamed as Vein 1 (Arista NW trend transitioning to Santiago vein), is a 100° (280°)-striking, sub-vertical extensional vein that comprises breccia colloform veins, and exhibits evidence for normal-dextral movement along with a rare sub-fault bounding the vein. |
| ● | The Baja Vein is a 320°-striking, sub-vertical extensional vein that comprises mainly colloform veins and limited breccia and exhibits only a narrow fault zone along its walls. |
| ● | Post Mineral Faults - approximately 345° (165°) striking, sub-vertical sinistral strike-slip faults offset gold-silver-lead-zinc-bearing veins and are interpreted to post-date mineralization. |
Late structural events are suspected of playing a significant role in the current configuration of vein positions (Figure 66), with the most prominent trend-oriented 340-350° (sinistral strike-slip, ± oblique thrust). Many veins, including Baja, exhibit internal deformation (multiphase concurrent with mineralization and post mineralization), and several veins and splays, including Arista and Vein 3, are suspected of having been juxtaposed side-by-side by the post mineralizing events, such that an artificial thickening of veins results from transposition or “stacking.” To support this interpretation, evidence has been documented on measurable fault surfaces exposed in the upper levels of current mine workings on the Arista fault vein, Vein 3, and Baja vein. Likewise, bonanza grades have been attributed to these intersecting structural sites.
31
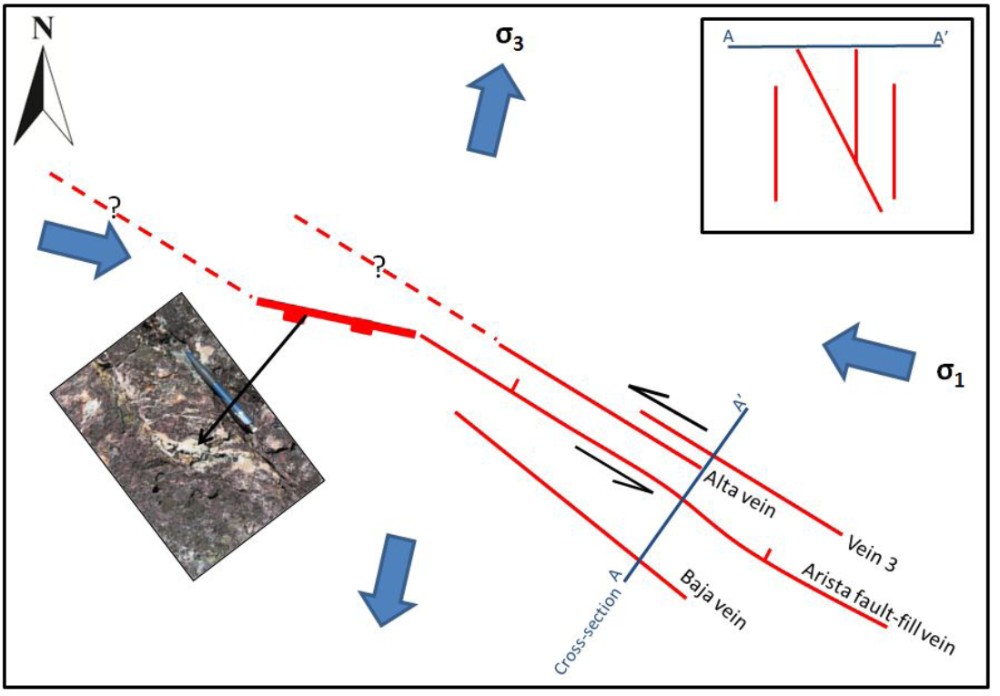
Figure 6-5: Simplified early structural framework for the Arista System highlighting fault-vein geometries; inset photo illustrates outcrop expression of dilation jog as favorable sites for vein/mineralization (mod. from Vos et al., 2012).
32
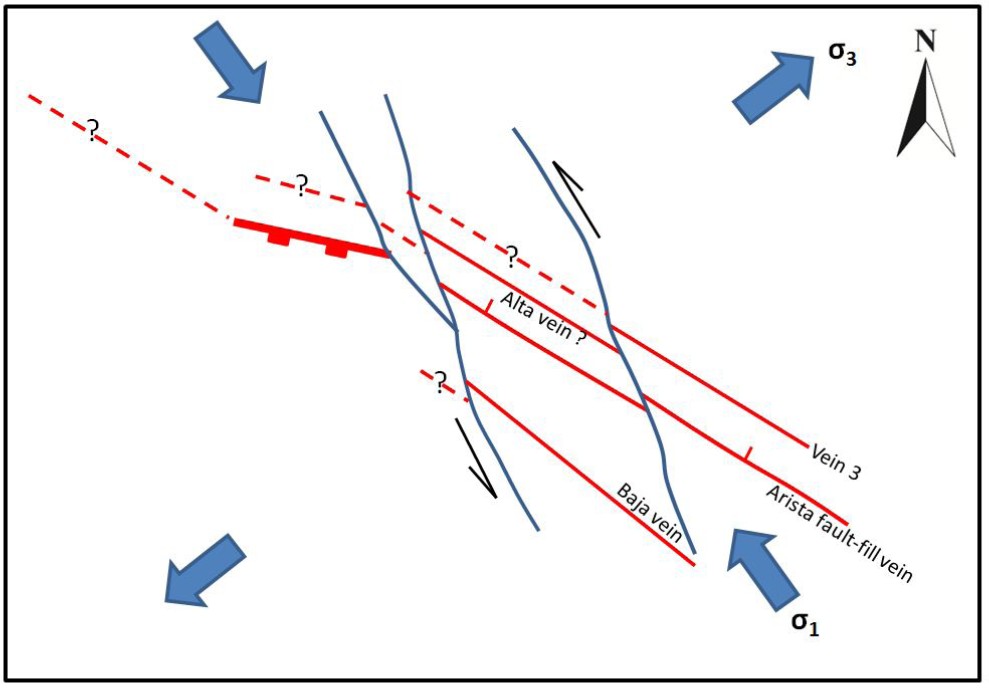
Figure 6-6: Generalized late structural framework, Arista System; shows post-mineralization deformation of the Arista vein system (mod. from Vos et al., 2012).
A consultant geologist performed additional structural work in 2018 (Hohbach, 2018) on the Switchback vein system, where similar transposition features are also seen in the principal veins. Hohbach identified four main mineralized structural orientations, which are, from oldest to youngest:
Hohbach also identified several preferred post-mineralization orientations, namely: FN0°, F60°, F90° (which can be confused with the mineralized set and can have notable offsets), and F325-330°, which can manifest as significant fault zones with significant gouge thicknesses. All can have fault gouge and show minimal mineral alteration. Most of the mineralized orientations correlate to directions identified by SRK for the Arista vein system.
33
6.3.2Alta Gracia Project:
Since April 2010, DDGM’s on-site geologic staff has reviewed available information and conducted geological reconnaissance and semi-detailed surface and underground geological mapping on the Alta Gracia property (Figure 67). The recorded information included lithology, structural, alteration zone features, and hand sample locations. Previous information based on aerial photographic interpretation and field data were incorporated in the geologic map.
6.3.2.1 Stratigraphy
The sedimentary and volcanic units mapped at Alta Gracia are like those observed at the Arista project. Known vein occurrences are mainly hosted in andesitic and rhyolitic units of the Cenozoic age.
The rock units mapped on the Alta Gracia Project can be divided as follows:
The sedimentary and volcanic units mapped at Alta Gracia are like those observed at the Arista Project. Known vein occurrences are mainly hosted in andesitic and rhyolitic units of the Cenozoic age.
The rock units mapped on the Alta Gracia Project can be divided as follows:
Cretaceous-age basement sedimentary rocks (Ksm Ar-Lu) consist mainly of sandstone and calcareous sandstone units. These units are deformed with numerous folds in moderate to thinly bedded strata. Thick Cenozoic volcano-sedimentary cover also unconformably overlies the Cretaceous sedimentary units. Basement rocks can only be observed in the roadcuts of the Pan-American Highway 190 in the vicinity of the town of San Juan Guegoyache. These rocks possibly correlate with the unit informally named “Black Breccia” of the Arista project. The basement rocks have not been encountered in DDGM’s drill holes, possibly due to the elevation difference between the zone where the basement crops out (1,100 masl) and the drilling area (1,600 masl).
Cenozoic-age volcano-sedimentary units consist mainly of pseudostratified tuffs of intermediate composition that vary from ash tuffs to volcanic breccias, medium to coarse-grained texture, and contain principally subangular clasts. Pyroclastic units are locally intercalated with porphyritic andesite flows (Tm Tan-Sed) that are possibly up to 400 m in thickness. The texture is generally aphanitic with the presence of quartz and feldspars. The thickness varies and ranges from one to a few meters up to 150 m, based on observations in drill holes completed to date. Also present are localized, possible calcareous horizons with interbeds of colloidal silica within the volcano-sedimentary units. These “exhalative” horizons can easily be confused with limestones interbedded with chert. Rhyolitic flows generally overly the pyroclastic and andesite units and crown the tops of the hills that make up the Alta Gracia area in the vicinity of historic mine workings. Rhyolite flows are typically white but become either yellow or brown when weathered.
Intrusive dikes of possible granodioritic and felsic composition (Tm Gr, Tm Ry-Fel) are also present in Aguacatillo Creek (arroyo). In some drill holes, hypabyssal rocks of probable monzonitic composition have been encountered.
6.3.2.2 Structures
The structural geology of the Alta Gracia area is somewhat masked at the surface by the presence of expansive soils and vegetation. However, numerous quartz veins are in accessible underground workings and prospect pits at Alta Gracia. Veins are mainly hosted in rhyolite at the surface, and andesite was developed in deeper underground mine workings. Two dominant vein trends have been mapped: N30°E dipping 65° - 85°NW and N50°E dipping 65° - 85°NW. Vein widths generally average from 0.2 to just over 2 m (true width). At least nine significant veins/vein systems have been identified at Alta Gracia that include the following:
Mirador Vein - The Mirador vein is a fissure filling vein hosted in andesite with a bearing 240°-250°, a dip of 60°-80°NW and a variable thickness of 0.80 m to 1.80 m. The Mirador vein is offset by a system of transverse faults bearing 340°-350°, dipping 45°-60°NE, with displacements of 1 to 11 m.
Huaje Veins - Two principal parallel veins, separated by 25 to 75 m, comprise the Huaje vein system. These veins strike from 230°-240° with a dip of 65°-70°NW and variable thicknesses from 0.80 to 0.90 m. The Huaje veins occur along faults hosted in andesite.
San Juan Veins - The San Juan and at least five subparallel ancillary veins strike 200°-210° with a dip of 60°-80° NW and a variable thickness of 0.30 m to 1.20 m. The veins are hosted in rhyolitic flows.
34
Victoria Vein - The Victoria vein strikes 210°-225°, dipping 70°-80°NW, and has a variable width from 0.15 m to 0.60 m. It is hosted in rhyolite flows.
Independencia Vein - The Independencia vein has a bearing of 240°-250°, a dip of 60°-80°NW and average thickness of 0.40 m to 1.20 m with intervals of up to 10 m (pinch and swell). It is mainly hosted in rhyolitic flows.
Aguacatillo Veins - The Aguacatillo area is comprised of two vein systems with very similar strikes of 040°-050°, dipping 80°-85°SE, and thicknesses varying between 0.25 m to 0.50 m. Rhyolitic flows host veins to the west and the east. They occur in andesitic tuff.
Chamizo Vein - The Chamizo vein has a bearing of 260°-280° and dips 45°- 70°NW. The vein contains good base metal values over very narrow widths (0.10 - 0.30 m). The Chamizo vein is hosted in andesitic tuff.
Navajas Veins - Navajas veins consist of a system of subparallel veins of variable thickness (0.20 - 0.30 m) with a bearing of 030°-040°, a dip of 70°-80°SE and contain significant levels of gold and silver. The veins are hosted in rhyolitic flows.
Base Metal Prospect - A prospective area with significant base metal showings in the southwest part of Alta Gracia. Mineralization is hosted at the rhyolite tuff and andesite contact with abundant carbonate flooding and local fault gouge. Geologic mapping indicates that the zone lies at the intersection of three structures. The intersection coincides roughly with an N45°E trending fault/contact between andesite and rhyolite.
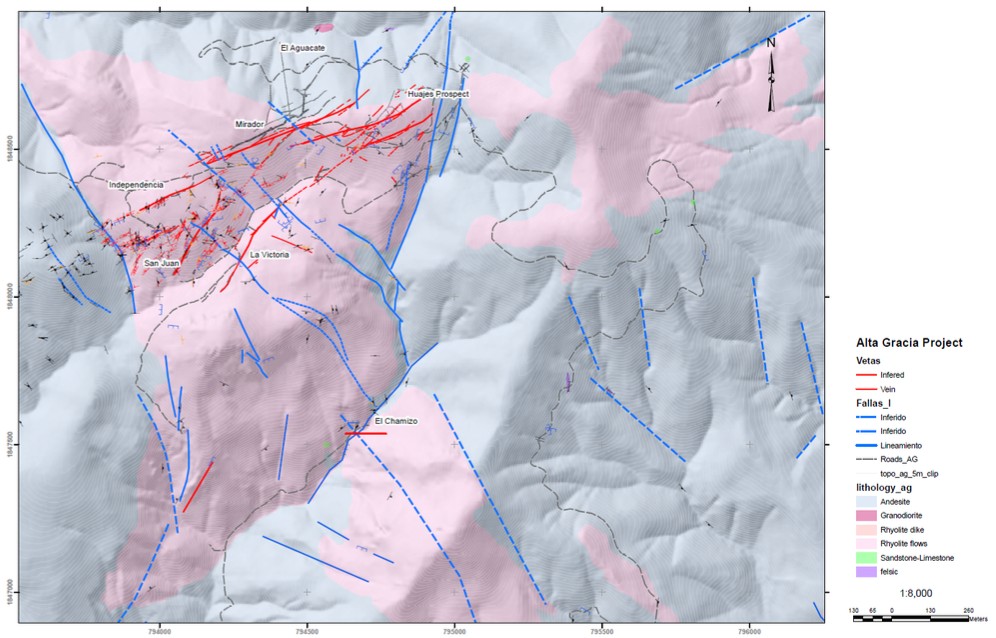
Figure 6-7: Plan Map Showing Geology and Vein Targets/Prospects at the Alta Gracia Property.
6.4Description of Mineralized Zones
The Don David Mine mineralization occurs as structurally controlled epithermal deposits in veins and stockwork zones consisting of concentrations of sulfides containing gold, silver, lead, copper, and zinc, associated with gangue minerals such as quartz calcite and other minor minerals.
35
The economic mineralization at the Arista Mine is gold, silver, copper, lead, and zinc. Structurally controlled epithermal veins and stockwork zones at the Alta Gracia Project (Mirador Mine) contain mainly silver-gold bearing sulfides. The economic mineralization currently exploited at the Alta Gracia Project is only gold and silver.
Primary sulfide mineralization within the mineralized structures contains pyrite, galena, sphalerite, argentite, chalcopyrite, and other silver sulfosalts associated with quartz and calcite as gangue minerals, which are found at depth.
Weathering of the mineralization has caused oxidization and shallow secondary enrichment zones containing sulfosalts (cerargyrite, pyrargyrite, stephanite) and carbonates (cerussite, hydrozincite, hemimorphite), sulfates (anglesite), silicates (willemite), and iron oxides (hematite, limonite, goethite, etc.) that may reach depths of up to 150 m from the surface outcrops. Other mineralization indicators recorded in the rocks, such as alteration-replacement events, include the presence of alunite-natrojarosite-jarosite and widespread sericitization and potassium alteration (adularia), especially in the Margaritas and Trenes prospect areas.
A petrographic study (Hansley, 2014) indicated additional species of silver sulfosalts, including miargyrite, freibergite, and acanthite, associated with mineralization, particularly at the Alta Gracia prospect. Samples from Splay 5 at the Arista mine exhibited abundant gold intimately associated with chalcopyrite, pyrite, and galena. Other vital observations included:
| ● | Disequilibrium features representing possible hybridization of intrusive units (Chacal-Escondida-Fossil Bend areas), |
| ● | Alteration assemblages such as widespread sericitization and potassium alteration (including adularia) at Margaritas and Trenes, and |
| ● | The associated Na-K alteration (alunite-natrojarosite-jarosite) indicates a hypogene event in the district. |
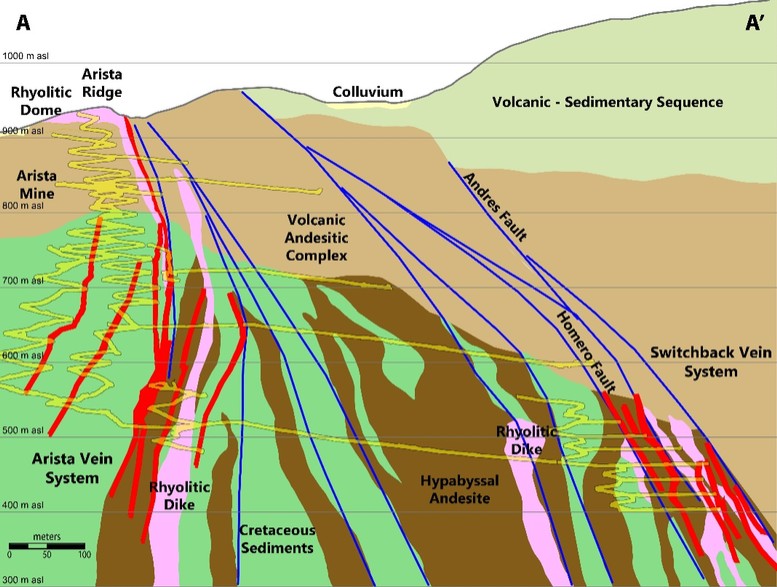
Figure 6-8: Arista Mine Schematic Cross-Section View Looking Northwest at the Arista and Switchback Vein Systems.
Economic concentrations of precious metals are present in “shoots” distributed vertically and laterally between non-mineralized segments of the veins. Vein intersections are the local site of important historic bonanzas. Overall, the style of mineralization is pinch-and-swell, with some flexures resulting in closures and others generating broad cymoidal breccia zones. A schematic cross-section through the Arista mine illustrates the general geologic configuration based on drilling intercepts (Figure 68).
36
The historic Don David Mine production at the Arista underground mine (part of the Arista Project) was mainly extracted from two principal veins, the Arista and Baja, and their related splays within the Arista vein system. Current production is focused on the Switchback vein system with extraction principally from the Soledad vein and associated splays and faulted offset sections, including the Selene and Susana veins.
Other significant veins and deposits at Arista include the historically exploited Aire and Aguila Manto veins and the recently discovered Three Sisters vein system (Sandy 1, Sandy 2, Sasha, and Sadie veins), between Arista and Switchback. Exploration drilling during 2023 discovered the Gloria vein system (Gloria, Gloria Footwall and Splay Gloria veins) located immediately to the north-west of the Three Sisters system. Historic (Pre GRC) underground production was also extracted from the Mirador and other veins at the Alta Gracia Project. Don David Mine production at Alta Gracia has been from the Mirador and Independencia vein systems.
6.4.1Arista Mine
6.4.1.1 Arista Vein
The Arista vein consists of multiple parallel veins and splays of varying lengths and widths associated with the predominant fault bounded structure. The vein is partially enclosed in strongly silicified rhyolite breccia, including stockwork zones related to the vein. The veining is also associated with the structural contact between hypabyssal andesitic rocks and Cretaceous sediments (Black Breccia). Mineralization is multi-phase (related to discrete structural and leaching events within the bounding fault), and restricted mineralogy is associated with variable grades and textures from fault contacts inward. Mineralization occurs within a range/mix of breccia, colloform banded quartz, crustiform quartz, and multi-phase banded sulfides with coarse-grained quartz intergrowths. Base-metal sulfides include massive galena, sphalerite, and chalcopyrite; ± disseminated remnants of pyrite; ± trace rhodochrosite; later quartz veins cut through sulfides; other trace sulfides include euhedral arsenopyrite overgrowths on dendritic native silver, magnetite, pyrrhotite, pyrite, acanthite, bornite, and tetrahedrite-tennanite. Areas of secondary sericite, clay, and microcrystalline quartz are often observed in petrographic analysis with complex intermixtures of hydrothermal, metasomatic, and retrograde minerals, including cordierite diopside, albite, calcite, epidote, adularia, chlorite, and clay. EM-EDX analyses confirmed the presence of argentite and freibergite associated with the leaching of base metals. Gold and silver are suggested to occurr late in the paragenetic sequence (after base metal sulfides and after a leaching/fracturing event). Gold occurs as micron-size “inclusions” in “recrystallized” arsenopyrite around vugs; antimony also appears related to gold based on petrographic evidence (Hansley, 2012).
Underground production and exploration of the Arista vein have been developed for more than 600 m of ore grade mineralization along strike and on multiple levels. The surface expression of the Arista vein consists of a narrow zone of silicified outcrop with a very weakly mineralized quartz vein of 20-25 cm width. The Arista vein was first accessed by cross-cutting on Level 2 at 872 masl, where it occurs as a narrow vein (35 to 40 cm). In the mine at Level 4 (831 masl), the vein has a 5.5 m true width. Figure 6.9 illustrates typical vein morphology in underground workings at the Arista mine.
37
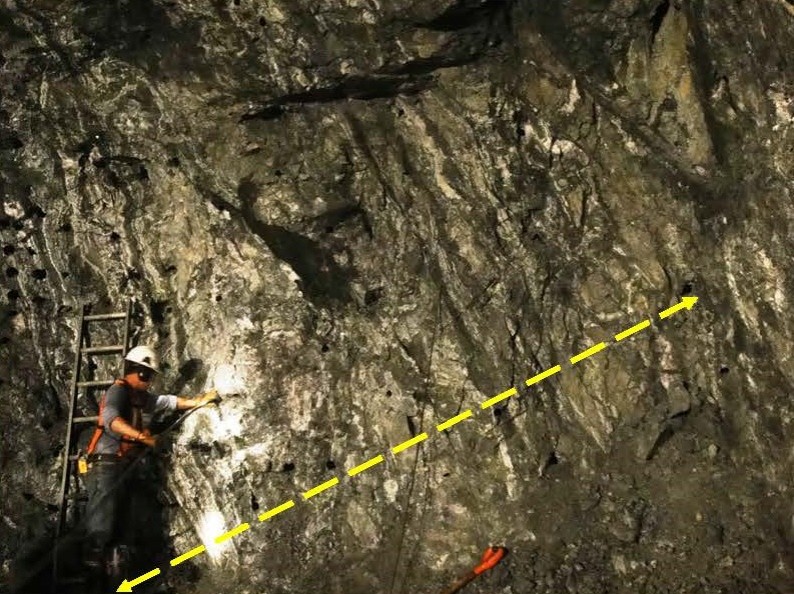
Figure 6-9: Typical Colloform Banded Style of the Arista Vein; Arista Mine Level 6. Vein is nearly 5 m wide from foot of miner to upper right of photo as indicated by yellow arrows.
6.4.1.2 Baja Vein
The Baja vein was discovered during an exploration drilling program on the Arista vein and generally hosts high-grade silver mineralization. The Baja vein occurs as a 1.0 to 1.5+ m wide mineralized structure with mineralization hosted within fractures and associated with crustiform features filling opened spaces. The vein comprises several splays and parallel veins of varying lengths and widths, including Splay 66. The general orientation is 310°-320°, dipping 70°SW to vertical, and has been developed, to date, by underground workings in the Arista mine between 460-800 masl elevations. It has a strike length (defined through drilling) of at least 500 m. The vein typically consists of multi-phase vuggy textured, crustiform banded, coarse-grained quartz, with some quartz replacement of carbonate; in addition, adularia replaced by carbonate has also been noted. Sulfides include fine to very fine-grained and banded occurrences, often disseminated at vein contacts. These are characteristics: bladed galena (possibly replacing carbonate), massive sphalerite, coarse stibnite, fine-grained and disseminated chalcopyrite, and pyrite. Other significant sulfides include proustite (Ag3AsS3), pyrargyrite (Ag3SbS3), and other silver minerals. Petrography has identified sub microscopic gold and argentite (after base metal sulfides), antimony associated with gold, and trace amounts of kyanite, corundum, and garnet.
6.4.1.3 Aire Vein
The Aire vein is located about 100 m west of the Arista vein and is oriented 345°, dipping 70°SW to vertical. It is hosted mainly by andesite, with some rhyolite occurring to the east of the vein. The Aire vein has been traced for over 400 m along the strike. Mineralization styles are similar to those veins previously described with abundant vuggy, replacement (after carbonate), coarse and cruciform quartz (locally recrystallized); sulfides often occur as massive masses including sphalerite, galena, proustite (microveinlets in sphalerite), disseminated arsenopyrite, and native silver; accessory minerals include abundant corundum (inclusions in quartz), adularia (as microveinlets) replaced by alunite, rhodochrosite rhombs (suggested as late-stage or post-event), calcite, sillimanite and kaolinite, fine-grained K-spar and rounded zircon.
38
While not economically significant, its exploration led to the discovery of the Arista mine.
6.4.1.4 Soledad Vein (Switchback Vein System)
Surface mapping in the ‘’Switchback’’ Hill area, approximately 500 meters northeast of the Arista underground mine, indicated the presence of an NNW-SSE trending porphyritic felsic dike with associated intense sulfate (gypsum) alteration and minor quartz-amethyst veining, sub-parallel to the Arista vein system. Geochemical rock chip samples taken by DDGM geologists from this altered zone returned base metal anomalies with weakly elevated silver values. Subsequent holes drilled from the Arista mine underground workings along the strike to the south of this area intercepted multiple zones of well-mineralized vein material associated with a strongly porphyritic felsic dike.
Like the Arista vein system, the Switchback vein system consists of subparallel veins, faulted offsets and splays of varying length and width. The principal vein for economic exploitation is the Soledad vein; associated splays, and faulted offsets, which have been locally named separate veins (e.g., Selene and Silvia). To date, several significant veins have been identified: Soledad, Selene, Silvia, Sofia, Sagrario and Susana. The quartz +/- minor calcite/dolomite/ankerite veins are hosted in andesite and associated with altered rhyolite porphyry dikes, and contacts to the Cretaceous sediments (“Black Breccia”); characteristics similar to the Arista vein. The host rocks of sediments/hornfels, andesite and rhyolite are often strongly silicified and pyritized with locally intense quartz stockwork veining. Rhyolite dykes are observed to be both pre- and post-mineral; strong evidence that they are coeval and have an association with mineralization.
The Soledad vein is generally NW to NNW striking, and 55-70°NE dipping. However, notable flexures occur along strike and along dip, with sectors of the vein being almost EW or NS striking, while vein dips can be vertical or locally up to 70°SW dipping (in the central NW section of the vein). In the SE the vein is more regularly NE dipping with azimuths of 320°-350° predominating. In the NW sector azimuths of the vein vary from 270°-360° and dips from 70°SW to 60°NE. The vein appears to have developed along several sigmoidal structural zones, with the principal sigmoid associated with the strongest mineralization. The Soledad vein is typically brecciated with fragments of quartz and variably bleached, silicified andesite wallrock fragments with a multi-phase quartz matrix. Carbonates are generally a minor component of the veins. Colloform and/or crustiform textures are common with bands of quartz, sphalerite and galena in places encrusting breccia fragments. Bands of white or amethyst quartz are also present, the latter being both an early and late feature. The breccia matrix mainly consists of fine-grained, dark grey quartz; the dark color due to the presence of very fine-grained pyrite. Small, drusy quartz crystals filling vugs are observed locally.
Abrupt changes in styles of veining are evidence for transposition and multiple mineralization events.
The vein mineralization comprises of pyrite with varying amounts of sphalerite and galena, commonly banded (where crustiform textures dominate) or disseminated in the breccia zone, as well as chalcopyrite. Semi-massive sulfides are locally observed. On a microscopic scale, patches and massive zones of sulfides as well as banded zones, notably sphalerite, show dendritic textures (Gissler, 2020 pers. comm.). Gold mineralization occurs at various levels of exploitation. Stronger gold mineralization, especially at deeper levels, is associated with intersections with other vein structures, e.g. the NNW Sofia vein, or structural flexures. Gold mineralization is generally stronger in the upper levels of exploitation. Silver enrichment is generally associated with zones of gold enrichment although there is no intimate relationship; a well-defined zone of silver enrichment is in the south-central section of the vein.
The wall rocks have been altered by silicification, carbonation, and pervasive argillization (smectite-illite-sericite); Hansley (2014) found pyrophyllite and kaolinite as alteration minerals in a rhyolitic dike associated with veining and cut in hole 513028, an indication of acid-sulphate alteration at the time of mineralization.
6.4.2Arista Manto Vein
The Manto vein consists of shallow dipping near-surface epithermal quartz vein oriented 070°, dipping 30°SW. It is composed of sugary to coarse-grained quartz hosted in volcanic hydrothermal breccia (consisting of large blocks of volcanic fragments and tuff). The host rock consists of pyroclastic rhyolitic deposits with bedded structure and textures varying from breccia tuff to lapilli and ash tuff, which is highly silicified and cut by quartz veinlets generating a stockwork, and with strong oxidation after pyrite and marcasite. Some of the fragments within the breccia zone are un-silicified and include fragments of basement sedimentary rocks. Typical mineralization is microcrystalline to coarse and vuggy quartz hosting dominantly “horn silver” cerargyrite (AgCl), with the sulfosalts jamesonite and boulangerite present in vugs. In thin polished section, gold appears exclusively within the “horn silver” and occurs with traces of pyrite, electrum, native silver, chalcopyrite, covellite, ± galena; large black to red oxides are also associated with antimony (bindheimite) and traces of native gold. Accessory minerals include disseminated calcite or aragonite and microcrystalline quartz, jarosite (after pyrite), illite (associated with quartz), leucoxene, and anatase (Hansley, 2008).
39
6.4.3Alta Gracia Veins
The Alta Gracia property hosts multiple sub-parallel veins and splays of varying length and width. Visible silver mineralization observed in the Alta Gracia veins includes accessory sulfide and sulfosalts such as pyrargyrite-proustite, arsenopyrite, abundant (3-5%) high color euhedral, and disseminated pyrite, sphalerite, traces of covelite, jamesonite, tetrahedrite, stibnite, and galena. Vein textures include carbonate coatings on quartz, bladed carbonate replacement by silica, banding/cockade white to grey quartz, drusy quartz coatings, massive amethyst, and open space voids and clay fillings. Other evidence for the presence of mineralization includes minerals such as malachite-azurite, limonite-hematite, and other oxides; argillization alteration as pervasive kaolinite, sericite, and illite, as well as zones with vuggy silica flooding.
Locally abundant pervasive silicification is noted, which often hosts disseminated pyrite. Examples of mineralized quartz veins at DDGM’s Don David Mine deposits are shown in Figure 610.
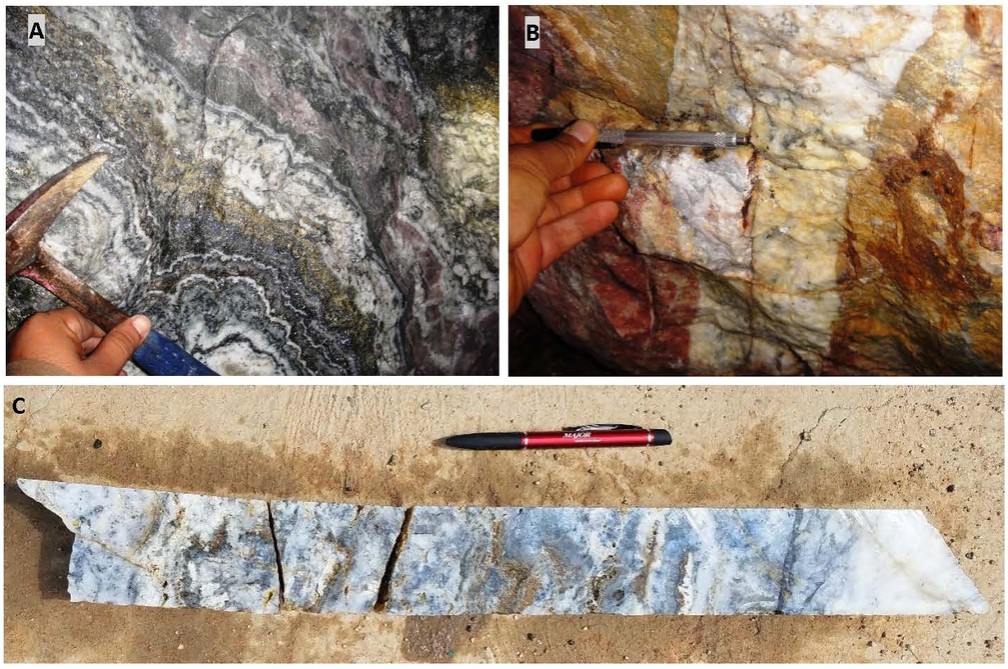
Figure 6-10: Examples of mineralized quartz veins at DDGM’s Don David Mine.
A) Colloform banded and crustiform quartz and banded sulfides of the Arista deposit from Mine Level 5 - note red banded mineralization in center (and throughout) is coarse ruby silver bordering banded quartz; view 0.5 m wide.
B) Underground photo of narrow, low-sulfidation quartz vein from the Alta Gracia property.
C) Drill core from Alta Gracia showing banded white to dark-gray quartz, open-space drusy quartz coatings, sulfides of pyrite, silver sulfosalts and arsenopyrite.
40
The San Jose de Gracia and Alta Gracia gold-silver sub-districts of the Don David Mine are characterized by classic, high-grade silver-gold, epithermal vein deposits with low to intermediate-sulfidation mineralization quartz-adularia-sericite alteration. The veins are typical of most epithermal silver-gold vein deposits in Mexico with respect to the volcanic or sedimentary host rocks and the paragenesis and tenor of mineralization. The Alta Gracia mineralization is typical of a low-sulfidation deposit (see Corbett, 2008 and Figure 611). The Arista mine vein systems are intermediate-sulfidation in nature and standard of many Mexican deposits, characterized by Camprubí & Albinson, 2007, and described as Polymetallic Ag-Au by Corbett.
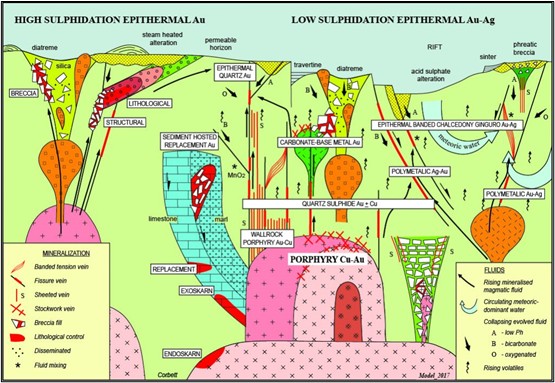
Figure 6-11: Conceptual model illustrating different styles of epithermal, magmatic arc mineralization (From Corbett, 2008).
Epithermal systems form near the surface, usually associated with hot springs, and to depths of a few hundred meters. Hydrothermal processes are driven by remnant heat from volcanic activity. Circulating thermal waters rising through fissures eventually reach a level where the hydrostatic pressure is low enough to allow boiling. This temperature can limit the mineralization’s vertical extent, as mineral’s boiling and deposition of minerals are confined to a relatively narrow range of thermal and hydrostatic conditions. In many cases, however, repeated healing and reopening of host structures can occur, imparting cyclical vertical movement of the boiling zone and resulting in mineralization that spans a much broader range of elevation.
As the mineralizing process is driven by filling void spaces and fissures, mineralization geometry is affected by the permeability and orientation of the host structures. Mineralization tends to favor dilatant zones in areas where fractures branch or change orientation, which may be driven, in turn, by wall rock competency and the relative hardness of individual strata.
Low to intermediate-sulfidation deposits are formed by the circulation of hydrothermal solutions that are near neutral in pH, resulting in minimal acidic alteration with the host rock units. The hydrothermal fluid can travel along in discrete fractures, creating vein deposits, or it can travel through permeable lithology such as poorly welded ignimbrite flows, where it may deposit its load of precious metals in a disseminated fashion.
41
The characteristic alteration assemblages include quartz, illite, sericite, and adularia, typically hosted either by the veins or in the vein wall rocks. Essentially all the prominent veins at the Don David Mine have silicification halos.
Epithermal veins in Mexico typically have a well-defined, sub-horizontal ore horizon about 300 to 1,000 m in vertical extent. High-grade ore shoots have been deposited by boiling hydrothermal fluids. The minimum and maximum elevations of the mineralized horizons at the Don David Mine have not yet been established. However, current production spans a vertical height of approximately 450 m, from 850 down to 400 masl. The mineralized horizon has been extended by drilling another 250 m vertically, down to 200 masl.
Similar geologic characteristics are present in other mining districts in Oaxaca. Another example includes Fortuna Silver’s San José mine, located closer to Oaxaca City, where mineralization has been reported to span vertical elevation ranges greater than 600 m.
In the opinion of the QPs, knowledge of the Arista and Alta Gracia Deposits, the settings, lithologies, and structural and alteration controls on mineralization is sufficient to support Mineral Resource estimation.
The Alta Gracia project is a typical low-sulfidation epithermal system, while the deposits of the Arista mine are intermediate-sulfidation systems with significant base metal components.
Understanding of the geological setting and an epithermal model concept for the Arista project, including the Arista mine and the Alta Gracia project, is adequate to guide exploitation and ongoing exploration.
42
GRC acquired its first properties of the Arista project in 2003 and began exploration that same year with initial efforts focused on the Manto Vein. The Aguila and Arista deposits are part of historic mining districts that have been inactive since about the 1950s (Lopez et al., 2012). The Alta Gracia Property has been dormant in a separate mining sub-district. The numerous remnant historic sites of small-scale mining and prospecting activities include the Arista mine. This site had exploited a shallow dipping manto-style vein using underground adits.
From 1998 to 1999, Apex Silver Mines Corporation (“Apex”) carried out an exploration program involving geologic mapping, surface sampling, and an 11-hole reverse circulation (RC) drilling program (1,242 m) into the Aguila shallow dipping vein (manto-style) deposit. Most information from this work is not available.
Don David Mine exploration for precious metals deposits include soil and rock chip sampling, spectral field measurements using a TerraSpec™ reflectance spectroradiometer, petrographic studies, fluid inclusion studies, geochemical studies, structural mapping and analysis, regional and local detailed geologic mapping, various scaled and themed geophysical studies, specialized reviews, and drilling programs.
First drilling, using the RC method, was undertaken on the Manto Vein in 2003. Since 2005 GRC has maintained nearly continuous drilling activities, with most of the drilling programs producing diamond drill core. Drilling is discussed in more detail in the later sections.
DDGM’s detailed exploration investigations have been mainly focused on the Aguila open pit and Arista underground mine areas. This area includes the significant Manto and Arista-Baja, Switchback vein systems, and other ancillary mineralized structures. The second area of considerable focus has been the Alta Gracia property. Different mineralized zones and properties have been investigated, including some preliminary drilling in areas such as Escondida, Chacal, Salina Blanca, and Pilón on the Arista Property as well as targets on the Margaritas and the Rey properties.
Primary exploration targets are extensions of vein mineralization at depth and along strike and other outlying sub-parallel veins present in the main block of contiguous claims that make up the Arista and Alta Gracia Properties. Continued exploration in the short to medium term will focus on locating sufficient viable mineralization to extend the mine life of the Don David Mine. While considered achievable, there are uncertainties and risks associated with exploring new areas or extensions to known mineralization. Many known gold and silver-bearing veins on DDGM’s mining concessions have not been fully explored. Mineralized veins are also known to occur on the Fuego property, located immediately south of the main concession block, and these veins also warrant further exploration. Exploration work to date has focused mainly on the Arista and Switchback vein systems of the Arista property and the Mirador and other veins of the Alta Gracia Property.
For more details on previous exploration programs, the reader is referred to earlier reports on mineral resources and mineral reserves for the Don David Mine (Brown et al., 2020; Brown et al., 2019, Brown & Devlin, 2018, Devlin, 2017, Devlin, 2016, Devlin, 2015, Devlin & Chaparro, 2014, Devlin & Chaparro, 2013, Lopez et al., 2012).
7.2Non-Drilling Exploration Methods
7.2.1Mapping
Geologic mapping, including a compilation of various data sources for the Arista property, has provided a cohesive base for exploration targeting. During initial exploration, period published maps and geologic investigations (including isotopic and geochemical analyses; petrographic, structural, and mineral resource studies; regional lithologic definition and correlation and aerial photographic interpretation) were incorporated into maps, and local definition of lithologic units for both surface and mine geology was established. From 2003-2007, GRC’s geologic staff and consultants completed semi-detailed geologic maps of the Arista property area at a scale of 1:5,000. Mapping information, including lithologic, structural, and alteration features, was recorded on handheld PC-GPS computers, using the software GeoInfomobile™ and TerraMapper™. Data were, and continue to be, stored in a Microsoft® Access® database and then imported into ArcGIS™ software. Detailed geologic mapping has included examining accessible historic mines and other surface workings. Mapping in conjunction with rock chip sampling has aided in delimiting individual veins and splays at the surface and defined associated highly altered areas for follow-up drill targeting, as well as locating specific host rock units related to mineralization.
43
7.2.2Geochemistry
Surface geochemical studies have been fundamental to the Don David Mine exploration programs. Much of the property area has been covered by stream sediment sampling and rock chip sampling, with systematic-grid soil sampling and trenching in selected areas.
7.2.2.1 Stream Sediment Geochemistry
The discovery of the Arista deposit was aided particularly by a regional stream sediment evaluation of the property, undertaken in 2006. The study results were reviewed by Jaacks (Jaacks, 2007) and indicated a strong gold anomaly located in the drainage from the Arista Open Pit to the Arista deposit (Anomaly #1). Anomalous Ag, As, Sb, and Hg were shown to accompany the Au anomaly and extend at least 1.5 km downstream from the deposit. In addition, the discrimination of 7 other potentially anomalous catchment basins was noted within the property (Figure 71), and nearly all were shown to be associated with the occurrence of a rhyolite host rock. The regional anomalies are summarized in Table 71, and the related geochemistry from this study is shown in Table 72.
The initial investigation determined that stream sediment sampling could locate known mineralization with Au dispersion extending between 0.8 and 2.0 km2 down-drainage. Additional areas for detailed exploration were also identified along the regional west-northwest trending corridor believed to control gold mineralization.
Follow-up work consisted of infill stream sediment sampling along the regional structural corridor (with up to 4-6 samples per km2), local detailed rock chip sampling, and denser grid soil sampling within anomalous catchment basins to define anomalies for other detailed investigations, including drilling.
Table 7-1: Regional Anomalies – Location and Geology (Jaacks, 2007).
ANOMALY |
SAMPLE |
E- UTM14N |
N- UTM14N |
LOCATION |
LITHOLOGY |
ALTERATION |
# |
# |
|||||
44
Table 7-2: Regional Anomalies Geochemistry (Jaacks, 2007).
ANOMALY |
SAMPLE |
AU |
AG |
AS |
BI |
CU |
HG |
MO |
PB |
SB |
SE |
TE |
TL |
W |
ZN |
|
# |
# |
PPB |
PPM |
PPM |
PPM |
PPM |
PPM |
PPM |
PPM |
PPM |
PPM |
PPM |
PPM |
PPM |
PPM |
|
In addition, basic statistics, correlation analysis between elements, and geochemical modeling were used to evaluate element associations (Jaacks, 2007), and results suggested several distinct mineralizing signatures were represented in the data. Within the Arista project, it was noted that precious and base metals were deposited in associations related to two events, an earlier skarn event at depth, followed by the main epithermal event of precious-base metal mineralization (Jaacks, 2007). Characteristics of a skarn environment were evident from geochemical sampling studies that demonstrated an association of Au+Ag+As+Sb+Hg+Cu+Pb+Zn+Mo+Bi+W characteristic Au-Ag-base metal veins developed in skarn setting peripheral to an intrusion. The second more limited element suite of Au+Ag+As+Sb+Hg suggests a signature typical of a volcanic-hosted epithermal Au-Ag vein system. Subsequent studies have indicated that veins are zoned from silicate/sulfide-dominant near the surface with increasing amounts of calc-silicate minerals at depth (e.g., Hansley, 2009 & 2012). A third Au association consists of elements Au+Ag+Hg+Mo+Te+Bi, which is located within an adjacent catchment basin on the Margaritas project. This gold association has a higher-level volcanic-hosted epithermal gold system, which is chemically distinct from the Arista systems.
45
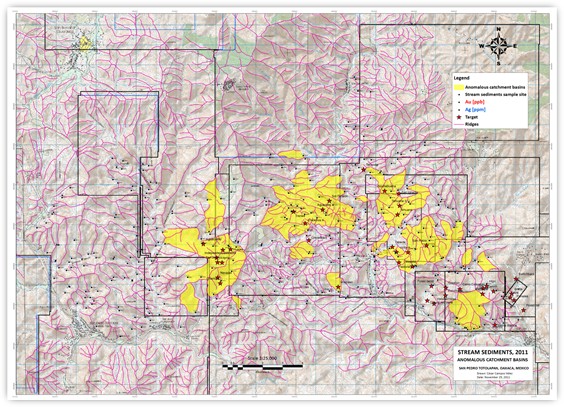
Figure 7-1: Regional Stream Sediment Anomalies (Jaacks, 2007).
7.2.2.2 Soil Sample Geochemistry
GRC has undertaken soil sampling programs over several areas, with most work undertaken on the Margaritas and Alta Gracia Projects. All samples from soil geochemistry programs have been submitted to ALS Chemex for analysis. Samples were prepared at ALS Labs Mexico (drying and -80 mesh sieve fraction). Analytical methods were performed on the pulps at ALS Vancouver utilizing 25g aqua regia digestion with an ICP-MS finish for Au. This analysis also included a suite of 51 elements with ICP finish (Method ME-MS41L). A summary of soil geochemistry programs undertaken by GRC on its concessions is given in Table 73.
46
Table 7-3: Summary of Soil Geochemistry programs undertaken by GRC from 2012 to 2023.
PROJECT |
YEAR |
LINE ORIENTATION |
LINE SPACING (M) |
SAMPLE SPACING (M) |
TOTAL |
PROGRAM AREA (HA) |
|
El Rey |
2011 |
0-180° |
(N-S) |
30 |
10 |
206 |
6.4 |
Las Margaritas |
2012 |
90-270° |
(E-W) |
50 |
50 |
24 |
8 |
2013 |
90-270° |
(E-W) |
50 |
50 |
249 |
61 |
|
2014 |
35-215° |
(NE-SW) |
100 |
30 |
1,495 |
447 |
|
2015 |
30-210° |
(NE-SW) |
100 |
30 |
1,657 |
521.6 |
|
2016 |
30-210° |
(NE-SW) |
100 |
30 |
859 |
270.4 |
|
2018 |
30-210° |
(NE-SW) |
100 |
30 |
574 |
216 |
|
Alta Gracia |
2019 |
310-130° |
(NW-SE) |
100 |
30 |
288 |
85 |
2020 |
310-130° |
(NW-SE) |
100 |
30 |
426 |
148.4 |
|
2022 |
320-140° |
(NW-SE) |
100 |
100 |
974 |
922.8 |
|
2023 |
220-040° |
(SW-NE) |
100 |
100 |
65 |
45.4 |
|
7.2.3Geophysics
Geophysical investigations aimed to delimit possible mineral concentrations or favorable structural settings related to mineable resources were undertaken progressively at the Arista property and over Don David Mine’s concession area. These examinations have included airborne and ground magnetometry, airborne radiometry, and ground surveys of induced polarization and magnetotellurics. Specific geophysical programs completed include:
| ● | Ground magnetic survey performed by Zonge Engineering and Research Organization; Inc. completed in 2007. |
| ● | Ground magnetic survey performed by Zonge Engineering and Research Organization; Inc. completed in 2011 & 2012: Follow-up to 2007 survey. |
| ● | Titan-24 Direct Current (DC)/Induced Polarization (IP)/Magnetotelluric (MT) ground survey performed by Quantec Geoscience completed 2010. |
| ● | New-Sense Geophysics Limited performed airborne magnetometry and radiometry in 2013. |
Most geophysical surveys were completed along northeast-southwest oriented lines, perpendicular to the dominant structural trends. Delineation and interpretation of the source of geophysical anomalies were evaluated with respect to mapped geologic features. Extreme value contrast areas (i.e., with adjacent high and low magnetic responses), primarily if associated with lineaments, were primary targets, as they were related to alteration and potential mineralization. Magnetic responses of the Manto Vein and the Arista zones were used as guides to identify other potential zones of interest.
Regional structural lineaments (including some vein systems) and other local structural fabric orientations were interpreted from detailed magnetic contrasts and often supported by corresponding MT and IP signatures. Radiometric signatures of uranium, thorium, and potassium helped follow up larger high-response magnetic delineated areas and often correlated well with intrusive or more intensely altered volcanic rocks. Potassium was considered a key indicator of hydrothermal alteration based on its association with the Arista and Manto deposits.
Interpreting the airborne magnetic data using standard digital image processing techniques and inversion modeling helped extend the interpretations of known mineralized structures and identify areas of potential magnetite destructive alteration and skarn mineralization (Ellis, 2013). The magnetic highs were generally related to buried intrusions, such as the sizeable magnetic anomaly outlined in Figure 72 for the Arista property area. Integrating 3D modeling with geology helped define drilling targets at the mine scale and better understand the regional geology. For example, a distinct magnetic low is associated with the Arista epithermal deposit, whereas peripheral magnetic highs typically indicate mixed intrusive rocks and related skarn (Figure 73). It is noteworthy that the subsequently discovered Switchback deposit is associated with a magnetic low anomaly.
47
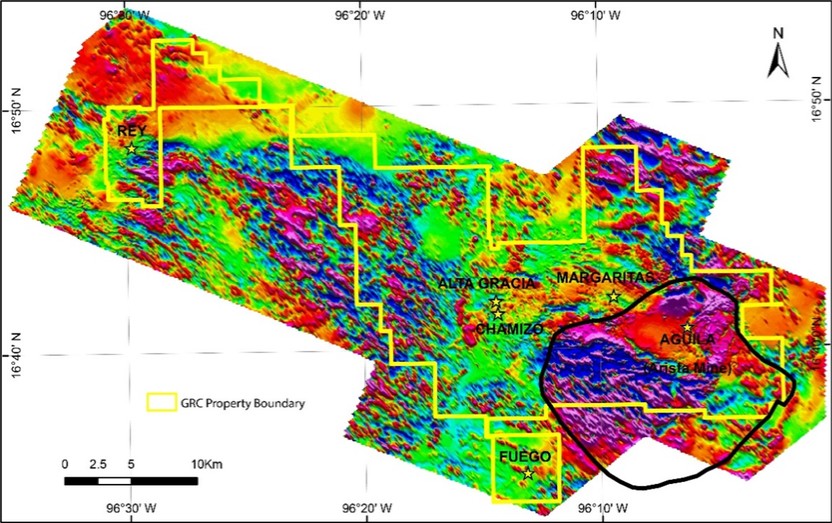
Figure 7-2: Aerial magnetic survey of Don David Mine properties.
In Figure 72 magnetic highs (red and magenta colors) are interpreted to be generally related to buried intrusions. A possible intrusion is interpreted to lie below the Arista property area – see black outline (Ellis, 2013).
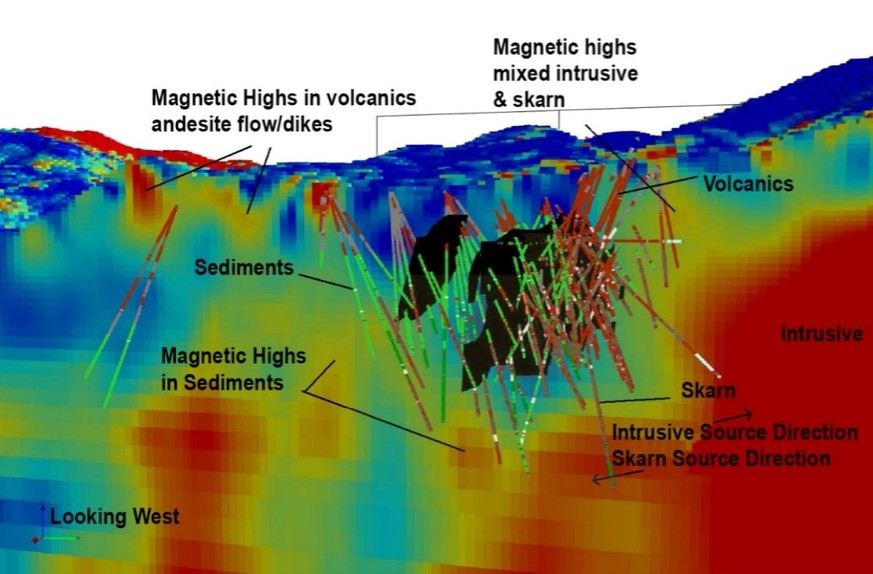
48
Figure 73 shows the amplitude component of the magnetic susceptibility inversion model from aerial magnetic survey in the Arista property area (looking west). Red is high susceptibility and blue is low susceptibility. The Arista vein system is shown as black shapes (Ellis, 2013). In computer-based modeling or graphic simulation, a voxel is an array of elements of volume that constitute a notional three-dimensional space, especially each of an array of discrete elements into which a representation of a three-dimensional object is divided.
7.2.4Petrographic, Fluid Inclusion and Other Studies
Numerous investigators have been contracted to help characterize the geology and mineralization of the Don David Mine projects in Oaxaca. Most studies have focused on the Arista property and the Arista mine itself, but work has also been undertaken on the Alta Gracia, Margaritas, and Rey properties.
Much work has focused on petrographic studies, with a summary of petrographic description studies given in Table 74. It should be noted that many studies contain only descriptions with no formal report.
In addition, fluid inclusion work on Arista and Alta Gracia veins has been undertaken by various researchers/authors, including Reynolds (2011, 2012), who noted that, “The nature of the quartz and the fluid inclusion textures within the quartz all indicate that the environment of precipitation is intermediate-sulfidation epithermal. Many different types of quartz are present in the core samples, and the highest temperature inclusions were found in the euhedral quartz crystals with homogenization temperatures of about 250°C and salinities of 1 wt% NaCleq.”
He also stated, “Boiling fluids at such temperatures require that pressures during trapping of the inclusions were about 40 bars, corresponding to a depth of about 400 m from the water table. Furthermore, comparing these data with other Mexican intermediate-sulfidation (IS) type of deposits of Camprubí and Albinson in GSA Special Paper 442, 2007. It is possible that significant base and precious metal mineralization could continue for hundreds of more meters below the current level of exploration.” Another notable study is that of Cabrera Roa (2019).
Table 7-4: Summary of Petrographic Thin and Polished section Studies.
* Includes Arista, Switchback and Manto deposits.
** Excludes samples of unknown provenance, or lacking detailed information (e.g. Cabrera Roa, 2019).
On-site field studies have been undertaken by authors such as Hedenquist (2008 & 2010) and Meinert (2010) on epithermal and skarn characterization, respectively; Jones (2008, 2013), who undertook work on the definition of possible calderas and Lipman (2011) on an additional volcanic definition.
During 2020, petrographic and fluid inclusion studies were started as part of a doctoral study of the Arista mine mineralization system. These studies are ongoing with 2020 – 2021 advance affected by the COVID-19 pandemic.
7.3 Exploration Activities 2023
7.3.1Arista Property
Underground drilling during 2023 continued to define and explore extensions of veins currently in production in the Arista Mine on both the Arista and Switchback vein systems. Both the Arista and Switchback systems extend for over 1,500 m along strike and remain open in both directions as well as up- and down-dip with exploration continuing to expand their footprints.
49
Exploration of the recently discovered Three Sisters system, located between the Arista and Switchback systems, continued in 2023 where drilling confirms that this system remains open along strike to the north-west as well as up- and down-dip. The Gloria vein system was discovered in early 2023 while continuing exploration drilling in the Three Sisters system. The Gloria vein system, located immediately north-west of Three Sisters, is comprised of no fewer than three discrete quartz veins with true widths locally in excess of six meters. Drilling is reviewed more completely in later sections within this Section. Surface geologic mapping also continued in the immediate vicinity and to the north-west of the Arista Mine to assist with structural interpretation of the newly discovered Gloria vein system.
7.3.2Alta Gracia Property
Surface exploration activity during 2023 centered around the Alta Gracia property with the interpretation of geologic surface mapping along with soil geochemistry results received in late-2022. Geological mapping continued in 2023 along with the completion of a 45 hectare soil geochemistry sampling and rock chip sampling program in the Aguacatillo prospect, covering an area to the south-west, west and north-west of the Independencia and Mirador mines. The program was successful in identifying several anomalous zones, which will be used to target follow-up detailed mapping to identify additional potential targets for future surface drilling.
In addition, analysis and interpretation was completed in 2023 of the geochemical results generated from a regional soil sampling program completed late 2022 in the La Fundicion prospect area located immediately south-southeast of the Independencia and Mirador mines. This interpretation was successful in identifying three distinct clusters of anomalous gold- and silver-in-soil anomalies which will be followed up with detailed geologic mapping and rock chip sampling.
The subsurface investigation by drilling has been a primary exploration tool at DDGM’s properties. To date, it has aided in defining three deposits mined on the Arista property and two deposits mined on the Alta Gracia property. Initially, in the 1990s, shallow testing (<100 m) was undertaken by RC drilling methods, prior to GRC’s involvement in the project, to examine the sub-cropping, historic Aguila shallow-dipping, manto-vein deposit. During the early 2000s, a combination of RC and core drilling further defined the mineralization of the Manto deposit. In 2005-2006 drilling had succeeded in determining the early indications of the Arista deposit. In 2007, the “discovery drill hole” into the Arista deposit (drill hole 107080) was completed, and additional core and RC drilling confirmed the presence of significant mineralization. Subsequent drilling led to the definition of the heart of the Arista vein system, and by 2010, DDGM had declared official production at the Arista mine. By 2013, drilling had intercepted more than ten significant veins, most notably the Arista and Baja veins, and an equal number of vein splays of the Arista system. Other drill testing included flanking areas on the Aguila property, such as Escondida, Salina Blanca, Cerro Colorado, Fossil Bend, Chacal – Red Zone, Pilon, and other regional exploration targets.
During 2013, the synthesis of exploration information led company geologists to examine a new area, the Switchback target, following up a suspected parallel structure about 500 m to the north-east of the Arista deposit. Favorable indications from geologic mapping and surface investigations of a hilly area along a narrow switchback road had intrigued the team, as it exhibited similarities to the Arista vein system, including the presence of an NNW-SSE trending porphyritic rhyolite dike along with gypsum (sulfate alteration), quartz vein fragments, minor quartz-amethyst veining, moderate-intense argillic and patchy intense iron oxide alteration all following a subparallel structural orientation, albeit offset to the northeast. Geochemical rock chips from this altered zone returned base metal anomalies with weakly elevated silver values. However, due to limited surface access, it was decided to utilize the nearest underground location in the Arista mine for drill testing, some 500 m to the south-west. The initial drill program consisted of holes drilled from the Arista mine at shallow dips across to the Switchback target zone more than 500 m below and 700 m to the south-east of the mapped surface indications. The discovery drill holes included 513016 (the main hole) and drill holes 513023, 513024, and 513028 (wedge holes off the main hole). Continued drilling identified sufficient mineralization to justify development access into the Switchback deposit. Mining of the Switchback system began in 2017. Drilling of the system has been ongoing, and the mineralized system has been extended by drilling along strike and up- and down-dip.
Drilling of targets outside the Arista project area, which hosts the Arista and Switchback deposits, has resulted in the definition of mineralization which has been mined on the Alta Gracia project, with operations developed on both the Mirador and Independencia deposits, as well as defining the La Tapada vein on the Margaritas project. DDGM continues to drill targets based on field results and interpretation.
50
Total exploration drilling by DDGM through the end of December 2023 at the Don David Mine amounts to 496,638 meters and 1,960 drill holes (Table 75). Surface drill holes completed through December 31, 2023, at the Don David Mine are shown in Figure 74, with underground drill holes in Figure 75.
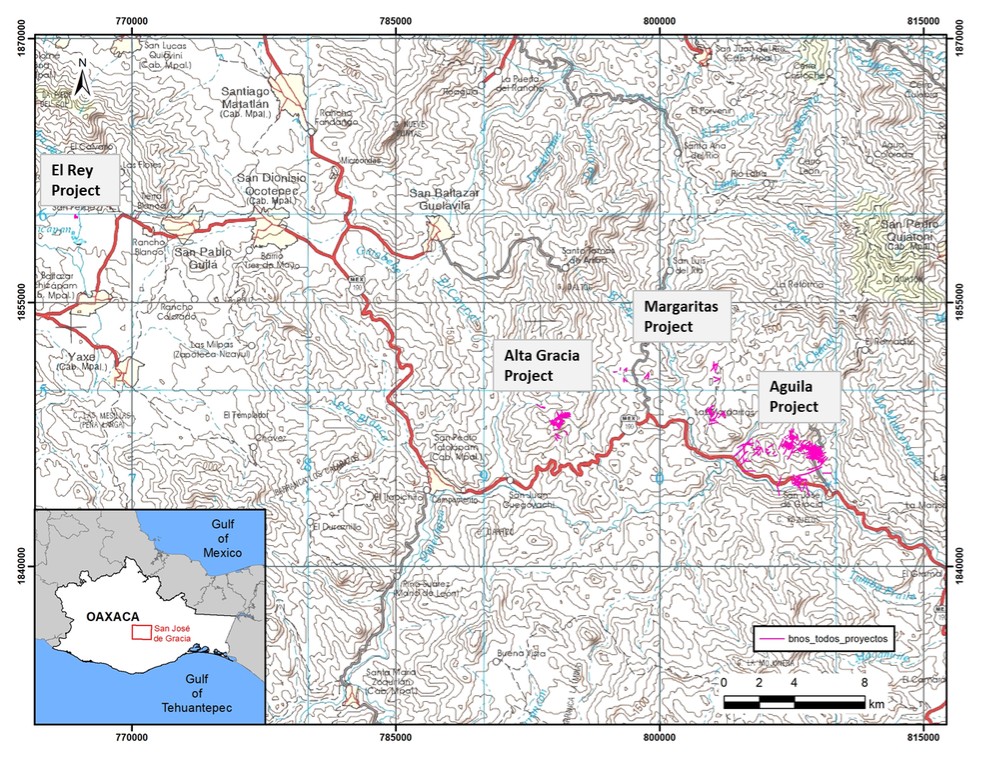
Figure 7-4: Surface Drill Hole Location Map of the Don David Mine.
51
Table 7-5: Don David Mine Exploration Drilling Activity through December 31, 2023.
PROJECT & YEAR |
RC - SURFACE |
CORE - SURFACE |
CORE - UNDERGROUND |
TOTAL |
||||
NO. OF |
METERS |
NO. OF |
METERS |
NO. OF |
METERS |
NO. OF |
METERS |
|
HOLES |
HOLES |
HOLES |
HOLES |
|||||
Arista (includes Manto, Arista & Switchback Veins) | ||||||||
2003 |
63 |
3,840 |
5 |
52 |
0 |
0 |
68 |
3,892 |
2005 |
0 |
0 |
37 |
2,808 |
0 |
0 |
37 |
2,808 |
2006 |
0 |
0 |
13 |
1,688 |
0 |
0 |
13 |
1,688 |
2007 |
103 |
10,527 |
93 |
15,195 |
0 |
0 |
196 |
25,722 |
2008 |
0 |
0 |
46 |
17,220 |
0 |
0 |
46 |
17,220 |
2009 |
0 |
0 |
12 |
7,394 |
0 |
0 |
12 |
7,394 |
2010 |
0 |
0 |
36 |
14,000 |
0 |
0 |
36 |
14,000 |
2011 |
0 |
0 |
43 |
21,026 |
44 |
5,182 |
87 |
26,208 |
2012 |
0 |
0 |
62 |
32,204 |
78 |
8,994 |
140 |
41,198 |
2013 |
0 |
0 |
94 |
36,688 |
64 |
14,819 |
158 |
51,507 |
2014 |
0 |
0 |
69 |
29,999 |
25 |
10,753 |
94 |
40,752 |
2015 |
0 |
0 |
58 |
15,491 |
41 |
12,011 |
99 |
27,502 |
2016 |
0 |
0 |
0 |
0 |
53 |
15,535 |
53 |
15,535 |
2017 |
0 |
0 |
0 |
0 |
41 |
13,021 |
41 |
13,021 |
2018 |
0 |
0 |
0 |
0 |
28 |
12,308 |
28 |
12,308 |
2019 |
0 |
0 |
0 |
0 |
35 |
11,094 |
35 |
11,094 |
2020 |
0 |
0 |
7 |
3,180 |
38 |
9,471 |
45 |
12,651 |
2021 |
0 |
0 |
30 |
9,929 |
112 |
25,104 |
142 |
35,033 |
2022 |
0 |
0 |
0 |
0 |
183 |
35,102 |
183 |
35,102 |
2023 |
0 |
0 |
0 |
0 |
168 |
36,350 |
168 |
36,350 |
Arista Total |
166 |
14,367 |
605 |
206,874 |
910 |
209,744 |
1,681 |
430,985 |
Rey | ||||||||
2007 |
0 |
0 |
12 |
1,276 |
0 |
0 |
12 |
1,276 |
2008 |
0 |
0 |
36 |
3,997 |
0 |
0 |
36 |
3,997 |
Rey Total |
0 |
0 |
48 |
5,273 |
0 |
0 |
48 |
5,273 |
Alta Gracia | ||||||||
2011 |
0 |
0 |
37 |
8,270 |
0 |
0 |
37 |
8,270 |
2012 |
0 |
0 |
12 |
3,262 |
0 |
0 |
12 |
3,262 |
2014 |
0 |
0 |
39 |
7,614 |
0 |
0 |
39 |
7,614 |
2015 |
0 |
0 |
9 |
2,554 |
0 |
0 |
9 |
2,554 |
2017 |
0 |
0 |
44 |
9,939 |
0 |
0 |
44 |
9,939 |
2018 |
0 |
0 |
20 |
4,279 |
0 |
0 |
20 |
4,279 |
2019 |
0 |
0 |
18 |
3,162 |
0 |
0 |
18 |
3,162 |
Alta Gracia Total |
0 |
0 |
179 |
39,081 |
0 |
0 |
179 |
39,081 |
Margaritas | ||||||||
2012 |
0 |
0 |
15 |
5,002 |
0 |
0 |
15 |
5,002 |
2013 |
0 |
0 |
9 |
3,033 |
0 |
0 |
9 |
3,033 |
2015 |
0 |
0 |
23 |
10,409 |
0 |
0 |
23 |
10,409 |
2016 |
0 |
0 |
5 |
2,855 |
0 |
0 |
5 |
2,855 |
Margaritas Total |
0 |
0 |
52 |
21,299 |
0 |
0 |
52 |
21,299 |
GRAND TOTAL |
166 |
14,367 |
884 |
272,527 |
910 |
209,744 |
1,960 |
496,638 |
52
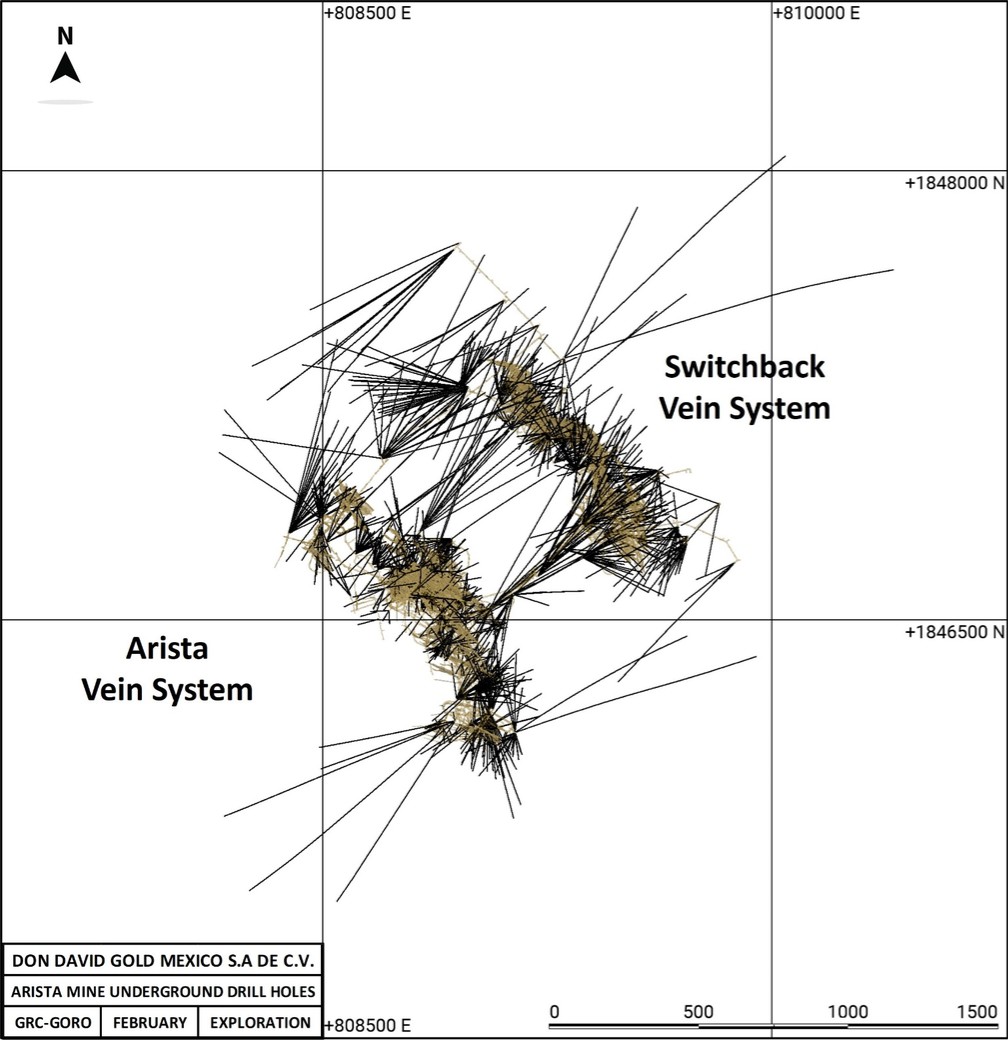
Figure 7-5: Drill hole traces (black lines) for completed underground drilling through December 31, 2023.
7.4.1Core Drilling Methods
Several contracting firms have performed exploration drilling for DDGM (e.g., Alta Drilling International S. de R. L. de C.V., GeoDrill S.A. de C.V., Grupo Drilcor S.A. de C.V., Major Drilling de Mexico S.A. de C.V., Maza Diamond Drilling S.A. de C.V.). These companies operate from bases in various localities throughout México. In 2023, DDGM used up to five underground diamond drill rigs for exploration and infill programs; three provided by contractor Major Drilling de Mexico S.A. de C.V. (Major), one by contractor Grupo Drilcor S.A. de C.V. (Drilcor) and one DDGM owned and operated Ingetrol EXPLORER-75E rig used principally for infill drilling.
53
The majority of exploration drill holes, and all drill holes since 2008, have been drilled by wireline diamond drill coring. Core size produced is typically 2.5 inches or 63.5 mm (a.k.a. HQ) and to a lesser extent 1.875 inches or 47.6 mm (a.k.a NQ). The contractors use conventional core handling methods and wax-impregnated cardboard core boxes for collection and storage. Core runs are typically 3 m or 1.5 m. In longer holes in non-mineralized zones, runs of 6 m may be used to increase drill productivity. In fractured ground, the blocky nature of the core can result in considerably shorter runs, with core recovery being the priority. The drill crews insert wooden blocks to mark the end of each core run, with hole depth, drilled interval, and the driller´s recovery estimate marked on the blocks. Both surface and underground drill holes are cased at their start.
7.4.2Geological and geotechnical logging procedures
The core from surface and underground exploration drilling is logged, sampled, and stored at the same core facility. Core from diamond drilling is placed in boxes, and drill contractor personnel transport the core to the central core facility. Sample handling at the core facility follows a standard industry-accepted procedure, during which depth markers are checked and confirmed the outside of the boxes are labeled with interval information; the core is washed and photographed; and the recovery and rock quality designation (“RQD”) are logged for each drill hole.
The geology of the core is logged, and the geologist marks potential mineralized zones for sampling. Sample lengths are determined, where possible, by mineralogical or lithological characteristics. The geologists take samples where there is a reasonable chance of obtaining significant results and where sampling is required for continuity of assay data. The core is generally not sampled over the entire drill hole length. The sampling crew then splits the core with a diamond saw, as indicated by the geologist, and one-half of the core is placed in a numbered bag with its corresponding sample tag and sent to the laboratory for analysis. The other half of the core is returned to the core boxes for storage. Generally, the samples represent core lengths of less than 1.50 m; the minimum sample length is 0.3m. Sample tags are also stapled inside the boxes. All core is photographed before and after sampling.
Bulk density measurements are routinely determined on whole drill core samples for each potentially mineralized vein. Geologists select samples as part of the routine logging procedure. Measurements are performed at the DDGM on-site analytical laboratory utilizing the volume displacement method. Geologists perform the selection of the samples as part of the routine logging procedure.
The management, monitoring, surveying, and logging of surface and underground exploration drill holes are carried out under the supervision of the Don David Mine exploration staff. Production (infill) drill holes are managed by the mine geological team, with logging and sampling support provided by the exploration department. All DDGM’s surface and underground drill hole samples are processed at the Don David Mine exploration office and core processing facility.
7.4.3Drill core recovery
All drill core recovery and RQD measurements were recorded manually and uploaded into the GeoInfo Tools database. Ground conditions are generally good, resulting in excellent core recovery. Core recovery is typically high within mineralized zones on all projects due to the association with silicification and the preferred use of HQ diameter core. One drill hole, 513116, had notably poor recovery, sufficient to identify the Switchback mineralization but was subsequently re-drilled using wedges to provide improved core recovery and better-quality information.
7.4.4Extent of drilling
To date, drilling on the Arista vein system has been conducted over a strike length of approximately 1,700 m, with the maximum depth extent to the 0 masl elevation, about 930 m below the surface. The Switchback vein system drilling has been conducted over a strike length of approximately 1,600 m, with the maximum depth extent to the 50 masl elevation, about 950 m below the surface.
Drilling of the Alta Gracia mineralized zones has been conducted over a strike length of approximately 1,300 m, with a maximum depth extent to the 1,150 masl elevation, about 450 m below the surface.
7.4.5Drill hole collar surveys
Surface drill hole collars were surveyed using total station and differential GPS survey methods. Concrete monuments are constructed for each surface drill hole with the drill hole name, total depth, azimuth, and inclination labelled. Underground drill holes collars are surveyed using total station methods.
54
The World Geodetic System 1984 (“WGS84”) is used to record all project survey data in the UTM grid.
7.4.6Downhole surveys
Downhole surveys are undertaken on all diamond core drill holes; early RC drill holes in the Aguila pit area were not surveyed. Surveys are taken approximately every 50 m down-hole for most drill holes, except for narrow core definition drill holes performed by the mine geology department. Since 2017 the company policy has been to record an additional survey at approximately 17 m depth (beyond the limit of casing effects), with the depth extended if necessitated by casing depth. Most surveys were performed using a Reflex™ EZ-TRACK, and some holes were surveyed using a Reflex™ FlexIT Smart tool. The drilling contractor carries out all surveys. The downhole survey is downloaded to CSV files by Reflex™ proprietary software and loaded into the GeoInfo Tools database.
7.4.7Drill Campaigns
7.4.7.1 1999 Apex Silver Corporation RC Drill Campaign
During 1998-1999, Apex undertook an 11-hole RC drilling program (1,242 m). No information from this drill program is in GRC´s database apart from location and hole lengths. All holes are reported as being vertical in the database.
7.4.7.2 2003 Drill Campaign
During 2003, GRC completed a total of 68 RC drill holes (3,840 m) in the vicinity of the shallow-dipping, manto-style vein. The maximum hole depth was 90 m, with most drill holes less than 60 m. RC drill holes were sampled and logged every 2 m. In addition, five shallow diamond-core drill holes were completed for 51.5 m of drilling, using a man-portable Winkie drill; core size is not recorded, although this drill is typically configured for “A” or ”E” drilling string (± 2.5 cm diameter). The maximum depth of the hole was 20 m. These drill holes were nominally sampled every 2 m, with sample ranges from 0.7 to 3 m; no lithological information is recorded for these five drill holes. RC results from this campaign were sufficiently encouraging for GRC to continue exploring the Arista property.
7.4.7.3 2005-2006 Drill Campaigns
During 2005 and 2006, GRC undertook its first major diamond drill campaign on the Arista property with a total of 35 drill holes completed for 3,207.15 m of coring focused on the Manto target and some drilling on the upper part of Cerro Colorado. A further 15 core drill holes (1,288.35 m) targeted areas close to the historically mined Aire vein in the vicinity of what is now the Arista mine. All samples from 2005 were analyzed by the Servicio Geológico de México laboratory in Oaxaca city for gold and silver using the fire assay method. In 2006, all samples were analyzed by ALS Chemex; subsequent to this, all exploration samples were analyzed by ALS Chemex. The 2005-2006 campaign succeeded in defining the early indications of the Arista deposit as the exploration footprint expanded to test other nearby historic surface workings as well step out to targets derived from the ongoing surface exploration work.
7.4.7.4 2007 Drill Campaigns
In 2007, both RC and diamond drill core programs were undertaken, with both the Manto Vein and the Arista mine area (known as the Aire zone at the time) being targeted. The Manto Vein mineralization continued to be defined with 72 RC drill holes (6,234.3 m) and 34 diamond core holes (4,124 m) completed. In the Arista mine area, a total of 31 RC drill holes (4,292.7 m) and 59 diamond core drill holes (11,070.64 m) were completed. During the 2007 campaign, the Arista deposit “discovery drill hole” 107080 was completed. This drill hole intercepted three mineralized zones over a total intercept length of 35 m averaging 2.81 g/t Au, 137 g/t Ag, 0.38% Cu, 1.54% Pb, and 5.58% Zn, including a higher-grade interval averaging 8.01 g/t Au, 329 g/t Ag, 0.76% Cu, 1.92% Pb and 9.92% Zn over 7.5 m. This discovery occurred while drilling beneath a small quartz vein outcrop associated with the historic Aire vein prospect. The 2007 RC drill campaign was the last time to date that this method was used at the Don David Mine properties.
In 2007, a small diamond drill core program was undertaken on the Rey property with 12 drill holes (1,276 m) completed. This drilling confirmed the potential for significant gold mineralization in two east-west trending quartz veins approximately 50 km north-west of the Arista property.
7.4.7.5 2008 - 2009 Drill Campaigns
The 2008 drill campaign focused on the newly discovered Arista vein and defined multiple sub-parallel veins within the system.
55
During 2008, a total of 46 core diamond drill holes (17,219.59 m) were completed. At this time, the significant Baja vein in the footwall of the Arista vein was defined. In 2009, drilling continued to follow up on the growing Arista deposit, albeit at a reduced tempo. In 2009, a total of 12 drill holes (7,393.57 m) were completed.
During 2008, additional drilling was undertaken on the Rey property, with 36 drill holes completed for 3,996.85 m of coring. Three drill holes in this campaign had intercepted 1 to 3 m quartz vein lengths, with average gold grades over 30 g/t and silver above 44 g/t.
7.4.7.6 2010 Drill Campaigns
In 2010, drilling focused on testing additional targets on the Arista property defined by surface mapping and sampling. Most drilling was undertaken to follow up on targets on the Cerro Colorado peak and its flanks; four drill holes tested the Salina Blanca zone, almost two km to the southwest of the Arista system. The non-mine Arista property exploration program drilled 29 drill holes for 10,496.85 m of coring. In addition, seven drill holes (3,503.4 m) were completed in the Arista vein system.
7.4.7.7 2011 Drill Campaigns
During 2011, drilling focused on the Arista system, with both surface and underground drilling undertaken. Underground exploration drilling was performed by contract drills and an in-house Termite drill; the latter was used for shorter definition drill holes. A total of 23 underground exploration drill holes were undertaken (4,120.1 m), with 21 Termites holes also completed (1,062.31 m). All Termite drill holes were logged and sampled by the exploration group. Forty-two drill holes were completed from the surface targeting the Arista vein system for 20,613.68 m of coring. In addition, one surface drill hole (412.3 m) was drilled into the Chacal exploration target to the northwest of Cerro Colorado peak.
During 2011, GRC initiated drilling on its Alta Gracia property, where targets were defined from numerous historic workings combined with geologic mapping and sampling. A total of 37 drill holes (8,269.7 m) were completed on the Alta Gracia property in 2011.
7.4.7.8 2012 Drill Campaigns
In 2012, drilling was performed from the surface and underground into the Arista deposit. From surface, a total of 43 drill holes were completed (26,819.4 m) along with a total of 29 underground exploration drill holes (6,417.16 m) and 49 narrow-core Termite drill holes were completed (2,576.79 m) during the year. All Termite drill holes were logged and sampled by the exploration group. Additional surface drilling on the surrounding surface areas was undertaken at depth below the Manto Vein open pit, and into the southern flank of Cerro Pilon, a rhyolitic dome north of the Manto Vein; a total of 9 drill holes were completed (4,943.5 m).
A small follow-up drilling program was undertaken on the Alta Gracia project with 12 drill holes completed (3,262.25 m) exploring previously drilled structures and new targets.
Margaritas is another area with well-known historic workings that were mainly exploited in the late nineteenth to early twentieth century. The drilling of targets on the Margaritas property was initiated in 2012. A total of 15 holes were completed (5,002 m).
In addition, ten geotechnical drill holes for the tailings dam expansion were undertaken at the Arista mine, with 440.9 m of drilling completed. The holes were logged, and the data was included in the geological database.
7.4.7.9 2013 Drill Campaigns
While drilling continued at the Arista deposit in 2013, the year was most notable for discovering the Switchback vein system. The discovery drill holes included drill hole 513016 (the main hole) and drill holes 513023, 513024, and 513028 (wedge holes off the main hole). During 2013, a total of 10 drill holes (5,553.75 m), including the three wedges off the first hole, were undertaken in the Switchback zone. Drilling of the Arista deposit continued from surface and underground. The program consisted of 24 underground exploration holes (7,659.05 m) and 30 Termite holes (1,606 m), as well as 49 surface drill holes (23,783.15 m), including some testing for possible extensions to the south-east and south-west. All Termite drill holes were logged and sampled by the exploration group. Drilling on surrounding surface areas focused on the Salina Blanca target (1.8 km south-west of the Arista mine) and testing objectives under and adjacent to the tailings dam expansion at the Arista mine; a total of 45 drill holes (12,905.2 m) were drilled on Arista exploration targets.
In addition, nine drill holes (3,033.25 m) were undertaken on the Margaritas project, primarily focused on the San Ignacio Target.
56
7.4.7.10 2014 Drill Campaigns
In 2014, drilling continued at the Arista and Switchback vein systems in the Arista Mine. On the Arista system, a total of 33 surface drill holes (12,244.25 m) and 15 underground exploration drill holes (4,749.7 m) were undertaken; in addition, 41 underground Termite drill holes (2,478.34 m) for mine definition were completed. On the Switchback system, a total of 10 drill holes (6,003.75 m), drilled from the Arista workings, were undertaken. From 2014 onwards, Termite drill holes were logged by the mine geologists. On the surrounding Arista project area, a total of 36 drill holes (17,755 m) were completed. Most drilling was undertaken in the vicinity of the Manto Vein with additional work on the Salina Blanca, Chacal, and Cerro Colorado targets.
The Alta Gracia project drilling in 2014 focused on four veins systems: Mirador, Huajes, Independencia, and San Juan where a total of 39 drill holes (7,614.35 m) were completed.
7.4.7.11 2015 Drill Campaigns
During 2015, underground drilling on the Arista and Switchback continued. A total of 16 underground exploration drill holes (8,005.95 m) were undertaken on the Switchback veins and 25 underground exploration drill holes (4,004.92 m) on the Arista veins. In addition, 73 Termite drill holes (5,212.07 m) for mine definition were undertaken. Ten surface drill holes (3,631.31 m) were completed on the Arista system, exploring the Santiago vein. Forty-eight drill holes (11,860 m) were conducted on the Manto Vein, Chacal, Salina Blanca, and Cerro Colorado areas on the surrounding surface areas.
During 2015, drilling was also undertaken on the Alta Gracia and Margaritas projects. At Alta Gracia, a total of 9 drill holes (2,554.15 m) were completed with efforts focused on the Mirador vein. On the Margaritas project, a total of 23 drill holes (10,408.78 m) were completed, with drilling focused on the La Tapada and Victoria targets.
7.4.7.12 2016 Drill Campaigns
During 2016, the underground exploration drilling carried on from the previous year’s program, with increased exploration focused on the Switchback vein system. A total of 29 exploration drill holes (10,156.4 m) were undertaken on the Switchback veins, including three drill holes drilled primarily for geotechnical evaluation but also sampled for mineralization. On the Arista veins, 24 exploration drill holes (5,378.25 m) were undertaken. In addition, 58 underground Termite drill holes (2,511.77 m) for definition drilling were undertaken.
No surface drilling was undertaken on the Arista project, which includes the Arista and Switchback deposits, during 2016.
A limited exploration surface drilling program was undertaken at the Margaritas project on the Trenes zone, with five drill holes (2,855.25 m) completed.
7.4.7.13 2017 Drill Campaigns
During 2017, mine development entered the Switchback vein system to begin mining the known veins. Consequently, some drilling of this zone was possible from footwall locations considerably closer to the veins than had been possible for previous drill holes. During 2017, a total of 26 underground exploration drill holes (9,723.84 m) were undertaken into the Switchback system. In addition, 32 Termite drill holes (880.1 m) were completed for vein definition. On the Arista veins, a total of 15 drill holes (3,296.94 m) targeting the recently discovered Splay 31 vein were completed. In addition, 20 Termite drill holes (1,215.8 m) were undertaken.
Surface drilling during 2017 was undertaken at the Alta Gracia project with 44 drill holes (9,939.15 m) completed. In addition, a total of 8 Termite drill holes (295.95 m) were completed into the Mirador vein system in support of mining development.
7.4.7.14 2018 Drill Campaigns
During 2018, exploration drilling continued to focus on extending the mineralization of the known deposits being actively mined: Arista, Switchback, and Alta Gracia. This year, the mine also acquired the Ingetrol drill machine to enable longer and larger diameter definition drill holes.
On the Switchback deposit, a total of 17 exploration underground drill holes (7,892.4 m) and 44 mine definition drill holes (1,861.65 m) were undertaken. On the Arista deposit, a total of 11 exploration underground drill holes (4,415.1 m) and 14 mine definition drill holes (743.7 m) were undertaken.
On the Alta Gracia project, exploration drill holes targeted veins proximal to the Mirador deposit and other vein systems on the project. A total of 20 surface exploration drill holes (4,278.8 m) were completed on the Alta Gracia project and 24 mine definition drill holes (1,236 m) were conducted on the Mirador deposit.
57
7.4.7.15 2019 Drill Campaigns
In 2019, the underground exploration drilling on the Switchback deposit focused on the north-west zone of mine development. A total of 16 underground exploration drill holes (6,830.15 m) were undertaken on the Switchback deposit, with 16 mine development drill holes (1,707.55 m) also drilled. On the Arista deposit, a total of 17 underground exploration drill holes (4,264.15 m) were undertaken, with ten mine development drill holes (1,012.1 m) drilled.
In Alta Gracia, exploration drilling focused on the Independencia deposit, which had become the focus of mining activities on the project. Exploration was undertaken from the surface and an underground drill station (13 drill holes) on the access ramp. A total of 18 exploration drill holes were completed for 3,162.25 m of drilling and 34 mine definition drill holes (2,902.4 m) were completed on the Independencia deposit. All exploration drilling was included in the surface exploration program and is reported as such.
7.4.7.16 2020 Drill Campaigns
Underground drilling during 2020 continued to explore extensions of veins currently in production in the Arista Mine, including the Soledad, Selene, Sadie, and Sasha veins in the Switchback vein system and the Baja Candelaria, Mercedes, Splay 66, and Splay 31 veins of the Arista vein system.
Twenty-four (24) underground diamond drill holes totaling 6,721.55 m were undertaken on the Switchback deposit and related structures. Fourteen (14) underground drill holes totaling 2,479.7 m were completed on the Arista deposit. In addition, 2 mine definition drill holes (94 m) were completed on the Switchback deposit and 40 definition drill holes (4,351 m) were completed on the Arista deposit. On the surrounding surface areas, 7 surface diamond drill holes totaling 3,180.15 m were completed during 2020.
From two underground exploration drill stations located in footwall developments ramp of the mine’s Switchback vein system 11 drill holes confirmed up-dip extensions of the Switchback vein system in its thicker central – northwest sector and narrow vein mineralization near its south-eastern limits.
From the underground exploration drill station located in a footwall development ramp of the mine’s Switchback vein system, 5 drill holes confirmed the up-dip extensions of the Switchback vein system approximately 35 m (two mine levels) above the 2020 mine workings.
7.4.7.17 2021 Drill Campaigns
In 2021, surface and underground drilling focused on the Arista project. Underground drilling during 2021 continued to explore extensions of veins currently in production in the Arista Mine and significant infill drilling for Reserve definition. Drilling was predominantly focused on the Switchback vein system, although both the Arista and newly defined Three Sisters vein systems were also drilled.
The drilling of the Switchback system consisted of both step-out expansion programs and infill definition drilling. Thirty-one (31) underground exploration drill holes were undertaken in 2021 in the Switchback project area totaling 9,881.3 m of core. Eleven (11) holes targeted the Three Sisters vein system for 3,618.45 m of drilling, which primarily targeted northwest extensions of the Sandy vein. One (1) exploration hole was drilled to the northeast of the Switchback system with a total of 1,917.9 m completed on this target, with one hole begun in 2020 also completed. Additionally, an infill Reserve definition drill program was undertaken on the Switchback vein system with fifty-seven (57) holes completed for 7,982.7 m of coring. On the Arista vein system, a total of eleven (11) infill Reserve definition drill holes were drilled in 2021 for 1,704.1 m of coring on the Splay 5 vein.
Underground mine production definition drilling was also performed on veins in the Arista and Switchback vein systems. In Arista production, core drilling focused on the Splay 5, Baja, and Candelaria veins with a total of 53 production definition drill holes undertaken, totaling 3,579.45 m. In Switchback, 21 production holes were drilled for 1,673.6 m.
Surface drilling in the Arista project included 5 holes totaling 2,056.6 m on the Santiago vein and 7 exploration holes totaling 4,931.75 m to test for southeasterly extension of the Arista vein system and targets in the Cero Pilon and Chacal zones. In addition, a condemnation drill program was undertaken below the Manto Vein open pit before the construction of the dry stack facility. It confirmed there was insufficient mineralization to support additional mining in this area. A total of 18 condemnation holes were completed for 2,941.1 m of drilling.
The infill drilling programs successfully defined additional Reserves within existing Resources. They extended the Resource limits in the Switchback and Three Sisters vein systems, most notably up- and down-dip in the south-eastern part of the Soledad vein.
58
In the latter part of the year, infill Reserve definition drilling began on the Splay 5 vein. Expansion drilling confirmed the presence of significant mineralization up to 100 m below mining operations. Down-dip drilling in the north-western sector of Soledad also identified additional potential for extension to Reserves.
Exploration drilling of the Switchback system was undertaken from footwall drill stations in access developments on Levels 27 and 20 of the Switchback for the infill programs and from stations in dedicated drill developments at the northern and southern limits of the Switchback system. Drill Development North (DDN) was continued as a NW heading drill development initiated from a NE heading cross-cut ramp from Arista Level 3. The drilling of the Three Sisters vein system was from a drill station between the Arista and Switchback systems in DDN and focused on the Sandy veins.
7.4.7.18 2022 Drill Campaigns
In 2022, underground drilling focused on the Arista project. Underground drilling continued to explore extensions of veins currently in production in the Arista Mine with significant infill drilling for Reserve definition. Drilling was predominantly focused on the Arista vein system, although both the Switchback and Three Sisters vein systems were also drilled. During 2022, a total of 182 exploration drill holes were completed with 34,829.0 m of coring undertaken. In addition, one geotechnical hole of 272.80 m which is included in the exploration database was drilled, as well as 31 production holes which produced 1,527.45 m of core. No surface drilling was undertaken during 2022.
Drilling of the Arista system focused on infill definition programs, although some step-out expansion drilling was undertaken. Five (5) exploration drill holes targeting the Marena system to the NW and below current workings, a total of 2,328.40 m of drilling was completed. Infill definition drilling was undertaken on the Splay 5, Splay 31, Luz, Splay 66, Baja, Candelaria, Marena, Santa Helena, Viridiana, Chuy, Veta 1 and Veta 3 veins and associated structures. In the Arista system a total of 117 infill Reserve definition drill holes were completed with 17,079.30 m of core drilled in 2022.
Drilling of the Switchback system consisted of both step-out expansion programs and infill definition drilling. Thirteen (13) underground exploration drill holes were completed in 2022 in the Switchback project area totaling 7,154.15 m of core. Six (6) holes targeted the Three Sisters vein system for 2,486.55 m of drilling, which primarily targeted northwest extensions of the Sandy vein. Additionally, infill Reserve definition drilling was undertaken on the Switchback vein system with 41 holes completed for 5,780.60 m of coring.
The infill drilling programs successfully defined additional Reserves within existing Resources. The infill drilling in the Arista system targeted several vein systems. In the early part of the year drilling was undertaken at the northerly and southern extremes of the Arista deposit on the Splay 31 and Splay 5 systems, respectively; both associated with high grade silver mineralization. A major focus of infill drilling was the Marena through to Veta 1 veins in the central part of the Arista deposit. In addition to confirming and adding to known mineralization in several veins, the drilling confirmed that the Arista system is open down-dip in this zone. Other veins targeted for infill drilling in 2022 were the west north-west trending Luz and Candelaria veins and the Baja-Splay 66 system in the southern part of the mine. Infill drill stations in Arista are typically located in the footwall of the veins (Marena and Splay 5), although in many veins hanging wall stations are also available (Splay 31, Baja-Splay 66, and Luz).
While expansion Resource drilling focused on the Switchback system, drilling into the northern extension of the Marena system (from a footwall station located in the Switchback deposit) confirmed that mineralization is open to the northwest. The expansion drilling in the Switchback SE zone, from the Drill Development South (DDS) heading, confirmed that mineralization is open down-dip, although narrower and lower grade along strike to the south-east. Drilling to the north-west in both the Switchback and Three Sisters systems was limited by delays in advancing exploration development in the Drill Development North (DDN) heading. In this area both systems remain open along strike to the north-west and up- and down-dip. Exploration in the Switchback and Three Sisters systems was predominantly undertaken from drill stations built in dedicated exploration development headings located in the hanging wall of the vein systems. Infill drilling was undertaken from both hanging wall and footwall drilling stations, the latter taking advantage of existing mine development. In the northern sector of the Switchback system, several new veins were identified and confirmed by infill drilling, such as the Sarabi, with high grade gold ore-shoots, and Salamanca veins. The infill drilling also enabled re-interpretation of existing structures, resulting in improved geological vein models.
7.4.7.19 2023 Drill Campaign
In 2023, underground drilling at DDGM continued to focus on the Arista project. Underground drilling explored extensions of veins currently in production in the Arista Mine for additional Resource definition along with significant infill drilling for Reserve definition. Drilling was predominantly focused on the Switchback vein system, although veins in Arista, the Three Sisters vein system and the newly discovered Gloria vein system were also drilled. During 2023, a total of 168 exploration diamond drill holes were completed producing a total of 36,349.90 m of core.
59
This drilling includes 18 step-out expansion drill holes totaling 10,293.15 m and 150 infill drill holes totaling 26,056.75 m in the Arista mine. In addition to exploration drilling, a total of 520 m of drift development was completed during the year in support of both the step-out expansion and infill drilling programs. No surface drilling was undertaken in 2023.
During 2023, exploration was strategically directed towards the infill and step-out expansion drilling of multiple high-grade, polymetallic epithermal veins within the Switchback vein system, both up- and down-dip and along strike of existing workings, as well as in the Three Sisters vein system and newly discovered Gloria vein system (step-out hole 523007) to define additional Mineral Reserves and Mineral Resources. The Gloria vein system, located immediately north-west of the Three Sisters vein system and near existing mine infrastructure, is comprised of no fewer than three distinct veins with estimated true widths locally greater than 6 m.
The 2023 step-out expansion drilling program also successfully targeted the extension of the Arista vein system along strike to the north-west with particular focus on the Splay 31, Santa Cecilia and Marena North veins, defining additional Mineral Resources. In the Arista system, a combination of infill and step-out expansion holes were drilled from a drill station located on Level 4 at the northern limit of the Arista mine workings. This drilling successfully identified the north-west extensions of the Splay 31, Santa Cecilia and Marena North veins an additional 100 m north-west from previous drilling.
Drilling of the Switchback system in 2023 (including the Three Sisters and Gloria vein systems) consisted of both step-out expansion Resource definition programs and infill Reserve definition drilling. Thirteen (13) underground step-out expansion drill holes totaling 7,747.95 m of core were completed in the Switchback project area from drill stations located on Level 3, specifically targeting the Three Sisters and Gloria vein systems. Step-out expansion holes here targeted north-west extensions along strike and down-dip of the Three Sisters Sandy 1 and Sandy 2 veins along with definition of the newly discovered Gloria vein system (Gloria, Gloria Footwall and Splay Gloria veins) located in the footwall of the Three Sisters vein system.
Additionally, infill Reserve definition drilling was undertaken on the Switchback vein system with 107 holes completed for 15,757.90 m of coring where infill drilling was primarily focused at depth on the Soledad North and South, Sagrario, and Susana North and South vein systems from drill stations located on Levels 27 and 28. Infill drilling was also completed on the Three Sisters vein system with 16 infill holes completed for 4,338.0 m of coring. Infill Reserve definition drilling at Three Sisters was focused on the upper-central areas of the Sandy 1 and Sandy 2 veins from drill stations located on Level 3.
Drilling of the Arista system in 2023 consisted of both step-out expansion programs and infill definition drilling. Five (5) underground step-out expansion drill holes were completed in the Arista project area, totaling 2,545.20 m of core, targeting northwest extensions of the Splay 31, Santa Cecilia and Marena North veins to the north of existing workings. Two (2) of the 5 Arista step-out expansion drill holes (523056 and 523065) were extended to intersect the Gloria and Three Sisters vein systems located to the north-east of Arista.
Although the primary focus of infill Reserve definition drilling in 2023 was on the Switchback system, infill Reserve definition drilling was undertaken in the Arista vein system with 27 holes completed for 5,960.85 m of coring. In the first half of the year drilling was undertaken from drill stations located on Level 21 focusing on the deep, northern portion of the Arista deposit, specifically the lower Veta 1. Veta 3, Chuy 2 and Viridiana vein zones. Drilling continued to add and confirm mineralization in this area of Arista as well as showing continuation of the veins at depth and along strike to the north. In late-2023, definition infill drilling using the DDGM owned and operated Ingetrol drill was focused on defining Reserves in the upper-central zones of the Splay 31 and Aire veins from drill stations located on Level 1 of the Arista mine. The infill drilling programs at the Arista, Switchback and Three Sisters systems successfully defined additional Reserves within existing Resources.
Total expansion and infill drill meters completed in 2023 are reported in Table 75 while underground exploration drill holes drilled to date at the Arista mine are shown in Figure 76. Notable intersections for the expansion and infill drilling completed at the Arista mine in 2023 are reported in Table 76.
A plan view and cross-section showing the Arista, Gloria, Three Sisters and Switchback vein systems with 2023 drilling results are shown in Figure 78 and Figure 79, respectively. Figure 79 shows a representative cross-section of the Sagrario and Soledad Sur veins in the Switchback vein system with 2023 drilling results.
60
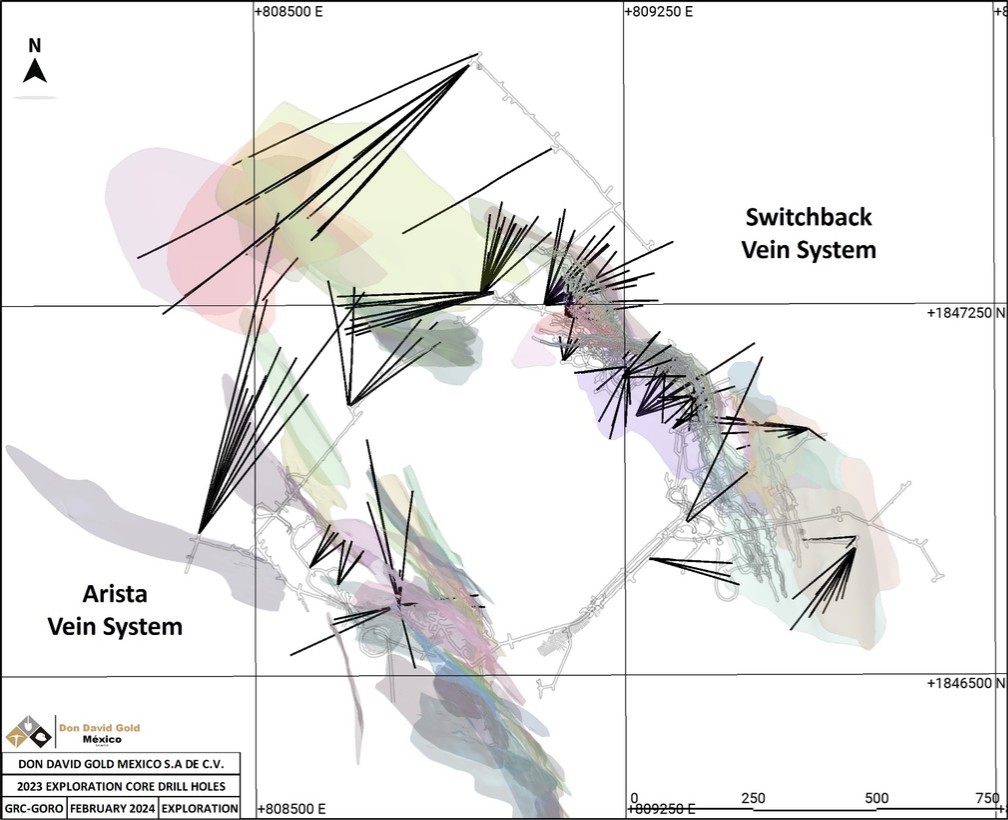
Figure 7-6: Plan view of Arista and Switchback vein systems showing exploration holes drilled during 2023.
61
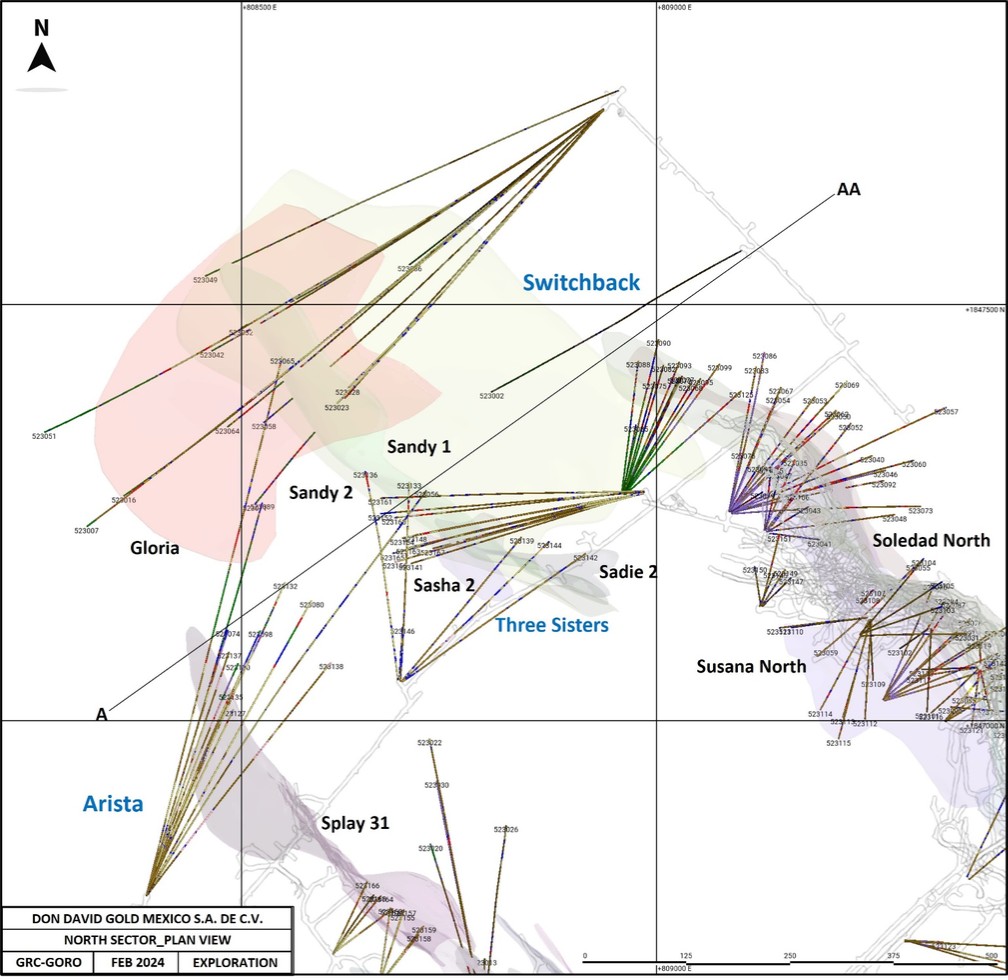
Figure 7-7: Plan view of the north-western Arista, Gloria, Three Sisters and Switchback area of the Arista mine showing exploration holes drilled in 2023.
62
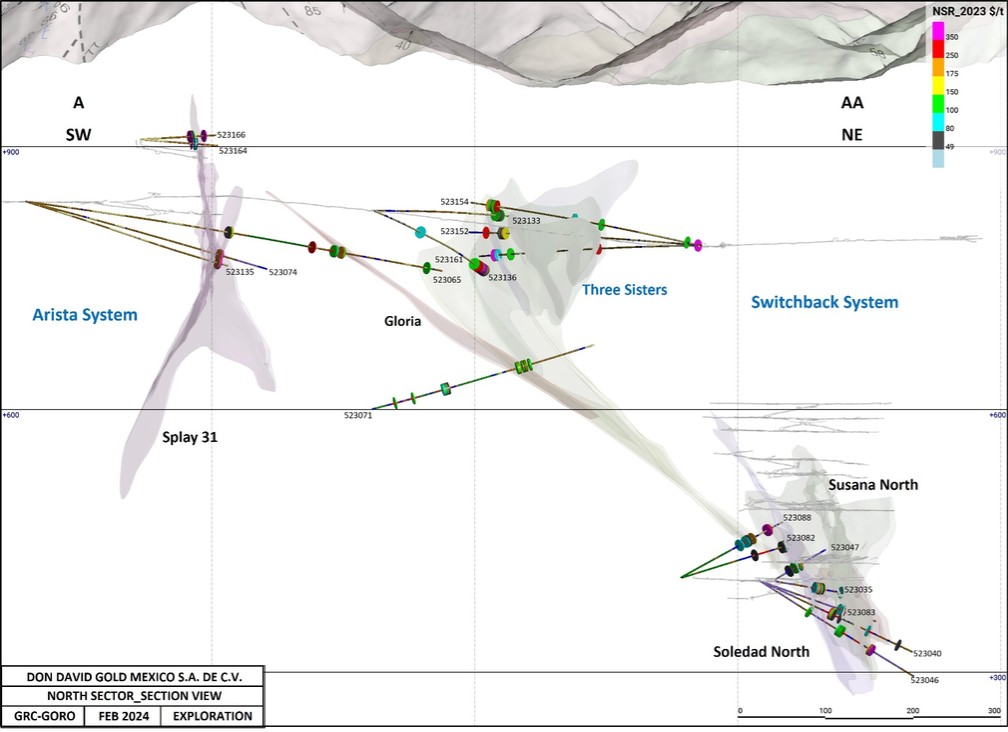
Figure 7-8: Cross section (A–AA) looking north-west through the Arista, Gloria, Three Sisters and Switchback vein systems of the Arista mine showing 2023 drilling results.
63
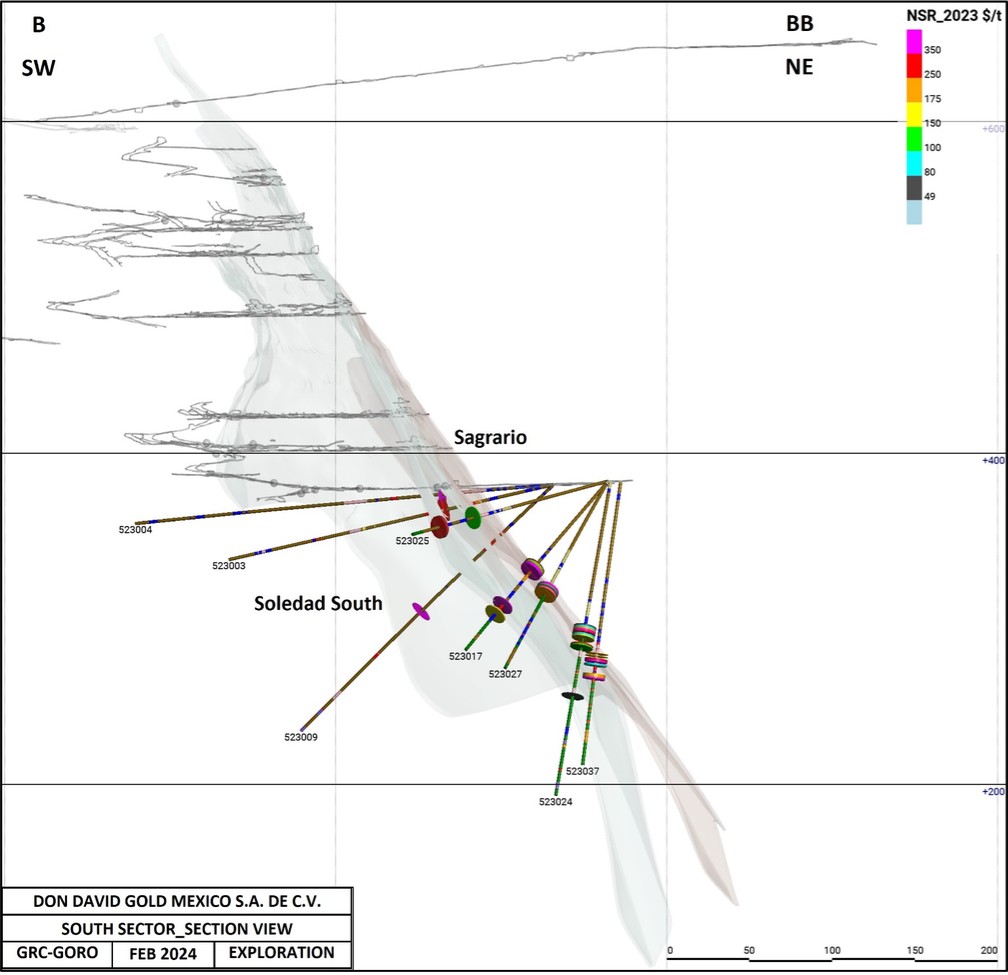
Figure 7-9: Cross section (B–BB) looking north-west through the Switchback vein system (Sagrario and Soledad South veins) of the Arista mine showing 2023 drilling results.
7.4.8Drill Sections
Representative drill sections displaying mineralized interpretations of the Arista and Switchback deposits in the Arista mine are shown in Figure 710 and Figure 711. Two sections of the Mirador and Independencia mineralized zones on the Alta Gracia project are shown in Figure 712 and Figure 713. Sectional interpretations are initially based on drill sections and then refined using systematic sections. Due to logistical and access issues, drilling along systematic sections has been difficult. Most drilling has been undertaken using fan patterns in plan and vertical sections and targeting based on long section impact spacing. Typical systematic drill sections, as presented in this report section, often only show partial traces of drill holes, which fall within section corridors.
64
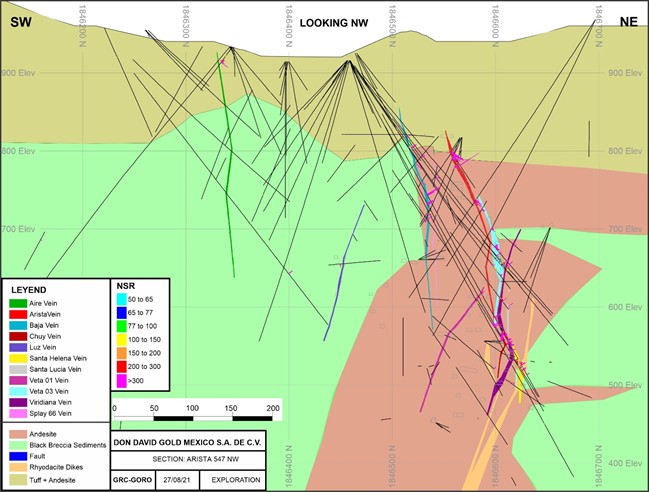
Figure 7-10: Arista Mine, Arista Deposit section displaying mineralization, modelled vein solids and lithology.
65
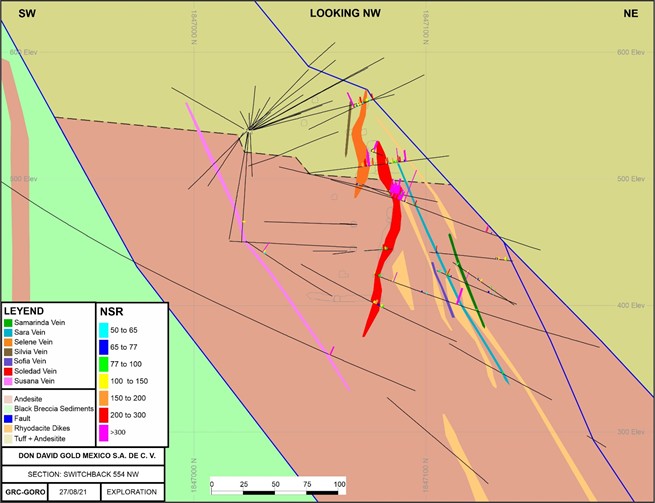
Figure 7-11: Arista Mine, Switchback Deposit section displaying mineralization, modelled vein solids and lithology.
66
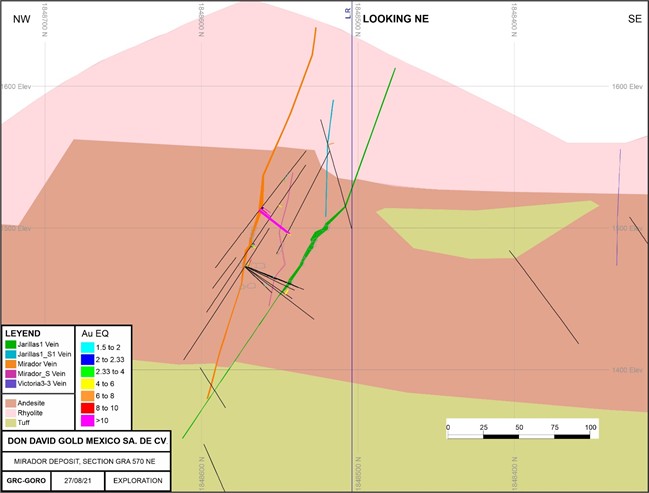
Figure 7-12: Alta Gracia Project, Mirador Deposit section displaying mineralization, modelled vein solids and lithology.
67
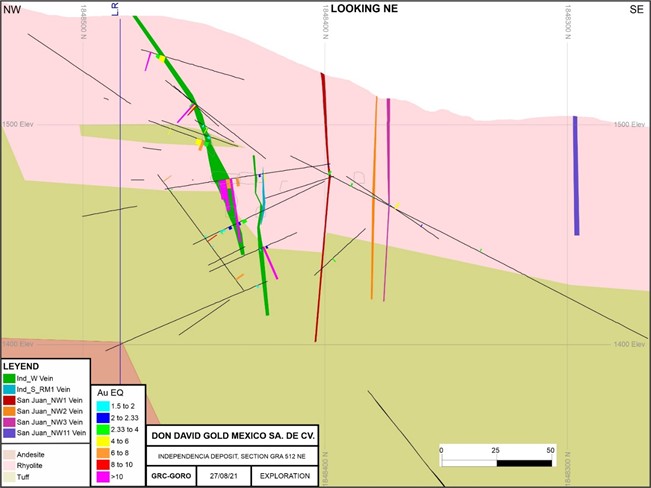
Figure 7-13: Alta Gracia Project, Independencia Deposit section displaying mineralization, modelled vein solids and lithology.
7.4.9Summary of drill intercepts
A selection of significant drill hole intercepts for zones drilled in 2023 are presented in this section. These are representative of how results have been, and are, reported and are a subset of data pertaining to the Arista project. The results presented do not represent the total mineralized intercepts that have been drilled on the Don David Mine projects. Some intercepts reported were received after Resource estimation data cutoff date and were not used for Resource estimation. Exploration results presented in this section have been or will be used to estimate Resources for identified veins. Other vein results may be used for Resource estimation if justified by additional interpretation. Other recent exploration activitiespresented in previous sections are early-stage activities that will require significant activity to bring to a Resource estimation standard. Significant drill hole results from 2023 drilling, received prior to this report preparation, from the Arista, Switchback, Three Sisters, and Gloria vein systems are summarized in Table 76.
68
Table 7-6: Significant 2023 Drilling Results for the Arista Mine.
HOLE |
VEIN |
FROM |
TO |
INTERVAL |
ETW* |
AU |
AG |
CU |
PB |
ZN |
ID |
(m) |
(m) |
(m) |
(m) |
( g/t ) |
( g/t ) |
( % ) |
( % ) |
( % ) |
|
523001 |
Sam 2 |
121.08 |
123.26 |
2.18 |
1.40 |
0.91 |
137 |
0.70 |
0.53 |
3.88 |
Incl. |
121.08 |
122.00 |
0.92 |
0.59 |
0.26 |
214 |
1.11 |
0.82 |
5.97 |
|
523003 |
Sagrario |
65.71 |
69.48 |
3.77 |
2.67 |
0.01 |
43 |
0.11 |
0.34 |
6.30 |
Incl. |
65.71 |
66.54 |
0.83 |
0.59 |
0.01 |
125 |
0.09 |
1.17 |
14.30 |
|
523004 |
Sagrario |
69.38 |
71.75 |
2.37 |
2.29 |
0.02 |
233 |
0.06 |
0.16 |
0.09 |
Incl. |
70.05 |
70.71 |
0.66 |
0.64 |
0.05 |
825 |
0.06 |
0.55 |
0.25 |
|
523006 |
Soledad South |
101.30 |
103.50 |
2.20 |
1.80 |
0.02 |
49 |
0.38 |
4.73 |
3.71 |
Incl. |
101.70 |
102.27 |
0.57 |
0.47 |
0.06 |
173 |
0.87 |
17.95 |
13.25 |
|
523007 |
Gloria |
717.14 |
719.56 |
2.42 |
1.56 |
0.39 |
47 |
0.12 |
0.56 |
2.37 |
523009 |
Sofia |
75.63 |
77.94 |
2.31 |
2.09 |
0.05 |
87 |
1.13 |
2.84 |
5.43 |
Incl. |
76.00 |
76.62 |
0.62 |
0.56 |
0.09 |
118 |
1.76 |
9.52 |
18.15 |
|
523009 |
Sam 2 |
113.26 |
115.82 |
2.56 |
1.96 |
0.67 |
504 |
0.71 |
0.90 |
1.70 |
Incl. |
114.20 |
114.91 |
0.71 |
0.54 |
2.41 |
1,810 |
2.31 |
3.24 |
6.08 |
|
523013 |
Veta 3 |
75.85 |
79.11 |
3.26 |
2.10 |
0.10 |
121 |
0.18 |
1.02 |
5.89 |
Incl. |
76.60 |
77.78 |
1.18 |
0.76 |
0.09 |
319 |
0.01 |
2.77 |
15.20 |
|
523015 |
Veta 3 |
65.05 |
68.84 |
3.79 |
3.66 |
0.25 |
103 |
0.75 |
2.84 |
13.09 |
Incl. |
67.21 |
68.04 |
0.83 |
0.80 |
0.40 |
165 |
0.15 |
2.75 |
34.99 |
|
523015 |
Daira |
207.52 |
210.47 |
2.95 |
2.55 |
1.53 |
106 |
0.08 |
0.54 |
4.96 |
Incl. |
208.90 |
209.43 |
0.53 |
0.46 |
8.31 |
498 |
0.02 |
2.32 |
23.40 |
|
523015 |
Marena |
286.13 |
287.86 |
1.73 |
1.50 |
16.03 |
7 |
0.00 |
0.09 |
1.13 |
Incl. |
286.13 |
287.06 |
0.93 |
0.81 |
29.80 |
12 |
0.00 |
0.16 |
2.09 |
|
523016 |
Sandy 2 |
512.66 |
515.90 |
3.24 |
3.19 |
3.22 |
77 |
0.09 |
0.69 |
1.42 |
523016 |
Gloria HW split |
566.75 |
569.00 |
2.25 |
2.25 |
0.07 |
32 |
0.32 |
0.33 |
5.69 |
Incl. |
566.75 |
567.80 |
1.05 |
1.05 |
0.10 |
48 |
0.39 |
0.48 |
11.50 |
|
523016 |
Gloria FW split |
578.10 |
580.54 |
2.44 |
2.44 |
0.07 |
18 |
0.03 |
1.84 |
6.44 |
Incl. |
579.94 |
580.54 |
0.60 |
0.60 |
0.10 |
34 |
0.04 |
2.03 |
14.95 |
69
523017 |
Sagrario |
80.73 |
85.27 |
4.54 |
3.21 |
1.05 |
92 |
0.83 |
1.73 |
8.56 |
Incl. |
83.27 |
84.27 |
1.00 |
0.71 |
0.15 |
132 |
1.17 |
3.48 |
21.70 |
|
523017 |
Soledad South |
115.48 |
117.66 |
2.18 |
2.10 |
4.91 |
9 |
0.20 |
0.09 |
2.75 |
Incl. |
116.20 |
116.77 |
0.57 |
0.55 |
16.95 |
26 |
0.56 |
0.29 |
9.30 |
|
523018 |
Veta 3 |
74.01 |
76.97 |
2.96 |
2.79 |
0.18 |
109 |
0.07 |
1.97 |
12.28 |
Incl. |
75.98 |
76.97 |
0.99 |
0.93 |
0.43 |
264 |
0.05 |
3.14 |
17.45 |
|
523018 |
Chuy 2 |
257.67 |
261.08 |
3.41 |
1.71 |
0.03 |
86 |
0.03 |
0.33 |
4.82 |
Incl. |
258.83 |
259.97 |
1.14 |
0.57 |
0.05 |
194 |
0.05 |
0.66 |
5.03 |
|
523018 |
Viridiana |
348.02 |
353.04 |
5.02 |
4.35 |
0.04 |
124 |
0.05 |
0.82 |
9.49 |
Incl. |
349.85 |
350.93 |
1.08 |
0.94 |
0.03 |
207 |
0.02 |
0.46 |
23.00 |
|
523018 |
Marena |
391.59 |
395.72 |
4.13 |
2.38 |
0.18 |
49 |
0.05 |
0.31 |
7.64 |
523019 |
Sagrario |
80.43 |
82.95 |
2.52 |
2.18 |
3.63 |
103 |
1.30 |
2.82 |
7.15 |
Incl. |
81.07 |
82.33 |
1.26 |
1.09 |
6.99 |
108 |
2.02 |
5.34 |
12.70 |
|
523019 |
Soledad South |
86.68 |
88.96 |
2.28 |
1.98 |
0.07 |
51 |
0.43 |
0.84 |
10.06 |
Incl. |
87.32 |
88.40 |
1.08 |
0.94 |
0.14 |
96 |
0.49 |
1.73 |
21.00 |
|
523020 |
Veta 3 |
85.77 |
90.78 |
5.01 |
3.54 |
0.05 |
48 |
0.01 |
0.99 |
4.23 |
Incl. |
89.96 |
90.78 |
0.82 |
0.58 |
0.03 |
110 |
0.02 |
1.67 |
11.65 |
|
523021 |
Sagrario |
91.60 |
97.45 |
5.85 |
5.50 |
0.05 |
99 |
0.38 |
1.07 |
4.35 |
Incl. |
93.58 |
94.22 |
0.64 |
0.60 |
0.11 |
539 |
1.75 |
7.60 |
26.80 |
|
523024 |
Sagrario |
92.50 |
100.10 |
7.60 |
5.82 |
0.26 |
56 |
0.50 |
0.64 |
8.07 |
Incl. |
95.51 |
96.63 |
1.12 |
0.86 |
0.05 |
130 |
1.54 |
0.87 |
19.35 |
|
523024 |
Soledad South |
104.30 |
106.93 |
2.63 |
2.01 |
0.37 |
55 |
0.31 |
1.34 |
5.63 |
Incl. |
104.30 |
105.11 |
0.81 |
0.62 |
1.17 |
148 |
0.68 |
3.31 |
12.45 |
|
523025 |
Soledad South |
138.83 |
140.86 |
2.03 |
1.56 |
3.08 |
15 |
0.29 |
1.63 |
4.03 |
Incl. |
138.83 |
139.59 |
0.76 |
0.58 |
6.68 |
27 |
0.26 |
1.41 |
0.88 |
|
523027 |
Sagrario |
91.41 |
96.23 |
4.82 |
3.69 |
2.95 |
46 |
1.13 |
2.79 |
9.28 |
Incl. |
92.11 |
93.07 |
0.96 |
0.73 |
8.82 |
56 |
2.28 |
7.46 |
17.20 |
|
523030 |
Veta 3 |
58.30 |
64.06 |
5.76 |
2.88 |
0.13 |
171 |
0.03 |
3.88 |
15.88 |
Incl. |
59.15 |
60.20 |
1.05 |
0.53 |
0.20 |
181 |
0.07 |
9.20 |
36.20 |
|
523030 |
Chuy 1 |
68.12 |
70.73 |
2.61 |
2.00 |
0.04 |
50 |
0.07 |
0.29 |
5.94 |
70
Incl. |
68.66 |
69.66 |
1.00 |
0.77 |
0.07 |
109 |
0.05 |
0.64 |
10.50 |
|
523032 |
Sandy 1 |
417.23 |
418.85 |
1.62 |
1.24 |
0.04 |
21 |
0.21 |
1.15 |
3.26 |
523032 |
Gloria |
517.08 |
518.90 |
1.82 |
1.39 |
0.00 |
15 |
0.00 |
1.30 |
4.38 |
523034 |
Sagrario |
76.90 |
79.48 |
2.58 |
2.23 |
4.11 |
54 |
0.80 |
2.64 |
5.78 |
523035 |
Susana North |
52.16 |
60.17 |
8.01 |
6.13 |
0.32 |
214 |
0.76 |
4.28 |
2.97 |
incl. |
56.84 |
57.95 |
1.11 |
0.85 |
1.12 |
748 |
0.51 |
21.49 |
3.21 |
|
523036 |
Gloria |
440.73 |
442.39 |
1.66 |
1.64 |
0.01 |
32 |
0.00 |
0.03 |
5.89 |
523037 |
Sagrario |
105.13 |
112.70 |
7.57 |
4.87 |
0.09 |
47 |
0.47 |
1.07 |
7.25 |
incl. |
109.48 |
110.53 |
1.05 |
0.68 |
0.06 |
221 |
1.41 |
3.58 |
27.60 |
|
523037 |
Soledad South |
117.84 |
121.71 |
3.87 |
2.49 |
0.96 |
27 |
1.01 |
1.06 |
9.69 |
incl. |
119.89 |
120.82 |
0.93 |
0.60 |
0.54 |
37 |
1.26 |
2.14 |
19.90 |
|
523040 |
Susana North |
91.97 |
96.49 |
4.52 |
3.46 |
0.24 |
198 |
0.74 |
0.58 |
4.95 |
incl. |
91.97 |
93.31 |
1.34 |
0.86 |
0.38 |
285 |
0.92 |
0.77 |
5.24 |
|
523042 |
Sandy 1 |
468.28 |
474.49 |
6.21 |
5.63 |
1.87 |
279 |
0.20 |
0.90 |
1.57 |
incl. |
472.76 |
473.52 |
0.76 |
0.69 |
3.55 |
722 |
0.45 |
0.60 |
2.14 |
|
523042 |
Sandy 2 |
486.82 |
489.79 |
2.97 |
2.57 |
1.07 |
139 |
0.20 |
0.29 |
0.55 |
incl. |
487.84 |
488.53 |
0.69 |
0.60 |
4.05 |
497 |
0.27 |
0.32 |
0.78 |
|
523043 |
Susana North |
26.34 |
32.77 |
6.43 |
6.33 |
0.14 |
60 |
0.62 |
0.13 |
2.21 |
incl. |
26.34 |
27.70 |
1.36 |
0.87 |
0.15 |
113 |
1.03 |
0.34 |
4.31 |
|
523045 |
Susana North |
50.07 |
55.21 |
5.14 |
3.30 |
0.12 |
94 |
0.43 |
1.30 |
4.72 |
incl. |
53.40 |
54.08 |
0.68 |
0.44 |
0.19 |
225 |
0.82 |
0.79 |
6.76 |
|
523046 |
Susana North |
112.11 |
118.13 |
6.02 |
3.87 |
0.09 |
101 |
0.45 |
0.57 |
0.82 |
incl. |
113.87 |
114.93 |
1.06 |
0.68 |
0.19 |
158 |
1.03 |
1.00 |
1.00 |
|
523046 |
Soledad North |
156.96 |
161.04 |
4.08 |
2.62 |
1.93 |
73 |
0.81 |
1.58 |
10.41 |
incl. |
159.81 |
161.04 |
1.23 |
0.79 |
4.01 |
119 |
1.25 |
2.59 |
15.05 |
|
523047 |
Susana North |
34.70 |
38.54 |
3.84 |
3.33 |
0.19 |
127 |
0.64 |
0.92 |
3.19 |
incl. |
36.30 |
37.60 |
1.30 |
1.13 |
0.37 |
268 |
0.23 |
2.06 |
6.92 |
71
523049 |
Sandy HW |
430.86 |
433.18 |
2.32 |
2.05 |
1.23 |
85 |
0.03 |
0.05 |
0.13 |
incl. |
431.74 |
432.09 |
0.35 |
0.31 |
6.28 |
408 |
0.13 |
0.20 |
0.64 |
|
523050 |
Soledad North FW |
104.75 |
109.68 |
4.93 |
4.46 |
0.31 |
38 |
0.45 |
0.76 |
2.34 |
incl. |
106.02 |
106.95 |
0.93 |
0.60 |
0.34 |
110 |
0.69 |
1.59 |
6.86 |
|
523050 |
Soledad North |
119.33 |
122.65 |
3.32 |
3.01 |
1.60 |
21 |
0.27 |
0.40 |
1.79 |
incl. |
119.85 |
121.22 |
1.37 |
0.88 |
3.69 |
33 |
0.41 |
0.80 |
3.21 |
|
523050 |
Salamanca |
125.08 |
127.45 |
2.37 |
2.15 |
0.99 |
46 |
0.25 |
1.68 |
4.17 |
incl. |
126.03 |
127.09 |
1.06 |
0.96 |
0.70 |
80 |
0.24 |
3.17 |
6.79 |
|
523051 |
Sandy 1 |
492.38 |
495.50 |
3.12 |
2.71 |
0.90 |
180 |
0.21 |
0.35 |
0.74 |
incl. |
494.54 |
495.50 |
0.96 |
0.83 |
1.85 |
295 |
0.30 |
0.82 |
1.61 |
|
523052 |
Susana North |
48.37 |
55.86 |
7.49 |
6.49 |
0.11 |
78 |
0.64 |
1.50 |
2.92 |
incl. |
49.70 |
51.80 |
2.10 |
1.35 |
0.19 |
164 |
1.06 |
2.20 |
5.98 |
|
523052 |
Salamanca |
129.90 |
136.08 |
6.18 |
2.07 |
0.68 |
106 |
0.21 |
1.97 |
4.66 |
incl. |
131.37 |
132.60 |
1.23 |
0.41 |
0.29 |
171 |
0.15 |
4.61 |
13.18 |
|
523053 |
Soledad North |
119.40 |
122.28 |
2.88 |
2.71 |
0.02 |
62 |
0.58 |
0.49 |
1.53 |
incl. |
120.91 |
122.28 |
1.37 |
0.88 |
0.01 |
100 |
0.63 |
0.78 |
1.89 |
|
523056 |
Marena North |
304.30 |
307.11 |
2.81 |
2.45 |
0.60 |
27 |
0.12 |
0.71 |
1.87 |
incl. |
306.38 |
307.11 |
0.73 |
0.64 |
1.79 |
25 |
0.28 |
2.60 |
6.69 |
|
523058 |
Gloria |
458.30 |
464.89 |
6.59 |
6.49 |
1.33 |
21 |
0.17 |
0.43 |
2.15 |
incl. |
460.45 |
461.30 |
0.85 |
0.84 |
2.83 |
21 |
0.17 |
0.78 |
3.79 |
|
523060 |
Susana North |
137.65 |
143.35 |
5.70 |
5.61 |
0.20 |
90 |
0.55 |
0.76 |
1.78 |
incl. |
140.04 |
141.08 |
1.04 |
0.67 |
0.25 |
105 |
0.45 |
1.28 |
3.19 |
|
523064 |
Sandy 2 |
486.80 |
492.44 |
5.64 |
5.50 |
3.87 |
652 |
0.35 |
0.63 |
1.45 |
incl. |
487.99 |
489.18 |
1.19 |
1.16 |
17.05 |
2,890 |
1.21 |
2.02 |
4.32 |
|
523065 |
Splay 31 |
290.57 |
294.08 |
3.51 |
2.88 |
1.49 |
49 |
0.16 |
2.99 |
3.91 |
incl. |
292.09 |
294.08 |
1.99 |
1.63 |
1.40 |
65 |
0.21 |
4.59 |
6.11 |
|
523065 |
Marena North |
411.10 |
413.42 |
2.32 |
1.78 |
0.81 |
38 |
0.52 |
2.15 |
2.03 |
incl. |
412.22 |
413.09 |
0.87 |
0.67 |
2.10 |
60 |
260.24 |
5.55 |
5.08 |
72
523065 |
Splay Gloria |
442.87 |
445.74 |
2.87 |
1.78 |
0.39 |
19 |
0.28 |
0.45 |
4.20 |
incl. |
442.87 |
444.39 |
1.52 |
1.26 |
0.24 |
25 |
0.37 |
0.58 |
5.00 |
|
523065 |
Gloria |
453.31 |
456.63 |
3.32 |
2.13 |
0.08 |
43 |
0.52 |
1.83 |
5.99 |
incl. |
453.31 |
454.82 |
1.51 |
0.97 |
0.08 |
60 |
0.57 |
3.42 |
7.32 |
|
523068 |
Soledad North |
135.14 |
146.73 |
11.59 |
10.39 |
0.26 |
33 |
0.37 |
0.83 |
2.76 |
incl. |
142.20 |
146.73 |
4.53 |
4.06 |
0.43 |
60 |
0.37 |
1.54 |
3.56 |
|
523069 |
Soledad North |
139.13 |
143.30 |
4.17 |
3.20 |
0.13 |
76 |
0.41 |
0.22 |
2.19 |
incl. |
140.30 |
141.49 |
1.19 |
0.91 |
0.30 |
158 |
0.19 |
0.29 |
5.34 |
|
523071 |
Sandy 1 & 2 + Gloria |
473.12 |
489.84 |
16.72 |
14.45 |
1.09 |
66 |
0.25 |
0.61 |
1.56 |
incl. |
481.33 |
483.43 |
2.10 |
1.81 |
2.21 |
178 |
0.30 |
1.48 |
2.81 |
|
523071 |
Splay Gloria |
571.34 |
579.19 |
7.85 |
6.80 |
0.12 |
132 |
0.45 |
2.20 |
2.84 |
incl. |
573.55 |
575.70 |
2.15 |
1.86 |
0.06 |
327 |
0.97 |
3.10 |
4.56 |
|
523074 |
Splay 31 |
272.66 |
276.35 |
3.69 |
3.63 |
0.86 |
58 |
0.23 |
4.22 |
15.27 |
incl. |
273.77 |
275.33 |
1.56 |
1.53 |
1.60 |
79 |
0.26 |
7.23 |
30.50 |
|
523075 |
Soledad North |
136.62 |
139.85 |
3.23 |
2.79 |
0.42 |
108 |
0.39 |
3.50 |
5.41 |
incl. |
138.93 |
139.85 |
0.92 |
0.79 |
0.26 |
155 |
0.41 |
5.36 |
6.02 |
|
523078 |
Soledad North |
75.66 |
77.70 |
2.04 |
1.56 |
1.21 |
47 |
0.14 |
0.60 |
3.48 |
incl. |
75.66 |
76.75 |
1.09 |
0.83 |
2.26 |
85 |
0.22 |
1.10 |
6.24 |
|
523080 |
Marena North |
386.91 |
395.09 |
8.18 |
8.06 |
0.30 |
58 |
0.20 |
2.00 |
7.42 |
incl. |
386.91 |
388.22 |
1.31 |
1.29 |
0.69 |
58 |
0.29 |
2.45 |
11.20 |
|
523082 |
Susana North |
141.70 |
147.04 |
5.34 |
4.62 |
3.36 |
26 |
0.35 |
0.52 |
3.39 |
incl. |
144.75 |
147.04 |
2.29 |
1.98 |
7.43 |
41 |
0.52 |
0.93 |
5.89 |
|
523083 |
Soledad North |
127.43 |
131.75 |
4.32 |
3.74 |
0.11 |
180 |
0.49 |
1.93 |
8.72 |
incl. |
130.30 |
131.75 |
1.45 |
1.26 |
0.03 |
265 |
0.24 |
4.36 |
14.75 |
|
523087 |
Soledad North |
106.87 |
109.40 |
2.53 |
2.19 |
0.06 |
62 |
0.58 |
0.43 |
2.67 |
incl. |
108.14 |
109.40 |
1.26 |
1.09 |
0.09 |
99 |
0.53 |
0.42 |
4.05 |
|
523087 |
Salamanca |
127.45 |
130.10 |
2.65 |
2.03 |
0.10 |
93 |
0.23 |
0.49 |
3.58 |
incl. |
129.39 |
130.10 |
0.71 |
0.54 |
0.05 |
174 |
0.26 |
0.82 |
8.81 |
73
523088 |
Sandy 2 |
119.30 |
121.66 |
2.36 |
2.02 |
0.10 |
17 |
0.01 |
1.60 |
4.56 |
incl. |
120.82 |
121.66 |
0.84 |
0.72 |
0.07 |
43 |
0.02 |
4.34 |
12.10 |
|
523088 |
Soledad North |
145.50 |
149.40 |
3.90 |
3.37 |
3.78 |
26 |
0.44 |
1.93 |
3.99 |
incl. |
146.48 |
147.55 |
1.07 |
0.92 |
8.14 |
36 |
0.58 |
2.90 |
6.43 |
|
523098 |
Splay 31 |
255.41 |
258.88 |
3.47 |
2.59 |
1.40 |
81 |
0.19 |
2.66 |
13.58 |
incl. |
257.40 |
258.42 |
1.02 |
0.88 |
3.42 |
115 |
0.34 |
6.47 |
25.40 |
|
523104 |
Selene |
103.60 |
112.06 |
8.46 |
5.44 |
2.57 |
236 |
0.19 |
0.93 |
1.71 |
Incl. |
110.61 |
111.59 |
0.98 |
0.63 |
5.13 |
100 |
0.62 |
5.68 |
7.18 |
|
523106 |
Susana North |
38.35 |
43.12 |
4.77 |
4.13 |
0.10 |
73 |
0.83 |
0.28 |
1.53 |
Incl. |
42.00 |
43.12 |
1.12 |
0.97 |
0.17 |
131 |
1.27 |
0.44 |
3.16 |
|
523113 |
Susana North |
109.20 |
111.07 |
1.87 |
1.43 |
0.05 |
44 |
1.01 |
0.80 |
2.42 |
incl. |
110.36 |
110.79 |
0.43 |
0.33 |
0.10 |
69 |
2.11 |
1.43 |
3.39 |
|
523114 |
Susana North HW |
61.69 |
66.91 |
5.22 |
2.99 |
0.68 |
21 |
0.20 |
1.91 |
2.61 |
incl. |
65.72 |
66.91 |
1.19 |
0.68 |
0.72 |
42 |
0.17 |
4.83 |
1.98 |
|
523114 |
Susana North |
104.51 |
107.90 |
3.39 |
2.59 |
0.66 |
57 |
0.86 |
1.48 |
6.67 |
incl. |
104.51 |
105.67 |
1.16 |
0.89 |
0.93 |
90 |
1.27 |
2.83 |
7.90 |
|
523120 |
Soledad North |
1.20 |
4.52 |
3.32 |
3.12 |
0.36 |
106 |
0.51 |
2.87 |
2.70 |
incl. |
3.72 |
4.52 |
0.80 |
0.75 |
0.15 |
189 |
1.07 |
6.34 |
5.83 |
|
523121 |
Soledad North |
0.00 |
4.89 |
4.89 |
4.59 |
1.29 |
59 |
0.25 |
0.23 |
3.81 |
incl. |
2.00 |
3.40 |
1.40 |
1.32 |
2.82 |
28 |
0.38 |
0.24 |
5.16 |
|
523121 |
Soledad South |
12.40 |
14.94 |
2.54 |
1.56 |
0.88 |
87 |
0.10 |
0.27 |
3.06 |
incl. |
12.72 |
13.24 |
0.52 |
0.32 |
0.75 |
73 |
0.13 |
0.30 |
5.23 |
|
523126 |
Soledad South |
168.28 |
170.76 |
2.48 |
1.90 |
0.21 |
18 |
0.42 |
0.58 |
3.87 |
incl. |
168.28 |
169.40 |
1.12 |
0.85 |
0.37 |
24 |
0.49 |
0.81 |
5.94 |
|
523129 |
Susana South |
70.83 |
73.29 |
2.46 |
2.13 |
2.42 |
15 |
0.30 |
1.09 |
2.42 |
incl. |
72.92 |
73.29 |
0.37 |
0.32 |
6.35 |
24 |
0.34 |
2.17 |
2.65 |
|
523130 |
Splay 31 |
252.44 |
254.82 |
2.38 |
2.06 |
0.04 |
39 |
0.19 |
0.79 |
4.42 |
incl. |
253.22 |
254.06 |
0.84 |
0.72 |
0.05 |
51 |
0.21 |
1.51 |
6.60 |
74
523132 |
Splay 31 |
262.05 |
265.73 |
3.68 |
3.19 |
0.45 |
61 |
0.33 |
3.20 |
6.20 |
incl. |
262.05 |
263.03 |
0.98 |
0.85 |
0.90 |
60 |
0.51 |
5.86 |
7.76 |
|
523132 |
Marena North |
383.42 |
388.17 |
4.75 |
4.11 |
0.09 |
73 |
0.28 |
0.93 |
1.85 |
incl. |
385.84 |
387.00 |
1.16 |
1.00 |
0.09 |
47 |
0.26 |
2.19 |
3.35 |
|
523133 |
Sandy 1 |
207.47 |
212.59 |
5.12 |
4.43 |
0.90 |
138 |
0.09 |
0.21 |
0.85 |
incl. |
212.15 |
212.59 |
0.44 |
0.38 |
1.71 |
1,155 |
0.08 |
0.32 |
0.84 |
|
523135 |
Splay 31 |
256.48 |
259.75 |
3.27 |
2.83 |
3.31 |
84 |
0.22 |
2.72 |
14.84 |
incl. |
257.43 |
258.45 |
1.02 |
0.88 |
6.93 |
88 |
0.26 |
3.46 |
14.30 |
|
523136 |
Sandy 1 + Sandy 2 |
243.48 |
260.81 |
17.33 |
15.01 |
9.42 |
263 |
0.62 |
4.43 |
4.72 |
incl. |
252.50 |
255.95 |
3.45 |
2.99 |
19.17 |
481 |
1.10 |
6.73 |
8.05 |
|
523142 |
Sasha 1 |
148.74 |
152.45 |
3.71 |
3.20 |
1.37 |
131 |
0.20 |
0.33 |
0.64 |
incl. |
151.29 |
152.45 |
1.16 |
1.00 |
4.14 |
387 |
0.56 |
0.94 |
1.82 |
|
523148 |
Sandy 2 |
256.87 |
259.69 |
2.82 |
2.55 |
1.13 |
17 |
0.09 |
1.97 |
1.79 |
incl. |
258.52 |
259.69 |
1.17 |
1.06 |
1.91 |
32 |
0.18 |
3.78 |
4.00 |
|
523151 |
Soledad RM5 |
88.07 |
94.50 |
6.43 |
4.93 |
2.55 |
25 |
0.15 |
0.28 |
0.67 |
incl. |
90.03 |
91.77 |
1.74 |
1.33 |
4.50 |
38 |
0.17 |
0.41 |
0.84 |
|
523152 |
Sandy 1 |
266.64 |
271.90 |
5.26 |
4.56 |
3.48 |
100 |
0.18 |
0.69 |
1.94 |
incl. |
268.65 |
269.70 |
1.05 |
0.91 |
12.25 |
112 |
0.19 |
0.91 |
2.17 |
|
523154 |
Sandy 1 + Sandy 2 |
265.39 |
273.69 |
8.30 |
7.78 |
1.37 |
101 |
0.16 |
0.71 |
1.24 |
incl. |
265.39 |
266.27 |
0.88 |
0.83 |
1.75 |
481 |
0.33 |
0.79 |
1.45 |
|
523156 |
Sandy 1 |
235.50 |
237.58 |
2.08 |
1.82 |
0.54 |
144 |
0.08 |
0.15 |
0.40 |
incl. |
235.50 |
235.92 |
0.42 |
0.37 |
2.19 |
641 |
0.25 |
0.57 |
1.61 |
|
523156 |
Sandy 2 |
259.93 |
262.54 |
2.61 |
2.57 |
0.96 |
49 |
0.09 |
0.38 |
1.28 |
incl. |
261.53 |
262.54 |
1.01 |
1.00 |
2.31 |
86 |
0.19 |
0.92 |
3.13 |
|
523156 |
Sasha 2 |
266.09 |
268.10 |
2.01 |
2.00 |
1.49 |
198 |
0.07 |
0.18 |
0.37 |
incl. |
267.63 |
268.10 |
0.47 |
0.47 |
2.70 |
541 |
0.12 |
0.37 |
0.70 |
|
523160 |
Sandy 1 |
265.88 |
269.13 |
3.25 |
3.21 |
0.83 |
65 |
0.18 |
0.90 |
1.94 |
incl. |
265.88 |
266.88 |
1.00 |
0.99 |
1.84 |
153 |
0.17 |
1.86 |
2.42 |
75
523161 |
Sandy 1 |
273.68 |
275.68 |
2.00 |
1.97 |
0.55 |
109 |
0.02 |
0.17 |
0.52 |
incl. |
273.68 |
274.65 |
0.97 |
0.96 |
0.85 |
164 |
0.03 |
0.28 |
0.91 |
|
523161 |
Sandy 2 |
295.15 |
297.78 |
2.63 |
2.59 |
3.68 |
80 |
0.16 |
1.11 |
1.63 |
incl. |
296.97 |
297.78 |
0.81 |
0.80 |
11.15 |
233 |
0.27 |
1.59 |
3.11 |
|
523163 |
Sadie 2 |
229.28 |
231.85 |
2.57 |
2.53 |
0.54 |
103 |
0.06 |
0.71 |
0.99 |
incl. |
229.28 |
230.74 |
1.46 |
1.44 |
0.79 |
161 |
0.06 |
1.19 |
1.53 |
*Estimated True Width, based on core intersection (alpha) angle methodology (Marjoribanks, 2010).
7.5Other Exploration Activities
Regional detailed regional and local geological studies have been undertaken, including geochemical and geophysical examinations, focused on past exploration programs on the Don David Mine. These studies currently serve as the basis for four main exploration target areas: Arista, Alta Gracia, Margaritas, and Rey. In 2022 an analysis of satellite derived ASTER and Landsat OLI 8 SWIR and NIR data for the Arista and Margaritas projects; this study confirmed known targets and identified additional areas for follow-up ground exploration and future drill campaigns, Data for these projects are reviewed and updated regularly.
There is significant potential for further discoveries in the Don David Mine properties. To date, most activities have focused on near-mine areas. However, GRC continues to evaluate its Oaxaca properties’ green and brownfield opportunities. Recent exploration activities reported in the previous sections of this report are focused on early-stage targets primarily defined by geochemical sample assay results and geological mapping if already undertaken. Significant work needs to be conducted to develop these targets to determine if they can contain Mineral Resources.
In the opinion of the QP:
| ● | The mineralization style and setting of the Don David Mine area is adequately well understood to support Mineral Resource and Mineral Reserve estimation. |
| ● | Exploration methods are consistent with industry practices and are adequate to support continuing exploration and Mineral Resource estimation. |
| ● | Exploration results support DDGM’s interpretation of the geological setting and mineralization. |
| ● | Continuing exploration may identify additional mineralization that could support Mineral Resource estimation. |
The QP has the following observations and conclusions regarding drilling conducted at the Property since 2020:
| ● | Data was collected using industry-standard practices. |
| ● | Drill orientations are appropriate to the orientation of the mineralization for the bulk of the area where Mineral Resources have been estimated. |
| ● | Core logging meets industry standards for exploration of epithermal-style deposits. Geotechnical logging is sufficient to support Mineral Resource estimation. |
| ● | Collar surveys have been performed using industry-standard instrumentation. |
| ● | Downhole surveys performed during the drill programs have been performed using industry-standard instrumentation. |
| ● | Drilling information is sufficient to support Mineral Reserve and Mineral Resource estimates. |
76
8SAMPLE PREPARATION, ANALYSES, AND SECURITY
The samples used in the mineral reserve estimates include both diamond drill core and underground chip channel samples. Routine sampling at the Don David Mine includes process and tailings samples and concentrate samples. Aside from their functions in maintaining good operations performance, these samples are essential for reserve validation and reconciliation of production to reserves. Don David Mine maintains sample preparation and laboratory facilities at the DDGM Processing Facility.
An external laboratory analyzes all exploration samples. Since 2006 the exploration department has used the ALS Global Group (ALS) for assaying. The ALS laboratory in Vancouver, where all exploration samples are analyzed, is ISO 9001:2015 and ISO/IEC 17025:2017 accredited for the techniques utilized for DDGM samples.
8.1.Exploration and Drill Hole Samples
All DDGM’s surface exploration samples of rock and soil and surface and underground exploration drill core were bagged and tagged at the Don David Mine core facility and since 2006, have been shipped to the ALS preparation facility in Guadalajara, Mexico. Beginning in 2023 all samples were shipped to the ALS preparation facility in Santiago de Queretaro, Mexico. After preparation, the samples were sent to the ALS laboratory in Vancouver, Canada. All samples are logged into the ALS group´s Laboratory Information Management System (LIMS), which enables tracking of sample status. Core samples generally range in length from 0.3 m to 1.5 m, with occasional longer samples. Surface exploration rock and soil samples were analyzed as described in the section on soil sampling.
Drill samples were dried and jaw crushed to 70% passing -10 mesh at the ALS preparation facility in Santiago de Queretaro. A subsample of 250 g was pulverized with a ring pulverizer and then sent to ALS in Vancouver for assaying. Preparation (crush) duplicates and analytical (pulp) duplicates were split from the samples at the crushing and pulverization phases of sample preparation, respectively. Certified reference materials (standards and blanks) were inserted into the sample stream before submittal, and the laboratory was asked to analyze the samples in the sequence submitted.
In Vancouver, ALS analyzed the samples for gold using a 30 g fire assay digestion with an atomic absorption finish (Method Au-AA23). Silver was analyzed by three methods depending upon the grade of the sample. All samples were analyzed for silver using an aqua regia digestion of 0.5 g sample with an ICP-OES finish (Method ME-ICP41). Any sample exceeding 100 ppm silver was reanalyzed using an aqua regia digestion on 0.4 g of the sample, followed by an ICP-AES finish (Method Ag-OG46). Any samples exceeding 1,500 ppm silver were reanalyzed using a 30 g fire assay with a gravimetric finish (Method Ag-GRA21). The samples were analyzed for copper, lead, and zinc using an aqua regia digestion of a 0.5 g sample with an ICP-OES finish (Method ME-ICP41). Any sample with copper, lead, or zinc concentrations exceeding 10,000 ppm was reanalyzed using an aqua regia digestion of a 0.4 g sample followed by an ICP-AES finish (Method OG46). Samples with lead concentrations exceeding 20,000 ppm and zinc concentrations exceeding 30,000 ppm were reanalyzed using 4-acid digestion with a titrated endpoint to determine lead and zinc concentrations.
Check assaying of underground channel samples was done by ALS. Underground development drill core samples are sent to DDGM’s in-house laboratory at the Arista Project. The samples are crushed using jaw crushers to 90% passing -12 mesh. The crushed material is split to obtain a 200 g sample pulverized with ring pulverizers to get a 90% passing -100 mesh sample used for analyses. After analysis, a pulp duplicate and the coarse reject material is collected by exploration personnel and stored with exploration coarse reject and pulp material for six months and then discarded. Oxide samples are analyzed for gold and silver by fire assay (approximately 30 g). Sulfide material is analyzed by fire assay for gold and silver with copper, lead, and zinc analyzed by atomic absorption spectrophotometry following 2-acid digestion.
The mine geologists manage the chip channel sampling process. After blasting each round, the mine geology department takes underground channel samples from mineralized zones, hanging walls, and footwall in the faces.
Chip channel sampling is conducted along the sub-level drifts in the mineralized zones. Channel samples are the primary means of sampling in the mine. They are taken horizontally across the faces of drifts and other workings, across the back of the drifts, and occasionally from sidewalls. While facing, the heading sampling is taken from the footwall of the vein structure to the hanging wall, with the entire face sampled in production headings. Past samples have been taken perpendicular to the vein structure, but this is not current practice.
Channel samples are taken using a rotary percussive drill or occasionally with chisel and hammer, collected in a canvas tarp, and deposited in numbered bags for transportation to the laboratory; in the past, sampling was performed solely with chisel and hammer. The canvas tarp is cleaned between each sample, and in the fractured ground, the face is cleaned after each sample to avoid contamination.
77
The samples are labelled and sealed in plastic bags with a plastic tie before being sent to the Don David Mine Arista laboratory.
Sampling crews typically take channel samples at regular intervals of 4 to 5 m along the working, depending on daily mine development, with typically five to eight samples along every sample channel “line” on new openings (drifts, crosscuts, ramps, stopes, etc.). Currently, there are multiple underground openings along the Arista and Switchback veins. Generally, 10 to 20 channel samples are taken per day from mine development and stopping areas in the Arista underground mine. Each sample typically weighs approximately 3 kg.
Channel samples are taken in consecutive lengths of no less than 0.3 m and no more than 1.50 m along the channel. Sample widths are defined based on geologic features such as wall rock type, mineralization type and intensity, quartz characteristics, silicification, veinlets, stockwork zones, and other features. If there is more than one vein present or divided by waste rock, then each of the divisions is sampled separately. The geologist paints the channels for sampling and numbers them on the drift wall for proper orientation and identification. The individual channel sample assays are composited to determine the average grade of each channel.
Where possible, sample locations are subsequently surveyed by underground surveyors. However, sample locations are typically obtained by chaining a mine survey point using a 30 or 50 m tape measure. The elevation relative to the survey point and orientation of the sample relative to the wall were also recorded.
The sample location is later manually entered into a sample database and treated as a string of samples in a drill hole type database. In the past, the start and endpoints for each sample were surveyed. It was then presented as a single string of samples in the database like a drill hole. Sample locations are plotted on stope plans using various software applications. The sample numbers and location data are recorded in the GeoInfo Tools (Microsoft SQL Server with Microsoft Access interface) database. Upon receiving assays, technicians and geologists produce reports for day-to-day monitoring and grade control.
Assaying at the Don David Mine Arista Laboratory uses the same techniques described in the previous section for core samples. The mine recovers the pulp duplicate, and selected samples are submitted to ALS for QAQC.
DDGM maintains the DDGM Processing Facility's sample preparation and laboratory facilities for process samples, concentrate, mine production samples, chip samples, and core from underground production drilling. The facilities are located within the plant compound and guarded 24 hours per day. The Arista assay laboratory is set up in one building near the plant. Plant samples are shown in Table 81, and the sample points within the process are located as shown in Figure 81.
78
Table 8-1: List of routine process sampling, the analysis performed, and reporting frequency.
SAMPLE NAME |
TYPE |
FREQUENCY OF |
ANALYSIS |
REPORT |
Head grade sample (Cyclone Overflow sample, Cu flotation feed) |
Composite |
1000 grams / 6 hours |
Ag, Au, Cu, Pb, Zn and Fe |
Two per Shift |
Cu Concentrate Samples |
Composite |
500 grams / 6 hours |
Ag, Au, Cu, Pb, Zn and Fe |
Two per Shift |
Pb Concentrate Samples |
Composite |
500 grams / 6 hours |
Ag, Au, Cu, Pb, Zn and Fe |
Two per Shift |
Zn Concentrate Samples |
Composite |
500 grams / 6 hours |
Ag, Au, Cu, Pb, Zn and Fe |
Two per Shift |
Final Tail (Zn Floatation Underflow) |
Composite |
1000 grams / 6 hours |
Ag, Au, Cu, Pb, Zn and Fe |
Two per Shift |
Cu Concentrate Shipments Samples (Truck Sampling) |
Lot |
80 Kg / truck |
Ag, Au, Cu, Pb, Zn and Fe |
Per Shipment |
Pb Concentrate Shipments Samples (Truck Sampling) |
Lot |
80 Kg / truck |
Ag, Au, Cu, Pb, Zn and Fe |
Per Shipment |
Zn Concentrate Shipments Samples (Truck Sampling) |
Lot |
80 Kg / truck |
Ag, Au, Cu, Pb, Zn and Fe |
Per Shipment |
Head grade sample (ore feed to oxide mill) |
Composite |
1500 grams/ shift |
Ag, Au, Cu, Pb, Zn and Fe |
One Per Shift |
Final Tail Solid (Clarifier 5 Underflow) |
Composite |
1500 grams/ shift |
Ag, Au, Cu, Pb, Zn and Fe |
One Per Shift |
Final Tail Liquid (Clarifier 5 Underflow) |
Composite |
10 liters/ shift |
Ag, Au, Cu, Pb, Zn and Fe |
One Per Shift |
Pregnant Solution (Merrill-Crowe Feed) |
Composite |
20 liters/ shift |
Ag and Au |
One Per Shift |
Barren Solution (Merrill-Crowe Tail) |
Composite |
20 liters/ shift |
Ag and Au |
One Per Shift |
Merril-Crowe Precipitate |
Lot |
1000 grams/lot |
Ag, Au, Cu, Pb, Zn and Fe |
One Per Lot |
Ingot Bar Dore |
Per ingot bar |
2 grams/ bar |
Ag, Au, Cu, Pb, Zn and Fe |
One Per Ingot Bar |
8.4.Sample Security and Chain of Custody
Grade control and processing-plant production samples from operations are managed by the Don David mining operation employees and its drill contractors. In contrast, exploration samples are collected by Don David exploration personnel and their contractors.
Channel samples are delivered directly from the underground operations to the Don David mine laboratory. Face channels are sampled by sample technicians and then brought to the surface. These are then brought to the sample room, where the control samples are inserted, and the batch is created. Once the samples are ready to be delivered, a delivery/reception sheet is made, filled in with the total number of samples, and lists each of them, indicating the origin, type of sample, requested analysis, and any observation of interest to both parties. When the samples (core or rock chips) are delivered to the laboratory, the person in charge of receiving them checks that the samples that are indicated in the dispatch-submittal sheets correspond to those that are delivered in the laboratory, confirming with the signatures of the person who delivery and who receives that they are ready to be analyzed.
After the sample assays are completed, the pulps received from the laboratory are stored in a pulp box in a container intended exclusively for that purpose. The pulps are ordered inside the box, with the record of the work orders always visible. The pulps are retained in the container for six months before being discarded.
80
All drill hole samples are the responsibility of the exploration department, as are surface exploration samples. All core and non-core surface samples are kept in a secure storage area in the exploration department facilities until they are transported to the external laboratory.
Drill core is sealed and carefully transported in sealed core boxes from the drill site to the company's core logging facilities located adjacent to the exploration office by the drilling contractor or in-house drilling crews—the drillers record hole identification and sequential box number during the drilling process. The logging and storage areas are located entirely within the company's operational facilities, patrolled by security guards.
Once logging and sampling are completed, all exploration core, and selected production core, are transferred to the on-site, permanent core storage facility. The core is stored on metal shelves chronologically and by project, with location plans of all cores maintained. Narrow diameter, production (infill drilling) core is sampled in its entirety for intervals of interest, and the remaining core is discarded after temporary storage. All pulps from the exploration core are returned from ALS and stored on metal shelves in dedicated, dry, secure storage facilities. Selected coarse reject samples are returned from ALS and kept at the company's facilities in the core storage area.
Exploration samples are kept in a dry, locked storage facility until shipment to ALS. All samples are collected by an ALS employee in a dedicated sample vehicle and transported to their sample preparation facility in Santiago de Queretaro. The same vehicle brings returned coarse reject and pulp samples from the ALS sample preparation facility. ALS is responsible for the shipment of pulps from its Santiago de Queretaro laboratory to its Vancouver facilities.
Sample security relies on the samples being either in the custody of Don David personnel or stored in the locked on-site preparation facility or stored in a secure area before pick-up by ALS Laboratory personnel or delivery to the on-site Don David laboratory. A unique and independent sample number is used for each sample with dispatch-submittal sheets and database entries used to track samples' progress and ensure that the laboratory receives all samples.
A QAQC program has been established for exploration programs conducted at the Don David Mine. Drill core sampling is subject to a QAQC program administered by the company, including submitting blind blank samples, duplicate split samples of quarter core, duplicate pulp splits, certified reference material (CRM) standards, and analysis of check samples. DDGM’s QAQC practices for exploration at Don David Mine comprise a minimum of one standard, one blank, one pulp duplicate, and one coarse duplicate introduced per batch of 40 samples to the sample stream resulting in at least 10% quality control samples. Underground grade control drilling involves the insertion of one standard and one control blank for every 40 samples. However, because the whole core is often sampled, there is no opportunity for coarse duplicate samples. For underground chip channel samples, one standard, one blank, and one duplicate are introduced per batch of 40 samples.
Additionally, internal laboratory reporting of quality control and assurance sampling is monitored by mine staff on an ongoing basis. The primary independent assay laboratory used is ALS Chemex Labs, S.A. De C.V. in Santiago de Queretaro, Mexico. CRM standards and blanks are obtained from CDN Resource Laboratories Ltd. of Langley, British Columbia, Canada. CRM standards are received in individually vacuum-sealed tin-top kraft bags containing 60 g of pulverized blended material. All exploration core is subject to data verification procedures through the sequential insertion of duplicate and control samples introduced into the sample stream at a targeted rate of one duplicate, one CRM standard, one blank, one coarse reject, and one pulp sample for every 40 regular samples.
Preparation reproducibility was measured with duplicate crush splits collected after crushing the sample. Analytical reproducibility was measured by analyzing duplicate pulp splits collected after pulverizing the sample. For the Don David Mine drilling program, sample reproducibility is measured with quarter split-core sample duplicates analyses.
The DDGM crew took the quarter core duplicate core samples from the remaining half by re-splitting the core to one-quarter size. Therefore, one-quarter of the core remains in the box for future reference.
The Arista laboratory’s quality controls include using a primary or secondary standard sample that is certified for analysis in fire assay, atomic absorption, and X-ray fluorescence. These standard samples are analyzed at the end of each month, evaluating the assay results. This analysis determines the quality control of the Arista lab’s analysis. Some duplicate samples are sent to ALS for lab-quality controls.
STANDARD SAMPLES
CRM samples are materials of known values used to check and quantify the analytical accuracy of laboratories.
81
CRM samples were purchased from CDN Resource Laboratories Ltd., where reference material was prepared after a 14 laboratory round robin. At Don David Mine, commercially available standards are used. The average value and standard deviation (SD) for the round robins are certified. The variation from the standard’s mean value in standard deviations defines the QAQC variance and is used to determine the acceptability of the standard sample assay. Approximately 100 g of sample material is submitted per QAQC sample.
The expected values of the CRM used at Don David Mine range from 0.01 ppm gold to 18.34 ppm gold and from 0.01 ppm silver to 2684 ppm silver. Standard samples are inserted into the sample stream at a ratio of 1:40 for surface exploration and underground production samples.
The criteria for pass or failure are as follows.
| ● | Assay value < certified mean ±2 SD → Pass |
| ● | Assay value ≥ mean ±2 SD → Warning or Failure |
A failure is declared when the same standard exceeds two consecutives ±2 SD warnings.
The geologist in charge is notified when a standard failure occurs. The geologist then determines if the failure can be accepted, e.g., located in an unmineralized zone or a verified CRM swap. If the geologist rejects the batch, the laboratory re-runs the failed batch.
BLANK SAMPLES
A blank control sample is a material with a zero-gold value. Blanks are inserted to assess sample preparation. Specifically, identify “grade smearing” or sample carryover of subsequent samples caused by improper preparation contamination and evaluate analytical “background noise.”
The material used by DDGM as the blank sample is purchased from CDN Resource Laboratories Ltd. The following criteria are used to evaluate analytical results received for blank samples:
| ● | Assay result less than 2 SD of the analyte’s certificate mean = Pass |
| ● | Assay result equal to or greater than 2 SD of the analyte’s certificate mean = Failure |
| ● | The geologist in charge is notified when a blank failure occurs. The geologist then determines if the failure can be ignored or if the batch needs to be re-run. Examples, where the failure might be excused include: |
| ● | The blank sample has been accidentally switched with a CRM or non-QAQC sample. |
| ● | The failure is in an area of known waste distal from mineralization. |
| ● | Laboratory procedures include cleaning of the sample preparation circuit after sample batches. |
DUPLICATE SAMPLES
Duplicate samples of coarse rejects provide information on sample preparation and assay precision, while duplicate pulp samples may be used to quantify analytical precision. The assay results of the duplicates were analyzed by preparing to scatter plots and relative difference plots that compared the difference of grade of the pairs to the mean grade of the pairs. The pass/fail criteria used by DDGM for duplicate pulp samples were nominal ± 15% and 30% for coarse duplicates.
OUTSIDE CHECK SAMPLES
The QP considers that the drilling and chip channel sampling programs meet industry standards and have been reviewed and confirmed in sufficient detail to permit the inclusion of the information in the Don David Mine database.
The processing team is currently determining what changes would be required to gain lab accreditation status for crucial analysis.
In the opinion of the QPs, the current QAQC protocols and reports meet industry-standard practice and provide the necessary control to identify potential analytical problems and allow for corrective follow-up and re-analysis when required.
82
The QP considers that the drilling and chip channel sampling programs meet industry standards and have been reviewed and confirmed in sufficient detail to permit the inclusion of the information in the Don David Mine database.
The processing team is currently determining what changes would be required to gain lab accreditation status for key analysis.
In the opinion of the QPs, the current QA/QC protocols and reports meet industry-standard practice and provide the necessary control to identify potential analytical problems and allow for corrective follow-up and re-analysis when required.
83
The DDGM staff follow stringent procedures for data storage and validation, performing verification of data on an ongoing basis. The operation employs a Database Manager responsible for overseeing data entry, verification, and database maintenance.
Data used for Mineral Resource estimation are stored in one database relating to the mine, mainly channel samples and diamond drilling results, both exploration and in-mine in-fill drilling. The database is in a Microsoft SQL database format.
The database administrator regularly maintains the resource database by using database validation routines and periodically checks the drill hole and channels data on-screen. The on-site database has a series of automated import, export, and validation tools to minimize potential errors.
The updated database for the Mineral Resource estimation includes all historical data (drill holes and channels) and new drill holes completed by October 15, 2023. Before using this database for Mineral Resource estimation, the database manager reviewed the data for geologic consistency and checked against the original information. Any inconsistencies were corrected during the analysis. The databases were handed over for final review and validation by Mr. Marcelo Zangrandi, an independent QP for this Technical Report.
During QP’s site visit from October 16 to November 4, 2023, the QP reviewed plans and sections, visited the core shack, examined drill core, and mineralized exposures at the underground mine, reviewed core logging and QAQC procedures and database management system, and held discussions with DDGM personnel.
As part of the data verification process, the QP inspected the drill holes in the section and planned to review geological interpretation related to the drill hole and channel database and found a good correlation. The QP also reviewed QAQC data collected by DDGM. The data verification procedures involved the following:
| ● | Inspection of selected drill core to assess the nature of the mineralization and to confirm geological descriptions. |
| ● | Inspection of geology and mineralization in underground workings of the Arista and Switchback vein systems. |
| ● | Verification that collars coordinates coincide with underground workings or the topographic surface. |
| ● | Verify for unique headers. |
| ● | Validation of overlapping intervals. |
| ● | Verification that downhole survey bearing and inclination values display consistency. |
| ● | Evaluation of minimum and maximum grade values. |
| ● | Investigation of minimum and maximum sample lengths. |
| ● | Randomly selecting assay data from the databases and comparing the stored grades to the original assay certificates. |
| ● | Assessing for inconsistences in spelling or coding (typographic and case sensitivity errors). |
| ● | Ensuring full data entry and that a specific data type (collar, survey, lithology, and assay) is not missing. |
| ● | Assessing for sample gaps or overlaps. |
| ● | All inconsistencies were corrected. |
9.3.Opinion of Qualified Person
The QP found that the assay database is well maintained and meets industry standards. The QP is of the opinion that the assay database and database verification procedures for Don David Mine comply with industry standards and are adequate for the estimation of Mineral Resources and Mineral Reserves.
84
10MINERAL PROCESSING AND METALLURGICAL TESTING
Mineralization processed from the Arista underground mine consists entirely of sulfides. The principal economic components are gold, silver, and zinc; however, the ores also contain economically significant amounts of copper and lead. Differential flotation is the primary metallurgical recovery method selected for processing the Arista sulfide mineralization. The DDGM Processing Facility flotation circuit is designed to produce three concentrates for sale:
| ● | A copper concentrate with gold-silver; |
| ● | A lead concentrate with gold-silver; |
| ● | A zinc concentrate with gold-silver. |
In addition, the process includes a gravity concentrate circuit with Gekko intensive leach to recover coarse gold from the grinding circuit.
A sulfur flotation cell system was installed after the zinc flotation circuit in 2022 to recover the remaining gold associated with sulfur. Bulk sulfide flotation concentrate is leached in agitated leach circuit and recovered using Merril-Crowe process.
A sulfur flotation cell system was installed after the zinc flotation circuit in 2022 to recover the remaining gold associated with sulfur. Bulk sulfide flotation concentrate is leached in agitated leach circuit and recovered using Merril-Crowe process.
10.1Metallurgical Assessment of new El Aguila Mining Zone (ALS, 2022)
A sample from a new zone of the El Aguila mine has been tested at ALS laboratory to evaluate the metallurgical performance of a flotation circuit like the one used in the Don David Gold processing plant. Different options to flotation have also been investigated.
The chemical and mineral contents of the new zone sample were comparable to historical ore processed. Copper sulfides, galena and sphalerite liberation were also similar to past plant measurement. Chalcopyrite is still the dominant copper sulfide mineral.
A maximum limiting grade-recovery curve for copper indicated a 5% reduction in recovery if the same concentrate grade of 25% is obtained. Inclusion of a regrinding in the copper circuit would alleviate this limitation so higher recovery and / or concentrate grade could be achieved as shown at Figure 101.
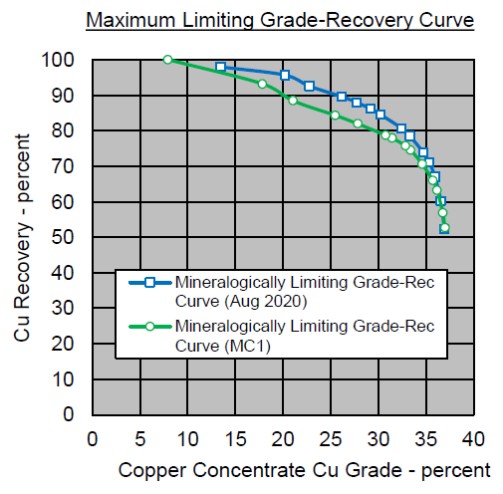
85
Bond work index measures ore resistance to crushing and grinding and is determined using a Bond Grindability Test, which SGS Laboratories performed. Figure 102 below graphically illustrates the test results. Report SGS-23-18 completed September 19, 2018, concludes a Bond work index ranges from 14.5-15.4 at a cut size of 150 mesh. Sulfide specifically had a Bond work Index of 15.0 and represents what DDGM was currently processing in 2021.
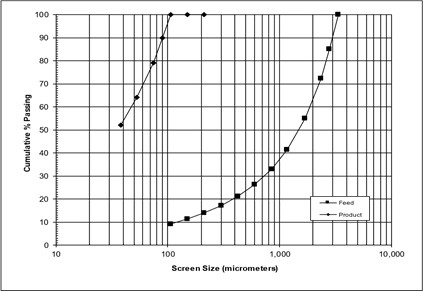
Figure 10-2: Feed and Product Size Distribution.
The latest flotation study was conducted by ALS in December 2019 and completed in August 2020. The findings of ALS report KM6252 identified opportunities to reduce the impurities and increase recoveries in the Cu, Pb, and Zn concentrates through reagent adjustments and reduction of liberation size (regrinding).
An estimated 3% improvement in Copper concentrate grade and an 8% improvement in recovery is expected if regrinding can be accomplished to achieve 80-95% liberation, which currently ranges between 55-75%.
Similarly, for Lead, regrinding to 80% passing 30 microns is expected to improve the grade by 5% and recovery by 8%.
Zinc concentrate improvements in grade are possible with process parameter changes such as increasing pH to 11.5 at the cleaning stage while reducing the SIPX dosage.
With the guidance of ALS report KM6252 and the systematic application of continuous improvement methodologies, the team has successfully improved recoveries in 2021.
A Thickening and Filtering study was conducted by Pocock Industrial (Lyntek) and published in August 2012. The scope of the study included:
| ● | Particle Size Analysis |
| ● | Flocculant Screening and Evaluation |
| ● | Static Thickening Tests |
| ● | Dynamic High-Rate Thickening Tests |
| ● | Pulp Rheology Studies |
| ● | Pressure Filtration Studies |
The particle size of the concentrate products was found to be Cu at P80: 40 um, Pb at P80 31 um, Zn at P80 52 um.
86
Hychem AF304 containing a medium to a high molecular weight of 15% charge density anionic polyacrylamide was found to be the most effective flocculent at the following dosages:
| ● | 10-15 g/MT for Cu concentrate |
| ● | 15-20 g/MT for Pb and Zn concentrates |
The local supplier equivalent is Asfloc 034 SH (Asfin Internacional), which is currently being used.
Static (for conventional thickening) and dynamic (high rate) thickening tests were performed. Static test results indicate an optimal 20-25% feed solids rate. Therefore, the recommended minimum unit area is 0.125-0.150 m2/MTPD for Cu and Zn and 0.135-0.160 m2/MTPD for Pb. Dynamic test results were also included but not relevant as conventional thickeners were installed in the process—recommended underflow density range from 65%-69% for Cu and Zn, and 58%-62% for Pb.
Pulp Rheology Studies determined pulp densities at which each concentrate pulp yielded mostly Newtonian behavior to predict flowability.
The Pressure Filtration Study results are shown below in Table 101 and were used to determine the sizing of the filtration equipment within the process.
Table 10-1: Concentrate Pressure Filtration Study Results (from Lyntek).
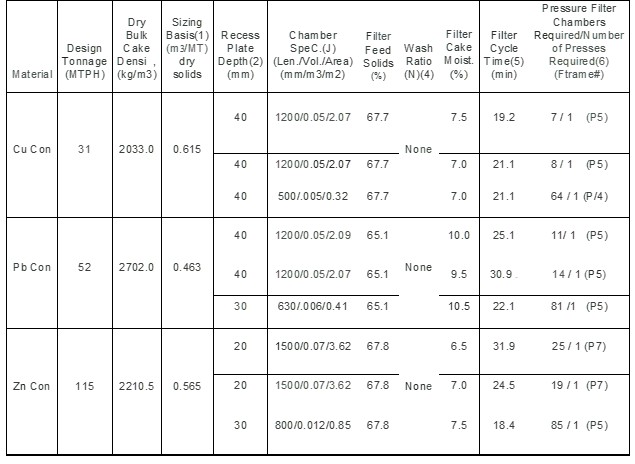
A filtered tailings method is being implemented to expand the tailings handling capacity of the DDGM site, with commissioning in 2022. Paterson and Cooke were retained to complete the filtered tailings study and provide a detailed design of the filter plant.
The filtered tailings study was conducted by Paterson and Cooke and is contained within Report 31-1048-00-TW-REP-0001 Rev A published on July 28, 2020. It can be broken down into four sections. Analysis of the slurry, analysis of the process water, the measure of flowability/moisture limits, and pressure filtration tests.
87
The slurry analysis results are contained in Table 102 below.
Parameter |
Value |
Slurry solids concentration (%m) |
52.6 |
Slurry pH |
8.9 |
Slurry conductivity (mS/cm) |
9.18 |
Temperature (⁰C) |
20.0 |
Liquid density (kg/m3) |
1008.0 |
Dissolved solids by mass (ppm) |
13,020 |
Solids density (kg/m³) |
2695 ± 2 |
Solids mass concentration (%m) |
70.0%m |
Test temperature (°C) |
19.3 |
Zero free water solids mass concentration (%m) |
80.8 ± 0.3%m |
Solids mass concentration (%m) |
10%m |
Test temperature (⁰C) |
19.1 |
Average zeta potential (mV) |
-1.4 ± 0.2 |
88
Slurry analysis includes particle size analysis and minerology of the slurry solids which are graphically shown below in Figure 103 and tabulated in Table 103.
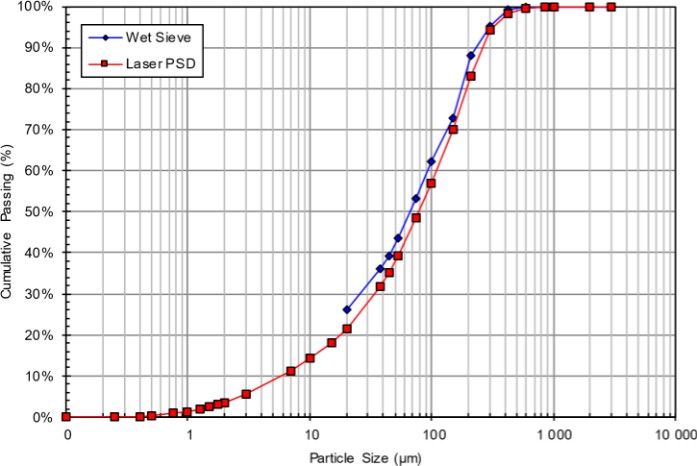
Figure 10-3: Slurry Particle Analysis.
Table 10-3: Slurry Solids Minerology.
Mineral |
Percentage |
Quartz |
81% |
Sphalerite |
3% |
Dolomite |
3% |
Pyrite |
<2% |
K-Feldspar |
<2% |
|
Total Clay Illite (% of total) Kaolinite (% of total) |
13% 12% 1% |
Illite |
95% |
Kaolinite |
5% |
The process water constituents and characteristics were also determined in the analysis and are listed below in Table 104.
89
Table 10-4: Process Water Constituents and Characteristics.
|
|
Element |
Concentration |
Aluminum (mg/l) |
<0.1 |
Boron (mg/l) |
14.9 |
Calcium (mg/l) |
459.3 |
Iron (mg/l) |
0.2 |
Magnesium (mg/l) |
58.1 |
Potassium (mg/l) |
154.7 |
Sodium (mg/l) |
3,420.0 |
Bicarbonate as CaCO₃ (mg/l) |
96.5 |
Chloride (mg/l) |
4,019.6 |
Nitrogen, Nitrate (mg/l) |
1.2 |
Sulfate (mg/l) |
4,001.7 |
Total Dissolved Solids (mg/l) |
11,826 |
Total Suspended Solids (mg/l) |
60 |
Specific Conductivity (mS/cm) |
17.2 |
pH |
7.4 |
Analyzed ionic balance (cations/anions) |
0.9 |
Calcium: Sodium Ratio |
0.1 |
Flow moisture point (FMP) and transportable moisture limit were measured to assist in determining the better method of transporting the filtered tailings. The results are shown in Table 105 below.
Table 10-5: Test Result for Flowability.
|
|
Parameter |
Percentage |
Flow moisture point (% moisture) |
15.5% |
Transportable moisture limit (% moisture) |
13.9% |
The initial test results were required to initiate the final series of pressure filtration test work. Target FMP (Flowability Moisture Point) of 15% and preliminary geotechnical target of 14% were provided by the client for these tests and were conducted for a range of chamber widths. The purpose of the tests was to provide information for the selection of the appropriate filter press by establishing equations/graphs for the following characteristics.
90
The resulting relationships were determined and represented in Table 106, Table 107, Table 108, and Table 109.
Table 10-6: Pressure Filtration – Dry Specific Cake Weight as a Function of Cake Thickness.
|
|
Parameter |
Value |
Dry specific cake weight (kg/m²) |
W = a(h) + b |
a |
0.80 |
b |
-0.98 |
Applicable chamber width range (mm) |
25 to 60 |
Applicable pressure (kPa) |
1500 |
Table 10-7: Pressure Filtration – Form Time as a Function of Dry Specific Cake Weight.
|
|
Parameter |
Value |
Log of the form time (min) |
Tf = a(W)+b |
a |
1.40 |
b |
-1.67 |
Applicable double-sided chamber width range (mm) |
25 to 60 |
Applicable form pressure (kPa) |
1,500 |
91
Table 10-8: Pressure Filtration – Form Cake Moisture Content as a Function of Form Time.
|
|
Parameter |
Value |
Form cake moisture content (%m) |
f = a ln(F) + b |
a |
-0.07 |
b |
0.03 |
Applicable form time factors (min m²/kg) |
0.07 to 0.10 |
Applicable pressure (kPa) |
1500 |
Table 10-9: Pressure Filtration – Dry Time Factor as a Function of Final Dry Cake Moisture Content.
|
|
Parameter |
Value |
Dry time factor (min.m²/kg) |
D = (a)e(f) |
a |
1.8 x 10¹² |
b |
-179 |
Applicable dry filter cake moisture (%m) |
14.4%m to 17.1%m |
Applicable pressure (kPa) |
600 |
Summary of Findings for Report 31-1048-00-TW-REP-0001 Rev A determined the graphs and equations required for the selection and sizing of the equipment for the full-scale pressure filtration plant and that the operational and preliminary geotechnical targets were achievable at all chamber widths.
As part of the filtered tailings study, 31-1048-00-HY-TEC-0001 Rev A report was also completed by Paterson and Cooke on May 6, 2020. The scope of the report included a steady-state hydraulic evaluation of the tailings feed pipeline, filtration return water pipeline, and paste plant transfer pipeline. Figure 104 and Figure 105 illustrate the piping runs.
92
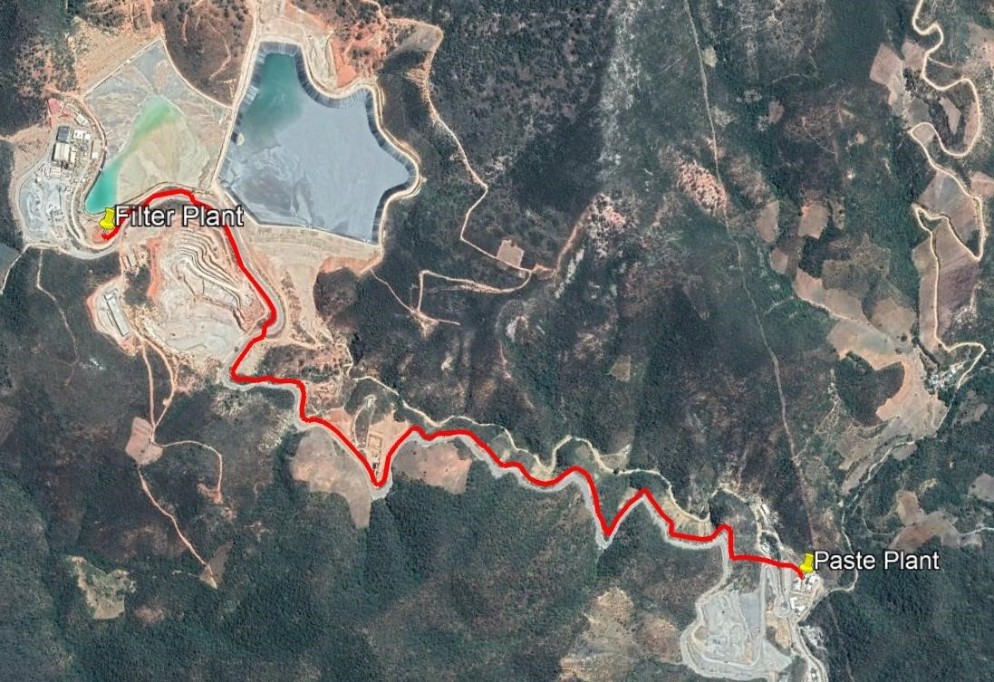
Figure 10-5: Pipeline Route from Filter Plant to Paste Plant.
The report provided the required analysis to determine the filtration plant's engineered specifications of the filtration and the process water return line. It also concluded that the installed pipe is suitable for the paste plant transfer pipeline in a new condition.
10.6Deleterious Elements – Copper Concentrate
The primary contaminant in the Copper concentrate is lead at 12.6%. Approximately 70 percent of galena is liberated, and there is potential to improve rejection of the lead with increased lead depressant in the copper circuit, such as MBS.
Sphalerite, pyrite, and non-sulfide gangue measured more typical concentrate dilution liberation, measuring between 46-50%. With the high locking of these minerals with copper sulfides, both in binary and multiphase, removing more of these minerals from the concentrate without regrinding would be difficult.
Antimony and arsenic are also present at elevated amounts, at 1.2 and 0.2 percent, respectively. Most antimony was included in copper and silver mineral structures, like in previous measurement periods. However, about half the arsenic was contained in arsenopyrite, which could be rejected similarly to pyrite. Arsenic penalties may be reduced or avoided if the rejection of arsenopyrite could be improved. But given the liberation of pyrite/arsenopyrite, further regrinding would likely be required to obtain a better separation.
94
Table 10-10: Characteristics of the Copper Concentrate, Minerals Content.
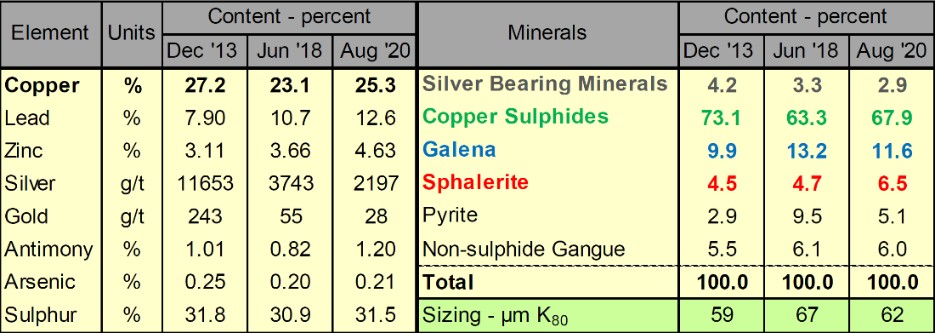
10.7Deleterious Elements – Lead Concentrate
Zinc and Quartz are deleterious elements within the Lead concentrate. Both sphalerite and non-sulfide gangue are over 63 percent liberated, and it should be possible to improve the rejection of both, to some extent, by enhancing the flowsheet or chemical conditions. The non-sulfide gangue, primarily Quartz, is not considered hydrophobic, with a third-sized finer than 8µm suggesting it is recovered via entrainment. Additional cleaning stages would reduce the recovery via entrainment. Redirecting the copper circuit cleaner tailing to the lead first cleaner may help reduce recovery of non-sulfide gangue to the Lead concentrate. It might be possible to reduce sphalerite recovery by using increased depressant dosages (such as sodium cyanide and zinc sulphate).
Table 10-11: Characteristics of the Lead Concentrate, Minerals Content.
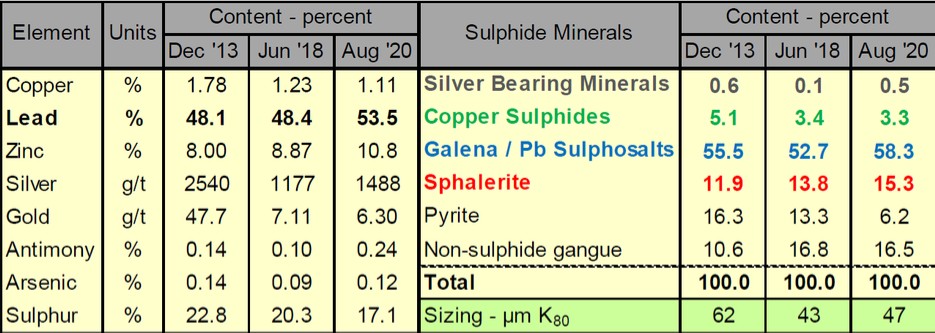
10.8Deleterious Elements – Zinc Concentrate
Non-sulfide gangue is the main diluent in the Zinc concentrate, at 11.8 percent. About a third of this non-sulfide gangue was measured in binary with sphalerite, explaining its presence in the zinc concentrate. Further, another one-third sized finer than 10µm and was likely recovered via froth entrainment. The use of froth wash water to reduce entrainment may reduce this component.
Pyrite liberation, however, is higher, and there is potential scope to reduce the recovery of liberated pyrite to the Zinc concentrate. Raising the pH to 11.5 in the zinc cleaners and reducing SIPX dosages (while increasing CuSO4 dosage) may help lower the Zinc concentrate's pyrite dilution.
95
Table 10-12: Characteristics of the Zinc Concentrate, Minerals Content.
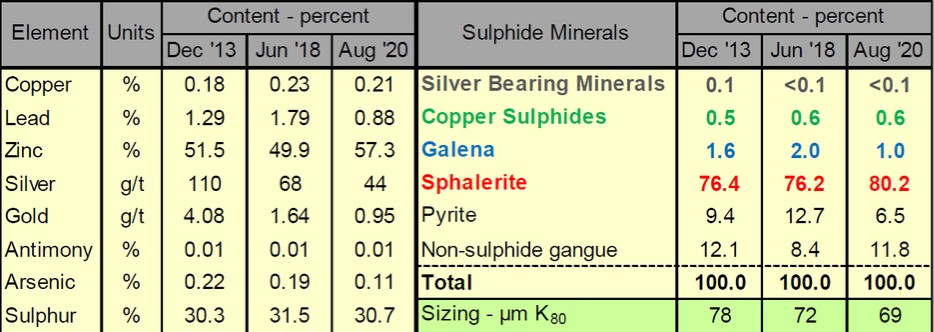
10.9Opinion of Qualified Person
Based on the ALS report KM65236 dated August 2020 from October 2022 and the last two years operating data compilation, regrinding of the copper rougher concentrate improved concentrate grade by 10% and increased copper recovery by 4%. Modifications to the plant to introduce regrind of copper rougher concentrate should be analyzed. In addition, according to flotation testwork results, reagent dosage and addition point should be reviewed to minimize metal misplacement.
96
The Mineral Resource estimate for the Don David Gold Mine, as of December 31, 2023, using all data available as of October 15, 2023, was completed by Marcelo Zangrandi, from AMBA Consultoria Ltda, an independent QP for this Technical Report.
The Mineral Resource estimate was completed using Vulcan software. Wireframes for geology and mineralization were constructed by DDGM geology staff using Leapfrog Geo, -based on underground mappings, assay results, lithological information from drill holes, and structural data. Assays were composited to 1 m lengths and capped to various levels based on exploratory data analysis for each vein. Wireframes were filled with blocks (parent cell size of 10 m by 1m by 10 m, x,y,z), which were sub-celled at wireframe boundaries (sub-cell minimum size 2.5 m by 0.5 m by 2.5 m, x,y,z). Blocks grades were interpolated using ordinary kriging (OK) interpolation algorithm. Classification of blocks used distance-based criteria related to the spatial continuity of the mineralization. Block estimates were validated using industry-standard validation techniques. After the depletion of the Mineral Reserves, the remaining material is reported unconstrained, using a breakeven NSR cutoff grade of $100/t for Arista mine (Arista and Switchback vein systems) and an AuEq of 2.35 g/t for Alta Gracia deposit.
A summary of the Don David Gold Mine Mineral Resources, exclusive of Mineral Reserves, for Arista mine, is shown in Table 111. Table 112 shows the Mineral Resources for the Alta Gracia deposit. NSR cutoff values for the Mineral Resources were established using a zinc price of $1.25/lb, a lead price of $0.95/lb, a copper price of $3.90/lb, a silver price of $23.30/oz, and a gold price of $1,800/oz. See Section 1.9 for an explanation of the metal prices used.
The definitions have classified Mineral Resources and Mineral Reserves in S-K 1300, which are consistent with the Canadian Institute of Mining, Metallurgy, and Petroleum (CIM) Definition Standards for Mineral Resources and Mineral Reserves (CIM (2014) definitions).
Table 11-1: Don David Gold Mine (Arista Mine) - Summary of Gold, Silver and Base Metal Mineral Resources, exclusive of Reserves at December 31, 2023.
Amount |
Grades |
Cut off grade |
|||||
Arista |
Ktonne |
Au (g/t) |
Ag (g/t) |
Cu (%) |
Pb (%) |
Zn (%) |
$/tonne |
Measured mineral resources |
68 |
1.49 |
109.69 |
0.42 |
1.42 |
4.39 |
100 |
Indicated mineral resources |
489 |
1.10 |
131.89 |
0.28 |
1.33 |
4.25 |
100 |
Measured + Indicated mineral resources |
557 |
1.15 |
129.16 |
0.29 |
1.34 |
4.26 |
100 |
Inferred mineral resources |
1,906 |
1.08 |
104.78 |
0.23 |
1.22 |
3.40 |
100 |
97
Table 11-2: Don David Gold Mine (Alta Gracia Mine) - Summary of Gold, Silver and Base Metal Mineral Resources, exclusive of Reserves at December 31, 2023.
Resources |
||||
Amount |
Grades |
Cut off grade |
||
Altagracia |
Ktonne |
Au (g/t) |
Ag (g/t) |
Au_Eq/tonne |
Measured mineral resources |
27 |
0.81 |
370.6 |
2.35 |
Indicated mineral resources |
141 |
0.49 |
270.0 |
2.35 |
Measured + Indicated mineral resources |
168 |
0.64 |
286.1 |
2.35 |
Inferred mineral resources |
148 |
0.62 |
295.6 |
2.35 |
Notes
| 1. | Mineral Resource estimated at December 31, 2023. |
| 2. | The definitions for Mineral Resources in S-K 1300 were followed for Mineral Resources, which are consistent with CIM (2014) definitions. |
| 3. | Metal prices used in the estimate were $1,800/oz Au, $23.30/oz Ag, $3.90/lb Cu, $0.95/lb Pb, and $1.25/lb Zn. See Section 1.9 for a discussion of the metal prices used. |
| 4. | Mineral Resources are exclusive of Mineral Reserves. |
| 5. | Mineral Resources that are not Mineral Reserves are materials of economic interest with reasonable prospects for economic extraction. |
| 6. | Mining, processing, and overhead costs were based on 2023 actual costs for the Don David Gold Mine and consider cost improvements made in the fourth quarter of 2023. |
| 7. | An exchange rate of 17 Mexican Pesos (“MXP”) to 1 U.S. dollar is applied to peso-denominated costs. |
| 8. | Rounding of tonnes, average grades, and contained ounces may result in discrepancies with total rounded tonnes, average grades, and total contained ounces. |
| 9. | Metallurgical recoveries are based on historical milling results and are 79.0% for Au, 91.2% for Ag, 78.0% for Cu, 75.4% for Pb, and 84.6% for Zn for Arista. For Altagracia, recoveries are 85.0% for Au and 72.0% for Ag. |
With consideration of the recommendations summarized in Section 1 and Section 23, the QP believes that any issues relating to all relevant technical and economic factors likely to influence the prospect of economic extraction can be resolved with further work.
The QP responsible for this Section 11 of this Technical Report has relied on the other experts regarding permitting, legal, title, taxation, socio-economic, marketing, political, or other relevant factors that could materially affect the Mineral Resource Estimate.
11.2.1. Known Issues That Materially Affect Mineral Resources
The QP is not aware of any issues that affect the Mineral Resource estimates materially. These conclusions are based on the following:
Environmental |
DDGM complies with Environmental Regulations and Standards set in Mexican Law as detailed in Section 20 |
Permitting |
DDGM has represented that those permits are in good standing. |
Legal |
DDGM has represented that there are no outstanding legal issues; no legal actions, and injunctions pending against the Project. |
Title |
DDGM has represented that the mineral and surface rights have secure title |
Taxation |
No known issues |
Socio-economic |
DDGM has represented that the operation has community support from the local town of San Jose del Gracia |
Marketing |
No known issues |
Political |
DDGM believes that the current government is supportive of the operation |
Other relevant issues |
No known issue |
Mining |
No known issues |
98
Metallurgical |
DDGM presently and successfully treats ore extracted from the Don David Mine in the onsite processing plant to produce concentrates with gold, silver, and base metals. This work has been described in Section 13 |
Infrastructure |
No known issues |
11.3.1. Resource Database
DDGM maintains the entire database at the mine site in Microsoft SQL Server. All data are centrally stored on the Arista Project server, backed up every night at 3:00 am. DDGM company policy includes Windows personal computer folder backup that automatically synchronizes Microsoft Desktop, Documents, and Pictures folders to a OneDrive cloud storage.
The Don David Gold Mine database comprises 1,960 drill holes for a total of 496,638 meters and 19,869 underground channels for a total of 71,198 meters. The resource database contains drilling information and analytical results until October 15, 2023. Information received after this date was not used in the Mineral Resource estimate. Data was delivered to AMBA in the form of Excel spreadsheets containing collar locations, down-hole survey data, lithology codes, sampling intervals, and assay results for gold, silver, copper, lead, and zinc, and a total of 1,740 rock density measurements. Analytical quality control data was also received, including assays for blanks, duplicates, and standards inserted into the sample stream as described and discussed in Section 9.
The coordinate reference system used is WGS84 UTM Zone 14N. Drill hole data have been reported in metric units. Gold and silver grades are in grams of metal per metric tonne, and copper, zinc, and lead grades are expressed in percentage metal.
Data were amalgamated, parsed as required, and imported by AMBA into Maptek’s Vulcan (Vulcan) software.
The drill hole and channel database comprise coordinate, length, azimuth, dip, lithology, density, and assay data. The channel sample data was converted into drill hole data for interpretation and Mineral Resource estimation. For grade estimation, unsampled intervals within mineralization wireframes were replaced with -9. Detection limit text values (e.g., “<0.05”) were replaced with numerical values that were half of the analytical detection limit.
Figure 111 illustrates drill hole locations with the block models.
99
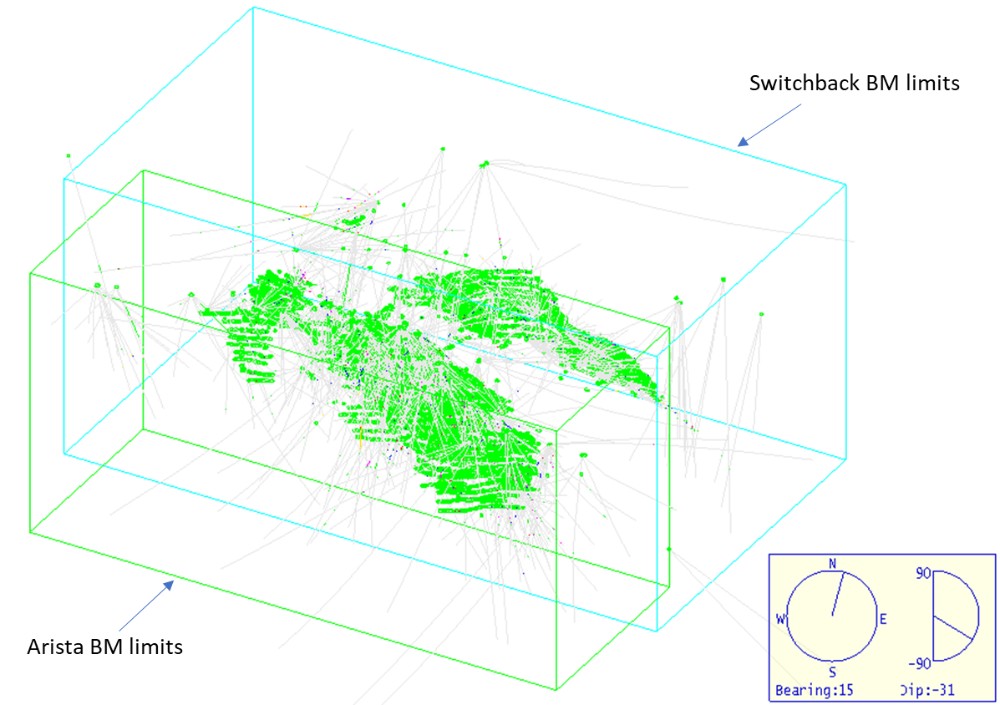
Figure 11-1: 3D view of block models limits and drill holes.
For the Mineral Resource estimate, the drill hole data were limited to those assays located inside the mineralization wireframes (veins). Summary statistics were tabulated for the assay data, including gold, silver, copper, lead, and zinc grades (Table 113).
Table 11-3: Summary Assay Statistics.
PROJECT |
AU_COUNT |
AU_MEAN |
AG_COUNT |
AG_MEAN |
CU_COUNT |
CU_MEAN |
PB_COUNT |
PB_MEAN |
ZN_COUNT |
ZN_MEAN |
Switchback |
28,988 |
1.795 |
28,988 |
76.92 |
28,987 |
0.42 |
28,987 |
1.54 |
29,898 |
4.47 |
Arista |
37,200 |
3.01 |
37,200 |
290.1 |
37,200 |
0.4 |
37,200 |
1.6 |
37,200 |
4.23 |
Alta Gracia |
3,714 |
0.7 |
3,714 |
269.7 |
3,695 |
0.01 |
3,696 |
0.14 |
3,696 |
0.25 |
The QP conducted several checks on the Mineral Resource database as discussed in Section 9, Data Verification. The database was interrogated for inconsistencies in naming conventions or analytical units, duplicate entries, interval, length, or distance values less than or equal to zero, blank, or zero-value assay results, out-of-sequence intervals, intervals, or distances more significant than the reported drill hole length, inappropriate collar locations, and missing interval and coordinate fields. The QP believes that the database is of good quality and appropriate to support Mineral Resource estimation.
11.3.2. Bulk Density
DDGM measures the bulk density of representative samples of mineralized veins and wall rocks by the water displacement method. The samples consist of 10-15 cm portions of selected dry whole drill core or irregular portions of representative rocks from the underground openings. Mine laboratory technicians use a conventional scale to get the mass of the sample. Then, they read the volume of water displaced submerging the object in a known volume of water and measured the change in water level.
100
The bulk density is then calculated by dividing the mass by the volume of the sample. Samples are not coated in paraffin wax; however, the core was generally solid with very few pores.
A total of 3,337 bulk density measurements are available for the drill holes samples and 1,740 bulk density measurements from underground hand samples. AMBA´s QP conducted a series of statistics and comparisons between the different sample’s sources and different lithologies (including mineralized vein and wall rock samples). A possible systematic bias was observed in the underground samples, maybe related to the recipient used to measure the water volume displacement. Thus, the bulk density analysis focused on the drill hole samples, specifically in samples from the mineralized veins.
AMBA´s QP applied low and high capping values to density measurements to limit the influence of a small number of outlier values in the lower and upper tail of the density distributions (Figure 112 and Figure 113). A summary of the capping levels is shown in Table 114.
Table 11-4: Density Capping Values.
DENSITY |
LOWER CAPPING (T/M3) |
UPPER CAPPING (T/M3) |
Arista |
2.46 |
4.14 |
Switchback |
2.31 |
3.59 |
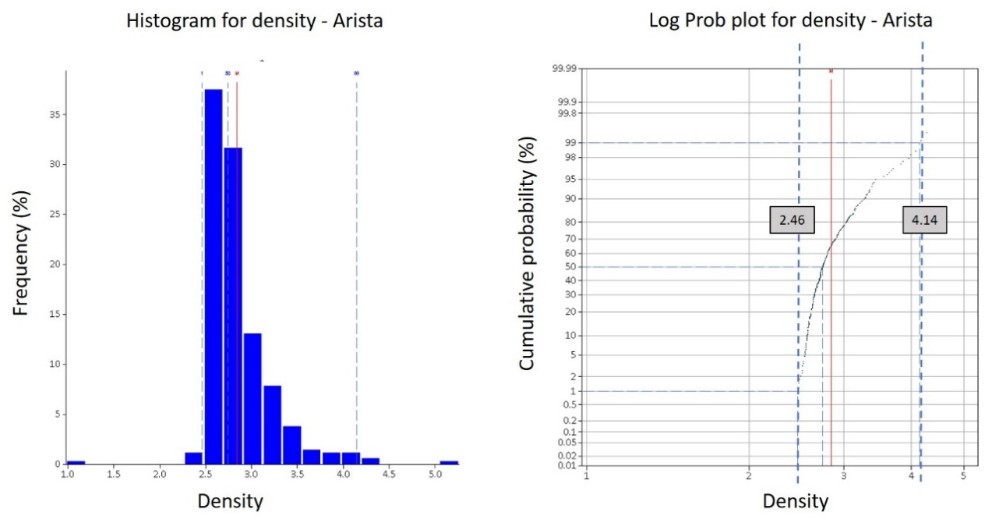
Figure 11-2: Density Capping Analysis for Arista.
101
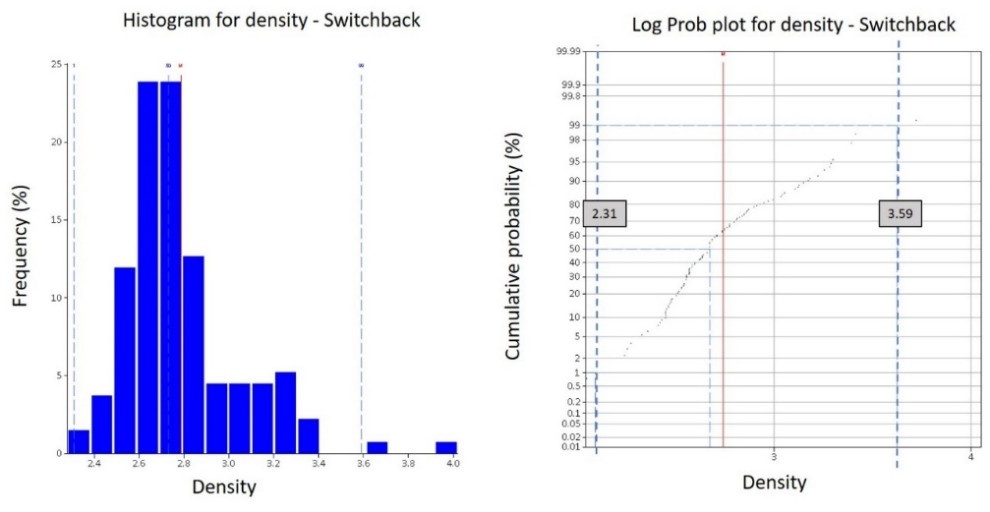
Figure 11-3: Density Capping Analysis for Switchback.
After applying the lower and upper capping, the average densities for each domain, Arista and Switchback, are 2.83 t/m3 and 2.77 t/m3, respectively. These density values are very similar to those used for the previous resource estimations and the mine production. The historic density value is used for the present resource estimation, considering the uncertainty related to the density lab measuring method. It is highly recommended that the laboratory improves density measurement methodology to minimize the bias and errors associated with the water displacement method.
11.3.3. Geological Interpretation
Structural data was used to help define the orientation of mineralization. Previous models were developed using successive polylines constructed in cross-section and oriented perpendicular to the overall trend of mineralization. In 2021, DDGM changed its modeling approach based on a defined economic cutoff. The defined economic cutoff determined the outlines of the polylines with demonstrated continuity between sections. The updated geological wireframes model veins or definable mineralized structures based on the geological description of the channels and drill holes, underground mapping, and a reference assay threshold. Some drill hole intercepts below NSR cutoff were included to maintain geological continuity.
At the Arista mine, the overall mineralization strike is approximately 300° azimuth, although individual veins can vary between 280° and 350° azimuth; mineralization extends over 1,450 meters of strike length.
11.3.4. Wire-Frame Modeling
DDGM performed geological modeling of the Arista, Switchback, and Alta Gracia deposits using Leapfrog. All mineralized veins were modeled based on the drilling and channel sampling geological descriptions and structural and lithological controls observed in underground workings and captured on level plan geological maps. The model incorporates all significant vein systems identified to date: a total of 35 veins were interpreted and modeled for the Switchback system, 41 veins for the Arista system, and 14 veins for the Alta Gracia system. Where available, underground mapping was used to guide the modeling, and 3D polylines were used to control better contacts where data was sparse.
The modeled mineralized veins were exported to Vulcan software to encode the block model and provide statistical analysis and compositing limits. Figure 114 is a three-dimensional view of the wireframe solids of the veins modeled for the Arista and Switchback vein systems. Figure 115 is a three-dimensional view of the wireframe solids of the veins modeled for the Alta Gracia system.
102
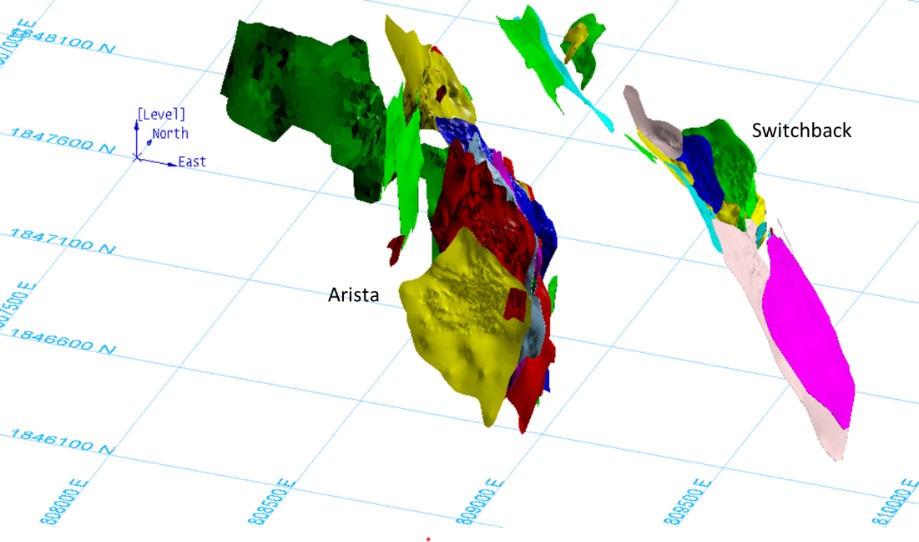
Figure 11-4: Three-dimensional view of the wire frame solids of the veins modeled for the Arista and Switchback vein systems.
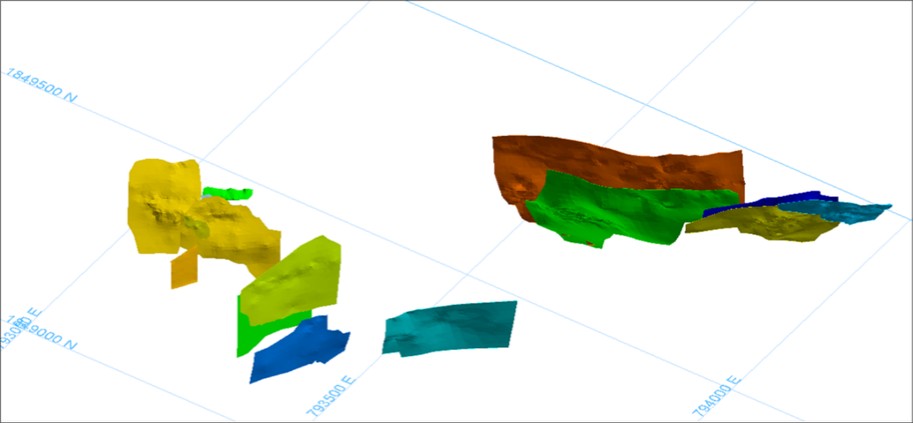
Figure 11-5: Three-dimensional view of the wire frame solids of the veins modeled for Resource estimation for the Alta Gracia Deposits.
Each vein is treated as a separate estimation domain, respecting the directions of continuity identified and modeled for each of them. The domains are numbered sequentially in order of priority as they were modeled. The domain (vein) codes are listed in Table 115. All wireframes enclosing mineralized domains were incorporated into the block model; a sub-blocking process was used to fill the domains adequately.
103
Table 11-5: Vein codes used in wireframes, composites and block models.
Switchback |
Code |
Arista |
Code |
Alta Gracia |
Code |
none |
0 |
none |
0 |
none |
0 |
SELENE |
1 |
AIRE |
1 |
huaje1_fw |
1 |
SILVIA |
13 |
ALTA |
2 |
huaje1_hw |
2 |
SOLEDAD-S |
14 |
ARISTA |
3 |
huaje2 |
3 |
SOLRAM5 |
15 |
BAJA-RM1 |
4 |
ind_s_rm1 |
4 |
SOLEDAD-N |
16 |
BAJA |
5 |
ind_m1 |
5 |
SUSANA-N |
17 |
CANDELARIA |
6 |
ind_m2 |
6 |
SAGRARIO |
18 |
CHUY1 |
7 |
jarillas1 |
7 |
SOFIA |
19 |
CHUY2 |
8 |
mirador |
8 |
SAM2 |
20 |
ESTE-NORTE |
9 |
san_juan |
9 |
SADIE-2 |
21 |
ESTE-SUR-RM1 |
10 |
san_juan_fw |
10 |
SARA |
22 |
ESTE-SUR |
11 |
san_juan_nw |
11 |
SADIE-1 |
23 |
GISELA |
12 |
victoria1 |
12 |
SBN1 |
24 |
LUZ |
13 |
victoria_ne |
13 |
SASHA-1 |
25 |
MARENA |
14 |
ind_w |
14 |
SANDY-2 |
26 |
MERCEDES |
15 |
|
|
SAGRAM1 |
27 |
SANTIAGO-RM1 |
16 |
|
|
SAM1 |
28 |
SANTIAGO |
17 |
|
|
SAMARINDA |
29 |
SPLAY05-RM1 |
18 |
|
|
SANDY-1 |
30 |
SPLAY05 |
19 |
|
|
SASHA-2 |
31 |
SPLAY06-SUR |
20 |
|
|
SOLRAM1 |
34 |
SPLAY06 |
21 |
|
|
SOLRAM2 |
35 |
SPLAY31-RM1 |
22 |
|
|
SOLRAM3 |
36 |
SPLAY-31 |
26 |
|
|
SOLRAM4 |
37 |
SPLAY66-RM1 |
27 |
|
|
SONYA |
38 |
SPLAY-66 |
28 |
|
|
SUSANA-S |
39 |
STA-CECILIA |
29 |
|
|
SARABI |
40 |
STA-CLARA |
30 |
|
|
SAI |
41 |
STA-HELENA |
31 |
|
|
SALAMANCA |
42 |
STA-LUCIA |
32 |
|
|
SUSOL |
43 |
VETA-01 |
33 |
|
|
GLORIA |
44 |
VETA-03 |
34 |
|
|
SPLAY- Gloria |
45 |
VIRIDIANA-RM1 |
35 |
|
|
SOLEDAD FW |
46 |
VIRIDIANA-RM2 |
36 |
|
|
MANTO-RAM5 |
47 |
VIRIDIANA |
37 |
|
|
MANTO-SOLEDAD |
48 |
CANDELARIA-RM1 |
38 |
|
|
|
|
SPLAY31-RM5 |
40 |
|
|
|
|
SPLAY5-RM2 |
41 |
|
|
|
|
MARENA-RM1 |
43 |
|
|
|
|
DAIRA |
44 |
|
|
|
|
ARGELIA |
45 |
|
|
|
|
MARENA-NORTE |
46 |
|
|
11.3.5. Resource Assays
The basic drill hole data was flagged with the wireframes for each mineralized domain and assessed through exploratory data analysis (EDA), including univariate statistics, histograms, cumulative probability plots, and box plots to compare geology domain statistics, verify the data distributions and assess the need for using a top-cut.
Table 116 and Table 117 list composited univariate statistics for zinc, copper, lead, and silver by estimation domain for the prominent mineralized veins from Switchback and Arista vein systems.
104
Table 11-6: Univariate statistics of the major mineralized veins of Switchback vein system.
Domain |
1 Selene |
13 Silvia |
14 Soledad Sur |
15 Soledad_RM5 |
16 Soledad Norte |
Au (g/t) - Count |
2942 |
807 |
7401 |
3301 |
9477 |
Au (g/t) - Mean |
3.25 |
4.67 |
1.25 |
3.16 |
1.46 |
Au (g/t) - Minimum |
0.0002 |
0.0002 |
0.0002 |
0.0002 |
0.0002 |
Au (g/t) -Maximum |
85.8 |
59.3 |
98.43 |
43.37 |
112.84 |
Au (g/t) - Std. Dev. |
5.74 |
5.93 |
3.88 |
4.25 |
2.79 |
Au (g/t) - CV |
1.76 |
1.27 |
3.1 |
1.35 |
1.91 |
Ag (g/t) - Count |
2942 |
807 |
7401 |
3301 |
9477 |
Ag (g/t) - Mean |
50.71 |
112.67 |
90.6 |
105.93 |
73.43 |
Ag (g/t) - Minimum |
0.01 |
0.01 |
0.01 |
0.01 |
0.01 |
Ag (g/t) -Maximum |
4051 |
3351.6 |
10989 |
8934 |
4989 |
Ag (g/t) - Std. Dev. |
144 |
246.7 |
283.43 |
288.45 |
168.04 |
Ag (g/t) - CV |
2.84 |
2.19 |
3.13 |
2.89 |
2.28 |
Cu (%) - Count |
2942 |
807 |
7401 |
3301 |
9477 |
Cu (%) - Mean |
0.3 |
0.47 |
0.47 |
0.43 |
0.4 |
Cu (%) - Minimum |
0.001 |
0.001 |
0.001 |
0.001 |
0.001 |
Cu (%) -Maximum |
4.41 |
3.22 |
10.94 |
7.26 |
6.18 |
Cu (%) - Std. Dev. |
0.28 |
0.36 |
0.57 |
0.37 |
0.32 |
Cu (%) - CV |
0.92 |
0.79 |
1.2 |
0.86 |
0.83 |
Pb (%) - Count |
2942 |
807 |
7401 |
3301 |
9477 |
Pb (%) - Mean |
1.56 |
2.66 |
1.38 |
2.37 |
1.7 |
Pb (%) - Minimum |
0.0008 |
0.0025 |
0.0001 |
0.0025 |
0.0015 |
Pb (%) -Maximum |
54.56 |
43.04 |
35.32 |
36.16 |
34.94 |
Pb (%) - Std. Dev. |
2.88 |
3.52 |
2.04 |
3.52 |
2.74 |
Pb (%) - CV |
1.85 |
1.32 |
1.49 |
1.48 |
1.61 |
Zn (%) - Count |
2942 |
807 |
7401 |
3301 |
9477 |
Zn (%) - Mean |
3.79 |
8.09 |
4.72 |
5.75 |
5.26 |
Zn (%) - Minimum |
0.004 |
0.005 |
0.0004 |
0.005 |
0.003 |
Zn (%) -Maximum |
36.39 |
31.59 |
50.75 |
37.22 |
58.71 |
Zn (%) - Std. Dev. |
4.73 |
6.38 |
5.01 |
5.51 |
5.24 |
Zn (%) - CV |
1.25 |
0.79 |
1.06 |
0.96 |
1 |
105
Table 11-7: Univariate statistics of the major mineralized veins of Arista vein system.
Domain |
4 Baja_RM1 |
5 Baja |
6 Candelaria |
14 Marena |
17 Santiago |
Au (g/t) - Count |
580 |
3399 |
1309 |
336 |
1229 |
Au (g/t) - Mean |
1.18 |
3.94 |
2.41 |
1.03 |
2.52 |
Au (g/t) - Minimum |
0.0002 |
0.0002 |
0.0002 |
0.0002 |
0.0002 |
Au (g/t) -Maximum |
49.83 |
307 |
98.2 |
33.9 |
100.27 |
Au (g/t) - Std. Dev. |
3.87 |
11.15 |
5.83 |
3.2 |
6.06 |
Au (g/t) - CV |
3.28 |
2.83 |
2.42 |
3.1 |
2.4 |
Ag (g/t) - Count |
580 |
3399 |
1309 |
336 |
1229 |
Ag (g/t) - Mean |
137.53 |
403.17 |
363.7 |
112.25 |
60.11 |
Ag (g/t) - Minimum |
0.01 |
0.01 |
0.01 |
0.01 |
0.01 |
Ag (g/t) -Maximum |
8610 |
10684 |
9451 |
8037 |
4407 |
Ag (g/t) - Std. Dev. |
443.6 |
856.75 |
789.5 |
514.38 |
191 |
Ag (g/t) - CV |
3.22 |
2.12 |
2.17 |
4.58 |
3.18 |
Cu (%) - Count |
580 |
3399 |
1309 |
336 |
1229 |
Cu (%) - Mean |
0.31 |
0.43 |
0.26 |
0.28 |
0.3 |
Cu (%) - Minimum |
0.0005 |
0.001 |
0.0007 |
0.0002 |
0.001 |
Cu (%) -Maximum |
4.15 |
25.11 |
12.29 |
4.41 |
4.83 |
Cu (%) - Std. Dev. |
0.38 |
0.8 |
0.52 |
0.46 |
0.35 |
Cu (%) - CV |
1.22 |
2 |
1.95 |
1.65 |
1.15 |
Pb (%) - Count |
580 |
3399 |
1309 |
336 |
1229 |
Pb (%) - Mean |
2.71 |
1.22 |
0.75 |
0.72 |
2.11 |
Pb (%) - Minimum |
0.002 |
0.001 |
0.0005 |
0.0004 |
0.002 |
Pb (%) -Maximum |
26.85 |
33.79 |
29.39 |
8.75 |
31.17 |
Pb (%) - Std. Dev. |
3.34 |
2.36 |
1.87 |
1.4 |
2.99 |
Pb (%) - CV |
1.2 |
1.93 |
2.48 |
1.95 |
1.41 |
Zn (%) - Count |
580 |
3399 |
1309 |
336 |
1229 |
Zn (%) - Mean |
7.85 |
3.62 |
1.43 |
2.34 |
4.52 |
Zn (%) - Minimum |
0.009 |
0.0038 |
0.002 |
0.001 |
0.005 |
Zn (%) -Maximum |
37.22 |
44.23 |
15.25 |
23.88 |
30.02 |
Zn (%) - Std. Dev. |
7.73 |
5.9 |
2.09 |
3.6 |
4.17 |
Zn (%) - CV |
0.98 |
1.63 |
1.46 |
1.53 |
0.92 |
The basic statistics of the domain-coded data indicated that the domains were characterized by mixed populations (due to the incorporation of low-grade internal waste) and strongly skewed distributions (due to the presence of extreme elevated values), which was reflected in their high coefficients of variation. The coefficient of variation (“CV”) is the ratio of the standard deviation to the mean. It is a relative measurement of sample variability and, if the ratio is much higher than 1, care should be taken during estimation using a linear Kriging algorithm. CV ratios significantly higher than one indicate skewed underlying statistical distributions. The influence of high grades during Kriging interpolation should be controlled to avoid unrealistic smearing of high assay values.
The composite statistics in Table 116 and Table 117 show that the CV ratios for the major mineralized domains are higher than 1, mainly for gold and silver, copper, lead, and zinc in some mineralized veins. The influence of high grades during estimation needs to be carefully controlled.
106
11.3.6. Compositing
A statistical assessment of the raw sample lengths indicates that most samples are taken at a nominal core length of approximately 1m. Figure 116shows the histogram of the sample lengths for all domains combined for Arista (on the left) and Switchback (on the right). The figure indicates that the average sample length is around 1.02 m for Switchback and 0.9 m for Arista. Several samples have more significant support (up to a maximum sample length of 6 m in Arista); however, this maximum sample length relates to an empty intersection.
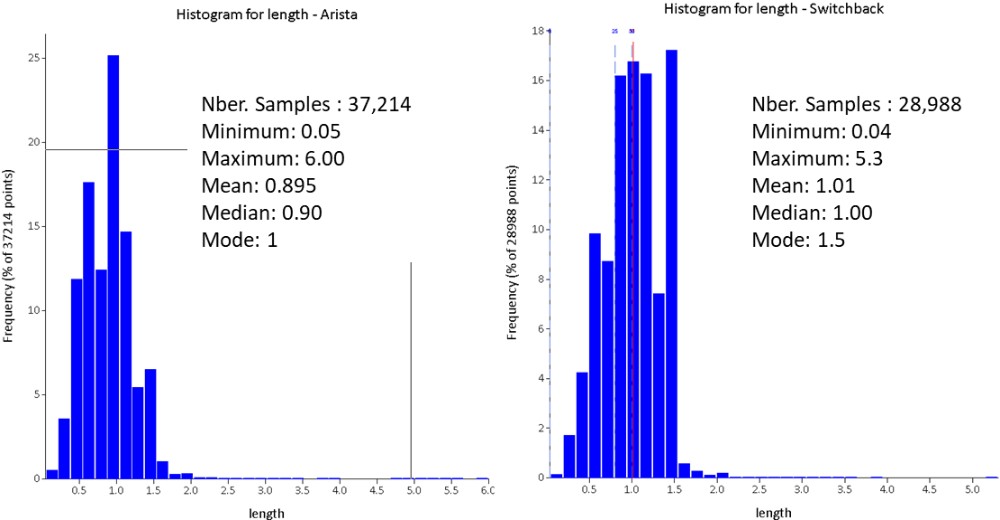
Figure 11-6: Histogram of raw sample lengths in all samples from Arista (left) and from Switchback (right).
AMBA´s QP composited the assays to 1 m with a 0.5 m tolerance, beginning at the collars. Compositing process respects the limits of the mineralized veins. Small intervals were merged with the previous interval. Composite lengths range from 0.1 m to 1.49 m.
The majority of composites (90%) had a length from 70 cm to 1.4 m, and 1% of the composites had a length less than 0.5 m. The composite length corresponds to half of the parent block size in the direction of the width of the veins.
11.3.7. Treatment of High-Grade Assays
Where the assay distribution is skewed positively or approaches log-normal, erratic high-grade values can have a disproportionate effect on the average grade of a deposit. One method of treating these outliers in order to reduce their influence on the average grade is to cut or cap them at a specific grade level. Another possibility is to limit the range of influence using a restricted search radius for these samples considered outliers.
107
AMBA´s QP applied a general high-grade capping to Au, Ag, Cu, Pb and Zn assays to a very small amount of outlier values located in the upper tail of the metal distributions. These extreme values are very erratic, do not seem to correspond with the grade distribution, and, in some situations, could even be sampling errors.
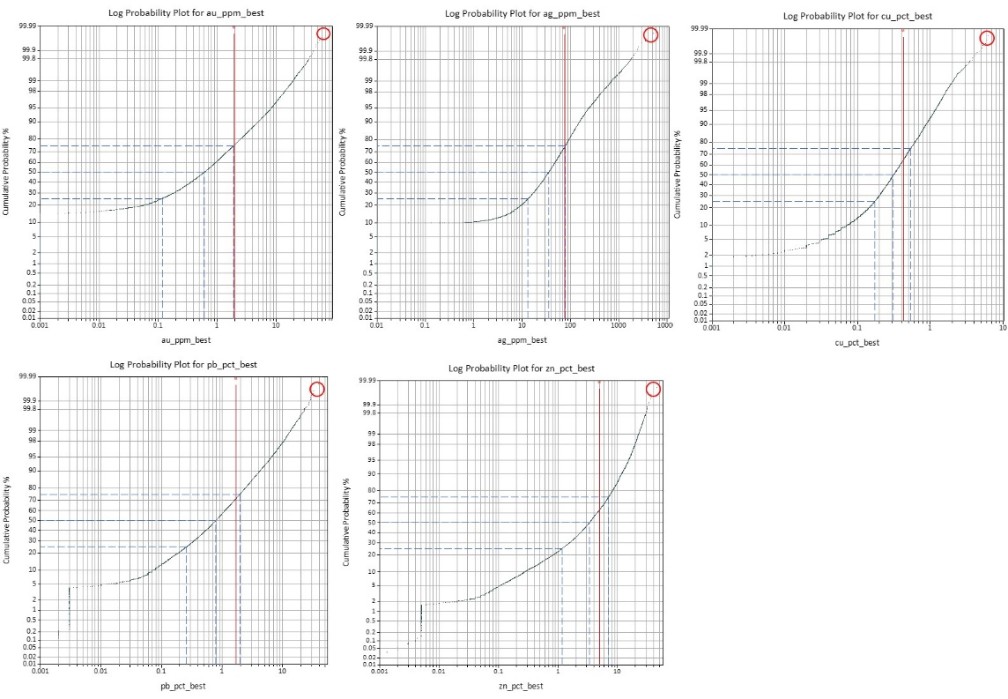
Figure 11-7: General capping for all Switchback vein domains.
108
A summary of general capping is shown in Table 118 with the number of capped for each metal. Composite samples above these thresholds were capped prior to estimation.
Table 11-8: Summary of general capping for Arista and Switchback.
Arista |
Grade capped |
Number of composites capped |
Au(g/t) |
190.5 |
6 |
Ag (g/t) |
15,618.80 |
10 |
Cu(%) |
14.33 |
3 |
Pb(%) |
35.47 |
5 |
Zn(%) |
- |
- |
Switchback |
Grade capped |
Number of composites capped |
Au(g/t) |
78 |
3 |
Ag (g/t) |
5,000 |
8 |
Cu(%) |
8 |
2 |
Pb(%) |
40 |
3 |
Zn(%) |
48 |
2 |
A second capping analysis was performed, individually for each vein. To determine the appropriate capping thresholds, composite sample population statistics, histograms and lognormal probability plots were examined for each modeled vein. An example of the Selene vein is shown in Figure 119.
110
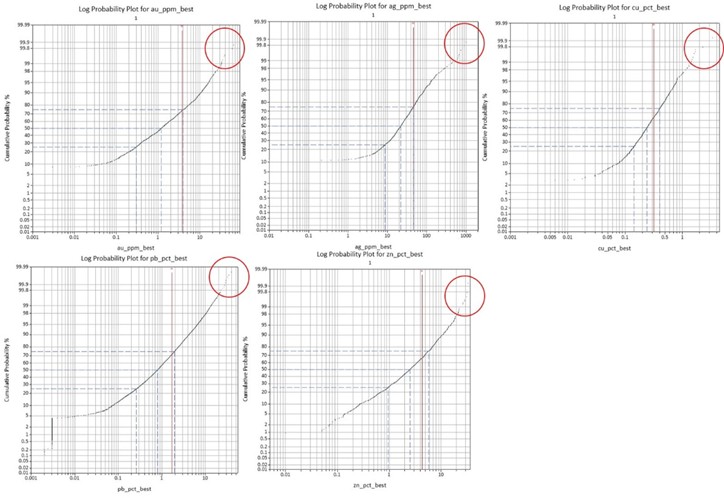
Figure 11-9: Log probability plots for Au, Ag, Cu, Pb and Zn, for Selene Vein, showing the capping criteria.
Log Probability plots commonly show outliers at the 98th to 99th percentile (disintegration of the upper tail of the cumulative distribution). The final outlier threshold was selected between these percentiles to adjust the capping levels with grade reconciliation with the mine and process, and to reduce global bias.
Each one of the thresholds defined for capping, each vein was applied during the grade estimation, limiting the search range, in order to use the capped grades for estimation, but restricting their influence to a few blocks next to the composite.
111
Table 11-9: Composite Capping Values Inside Wire-Framed Veins of the Don David Mine.
SYSTEM |
VEIN |
AU |
AG |
CU |
PB |
ZN |
SYSTEM |
VEIN |
AU |
AG |
CU |
PB |
ZN |
G/T |
G/T |
% |
% |
% |
G/T |
G/T |
% |
% |
% |
||||
Switchback |
selene |
50 |
700 |
1.5 |
22 |
n.a. |
Arista |
BAJA-RM1 |
22 |
700 |
1.5 |
12 |
28 |
Switchback |
silvia |
22 |
575 |
1.6 |
11 |
24 |
Arista |
BAJA |
60 |
5200 |
4 |
13 |
28 |
Switchback |
soledad_s |
14 |
900 |
4.5 |
11 |
28 |
Arista |
CANDELARIA |
50 |
6000 |
5 |
15 |
12 |
Switchback |
soledad_rm5 |
20 |
1000 |
1.8 |
17 |
25 |
Arista |
CHUY1 |
60 |
2500 |
6.5 |
15 |
35 |
Switchback |
soledad_n |
25 |
1250 |
2.3 |
23 |
31 |
Arista |
CHUY2 |
6.4 |
5000 |
0.9 |
9 |
22 |
Switchback |
susana_n |
n.a. |
n.a. |
n.a. |
n.a. |
n.a. |
Arista |
ESTE-NORTE |
7 |
300 |
2 |
6 |
11 |
Switchback |
sagrario |
15 |
400 |
3 |
10 |
14 |
Arista |
ESTE-SUR-RM1 |
n.a. |
95 |
n.a. |
n.a. |
3.1 |
Switchback |
sofia |
24 |
250 |
2.4 |
10 |
16 |
Arista |
ESTE-SUR |
45 |
4500 |
8 |
10 |
10 |
Switchback |
sam2 |
3 |
90 |
1.5 |
2 |
7 |
Arista |
GISELA |
0.35 |
1000 |
n.a. |
10 |
10 |
Switchback |
sadie2 |
1 |
610 |
n.a. |
n.a. |
n.a. |
Arista |
LUZ |
22 |
3500 |
2.7 |
8 |
10 |
Switchback |
sara |
11 |
215 |
1 |
2.5 |
9 |
Arista |
MARENA |
15 |
2500 |
3.5 |
5 |
10 |
Switchback |
sadie1 |
2.2 |
1200 |
0.2 |
n.a. |
2.8 |
Arista |
MERCEDES |
4 |
200 |
3 |
11 |
28 |
Switchback |
sbn1 |
2.5 |
90 |
0.9 |
8 |
11 |
Arista |
SANTIAGO-RM1 |
n.a. |
n.a. |
n.a. |
2.1 |
5 |
Switchback |
sasha1 |
n.a. |
750 |
n.a. |
0.5 |
2 |
Arista |
SANTIAGO |
18 |
900 |
1.2 |
8 |
13 |
Switchback |
sandy2 |
8 |
600 |
2 |
3 |
8 |
Arista |
SPLAY05-RM1 |
17 |
2700 |
0.8 |
15 |
14 |
Switchback |
sagram1 |
1.2 |
80 |
1 |
3.5 |
3.5 |
Arista |
SPLAY5 |
70 |
14000 |
1.25 |
14 |
14.5 |
Switchback |
sam1 |
3.5 |
22 |
1 |
2.5 |
10.5 |
Arista |
SPLAY06-SUR |
0.5 |
93 |
n.a. |
n.a. |
n.a. |
Switchback |
samarinda |
n.a. |
n.a. |
n.a. |
n.a. |
n.a. |
Arista |
SPLAY06 |
4 |
700 |
0.6 |
2.5 |
1.8 |
Switchback |
sandy1 |
5 |
755 |
0.7 |
1.5 |
3 |
Arista |
SPLAY31-RM1 |
1.2 |
250 |
1.4 |
3.5 |
n.a. |
Switchback |
sasha2 |
1.1 |
11 |
0.2 |
0.5 |
3 |
Arista |
SPLAY31 |
35 |
3300 |
2.6 |
13 |
21 |
Switchback |
soledad_rm1 |
10 |
800 |
1.2 |
8 |
20 |
Arista |
SPLAY66-RM1 |
20 |
2100 |
2.5 |
10 |
27 |
Switchback |
soledad_rm2 |
3 |
110 |
1 |
2.1 |
8 |
Arista |
SPLAY66 |
50 |
5000 |
5 |
16 |
40 |
Switchback |
soledad_rm3 |
3 |
800 |
n.a. |
12 |
14 |
Arista |
STA-CECILIA |
10.5 |
250 |
2 |
9.5 |
14 |
Switchback |
soledad_rm4 |
0.35 |
n.a. |
n.a. |
3.5 |
17 |
Arista |
STA-CLARA |
2.5 |
680 |
1.6 |
11 |
15 |
Switchback |
sonya |
0.1 |
4 |
0.25 |
0.8 |
1.2 |
Arista |
STA-HELENA |
30 |
2050 |
5.5 |
18 |
30.5 |
Switchback |
susana_s |
2.5 |
800 |
1 |
11 |
13 |
Arista |
STA-LUCIA |
40 |
2400 |
2.6 |
11 |
15 |
Switchback |
sarabi |
30 |
900 |
1 |
7 |
8 |
Arista |
VETA01 |
40 |
2200 |
2.25 |
17 |
26 |
Switchback |
sai |
0.02 |
n.a. |
0.1 |
0.1 |
n.a. |
Arista |
VETA03 |
60 |
2500 |
4.8 |
20 |
40 |
Switchback |
salamanca |
5 |
300 |
1 |
3 |
8 |
Arista |
VIRIDIANA-RM1 |
80 |
4000 |
10 |
12 |
12 |
Switchback |
susol |
15 |
160 |
2.5 |
3 |
7 |
Arista |
VIRIDIANA-RM2 |
16.5 |
310 |
n.a. |
n.a. |
19 |
Switchback |
gloria |
0.7 |
60 |
0.4 |
1 |
3 |
Arista |
VIRIDIANA |
35 |
2100 |
5.5 |
20 |
37 |
Switchback |
spl_gloria |
n.a. |
80 |
0.7 |
1.5 |
4 |
Arista |
CANDELARIA-RM1 |
2 |
260 |
0.61 |
2 |
n.a. |
Switchback |
soledad_fw |
8 |
700 |
n.a. |
5 |
16 |
Arista |
SPLAY31-RM5 |
n.a. |
170 |
n.a. |
n.a. |
2 |
Switchback |
manto_rm5 |
n.a. |
540 |
1 |
3.6 |
7 |
Arista |
SPLAY05-RM2 |
4 |
640 |
n.a. |
n.a. |
2 |
Switchback |
manto_soledad |
16 |
530 |
0.9 |
8 |
13 |
Arista |
MARENA-RM1 |
n.a. |
200 |
n.a. |
4 |
13 |
112
Arista |
AIRE |
7 |
750 |
0.5 |
4.5 |
7 |
Arista |
DAIRA |
0.5 |
50 |
n.a. |
2.5 |
4 |
Arista |
ALTA |
45 |
1400 |
2.9 |
15 |
26 |
Arista |
ARGELIA |
6 |
400 |
n.a. |
4 |
6 |
Arista |
ARISTA |
60 |
7950 |
4.8 |
25 |
28.5 |
Arista |
MARENA_NORTE |
n.a. |
n.a. |
n.a. |
4 |
9 |
n.a.: not applicable
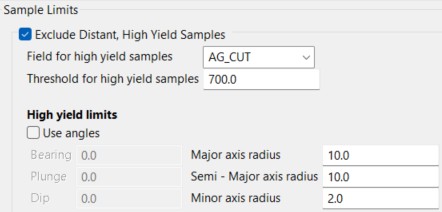
Figure 11-10: Exclusion of distant high yield samples in Vulcan, for Ag grades estimation, Selene Vein.
11.3.8. Trend Analysis - Variography
A variogram is a geostatistical tool that describes the spatial continuity of the data as a function of distance and direction. The experimental variogram is a discrete function calculated using a measure of variability between pairs of points at various distances and directions. A variogram parameter is thus a vector describing grade spatial variability in space. The spatial variability model should be compatible with accepted geologic knowledge. Therefore, variography is closely related to the understanding of the mineralization and its geological parameters. For example, the modeled anisotropies should be consistent with the spatial distribution of known geologic controls, and the variances and ranges of the models should be consistent with the overall variability observed in the data (Rossi & Deutsch, 2014).
The mineralized veins that control the continuity of the mineralization show a wide variability in their spatial orientation, both in azimuth and dip. Experimental variograms were calculated for each vein using length-weighted composites.
Analysis of the spatial distribution of Au, Ag, Cu, Pb and Zn grades consisted of variographic maps and the modeling of directional grade variograms. Directional variograms were modelled to obtain the variogram models to be used for estimation process. Variogram analyses started with the definition of the 3 main directions of continuity, following the main directions of known geological continuity (spatial orientation of the veins) for each domain, with the support of the variographic maps. Experimental variograms were obtained for each direction of continuity. Experimental variograms were modelled, generally using one exponential and one spherical structure or two spherical structures. Figure 1111 and Figure 1112 show examples of variograms for Ag, for Selene (Switchback) and Santa Cecilia (Arista), respectively. For veins with insufficient composite data to define spatial models for the mineralization as a separate domain, variogram continuity parameters were assumed to be the same as a spatially proximal vein with similar geological, orientation and/or mineralization characteristics.
113
Table 11-10: Summary of parameters describing grade continuity for major estimation domains.
Vein |
Element |
Nugget |
Model Type |
Sill |
Bearing |
Plunge |
Dip |
Major Axis |
Semi Axis |
Minor Axis |
Model Type |
Sill |
Bearing |
Plunge |
Dip |
Major Axis |
Semi Axis |
Minor Axis |
|---|---|---|---|---|---|---|---|---|---|---|---|---|---|---|---|---|---|---|
1 |
Au |
0.05 |
Exp |
0.56 |
vein_bear |
0 |
vein_dip |
7.4 |
15.2 |
0.6 |
Sph |
0.39 |
vein_bear |
0 |
vein_dip |
60 |
20 |
10 |
Selene |
Ag |
0.1 |
Exp |
0.49 |
vein_bear |
0 |
vein_dip |
6.6 |
26.6 |
4 |
Sph |
0.41 |
vein_bear |
0 |
vein_dip |
122 |
54 |
7 |
|
Cu |
0.11 |
Sph |
0.53 |
vein_bear |
0 |
vein_dip |
6.4 |
19.2 |
3.6 |
Sph |
0.18 |
vein_bear |
0 |
vein_dip |
60 |
38 |
7 |
|
Pb |
0.15 |
Exp |
0.56 |
vein_bear |
0 |
vein_dip |
9.6 |
27.8 |
1.2 |
Sph |
0.29 |
vein_bear |
0 |
vein_dip |
114 |
37 |
10 |
|
Zn |
0.07 |
Exp |
0.48 |
vein_bear |
0 |
vein_dip |
2.6 |
6.2 |
4.6 |
Sph |
0.45 |
vein_bear |
0 |
vein_dip |
129 |
77 |
6 |
13 |
Au |
0.04 |
Sph |
0.58 |
vein_bear |
0 |
vein_dip |
4.6 |
23.8 |
3.5 |
Sph |
0.38 |
vein_bear |
0 |
vein_dip |
63 |
45 |
10 |
Silvia |
Ag |
0.17 |
Sph |
0.45 |
vein_bear |
0 |
vein_dip |
4.6 |
30.2 |
7 |
Sph |
0.38 |
vein_bear |
0 |
vein_dip |
63 |
60 |
14 |
|
Cu |
0.11 |
Exp |
0.46 |
vein_bear |
0 |
vein_dip |
4.6 |
20.4 |
2.2 |
Sph |
0.43 |
vein_bear |
0 |
vein_dip |
25 |
24 |
7 |
|
Pb |
0.11 |
Exp |
0.54 |
vein_bear |
0 |
vein_dip |
3 |
15.8 |
2.6 |
Sph |
0.35 |
vein_bear |
0 |
vein_dip |
24 |
26 |
8 |
|
Zn |
0.14 |
Exp |
0.59 |
vein_bear |
0 |
vein_dip |
9.4 |
18.8 |
9.8 |
Sph |
0.27 |
vein_bear |
0 |
vein_dip |
52 |
30 |
10 |
14 |
Au |
0.13 |
Exp |
0.52 |
vein_bear |
0 |
vein_dip |
6.2 |
5.2 |
5.2 |
Sph |
0.35 |
vein_bear |
0 |
vein_dip |
175 |
92 |
8 |
Soledad |
Ag |
0.14 |
Exp |
0.66 |
vein_bear |
0 |
vein_dip |
5 |
13 |
6 |
Sph |
0.2 |
vein_bear |
0 |
vein_dip |
100 |
100 |
10 |
Sur |
Cu |
0.13 |
Exp |
0.53 |
vein_bear |
0 |
vein_dip |
10.4 |
4.2 |
0.8 |
Sph |
0.34 |
vein_bear |
0 |
vein_dip |
105 |
58 |
10 |
|
Pb |
0.11 |
Exp |
0.59 |
vein_bear |
0 |
vein_dip |
3 |
9.8 |
3 |
Sph |
0.3 |
vein_bear |
0 |
vein_dip |
120 |
82 |
10 |
|
Zn |
0.07 |
Exp |
0.62 |
vein_bear |
0 |
vein_dip |
6.8 |
5.2 |
3 |
Sph |
0.31 |
vein_bear |
0 |
vein_dip |
116 |
104 |
6 |
16 |
Au |
0.13 |
Exp |
0.52 |
vein_bear |
0 |
vein_dip |
6.2 |
5.2 |
5.2 |
Sph |
0.35 |
vein_bear |
0 |
vein_dip |
175 |
92 |
10 |
Soledad |
Ag |
0.14 |
Exp |
0.66 |
vein_bear |
0 |
vein_dip |
5 |
13 |
6 |
Sph |
0.2 |
vein_bear |
0 |
vein_dip |
100 |
100 |
10 |
Norte |
Cu |
0.13 |
Exp |
0.53 |
vein_bear |
0 |
vein_dip |
10.4 |
4.2 |
0.8 |
Sph |
0.34 |
vein_bear |
0 |
vein_dip |
105 |
58 |
10 |
|
Pb |
0.11 |
Exp |
0.59 |
vein_bear |
0 |
vein_dip |
3 |
9.8 |
3 |
Sph |
0.4 |
vein_bear |
0 |
vein_dip |
120 |
82 |
10 |
|
Zn |
0.07 |
Exp |
0.62 |
vein_bear |
0 |
vein_dip |
6.8 |
5.2 |
3 |
Sph |
0.31 |
vein_bear |
0 |
vein_dip |
116 |
104 |
6 |
17 |
Au |
0.2 |
Exp |
0.31 |
vein_bear |
0 |
vein_dip |
9 |
57 |
1 |
Sph |
0.49 |
vein_bear |
0 |
vein_dip |
55 |
74 |
5 |
Santiago |
Ag |
0.09 |
Exp |
0.63 |
vein_bear |
0 |
vein_dip |
6.6 |
26.6 |
4 |
Sph |
0.28 |
vein_bear |
0 |
vein_dip |
122 |
54 |
7 |
|
Cu |
0.09 |
Exp |
0.56 |
vein_bear |
0 |
vein_dip |
15 |
131 |
4 |
Sph |
0.35 |
vein_bear |
0 |
vein_dip |
91 |
134 |
7 |
|
Pb |
0.05 |
Exp |
0.73 |
vein_bear |
0 |
vein_dip |
5 |
20 |
3 |
Sph |
0.2 |
vein_bear |
0 |
vein_dip |
41 |
43 |
4 |
|
Zn |
0.09 |
Exp |
0.48 |
vein_bear |
0 |
vein_dip |
6 |
19 |
4 |
Sph |
0.43 |
vein_bear |
0 |
vein_dip |
45 |
55 |
6 |
29 |
Au |
0.07 |
Exp |
0.67 |
vein_bear |
0 |
vein_dip |
22 |
32 |
3 |
Sph |
0.26 |
vein_bear |
0 |
vein_dip |
100 |
62 |
4 |
S Cecilia |
Ag |
0.05 |
Exp |
0.65 |
vein_bear |
0 |
vein_dip |
15 |
31 |
3.5 |
Sph |
0.3 |
vein_bear |
0 |
vein_dip |
115 |
35 |
5 |
|
Cu |
0.1 |
Exp |
0.53 |
vein_bear |
0 |
vein_dip |
10 |
22 |
4 |
Sph |
0.37 |
vein_bear |
0 |
vein_dip |
77 |
70 |
5 |
|
Pb |
0.12 |
Exp |
0.38 |
vein_bear |
0 |
vein_dip |
9 |
12 |
2.5 |
Sph |
0.5 |
vein_bear |
0 |
vein_dip |
46 |
78 |
4 |
|
Zn |
0.01 |
Exp |
0.57 |
vein_bear |
0 |
vein_dip |
5 |
28 |
2.5 |
Sph |
0.42 |
vein_bear |
0 |
vein_dip |
47 |
39 |
5 |
37 |
Au |
0.05 |
Exp |
0.87 |
vein_bear |
0 |
vein_dip |
7 |
22.6 |
3 |
Sph |
0.08 |
vein_bear |
0 |
vein_dip |
51 |
41.8 |
5.4 |
Viridiana |
Ag |
0.05 |
Exp |
0.59 |
vein_bear |
0 |
vein_dip |
2.4 |
8.2 |
3 |
Sph |
0.23 |
vein_bear |
0 |
vein_dip |
72.4 |
78.6 |
5.6 |
|
Cu |
0.07 |
Exp |
0.56 |
vein_bear |
0 |
vein_dip |
2.8 |
9.2 |
3 |
Sph |
0.17 |
vein_bear |
0 |
vein_dip |
47 |
106.6 |
8.4 |
|
Pb |
0.08 |
Exp |
0.49 |
vein_bear |
0 |
vein_dip |
2.2 |
10 |
3.6 |
Sph |
0.31 |
vein_bear |
0 |
vein_dip |
53.6 |
48.8 |
6 |
|
Zn |
0.07 |
Exp |
0.48 |
vein_bear |
0 |
vein_dip |
4.6 |
2.8 |
3.6 |
Sph |
0.25 |
vein_bear |
0 |
vein_dip |
81 |
50 |
5 |
14 |
Au |
0.1 |
Exp |
0.78 |
vein_bear |
0 |
vein_dip |
5.8 |
52 |
5 |
Sph |
0.31 |
vein_bear |
0 |
vein_dip |
45.6 |
87.5 |
11 |
Marena |
Ag |
0.08 |
Exp |
0.61 |
vein_bear |
0 |
vein_dip |
8.2 |
45.2 |
1.6 |
Sph |
0.12 |
vein_bear |
0 |
vein_dip |
31.6 |
55 |
5.2 |
|
Cu |
0.1 |
Exp |
0.56 |
vein_bear |
0 |
vein_dip |
4.6 |
13.8 |
10.2 |
Sph |
0.34 |
vein_bear |
0 |
vein_dip |
31.8 |
48 |
10.4 |
|
Pb |
0.07 |
Exp |
0.58 |
vein_bear |
0 |
vein_dip |
3.6 |
10.6 |
3 |
Sph |
0.35 |
vein_bear |
0 |
vein_dip |
39 |
109.6 |
11 |
|
Zn |
0.05 |
Exp |
0.55 |
vein_bear |
0 |
vein_dip |
6.6 |
16.6 |
2.2 |
Sph |
0.4 |
vein_bear |
0 |
vein_dip |
48 |
93.2 |
12 |
11.3.9. Block Models
Base block models were constructed in Maptek Vulcan software using the vein systems wireframes for Arista, Switchback and Alta Gracia, with empty or blank values assigned to the individual blocks/sub-blocks prior to modeling.
Table 1111 provides a listing of block model extents and orientations, and the sub-blocking parameters are used to define the volume of the wireframes within the models. The block models were rotated to the average strike of the vein systems. Table 1112 provides a listing of the standard block model parameters, their data type, default values and a descriptive comment on value estimation or assignment.
116
Table 11-11: Block Model Specifications – Arista, Switchback and Alta Gracia models.
SWITCHBACK |
EASTING (M) |
NORTHING (M) |
RL (M) |
Minimum Coordinates |
808,150 |
1,847,350 |
100 |
Maximum Coordinates |
809,950 |
1,848,350 |
950 |
Model Extent |
1,800 |
1,000 |
850 |
Parent Block Size |
10 |
1 |
10 |
Sub-block Size |
2.5 |
0.5 |
2.5 |
Rotation (degrees, following left hand rule) |
135 |
0 |
0 |
ARISTA |
EASTING (M) |
NORTHING (M) |
RL (M) |
Minimum Coordinates |
807,938.3 |
1,846,913.6 |
150.0 |
Maximum Coordinates |
809,538.3 |
1,847,513.6 |
950.0 |
Model Extent |
1,600.0 |
600.0 |
800.0 |
Parent Block Size |
10 |
1 |
10 |
Sub-block Size |
2.5 |
0.5 |
2.5 |
Rotation (degrees, following left hand rule) |
135 |
0 |
0 |
ALTA GRACIA |
EASTING (M) |
NORTHING (M) |
RL (M) |
Minimum Coordinates |
794,100 |
1,847,700 |
1,200 |
Maximum Coordinates |
795,400 |
1,848,450 |
1,700 |
Model Extent |
1,300 |
750 |
500 |
Parent Block Size |
2.5 |
750 |
2.5 |
Sub-block Size |
2.5 |
0.5 |
2.5 |
Rotation (degrees, following left hand rule) |
50 |
0 |
0 |
117
Table 11-12: Block Model Variables – Arista, Switchback and Alta Gracia models.
VARIABLE |
DATA TYPE |
DEFAULT |
DESCRIPTION |
au_ok |
Float (Real * 4) |
-9 |
Kriged Au grade |
ag_ok |
Float (Real * 4) |
-9 |
Kriged Ag grade |
zn_ok |
Float (Real * 4) |
-9 |
Kriged Zn grade |
cu_ok |
Float (Real * 4) |
-9 |
Kriged Cu grade |
pb_ok |
Float (Real * 4) |
-9 |
Kriged Pb grade |
categ |
Integer (Integer * 4) |
0 |
resource class (1=Measured, 2=Indicated, 3=Inferred) |
dist_au_ok |
Float (Real * 4) |
-9 |
distance to the closest sample Au estimation |
dist_ag_ok |
Float (Real * 4) |
-9 |
distance to the closest sample Ag estimation |
dist_zn_ok |
Float (Real * 4) |
-9 |
distance to the closest sample Zn estimation |
dist_cu_ok |
Float (Real * 4) |
-9 |
distance to the closest sample Cu estimation |
dist_pb_ok |
Float (Real * 4) |
-9 |
distance to the closest sample Pb estimation |
flag_au_ok |
Integer (Integer * 4) |
-9 |
Au estimation pass |
flag_ag_ok |
Integer (Integer * 4) |
-9 |
Ag estimation pass |
flag_zn_ok |
Integer (Integer * 4) |
-9 |
Zn estimation pass |
flag_cu_ok |
Integer (Integer * 4) |
-9 |
Cu estimation pass |
flag_pb_ok |
Integer (Integer * 4) |
-9 |
Pb estimation pass |
nsamples_au_ok |
Integer (Integer * 4) |
-9 |
Number of samples Au estimation |
nsamples_ag_ok |
Integer (Integer * 4) |
-9 |
Number of samples Ag estimation |
nsamples_zn_ok |
Integer (Integer * 4) |
-9 |
Number of samples Zn estimation |
nsamples_cu_ok |
Integer (Integer * 4) |
-9 |
Number of samples Cu estimation |
nsamples_pb_ok |
Integer (Integer * 4) |
-9 |
Number of samples Pb estimation |
densidad |
Float (Real * 4) |
2.79 |
Density |
au_eqv |
Float (Real * 4) |
-9 |
calculated au equivalent |
vein |
Integer (Integer * 4) |
-9 |
vein domain code |
nsr |
Float (Real * 4) |
-9 |
calculated nsr |
ag_nn |
Float (Real * 4) |
-9 |
ag nn assignment |
au_nn |
Float (Real * 4) |
-9 |
au nn assignment |
cu_nn |
Float (Real * 4) |
-9 |
cu nn assignment |
pb_nn |
Float (Real * 4) |
-9 |
pb nn assignment |
zn_nn |
Float (Real * 4) |
-9 |
zn nn assignment |
minada |
Integer (Integer * 4) |
0 |
mined out = 1 |
vein_bear |
Float (Real * 4) |
-9 |
vein bearing |
vein_dip |
Float (Real * 4) |
-9 |
vein dip |
vein_plunge |
Float (Real * 4) |
-9 |
vein plunge |
minor |
Float (Real * 4) |
-9 |
minor anisotrpy direction |
The sub-celled block model accurately represents the volume and tonnage contained within the constraining wireframes. Table 1113 shows the block model tonnage compared with the tonnage of the wireframes, for the major mineralized veins.
Table 11-13: Comparison between wireframes and block model tonnages.
VEIN |
BM TONNAGE |
WIREFRAMES TONNAGE |
% DIFFERENCE |
17_SANTIAGO |
569,343 |
569,642 |
0.05 |
29_STA_CECILIA |
371,794 |
371,651 |
-0.04 |
37_VIRIDIANA |
1,123,829 |
1,124,648 |
0.07 |
14_MARENA |
451,274 |
451,232 |
-0.01 |
28_SP-66 |
771,296 |
771,892 |
0.08 |
05_BAJA |
624,193 |
624,602 |
0.07 |
01_SELENE |
123,440 |
123,323 |
-0.10 |
13_SILVIA |
1,883,006 |
1,887,105 |
0.22 |
14_SOLEDAD_SUR |
2,135,422 |
2,138,043 |
0.12 |
16_SOLEDAD_NORTE |
569,343 |
569,642 |
0.05 |
118
The block model limits are shown relative to drilling and mineralized vein wireframes at Arista and Switchback in Figure 1113. Figure 1114 shows a corresponding view of the Alta Gracia block model limits.
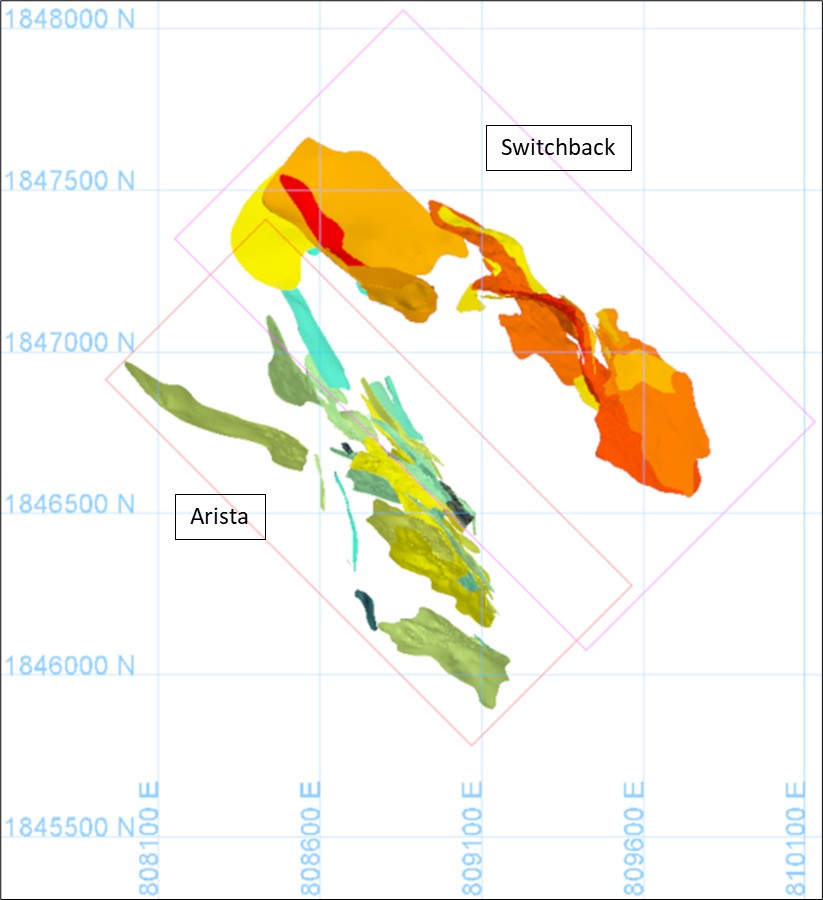
Figure 11-13: Block Model locations, orientations and dimensions for the Arista and Switchback Vein Systems at the Arista Underground Mine.
119
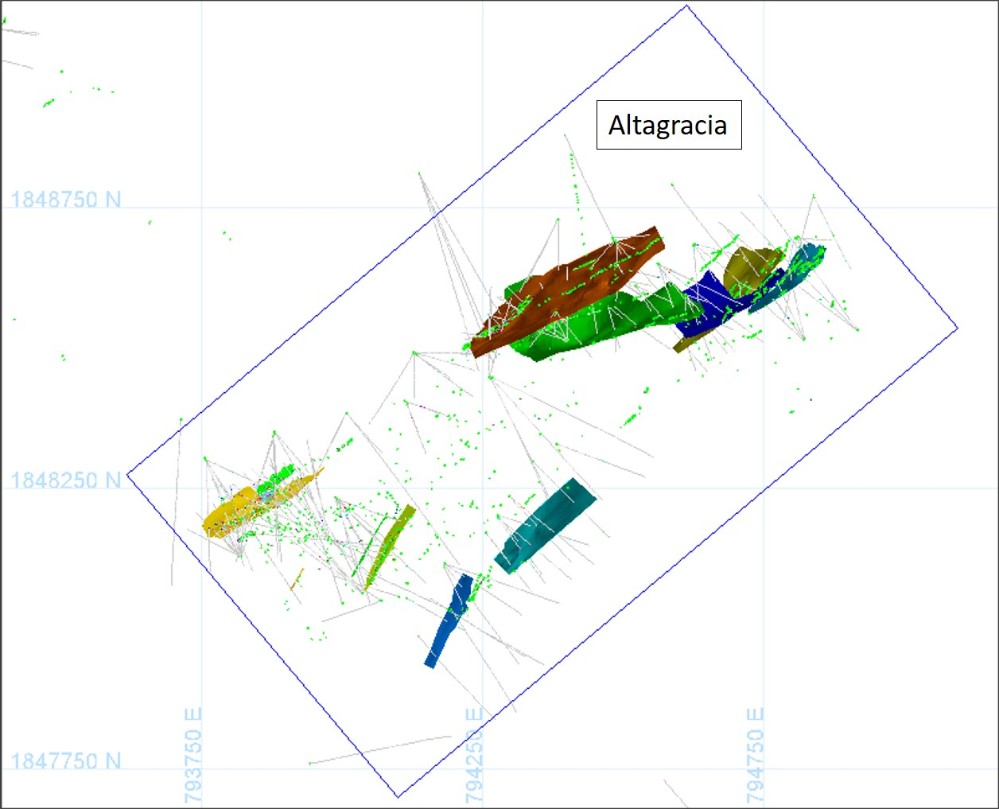
Figure 11-14: Block Model Location, orientation, and dimension for the Alta Gracia Vein Systems.
11.3.10. Search Strategy and Grade Interpolation Parameters
Prior to grade estimation, the raw drillhole data set was coded (“flagged”) with the domain (vein) code delimited using the modelled wireframes. The result of this flagging was visually checked. The samples were subsequently composited to 1 m length, respecting the flagged domain code limits for each individual domain. Length-weighted compositing was performed for each metal used for resource modeling (Au, Ag, Cu, Pb and Zn). For a listing of domain codes refer to Table 115 that shows the coding of the individual wireframes. The numeric codes for the wireframes, for the composites and for the mineralized domains in the block model are identical and unique for each vein.
Ordinary Kriging (“OK”) was selected as the method for the estimation for Au, Ag, Cu, Pb and Zn grades. Block Kriging was done with a discretization of the parent cell into a 4x1x4 grid for Arista and Switchback estimation and 2x2x2 grid for Alta Gracia estimation.
120
All search directions were based on Vulcan’s dynamic anisotropy, which varies search ellipsoid orientations according to the trend of the mineralization domain (Figure 1115).
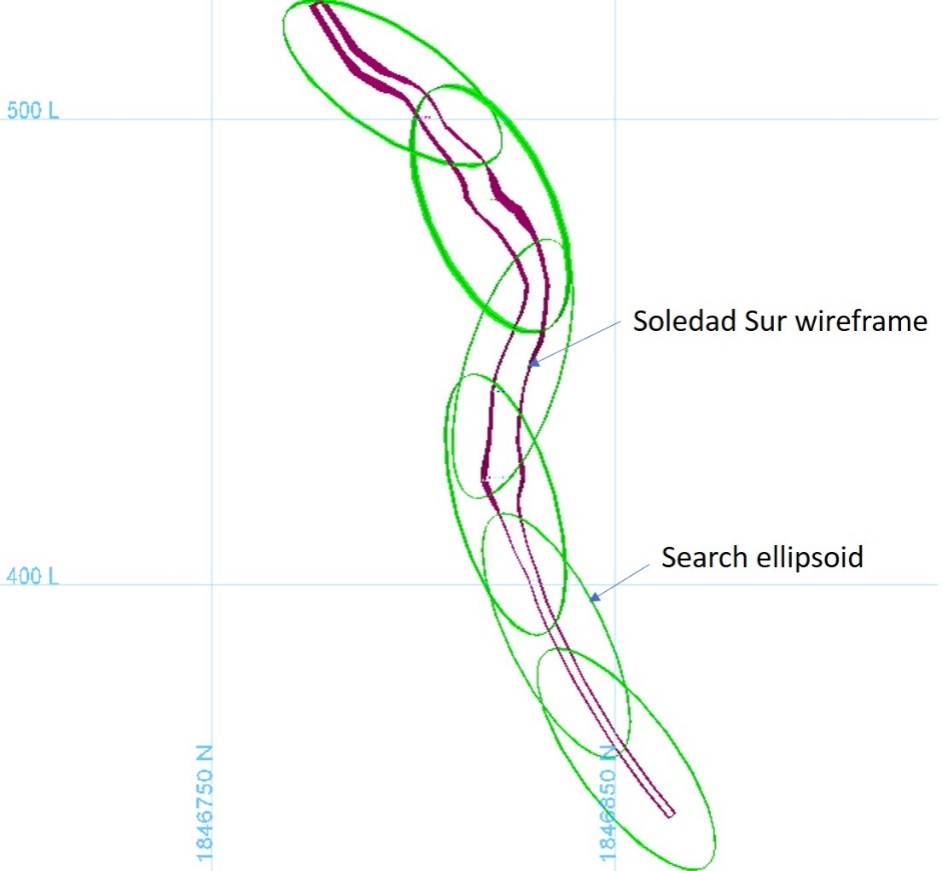
Figure 11-15: Vertical cross-section of Soledad Sur vein with Ag search ellipsoids showing variable anisotropy.
All available 1 m drillhole composites with a variable top-cut for each domain (as described in Section 11.3.7) were used in the model estimation. The variogram parameters and the ranges of influence described in Section 11.3.8 were used for the estimation of each vein.
The block grade estimation was completed in three passes of expanding search ellipsoids, with only blocks not estimated in an earlier pass available for estimation during the next pass. Pass 1 uses a search radius equal to the variogram range corresponding to 80% of the total variance; Pass 2 uses a search radius equal to the variogram range corresponding to 90% of the total variance (Figure 1116); and Pass 3 uses a search radius of 80 m in the major and semi-major axis and 15 m in the minor axis (this is normally 2 to 3 times the range of the variogram).
121
Search parameters examples are listed in Table 1114 for some domains in Switchback and Arista.
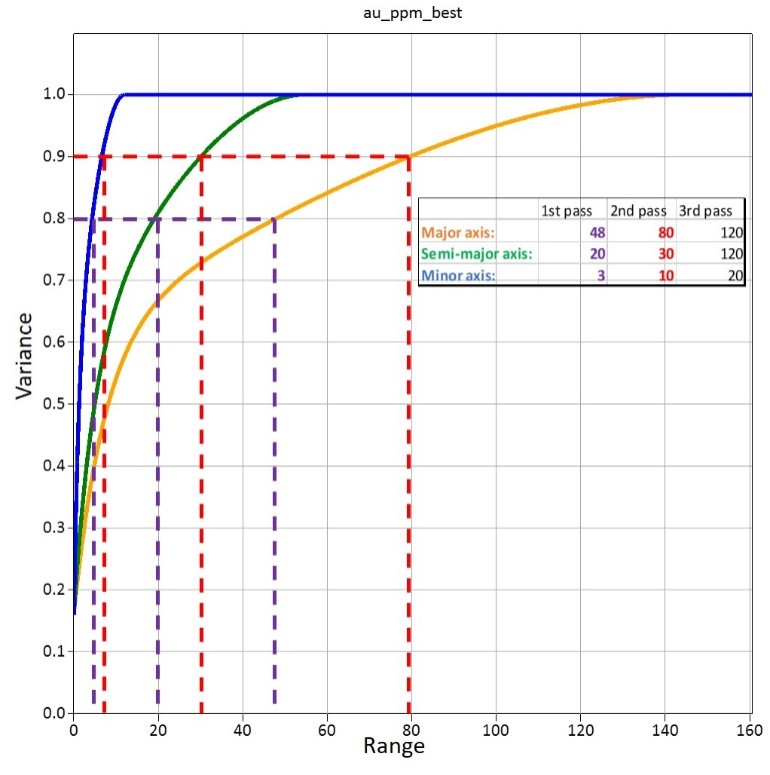
Figure 11-16: Example of relationship between variogram range and search radii (Soledad Sur, continuity models for gold).
122
Table 11-14: Example of search parameters.
ESTIMATION |
PASS |
ROTATION ANGLES BM |
SEARCH ELLIPSE RADIO (M) |
THRESHOLD |
HIGH YIELD LIMITS (RADII |
# OF |
MAX # |
MAX |
|||||||
DOMAIN |
VARIABLE |
HIGH YIELD |
FOR CAPPING) |
COMPOSITES |
OF |
SAMPLE |
|||||||||
GRADES |
COMP |
PER |
|||||||||||||
PER |
OCTANT |
||||||||||||||
BEARING |
PLUNGE |
DIP |
MAJOR |
SEMI- |
MINOR |
MAJOR |
SEMI-MAJOR |
MINOR |
MIN |
MAX |
DH |
||||
MAJOR |
|||||||||||||||
16 |
1 |
vein_bear |
0 |
Vein_dip |
10 |
10 |
3 |
1250 |
10 |
10 |
2 |
5 |
12 |
2 |
2 |
Soledad |
2 |
vein_bear |
0 |
Vein_dip |
25 |
15 |
10 |
1250 |
10 |
10 |
2 |
3 |
12 |
2 |
2 |
Norte - Ag |
3 |
vein_bear |
0 |
Vein_dip |
80 |
80 |
15 |
1250 |
10 |
10 |
2 |
2 |
12 |
1 |
- |
16 |
1 |
vein_bear |
0 |
Vein_dip |
18 |
10 |
3 |
25 |
15 |
10 |
2 |
5 |
12 |
2 |
2 |
Soledad |
2 |
vein_bear |
0 |
Vein_dip |
30 |
15 |
10 |
25 |
15 |
10 |
2 |
3 |
12 |
2 |
2 |
Norte - Au |
3 |
vein_bear |
0 |
Vein_dip |
80 |
80 |
15 |
25 |
15 |
10 |
2 |
2 |
12 |
1 |
- |
37 |
1 |
vein_bear |
0 |
Vein_dip |
15 |
20 |
3 |
- |
- |
- |
- |
5 |
20 |
2 |
- |
Viridiana - |
2 |
vein_bear |
0 |
Vein_dip |
25 |
25 |
10 |
- |
- |
- |
- |
3 |
20 |
2 |
- |
Ag |
3 |
vein_bear |
0 |
Vein_dip |
80 |
80 |
15 |
2100 |
15 |
10 |
2 |
2 |
20 |
1 |
- |
37 |
1 |
vein_bear |
0 |
Vein_dip |
20 |
20 |
3 |
- |
- |
- |
- |
5 |
20 |
2 |
- |
Viridiana - |
2 |
vein_bear |
0 |
Vein_dip |
30 |
25 |
10 |
- |
- |
- |
- |
3 |
20 |
2 |
- |
Zn |
3 |
vein_bear |
0 |
Vein_dip |
80 |
80 |
15 |
37 |
13 |
15 |
2 |
2 |
20 |
1 |
- |
5 |
1 |
vein_bear |
0 |
Vein_dip |
10 |
15 |
3 |
- |
- |
- |
- |
5 |
15 |
2 |
2 |
Baja - Ag |
2 |
vein_bear |
0 |
Vein_dip |
15 |
20 |
10 |
- |
- |
- |
- |
3 |
15 |
2 |
2 |
|
3 |
vein_bear |
0 |
Vein_dip |
80 |
80 |
15 |
5200 |
10 |
15 |
2 |
2 |
15 |
1 |
- |
5 |
1 |
vein_bear |
0 |
Vein_dip |
10 |
15 |
3 |
28 |
10 |
10 |
2 |
5 |
15 |
2 |
2 |
Baja - Au |
2 |
vein_bear |
0 |
Vein_dip |
20 |
25 |
10 |
28 |
10 |
10 |
2 |
3 |
15 |
2 |
2 |
|
3 |
vein_bear |
0 |
Vein_dip |
80 |
80 |
15 |
28 |
10 |
10 |
2 |
2 |
15 |
1 |
- |
Octant search was applied for the two first passes, with a maximum of 2 (two) samples per octant.
The minimum number of samples in the first pass is set at 5, decreasing to 3 and 2 composites in the second and third pass respectively, using a maximum number of composites of 20. In some veins of limited extent, with a small number of composites, a greater restriction for the minimum and maximum composites was applied, to avoid over-smoothing of the estimated grades. Estimation is into parent cell size. For the two first passes, a maximum of 2 composites were allowed to be derived from one drillhole. Estimation takes place within each mineralized domain using hard boundaries as defined by the wireframes and the data flagging. Therefore, only composites within a domain will be used for the estimation of resources within the domain.
After the block grades estimation, individual estimated metal grades were used to calculate an NSR value and/or an AuEq grade. Nearest Neighbor (“NN”) block grades were also assigned for validation and comparative purposes using the same search parameters.
123
11.3.11. Block Model Validation
Block model validation was completed using the following procedures:
| ● | Comparison of means between OK and NN block grades, per domain. |
| ● | Swath plots. |
| ● | Visual inspection of composite versus block grades. |
AMBA´s QP compared the OK grade estimates with NN mean grades, per domain. The block model estimates were checked for global bias by comparing the average metal grades to Nearest Neighbor model means for Measured and Indicated mineral resources Table 1115. A Nearest Neighbor estimator produces a theoretically unbiased estimate of the average value when no cutoff grade is imposed and is a reasonable basis for checking the performance of different estimation methods (typically the target comparison should be less than 5%). Overall, the differences were below 5% for the comparison between the OK and NN grades.
Table 11-15: Measured and Indicated OK vs NN estimates comparison.
DOMAIN |
AG_OK Mean |
AG_NN Mean |
AG_OK vs AG_NN (% DIFF) |
AU_OK Mean |
AU_NN Mean |
AU_OK vs AU_NN (% DIFF) |
CU_OK Mean |
CU_NN Mean |
CU_OK vs CU_NN (% DIFF) |
PB_OK Mean |
PB_NN Mean |
PB_OK vs PB_NN (% DIFF) |
ZN_OK |
ZN_NN |
ZN_OK vs ZN_NN (% DIFF) |
All Switchback |
71.32 |
70.73 |
0.8% |
1.63 |
1.58 |
3.2% |
0.38 |
0.37 |
2.7% |
1.32 |
1.33 |
-0.8% |
3.86 |
3.85 |
0.3% |
All Arista |
188.63 |
189.66 |
-0.5% |
2.11 |
2.07 |
1.9% |
0.32 |
0.31 |
3.2% |
1.31 |
1.28 |
2.3% |
3.8 |
3.75 |
1.3% |
All Alta Gracia |
222.9 |
224.2 |
-0.6% |
0.49 |
0.48 |
2.1% |
- |
- |
- |
- |
- |
- |
- |
- |
- |
Swath plots are constructed slicing through the block model along Easting, Northing and Elevation and comparing average NN grades against average OK block grades. Swath plots show acceptable agreement between NN and OK estimates. Figure 1117,Figure 1118, and Figure 1119 show swath plots comparing OK and NN estimates, for Au, Ag, Cu, Pb, and Zn, using slicing of 10 m width, perpendicular to the average strike of the veins, for each vein system.
124
125
The visual inspection of composite and block grades, in successive section lines, revealed that the spatial grade correlation is good, with the model reliably reflecting the distribution of high-grade and low-grade assay values. Figure 1120, Figure 1121, and Figure 1122 show examples of the visual validation conducted for each block model.
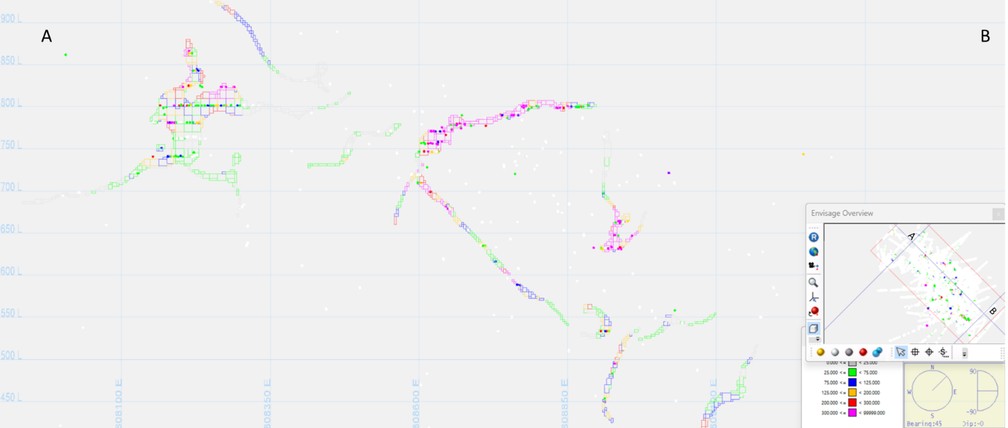
Figure 11-20: Arista longitudinal vertical section showing Ag blocks versus composite grades.
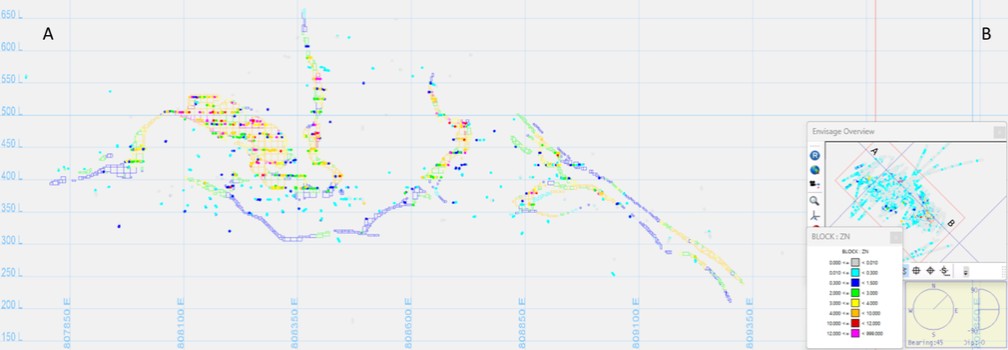
Figure 11-21: Switchback longitudinal vertical section showing Zn blocks versus composite grades.
128
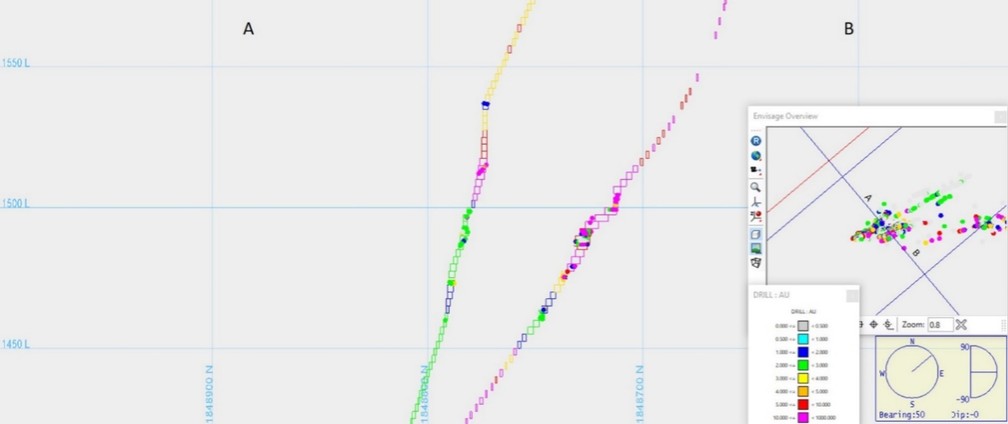
Figure 11-22: Alta Gracia vertical cross section showing Au blocks versus composite grades.
AMBA validation results suggest that the grade estimates for gold, silver, zinc, copper, and lead are reasonable, and that the block model is suitable to support the Mineral Resource and Mineral Reserve estimation.
SK1300 defines a mineral resource “to mean a concentration or occurrence of material of economic interest in or on the Earth’s crust in such form, grade or quality, and quantity that there are reasonable prospects for economic extraction”. Definitions for resource categories used in this report are those defined by S-K 1300. Mineral Resources are classified into Measured, Indicated, and Inferred categories. S-K 1300 defines:
| ● | An Inferred Mineral Resources as “that part of a mineral resource for which quantity and grade or quality are estimated on the basis of limited geological evidence and sampling”. |
| ● | An Indicated Mineral Resource as “that part of a mineral resource for which quantity and grade or quality are estimated on the basis of adequate geological evidence and sampling”. |
| ● | A Measured Mineral Resource as “that part of a mineral resource for which quantity and grade or quality are estimated on the basis of conclusive geological evidence and sampling”. |
Mineral Resource classification for the Arista, Switchback and Alta Gracia is based on the distances determined by variogram ranges that are indicative of grade continuity, and geological continuity.
Search ranges for each grade estimation pass were defined as a function of the variogram range, as mentioned in Section 11.3.8. Flagging of the blocks by estimation pass was performed during the estimation process, for each metal.
The classification of the Mineral Resource estimate was applied, using a Vulcan script, as follows:
Measured Mineral Resources: Measured blocks were defined as those blocks in which all 5 elements (Au, Ag, Cu, Pb, Zn) were estimated in the first estimation pass. The following additional minimum criteria were also met, the search radii are equal to the range of the variogram for the 80% of the total variance and at least 5 composites from a minimum of 3 drill holes were used for the block estimation. Measured Resources are supported with data of a low level of uncertainty as follows:
| ● | Drilling, sampling, and sample preparation and assay procedures follow industry standards and best practices. |
| ● | Reliability of sampling data: excellent database integrity and representativity based on AMBA´s independent data verification and validation, as well as no significant bias observed in QAQC analysis results. |
| ● | Confidence in interpretation and modeling of geological and estimation domains: veins wireframes show good agreement with the drill holes and underground mapping. |
129
| ● | Geology and grade continuity: based on drilling and underground mapping, trend analysis and variography. |
| ● | Confidence in estimation of block grades: block grades correlate well with composite data, statistically and spatially, locally and globally. |
| ● | Well supported drilling spacing criteria: based on three drill holes. |
Indicated Mineral Resources: Indicated blocks were defined as those blocks in which at least 3 elements were estimated in the first or second estimation pass. The following additional minimum criteria were also met, the search radii are equal to the range of the variogram for the 90% of the total variance and at least 3 composites from a minimum of 2 drill holes were used for the block estimation. Indicated Resources are supported with data of a low and/or medium level of uncertainty as follows:
| ● | Drilling, sampling, and sample preparation and assay procedures follow industry standards and best practices. |
| ● | Reliability of sampling data: excellent database integrity and representativity based on AMBA´s independent data verification and validation, as well as no significant bias observed in QAQC analysis results. |
| ● | Confidence in interpretation and modeling of geological and estimation domains: veins wireframes show good agreement with the drill holes and underground mapping and show relatively acceptable agreement with the drill holes and underground mapping where the density of drill holes is less, particularly at the mineralization edges. |
| ● | Geology and grade continuity: based on drilling and underground mapping, trend analysis and variography. |
| ● | Confidence in estimation of block grades: block grades correlate well with composite data, statistically and spatially, locally, and globally. |
| ● | Well supported drilling spacing criteria: based on two drill holes. |
Inferred Mineral Resources: Inferred blocks were defined as those blocks that were estimated in the third estimation pass, or in first or second passes but did not meet the conditions for Measured or Indicated Mineral Resource categorization. Inferred Resources are supported with data of a low and/or medium and/or high level of uncertainty as follows:
| ● | Drilling, sampling, and sample preparation and assay procedures follow industry standards and best practices. |
| ● | Reliability of sampling data: Excellent database integrity and representativity based on AMBA´s independent data verification and validation, as well as no significant bias observed in QAQC analysis results. Less data is available at the mineralization edges. |
| ● | Confidence in interpretation and modeling of geological and estimation domains: veins wireframes show good agreement with the drill holes and underground mapping and show relatively acceptable agreement with the drill holes and underground mapping where the density of drill holes is less, particularly at the mineralization edges. |
| ● | Geology and grade continuity: based on drilling and underground mapping, trend analysis and variography. |
| ● | Confidence in estimation of block grades: block grades correlate reasonably well with composite data, statistically and spatially, locally, and globally. |
| ● | Infill drilling: more drilling is required to determine continuity of mineralization in areas of wide drill spacing in order to upgrade Inferred Resources to Indicated. |
130
Figure 1123, Figure 1124, and Figure 1125 show histogram validations of the classification based on the average distance of each block to the samples used for estimation of each Resource category: Green (value 1) show Measured Resources, Blue (value 2) shows Indicated Resources and Red (value 3) shows Indicated Resources.
Figure 1126, Figure 1127, and Figure 1128 show a plan view of the final model classification for Arista, Switchback and Alta Gracia models, respectively, using the same color and value criteria.
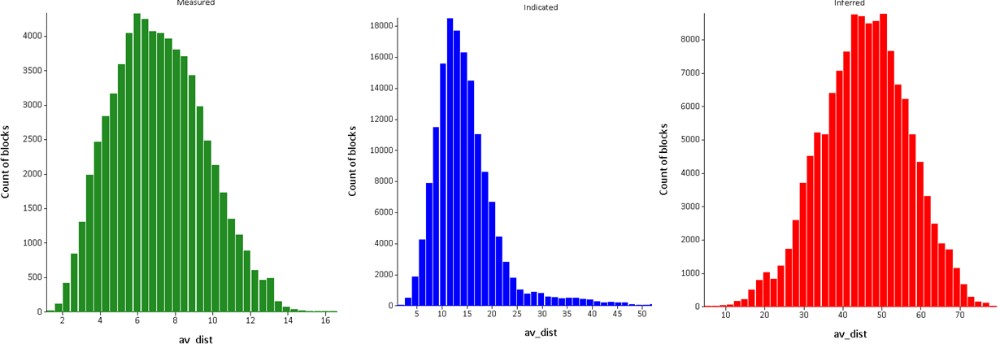
Figure 11-23: Validation of Classification Arista.
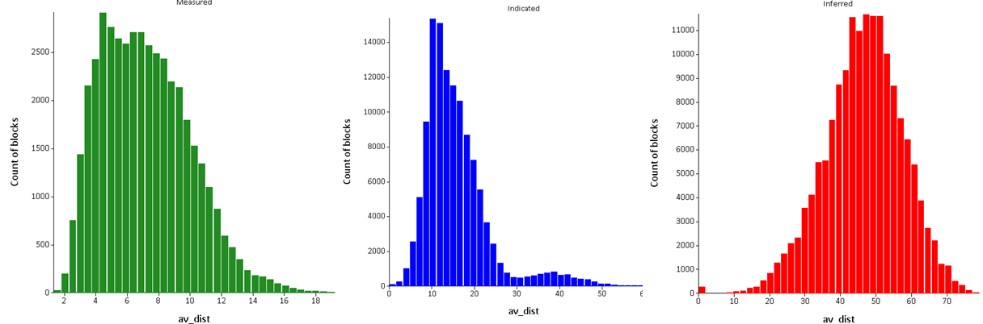
Figure 11-24: Validation of Classification Switchback.
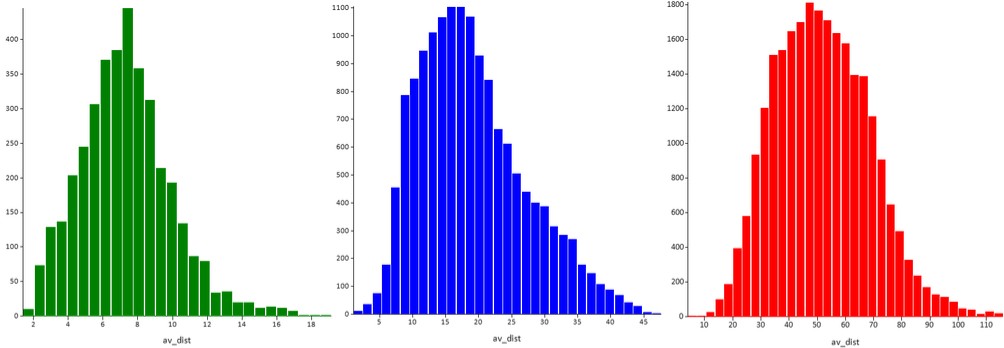
131
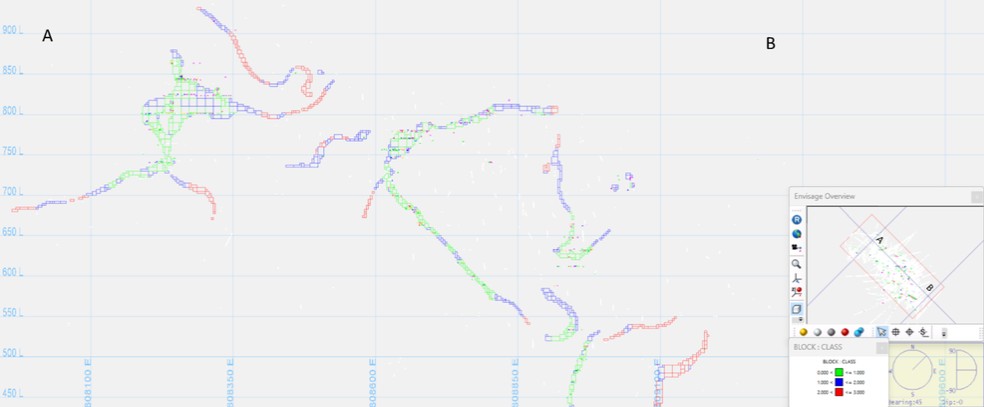
Figure 11-26: Arista vertical cross section view showing the final model classification.
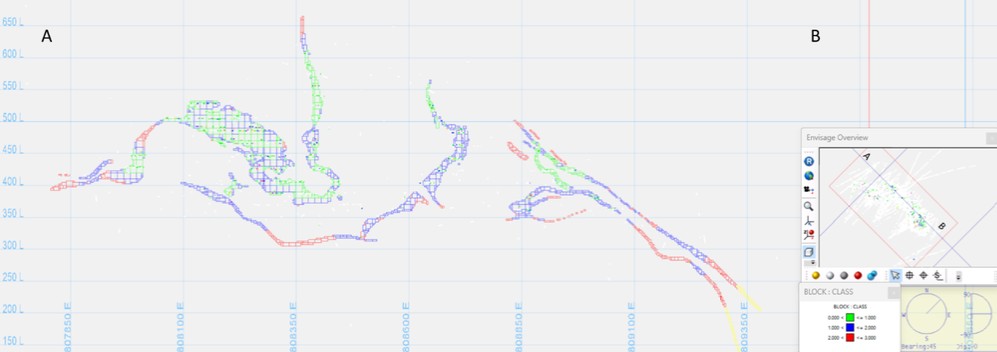
Figure 11-27: Switchback Arista vertical cross section view showing the final model classification.
132
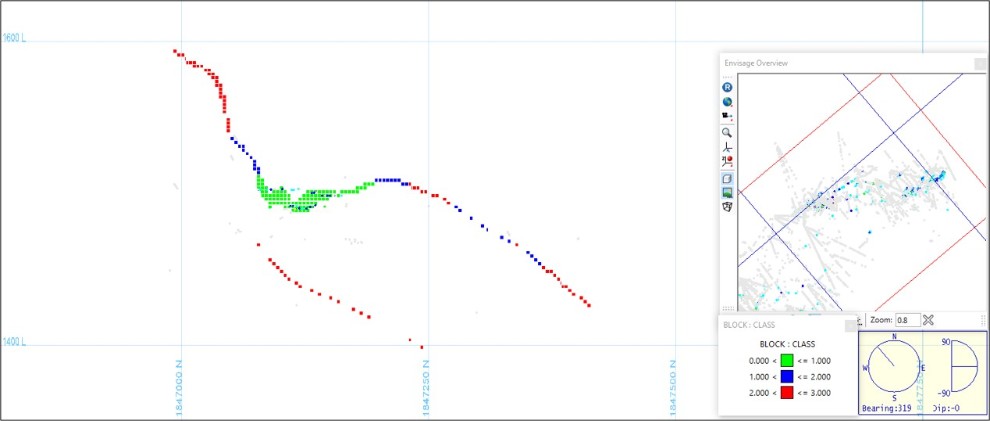
Figure 11-28: Alta Gracia vertical cross section view showing the final model classification.
The classification is considered appropriate for the style of mineralization and information available, however, it is recommended monitoring the production data to ensure that the selected drill spacing is appropriate to support detailed mine planning, especially in narrow veins, as these domains show less grade and geological continuity than the wider veins.
The definitions for Mineral Resources used in this report have been classified in accordance with the definitions for Mineral Resources in subpart 1300 of SEC Regulation S-K, which are consistent with Canadian Institute of Mining, Metallurgy and Petroleum (CIM) Definition Standards for Mineral Resources and Mineral Reserves dated May 10, 2014 (CIM (2014) definitions).
The Mineral Resources for the Arista mine underground operation (Arista and Switchback vein systems) and for Alta Gracia mine as of December 31, 2023, exclusive of Mineral Reserves, are summarized respectively. Following the depletion of Mineral Reserves at the Arista mine, the reporting of Mineral Resources involves incorporating all remaining material constrained within resource shapes generated in Deswik software. This includes adherence to minimum mining size, mineralization continuity criteria, and application of an NSR cut-off value of US$100/t. In the case of Alta Gracia mine, the Mineral Resource is reported constrained only by a AuEq cut-off grade of 2.35 g/t (Figure 1129). Measured and Indicated Mineral Resources that are not Mineral Reserves do not have demonstrated economic viability. Arista and Alta Gracia Mineral Resources are in compliance with the S-K 1300 resource definition requirement of “reasonable prospects for economic extraction”.
Also, wireframe models for the underground mining completed at Arista and Alta Gracia as of December 31, 2023 were prepared to remove the portions of the mineralized zones that had been mined out before the resource and reserve stopes were generated.
The sub-blocking functions of the Deswik software package were employed to maximize the accuracy of the mined-out limits.
DDGM also generated solids for non-recoverable areas (“not possible” or “condemned” solids) due to poor ground conditions and inaccessibility, to remove these zones from the Mineral Resources and Mineral Reserves. AMBA recommends documenting all the data support to define non-recoverable solids and document any changes to these solids.
In the AMBA QP’s opinion, the assumptions, parameters, and methodology used for the Arista and Alta Gracia Mineral Resource estimates are appropriate for the style of mineralization and mining methods.
The AMBA QP is of the opinion that, with consideration of the recommendations summarized in Section 1 and Section 23, any issues relating to all relevant technical and economic factors likely to influence the prospect of economic extraction can be resolved with further work.
133
134
11.5.1. Mineral Resource Estimate Sensitivity
The sensitivity of the mineral resources inventory to changes in cutoff grade was also examined by summarizing tonnes and NSR value at varying NSR cutoff values for Resources exclusive of Mineral Reserves for each vein system separately.
Table 11-16: Grade and tonnages at incremental cutoff grades for Arista.
Arista Measured + Indicated |
Arista Inferred |
|||||
Cutoff |
NSR $/t |
KTonnes |
Cutoff |
NSR $/t |
KTonnes |
|
0 |
199.42 |
326 |
0 |
185.18 |
660 |
|
10 |
199.48 |
326 |
10 |
185.52 |
659 |
|
20 |
199.69 |
326 |
20 |
185.54 |
659 |
|
30 |
199.98 |
325 |
30 |
186.12 |
657 |
|
40 |
200.23 |
325 |
40 |
186.84 |
654 |
|
50 |
200.54 |
324 |
50 |
187.57 |
650 |
|
60 |
201.01 |
323 |
60 |
188.92 |
644 |
|
70 |
202.18 |
320 |
70 |
190.36 |
636 |
|
80 |
204.26 |
315 |
80 |
192.15 |
627 |
|
90 |
207.22 |
307 |
90 |
194.41 |
614 |
|
100 |
210.6 |
298 |
100 |
198.96 |
587 |
|
110 |
215.46 |
285 |
110 |
206.31 |
544 |
|
120 |
222.63 |
266 |
120 |
218.41 |
480 |
|
130 |
231.26 |
245 |
130 |
229.5 |
430 |
|
140 |
241.32 |
221 |
140 |
242.31 |
378 |
|
150 |
253.06 |
197 |
150 |
257.61 |
327 |
|
135
Table 11-17: Grade and tonnages at incremental cutoff grades for Switchback
Switchback Measured + Indicated |
Switchback Inferred |
|||||
Cutoff |
NSR $/t |
KTonnes |
Cutoff |
NSR $/t |
KTonnes |
|
0 |
172.02 |
231 |
0 |
183.48 |
564 |
|
10 |
172.03 |
231 |
10 |
183.93 |
562 |
|
20 |
172.21 |
231 |
20 |
183.99 |
562 |
|
30 |
172.63 |
230 |
30 |
184.2 |
561 |
|
40 |
173.04 |
229 |
40 |
184.64 |
560 |
|
50 |
173.79 |
228 |
50 |
185.23 |
557 |
|
60 |
174.75 |
226 |
60 |
187.46 |
548 |
|
70 |
176.31 |
223 |
70 |
190.87 |
533 |
|
80 |
179.26 |
217 |
80 |
193.82 |
520 |
|
90 |
183.18 |
208 |
90 |
197.69 |
502 |
|
100 |
187.37 |
198 |
100 |
201.79 |
483 |
|
110 |
192.33 |
187 |
110 |
206.48 |
460 |
|
120 |
198.46 |
173 |
120 |
212 |
434 |
|
130 |
205.24 |
159 |
130 |
219.07 |
401 |
|
140 |
212.86 |
143 |
140 |
228.21 |
362 |
|
150 |
221.13 |
128 |
150 |
236.93 |
328 |
|
137
Table 11-18: Grade and tonnages at incremental cutoff grades for Alta Gracia.
Alta Gracia Measured + Indicated |
Alta Gracia Inferred |
||||||
Cutoff |
au_eqv |
KTonnes |
|
Cutoff |
au_eqv |
KTonnes |
|
0 |
2.96 |
260 |
0 |
2.63 |
329 |
||
0.25 |
3.15 |
243 |
0.25 |
3.01 |
286 |
||
0.5 |
3.28 |
233 |
0.5 |
3.12 |
275 |
||
0.75 |
3.45 |
219 |
0.75 |
3.28 |
258 |
||
1 |
3.64 |
203 |
1 |
3.51 |
236 |
||
1.25 |
3.89 |
185 |
1.25 |
3.76 |
213 |
||
1.5 |
4.17 |
166 |
1.5 |
3.91 |
200 |
||
1.75 |
4.45 |
150 |
1.75 |
4.13 |
183 |
||
2 |
4.78 |
133 |
2 |
4.44 |
161 |
||
2.25 |
5.08 |
119 |
2.25 |
4.57 |
152 |
||
2.5 |
5.37 |
108 |
2.5 |
4.73 |
142 |
||
2.75 |
5.67 |
97 |
2.75 |
4.93 |
130 |
||
3 |
5.95 |
88 |
3 |
5.09 |
120 |
||
3.25 |
6.22 |
81 |
3.25 |
5.27 |
110 |
||
3.5 |
6.48 |
74 |
3.5 |
5.41 |
103 |
||
3.75 |
6.74 |
68 |
3.75 |
5.58 |
94 |
||
4 |
7.01 |
62 |
4 |
5.82 |
83 |
||
4.25 |
7.3 |
56 |
4.25 |
6.17 |
68 |
||
4.5 |
7.61 |
51 |
4.5 |
6.5 |
58 |
||
4.75 |
7.89 |
47 |
4.75 |
6.72 |
52 |
||
5 |
8.21 |
42 |
5 |
6.98 |
45 |
||
139
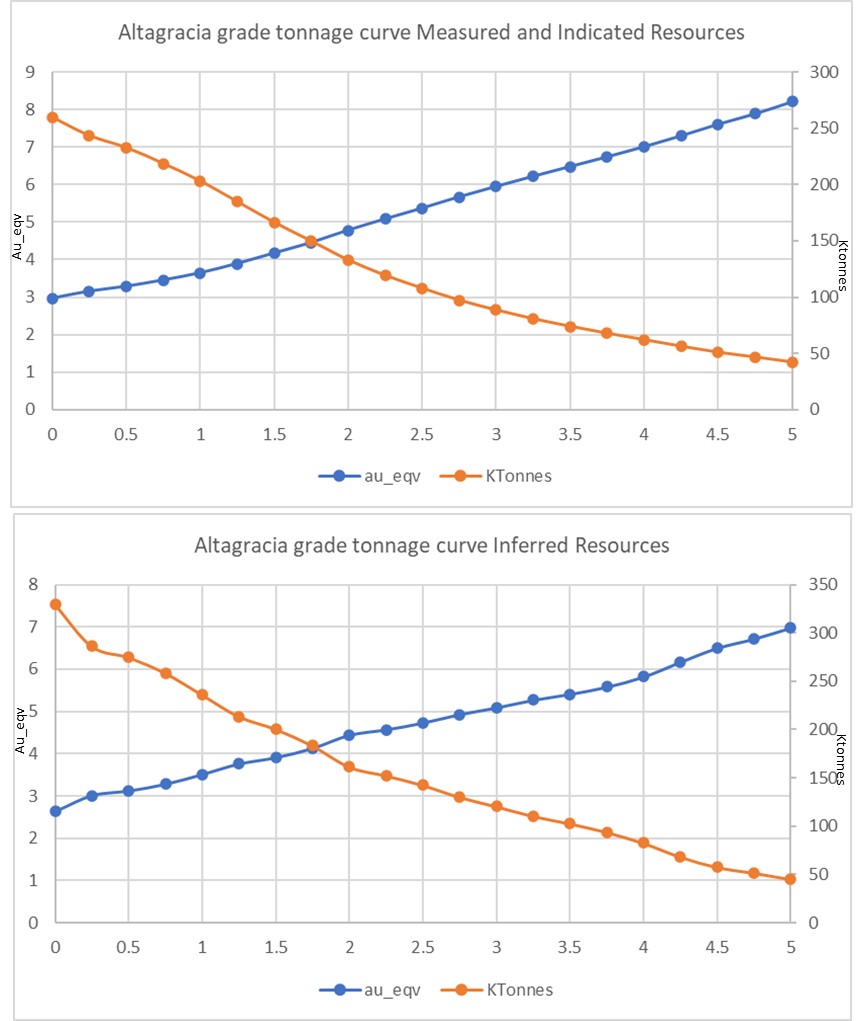
Figure 11-32: Grade tonnage curves for Alta Gracia.
11.5.2. Comparison to Previous Mineral Resource Estimates
A comparison of the December 31, 2023 Mineral Resource estimate, exclusive of Mineral Reserves, to the previous December 31, 2022 Mineral Resource estimate is presented for Arista mine and Alta Gracia, in Table 1119 and Table 1120, and Figure 1133 and Figure 1134, respectively. The differences are primarily due to the following changes:
| ● | Metal price and exchange rate assumptions |
140
| ● | Higher NSR cutoff value. |
| ● | Addition by exploration and conversion to Reserves. |
| ● | Changes in local interpretations of mineralization geometry and continuity of mineralized zones. |
| ● | Use of more restrictive parameters for creation of resource shapes, similar to ones used for reserves, with a $100/t NSR cut-off (DSOs). |
| ● | The downgrade of previous Alta Gracia reserves to resources. |
Table 11-19: Comparison of 12/31/2022 Versus 12/31/2023 Arista Mine Mineral Resources.
2022 YE Arista M+I Resources |
Kt |
1,499 |
Conversion and addition |
Kt |
1,093 |
Engineering (DSO) |
Kt |
-1,444 |
Cut-off |
Kt |
-591 |
2023 YE Arista M+I Resources |
Kt |
557 |
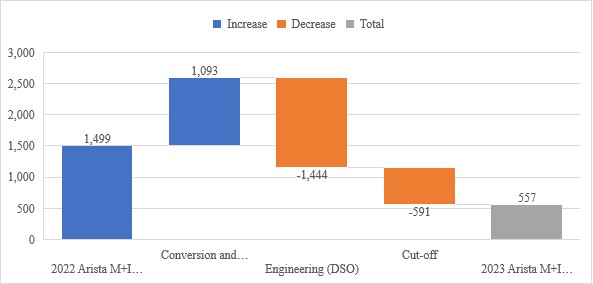
Figure 11-33: Comparison of 12/31/2022 to 12/31/2023 Arista Mineral Resources.
Table 11-20: Comparison of 12/31/2022 Versus 12/31/2023 Arista Mine Inferred Mineral Resources.
2022 YE Arista M+I Resources |
Kt |
1,916 |
Conversion and addition |
Kt |
1,606 |
Engineering (DSO) |
Kt |
-697 |
Cut-off |
Kt |
-919 |
2023 YE Arista M+I Resources |
Kt |
1,906 |
141
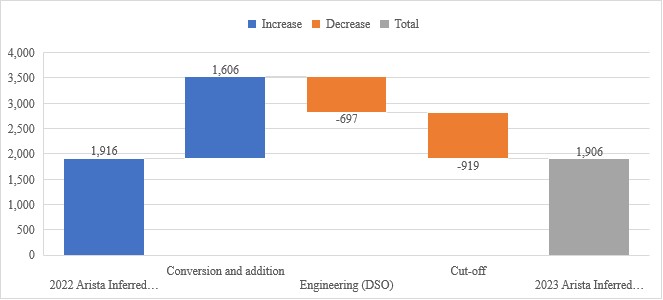
Figure 11-34: Comparison of 12/31/2022 to 12/31/2023 Arista Inferred Mineral Resources
Table 11-21: Comparison of 12/31/2022 Versus 12/31/2023 Alta Gracia Mineral Resources.
2022 Alta Gracia M+I Resources |
tonnes |
114,000 |
Reserves downgraded to Resource |
tonnes |
54,000 |
2023 Alta Gracia M+I Resources |
tonnes |
168,000 |
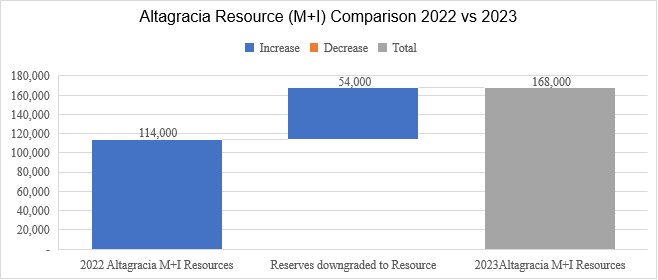
Figure 11-35: Comparison of 12/31/2021 to 12/31/2022 Alta Gracia Mineral Resources.
142
11.5.3. Risk Factors
Relevant factors which may affect the estimation of mineral resources include changes to the geological, geotechnical, and geo-metallurgical models, infill drilling to convert material to a higher classification, drilling to test for extensions to known mineral resources, collection of additional bulk density data and significant changes to commodity prices. It should be noted that these and other factors pose potential risks and opportunities, of greater or lesser degree to the estimate, since the model is based on currently available data. Risks associated with key estimation parameters include the following:
| ● | Survey errors associated with channel samples may locate some assay results outside the modeled vein structures |
| ● | Complex structural geology can make it difficult to assign high-grade drill hole samples to the correct vein |
| ● | High variance in on-site assay results may artificially bias local estimates |
| ● | Lack of a robust reconciliation program implemented at the mine makes comparison of estimated grades and tonnages to the actuals difficult |
The QP responsible for this Section 11 of this Technical Report considers that:
| ● | Protocols for drilling, sampling preparation and analysis, verification, and security meet industry standard practices and are appropriate for the purposes of a Mineral Resource estimate. |
| ● | The QAQC program as designed and implemented by DDGM is adequate, with no significant bias, to support the resource database. The resource database was verified by AMBA and is suitable for Mineral Resource estimation. |
| ● | The geological models are reasonably constructed using available geological information and are appropriate for Mineral Resource estimation. |
| ● | The assumptions, parameters, and methodology used for the Mineral Resource estimate are appropriate for the style of mineralization and proposed mining methods. |
143
A Mineral Reserve is the economically mineable part of a Measured or Indicated Mineral Resource. It includes diluting materials and allowances for losses which may occur when the material is mined. Appropriate assessments have been carried out and include consideration of and modification by realistically assumed mining, metallurgical, economic, marketing, legal, environmental, social, and governmental factors. These assessments demonstrate at the time of reporting that extraction is reasonably justified. Mineral Reserves are subdivided in order of increasing confidence into Probable Mineral Reserves and Proven Mineral Reserves.
Upon receipt of the block model, a review was conducted to confirm the Mineral Resource was reported correctly and to validate the various fields in the model.
A breakeven NSR cutoff grade of $120/t was used for estimations of Proven and Probable reserves at the Arista Underground Mine. The term “cutoff grade” means the lowest NSR value considered economic to process.
In 2023, the reserves at the Mirador Underground Mine were converted back into resources due to higher cutoff grade applied and the lack of geological and engineering work undertaken in the past 4 years. Production from the Mirador Mine was temporarily halted in June 2020, as such, an updated economic assessment is required in order to properly classify Reserves.
The Mineral Reserve estimate for the Arista Underground Mine is based on technical data and information available as of December 31, 2023, mainly using results of underground chip channel and drill hole sampling, available as of October 15, 2023. The current Mineral Reserve estimate was prepared by the QPs described in Section 2 with contributions provided by DDGM project technical staff.
12.2Mineral Reserve Confidence
Reserve classification considers several aspects affecting confidence in reserve estimations, such as:
| ● | Geological continuity (including geological understanding and complexity) |
| ● | Data density and orientation |
| ● | Data accuracy and precision |
| ● | Grade continuity (including spatial continuity of mineralization) |
There is substantial information to support a good understanding of the geological continuity of the primary veins at the Arista Underground Mine. Development and exploration drilling have defined the geological continuity along strike and up and down dip of the primary veins currently in production, mainly the Soledad and Selene veins at Switchback and the Baja and Splay 5 veins in the Arista vein system.
Confidence in the geological continuity of secondary veins and splays is lower as there tend to be fewer intercepts. The uncertainty in the geology of the secondary veins has been considered during Mineral Reserve classification.
Understanding of the vein systems has been greatly increased by the presence of extensive underground workings allowing detailed mapping of the geology.
Underground observations have increased the ability to accurately model the mineralization. The proximity of Mineral Reserves to underground workings has been considered during Mineral Reserve classification.
12.3Reserve Estimation Methodology
The following describes DDGM’s Mineral Reserve estimation methodology conducted during December 2023 based on Mineral Resource block models created as of November 30, 2023. Reserves reported reflect mining depletion as of December 31, 2023. The Mineral Reserve estimation was performed in Deswik software.
The Mineral Reserve estimation process for the Arista Underground Mine first involves a review of Mineral Resource block models created from the 3D vein wire-framed solids. The NSR values are calculated for each block and used as a reference for the mine design.
144
The Block Model is prepared to be used for the reserve definition process. Other than a statistical check and a review in the tons and grade curve, the main changes are the overwriting of all grades to zero for Inferred blocks (CLASS = 3) and the subsequent calculation of NSR for each block.
The design and evaluation of stopes solids are currently done in Deswik Software utilizing the Deswik Stope Optimizer (DSO). The block model filtered to blocks above the COG is used as a reference for the stope design. The stope parameters are summarized in Table 121.
Description |
Value |
Minimum Stope width (m) |
1.5 |
Maximum Stope width (m) |
15 |
Stope along Strike (m) |
15 |
Minimum Hanging wall and Footwall angle |
60 |
The DSO creates stopes that respects the design parameters listed in the table above and also the NSR COG value. Using the stope design as reference, the development design is added. The mine design for Arista Mine is shown Figure 121 and Figure 122.
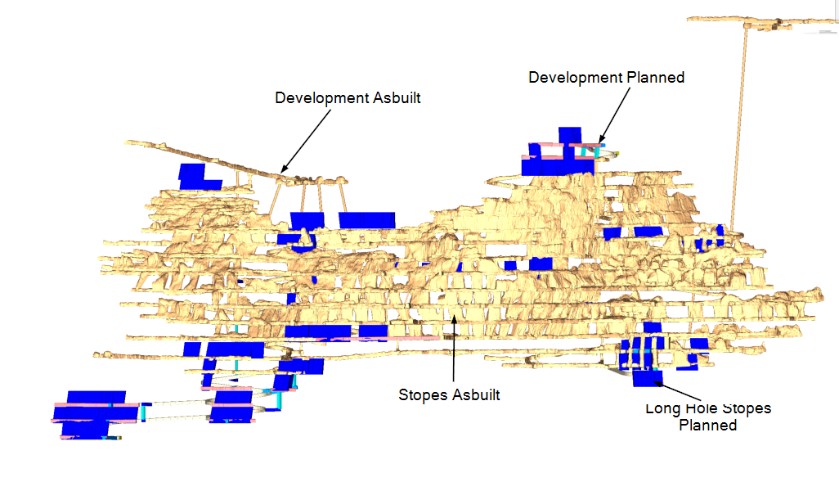
145
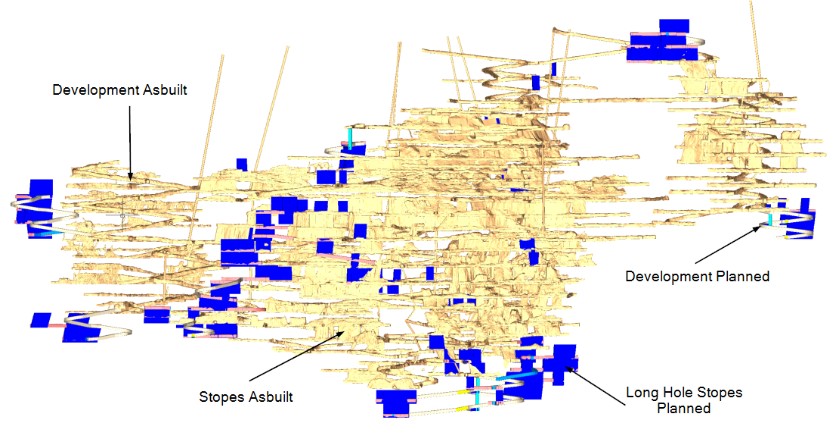
Figure 12-2: Arista Mine Design – Arista Deposit.
DDGM uses available information upon which to estimate actual dilution in the development headings, stopes, and transport system. Dilution is a function of many factors including workmanship, heading design, vein width, mining method, extraction, and transport. Misclassification of economic material and waste by mine operations personnel due to a variety of factors also contributes to variations in dilution.
DDGM uses different dilution and mining recovery factors depending on the underground mining method employed. Dilution and minimum mining width assumptions are made for tonnes and grades based on factors estimated by DDGM’s geology and mine planning departments. Three sources of dilution are usually considered: internal (planned), external (unplanned) and loading (mucking) dilution. Figure 123 illustrates the basic components of the applied dilution in an underground mine (loading dilution not shown on this illustration).
During the mine design, the material that is outside of the economic limits is incorporated as applied dilution. Waste material is considered to contain no mineralization, with gold, silver and base metal grades set at a zero value.
In the Long Hole Stopes, the external dilution was applied in DSO as Equivalent Linear Overbreak Slough (ELOS) in both Hangwall and Footwall. The ELOS value is based on historical data observed on site. Back fill is considered to contain no mineralization with gold, silver and base metal grades set at a zero value. Table 122 summarizes the external dilution factors used in the design criteria.
Table 12-2: External Mine Dilution.
Description |
Value |
Long Hole Hanging wall ELOS (m) |
1.5 |
Long Hole Footwall ELOS (m) |
0.5 |
Development Overbreak (%) |
7 |
146
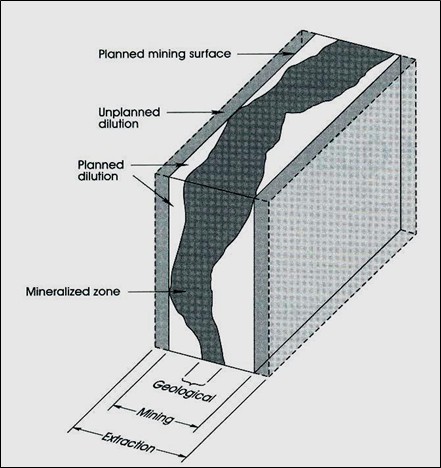
Figure 12-3: Conceptual Model Illustrating the Basic Contributing Components of the Applied Dilution in an Underground Mine.
DDGM uses available information upon which to estimate actual mining recovery in the development headings, stopes, and transport system. Mining recoveries are functions of many factors including workmanship, heading design, vein width, mining method, extraction, and transport. Misclassification of economic material and waste by mine operations personnel due to a variety of factors also contributes to variations in mining recovery.
Mine recovery factor estimation is based on the mine design and whether pillars are required in ore blocks for ground support, and ore recovery inefficiencies due to losses in stopes that can occur from inefficient drilling and blasting and remote-control mucking resulting in ore being left behind in stopes. Overall mining recoveries are estimated at 90% for LHOS.
In order to represent the base metal contribution, DDGM uses an economic breakeven NSR cutoff grade for Mineral Resources and Mineral Reserves estimations.
The NSR cutoff grade calculation considers:
| ● | Direct mining, |
| ● | Milling, and |
| ● | Overhead costs. |
The NSR calculation considers:
147
| ● | Metal prices as per the Resource and Reserve Price Deck, |
| ● | Plant recoveries, |
| ● | Treatment charges, |
| ● | Smelting and refining costs, |
| ● | Metal price participation and penalties by the smelters, and |
| ● | Royalties to private royalty holders. |
Plant recoveries used are the average of actual recoveries reported by the plant during the twelve months of 2023. Current dore and concentrate contracts outlined in Section 16 were used to determine treatment charges, smelting and refining costs, metal price participation and penalties. The breakeven NSR cutoff grade is determined by the actual unit costs for the Don David Mine for the twelve-month period from January through December 2023. Cost improvement initiatives related to headcount reductions, improvements to maintenance planning and other efficiency opportunities identified throughout the operations.
Table 12-3: Mine Site Cash Operating Costs Used for Breakeven NSR Cutoff Grade Calculations.
Description |
Value $ per tonne milled |
Mining |
62 |
Plant |
33 |
Overheads |
25 |
Total Mine Site Operating Cash Cost |
120 |
The NSR breakeven cutoff calculation excludes exploration, sustaining capital, capital development, indirect, or one-off, costs such as insurance, community agreements and one-off studies and taxes, furthermore the calculations of breakeven cutoff grade contain no profit assumptions (hence the “breakeven” designation). These expenditures have been included in the economic analysis in Section 19. Of note, an exchange rate of 17 Mexican Pesos (“MXP”) exchange rate to 1 U.S. dollar is applied to peso-denominated costs.
A sensitivity analysis of the NSR breakeven cutoff grade calculation was performed, considering a 25% increase from the $120 per tonne milled and therefore resulting in a $150 per tonne milled sensitivity value. The calculated NSR breakeven cutoff grade calculation using $150 per tonne milled would result in lowered Mineral Reserves of 400,054 tonnes.
Parameters used for estimation of the NSR value are in Table 124. The NSR multiplier values calculated for each product which takes into consideration the commercial terms for 2023 are detailed in Table 125. For each reserve block, gold, silver, copper, lead and zinc grades are multiplied by their respective NSR multiplier value and then summed together to determine the total NSR value for the block. If the total NSR value (diluted) is above the breakeven NSR cutoff grade of $120/t, then the reserve block is further evaluated for economic extraction.
148
Table 12-4: Parameters Used for Breakeven NSR Cutoff Grade Calculations.
ITEM |
UNIT |
VALUE |
UNIT |
VALUE |
SOURCE / COMMENTS |
|
Metal Prices | ||||||
Copper |
$/lb |
3.90 |
$/t |
8,598 |
See Section 16.4 |
|
Zinc |
$/lb |
1.25 |
$/t |
2,756 |
See Section 16.4 |
|
Lead |
$/lb |
0.95 |
$/t |
2,094 |
See Section 16.4 |
|
Silver |
$/oz |
23.30 |
$/g |
0.75 |
See Section 16.4 |
|
Gold |
$/oz |
1,800 |
$/g |
57.88 |
See Section 16.4 |
|
Item |
Unit |
Cu |
Zn |
Pb |
Knelson |
Source / Comments |
Concentrate |
Concentrate |
Concentrate |
Concentrate |
|||
Flotation Recovery | ||||||
Ag |
% |
53.0% |
5.6% |
32.0% |
0.3% |
2023 Met Balance FINAL |
Au |
% |
50.7% |
9.0% |
15.6% |
3.2% |
2023 Met Balance FINAL |
Cu |
% |
77.0% |
5.2% |
10.6% |
0.1% |
2023 Met Balance FINAL |
Pb |
% |
14.5% |
5.2% |
73.4% |
0.5% |
2023 Met Balance FINAL |
Zn |
% |
1.4% |
83.9% |
6.5% |
0.1% |
2023 Met Balance FINAL |
Concentrate Grade | ||||||
Ag |
g/t |
3,458 |
80.8 |
1,082.2 |
434.7 |
2023 Met Balance FINAL |
Au |
g/t |
69.4 |
2.7 |
11.1 |
105.7 |
2023 Met Balance FINAL |
Cu |
% |
20.8 |
0.3 |
1.5 |
0.4 |
2023 Met Balance FINAL |
Pb |
% |
17.1 |
1.3 |
44.8 |
13.7 |
2023 Met Balance FINAL |
Zn |
% |
3.7 |
50.3 |
9.2 |
5.6 |
2023 Met Balance FINAL |
Moisture content | ||||||
% |
6.30% |
9.90% |
7.10% |
0% |
2022 Metal Sales |
|
Smelter Payables | ||||||
Ag payable |
% |
97.0% |
70% |
95% |
99.25% |
2023 contract terms |
Au payable |
% |
97.50% |
70% |
95% |
99.93% |
2023 contract terms |
Cu payable |
% |
96.50% |
|
|
|
2023 contract terms |
Pb payable |
% |
|
|
95% |
|
2023 contract terms |
Zn payable |
% |
|
85% |
10% |
|
2023 contract terms |
Minimum Deductions | ||||||
Ag |
g/t in conc |
93.3 |
50 |
2023 contract terms |
||
Au |
g/t in conc |
1 |
1 |
2023 contract terms |
||
Cu |
% dry net weight of con |
1% |
2023 contract terms |
|||
Pb |
% dry net weight of con |
3% |
2023 contract terms |
|||
Zn |
% dry net weight of con |
8% |
8% |
2023 contract terms |
||
149
Treatment Charges/Refining Charges | ||||||
Base Treatment Charge |
$/dmt conc or oz metal received |
205 |
282.5 |
58.0 |
0.75 |
2023 contract terms |
Ag |
$/pay oz |
0.80 |
0.55 |
2023 contract terms |
||
Au |
$/pay oz |
8.0 |
15.0 |
1.00 |
2023 contract terms |
|
Cu |
$/lb |
0.205 |
2023 contract terms |
|||
Pb |
$/lb |
2023 contract terms |
||||
Zn |
$/lb |
2023 contract terms |
||||
Deleterious Element Penalties | ||||||
2023 Conc Produced |
dmt conc |
|
||||
Se penalty |
$/dmt conc |
2023 actual & contract |
||||
Pb+Zn penalty |
$/dmt conc |
33.75 |
2023 actual & contract |
|||
Bi Penalty |
|
0.0 |
2023 actual & contract |
|||
Sb Penalty |
|
28.5 |
2023 actual & contract |
|||
As Penalty |
$/dmt conc |
3.00 |
2023 actual & contract |
|||
Hg + Se Penalty |
$/dmt conc |
2023 actual & contract |
||||
SiO2 Penalty |
$/dmt conc |
2.33 |
2023 actual & contract |
|||
Cd Penalty |
$/dmt conc |
2.25 |
2023 actual & contract |
|||
Weight Franchise Fee |
$/dmt conc |
12.23 |
|
2.38 |
|
|
F + CL Penalty |
$/dmt conc |
2023 actual & contract |
||||
Total Penalty Unit Cost |
$/dmt conc |
77.48 |
4.58 |
2.38 |
2023 actual & contract |
|
Transport Costs | ||||||
Transport to smelter |
$/wmt |
180.0 |
191.0 |
180.0 |
Contract costs $3,124 & 3,305 MXN |
|
Doré fixed transport fee |
$/bar |
3361.62 |
ASAHI contract |
|||
Table 12-5: NSR Multiplier Values used for Breakeven Cutoff Grade Calculations.
Metal (Units) |
NSR Multiplier |
Gold ($ /g) |
34.9 |
Silver ($ /g) |
0.53 |
Copper ($ /%) |
53.5 |
Lead ($ /%) |
12.5 |
Zinc ($ /%) |
11.0 |
The mineral reserve estimate for the Don David Gold Mine is presented in Table 126. These Mineral Reserves are contained in the Measured and Indicated Mineral Resources estimated for the deposit.
As of December 31, 2023, Mineral Reserves for the Arista Underground Mine totaled 1,063,000 tonnes grading 1.3 g/t Au, 131 g/t Ag, 0.3 % Cu, 0.9 % Pb and 2.7 % Zn. Contained ounces of Proven and Probable reserves totaled approximately 44,000 gold ounces and 4,500,000 silver ounces.
Proven and Probable reserves for the Arista Mine as of December 31, 2023 is summarized in Table 126.
150
Table 12-6: Don David Gold Mine – Summary of Gold, Silver and Base Metal Mineral Reserves at December 31, 2023.
Description |
Amount |
Grades |
Cutoff Grade |
Metallurgical Recovery (%) |
||||||||||||||||
Arista |
KTonne |
Au (g/t) |
Ag (g/t) |
Cu (%) |
Pb (%) |
Zn (%) |
$/tonne |
Au |
Ag |
Cu |
Pb |
Zn |
||||||||
Proven Mineral Reserves |
90 |
2.9 |
176 |
0.5 |
1.6 |
5.0 |
120 |
79.5 |
91.1 |
76.6 |
73.9 |
83.9 |
||||||||
Probable Mineral Reserves |
973 |
1.1 |
126 |
0.2 |
0.8 |
2.5 |
120 |
79.5 |
91.1 |
76.6 |
73.9 |
83.9 |
||||||||
Arista Mine Total |
1,063 |
1.3 |
131 |
0.3 |
0.9 |
2.7 |
|
|
|
|
|
|||||||||
Notes on Mineral Reserves in Tables 12.6:
1. Metal prices used for P & P reserves were $1,800 per ounce of gold, $23.3 per ounce of silver, $3.90 per pound of copper, $0.95 per pound of lead and $1.25 per pound of zinc. See Section 1.9 for a discussion of metal prices used.
2. A breakeven NSR cutoff grade of $120/t was used for estimations of P & P reserves at the Arista Underground Mine. The term “cutoff grade” means the lowest NSR value considered economic to process.
3. Mining, processing, and overheads were based on 2023 actual costs for the Don David Gold Mine and consider cost improvements made in the fourth quarter of 2023.
4. P & P reserves are diluted and factored for expected mining recovery.
5. An exchange rate of 17 Mexican Pesos (“MXP”) to 1 U.S. dollar is applied to peso-denominated costs
6. Rounding of tonnes, average grades, and contained ounces may result in apparent discrepancies with total rounded tonnes, average grades, and total contained ounces.
Factors that may affect the estimates include:
| ● | Metal price and exchange rate assumptions |
| ● | Assumptions used to generate the cutoff grade |
| ● | Changes in local interpretations of mineralization geometry and continuity of mineralized zones |
| ● | Changes to geological and mineralization shape and geological and grade continuity assumptions |
| ● | Changes to geotechnical, mining, dilution, and metallurgical recovery assumptions |
| ● | Assumptions as to the continued ability to access the site, retain mineral and surface rights titles, maintain environment and other regulatory permits, and maintain the social license to operate. |
To the best of the QP’s knowledge, there are no other known environment, legal, title, taxation, socioeconomic, marketing, political or other relevant factors that would materially affect the estimation of Mineral Reserves that are not discussed in this Report.
A comparison between the December 2022 and December 2023 Mineral Reserves inventory was performed, and the results are presented in Figure 124 and Figure 125. The previous year Mineral Reserves are presented in Table 127 and the current Mineral Reserve is presented in Table 126. For Arista Mine, at 12/31/2022, the total reserves amounted to 1.35 million tonnes, during 2023 458 thousand tonnes were depleted due to production, approximate 726,000 tonnes were added from the conversion of resources to reserves and approximate 561,000 tonnes were removed from the change of cutoff value. The final comparison shows that 2023 total reserves is approximate 294,000 tonnes lower than the 2022 total reserves. Alta Gracia Mineral Reserves were moved back to the resource category.
151
Table 12-7: Don David Gold Mine – Summary of Gold, Silver and Base Metal Mineral Reserves at December 31, 2022.
Description |
Amount |
Grades |
Cutoff Grade |
Metallurgical Recovery (%) |
||||||||
Arista |
KTonne |
Au (g/t) |
Ag (g/t) |
Cu (%) |
Pb (%) |
Zn (%) |
$/tonne |
Au |
Ag |
Cu |
Pb |
Zn |
Proven Mineral Reserves |
237 |
2.3 |
146 |
0.4 |
1.6 |
4.1 |
80 |
81.6 |
90.8 |
71.2 |
70.4 |
84.2 |
Probable Mineral Reserves |
1,120 |
0.9 |
83 |
0.2 |
0.8 |
2.8 |
80 |
81.6 |
90.8 |
81.2 |
70.4 |
84.2 |
Arista Mine Total |
1,357 |
1.2 |
94 |
0.3 |
1.0 |
3.0 |
|
|
|
|
|
|
Alta Gracia |
KTonne |
Au (g/t) |
Ag (g/t) |
Cu (%) |
Pb (%) |
Zn (%) |
AuEq/tonne |
Au |
Au |
Cu |
Pb |
Zn |
Proven Mineral Reserves |
3 |
0.85 |
392 |
- |
- |
- |
2.36 |
85.0 |
72.0 |
- |
- |
- |
Probable Mineral Reserves |
51 |
0.27 |
169 |
- |
- |
- |
2.36 |
85.0 |
72.0 |
- |
- |
- |
Mirador Mine Total |
54 |
0.30 |
181 |
- |
- |
- |
|
|
||||
Don David Mine Total |
1,538 |
1.51 |
72.77 |
|
|
|
|
|
|
|||
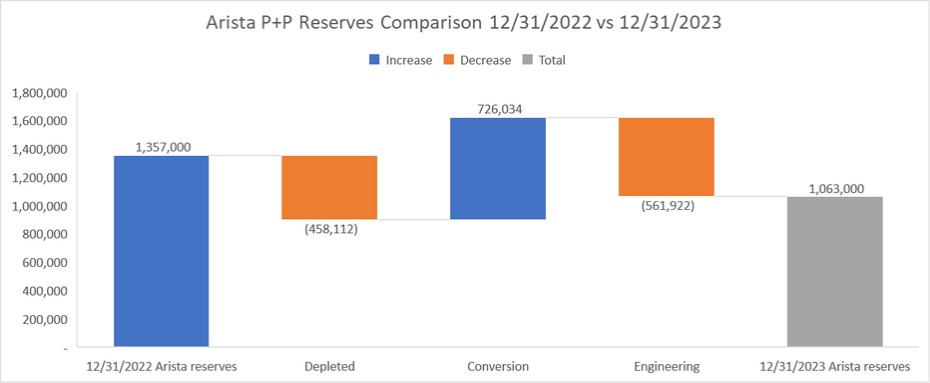
152
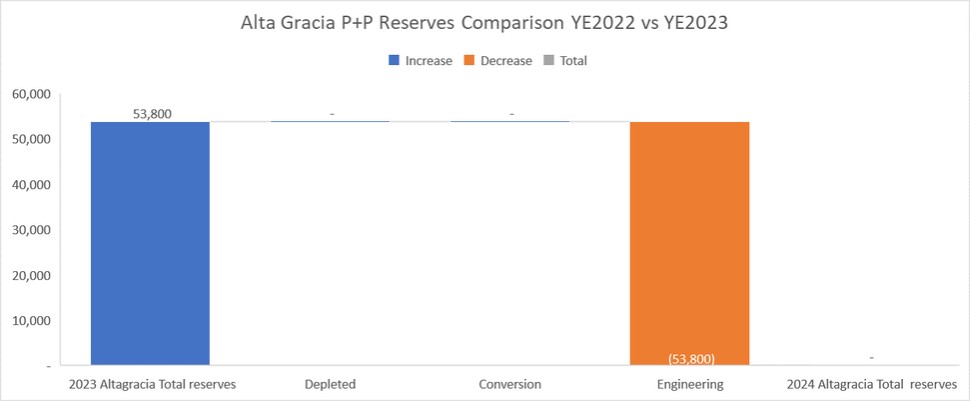
Figure 12-5: Alta Gracia Mine Reserves Comparison
12.10Production Reconciliation
Production reconciliation is the process of comparing, balancing and adjusting production estimates between mine and plant for consistency in reporting. Reserve models are also used for short and long-term mine planning, mining selectivity, dilution, losses and ore allocation records, stockpile records, plant feed records and production results. A comparison can then be made of what is planned versus what is actually mined. GRC currently maintains records of reserves, mine production and plant processing for tonnage and grade reconciliation.
12.11Opinion of the Qualified Person
In the opinion of the QP responsible for this Section 12 of this Technical Report, Mineral Reserves are reported appropriately with the application of reasonable mining recovery and dilution factors based on operational observations and a transparent breakeven NSR cutoff grade based on actual mining, processing and smelting costs; actual metallurgical recoveries achieved in the plant; and reasonable metal prices.
The QP responsible for Section 12 of this Technical Report is of the opinion that the Proven and Probable Mineral Reserve estimate has been undertaken with reasonable care and has been classified in accordance with SEC S-K 1300. Furthermore, it is their opinion that Mineral Reserves are unlikely to be materially affected by mining, metallurgical, infrastructure, permitting or other factors, as these have all been well established over the past ten years of mining.
153
Mining method selection is critical as it impacts dilution, recoveries, productivity, development, backfilling and ventilation requirements. All mine planning, hydrological, geotechnical assessment, mine services, ventilation and electric power supply evaluations are undertaken by the Mine Technical Services department at DDGM.
Based on information generated, collected and interpreted by mine technical staff and various consultants (e.g., SRK 2015), it has been possible to characterize the water encountered at the mine underground workings. The chemical composition of groundwater shows that it is water with a high degree of evolution within a hydrothermal flow system.
The underground water flow direction estimated in the interior of the mine is NW-SE, similar to the regional flow direction determined by CONAGUA in 2009 for the entire aquifer. The main vein structures are the water conductors.
Due to its location, the Arista project is within a barrier zone, which in turn represents the main recharging zone. In its study CONAGUA considers the calcareous formations, that surface mainly to the north of the aquifer, as a potential source of groundwater. However, it is recognized that complementary studies are required to know their extension under the granular materials of the valley and that according to the springs that emerge to the north of the area, they can supply considerable volumes to increase human development (CONAGUA, 2009).
The system receives recharge by superficial infiltration and lateral flow; however, the majority is upwards from a deep geothermal source, this is observed in the increase in water temperatures and chemical concentrations at depth. The concentration of total dissolved solids varies from 300 ppm in the foothills of the Sierra, to 4,000 ppm in the southern portion of the right bank of the Tehuantepec River.
The original water table at the Arista mine was reached at level 12, approximately 682 meters above sea level, with an average drainage volume of 580 gpm. SRK in 2015 noted the increase in temperature and water flow with the increase in depth of the underground workings.
Based on the above referenced hydrogeological studies, the estimated groundwater inflows to the proposed areas of the underground mine reach a nominal 1,200 gpm. This value has been used for the design of the mine dewatering system which is discussed in Section 13.6.7.
It is a standard procedure throughout the mine to install systematic ground control, which is carried out using a combination of split sets, mesh, w-straps, shotcrete, and other methods. The type of support varies according to the conditions encountered, but split sets are most common and are complemented as needed with mesh and/or W-straps.
The upper levels of the mine are relatively dry. Water inflows are a factor in the lowest development levels where they are collected, pumped, and distributed to help supply the mine’s needs for water.
Based on the structural evidence available, the Arista veins have formed in a dilatant jog along a regional fault zone striking at 280°; the veins are a combination of fault-veins and filled extension fractures. The model is based on a paleo-stress axis trend of about 315°; this direction corresponds to the orientation of sigma1 (or sigma 1 max-horiz) at the time of formation (Ross-Brown and Levy, 2012).
DDGM also uses a rock mass quality classification system for engineering design and rock stability analysis. This system is based on empirical relations between rock mass parameters and engineering applications, such as underground mine workings.
The objectives of rock mass quality classifications are to:
| ● | Identify the most significant parameters influencing the behavior of a rock mass. |
| ● | Divide a particular rock mass formulation into groups of similar behavior – rock mass classes of varying quality. |
| ● | Provide a basis of understanding the characteristics of each rock mass class. |
| ● | Relate the experience of rock conditions at one site to the conditions and experience encountered at others. |
| ● | Derive quantitative data and guidelines for engineering design. |
| ● | Provide common basis for communication between engineers and geologists. |
The main benefits of rock mass classifications:
154
| ● | Improving the quality of site investigations by calling for the minimum input data as classification parameters. |
| ● | Providing quantitative information for design purposes. |
| ● | Enabling better engineering judgment and more effective communication on a project. |
DDGM has also conducted Triaxial shear tests, a common method used to measure the mechanical properties of many deformable solids (e.g., quartz veins and andesite host rock). In 2016 CFE performed in situ stress measurements of the rock at level 22, which is 500 masl or 400 meters below the mine portal entrance. The technique used to do this measurement was overcoring using a triaxial cell developed by CSIRO. It was determined that the relation between horizontal and vertical stresses (h/v) was 1.5 for the north-south direction and 1.2 for the east-west direction. This data was important to collect for its use in subsequent studies.
In 2017, based on geotechnical drilling and core logging data, INGEROC consultants calculated GSI, Q, RMR Bieniawski and RMR Laubscher values for rock mass characterization of the Switchback veins system at the Arista underground mine. Numerical models were also developed for stability analysis.
The study concluded that in areas where the veins exceed 10 meters in width, a transversal long hole stoping mining method is recommended. The addition of paste backfill to the mining cycle in 2019 contributed to the safe mining of Switchback through primary and secondary stoping methods.
In 2021, INGEROC consultants reviewed and audited the geotechnical procedures in place at DDGM including the characterization of the rock mass, operational geotechnical control, geotechnical design of stopes and validation of the information used as input for the geotechnical procedures. The study gave recommendations on each point mentioned above and some improvement opportunities which are currently being in development.
In 2022 and 2023, Langston and Associates reviewed and audited the geotechnical procedures in place at DDGM including the Ground Control Management Plan, characterization of the rock mass, operational geotechnical practices, The study gave recommendations on each point mentioned above which are currently being developed.
DDGM declared commercial production at the Arista Mine on July 1, 2010. Mineral production during 2010 consisted of processing Mineral Resources from the open pit located approximately 0.5 km from the mill (Figure 131).
DDGM developed and mined the shallow-dipping accessible portion of the Manto Vein by open pit methods, while the projection of the vein to depth indicated additional underground mine potential. Initially, tonnes and grade minded from the open pit Manto Vein were approximately 345,000 tonnes at an average grade of 4.4 g/t gold and 43 g/t silver.
Initial mining of the open pit Mineral Resource was essentially completed in 2010. A low-grade stockpile of open pit material estimated at approximately 60,000 tonnes grading 1.4 g/t Au and 19 g/t Ag was processed through the Agitated Leach circuit at the DDGM processing facility during 2016 and 2017. Open pit mining resumed on the Manto Vein in 2017. During 2019, DDGM commenced underground mining of the Manto Vein exposed in the high wall of the open pit. From 2017 through 2020, approximately 157,400 tonnes of Mineral Resource grading 1.7 g/t Au and 40 g/t Ag on the Manto Vein was mined by open pit/underground and processed through the DDGM agitated leach circuit.
155
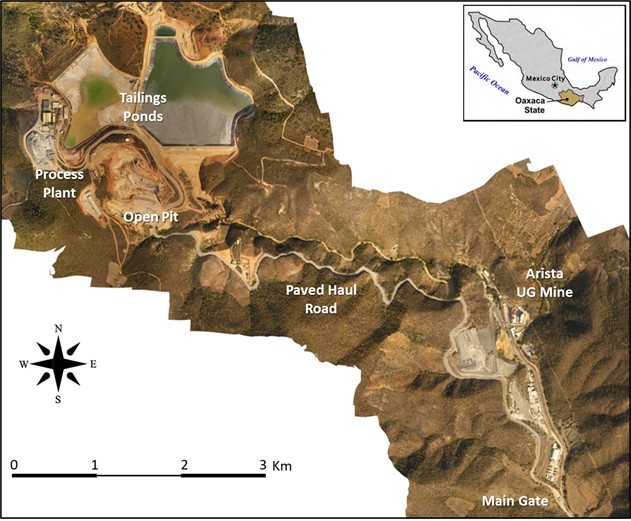
Figure 13-1: Surface Layout Map for Underground and Open Pit Mines, Process Plant and Tailings Ponds of DDGM’s Arista project.
Substantial development was undertaken from 2010-2011 to access the Mineral Resources of the Arista vein system and to provide ancillary access for further exploration and development. In addition, a significant amount of mining on the Arista vein system was achieved to determine the “mineability” of the orebody and to optimize an extraction method(s) for mining the mineralized zones. The principal exploration access and haulage decline ramp were opened at surface positioned along Aire Creek. The portal opening is located at an elevation at 902 (masl) accessing the mineralized area of the Arista vein system. The decline was driven as a spiral with a minus 10 percent grade in the footwall of the mineralized area. Underground mine planning and exploitation is based on a typical vertical separation of mine levels of approximately 20m.
To date, DDGM has advanced the primary decline ramp down to Level 28, approximately 4,400 meters ramp distance from the mine portal. DDGM has also constructed a safety/ventilation decline ramp in conjunction with the primary decline ramp along with various drifts, raises and stopes encompassing approximately 500 m vertically and 1,300 m along strike length.
In 2017, in addition to the Arista underground mine, DDGM completed development of the Mirador Mine at the Alta Gracia Project and began delivering development ore to the Arista processing facility. Two mine portals were developed to provide access to the Mirador vein. Mine site offices and mobile equipment maintenance facilities were established adjacent to the mine portals. Additionally, a diesel power generation plant, compressed air and a mine water pumping stations were developed. Operations at the Mirador Alta Gracia mine were temporarily halted in June 2020.
156
Access to the mining areas is provided mainly by ramps. Mine development headings are either drilled by jumbo or by jackleg. The dimensions of the different development sections are as follows:
| ● | Main Ramps: 5. W x 5 H meters |
| ● | Accesses: 4.5 W x 4 H meters |
| ● | Sill in Mineral 4.5 W x 4 Hmeters (if wider width of structure) |
| ● | Raise: 3 x 3 meters |
| ● | Bore Holes Raise: 3.1 meters diameter |
Compressed air for mechanized tool operation is supplied to the mine by compressors which are all located in different areas on surface. The choice of equipment is generally guided by the anticipated vein widths, stoping method, and equipment availability.
Table 131 indicates the various mine levels for the Arista Underground Mine, including Switchback, and corresponding elevations shown as meters above sea level (masl). Table 132 indicates the mine levels for the Mirador Underground Mine and corresponding elevations (masl).
157
Table 13-1: Arista Underground Mine Levels and Corresponding Elevation.
MINE LEVELS | ||
LEVEL |
ELEVATION- METERS ABOVE SEA LEVEL (MASL) |
|
Ramp Collar |
902 |
|
1 |
884 |
|
2 |
874 |
|
3 |
855.5 |
|
4 |
831.5 |
|
5 |
813.6 |
|
6 |
795.1 |
|
7 |
775.8 |
|
8 |
753.6 |
|
9 |
735.9 |
|
10 |
717.5 |
|
11 |
691.1 |
|
12 |
677.3 |
|
13 |
659.3 |
|
14 |
644.9 |
|
15 |
628.5 |
|
16 |
619.8 |
|
17 |
600.4 |
|
18 |
566.8 |
|
19 |
555.3 |
|
20 |
533.5 |
|
21 |
513.5 |
|
22 |
496.0 |
|
23 |
480.0 |
|
24 |
460.0 |
|
25 |
440.0 |
|
26 |
420.0 |
|
27 |
400.0 |
|
28 |
380.0 |
|
Table 13-2: Mirador Underground Mine Levels and Corresponding Elevation.
MINE LEVELS | ||
LEVEL |
ELEVATION- METERS ABOVE SEA LEVEL (MASL) |
|
1500 |
1,500 |
|
1485 |
1,485 |
|
1470 (Aguacate) |
1,470 |
|
Conventional drill and blast methods are used to extract the Mineral Resources from the Arista mine at the Arista project.
Historically, the Arista mine used two main mining methods: 1) overhand mechanized cut and fill (CAF) and 2) long-hole open stoping (LHOS) with delayed fill. Currently, The Arista mine uses the LHOS method exclusively. Paste fill, cemented rock fill and uncemented rock fill are applied to long-hole stoping areas in order to increase extraction levels (removal of rib pillars), CAF if applied uses uncemented rock fill as a backfill method.
158
For the stoping methods, a crosscut from the main ramp intersects the vein, from which an initial drift is excavated perpendicular in both directions along the strike length of the vein. Once the economic limits of the vein have been reached the production cycle starts.
13.4.1. Overhand Mechanized Cut and Fill (CAF)
The following describes the method utilized historically in the CAF areas. A CAF stope is started by means of a short (40 to 60 meter) negative 15 percent access ramp usually in the footwall of the vein to provide access to the bottom of the mining block (Figure 132). The ore is then mined in 3-meter horizontal slices using a Jumbo drill (Figure 133). The jumbo will drill 4-meter long essentially parallel and horizontal 1-3/4-inch holes that will later be charged with explosives to “breast down” and break the ore.
The length of these mining blocks can vary from 50 to 250 meters in strike length. After the first slice or cut is complete, the void will be filled with loose waste rock to form the floor of the next cut. Access to the second and subsequent cuts is gained from the access ramp by changing its grade to reach the higher elevation.
For CAF stoping, upper holes are sometimes drilled using a jackleg. In this case, geologists will mark up the vein, and the stope is drilled and blasted accordingly. In some cases, the drill holes on the vein are blasted first. After the ore has been mucked, the holes drilled in waste are then blasted to achieve the dimensions required to work in the next production lift. Since 2023, the only mining method used at the Arista mine is the LHOS.
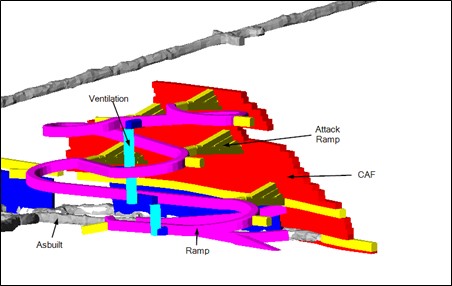
Figure 13-2: Three-Dimensional Schematic of the Overhand Mechanized Cut-and-Fill (CAF) Mining Method.
159
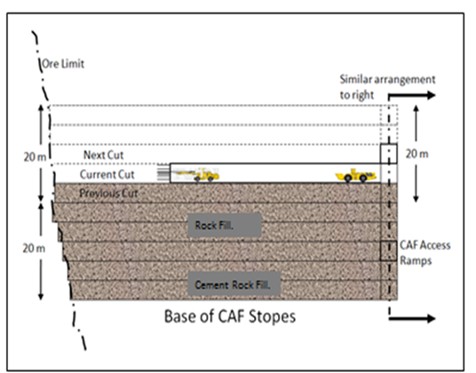
Figure 13-3: Longitudinal View of Cut-and-fill (CAF) Mining Method Using a Jumbo.
Figure 13-3: Longitudinal View of Cut-and-fill (CAF) Mining Method Using a Jumbo.
160
13.4.2. Long Hole Open Stoping (LHOS)
DDGM targets to long-hole open-stoping as its primary long-term stoping method (Figure 134).
The mineralized vein is developed with the assistance of an electric hydraulic drill or jumbo. The size of the tunnel is 4.0 meters in height with a minimum width of 3.2 meters to accommodate mining equipment. Ground or rock support is applied in the vein development to match the rock or ground condition as specified by the staff rock mechanic engineer. This artificial support can be spilt set bolts, resin rebar bolts, screen and /or shotcrete. The ore development or drill levels have a 20-meter floor to floor interval. The mineralized vein is broken by means of drilling 3-inch diameter holes from the top level to the bottom levels. The drill length is approximately 14 meters, depending on the angle or dip of the vein. These drill holes are then charged or loaded with explosives and detonated. The broken rock is then extracted from the bottom level with a 6-yard articulated loader or scoop. For safety reasons, the scoop is operated remotely at a safe distance from the brow of the open stope and any rock that could slough off from the walls. As mining progresses in a bottom-up sequence (lower level first), the lower mining block is filled with paste fill or loose waste development rock, to form the floor of the next stope. The stoping sequence will then be repeated on the mining block above the lower now mined out block.
For long-hole open stoping DDGM utilizes a Stopemaster HX long-hole drilling machine.
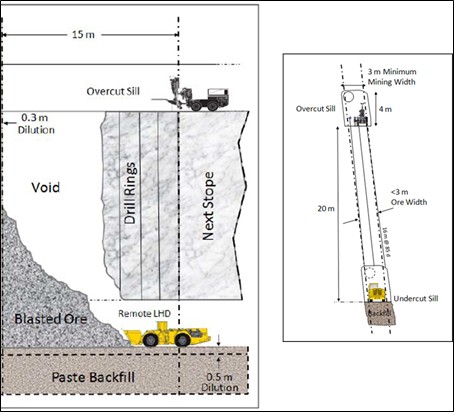
Figure 13-4: Schematic Vertical Longitudinal Projection of Typical Long-hole stope Design.
For areas where the orebody is thicker than 10m across strike the stopes are mined on a transversal direction with a primary and secondary extraction sequence. Currently, just a localized area in Switchback has transverse stopes, Figure 135 shows the mine design identifying the transverse stopes colored by primary and secondary stopes.
161
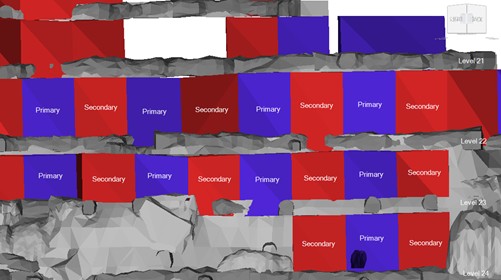
Figure 13-5: Stope design for a transverse mining sequence.
Mineral Reserves will sustain a four-year LOM for a mill throughput of approximately 1,200 tpd. (Table 133). The LOM total production will be approximately 51.1 koz of gold and 4.1 Moz of silver on an average head grade of 1.29 g/t Au and 131.3 g/t Ag. Inferred Mineral Resources are not taken into consideration in the LOM evaluation.
162
Table 13-3: Don David Mine Life-of-Mine Production Summary
LOM PLAN - DETAILS |
UNITS |
TOTAL |
2024 |
2025 |
2026 |
2027 |
Lateral Development Meters |
Meters |
10,590 |
4,394 |
3718 |
1673 |
805 |
Lateral Development (m) CAPEX |
Meters |
4,931 |
1,809 |
1,743 |
939 |
440 |
Lateral Development (m) OPEX |
Meters |
5,410 |
2,335 |
1,975 |
734 |
365 |
Total Vertical Development Meters |
Meters |
312 |
85 |
87 |
73 |
67 |
Exploration Drift Meters |
Meters |
250 |
250 |
- |
- |
- |
Waste Tonnes |
t |
388,559 |
157,214 |
132,306 |
65,915 |
33,125 |
|
||||||
Ore Tonnes |
t |
1,063,505 |
450,862 |
371,622 |
168,507 |
72,514 |
Ore Tonnes per Day |
1,235 |
1018 |
462 |
199 |
||
Silver Grade |
g/t |
131.3 |
103.6 |
129.2 |
162.7 |
241.0 |
Gold Grade |
g/t |
1.29 |
1.36 |
1.41 |
1.11 |
0.61 |
Copper Grade |
% |
0.26 |
0.28 |
0.25 |
0.27 |
0.11 |
Lead Grade |
% |
0.91 |
1.04 |
0.93 |
0.65 |
0.64 |
Zinc Grade |
% |
2.73 |
3.08 |
2.71 |
2.00 |
2.36 |
Waste Rock Backfill |
t |
746,287 |
269,030 |
302,415 |
174,843 |
|
Pastefill Placed |
t |
46,109 |
46,109 |
- |
- |
|
Note: Above Production Table assumes full depletion of Reserves by end of 2027. Total may not add up due to rounding.
13.6Equipment, Manpower, and Services
On December 31, 2023, DDGM had contracted a total of 483 full-time workers distributed in different department areas (Table 134). Contractors consist of salaried professional staff and members of two local trade unions (Sindicatos): Sección 02 del Sindicato de Trabajadores de la Construcción, Similares y Conexos del Estado de Oaxaca, C.T.M. and Sindicato de Trabajadores de la Construcción, Similares y Conexos del Estado de Oaxaca, C.T.M. The former represents the truck drivers hauling ore and concentrates and the latter is the trade union for the miners, laborers and construction-related workers.
163
Table 13-4: Full-time, Direct Employees for the Oaxaca Mining Unit.
AREAS |
TOTALS |
Mine |
105 |
Technical Services, Geology-Planning |
36 |
Plant |
92 |
Mine Maintenance |
67 |
Mill Maintenance |
38 |
Safety & Health |
13 |
Projects |
4 |
Environment |
9 |
Logistics |
20 |
Mine Accounting |
3 |
Human Resources & Training |
14 |
Information Technology |
4 |
Community |
1 |
Overhead Oaxaca |
16 |
Commercial |
1 |
Total Operations |
469 |
Exploration |
14 |
Total Oaxaca Mining Unit |
483 |
13.6.1. Mining Equipment
DDGM has its own mining equipment and no underground mining contractors are currently being used. The current mining fleet consists of the following main equipment:
| ● | Five Scooptrams of 6yd3 capacity |
| ● | Two Scooptrams of 2.5yd3 capacity |
| ● | Four electric hydraulic jumbos |
| ● | Four electric hydraulic bolter jumbos |
| ● | Two Stopemaster longhole drills |
| ● | One top hammer longhole drill |
| ● | Three jacklegs |
| ● | Five trucks of 17 m3 capacity |
| ● | Five trucks of 10 m3 capacity |
| ● | Two scissor lifts |
| ● | Two loaders |
| ● | One utility truck (diesel-oil) |
| ● | One Boom Truck |
| ● | 8 personnel carriers |
164
13.6.2. Mine Manpower
DDGM estimates a total of 483 employees are required for operation related activities in 2024. Efficiency opportunities are being explored to determine if headcount reductions are warranted with similar numbers maintained over the next 2 years. See Table 134.
13.6.3. Underground Drilling
The underground mine uses several different drilling techniques and equipment including:
| ● | Mechanized drilling for horizontal and decline drifts using electro-hydraulic jumbos |
| ● | Mechanized drilling for long hole stoping and vertical raises using stope masters and top hammer drills |
| ● | Mechanized bolting with the use of three bolter jumbos |
| ● | Exploration, infill and ore definition drilling |
13.6.4. Ore and Waste Handling
Haulage of ore and waste is done via main and secondary ramps by trucks with a 17m3 and 10m3 capacity. The 10m3 trucks are normally used to haul material from the face to a remuck located in level and the 17m3 truck haul the material from the remuck to surface.
13.6.5. Mine Ventilation
Air requirements at the mine have been analyzed in accordance with local and international best practices and standards. The ventilation at the mine considers the main and auxiliary ventilation systems (for stopes and blind developments).
The current air flow at the Arista Mine enters through the access ramp and designated raise bore holes. It moves down to the lower part of the mine and exhausts through the remaining raise bore holes in the ventilation system. The system encompasses six (6) 2.4-meter diameter and three (3) 3.1-meter diameter raise bore holes from surface to various points in the mine and access ramps. At present, DDGM has four (4) extractor fans at the top of four raise bore holes with a total mine ventilation system capacity of 600,000 cubic feet per minute CFM (Figure 136). This capacity considers the total number of people working inside and the diesel equipment being used to achieve the daily production targets.
165
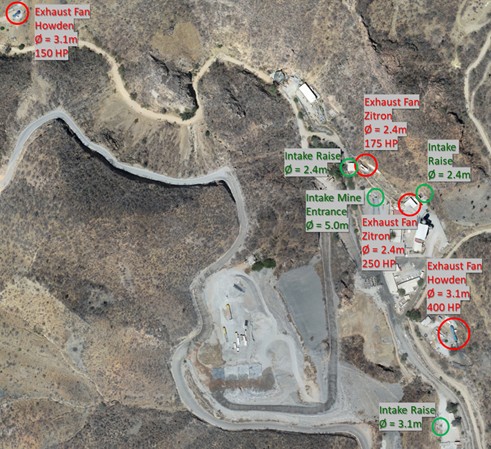
Figure 13-6: Ventilation Fans and Raise Bore Holes Installed at the Arista Underground Mine.
The normal ventilation system for the mine must be continually improved to minimize the risk of an underground fire, improve environmental working conditions, and improve production levels. There are three major components to the planned improvements to the ventilation system: 1) purchasing ventilation equipment; 2) increasing electrical power capacity; and 3) increasing the number of raise bore holes dedicated to ventilation in strategic locations. Since 2014, DDGM has engaged SRK as an ongoing consultant for ventilation design support and training of its mine ventilation engineers.
In 2020, SRK conducted a site visit with the objective to assess existing systems and determine options that could improve conditions in the Switchback zone. The recommendations are currently being developed.
166
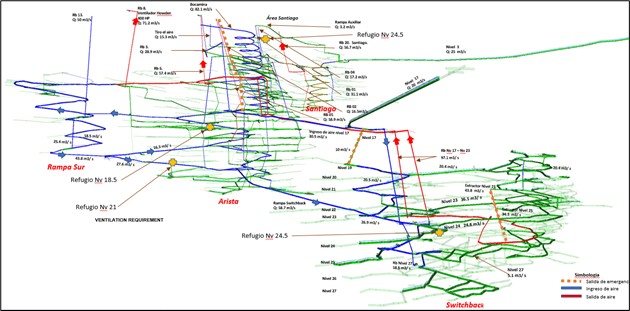
Figure 13-7: Three-Dimensional View of the Arista Mine Ventilation System.
13.6.6. Backfill Method
DDGM uses different kinds of backfill; waste rock backfill generated during underground mining, paste fill and cemented rock fill. All primary stopes use paste fill and waste rock is used on secondary stopes, longitudinal stopes and other stopes that don’t require a free-standing face to mine next to them. Cemented rock fill is used locally on some occasions if paste fill is not available (Figure 138).
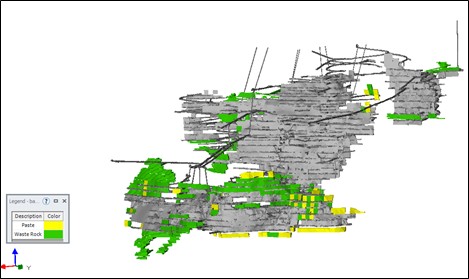
Figure 13-8: Schematic of cemented and uncemented rock filled stope.
167
The paste fill is comprised of a mixture of the concentrator plant tailings, cement, and water. The paste has a solid content of between 60 and 68 % that ensures consistency and a rheology that allows it to be pumped through the underground pipe reticulation system at the Arista mine (Figure 139). The added cement helps to dry the mixture and ensure that the fill sets to a specified minimum level of strength within a reasonable timeframe. Thickened tailings coming from the flotation plant are stored in a continuously agitated tank. The pulp has an average density of 1470 g/l, equivalent to a solids content of 50 %. These thickened tailings are filtered in filter press and a cake with a solids content of 86% is produced. Cement is supplied via a 200-tonne silo and represents between 3% to 6% of the dry solids of the tailings depending on the targeted strength in the mix. Water is supplied from the pulp in the agitated tank. Paste design resistance is based on operational requirements and varies between 120 kPa and 300 kPa. It is advisable to wait a minimum of thirty days before mucking to ensure the paste fill can handle the weight of the scoop trams.
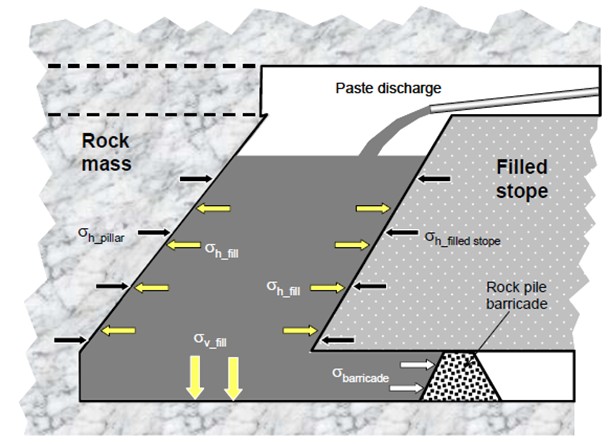
Figure 13-9: Schematic showing the components of a backfilled stope and the stress field distribution (after Belem and Benzaazoua, 2004).
13.6.7. Mine Dewatering System
The pumping system at the Don David Mine is used to avoid the accumulation of water that is encountered underground or generated during drilling activities. Underground water is pumped to the surface by 2 primary, 8 secondary and 14 tertiary pumping pools and stations.
Primary: Pumping stations at levels 11.5 and 19. It uses 400-450 hp pumps and a 12-inch pipeline; the average pumped flow is 4,000 m3 /day.
Secondary: Sumps at levels 5.5, 15, 21, 24, 25, 26.5, 27 and 28. It uses 140 hp pumps and its primary purpose is to retain around 80% of solids contained in the water. The cleaning of these solids is by mud pumps and scooptrams.
Tertiary: This is the pumping of water (pneumatic pumps), from production headings, stopes, drifts and development ramps to the secondary pools. The main function of the tertiary pumping bays is to accumulate the greatest number of solids to avoid them getting into the primary and secondary pumping stages.
168
The pumping station at level 19.5 has 3 decantation pools from which water overflows into the suction pools. Flocculants and coagulants are added to accelerate this process, the decantation pools have an approximate volume of 200 m3 each. The suction pools have an approximate total capacity of 600 m3.
The pumping system and water distribution work as follows:
| ● | Surface Sump: Receives water from level 11.5 and supplies water to mine operations, paste plant and flotation plant. |
| ● | Level 11.5 Sump: Receives water from levels 10, 15 and 19 and supplies water to the pool at level 13. |
| ● | Level 19 Sump: Receives water from levels 21, 24 and 25. |
The Switchback pumping system currently has a 6-inch pipeline to pump water to level 19. The internal area has a 4-inch pipeline to pump water from level 25 to level 19.
The industrial water required by the operation of the mine is recovered from the pumped water to the surface pool. Water returns to the mine through a 4-inch pipeline in the main ramps and a 2-inch pipeline in ore drift to supply the various drilling requirements. (Figure 1310)
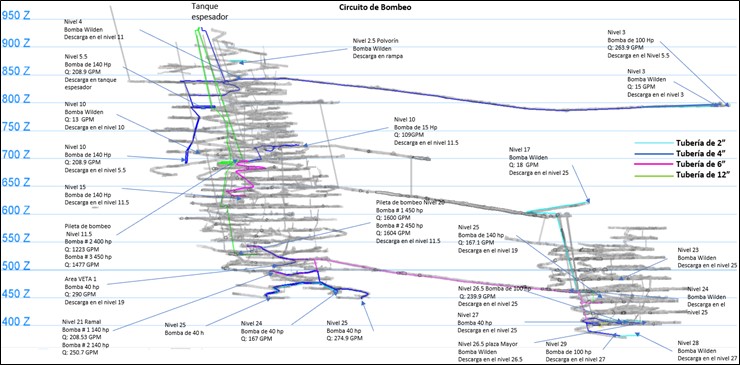
Figure 13-10: Schematic showing the mine dewatering system.
13.6.8. Maintenance Facilities
The Don David Mine has a well-equipped workshop on surface and a small mobile equipment maintenance and repair shop underground at Level 6.
The workshop on surface is for major, minor, and preventive maintenance. The workshop area is approximately 1,250 m2 in area and includes the following:
| ● | Maintenance office |
| ● | Maintenance area for jumbos and scoops |
| ● | Washing area for mechanical equipment |
| ● | Spare parts warehouse |
| ● | Welding area |
| ● | Utility area |
| ● | Grease trap |
169
| ● | Lunchroom |
| ● | Sanitary facilities |
13.6.9. Power Distribution
The mining unit is fed from the Mitla electrical substation on an overhead distribution line of the Comision Federal de Electricidad (“CFE”) with a length of 68 km, 3 Phase-4 Wire with a voltage of 34500 volts with an ACSR 266 conductor.
The distribution line reaches a main transformer with a capacity of 10 Mva - 34500/13200 volts. The distribution is carried out in 3 branch circuits of 13200 volts.
Circuit 01 feeds the beneficiation plant with an overhead distribution line of 13200 volts with a trajectory of 2.7 km with an ACSR 266 conductor:
| ● | Substation 2000 kva-13200/4160 (1040 hp Mill) |
| ● | Substation 2000 kva .13200 / 4160 volts (800 hp Mill) |
| ● | 4000 kva substation 13200/480 Volts (Crushing, Flotation, Thickening, Workshops, Laboratory and offices) |
| ● | 750 kva substation 13200/480 volts Tailings Dam |
| ● | 1500 kva substation 13200/480 volts Filtering Area. |
Circuit 02 feeds the South ramp sector with an overhead distribution line of 13200 volts with a trajectory of 1 km:
| ● | Main substation 2000 kva 13200 -4160 volts |
| ● | Secondary substation 1000 kva-13200/480 Volts (400 hp Howden fan) |
| ● | Secondary substation 1500 kva-13 200/480 volts (Paste plant) |
| ● | Secondary substation 1500 kva 4160/480 Volts (underground mine sector level 17). |
Circuit 03 feeds the North ramp sector with an overhead distribution line of 13200 volts with a trajectory of 1.3 km:
| ● | Main substation 4000 kva 13200 -4160 volts (located inside mine level 11) |
| ● | There are 6 substations 1500 kva 4160 / 480 volts type in the underground mine that feed the main pumping stations of level 11, pumping of level 20, Switchback district, level 3, secondary ventilation and secondary pumping. |
There are 6 Caterpillar 3516b generators with a total installed capacity of 6.56 MW as backup for a continuous operation.
13.6.10. Other Services and Infrastructure
Explosive storage
The underground explosive storage is comprised of two separate areas that meet the safety and security requirements established by Mexican Federal Regulations. The facilities are designed to store explosives and blasting accessories separately.
Refuge station and mine rescue facilities
Safety is of prime importance at the Don David Mine. A network of vertical manway exits has been built to ensure that if a major incident occurred the workforce can escape. Additionally, a permanent refuge station is located on Level 4 and 2 mobile refuge station is installed at different strategic points of the underground mine.
170
DDGM currently mills and processes the Arista and Switchback underground mines ore through the flotation circuit at the DDGM Processing Facility (Figure 141). The Arista processing plant was built near the mine site and consists of both a sequential flotation (sulfide) circuit and an agitated cyanide leach (oxide) circuit. The flotation circuit produces three separate saleable concentrate products (gold-copper, silver-lead and zinc) from polymetallic ore extracted from the Arista/Switchback underground mines (Figure 142). The Aguila open pit was depleted in May 2021 and is now accepting thickened tailings. The gravity concentrator receives feed material from the cyclone underflow and utilizes the principles of a centrifuge to enhance the gravitational force experienced by feed particles to effect separation based on particle density. In 2014, a Gekko Systems InLine Leach Reactor™ (ILR) and zinc dust precipitation circuit was installed to upgrade the gravity concentrate to doré. Concentrates are sold to various concentrate buyers located in Mexico. DDGM sells its doré to various precious metals refiners and mints, currently Asahi Refining USA, Inc. A flotation circuit was installed at the tail of the zinc flotation circuit in 2022. The new flotation circuit is floating the remaining sulphur associated with gold. Sulphur concentrate recovered from the circuit is leached in the agitated cyanide circuit previously used for oxide leaching (Figure 143).
Mining and milling operations at the DDGM property commenced in 2010. Initial production processed ore from the open-pit of the Manto-Vein. Subsequently, after their discovery, a new underground mine was developed to access the Arista and Baja veins composing the heart of the Arista vein system. The Arista mine was developed via a decline and spiral ramps utilizing rubber-tired vehicles and conventional drill and blast methods to extract the ore. Mining methods are mainly overhand mechanized cut and fill and long-hole open stoping with most mining voids backfilled with waste rock. In 2019, a surface paste fill plant was constructed and now in addition to waste rock backfill, a slurry containing about 30% of mill tailings are mixed with cement and pumped back underground. The dried cake filtered tailings is transported overland by conveyor and trucks, deposited, and compacted into a stable, unsaturated tailings residue.
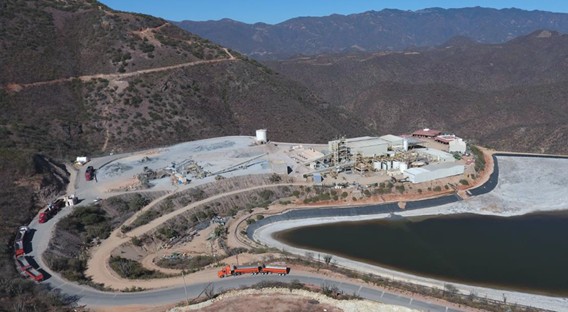
Figure 14-1: The DDGM Processing Facility.
Schematic flow sheets for the differential flotation circuit and the agitated leach circuit processing plant at the Arista processing plant are shown in Figure 142 and Figure 143, respectively.
171
In summary, the principal stages of the DDGM Plant are as follows:
Flotation Circuit |
Agitated Leach Circuit |
Crushing and Milling |
Milling of sulphur flotation concentrate |
Gravity Concentration |
Leaching |
Differential Flotation (Cu, Pb, Zn) |
Counter Current Decantation (CCD) |
Sulphur Flotation |
Merrill Crowe Zinc Precipitation |
Thickening, filtering, and shipping |
Bullion Furnace/Doré |
During 2023, 458,111 metric tonnes of ore were processed yielding 20,328oz of Au, 1,142,275 oz of Ag, 1,287 metric tonnes of Cu, 5,068 metric tonnes of Pb, and 13,513 metric tonnes of Zn. The average production rate of the DDGM processing plant was 1,436 tpd in 2023. Metallurgical recoveries at the DDGM plant for ore produced from the Arista mine averaged 79.63% for gold, 91.6% for silver, 77.3% for copper, 73% for lead and 85.4% for zinc. Overall production grades for 2023 for the Arista deposit have averaged approximately 1.72 g/t Au, 84.68 g/t Ag, 0.36% Cu, 1.52% Pb and 3.45% Zn.
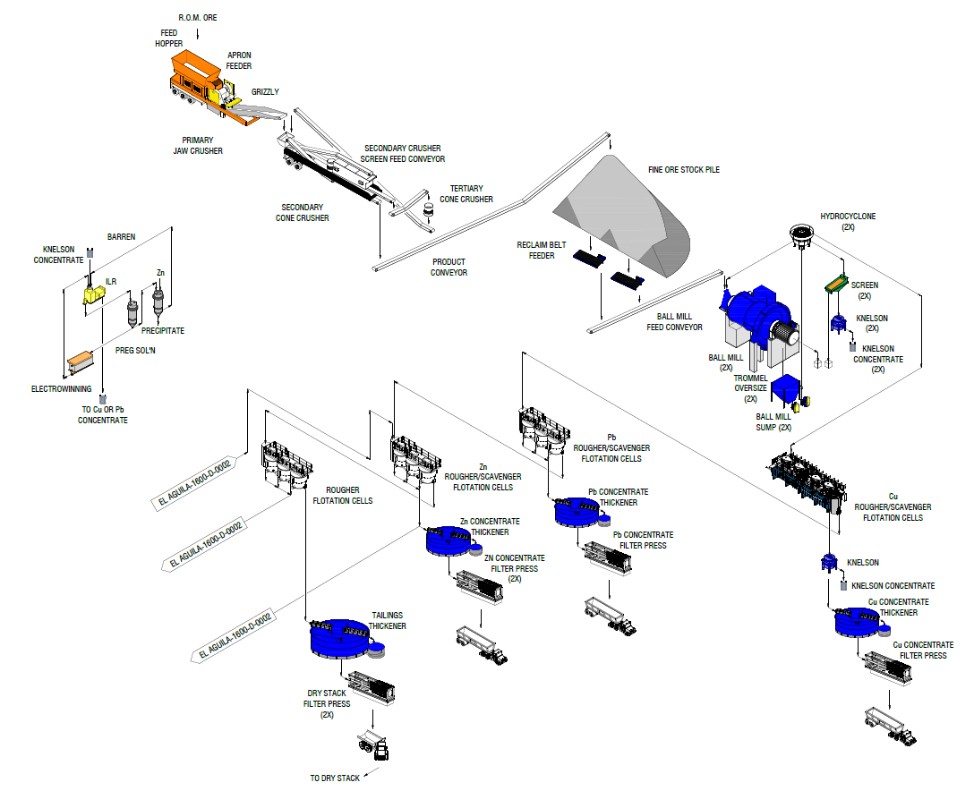
Figure 14-2: Simplified flowsheets for the production circuits of the Arista processing sequential flotation (sulfide) circuit with Knelson Semi-Continuous Concentrator™.
172
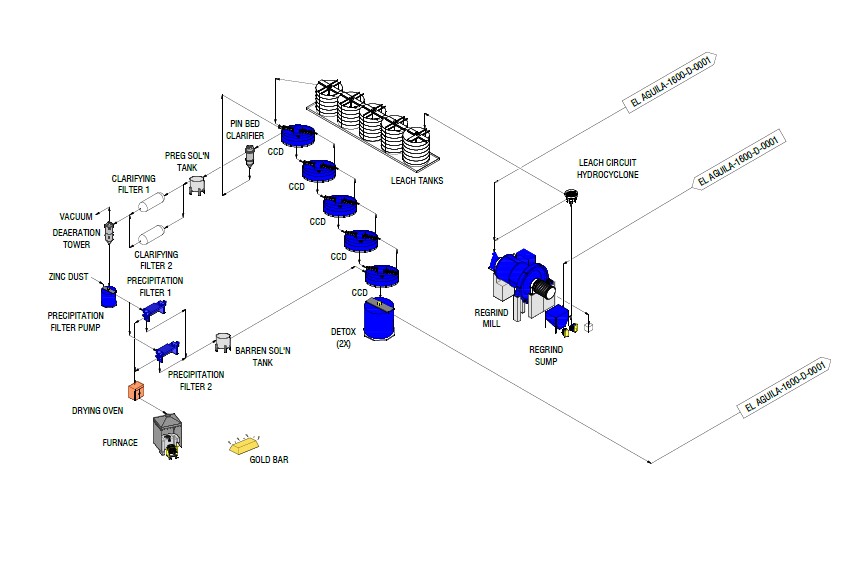
Figure 14-3: Simplified flowsheets for the production circuits of the Arista processing agitated tank leaching, counter current decantation and zinc dust precipitation circuit.
Ore is trucked from the mine and discharged onto ground. Ore is fed in a primary jaw crusher using a front head loader. Crushed ore from the primary crusher is screened onto a double deck screen. The first deck product is crushed by the secondary cone crusher. Crushed material is recirculated to feed the double deck screen. The screen second deck oversized products are crushed by a tertiary cone crusher. The tertiary cone crusher material is also recirculated to the feed of double deck screen. Finally, the double deck fine particle (-9.5mm) is stockpiled before being fed into the ball mills. The maximum crushing rate for this plant is about 110 tonnes per hour. The fine ore is stockpiled before being fed into the crusher and ball mills.
The fine crushed ore is transported via conveyor belts to the flotation plant grinding circuit. Grinding circuit consists of two parallel ball mills. Each mill is in close circuit hydrocyclones, with cyclone overflow reporting to flotation circuit. A portion of the cyclone underflow reports to the gravity circuit, while the remainder of the cyclone underflow and gravity circuit tailing reports to the ball mill for further grinding. One ball mill is 3.2m diameter and 4.29m length driven by 798 kW motor. The second ball mill is 3.2m diameter and 3.68m length driven by 597 kW motor.
Concentrate recovered by the Knelson concentrator is leached in an intensive leach reactor. When leaching is complete, the leached material is combined with a based metal concentrate which corresponds to the grade.
Most of the underground ore from the Arista vein system consists of very clean, primary sulfides, which have high recoveries in the differential flotation circuit. The principal economic components are gold, zinc, and silver; however, the ores also contain economically significant amounts of lead and copper. The flotation plant produces three concentrates for sale: a copper concentrate with gold-silver, a lead concentrate with gold-silver, and a zinc concentrate with gold-silver.
173
Cyclone overflow gravity feed the conditioning tank for reagent additions. Slurry flows to a row of four copper rougher cells followed by 4 copper scavenger cells. Concentrate from copper scavenger cell is pumped back to the copper rougher flotation feed. Concentrate from copper rougher is pumped to the copper 2nd cleaner circuit. Concentrate from copper 2nd cleaner is pumped to the copper 3rd cleaner. Tailing from copper 2nd cleaner gravity flows into the copper 1st cleaner cell. The concentrate from the 1st cleaner is pumped to copper 2nd cleaner and copper 1st cleaner tailing is pumped directly to the lead concentrate thickener due to high lead grade. Concentrate from copper 3rd cleaner is pumped to the concentrate thickener. Thickened copper concentrate is filtered in a pressure filter to produce a final saleable product.
Copper scavenger tailing are feeding the lead circuit rougher. Lead rougher concentrate is pumped to lead 1st cleaner circuit. Lead rougher tailing gravity feeds the lead scavenger cells. Lead scavenger concentrate is pumped back of lead rougher feed and lead scavenger tail is pumped to the zinc circuit. Lead 1st cleaner concentrate is pumped to the lead 2nd cleaner cell while lead 1st cleaner tailing is pumped back to the lead rougher feed. Tailing from lead 2nd cleaner is pumped back to the lead rougher feed. Lead 2nd cleaner concentrate gravity feeds the lead concentrate thickener. Thickened lead concentrate is filtered in a pressure filter to produce a final saleable concentrate.
Tailing from lead scavenger is pumped to the zinc conditioning tank. From zinc conditioning tank, slurry gravity feeds the zinc rougher cell. First 2 rougher cells concentrate is pumped to the zinc 2nd cleaner while the last 2 zinc rougher cells concentrate is pumped to the zinc 1st cleaner cell. Concentrate from the zinc 1st cleaner cell is pumped to the zinc 2nd cleaner cell. Tailing of zinc 1st cleaner cell is pumped to the zinc conditioning tank. Concentrate from zinc 2nd cleaner is pumped to the zinc 3rd cleaner cell. Tailing from zinc 2nd cleaner gravity feeds the zinc 1st cleaner circuit. The zinc 3rd cleaner tailing gravity feeds the zinc 2nd cleaner cell while the zinc 3rd cleaner concentrate is pumped to the zinc concentrate thickener and the thickened zinc concentrate is filtered in the pressure filter to produce a final saleable concentrate.
Tailing from the zinc rougher gravity feeds the first scavenger cell. Concentrate from these cells is pumped to the zinc circuit conditioner tank while the tailing is pumped to the second zinc scavenger cells. Tailing from the second zinc scavenger cell passes through a trash screen prior to be pumped to the sulphur flotation cell.
The three concentrates are stored separately in a shed. Concentrates are bulk shipped on contracted tractor-trailer trucks.
The flotation cells for the DDGM Processing Facility are shown in Figure 144.
174
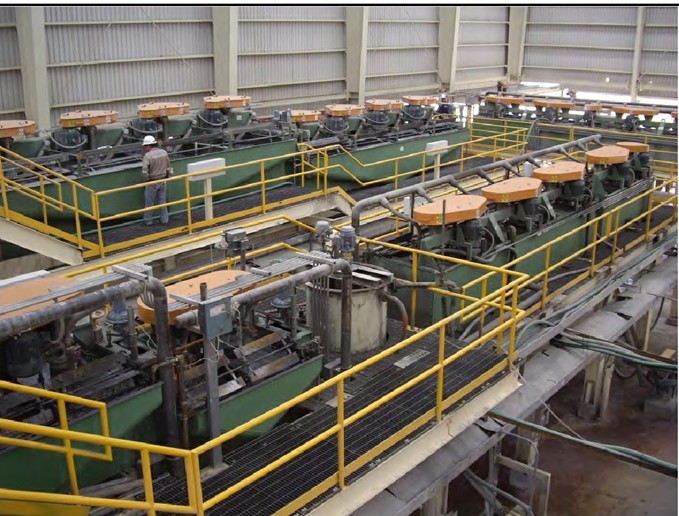
Figure 14-4: Banks of Flotation Cells at the DDGM Processing Facility.
After trash removal of the tailing second zinc scavenger cell onto the static screen, slurry is pumped into bulk sulphur flotation rougher circuit. Concentrate from the sulphur flotation is regrind into the old oxide circuit ball mill. Regrind ball mill is a closed circuit with hydrocyclone. Hydrocyclone underflow is returning to the mill for additional grinding while hydrocyclone overflow is feeding the pre-aeration tank. Regrind size of 50 microns is targeted for leaching. Leaching is performed using sodium cyanide and lime to control slurry pH. Leaching circuit consists of 5 agitated tanks of 170 m3 of capacities with air injection (Figure 145). When leaching is completed, slurry gravity flow through 5 counter current wash clarifiers. Washed solution is pumped to clarifying filter for additional removal of solid in solution. Clear solution is pumped to deaeration tower to decrease the oxygen in solution and zinc powder is added for precipitation. Humidity from precipitated sludge is removed through the press filter. Concentrate then calcinates in the drying oven and is melted in a furnace to be poured in the cascade stand. Gold doré is then produced. Solid tailing from clarifier circuit is pumped to cyanide destruction circuit and pumped back to zinc scavenger cell.
175
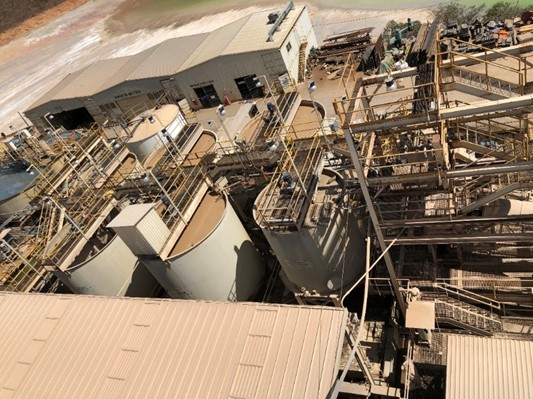
Figure 14-5: Agitated Leach Circuit of the DDGM Processing Facility.
14.5Tailings and Water Management
Tailing from the rougher sulphur flotation is pumped to the tailing thickener. Tailings is pumped from the thickener underflow of the processing plant at ~50% solid. Slurry is distributed into two parallel holding tanks which keeps the pulp mixed while providing temporary storage and continuous supply to both filter presses. The temporary storage mixing tanks also supply the paste plant as required. The two parallel vertical plate and frame filter presses (see Figure 147 below) can process 75-82 TPH of solid tailings combined. The process water and rinse water collected at the filter press is recycled back to the processing plant while the cake containing ~14% moisture is deposited onto conveyors and then routed to a single stacker conveyor. The radial stacker conveyor layers the thickened tailings in the depleted open pit area where it naturally dewaters further and is compacted for stability. When the underground mine needs paste backfill, thickened slurry is pumped to paste backfill plant (Figure 148) rather than to the dry stack press filter (Figure 146).
176
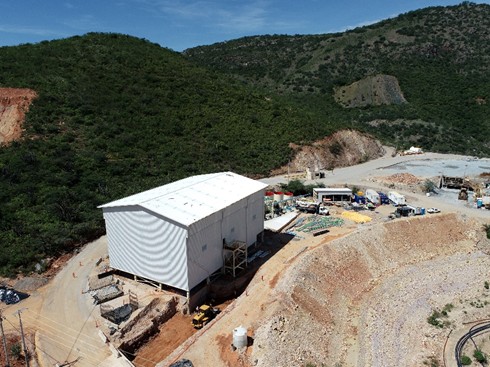
Figure 14-6: DDGM Tailings Filtration Plant.
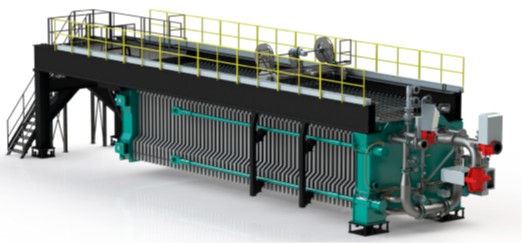
Figure 14-7: Diemme Filtration – Aqseptence GHT-F Filter Press.
177
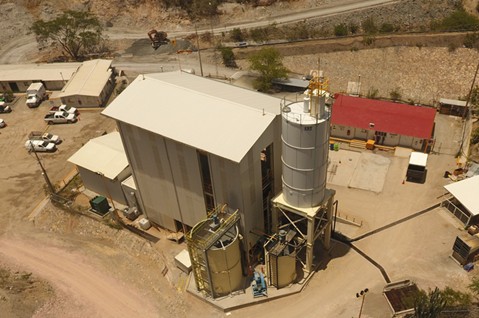
Figure 14-8: DDGM’s Paste Plant.
DDGM has designed and constructed a laboratory for assaying samples and metallurgical testing (Figure 149). The laboratory staff currently consists of 23 employees for sample preparation, assaying and metallurgical testing. The Arista Laboratory prepares about 100 samples per day and assays (Atomic Adsorption and Fire Assay) of greater than 400 samples per day. In addition, the laboratory conducts between 5 and 10 metallurgical tests per day.
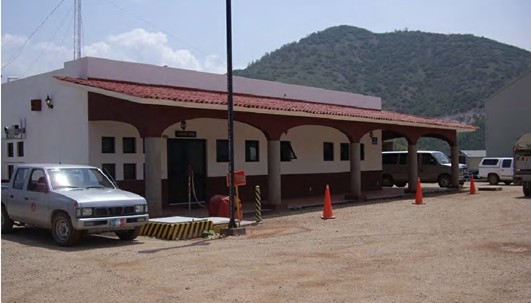
Figure 14-9: Arista Project Laboratory.
The Don David Gold Mine laboratory sample preparation consists of the following stages:
| ● | Reception and identification of the samples |
| ● | Drying |
178
| ● | Primary, secondary, and tertiary crushing to particle about 4 mm |
| ● | Homogenization (mixing) |
| ● | Sample splitting (Jones splitter) |
| ● | Pulverization in Spray rings to 100% <100 mesh sample for analysis |
| ● | Sample control and analysis |
The fire assaying procedures employed at the Don David Gold Mine laboratory are as follows:
| ● | Fusion: Fusion is carried outweighing 5 to 20 grams of sample depending on the source, mixed with lead-based flux, fusion performed at 1050 ° C for 50 minutes. |
| ● | Cupellation: it starts with cleaning of lead button hammered, then the cups are placed in the oven at 940 ° C, then place the button of lead inside the cups for 45 minutes. |
| ● | Dissolution: brown button obtained weighed, the next step is dissolved in nitric acid for 25 minutes. After dissolving the silver buttercup washed and calcinations. |
| ● | The button of gold is weighed on a microbalance. |
X-Ray fluorescence (“XRF”) is the emission of characteristic "secondary" (or fluorescent) X-rays from a material that has been excited by bombarding with high-energy X-rays or gamma rays. The phenomenon is widely used for elemental analysis and chemical analysis, particularly in the investigation of metals and for research in geochemistry.
This analysis is performed by mixing the sample with wax, then form a compressed tablet. It is then placed in the auto-sampler Brucker Ranger. The analysis time depends on the origin of the samples; it takes 3 to 5 minutes for reading per sample.
Atomic absorption spectroscopy (AAS) is a spectroanalytical procedure for the quantitative determination of chemical elements employing the absorption of optical radiation (light) by free atoms in the gaseous state. In analytical chemistry the technique is used for determining the concentration of a particular element (the analyte) in a sample to be analyzed. AAS can be used to determine over 70 different elements either in solution or directly in solid samples.
DDGM has two atomic absorption units for the analysis of gold, silver and base metals. Samples are analyzed for mainly gold and silver, as well as copper, lead, zinc and arsenic. The analysis is performed with partial digestion in a microwave oven with mixer acids (hydrochloric and nitric).
DDGM has completed and continues to conduct the following metallurgical tests at the Aguila laboratory:
The Don David Gold Mine laboratory’s quality controls include the use of a primary or secondary standard sample which is certified for analysis in fire assay, atomic absorption and X-ray fluorescence. These standard samples are analyzed at the end of each month, evaluating the assay results.
The lab is currently not accredited. Work instructions have been developed for all lab analysis and QAQC controls have been put in place to quantify the confidence level of the analysis.
179
Duplicate analysis has been established since Jan 2020 with over 523 duplicates performed (30-40 per month). Results are consistent which has built confidence in the Aguila Laboratory analysis capability. Figure 1410 to Figure 1424 illustrate the details of the duplicate analysis.
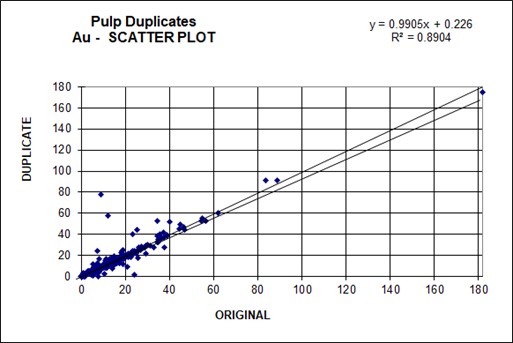
Figure 14-10: Au Duplicate Vs Original Scatter.
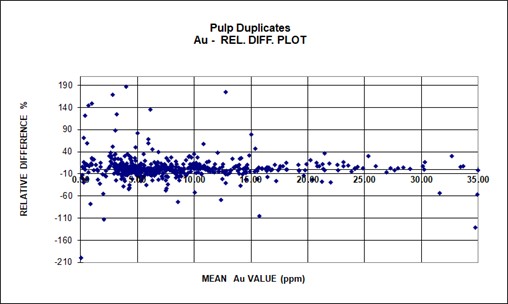
Figure 14-11: Au Relative Difference Plot Versus Mean PMM Analysis.
180
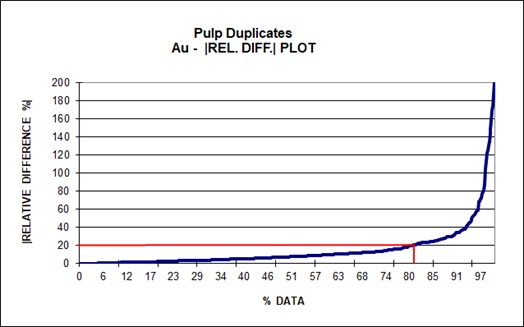
Figure 14-12: Au Relative Difference Versus Population of Data.
·80% of the Au analysis fell under 20% relative error.
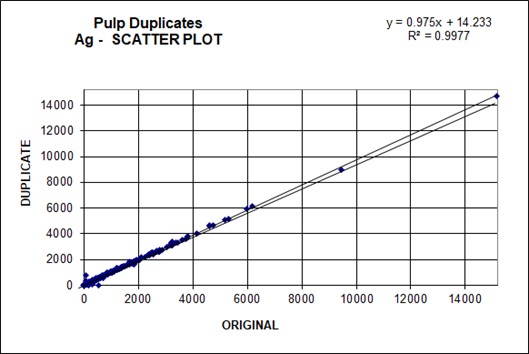
Figure 14-13: Ag Duplicate Vs Original Scatter.
181
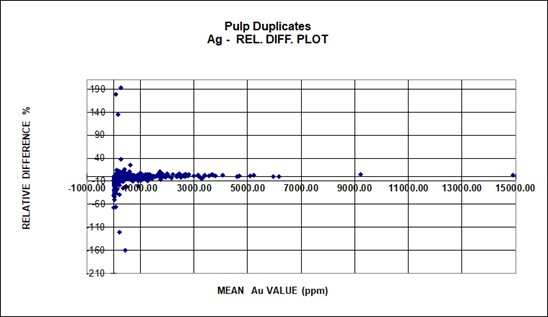
Figure 14-14: Ag Relative Difference Plot Versus Mean PMM Analysis.
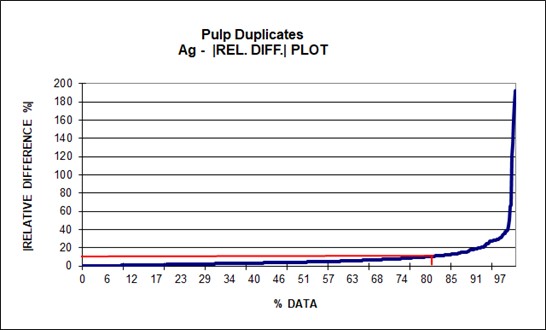
Figure 14-15: Ag Relative Difference Versus Population of Data.
·80% of the Ag analysis fell under 10% relative error.
182
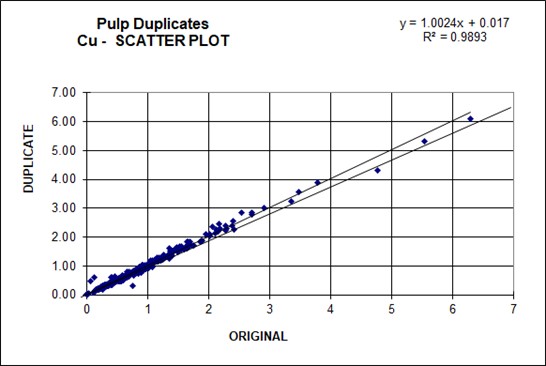
Figure 14-16: Cu Duplicate Vs Original Scatter.
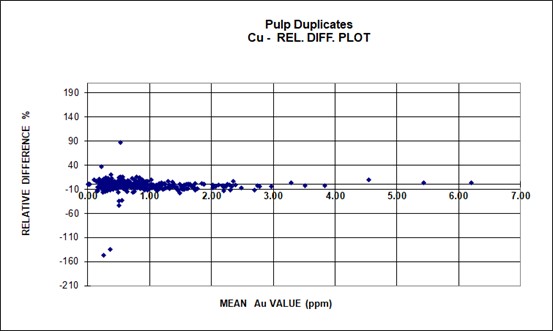
Figure 14-17: Cu Relative Difference Plot Versus Mean PMM Analysis.
183
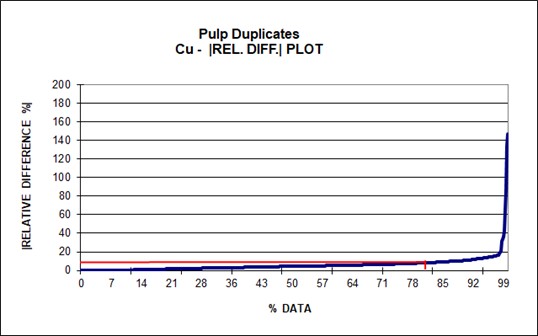
Figure 14-18: Cg Relative Difference Versus Population of Data.
·80% of the Cu analysis fell under 9% relative error.
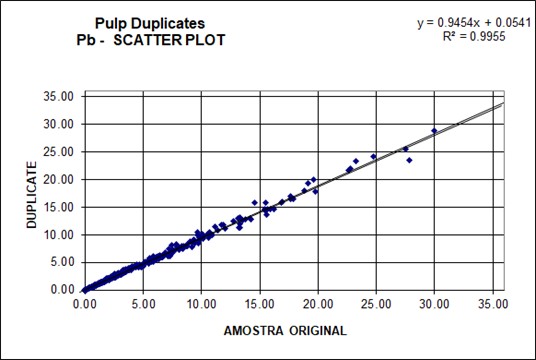
184
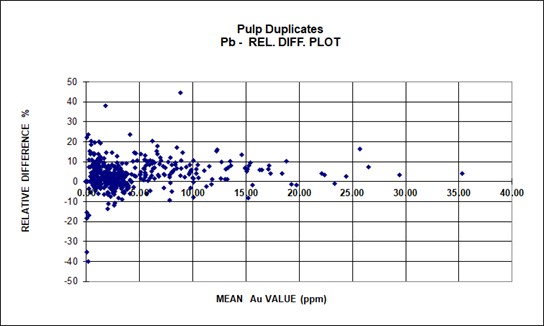
Figure 14-20: Pb Relative Difference Plot Versus Mean PMM Analysis.
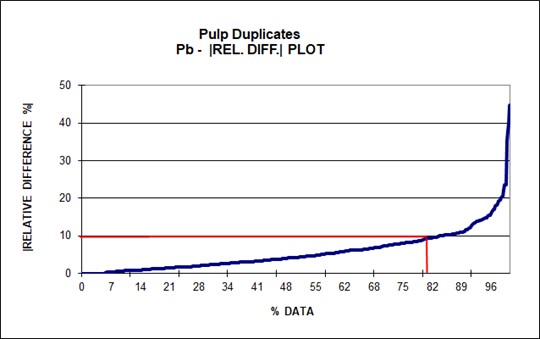
Figure 14-21: Pb Relative Difference Versus Population of Data.
·80% of the Pb analysis fell under 10% relative error.
185
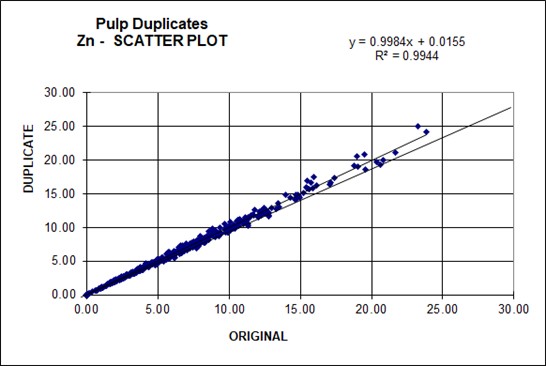
Figure 14-22: Duplicate Vs Original Scatter.
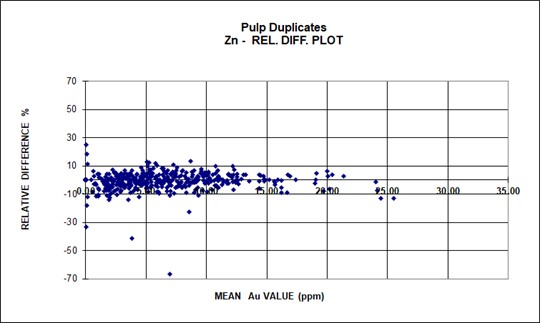
Figure 14-23: Zn Relative Difference Plot Versus Mean PMM Analysis.
186
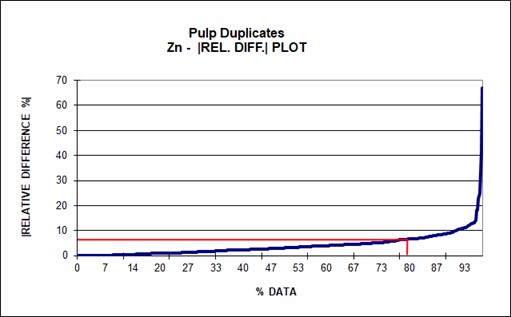
Figure 14-24: Zn Relative Difference Versus Population of Data.
·80% of the Zn analysis fell under 6% relative error.
The primary equipment utilized in the Aguila laboratory consists of the following:
Analytical Balance (Mettler Toledo)
187
The Arista Project is on paved Mexican Federal Highway No. 190, 115 km from the capital city of Oaxaca. The highway, which is a leg of the Pan American Highway system, runs through the nearby village of San José de Gracía. The road distances from San José de Gracía to the mine and plant sites are 2.4 km and 6.0 km respectively.
The operation has a relatively small surface infrastructure consisting primarily of the flotation and leaching plants, electrical power station, water storage facilities, paste plant, stockpiles, and workshop facilities, all connected by sealed and unsealed roads.
15.2Tailing Disposal Facilities
The Tailings Storage Facility (“TSF”) is in a valley below and south of the process plant site. The tailings facility was constructed using international standards that exceed Mexican permit requirements. The TSF is formed by two rock filled dams that have been raised once 10 meters using the downstream construction method. The TSF is double lined with the first liner made of a clay and synthetic material that acts as a leak prevention system with the effective absorption equal to ~ 3 meters of clay. The second liner is made of 1.5 mm Linear Low-Density Polyethylene (LLDPE), which was a permitting requirement.
The TSF is zero discharge with the process water being recycled to the plant. Additional make-up water for the flotation process comes from mine discharge water.
Construction of a filtration plant and dry stack facility was completed in 2022. The filtration plant and existing paste plant (commissioned in October of 2019) will handle 100% of future tailings production.
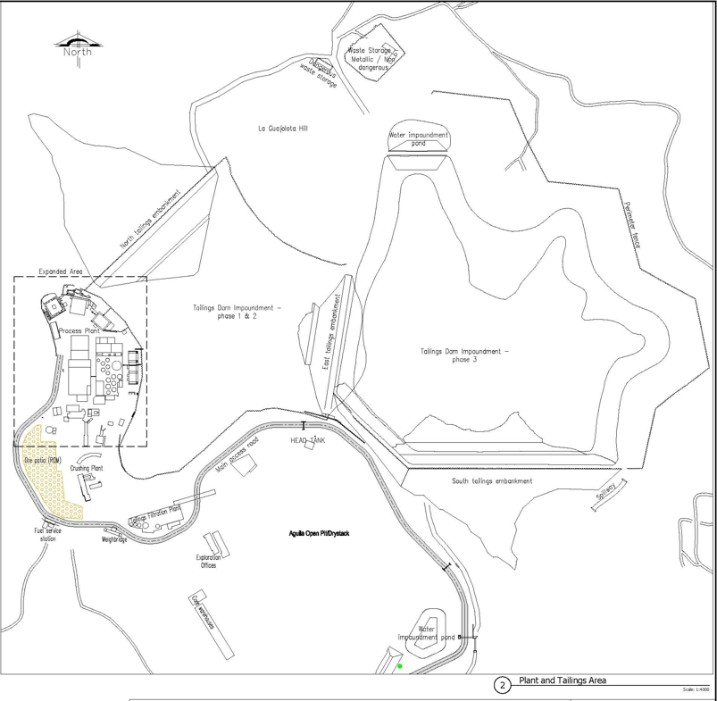
Figure 15-1: Site Map Including Tailings Storage Facilities.
188
The mine currently has one waste stockpile used for storing waste material that could not be effectively disposed of underground. The waste is generated mainly from mine development activities and is not expected to increase significantly over the life of the mine unless some additional infrastructure or new mine areas are incorporated into the Mineral Reserves.
The Oaxaca Mining Unit maintains small stockpiles underground and at the mine entrance in order to manage continuous ore haulage. Mined ore for processing is also stockpiled on a large patio (capacity 30,000 to 40,000 tonnes) near the crushing plant. The mined ore undergoes a rigorous blending program to ensure a homogeneous feed is sent to the plant.
15.5Concentrate Transportation
As the final products consist of metal concentrates and bullion (doré), and because the property and facilities are easily connected to the paved Pan American highway (and from there to major cities by means of the national paved road system), there is no need for construction of new external processing facilities.
Tractor trailers that can transport two 26-tonne trailers each are used to transport concentrate. The containers must be made of stainless steel. Each container is registered and weighed at the mine scales before the loading, sampling, and weighing process is performed of the concentrate prior to the unit being sealed and registered. The concentrate is then transported by road to a port in Mexico for subsequent shipping to purchasers in 400, 600 and 1,200 tonne lots for copper, lead, and zinc concentrates, respectively. Concentrate trucks are formed into convoys and escorted by contracted security personnel during the entire trip to the purchaser’s warehouse.
Up until 2018, power was mainly provided by diesel generators at the site. In 2019, DDGM successfully connected a power line to its Arista project from the Mexican Federal Electricity Commission’s (Comisión Federal de Electricidad or CFE) power grid. Prior to this connection, the Arista project operated 100% from electricity generated from more expensive and higher emission diesel fuel.
The mining unit is fed from the Mitla electrical substation on an overhead distribution line of the Comision Federal de Electricidad with a length of 68 km, 3 Phase-4 Wire with a voltage of 34500 volts with an ACSR 266 conductor.
The distribution line reaches a main transformer with a capacity of 10 Mva - 34500/13200 volts. The distribution is carried out in 3 branch circuits of 13200 volts.
Circuit 01 feeds the beneficiation plant with an overhead distribution line of 13200 volts with a trajectory of 2.7 km with an ACSR 266 conductor:
| ● | Substation 2000 kva-13200/4160 (1040 hp Mill) |
| ● | Substation 2000 kva .13200 / 4160 volts (800 hp Mill) |
| ● | 4000 kva substation 13200/480 Volts (Crushing, Flotation, Thickening, Workshops, Laboratory and offices) |
| ● | 750 kva substation 13200/480 volts Tailings Dam |
| ● | 1500 kva substation 13200/480 volts Filtering Area. |
Circuit 02 feeds the South ramp sector with an overhead distribution line of 13200 volts with a trajectory of 1 km:
| ● | Main substation 2000 kva 13200 -4160 volts |
| ● | Secondary substation 1000 kva-13200/480 Volts (400 hp Howden fan) |
| ● | Secondary substation 1500 kva-13 200/480 volts (Paste plant) |
| ● | Secondary substation 1500 kva 4160/480 Volts (underground mine sector level 17). |
Circuit 03 feeds the North ramp sector with an overhead distribution line of 13200 volts with a trajectory of 1.3 km:
| ● | Main substation 4000 kva 13200 -4160 volts (located inside mine level 11) |
189
| ● | There are 6 substations 1500 kva 4160 / 480 volts type in the underground mine that feed the main pumping stations of level 11, pumping of level 20, Switchback district, level 3, secondary ventilation, and secondary pumping. |
There are 6 Caterpillar 3516b generators with a total installed capacity of 6.56 MW as backup for a continuous operation. In 2021, there was an increase in power consumption due to ventilation and dewatering pumps requiring the installation of capacitors that improved and stabilized the power supply. In 2021, DDGM also initiated conversations with CFE for the expansion of the load delivered to further stabilize the energy supply. In 2022 the capacitors were installed and commissioned and CFE expanded the load delivered to attend to the higher demand on site.
DDGM has a permit granted by the Mexican federal water authority, Comisión Nacional del Agua (CONAGUA) for the usage of 150,000 cubic meters annually. However, water requirements to process ore are being primarily sourced from water pumped to the surface from the underground dewatering system. Water in the tailings facility is recycled to the Arista processing plant and the excess water pumped from the underground workings is discharged at the surface into decantation ponds. DDGM has the necessary permits to discharge underground mine water at the surface. Water sampling from rivers and creeks is conducted regularly and sent for analysis to an external laboratory.
190
DDGM has constructed substantial infrastructure to support the DDGM operations. The main administration and offices are in the vicinity of the processing facilities. The mine office is located 2 kilometers to the southeast, near the entrance to the Arista underground mine ramp. Nearly all the administrative personnel and activities are currently conducted from these offices.
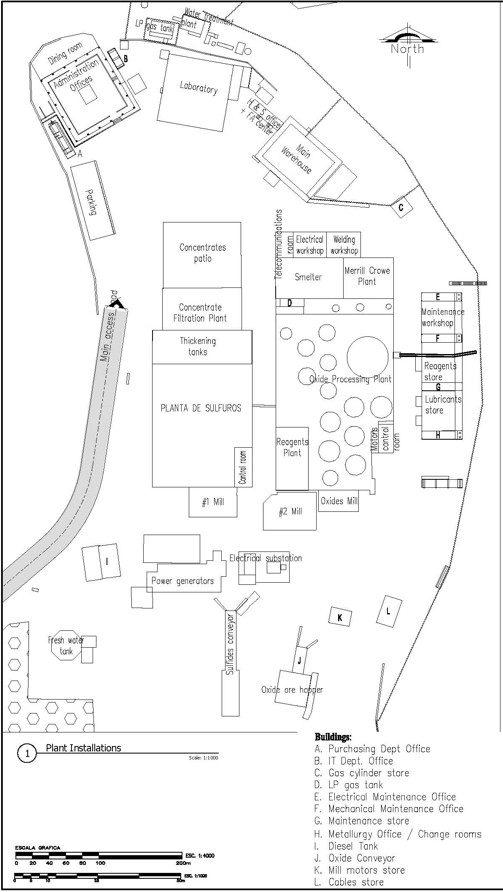
Figure 15-2: Site Map Including Process Facilities.
The underground mine site has a small mobile equipment maintenance and repair shop, a parts and supply warehouse, dining hall and offices and workspace for engineering, geology, and mine administration. Most building construction consists of concrete-block buildings, although the shop structures are steel frame buildings with steel sheet cladding. DDGM has also constructed exploration offices near the lower end of the open pit. These are similar block buildings with patios covered with steel structures, roofed with steel sheets.
191
DDGM has constructed a good quality housing, recreation, and dining hall facility, called “Tres Palmas’’, in the town of San José de Gracía, which is situated in the Rio Grande River valley (Figure 151). Buildings are constructed of concrete blocks and all are designed for the tropical climate. This housing area is mainly for salaried employees and their families, and there are more than 50 employees housed in the facility. In addition, DDGM rents numerous houses in the village of San José de Gracía, as well as a local hotel, where about 30 employees are housed.
Mexican government medical services (Servicios de La Secretaría de Salúd) are close by the operation in the villages of El Camerón (first aid), and Nejapa de Madero (hospitalization, surgery, etc.). DDGM has an ambulance at the mine site available to transport injured or sick employees to one of these facilities.
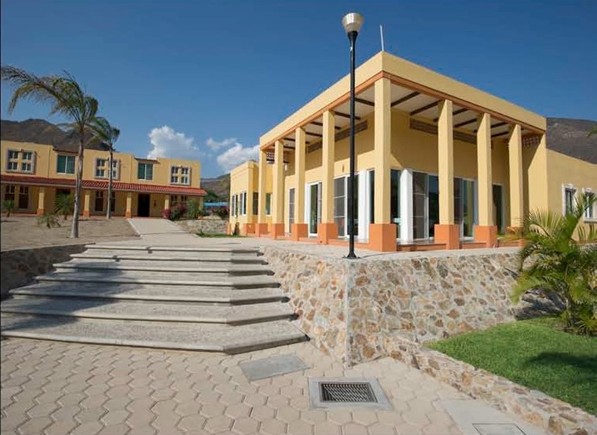
Figure 15-3: Recreation and Dining Hall Facility for Oaxaca Mining Unit (Tres Palmas) in the Town of San José de Gracia.
In 2015, DDGM began construction of a permanent core storage facility to store the thousands of meters of diamond drill core collected during past drilling programs (Figure 154). The core storage facility is located near the Exploration Office, above the Aguila open pit and near the DDGM Processing Facility.
192
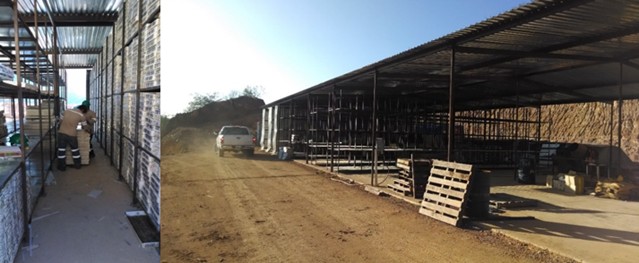
Figure 15-4: Core Storage Facility for the Arista Project.
The telecommunications service is rented from Telefonos de México SAB de CV (“Telmex”); this company provides the Don David Mine with Internet and Telephone services in the same communication channel (optical fiber), with a contracted Business Internet Service synchronous band width of 100 MB, received through router.
These services are then distributed in the LAN by a star-type network linked by Cisco switches; in the case of distribution to the local population (with whom DDGM shares the internet service) and to the mine camp, it is done through Airfiber wireless links in a 2.4 GHZ band, mounted on communication towers.
In the case of the underground mine, IP telephone and network services are distributed through optical fiber to the levels where the operation requires it.
The main communication on the ramp and levels inside the mine is done through a Leaky Feeder radio system, it is a communication system in a VHF band, which is distributed through a special coaxial cable that distributes communication from the base to all wired areas. Due to operational demands, two communication channels are managed, channel 9 exclusively for traffic and channel 8 for operations.
The telephone system is received at the SITE by means of an E1 service, it is connected to an IP switch that distributes the service to 107 extensions.
15.11Opinion of Qualified Person
Infrastructure required to support the LOM is in place and is operational. The filtration plant and dry stack facility was completed in 2022 providing sufficient space for LOM requirements.
193
16MARKET STUDIES AND CONTRACTS
Since 2010, DDGM has produced and sold doré containing gold and silver and metal concentrates that contain gold, silver, copper, lead and zinc from the Arista and Alta Gracia projects of the Don David Gold Mine. Shipments of doré and concentrates are contracted to be sold to various Buyers. Sale prices are obtained based on either world spot or London Metals Exchange (“LME”) market pricing and payment terms are typical within the industry.
This practice is consistent with industry norms and can be used in mine planning and financial analysis for the Don David Gold Mine in the context of this Technical Report.
DDGM contracts for services to run the mining operations, construct projects and treat, refine and sell doré and concentrates. The costs of such contracts are accounted for in the capital and operating expenditures depending on the nature of the work performed. Contracts are negotiated and renewed as needed. Contract terms are typical of similar contracts in Mexico that DDGM is familiar with.
On April 23, 2021, a decree that reforms labor outsourcing in Mexico was published in the Federation’s Official Gazette. This new decree amends the outsourcing provisions, whereby operating companies will no longer be able to source their labor resources used to carry out the core business functions from service entities or third-party providers. Under Mexican law, employees are entitled to receive statutory profit sharing (Participacion a los Trabajadores de las Utilidades or “PTU”) payments. The required cash payment to employees in the aggregate is equal to 10% of their employer’s profit subject to PTU, which differs from profit determined under U.S. GAAP. DDGM continues to contract specialized services with registered service providers.
For the 2023 period, DDGM had a contract to refine and sell doré with Asahi Refining USA, Inc., treat and sell zinc concentrates to Metalurgica Me-Mex Penoles, S.A. de C.V. (“Penoles”), to treat and sell copper concentrates to METAGRIS.A DE C.V. (a subsidiary of Glencore or “Glencore”), and to treat and sell lead concentrates to Trafigura Mexico, S.A. de C.V (a subsidiary of Trafigura Group Pte. Ltd. or “Trafigura”).
Concentrates produced at DDGM are transported to our contracted customers on highway trucks operated by Sección 02 del Sindicato de Trabajadores de la Construcción, Similares y Conexos del Estado de Oaxaca, C.T.M. (“C.T.M.”).
The zinc contract with Penoles was awarded in 2020, for the period January 1, 2021 to March 31, 2024. Treatment charges are based on spot and benchmark prices. Penalties are assessed if Cadmium, Silica or Iron exceed an agreed tolerance.
The copper contract with Glenore was awarded in 2020. Terms for treatment and other charges are negotiated annually and most recently for the period January 1, 2023 to March 31, 2024. Penalties are assessed if Selenium, Arsenic, Antimony, Lead and Bismuth exceed an agreed tolerance.
The lead contract with Trafigura was awarded in 2022. Terms for treatment and other charges is for the period January 1, 2023 to March 31, 2024. Penalties are not assessed unless any element is materially outside the typical specifications.
The sales contract for all concentrates is combined with the smelting and trade agreements. Representatives and umpires provide settlement assistance services from time to time. DDGM has arranged financially settled forward contracts for approximately 90% of provisional sales. Pricing is based on the market price one month after delivery to the warehouse (M +1). Rates and charges are within industry norms.
16.4Commodity Price Projections
Since 2010, DDGM has produced and sold doré containing gold and silver and metal concentrates that contain gold, silver, copper, lead and zinc from the Arista and Alta Gracia projects of the Don David Gold Mine. Shipments of doré and concentrates are contracted to be sold to various Buyers. Sale prices are obtained based on either world spot or London Metals Exchange market pricing and payment terms are typical within the industry. This practice is consistent with industry norms and can be used in mine planning and financial analyses for the Don David Gold Mine in the context of this Technical Report.
For the purpose of estimating the Mineral Reserves and Mineral Resources in this report, the QP utilized prices based on conservative estimates (“Resource & Reserve Price Deck”) which closely approximate to the average median consensus prices for each of the five years starting 2024 through 2028 as provided by the Bank of Montreal in June 2023.
194
The median price was based on the price estimates contributed by 38 participating financial institutions.
The prices were subsequently compared to the actual 2023 closing spot price as at September 29, 2023 and the 36-month average as at August 28, 2023 and as per published exchanges (Comex for precious metals and London Metal Exchange (“LME”) for base metals) to ensure the prices used for the Mineral Resources and Mineral Reserves were still considered to be reasonably conservative estimates. These metal prices are the same used in the company’s Back Forty Mine Project S-K 1300 issued on October 26, 2023.
Table 16-1: 2023 Resource and reserves metal prices.
Metal |
Measure |
Base Case |
36-month average (as of August 28, 2023) |
Spot Price (As of September 29, 2023) |
Au |
$/oz |
1,800 |
1,841 |
1,850 |
Ag |
$/oz |
23.30 |
23.70 |
22.20 |
Cu |
$/lb |
3.90 |
3.95 |
3.70 |
Zn |
$/lb |
1.25 |
1.39 |
1.18 |
Pb |
$/lb |
0.95 |
0.97 |
1.02 |
For the Economic Analysis, the QP utilized the median consensus prices for each of the four years starting 2024 through 2027 as provided by Bloomberg’s consensus commodity price forecast as at February 27, 2024. The 2027 consensus was used for the remaining life of mine. The Economic Analysis Price Deck is set forth in the below table:
Table 16-2: Consensus metal prices 2024-2028.
Metal |
Measure |
2024 |
2025 |
2026 |
2027 |
Au |
$/oz |
2,040 |
2,050 |
1,900 |
1,800 |
Ag |
$/oz |
24.25 |
24.40 |
25.00 |
24.25 |
Cu |
$/lb |
3.90 |
4.10 |
4.20 |
4.30 |
Zn |
$/lb |
0.96 |
0.97 |
0.98 |
1.00 |
Pb |
$/lb |
1.15 |
1.20 |
1.20 |
1.25 |
The actual metal prices can change, either positively or negatively, from both the Resource and Reserve Price Deck and the Economic Analysis Price Deck. If the assumed metal prices are not realized, this could have a negative impact on the operation’s financial outcome. At the same time, higher than predicted metal prices could have a positive impact. Gold equivalencies are determined by taking the Resource and Reserve Price Deck for gold and silver and converting them to a gold equivalent ratio for the period (average is 82.5 silver: 1 gold).
The QPs have reviewed the information provided by GRC on marketing, contracts, concentrate sales and commodity price projections. The QPs note that the information provided is consistent with the source documents used, and that the information is consistent with what is publicly available on industry norms. The information can be used in mine planning and financial analysis for the Don David Gold Mine in the context of this Report.
Metal price assumptions used in the Economic Analysis (Section 19 of this report) are based on the Economic Analysis Price Deck (refer to Section 16.4) for gold, silver, copper, lead and zinc. The actual metal prices can change, either positively or negatively from the Economic Analysis Price Deck. If the assumed metal prices are not realized, this could have a negative impact on the operation’s financial outcome. At the same time, higher than predicted metal prices could have a positive impact. QPs have reviewed the information provided by GRC on marketing, contracts, concentrate sales and commodity price projections. The QPs note that the information provided is consistent with the source documents used, and that the information is consistent with what is publicly available on industry norms. The information can be used in mine planning and financial analyses for the Don David Gold Mine in the context of this Report.
195
17ENVIRONMENTAL STUDIES, PERMITTING, PLANS, NEGOTIATIONS OR AGREEMENTS WITH LOCAL INDIVIDUALS OR GROUPS
17.1.Environmental Compliance and Considerations
Following the mining, milling and exploration activities, DDGM is subject to all Mexican federal, state, and local laws and regulations governing the protection of the environment, including laws and regulations relating to the protection of air and water quality, hazardous waste management and mine reclamation as well as the protection of endangered or threatened species. Potential areas of environmental consideration for mining companies include but are not limited to acid rock drainage, cyanide containment and handling, contamination of watercourses, dust and noise.
All mining and environmental activities in México are regulated by the Dirección General de Minas (“DGM”) and by the Secretaría de Medio Ambiente y Recursos Naturales (“SEMARNAT”), both representing the Mexican Federal Government, under the corresponding laws and regulations. DDGM's mining operations are subject to environmental regulation by SEMARNAT. Regulations governing the advancement of new projects or significant changes to existing projects require an environmental impact statement, known in Mexico as a Manifiesto Impacto Ambiental (“MIA”). DDGM is also required to submit proof of local community support for a project to obtain final approval.
The DDGM operations in Mexico operate under a unique environmental license (“LAU”), which covers the environmental impact and risk of atmosphere emissions hazardous waste production and treatment. This environmental license was issued after approval of the Evaluación del Impacto Ambiental (“EIA”). Also, special permits are issued for certain types of expansions, tailings dams, etc.as required.
DDGM obtained various permits for surface and underground water use and discharge. The permissions are granted by the Comisión Nacional del Agua (“CONAGUA”), an administrative and technical advisory branch of SEMARNAT. CONAGUA administers national waters, manages, and controls the country's hydrological system, and promotes social development.
DDGM currently operates under the permits and status as indicated in Table 171 and Table 172. The document description and code are based on the information contained in the documents registered with the appropriate authority. Table 173 defines the codes used to describe the permits outlined in Table 171 and Table 172. The El Aire concessions renewal is complete, the documents were registered and DDGM is waiting for renewal confirmation from SEMARNAT. The Alta Gracia project concession is not active at the moment and all permit applications are on hold.
196
Table 17-1: Don David Mine Environmental Permits and Issuing Agencies for Arista.
ARISTA PROJECT | |||||||
PERMIT NUMBER |
DESCRIPTION |
CODE |
AREA |
CONCESSIONS |
DATE |
EXPIRATION |
STATUS |
|
SEMARNAT-SGPA-DIRA- 049-2008 SEMARNAT-SGPA-DIRA- 413-2008 SEMARNAT-SGPA-DIRA- 1212-2009 SEMARNAT-SGPA-DIRA-716-2012 SEMARNAT-UGA-1312-2019 |
Process plant Environmental Impact permit |
AIA |
9.4 ha |
El Aguila. |
2008 |
2024 |
Full compliance |
|
SEMARNAT-SGPA-AR- 1246-2008 SEMARNAT-SGPA-AR- 0654-2008 |
Process plant Land Use Modification permit |
ACS |
9.4 ha |
El Aguila. |
2008 |
2024 |
Renewal in progress |
SEMARNAT-SGPA-DIRA- 1010/2008 |
TSF phase I-II Environmental Impact permit |
AIA |
12.1 Ha |
El Aguila |
13/11/2008 |
2016 |
Renewal in progress |
|
SEMARNAT-SGPA-AR-0390-2009 SEMARNAT-SGPA-AR-0800-2011 |
Open pit Land Use Modification Permit |
ACS |
9.186 ha |
El Aguila |
07/06/2012 |
05/03/2026 |
Full compliance |
|
SEMARNAT-SGPA-DIRA- 1310-2009 SEMARNAT-SGPA-DIRA- 1423-2011 |
Open pit Environmental Impact permit |
AIA |
10.5297 ha |
El Aguila |
06/03/2018 |
05/03/2026 |
Full compliance |
|
SEMARNAT-SGPA-DIRA- 474-2010 SEMARNAT-SGPA-DIRA- 858-2010 |
UG access ramp Environmental Impact permit. |
AIA |
6.3 Ha |
El Aire |
18/05/2010 |
2021 |
Full compliance pending renewal confirmation from SEMARNAT |
SEMARNAT-SGPA-AR- 1825/2010 |
UG access ramp Land Use Modification permit |
ACS |
2.44 ha |
El Aire |
01/11/2010 |
2021 |
Full compliance Renewal in progress |
SEMARNAT-SGPA-DIRA- 035-2012 |
“Tepetatera 4” Environmental Impact permit |
AIA |
4.0 Ha |
El Aire |
11/1/2012 |
2014 |
Full compliance |
SEMARNAT-SGPA-UGA-1304-2015 |
“Tepetatera 5” and Robbins Environmental Impact permit |
AIA |
2.1208 Ha |
El Aguila |
18/09/2015 |
18/01/24 |
Full compliance |
SEMARNAT-SGPA-DIRA- 152-2010 |
“El Águila” Environmental Impact Preventive Report |
AIP |
2,062.5 Ha |
El Chacal, el Pilón ,Pitayo 3, and el Pitayo 4. |
08/04/2010 |
NA |
Exploration in process |
|
20/EV-0167/01/10 20/HR-0142/04/21 20-PMG-I.2005-2016 20-PMM-I-0151-2016 |
Hazardous waste management permits |
GIR |
**** |
El Aguila |
2010 |
2026 |
Full compliance |
|
05OAX137811/22FADA13 05OAX137811/22FSDA16 |
Underground water use and treated wastewater discharges permit |
DIV |
150, 000 m3/year |
El Aguila |
27/07/2015 |
30/09/2024 |
Full compliance |
|
SEMARNAT-SGPA-DMIC-039-2017 20/COW0151/06/21 |
Environmental License (LAU in Spanish) |
LAU |
This is a global report of all environmental permits |
El Aguila |
15/11/2017 |
NA |
Full compliance |
|
SEMARNAT.SGPA-DIRA-1514-2014 SEMARNAT.SGPA-UGA-1685-2017 |
TSF phase 3 and ampliation Environmental Impact Permit |
AIA |
16.7022 ha |
El Aguila |
04/10/2017 |
31/08/2022 |
Full compliance |
|
SEMARNAT.SGPA-AR-1781/2014 SEMARNAT.SGPA-AR-1551-2017 |
TSF phase 3 and ampliation Land Use Modification Permit |
ACS |
11.54 ha |
El Aguila |
03/08/2017 |
15/08/2018 |
Full compliance |
SEMARNAT-UGA-1469-2019 |
Environmental impact No requirement for “Horno de cal” exploration project |
NRIA |
1 drilling site |
El Aguila |
28/10/2019 |
2024 |
Exploration in process |
SEMARNAT-UGA-1470-2019 |
Environmental impact No requirement for “Cerro Colorado” exploration project |
NRIA |
1 drilling site |
El Águila |
28/10/2019 |
2024 |
Exploration in process |
197
Table 17-2: Don David Mine Environmental Permits and Issuing Agencies for Alta Gracia.
ALTA GRACIA PROJECT | |||||||
PERMIT NUMBER |
DESCRIPTION |
CODE |
AREA |
CONCESSIONS |
DATE |
EXPIRATION |
STATUS |
20/IP-0002/11/10/SEMARNAT-SGPA-DIRA- 844-2010 |
Environmental Impact Preventive Report for the Alta Gracia Exploration Area |
AIP |
67.45 Ha |
La Herradura and David Fraction 1. |
23/11/2010 |
NA |
Exploration in process |
SEMARNAT-SGPA-UGA-2411-2015 SEMARNAT-UGA-1313-2019 |
Environmental Impact for Alta Gracia project |
DIV |
1 waste rock dump 651.73 m2 no change in land use 13 blasthole Mining |
Alta Gracia project |
15/02/16 |
16/07/2018 31/03/2021 |
Full compliance |
SEMARNAT.SGPA-UGA-AR-1411-2017 |
Environmental Impact for Tepetatera Alicia |
AIA |
0.337 ha |
Alta Gracia Project |
10/07/2017 |
14/01/2018 |
Full compliance |
SEMARNAT.SGPA-AR-0682-2017 |
Environmental Impact for exploration project “Camino 10 Alta Gracia” |
AIA |
0.179 ha |
Alta Gracia project |
27/04/2017 |
27/04/2018 |
Full compliance |
SEMARNAT-SGPA-DIRA-0318-2017 |
Environmental impact No requirement “Alta Gracia phase II” exploration project |
NRIA |
14 drilling sites |
Alta Gracia project |
16/06/2017 |
2024 |
Exploration in process |
SEMARNAT-SGPA-UGA-0484-2018 |
Environmental impact No requirement “Alta Gracia phase III” exploration project |
NRIA |
3 drilling sites |
Alta Gracia project |
31/05/2018 |
2024 |
Exploration in process |
SEMARNAT-SGPA-UGA-0485-2018 |
Environmental impact No requirement “Alta Gracia Zona Victoria” exploration project |
NRIA |
3 drilling sites |
Alta Gracia project |
31/05/2018 |
2024 |
Exploration in process |
SEMARNAT-UGA-1468-2019 |
Environmental impact No requirement “Trenes phase II, Barreno Capilla Alta Gracia” exploration project |
NRIA |
3 drilling sites |
Alta Gracia Project |
28/10/2019 |
2024 |
Exploration in process |
198
Table 17-3: Description of Information and Codes for DDGM’s Environmental Documents.
Code |
Description |
AIA |
Environmental Impact Authorization |
ACS |
Land Use Change Authorization. |
AIP |
Exploration Preventive Report Authorization. |
ETJ |
Technical Justification Study (land use change study) |
MIA |
Environmental Impact Statement (study for environmental impact valuation) |
IP |
Preventive Reports (exploration mining claims) |
ERA |
Environmental Risk Valuation |
PPE |
Plans, Programs and Studies |
PFP |
PROFEPA (Documentation related to administrative records we have with Profepa) |
GIR |
Waste (Information related to integrated waste management) |
DIV |
Miscellaneous. |
NRIA |
Environmental Impact No requirement |
LAU |
Environmental Single License |
The process plant, underground mine, and mine camp have individual sewage treatment plants. The treatment systems are biochemical tanks and filtration. The treated water is returned to the soil through an absorption well.
All waste generated in the unit is separated, characterized, and disposed of according to national and international standards in temporary warehouses where a supplier with the corresponding accreditations will oversee its final disposal according to the law. Those wastes with any commercial value are also separated in order to reintegrate them into the production system, seeking to insert them into the circular economy process. This includes some waste generated in the communities, which we also support in the collection and final disposal.
DDGM has established strict procedures of operation and monitoring water and air quality following accepted standards.
The process plant, underground mine, and mine camp have individual sewage treatment plants. The treatment systems are biochemical tanks and filtration. The treated water is returned to the soil through an absorption well. This treatment is for service water (toilets, dining room, bedrooms). Discharge is authorized by CONAGUA.
The tailing facilities require primary environmental and operation control. Water in the tailings facility is recycled to the Arista processing plant.
Some water pumped from the underground workings is discharged at the surface into decantation ponds. Special attention is focused on reducing the possibility of an incident regarding any potential contamination. DDGM has established strict protocols including:
| ● | Quarterly testing of water into rivers near the tailings dams for pollutants. |
| ● | Testing of discharge sewage pollutants. |
| ● | Testing of running water in the intermittent streams within the property for mineral elements and contaminants. |
| ● | Testing of the combustion gases from laboratory chimneys and foundry and lead exposure to the lab's personnel. |
199
The sampling of surface waters in rivers and creeks is conducted every three months, and underground water sampling is completed every three months. The water samples are sent for analysis to an external laboratory (Laboratorios ABC, Mexico City), which has been accredited by the Mexican Entity of Accreditations. (“EMA”).
For monitoring of air quality, suspended particulate matter monitoring continues at the unit and during 2023, air quality monitoring was implemented in the communities of San Jose de Gracia and San Juan Guegovache. The objective is to have evidence that the operation does not generate air quality impacts for the community.
DDGM is required to prepare a mine closure plan for the possible future abandonment of the Arista and Alta Gracia Projects. In compliance with environmental obligations, DDGM is required to consider two levels of care:
| ● | Works and actions that are specifically identified in the current environmental regulations, or in case of modifications or new regulations arising and, |
| ● | Those terms and conditions listed in the permissions, registers, or certificates, as established in the authorization in terms of environmental impact and land use change (CUS), and although not specifically identified in any order, are the result of case-specific analysis. |
The environmental authority in all cases, however, makes it clear that individual or project specific conditions are additional to what the legislation requires. In this case, it is necessary to maintain constant reviews and updates of the information related to either new regulations or other legal instruments that affects DDGM, including that Mexican law principle is such that the lack of knowledge does not imply exemption from its obligation.
The environmental study presented here is mainly an exercise in self-environmental evaluation involving monitoring and systematic review of the facilities and business processes, in terms of their environmental practices and procedures, in order to check the level of compliance with both matters governed by the laws, regulations, and existing standards, that affect the good performance and process improvement in the permits that have been granted by SEMARNAT, PROFEPA and CONAGUA.
To be compliant, any mine closure activities should broadly consist of the following:
| ● | Prevent erosion in all areas where authorized land use changes involve placing containment structures such as buttresses, retaining walls, rock gabions and balances. There shall be a buffer zone of native vegetation around the perimeter of polygons of various facilities such as Processing Plant, Open Pit Mine, Plant Access Road, Ramp, waste dumps (No.’s 3 & 4, etc..), at least a 4.0 meters width. |
| ● | Consider within the main points, installing wells to monitor water quality in the pits and tailings dams, in order to analyze whether the runoff from these areas alter the quality of surface water, soil, or subsoil in the rainy season. Perform technical and environmental examinations that determined the location of these wells, likewise, attach the graphic material showing its location relative to mine workings. Integrate the results of the trimestral monitoring of the wells in the Annual Technical Report of Environmental Monitoring, and finally, record the results of these actions in the field logbook including description of activities. |
| ● | Determine the Ecological Restoration Program plans and actions for the conservation of soil, which must be proposed according to the parameters that the petitioner stated in Soil Management Program and considering the Ecological Restoration Program; must conform to functional and operational integration in space and time to provide continuity-discontinuity of the processes of nature and thus, improve the basic benefit-cost ratio to ensure the achievement of sustainable development. |
| ● | Maintain the equipment use in good condition in such a way that the emissions are within permissible limits. Maintain the equipment units to prevent spills on the floor, draining or dumping into water bodies present in the area, including waste fats, oils, solvents and any substance or hazardous waste encountered at different stages of the project. |
200
17.4.1 2022 Estimate of Current Closure Costs
For 2023, Golder Consulting has prepared a Mine Closure Plan and Reclamation Budgets. The closure cost estimate includes funds for covering the tailings ponds, waste rock stockpiles (tepetateras), and for securing, and cleaning up the other surface and underground mine facilities. In December 2023, Golder provided an assessment of the closure costs liabilities that exist at the Arista Mine and Alta Gracia Projects as of the end-of-year 2023 and prepared a schedule for the direct costs of the various tasks in accordance with a mine plan provided by DDGM.
The total estimated closure and reclamation cost for the Arista Mine according to the information provided in 2023 subject to assumptions, exclusions and caveats provided in the Technical Memorandum provided by the consultant WSP Golder amounts to $12.0 million (excluding taxes). This amount was calculated with the assumptions of the technical information available at the time of the assessment. The total estimated closure and reclamation cost for the Alta Gracia Project is estimated to be 11.3 million Mexican Pesos (MXP), which equates to approximately $0.6 million.
WSP Golder Consulting’s conceptual closure and reclamation cost summaries for the Arista mine and the SRK estimation for Alta Gracia projects are in Table 174 and Table 175.
Table 17-4: Conceptual Mine Closure and Reclamation Cost Summary for the Arista project.
DDGM ARO 2023 Closure Costs, as of November 2023 |
|
|
Closure Components |
Scheduled Closure (2027) |
|
Infrastructural aspects |
$3,324,908 |
|
Mining aspects |
$4,335,764 |
|
General surface reclamation |
$289,957 |
|
Water management |
$24,534 |
|
Sub-Total 1 |
$7,975,163 |
|
Post-Closure Aspects |
|
|
Surface water monitoring |
$253,500 |
|
Groundwater monitoring |
$770,000 |
|
Rehabilitation monitoring (Included in 5.4) |
$ - |
|
Rehabilitation Monitoring & Care and maintenance |
$523,971 |
|
Contingencies for post-closure aspects |
$311,294 |
|
Sub-Total 2 |
$1,867,765 |
|
Additional Allowances |
|
|
Preliminary and general |
$1,054,729 |
|
Contingencies |
$1,054,729 |
|
Additional studies |
$ - |
|
Sub-Total 3 |
$2,109,458 |
|
Grand Total |
$11,952,386 |
|
201
Table 17-5: Conceptual Mine Closure and Reclamation Cost Summary for the Alta Gracia Project.
ACTIVITY |
COST 2022 |
COMMENTS |
1.0 Direct Costs |
|
|
1.1 Support Facilities Area |
|
|
Revegetate and maintain disturbed areas |
14,776 |
Considering 1 Ha as total area |
Slope stabilization (pits, waste dumps, haulage, |
187,222 |
Considering 1 Ha as total area |
1.1 Subtotal |
201,998 |
|
1.2 Haul Road and Ancillary Area |
|
|
1.2 Subtotal |
1,588,963 |
Assuming 7.914 kilometers of |
1.0 Total |
1,790,961 |
|
2.0 Indirect Costs |
|
|
1-year owner's supervision |
3,500,000 |
|
Contingency and contractor profit |
2,500,000 |
|
Permitting support (amendments) |
3,500,000 |
|
2.0 Total |
9,500,000 |
Assuming indirect costs and |
Grand Total |
11,290,961 |
|
Notes: One or more EIA approvals specifies a 5-year post-closure monitoring period. The post-closure monitoring effort for Alta Gracia will be covered by Arista.
The estimated costs are currently based on changes on disturbed areas. The volume costs related to earthworks and distances to borrow sources, if any, are not currently considered.
17.5.Ejido Lands and Surface Rights Acquisitions
Surface lands of the Don David Mine mining properties are Ejido lands (agrarian cooperative lands granted by the federal government to groups of Campesinos [farmers] pursuant to Article 27 of the Mexican Constitution of 1917). Prior to January 1, 1994, Ejidos could not transfer Ejido lands into private ownership. Amendments to Article 27 of the Mexican Constitution in 1994 now allow individual property ownership within Ejidos and allow Ejidos to enter into commercial ventures with individuals or entities, including foreign corporations.
The Ejidos have legal status and their own patrimony, they are owners of the lands that were endowed to them by sentence, decrees, or presidential resolution. As well as those that they have acquired by any other title.
The Ejidos operate in accordance with their internal regulations which must be registered in the National Agrarian Registry and must have the general basis for the economic and social organization of the Ejido that they freely adopt, as well as rules for the use of the lands of common use.
The exploitation of land for common use may be adopted by an Ejido when the assembly (supreme organ of the Ejido) so decides, in which case the provisions relating to the way of organizing work and the exploitation of resources must be established in advance.
Mexican legislation recognizes mining as a generally superior land use to agriculture. However, the agrarian law recognizes the rights of the Ejidos and empowers them to enter into contracts and agreements that have as their object the use or enjoyment of third parties for the use of parceled or common use lands, these contracts can have a duration not longer than thirty years extendable.
For the conclusion of these contracts, a representative of the Agrarian Prosecutor's Office must be present, as well as a Public Notary, to guarantee compliance with the contract or agreement that is made.
In case of any breach by any of the parties, the agrarian court will oversee resolving.
202
DDGM has established agreements for the exploration and exploitation of common use lands with the Ejido San Pedro Totolapam and with the Ejido lands that allow current and proposed operations for the modification of the surface when necessary for the exploration activities and mining operations of DDGM.
While Mexican law recognizes mining as a land use generally superior to agricultural, law also recognizes the rights of the Ejidos to compensation in the event mining activity interrupts or discontinues their use of the agricultural lands. Compensation is typically made in the form of a cash payment to the holder of the agricultural rights. The amount of such compensation is generally related to the perceived value of the agricultural rights as negotiated in the first instance between the Ejidos and the owner of the mineral rights. If the parties are unable to reach agreement on the amount of the compensation, the decision will be referred to the government.
DDGM has established surface rights agreements with several neighboring communities with the most significant agreement being with the San Pedro Totolapam Ejido and the individuals impacted by current and proposed operations which allow disturbance of the surface where necessary for DDGM’s exploration activities and mining operations.
17.6.Social or Community Impact
DDGM considers nearby communities as essential stakeholders; as such, the company pays special attention to their problems and needs. A good neighbor and open-door policy characterize the relations with the communities inside and around the area of operations. Our Community Relations department interacts with the local authorities frequently.
DDGM has a policy of social responsibility based on community development. The tactic used to achieve this strategic principle is focused on:
| ● | Encouraging sustainable self-development of communities for a positive legacy. |
| ● | Systematically promoting human rights quality of life conditions that ensure ongoing successful operation of the company in the locality. |
| ● | Respect for the uses and customs of the communities, as well as the protection of the environment. |
DDGM follows internal due diligence with protocols and procedures intended to channel the demands and grievances of the local communities, assess, evaluate, and prioritize their needs. All donations are coordinated by the communities involved and are destined to programs that improve their quality of life. DDGM is interested in maintaining a social license to operate by working together with the communities, providing communication support in resolving problems, promoting good practices in social solidarity through a work plan with the localities, and aiming for sustainability in all its actions.
DDGM works respectfully and in coordination with the established leaders in the surrounding communities, local authorities, educational institutions, and government agencies to achieve sustainable development. The company promotes education, sports, culture, health, and environmental care.
Together with the municipal and state governments, DDGM promotes cultural activities in the communities. The company has a cultural center open to the public where workshops on handicrafts, music, and painting occur. In addition, DDGM encourages the realization of social events (e.g., festivals, theatre plays, and cinema for children and adults), and facilitates the transportation of students to civic and cultural events and sports competitions.
Our community relations department assists with garbage collection services to contribute to environmental sanitation and prevent gastrointestinal diseases and a recycling station. The company also supplies medical services and medicines in cases of emergency or whenever community service is not available.
In 2017, DDGM was awarded the distinction of being a Socially Responsible Company (“ESR”) by the Mexican Center for Philanthropy (“Cemefi”) and the Mexican Alliance for Corporate Social Responsibility (“AliaRSE”). This certifies that the company is an organization committed voluntarily and publicly to social responsibility as part of its culture and business management strategy.
In 2019, DDGM contributed with supplies for the construction and opening of a San Pedro Totolápam Community hospital.
DDGM conducted a vision care campaign in 2019 in coordination with the organization "Manos de Ayuda" (helping hands). The collaboration had as an objective providing low-cost eyeglasses to senior citizens.
DDGM covered the cost of material and labor to run water from a source located in Horno de Cal, to the community of San José de Gracia for the use and benefit of its inhabitants.
203
17.7.Community Actions for Social Welfare and Development
17.7.1. Education
DDGM promotes progress in education, motivating young people to continue with their studies, allocating monthly financial contributions aim at scholarships distributed according to the educational level in San Jose de Gracia and San Pedro Totolapam.
Other initiatives also include donation of school furniture to the Primary School of San Juan Guegoyache, Secondary School of San Pedro Totolapam and group of Initial Education of children in San Jose de Gracia.
The 2023 Scholarship provided for the community are described in the table below.
Table 17-6: 2023 Scholarship provided for the community.
COMMUNITY |
ELEMENTARY SCHOOL |
MIDDLE SCHOOL |
HIGH SCHOOL |
UNIVERSITY |
TOTAL |
ANNUAL |
San José de Gracia |
35 |
10 |
13 |
9 |
67 |
$ 61,550 |
San Pedro Totolapam |
7 |
8 |
9 |
18 |
42 |
$ 54,857 |
17.7.2. Infrastructure
Social development of the communities where we have a presence is essential for the company, and our social programs are designed to meet the needs of each community.
| ● | Support was granted for the acquisition and installation of a repeater and antenna for radio communication, thus contributing to strengthening the telecommunication infrastructure with an investment of $4,571. The radios are for use by the authority of the municipality of San Pedro Totolapam, the ejido of San Pedro Totolapam and the communal property authority, they will be used for emergency response in the community and on the road, surveillance, as well as improving the organization and attention to any eventuality scheduled or not in the community. |
| ● | As part of the support for infrastructure projects and productive projects in San Juan Guegoyachi, materials were delivered for the construction of a community kitchen that will be used for community cooks to cook during festivities and community events. The investment is equivalent to $15,735. |
| ● | DDGM participated by donating a portion of electrical equipment and specialized labor for the repair of drinking water pumping equipment in the community of Nejapa de Madero, thus contributing to guaranteeing access to the vital liquid among its residents. |
In response to the request issued by the El Camarón Telesecundaria School, it was supported with part of the electrical material and specialized personnel for the installation of a charging center at the school, which will allow them to have the proper installation of their air conditioning equipment. and other electrical equipment.
17.7.3. Cultural and Social Activities
Every year, DDGM carries out social activities for the celebrations of the “Dia de Los Reyes” (Epiphany), Children´s Day and Mother´s Day in host communities, such as San José de Gracia, San Pedro Totolapam, San Juan Guegoyache, Las Margaritas, Santo Tomas de Arriba and San Luis del Rio. In 2023 a total investment of $31,287 were distributed by DDGM in these communities.
| ● | DDGM contributes with in-kind support for the development of some cultural and traditional activities related to the local festivities in San José de Gracia, San Pedro Totolapam, San Juan Guegoyache, Santo Tomás de Arriba, Las Margaritas, Nejapa de Madero, El Camarón, Las Animas y La Baeza as the main local festivities with an investment of $8,613. |
204
| ● | In San José de Gracia, San Pedro Totolapam and San Juan Guegoyache we participated and supported with sweets, drinks and bread for the "comparsas" or tours in the streets in celebration of the Day of the Dead, the investment was $1,360. |
| ● | In San José de Gracia and San Pedro Totolapam, summer courses were held for the children of the communities; mathematics, English, environment, reading, cooking and painting classes were taught. 102 children attended the summer courses and the investment was $5,844. |
| ● | Derived from a biodiversity baseline that was carried out in the municipality of San Pedro Totolapam, some materials were generated to disseminate knowledge of the biodiversity that exists in the area of influence of the mining unit, for which a presentation of the Biodiversity guide for students from primary to high school in San Pedro Totolapam, 250 students and 50 teachers participated, who appreciated the importance of the fauna of the region. |
17.7.4. Health
Continuing with the actions for the prevention of the COVID 19 virus, as part of the community assistance actions of 2022, DDGM donated to the Municipality of San Pedro Totolapam material to reinforce preventative actions. Consisting of masks, sanitizing liquid for the sanitization filters placed in each community and antibacterial gel in the order of $3,200.
As part of the actions aimed at health care, DDGM held a dental day in San Juan Guegoyachi, providing dental material and providing consultations to the general population, serving 27 people. Additionally, 17 primary school children received a talk to learn the brushing technique and fluoride was applied to them.
17.7.5. Employment in Host Communities
The company's commitment to investment in the community is presented below on Table 177:
Table 17-7: Full-time, Direct Employees for the Oaxaca Mining Unit by Community.
No. |
Community |
Contribution 2021 |
Contribution 2022 |
Contribution 2023 |
1 |
Community Assembly |
$ 377,634 |
$ 442,034 |
$ 636,635 |
2 |
San José de Gracia Agency |
$ 60,000 |
$ 60,000 |
$ 60,000 |
3 |
San Pedro Totolapam Municipio |
$ 56,366 |
$ 55,442 |
$ 71,620 |
4 |
San Pedro Totolapam Ejido |
$ 187,270 |
$ 238,173 |
$ 234,534 |
5 |
San Juan Guegoyache |
$ 71,762 |
$ 76,730 |
$ 92,170 |
6 |
San Lujs del Rio |
$ 9,600 |
$ 6,400 |
$ 0 |
7 |
Santo Tomás de Arriba |
$ 13,000 |
$ 6,500 |
$ 17,714 |
|
TOTAL USD |
$ 775,631 |
$ 894,981 |
$ 714,349 |
17.8.Opinion of Qualified Person
It is the opinion of the QPs that the appropriate environmental, social and community impact studies have been conducted to date. DDGM has maintained the necessary permits that are prerequisites for construction of the Project infrastructure and the maintenance of mining activities.
205
The support for capital and operating costs are based on realized costs, quotations, and estimates in 2023 dollars. No inflation factors or changes to exchange rates have been used in the economic projections. The estimated capital and operating costs are to a feasibility level of accuracy (within 15%) and include a contingency of 3%.
18.1.Life-of-Mine Capital Costs
A summary of total estimated capital expenditures for the Don David mine is presented in Table 181. There are no growth capital projects currently planned for DDGM. There is growth exploration planned as shown in the table below and discussed in exploration recommendations of this Technical Report. The most significant capital to be incurred at DDGM relates to the underground development which is critical for advancing mining efforts. Concerning sustaining activities, exploration includes drift development, infill drilling, underground and surface exploration. Capital other sustaining includes tailings dam, infrastructure, equipment, and IT costs. Concerning mine closure, details or a breakdown of the related costs can be found in Section 17.
The capital costs are based on realized costs as well as vendor and specialist quotations. A 3% contingency has been applied to these estimates to compensate for any unintentional omissions or oversights. Total estimated capital costs for the next four (4) years total $38.7 million and capital costs for the remainder of the life of mine total $40.5 million, including closure cost estimates. An exchange rate of 17.5 Mexican Pesos (“MXP”) exchange rate to 1 U.S. dollar is applied to peso-denominated costs.
Table 18-1: Don David Mine Life-of-Mine Capital Cost Summary (in thousands).
Description |
Type |
2024 |
2025 |
2026 |
2027 |
2028 |
LOM Total |
Capital |
Underground Development |
5,781 |
4,487 |
2,419 |
1,132 |
- |
13,820 |
|
Other Sustaining |
1,545 |
515 |
515 |
0 |
- |
2,575 |
|
Non-Sustaining |
- |
- |
- |
- |
- |
- |
Exploration |
Sustaining |
2,704 |
3,090 |
3,090 |
- |
- |
8,884 |
|
Non-Sustaining |
3,271 |
- |
- |
- |
- |
3,271 |
Sub-Total |
Sustaining |
10,030 |
8,092 |
6,024 |
1,132 |
- |
25,278 |
|
Non-Sustaining |
3,271 |
- |
- |
- |
- |
3,271 |
Mine Closure |
|
- |
3,423 |
3,394 |
3,394 |
175 |
11,952 |
Total Capital Costs |
|
13,300 |
11,516 |
9,417 |
4,526 |
175 |
40,501 |
Note: Mine closure LOM Total includes costs after 2028
18.2.Life-of-Mine Operating Costs
Operating costs were estimated based on evaluating the actual historical and current costs for labor, consumables and established DDGM contracts. The operating costs have a fixed and variable component. Variable components are affected by the volume of ore and waste material mined and volume of ore processed through the processing facilities.
The variable mining costs relate to ore and waste activities such as drilling, blasting, loading, and hauling, ground support, fuel, energy and maintenance. The primary fixed costs are related to labor and machinery rentals.
Processing costs are largely variable and based on actual processing costs incurred historically adjusted for current knowledge on reagent consumption at current prices and understanding of wear and replacement parts.
Overheads primarily relate to current supervisory, administrative support, insurance, community agreements, environmental studies, and compliance matters. Staff numbers are sufficient to efficiently handle the administrative, technical and management functions required for the operations. Provisions for health and safety, security, training, and other regulatory mandated functions are also included.
206
Transportation, refining and treatment charge costs relate to those costs required to sell the doré and copper, lead and zinc concentrates. These sales costs are included as deductions in the NSR calculation.
Labor is allocated to the major cost categories and makes up 26% of total operating costs. Operating and sales costs have been estimates for the LOM in Table 182. A 3% contingency has been added to some of the operating costs to compensate for any unintentional omissions or oversights.
Mining, processing, and overhead costs were based on 2023 actual costs. An exchange rate of 17.5 Mexican Pesos (“MXP”) exchange rate to 1 U.S. dollar is applied to peso-denominated costs.
Table 18-2: Don David Mine Life-of-Mine Cost of Sale Summary (in thousands).
Description |
% Costs |
Value $ per tonne milled |
Value $ per tonne milled |
|
Fixed |
Variable |
|||
Mining |
33% |
67% |
54.17 |
55.80 |
Plant |
25% |
75% |
34.27 |
35.30 |
Site G&A |
69% |
31% |
43.92 |
44.54 |
Total Mine Site Operating Cash Cost |
43% |
57% |
132.36 |
135.64 |
Transportation Cost |
0% |
100% |
17.73 |
18.26 |
Royalties |
0% |
100% |
4.14 |
4.14 |
Refining & Treatment Charges |
0% |
100% |
17.36 |
17.36 |
Total Operating Cash Cost |
24% |
76% |
171.59 |
175.40 |
207
Below is a summary of the economic viability for the DDGM Mineral Reserves, exclusive of Mineral Resources.
The Don David Gold Mine has a four-year life of mine given the Mineral Reserves as described in this report. Capital and operating costs are based on realized costs, quotations and estimates in 2023 dollars. No inflation factors have been used in economic projections. The analysis assumes metal prices applied as per the Economic Analysis Price Deck, as discussed in Section 16, over the remaining life of mine.
Don David Life-of-Mine gross sales used in the economic analysis is summarized in Table 191 and included in Table 192.
Table 19-1: Don David Life-of-Mine Gross Sales (dollars in thousands).
Description |
2024 |
2025 |
2026 |
2027 |
TOTAL |
Gold payable (oz) |
13,951 |
11,933 |
4,274 |
1,015 |
31,174 |
Gold Price ($/oz) |
$ 2,040 |
$ 2,050 |
$ 1,900 |
$ 1,800 |
$ 2,017 |
Revenue from Gold ($) |
$ 28,461 |
$ 24,463 |
$ 8,121 |
$ 1,828 |
$ 62,873 |
Silver payable (oz) |
1,194,783 |
1,228,034 |
701,638 |
447,193 |
3,571,649 |
Silver Price ($/oz) |
$ 24.25 |
$ 24.40 |
$ 25.00 |
$ 24.25 |
$ 24.45 |
Revenue from Silver ($) |
$ 28,973 |
$ 29,964 |
$ 17,541 |
$ 10,844 |
$ 87,323 |
Gold Equivalent Ounces |
28,154 |
26,550 |
13,507 |
7,040 |
75,250 |
Cu payable (tonne) |
915 |
663 |
329 |
55 |
1,962 |
Cu Price ($/lb) |
$ 3.90 |
$ 4.10 |
$ 4.20 |
$ 4.30 |
$ 4.03 |
Revenue from Cu ($) |
$ 7,870 |
$ 5,990 |
$ 3,050 |
$ 517 |
$ 17,427 |
Pb payable (tonne) |
3,300 |
2,432 |
773 |
327 |
6,831 |
Pb Price ($/lb) |
$ 0.96 |
$ 0.97 |
$ 0.98 |
$ 1.00 |
$ 0.97 |
Revenue from Pb ($) |
$ 6,984 |
$ 5,200 |
$ 1,669 |
$ 720 |
$ 14,574 |
Zn payable (tonne) |
10,252 |
7,595 |
2,541 |
1,291 |
21,679 |
Zn Price ($/lb) |
$ 1.15 |
$ 1.20 |
$ 1.20 |
$ 1.25 |
$ 1.18 |
Revenue from Zn ($) |
$ 25,992 |
$ 20,093 |
$ 6,722 |
$ 3,558 |
$ 56,365 |
|
|
|
|
|
|
TOTAL SALES |
$ 98,280 |
$ 85,710 |
$ 37,104 |
$ 17,467 |
$ 238,562 |
Based on Mineral Reserves, excluding Mineral Resources, after-taxes, the net cash flow is $1.6 million, at a discount rate of 5%, the Net Present Value (NPV) is $2.8 million. The following provides the basis of the Don David Mine LOM plan and economics.
| ● | A remaining mine life of 4 years as based on current Reserves. |
| ● | Optimized mine that assumes full depletion of Arista Reserves through 2027. |
| ● | An average operating and selling cost of $175/t milled (with a 3% contingency) |
| ● | Capital costs of $40.5 million through end of life of mine |
| ● | An exchange rate of 17.5 Mexican Pesos (“MXP”) exchange rate to 1 U.S. dollar is applied to peso-denominated costs. |
| ● | Analysis does not include any allowance for end of mine salvage value. |
208
Table 19-2: Don David Life-of-Mine Cash Flow Forecast (dollars in thousands).
Cash Flow Forecast ($ 000's) |
TOTAL |
2024 |
2025 |
2026 |
2027 |
2028-LOM |
|
Precious Metals |
Gold |
$62,873 |
$28,461 |
$24,463 |
$8,121 |
$1,828 |
$0 |
|
Silver |
$87,323 |
$28,973 |
$29,964 |
$17,541 |
$10,844 |
$0 |
Co-Product |
Copper |
$17,427 |
$7,870 |
$5,990 |
$3,050 |
$517 |
$0 |
|
Lead |
$14,574 |
$6,984 |
$5,200 |
$1,669 |
$720 |
$0 |
|
Zinc |
$56,365 |
$25,992 |
$20,093 |
$6,722 |
$3,558 |
$0 |
Net Revenue |
$238,562 |
$98,280 |
$85,710 |
$37,104 |
$17,467 |
$0 |
|
Production Costs |
Mining |
($59,340) |
($25,088) |
($20,833) |
($9,335) |
($4,084) |
$0 |
|
Processing |
($37,540) |
($15,915) |
($13,118) |
($5,948) |
($2,560) |
$0 |
|
Site G&A |
($47,537) |
($18,698) |
($16,255) |
($8,681) |
($3,903) |
$0 |
Total - Production Costs |
($144,417) |
($59,701) |
($50,205) |
($23,964) |
($10,547) |
$0 |
|
|
Transportation Cost |
($19,422) |
($8,234) |
($6,787) |
($3,077) |
($1,324) |
$0 |
|
Royalties |
($4,404) |
($1,688) |
($1,598) |
($750) |
($368) |
$0 |
Refining & Treatment Charges |
($18,464) |
($8,299) |
($6,442) |
($2,508) |
($1,215) |
$0 |
|
Total - Operating Costs |
($186,706) |
($77,921) |
($65,032) |
($30,300) |
($13,454) |
$0 |
|
Operating Surplus / (Deficit) |
$51,855 |
$20,359 |
$20,679 |
$6,804 |
$4,013 |
$0 |
|
Capital Costs |
Growth |
($3,271) |
($3,271) |
$0 |
$0 |
$0 |
$0 |
|
Sustaining |
($25,278) |
($10,030) |
($8,092) |
($6,024) |
($1,132) |
$0 |
|
Mine Closure |
($11,952) |
$0 |
($3,423) |
($3,394) |
($3,394) |
($1,742) |
Total - Capital Costs |
($40,501) |
($13,300) |
($11,516) |
($9,417) |
($4,526) |
($1,742) |
|
Employee Profit Sharing |
($599) |
($156) |
($444) |
$0 |
$0 |
$0 |
|
Net Cash Flow Before Tax |
$10,755 |
$6,903 |
$8,719 |
($2,613) |
($512) |
($1,742) |
|
|
Tax |
($9,135) |
($993) |
($5,007) |
($2,113) |
($1,022) |
$0 |
Net Cash Flow After Tax |
$1,620 |
$5,910 |
$3,713 |
($4,726) |
($1,535) |
($1,742) |
|
|
|
|
|
|
|
|
|
After-Tax NPV 5% |
$2,807 |
$5,767 |
$3,450 |
($4,183) |
($1,293) |
($933) |
|
A sensitivity analysis was performed to evaluate the resulting financial impact to free cash flow and net present value (at 5% discount) as per shown in the Economic Analysis from the application of lower metal prices, lower resource grades, increased operating & selling costs unit prices and increased capital costs. Table 193 summarizes the results of the sensitivity analysis; most scenarios apply a 10% unfavorable change and further consider the resulting financial impact to royalty and tax calculations.
209
Table 19-3: Don David Life-of-Mine Sensitivity Analysis.
Sensitivity Scenario |
Economic Analysis Value (4 Yr Avg of Price Deck) |
Sensitivity Value |
Financial Impact |
Financial Impact |
Lower Metal Prices (10%) |
||||
Gold |
$2,017/oz |
$1,815/oz |
($5.2) |
($4.9) |
Silver |
$24.45/oz |
$22.00/oz |
($7.3) |
($6.7) |
Copper |
$4.03/lb |
$3.63/lb |
($1.5) |
($1.4) |
Lead |
$0.97/lb |
$0.87/lb |
($1.2) |
($1.2) |
Zinc |
$1.18/lb |
$1.06/lb |
($4.8) |
($4.5) |
Lower Resource Grades (10%) |
||||
Gold |
1.29 g/t |
1.16 g/t |
($5.1) |
($4.8) |
Silver |
131.3 g/t |
118.1 g/t |
($7.0) |
($6.5) |
Copper |
0.26% |
0.23% |
($1.3) |
($1.2) |
Lead |
0.91% |
0.82% |
($1.1) |
($1.0) |
Zinc |
2.73% |
2.46% |
($3.7) |
($3.5) |
Increased Operating & Selling Unit Costs (10%) |
$172/t milled |
$187/t milled |
($14.8) |
($13.7) |
Increased Capital Costs (10%) |
$39.7 M |
$42.4 M |
($2.7) |
($2.6) |
Note: Operating & Capital costs exclude contingency. Operating & Selling Unit Costs further excludes unit costs relating to Royalties.
In Mexico, value added (“IVA”) taxes are assessed on purchases of materials and services and sales of products. Likewise, businesses owe IVA taxes as the business sells a product and collects IVA taxes from its customers. Businesses are generally entitled to recover the taxes they have paid related to purchases of materials and services, either as a refund or credit to IVA tax payable.
Mining entities in Mexico are subject to two mining duties, in addition to the 30% Mexico corporate income tax: (i) a “special” mining duty of 7.5% of taxable income as defined under Mexican tax law (also referred to as “mining royalty tax”) on extraction activities performed by concession holders, and (ii) the “extraordinary” mining duty of 0.5% on gross revenue from the sale of gold, silver and platinum. The mining royalty tax is generally applicable to earnings before income tax, depreciation, depletion, amortization, and interest. In calculating the mining royalty tax, there are no deductions related to depreciable costs from operational fixed assets, but exploration and prospecting depreciable costs are deductible when incurred. Both duties are tax deductible for income tax purposes. As a result, our effective tax rate applicable to the Company’s Mexican operations is substantially higher than Mexico statutory rate.
The Company periodically transfers funds from its Mexican wholly owned subsidiary to the U.S. in the form of dividends. Mexico requires a 10% withholding tax on dividends on all post-2013 earnings. According to the existing U.S. – Mexico tax treaty, the dividend withholding tax between these countries is limited to 5% if certain requirements are met. The Company determined that it had met such requirements and pays a 5% withholding tax on dividends distributed from Mexico.
210
DDGM has consolidated ownership of the area consisting of the Don David Mine. Concessions totaling 55,119 hectares (551 km2) cover numerous old mine workings and exploration targets. This includes the 18 contiguous mining concessions surrounding the Arista Project. These claims have been registered at the Dirección General de Minas under DDGM. According to the legal opinion by DDGM’s legal advisers, these mining concessions are current in legal standing.
Many old mine workings in Oaxaca have been in operation intermittently since the seventeenth century, when many of the Mexican mining districts were discovered, such as Zacatecas, Guanajuato, Fresnillo, San Martín, Taxco, Sombrerete, Tayoltita, etc. Silver and gold production from the Arista project area is unknown.
Several historic mining districts, including Rey, La Escondida, El Aguila, El Aire, Cerro Colorado, Mirador, Tapada, and other mines, are covered by mining concessions owned by DDGM.
No adjacent operating properties exist within the immediate area surrounding the Don David Gold Mine.
21OTHER RELEVANT DATA AND INFORMATION
The Qualified Persons are not aware of any other relevant data or information that has not been included in this Technical Report.
211
22INTERPRETATION AND CONCLUSIONS
22.1Property Description, Location and Ownership
The Don David Gold Mine located in the southern state of Oaxaca in México is 100% owned by GRC. DDGM acquired its first mining concessions in 2003 and has continued to acquire additional land holdings totaling 55,119 hectares within 29 mining concessions. DDGM has all the corresponding Environmental Impact Studies and permits to continue operating in accordance with Mexican Laws and Regulations. The physiography, climate and topography of the region are well understood and are amenable to the exploration, mining and recovery operations presented in this document.
In the opinion of the QPs:
| ● | GRC was provided with legal opinion that supported that the mining concessions held by DDGM for the Don David Gold Mine are valid and that GRC has a legal right to mine the deposit. |
| ● | GRC was provided with legal opinion that supported that the surface rights held by DDGM are in good standing. The surface rights are sufficient in area for the mining operation infrastructure and tailings facilities. |
| ● | GRC was provided with legal opinion that outlined royalty’s payable for the concessions held by DDGM. |
The information discussed in this section supports the declaration of Mineral Resources. Mineral Reserves and the development of a mine plan with an accompanying economic analysis.
In the opinion of the QP, the existing infrastructure, availability of staff, the existing power, water, and communications facilities, the methods whereby goods are transported to and from the mine site, and any planned modifications or supporting studies are well-established, or the requirements to establish such, are well understood by GRC and support the declaration of Mineral Resources and Mineral Reserves and the proposed mine plan. There are sufficient mineral tenure and surface rights held to support the LOM mining operations.
22.2Geology and Mineralization
The Don David Gold Mine area is dominated by volcanic rocks, of presumed Miocene age, which overlay and intrude into basement rocks consisting of Cretaceous marine sediments. Gold and silver mineralization in this district is related to volcanic domes and a volcanogenic system and is considered epithermal in character. The DDGM mineralization occurs as structurally controlled epithermal deposits in veins and stockwork zones consisting of concentrations of sulfides containing gold, silver, lead, copper, and zinc, associated with gangue minerals such as quartz, calcite, and other minor elements. Primary sulfide mineralization consists of pyrite, galena, sphalerite, chalcopyrite associated with minor amounts of argentite and silver sulfosalts.
Don David Gold Mine’s exploration efforts have been mainly focused on the Arista Project which contains the Aguila Manto, Arista and Switchback deposits, and includes the significant Arista, Baja and Soledad veins as well as multiple ancillary structures. The principal hosts of mineralization are the Arista and Switchback vein systems, which are known from drilling and underground workings in the Arista Underground mine. The Switchback deposit is located approximately 500 m northeast of the Arista deposit. Both vein systems are associated with andesitic host rocks, rhyolite dikes and structural contacts with the basement sedimentary rocks. The mineralization in these systems is intermediate sulfidation with precious and base metals at economic grades. Both vein systems trend north-westerly, although locally vein orientations can range from north-south to east-west.
A second zone of interest is the Alta Gracia property where low sulfidation epithermal, predominantly silver mineralized, veins are hosted in andesitic and rhyolitic rocks; this property has been investigated by drilling as well as surface and underground mapping of historic and recent workings. The Mirador and Independencia vein systems, which have been mined by DDGM, are one of several predominantly northeast trending vein systems on the property.
Other mineralized zones and properties have been investigated, including some preliminary drilling in areas such as Escondida, Chacal and Salina Blanca on the Arista project, and the Margaritas and Rey properties. The Margaritas and Rey properties are considered to host low sulfidation epithermal veins with volcanic associations.
In the opinion of the QPs, knowledge of the Arista and Alta Gracia Deposits, the settings, lithologies, and structural and alteration controls on mineralization is sufficient to support Mineral Resource estimation.
212
22.3Exploration, Drilling and Sampling
Don David Mine began exploring the Manto deposit in 2003. Two major deposits, the Arista and Switchback vein systems, have been defined and exploration has also identified satellite deposits which have been mined, such as the open pit and Alta Gracia deposits. Don David Mine continues to actively explore a 55 km trend, within which the Arista mine is located close to its south-eastern limit, using techniques that include geophysics (airborne and ground), stream, soil and rock geochemistry, mapping, petrographic and fluid inclusion studies, and drilling. These activities have identified multiple exploration targets. Exploration has focused on the Arista and Alta Gracia zones due to proximity and ease of access to the DDGM processing facilities; however, other projects where more advanced exploration has been undertaken are the Margaritas and Rey properties, the latter close to the north-western limits of the Don David Mine´s 55 km structural corridor.
DDGM continues the development of an aggressive exploration program that includes extensive surface and underground drilling, along with underground mine development, such as access ramps, drifts and crosscuts, into the Arista, Switchback and Alta Gracia vein systems. Total exploration drilling (core and RC, including geotechnical holes, but not production drilling) by DDGM through the end of December 2023 amounts to a total of 1,960 drill holes totaling 496,638 meters.
All assaying of exploration samples has been performed by the ALS (ALS Global) group since 2006 at their Vancouver laboratory, with sample preparation performed in the ALS Mexico Santiago de Queretaro facility; the ALS laboratories and samples preparation facilities are ISO/IEC 17025:2017 certified. All assay batches are subject to strict QAQC protocols using certified reference materials (standards and blanks), and field and pulp duplicates. Production channel and drill samples are analyzed at the mine site laboratory. Selected production samples are submitted to ALS Global for check assaying. Bulk density measurements are performed on site at the mine site laboratory.
22.3.1. 2022 District Exploration Expenditure
An exploration budget for 2023 was allocated by DDGM to continue drilling and investigating targets within the DDGM properties where the potential for high grade precious metals concentrations have been identified. Table 221 shows a summary of actual expenditures for surface and underground exploration at the Project during 2023. This includes underground mine development allocated to exploration. The program was managed by DDGM’s exploration and mining geology staff with support as needed from DDGM operations.
The 2023 district exploration work program included 168 total drill holes 36,350 meters of underground diamond drilling with expenditures totaling $6.0 million. Exploration mine development in 2022 totaled 520 meters at a total cost of $1.5 million. Geotechnical and production drill holes are not included in the exploration budget.
Table 22-1: Summary of Exploration Expenditure 2023 Exploration.
DESCRIPTION | |
Surface Exploration | |
Total Surface Exploration, Admin & Other |
$ 2,245,248 |
Total Surface Infill Drilling |
$ 0 |
Total Surface Exploration 1 |
$ 2,245,248 |
Surface Drill Meters |
0 |
Surface Drill Cost / Meter |
$ 0 |
Underground Exploration | |
Total Underground Expansion Drilling |
$ 1,927,648 |
Total Underground Infill Drilling |
$ 4,095,979 |
Total Underground Exploration |
$ 6,023,627 |
Underground Drill Meters |
36,350 |
Underground Drill Cost / Meter |
$ 166 |
Underground Exploration Development | |
Total Expansion Underground Development |
$ 356,800 |
Total Infill Underground Development |
$ 1,128,941 |
Total Underground Development |
$ 1,485,741 |
Underground Development Meters |
520 |
Underground Development Cost / Meter |
$ 2,857 |
Total Exploration Expenditure |
$9,754,616 |
1 Surface Exploration costs are considered as overheads and not as per meter drilling costs.
The 2023 exploration program covered testing of several readily accessible targets from underground, with dedicated mine exploration development also undertaken to provide access for drill stations.
213
Diamond drilling at the Don David Gold Mine was conducted under two general modes of operation: one by the surface exploration staff (surface exploration, underground expansion and infill drilling and geological and geochemical studies) and the other by the mine exploration staff (production and underground infill drilling). Production drilling was predominantly concerned with definition and extension of the known mineralized zones in order to guide development and mining. Infill drilling was undertaken to upgrade inferred Resources to Reserves and locally improve confidence for mine-planning. Exploration drilling was conducted farther from the active mining area with the goal of expanding the resource limits. Drilling results from both diamond and production programs were used in the Resource and Reserve estimates presented in this report. No surface drilling was undertaken in 2023.
Work on surface exploration prospects also included detailed mapping and geochemical sampling, to identify and better define prospects and drill targets. Work in 2023 focused on the Alta Gracia property.
22.3.2. 2022 Arista Project Area Exploration
The exploration program at the Arista Project during 2023 continued to focus on expanding known mineralization on the Arista, Switchback, and the Three Sisters vein systems at the Arista underground mine. Exploration and development of these vein systems remain the highest exploration priority.
Underground drilling during 2023 continued to explore extensions and infill definition of veins currently in production in the Arista Mine, including the Marena, Sta Helena, Viridiana, Chuy, Veta 3 and Veta 1, Splay 31, Splay 5 and Candelaria veins in the Arista system and Soledad, Selene, Sagrario in the Switchback vein system, as well as Sandy 1 and Sandy 2 veins in the Three Sisters vein system. Production drilling was undertaken in the Switchback system. No surface drilling was undertaken in 2023 and limited surface mapping in the immediate vicinity and to the north-west of the Arista Mine to assist with structural interpretation of the newly discovered Gloria vein system was performed.
22.3.3. 2022 Alta Gracia Property Area
Alta Gracia experienced small-scale artisanal mining in the past but with only limited historical exploration. Previous surface sampling and geologic mapping at Alta Gracia has identified several structural targets containing gold and silver mineralization, including three high-grade polymetallic veins that outcrop on the surface near some historic workings. To-date, 179 exploratory core holes for a total of 38,227 meters has been completed at Alta Gracia. Initial drill results were encouraging and warranted continued drilling to test other targets generated from surface sampling and the deeper zones of veins encountered to date. To date, over 49 veins have been identified and modelled at the Alta Gracia Project at or near its Mirador Mine.
In 2023 surface exploration focused on the Alta Gracia project with the interpretation of geologic surface mapping along with soil geochemistry results received in late-2022. Geological mapping along with the completion of a 45-hectare soil geochemistry sampling and rock chip sampling program in the Aguacatillo prospect, covering an area to the south-west, west and north-west of the Independencia and Mirador mines was completed. The program was successful in identifying several anomalous zones, which will be used to target follow-up detailed mapping to identify additional potential targets for future surface drilling. Analysis and interpretation were completed of the geochemical results generated from a regional soil sampling program completed late-2022 in the La Fundicion prospect area. This interpretation was successful in identifying three distinct clusters of anomalous gold- and silver-in-soil anomalies which will be followed up with detailed geologic mapping and rock chip sampling.
22.3.4. Exploration, Drilling and Sampling Conclusions
The QP has the following observations and conclusions regarding exploration conducted at the Property since 2003:
| ● | The mineralization style and setting of the Don David Gold Mine area is sufficiently well understood to support Mineral Resource and Mineral Reserve estimation. |
| ● | Exploration methods are consistent with industry practices and are adequate to support continuing exploration and Mineral Resource estimation. |
| ● | Exploration results support DDGM’s interpretation of the geological setting and mineralization. |
| ● | Continuing exploration may identify additional mineralization that could support Mineral Resource estimation. |
The QP has the following observations and conclusions regarding drilling conducted at the Property up to 2023:
| ● | Data were collected using industry standard practices. |
214
| ● | Drill orientations are appropriate to the orientation of the mineralization for the bulk of the area where Mineral Resources have been estimated (see Section 7.5 and Section 10.9 for representative cross-sections showing geology and mineralization, respectively). |
| ● | Core logging meets industry standards for exploration of epithermal-style deposits. Geotechnical logging is sufficient to support Mineral Resource estimation. |
| ● | Collar surveys have been performed using industry-standard instrumentation. |
| ● | Downhole surveys performed during the drill programs have been performed using industry-standard instrumentation. |
| ● | Drilling information is sufficient to support Mineral Reserve and Mineral Resource estimates. |
The QP considers that the drilling and chip channel sampling programs meet industry standards and have been reviewed and confirmed in sufficient detail to permit inclusion of the information in the DDGM database.
The processing team is currently determining what changes would be required to gain lab accreditation status for key analysis.
In the opinion of the QPs, the current QAQC protocols and reports meet industry-standard practice and provide the necessary control to identify potential analytical problems and allow for corrective follow-up and re-analysis when required.
The DDGM staff follow a stringent set of procedures for data storage and validation, performing verification of data on an on-going basis. Preliminary validation of the database was performed by the DDGM database manager in October 2023. The on-site database has a series of automated import, export, and validation tools to minimize potential errors. Any inconsistencies were corrected during the validation process before being handed over for final review and validation. The QP visited the site on numerous occasions in 2023 to review data collection, storage and undertake validation. The data verification procedures involved the following:
| ● | Inspection of selected drill core to assess the nature of the mineralization and to confirm geological descriptions. |
| ● | Inspection of geology and mineralization in underground workings of the Arista and Switchback veins. |
| ● | Verification that collar coordinates coincide with underground workings or the topographic surface. |
| ● | Verification that downhole survey bearing, and inclination values display consistency. |
| ● | Evaluation of minimum and maximum grade values. |
| ● | Investigation of minimum and maximum sample lengths. |
| ● | Randomly selecting assay data from the databases and comparing the stored grades to the original assay certificates. |
| ● | Assessing for inconsistences in spelling or coding (typographic and case sensitivity errors). |
| ● | Ensuring full data entry and that a specific data type (collar, survey, lithology, and assay) is not missing. |
| ● | Assessing for sample gaps or overlaps. |
Investigations of all aspects of current and historical data quality indicate that the quality of the information is suitable for Mineral Resource and Mineral Reserve estimation.
22.5Mineral Processing and Metallurgical Testing
Metallurgical testing performed by ALS in 2014, 2018, and more recently in 2020 supports the Arista Project processing methodology. As exploration continues additional metallurgical testing will be required if the constituents of the ore should change.
Deleterious elements in the concentrate products are predominantly non-liberated sulfide and non-sulfide gangue, except for Antimony and Arsenic within the Copper concentrate and Quartz in the lead concentrate.
215
Metallurgical recoveries at the DDGM Processing Facility for ore produced from the Arista mine averaged 76% for gold, 92% for silver, 80% for copper, 79% for lead, and 80% for zinc.
The DDGM Arista Project processing facility has sufficient body of metallurgical information comprising of historic testing supported by the studies completed by ALS. The metallurgical samples tested and the ore that is presently treated in the plant is representative of the material included in the LOM plan with respect to grade and metallurgical response.
The team continues to seek process improvements to increase concentrate grade, improve recovery, and reduce cost. The following suggestions are recommended as short- and long-term process improvements and are also supported by ALS report KM652 dated August 2020.
It is understood that Cu, Pb, and Zn flotation processes as well as overall Au recovery from tailings would benefit from an overall finer grind. Also, the processing team is currently completing two projects to recovery Au from tailings and Zn concentrates through re-grinding and retreatment. A cost benefit analysis will therefore be conducted to determine if regrinding prior to flotation is overall more advantageous due to the potential improvements in floatation which would positively influence the current impact of the deleterious elements.
The modeling and estimation of Mineral Resources presented herein is based on technical data and information available as of December 31, 2023. DDGM models and estimates Mineral Resources from available technical information prior to the generation of Mineral Reserves.
A Mineral Resource is a concentration or occurrence of material of intrinsic economic interest in or on the Earth’s crust (a deposit) in such form, grade or quality, and quantity that there are reasonable prospects for eventual economic extraction. The location, quantity, grade, geological characteristics, and continuity of a Mineral Resource are known, estimated or interpreted from specific geological evidence and knowledge. Mineral Resources are sub-divided, in order of increasing geological confidence, into Inferred, Indicated and Measured categories. Portions of a deposit that do not have reasonable prospects for eventual economic extraction must not be included in a Mineral Resource.
Three-dimensional models were constructed by DDGM staff as triangulated irregular network wireframes defining the extent of underground workings and mineralized structures and incorporate all significant vein systems identified to date. A total of 41 individual wireframes were reported for the Arista system, 35 for the Switchback system, and 14 for the Alta Gracia system. Measured, Indicated, and Inferred mineral resources exclusive of Mineral Reserves reported for the Don David Gold Mine as of December 31, 2023, are summarized in Table 111.
The QP considers that the drill hole database supplied is suitable for Mineral Resource estimation, and that the drilling program results meet industry standards for drilling and QAQC measures. Drilling results have been reviewed and confirmed in sufficient detail to permit the generation of Measured and Indicated mineral resource estimates. The quality assurance/quality control (QA/QC) program as designed and implemented by DDGM is adequate, with no significant bias, to support the resource database. The geological models are reasonably constructed using available geological information and are appropriate for Mineral Resource estimation. The assumptions, parameters, and methodology used for the Mineral Resource estimate are appropriate for the style of mineralization and proposed mining methods.
The Arista and Mineral Reserve estimates follow standard industry practices, considering only Measured and Indicated Mineral Resources as only these categories have sufficient geological confidence to be considered Mineral Reserves. Subject to the application of modifying factors, Measured Resources may become Proven Reserves and Indicated Resources may become Probable Reserves. Mineral Reserves are reconciled quarterly against production to validate dilution and recovery factors. The reserve estimate is based on technical data and information available as of December 31, 2023.
Mineral Reserve blocks that meet dilution and cutoff grade requirements, and that are deemed feasible and economic for extraction in a life-of-reserve mine plan, are classified as Proven and Probable, respectively, after further adjustment of tonnage for expected mining recovery. Mining dilution is applied to in situ tonnes depending on the mining method employed.
DDGM uses a breakeven NSR cutoff grade, which considers actual metal prices, total mining, milling and general administration, smelting/refining costs and plant recoveries for Proven and Probable Reserve estimations. The cutoff grade calculation does not include either exploration or capital costs and the average operating costs used for reserve calculations are net of base metal credits and royalty payments. Plant recoveries used are the average of actual recoveries reported by the plant during the twelve months of 2023.
216
The 2023 breakeven NSR cutoff grade for the Arista underground mine is based on a $120/t NSR using gold, silver, copper, lead, and zinc metal prices as per the Resources & Reserves Price Deck to calculate the NSR value.
In the opinion of the QP responsible for this Section of this Technical Report, Mineral Reserves are reported appropriately with the application of reasonable mining recovery and dilution factors based on operational observations and a transparent breakeven NSR cutoff grade based on actual mining, processing, and smelting costs; actual metallurgical recoveries achieved in the plant; and reasonable metal prices.
The QP responsible for the Mineral Reserves section of this Technical Report is of the opinion that the Proven and Probable Mineral Reserve estimate has been undertaken with reasonable care and has been classified using the SEC S-K 1300 Definition Standards. Furthermore, it is their opinion that Mineral Reserves are unlikely to be materially affected by mining, metallurgical, infrastructure, permitting or other factors, as these have all been well established over the past ten years of mining.
DDGM commenced mining and milling operations at the Arista project on July 1, 2010. Mineral production during 2010 consisted of processing Mineral Resources from the open pit mine, located approximately 0.5 km from the plant. DDGM developed and mined the shallow-dipping accessible portion of the Manto Vein by open pit methods.
During 2010, DDGM began developing an underground mine to access two veins called the Arista and Baja veins, part of the “Arista vein system”. The underground mine is approximately three km from the plant. In March 2011, DDGM began transitioning from processing the open pit to the underground mineralization. Conventional drill and blast methods are currently used to extract the Proven and Probable reserves from the Arista underground mine. Historically, the Arista mine used two main mining methods: 1) overhand mechanized cut and fill (CAF) and 2) long-hole open stopping (LHOS) with delayed fill. Currently, the Arista mine used the LHOS method exclusively.
Production from the Don David Gold Mine has proven that the project has the grade and continuity required to justify continued development and mining. The known veins and other targets on the Don David Gold Mine are underexplored by drilling. If DDGM maintains its exploration programs, estimation of additional Mineral Resources, or upgrade in Mineral Resources confidence categories, there is good potential for Mineral Reserves to maintain or grow.
This Report concludes that:
| ● | The mining methods being used are appropriate for the deposit being mined. The underground mine design, stockpiles, tailings facilities, and equipment fleet selection are appropriate for the operation. The mine plan is based on historical mining and planning methods practiced at the operation for the previous years and presents low risk. The mine plan is appropriately developed to maximize mining efficiencies, based on the current knowledge of geotechnical, hydrological, mining and processing information on the project. |
| ● | The mine plan is based on historical mining and planning methods practiced at the operation for the previous years and presents low risk. |
| ● | Inferred Mineral Resources are not included in the mine plan and were set to waste. |
| ● | The mobile equipment fleet presented is based on the actual present-day mining operations, which is known to achieve the production targets set out in the LOM. |
| ● | All mine infrastructure and supporting facilities meet the needs of the current mine plan and production rate Production from the Don David Gold Mine has proven that the project has the grade and continuity required to justify continued development and mining. The known veins and other targets on the Don David Gold Mine are underexplored by drilling. If DDGM maintains its exploration programs, excellent potential exists for reserves to maintain or grow. |
As part of day-to-day operations, Don David Mine will continue to undertake reviews of the mine plan and considerations of alternatives to and variations within the plan. Alternative scenarios and reviews may be based on ongoing or future mining considerations, evaluation of different potential input factors and assumptions, and corporate directives.
217
During 2009 and 2010, DDGM constructed a processing plant and infrastructure at the Arista project. The processing plant has a differential flotation section capable of processing polymetallic ores and producing up to three separate concentrate products for sale, and an agitated leach circuit capable of producing gold and silver doré for sale. The DDGM mill’s flotation circuit and agitated leach processing capacity is a nominal 2,000 tpd.
Process requirements are considered to be well understood, and consistent based on the actual observed conditions in the DDGM processing facilities. There is no indication that the characteristics of the material planned for mining will change and therefore the recovery assumptions applied for future mining are considered as reasonable for the life of mine.
The QP responsible for this section of this Report considers process requirements to be well understood, and consistent based on the actual observed conditions in the processing facilities. There is no indication that the characteristics of the material being mined will change and therefore the recovery assumptions applied for future mining are considered reasonable for the life of mine. The plant is of a conventional design and uses conventional consumables.
All material mine and process infrastructure and supporting facilities are included in the present general layout to ensure that they meet the needs of the mine plan and production rate and notes that:
| ● | The Don David Gold Mine is located 114 km, or two hours by road from the city of Oaxaca, the main service center for the operation, with good year-round access. |
| ● | A flotation tailings impoundment was constructed in a valley just below the process plant site. The impoundment is double lined with the first liner made of a clay and synthetic material that acts as a leak prevention system with the effective absorption equal to ~ 3 meters of clay. The second liner is made of 1.5 mm Linear Low-Density Polyethylene (LLDPE), which was a permitting requirement. The method of subsequent embankment construction to obtain full capacity was down-stream. |
| ● | Construction of a filtration plant and dry stack facility commenced in September of 2020 with target completion date for Q1 2022. The filtration plant and existing paste plant (commissioned in October of 2019) will handle 100% of future tailings production. |
| ● | Up until 2018, power was mainly provided by diesel generators at the site. In 2019, DDGM successfully connected a power line to its Arista project from the Mexican Federal Electricity Commission’s (Comisión Federal de Electricidad or CFE) power grid. Prior to this connection, the Arista project operated 100% from electricity generated from more expensive and higher emission diesel fuel. In 2021, there was an increase in power consumption due to ventilation and dewatering pumps requiring the installation of capacitors that improved and stabilized the power supply. In 2021, DDGM also initiated conversations with CFE for the expansion of the load delivered to further stabilizing the energy supply. In 2022, the capacitors were installed and commissioned and CFE expanded the load delivered to attend to the higher demand on site. |
| ● | Water requirements to process ore is being primarily sourced from water pumped to the surface from the underground dewatering system. Water in the tailings facility is recycled to the Arista processing plant and the excess water pumped from the underground workings is discharged at the surface into decantation ponds. DDGM has the necessary permits to discharge underground mine water at the surface. Water sampling from rivers and creeks is conducted regularly and sent to an external laboratory for testing. |
| ● | All process buildings and offices for operating the mine have been constructed. Camp facilities are located in the village of San Jose de Gracia. |
218
Infrastructure required to support the LOM plan is in place and is operational.
22.11Market Studies and Contracts
Since the operation commenced into commercial production in July 2010, a corporate decision was made to sell the concentrate on the open market. All commercial terms entered between the buyer and DDGM are regarded as confidential but are within standard industry norms.
The information provided by DDMG on marketing, contracts, metal price projections and exchange rate forecasts and notes that the information provided support the assumptions used in this Report and are consistent with the source documents, and that the information is consistent with what is publicly available within industry norms.
The QPs have reviewed the information provided by DDGM on marketing, contracts and concentrate sales. The QPs note that the information provided is consistent with the source documents used, and that the information is consistent with what is publicly available on industry norms. The information can be used in mine planning and financial analyses for the Don David Gold Mine in the context of this Technical Report.
Metal price assumptions used in the Economic Analysis are based on the Economic Analysis Price Deck (refer to Section 16) for gold, silver, copper, lead and zinc. The actual metal prices can change, either positively or negatively from the assumed prices. If the assumed metal prices are not realized, this could have a negative impact on the operation’s financial outcome. At the same time, higher than predicted metal prices could have a positive impact.
22.12Environmental Studies, Permitting, Social and Community Impact
In connection with mining, milling and exploration activities, DDGM is subject to all Mexican federal, state, and local laws and regulations governing the protection of the environment, including laws and regulations relating to protection of air and water quality, hazardous waste management and mine reclamation as well as the protection of endangered or threatened species. Potential areas of environmental consideration for mining companies, including DDGM, include but are not limited to, acid rock drainage, cyanide containment and handling, contamination of water courses, dust, and noise.
All mining and environmental activities in México are regulated by the Dirección General de Minas (DGM) and by the Secretaría de Medio Ambiente y Recursos Naturales (SEMARNAT) from México City, under the corresponding laws and regulations. Mining operations in México operate under a unique environmental license (Licencia Ambiental Unica). This environmental license is issued after approval of the Evaluación del Impacto Ambiental (EIA). As well, special permits are issued for certain new developments such as expansions, tailings dams, etc. DDGM is also required to obtain various permits for surface and underground water use and discharge of waste-water discharge. The permissions are granted by the Comisión Nacional del Agua (CONAGUA), the administrative, technical advisory commission of SEMARNAT. CONAGUA administers national waters, manages, and controls the country's hydrological system, and promotes social development.
DDGM is required to prepare a mine closure plan for the possible future abandonment of the Arista and Alta Gracia Projects. A Mine Closure Plan and Reclamation Budgets have been prepared by Golder. The closure cost estimate includes funds for covering the tailings ponds, waste rock stockpiles, and for securing, and cleaning up the other surface and underground mine facilities. The total estimated closure and reclamation cost for the Arista Project is estimated to be $12.0 million (excluding taxes). The total estimated closure and reclamation cost for the Alta Gracia Project is estimated to be 11.3 million Mexican Pesos (MXP), which equates to approximately $0.6 million.
It is the opinion of the QP that the appropriate environmental, social, and community impact studies have been conducted to date. DDGM has maintained all necessary environmental permits that are prerequisites for construction of Project infrastructure and the maintenance of mining activities. The QP was provided and relayed on legal opinion that supported the mining concessions, surface rights and concessions royalties held by DDGM.
22.13Capital and Operating Costs
The capital and operating costs in this report have been adequately accounted for using the following assumption:
| ● | All capital and operating costs have been updated to full-year 2024 US dollars. |
| ● | A contingency of 3% was applied to both capital and operating costs. |
| ● | Total Don David Gold Mine LOM capital expenditures are estimated to be US$40.5 million. |
| ● | Mine closure costs have been included per the Golder Report issued in December 2023. |
219
| ● | The operating costs have a fixed and variable component and are estimated at $172/t, before contingency. |
| ● | An exchange rate of 17.5 Mexican Pesos (“MXP”) exchange rate to 1 U.S. dollar is applied to peso-denominated costs. |
The economic analysis is supportive of current Mineral Resources and Mineral Reserves to feasibility level accuracy. The following assumptions were made to support the economic analysis:
| ● | All capital and operating costs have been updated to full-year 2024 US dollars. Costs were based on 2023 actual costs. |
| ● | Optimized mine that assumes full depletion of Arista Reserves through 2027. |
| ● | An exchange rate of 17.5 Mexican Pesos (“MXP”) exchange rate to 1 U.S. dollar is applied to peso-denominated costs |
| ● | Using the assumptions set out in this report, including the metal prices at the Economic Analysis Price Deck, the after-tax net present value at a discount rate of 5% is $2.8 million including a 3% contingency. The cumulative undiscounted after-tax cash flow value is $1.6 million. |
| ● | Sensitivity Analysis has been performed on gold, silver, copper, lead and zinc prices, resource grades, operating costs, and capital costs to determine the most sensitive variations. Gold and zinc price and less sensitive and to a lesser degree operating costs. |
This Report represents the most accurate interpretation of the Mineral Reserve and Mineral Resource available as of the effective date of this report. The conversion of Mineral Resources to Mineral Reserves was undertaken using industry-recognized methods, and estimated operational costs, capital costs, and plant performance data. This Report has been prepared with the latest information regarding environmental and closure cost requirements.
The Switchback system remains open up- and down-dip and along strike; additional drilling has the potential to add Mineral Resources and Reserves. Drilling has identified the potential for previously unknown mineralization to be added to Mineral Resources and Reserves. These can be expanded by additional exploration drilling, especially in the Three Sisters and Gloria areas where a significant discovery has been made in 2023.
Improvements in mining efficiency can be obtained by increased infill drilling and improved geotechnical assessment of ground conditions.
The narrow nature of many of the remaining veins are more variable in their mineralization resulting in increased possibility of more erratic mineralization. In places drilling or sampling support may not be appropriate for Resource categorization which was designed for wider more robust veins.
Reconciliation studies up to December 31, 2023 provided better information on mine stope dilution and of the reconciliation of the Mineral Resource and Mineral Reserve estimates on a mining unit scale. While models appear to have been reliable on a global scale to date, improved analysis is currently being undertaken and may identify issues which will need to be addressed. Ground stability issues can affect the production of Mineral Reserves. Delays to the dry stack tailings filtration plant may affect the ability to adequately store tailings in the short term.
The project implemented new criteria and methodologies with the adoption of S-K 1300 and NI 43-101 standards for the December 31, 2022 Technical Report. The new methodology focused on geological interpretations, improved grade estimation, better variable anisotropy, inclusion of channel sampling and improved ore control models. This approach creates greater confidence in the reliability of the Mineral Resources and Mineral Reserves.
The project will be adopting new methodologies and systems to improve recoveries and efficiencies. This includes but is not limited to the Gold Recovery project and the continued roll out of a Management Operating System (“MOS”) to improve communication and strategy execution.
220
The information set forth in this Report continues to demonstrate that the Don David Gold Mine is a technically and economically viable operation.
Recommendations for the next phase of work have been broken into those related to ongoing exploration activities and those related to additional technical studies focused on operational improvements. Recommended work programs are independent of each other and can be conducted concurrently unless otherwise stated.
Continue utilizing the newly implemented MOS to expand understanding, improve recoveries, and reduce cost. The QP suggests conducting a cost benefit analysis to compare the cost to reduce the overall liberation size versus the projected revenue increases in Au, Ag, Cu, Pb, and Zn recoveries.
Several business improvement initiatives were successfully completed in 2022 and 2023 to improve recoveries, therefore the team should continue to employ continuous improvement methodologies to further improve recoveries. The team may consider a Design of Experiment (DoE) approach to further expand understanding of the relationship between reagents, operating parameters, head grade, and recovery. There may also be an opportunity to further increase revenue by recovering Au from Cu concentrate.
Review of geotechnical standard procedures and geotechnical reports that will facilitate the creation of a geotechnical model that takes all the input parameters and historical information in order to have better control on the ground support requirements, reconciliation, mine development advance rates and stope dilution control.
Exploration in 2023 followed-up on prospective targets that were generated from previous exploration programs while generating additional targets. Field mapping, geochemical sampling and geophysical surveys have all been successful in identifying anomalous areas that appear worthy of further work including drilling. Exploration recommendations for 2024 will continue from these activities.
23.4.1. Recommended and Proposed District Exploration 2024
DDGM’s 2023 exploration program was successful in identifying zones of interest for follow-up activity and identifying additional Reserves. A budget of $5.8 million has been proposed for 2024 which will focus primarily on Reserve definition on the Arista mine’s Arista, Switchback, Three Sisters and Gloria vein systems. The primary long-term goal of this program is to expand known mineralization and discover new areas. Included within this budget are the underground mine developments required to access drill zones.
The proposed exploration program shall focus on exploring the highest priority areas, in order to prepare these areas for an updated Mineral Resource and Reserve report at year-end 2024. Don David Gold Mine exploration budgetary priority targets for 2024 are listed in Table 231.
Exploration expenditures may vary from those listed below depending on factors including, but not limited to, metal prices, expenditures, and available cash flows.
221
Table 23-1: Don David Mine Exploration Budget Priority Targets – 2024.
DESCRIPTION |
US $ |
Surface Exploration | |
Total - Surface Arista |
$2,472,000 |
Total - Surface El Rey |
$0 |
Total - Surface Alta Gracia |
$15,000 |
Total - Surface Margaritas |
$15,000 |
Total – Surface Trenes |
$15,000 |
Total – Surface Cerro Jabali |
$0 |
Total – Surface Rio Grande |
$15,000 |
Total - Prospects |
$0 |
Summary - Surface Exploration |
$2,532,000 |
Underground Exploration | |
Total - Underground Arista |
$0 |
Total - Underground Switchback |
$118,900 |
Total – Underground Infill |
$2,049,430 |
Summary - Underground Exploration |
$2,168,330 |
Underground Meter |
14,954 |
Underground Cost per Meter US |
$145 |
Summary - Analytical |
$441,000 |
Analytical Cost per Sample US |
$42 |
Exploration Mine Development | |
Total Underground NE |
$0 |
Total Underground Switchback Exploration |
$625,000 |
Total Underground Infill |
$0 |
Summary Exploration Mine Development |
$625,000 |
Total Exploration & Development Cost |
$5,766,330 |
23.4.2. Surface Exploration Program 2024
The 2024 surface exploration program will mainly focus on evaluation of previous stream sediment, soil and rock geochemistry and geologic mapping programs to improve project prioritization and target identification in the properties surrounding the Arista Project. It is planned to do work on the Alta Gracia, Margaritas-Trenes properties and Rio Grande target areas. Follow-up work will be undertaken on the Alta Gracia Fundicion prospect based on soil sampling geochemistry anomalies. Field work will continue to follow-up on targets identified during the 2020 to 2023 field programs and follow-up on existing areas of interest. The budget also includes administration, mainly exploration staff salaries, and concession holding costs. The total surface exploration budget for 2024 is $2.5 million (Table 231).
23.4.3. Underground Exploration Program 2024
The main objective of the Arista underground mine exploration program is to increase reserves on known veins and discover new vein structures. A total of 14,134 meters of infill drilling in 62 holes and 820 meters of expansion drilling in 3 holes is planned for 2024 with a budget of $2.2 million (Table 23.1). The drilling program will be conducted from existing underground workings in the Arista mine and from new drilling stations to be constructed for drilling the north-west targets of the Switchback vein system (Three Sisters and Gloria vein systems).
23.4.4. Underground Exploration Mine Development Program 2024
To complement underground exploration drilling, 2024 exploration expenditures shall include underground exploration mine development to provide access to, and platforms for underground exploration drilling. A total of 250 meters of exploration mine development is scheduled for 2024 with a budget of $0.6 million (Table 231). The new drill stations will be constructed to enable the drilling of targets in the north-west zones of the Switchback vein system, specifically to step-out along strike to the north-west and down-dip on the Three Sisters and Gloria vein systems. In addition, access for and construction of drill stations for the infill program are included in the budget.
222
23.4.5. Additional Recommendations for 2024
The ability of the models to accurately reflect mineralization requires additional evaluation based on more detailed reconciliation studies in conjunction with the mining operations, this may also impact on Resource classification; it is recommended that more detailed reconciliation studies be undertaken.
Continued infill drilling is recommended to be undertaken to better define continuity and widths of mineralization for mine planning, estimation, and inclusion in Mineral Reserves. Expansion drilling should continue to define additional Mineral Resources which may subsequently, with additional drilling, be converted into Mineral Reserves.
Geological modeling of non-mineralized features, such as structural blocks and alteration parameters, of the Arista, Switchback and Alta Gracia deposits, which began in 2022, need additional work and interpretation to assist target identification of additional mineralized structures, such as the recently discovered Three Sisters (2022) and Gloria (2023) vein systems.
The density database of the deposit should continue to be expanded to support information provided, this work is on-going. The laboratory should acquire and use a balance suitable for hook-under-balance gravimetric buoyancy bulk density measurement to reduce uncertainty in the measurements obtained.
For in-house sampling, the in-house laboratory should begin a process of ISO accreditation to ensure improved confidence in the results returned from its analysis.
A revision of the conceptual closure plan reflects the already offline status of Phase 1 and 2 tailings dam, the Phase 3 tailings dam conclusion of its operation cycle in 2022, and the Alta Gracia Waste Rock Dump (WRD) as out of operation. This effort should include re-calculation of the closure costs estimate including earthwork, borrow material requirements, and other closure related design elements.
The project will be adopting new methodologies and systems to improve recoveries and efficiencies. This includes but is not limited to the Gold Recovery project and the continued roll out of a Management Operating System (MOS) to improve communication and strategy execution.
Brown, F. H. & Devlin, B. D., 2018. Report on Estimates of Reserves and Mineralized Material at the Oaxaca Mining Unit, Oaxaca, Mexico for Gold Resource Corporation; Internal company report, p. 264 pgs.
Brown, F. H., Garcia, J. R., and Devlin, B.D., 2021. Report on the Estimates of Mineral Resources and Mineral Reserves for the Don David Mine, Oaxaca, Mexico for Don David Gold Mexico, S.A. de C.V. (a wholly-owned subsidiary of Gold Resource Corp.), Internal Company report, p. 184 pgs.
Brown, F. H., Garcia, J. R., 2021. NI43-101 Technical Report - DDGM Resource and Reserve Update, p. 259 pgs.
Brown, F. H., Garcia, J. R., Devlin, B. D., and Lester, J. L., 2019. Report on the estimate of mineral resources and mineral reserves for the Oaxaca Mining Unit, Oaxaca, Mexico for Don David Gold Mexico, S.A. de C.V. (a wholly-owned subsidiary of Gold Resource Corp.), Internal Company report, p. 247 pgs.
Brown, F. H., Garcia, J. R., Devlin, B. D., and Lester, J. L., 2020, Report on the estimate of mineral resources and mineral reserves for the Oaxaca Mining Unit, Oaxaca, Mexico for Don David Gold Mexico, S.A. de C.V. (a wholly-owned subsidiary of Gold Resource Corp.), Internal Company report, p. 201 pgs.
Cabrera-Roa, M. A., 2019, Caracterización Mineralógica e Inclusiones Fluidas del Proyecto El Águila, Distrito Tlacolula, Oaxaca; Tésis Que para optar por el grado de maestro en ciencia de la tierra (petrología y geoquímica), Universidad Autonomía de Mexico, p. 136 pgs.
Camprubí, A & Albinson, T, 2007, Epithermal Deposits in México – Update of current knowledge, and an empirical reclassification. In - Geology of México: Celebrating the Centenary of the Geological Society of Mexico, Eds. Alaniz-Álvarez, S.A., Nieto-Samaniego, A.F., Geological Society of America Special Paper 422, pp 377-415.
Corbett, G.J., 2008, Influence of magmatic arc geothermal systems on porphyry-epithermal Au-CuAg exploration models: Terry Leach Symposium, Australian Institute of Geoscientists, Bulletin 48, p. 25-43.
223
Couture, J-F. 2012 Site Visit Report-Memo La Arista Mine, Oaxaca, Mexico June 2012; SRK Consulting (Canada Inc.), Project/Report 3CA031.000; 7pg.
Devlin, B. D., 2015, Report on Estimates of Reserves and Measured and Indicated Mineralized Material at the El Arista project, Oaxaca, Mexico for Gold Resource Corporation; Internal company report, p. 215 pgs
Devlin, B. D., 2016, Report on Estimates of Reserves and Mineralized Material at the Arista project, Oaxaca, Mexico for Gold Resource Corporation; Internal company report, p. 215 pgs
Devlin, B. D., 2017, Report on Estimates of Reserves and Mineralized Material at the Oaxaca Mining Unit, Oaxaca, Mexico for Gold Resource Corporation; Internal company report, p. 249 pgs
Devlin, B. D. & Alvarado-Chaparro, I., 2013, Report on the Reserve Estimate for the La Arista underground mine at the El Arista project, Oaxaca, Mexico for Gold Resource Corporation; Internal company report, p. 181 pgs
Devlin, B. D. & Alvarado-Chaparro, I., 2014, Report on the Reserve Estimate for the La Arista underground mine at the El Arista project, Oaxaca, Mexico for Gold Resource Corporation; Internal company report, p. 194 pgs
Ellis R. B., 2013, Interpretation of Aeromagnetic and Radiometric Survey for the La Arista Project for Don David Gold Mexico S.A. de C.V. Oaxaca State, Mexico, 20 pp
Ferrusquía-Villafranca, I. and McDowell, F.W., 1991, The Cenozoic sequence of selected areas in southeastern Mexico; its bearing in understanding regional basin development there. In: Convención Sobre la Evolución Geológica de México y Primer Congreso Mexicano de Mineralogía, Pachuca, Hgo., México. Memoria, pp. 45-50.
Hansley, P. 2008 Petrography of Volcanic, Skarn, and Clastic Breccia Samples, Oaxaca, Mexico; Petrographic Consultants International, Inc. (Colorado, USA), 27 pgs.
Hansley, P. 2012 Petrography of Sulfides and Precious Metals, Quartz-Sulfide Veins, La Fortuna Mine [El Arista project], Oaxaca, Mexico; Feb 18, 2012; Petrographic Consultants International, Inc. (Colorado, USA), 72pg.
Hansley, P. 2014 Petrography of 30 Samples for Gold Resource Corporation, December 10, 2014, Petrographic Consultants International, Inc. (Colorado, USA), 61 pgs.
Hedenquist, J. W., 2008, Observations on epithermal mineralization at El Aguila and La Arista-El Aire, Oaxaca, Mexico, Report for: Gold Resource Corporation, Hedenquist Consulting, Inc., 26 pgs.
Hedenquist, J. W., 2010, Comments on the epithermal systems in the El Aguila district, Oaxaca, Mexico, Report for: Gold Resource Corporation, Hedenquist Consulting, Inc., 23 pgs.
Hohbach, P. 2018 Brief Report on October 2018 UG Mapping & Structural Geology at the Arista Mine, 30 pgs
Iund, M., Martin, A.K. , Frenette, P., Laroche, C. and Foley, M.J., 2023, S-K 1300 Technical Report Summary on the Initial Assessment for the Back Forty Mine Project, Michigan, USA, Gold Resource Corporation, 370 pgs.
Jaacks J. A., 2007 Evaluation of the 2006 stream sediment program at the El Aguila Property, Oaxaca, Mexico; Geochemical Applications International Inc. (Colorado, USA), 25 pp
Jones, D. M., 2008, Geologic review and investigative mapping at the El Aguila-La Arista project, Oaxaca, Mexico, 18 pgs.
Jones, D. M., 2013, May 2013 site visit to the El Arista project, Oaxaca, Mexico, Internal company memorandum, 11 pgs.
Kramer, J.B. and Couture, J-F. 2013 Structural Geology Review El Arista project, Oaxaca, Mexico; SRK Consulting (Canada Inc.) Project 3UD012_002; 46 pgs.
Lester, J., 2020, Distribution and Controls for Ag-Au Mineralization Andesite Hill-Salina Blanca-Rio Grande Area, Oaxaca Mining Unit, DDGM, Internal company report, p. 48 pgs
Lipman, P. 2011 Observations on Regional Volcanic Framework of the El Aguila –La Arista Mine Area, Oaxaca Volcanic Field, Mexico; GEOHAZ Consulting (Colorado and California, USA); 32 pgs.
Lopez L, Noble AC and Jaacks JA, 2012, NI-43-101 Technical Report for Mineral Resources for the El Arista project, Oaxaca State, Mexico; Report # DE-00186, Pincock, Allen and Holt, (Colorado, USA); 150 pp
Meinart, L. D., 2010, Observations on Skarn Potential of the Aguila-Arista district, Oaxaca, Mexico, Compiled for: Dave Reid, Gold Resource Corporation, 13 pgs.
224
Mendieta G., Talonia U. and Castellanos V., 2016. Informe de la Medicion de Esfuerzos In situ en la Mina Don David Gold, Estado de Oaxaca, Comision Federal de Electricidad (CFE), 23 pgs.
Morán-Zenteno, D. J., Tolson, G., Martínez-Serrano, R. G., Martiny, B., Schaaf, P., Silva-Romo, G., Macías-Romo, C., Alba-Aldave, L., Hernández-Bernal, M. S., Solís-Pichardo, G. N., 1999, Tertiary arcmagmatism of the Sierra Madre del Sur, Mexico, and its transition to the volcanic activity of the Trans-Mexican Volcanic Belt: Journal of South American Earth Sciences, 12, pp 513 – 535.
Miskelly, N., 2003 Progress on International Standards for Reporting of Mineral Resources and Reserves by Norman Miskelly, Chairman, Combined Reserves International Reporting Standards Committee (CRIRSCO) dated September 20, 2003; 22 pgs.
Murillo, G. and Torres R., 1987 Mapa Petrogenetico y Radiometrico de la República Mexicana. Instituto Mexicano del Petroleo (IMP); Projecto C-120g.
Perez, A., 2021, Findings of Closure Plan Review and FY 2021 Cost Estimate for Asset Retirement Obligation, El Aguila and Alta Gracia Properties, Oaxaca, Mexico, internal report by SRK Consulting, Project #369200.070 (Colorado, USA); 11 pgs.
Perez, A. And Cope L., 2015 Hydrogeological Study, Arista Mine, Dewatering Phase I, Don David Gold, Oaxaca, Mexico; SRK Consulting Mexico; 152 pgs.
Reynolds, J. T., 2011, Memorandum, Survey of Fluid Inclusions Petrography from La Fortuna. Prepared for Mr. David Reid, Gold Resource, December 27.
Ross-Brown, D. and Levy, M. 2012 Preliminary Geotechnical Assessment for Underground Mine Design of the Arista Deposit [Memo], Project# 373200.010, SRK Consulting, Colorado USA; 16 pgs.
Rossi, M. E. and Deutsch, C. V. 2014, Mineral Resource Estimation, Springer, Berlin Heidelberg, Germany; 332 pgs.
Sánchez Rojas, L. E., Aranda Osorio, J. N., Zárate López, J. and Castro Rodríguez, M. G., 2000, [Geologic Map] Carta Geológico-Minera ZAACHILA E14-12, Oaxaca; Scale 1:250,000, Servicio Geologico Mexicano (SGM).
Van Diest, Jess, 2020 Technical Memorandum – Ventilation review DDGM Site Visit; SRK Consulting (USA) Report # 373200.060); 9 pgs.
Villarroel, R. and Bascur, R, 2017, Switchback Mining Study, Project # P-IDR-356-317-17-02-00, INGEROC SPA, 65 pgs.
Villarroel, R. and Merino, P, 2021, Auditoria geomecanica operaciones Don David Gold, Oaxaca, Mexico, Project # P-IDR-563-317-21-0, INGEROC SPA, 33 pgs.
Vos, I., Kramer, J. B., and Couture, J-F., 2012 Structural Geology Review of the La Arista Deposit, Oaxaca, Mexico; SRK Consulting (Canada Inc.) Report # 3UD012.001; 38 pgs.
25RELIANCE ON INFORMATION PROVIDED BY THE REGISTRANT
The QPs have relied on input from GRC, DDGM and qualified independent consulting companies in preparing this report. The QPs’ responsibility was to ensure that this SEC S-K 1300 Technical Report met the required guidelines and standards considering that certain information reviewed in connection with the preparation hereof was contributed by certain external consultants for GRC. Table 251 provides a detailed list of information provided by the registrant for matters discussed in this report.
The information, conclusions, opinions, and estimates contained herein are also based on data, reports, and other information supplied by GRC and other third-party sources, including those referenced in Section 24 “References”.
225
Table 25-1: Information Provided by Registrant.
Category |
TRS Section |
Reliance |
Legal Matters |
Section 3 and Section 17 |
Information and Documentation regarding mineral titles, Surface, land agreements, current permit status, royalties and other agreements provided by Gold Resource Corp |
General Information |
Section 4 and Section 5 |
Physical and historical information was provided by Gold Resource Corp., primarily previous technical reports. |
Technical Information |
Section 17.5 |
“Findings of Closure Plan Review and FY2021 Cost Estimate for Asset Retirement Obligation, El Aguila and Altagracia Properties” Authored by SRK Consultants and provided by Gold Resource Corp. |
Technical Information |
Section 18 and 19 |
Economic analysis and Cost estimates assumptions was provided by Gold Resource Corp. |
Technical Information |
Section 13.2 |
“Auditoria Geomecanica Operaciones DDGM” Authored by INGEROC SPA and provided by Gold Resource Corp. |
226
26DATE AND SIGNATURE PAGE
This report titled “S-K 1300 Technical Report Summary on the Don David Gold Mine Project, Oaxaca, Mexico” is current as of December 31, 2023. It was prepared and signed by the below QP’s for their respective sections of the responsibility for the report.
|
|
|
|
Rodrigo Simidu, P. Eng. (GRC employee) |
|
Date |
|
Sections: |
|
|
|
1, 4, 5, 12, 13, 15, 16, 17, 22, and 23 |
|
|
|
|
|
|
|
|
|
|
|
Marcelo Zangrandi, B. Geo (AMBA Employee) |
|
Date |
|
Sections: |
|
|
|
1, 8, 9, 11, 22, and 23. |
|
|
|
|
|
|
|
|
|
|
|
Christian Laroche, (GRC Employee) |
|
Date |
|
Sections: |
|
|
|
1, 10, 14, 22, and 23 |
|
|
|
|
|
|
|
Patrick Frenette, P. Eng (GRC Employee) |
|
Date |
|
Sections: |
|
|
|
1, 2, 18, 19, 22, 23, 24, and 25 |
|
|
|
|
|
|
|
David Turner, P. Geo (GRC Employee) |
|
Date |
|
Sections: |
|
|
|
1, 3, 5, 6, 7, 8, 9, 20, 21, 22, and 23 |
|
|
|
227
Exhibit 97.1
|
|
|||
 |
FUNCTION: |
Recovery of previously paid incentive compensation |
EFFECTIVE (ISSUANCE) DATE: |
7/26/23 |
TITLE: |
Executive Compensation Clawback Policy |
MOST CURRENT (APPROVAL) REVISION DATE: |
7/26/23 |
|
Updated By: |
|
|
|
|
APPROVED BY (Name / Title): |
GRC Board of Directors |
|||
|
|
|||
Executive Compensation Clawback
Statement of Purpose
This Clawback Policy (this “Policy”) has been adopted by the Compensation Committee of the Board of Directors (the “Committee”) of Gold Resource Corporation (the “Company”) effective as of July 26, 2023 (the “Effective Date”). The purpose of this Policy is to provide the Committee with the ability to recover “Incentive Compensation” (as defined below) in the event of a restatement of the financial statements of the Company due to a material non-compliance with any financial reporting requirement under the securities laws (such event, a “Triggering Event”). Upon the occurrence of a Triggering Event, the Company may seek recovery of Incentive Compensation received by any “Covered Employee” (as defined below) during the three completed fiscal years immediately preceding the date on which the Company is required to prepare an accounting restatement, that would not otherwise have been paid to a Covered Employee if the correct performance data had been used to determine the amount payable.
The Company’s Board of Directors (the “Board”) or the Committee shall have full authority to interpret and enforce the Policy (to the extent administering this Policy, the Board or the Committee is referred to herein as the “Administrator”).
For purposes of this Policy, “Company” shall include any subsidiary or affiliate of the Company.
Statement of Policy:
Covered Employees
For purposes of this Policy, “Covered Employee” is defined as the Company’s current and former executive officers, as determined by the Administrator in accordance with Section 10D of the Securities Exchange Act of 1934, as amended (the “Exchange Act”) and the listing standards of the national securities exchange on which the Company’s securities are listed, and any other employee of the Company and its subsidiaries designated by the Administrator.
Incentive Compensation
For purposes of this Policy, “Incentive Compensation” means any of the following, provided that, such compensation that is granted, earned, or vested wholly or in part upon the attainment of a financial reporting measure: (1) the amount of (or payment or value received with respect to) a Covered Employee’s annual incentive awards under the Company’s short-term incentive plan or program; (2) the stock options, stock appreciation rights, restricted stock or units, and performance-based equity or equity-based awards (or any amount attributable to such awards) to the Covered Employee under the Company’s equity incentive plans or other long-term incentive plans or programs; and (3) any other incentive-based compensation in respect of any Company plan or agreement. Financial reporting measures are measures that are determined and presented in accordance with the accounting principles used in preparing the Company’s financial statements, and any measures that are derived wholly or in part from such measures, including, but not limited to, the following: (1) stock price; (2) total shareholder return; (3) revenue; (4) net income; (5) EBITDA; (6) funds from operations; (7) liquidity measures such as working capital or operating cash flow; (8) return measures such as return on invested capital or return on assets; (9) earnings measures such as earnings per share; and (10) any other financial measures as determined by the Administrator.
Amount Subject to Recovery
If the Administrator determines that Incentive Compensation of a Covered Employee was overpaid, in whole or in part, as a result of a restatement of the financial statements of the Company due to material non-compliance with financial reporting requirements under the securities laws, the Administrator will review the Incentive Compensation paid, granted, vested or accrued based on the prior inaccurate results.
As permitted by applicable law, the Administrator will seek to recover or cancel the excess, if any, of (i) any Incentive Compensation paid or accrued based on the belief that the Company had met or exceeded performance thresholds, over (ii) the Incentive Compensation that would have been paid or granted to the Covered Employee, or the Incentive Compensation in which the Covered Employee would have vested, had the actual payment, granting or vesting been calculated based on the accurate data or restated results, as applicable (the “Overpayment”).
The Administrator may make determinations of Overpayment at any time through the end of the third fiscal year following the year for which the inaccurate performance criteria were attained; provided, that if steps have been taken within such period to restate the Company’s financial or operating results, the time period shall be extended until such restatement is completed.
If the Administrator cannot determine the amount of the Overpayment directly from the information in the accounting restatement, then it will make its determination based on a reasonable estimate of the effect of the accounting restatement. For Incentive Compensation based on stock price or total shareholder return, where the amount of Overpayment is not subject to mathematical recalculation directly from the information in an accounting restatement: (A) the amount must be based on a reasonable estimate of the effect of the accounting restatement on the stock price or total shareholder return upon which the Incentive Compensation was received and (B) the Company will maintain documentation of the determination of that reasonable estimate and provide such documentation to the national securities exchange on which the Company’s securities are listed as required by the listing standards of such national securities exchange.
Recovery Process
If the Administrator determines to seek recovery of a Covered Employee’s Incentive Compensation under this Policy, the Company shall have the right to demand that the Covered Employee repay such Incentive Compensation to the Company. In addition, the Administrator may seek to recover any shares issued in connection with such Incentive Compensation and to require the Covered Employee to pay to the Company the proceeds resulting from the sale or other disposition of shares issued upon the exercise of options or the settlement or vesting of equity awards.
To the extent the Covered Employee does not reimburse the Company for the demanded Incentive Compensation, the Company shall have the right to enforce the repayment through the reduction or cancellation of outstanding and future Incentive Compensation and, if necessary or desirable, to sue for repayment. To the extent any shares have been issued under vested awards or such shares have been sold by the Covered Employee, the Company shall have the right to cancel any other outstanding stock-based awards with a value equivalent to the Overpayment, as determined by the Administrator.
No Additional Payments
In no event shall the Company be required to award Covered Employees an additional payment if the restated or accurate financial results would have resulted in a higher Incentive Compensation payment.
No Indemnification
The Company shall not indemnify any Covered Employee against the loss of any incorrectly awarded Incentive Compensation.
Administration of Policy
The Administrator shall have the exclusive power and authority to administer this Policy, including, without limitation, the right and power to interpret the provisions of this Policy and to make all determinations deemed necessary or advisable for the administration of this Policy, including, without limitation, any determination as to: (a) whether a Triggering Event has occurred; and (b) what constitutes Incentive Compensation.
It is intended that this Policy be interpreted in a manner that is consistent with the requirements of Section 10D of the Exchange Act and any applicable rules or standards adopted by the Securities and Exchange Commission or any national securities exchange on which the Company’s securities are listed.
Committee Determination Final
Any actions, interpretations and determination by the Administrator (or by any officer of the Company to whom enforcement authority has been delegated) in good faith with respect to this Policy shall be final, conclusive and binding on all interested parties.
Impracticability
The Administrator shall recover any excess Incentive Compensation in accordance with this Policy unless such recovery would be impracticable, as determined by the Administrator in accordance with Rule 10D-1 of the Exchange Act and the listing standards of the national securities exchange on which the Company’s securities are listed.
Amendment and Termination
The Board or the Committee may at any time in its sole discretion supplement or amend any provision of this Policy in any respect, terminate this Policy in whole or part, or adopt a new policy relating to recovery of Incentive Compensation with such terms as the Committee or the Board determine in their sole discretion to be appropriate.
Application of Policy
This Policy applies to all Incentive Compensation granted, paid or credited by the Company. Application of the Policy does not preclude the Company from taking any other action to enforce a Covered Employee’s obligations to the Company, including termination of employment or institution of civil or criminal proceedings.
Other Recoupment Rights
The Administrator intends that this Policy will be applied to the fullest extent of the law. The Administrator may require that any employment agreement, equity award agreement, or similar agreement entered into on or after the Effective Date of this Policy shall, as a condition to the grant of any benefit thereunder, require a Covered Employee to agree to abide by the terms of this Policy. The Policy is in addition to (and not in lieu of) any right of repayment, forfeiture or right of offset against any Covered Employee that is required pursuant to the terms of any similar policy in any employment agreement, equity award agreement, or similar agreement, any statutory repayment requirement (regardless of whether implemented at any time prior to or following the adoption of the Policy), and any other legal remedies available to the Company.
Successors
This Policy shall be binding and enforceable against all Covered Employees and their beneficiaries, heirs, executors, administrators, or other legal representatives.
Effective Date
This Policy shall be effective as of the Effective Date and shall apply to any Incentive Compensation that is received (as such term is defined by Rule 10D-1(d) promulgated under the Exchange Act) by the Covered Employee on or after the Effective Date.