UNITED STATES
SECURITIES AND EXCHANGE COMMISSION
Washington, D.C. 20549
FORM 40-F
(Check One)
☐ |
Registration statement pursuant to Section 12 of the Securities Exchange Act of 1934 |
|
or |
☒ |
Annual report pursuant to Section 13(a) or 15(d) of the Securities Exchange Act of 1934 |
For fiscal year ended: |
December 31, 2023 |
|
SUNCOR ENERGY INC.
(Exact name of registrant as specified in its charter)
Canada |
1311,1321,2911, |
98-0343201 |
150 - 6th Avenue S.W.
P.O. Box 2844
Calgary, Alberta, Canada T2P 3E3
(403) 296-8000
(Address and telephone number of registrant’s principal executive office)
CT Corporation System
28 Liberty St.
New York, New York 10005
(212) 894-8940
(Name, address and telephone number of agent for service in the United States)
Securities registered pursuant to Section 12(b) of the Act:
Title of each class: |
Trading Symbol(s): |
Name of each exchange on which registered: |
Common shares |
SU |
New York Stock Exchange |
Securities registered or to be registered pursuant to Section 12(g) of the Act:
None
Securities for which there is a reporting obligation pursuant to Section 15(d) of the Act:
None
For annual reports, indicate by check mark the information filed with this form:
☒ |
Annual Information Form |
☒ |
Annual Audited Financial Statements |
Indicate the number of outstanding shares of each of the issuer’s classes of capital or common stock as of the close of the period covered by the annual report:
Common Shares |
As of December 31, 2023 there were |
Indicate by check mark whether the registrant: (1) has filed all reports required to be filed by Section 13 or 15(d) of the Exchange Act during the preceding 12 months (or for such shorter period that the registrant was required to file such reports); and (2) has been subject to such filing requirements for the past 90 days.
Yes |
☒ |
No |
◻ |
|
|
|
|
Indicate by check mark whether the registrant has submitted electronically every Interactive Data File required to be submitted pursuant to Rule 405 of Regulation S-T (§232.405 of this chapter) during the preceding 12 months (or for such shorter period that the registrant was required to submit such files).
Yes |
☒ |
No |
◻ |
Indicate by check mark whether the registrant is an emerging growth company as defined in Rule 12b-2 of the Exchange Act.
Emerging growth company |
☐ |
If an emerging growth company that prepares its financial statements in accordance with U.S. GAAP, indicate by check mark if the registrant has elected not to use the extended transition period for complying with any new or revised financial accounting standards provided pursuant to Section 13(a) of the Exchange Act.
Indicate by check mark whether the registrant has filed a report on and attestation to its management’s assessment of the effectiveness of its internal control over financial reporting under Section 404(b) of the Sarbanes-Oxley Act (15 U.S.C. 7262(b)) by the registered public accounting firm that prepared or issued its audit report. ☒
If securities are registered pursuant to Section 12(b) of the Act, indicate by check mark whether the financial statements of the registrant included in the filing reflect the correction of an error to previously issued financial statements. ☐
Indicate by check mark whether any of those error corrections are restatements that required a recovery analysis of incentive-based compensation received by any of the registrant’s executive officers during the relevant recovery period pursuant to §240.10D-1(b). ☐
INCORPORATION BY REFERENCE
This annual report on Form 40-F is incorporated by reference into and as an exhibit to, as applicable, each of the following Registration Statements of the Registrant under the Securities Act of 1933: Form S-8 (File No. 333-87604), Form S-8 (File No. 333-112234), Form S-8 (File No. 333-118648), Form S-8 (File No. 333-124415), Form S-8 (File No. 333-149532), Form S-8 (File No. 333-161021) and Form S-8 (File No. 333-161029). The Registrant's Annual Information Form dated March 21, 2024, Audited Consolidated Financial Statements, Management's Discussion and Analysis for the year ended December 31, 2023 and Supplementary Oil and Gas Disclosures, included as Exhibit 99-1, Exhibit 99-2, Exhibit 99-3 and Exhibit 99-10, respectively, to this annual report on Form 40-F, are incorporated by reference into and as an exhibit to, as applicable, the Registrant’s Registration Statement on Form F-10 (File No. 333- 265216).
UNDERTAKING AND CONSENT TO SERVICE OF PROCESS
A. |
Undertaking |
Suncor Energy Inc. (the “Registrant”) undertakes to make available, in person or by telephone, representatives to respond to inquiries made by the staff of the Securities and Exchange Commission (“SEC”), and to furnish promptly, when requested to do so by the SEC staff, information relating to the securities in relation to which the obligation to file an annual report on Form 40-F arises, or transactions in said securities.
B. |
Consent to Service of Process |
The Registrant has filed previously with the SEC a Form F-X in connection with the Common Shares.
DISCLOSURE CONTROLS AND PROCEDURES AND INTERNAL CONTROL OVER FINANCIAL REPORTING
See pages 2 and 3 of Exhibit 99-2 and pages 56 and 57 of Exhibit 99-3.
ATTESTATION REPORT OF THE REGISTERED PUBLIC ACCOUNTING FIRM
See pages 4, 5, 6 and 7 of Exhibit 99-2.
AUDIT COMMITTEE FINANCIAL EXPERT
See page 62 of Exhibit 99-1.
CODE OF ETHICS
See page 22 of Exhibit 99-1.
FEES PAID TO PRINCIPAL ACCOUNTANT
See page 63 of Exhibit 99-1.
AUDIT COMMITTEE PRE-APPROVAL POLICIES
See Schedule “B” of Exhibit 99-1.
APPROVAL OF NON-AUDIT SERVICES
See Schedule “B” of Exhibit 99-1.
IDENTIFICATION OF THE AUDIT COMMITTEE
See page 62 of Exhibit 99-1.
EXHIBIT INDEX
Exhibit No. |
|
Description |
97 |
|
|
99-1 |
|
|
99-2 |
|
|
99-3 |
|
|
99-4 |
|
|
99-5 |
|
|
99-6 |
|
Certificate of the Chief Executive Officer Pursuant to Exchange Act Rules 13a-14(a) or 15d-14(a) |
99-7 |
|
Certificate of the Chief Financial Officer Pursuant to Exchange Act Rules 13a-14(a) or 15d-14(a) |
99-8 |
|
|
99-9 |
|
|
99-10 |
|
|
101 |
|
Inline interactive data file |
104 |
|
Cover page interactive data file (formatted as Inline XBRL and contained in Exhibit 101) |
SIGNATURES
Pursuant to the requirements of the Exchange Act, the registrant certifies that it meets all of the requirements for filing on Form 40-F and has duly caused this annual report to be signed on its behalf by the undersigned, thereto duly authorized.
|
SUNCOR ENERGY INC. |
|
DATE: March 21, 2024 |
|
|
|
PER: |
/s/ KRIS P. SMITH |
|
|
|
|
|
Kris P. Smith |
Exhibit 97
|
EXECUTIVE COMPENSATION CLAWBACK POLICY |
I. |
BACKGROUND |
The board of directors (the “Board”) of Suncor Energy Inc. (“Suncor” or the “Company”) has adopted this Executive Compensation Clawback Policy (the “Policy”) in accordance with Securities and Exchange Commission (“SEC”) rules, the Sarbanes-Oxley Act of 2002, and the New York Stock Exchange (“NYSE”) listing requirements.
II. |
APPLICATION OF POLICY |
This Policy applies in the event of any restatement (“Restatement”) of Suncor’s financial results due to its material non-compliance with financial reporting requirements under applicable securities laws.1 This Policy does not apply to restatements that are not caused by non-compliance with financial reporting requirements, including but not limited to, a retrospective: (1) application of a change in accounting principles; (2) revision to reportable segment information due to a change in the structure of the Company’s internal organization; (3) reclassification due to a discontinued operation; (4) application of a change in reporting entity, such as from a reorganization of entities under common control; (5) adjustment to provision amounts in connection with a prior business combination; and (6) revision for stock splits, reverse stock splits, dividends or other changes in capital structure.
III. |
EXECUTIVE OFFICERS SUBJECT TO THE POLICY |
This Policy applies to the executive officers of Suncor. This includes the Company’s current or former President, Chief Executive Officer, Chief Financial Officer, Vice-President and Controller, any Executive or Senior Vice-President of Suncor in charge of a principal business unit, division or function, and any other current or former officer or person who performs a significant policy-making function for Suncor Energy Inc. including executive officers of the Company’s subsidiaries if they perform a significant policy-making function for Suncor Energy Inc. (the “Executive Officers”).
For the purposes of this Policy, as at the date of approval, the Executive Officers comprise the Chief Executive Officer, Chief Financial Officer, all Executive and Senior Vice-Presidents who report to the Chief Executive Officer, and the Vice-President and Controller.
IV. |
COMPENSATION SUBJECT TO THE POLICY |
This Policy applies to any incentive-based compensation received by an Executive Officer during the period (the “Clawback Period”) consisting of any of the three completed fiscal years immediately preceding: (1) the date that the Board (or Audit Committee) concludes, or reasonably should have concluded, that Suncor is required to prepare a Restatement; or (2) the date that a court, regulator, or other legally authorized body directs Suncor to prepare a Restatement.
1 |
This includes both: (i) restatements to correct a material error to previously issued financial statements; and (ii) restatements to correct errors that are not material to previously issued financial statements but would result in a material misstatement if: (a) the errors were left uncorrected in the current report; or (b) the error correction was recognized in the current period. |
|
EXECUTIVE COMPENSATION CLAWBACK POLICY |
This Policy covers all incentive-based compensation (including any cash or equity compensation) that is granted, earned or vested based wholly or in part upon the attainment of any “financial reporting measure”. Financial reporting measures are those that are determined and presented in accordance with the accounting principles used in preparing the Company’s financial statements and any measures derived wholly or in part from such financial information (including non-GAAP measures, stock price and total shareholder return). Incentive-based compensation is deemed “received” in the fiscal period during which the applicable financial reporting measure (as specified in the terms of the award) is attained, even if the payment or grant occurs after the end of that fiscal period.
Incentive-based compensation does not include annual base salary, compensation which is awarded based solely on service to Suncor (e.g. a time-vested award, including time-vested stock options or restricted share units), nor does it include compensation which is awarded based on subjective standards, strategic measures (e.g. completion of a merger) or operational measures (e.g. attainment of a certain market share).
V. |
AMOUNT REQUIRED TO BE REPAID PURSUANT TO THIS POLICY |
The amount of incentive-based compensation that must be repaid (subject to the limitations discussed below) is the amount of incentive-based compensation received by the Executive Officer that exceeds the amount of incentive-based compensation that otherwise would have been received had it been determined based on the Restatement (the “Recoverable Amount”).
After a Restatement, the Company will recalculate the applicable financial reporting measure and the Recoverable Amount in accordance with the SEC and NYSE rules. The Company will determine whether, based on that financial reporting measure as calculated relying on the original financial statements, an Executive Officer received a greater amount of incentive-based compensation than would have been received applying the recalculated financial measure. Where incentive-based compensation is based only in part on the achievement of a financial reporting measure performance goal, the Company will determine the portion of the original incentive-based compensation based on or derived from the financial reporting measure which was restated and will recalculate the affected portion based on the financial reporting measure as restated to determine the difference between the greater amount based on the original financial statements and the lesser amount that would have been received based on the Restatement. The Recoverable Amounts will be calculated on a pre-tax basis to ensure that the Company recovers the full amount of incentive-based compensation that was erroneously awarded.
In no event shall Suncor be required to award Executive Officers an additional payment if the restated or accurate financial results would have resulted in a higher incentive compensation payment.
If equity compensation is recoverable due to being granted to the Executive Officer (when the accounting results were the reason the equity compensation was granted) or have vested to the benefit of the Executive Officer (when the accounting results were the reason the equity compensation was vested), in each case in the Clawback Period, the Company will recover the excess portion of the equity award that would not have been granted or vested based on the Restatement, as follows:
Page 2
|
EXECUTIVE COMPENSATION CLAWBACK POLICY |
· |
if the equity award is still outstanding, the Executive Officer will forfeit the excess portion of the award; |
· |
if the equity award has been exercised or settled into shares (the “Underlying Shares”), and the Executive Officer still holds the Underlying Shares, the Company will recover the number of Underlying Shares relating to the excess portion of the award (less any exercise price paid for the Underlying Shares); and |
· |
if the Underlying Shares have been sold by the Executive Officer, the Company will recover the proceeds received by the Executive Officer from the sale of the Underlying Shares relating to the excess portion of the award (less any exercise price paid for the Underlying Shares). |
The Board will take such action as it deems appropriate, in its sole and absolute discretion, reasonably promptly to recover the Recoverable Amount, unless the Human Resources & Compensation Committee determines that it would be impracticable to recover such amount because: (1) the direct costs of enforcing recovery would exceed the Recoverable Amount;2 (2) recovery would likely cause an otherwise tax-qualified retirement plan, under which benefits are broadly available to employees of the Company, to fail to meet the requirements of 26 U.S.C. 401(a)(13) or 26 U.S.C. 411(a) and regulations thereunder;3 or (3) if the recovery of the incentive-based compensation would violate the home-country laws of the Company.
VI. |
ADDITIONAL CLAWBACK REQUIREMENT BY SECTION 304 OF THE SARBANES-OXLEY ACT OF 2002 |
In addition to the provisions described above, if the Company is required to prepare an accounting Restatement due to the material noncompliance of the Company, as a result of misconduct, with any financial reporting requirement under applicable securities laws, then, in accordance with Section 304 of the Sarbanes-Oxley Act of 2002, the Chief Executive Officer and Chief Financial Officer (at the time the financial document embodying such financial reporting requirement was originally issued) shall reimburse the Company for:
· |
any bonus or other incentive-based or equity-based compensation received from the Company during the 12-month period following the first public issuance or filing with the SEC (whichever first occurs) of such financial document; and |
· |
any profits realized from the sale of securities of the Company during that 12-month period. |
VII. |
CREDITING OF RECOVERY AMOUNTS |
To the extent that subsections II, III, IV and V of this Policy (the “Rule 10D-1 Clawback Requirements”) would provide for recovery of incentive-based compensation recoverable by the Company pursuant to Section 304 of the Sarbanes-Oxley Act, in accordance with subsection VI of this Policy (the “Sarbanes-Oxley Clawback Requirements”), and/or any other recovery obligations (including pursuant to employment agreements, or plan awards), the amount such Executive Officer has already reimbursed the Company shall be credited to the required recovery under the Rule 10D-1 Clawback Requirements. Recovery pursuant to the Rule 10D-1 Clawback Requirements does not preclude recovery under the Sarbanes-Oxley Clawback Requirements, to the extent any applicable amounts have not been reimbursed to the Company.
2 |
To reach this determination, Suncor must have first made a reasonable and documented attempt at recovery. |
3 |
To reach this determination, Suncor must obtain an opinion of counsel. |
Page 3
|
EXECUTIVE COMPENSATION CLAWBACK POLICY |
VIII. |
GENERAL PROVISIONS |
This Policy may be amended by the Board from time to time. Changes to this Policy will be communicated to all persons to whom this Policy applies.
Suncor will not indemnify or provide insurance to cover any repayment of incentive-based compensation in accordance with this Policy, the SEC rules and the NYSE listing requirements.
The provisions of this Policy apply to the fullest extent of the law; provided however, to the extent that any provisions of this Policy are found to be unenforceable or invalid under any applicable law, such provision will be applied to the maximum extent permitted and shall automatically be deemed amended in a manner consistent with its objectives to the extent necessary to conform to any limitations required under applicable law.
This Policy is in addition to (and not in lieu of) any right of repayment, forfeiture or right of offset against any Executive Officer that is required pursuant to any other statutory repayment requirement (regardless of whether implemented at any time prior to or following the adoption of this Policy). Nothing in this Policy in any way detracts from or limits any obligation that those subject to it have in law or pursuant to a management, employment, consulting or other agreement with the Company or any of its subsidiaries.
All determinations and decisions made by the Board (or any committee thereof) pursuant to the provisions of this Policy shall be final, conclusive and binding on the Company, its subsidiaries and the persons to whom this Policy applies.
If you have questions about the interpretation of this Policy, please contact either of the following:
|
Jacquie Moore General Counsel & Corporate Secretary |
(403) 296-4746 jmoore@suncor.com |
|
Shawn Poirier Vice President Legal Affairs, Corporate & Assistant Corporate Secretary |
(403) 296-6618 shpoirier@suncor.com |
IX. |
Effective Date |
This Policy is effective as of December 1, 2023.
Approved on August 14, 2023
Page 4
EXHIBIT 99-1
Annual Information Form dated March 21, 2024
Table of Contents
2 |
|
3 |
|
4 |
|
5 |
|
9 |
|
9 |
|
14 |
|
16 |
|
21 |
|
21 |
|
22 |
|
23 |
Statement of Reserves Data and Other Oil and Gas Information |
24 |
|
29 |
|
34 |
|
43 |
|
48 |
|
48 |
|
49 |
|
52 |
|
53 |
|
62 |
|
64 |
|
64 |
|
64 |
|
64 |
|
64 |
|
64 |
|
65 |
|
66 |
Advisory – Forward-Looking Statements and Non-GAAP Financial Measures |
|
|
A-1 |
|
B-1 |
|
C-1 |
|
D-1 |
|
SUNCOR ENERGY INC. ANNUAL INFORMATION FORM 2023 1
Advisories
In this Annual Information Form (AIF), references to “Suncor” or “the company” mean Suncor Energy Inc., its subsidiaries, partnerships and joint arrangements, unless otherwise specified or the context otherwise requires.
All financial information is reported in Canadian dollars, unless otherwise noted. Production volumes are presented on a working-interest basis, before royalties, except for production volumes from the company’s Libyan operations, which are presented on an economic basis.
References to the 2023 audited Consolidated Financial Statements mean Suncor’s audited Consolidated Financial Statements prepared in accordance with International Financial Reporting Standards (IFRS) as issued by the International Accounting Standards Board (IASB), the notes thereto and the auditor’s report thereon, as at and for the years ended December 31, 2023 and 2022. References to the annual 2023 MD&A mean Suncor’s Management’s Discussion and Analysis for the year ended December 31, 2023, dated March 21, 2024.
This AIF contains forward-looking statements and forward-looking information based on Suncor’s current plans, expectations, estimates, projections and assumptions. This information is subject to a number of risks and uncertainties, many of which are beyond the company’s control. Many of these risk factors and other assumptions related to Suncor’s forward-looking statements are discussed in further detail throughout this AIF and the company’s annual 2023 MD&A under the heading Risk Factors, which section is incorporated by reference herein and available on Suncor’s SEDAR+ profile at sedarplus.ca. Users of this information are cautioned that actual results may differ materially from those expressed or implied by the forward-looking statements contained herein. Refer to the Advisory – Forward-Looking Statements and Non-GAAP Financial Measures section of this AIF for information on risk factors and the material assumptions underlying the forward-looking statements.
Information contained in or otherwise accessible through Suncor’s website www.suncor.com does not form a part of this AIF and is not incorporated into this AIF by reference.
2 ANNUAL INFORMATION FORM 2023 SUNCOR ENERGY INC.
Abbreviations
Measurement, Products and Markets | |
mbbls |
thousands of barrels |
mbbls/d |
thousands of barrels per day |
mmbbls |
millions of barrels |
boe |
barrels of oil equivalent |
mboe |
thousands of barrels of oil equivalent |
mboe/d |
thousands of barrels of oil equivalent per day |
mmboe |
millions of barrels of oil equivalent |
mcf |
thousands of cubic feet of natural gas |
mmcfe/d |
millions of cubic feet of natural gas equivalent per day |
bcfe |
billions of cubic feet of natural gas equivalent |
GHG |
greenhouse gas |
mmbtu |
millions of British thermal units |
CO2 |
carbon dioxide |
CO2e |
carbon dioxide equivalent |
NGL(s) |
natural gas liquid(s) |
NO2 |
nitrogen dioxide |
NOx |
nitrogen oxides |
SAGD |
steam assisted gravity drainage |
SCO |
synthetic crude oil |
SO2 |
sulphur dioxide |
MW |
megawatts |
Mt |
megatonnes |
WCS |
Western Canadian Select |
WTI |
West Texas Intermediate |
| |
Places and Currencies | |
U.S. |
United States |
U.K. |
United Kingdom |
$ or Cdn$ |
Canadian dollars |
US$ |
United States dollars |
Suncor converts certain natural gas volumes to boe, mboe and mmboe on the basis of six mcf to one boe. Any figure presented in boe, mboe or mmboe may be misleading, particularly if used in isolation. A conversion ratio of six mcf of natural gas to one bbl of crude oil or NGLs is based on an energy-equivalency conversion method primarily applicable at the burner tip and does not necessarily represent value equivalency at the wellhead. Given that the value ratio based on the current price of crude oil as compared to natural gas is significantly different from the energy equivalency of 6:1, conversion on a 6:1 basis may be misleading as an indication of value.
SUNCOR ENERGY INC. ANNUAL INFORMATION FORM 2023 3
Corporate Structure
Name, Address and Incorporation
Suncor Energy Inc. (formerly Suncor Inc.) was originally formed by amalgamation under the Canada Business Corporations Act (the CBCA) on August 22, 1979, of Sun Oil Company Limited, incorporated in 1923, and Great Canadian Oil Sands Limited, incorporated in 1953. On January 1, 1989, the company amalgamated with a wholly owned subsidiary under the CBCA. The company amended its Articles in 1995 to move its registered office from Toronto, Ontario, to Calgary, Alberta, and in April 1997 to adopt the name, “Suncor Energy Inc.” In April 1997, May 2000, May 2002 and May 2008 the company amended its Articles to divide its issued and outstanding shares on a two-for-one basis.
Pursuant to an arrangement under the CBCA, which was completed effective August 1, 2009, Suncor amalgamated with Petro-Canada™ to form a single corporation continuing under the name “Suncor Energy Inc.” On January 1, 2017, and November 20, 2023, Suncor amalgamated with certain of its wholly owned subsidiaries under the CBCA.
Suncor’s registered and head office is located at 150 – 6th Avenue S.W., Calgary, Alberta, T2P 3E3.
Intercorporate Relationships
Suncor’s material subsidiaries, the voting securities of which were held either directly or indirectly by the company as at December 31, 2023, are shown below.
Name |
Jurisdiction Where Organized |
Percentage Owned |
|
Canadian operations |
|
|
|
Suncor Energy Oil Sands Limited Partnership |
Alberta |
100% |
|
Suncor Energy Products Partnership |
Alberta |
100% |
|
Suncor Energy Marketing Inc. |
Alberta |
100% |
|
Suncor Energy Ventures Corporation |
Alberta |
100% |
|
Suncor Energy Ventures Partnership |
Alberta |
100% |
|
U.S. operations |
|
|
|
Suncor Energy (U.S.A.) Marketing Inc. |
Delaware |
100% |
|
Suncor Energy (U.S.A.) Inc. |
Delaware |
100% |
|
The company’s remaining subsidiaries each accounted for (i) less than 10% of the company’s consolidated assets as at December 31, 2023, and (ii) less than 10% of the company’s consolidated revenues for the fiscal year ended December 31, 2023. In aggregate, the company’s remaining subsidiaries accounted for less than 20% of the company’s consolidated assets as at December 31, 2023, and less than 20% of the company’s consolidated revenues for the fiscal year ended December 31, 2023.
4 ANNUAL INFORMATION FORM 2023 SUNCOR ENERGY INC.
General Development of the Business
Overview
Suncor is an integrated energy company headquartered in Calgary, Alberta, Canada. Suncor’s operations include oil sands development, production and upgrading; offshore oil production; petroleum refining in Canada and the U.S.; and the company’s Petro-Canada™ retail and wholesale distribution networks (including Canada’s Electric Highway™, a coast-to-coast network of fast-charging electric vehicle stations). Suncor is developing petroleum resources while advancing the transition to a low-emissions future through investments in power and renewable fuels. Suncor also conducts energy trading activities focused primarily on marketing and trading crude oil, natural gas, byproducts, refined products and power. Suncor’s common shares (symbol: SU) are listed on the Toronto Stock Exchange (TSX) and New York Stock Exchange (NYSE).
Three-Year History
Over the last three years, the following events have influenced the general development of Suncor’s business.
2021
| • | Renewal of share repurchase program. Suncor commenced a new normal course issuer bid (NCIB) to repurchase up to 44,000,000 of the company’s common shares through the facilities of the TSX, NYSE and/or alternative trading platforms, which was later increased to approximately 7% of Suncor’s public float. During 2021, Suncor repurchased approximately 84.0 million of its common shares, or the equivalent of 5.5% of Suncor’s issued and outstanding common shares as at January 31, 2021, at an average price of $27.45 per common share. |
| • | Debt reduction. Suncor cancelled $2.8 billion in bilateral credit facilities, which were entered into in March and April of 2020 to ensure access to adequate financial resources in connection with the COVID-19 pandemic. In addition, the company completed an early redemption of its outstanding US$220 million of 9.40% senior unsecured notes and $750 million of 3.10% medium-term notes, both due in 2021. |
| • | Issuance of senior notes. Suncor issued US$750 million of 3.75% senior unsecured notes and $500 million of 3.95% senior unsecured medium-term notes, both due on March 4, 2051. |
| • | Updated strategy focused on shareholder returns and GHG emissions reductions. On May 26, 2021, the company outlined its medium-term outlook for structural cost reductions, a stronger balance sheet, improved margin capture and a sustainable increase of cash returns to shareholders while strengthening the company’s environmental performance. The strategy included the goal for Suncor to become a net-zero GHG emissions from operations company by 2050 and to substantially contribute to society’s net-zero ambitions. |
| • | Oil Sands Pathways to Net Zero Alliance. On June 9, 2021, Suncor, together with industry partners, announced the Oil Sands Pathways to Net Zero alliance, an alliance of peers working collectively with governments with a goal to achieve net-zero GHG from oil sands operations by 2050. |
| • | Suncor assumes operatorship of Syncrude. On September 30, 2021, Suncor assumed the role of operator of the Syncrude joint operation. |
| • | Completed sale of the Golden Eagle Area Development. The company completed the sale of its 26.69% working interest in the Golden Eagle Area Development for gross proceeds of US$250 million net of closing adjustments and other closing costs, in addition to future contingent consideration of up to US$50 million. The effective date of the sale was January 1, 2021. |
SUNCOR ENERGY INC. ANNUAL INFORMATION FORM 2023 5
| • | Terra Nova ALE Project moving forward. Suncor and the co-owners of the Terra Nova project finalized an agreement to restructure the project ownership and move forward with the asset life extension (ALE) Project. As a result of the agreement, Suncor increased its ownership in the project by approximately 10% to 48%. |
| • | Historic partnership with Indigenous communities. Suncor, together with eight Indigenous communities, acquired a 15% equity interest in the Northern Courier Pipeline in the fourth quarter of 2021. The Northern Courier Pipeline, which connects Fort Hills to Suncor’s East Tank Farm, is operated by Suncor and is expected to provide the eight Indigenous communities with reliable income for decades. |
| • | Dividend increase. In the fourth quarter of 2021, the Board approved a quarterly dividend of $0.42 per share, reinstating the quarterly dividend to 2019 levels. |
| • | Fort Hills resumed operation of the second primary extraction train. Fort Hills resumed two-train operations late in the fourth quarter of 2021. |
2022
| • | Renewal of share repurchase program. In the first quarter of 2022, Suncor renewed its NCIB to repurchase up to approximately 5% of Suncor’s issued and outstanding common shares through the facilities of the TSX, NYSE and/or alternative trading platforms, which was later increased to approximately 10% of Suncor’s public float. During 2022, the company repurchased approximately 116.9 million of its common shares, or the equivalent of 8.1% of its issued and outstanding common shares as at December 31, 2021, at an average share price of $43.92 per common share. |
| • | Dividend increases. In the second and fourth quarters of 2022, the Board approved increases to the quarterly dividend, raising it to $0.47 per share and $0.52 per share, respectively. |
| • | Executed debt tender offer. In the fourth quarter of 2022, the company completed a debt tender offer and repurchased approximately $3.6 billion of its various series of outstanding notes below par. |
| • | Restart of West White Rose Project. In the second quarter of 2022, Suncor and the joint venture owners announced the decision to restart the West White Rose Project offshore the east coast of Canada, which is expected to extend the production life of the White Rose field. As a result of the restart decision, Suncor increased its ownership in the White Rose assets by an additional 12.5% to approximately 39%. Production from the West White Rose Project is expected to commence in 2026. |
| • | Kris Smith appointed interim President and Chief Executive Officer. On July 8, 2022, Mr. Smith was named interim President and Chief Executive Officer, replacing Mark Little. |
| • | Suncor enters into agreement with Elliott Investment Management. In the third quarter of 2022, Suncor entered into an agreement with affiliates of Elliott Investment Management (Elliott), pursuant to which Suncor appointed three new independent directors to its Board. |
| • | Completed sale of Norway operations. The company completed the sale of its Exploration and Production (E&P) assets in Norway for gross proceeds of approximately $430 million, before closing adjustments and other closing costs. |
| • | Fort Hills mine improvement plan. Fort Hills commenced its three-year mine improvement plan, which includes an accelerated sequence of mine development relative to historical plans, during which time the asset is expected to average lower than 90% production rates. |
| • | Results of retail review. In the fourth quarter of 2022, following a comprehensive strategic review of its downstream retail business, the company announced that it would retain and continue to improve and optimize the Petro-Canada™ retail business. |
6 ANNUAL INFORMATION FORM 2023 SUNCOR ENERGY INC.
2023
| • | Renewal of share repurchase program. In the first quarter of 2023, Suncor renewed its NCIB to repurchase up to 132,900,000 of the company’s common shares through the facilities of the TSX, NYSE and/or alternative trading platforms. As at December 31, 2023, the company repurchased approximately 52.0 million of its common shares, or the equivalent of 3.9% of its issued and outstanding common shares as at December 31, 2022, at an average share price of $42.96 per common share. Subsequent to 2023, Suncor renewed its NCIB for the purchase of up to 10% of Suncor’s public float as at February 12, 2024, through the facilities of the TSX, NYSE and/or alternative trading platforms. The renewed NCIB will begin February 26, 2024, and end February 25, 2025. |
| • | Suncor amends agreement with Elliott. In the first quarter of 2023, the agreement with Elliott was amended to extend the right for Elliott to appoint an additional director to the Board, which occurred in March 2023. |
| • | Sale of wind and solar assets. In the first quarter of 2023, Suncor completed the sale of its wind and solar assets for gross proceeds of $730 million, before closing adjustments and other closing costs. The sale included the company’s interest in Forty Mile, Adelaide, Magrath and Chin Chute. |
| • | Acquired additional interest in Fort Hills. On February 2, 2023, Suncor completed the acquisition of an additional 14.65% working interest in Fort Hills for $712 million from Teck Resources Limited, bringing the company’s working interest to 68.76%. The effective date of the transaction was November 1, 2022. |
| • | Rich Kruger appointed President and Chief Executive Officer. Effective April 3, 2023, Mr. Kruger was named Suncor’s President and Chief Executive Officer. Effective May 9, 2023, Kris Smith assumed the role of Chief Financial Officer. |
| • | Sale of U.K. assets. In the second quarter of 2023, Suncor completed the sale of its U.K. E&P portfolio for gross proceeds of $1.1 billion, before closing adjustments and other closing costs. |
| • | Cybersecurity incident. In the second quarter of 2023, Suncor experienced a cybersecurity incident. The incident did not impact the safety and reliability of the company’s field operations but did impact some business operations and services. The cybersecurity incident did not have a material impact on the company’s 2023 financial results. |
| • | Co-ownership agreement with North Atlantic. In the first quarter of 2023, Suncor entered into a co-ownership agreement with North Atlantic to combine retail fuel networks. The combined network has 110 sites and will include the rebranding of a number of North Atlantic’s sites to the Petro-Canada™ brand. |
| • | Petro-Canada™ and Canadian Tire Corporation partnership. In the second quarter of 2023, Petro-Canada™ and Canadian Tire Corporation announced a new partnership that will result in the rebranding of over 200 of Canadian Tire Corporation’s retail fuel network sites to the Petro-Canada™ brand, as well as the partnering of the two brand’s loyalty programs. Suncor will also become the primary fuel provider for Canadian Tire Corporation’s retail fuel network. |
| • | Workforce reductions. During the second half of 2023, Suncor completed workforce reductions of approximately 1,500 employees. |
| • | Terra Nova returns to production. In the fourth quarter of 2023, the Terra Nova Floating, Production, Storage and Offloading (FPSO) vessel safely restarted production, with production expected to continue ramping up in the beginning of 2024. |
| • | Dividend increase. In the fourth quarter of 2023, the Board approved a quarterly dividend of $0.545 per share, an increase of approximately 5% over the prior quarter dividend. |
SUNCOR ENERGY INC. ANNUAL INFORMATION FORM 2023 7
| • | Acquired remaining interest in Fort Hills. On November 20, 2023, Suncor completed the acquisition of TotalEnergies EP Canada Ltd. (TotalEnergies Canada), which held the remaining 31.23% working interest in Fort Hills, for $1.468 billion before closing adjustments and other closing costs, making Suncor the sole owner of Fort Hills. The effective date of the transaction was April 1, 2023. |
| • | Issuance of senior notes. During the fourth quarter of 2023, Suncor issued $1.0 billion principal amount of 5.60% senior unsecured medium term notes and $500 million principal amount of 5.40% senior unsecured medium term notes, due on November 17, 2025, and November 17, 2026, respectively, to finance the acquisition of TotalEnergies Canada. |
8 ANNUAL INFORMATION FORM 2023 SUNCOR ENERGY INC.
Narrative Description of Suncor’s Businesses
Suncor has classified its operations into the following segments: Oil Sands, Exploration & Production, Refining & Marketing (R&M), and Corporate & Eliminations.
Oil Sands
Suncor’s Oil Sands segment produces bitumen from mining and in situ operations located in the Athabasca oil sands of northeast Alberta. Suncor has integrated upgrading facilities where bitumen is either upgraded into SCO or blended with diluent for either refinery feedstock or direct sale to market.
Mining Operations
Suncor has two wholly owned open-pit mining operations, Oil Sands Base and Fort Hills, and owns a 58.74% interest in the Syncrude joint operation, also an open-pit mining operation. Suncor has been the operator of the Syncrude joint operation since September 30, 2021.
Oil Sands Base Mining
Bitumen at Oil Sands Base is mined from the Millennium area, which began production in 2001, and the North Steepbank area, which began production in 2011. During 2023, the company mined approximately 149.0 million tonnes of bitumen ore (2022 – 147.1 million tonnes) and processed an average of 250.1 mbbls/d of mined bitumen in its extraction facilities (2022 – 256.9 mbbls/d).
Millennium and North Steepbank use shovels to excavate oil sands bitumen ore, which is trucked to sizers and breaker units that reduce the size of the ore. Next, a slurry of hot water, sand and bitumen is created and delivered via a pipeline to extraction plants. The raw bitumen is separated from the slurry using a hot water process that creates a bitumen froth. Naphtha is added to the bitumen froth to form a diluted bitumen, which is subsequently sent to a centrifuge plant that removes most of the remaining impurities and minerals. Coarse tailings produced in the process are placed directly into sand placement areas.
Fort Hills Mining
Fort Hills mine, comprising leases on the east side of the Athabasca River, is north of Oil Sands Base operations. Fort Hills achieved first production in early 2018.
Fort Hills operations are substantially similar to those of Suncor’s Oil Sands Base mining and extraction assets, however, Fort Hills uses a paraffinic froth treatment process to produce a marketable bitumen product that is partially decarbonized, resulting in a higher-quality bitumen requiring less diluent and eliminating the need for on-site upgrading facilities.
During 2023, Fort Hills operated at reduced production rates in support of its three-year mine improvement plan, which commenced in the fourth quarter of 2022. In 2023, Fort Hills gross production averaged 147.1 mbbls/d of bitumen (106.4 mbbls/d, net to Suncor) (2022 – 157.3 mbbls/d gross production; 85.1 mbbls/d, net to Suncor) from approximately 72.5 million tonnes of bitumen ore mined, net to Suncor (2022 – 53.5 million tonnes, net to Suncor).
In 2023, Suncor completed two separate acquisitions of additional working interests in Fort Hills, increasing its ownership from 54.11% to 100%.
Syncrude Mining
Syncrude mining and extraction operations are similar to those at Oil Sands Base.
Syncrude began producing in 1978 and is located near Fort McMurray. It includes mining operations at Mildred Lake and Aurora North.
SUNCOR ENERGY INC. ANNUAL INFORMATION FORM 2023 9
Syncrude is progressing the Mildred Lake West Extension (MLX-W) project, which is expected to sustain bitumen production levels at the Mildred Lake site after resource depletion at the North Mine using existing mining and extraction facilities. First oil from MLX-W is expected in late 2025. The Mildred Lake East Extension (MLX-E) program will follow the MLX-W development if economic conditions remain suitable.
In 2023, Suncor’s share of Syncrude production, including internal consumption and transfers through the interconnecting pipelines, averaged 192.6 mbbls/d of SCO, intermediate products and bitumen (2022 – 184.8 mbbls/d).
Other Mining Leases
Suncor directly owns interests in several other mineable oil sands leases, including Base Mine Extension (100%) and Audet (100%). Suncor undertakes exploratory drilling programs on such leases from time to time as part of its mine replacement projects.
Suncor indirectly owns interests in other mineable oil sands leases, including Mildred Lake West, Mildred Lake East, Lease 29, Lease 30 and Lease 31, through the company’s interest in Syncrude.
In Situ Operations
Suncor’s In Situ operations include oil sands bitumen production from Firebag and MacKay River, as well as supporting infrastructure, including central processing facilities, cogeneration units, product transportation infrastructure, diluent import capabilities, storage assets and a cooling and blending facility.
In Situ operations use SAGD technology for producing bitumen from oil sands deposits that are too deep to be mined.
Once Through Steam Generators (OTSGs) or cogeneration units are used to generate steam and electricity for operations and are fuelled by both purchased natural gas and produced natural gas recovered at central processing facilities. Excess electricity generation is used at Oil Sands Base facilities or sold to the Alberta power grid.
Firebag
Production from Firebag operations commenced in 2004. The Firebag complex has central processing facilities with a total capacity of 215 mbbls/d of bitumen.
Firebag has 25 well pads in operation, with 320 SAGD well pairs and 53 infill wells either producing or on initial steam injection. Central processing facilities have been designed to provide some flexibility as to which well pads supply bitumen. Steam generated at the various facilities can be used at multiple well pads. In addition, Firebag includes five cogeneration units that generate steam and are capable of producing approximately 474 MW of electricity. Firebag power load requirements were approximately 122 MW in 2023, Firebag exported approximately 229 MW of electricity to the Alberta power grid and Oil Sands Base. There are also 15 OTSGs at the site for additional steam generation.
During 2023, Firebag production averaged 217.4 mbbls/d of bitumen (2022 – 198.9 mbbls/d) with a steam-to-oil ratio of 2.7 (2022 – 2.7).
MacKay River
Production from MacKay River operations commenced in 2002. The MacKay River central processing facilities have a bitumen processing capacity of 38 mbbls/d. MacKay River includes nine well pads with 133 well pairs either producing or on initial steam injection. A third party owns the on-site cogeneration unit, which Suncor operates, that generates steam and electricity. There are also four OTSGs at the site for additional steam generation.
During 2023, MacKay River production averaged 33.7 mbbls/d of bitumen (2022 – 32.4 mbbls/d) with a steam-to-oil ratio of 2.9 (2022 – 2.8).
10 ANNUAL INFORMATION FORM 2023 SUNCOR ENERGY INC.
Other In Situ Leases
Suncor holds a large portfolio of In Situ lands in proximity to Fort McMurray. Suncor holds a 100% working interest in Lewis and Gregoire, a 100% working interest in Firebag South, a 77.78% working interest in OSLO and interests varying from 25% to 50% in Chard. Lewis has received regulatory approval for future production. The portfolio is well positioned to leverage Suncor’s existing asset base and is currently being evaluated as part of Suncor’s integrated Bitumen Supply Strategy.
Upgrading Facilities
Base Plant
Base Plant upgrades bitumen to SCO with two upgraders: Upgrader 1, which has a capacity of approximately 110 mbbls/d of SCO, and Upgrader 2, which has a capacity of approximately 240 mbbls/d of SCO. Suncor’s secondary upgrading facilities consist of three hydrogen plants, three naphtha hydrotreaters, two gas oil hydrotreaters, one diesel hydrotreater and one kerosene hydrotreater.
During 2023, Suncor’s Oil Sands Base assets averaged 314.9 mbbls/d of upgraded (SCO and diesel) production, mainly sourced from bitumen provided by Oil Sands Base, In Situ operations, and Fort Hills, including the company’s internal consumption and transfers through the interconnecting pipelines (2022 – 314.6 mbbls/d).
The SCO is either sold as sour SCO or upgraded further into sweet SCO by removing sulphur and nitrogen using a hydrotreating process. Upgrading processes also produce ultra-low sulphur diesel fuel and other byproducts.
Syncrude
Upgrading technologies at Syncrude are similar to those used at Oil Sands Base, with the exception that Syncrude uses a fluid coking process that involves the continuous thermal cracking of the heaviest hydrocarbons. At Mildred Lake, electricity is provided by a utility plant fuelled by natural gas and rich fuel gas from upgrading operations. At Aurora North, Syncrude operates two cogeneration units that provide heat and electricity.
Syncrude primarily produces a sweet SCO product, and each individual Syncrude owner is responsible for marketing its share of production.
Regional Integration
In Situ and Fort Hills to Base Plant
In Situ bitumen production processed by Oil Sands Base upgrading facilities in 2023 decreased to 127.7 mbbls/d or 51% (2022 – 130.2 mbbls/d or 56%) of total In Situ bitumen production. Commencing in 2022, up to 60 mbbls/d of Fort Hills bitumen can be transported to Oil Sands Base for upgrading. During 2023, 18.6 mbbls/d (2022 – 0.3 mbbls/d) of Fort Hills bitumen was upgraded at Oil Sands Base.
Bi-lateral between Base Plant and Syncrude
Interconnecting pipelines connect Syncrude’s Mildred Lake site and Suncor’s Oil Sands Base. The pipelines provide increased operational flexibility through the ability to transfer bitumen and sour SCO between the two plants, enabling higher upgrader utilization. The pipelines create flexibility for Suncor to sell intermediate products to Syncrude, which include bitumen and sour SCO.
Power Generation
Suncor is constructing an 800 MW cogeneration facility to replace the existing coke-fired boilers at Oil Sands Base. The project will provide steam generation required for Suncor’s extraction and upgrading activities and reduce the GHG emissions intensity associated with steam production at Oil Sands Base by approximately 25%. In addition, the excess electricity produced will be transmitted to Alberta’s power grid, providing reliable, baseload, low-carbon electricity. In total, this project is expected to reduce GHG
SUNCOR ENERGY INC. ANNUAL INFORMATION FORM 2023 11
emissions in the province of Alberta by approximately 5.1 Mt per year and is expected to be in service in late 2024.
New Technology
Suncor leverages innovation and technology across the company’s operations to enhance safety, help further reduce our environmental impact, upgrade the tools and processes we use in our day-to-day operations, maximize our financial performance and enhance our product value. Additionally, the Company looks for opportunities to collaborate with others and accelerate the development of technologies to reduce our impact on air, land and water resources.
Suncor is also working on, or has completed, several new technology projects that are now being deployed or implemented in operations or are proceeding with the next phase of field testing. Examples of these projects include:
| ● | Collision Awareness & Fatigue Management Technology – In 2023, Suncor successfully implemented collision awareness technology and a fatigue management solution (technologies aimed at preventing mobile equipment contact) on over 1,000 pieces of mobile equipment combined in its mining fleet. |
| ● | Autonomous Haulage Systems (AHS) – Following a successful commercial scale evaluation in 2018, the company began a phased implementation of autonomous haulage systems at its operated mine sites. AHS were deployed at North Steepbank in 2018 and at Fort Hills in 2020. Subsequently, in 2021, Fort Hills temporarily returned to a staffed fleet to better manage congestion and interactions between staffed and autonomous operations. Redeployment at Fort Hills is planned upon completion of the three-year mine improvement plan and progression of North Pit development to establish sufficient surface area for autonomous operations. At Oil Sands Base, the company plans to further deploy autonomous haul trucks at its Millennium mine and expects to have 91 autonomous haul trucks in its Oil Sands Base operations by the end of 2024. |
| ● | Permanent Aquatic Storage Structure (PASS) – Building upon the process used in Suncor’s Tailings Reduction Operations (TRO™), Suncor has developed PASS fluid tailings treatment process to significantly increase the amount of fluid tailings it can treat in a more sustainable manner. PASS combines the TRO™ process with the application of a treatment technology to improve the quality of the water. |
| ● | Enhanced Solvent SAGD (ES-SAGD) – ES-SAGD is an enhancement of SAGD technology that accelerates bitumen production and reduces the steam-to-oil ratio and lowers GHG emissions. This technology was successfully piloted in a half-pad configuration at Firebag from 2019 to 2021, and a follow-up full-pad commercial demonstration began at Firebag in the fourth quarter of 2022, focused on demonstrating a material improvement in both environmental and economic performance. Pending a successful demonstration, the technology is expected to be ready for commercial deployment in Suncor’s In Situ projects as early as 2027. |
| ● | SAGD Solvent-Dominated Process – Solvent-dominated processes involve the full or near-full replacement of steam with a hydrocarbon solvent to reduce GHG emissions by up to 70%. The combined solvent and thermal effect are expected to materially lower the energy requirements and result in a potential step-change in both economic and environmental performance, including a greater than 50% reduction in emissions intensity relative to SAGD. |
| ● | Non-Aqueous Extraction (NAE) – NAE is a potential new extraction process for oil sands mining operations that uses solvents, as opposed to water, as the primary extraction means. This has the potential to reduce water usage and tailings, and simplify extraction processes, while reducing costs and GHG emissions. |
12 ANNUAL INFORMATION FORM 2023 SUNCOR ENERGY INC.
Sales of Principal Products
Primary markets for SCO and bitumen production from Suncor’s Oil Sands segment include refining operations in Alberta, Ontario, Quebec, the U.S. Midwest and the U.S. Rocky Mountain regions, and markets on the U.S. Gulf Coast. Diesel production from upgrading operations is sold primarily in Western Canada and the U.S.
|
|
2023 |
|
2022 |
||||
Sales Volumes and Operating Revenues - Principal Products |
|
mbbls/d |
|
% Operating |
|
mbbls/d |
|
% Operating |
SCO and diesel |
|
486.6 |
|
72 |
|
482.6 |
|
77 |
Bitumen |
|
199.4 |
|
27 |
|
180.7 |
|
21 |
Byproducts and other operating revenues(1) |
|
n/a |
|
1 |
|
n/a |
|
2 |
|
|
686.0 |
|
|
|
663.3 |
|
|
| (1) | Operating revenues include revenues associated with excess electricity from cogeneration units. |
In the normal course of business, Suncor processes its proprietary sour SCO at the company’s refineries or enters into long-term sales agreements, which contain varying terms with respect to pricing, volume, expiry and termination.
Distribution of Products
Production from Oil Sands operations and Fort Hills is gathered into facilities at the Athabasca Terminal, operated by Enbridge, or the East Tank Farm, which is operated by Suncor and connected to the Athabasca Terminal.
Suncor has arrangements with Enbridge to store SCO, diluted bitumen and diesel at the Athabasca Terminal. Product moves from the Athabasca Terminal in the following ways:
• |
To Edmonton via the Oil Sands pipeline, owned and operated by Suncor. At Edmonton, the product is processed in Suncor’s Edmonton refinery, sold to other local refiners or transferred on the Enbridge Mainline or the Trans Mountain Pipeline system. |
• |
To Cheecham, Alberta, on the Enbridge Athabasca Pipeline or the Enbridge Wood Buffalo Pipeline and from Cheecham on the Enbridge Athabasca Pipeline or the Enbridge Wood Buffalo Pipeline Extension to Hardisty, Alberta. |
• |
To Edmonton via the Enbridge Waupisoo Pipeline, originating at Cheecham. |
From Edmonton and Hardisty, where Suncor owns storage capacity and has additional capacity under contract, there are various options for delivering SCO and bitumen to customers:
• |
To Suncor’s Commerce City refinery via the Express and Platte pipelines, and via the mainline from Rose Rock’s Platteville Terminal to Suncor’s Fort Lupton Station. Suncor owns and operates a pipeline that is connected to the Commerce City refinery, which originates from the Guernsey, Wyoming, station. |
• |
To Suncor’s Sarnia refinery on the Enbridge Mainline and to Suncor’s Montreal refinery from Sarnia on Enbridge’s Line 9. |
• |
To most major refining hubs via the Enbridge Mainline, Express/Platte, Keystone and Flanagan South pipeline systems. |
• |
To U.S. Puget Sound refineries and to global markets via the Trans Mountain Pipeline, as well as by rail. |
Production from Syncrude is moved to market via the Pembina Alberta Oil Sands Pipeline.
SUNCOR ENERGY INC. ANNUAL INFORMATION FORM 2023 13
Exploration and Production
Suncor’s E&P segment consists of offshore operations off the east coast of Canada and onshore assets in Libya and Syria.
E&P Canada – Assets and Operations
Based in St. John’s, Newfoundland and Labrador, this business includes interests in four producing fields and future developments and extensions. Suncor is also involved in exploration drilling for new opportunities. Suncor is the only company in this region with interests in every field currently in production.
Terra Nova
Suncor holds a 48% working interest in the Terra Nova oilfield. Terra Nova, which is approximately 350 kilometres southeast of St. John’s, was discovered in 1984 and was the second oilfield to be developed offshore Newfoundland and Labrador. Operated by Suncor, the production system uses an FPSO vessel that is moored on location. The Terra Nova oilfield is divided into three distinct areas: the Graben, the East Flank and the Far East. Production from Terra Nova began in January 2002.
In preparation for the ALE Project, in 2019, Terra Nova was taken offline. In 2021, Suncor and the co-owners of the Terra Nova project finalized an agreement to restructure the project ownership and move forward with the ALE Project. Under this agreement, the company’s working interest increased to 48% from approximately 38% in exchange for a cash payment from the exiting owners. This agreement included royalty and financial support from the Government of Newfoundland and Labrador.
Following the completion of the ALE Project, Terra Nova safely restarted production in the fourth quarter of 2023, with production expected to continue ramping up in the beginning of 2024. In 2023, Suncor’s share of Terra Nova production averaged 0.6 mbbls/d of crude oil (2022 – nil mbbls/d).
Hibernia and the Hibernia Southern Extension Unit
Suncor holds a non-operated interest in Hibernia (20% in the base project and 19.485% in the Hibernia Southern Extension Unit). The Hibernia oilfield, encompassing the Hibernia and Ben Nevis Avalon reservoirs, is approximately 315 kilometres southeast of St. John’s and was the first field to be developed in the Jeanne d’Arc Basin. Operated by Hibernia Management and Development Company Ltd., the production system is a fixed gravity-based structure that sits on the ocean floor. Hibernia commenced production in November 1997. There are 74 wells: 41 oil production wells, 27 water injection wells, five gas injection wells and one water-alternating-gas injection well.
In 2010, the Hibernia co-venturers and the Government of Newfoundland and Labrador agreed to develop the Hibernia Southern Extension Unit (HSEU). There are eight oil production wells and nine water injection wells in the HSEU.
In 2023, Suncor’s share of Hibernia production averaged 13.8 mbbls/d of crude oil (2022 – 15.1 mbbls/d).
White Rose and the White Rose Extensions
White Rose is approximately 350 kilometres southeast of St. John’s. Operated by Cenovus Energy Inc., White Rose uses the SeaRose FPSO vessel. Production from White Rose began in November 2005. There are 45 wells: 23 oil production wells, 16 water injection wells, three gas storage wells and three gas injection wells.
The White Rose Extensions include the North Amethyst, South White Rose Extension, and West White Rose satellite fields (the Extensions). First oil was achieved at North Amethyst in May 2010. First oil was achieved at the South White Rose Extension in June 2015.
Development of the West White Rose field has been divided into two stages. The first stage achieved first oil in September 2011 and the second stage, West White Rose Project, was sanctioned in 2017. Major development activity began in 2018. In 2020, the operator moved the project into safe mode due to
14 ANNUAL INFORMATION FORM 2023 SUNCOR ENERGY INC.
COVID-19-related market uncertainty. In 2022, concurrent with the decision to restart the project by the joint venture owners, Suncor increased its ownership in White Rose from 27.5% to 40% in the White Rose Field, and from 26.1% to 38.6% in the Extensions. White Rose was taken offline late in the fourth quarter of 2023 to commence the SeaRose FPSO Asset Life Extension Project. Production at White Rose is planned to resume once the project is completed. Production from the West White Rose Project is expected to commence in 2026.
In 2023, Suncor’s share of White Rose production averaged 5.2 mbbls/d of crude oil (2022 – 6.1 mbbls/d).
Hebron
Suncor holds a 21.034% interest in the Hebron oilfield, located approximately 340 kilometres southeast of St. John’s and operated by ExxonMobil. The development includes a concrete gravity-based structure that sits on the ocean floor and supports an integrated topsides deck used for production, drilling and accommodations. First oil was achieved in November 2017.
There are 30 wells: 20 oil production wells, six water injection wells, one gas injection well, one cuttings reinjection well and two water alternating gas injection wells. In 2023, Suncor’s share of production averaged 24.8 mbbls/d of crude oil (2022 – 29.0 mbbls/d).
Other Assets
Suncor holds interests in 49 significant discovery licences and three exploration licences offshore in this area.
Distribution of Products
East Coast Canada: Field production is transported by shuttle tanker from offshore installations and either delivered directly to customers or to the Newfoundland transshipment terminal in Placentia Bay, where it is subsequently loaded onto tankers for transport to markets in Eastern Canada, the U.S., Europe, Latin America and Asia. Suncor has a 14% ownership interest in the transshipment facility and is part of a group of companies that share the operation of marine transportation assets for East Coast Canada.
E&P International – Assets and Operations
Offshore U.K.
During the second quarter of 2023, Suncor completed the sale of its U.K. E&P portfolio for gross proceeds of $1.1 billion, before closing adjustments and other closing costs, which included its interests in Buzzard and Rosebank located in the U.K. sector of the North Sea.
Other International
Libya
In Libya, Suncor is a signatory to seven exploration and production sharing agreements (EPSAs) with the National Oil Corporation (NOC). Under the EPSAs, Suncor pays 100% of the exploration costs, 50% of the development costs and 12% of the operating costs. The development, operating and eligible exploration costs are recovered through a 12% share of production (Cost Recovery Oil). Any Cost Recovery Oil remaining after Suncor’s costs have been recovered is shared between Suncor and the NOC based on several factors. The EPSAs expire on December 31, 2032, but include an initial five-year extension through the end of 2037.
Since 2013, production and liftings in Libya have been intermittent due to ongoing political unrest, and the remaining value of Suncor’s assets in Libya was impaired in 2015. The timing of a return to normal operations in Libya remains uncertain due to continued political unrest.
SUNCOR ENERGY INC. ANNUAL INFORMATION FORM 2023 15
The estimated cost of Suncor’s remaining exploration work program commitment at December 31, 2023, is US$359 million. Suncor declared force majeure for all exploration commitments in Libya effective December 14, 2014, and this declaration remains in effect.
Suncor’s share of production in Libya on an economic basis averaged 4.0 mbbls/d in 2023 of crude oil (2022 – 3.3 mbbls/d).
Syria
In December 2011, due to unrest in Syria, sanctions were imposed, and Suncor declared force majeure under its contractual obligations, suspending its operations in the country. Consequently, the company has ceased recording all production and revenue associated with its Syrian assets. As a result of continued uncertainty about Suncor’s future in the country, the remaining value of the Suncor assets in Syria was impaired to zero in 2013.
Sales of Principal Products
Oil and gas production from East Coast Canada and Offshore U.K., prior to its divestment, is marketed by Suncor’s Energy Trading business. Suncor does not typically enter into long-term supply arrangements to sell its production from its E&P segment. Contracts for these direct sales arrangements are all made on a spot basis and incorporate pricing that is generally determined on a daily or monthly basis in relation to a specified market reference price.
In Libya, crude oil is marketed by the NOC on behalf of Suncor.
Exploration and Production Sales Summary:
|
|
2023 |
|
2022 |
||||
Sales Volumes |
|
mboe/d |
|
% Operating |
|
mboe/d |
|
% Operating |
E&P Canada |
|
|
|
|
|
|
|
|
Crude oil |
|
41.5 |
|
78 |
|
51.4 |
|
63 |
E&P International |
|
|
|
|
|
|
|
|
Crude oil and NGLs(1)(2) |
|
11.4 |
|
22 |
|
28.5 |
|
36 |
Natural gas |
|
— |
|
— |
|
0.7 |
|
1 |
Total Exploration and Production |
|
|
|
|
|
|
|
|
Crude oil and NGLs(2) |
|
52.9 |
|
100 |
|
79.9 |
|
99 |
Natural gas |
|
— |
|
— |
|
0.7 |
|
1 |
| (1) | E&P International crude oil and NGLs include production volumes for Libya on an economic basis. |
| (2) | Includes immaterial amounts of NGLs. |
Refining and Marketing
Suncor’s refining and marketing (R&M) segment consists of two primary operations: the Refining and Supply and Marketing operations, as well as the infrastructure supporting the marketing, supply and risk management of refined products, crude oil, natural gas, power and byproducts. This segment also includes the trading of crude oil, refined products, natural gas and power.
Refining and Supply – Assets and Operations
Eastern North America
Montreal Refinery
The Montreal refinery has a flexible configuration that allows processing of sweet SCO from the company’s Oil Sands segment, WCS, conventional crude oil and intermediate feedstock. Crude oil is procured at market prices on a spot basis or under contracts that can be terminated on short notice. Crude oil for the refinery can be supplied through several channels, including via Enbridge’s Line 9 and the Portland-Montreal Pipeline, by marine transportation and by rail.
16 ANNUAL INFORMATION FORM 2023 SUNCOR ENERGY INC.
Production yield from the Montreal refinery includes gasoline, distillate, heavy fuel oil, solvents, asphalt and petrochemicals, which are distributed primarily across Quebec and Ontario. The Montreal refinery also produces feedstock sold under a long-term supply contract with HollyFrontier’s lubricants facility. Refined products are delivered to distribution terminals and customers via the Trans-Northern Pipeline, truck, rail and marine vessel.
To meet the demands of Suncor’s marketing network in eastern North America, the company also purchases gasoline and distillate from other refiners. Suncor enters into reciprocal exchange arrangements with refiners in eastern North America, primarily for gasoline and distillate, as a means of minimizing transportation costs and balancing product availability. Specialty products, such as asphalt and petrochemicals, are also exported to customers in the U.S.
Sarnia Refinery
The Sarnia refinery processes both SCO from the company’s Oil Sands segment and conventional crude oil purchased from third parties on a spot basis or under contracts that can be terminated on short notice. Crude oil is supplied to the Sarnia refinery primarily via the Enbridge Mainline and Lakehead pipeline systems. Suncor procures conventional crude oil feedstock primarily from Western Canada and has the ability to supplement supply with purchases from the U.S.
Production yield from the Sarnia refinery includes gasoline, jet and diesel fuels, petrochemicals and asphalt, which are primarily distributed in Ontario. Refined products are delivered to distribution terminals in Ontario via the Sun-Canadian Pipeline or delivered to customers directly via marine vessel and rail. The Sarnia refinery also has limited access to pipelines delivering refined products into the U.S.
The Sarnia refinery also enters into reciprocal exchange arrangements for gasoline and distillate and export specialty products to the U.S.
Other Facilities
Suncor operates Canada’s largest ethanol facility, the St. Clair ethanol plant in the Sarnia-Lambton region of Ontario. In 2023, the plant produced 360 million litres of ethanol (2022 – 358 million litres).
Suncor holds a 51% interest in ParaChem Chemicals L.P., which owns and operates a petrochemicals plant located adjacent to the Montreal refinery. The plant primarily produces paraxylene, which is used by customers to manufacture polyester textiles and plastic bottles. Paraxylene production was approximately 271 303 metric tonnes in 2023 (2022 – 342,500 metric tonnes).
Western North America
Edmonton Refinery
The Edmonton refinery has the capability to run a full slate of feedstock sourced from Suncor’s Oil Sands segment and from other producers from the Wood Buffalo and Cold Lake regions of Alberta. Crude oil is supplied to the refinery via company-owned and third-party pipelines.
The refinery can process approximately 44 mbbls/d of blended heavy feedstock, 44 mbbls/d of sour SCO and 58 mbbls/d of sweet SCO.
Production yield from the Edmonton refinery includes primarily gasoline, jet and diesel fuels and other light oils, which are delivered to distribution terminals across Western Canada via the Alberta Products Pipeline, the Trans Mountain Pipeline and the Enbridge pipeline system, as well as via truck and rail.
Commerce City Refinery
The Commerce City refinery processes primarily conventional crude oil and has the capacity to process up to 16 mbbls/d of sour SCO and diluted bitumen from Suncor’s Oil Sands operations. A majority of the crude feedstock is supplied from sources in the U.S., while the remainder is sourced from Suncor’s Oil Sands segment or is purchased from other Canadian sources. Crude oil purchase contracts have terms
SUNCOR ENERGY INC. ANNUAL INFORMATION FORM 2023 17
ranging from month-to-month to multi-year. Crude oil is supplied to the Commerce City refinery primarily by pipeline, with the remainder transported via truck.
Production yield from the Commerce City refinery includes primarily gasoline, jet and diesel fuels and paving-grade asphalt.
The majority of the refined products are sold to commercial and wholesale customers in Colorado and Wyoming, and a retail network in Colorado and Wyoming. Refined products are distributed by truck, rail and pipeline.
Other Facilities
Suncor imports and exports finished products through its Burrard distribution terminal located on the west coast of British Columbia. The Burrard distribution terminal has total export capacity of 40 mbbls/d and supports the supply and demand balance in the Vancouver area.
Refinery Throughputs, Utilizations and Yields
The following tables summarize the crude feedstock, utilizations and production yield mix for Suncor’s refineries for the years ended December 31, 2023 and 2022.
Average Daily Crude Throughput |
Montreal |
Sarnia |
Edmonton |
Commerce City |
||||
(mbbls/d, except as noted) |
2023 |
2022 |
2023 |
2022 |
2023 |
2022 |
2023 |
2022 |
Sweet SCO |
25.7 |
20.2 |
31.3 |
25.0 |
60.6 |
53.8 |
— |
— |
Sour SCO |
— |
— |
32.1 |
32.4 |
45.3 |
45.2 |
7.0 |
8.4 |
Diluted bitumen |
25.1 |
26.1 |
— |
— |
32.6 |
39.0 |
9.4 |
9.5 |
Sweet conventional |
70.4 |
74.2 |
— |
— |
— |
— |
46.3 |
60.3 |
Sour conventional |
8.5 |
7.8 |
19.3 |
20.5 |
— |
— |
7.1 |
10.8 |
Total |
129.7 |
128.3 |
82.7 |
77.9 |
138.5 |
138.0 |
69.8 |
89.0 |
Total Capacity |
137 |
137 |
85 |
85 |
146 |
146 |
98 |
98 |
Utilization (%) |
95 |
94 |
97 |
92 |
95 |
95 |
71 |
91 |
Equity crude processed(1) |
23.6 |
19.2 |
47.7 |
46.7 |
98.6 |
99.4 |
7.0 |
8.4 |
| (1) | Includes Suncor’s upstream operations, including its working interest in Syncrude. |
Refined Petroleum Production Yield Mix |
Montreal |
Sarnia |
Edmonton |
Commerce City |
||||
(%) |
2023 |
2022 |
2023 |
2022 |
2023 |
2022 |
2023 |
2022 |
Gasoline |
38 |
35 |
45 |
45 |
42 |
38 |
47 |
48 |
Distillates |
39 |
39 |
41 |
40 |
53 |
56 |
34 |
34 |
Other |
23 |
26 |
14 |
15 |
5 |
6 |
20 |
18 |
Distribution Terminals and Pipelines
Suncor owns and operates 13 major refined product terminals across Canada (including terminals adjacent to refineries) and three product terminals in Colorado. Combined with access to facilities under long-term contractual arrangements with other parties, Suncor’s North American assets are sufficient to meet the R&M segment’s current storage and distribution needs.
18 ANNUAL INFORMATION FORM 2023 SUNCOR ENERGY INC.
As at December 31, 2023, Suncor’s ownership interests in certain pipelines were as follows:
Pipeline |
|
Ownership |
|
Type |
|
Origin |
|
Destinations |
Portland-Montreal Pipeline |
|
100.00% |
|
Crude oil |
|
Portland, Maine |
|
Montreal, Quebec |
Trans-Northern Pipeline |
|
33.30% |
|
Refined product |
|
Montreal, Quebec |
|
Ontario – Ottawa, Toronto & Oakville |
Sun-Canadian Pipeline |
|
55.00% |
|
Refined product |
|
Sarnia, Ontario |
|
Ontario – Toronto, London & Hamilton |
Alberta Products Pipeline |
|
35.00% |
|
Refined product |
|
Edmonton, Alberta |
|
Calgary, Alberta |
Rocky Mountain Crude Pipeline |
|
100.00% |
|
Crude oil |
|
Guernsey, Wyoming |
|
Denver, Colorado |
Centennial Pipeline |
|
100.00% |
|
Crude oil |
|
Guernsey, Wyoming |
|
Cheyenne, Wyoming |
Oil Sands Pipeline |
|
100.00% |
|
Crude oil |
|
Fort McMurray, Alberta |
|
Edmonton, Alberta |
Marketing – Assets and Operations
Suncor’s retail service station network operates nationally in Canada primarily under the Petro-Canada™ brand. This network consists of 1,585 outlets across Canada, of which 758 locations are company-owned locations and 827 are branded dealers. Selected locations along the Trans-Canada Highway are part of Canada’s Electric Highway™, a network of fast-charging electric vehicle stations. Suncor’s Canadian retail network had sales of gasoline motor fuels averaging approximately 4.2 million litres per site in 2023 (2022 – 4.2 million litres).
Suncor’s Colorado retail network consists of 44 owned or leased Shell™, Exxon™ or Mobil™ branded outlets. Suncor also has product supply agreements with 100 Shell-branded sites in both Colorado and Wyoming, and with 69 Exxon and Mobil-branded sites in Colorado.
Marketing activities from the retail network also generate revenues from convenience store sales and car washes.
Suncor’s wholesale operations sell refined products into farm, home heating, paving, small industrial, commercial and truck markets. Through its PETRO-PASS™ network, Suncor is a national marketer to the commercial road transport segment in Canada. Suncor also sells refined products directly to large industrial and commercial customers and independent marketers.
In the first quarter of 2023, Suncor entered into a co-ownership agreement with North Atlantic to combine retail fuel networks. The combined network has 110 sites and will include the rebranding of a number of North Atlantic’s sites to the Petro-Canada™ brand.
In the second quarter of 2023, Petro-Canada™ and Canadian Tire Corporation announced a new partnership that will result in the rebranding of over 200 of Canadian Tire Corporation’s retail fuel network sites to the Petro-Canada™ brand, as well as the partnering of the two brand’s loyalty programs. Suncor will also become the primary fuel provider for Canadian Tire Corporation’s retail fuel network.
SUNCOR ENERGY INC. ANNUAL INFORMATION FORM 2023 19
Retail and Wholesale Summary
Suncor’s retail network consists of the following branded outlets supplied with Suncor fuel. These outlets are comprised of Suncor owned or leased locations, as well as third-party sites branded and supplied with branded fuel through Suncor. The number of wholesale sites is shown in the table below.
|
|
|
|
|
|
As at December 31 |
||
Locations |
|
|
|
|
|
2023 |
|
2022 |
Retail Service Stations - Canada |
|
|
|
|
|
|
|
|
Petro-Canada branded |
|
|
|
|
|
1 584 |
|
1 589 |
Sunoco branded |
|
|
|
|
|
1 |
|
1 |
|
|
|
|
|
|
1 585 |
|
1 590 |
Retail Service Stations - U.S. |
|
|
|
|
|
|
|
|
Shell-branded retail service stations - Colorado/Wyoming |
|
|
|
|
|
135 |
|
143 |
Exxon-branded retail service stations - Colorado |
|
|
|
|
|
54 |
|
46 |
Mobil-branded retail service stations - Colorado |
|
|
|
|
|
24 |
|
31 |
|
|
|
|
|
|
213 |
|
220 |
Wholesale Cardlock Sites - Canada |
|
|
|
|
|
|
|
|
Petro-Canada-branded cardlock sites (PETRO-PASS) |
|
|
|
|
|
323 |
|
323 |
| (1) | Shell™ is a registered U.S. trademark of Shell Trademark Management B.V., and Exxon™ and Mobil™ are registered U.S. trademarks of Exxon Mobil Corporation. |
Refined Products Sales Volumes |
|
|
|
|
|
|
|
|
|
|
2023 |
|
2022 |
||||
Sales Volumes |
|
mbbls/d |
|
% Operating |
|
mbbls/d |
|
% Operating |
Gasoline (includes motor and aviation gasoline) |
|
|
|
|
|
|
|
|
Eastern North America |
|
112.2 |
|
|
|
107.0 |
|
|
Western North America |
|
115.8 |
|
|
|
120.6 |
|
|
|
|
228.0 |
|
42 |
|
227.6 |
|
40 |
Distillates (includes diesel and heating oils, and aviation jet fuels) |
|
|
|
|
|
|
|
|
Eastern North America |
|
104.3 |
|
|
|
96.9 |
|
|
Western North America |
|
139.6 |
|
|
|
147.7 |
|
|
|
|
243.9 |
|
49 |
|
244.6 |
|
51 |
Other (includes heavy fuel oil, asphalts, petrochemicals, other) |
|
|
|
|
|
|
|
|
Eastern North America |
|
51.9 |
|
|
|
55.4 |
|
|
Western North America |
|
29.3 |
|
|
|
26.0 |
|
|
|
|
81.2 |
|
9 |
|
81.4 |
|
9 |
|
|
553.1 |
|
|
|
553.6 |
|
|
Sales volumes for specific products are moderately affected by seasonal cycles: gasoline sales are typically higher during the summer driving season; heating oil sales are typically higher during the winter season; diesel sales are typically higher during the drilling season at the beginning of the year in Western Canada and during agricultural planting and harvest seasons in early spring and late summer, respectively; and asphalt sales are typically higher during the summer construction paving period. Suncor has the flexibility to modify refinery inputs and outputs to match production yields with anticipated product demands. Suncor also has the flexibility to import and export refined products to optimize domestic seasonal cycles and to capture incremental margins from market dislocations.
Sales volumes can also be impacted when refineries undergo maintenance events. Suncor is able to mitigate this impact through its integrated facilities, inventory management and purchasing refined products from third parties.
20 ANNUAL INFORMATION FORM 2023 SUNCOR ENERGY INC.
Other Suncor Businesses
Energy Trading
Suncor’s Energy Trading business is organized around five main commodity groups – crude oil, transportation fuels, specialty products and feedstock, natural gas, and electricity – and has trading offices in Canada, the U.K. and the U.S. Energy Trading manages open price exposure along the Suncor value chain and provides commodity supply, transportation and storage while optimizing price realizations for Suncor’s products. The company’s customers include mid to large sized commercial and industrial consumers, utility companies and energy producers.
The Energy Trading business supports the company’s Oil Sands and E&P production by optimizing price realizations, managing inventory levels and managing the impacts of external market factors, such as pipeline disruptions or outages at refining customers. The Energy Trading business has entered into contractual arrangements for other midstream infrastructure, such as pipeline, storage capacity and rail access, to optimize delivery of existing and future growth production, while generating earnings on select trading strategies and opportunities.
The Energy Trading business supports the company’s Refining and Marketing business by optimizing the supply of crude oil and NGL feedstock to the company’s four refineries, managing crude inventory levels during refinery turnarounds and periods of unplanned maintenance, as well as managing external impacts from pipeline disruptions. Energy Trading also moves Suncor’s refinery production to market and ensures supply to Suncor’s branded retail and wholesale marketing channels. The business provides reliable natural gas supply to Suncor’s upstream and downstream operations and generates incremental revenue through trading and asset optimization.
Corporate and Eliminations
The Corporate and Eliminations segment includes activities not directly attributable to any other operating segment. Corporate activities include Suncor’s debt and borrowing costs, expenses not allocated to the company’s businesses, and investments in certain clean technologies.
Intersegment activity includes the sale of product between the company’s segments, primarily relating to crude refining feedstock sold from Oil Sands to R&M.
Suncor Employees
The following table shows the distribution of Suncor’s full- and part-time employees:
As at December 31 |
|
2023 |
2022 |
Oil Sands |
|
9 590 |
10 076 |
Exploration and Production |
|
215 |
293 |
Refining and Marketing |
|
2 447 |
2 615 |
Corporate |
|
2 654 |
3 574 |
Total |
|
14 906 |
16 558 |
In addition to Suncor’s employees, the company also uses independent contractors to supply a range of services. As at December 31, 2023, Suncor had 404 contractors (2022 – 713 contractors).
Approximately 25% of the company’s employees are covered by collective agreements.
SUNCOR ENERGY INC. ANNUAL INFORMATION FORM 2023 21
Ethics, Social and Environmental Policies
Suncor has adopted several policies focused on ethics, social and environmental matters, which are reviewed regularly and accessible to employees and contractors. Additional workshops and training sessions are also conducted as warranted throughout the year.
Suncor’s standards for the ethical conduct of business are set forth in its Standards of Business Conduct Code (the Code). Topics addressed in the Code include competition, conflict of interest, protection and proper use of corporate assets and opportunities, confidentiality, disclosure of material information, trading in shares and securities of the company, communications to the public, improper payments, equal opportunity and discrimination, respectful workplace, fair dealing in trade relations, and accounting, reporting and business controls. The Code is supported by a compliance program, under which every Suncor director, officer, employee and independent contractor is required to annually complete a training course and affirm their understanding of the requirements of the Code and provide confirmation of compliance since their last affirmation or confirmation that any instance of non-compliance has been resolved with the individual’s supervisor. Compliance is reported to Suncor’s Governance Committee of the Board of Directors.
Compliance with Suncor’s Supplier Code of Conduct is a requirement for all suppliers, contractors, consultants and other third parties with whom Suncor does business. It addresses topics such as safety, human rights, harassment, bribery and corruption, and confidential information, among others.
Suncor’s Human Rights Policy is intended to ensure that Suncor is not complicit in human rights abuses. The policy makes clear that the scope of Suncor’s human rights due diligence should include its own operations and, where it can influence its third-party business relationships, the operations of others.
Suncor’s Stakeholder Relations Policy reflects Suncor’s values. The policy states Suncor’s belief that successful stakeholder relations provide significant mutual benefits, including enabling informed decision-making, resolving issues with timely, cost-effective and mutually beneficial solutions, building stronger communities and supporting shared learning.
The Canadian Indigenous Relations Policy affirms Suncor’s desire to work in collaboration with Indigenous Peoples to create shared value. The policy sets the foundation for a consistent approach to the company’s relationships with Indigenous Peoples and outlines Suncor’s responsibilities and commitments and is intended to guide Suncor’s business decisions on a day-to-day basis.
The Environment, Health and Safety (EH&S) policy states that Suncor management is responsible for ensuring that employees and contractors under their direction are competent to manage their EH&S responsibilities and are knowledgeable of the hazards and risks associated with their jobs, and that all Suncor employees and contractors are accountable for compliance with relevant acts, codes, regulations, standards and procedures, and for their own personal safety and the safety of their co-workers.
22 ANNUAL INFORMATION FORM 2023 SUNCOR ENERGY INC.
Statement of Reserves Data and Other Oil and Gas Information
Date of Statement
The Statement of Reserves Data and Other Oil and Gas Information outlined below is dated March 21, 2024, with an effective date of December 31, 2023. Reserves evaluations have not been updated since the effective date and, therefore, do not reflect changes in the company’s reserves since that date. The preparation date of the Statement of Reserves Data and Other Oil and Gas Information outlined below is January 17, 2024.
Disclosure of Reserves Data
Suncor is subject to the reporting requirements of Canadian securities laws, including the reporting of reserves data in accordance with National Instrument 51-101 – Standards of Disclosure for Oil and Gas Activities (NI 51-101).
The reserves data included in this section of the AIF is based upon evaluations conducted by GLJ Ltd. (GLJ), contained in its report dated February 16, 2024 (the GLJ Report). GLJ is an independent qualified reserves evaluator as defined in NI 51-101.
The reserves data summarizes Suncor’s SCO, bitumen, light crude oil and medium crude oil (combined, including heavy crude oil) reserves and the net present values of future net revenues for these reserves using forecast prices and costs prior to provision for interest and general and administrative expense. All of Suncor’s reserves are located in Canada as at December 31, 2023.
Advisories – Reserves Data
Classifications of reserves as proved or probable are only attempts to define the degree of certainty associated with the estimates. There are numerous uncertainties inherent in estimating quantities of petroleum reserves. It should not be assumed that the estimates of future net revenues presented in the tables below represent the fair market value of the reserves. There is no assurance that the forecast prices and cost assumptions will be attained and variances could be material. There is no guarantee that the estimates for SCO, bitumen, light, medium and heavy crude oil reserves provided herein will be recovered. Actual SCO, bitumen, light, medium and heavy crude oil volumes recovered may be greater than or less than the estimates provided herein. Readers should review the Abbreviations and the definitions and information contained in the Notes to Reserves Data Tables, Definitions for Reserves Data Tables and Notes to Future Net Revenues Tables in conjunction with the following notes and tables. For additional information, see the section entitled Risk Factors in the company’s annual 2023 MD&A, which section is incorporated by reference into this AIF, and is available on SEDAR+ at sedarplus.ca and EDGAR at sec.gov.
SUNCOR ENERGY INC. ANNUAL INFORMATION FORM 2023 23
Oil and Gas Reserves Tables and Notes
Summary of Oil and Gas Reserves(1)
as at December 31, 2023
(forecast prices and costs)(2)
|
|
SCO(3) |
|
Bitumen |
|
Light Crude Oil & |
Total |
||||||||
|
|
(mmbbls) |
|
(mmbbls) |
|
(mmbbls) |
(mmboe) |
||||||||
|
|
Gross |
|
Net |
|
Gross |
|
Net |
|
Gross |
|
Net |
Gross |
|
Net |
Proved Developed Producing |
|
|
|
|
|
|
|
|
|
|
|
|
|
|
|
Mining |
|
1 509 |
|
1 354 |
|
1 379 |
|
1 263 |
|
- |
|
- |
2 887 |
|
2 617 |
In Situ |
|
249 |
|
208 |
|
115 |
|
89 |
|
- |
|
- |
363 |
|
297 |
E&P Canada |
|
- |
|
- |
|
- |
|
- |
|
77 |
|
65 |
77 |
|
65 |
Total Proved Developed Producing |
|
1 757 |
|
1 562 |
|
1 493 |
|
1 352 |
|
77 |
|
65 |
3 328 |
|
2 978 |
Proved Developed Non-Producing |
|
|
|
|
|
|
|
|
|
|
|
|
|
|
|
Mining |
|
- |
|
- |
|
- |
|
- |
|
- |
|
- |
- |
|
- |
In Situ |
|
- |
|
- |
|
- |
|
- |
|
- |
|
- |
- |
|
- |
E&P Canada |
|
- |
|
- |
|
- |
|
- |
|
- |
|
- |
- |
|
- |
Total Proved Developed Non-Producing |
|
- |
|
- |
|
- |
|
- |
|
- |
|
- |
- |
|
- |
Proved Undeveloped |
|
|
|
|
|
|
|
|
|
|
|
|
|
|
|
Mining |
|
281 |
|
252 |
|
14 |
|
12 |
|
- |
|
- |
295 |
|
263 |
In Situ |
|
854 |
|
723 |
|
563 |
|
456 |
|
- |
|
- |
1 418 |
|
1 180 |
E&P Canada |
|
- |
|
- |
|
- |
|
- |
|
60 |
|
53 |
60 |
|
53 |
Total Proved Undeveloped |
|
1 135 |
|
975 |
|
577 |
|
468 |
|
60 |
|
53 |
1 772 |
|
1 496 |
Proved |
|
|
|
|
|
|
|
|
|
|
|
|
|
|
|
Mining |
|
1 789 |
|
1 606 |
|
1 392 |
|
1 275 |
|
- |
|
- |
3 182 |
|
2 881 |
In Situ |
|
1 103 |
|
931 |
|
678 |
|
545 |
|
- |
|
- |
1 781 |
|
1 476 |
E&P Canada |
|
- |
|
- |
|
- |
|
- |
|
137 |
|
117 |
137 |
|
117 |
Total Proved |
|
2 893 |
|
2 537 |
|
2 070 |
|
1 820 |
|
137 |
|
117 |
5 100 |
|
4 474 |
Probable |
|
|
|
|
|
|
|
|
|
|
|
|
|
|
|
Mining |
|
313 |
|
275 |
|
283 |
|
249 |
|
- |
|
- |
596 |
|
525 |
In Situ |
|
1 159 |
|
930 |
|
221 |
|
168 |
|
- |
|
- |
1 380 |
|
1 098 |
E&P Canada |
|
- |
|
- |
|
- |
|
- |
|
114 |
|
89 |
114 |
|
89 |
Total Probable |
|
1 472 |
|
1 206 |
|
504 |
|
417 |
|
114 |
|
89 |
2 090 |
|
1 712 |
Proved Plus Probable |
|
|
|
|
|
|
|
|
|
|
|
|
|
|
|
Mining |
|
2 102 |
|
1 881 |
|
1 675 |
|
1 524 |
|
- |
|
- |
3 778 |
|
3 405 |
In Situ |
|
2 262 |
|
1 861 |
|
899 |
|
713 |
|
- |
|
- |
3 161 |
|
2 574 |
E&P Canada |
|
- |
|
- |
|
- |
|
- |
|
251 |
|
206 |
251 |
|
206 |
Total Proved Plus Probable |
|
4 365 |
|
3 743 |
|
2 574 |
|
2 237 |
|
251 |
|
206 |
7 189 |
|
6 185 |
|
|
|
|
|
|
|
|
|
|
|
|
|
|
|
|
Please see Notes (1) through (4) at the end of the reserves data section for important information about volumes in this table. | |||||||||||||||
24 ANNUAL INFORMATION FORM 2023 SUNCOR ENERGY INC.
Reconciliation of Gross Reserves(1)
as at December 31, 2023 (forecast prices and costs)(2)
|
|
SCO(3) |
|
Bitumen |
|
Light Crude Oil & Medium |
|
Conventional Natural Gas |
|
Total |
||||||||||||||||||||
|
|
|
|
|
|
Proved |
|
|
|
|
|
Proved |
|
|
|
|
|
Proved |
|
|
|
|
|
Proved |
|
|
|
|
|
Proved |
|
|
|
|
|
|
Plus |
|
|
|
|
|
Plus |
|
|
|
|
|
Plus |
|
|
|
|
|
Plus |
|
|
|
|
|
Plus |
|
|
Proved |
|
Probable |
|
Probable |
|
Proved |
|
Probable |
|
Probable |
|
Proved |
|
Probable |
|
Probable |
|
Proved |
|
Probable |
|
Probable |
|
Proved |
|
Probable |
|
Probable |
|
|
mmbbls |
|
mmbbls |
|
mmbbls |
|
mmbbls |
|
mmbbls |
|
mmbbls |
|
mmbbls |
|
mmbbls |
|
mmbbls |
|
bcfe |
|
bcfe |
|
bcfe |
|
mmboe |
|
mmboe |
|
mmboe |
Mining |
|
|
|
|
|
|
|
|
|
|
|
|
|
|
|
|
|
|
|
|
|
|
|
|
|
|
|
|
|
|
December 31, 2022 |
|
1 646 |
|
302 |
|
1 948 |
|
826 |
|
383 |
|
1 209 |
|
— |
|
— |
|
— |
|
— |
|
— |
|
— |
|
2 472 |
|
685 |
|
3 157 |
Extensions & Improved Recovery(6) |
|
— |
|
— |
|
— |
|
— |
|
— |
|
— |
|
— |
|
— |
|
— |
|
— |
|
— |
|
— |
|
— |
|
— |
|
— |
Technical Revisions(7) |
|
181 |
|
(21) |
|
160 |
|
(37) |
|
(229) |
|
(266) |
|
— |
|
— |
|
— |
|
— |
|
— |
|
— |
|
144 |
|
(250) |
|
(106) |
Discoveries(8) |
|
— |
|
— |
|
— |
|
— |
|
— |
|
— |
|
— |
|
— |
|
— |
|
— |
|
— |
|
— |
|
— |
|
— |
|
— |
Acquisitions(9) |
|
95 |
|
31 |
|
126 |
|
642 |
|
129 |
|
771 |
|
— |
|
— |
|
— |
|
— |
|
— |
|
— |
|
736 |
|
160 |
|
897 |
Dispositions(10) |
|
— |
|
— |
|
— |
|
— |
|
— |
|
— |
|
— |
|
— |
|
— |
|
— |
|
— |
|
— |
|
— |
|
— |
|
— |
Economic Factors(11) |
|
— |
|
— |
|
— |
|
— |
|
— |
|
— |
|
— |
|
— |
|
— |
|
— |
|
— |
|
— |
|
— |
|
— |
|
— |
Production(12) |
|
(132) |
|
— |
|
(132) |
|
(39) |
|
— |
|
(39) |
|
— |
|
— |
|
— |
|
— |
|
— |
|
— |
|
(170) |
|
— |
|
(170) |
December 31, 2023 |
|
1 789 |
|
313 |
|
2 102 |
|
1 392 |
|
283 |
|
1 675 |
|
— |
|
— |
|
— |
|
— |
|
— |
|
— |
|
3 182 |
|
596 |
|
3 778 |
In Situ |
|
|
|
|
|
|
|
|
|
|
|
|
|
|
|
|
|
|
|
|
|
|
|
|
|
|
|
|
|
|
December 31, 2022 |
|
930 |
|
1 331 |
|
2 261 |
|
593 |
|
244 |
|
836 |
|
— |
|
— |
|
— |
|
— |
|
— |
|
— |
|
1 523 |
|
1 575 |
|
3 098 |
Extensions & Improved Recovery(6) |
|
233 |
|
(130) |
|
102 |
|
86 |
|
(67) |
|
20 |
|
— |
|
— |
|
— |
|
— |
|
— |
|
— |
|
319 |
|
(197) |
|
122 |
Technical Revisions(7) |
|
(21) |
|
(42) |
|
(63) |
|
42 |
|
44 |
|
86 |
|
— |
|
— |
|
— |
|
— |
|
— |
|
— |
|
21 |
|
3 |
|
24 |
Discoveries(8) |
|
— |
|
— |
|
— |
|
— |
|
— |
|
— |
|
— |
|
— |
|
— |
|
— |
|
— |
|
— |
|
— |
|
— |
|
— |
Acquisitions(9) |
|
— |
|
— |
|
— |
|
— |
|
— |
|
— |
|
— |
|
— |
|
— |
|
— |
|
— |
|
— |
|
— |
|
— |
|
— |
Dispositions(10) |
|
— |
|
— |
|
— |
|
— |
|
— |
|
— |
|
— |
|
— |
|
— |
|
— |
|
— |
|
— |
|
— |
|
— |
|
— |
Economic Factors(11) |
|
— |
|
— |
|
— |
|
— |
|
— |
|
— |
|
— |
|
— |
|
— |
|
— |
|
— |
|
— |
|
— |
|
— |
|
— |
Production(12) |
|
(38) |
|
— |
|
(38) |
|
(44) |
|
— |
|
(44) |
|
— |
|
— |
|
— |
|
— |
|
— |
|
— |
|
(82) |
|
— |
|
(82) |
December 31, 2023 |
|
1 103 |
|
1 159 |
|
2 262 |
|
678 |
|
221 |
|
899 |
|
— |
|
— |
|
— |
|
— |
|
— |
|
— |
|
1 781 |
|
1 380 |
|
3 161 |
E&P Canada |
|
|
|
|
|
|
|
|
|
|
|
|
|
|
|
|
|
|
|
|
|
|
|
|
|
|
|
|
|
|
December 31, 2022 |
|
— |
|
— |
|
— |
|
— |
|
— |
|
— |
|
153 |
|
114 |
|
267 |
|
— |
|
— |
|
— |
|
153 |
|
114 |
|
267 |
Extensions & Improved Recovery(6) |
|
— |
|
— |
|
— |
|
— |
|
— |
|
— |
|
— |
|
1 |
|
1 |
|
— |
|
— |
|
— |
|
— |
|
1 |
|
1 |
Technical Revisions(7) |
|
— |
|
— |
|
— |
|
— |
|
— |
|
— |
|
1 |
|
(1) |
|
— |
|
— |
|
— |
|
— |
|
1 |
|
(1) |
|
— |
Discoveries(8) |
|
— |
|
— |
|
— |
|
— |
|
— |
|
— |
|
— |
|
— |
|
— |
|
— |
|
— |
|
— |
|
— |
|
— |
|
— |
Acquisitions(9) |
|
— |
|
— |
|
— |
|
— |
|
— |
|
— |
|
— |
|
— |
|
— |
|
— |
|
— |
|
— |
|
— |
|
— |
|
— |
Dispositions(10) |
|
— |
|
— |
|
— |
|
— |
|
— |
|
— |
|
— |
|
— |
|
— |
|
— |
|
— |
|
— |
|
— |
|
— |
|
— |
Economic Factors(11) |
|
— |
|
— |
|
— |
|
— |
|
— |
|
— |
|
— |
|
— |
|
— |
|
— |
|
— |
|
— |
|
— |
|
— |
|
— |
Production(12) |
|
— |
|
— |
|
— |
|
— |
|
— |
|
— |
|
(17) |
|
— |
|
(17) |
|
— |
|
— |
|
— |
|
(17) |
|
— |
|
(17) |
December 31, 2023 |
|
— |
|
— |
|
— |
|
— |
|
— |
|
— |
|
137 |
|
114 |
|
251 |
|
— |
|
— |
|
— |
|
137 |
|
114 |
|
251 |
Total Canada |
|
|
|
|
|
|
|
|
|
|
|
|
|
|
|
|
|
|
|
|
|
|
|
|
|
|
|
|
|
|
December 31, 2022 |
|
2 576 |
|
1 633 |
|
4 210 |
|
1 419 |
|
626 |
|
2 045 |
|
153 |
|
114 |
|
267 |
|
— |
|
— |
|
— |
|
4 148 |
|
2 374 |
|
6 521 |
Extensions & Improved Recovery(6) |
|
233 |
|
(130) |
|
102 |
|
86 |
|
(67) |
|
20 |
|
— |
|
1 |
|
1 |
|
— |
|
— |
|
— |
|
319 |
|
(196) |
|
123 |
Technical Revisions(7) |
|
159 |
|
(62) |
|
97 |
|
6 |
|
(185) |
|
(179) |
|
1 |
|
(1) |
|
— |
|
— |
|
— |
|
— |
|
166 |
|
(248) |
|
(82) |
Discoveries(8) |
|
— |
|
— |
|
— |
|
— |
|
— |
|
— |
|
— |
|
— |
|
— |
|
— |
|
— |
|
— |
|
— |
|
— |
|
— |
Acquisitions(9) |
|
95 |
|
31 |
|
126 |
|
642 |
|
129 |
|
771 |
|
— |
|
— |
|
— |
|
— |
|
— |
|
— |
|
736 |
|
160 |
|
897 |
Dispositions(10) |
|
— |
|
— |
|
— |
|
— |
|
— |
|
— |
|
— |
|
— |
|
— |
|
— |
|
— |
|
— |
|
— |
|
— |
|
— |
Economic Factors(11) |
|
— |
|
— |
|
— |
|
— |
|
— |
|
— |
|
— |
|
— |
|
— |
|
— |
|
— |
|
— |
|
— |
|
— |
|
— |
Production(12) |
|
(170) |
|
— |
|
(170) |
|
(82) |
|
— |
|
(82) |
|
(17) |
|
— |
|
(17) |
|
— |
|
— |
|
— |
|
(269) |
|
— |
|
(269) |
December 31, 2023 |
|
2 893 |
|
1 472 |
|
4 365 |
|
2 070 |
|
504 |
|
2 574 |
|
137 |
|
114 |
|
251 |
|
— |
|
— |
|
— |
|
5 100 |
|
2 090 |
|
7 189 |
Please see Notes (1) through (12) at the end of the reserves data section for important information about volumes in this table. Suncor’s resources in Libya and Syria are classified as contingent resources and are not disclosed above.
SUNCOR ENERGY INC. ANNUAL INFORMATION FORM 2023 25
Reconciliation of Gross Reserves(1) (continued)
as at December 31, 2023
(forecast prices and costs)(2)
|
|
SCO(3) |
|
Bitumen |
|
Light Crude Oil & Medium |
|
Conventional Natural Gas |
|
Total |
||||||||||||||||||||
|
|
Proved |
|
Probable |
|
Proved Plus Probable |
|
Proved |
|
Probable |
|
Proved Plus Probable |
|
Proved |
|
Probable |
|
Proved Plus Probable |
|
Proved |
|
Probable |
|
Proved Plus Probable |
|
Proved |
|
Probable |
|
Proved Plus Probable |
|
|
mmbbls |
|
mmbbls |
|
mmbbls |
|
mmbbls |
|
mmbbls |
|
mmbbls |
|
mmbbls |
|
mmbbls |
|
mmbbls |
|
bcfe |
|
bcfe |
|
bcfe |
|
mmboe |
|
mmboe |
|
mmboe |
North Sea |
|
|
|
|
|
|
|
|
|
|
|
|
|
|
|
|
|
|
|
|
|
|
|
|
|
|
|
|
|
|
December 31, 2022 |
|
— |
|
— |
|
— |
|
— |
|
— |
|
— |
|
33 |
|
11 |
|
43 |
|
2 |
|
1 |
|
3 |
|
33 |
|
11 |
|
44 |
Extensions & Improved Recovery(6) |
|
— |
|
— |
|
— |
|
— |
|
— |
|
— |
|
— |
|
— |
|
— |
|
— |
|
— |
|
— |
|
— |
|
— |
|
— |
Technical Revisions(7) |
|
— |
|
— |
|
— |
|
— |
|
— |
|
— |
|
— |
|
— |
|
— |
|
— |
|
— |
|
— |
|
— |
|
— |
|
— |
Discoveries(8) |
|
— |
|
— |
|
— |
|
— |
|
— |
|
— |
|
— |
|
— |
|
— |
|
— |
|
— |
|
— |
|
— |
|
— |
|
— |
Acquisitions(9) |
|
— |
|
— |
|
— |
|
— |
|
— |
|
— |
|
— |
|
— |
|
— |
|
— |
|
— |
|
— |
|
— |
|
— |
|
— |
Dispositions(10) |
|
— |
|
— |
|
— |
|
— |
|
— |
|
— |
|
(30) |
|
(11) |
|
(41) |
|
(2) |
|
(1) |
|
(3) |
|
(30) |
|
(11) |
|
(41) |
Economic Factors(11) |
|
— |
|
— |
|
— |
|
— |
|
— |
|
— |
|
— |
|
— |
|
— |
|
— |
|
— |
|
— |
|
— |
|
— |
|
— |
Production(12) |
|
— |
|
— |
|
— |
|
— |
|
— |
|
— |
|
(3) |
|
— |
|
(3) |
|
— |
|
— |
|
— |
|
(3) |
|
— |
|
(3) |
December 31, 2023 |
|
— |
|
— |
|
— |
|
— |
|
— |
|
— |
|
— |
|
— |
|
— |
|
— |
|
— |
|
— |
|
— |
|
— |
|
— |
Total |
|
|
|
|
|
|
|
|
|
|
|
|
|
|
|
|
|
|
|
|
|
|
|
|
|
|
|
|
|
|
December 31, 2022 |
|
2 576 |
|
1 633 |
|
4 210 |
|
1 419 |
|
626 |
|
2 045 |
|
185 |
|
125 |
|
310 |
|
2 |
|
1 |
|
3 |
|
4 181 |
|
2 385 |
|
6 565 |
Extensions & Improved Recovery(6) |
|
233 |
|
(130) |
|
102 |
|
86 |
|
(67) |
|
20 |
|
— |
|
1 |
|
1 |
|
— |
|
— |
|
— |
|
319 |
|
(196) |
|
123 |
Technical Revisions(7) |
|
159 |
|
(62) |
|
97 |
|
6 |
|
(185) |
|
(179) |
|
1 |
|
(1) |
|
— |
|
— |
|
— |
|
— |
|
166 |
|
(248) |
|
(82) |
Discoveries(8) |
|
— |
|
— |
|
— |
|
— |
|
— |
|
— |
|
— |
|
— |
|
— |
|
— |
|
— |
|
— |
|
— |
|
— |
|
— |
Acquisitions(9) |
|
95 |
|
31 |
|
126 |
|
642 |
|
129 |
|
771 |
|
— |
|
— |
|
— |
|
— |
|
— |
|
— |
|
736 |
|
160 |
|
897 |
Dispositions(10) |
|
— |
|
— |
|
— |
|
— |
|
— |
|
— |
|
(30) |
|
(11) |
|
(41) |
|
(2) |
|
(1) |
|
(3) |
|
(30) |
|
(11) |
|
(41) |
Economic Factors(11) |
|
— |
|
— |
|
— |
|
— |
|
— |
|
— |
|
— |
|
— |
|
— |
|
— |
|
— |
|
— |
|
— |
|
— |
|
— |
Production(12) |
|
(170) |
|
— |
|
(170) |
|
(82) |
|
— |
|
(82) |
|
(20) |
|
— |
|
(20) |
|
— |
|
— |
|
— |
|
(272) |
|
— |
|
(272) |
December 31, 2023 |
|
2 893 |
|
1 472 |
|
4 365 |
|
2 070 |
|
504 |
|
2 574 |
|
137 |
|
114 |
|
251 |
|
— |
|
— |
|
— |
|
5 100 |
|
2 090 |
|
7 189 |
Please see Notes (1) through (12) at the end of the reserves data section for important information about volumes in this table. Suncor’s resources in Libya and Syria are classified as contingent resources and are not disclosed above.
26 ANNUAL INFORMATION FORM 2023 SUNCOR ENERGY INC.
Notes to Reserves Data Tables
as at December 31, 2023
(1) |
Reserves data tables may not add due to rounding. |
(2) |
See the Notes to the Future Net Revenues tables for information on forecast prices and costs. |
(3) |
SCO reserves figures include the company’s diesel sales volumes. |
(4) |
Gross volumes of light crude oil and medium crude oil for E&P Canada include quantities of heavy crude oil as follows: proved developed producing of 48 mmbbls, proved of 48 mmbbls, probable of 17 mmbbls and proved plus probable of 65 mmbbls. Net volumes of light crude oil & medium crude oil for E&P Canada include quantities of heavy crude oil as follows: proved developed producing of 40 mmbbls, proved of 40 mmbbls, probable of 14 mmbbls and proved plus probable of 53 mmbbls. |
(5) |
Light crude oil and medium crude oil technical revisions for E&P Canada include quantities of heavy crude oil as follows: proved of 5 mmbbls, probable of (2) mmbbls and proved plus probable of 3 mmbbls. |
(6) |
Extensions & improved recovery are additions to the reserves resulting from step-out drilling, infill drilling and implementation of improved recovery schemes. Negative volumes, if any, for probable reserves result from the transfer of probable reserves to proved reserves. Changes in 2023 are primarily a result of additions from Firebag. |
(7) |
Technical revisions include changes in previous estimates resulting from new technical data or revised interpretations. Changes in 2023 are primarily due to updates to development and operational plans, and new information obtained during the year, including drilling results and ongoing field performance. In 2023, Mining changes are primarily due to mine plan updates. In 2023, In Situ and E&P changes are primarily due to production performance updates. |
(8) |
Discoveries are additions to reserves in reservoirs where no reserves were previously booked and are as a result of the confirmation of the existence of an accumulation of a significant quantity of potentially recoverable petroleum. There were no discoveries in 2023. |
(9) |
Acquisitions are additions to reserves estimates as a result of purchasing interests in oil and gas properties. In 2023, Suncor increased its working interest in Fort Hills to 100%. |
(10) |
Dispositions are reductions in reserves estimates as a result of selling all or a portion of an interest in oil and gas properties. In 2023, Suncor divested its interest in the U.K. |
(11) |
Economic factors are changes due primarily to price forecasts, inflation rates or regulatory changes. |
(12) |
Production quantities may include estimated production for periods near the end of the year when actual sales quantities were not available at the time the reserves evaluations were conducted. |
Definitions for Reserves Data Tables
In the tables set forth above and elsewhere in this AIF, the following definitions and other notes are applicable:
Gross means:
(a) |
in relation to Suncor’s interest in production or reserves, Suncor’s working-interest share before deduction of royalties and without including any royalty interests of Suncor; |
(b) |
in relation to Suncor’s interest in wells, the total number of wells in which Suncor has an interest; and |
(c) |
in relation to Suncor’s interest in properties, the total area of properties in which Suncor has an interest. |
SUNCOR ENERGY INC. ANNUAL INFORMATION FORM 2023 27
Net means:
(a) |
in relation to Suncor’s interest in production or reserves, Suncor’s working-interest share after deduction of royalty obligations, plus the company’s royalty interests in production or reserves; |
(b) |
in relation to Suncor’s interest in wells, the number of wells obtained by aggregating Suncor’s working interest in each of the company’s gross wells; and |
(c) |
in relation to Suncor’s interest in a property, the total area in which Suncor has an interest multiplied by the working interest owned by Suncor. |
Reserves Categories
The reserves estimates presented are based on the definitions and guidelines contained in the Canadian Oil and Gas Evaluation (COGE) Handbook. A summary of those definitions is set forth below.
Reserves are estimated remaining quantities of oil and natural gas and related substances anticipated to be recoverable from known accumulations, as of a given date, based on analyses of drilling, geological, geophysical and engineering data, the use of established technology, and specified economic conditions, which are generally accepted as being reasonable.
Reserves are classified according to the degree of certainty associated with the estimates:
Proved reserves are those reserves that can be estimated with a high degree of certainty to be recoverable. It is likely that the actual remaining quantities recovered will exceed the estimated proved reserves.
Probable reserves are those additional reserves that are less certain to be recovered than proved reserves. It is equally likely that the actual remaining quantities recovered will be greater or less than the sum of the estimated proved plus probable reserves.
Proved and probable reserves categories may be divided into developed and undeveloped categories:
Developed reserves are those reserves that are expected to be recovered (i) from existing wells and installed facilities or, if facilities have not been installed, that would involve a low expenditure (for example, when compared to the cost of drilling a well) to put the reserves on production, or (ii) for mining assets, through installed extraction equipment and infrastructure that is operational at the time of the reserves estimate. The developed category may be subdivided into producing and non-producing.
(a) |
Developed producing reserves are those reserves that are expected to be recovered from completion intervals open at the time of the estimate. These reserves may be currently producing or, if shut in, they must have previously been on production, and the date of resumption of production must be known with reasonable certainty. |
(b) |
Developed non-producing reserves are those reserves that either have not been on production, or have previously been on production but are shut in, and the date of resumption of production is unknown. |
Undeveloped reserves are those reserves expected to be recovered from known accumulations where a significant expenditure (for example, when compared to the cost of drilling a well) is required to render them capable of production. They must fully meet the requirements of the reserves category (proved or probable) to which they are assigned.
28 ANNUAL INFORMATION FORM 2023 SUNCOR ENERGY INC.
Future Net Revenues Tables and Notes
Net Present Values of Future Net Revenues Before Income Taxes(1)
as at December 31, 2023
(forecast prices and costs)
|
|
(in $ millions, discounted at % per year) |
|
Unit Value(2) |
||||||||
|
|
0% |
|
5% |
|
10% |
|
15% |
|
20% |
|
($/boe) |
Proved Developed Producing |
|
|
|
|
|
|
|
|
|
|
|
|
Mining |
|
14 285 |
|
30 360 |
|
24 793 |
|
19 415 |
|
15 588 |
|
10.00 |
In Situ |
|
13 521 |
|
11 581 |
|
10 077 |
|
8 903 |
|
7 973 |
|
35.00 |
E&P Canada |
|
3 397 |
|
3 202 |
|
2 981 |
|
2 779 |
|
2 605 |
|
47.00 |
Total Proved Developed Producing |
|
31 203 |
|
45 143 |
|
37 851 |
|
31 096 |
|
26 165 |
|
13.00 |
Proved Developed Non-Producing |
|
|
|
|
|
|
|
|
|
|
|
|
Mining |
|
— |
|
— |
|
— |
|
— |
|
— |
|
— |
In Situ |
|
— |
|
— |
|
— |
|
— |
|
— |
|
— |
E&P Canada |
|
— |
|
— |
|
— |
|
— |
|
— |
|
— |
Total Proved Developed Non-Producing |
|
— |
|
— |
|
— |
|
— |
|
— |
|
— |
Proved Undeveloped |
|
|
|
|
|
|
|
|
|
|
|
|
Mining |
|
5 649 |
|
4 051 |
|
2 736 |
|
1 877 |
|
1 318 |
|
11.00 |
In Situ |
|
46 732 |
|
22 933 |
|
12 548 |
|
7 511 |
|
4 823 |
|
12.00 |
E&P Canada |
|
1 246 |
|
1 009 |
|
768 |
|
552 |
|
370 |
|
15.00 |
Total Proved Undeveloped |
|
53 627 |
|
27 993 |
|
16 052 |
|
9 940 |
|
6 511 |
|
12.00 |
Proved |
|
|
|
|
|
|
|
|
|
|
|
|
Mining |
|
19 934 |
|
34 411 |
|
27 529 |
|
21 292 |
|
16 906 |
|
10.00 |
In Situ |
|
60 253 |
|
34 513 |
|
22 625 |
|
16 414 |
|
12 796 |
|
17.00 |
E&P Canada |
|
4 643 |
|
4 211 |
|
3 748 |
|
3 331 |
|
2 974 |
|
33.00 |
Total Proved |
|
84 829 |
|
73 135 |
|
53 903 |
|
41 037 |
|
32 676 |
|
13.00 |
Probable |
|
|
|
|
|
|
|
|
|
|
|
|
Mining |
|
13 357 |
|
8 871 |
|
5 716 |
|
4 043 |
|
3 100 |
|
12.00 |
In Situ |
|
81 613 |
|
20 839 |
|
7 602 |
|
3 901 |
|
2 565 |
|
8.00 |
E&P Canada |
|
6 064 |
|
4 632 |
|
3 568 |
|
2 797 |
|
2 232 |
|
42.00 |
Total Probable |
|
101 034 |
|
34 342 |
|
16 887 |
|
10 741 |
|
7 897 |
|
11.00 |
Proved Plus Probable |
|
|
|
|
|
|
|
|
|
|
|
|
Mining |
|
33 291 |
|
43 282 |
|
33 245 |
|
25 335 |
|
20 005 |
|
10.00 |
In Situ |
|
141 866 |
|
55 353 |
|
30 228 |
|
20 314 |
|
15 361 |
|
13.00 |
E&P Canada |
|
10 707 |
|
8 843 |
|
7 317 |
|
6 128 |
|
5 207 |
|
37.00 |
Total Proved Plus Probable |
|
185 864 |
|
107 478 |
|
70 790 |
|
51 777 |
|
40 573 |
|
12.00 |
|
|
|
|
|
|
|
|
|
|
|
|
|
Please see the Notes at the end of the Future Net Revenues Tables. | ||||||||||||
SUNCOR ENERGY INC. ANNUAL INFORMATION FORM 2023 29
Net Present Values of Future Net Revenues After Income Taxes(1)
as at December 31, 2023
(forecast prices and costs)
|
|
(in $ millions, discounted at % per year) |
||||||||
|
|
0% |
|
5% |
|
10% |
|
15% |
|
20% |
Proved Developed Producing |
|
|
|
|
|
|
|
|
|
|
Mining |
|
3 897 |
|
23 172 |
|
19 476 |
|
15 277 |
|
12 238 |
In Situ |
|
10 577 |
|
9 042 |
|
7 851 |
|
6 922 |
|
6 189 |
E&P Canada |
|
2 811 |
|
2 668 |
|
2 484 |
|
2 312 |
|
2 162 |
Total Proved Developed Producing |
|
17 285 |
|
34 882 |
|
29 811 |
|
24 510 |
|
20 588 |
Proved Developed Non-Producing |
|
|
|
|
|
|
|
|
|
|
Mining |
|
— |
|
— |
|
— |
|
— |
|
— |
In Situ |
|
— |
|
— |
|
— |
|
— |
|
— |
E&P Canada |
|
— |
|
— |
|
— |
|
— |
|
— |
Total Proved Developed Non-Producing |
|
— |
|
— |
|
— |
|
— |
|
— |
Proved Undeveloped |
|
|
|
|
|
|
|
|
|
|
Mining |
|
4 127 |
|
2 990 |
|
1 976 |
|
1 317 |
|
893 |
In Situ |
|
35 695 |
|
17 244 |
|
9 286 |
|
5 466 |
|
3 446 |
E&P Canada |
|
806 |
|
634 |
|
454 |
|
292 |
|
154 |
Total Proved Undeveloped |
|
40 627 |
|
20 869 |
|
11 717 |
|
7 074 |
|
4 493 |
Proved |
|
|
|
|
|
|
|
|
|
|
Mining |
|
8 024 |
|
26 162 |
|
21 452 |
|
16 593 |
|
13 131 |
In Situ |
|
46 271 |
|
26 286 |
|
17 137 |
|
12 388 |
|
9 635 |
E&P Canada |
|
3 617 |
|
3 302 |
|
2 938 |
|
2 603 |
|
2 315 |
Total Proved |
|
57 913 |
|
55 750 |
|
41 527 |
|
31 585 |
|
25 081 |
Probable |
|
|
|
|
|
|
|
|
|
|
Mining |
|
9 920 |
|
6 782 |
|
4 283 |
|
2 971 |
|
2 245 |
In Situ |
|
62 722 |
|
15 907 |
|
5 826 |
|
3 022 |
|
2 008 |
E&P Canada |
|
4 543 |
|
3 478 |
|
2 672 |
|
2 085 |
|
1 656 |
Total Probable |
|
77 185 |
|
26 167 |
|
12 781 |
|
8 078 |
|
5 909 |
Proved Plus Probable |
|
|
|
|
|
|
|
|
|
|
Mining |
|
17 944 |
|
32 945 |
|
25 736 |
|
19 564 |
|
15 376 |
In Situ |
|
108 993 |
|
42 193 |
|
22 963 |
|
15 410 |
|
11 642 |
E&P Canada |
|
8 160 |
|
6 780 |
|
5 610 |
|
4 688 |
|
3 971 |
Total Proved Plus Probable |
|
135 097 |
|
81 917 |
|
54 309 |
|
39 662 |
|
30 990 |
|
|
|
|
|
|
|
|
|
|
|
Please see the Notes at the end of the Future Net Revenues Tables. | ||||||||||
30 ANNUAL INFORMATION FORM 2023 SUNCOR ENERGY INC.
Total Future Net Revenues(1)
as at December 31, 2023
(forecast prices and costs)
(in $ millions, undiscounted) |
|
Revenue |
|
Royalties |
|
Operating |
|
Development |
|
Abandonment |
|
Future Net |
|
Future Income |
|
Future Net |
Proved Developed Producing |
|
|
|
|
|
|
|
|
|
|
|
|
|
|
|
|
Mining |
|
294 020 |
|
27 337 |
|
154 606 |
|
39 120 |
|
58 672 |
|
14 285 |
|
10 388 |
|
3 897 |
In Situ |
|
34 933 |
|
5 556 |
|
12 173 |
|
2 798 |
|
886 |
|
13 521 |
|
2 944 |
|
10 577 |
E&P Canada |
|
8 343 |
|
1 357 |
|
1 795 |
|
139 |
|
1 655 |
|
3 397 |
|
586 |
|
2 811 |
Total Proved Developed Producing |
|
337 295 |
|
34 249 |
|
168 574 |
|
42 057 |
|
61 213 |
|
31 203 |
|
13 918 |
|
17 285 |
Proved Developed Non-Producing |
|
|
|
|
|
|
|
|
|
|
|
|
|
|
|
|
Mining |
|
— |
|
— |
|
— |
|
— |
|
— |
|
— |
|
— |
|
— |
In Situ |
|
— |
|
— |
|
— |
|
— |
|
— |
|
— |
|
— |
|
— |
E&P Canada |
|
— |
|
— |
|
— |
|
— |
|
— |
|
— |
|
— |
|
— |
Total Proved Developed Non-Producing |
|
— |
|
— |
|
— |
|
— |
|
— |
|
— |
|
— |
|
— |
Proved Undeveloped |
|
|
|
|
|
|
|
|
|
|
|
|
|
|
|
|
Mining |
|
33 846 |
|
3 606 |
|
18 976 |
|
3 762 |
|
1 853 |
|
5 649 |
|
1 522 |
|
4 127 |
In Situ |
|
156 902 |
|
24 193 |
|
60 203 |
|
24 123 |
|
1 651 |
|
46 732 |
|
11 038 |
|
35 695 |
E&P Canada |
|
6 922 |
|
862 |
|
1 652 |
|
1 986 |
|
1 177 |
|
1 246 |
|
440 |
|
806 |
Total Proved Undeveloped |
|
197 669 |
|
28 661 |
|
80 830 |
|
29 871 |
|
4 681 |
|
53 627 |
|
12 999 |
|
40 627 |
Proved |
|
|
|
|
|
|
|
|
|
|
|
|
|
|
|
|
Mining |
|
327 866 |
|
30 943 |
|
173 582 |
|
42 882 |
|
60 525 |
|
19 934 |
|
11 909 |
|
8 024 |
In Situ |
|
191 835 |
|
29 749 |
|
72 375 |
|
26 921 |
|
2 537 |
|
60 253 |
|
13 981 |
|
46 271 |
E&P Canada |
|
15 264 |
|
2 219 |
|
3 447 |
|
2 125 |
|
2 831 |
|
4 643 |
|
1 026 |
|
3 617 |
Total Proved |
|
534 965 |
|
62 910 |
|
249 404 |
|
71 928 |
|
65 893 |
|
84 829 |
|
26 917 |
|
57 913 |
Probable |
|
|
|
|
|
|
|
|
|
|
|
|
|
|
|
|
Mining |
|
72 389 |
|
8 482 |
|
33 621 |
|
9 085 |
|
7 844 |
|
13 357 |
|
3 438 |
|
9 920 |
In Situ |
|
231 466 |
|
42 282 |
|
76 147 |
|
29 728 |
|
1 696 |
|
81 613 |
|
18 891 |
|
62 722 |
E&P Canada |
|
13 158 |
|
3 200 |
|
2 808 |
|
792 |
|
293 |
|
6 064 |
|
1 521 |
|
4 543 |
Total Probable |
|
317 013 |
|
53 964 |
|
112 576 |
|
39 605 |
|
9 833 |
|
101 034 |
|
23 850 |
|
77 185 |
Proved Plus Probable |
|
|
|
|
|
|
|
|
|
|
|
|
|
|
|
|
Mining |
|
400 255 |
|
39 425 |
|
207 204 |
|
51 967 |
|
68 369 |
|
33 291 |
|
15 347 |
|
17 944 |
In Situ |
|
423 301 |
|
72 031 |
|
148 522 |
|
56 649 |
|
4 234 |
|
141 866 |
|
32 873 |
|
108 993 |
E&P Canada |
|
28 422 |
|
5 418 |
|
6 255 |
|
2 917 |
|
3 124 |
|
10 707 |
|
2 547 |
|
8 160 |
Total Proved Plus Probable |
|
851 978 |
|
116 874 |
|
361 981 |
|
111 532 |
|
75 727 |
|
185 864 |
|
50 766 |
|
135 097 |
|
|
|
|
|
|
|
|
|
|
|
|
|
|
|
|
|
Please see the Notes at the end of the Future Net Revenues Tables. | ||||||||||||||||
SUNCOR ENERGY INC. ANNUAL INFORMATION FORM 2023 31
Future Net Revenues by Product Type(1)
as at December 31, 2023
(forecast prices and costs)
|
|
|
|
Unit Value |
(before income taxes, discounted at 10% per year) |
|
$ millions |
|
$/boe(2) |
Proved Developed Producing |
|
|
|
|
SCO |
|
24 433 |
|
15.65 |
Bitumen |
|
10 437 |
|
7.72 |
Light Crude Oil & Medium Crude Oil(3) |
|
2 981 |
|
46.11 |
Total Proved Developed Producing |
|
37 851 |
|
12.71 |
Proved |
|
|
|
|
SCO |
|
35 624 |
|
14.04 |
Bitumen |
|
14 530 |
|
7.99 |
Light Crude Oil & Medium Crude Oil(3) |
|
3 748 |
|
31.96 |
Total Proved |
|
53 903 |
|
12.05 |
Proved Plus Probable |
|
|
|
|
SCO |
|
47 951 |
|
12.81 |
Bitumen |
|
15 523 |
|
6.94 |
Light Crude Oil & Medium Crude Oil(3) |
|
7 317 |
|
35.53 |
Total Proved Plus Probable |
|
70 790 |
|
11.44 |
| (1) | Figures may not add due to rounding. |
| (2) | Unit values are net present values of future net revenues before deducting estimated cash income taxes payable, discounted at 10%, divided by net reserves. |
| (3) | Light crude oil and medium crude oil includes immaterial quantities of heavy crude oil from Hebron, which produces a commingled blend of light, medium and heavy crude oil. |
32 ANNUAL INFORMATION FORM 2023 SUNCOR ENERGY INC.
Notes to Future Net Revenues Tables
In Situ and Mining Future Net Revenues
Future net revenues for SCO include upgraded In Situ and Fort Hills bitumen volumes based on estimated available upgrading capacity and the company’s bitumen supply strategy. The future net revenues include SCO volumes and estimates for upgrader operating and capital costs. For net proved plus probable reserves, approximately 55% of Firebag bitumen production is expected to be upgraded to SCO by 2035 and 100% thereafter. Approximately 17% of Fort Hills bitumen production is expected to be upgraded to SCO.
Power sale revenues and the natural gas fuel expense associated with excess electricity generated from cogeneration facilities at Firebag, Fort Hills and Base Mine are included in future net revenues.
Forecast Prices and Costs
Crude oil, natural gas and other important benchmark reference pricing, as well as inflation and exchange rates utilized in the GLJ Report, were derived using averages of forecasts developed by GLJ (dated January 1, 2024), Sproule Associates Limited (dated December 31, 2023) and McDaniel & Associates Consultants Ltd. (dated January 1, 2024), all of whom are independent qualified reserves evaluators. Benchmark forecast prices have been adjusted for quality differentials and transportation costs applicable to the specific evaluation areas and products. The inflation rates utilized in cost forecasts were 0% in 2024 and 2.0% thereafter.
Carbon cost compliance for Canadian reserves is based on the Greenhouse Gas Pollution Pricing Act (Canada) which escalates from $80/tonne in 2024 to $170/tonne in 2030.
Prices Impacting Reserves Tables
Forecast |
|
Brent North Sea(1) |
|
WTI Cushing |
|
WCS Hardisty |
|
Light Sweet |
|
Pentanes Plus |
|
AECO Gas(6) |
|
Year |
|
US$/bbl |
|
US$/bbl |
|
Cdn$/bbl |
|
Cdn$/bbl |
|
Cdn$/bbl |
|
Cdn$/mmbtu |
US$/Cdn$ |
2024 |
|
78.00 |
|
73.67 |
|
76.74 |
|
92.91 |
|
96.79 |
|
2.20 |
0.7517 |
2025 |
|
79.18 |
|
74.98 |
|
79.77 |
|
95.04 |
|
98.75 |
|
3.37 |
0.7517 |
2026 |
|
80.36 |
|
76.14 |
|
81.12 |
|
96.07 |
|
100.71 |
|
4.05 |
0.7550 |
2027 |
|
81.79 |
|
77.66 |
|
82.88 |
|
97.99 |
|
102.72 |
|
4.13 |
0.7550 |
2028 |
|
83.41 |
|
79.22 |
|
85.04 |
|
99.95 |
|
104.78 |
|
4.21 |
0.7550 |
2029 |
|
+2.0%/yr |
|
+2.0%/yr |
|
+2.0%/yr |
|
+2.0%/yr |
|
+2.0%/yr |
|
+2.0%/yr |
0.7550 |
| (1) | Price used when determining offshore light, medium and heavy crude oil reserves for E&P Canada and North Sea reserves. |
| (2) | Price used when determining portions of bitumen reserves presented as In Situ and Mining reserves that are sold at the U.S. Gulf Coast, as well as for determining portions of bitumen pricing for royalty calculation purposes. |
| (3) | Price used when determining portions of bitumen reserves presented as In Situ and Mining reserves that are sold in Canada, as well as for determining bitumen pricing for royalty calculation purposes. |
| (4) | Price used when determining SCO reserves presented as In Situ and Mining reserves. |
| (5) | Price used when determining the cost of diluent associated with bitumen reserves presented as In Situ and Mining reserves, as well as when accounting for diluent in determining bitumen pricing for royalty calculation purposes. A bitumen/diluent ratio of approximately two barrels of bitumen for one barrel of diluent was used for In Situ reserves and a ratio of approximately three barrels of bitumen for one barrel of diluent was used for Mining reserves. |
| (6) | Price used when determining natural gas input costs for production of SCO and bitumen reserves. |
Disclosure of Net Present Values of Future Net Revenues After Income Taxes
Values presented in the table for Net Present Values of Future Net Revenues After Income Taxes reflect income tax burdens of assets at a business area or legal entity level based on tax pools associated with that business area or legal entity. Suncor’s actual corporate legal entity structure for income taxes and income tax planning has not been considered, and, therefore, the total value for income taxes presented in the total future net revenues table may not provide an estimate of the value at the corporate entity level, which may be significantly different. The 2023 audited Consolidated Financial Statements and the annual 2023 MD&A should be consulted for information on income taxes at the corporate entity level.
SUNCOR ENERGY INC. ANNUAL INFORMATION FORM 2023 33
Additional Information Relating to Reserves Data
Future Development Costs(1)
as at December 31, 2023
(forecast prices and costs)
($ millions) |
|
2024 |
|
2025 |
|
2026 |
|
2027 |
|
2028 |
|
Remainder |
|
Total |
|
Discounted at |
Proved |
|
|
|
|
|
|
|
|
|
|
|
|
|
|
|
|
Mining |
|
3 267 |
|
3 692 |
|
3 350 |
|
3 115 |
|
2 638 |
|
26 820 |
|
42 882 |
|
22 650 |
In Situ |
|
811 |
|
987 |
|
1 069 |
|
477 |
|
906 |
|
22 671 |
|
26 921 |
|
9 178 |
E&P Canada |
|
603 |
|
511 |
|
245 |
|
121 |
|
153 |
|
492 |
|
2 125 |
|
1 656 |
Total Proved |
|
4 680 |
|
5 189 |
|
4 664 |
|
3 714 |
|
3 697 |
|
49 983 |
|
71 928 |
|
33 483 |
Proved Plus Probable |
|
|
|
|
|
|
|
|
|
|
|
|
|
|
|
|
Mining |
|
3 481 |
|
3 973 |
|
3 732 |
|
3 497 |
|
2 936 |
|
34 348 |
|
51 967 |
|
25 437 |
In Situ |
|
815 |
|
752 |
|
681 |
|
586 |
|
739 |
|
53 075 |
|
56 649 |
|
9 707 |
E&P Canada |
|
700 |
|
619 |
|
354 |
|
279 |
|
315 |
|
649 |
|
2 917 |
|
2 219 |
Total Proved Plus Probable |
|
4 997 |
|
5 344 |
|
4 767 |
|
4 362 |
|
3 989 |
|
88 073 |
|
111 532 |
|
37 363 |
| (1) | Figures may not add due to rounding. |
Management believes that internally generated cash flows, existing and future credit facilities and access to capital markets will be sufficient to fund future development costs. Failure to develop those reserves would have a negative impact on future cash flow provided by operating activities.
Interest expense or other costs of external funding are not included in the reserves and future net revenues estimates and could reduce future net revenues. Suncor does not anticipate the costs of funding would make development of any property uneconomic.
Abandonment and Reclamation Costs
The company completes an annual review of its consolidated abandonment and reclamation cost estimates. The estimates are limited to current disturbances and based on the anticipated method and extent of restoration, consistent with legal requirements and the possible future use of the site.
Suncor estimates its undiscounted, uninflated abandonment and reclamation costs for its upstream assets to be approximately $23.2 billion (discounted at 10%, approximately $5.0 billion). Suncor estimates that it will incur $1.5 billion of its identified abandonment and reclamation costs during the next three years.
The abandonment and reclamation costs for current and future disturbances of $75.7 billion (inflated and undiscounted) have been deducted from the net present values of the company’s proved and probable reserves.
Gross Proved and Probable Undeveloped Reserves
The tables below outline the gross proved and probable undeveloped reserves and represent undeveloped reserves additions resulting from acquisitions, discoveries, infill drilling, improved recovery and/or extensions in the year when the events first occurred.
34 ANNUAL INFORMATION FORM 2023 SUNCOR ENERGY INC.
Gross Proved Undeveloped Reserves(1)
(forecast prices and costs)
|
|
2021 |
|
2022 |
|
2023 |
||||||
|
|
First Attributed |
|
Total as at December 31, 2021 |
|
First Attributed |
|
Total as at December 31, 2022 |
|
First Attributed |
|
Total as at December 31, 2023 |
SCO (mmbbls) |
|
|
|
|
|
|
|
|
|
|
|
|
Mining |
|
— |
|
295 |
|
— |
|
273 |
|
— |
|
281 |
In Situ |
|
2 |
|
715 |
|
6 |
|
668 |
|
181 |
|
854 |
Total SCO |
|
2 |
|
1 010 |
|
6 |
|
941 |
|
181 |
|
1 135 |
Bitumen (mmbbls) |
|
|
|
|
|
|
|
|
|
|
|
|
Mining |
|
— |
|
— |
|
— |
|
26 |
|
— |
|
14 |
In Situ |
|
1 |
|
478 |
|
2 |
|
514 |
|
151 |
|
563 |
Total bitumen |
|
1 |
|
478 |
|
2 |
|
540 |
|
151 |
|
577 |
Light crude oil & medium crude oil (mmbbls) |
|
|
|
|
|
|
|
|
|
|
|
|
E&P Canada(2) |
|
— |
|
15 |
|
46 |
|
59 |
|
— |
|
60 |
North Sea |
|
1 |
|
7 |
|
1 |
|
1 |
|
— |
|
— |
Total light crude oil & medium crude oil |
|
1 |
|
23 |
|
47 |
|
60 |
|
— |
|
60 |
Conventional natural gas (bcfe) |
|
|
|
|
|
|
|
|
|
|
|
|
E&P Canada |
|
— |
|
— |
|
— |
|
— |
|
— |
|
— |
North Sea(3) |
|
— |
|
11 |
|
— |
|
— |
|
— |
|
— |
Total conventional natural gas |
|
— |
|
11 |
|
— |
|
— |
|
— |
|
— |
Total (mmboe) |
|
3 |
|
1 513 |
|
55 |
|
1 541 |
|
333 |
|
1 772 |
| (1) | Figures may not add due to rounding. |
| (2) | Includes immaterial amounts of heavy crude oil. |
| (3) | Includes immaterial amounts of NGLs. |
SUNCOR ENERGY INC. ANNUAL INFORMATION FORM 2023 35
Gross Probable Undeveloped Reserves(1)
(forecast prices and costs)
|
|
2021 |
|
2022 |
|
2023 |
||||||
|
|
First Attributed |
|
Total as at December 31, 2021 |
|
First Attributed |
|
Total as at December 31, 2022 |
|
First Attributed |
|
Total as at December 31, 2023 |
SCO (mmbbls) |
|
|
|
|
|
|
|
|
|
|
|
|
Mining |
|
— |
|
23 |
|
110 |
|
133 |
|
— |
|
132 |
In Situ |
|
— |
|
1 185 |
|
— |
|
1 249 |
|
42 |
|
1 085 |
Total SCO |
|
— |
|
1 208 |
|
110 |
|
1 382 |
|
42 |
|
1 217 |
Bitumen (mmbbls) |
|
|
|
|
|
|
|
|
|
|
|
|
Mining |
|
— |
|
— |
|
3 |
|
3 |
|
— |
|
2 |
In Situ |
|
— |
|
283 |
|
— |
|
175 |
|
7 |
|
133 |
Total bitumen |
|
— |
|
283 |
|
3 |
|
178 |
|
7 |
|
135 |
Light crude oil & medium crude oil (mmbbls) |
|
|
|
|
|
|
|
|
|
|
|
|
E&P Canada(2) |
|
8 |
|
62 |
|
15 |
|
76 |
|
1 |
|
77 |
North Sea |
|
— |
|
3 |
|
— |
|
1 |
|
— |
|
— |
Total light crude oil & medium crude oil |
|
8 |
|
65 |
|
15 |
|
77 |
|
— |
|
77 |
Conventional natural gas (bcfe) |
|
|
|
|
|
|
|
|
|
|
|
|
E&P Canada |
|
— |
|
— |
|
— |
|
— |
|
— |
|
— |
North Sea(3) |
|
— |
|
4 |
|
— |
|
— |
|
— |
|
— |
Total conventional natural gas |
|
— |
|
4 |
|
— |
|
— |
|
— |
|
— |
Total (mmboe) |
|
8 |
|
1 556 |
|
129 |
|
1 638 |
|
49 |
|
1 428 |
| (1) | Figures may not add due to rounding. |
| (2) | Includes immaterial amounts of heavy crude oil. |
| (3) | Includes immaterial amounts of NGLs. |
Proved undeveloped and proved plus probable undeveloped reserves are attributed in accordance with COGE Handbook guidelines. Suncor plans to proceed with the development of essentially all proved undeveloped reserves within the next three years and with the development of all probable undeveloped reserves within the next five years.
In Situ
Undeveloped In Situ reserves are related only to sustaining pads and well pairs required for current producing or sanctioned projects. Proved undeveloped reserves have been assigned to areas delineated with vertical wells on 80-acre well spacing with 3D seismic control or 40-acre spacing without 3D seismic control. Probable undeveloped areas are limited to areas delineated with vertical wells on 320-acre spacing with seismic control or 160-acre spacing without seismic control. Development of undeveloped In Situ reserves is an ongoing process and is a function of estimating excess processing capacity and production decline forecasts from existing In Situ wells. These forecasts align current production, processing and pipeline constraints (which, in the case of processing constraints, do not permit Suncor to develop all of its undeveloped In Situ reserves within two years), capital spending commitments and future development for the next 10 years, and are updated and approved annually for internal and external factors affecting planned activity.
Mining
Undeveloped Mining reserves relate to the Syncrude MLX-W and MLX-E mining areas, which received regulatory approval in 2019 and 2020, respectively. Construction activities were restarted in 2021 and continued through 2023. MLX-W reserves will remain as undeveloped until major projects, such as the McKay River bridge, are completed in 2024. First ore is scheduled for 2025. Development of MLX-E requires the relocation of infrastructure that currently occupies the lease footprint and construction of a production haul road from the lease; project engineering commenced in 2022. MLX-E reserves will remain as undeveloped until its major components, such as infrastructure relocation and the production
36 ANNUAL INFORMATION FORM 2023 SUNCOR ENERGY INC.
haul road, are completed. Further ore body delineation drilling will continue in 2024. Both projects will utilize existing ore processing and extraction facilities at Syncrude’s Mildred Lake operation and are expected to sustain bitumen production levels at Mildred Lake after resource depletion at the North Mine.
E&P
Undeveloped conventional reserves are mainly associated with future drilling at Hebron, Hibernia and White Rose. Attribution of proved undeveloped and probable undeveloped reserves reflect, where applicable, the respective degrees of certainty with respect to various reservoir parameters, primarily drainage areas and recovery factors. In developing undeveloped conventional reserves, Suncor considers existing facility capacity, capital allocation plans, and remaining reserves availability.
Properties with no Attributed Reserves
The following table shows a summary of properties to which no reserves are attributed as at December 31, 2023. For lands in which Suncor holds interests in different formations under the same surface area pursuant to separate leases, the area has been counted for each lease.
Country |
|
Gross Hectares |
|
Net Hectares |
Canada |
|
1 730 126 |
|
872 331 |
Libya |
|
3 117 800 |
|
1 422 900 |
Syria |
|
345 194 |
|
345 194 |
Total |
|
5 193 120 |
|
2 640 425 |
Suncor’s properties with no attributed reserves range from exploration properties in a preliminary phase of evaluation to discovery areas where tenure to the property is held indefinitely on the basis of hydrocarbon test results, but where economic development is not currently possible or has not yet been sanctioned. Certain properties may be in a relatively mature phase of evaluation, where a significant amount of appraisal or even development has occurred; however, reserves cannot be attributed due to one or more contingencies, such as project sanction, or, in the case of Libya and Syria, political unrest. In many cases where reserves are not attributed to lands containing one or more discovery wells, the key limiting factor is the lack of available production infrastructure. As part of the company’s ongoing process to review the economic viability of its properties, some properties are selected for further development activities, while others are temporarily deferred, sold, swapped or relinquished back to the mineral rights owner.
In 2024, Suncor’s rights to 59,136 net hectares in Canada are scheduled to expire. The lands expiring in 2024 include approximately 36,864 net hectares in In Situ and 8,448 net hectares in Mining. Substantial portions of expiring lands may have their tenure continued beyond 2024 through the conduct of work programs and/or the payment of prescribed fees to the mineral rights owner.
Work Commitments
Suncor’s properties in Libya have no attributed reserves. The practice of governments requiring companies to pledge to carry out work commitments in exchange for the right to carry out exploration and development activities is common in Libya. Suncor has work commitments primarily for conducting seismic programs and drilling exploration wells. As at December 31, 2023, Suncor estimates that the value of the work commitment associated with its properties with no attributed reserves was US$359 million. Due to the political unrest in Libya, it is uncertain when the work commitments will be incurred.
SUNCOR ENERGY INC. ANNUAL INFORMATION FORM 2023 37
Oil and Gas Properties and Wells
The following table is a summary of the company’s oil and gas wells as at December 31, 2023.
|
|
Oil Wells(1) |
|
Natural Gas Wells(1) |
||||||||||||
|
|
Producing |
|
Non-producing(2)(3) |
|
Producing |
|
Non-producing(2)(3) |
||||||||
|
|
Gross |
|
Net |
|
Gross |
|
Net |
|
Gross |
|
Net |
|
Gross |
|
Net |
Alberta – In Situ(4) |
|
506.0 |
|
506.0 |
|
65.0 |
|
65.0 |
|
— |
|
— |
|
— |
|
— |
Newfoundland and Labrador |
|
95.0 |
|
27.7 |
|
7.0 |
|
2.4 |
|
— |
|
— |
|
— |
|
— |
Other International(5) |
|
— |
|
— |
|
422.0 |
|
212.6 |
|
— |
|
— |
|
6.0 |
|
6.0 |
Total |
|
601.0 |
|
533.7 |
|
494.0 |
|
280.0 |
|
— |
|
— |
|
6.0 |
|
6.0 |
| (1) | Alberta oil wells and Other International oil and gas wells are onshore, and Newfoundland and Labrador are offshore. |
| (2) | Non-producing wells include, but are not limited to, wells where there is no near-term plan for abandonment, wells where drilling has finished but the well has not been completed, wells requiring maintenance or workover where the resumption of production is not known, and wells that have been shut in and the date of resumption of production is not known with reasonable certainty. |
| (3) | Non-producing wells do not necessarily lead to classification of non-producing reserves. |
| (4) | SAGD well pairs and multilateral wells are each counted as one well. |
| (5) | Other International includes wells associated with the company’s operations in Syria and Libya. |
Costs Incurred
The table below summarizes the company’s costs incurred related to its exploration and development activities for the year ended December 31, 2023.
($ millions) |
|
Exploration Costs |
|
Proved Property |
|
Unproved Property |
|
Development Costs |
|
Total |
Canada – Mining and In Situ |
|
63 |
|
3 322 |
|
— |
|
4 091 |
|
7 476 |
Canada – E&P Canada |
|
5 |
|
— |
|
— |
|
702 |
|
707 |
Total Canada |
|
68 |
|
3 322 |
|
— |
|
4 793 |
|
8 183 |
North Sea |
|
96 |
|
— |
|
— |
|
— |
|
96 |
Other International |
|
5 |
|
— |
|
— |
|
— |
|
5 |
Total |
|
169 |
|
3 322 |
|
— |
|
4 793 |
|
8 284 |
38 ANNUAL INFORMATION FORM 2023 SUNCOR ENERGY INC.
Exploration and Development Activities
The table below outlines the gross and net exploratory and development wells the company completed during the year ended December 31, 2023.
|
|
Exploratory Wells(1) |
|
Development Wells |
||||
Total Number of Wells Completed |
|
Gross |
|
Net |
|
Gross |
|
Net |
Canada – Oil Sands |
|
|
|
|
|
|
|
|
Oil |
|
— |
|
— |
|
39.0 |
|
39.0 |
Service(2) |
|
— |
|
— |
|
55.0 |
|
55.0 |
Stratigraphic test(3) |
|
100.0 |
|
58.7 |
|
772.0 |
|
684.5 |
Total |
|
100.0 |
|
58.7 |
|
866.0 |
|
778.5 |
Canada – E&P Canada |
|
|
|
|
|
|
|
|
Oil |
|
— |
|
— |
|
1.0 |
|
0.2 |
Total |
|
— |
|
— |
|
1.0 |
|
0.2 |
Total Canada |
|
|
|
|
|
|
|
|
Oil |
|
— |
|
— |
|
40.0 |
|
39.2 |
Service |
|
— |
|
— |
|
55.0 |
|
55.0 |
Stratigraphic test |
|
100.0 |
|
58.7 |
|
772.0 |
|
684.5 |
Total |
|
100.0 |
|
58.7 |
|
867.0 |
|
778.7 |
| (1) | Exploratory wells for Oil Sands include activity related to technology pilot projects. |
| (2) | Service wells for Oil Sands include the injection well in a SAGD well pair, in addition to observation and disposal wells. |
| (3) | Stratigraphic test wells for Oil Sands include core hole drilling wells. |
Significant exploration and development activities in 2023 included:
• |
For Mining, at Oil Sands Base, asset sustainment activities, the continued development of tailings infrastructure and continued construction of a new cogeneration facility. At Fort Hills, construction of tailings infrastructure and mine advancement activities. At Syncrude, asset sustainment expenditures, scheduled turnaround, the ongoing development of MLX-W and further delineation of the Lease 29 asset. |
• |
For In Situ, the drilling of new well pairs, infill and sidetracked wells at Firebag and MacKay River are expected to assist in maintaining production levels in future years. Also included are stratigraphic test well and observation well drilling programs. |
• |
For E&P Canada, spending on the Terra Nova ALE Project, development work at the West White Rose Project and drilling activities at Hebron. |
For significant exploration and development activities expected to occur in 2024 and beyond, refer to the Narrative Description of Suncor’s Businesses and Additional Information Relating to Reserves Data – Future Development Costs sections in this AIF.
SUNCOR ENERGY INC. ANNUAL INFORMATION FORM 2023 39
Production History(1)
2023 |
|
Q1 |
|
Q2 |
|
Q3 |
|
Q4 |
|
Year Ended |
Canada - Oil Sands |
|
|
|
|
|
|
|
|
|
|
Upgraded product (SCO and diesel) production (mbbls/d) |
|
|
|
|
|
|
|
|
|
|
Oil Sands operations |
|
315.2 |
|
336.3 |
|
272.2 |
|
271.9 |
|
298.8 |
Syncrude |
|
182.6 |
|
168.7 |
|
197.1 |
|
203.8 |
|
188.2 |
Total upgraded production |
|
497.8 |
|
505.0 |
|
469.3 |
|
475.7 |
|
487.0 |
Non-upgraded bitumen production (mbbls/d) |
|
|
|
|
|
|
|
|
|
|
Oil Sands operations |
|
108.1 |
|
78.3 |
|
103.0 |
|
169.4 |
|
114.8 |
Fort Hills |
|
69.2 |
|
95.8 |
|
73.8 |
|
112.3 |
|
87.8 |
Total Oil Sands non-upgraded bitumen production |
|
177.3 |
|
174.1 |
|
176.8 |
|
281.7 |
|
202.6 |
Total production (mbbls/d) |
|
675.1 |
|
679.1 |
|
646.1 |
|
757.4 |
|
689.6 |
|
|
|
|
|
|
|
|
|
|
|
Netbacks(3)(4) |
|
|
|
|
|
|
|
|
|
|
Non-upgraded bitumen ($/bbl) |
|
|
|
|
|
|
|
|
|
|
Average price realized(2) |
|
51.50 |
|
69.91 |
|
89.35 |
|
62.97 |
|
67.97 |
Royalties |
|
(3.88) |
|
(10.07) |
|
(15.44) |
|
(10.62) |
|
(10.16) |
Operating costs |
|
(22.92) |
|
(21.65) |
|
(21.46) |
|
(17.91) |
|
(20.56) |
Netback |
|
24.70 |
|
38.19 |
|
52.45 |
|
34.44 |
|
37.25 |
|
|
|
|
|
|
|
|
|
|
|
Upgraded - net SCO and diesel ($/bbl) |
|
|
|
|
|
|
|
|
|
|
Average price realized(2) |
|
98.87 |
|
95.36 |
|
107.19 |
|
96.32 |
|
99.40 |
Royalties |
|
(4.66) |
|
(9.64) |
|
(19.56) |
|
(8.80) |
|
(10.60) |
Operating costs |
|
(38.72) |
|
(38.66) |
|
(37.42) |
|
(40.96) |
|
(38.92) |
Netback |
|
55.49 |
|
47.06 |
|
50.21 |
|
46.56 |
|
49.88 |
|
|
|
|
|
|
|
|
|
|
|
Average Oil Sands segment ($/bbl) |
|
|
|
|
|
|
|
|
|
|
Average price realized(2) |
|
86.71 |
|
89.19 |
|
102.25 |
|
83.72 |
|
90.27 |
Royalties |
|
(4.46) |
|
(9.74) |
|
(18.42) |
|
(9.49) |
|
(10.48) |
Operating costs |
|
(34.67) |
|
(34.54) |
|
(33.00) |
|
(32.26) |
|
(33.58) |
Netback |
|
47.58 |
|
44.91 |
|
50.83 |
|
41.97 |
|
46.21 |
|
|
|
|
|
|
|
|
|
|
|
Exploration and Production - light crude oil & medium crude oil |
|
|
|
|
|
|
|
|
|
|
Exploration and Production Canada (mbbls/d) |
|
46.7 |
|
45.9 |
|
39.8 |
|
45.3 |
|
44.4 |
Exploration and Production North Sea (mboe/d) |
|
17.9 |
|
13.6 |
|
— |
|
— |
|
7.7 |
Total production volumes (mboe/d) |
|
64.6 |
|
59.5 |
|
39.8 |
|
45.3 |
|
52.1 |
|
|
|
|
|
|
|
|
|
|
|
Netbacks(3)(4) |
|
|
|
|
|
|
|
|
|
|
Canada - light crude oil & medium crude oil ($/bbl) |
|
|
|
|
|
|
|
|
|
|
Average price realized(2) |
|
101.11 |
|
105.81 |
|
117.21 |
|
109.51 |
|
107.62 |
Royalties |
|
(11.60) |
|
(13.46) |
|
(16.33) |
|
(15.10) |
|
(13.82) |
Operating costs |
|
(16.48) |
|
(18.57) |
|
(20.18) |
|
(31.23) |
|
(20.17) |
Netback |
|
73.03 |
|
73.78 |
|
80.70 |
|
63.18 |
|
73.63 |
|
|
|
|
|
|
|
|
|
|
|
North Sea - light crude oil & medium crude oil ($/boe)(5) |
|
|
|
|
|
|
|
|
|
|
Average price realized(2) |
|
113.82 |
|
102.44 |
|
— |
|
— |
|
109.00 |
Operating costs |
|
(12.00) |
|
(19.16) |
|
— |
|
— |
|
(15.03) |
Netback(4) |
|
101.82 |
|
83.28 |
|
— |
|
— |
|
93.97 |
| (1) | Production and liftings in Libya were not material to Suncor, and therefore are not included. |
| (2) | Average price realized is net of transportation costs, and before royalties. |
| (3) | Netbacks are based on sales volumes. |
| (4) | Netback is a non-GAAP financial measure. See the Advisory – Forward-Looking Statements and Non-GAAP Financial Measures section of this AIF. |
| (5) | Volumes include field production for immaterial amounts of associated gas and NGLs. |
40 ANNUAL INFORMATION FORM 2023 SUNCOR ENERGY INC.
The following table provides the production volumes(1) on a working-interest basis, before royalties for each of Suncor’s important fields for the year ended December 31, 2023.
|
|
|
|
|
|
SCO |
|
Bitumen |
|
Light Crude |
|
|
|
|
|
|
mbbls/d |
|
mbbls/d |
|
mbbls/d |
Mining – Suncor |
|
|
|
|
|
186.0 |
|
— |
|
— |
Mining – Syncrude |
|
|
|
|
|
188.2 |
|
— |
|
— |
Mining – Fort Hills |
|
|
|
|
|
14.3 |
|
87.8 |
|
— |
Firebag |
|
|
|
|
|
98.5 |
|
81.1 |
|
— |
MacKay River |
|
|
|
|
|
— |
|
33.7 |
|
— |
Hibernia |
|
|
|
|
|
— |
|
— |
|
13.8 |
White Rose |
|
|
|
|
|
— |
|
— |
|
5.2 |
Terra Nova |
|
|
|
|
|
— |
|
— |
|
0.6 |
Hebron(2) |
|
|
|
|
|
— |
|
— |
|
24.8 |
| (1) | Volumes shown are actual volumes and may differ from the estimated volumes shown in the Reconciliation of Gross Reserves Table. |
| (2) | Includes immaterial quantities of heavy crude oil, which is produced as a commingled blend of light, medium and heavy crude oil. |
Production Estimates
The table below outlines the production estimates for 2024 that are included in the estimates of proved reserves and probable reserves as at December 31, 2023.
|
|
SCO |
|
Bitumen |
|
Light Crude Oil & |
|
Total |
||||||||
|
|
(mbbls/d)(1) |
|
(mbbls/d)(1) |
|
(mbbls/d)(1) |
|
(mbbls/d)(1) |
||||||||
|
|
Gross |
|
Net |
|
Gross |
|
Net |
|
Gross |
|
Net |
|
Gross |
|
Net |
Total(1) |
|
|
|
|
|
|
|
|
|
|
|
|
|
|
|
|
Proved |
|
448 |
|
403 |
|
242 |
|
210 |
|
51 |
|
47 |
|
741 |
|
660 |
Probable |
|
34 |
|
29 |
|
24 |
|
18 |
|
5 |
|
4 |
|
63 |
|
51 |
Proved Plus Probable |
|
482 |
|
432 |
|
266 |
|
228 |
|
56 |
|
51 |
|
804 |
|
711 |
| (1) | Figures may not add due to rounding. |
The following properties each account for approximately 20% or more of total estimated production for 2024.
Proved
• |
From Millennium and North Steepbank: 179 mbbls/d of SCO, which represents approximately 24% of total estimated production for 2024. |
• |
From Fort Hills: 149 mbbls/d of SCO and bitumen (22 mbbls/d and 128 mbbls/d, respectively), which represents approximately 20% of total estimated production for 2024. |
• |
From Firebag: 173 mbbls/d of SCO and bitumen (91 mbbls/d and 82 mbbls/d, respectively), which represents approximately 23% of total estimated production for 2024. |
• |
From Syncrude: 158 mbbls/d of SCO and bitumen (157 mbbls/d and 1 mbbls/d, respectively), which represents approximately 21% of total estimated production for 2024. |
Proved Plus Probable
• |
From Millennium and North Steepbank: 191 mbbls/d of SCO, which represents approximately 24% of total estimated production for 2024. |
• |
From Fort Hills: 159 mbbls/d of SCO and bitumen (24 mbbls/d and 135 mbbls/d, respectively), which represents approximately 20% of total estimated production for 2024. |
• |
From Firebag: 190 mbbls/d of SCO and bitumen (96 mbbls/d and 95 mbbls/d, respectively), which represents approximately 24% of total estimated production for 2024. |
SUNCOR ENERGY INC. ANNUAL INFORMATION FORM 2023 41
• |
From Syncrude: 172 mbbls/d of SCO and bitumen (171 mbbls/d and 1 mbbls/d, respectively) which represents approximately 21% of total estimated production for 2024. |
Forward Contracts
Suncor may use financial derivatives to manage its exposure to fluctuations in commodity prices. A description of Suncor’s use of such instruments is provided in the 2023 audited Consolidated Financial Statements and related annual 2023 MD&A.
42 ANNUAL INFORMATION FORM 2023 SUNCOR ENERGY INC.
Industry Conditions
The oil and natural gas industry is subject to extensive regulations imposed by legislation enacted by various levels of government and, with respect to the export and taxation of oil and natural gas, by agreements among the federal and provincial governments of Canada, as well as the governments of the U.S. and other foreign jurisdictions in which Suncor operates. All governments have the ability to change legislation, and the company is unable to predict what additional legislation or amendments to legislation may be enacted. Suncor may engage in government consultation regarding proposed legislative changes to ensure Suncor’s interests are recognized. The following discussion outlines some of the principal legislation, regulations and agreements that govern Suncor’s operations.
Royalties
Canada
The royalty regime is a significant factor in the profitability of SCO, bitumen, crude oil, NGLs and natural gas production. Crown royalties are determined by governmental regulation or by agreement with governments in certain circumstances, which are subject to change as a result of numerous factors, including political considerations.
Oil sands projects are subject to the royalty framework issued by the Government of Alberta. Under the royalty framework, royalties for oil sands projects are based on a sliding-scale rate of 25% to 40% of net revenue (net revenue royalty or NRR), subject to a minimum royalty within a range of 1% to 9% of gross revenue (gross revenue royalty or GRR) depending on benchmark crude oil pricing. A royalty project remains subject to the minimum royalty (the pre-payout phase) until the project’s cumulative gross revenue exceeds its cumulative costs, including an annual investment allowance (the post-payout phase). During the post-payout phase, the annual royalty paid to the province is the greater of the GRR and NRR.
In 2023, all oil sands projects were in the post-payout phase with the exception of Fort Hills which was in the pre-payout phase. Both Fort Hills and Base Mine (due to a carry-forward costs balance) were at GRR, while MacKay River, Firebag and Syncrude were at NRR.
Suncor’s East Coast projects are subject to royalty agreements and regulations issued by the Government of Newfoundland and Labrador. The royalty regime for each project has been negotiated on an individual basis. The current East Coast royalty regime has a tiered rate structure ranging from a minimum of 1% of gross revenue to a maximum of 42.5% of net revenue, based upon profitability levels. An East Coast project will be subject to the minimum royalty (the pre-payout phase) until the project’s cumulative gross revenue exceeds its cumulative costs, including an annual investment allowance (the post-payout phase).
During 2023, all producing E&P assets were in the post-payout phase with the exception of Hebron, which was in the pre-payout phase. Both Terra Nova and White Rose, due to a carry-forward costs balance, were calculated at Base royalty, while Hibernia was calculated at Net Royalty.
Other Jurisdictions
For operations in Libya, all government interests, except for income taxes, are presented as royalties and are determined pursuant to EPSAs. The amounts calculated reflect the difference between Suncor’s working interest in the particular period and the net revenue attributable to Suncor under the terms of the respective EPSAs.
Land Tenure
In Canada, crude oil and natural gas are predominantly owned by the respective provincial governments which grant rights to explore for and produce oil and natural gas pursuant to leases, licences and permits for varying terms, and on conditions set forth in provincial legislation, including requirements to perform specific work or make payments.
SUNCOR ENERGY INC. ANNUAL INFORMATION FORM 2023 43
In many international jurisdictions, crude oil and natural gas are most commonly owned by national governments that grant rights in the form of exploration licences and permits, production licences, production sharing contracts and other similar forms of tenure. In all cases, Suncor’s right to explore, develop and produce crude oil and natural gas is subject to ongoing compliance with the regulatory requirements established by the relevant country.
Environmental Regulations
The company is subject to environmental regulations under a variety of Canadian, U.S. and other foreign, federal, provincial, territorial, state and municipal laws and regulations. Governments continue to revise and add new environmental regulations. It is not possible to accurately predict the nature of any future legislative requirements, nor the impacts of those regulatory changes on the company.
Climate Change and GHG Emissions
Suncor operates in many jurisdictions that regulate, or have proposed to regulate, GHG emissions. As part of its ongoing business planning, Suncor estimates future costs associated with GHG emissions in its operations and in the evaluation of future projects. These estimates use the company’s outlook for the carbon price under current and pending GHG regulations, which are used in conjunction with other tools to test the company’s business strategy against a range of policy designs.
Environmental regulations and initiatives related to climate change and GHG emissions are described below.
Canadian Federal GHG and Fuel Regulations
The federal government requires all provinces and territories to have a carbon price, which was $65 per tonne of CO2e in 2023 and will increase by $15 per tonne of CO2e annually, rising to $170 per tonne of CO2e in 2030. Provinces and territories have the ability to customize their carbon pricing systems to maintain competitiveness and federal equivalency.
Jurisdictions can implement: (i) an explicit price-based system (such as the carbon tax adopted by British Columbia), (ii) the carbon levy and performance-based emissions system (adopted in Alberta) or (iii) a cap and trade system (adopted in Quebec).
The Clean Fuel Regulations (CFR) were enacted by the federal government effective July 1, 2023, replacing the Renewable Fuels Regulations. The CFR requires reductions in the carbon intensity of gasoline and diesel fuels supplied into Canada. Credits for CFR are generated for blending renewable fuels, reducing GHGs at fossil fuel facilities, facilitating fuel switching in transportation or purchasing CFR compliance credits. Additionally, for fossil fuel facility projects, credits cannot be earned from products exported from Canada.
The Canadian Net-Zero Emissions Accountability Act legislates Canada’s commitment to achieve net-zero emissions by 2050 and requires the federal government to set national GHG emission reduction targets on a rolling five-year basis necessary to achieve net-zero emissions by 2050. Further, pursuant to the Paris Agreement, the Government of Canada set a goal to reduce GHG emissions economy-wide by 40% to 45% below 2005 levels by 2030.
Under Development
In addition to existing federal GHG and fuel regulations, the federal government is developing the following climate-related regulations.
Draft Clean Electricity Regulations propose to achieve a net-zero electricity system in Canada by 2035. Consultations are ongoing and Suncor has provided feedback. Final regulations are expected to be released in 2024.
In December 2023, the federal government proposed a Regulatory Framework for the oil and gas sector GHG emissions cap that proposes to limit emissions. The proposed 2030 emissions cap is 35% to 38% below 2019 levels. A cap and trade system is also proposed, which includes free allocation and
44 ANNUAL INFORMATION FORM 2023 SUNCOR ENERGY INC.
compliance flexibilities, both of which will be reduced annually to meet net-zero by 2050. Final regulations are expected to be released in 2025.
To incentivize investment in decarbonization, the federal government is finalizing details of an investment tax credit (ITC) for capital invested in carbon capture, utilization and storage (CCUS). The ITC would apply to CCUS projects that permanently store captured CO2 through eligible use, which includes dedicated geological storage. From 2022 to 2030, a 50% ITC for investment in equipment to capture CO2 is proposed for CCUS projects, with that rate being halved starting in 2031. The incentive will support CCUS project economics.
Provincial GHG and Fuel Regulations
Alberta
The Oil Sands Emissions Limit Act sets an emissions limit of 100 Mt of CO2e per year in the oil sands sector, excluding emissions from cogeneration and new upgrading capacity. Current oil sands emissions in Alberta are estimated to be between 70 to 80 Mt per year. The implementation and enforcement of this legislation remain under review by the Government of Alberta and it is therefore not yet possible to predict the long-term impact on Suncor.
The Technology Innovation and Emissions Reduction Regulation (TIER) is a provincial carbon pricing regulation for large industrial emitters and applies to Suncor assets in Alberta. Facilities are required to reduce emissions intensity from their historical performance. Facilities that outperform their reduction targets can generate emission performance credits, while facilities that do not meet their emission intensity target can meet compliance obligations through: i) use of emissions performance credits that are generated by other regulated facilities; ii) use of Alberta-based emission offsets that are generated by projects that have voluntarily reduced their GHG emissions following an approved quantification protocol; and/or iii) pay into the TIER fund, which provides credits based on the minimum federal carbon pricing schedule. Currently, the company’s cogeneration facilities earn credits towards compliance as the electricity generated by these facilities is less GHG-intensive than the current electricity standard.
Effective January 1, 2023, the TIER regulation was amended to maintain federal equivalency from 2023 to 2030. Impactful changes include: the increased stringency on the benchmark tightening rate on oil sands facilities from 1% to 2% from 2023 to 2028, and 4% in 2029 and 2030, improvements to CCUS crediting; the increase to annual credit usage limits; and the tightening of electricity benchmarks starting in 2023. Suncor has incorporated these amendments into long-term forecasting and planning.
Under Development
In November 2023, the Government of Alberta announced the framework for an Alberta Carbon Capture Incentive Program (ACCIP) to support the development of CCUS in the province. The ACCIP offers a 12% grant for eligible capital costs once projects become operational to select industries for hard-to-abate emissions, including oil and gas and petrochemicals. Like the federal ITC, the incentive will support CCUS project economics. Detailed information is expected to be available in Spring 2024.
British Columbia
CleanBC’s Roadmap to 2030 establishes a series of actions to enable the province to achieve its 2030 emissions reduction target and eventually its net-zero target by 2050. The actions include: a commitment to increase the price on carbon to meet or exceed the federal benchmark; increased clean fuel and energy-efficiency requirements; a reduction of methane emissions from oil and gas by 75% by 2030 and the elimination of all industrial methane emissions by 2035; requirements for new large industrial facilities; and support for innovation in areas like low-carbon hydrogen and negative emissions technology.
Newfoundland and Labrador
Newfoundland and Labrador’s carbon pricing program is a hybrid system comprised of performance standards for large industrial facilities, plus a consumer carbon tax on transportation, building fuels and other fuels combusted in the province. Performance standards for large industrial facilities are legislated
SUNCOR ENERGY INC. ANNUAL INFORMATION FORM 2023 45
under the Management of Greenhouse Gas Act and associated regulations, which apply to Terra Nova, Hibernia, White Rose and Hebron.
Under Development
The Management of Greenhouse Gas Act established a fund to support energy-efficient and clean technology investments through compliance payments made by industrial emitters. This is expected to support technology and innovation as well as provide flexible compliance options and protect the competitiveness of energy-intensive, trade-exposed sectors such as the province’s offshore petroleum sector.
Ontario
Ontario’s Greenhouse Gas Emissions Performance Standards (EPS) applies to Suncor’s Sarnia refinery and St. Clair ethanol plant. The EPS requires facilities to pay the carbon price per tonne of CO2e of excess emissions units. The Ontario carbon price is aligned with the federal carbon price.
Under the Environmental Protection Act, the Cleaner Transportation Fuels Regulation requires fuel supplies blend renewable content in gasoline, with increasing renewable content requirements, to support the provincial government’s goal of reducing GHG emissions by 30% below 2005 levels by 2030.
Quebec
Quebec’s cap-and-trade system for GHG emissions applies to the Montreal refinery. Emitters are required to either reduce their emissions or purchase eligible emissions allowances to cover their emissions beyond their allocated emission allowance. The cap on overall annual GHG emissions and the maximum amount of emission allowances allocated to regulated emitters are established by the province.
On January 1, 2023, the Regulation Respecting the Integration of Low Carbon-Intensity Fuel Content into Gasoline and Diesel Fuel was enacted, requiring integration of low-carbon-intensity fuel content of 10% volume in gasoline and 3% in diesel in 2023, increasing to 15% volume in gasoline and 10% in diesel by 2030.
U.S. GHG Regulations
The U.S. Environmental Protection Agency (EPA) established a rule mandating that all large facilities report their GHG emissions. This applies to Suncor’s refinery in Commerce City, Colorado.
The State of Colorado passed a suite of energy and climate-change-related legislation that includes setting statewide targets to reduce GHG emissions and transition of the electricity system to become renewable. The legislation requires several supporting regulations to be enacted.
The GHG Emissions and Energy Management for Manufacturing Phase 2 rule was passed in September 2023 that requires facility-specific GHG reductions requirements. To meet the reductions requirement, the Commerce City Refinery will be required to reduce absolute facility emissions by 1.5% between 2024-2029 and 14% from 2030 and beyond compared to its facility GHG baseline emissions.
Land Use and Natural Resources Management Frameworks
Canadian Land Use and Natural Resources Management
Alberta Land Use and Water Management Regulatory Frameworks
The Lower Athabasca Regional Plan (LARP) addresses land use management in the Lower Athabasca region, which includes the area in which Suncor’s Oil Sands business is located. The management frameworks established under LARP to date include Surface Water Quality and Quantity, Groundwater, Air and Tailings. The regulatory frameworks required to enable the safe release of treated mine water are under development with both the provincial and federal governments. This framework is necessary to support Suncor’s reclamation and closure plans.
46 ANNUAL INFORMATION FORM 2023 SUNCOR ENERGY INC.
Air Quality Regulations
Air quality in Suncor’s operating areas is an increasing focus and has resulted in the introduction and/or update of policies and regulations. Regulators are setting more stringent limits that often require updating or replacing equipment, as well as additional monitoring and reporting requirements. Air quality regulations impacting Suncor’s Canadian operations include federal Base-level Industrial Emissions Requirements and Multi-sector Air Pollutants Regulations, Canadian Ambient Air Quality Standards, Methane Regulations, and Volatile Organic Compound Regulations.
Ontario regulates sulphur dioxide emissions, which impacts the Sarnia refinery.
U.S. Land Use and Natural Resources Management
Water Management Regulations
In late 2021, the Water Division for the Colorado Department of Public Health and Environment issued a draft water permit, which contains new and additional proposed requirements that could impose an additional financial impact on the company.
Air Quality Regulations
Air quality in Suncor’s U.S. operating areas is an increased area of focus and has resulted in the introduction and/or update of policies and regulations. Overall, regulators are moving toward setting more stringent limits that often require updating or replacing equipment, as well as additional monitoring and reporting requirements. Air quality regulations impacting Suncor’s U.S. operations include the Federal Title V Air Operating Permit, the National Ambient Air Quality Standards, the EPA Regional Haze Rule and Air Toxics Regulations.
Reclamation
The Government of Alberta’s Mine Financial Security Program (MFSP) accounts for the environmental liability associated with the suspension, abandonment, remediation and surface reclamation of oil sands mines and plant sites. The MFSP requires a base amount of security for each project. Suncor is in compliance with the MFSP. Additional security may be required under other MFSP conditions, such as failure to meet reclamation plans, falling below a specified asset to liability ratio, or when the estimated remaining production life of the mine reaches certain milestones; however, Suncor has not been required to provide any additional security to date. In 2022, a review of MFSP was conducted by the Government of Alberta with expected revisions to the MFSP to be identified and applied to the 2024 MFSP filing.
Under the Tailings Management Framework (TMF), tailings management plans have been submitted and approved for Suncor Base Plant (2017), Syncrude Aurora North (2018), Syncrude Mildred Lake (2019) and Fort Hills (2019). Updates to the Suncor Base Plant and Fort Hills tailings management plans were submitted to the Alberta Energy Regulator in 2022 and updates to the Syncrude Aurora North and Mildred Lake tailings management plans and Life of Mine Closure Plan were submitted in 2023. Pit lakes and integrated water management are important components in the TMF. Pit lakes are integral components of our closure landscapes, some of which provide permanent storage of fluid tailings. In order to support successful closure and reclamation, water quantity must be reduced, and quality must be managed.
SUNCOR ENERGY INC. ANNUAL INFORMATION FORM 2023 47
Risk Factors
A discussion of Suncor’s risk factors can be found in the “Risk Factors” section in Suncor’s annual 2023 MD&A, which section is incorporated by reference herein and available on the Company’s SEDAR+ profile at www.sedarplus.ca.
Dividends
The Board of Directors has established a practice of paying dividends on Suncor’s common shares on a quarterly basis. Suncor reviews its ability to pay dividends from time to time with regard to legislative requirements, the company’s financial position, financing requirements for growth, cash flow and other factors. Dividends are paid subject to applicable law, if, as and when declared by the Board.
Suncor paid the following common share dividends over the last three years ended December 31:
($ per share) |
|
Year |
Q4 |
Q3 |
Q2 |
Q1 |
2023 |
|
2.11 |
0.55 |
0.52 |
0.52 |
0.52 |
2022 |
|
1.88 |
0.52 |
0.47 |
0.47 |
0.42 |
2021 |
|
1.05 |
0.42 |
0.21 |
0.21 |
0.21 |
48 ANNUAL INFORMATION FORM 2023 SUNCOR ENERGY INC.
Description of Capital Structure
The company’s authorized share capital is comprised of an unlimited number of common shares, an unlimited number of preferred shares issuable in series designated as senior preferred shares, and an unlimited number of preferred shares issuable in series designated as junior preferred shares.
The holders of common shares are entitled to attend all meetings of shareholders and vote at any such meeting on the basis of one vote for each common share held. Common shareholders are entitled to receive any dividend declared by the Board on the common shares and to participate in a distribution of the company’s assets among its shareholders for the purpose of winding up its affairs. The holders of the common shares shall be entitled to share, on a pro rata basis, in all distributions of such assets.
The company has no preferred shares outstanding.
Petro-Canada Public Participation Act
The Petro-Canada Public Participation Act requires that the Articles of Suncor include certain restrictions on the ownership and voting of voting shares of the company. The common shares of Suncor are voting shares. Pursuant to the Petro-Canada Public Participation Act, no person, together with associates of that person, may subscribe for, have transferred to that person, hold, beneficially own or control otherwise than by way of security only, or vote in the aggregate, voting shares of Suncor to which are attached more than 20% of the votes attached to all outstanding voting shares of Suncor. Additional restrictions include provisions for suspension of voting rights, forfeiture of dividends, prohibitions against share transfer, compulsory sale of shares, and redemption and suspension of other shareholder rights. The Board may at any time require holders of, or subscribers for, voting shares, and certain other persons, to furnish statutory declarations as to ownership of voting shares and certain other matters relevant to the enforcement of the restrictions. Suncor is prohibited from accepting any subscription for, and issuing or registering a transfer of, any voting shares if a contravention of the individual ownership restrictions results.
Suncor’s Articles, as required by the Petro-Canada Public Participation Act, also include provisions requiring Suncor to maintain its head office in Calgary, Alberta; prohibiting Suncor from selling, transferring or otherwise disposing of all or substantially all of its assets in one transaction, or several related transactions, to any one person or group of associated persons, or to non-residents, other than by way of security only in connection with the financing of Suncor; and requiring Suncor to ensure (and to adopt, from time to time, policies describing the manner in which Suncor will fulfil the requirement to ensure) that any member of the public can, in either official language of Canada (English or French), communicate with and obtain available services from Suncor’s head office and any other facilities where Suncor determines there is significant demand for communication with, and services from, that facility in that language.
Credit Ratings
The following information regarding the company’s credit ratings is provided as it relates to the company’s cost of funds and liquidity. In particular, the company’s ability to access unsecured funding markets and to engage in certain collateralized business activities on a cost-effective basis is primarily dependent upon maintaining competitive credit ratings. A lowering of the company’s credit rating may also have potentially adverse consequences for the company’s funding capacity for growth projects or access to capital markets; may affect the company’s ability, and the cost, to enter into normal course derivative or hedging transactions; and may require the company to post additional collateral under certain contracts.
The following table shows the ratings issued for Suncor by the rating agencies noted herein. The credit ratings are not recommendations to purchase, hold or sell the debt securities in as much as such ratings do not comment as to the market price or suitability for a particular investor. Any rating may not remain in
SUNCOR ENERGY INC. ANNUAL INFORMATION FORM 2023 49
effect for any given period of time or may be revised or withdrawn entirely at any time by a rating agency in the future if, in its judgment, circumstances so warrant.
|
|
Senior |
|
Outlook |
|
Canadian |
|
U.S. |
S&P Global Ratings (S&P) |
|
BBB |
|
Negative |
|
Not rated |
|
A-2 |
Morningstar DBRS (DBRS) |
|
A (low) |
|
Stable |
|
R-1 (low) |
|
Not rated |
Moody's Investors Service (Moody's) |
|
Baa1 |
|
Stable |
|
Not rated |
|
P-2 |
Fitch Ratings (Fitch) |
|
BBB+ |
|
Stable |
|
Not rated |
|
F-1 |
S&P credit ratings on long-term debt are on a rating scale that ranges from AAA to D, representing the range of such securities rated from highest to lowest quality. A rating of BBB by S&P is the fourth highest of 10 categories. An obligation rated BBB exhibits adequate protection parameters. However, adverse economic conditions or changing circumstances are more likely to weaken the obligor’s capacity to meet its financial commitments on the obligation. The addition of a plus (+) or minus (-) designation after the rating indicates the relative standing within a particular rating category. An S&P rating outlook assesses the potential direction of a long-term credit rating over the immediate term, which is generally up to two years for investment grade and generally up to one year for speculative grade. Rating outlooks fall into four categories: “Positive”, “Negative”, “Stable” and “Developing”. In determining a rating outlook, consideration is given to any changes in the economic and/or fundamental business conditions. A negative outlook indicates S&P’s view that an event or trend has at least a one-in-three likelihood, as a broad guideline, of resulting in a rating change in two years for investment-grade credits. S&P credit ratings on commercial paper are on a short-term debt rating scale that ranges from A-1 to D, representing the range of such securities rated from highest to lowest quality. A U.S. rating of A-2 is the second highest of six categories, indicating a slightly higher susceptibility to the adverse effects of changes in circumstances and economic conditions than obligations in higher categories; the obligor's capacity to meet its financial commitment on the obligation is satisfactory.
DBRS credit ratings on long-term debt are on a rating scale that ranges from AAA to D, representing the range of such securities rated from highest to lowest. A rating of A by DBRS is the third highest of 10 categories and is assigned to debt securities considered to be of good credit quality, with the capacity for the payment of financial obligations being substantial, but of a lesser credit quality than an AA rating. Entities in the A category may be vulnerable to future events, but qualifying negative factors are considered manageable. All rating categories other than AAA and D also contain designations for (high) and (low). The assignment of a (high) or (low) designation within a rating category indicates relative standing within that category. The absence of either a (high) or (low) designation indicates the rating is in the middle of the category. Rating trends provide guidance in respect of DBRS’s opinion regarding the outlook for the rating in question, with rating trends falling into one of three categories: “Positive”, “Stable” or “Negative”. The rating trend indicates the direction in which DBRS considers the rating is headed should present circumstances continue, or in some cases, unless challenges are addressed. DBRS’s credit ratings on commercial paper are on a short-term debt rating scale that ranges from R-1 (high) to D, representing the range of such securities rated from highest to lowest quality. A rating of R-1 (low) by DBRS is the third highest of 10 categories and is assigned to debt securities considered to be of good credit quality. The capacity for the payment of short-term financial obligations as they fall due is substantial, with overall strength not as favourable as higher rating categories. Entities in this category may be vulnerable to future events, but qualifying negative factors are considered manageable. The R-1 and R-2 commercial paper categories are denoted by (high), (middle) and (low) designations.
Moody’s credit ratings on long-term debt are on a rating scale that ranges from Aaa to C, which represents the range from highest to lowest quality of such securities rated. A rating of Baa by Moody’s is the fourth highest of nine categories. Obligations rated Baa are judged to be medium grade and subject to
50 ANNUAL INFORMATION FORM 2023 SUNCOR ENERGY INC.
moderate credit risk and, as such, may possess certain speculative characteristics. For rating categories Aa through Caa, Moody’s appends the numerical modifiers 1, 2 or 3 to each generic rating classification. The modifier 1 indicates that the obligation ranks in the higher end of its generic rating category; the modifier 2 indicates a mid-range ranking; and the modifier 3 indicates a ranking in the lower end of that generic rating category. A Moody’s rating outlook is an opinion regarding the likely rating direction over the medium term. Rating outlooks fall into four categories: “Positive”, “Negative”, “Stable” and “Developing”. A Stable outlook indicates a low likelihood of a rating change over the medium term. A rating of P-2 by Moody’s for commercial paper is the second highest of four rating categories and indicates a strong ability to repay short-term debt obligations.
Fitch’s long-term credit ratings are on a rating scale that ranges from AAA to BBB (investment grade) and BB to D (speculative grade), which represents the range from highest to lowest quality of such securities rated. The terms "investment grade" and "speculative grade" are market conventions and do not imply any recommendation or endorsement of a specific security for investment purposes. A rating of BBB+ is within the fourth highest of 11 categories and indicates that expectations of default risk are currently low. The capacity for payment of financial commitments is considered adequate, but adverse business or economic conditions are more likely to impair this capacity. The modifiers “+” or ”-” may be appended to a rating to denote relative status within major rating categories. A Fitch rating outlook indicates the direction a rating is likely to move over a one- to two-year period, with rating outlooks falling into four categories: “Positive”, “Negative”, “Stable” or “Evolving”. Rating outlooks reflect financial or other trends that have not yet reached, or have not been sustained at, a level that would trigger a rating action, but which may do so if such trends continue. Positive or Negative outlooks do not imply that a rating change is inevitable and similarly, ratings with Stable outlooks can be raised or lowered without prior revision of the outlook. Where the fundamental trend has strong, conflicting elements of both positive and negative, the rating outlook may be described as Evolving. A Stable Rating outlook indicates a low likelihood of rating change over a one- to two-year period. A short-term issuer or obligation rating is based in all cases on the short-term vulnerability to default of the rated entity and relates to the capacity to meet financial obligations in accordance with the documentation governing the relevant obligation. A rating of F-1 for commercial paper is the highest of seven rating categories for short-term debt issuers. Issuers rated F-1 have the strongest capacity for timely payment of financial commitments relative to other issuers or obligations in the same country. Where a liquidity profile is particularly strong, a “+” is added to the assigned rating.
Suncor has paid each of S&P, DBRS, Moody’s and Fitch their customary fees in connection with the provision of the above ratings. Suncor has not made any payments to DBRS, Moody’s or Fitch in the past two years for services unrelated to the provision of such ratings.
SUNCOR ENERGY INC. ANNUAL INFORMATION FORM 2023 51
Market for Securities
Suncor’s common shares are listed on the TSX and the NYSE. The price ranges and the volumes traded on the TSX in 2023 are as follows:
|
|
Price Range (Cdn$) |
|
Trading Volume |
||
Month |
|
High |
|
Low |
|
(000s) |
January |
|
47.21 |
|
39.94 |
|
150 210 |
February |
|
47.62 |
|
43.40 |
|
242 763 |
March |
|
48.26 |
|
38.82 |
|
297 828 |
April |
|
44.78 |
|
39.76 |
|
122 787 |
May |
|
42.65 |
|
37.61 |
|
260 993 |
June |
|
40.74 |
|
37.09 |
|
267 164 |
July |
|
41.59 |
|
37.73 |
|
111 554 |
August |
|
46.55 |
|
40.01 |
|
242 779 |
September |
|
47.76 |
|
45.26 |
|
192 563 |
October |
|
47.55 |
|
43.35 |
|
96 252 |
November |
|
45.52 |
|
42.94 |
|
207 701 |
December |
|
45.52 |
|
40.07 |
|
179 595 |
For information in respect of options to purchase common shares of Suncor and common shares issued upon the exercise of options, see note 26 to the 2023 audited Consolidated Financial Statements, which is incorporated by reference into this AIF and available on SEDAR+ at www.sedarplus.ca.
52 ANNUAL INFORMATION FORM 2023 SUNCOR ENERGY INC.
Directors and Executive Officers
Directors
The following individuals are directors of Suncor. The term of each director is from the date of the meeting at which he or she is elected or appointed until the next annual meeting of shareholders or until a successor is elected or appointed.
Name and Jurisdiction of Residence |
Period Served and |
Biography |
|
Ian R. Ashby(1)(2) Queensland, Australia |
Director since 2022 Independent |
Ian Ashby is the former President of BHP Billiton’s iron ore customer sector group. Mr. Ashby has almost 40 years of experience in the mining industry, including 25 years in a wide variety of roles with BHP Billiton in its iron ore, base metals and gold businesses in Australia, the U.S. and Chile, as well as project roles in the corporate office, ultimately leading the company’s iron ore business. Since retiring from BHP Billiton in 2012, Mr. Ashby has taken on a number of advisory and board roles with other mining and related organizations. He currently serves as an independent director on the board of Anglo American plc. He has served as a director on the boards of IAMGOLD Corporation, New World Resources PLC, Genco Shipping & Trading, Nevsun Resources Ltd. and Alderon Iron Ore Corp. He has also served in an advisory capacity with Apollo Global Management and Temasek. Mr. Ashby holds a bachelor of engineering (mining) degree from the University of Melbourne in Australia. |
|
Patricia M. Bedient(2)(3) Washington, U.S. |
Director since 2016 Independent |
Patricia Bedient retired as Executive Vice President of Weyerhaeuser Company (Weyerhaeuser), one of the world’s largest integrated forest products companies, on July 1, 2016. From 2007 until February 2016, she also served as Weyerhaeuser’s Chief Financial Officer. Prior to this, she held a variety of leadership roles in finance and strategic planning at Weyerhaeuser after joining the company in 2003. Before joining Weyerhaeuser, she spent 27 years with Arthur Andersen LLP and ultimately served as the Managing Partner for its Seattle office and partner in charge of the firm’s forest products practice. Ms. Bedient serves on the board of directors of Alaska Air Group, Inc. and Park Hotels & Resorts Inc. and also serves on the Oregon State University board of trustees and the University of Washington Foster School of Business advisory board. She achieved national recognition in 2012 when The Wall Street Journal named her one of the Top 25 CFOs in the United States. She is a member of the American Institute of CPAs and the Washington Society of CPAs. Ms. Bedient received her bachelor’s degree in business administration, with concentrations in finance and accounting, from Oregon State University in 1975. |
SUNCOR ENERGY INC. ANNUAL INFORMATION FORM 2023 53
|
Russell Girling(1)(4)(5) Alberta, Canada |
Director since 2021 Independent |
Russell (Russ) K. Girling was the President and Chief Executive Officer of TransCanada Pipelines Limited and TC Energy Corporation (TC Energy), a North American energy infrastructure company, from 2010 until his retirement on December 31, 2020. Mr. Girling joined TC Energy in 1994 and held progressively senior roles during his 26 years with the company, including seven years as Chief Financial Officer. Prior to joining TC Energy in 1994, he worked at Suncor, Northridge Energy Marketing and Dome Petroleum. Mr. Girling is Chair and a director of the board of Nutrien Ltd. Until December 31, 2020, Mr. Girling was a member of the U.S. National Petroleum Council and the U.S. Business Roundtable, and served as a director of the American Petroleum Institute, the Business Council of Canada and the Business Council of Alberta. Mr. Girling is a graduate of the Institute of Corporate Directors Education Program and holds a bachelor of commerce and a master of business administration (finance) from the University of Calgary. |
|
Jean Paul Gladu(3)(4) Ontario, Canada |
Director since 2020 Independent |
Jean Paul (JP) Gladu previously served as President and Chief Executive Officer of the Canadian Council for Aboriginal Business for approximately eight years. Mr. Gladu has over 30 years of experience in the natural resource sector, including working with Indigenous communities and organizations, environmental non-governmental organizations, industry and governments from across Canada. Mr. Gladu also serves on the board of Broden Mining Ltd. and the Institute of Corporate Directors. He was appointed Chancellor of St. Paul’s University College Waterloo in 2017 and served on the board of Ontario Power Generation. Mr. Gladu has a forestry technician diploma, an undergraduate degree in forestry from Northern Arizona University, an Executive MBA from Queen’s University and the ICD.D from Rotman School of Management at the University of Toronto. Anishinaabe from Thunder Bay, Mr. Gladu is a member of Bingwi Neyaashi Anishinaabek located on Lake Nipigon, Ontario. |
54 ANNUAL INFORMATION FORM 2023 SUNCOR ENERGY INC.
|
Dennis M. Houston(1)(4)(6) Texas, U.S. |
Director since 2018 Independent |
Dennis Houston served as executive vice president of ExxonMobil Refining & Supply Company, chair and president of ExxonMobil Sales & Supply LLC and chair of Standard Tankers Bahamas Limited until his retirement in 2010. Prior to that, he held a variety of leadership and engineering roles in the midstream and downstream businesses in the ExxonMobil organization. Mr. Houston has approximately 40 years’ experience in the oil and gas industry, including over 35 years with ExxonMobil and its related companies. He serves on the board of directors of Argus Media Limited. Mr. Houston has a bachelor’s degree in chemical engineering from the University of Illinois and an honorary doctorate of public administration degree from Massachusetts Maritime Academy. He has served on a variety of advisory councils, including an appointment by President George H.W. Bush to the National Infrastructure Advisory Council and serving on the Chemical Sciences Leadership Council at the University of Illinois and the Advisory Council at the Center for Energy, Marine Transportation & Public Policy at Columbia University. He also serves on the Alexander S. Onassis Public Benefit Foundation board, is honorary consul to the Texas Region for the Principality of Liechtenstein and is a board member for the American Bureau of Shipping Group of Companies. |
|
Richard M. Kruger Alberta, Canada |
Director since 2023 Non-Independent, Management |
Richard M. Kruger is President and Chief Executive Officer of Suncor. Mr. Kruger has nearly 40 years of experience in the energy industry including extensive experience in the Canadian oil sands. Mr. Kruger was Chairman, President and Chief Executive Officer of Imperial Oil Limited from 2013 until his retirement in December 2019. Mr. Kruger worked for Exxon Mobil Corporation and its predecessor companies since 1981 in various upstream and downstream assignments with responsibilities in the U.S., the former Soviet Union, the Middle East, Africa and Southeast Asia. Prior to this, Mr. Kruger was Vice President of Exxon Mobil and president of ExxonMobil Production Company, a division of Exxon Mobil Corporation, with responsibility for ExxonMobil’s global oil and gas producing operations. He holds a mechanical engineering degree from the University of Minnesota and an MBA from the University of Houston. |
SUNCOR ENERGY INC. ANNUAL INFORMATION FORM 2023 55
|
Brian MacDonald(2)(3) Florida, U.S. |
Director since 2018 Independent |
Brian MacDonald is President and Chief Executive Officer, and is a director of CDK Global, Inc., a leading global provider of integrated information technology and digital marketing solutions to the automotive retail and adjacent industries. Prior to joining CDK Global, Mr. MacDonald served as Chief Executive Officer and President of Hertz Equipment Rental Corporation and served as Interim Chief Executive Officer of Hertz Corporation. Mr. MacDonald previously served as President and Chief Executive Officer of ETP Holdco Corporation, an entity formed following Energy Transfer Partners' $5.3 billion acquisition of Sunoco Inc., where Mr. MacDonald had served as chair, president and chief executive officer. He was the chief financial officer at Sunoco Inc. and held senior financial roles at Dell Inc. Prior to Dell Inc., Mr. MacDonald spent more than 13 years in several financial management roles at General Motors Corporation in North America, Asia and Europe. He previously served on the board of directors for ComputerSciences Corporation (now DXC Technology Company), Ally Financial Inc., Sunoco Inc. and Sunoco Logistics L.P. Mr. MacDonald holds an MBA from McGill University and a bachelor of science from Mount Allison University. |
|
Lorraine Mitchelmore(1)(2) Alberta, Canada |
Director since 2019 Independent |
Lorraine Mitchelmore has over 30 years’ international oil and gas industry experience. She most recently served as President and Chief Executive Officer for Enlighten Innovations Inc., a fuel upgrading technology company. Prior to Enlighten Innovations, she held progressively senior roles at Royal Dutch Shell. Ms. Mitchelmore joined Shell in 2002, becoming President and Country Chair of Shell Canada Limited in 2009, in addition to her role as Executive Vice President of Heavy Oil Americas. Prior to joining Shell, she worked with Petro-Canada (now Suncor), Chevron and BHP Petroleum in the upstream business units in a combination of technical, exploration & development, and commercial roles. Ms. Mitchelmore is a director of the Bank of Montreal, Cheniere Energy Inc. and Alberta Investment Management Corporation, and has served on the boards of Shell Canada Limited, the Canada Advisory Board at Catalyst, Inc. and Trans Mountain Corporation. Ms. Mitchelmore holds a bachelor of science (honours) in geophysics from Memorial University of Newfoundland, a master’s of science in geophysics from the University of Melbourne, Australia, and an MBA with distinction from Kingston Business School in London, England. |
56 ANNUAL INFORMATION FORM 2023 SUNCOR ENERGY INC.
|
Jane Peverett(2)(3) British Columbia, Canada |
Director since 2023 Independent |
Jane Peverett has over 25 years of experience in the energy sector, primarily in the utility space. In 2009, she retired as President and Chief Executive Officer of the British Columbia Transmission Corporation (BCTC), prior to that having served as BCTC’s Chief Financial Officer from 2003 to 2005. Before joining BCTC, Ms. Peverett held progressively more senior finance and regulatory affairs roles at Westcoast Energy Inc. until her appointment in 2001 as President and Chief Executive Officer of Union Gas Limited. A professional corporate director since 2009, Ms. Peverett has served on numerous corporate boards in the energy, banking, insurance, transportation, utility and media industries in Canada and the U.S. She currently serves on the boards of Canadian Pacific Kansas City Limited, Northwest Natural Holding Company and Capital Power Corporation. Ms. Peverett also serves as Chair of the CSA Group (formerly the Canadian Standards Association). Ms. Peverett holds a bachelor of commerce from McMaster University, a master of business administration from Queen’s University and is a Certified Management Accountant. She is a Fellow of the Society of Management Accountants and holds the ICD.D designation from the Institute of Corporate Directors. |
|
Daniel Romasko(1)(2) Texas, U.S. |
Director since 2023 Independent |
Dan Romasko has more than 30 years of experience in the energy industry. Mr. Romasko was most recently President and Chief Executive Officer for Enlighten Innovations Inc., a fuel upgrading technology company. Mr. Romasko is a director of Enlighten Innovations Inc. From 2014 to 2018, Mr. Romasko was the President and Chief Executive Officer of Motiva Enterprises LLC, a leading refiner, distributor and marketer of transportation fuels and lubricant base oils in the eastern, southern and Gulf Coast regions of the United States. Prior to that, he was the Executive Vice President of Operations for Tesoro, and preceding that role, held the positions of General Manager, Fort Hills and Vice President, Technical Competence, at Petro-Canada/Suncor Energy Inc. Mr. Romasko began his career with ConocoPhillips and held a variety of progressively senior leadership positions in mid-stream, supply and trading, global specialty products, and refining. Mr. Romasko has a bachelor of science degree in chemical engineering from Montana State University. |
SUNCOR ENERGY INC. ANNUAL INFORMATION FORM 2023 57
|
Christopher R. Seasons(1)(4) Alberta, Canada |
Director since 2022 Independent |
Christopher Seasons is a professional engineer with more than 30 years of domestic and international experience in the upstream oil and gas industry. Mr. Seasons is currently a partner at ARC Financial Corporation, an energy-focused private equity firm. From 2004 until his retirement in June 2014, he served as President of Devon Canada Corporation, a subsidiary of Oklahoma-based Devon Energy Corporation. Mr. Seasons has long been active in the Calgary community with several not-for-profit organizations including the Canadian Association of Petroleum Producers (former Chairman and head of numerous committees), the Alberta Children’s Hospital Foundation (past Chairman) and the United Way of Calgary and Area (past Co-Chair of the annual campaign and board member). Mr. Seasons graduated from Queen’s University with a bachelor of science degree in chemical engineering. |
|
M. Jacqueline Sheppard(3)(4) Alberta, Canada |
Director since 2022 Independent |
M. Jacqueline Sheppard has held numerous roles as an executive in the energy industry and as a director of public, private and crown corporations. Ms. Sheppard is the former Executive Vice President, Corporate & Legal, of Talisman Energy Inc., where she was responsible for legal affairs, business development, major projects, corporate communications, investor relations, corporate responsibility and government affairs. Ms. Sheppard is Chair of the board of Emera Inc. and serves on the board of ARC Resources Ltd. Ms. Sheppard was also a founder and lead director of Black Swan Energy Inc., an Alberta upstream energy company that was private-equity financed and sold to Tourmaline Oil Corp., and a former director of Alberta Investment Management Corporation, Pacific Northwest LNG Ltd., Seven Generations Energy Ltd. and Cairn Energy PLC. Ms. Sheppard was named one of Canada’s Most Powerful Women: Top 100 by the Women’s Executive Network and the National Post from 2002-2007. In honour of her exceptional merit and integrity in the legal profession, she was appointed the King’s Counsel designation in 2008. Ms. Sheppard holds a bachelor of arts degree from Memorial University of Newfoundland, she became a Rhodes Scholar receiving an honours jurisprudence, bachelor of arts and master of arts from Oxford University. She earned her bachelor of laws (Honours) from McGill University and holds an honorary doctor of laws degree from Memorial University of Newfoundland. |
58 ANNUAL INFORMATION FORM 2023 SUNCOR ENERGY INC.
|
Michael M. Wilson(6) Alberta, Canada |
Director since 2014 Independent |
Michael Wilson is former president and chief executive officer of Agrium Inc. (now Nutrien Ltd.), a retail supplier of agricultural products and services and a wholesale producer and marketer of agricultural nutrients, a position he held from 2003 until his retirement in 2013. He had previously served as Agrium’s executive vice president and chief operating officer. Mr. Wilson has significant experience in the petrochemical industry, serving as president of Methanex Corporation and holding various positions with increasing responsibility in North America and Asia with Dow Chemical Company. He has a bachelor’s degree in chemical engineering from the University of Waterloo and currently serves on the boards of Air Canada and Celestica Inc. |
| (1) | Environment, Health, Safety and Sustainable Development Committee |
| (2) | Audit Committee |
| (3) | Governance Committee |
| (4) | Human Resources and Compensation Committee |
| (5) | Effective March 15, 2024, Mr. Girling will assume the role of Chair of the Board. |
| (6) | Mr. Houston and Mr. Wilson will be retiring from the Board and not standing for re-election at the 2024 annual general meeting. |
SUNCOR ENERGY INC. ANNUAL INFORMATION FORM 2023 59
Executive Officers
The following individuals are the executive officers of Suncor:
|
Name and Jurisdiction of Residence |
Office |
Principal Occupation During Past 5 Years |
|
|
Richard M. Kruger Alberta, Canada |
President and Chief Executive Officer |
Appointed CEO of Suncor in April 2023. Prior thereto, Chair, President and CEO of Imperial Oil Limited from 2013 until his retirement in 2019. |
|
|
Kris Smith Alberta, Canada |
Chief Financial Officer |
Appointed CFO and EVP Corporate Development on May 9, 2023. Prior thereto, interim CEO from July 2022 until April 2023, and EVP Downstream from September 2013 until July 2022. |
|
|
Karen Keegans Alberta, Canada |
Chief Human Resources Officer |
Appointed Chief Human Resources Officer of Suncor on July 24, 2023. Prior thereto, VP, Executive Partner, at CHRO practice at Gartner from May 2022 to July 2023, Independent Consultant from 2021 to 2022, and SVP & Chief Human Resources Officer at Rockwell Automation from January 7, 2019, to August 2021. |
|
|
Jacqueline Moore Alberta, Canada |
General Counsel & Corporate Secretary |
Appointed General Counsel & Corporate Secretary on February 1, 2023. Prior thereto, VP Legal Operations from September 2022 to February 2023, VP External Relations, from July 2021 to September 2022, VP Government Relations, from February 2020 to July 2021 and VP Legal Corporate from April 2011 to February 2020. |
|
|
Dave Oldreive Alberta, Canada |
Executive Vice President, Downstream |
Appointed EVP, Downstream on June 19, 2023. Prior thereto, Refinery Manager for ExxonMobil Corporation from February 2021 to June 2023, and Refinery Manager for Imperial Oil Limited from July 2016 to January 2021. |
|
|
Shelley Powell Alberta, Canada |
Senior Vice President, Operational Improvement & Support Services |
Appointed SVP, Operational Improvement & Support Services on August 14, 2023. Prior thereto, SVP, In Situ & E&P from September 2021 to August 2023 and SVP Oil Sands Base Plant from May 2017 to August 2021. |
|
|
Peter Zebedee Alberta, Canada |
Executive Vice President, Oil Sands |
Appointed EVP, Oil Sands on April 11, 2022. Prior thereto, CEO of LNG Canada from July 2019 to March 2022 and VP Canada Manufacturing & GM Scotford of Shell Canada from December 2018 to June 2019. |
|
| |||
Effective January 29, 2024, Kent Ferguson was appointed to Senior Vice President of Strategy, Sustainability and Corporate Development. Prior to joining Suncor, Mr. Ferguson was Managing Director and Co-Head of Global Energy at RBC Capital Markets.
As at March 20, 2024, the directors and executive officers of Suncor as a group beneficially owned, or controlled or directed, directly or indirectly, 323,069 common shares of Suncor, which represents 0.03% of the outstanding common shares of Suncor. Inclusive of deferred share units, the total share ownership
60 ANNUAL INFORMATION FORM 2023 SUNCOR ENERGY INC.
of Suncor’s directors and executive officers as at March 20, 2024, is 1,028,507 common shares and units of Suncor (for the purpose of share ownership targets, deferred share units are included).
Bankruptcies
As at the date hereof, no director or executive officer of Suncor, or any of their respective personal holding companies, nor any shareholder holding a sufficient number of securities to affect materially the control of Suncor:
(a) |
is, or has been within the last 10 years, a director or executive officer of any company (including Suncor) that, while that person was acting in that capacity, or within a year of that person ceasing to act in that capacity, became bankrupt, made a proposal under any legislation relating to bankruptcy or insolvency or was subject to or instituted any proceedings, arrangement or compromise with creditors or had a receiver, receiver manager or trustee appointed to hold its assets, other than Mr. Gladu, who was an officer of A2A Rail, which obtained creditor protection under Canadian insolvency legislation that was initiated on June 18, 2021. Mr. Gladu ceased to be an officer of A2A Rail on June 2, 2021; or |
(b) |
has, within the last 10 years, become bankrupt, made a proposal under any legislation relating to bankruptcy or insolvency or become subject to or instituted any proceedings, arrangement or compromise with creditors, or had a receiver, receiver manager or trustee appointed to hold the assets of the director, executive officer or shareholder. |
Conflicts of Interest
The directors and officers of Suncor may be directors or officers of entities that are in competition with or are customers or suppliers of Suncor or certain entities in which Suncor holds an equity investment. As such, these directors or officers may encounter conflicts of interest in the administration of their duties with respect to Suncor. Directors and officers of Suncor are required to disclose the existence of potential conflicts in accordance with Suncor's policies and in accordance with the CBCA.
SUNCOR ENERGY INC. ANNUAL INFORMATION FORM 2023 61
Audit Committee Information
The Audit Committee Mandate is attached as Schedule “A” to this AIF.
Composition of the Audit Committee
As at December 31, 2023, the Audit Committee is comprised of Ms. Bedient (Chair), Mr. Ashby, Mr. MacDonald, Ms. Mitchelmore, Ms. Peverett and Mr. Romasko. All members are independent and financially literate. The education and experience of each member that has led to the determination of financial literacy is described in the Directors and Executive Officers section of this AIF.
For the purpose of making appointments to the company’s Audit Committee, and in addition to the independence requirements, all directors nominated to the Audit Committee must meet the test of financial literacy as determined in the judgment of the Board. Also, at least one director so nominated must meet the requirements of being an Audit Committee Financial Expert (as defined below) as determined in the judgment of the Board of Directors. The Audit Committee Financial Experts on the Audit Committee are Ms. Bedient, Mr. MacDonald and Ms. Peverett.
Audit Committee Financial Expert
An “Audit Committee Financial Expert” means a person who, in the judgment of the Board of Directors, has the following attributes:
(a) |
an understanding of Canadian generally accepted accounting principles and financial statements; |
(b) |
the ability to assess the general application of such principles in connection with the accounting for estimates, accruals, and reserves; |
(c) |
experience preparing, auditing, analyzing or evaluating financial statements that present a breadth and level of complexity of accounting issues that are generally comparable to the breadth and complexity of issues that can reasonably be expected to be raised by Suncor’s financial statements, or experience actively supervising one or more persons engaged in such activities; |
(d) |
an understanding of internal controls and procedures for financial reporting; and |
(e) |
an understanding of audit committee functions. |
A person shall have acquired the attributes referred to in items (a) through (e) inclusive above through:
(a) |
education and experience as a principal financial officer, principal accounting officer, controller, public accountant or auditor, or experience in one or more positions that involve the performance of similar functions; |
(b) |
experience actively supervising a principal financial officer, principal accounting officer, controller, public accountant, auditor or person performing similar functions; |
(c) |
experience overseeing or assessing the performance of companies or public accountants with respect to the preparation, auditing or evaluation of financial statements; or |
(d) |
other relevant experience. |
Audit Committee Pre-Approval Policies for Non-Audit Services
Suncor’s Audit Committee has considered whether the provision of services other than audit services is compatible with maintaining the company’s auditors’ independence and has a policy governing the provision of these services. A copy of the company’s policy relating to Audit Committee approval of fees paid to the company’s auditors, in compliance with the Sarbanes-Oxley Act of 2002 and applicable Canadian securities laws, is attached as Schedule “B” to this AIF.
62 ANNUAL INFORMATION FORM 2023 SUNCOR ENERGY INC.
Fees Paid to Auditors
Fees paid or payable to the company’s auditors, KPMG LLP (Calgary, Canada), in 2023 and 2022 are as follows:
($ thousands) |
|
2023 |
|
2022 |
Audit fees(1) |
|
11 923 |
|
7 406 |
Audit-related fees |
|
615 |
|
835 |
All other fees |
|
441 |
|
241 |
Total |
|
12 979 |
|
8 482 |
| (1) | 2023 Audit Fees include charges related to the 2022 audit and enterprise resource planning transition, fees related to 2023 asset transactions, and the cybersecurity incident. |
Audit fees were paid, or are payable, for professional services rendered by the auditors for the audit of Suncor’s annual financial statements, or services provided in connection with statutory and regulatory filings or engagements. Audit-related fees were paid for professional services rendered by the auditors for the review of quarterly financial statements and for the preparation of reports on specified procedures as they relate to audits of joint arrangements and attest services not required by statute or regulation. All other fees primarily relate to advisory services around ESG. All services described beside the captions “audit fees”, “audit-related fees” and “all other fees” were approved by the Audit Committee.
SUNCOR ENERGY INC. ANNUAL INFORMATION FORM 2023 63
Legal Proceedings and Regulatory Actions
There are no legal proceedings in respect of which Suncor is or was a party, or in respect of which any of the company’s property is or was the subject during the year ended December 31, 2023, nor are there any such proceedings known by the company to be contemplated, that involve a claim for damages exceeding 10% of the company’s current assets. In addition, there have not been any (a) penalties or sanctions imposed against the company by a court relating to securities legislation or by a securities regulatory authority during the year ended December 31, 2023, (b) any other penalties or sanctions imposed by a court or regulatory body against the company that would likely be considered important to a reasonable investor in making an investment decision, or (c) settlement agreements entered into by the company before a court relating to securities legislation or with a securities regulatory authority during the year ended December 31, 2023.
Interests of Management and Others in Material Transactions
No director or executive officer, or any associate or affiliate of these persons has, or has had, any material interest, direct or indirect, in any transaction or any proposed transaction that has materially affected, or is reasonably expected to materially affect, Suncor within the three most recently completed financial years or during the current financial year.
Transfer Agent and Registrar
The transfer agent and registrar for Suncor’s common shares is Computershare Trust Company of Canada at its principal offices in Calgary, Alberta; Montreal, Quebec; Toronto, Ontario; and Vancouver, British Columbia; and Computershare Trust Company N.A. in Canton, Massachusetts; Jersey City, New Jersey; and Louisville, Kentucky.
Material Contracts
During the year ended December 31, 2023, Suncor did not enter into any contracts, nor are there any contracts still in effect, that are material to the company’s business, other than contracts entered into in the ordinary course of business, which are not required to be filed by Section 12.2 of National Instrument 51-102 – Continuous Disclosure Obligations.
Interests of Experts
Reserves contained in this AIF are based in part upon reports prepared by GLJ, Suncor’s independent qualified reserves evaluator. As at the date hereof, none of the partners, employees or consultants of GLJ as a group, through registered or beneficial interests, direct or indirect, held or are entitled to receive more than 1% of any class of Suncor’s outstanding securities, including the securities of the company’s associates and affiliates.
The company’s independent auditors are KPMG LLP, Chartered Professional Accountants (KPMG). KPMG has confirmed with respect to the company that they are independent within the meaning of the relevant rules and related interpretations prescribed by the relevant professional bodies in Canada and any applicable legislation or regulations and also that they are independent accountants with respect to the company under all relevant U.S. professional and regulatory standards.
Disclosure Pursuant to the Requirements of the NYSE
As a Canadian issuer listed on the NYSE, Suncor is not required to comply with most of the NYSE’s governance rules and instead may comply with Canadian requirements. As a foreign private issuer, the company is only required to comply with four of the NYSE’s governance rules. These rules provide that (i) Suncor must have an audit committee that satisfies the requirements of Rule 10A-3 under the Exchange Act; (ii) the chief executive officer of Suncor must promptly notify the NYSE in writing after an executive officer becomes aware of any material non-compliance with the applicable NYSE rules; (iii) Suncor must provide a brief description of any significant differences between the company’s
64 ANNUAL INFORMATION FORM 2023 SUNCOR ENERGY INC.
corporate governance practices and those followed by U.S. companies listed under the NYSE; and (iv) Suncor must provide annual and, as required, written affirmations of compliance with applicable NYSE Corporate Governance Standards.
The company has disclosed in its 2024 management proxy circular, which is available on Suncor’s website at www.suncor.com, significant areas in which the company does not comply with the NYSE Corporate Governance Standards. In certain instances, it is not required to obtain shareholder approval for material amendments to equity compensation plans under TSX requirements, while the NYSE requires shareholder approval of all equity compensation plans. Suncor, while in compliance with the independence requirements of applicable securities laws in Canada (specifically National Instrument 52-110 – Audit Committees) and the U.S. (specifically Rule 10A-3 of the Exchange Act), has not adopted, and is not required to adopt, the director independence standards contained in Section 303A.02 of the NYSE’s Listed Company Manual, including with respect to its audit committee and compensation committee. The Board has not adopted, nor is it required to adopt, procedures to implement Section 303A.05(c)(iv) of the NYSE’s Listed Company Manual in respect of compensation committee advisor independence. Except as described herein, the company is in compliance with the NYSE Corporate Governance Standards in all other significant respects.
Additional Information
Additional information, including directors’ and officers’ remuneration and indebtedness, principal holders of Suncor’s securities, and securities authorized for issuance under equity compensation plans, where applicable, is contained in the company’s most recent management proxy circular for the most recent annual meeting of shareholders that involved the election of directors. Additional financial information is provided in Suncor’s 2023 audited Consolidated Financial Statements and in the annual 2023 MD&A.
Further information about Suncor, filed with Canadian securities commissions and the U.S. Securities and Exchange Commission (SEC), including periodic quarterly and annual reports and the Form 40-F, is available online on SEDAR+ at www.sedarplus.ca and on EDGAR at www.sec.gov. In addition, Suncor’s Standards of Business Conduct Code is available online at www.suncor.com. Information contained in or otherwise accessible through the company’s website does not form part of this AIF, and is not incorporated into the AIF by reference.
SUNCOR ENERGY INC. ANNUAL INFORMATION FORM 2023 65
Advisory – Forward-Looking Statements and Non-GAAP Financial Measures
This AIF contains certain forward-looking statements and forward-looking information (collectively, forward-looking statements) within the meaning of applicable Canadian and U.S. securities laws and other information based on Suncor’s current expectations, estimates, projections and assumptions that were made by the company in light of information available at the time the statement was made and consider Suncor’s experience and its perception of historical trends, including expectations and assumptions concerning: the accuracy of reserves estimates; commodity prices and interest and foreign exchange rates; the performance of assets and equipment; capital efficiencies and cost-savings; applicable laws and government policies; future production rates; the sufficiency of budgeted capital expenditures in carrying out planned activities; the availability and cost of labour, services and infrastructure; the satisfaction by third parties of their obligations to Suncor; the development and execution of projects; and the receipt, in a timely manner, of regulatory and third-party approvals. All statements and information that address expectations or projections about the future, and statements and information about Suncor’s strategy for growth, expected and future expenditures or investment decisions, commodity prices, costs, schedules, production volumes, operating and financial results, future financing and capital activities, and the expected impact of future commitments are forward-looking statements. Some of the forward-looking statements may be identified by words like “expects”, “anticipates”, “will”, “estimates”, “plans”, “scheduled”, “intends”, “believes”, “projects”, “indicates”, “could”, “focus”, “vision”, “goal”, “outlook”, “proposed”, “target”, “objective”, “continue”, “should”, “may”, “potential”, “future”, “opportunity”, “would”, “forecast” and similar expressions.
Forward-looking statements in this AIF include references to:
Suncor’s strategy, business plans and expectations about projects, the performance of assets, production volumes, and capital expenditures, including:
| • | Expectations about White Rose, including that production at White Rose will resume upon completion of the SeaRose FPSO Asset Life Extension Project, that the West White Rose Project will extend the life of the White Rose field and that production from the West White Rose Project will commence in 2026; |
| • | Suncor's strategic objective to become a net-zero GHG emissions company by 2050 and to substantially contribute to society's net-zero ambitions as well as Suncor's near-term goals of reducing emissions across its value chain and the plans and areas of focus that Suncor has to achieve these objectives and goals; |
| • | Expectations about Terra Nova, including that production will continue ramping up in the beginning of 2024; |
| • | Statements about Suncor’s coke-fired boiler replacement program, including the expectation that the replacement cogeneration facilities will reduce the GHG emissions intensity associated with steam production at Oil Sands Base operations by approximately 25%, reduce GHG emissions in the province of Alberta by approximately 5.1 Mt per year, the expectation that the excess electricity produced will be transmitted to Alberta’s power grid, and the expected benefits therefrom, and the expectation that it will be in-service in late 2024; |
| • | Suncor's expectation that the Northern Courier Pipeline will provide the eight Indigenous communities reliable income for decades; |
| • | Expectations regarding the MLX-W and MLX-E programs, including that the MLX-E program will follow MLX-W development if economic conditions remain suitable, that the MLX-W program will sustain bitumen production levels at the Mildred Lake site after resource depletion at the North Mine and use existing mining and extraction facilities, and that MLX-W will achieve first oil in late 2025; |
66 ANNUAL INFORMATION FORM 2023 SUNCOR ENERGY INC.
| • | Statements regarding the expected impacts to production rates related to the Fort Hills three-year mine improvement plan; |
| • | The estimated cost of Suncor’s remaining exploration work program commitment in Libya; |
| • | The expectation that the drilling of new well pairs and infill and sidetracked wells at Firebag and MacKay River will assist in maintaining production levels in future years; |
| • | The expectation that the company will continue to improve and optimize the Petro-Canada™ retail business; |
| • | Expectations regarding the co-ownership agreements with North Atlantic, including that a number of sites will be rebranded to the Petro-Canada™ brand; |
| • | Expectations regarding the Petro-Canada™ and Canadian Tire partnership, including the anticipated rebranding of the Canadian Tire retail fuel network, partnering of loyalty programs and Suncor becoming the primary fuel provider to the Canadian Tire retail fuel network; and |
| • | Statements regarding the Pathways Alliance, including the goals, expectations regarding timing and the expected pathways the alliance will take to address GHG emissions. |
Also:
| • | Expectations (including with respect to timing), goals and plans around technologies, including autonomous haulage systems, permanent aquatic storage structures, enhanced solvent SAGD, SAGD solvent dominated process and, non-aqueous extraction, including the expectation that autonomous haul trucks will be redeployed at Fort Hills upon completion of the three-year mine improvement plan, that the company plans to further deploy autonomous haul trucks at Millennium and expects to have 91 autonomous haul trucks in its Oil Sands Base operations by the end of 2024 and that pending a successful demonstration, ES-SAGD is expected to be ready for commercial deployment as early as 2027; |
| • | Statements about Suncor’s reserves, including reserves volumes, estimates of future net revenues, commodity price forecasts, exchange and interest rate expectations, and production estimates; |
| • | Significant development activities and costs anticipated to occur or be incurred in 2024, including those identified under the Future Development Costs table in the Statement of Reserves Data and Other Oil and Gas Information section of this AIF; Suncor’s belief that internally generated cash flows, existing and future credit facilities, and accessing capital markets will be sufficient to fund future development costs and that interest expense or other external funding costs on their own would not make development of any property uneconomic; plans for the development of reserves; and the estimated value of work commitments; |
| • | Estimated abandonment and reclamations costs; |
| • | Expectations about royalties and income taxes and their impact on Suncor; |
| • | Anticipated effects of and responses to environmental laws and regulations, including climate change and GHG emissions laws and regulations, regulatory permits and Suncor’s estimated compliance costs; and |
| • | Expectations about changes to laws and the impact thereof. |
SUNCOR ENERGY INC. ANNUAL INFORMATION FORM 2023 67
Forward-looking statements are not guarantees of future performance and involve a number of risks and uncertainties, some that are similar to other oil and gas companies and some that are unique to Suncor. Suncor’s actual results may differ materially from those expressed or implied by its forward-looking statements, so readers are cautioned not to place undue reliance on them.
The financial and operating performance of the company’s reportable operating segments, specifically Oil Sands, Exploration and Production, and Refining and Marketing, may be affected by a number of factors.
Factors that affect Suncor’s Oil Sands segment include, but are not limited to, volatility in the prices for crude oil and other production, and the related impacts of fluctuating light/heavy and sweet/sour crude oil differentials; changes in the demand for refinery feedstock and diesel fuel, including the possibility that refiners that process the company’s proprietary production will be closed, experience equipment failure or other accidents; Suncor’s ability to operate its Oil Sands facilities reliably in order to meet production targets; the output of newly commissioned facilities, the performance of which may be difficult to predict during initial operations; Suncor’s dependence on pipeline capacity and other logistical constraints, which may affect the company’s ability to distribute products to market and which may cause the company to delay or cancel planned growth projects in the event of insufficient takeaway capacity; Suncor’s ability to finance Oil Sands economic investment and asset sustainability and maintenance capital expenditures; the availability of bitumen feedstock for upgrading operations, which can be negatively affected by poor ore grade quality, unplanned mine equipment and extraction plant maintenance, tailings storage, and in situ reservoir and equipment performance, or the unavailability of third-party bitumen; changes in operating costs, including the cost of labour, natural gas and other energy sources used in oil sands processes; and the company’s ability to complete projects, including planned maintenance events, both on time and on budget, which could be impacted by competition from other projects (including other oil sands projects) for goods and services and demands on infrastructure in Alberta’s Wood Buffalo region and the surrounding area (including housing, roads and schools).
Factors that affect Suncor’s Exploration and Production segment include, but are not limited to, volatility in crude oil and natural gas prices; operational risks and uncertainties associated with oil and gas activities, including unexpected formations or pressures, premature declines of reservoirs, fires, blow-outs, equipment failures and other accidents, uncontrollable flows of crude oil, natural gas or well fluids, and pollution and other environmental risks; adverse weather conditions, which could disrupt output from producing assets or impact drilling programs, resulting in increased costs and/or delays in bringing on new production; political, economic and socioeconomic risks associated with Suncor’s foreign operations, including the unpredictability of operating in Libya due to ongoing political unrest; and market demand for mineral rights and producing properties, potentially leading to losses on disposition or increased property acquisition costs.
Factors that affect Suncor’s Refining and Marketing segment include, but are not limited to, fluctuations in demand and supply for refined products that impact the company’s margins; market competition, including potential new market entrants; the company’s ability to reliably operate refining and marketing facilities to meet production or sales targets; and risks and uncertainties affecting construction or planned maintenance schedules, including the availability of labour and other impacts of competing projects drawing on the same resources during the same time period.
Additional risks, uncertainties and other factors that could influence the financial and operating performance of all of Suncor’s operating segments and activities include, but are not limited to, changes in general economic, market and business conditions, such as commodity prices, interest rates and currency exchange rates (including as a result of demand and supply effects resulting from the actions of OPEC+); fluctuations in supply and demand for Suncor’s products; the successful and timely implementation of capital projects, including growth projects and regulatory projects; risks associated with the development and execution of Suncor’s projects and the commissioning and integration of new facilities; the possibility that completed maintenance activities may not improve operational performance or the output of related facilities; the risk that projects and initiatives intended to achieve cash flow growth and/or reductions in operating costs may not achieve the expected results in the time anticipated or at all; competitive actions of other companies, including increased competition from other oil and gas companies or from companies that provide alternative sources of energy; labour and material shortages; actions by government authorities, including the imposition or reassessment of, or changes to, taxes,
68 ANNUAL INFORMATION FORM 2023 SUNCOR ENERGY INC.
fees, royalties, duties, tariffs, quotas and other government-imposed compliance costs and mandatory production curtailment orders and changes thereto; changes to laws and government policies that could impact the company’s business, including environmental (including climate change), royalty and tax laws and policies; the ability and willingness of parties with whom Suncor has material relationships to perform their obligations to the company; the unavailability of, or outages to, third-party infrastructure that could cause disruptions to production or prevent the company from being able to transport its products; the occurrence of a protracted operational outage, a major safety or environmental incident, or unexpected events such as fires (including forest fires), equipment failures and other similar events affecting Suncor or other parties whose operations or assets directly or indirectly affect Suncor; the potential for security breaches of Suncor’s information technology and infrastructure by malicious persons or entities, and the unavailability or failure of such systems to perform as anticipated as a result of such breaches; security threats and terrorist or activist activities; the risk that competing business objectives may exceed Suncor’s capacity to adopt and implement change; risks and uncertainties associated with obtaining regulatory, third-party and stakeholder approvals outside of Suncor’s control for the company’s operations, projects, initiatives, and exploration and development activities and the satisfaction of any conditions to approvals; the potential for disruptions to operations and construction projects as a result of Suncor’s relationships with labour unions that represent employees at the company’s facilities; the company’s ability to find new oil and gas reserves that can be developed economically; the accuracy of Suncor’s reserves and future production estimates; Suncor’s ability to access capital markets at acceptable rates or to issue securities at acceptable prices; maintaining an optimal debt to cash flow ratio; the success of the company’s risk management activities using derivatives and other financial instruments; the cost of compliance with current and future environmental laws, including climate change laws; risks relating to increased activism and public opposition to fossil fuels and oil sands; risks and uncertainties associated with closing a transaction for the purchase or sale of a business, asset or oil and gas property, including estimates of the final consideration to be paid or received; the ability of counterparties to comply with their obligations in a timely manner; risks associated with joint arrangements in which the company has an interest; risks associated with land claims and Indigenous consultation requirements; the risk that the company may be subject to litigation; the impact of technology and risks associated with developing and implementing new technologies; and the accuracy of cost estimates, some of which are provided at the conceptual or other preliminary stage of projects and prior to commencement or conception of the detailed engineering that is needed to reduce the margin of error and increase the level of accuracy. The foregoing important factors are not exhaustive.
Many of these risk factors and other assumptions related to Suncor’s forward-looking statements are discussed in further detail throughout this AIF and the company’s annual 2023 MD&A including under the heading Risk Factors, and Form 40-F on file with Canadian securities commissions at www.sedarplus.ca and the SEC at www.sec.gov. Readers are also referred to the risk factors and assumptions described in other documents that Suncor files from time to time with securities regulatory authorities. Copies of these documents are available without charge from the company.
The forward-looking statements contained in this AIF are made as of the date of this AIF. Except as required by applicable securities laws, we assume no obligation to update publicly or otherwise revise any forward-looking statements or the foregoing risks and assumptions affecting such forward-looking statements, whether as a result of new information, future events or otherwise.
Non-GAAP Financial Measures – Netback
Netback is a financial measure that is not prescribed by GAAP. Non-GAAP measures do not have any standardized meaning under GAAP and therefore are unlikely to be comparable to similar measures presented by other companies and should not be considered in isolation or as a substitute for measures of performance prepared in accordance with GAAP. Additional information relating to netback, including disclosure of its composition, an explanation of how netback provides useful information to investors and the additional purposes, if any, for which management uses netback and a quantitative reconciliation of netback to the most directly comparable financial measure that is specified, defined and determined in accordance with GAAP, is contained in the Operating Metrics Reconciliation and the Operating Summary Information – Non-GAAP Financial Measures section within Suncor’s Annual Report for the year ended December 31, 2023, and dated March 21, 2024.
SUNCOR ENERGY INC. ANNUAL INFORMATION FORM 2023 69
Schedule “A”
Audit Committee Mandate
The Audit Committee
The by-laws of Suncor Energy Inc. provide that the Board of Directors may establish Board committees to whom certain duties may be delegated by the Board. The Board has established, among others, the Audit Committee, and has approved this mandate, which sets out the objectives, functions and responsibilities of the Audit Committee.
Objectives
The Audit Committee assists the Board by:
• |
monitoring the effectiveness and integrity of the Corporation’s internal controls of Suncor’s business processes, including: financial and management reporting systems, internal control systems; |
• |
monitoring and reviewing financial reports and other financial matters; |
• |
selecting, monitoring and reviewing the independence and effectiveness of, and where appropriate replacing, subject to shareholder approval as required by law, external auditors, and ensuring that external auditors are ultimately accountable to the Board of Directors and to the shareholders of the Corporation; |
• |
reviewing the effectiveness of the internal auditors, excluding the Operations Integrity Audit department, which is specifically within the mandate of the Environment, Health & Safety Committee (references throughout this mandate to “Internal Audit” shall not include the Operations Integrity Audit department); and |
• |
approving on behalf of the Board of Directors certain financial matters as delegated by the Board, including the matters outlined in this mandate. |
The Committee does not have decision-making authority, except in the very limited circumstances described herein or where and to the extent that such authority is expressly delegated by the Board of Directors. The Committee conveys its findings and recommendations to the Board of Directors for consideration and, where required, decision by the Board of Directors.
Constitution
The Terms of Reference of Suncor’s Board of Directors set out requirements for the composition of Board Committees and the qualifications for committee membership, and specify that the Chair and membership of the committees are determined annually by the Board. As required by Suncor’s by-laws, unless otherwise determined by resolution of the Board of Directors, a majority of the members of a committee constitute a quorum for meetings of committees, and in all other respects, each committee determines its own rules of procedure.
Functions and Responsibilities
The Audit Committee has the following functions and responsibilities:
Internal Controls
1. |
Inquire as to the adequacy of the Corporation's system of internal controls of Suncor’s business processes, and review the evaluation of internal controls by Internal Auditors, and the evaluation of financial and internal controls by external auditors. |
2. |
Review audits conducted of the Corporation’s Standards of Business Conduct-Compliance Program. |
SUNCOR ENERGY INC. ANNUAL INFORMATION FORM 2023 A-1
3. |
Establish procedures for the confidential submission by employees of complaints relating to any concerns with accounting, internal control, auditing or Standards of Business Conduct Code matters, and periodically review a summary of complaints and their related resolution. |
4. |
Review the findings of any significant examination by regulatory agencies concerning the Corporation's financial matters. |
5. |
Periodically review management’s governance processes for information technology resources, to assess their effectiveness in addressing the integrity, the protection and the security of the Corporation's electronic information systems and records. |
6. |
Review the management practices overseeing officers' expenses and perquisites. |
External and Internal Auditors
7. |
Evaluate the performance of the external auditors and initiate and approve the engagement or termination of the external auditors, subject to shareholder approval as required by applicable law. |
8. |
Review the audit scope and approach of the external auditors, and approve their terms of engagement and fees. |
9. |
Review any relationships or services that may impact the objectivity and independence of the external auditor, including annual review of the auditor’s written statement of all relationships between the auditor (including its affiliates) and the Corporation; review and approve all engagements for non-audit services to be provided by external auditors or their affiliates. |
10. |
Review the external auditor’s quality control procedures including any material issues raised by the most recent quality control review or peer review and any issues raised by a government authority or professional authority investigation of the external auditor, providing details on actions taken by the firm to address such issues. |
11. |
Approve the appointment or termination of the Head of Internal Audit and Enterprise Risk, and approve annually the performance assessment and resulting compensation of the Head of Internal Audit and Enterprise Risk as provided by the Chief Financial Officer. Periodically review the performance and effectiveness of the Internal Audit function including conformance with The Institute of Internal Auditors’ International Standards for the Professional Practice of Internal Auditing and the Code of Ethics. |
12. |
Approve the Internal Audit Department Charter, the annual Internal Audit schedule, as well as the Internal Audit budget and resource plan. Review the plans, activities, organizational structure, resource capacity and qualifications of the Internal Auditors, and monitor the department’s independence. |
13. |
Provide direct and unrestricted access by management, the Internal Auditors and the external auditors to the Board of Directors. |
Financial Reporting and other Public Disclosure
14. |
Review the external auditor’s management comment letter and management’s responses thereto, and inquire as to any disagreements between management and external auditors or restrictions imposed by management on external auditors. Review any unadjusted differences brought to the attention of management by the external auditor and the resolution thereof. |
15. |
Review with management and the external auditors the financial materials and other disclosure documents referred to in paragraph 16, including any significant financial reporting issues, the presentation and impact of significant risks and uncertainties, and key estimates and judgments of management that may be material to financial reporting including alternative treatments and their impacts. |
16. |
Review and approve the Corporation’s interim consolidated financial statements and accompanying management’s discussion and analysis (“MD&A”). Review and make |
A-2 ANNUAL INFORMATION FORM 2023 SUNCOR ENERGY INC.
recommendations to the Board of Directors on approval of the Corporation’s annual audited financial statements and MD&A, Annual Information Form and Form 40-F. Review other material annual and quarterly disclosure documents or regulatory filings containing or accompanying audited or unaudited financial information.
17. |
Authorize any changes to the categories of documents and information requiring audit committee review or approval prior to external disclosure, as set out in the Corporation’s policy on external communication and disclosure of material information. |
18. |
Review any change in the Corporation’s accounting policies. |
19. |
Review with legal counsel any legal matters having a significant impact on the financial reports. |
Oil and Gas Reserves
20. |
Review with reasonable frequency Suncor’s procedures for: |
(A) |
the disclosure, in accordance with applicable law, of information with respect to Suncor’s oil and gas activities including procedures for complying with applicable disclosure requirements; |
(B) |
providing information to the qualified reserves evaluators (“Evaluators”) engaged annually by Suncor to evaluate Suncor’s reserves data for the purpose of public disclosure of such data in accordance with applicable law. |
21. |
Annually approve the appointment and terms of engagement of the Evaluators, including the qualifications and independence of the Evaluators; review and approve any proposed change in the appointment of the Evaluators, and the reasons for such proposed change including whether there have been disputes between the Evaluators and management. |
22. |
Annually review Suncor’s reserves data and the report of the Evaluators thereon; annually review and make recommendations to the Board of Directors on the approval of (i) the content and filing by the Company of a statement of reserves data (“Statement”) and the report thereon of management and the directors to be included in or filed with the Statement, and (ii) the filing of the report of the Evaluators to be included in or filed with the Statement, all in accordance with applicable law. |
Risk Management
23. |
Periodically review the policies and practices of the Corporation respecting cash management, financial derivatives, financing, credit, insurance, taxation, commodities trading and related matters. Oversee the Board’s risk management governance model and processes by conducting periodic reviews with the objective of appropriately reflecting the principal risks of the Corporation’s business in the mandate of the Board and its committees. Conduct periodic review and provide oversight on the specific Suncor Principal Risks which have been delegated to the Committee for oversight. |
Pension Plans
24. |
Review the assets, financial performance, funding status and strategy of the Corporation’s pension plans, and the Pension Governance Policy including the allocation of fiduciary roles and responsibilities. |
Security
25. |
Review on a summary basis any significant physical security management and strategies to address such risks. |
SUNCOR ENERGY INC. ANNUAL INFORMATION FORM 2023 A-3
Other Matters
26. |
Conduct any independent investigations into any matters which come under its scope of responsibilities. |
27. |
Review any recommended appointees to the office of Chief Financial Officer. |
28. |
Review and/or approve other financial matters delegated specifically to it by the Board of Directors. |
Reporting to the Board
29. |
Report to the Board of Directors on the activities of the Audit Committee with respect to the foregoing matters as required at each Board meeting and at any other time deemed appropriate by the Committee or upon request of the Board of Directors. |
Approved by resolution of the Board of Directors on November 14, 2023
A-4 ANNUAL INFORMATION FORM 2023 SUNCOR ENERGY INC.
Schedule “B” – Suncor Energy Inc. Policy and Procedures for Pre-Approval of Audit and Non-Audit Services
Pursuant to the Sarbanes-Oxley Act of 2002 and Multilateral Instrument 52-110, the Securities and Exchange Commission and the Ontario Securities Commission respectively has adopted final rules relating to audit committees and auditor independence. These rules require the Audit Committee of Suncor Energy Inc. (“Suncor”) to be responsible for the appointment, compensation, retention and oversight of the work of its independent auditor. The Audit Committee must also pre-approve any audit and non-audit services performed by the independent auditor or such services must be entered into pursuant to pre-approval policies and procedures established by the Audit Committee pursuant to this policy.
I. Statement of Policy
The Audit Committee has adopted this Policy and Procedures for Pre-Approval of Audit and Non-Audit Services (the “Policy”), which sets forth the procedures and the conditions pursuant to which services proposed to be performed by the independent auditor will be pre-approved. The procedures outlined in this Policy are applicable to all Audit, Audit-Related, Tax Services and All Other Services provided by the independent auditor.
II. Responsibility
Responsibility for the implementation of this Policy rests with the Audit Committee. The Audit Committee delegates its responsibility for administration of this policy to management. The Audit Committee shall not delegate its responsibilities to pre-approve services performed by the independent auditor to management.
III. Definitions
For the purpose of these policies and procedures and any pre-approvals:
(a) |
“Audit services” include services that are a necessary part of the annual audit process and any activity that is a necessary procedure used by the auditor in reaching an opinion on the financial statements as is required under generally accepted auditing standards (“GAAS”), including technical reviews to reach audit judgment on accounting standards; |
The term “audit services” is broader than those services strictly required to perform an audit pursuant to GAAS and include such services as:
(i) |
the issuance of comfort letters and consents in connections with offerings of securities; |
(ii) |
the performance of domestic and foreign statutory audits; |
(iii) |
Attest services required by statute or regulation; |
(iv) |
Internal control reviews; and |
(v) |
Assistance with and review of documents filed with the Canadian Securities administrators, the Securities and Exchange Commission and other regulators having jurisdiction over Suncor and its subsidiaries, and responding to comments from such regulators; |
(b) |
“Audit-related services” are assurance (e.g., due diligence services) and related services traditionally performed by the external auditors and that are reasonably related to the performance of the audit or review of financial statements and not categorized under “audit fees” for disclosure purposes. |
“Audit-related services” include:
(i) |
employee benefit plan audits, including audits of employee pension plans; |
SUNCOR ENERGY INC. ANNUAL INFORMATION FORM 2023 B-1
(ii) |
due diligence related to mergers and acquisitions; |
(iii) |
consultations and audits in connection with acquisitions, including evaluating the accounting treatment for proposed transactions; |
(iv) |
internal control reviews; |
(v) |
attest services not required by statute or regulation; and |
(vi) |
consultations regarding financial accounting and reporting standards. |
Non-financial operational audits are not “audit-related” services.
(c) |
“Tax services” include, but are not limited to, services related to the preparation of corporate and/or personal tax filings, tax due diligence as it pertains to mergers, acquisitions and/or divestitures, and tax planning; |
(d) |
“All other services” consist of any other work that is neither an Audit service, nor an Audit-Related service nor a Tax service, the provision of which by the independent auditor is not expressly prohibited by Rule 2-01(c)(7) of Regulation S-X under the Securities and Exchange Act of 1934, as amended. (See Appendix A for a summary of the prohibited services.) |
IV. General Policy
The following general policy applies to all services provided by the independent auditor.
• |
All services to be provided by the independent auditor will require specific pre-approval by the Audit Committee. The Audit Committee will not approve engaging the independent auditor for services which can reasonably be classified as “tax services” or “all other services” unless a compelling business case can be made for retaining the independent auditor instead of another service provider. |
• |
The Audit Committee will not provide pre-approval for services to be provided in excess of twelve months from the date of the pre-approval, unless the Audit Committee specifically provides for a different period. |
• |
The Audit Committee has delegated authority to pre-approve services with an estimated cost not exceeding $100,000 in accordance with this Policy to the Chairman of the Audit Committee. The delegate member of the Audit Committee must report any pre-approval decision to the Audit Committee at its next meeting. |
• |
The Chairman of the Audit Committee may delegate his authority to pre-approve services to another sitting member of the Audit Committee provided that the recipient has also been delegated the authority to act as Chairman of the Audit Committee in the Chairman’s absence. A resolution of the Audit Committee is required to evidence the Chairman’s delegation of authority to another Audit Committee member under this policy. |
• |
The Audit Committee will, from time to time, but no less than annually, review and pre-approve the services that may be provided by the independent auditor. |
• |
The Audit Committee must establish pre-approval fee levels for services provided by the independent auditor on an annual basis. On at least a quarterly basis, the Audit Committee will be provided with a detailed summary of fees paid to the independent auditor and the nature of the services provided, and a forecast of fees and services that are expected to be provided during the remainder of the fiscal year. |
• |
The Audit Committee will not approve engaging the independent auditor to provide any prohibited non-audit services as set forth in Appendix A. |
• |
The Audit Committee shall evidence their pre-approval for services to be provided by the independent auditor as follows: |
(a) |
In situations where the Chairman of the Audit Committee pre-approves work under his delegation of authority, the Chairman will evidence his pre-approval by signing and dating |
B-2 ANNUAL INFORMATION FORM 2023 SUNCOR ENERGY INC.
the pre-approval request form, attached as Appendix B. If it is not practicable for the Chairman to complete the form and transmit it to the Company prior to engagement of the independent audit, the Chairman may provide verbal or email approval of the engagement, followed up by completion of the request form at the first practical opportunity.
(b) |
In all other situations, a resolution of the Audit Committee is required. |
• |
All audit and non-audit services to be provided by the independent auditors shall be provided pursuant to an engagement letter that shall: |
(a) |
be in writing and signed by the auditors; |
(b) |
specify the particular services to be provided; |
(c) |
specify the period in which the services will be performed; |
(d) |
specify the estimated total fees to be paid, which shall not exceed the estimated total fees approved by the Audit Committee pursuant to these procedures, prior to application of the 10% overrun; |
(e) |
include a confirmation by the auditors that the services are not within a category of services the provision of which would impair their independence under applicable law and Canadian and U.S. generally accepted accounting standards. |
• |
The Audit Committee pre-approval permits an overrun of fees pertaining to a particular engagement of no greater than 10% of the estimate identified in the associated engagement letter. The intent of the overrun authorization is to ensure on an interim basis only, that services can continue pending a review of the fee estimate, and, if required, further Audit Committee approval of the overrun. If an overrun is expected to exceed the 10% threshold, as soon as the overrun is identified, the Audit Committee or its designate must be notified and an additional pre-approval obtained prior to the engagement continuing. |
V. Responsibilities of External Auditors
To support the independence process, the independent auditors will:
(a) |
Confirm in each engagement letter that performance of the work will not impair independence; |
(b) |
Satisfy the Audit Committee that they have in place comprehensive internal policies and processes to ensure adherence, world-wide, to independence requirements, including robust monitoring and communications; |
(c) |
Provide communication and confirmation to the Audit Committee regarding independence on at least a quarterly basis; |
(d) |
Maintain registration by the Canadian Public Accountability Board and the U.S. Public Company Accounting Oversight Board; and |
(e) |
Review their partner rotation plan and advise the Audit Committee on an annual basis. |
In addition, the external auditors will:
(f) |
Provide regular, detailed fee reporting including balances in the “Work in Progress” account; |
(g) |
Monitor fees and notify the Audit Committee as soon as a potential overrun is identified. |
VI. Disclosures
Suncor will, as required by applicable law, annually disclose its pre-approval policies and procedures, and will provide the required disclosure concerning the amounts of audit fees, audit-related fees, tax fees and all other fees paid to its outside auditors in its filings with the SEC.
Approved and Accepted April 28, 2004
SUNCOR ENERGY INC. ANNUAL INFORMATION FORM 2023 B-3
Appendix A – Prohibited Non-Audit Services
An external auditor is not independent if, at any point during the audit and professional engagement period, the auditor provides the following non-audit services to an audit client.
Bookkeeping or other services related to the accounting records or financial statements of the audit client. Any service, unless it is reasonable to conclude that the results of these services will not be subject to audit procedures during an audit of Suncor’s financial statements, including:
• |
Maintaining or preparing the audit client’s accounting records; |
• |
Preparing Suncor’s financial statements that are filed with the SEC or that form the basis of financial statements filed with the SEC; or |
• |
Preparing or originating source data underlying Suncor’s financial statements. |
Financial information systems design and implementation. Any service, unless it is reasonable to conclude that the results of these services will not be subject to audit procedures during an audit of Suncor’s financial statements, including:
• |
Directly or indirectly operating, or supervising the operation of, Suncor’s information systems or managing Suncor’s local area network; or |
• |
Designing or implementing a hardware or software system that aggregates source data underlying the financial statements or generates information that is significant to Suncor’s financial statements or other financial information systems taken as a whole. |
Appraisal or valuation services, fairness opinions or contribution-in-kind reports. Any appraisal service, valuation service or any service involving a fairness opinion or contribution-in-kind report for Suncor, unless it is reasonable to conclude that the results of these services will not be subject to audit procedures during an audit of Suncor’s financial statements.
Actuarial services. Any actuarially-oriented advisory service involving the determination of amounts recorded in the financial statements and related accounts for Suncor other than assisting Suncor in understanding the methods, models, assumptions, and inputs used in computing an amount, unless it is reasonable to conclude that the results of these services will not be subject to audit procedures during an audit of Suncor’s financial statements.
Internal audit outsourcing services. Any internal audit service that has been outsourced by Suncor that relates to Suncor’s internal accounting controls, financial systems or financial statements, unless it is reasonable to conclude that the result of these services will not be subject to audit procedures during an audit of Suncor’s financial statements.
Management functions. Acting, temporarily or permanently, as a director, officer, or employee of Suncor, or performing any decision-making, supervisory, or ongoing monitoring function for Suncor.
Human resources. Any of the following:
• |
Searching for or seeking out prospective candidates for managerial, executive, or director positions; |
• |
Engaging in psychological testing, or other formal testing or evaluation programs; |
• |
Undertaking reference checks of prospective candidates for an executive or director position; |
• |
Acting as a negotiator on Suncor’s behalf, such as determining position, status or title, compensation, fringe benefits, or other conditions of employment; or |
• |
Recommending, or advising Suncor to hire a specific candidate for a specific job (except that an accounting firm may, upon request by Suncor, interview candidates and advise Suncor on the candidate’s competence for financial accounting, administrative, or control positions). |
Broker-dealer, investment adviser or investment banking services. Acting as a broker-dealer (registered or unregistered), promoter, or underwriter, on behalf of Suncor, making investment decisions on behalf of Suncor or otherwise having discretionary authority over Suncor’s investments, executing a transaction to
B-4 ANNUAL INFORMATION FORM 2023 SUNCOR ENERGY INC.
buy or sell Suncor’s investment, or having custody of Suncor’s assets, such as taking temporary possession of securities purchased by Suncor.
Legal services. Providing any service to Suncor that, under circumstances in which the service is provided, could be provided only by someone licenced, admitted, or otherwise qualified to practice law in the jurisdiction in which the service is prohibited.
Expert services unrelated to the audit. Providing an expert opinion or other expert service for Suncor, or Suncor’s legal representative, for the purpose of advocating Suncor’s interest in litigation or in a regulatory or administrative proceeding or investigation. In any litigation or regulatory or administrative proceeding or investigation, an accountant’s independence shall not be deemed to be impaired if the accountant provides factual accounts, including testimony, of work performed or explains the positions taken or conclusions reached during the performance of any service provided by the accountant for Suncor.
Appendix B – Pre-Approval Request Form
NATURE OF WORK |
ESTIMATED FEES |
Total |
|
Date |
Signature |
SUNCOR ENERGY INC. ANNUAL INFORMATION FORM 2023 B-5
Schedule “C” – Form 51-101F2 Report on Reserves Data by Independent Qualified Reserves Evaluator or Auditor
To the board of directors of Suncor Energy Inc. (the “Company”):
1. |
We have evaluated the Company’s reserves data as at December 31, 2023. The reserves data are estimates of proved reserves and probable reserves and related future net revenue as at December 31, 2023, estimated using forecast prices and costs. |
2. |
The reserves data are the responsibility of the Company’s management. Our responsibility is to express an opinion on the reserves data based on our evaluation. |
3. |
We carried out our evaluation in accordance with standards set out in the Canadian Oil and Gas Evaluation Handbook as amended from time to time (the “COGE Handbook”) maintained by the Society of Petroleum Evaluation Engineers (Calgary Chapter). |
4. |
Those standards require that we plan and perform an evaluation to obtain reasonable assurance as to whether the reserves data are free of material misstatement. An evaluation also includes assessing whether the reserves data are in accordance with principles and definitions presented in the COGE Handbook. |
5. |
The following table shows the net present value of future net revenue (before deduction of income taxes) attributed to proved plus probable reserves, estimated using forecast prices and costs and calculated using a discount rate of 10 percent, included in the reserves data of the Company evaluated for the year ended December 31, 2023, and identifies the respective portions thereof that we have evaluated and reported on to the Company’s management and board of directors: |
Independent Qualified |
|
Effective Date of |
|
Location of Reserves |
|
Net Present Value of Future Net Revenue |
||||||
|
|
|
|
|
|
Audited |
|
Evaluated |
|
Reviewed |
|
Total |
GLJ Ltd. |
|
December 31, 2023 |
|
Oil Sands In Situ, Canada |
|
— |
|
30 228 |
|
— |
|
30 228 |
GLJ Ltd. |
|
December 31, 2023 |
|
Oil Sands Mining, Canada |
|
— |
|
33 245 |
|
— |
|
33 245 |
GLJ Ltd. |
|
December 31, 2023 |
|
East Coast Canada, Newfoundland Offshore, Canada |
|
— |
|
7 317 |
|
— |
|
7 317 |
|
|
|
|
|
|
— |
|
70 790 |
|
— |
|
70 790 |
6. |
In our opinion, the reserves data respectively evaluated by us have, in all material respects, been determined and are in accordance with the COGE Handbook, consistently applied. We express no opinion on the reserves data that we reviewed but did not audit or evaluate. |
7. |
We have no responsibility to update our reports referred to in paragraph 5 for events and circumstances occurring after the effective date of our reports. |
8. |
Because the reserves data are based on judgments regarding future events, actual results will vary and the variations may be material. |
EXECUTED as to our report referred to above:
GLJ Ltd., Calgary, Alberta, Canada, March 21, 2024
“Tracy K. Bellingham”
Tracy K. Bellingham, P.Eng.
Vice President
SUNCOR ENERGY INC. ANNUAL INFORMATION FORM 2023 C-1
Schedule “D” – Form 51-101F3 Report of Management and Directors on Reserves Data and Other Information
Management of Suncor Energy Inc. (the “Company”) are responsible for the preparation and disclosure of information with respect to the Company’s oil and gas activities in accordance with securities regulatory requirements. This information includes reserves data.
Independent qualified reserves evaluators have evaluated the Company’s reserves data. The reports of the independent qualified reserves evaluators will be filed with securities regulatory authorities concurrently with this report.
The Audit Committee of the board of directors of the Company has:
(a) |
reviewed the Company’s procedures for providing information to the independent qualified reserves evaluators; |
(b) |
met with the independent qualified reserves evaluators to determine whether any restrictions affected the ability of the independent qualified reserves evaluators to report without reservation; and |
(c) |
reviewed the reserves data with management and the independent qualified reserves evaluators. |
The Audit Committee of the board of directors has reviewed the Company’s procedures for assembling and reporting other information associated with oil and gas activities and has reviewed that information with management. The board of directors has, on the recommendation of the Audit Committee, approved:
(a) |
the content and filing with securities regulatory authorities of Form 51-101F1 containing reserves data and other oil and gas information; |
(b) |
the filing of Form 51-101F2 which is the report of the independent qualified reserves evaluators on the reserves data; and |
(c) |
the content and filing of this report. |
Because the reserves data are based on judgments regarding future events, actual results will vary and the variations may be material.
“Richard M. Kruger”
RICHARD M. KRUGER
President and Chief Executive Officer
“Kris P. Smith”
KRIS P. SMITH
Chief Financial Officer
“Michael M. Wilson”
MICHAEL M. WILSON
Chair of the Board of Directors
“Patricia M. Bedient”
PATRICIA M. BEDIENT
Chair of the Audit Committee
March 21, 2024
D-1 ANNUAL INFORMATION FORM 2023 SUNCOR ENERGY INC.
|
Suncor Energy Inc. 150 - 6 Avenue S.W., Calgary, Alberta, Canada T2P 3E3 T: 403-296-8000 Suncor.com |
Exhibit 99-2
Audited Consolidated Financial Statements and Notes - Table of Contents
MANAGEMENT’S STATEMENT OF RESPONSIBILITY FOR FINANCIAL REPORTING |
2 |
MANAGEMENT’S REPORT ON INTERNAL CONTROL OVER FINANCIAL REPORTING |
3 |
REPORT OF INDEPENDENT REGISTERED PUBLIC ACCOUNTING FIRM (AUDIT FIRM ID: 85) |
4 |
8 |
|
9 |
|
10 |
|
11 |
|
12 |
|
12 |
|
12 |
|
12 |
|
16 |
|
18 |
|
19 |
|
22 |
|
22 |
|
23 |
|
23 |
|
25 |
|
25 |
|
26 |
|
27 |
|
28 |
|
29 |
|
33 |
|
34 |
|
34 |
|
34 |
|
35 |
|
38 |
|
38 |
|
42 |
|
43 |
|
44 |
|
47 |
|
51 |
|
52 |
|
53 |
|
54 |
|
54 |
|
55 |
ANNUAL REPORT 2023 SUNCOR ENERGY INC. 1
Management’s Statement of Responsibility for Financial Reporting
The management of Suncor Energy Inc. is responsible for the presentation and preparation of the accompanying consolidated financial statements of Suncor Energy Inc. and all related financial information contained in the Annual Report, including Management’s Discussion and Analysis.
The consolidated financial statements have been prepared in accordance with International Financial Reporting Standards as issued by the International Accounting Standards Board. They include certain amounts that are based on estimates and judgments.
In management’s opinion, the consolidated financial statements have been properly prepared within reasonable limits of materiality and within the framework of the significant accounting policies adopted by management. If alternate accounting methods exist, management has chosen those policies it deems the most appropriate in the circumstances. In discharging its responsibilities for the integrity and reliability of the financial statements, management maintains and relies upon a system of internal controls designed to ensure that transactions are properly authorized and recorded, assets are safeguarded against unauthorized use or disposition and liabilities are recognized. These controls include quality standards in hiring and training of employees, formalized policies and procedures, a corporate code of conduct and associated compliance program designed to establish and monitor conflicts of interest, the integrity of accounting records and financial information, among others, and employee and management accountability for performance within appropriate and well-defined areas of responsibility.
The system of internal controls is further supported by the professional staff of an internal audit function who conduct periodic audits of the company’s financial reporting.
The Audit Committee of the Board of Directors, currently composed of four independent directors, reviews the effectiveness of the company’s financial reporting systems, management information systems, internal control systems and internal auditors. It recommends to the Board of Directors the external auditor to be appointed by the shareholders at each annual meeting and reviews the independence and effectiveness of their work. In addition, it reviews with management and the external auditor any significant financial reporting issues, the presentation and impact of significant risks and uncertainties, and key estimates and judgments of management that may be material for financial reporting purposes. The Audit Committee appoints the independent reserve consultants. The Audit Committee meets at least quarterly to review and approve interim financial statements prior to their release, as well as annually to review Suncor’s annual financial statements and Management’s Discussion and Analysis, Annual Information Form/Form 40-F, and annual reserves estimates, and recommend their approval to the Board of Directors. The internal auditors and the external auditor, KPMG LLP, have unrestricted access to the company, the Audit Committee and the Board of Directors.
|
|
|
|
|
|
Rich Kruger |
|
Kris Smith |
President and Chief Executive Officer |
|
Chief Financial Officer |
March 21, 2024
2 ANNUAL REPORT 2023 SUNCOR ENERGY INC.
The following report is provided by management in respect of the company’s internal control over financial reporting (as defined in Rule 13a-15(f) and 15d-15(f) under the U.S. Securities Exchange Act of 1934):
Management’s Report on Internal Control
Over Financial Reporting
| 1. | Management is responsible for establishing and maintaining adequate internal control over the company’s financial reporting. |
| 2. | Management has used the Committee of Sponsoring Organizations of the Treadway Commission (COSO) framework (2013) in Internal Control – Integrated Framework to evaluate the effectiveness of the company’s internal control over financial reporting. |
| 3. | Management has assessed the effectiveness of the company’s internal control over financial reporting as at December 31, 2023, and has concluded that such internal control over financial reporting was effective as of that date. In addition, based on this assessment, management determined that there were no material weaknesses in internal control over financial reporting as at December 31, 2023. Because of inherent limitations, systems of internal control over financial reporting may not prevent or detect misstatements and even those systems determined to be effective can provide only reasonable assurance with respect to financial statement preparation and presentation. |
| 4. | The effectiveness of the company’s internal control over financial reporting as at December 31, 2023, has been audited by KPMG LLP, independent auditor, as stated in their report which appears herein. |
|
|
|
|
|
|
Rich Kruger |
|
Kris Smith |
President and Chief Executive Officer |
|
Chief Financial Officer |
March 21, 2024
ANNUAL REPORT 2023 SUNCOR ENERGY INC. 3
Report of Independent Registered Public Accounting Firm
To the Shareholders and Board of Directors of Suncor Energy Inc.
Opinions on the Consolidated Financial Statements and Internal Control Over Financial Reporting
We have audited the accompanying consolidated balance sheets of Suncor Energy Inc. and subsidiaries (the Company) as of December 31, 2023 and 2022, the related consolidated statements of comprehensive income, changes in equity, and cash flows for each of the years in the two-year period ended December 31, 2023, and the related notes (collectively, the consolidated financial statements). We also have audited the Company’s internal control over financial reporting as of December 31, 2023, based on criteria established in Internal Control – Integrated Framework (2013) issued by the Committee of Sponsoring Organizations of the Treadway Commission.
In our opinion, the consolidated financial statements referred to above present fairly, in all material respects, the financial position of the Company as of December 31, 2023 and 2022, and the results of its operations and its cash flows for each of the years in the two-year period ended December 31, 2023, in conformity with International Financial Reporting Standards (IFRS) as issued by the International Accounting Standards Board (IASB). Also in our opinion, the Company maintained, in all material respects, effective internal control over financial reporting as of December 31, 2023 based on criteria established in Internal Control – Integrated Framework (2013) issued by the Committee of Sponsoring Organizations of the Treadway Commission.
Basis for Opinions
The Company’s management is responsible for these consolidated financial statements, for maintaining effective internal control over financial reporting, and for its assessment of the effectiveness of internal control over financial reporting, included in the accompanying Management’s Report on Internal Control Over Financial Reporting. Our responsibility is to express an opinion on the Company’s consolidated financial statements and an opinion on the Company’s internal control over financial reporting based on our audits. We are a public accounting firm registered with the Public Company Accounting Oversight Board (United States) (PCAOB) and are required to be independent with respect to the Company in accordance with the U.S. federal securities laws and the applicable rules and regulations of the Securities and Exchange Commission and the PCAOB.
We conducted our audits in accordance with the standards of the PCAOB. Those standards require that we plan and perform the audits to obtain reasonable assurance about whether the consolidated financial statements are free of material misstatement, whether due to error or fraud, and whether effective internal control over financial reporting was maintained in all material respects.
Our audits of the consolidated financial statements included performing procedures to assess the risks of material misstatement of the consolidated financial statements, whether due to error or fraud, and performing procedures that respond to those risks. Such procedures included examining, on a test basis, evidence regarding the amounts and disclosures in the consolidated financial statements. Our audits also included evaluating the accounting principles used and significant estimates made by management, as well as evaluating the overall presentation of the consolidated financial statements. Our audit of internal control over financial reporting included obtaining an understanding of internal control over financial reporting, assessing the risk that a material weakness exists, and testing and evaluating the design and operating effectiveness of internal control based on the assessed risk. Our audits also included performing such other procedures as we considered necessary in the circumstances. We believe that our audits provide a reasonable basis for our opinions.
Definition and Limitations of Internal Control Over Financial Reporting
A company’s internal control over financial reporting is a process designed to provide reasonable assurance regarding the reliability of financial reporting and the preparation of financial statements for external purposes in accordance with generally accepted accounting principles. A company’s internal control over financial reporting includes those policies and procedures that (1) pertain to the maintenance of records that, in reasonable detail, accurately and fairly reflect the transactions and dispositions of the assets of the company; (2) provide reasonable assurance that transactions are recorded as necessary to
4 ANNUAL REPORT 2023 SUNCOR ENERGY INC.
permit preparation of financial statements in accordance with generally accepted accounting principles, and that receipts and expenditures of the company are being made only in accordance with authorizations of management and directors of the company; and (3) provide reasonable assurance regarding prevention or timely detection of unauthorized acquisition, use, or disposition of the company’s assets that could have a material effect on the financial statements.
Because of its inherent limitations, internal control over financial reporting may not prevent or detect misstatements. Also, projections of any evaluation of effectiveness to future periods are subject to the risk that controls may become inadequate because of changes in conditions, or that the degree of compliance with the policies or procedures may deteriorate.
Critical Audit Matters
The critical audit matters communicated below are matters arising from the current period audit of the consolidated financial statements that were communicated or required to be communicated to the audit committee and that: (1) relate to accounts or disclosures that are material to the consolidated financial statements and (2) involved our especially challenging, subjective, or complex judgments. The communication of critical audit matters does not alter in any way our opinion on the consolidated financial statements, taken as a whole, and we are not, by communicating the critical audit matters below, providing separate opinions on the critical audit matters or on the accounts or disclosures to which they relate.
Assessment of indicators of impairment loss or reversal related to Oil Sands and certain Exploration and Production property, plant and equipment
As discussed in Note 3(h) to the consolidated financial statements, when circumstances indicate that a cash generating unit (“CGU”) may be impaired or a previous impairment reversed, the Company compares the carrying amount of the CGU to its recoverable amount. Quarterly, the Company analyzes indicators of impairment loss or reversal (“impairment indicators”), such as significant increases or decreases in forecasted production volumes (which include assumptions related to proved and probable oil reserves), commodity prices, capital expenditures and operating costs (collectively, “reserve assumptions”). The estimate of reserve assumptions requires the expertise of independent qualified reserves evaluators. The Company engages independent qualified reserves evaluators to evaluate the Company’s proved and probable oil reserves.
We identified the evaluation of the assessment of indicators of impairment loss or reversal related to the Oil Sands and certain Exploration and Production property, plant and equipment as a critical audit matter. A high degree of subjective auditor judgment was required to evaluate the reserve assumptions used by the Company in their assessment.
The following are the primary procedures we performed to address this critical audit matter. We evaluated the design and tested the operating effectiveness of certain internal controls related to the critical audit matter. This included controls related to the Company’s assessment of indicators of impairment loss or reversal, including controls related to the reserve assumptions. We evaluated the Company’s reserve assumptions by comparing the current year externally evaluated proved and probable oil reserves to historical results. We compared the Company’s current year actual production volumes, operating costs and capital expenditures to those respective assumptions used in the prior year externally evaluated proved and probable oil reserves to assess the Company’s ability to accurately forecast. We evaluated the Company’s future commodity price estimates by comparing to a number of publicly available external price curves for the same benchmark pricing. We evaluated the competence, capabilities, and objectivity of the Company’s independent qualified reserves evaluators engaged by the Company, who evaluated the proved and probable oil reserves. We evaluated the methodology used by the independent qualified reserves evaluators to evaluate proved and probable oil reserves for compliance with regulatory standards.
Assessment of the valuation of property, plant and equipment (“PP&E”) of Fort Hills Energy Limited Partnership (“Fort Hills”) and the recognition of a deferred income tax asset on the acquisition of TotalEnergies EP Canada Ltd. (“TotalEnergies Canada”)
As discussed in Note 16 to the consolidated financial statements, the Company previously held a 68.76% ownership interest in Fort Hills and, on November 20, 2023, acquired the remaining 31.23% ownership interest held by TotalEnergies Canada through a business combination. As required in a business combination achieved in stages, the Company’s previously held interest in Fort Hills was remeasured to fair value at the acquisition date and, as result, a $17 million loss on remeasurement was recognized. The acquisition-date fair value of the PP&E of Fort Hills acquired from TotalEnergies Canada (“Acquired PP&E”)
ANNUAL REPORT 2023 SUNCOR ENERGY INC. 5
was $2.4 billion and the fair value of the previously held interest of Fort Hills was $3.9 billion which includes the fair value of the previously held PP&E (“Pre-Existing PP&E”). The Company’s determination of acquisition-date fair value of the Acquired PP&E and Pre-Existing PP&E involves numerous estimates, including forecasted cash flows associated with proved and probable oil reserves and the discount rate. The estimation of forecasted cash flows associated with proved and probable oil reserves involves the expertise of internal reservoir engineering specialists, who take into consideration significant assumptions related to forecasted production volumes, commodity prices (including foreign exchange rates), and operating and capital costs (“forecasted cash flow assumptions”). The Company also engages independent qualified reserves evaluators to separately estimate forecasted cash flows associated with proved and probable oil reserves (“external reserve report”).
As discussed in Note 16 to the consolidated financial statements, the Company recognized a deferred income tax asset on the acquisition of TotalEnergies Canada of $1.1 billion. The recognition of the deferred income tax asset involves the interpretation of tax law applicable to the acquired tax attributes. As discussed in Note 3(j) to the consolidated financial statements, the Company recognizes the impact of a tax filing position when it is probable, based on the technical merits, that the position will be sustained upon audit by tax regulatory authorities.
We identified the assessments of the fair value of the Acquired PP&E and Pre-Existing PP&E, and the recognition of the deferred income tax asset on the acquisition of TotalEnergies Canada as a critical audit matter. Minor changes in forecasted cash flow assumptions and the discount rate could have had a significant impact on the calculation of the fair value of the Acquired PP&E and Pre-Existing PP&E. Additionally, the evaluation of the fair value of the Acquired PP&E and Pre-Existing PP&E required the involvement of valuation professionals with specialized skills and knowledge. Complex auditor judgment was required to evaluate the Company’s interpretation of tax law in the recognition of the deferred income tax asset on the acquisition of TotalEnergies Canada. Additionally, the evaluation of the recognition of the deferred income tax asset required involvement of tax professionals with specialized skills and knowledge.
The following are the primary procedures we performed to address this critical audit matter. We evaluated the design and tested the operating effectiveness of certain internal controls related to the critical audit matter. This included controls related to:
| • | The Company’s determination of the acquisition-date fair value of the Acquired PP&E and Pre-Existing PP&E, including the discount rate |
| • | The Company’s determination of the forecasted cash flow assumptions |
| • | The Company’s interpretation of tax law in the determination of the probability of tax filing positions in the recognition of the deferred income tax asset. |
We evaluated the Company’s forecasted commodity price (including foreign exchange rate) estimates by comparing to a number of publicly available external price curves for the same benchmark pricing. We compared the 2023 actual production volumes and operating and capital costs for Fort Hills to the forecasted cash flow assumptions used in the prior year to assess the Company’s ability to accurately forecast. We evaluated the Company’s forecasted production volumes and operating and capital cost assumptions by comparing them to amounts determined in the external reserve report prepared by the independent qualified reserves evaluators.
With respect to the estimate of forecasted cash flows associated with proved and probable oil reserves determined by the Company’s independent qualified reserves evaluators at December 31, 2023:
| • | We evaluated the competence, capabilities and objectivity of the independent qualified reserves evaluators engaged by the Company |
| • | We evaluated the methodology used by the independent qualified reserves evaluators to estimate the proved and probable oil reserves for compliance with regulatory standards |
| • | We compared the 2023 actual production volumes and operating and capital costs for Fort Hills to those assumptions used in the prior year external reserve report for Fort Hills |
6 ANNUAL REPORT 2023 SUNCOR ENERGY INC.
| • | We assessed the forecasted commodity prices in the external reserve report by comparing them to those published by other reserve engineering companies |
| • | We evaluated the forecasted production volumes and operating and capital cost assumptions used in the external reserve report for Fort Hills by comparing them to historical results. |
We involved valuation professionals with specialized skills and knowledge, who assisted in:
| • | Evaluating the Company’s determination of the discount rate, by comparing the inputs to the discount rate to publicly available market data for comparable entities and assessed the resulting discount rate |
| • | Evaluating the Company’s estimate of the acquisition-date fair value of the Acquired PP&E and Pre-Existing PP&E by comparing them to publicly available market data and valuation metrics for comparable entities or asset transactions. |
We involved tax professionals with specialized skills and knowledge, who assisted in evaluating the Company’s interpretation of tax law in the determination of the probability of tax filing positions by inspecting advice and information obtained from the Company and its external tax specialists and comparing to our understanding and interpretation of tax law.
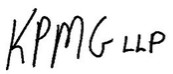
|
|
Chartered Professional Accountants |
|
|
|
We have served as the Company’s auditor since 2019. |
|
|
|
Calgary, Canada |
|
March 21, 2024 |
|
ANNUAL REPORT 2023 SUNCOR ENERGY INC. 7
Consolidated Statements of Comprehensive Income
For the years ended December 31 ($ millions) |
|
Notes |
|
2023 |
|
2022 |
|
Revenues and Other Income |
|
|
|
|
|
|
|
Gross revenues |
|
6 |
|
52 206 |
|
62 907 |
|
Less: royalties |
|
6 |
|
(3 114) |
|
(4 571) |
|
Other income |
|
7 |
|
1 654 |
|
131 |
|
|
|
|
|
50 746 |
|
58 467 |
|
|
|
|
|
|
|
|
|
Expenses |
|
|
|
|
|
|
|
Purchases of crude oil and products |
|
|
|
18 215 |
|
20 775 |
|
Operating, selling and general |
|
8 and 26 |
|
13 383 |
|
12 807 |
|
Transportation and distribution |
|
|
|
1 775 |
|
1 671 |
|
Depreciation, depletion, amortization and impairment |
|
15 and 16 |
|
6 435 |
|
8 786 |
|
Exploration |
|
|
|
74 |
|
56 |
|
(Gain) loss on disposal of assets |
|
16 |
|
(992) |
|
45 |
|
Financing expenses |
|
9 |
|
1 267 |
|
2 011 |
|
|
|
|
|
40 157 |
|
46 151 |
|
Earnings before Income Taxes |
|
|
|
10 589 |
|
12 316 |
|
Income Tax Expense (Recovery) |
|
|
|
|
|
|
|
Current |
|
10 |
|
1 734 |
|
4 229 |
|
Deferred |
|
10 and 16 |
|
560 |
|
(990) |
|
|
|
|
|
2 294 |
|
3 239 |
|
Net Earnings |
|
|
|
8 295 |
|
9 077 |
|
|
|
|
|
|
|
|
|
Other Comprehensive Income |
|
|
|
|
|
|
|
Items That May be Subsequently Reclassified to Earnings: |
|
|
|
|
|
|
|
Foreign currency translation adjustment |
|
|
|
74 |
|
160 |
|
Items That Will Not be Reclassified to Earnings: |
|
|
|
|
|
|
|
Actuarial gain on employee retirement benefit plans, net of income taxes |
|
|
|
128 |
|
838 |
|
|
|
|
|
|
|
|
|
Other Comprehensive Income |
|
|
|
202 |
|
998 |
|
|
|
|
|
|
|
|
|
Total Comprehensive Income |
|
|
|
8 497 |
|
10 075 |
|
|
|
|
|
|
|
|
|
Per Common Share (dollars) |
|
11 |
|
|
|
|
|
Net earnings – basic |
|
|
|
6.34 |
|
6.54 |
|
Net earnings – diluted |
|
|
|
6.33 |
|
6.53 |
|
Cash dividends |
|
|
|
2.11 |
|
1.88 |
|
The accompanying notes are an integral part of the consolidated financial statements.
8 ANNUAL REPORT 2023 SUNCOR ENERGY INC.
Consolidated Balance Sheets
|
|
|
|
|
|
|
|
|
|
|
|
December 31 |
|
December 31 |
|
($ millions) |
|
Notes |
|
2023 |
|
2022 |
|
Assets |
|
|
|
|
|
|
|
Current assets |
|
|
|
|
|
|
|
Cash and cash equivalents |
|
12 |
|
1 729 |
|
1 980 |
|
Accounts receivable |
|
|
|
5 735 |
|
6 068 |
|
Inventories |
|
14 |
|
5 365 |
|
5 058 |
|
Income taxes receivable |
|
|
|
980 |
|
244 |
|
Assets held for sale |
|
33 |
|
- |
|
1 186 |
|
Total current assets |
|
|
|
13 809 |
|
14 536 |
|
Property, plant and equipment, net |
|
15 - 17 |
|
67 650 |
|
62 654 |
|
Exploration and evaluation |
|
18 |
|
1 758 |
|
1 995 |
|
Other assets |
|
19 |
|
1 710 |
|
1 766 |
|
Goodwill and other intangible assets |
|
20 |
|
3 528 |
|
3 586 |
|
Deferred income taxes |
|
10 |
|
84 |
|
81 |
|
Total assets |
|
|
|
88 539 |
|
84 618 |
|
|
|
|
|
|
|
|
|
Liabilities and Shareholders’ Equity |
|
|
|
|
|
|
|
Current liabilities |
|
|
|
|
|
|
|
Short-term debt |
|
21 |
|
494 |
|
2 807 |
|
Current portion of long-term lease liabilities |
|
21 |
|
348 |
|
317 |
|
Accounts payable and accrued liabilities |
|
|
|
7 731 |
|
8 167 |
|
Current portion of provisions |
|
24 |
|
983 |
|
564 |
|
Income taxes payable |
|
|
|
41 |
|
484 |
|
Liabilities associated with assets held for sale |
|
33 |
|
- |
|
530 |
|
Total current liabilities |
|
|
|
9 597 |
|
12 869 |
|
Long-term debt |
|
21 |
|
11 087 |
|
9 800 |
|
Long-term lease liabilities |
|
21 |
|
3 478 |
|
2 695 |
|
Other long-term liabilities |
|
22 |
|
1 488 |
|
1 642 |
|
Provisions |
|
24 |
|
11 610 |
|
9 800 |
|
Deferred income taxes |
|
10 and 16 |
|
8 000 |
|
8 445 |
|
Equity |
|
|
|
43 279 |
|
39 367 |
|
Total liabilities and shareholders’ equity |
|
|
|
88 539 |
|
84 618 |
|
The accompanying notes are an integral part of the consolidated financial statements.
Approved on behalf of the Board of Directors:
|
|
|
|
Rich Kruger |
Patricia M. Bedient |
Director |
Director |
March 21, 2024
ANNUAL REPORT 2023 SUNCOR ENERGY INC. 9
Consolidated Statements of Cash Flows
For the years ended December 31 ($ millions) |
|
Notes |
|
2023 |
|
2022 |
|
Operating Activities |
|
|
|
|
|
|
|
Net earnings |
|
|
|
8 295 |
|
9 077 |
|
Adjustments for: |
|
|
|
|
|
|
|
Depreciation, depletion, amortization and impairment |
|
|
|
6 435 |
|
8 786 |
|
Deferred income tax expense (recovery) |
|
10 and 16 |
|
560 |
|
(990) |
|
Accretion |
|
9 |
|
532 |
|
316 |
|
Unrealized foreign exchange loss (gain) on U.S. dollar denominated debt |
|
9 |
|
(184) |
|
729 |
|
Change in fair value of financial instruments and trading inventory |
|
|
|
(5) |
|
(38) |
|
Bargain purchase gain and revaluations |
|
7 and 16 |
|
(1 125) |
|
- |
|
(Gain) loss on disposal of assets |
|
16 |
|
(992) |
|
45 |
|
Loss on extinguishment of long-term debt |
|
9 and 21 |
|
- |
|
32 |
|
Share-based compensation |
|
26 |
|
108 |
|
328 |
|
Settlement of decommissioning and restoration liabilities |
|
24 |
|
(390) |
|
(314) |
|
Other |
|
|
|
91 |
|
130 |
|
Increase in non-cash working capital |
|
13 |
|
(981) |
|
(2 421) |
|
Cash flow provided by operating activities |
|
|
|
12 344 |
|
15 680 |
|
|
|
|
|
|
|
|
|
Investing Activities |
|
|
|
|
|
|
|
Capital and exploration expenditures |
|
|
|
(5 828) |
|
(4 987) |
|
Capital expenditures on assets held for sale |
|
33 |
|
(108) |
|
(133) |
|
Acquisitions, net of cash acquired |
|
16 |
|
(2 394) |
|
- |
|
Proceeds from disposal of assets |
|
16 |
|
1 882 |
|
315 |
|
Other investments |
|
|
|
(83) |
|
(36) |
|
Decrease in non-cash working capital |
|
13 |
|
20 |
|
52 |
|
Cash flow used in investing activities |
|
|
|
(6 511) |
|
(4 789) |
|
|
|
|
|
|
|
|
|
Financing Activities |
|
|
|
|
|
|
|
Net (decrease) increase in short-term debt |
|
|
|
(2 343) |
|
1 473 |
|
Repayment of long-term debt |
|
21 |
|
(5) |
|
(5 128) |
|
Issuance of long-term debt |
|
21 |
|
1 500 |
|
- |
|
Lease liability payments |
|
|
|
(331) |
|
(329) |
|
Issuance of common shares under share option plans |
|
|
|
187 |
|
496 |
|
Repurchase of common shares |
|
25 |
|
(2 233) |
|
(5 135) |
|
Distributions relating to non-controlling interest |
|
|
|
(16) |
|
(9) |
|
Dividends paid on common shares |
|
|
|
(2 749) |
|
(2 596) |
|
Cash flow used in financing activities |
|
|
|
(5 990) |
|
(11 228) |
|
|
|
|
|
|
|
|
|
Decrease in Cash and Cash Equivalents |
|
|
|
(157) |
|
(337) |
|
Effect of foreign exchange on cash and cash equivalents |
|
|
|
(94) |
|
112 |
|
Cash and cash equivalents at beginning of year |
|
|
|
1 980 |
|
2 205 |
|
Cash and Cash Equivalents at End of Year |
|
|
|
1 729 |
|
1 980 |
|
|
|
|
|
|
|
|
|
Supplementary Cash Flow Information |
|
|
|
|
|
|
|
Interest paid |
|
|
|
887 |
|
973 |
|
Income taxes paid |
|
|
|
2 604 |
|
4 737 |
|
The accompanying notes are an integral part of the consolidated financial statements.
10 ANNUAL REPORT 2023 SUNCOR ENERGY INC.
Consolidated Statements of Changes in Equity
|
|
|
|
|
|
|
|
Accumulated |
|
|
|
|
|
Number of |
|
|
|
|
|
|
|
|
|
Other |
|
|
|
|
|
Common |
|
|
|
|
|
Share |
|
Contributed |
|
Comprehensive |
|
Retained |
|
|
|
Shares |
|
($ millions) |
|
Notes |
|
Capital |
|
Surplus |
|
Income |
|
Earnings |
|
Total |
|
(thousands) |
|
|
|
|
|
|
|
|
|
|
|
|
|
|
|
|
|
At December 31, 2021 |
|
|
|
23 650 |
|
612 |
|
814 |
|
11 538 |
|
36 614 |
|
1 441 251 |
|
|
|
|
|
|
|
|
|
|
|
|
|
|
|
|
|
Net earnings |
|
|
|
- |
|
- |
|
- |
|
9 077 |
|
9 077 |
|
- |
|
|
|
|
|
|
|
|
|
|
|
|
|
|
|
|
|
Foreign currency translation adjustment |
|
|
|
- |
|
- |
|
160 |
|
- |
|
160 |
|
- |
|
|
|
|
|
|
|
|
|
|
|
|
|
|
|
|
|
Actuarial gain on employee retirement benefit plans, net of income taxes of $264 |
|
23 |
|
- |
|
- |
|
- |
|
838 |
|
838 |
|
- |
|
|
|
|
|
|
|
|
|
|
|
|
|
|
|
|
|
Total comprehensive income |
|
|
|
- |
|
- |
|
160 |
|
9 915 |
|
10 075 |
|
- |
|
|
|
|
|
|
|
|
|
|
|
|
|
|
|
|
|
Issued under share option plans |
|
|
|
570 |
|
(58) |
|
- |
|
- |
|
512 |
|
13 158 |
|
|
|
|
|
|
|
|
|
|
|
|
|
|
|
|
|
Common shares forfeited |
|
|
|
- |
|
- |
|
- |
|
- |
|
- |
|
(30) |
|
|
|
|
|
|
|
|
|
|
|
|
|
|
|
|
|
Repurchase of common shares for cancellation |
|
25 |
|
(1 947) |
|
- |
|
- |
|
(3 188) |
|
(5 135) |
|
(116 908) |
|
|
|
|
|
|
|
|
|
|
|
|
|
|
|
|
|
Change in liability for share purchase commitment |
|
25 |
|
(16) |
|
- |
|
- |
|
(104) |
|
(120) |
|
- |
|
|
|
|
|
|
|
|
|
|
|
|
|
|
|
|
|
Share-based compensation |
|
26 |
|
- |
|
17 |
|
- |
|
- |
|
17 |
|
- |
|
|
|
|
|
|
|
|
|
|
|
|
|
|
|
|
|
Dividends paid on common shares |
|
|
|
- |
|
- |
|
- |
|
(2 596) |
|
(2 596) |
|
- |
|
|
|
|
|
|
|
|
|
|
|
|
|
|
|
|
|
At December 31, 2022 |
|
|
|
22 257 |
|
571 |
|
974 |
|
15 565 |
|
39 367 |
|
1 337 471 |
|
|
|
|
|
|
|
|
|
|
|
|
|
|
|
|
|
Net earnings |
|
|
|
- |
|
- |
|
- |
|
8 295 |
|
8 295 |
|
- |
|
|
|
|
|
|
|
|
|
|
|
|
|
|
|
|
|
Foreign currency translation adjustment |
|
|
|
- |
|
- |
|
74 |
|
- |
|
74 |
|
- |
|
|
|
|
|
|
|
|
|
|
|
|
|
|
|
|
|
Actuarial gain on employee retirement benefit plans, net of income taxes of $42 |
|
23 |
|
- |
|
- |
|
- |
|
128 |
|
128 |
|
- |
|
|
|
|
|
|
|
|
|
|
|
|
|
|
|
|
|
Total comprehensive income |
|
|
|
- |
|
- |
|
74 |
|
8 423 |
|
8 497 |
|
- |
|
|
|
|
|
|
|
|
|
|
|
|
|
|
|
|
|
Issued under share option plans |
|
|
|
199 |
|
(18) |
|
- |
|
- |
|
181 |
|
4 611 |
|
|
|
|
|
|
|
|
|
|
|
|
|
|
|
|
|
Repurchase of common shares for cancellation |
|
25 |
|
(871) |
|
- |
|
- |
|
(1 362) |
|
(2 233) |
|
(51 982) |
|
|
|
|
|
|
|
|
|
|
|
|
|
|
|
|
|
Change in liability for share purchase commitment |
|
25 |
|
76 |
|
- |
|
- |
|
124 |
|
200 |
|
- |
|
|
|
|
|
|
|
|
|
|
|
|
|
|
|
|
|
Share-based compensation |
|
26 |
|
- |
|
16 |
|
- |
|
- |
|
16 |
|
- |
|
|
|
|
|
|
|
|
|
|
|
|
|
|
|
|
|
Dividends paid on common shares |
|
|
|
- |
|
- |
|
- |
|
(2 749) |
|
(2 749) |
|
- |
|
|
|
|
|
|
|
|
|
|
|
|
|
|
|
|
|
At December 31, 2023 |
|
|
|
21 661 |
|
569 |
|
1 048 |
|
20 001 |
|
43 279 |
|
1 290 100 |
|
The accompanying notes are an integral part of the consolidated financial statements.
ANNUAL REPORT 2023 SUNCOR ENERGY INC. 11
Notes to the Consolidated Financial Statements
1. Reporting Entity and Description of the Business
Suncor is an integrated energy company headquartered in Calgary, Alberta, Canada. Suncor’s operations include oil sands development, production and upgrading; offshore oil production; petroleum refining in Canada and the U.S.; and the company’s Petro-Canada™ retail and wholesale distribution networks (including Canada’s Electric Highway™, a coast-to-coast network of fast-charging electric vehicle stations). Suncor is developing petroleum resources while advancing the transition to a low-emissions future through investments in power and renewable fuels. Suncor also conducts energy trading activities focused primarily on the marketing and trading of crude oil, natural gas, byproducts, refined products and power. Suncor’s common shares (symbol: SU) are listed on the Toronto Stock Exchange (TSX) and New York Stock Exchange (NYSE).
The address of the company’s registered office is 150 – 6th Avenue S.W., Calgary, Alberta, Canada, T2P 3E3.
2. Basis of Preparation
(a) Statement of Compliance
These consolidated financial statements have been prepared in accordance with International Financial Reporting Standards (IFRS) as issued by the International Accounting Standards Board (IASB).
Suncor’s accounting policies are based on IFRS issued and outstanding for all periods presented in these consolidated financial statements. These consolidated financial statements were approved by the Board of Directors on March 21, 2024.
(b) Basis of Measurement
The consolidated financial statements are prepared on a historical cost basis except as detailed in the accounting policies disclosed in note 3. The accounting policies described in note 3 have been applied consistently to all periods presented in these consolidated financial statements.
(c) Functional Currency and Presentation Currency
These consolidated financial statements are presented in Canadian dollars, which is the company’s functional currency.
(d) Use of Estimates, Assumptions and Judgments
The timely preparation of financial statements requires that management make estimates and assumptions and use judgment. Accordingly, actual results may differ from estimated amounts as future confirming events occur. Significant estimates and judgments used in the preparation of the consolidated financial statements are described in note 4.
3. Summary of Material Accounting Policies
(a) Joint Arrangements
The classification of joint arrangements considers the contractual rights and obligations of each investor and whether the legal structure of the joint arrangement gives the entity direct rights to the assets and obligations for the liabilities.
(b) Foreign Currency Translation
Functional currencies of the company’s individual entities are the currency of the primary economic environment in which the entity operates. Transactions in foreign currencies are translated to the appropriate functional currency at foreign exchange rates that approximate those on the date of the transaction. Monetary assets and liabilities denominated in foreign currencies are translated to the appropriate functional currency at foreign exchange rates as at the balance sheet date. Foreign
12 ANNUAL REPORT 2023 SUNCOR ENERGY INC.
exchange differences arising on translation are recognized in net earnings. Non-monetary assets that are measured in a foreign currency at historical cost are translated using the exchange rate at the date of the transaction.
In preparing the company’s consolidated financial statements, the financial statements of each entity are translated into Canadian dollars. The assets and liabilities of foreign operations are translated into Canadian dollars at exchange rates as at the balance sheet date. Revenues and expenses of foreign operations are translated into Canadian dollars using foreign exchange rates that approximate those on the date of the underlying transaction. Foreign exchange differences are recognized in other comprehensive income.
If the company or any of its entities disposes of its entire interest in a foreign operation, or loses control, joint control or significant influence over a foreign operation, the accumulated foreign currency translation gains or losses related to the foreign operation are recognized in net earnings.
(c) Revenues
Revenue from the sale of crude oil, natural gas, natural gas liquids, purchased products, refined petroleum products and power represent the company’s contractual arrangements with customers. Revenue is recorded when control passes to the customer, in accordance with specified contract terms. All operating revenue is earned at a point in time and is based on the consideration that the company expects to receive for the transfer of the goods to the customer. Revenues are usually collected in the month following delivery except retail gasoline, diesel and ancillary products, which are due upon delivery and, accordingly, the company does not adjust consideration for the effects of a financing component.
International operations conducted pursuant to Production Sharing Contracts (PSCs) are reflected in the consolidated financial statements based on the company’s working interest. Each PSC establishes the exploration, development and operating costs the company is required to fund and terms for the company to recover these costs and to share in the production profits. Cost recovery is generally limited to a specified percentage of production during each year (Cost Recovery Oil). Any Cost Recovery Oil remaining after costs have been recovered is referred to as Excess Petroleum and is shared between the company and the respective government. Assuming collection is reasonably assured, the company records revenue when the sale of product to a third party occurs. Revenue also includes income taxes paid on the company’s behalf by government joint partners.
(d) Inventories
Inventories of crude oil and refined products, other than inventories held for trading purposes, are valued at the lower of cost, using the first-in, first-out method, and net realizable value. Cost of inventory consists of purchase costs, direct production costs, direct overhead and depreciation, depletion and amortization. Materials and supplies are valued at the lower of average cost and net realizable value.
Inventories held for trading purposes are carried at fair value less costs to sell and any changes in fair value are recognized in Other Income within the respective reporting segment to which the trading activity relates.
(e) Exploration and Evaluation Assets
The costs to acquire non-producing oil and gas properties or licences to explore, drill exploratory wells and the costs to evaluate the commercial potential of underlying resources, including related borrowing costs, are initially capitalized as Exploration and Evaluation assets. Certain exploration costs, including geological, geophysical and seismic expenditures and delineation on oil sands properties, are charged to Exploration expense as incurred.
Exploration and Evaluation assets are subject to technical, commercial and management review to confirm the continued intent to develop and extract the underlying resources. If an area or exploration well is no longer considered commercially viable, the related capitalized costs are expensed.
When management determines with reasonable certainty that an Exploration and Evaluation asset will be developed, as evidenced by the classification of proved or probable reserves and the appropriate internal and external approvals, the asset is transferred to Property, Plant and Equipment.
ANNUAL REPORT 2023 SUNCOR ENERGY INC. 13
(f) Property, Plant and Equipment
The costs to acquire and to develop oil and gas properties, including completing geological and geophysical surveys and drilling development wells, and the costs to construct and install development infrastructure, such as wellhead equipment, well platforms, well pairs, offshore platforms, subsea structures and an estimate of asset retirement costs, are capitalized as oil and gas properties within Property, Plant and Equipment.
The costs to construct, install and commission, or acquire, oil and gas production equipment, including oil sands upgraders, extraction plants, mine equipment, processing and power generation facilities, utility plants, and all renewable energy, refining, and marketing assets, are capitalized as plant and equipment within Property, Plant and Equipment.
Stripping activity required to access oil sands mining resources incurred in the initial development phase is capitalized as part of the construction cost of the mine. Stripping costs incurred in the production phase are charged to expense as they normally relate to production for the current period.
The costs of planned major inspection, overhaul and turnaround activities that maintain Property, Plant and Equipment and benefit future years of operations are capitalized. Recurring planned maintenance activities performed on shorter intervals are expensed as operating costs. Replacements outside of a major inspection, overhaul or turnaround are capitalized when it is probable that future economic benefits will be realized by the company and the associated carrying amount of the replaced component is derecognized.
Borrowing costs relating to assets that take over one year to construct are capitalized as part of the asset. Capitalization of borrowing costs ceases when the asset is in the location and condition necessary for its intended use, and is suspended when construction of an asset is ceased for extended periods.
(g) Depreciation, Depletion and Amortization
Exploration and Evaluation assets are not subject to depreciation, depletion and amortization. Once transferred to oil and gas properties within Property, Plant and Equipment and commercial production commences, these costs are depleted on a unit-of-production basis over proved developed reserves, with the exception of costs associated with oil sands mines, which are depreciated on a straight-line basis over the life of the mine, and property acquisition costs, which are depleted over proved reserves.
Capital expenditures are not depreciated or depleted until assets are substantially complete and ready for their intended use.
Costs to develop oil and gas properties other than certain oil sands mining assets, including costs of dedicated infrastructure, such as well pads and wellhead equipment, are depleted on a unit-of-production basis over proved developed reserves. A portion of these costs may not be depleted if they relate to undeveloped reserves. Costs related to offshore facilities are depleted over proved and probable reserves. Costs to develop and construct oil sands mines are depreciated on a straight-line basis over the life of the mine.
Major components of Property, Plant and Equipment are depreciated on a straight-line basis over their expected useful lives.
|
|
Oil sands upgraders, extraction plants and mine facilities |
10 to 40 years |
Oil sands mine equipment |
5 to 15 years |
Oil sands in situ processing facilities |
30 years |
Power generation and utility plants |
30 to 40 years |
Refineries and other processing plants |
20 to 40 years |
Marketing and other distribution assets |
10 to 40 years |
The costs of major inspection, overhaul and turnaround activities that are capitalized are depreciated on a straight-line basis over the period to the next scheduled activity, which varies from two to five years.
Depreciation, depletion and amortization rates are reviewed annually or when events or conditions occur that impact capitalized costs, reserves or estimated service lives.
14 ANNUAL REPORT 2023 SUNCOR ENERGY INC.
Right-of-use assets within Property, Plant and Equipment are depreciated on a straight-line basis over the shorter of the estimated useful life of the right-of-use asset or the lease term.
(h) Impairment of Assets
Non-Financial Assets
Property, Plant and Equipment and Exploration and Evaluation assets are reviewed quarterly to assess whether there is any indication of impairment. Goodwill and intangible assets that have an indefinite useful life are tested for impairment annually. Exploration and Evaluation assets are also tested for impairment immediately prior to being transferred to Property, Plant and Equipment.
If any indication of impairment exists, an estimate of the asset’s recoverable amount is calculated as the higher of the fair value less costs of disposal and value-in-use. In determining fair value less costs of disposal, recent market transactions are considered, if available. In the absence of such transactions, an appropriate valuation model is used. Value-in-use is assessed using the present value of the expected future cash flows of the relevant asset. If the asset does not generate cash inflows that are largely independent of those from other assets or groups of assets, the asset is tested as part of a cash generating unit (CGU), which is the smallest identifiable group of assets that generates cash inflows that are largely independent of the cash inflows from other assets or groups of assets. An impairment loss is the amount by which the carrying amount of the individual asset or CGU exceeds its recoverable amount.
Impairments may be reversed for all CGUs and individual assets, other than goodwill, if there has been a change in the estimates and judgments used to determine the asset’s recoverable amount since the last impairment loss was recognized. If such indication exists, the carrying amount of the CGU or asset is increased to its revised recoverable amount, which cannot exceed the carrying amount that would have been determined, net of depletion, depreciation and amortization, had no impairment been recognized.
Impairments and impairment reversals are recognized within Depreciation, Depletion, Amortization and Impairment.
Financial Assets
At each reporting date, the company assesses the expected credit losses associated with its financial assets measured at amortized cost. Expected credit losses are measured as the difference between the cash flows that are due to the company and the cash flows that the company expects to receive, discounted at the effective interest rate determined at initial recognition. For trade accounts receivables, the company applies the simplified approach permitted by IFRS 9 Financial Instruments, which requires lifetime expected credit losses to be recognized from initial recognition of the receivables. To measure expected credit losses, accounts receivables are grouped based on the number of days the receivables have been outstanding and the internal credit assessments of the customers. Credit risk for longer term receivables is assessed based on an external credit rating of the counterparty.
(i) Provisions
Provisions are recognized for decommissioning and restoration obligations associated with the company’s Exploration and Evaluation assets and Property, Plant and Equipment. Provisions for decommissioning and restoration obligations are measured at the present value of management’s best estimate of the future cash flows required to settle the present obligation, using the credit-adjusted risk-free interest rate. The value of the obligation is added to the carrying amount of the associated asset and amortized over the useful life of the asset. The provision is accreted over time through Financing Expense with actual expenditures charged against the accumulated obligation. Changes in the future cash flow estimates resulting from revisions to the estimated timing or amount of undiscounted cash flows are recognized as a change in the decommissioning and restoration provision and related asset.
(j) Income Taxes
The company follows the liability method of accounting for income taxes whereby deferred income taxes are recorded for the effect of differences between the accounting and income tax basis of an asset or liability. Deferred income tax assets and liabilities are measured using enacted or substantively enacted income tax rates as at the balance sheet date that are anticipated to apply to taxable income in the years in which temporary differences are expected to be recovered or settled.
ANNUAL REPORT 2023 SUNCOR ENERGY INC. 15
Changes to these balances are recognized in net earnings or in other comprehensive income in the period they occur. Investment tax credits are recorded as a reduction to the related expenditures.
The company recognizes the impact of a tax filing position when it is probable, based on the technical merits, that the position will be sustained upon audit. If it is determined a tax filing position is not considered probable, the company assesses the possible outcomes and their associated probabilities and records a tax provision based on the best estimate of the amount of tax payable.
(k) Pensions and Other Post-Retirement Benefits
The company sponsors defined benefit pension plans, defined contribution pension plans and other post-retirement benefits.
The cost of pension benefits earned by employees in the defined contribution pension plan is expensed as incurred. The cost of defined benefit pension plans and other post-retirement benefits are actuarially determined using the projected unit credit method based on present pay levels and management’s best estimates of demographic and financial assumptions.
The liability recognized on the balance sheet is the present value of the defined benefit obligations less the fair value of plan assets. The value of plan assets is limited to the total of unrecognized past service cost and the present value of the economic benefits available in the form of refunds from the plan or reductions in future contributions to the plan (“effect of the asset ceiling”). Any surplus is immediately recognized in other comprehensive income. In addition, a minimum liability is recognized when the statutory minimum funding requirement for past service exceeds the economic benefits available in the form of refunds from the plan or reductions in future contributions to the plan.
Pension benefits earned during the current year are recorded in Operating, Selling and General expense. Interest costs on the net unfunded obligation are recorded in Financing Expense. Any actuarial gains or losses related to the plan assets and the defined benefit obligation, as well as the change in the asset ceiling and any minimum liability, are recognized immediately through other comprehensive income and transferred directly to retained earnings.
(l) Emissions Obligations and Rights
Emissions obligations are measured at the weighted average cost per unit of emissions expected to be incurred to settle the obligation and are recorded in the period in which the emissions occur within Operating, Selling and General expense, or Purchases.
Purchases of emissions rights are recognized as Other Assets on the balance sheet and are measured at historical cost. Emissions rights received by way of grant are recorded at a nominal amount.
(m) Leases
The company has elected not to recognize right-of-use assets and lease liabilities for short-term leases that have a lease term of twelve months or less. The lease payments are recognized as an expense when incurred over the lease term. As well, the company has accounted for each lease component and any non-lease components as a single lease component for crude oil storage tanks.
The lease liability is initially measured at the present value of the future lease payments, discounted using the interest rate implicit in the lease or, if that rate cannot be readily determined, the company’s incremental borrowing rate. Lease payments include fixed payments, as well as variable payments that are based on an index or rate.
The company has lease contracts that include storage tanks, pipelines, railway cars, vessels, buildings, land, and mobile equipment.
4. Significant and Other Accounting Estimates and Judgments
The preparation of financial statements in accordance with IFRS requires management to make estimates and judgments that affect reported assets, liabilities, revenues, expenses, gains, losses and disclosures of contingencies. These estimates and judgments are subject to change based on experience and new information.
16 ANNUAL REPORT 2023 SUNCOR ENERGY INC.
Climate Change
Suncor supports the goals of the Paris Agreement and is committed to achieving the long-term objective of net-zero greenhouse gas (GHG) emissions from its operations by 2050, including those in which it has a working interest. Addressing climate change and providing the secure, affordable and reliable energy the world needs requires investment, technological advancement, product innovation, regulatory support and collaborative partnerships, such as the Pathways Alliance. The rate of change of public policy, consumer behaviour and resulting demand for low-carbon options is not certain. Suncor is committed to reducing emissions in our base business, while expanding in complementary low-emissions businesses and working with our customers, governments and partners to realize our shared climate objectives.
Climate change and the transition to a low-emissions economy was considered in preparing the consolidated financial statements, primarily in estimating commodity prices used in impairment and reserves analysis. These may have significant impacts on the currently reported amounts of the company’s assets and liabilities discussed below and on similar assets and liabilities that may be recognized in the future. As part of its ongoing business planning, Suncor estimates future costs associated with GHG emissions in its operations and in the evaluation of future projects. The company uses future climate scenarios to test and assess the resilience of its strategy. Changes in market and regulatory conditions and assumptions, as well as climate change, and the evolving worldwide demand for energy and global advancement of alternative sources of energy that are not sourced from fossil fuels, can materially impact the estimation of net reserves, asset valuation and reclamation and timing and requirements. The timing and pace at which global energy markets transition from carbon-based sources to alternative energy is highly uncertain.
Oil and Gas Reserves
The company’s estimate of oil and gas reserves is considered in the measurement of depletion, depreciation, impairment, decommissioning and restoration obligations and business combinations. The estimation of reserves is an inherently complex process and involves professional judgment. All reserves have been evaluated at December 31, 2023, by independent qualified reserves evaluators. Oil and gas reserves estimates are based on a range of geological, technical and economic factors, including projected future rates of production, projected future commodity prices, engineering data, and the timing and amount of future expenditures, all of which are subject to uncertainty. Estimates reflect market and regulatory conditions existing at December 31, 2023, which could differ significantly from other points in time throughout the year, or future periods.
Exploration and Evaluation Costs
Certain exploration and evaluation costs are initially capitalized with the intent to establish commercially viable reserves. The company is required to make judgments about future events and circumstances and applies estimates to assess the economic viability of extracting the underlying resources. The costs are subject to technical, commercial and management review to confirm the continued intent to develop the project. The level of drilling success or changes to project economics, resource quantities, expected production techniques, production costs and required capital expenditures are important judgments when making this determination. Management uses judgment to determine when these costs are reclassified to Property, Plant and Equipment based on several factors, including the existence of reserves, appropriate approvals from regulatory bodies, joint arrangement partners and the company’s internal project approval process.
Determination of Cash Generating Units (CGUs)
A CGU is the lowest grouping of integrated assets that generates identifiable cash inflows that are largely independent of the cash inflows of other assets or groups of assets. The allocation of assets into CGUs requires significant judgment and interpretations with respect to the integration between assets, the existence of active markets, similar exposure to market risks, shared infrastructure and the way in which management monitors the operations.
Asset Impairment and Reversals
Management applies judgment in assessing the existence of impairment and impairment reversal indicators based on various internal and external factors.
The recoverable amount of CGUs and individual assets is determined based on the higher of fair value less costs of disposal or value-in-use calculations. The key estimates the company applies to determine the recoverable amount normally include estimated future commodity prices, discount rates, expected production volumes, future operating and development costs, income taxes and refining margins.
ANNUAL REPORT 2023 SUNCOR ENERGY INC. 17
In determining the recoverable amount, management may also be required to make judgments regarding the likelihood of occurrence of a future event. Changes to these estimates and judgments will affect the recoverable amounts of CGUs and individual assets and may then require a material adjustment to their related carrying value.
Decommissioning and Restoration Costs
The company recognizes liabilities for the future decommissioning and restoration of Exploration and Evaluation assets and Property, Plant and Equipment based on estimated future decommissioning and restoration costs. Management applies judgment in assessing the future regulatory requirements, the existence and extent as well as the expected method of reclamation of the company’s decommissioning and restoration obligations at the end of each reporting period. Management also uses judgment to determine whether the nature of the activities performed is related to decommissioning and restoration activities or normal operating activities.
Actual costs are uncertain, and estimates may vary as a result of changes to relevant laws and regulations related to the use of certain technologies, the emergence of new technology, operating experience, prices and closure plans. The estimated timing of future decommissioning and restoration may change due to certain factors, including reserves life. Changes to estimates related to future expected costs, discount rates, inflation assumptions and timing may have a material impact on the amounts presented.
Employee Future Benefits
The company provides benefits to employees, including pensions and other post-retirement benefits. The cost of defined benefit pension plans and other post-retirement benefits received by employees is estimated based on actuarial valuation methods that require professional judgment. Estimates typically used in determining these amounts include, as applicable, rates of employee turnover, future claim costs, discount rates, future salary and benefit levels, the return on plan assets, mortality rates and future medical costs. Changes to these estimates may have a material impact on the amounts presented.
Income Taxes
Management evaluates tax positions, annually or when circumstances require, which involves judgment and could be subject to differing interpretations of applicable tax legislation. The company recognizes a tax provision when a payment to tax authorities is considered probable. However, the results of audits and reassessments and changes in the interpretations of standards may result in changes to those positions and, potentially, a material increase or decrease in the company’s assets, liabilities and net earnings.
5. New IFRS Standards
(a) Adoption of New IFRS Standards
The standards, amendments and interpretations that are adopted up to the date of authorization of the company’s consolidated financial statements, and that may have an impact on the disclosures and financial position of the company, are disclosed below.
Disclosure Initiative – Accounting Policies
In February 2021, the IASB issued Disclosure Initiative – Accounting Policies. The amendment requires companies to disclose material rather than significant accounting policies to provide more relevant, company-specific accounting policy disclosures. The company adopted the amendments prospectively on the effective date January 1, 2023, and there were impacts that have been reflected in note 3 of the consolidated financial statements as a result of the initial application.
(b) Recently Announced Accounting Pronouncements
The standards, amendments and interpretations that are issued, but not yet effective up to the date of authorization of the company’s consolidated financial statements, and that may have an impact on the disclosures and financial position of the
18 ANNUAL REPORT 2023 SUNCOR ENERGY INC.
company, are disclosed below. The company intends to adopt these standards, amendments and interpretations when they become effective.
General Sustainability-related Disclosures and Climate-related Disclosures
In March 2024, the Canadian Sustainability Standards Board proposed Canadian-specific modifications to IFRS S1: General Sustainability-related Disclosures and IFRS S2: Climate-related disclosures, which were issued by the International Sustainability Standards Board (ISSB) in June 2023. The new standards add sustainability and climate disclosure requirements for annual reporting purposes. The Canadian-specific versions of IFRS S1 and S2 are expected to be available for voluntary adoption starting January 1, 2025; however, the Canadian Securities Administrators have not yet confirmed whether the new standards will be mandated for Canadian reporting issuers. The company is currently disclosing sustainability and climate-related information in its annual Report on Sustainability and Climate Report and anticipates changes resulting from these new standards on the consolidated financial statements as a result of future application.
6. Segmented Information
The company’s operating segments are reported based on the nature of their products and services and management responsibility. The following summary describes the operations in each of the segments:
| ● | Oil Sands includes the company’s operations in Northern Alberta to explore, develop and produce bitumen, synthetic crude oil and related products, through the recovery and upgrading of bitumen from mining and in situ operations. This segment also includes the company’s joint interests in Syncrude and Fort Hills. In 2023, the company completed two separate acquisitions of additional working interests in the Fort Hills mining and extraction operation, increasing its ownership from 54.11% to 100% (see note 16). The individual operating segments related to mining operations, In Situ, Fort Hills and Syncrude have been aggregated into one reportable segment (Oil Sands) due to the similar nature of their business activities, including the production of bitumen, and the single geographic area and regulatory environment in which they operate. |
| ● | Exploration and Production (E&P) includes offshore activity in East Coast Canada, with interests in the Terra Nova, White Rose, Hibernia and Hebron oilfields, as well as the marketing and risk management of crude oil and natural gas. International onshore assets include the company’s working interests in Libya and Syria. Suncor completed the divestments of its United Kingdom (U.K.) portfolio and Norway assets in 2023 and 2022, respectively (see note 16). |
| ● | Refining and Marketing includes the refining of crude oil products, and the distribution, marketing, transportation and risk management of refined and petrochemical products, and other purchased products through the retail and wholesale networks located in Canada and the United States (U.S.). The segment also includes trading of crude oil, refined products, natural gas and power. |
The company also reports activities not directly attributable to an operating segment under Corporate and Eliminations. This segment previously included renewable energy assets, which were sold in the first quarter of 2023 (see note 16). Corporate activities include Suncor’s debt and borrowing costs, expenses not allocated to the company’s businesses, and investments in certain clean technologies.
ANNUAL REPORT 2023 SUNCOR ENERGY INC. 19
|
|
|
|
|
|
|
|
|
|
|
|
|
|
|
|
|
|
|
|
||
|
|
|
|
|
|
|
|
|
|
|
|
|
|
|
|
|
|
|
|
||
|
|
|
|
|
|
Exploration |
|
Refining and |
|
Corporate and |
|
|
|
|
|
||||||
For the years ended December 31 |
|
Oil Sands |
|
and Production |
|
Marketing |
|
Eliminations |
|
Total |
|
||||||||||
($ millions) |
|
2023 |
|
2022 |
|
2023 |
|
2022 |
|
2023 |
|
2022 |
|
2023 |
|
2022 |
|
2023 |
|
2022 |
|
|
|
|
|
|
|
|
|
|
|
|
|
|
|
|
|
|
|
|
|
|
|
Revenues and Other Income |
|
|
|
|
|
|
|
|
|
|
|
|
|
|
|
|
|
|
|
|
|
Gross revenues |
|
18 569 |
|
21 905 |
|
2 689 |
|
4 331 |
|
30 959 |
|
36 622 |
|
(11) |
|
49 |
|
52 206 |
|
62 907 |
|
Intersegment revenues |
|
7 466 |
|
8 526 |
|
- |
|
- |
|
109 |
|
106 |
|
(7 575) |
|
(8 632) |
|
- |
|
- |
|
Less: Royalties |
|
(2 623) |
|
(3 963) |
|
(491) |
|
(608) |
|
- |
|
- |
|
- |
|
- |
|
(3 114) |
|
(4 571) |
|
Operating revenues, net of royalties |
|
23 412 |
|
26 468 |
|
2 198 |
|
3 723 |
|
31 068 |
|
36 728 |
|
(7 586) |
|
(8 583) |
|
49 092 |
|
58 336 |
|
Other income (loss) |
|
1 469 |
|
(53) |
|
10 |
|
164 |
|
224 |
|
(60) |
|
(49) |
|
80 |
|
1 654 |
|
131 |
|
|
|
24 881 |
|
26 415 |
|
2 208 |
|
3 887 |
|
31 292 |
|
36 668 |
|
(7 635) |
|
(8 503) |
|
50 746 |
|
58 467 |
|
Expenses |
|
|
|
|
|
|
|
|
|
|
|
|
|
|
|
|
|
|
|
|
|
Purchases of crude oil and products |
|
1 935 |
|
2 050 |
|
- |
|
- |
|
23 867 |
|
27 261 |
|
(7 587) |
|
(8 536) |
|
18 215 |
|
20 775 |
|
Operating, selling and general |
|
9 329 |
|
9 152 |
|
475 |
|
490 |
|
2 558 |
|
2 427 |
|
1 021 |
|
738 |
|
13 383 |
|
12 807 |
|
Transportation and distribution |
|
1 213 |
|
1 210 |
|
76 |
|
101 |
|
521 |
|
396 |
|
(35) |
|
(36) |
|
1 775 |
|
1 671 |
|
Depreciation, depletion, amortization and impairment |
|
4 902 |
|
7 927 |
|
483 |
|
(105) |
|
934 |
|
844 |
|
116 |
|
120 |
|
6 435 |
|
8 786 |
|
Exploration |
|
60 |
|
37 |
|
14 |
|
19 |
|
- |
|
- |
|
- |
|
- |
|
74 |
|
56 |
|
(Gain) loss on disposal of assets |
|
(39) |
|
(7) |
|
(600) |
|
66 |
|
(28) |
|
(11) |
|
(325) |
|
(3) |
|
(992) |
|
45 |
|
Financing expenses |
|
670 |
|
413 |
|
69 |
|
95 |
|
57 |
|
57 |
|
471 |
|
1 446 |
|
1 267 |
|
2 011 |
|
|
|
18 070 |
|
20 782 |
|
517 |
|
666 |
|
27 909 |
|
30 974 |
|
(6 339) |
|
(6 271) |
|
40 157 |
|
46 151 |
|
Earnings (Loss) before Income Taxes |
|
6 811 |
|
5 633 |
|
1 691 |
|
3 221 |
|
3 383 |
|
5 694 |
|
(1 296) |
|
(2 232) |
|
10 589 |
|
12 316 |
|
Income Tax Expense (Recovery) |
|
|
|
|
|
|
|
|
|
|
|
|
|
|
|
|
|
|
|
|
|
Current |
|
- |
|
- |
|
- |
|
- |
|
- |
|
- |
|
- |
|
- |
|
1 734 |
|
4 229 |
|
Deferred |
|
- |
|
- |
|
- |
|
- |
|
- |
|
- |
|
- |
|
- |
|
560 |
|
(990) |
|
|
|
- |
|
- |
|
- |
|
- |
|
- |
|
- |
|
- |
|
- |
|
2 294 |
|
3 239 |
|
Net Earnings |
|
- |
|
- |
|
- |
|
- |
|
- |
|
- |
|
- |
|
- |
|
8 295 |
|
9 077 |
|
Capital and Exploration Expenditures(1) |
|
4 096 |
|
3 540 |
|
668 |
|
443 |
|
1 002 |
|
816 |
|
62 |
|
188 |
|
5 828 |
|
4 987 |
|
| (1) | Excludes capital expenditures related to assets previously held for sale of $108 million for the year ended December 31, 2023 (2022 - $133 million). |
20 ANNUAL REPORT 2023 SUNCOR ENERGY INC.
Disaggregation of Revenue from Contracts with Customers and Intersegment Revenue
The company’s revenues are from the following major commodities and geographical regions:
|
|
|
|
|
|
|
|
|
|
|
|
|
For the years ended December 31 |
|
2023 |
|
2022 |
||||||||
($ millions) |
|
North America |
|
International |
|
Total |
|
North America |
|
International |
|
Total |
Oil Sands |
|
|
|
|
|
|
|
|
|
|
|
|
Synthetic crude oil and diesel |
|
18 817 |
|
- |
|
18 817 |
|
22 539 |
|
- |
|
22 539 |
Bitumen |
|
7 218 |
|
- |
|
7 218 |
|
7 892 |
|
- |
|
7 892 |
|
|
26 035 |
|
- |
|
26 035 |
|
30 431 |
|
- |
|
30 431 |
Exploration and Production |
|
|
|
|
|
|
|
|
|
|
|
|
Crude oil and natural gas liquids |
|
1 689 |
|
994 |
|
2 683 |
|
2 464 |
|
1 834 |
|
4 298 |
Natural gas |
|
- |
|
6 |
|
6 |
|
- |
|
33 |
|
33 |
|
|
1 689 |
|
1 000 |
|
2 689 |
|
2 464 |
|
1 867 |
|
4 331 |
Refining and Marketing |
|
|
|
|
|
|
|
|
|
|
|
|
Gasoline |
|
13 106 |
|
- |
|
13 106 |
|
14 540 |
|
- |
|
14 540 |
Distillate |
|
15 283 |
|
- |
|
15 283 |
|
18 663 |
|
- |
|
18 663 |
Other |
|
2 679 |
|
- |
|
2 679 |
|
3 525 |
|
- |
|
3 525 |
|
|
31 068 |
|
- |
|
31 068 |
|
36 728 |
|
- |
|
36 728 |
Corporate and Eliminations |
|
|
|
|
|
|
|
|
|
|
|
|
|
|
(7 586) |
|
- |
|
(7 586) |
|
(8 583) |
|
- |
|
(8 583) |
Total Gross Revenue from Contracts with Customers |
|
51 206 |
|
1 000 |
|
52 206 |
|
61 040 |
|
1 867 |
|
62 907 |
Geographical Information
Operating Revenues, net of Royalties
($ millions) |
|
2023 |
|
2022 |
|
|
|
|
|
|
|
|
|
|
|
|
|
Canada |
|
41 948 |
|
49 169 |
|
United States |
|
6 447 |
|
7 544 |
|
Other foreign |
|
697 |
|
1 623 |
|
|
|
49 092 |
|
58 336 |
|
Non-Current Assets(1)
|
|
December 31 |
|
December 31 |
|
($ millions) |
|
2023 |
|
2022 |
|
|
|
|
|
|
|
Canada |
|
71 438 |
|
66 346 |
|
United States |
|
2 624 |
|
2 629 |
|
Other foreign |
|
584 |
|
1 026 |
|
|
|
74 646 |
|
70 001 |
|
| (1) | Excludes deferred income tax assets. |
ANNUAL REPORT 2023 SUNCOR ENERGY INC. 21
7. Other Income (Loss)
Other income (loss) consists of the following:
($ millions) |
|
2023 |
|
2022 |
|
|
|
|
|
|
|
Energy trading and risk management |
|
307 |
|
(209) |
|
Investment and interest income(1)(2) |
|
94 |
|
149 |
|
Bargain purchase gain and revaluations(3) |
|
1 125 |
|
- |
|
Insurance proceeds(4) |
|
- |
|
179 |
|
Other(2)(5) |
|
128 |
|
12 |
|
|
|
1 654 |
|
131 |
|
| (1) | 2023 includes a $158 million impairment on an equity investment, within the Corporate segment. |
| (2) | Prior year amounts have been reclassified to align with current period presentation of Investment and interest income. In 2022, $49 million was reclassified from Other to Investment and interest income. This reclassification had no effect on net earnings and was within the Corporate segment. |
| (3) | 2023 includes a $1.1 billion bargain purchase gain and revaluation (note 16), within the Oil Sands segment. |
| (4) | 2022 includes $147 million of property damage insurance proceeds related to the company’s assets in Libya, within the Exploration and Production segment, and $32 million of insurance proceeds for the secondary extraction facilities at Oil Sands Base, within the Oil Sands segment. |
| (5) | 2023 includes a provision reversal related to the company’s arrangement involving a third-party byproduct processor, within the Oil Sands segment. 2022 includes a US$50 million contingent consideration gain related to the sale of the company’s 26.69% working interest in the Golden Eagle Area Development in the fourth quarter of 2021, within the Exploration and Production segment. |
8. Operating, Selling and General Expense
Operating, Selling and General expense consists of the following:
|
|
|
|
|
|
($ millions) |
|
2023 |
|
2022 |
|
Employee and contract service costs |
|
8 458 |
|
8 037 |
|
Materials and equipment |
|
2 518 |
|
1 901 |
|
Commodities |
|
1 739 |
|
2 196 |
|
Travel, marketing and other(1) |
|
668 |
|
673 |
|
|
|
13 383 |
|
12 807 |
|
| (1) | The company recorded a $275 million restructuring charge in the second quarter of 2023 that has been reported under travel, marketing and other. |
22 ANNUAL REPORT 2023 SUNCOR ENERGY INC.
9. Financing Expenses
Financing expenses consist of the following:
($ millions) |
|
2023 |
|
2022 |
|
Interest on debt |
|
783 |
|
815 |
|
Interest on lease liabilities |
|
198 |
|
167 |
|
Capitalized interest at 5.9% (2022 – 5.2%) |
|
(255) |
|
(168) |
|
Interest expense |
|
726 |
|
814 |
|
Interest on partnership liability |
|
49 |
|
51 |
|
Interest on pension and other post-retirement benefits |
|
11 |
|
41 |
|
Accretion |
|
532 |
|
316 |
|
Foreign exchange (gain) loss on U.S. dollar denominated debt |
|
(184) |
|
729 |
|
Operational foreign exchange and other |
|
133 |
|
28 |
|
Loss on extinguishment of long-term debt |
|
- |
|
32 |
|
|
|
1 267 |
|
2 011 |
|
10. Income Taxes
Income Tax Expense (Recovery)
($ millions) |
|
2023 |
|
2022 |
|
Current: |
|
|
|
|
|
Current year |
|
1 782 |
|
4 333 |
|
Adjustments in respect of current income tax of prior years |
|
(48) |
|
(104) |
|
Deferred: |
|
|
|
|
|
Origination and reversal of temporary differences |
|
542 |
|
(1 063) |
|
Adjustments in respect of deferred income tax of prior years |
|
96 |
|
54 |
|
Changes in tax rates and legislation |
|
(60) |
|
(27) |
|
Movement in unrecognized deferred income tax assets |
|
(18) |
|
46 |
|
Total income tax expense |
|
2 294 |
|
3 239 |
|
ANNUAL REPORT 2023 SUNCOR ENERGY INC. 23
Reconciliation of Effective Tax Rate
The provision for income taxes reflects an effective tax rate that differs from the statutory tax rate. A reconciliation of the difference is as follows:
($ millions) |
|
2023 |
|
2022 |
|
Earnings before income tax |
|
10 589 |
|
12 316 |
|
Canadian statutory tax rate |
|
23.99% |
|
24.16% |
|
Statutory tax |
|
2 540 |
|
2 976 |
|
Add (deduct) the tax effect of: |
|
|
|
|
|
Non-taxable component of capital (gains) losses |
|
(10) |
|
67 |
|
Share-based compensation and other permanent items |
|
14 |
|
- |
|
Assessments and adjustments |
|
63 |
|
(49) |
|
Impact of income tax rates and legislative changes(1) |
|
(74) |
|
(84) |
|
Non-taxable component of acquisitions and dispositions(2) |
|
(461) |
|
(25) |
|
Foreign tax rate differential(3) |
|
234 |
|
290 |
|
Movement in unrecognized deferred income tax assets |
|
(18) |
|
46 |
|
Other |
|
6 |
|
18 |
|
Total income tax expense |
|
2 294 |
|
3 239 |
|
Effective tax rate |
|
21.7% |
|
26.3% |
|
| (1) | The year ended December 31, 2022 includes a current income tax recovery of $39 million related to the sale of the company’s wind and solar assets (note 16). |
| (2) | The year ended December 31, 2023 includes a non-taxable gain on the U.K. disposition and a bargain purchase gain on the TotalEnergies Canada acquisition (note 16). |
| (3) | The year ended December 31, 2022 includes a deferred income tax recovery of $171 million related to the sale of the company’s UK assets (note 16) |
Deferred Income Tax Balances
The significant components of the company’s deferred income tax (assets) liabilities and deferred income tax expense (recovery) are comprised of the following:
|
|
Deferred Income Tax Expense (Recovery) |
|
Deferred Income Tax Liability (Asset) |
|
||||
|
|
|
|
|
|
|
|
|
|
|
|
|
|
|
|
December 31 |
|
December 31 |
|
($ millions) |
|
2023 |
|
2022 |
|
2023 |
|
2022 |
|
Property, plant and equipment |
|
(423) |
|
(729) |
|
10 996 |
|
11 093 |
|
Decommissioning and restoration provision |
|
(25) |
|
(10) |
|
(2 644) |
|
(2 292) |
|
Employee retirement benefit plans |
|
(23) |
|
(92) |
|
(278) |
|
(297) |
|
Tax loss carry-forwards(1) |
|
867 |
|
(14) |
|
(11) |
|
(29) |
|
Other |
|
164 |
|
(145) |
|
(147) |
|
(111) |
|
Net deferred income tax (recovery) / expense and liability |
|
560 |
|
(990) |
|
7 916 |
|
8 364 |
|
| (1) | The year ended December 31, 2023, the company used tax losses arising from the acquisition of TotalEnergies Canada (note 16). |
24 ANNUAL REPORT 2023 SUNCOR ENERGY INC.
Change in Deferred Income Tax Balances
($ millions) |
|
2023 |
|
2022 |
|
Net deferred income tax liability, beginning of year |
|
8 364 |
|
9 081 |
|
Recognized in deferred income tax (recovery) / expense |
|
560 |
|
(990) |
|
Recognized in other comprehensive income |
|
42 |
|
264 |
|
Foreign exchange, acquisition, disposition and other |
|
(1 050) |
|
9 |
|
Net deferred income tax liability, end of year |
|
7 916 |
|
8 364 |
|
Deferred Tax in Shareholders’ Equity
($ millions) |
|
2023 |
|
2022 |
|
Deferred Tax in Other Comprehensive Income |
|
|
|
|
|
Actuarial gain on employment retirement benefit plans |
|
42 |
|
264 |
|
Total income tax expense reported in equity |
|
42 |
|
264 |
|
Deferred income tax assets are recognized for tax loss carry-forwards to the extent that the realization of the related tax benefit is probable based on estimated future earnings. Suncor has not recognized a $101 million (2022 – $120 million) deferred income tax asset on $845 million (2022 – $986 million) of capital losses related to unrealized foreign exchange on U.S. dollar denominated debt, which can only be utilized against future capital gains.
No deferred tax liability has been recognized at December 31, 2023, on unremitted net earnings of foreign subsidiaries, as the company is able to control the timing and amount of distributions and is not expected to incur any taxes associated with future distributions.
11. Earnings per Common Share
($ millions) |
|
2023 |
|
2022 |
|
Net earnings |
|
8 295 |
|
9 077 |
|
|
|
|
|
|
|
(millions of common shares) |
|
|
|
|
|
Weighted average number of common shares |
|
1 308 |
|
1 387 |
|
Dilutive securities: |
|
|
|
|
|
Effect of share options |
|
2 |
|
3 |
|
Weighted average number of diluted common shares |
|
1 310 |
|
1 390 |
|
|
|
|
|
|
|
(dollars per common share) |
|
|
|
|
|
Basic earnings per share |
|
6.34 |
|
6.54 |
|
Diluted earnings per share |
|
6.33 |
|
6.53 |
|
12. Cash and Cash Equivalents
|
|
December 31 |
|
December 31 |
|
($ millions) |
|
2023 |
|
2022 |
|
Cash |
|
1 717 |
|
1 782 |
|
Cash equivalents |
|
12 |
|
198 |
|
|
|
1 729 |
|
1 980 |
|
ANNUAL REPORT 2023 SUNCOR ENERGY INC. 25
13. Supplemental Cash Flow Information
The (increase) decrease in non-cash working capital is comprised of:
($ millions) |
|
2023 |
|
2022 |
|
Accounts receivable |
|
526 |
|
(1 750) |
|
Inventories |
|
(153) |
|
(1 128) |
|
Accounts payable and accrued liabilities |
|
(415) |
|
1 512 |
|
Current portion of provisions |
|
339 |
|
(286) |
|
Income taxes payable (net) |
|
(1 258) |
|
(717) |
|
|
|
(961) |
|
(2 369) |
|
Relating to: |
|
|
|
|
|
Operating activities |
|
(981) |
|
(2 421) |
|
Investing activities |
|
20 |
|
52 |
|
|
|
(961) |
|
(2 369) |
|
Reconciliation of movements of liabilities to cash flows arising from financing activities:
|
|
|
|
Current Portion |
|
|
|
Current Portion |
|
|
|
|
|
|
|
|
Short-Term |
|
of Long-Term |
|
Long-Term |
|
of Long-Term |
|
Long-Term |
|
Partnership |
|
Dividends |
($ millions) |
|
Debt |
|
Lease Liabilities |
|
Lease Liabilities |
|
Debt |
|
Debt |
|
Liability |
|
Payable |
At December 31, 2021 |
|
1 284 |
|
310 |
|
2 540 |
|
231 |
|
13 989 |
|
427 |
|
- |
Changes from financing cash flows: |
|
|
|
|
|
|
|
|
|
|
|
|
|
|
Net issuance of commercial paper |
|
1 473 |
|
- |
|
- |
|
- |
|
- |
|
- |
|
- |
Repayment of long-term debt |
|
- |
|
- |
|
- |
|
(233) |
|
(4 895) |
|
- |
|
- |
Loss on extinguishment of long-term debt |
|
- |
|
- |
|
- |
|
- |
|
32 |
|
- |
|
- |
Realized foreign exchange (gains) and losses |
|
(19) |
|
15 |
|
- |
|
2 |
|
(91) |
|
- |
|
- |
Dividends paid on common shares |
|
- |
|
- |
|
- |
|
- |
|
- |
|
- |
|
(2 596) |
Lease liability payments |
|
- |
|
(329) |
|
- |
|
- |
|
- |
|
- |
|
- |
Distributions to non-controlling interest |
|
- |
|
- |
|
- |
|
- |
|
- |
|
(14) |
|
- |
Other |
|
- |
|
- |
|
- |
|
- |
|
(13) |
|
- |
|
- |
Non-cash changes: |
|
|
|
|
|
|
|
|
|
|
|
|
|
|
Dividends declared on common shares |
|
- |
|
- |
|
- |
|
- |
|
- |
|
- |
|
2 596 |
Unrealized foreign exchange losses and (gains) |
|
69 |
|
- |
|
(25) |
|
- |
|
778 |
|
- |
|
- |
Lease derecognition |
|
- |
|
- |
|
(22) |
|
- |
|
- |
|
- |
|
- |
Reclassification of lease obligations |
|
- |
|
321 |
|
(321) |
|
- |
|
- |
|
- |
|
- |
Deferred financing costs |
|
- |
|
- |
|
- |
|
- |
|
- |
|
- |
|
- |
New lease liabilities |
|
- |
|
- |
|
523 |
|
- |
|
- |
|
- |
|
- |
At December 31, 2022 |
|
2 807 |
|
317 |
|
2 695 |
|
- |
|
9 800 |
|
413 |
|
- |
Changes from financing cash flows: |
|
|
|
|
|
|
|
|
|
|
|
|
|
|
Net issuance of commercial paper |
|
(2 343) |
|
- |
|
- |
|
- |
|
1 500 |
|
- |
|
- |
Gross proceeds from issuance of long-term debt |
|
- |
|
- |
|
- |
|
- |
|
- |
|
- |
|
- |
Debt issuance costs |
|
- |
|
- |
|
- |
|
- |
|
(8) |
|
- |
|
- |
Repayment of long-term debt |
|
- |
|
- |
|
- |
|
- |
|
(5) |
|
- |
|
- |
Loss on extinguishment of long-term debt |
|
- |
|
- |
|
- |
|
- |
|
- |
|
- |
|
- |
Realized foreign exchange (gains) and losses |
|
38 |
|
- |
|
- |
|
- |
|
5 |
|
- |
|
- |
Dividends paid on common shares |
|
- |
|
- |
|
- |
|
- |
|
- |
|
- |
|
(2 749) |
Lease liability payments |
|
- |
|
(331) |
|
- |
|
- |
|
- |
|
- |
|
- |
Distributions to non-controlling interest |
|
- |
|
- |
|
- |
|
- |
|
- |
|
(16) |
|
- |
Other |
|
- |
|
- |
|
- |
|
- |
|
(3) |
|
1 |
|
- |
26 ANNUAL REPORT 2023 SUNCOR ENERGY INC.
Non-cash changes: |
|
|
|
|
|
|
|
|
|
|
|
|
|
|
Dividends declared on common shares |
|
- |
|
- |
|
- |
|
- |
|
- |
|
- |
|
2 749 |
Unrealized foreign exchange losses and (gains) |
|
(8) |
|
(3) |
|
(14) |
|
- |
|
(202) |
|
- |
|
- |
Lease derecognition |
|
- |
|
- |
|
(682) |
|
- |
|
- |
|
- |
|
- |
Reclassification of lease obligations |
|
- |
|
365 |
|
(365) |
|
- |
|
- |
|
- |
|
- |
Deferred financing costs |
|
- |
|
- |
|
- |
|
- |
|
- |
|
- |
|
- |
New lease liabilities |
|
- |
|
- |
|
1 844 |
|
- |
|
- |
|
- |
|
- |
At December 31, 2023 |
|
494 |
|
348 |
|
3 478 |
|
- |
|
11 087 |
|
398 |
|
- |
14. Inventories
|
|
December 31 |
|
December 31 |
|
($ millions) |
|
2023 |
|
2022 |
|
Crude oil(1)(2) |
|
2 127 |
|
2 224 |
|
Refined products |
|
2 244 |
|
2 014 |
|
Materials, supplies and merchandise(1) |
|
994 |
|
834 |
|
Reclassified to assets held for sale (note 33) |
|
- |
|
(14) |
|
|
|
5 365 |
|
5 058 |
|
| (1) | Prior period amounts have been reclassified to align with the current year presentation of Inventories. For the year ended December 31, 2022, $149 million was reclassified from crude oil to materials, supplies and equipment. This reclassification had no effect on the inventories presentation on the consolidated balance sheet. |
| (2) | Includes $113 million of inventories held for trading purposes (2022 – $131 million), which are measured at fair value less costs to sell based on Level 1 and Level 2 fair value inputs. |
During 2023, purchased product inventories of $18.2 billion (2022 - $21.7 billion) were recorded as an expense.
ANNUAL REPORT 2023 SUNCOR ENERGY INC. 27
15. Property, Plant and Equipment
|
|
Oil and Gas |
|
Plant and |
|
|
|
($ millions) |
|
Properties |
|
Equipment |
|
Total |
|
Cost |
|
|
|
|
|
|
|
At December 31, 2021 |
|
41 230 |
|
85 329 |
|
126 559 |
|
Additions |
|
1 149 |
|
4 261 |
|
5 410 |
|
Transfers from exploration and evaluation |
|
34 |
|
- |
|
34 |
|
Changes in decommissioning and restoration |
|
1 321 |
|
(10) |
|
1 311 |
|
Disposals and derecognition |
|
(585) |
|
(884) |
|
(1 469) |
|
Foreign exchange adjustments |
|
101 |
|
218 |
|
319 |
|
Reclassified to assets held for sale (note 33) |
|
(4 475) |
|
(480) |
|
(4 955) |
|
At December 31, 2022 |
|
38 775 |
|
88 434 |
|
127 209 |
|
Additions |
|
591 |
|
5 477 |
|
6 068 |
|
Acquisition (note 16)(1) |
|
1 793 |
|
6 076 |
|
7 869 |
|
Transfers |
|
958 |
|
(958) |
|
- |
|
Changes in decommissioning and restoration |
|
1 346 |
|
94 |
|
1 440 |
|
Disposals and derecognition |
|
(8) |
|
(1 850) |
|
(1 858) |
|
Foreign exchange adjustments |
|
(128) |
|
(87) |
|
(215) |
|
Divestitures (note 16)(1) |
|
(2 226) |
|
(12 705) |
|
(14 931) |
|
At December 31, 2023 |
|
41 101 |
|
84 481 |
|
125 582 |
|
|
|
|
|
|
|
|
|
Accumulated provision |
|
|
|
|
|
|
|
At December 31, 2021 |
|
(25 227) |
|
(35 786) |
|
(61 013) |
|
Depreciation, depletion, amortization and impairment |
|
(1 049) |
|
(7 347) |
|
(8 396) |
|
Disposals and derecognition |
|
510 |
|
338 |
|
848 |
|
Foreign exchange adjustments |
|
(60) |
|
(107) |
|
(167) |
|
Reclassified to assets held for sale (note 33) |
|
4 111 |
|
62 |
|
4 173 |
|
At December 31, 2022 |
|
(21 715) |
|
(42 840) |
|
(64 555) |
|
Depreciation, depletion, amortization and impairment |
|
(1 686) |
|
(4 352) |
|
(6 038) |
|
Transfers |
|
(1 090) |
|
1 090 |
|
- |
|
Disposals and derecognition |
|
4 |
|
1 611 |
|
1 615 |
|
Foreign exchange adjustments |
|
132 |
|
23 |
|
155 |
|
Divestitures (note 16)(1) |
|
1 044 |
|
9 847 |
|
10 891 |
|
At December 31, 2023 |
|
(23 311) |
|
(34 621) |
|
(57 932) |
|
|
|
|
|
|
|
|
|
Net property, plant and equipment |
|
|
|
|
|
|
|
December 31, 2022 |
|
17 060 |
|
45 594 |
|
62 654 |
|
December 31, 2023 |
|
17 790 |
|
49 860 |
|
67 650 |
|
| (1) | In connection with both the Teck acquisition (note 16) and the TotalEnergies Canada acquisition (note16), Suncor was deemed to have divested of its pre-existing interest in Fort Hills, presented as divestments, and re-acquired it at fair value. As such, acquisitions include 100% of the fair value of property, plant and equipment related to the TotalEnergies Canada acquisition, including the reevaluations of the existing working interest and the remaining capacity on a regional pipeline. |
|
|
December 31, 2023 |
|
December 31, 2022 |
|
||||||||
|
|
|
|
|
|
|
|
|
|
|
|
|
|
|
|
|
|
Accumulated |
|
Net Book |
|
|
|
Accumulated |
|
Net Book |
|
($ millions) |
|
Cost |
|
Provision |
|
Value |
|
Cost |
|
Provision |
|
Value |
|
Oil Sands |
|
89 230 |
|
(37 629) |
|
51 601 |
|
92 601 |
|
(45 288) |
|
47 313 |
|
Exploration and Production |
|
17 364 |
|
(11 750) |
|
5 614 |
|
16 541 |
|
(11 360) |
|
5 181 |
|
Refining and Marketing |
|
17 923 |
|
(8 038) |
|
9 885 |
|
17 101 |
|
(7 435) |
|
9 666 |
|
Corporate and Eliminations |
|
1 065 |
|
(515) |
|
550 |
|
966 |
|
(472) |
|
494 |
|
|
|
125 582 |
|
(57 932) |
|
67 650 |
|
127 209 |
|
(64 555) |
|
62 654 |
|
28 ANNUAL REPORT 2023 SUNCOR ENERGY INC.
At December 31, 2023, the balance of assets under construction and not subject to depreciation or depletion was $7.9 billion (December 31, 2022 – $6.3 billion). For the year ended December 31, 2022, both the U.K operations, reported in the Exploration and Production segment, and the wind and solar assets, reported in the Corporate segment, were classified as assets held for sale (note 33).
16. Asset Transactions and Impairments
No indicators of impairment or reversals of impairment were identified at December 31, 2023.
Oil Sands
Acquisition of Additional Ownership Interest in Fort Hills:
On February 2, 2023, Suncor completed the acquisition of an additional 14.65% working interest in Fort Hills from Teck Resources Limited (Teck) for $712 million, bringing the company’s working interest in Fort Hills to 68.76%.
The acquisition has been accounted for as a business combination using the acquisition method.
($ millions) |
|
|
|
Accounts receivable |
|
35 |
|
Inventory |
|
37 |
|
Property, plant and equipment |
|
1 149 |
|
Other assets(1) |
|
6 |
|
Total assets acquired |
|
1 227 |
|
Accounts payable and other liabilities |
|
(102) |
|
Lease liabilities |
|
(284) |
|
Decommissioning provision |
|
(83) |
|
Deferred income taxes |
|
(46) |
|
Total liabilities assumed |
|
(515) |
|
Net assets acquired |
|
712 |
|
| (1) | Other assets include $3 million of cash and cash equivalents. |
The fair values of accounts receivables and accounts payable approximate their carrying values due to the short-term maturity of the instruments. The fair value of materials and supplies inventory approximates book value due to short-term turnover rates. The fair values of property, plant and equipment and the decommissioning provision were determined using an expected future cash flow approach (Level 3 fair value inputs – note 27). Key assumptions used in the calculations were discount rates, forecasted production volumes, commodity prices (including foreign exchange rates), operating costs and capital costs (“forecasted cash flow assumptions”).
The additional 14.65% working interest in Fort Hills contributed $501 million to gross revenues and $22 million net earnings to consolidated net earnings from the acquisition date to December 31, 2023.
Had the acquisition occurred on January 1, 2023, the additional working interest would have contributed an additional $20 million to gross revenues and a $21 million net loss, which would have resulted in gross revenues of $52.2 billion and consolidated net earnings of $8.3 billion for the year ended December 31, 2023.
The proforma information is not necessarily indicative of the results that would have been obtained if the Teck acquisition had actually occurred on January 1, 2023.
Acquisition of TotalEnergies EP Canada Ltd. and Remaining Working Interest in Fort Hills:
On November 20, 2023, Suncor completed the acquisition of TotalEnergies EP Canada Ltd. (TotalEnergies Canada), which held the remaining 31.23% working interest in Fort Hills, for a purchase price of $1.468 billion before working capital, closing adjustments and other closing costs, making Suncor the sole owner of Fort Hills. The effective date of the transaction was April 1, 2023.
ANNUAL REPORT 2023 SUNCOR ENERGY INC. 29
The determination of fair value of the preliminary purchase price is based on management’s best estimate as of the closing date.
The following table summarizes the fair value of the net assets acquired:
|
|
|
|
($ millions) |
|
|
|
Cash |
|
150 |
|
Accounts receivable |
|
521 |
|
Inventory |
|
180 |
|
Property, plant and equipment |
|
2 361 |
|
Deferred income taxes |
|
1 084 |
|
Total assets acquired |
|
4 296 |
|
Accounts payable and accrued liabilities |
|
(527) |
|
Lease liabilities |
|
(347) |
|
Decommissioning provision |
|
(392) |
|
Total liabilities assumed |
|
(1 266) |
|
Net assets acquired |
|
3 030 |
|
|
|
|
|
The acquisition has been accounted for as a step business combination using the acquisition method pursuant to IFRS 3. Under the acquisition method, assets and liabilities are recorded at their fair values on the date of acquisition. In addition, when an acquirer achieves control in stages, the previously held interest is re-measured to fair value at the acquisition date with a gain or loss recognized in net earnings.
The fair values of accounts receivables and accounts payable approximate their carrying values due to the short-term maturity of the instruments. The fair value of inventory was determined using market prices and rates from available pricing sources. The fair values of property, plant and equipment and the decommissioning provision were determined using an expected future cash flow approach (Level 3 fair value inputs – note 27). Key assumptions used in the calculations were discount rates, forecasted production volumes, commodity prices (including foreign exchange rates), operating costs and capital costs (“forecasted cash flow assumptions”). The deferred income tax asset recognized as a result of the acquisition of TotalEnergies Canada involves numerous assumptions made by management and the interpretation of the tax laws applicable to the circumstances surrounding the historical tax positions taken by, and acquisition of, TotalEnergies Canada.
The previously held interest in Fort Hills has been re-measured to fair value and estimated to be $3.887 billion and the net carrying value of the Fort Hills assets was $3.904 billion. The company recognized a non-cash revaluation loss of its existing interest of $17 million in other income in the consolidated statements of comprehensive income.
|
|
|
|
($ millions) |
|
|
|
Total consideration(1) |
|
1 832 |
|
Net assets acquired |
|
(3 030) |
|
Bargain purchase gain |
|
(1 198) |
|
Revaluation loss on existing interest |
|
17 |
|
Fair value of pre-existing relationship |
|
56 |
|
Bargain purchase gain and revaluations (note 7) |
|
(1 125) |
|
|
|
|
|
| (1) | Total consideration includes working capital as at April 1, 2023. |
Acquisition costs of $12 million, have been charged to operating, selling and general expense in the consolidated statements of comprehensive income for the three and twelve months ended December 31, 2023.
The acquisition of TotalEnergies Canada contributed $148 million to gross revenues and $18 million net earnings to consolidated net earnings from the acquisition date to December 31, 2023.
30 ANNUAL REPORT 2023 SUNCOR ENERGY INC.
Had the acquisition occurred on January 1, 2023, TotalEnergies Canada would have contributed an additional $1.1 billion to gross revenues and $71 million to net earnings, which would have resulted in gross revenues of $53.3 billion and consolidated net earnings of $8.4 billion for the year ended December 31, 2023.
The proforma information is not necessarily indicative of the results that would have been obtained if the TotalEnergies Canada acquisition had actually occurred on January 1, 2023.
As part of the acquisition, the company assumed various pipeline commitments and ancillary assets, including the remaining capacity on a regional pipeline, which has been recognized accordingly as an ROU asset in property plant and equipment and long-term lease liability.
Exploration and Production
Sale of United Kingdom Operations:
During the second quarter of 2023, the company completed the sale of its U.K. operations, including its interests in Buzzard and Rosebank located in the U.K. sector of the North Sea, for gross proceeds of $1.1 billion, before closing adjustments and other closing costs, resulting in an after-tax gain on sale of $607 million ($607 million before-tax), including $25 million in foreign exchange gains recognized as a result of the disposal. The U.K. operations are reported within the Exploration and Production segment.
Corporate
Sale of Wind and Solar Assets:
During the first quarter of 2023, the company completed the sale of its wind and solar assets (Forty Mile, Adelaide, Magrath and Chin Chute) for gross proceeds of $730 million, before closing adjustments and other closing costs, resulting in an after-tax gain on sale of approximately $260 million ($302 million before-tax). The wind and solar assets were reported in the Corporate segment.
Asset Impairments and Transactions in 2022
No indicators of impairment or reversals of impairment were identified at December 31, 2022.
Oil Sands
Fort Hills assets:
During the fourth quarter of 2022, the company entered into an agreement to acquire Teck’s 21.3% interest in Fort Hills. Prior to entering the agreement with Teck, the company also updated its long-range plan for Fort Hills, which incorporated lower gross production and increased operating costs per barrel for the next three years.
Management considered these indicators of impairment and performed an asset impairment test using recoverable amounts based on fair value less costs of disposal. An impairment charge of $2.6 billion (net of taxes of $0.8 billion) was recognized on its share of Fort Hills in the Oil Sands segment in the third quarter of 2022. An expected cash flow approach with the following asset specific assumptions (Level 3 fair value inputs note 27) were applied:
| ● | Western Canada Select (WCS) price forecast of US$69.00/bbl in 2023, US$62.00/bbl in 2024, and an average price of US$50.00/bbl between 2025 and 2031, escalating at 2% per year thereafter over the life of the project up to 2060, adjusted for asset-specific location and quality differentials; |
| ● | the company’s share of production ranging from 87,000 bbls/d to 106,000 bbls/d over the life of the project; |
| ● | cash operating costs averaging approximately $25.00/bbl over the life of the project (expressed in real dollars), which reflects operating, selling and general expenses adjusted for non-production costs, including share-based compensation, research costs, and excess power revenue; |
| ● | foreign exchange rate of US$0.76 per one Canadian dollar; and |
| ● | risk adjusted discount rate of 8.25% (after-tax). |
ANNUAL REPORT 2023 SUNCOR ENERGY INC. 31
The recoverable amount of the Fort Hills CGU was $2.8 billion (net of taxes) as at September 30, 2022. The recoverable amount estimate is most sensitive to price and discount rate. A 5% average decrease in price over the life of the project would have resulted in an additional impairment charge of approximately $1.0 billion (after-tax) on the company’s share of the Fort Hills assets. A 1% increase in the discount rate would have resulted in an additional impairment charge of approximately $0.2 billion (after-tax) on the company’s share of the Fort Hills assets.
Exploration and Production
White Rose assets:
In the second quarter of 2022, the company announced that concurrent with the decision to restart the West White Rose project by the joint venture owners, Suncor increased its ownership in the White Rose asset by 12.5% to approximately 39% (previously approximately 26%). The decision to restart was driven by a revised royalty structure and development plan. The company received $38 million (net of taxes of $12 million) in cash consideration to acquire the additional working interest, which was primarily allocated to the asset retirement obligation and property, plant and equipment of the project. As a result of these events, during the second quarter of 2022, the company performed an impairment reversal test on the White Rose CGU as the recoverable amount of this CGU was sensitive to the restart decision. The impairment reversal test was performed using a recoverable amount based on the fair value less cost of disposal. An expected cash flow approach was used with the key assumptions discussed below (Level 3 fair value inputs note 27).
As a result of the impairment reversal test, the recoverable amounts were determined to be greater than the carrying values of the White Rose CGU and the company recorded an impairment reversal of $542 million (net of taxes of $173 million) on its previous share of the White Rose assets in the Exploration and Production segment. The recoverable amount was determined based on the following asset-specific assumptions:
| ● | Brent price forecast of US$85.00/bbl in 2023, US$68.00 in 2024 and US$69.00 in 2025, escalating at 2% per year thereafter over the life of the project to 2038 and adjusted for asset-specific location and quality differentials; |
| ● | anticipated first oil for the West White Rose project in the first half of 2026 and the company’s share of production of approximately 9,800 bbls/d (based on its previous working interest of approximately 26%) over the life of the project; |
| ● | the company’s share of future capital expenditures of $1.5 billion, including the West White Rose expansion; and |
| ● | risk-adjusted discount rate of 9.0% (after-tax). |
Norway assets:
During the third quarter of 2022, the company completed the sale of its Norway assets, including its 30% working interest in Oda and its 17.5% working interest in the Fenja Development Joint Operations, for net proceeds of $297 million (net of cash disposed of $133 million), resulting in a $65 million loss including foreign exchange impacts. The Norway assets are reported in the Exploration and Production segment.
The company reclassified the assets and liabilities related to its Norway operations as assets held for sale and performed an impairment test on the Norway assets held for sale as at June 30, 2022. The impairment test was performed using the lower of its carrying amount and fair value less costs to sell (Level 2 fair value inputs note 27). As a result of the impairment test, the company recorded a $47 million charge related to its share of the Norway operations, net of a $23 million deferred tax adjustment.
32 ANNUAL REPORT 2023 SUNCOR ENERGY INC.
17. Right-of-Use Assets and Leases
Right-of-use (ROU) assets within Property, Plant and Equipment:
|
|
December 31 |
|
December 31 |
|
($ millions) |
|
2023 |
|
2022 |
|
Property, plant and equipment, net – excluding ROU assets |
|
63 982 |
|
59 778 |
|
ROU assets |
|
3 668 |
|
2 876 |
|
|
|
67 650 |
|
62 654 |
|
The following table presents the ROU assets by asset class:
|
|
Plant and |
|
($ millions) |
|
Equipment |
|
Cost |
|
|
|
At January 1, 2022 |
|
3 861 |
|
Additions and adjustments |
|
523 |
|
Disposals |
|
(156) |
|
Foreign exchange |
|
20 |
|
At December 31, 2022 |
|
4 248 |
|
Additions and adjustments |
|
423 |
|
Acquisition(1) (note16) |
|
1 425 |
|
Disposals(2) |
|
(176) |
|
Divestitures(1) (note 16) |
|
(707) |
|
Foreign exchange |
|
(7) |
|
At December 31, 2023 |
|
5 206 |
|
|
|
|
|
Accumulated provision |
|
|
|
At January 1, 2022 |
|
(1 136) |
|
Depreciation |
|
(356) |
|
Disposals |
|
126 |
|
Foreign exchange |
|
(6) |
|
At December 31, 2022 |
|
(1 372) |
|
Depreciation |
|
(358) |
|
Disposals(2) |
|
94 |
|
Divestitures(1) (note 16) |
|
96 |
|
Foreign exchange |
|
2 |
|
At December 31, 2023 |
|
(1 538) |
|
|
|
|
|
Net ROU assets |
|
|
|
At December 31, 2022 |
|
2 876 |
|
At December 31, 2023 |
|
3 668 |
|
|
|
|
|
| (1) | In connection with both the Teck acquisition (note 16) and the TotalEnergies Canada step acquisition (note16), Suncor was deemed to have divested of its pre-existing interest in Fort Hills, presented as divestments, and re-acquired it at fair value. As such, acquisitions include 100% of the fair value of ROU assets related to the TotalEnergies Canada acquisition, including the reevaluations of the existing working interest and the remaining capacity on a regional pipeline. |
| (2) | Disposals primarily relate to early lease terminations. |
Other lease-related items recognized in the Consolidated Statements of Comprehensive Income:
There were no leases with residual value guarantees. For the year ended December 31, 2023, total cash outflow for leases, excluding short-term lease expense and variable lease expense, was $529 million (2022 – $496 million).
ANNUAL REPORT 2023 SUNCOR ENERGY INC. 33
18. Exploration and Evaluation Assets
|
|
December 31 |
|
December 31 |
|
($ millions) |
|
2023 |
|
2022 |
|
Beginning of year |
|
1 995 |
|
2 226 |
|
Acquisitions and additions |
|
3 |
|
41 |
|
Transfers to oil and gas assets |
|
- |
|
(34) |
|
Disposals and derecognition |
|
(240) |
|
- |
|
Reclassified to assets held for sale (note 33) |
|
- |
|
(239) |
|
Foreign exchange adjustments |
|
- |
|
1 |
|
End of year |
|
1 758 |
|
1 995 |
|
In 2023, the company derecognized $240 million on its Meadow Creek development properties in the Oil Sands segment as these properties no longer align with the company’s future development plans.
19. Other Assets
|
|
December 31 |
|
December 31 |
|
($ millions) |
|
2023 |
|
2022 |
|
Investments(1) |
|
490 |
|
532 |
|
Prepaids |
|
661 |
|
481 |
|
Pension (note 23) |
|
207 |
|
212 |
|
Other(1) |
|
352 |
|
541 |
|
|
|
1 710 |
|
1 766 |
|
| (1) | Prior period amounts have been reclassified to align with current period presentation of Other Assets. For the year ended December 31, 2022, $226 million was reclassified from Investments to Other. This reclassification had no effect on the other assets presentation on the consolidated balance sheet. |
Prepaids includes long-term accounts receivable related to deposits paid on account to support reclamation activities into the Syncrude Reclamation Trust and emissions credits and are unlikely to be settled within one year.
Other includes long-term accounts receivable related to Notices of Reassessments that have been received from the Canada Revenue Agency and are unlikely to be settled within one year.
20. Goodwill and Other Intangible Assets
|
|
|
|
Refining and |
|
|
|
|
|
|
|
Oil Sands |
|
Marketing |
|
Other |
|
|
|
($ millions) |
|
Goodwill |
|
Goodwill |
|
Intangibles |
|
Total |
|
At December 31, 2021 |
|
2 752 |
|
140 |
|
631 |
|
3 523 |
|
Additions |
|
- |
|
- |
|
140 |
|
140 |
|
Amortization |
|
- |
|
- |
|
(57) |
|
(57) |
|
Reclassified to assets held for sale (note 33) |
|
- |
|
- |
|
(20) |
|
(20) |
|
At December 31, 2022 |
|
2 752 |
|
140 |
|
694 |
|
3 586 |
|
Additions |
|
- |
|
- |
|
22 |
|
22 |
|
Amortization |
|
- |
|
- |
|
(80) |
|
(80) |
|
At December 31, 2023 |
|
2 752 |
|
140 |
|
636 |
|
3 528 |
|
The company performed a goodwill impairment test at December 31, 2023 on its Oil Sands segment. Recoverable amounts were based on fair value less costs of disposal calculated using the present value of the segment’s expected future cash flows.
Cash flow forecasts are based on past experience, historical trends, third-party evaluations of the company’s reserves and resources to estimate production profiles and volumes, and estimates of operating costs, maintenance and capital expenditures. These estimates are validated against the estimates approved through the company’s annual reserves
34 ANNUAL REPORT 2023 SUNCOR ENERGY INC.
evaluation process and determine the duration of the underlying cash flows used in the discounted cash flow test. Projected cash flows reflect current market assessments of key assumptions, including climate change, long-term forecasts of commodity prices, inflation rates, foreign exchange rates and discount rates (Level 3 fair value inputs note 27).
Future cash flow estimates are discounted using after-tax risk-adjusted discount rates. The after-tax discount rate applied to cash flow projections was an average of 7.8% (2022 – 7.8%). The company based its cash flow projections on a West Texas Intermediate price of US$76.00/bbl in 2024, US$73.44/bbl in 2025, US$71.79/bbl in 2026 and escalating at an average of 2% thereafter, adjusted for applicable quality and location differentials. The forecast cash flow period ranged from 50 years to 55 years. As a result of this analysis, management did not identify any impairment of goodwill within the Oil Sands operating segment.
The company also performed a goodwill impairment test of its Refining and Marketing CGUs. The recoverable amounts are based on fair value less costs of disposal calculated using the present value of the CGUs’ expected future cash flows, based primarily on historical results adjusted for current economic conditions. As a result of this analysis, management did not identify any impairment of goodwill within the Refining and Marketing segment.
21. Debt and Credit Facilities
Debt and credit facilities are comprised of the following:
Short-Term Debt
|
|
December 31 |
|
December 31 |
($ millions) |
|
2023 |
|
2022 |
Commercial paper(1) |
|
494 |
|
2 807 |
| (1) | The commercial paper is supported by a revolving credit facility with a syndicate of lenders. The company is authorized to issue commercial paper to a maximum of $5.0 billion having a term not to exceed 365 days. The weighted average interest rate as at December 31, 2023 was 5.57% (December 31, 2022 – 4.93%). |
ANNUAL REPORT 2023 SUNCOR ENERGY INC. 35
Long-Term Debt
|
|
December 31 |
|
December 31 |
|
($ millions) |
|
2023 |
|
2022 |
|
Fixed-term debt(2)(3) |
|
|
|
|
|
5.60% Series 9 Medium Term Notes, due 2025 |
|
1 000 |
|
- |
|
5.40% Series 10 Medium Term Notes, due 2026 |
|
500 |
|
- |
|
3.00% Series 5 Medium Term Notes, due 2026 |
|
115 |
|
115 |
|
7.875% Debentures, due 2026 (US$275) |
|
369 |
|
381 |
|
8.20% Notes, due 2027 (US$59)(4) |
|
57 |
|
61 |
|
7.00% Debentures, due 2028 (US$250) |
|
333 |
|
342 |
|
3.10% Series 6 Medium Term Notes, due 2029 |
|
79 |
|
79 |
|
5.00% Series 7 Medium Term Notes, due 2030 |
|
154 |
|
154 |
|
7.15% Notes, due 2032 (US$500) |
|
659 |
|
676 |
|
5.35% Notes, due 2033 (US$300) |
|
153 |
|
161 |
|
5.95% Notes, due 2034 (US$500) |
|
659 |
|
675 |
|
5.95% Notes, due 2035 (US$600) |
|
262 |
|
268 |
|
5.39% Series 4 Medium Term Notes, due 2037 |
|
279 |
|
279 |
|
6.50% Notes, due 2038 (US$1 150) |
|
1 516 |
|
1 553 |
|
6.80% Notes, due 2038 (US$900) |
|
1 204 |
|
1 235 |
|
6.85% Notes, due 2039 (US$750) |
|
988 |
|
1 013 |
|
6.00% Notes, due 2042 (US$152)(4) |
|
42 |
|
35 |
|
4.34% Series 5 Medium Term Notes, due 2046 |
|
300 |
|
300 |
|
4.00% Notes, due 2047 (US$750) |
|
987 |
|
1 011 |
|
3.95% Series 8 Medium Term Notes, due 2051 |
|
493 |
|
493 |
|
3.75% Notes, due 2051 (US$750) |
|
980 |
|
1 009 |
|
Total unsecured long-term debt |
|
11 129 |
|
9 840 |
|
|
|
|
|
|
|
Lease liabilities(5) |
|
3 826 |
|
3 012 |
|
Deferred financing costs |
|
(42) |
|
(40) |
|
|
|
14 913 |
|
12 812 |
|
Current portion of long-term debt and lease liabilities |
|
|
|
|
|
Lease liabilities |
|
(348) |
|
(317) |
|
Long-term debt |
|
- |
|
- |
|
|
|
(348) |
|
(317) |
|
Total long-term lease liabilities |
|
3 478 |
|
2 695 |
|
Total long-term debt |
|
11 087 |
|
9 800 |
|
| (2) | The value of debt includes the unamortized balance of premiums or discounts. |
| (3) | Certain securities are redeemable at the option of the company. |
| (4) | Debt acquired through the acquisition of Canadian Oil Sands Limited (COS). |
| (5) | Interest rates range from 0.9% to 13.4% and maturity dates range from 2024 to 2062. |
On November 17, 2023, the company issued $1.5 billion in aggregate principal of senior unsecured notes, consisting of $1.0 billion principal amount of Series 9 Medium Term Notes, maturing on November 17, 2025, having a coupon of 5.60% and $500 million principal amount of Series 10 Medium Term Notes, maturing on November 17, 2026, having a coupon of 5.40%. Debt issuance costs were $8 million and were netted against the carrying amount of the debt and amortized using the effective interest method.
In the second quarter of 2023, the company extended the maturity of its syndicated credit facilities from June 2024 and June 2025 to June 2026, and reduced the size of its $3.0 billion tranche by $200 million, to $2.8 billion.
36 ANNUAL REPORT 2023 SUNCOR ENERGY INC.
In the fourth quarter of 2022, the company repaid $3.6 billion aggregate principal amount of debt at an amount below par of $51 million plus accrued and unpaid interest. As a result of the extinguishment, the company incurred non-cash charges of $83 million related to accelerated amortization. This resulted in a total loss on extinguishment of long-term debt of $32 million. The general terms of the notes that were extinguished are as follows:
| ● | 3.00% Series 5 Medium Term Notes, due 2026, with a principal amount of $700 million (partial repayment of $585 million); |
| ● | 8.20% Notes, due 2027, with a principal amount of US$59 million (partial repayment of US$16 million); |
| ● | 3.10% Series 6 Medium Term Notes, due 2029, with a principal amount of $750 million (partial repayment of $671 million); |
| ● | 5.00% Series 7 Medium Term Notes, due 2030, with a principal amount of $1.3 billion (partial repayment of $1.1 billion); |
| ● | 5.35% Notes, due 2033, with a principal amount of US$300 million (partial repayment of US$178 million); |
| ● | 5.95% Notes, due 2035, with a principal amount of US$600 million (partial repayment of US$401 million); |
| ● | 5.39% Series 4 Medium Term Notes, due 2037, with a principal amount of $600 million (partial repayment of $321 million); and |
| ● | 6.00% Notes, due 2042, with a principal amount of US$142 million (partial repayment of US$110 million). |
In the second quarter of 2022, the company completed an early redemption, at par, of its outstanding US$450 million 2.80% notes and US $550 million 3.10% notes, originally due in 2023 and 2025, respectively. The company also completed a partial redemption, at par, for US$10.2 million of its outstanding US$152 million 6.00% notes, due in 2042.
In the first quarter of 2022, the company completed an early redemption of its outstanding US$182 million 4.50% notes, originally scheduled to mature in the second quarter of 2022.
Scheduled Debt Repayments
Scheduled principal repayments as at December 31, 2023 for lease liabilities, short-term debt and long-term debt are as follows:
($ millions) |
|
Repayment |
|
2024 |
|
842 |
|
2025 |
|
1 310 |
|
2026 |
|
1 246 |
|
2027 |
|
307 |
|
2028 |
|
570 |
|
Thereafter |
|
11 132 |
|
|
|
15 407 |
|
Credit Facilities
A summary of available and unutilized credit facilities is as follows:
($ millions) |
|
2023 |
|
Fully revolving and expiring in 2026 |
|
5 451 |
|
Can be terminated at any time at the option of the lenders |
|
1 520 |
|
Total credit facilities |
|
6 971 |
|
Credit facilities supporting outstanding commercial paper |
|
(494) |
|
Credit facilities supporting standby letters of credit |
|
(944) |
|
Total unutilized credit facilities(1) |
|
5 533 |
|
| (1) | Available credit facilities for liquidity purposes at December 31, 2023 increased to $4.957 billion, compared to $2.900 billion at December 31, 2022. |
ANNUAL REPORT 2023 SUNCOR ENERGY INC. 37
22. Other Long-Term Liabilities
|
|
December 31 |
|
December 31 |
|
($ millions) |
|
2023 |
|
2022 |
|
Pensions and other post-retirement benefits (note 23) |
|
598 |
|
564 |
|
Share-based compensation plans (note 26) |
|
339 |
|
469 |
|
Partnership liability (note 27)(1) |
|
398 |
|
413 |
|
Deferred revenue |
|
13 |
|
22 |
|
Libya Exploration and Production Sharing Agreement (EPSA) signature bonus(2) |
|
83 |
|
85 |
|
Other |
|
57 |
|
89 |
|
|
|
1 488 |
|
1 642 |
|
| (1) | The company paid $65 million in 2023 (2022 – $60 million) in distributions to the partners of the East Tank Farm Development, of which $49 million (2022 – $51 million) was allocated to interest expense and $16 million (2022 – $9 million) to the principal. |
| (2) | The company had a US$500 million obligation for a signature bonus relating to Petro-Canada’s ratification of six EPSAs in Libya. At December 31, 2023, the carrying amount of the Libya EPSAs’ signature bonus is $83 million (December 31, 2022 – $85 million). |
23. Pensions and Other Post-Retirement Benefits
The company’s defined benefit pension plans provide pension benefits at retirement based on years of service and final average earnings (if applicable). These obligations are met through funded registered retirement plans and through unregistered supplementary pensions that are funded through retirement compensation arrangements, and/or paid directly to recipients. The company’s contributions to the funded plans are deposited with independent trustees who act as custodians of the plans’ assets, as well as the disbursing agents of the benefits to recipients. Plan assets are managed by a pension committee on behalf of beneficiaries. The committee retains independent managers and advisors.
Asset-liability matching studies are performed by a third-party consultant to set the asset mix by quantifying the risk-and-return characteristics of possible asset mix strategies. Investment and contribution policies are integrated within this study, and areas of focus include asset mix as well as interest rate sensitivity.
Funding of the registered retirement plans complies with applicable regulations that require actuarial valuations of the pension funds at least once every three years in Canada and the U.K., and every year in the United States and Germany. The most recent valuations for the registered Canadian plans and U.K. plans were performed as at December 31, 2022. The company uses a measurement date of December 31 to value the plan assets and remeasure the accrued benefit obligation for accounting purposes. In 2023, the U.K. defined benefit plan was sold concurrently with the sale of the U.K. operations (see note 16).
The company’s other post-retirement benefits programs are unfunded and include certain health care and life insurance benefits provided to retired employees and eligible surviving dependents.
The company reports its share of Syncrude’s defined benefit and defined contribution pension plans and Syncrude’s other post-retirement benefits plan.
The company also provides a number of defined contribution plans, including a U.S. 401(k) savings plan, that provide for an annual contribution of 5% to 11.5% of each participating employee’s pensionable earnings.
38 ANNUAL REPORT 2023 SUNCOR ENERGY INC.
Defined Benefit Obligations and Funded Status
|
|
|
|
|
|
Other |
|
||
|
|
|
|
|
|
Post-Retirement |
|
||
|
|
Pension Benefits |
|
Benefits |
|
||||
($ millions) |
|
2023 |
|
2022 |
|
2023 |
|
2022 |
|
Change in benefit obligation |
|
|
|
|
|
|
|
|
|
Benefit obligation at beginning of year |
|
6 155 |
|
8 303 |
|
519 |
|
672 |
|
Current service costs |
|
165 |
|
263 |
|
12 |
|
19 |
|
Plan participants’ contributions |
|
17 |
|
17 |
|
- |
|
- |
|
Benefits paid |
|
(345) |
|
(367) |
|
(30) |
|
(28) |
|
Interest costs |
|
305 |
|
246 |
|
26 |
|
20 |
|
Obligations disposed (note 16) |
|
(122) |
|
- |
|
- |
|
- |
|
Foreign exchange |
|
- |
|
(2) |
|
- |
|
- |
|
Settlements |
|
9 |
|
10 |
|
- |
|
- |
|
Termination benefits |
|
6 |
|
- |
|
|
|
|
|
Actuarial remeasurement: |
|
|
|
|
|
|
|
|
|
Experience loss (gain) arising on plan liabilities |
|
6 |
|
(86) |
|
3 |
|
3 |
|
Actuarial gain arising from changes in demographic assumptions |
|
- |
|
- |
|
- |
|
- |
|
Actuarial gain arising from changes in financial assumptions |
|
411 |
|
(2 229) |
|
29 |
|
(167) |
|
Benefit obligation at end of year |
|
6 607 |
|
6 155 |
|
559 |
|
519 |
|
|
|
|
|
|
|
|
|
|
|
Change in plan assets |
|
|
|
|
|
|
|
|
|
Fair value of plan assets at beginning of year |
|
6 471 |
|
7 701 |
|
- |
|
- |
|
Employer contributions |
|
(27) |
|
61 |
|
- |
|
- |
|
Plan participants’ contributions |
|
17 |
|
17 |
|
- |
|
- |
|
Benefits paid |
|
(327) |
|
(347) |
|
- |
|
- |
|
Assets disposed (note 16) |
|
(153) |
|
- |
|
- |
|
- |
|
Foreign exchange |
|
1 |
|
(4) |
|
- |
|
- |
|
Settlements |
|
9 |
|
10 |
|
- |
|
- |
|
Administrative costs |
|
(6) |
|
(2) |
|
- |
|
- |
|
Income on plan assets |
|
320 |
|
225 |
|
- |
|
- |
|
Actuarial remeasurement: |
|
|
|
|
|
|
|
|
|
Return on plan assets greater / (less) than discount rate |
|
433 |
|
(1 190) |
|
- |
|
- |
|
Fair value of plan assets at end of year |
|
6 738 |
|
6 471 |
|
- |
|
- |
|
|
|
|
|
|
|
|
|
|
|
Change in Irrecoverable Surplus |
|
|
|
|
|
|
|
|
|
Irrecoverable surplus at beginning of year |
|
187 |
|
- |
|
- |
|
- |
|
Interest on irrecoverable surplus |
|
10 |
|
- |
|
- |
|
- |
|
Change in irrecoverable surplus during the year |
|
(197) |
|
187 |
|
- |
|
- |
|
Irrecoverable surplus at end of year |
|
- |
|
187 |
|
- |
|
- |
|
Net surplus / (unfunded obligation) at end of year |
|
131 |
|
129 |
|
(559) |
|
(519) |
|
The defined benefit asset (liability) is included as follows in the Consolidated Balance Sheet:
|
|
December 31 |
|
December 31 |
|
($ millions) |
|
2023 |
|
2022 |
|
Amounts charged to |
|
|
|
|
|
Other assets (note 19) |
|
207 |
|
212 |
|
Accounts payable and accrued liabilities |
|
(37) |
|
(38) |
|
Other long-term liabilities (note 22) |
|
(598) |
|
(564) |
|
|
|
(428) |
|
(390) |
|
ANNUAL REPORT 2023 SUNCOR ENERGY INC. 39
The Government of Alberta issued an amendment to the Employment Pension Plans Regulation to provide additional forms of funding relief to administrators of Alberta-registered pension plans. The company was approved for funding relief starting in late 2020 for both the defined benefit plan and the defined contribution plan based on funding levels in the defined benefit plan. In 2022, upon filing the new actuarial funding valuations, the company entered into another contribution holiday for the defined benefit plans. In 2023, the company again entered into another contribution holiday for both the defined benefit plans and defined contribution plans, with the company anticipating to fully resume cash contributions in late 2025.
Of the total net obligations as at December 31, 2023, 91% relates to Canadian pension plans and other post-retirement benefits obligation (December 31, 2022 – 96%). The weighted average duration of the defined benefit obligation under the Canadian pension plans and other post-retirement plans is 15.7 years (2022 – 16.4 years).
|
|
|
|
|
|
Other |
|
||
|
|
|
|
|
|
Post-Retirement |
|
||
|
|
Pension Benefits |
|
Benefits |
|
||||
($ millions) |
|
2023 |
|
2022 |
|
2023 |
|
2022 |
|
Analysis of amount charged to earnings: |
|
|
|
|
|
|
|
|
|
Current service costs |
|
165 |
|
263 |
|
12 |
|
19 |
|
Interest (income) costs |
|
(15) |
|
21 |
|
26 |
|
20 |
|
Defined benefit plans expense |
|
150 |
|
284 |
|
38 |
|
39 |
|
Defined contribution plans expense |
|
56 |
|
95 |
|
- |
|
- |
|
Total benefit plans expense charged to earnings |
|
206 |
|
379 |
|
38 |
|
39 |
|
Components of defined benefit costs recognized in Other Comprehensive Income:
|
|
|
|
|
|
Other |
|
||
|
|
|
|
|
|
Post-Retirement |
|
||
|
|
Pension Benefits |
|
Benefits |
|
||||
($ millions) |
|
2023 |
|
2022 |
|
2023 |
|
2022 |
|
|
|
|
|
|
|
|
|
|
|
Actuarial loss (gain) arising from changes in experience |
|
6 |
|
(86) |
|
3 |
|
3 |
|
Actuarial loss (gain) arising from changes in financial assumptions |
|
411 |
|
(2 229) |
|
29 |
|
(167) |
|
Actuarial gain arising from changes in demographic assumptions |
|
- |
|
- |
|
- |
|
- |
|
Benefit Obligation loss (gain) |
|
417 |
|
(2 315) |
|
32 |
|
(164) |
|
Return on plan assets (greater) / less than discount rate (excluding amounts included in net interest expense) |
|
(433) |
|
1 190 |
|
- |
|
- |
|
OCI disposed through divestiture |
|
11 |
|
- |
|
- |
|
- |
|
Effect of the asset ceiling |
|
(197) |
|
187 |
|
- |
|
- |
|
Plan assets (gain) / loss |
|
(619) |
|
1 377 |
|
- |
|
- |
|
Actuarial (gain) loss recognized in other comprehensive income |
|
(202) |
|
(938) |
|
32 |
|
(164) |
|
Actuarial Assumptions
The cost of the defined benefit pension plans and other post-retirement benefits received by employees is actuarially determined using the projected unit credit method of valuation that includes employee service to date and present pay levels, as well as the projection of salaries and service to retirement.
The significant weighted average actuarial assumptions were as follows:
|
|
|
|
|
|
Other |
|
||
|
|
|
|
|
|
Post-Retirement |
|
||
|
|
Pension Benefits |
|
Benefits |
|
||||
|
|
December 31 |
|
December 31 |
|
December 31 |
|
December 31 |
|
(%) |
|
2023 |
|
2022 |
|
2023 |
|
2022 |
|
Discount rate |
|
4.60 |
|
5.10 |
|
4.60 |
|
5.10 |
|
Rate of compensation increase |
|
3.00 |
|
3.00 |
|
3.00 |
|
3.00 |
|
40 ANNUAL REPORT 2023 SUNCOR ENERGY INC.
The discount rate assumption is based on the interest rate on high-quality bonds with maturity terms equivalent to the benefit obligations.
The defined benefit obligation reflects the best estimate of the mortality of plan participants both during and after their employment. The mortality assumption is based on a standard mortality table adjusted for actual experience over the past five years.
In order to measure the expected cost of other post-retirement benefits, it was assumed that the health care costs would increase annually by 5%.
Assumed discount rates and health care cost trend rates may have a significant effect on the amounts reported for pensions and other post-retirement benefits obligations for the company’s Canadian plans. A change in these assumptions would have the following effects:
|
|
Pension Benefits |
|
||
($ millions) |
|
Increase |
|
Decrease |
|
1% change in discount rate |
|
|
|
|
|
Effect on the aggregate service and interest costs |
|
(17) |
|
20 |
|
Effect on the benefit obligations |
|
(767) |
|
963 |
|
|
|
Other |
|
||
|
|
Post-Retirement |
|
||
|
|
Benefits |
|
||
($ millions) |
|
Increase |
|
Decrease |
|
1% change in discount rate |
|
|
|
|
|
Effect on the benefit obligations |
|
(58) |
|
70 |
|
1% change in health care cost |
|
|
|
|
|
Effect on the aggregate service and interest costs |
|
1 |
|
(1) |
|
Effect on the benefit obligations |
|
22 |
|
(19) |
|
Plan Assets and Investment Objectives
The company’s long-term investment objective is to secure the defined pension benefits while managing the variability and level of its contributions. The portfolio is rebalanced periodically, as required, to the plans’ target asset allocation as prescribed in the Statement of Investment Policies and Procedures approved by the Board of Directors. Plan assets are restricted to those permitted by legislation, where applicable. Investments are made through pooled, mutual, segregated or exchange traded funds.
The company’s weighted average pension plan asset allocations, based on market values as at December 31, are as follows:
(%) |
|
2023 |
|
2022 |
|
Equities |
|
53 |
|
52 |
|
Fixed income |
|
22 |
|
27 |
|
Plan assets, comprised of: |
|
|
|
|
|
– Real Estate |
|
25 |
|
21 |
|
Total |
|
100 |
|
100 |
|
Equity securities do not include any direct investments in Suncor shares. The fair value of equity and fixed income securities is based on the trading price of the underlying fund. The fair value of real estate investments is based on independent third-party appraisals.
ANNUAL REPORT 2023 SUNCOR ENERGY INC. 41
24. Provisions
|
|
Decommissioning |
|
|
|
|
|
|
|
($ millions) |
|
and Restoration(1) |
|
Royalties |
|
Other(2) |
|
Total |
|
At December 31, 2021 |
|
8 792 |
|
222 |
|
541 |
|
9 555 |
|
Liabilities incurred |
|
114 |
|
89 |
|
3 |
|
206 |
|
Change in discount rate |
|
(2 456) |
|
- |
|
- |
|
(2 456) |
|
Changes in estimates |
|
3 596 |
|
(4) |
|
69 |
|
3 661 |
|
Liabilities settled |
|
(314) |
|
(125) |
|
(332) |
|
(771) |
|
Accretion |
|
316 |
|
- |
|
- |
|
316 |
|
Asset disposals |
|
62 |
|
- |
|
- |
|
62 |
|
Reclassified to assets held for sale (note 33) |
|
(226) |
|
- |
|
- |
|
(226) |
|
Foreign exchange |
|
17 |
|
- |
|
- |
|
17 |
|
At December 31, 2022 |
|
9 901 |
|
182 |
|
281 |
|
10 364 |
|
Less: current portion |
|
(337) |
|
(182) |
|
(45) |
|
(564) |
|
|
|
9 564 |
|
- |
|
236 |
|
9 800 |
|
At December 31, 2022 |
|
9 901 |
|
182 |
|
281 |
|
10 364 |
|
Liabilities incurred |
|
212 |
|
134 |
|
327 |
|
673 |
|
Acquisitions (note 16)(3) |
|
1 242 |
|
- |
|
- |
|
1 242 |
|
Change in discount rate |
|
515 |
|
- |
|
- |
|
515 |
|
Changes in estimates |
|
688 |
|
- |
|
(123) |
|
565 |
|
Liabilities settled |
|
(390) |
|
(26) |
|
(113) |
|
(529) |
|
Accretion |
|
532 |
|
- |
|
- |
|
532 |
|
Asset disposals |
|
(17) |
|
- |
|
- |
|
(17) |
|
Divestments (note 16)(3) |
|
(757) |
|
- |
|
- |
|
(757) |
|
Foreign exchange |
|
5 |
|
- |
|
- |
|
5 |
|
At December 31, 2023 |
|
11 931 |
|
290 |
|
372 |
|
12 593 |
|
Less: current portion |
|
(430) |
|
(290) |
|
(263) |
|
(983) |
|
|
|
11 501 |
|
- |
|
109 |
|
11 610 |
|
| (1) | Represents decommissioning and restoration provisions associated with the retirement of Property, Plant and Equipment and Exploration and Evaluation assets. The total undiscounted and uninflated amount of estimated future cash flows required to settle the obligations at December 31, 2023 was approximately $23.5 billion (December 31, 2022 – $22.4 billion). A weighted average credit-adjusted risk-free interest rate of 5.20% was used to discount the provision recognized at December 31, 2023 (December 31, 2022 – 5.50%). The credit-adjusted risk-free interest rate used reflects the expected time frame of the provisions. Payments to settle the decommissioning and restoration provisions occur on an ongoing basis and will continue over the lives of the operating assets, which can exceed 50 years. |
| (2) | During 2023, liabilities incurred include a restructuring provision for $275 million, changes in estimates include a $117 million provision reversal related to the company’s arrangement involving a third-party by product processor, and liabilities settled include restructuring related payments of $113 million. As at December 31, 2023, other provisions include a restructuring provision and other legal, insurance, and environmental provisions. |
| (3) | In connection with both the Teck acquisition (note 16) and the TotalEnergies Canada acquisition (note16), Suncor was deemed to have divested of its pre-existing interest in Fort Hills, presented as divestments, and re-acquired it at fair value. As such, acquisitions include 100% of the fair value of the decommissioning and restoration provision related to the TotalEnergies Canada acquisition, including the reevaluations of the existing working interest and the remaining capacity on a regional pipeline. |
Sensitivities
Changes to the discount rate would have the following impact on Decommissioning and Restoration liabilities:
As at December 31 |
|
2023 |
|
2022 |
|
1% Increase |
|
(1 799) |
|
(1 594) |
|
1% Decrease |
|
2 390 |
|
2 131 |
|
42 ANNUAL REPORT 2023 SUNCOR ENERGY INC.
25. Share Capital
Authorized
Common Shares
The company is authorized to issue an unlimited number of common shares without nominal or par value.
Preferred Shares
The company is authorized to issue an unlimited number of senior and junior preferred shares in series, without nominal or par value.
Normal Course Issuer Bid
During the first quarter of 2023, the TSX accepted a notice filed by Suncor to renew its normal course issuer bid (NCIB) to purchase the company’s common shares through the facilities of the TSX, NYSE and/or alternative trading systems. The notice provides that, beginning February 17, 2023, and ending February 16, 2024, Suncor may purchase for cancellation up to 132,900,000 common shares, which is equal to approximately 10% of Suncor’s public float (as defined in the TSX Company Manual) as of February 3, 2023. On February 3, 2023, Suncor had 1,330,006,760 common shares issued and outstanding.
For the twelve months ended December 31, 2023, the company repurchased 8.3 million common shares under the previous 2022 NCIB and 43.7 million common shares under the 2023 renewed NCIB at an average price of $42.96 per share, for a total repurchase cost of $2.2 billion.
Subsequent to the fourth quarter of 2023, the TSX accepted a notice filed by Suncor to renew its NCIB to purchase the company’s common shares through the facilities of the TSX, NYSE and/or alternative trading systems. The notice provides that, beginning February 26, 2024, and ending February 25, 2025, Suncor may purchase for cancellation up to 128,700,000 common shares, which is equal to approximately 10% of Suncor’s public float as of February 12, 2024. On February 12, 2024, Suncor had 1,287,461,183 common shares issued and outstanding.
During the first quarter of 2022, the TSX accepted a notice filed by Suncor to renew its previous NCIB to purchase the company’s common shares through the facilities of the TSX, NYSE and/or alternative trading systems. The notice provided that, beginning February 8, 2022, and ending February 7, 2023, Suncor may purchase for cancellation up to 71,650,000 common shares, which is equal to approximately 5% of Suncor’s issued and outstanding common shares as at the date hereof.
Suncor received approval from the TSX to amend its previous NCIB effective as of the close of markets on May 11, 2022, to increase the maximum number of common shares that may be repurchased in the period beginning February 8, 2022, and ending February 7, 2023, from 71,650,000 common shares, or approximately 5% of Suncor’s issued and outstanding common shares as at January 31, 2022, to 143,500,000, or approximately 10% of Suncor’s public float as at January 31, 2022. No other terms of the NCIB were amended.
For the twelve months ended December 31, 2022, the company repurchased 7.1 million common shares under the previous 2021 NCIB and 109.8 million under the previous 2022 NCIB at an average price of $43.92 per share, for a total repurchase cost of $5.1 billion.
ANNUAL REPORT 2023 SUNCOR ENERGY INC. 43
The following table summarizes the share repurchase activities during the period:
($ millions, except as noted) |
|
2023 |
|
2022 |
|
Share repurchase activities (thousands of common shares) |
|
|
|
|
|
Shares repurchased |
|
51 982 |
|
116 908 |
|
Amounts charged to |
|
|
|
|
|
Share capital |
|
871 |
|
1 947 |
|
Retained earnings |
|
1 362 |
|
3 188 |
|
Share repurchase cost |
|
2 233 |
|
5 135 |
|
Average repurchase cost per share |
|
42.96 |
|
43.92 |
|
Under an automatic repurchase plan agreement with an independent broker, the company has recorded the following liability for share repurchases that may take place during its internal blackout period:
|
|
December 31 |
|
December 31 |
|
($ millions) |
|
2023 |
|
2022 |
|
Amounts charged to |
|
|
|
|
|
Share capital |
|
60 |
|
136 |
|
Retained earnings |
|
90 |
|
214 |
|
Liability for share purchase commitment |
|
150 |
|
350 |
|
26. Share-Based Compensation
Share-Based Compensation Expense
Included in the Consolidated Statements of Comprehensive Income within Operating, Selling and General expense are the following share-based compensation amounts:
($ millions) |
|
2023 |
|
2022 |
|
Equity-settled plans |
|
16 |
|
17 |
|
Cash-settled plans |
|
413 |
|
484 |
|
Total share-based compensation expense |
|
429 |
|
501 |
|
Liability Recognized for Share-Based Compensation
Included in the Consolidated Balance Sheets within accounts payable and accrued liabilities and other long-term liabilities are the following fair value amounts for the company’s cash-settled plans:
|
|
December 31 |
|
December 31 |
|
($ millions) |
|
2023 |
|
2022 |
|
Current liability |
|
549 |
|
326 |
|
Long-term liability (note 22) |
|
339 |
|
469 |
|
Total Liability |
|
888 |
|
795 |
|
The intrinsic value of the vested awards at December 31, 2023 was $630 million (December 31, 2022 – $415 million).
Stock Option Plans
Suncor grants stock option awards as a form of retention and incentive compensation.
Stock options granted by the company provide the holder with the right to purchase common shares at the market price on the grant date, subject to fulfilling vesting terms. Options granted have a seven-year life, vest annually over a three-year period and are accounted for as equity-settled awards.
44 ANNUAL REPORT 2023 SUNCOR ENERGY INC.
The weighted average fair value of options granted during the period and the weighted average assumptions used in their determination are noted below:
|
|
|
2023 |
|
|
2022 |
|
Annual dividend per share (dollars) |
|
|
2.11 |
|
|
1.88 |
|
Risk-free interest rate |
|
|
3.66% |
|
|
1.73% |
|
Expected life |
|
|
4.5 years |
|
|
5 years |
|
Expected volatility |
|
|
45% |
|
|
42% |
|
Weighted average fair value per option (dollars) |
|
|
12.70 |
|
|
9.27 |
|
The expected life is based on historical stock option exercise data and current expectations. The expected volatility considers the historical volatility in the price of Suncor’s common shares over a period similar to the life of the options, and is indicative of future trends.
The following table presents a summary of the activity related to Suncor’s stock option plans:
|
|
2023 |
|
2022 |
|
||||
|
|
|
|
|
|
|
|
|
|
|
|
|
|
Weighted |
|
|
|
Weighted |
|
|
|
|
|
Average |
|
|
|
Average |
|
|
|
Number |
|
Exercise Price |
|
Number |
|
Exercise Price |
|
|
|
(thousands) |
|
($) |
|
(thousands) |
|
($) |
|
Outstanding, beginning of year |
|
21 068 |
|
38.55 |
|
37 090 |
|
38.39 |
|
Granted |
|
1 610 |
|
44.56 |
|
2 191 |
|
37.22 |
|
Exercised as options for common shares |
|
(4 611) |
|
37.11 |
|
(13 158) |
|
37.69 |
|
Forfeited/expired |
|
(1 031) |
|
41.77 |
|
(5 055) |
|
38.99 |
|
Outstanding, end of year |
|
17 036 |
|
39.32 |
|
21 068 |
|
38.55 |
|
Exercisable, end of year |
|
14 300 |
|
39.61 |
|
16 407 |
|
40.19 |
|
For the options outstanding at December 31, 2023, the exercise price ranges and weighted average remaining contractual lives are shown below:
|
|
Outstanding |
|
Exercisable |
|
||||||
|
|
|
|
|
|
|
|
|
|
|
|
|
|
|
|
Weighted |
|
|
|
|
|
|
|
|
|
|
|
Average |
|
Weighted |
|
|
|
Weighted |
|
|
|
|
|
Remaining |
|
Average |
|
|
|
Average |
|
|
|
Number |
|
Contractual Life |
|
Exercise |
|
Number |
|
Exercise |
|
Exercise Prices ($) |
|
(thousands) |
|
(years) |
|
Price ($) |
|
(thousands) |
|
Price ($) |
|
22.63-24.99 |
|
1 980 |
|
3 |
|
22.65 |
|
1 422 |
|
22.66 |
|
25.00-29.99 |
|
4 |
|
4 |
|
28.86 |
|
1 |
|
27.21 |
|
30.00-34.99 |
|
19 |
|
4 |
|
31.26 |
|
16 |
|
31.09 |
|
35.00-39.99 |
|
5 414 |
|
3 |
|
38.35 |
|
4 429 |
|
38.59 |
|
40.00-44.99 |
|
8 239 |
|
1 |
|
42.83 |
|
8 117 |
|
42.83 |
|
45.00-49.99 |
|
1 291 |
|
5 |
|
45.76 |
|
231 |
|
46.26 |
|
50.00-54.27 |
|
89 |
|
2 |
|
52.79 |
|
84 |
|
52.84 |
|
Total |
|
17 036 |
|
3 |
|
39.32 |
|
14 300 |
|
39.61 |
|
Common shares authorized for issuance by the Board of Directors that remain available for the granting of future options:
(thousands) |
|
2023 |
|
2022 |
|
|
|
27 322 |
|
27 901 |
|
Share Unit Plans
Suncor grants share units as a form of retention and incentive compensation. Share unit plans are accounted for as cash-settled awards.
ANNUAL REPORT 2023 SUNCOR ENERGY INC. 45
(a) Performance Share Units (PSUs)
A PSU is a time-vested award entitling employees to receive varying degrees of cash (0%–200% of the company’s share price at time of vesting) contingent upon Suncor’s total shareholder return (stock price appreciation and dividend income) relative to a peer group of companies. PSUs vest approximately three years after the grant date.
(b) Restricted Share Units (RSUs)
A RSU is a time-vested award entitling employees to receive cash calculated based on an average of the company’s share price leading up to vesting. RSUs vest approximately three years after the grant date.
In 2022, Syncrude’s Long Term Incentive Plans (LTIP) of approximately $123 million were converted into Suncor RSUs at a conversion price of $30.93.
(c) Deferred Share Units (DSUs)
A DSU is redeemable for cash or a common share for a period of time after a unitholder ceases employment or Board membership. The DSU Plan is limited to executives and members of the Board of Directors. Members of the Board of Directors receive an annual grant of DSUs as part of their compensation and may elect to receive their fees in cash only or in increments of 50% or 100% allocated to DSUs. Executives may elect to receive their annual incentive bonus in cash only or in increments of 25%, 50%, 75% or 100% allocated to DSUs.
The following table presents a summary of the activity related to Suncor’s share unit plans:
(thousands) |
|
PSU |
|
RSU |
|
DSU |
|
Outstanding, December 31, 2021 |
|
2 766 |
|
21 437 |
|
1 382 |
|
Granted |
|
947 |
|
13 235 |
|
187 |
|
Redeemed for cash |
|
(794) |
|
(4 533) |
|
(238) |
|
Forfeited/expired |
|
(710) |
|
(1 877) |
|
- |
|
Outstanding, December 31, 2022 |
|
2 209 |
|
28 262 |
|
1 331 |
|
Granted |
|
814 |
|
9 006 |
|
299 |
|
Redeemed for cash |
|
(436) |
|
(7 582) |
|
(461) |
|
Forfeited/expired |
|
(273) |
|
(3 156) |
|
- |
|
Outstanding, December 31, 2023 |
|
2 314 |
|
26 530 |
|
1 169 |
|
Stock Appreciation Rights (SARs)
A SAR entitles the holder to receive a cash payment equal to the difference between the stated exercise price and the market price of the company’s common shares on the date the SAR is exercised, and is accounted for as a cash-settled award.
SARs have a seven-year life and vest annually over a three-year period.
|
|
2023 |
|
2022 |
|
||||
|
|
|
|
|
|
|
|
|
|
|
|
|
|
Weighted |
|
|
|
Weighted |
|
|
|
|
|
Average |
|
|
|
Average |
|
|
|
Number |
|
Exercise Price |
|
Number |
|
Exercise Price |
|
|
|
(thousands) |
|
($) |
|
(thousands) |
|
($) |
|
Outstanding, beginning of year |
|
287 |
|
39.95 |
|
463 |
|
39.06 |
|
Granted |
|
20 |
|
42.96 |
|
10 |
|
36.76 |
|
Exercised |
|
(128) |
|
38.17 |
|
(121) |
|
37.18 |
|
Forfeited/expired |
|
(3) |
|
45.57 |
|
(65) |
|
38.25 |
|
Outstanding, end of year |
|
176 |
|
41.48 |
|
287 |
|
39.95 |
|
Exercisable, end of year |
|
156 |
|
41.48 |
|
242 |
|
40.82 |
|
46 ANNUAL REPORT 2023 SUNCOR ENERGY INC.
27. Financial Instruments and Risk Management
The company’s financial instruments consist of cash and cash equivalents, accounts receivable, derivative contracts, substantially all accounts payable and accrued liabilities, debt, and certain portions of other assets and other long-term liabilities.
Non-Derivative Financial Instruments
The fair values of cash and cash equivalents, accounts receivable, short-term debt, and accounts payable and accrued liabilities approximate their carrying values due to the short-term maturities of those instruments.
The company’s long-term debt and long-term financial liabilities are recorded at amortized cost using the effective interest method. At December 31, 2023, the carrying value of fixed-term debt accounted for under amortized cost was $11.1 billion (December 31, 2022 – $9.8 billion) and the fair value at December 31, 2023 was $11.1 billion (December 31, 2022 – $9.4 billion). The increase in carrying value and fair value of debt is mainly due to the issuance of $1.5 billion in aggregate principal of senior unsecured notes. The estimated fair value of long-term debt is based on pricing sourced from market data, which is considered a Level 2 fair value input.
Suncor entered into a partnership with Fort McKay First Nation (FMFN) and Mikisew Cree First Nation (MCFN) in 2018 where FMFN and MCFN acquired a combined 49% partnership interest in the East Tank Farm Development. The partnership liability is recorded at amortized cost using the effective interest method. At December 31, 2023, the carrying value of the Partnership liability accounted for under amortized cost was $413 million (December 31, 2022 – $427 million).
Derivative Financial Instruments
(a) Non-Designated Derivative Financial Instruments
The company uses derivative financial instruments, such as physical and financial contracts, to manage certain exposures to fluctuations in interest rates, commodity prices and foreign currency exchange rates, as part of its overall risk management program, as well as for trading purposes.
The changes in the fair value of non-designated derivatives are as follows:
($ millions) |
|
2023 |
|
2022 |
|
Fair value outstanding, beginning of year |
|
(65) |
|
(98) |
|
Changes in fair value recognized in earnings during the year (note 7) |
|
25 |
|
(187) |
|
Cash settlements - paid (received) during the year |
|
20 |
|
220 |
|
Fair value outstanding, end of year |
|
(20) |
|
(65) |
|
(b) Fair Value Hierarchy
To estimate the fair value of derivatives, the company uses quoted market prices when available, or third-party models and valuation methodologies that utilize observable market data. In addition to market information, the company incorporates transaction-specific details that market participants would utilize in a fair value measurement, including the impact of non-performance risk. However, these fair value estimates may not necessarily be indicative of the amounts that could be realized or settled in a current market transaction. The company characterizes inputs used in determining fair value using a hierarchy that prioritizes inputs depending on the degree to which they are observable. The three levels of the fair value hierarchy are as follows:
| ● | Level 1 consists of instruments with a fair value determined by an unadjusted quoted price in an active market for identical assets or liabilities. An active market is characterized by readily and regularly available quoted prices where the prices are representative of actual and regularly occurring market transactions to assure liquidity. |
| ● | Level 2 consists of instruments with a fair value that is determined by quoted prices in an inactive market, prices with observable inputs, or prices with insignificant non-observable inputs. The fair value of these positions is determined using observable inputs from exchanges, pricing services, third-party independent broker quotes, and published transportation |
ANNUAL REPORT 2023 SUNCOR ENERGY INC. 47
| tolls. The observable inputs may be adjusted using certain methods, which include extrapolation over the quoted price term and quotes for comparable assets and liabilities. |
| ● | Level 3 consists of instruments with a fair value that is determined by prices with significant unobservable inputs. As at December 31, 2023, the company does not have any derivative instruments measured at fair value Level 3. |
In forming estimates, the company utilizes the most observable inputs available for valuation purposes. If a fair value measurement reflects inputs of different levels within the hierarchy, the measurement is categorized based upon the lowest level of input that is significant to the fair value measurement.
The following table presents the company’s derivative financial instrument assets and liabilities measured at fair value for each hierarchy level as at December 31, 2023 and 2022.
($ millions) |
|
Level 1 |
|
Level 2 |
|
Level 3 |
|
Total Fair Value |
|
Accounts receivable |
|
36 |
|
107 |
|
- |
|
143 |
|
Accounts payable |
|
(85) |
|
(123) |
|
- |
|
(208) |
|
Balance at December 31, 2022 |
|
(49) |
|
(16) |
|
- |
|
(65) |
|
Accounts receivable |
|
41 |
|
24 |
|
- |
|
65 |
|
Accounts payable |
|
(51) |
|
(34) |
|
- |
|
(85) |
|
Balance at December 31, 2023 |
|
(10) |
|
(10) |
|
- |
|
(20) |
|
During the year ended December 31, 2023, there were no transfers between Level 1 and Level 2 fair value measurements.
Offsetting Financial Assets and Liabilities
The company enters into arrangements that allow for offsetting of derivative financial instruments and accounts receivable (payable), which are presented on a net basis on the balance sheet, as shown in the table below as at December 31, 2023 and 2022.
Financial Assets
|
|
|
|
Gross |
|
|
|
|
|
Gross |
|
Liabilities |
|
Net Amounts |
|
($ millions) |
|
Assets |
|
Offset |
|
Presented |
|
Fair value of derivative assets |
|
4 305 |
|
(4 162) |
|
143 |
|
Accounts receivable |
|
10 349 |
|
(8 633) |
|
1 716 |
|
Balance at December 31, 2022 |
|
14 654 |
|
(12 795) |
|
1 859 |
|
Fair value of derivative assets |
|
7 098 |
|
(7 033) |
|
65 |
|
Accounts receivable |
|
9 971 |
|
(6 897) |
|
3 074 |
|
Balance at December 31, 2023 |
|
17 069 |
|
(13 930) |
|
3 139 |
|
Financial Liabilities
|
|
|
|
Gross |
|
|
|
|
|
Gross |
|
Assets |
|
Net Amounts |
|
($ millions) |
|
Liabilities |
|
Offset |
|
Presented |
|
Fair value of derivative liabilities |
|
(4 370) |
|
4 162 |
|
(208) |
|
Accounts payable |
|
(10 036) |
|
8 633 |
|
(1 403) |
|
Balance at December 31, 2022 |
|
(14 406) |
|
12 795 |
|
(1 611) |
|
Fair value of derivative liabilities |
|
(7 118) |
|
7 033 |
|
(85) |
|
Accounts payable |
|
(8 966) |
|
6 897 |
|
(2 069) |
|
Balance at December 31, 2023 |
|
(16 084) |
|
13 930 |
|
(2 154) |
|
48 ANNUAL REPORT 2023 SUNCOR ENERGY INC.
Risk Management
The company is exposed to a number of different risks arising from financial instruments. These risk factors include market risks, comprising commodity price risk, foreign currency risk and interest rate risk, as well as liquidity risk and credit risk.
The company maintains a formal governance process to manage its financial risks. The company’s Commodity Risk Management Committee (CRMC) is charged with the oversight of the company’s trading and credit risk management activities. These activities are intended to manage risk associated with open price exposure of specific volumes in transit or storage, enhance the company’s operations, and enhance profitability through informed market calls, market diversification, economies of scale, improved transportation access, and leverage of assets, both physical and contractual. The CRMC, acting under the authority of the company’s Board of Directors, meets regularly to monitor limits on risk exposures, review policy compliance and validate risk-related methodologies and procedures.
1) Market Risk
Market risk is the risk or uncertainty arising from market price movements and their impact on the future performance of the business. The market price movements that could adversely affect the value of the company’s financial assets, liabilities and expected future cash flows include commodity price risk, foreign currency exchange risk and interest rate risk.
(a) Commodity Price Risk
Suncor’s financial performance is closely linked to crude oil and refined product prices (including pricing differentials for various product types) and, to a lesser extent, natural gas and electricity prices. The company may reduce its exposure to commodity price risk through a number of strategies. These strategies include entering into derivative contracts to limit exposure to changes in crude oil and refined product prices during transportation and natural gas prices.
An increase or decrease of US$10/bbl of crude oil as at December 31, 2023, would increase or decrease pre-tax earnings for the company’s outstanding derivative financial instruments by approximately $45 million (2022 – $70 million increase or decrease).
(b) Foreign Currency Exchange Risk
The company is exposed to foreign currency exchange risk on revenues, capital expenditures or financial instruments that are denominated in a currency other than the company’s functional currency (Canadian dollars). As crude oil is priced in U.S. dollars, fluctuations in US$/Cdn$ exchange rates may have a significant impact on revenues. This exposure is partially offset through the issuance of U.S. dollar denominated debt. A 1% strengthening in the Cdn$ relative to the US$ as at December 31, 2023, would decrease pre-tax earnings related to the company’s U.S. dollar denominated long-term debt, commercial paper and working capital by approximately $31 million (2022 – $100 million increase).
(c) Interest Rate Risk
The company is exposed to interest rate risk as changes in interest rates may affect future cash flows and the fair values of its financial instruments. The primary exposure is related to its revolving-term debt of commercial paper and future debt issuances.
To manage the company’s exposure to interest rate volatility, the company may periodically enter into interest rate swap contracts to fix the interest rate of future debt issuances. As at December 31, 2023, the company had no outstanding forward interest rate swaps. The simple average interest rate on total debt, including lease liabilities, for the year ended December 31, 2023 was 6.3% (2022 – 5.8%).
The company’s net earnings are sensitive to changes in interest rates on the floating rate portion of the company’s debt, which are offset by cash balances. To the extent interest expense is not capitalized, if interest rates applicable to floating rate instruments increased by 1%, it is estimated that the company’s pre-tax earnings would increase by approximately $12 million primarily due to a lower short-term debt balance (2022 – approximately $8 million decrease). This assumes that the amount and mix of fixed and floating rate debt remains unchanged from December 31, 2023. The proportion of floating interest rate exposure at December 31, 2023 was 3.2% of total debt outstanding (2022 – 18.0%).
ANNUAL REPORT 2023 SUNCOR ENERGY INC. 49
2) Liquidity Risk
Liquidity risk is the risk that Suncor will not be able to meet its financial obligations when due. The company mitigates this risk by forecasting spending requirements as well as cash flow from operating activities, and maintaining sufficient cash, credit facilities, and debt shelf prospectuses to meet these requirements. Suncor’s cash and cash equivalents and total credit facilities at December 31, 2023 were $1.7 billion and $7.0 billion, respectively. Of Suncor’s $7.0 billion in total credit facilities, $5.5 billion were unutilized at December 31, 2023. In addition, Suncor has unused capacity under the Board of Directors authority of US$5.0 billion to issue debt. The ability of the company to raise additional capital utilizing these shelf prospectuses is dependent on market conditions. The company believes it has sufficient funding through the use of these facilities and access to capital markets to meet its future capital requirements.
Surplus cash is invested into a range of short-dated money market securities. Investments are only permitted in high credit quality government or corporate securities. Diversification of these investments is managed through counterparty credit limits.
The following table shows the timing of cash outflows related to trade and other payables and debt.
|
|
December 31, 2022 |
|
||||||
|
|
|
|
|
|
|
|
|
|
|
|
Trade and |
|
Gross Derivative |
|
|
|
Lease |
|
($ millions) |
|
Other Payables(1) |
|
Liabilities(2) |
|
Debt(3) |
|
Liabilities |
|
Within one year |
|
7 959 |
|
3 824 |
|
3 375 |
|
477 |
|
2 to 3 years |
|
39 |
|
546 |
|
1 066 |
|
807 |
|
4 to 5 years |
|
39 |
|
- |
|
1 541 |
|
652 |
|
Over 5 years |
|
- |
|
- |
|
16 317 |
|
3 047 |
|
|
|
8 037 |
|
4 370 |
|
22 299 |
|
4 983 |
|
|
|
December 31, 2023 |
|
||||||
|
|
|
|
|
|
|
|
|
|
|
|
Trade and |
|
Gross Derivative |
|
|
|
Lease |
|
($ millions) |
|
Other Payables(1) |
|
Liabilities(2) |
|
Debt(3) |
|
Liabilities |
|
Within one year |
|
7 646 |
|
6 586 |
|
1 132 |
|
561 |
|
2 to 3 years |
|
53 |
|
532 |
|
3 184 |
|
991 |
|
4 to 5 years |
|
1 |
|
- |
|
1 425 |
|
846 |
|
Over 5 years |
|
- |
|
- |
|
14 175 |
|
4 038 |
|
|
|
7 700 |
|
7 118 |
|
19 916 |
|
6 436 |
|
| (1) | Trade and other payables exclude net derivative liabilities of $85 million (2022 – $208 million). |
| (2) | Gross derivative liabilities of $7.118 billion (2022 – $4.370 billion) are offset by gross derivative assets of $7.033 billion (2022 – $4.162 billion), resulting in a net amount of $85 million (2022 – $208 million). |
| (3) | Debt includes short-term debt, long-term debt and interest payments on fixed-term debt. |
3) Credit Risk
Credit risk is the risk that a customer or counterparty will fail to perform an obligation or fail to pay amounts due, causing a financial loss. The company’s credit policy is designed to ensure there is a standard credit practice throughout the company to measure and monitor credit risk. The policy outlines delegation of authority, the due diligence process required to approve a new customer or counterparty and the maximum amount of credit exposure per single entity. Before transactions begin with a new customer or counterparty, its creditworthiness is assessed, and a credit rating and a maximum credit limit are assigned. The assessment process is outlined in the credit policy and considers both quantitative and qualitative factors. The company constantly monitors the exposure to any single customer or counterparty along with the financial position of the customer or counterparty. If it is deemed that a customer or counterparty has become materially weaker, the company will work to reduce the credit exposure and lower the assigned credit limit. Regular reports are generated to monitor credit risk and the Credit Committee meets quarterly to ensure compliance with the credit policy and review the exposures.
A substantial portion of the company’s accounts receivable are with customers in the oil and gas industry and are subject to normal industry credit risk. At December 31, 2023, substantially all of the company’s trade receivables were current.
50 ANNUAL REPORT 2023 SUNCOR ENERGY INC.
The company may be exposed to certain losses in the event that counterparties to derivative financial instruments are unable to meet the terms of the contracts. The company’s exposure is limited to those counterparties holding derivative contracts owing to the company at the reporting date. At December 31, 2023, the company’s net exposure was $65 million (December 31, 2022 – $143 million).
28. Capital Structure Financial Policies
The company’s primary capital management strategy is to maintain a conservative balance sheet, which supports a solid investment grade credit rating profile. This objective affords the company the financial flexibility and access to the capital it requires to execute on its growth objectives.
The company’s capital is primarily monitored by reviewing the ratios of net debt to adjusted funds from operations(2) and total debt to total debt plus shareholders’ equity.
Net debt to adjusted funds from operations(2) is calculated as short-term debt plus total long-term debt less cash and cash equivalents, divided by adjusted funds from operations for the year then ended.
Total debt to total debt plus shareholders’ equity is calculated as short-term debt plus total long-term debt divided by short-term debt plus total long-term debt plus shareholders’ equity. This financial covenant under the company’s various banking and debt agreements shall not be greater than 65%.
The company’s financial covenant is reviewed regularly, and controls are in place to maintain compliance with the covenant. The company complied with financial covenants for the years ended December 31, 2023 and 2022. The company’s financial measures, as set out in the following schedule, were unchanged from 2022. The company believes that achieving its capital target helps to provide the company with access to capital at a reasonable cost by maintaining solid investment grade credit ratings. Total debt to total debt plus shareholders’ equity was 26.3% at December 31, 2023 and decreased slightly due to higher shareholders’ equity as a result of a decrease in the repurchase of common shares for cancellation. The company operates in a fluctuating business environment and ratios may periodically fall outside of management’s targets. The company addresses these fluctuations by capital expenditure reductions and sales of non-core assets to ensure net debt achieves management’s targets.
|
|
Capital |
|
|
|
|
|
|
|
Measure |
|
December 31 |
|
December 31 |
|
($ millions) |
|
Target |
|
2023 |
|
2022 |
|
Components of ratios |
|
|
|
|
|
|
|
Short-term debt |
|
|
|
494 |
|
2 807 |
|
Current portion of long-term debt |
|
|
|
- |
|
- |
|
Current portion of long-term lease liabilities |
|
|
|
348 |
|
317 |
|
Long-term debt |
|
|
|
11 087 |
|
9 800 |
|
Long-term lease liabilities |
|
|
|
3 478 |
|
2 695 |
|
Total debt(1) |
|
|
|
15 407 |
|
15 619 |
|
Less: Cash and cash equivalents |
|
|
|
1 729 |
|
1 980 |
|
Net debt(1) |
|
|
|
13 678 |
|
13 639 |
|
Shareholders’ equity |
|
|
|
43 279 |
|
39 367 |
|
Total capitalization (total debt plus shareholders’ equity) |
|
|
|
58 686 |
|
54 986 |
|
Adjusted funds from operations(2) |
|
|
|
13 325 |
|
18 101 |
|
Net debt to adjusted funds from operations |
|
<3.0 times |
|
1.0 |
|
0.8 |
|
Total debt to total debt plus shareholders’ equity |
|
20% - 35% |
|
26.3% |
|
28.4% |
|
| (1) | Total debt and net debt are non-GAAP financial measures. |
| (2) | Adjusted funds from operations is calculated as cash flow from operating activities before changes in non-cash working capital, and is a non-GAAP financial measure. |
ANNUAL REPORT 2023 SUNCOR ENERGY INC. 51
29. Joint Arrangements
Joint Operations
The company’s material joint operations as at December 31 are set out below:
|
|
|
|
Country of |
|
|
|
|
|
|
|
|
|
Incorporation and |
|
|
|
|
|
|
|
|
|
Principal Place of |
|
Ownership % |
|
Ownership % |
|
Material Joint Operations |
|
Principal Activity |
|
Business |
|
2023 |
|
2022 |
|
Oil Sands |
|
|
|
|
|
|
|
|
|
Operated by Suncor: |
|
|
|
|
|
|
|
|
|
Fort Hills Energy Limited Partnership(1) |
|
Oil sands development |
|
Canada |
|
100.00 |
|
54.11 |
|
Syncrude |
|
Oil sands development |
|
Canada |
|
58.74 |
|
58.74 |
|
Exploration and Production |
|
|
|
|
|
|
|
|
|
Operated by Suncor: |
|
|
|
|
|
|
|
|
|
Terra Nova |
|
Oil and gas production |
|
Canada |
|
48.00 |
|
48.00 |
|
Non-operated: |
|
|
|
|
|
|
|
|
|
Buzzard(2) |
|
Oil and gas production |
|
United Kingdom |
|
— |
|
29.89 |
|
Hibernia and the Hibernia South Extension Unit |
|
Oil and gas production |
|
Canada |
|
19.48-20.00 |
|
19.48-20.00 |
|
Hebron |
|
Oil and gas production |
|
Canada |
|
21.03 |
|
21.03 |
|
Harouge Oil Operations |
|
Oil and gas production |
|
Libya |
|
49.00 |
|
49.00 |
|
North Sea Rosebank Project(2) |
|
Oil and gas production |
|
United Kingdom |
|
— |
|
40.00 |
|
White Rose and the White Rose Extensions |
|
Oil and gas production |
|
Canada |
|
38.625-40.00 |
|
38.625-40.00 |
|
|
|
|
|
|
|
|
|
|
|
| (1) | In the first quarter of 2023, Suncor acquired an additional 14.65% working interest in Fort Hills, bringing the company’s and its affiliate’s total aggregate working interest to 68.76%. In the fourth quarter of 2023, Suncor acquired the remaining 31.23% working interest in Fort Hills, making Suncor the sole owner of Fort Hills. |
| (2) | In the second quarter of 2023, Suncor completed the sale of its U.K. operations, including its interests in Buzzard and Rosebank. |
Joint Ventures and Associates
The company does not have any joint ventures or associates that are considered individually material. Summarized aggregate financial information of the joint ventures and associates, which are all included in the company’s Refining and Marketing operations, are shown below:
|
|
Joint ventures |
|
Associates |
|
||||
|
|
|
|
|
|
|
|
|
|
($ millions) |
|
2023 |
|
2022(1) |
|
2023 |
|
2022(1) |
|
Net earnings (loss) |
|
27 |
|
1 |
|
(1) |
|
(1) |
|
Total comprehensive earnings (loss) |
|
27 |
|
1 |
|
(1) |
|
(1) |
|
Carrying amount as at December 31 |
|
149 |
|
105 |
|
60 |
|
63 |
|
| (1) | Prior period amounts have been restated to align with current period presentation of the financial information of the joint ventures and associates. |
52 ANNUAL REPORT 2023 SUNCOR ENERGY INC.
30. Subsidiaries
Material subsidiaries, either directly or indirectly, by the company as at December 31, 2023 are shown below:
Material Subsidiaries |
Principal Activity |
|
Canadian Operations |
|
|
|
|
|
Suncor Energy Oil Sands Limited Partnership |
This partnership holds most of the company’s Oil Sands operations assets. |
|
Suncor Energy Ventures Corporation |
A subsidiary which indirectly owns a 36.74% ownership in the Syncrude joint operation. |
|
Suncor Energy Ventures Partnership |
A subsidiary which owns a 22% ownership in the Syncrude joint operation. |
|
Suncor Energy Products Partnership |
This partnership holds substantially all of the company’s Canadian refining and marketing assets. |
|
Suncor Energy Marketing Inc. |
This subsidiary markets production from the upstream Canadian businesses. It also administers Suncor’s energy trading activities and power business, markets certain third-party products, procures crude oil feedstock and natural gas for its downstream business, and procures and markets natural gas liquids (NGLs) and liquefied petroleum gas (LPG) for its downstream business. |
|
U.S. Operations |
|
|
|
|
|
Suncor Energy (U.S.A.) Marketing Inc. |
A subsidiary that procures, markets and trades crude oil, in addition to procuring crude oil feedstock for the company’s refining operations. |
|
Suncor Energy (U.S.A.) Inc. |
A subsidiary through which the company’s U.S. refining and marketing operations are conducted. |
|
The table does not include wholly owned subsidiaries that are immediate holding companies of the operating subsidiaries. For certain foreign operations of the company, there are restrictions on the sale or transfer of production licences, which would require approval of the applicable foreign government.
ANNUAL REPORT 2023 SUNCOR ENERGY INC. 53
31. Related Party Disclosures
Related Party Transactions
The company enters into transactions with related parties in the normal course of business, which includes purchases of feedstock, distribution of refined products, and the sale of refined products and byproducts. These transactions are with joint ventures and associated entities in the company’s Refining and Marketing operations, including pipeline, refined product and petrochemical companies. A summary of the significant related party transactions as at and for the years ended December 31, 2023 and 2022 are as follows:
($ millions) |
|
2023 |
|
2022 |
|
Sales(1) |
|
1 356 |
|
1 616 |
|
Purchases |
|
139 |
|
265 |
|
Accounts receivable |
|
108 |
|
135 |
|
Accounts payable and accrued liabilities |
|
3 |
|
69 |
|
| (1) | Includes sales to Petroles Cadeko Inc. of $585 million (2022 - $645 million) and Parachem Chemicals Inc. of $400 million (2022 – $487 million). |
Compensation of Key Management Personnel
Compensation of the company’s Board of Directors and members of the Executive Leadership Team for the years ended December 31 is as follows:
($ millions) |
|
2023 |
|
2022 |
|
Salaries and other short-term benefits |
|
10 |
|
20 |
|
Pension and other post-retirement benefits |
|
3 |
|
4 |
|
Share based compensation |
|
46 |
|
73 |
|
|
|
59 |
|
97 |
|
32. Commitments, Contingencies and Guarantees
(a) Commitments
Future payments under the company’s commitments, including service arrangements for pipeline transportation agreements and for other property and equipment, are as follows:
|
|
Payment Due by Period |
|
||||||||||||
|
|
|
|
|
|
|
|
|
|
|
|
|
|
|
|
($ millions) |
|
2024 |
|
2025 |
|
2026 |
|
2027 |
|
2028 |
|
Thereafter |
|
Total |
|
Commitments |
|
|
|
|
|
|
|
|
|
|
|
|
|
|
|
Product transportation and storage |
|
1 652 |
|
1 625 |
|
1 438 |
|
1 420 |
|
1 400 |
|
12 559 |
|
20 094 |
|
Energy services |
|
112 |
|
111 |
|
130 |
|
71 |
|
30 |
|
48 |
|
502 |
|
Exploration work commitments |
|
- |
|
53 |
|
1 |
|
- |
|
- |
|
475 |
|
529 |
|
Other |
|
435 |
|
181 |
|
120 |
|
70 |
|
30 |
|
170 |
|
1 006 |
|
|
|
2 199 |
|
1 970 |
|
1 689 |
|
1 561 |
|
1 460 |
|
13 252 |
|
22 131 |
|
In addition to the commitments in the above table, the company has other obligations for goods and services and raw materials entered into in the normal course of business, which may terminate on short notice. Such obligations include commodity purchase obligations which are transacted at market prices.
54 ANNUAL REPORT 2023 SUNCOR ENERGY INC.
(b) Contingencies
Legal and Environmental Contingent Liabilities and Assets
The company is defendant and plaintiff in a number of legal actions that arise in the normal course of business. The company believes that any liabilities or assets that might arise pertaining to such matters would not have a material effect on its consolidated financial position.
The company may also have environmental contingent liabilities, beyond decommissioning and restoration liabilities (recognized in note 24), which are reviewed individually and are reflected in the company’s consolidated financial statements if material and more likely than not to be incurred. These contingent environmental liabilities primarily relate to the mitigation of contamination at sites where the company has had operations. For any unrecognized environmental contingencies, the company believes that any liabilities that might arise pertaining to such matters would not have a material effect on its consolidated financial position.
Costs attributable to these commitments and contingencies are expected to be incurred over an extended period of time and to be funded from the company’s cash flow from operating activities. Although the ultimate impact of these matters on net earnings cannot be determined at this time, the impact is not expected to be material.
Contingent assets are only disclosed when the inflow of economic benefits is probable. When the economic benefit becomes virtually certain, the asset is no longer contingent and is recognized in the consolidated financial statements.
(c) Guarantees
At December 31, 2023, the company has provided loan guarantees to certain retail licensees and wholesale marketers. Suncor’s maximum potential amount payable under these loan guarantees is $125 million.
The company has also agreed to indemnify holders of all notes and debentures and the company’s credit facility lenders (see note 21) for added costs relating to withholding taxes. Similar indemnity terms apply to certain facility and equipment leases. There is no limit to the maximum amount payable under these indemnification agreements. The company is unable to determine the maximum potential amount payable as government regulations and legislation are subject to change without notice. Under these agreements, the company has the option to redeem or terminate these contracts if additional costs are incurred.
The company also has guaranteed its working-interest share of certain joint operation undertakings related to transportation services agreements entered into with third parties. The guaranteed amount is limited to the company’s share in the joint arrangement. As at December 31, 2023, the probability is remote that these guarantee commitments will impact the company.
33. Assets Held for Sale
The company had the following assets and liabilities held for sale as at December 31, 2022, that were sold in 2023 (note 16):
($ millions) |
|
U.K. Operations |
|
Wind and Solar |
|
Total |
|
Assets |
|
|
|
|
|
|
|
Current assets |
|
83 |
|
62 |
|
145 |
|
Property, plant and equipment, net and intangible assets |
|
364 |
|
438 |
|
802 |
|
Exploration and evaluation |
|
239 |
|
- |
|
239 |
|
Total Assets |
|
686 |
|
500 |
|
1 186 |
|
Liabilities |
|
|
|
|
|
|
|
Current liabilities |
|
(241) |
|
(32) |
|
(273) |
|
Other long-term liabilities and provisions |
|
(217) |
|
(40) |
|
(257) |
|
Total Liabilities |
|
(458) |
|
(72) |
|
(530) |
|
Net Assets |
|
228 |
|
428 |
|
656 |
|
ANNUAL REPORT 2023 SUNCOR ENERGY INC. 55
Exhibit 99-3
Management’s Discussion and Analysis
March 21, 2024
| ||
MD&A – Table of Contents | ||
2 |
|
|
5 |
|
|
8 |
|
|
14 |
|
|
29 |
|
|
30 |
|
|
33 |
|
|
35 |
|
|
38 |
|
|
44 |
|
Material Accounting Policies and Critical Accounting Estimates |
46 |
|
|
56 |
|
|
58 |
|
|
This Management’s Discussion and Analysis (MD&A) should be read in conjunction with Suncor’s December 31, 2023 audited Consolidated Financial Statements and the accompanying notes. Additional information about Suncor filed with Canadian securities regulatory authorities and the United States Securities and Exchange Commission (SEC), including quarterly and annual reports and Suncor’s Annual Information Form dated March 21, 2024 (the 2023 AIF), which is also filed with the SEC under cover of Form 40-F, is available online at www.sedarplus.ca, www.sec.gov and on our website at www.suncor.com. Information contained in or otherwise accessible through our website, even if referred to in this MD&A, does not constitute part of this MD&A and is not incorporated by reference into this MD&A.
References to “we”, “our”, “Suncor” or “the company” means Suncor Energy Inc., its subsidiaries, partnerships and joint arrangements, unless otherwise specified or the context otherwise requires. For a list of abbreviations that may be used in this MD&A, refer to the Advisories – Common Abbreviations section of this MD&A.
Basis of Presentation
Unless otherwise noted, all financial information contained herein has been prepared in accordance with International Financial Reporting Standards (IFRS) as issued by the International Accounting Standards Board (IASB).
All financial information is reported in Canadian dollars, unless otherwise noted. Production volumes are presented on a working-interest basis, before royalties, except for production volumes from the company’s Libya operations, which are presented on an economic basis.
References to Oil Sands operations exclude Suncor’s interests in Fort Hills and Syncrude.
Beginning in 2022, to align with how management evaluates segment performance, the company revised its segment presentation to reflect segment results before income tax expense and present tax at a consolidated level. This presentation change had no effect on consolidated net earnings, adjusted operating earnings and adjusted funds from operations. Comparative periods have been revised to reflect this change. See the Income Tax section of this MD&A for a discussion of income taxes.
ANNUAL REPORT 2023 SUNCOR ENERGY INC. 1
1. Consolidated Financial and Operating Summary
Financial Summary
Year ended December 31 ($ millions, except per share amounts) |
|
2023 |
|
2022 |
|
2021 |
|
Gross revenues |
|
52 206 |
|
62 907 |
|
41 133 |
|
Royalties |
|
(3 114) |
|
(4 571) |
|
(2 001) |
|
Operating revenues, net of royalties |
|
49 092 |
|
58 336 |
|
39 132 |
|
Net earnings |
|
8 295 |
|
9 077 |
|
4 119 |
|
Per common share – basic (dollars) |
|
6.34 |
|
6.54 |
|
2.77 |
|
Per common share – diluted (dollars) |
|
6.33 |
|
6.53 |
|
2.77 |
|
Adjusted operating earnings(1) |
|
6 677 |
|
11 566 |
|
3 805 |
|
Per common share(1)(2) |
|
5.10 |
|
8.34 |
|
2.56 |
|
Adjusted funds from operations(1) |
|
13 325 |
|
18 101 |
|
10 257 |
|
Per common share(1)(2) |
|
10.19 |
|
13.05 |
|
6.89 |
|
Cash flow provided by operating activities |
|
12 344 |
|
15 680 |
|
11 764 |
|
Per common share(2) |
|
9.44 |
|
11.30 |
|
7.91 |
|
Dividends paid on common shares |
|
2 749 |
|
2 596 |
|
1 550 |
|
Per common share(2) |
|
2.11 |
|
1.88 |
|
1.05 |
|
Share repurchases |
|
2 233 |
|
5 135 |
|
2 304 |
|
Per common share(2) |
|
1.71 |
|
3.70 |
|
1.55 |
|
Weighted average number of common shares in millions – basic |
|
1 308 |
|
1 387 |
|
1 488 |
|
Weighted average number of common shares in millions – diluted |
|
1 310 |
|
1 390 |
|
1 489 |
|
Capital expenditures(3)(4) |
|
5 573 |
|
4 819 |
|
4 411 |
|
Asset sustainment and maintenance |
|
3 543 |
|
3 315 |
|
3 057 |
|
Economic investment |
|
2 030 |
|
1 504 |
|
1 354 |
|
Free funds flow(1) |
|
7 497 |
|
13 114 |
|
5 702 |
|
Returns to shareholders(5) |
|
4 982 |
|
7 731 |
|
3 854 |
|
Balance sheet (at December 31) |
|
|
|
|
|
|
|
Total assets |
|
88 539 |
|
84 618 |
|
83 739 |
|
Net debt(1) |
|
13 678 |
|
13 639 |
|
16 149 |
|
Total long-term liabilities(6) |
|
35 663 |
|
32 382 |
|
36 726 |
|
| (1) | Non-GAAP financial measures or contains non-GAAP financial measures. See the Advisories – Non-GAAP and Other Financial Measures section of this MD&A. |
| (2) | Represented on a basic per share basis. |
| (3) | Excludes capitalized interest of $255 million in 2023, $168 million in 2022 and $144 million in 2021. |
| (4) | Excludes capital expenditures related to assets previously held for sale of $108 million in 2023 and $133 million in 2022. |
| (5) | Includes dividends paid on common shares and repurchases of common shares. |
| (6) | Includes long-term debt, long-term lease liabilities, other long-term liabilities, provisions and deferred income taxes. |
2 ANNUAL REPORT 2023 SUNCOR ENERGY INC.
Operating Summary
Year ended December 31 |
|
2023 |
|
2022 |
|
2021 |
|
Production volumes |
|
|
|
|
|
|
|
Oil Sands – Upgraded – net SCO and diesel (mbbls/d) |
|
487.0 |
|
480.0 |
|
468.6 |
|
Oil Sands – Non-upgraded bitumen (mbbls/d) |
|
202.6 |
|
185.2 |
|
175.6 |
|
Total Oil Sands production volumes (mbbls/d) |
|
689.6 |
|
665.2 |
|
644.2 |
|
Exploration and Production (mboe/d) |
|
56.1 |
|
78.0 |
|
87.5 |
|
Total upstream production (mboe/d) |
|
745.7 |
|
743.2 |
|
731.7 |
|
Average price realizations(1)(2) ($/boe) |
|
|
|
|
|
|
|
Upgraded – net SCO and diesel |
|
99.40 |
|
118.88 |
|
77.73 |
|
Non-upgraded bitumen |
|
67.97 |
|
84.63 |
|
53.80 |
|
Average crude |
|
90.27 |
|
109.57 |
|
70.96 |
|
Exploration and Production Canada |
|
107.62 |
|
128.07 |
|
84.70 |
|
Exploration and Production International(3) |
|
109.00 |
|
126.61 |
|
82.16 |
|
Refinery crude oil processed (mbbls/d) |
|
420.7 |
|
433.2 |
|
415.5 |
|
Refinery utilization(4) (%) |
|
|
|
|
|
|
|
Eastern North America |
|
96 |
|
93 |
|
91 |
|
Western North America |
|
85 |
|
93 |
|
87 |
|
Total |
|
90 |
|
93 |
|
89 |
|
Refining and marketing gross margin - FIFO(1) ($/bbl) |
|
45.00 |
|
55.85 |
|
36.85 |
|
Refining and marketing gross margin - LIFO(1) ($/bbl) |
|
47.00 |
|
54.45 |
|
30.90 |
|
| (1) | Contains non-GAAP financial measures. See the Advisories – Non-GAAP and Other Financial Measures section of this MD&A. |
| (2) | Net of transportation costs, but before royalties. |
| (3) | Exploration and Production (E&P) International price realizations exclude Libya for all periods presented. |
| (4) | Refinery utilization is the amount of crude oil and natural gas liquids processed by crude distillation units, expressed as a percentage of the nameplate capacity of these units. |
ANNUAL REPORT 2023 SUNCOR ENERGY INC. 3
Segment Summary
Year ended December 31 ($ millions) |
|
2023 |
|
2022 |
|
2021 |
|
Earnings (loss) before income taxes(1) |
|
|
|
|
|
|
|
Oil Sands |
|
6 811 |
|
5 633 |
|
2 825 |
|
Exploration and Production |
|
1 691 |
|
3 221 |
|
1 791 |
|
Refining and Marketing |
|
3 383 |
|
5 694 |
|
2 867 |
|
Corporate and Eliminations |
|
(1 296) |
|
(2 232) |
|
(1 913) |
|
Income tax expense |
|
(2 294) |
|
(3 239) |
|
(1 451) |
|
Net earnings |
|
8 295 |
|
9 077 |
|
4 119 |
|
Adjusted operating earnings (loss)(1)(2) |
|
|
|
|
|
|
|
Oil Sands |
|
5 967 |
|
9 042 |
|
2 829 |
|
Exploration and Production |
|
1 084 |
|
2 494 |
|
1 343 |
|
Refining and Marketing |
|
3 367 |
|
5 687 |
|
2 857 |
|
Corporate and Eliminations |
|
(1 349) |
|
(1 503) |
|
(1 778) |
|
Income tax expense included in adjusted operating earnings |
|
(2 392) |
|
(4 154) |
|
(1 446) |
|
Total |
|
6 677 |
|
11 566 |
|
3 805 |
|
Adjusted funds from (used in) operations(1)(2) |
|
|
|
|
|
|
|
Oil Sands |
|
10 725 |
|
13 831 |
|
7 575 |
|
Exploration and Production |
|
1 612 |
|
3 178 |
|
1 951 |
|
Refining and Marketing |
|
4 268 |
|
6 561 |
|
3 831 |
|
Corporate and Eliminations |
|
(1 546) |
|
(1 240) |
|
(1 705) |
|
Current income tax expense |
|
(1 734) |
|
(4 229) |
|
(1 395) |
|
Total |
|
13 325 |
|
18 101 |
|
10 257 |
|
Change in non-cash working capital |
|
(981) |
|
(2 421) |
|
1 507 |
|
Cash flow provided by operating activities |
|
12 344 |
|
15 680 |
|
11 764 |
|
| (1) | Beginning in 2022, to align with how management evaluates segment performance, the company revised its segment presentation to reflect segment results before income tax expense and present tax at a consolidated level. This presentation change had no effect on consolidated net earnings, adjusted operating earnings and adjusted funds from operations. Comparative periods have been revised to reflect this change. See the Income Tax section of this MD&A for a discussion of income taxes. |
| (2) | Non-GAAP financial measures. See the Advisories – Non-GAAP and Other Financial Measures section of this MD&A. |
4 ANNUAL REPORT 2023 SUNCOR ENERGY INC.
Suncor is an integrated energy company headquartered in Calgary, Alberta, Canada. Suncor’s operations include oil sands development, production and upgrading; offshore oil production; petroleum refining in Canada and the U.S.; and the company’s Petro-Canada™ retail and wholesale distribution networks (including Canada’s Electric Highway™, a coast-to-coast network of fast-charging electric vehicle stations). Suncor is developing petroleum resources while advancing the transition to a low-emissions future through investments in power and renewable fuels. Suncor also conducts energy trading activities focused primarily on the marketing and trading of crude oil, natural gas, byproducts, refined products and power. Suncor’s common shares (symbol: SU) are listed on the Toronto Stock Exchange (TSX) and the New York Stock Exchange (NYSE).
For a description of Suncor’s business segments, refer to the Segment Results and Analysis section of this MD&A.
Suncor’s Strategy
Suncor aims to be Canada’s leading energy provider, delivering competitive and sustainable returns to shareholders. Suncor is well positioned to execute on its strategy through the company’s competitive advantages that include its unparalleled, integrated upstream and downstream asset base and business model, underpinned by its large-scale, long-life oil sands resources.
Key components of Suncor’s strategy include the following:
| ● | Deliver industry-leading performance by focusing on the fundamentals of safety, operational integrity, reliability and profitability: Suncor is focused on driving industry-leading safety, environmental and reliability performance through operational excellence and aligning its asset base with its competencies and competitive advantages to maximize value. The company aims to provide clear priorities and focus to ensure Suncor is a profitable, high-performing company today and in the future. |
| ● | Achieve financial resiliency by structurally lowering costs: Suncor is focused on driving down costs, increasing product margins and exercising capital discipline across the company to provide financial strength and flexibility. |
| ● | Leverage integration to maximize value from upstream production to downstream customers: From the ground to the gas station, Suncor maximizes profit along each step of the value chain through its unparalleled asset integration. This includes leveraging the interconnectivity of its Oil Sands assets to prioritize higher-value synthetic crude oil (SCO) production, and capturing additional margin through its extensive midstream and structurally advantaged downstream assets. |
| ● | Decarbonize base business while maintaining competitiveness and capturing new opportunities to achieve net-zero greenhouse gas (GHG) emissions from operations by 2050: The company is taking tangible actions to decarbonize its existing hydrocarbon business, while investing in other areas aligned with its core competencies, including investments in lower-carbon power and renewable fuels. |
The execution of Suncor’s strategy and key priorities is expected to grow free funds flow per share and enable the company to deliver industry-leading shareholder returns through a combination of share price appreciation, dividend growth and share repurchases.
ANNUAL REPORT 2023 SUNCOR ENERGY INC. 5
2023 Highlights
Best overall employee and contractor safety performance in the company’s history.
| ● | In 2023, Suncor delivered its best overall employee and contractor safety performance, with zero life-threatening or life-altering injuries. Year-over-year, lost-time injuries were down nearly 50%. |
| ● | Aligned with its objective to achieve industry-leading safety performance, Suncor successfully implemented collision awareness technology and a fatigue management solution (technologies aimed at preventing mobile equipment contact) on over 1,000 pieces of mobile equipment combined in its mining fleet. Suncor is the first oil sands operator to execute a full-scale implementation of these technologies. |
Suncor generated adjusted funds from operations(1) of $13.3 billion, the second highest in the company’s history, reflecting the strength of its integrated business model.
| ● | In 2023, Suncor generated $13.325 billion in adjusted funds from operations, or $10.19 per common share, compared to $18.101 billion, or $13.05 per common share, in the prior year. Cash flow provided by operating activities, which includes changes in non-cash working capital, was $12.344 billion, or $9.44 per common share, in 2023, compared to $15.680 billion, or $11.30 per common share, in the prior year. The decreased cash flows were primarily a result of a weaker business environment in the current year. |
| ● | Suncor generated its second highest annual adjusted operating earnings(1) of $6.677 billion in 2023, or $5.10 per common share, compared to $11.566 billion, or $8.34 per common share, in the prior year. Net earnings of $8.295 billion in 2023, or $6.34 per common share, were also the second highest in the company’s history, compared to $9.077 billion, or $6.54 per common share, in the prior year. |
The company returned $5.0 billion to its shareholders in 2023, which included a quarterly dividend increase of approximately 5% in the fourth quarter.
| ● | Suncor returned $5.0 billion of value to its shareholders in 2023, which included $2.8 billion of dividends paid and $2.2 billion in share repurchases. In 2023, the company repurchased 52.0 million common shares at an average price of $42.96 per common share, or 3.9% of its issued and outstanding common shares as at December 31, 2022. |
| ● | Suncor increased its dividend per share to $0.545 per common share in the fourth quarter of 2023, an increase of approximately 5% over the prior quarter dividend. |
The company focused on core assets to drive value.
| ● | During the first quarter of 2023, the company completed the sale of its wind and solar assets for gross proceeds of $730 million, before closing adjustments and other closing costs, resulting in a gain on sale of $302 million. |
| ● | During the second quarter of 2023, Suncor completed the sale of its U.K. E&P portfolio for gross proceeds of $1.1 billion, before closing adjustments and other closing costs, resulting in a gain on sale of $607 million. |
| ● | In 2023, the company completed two separate transactions to acquire the remaining 45.89% working interest in Fort Hills for $2.2 billion, making Suncor the sole owner of Fort Hills. These transactions advanced the company’s long-term bitumen supply strategy, and collectively added 89,000 bbls/d of high-quality bitumen production capacity to the company’s portfolio. |
Oil Sands delivered record annual production, including the highest-ever production at Syncrude and Firebag.
| ● | Suncor delivered record Oil Sands production of 689,600 bbls/d in 2023, compared to 665,200 bbls/d in 2022, reflecting the company’s increased working interest in Fort Hills. Oil Sands production also included record production from Syncrude and Firebag. |
| (1) | Non-GAAP financial measure. See the Advisories – Non-GAAP and Other Financial Measures section of this MD&A. |
6 ANNUAL REPORT 2023 SUNCOR ENERGY INC.
Oil Sands delivered its best-ever combined upgrader utilization of 92%, 3% better than previous high.
| ● | The company leveraged its regional asset connectivity to maximize upgrader utilization, resulting in combined upgrader utilization of 92% in 2023, compared to 89% in the prior year. |
Safe restart of production at Terra Nova.
| ● | The Terra Nova Floating, Production, Storage and Offloading vessel safely restarted production in the fourth quarter of 2023, with production expected to continue ramping up in the beginning of 2024. The restart of production at this key offshore asset is expected to provide long-term value to shareholders as well as many benefits to the Newfoundland and Labrador and Canadian economies. |
Refining and Marketing (R&M) continued to deliver strong results, as the company focused on strengthening its integrated R&M business and driving increased long-term value for shareholders.
| ● | The company delivered refinery crude throughput of 420,700 bbls/d and refinery utilization of 90% in 2023, which included 99% utilization in the second half of the year, compared to 433,200 bbls/d and 93% in the prior year. |
| ● | The company entered into a co-ownership agreement with North Atlantic, a leading gas station and convenience store operator in Atlantic Canada, to combine retail fuel networks. The combined network has 110 sites and will include the rebranding of a number of North Atlantic’s sites to the Petro-Canada™ brand. |
| ● | Petro-Canada™ and Canadian Tire Corporation announced a new partnership that will result in the rebranding of over 200 of Canadian Tire Corporation’s retail fuel network sites to the Petro-Canada™ brand, increasing the presence of Petro-Canada’s brand across the country, as well as the partnering of the two brands’ loyalty programs, benefiting millions of loyalty members. Suncor will also become the primary fuel provider for Canadian Tire Corporation’s retail fuel network. |
The company continued to decarbonize its business while maintaining its competitiveness.
| ● | To help reach Suncor’s strategic objective to achieve net-zero GHG emissions from operations by 2050, the company has continued to work collaboratively with industry peers through the Oil Sands Pathways to Net Zero alliance (Pathways Alliance) and with federal and provincial governments and other stakeholders in the implementation of a global-scale carbon capture and storage facility for the Canadian Oil Sands. In 2023, the Pathways Alliance was awarded exploratory rights from the Government of Alberta for its proposed carbon capture and storage hub, which is expected to enable the safe and permanent storage of CO2 captured from over 20 oil sands facilities in northern Alberta. |
| ● | The company continued to advance other projects aimed at decarbonizing its existing hydrocarbon business, including advancing construction on the new cogeneration facility to replace the coke-fired boilers at Oil Sands Base. |
ANNUAL REPORT 2023 SUNCOR ENERGY INC. 7
Net Earnings
Suncor’s net earnings in 2023 were $8.295 billion, compared to $9.077 billion in 2022. Net earnings were impacted by the same factors that influenced adjusted operating earnings discussed below. Other items affecting net earnings in 2023 and 2022 included:
| ● | An unrealized foreign exchange gain on the revaluation of U.S. dollar denominated debt of $184 million recorded in financing expenses in the Corporate and Eliminations segment in 2023, compared to a loss of $729 million in 2022. |
| ● | An unrealized loss on risk management activities of $12 million recorded in other income in 2023, compared to $5 million in 2022. |
| ● | In 2023, Suncor recorded a gain of $607 million on the sale of its U.K. E&P portfolio and a gain of $302 million on the sale of its wind and solar assets in the Corporate and Eliminations segment. Also in 2023, the company recorded a non-cash gain of $1.125 billion in the Oil Sands segment as a result of the acquisition of the remaining working interest in Fort Hills, via the purchase of TotalEnergies EP Canada Ltd. (TotalEnergies Canada). In 2022, the company recorded a $65 million foreign exchange loss related to the sale of the company’s share of its assets in Norway in the E&P segment. |
| ● | In 2023, the company recorded non-cash derecognition charges of $253 million on its Meadow Creek development properties in the Oil Sands segment and a non-cash impairment of $158 million against an equity investment in the Corporate and Eliminations segment. In 2022, the company recorded a non-cash impairment of $3.397 billion against its share of the Fort Hills assets in the Oil Sands segment. Also in 2022, the company recorded a non-cash impairment reversal of $715 million on its share of the White Rose assets in the E&P segment and a non-cash impairment of $70 million against its share of its assets in Norway in the E&P segment. |
| ● | In 2023, the company recorded a restructuring charge of $275 million in operating, selling and general (OS&G) expenses in the Corporate and Eliminations segment related to the company’s workforce reductions. |
| ● | In 2022, the company recognized $147 million of property damage insurance proceeds in other income related to the company’s assets in Libya in the E&P segment. |
| ● | An income tax recovery related to the items noted above of $98 million in 2023, compared to $915 million in 2022. |
8 ANNUAL REPORT 2023 SUNCOR ENERGY INC.
Adjusted Operating Earnings
Consolidated Adjusted Operating Earnings Reconciliation(1)
Year ended December 31 ($ millions) |
|
2023 |
|
2022 |
|
2021 |
|
Net earnings |
|
8 295 |
|
9 077 |
|
4 119 |
|
Unrealized foreign exchange (gain) loss on U.S. dollar denominated debt |
|
(184) |
|
729 |
|
(113) |
|
Unrealized loss (gain) on risk management activities |
|
12 |
|
5 |
|
(6) |
|
(Gain) loss on significant disposals and acquisitions(2) |
|
(2 034) |
|
65 |
|
(227) |
|
Asset impairments (reversals) and derecognition(3) |
|
411 |
|
2 752 |
|
(221) |
|
Restructuring charge(4) |
|
275 |
|
— |
|
168 |
|
Recognition of insurance proceeds |
|
— |
|
(147) |
|
— |
|
Loss on early repayment of long-term debt(5) |
|
— |
|
— |
|
80 |
|
Income tax (recovery) expense on adjusted operating earnings adjustments |
|
(98) |
|
(915) |
|
5 |
|
Adjusted operating earnings(1) |
|
6 677 |
|
11 566 |
|
3 805 |
|
| (1) | Non-GAAP financial measure. All reconciling items are presented on a before-tax basis and adjusted for income taxes in the income tax (recovery) expense on adjusted operating earnings adjustments line. See the Advisories – Non-GAAP and Other Financial Measures section of this MD&A. |
| (2) | In 2021, the company recorded a gain of $227 million on the sale of the company’s interest in the Golden Eagle Area Development in the E&P segment. |
| (3) | In 2021, the company recorded a non-cash impairment reversal of $221 million against its share of the Terra Nova assets in the E&P segment as a result of the decision to proceed with the Terra Nova Asset Life Extension (ALE) Project and the benefit of royalty and financial support from the Government of Newfoundland and Labrador. |
| (4) | In 2021, the company recorded a restructuring charge of $168 million related to workforce reductions in OS&G expenses in the Corporate and Eliminations segment. |
| (5) | In 2021, in connection with the early repayment of long-term debt, the company recorded a loss of $80 million in financing expenses in the Corporate and Eliminations segment. |
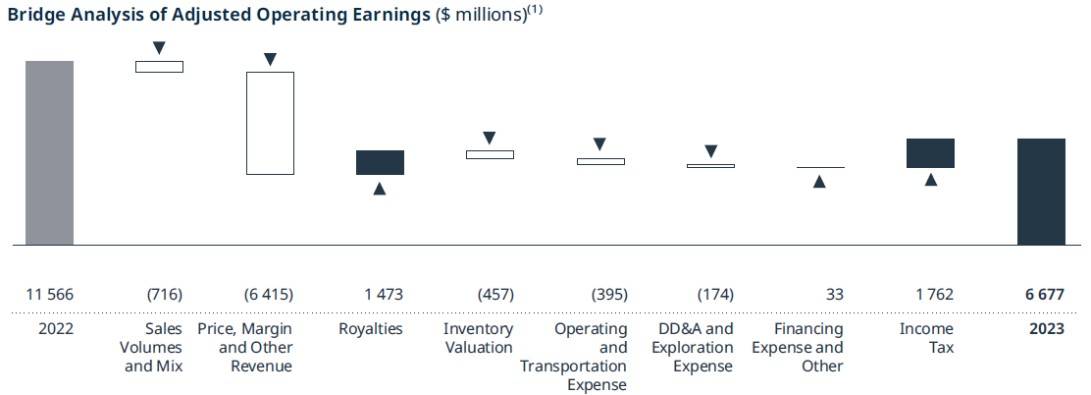
| (1) | For an explanation of this bridge analysis, see the Advisories – Non-GAAP and Other Financial Measures section of this MD&A. |
Suncor’s consolidated adjusted operating earnings were $6.677 billion in 2023, compared to $11.566 billion in the prior year. The decrease in adjusted operating earnings in 2023 was primarily due to decreased crude oil and refined product price realizations compared to the prior year, reflecting a weaker business environment in the current year, and decreased sales volumes in E&P in 2023 due to international asset divestments, partially offset by lower incomes taxes and royalties, and increased sales volumes in Oil Sands. Adjusted operating earnings were also unfavourably impacted by a weakening in benchmark pricing in 2023 compared to a strengthening in 2022, resulting in a first-in, first-out (FIFO) inventory valuation loss, partially offset by a realization of intersegment profit in 2023, compared to a FIFO inventory valuation gain, partially offset by a deferral of intersegment profit in 2022.
Adjusted Funds from Operations and Cash Flow Provided by Operating Activities
Adjusted funds from operations were $13.325 billion in 2023, compared to $18.101 billion in 2022, and were primarily influenced by the same factors impacting adjusted operating earnings. Adjusted funds from operations in 2023 were also impacted by a one-time tax benefit of approximately $880 million relating to the acquisition of TotalEnergies Canada and a restructuring charge of $275 million related to the company’s workforce reductions. Adjusted funds from operations in 2022 were also impacted by the recognition of $147 million of property damage insurance proceeds related to the company’s assets in Libya.
ANNUAL REPORT 2023 SUNCOR ENERGY INC. 9
Cash flow provided by operating activities, which includes changes in non-cash working capital, was $12.344 billion in 2023, compared to $15.680 billion in 2022. In addition to the factors discussed above, cash flow provided by operating activities was impacted by a significant decrease in the use of working capital in the current year compared to the prior year. The use of cash in 2023 was primarily due to significantly lower net income taxes payable, and a decrease in accounts payable and accrued liabilities, partially offset by a decrease in accounts receivable balances related to the decrease in commodity prices in 2023.
Results for 2022 Compared with 2021
Suncor’s consolidated adjusted operating earnings increased to $11.566 billion in 2022, compared to $3.805 billion in the prior year. The increase in adjusted operating earnings in 2022 was primarily due to significantly higher crude oil and refined product price realizations compared to the prior year, reflecting the improved business environment, and higher overall crude production and refinery throughput in 2022. These factors were partially offset by an increase in income taxes associated with increased earnings, increased royalties associated with higher crude price realizations, and increased operating and transportation expenses. Adjusted operating earnings were also impacted by a smaller strengthening in benchmark pricing in 2022 compared to the prior year, resulting in a net unfavourable inventory valuation change of $742 million on crude feedstock costs.
Adjusted funds from operations for 2022 were $18.101 billion, compared to $10.257 billion in 2021, and were impacted by the same factors as adjusted operating earnings.
Cash flow provided by operating activities, which includes changes in non-cash working capital, was $15.680 billion in 2022, compared to $11.764 billion in 2021. In addition to the factors discussed above, cash flow provided by operating activities was further impacted by a use of cash in working capital in 2022, compared to a source of cash in the prior year. The use of cash in 2022 was primarily due to an increase in accounts receivable and inventory balances related to the increase in commodity prices and crude oil price realizations in 2022, partially offset by an increase in accounts payable and accrued liabilities.
10 ANNUAL REPORT 2023 SUNCOR ENERGY INC.
Business Environment
Commodity prices, refining crack spreads and foreign exchange rates are important factors that affect the results of Suncor’s operations.
Average for the year ended December 31 |
|
2023 |
|
2022 |
|
2021 |
|
WTI crude oil at Cushing (US$/bbl) |
|
77.60 |
|
94.25 |
|
67.95 |
|
Dated Brent Crude (US$/bbl) |
|
82.60 |
|
101.20 |
|
70.75 |
|
Dated Brent/Maya crude oil FOB price differential (US$/bbl) |
|
25.35 |
|
15.50 |
|
6.85 |
|
MSW at Edmonton (Cdn$/bbl) |
|
100.45 |
|
120.10 |
|
80.30 |
|
WCS at Hardisty (US$/bbl) |
|
59.00 |
|
75.95 |
|
54.90 |
|
WTI-WCS light/heavy differential (US$/bbl) |
|
(18.60) |
|
(18.30) |
|
(13.05) |
|
SYN-WTI premium (differential) (US$/bbl) |
|
2.00 |
|
4.45 |
|
(1.65) |
|
Condensate at Edmonton (US$/bbl) |
|
76.60 |
|
93.75 |
|
68.25 |
|
Natural gas (Alberta spot) at AECO (Cdn$/GJ) |
|
2.50 |
|
5.10 |
|
3.45 |
|
Alberta Power Pool Price (Cdn$/MWh) |
|
133.65 |
|
162.45 |
|
101.95 |
|
New York Harbor 2-1-1 crack(1) (US$/bbl) |
|
34.40 |
|
47.00 |
|
19.40 |
|
Chicago 2-1-1 crack(1) (US$/bbl) |
|
26.15 |
|
38.10 |
|
17.75 |
|
Portland 2-1-1 crack(1) (US$/bbl) |
|
40.00 |
|
51.35 |
|
23.15 |
|
Gulf Coast 2-1-1 crack(1) (US$/bbl) |
|
32.20 |
|
40.40 |
|
18.00 |
|
U.S. Renewable Volume Obligation (US$/bbl) |
|
7.00 |
|
7.75 |
|
6.80 |
|
Suncor custom 5-2-2-1 index(2) (US$/bbl) |
|
36.60 |
|
45.30 |
|
26.55 |
|
Exchange rate (average) (US$/Cdn$) |
|
0.74 |
|
0.77 |
|
0.80 |
|
Exchange rate (end of period) (US$/Cdn$) |
|
0.76 |
|
0.74 |
|
0.79 |
|
| (1) | 2-1-1 crack spreads are indicators of the refining margin generated by converting two barrels of WTI into one barrel of gasoline and one barrel of diesel. The crack spreads presented here generally approximate the regions into which the company sells refined products through retail and wholesale channels. |
| (2) | Suncor has developed an indicative 5-2-2-1 index based on publicly available pricing data to more accurately reflect the company’s realized refining and marketing gross margin. |
Commodity market volatility increased during 2023 due to ongoing economic concerns regarding rising interest rates, inflationary pressures and future economic growth.
Suncor’s sweet SCO price realizations are influenced primarily by the price of WTI at Cushing and by the supply and demand for sweet SCO from Western Canada. Sweet SCO price realizations in 2023 reflected a decrease in WTI at Cushing, which averaged US$77.60/bbl, compared to US$94.25/bbl in the prior year, and also reflected declining SYN-WTI premiums.
Suncor also produces sour SCO, the price of which is influenced by various crude benchmarks, including, but not limited to, MSW at Edmonton and WCS at Hardisty. The price of sour SCO can also be affected by prices negotiated for spot sales. Prices for MSW at Edmonton decreased to $100.45/bbl in 2023 compared to $120.10/bbl in 2022, and prices for WCS at Hardisty decreased to US$59.00/bbl in 2023, from US$75.95/bbl in 2022.
Bitumen production that Suncor does not upgrade is blended with diluent or SCO to facilitate delivery through pipeline systems. Net bitumen price realizations are therefore influenced by both prices for Canadian heavy crude oil (WCS at Hardisty is a common reference), prices for diluent (condensate at Edmonton) and SCO.
The company leverages its marketing and logistics business to optimize midstream capacity to the U.S. Gulf Coast, which is reflected in bitumen and sour SCO price realizations. Bitumen prices were unfavourably impacted by the widening of heavy crude oil differentials in 2023 compared to 2022.
Suncor’s price realizations for production from E&P Canada and E&P International assets are influenced primarily by the price for Brent crude, which decreased to US$82.60/bbl in 2023, compared to US$101.20/bbl in 2022.
Suncor’s refining and marketing gross margins are primarily influenced by 2-1-1 benchmark crack spreads, which are industry indicators approximating the gross margin on a barrel of crude oil that is refined to produce gasoline and distillates. Market crack spreads are based on quoted near-month contracts for WTI and spot prices for gasoline and diesel, and do not necessarily reflect the margins at a specific refinery. Suncor’s realized refining and marketing gross margins are influenced by crude mix, actual crude oil feedstock costs, refinery configuration, product mix and realized market prices unique to Suncor’s refining and marketing business. In addition, U.S. regulatory renewable blending obligations influence the benchmark cracks, which may increase their volatility. The cost of regulatory compliance is not deducted in calculating the benchmark cracks.
Suncor has developed an indicative 5-2-2-1 index based on publicly available pricing data to reflect the company’s realized refining and marketing gross margin more accurately.
ANNUAL REPORT 2023 SUNCOR ENERGY INC. 11
This custom index is a single value representing a notional five barrels of crude oil of varying grades refined to produce two barrels each of gasoline and distillate and one barrel of secondary product to approximate Suncor’s unique set of refinery configurations, overall crude slate and product mix, location, quality and grade differentials, and the benefits of its marketing margins. The custom index is calculated by taking the product value of refined products less the crude value of refinery feedstock excluding the impact of FIFO inventory accounting methodology. The product value incorporates the New York Harbor 2-1-1 crack, Chicago 2-1-1 crack, WTI benchmarks and a seasonal factor. The seasonal factor applies an incremental US$6.50/bbl in the first and fourth quarters and US$5.00/bbl in the second and third quarters and reflects the location, quality and grade differentials for refined products sold in the company’s core markets during the winter and summer months, respectively. The crude value incorporates the SYN, WCS and WTI benchmarks.
Crack spreads are based on current crude feedstock prices, whereas actual earnings are accounted for on a FIFO basis in accordance with IFRS where a delay exists between the time that feedstock is purchased to when it is processed and when products are sold to a third party. A FIFO loss normally reflects a declining price environment for crude oil and finished products, whereas FIFO gains reflect an increasing price environment for crude oil and finished products. The company’s realized refining and marketing gross margins are also presented on a last-in, first-out (LIFO) basis, which is consistent with how industry benchmarks and the Suncor 5-2-2-1 index are calculated and with how management evaluates performance.
In 2023, 2-1-1 benchmark crack spreads decreased compared to 2022, primarily due to inventory growth as a result of increased global refining runs and softening demand. The Suncor 5-2-2-1 index was US$36.60/bbl in 2023 compared to US$45.30/bbl in 2022, reflecting the decrease in benchmark crack spreads.
The cost of natural gas used in Suncor’s Oil Sands and Refining operations is primarily referenced to Alberta spot prices at AECO. The average AECO benchmark decreased to $2.50/GJ in 2023, from $5.10/GJ in the prior year.
Excess electricity produced at Suncor’s Oil Sands assets is sold to the Alberta Electric System Operator, with the proceeds netted against the applicable cash operating cost per barrel metric. The Alberta power pool price decreased to an average of $133.65/MWh in 2023 from $162.45/MWh in the prior year.
The majority of Suncor’s revenues from the sale of oil and natural gas commodities are based on prices that are determined by or referenced to U.S. dollar benchmark prices, while the majority of Suncor’s expenditures are realized in Canadian dollars. A decrease in the value of the Canadian dollar relative to the U.S. dollar will increase the revenues received from the sale of commodities. An increase in the value of the Canadian dollar relative to the U.S. dollar will decrease revenues received from the sale of commodities. In 2023, the Canadian dollar weakened in relation to the U.S. dollar as the average exchange rate decreased to US$0.74 per one Canadian dollar from US$0.77 per one Canadian dollar in 2022. The decrease in the Canadian dollar relative to the U.S. dollar had a positive impact on price realizations for the company in 2023 when compared to 2022.
Suncor also has assets and liabilities, including approximately 55% of the company’s debt, that are denominated in U.S. dollars and translated to Suncor’s reporting currency (Canadian dollars) at each balance sheet date. A decrease in the value of the Canadian dollar, relative to the U.S. dollar, from the previous balance sheet date increases the amount of Canadian dollars required to settle U.S. dollar denominated obligations, while an increase in the value of the Canadian dollar, relative to the U.S. dollar, decreases the amount of Canadian dollars required to settle U.S. dollar denominated obligations. As at December 31, 2023, the Canadian dollar strengthened in relation to the U.S. dollar as the exchange rate at the end of the period increased to US$0.76 per one Canadian dollar from US$0.74 per one Canadian dollar at the end of the prior year. This exchange rate increase had a positive impact on the company’s debt balances as at December 31, 2023, compared to December 31, 2022.
12 ANNUAL REPORT 2023 SUNCOR ENERGY INC.
Economic Sensitivities(1)(2)
The following table illustrates the estimated effects that changes in certain factors would have had on 2023 net earnings and adjusted funds from operations(3) if the listed changes had occurred.
|
|
|
|
|
|
|
|
Impact on 2023 |
|
Impact on 2023 |
|
(Estimated change, in $ millions) |
|
Net Earnings |
|
Adjusted Funds from Operations(3) |
|
Crude oil +US$1.00/bbl |
|
180 |
|
180 |
|
Natural gas +Cdn$1.00/GJ(4) |
|
(160) |
|
(160) |
|
2-1-1 crack spreads +US$1.00/bbl |
|
140 |
|
140 |
|
Foreign exchange +$0.01 US$/Cdn$ related to operating activities(5) |
|
(200) |
|
(200) |
|
Foreign exchange on U.S. dollar denominated debt +$0.01 US$/Cdn$ |
|
120 |
|
— |
|
| (1) | Each line item in this table shows the effects of a change in that variable only, with other variables being held consistent. |
| (2) | Changes for a variable imply that all such similar variables are impacted, such that Suncor’s average price realizations increase uniformly. For instance, “Crude oil +US$1.00/bbl” implies that price realizations influenced by WTI, Brent, SCO, WCS, par crude at Edmonton and condensate all increase by US$1.00/bbl. |
| (3) | Non-GAAP financial measure. See the Advisories – Non-GAAP and Other Financial Measures section of this MD&A. |
| (4) | The company’s exposure to natural gas costs is partially mitigated by revenue from power sales, which is not included in the above sensitivity. |
| (5) | Excludes the foreign exchange impact on U.S. dollar denominated debt. |
ANNUAL REPORT 2023 SUNCOR ENERGY INC. 13
4. Segment Results and Analysis
Suncor has classified its operations into the following segments:
Oil Sands
Suncor’s Oil Sands segment produces bitumen from mining and in situ operations in northern Alberta. Bitumen is either upgraded into SCO or blended with diluent for either refinery feedstock or direct sale to market. The segment includes the marketing, supply, transportation and risk management of crude oil, power and byproducts.
The Oil Sands segment includes:
| ● | Oil Sands operations refer to Suncor’s owned and operated mining, extraction, upgrading, in situ and related logistics, blending and storage assets. Oil Sands operations consist of: Oil Sands Base operations, which include the Millennium and North Steepbank mines, integrated upgrading facilities Upgrader 1 and Upgrader 2, and the associated infrastructure for these assets, as well as interests in future mining development opportunities; and In Situ operations, which include oil sands bitumen production from Firebag and MacKay River and supporting infrastructure, as well as development opportunities that may support future in situ production. |
| ● | Fort Hills includes Suncor’s wholly owned and operated Fort Hills mining and extraction operation, and the East Tank Farm Development, which Suncor operates and holds a 51% interest. In 2023, Suncor completed two separate acquisitions of additional working interests in the Fort Hills mining and extraction operation, increasing its ownership from 54.11% to 100%. |
| ● | Syncrude refers to Suncor’s 58.74% operated working interest in Syncrude’s two producing oil sands mines, Mildred Lake and Aurora North, and integrated upgrading facilities. Syncrude also includes development opportunities that may support future production. |
Exploration and Production
Suncor’s E&P segment consists of offshore operations off the East Coast of Canada, and onshore assets in Libya and Syria. This segment also includes the marketing and risk management of crude oil and natural gas.
| ● | E&P Canada operations include Suncor’s 48% working interest in Terra Nova, which Suncor operates. Suncor also holds non-operated interests in the White Rose assets (40% in the base project and 38.6% in the extensions), Hibernia (20% in the base project and 19.485% in the Hibernia Southern Extension Unit) and Hebron (21.034%). In addition, the company holds interests in several exploration licences and significant discovery licences offshore Newfoundland and Labrador. |
| ● | E&P International operations include Suncor’s working interests in the exploration and development of oilfields in the Sirte Basin in Libya, pursuant to exploration and production sharing agreements. Suncor also owns, pursuant to a production sharing contract, an interest in the Ebla gas development in Syria, which has been suspended indefinitely since 2011 due to political unrest in the country. E&P International previously included Suncor’s U.K. portfolio and Norway assets which were divested in 2023 and 2022, respectively. |
Refining and Marketing
Suncor’s R&M segment consists of two primary operations, discussed below. This segment also includes the trading of crude oil, refined products, natural gas and power.
| ● | Refining and Supply operations refine crude oil and intermediate feedstock into a wide range of petroleum and petrochemical products. Refining and Supply consists of: Eastern North America operations, which include a 137 mbbls/d refinery located in Montreal, Quebec, and an 85 mbbls/d refinery located in Sarnia, Ontario; and Western North America operations, which include a 146 mbbls/d refinery located in Edmonton, Alberta, and a 98 mbbls/d refinery in Commerce City, Colorado. Other Refining and Supply assets include interests in a petrochemical plant and a sulphur recovery facility in Montreal, Quebec, product pipelines and terminals throughout Canada and the U.S., and the St. Clair ethanol plant in Ontario. |
14 ANNUAL REPORT 2023 SUNCOR ENERGY INC.
| ● | Marketing operations sell refined petroleum products to retail customers primarily through a combination of company-owned Petro-Canada™ locations, branded dealers in Canada and company-owned locations in the U.S. marketed under other international brands. This includes Canada’s Electric Highway™, a coast-to-coast network of fast-charging electric vehicle stations. The company’s marketing operations also sells refined petroleum products through a nationwide commercial road transportation network in Canada, and to other commercial and industrial customers, including other retail sellers, in Canada and the U.S. |
Corporate and Eliminations
The Corporate and Eliminations segment includes activities not directly attributable to any other operating segment. This segment previously included Suncor’s renewable energy assets, which were sold in the first quarter of 2023.
| ● | Corporate activities include Suncor’s debt and borrowing costs, expenses not allocated to the company’s businesses, and investments in certain clean technologies. |
| ● | Intersegment revenues and expenses are removed from consolidated results in Eliminations. Intersegment activity includes the sale of product between the company’s segments, primarily relating to crude refining feedstock sold from Oil Sands to R&M. |
ANNUAL REPORT 2023 SUNCOR ENERGY INC. 15
Oil Sands
Strategy and Investment Updates
| ● | At Oil Sands Base, the company plans to further deploy autonomous haul trucks at its Millennium mine and expects to have 91 autonomous haul trucks in its Oil Sands Base operations by the end of 2024. Autonomous haul trucks offer a number of advantages over existing staffed trucks, including enhanced safety, environmental and operational performance. |
| ● | The company plans to continue construction of a cogeneration facility to replace the coke-fired boilers at Oil Sands Base, which is expected to be in service in late 2024 and provide the steam generation required for extraction and upgrading activities at a lower cost and with significantly lower carbon emissions. The cogeneration facility is also expected to generate lower-carbon-intensive electricity that will be transmitted to Alberta’s power grid. |
| ● | In 2024, the company plans to continue to progress the Upgrader 1 coke drum replacement project, which is expected to be in service in late 2025. The Upgrader 1 coke drum replacement project is expected to extend the life of the Upgrader 1 facility by approximately 30 years and reduce the facility’s future operating and capital cost requirements. |
| ● | In 2024, the company plans to continue to advance the Mildred Lake West Extension (MLX-W) project at Syncrude, which is expected to sustain Syncrude’s current production levels by extending the life of its North Mine using existing extraction and upgrading facilities. MLX-W is expected to commence production in late 2025. |
| ● | In 2024, the company will be in the second year of its three-year mine improvement plan at Fort Hills, while also accelerating a sequence of mine development relative to its historical plans, requiring the opening of two sections in the North Pit rather than one as originally planned. Upon completion of the three-year mine improvement plan, opportunities for further value optimization will be implemented for the remaining life of the mine. |
| ● | The company will continue to leverage its integrated regional asset base to generate incremental value by maximizing upgrader utilizations. This includes internal asset transfers on the interconnecting pipelines, as well as directing higher quantities of Fort Hills bitumen to upgrading at Oil Sands Base. |
| ● | The company will continue efforts to decarbonize its Oil Sands business, including through its participation in the Pathways Alliance. The Pathways Alliance expects to submit required regulatory applications for a proposed carbon capture and storage hub in 2024. |
Financial Highlights
Year ended December 31 ($ millions) |
|
2023 |
|
2022 |
|
2021 |
|
Operating revenues |
|
26 035 |
|
30 431 |
|
19 920 |
|
Less: Royalties |
|
(2 623) |
|
(3 963) |
|
(1 523) |
|
Operating revenues, net of royalties |
|
23 412 |
|
26 468 |
|
18 397 |
|
Earnings before income taxes(1) |
|
6 811 |
|
5 633 |
|
2 825 |
|
Adjusted for: |
|
|
|
|
|
|
|
Unrealized loss on risk management activities |
|
28 |
|
12 |
|
4 |
|
Gain on significant acquisition |
|
(1 125) |
|
— |
|
— |
|
Derecognition and asset impairment |
|
253 |
|
3 397 |
|
— |
|
Adjusted operating earnings(1)(2) |
|
5 967 |
|
9 042 |
|
2 829 |
|
Adjusted funds from operations(1)(2) |
|
10 725 |
|
13 831 |
|
7 575 |
|
Free funds flow(2) |
|
6 629 |
|
10 291 |
|
4 407 |
|
| (1) | Beginning in 2022, to align with how management evaluates segment performance, the company revised its segment presentation to reflect segment results before income tax expense and present tax at a consolidated level. This presentation change had no effect on consolidated net earnings, adjusted operating earnings and adjusted funds from operations. Comparative periods have been revised to reflect this change. See the Income Tax section of this MD&A for a discussion of income taxes. |
| (2) | Non-GAAP financial measures. See the Advisories – Non-GAAP and Other Financial Measures section of this MD&A. |
16 ANNUAL REPORT 2023 SUNCOR ENERGY INC.
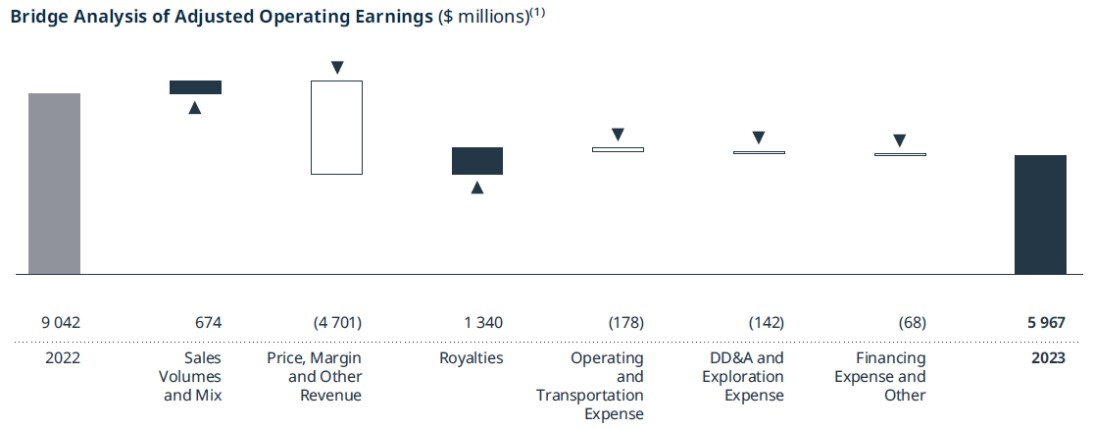
| (1) | For an explanation of this bridge analysis, see the Advisories – Non-GAAP and Other Financial Measures section of this MD&A. |
The Oil Sands segment had adjusted operating earnings of $5.967 billion in 2023, compared to $9.042 billion in 2022. The decrease was primarily due to lower realized crude oil prices compared to the prior year, partially offset by decreased royalties due to lower crude benchmark prices and increased sales volumes.
Oil Sands earnings before income taxes were $6.811 billion in 2023, compared to $5.633 billion in 2022. In addition to the factors impacting adjusted operating earnings, earnings before income taxes for 2023 included a non-cash gain of $1.125 billion as a result of the acquisition of TotalEnergies Canada, and non-cash derecognition charges of $253 million on the company’s Meadow Creek development properties. Earnings before income taxes in 2022 included a non-cash impairment charge of $3.397 billion against the company’s share of the Fort Hills assets. Additionally, both periods were impacted by unrealized losses on risk management activities.
Adjusted funds from operations for the Oil Sands segment were $10.725 billion in 2023, compared to $13.831 billion in 2022, and were influenced by the same factors that impacted adjusted operating earnings.
ANNUAL REPORT 2023 SUNCOR ENERGY INC. 17
Production Volumes(1)
Year ended December 31 |
|
|
|
|
|
|
|
(mbbls/d) |
|
2023 |
|
2022 |
|
2021 |
|
Total Oil Sands bitumen production |
|
819.8 |
|
790.5 |
|
770.3 |
|
SCO and diesel production(2) |
|
505.8 |
|
493.7 |
|
483.5 |
|
Internally consumed diesel and internal transfers(3)(4) |
|
(18.8) |
|
(13.7) |
|
(14.9) |
|
Upgraded production – net SCO and diesel |
|
487.0 |
|
480.0 |
|
468.6 |
|
Bitumen production |
|
231.5 |
|
191.9 |
|
178.8 |
|
Internal bitumen transfers(5)(6) |
|
(28.9) |
|
(6.7) |
|
(3.2) |
|
Non-upgraded bitumen production |
|
202.6 |
|
185.2 |
|
175.6 |
|
Total Oil Sands production |
|
689.6 |
|
665.2 |
|
644.2 |
|
| (1) | Bitumen production from Oil Sands Base is upgraded, while bitumen production from In Situ operations and Fort Hills is either upgraded or sold as bitumen, with SCO and diesel yields of approximately 79% of bitumen feedstock input. Nearly all bitumen produced at Syncrude is upgraded to sweet SCO and a small amount of diesel at an approximate yield of 85%. |
| (2) | Upgrader utilization rates are calculated using total upgraded production, inclusive of internally consumed diesel and internal transfers. |
| (3) | Both Oil Sands operations and Syncrude produce diesel, which is internally consumed in mining operations. In addition, Fort Hills and Syncrude use internally produced diesel from Oil Sands Base. In 2023, Oil Sands operations production volumes included 11,400 bbls/d of internally consumed diesel, of which 6,900 bbls/d was consumed at Oil Sands Base, 3,200 bbls/d was consumed at Fort Hills and 1,300 bbls/d was consumed at Syncrude. Syncrude production volumes included 2,700 bbls/d of internally consumed diesel. |
| (4) | Internal feedstock transfers between Oil Sands operations and Syncrude are included in SCO and diesel production volumes. In 2023, Oil Sands operations production included 4,700 bbls/d of SCO that were transferred to Suncor’s share of Syncrude. |
| (5) | Internal feedstock transfers between Oil Sands operations and Syncrude are included in bitumen production volumes. In 2023, Oil Sands operations production included 8,600 bbls/d of bitumen that were transferred to Suncor’s share of Syncrude. Syncrude production included 1,700 bbls/d of bitumen that were transferred to Oil Sands Base. |
| (6) | Internal feedstock transfers from Fort Hills to Oil Sands operations are included in bitumen production volumes. In 2023, Fort Hills production included 18,600 bbls/d of bitumen that was transferred to Oil Sands Base. |
Total Oil Sands bitumen production increased in 2023 compared to 2022, primarily due to the company’s increased working interest in Fort Hills and record Firebag bitumen production.
The company’s net SCO production was a record 487,000 bbls/d in 2023, compared to 480,000 bbls/d in 2022. During 2023, the company achieved a combined upgrader utilization rate of 92%, compared to 89% in the prior year, with both periods benefiting from Suncor’s regional asset connectivity.
Non-upgraded bitumen production increased to 202,600 bbls/d in 2023, compared to 185,200 bbls/d in the prior year. Increased In Situ and Fort Hills bitumen production to market in 2023 was due to the company’s increased working interest in Fort Hills and strong In Situ production, being partially offset by increased internal transfers due to higher upgrader availability in the current period.
18 ANNUAL REPORT 2023 SUNCOR ENERGY INC.
Sales Volumes
Year ended December 31 |
|
|
|
|
|
|
|
(mbbls/d) |
|
2023 |
|
2022 |
|
2021 |
|
Upgraded – net SCO and diesel |
|
486.6 |
|
482.6 |
|
465.7 |
|
Non-upgraded bitumen |
|
199.4 |
|
180.7 |
|
183.8 |
|
Total |
|
686.0 |
|
663.3 |
|
649.5 |
|
SCO and diesel sales volumes increased to 486,600 bbls/d in 2023, compared to 482,600 bbls/d in 2022, consistent with the increase in production, partially offset by a draw of inventory in the prior year.
Non-upgraded bitumen sales volumes increased to 199,400 bbls/d in 2023, from 180,700 bbls/d in the prior year, primarily due to the increase in production.
Price Realizations(1)
Year ended December 31 |
|
|
|
|
|
|
|
Net of transportation costs, but before royalties ($/bbl) |
|
2023 |
|
2022 |
|
2021 |
|
Upgraded – net SCO and diesel |
|
99.40 |
|
118.88 |
|
77.73 |
|
Non-upgraded bitumen |
|
67.97 |
|
84.63 |
|
53.80 |
|
Average crude |
|
90.27 |
|
109.57 |
|
70.96 |
|
Average crude, relative to WTI |
|
(14.44) |
|
(13.02) |
|
(14.20) |
|
| (1) | Contains non-GAAP financial measures. See the Advisories – Non-GAAP and Other Financial Measures section of this MD&A. |
Oil Sands price realizations decreased in 2023 compared to 2022, in line with the decrease in crude oil benchmark prices, the impact of weaker SYN-WTI differentials and the widening of heavy crude oil differentials in 2023, partially offset by a weaker Canadian dollar in relation to the U.S. dollar.
Royalties
Royalties for the Oil Sands segment decreased in 2023 compared to 2022, primarily due to the decrease in crude benchmark prices and crude price realizations, partially offset by increased bitumen production volumes.
Expenses and Other Factors
Total Oil Sands operating expenses for 2023 were higher relative to 2022, primarily due to increased operating expenses associated with the company’s additional working interests in Fort Hills acquired in the first and fourth quarters of 2023, increased maintenance costs, higher levels of mining activity and inflationary impacts, partially offset by lower natural gas prices and other commodity costs. See the Cash Operating Costs section below for additional details regarding cash operating costs and a breakdown of non-production costs by asset.
In 2023, depreciation, depletion, and amortization (DD&A) expense, adjusting for the impacts of derecognitions and asset impairments, was higher than 2022, primarily due to increased depreciation related to the company’s asset retirement obligation asset and the company’s increased working interest in Fort Hills, partially offset by lower derecognition charges of property, plant and equipment in the current year.
Financing expense and other, which includes other income, adjusted for the $1.125 billion non-cash gain on acquisition, increased in 2023 compared to 2022. The increase was primarily due to increased accretion expense resulting from asset retirement obligations and increased interest on leases, as a result of net leases assumed with the Fort Hills acquisitions, and entered into, during 2023, partially offset by a provision reversal in 2023 related to the company’s arrangement involving a third-party byproduct processor.
ANNUAL REPORT 2023 SUNCOR ENERGY INC. 19
Cash Operating Costs
Year ended December 31 |
|
2023 |
|
2022 |
|
2021 |
|
Oil Sands OS&G(1) |
|
9 329 |
|
9 152 |
|
8 056 |
|
Oil Sands operations cash operating costs reconciliation |
|
|
|
|
|
|
|
Oil Sands operations OS&G |
|
5 174 |
|
5 429 |
|
4 840 |
|
Non-production costs(3) |
|
(35) |
|
(302) |
|
(317) |
|
Excess power capacity and other(4) |
|
(388) |
|
(586) |
|
(366) |
|
Oil Sands operations cash operating costs(2) ($ millions) |
|
4 751 |
|
4 541 |
|
4 157 |
|
Oil Sands operations production volumes (mbbls/d) |
|
438.3 |
|
415.7 |
|
439.2 |
|
Oil Sands operations cash operating costs(2) ($/bbl) |
|
29.70 |
|
29.95 |
|
25.90 |
|
Fort Hills cash operating costs reconciliation |
|
|
|
|
|
|
|
Fort Hills OS&G |
|
1 607 |
|
1 146 |
|
882 |
|
Non-production costs(3) |
|
(220) |
|
(161) |
|
(81) |
|
Excess power capacity(4) |
|
(52) |
|
(53) |
|
(37) |
|
Fort Hills cash operating costs(2) ($ millions) |
|
1 335 |
|
932 |
|
764 |
|
Fort Hills production volumes (mbbls/d) |
|
106.4 |
|
85.1 |
|
50.7 |
|
Fort Hills cash operating costs(2) ($/bbl) |
|
34.40 |
|
30.00 |
|
41.35 |
|
Syncrude cash operating costs reconciliation |
|
|
|
|
|
|
|
Syncrude OS&G |
|
2 837 |
|
2 840 |
|
2 449 |
|
Non-production costs(3) |
|
(202) |
|
(337) |
|
(214) |
|
Excess power capacity(4) |
|
(24) |
|
(31) |
|
(20) |
|
Syncrude cash operating costs(2) ($ millions) |
|
2 611 |
|
2 472 |
|
2 215 |
|
Syncrude production volumes (mbbls/d) |
|
192.6 |
|
184.8 |
|
172.4 |
|
Syncrude cash operating costs(2) ($/bbl) |
|
37.15 |
|
36.65 |
|
35.20 |
|
| (1) | Beginning in 2022, the company revised the presentation of its cash operating costs reconciliation to present Oil Sands inventory changes and internal transfers on an aggregate basis and reflect: i) the impacts of changes in inventory levels and valuations, such that the company is able to present cost information based on production volumes; and ii) adjustments for internal diesel sales between assets. Comparative periods have been updated to reflect this change, with no impact to total Oil Sands operations, Fort Hills or Syncrude cash operating costs or cash operating costs per barrel. In 2023, Oil Sands OS&G included ($289) million of inventory changes and internal transfers. In 2022, Oil Sands OS&G included ($263) million of inventory changes and internal transfers. In 2021, Oil Sands OS&G included ($115) million of inventory changes and internal transfers. |
| (2) | Non-GAAP financial measures. Related per barrel amounts contain non-GAAP financial measures. See the Advisories – Non-GAAP and Other Financial Measures section of this MD&A. |
| (3) | Non-production costs include, but are not limited to, share-based compensation adjustments, research costs, project startup costs and adjustments to reflect the cost of internal transfers in the receiving asset at the cost of production versus the cost of purchase. Non-production costs at Fort Hills and Syncrude also include, but are not limited to, an adjustment to reflect internally produced diesel from Oil Sands operations at the cost of production. |
| (4) | Represents excess power revenue from cogeneration units that is recorded in operating revenues. Oil Sands operations excess power capacity and other also includes, but is not limited to, the natural gas expense recorded as part of a non-monetary arrangement involving a third-party processor. |
Oil Sands operations cash operating costs per barrel(1) in 2023 decreased to $29.70 compared to $29.95 in 2022, primarily due to lower natural gas prices and increased production, partially offset by a higher proportion of Fort Hills bitumen being directed to upgrading at Oil Sands Base, increased maintenance costs and a decrease in excess power revenues resulting from lower power prices.
Fort Hills cash operating costs per barrel(1) averaged $34.40 in 2023, compared to $30.00 in 2022, with the increase primarily due to increased mining activity associated with the mine improvement plan and lower gross production volumes, partially offset by lower natural gas prices and other commodity costs.
Syncrude cash operating costs per barrel(1) averaged $37.15 in 2023, compared to $36.65 in 2022, with the increase primarily due to a higher proportion of volumes transferred from Oil Sands Base and In Situ, and increased mining activity, partially offset by higher production volumes.
| (1) | Contains non-GAAP financial measures. See the Advisories – Non-GAAP and Other Financial Measures section of this MD&A. |
20 ANNUAL REPORT 2023 SUNCOR ENERGY INC.
Non-Cash Asset Impairment
During the third quarter of 2022, in connection with the company entering into an agreement to acquire Teck Resources Limited's interest in Fort Hills, as well as updates to the Fort Hills long-range plan including production and operating cost plans, the company recorded a non-cash impairment of $3.397 billion against its share of the Fort Hills assets.
Asset Transactions
On February 2, 2023, the company completed the acquisition of an additional 14.65% working interest in Fort Hills from Teck Resources Limited for $712 million, bringing the company’s working interest to 68.76%.
On November 20, 2023, Suncor completed the acquisition of TotalEnergies Canada, which held the remaining 31.23% working interest in Fort Hills, for $1.468 billion before closing adjustments and other closing costs, making Suncor the sole owner of Fort Hills. The effective date of the transaction was April 1, 2023, and the acquisition resulted in a non-cash gain of $1.125 billion.
Planned Maintenance
Significant planned turnaround activities at Syncrude are scheduled to commence in the first quarter of 2024 and are expected to be completed in the second quarter of 2024. Significant planned turnaround activities at Oil Sands Base Upgrader 1 are scheduled for the second quarter of 2024, and planned annual coker maintenance at Oil Sands Base Upgrader 2 is scheduled to commence in the third quarter of 2024 and is expected to be completed in the fourth quarter of 2024. Planned turnaround activities are scheduled at MacKay River in the third quarter of 2024. At Fort Hills, planned maintenance activities are scheduled for the second and fourth quarters of 2024. The anticipated impact of these maintenance events has been reflected in the company’s 2024 guidance.
ANNUAL REPORT 2023 SUNCOR ENERGY INC. 21
Exploration and Production
Strategy and Investment Updates
| ● | The company will continue to focus on the safe ramp up of production at Terra Nova in the beginning of 2024. Additionally in 2024, Suncor will continue development activities expected to extend the productive life of existing fields, such as development drilling at Hebron and Hibernia. |
| ● | In 2024, the company intends to invest in the SeaRose Floating, Production, Storage and Offloading (FPSO) Asset Life Extension Project at White Rose, and the West White Rose Project, which are expected to provide long-term value for the company by extending the production life of the field. Production at White Rose is expected to resume once the SeaRose FPSO Asset Life Extension Project is completed. Production from the West White Rose Project is expected to commence in 2026. |
Financial Highlights
Year ended December 31 ($ millions) |
|
2023 |
|
2022 |
|
2021 |
|
Operating revenues(1) |
|
2 689 |
|
4 331 |
|
2 978 |
|
Less: Royalties(1) |
|
(491) |
|
(608) |
|
(478) |
|
Operating revenues, net of royalties |
|
2 198 |
|
3 723 |
|
2 500 |
|
Earnings before income taxes(2) |
|
1 691 |
|
3 221 |
|
1 791 |
|
Adjusted for: |
|
|
|
|
|
|
|
(Gain) loss on significant disposals(3) |
|
(607) |
|
65 |
|
(227) |
|
Asset impairment (reversal)(4) |
|
— |
|
(645) |
|
(221) |
|
Recognition of insurance proceeds |
|
— |
|
(147) |
|
— |
|
Adjusted operating earnings(2)(5) |
|
1 084 |
|
2 494 |
|
1 343 |
|
Adjusted funds from operations(2)(5) |
|
1 612 |
|
3 178 |
|
1 951 |
|
Free funds flow(5) |
|
944 |
|
2 735 |
|
1 681 |
|
| (1) | Production from the company’s Libya operations has been presented in the E&P section of this MD&A on an economic basis. Revenue and royalties from the company’s Libya operations are presented on a working-interest basis, which is required for presentation purposes in the company’s financial statements. In 2023, revenue included a gross-up amount of $528 million, with an offsetting amount of $282 million in royalties in the E&P segment and $246 million in income tax expense recorded at the consolidated level. In 2022, revenue included a gross-up amount of $486 million, with an offsetting amount of $266 million in royalties in the E&P segment and $220 million in income tax expense recorded at the consolidated level. In 2021, revenue included a gross-up amount of $345 million, with an offsetting amount of $241 million in royalties in the E&P segment and $104 million in income tax expense recorded at the consolidated level. |
| (2) | Beginning in 2022, to align with how management evaluates segment performance, the company revised its segment presentation to reflect segment results before income tax expense and present tax at a consolidated level. This presentation change had no effect on consolidated net earnings, adjusted operating earnings and adjusted funds from operations. Comparative periods have been revised to reflect this change. See the Income Tax section of this MD&A for a discussion of income taxes. |
| (3) | In 2021, the company recorded a gain of $227 million on the sale of its interest in the Golden Eagle Area Development. |
| (4) | In 2021, the company recorded a non-cash impairment reversal of $221 million against its share of the Terra Nova assets as a result of the decision to proceed with the Terra Nova ALE Project and the benefit of royalty and financial support from the Government of Newfoundland and Labrador. |
| (5) | Non-GAAP financial measures. See the Advisories – Non-GAAP and Other Financial Measures section of this MD&A. |
22 ANNUAL REPORT 2023 SUNCOR ENERGY INC.
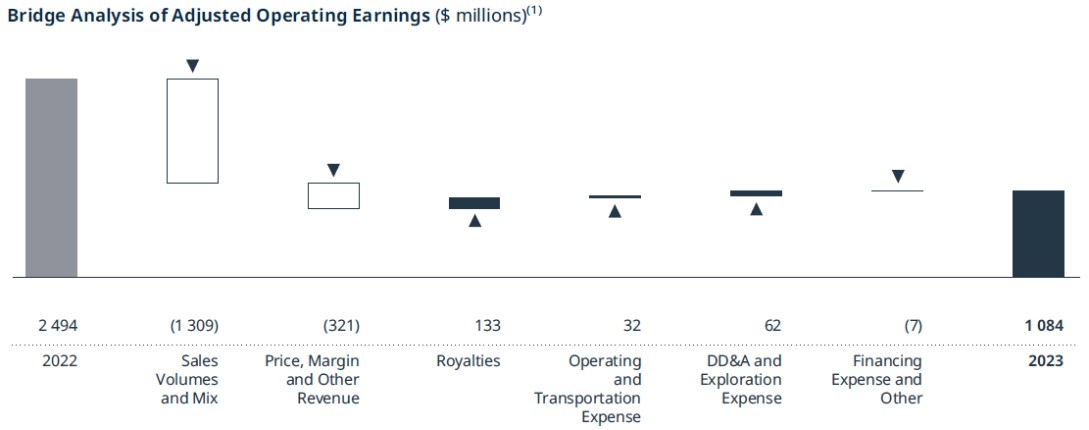
| (1) | For an explanation of this bridge analysis, see the Advisories – Non-GAAP and Other Financial Measures section of this MD&A. |
Adjusted operating earnings were $1.084 billion for E&P in 2023, compared to $2.494 billion in the prior year, with the decrease due to lower sales volumes as a result of asset divestments, and lower realized crude prices, partially offset by decreased royalties.
Earnings before income taxes for E&P were $1.691 billion in 2023, compared to $3.221 billion in 2022. In addition to the factors impacting adjusted operating earnings, earnings before income taxes in 2023 included a gain of $607 million on the sale of the company’s U.K. portfolio, which was completed in the second quarter of 2023. Earnings before income taxes in 2022 included a non-cash impairment reversal of $715 million on the company’s share of the White Rose assets, a non-cash impairment of $70 million against the company’s share of its assets in Norway, the recognition of $147 million of property damage insurance proceeds related to the company’s assets in Libya and a $65 million foreign exchange loss related to the sale of the company’s share of its assets in Norway.
Adjusted funds from operations were $1.612 billion in 2023, compared to $3.178 billion in 2022, and were influenced by the same factors that impacted adjusted operating earnings. Adjusted funds from operations in 2022 were also impacted by the recognition of $147 million of property damage insurance proceeds related to the company’s assets in Libya.
Volumes
Year ended December 31 |
|
2023 |
|
2022 |
|
2021 |
|
E&P Canada (mbbls/d) |
|
44.4 |
|
50.2 |
|
54.4 |
|
E&P International (mboe/d) |
|
11.7 |
|
27.8 |
|
33.1 |
|
Total production (mboe/d) |
|
56.1 |
|
78.0 |
|
87.5 |
|
Total sales volumes (mboe/d) |
|
52.9 |
|
80.6 |
|
82.8 |
|
ANNUAL REPORT 2023 SUNCOR ENERGY INC. 23
E&P Canada production volumes averaged 44,400 bbls/d in 2023, compared to 50,200 bbls/d the prior year, with the decrease primarily due to natural declines. White Rose was taken offline late in the fourth quarter of 2023 to commence the SeaRose FPSO Asset Life Extension Project. Production at White Rose is planned to resume once the project is completed.
E&P International production volumes averaged 11,700 boe/d in 2023, compared to 27,800 boe/d in 2022, with the decrease primarily due to the divestment of the company’s U.K. portfolio in the second quarter of 2023 and the company’s Norway assets in the third quarter of 2022.
E&P sales volumes averaged 52,900 boe/d in 2023, compared to 80,600 boe/d in the prior year, consistent with the decrease in production, as well as a build of inventory in 2023, compared to a draw in the prior year.
Price Realizations(1)
Year ended December 31 |
|
|
|
|
|
|
|
Net of transportation costs, but before royalties |
|
2023 |
|
2022 |
|
2021 |
|
E&P Canada ($/bbl) |
|
107.62 |
|
128.07 |
|
84.70 |
|
E&P International(2) ($/boe) |
|
109.00 |
|
126.61 |
|
82.16 |
|
| (1) | Contains non-GAAP financial measures. See the Advisories – Non-GAAP and Other Financial Measures section of this MD&A. |
| (2) | E&P International price realizations exclude Libya for all periods presented. |
E&P price realizations decreased in 2023 from the prior year, in line with the decrease in benchmark prices for Brent crude, partially offset by weaker foreign exchange rates.
Royalties
E&P royalties, excluding the impact of Libya, were lower in 2023 than the prior year primarily due to the decrease in price realizations and sales volumes.
Expenses and Other Factors
Operating and transportation expenses for 2023 were lower compared to the prior year primarily due to asset divestments at E&P International, partially offset by increased commissioning costs related to the Terra Nova ALE Project.
DD&A and exploration expenses, excluding the impacts of asset impairments, were lower in 2023 compared to the prior year primarily due to lower sales volumes and asset divestments at E&P International.
Non-Cash Asset Impairment Reversal and Impairment
During the second quarter of 2022, as a result of the decision to restart the West White Rose Project, the company recorded a non-cash impairment reversal of $715 million before-tax on its share of the White Rose assets. Also, during the second quarter of 2022, as a result of the company’s expected sale of its assets in Norway, and the subsequently reached agreement for such sale, the company recorded a non-cash impairment of $70 million before-tax against its share of the Norway assets.
Asset Transactions
During the third quarter of 2022, the company completed the sale of its assets in Norway for gross proceeds of approximately $430 million, before closing adjustments and other closing costs, resulting in a $65 million loss including foreign exchange impacts.
During the second quarter of 2023, the company completed the sale of its U.K. E&P portfolio for gross proceeds of $1.1 billion before closing adjustments and other closing costs, resulting in a gain on sale of $607 million ($607 million after-tax).
Planned Maintenance of Operated Assets
There are no planned maintenance activities scheduled for Suncor’s operated E&P assets in 2024.
24 ANNUAL REPORT 2023 SUNCOR ENERGY INC.
Refining and Marketing
Strategy and Investment Updates
| ● | In 2024, the company will continue the enhancement of its Petro-Canada™ retail business, with the goal of maintaining its industry leading brand position and driving increased long-term value for shareholders. Economic investment in 2024 is expected to focus on company-owned and controlled sites in the most profitable locations and markets, while targeting non-company-controlled sites in less densely populated areas using alternative ownership structures and partnerships to grow the brand’s scale and presence. |
| ● | Suncor will continue to invest in the sustainment and enhancement of its refinery operations to improve efficiency and maintain safe and reliable downstream operations and its industry-leading profitability. |
Financial Highlights
Year ended December 31 ($ millions) |
|
2023 |
|
2022 |
|
2021 |
|
Operating revenues |
|
31 068 |
|
36 728 |
|
22 915 |
|
Earnings before income taxes(1) |
|
3 383 |
|
5 694 |
|
2 867 |
|
Adjusted for: |
|
|
|
|
|
|
|
Unrealized gain on risk management activities |
|
(16) |
|
(7) |
|
(10) |
|
Adjusted operating earnings(1)(2) |
|
3 367 |
|
5 687 |
|
2 857 |
|
Adjusted funds from operations(1)(2) |
|
4 268 |
|
6 561 |
|
3 831 |
|
Free funds flow(2) |
|
3 266 |
|
5 745 |
|
3 006 |
|
| (1) | Beginning in 2022, to align with how management evaluates segment performance, the company revised its segment presentation to reflect segment results before income tax expense and present tax at a consolidated level. This presentation change had no effect on consolidated net earnings, adjusted operating earnings and adjusted funds from operations. Comparative periods have been revised to reflect this change. See the Income Tax section of this MD&A for a discussion of income taxes. |
| (2) | Non-GAAP financial measures. See the Advisories – Non-GAAP and Other Financial Measures section of this MD&A. |
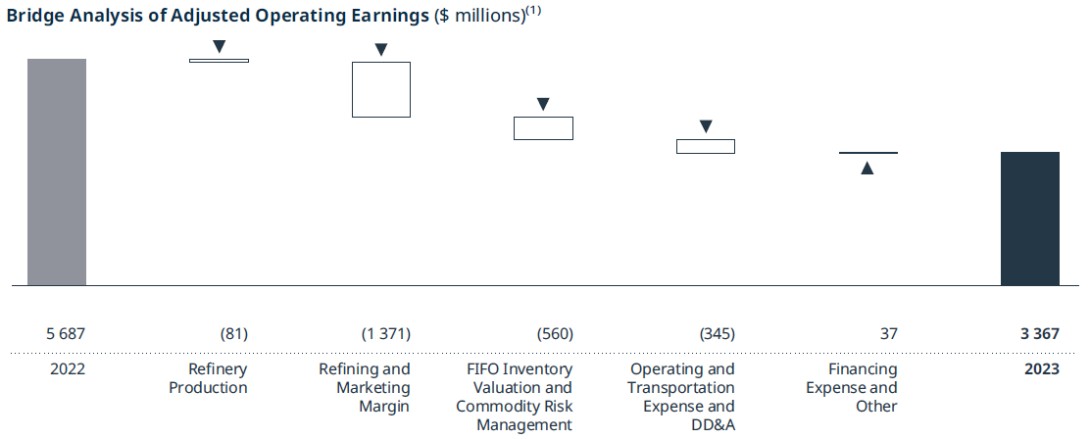
| (1) | For an explanation of this bridge analysis, see the Advisories – Non-GAAP and Other Financial Measures section of this MD&A. |
R&M adjusted operating earnings were $3.367 billion in 2023, compared with $5.687 billion in 2022. The decrease in adjusted operating earnings was primarily due to a decrease in refining and marketing benchmark crack spreads, a FIFO inventory valuation loss in 2023, compared to a gain in 2022, and increased operating and transportation expenses.
R&M earnings before income taxes in 2023 were $3.383 billion compared to $5.694 billion in 2022. In addition to the factors impacting adjusted operating earnings, earnings before income taxes in both periods were impacted by unrealized gains on risk management activities.
ANNUAL REPORT 2023 SUNCOR ENERGY INC. 25
R&M achieved annual adjusted funds from operations of $4.268 billion in 2023, compared to $6.561 billion in 2022, due primarily to the same factors that impacted adjusted operating earnings.
Volumes
Year ended December 31 |
|
2023 |
|
2022 |
|
2021 |
|
Crude oil processed (mbbls/d) |
|
|
|
|
|
|
|
Eastern North America |
|
212.4 |
|
206.2 |
|
202.8 |
|
Western North America |
|
208.3 |
|
227.0 |
|
212.7 |
|
Total |
|
420.7 |
|
433.2 |
|
415.5 |
|
Refinery utilization(1) (%) |
|
|
|
|
|
|
|
Eastern North America |
|
96 |
|
93 |
|
91 |
|
Western North America |
|
85 |
|
93 |
|
87 |
|
Total |
|
90 |
|
93 |
|
89 |
|
Refined product sales (mbbls/d) |
|
|
|
|
|
|
|
Gasoline |
|
228.0 |
|
227.6 |
|
225.8 |
|
Distillate |
|
243.9 |
|
244.6 |
|
228.5 |
|
Other |
|
81.2 |
|
81.4 |
|
74.1 |
|
Total |
|
553.1 |
|
553.6 |
|
528.4 |
|
Refinery production(2) (mbbls) |
|
163 895 |
|
168 149 |
|
162 862 |
|
Refining and marketing gross margin – First-in, first-out (FIFO)(3) ($/bbl) |
|
45.00 |
|
55.85 |
|
36.85 |
|
Refining and marketing gross margin – Last-in, first-out (LIFO)(3) ($/bbl) |
|
47.00 |
|
54.45 |
|
30.90 |
|
Refining operating expense(3) ($/bbl) |
|
7.45 |
|
7.00 |
|
5.95 |
|
| (1) | Refinery utilization is the amount of crude oil and natural gas liquids processed by crude distillation units, expressed as a percentage of the nameplate capacity of these units. |
| (2) | Refinery production is the output of the refining process and differs from crude oil processed as a result of volumetric adjustments for non-crude feedstock, volumetric gain associated with the refining process and changes in unfinished product inventories. |
| (3) | Contains non-GAAP financial measures. See the Advisories – Non-GAAP and Other Financial Measures section of this MD&A. |
Refinery crude throughput was 420,700 bbls/d and refinery utilization averaged 90% in 2023, compared to refinery crude throughput of 433,200 bbls/d and refinery utilization of 93% in 2022, with the current year being impacted by unplanned maintenance at the Commerce City refinery in the first quarter of 2023. Refinery utilization was 99% in the second half of 2023.
Total refined product sales of 553,100 bbls/d in 2023 were comparable to 553,600 bbls/d in 2022.
26 ANNUAL REPORT 2023 SUNCOR ENERGY INC.
Refining and Marketing Gross Margins(1)
Refining and marketing gross margins were influenced by the following:
| ● | On a LIFO(2) basis, Suncor’s refining and marketing gross margin decreased to $47.00/bbl in 2023 from $54.45/bbl in the prior year. The decrease was due to lower benchmark crack spreads compared to the prior year, which were partially offset by strong location and quality differentials from regional benchmarks to the company’s local markets. Suncor’s refining and marketing gross margin also reflects the company’s feedstock advantage, which enables Suncor to process heavier crude oil, marketing and logistics capabilities and strong sales channels within its integrated retail and wholesale networks. On a LIFO basis, Suncor’s refining and marketing gross margin represents a margin capture of 95% of Suncor’s 5-2-2-1 index in 2023, compared to 92% in 2022. |
| ● | On a FIFO basis, Suncor’s refining and marketing gross margin decreased to $45.00/bbl in 2023, from $55.85/bbl in the prior year due to the same factors discussed above, in addition to FIFO inventory valuation impacts. In 2023, the impact of the FIFO method of inventory valuation, relative to an estimated LIFO(2) accounting method, resulted in a loss of $330 million. In 2022, FIFO resulted in a gain of $230 million, for an overall unfavourable year-over-year impact of $560 million. |
Expenses and Other Factors
R&M operating and transportation expenses increased compared to the prior year due to higher maintenance costs and inflationary impacts, partially offset by lower natural gas and other commodity input costs.
Refining operating expense per barrel(1) was $7.45 in 2023, compared to $7.00 in the prior year, with the increase primarily due to higher maintenance costs and lower production, partially offset by lower natural gas and other commodity input costs.
Planned Maintenance
Planned maintenance activities have commenced at the company’s Commerce City refinery and are expected to be completed in the first quarter of 2024. Planned turnaround maintenance is scheduled to commence at the company’s Montreal refinery in the first quarter of 2024 and is expected to be completed in the second quarter of 2024, and planned turnaround maintenance at the company’s Sarnia refinery is scheduled for the second quarter of 2024. The anticipated impact of these maintenance events has been reflected in the company’s 2024 guidance.
| (1) | Contains non-GAAP financial measures. See the Advisories – Non-GAAP and Other Financial Measures section of this MD&A. |
| (2) | The estimated impact of the LIFO method is a non-GAAP financial measure. The impact of the FIFO method of inventory valuation, relative to an estimated LIFO accounting method, also includes the impact of the realized portion of commodity risk management activities. See the Advisories – Non-GAAP and Other Financial Measures section of this MD&A. |
ANNUAL REPORT 2023 SUNCOR ENERGY INC. 27
Corporate and Eliminations
Strategy and Investment Updates
| ● | The company remains committed to the execution of its capital allocation framework, strengthening its balance sheet through debt reductions and maximizing shareholder returns. While the company’s net debt levels are between $12 billion and $15 billion, the company expects to allocate excess funds equally towards share repurchases and debt reductions. Once net debt is reduced to $12 billion, the company expects to allocate 75% of excess funds towards share repurchases and 25% towards debt repayment. |
| ● | Suncor also has investments in low-carbon projects, including alternative fuel facilities such as the Varennes Carbon Recycling facility, a biofuel plant that is designed to convert commercial and industrial non-recyclable waste into biofuels, and in LanzaJet, Inc., a company working to bring sustainable aviation fuel and renewable diesel to the commercial market. The Varennes Carbon Recycling facility is currently under construction and expected to be operational in 2026. LanzaJet’s Freedom Pines Fuel facility, the world’s first ethanol-to-sustainable aviation fuel production facility, is currently completing fabrication and is expected to be operational in early 2024. |
Financial Highlights
Year ended December 31 ($ millions) |
|
2023 |
|
2022 |
|
2021 |
|
Loss before income taxes(1) |
|
(1 296) |
|
(2 232) |
|
(1 913) |
|
Adjusted for: |
|
|
|
|
|
|
|
Unrealized foreign exchange (gain) loss on U.S. dollar denominated debt |
|
(184) |
|
729 |
|
(113) |
|
Asset impairment |
|
158 |
|
— |
|
— |
|
Restructuring charge(2) |
|
275 |
|
— |
|
168 |
|
Gain on significant disposal |
|
(302) |
|
— |
|
— |
|
Loss on early repayment of long-term debt(3) |
|
— |
|
— |
|
80 |
|
Adjusted operating loss(1)(4) |
|
(1 349) |
|
(1 503) |
|
(1 778) |
|
Corporate and Renewables |
|
(1 405) |
|
(1 456) |
|
(1 588) |
|
Eliminations - Intersegment profit realized (eliminated) |
|
56 |
|
(47) |
|
(190) |
|
Adjusted funds used in operations(1)(4) |
|
(1 546) |
|
(1 240) |
|
(1 705) |
|
Free funds deficit(4) |
|
(1 608) |
|
(1 428) |
|
(1 997) |
|
| (1) | Beginning in 2022, to align with how management evaluates segment performance, the company revised its segment presentation to reflect segment results before income tax expense and present tax at a consolidated level. This presentation change had no effect on consolidated net earnings, adjusted operating earnings and adjusted funds from operations. Comparative periods have been revised to reflect this change. See the Income Tax section of this MD&A for a discussion of income taxes. |
| (2) | In 2021, the company recorded a restructuring charge of $168 million related to workforce reductions in OS&G expenses. |
| (3) | In 2021, in connection with the early repayment of long-term debt, the company recorded a loss of $80 million in financing expenses. |
| (4) | Non-GAAP financial measures. See the Advisories – Non-GAAP and Other Financial Measures section of this MD&A. |
Corporate
The adjusted operating loss for Corporate was $1.405 billion in 2023, compared to $1.456 billion in 2022. The decrease in adjusted operating loss was primarily due to an increase in interest revenue on the company’s cash balances, higher costs associated with the early redemption of long-term debt in the prior year, lower share-based compensation expense and a net decrease in interest expense due to debt reductions in 2022. The decreased loss was partially offset by an operational foreign exchange loss in 2023, versus a gain in 2022, and an unrealized gain on investment recorded in 2022.
Suncor capitalized $255 million of its borrowing costs in 2023, compared to $168 million in 2022, as part of the cost of major development assets and construction projects in progress.
Eliminations – Intersegment Profit Eliminated
Eliminations reflect the deferral or realization of profit or loss on crude oil sales from Oil Sands to Suncor’s refineries. Consolidated profits and losses are only realized when the refined products produced from internal purchases of crude feedstock have been sold to third parties. In 2023, the company realized $56 million of intersegment profit, compared to a deferral of profit of $47 million in the prior year. The realization of profit in 2023 was primarily driven by a weakening in benchmark pricing in the current year, compared to the increase in Oil Sands price realizations in 2022.
28 ANNUAL REPORT 2023 SUNCOR ENERGY INC.
Adjusted funds used in operations for the Corporate and Eliminations segment were $1.546 billion in 2023, compared to $1.240 billion in 2022, and were influenced by the same factors that impacted adjusted operating loss, excluding the impact of the non-cash component of share-based compensation expense, the unrealized gain on investment recorded in 2022, and the impact of costs associated with the early redemption of long-term debt in 2022. Adjusted funds from operations in 2023 were also impacted by a restructuring charge related to the company’s workforce reductions in the second quarter of 2023.
Asset Transactions
During the first quarter of 2023, the company completed the sale of its wind and solar assets for gross proceeds of $730 million, before closing adjustments and other closing costs, resulting in a gain on sale of $302 million ($260 million after-tax).
Year ended December 31 ($ millions) |
|
2023 |
|
2022 |
|
2021 |
|
Current income tax expense |
|
1 734 |
|
4 229 |
|
1 395 |
|
Deferred income tax expense (recovery) |
|
560 |
|
(990) |
|
56 |
|
Income tax expense included in net earnings |
|
2 294 |
|
3 239 |
|
1 451 |
|
Less: Income tax (recovery) expense on adjusted operating earnings adjustments |
|
(98) |
|
(915) |
|
5 |
|
Income tax expense included in adjusted operating earnings |
|
2 392 |
|
4 154 |
|
1 446 |
|
Effective tax rate |
|
21.7% |
|
26.3% |
|
26.1% |
|
The provision for income taxes in 2023 decreased compared to the prior year, primarily due to decreased earnings. In 2023, the company’s effective tax rate on net earnings decreased compared to the prior year, primarily due to the non-cash gain on the acquisition of TotalEnergies Canada, the non-taxable gain on the disposition of the company’s U.K. portfolio, as well as non-taxable foreign exchange gains on the revaluation of U.S. dollar denominated debt and other permanent items impacting total tax expense.
ANNUAL REPORT 2023 SUNCOR ENERGY INC. 29
6. Fourth Quarter 2023 Analysis
Financial and Operational Highlights
Three months ended December 31 |
|
|
|
|
|
($ millions, except as noted) |
|
2023 |
|
2022 |
|
Earnings (loss) before income taxes |
|
|
|
|
|
Oil Sands |
|
2 660 |
|
1 625 |
|
Exploration and Production |
|
133 |
|
578 |
|
Refining and Marketing |
|
598 |
|
1 517 |
|
Corporate and Eliminations |
|
(1) |
|
(182) |
|
Income tax expense |
|
(570) |
|
(797) |
|
Net earnings |
|
2 820 |
|
2 741 |
|
Adjusted operating earnings (loss)(1) |
|
|
|
|
|
Oil Sands |
|
1 526 |
|
1 719 |
|
Exploration and Production |
|
133 |
|
578 |
|
Refining and Marketing |
|
598 |
|
1 529 |
|
Corporate and Eliminations |
|
(42) |
|
(382) |
|
Income tax expense included in adjusted operating earnings |
|
(580) |
|
(1 012) |
|
Total |
|
1 635 |
|
2 432 |
|
Adjusted funds from (used in) operations(1) |
|
|
|
|
|
Oil Sands |
|
2 651 |
|
2 929 |
|
Exploration and Production |
|
228 |
|
719 |
|
Refining and Marketing |
|
811 |
|
1 663 |
|
Corporate and Eliminations |
|
10 |
|
(273) |
|
Current income tax recovery (expense) |
|
334 |
|
(849) |
|
Total adjusted funds from operations |
|
4 034 |
|
4 189 |
|
Changes in non-cash working capital |
|
284 |
|
(265) |
|
Cash flow provided by operating activities |
|
4 318 |
|
3 924 |
|
Free funds flow(1) |
|
2 482 |
|
2 887 |
|
Production volumes |
|
|
|
|
|
Oil Sands – Upgraded – net SCO and diesel (mbbls/d) |
|
475.7 |
|
517.5 |
|
Oil Sands – Non-upgraded bitumen (mbbls/d) |
|
281.7 |
|
170.6 |
|
Total Oil Sands production volumes (mbbls/d) |
|
757.4 |
|
688.1 |
|
Exploration and Production (mboe/d) |
|
50.7 |
|
75.0 |
|
Total upstream production (mboe/d) |
|
808.1 |
|
763.1 |
|
| (1) | Non-GAAP financial measures. See the Advisories – Non-GAAP and Other Financial Measures section of this MD&A. |
Net Earnings
Suncor’s consolidated net earnings for the fourth quarter of 2023 were $2.820 billion, compared to $2.741 billion in the prior year quarter. Net earnings were primarily influenced by the same factors that impacted adjusted operating earnings discussed below.
Other items affecting net earnings over these periods included:
| ● | An unrealized foreign exchange gain on the revaluation of U.S. dollar denominated debt of $199 million recorded in financing expenses in the Corporate and Eliminations segment in the fourth quarter of 2023, compared to $200 million in the fourth quarter of 2022. |
| ● | An unrealized gain on risk management activities of $9 million recorded in other income (loss) in the fourth quarter of 2023, compared to an unrealized loss of $106 million in the fourth quarter of 2022. |
| ● | During the fourth quarter of 2023, the company recorded a non-cash gain of $1.125 billion in the Oil Sands segment as a result of the acquisition of TotalEnergies Canada. |
30 ANNUAL REPORT 2023 SUNCOR ENERGY INC.
| ● | During the fourth quarter of 2023, Suncor recorded a non-cash impairment of $158 million against an equity investment in the Corporate and Eliminations segment. |
| ● | An income tax recovery related to the items noted above of $10 million in the fourth quarter of 2023, compared to $215 million in the fourth quarter of 2022. |
Adjusted Operating Earnings
Suncor’s adjusted operating earnings were $1.635 billion ($1.26 per common share) in the fourth quarter of 2023, compared to $2.432 billion ($1.81 per common share) in the prior year quarter, with the decrease primarily due to lower crude oil and refined product realizations reflecting a weaker business environment in the current quarter, and decreased sales volumes in E&P, partially offset by lower income taxes, increased sales volumes in Oil Sands and increased refinery production in R&M. Adjusted operating earnings were also impacted by a weakening of benchmark pricing in both periods, resulting in an increased realization of intersegment profit in the current quarter compared to the prior year quarter.
Adjusted Funds from Operations and Cash Flow Provided by Operating Activities
Adjusted funds from operations were $4.034 billion ($3.12 per common share) in the fourth quarter of 2023, compared to $4.189 billion ($3.11 per common share) in the prior year quarter, and were influenced by the same factors impacting adjusted operating earnings, as well as a one-time tax benefit of approximately $880 million relating to the acquisition of TotalEnergies Canada in the fourth quarter of 2023.
Cash flow provided by operating activities, which includes changes in non-cash working capital, was $4.318 billion ($3.34 per common share) in the fourth quarter of 2023, compared to $3.924 billion ($2.91 per common share) in the prior year quarter. In addition to the factors impacting adjusted funds from operations, cash flow provided by operating activities was impacted by a source of cash associated with the company’s working capital balances in the current quarter compared to a use of cash in the prior year quarter. The source of cash in the fourth quarter of 2023 was primarily due to lower accounts receivable balances, as a result of a decrease in benchmark commodity prices during the quarter, partially offset by lower current income taxes payable, and a decrease in accounts payable and accrued liabilities.
Segmented Analysis
Oil Sands
Oil Sands segment adjusted operating earnings were $1.526 billion in the fourth quarter of 2023, compared to $1.719 billion in the prior year quarter, with the decrease primarily due to lower realized crude oil prices and increased DD&A expense, partially offset by increased sales volumes.
Total Oil Sands bitumen production increased in the fourth quarter of 2023 compared to the prior year quarter, primarily due to the company’s increased working interest and strong bitumen production at Fort Hills, partially offset by decreased bitumen production at Oil Sands Base and Firebag as a result of planned turnaround and maintenance activities.
The company’s net SCO production was 475,700 bbls/d in the fourth quarter of 2023, compared to 517,500 bbls/d in the prior year quarter, reflecting significant planned turnaround activities at Oil Sands Base Upgrader 2 that were completed in the first part of the fourth quarter of 2023. Oil Sands Base upgrader utilization was 83% in the fourth quarter of 2023, compared to 93% in the prior year quarter. Syncrude upgrader utilization was 101% in the fourth quarter of 2023, compared to 99% in the prior year quarter.
Internal bitumen transfers reached 45,300 bbls/d in the fourth quarter of 2023, demonstrating the increased level of integration within Suncor’s regional Oil Sands assets. The increase was primarily driven by 41,800 bbls/d of bitumen transferred from Fort Hills to upgrading at Oil Sands Base, taking advantage of the yield uplift from Fort Hills barrels.
The company’s saleable non-upgraded bitumen production increased to 281,700 bbls/d in the fourth quarter of 2023, compared to 170,600 bbls/d in the prior year quarter, reflecting the company’s increased working interest and strong production at Fort Hills, as well as increased In Situ and Fort Hills bitumen production sent to market in the current quarter due to lower upgrader availability as a result of the planned turnaround at Oil Sands Base Upgrader 2.
ANNUAL REPORT 2023 SUNCOR ENERGY INC. 31
Exploration and Production
Adjusted operating earnings for the E&P segment in the fourth quarter of 2023 were $133 million, compared to $578 million in the prior year quarter, with the decrease primarily due to decreased sales volumes.
Production volumes for E&P Canada were 45,300 bbls/d in the fourth quarter of 2023, compared to 49,100 bbls/d in the prior year quarter, with the decrease primarily due to natural declines, partially offset by the ramp up of production at Terra Nova in the current quarter.
Production volumes for E&P International were 5,400 boe/d in the fourth quarter of 2023, compared to 25,900 boe/d in the prior year quarter, with the decrease primarily due the divestment of the company’s U.K. portfolio in the second quarter of 2023.
Total E&P sales volumes were 29,200 boe/d in the fourth quarter of 2023, compared to 75,100 boe/d in the prior year quarter, primarily due to the same factors that impacted production volumes, as well as a larger build of inventory in E&P Canada in the fourth quarter of 2023 compared to the prior year quarter, associated with the timing of cargo sales at year-end, and a draw of inventory in E&P International in the prior year quarter.
Refining and Marketing
R&M adjusted operating earnings in the fourth quarter of 2023 were $598 million, compared to $1.529 billion in the prior year quarter. The decrease in adjusted operating earnings was primarily due to lower benchmark crack spreads in the current quarter compared to the prior year quarter, partially offset by increased refinery production.
Refinery crude throughput was 455,900 bbls/d and refinery utilization was 98% in the fourth quarter of 2023, compared to 440,000 bbls/d and 94% in the prior year quarter, reflecting strong utilization across all refineries in the current quarter, and the impact of unplanned maintenance in the prior year quarter, including a weather-related event at the Commerce City refinery.
Refined product sales were 575,500 bbls/d in the fourth quarter of 2023, compared to 548,200 bbls/d in the prior year quarter, with the increase due to higher refinery production, partially offset by a larger build of refined product inventory in the current quarter compared to the prior year quarter.
Corporate and Eliminations
Corporate incurred an adjusted operating loss of $341 million in the fourth quarter of 2023, compared to $482 million in the prior year quarter. The decreased loss was primarily attributable to an operational foreign exchange gain in the fourth quarter of 2023, compared to a loss in the prior year quarter. The decreased loss was also driven by a lower share-based compensation expense, decreased spend in low-carbon fuel development projects compared to the prior year quarter, and increased costs associated with the early redemption of long-term debt in the prior year quarter. Suncor capitalized $70 million of its borrowing costs in the fourth quarter of 2023, as part of the cost of major development assets and construction projects in progress, compared to $44 million in the prior year quarter.
Eliminations reflect the deferral or realization of profit or loss on crude oil sales from Oil Sands to Suncor’s refineries. Consolidated profits and losses are only realized when the refined products produced from internal purchases of crude feedstock have been sold to third parties. During the fourth quarter of 2023, the company realized $299 million of intersegment profit, compared to $100 million in the prior year quarter. The realization of intersegment profit was primarily driven by a weakening in benchmark pricing in both periods.
32 ANNUAL REPORT 2023 SUNCOR ENERGY INC.
Financial Summary
Three months ended |
|
Dec 31 |
|
Sept 30 |
|
June 30 |
|
Mar 31 |
|
Dec 31 |
|
Sept 30 |
|
June 30 |
|
Mar 31 |
|
($ millions, unless otherwise noted) |
|
2023 |
|
2023 |
|
2023 |
|
2023 |
|
2022 |
|
2022 |
|
2022 |
|
2022 |
|
Total production (mboe/d) |
|
|
|
|
|
|
|
|
|
|
|
|
|
|
|
|
|
Oil Sands |
|
757.4 |
|
646.1 |
|
679.1 |
|
675.1 |
|
688.1 |
|
646.0 |
|
641.5 |
|
685.7 |
|
Exploration and Production |
|
50.7 |
|
44.4 |
|
62.8 |
|
67.0 |
|
75.0 |
|
78.1 |
|
78.7 |
|
80.4 |
|
Total upstream production |
|
808.1 |
|
690.5 |
|
741.9 |
|
742.1 |
|
763.1 |
|
724.1 |
|
720.2 |
|
766.1 |
|
Revenues and other income |
|
|
|
|
|
|
|
|
|
|
|
|
|
|
|
|
|
Operating revenues, net of royalties(1) |
|
12 810 |
|
12 649 |
|
11 719 |
|
11 914 |
|
13 920 |
|
14 944 |
|
16 135 |
|
13 337 |
|
Other income (loss) |
|
1 328 |
|
(13) |
|
(3) |
|
342 |
|
(65) |
|
113 |
|
69 |
|
14 |
|
|
|
14 138 |
|
12 636 |
|
11 716 |
|
12 256 |
|
13 855 |
|
15 057 |
|
16 204 |
|
13 351 |
|
Net earnings (loss) |
|
2 820 |
|
1 544 |
|
1 879 |
|
2 052 |
|
2 741 |
|
(609) |
|
3 996 |
|
2 949 |
|
Per common share – basic (dollars) |
|
2.18 |
|
1.19 |
|
1.44 |
|
1.54 |
|
2.03 |
|
(0.45) |
|
2.84 |
|
2.06 |
|
Per common share – diluted (dollars) |
|
2.18 |
|
1.19 |
|
1.43 |
|
1.54 |
|
2.03 |
|
(0.45) |
|
2.83 |
|
2.06 |
|
Adjusted operating earnings(2) |
|
1 635 |
|
1 980 |
|
1 253 |
|
1 809 |
|
2 432 |
|
2 565 |
|
3 814 |
|
2 755 |
|
Per common share(3)(4) (dollars) |
|
1.26 |
|
1.52 |
|
0.96 |
|
1.36 |
|
1.81 |
|
1.88 |
|
2.71 |
|
1.92 |
|
Adjusted funds from operations(2) |
|
4 034 |
|
3 634 |
|
2 655 |
|
3 002 |
|
4 189 |
|
4 473 |
|
5 345 |
|
4 094 |
|
Per common share(3)(4) (dollars) |
|
3.12 |
|
2.80 |
|
2.03 |
|
2.26 |
|
3.11 |
|
3.28 |
|
3.80 |
|
2.86 |
|
Cash flow provided by operating activities |
|
4 318 |
|
4 184 |
|
2 803 |
|
1 039 |
|
3 924 |
|
4 449 |
|
4 235 |
|
3 072 |
|
Per common share(4) (dollars) |
|
3.34 |
|
3.22 |
|
2.14 |
|
0.78 |
|
2.91 |
|
3.26 |
|
3.01 |
|
2.14 |
|
Return on Capital Employed (ROCE)(3) (%) for the twelve months ended |
|
15.6 |
|
15.8 |
|
12.8 |
|
17.8 |
|
19.4 |
|
17.5 |
|
19.4 |
|
12.7 |
|
ROCE excluding impairments and impairment reversals(3)(5) (%) for the twelve months ended |
|
15.6 |
|
15.8 |
|
16.3 |
|
21.6 |
|
22.9 |
|
21.0 |
|
18.2 |
|
12.4 |
|
Common share information (dollars) |
|
|
|
|
|
|
|
|
|
|
|
|
|
|
|
|
|
Dividend per common share(4) |
|
0.55 |
|
0.52 |
|
0.52 |
|
0.52 |
|
0.52 |
|
0.47 |
|
0.47 |
|
0.42 |
|
Share price at the end of trading |
|
|
|
|
|
|
|
|
|
|
|
|
|
|
|
|
|
Toronto Stock Exchange (Cdn$) |
|
42.45 |
|
46.71 |
|
38.86 |
|
41.96 |
|
42.95 |
|
38.90 |
|
45.16 |
|
40.70 |
|
New York Stock Exchange (US$) |
|
32.04 |
|
34.38 |
|
29.32 |
|
31.05 |
|
31.73 |
|
28.15 |
|
35.07 |
|
32.59 |
|
| (1) | The company revised certain gross revenues and purchases of crude oil and products to align with the current period presentation. For the three months ended March 31, 2022, gross revenues and purchases of crude oil and products was decreased by $150 million, with no effect on net earnings. |
| (2) | Non-GAAP financial measures. See the Advisories – Non-GAAP and Other Financial Measures section of this MD&A. Adjusted operating earnings (loss) for each quarter are defined in the Non-GAAP and Other Financial Measures Advisory section and reconciled to the most directly comparable GAAP measure in the Consolidated Financial Information and Segment Results and Analysis sections of each Quarterly Report to Shareholders issued by Suncor (Quarterly Reports) in respect of the relevant quarter, with such information being incorporated by reference herein and available on SEDAR+ at www.sedarplus.ca. Adjusted funds from operations for each quarter are defined and reconciled to the most directly comparable GAAP measure in the Non-GAAP and Other Financial Measures Advisory section of each Quarterly Report in respect of the relevant quarter, with such information being incorporated by reference herein and available on SEDAR+ at www.sedarplus.ca. |
| (3) | Contains non-GAAP financial measures. See the Advisories – Non-GAAP and Other Financial Measures section of this MD&A. Non-GAAP measures included in ROCE and ROCE excluding impairments and impairment reversals are defined and reconciled to the most directly comparable GAAP measure in the Non-GAAP and Other Financial Measures Advisory section of each Quarterly Report in respect of the relevant quarter, with such information being incorporated by reference herein and available on SEDAR+ at www.sedarplus.ca. |
| (4) | Represented on a basic per share basis. |
| (5) | ROCE would have been 13.6% for the twelve months ended December 31, 2023, excluding the impact of the $1.125 billion non-cash gain on acquisition of TotalEnergies Canada. |
ANNUAL REPORT 2023 SUNCOR ENERGY INC. 33
Business Environment
Three months ended |
|
|
|
Dec 31 |
|
Sept 30 |
|
June 30 |
|
Mar 31 |
|
Dec 31 |
|
Sept 30 |
|
June 30 |
|
Mar 31 |
|
(average for the period ended, except as noted) |
|
|
|
2023 |
|
2023 |
|
2023 |
|
2023 |
|
2022 |
|
2022 |
|
2022 |
|
2022 |
|
WTI crude oil at Cushing |
|
US$/bbl |
|
78.35 |
|
82.20 |
|
73.75 |
|
76.10 |
|
82.65 |
|
91.65 |
|
108.40 |
|
94.40 |
|
Dated Brent crude |
|
US$/bbl |
|
84.05 |
|
86.70 |
|
78.35 |
|
81.25 |
|
88.65 |
|
100.95 |
|
113.75 |
|
101.50 |
|
Dated Brent/Maya FOB price differential |
|
US$/bbl |
|
56.80 |
|
11.15 |
|
14.75 |
|
18.40 |
|
17.70 |
|
17.95 |
|
11.65 |
|
14.30 |
|
MSW at Edmonton |
|
Cdn$/bbl |
|
99.70 |
|
107.80 |
|
95.10 |
|
99.05 |
|
110.05 |
|
116.85 |
|
137.80 |
|
115.75 |
|
WCS at Hardisty |
|
US$/bbl |
|
56.45 |
|
69.30 |
|
58.70 |
|
51.35 |
|
57.00 |
|
71.75 |
|
95.60 |
|
79.80 |
|
WTI-WCS light/heavy differential |
|
US$/bbl |
|
(21.90) |
|
(12.90) |
|
(15.05) |
|
(24.75) |
|
(25.65) |
|
(19.90) |
|
(12.80) |
|
(14.60) |
|
SYN-WTI premium (differential) |
|
US$/bbl |
|
0.30 |
|
2.80 |
|
2.90 |
|
2.10 |
|
4.15 |
|
8.80 |
|
6.05 |
|
(1.30) |
|
Condensate at Edmonton |
|
US$/bbl |
|
76.25 |
|
77.90 |
|
72.35 |
|
79.85 |
|
83.40 |
|
87.35 |
|
108.35 |
|
96.15 |
|
Natural gas (Alberta spot) at AECO |
|
Cdn$/GJ |
|
2.15 |
|
2.50 |
|
2.35 |
|
3.05 |
|
4.90 |
|
4.15 |
|
6.90 |
|
4.50 |
|
Alberta Power Pool Price |
|
Cdn$/MWh |
|
81.60 |
|
151.60 |
|
159.80 |
|
142.00 |
|
213.95 |
|
221.40 |
|
122.45 |
|
90.00 |
|
New York Harbor 2-1-1 crack(1) |
|
US$/bbl |
|
28.60 |
|
39.95 |
|
32.30 |
|
36.70 |
|
52.75 |
|
46.70 |
|
60.05 |
|
28.25 |
|
Chicago 2-1-1 crack(1) |
|
US$/bbl |
|
17.10 |
|
27.45 |
|
28.60 |
|
31.55 |
|
39.20 |
|
43.30 |
|
49.40 |
|
20.20 |
|
Portland 2-1-1 crack(1) |
|
US$/bbl |
|
29.35 |
|
55.90 |
|
37.30 |
|
37.40 |
|
50.70 |
|
57.30 |
|
63.45 |
|
33.80 |
|
Gulf Coast 2-1-1 crack(1) |
|
US$/bbl |
|
23.00 |
|
39.10 |
|
29.15 |
|
37.65 |
|
40.20 |
|
41.85 |
|
52.55 |
|
26.80 |
|
U.S. Renewable Volume Obligation |
|
US$/bbl |
|
4.75 |
|
7.45 |
|
7.70 |
|
8.20 |
|
8.55 |
|
8.10 |
|
7.80 |
|
6.45 |
|
Suncor custom 5-2-2-1 index(2) |
|
US$/bbl |
|
33.45 |
|
36.00 |
|
34.20 |
|
42.80 |
|
51.90 |
|
45.45 |
|
51.45 |
|
32.25 |
|
Exchange rate (average) |
|
US$/Cdn$ |
|
0.73 |
|
0.75 |
|
0.74 |
|
0.74 |
|
0.74 |
|
0.77 |
|
0.78 |
|
0.79 |
|
Exchange rate (end of period) |
|
US$/Cdn$ |
|
0.76 |
|
0.74 |
|
0.76 |
|
0.74 |
|
0.74 |
|
0.73 |
|
0.78 |
|
0.80 |
|
| (1) | 2-1-1 crack spreads are indicators of the refining margin generated by converting two barrels of WTI into one barrel of gasoline and one barrel of diesel. The crack spreads presented here generally approximate the regions into which the company sells refined products through retail and wholesale channels. |
| (2) | Suncor has developed an indicative 5-2-2-1 index based on publicly available pricing data to more accurately reflect the company’s realized refining and marketing gross margin. |
Significant or Unusual Items Impacting Net Earnings (Loss)
Trends in Suncor’s quarterly revenue, net earnings (loss) and adjusted funds from operations are driven primarily by production volumes, which can be significantly impacted by major maintenance events, changes in commodity prices and crude differentials, refining crack spreads and foreign exchange rates as described in the Financial Information section of this MD&A. Trends in Suncor’s quarterly net earnings (loss) and adjusted funds from operations are also affected by other significant events impacting operations, such as operational incidents.
In addition to the impacts of changes in production volumes and business environment, net earnings (loss) over the last eight quarters were affected by the following events or significant adjustments:
| ● | During the fourth quarter of 2023, the company recorded a non-cash gain of $1.125 billion in the Oil Sands segment as a result of the acquisition of TotalEnergies Canada. |
| ● | During the fourth quarter of 2023, Suncor recorded a non-cash impairment of $158 million against an equity investment in the Corporate and Eliminations segment. |
| ● | During the third quarter of 2023, the company recorded non-cash derecognition charges of $253 million on its Meadow Creek development properties in the Oil Sands segment. |
| ● | During the second quarter of 2023, Suncor recorded a gain of $607 million on the sale of its U.K. E&P portfolio. |
| ● | In the second quarter of 2023, the company recorded a restructuring charge of $275 million in OS&G expenses in the Corporate and Eliminations segment, related to the company’s workforce reductions. |
34 ANNUAL REPORT 2023 SUNCOR ENERGY INC.
| ● | During the first quarter of 2023, the company recorded a gain of $302 million on the sale of its wind and solar assets in the Corporate and Eliminations segment. |
| ● | During the third quarter of 2022, the company recorded a non-cash impairment of $3.397 billion before-tax against its share of the Fort Hills assets in the Oil Sands segment. |
| ● | During the third quarter of 2022, Suncor recognized $147 million of property damage insurance proceeds, in other income, related to the company’s assets in Libya in the E&P segment. |
| ● | During the third quarter of 2022, the company recorded a $65 million foreign exchange loss related to the sale of the company’s share of its assets in Norway in the E&P segment. |
| ● | During the second quarter of 2022, Suncor recorded a non-cash impairment reversal of $715 million on its share of the White Rose assets in the E&P segment, and a non-cash impairment of $70 million against its share of its assets in Norway in the E&P segment. |
Capital and Exploration Expenditures by Type, Excluding Capitalized Interest
|
|
Year ended |
||||||
|
|
December 31, 2023 |
|
December 31, 2022 |
||||
($ millions) |
|
Asset Sustainment and Maintenance(1) |
|
Economic Investment(2) |
|
Total |
|
Total |
Oil Sands |
|
|
|
|
|
|
|
|
Oil Sands Base |
|
1 345 |
|
627 |
|
1 972 |
|
1 673 |
In Situ |
|
160 |
|
357 |
|
517 |
|
543 |
Fort Hills |
|
376 |
|
21 |
|
397 |
|
337 |
Syncrude |
|
738 |
|
252 |
|
990 |
|
852 |
E&P(3) |
|
— |
|
635 |
|
635 |
|
420 |
R&M |
|
876 |
|
124 |
|
1 000 |
|
816 |
Corporate and Eliminations(4) |
|
48 |
|
14 |
|
62 |
|
178 |
|
|
3 543 |
|
2 030 |
|
5 573 |
|
4 819 |
Capitalized interest on debt |
|
|
|
|
|
255 |
|
168 |
Total capital and exploration expenditures |
|
|
|
|
|
5 828 |
|
4 987 |
| (1) | Asset sustainment and maintenance capital expenditures include capital investments that deliver on existing value by ensuring compliance or maintaining relations with regulators and other stakeholders, maintaining current processing capacity and delivering existing developed reserves. |
| (2) | Economic investment capital expenditures include capital investments that result in an increase in value by adding reserves or improving processing capacity, utilization, cost or margin, including associated infrastructure. |
| (3) | Excludes capital expenditures related to assets previously held for sale of $108 million in 2023, compared to $57 million in 2022. |
| (4) | Excludes capital expenditures related to assets previously held for sale of $76 million in 2022. |
In 2023 Suncor’s capital expenditures, excluding capitalized borrowing costs, were $5.573 billion, compared to $4.819 billion in 2022. The increase was due to increased economic expenditures, primarily at E&P, related to the West White Rose Project and Terra Nova ALE Project, at Oil Sands Base, related to the new cogeneration facility, and at Syncrude, related to Mildred Lake West Extension mining project, which was partially offset by decreased economic expenditures in the Corporate and Eliminations segment in 2023, primarily due higher investment in digital technologies and the Forty Mile Wind Power Project in the prior year. The increase was also due to increased asset sustainment and maintenance capital expenditures at Oil Sands Base and R&M.
Activity in 2023 included the following:
Oil Sands Base
Oil Sands Base asset sustainment and maintenance capital expenditures were $1.345 billion in 2023 and were primarily focused on ensuring continued safe, reliable and efficient operations. The company’s planned maintenance program in 2023 included mine and tailings development, significant planned turnaround activities at Upgrader 2 and planned annual coker maintenance at Upgrader 1.
ANNUAL REPORT 2023 SUNCOR ENERGY INC. 35
Oil Sands Base economic capital of $627 million in 2023 was primarily focused on progressing the investment in low-carbon power generation by replacing the coke-fired boilers with a new cogeneration facility, which is expected to be in service in late 2024.
In Situ
In Situ capital expenditures were $517 million in 2023, of which $357 million was directed towards economic investment activities, which focused on the ongoing design and construction of well pads to develop additional reserves that are expected to maintain existing production levels at Firebag and MacKay River in future years. Asset sustainment and maintenance capital expenditures of $160 million were primarily directed towards the company’s planned maintenance program.
Fort Hills
Fort Hills capital expenditures were $397 million in 2023, the majority of which were directed towards asset sustainment related to mine and tailings development to support ongoing operations, including the execution of the mine improvement plan, as well as its first full plant turnaround and planned maintenance activities.
Syncrude
Syncrude capital expenditures were $990 million in 2023, the majority of which were directed toward asset sustainment and maintenance capital expenditures that focused on its planned turnaround, planned maintenance activities, mine equipment replacements and tailings development. Economic investment activities were directed towards progressing the Mildred Lake West Extension mining project.
Exploration and Production
E&P capital and exploration expenditures were $635 million in 2023, and were focused on economic investment projects, primarily development work on the West White Rose Project and the Terra Nova ALE Project.
Refining and Marketing
R&M capital expenditures were $1.000 billion in 2023, of which $876 million was directed toward asset sustainment and maintenance capital expenditures of refinery and retail operations. This included planned turnaround and maintenance activities at each of the company’s refineries during the year.
R&M economic capital expenditures of $124 million in 2023 was primarily directed towards expanding and strengthening the company’s sales and marketing business, including investment into the enhancement of its retail operations.
Corporate
Corporate capital expenditures were $62 million in 2023, primarily directed towards investment in digital technologies.
Suncor anticipates 2024 capital expenditures to be directed to the following projects and initiatives:
Oil Sands operations
Plans for economic investment in 2024 include capital related to the Upgrader 1 coke drum replacement and the safe commissioning of the new cogeneration facility to replace the coke-fired boilers at Oil Sands Base. Additional investment includes the ongoing design and construction of well pads to develop additional reserves that are expected to maintain existing production levels at Firebag and MacKay River in future years.
Asset sustainment and maintenance capital expenditures for 2024 are expected to include expenditures relating to the company’s planned maintenance program, including the significant planned turnaround at Upgrader 1, planned annual coker maintenance at Upgrader 2 and planned turnaround activities at MacKay River, as well as mine and tailings development activities, and mine equipment replacements.
36 ANNUAL REPORT 2023 SUNCOR ENERGY INC.
Fort Hills
Asset sustainment and maintenance capital expenditures for 2024 are expected to focus on ongoing development of mining and tailings management projects to preserve production capacity and execute on the mine improvement plan, as well as planned maintenance activities. Plans for economic investment in 2024 include mine equipment purchases and replacements, including haul trucks, and the second North Pit mine development.
Syncrude
Asset sustainment and maintenance capital expenditures for 2024 are expected to include expenditures relating to the Syncrude’s planned maintenance program, including the significant planned spring turnaround, as well as other planned maintenance activities. Additionally, asset sustainment and maintenance expenditures in 2024 are expected to include expenditures related to tailings development and mine equipment replacements.
For 2024, plans for economic investment are primarily focused on progressing the Mildred Lake West Extension mining project.
Exploration and Production
Economic investment for 2024 is expected to be primarily focused on development work at the SeaRose FPSO Asset Life Extension Project and the West White Rose Project, as well as development activities to extend the productive life of existing fields, including development drilling at Hebron and Hibernia.
Refining and Marketing
Sustaining capital expenditures for 2024 are expected to focus on ongoing sustainment of refinery, logistics and retail operations, including planned refinery turnaround maintenance.
Economic investment projects in 2024 are expected to be primarily directed towards expanding and strengthening the company’s sales and marketing business, including investment into the enhancement of its retail and wholesale operations.
ANNUAL REPORT 2023 SUNCOR ENERGY INC. 37
9. Financial Condition and Liquidity
Liquidity and Capital Resources
At December 31 ($ millions, except as noted) |
|
2023 |
|
2022 |
|
2021 |
|
Cash flow provided by (used in) |
|
|
|
|
|
|
|
Operating activities |
|
12 344 |
|
15 680 |
|
11 764 |
|
Investing activities |
|
(6 511) |
|
(4 789) |
|
(3 977) |
|
Financing activities |
|
(5 990) |
|
(11 228) |
|
(7 464) |
|
Foreign exchange loss on cash and cash equivalents |
|
(94) |
|
112 |
|
(3) |
|
(Decrease) increase in cash and cash equivalents |
|
(251) |
|
(225) |
|
320 |
|
Cash and cash equivalents, end of year |
|
1 729 |
|
1 980 |
|
2 205 |
|
ROCE(1)(2) (%) |
|
15.6 |
|
19.4 |
|
8.6 |
|
Net debt to adjusted funds from operations(1) (times) |
|
1.0 |
|
0.8 |
|
1.6 |
|
Total debt to total debt plus shareholders’ equity(1) (%) |
|
26.3 |
|
28.4 |
|
33.4 |
|
Net debt to net debt plus shareholders’ equity(1) (%) |
|
24.0 |
|
25.7 |
|
30.6 |
|
Net debt to net debt plus shareholders’ equity - excluding leases(1) (%) |
|
18.5 |
|
21.3 |
|
26.6 |
|
| (1) | Non-GAAP financial measures or contains non-GAAP financial measures. See the Advisories – Non-GAAP and Other Financial Measures section of this MD&A. |
| (2) | For the twelve months ended December 31, 2023, there were no impairments or impairment reversals. As a result, ROCE excluding impairments was equal to ROCE. ROCE would have been 13.6% for the twelve months ended December 31, 2023, excluding the impact of the $1.125 billion non-cash gain on acquisition of TotalEnergies Canada. ROCE would have been 22.9% for the twelve months ended December 31, 2022, excluding the impact of the impairment reversal of $715 million ($542 million after-tax) and impairment of $70 million ($47 million after-tax) in the second quarter of 2022, and the impact of the impairment of $3.397 billion ($2.586 billion after-tax) in the third quarter of 2022. ROCE would have been 8.2% for the twelve months ended December 31, 2021, excluding the impact of the impairment reversal of $221 million ($168 million after-tax) in the third quarter of 2021. |
Cash Flow Provided by Operating Activities
Cash flow provided by operating activities was $12.344 billion in 2023, compared to $15.680 billion in 2022. The decrease was primarily due to a weaker business environment in the current year, resulting in decreased crude oil and refined product price realizations, and decreased sales volumes in E&P due to international asset divestments, partially offset by lower income taxes and royalties, and increased sales volumes in Oil Sands.
The current period cash flow provided by operating activities reflects a use of cash in working capital, primarily due to significantly lower net income taxes payable, and a decrease in accounts payable and accrued liabilities, partially offset by a decrease in accounts receivable balances related to the decrease in commodity prices in 2023. The prior period cash flow provided by operating activities reflects a significant use of cash in working capital, primarily due to an increase in inventory balances and accounts receivable related to the increase in commodity prices and crude oil price realizations in 2022, and a net decrease in taxes payable due to income tax instalments paid throughout the year, partially offset by an increase in accounts payable and accrued liabilities.
Cash Flow Used in Investing Activities
Cash flow used in investing activities was $6.511 billion in 2023, compared to $4.789 billion in 2022. The increase was primarily due to the impacts of the acquisition of an additional 45.89% working interest in Fort Hills in 2023, and increased capital expenditures, partially offset by proceeds from the sale of the company’s U.K. E&P portfolio and wind and solar assets in 2023.
Cash Flow Used in Financing Activities
Cash flow used in financing activities was $5.990 billion in 2023, compared to $11.228 billion in 2022. The decrease was primarily due to a significant decrease in long-term debt in the prior year, a decrease in share repurchases and the issuance of long-term debt in the current year, partially offset by a net decrease in short-term debt in 2023 compared to an increase in 2022.
Capital Resources
Suncor’s capital resources consist primarily of cash flow provided by operating activities, cash and cash equivalents, and available credit facilities, including commercial paper. Suncor’s management believes the company will have the capital
38 ANNUAL REPORT 2023 SUNCOR ENERGY INC.
resources required to fund its planned 2024 capital spending program of $6.3 billion to $6.5 billion, and to meet current and future working capital requirements through cash and cash equivalents balances, cash flow provided by operating activities, available committed credit facilities, issuing commercial paper and, if needed, accessing capital markets. The company’s cash flow provided by operating activities depends on several factors, including commodity prices, production, sales volumes, refining and marketing margins, operating expenses, taxes, royalties and foreign exchange rates.
The company has invested cash in short-term financial instruments that are presented as cash and cash equivalents. The objectives of the company’s short-term investment portfolio are to ensure the preservation of capital, maintain adequate liquidity to meet Suncor’s cash flow requirements and deliver competitive returns derived from the quality and diversification of investments within acceptable risk parameters. The maximum weighted average term to maturity of the short-term investment portfolio is not expected to exceed six months, and all investments are with counterparties with investment grade debt ratings.
Available Sources of Liquidity
Cash and Cash Equivalents
Included in cash and cash equivalents of $1.729 billion at December 31, 2023, are short-term investments with weighted average days to maturity of approximately 20 days. In 2023, the company earned approximately $3 million of interest income on these investments.
Financing Activities
Suncor’s interest on debt and lease liabilities (before capitalized interest) in 2023 was $981 million, comparable to $982 million in 2022, with interest expense on debt decreasing as a result of debt reductions in 2022, offset by an increase in interest on leases.
Available lines of credit at December 31, 2023, increased to $4.957 billion compared to $2.900 billion as at December 31, 2022. The increase in liquidity was primarily due to a decrease in short-term indebtedness, partially offset by a reduction in the size of the company’s syndicated credit facilities. In the second quarter of 2023, the company extended the maturity of its syndicated credit facilities from June 2024 and June 2025 to June 2026, and reduced the size of its $3.0 billion tranche to $2.8 billion. As of December 31, 2023, Suncor had approximately $6.7 billion of liquidity.
A summary of total and unutilized credit facilities at December 31, 2023, is as follows:
($ millions) |
|
2023 |
|
Fully revolving and expiring in 2026 |
|
5 451 |
|
Can be terminated at any time at the option of the lenders |
|
1 520 |
|
Total credit facilities |
|
6 971 |
|
Credit facilities supporting outstanding commercial paper |
|
(494) |
|
Credit facilities supporting standby letters of credit |
|
(944) |
|
Total unutilized credit facilities(1) |
|
5 533 |
|
| (1) | Available credit facilities for liquidity purposes were $4.957 billion at December 31, 2023 (December 31, 2022 – $2.900 billion). |
ANNUAL REPORT 2023 SUNCOR ENERGY INC. 39
Total Debt to Total Debt Plus Shareholders’ Equity
Suncor is subject to financial and operating covenants related to its bank debt and public market debt. Failure to meet the terms of one or more of these covenants may constitute an “event of default” as defined in the respective debt agreements, potentially resulting in accelerated repayment of one or more of the debt obligations. The company is in compliance with its financial covenant that requires total debt to not exceed 65% of its total debt plus shareholders’ equity. At December 31, 2023, total debt to total debt plus shareholders’ equity was 26.3% (December 31, 2022 – 28.4%), a decrease from the prior year due primarily to higher shareholders’ equity as a result of increased net earnings. The company is currently in compliance with all operating covenants as at December 31, 2023.
Change in Debt
($ millions) |
|
2023 |
|
Total debt(1) – December 31, 2022 |
|
15 619 |
|
Increase in long-term debt |
|
1 495 |
|
Decrease in short-term debt |
|
(2 343) |
|
Increase in lease liability |
|
1 156 |
|
Lease payments |
|
(331) |
|
Foreign exchange on debt, and other |
|
(189) |
|
Total debt(1) – December 31, 2023 |
|
15 407 |
|
Less: Cash and cash equivalents – December 31, 2023 |
|
1 729 |
|
Net debt(1) – December 31, 2023 |
|
13 678 |
|
| (1) | Non-GAAP financial measures. See the Advisories – Non-GAAP and Other Financial Measures section of this MD&A. |
The company’s total debt decreased in the twelve months ended December 31, 2023, primarily due to a decrease in short-term indebtedness, principal lease payments made during the period and favourable foreign exchange rates on U.S. dollar denominated debt compared to December 31, 2022, partially offset by the issuance of long-term debt, as discussed below, and an increase in net leases assumed with the Fort Hills acquisitions, and entered into, during the period.
During the fourth quarter of 2023, the company issued $1.0 billion principal amount of 5.60% senior unsecured medium term notes and $500 million principal amount of 5.40% senior unsecured medium term notes, due on November 17, 2025, and November 17, 2026, respectively, to finance the acquisition of TotalEnergies Canada.
As at December 31, 2023, Suncor’s net debt was $13.678 billion, compared to $13.639 billion at December 31, 2022. The change in net debt was primarily due to the factors discussed above, and a decrease in cash and cash equivalents.
For the year ended December 31, 2023, the company’s net debt to adjusted funds from operations measure was 1.0 times, which is lower than management’s maximum target of less than 3.0 times.
Credit Ratings
The company’s credit ratings affect its cost of funds and liquidity. In particular, the company’s ability to access unsecured funding markets and to engage in certain activities on a cost-effective basis is primarily dependent upon maintaining a strong credit rating. A lowering of the company’s credit rating may also have potentially adverse consequences for the company’s funding capacity or access to the capital markets, may affect the company’s ability, and the cost, to enter into normal course derivative or hedging transactions, and may require the company to post additional collateral under certain contracts.
As at March 21, 2024, the company’s long-term senior debt ratings are:
|
|
|
|
Long-Term |
|
Long-Term Senior Debt |
|
Rating |
|
Outlook |
|
S&P Global Ratings |
|
BBB |
|
Negative |
|
Morningstar DBRS |
|
A (low) |
|
Stable |
|
Moody’s Investors Service |
|
Baa1 |
|
Stable |
|
Fitch Ratings |
|
BBB+ |
|
Stable |
|
40 ANNUAL REPORT 2023 SUNCOR ENERGY INC.
As at March 21, 2024, the company’s commercial paper ratings are:
|
|
Cdn Program |
|
U.S. Program |
|
Commercial Paper |
|
Rating |
|
Rating |
|
S&P Global Ratings |
|
Not rated |
|
A-2 |
|
Morningstar DBRS |
|
R-1 (low) |
|
Not rated |
|
Moody’s Investors Service |
|
Not rated |
|
P-2 |
|
Fitch Ratings |
|
Not rated |
|
F-1 |
|
Refer to the Description of Capital Structure – Credit Ratings section of Suncor’s 2023 AIF for a description of credit ratings listed above.
Common Shares
Outstanding Shares
(thousands) |
|
December 31, 2023 |
|
Common shares |
|
1 290 100 |
|
Common share options – exercisable |
|
14 300 |
|
Common share options – non-exercisable |
|
2 736 |
|
As at March 20, 2024, the total number of common shares outstanding was 1,287,023,119 and the total number of exercisable and non-exercisable common share options outstanding was 15,467,647. Once vested, each outstanding common share option is exercisable for one common share.
Share Repurchases
During the first quarter of 2023, the TSX accepted a notice filed by Suncor to renew its normal course issuer bid (NCIB) to repurchase the company’s common shares through the facilities of the TSX, NYSE and/or alternative trading systems. The notice provides that, beginning February 17, 2023, and ending February 16, 2024, Suncor may purchase for cancellation up to 132,900,000 common shares, which is equal to approximately 10% of Suncor’s public float as of February 3, 2023. On February 3, 2023, Suncor had 1,330,006,760 common shares issued and outstanding.
Subsequent to the fourth quarter of 2023, the TSX accepted a notice filed by Suncor to renew its NCIB to purchase the company's common shares through the facilities of the TSX, NYSE and/or alternative trading systems. The notice provides that, beginning February 26, 2024, and ending February 25, 2025, Suncor may purchase for cancellation up to 128,700,000 common shares, which is equal to approximately 10% of Suncor's public float as of February 12, 2024. On February 12, 2024, Suncor had 1,287,461,183 common shares issued and outstanding.
Between February 17, 2023, and February 16, 2024, pursuant to Suncor’s previous NCIB, Suncor repurchased 47,106,802 common shares on the open market, representing the equivalent of 3.5% of its common shares as at February 3, 2023, for $2.019 billion, at a weighted average price of $42.87 per share.
Between February 26, 2024, and March 20, 2024, pursuant to Suncor’s current NCIB (as renewed), Suncor repurchased 2,266,200 common shares on the open market, representing the equivalent of 0.2% of its common shares as at February 12, 2024, for $107 million, at a weighted average price of $47.32 per share.
The actual number of common shares that may be repurchased under the NCIB and the timing of any such purchases will be determined by Suncor. The company believes that, depending on the trading price of its common shares and other relevant factors, repurchasing its common shares represents an attractive investment opportunity and is in the best interests of the company and its shareholders. The company does not expect that the decision to allocate cash to repurchase its common shares will affect its long-term strategy.
At December 31 |
|
|
|
|
|
|
($ millions, except as noted) |
|
2023 |
|
2022 |
|
2021 |
Share repurchase activities (thousands of common shares) |
|
51 982 |
|
116 908 |
|
83 959 |
Weighted average repurchase price per share (dollars per share) |
|
42.96 |
|
43.92 |
|
27.45 |
Share repurchase cost |
|
2 233 |
|
5 135 |
|
2 304 |
ANNUAL REPORT 2023 SUNCOR ENERGY INC. 41
Contractual Obligations, Commitments, Guarantees and Off-Balance Sheet Arrangements
In addition to the enforceable and legally binding obligations in the table below, Suncor has other obligations for goods and services that were entered into in the normal course of business, which may terminate on short notice, including commitments for the purchase of commodities for which an active, highly liquid market exists, and which are expected to be resold shortly after purchase.
The company does not believe it has any guarantees or off-balance sheet arrangements that have, or are reasonably likely to have, a current or future material effect on the company’s financial condition or financial performance, including liquidity and capital resources.
In the normal course of business, the company is obligated to make future payments, including contractual obligations and non-cancellable commitments.
|
|
Payment due by period |
|
||||||||||||
|
|
|
|
|
|
|
|
|
|
|
|
|
|
|
|
($ millions) |
|
2024 |
|
2025 |
|
2026 |
|
2027 |
|
2028 |
|
Thereafter |
|
Total |
|
Long-term debt(1) |
|
638 |
|
1 638 |
|
1 546 |
|
577 |
|
848 |
|
14 175 |
|
19 422 |
|
Decommissioning and restoration costs(2) |
|
471 |
|
437 |
|
563 |
|
602 |
|
540 |
|
20 887 |
|
23 500 |
|
Long-term contracts, pipeline capacity and energy services commitments(3) |
|
2 199 |
|
1 917 |
|
1 688 |
|
1 561 |
|
1 460 |
|
12 777 |
|
21 602 |
|
Exploration work commitments(3) |
|
— |
|
53 |
|
1 |
|
— |
|
— |
|
475 |
|
529 |
|
Lease obligations(4) |
|
561 |
|
524 |
|
467 |
|
435 |
|
411 |
|
4 038 |
|
6 436 |
|
Other long-term obligations(5) |
|
26 |
|
26 |
|
26 |
|
2 |
|
63 |
|
— |
|
143 |
|
Total |
|
3 895 |
|
4 595 |
|
4 291 |
|
3 177 |
|
3 322 |
|
52 352 |
|
71 632 |
|
| (1) | Includes long-term debt and interest payments on long-term debt. Refer to note 21 and note 27 of Suncor’s 2023 audited Consolidated Financial Statements. |
| (2) | Represents the undiscounted and uninflated amount of decommissioning and restoration costs. Refer to note 24 of Suncor’s 2023 audited Consolidated Financial Statements. |
| (3) | Refer to note 32 of Suncor’s 2023 audited Consolidated Financial Statements. |
| (4) | Refer to note 21 and note 27 of Suncor’s 2023 audited Consolidated Financial Statements. |
| (5) | Includes Libya exploration and production sharing agreement signature bonus and merger consent. Refer to note 22 of Suncor's 2023 audited Consolidated Financial Statements. |
42 ANNUAL REPORT 2023 SUNCOR ENERGY INC.
Transactions with Related Parties
Suncor enters into transactions with related parties in the normal course of business, which includes purchases of feedstock, distribution of refined products and the sale of refined products and byproducts. These transactions are with joint ventures and associated entities in the company’s R&M operations, including pipeline, refined product and petrochemical companies. For more information on these transactions and for a summary of Compensation of Key Management Personnel, refer to note 31 of the 2023 audited Consolidated Financial Statements.
Financial Instruments
The company uses derivative financial instruments, such as physical and financial contracts, to manage certain exposures to fluctuations in interest rates, commodity prices and foreign currency exchange rates as part of its overall risk management program, as well as for trading purposes. For the year ended December 31, 2023, the pre-tax earnings impact of risk management and trading activities was $25 million (2022 – pre-tax loss of $187 million).
Gains or losses related to derivatives are recorded as Other Income in the Consolidated Statements of Comprehensive Income.
|
|
|
|
|
|
($ millions) |
|
2023 |
|
2022 |
|
Fair value outstanding, beginning of year |
|
(65) |
|
(98) |
|
Changes in fair value recognized in earnings during the year |
|
25 |
|
(187) |
|
Cash settlements - paid (received) during the year |
|
20 |
|
220 |
|
Fair value outstanding, end of year |
|
(20) |
|
(65) |
|
The fair value of derivative financial instruments is recorded on the Consolidated Balance Sheets.
Fair value of derivative contracts at |
|
|
|
|
|
December 31 ($ millions) |
|
2023 |
|
2022 |
|
Accounts receivable |
|
65 |
|
143 |
|
Accounts payable |
|
(85) |
|
(208) |
|
|
|
(20) |
|
(65) |
|
Risks Associated with Derivative Financial Instruments
Suncor may be exposed to certain losses in the event that counterparties to derivative financial instruments are unable to fulfil their obligations under these contracts. The company minimizes this risk by entering into agreements with investment grade counterparties. Risk is also minimized through regular management review of the potential exposure to and credit ratings of such counterparties. Suncor’s exposure is limited to those counterparties holding derivative contracts with net positive fair values at a reporting date.
Suncor’s risk management activities are subject to periodic reviews by management to determine appropriate hedging requirements based on the company’s tolerance for exposure to market volatility, as well as the need for stable cash flow to finance future growth. Commodity risk management and trading activities are governed by a separate risk management group that reviews and monitors practices and policies and provides independent verification and valuation of these activities.
For further details on our derivative financial instruments, including assumptions made in the calculation of fair value, a sensitivity analysis of the effect of changes in commodity prices on our derivative financial instruments, and additional discussion of exposure to risks and mitigation activities, refer to note 27 of the company’s 2023 audited Consolidated Financial Statements.
ANNUAL REPORT 2023 SUNCOR ENERGY INC. 43
10. Material Accounting Policies and Critical Accounting Estimates
Suncor’s material accounting policies are described in note 3 of the audited Consolidated Financial Statements for the year ended December 31, 2023.
Adoption of New IFRS Standards
The standards, amendments and interpretations that are adopted up to the date of authorization of the company’s Consolidated Financial Statements, and that may have an impact on the disclosures and financial position of the company, are disclosed below.
Disclosure Initiative – Accounting Policies
In February 2021, the IASB issued Disclosure Initiative – Accounting Policies. The amendment requires companies to disclose material rather than significant accounting policies to provide more relevant, company-specific accounting policy disclosures. The company adopted the amendments prospectively on the effective date January 1, 2023, and there were impacts that have been reflected in note 3 of the Consolidated Financial Statements as a result of the initial application.
Recently Announced Accounting Pronouncements
The standards, amendments and interpretations that are issued, but not yet effective up to the date of authorization of the company’s Consolidated Financial Statements, and that may have an impact on the disclosures and financial position of the company, are disclosed below. The company intends to adopt these standards, amendments and interpretations when they become effective.
General Sustainability-related Disclosures and Climate-related Disclosures
In March 2024, the Canadian Sustainability Standards Board proposed Canadian-specific modifications to IFRS S1: General Sustainability-related Disclosures and IFRS S2: Climate-related disclosures, which were issued by the International Sustainability Standards Board (ISSB) in June 2023. The new standards add sustainability and climate disclosure requirements for annual reporting purposes. The Canadian-specific versions of IFRS S1 and S2 are expected to be available for voluntary adoption starting January 1, 2025; however, the Canadian Securities Administrators have not yet confirmed whether the new standards will be mandated for Canadian reporting issuers. The company is currently disclosing sustainability and climate-related information in its annual Report on Sustainability and Climate Report and anticipates changes resulting from these new standards on the Consolidated Financial Statements as a result of future application.
Significant and Other Accounting Estimates and Judgments
The preparation of financial statements in accordance with IFRS requires management to make estimates and judgments that affect reported assets, liabilities, revenues, expenses, gains, losses and disclosures of contingencies. These estimates and judgments are subject to change based on experience and new information.
Climate Change
Suncor supports the goals of the Paris Agreement and is committed to achieving the long-term objective of net-zero GHG emissions from its operations by 2050, including those in which it has a working interest. Addressing climate change and providing the secure, affordable and reliable energy the world needs requires investment, technological advancement, product innovation, regulatory support and collaborative partnerships, such as the Pathways Alliance. The rate of change of public policy, consumer behaviour and resulting demand for low-carbon options is not certain. Suncor is committed to reducing emissions in our base business, while expanding in complementary low-emissions businesses and working with our customers, governments and partners to realize our shared climate objectives.
Climate change and the transition to a low-emissions economy was considered in preparing the Consolidated Financial Statements, primarily in estimating commodity prices used in impairment and reserves analysis. These may have significant impacts on the currently reported amounts of the company’s assets and liabilities discussed below and on similar assets and liabilities that may be recognized in the future. As part of its ongoing business planning, Suncor estimates future costs associated with GHG emissions in its operations and in the evaluation of future projects. The company uses future climate scenarios to test and assess the resilience of its strategy. Changes in market and regulatory conditions and assumptions, as
44 ANNUAL REPORT 2023 SUNCOR ENERGY INC.
well as climate change, and the evolving worldwide demand for energy and global advancement of alternative sources of energy that are not sourced from fossil fuels, can materially impact the estimation of net reserves, asset valuation and reclamation and timing and requirements. The timing and pace at which global energy markets transition from carbon-based sources to alternative energy is highly uncertain.
Oil and Gas Reserves
The company’s estimate of oil and gas reserves is considered in the measurement of depletion, depreciation, impairment, decommissioning and restoration obligations and business combinations. The estimation of reserves is an inherently complex process and involves professional judgment. All reserves have been evaluated at December 31, 2023, by independent qualified reserves evaluators. Oil and gas reserves estimates are based on a range of geological, technical and economic factors, including projected future rates of production, projected future commodity prices, engineering data, and the timing and amount of future expenditures, all of which are subject to uncertainty. Estimates reflect market and regulatory conditions existing at December 31, 2023, which could differ significantly from other points in time throughout the year, or future periods.
Exploration and Evaluation Costs
Certain exploration and evaluation costs are initially capitalized with the intent to establish commercially viable reserves. The company is required to make judgments about future events and circumstances and applies estimates to assess the economic viability of extracting the underlying resources. The costs are subject to technical, commercial and management review to confirm the continued intent to develop the project. The level of drilling success or changes to project economics, resource quantities, expected production techniques, production costs and required capital expenditures are important judgments when making this determination. Management uses judgment to determine when these costs are reclassified to Property, Plant and Equipment based on several factors, including the existence of reserves, appropriate approvals from regulatory bodies, joint arrangement partners and the company’s internal project approval process.
Determination of Cash Generating Units (CGUs)
A CGU is the lowest grouping of integrated assets that generates identifiable cash inflows that are largely independent of the cash inflows of other assets or groups of assets. The allocation of assets into CGUs requires significant judgment and interpretations with respect to the integration between assets, the existence of active markets, similar exposure to market risks, shared infrastructure and the way in which management monitors the operations.
Asset Impairment and Reversals
Management applies judgment in assessing the existence of impairment and impairment reversal indicators based on various internal and external factors.
The recoverable amount of CGUs and individual assets is determined based on the higher of fair value less costs of disposal or value-in-use calculations. The key estimates the company applies to determine the recoverable amount normally include estimated future commodity prices, discount rates, expected production volumes, future operating and development costs, income taxes and refining margins. In determining the recoverable amount, management may also be required to make judgments regarding the likelihood of occurrence of a future event. Changes to these estimates and judgments will affect the recoverable amounts of CGUs and individual assets and may then require a material adjustment to their related carrying value.
Decommissioning and Restoration Costs
The company recognizes liabilities for the future decommissioning and restoration of Exploration and Evaluation assets and Property, Plant and Equipment based on estimated future decommissioning and restoration costs. Management applies judgment in assessing the future regulatory requirements, the existence and extent as well as the expected method of reclamation of the company’s decommissioning and restoration obligations at the end of each reporting period. Management also uses judgment to determine whether the nature of the activities performed is related to decommissioning and restoration activities or normal operating activities.
Actual costs are uncertain, and estimates may vary as a result of changes to relevant laws and regulations related to the use of certain technologies, the emergence of new technology, operating experience, prices and closure plans. The estimated timing of future decommissioning and restoration may change due to certain factors, including reserves life. Changes to estimates related to future expected costs, discount rates, inflation assumptions and timing may have a material impact on the amounts presented.
ANNUAL REPORT 2023 SUNCOR ENERGY INC. 45
Employee Future Benefits
The company provides benefits to employees, including pensions and other post-retirement benefits. The cost of defined benefit pension plans and other post-retirement benefits received by employees is estimated based on actuarial valuation methods that require professional judgment. Estimates typically used in determining these amounts include, as applicable, rates of employee turnover, future claim costs, discount rates, future salary and benefit levels, the return on plan assets, mortality rates and future medical costs. Changes to these estimates may have a material impact on the amounts presented.
Income Taxes
Management evaluates tax positions, annually or when circumstances require, which involves judgment and could be subject to differing interpretations of applicable tax legislation. The company recognizes a tax provision when a payment to tax authorities is considered probable. However, the results of audits and reassessments and changes in the interpretations of standards may result in changes to those positions and, potentially, a material increase or decrease in the company’s assets, liabilities and net earnings.
Suncor is committed to a proactive program of enterprise risk management intended to enable decision-making through consistent identification and assessment of risks inherent to its assets, activities and operations. Some of these risks are common to operations in the oil and gas industry as a whole, while some are unique to Suncor. The realization of any of the following risks could have a material adverse effect on Suncor’s business, financial condition, reserves and results of operations.
Volatility of Commodity Prices
Suncor’s financial performance is closely linked to prices for crude oil, refined petroleum products and, to a lesser extent, natural gas and electricity prices. The prices for all of these commodities can be influenced by global and regional supply and demand factors, which are beyond the company’s control and can result in a high degree of price volatility.
Crude oil prices are also affected by, among other things, global economic health (particularly in emerging markets), market access constraints, regional and international supply and demand imbalances, political developments and government action, decisions by OPEC+ regarding quotas on its members, compliance or non-compliance with quotas agreed upon by OPEC+ members and other countries, and weather. These factors impact the various types of crude oil and refined products differently and can impact differentials between light and heavy grades of crude oil (including blended bitumen), and between conventional oil and SCO.
Refined petroleum product prices and refining margins are also affected by, among other things, crude oil prices, the availability of crude oil and other feedstock, levels of refined product inventories, regional refinery availability, market access, marketplace competitiveness, regulatory compliance costs and other local market factors. Natural gas prices in North America are affected by, among other things, supply and demand, inventory levels, weather and prices for alternative energy sources.
In addition, oil and natural gas producers in North America, and particularly in Canada, may receive discounted prices for their production relative to certain international prices, due in part to constraints on the ability to transport and sell such products to international markets. A failure to resolve such constraints may result in continued discounted or reduced commodity prices realized by oil and natural gas producers. Suncor’s production from Oil Sands includes significant quantities of bitumen and SCO that may trade at a discount to light and medium crude oil. Bitumen and SCO are typically more expensive to produce and process. In addition, the market prices for these products may differ from the established market indices for light and medium grades of crude oil. As a result, the price received for bitumen and SCO may differ from the benchmark they are priced against.
Wide differentials or a prolonged period of low and/or volatile commodity prices, particularly for crude oil may lead to the impairment of assets, or to the cancellation or deferral of Suncor’s growth projects.
Commodity prices could be materially and adversely affected by the outbreak of epidemics, pandemics and other public health crises in geographic areas in which Suncor has operations, suppliers, customers or employees. A prolonged period of
46 ANNUAL REPORT 2023 SUNCOR ENERGY INC.
decreased demand for, and prices of, these commodities, and any applicable storage constraints, could also result in voluntary curtailment or shutting in production and a decrease in Suncor’s refined product volumes and refinery utilization rates.
Carbon Risk
Public support for climate change action and receptivity to alternative or renewable energy technologies has grown in recent years. There has also been increased activism and public opposition to fossil fuels, and oil sands in particular. Existing and future laws and regulations in support of a transition to low-carbon energy and climate change action may impose significant constraints on fossil fuel development. Concerns over climate change, fossil fuel extraction, GHG emissions, and water and land-use practices could lead governments to enact additional or more stringent laws and regulations applicable to Suncor and other companies in the energy industry in general, and in the oil sands industry in particular.
Changes to environmental regulations, including regulations relating to climate change, could impact the demand for the company’s products or could require increased capital expenditures, operating expenses, abandonment and reclamation obligations, and distribution costs. These potential added costs may not be recoverable in the marketplace and may result in some current operations or growth projects becoming less profitable or uneconomic. Such regulatory changes could require significant Suncor investment into the development of technologies or other energy products.
Suncor continues to monitor international and domestic efforts to address climate change. While GHG regulations and targets will continue to become more stringent, and while Suncor continues its efforts to reduce its GHG emissions, the absolute operational GHG emissions of the company may rise as a result of growth, mergers and acquisition activities, and changes in the operatorship of assets by Suncor or affiliates. This is particularly relevant with Suncor’s increase in emissions as a result of Suncor’s purchase of additional working interest in Fort Hills in 2023. Increases in GHG emissions may impact the profitability of the company’s projects, as Suncor will be subject to incremental levies and taxes. There is also a risk that Suncor could face litigation initiated by third parties relating to climate change, including litigation pertaining to GHG emissions, the production, sale, or promotion of fossil fuels and petroleum products, and/or disclosure.
These developments and future developments could adversely impact the demand for Suncor’s products, the ability of Suncor to maintain and grow its production and reserves, and Suncor’s reputation.
Greenhouse Gas Emissions and Targets
Among other sustainability goals, Suncor’s strategic objective is to be a net-zero GHG emissions from operations company by 2050 and the company has set ambitious near-term goals to reduce emissions across its value chain. The company’s ability to deliver GHG emissions reductions is subject to numerous risks and uncertainties, and actions taken to implement these objectives may also expose Suncor to certain additional and/or heightened financial and operational risks.
A reduction in GHG emissions relies on, among other things, Suncor’s ability to implement and improve energy efficiency at all of its facilities, future development and growth opportunities, development and deployment of new technologies, the ability to sequester and capture carbon and investment in low-carbon power, as well as a transition to low-carbon fuels. In the event that Suncor is unable to implement these strategies and technologies as planned without negatively impacting our expected operations or business plans, or in the event that such strategies or technologies do not perform as expected, Suncor may be unable to meet its GHG targets on the current timelines, or at all.
In addition, achieving the company’s GHG emissions reduction targets could require significant capital expenditures and resources, with the potential that the costs required to achieve our target and goals materially differ from our original estimates and expectations, and these differences may be material. While the intent is to improve efficiency and increase the offering of low-carbon energy, the shift in resources and focus towards emissions reduction could have a negative impact on our operating results.
Environmental Compliance
Tailings Management and Water Release
Each oil sands mine is required under the Alberta Energy Regulator’s Directive 085 – Fluid Tailings Management for Oil Sands Mining Projects to seek approval for its fluid tailings management plan. If a Suncor mine fails to meet a condition of its approved plan, the company could be subject to enforcement actions, including production curtailment, and financial consequences, such as compliance levies or being required to post additional security under the Mine Financial Security Program.
ANNUAL REPORT 2023 SUNCOR ENERGY INC. 47
The consequences of not meeting approval conditions are not yet fully known, as certain associated policy and regulation reviews and updates are still under development. Such updates could impact the technologies that the company plans to employ for tailings management and reclamation, which could adversely impact the company’s business plans. There could also be risks if the company’s tailings management operations fail to operate as anticipated.
Suncor uses pit lakes and supports an integrated water and tailings management approach for effective operations, successful reclamation and closure, and positive environmental outcomes. The inability to release treated mine water to the environment continues to result in an increase to both water quality concerns and water containment concerns at Suncor mine sites, which impacts current operations and reclamation and closure planning. The absence of an effective regulatory framework in this area could significantly impact operations and the success and timing of closure and reclamation plans.
Alberta’s Land-Use Framework
The implementation of, and compliance with, the terms of Alberta’s Land-Use Framework through the Lower Athabasca Regional Plan (LARP) may adversely impact Suncor’s current properties and projects in northern Alberta due to, among other things, environmental limits and thresholds. The impact of the LARP on Suncor’s operations may be outside of the control of the company, as Suncor’s operations could be impacted as a result of restrictions imposed due to the cumulative impact of development by the other operators in the area and not solely in relation to Suncor’s direct impact.
Water Management Regulations
Suncor currently relies on water obtained under licences and permits from government and regulators in its operating areas. Water licences and permits contain conditions to be met in order to maintain compliance with the licence. There can be no assurance that the licences to withdraw and use water will not be rescinded or restricted, or that additional conditions will not be added. It is also possible that regional water management approaches may require water-sharing agreements between stakeholders. In addition, any changes or expansions of the company’s projects may rely on securing licences and permits for additional water withdrawal and use, and there can be no assurance that these licences will be granted in a timely manner or that they will be granted on terms favourable to Suncor. There is also a risk that future laws or changes to existing laws or regulations relating to water access or water management could cause capital expenditures and operating expenses relating to water licence compliance to increase.
Biodiversity
Species at risk exist in the areas where Suncor conducts its operations. For example, existing, planned and potential future projects in Alberta are located within the range of woodland caribou, which have been identified as “threatened” under the Species at Risk Act (Canada). In response to the Government of Canada’s Recovery Strategy for the Woodland Caribou, provincial caribou range plans are being developed through sub-regional planning. The development and implementation of sub-regional plans may have an impact on the pace and amount of development in these areas and could potentially increase costs due to restoration or offsetting requirements.
Pursuant to the Alberta Wetland Policy, future development in wetland areas may be obligated to avoid wetlands or mitigate the development’s effects on wetlands. Certain Suncor operations and growth projects where wetlands are regionally abundant will be affected by aspects of the policy where avoidance is not possible and wetland reclamation or replacement may be required. Wetland replacement costs are based on wetland value and may be especially high for future oil sands projects and expansions due to the limited opportunity to avoid or minimize impacts to wetlands.
Air and Water Quality Management
A number of Canadian federal and provincial, and U.S. federal and state, air and water quality regulations and frameworks are in place currently and being developed, changed and/or implemented, which could have an impact on the company’s existing operations and planned projects, such as requiring the company to invest additional capital or incur additional operating and compliance expenses, including, among other things, potentially requiring the company to retrofit equipment to meet new requirements and increase monitoring and mitigation plans. The full impact of these regulations and frameworks is not yet known.
Major Operational Incidents (Safety, Environmental and Reliability)
Each of Suncor’s primary operating businesses carries economic risk associated with operating reliably or enduring a protracted operational outage. The breadth and level of integration of Suncor’s operations adds complexity.
48 ANNUAL REPORT 2023 SUNCOR ENERGY INC.
The company’s businesses also carry the risks associated with poor or substandard environmental and safety performance, which is closely scrutinized by governments, the public and the media, and could result in a suspension of or inability to obtain regulatory approvals and permits, or, in the case of a major environmental or safety incident, delays in resuming normal operations, fines, civil suits or criminal charges against the company.
In general, Suncor’s operations are subject to operational hazards and risks such as, among others, fires (including forest fires), explosions, blow-outs, power outages, prolonged periods of extreme cold or extreme heat, severe winter climate conditions, flooding, droughts and other extreme weather conditions, railcar incidents or derailments, the migration of harmful substances such as, among others, oil spills, gaseous leaks or a release of deleterious substances, loss of tailings dam integrity, pollution and other environmental risks, and accidents, any of which can interrupt operations or cause personal injury or death, or damage to property, equipment (including information technology and related data and controls systems), and the environment.
The reliable operation of production and processing facilities at planned levels and Suncor’s ability to produce higher-value products can also be impacted by, among other things, failure to follow the company’s policies, standards and operating procedures or operate within established operating parameters, equipment failure through inadequate maintenance, unanticipated erosion or corrosion of facilities, manufacturing and engineering flaws, and labour shortage or interruption. The company is also subject to operational risks such as sabotage, terrorism, trespass, theft and malicious software, network or cyberattacks.
In addition to the foregoing factors that affect Suncor’s business generally, each business unit is susceptible to additional risks due to the nature of its business, including, among others, the following:
| ● | Suncor’s Oil Sands business is susceptible to loss of production, slowdowns, shutdowns or restrictions on its ability to produce higher-value products, due to the failure of any one or more interdependent component systems, and other risks inherent to oil sands operations; |
| ● | For Suncor’s E&P businesses, there are risks and uncertainties associated with drilling for oil and natural gas, the operation and development of such properties and wells (including encountering unexpected formations, pressures or the presence of hydrogen sulphide), premature declines of reservoirs, sour gas releases, uncontrollable flows of crude oil, natural gas or well fluids and other accidents; |
| ● | Suncor’s E&P offshore operations occur in areas subject to hurricanes and other extreme weather conditions, such as winter storms, pack ice, icebergs and fog. The occurrence of any of these events could result in production shut-ins, the suspension of drilling operations and damage to or destruction of the equipment involved. Harsh weather conditions, particularly in the winter season, may also impact the successful execution of maintenance and startup of operations. Suncor’s E&P offshore operations could be indirectly affected by catastrophic events occurring at other third-party offshore operations, which could give rise to liability, damage to the company’s equipment, harm to individuals, force a shutdown of facilities or operations, or result in a shortage of appropriate equipment or specialists required to perform planned operations; and |
| ● | Suncor’s R&M operations are subject to all of the risks normally inherent in the operation of refineries, terminals, pipelines and other distribution facilities and service stations, including, among others, loss of production, slowdowns or shutdowns due to equipment failures, unavailability of feedstock, price and quality of feedstock, or other incidents. |
Suncor is also subject to risks relating to the health and safety of its people, and the potential for a slowdown or temporary suspension of its operations in locations impacted by an outbreak of an epidemic, pandemic or other public health crisis. This could negatively impact Suncor’s production or refined product volumes and refinery utilization rates for a sustained period of time.
Government/Regulatory Policy
Suncor’s businesses operate under federal, provincial, territorial, state and municipal laws in numerous countries. The company is subject to regulation and intervention by governments in oil and gas industry matters, such as, among others, land tenure; royalties; taxes (including income taxes); government fees; production rates; environmental protection; water; wildlife; fish; air quality; safety performance; the reduction of GHG and other emissions; the export of crude oil, natural gas and other products; cybersecurity; interactions with foreign governments; the awarding or acquisition of exploration and production rights, oil sands leases or other interests; the imposition of specific drilling obligations; control over the development, reclamation and abandonment of fields and mine sites; mine financial security requirements; approval of logistics infrastructure; and possibly expropriation or cancellation of contract rights.
ANNUAL REPORT 2023 SUNCOR ENERGY INC. 49
As part of ongoing operations, the company is also required to comply with a significant number of environmental, health and safety regulations under a variety of Canadian, U.S. and other foreign, federal, provincial, territorial, state and municipal laws and regulations. Failure to comply with applicable laws and regulations may result in, among other things, the imposition of fines and penalties, production constraints, a compulsory shutdown of facilities or suspension of operations (temporarily or permanently), reputational damage, delays, increased costs, denial of operation and growth permit applications, censure, liability for cleanup costs and damages, and the loss of important licenses and permits.
Before proceeding with certain projects, including changes to existing operations, Suncor must obtain permits, regulatory approvals, and licences to operate certain assets. These processes can involve, among other things, Indigenous and stakeholder consultation, government intervention, environmental impact assessments and public hearings and may be subject to conditions, including security deposit obligations and other commitments. In some cases, abandonment and reclamation obligations may remain with the company even after disposition of an asset to a third party. Compliance can be affected by the loss of skilled staff, inadequate internal processes and compliance auditing.
Failure to obtain, comply with, satisfy the conditions of or maintain regulatory permits, licences and approvals, or failure to obtain them on a timely basis or on satisfactory terms, could result in prosecution, fines and penalties, delays, abandonment or restructuring of projects, impacts to production, reputational damage and increased costs, denial of operating and growth permit applications and public censure. Suncor’s businesses can also be indirectly impacted by a third-party’s inability to obtain regulatory approval for a shared infrastructure project or a third-party infrastructure project on which a portion of Suncor’s business depends.
Changes in government policy, regulation or other laws, or the interpretation thereof, or the revocation of existing approvals or permits by the government or opposition to Suncor’s projects or third-party pipeline and infrastructure projects that delay or prevent necessary permits or regulatory approvals, or that make current operations or growth projects less profitable or uneconomic could materially impact Suncor’s operations, existing and planned projects.
Digital and Cybersecurity
The efficient operation of Suncor’s business is dependent on computer hardware, software and a large and complex information framework, including the systems of cloud providers and third parties with which Suncor conducts business. Digital transformation continues to increase the number of, and complexity of, such systems. In the ordinary course of Suncor’s business, Suncor collects and stores sensitive data, including intellectual property, proprietary business information and personal information of the company’s employees and retail customers. Suncor relies on industry-accepted security measures, controls and technology to protect Suncor’s information systems and securely maintain confidential and proprietary information stored on the company’s information systems, and has adopted a continuous process to identify, assess and manage threats to the company’s information systems.
As a result of the critical nature of the energy supply chain and Suncor’s use of information systems and other digital technologies to control its assets, Suncor faces a heightened risk of cyber-attacks. While Suncor has an information and cybersecurity program in place, the measures, controls and technology on which the company relies may not be adequate due to the increasing volume, sophistication and rapidly evolving nature of cyber threats. Suncor’s information technology and infrastructure, including process control systems, has and will likely continue to face attacks by malicious persons or entities motivated by, among other things, geopolitical, financial or activist reasons, or may be breached due to employee error or malfeasance, or otherwise vulnerable due to other disruptions. Although the company maintains a risk management program, which includes an insurance component that may provide coverage for the operational impacts from an attack to, or breach of, Suncor’s information technology and infrastructure, including process control systems, the company does not maintain stand-alone cyber insurance. Furthermore, not all cyber risks are insurable. As a result, Suncor’s existing insurance may not provide adequate coverage for losses stemming from a cyberattack to, or breach of, its information technology and infrastructure.
Any such attack or breach could compromise Suncor’s networks, and the information Suncor stores could be accessed, publicly disclosed, lost, stolen or compromised. Any such attack, breach, access, disclosure or loss of information could result in legal claims or proceedings, liability under laws that protect the privacy of personal information, regulatory penalties, disruptions to Suncor’s operations, decreased performance and production, increased costs, damage to Suncor’s reputation, physical harm to people or the environment or other negative consequences to Suncor or third parties.
50 ANNUAL REPORT 2023 SUNCOR ENERGY INC.
Market Access
The markets for bitumen blends and heavy crude oil are limited compared to those for light crude oil, making them more susceptible to supply and demand changes and imbalances (whether as a result of the availability, proximity and capacity of pipeline facilities, railcars or otherwise). Heavy crude oil generally receives lower market prices than light crude oil, due principally to the lower quality and value of the refined product yield and the higher cost to transport the more viscous product on pipelines, and this price differential can be amplified due to supply and demand imbalances.
Market access for Suncor’s oil sands production may be constrained by insufficient pipeline takeaway capacity. In order to secure future market access, financial commitments could be made for projects that do not proceed. There is a risk that constrained market access for oil sands production, growing inland production and refinery outages could create widening price differentials that could impact the profitability of product sales. Market access for refined products may also be constrained by insufficient takeaway capacity, which could create a supply/demand imbalance.
Competition
The global petroleum industry is highly competitive in many aspects, including the exploration for and the development of new sources of supply, the acquisition of crude oil and natural gas interests, and the refining, distribution and marketing of refined petroleum products. Suncor competes in virtually every aspect of its business with other energy companies. The petroleum industry also competes with other industries in supplying energy, fuel and related products to consumers. The increasing volatility of the political and social landscape adds complexity.
For Suncor’s Oil Sands and E&P businesses, it is difficult to assess the number, level of production and ultimate timing of all potential new projects or when existing production levels of competitors may increase. Although increased regulatory requirements have slowed certain larger projects in the short term, an increase in the level of activity may have an impact on regional infrastructure, including pipelines, and could place stress on the availability and cost of all resources required to build and run new and existing oil sands operations.
For Suncor’s R&M business, management expects that fluctuations in demand for refined products, margin volatility and overall marketplace competitiveness will continue.
There is a risk that increased competition could cause costs to increase, put further strain on existing infrastructure and cause margins for refined and unrefined products to be volatile, and impact demand for Suncor’s products.
Portfolio Development and Execution
There are certain risks associated with the development and execution of Suncor’s complex and integrated portfolio of projects and the commissioning and integration of new facilities within its existing asset base. This includes development, engineering, construction, commissioning and startup.
Portfolio development and execution can also be impacted by, among other things, the effect of changing government regulations; the company’s ability to obtain the necessary environmental and other regulatory approvals; the complexity and diversity of Suncor’s portfolio; the ability to negotiate with joint venture partners; the accuracy of project cost and schedule estimates; the availability and cost of materials, equipment, qualified personnel and logistics infrastructure; weather; unanticipated technical challenges; or general business conditions.
Technology Risk
There are risks associated with sustainability, growth and capital projects that rely largely or partly on new technologies and the incorporation of such technologies into new or existing operations, including that the results of the application of new technologies may differ from simulated, test or pilot environments, or that third-party intellectual property protections may impede the development and implementation of new technology. The success of projects incorporating new technologies cannot be assured and advantages accrue to companies that can develop and adopt emerging technologies in advance of competitors. The inability to develop, implement and monitor new technologies may impact the company’s ability to develop its new or existing operations in a profitable manner or comply with regulatory requirements.
ANNUAL REPORT 2023 SUNCOR ENERGY INC. 51
Cumulative Impact and Pace of Change
The energy industry is evolving at a rapid pace and change is necessary to meet business objectives. These business objectives compete for resources and may negatively impact the company should there be inadequate consideration of the cumulative impacts of prior and parallel initiatives on people, processes and systems. There is a risk that measures undertaken to achieve these objectives may exceed Suncor’s capacity to adopt and implement change.
Skills, Resource Shortage and Reliance on Key Personnel
The successful operation of Suncor’s businesses will depend upon the availability of, and competition for skilled labour and materials supply. There is a risk that the company may have difficulty sourcing and retaining the skilled labour in certain talent segments for current and future operations. The availability of competent and skilled contractors for current and future operations is also a risk depending on market conditions and continued cost reduction initiatives. Suncor’s ability to operate safely and effectively and complete all projects on time and on budget has the potential to be significantly impacted by these risks and this impact could be material. The company’s success also depends in large measure on certain key personnel. The contributions of the existing management team to the immediate and near-term operations of the company are likely to continue to be of central importance for the foreseeable future.
Labour Relations
Hourly employees at Suncor’s oil sands facilities (excluding MacKay River and Fort Hills), all of the company’s refineries and the majority of the company’s terminal and distribution operations and certain of the company’s E&P operations are represented by labour unions or employee associations. Any work interruptions involving the company’s employees, contract trades utilized in the company’s projects or operations, or any jointly owned facilities operated by another entity present a significant risk to the company.
Joint Arrangement Risk
Suncor has entered into joint arrangements and other contractual arrangements with third parties, including arrangements where other entities operate assets in which Suncor has ownership or other interests and arrangements where Suncor operates assets in which other entities have ownership or other interests. The success and timing of activities relating to assets and projects operated by others, or developed jointly with others, depend upon a number of factors that are outside of Suncor’s control, including, among others, the timing and amount of capital expenditures, operational and maintenance expenditures; misalignment of partner interests, the operator’s expertise, financial resources and risk management practices; the approval of other participants; and the selection of technology.
Financial Risks
Access to Capital
Suncor expects that future capital expenditures will be financed out of cash and cash equivalents balances, cash flow provided by operating activities, available committed credit facilities, issuing commercial paper and, if needed, accessing capital markets. This ability is dependent on, among other factors, commodity prices, the overall state of the capital markets, and financial institutions and investor appetite for investments in the energy industry generally, and the company’s securities in particular. The company’s ability to access capital may also be adversely affected in the event that financial institutions, investors, rating agencies and/or lenders adopt more restrictive decarbonization policies. To the extent that external sources of capital become limited or unavailable or available on unfavourable terms, the ability to make capital investments and maintain existing properties may be constrained.
If the company finances capital expenditures in whole or in part with debt, that may increase its debt levels above industry standards for oil and gas companies of similar size. Depending on future development and growth plans, additional debt financing may be required that may not be available or, if available, may not be available on favourable terms. Neither the Articles of Suncor nor its bylaws limit the amount of indebtedness that may be incurred; however, Suncor is subject to covenants in its existing credit facilities and seeks to avoid an unfavourable cost of debt. The level of the company’s indebtedness, and the level of indebtedness relative to the company’s ability to generate cash flow, from time to time, could impair its ability to obtain additional financing on a timely basis to take advantage of business opportunities that may arise and could negatively affect its credit ratings.
52 ANNUAL REPORT 2023 SUNCOR ENERGY INC.
Suncor is required to comply with financial and operating covenants under existing credit facilities and debt securities. Covenants are reviewed based on actual and forecast results and the company has the ability to make changes to its development plans, capital structure and/or dividend policy to comply with covenants under the credit facilities. If Suncor does not comply with the applicable covenants under its credit facilities and debt securities, there is a risk that repayment could be accelerated and/or the company’s access to capital could be restricted or only be available on unfavourable terms.
Rating agencies regularly evaluate the company, including its subsidiaries. Their ratings of Suncor’s long-term and short-term debt are based on a number of factors, including the company’s financial strength, as well as factors not entirely within its control, including conditions affecting the oil and gas industry generally, and the wider state of the economy. Credit ratings may be important to customers or counterparties when Suncor competes in certain markets and when it seeks to engage in certain transactions, including some commodity sales or purchase transactions or those involving over-the-counter derivatives. There is a risk that one or more of Suncor’s credit ratings could be downgraded, which could potentially limit its access to private and public credit markets and increase the company’s cost of borrowing.
Inflation
The company purchases materials and commodities for use in its business and uses contractors to supplement its workforce in many areas of the organization. Due to the lingering impacts of the COVID-19 pandemic and the limited availability of labour, many supply chains have been stretched, resulting in an increase in inflation. While many central banks have increased interest rates in an attempt to reduce inflation, there is no certainty that attempts to control inflation will be successful, or if they are successful, the pace at which inflation may subside.
Even a short period of higher-than-average inflation can lead to structural cost increases in Suncor’s business, which may impact its business plans going forward. Furthermore, governmental actions, such as the imposition of higher interest rates or wage or price controls may also negatively impact the company’s costs and magnify the impacts of other risks identified in this Risk Factors section of the MD&A, including those set out below under Financial Risks – Interest Rate Risks.
Energy Trading and Risk Management Activities and the Exposure to Counterparties
The nature of Suncor’s energy trading and risk management activities, which may make use of derivative financial instruments to manage its exposure to commodity price and other market risks, creates exposure to financial risks, which include, but are not limited to, unfavourable movements in commodity prices, interest rates or foreign exchange that could result in a financial or opportunity loss to the company; a lack of counterparties, due to market conditions or other circumstances that could leave the company unable to liquidate or offset a position, or unable to do so at or near the previous market price; and counterparty default risk.
Exchange Rate Fluctuations
The majority of Suncor’s revenues from the sale of oil and natural gas commodities are based on prices that are determined by, or referenced to, U.S. dollar benchmark prices, while the majority of Suncor’s expenditures are realized in Canadian dollars. Suncor also has assets and liabilities, including approximately 60% of the company’s debt, that are denominated in U.S. dollars and translated to Suncor’s reporting currency (Canadian dollars) at each balance sheet date. Suncor’s financial results, therefore, can be affected significantly by the exchange rates between the Canadian dollar and the U.S. dollar. These exchange rates may vary substantially and may give rise to favourable or unfavourable foreign currency exposure. A decrease in the value of the Canadian dollar relative to the U.S. dollar will increase the revenues received from the sale of commodities. An increase in the value of the Canadian dollar relative to the U.S. dollar will decrease revenues received from the sale of commodities. A decrease in the value of the Canadian dollar relative to the U.S. dollar from the previous balance sheet date increases the amount of Canadian dollars required to settle U.S. dollar denominated obligations.
Interest Rate Risk
The company is exposed to fluctuations in short-term Canadian and U.S. interest rates as Suncor maintains a portion of its debt capacity in revolving and floating rate credit facilities and commercial paper, and invests surplus cash in short-term debt instruments and money market instruments, which are off-setting exposures to some degree. Throughout 2023, benchmark interest rates rose in both Canada and the United States. Suncor may also be exposed to higher interest rates when debt instruments are maturing and require refinancing, or when new debt capital needs to be raised. The company is also exposed to changes in interest rates if derivative instruments are used to manage the debt portfolio.
ANNUAL REPORT 2023 SUNCOR ENERGY INC. 53
Royalties and Taxes
Suncor is subject to royalties and taxes imposed by governments in numerous jurisdictions. Royalties can be impacted by changes in crude oil and natural gas pricing, production volumes, sales volumes, and capital and operating costs, by changes to existing legislation or production sharing contracts; and by results of regulatory audits of prior year filings and other such events. The final determination of these events may have a material impact on the company’s royalties expense. A failure to fully realize anticipated tax-benefits, including the expected tax benefit relating to the acquisition of TotalEnergies Canada, or an increase in Suncor’s royalties expense, income taxes, property taxes, carbon taxes, levies, tariffs, duties, quotas, border taxes, other taxes and government-imposed compliance costs may increase our cost of tax compliance.
Dividends and Share Repurchases
Suncor’s payment of future dividends on its common shares and future share repurchases by Suncor of its common shares will be dependent on, among other things, legislative and stock exchange requirements, the prevailing business environment, the company’s financial condition, results of operations, cash flow, the need for funds to finance ongoing operations and growth projects, debt covenants and other business considerations as the company’s Board considers relevant. There can be no assurance that Suncor will continue to pay dividends or repurchase shares in the future.
E&P Reserves Replacement
Suncor’s future offshore production, and therefore its cash flows and results of operations from E&P, are highly dependent upon success in exploiting its current reserves base and acquiring or discovering additional reserves. Without additions to its E&P reserves through exploration, acquisition or development activities, Suncor’s production from its offshore assets will decline over time as reserves are depleted. The business of exploring for, developing or acquiring reserves is capital intensive. To the extent Suncor’s cash flows is insufficient to fund capital expenditures and external sources of capital become limited or unavailable, Suncor’s ability to make the necessary capital investments to maintain and expand its reserves will be impaired. In addition, Suncor may be unable to develop or acquire additional reserves to replace its crude oil production at acceptable costs.
Uncertainties Affecting Reserves Estimates
There are numerous uncertainties inherent in estimating quantities of reserves, including many factors beyond the company’s control. Suncor’s actual production, revenues, royalties, taxes, and development and operating expenditures with respect to the company’s reserves will vary from its estimates, and such variances could be material.
The evaluation of reserves is a continuous process, one that can be significantly impacted by a variety of internal and external influences. Revisions are often required as a result of newly acquired technical data, technology improvements or changes in performance, pricing, economic conditions, market availability or regulatory requirements. Additional technical information regarding geology, hydrogeology, reservoir properties and reservoir fluid properties is obtained through seismic programs, drilling programs, updated reservoir performance studies and analysis and production history, and may result in revisions to reserves. Pricing, market availability and economic conditions affect the profitability of reserves development. Royalty regimes and environmental regulations and other regulatory changes cannot be predicted but may have positive or negative effects on reserves. Future technology improvements would be expected to have a favourable impact on the economics of reserves development and exploitation, and therefore may result in an increase to reserves. Political unrest, such as is occurring in Syria and Libya, has resulted in volumes that would otherwise be classified as reserves being classified as contingent resources.
There are numerous uncertainties inherent in estimating the quantities and quality of these reserves, including many factors beyond the company’s control. In general, estimates of reserves and the future net cash flows from these reserves are based upon a number of factors and assumptions – such as production forecasts, regulations, pricing, the timing and amount of capital expenditures, future royalties, future operating costs, yield rates for upgraded production of SCO from bitumen, and future abandonment and reclamation costs – all of which may vary considerably from actual results. The accuracy of any reserves estimate is a matter of interpretation and judgment and is a function of the quality and quantity of available data, which may have been gathered over time. For these reasons, estimates of reserves and categorization of such reserves based on the certainty of recovery, prepared by different engineers or by the same engineers at different times, may vary.
Reserves estimates are based upon geological assessment, including drilling and laboratory tests. Mining reserves estimates also consider production capacity and upgrading yields, mine plans, operating life and regulatory constraints. In Situ reserves estimates are also based upon the testing of core samples and seismic operations and demonstrated commercial success of
54 ANNUAL REPORT 2023 SUNCOR ENERGY INC.
in situ processes. Suncor’s actual production, revenues, royalties, taxes, and development and operating expenditures with respect to the company’s reserves will vary from such estimates, and such variances could be material. Production performance subsequent to the date of the estimate may justify future revision, either upward or downward, if material.
Reserves evaluations are based in part on the assumed success of activities the company intends to undertake in future years. Estimated reserves and associated cash flows may be increased or reduced to the extent that such activities do or do not achieve the level of success assumed in the reserves evaluations.
Third-Party Service Providers
Suncor’s businesses are reliant on the operational integrity of a large number of third-party service providers, including input and output commodity transport (pipelines, rail, trucking, marine) and utilities associated with various Suncor and jointly owned facilities. A disruption in service or limited availability by one of these third parties can have a dramatic impact on Suncor’s operations and growth plans. Pipeline constraints that affect takeaway capacity or supply of inputs, such as hydrogen and power, could impact the company’s ability to produce at capacity levels. Disruptions in pipeline service could adversely affect commodity prices, Suncor’s price realizations, refining operations and sales volumes, or limit the company’s ability to produce and deliver production. These interruptions may be caused by the inability of the pipeline to operate or by the oversupply of feedstock into the system that exceeds pipeline capacity. Short-term operational constraints on pipeline systems arising from pipeline interruption and/or increased supply of crude oil have occurred in the past and could occur in the future. There is a risk that third-party outages could impact Suncor’s production or price realizations.
Foreign Operations
The company has operations in countries with different political, economic and social systems. As a result, the company’s operations and related assets are subject to a number of risks and other uncertainties arising from foreign government sovereignty over the company’s international operations, which may include, among other things, currency restrictions and restrictions on repatriation of funds; loss of revenue, property and equipment as a result of expropriation, nationalization, terrorism, war, insurrection, and geopolitical and other political risks; increases in taxes and government royalties; compliance with existing and emerging anti-corruption laws, including the Corruption of Foreign Public Officials Act (Canada) and the Foreign Corrupt Practices Act (United States); renegotiation of contracts with government entities and quasi-government agencies; changes in laws and policies governing operations of foreign-based companies; and economic and legal sanctions (such as restrictions against countries experiencing political violence, or countries that other governments may deem to sponsor terrorism).
If a dispute arises in the company’s foreign operations, the company may be subject to the exclusive jurisdiction of foreign courts or may not be able to subject foreign persons to the jurisdiction of a court in Canada or the U.S. In addition, as a result of activities in these areas and a continuing evolution of an international framework for corporate responsibility and accountability for international crimes, there is a risk the company could be exposed to potential claims for alleged breaches of international or local law.
The impact that future potential terrorist attacks, regional hostilities or political violence, such as that experienced in Libya and Syria, may have on the oil and gas industry, and on Suncor’s operations in particular, is not known at this time. Suncor may be required to incur significant costs in the future to safeguard its assets against terrorist activities or to remediate potential damage to its facilities. There can be no assurance that Suncor will be successful in protecting itself against these risks and the related safety and financial consequences.
Despite Suncor’s training and policies around bribery and other forms of corruption, there is a risk that Suncor, or some of its employees or contractors, could be charged with bribery or corruption. Any of these violations could result in onerous penalties. Even allegations of such behaviour could impair Suncor’s ability to work with governments or non-government organizations and could result in the formal exclusion of Suncor from a country or area, sanctions, fines, project cancellations or delays, the inability to raise or borrow capital, reputational impacts and increased investor concern.
Security and Terrorist Threats
Security threats and terrorist or activist activities may impact Suncor’s personnel, which could result in injury, death, extortion, hostage situations and/or kidnapping, including unlawful confinement. A security threat, terrorist attack or activist incident targeted at a facility or office owned or operated by Suncor could result in the interruption or cessation of key elements of Suncor's operations and may result in property damage.
ANNUAL REPORT 2023 SUNCOR ENERGY INC. 55
Land Claims and Indigenous Consultation
Indigenous Peoples have claimed Indigenous title and rights to portions of Western Canada. In addition, Indigenous Peoples have filed claims against industry participants relating in part to land claims, which may affect the company’s business.
Consulting requirements with Indigenous Peoples in respect of oil and gas projects and related infrastructure have increased in recent years, and the Canadian federal government and the provincial government in Alberta have committed to renew their relationships with the Indigenous Peoples of Canada. In particular, on June 21, 2021, Canada’s United Nations Declaration on the Rights of Indigenous Peoples Act (the UNDRIP Act) received Royal Assent and came into force. It is unknown how the UNDRIP Act will ultimately be implemented and interpreted as a part of Canadian law, and it therefore also remains unclear what its corresponding impact will be on the Crown’s duty to consult with and accommodate Indigenous Peoples.
At this point Suncor is unable to assess the effect, if any, that any such land claims, consultation requirements with Indigenous Peoples or the implementation of the UNDRIP Act may have on Suncor’s business.
Litigation Risk
There is a risk that Suncor or entities in which it has an interest may be subject to litigation and claims under such litigation may be material. Various types of claims may be raised in these proceedings, including, but not limited to, environmental damage, climate change and the impacts thereof, breach of contract, common law duties, product liability, antitrust, bribery and other forms of corruption, tax, patent infringement, disclosure, employment matters and in relation to an attack, breach or unauthorized access to Suncor’s information technology and infrastructure. Litigation is subject to uncertainty, and it is possible that there could be material adverse developments in pending or future cases. Unfavourable outcomes or settlements of litigation could encourage the commencement of additional litigation. Suncor may also be subject to adverse publicity and reputational impacts associated with such matters, regardless of whether Suncor is ultimately found liable. There is a risk that the outcome of such litigation may be materially adverse to the company and/or the company may be required to incur significant expenses or devote significant resources in defence against such litigation, the success of which cannot be guaranteed.
Control Environment
Based on their inherent limitations, disclosure controls and procedures and internal controls over financial reporting may not prevent or detect misstatements, and even those controls determined to be effective can provide only reasonable assurance with respect to financial statement preparation and presentation. Failure to adequately prevent, detect and correct misstatements could have an impact on how Suncor’s business, financial condition and results of operations are reported.
Insurance Coverage
Suncor maintains insurance coverage as part of its risk management program. However, such insurance may not provide comprehensive coverage in all circumstances, nor are all such risks insurable. The company self-insures some risks, and the company’s insurance coverage does not cover all the costs arising out of the allocation of liabilities and risk of loss arising from Suncor operations.
In some instances, certain insurance may become unavailable or available only for reduced amounts of coverage. Significantly increased costs could lead the company to decide to reduce, or possibly eliminate, coverage. In addition, insurance is purchased from a number of third-party insurers, often in layered insurance arrangements, some of whom may discontinue providing insurance coverage for their own policy or strategic reasons. Should any of these insurers refuse to continue to provide insurance coverage, the company’s overall risk exposure could be increased.
Control Environment
Based on their evaluation as of December 31, 2023, Suncor’s Chief Executive Officer and Chief Financial Officer concluded that the company’s disclosure controls and procedures (as defined in Rules 13a-15(e) and 15d-15(e) under the United States Securities Exchange Act of 1934, as amended (the Exchange Act)), are effective to ensure that information required to be disclosed by the company in reports that are filed or submitted to Canadian and U.S. securities authorities is recorded,
56 ANNUAL REPORT 2023 SUNCOR ENERGY INC.
processed, summarized and reported within the time periods specified in Canadian and U.S. securities laws. In April 2022, the company implemented a new enterprise resource planning system across the entire organization; accordingly, the company has modified and added a number of internal controls, including verifications, and testing to ensure data accuracy. Additionally, the company confirmed that it had experienced a cybersecurity incident on June 25, 2023, which also impacted the early part of the third quarter of 2023. The incident resulted in a breach of customer data from the Petro-Points program and impacted certain transactional systems for a short period following the incident; however, the event did not have a material impact on the company’s 2023 financial results. Suncor has taken actions to monitor and maintain appropriate internal controls during the period following the cybersecurity incident and, accordingly, has implemented interim, or modified certain existing, internal controls. There were no other changes in the internal control over financial reporting (as defined in Exchange Act Rules 13a-15(f) and 15d-15(f)) that occurred during the period ended December 31, 2023, that have materially affected, or are reasonably likely to materially affect, the company’s internal control over financial reporting. Management will continue to periodically evaluate the company’s disclosure controls and procedures and internal control over financial reporting and will make any modifications from time to time as deemed necessary.
The effectiveness of our internal control over financial reporting as at December 31, 2023, was audited by KPMG LLP, an independent registered public accounting firm, as stated in their report, which is included in our audited Consolidated Financial Statements for the year ended December 31, 2023.
Based on their inherent limitations, disclosure controls and procedures and internal control over financial reporting may not prevent or detect misstatements, and even those controls determined to be effective can provide only reasonable assurance with respect to financial statement preparation and presentation.
Corporate Guidance
There have been no changes to the corporate guidance ranges previously issued on December 5, 2023. For further details and advisories regarding Suncor’s 2024 corporate guidance, see www.suncor.com/guidance.
ANNUAL REPORT 2023 SUNCOR ENERGY INC. 57
Non-GAAP and Other Financial Measures
Certain financial measures in this MD&A – namely adjusted operating earnings (loss), adjusted funds from (used in) operations, measures contained in ROCE and ROCE excluding impairments and impairment reversals, price realizations, free funds flow, Oil Sands operations cash operating costs, Fort Hills cash operating costs, Syncrude cash operating costs, refining and marketing margin, refining operating expense, net debt, total debt, LIFO inventory valuation methodology and related per share or per barrel amounts or metrics that contain such measures – are not prescribed by GAAP. These non-GAAP financial measures are included because management uses the information to analyze business performance, leverage and liquidity, and it may be useful to investors on the same basis. These non-GAAP financial measures do not have any standardized meaning and, therefore, are unlikely to be comparable to similar measures presented by other companies. Therefore, these non-GAAP financial measures should not be considered in isolation or as a substitute for measures of performance prepared in accordance with GAAP. Except as otherwise indicated, these non-GAAP financial measures are calculated and disclosed on a consistent basis from period to period. Specific adjusting items may only be relevant in certain periods.
| (a) | Adjusted Operating Earnings (Loss) |
Adjusted operating earnings (loss) is a non-GAAP financial measure that adjusts net earnings (loss) for significant items that are not indicative of operating performance. Management uses adjusted operating earnings (loss) to evaluate operating performance because management believes it provides better comparability between periods. For the years ended December 31, 2023, December 31, 2022, and December 31, 2021, consolidated adjusted operating earnings (loss) are reconciled to net earnings (loss) in the Financial Information section of this MD&A and adjusted operating earnings (loss) for each segment are reconciled to net earnings (loss) in the Segment Results and Analysis section of this MD&A. Adjusted operating earnings (loss) for the three months ended December 31, 2023, and December 31, 2022, are reconciled to net earnings (loss) below.
Beginning in the first quarter of 2022, to align with how management evaluates segment performance, the company revised its segment presentation to reflect segment results before income tax expense and present tax at a consolidated level. This presentation change has no effect on consolidated adjusted operating earnings (loss). Comparative periods have been revised to reflect this change. See the Income Tax section of this MD&A for a discussion of income taxes.
| (b) | Bridge Analyses of Adjusted Operating Earnings (Loss) |
Throughout this MD&A, the company presents charts that illustrate the change in adjusted operating earnings (loss) from the comparative period through key variance factors. These factors are analyzed in the Adjusted Operating Earnings (Loss) narratives following the bridge analyses in specific sections of this MD&A. These bridge analyses are presented because management uses this presentation to evaluate performance. All reconciling items are presented on a before-tax basis and adjusted for income taxes in the Income Tax bridge factor.
| ● | The factor for Sales Volumes and Mix is calculated based on sales volumes and mix for the Oil Sands and E&P segments and refinery production volumes for the R&M segment. |
| ● | The factor for Price, Margin and Other Revenue includes upstream price realizations before royalties, except for Libya, which is net of royalties, and upstream marketing and logistics. Also included are refining and marketing margins, other operating revenue, and the net impacts of sales and purchases of third-party crude, including product purchased for use as diluent in the company’s Oil Sands operations and subsequently sold as part of diluted bitumen. |
| ● | The factor for Royalties excludes the impact of Libya, as royalties in Libya are taken into account in Price, Margin and Other Revenue as described above. |
| ● | The factor for Inventory Valuation is comprised of changes in the FIFO inventory valuation and the realized portion of commodity risk management activities reported in the R&M segment, as well as the impact of the deferral or realization of profit or loss on crude oil sales from the Oil Sands segment to Suncor’s refineries reported in the Corporate and Eliminations segment. |
58 ANNUAL REPORT 2023 SUNCOR ENERGY INC.
| ● | The factor for Operating and Transportation Expense includes project startup costs, OS&G expense and transportation expense. |
| ● | The factor for Financing Expense and Other includes financing expenses, other income, operational foreign exchange gains and losses, and changes in gains and losses on disposal of assets that are not adjusted operating earnings (loss) adjustments. |
| ● | The factor for DD&A and Exploration Expense includes depreciation, depletion and amortization expense, and exploration expense. |
| ● | The factor for Income Tax includes the company’s current and deferred income tax expense on adjusted operating earnings, changes in statutory income tax rates and other income tax adjustments. |
| (c) | Return on Capital Employed (ROCE) and ROCE Excluding Impairments and Impairment Reversals |
ROCE is a non-GAAP ratio that management uses to analyze operating performance and the efficiency of Suncor’s capital allocation process. ROCE is calculated using the non-GAAP financial measures adjusted net earnings and average capital employed. Adjusted net earnings is calculated by taking net earnings (loss) and adjusting after-tax amounts for unrealized foreign exchange on U.S. dollar denominated debt and net interest expense. Average capital employed is calculated as a twelve-month average of the capital employed balance at the beginning of the twelve-month period and the month-end capital employed balances throughout the remainder of the twelve-month period. Figures for capital employed at the beginning and end of the twelve-month period are presented to show the changes in the components of the calculation over the twelve-month period.
Year ended December 31 |
|
|
|
|
|
|
|
|
|
($ millions, except as noted) |
|
|
|
2023 |
|
2022 |
|
2021 |
|
Adjustments to net earnings |
|
|
|
|
|
|
|
|
|
Net earnings |
|
|
|
8 295 |
|
9 077 |
|
4 119 |
|
(Deduct) add after-tax amounts for: |
|
|
|
|
|
|
|
|
|
Unrealized foreign exchange (gain) loss on U.S. dollar denominated debt |
|
|
|
(179) |
|
679 |
|
(101) |
|
Net interest expense |
|
|
|
543 |
|
642 |
|
645 |
|
Adjusted net earnings(1) |
|
A |
|
8 659 |
|
10 398 |
|
4 663 |
|
Capital employed – beginning of twelve-month period |
|
|
|
|
|
|
|
|
|
Net debt(2) |
|
|
|
13 639 |
|
16 149 |
|
19 814 |
|
Shareholders’ equity |
|
|
|
39 367 |
|
36 614 |
|
35 757 |
|
|
|
|
|
53 006 |
|
52 763 |
|
55 571 |
|
Capital employed – end of twelve-month period |
|
|
|
|
|
|
|
|
|
Net debt(2) |
|
|
|
13 678 |
|
13 639 |
|
16 149 |
|
Shareholders’ equity |
|
|
|
43 279 |
|
39 367 |
|
36 614 |
|
|
|
|
|
56 957 |
|
53 006 |
|
52 763 |
|
Average capital employed |
|
B |
|
55 462 |
|
53 651 |
|
54 069 |
|
ROCE (%)(3) |
|
A/B |
|
15.6 |
|
19.4 |
|
8.6 |
|
| (1) | Total before-tax impact of adjustments is $530 million for the year ended December 31, 2023, $1.575 billion for the year ended December 31, 2022, and $738 million for the year ended December 31, 2021. |
| (2) | Net debt is a non-GAAP financial measure. |
| (3) | For the twelve months ended December 31, 2023, there were no impairments or impairment reversals. As a result, ROCE excluding impairments was equal to ROCE. ROCE would have been 13.6% for the twelve months ended December 31, 2023, excluding the impact of the $1.125 billion non-cash gain on acquisition of TotalEnergies Canada. ROCE would have been 22.9% for the twelve months ended December 31, 2022, excluding the impact of the impairment reversal of $715 million ($542 million after-tax) and impairment of $70 million ($47 million after-tax) in the second quarter of 2022, and the impact of the impairment of $3.397 billion ($2.586 billion after-tax) in the third quarter of 2022. ROCE would have been 8.2% for the twelve months ended December 31, 2021, excluding the impact of the impairment reversal of $221 million ($168 million after-tax) in the third quarter of 2021. |
ANNUAL REPORT 2023 SUNCOR ENERGY INC. 59
| (d) | Adjusted Funds from (Used in) Operations |
Adjusted funds from (used in) operations is a non-GAAP financial measure that adjusts a GAAP measure – cash flow provided by operating activities – for changes in non-cash working capital, which management uses to analyze operating performance and liquidity. Changes to non-cash working capital can be impacted by, among other factors, the timing of offshore feedstock purchases and payments for commodity and income taxes, the timing of cash flows related to accounts receivable and accounts payable, and changes in inventory that management believe reduces comparability between periods.
|
|
|
|
|
|
|
|
Exploration and |
|
|
|
|
|
|
|
||||
|
|
Oil Sands |
|
Production |
|
Refining and Marketing |
|
||||||||||||
Year ended December 31 ($ millions) |
|
2023 |
|
2022 |
|
2021 |
|
2023 |
|
2022 |
|
2021 |
|
2023 |
|
2022 |
|
2021 |
|
Earnings (loss) before income taxes(1) |
|
6 811 |
|
5 633 |
|
2 825 |
|
1 691 |
|
3 221 |
|
1 791 |
|
3 383 |
|
5 694 |
|
2 867 |
|
Adjustments for: |
|
|
|
|
|
|
|
|
|
|
|
|
|
|
|
|
|
|
|
Depreciation, depletion, amortization and impairment |
|
4 902 |
|
7 927 |
|
4 585 |
|
483 |
|
(105) |
|
324 |
|
934 |
|
844 |
|
853 |
|
Accretion |
|
460 |
|
249 |
|
240 |
|
64 |
|
60 |
|
58 |
|
8 |
|
8 |
|
6 |
|
Unrealized foreign exchange (gain) loss on U.S. dollar denominated debt |
|
— |
|
— |
|
— |
|
— |
|
— |
|
— |
|
— |
|
— |
|
— |
|
Change in fair value of financial instruments and trading inventory |
|
27 |
|
18 |
|
(66) |
|
(3) |
|
(6) |
|
3 |
|
(29) |
|
(50) |
|
50 |
|
Bargain purchase gain and revaluations |
|
(1 125) |
|
— |
|
— |
|
— |
|
— |
|
— |
|
— |
|
— |
|
— |
|
(Gain) loss on disposal of assets |
|
(39) |
|
(7) |
|
(4) |
|
(600) |
|
66 |
|
(227) |
|
(28) |
|
(11) |
|
(19) |
|
Loss on extinguishment of long-term debt |
|
— |
|
— |
|
— |
|
— |
|
— |
|
— |
|
— |
|
— |
|
— |
|
Share-based compensation |
|
71 |
|
139 |
|
61 |
|
12 |
|
6 |
|
5 |
|
25 |
|
50 |
|
34 |
|
Exploration |
|
— |
|
— |
|
— |
|
— |
|
— |
|
— |
|
— |
|
— |
|
— |
|
Settlement of decommissioning and restoration liabilities |
|
(326) |
|
(264) |
|
(245) |
|
(29) |
|
(21) |
|
(1) |
|
(35) |
|
(23) |
|
(17) |
|
Other |
|
(56) |
|
136 |
|
179 |
|
(6) |
|
(43) |
|
(2) |
|
10 |
|
49 |
|
57 |
|
Current income tax expense |
|
— |
|
— |
|
— |
|
— |
|
— |
|
— |
|
— |
|
— |
|
— |
|
Adjusted funds from (used in) operations(1) |
|
10 725 |
|
13 831 |
|
7 575 |
|
1 612 |
|
3 178 |
|
1 951 |
|
4 268 |
|
6 561 |
|
3 831 |
|
Change in non-cash working capital |
|
|
|
|
|
|
|
|
|
|
|
|
|
|
|
|
|
|
|
Cash flow provided by operating activities |
|
|
|
|
|
|
|
|
|
|
|
|
|
|
|
|
|
|
|
| (1) | Beginning in 2022, to align with how management evaluates segment performance, the company revised its segment presentation to reflect segment results before income tax expense and present tax at a consolidated level. This presentation change had no effect on consolidated adjusted funds from operations. Comparative periods have been revised to reflect this change. See the Income Tax section of this MD&A for a discussion of income taxes. |
60 ANNUAL REPORT 2023 SUNCOR ENERGY INC.
|
|
Corporate |
|
|
|
|
|
|
|
|
|
|
|
|
|
||||
|
|
and Eliminations |
|
Income Taxes(1) |
|
Total |
|
||||||||||||
Year ended December 31 ($ millions) |
|
2023 |
|
2022 |
|
2021 |
|
2023 |
|
2022 |
|
2021 |
|
2023 |
|
2022 |
|
2021 |
|
Earnings (loss) before income taxes(1) |
|
(1 296) |
|
(2 232) |
|
(1 913) |
|
— |
|
— |
|
— |
|
10 589 |
|
12 316 |
|
5 570 |
|
Adjustments for: |
|
|
|
|
|
|
|
|
|
|
|
|
|
|
|
|
|
|
|
Depreciation, depletion, amortization and impairment |
|
116 |
|
120 |
|
88 |
|
— |
|
— |
|
— |
|
6 435 |
|
8 786 |
|
5 850 |
|
Accretion |
|
— |
|
(1) |
|
— |
|
— |
|
— |
|
— |
|
532 |
|
316 |
|
304 |
|
Unrealized foreign exchange (gain) loss on U.S. dollar denominated debt |
|
(184) |
|
729 |
|
(113) |
|
— |
|
— |
|
— |
|
(184) |
|
729 |
|
(113) |
|
Change in fair value of financial instruments and trading inventory |
|
— |
|
— |
|
— |
|
— |
|
— |
|
— |
|
(5) |
|
(38) |
|
(13) |
|
Bargain purchase gain and revaluations |
|
— |
|
— |
|
— |
|
— |
|
— |
|
— |
|
(1 125) |
|
— |
|
— |
|
(Gain) loss on disposal of assets |
|
(325) |
|
(3) |
|
(7) |
|
— |
|
— |
|
— |
|
(992) |
|
45 |
|
(257) |
|
Loss on extinguishment of long-term debt |
|
— |
|
32 |
|
80 |
|
— |
|
— |
|
— |
|
— |
|
32 |
|
80 |
|
Share-based compensation |
|
— |
|
133 |
|
105 |
|
— |
|
— |
|
— |
|
108 |
|
328 |
|
205 |
|
Exploration |
|
— |
|
— |
|
— |
|
— |
|
— |
|
— |
|
— |
|
— |
|
— |
|
Settlement of decommissioning and restoration liabilities |
|
— |
|
(6) |
|
— |
|
— |
|
— |
|
— |
|
(390) |
|
(314) |
|
(263) |
|
Other |
|
143 |
|
(12) |
|
55 |
|
— |
|
— |
|
— |
|
91 |
|
130 |
|
289 |
|
Current income tax expense |
|
— |
|
— |
|
— |
|
(1 734) |
|
(4 229) |
|
(1 395) |
|
(1 734) |
|
(4 229) |
|
(1 395) |
|
Adjusted funds from (used in) operations(1) |
|
(1 546) |
|
(1 240) |
|
(1 705) |
|
(1 734) |
|
(4 229) |
|
(1 395) |
|
13 325 |
|
18 101 |
|
10 257 |
|
Change in in non-cash working capital |
|
|
|
|
|
|
|
|
|
|
|
|
|
(981) |
|
(2 421) |
|
1 507 |
|
Cash flow provided by operating activities |
|
|
|
|
|
|
|
|
|
|
|
|
|
12 344 |
|
15 680 |
|
11 764 |
|
| (1) | Beginning in 2022, to align with how management evaluates segment performance, the company revised its segment presentation to reflect segment results before income tax expense and present tax at a consolidated level. This presentation change had no effect on consolidated adjusted funds from operations. Comparative periods have been revised to reflect this change. See the Income Tax section of this MD&A for a discussion of income taxes. |
ANNUAL REPORT 2023 SUNCOR ENERGY INC. 61
| (e) | Free Funds Flow |
Free funds flow is a non-GAAP financial measure that is calculated by taking adjusted funds from operations and subtracting capital expenditures, including capitalized interest. Free funds flow reflects cash available for increasing distributions to shareholders and reducing debt. Management uses free funds flow to measure the capacity of the company to increase returns to shareholders and to grow Suncor’s business.
|
|
|
|
|
|
|
|
Exploration and |
|
|
|
|
|
|
|
||||
|
|
Oil Sands |
|
Production |
|
Refining and Marketing |
|
||||||||||||
Year ended December 31 ($ millions) |
|
2023 |
|
2022 |
|
2021 |
|
2023 |
|
2022 |
|
2021 |
|
2023 |
|
2022 |
|
2021 |
|
Adjusted funds from (used in) operations |
|
10 725 |
|
13 831 |
|
7 575 |
|
1 612 |
|
3 178 |
|
1 951 |
|
4 268 |
|
6 561 |
|
3 831 |
|
Capital expenditures including capitalized interest(1) |
|
(4 096) |
|
(3 540) |
|
(3 168) |
|
(668) |
|
(443) |
|
(270) |
|
(1 002) |
|
(816) |
|
(825) |
|
Free funds flow (deficit) |
|
6 629 |
|
10 291 |
|
4 407 |
|
944 |
|
2 735 |
|
1 681 |
|
3 266 |
|
5 745 |
|
3 006 |
|
|
|
Corporate |
|
|
|
|
|
|
|
|
|
|
|
|
|
||||
|
|
and Eliminations |
|
Income Taxes |
|
Total |
|
||||||||||||
Year ended December 31 ($ millions) |
|
2023 |
|
2022 |
|
2021 |
|
2023 |
|
2022 |
|
2021 |
|
2023 |
|
2022 |
|
2021 |
|
Adjusted funds from (used in) operations |
|
(1 546) |
|
(1 240) |
|
(1 705) |
|
(1 734) |
|
(4 229) |
|
(1 395) |
|
13 325 |
|
18 101 |
|
10 257 |
|
Capital expenditures including capitalized interest(1) |
|
(62) |
|
(188) |
|
(292) |
|
— |
|
— |
|
— |
|
(5 828) |
|
(4 987) |
|
(4 555) |
|
Free funds flow (deficit) |
|
(1 608) |
|
(1 428) |
|
(1 997) |
|
(1 734) |
|
(4 229) |
|
(1 395) |
|
7 497 |
|
13 114 |
|
5 702 |
|
| (1) | Excludes capital expenditures related to assets previously held for sale of $108 million in 2023 and $133 million in 2022. |
| (f) | Oil Sands Operations, Fort Hills and Syncrude Cash Operating Costs |
Cash operating costs are calculated by adjusting Oil Sands segment OS&G expense for non-production costs and excess power capacity. Significant non-production costs include, but are not limited to, share based compensation adjustments, research costs, project startup costs and adjustments to reflect the cost of internal transfers in the receiving asset at the cost of production versus the cost of purchase. Non-production costs at Fort Hills and Syncrude also include, but are not limited to, an adjustment to reflect internally produced diesel from Oil Sands operations at the cost of production. Excess power capacity represents excess power revenue from cogeneration units that is recorded in operating revenues. Oil Sands operations excess power capacity and other also includes, but is not limited to, the natural gas expense recorded as part of a non-monetary arrangement involving a third-party processor. Oil Sands operations, Fort Hills and Syncrude production volumes are gross of internally consumed diesel and feedstock transfers between assets. Oil Sands operations, Fort Hills and Syncrude cash operating costs are reconciled in the Segment Results and Analysis – Oil Sands – Cash Operating Costs section of this MD&A. Management uses cash operating costs to measure operating performance.
62 ANNUAL REPORT 2023 SUNCOR ENERGY INC.
| (g) | Refining and Marketing Gross Margin and Refining Operating Expense |
Refining and marketing gross margins and refining operating expense are non-GAAP financial measures. Refining and marketing gross margin, on a FIFO basis, is calculated by adjusting R&M segment operating revenue, other income and purchases of crude oil and products (all of which are GAAP measures) for intersegment marketing fees recorded in intersegment revenues and the impact of inventory write-downs recorded in purchases of crude oil and products. Refining and marketing gross margin, on a LIFO basis, is further adjusted for the impacts of FIFO inventory valuation recorded in purchases of crude oil and products and short-term risk management activities recorded in other income (loss). Refinery operating expense is calculated by adjusting R&M segment OS&G for i) non-refining costs pertaining to the company’s supply, marketing and ethanol businesses; and ii) non-refining costs that management believes do not relate to the production of refined products, including, but not limited to, share-based compensation and enterprise shared service allocations. Management uses refining and marketing gross margin and refining operating expense to measure operating performance on a production barrel basis.
Year ended December 31 |
|
|
|
|
|
|
|
($ millions, except as noted) |
|
2023 |
|
2022 |
|
2021 |
|
Refining and marketing gross margin reconciliation |
|
|
|
|
|
|
|
Operating revenues |
|
31 068 |
|
36 728 |
|
22 915 |
|
Purchases of crude oil and products |
|
(23 867) |
|
(27 261) |
|
(16 807) |
|
|
|
7 201 |
|
9 467 |
|
6 108 |
|
Other income (loss) |
|
224 |
|
(60) |
|
(50) |
|
Non-refining and marketing margin |
|
(50) |
|
(20) |
|
(54) |
|
Refining and marketing gross margin – FIFO |
|
7 375 |
|
9 387 |
|
6 004 |
|
Refinery production(1) (mbbls) |
|
163 895 |
|
168 149 |
|
162 862 |
|
Refining and marketing gross margin – FIFO ($/bbl) |
|
45.00 |
|
55.85 |
|
36.85 |
|
FIFO and risk management activities adjustment |
|
330 |
|
(230) |
|
(972) |
|
Refining and marketing gross margin – LIFO |
|
7 705 |
|
9 157 |
|
5 032 |
|
Refining and marketing gross margin – LIFO ($/bbl) |
|
47.00 |
|
54.45 |
|
30.90 |
|
Refining operating expense reconciliation |
|
|
|
|
|
|
|
Operating, selling and general expense |
|
2 558 |
|
2 427 |
|
2 019 |
|
Non-refining costs |
|
(1 340) |
|
(1 246) |
|
(1 051) |
|
Refining operating expense |
|
1 218 |
|
1 181 |
|
968 |
|
Refinery production(1) |
|
163 895 |
|
168 149 |
|
162 862 |
|
Refining operating expense ($/bbl) |
|
7.45 |
|
7.00 |
|
5.95 |
|
| (1) | Refinery production is the output of the refining process and differs from crude oil processed as a result of volumetric adjustments for non-crude feedstock, volumetric gain associated with the refining process and changes in unfinished product inventories. |
| (h) | Impact of FIFO Inventory Valuation on Refining and Marketing Net Earnings |
GAAP requires the use of a FIFO inventory valuation methodology. For Suncor, this results in a disconnect between the sales prices for refined products, which reflect current market conditions, and the amount recorded as the cost of sale for the related refinery feedstock, which reflects market conditions at the time when the feedstock was purchased. This lag between purchase and sale can be anywhere from several weeks to several months and is influenced by the time to receive crude after purchase, regional crude inventory levels, the completion of refining processes, transportation time to distribution channels and regional refined product inventory levels.
Suncor prepares and presents an estimate of the impact of using a FIFO inventory valuation methodology compared to a LIFO methodology, because management uses the information to analyze operating performance and compare itself against refining peers that are permitted to use LIFO inventory valuation under U.S. GAAP.
The company’s estimate is not derived from a standardized calculation and, therefore, may not be directly comparable to similar measures presented by other companies, and should not be considered in isolation or as a substitute for measures of performance prepared in accordance with GAAP or U.S. GAAP.
ANNUAL REPORT 2023 SUNCOR ENERGY INC. 63
| (i) | Net Debt and Total Debt |
Net debt and total debt are non-GAAP financial measures that management uses to analyze the financial condition of the company. Total debt includes short-term debt, current portion of long-term debt, current portion of long-term lease liabilities, long-term debt and long-term lease liabilities (all of which are GAAP measures). Net debt is equal to total debt less cash and cash equivalents (a GAAP measure).
At December 31 |
|
|
|
|
|
|
|
($ millions, except as noted) |
|
2023 |
|
2022 |
|
2021 |
|
Short-term debt |
|
494 |
|
2 807 |
|
1 284 |
|
Current portion of long-term debt |
|
— |
|
— |
|
231 |
|
Current portion of long-term lease liabilities |
|
348 |
|
317 |
|
310 |
|
Long-term debt |
|
11 087 |
|
9 800 |
|
13 989 |
|
Long-term lease liabilities |
|
3 478 |
|
2 695 |
|
2 540 |
|
Total debt |
|
15 407 |
|
15 619 |
|
18 354 |
|
Less: Cash and cash equivalents |
|
1 729 |
|
1 980 |
|
2 205 |
|
Net debt |
|
13 678 |
|
13 639 |
|
16 149 |
|
Shareholders’ equity |
|
43 279 |
|
39 367 |
|
36 614 |
|
Total debt plus shareholders’ equity |
|
58 686 |
|
54 986 |
|
54 968 |
|
Total debt to total debt plus shareholders’ equity (%) |
|
26.3 |
|
28.4 |
|
33.4 |
|
Net debt to net debt plus shareholders’ equity (%) |
|
24.0 |
|
25.7 |
|
30.6 |
|
Net debt to net debt plus shareholders’ equity – excluding leases (%) |
|
18.5 |
|
21.3 |
|
26.6 |
|
64 ANNUAL REPORT 2023 SUNCOR ENERGY INC.
| (j) | Price Realizations |
Price realizations are a non-GAAP measure used by management to measure profitability. Oil Sands price realizations are presented on a crude product basis and are derived from the Oil Sands segmented statement of net earnings (loss), after adjusting for items not directly attributable to the revenues associated with production. E&P price realizations are presented on an asset location basis and are derived from the E&P segmented statement of net earnings (loss), after adjusting for other E&P assets, such as Libya, for which price realizations are not provided.
Oil Sands Price Realizations
For the year ended |
December 31, 2023 |
|
December 31, 2022 |
||||||
($ millions, except as noted) |
Non-Upgraded Bitumen |
Upgraded – Net SCO and Diesel |
Average Crude |
Oil Sands Segment |
|
Non-Upgraded Bitumen |
Upgraded – Net SCO and Diesel |
Average Crude |
Oil Sands Segment |
Operating revenues |
7 218 |
18 817 |
26 035 |
26 035 |
|
7 892 |
22 539 |
30 431 |
30 431 |
Other income (loss) |
1 519 |
(50) |
1 469 |
1 469 |
|
(80) |
27 |
(53) |
(53) |
Purchases of crude oil and products |
(1 758) |
(177) |
(1 935) |
(1 935) |
|
(1 673) |
(377) |
(2 050) |
(2 050) |
Gross realization adjustment(1) |
(1 463) |
(294) |
(1 757) |
|
|
(119) |
(420) |
(539) |
|
Gross realizations |
5 516 |
18 296 |
23 812 |
|
|
6 020 |
21 769 |
27 789 |
|
Transportation and distribution |
(567) |
(646) |
(1 213) |
(1 213) |
|
(438) |
(772) |
(1 210) |
(1 210) |
Price realization |
4 949 |
17 650 |
22 599 |
|
|
5 582 |
20 997 |
26 579 |
|
Sales volumes (mbbls) |
72 795 |
177 601 |
250 396 |
|
|
65 960 |
176 632 |
242 592 |
|
Price realization per barrel |
67.97 |
99.40 |
90.27 |
|
|
84.63 |
118.88 |
109.57 |
|
|
|
|
|
|
|
|
|
|
|
For the year ended |
December 31, 2021 |
|
|
||||||
($ millions, except as noted) |
Non-Upgraded Bitumen |
Upgraded – Net SCO and Diesel |
Average Crude |
Oil Sands Segment |
|
|
|
|
|
Operating revenues |
5 468 |
14 452 |
19 920 |
19 920 |
|
|
|
|
|
Other (loss) income |
(56) |
62 |
6 |
6 |
|
|
|
|
|
Purchases of crude oil and products |
(1 231) |
(213) |
(1 444) |
(1 444) |
|
|
|
|
|
Gross realization adjustment(1) |
(210) |
(325) |
(535) |
|
|
|
|
|
|
Gross realizations |
3 971 |
13 976 |
17 947 |
|
|
|
|
|
|
Transportation and distribution |
(359) |
(767) |
(1 126) |
(1 126) |
|
|
|
|
|
Price realization |
3 612 |
13 209 |
16 821 |
|
|
|
|
|
|
Sales volumes (mbbls) |
67 094 |
169 983 |
237 077 |
|
|
|
|
|
|
Price realization per barrel |
53.80 |
77.73 |
70.96 |
|
|
|
|
|
|
| (1) | Reflects the items not directly attributed to revenues received from the sale of proprietary crude and net non-proprietary activity at its deemed point of sale. |
ANNUAL REPORT 2023 SUNCOR ENERGY INC. 65
E&P Price Realizations
For the year ended |
December 31, 2023 |
|
December 31, 2022 |
||||||
($ millions, except as noted) |
E&P International |
E&P Canada |
Other(1)(2) |
E&P Segment |
|
E&P International |
E&P Canada |
Other(1)(2) |
E&P Segment |
Operating revenues |
306 |
1 689 |
694 |
2 689 |
|
1 222 |
2 464 |
645 |
4 331 |
Transportation and distribution |
(9) |
(58) |
(9) |
(76) |
|
(24) |
(61) |
(16) |
(101) |
Price realization |
297 |
1 631 |
685 |
|
|
1 198 |
2 403 |
629 |
|
Sales volumes (mbbls) |
2 729 |
15 149 |
|
|
|
9 453 |
18 753 |
|
|
Price realization per barrel |
109.00 |
107.62 |
|
|
|
126.61 |
128.07 |
|
|
|
|
|
|
|
|
|
|
|
|
For the year ended |
December 31, 2021 |
|
|
||||||
($ millions, except as noted) |
E&P International |
E&P Canada |
Other(1)(2) |
E&P Segment |
|
|
|
|
|
Operating revenues |
815 |
1 684 |
479 |
2 978 |
|
|
|
|
|
Transportation and distribution |
(25) |
(44) |
(43) |
(112) |
|
|
|
|
|
Price realization |
790 |
1 640 |
436 |
|
|
|
|
|
|
Sales volumes (mbbls) |
9 616 |
19 386 |
|
|
|
|
|
|
|
Price realization per barrel |
82.16 |
84.70 |
|
|
|
|
|
|
|
| (1) | Reflects other E&P assets, such as Libya, for which price realizations are not provided. |
| (2) | Production from the company’s Libya operations has been presented in the E&P section of this MD&A on an economic basis. Revenue and royalties from the company’s Libya operations are presented under the working-interest basis, which is required for presentation purposes in the company’s financial statements. In 2023, revenue included a gross-up amount of $528 million, with an offsetting amount of $282 million in royalties in the E&P segment and $246 million in income tax expense recorded at the consolidated level. In 2022, revenue included a gross-up amount of $486 million, with an offsetting amount of $266 million in royalties in the E&P segment and $220 million in income tax expense recorded at the consolidated level. In 2021, revenue included a gross-up amount of $345 million, with an offsetting amount of $241 million in royalties in the E&P segment and $104 million in income tax expense recorded at the consolidated level. |
| (k) | Adjusted Operating Earnings (Loss) Reconciliations – Fourth Quarter 2023 and 2022 |
|
|
|
|
|
|
|
|
|
|
|
|
|
|
|
|
|
|
|
|
|
|
|
|
|
|
|
|
|
|
|
|
Exploration and |
|
Refining and |
|
Corporate |
|
|
|
|
|
|
|
|
|
||||||
For the quarter ended December 31 |
|
Oil Sands |
|
Production |
|
Marketing |
|
and Eliminations |
|
Income Taxes |
|
Total |
|
||||||||||||
($ millions) |
|
2023 |
|
2022 |
|
2023 |
|
2022 |
|
2023 |
|
2022 |
|
2023 |
|
2022 |
|
2023 |
|
2022 |
|
2023 |
|
2022 |
|
Net earnings (loss) |
|
2 660 |
|
1 625 |
|
133 |
|
578 |
|
598 |
|
1 517 |
|
(1) |
|
(182) |
|
(570) |
|
(797) |
|
2 820 |
|
2 741 |
|
Unrealized foreign exchange gain on U.S. dollar denominated debt |
|
— |
|
— |
|
— |
|
— |
|
— |
|
— |
|
(199) |
|
(200) |
|
— |
|
— |
|
(199) |
|
(200) |
|
Unrealized (gain) loss on risk management activities |
|
(9) |
|
94 |
|
— |
|
— |
|
— |
|
12 |
|
— |
|
— |
|
— |
|
— |
|
(9) |
|
106 |
|
Gain on significant acquisition |
|
(1 125) |
|
— |
|
— |
|
— |
|
— |
|
— |
|
— |
|
— |
|
— |
|
— |
|
(1 125) |
|
— |
|
Asset impairment |
|
— |
|
— |
|
— |
|
— |
|
— |
|
— |
|
158 |
|
— |
|
— |
|
— |
|
158 |
|
— |
|
Income tax recovery on adjusted operating earnings adjustments |
|
— |
|
— |
|
— |
|
— |
|
— |
|
— |
|
— |
|
— |
|
(10) |
|
(215) |
|
(10) |
|
(215) |
|
Adjusted operating earnings (loss) |
|
1 526 |
|
1 719 |
|
133 |
|
578 |
|
598 |
|
1 529 |
|
(42) |
|
(382) |
|
(580) |
|
(1 012) |
|
1 635 |
|
2 432 |
|
66 ANNUAL REPORT 2023 SUNCOR ENERGY INC.
| (l) | Adjusted Funds from (Used in) Operations Reconciliations – Fourth Quarter 2023 and 2022 |
|
|
|
|
|
|
|
|
|
|
|
|
|
|
|
|
|
|
|
|
|
|
|
|
||
|
|
|
|
|
|
Exploration and |
|
Refining and |
|
Corporate |
|
|
|
|
|
|
|
|
|
||||||
For the quarter ended December 31 |
|
Oil Sands |
|
Production |
|
Marketing |
|
and Eliminations |
|
Income Taxes |
|
Total |
|
||||||||||||
($ millions) |
|
2023 |
|
2022 |
|
2023 |
|
2022 |
|
2023 |
|
2022 |
|
2023 |
|
2022 |
|
2023 |
|
2022 |
|
2023 |
|
2022 |
|
Earnings (loss) before income taxes |
|
2 660 |
|
1 625 |
|
133 |
|
578 |
|
598 |
|
1 517 |
|
(1) |
|
(182) |
|
— |
|
— |
|
3 390 |
|
3 538 |
|
Adjustments for: |
|
|
|
|
|
|
|
|
|
|
|
|
|
|
|
|
|
|
|
|
|
|
|
|
|
Depreciation, depletion, amortization and impairment |
|
1 214 |
|
1 080 |
|
99 |
|
130 |
|
256 |
|
226 |
|
29 |
|
29 |
|
— |
|
— |
|
1 598 |
|
1 465 |
|
Accretion |
|
116 |
|
64 |
|
15 |
|
15 |
|
2 |
|
2 |
|
— |
|
— |
|
— |
|
— |
|
133 |
|
81 |
|
Unrealized foreign exchange gain on U.S. dollar denominated debt |
|
— |
|
— |
|
— |
|
— |
|
— |
|
— |
|
(199) |
|
(200) |
|
— |
|
— |
|
(199) |
|
(200) |
|
Change in fair value of financial instruments and trading inventory |
|
(65) |
|
105 |
|
(1) |
|
(11) |
|
(30) |
|
(121) |
|
— |
|
— |
|
— |
|
— |
|
(96) |
|
(27) |
|
Bargain purchase gain and revaluations |
|
(1 125) |
|
— |
|
— |
|
— |
|
— |
|
— |
|
— |
|
— |
|
— |
|
— |
|
(1 125) |
|
— |
|
(Gain) loss on disposal of assets |
|
— |
|
(5) |
|
8 |
|
1 |
|
(2) |
|
(1) |
|
(3) |
|
(3) |
|
— |
|
— |
|
3 |
|
(8) |
|
Loss on extinguishment of long-term debt |
|
— |
|
— |
|
— |
|
— |
|
— |
|
— |
|
— |
|
32 |
|
— |
|
— |
|
— |
|
32 |
|
Share-based compensation |
|
30 |
|
66 |
|
4 |
|
5 |
|
10 |
|
30 |
|
24 |
|
66 |
|
— |
|
— |
|
68 |
|
167 |
|
Settlement of decommissioning and restoration liabilities |
|
(70) |
|
(61) |
|
(24) |
|
(2) |
|
(16) |
|
(11) |
|
— |
|
(5) |
|
— |
|
— |
|
(110) |
|
(79) |
|
Other |
|
(109) |
|
55 |
|
(6) |
|
3 |
|
(7) |
|
21 |
|
160 |
|
(10) |
|
— |
|
— |
|
38 |
|
69 |
|
Current income tax recovery (expense) |
|
— |
|
— |
|
— |
|
— |
|
— |
|
— |
|
— |
|
— |
|
334 |
|
(849) |
|
334 |
|
(849) |
|
Adjusted funds from (used in) operations |
|
2 651 |
|
2 929 |
|
228 |
|
719 |
|
811 |
|
1 663 |
|
10 |
|
(273) |
|
334 |
|
(849) |
|
4 034 |
|
4 189 |
|
Change in non-cash working capital |
|
|
|
|
|
|
|
|
|
|
|
|
|
|
|
|
|
|
|
|
|
284 |
|
(265) |
|
Cash flow provided by operating activities |
|
|
|
|
|
|
|
|
|
|
|
|
|
|
|
|
|
|
|
|
|
4 318 |
|
3 924 |
|
ANNUAL REPORT 2023 SUNCOR ENERGY INC. 67
Measurement Conversions
Certain crude oil and natural gas liquids volumes have been converted to mcfe or mmcfe on the basis of one bbl to six mcf. Also, certain natural gas volumes have been converted to boe or mboe on the same basis. Any figure presented in mcfe, mmcfe, boe or mboe may be misleading, particularly if used in isolation. A conversion ratio of one bbl of crude oil or natural gas liquids to six mcf of natural gas is based on an energy-equivalency conversion method primarily applicable at the burner tip and does not necessarily represent value equivalency at the wellhead. Given that the value ratio based on the current price of crude oil as compared to natural gas is significantly different from the energy equivalency of 6:1, conversion on a 6:1 basis may be misleading as an indication of value.
Common Abbreviations
The following is a list of abbreviations that may be used in this MD&A:
Measurement | |
|
|
bbl |
barrel |
bbls/d |
barrels per day |
mbbls/d |
thousands of barrels per day |
boe |
barrels of oil equivalent |
boe/d |
barrels of oil equivalent per day |
|
|
mboe |
thousands of barrels of oil equivalent |
mboe/d |
thousands of barrels of oil equivalent per day |
mcf |
thousands of cubic feet of natural gas |
mcfe |
thousands of cubic feet of natural gas equivalent |
mmcf |
millions of cubic feet of natural gas |
mmcf/d |
millions of cubic feet of natural gas per day |
mmcfe |
millions of cubic feet of natural gas equivalent |
mmcfe/d |
millions of cubic feet of natural gas equivalent per day |
m3 |
cubic metres |
|
|
MW |
megawatts |
MWh |
megawatt hour |
| |
Places and Currencies | |
|
|
U.S. |
United States |
U.K. |
United Kingdom |
B.C. |
British Columbia |
|
|
$ or Cdn$ |
Canadian dollars |
US$ |
United States dollars |
£ |
Pounds sterling |
€ |
Euros |
| |
Financial and Business Environment | |
|
|
DD&A |
Depreciation, depletion and amortization |
|
|
WTI |
West Texas Intermediate |
WCS |
Western Canadian Select |
SCO |
Synthetic crude oil |
|
SYN MSW |
Synthetic crude oil benchmark Mixed Sweet Blend |
NYMEX |
New York Mercantile Exchange |
68 ANNUAL REPORT 2023 SUNCOR ENERGY INC.
Forward-Looking Statements
This MD&A contains certain forward-looking statements and forward-looking information (collectively, forward-looking statements) within the meaning of applicable Canadian and U.S. securities laws and other information based on Suncor’s current expectations, estimates, projections and assumptions that were made by the company in light of information available at the time the statement was made and consider Suncor’s experience and its perception of historical trends, including expectations and assumptions concerning: the accuracy of reserves estimates; commodity prices and interest and foreign exchange rates; the performance of assets and equipment; capital efficiencies and cost savings; applicable laws and government policies; future production rates; the sufficiency of budgeted capital expenditures in carrying out planned activities; the availability and cost of labour, services and infrastructure; the satisfaction by third parties of their obligations to Suncor; the development and execution of projects; and the receipt, in a timely manner, of regulatory and third-party approvals. All statements and information that address expectations or projections about the future, and statements and information about Suncor’s strategy for growth, expected and future expenditures or investment decisions, commodity prices, costs, schedules, production volumes, operating and financial results, future financing and capital activities, and the expected impact of future commitments are forward-looking statements. Some of the forward-looking statements may be identified by words like “expects”, “anticipates”, “will”, “estimates”, “plans”, “scheduled”, “intends”, “believes”, “projects”, “indicates”, “could”, “focus”, “vision”, “goal”, “outlook”, “proposed”, “target”, “objective”, “continue”, “should”, “may”, “potential”, “future”, “opportunity”, “would”, “priority” and similar expressions.
Forward-looking statements in this MD&A include references to:
| ● | Suncor's strategy, including its aim to deliver competitive and sustainable returns to shareholders, its plans on how to achieve this strategy, and its expectation that execution of the company’s strategy and key priorities will grow free funds flow per share and enable the delivery of industry leading shareholder returns; |
| ● | expectations about the West White Rose Project and the SeaRose FPSO Asset Life Extension Project, including the expectation that the projects will extend the production life of White Rose, providing long-term value for the company, and the expectation that production will commence at White Rose upon completion of the SeaRose FPSO Asset Life Extension Project, and at the West White Rose Project in 2026; |
| ● | expectations about Terra Nova, including the expectations that Terra Nova will continue to safely ramp up production in the beginning of 2024 and that the production restart at Terra Nova will provide long-term value to shareholders and many benefits to the Newfoundland and Labrador and Canadian economies; |
| ● | statements about Suncor's strategic objective to be a net-zero GHG emissions from operations company by 2050 and its near-term GHG emissions reduction goal; |
| ● | statements regarding the Pathways Alliance, including its aims, expectations regarding timing and the expected pathways the alliance will take to address GHG emissions, the expectation that the proposed CO2 storage hub will enable safe and permanent storage for CO2 from over 20 oil sands facilities in northern Alberta and that it expects to submit a regulatory application for the storage hub in 2024; |
| ● | the expectation that the Varennes Carbon Recycling facility will be operational in 2026 and that LanzaJet’s Freedom Pines Fuel facility will be operational in early 2024; |
| ● | Suncor's expectations for the coke-fired boiler replacement project, including the expectation that the cogeneration units will provide reliable steam generation required for Suncor's extraction and upgrading operations at a lower cost and with significantly lower emissions, the expectation that the project will generate lower carbon-intensive electricity that will be transmitted to Alberta’s power grid, and the expectation that the project will be in service in late 2024; |
| ● | expectations regarding the Upgrader 1 coke drum replacement project, including that the project will be in service in late 2025 and that the project will extend the life of Upgrader 1 by 30 years and will reduce the facilities future operating and capital cost requirements; |
| ● | the expectation that the company will have 91 autonomous haul trucks in its Oil Sands Base operations by the end of 2024; |
ANNUAL REPORT 2023 SUNCOR ENERGY INC. 69
| ● | the expectation that the Mildred Lake Extension project will sustain Syncrude’s current production levels by extending the life of the North Mine using existing extraction and upgrading facilities, and that the project will commence production in late 2025; |
| ● | the expectation that the company will continue to leverage its integrated regional asset base to generate incremental value by maximizing upgrader utilizations and by directing higher quantities of Fort Hills bitumen to upgrading at Oil Sands Base; |
| ● | the expectation that the three-year mine improvement plan at Fort Hills will continue, accelerating a sequence of mine development, opening two sections of the North Pit and that upon completion of the three-year mine improvement plan opportunities for future value optimization will be implemented for the remaining life of mine; |
| ● | the expectation that the company will continue efforts to decarbonize its Oil Sands business; |
| ● | expectations for the E&P segment, including that the segment will continue to focus on ongoing development activities intended to extend the productive life of existing fields and that these development activities are planned to continue in 2024, including development drilling at Hebron and Hibernia; |
| ● | expectations for the R&M segment, including that the company will continue to optimize the Petro-Canada™ retail business, as well as expected economic investment spending and sustaining capital in 2024; |
| ● | expectations that the Petro-Canada™ and Canadian Tire Corporation partnership will result in the rebranding of over 200 retail fuel network sites to the Petro-Canada™ brand and an increase in the presence of Petro-Canada’s brand across the country, that the partnering of the two iconic brands’ loyalty programs will benefit millions of loyalty members, and that Suncor will become the primary fuel provider for Canadian Tire Corporation’s retail fuel network; |
| ● | the expectation that the company will continue to invest in sustainment and enhancement of refining operations to improve efficiency and maintain safe and reliable downstream operations and industry leading profitability; |
| ● | the expectation that fluctuations in demand for refined products, margin volatility and overall marketplace competitiveness will continue for the company’s R&M business; |
| ● | the expectation that while the company’s net debt levels are between $12 billion and $15 billion, it expects to allocate excess funds equally towards share repurchases and debt reductions, and that once net debt is reduced to $12 billion, it expects to allocate 75% of excess funds towards share repurchases and 25% towards debt repayment; and |
| ● | the expectation that well pads under construction will maintain existing production levels at Firebag and MacKay River in future years as production from existing well pads declines. |
The anticipated duration and impact of planned maintenance events, including:
| ● | planned turnaround activities at Syncrude, Oil Sands Base, Upgrader 1 and McKay River and the Montreal and Sarnia refineries; and |
| ● | planned maintenance at Fort Hills, Upgrader 2 and Commerce City. |
Also:
| ● | economic sensitivities; |
| ● | Suncor’s belief that its indicative 5-2-2-1 index will continue to be an appropriate measure against Suncor’s actual results; |
| ● | statements about Suncor's share repurchase program, including its belief that, depending on the trading price of its common shares and other relevant factors, purchasing its own shares represents an attractive investment opportunity and is in the best interests of the company and its shareholders, and Suncor's expectation that the decision to allocate cash to repurchase shares will not affect its long-term strategy; |
70 ANNUAL REPORT 2023 SUNCOR ENERGY INC.
| ● | the company’s belief that it does not have any guarantees or off-balance sheet arrangements that have, or are reasonably likely to have, a current or future material effect on the company’s financial condition or financial performance, including liquidity and capital resources; |
| ● | Suncor’s planned 2024 capital spending program of $6.3 billion to $6.5 billion and the belief that the company will have the capital resources to fund its planned 2024 capital spending program and to meet current and future working capital requirements through cash and cash equivalents balances, cash flow provided by operating activities, available committed credit facilities, issuing commercial paper and accessing capital markets; |
| ● | Suncor's expectations as to how its 2024 capital expenditures will be directed and the expected benefits therefrom; |
| ● | the objectives of the company’s short-term investment portfolio and the expectation that the maximum weighted average term to maturity of the company’s short-term investment portfolio will not exceed six months, and all investments will be with counterparties with investment grade debt ratings; |
| ● | Suncor's intention to adopt certain accounting standards, amendments and interpretations when they become effective; and |
| ● | expectations with respect to changes to law and government policy. |
Forward-looking statements are not guarantees of future performance and involve a number of risks and uncertainties, some that are similar to other oil and gas companies and some that are unique to Suncor. Suncor’s actual results may differ materially from those expressed or implied by its forward-looking statements, so readers are cautioned not to place undue reliance on them.
The financial and operating performance of the company’s reportable operating segments, specifically Oil Sands, E&P and R&M, may be affected by a number of factors.
Factors that affect Suncor’s Oil Sands segment include, but are not limited to, volatility in the prices for crude oil and other production, and the related impacts of fluctuating light/heavy and sweet/sour crude oil differentials; changes in the demand for refinery feedstock and diesel fuel, including the possibility that refiners that process the company’s proprietary production will be closed, experience equipment failure or other accidents; Suncor’s ability to operate its Oil Sands facilities reliably in order to meet production targets; the output of newly commissioned facilities, the performance of which may be difficult to predict during initial operations; Suncor’s dependence on pipeline capacity and other logistical constraints, which may affect the company’s ability to distribute products to market and which may cause the company to delay or cancel planned growth projects in the event of insufficient takeaway capacity; Suncor’s ability to finance Oil Sands economic investment and asset sustainment and maintenance capital expenditures; the availability of bitumen feedstock for upgrading operations, which can be negatively affected by poor ore grade quality, unplanned mine equipment and extraction plant maintenance, tailings storage, and in situ reservoir and equipment performance, or the unavailability of third-party bitumen; changes in operating costs, including the cost of labour, natural gas and other energy sources used in oil sands processes; and the company’s ability to complete projects, including planned maintenance events, both on time and on budget, which could be impacted by competition from other projects (including other oil sands projects) for goods and services and demands on infrastructure in Alberta’s Wood Buffalo region and the surrounding area (including housing, roads and schools).
Factors that affect Suncor’s E&P segment include, but are not limited to, volatility in crude oil and natural gas prices; operational risks and uncertainties associated with oil and gas activities, including unexpected formations or pressures, premature declines of reservoirs, fires, blow-outs, equipment failures and other accidents, uncontrollable flows of crude oil, natural gas or well fluids, and pollution and other environmental risks; adverse weather conditions, which could disrupt output from producing assets or impact drilling programs, resulting in increased costs and/or delays in bringing on new production; political, economic and socio-economic risks associated with Suncor’s foreign operations, including the unpredictability of operating in Libya due to ongoing political unrest; and market demand for mineral rights and producing properties, potentially leading to losses on disposition or increased property acquisition costs.
Factors that affect Suncor’s R&M segment include, but are not limited to, fluctuations in demand and supply for refined products that impact the company’s margins; market competition, including potential new market entrants; the company’s ability to reliably operate refining and marketing facilities in order to meet production or sales targets; and risks and uncertainties affecting construction or planned maintenance schedules, including the availability of labour and other impacts of competing projects drawing on the same resources during the same time period.
ANNUAL REPORT 2023 SUNCOR ENERGY INC. 71
Additional risks, uncertainties and other factors that could influence the financial and operating performance of all of Suncor’s operating segments and activities include, but are not limited to, changes in general economic, market and business conditions, such as commodity prices, interest rates and currency exchange rates (including as a result of demand and supply effects resulting from the actions of OPEC+); fluctuations in supply and demand for Suncor’s products; the successful and timely implementation of capital projects, including growth projects and regulatory projects; risks associated with the development and execution of Suncor’s projects and the commissioning and integration of new facilities; the possibility that completed maintenance activities may not improve operational performance or the output of related facilities; the risk that projects and initiatives intended to achieve cash flow growth and/or reductions in operating costs may not achieve the expected results in the time anticipated or at all; competitive actions of other companies, including increased competition from other oil and gas companies or from companies that provide alternative sources of energy; labour and material shortages; actions by government authorities, including the imposition or reassessment of, or changes to, taxes, fees, royalties, duties, tariffs, quotas and other government-imposed compliance costs, and mandatory production curtailment orders and changes thereto; changes to laws and government policies that could impact the company’s business, including environmental (including climate change), royalty and tax laws and policies; the ability and willingness of parties with whom Suncor has material relationships to perform their obligations to the company; the unavailability of, or outages to, third-party infrastructure that could cause disruptions to production or prevent the company from being able to transport its products; the occurrence of a protracted operational outage, a major safety or environmental incident, or unexpected events such as fires (including forest fires), equipment failures and other similar events affecting Suncor or other parties whose operations or assets directly or indirectly affect Suncor; the potential for security breaches of Suncor’s information technology and infrastructure by malicious persons or entities, and the unavailability or failure of such systems to perform as anticipated as a result of such breaches; security threats and terrorist or activist activities; the risk that competing business objectives may exceed Suncor’s capacity to adopt and implement change; risks and uncertainties associated with obtaining regulatory, third-party and stakeholder approvals outside of Suncor’s control for the company’s operations, projects, initiatives, and exploration and development activities and the satisfaction of any conditions to approvals; the potential for disruptions to operations and construction projects as a result of Suncor’s relationships with labour unions that represent employees at the company’s facilities; the company’s ability to find new oil and gas reserves that can be developed economically; the accuracy of Suncor’s reserves and future production estimates; Suncor’s ability to access capital markets at acceptable rates or to issue other securities at acceptable prices; maintaining an optimal debt to cash flow ratio; the success of the company’s risk management activities using derivatives and other financial instruments; the cost of compliance with current and future environmental laws, including climate change laws; risks relating to increased activism and public opposition to fossil fuels and oil sands; risks and uncertainties associated with closing a transaction for the purchase or sale of a business, asset or oil and gas property, including estimates of the final consideration to be paid or received; the ability of counterparties to comply with their obligations in a timely manner; risks associated with joint arrangements in which the company has an interest; risks associated with land claims and Indigenous consultation requirements; the risk that the company may be subject to litigation; the impact of technology and risks associated with developing and implementing new technologies; and the accuracy of cost estimates, some of which are provided at the conceptual or other preliminary stage of projects and prior to commencement or conception of the detailed engineering that is needed to reduce the margin of error and increase the level of accuracy. The foregoing important factors are not exhaustive.
Many of these risk factors and other assumptions related to Suncor’s forward-looking statements are discussed in further detail throughout this MD&A, including under the heading Risk Factors, and the company’s 2023 AIF and Form 40-F on file with Canadian securities commissions at www.sedarplus.ca and the United States Securities and Exchange Commission at www.sec.gov. Readers are also referred to the risk factors and assumptions described in other documents that Suncor files from time to time with securities regulatory authorities. Copies of these documents are available without charge from the company.
The forward-looking statements contained in this MD&A are made as of the date of this MD&A. Except as required by applicable securities laws, we assume no obligation to update publicly or otherwise revise any forward-looking statements or the foregoing risks and assumptions affecting such forward-looking statements, whether as a result of new information, future events or otherwise.
72 ANNUAL REPORT 2023 SUNCOR ENERGY INC.
EXHIBIT 99-4
Consent of KPMG LLP
CONSENT OF INDEPENDENT REGISTERED PUBLIC ACCOUNTING FIRM
The Board of Directors
Suncor Energy Inc.
We consent to the use of:
| ● | our report dated March 21, 2024 on the consolidated financial statements of Suncor Energy Inc. (the “Entity”) which comprise the consolidated balance sheets as at December 31, 2023 and December 31, 2022, the related consolidated statements of comprehensive income, changes in equity and cash flows for each of the years in the two-year period ended December 31, 2023, and the related notes (collectively the “consolidated financial statements”), and |
| ● | our report dated March 21, 2024 on the effectiveness of the Entity’s internal control over financial reporting as of December 31, 2023 |
each of which is included in the Annual Report on Form 40-F of the Entity for the fiscal year ended December 31, 2023.
We also consent to the incorporation by reference of such report(s) in the Registration Statements (No. 333-87604, 333-112234, 333-118648, 333-124415, 333-149532, 333-161021 and 333-161029) on Form S-8, and No. 333-265216 on Form F-10 of the Entity.
“KPMG LLP”
Chartered Professional Accountants
Calgary, Canada
March 21, 2024
EXHIBIT 99-5
Consent of GLJ Ltd.
LETTER OF CONSENT
TO: |
Suncor Energy Inc. |
|
The Securities and Exchange Commission |
|
The Securities Regulatory Authorities of Each of the Provinces and Territories of Canada |
Dear Sirs/Mesdames:
Re: Suncor Energy Inc. (“Suncor”)
We refer to the following reports (the “Reports”) prepared by GLJ Ltd. (“GLJ”):
· |
Reserves Assessment and Evaluation of In Situ Oil Sands Properties – Corporate Summary dated February 16, 2024; |
· |
Reserves Assessment and Evaluation of Oil Sands Mining Properties – Corporate Summary dated February 16, 2024; and |
· |
Reserves Assessment and Evaluation of the P&NG Reserves of Suncor Energy Inc., Newfoundland Offshore Areas dated February 16, 2024, |
which provide GLJ’s reports on proved and probable reserves evaluations of Suncor’s Canadian mining and in-situ leases, Canadian offshore conventional assets and international operations that were evaluated as at December 31, 2023.
We hereby consent to being named and to the use of, reference to and excerpts and information derived from the said Reports by Suncor in its:
1. |
Annual Report on Form 40-F for the year ended December 31, 2023 (the “Form 40-F”) and the incorporation by reference in the registration statements on Form S-8 (File No. 333-87604), Form S-8 (File No. 333-112234), Form S-8 (File No. 333-118648), Form S-8 (File No. 333-124415), Form S-8 (File No. 333-149532), Form S-8 (File No. 333-161021), Form S-8 (File No. 333-161029) and Form F-10 (File No. 333-265216) of Suncor, of our Reports; |
2. |
Annual Report for the year ended December 31, 2023 (the “Annual Report”) to be filed with the securities regulatory authorities of each of the provinces and territories of Canada; and |
3. |
Annual Information Form dated March 21, 2024 (the “AIF”), which is incorporated by reference into the following prospectuses (collectively, the “Prospectuses”): (i) the short form base shelf prospectus of Suncor dated May 25, 2022 relating to the sale and issue of debt securities, common shares, preferred shares, subscription receipts, warrants, units, share purchase contracts and share purchase units from time to time, and (ii) the short form base shelf prospectus of Suncor dated May 25, 2022 relating to the sale and issue of medium term notes, from time to time. |
We have read the Form 40-F, Annual Report, AIF and Prospectuses and have no reason to believe that there are any misrepresentations in the information contained therein that is derived from our Reports or that are within our knowledge as a result of the services which we performed in connection with the Reports.
|
|
Yours very truly, |
|
|
|
GLJ LTD. |
|
|
|
|
|
|
|
“Tracy K. Bellingham” |
|
|
|
|
|
|
|
Tracy K. Bellingham, P. Eng. |
|
Dated: March 21, 2024
Calgary, Alberta, Canada
EXHIBIT 99-6
CERTIFICATION
I, Richard M. Kruger, certify that:
| 1. | I have reviewed this annual report on Form 40-F of Suncor Energy Inc.; |
| 2. | Based on my knowledge, this report does not contain any untrue statement of a material fact or omit to state a material fact necessary to make the statements made, in light of the circumstances under which such statements were made, not misleading with respect to the period covered by this report; |
| 3. | Based on my knowledge, the financial statements, and other financial information included in this report, fairly present in all material respects the financial condition, results of operations and cash flows of the issuer as of, and for, the periods presented in this report; |
| 4. | The issuer’s other certifying officer and I are responsible for establishing and maintaining disclosure controls and procedures (as defined in Exchange Act Rules 13a-15(e) and 15d-15(e)) and internal control over financial reporting (as defined in Exchange Act Rules 13a-15(f) and 15d-15(f)) for the issuer and have: |
| (a) | Designed such disclosure controls and procedures, or caused such disclosure controls and procedures to be designed under our supervision, to ensure that material information relating to the issuer, including its consolidated subsidiaries, is made known to us by others within those entities, particularly during the period in which this report is being prepared; |
| (b) | Designed such internal control over financial reporting, or caused such internal control over financial reporting to be designed under our supervision, to provide reasonable assurance regarding the reliability of financial reporting and the preparation of financial statements for external purposes in accordance with generally accepted accounting principles; |
| (c) | Evaluated the effectiveness of the issuer’s disclosure controls and procedures and presented in this report our conclusions about the effectiveness of the disclosure controls and procedures, as of the end of the period covered by this report based on such evaluation; and |
| (d) | Disclosed in this report any change in the issuer’s internal control over financial reporting that occurred during the period covered by the annual report that has materially affected, or is reasonably likely to materially affect, the issuer’s internal control over financial reporting; and |
| 5. | The issuer’s other certifying officer and I have disclosed, based on our most recent evaluation of internal control over financial reporting, to the issuer’s auditors and the audit committee of the issuer’s board of directors (or persons performing the equivalent functions): |
| (a) | All significant deficiencies and material weaknesses in the design or operation of internal control over financial reporting which are reasonably likely to adversely affect the issuer’s ability to record, process, summarize and report financial information; and |
| (b) | Any fraud, whether or not material, that involves management or other employees who have a significant role in the issuer’s internal control over financial reporting. |
DATE: March 21, 2024 |
|
|
|
|
/s/ RICHARD M. KRUGER |
|
|
|
|
|
Richard M. Kruger |
|
|
President and Chief Executive Officer |
EXHIBIT 99-7
CERTIFICATION
I, Kris P. Smith, certify that:
| 1. | I have reviewed this annual report on Form 40-F of Suncor Energy Inc.; |
| 2. | Based on my knowledge, this report does not contain any untrue statement of a material fact or omit to state a material fact necessary to make the statements made, in light of the circumstances under which such statements were made, not misleading with respect to the period covered by this report; |
| 3. | Based on my knowledge, the financial statements, and other financial information included in this report, fairly present in all material respects the financial condition, results of operations and cash flows of the issuer as of, and for, the periods presented in this report; |
| 4. | The issuer’s other certifying officer and I are responsible for establishing and maintaining disclosure controls and procedures (as defined in Exchange Act Rules 13a-15(e) and 15d-15(e)) and internal control over financial reporting (as defined in Exchange Act Rules 13a-15(f) and 15d-15(f)) for the issuer and have: |
| (a) | Designed such disclosure controls and procedures, or caused such disclosure controls and procedures to be designed under our supervision, to ensure that material information relating to the issuer, including its consolidated subsidiaries, is made known to us by others within those entities, particularly during the period in which this report is being prepared; |
| (b) | Designed such internal control over financial reporting, or caused such internal control over financial reporting to be designed under our supervision, to provide reasonable assurance regarding the reliability of financial reporting and the preparation of financial statements for external purposes in accordance with generally accepted accounting principles; |
| (c) | Evaluated the effectiveness of the issuer’s disclosure controls and procedures and presented in this report our conclusions about the effectiveness of the disclosure controls and procedures, as of the end of the period covered by this report based on such evaluation; and |
| (d) | Disclosed in this report any change in the issuer’s internal control over financial reporting that occurred during the period covered by the annual report that has materially affected, or is reasonably likely to materially affect, the issuer’s internal control over financial reporting; and |
| 5. | The issuer’s other certifying officer and I have disclosed, based on our most recent evaluation of internal control over financial reporting, to the issuer’s auditors and the audit committee of the issuer’s board of directors (or persons performing the equivalent functions): |
| (a) | All significant deficiencies and material weaknesses in the design or operation of internal control over financial reporting which are reasonably likely to adversely affect the issuer’s ability to record, process, summarize and report financial information; and |
| (b) | Any fraud, whether or not material, that involves management or other employees who have a significant role in the issuer’s internal control over financial reporting. |
DATE: March 21, 2024 |
|
|
|
|
/s/ KRIS P. SMITH |
|
|
|
|
|
Kris P. Smith |
|
|
Chief Financial Officer |
EXHIBIT 99-8
CERTIFICATION PURSUANT TO 18 U.S.C. SECTION 1350,
AS ENACTED PURSUANT TO
SECTION 906 OF THE SARBANES-OXLEY ACT OF 2002
In connection with the annual report of Suncor Energy Inc. (the “Company”) on Form 40-F for the fiscal year ending December 31, 2023 as filed with the Securities and Exchange Commission on the date hereof (the “Report”), I, RICHARD M. KRUGER, President and Chief Executive Officer of the Company, certify, pursuant to 18 U.S.C. section 1350, as adopted pursuant to section 906 of the Sarbanes-Oxley Act of 2002, that:
1. |
The Report fully complies with the requirements of section 13(a) or 15(d) of the Securities Exchange Act of 1934; and |
2. |
The information contained in the Report fairly presents, in all material respects, the financial condition and results of operations of the Company. |
|
/s/ RICHARD M. KRUGER |
|
|
|
Richard M. Kruger |
|
President and Chief Executive Officer |
|
Suncor Energy Inc. |
|
DATE: March 21, 2024 |
EXHIBIT 99-9
CERTIFICATION PURSUANT TO 18 U.S.C. SECTION 1350,
AS ENACTED PURSUANT TO
SECTION 906 OF THE SARBANES-OXLEY ACT OF 2002
In connection with the annual report of Suncor Energy Inc. (the “Company”) on Form 40-F for the fiscal year ending December 31, 2023 as filed with the Securities and Exchange Commission on the date hereof (the “Report”), I, KRIS P.SMITH, Chief Financial Officer of the Company, certify, pursuant to 18 U.S.C. section 1350, as adopted pursuant to section 906 of the Sarbanes-Oxley Act of 2002, that:
1. |
The Report fully complies with the requirements of section 13(a) or 15(d) of the Securities Exchange Act of 1934; and |
2. |
The information contained in the Report fairly presents, in all material respects, the financial condition and results of operations of the Company. |
|
/s/ KRIS P.SMITH |
|
|
|
Kris P. Smith |
|
Chief Financial Officer |
|
Suncor Energy Inc. |
|
DATE: March 21, 2024 |
EXHIBIT 99-10
Supplementary Oil and Gas Disclosures (unaudited)
The following disclosures are presented in accordance with United States Financial Accounting Standards Board (“FASB”) Topic 932 — “Extractive Activities — Oil and Gas” and Subpart 1200 of Regulation S-K (“Subpart 1200”) of the United States Securities and Exchange Commission. Disclosures pertaining to the audited consolidated financial statements as at and for the year ended December 31, 2023 (the “2023 Consolidated Financial Statements”) of Suncor Energy Inc. (“Suncor” or the “company”) were prepared in accordance with International Financial Reporting Standards as issued by the International Accounting Standards Board and Canadian generally accepted accounting principles contained within Part 1 of the Chartered Professional Accountants Canada Handbook, which differ in material respects from financial statements prepared in accordance with United States generally accepted accounting principles. The 2023 Consolidated Financial Statements are attached as Exhibit 99.2 to Suncor’s annual report on Form 40-F for the year ended December 31, 2023 (the “Form 40-F”).
Reserves Data
Reserves data included herein are estimates only and can be significantly impacted by a variety of internal and external factors. For more information on the risks involved when estimating reserves, see the discussion in the “Statement of Reserves Data and Other Oil and Gas Information — Advisories – Reserves Data” section in Suncor’s 2023 Annual Information Form (the “2023 AIF”), which is attached as Exhibit 99.1 to the Form 40-F. Readers should also see Suncor’s Management’s Discussion and Analysis for the year ended December 31, 2023, which is attached as Exhibit 99.3 to the Form 40-F (the “2023 Management’s Discussion and Analysis”).
The reserves data presented herein, with an effective date of December 31, 2023, may differ in relation to the format and the basis from which volumes are economically determined under National Instrument 51-101 — “Standards of Disclosure for Oil and Gas Activities” (“NI 51-101”), as disclosed in the 2023 AIF. Subpart 1200 requires disclosure of net proved reserves, after royalties, using the average of the first-day-of-the-month prices for the twelve-month period prior to the end of the reporting period, whereas NI 51-101 requires disclosure of gross and net reserves, estimated using forecast prices and costs. In 2023, Suncor’s reserves were economic utilizing both constant pricing permitted by Subpart 1200, as well as forecast pricing permitted by NI 51-101.
Net Proved Oil and Gas Reserves(1)(2)
To align with the company’s business segments, the company presents the following supplementary oil and gas disclosures by showing its Oil Sands segment, which is exclusively in Canada and produce synthetic crude oil (“SCO”) and bitumen, separate from other Canadian operations, which are aggregated with Suncor’s international operations (collectively, “Exploration and Production”) and produce crude oil, natural gas and natural gas liquids (“NGLs”). During 2023, Suncor divested its U.K. assets and as a result, as at December 31, 2023, all Exploration and Production reserves are in offshore Canada.
|
|
SCO |
|
Bitumen |
|
Crude Oil(3) |
|
Natural Gas |
|
Total |
||||||||||
At December 31, |
|
(mmbbls) |
|
(mmbbls) |
|
(mmbbls) |
|
(bcf) |
|
(mmboe) |
||||||||||
(net reserves, constant prices and costs) |
|
2023 |
|
2022 |
|
2023 |
|
2022 |
|
2023 |
|
2022 |
|
2023 |
|
2022 |
|
2023 |
|
2022 |
Proved Developed |
|
|
|
|
|
|
|
|
|
|
|
|
|
|
|
|
|
|
|
|
Oil Sands |
|
1,571 |
|
1,343 |
|
1,364 |
|
729 |
|
— |
|
— |
|
— |
|
— |
|
2,935 |
|
2,071 |
Exploration and Production |
|
— |
|
— |
|
— |
|
— |
|
64 |
|
113 |
|
— |
|
1 |
|
64 |
|
113 |
|
|
1,571 |
|
1,343 |
|
1,364 |
|
729 |
|
64 |
|
113 |
|
— |
|
1 |
|
2,999 |
|
2,185 |
Proved Undeveloped |
|
|
|
|
|
|
|
|
|
|
|
|
|
|
|
|
|
|
|
|
Oil Sands |
|
987 |
|
756 |
|
462 |
|
410 |
|
— |
|
— |
|
— |
|
— |
|
1,449 |
|
1,166 |
Exploration and Production |
|
— |
|
— |
|
— |
|
— |
|
52 |
|
49 |
|
— |
|
— |
|
52 |
|
49 |
|
|
987 |
|
756 |
|
462 |
|
410 |
|
52 |
|
49 |
|
— |
|
— |
|
1,501 |
|
1,215 |
Proved |
|
|
|
|
|
|
|
|
|
|
|
|
|
|
|
|
|
|
|
|
Oil Sands |
|
2,558 |
|
2,098 |
|
1,826 |
|
1,139 |
|
— |
|
— |
|
— |
|
— |
|
4,384 |
|
3,237 |
Exploration and Production |
|
— |
|
— |
|
— |
|
— |
|
116 |
|
162 |
|
— |
|
1 |
|
116 |
|
162 |
|
|
2,558 |
|
2,098 |
|
1,826 |
|
1,139 |
|
116 |
|
162 |
|
— |
|
1 |
|
4,500 |
|
3,399 |
Reconciliation of Net Proved Oil and Gas Reserves
|
|
Balance at |
|
Revisions of |
|
|
|
Extensions |
|
|
|
|
|
Balance at |
(net reserves, |
|
December 31 |
|
Previous |
|
|
|
and |
|
|
|
|
|
December 31 |
constant prices and costs) |
|
2021 |
|
Estimates(4) |
|
Acquisitions(5) |
|
Discoveries(6) |
|
Production |
|
Dispositions(7) |
|
2022 |
Oil Sands |
|
|
|
|
|
|
|
|
|
|
|
|
|
|
SCO (mmbbls) |
|
2,386 |
|
(144) |
|
— |
|
5 |
|
(150) |
|
— |
|
2,098 |
Bitumen (mmbbls) |
|
1,224 |
|
(32) |
|
— |
|
2 |
|
(54) |
|
— |
|
1,139 |
Exploration and Production |
|
|
|
|
|
|
|
|
|
|
|
|
|
|
Crude oil(3) (mmbbls) |
|
149 |
|
— |
|
2 |
|
44 |
|
(25) |
|
(8) |
|
162 |
Natural gas (bcf) |
|
9 |
|
1 |
|
— |
|
1 |
|
(2) |
|
(8) |
|
1 |
Total (mmboe) |
|
3,760 |
|
(175) |
|
2 |
|
51 |
|
(230) |
|
(9) |
|
3,399 |
|
|
Balance at |
|
Revisions of |
|
|
|
Extensions |
|
|
|
|
|
Balance at |
(net reserves, |
|
December 31 |
|
Previous |
|
|
|
and |
|
|
|
|
|
December 31 |
constant prices and costs) |
|
2022 |
|
Estimates(4) |
|
Acquisitions(5) |
|
Discoveries(6) |
|
Production |
|
Dispositions(7) |
|
2023 |
Oil Sands |
|
|
|
|
|
|
|
|
|
|
|
|
|
|
SCO (mmbbls) |
|
2,098 |
|
342 |
|
88 |
|
178 |
|
(148) |
|
— |
|
2,558 |
Bitumen (mmbbls) |
|
1,139 |
|
94 |
|
594 |
|
68 |
|
(69) |
|
— |
|
1,826 |
Exploration and Production |
|
|
|
|
|
|
|
|
|
|
|
|
|
|
Crude oil(3) (mmbbls) |
|
162 |
|
4 |
|
— |
|
— |
|
(18) |
|
(31) |
|
116 |
Natural gas (bcf) |
|
1 |
|
— |
|
— |
|
— |
|
— |
|
(1) |
|
— |
Total (mmboe) |
|
3,399 |
|
439 |
|
682 |
|
246 |
|
(235) |
|
(32) |
|
4,500 |
Notes to Reserves Data:
(1) |
Definitions |
a. |
Net reserves, in relation to Suncor’s production and reserves, represents the company’s working interest share after deduction of royalty obligations, plus the company’s royalty interests in production and reserves. |
b. |
Proved oil and gas reserves are those quantities of oil and gas, which, by analysis of geoscience and engineering data, can be estimated with reasonable certainty (at least a 90% probability that the quantities actually recovered will equal or exceed the estimate) to be economically producible, from a given date forward, from known reservoirs, and under existing economic conditions, operating methods and government regulations. |
c. |
Proved developed oil and gas reserves are those quantities that can be expected to be recovered through existing wells with existing equipment and operating methods or in which the cost of the required equipment is relatively minor compared to the cost of a new well; and can be expected to be recovered through extraction equipment and infrastructure installed and operational at the time of the reserves estimate for projects that extract oil by means not involving a well. |
d. |
Proved undeveloped oil and gas reserves are those quantities that are expected to be recovered from new wells on undrilled acreage, or from existing wells where a relatively major expenditure is required for recompletion; and can be expected to be recovered through extraction equipment and infrastructure to be installed for projects that extract oil by means not involving a well. |
(2) |
Reserve data tables may not add due to rounding. |
(3) |
Natural gas liquids reserves are not significant and have been presented in combination with crude oil reserves. |
(4) |
Revisions of previous estimates include changes to proved reserves, resulting from new information (except for an increase in proved acreage) normally obtained from development drilling and production history or resulting from a change in economic factors, such as changes in constant prices used for the reserve evaluation. In 2023, positive technical revisions of SCO was made at Syncrude, Fort Hills, Firebag, Millenium and North Steepbank Extension. Positive technical revisions of bitumen was made at Fort Hills, Firebag and MacKay River and partially offset by downward revisions at Syncrude. |
(5) |
Acquisitions in 2022 are due to Suncor increasing its interest in the White Rose assets by 12.5% to 40% in the base project and 38.6% in the White Rose extension. Acquisitions in 2023 are due to Suncor increasing its interest in Fort Hills by 14.65% during the first quarter and by 31.23% in the fourth quarter, making Suncor the sole owner of Fort Hills. |
(6) |
Extensions and discoveries are additions to proved reserves from proved acreage of previously discovered reservoirs through additional drilling in periods subsequent to discovery or discovery of new fields with proved reserves or of new reservoirs of proved reserves in old fields. Proved undeveloped reserves associated with White Rose and proved developed reserves associated with Firebag, Hebron, and U.K. Buzzard were added in 2022. Proved undeveloped reserves associated with Firebag was added in 2023. |
(7) |
Dispositions in 2022 relate to Suncor completing the sale of its 30% working interest in Oda and its 17.5% working interest in the Fenja Development Joint Operations in Norway in the third quarter of 2022. Dispositions in 2023 are due to Suncor divesting its U.K. assets which included a 29.89% working interest in Buzzard. |
Capitalized Costs
|
|
At December 31, 2023 |
|
At December 31, 2022 |
||||||||
|
|
|
|
Exploration |
|
|
|
|
|
Exploration |
|
|
|
|
|
|
and |
|
|
|
|
|
and |
|
|
($ millions) |
|
Oil Sands |
|
Production |
|
Total |
|
Oil Sands |
|
Production |
|
Total |
Exploration and evaluation assets(1) |
|
1,742 |
|
16 |
|
1,758 |
|
1,979 |
|
16 |
|
1,995 |
Oil and gas properties(2)(3) |
|
24,035 |
|
17,066 |
|
41,101 |
|
23,058 |
|
15,717 |
|
38,775 |
Plant and equipment(2)(3) |
|
65,192 |
|
298 |
|
65,490 |
|
69,543 |
|
823 |
|
70,366 |
- accumulated provision(2) |
|
(37,629) |
|
(11,750) |
|
(49,379) |
|
(45,288) |
|
(11,360) |
|
(56,648) |
Total |
|
53,340 |
|
5,630 |
|
58,970 |
|
49,292 |
|
5,196 |
|
54,488 |
(1) |
Exploration and evaluation assets largely represent amounts associated with unproved properties, but may include properties with proved reserves for which Suncor’s Board of Directors have not sanctioned development. See note 18 of the 2023 Consolidated Financial Statements. |
(2) |
Oil and Gas Properties, Plant and Equipment and the accumulated provision largely represent amounts associated with proved properties. See note 15 of the 2023 Consolidated Financial Statements. Includes amounts capitalized to Property, Plant and Equipment on the Consolidated Balance Sheets of the 2023 Consolidated Financial Statements that relate to the company’s right-of-use assets under IFRS 16. See note 17 of the 2023 Consolidated Financial Statements. |
(3) |
Includes amounts capitalized to Property, Plant and Equipment on the Consolidated Balance Sheets of the 2023 Consolidated Financial Statements that relate to the company’s decommissioning and restoration activities. |
Costs Incurred for Property Acquisition, Exploration and Development Activities
|
|
Year ended December 31, 2023 |
|
Year Ended December 31, 2022 |
||||||||
|
|
|
|
Exploration |
|
|
|
|
|
Exploration |
|
|
|
|
|
|
and |
|
|
|
|
|
and |
|
|
($ millions) |
|
Oil Sands |
|
Production |
|
Total |
|
Oil Sands |
|
Production |
|
Total |
Unproved property acquisition |
|
— |
|
— |
|
— |
|
— |
|
— |
|
— |
Proved property acquisition(1) |
|
3,322 |
|
— |
|
3,322 |
|
— |
|
— |
|
— |
Exploration(2) |
|
63 |
|
106 |
|
169 |
|
38 |
|
60 |
|
98 |
Development(3) |
|
4,091 |
|
702 |
|
4,793 |
|
3,633 |
|
548 |
|
4,181 |
Total |
|
7,476 |
|
808 |
|
8,284 |
|
3,671 |
|
608 |
|
4,279 |
(1) |
Proved property acquisitions in 2023 are primarily due to Suncor increasing its interest in Fort Hills by 14.65% during the first quarter and by 31.23% in the fourth quarter, making Suncor the sole owner of Fort Hills. |
(2) |
Includes amounts capitalized to Exploration and Evaluation on the Consolidated Balance Sheets as well as those charged to Exploration Expense on the Consolidated Statements of Comprehensive Income (Loss), of the 2023 Consolidated Financial Statements. |
(3) |
Includes amounts capitalized to Property, Plant and Equipment on the Consolidated Balance Sheets of the 2023 Consolidated Financial Statements that relate to the company’s decommissioning and restoration activities. |
Results of Operations for Oil and Gas Producing Activities
|
|
Year ended December 31, 2023 |
|
Year Ended December 31, 2022 |
||||||||
|
|
|
|
Exploration |
|
|
|
|
|
Exploration |
|
|
|
|
|
|
and |
|
|
|
|
|
and |
|
|
($ millions) |
|
Oil Sands |
|
Production |
|
Total |
|
Oil Sands |
|
Production |
|
Total |
Operating revenues, net of royalties |
|
23,412 |
|
2,198 |
|
25,610 |
|
26,468 |
|
3,723 |
|
30,191 |
Other income (loss) |
|
1,469 |
|
10 |
|
1,479 |
|
(53) |
|
164 |
|
111 |
|
|
24,881 |
|
2,208 |
|
27,089 |
|
26,415 |
|
3,887 |
|
30,302 |
Purchases of crude oil and products |
|
1,935 |
|
(1) |
|
1,934 |
|
2,050 |
|
— |
|
2,050 |
Operating, selling and general |
|
9,329 |
|
476 |
|
9,805 |
|
9,152 |
|
490 |
|
9,642 |
Transportation and distribution |
|
1,213 |
|
76 |
|
1,289 |
|
1,210 |
|
101 |
|
1,311 |
Depreciation, depletion, amortization and impairment |
|
4,902 |
|
483 |
|
5,385 |
|
7,927 |
|
(105) |
|
7,822 |
Exploration |
|
60 |
|
14 |
|
74 |
|
37 |
|
19 |
|
56 |
(Gain) loss on disposal of assets |
|
(39) |
|
(600) |
|
(639) |
|
(7) |
|
66 |
|
59 |
Financing expenses |
|
670 |
|
69 |
|
739 |
|
413 |
|
95 |
|
508 |
Earnings before income taxes |
|
6,811 |
|
1,691 |
|
8,502 |
|
5,633 |
|
3,221 |
|
8,854 |
Income tax expense |
|
1,324 |
|
519 |
|
1,843 |
|
1,314 |
|
925 |
|
2,239 |
Net earnings |
|
5,487 |
|
1,172 |
|
6,659 |
|
4,319 |
|
2,296 |
|
6,615 |
Standardized Measure of Discounted Future Net Cash Flows Relating to Proved Oil and Gas Reserves(1)
The standardized measure of discounted future net cash flows relating to Suncor’s proved oil and gas reserves are calculated in accordance with FASB Topic 932 — “Extractive Activities — Oil and Gas”. Future cash inflows are estimated using the average of the first-day-of-the-month prices for the twelve-month period prior to the end of the reporting period, which are also used in estimating the entity’s proved oil and gas reserves. Future development and production costs, including the associated decommissioning and restoration activities, are calculated by estimating the expenditures to be incurred in developing and producing the proved oil and gas reserves at the end of the year, based on year-end costs and assuming continuation of existing economic conditions. The appropriate year-end statutory tax rates, with consideration of future tax rates already legislated, were applied to the future pretax net cash flows, less the tax basis of the properties involved. A prescribed rate of 10% is applied to discount the future net cash flows.
The calculation of the standardized measure of discounted future net cash flows is based upon information prepared by the company’s independent qualified reserves evaluator (which includes decommissioning and restoration activities), and adjusted for future income taxes.
It should not be assumed that the estimates of future net cash flows presented in the tables below represent the fair market value of the reserves. There is no assurance that the price and cost assumptions will be attained and variances could be material. Future changes to income tax, royalty and environmental regulations could also have a significant impact on the respective assumptions. There is no guarantee that the estimates for SCO, bitumen, crude oil, and natural gas reserves provided herein will be recovered. Actual SCO, bitumen, crude oil, and natural gas reserves may be greater than or less than the estimates provided herein.
The following twelve-month average prices were used to calculate the standardized measure of discounted future net cash flows (using the first-day-of-the-month prices for the twelve-month period prior to the end of the reporting period):
|
|
|
|
|
|
|
|
Light |
|
|
|
|
|
National |
|
|
|
|
WTI |
|
WCS |
|
Sweet |
|
Pentanes Plus |
|
|
|
Balancing |
|
|
Brent |
|
Cushing |
|
Hardisty |
|
Edmonton |
|
Edmonton |
|
AECO |
|
Point |
Year |
|
North Sea |
|
Oklahoma |
|
Alberta |
|
Alberta |
|
Alberta |
|
Gas |
|
North Sea |
|
|
US$/bbl |
|
US$/bbl |
|
Cdn$/bbl |
|
Cdn$/bbl |
|
Cdn$/bbl |
|
Cdn$/mmbtu |
|
Cdn$/mmbtu |
2023 |
|
82.83 |
|
78.10 |
|
81.33 |
|
100.98 |
|
104.05 |
|
2.76 |
|
17.83 |
2022 |
|
97.98 |
|
94.13 |
|
98.14 |
|
119.59 |
|
120.70 |
|
5.59 |
|
42.80 |
|
|
At December 31, 2023 |
|
At December 31, 2022 |
||||||||
|
|
|
|
Exploration |
|
|
|
|
|
Exploration |
|
|
|
|
|
|
and |
|
|
|
|
|
and |
|
|
($ millions) |
|
Oil Sands |
|
Production |
|
Total |
|
Oil Sands |
|
Production |
|
Total |
Future cash inflows |
|
388,522 |
|
12,670 |
|
401,192 |
|
353,676 |
|
20,253 |
|
373,929 |
Future production costs |
|
(179,553) |
|
(2,822) |
|
(182,375) |
|
(148,250) |
|
(4,915) |
|
(153,165) |
Future development costs |
|
(89,763) |
|
(4,497) |
|
(94,260) |
|
(69,267) |
|
(4,755) |
|
(74,022) |
Future income tax expenses |
|
(28,515) |
|
(1,150) |
|
(29,666) |
|
(31,615) |
|
(3,993) |
|
(35,608) |
Future net cash flows |
|
90,691 |
|
4,201 |
|
94,892 |
|
104,544 |
|
6,590 |
|
111,134 |
10% Discount Factor |
|
(44,748) |
|
(921) |
|
(45,670) |
|
(48,137) |
|
(1,528) |
|
(49,665) |
Standardized measure of discounted future net cash flows |
|
45,943 |
|
3,279 |
|
49,222 |
|
56,407 |
|
5,062 |
|
61,469 |
Changes in Standardized Measure of Discounted Future Net Cash Flows Relating to Proved Oil and Gas Reserves
($ millions) |
|
2023 |
|
2022 |
Standardized measure of discounted future net cash flows - beginning of year |
|
61,469 |
|
35,376 |
Sales and transfers of oil and gas produced |
|
(15,323) |
|
(9,820) |
Net changes in sales prices and operating costs related to future production |
|
(29,494) |
|
45,518 |
Net change due to extensions, discoveries and improved recovery |
|
5,682 |
|
2,710 |
Net change due to acquisition and dispositions |
|
6,555 |
|
(128) |
Net change due to revisions in quantity estimates |
|
9,981 |
|
(4,650) |
Previously estimated development costs incurred during the period |
|
4,833 |
|
4,036 |
Changes in estimated future development costs |
|
(7,449) |
|
(6,082) |
Accretion of discount |
|
7,307 |
|
4,143 |
Net change in income taxes |
|
5,661 |
|
(9,637) |
Standardized measure of discounted future net cash flows - end of year |
|
49,222 |
|
61,469 |
(1) |
Tables may not add due to rounding. |