UNITED STATES
SECURITIES AND EXCHANGE COMMISSION
Washington, D.C. 20549
FORM 8-K
CURRENT REPORT PURSUANT
TO SECTION 13 or 15(d) OF THE
SECURITIES EXCHANGE ACT OF 1934
Date of Report (Date of earliest event reported): March 19, 2024
Enfusion, Inc.
(Exact name of registrant as specified in its charter)
Delaware |
|
001-40949 |
|
87-1268462 |
(State or other jurisdiction |
|
(Commission File Number) |
|
(I.R.S. Employer Identification No.) |
125 South Clark Street, Suite 750 |
60603 |
Chicago, Illinois |
|
(Address of principal executive offices) |
(Zip code) |
|
|
(312) 253-9800 | |
(Registrant’s telephone number, including area code) | |
N/A
(Former name or former address, if changed since last report)
Check the appropriate box below if the Form 8-K filing is intended to simultaneously satisfy the filing obligation of the registrant under any of the following provisions:
☐ |
Written communications pursuant to Rule 425 under the Securities Act (17 CFR 230.425) |
☐ |
Soliciting material pursuant to Rule 14a-12 under the Exchange Act (17 CFR 240.14a-12) |
☐ |
Pre-commencement communications pursuant to Rule 14d-2(b) under the Exchange Act (17 CFR 240.14d-2(b)) |
☐ |
Pre-commencement communications pursuant to Rule 13e-4(c) under the Exchange Act (17 CFR 240.13e- 4(c)) |
Securities registered pursuant to Section 12(b) of the Act:
Title of each class |
|
Trading |
|
Name of each exchange |
Class A common stock, par value $0.001 per share |
|
ENFN |
|
New York Stock Exchange |
Indicate by check mark whether the registrant is an emerging growth company as defined in Rule 405 of the Securities Act of 1933 or Rule 12b-2 of the Securities Exchange Act of 1934.
Emerging growth company ☒
If an emerging growth company, indicate by check mark if the registrant has elected not to use the extended transition period for complying with any new or revised financial accounting standards provided pursuant to Section 13(a) of the Exchange Act. ☐
Item 7.01 - Regulation FD Disclosure.
On March 19, 2024, Enfusion, Inc. will hold an Investor Day beginning at 8:30 AM ET. A copy of the presentation that will be used in connection with the Investor Day is attached hereto as Exhibit 99.1.
The information in this Current Report on Form 8-K and Exhibit 99.1 attached hereto is intended to be furnished and shall not be deemed “filed” for purposes of Section 18 of the Securities Exchange Act of 1934, as amended (the “Exchange Act”), or otherwise subject to the liabilities of that section, nor shall it be deemed incorporated by reference in any filing under the Securities Act of 1933, as amended, or the Exchange Act, except as expressly set forth by specific reference in such filing.
Item 9.01 - Financial Statements and Exhibits.
(d) |
The following exhibits are being filed herewith: |
Exhibit No. |
|
Description |
99.1 |
|
Investor Day Presentation dated March 19, 2024, furnished herewith. |
104 |
|
Cover Page Interactive Data File (embedded within the Inline XBRL document) |
SIGNATURES
Pursuant to the requirements of the Securities Exchange Act of 1934, the registrant has duly caused this report to be signed on its behalf by the undersigned hereunto duly authorized.
Date: March 19, 2024 |
ENFUSION, INC. |
|
|
|
|
|
By: |
/s/ Matthew R. Campobasso |
|
Name: |
Matthew R. Campobasso |
|
Title: |
General Counsel |
|
Investor & Analyst Day 2024 |
|
PROPRIETARY ©2024 ENFUSION. ALL RIGHTS RESERVED. 2 Statements we make in this presentation may include statements which are not historical facts and are considered forward-looking within the meaning of Section 27A of the Securities Act of 1933 (the “Securities Act”) and Section 21E of the Securities Exchange Act of 1934 (the “Exchange Act”), including expectations regarding future financial performance. These forward-looking statements are usually identified by the use of words such as “anticipates,” “believes,” “estimates,” “expects,” “intends,” “may,” “plans,” “projects,” “seeks,” “should,” “could,” “will,” and variations of such words or similar expressions, and include, among other items, estimates of future business and financial performance and the expected drivers thereof. We intend these forward-looking statements to be covered by the safe harbor provisions for forward-looking statements contained in Section 27A of the Securities Act and Section 21E of the Exchange Act and are making this statement for purposes of complying with those safe harbor provisions. These forward-looking statements reflect our current views about our plans, intentions, expectations, strategies and prospects, which are based on the information currently available to us and on assumptions we have made. Although we believe that our plans, intentions, expectations, strategies and prospects as reflected in or suggested by those forward-looking statements are reasonable, we can give no assurance that the plans, intentions, expectations or strategies will be attained or achieved. Furthermore, actual results may differ materially from those described in the forward-looking statements and will be affected by a variety of risks and factors that are beyond our control. More information on these risks and other potential factors that could affect our business, financial performance and results of operations can be found in our filings with the SEC, including in the “Risk Factors” and “Management’s Discussion and Analysis of Financial Condition and Results of Operations” sections of our most recently filed periodic reports on Form 10- K and Form 10-Q. We assume no obligation to update publicly any forward-looking statements, whether as a result of new information, future events or otherwise. |
|
Enfusion: Our Time is Now Oleg Movchan Chief Executive Officer |
|
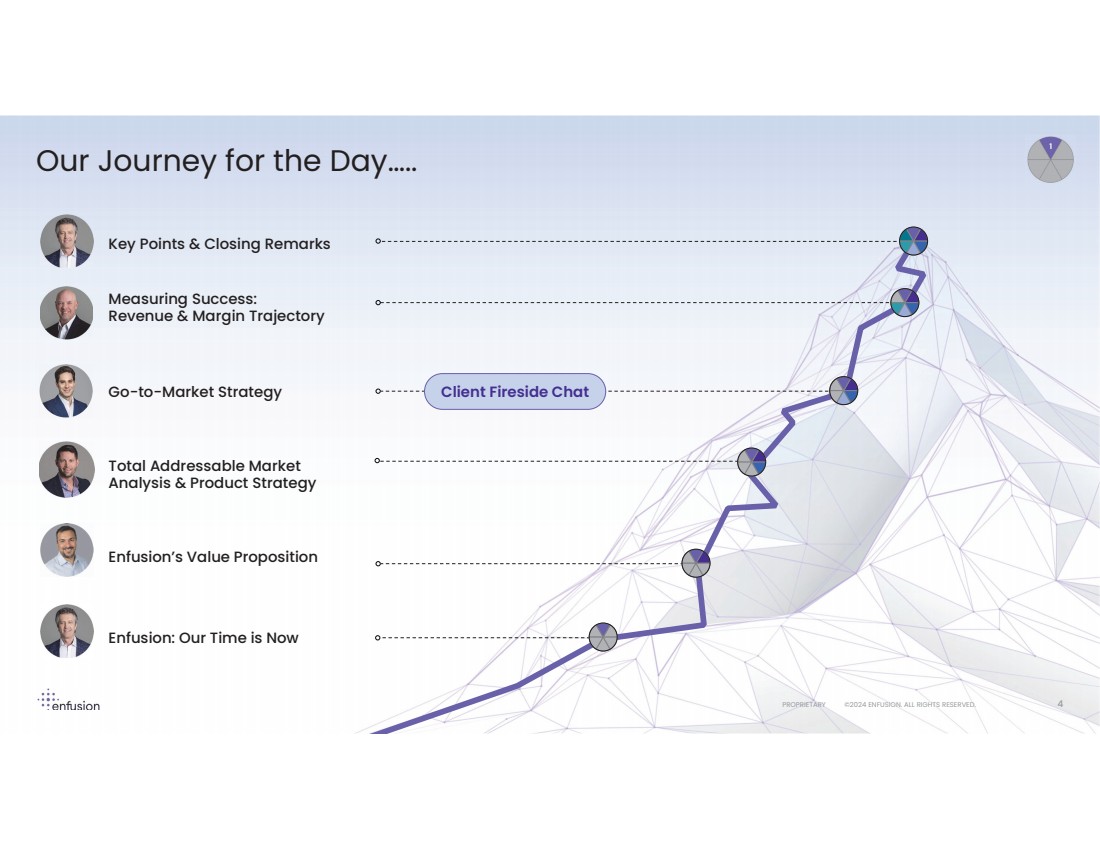
PROPRIETARY ©2024 ENFUSION. ALL RIGHTS RESERVED. Client Fireside Chat Key Points & Closing Remarks Measuring Success: Revenue & Margin Trajectory Go-to-Market Strategy Total Addressable Market Analysis & Product Strategy Enfusion’s Value Proposition Enfusion: Our Time is Now 4 Our Journey for the Day….. |
|
PROPRIETARY ©2024 ENFUSION. ALL RIGHTS RESERVED. 5 |
|
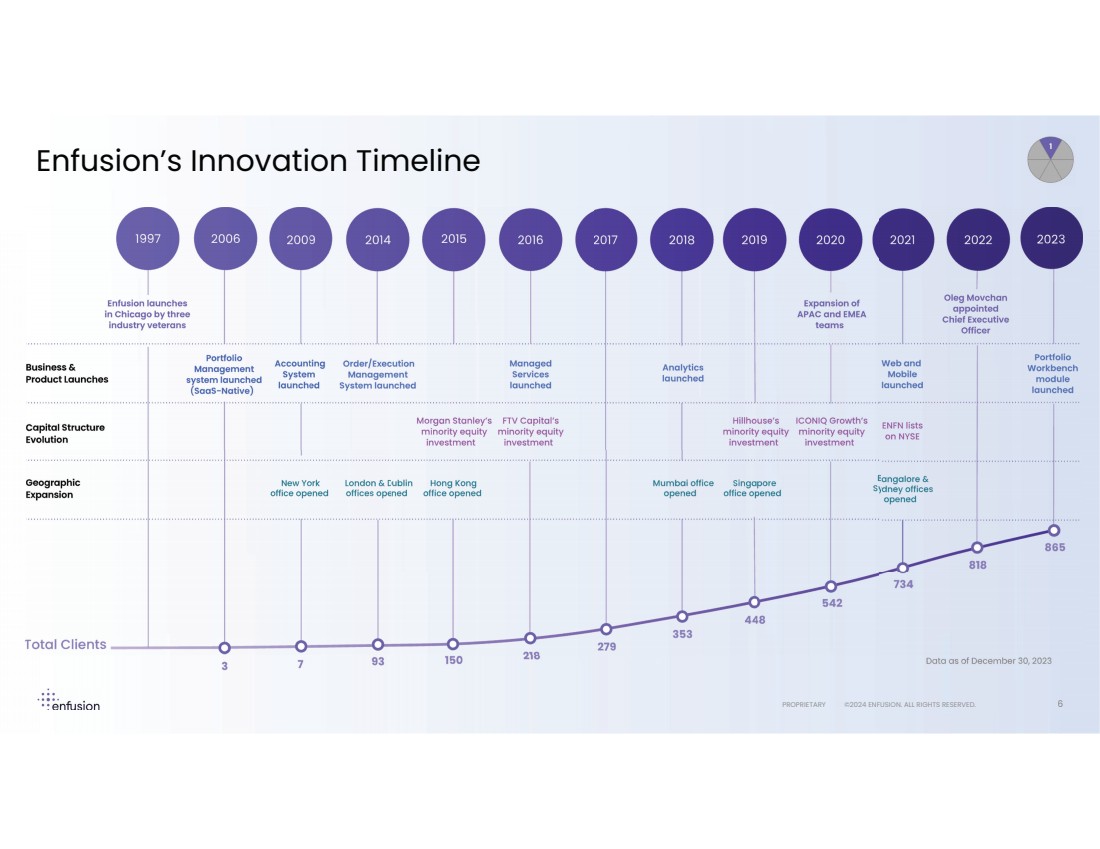
PROPRIETARY ©2024 ENFUSION. ALL RIGHTS RESERVED. 6 Enfusion’s Innovation Timeline PROPRIETARY ©2024 ENFUSION. ALL RIGHTS RESERVED. 6 Enfusion’s Innovation Timeline |
|
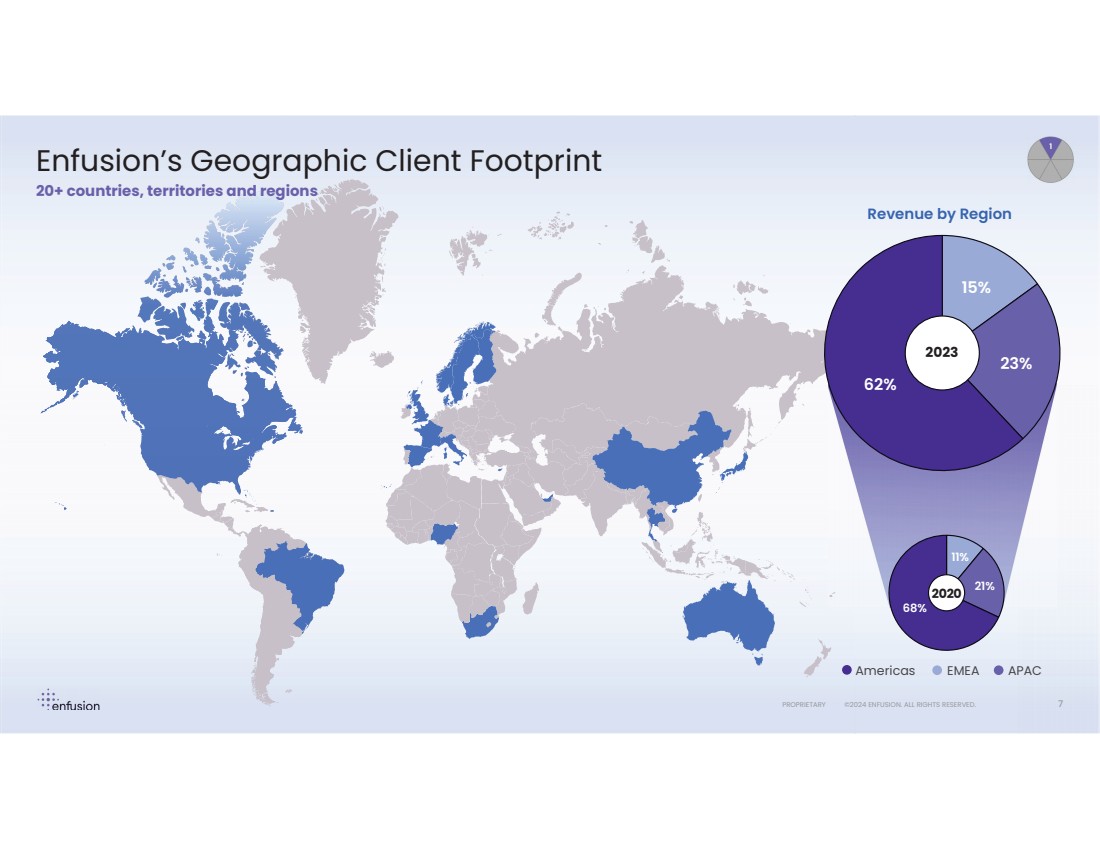
PROPRIETARY ©2024 ENFUSION. ALL RIGHTS RESERVED. PROPRIETARY ©2024 ENFUSION. ALL RIGHTS RESERVED. RIETARY ©2024 ENFUSION. ALL RIGHTS RESERVED. 7 Revenue by Region Americas EMEA APAC 21% 11% 68% 2020 15% 23% 62% 2023 Enfusion’s Geographic Client Footprint 20+ countries, territories and regions |
|
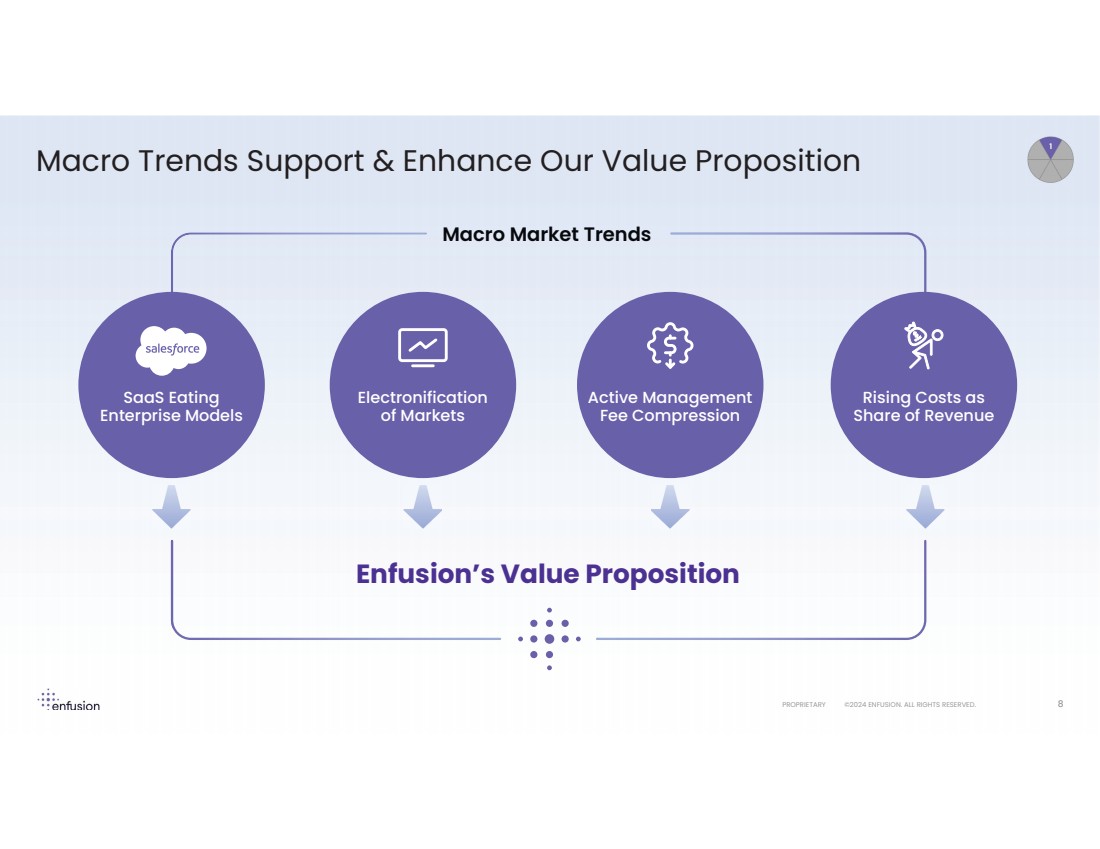
PROPRIETARY ©2024 ENFUSION. ALL RIGHTS RESERVED. 8 Macro Trends Support & Enhance Our Value Proposition Enfusion’s Value Proposition Active Management Fee Compression Electronification of Markets Macro Market Trends SaaS Eating Enterprise Models Rising Costs as Share of Revenue |
|
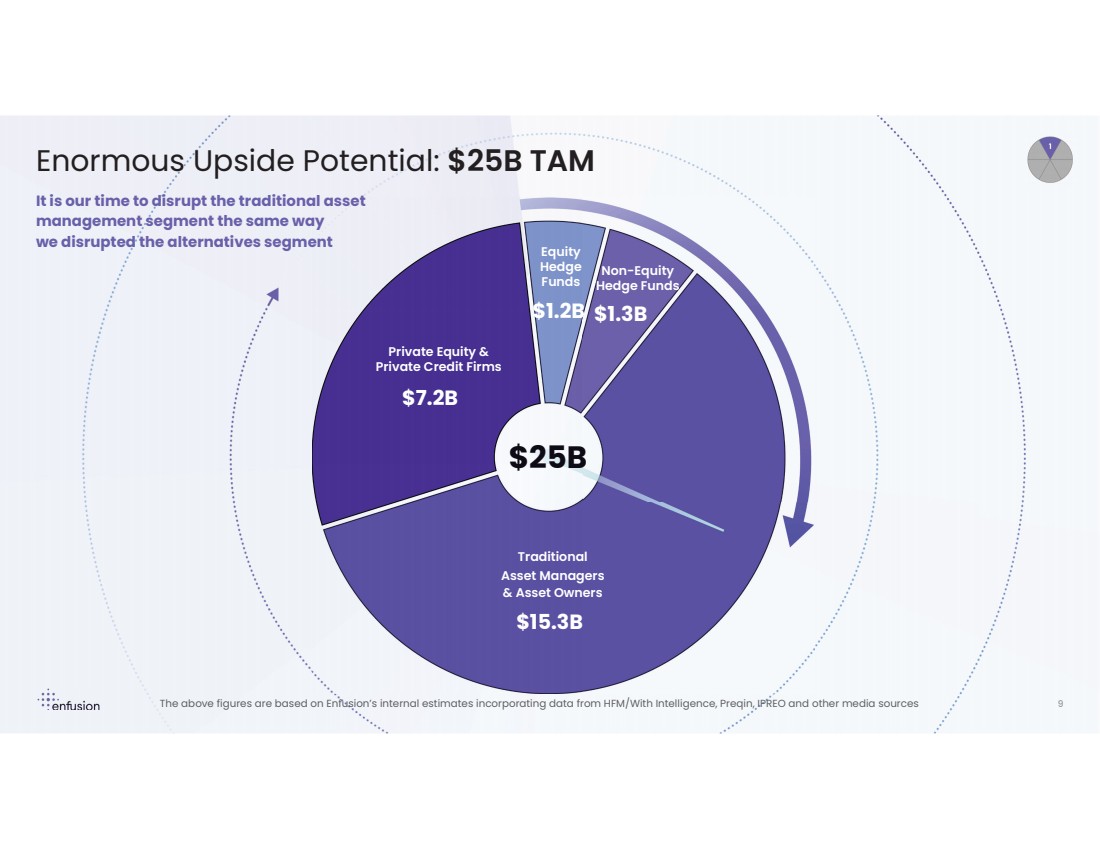
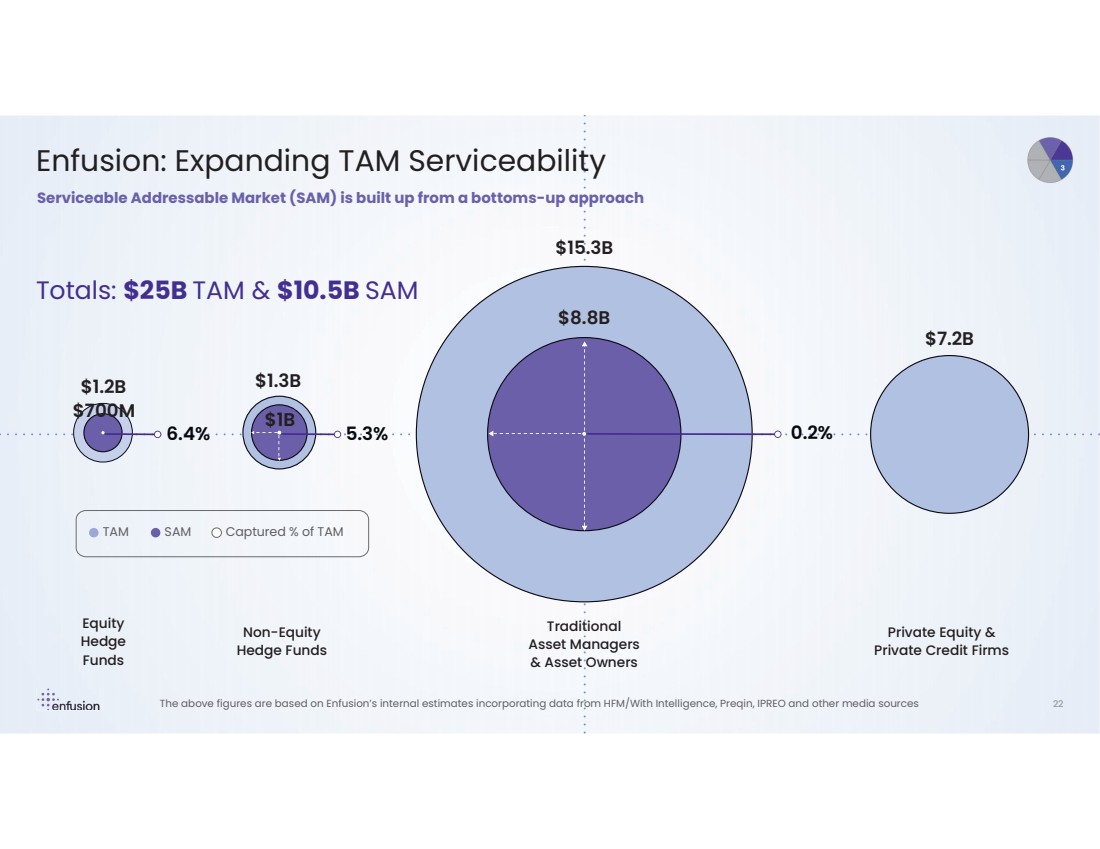
PROPRIETARY ©2024 ENFUSION. ALL RIGHTS RESERVED. 9 It is our time to disrupt the traditional asset management segment the same way we disrupted the alternatives segment Enormous Upside Potential: $25B TAM $25B $15.3B $1.2B $1.3B $7.2B Private Equity & Private Credit Firms Equity Hedge Funds Non-Equity Hedge Funds Traditional Asset Managers & Asset Owners The above figures are based on Enfusion’s internal estimates incorporating data from HFM/With Intelligence, Preqin, IPREO and other media sources |
|
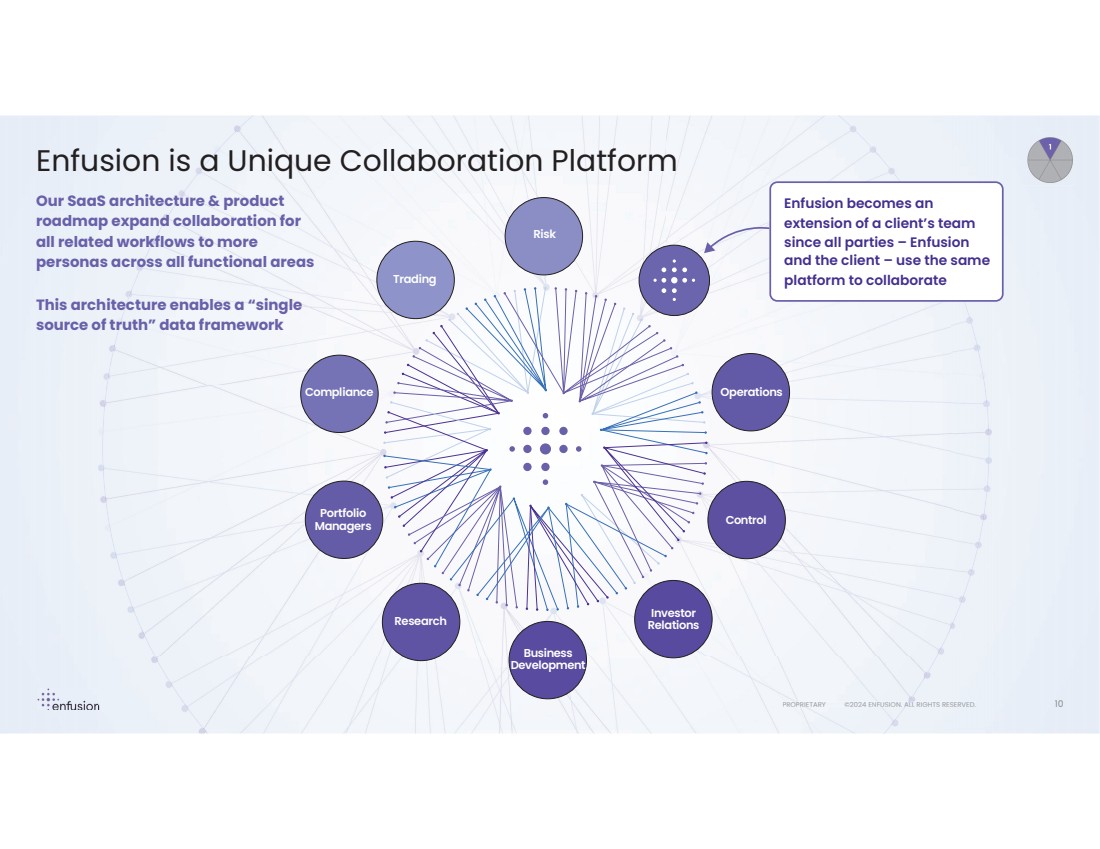
PROPRIETARY ©2024 ENFUSION. ALL RIGHTS RESERVED. PROPRIETARY ©2024 ENFUSION. ALL RIGHTS RESERVED. Compliance Trading Risk Operations Investor Relations Business Development Portfolio Managers Research Enfusion is a Unique Collaboration Platform Our SaaS architecture & product roadmap expand collaboration for all related workflows to more personas across all functional areas This architecture enables a “single source of truth” data framework Control Enfusion becomes an extension of a client’s team since all parties – Enfusion and the client – use the same platform to collaborate 10 |
|
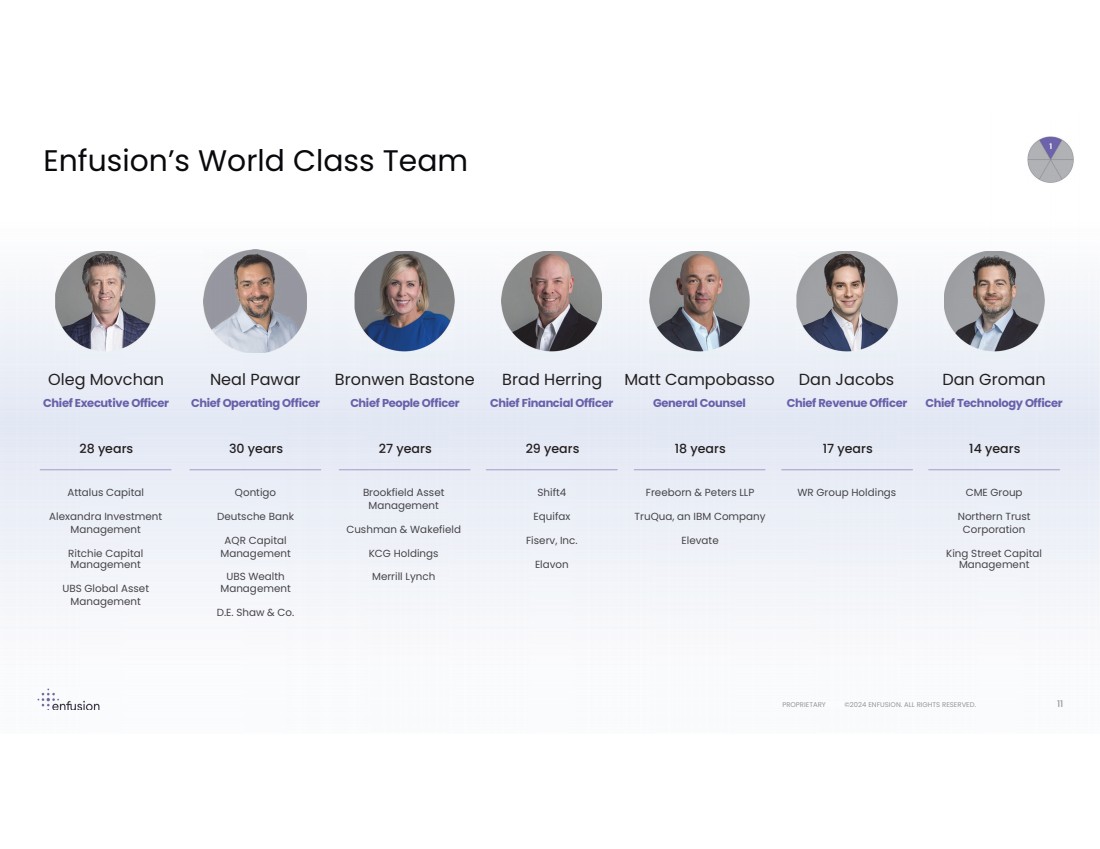
PROPRIETARY ©2024 ENFUSION. ALL RIGHTS RESERVED. PROPRIETARY ©2024 ENFUSION. ALL RIGHTS RESERVED. RIETARY ©2024 ENFUSION. ALL RIGHTS RESERVED. Enfusion’s World Class Team Oleg Movchan Chief Executive Officer Neal Pawar Chief Operating Officer Bronwen Bastone Chief People Officer Brad Herring Chief Financial Officer Matt Campobasso General Counsel 28 years 30 years 27 years 29 years 18 years 17 years 14 years Attalus Capital Alexandra Investment Management Ritchie Capital Management UBS Global Asset Management Qontigo Deutsche Bank AQR Capital Management UBS Wealth Management D.E. Shaw & Co. Shift4 Equifax Fiserv, Inc. Elavon Freeborn & Peters LLP TruQua, an IBM Company Elevate CME Group Northern Trust Corporation King Street Capital Management Dan Jacobs Chief Revenue Officer Dan Groman Chief Technology Officer Brookfield Asset WR Group Holdings Management Cushman & Wakefield KCG Holdings Merrill Lynch 11 |
|
Enfusion’s Value Proposition Neal Pawar Chief Operating Officer |
|
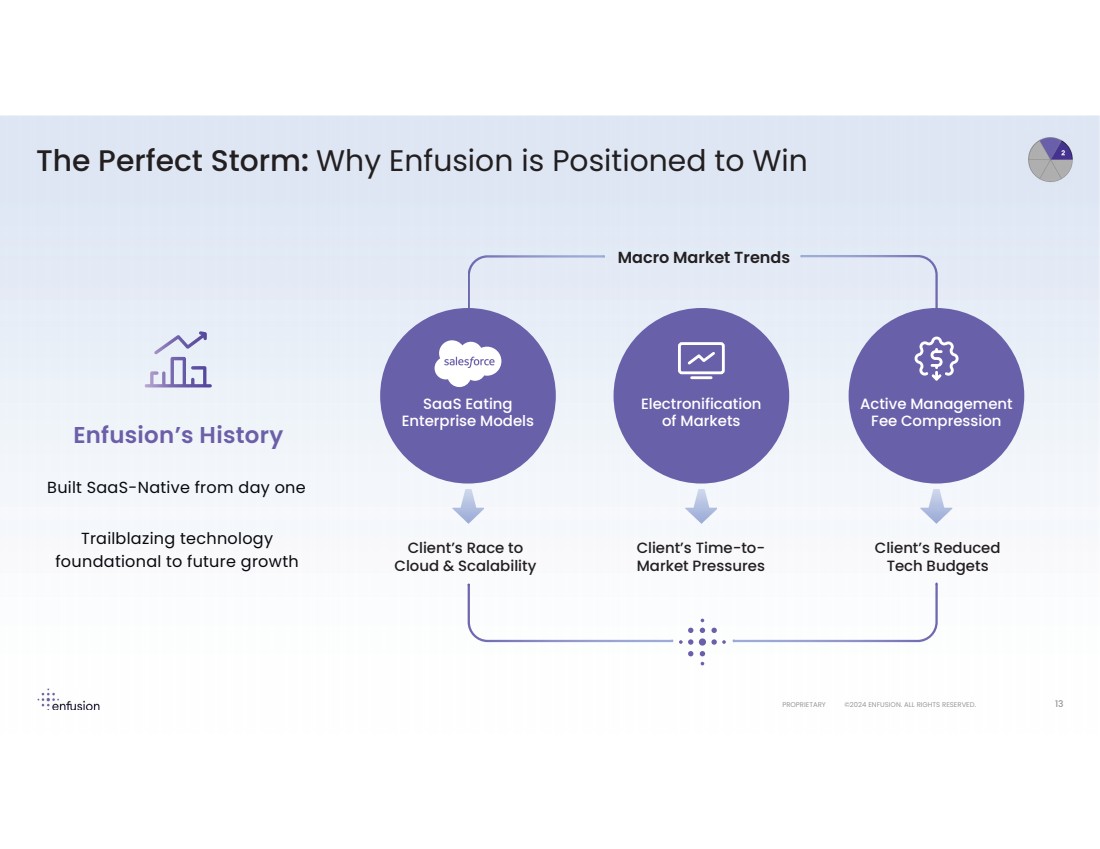
PROPRIETARY ©2024 ENFUSION. ALL RIGHTS RESERVED. 13 The Perfect Storm: Why Enfusion is Positioned to Win Built SaaS-Native from day one Enfusion’s History Trailblazing technology foundational to future growth Client’s Race to Cloud & Scalability Client’s Time-to-Market Pressures Macro Market Trends Electronification of Markets SaaS Eating Enterprise Models Client’s Reduced Tech Budgets Active Management Fee Compression |
|
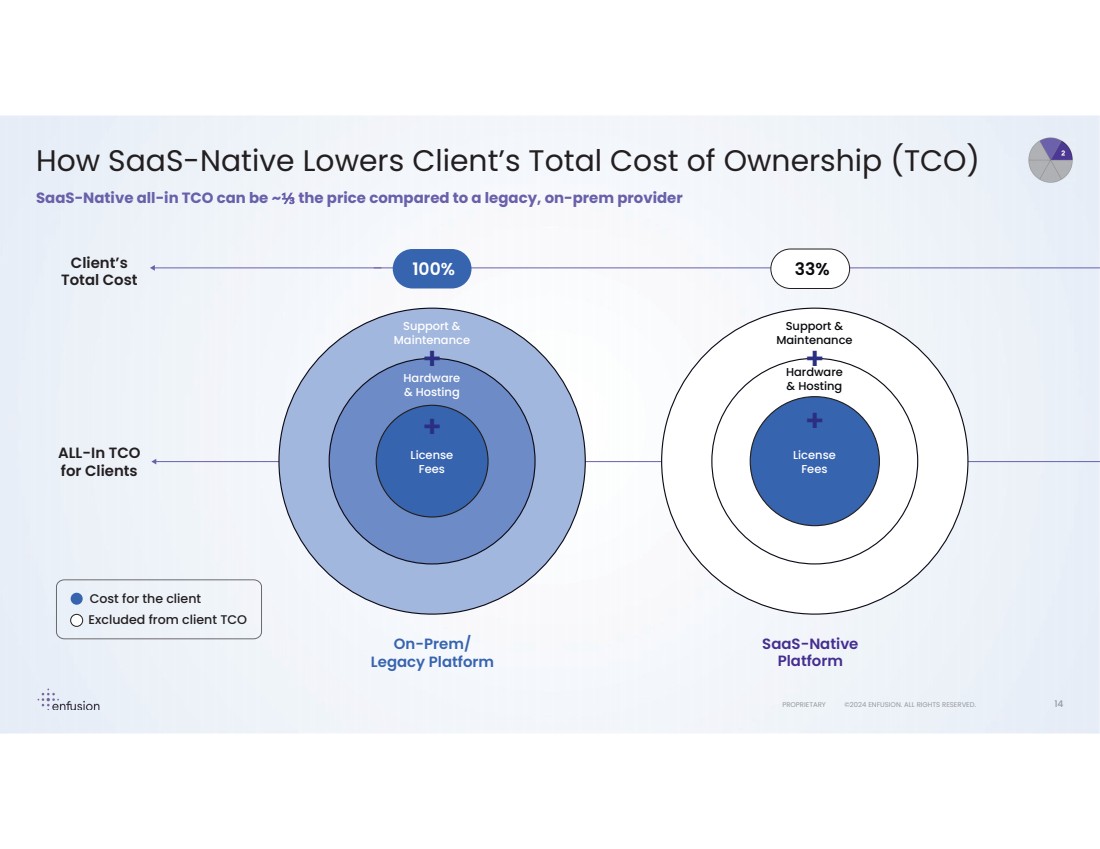
PROPRIETARY ©2024 ENFUSION. ALL RIGHTS RESERVED. How SaaS-Native Lowers Client’s Total Cost of Ownership (TCO) SaaS-Native all-in TCO can be ~ the price compared to a legacy, on-prem provider Cost for the client 100% 33% + + Excluded from client TCO ALL-In TCO for Clients Client’s Total Cost + + On-Prem/ Legacy Platform SaaS-Native Platform License Fees Hardware & Hosting Support & Maintenance License Fees Hardware & Hosting Support & Maintenance 14 |
|
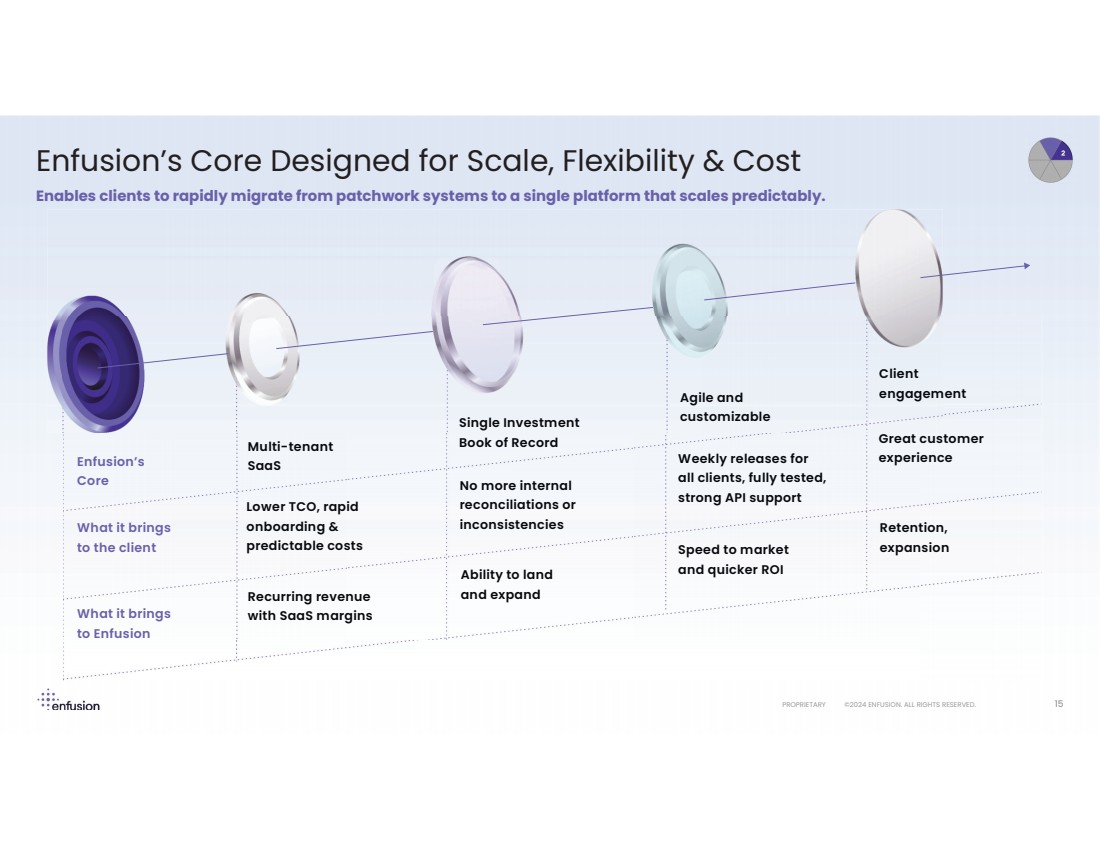
PROPRIETARY ©2024 ENFUSION. ALL RIGHTS RESERVED. 15 Enfusion’s Core Designed for Scale, Flexibility & Cost Enables clients to rapidly migrate from patchwork systems to a single platform that scales predictably. Enfusion’s Core What it brings to the client Multi-tenant SaaS Lower TCO, rapid onboarding & predictable costs Single Investment Book of Record No more internal reconciliations or inconsistencies Agile and customizable Weekly releases for all clients, fully tested, strong API support Client engagement Great customer experience What it brings to Enfusion Recurring revenue with SaaS margins Ability to land and expand Speed to market and quicker ROI Retention, expansion |
|
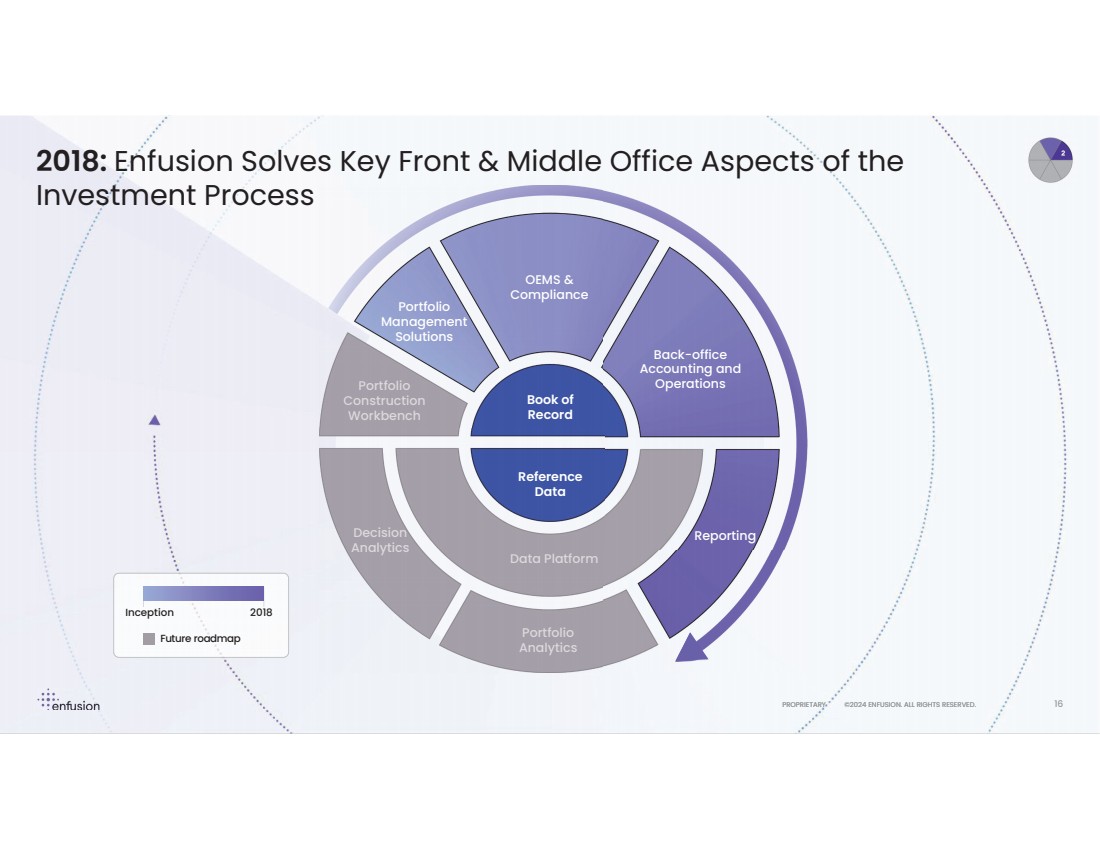
PROPRIETARY ©2024 ENFUSION. ALL RIGHTS RESERVED. 16 2018: Enfusion Solves Key Front & Middle Office Aspects of the Investment Process OEMS & Compliance Portfolio Management Solutions Portfolio Construction Workbench Decision Analytics Data Platform Portfolio Analytics Reference Data Book of Record Inception 2018 Back-office Accounting and Operations Reporting Future roadmap |
|
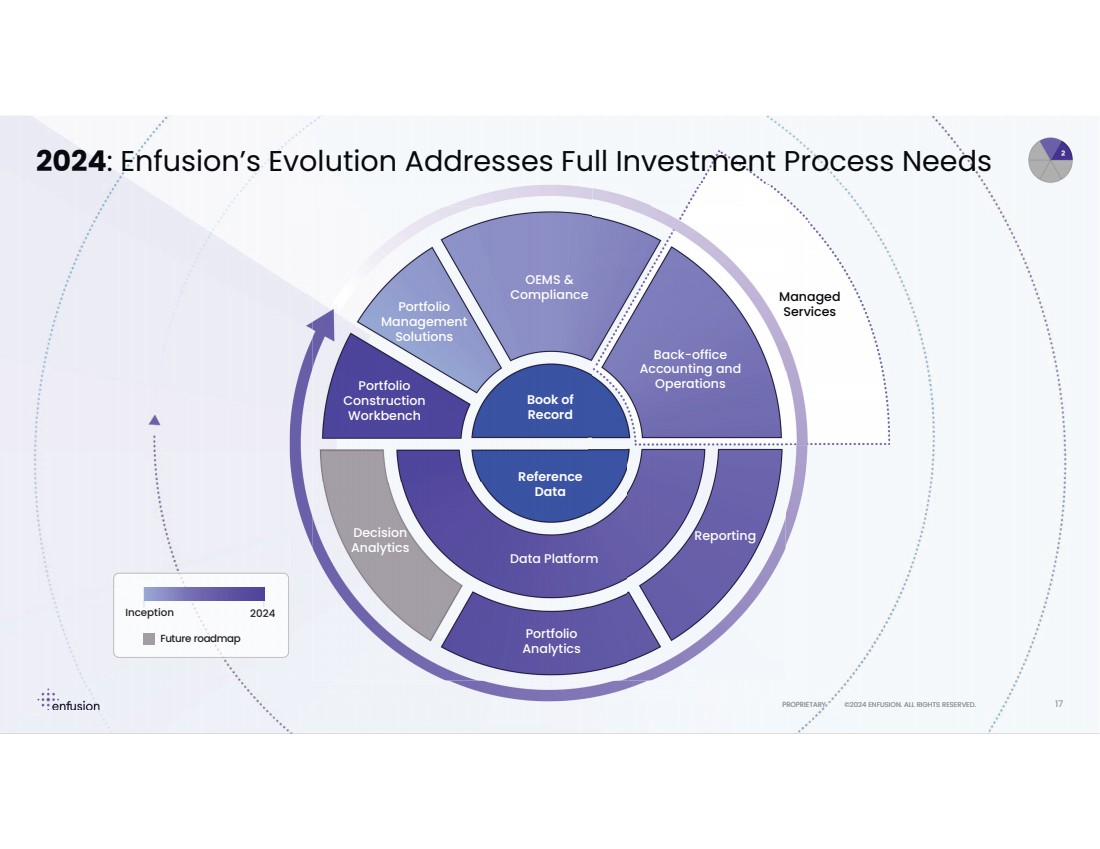
PROPRIETARY ©2024 ENFUSION. ALL RIGHTS RESERVED. PROPRIE 17 OEMS & Compliance Portfolio Management Solutions Portfolio Construction Workbench Decision Analytics Data Platform Portfolio Analytics Reporting Reference Data Book of Record Managed Services 2024: Enfusion’s Evolution Addresses Full Investment Process Needs Back-office Accounting and Operations Future roadmap Inception 2024 |
|
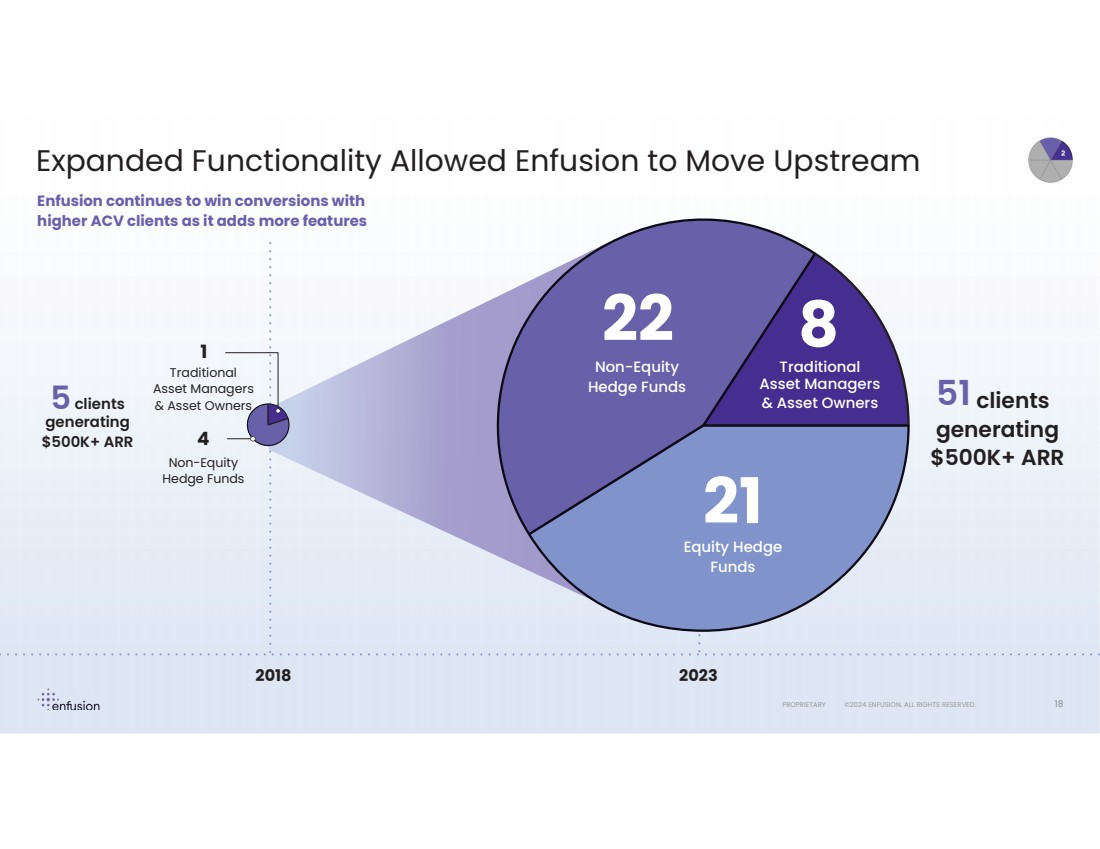
PROPRIETARY ©2024 ENFUSION. ALL RIGHTS RESERVED. Expanded Functionality Allowed Enfusion to Move Upstream 18 2018 2023 1 22 21 4 Traditional Asset Managers & Asset Owners Non-Equity Hedge Funds 5clients generating $500K+ ARR clients generating $500K+ ARR Non-Equity Hedge Funds Equity Hedge Funds 51 8 Traditional Asset Managers & Asset Owners Enfusion continues to win conversions with higher ACV clients as it adds more features |
|
PROPRIETARY ©2024 ENFUSION. ALL RIGHTS RESERVED. 19 |
|
Q&A |
|
Total Addressable Market Analysis & Product Strategy Brad LeClair Head of Product |
|
PROPRIETARY ©2024 ENFUSION. ALL RIGHTS RESERVED. 22 Enfusion: Expanding TAM Serviceability Serviceable Addressable Market (SAM) is built up from a bottoms-up approach $15.3B $8.8B 0.2% $1.2B $700M 6.4% $1.3B $1B 5.3% $7.2B TAM SAM Captured % of TAM Traditional Asset Managers & Asset Owners Equity Hedge Funds Non-Equity Hedge Funds Private Equity & Private Credit Firms Totals: $25B TAM & $10.5B SAM The above figures are based on Enfusion’s internal estimates incorporating data from HFM/With Intelligence, Preqin, IPREO and other media sources |
|
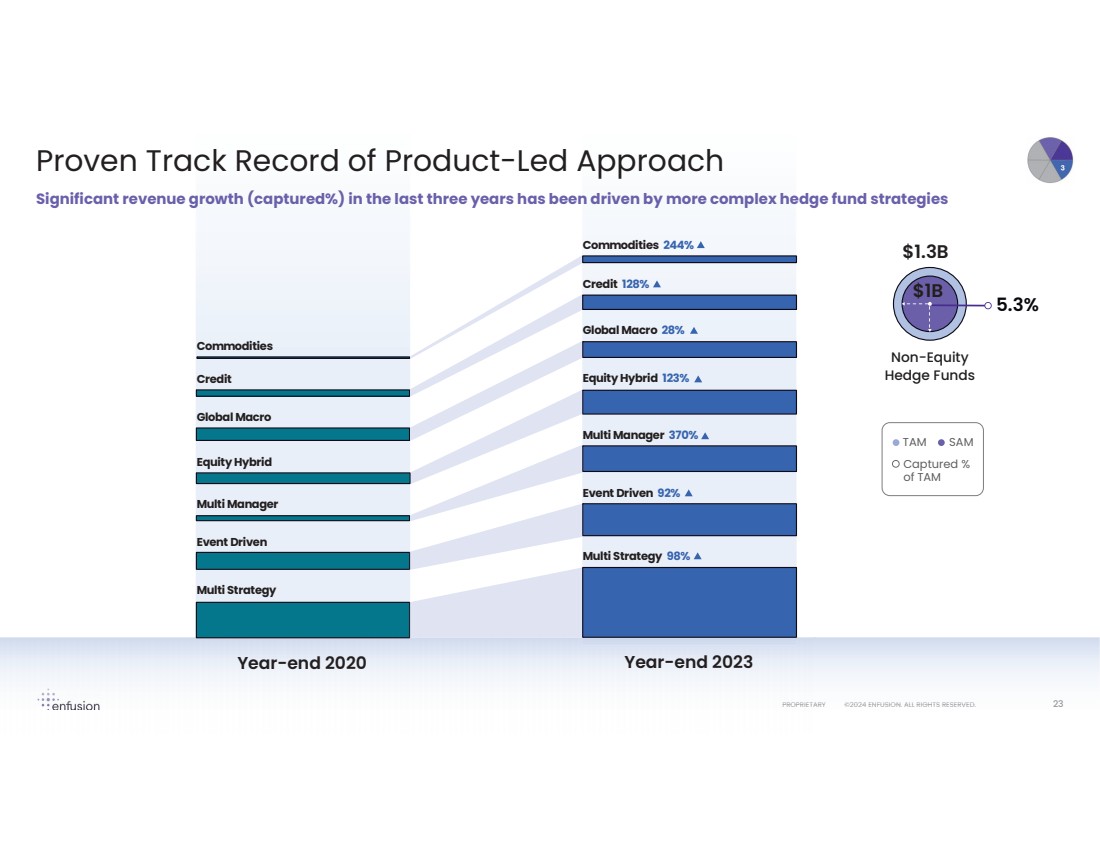
PROPRIETARY ©2024 ENFUSION. ALL RIGHTS RESERVED. PROPRIETARY ©2024 E NFUSION. ALL RIGHTS RESERVED. Commodities Year-end 2020 Year-end 2023 TAM SAM Captured % of TAM $1.3B $1B 5.3% Non-Equity Credit Hedge Funds Global Macro Equity Hybrid Multi Manager Event Driven Multi Strategy Commodities 244% Credit 128% Global Macro 28% Equity Hybrid 123% Multi Manager 370% Event Driven 92% Multi Strategy 98% 23 Significant revenue growth (captured%) in the last three years has been driven by more complex hedge fund strategies Proven Track Record of Product-Led Approach |
|
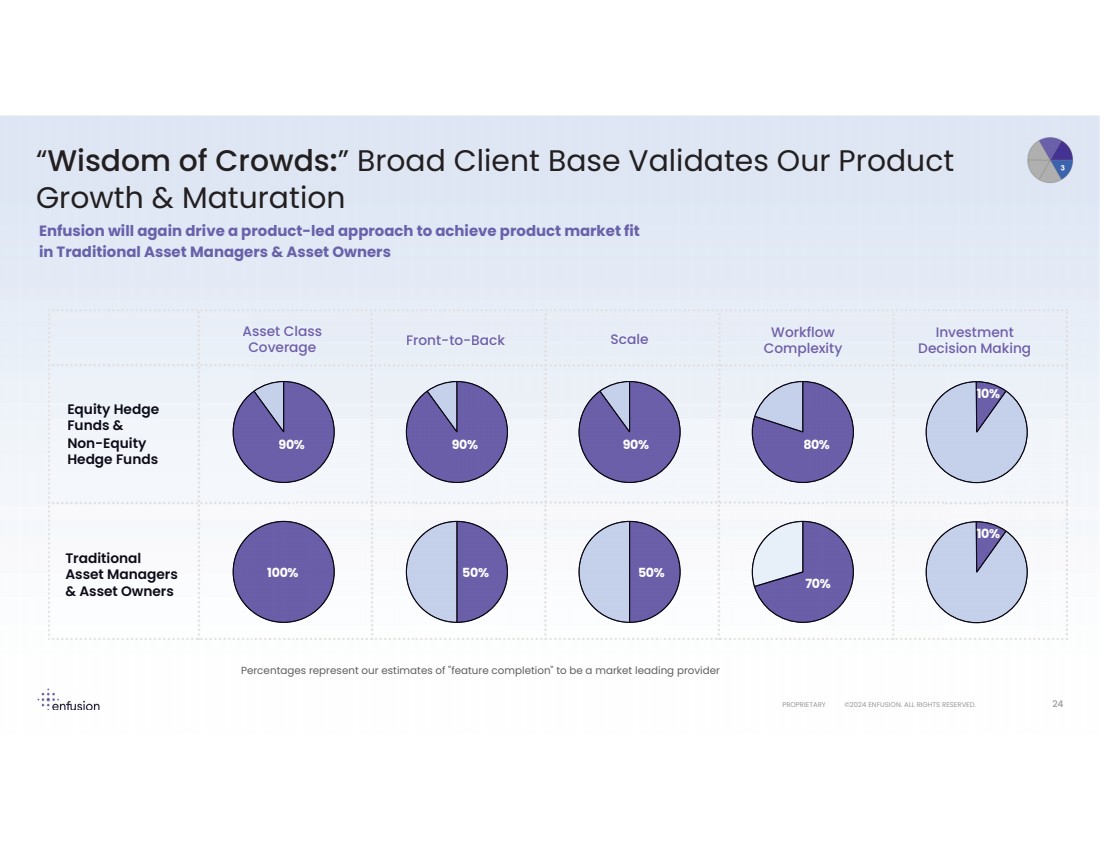
PROPRIETARY ©2024 ENFUSION. ALL RIGHTS RESERVED. 24 “Wisdom of Crowds:” Broad Client Base Validates Our Product Growth & Maturation Enfusion will again drive a product-led approach to achieve product market fit in Traditional Asset Managers & Asset Owners Front-to-Back 50% Traditional Asset Managers & Asset Owners 90% 90% 100% Workflow Complexity Scale 50% 90% Investment Decision Making 10% 10% 80% 70% Asset Class Coverage Equity Hedge Funds & Non-Equity Hedge Funds Percentages represent our estimates of "feature completion" to be a market leading provider Front-to-Back 50% Traditional Asset Managers & Asset Owners 90% 90% 100% Workflow Complexity Scale 50% 90% Investment Decision Making 10% 10% 80% 70% Asset Class Coverage Equity Hedge Funds & Non-Equity Hedge Funds |
|
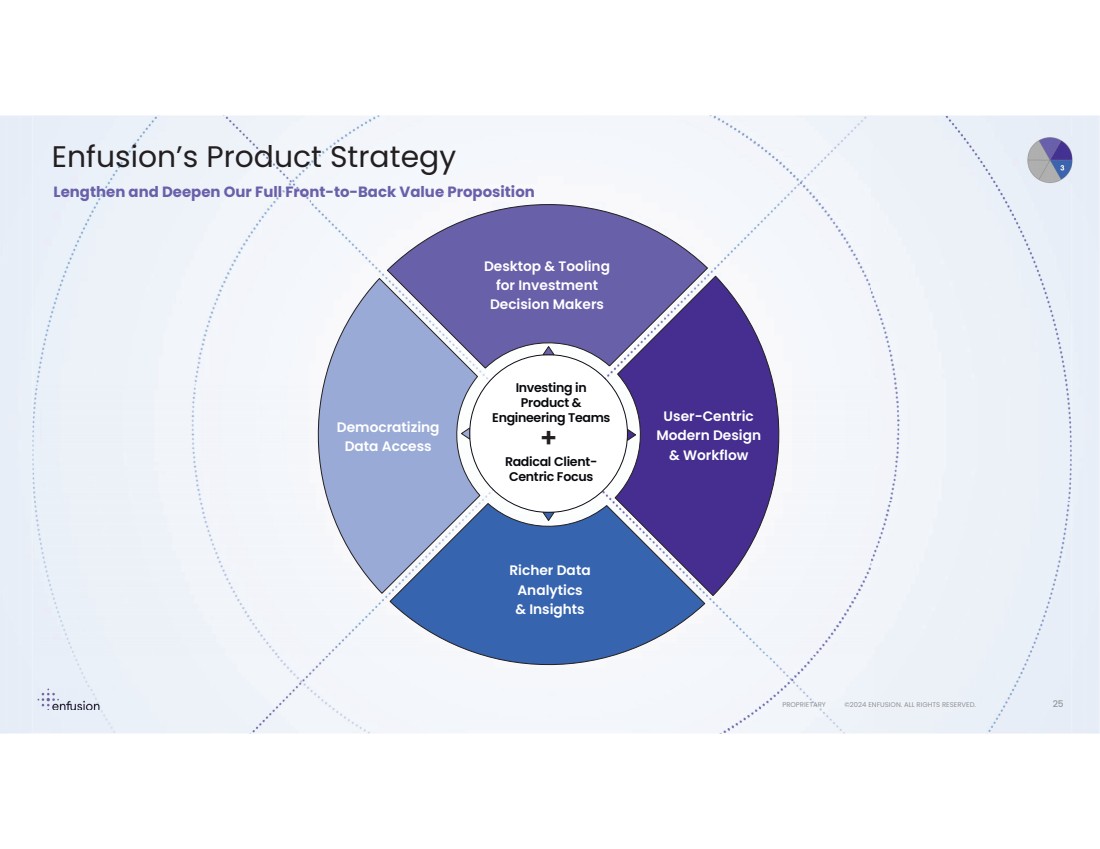
PROPRIETARY ©2024 ENFUSION. ALL RIGHTS RESERVED. PROPRIETARY ©2024 ENFUSION. ALL RIGHTS RESERVED. 25 Desktop & Tooling for Investment Decision Makers + User-Centric Modern Design & Workflow Richer Data Analytics & Insights Democratizing Data Access Investing in Product & Engineering Teams Radical Client-Centric Focus Enfusion’s Product Strategy Lengthen and Deepen Our Full Front-to-Back Value Proposition |
|
Q&A |
|
Go-to-Market Strategy: Product Led Strategy and Client Evangelism Dan Jacobs Chief Revenue Officer |
|
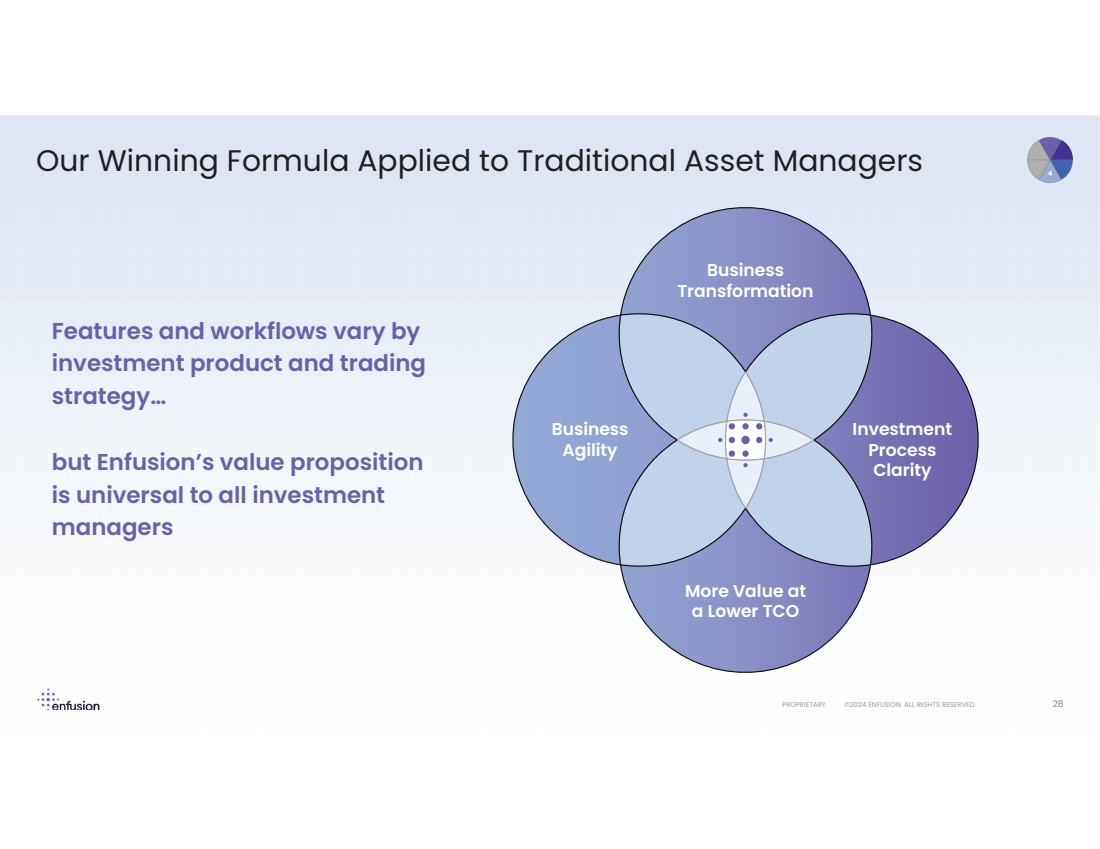
PROPRIETARY ©2024 ENFUSION. ALL RIGHTS RESERVED. Features and workflows vary by investment product and trading strategy… but Enfusion’s value proposition is universal to all investment managers 28 Our Winning Formula Applied to Traditional Asset Managers Investment Process Clarity Business Transformation Business Agility More Value at a Lower TCO |
|
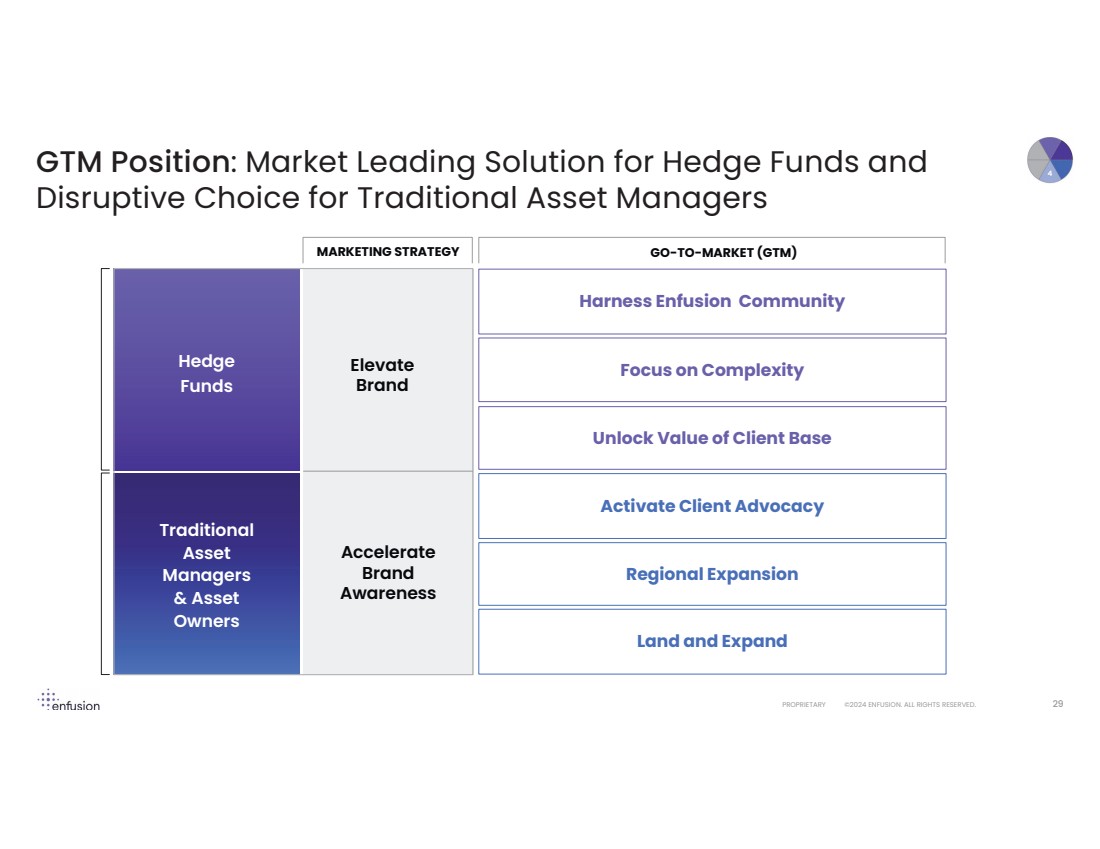
PROPRIETARY ©2024 ENFUSION. ALL RIGHTS RESERVED. 29 GTM Position: Market Leading Solution for Hedge Funds and Disruptive Choice for Traditional Asset Managers Hedge Funds 1 MARKETING STRATEGY Elevate Brand Accelerate Brand Awareness GO-TO-MARKET (GTM) Land and Expand Harness Enfusion Community Unlock Value of Client Base Regional Expansion Activate Client Advocacy Focus on Complexity Traditional Asset Managers & Asset Owners |
|
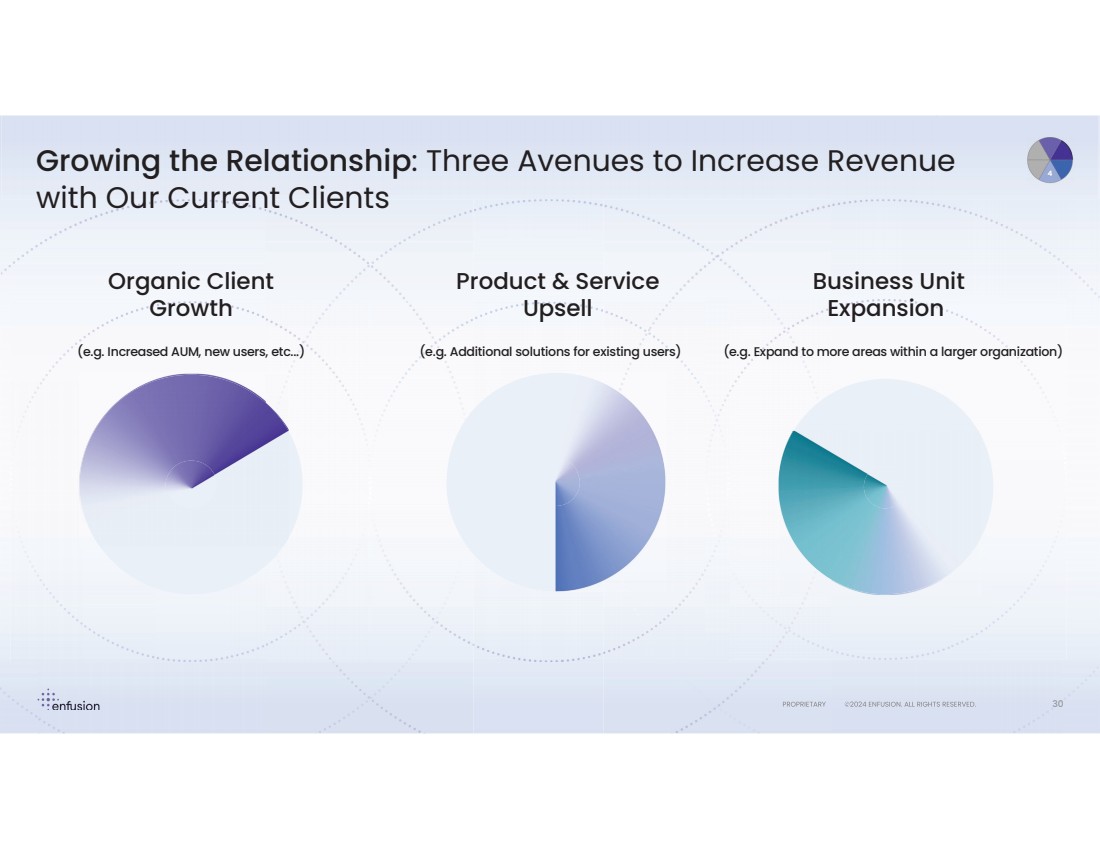
PROPRIETARY ©2024 ENFUSION. ALL RIGHTS RESERVED. PROPRIETARY©2024 ENFUSION. ALL RIGHTSRESERVED. Organic Client Growth (e.g. Increased AUM, new users, etc...) Product & Service Upsell (e.g. Additional solutions for existing users) Business Unit Expansion (e.g. Expand to more areas within a larger organization) 30 Growing the Relationship: Three Avenues to Increase Revenue with Our Current Clients |
|
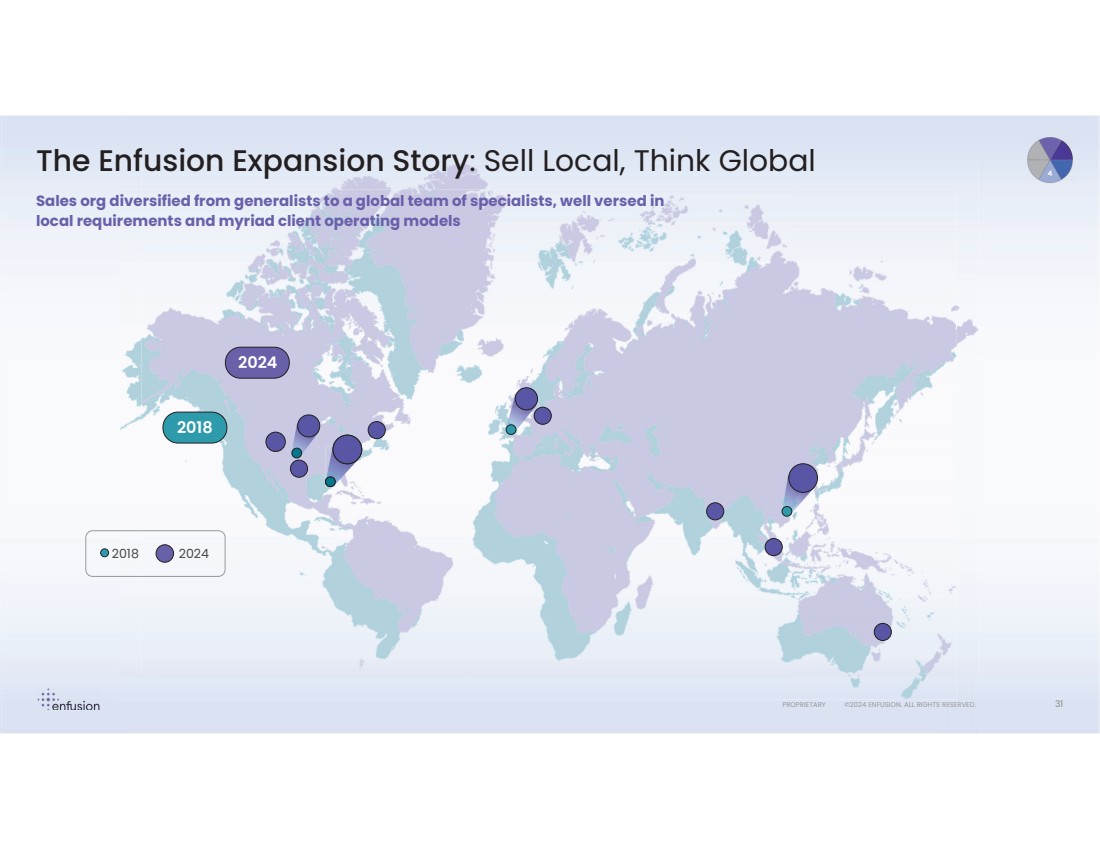
PROPRIETARY ©2024 ENFUSION. ALL RIGHTS RESERVED. PROPRIETARY ©2024 ENFUSION. ALL RIGHTS RESERVED. RIETARY ©2024 ENFUSION. ALL RIGHTS RESERVED. The Enfusion Expansion Story: Sell Local, Think Global Sales org diversified from generalists to a global team of specialists, well versed in local requirements and myriad client operating models 2018 2018 2024 2024 31 |
|
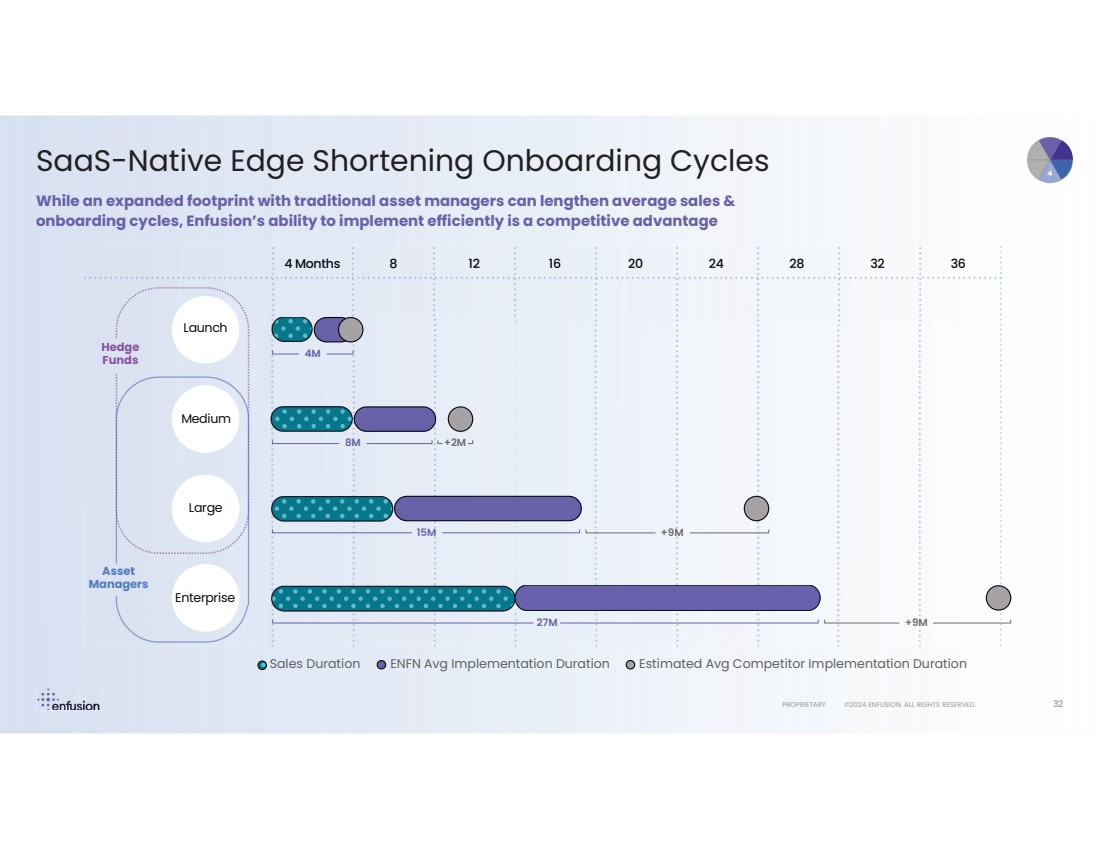
PROPRIETARY ©2024 ENFUSION. ALL RIGHTS RESERVED. 32 SaaS-Native Edge Shortening Onboarding Cycles While an expanded footprint with traditional asset managers can lengthen average sales & onboarding cycles, Enfusion’s ability to implement efficiently is a competitive advantage 4 Months Hedge Funds 8 12 16 20 24 28 32 36 Launch Medium Large Enterprise 4M 8M +2M +9M +9M 15M 27M Sales Duration ENFN Avg Implementation Duration Estimated Avg Competitor Implementation Duration Asset Managers |
|
Q&A |
|
PROPRIETARY ©2024 ENFUSION. ALL RIGHTS RESERVED. 34 Fireside Chat: Sculptor Capital Management & PanAgora Asset Management Lotte Tønsberg EMEA Head of Sales Srinivas Vasantharajan Chief Information Officer Will Pearce Senior Trader |
|
Financial: Revenue & Margin Trajectory Brad Herring Chief Financial Officer |
|
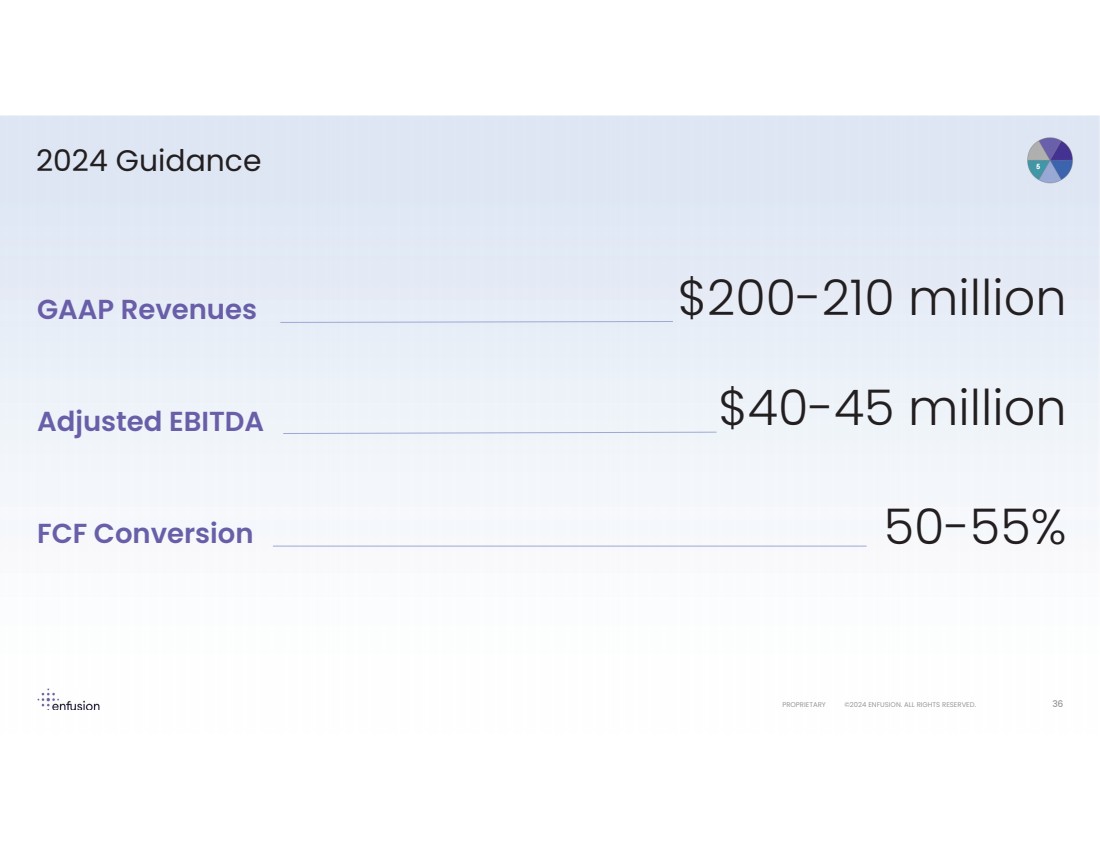
PROPRIETARY ©2024 ENFUSION. ALL RIGHTS RESERVED. 36 2024 Guidance GAAP Revenues $200-210 million $40-45 million 50-55% Adjusted EBITDA FCF Conversion |
|
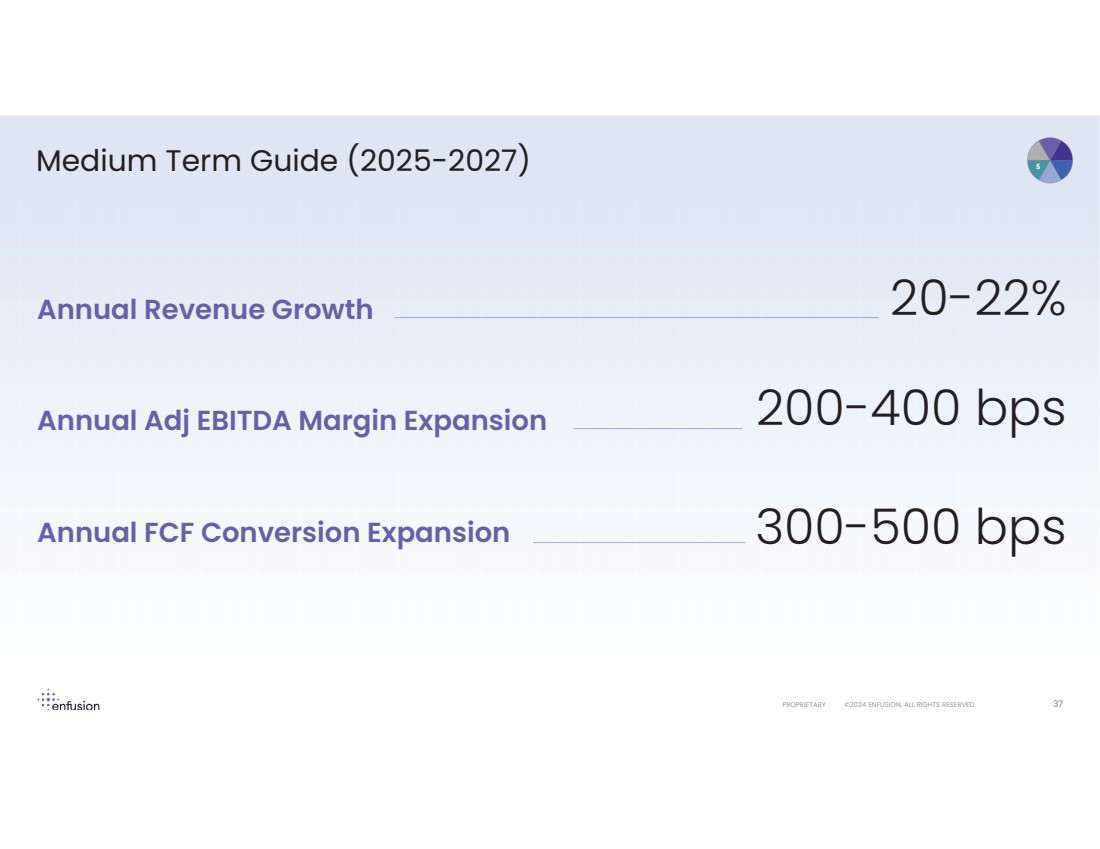
PROPRIETARY ©2024 ENFUSION. ALL RIGHTS RESERVED. 37 Medium Term Guide (2025-2027) Annual Revenue Growth 20-22% 200-400 bps 300-500 bps Annual Adj EBITDA Margin Expansion Annual FCF Conversion Expansion |
|
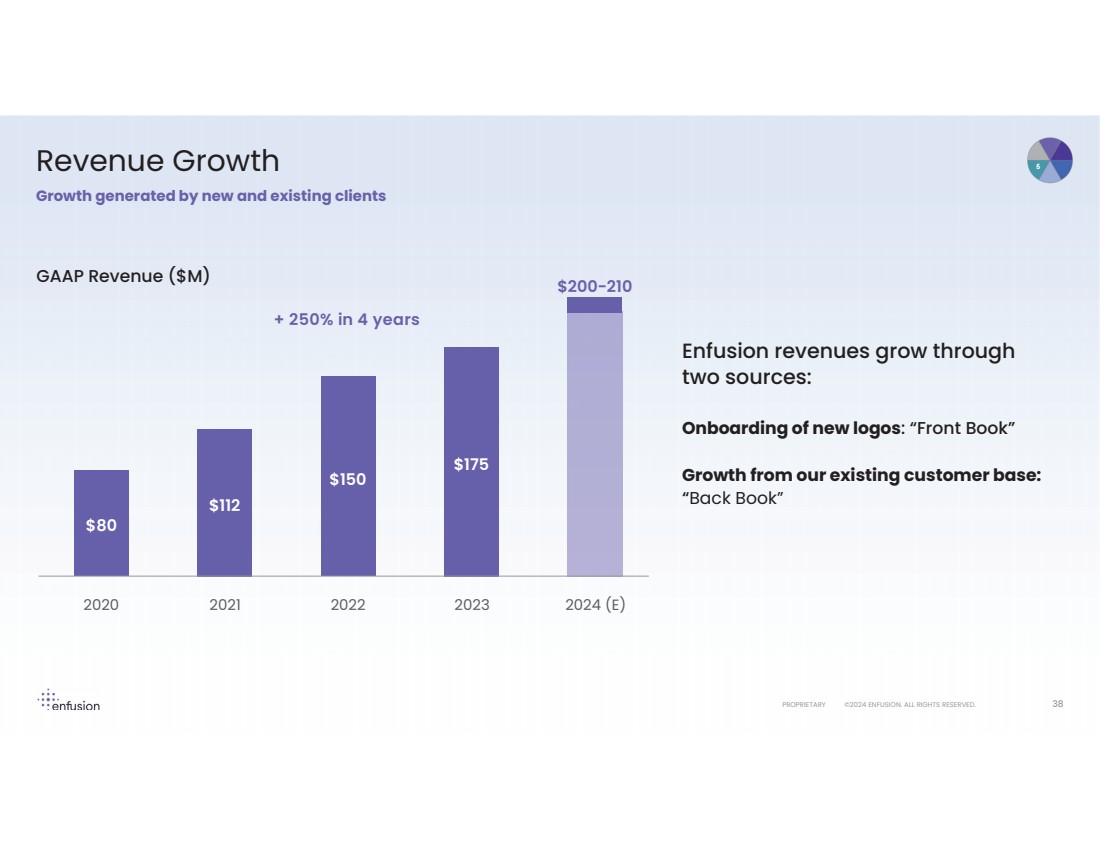
PROPRIETARY ©2024 ENFUSION. ALL RIGHTS RESERVED. 38 Revenue Growth Growth generated by new and existing clients $112 $80 $200-210 2024 (E) $175 2023 $150 2020 2021 2022 + 250% in 4 years Onboarding of new logos: “Front Book” Growth from our existing customer base: “Back Book” Enfusion revenues grow through two sources: GAAP Revenue ($M) |
|
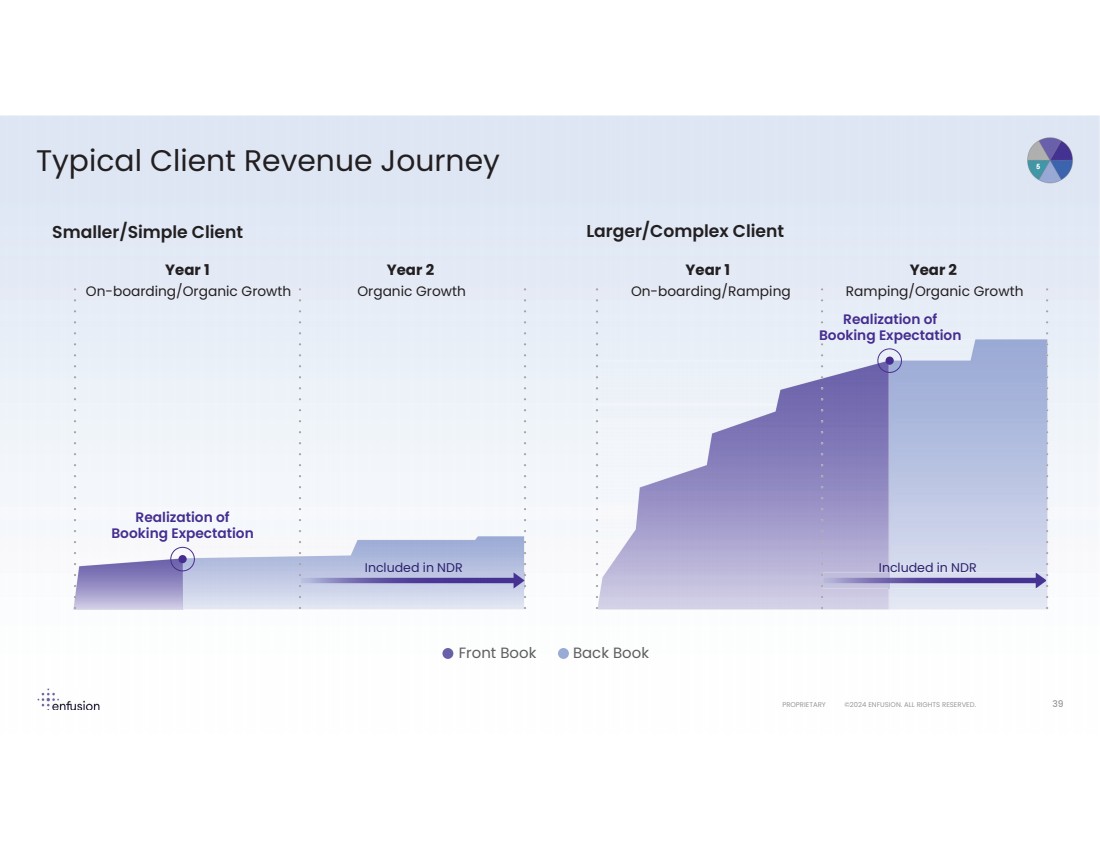
PROPRIETARY ©2024 ENFUSION. ALL RIGHTS RESERVED. 39 Typical Client Revenue Journey Smaller/Simple Client Year 1 On-boarding/Organic Growth Year 2 Organic Growth Included in NDR Realization of Booking Expectation Larger/Complex Client Year 1 On-boarding/Ramping Year 2 Ramping/Organic Growth Front Book Back Book Included in NDR Realization of Booking Expectation |
|
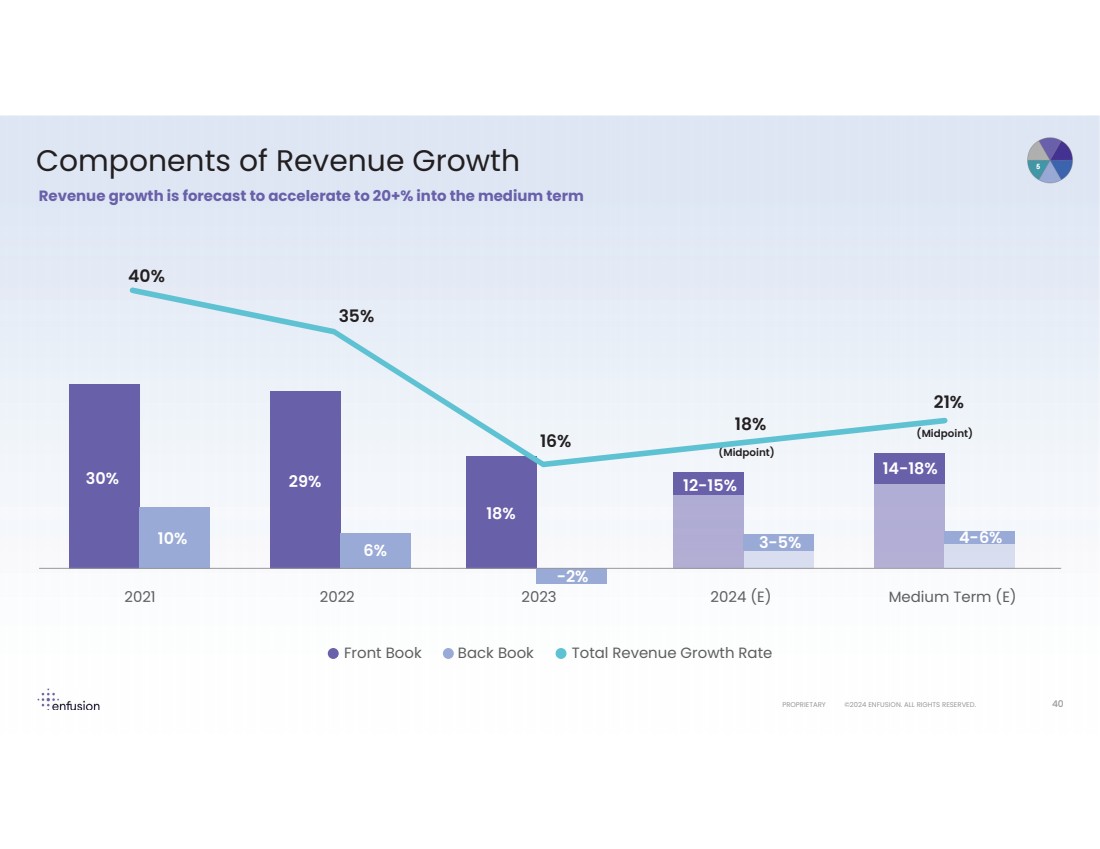
PROPRIETARY ©2024 ENFUSION. ALL RIGHTS RESERVED. 40 Components of Revenue Growth Revenue growth is forecast to accelerate to 20+% into the medium term 40% 35% 16% (Midpoint) (Midpoint) 2021 2022 2023 2024 (E) Medium Term (E) 30% 10% 3-5% 12-15% 4-6% 14-18% 29% 6% -2% 18% 18% 21% Front Book Back Book Total Revenue Growth Rate |
|
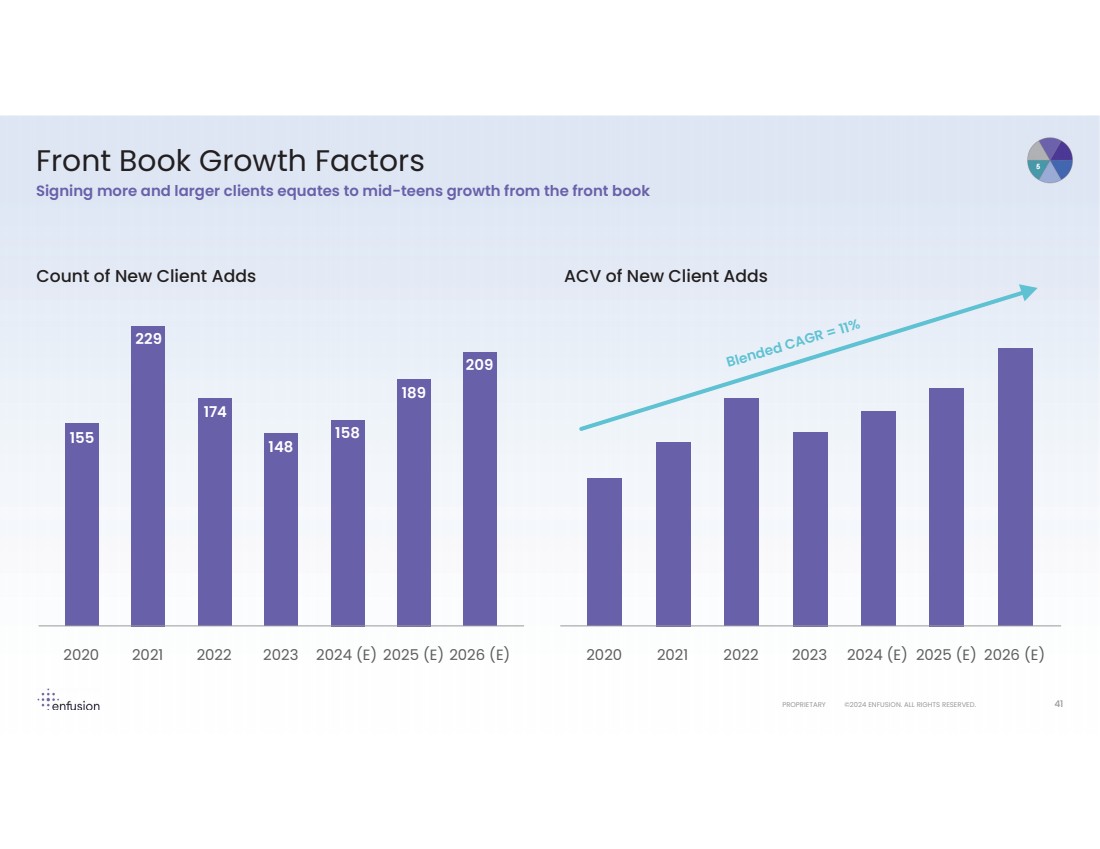
PROPRIETARY ©2024 ENFUSION. ALL RIGHTS RESERVED. 41 Front Book Growth Factors Signing more and larger clients equates to mid-teens growth from the front book Blended CAGR = 11% 2020 2021 2022 2023 2024 (E) 2025 (E) 2026 (E) Count of New Client Adds ACV of New Client Adds 2020 2021 2022 2023 2024 (E) 2025 (E) 2026 (E) 155 229 174 148 158 189 209 |
|
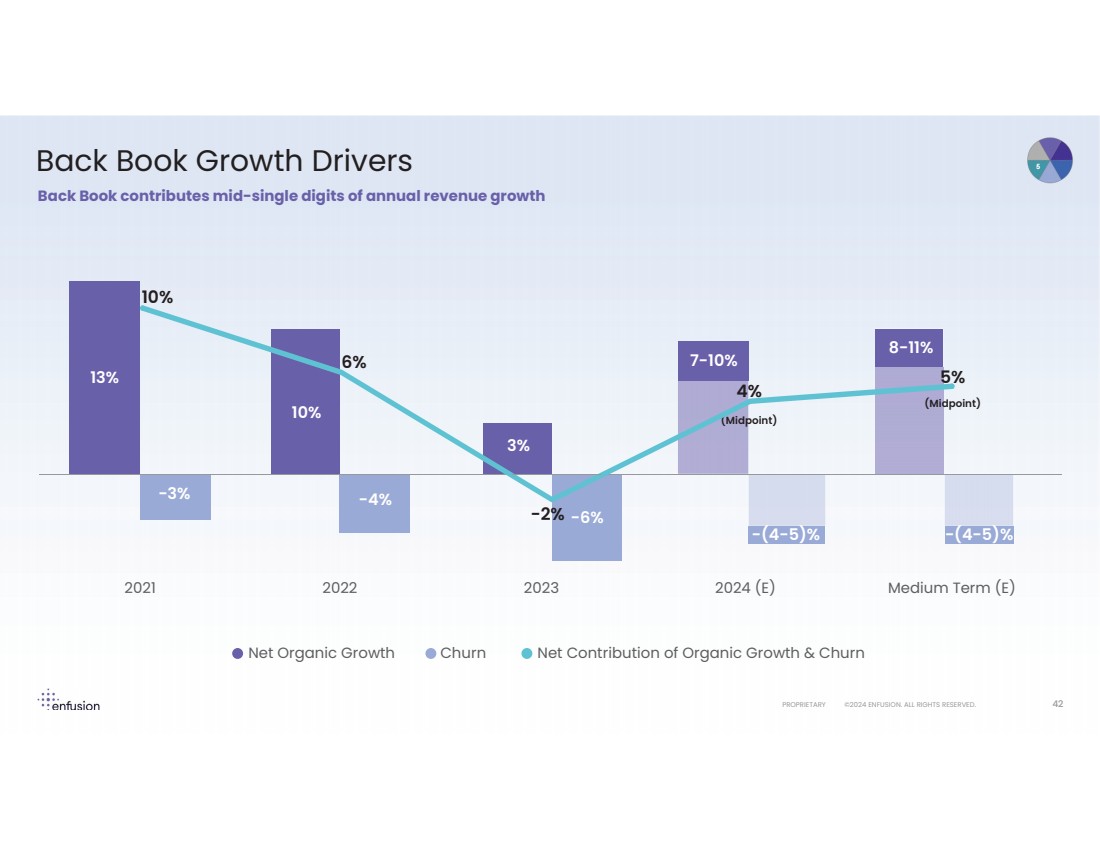
PROPRIETARY ©2024 ENFUSION. ALL RIGHTS RESERVED. 42 Back Book Growth Drivers Back Book contributes mid-single digits of annual revenue growth 13% 10% 6% -2% (Midpoint) (Midpoint) -3% 10% 3% 7-10% 8-11% -(4-5)% -4% -6% 2021 2022 2023 2024 (E) Medium Term (E) 4% 5% -(4-5)% Net Organic Growth Churn Net Contribution of Organic Growth & Churn |
|
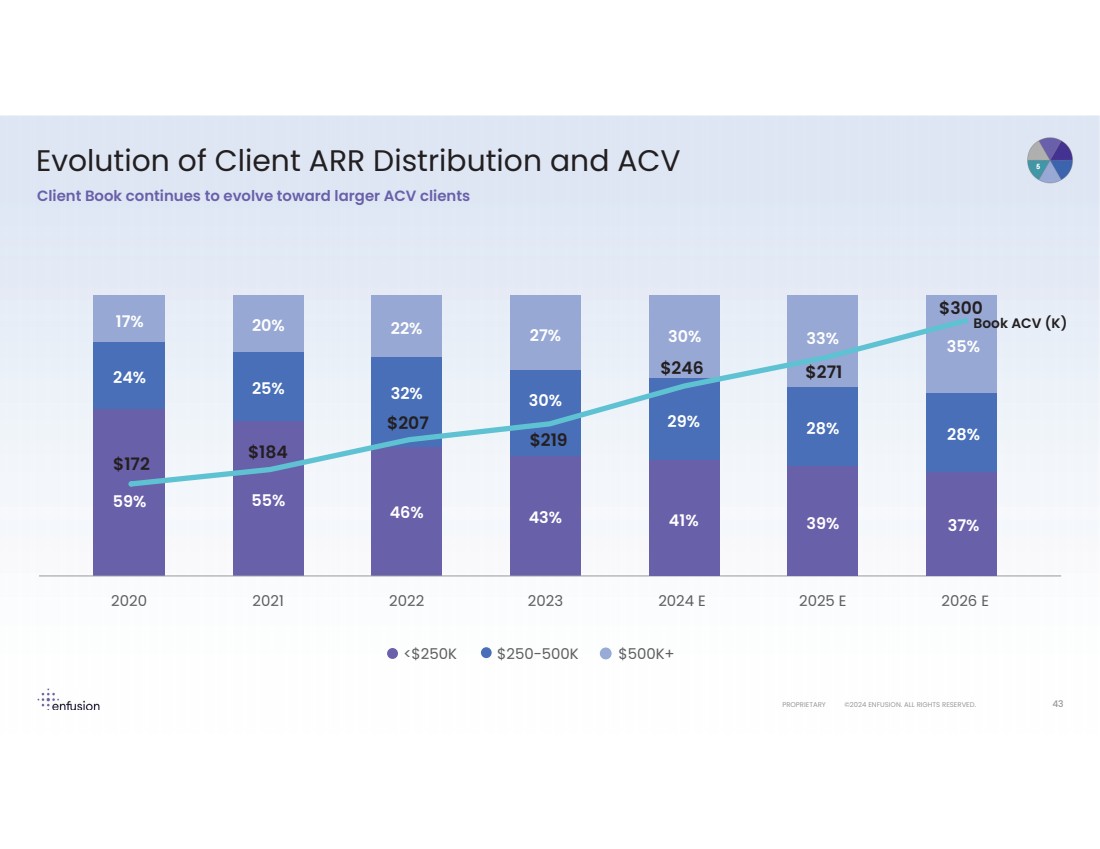
PROPRIETARY ©2024 ENFUSION. ALL RIGHTS RESERVED. 43 Evolution of Client ARR Distribution and ACV Client Book continues to evolve toward larger ACV clients 59% 24% 55% 25% 32% 46% 30% 43% 2020 2021 2022 2023 2024 E 2025 E 2026 E 17% 20% 22% 27% 28% 39% 33% 28% 37% 35% $172 $184 $207 $219 29% 41% 30% $246 $271 $300Book ACV (K) <$250K $250-500K $500K+ |
|
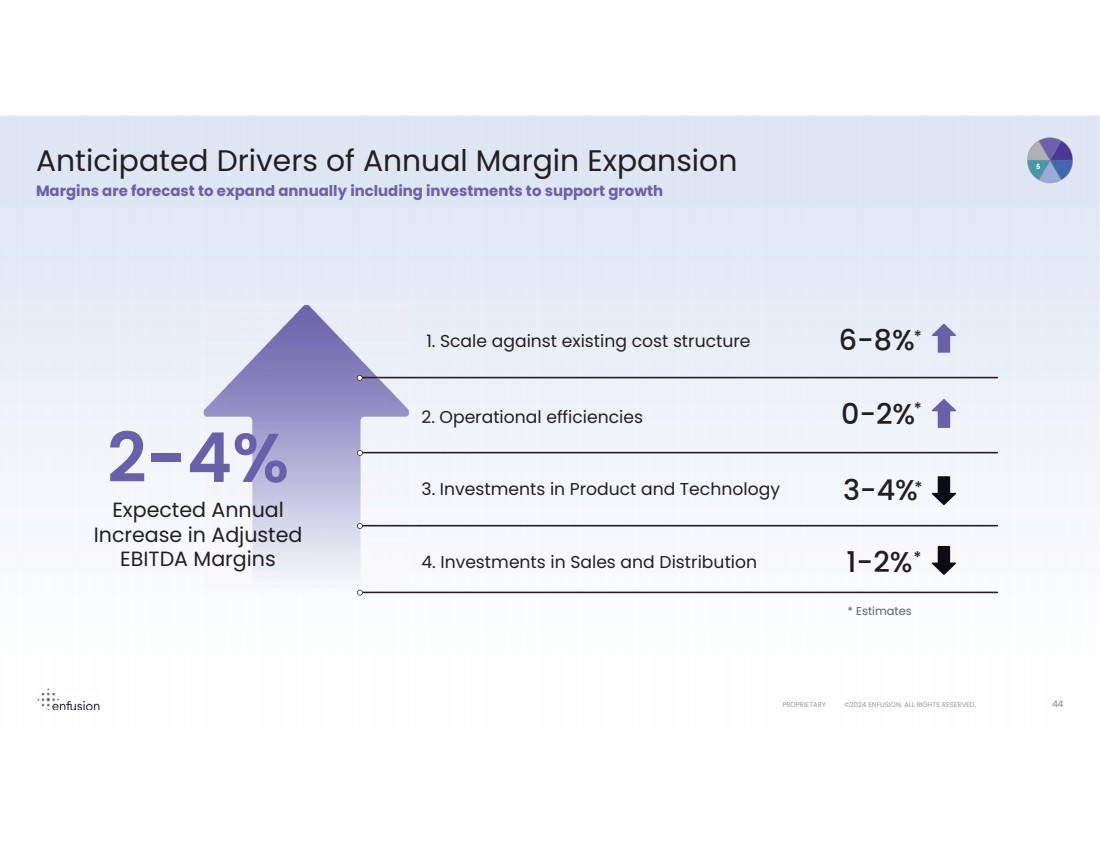
PROPRIETARY ©2024 ENFUSION. ALL RIGHTS RESERVED. 44 Anticipated Drivers of Annual Margin Expansion Margins are forecast to expand annually including investments to support growth 6-8% 3. Investments in Product and Technology 2. Operational efficiencies 4. Investments in Sales and Distribution 1. Scale against existing cost structure 0-2% 3-4% 1-2% * Estimates 2-4% Expected Annual Increase in Adjusted EBITDA Margins * * * * |
|
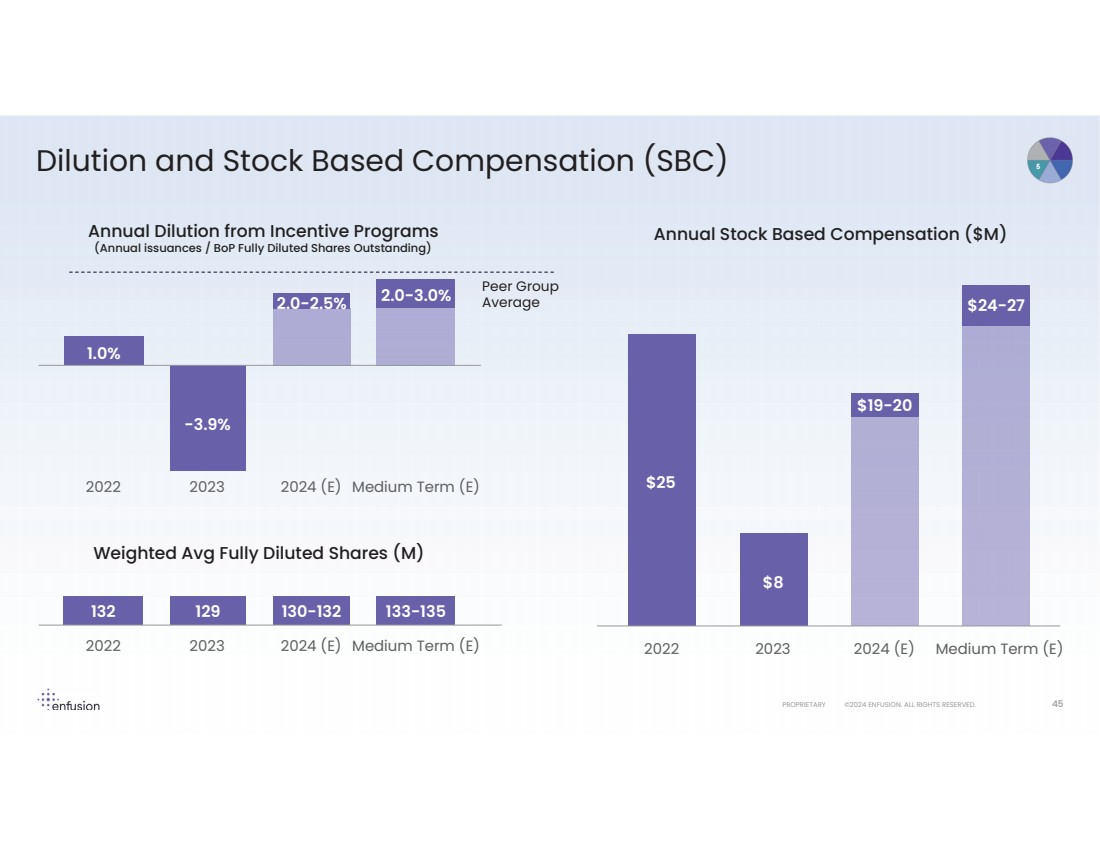
PROPRIETARY ©2024 ENFUSION. ALL RIGHTS RESERVED. 45 Dilution and Stock Based Compensation (SBC) 2022 2023 2024 (E) Medium Term (E) 1.0% -3.9% 2.0-2.5% 2.0-3.0% Annual Dilution from Incentive Programs (Annual issuances / BoP Fully Diluted Shares Outstanding) Annual Stock Based Compensation ($M) Weighted Avg Fully Diluted Shares (M) 132 129 130-132 133-135 2022 2023 2024 (E) Medium Term (E) $25 $8 $19-20 $24-27 2022 2023 2024 (E) Medium Term (E) Peer Group Average |
|
Q&A |
|
Closing Remarks Oleg Movchan Chief Executive Officer |
|
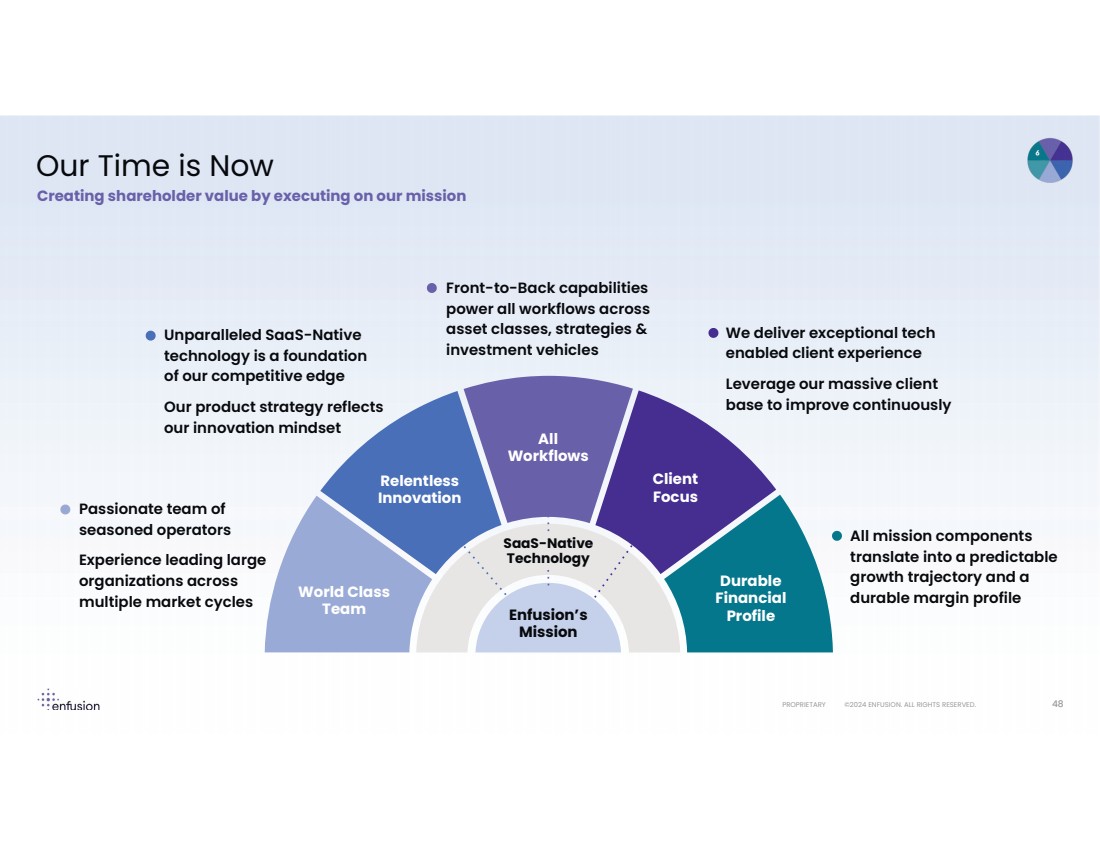
PROPRIETARY ©2024 ENFUSION. ALL RIGHTS RESERVED. 48 Our Time is Now Creating shareholder value by executing on our mission All Workflows Durable Financial Profile Relentless Innovation World Class Team Enfusion’s Mission We deliver exceptional tech enabled client experience Leverage our massive client base to improve continuously All mission components translate into a predictable growth trajectory and a durable margin profile Front-to-Back capabilities power all workflows across asset classes, strategies & investment vehicles Unparalleled SaaS-Native technology is a foundation of our competitive edge Our product strategy reflects our innovation mindset Passionate team of seasoned operators Experience leading large organizations across multiple market cycles Client Focus SaaS-Native Technology |
|
Q&A |
|
Thank you |