UNITED STATES
SECURITIES AND EXCHANGE COMMISSION
Washington, D.C. 20549
FORM 8-K
CURRENT REPORT PURSUANT
TO SECTION 13 or 15(d) OF THE
SECURITIES EXCHANGE ACT OF 1934
Date of Report (Date of earliest event reported): March 12, 2024
Enfusion, Inc.
(Exact name of registrant as specified in its charter)
Delaware |
|
001-40949 |
|
87-1268462 |
(State or other jurisdiction |
|
(Commission File Number) |
|
(I.R.S. Employer Identification No.) |
125 South Clark Street, Suite 750 |
60603 |
Chicago, Illinois |
|
(Address of principal executive offices) |
(Zip code) |
|
|
(312) 253-9800 | |
(Registrant’s telephone number, including area code) | |
N/A
(Former name or former address, if changed since last report)
Check the appropriate box below if the Form 8-K filing is intended to simultaneously satisfy the filing obligation of the registrant under any of the following provisions:
☐ |
Written communications pursuant to Rule 425 under the Securities Act (17 CFR 230.425) |
☐ |
Soliciting material pursuant to Rule 14a-12 under the Exchange Act (17 CFR 240.14a-12) |
☐ |
Pre-commencement communications pursuant to Rule 14d-2(b) under the Exchange Act (17 CFR 240.14d-2(b)) |
☐ |
Pre-commencement communications pursuant to Rule 13e-4(c) under the Exchange Act (17 CFR 240.13e- 4(c)) |
Securities registered pursuant to Section 12(b) of the Act:
Title of each class |
|
Trading |
|
Name of each exchange |
Class A common stock, par value $0.001 per share |
|
ENFN |
|
New York Stock Exchange |
Indicate by check mark whether the registrant is an emerging growth company as defined in Rule 405 of the Securities Act of 1933 or Rule 12b-2 of the Securities Exchange Act of 1934.
Emerging growth company ☒
If an emerging growth company, indicate by check mark if the registrant has elected not to use the extended transition period for complying with any new or revised financial accounting standards provided pursuant to Section 13(a) of the Exchange Act. ☐
Item 2.02 - Results of Operations and Financial Condition.
On March 12, 2024, Enfusion, Inc. announced its financial results for the fiscal quarter and year ended December 31, 2023. A copy of the press release is furnished as Exhibit 99.1 to this Current Report on Form 8-K and is incorporated by reference herein.
The information in this Current Report on Form 8-K and Exhibit 99.1 attached hereto is intended to be furnished and shall not be deemed “filed” for purposes of Section 18 of the Securities Exchange Act of 1934, as amended (the “Exchange Act”), or otherwise subject to the liabilities of that section, nor shall it be deemed incorporated by reference in any filing under the Securities Act of 1933, as amended, or the Exchange Act, except as expressly set forth by specific reference in such filing.
Item 9.01 - Financial Statements and Exhibits.
(d) |
The following exhibits are being filed herewith: |
Exhibit No. |
|
Description |
99.1 |
|
Press Release issued by the registrant on March 12, 2024, furnished herewith. |
104 |
|
Cover Page Interactive Data File (embedded within the Inline XBRL document) |
SIGNATURES
Pursuant to the requirements of the Securities Exchange Act of 1934, the registrant has duly caused this report to be signed on its behalf by the undersigned hereunto duly authorized.
Date: March 12, 2024 |
ENFUSION, INC. |
|
|
|
|
|
By: |
/s/ Matthew R. Campobasso |
|
Name: |
Matthew R. Campobasso |
|
Title: |
General Counsel |
|
PROPRIETARY AND CONFIDENTIAL ©2023 ENFUSION. ALL RIGHTS RESERVED. ©2023 ENFUSION. ALL RIGHTS RESERVED. Enfusion 4Q 2023 Shareholder Letter March 2024 |
|
PROPRIETARY AND CONFIDENTIAL ©2023 ENFUSION. ALL RIGHTS RESERVED. Disclaimer 2 Forward-Looking Statements Statements we make in this presentation may include statements which are not historical facts and are considered forward-looking within the meaning of Section 27A of the Securities Act of 1933 (Securities Act) and Section 21E of the Securities Exchange Act of 1934 (Exchange Act), including expectations regarding future financial performance. These forward-looking statements are usually identified by the use of words such as “anticipates,” “believes,” “estimates,” “expects,” “intends,” “may,” “plans,” “projects,” “seeks,” “should,” “could,” “will,” and variations of such words or similar expressions. We intend these forward-looking statements to be covered by the safe harbor provisions for forward-looking statements contained in Section 27A of the Securities Act and Section 21E of the Exchange Act and are making this statement for purposes of complying with those safe harbor provisions. These forward-looking statements reflect our current views about our plans, intentions, expectations, strategies and prospects, which are based on the information currently available to us and on assumptions we have made. Although we believe that our plans, intentions, expectations, strategies and prospects as reflected in or suggested by those forward-looking statements are reasonable, we can give no assurance that the plans, intentions, expectations or strategies will be attained or achieved. Furthermore, actual results may differ materially from those described in the forward-looking statements and will be affected by a variety of risks and factors that are beyond our control. More information on these risks and other potential factors that could affect our business, financial performance and results of operations can be found in our filings with the Securities & Exchange Commission, including in the “Risk Factors” and “Management’s Discussion and Analysis of Financial Condition and Results of Operations” sections of our most recently filed periodic reports on Form 10-K and Form 10-Q. We assume no obligation to update publicly any forward-looking statements, whether as a result of new information, future events or otherwise. |
|
PROPRIETARY AND CONFIDENTIAL ©2023 ENFUSION. ALL RIGHTS RESERVED. 3 Dear Shareholders, I’m pleased to share that Enfusion ended 2023 with excellent financial performance and increased momentum as we start 2024. Our results demonstrate our ability to navigate a challenging macroeconomic backdrop while exceeding our expectations for operating margin improvement and customer wins. We continue to focus on our primary mission of powering all investment workflows with unparalleled technology, relentless innovation, and dedicated focus on our clients. 4Q23 Highlights: • The economic profile of our business continues to strengthen. Our economic trajectory inflected upward in Q423, reflected by our 14.7% revenue growth, year over year. Our net income margin remained unchanged at 1.9% year over year, while our adjusted EBITDA margins increased from 16.7% to 21.1% year over year, which represents a significant expansion compared to the same period a year ago. We anticipate our adjusted EBITDA margins will continue to improve in 2024 and follow a similar seasonal cadence as 2023. • Our business is becoming more predictable. Our increased momentum led to 45 new client wins in the fourth quarter, our largest number of quarterly client wins since 2Q22. In Europe, the Middle East, and Africa, revenue growth was particularly strong this quarter, up 24.4%, year over year, and included the addition of our first asset manager in Belgium and a large multifamily office in Sweden. Revenue in the Americas grew 15.3% year over year, and included the addition of the Utah Retirement System, while Asia Pacific revenue grew 7.4% year over year, and included a notable client conversion from an asset management arm of a large corporation headquartered in South Korea. As our client base continues to expand geographically and we serve a wider array of client strategies, our financial results have achieved greater consistency and predictability. • We are poised for growth. Thanks to foresight and focus on execution, we believe we have successfully positioned the company for growth in 2024. Our product strategy over the past 18 months successfully expanded our ability to support non-equity trading strategies and enhance our portfolio construction capabilities. These investments are already paying dividends as we registered 2.5 times as many sales to investment managers whose primary trading strategy is credit in 2023 compared to the year prior. Similarly, we have continued our journey in strengthening our presence with traditional long-only strategies, highlighted by the release of Portfolio Workbench, which is a fundamental part of the portfolio construction process and has been well received by both traditional and alternative asset managers. Notably, as our client base shifts up-market, our onboarding process becomes faster and more streamlined relative to our competition, while still requiring a high level of customization and collaboration that results in building trust and deep relationships with our clients. This quarter’s strong performance wraps up a solid year and validates our strategy. We anticipate continued double-digit revenue growth in 2024, which we expect will allow us to further invest in our best-in-class technology while simultaneously improving profitability. Sincerely, Oleg Movchan Chief Executive Officer |
|
PROPRIETARY AND CONFIDENTIAL ©2023 ENFUSION. ALL RIGHTS RESERVED. To power all investment workflows with our unparalleled technology, relentless innovation, and dedicated focus on clients Our mission 4 |
|
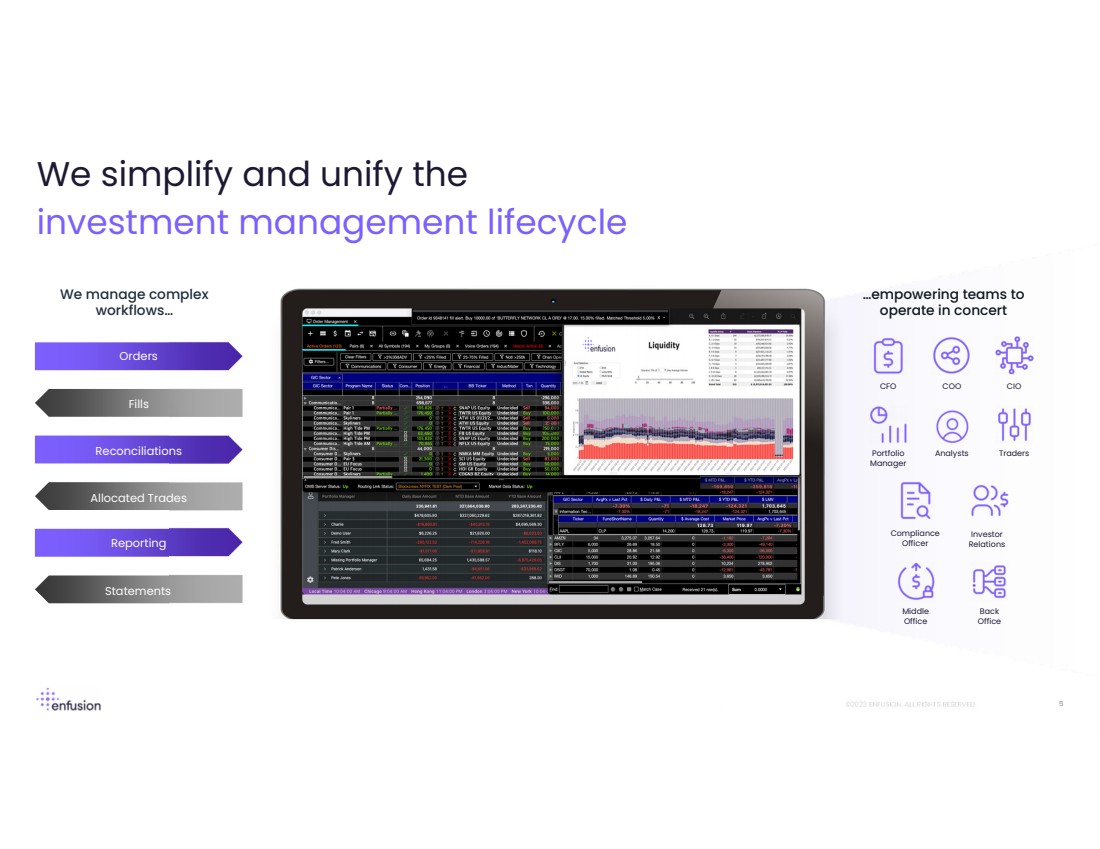
PROPRIETARY AND CONFIDENTIAL ©2023 ENFUSION. ALL RIGHTS RESERVED. …empowering teams to operate in concert CFO COO CIO Portfolio Manager Analysts Traders Compliance Officer Investor Relations Middle Office Back Office We simplify and unify the investment management lifecycle We manage complex workflows… Orders Fills Reconciliations Allocated Trades Reporting Statements 5 |
|
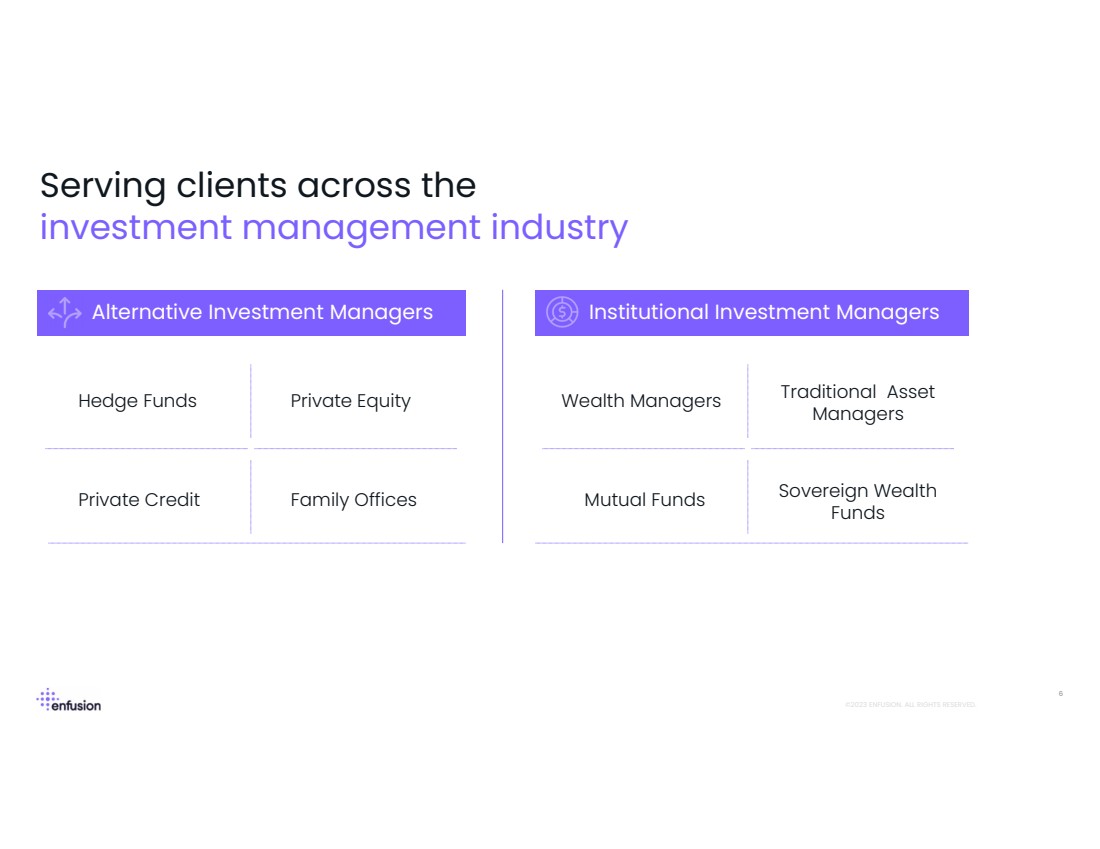
PROPRIETARY AND CONFIDENTIAL ©2023 ENFUSION. ALL RIGHTS RESERVED. 6 Serving clients across the investment management industry Alternative Investment Managers Hedge Funds Private Equity Private Credit Family Offices Institutional Investment Managers Wealth Managers Traditional Asset Managers Mutual Funds Sovereign Wealth Funds |
|
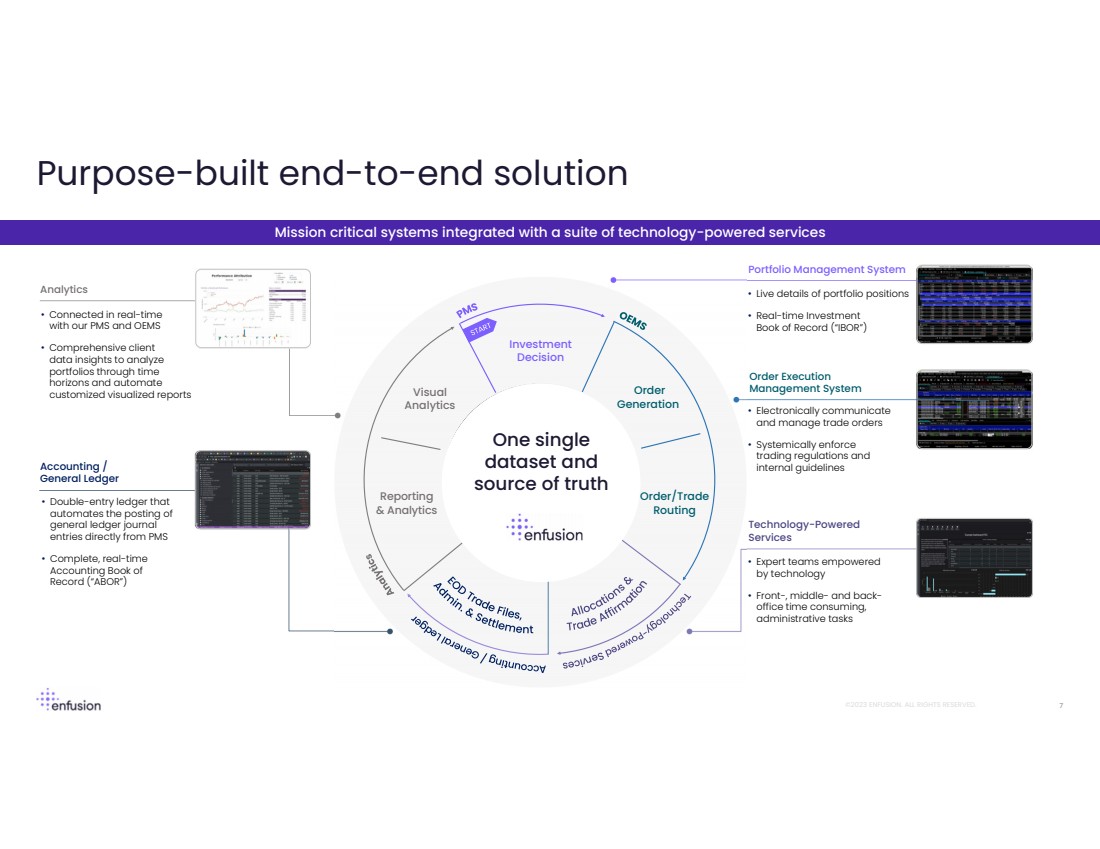
PROPRIETARY AND CONFIDENTIAL ©2023 ENFUSION. ALL RIGHTS RESERVED. Purpose-built end-to-end solution 7 Portfolio Management System Order Execution Management System Technology-Powered Services Accounting / General Ledger Analytics • Live details of portfolio positions • Real-time Investment Book of Record (“IBOR”) Reporting & Analytics Visual Analytics Investment Decision Order Generation Order/Trade Routing • Electronically communicate and manage trade orders • Systemically enforce trading regulations and internal guidelines • Expert teams empowered by technology • Front-, middle- and back-office time consuming, administrative tasks • Double-entry ledger that automates the posting of general ledger journal entries directly from PMS • Complete, real-time Accounting Book of Record (“ABOR”) • Connected in real-time with our PMS and OEMS • Comprehensive client data insights to analyze portfolios through time horizons and automate customized visualized reports Mission critical systems integrated with a suite of technology-powered services One single dataset and source of truth |
|
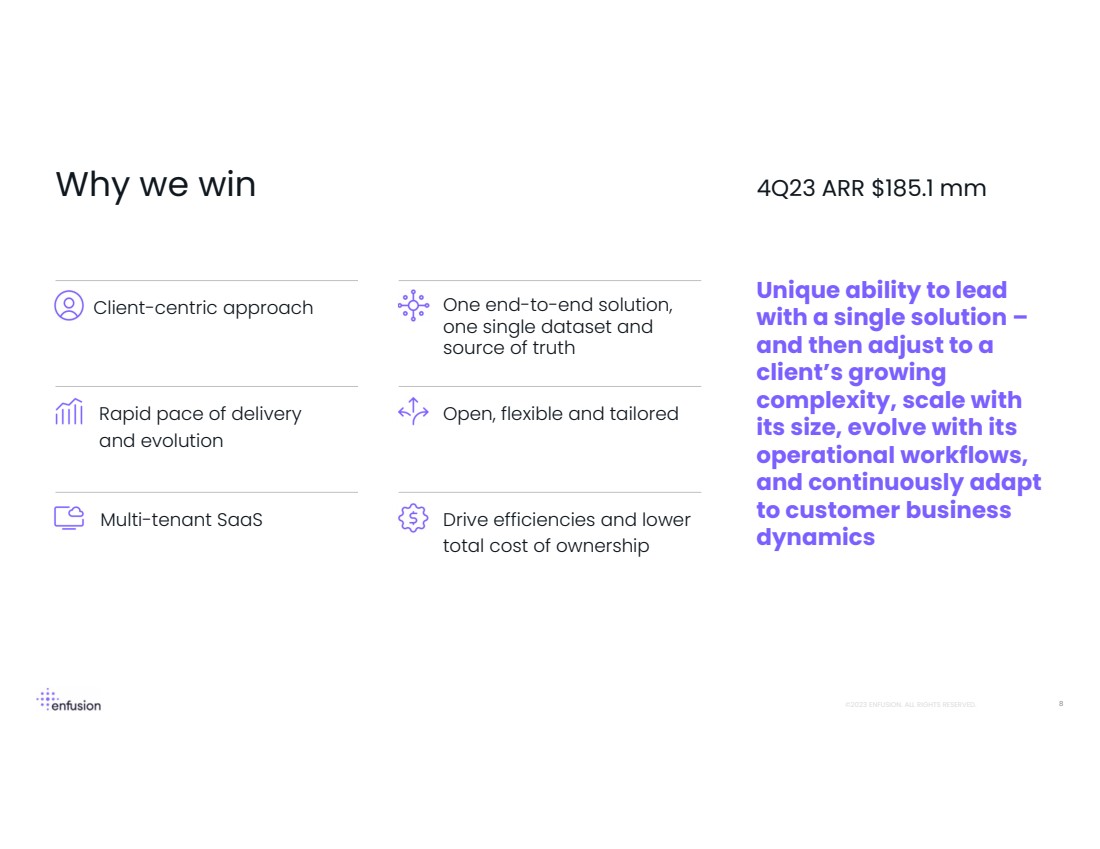
PROPRIETARY AND CONFIDENTIAL ©2023 ENFUSION. ALL RIGHTS RESERVED. 8 Client-centric approach Why we win 4Q23 ARR $185.1 mm One end-to-end solution, one single dataset and source of truth Rapid pace of delivery and evolution Open, flexible and tailored Unique ability to lead with a single solution – and then adjust to a client’s growing complexity, scale with its size, evolve with its operational workflows, and continuously adapt to customer business dynamics Multi-tenant SaaS Drive efficiencies and lower total cost of ownership |
|
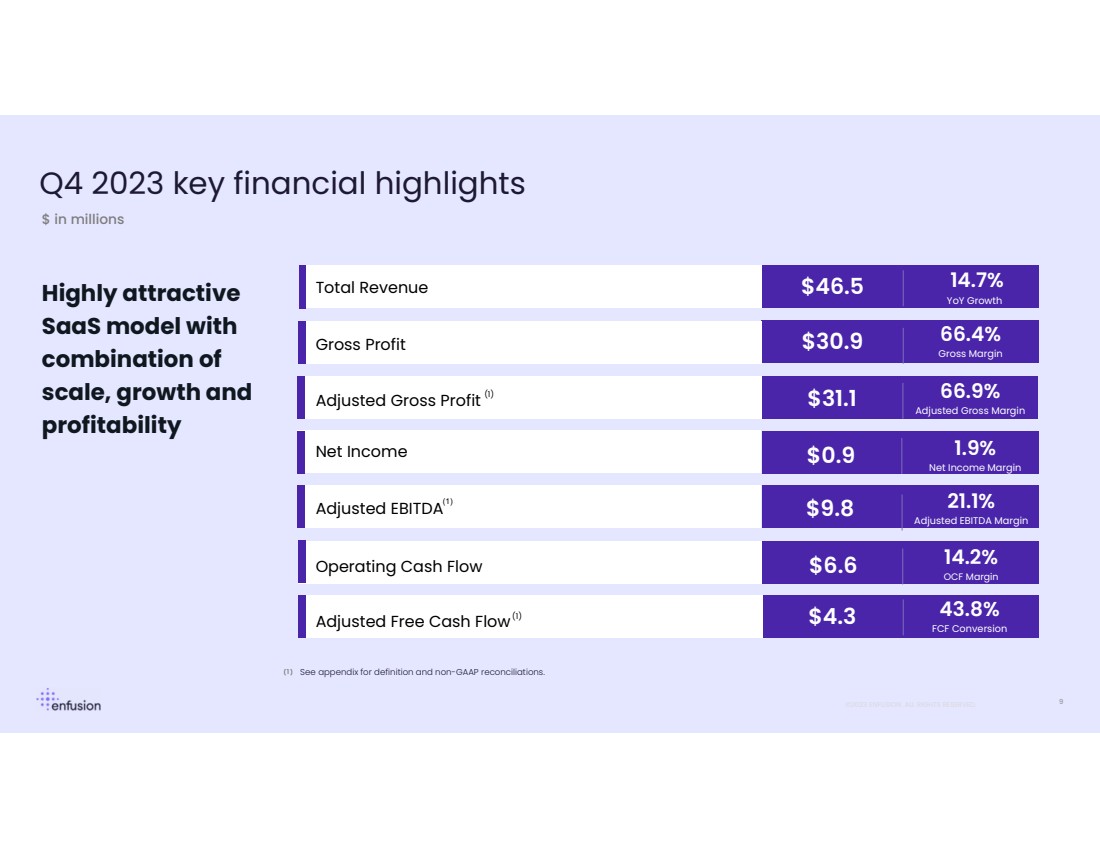
PROPRIETARY AND CONFIDENTIAL ©2023 ENFUSION. ALL RIGHTS RESERVED. Q4 2023 key financial highlights $46.5 14.7% YoY Growth Adjusted Free Cash Flow Z00 Total Revenue Z00 Adjusted EBITDA Z00 43.8% FCF Conversion $4.3 $30.9 66.4% Gross Margin Highly attractive SaaS model with combination of scale, growth and profitability $ in millions Gross Profit Z00 21.1% Adjusted EBITDA Margin $9.8 9 See appendix for definition and non-GAAP reconciliations. (1) (1) (1) $31.1 66.9% Adjusted Gross Margin Adjusted Gross Profit Z00 (1) Net Income Z00 1.9% Net Income Margin $0.9 Operating Cash Flow Z00 14.2% OCF Margin $6.6 |
|
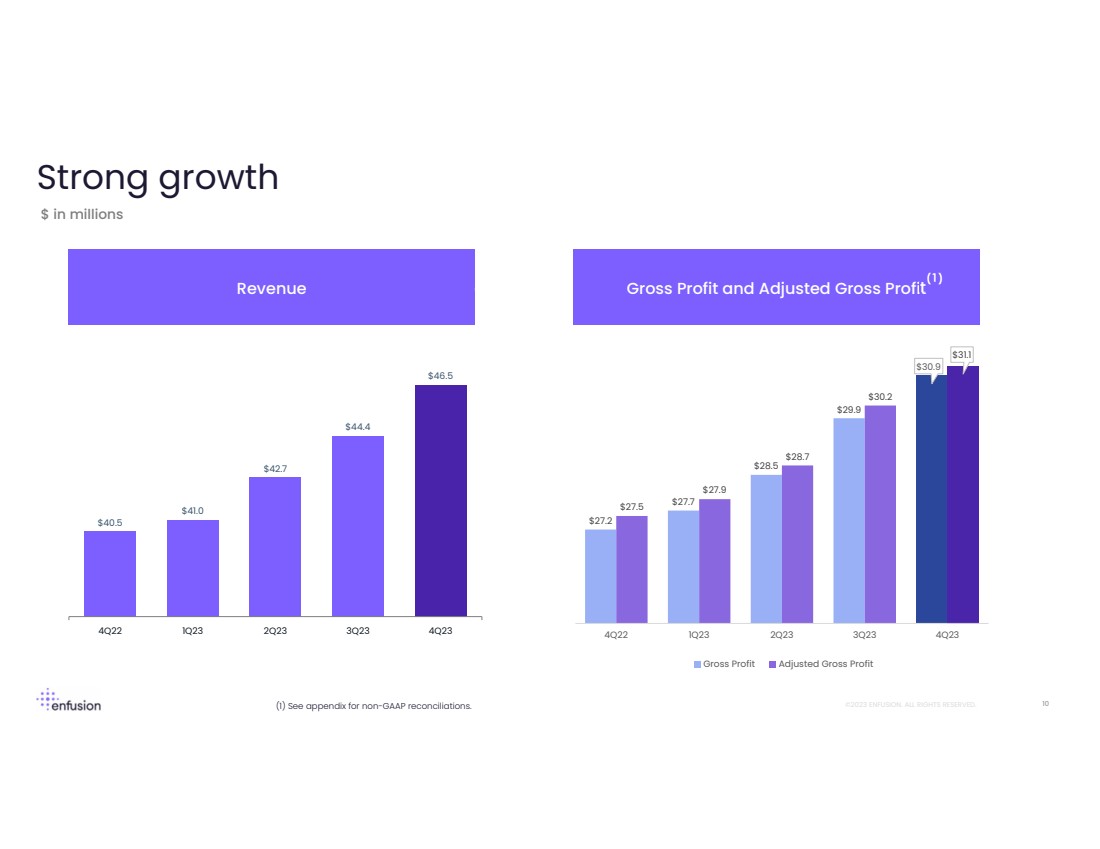
PROPRIETARY AND CONFIDENTIAL ©2023 ENFUSION. ALL RIGHTS RESERVED. Strong growth $ in millions $40.5 $41.0 $42.7 $44.4 $46.5 4Q22 1Q23 2Q23 3Q23 4Q23 Revenue 10 (1) (1) (1) $(4.1) $27.2 $27.7 $28.5 $29.9 $30.9 $27.5 $27.9 $28.7 $30.2 $31.1 4Q22 1Q23 2Q23 3Q23 4Q23 Gross Profit Adjusted Gross Profit Gross Profit and Adjusted Gross Profit (1) See appendix for non-GAAP reconciliations. |
|
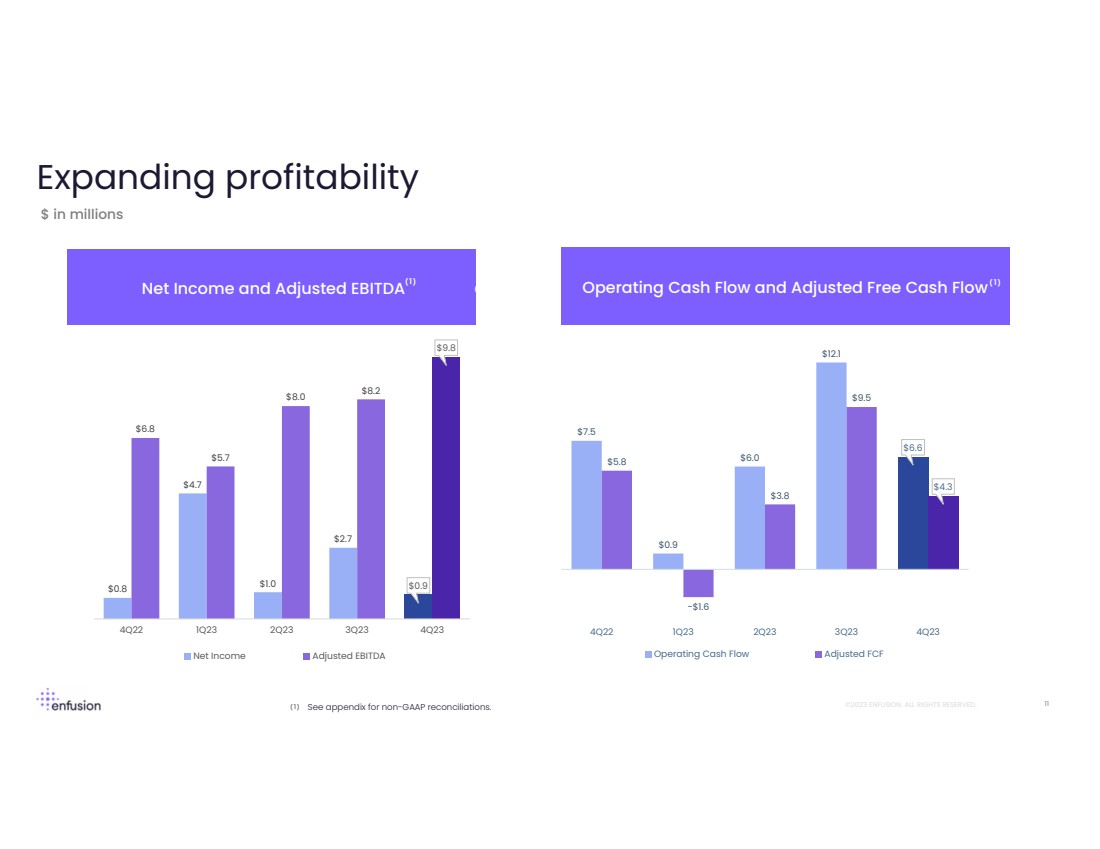
PROPRIETARY AND CONFIDENTIAL ©2023 ENFUSION. ALL RIGHTS RESERVED. Expanding profitability Operating Cash Flow and Adjusted Free Cash Flow $ in millions 11 See appendix for non-GAAP reconciliations. Net Income and Adjusted EBITDA (1) (1) (1) $(4.1) $0.8 $4.7 $1.0 $2.7 $0.9 $6.8 $5.7 $8.0 $8.2 $9.8 4Q22 1Q23 2Q23 3Q23 4Q23 Net Income Adjusted EBITDA $7.5 $0.9 $6.0 $12.1 $6.6 $5.8 -$1.6 $3.8 $9.5 $4.3 4Q22 1Q23 2Q23 3Q23 4Q23 Operating Cash Flow Adjusted FCF (1) |
|
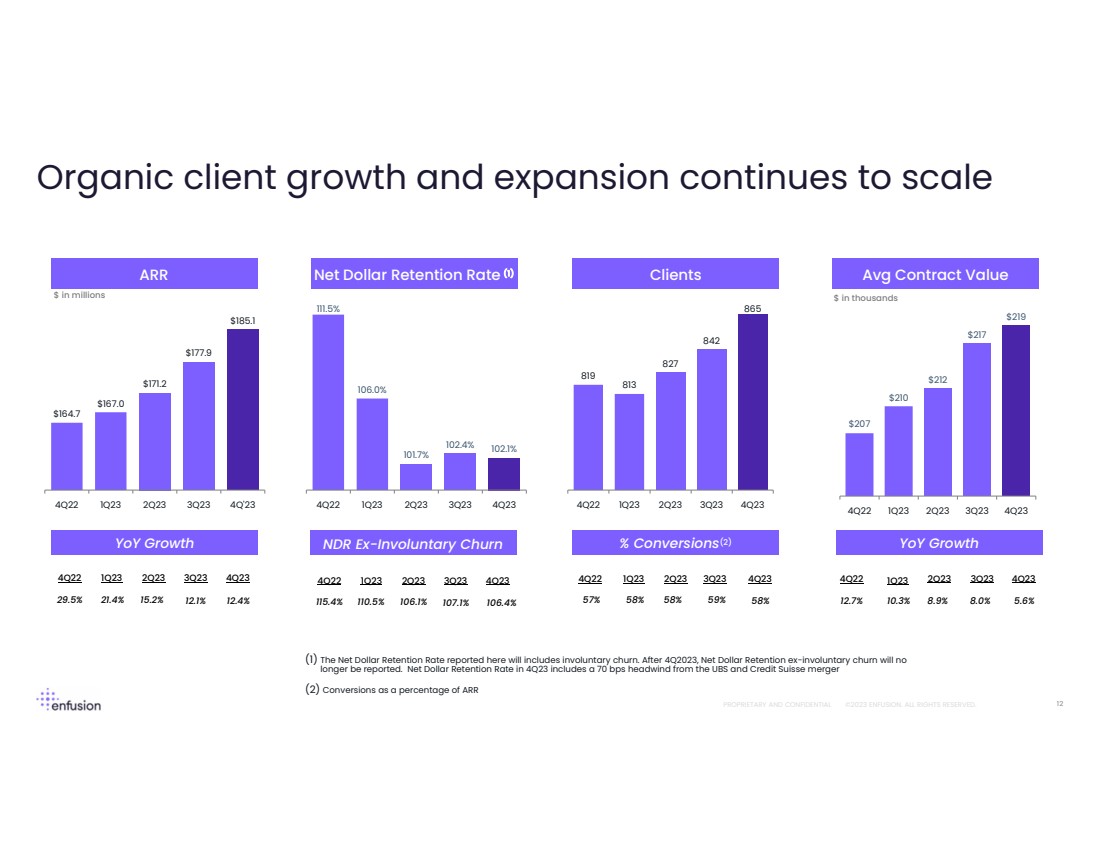
PROPRIETARY AND CONFIDENTIAL ©2023 ENFUSION. ALL RIGHTS RESERVED. $164.7 $167.0 $171.2 $177.9 $185.1 4Q22 1Q23 2Q23 3Q23 4Q'23 111.5% 106.0% 101.7% 102.4% 102.1% 4Q22 1Q23 2Q23 3Q23 4Q23 Organic client growth and expansion continues to scale 12 Net Dollar Retention Rate (1) Avg Contract Value 819 813 827 842 865 4Q22 1Q23 2Q23 3Q23 4Q23 $207 $210 $212 $217 $219 4Q22 1Q23 2Q23 3Q23 4Q23 29.5% 21.4% 15.2% 57% 58% 58% 12.7% 10.3% 8.0% $ in millions (1) The Net Dollar Retention Rate reported here will includes involuntary churn. After 4Q2023, Net Dollar Retention ex-involuntary churn will no longer be reported. Net Dollar Retention Rate in 4Q23 includes a 70 bps headwind from the UBS and Credit Suisse merger (2) Conversions as a percentage of ARR ARR Clients YoY Growth % Conversions(2) YoY Growth 4Q22 1Q23 2Q23 3Q23 4Q23 4Q22 1Q23 2Q23 3Q23 4Q23 4Q22 1Q23 2Q23 3Q23 4Q23 $ in thousands 12.1% 12.4% 59% 58% 8.9% 5.6% NDR Ex-Involuntary Churn 115.4% 110.5% 106.1% 4Q22 1Q23 2Q23 3Q23 4Q23 107.1% 106.4% |
|
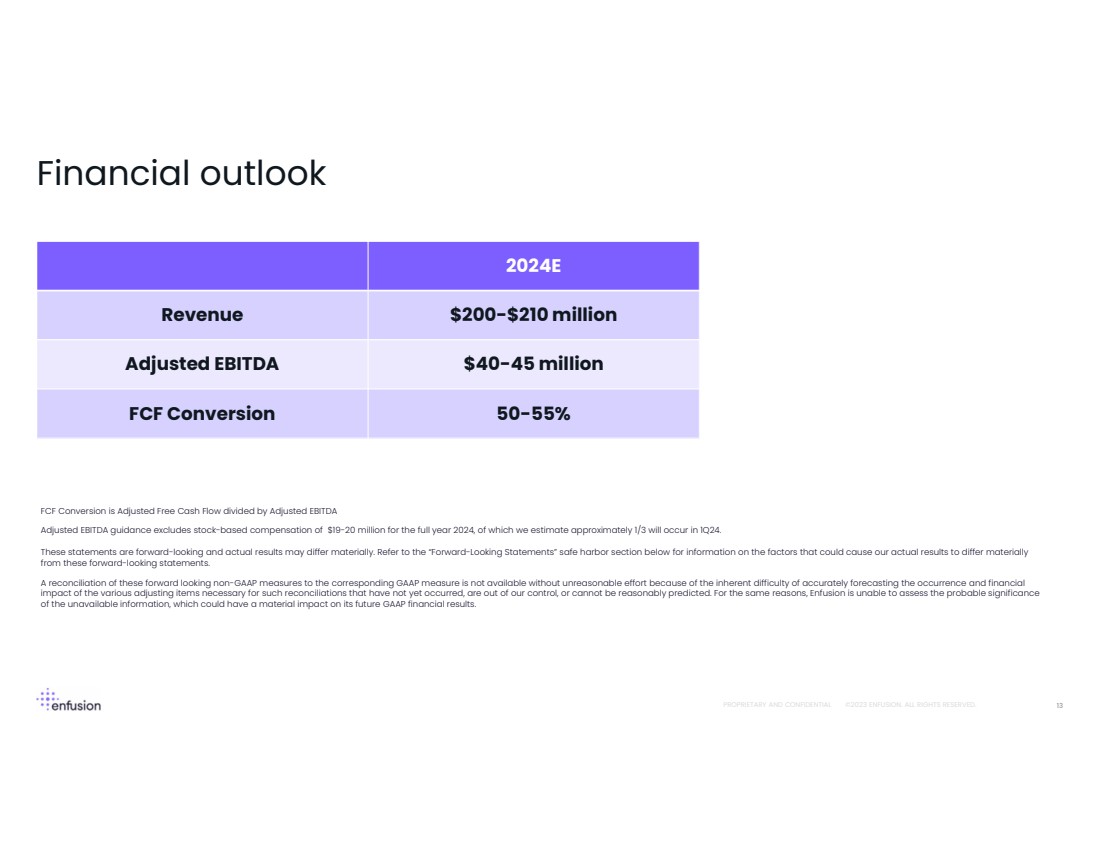
PROPRIETARY AND CONFIDENTIAL ©2023 ENFUSION. ALL RIGHTS RESERVED. Financial outlook 13 These statements are forward-looking and actual results may differ materially. Refer to the “Forward-Looking Statements” safe harbor section below for information on the factors that could cause our actual results to differ materially from these forward-looking statements. A reconciliation of these forward looking non-GAAP measures to the corresponding GAAP measure is not available without unreasonable effort because of the inherent difficulty of accurately forecasting the occurrence and financial impact of the various adjusting items necessary for such reconciliations that have not yet occurred, are out of our control, or cannot be reasonably predicted. For the same reasons, Enfusion is unable to assess the probable significance of the unavailable information, which could have a material impact on its future GAAP financial results. Adjusted EBITDA guidance excludes stock-based compensation of $19-20 million for the full year 2024, of which we estimate approximately 1/3 will occur in 1Q24. FCF Conversion is Adjusted Free Cash Flow divided by Adjusted EBITDA 2024E Revenue $200-$210 million Adjusted EBITDA $40-45 million FCF Conversion 50-55% |
|
PROPRIETARY AND CONFIDENTIAL ©2023 ENFUSION. ALL RIGHTS RESERVED. Appendix |
|
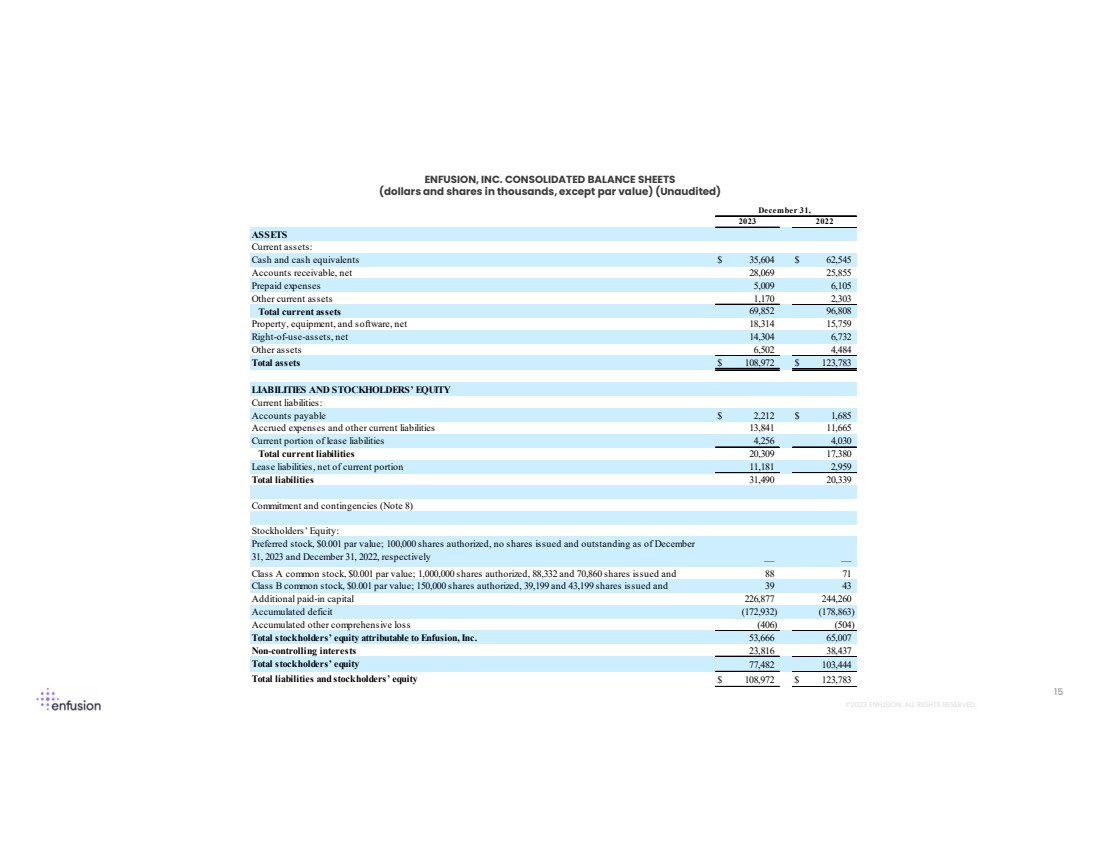
PROPRIETARY AND CONFIDENTIAL ©2023 ENFUSION. ALL RIGHTS RESERVED. 15 ENFUSION, INC. CONSOLIDATED BALANCE SHEETS (dollars and shares in thousands, except par value) (Unaudited) ASSETS Current assets: Cash and cash equivalents $ 35,604 $ 62,545 Accounts receivable, net 28,069 25,855 Prepaid expenses 5,009 6,105 Other current assets 1,170 2,303 Total current assets 69,852 96,808 Property, equipment, and software, net 18,314 15,759 Right-of-use-assets, net 14,304 6,732 Other assets 6,502 4,484 Total assets $ 108,972 $ 123,783 LIABILITIES AND STOCKHOLDERS’ EQUITY Current liabilities: Accounts payable $ 2,212 $ 1,685 Accrued expenses and other current liabilities 13,841 11,665 Current portion of lease liabilities 4,256 4,030 Total current liabilities 20,309 17,380 Lease liabilities, net of current portion 11,181 2,959 Total liabilities 31,490 20,339 Commitment and contingencies (Note 8) Stockholders’ Equity: Preferred stock, $0.001 par value; 100,000 shares authorized, no shares issued and outstanding as of December 31, 2023 and December 31, 2022, respectively — — Class A common stock, $0.001 par value; 1,000,000 shares authorized, 88,332 and 70,860 shares issued and 88 71 Class B common stock, $0.001 par value; 150,000 shares authorized, 39,199 and 43,199 shares issued and 39 43 Additional paid-in capital 226,877 244,260 Accumulated deficit (172,932) (178,863) Accumulated other comprehensive loss (406) (504) Total stockholders’ equity attributable to Enfusion, Inc. 53,666 65,007 Non-controlling interests 23,816 38,437 Total stockholders’ equity 77,482 103,444 Total liabilities andstockholders’ equity $ 108,972 $ 123,783 2023 2022 December 31, |
|
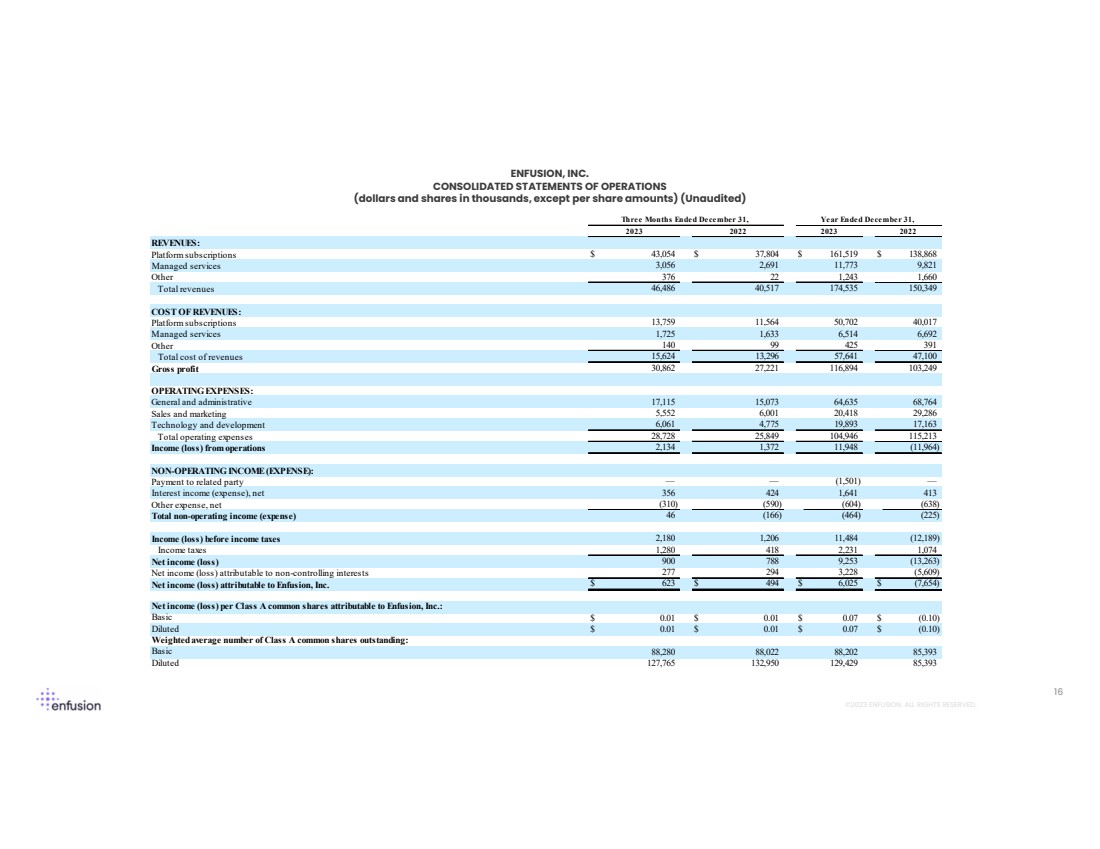
PROPRIETARY AND CONFIDENTIAL ©2023 ENFUSION. ALL RIGHTS RESERVED. 16 ENFUSION, INC. CONSOLIDATED STATEMENTS OF OPERATIONS (dollars and shares in thousands, except per share amounts) (Unaudited) REVENUES: Platformsubscriptions $ 43,054 $ 37,804 $ 161,519 $ 138,868 Managed services 3,056 2,691 11,773 9,821 Other 376 22 1,243 1,660 Total revenues 46,486 40,517 174,535 150,349 COST OF REVENUES: Platformsubscriptions 13,759 11,564 50,702 40,017 Managed services 1,725 1,633 6,514 6,692 Other 140 99 425 391 Total cost of revenues 15,624 13,296 57,641 47,100 Gross profit 30,862 27,221 116,894 103,249 OPERATINGEXPENSES: General and administrative 17,115 15,073 64,635 68,764 Sales and marketing 5,552 6,001 20,418 29,286 Technology and development 6,061 4,775 19,893 17,163 Total operating expenses 28,728 25,849 104,946 115,213 Income (loss) from operations 2,134 1,372 11,948 (11,964) NON-OPERATINGINCOME(EXPENSE): Payment to related party — — (1,501) — Interest income (expense), net 356 424 1,641 413 Other expense, net (310) (590) (604) (638) Total non-operating income (expense) 46 (166) (464) (225) Income (loss) before income taxes 2,180 1,206 11,484 (12,189) Income taxes 1,280 418 2,231 1,074 Net income (loss) 900 788 9,253 (13,263) Net income (loss) attributable to non-controlling interests 277 294 3,228 (5,609) Net income (loss) attributable to Enfusion, Inc. $ 623 $ 494 $ 6,025 $ (7,654) Net income (loss) per Class A common shares attributable to Enfusion, Inc.: Basic $ 0.01 $ 0.01 $ 0.07 $ (0.10) Diluted $ 0.01 $ 0.01 $ 0.07 $ (0.10) Weightedaverage number of Class A common shares outstanding: Basic 88,280 88,022 88,202 85,393 Diluted 127,765 132,950 129,429 85,393 Three Months Ended December 31, Year Ended December 31, 2023 2022 2023 2022 |
|
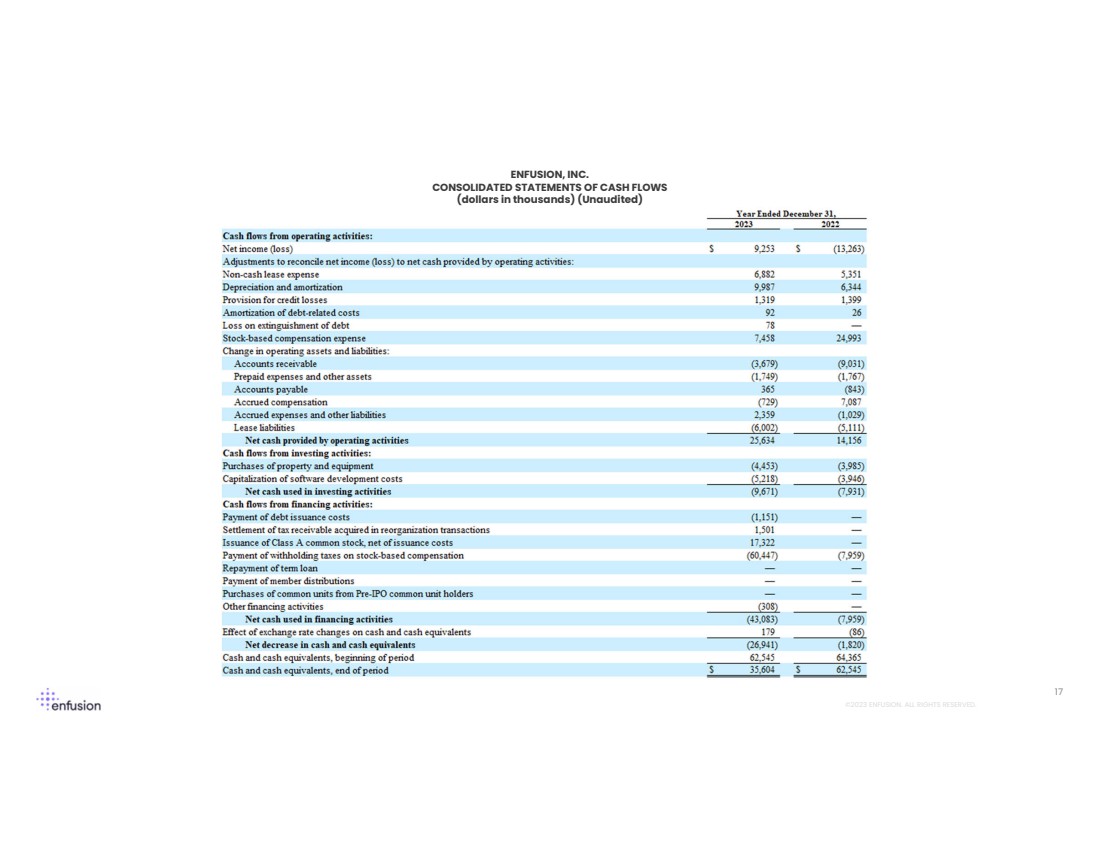
PROPRIETARY AND CONFIDENTIAL ©2023 ENFUSION. ALL RIGHTS RESERVED. 17 ENFUSION, INC. CONSOLIDATED STATEMENTS OF CASH FLOWS (dollars in thousands) (Unaudited) |
|
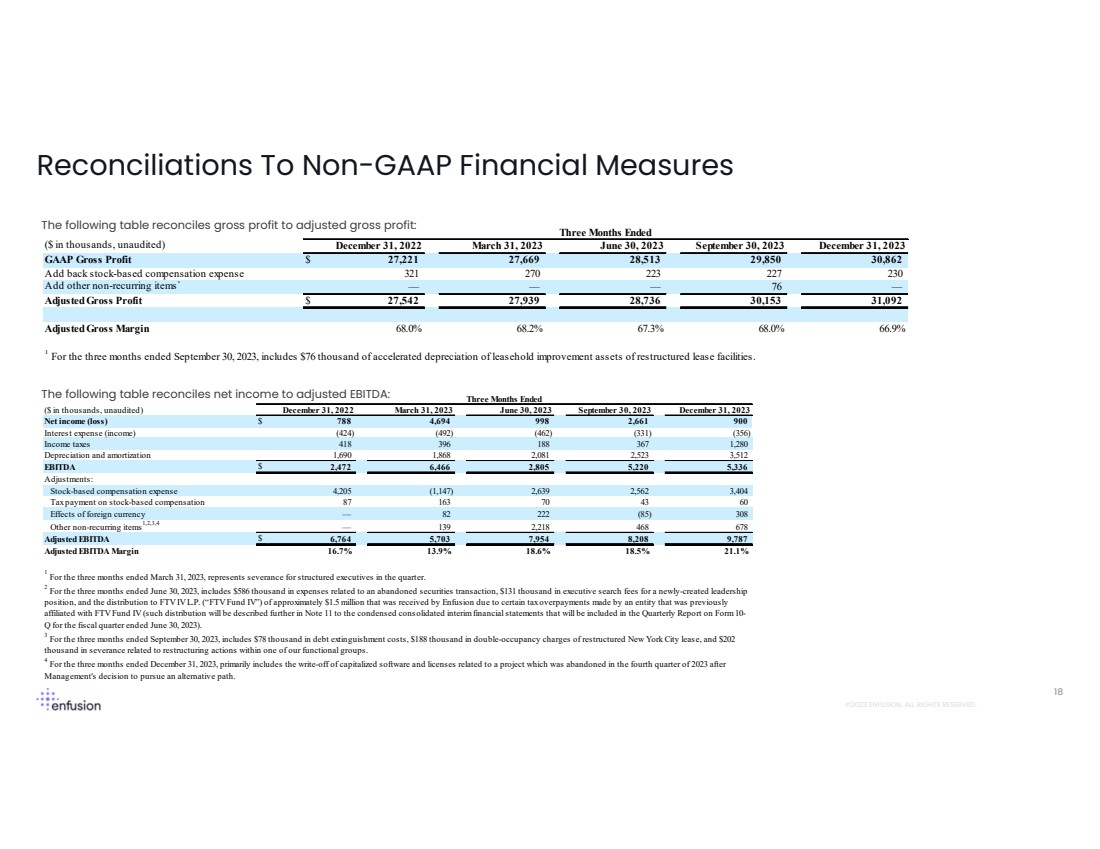
PROPRIETARY AND CONFIDENTIAL ©2023 ENFUSION. ALL RIGHTS RESERVED. Reconciliations To Non-GAAP Financial Measures 18 The following table reconciles net income to adjusted EBITDA: The following table reconciles gross profit to adjusted gross profit: ($ in thousands, unaudited) December 31, 2022 March 31, 2023 June 30, 2023 September 30, 2023 December 31, 2023 GAAP Gross Profit $ 27,221 27,669 28,513 29,850 30,862 Add back stock-based compensation expense 321 270 223 227 230 Add other non-recurring items1 — — — 76 — AdjustedGross Profit $ 27,542 27,939 28,736 30,153 31,092 AdjustedGross Margin 68.0% 68.2% 67.3% 68.0% 66.9% Three Months Ended 1 For the three months ended September 30, 2023, includes $76 thousand of accelerated depreciation of leasehold improvement assets of restructured lease facilities. ($ in thousands, unaudited) December 31, 2022 March 31, 2023 June 30, 2023 September 30, 2023 December 31, 2023 Net income (loss) $ 788 4,694 998 2,661 900 Interest expense (income) (424) (492) (462) (331) (356) Income taxes 418 396 188 367 1,280 Depreciation and amortization 1,690 1,868 2,081 2,523 3,512 EBITDA $ 2,472 6,466 2,805 5,220 5,336 Adjustments: Stock-based compensation expense 4,205 (1,147) 2,639 2,562 3,404 Taxpayment on stock-based compensation 87 163 70 43 60 Effects of foreign currency — 82 222 (85) 308 Other non-recurring items1,2,3,4 — 139 2,218 468 678 AdjustedEBITDA $ 6,764 5,703 7,954 8,208 9,787 AdjustedEBITDA Margin 16.7% 13.9% 18.6% 18.5% 21.1% Three Months Ended 1 For the three months ended March 31, 2023, represents severance for structured executives in the quarter. 2 For the three months ended June 30, 2023, includes $586 thousand in expenses related to an abandoned securities transaction, $131 thousand in executive search fees for a newly-created leadership position, and the distribution to FTVIVL.P. (“FTVFund IV”) of approximately $1.5 million that was received by Enfusion due to certain taxoverpayments made by an entity that was previously affiliated with FTVFund IV(such distribution will be described further in Note 11 to the condensed consolidated interimfinancialstatements that will be included in the Quarterly Report on Form10- Q for the fiscal quarter ended June 30, 2023). 3 For the three months ended September 30, 2023, includes $78 thousand in debt extinguishment costs, $188 thousand in double-occupancy charges of restructured New York City lease, and $202 thousand in severance related to restructuring actions within one of our functional groups. 4 For the three months ended December 31, 2023, primarily includes the write-off of capitalized software and licenses related to a project which was abandoned in the fourth quarter of 2023 after Management's decision to pursue an alternative path. |
|
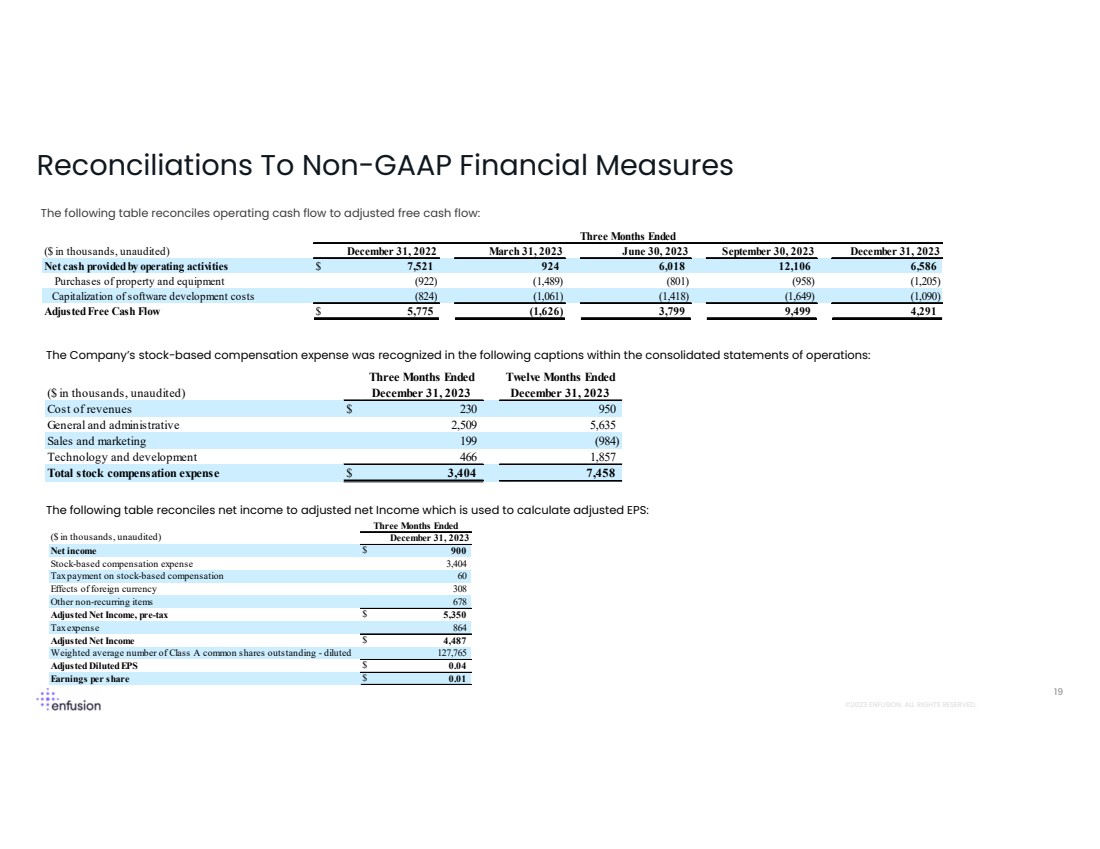
PROPRIETARY AND CONFIDENTIAL ©2023 ENFUSION. ALL RIGHTS RESERVED. Reconciliations To Non-GAAP Financial Measures 19 The following table reconciles operating cash flow to adjusted free cash flow: The Company’s stock-based compensation expense was recognized in the following captions within the consolidated statements of operations: The following table reconciles net income to adjusted net Income which is used to calculate adjusted EPS: ($ in thousands, unaudited) December 31, 2022 March 31, 2023 June 30, 2023 September 30, 2023 December 31, 2023 Net cash providedby operating activities $ 7,521 924 6,018 12,106 6,586 Purchases of property and equipment (922) (1,489) (801) (958) (1,205) Capitalization of software development costs (824) (1,061) (1,418) (1,649) (1,090) AdjustedFree Cash Flow $ 5,775 (1,626) 3,799 9,499 4,291 Three Months Ended ($ in thousands, unaudited) Three Months Ended December 31, 2023 Twelve Months Ended December 31, 2023 Cost of revenues $ 230 950 General and administrative 2,509 5,635 Sales and marketing 199 (984) Technology and development 466 1,857 Total stock compensation expense $ 3,404 7,458 ($ in thousands, unaudited) December 31, 2023 Net income $ 900 Stock-based compensation expense 3,404 Taxpayment on stock-based compensation 60 Effects of foreign currency 308 Other non-recurring items 678 AdjustedNet Income, pre-tax $ 5,350 Taxexpense 864 AdjustedNet Income $ 4,487 Weighted average number of Class A common shares outstanding - diluted 127,765 AdjustedDilutedEPS $ 0.04 Earnings per share $ 0.01 Three Months Ended |
|
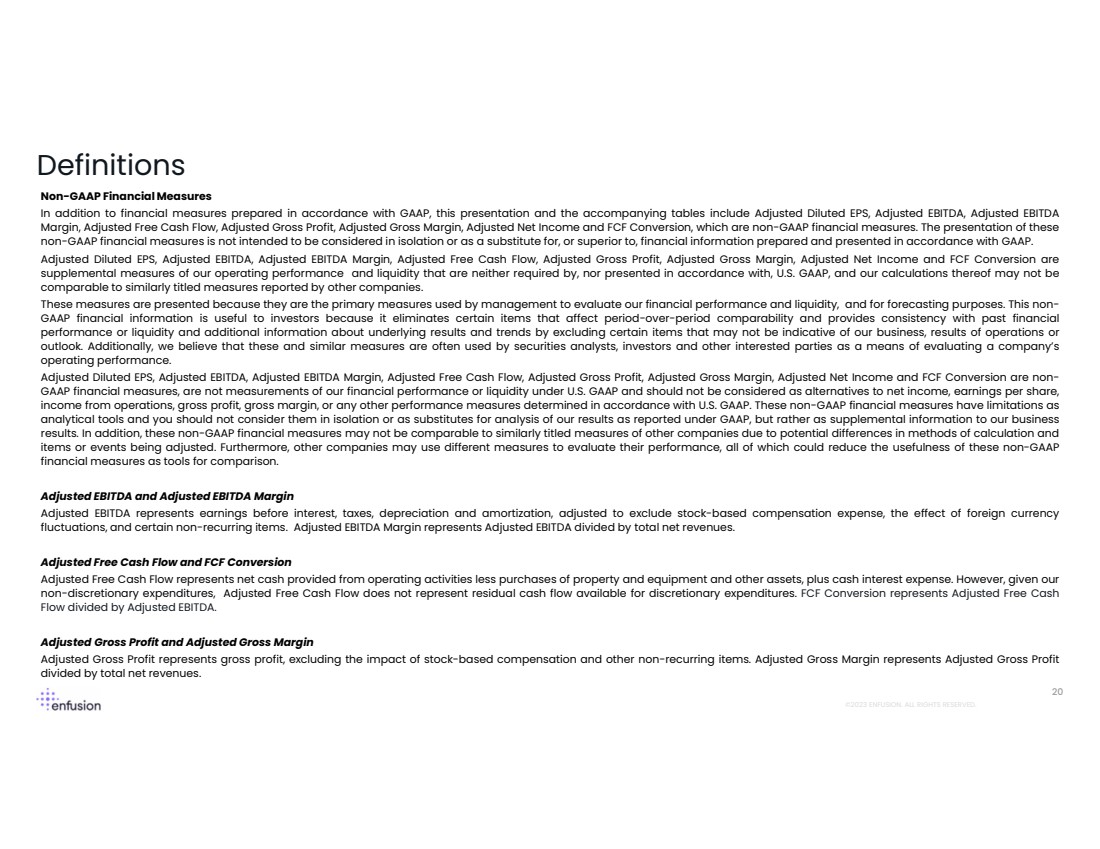
PROPRIETARY AND CONFIDENTIAL ©2023 ENFUSION. ALL RIGHTS RESERVED. 20 Definitions Non-GAAP Financial Measures In addition to financial measures prepared in accordance with GAAP, this presentation and the accompanying tables include Adjusted Diluted EPS, Adjusted EBITDA, Adjusted EBITDA Margin, Adjusted Free Cash Flow, Adjusted Gross Profit, Adjusted Gross Margin, Adjusted Net Income and FCF Conversion, which are non-GAAP financial measures. The presentation of these non-GAAP financial measures is not intended to be considered in isolation or as a substitute for, or superior to, financial information prepared and presented in accordance with GAAP. Adjusted Diluted EPS, Adjusted EBITDA, Adjusted EBITDA Margin, Adjusted Free Cash Flow, Adjusted Gross Profit, Adjusted Gross Margin, Adjusted Net Income and FCF Conversion are supplemental measures of our operating performance and liquidity that are neither required by, nor presented in accordance with, U.S. GAAP, and our calculations thereof may not be comparable to similarly titled measures reported by other companies. These measures are presented because they are the primary measures used by management to evaluate our financial performance and liquidity, and for forecasting purposes. This non-GAAP financial information is useful to investors because it eliminates certain items that affect period-over-period comparability and provides consistency with past financial performance or liquidity and additional information about underlying results and trends by excluding certain items that may not be indicative of our business, results of operations or outlook. Additionally, we believe that these and similar measures are often used by securities analysts, investors and other interested parties as a means of evaluating a company’s operating performance. Adjusted Diluted EPS, Adjusted EBITDA, Adjusted EBITDA Margin, Adjusted Free Cash Flow, Adjusted Gross Profit, Adjusted Gross Margin, Adjusted Net Income and FCF Conversion are non-GAAP financial measures, are not measurements of our financial performance or liquidity under U.S. GAAP and should not be considered as alternatives to net income, earnings per share, income from operations, gross profit, gross margin, or any other performance measures determined in accordance with U.S. GAAP. These non-GAAP financial measures have limitations as analytical tools and you should not consider them in isolation or as substitutes for analysis of our results as reported under GAAP, but rather as supplemental information to our business results. In addition, these non-GAAP financial measures may not be comparable to similarly titled measures of other companies due to potential differences in methods of calculation and items or events being adjusted. Furthermore, other companies may use different measures to evaluate their performance, all of which could reduce the usefulness of these non-GAAP financial measures as tools for comparison. Adjusted EBITDA and Adjusted EBITDA Margin Adjusted EBITDA represents earnings before interest, taxes, depreciation and amortization, adjusted to exclude stock-based compensation expense, the effect of foreign currency fluctuations, and certain non-recurring items. Adjusted EBITDA Margin represents Adjusted EBITDA divided by total net revenues. Adjusted Free Cash Flow and FCF Conversion Adjusted Free Cash Flow represents net cash provided from operating activities less purchases of property and equipment and other assets, plus cash interest expense. However, given our non-discretionary expenditures, Adjusted Free Cash Flow does not represent residual cash flow available for discretionary expenditures. FCF Conversion represents Adjusted Free Cash Flow divided by Adjusted EBITDA. Adjusted Gross Profit and Adjusted Gross Margin Adjusted Gross Profit represents gross profit, excluding the impact of stock-based compensation and other non-recurring items. Adjusted Gross Margin represents Adjusted Gross Profit divided by total net revenues. |
|
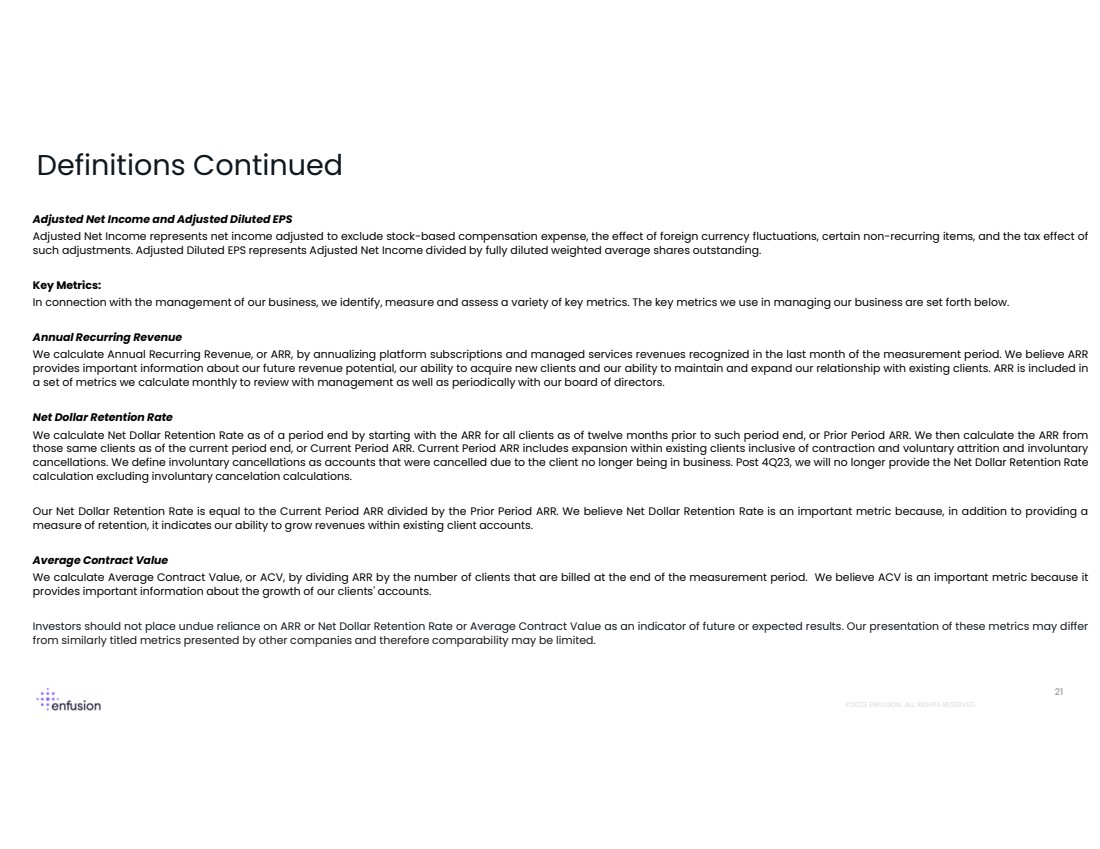
PROPRIETARY AND CONFIDENTIAL ©2023 ENFUSION. ALL RIGHTS RESERVED. 21 Definitions Continued Adjusted Net Income and Adjusted Diluted EPS Adjusted Net Income represents net income adjusted to exclude stock-based compensation expense, the effect of foreign currency fluctuations, certain non-recurring items, and the tax effect of such adjustments. Adjusted Diluted EPS represents Adjusted Net Income divided by fully diluted weighted average shares outstanding. Key Metrics: In connection with the management of our business, we identify, measure and assess a variety of key metrics. The key metrics we use in managing our business are set forth below. Annual Recurring Revenue We calculate Annual Recurring Revenue, or ARR, by annualizing platform subscriptions and managed services revenues recognized in the last month of the measurement period. We believe ARR provides important information about our future revenue potential, our ability to acquire new clients and our ability to maintain and expand our relationship with existing clients. ARR is included in a set of metrics we calculate monthly to review with management as well as periodically with our board of directors. Net Dollar Retention Rate We calculate Net Dollar Retention Rate as of a period end by starting with the ARR for all clients as of twelve months prior to such period end, or Prior Period ARR. We then calculate the ARR from those same clients as of the current period end, or Current Period ARR. Current Period ARR includes expansion within existing clients inclusive of contraction and voluntary attrition and involuntary cancellations. We define involuntary cancellations as accounts that were cancelled due to the client no longer being in business. Post 4Q23, we will no longer provide the Net Dollar Retention Rate calculation excluding involuntary cancelation calculations. Our Net Dollar Retention Rate is equal to the Current Period ARR divided by the Prior Period ARR. We believe Net Dollar Retention Rate is an important metric because, in addition to providing a measure of retention, it indicates our ability to grow revenues within existing client accounts. Average Contract Value We calculate Average Contract Value, or ACV, by dividing ARR by the number of clients that are billed at the end of the measurement period. We believe ACV is an important metric because it provides important information about the growth of our clients' accounts. Investors should not place undue reliance on ARR or Net Dollar Retention Rate or Average Contract Value as an indicator of future or expected results. Our presentation of these metrics may differ from similarly titled metrics presented by other companies and therefore comparability may be limited. |