UNITED STATES
SECURITIES AND EXCHANGE COMMISSION
WASHINGTON, D.C. 20549
Form 40-F
◻ Registration statement pursuant to Section 12 of the Securities Exchange Act of 1934; or
þ Annual report pursuant to Section 13(a) or 15(d) of the Securities Exchange Act of 1934
For the fiscal year ended: December 31, 2023
Commission file number: No. 001-35829
Vermilion Energy Inc.
(Exact name of registrant as specified in its charter)
Alberta
(Province or other jurisdiction of incorporation or organization)
1311
(Primary standard industrial classification code number)
N/A
(I.R.S. employer identification number)
3500, 520 - 3rd Avenue S.W.
Calgary, Alberta T2P 0R3 Canada
(403) 269-4884
(Address and telephone number of registrant’s principal executive office)
National Corporate Research, Ltd.
225 West 34th Street, Suite 910
New York, New York 10122 U.S.A.
(212) 947-7200
(Name, address and telephone number of agent for service in the United States)
Securities registered pursuant to Section 12(b) of the Act:
Title of each class: |
Trading Symbol: |
Name of each exchange on which registered: |
|
|
|
Common Shares |
VET |
New York Stock Exchange |
Securities registered or to be registered pursuant to Section 12(g) of the Act: None
Securities for which there is a reporting obligation pursuant to Section 15(d) of the Act: None
For annual reports, indicate by check mark the information filed with this form:
þ |
Annual Information Form |
þ |
Audited Annual Financial Statements |
Indicate the number of outstanding shares of each of the issuer's classes of capital or common stock as of the close of the period covered by the annual report: 162,271,071 shares
Indicate by check mark whether the Registrant: (1) has filed all reports required to be filed by Section 13 or 15(d) of the Exchange Act during the preceding 12 months (or for such shorter period that the Registrant was required to file such reports); and (2) has been subject to such filing requirements for the past 90 days.
Yes |
þ |
No |
◻ |
Indicate by check mark whether the registrant has submitted electronically every Interactive Data File required to be submitted pursuant to Rule 405 of Regulation S-T (§232.405 of this chapter) during the preceding 12 months (or for such shorter period that the Registrant was required to submit such files).
Yes |
þ |
No |
◻ |
Indicate by check mark whether the registrant is an emerging growth company as defined in Rule 12b-2 of the Exchange Act.
Emerging growth company ◻
If an emerging growth company that prepares its financial statements in accordance with U.S. GAAP, indicate by check mark if the registrant has elected not to use the extended transition period for complying with any new or revised financial accounting standards† provided pursuant to Section 13(a) of the Exchange Act. ◻
† The term “new or revised financial accounting standard” refers to any update issued by the Financial Accounting Standards Board to its Accounting Standards Codification after April 5, 2012.
Indicate by check mark whether the registrant has filed a report on and attestation to its management’s assessment of the effectiveness of its internal control over financial reporting under Section 404(b) of the Sarbanes-Oxley Act (15 U.S.C. 7262(b)) by the registered public accounting firm that prepared or issued its audit report. þ
If securities are registered pursuant to Section 12(b) of the Act, indicate by check mark whether the financial statements of the registrant included in the filing reflect the correction of an error to previously issued financial statements. ☐
Indicate by check mark whether any of those error corrections are restatements that required a recovery analysis of incentive-based compensation received by any of the registrant's executive officers during the relevant recovery period pursuant to §240.10D-1(b). ◻ In accordance with General Instruction B.(3) of Form 40-F, the Registrant has filed the following documents as part of this Annual Report on Form 40-F, as set forth in the Exhibit Index attached hereto:
DOCUMENTS FILED PURSUANT TO GENERAL INSTRUCTIONS
Exhibit 99.1 - Annual Information Form for the fiscal year ended December 31, 2023
Exhibit 99.2 - Management’s Discussion and Analysis for the fiscal year ended December 31, 2023; and
Exhibit 99.3 - Audited Annual Financial Statements for the fiscal year ended December 31, 2023
In accordance with General Instruction D.(9) of Form 40-F, the Registrant has filed the written consent of certain experts named in the foregoing Exhibits as Exhibit 99.5 and the written consent of its Independent Registered Public Accounting Firm as Exhibit 99.4, as set forth in the Exhibit Index attached hereto.
DISCLOSURE CONTROLS AND PROCEDURES
A. Evaluation of Disclosure Controls and Procedures
Vermilion Energy Inc. (the "Registrant") maintains disclosure controls and procedures designed to ensure that information required to be disclosed in the Registrant's filings under the Securities Exchange Act of 1934, as amended (the "Exchange Act") is recorded, processed, summarized and reported within the time period specified in the rules and forms of the Securities and Exchange Commission (the "Commission"). Disclosure controls and procedures include, without limitation, controls and procedures designed to ensure that information required to be disclosed by the Registrant in the reports that it files or submits under the Exchange Act is accumulated and communicated to the issuer's management, including its principal executive and principal financial officers, or persons performing similar functions, as appropriate to allow timely decisions regarding required disclosure. The Registrant's Chief Executive Officer, and Chief Financial Officer, after having evaluated the effectiveness of the Registrant's disclosure controls and procedures (as defined in Exchange Act Rules 13a-15(e) and 15d-15(e)) as of the end of the period covered by this report have concluded that, as of such date, the Registrant's disclosure controls and procedures are effective.
It should be noted that while the Registrant’s Chief Executive Officer and the Chief Financial Officer believe that the Registrant’s disclosure controls and procedures provide a reasonable level of assurance that they are effective, they do not expect that the Registrant’s disclosure controls and procedures will prevent all errors and fraud. A control system, no matter how well conceived or operated, can provide only reasonable, not absolute, assurance that the objectives of the control system are met.
B. Management’s Annual Report on Internal Control Over Financial Reporting
See page 1 of the 2023 Audited Consolidated Financial Statements included as Exhibit 99.3 to this report.
C. Auditor Attestation
See page 3 of the 2023 Audited Consolidated Financial Statements included as Exhibit 99.3 to this report.
D. Changes in Internal Control Over Financial Reporting
There was no change in the Registrant's internal control over financial reporting that occurred during the period covered by this report that has materially affected, or is reasonably likely to materially affect, its internal control over financial reporting.
NOTICES REQUIRED BY RULE 104 OF REGULATION BTR
None
AUDIT COMMITTEE FINANCIAL EXPERT
The Registrant's Board of Directors has determined that it has at least one audit committee financial expert (as such term is defined in the rules and regulations of the Commission) serving on its Audit Committee. Manjit Sharma has been determined to be such audit committee financial expert and is independent (as such term is defined by the New York Stock Exchange's corporate governance standards).
The Commission has indicated that the designation of Manjit Sharma as an audit committee financial expert does not make him an "expert" for any purpose, impose on his any duties, obligations or liability that are greater than the duties, obligations or liability imposed on him as a member of the Audit Committee and the Board of Directors in absence of such designation, or affect the duties, obligations or liability of any other member of the Audit Committee or Board of Directors.
CODE OF ETHICS
The Registrant has adopted a written “code of ethics” (as that term is defined in Form 40-F) that applies to its directors, officers and employees, including its principal executive officer, principal financial officer, principal accounting officer or controller, and persons performing similar functions. A copy of such code of ethics is available upon request or on the Registrant’s website at https://www.vermilionenergy.com/about-us/governance/. In 2023, there were no amendments to the code of ethics or waivers, including implicit waivers, from any provisions of the code of ethics.
PRINCIPAL ACCOUNTANT FEES AND SERVICES
Information about aggregate fees billed to us by our principal accountant, Deloitte LLP (PCAOB ID No. 1208) will be presented under the caption “Audit Committee Matters - External audit service fees” on page 58 of the Annual Information Form for the year ended December 31, 2023 included as Exhibit 99.1 to this report.
The Audit Committee pre-approves all audit related fees. The auditors present the estimate for the annual audit related services to the Audit Committee for approval prior to undertaking the annual audit of the financial statements.
All non-audit fees were pre-approved by the Audit Committee and none were approved on the basis of the de minimis exemption set forth in Rule 2-01(c)(7)(i)(C) of Regulation S-X.
RECOVERY OF ERRONEOUSLY AWARDED COMPENSATION
The Registrant has adopted a compensation recovery policy (referred to as the “Executive Compensation Clawback Policy”) as required by NYSE listing standards and pursuant to Rule 10D-1 of the Exchange Act. The Executive Compensation Clawback Policy is filed as Exhibit 97 to this Form 40-F. At no time during or after the fiscal year ended December 31, 2023 (as of the date of this Annual Report), was the Registrant required to prepare an accounting restatement that required recovery of erroneously awarded compensation pursuant to the Executive Compensation Clawback Policy and, as of December 31, 2023, there was no outstanding balance of erroneously awarded compensation to be recovered from the application of the Executive Compensation Clawback Policy to a prior restatement.
OFF-BALANCE SHEET ARRANGEMENTS
The Registrant does not have any commitments or obligations, including contingent obligations, arising from arrangements with unconsolidated entities or persons (which are not otherwise discussed in the Registrant's Management’s Discussion and Analysis for the fiscal year ended December 31, 2023, filed as Exhibit 99.2 to this annual report on Form 40-F), that have or are reasonably likely to have a material current or future effect on its financial condition, changes in financial condition, revenues or expenses, results of operations, liquidity, cash requirements or capital resources.
DISCLOSURE OF CONTRACTUAL OBLIGATIONS
The required disclosure is included under the heading “Contractual Obligations and Commitments” in the Registrant’s Management’s Discussion and Analysis for the fiscal year ended December 31, 2023, filed as Exhibit 99.2 to this annual report on Form 40-F.
IDENTIFICATION OF THE AUDIT COMMITTEE
The Registrant’s Board of Directors has a separately designated standing Audit Committee established in accordance with Section 3(a)(58)(A) of the Exchange Act which satisfies the requirements of Exchange Act Rule 10A-3. The Registrant’s Audit Committee is comprised of Manjit Sharma (Chair), Robert Michaleski, Stephen Larke, and Judy Steele, all of whom, in the opinion of the Registrant’s Board of Directors are independent (as determined under Rule 10A-3 of the Exchange Act and the corporate governance standards of the NYSE) and are financially literate. Please refer to the Registrant's Annual Information Form attached as Exhibit 99.1 to this annual report on Form 40-F for details in connection with each of these members and their qualifications.
The members of the Audit Committee do not have fixed terms and are appointed from time to time by resolution of the directors.
The Audit Committee meets with the Registrant's Chief Executive Officer, Chief Financial Officer and the Registrant's independent auditors to review and inquire into matters affecting financial reporting, the system of internal accounting and financial controls, as well as audit procedures and audit plans. The Audit Committee also recommends to the Board of Directors which independent registered public auditing firm should be appointed by the Registrant, and reviews and recommends to the Board of Directors for approval the Registrant’s audited annual financial statements and accompanying management’s discussion and analysis.
The full text of the Audit Committee Terms of Reference is disclosed in the Registrant's Annual Information Form, attached hereto as Exhibit 99.1, and is incorporated by reference in this annual report on Form 40-F.
NYSE STATEMENT OF GOVERNANCE DIFFERENCES
As a Canadian corporation with securities listed on the Toronto Stock Exchange (“TSX”) and the New York Stock Exchange (“NYSE”), the Registrant is required to comply with all applicable Canadian requirements adopted by the Canadian Securities Administrators and the TSX, and applicable rules for foreign private issuers adopted by the Commission which give effect to the provisions of the Sarbanes-Oxley Act of 2002 (“Sarbanes-Oxley”).
The Registrant’s corporate governance practices meet or exceed all applicable Canadian and Sarbanes-Oxley requirements and also incorporate many “best practices” derived from those required to be followed by U.S. domestic companies under the NYSE listing standards. In accordance with Section 303A.11 of the NYSE Listed Company Manual, the Registrant has prepared a summary of the significant ways in which its corporate governance practices differ from those required to be followed by U.S. domestic companies under the NYSE’s corporate governance standards, which is accessible on the Registrant’s website at https://www.vermilionenergy.com/about-us/governance/.
DISCLOSURE PURSUANT TO SECTION 13(r) OF THE EXCHANGE ACT
In accordance with Section 13(r) of the Exchange Act, the Registrant is required to include certain disclosures in its periodic reports if it or any of its affiliates knowingly engaged in certain specified activities during the period covered by the report. Neither the Registrant nor its affiliates have knowingly engaged in any transaction or dealing reportable under Section 13(r) of the Exchange Act during the year ended December 31, 2023.
UNDERTAKING AND CONSENT TO SERVICE OF PROCESS
A. Undertaking
The Registrant undertakes to make available, in person or by telephone, representatives to respond to inquiries made by the Commission staff and to furnish promptly, when requested to do so by the Commission staff, information relating to: the securities registered pursuant to Form 40-F; the securities in relation to which the obligation to file an annual report on Form 40-F arises; or transactions in said securities.
B. Consent to Service of Process
The Registrant has previously filed with the Commission a Form F-X in connection with the class of securities in relation to which the obligation to file this report arises.
Any change to the name or address of the Registrant’s agent for service shall be communicated promptly to the Commission by amendment to Form F-X referencing the file number of the Registrant.
SIGNATURES
Pursuant to the requirements of the Exchange Act, the Registrant certifies that it meets all of the requirements for filing on Form 40-F and has duly caused this annual report to be signed on its behalf by the undersigned, thereto duly authorized.
|
|
VERMILION ENERGY INC (the Registrant) |
|
|
|
|
|
Date: March 6, 2024 |
|
By: |
/s/ (“Lars Glemser”) |
|
|
Lars Glemser |
|
|
|
Vice President and Chief Financial Officer |
|
EXHIBIT INDEX
The following exhibits have been filed as part of this annual report:
Exhibits |
|
Description |
|
|
|
97 |
|
|
|
|
|
99.1 |
|
Annual Information Form for the Year Ended December 31, 2023 |
|
|
|
99.2 |
|
Management's Discussion and Analysis from the 2023 Annual Report to Shareholders |
|
|
|
99.3 |
|
Audited Annual Financial Statements for the Year Ended December 31, 2023 |
|
|
|
99.4 |
|
|
|
|
|
99.5 |
|
|
|
|
|
99.6 |
|
|
|
|
|
99.7 |
|
|
|
|
|
101 |
|
Interactive Data File (formatted as Inline XBRL) |
|
|
|
104 |
|
Cover Page Interactive Data File (formatted as Inline XBRL and contained in Exhibit 101) |
Exhibit 97
Recovery Policy
Scope
This Recovery Policy (this “Policy”) applies to any individual who is or was an Executive Officer (as defined below) of Vermilion Energy Inc. (the “Company”) at the relevant time. Should the Company be required to prepare an Accounting Restatement (as defined below), certain excess Incentive-Based Compensation (as defined below) received by its Executive Officers will be clawed back, on and subject to the terms provided for in this Policy.
Definitions
For the purposes of this Policy, the following terms will have the meanings set forth below:
“Accounting Restatement” |
|
means any accounting restatement of the Company’s financial statements due to material noncompliance with any financial reporting requirement under United States federal securities laws, including any required accounting restatement to correct a material error in the Company’s previously-issued financial statements, or to avoid a material misstatement if the error were corrected in the current period or left uncorrected in the current period. |
“Board” |
|
means the Board of Directors of the Company. |
“Erroneously Awarded |
|
means, in connection with an Accounting Restatement, the amount of Incentive-Based Compensation received by Executive Officers that exceeds the amount of Incentive-Based Compensation that otherwise would have been received by such Executive Officers had such Incentive-Based Compensation been determined based on the restated amounts after giving effect to such Accounting Restatement, without regard to any taxes paid by such Executive Officers. |
“Exchange Act” |
|
means the United States Securities Exchange Act of 1934, as amended. |
“Executive Officer” |
|
means the Company’s president, principal financial officer, principal accounting officer (or if there is no such accounting officer, the controller), any vice-president of the Company in charge of a principal business unit, division or function (such as sales, administration or finance), any other officer who performs a significant policy-making function or any other person who performs similar significant policy-making functions for the Company, as identified in the Company’s most recently filed annual report on Form 40-F. Executive officers of the Company’s parent(s) or subsidiaries are deemed “Executive Officers” if they perform such policy making functions for the Company. |
“Financial Reporting |
|
means measures that are determined and presented in accordance with the accounting principles used in preparing the Company’s financial statements, and any measures that are derived wholly or in part from such measures. |
“Incentive-Based |
|
means any compensation to any Executive Officer that is granted, earned, or vested based wholly or in part upon the attainment of a Financial Reporting Measure. |
“Restatement Date” |
|
means the date on which the Company is required to prepare an Accounting Restatement (such date as determined by Rule 10D-1(b)(1)(ii) under the Exchange Act and the applicable U.S. Stock Exchange Rules). |
“SEC” |
|
means the United States Securities and Exchange Commission. |
“U.S. Stock Exchange” |
|
means the [New York Stock Exchange] [National Association of Securities Dealers Automated Quotations (NASDAQ)] and/or any other U.S. national securities exchange(s) on which the Company’s securities are listed. |
“U.S. Stock Exchange Rules” |
|
means Section 303A.14 of the New York Stock Exchange Listed Company Manual and/or the listing standards of any other U.S. national securities exchange(s) on which the Company’s securities are listed to implement Rule 10D-1 under the Exchange Act. |
Accounting Restatements
In the event the Company is required to prepare an Accounting Restatement, the Board will review all Incentive-Based Compensation received by Executive Officers (a) after beginning service as an Executive Officer, (b) who served as an Executive Officer at any time during the performance period for such Incentive-Based Compensation, (c) during the three completed fiscal years immediately preceding the applicable Restatement Date (as well as during any transition period specified in Rule 10D-1(b)(1)(i)(D) under the Exchange Act and the applicable U.S. Stock Exchange Rules), (d) while the Company had a class of securities listed on a U.S. Stock Exchange, and (e) after the U.S. Stock Exchange Rules became effective. Incentive-Based Compensation is deemed “received” in the fiscal period during which the Financial Reporting Measure specified in the Incentive-Based Compensation is attained, even if the payment or grant of Incentive-Based Compensation occurs after the end of that period.
If the Board determines that one or more Executive Officers have received any Erroneously Awarded Compensation in connection with such Accounting Restatement, the Company shall, reasonably promptly after the Restatement Date, seek recoupment from all such Executive Officers of all such Erroneously Awarded Compensation, subject to the exceptions set forth below under “—Recoupment Exceptions”. Any appropriate method may be used for recouping Erroneously Awarded Compensation hereunder.
Calculation of Erroneously Awarded Compensation
For Incentive-Based Compensation based on stock price or total shareholder return, where the amount of Erroneously Awarded Compensation is not subject to mathematical recalculation directly from the information in an Accounting Restatement: (i) the amount of Erroneously Awarded Compensation must be based on a reasonable estimate of the effect of the Accounting Restatement on the stock price or total shareholder return upon which the Incentive-Based Compensation was received; and (ii) the Company must maintain documentation of the determination of that reasonable estimate and provide such documentation to the applicable U.S. Stock Exchange. Reference is further made to Rule 10D-1(b)(1)(iii) under the Exchange Act and the applicable U.S. Stock Exchange Rules for calculation of Erroneously Awarded Compensation.
Recoupment Exceptions
Any Erroneously Awarded Compensation must be recovered as provided in this Policy unless a committee of independent directors responsible for executive compensation decisions (or in the absence of such a committee, a majority of the independent directors serving on the Board) determines that any of the impracticality exceptions set forth in Rule 10D-1(b)(1)(iv) under the Exchange Act and/or the applicable U.S. Stock Exchange Rules are available, as set forth below:
(a) |
The direct expense paid to a third party to assist in enforcing this Policy would exceed the amount of Erroneously Awarded Compensation to be recovered. Before concluding that it would be impracticable to recover any amount of Erroneously Awarded Compensation pursuant to this clause (a), the Company must make a reasonable attempt to recover such Erroneously Awarded Compensation, document such reasonable attempt(s) to recover and provide that documentation to the applicable U.S. Stock Exchange. |
(b) |
Recovery would violate home country law where that law was adopted prior to November 28, 2022. Before concluding that it would be impracticable to recover any amount of Erroneously Awarded Compensation pursuant to this clause (b), the Company must obtain an opinion of home country counsel, acceptable to the applicable U.S. Stock Exchange, that recovery would result in such a violation, and must provide such opinion to the applicable U.S. Stock Exchange. |
(c) |
Recovery would likely cause an otherwise tax-qualified retirement plan, under which benefits are broadly available to employees of the Company, to fail to meet the requirements of 26 U.S.C. 401(a)(13) or 26 U.S.C. 411(a) and regulations thereunder. |
The obligation to recover Erroneously Awarded Compensation is not dependent on if or when the restated financial statements in connection with the Accounting Restatement have been filed.
Recoupment of Erroneously Awarded Compensation due to an Accounting Restatement will be made on a “no fault” basis, without regard to whether any Executive Officer is responsible for the noncompliance that resulted in the Accounting Restatement.
No Indemnification of Executive Officers
The Company shall not indemnify any Executive Officer against the loss of any Erroneously Awarded Compensation.
Indemnification of the Board
Any members of the Board who assist in the administration of this Policy will not be personally liable for any action, determination or interpretation made with respect to this Policy and will be fully indemnified by the Company to the fullest extent under applicable law and Company policy with respect to any such action, determination or interpretation. The foregoing sentence will not limit any other rights to indemnification of the members of the Board under applicable law or Company policy.
Further Reference to Applicable SEC and U.S. Stock Exchange Rules
This Policy shall be qualified by reference to, is designed to comply with, and will be interpreted consistent with applicable SEC rules (including, without limitation, Section 10D of the Exchange Act and Rule 10D-1 under the Exchange Act) and the applicable U.S. Stock Exchange Rules.
Applicability
Each document setting forth the terms and conditions of any Incentive-Based Compensation granted or paid to an Executive Officer will include a provision incorporating this Policy or the requirements of this Policy. The remedies specified in this Policy shall not be exclusive and shall be in addition to every other right or remedy at law or in equity that may be available to the Company.
Other Recovery Obligations
To the extent that the application of this Policy would provide for recovery of Incentive-Based Compensation that the Company already recovered pursuant to Section 304 of the Sarbanes-Oxley Act or other recovery obligations, the amount already recovered from the relevant Executive Officer will be credited to the required recovery under this Policy.
Filing with the SEC
This Policy and any amendments thereto shall be filed with the SEC as an exhibit to the Company’s annual report on Form 40-F (or other applicable form) beginning with the first report as specified under applicable U.S. Stock Exchange Rules.
Interpretation
The Board shall have full and final authority to make all determinations under this Policy with respect to any Erroneously Awarded Compensation, including, without limitation, whether this Policy applies and if so, the amount of compensation to be repaid or forfeited by an Executive Officer. All determinations and decisions made by the Board pursuant to the provisions of this Policy shall be final, conclusive and binding on all parties.
The Board may amend this Policy from time to time in its sole and absolute discretion and shall amend this Policy as it deems necessary to comply with the U.S. Stock Exchange Rules.
Severability
The provisions in this Policy are intended to be applied to the fullest extent of the law. To the extent that any provision of this Policy is found to be unenforceable or invalid under any applicable law, such provision shall be applied to the maximum extent permitted, and shall automatically be deemed amended in a manner consistent with its objectives to the extent necessary to conform to any limitations required under applicable law.
Successors
This Policy is binding and enforceable against all Executive Officers and their beneficiaries, heirs, executors, administrators or other legal representatives.
ADOPTED by the Board of Directors of the Company on November 30, 2023.
Exhibit 99.1
Table of Contents
2 |
|
4 |
|
5 |
|
5 |
|
6 |
|
6 |
|
10 |
|
Statement of Reserves Data and Other Oil and Gas Information |
13 |
51 |
|
54 |
|
56 |
|
57 |
|
58 |
|
58 |
|
58 |
|
58 |
|
58 |
|
59 |
|
59 |
|
66 |
|
|
|
Report on reserves data by Independent Qualified Reserves Evaluator or Auditor (Form 51-101F2) |
67 |
|
|
Report of Management and Directors on reserves data and other information (Form 51-101F3) |
68 |
|
|
69 |
In addition to terms defined elsewhere in this annual information form, the following are defined terms used in this annual information form:
“ABCA” means the Business Corporations Act (Alberta), R.S.A. 2000, c. B-9, as amended, including the regulations promulgated thereunder.
“AIF” means this Annual Information Form and the appendices attached hereto.
“Affiliate” when used to indicate a relationship with a person or company, has the same meaning as set forth in the Securities Act (Alberta).
“Common Shares” means a common share in the capital of the Company.
“Conversion Arrangement” means the plan of arrangement effected on September 1, 2010 under section 193 of the ABCA pursuant to which the Trust converted from an income trust to a corporate structure, and Unitholders exchanged their Trust Units for common shares of the Company on a one-for-one basis and holders of exchangeable shares of Vermilion Resources Ltd., previously a subsidiary of the company ("VRL"), received 1.89344 common shares for each exchangeable share held.
“Dividend” means a dividend paid by Vermilion in respect of the common shares, expressed as an amount per common share.
“McDaniel & Associates” means McDaniel & Associates Consultants Ltd., independent petroleum engineering consultants of Calgary, Alberta.
“McDaniel & Associates Report” means the independent engineering reserves evaluation of certain oil, NGL and natural gas interests of the Company prepared by McDaniel & Associates dated March 5, 2024 and effective December 31, 2023.
“NCIB” means the normal course issuer bid approved by the Toronto Stock Exchange allowing Vermilion to repurchase its common shares.
“Shareholders” means holders from time to time of the Company’s common shares.
“Subsidiary” means, in relation to any person, any corporate, partnership, joint venture, association or other entity of which more than 50% of the total voting power of common shares or units of ownership or beneficial interest entitled to vote in the election of directors (or members of a comparable governing body) is owned or controlled, directly or indirectly, by such person.
“Trust” means Vermilion Energy Trust, an unincorporated open-ended investment trust governed by the laws of the Province of Alberta that was dissolved and ceased to exist pursuant to the Conversion Arrangement.
“Trust Unit” means units in the capital of the Trust.
“Unitholders” means former unitholders of the Trust.
“Vermilion” or the “Company” means Vermilion Energy Inc. and where context allows, its consolidated business enterprise, except that a reference to “Vermilion” prior to the date of the Conversion Arrangement means the consolidated business enterprise of the Trust, unless otherwise indicated.
Vermilion Energy Inc. ■ Page 2 ■ 2023 Annual Information Form Unless otherwise indicated, references herein to "$" or "dollars" are to Canadian dollars.
Conventions
Production numbers stated refer to Vermilion's working interest share before deduction of crown, freehold, and other royalties. Reserve amounts are gross reserves, stated before deduction of royalties, as at December 31, 2023, based on forecast costs and price assumptions as evaluated in the McDaniel & Associates Report.
Abbreviations
$M |
thousand dollars |
$MM |
million dollars |
°API |
an indication of the specific gravity of crude oil measured on the API (American Petroleum Institute) gravity scale |
AECO |
the daily average benchmark price for natural gas at the AECO ‘C’ hub in southeast Alberta |
bbl(s) |
barrel(s) |
bbls/d |
barrels per day |
boe |
barrel of oil equivalent, including: crude oil, condensate, natural gas liquids, and natural gas (converted on the basis of one boe for six mcf of natural gas) |
mbbl |
thousand barrels |
mboe |
thousand barrels of oil equivalent |
mcf |
thousand cubic feet |
mcf/d |
thousand cubic feet per day |
mmboe |
million barrels of oil equivalent |
mmbtu |
million British Thermal Units |
mmcf |
million cubic feet |
mmcf/d |
million cubic feet per day |
NBP |
the reference price paid for natural gas in the United Kingdom at the National Balancing Point Virtual Trading Point operated by National Grid |
NCIB |
normal course issuer bid |
TTF |
the day-ahead price for natural gas at the Title Transfer Facility Virtual Trading Point operated by Dutch TSO Gas Transport Services |
WTI |
West Texas Intermediate, the reference price paid in U.S. dollars at Cushing, Oklahoma for crude oil of standard grade |
Conversions
The following table sets forth certain standard conversions from Standard Imperial Units to the International System of Units (or metric units):
To Convert From |
To |
Multiply By |
mcf |
Cubic metres |
28.174 |
Cubic metres |
Cubic feet |
35.494 |
bbls |
Cubic metres |
0.159 |
Cubic metres |
bbls oil |
6.290 |
Feet |
Metres |
0.305 |
Metres |
Feet |
3.281 |
Miles |
Kilometres |
1.609 |
Kilometres |
Miles |
0.621 |
Acres |
Hectares |
0.405 |
Hectares |
Acres |
2.471 |
Vermilion Energy Inc. ■ Page 3 ■ 2023 Annual Information Form Certain statements included or incorporated by reference in this annual information form may constitute forward looking statements or information under applicable securities legislation.
Special Note Regarding Forward Looking Statements
Such forward looking statements or information typically contain statements with words such as "anticipate", "believe", "expect", "plan", "intend", "estimate", "propose", or similar words suggesting future outcomes or statements regarding an outlook. Forward looking statements or information in this annual information form may include, but are not limited to:
| ● | capital expenditures; |
| ● | return of capital; |
| ● | business strategies and objectives; |
| ● | estimated reserve quantities and the discounted present value of future net cash flows from such reserves; |
| ● | petroleum and natural gas sales; |
| ● | future production levels (including the timing thereof) and rates of average annual production growth; |
| ● | exploration and development plans; |
| ● | acquisition and disposition plans and the timing thereof; |
| ● | operating and other expenses, including the payment of future dividends; |
| ● | royalty, income tax and inflation rates; and |
| ● | the timing of regulatory proceedings and approvals. |
Such forward-looking statements or information are based on a number of assumptions of which all or any may prove to be incorrect. In addition to any other assumptions identified in this document, assumptions have been made regarding, among other things:
| ● | the ability of the Company to obtain equipment, services and supplies in a timely manner to carry out its activities in Canada and internationally; |
| ● | the ability of the Company to market crude oil, natural gas liquids and natural gas successfully to current and new customers; |
| ● | the timing and costs of pipeline and storage facility construction and expansion and the ability to secure adequate product transportation; |
| ● | the timely receipt of required regulatory approvals; |
| ● | the ability of the Company to obtain financing on acceptable terms; |
| ● | foreign currency exchange rates and interest and inflation rates; |
| ● | future crude oil, natural gas liquids and natural gas prices; and |
| ● | Management’s expectations relating to the timing and results of development activities. |
Although the Company believes that the expectations reflected in such forward looking statements or information are reasonable, undue reliance should not be placed on forward looking statements because the Company can give no assurance that such expectations will prove to be correct. Financial outlooks are provided for the purpose of understanding the Company’s financial strength and business objectives and the information may not be appropriate for other purposes. Forward looking statements or information are based on current expectations, estimates and projections that involve a number of risks and uncertainties which could cause actual results to differ materially from those anticipated by the Company and described in the forward looking statements or information. These risks and uncertainties include but are not limited to:
| ● | the ability of management to execute its business plan; |
| ● | the risks of the oil and gas industry, both domestically and internationally, such as operational risks in exploring for, developing and producing crude oil, natural gas liquids and natural gas; |
| ● | risks and uncertainties involving geology of crude oil, natural gas liquids and natural gas deposits; |
| ● | risks inherent in the Company's marketing operations, including credit risk; |
| ● | the uncertainty of reserves estimates and reserves life and associated expenditures; |
| ● | the uncertainty of estimates and projections relating to production, costs and expenses; |
| ● | potential delays or changes in plans with respect to exploration or development projects or capital expenditures; |
| ● | the Company's ability to enter into or renew leases on acceptable terms; |
| ● | fluctuations in crude oil, natural gas liquids and natural gas prices, foreign currency exchange rates and interest and inflation rates; |
| ● | health, safety and environmental risks; |
| ● | uncertainties as to the availability and cost of financing; |
| ● | the ability of the Company to add production and reserves through exploration and development activities; |
| ● | general economic and business conditions; |
| ● | the possibility that government policies or laws may change or governmental approvals may be delayed or withheld; |
| ● | uncertainty in amounts and timing of royalty payments; |
| ● | risks associated with existing and potential future law suits and regulatory actions against or involving the Company; and |
| ● | other risks and uncertainties described elsewhere in this annual information form or in the Company's other filings with Canadian securities authorities. |
Vermilion Energy Inc.
■ Page 4 ■ 2023 Annual Information Form The forward-looking statements or information contained in this annual information form are made as of the date hereof and the Company undertakes no obligation to update publicly or revise any forward-looking statements or information, whether as a result of new information, future events or otherwise, unless required by applicable securities laws.
Presentation of Oil and Gas Information
Oil and gas reserves and production
All oil and natural gas reserve information contained in this annual information form is derived from the McDaniel & Associates Report and has been prepared and presented in accordance with the Canadian Oil and Gas Evaluation Handbook (“COGEH”) and National Instrument 51-101 Standards of Disclosure for Oil and Gas Activities ("NI 51-101"). The actual oil and natural gas reserves and future production will be greater than or less than the estimates provided in this annual information form. The estimated future net revenue from the production of the disclosed oil and natural gas reserves does not represent the fair market value of these reserves.
Under NI 51-01, disclosure of production volumes should include segmentation by product type as defined in the instrument. In this report, references to "crude oil" and "light and medium crude oil" mean "light crude oil and medium crude oil" and references to "natural gas" mean "conventional natural gas".
Natural gas volumes have been converted on the basis of six thousand cubic feet of natural gas to one barrel of oil equivalent. Barrels of oil equivalent (“boe”) may be misleading, particularly if used in isolation. A boe conversion ratio of six thousand cubic feet of natural gas to one barrel of oil is based on an energy equivalency conversion method primarily applicable at the burner tip and does not represent a value equivalency at the wellhead.
Additional Non-GAAP and Other Specified Financial Measures
This AIF includes references to certain financial and performance measures which do not have standardized meanings prescribed by International Financial Reporting Standards ("IFRS") and therefore may not be comparable to similar measures disclosed by other issuer. These measures include:
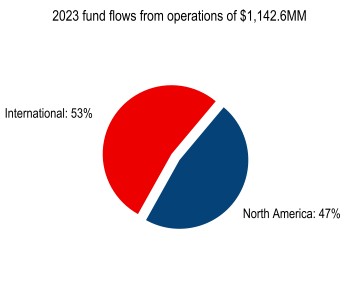
| ● | Fund flows from operations: Fund flows from operations (FFO) is a total of segments measure most directly comparable to net earnings and is comprised of sales less royalties, transportation, operating, G&A, corporate income tax, PRRT, windfall taxes, interest expense, realized loss on derivatives, realized foreign exchange gain (loss), and realized other income. The measure is used to assess the contribution of each business unit to Vermilion's ability to generate income necessary to pay dividends, repay debt, fund asset retirement obligations and make capital investments. A reconciliation to Net Earnings can be found within the "Non-GAAP and Other Specified Financial Measures" section of the December 31, 2023 MD&A available on SEDAR+ at www.sedarplus.ca. |
| ● | Operating Netbacks: Operating Netbacks is a non-GAAP financial measure most directly comparable to net earnings and is calculated as sales less royalties, operating expense, transportation costs, PRRT, and realized hedging gains and losses presented on a per unit basis. Management assesses operating netback as a measure of the profitability and efficiency of our field operations. A reconciliation to the primary financial statement measures can be found within "Supplemental Table 1: Netbacks" of the December 31, 2023 MD&A available on SEDAR+ at www.sedarplus.ca. |
| ● | Cash dividends per share: Represents actual cash dividends paid per share by the Company during the relevant periods. Information is included in this document by reference, more information can be found within the "Non-GAAP Financial Measures" section of the December 31, 2023 MD&A available on SEDAR+ at www.sedarplus.ca. |
| ● | Capital expenditures: Represents the sum of drilling and development and exploration and evaluation costs from the Consolidated Statements of Cash Flows and most directly comparable to cash flows used in investing activities. Information is included in this document by reference, more information and a reconciliation to primary financial statement measures can be found within the "Non-GAAP Financial Measures" section of the December 31, 2023 MD&A available on SEDAR+ at www.sedarplus.ca. Capital expenditures are also referred to as E&D capital. |
In addition, this AIF includes references to certain financial measures which are not specified, defined, or determined under IFRS and are therefore considered non-GAAP and other specified financial measures. These financial measures are unlikely to be comparable to similar financial measures presented by other issuers.
Vermilion Energy Inc.
Vermilion's Organizational Structure
■ Page 5 ■ 2023 Annual Information Form Vermilion Energy Inc. is the successor to the Trust, following the completion of the Conversion Arrangement whereby the Trust converted from an income trust to a corporate structure by way of a court approved plan of arrangement under the ABCA on September 1, 2010.
As at December 31, 2023, Vermilion had 740 full time employees of which 249 employees were located in its Calgary head office, 96 employees in its Canadian field offices,120 employees in France,74 employees in the Netherlands, 36 employees in Australia, 29 employees in the United States, 41 employees in Germany, 6 employees in Hungary, 10 employees in Croatia and 79 employees in Ireland.
Vermilion was incorporated on July 21, 2010 pursuant to the provisions of the ABCA for the purpose of facilitating the Conversion Arrangement. The registered and head office of Vermilion Energy Inc. is located at Suite 3500, 520 – 3rd Avenue S.W., Calgary, Alberta, T2P 0R3.
The following is a list of the Company's material subsidiaries and where each material subsidiary was incorporated or formed. The Company holds 100% of the votes attaching to all voting securities of each material subsidiary beneficially owned directly or indirectly by Vermilion.
| ● | Vermilion Oil & Gas Australia Pty Ltd. (Australia) |
| ● | Vermilion Energy Corrib Ireland Limited (Ireland) |
| ● | Vermilion Energy Germany GmbH & Co. KG (Germany) |
| ● | Vermilion Energy Ireland Limited (Ireland) |
| ● | Vermilion Energy Netherlands B.V. (Netherlands) |
| ● | Vermilion Energy USA LLC (United States) |
| ● | Vermilion Exploration and Production Ireland Limited (Ireland) |
| ● | Vermilion Exploration SAS (France) |
| ● | Vermilion Hungary Southern Battonya Concession Kft. (Hungary) |
| ● | Vermilion Moraine SAS (France) |
| ● | Vermilion Pyrénées SAS (France) |
| ● | Vermilion Rep SAS (France) |
| ● | Vermilion Resources (Alberta) |
| ● | Vermilion Slovakia Exploration s.r.o. (Slovakia) |
| ● | Vermilion Zagreb Exploration d.o.o. (Croatia) |
Vermilion is an international energy producer that seeks to create value through the acquisition, exploration, development and optimization of producing assets in North America, Europe and Australia. Our business model emphasizes free cash flow generation and returning capital to investors when economically warranted, augmented by value-adding acquisitions. Vermilion's operations are focused on the exploitation of light oil and liquids-rich natural gas conventional and unconventional resource plays in North America and the exploration and development of conventional natural gas and oil opportunities in Europe and Australia.
Vermilion's priorities are health and safety, the environment, and profitability, in that order. Nothing is more important to us than the safety of the public and those who work with us, and the protection of our natural surroundings. We have been recognized by leading ESG rating agencies for our transparency on, and management of, key environmental, social and governance issues. In addition, we emphasize strategic community investment in each of our operating areas.
Vermilion has operations in two geographic regions: North America and International. Vermilion's business within these regions is managed at the country level through business units which form the basis of the Company's operating segments. These business units and the material crude oil and natural gas properties, facilities and installations in which Vermilion has an interest are discussed below.
Vermilion Energy Inc. ■ Page 6 ■ 2023 Annual Information Form The following table summarizes production, sales, proved reserves, and proved plus probable reserves for each of Vermilion's business units as at and for the year ended December 31, 2023:
|
|
|
|
|
|
|
|
|
|
|
|
|
|
Gross Proved |
|
|
|
|
|
|
|
|
|
|
|
|
Gross Proved |
|
Plus Probable |
|
|
Production |
|
Oil sales |
|
NGL sales |
|
Natural gas sales |
|
Sales |
|
Reserves |
|
Reserves |
Business Unit |
|
(boe/d) |
|
($ millions) |
|
($ millions) |
|
($ millions) |
|
($ millions) |
|
(mboe)(1) |
|
(mboe)(1) |
Canada |
|
50,503 |
|
621,985 |
|
68,753 |
|
170,653 |
|
861,391 |
|
172,715 |
|
278,475 |
France |
|
7,584 |
|
285,626 |
|
— |
|
— |
|
285,626 |
|
26,015 |
|
35,846 |
Netherlands |
|
4,768 |
|
2,306 |
|
— |
|
184,548 |
|
186,854 |
|
4,646 |
|
11,327 |
Germany |
|
5,310 |
|
57,464 |
|
— |
|
138,017 |
|
195,481 |
|
16,547 |
|
29,032 |
Ireland |
|
8,520 |
|
74 |
|
— |
|
302,330 |
|
302,404 |
|
16,258 |
|
23,371 |
Australia |
|
1,492 |
|
36,381 |
|
— |
|
— |
|
36,381 |
|
7,563 |
|
11,921 |
United States |
|
5,754 |
|
129,775 |
|
15,240 |
|
6,143 |
|
151,158 |
|
22,970 |
|
37,565 |
Central and Eastern Europe |
|
63 |
|
— |
|
— |
|
3,260 |
|
3,260 |
|
1,670 |
|
2,302 |
Total |
|
83,994 |
|
1,133,611 |
|
83,993 |
|
804,951 |
|
2,022,555 |
|
268,385 |
|
429,838 |
North America |
|
56,257 |
|
751,760 |
|
83,993 |
|
176,796 |
|
1,012,549 |
|
195,685 |
|
316,040 |
International |
|
27,737 |
|
381,851 |
|
— |
|
628,155 |
|
1,010,006 |
|
72,700 |
|
113,798 |
| (1) | "Gross Reserves" are Vermilion's working interest (operating or non-operating) share before deduction of royalty obligations and without including any royalty interests of Vermilion. |
Canada Business Unit
Vermilion’s Canadian operations are primarily focused in the West Pembina region of West Central Alberta, in southeast Saskatchewan and Manitoba, and in the Mica property straddling the Alberta and British Columbia borders. In West Pembina, the Company targets condensate-rich Mannville natural gas and Cardium light oil, while in southeast Saskatchewan and Manitoba the Company targets light oil in the Mississippian Midale, Frobisher/Alida and Ratcliffe formations. At Mica, the Company targets tight oil and shale gas in the Montney formation.
Vermilion holds an average 79% working interest in 721,732 (569,117 net) acres of developed land, and an average 80% working interest in 330,154 (265,279 net) acres of undeveloped land in Canada. Vermilion had 637 (481.5 net) producing conventional natural gas and shale gas wells and 2,043 (1,197.1 net) producing light and medium crude oil wells in Canada as at December 31, 2023.
Vermilion has access to ample facilities and processing capacity across the major plays in its Canadian portfolio. In West Central Alberta, Vermilion's operations are concentrated in core areas where the Company owns and operates the large majority of associated key infrastructure including pipelines, compressor stations, oil batteries and gas plants, many of which have surplus capacity for future production. Furthermore, the Company is interconnected in several locations with third party midstream infrastructure that provides significant capacity for growth. In Saskatchewan, where operations are focused on light crude oil, Vermilion owns and operates an extensive network of pipelines and oil batteries that also have surplus capacity for future production. At Mica, the Company has infrastructure in place for current operations, with short-term growth plans currently being permitted for construction and a long-term development plan in place targeting production of 28,000 boe/d. The Company's high degree of operating control and access to key infrastructure across our Canadian properties allows Vermilion to drive operating efficiencies in the field while supporting future growth opportunities.
During 2023, Vermilion drilled or participated in 46 (35.9 net) wells across our Canadian assets. In 2024, we plan to drill or participate in 18 (17.0 net) light crude oil wells in Saskatchewan, nine (9.0 net) liquids-rich conventional natural gas wells and four (4.0 net) light crude oil wells in Alberta, and 11 (11.0 net) tight oil and shale gas wells in the Montney.
United States Business Unit
Vermilion entered the United States in 2014 through the acquisition of land and producing assets in the East Finn crude oil field in the Powder River Basin of northeastern Wyoming and expanded its position through acquisitions of mineral land and producing assets in the Hilight crude oil field, located approximately 40 miles northwest of the East Finn assets, in 2018 and 2021. In December 2023, the Company divested of non-core assets in East Finn. The Company's assets include 111,685 (83,942 net) acres of land in the Powder River basin, of which 31% is undeveloped. Vermilion had 159 (130.9 net) producing light and medium crude oil wells in the United States as at December 31, 2023. The majority of our working interest ownership in Wyoming is Company operated.
Vermilion Energy Inc. ■ Page 7 ■ 2023 Annual Information Form During 2023, Vermilion continued to focus on the Turner Sand development in the Powder River Basin, drilling 18 (8.4 net) light and medium crude oil wells on its Hilight asset.
Included in the 2023 well count was the Company's participation in the drilling of ten (3.2 net) non-operated Parkman wells and two (0.2 net) non-operated Niobrara wells. In 2024, Vermilion intends to mitigate declines through maintenance capital spending and participation in non - operated activity. We will also continue to monitor and evaluate industry activity in the emerging Niobrara play to assess the future potential on our Hilight lands, where we have 15,000 net acres prospective for the Niobrara and Parkman.
France Business Unit
Vermilion entered France in 1997 and completed three additional acquisitions in subsequent years. Vermilion is the largest oil producer in the country with approximately two-thirds of the domestic market share. The Company's oil is priced with reference to Dated Brent.
Vermilion's main producing areas in France are located in the Aquitaine Basin which is located southwest of Bordeaux, France and in the Paris Basin, located just east of Paris. The two major fields in the Paris Basin area are Champotran and Chaunoy and the two major fields in the Aquitaine Basin are Parentis and Cazaux. Vermilion operates several oil batteries in the country and, given the legacy nature of these assets, the throughput capability of these batteries exceeds any projected future requirements. Vermilion holds an average 96% working interest in 257,394 (248,142 net) acres of developed land and an average 100% working interest in 63,010 (63,010 net) acres of undeveloped land in the Aquitaine and Paris Basins. Vermilion had 305 (299.0 net) producing light and medium crude oil wells in France as at December 31, 2023.
In 2024, we plan to drill two (2.0 net) light and medium crude oil wells in the Cazaux field. We also intend to continue our ongoing program of workovers and well optimizations to maintain production by mitigating declines.
Netherlands Business Unit
Vermilion entered the Netherlands in 2004 and is the second largest onshore operator in the country. Vermilion's natural gas production in the Netherlands is priced off of the TTF index.
Vermilion's Netherlands assets consist of 28 onshore concessions (100% operated) and 17 offshore concessions (non-operated). Production consists primarily of natural gas with a small amount of associated natural gas liquids. Vermilion’s total land position in the Netherlands covers 1,604,206 (844,409 net) acres at an average 54% working interest, of which 90% is undeveloped. Vermilion had 80 (32.7 net) producing conventional natural gas wells as at December 31, 2023.
During 2023, the Company drilled two (1.0 net) conventional natural gas well in the Netherlands. In 2024, we plan to mitigate declines through maintenance capital spending. Vermilion expects that its inventory of potentially high-impact exploration and development opportunities in the Netherlands will maintain or moderately grow the Company's production base in the country.
Germany Business Unit
Vermilion entered Germany in 2014 through the acquisition of a 25% non-operated interest in natural gas producing assets. In December 2016, Vermilion completed an acquisition of crude oil and natural gas producing properties that provided Vermilion with its first operated position in the country. Vermilion holds a significant undeveloped land base in Germany as a result of an extensive farm-in agreement the Company entered into in 2015. In 2021, Vermilion completed two minor acquisitions, increasing the Company’s non-operated working interest in certain assets to 50%. Vermilion's natural gas production in Germany is priced off the THE index, which is highly correlated to the TTF benchmark, and Vermilion's light and medium crude oil production is priced with reference to Dated Brent.
Vermilion’s producing assets in Germany consist of operated and non-operated interests in eleven natural gas fields and nine light and medium crude oil fields with extensive infrastructure in place. Vermilion had 75 (60.6 net) producing light and medium crude oil wells and 23 (12.9 net) producing conventional natural gas wells as at December 31, 2023.
Vermilion's land position in northwest Germany is comprised of 108,675 (55,951 net) developed acres and 1,512,617 (693,226 net) undeveloped acres. In addition, the Company holds a 50% equity interest in Hannoversche Erdölleitung GmbH ("HEG"), a joint venture company created in 1959 that collects and transports crude oil through a 185 km network of infrastructure from the Hannover region to rail loading facilities in Hannover.
During 2023, Vermilion drilled two (2.0 net) light and medium crude oil wells and progressed the Company's deep gas exploration and development plans. In 2024, Vermilion plans to drill two (1.6 net) deep gas exploration conventional natural gas wells. The results from this program will provide valuable information in assessing the future potential on the approximate 700,000 net acres of undeveloped land we have in Germany.
Vermilion Energy Inc. ■ Page 8 ■ 2023 Annual Information Form Vermilion has a 56.5% operated interest in the offshore Corrib natural gas field and related processing facilities located off the northwest coast of Ireland.
Ireland Business Unit
Vermilion initially acquired an 18.5% non-operated interest in 2009. In 2018, Vermilion entered into a strategic partnership with the Canadian Pension Plan Investment Board ("CPPIB"), as a result of which Vermilion acquired an additional 1.5% working interest and assumed operatorship of Corrib. In 2023 Vermilion purchased all of the outstanding shares of Equinor Energy Ireland Limited ("EEIL") from Equinor ASA, adding an incremental 36.5% interest in the Corrib Natural Gas Project.
Corrib first began natural gas production in late December 2015. Production volumes reached full plant capacity of approximately 350 mmcf/d (gross) at the end of 2016. Production plateaued at this level until decline started at the beginning of 2018. The Corrib field constitutes 100% of Ireland's domestic natural gas production.
Central and Eastern Europe ("CEE") Business Unit
Vermilion established its CEE business unit in 2014 with a head office in Budapest, Hungary. The CEE business unit is responsible for business development in the CEE, including managing the exploration and development opportunities associated with the Company's land holdings in Hungary, Slovakia and Croatia.
Vermilion's land position in the CEE consists of 514,969 (514,969 net) acres in Croatia, 300,571 (300,571 net) acres in Hungary and 97,960 (48,980 net) acres in Slovakia. Currently, 99% of Vermilion's land position in the CEE is undeveloped. In 2022, the Company let certain non-prospective licenses in Hungary expire.
During 2023, Vermilion did not drill in Croatia or Hungary. The Company continued to advance the gas plant on the SA-10 block in Croatia in preparation for the tie-in of two previously drilled conventional natural gas wells. Permitting was successful in the fourth quarter of 2023 and the facility is expected to begin processing in mid-2024. In 2024, the Company plans to drill four (4.0 net) exploration wells on the SA-07 block in Croatia.
Australia Business Unit
Vermilion holds a 100% operated working interest in the Wandoo offshore crude oil field and related production facilities, located on Western Australia's northwest shelf. Vermilion acquired its interest over two acquisitions completed in 2005 and 2007. Production is sourced from 19 producing well-bores including five dual laterals that are tied into two platforms, Wandoo 'A' and Wandoo 'B'. Wandoo 'B' is permanently manned, houses the required production facilities and incorporates 400,000 bbls of crude oil storage within the platform's concrete gravity structure. The Wandoo 'B' facilities are capable of processing 208,000 bbl/d of total fluid to separate crude oil from produced water. Vermilion's land position in the Wandoo field is comprised of 59,552 acres (gross and net).
In 2023, Vermilion did not drill any wells, and the Company does not expect to drill additional Australian wells in 2024. The Company intends to manage its Australian production and related capital investment programs to achieve corporate targets while meeting long-term supply requirements of our customers.
Vermilion Energy Inc. ■ Page 9 ■ 2023 Annual Information Form The following describes the development of Vermilion's business over the last three completed financial years.
General Development of the Business
Three Year History and Outlook
2021
Vermilion achieved annual production of 85,408 boe/d on total E&D capital investment of $375 million. E&D capital investment in 2021 was limited as the Company focused on preserving liquidity, maximizing free cash flow and reducing debt.
During the third quarter of 2021, the Company completed a strategic acquisition which included 20,000 net acres of land adjacent to its Hilight field in Wyoming, with production of approximately 1,500 boe/d. Total consideration for the acquisition was US$76 million.
On September 8, 2021, Vermilion appointed Dion Hatcher as President effective January 1, 2022, replacing Curtis Hicks as President (who remained with the Company as an advisor until April 1, 2022). At the time of his appointment, Mr. Hatcher had over 25 years of industry experience and had spent the last 15 years in a variety of leadership roles during his tenure at Vermilion, most recently in the role of Vice President, North America.
On November 29, 2021, Vermilion announced an agreement to acquire an incremental 36.5% working interest in Corrib from Equinor ASA, increasing the Company's operated ownership to 56.5% and adding approximately 7,700 boe/d of production for total consideration of $556 million, before closing adjustments and contingent payment. The acquisition has an effective date of January 1, 2022, and is anticipated to close in 2023 after all requisite approvals have been received. This acquisition consolidates interest in a high margin, low decline and low emission asset, while increasing exposure to premium priced European natural gas and rebalances Vermilion's international weighting.
Vermilion continued to deliver superior ESG performance based on rankings by third party rating agencies in 2021. Vermilion ranked at the top of its peer group in 2021 in the S&P Global Corporate Sustainability Assessment (“CSA”). The Company was also selected for The Sustainability Yearbook 2022, which recognizes that our CSA sustainability performance is within the top 15% of our industry (S&P Global’s Upstream Oil & Gas and Integrated category). Vermilion maintained its rating of "AA" on a scale of AAA (leader) to CCC (laggard) in the MSCI ESG Ratings assessment, which reflects exposure to industry-specific ESG risks and the ability to manage those risks. Vermilion received a B in 2021 for both CDP Climate and CDP Water submissions, a combined performance that places it tied for the top decile of oil and gas companies globally. In August 2021, Vermilion released its 2021 Sustainability Report, marking the Company's 8th year of ESG reporting. Note that effective in 2022, Vermilion’s reporting in alignment with the Task Force on Climate-related Financial Disclosure relating to: Governance is located in our management proxy circular for our annual meeting of shareholders, and relating to Strategy, Risk Management, and Metrics and Targets in our annual MD&A. This information is also located in the Energy Transition section of our Sustainability Report, available online at www.vermilionenergy.com/sustainability.
2022
Vermilion achieved annual production of 85,187 boe/d on total E&D capital investment of $552 million. During the second quarter of 2022, the Company acquired all of the issued and outstanding securities of Leucrotta Exploration Inc. ("Leucrotta") for total consideration of $500 million. The primary asset acquired pursuant to the Leucrotta acquisition was the Mica property, comprised of 81,000 gross (77,000 net) contiguous acres of Montney mineral rights in the Peace River Arch straddling the Alberta and British Columbia borders. At the time of acquisition, we conservatively identified 275 multi-zone, extended reach, drilling prospects, representing an expected two decades or more of low-risk, self-funding, high-deliverability drilling inventory with strong rates of return.
In March 2022, Vermilion reinstated a quarterly dividend of $0.06 per share, which was subsequently increased to $0.08 per share in August 2022. In July 2022, Vermilion received TSX approval for the NCIB, allowing the Company to purchase up to 16,076,666 common shares, representing approximately 10% of its public float as at June 22, 2022, over a twelve month period commencing on July 6, 2022. In 2022, Vermilion declared $46 million in dividends and repurchased 2.3 million shares pursuant to the NCIB for a total of $72 million.
In April 2022, Vermilion issued US$400 million aggregate principal amount of eight-year senior unsecured notes bearing interest at a rate of 6.875% per annum, extended the maturity date of the Company's revolving credit facility to May 29, 2026 (from May 31, 2024), and reduced the total facility amount to Vermilion's targeted level of $1.6 billion (from $2.1 billion).
Vermilion Energy Inc. ■ Page 10 ■ 2023 Annual Information Form Subsequent to year-end, we signed an agreement to sell certain assets in southeast Saskatchewan.
The assets are comprised of approximately 5,500 boe/d of non-core light oil production spread across the greater Arcola and Queensdale areas of southeast Saskatchewan. Total cash consideration is $225 million, before closing adjustments. The transaction has an effective date of September 1, 2022 and is expected to close in March 2023.
Vermilion's commitment to reducing the environmental impact of traditional energy production continued to be reflected in superior ESG performance based on rankings by third party rating agencies in 2022. Vermilion ranked top of our peer group in the S&P Global Corporate Sustainability Assessment (“CSA”). The Company improved its rating to "AAA" on a scale of AAA (leader) to CCC (laggard) in the MSCI ESG Ratings assessment, which reflects exposure to industry-specific ESG risks and the ability to manage those risks. Vermilion received an A- and a B for CDP Climate and CDP Water submissions, respectively. In July 2022, Vermilion released its 2022 Sustainability Report, marking the Company's 9th year of ESG reporting. Note that effective in 2022, Vermilion’s reporting aligned with the Task Force on Climate-related Financial Disclosure relating to Governance (located in our management proxy circular for our annual meeting of shareholders), and relating to Strategy, Risk Management, and Metrics and Targets (located in our annual MD&A). This information is also located in the Energy Transition section of our Sustainability Report, available online at www.vermilionenergy.com/sustainability.
2023
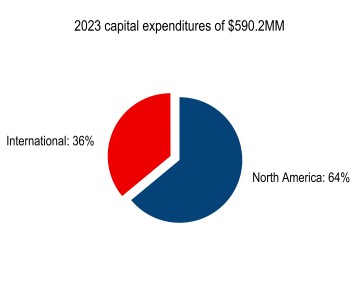
Vermilion achieved annual production of 83,994 boe/d on total E&D capital investment of $590 million. On March 31, 2023, Vermilion completed the purchase of all of the outstanding shares of EEIL from Equinor ASA for $192 million, net of cash and working capital deficit acquired. The acquisition added an incremental 36.5% interest in the Corrib Natural Gas Project, increasing Vermilion's operated interest to 56.5%, and making Vermilion the largest provider of domestic natural gas in Ireland.
In January 2023, Vermilion increased the quarterly dividend to $0.10 per share, effective with the Q1 2023 dividend payable in April 2023. In July 2023, Vermilion received TSX approval for renewal of the Company's NCIB, allowing the Company to purchase up to 16,308,587 common shares, representing approximately 10% of its public float as at June 28, 2028, over a twelve month period commencing on July 12, 2023. In total in 2023, Vermilion declared $65 million in dividends and repurchased 5.4 million shares pursuant to the NCIB for a total of $96 million.
In March 2023, Vermilion closed the sale of non-core assets in southeast Saskatchewan for net proceeds of $182 million. The divestment was part of our strategy to re-position Vermilion for long term success by high-grading our North American inventory, reducing unit cost and accelerating the timeline of achieving our debt reduction targets.
In May 2023, the Company's operations in West Central Alberta were impacted by forest fires. In response, the Company temporarily shut-in approximately 30,000 boe/d of production while we assessed the risk to our operations. Once the immediate risk from the forest fires had eased, we inspected all of our key assets and confirmed that there was no major damage to our facilities or well sites, which allowed remaining production to be brought back online as soon as it was safe to do so.
In September 2023, the Company successfully completed the remaining inspection and repair work on our Wandoo facility and restarted production on the Wandoo platform in Australia following extended maintenance downtime.
Vermilion's commitment to reducing the environmental impact of traditional energy production continued to be reflected in superior ESG performance based on rankings by third party rating agencies in 2023. Vermilion ranked in the top decile of our industry in the S&P Global Corporate Sustainability Assessment (“CSA”). The Company maintained its "AAA" rating on a scale of AAA (leader) to CCC (laggard) in the MSCI ESG Ratings assessment, which reflects exposure to industry-specific ESG risks and the ability to manage those risks. Vermilion received an A- and a B for CDP Climate and CDP Water submissions, respectively. In July 2023, Vermilion released its 2023 Sustainability Report, marking the Company's 10th year of ESG reporting. Vermilion’s reporting aligned with the Task Force on Climate-related Financial Disclosure relating to Governance (located in our management proxy circular for our annual meeting of shareholders), and relating to Strategy, Risk Management, and Metrics and Targets (located in our annual MD&A). This information is also located in the TCFD Report section of our Sustainability Report, available online at www.vermilionenergy.com/sustainability.
Outlook
In December 2023, Vermilion announced an E&D capital budget for 2024 of $600 to 625 million, with corresponding production guidance of 82,000 to 86,000 boe/d, assuming a mid-year start-up of the new BC Montney battery and Croatia gas plant. In conjunction with the 2024 budget release, the Company also announced its plan to increase the quarterly dividend to $0.12 per share in Q1 2024 and increase the percentage of free cash flow allocated to return of capital from 30% of excess free cash flow to 50% of excess free cash flow, beginning April 1, 2024. On March 6, 2024, in conjunction with the release of the 2023 Annual Report, the Company announced a capital return target of 50% of excess free cash flow ona full-year basis for 2024. Excess free cash flow is defined as free cash flow less a deduction for asset retirement obligations settled and capital lease payments, which are ongoing costs associated with running our business, and more accurately reflects the free cash available to return to shareholders. Vermilion's business model allows for flexibility in capital allocation, including the allocation between capital investment, acquisitions, debt repayment
Vermilion Energy Inc. ■ Page 11 ■ 2023 Annual Information Form and shareholder returns.
The Company intends to fund our return of capital and E&D capital investment from internally generated cash flow from operating activities.
Vermilion Energy Inc. ■ Page 12 ■ 2023 Annual Information Form The following is a summary of the crude oil and natural gas reserves and the value of future net revenue of Vermilion as evaluated by McDaniel & Associates in a report dated March 5, 2024 with an effective date of December 31, 2023.
Statement of Reserves Data and Other Oil and Gas Information
Reserves and future net revenue
Pricing used in the forecast price evaluations is set forth in the notes to the tables.
Reserves and other oil and gas information contained in this section is effective December 31, 2023 unless otherwise stated.
All evaluations of future net revenue set forth in the tables below are stated after overriding and lessor royalties, Crown royalties, freehold royalties, mineral taxes, direct lifting costs, normal allocated overhead and future capital investments, including abandonment and reclamation obligations. Future net revenues estimated by the McDaniel & Associates Report do not represent the fair market value of the reserves. Other assumptions relating to the costs, prices for future production and other matters are included in the McDaniel & Associates Report. There is no assurance that the future price and cost assumptions used in the McDaniel & Associates Report will prove accurate and variances could be material.
Reserves are established using deterministic methodology. Total proved reserves are established at the 90 percent probability (P90) level. There is a 90 percent probability that the actual reserves recovered will be equal to or greater than the P90 reserves. Total proved plus probable reserves are established at the 50 percent probability (P50) level. There is a 50 percent probability that the actual reserves recovered will be equal to or greater than the P50 reserves.
The Report on Reserves Data by Independent Qualified Reserves Evaluator or Auditor in Form 51-101F2 and the Report of Management and Directors on Oil and Gas Disclosure in Form 51-101F3 are contained in Schedules "A" and "B", respectively.
The following tables provide reserves data and a breakdown of future net revenue by component and product type using forecast prices and costs. For Canada, the tables following include Alberta Gas Cost Allowance.
Vermilion Energy Inc. ■ Page 13 ■ 2023 Annual Information Form The following tables may not total due to rounding.
Oil and gas reserves - Gross and net interest (2), based on forecast prices and costs (1)
|
|
Light Crude Oil & Medium |
|
Heavy Crude Oil (mbbl) |
|
Tight Oil (mbbl) |
|
Conventional Natural Gas |
||||||||
Proved Developed Producing (3) (5) (6) |
|
Gross (2) |
|
Net (2) |
|
Gross (2) |
|
Net (2) |
|
Gross (2) |
|
Net (2) |
|
Gross (2) |
|
Net (2) |
Australia |
|
7,563 |
|
7,563 |
|
— |
|
— |
|
— |
|
— |
|
— |
|
— |
Canada |
|
31,103 |
|
27,587 |
|
20 |
|
17 |
|
1,887 |
|
1,726 |
|
234,239 |
|
217,146 |
CEE |
|
— |
|
— |
|
— |
|
— |
|
— |
|
— |
|
66 |
|
65 |
France |
|
21,694 |
|
18,623 |
|
— |
|
— |
|
— |
|
— |
|
— |
|
— |
Germany |
|
5,089 |
|
4,981 |
|
— |
|
— |
|
— |
|
— |
|
39,522 |
|
37,390 |
Ireland |
|
— |
|
— |
|
— |
|
— |
|
— |
|
— |
|
97,491 |
|
97,491 |
Netherlands |
|
— |
|
— |
|
— |
|
— |
|
— |
|
— |
|
19,614 |
|
19,301 |
United States |
|
4,983 |
|
4,111 |
|
— |
|
— |
|
— |
|
— |
|
15,547 |
|
12,866 |
Total Proved Developed Producing |
|
70,431 |
|
62,864 |
|
20 |
|
17 |
|
1,887 |
|
1,726 |
|
406,479 |
|
384,258 |
North America |
|
36,086 |
|
31,697 |
|
20 |
|
17 |
|
1,887 |
|
1,726 |
|
249,786 |
|
230,011 |
International |
|
34,345 |
|
31,167 |
|
— |
|
— |
|
— |
|
— |
|
156,693 |
|
154,247 |
|
|
Shale Gas (mmcf) |
|
Coal Bed Methane (mmcf) |
|
Natural Gas Liquids (mbbl) |
|
BOE (mboe) |
||||||||
Proved Developed Producing (3) (5) (6) |
|
Gross (2) |
|
Net (2) |
|
Gross (2) |
|
Net (2) |
|
Gross (2) |
|
Net (2) |
|
Gross (2) |
|
Net (2) |
Australia |
|
— |
|
— |
|
— |
|
— |
|
— |
|
— |
|
7,563 |
|
7,563 |
Canada |
|
52,858 |
|
48,242 |
|
4,589 |
|
4,302 |
|
20,673 |
|
17,377 |
|
102,298 |
|
91,655 |
CEE |
|
— |
|
— |
|
— |
|
— |
|
— |
|
— |
|
11 |
|
11 |
France |
|
— |
|
— |
|
— |
|
— |
|
— |
|
— |
|
21,694 |
|
18,623 |
Germany |
|
— |
|
— |
|
— |
|
— |
|
— |
|
— |
|
11,676 |
|
11,213 |
Ireland |
|
— |
|
— |
|
— |
|
— |
|
10 |
|
10 |
|
16,258 |
|
16,258 |
Netherlands |
|
— |
|
— |
|
— |
|
— |
|
32 |
|
31 |
|
3,301 |
|
3,248 |
United States |
|
— |
|
— |
|
— |
|
— |
|
2,332 |
|
1,930 |
|
9,906 |
|
8,185 |
Total Proved Developed Producing |
|
52,858 |
|
48,242 |
|
4,589 |
|
4,302 |
|
23,047 |
|
19,348 |
|
172,706 |
|
156,756 |
North America |
|
52,858 |
|
48,242 |
|
4,589 |
|
4,302 |
|
23,005 |
|
19,307 |
|
112,204 |
|
99,840 |
International |
|
— |
|
— |
|
— |
|
— |
|
42 |
|
41 |
|
60,502 |
|
56,915 |
|
|
Light Crude Oil & Medium |
|
Heavy Crude Oil (mbbl) |
|
Tight Oil (mbbl) |
|
Conventional Natural Gas |
||||||||
Proved Developed Non-Producing (3) (5) (7) |
|
Gross (2) |
|
Net (2) |
|
Gross (2) |
|
Net (2) |
|
Gross (2) |
|
Net (2) |
|
Gross (2) |
|
Net (2) |
Australia |
|
— |
|
— |
|
— |
|
— |
|
— |
|
— |
|
— |
|
— |
Canada |
|
1,755 |
|
1,564 |
|
— |
|
— |
|
28 |
|
27 |
|
12,629 |
|
11,782 |
CEE |
|
— |
|
— |
|
— |
|
— |
|
— |
|
— |
|
9,955 |
|
6,957 |
France |
|
860 |
|
728 |
|
— |
|
— |
|
— |
|
— |
|
— |
|
— |
Germany |
|
1,401 |
|
1,372 |
|
— |
|
— |
|
— |
|
— |
|
9,768 |
|
9,399 |
Ireland |
|
— |
|
— |
|
— |
|
— |
|
— |
|
— |
|
— |
|
— |
Netherlands |
|
— |
|
— |
|
— |
|
— |
|
— |
|
— |
|
8,014 |
|
7,963 |
United States |
|
— |
|
— |
|
— |
|
— |
|
— |
|
— |
|
— |
|
— |
Total Proved Developed Non-Producing |
|
4,015 |
|
3,664 |
|
— |
|
— |
|
28 |
|
27 |
|
40,366 |
|
36,101 |
North America |
|
1,755 |
|
1,564 |
|
— |
|
— |
|
28 |
|
27 |
|
12,629 |
|
11,782 |
International |
|
2,260 |
|
2,100 |
|
— |
|
— |
|
— |
|
— |
|
27,737 |
|
24,319 |
|
|
Shale Gas (mmcf) |
|
Coal Bed Methane (mmcf) |
|
Natural Gas Liquids (mbbl) |
|
BOE (mboe) |
||||||||
Proved Developed Non-Producing (3) (5) (7) |
|
Gross (2) |
|
Net (2) |
|
Gross (2) |
|
Net (2) |
|
Gross (2) |
|
Net (2) |
|
Gross (2) |
|
Net (2) |
Australia |
|
— |
|
— |
|
— |
|
— |
|
— |
|
— |
|
— |
|
— |
Canada |
|
1,863 |
|
1,694 |
|
712 |
|
668 |
|
1,134 |
|
1,002 |
|
5,450 |
|
4,950 |
CEE |
|
— |
|
— |
|
— |
|
— |
|
— |
|
— |
|
1,659 |
|
1,160 |
France |
|
— |
|
— |
|
— |
|
— |
|
— |
|
— |
|
860 |
|
728 |
Germany |
|
— |
|
— |
|
— |
|
— |
|
— |
|
— |
|
3,029 |
|
2,939 |
Ireland |
|
— |
|
— |
|
— |
|
— |
|
— |
|
— |
|
— |
|
— |
Netherlands |
|
— |
|
— |
|
— |
|
— |
|
9 |
|
9 |
|
1,345 |
|
1,336 |
United States |
|
— |
|
— |
|
— |
|
— |
|
— |
|
— |
|
— |
|
— |
Total Proved Developed Non-Producing |
|
1,863 |
|
1,694 |
|
712 |
|
668 |
|
1,143 |
|
1,011 |
|
12,342 |
|
11,113 |
North America |
|
1,863 |
|
1,694 |
|
712 |
|
668 |
|
1,134 |
|
1,002 |
|
5,450 |
|
4,950 |
International |
|
— |
|
— |
|
— |
|
— |
|
9 |
|
9 |
|
6,892 |
|
6,162 |
Vermilion Energy Inc. ■ Page 14 ■ 2023 Annual Information Form
|
|
Light Crude Oil & Medium |
|
Heavy Crude Oil (mbbl) |
|
Tight Oil (mbbl) |
|
Conventional Natural Gas |
||||||||
Proved Undeveloped (3) (8) |
|
Gross (2) |
|
Net (2) |
|
Gross (2) |
|
Net (2) |
|
Gross (2) |
|
Net (2) |
|
Gross (2) |
|
Net (2) |
Australia |
|
— |
|
— |
|
— |
|
— |
|
— |
|
— |
|
— |
|
— |
Canada |
|
17,496 |
|
14,217 |
|
83 |
|
69 |
|
4,995 |
|
4,922 |
|
73,852 |
|
68,013 |
CEE |
|
— |
|
— |
|
— |
|
— |
|
— |
|
— |
|
— |
|
— |
France |
|
3,462 |
|
2,930 |
|
— |
|
— |
|
— |
|
— |
|
— |
|
— |
Germany |
|
1,170 |
|
1,165 |
|
— |
|
— |
|
— |
|
— |
|
4,038 |
|
3,666 |
Ireland |
|
— |
|
— |
|
— |
|
— |
|
— |
|
— |
|
— |
|
— |
Netherlands |
|
— |
|
— |
|
— |
|
— |
|
— |
|
— |
|
— |
|
— |
United States |
|
8,446 |
|
6,864 |
|
— |
|
— |
|
— |
|
— |
|
14,585 |
|
11,871 |
Total Proved Undeveloped |
|
30,573 |
|
25,177 |
|
83 |
|
69 |
|
4,995 |
|
4,922 |
|
92,475 |
|
83,550 |
North America |
|
25,941 |
|
21,081 |
|
83 |
|
69 |
|
4,995 |
|
4,922 |
|
88,437 |
|
79,884 |
International |
|
4,632 |
|
4,096 |
|
— |
|
— |
|
— |
|
— |
|
4,038 |
|
3,666 |
|
|
Shale Gas (mmcf) |
|
Coal Bed Methane (mmcf) |
|
Natural Gas Liquids (mbbl) |
|
BOE (mboe) |
||||||||
Proved Undeveloped (3) (8) |
|
Gross (2) |
|
Net (2) |
|
Gross (2) |
|
Net (2) |
|
Gross (2) |
|
Net (2) |
|
Gross (2) |
|
Net (2) |
Australia |
|
— |
|
— |
|
— |
|
— |
|
— |
|
— |
|
— |
|
— |
Canada |
|
128,467 |
|
120,607 |
|
391 |
|
313 |
|
8,608 |
|
7,615 |
|
64,967 |
|
58,313 |
CEE |
|
— |
|
— |
|
— |
|
— |
|
— |
|
— |
|
— |
|
— |
France |
|
— |
|
— |
|
— |
|
— |
|
— |
|
— |
|
3,462 |
|
2,930 |
Germany |
|
— |
|
— |
|
— |
|
— |
|
— |
|
— |
|
1,843 |
|
1,776 |
Ireland |
|
— |
|
— |
|
— |
|
— |
|
— |
|
— |
|
— |
|
— |
Netherlands |
|
— |
|
— |
|
— |
|
— |
|
— |
|
— |
|
— |
|
— |
United States |
|
— |
|
— |
|
— |
|
— |
|
2,188 |
|
1,781 |
|
13,064 |
|
10,623 |
Total Proved Undeveloped |
|
128,467 |
|
120,607 |
|
391 |
|
313 |
|
10,796 |
|
9,396 |
|
83,336 |
|
73,642 |
North America |
|
128,467 |
|
120,607 |
|
391 |
|
313 |
|
10,796 |
|
9,396 |
|
78,031 |
|
68,936 |
International |
|
— |
|
— |
|
— |
|
— |
|
— |
|
— |
|
5,305 |
|
4,707 |
|
|
Light Crude Oil & Medium |
|
Heavy Crude Oil (mbbl) |
|
Tight Oil (mbbl) |
|
Conventional Natural Gas |
||||||||
Proved (3) |
|
Gross (2) |
|
Net (2) |
|
Gross (2) |
|
Net (2) |
|
Gross (2) |
|
Net (2) |
|
Gross (2) |
|
Net (2) |
Australia |
|
7,563 |
|
7,563 |
|
— |
|
— |
|
— |
|
— |
|
— |
|
— |
Canada |
|
50,353 |
|
43,368 |
|
103 |
|
86 |
|
6,910 |
|
6,676 |
|
320,721 |
|
296,941 |
CEE |
|
— |
|
— |
|
— |
|
— |
|
— |
|
— |
|
10,020 |
|
7,023 |
France |
|
26,015 |
|
22,281 |
|
— |
|
— |
|
— |
|
— |
|
— |
|
— |
Germany |
|
7,659 |
|
7,518 |
|
— |
|
— |
|
— |
|
— |
|
53,328 |
|
50,454 |
Ireland |
|
— |
|
— |
|
— |
|
— |
|
— |
|
— |
|
97,491 |
|
97,491 |
Netherlands |
|
— |
|
— |
|
— |
|
— |
|
— |
|
— |
|
27,628 |
|
27,264 |
United States |
|
13,428 |
|
10,975 |
|
— |
|
— |
|
— |
|
— |
|
30,132 |
|
24,737 |
Total Proved |
|
105,019 |
|
91,705 |
|
103 |
|
86 |
|
6,910 |
|
6,676 |
|
539,320 |
|
503,909 |
North America |
|
63,781 |
|
54,343 |
|
103 |
|
86 |
|
6,910 |
|
6,676 |
|
350,853 |
|
321,677 |
International |
|
41,237 |
|
37,362 |
|
— |
|
— |
|
— |
|
— |
|
188,467 |
|
182,232 |
|
|
Shale Gas (mmcf) |
|
Coal Bed Methane (mmcf) |
|
Natural Gas Liquids (mbbl) |
|
BOE (mboe) |
||||||||
Proved (3) |
|
Gross (2) |
|
Net (2) |
|
Gross (2) |
|
Net (2) |
|
Gross (2) |
|
Net (2) |
|
Gross (2) |
|
Net (2) |
Australia |
|
— |
|
— |
|
— |
|
— |
|
— |
|
— |
|
7,563 |
|
7,563 |
Canada |
|
183,188 |
|
170,544 |
|
5,692 |
|
5,283 |
|
30,416 |
|
25,994 |
|
172,715 |
|
154,918 |
CEE |
|
— |
|
— |
|
— |
|
— |
|
— |
|
— |
|
1,670 |
|
1,170 |
France |
|
— |
|
— |
|
— |
|
— |
|
— |
|
— |
|
26,015 |
|
22,281 |
Germany |
|
— |
|
— |
|
— |
|
— |
|
— |
|
— |
|
16,547 |
|
15,927 |
Ireland |
|
— |
|
— |
|
— |
|
— |
|
10 |
|
10 |
|
16,258 |
|
16,258 |
Netherlands |
|
— |
|
— |
|
— |
|
— |
|
41 |
|
40 |
|
4,646 |
|
4,584 |
United States |
|
— |
|
— |
|
— |
|
— |
|
4,520 |
|
3,711 |
|
22,970 |
|
18,808 |
Total Proved |
|
183,188 |
|
170,544 |
|
5,692 |
|
5,283 |
|
34,986 |
|
29,755 |
|
268,385 |
|
241,511 |
North America |
|
183,188 |
|
170,544 |
|
5,692 |
|
5,283 |
|
34,935 |
|
29,705 |
|
195,685 |
|
173,726 |
International |
|
— |
|
— |
|
— |
|
— |
|
51 |
|
50 |
|
72,700 |
|
67,784 |
Vermilion Energy Inc. ■ Page 15 ■ 2023 Annual Information Form
|
|
Light Crude Oil & Medium |
|
Heavy Crude Oil (mbbl) |
|
Tight Oil (mbbl) |
|
Conventional Natural Gas |
||||||||
Probable (4) |
|
Gross (2) |
|
Net (2) |
|
Gross (2) |
|
Net (2) |
|
Gross (2) |
|
Net (2) |
|
Gross (2) |
|
Net (2) |
Australia |
|
4,358 |
|
4,358 |
|
— |
|
— |
|
— |
|
— |
|
— |
|
— |
Canada |
|
17,072 |
|
14,557 |
|
95 |
|
80 |
|
8,174 |
|
7,926 |
|
165,883 |
|
148,502 |
CEE |
|
— |
|
— |
|
— |
|
— |
|
— |
|
— |
|
3,790 |
|
2,320 |
France |
|
9,831 |
|
8,386 |
|
— |
|
— |
|
— |
|
— |
|
— |
|
— |
Germany |
|
3,593 |
|
3,548 |
|
— |
|
— |
|
— |
|
— |
|
53,350 |
|
49,553 |
Ireland |
|
— |
|
— |
|
— |
|
— |
|
— |
|
— |
|
42,650 |
|
42,650 |
Netherlands |
|
— |
|
— |
|
— |
|
— |
|
— |
|
— |
|
39,731 |
|
36,135 |
United States |
|
9,167 |
|
7,572 |
|
— |
|
— |
|
— |
|
— |
|
17,140 |
|
14,136 |
Total Probable |
|
44,021 |
|
38,422 |
|
95 |
|
80 |
|
8,174 |
|
7,926 |
|
322,545 |
|
293,295 |
North America |
|
26,239 |
|
22,129 |
|
95 |
|
80 |
|
8,174 |
|
7,926 |
|
183,023 |
|
162,637 |
International |
|
17,782 |
|
16,292 |
|
— |
|
— |
|
— |
|
— |
|
139,521 |
|
130,658 |
|
|
Shale Gas (mmcf) |
|
Coal Bed Methane (mmcf) |
|
Natural Gas Liquids (mbbl) |
|
BOE (mboe) |
||||||||
Probable (4) |
|
Gross (2) |
|
Net (2) |
|
Gross (2) |
|
Net (2) |
|
Gross (2) |
|
Net (2) |
|
Gross (2) |
|
Net (2) |
Australia |
|
— |
|
— |
|
— |
|
— |
|
— |
|
— |
|
4,358 |
|
4,358 |
Canada |
|
217,991 |
|
196,989 |
|
1,932 |
|
1,795 |
|
16,118 |
|
13,070 |
|
105,760 |
|
93,514 |
CEE |
|
— |
|
— |
|
— |
|
— |
|
— |
|
— |
|
632 |
|
387 |
France |
|
— |
|
— |
|
— |
|
— |
|
— |
|
— |
|
9,831 |
|
8,386 |
Germany |
|
— |
|
— |
|
— |
|
— |
|
— |
|
— |
|
12,485 |
|
11,807 |
Ireland |
|
— |
|
— |
|
— |
|
— |
|
4 |
|
4 |
|
7,113 |
|
7,113 |
Netherlands |
|
— |
|
— |
|
— |
|
— |
|
59 |
|
50 |
|
6,681 |
|
6,073 |
United States |
|
— |
|
— |
|
— |
|
— |
|
2,571 |
|
2,120 |
|
14,595 |
|
12,048 |
Total Probable |
|
217,991 |
|
196,989 |
|
1,932 |
|
1,795 |
|
18,752 |
|
15,245 |
|
161,453 |
|
143,686 |
North America |
|
217,991 |
|
196,989 |
|
1,932 |
|
1,795 |
|
18,689 |
|
15,191 |
|
120,355 |
|
105,563 |
International |
|
— |
|
— |
|
— |
|
— |
|
63 |
|
55 |
|
41,098 |
|
38,123 |
|
|
Light Crude Oil & Medium |
|
Heavy Crude Oil (mbbl) |
|
Tight Oil (mbbl) |
|
Conventional Natural Gas |
||||||||
Proved Plus Probable (3) (4) |
|
Gross (2) |
|
Net (2) |
|
Gross (2) |
|
Net (2) |
|
Gross (2) |
|
Net (2) |
|
Gross (2) |
|
Net (2) |
Australia |
|
11,921 |
|
11,921 |
|
— |
|
— |
|
— |
|
— |
|
— |
|
— |
Canada |
|
67,425 |
|
57,925 |
|
198 |
|
166 |
|
15,084 |
|
14,601 |
|
486,604 |
|
445,443 |
CEE |
|
— |
|
— |
|
— |
|
— |
|
— |
|
— |
|
13,810 |
|
9,342 |
France |
|
35,846 |
|
30,668 |
|
— |
|
— |
|
— |
|
— |
|
— |
|
— |
Germany |
|
11,252 |
|
11,066 |
|
— |
|
— |
|
— |
|
— |
|
106,678 |
|
100,007 |
Ireland |
|
— |
|
— |
|
— |
|
— |
|
— |
|
— |
|
140,141 |
|
140,141 |
Netherlands |
|
— |
|
— |
|
— |
|
— |
|
— |
|
— |
|
67,359 |
|
63,399 |
United States |
|
22,596 |
|
18,547 |
|
— |
|
— |
|
— |
|
— |
|
47,272 |
|
38,872 |
Total Proved Plus Probable |
|
149,040 |
|
130,127 |
|
198 |
|
166 |
|
15,084 |
|
14,601 |
|
861,865 |
|
797,204 |
North America |
|
90,021 |
|
76,472 |
|
198 |
|
166 |
|
15,084 |
|
14,601 |
|
533,876 |
|
484,315 |
International |
|
59,019 |
|
53,655 |
|
— |
|
— |
|
— |
|
— |
|
327,989 |
|
312,890 |
|
|
Shale Gas (mmcf) |
|
Coal Bed Methane (mmcf) |
|
Natural Gas Liquids (mbbl) |
|
BOE (mboe) |
||||||||
Proved Plus Probable (3) (4) |
|
Gross (2) |
|
Net (2) |
|
Gross (2) |
|
Net (2) |
|
Gross (2) |
|
Net (2) |
|
Gross (2) |
|
Net (2) |
Australia |
|
— |
|
— |
|
— |
|
— |
|
— |
|
— |
|
11,921 |
|
11,921 |
Canada |
|
401,179 |
|
367,533 |
|
7,624 |
|
7,078 |
|
46,533 |
|
39,064 |
|
278,475 |
|
248,432 |
CEE |
|
— |
|
— |
|
— |
|
— |
|
— |
|
— |
|
2,302 |
|
1,557 |
France |
|
— |
|
— |
|
— |
|
— |
|
— |
|
— |
|
35,846 |
|
30,668 |
Germany |
|
— |
|
— |
|
— |
|
— |
|
— |
|
— |
|
29,032 |
|
27,734 |
Ireland |
|
— |
|
— |
|
— |
|
— |
|
14 |
|
14 |
|
23,371 |
|
23,371 |
Netherlands |
|
— |
|
— |
|
— |
|
— |
|
100 |
|
91 |
|
11,327 |
|
10,657 |
United States |
|
— |
|
— |
|
— |
|
— |
|
7,091 |
|
5,831 |
|
37,565 |
|
30,857 |
Total Proved Plus Probable |
|
401,179 |
|
367,533 |
|
7,624 |
|
7,078 |
|
53,739 |
|
45,000 |
|
429,838 |
|
385,197 |
North America |
|
401,179 |
|
367,533 |
|
7,624 |
|
7,078 |
|
53,624 |
|
44,895 |
|
316,040 |
|
279,289 |
International |
|
— |
|
— |
|
— |
|
— |
|
114 |
|
105 |
|
113,798 |
|
105,908 |
Vermilion Energy Inc. ■ Page 16 ■ 2023 Annual Information Form
Notes:
| (1) | The pricing assumptions used in the McDaniel & Associates Report with respect to net present value of future net revenue (forecast) as well as the inflation rates used for operating and capital costs are set forth in “Forecast Prices used in Estimates”. McDaniel & Associates is an independent qualified reserves evaluator appointed pursuant to NI 51-101. |
| (2) | "Gross Reserves" are Vermilion's working interest (operating or non-operating) share before deduction of royalty obligations and without including any royalty interests of Vermilion. "Net Reserves" are Vermilion's working interest (operating or non-operating) share after deduction of royalty obligations, plus Vermilion's royalty interests in reserves. |
| (3) | "Proved" reserves are those reserves that can be estimated with a high degree of certainty to be recoverable. It is likely that the actual remaining quantities recovered will exceed the estimated proved reserves. |
| (4) | "Probable" reserves are those additional reserves that are less certain to be recovered than proved reserves. It is equally likely that the actual remaining quantities recovered will be greater or less than the sum of the estimated proved plus probable reserves. |
| (5) | "Developed" reserves are those reserves that are expected to be recovered from existing wells and installed facilities or, if facilities have not been installed, that would involve a low expenditure (e.g. when compared to the cost of drilling a well) to put the reserves on production. |
| (6) | "Developed Producing" reserves are those reserves that are expected to be recovered from completion intervals open at the time of the estimate. These reserves may be currently producing or, if shut-in, they must have previously been on production, and the date of resumption of production must be known with reasonable certainty. |
| (7) | "Developed Non-Producing" reserves are those reserves that either have not been on production, or have previously been on production, but are shut in, and the date of resumption of production is unknown. |
| (8) | "Undeveloped" reserves are those reserves expected to be recovered from known accumulations where a significant expenditure (for example, when compared to the cost of drilling a well) is required to render them capable of production. They must fully meet the requirements of the reserves classification (proved, probable, possible) to which they are assigned. |
Vermilion Energy Inc. ■ Page 17 ■ 2023 Annual Information Form
Net present value of future net revenue - Based on forecast prices and costs (1)
|
|
Before Deducting Future Income Taxes Discounted At |
|
After Deducting Future Income Taxes Discounted At |
||||||||||||||||
($M) |
|
0% |
|
5% |
|
10% |
|
15% |
|
20% |
|
0% |
|
5% |
|
10% |
|
15% |
|
20% |
Proved Developed Producing (2) (4) (5) |
|
|
|
|
|
|
|
|
|
|
|
|
|
|
|
|
|
|
|
|
Australia |
|
194,751 |
|
244,973 |
|
258,902 |
|
256,543 |
|
247,231 |
|
172,496 |
|
195,742 |
|
198,789 |
|
193,215 |
|
184,312 |
Canada |
|
1,901,057 |
|
1,596,875 |
|
1,316,727 |
|
1,114,944 |
|
969,393 |
|
1,901,057 |
|
1,596,875 |
|
1,316,727 |
|
1,114,944 |
|
969,393 |
CEE |
|
(2,881) |
|
(1,397) |
|
(721) |
|
(394) |
|
(227) |
|
(2,881) |
|
(1,397) |
|
(721) |
|
(394) |
|
(227) |
France |
|
337,148 |
|
437,254 |
|
427,504 |
|
391,264 |
|
353,004 |
|
276,284 |
|
391,511 |
|
391,039 |
|
360,861 |
|
326,791 |
Germany |
|
123,824 |
|
349,025 |
|
353,338 |
|
326,572 |
|
298,360 |
|
109,259 |
|
335,357 |
|
340,457 |
|
314,385 |
|
286,793 |
Ireland |
|
956,588 |
|
896,712 |
|
823,566 |
|
753,034 |
|
689,971 |
|
956,588 |
|
896,712 |
|
823,566 |
|
753,034 |
|
689,971 |
Netherlands |
|
(135,011) |
|
(41,405) |
|
12,179 |
|
43,052 |
|
60,758 |
|
(135,011) |
|
(41,405) |
|
12,179 |
|
43,052 |
|
60,758 |
United States |
|
94,957 |
|
105,461 |
|
102,338 |
|
96,095 |
|
89,723 |
|
94,957 |
|
105,461 |
|
102,338 |
|
96,095 |
|
89,723 |
Total Proved Developed Producing |
|
3,470,432 |
|
3,587,497 |
|
3,293,833 |
|
2,981,108 |
|
2,708,213 |
|
3,372,748 |
|
3,478,855 |
|
3,184,373 |
|
2,875,191 |
|
2,607,514 |
North America |
|
1,996,013 |
|
1,702,336 |
|
1,419,065 |
|
1,211,039 |
|
1,059,115 |
|
1,996,013 |
|
1,702,336 |
|
1,419,065 |
|
1,211,039 |
|
1,059,115 |
International |
|
1,474,419 |
|
1,885,162 |
|
1,874,768 |
|
1,770,070 |
|
1,649,097 |
|
1,376,735 |
|
1,776,519 |
|
1,765,309 |
|
1,664,153 |
|
1,548,399 |
Proved Developed Non-Producing (2) (4) (6) |
|
|
|
|
|
|
|
|
|
|
|
|
|
|
|
|
|
|
|
|
Australia |
|
— |
|
— |
|
— |
|
— |
|
— |
|
— |
|
— |
|
— |
|
— |
|
— |
Canada |
|
127,807 |
|
101,964 |
|
80,318 |
|
64,866 |
|
53,894 |
|
127,807 |
|
101,964 |
|
80,318 |
|
64,866 |
|
53,894 |
CEE |
|
107,559 |
|
97,958 |
|
90,056 |
|
83,447 |
|
77,839 |
|
103,302 |
|
94,216 |
|
86,732 |
|
80,468 |
|
75,148 |
France |
|
18,899 |
|
17,477 |
|
14,786 |
|
12,138 |
|
9,861 |
|
12,296 |
|
11,966 |
|
10,079 |
|
8,041 |
|
6,240 |
Germany |
|
118,840 |
|
110,572 |
|
86,207 |
|
67,985 |
|
55,108 |
|
89,806 |
|
85,784 |
|
64,683 |
|
49,023 |
|
38,192 |
Ireland |
|
— |
|
— |
|
— |
|
— |
|
— |
|
— |
|
— |
|
— |
|
— |
|
— |
Netherlands |
|
51,492 |
|
49,292 |
|
45,575 |
|
41,633 |
|
37,937 |
|
40,136 |
|
38,461 |
|
35,215 |
|
31,700 |
|
28,391 |
United States |
|
— |
|
— |
|
— |
|
— |
|
— |
|
— |
|
— |
|
— |
|
— |
|
— |
Total Proved Developed Non-Producing |
|
424,596 |
|
377,263 |
|
316,941 |
|
270,069 |
|
234,638 |
|
373,347 |
|
332,391 |
|
277,026 |
|
234,097 |
|
201,865 |
North America |
|
127,807 |
|
101,964 |
|
80,318 |
|
64,866 |
|
53,894 |
|
127,807 |
|
101,964 |
|
80,318 |
|
64,866 |
|
53,894 |
International |
|
296,790 |
|
275,299 |
|
236,624 |
|
205,203 |
|
180,744 |
|
245,541 |
|
230,426 |
|
196,708 |
|
169,230 |
|
147,971 |
Proved Undeveloped (2) (7) |
|
|
|
|
|
|
|
|
|
|
|
|
|
|
|
|
|
|
|
|
Australia |
|
— |
|
— |
|
— |
|
— |
|
— |
|
— |
|
— |
|
— |
|
— |
|
— |
Canada |
|
1,095,742 |
|
522,645 |
|
269,611 |
|
132,554 |
|
48,965 |
|
1,083,080 |
|
519,077 |
|
268,520 |
|
132,198 |
|
48,841 |
CEE |
|
— |
|
— |
|
— |
|
— |
|
— |
|
— |
|
— |
|
— |
|
— |
|
— |
France |
|
105,886 |
|
78,514 |
|
57,543 |
|
41,977 |
|
30,460 |
|
76,787 |
|
52,996 |
|
35,192 |
|
22,323 |
|
13,068 |
Germany |
|
73,062 |
|
61,046 |
|
42,399 |
|
29,163 |
|
20,151 |
|
49,305 |
|
42,287 |
|
27,194 |
|
16,561 |
|
9,502 |
Ireland |
|
— |
|
— |
|
— |
|
— |
|
— |
|
— |
|
— |
|
— |
|
— |
|
— |
Netherlands |
|
— |
|
— |
|
— |
|
— |
|
— |
|
— |
|
— |
|
— |
|
— |
|
— |
United States |
|
135,157 |
|
87,426 |
|
50,047 |
|
24,459 |
|
7,089 |
|
135,157 |
|
87,426 |
|
50,047 |
|
24,459 |
|
7,089 |
Total Proved Undeveloped |
|
1,409,848 |
|
749,632 |
|
419,599 |
|
228,155 |
|
106,664 |
|
1,344,329 |
|
701,786 |
|
380,953 |
|
195,541 |
|
78,499 |
North America |
|
1,230,900 |
|
610,071 |
|
319,657 |
|
157,014 |
|
56,053 |
|
1,218,237 |
|
606,503 |
|
318,567 |
|
156,657 |
|
55,930 |
International |
|
178,948 |
|
139,561 |
|
99,941 |
|
71,141 |
|
50,610 |
|
126,092 |
|
95,283 |
|
62,386 |
|
38,884 |
|
22,569 |
Proved (2) |
|
|
|
|
|
|
|
|
|
|
|
|
|
|
|
|
|
|
|
|
Australia |
|
194,751 |
|
244,973 |
|
258,902 |
|
256,543 |
|
247,231 |
|
172,496 |
|
195,742 |
|
198,789 |
|
193,215 |
|
184,312 |
Canada |
|
3,124,606 |
|
2,221,484 |
|
1,666,655 |
|
1,312,365 |
|
1,072,251 |
|
3,111,943 |
|
2,217,916 |
|
1,665,565 |
|
1,312,008 |
|
1,072,127 |
CEE |
|
104,677 |
|
96,561 |
|
89,335 |
|
83,053 |
|
77,612 |
|
100,421 |
|
92,819 |
|
86,011 |
|
80,073 |
|
74,921 |
France |
|
461,933 |
|
533,245 |
|
499,833 |
|
445,379 |
|
393,325 |
|
365,367 |
|
456,473 |
|
436,310 |
|
391,225 |
|
346,099 |
Germany |
|
315,727 |
|
520,644 |
|
481,944 |
|
423,720 |
|
373,619 |
|
248,370 |
|
463,427 |
|
432,333 |
|
379,969 |
|
334,487 |
Ireland |
|
956,588 |
|
896,712 |
|
823,566 |
|
753,034 |
|
689,971 |
|
956,588 |
|
896,712 |
|
823,566 |
|
753,034 |
|
689,971 |
Netherlands |
|
(83,519) |
|
7,887 |
|
57,754 |
|
84,685 |
|
98,695 |
|
(94,874) |
|
(2,944) |
|
47,394 |
|
74,751 |
|
89,150 |
United States |
|
230,114 |
|
192,887 |
|
152,385 |
|
120,554 |
|
96,812 |
|
230,114 |
|
192,887 |
|
152,385 |
|
120,554 |
|
96,812 |
Total Proved |
|
5,304,876 |
|
4,714,392 |
|
4,030,373 |
|
3,479,332 |
|
3,049,514 |
|
5,090,425 |
|
4,513,032 |
|
3,842,352 |
|
3,304,829 |
|
2,887,878 |
North America |
|
3,354,720 |
|
2,414,371 |
|
1,819,040 |
|
1,432,919 |
|
1,169,062 |
|
3,342,057 |
|
2,410,803 |
|
1,817,949 |
|
1,432,562 |
|
1,168,939 |
International |
|
1,950,157 |
|
2,300,021 |
|
2,211,333 |
|
2,046,413 |
|
1,880,452 |
|
1,748,368 |
|
2,102,228 |
|
2,024,403 |
|
1,872,267 |
|
1,718,939 |
Vermilion Energy Inc. ■ Page 18 ■ 2023 Annual Information Form
|
|
Before Deducting Future Income Taxes Discounted At |
|
After Deducting Future Income Taxes Discounted At |
||||||||||||||||
($M) |
|
0% |
|
5% |
|
10% |
|
15% |
|
20% |
|
0% |
|
5% |
|
10% |
|
15% |
|
20% |
Probable (3) |
|
|
|
|
|
|
|
|
|
|
|
|
|
|
|
|
|
|
|
|
Australia |
|
242,597 |
|
201,178 |
|
159,716 |
|
125,350 |
|
98,518 |
|
144,118 |
|
118,264 |
|
93,208 |
|
72,726 |
|
56,869 |
Canada |
|
2,639,214 |
|
1,512,937 |
|
984,358 |
|
693,834 |
|
516,607 |
|
2,007,940 |
|
1,187,581 |
|
798,677 |
|
580,019 |
|
443,086 |
CEE |
|
32,620 |
|
29,170 |
|
26,480 |
|
24,324 |
|
22,556 |
|
26,801 |
|
24,034 |
|
21,881 |
|
20,160 |
|
18,751 |
France |
|
445,774 |
|
298,475 |
|
204,586 |
|
143,808 |
|
103,515 |
|
327,974 |
|
213,021 |
|
139,823 |
|
92,931 |
|
62,350 |
Germany |
|
810,217 |
|
534,775 |
|
369,102 |
|
269,766 |
|
206,504 |
|
567,853 |
|
368,840 |
|
246,404 |
|
173,992 |
|
128,725 |
Ireland |
|
490,124 |
|
357,475 |
|
258,258 |
|
189,313 |
|
142,294 |
|
490,124 |
|
357,475 |
|
258,258 |
|
189,313 |
|
142,294 |
Netherlands |
|
354,671 |
|
274,285 |
|
213,985 |
|
169,289 |
|
135,989 |
|
222,424 |
|
166,401 |
|
124,203 |
|
93,239 |
|
70,554 |
United States |
|
507,591 |
|
320,620 |
|
215,915 |
|
155,457 |
|
117,963 |
|
500,821 |
|
316,622 |
|
213,373 |
|
153,763 |
|
116,797 |
Total Probable |
|
5,522,808 |
|
3,528,915 |
|
2,432,400 |
|
1,771,140 |
|
1,343,946 |
|
4,288,055 |
|
2,752,239 |
|
1,895,826 |
|
1,376,143 |
|
1,039,426 |
North America |
|
3,146,805 |
|
1,833,557 |
|
1,200,273 |
|
849,291 |
|
634,570 |
|
2,508,761 |
|
1,504,203 |
|
1,012,050 |
|
733,782 |
|
559,883 |
International |
|
2,376,003 |
|
1,695,358 |
|
1,232,127 |
|
921,850 |
|
709,377 |
|
1,779,294 |
|
1,248,035 |
|
883,777 |
|
642,361 |
|
479,543 |
Proved Plus Probable (2) (3) |
|
|
|
|
|
|
|
|
|
|
|
|
|
|
|
|
|
|
|
|
Australia |
|
437,347 |
|
446,151 |
|
418,618 |
|
381,893 |
|
345,749 |
|
316,614 |
|
314,006 |
|
291,998 |
|
265,941 |
|
241,181 |
Canada |
|
5,763,820 |
|
3,734,421 |
|
2,651,014 |
|
2,006,199 |
|
1,588,857 |
|
5,119,883 |
|
3,405,497 |
|
2,464,242 |
|
1,892,027 |
|
1,515,213 |
CEE |
|
137,297 |
|
125,731 |
|
115,814 |
|
107,376 |
|
100,168 |
|
127,222 |
|
116,853 |
|
107,892 |
|
100,233 |
|
93,672 |
France |
|
907,707 |
|
831,720 |
|
704,419 |
|
589,187 |
|
496,840 |
|
693,341 |
|
669,495 |
|
576,133 |
|
484,156 |
|
408,449 |
Germany |
|
1,125,944 |
|
1,055,419 |
|
851,047 |
|
693,487 |
|
580,122 |
|
816,223 |
|
832,267 |
|
678,737 |
|
553,961 |
|
463,212 |
Ireland |
|
1,446,712 |
|
1,254,187 |
|
1,081,824 |
|
942,346 |
|
832,265 |
|
1,446,712 |
|
1,254,187 |
|
1,081,824 |
|
942,346 |
|
832,265 |
Netherlands |
|
271,153 |
|
282,172 |
|
271,739 |
|
253,973 |
|
234,684 |
|
127,549 |
|
163,457 |
|
171,596 |
|
167,990 |
|
159,704 |
United States |
|
737,705 |
|
513,507 |
|
368,300 |
|
276,011 |
|
214,775 |
|
730,934 |
|
509,509 |
|
365,757 |
|
274,317 |
|
213,608 |
Total Proved Plus Probable |
|
10,827,685 |
|
8,243,307 |
|
6,462,773 |
|
5,250,472 |
|
4,393,461 |
|
9,378,480 |
|
7,265,270 |
|
5,738,179 |
|
4,680,972 |
|
3,927,304 |
North America |
|
6,501,525 |
|
4,247,928 |
|
3,019,313 |
|
2,282,209 |
|
1,803,632 |
|
5,850,818 |
|
3,915,007 |
|
2,829,999 |
|
2,166,344 |
|
1,728,821 |
International |
|
4,326,160 |
|
3,995,379 |
|
3,443,460 |
|
2,968,263 |
|
2,589,829 |
|
3,527,662 |
|
3,350,263 |
|
2,908,180 |
|
2,514,628 |
|
2,198,482 |
Notes:
| (1) | The pricing assumptions used in the McDaniel & Associates Report with respect to net present value of future net revenue (forecast) as well as the inflation rates used for operating and capital costs are set forth in “Forecast Prices used in Estimates”. McDaniel & Associates is an independent qualified reserves evaluator appointed pursuant to NI 51-101. |
| (2) | "Proved" reserves are those reserves that can be estimated with a high degree of certainty to be recoverable. It is likely that the actual remaining quantities recovered will exceed the estimated proved reserves. |
| (3) | "Probable" reserves are those additional reserves that are less certain to be recovered than proved reserves. It is equally likely that the actual remaining quantities recovered will be greater or less than the sum of the estimated proved plus probable reserves. |
| (4) | "Developed" reserves are those reserves that are expected to be recovered from existing wells and installed facilities or, if facilities have not been installed, that would involve a low expenditure (e.g. when compared to the cost of drilling a well) to put the reserves on production. |
| (5) | "Developed Producing" reserves are those reserves that are expected to be recovered from completion intervals open at the time of the estimate. These reserves may be currently producing or, if shut-in, they must have previously been on production, and the date of resumption of production must be known with reasonable certainty. |
| (6) | "Developed Non-Producing" reserves are those reserves that either have not been on production, or have previously been on production, but are shut in, and the date of resumption of production is unknown. |
| (7) | "Undeveloped" reserves are those reserves expected to be recovered from known accumulations where a significant expenditure (for example, when compared to the cost of drilling a well) is required to render them capable of production. They must fully meet the requirements of the reserves classification (proved, probable, possible) to which they are assigned. |
Vermilion Energy Inc. ■ Page 19 ■ 2023 Annual Information Form
Total future net revenue (undiscounted) - Based on forecast prices and costs (1)
|
|
|
|
|
|
|
|
|
|
Abandonment |
|
Future Net |
|
|
|
Future Net |
|
|
|
|
|
|
|
|
Capital |
|
and |
|
Revenue |
|
|
|
Revenue |
|
|
|
|
|
|
Operating |
|
Development |
|
Reclamation |
|
Before Future |
|
Future |
|
After Future |
($M) |
|
Revenue |
|
Royalties |
|
Costs (5) |
|
Costs |
|
Costs (6) |
|
Income Taxes |
|
Income Taxes (4) |
|
Income Taxes |
Proved (2) |
|
|
|
|
|
|
|
|
|
|
|
|
|
|
|
|
Australia |
|
926,260 |
|
— |
|
530,063 |
|
— |
|
201,446 |
|
194,751 |
|
22,255 |
|
172,496 |
Canada |
|
9,855,392 |
|
1,388,806 |
|
3,694,068 |
|
1,057,119 |
|
590,793 |
|
3,124,606 |
|
12,663 |
|
3,111,943 |
CEE |
|
170,598 |
|
51,710 |
|
10,338 |
|
714 |
|
3,159 |
|
104,677 |
|
4,256 |
|
100,421 |
France |
|
2,590,410 |
|
370,602 |
|
1,127,085 |
|
128,409 |
|
502,380 |
|
461,933 |
|
96,566 |
|
365,367 |
Germany |
|
1,640,365 |
|
79,978 |
|
697,515 |
|
55,000 |
|
492,145 |
|
315,727 |
|
67,357 |
|
248,370 |
Ireland |
|
1,620,533 |
|
— |
|
384,182 |
|
61,840 |
|
217,923 |
|
956,588 |
|
— |
|
956,588 |
Netherlands |
|
452,215 |
|
5,954 |
|
227,697 |
|
16,541 |
|
285,542 |
|
(83,519) |
|
11,356 |
|
(94,874) |
United States |
|
1,826,579 |
|
517,586 |
|
682,032 |
|
331,414 |
|
65,434 |
|
230,114 |
|
— |
|
230,114 |
Total Proved |
|
19,082,351 |
|
2,414,636 |
|
7,352,980 |
|
1,651,038 |
|
2,358,820 |
|
5,304,876 |
|
214,451 |
|
5,090,425 |
North America |
|
11,681,971 |
|
1,906,392 |
|
4,376,100 |
|
1,388,533 |
|
656,226 |
|
3,354,720 |
|
12,663 |
|
3,342,057 |
International |
|
7,400,380 |
|
508,244 |
|
2,976,880 |
|
262,505 |
|
1,702,594 |
|
1,950,157 |
|
201,789 |
|
1,748,368 |
Proved Plus Probable (2) (3) |
|
|
|
|
|
|
|
|
|
|
|
|
|
|
|
|
Australia |
|
1,493,023 |
|
— |
|
749,243 |
|
88,569 |
|
217,863 |
|
437,347 |
|
120,733 |
|
316,614 |
Canada |
|
15,574,565 |
|
2,141,275 |
|
5,403,686 |
|
1,626,664 |
|
639,121 |
|
5,763,820 |
|
643,936 |
|
5,119,883 |
CEE |
|
234,829 |
|
77,382 |
|
16,271 |
|
714 |
|
3,166 |
|
137,297 |
|
10,075 |
|
127,222 |
France |
|
3,599,839 |
|
518,295 |
|
1,373,131 |
|
279,029 |
|
521,678 |
|
907,707 |
|
214,366 |
|
693,341 |
Germany |
|
2,966,788 |
|
157,731 |
|
1,047,834 |
|
100,619 |
|
534,660 |
|
1,125,944 |
|
309,721 |
|
816,223 |
Ireland |
|
2,370,216 |
|
— |
|
618,254 |
|
61,840 |
|
243,410 |
|
1,446,712 |
|
— |
|
1,446,712 |
Netherlands |
|
1,168,447 |
|
69,707 |
|
445,976 |
|
84,077 |
|
297,534 |
|
271,153 |
|
143,603 |
|
127,549 |
United States |
|
3,165,539 |
|
888,663 |
|
967,005 |
|
490,999 |
|
81,166 |
|
737,705 |
|
6,771 |
|
730,934 |
Total Proved Plus Probable |
|
30,573,247 |
|
3,853,053 |
|
10,621,401 |
|
2,732,511 |
|
2,538,597 |
|
10,827,685 |
|
1,449,205 |
|
9,378,480 |
North America |
|
18,740,104 |
|
3,029,938 |
|
6,370,691 |
|
2,117,663 |
|
720,287 |
|
6,501,525 |
|
650,707 |
|
5,850,818 |
International |
|
11,833,143 |
|
823,114 |
|
4,250,710 |
|
614,849 |
|
1,818,310 |
|
4,326,160 |
|
798,498 |
|
3,527,662 |
Notes:
| (1) | The pricing assumptions used in the McDaniel & Associates Report with respect to net present value of future net revenue (forecast) as well as the inflation rates used for operating and capital costs are set forth in “Forecast Prices used in Estimates”. McDaniel & Associates is an independent qualified reserves evaluator appointed pursuant to NI 51-101. |
| (2) | "Proved" reserves are those reserves that can be estimated with a high degree of certainty to be recoverable. It is likely that the actual remaining quantities recovered will exceed the estimated proved reserves. |
| (3) | "Probable" reserves are those additional reserves that are less certain to be recovered than proved reserves. It is equally likely that the actual remaining quantities recovered will be greater or less than the sum of the estimated proved plus probable reserves. |
| (4) | "Future Income Taxes" are calculated using future net revenue before income taxes as shown, after incorporating Vermilion's existing tax pools, corporate charge-outs, and related expenditures. This calculation applies the year-end statutory rate, taking into account future tax rates already legislated. |
| (5) | Capital Development Costs include the costs for the drilling, completion, and tie-in of wells, the construction of production and processing facilities, major facilities projects and well workovers. For the purposes of determining Future Net Revenue, costs related to the replacement of certain downhole and facilities equipment as well as facility turnarounds are included in Operating Costs. |
| (6) | Abandonment and Reclamation Costs include all entities with associated reserves included in the McDaniel & Associates Report. Further information on Abandonment and reclamation costs can be found in the MD&A Report on our website at www.vermilionenergy.com or www.sedarplus.ca |
Vermilion Energy Inc. ■ Page 20 ■ 2023 Annual Information Form
Future net revenue by product type - Based on forecast prices and costs (1)
|
|
Future Net Revenue |
|
|
|
|
Before Income Taxes (2) |
|
|
|
|
(Discounted at 10% Per Year) |
|
Unit Value ($/mcf or |
|
|
($M) |
|
$/boe) |
Proved Developed Producing |
|
|
|
|
Light Crude Oil & Medium Crude Oil (3) |
|
1,525,433 |
|
24.38 |
Tight Oil (3) |
|
44,504 |
|
30.19 |
Heavy Oil (3) |
|
559 |
|
33.33 |
Conventional Natural Gas (4) |
|
1,684,074 |
|
4.92 |
Coal Bed Methane |
|
(1,116) |
|
(0.26) |
Shale Gas |
|
40,379 |
|
3.64 |
Total Proved Developed Producing |
|
3,293,833 |
|
|
Proved Developed Non-Producing |
|
|
|
|
Light Crude Oil & Medium Crude Oil (3) |
|
104,703 |
|
28.58 |
Tight Oil (3) |
|
5,039 |
|
185.31 |
Heavy Oil (3) |
|
6 |
|
— |
Conventional Natural Gas (4) |
|
206,294 |
|
6.24 |
Coal Bed Methane |
|
792 |
|
1.19 |
Shale Gas |
|
110 |
|
1.14 |
Total Proved Developed Non-Producing |
|
316,941 |
|
|
Proved Undeveloped |
|
|
|
|
Light Crude Oil & Medium Crude Oil (3) |
|
276,852 |
|
11.00 |
Tight Oil (3) |
|
58,282 |
|
13.01 |
Heavy Oil (3) |
|
1,071 |
|
15.49 |
Conventional Natural Gas (4) |
|
74,749 |
|
1.20 |
Coal Bed Methane |
|
158 |
|
0.51 |
Shale Gas |
|
8,487 |
|
0.78 |
Total Proved Undeveloped |
|
419,599 |
|
|
Proved |
|
|
|
|
Light Crude Oil & Medium Crude Oil (3) |
|
1,906,986 |
|
20.87 |
Tight Oil (3) |
|
107,824 |
|
18.03 |
Heavy Oil (3) |
|
1,636 |
|
19.03 |
Conventional Natural Gas (4) |
|
1,965,117 |
|
4.49 |
Coal Bed Methane |
|
(166) |
|
(0.03) |
Shale Gas |
|
48,976 |
|
2.22 |
Total Proved |
|
4,030,373 |
|
|
Probable |
|
|
|
|
Light Crude Oil & Medium Crude Oil (3) |
|
985,513 |
|
25.72 |
Tight Oil (3) |
|
356,003 |
|
48.99 |
Heavy Oil (3) |
|
1,972 |
|
24.53 |
Conventional Natural Gas (4) |
|
1,049,825 |
|
3.98 |
Coal Bed Methane |
|
1,842 |
|
1.03 |
Shale Gas |
|
37,246 |
|
1.97 |
Total Probable |
|
2,432,400 |
|
|
Proved Plus Probable |
|
|
|
|
Light Crude Oil & Medium Crude Oil (3) |
|
2,892,499 |
|
22.30 |
Tight Oil (3) |
|
463,827 |
|
35.01 |
Heavy Oil (3) |
|
3,608 |
|
21.69 |
Conventional Natural Gas (4) |
|
3,014,942 |
|
4.30 |
Coal Bed Methane |
|
1,676 |
|
0.24 |
Shale Gas |
|
86,222 |
|
2.11 |
Total Proved Plus Probable |
|
6,462,773 |
|
|
Vermilion Energy Inc. ■ Page 21 ■ 2023 Annual Information Form Vermilion Energy Inc. ■ Page 22 ■ 2023 Annual Information Form
Notes:
| (1) | The pricing assumptions used in the McDaniel & Associates Report with respect to net present value of future net revenue (forecast) as well as the inflation rates used for operating and capital costs are set forth in “Forecast Prices used in Estimates”. McDaniel & Associates is an independent qualified reserves evaluator appointed pursuant to NI 51-101. |
| (2) | Other Company revenue and costs not related to a specific product type have been allocated proportionately to the specified product types. Unit values are based on Company net reserves. Net present value of reserves categories are an approximation based on major products. |
| (3) | Including solution gas and other by-products. |
| (4) | Including by-products but excluding solution gas. |
Forecast prices used in estimates (1)(2)
|
|
Light Crude Oil & Medium |
|
|
|
Conventional Natural Gas |
|
|
|
|
|
|
|
|
|
|
|
|
|
|
||||||
|
|
Crude Oil |
|
Crude Oil |
|
Canada |
|
Europe |
|
Natural Gas Liquids |
|
Inflation Rate |
|
Exchange Rate |
||||||||||||
|
|
WTI |
|
Edmonton |
|
Cromer |
|
Brent Blend |
|
|
|
UK National |
|
|
|
|
|
|
|
|
|
|
|
|
|
|
|
|
Cushing |
|
Par Price |
|
Light |
|
FOB |
|
AECO |
|
Balancing |
|
Edmonton |
|
Edmonton |
|
Edmonton |
|
|
|
|
|
|
|
|
|
|
Oklahoma |
|
40˚ API |
|
35˚ API |
|
North Sea |
|
Gas Price |
|
Point |
|
Ethane |
|
Propane |
|
Butane |
|
Edmonton C5+ |
|
|
|
|
|
|
Year |
|
($US/bbl) |
|
($Cdn/bbl) |
|
($Cdn/bbl) |
|
($US/bbl) |
|
($Cdn/mmbtu) |
|
($US/mmbtu) |
|
($Cdn/bbl) |
|
($Cdn/bbl) |
|
($Cdn/bbl) |
|
($Cdn/bbl) |
|
Percent Per Year |
|
USD/CAD |
|
CAD/EUR |
2023 |
|
77.55 |
|
100.40 |
|
92.58 |
|
81.15 |
|
2.95 |
|
12.68 |
|
7.33 |
|
29.40 |
|
45.55 |
|
103.40 |
|
3.85 |
% |
0.74 |
|
1.45 |
Forecast |
|
|
|
|
|
|
|
|
|
|
|
|
|
|
|
|
|
|
|
|
|
|
|
|
|
|
2024 |
|
73.67 |
|
92.91 |
|
94.72 |
|
78.00 |
|
2.20 |
|
11.87 |
|
6.88 |
|
29.65 |
|
47.69 |
|
96.79 |
|
— |
% |
0.75 |
|
1.45 |
2025 |
|
74.98 |
|
95.04 |
|
95.73 |
|
79.18 |
|
3.37 |
|
13.09 |
|
10.76 |
|
35.13 |
|
48.83 |
|
98.75 |
|
2.00 |
% |
0.75 |
|
1.47 |
2026 |
|
76.14 |
|
96.07 |
|
97.65 |
|
80.36 |
|
4.05 |
|
12.81 |
|
13.17 |
|
35.43 |
|
49.36 |
|
100.71 |
|
2.00 |
% |
0.76 |
|
1.48 |
2027 |
|
77.66 |
|
97.99 |
|
99.60 |
|
81.79 |
|
4.13 |
|
12.62 |
|
13.44 |
|
36.14 |
|
50.35 |
|
102.72 |
|
2.00 |
% |
0.76 |
|
1.49 |
2028 |
|
79.22 |
|
99.95 |
|
101.59 |
|
83.41 |
|
4.21 |
|
12.87 |
|
13.71 |
|
36.86 |
|
51.35 |
|
104.78 |
|
2.00 |
% |
0.76 |
|
1.50 |
2029 |
|
80.80 |
|
101.94 |
|
103.62 |
|
85.09 |
|
4.30 |
|
13.13 |
|
14.00 |
|
37.60 |
|
52.38 |
|
106.87 |
|
2.00 |
% |
0.76 |
|
1.50 |
2030 |
|
82.42 |
|
103.98 |
|
105.69 |
|
86.80 |
|
4.38 |
|
13.40 |
|
14.28 |
|
38.35 |
|
53.43 |
|
109.01 |
|
2.00 |
% |
0.76 |
|
1.50 |
2031 |
|
84.06 |
|
106.06 |
|
107.81 |
|
88.52 |
|
4.47 |
|
13.66 |
|
14.58 |
|
39.12 |
|
54.50 |
|
111.19 |
|
2.00 |
% |
0.76 |
|
1.50 |
2032 |
|
85.74 |
|
108.18 |
|
109.96 |
|
90.29 |
|
4.56 |
|
13.94 |
|
14.87 |
|
39.90 |
|
55.58 |
|
113.41 |
|
2.00 |
% |
0.76 |
|
1.50 |
2033 |
|
87.46 |
|
110.35 |
|
112.16 |
|
92.10 |
|
4.65 |
|
14.21 |
|
15.17 |
|
40.70 |
|
56.70 |
|
115.67 |
|
2.00 |
% |
0.76 |
|
1.50 |
Thereafter |
|
+2.0%/yr |
|
+2.0%/yr |
|
+2.0%/yr |
|
+2.0%/yr |
|
+2.0%/yr |
|
+2.0%/yr |
|
+2.0%/yr |
|
+2.0%/yr |
|
+2.0%/yr |
|
+2.0%/yr |
|
+2.0%/yr |
|
0.76 |
|
1.50 |
Notes:
| (1) | The pricing assumptions used in the McDaniel & Associates Report with respect to net present value of future net revenue (forecast) as well as the inflation rates used for operating and capital costs are set forth above. The pricing assumptions above are the January 2024 3 Consultants' Average pricing which were provided by McDaniel & Associates, an independent qualified reserves evaluator appointed pursuant to NI 51-101. The consultants price forecasts being averaged are McDaniel & Associates, Sproule and GLJ Ltd., all independent qualified reserves evaluators. |
| (2) | For light crude oil and medium crude oil, the pricing assumptions used are WTI, Edmonton Par Price, Cromer Medium, and Brent Blend. For conventional natural gas in Canada, the pricing assumptions used are AECO and for conventional natural gas in Europe, the pricing assumptions used are National Balancing Point. |
For 2023, average realized prices before hedging were:
|
|
Crude oil |
|
NGLs |
|
Natural gas |
Country |
|
($/bbl) |
|
($/bbl) |
|
($/mcf) |
Australia |
|
143.69 |
|
— |
|
— |
Canada |
|
97.52 |
|
52.32 |
|
2.91 |
CEE |
|
— |
|
— |
|
23.46 |
France |
|
109.47 |
|
— |
|
— |
Germany |
|
106.20 |
|
— |
|
17.25 |
Ireland |
|
— |
|
— |
|
16.21 |
Netherlands |
|
81.48 |
|
95.68 |
|
17.93 |
United States |
|
102.68 |
|
39.49 |
|
2.31 |
Vermilion Energy Inc.
Reconciliations of changes in reserves
■ Page 23 ■ 2023 Annual Information Form The following tables set forth a reconciliation of the changes by product type (light crude oil and medium crude oil, heavy crude oil, tight oil, conventional natural gas, coal bed methane, shale gas and NGLs) in Vermilion's gross reserves as at December 31, 2023 compared to such reserves as at December 31, 2022 based on the forecast price and cost assumptions set forth in note 3.
Reconciliation of Company Gross Reserves by Principal Product Type - Based on Forecast Prices and Costs (3)
Australia |
|
Total Oil (4) |
|
Light & Medium Crude Oil |
|
Heavy Crude Oil |
|
Tight Oil |
||||||||||||||||
Proved Probable P+P (1) (2) |
|
Proved |
|
Probable |
|
P+P |
|
Proved |
|
Probable |
|
P+P |
|
Proved |
|
Probable |
|
P+P |
|
Proved |
|
Probable |
|
P+P |
Factors |
|
(mbbl) |
|
(mbbl) |
|
(mbbl) |
|
(mbbl) |
|
(mbbl) |
|
(mbbl) |
|
(mbbl) |
|
(mbbl) |
|
(mbbl) |
|
(mbbl) |
|
(mbbl) |
|
(mbbl) |
At December 31, 2022 |
|
6,403 |
|
6,129 |
|
12,531 |
|
6,403 |
|
6,129 |
|
12,531 |
|
— |
|
— |
|
— |
|
— |
|
— |
|
— |
Discoveries |
|
— |
|
— |
|
— |
|
— |
|
— |
|
— |
|
— |
|
— |
|
— |
|
— |
|
— |
|
— |
Extensions & Improved Recovery(5) |
|
— |
|
— |
|
— |
|
— |
|
— |
|
— |
|
— |
|
— |
|
— |
|
— |
|
— |
|
— |
Technical Revisions(6) |
|
711 |
|
(656) |
|
56 |
|
711 |
|
(656) |
|
56 |
|
— |
|
— |
|
— |
|
— |
|
— |
|
— |
Acquisitions(7) |
|
— |
|
— |
|
— |
|
— |
|
— |
|
— |
|
— |
|
— |
|
— |
|
— |
|
— |
|
— |
Dispositions |
|
— |
|
— |
|
— |
|
— |
|
— |
|
— |
|
— |
|
— |
|
— |
|
— |
|
— |
|
— |
Economic Factors(8) |
|
993 |
|
(1,115) |
|
(122) |
|
993 |
|
(1,115) |
|
(122) |
|
— |
|
— |
|
— |
|
— |
|
— |
|
— |
Production |
|
(544) |
|
— |
|
(544) |
|
(544) |
|
— |
|
(544) |
|
— |
|
— |
|
— |
|
— |
|
— |
|
— |
At December 31, 2023 |
|
7,563 |
|
4,358 |
|
11,921 |
|
7,563 |
|
4,358 |
|
11,921 |
|
— |
|
— |
|
— |
|
— |
|
— |
|
— |
Australia |
|
Total Gas (4) |
|
Conventional Natural Gas |
|
Coal Bed Methane |
|
Shale Gas |
||||||||||||||||
Proved Probable P+P (1) (2) |
|
Proved |
|
Probable |
|
P+P |
|
Proved |
|
Probable |
|
P+P |
|
Proved |
|
Probable |
|
P+P |
|
Proved |
|
Probable |
|
P+P |
Factors |
|
(mmcf) |
|
(mmcf) |
|
(mmcf) |
|
(mmcf) |
|
(mmcf) |
|
(mmcf) |
|
(mmcf) |
|
(mmcf) |
|
(mmcf) |
|
(mmcf) |
|
(mmcf) |
|
(mmcf) |
At December 31, 2022 |
|
— |
|
— |
|
— |
|
— |
|
— |
|
— |
|
— |
|
— |
|
— |
|
— |
|
— |
|
— |
Discoveries |
|
— |
|
— |
|
— |
|
— |
|
— |
|
— |
|
— |
|
— |
|
— |
|
— |
|
— |
|
— |
Extensions & Improved Recovery(5) |
|
— |
|
— |
|
— |
|
— |
|
— |
|
— |
|
— |
|
— |
|
— |
|
— |
|
— |
|
— |
Technical Revisions(6) |
|
— |
|
— |
|
— |
|
— |
|
— |
|
— |
|
— |
|
— |
|
— |
|
— |
|
— |
|
— |
Acquisitions(7) |
|
— |
|
— |
|
— |
|
— |
|
— |
|
— |
|
— |
|
— |
|
— |
|
— |
|
— |
|
— |
Dispositions |
|
— |
|
— |
|
— |
|
— |
|
— |
|
— |
|
— |
|
— |
|
— |
|
— |
|
— |
|
— |
Economic Factors(8) |
|
— |
|
— |
|
— |
|
— |
|
— |
|
— |
|
— |
|
— |
|
— |
|
— |
|
— |
|
— |
Production |
|
— |
|
— |
|
— |
|
— |
|
— |
|
— |
|
— |
|
— |
|
— |
|
— |
|
— |
|
— |
At December 31, 2023 |
|
— |
|
— |
|
— |
|
— |
|
— |
|
— |
|
— |
|
— |
|
— |
|
— |
|
— |
|
— |
Australia |
|
Natural Gas Liquids |
|
BOE |
||||||||
Proved Probable P+P (1) (2) |
|
Proved |
|
Probable |
|
P+P |
|
Proved |
|
Probable |
|
P+P |
Factors |
|
(mbbl) |
|
(mbbl) |
|
(mbbl) |
|
(mboe) |
|
(mboe) |
|
(mboe) |
At December 31, 2022 |
|
— |
|
— |
|
— |
|
6,403 |
|
6,129 |
|
12,531 |
Discoveries |
|
— |
|
— |
|
— |
|
— |
|
— |
|
— |
Extensions & Improved Recovery(5) |
|
— |
|
— |
|
— |
|
— |
|
— |
|
— |
Technical Revisions(6) |
|
— |
|
— |
|
— |
|
711 |
|
(656) |
|
56 |
Acquisitions(7) |
|
— |
|
— |
|
— |
|
— |
|
— |
|
— |
Dispositions |
|
— |
|
— |
|
— |
|
— |
|
— |
|
— |
Economic Factors(8) |
|
— |
|
— |
|
— |
|
993 |
|
(1,115) |
|
(122) |
Production |
|
— |
|
— |
|
— |
|
(544) |
|
— |
|
(544) |
At December 31, 2023 |
|
— |
|
— |
|
— |
|
7,563 |
|
4,358 |
|
11,921 |
Vermilion Energy Inc. ■ Page 24 ■ 2023 Annual Information Form
Canada |
|
Total Oil (4) |
|
Light & Medium Crude Oil |
|
Heavy Crude Oil |
|
Tight Oil |
||||||||||||||||
Proved Probable P+P (1) (2) |
|
Proved |
|
Probable |
|
P+P |
|
Proved |
|
Probable |
|
P+P |
|
Proved |
|
Probable |
|
P+P |
|
Proved |
|
Probable |
|
P+P |
Factors |
|
(mbbl) |
|
(mbbl) |
|
(mbbl) |
|
(mbbl) |
|
(mbbl) |
|
(mbbl) |
|
(mbbl) |
|
(mbbl) |
|
(mbbl) |
|
(mbbl) |
|
(mbbl) |
|
(mbbl) |
At December 31, 2022 |
|
89,131 |
|
45,907 |
|
135,037 |
|
82,919 |
|
39,380 |
|
122,298 |
|
101 |
|
96 |
|
197 |
|
6,111 |
|
6,431 |
|
12,542 |
Discoveries |
|
— |
|
— |
|
— |
|
— |
|
— |
|
— |
|
— |
|
— |
|
— |
|
— |
|
— |
|
— |
Extensions & Improved Recovery(5) |
|
3,123 |
|
1,350 |
|
4,473 |
|
1,081 |
|
263 |
|
1,344 |
|
— |
|
— |
|
— |
|
2,042 |
|
1,087 |
|
3,129 |
Technical Revisions(6) |
|
(10,510) |
|
(11,155) |
|
(21,665) |
|
(9,945) |
|
(11,792) |
|
(21,737) |
|
7 |
|
(1) |
|
6 |
|
(572) |
|
638 |
|
66 |
Acquisitions(7) |
|
25 |
|
(1) |
|
24 |
|
25 |
|
(1) |
|
24 |
|
— |
|
— |
|
— |
|
— |
|
— |
|
— |
Dispositions |
|
(20,249) |
|
(10,697) |
|
(30,947) |
|
(20,249) |
|
(10,697) |
|
(30,947) |
|
— |
|
— |
|
— |
|
— |
|
— |
|
— |
Economic Factors(8) |
|
698 |
|
(61) |
|
637 |
|
744 |
|
(79) |
|
665 |
|
— |
|
— |
|
— |
|
(46) |
|
18 |
|
(28) |
Production |
|
(4,851) |
|
— |
|
(4,851) |
|
(4,221) |
|
— |
|
(4,221) |
|
(5) |
|
— |
|
(5) |
|
(625) |
|
— |
|
(625) |
At December 31, 2023 |
|
57,366 |
|
25,341 |
|
82,707 |
|
50,353 |
|
17,072 |
|
67,425 |
|
103 |
|
95 |
|
198 |
|
6,910 |
|
8,174 |
|
15,084 |
Canada |
|
Total Gas (4) |
|
Conventional Natural Gas |
|
Coal Bed Methane |
|
Shale Gas |
||||||||||||||||
Proved Probable P+P (1) (2) |
|
Proved |
|
Probable |
|
P+P |
|
Proved |
|
Probable |
|
P+P |
|
Proved |
|
Probable |
|
P+P |
|
Proved |
|
Probable |
|
P+P |
Factors |
|
(mmcf) |
|
(mmcf) |
|
(mmcf) |
|
(mmcf) |
|
(mmcf) |
|
(mmcf) |
|
(mmcf) |
|
(mmcf) |
|
(mmcf) |
|
(mmcf) |
|
(mmcf) |
|
(mmcf) |
At December 31, 2022 |
|
512,721 |
|
411,689 |
|
924,410 |
|
345,334 |
|
218,574 |
|
563,908 |
|
7,475 |
|
2,643 |
|
10,118 |
|
159,912 |
|
190,472 |
|
350,384 |
Discoveries |
|
— |
|
— |
|
— |
|
— |
|
— |
|
— |
|
— |
|
— |
|
— |
|
— |
|
— |
|
— |
Extensions & Improved Recovery(5) |
|
78,396 |
|
16,649 |
|
95,045 |
|
28,417 |
|
(7,073) |
|
21,344 |
|
— |
|
— |
|
— |
|
49,979 |
|
23,722 |
|
73,701 |
Technical Revisions(6) |
|
(28,464) |
|
(43,306) |
|
(71,770) |
|
(14,760) |
|
(45,621) |
|
(60,381) |
|
(864) |
|
(754) |
|
(1,618) |
|
(12,840) |
|
3,069 |
|
(9,771) |
Acquisitions(7) |
|
11,421 |
|
3,283 |
|
14,705 |
|
11,171 |
|
3,205 |
|
14,376 |
|
250 |
|
78 |
|
329 |
|
— |
|
— |
|
— |
Dispositions |
|
(5,258) |
|
(2,827) |
|
(8,084) |
|
(5,258) |
|
(2,827) |
|
(8,084) |
|
— |
|
— |
|
— |
|
— |
|
— |
|
— |
Economic Factors(8) |
|
(472) |
|
318 |
|
(155) |
|
1,641 |
|
(375) |
|
1,267 |
|
(345) |
|
(35) |
|
(381) |
|
(1,768) |
|
728 |
|
(1,041) |
Production |
|
(58,742) |
|
— |
|
(58,742) |
|
(45,824) |
|
— |
|
(45,824) |
|
(824) |
|
— |
|
(824) |
|
(12,094) |
|
— |
|
(12,094) |
At December 31, 2023 |
|
509,601 |
|
385,806 |
|
895,407 |
|
320,721 |
|
165,883 |
|
486,604 |
|
5,692 |
|
1,932 |
|
7,624 |
|
183,188 |
|
217,991 |
|
401,179 |
Canada |
|
Natural Gas Liquids |
|
BOE |
||||||||
Proved Probable P+P (1) (2) |
|
Proved |
|
Probable |
|
P+P |
|
Proved |
|
Probable |
|
P+P |
Factors |
|
(mbbl) |
|
(mbbl) |
|
(mbbl) |
|
(mboe) |
|
(mboe) |
|
(mboe) |
At December 31, 2022 |
|
35,750 |
|
23,944 |
|
59,695 |
|
210,335 |
|
138,465 |
|
348,800 |
Discoveries |
|
— |
|
— |
|
— |
|
— |
|
— |
|
— |
Extensions & Improved Recovery(5) |
|
2,626 |
|
(190) |
|
2,436 |
|
18,815 |
|
3,934 |
|
22,750 |
Technical Revisions(6) |
|
(4,257) |
|
(7,432) |
|
(11,689) |
|
(19,511) |
|
(25,804) |
|
(45,315) |
Acquisitions(7) |
|
884 |
|
255 |
|
1,139 |
|
2,812 |
|
801 |
|
3,613 |
Dispositions |
|
(763) |
|
(407) |
|
(1,170) |
|
(21,888) |
|
(11,576) |
|
(33,464) |
Economic Factors(8) |
|
(34) |
|
(53) |
|
(86) |
|
586 |
|
(61) |
|
525 |
Production |
|
(3,791) |
|
— |
|
(3,791) |
|
(18,434) |
|
— |
|
(18,434) |
At December 31, 2023 |
|
30,416 |
|
16,118 |
|
46,533 |
|
172,715 |
|
105,760 |
|
278,475 |
Vermilion Energy Inc. ■ Page 25 ■ 2023 Annual Information Form
CEE |
|
Total Oil (4) |
|
Light & Medium Crude Oil |
|
Heavy Crude Oil |
|
Tight Oil |
||||||||||||||||
Proved Probable P+P (1) (2) |
|
Proved |
|
Probable |
|
P+P |
|
Proved |
|
Probable |
|
P+P |
|
Proved |
|
Probable |
|
P+P |
|
Proved |
|
Probable |
|
P+P |
Factors |
|
(mbbl) |
|
(mbbl) |
|
(mbbl) |
|
(mbbl) |
|
(mbbl) |
|
(mbbl) |
|
(mbbl) |
|
(mbbl) |
|
(mbbl) |
|
(mbbl) |
|
(mbbl) |
|
(mbbl) |
At December 31, 2022 |
|
— |
|
— |
|
— |
|
— |
|
— |
|
— |
|
— |
|
— |
|
— |
|
— |
|
— |
|
— |
Discoveries |
|
— |
|
— |
|
— |
|
— |
|
— |
|
— |
|
— |
|
— |
|
— |
|
— |
|
— |
|
— |
Extensions & Improved Recovery(5) |
|
— |
|
— |
|
— |
|
— |
|
— |
|
— |
|
— |
|
— |
|
— |
|
— |
|
— |
|
— |
Technical Revisions(6) |
|
— |
|
— |
|
— |
|
— |
|
— |
|
— |
|
— |
|
— |
|
— |
|
— |
|
— |
|
— |
Acquisitions(7) |
|
— |
|
— |
|
— |
|
— |
|
— |
|
— |
|
— |
|
— |
|
— |
|
— |
|
— |
|
— |
Dispositions |
|
— |
|
— |
|
— |
|
— |
|
— |
|
— |
|
— |
|
— |
|
— |
|
— |
|
— |
|
— |
Economic Factors(8) |
|
— |
|
— |
|
— |
|
— |
|
— |
|
— |
|
— |
|
— |
|
— |
|
— |
|
— |
|
— |
Production |
|
— |
|
— |
|
— |
|
— |
|
— |
|
— |
|
— |
|
— |
|
— |
|
— |
|
— |
|
— |
At December 31, 2023 |
|
— |
|
— |
|
— |
|
— |
|
— |
|
— |
|
— |
|
— |
|
— |
|
— |
|
— |
|
— |
CEE |
|
Total Gas (4) |
|
Conventional Natural Gas |
|
Coal Bed Methane |
|
Shale Gas |
||||||||||||||||
Proved Probable P+P (1) (2) |
|
Proved |
|
Probable |
|
P+P |
|
Proved |
|
Probable |
|
P+P |
|
Proved |
|
Probable |
|
P+P |
|
Proved |
|
Probable |
|
P+P |
Factors |
|
(mmcf) |
|
(mmcf) |
|
(mmcf) |
|
(mmcf) |
|
(mmcf) |
|
(mmcf) |
|
(mmcf) |
|
(mmcf) |
|
(mmcf) |
|
(mmcf) |
|
(mmcf) |
|
(mmcf) |
At December 31, 2022 |
|
9,945 |
|
5,399 |
|
15,345 |
|
9,945 |
|
5,399 |
|
15,345 |
|
— |
|
— |
|
— |
|
— |
|
— |
|
— |
Discoveries |
|
— |
|
— |
|
— |
|
— |
|
— |
|
— |
|
— |
|
— |
|
— |
|
— |
|
— |
|
— |
Extensions & Improved Recovery(5) |
|
— |
|
— |
|
— |
|
— |
|
— |
|
— |
|
— |
|
— |
|
— |
|
— |
|
— |
|
— |
Technical Revisions(6) |
|
374 |
|
(1,754) |
|
(1,380) |
|
374 |
|
(1,754) |
|
(1,380) |
|
— |
|
— |
|
— |
|
— |
|
— |
|
— |
Acquisitions(7) |
|
— |
|
— |
|
— |
|
— |
|
— |
|
— |
|
— |
|
— |
|
— |
|
— |
|
— |
|
— |
Dispositions |
|
— |
|
— |
|
— |
|
— |
|
— |
|
— |
|
— |
|
— |
|
— |
|
— |
|
— |
|
— |
Economic Factors(8) |
|
(167) |
|
144 |
|
(23) |
|
(167) |
|
144 |
|
(23) |
|
— |
|
— |
|
— |
|
— |
|
— |
|
— |
Production |
|
(132) |
|
— |
|
(132) |
|
(132) |
|
— |
|
(132) |
|
— |
|
— |
|
— |
|
— |
|
— |
|
— |
At December 31, 2023 |
|
10,020 |
|
3,790 |
|
13,810 |
|
10,020 |
|
3,790 |
|
13,810 |
|
— |
|
— |
|
— |
|
— |
|
— |
|
— |
CEE |
|
Natural Gas Liquids |
|
BOE |
||||||||
Proved Probable P+P (1) (2) |
|
Proved |
|
Probable |
|
P+P |
|
Proved |
|
Probable |
|
P+P |
Factors |
|
(mbbl) |
|
(mbbl) |
|
(mbbl) |
|
(mboe) |
|
(mboe) |
|
(mboe) |
At December 31, 2022 |
|
— |
|
— |
|
— |
|
1,658 |
|
900 |
|
2,557 |
Discoveries |
|
— |
|
— |
|
— |
|
— |
|
— |
|
— |
Extensions & Improved Recovery(5) |
|
— |
|
— |
|
— |
|
— |
|
— |
|
— |
Technical Revisions(6) |
|
— |
|
— |
|
— |
|
62 |
|
(292) |
|
(230) |
Acquisitions(7) |
|
— |
|
— |
|
— |
|
— |
|
— |
|
— |
Dispositions |
|
— |
|
— |
|
— |
|
— |
|
— |
|
— |
Economic Factors(8) |
|
— |
|
— |
|
— |
|
(28) |
|
24 |
|
(4) |
Production |
|
— |
|
— |
|
— |
|
(22) |
|
— |
|
(22) |
At December 31, 2023 |
|
— |
|
— |
|
— |
|
1,670 |
|
632 |
|
2,302 |
Vermilion Energy Inc. ■ Page 26 ■ 2023 Annual Information Form
France |
|
Total Oil (4) |
|
Light & Medium Crude Oil |
|
Heavy Crude Oil |
|
Tight Oil |
||||||||||||||||
Proved Probable P+P (1) (2) |
|
Proved |
|
Probable |
|
P+P |
|
Proved |
|
Probable |
|
P+P |
|
Proved |
|
Probable |
|
P+P |
|
Proved |
|
Probable |
|
P+P |
Factors |
|
(mbbl) |
|
(mbbl) |
|
(mbbl) |
|
(mbbl) |
|
(mbbl) |
|
(mbbl) |
|
(mbbl) |
|
(mbbl) |
|
(mbbl) |
|
(mbbl) |
|
(mbbl) |
|
(mbbl) |
At December 31, 2022 |
|
29,528 |
|
9,426 |
|
38,954 |
|
29,528 |
|
9,426 |
|
38,954 |
|
— |
|
— |
|
— |
|
— |
|
— |
|
— |
Discoveries |
|
— |
|
— |
|
— |
|
— |
|
— |
|
— |
|
— |
|
— |
|
— |
|
— |
|
— |
|
— |
Extensions & Improved Recovery(5) |
|
— |
|
— |
|
— |
|
— |
|
— |
|
— |
|
— |
|
— |
|
— |
|
— |
|
— |
|
— |
Technical Revisions(6) |
|
(546) |
|
360 |
|
(186) |
|
(546) |
|
360 |
|
(186) |
|
— |
|
— |
|
— |
|
— |
|
— |
|
— |
Acquisitions(7) |
|
— |
|
— |
|
— |
|
— |
|
— |
|
— |
|
— |
|
— |
|
— |
|
— |
|
— |
|
— |
Dispositions |
|
— |
|
— |
|
— |
|
— |
|
— |
|
— |
|
— |
|
— |
|
— |
|
— |
|
— |
|
— |
Economic Factors(8) |
|
(198) |
|
44 |
|
(154) |
|
(198) |
|
44 |
|
(154) |
|
— |
|
— |
|
— |
|
— |
|
— |
|
— |
Production |
|
(2,768) |
|
— |
|
(2,768) |
|
(2,768) |
|
— |
|
(2,768) |
|
— |
|
— |
|
— |
|
— |
|
— |
|
— |
At December 31, 2023 |
|
26,015 |
|
9,831 |
|
35,846 |
|
26,015 |
|
9,831 |
|
35,846 |
|
— |
|
— |
|
— |
|
— |
|
— |
|
— |
France |
|
Total Gas (4) |
|
Conventional Natural Gas |
|
Coal Bed Methane |
|
Shale Gas |
||||||||||||||||
Proved Probable P+P (1) (2) |
|
Proved |
|
Probable |
|
P+P |
|
Proved |
|
Probable |
|
P+P |
|
Proved |
|
Probable |
|
P+P |
|
Proved |
|
Probable |
|
P+P |
Factors |
|
(mmcf) |
|
(mmcf) |
|
(mmcf) |
|
(mmcf) |
|
(mmcf) |
|
(mmcf) |
|
(mmcf) |
|
(mmcf) |
|
(mmcf) |
|
(mmcf) |
|
(mmcf) |
|
(mmcf) |
At December 31, 2022 |
|
— |
|
— |
|
— |
|
— |
|
— |
|
— |
|
— |
|
— |
|
— |
|
— |
|
— |
|
— |
Discoveries |
|
— |
|
— |
|
— |
|
— |
|
— |
|
— |
|
— |
|
— |
|
— |
|
— |
|
— |
|
— |
Extensions & Improved Recovery(5) |
|
— |
|
— |
|
— |
|
— |
|
— |
|
— |
|
— |
|
— |
|
— |
|
— |
|
— |
|
— |
Technical Revisions(6) |
|
— |
|
— |
|
— |
|
— |
|
— |
|
— |
|
— |
|
— |
|
— |
|
— |
|
— |
|
— |
Acquisitions(7) |
|
— |
|
— |
|
— |
|
— |
|
— |
|
— |
|
— |
|
— |
|
— |
|
— |
|
— |
|
— |
Dispositions |
|
— |
|
— |
|
— |
|
— |
|
— |
|
— |
|
— |
|
— |
|
— |
|
— |
|
— |
|
— |
Economic Factors(8) |
|
— |
|
— |
|
— |
|
— |
|
— |
|
— |
|
— |
|
— |
|
— |
|
— |
|
— |
|
— |
Production |
|
— |
|
— |
|
— |
|
— |
|
— |
|
— |
|
— |
|
— |
|
— |
|
— |
|
— |
|
— |
At December 31, 2023 |
|
— |
|
— |
|
— |
|
— |
|
— |
|
— |
|
— |
|
— |
|
— |
|
— |
|
— |
|
— |
France |
|
Natural Gas Liquids |
|
BOE |
||||||||
Proved Probable P+P (1) (2) |
|
Proved |
|
Probable |
|
P+P |
|
Proved |
|
Probable |
|
P+P |
Factors |
|
(mbbl) |
|
(mbbl) |
|
(mbbl) |
|
(mboe) |
|
(mboe) |
|
(mboe) |
At December 31, 2022 |
|
— |
|
— |
|
— |
|
29,528 |
|
9,426 |
|
38,954 |
Discoveries |
|
— |
|
— |
|
— |
|
— |
|
— |
|
— |
Extensions & Improved Recovery(5) |
|
— |
|
— |
|
— |
|
— |
|
— |
|
— |
Technical Revisions(6) |
|
— |
|
— |
|
— |
|
(546) |
|
360 |
|
(186) |
Acquisitions(7) |
|
— |
|
— |
|
— |
|
— |
|
— |
|
— |
Dispositions |
|
— |
|
— |
|
— |
|
— |
|
— |
|
— |
Economic Factors(8) |
|
— |
|
— |
|
— |
|
(198) |
|
44 |
|
(154) |
Production |
|
— |
|
— |
|
— |
|
(2,768) |
|
— |
|
(2,768) |
At December 31, 2023 |
|
— |
|
— |
|
— |
|
26,015 |
|
9,831 |
|
35,846 |
Vermilion Energy Inc. ■ Page 27 ■ 2023 Annual Information Form
Germany |
|
Total Oil (4) |
|
Light & Medium Crude Oil |
|
Heavy Crude Oil |
|
Tight Oil |
||||||||||||||||
Proved Probable P+P (1) (2) |
|
Proved |
|
Probable |
|
P+P |
|
Proved |
|
Probable |
|
P+P |
|
Proved |
|
Probable |
|
P+P |
|
Proved |
|
Probable |
|
P+P |
Factors |
|
(mbbl) |
|
(mbbl) |
|
(mbbl) |
|
(mbbl) |
|
(mbbl) |
|
(mbbl) |
|
(mbbl) |
|
(mbbl) |
|
(mbbl) |
|
(mbbl) |
|
(mbbl) |
|
(mbbl) |
At December 31, 2022 |
|
6,984 |
|
5,431 |
|
12,416 |
|
6,984 |
|
5,431 |
|
12,416 |
|
— |
|
— |
|
— |
|
— |
|
— |
|
— |
Discoveries |
|
— |
|
— |
|
— |
|
— |
|
— |
|
— |
|
— |
|
— |
|
— |
|
— |
|
— |
|
— |
Extensions & Improved Recovery(5) |
|
650 |
|
(650) |
|
— |
|
650 |
|
(650) |
|
— |
|
— |
|
— |
|
— |
|
— |
|
— |
|
— |
Technical Revisions(6) |
|
740 |
|
(1,092) |
|
(352) |
|
740 |
|
(1,092) |
|
(352) |
|
— |
|
— |
|
— |
|
— |
|
— |
|
— |
Acquisitions(7) |
|
— |
|
— |
|
— |
|
— |
|
— |
|
— |
|
— |
|
— |
|
— |
|
— |
|
— |
|
— |
Dispositions |
|
— |
|
— |
|
— |
|
— |
|
— |
|
— |
|
— |
|
— |
|
— |
|
— |
|
— |
|
— |
Economic Factors(8) |
|
(111) |
|
(96) |
|
(207) |
|
(111) |
|
(96) |
|
(207) |
|
— |
|
— |
|
— |
|
— |
|
— |
|
— |
Production |
|
(604) |
|
— |
|
(604) |
|
(604) |
|
— |
|
(604) |
|
— |
|
— |
|
— |
|
— |
|
— |
|
— |
At December 31, 2023 |
|
7,659 |
|
3,593 |
|
11,252 |
|
7,659 |
|
3,593 |
|
11,252 |
|
— |
|
— |
|
— |
|
— |
|
— |
|
— |
Germany |
|
Total Gas (4) |
|
Conventional Natural Gas |
|
Coal Bed Methane |
|
Shale Gas |
||||||||||||||||
Proved Probable P+P (1) (2) |
|
Proved |
|
Probable |
|
P+P |
|
Proved |
|
Probable |
|
P+P |
|
Proved |
|
Probable |
|
P+P |
|
Proved |
|
Probable |
|
P+P |
Factors |
|
(mmcf) |
|
(mmcf) |
|
(mmcf) |
|
(mmcf) |
|
(mmcf) |
|
(mmcf) |
|
(mmcf) |
|
(mmcf) |
|
(mmcf) |
|
(mmcf) |
|
(mmcf) |
|
(mmcf) |
At December 31, 2022 |
|
67,892 |
|
53,742 |
|
121,635 |
|
67,892 |
|
53,742 |
|
121,635 |
|
— |
|
— |
|
— |
|
— |
|
— |
|
— |
Discoveries |
|
— |
|
— |
|
— |
|
— |
|
— |
|
— |
|
— |
|
— |
|
— |
|
— |
|
— |
|
— |
Extensions & Improved Recovery(5) |
|
— |
|
— |
|
— |
|
— |
|
— |
|
— |
|
— |
|
— |
|
— |
|
— |
|
— |
|
— |
Technical Revisions(6) |
|
(6,404) |
|
(115) |
|
(6,519) |
|
(6,404) |
|
(115) |
|
(6,519) |
|
— |
|
— |
|
— |
|
— |
|
— |
|
— |
Acquisitions(7) |
|
— |
|
— |
|
— |
|
— |
|
— |
|
— |
|
— |
|
— |
|
— |
|
— |
|
— |
|
— |
Dispositions |
|
— |
|
— |
|
— |
|
— |
|
— |
|
— |
|
— |
|
— |
|
— |
|
— |
|
— |
|
— |
Economic Factors(8) |
|
(154) |
|
(278) |
|
(432) |
|
(154) |
|
(278) |
|
(432) |
|
— |
|
— |
|
— |
|
— |
|
— |
|
— |
Production |
|
(8,006) |
|
— |
|
(8,006) |
|
(8,006) |
|
— |
|
(8,006) |
|
— |
|
— |
|
— |
|
— |
|
— |
|
— |
At December 31, 2023 |
|
53,328 |
|
53,350 |
|
106,678 |
|
53,328 |
|
53,350 |
|
106,678 |
|
— |
|
— |
|
— |
|
— |
|
— |
|
— |
Germany |
|
Natural Gas Liquids |
|
BOE |
||||||||
Proved Probable P+P (1) (2) |
|
Proved |
|
Probable |
|
P+P |
|
Proved |
|
Probable |
|
P+P |
Factors |
|
(mbbl) |
|
(mbbl) |
|
(mbbl) |
|
(mboe) |
|
(mboe) |
|
(mboe) |
At December 31, 2022 |
|
— |
|
— |
|
— |
|
18,300 |
|
14,388 |
|
32,688 |
Discoveries |
|
— |
|
— |
|
— |
|
— |
|
— |
|
— |
Extensions & Improved Recovery(5) |
|
— |
|
— |
|
— |
|
650 |
|
(650) |
|
— |
Technical Revisions(6) |
|
— |
|
— |
|
— |
|
(327) |
|
(1,112) |
|
(1,439) |
Acquisitions(7) |
|
— |
|
— |
|
— |
|
— |
|
— |
|
— |
Dispositions |
|
— |
|
— |
|
— |
|
— |
|
— |
|
— |
Economic Factors(8) |
|
— |
|
— |
|
— |
|
(137) |
|
(142) |
|
(279) |
Production |
|
— |
|
— |
|
— |
|
(1,938) |
|
— |
|
(1,938) |
At December 31, 2023 |
|
— |
|
— |
|
— |
|
16,547 |
|
12,485 |
|
29,032 |
Vermilion Energy Inc. ■ Page 28 ■ 2023 Annual Information Form
Ireland |
|
Total Oil (4) |
|
Light & Medium Crude Oil |
|
Heavy Crude Oil |
|
Tight Oil |
||||||||||||||||
Proved Probable P+P (1) (2) |
|
Proved |
|
Probable |
|
P+P |
|
Proved |
|
Probable |
|
P+P |
|
Proved |
|
Probable |
|
P+P |
|
Proved |
|
Probable |
|
P+P |
Factors |
|
(mbbl) |
|
(mbbl) |
|
(mbbl) |
|
(mbbl) |
|
(mbbl) |
|
(mbbl) |
|
(mbbl) |
|
(mbbl) |
|
(mbbl) |
|
(mbbl) |
|
(mbbl) |
|
(mbbl) |
At December 31, 2022 |
|
— |
|
— |
|
— |
|
— |
|
— |
|
— |
|
— |
|
— |
|
— |
|
— |
|
— |
|
— |
Discoveries |
|
— |
|
— |
|
— |
|
— |
|
— |
|
— |
|
— |
|
— |
|
— |
|
— |
|
— |
|
— |
Extensions & Improved Recovery(5) |
|
— |
|
— |
|
— |
|
— |
|
— |
|
— |
|
— |
|
— |
|
— |
|
— |
|
— |
|
— |
Technical Revisions(6) |
|
— |
|
— |
|
— |
|
— |
|
— |
|
— |
|
— |
|
— |
|
— |
|
— |
|
— |
|
— |
Acquisitions(7) |
|
— |
|
— |
|
— |
|
— |
|
— |
|
— |
|
— |
|
— |
|
— |
|
— |
|
— |
|
— |
Dispositions |
|
— |
|
— |
|
— |
|
— |
|
— |
|
— |
|
— |
|
— |
|
— |
|
— |
|
— |
|
— |
Economic Factors(8) |
|
— |
|
— |
|
— |
|
— |
|
— |
|
— |
|
— |
|
— |
|
— |
|
— |
|
— |
|
— |
Production |
|
— |
|
— |
|
— |
|
— |
|
— |
|
— |
|
— |
|
— |
|
— |
|
— |
|
— |
|
— |
At December 31, 2023 |
|
— |
|
— |
|
— |
|
— |
|
— |
|
— |
|
— |
|
— |
|
— |
|
— |
|
— |
|
— |
Ireland |
|
Total Gas (4) |
|
Conventional Natural Gas |
|
Coal Bed Methane |
|
Shale Gas |
||||||||||||||||
Proved Probable P+P (1) (2) |
|
Proved |
|
Probable |
|
P+P |
|
Proved |
|
Probable |
|
P+P |
|
Proved |
|
Probable |
|
P+P |
|
Proved |
|
Probable |
|
P+P |
Factors |
|
(mmcf) |
|
(mmcf) |
|
(mmcf) |
|
(mmcf) |
|
(mmcf) |
|
(mmcf) |
|
(mmcf) |
|
(mmcf) |
|
(mmcf) |
|
(mmcf) |
|
(mmcf) |
|
(mmcf) |
At December 31, 2022 |
|
40,366 |
|
24,861 |
|
65,227 |
|
40,366 |
|
24,861 |
|
65,227 |
|
— |
|
— |
|
— |
|
— |
|
— |
|
— |
Discoveries |
|
— |
|
— |
|
— |
|
— |
|
— |
|
— |
|
— |
|
— |
|
— |
|
— |
|
— |
|
— |
Extensions & Improved Recovery(5) |
|
— |
|
— |
|
— |
|
— |
|
— |
|
— |
|
— |
|
— |
|
— |
|
— |
|
— |
|
— |
Technical Revisions(6) |
|
496 |
|
(10,178) |
|
(9,682) |
|
496 |
|
(10,178) |
|
(9,682) |
|
— |
|
— |
|
— |
|
— |
|
— |
|
— |
Acquisitions(7) |
|
75,289 |
|
27,968 |
|
103,256 |
|
75,289 |
|
27,968 |
|
103,256 |
|
— |
|
— |
|
— |
|
— |
|
— |
|
— |
Dispositions |
|
— |
|
— |
|
— |
|
— |
|
— |
|
— |
|
— |
|
— |
|
— |
|
— |
|
— |
|
— |
Economic Factors(8) |
|
— |
|
— |
|
— |
|
— |
|
— |
|
— |
|
— |
|
— |
|
— |
|
— |
|
— |
|
— |
Production |
|
(18,660) |
|
— |
|
(18,660) |
|
(18,660) |
|
— |
|
(18,660) |
|
— |
|
— |
|
— |
|
— |
|
— |
|
— |
At December 31, 2023 |
|
97,491 |
|
42,650 |
|
140,141 |
|
97,491 |
|
42,650 |
|
140,141 |
|
— |
|
— |
|
— |
|
— |
|
— |
|
— |
Ireland |
|
Natural Gas Liquids |
|
BOE |
||||||||
Proved Probable P+P (1) (2) |
|
Proved |
|
Probable |
|
P+P |
|
Proved |
|
Probable |
|
P+P |
Factors |
|
(mbbl) |
|
(mbbl) |
|
(mbbl) |
|
(mboe) |
|
(mboe) |
|
(mboe) |
At December 31, 2022 |
|
— |
|
— |
|
— |
|
6,728 |
|
4,143 |
|
10,871 |
Discoveries |
|
— |
|
— |
|
— |
|
— |
|
— |
|
— |
Extensions & Improved Recovery(5) |
|
— |
|
— |
|
— |
|
— |
|
— |
|
— |
Technical Revisions(6) |
|
— |
|
— |
|
— |
|
93 |
|
(1,692) |
|
(1,599) |
Acquisitions(7) |
|
— |
|
— |
|
— |
|
12,548 |
|
4,661 |
|
17,209 |
Dispositions |
|
— |
|
— |
|
— |
|
— |
|
— |
|
— |
Economic Factors(8) |
|
— |
|
— |
|
— |
|
— |
|
— |
|
— |
Production |
|
— |
|
— |
|
— |
|
(3,110) |
|
— |
|
(3,110) |
At December 31, 2023 |
|
— |
|
— |
|
— |
|
16,258 |
|
7,113 |
|
23,371 |
Vermilion Energy Inc. ■ Page 29 ■ 2023 Annual Information Form
Netherlands |
|
Total Oil (4) |
|
Light & Medium Crude Oil |
|
Heavy Crude Oil |
|
Tight Oil |
||||||||||||||||
Proved Probable P+P (1) (2) |
|
Proved |
|
Probable |
|
P+P |
|
Proved |
|
Probable |
|
P+P |
|
Proved |
|
Probable |
|
P+P |
|
Proved |
|
Probable |
|
P+P |
Factors |
|
(mbbl) |
|
(mbbl) |
|
(mbbl) |
|
(mbbl) |
|
(mbbl) |
|
(mbbl) |
|
(mbbl) |
|
(mbbl) |
|
(mbbl) |
|
(mbbl) |
|
(mbbl) |
|
(mbbl) |
At December 31, 2022 |
|
— |
|
— |
|
— |
|
— |
|
— |
|
— |
|
— |
|
— |
|
— |
|
— |
|
— |
|
— |
Discoveries |
|
— |
|
— |
|
— |
|
— |
|
— |
|
— |
|
— |
|
— |
|
— |
|
— |
|
— |
|
— |
Extensions & Improved Recovery(5) |
|
— |
|
— |
|
— |
|
— |
|
— |
|
— |
|
— |
|
— |
|
— |
|
— |
|
— |
|
— |
Technical Revisions(6) |
|
— |
|
— |
|
— |
|
— |
|
— |
|
— |
|
— |
|
— |
|
— |
|
— |
|
— |
|
— |
Acquisitions(7) |
|
— |
|
— |
|
— |
|
— |
|
— |
|
— |
|
— |
|
— |
|
— |
|
— |
|
— |
|
— |
Dispositions |
|
— |
|
— |
|
— |
|
— |
|
— |
|
— |
|
— |
|
— |
|
— |
|
— |
|
— |
|
— |
Economic Factors(8) |
|
— |
|
— |
|
— |
|
— |
|
— |
|
— |
|
— |
|
— |
|
— |
|
— |
|
— |
|
— |
Production |
|
— |
|
— |
|
— |
|
— |
|
— |
|
— |
|
— |
|
— |
|
— |
|
— |
|
— |
|
— |
At December 31, 2023 |
|
— |
|
— |
|
— |
|
— |
|
— |
|
— |
|
— |
|
— |
|
— |
|
— |
|
— |
|
— |
Netherlands |
|
Total Gas (4) |
|
Conventional Natural Gas |
|
Coal Bed Methane |
|
Shale Gas |
||||||||||||||||
Proved Probable P+P (1) (2) |
|
Proved |
|
Probable |
|
P+P |
|
Proved |
|
Probable |
|
P+P |
|
Proved |
|
Probable |
|
P+P |
|
Proved |
|
Probable |
|
P+P |
Factors |
|
(mmcf) |
|
(mmcf) |
|
(mmcf) |
|
(mmcf) |
|
(mmcf) |
|
(mmcf) |
|
(mmcf) |
|
(mmcf) |
|
(mmcf) |
|
(mmcf) |
|
(mmcf) |
|
(mmcf) |
At December 31, 2022 |
|
34,939 |
|
43,500 |
|
78,439 |
|
34,939 |
|
43,500 |
|
78,439 |
|
— |
|
— |
|
— |
|
— |
|
— |
|
— |
Discoveries |
|
— |
|
— |
|
— |
|
— |
|
— |
|
— |
|
— |
|
— |
|
— |
|
— |
|
— |
|
— |
Extensions & Improved Recovery(5) |
|
252 |
|
(104) |
|
148 |
|
252 |
|
(104) |
|
148 |
|
— |
|
— |
|
— |
|
— |
|
— |
|
— |
Technical Revisions(6) |
|
4,124 |
|
(1,799) |
|
2,324 |
|
4,124 |
|
(1,799) |
|
2,324 |
|
— |
|
— |
|
— |
|
— |
|
— |
|
— |
Acquisitions(7) |
|
— |
|
— |
|
— |
|
— |
|
— |
|
— |
|
— |
|
— |
|
— |
|
— |
|
— |
|
— |
Dispositions |
|
— |
|
— |
|
— |
|
— |
|
— |
|
— |
|
— |
|
— |
|
— |
|
— |
|
— |
|
— |
Economic Factors(8) |
|
(1,401) |
|
(1,865) |
|
(3,266) |
|
(1,401) |
|
(1,865) |
|
(3,266) |
|
— |
|
— |
|
— |
|
— |
|
— |
|
— |
Production |
|
(10,285) |
|
— |
|
(10,285) |
|
(10,285) |
|
— |
|
(10,285) |
|
— |
|
— |
|
— |
|
— |
|
— |
|
— |
At December 31, 2023 |
|
27,628 |
|
39,731 |
|
67,359 |
|
27,628 |
|
39,731 |
|
67,359 |
|
— |
|
— |
|
— |
|
— |
|
— |
|
— |
Netherlands |
|
Natural Gas Liquids |
|
BOE |
||||||||
Proved Probable P+P (1) (2) |
|
Proved |
|
Probable |
|
P+P |
|
Proved |
|
Probable |
|
P+P |
Factors |
|
(mbbl) |
|
(mbbl) |
|
(mbbl) |
|
(mboe) |
|
(mboe) |
|
(mboe) |
At December 31, 2022 |
|
21 |
|
50 |
|
70 |
|
5,844 |
|
7,300 |
|
13,143 |
Discoveries |
|
— |
|
— |
|
— |
|
— |
|
— |
|
— |
Extensions & Improved Recovery(5) |
|
— |
|
— |
|
— |
|
42 |
|
(17) |
|
25 |
Technical Revisions(6) |
|
48 |
|
11 |
|
59 |
|
736 |
|
(289) |
|
447 |
Acquisitions(7) |
|
— |
|
— |
|
— |
|
— |
|
— |
|
— |
Dispositions |
|
— |
|
— |
|
— |
|
— |
|
— |
|
— |
Economic Factors(8) |
|
(2) |
|
(2) |
|
(4) |
|
(235) |
|
(313) |
|
(548) |
Production |
|
(26) |
|
— |
|
(26) |
|
(1,740) |
|
— |
|
(1,740) |
At December 31, 2023 |
|
41 |
|
59 |
|
100 |
|
4,646 |
|
6,681 |
|
11,327 |
Vermilion Energy Inc. ■ Page 30 ■ 2023 Annual Information Form
United States |
|
Total Oil (4) |
|
Light & Medium Crude Oil |
|
Heavy Crude Oil |
|
Tight Oil |
||||||||||||||||
Proved Probable P+P (1) (2) |
|
Proved |
|
Probable |
|
P+P |
|
Proved |
|
Probable |
|
P+P |
|
Proved |
|
Probable |
|
P+P |
|
Proved |
|
Probable |
|
P+P |
Factors |
|
(mbbl) |
|
(mbbl) |
|
(mbbl) |
|
(mbbl) |
|
(mbbl) |
|
(mbbl) |
|
(mbbl) |
|
(mbbl) |
|
(mbbl) |
|
(mbbl) |
|
(mbbl) |
|
(mbbl) |
At December 31, 2022 |
|
20,162 |
|
18,511 |
|
38,673 |
|
20,162 |
|
18,511 |
|
38,673 |
|
— |
|
— |
|
— |
|
— |
|
— |
|
— |
Discoveries |
|
— |
|
— |
|
— |
|
— |
|
— |
|
— |
|
— |
|
— |
|
— |
|
— |
|
— |
|
— |
Extensions & Improved Recovery(5) |
|
3,616 |
|
(337) |
|
3,279 |
|
3,616 |
|
(337) |
|
3,279 |
|
— |
|
— |
|
— |
|
— |
|
— |
|
— |
Technical Revisions(6) |
|
(5,045) |
|
(2,781) |
|
(7,826) |
|
(5,045) |
|
(2,781) |
|
(7,826) |
|
— |
|
— |
|
— |
|
— |
|
— |
|
— |
Acquisitions(7) |
|
— |
|
— |
|
— |
|
— |
|
— |
|
— |
|
— |
|
— |
|
— |
|
— |
|
— |
|
— |
Dispositions |
|
(4,047) |
|
(6,226) |
|
(10,273) |
|
(4,047) |
|
(6,226) |
|
(10,273) |
|
— |
|
— |
|
— |
|
— |
|
— |
|
— |
Economic Factors(8) |
|
— |
|
— |
|
— |
|
— |
|
— |
|
— |
|
— |
|
— |
|
— |
|
— |
|
— |
|
— |
Production |
|
(1,257) |
|
— |
|
(1,257) |
|
(1,257) |
|
— |
|
(1,257) |
|
— |
|
— |
|
— |
|
— |
|
— |
|
— |
At December 31, 2023 |
|
13,428 |
|
9,167 |
|
22,596 |
|
13,428 |
|
9,167 |
|
22,596 |
|
— |
|
— |
|
— |
|
— |
|
— |
|
— |
United States |
|
Total Gas (4) |
|
Conventional Natural Gas |
|
Coal Bed Methane (5) |
|
Shale Gas |
||||||||||||||||
Proved Probable P+P (1) (2) |
|
Proved |
|
Probable |
|
P+P |
|
Proved |
|
Probable |
|
P+P |
|
Proved |
|
Probable |
|
P+P |
|
Proved |
|
Probable |
|
P+P |
Factors |
|
(mmcf) |
|
(mmcf) |
|
(mmcf) |
|
(mmcf) |
|
(mmcf) |
|
(mmcf) |
|
(mmcf) |
|
(mmcf) |
|
(mmcf) |
|
(mmcf) |
|
(mmcf) |
|
(mmcf) |
At December 31, 2022 |
|
47,095 |
|
33,803 |
|
80,898 |
|
47,095 |
|
33,803 |
|
80,898 |
|
— |
|
— |
|
— |
|
— |
|
— |
|
— |
Discoveries |
|
— |
|
— |
|
— |
|
— |
|
— |
|
— |
|
— |
|
— |
|
— |
|
— |
|
— |
|
— |
Extensions & Improved Recovery(5) |
|
4,261 |
|
(310) |
|
3,951 |
|
4,261 |
|
(310) |
|
3,951 |
|
— |
|
— |
|
— |
|
— |
|
— |
|
— |
Technical Revisions(6) |
|
(13,910) |
|
(9,329) |
|
(23,239) |
|
(13,910) |
|
(9,329) |
|
(23,239) |
|
— |
|
— |
|
— |
|
— |
|
— |
|
— |
Acquisitions(7) |
|
— |
|
— |
|
— |
|
— |
|
— |
|
— |
|
— |
|
— |
|
— |
|
— |
|
— |
|
— |
Dispositions |
|
(4,625) |
|
(6,964) |
|
(11,589) |
|
(4,625) |
|
(6,964) |
|
(11,589) |
|
— |
|
— |
|
— |
|
— |
|
— |
|
— |
Economic Factors(8) |
|
(33) |
|
(59) |
|
(92) |
|
(33) |
|
(59) |
|
(92) |
|
— |
|
— |
|
— |
|
— |
|
— |
|
— |
Production |
|
(2,656) |
|
— |
|
(2,656) |
|
(2,656) |
|
— |
|
(2,656) |
|
— |
|
— |
|
— |
|
— |
|
— |
|
— |
At December 31, 2023 |
|
30,132 |
|
17,140 |
|
47,272 |
|
30,132 |
|
17,140 |
|
47,272 |
|
— |
|
— |
|
— |
|
— |
|
— |
|
— |
United States |
|
Natural Gas Liquids |
|
BOE |
||||||||
Proved Probable P+P (1) (2) |
|
Proved |
|
Probable |
|
P+P |
|
Proved |
|
Probable |
|
P+P |
Factors |
|
(mbbl) |
|
(mbbl) |
|
(mbbl) |
|
(mboe) |
|
(mboe) |
|
(mboe) |
At December 31, 2022 |
|
6,324 |
|
4,765 |
|
11,089 |
|
34,335 |
|
28,910 |
|
63,244 |
Discoveries |
|
— |
|
— |
|
— |
|
— |
|
— |
|
— |
Extensions & Improved Recovery(5) |
|
593 |
|
(1) |
|
593 |
|
4,920 |
|
(390) |
|
4,530 |
Technical Revisions(6) |
|
(1,337) |
|
(1,198) |
|
(2,534) |
|
(8,700) |
|
(5,533) |
|
(14,233) |
Acquisitions(7) |
|
— |
|
— |
|
— |
|
— |
|
— |
|
— |
Dispositions |
|
(655) |
|
(987) |
|
(1,642) |
|
(5,473) |
|
(8,374) |
|
(13,846) |
Economic Factors(8) |
|
(5) |
|
(9) |
|
(14) |
|
(11) |
|
(19) |
|
(30) |
Production |
|
(400) |
|
— |
|
(400) |
|
(2,100) |
|
— |
|
(2,100) |
At December 31, 2023 |
|
4,520 |
|
2,571 |
|
7,091 |
|
22,970 |
|
14,595 |
|
37,565 |
Vermilion Energy Inc. ■ Page 31 ■ 2023 Annual Information Form
Total Company |
|
Total Oil (4) |
|
Light & Medium Crude Oil |
|
Heavy Crude Oil |
|
Tight Oil |
||||||||||||||||
Proved Probable P+P (1) (2) |
|
Proved |
|
Probable |
|
P+P |
|
Proved |
|
Probable |
|
P+P |
|
Proved |
|
Probable |
|
P+P |
|
Proved |
|
Probable |
|
P+P |
Factors |
|
(mbbl) |
|
(mbbl) |
|
(mbbl) |
|
(mbbl) |
|
(mbbl) |
|
(mbbl) |
|
(mbbl) |
|
(mbbl) |
|
(mbbl) |
|
(mbbl) |
|
(mbbl) |
|
(mbbl) |
At December 31, 2022 |
|
152,208 |
|
85,404 |
|
237,611 |
|
145,996 |
|
78,877 |
|
224,872 |
|
101 |
|
96 |
|
197 |
|
6,111 |
|
6,431 |
|
12,542 |
Discoveries |
|
— |
|
— |
|
— |
|
— |
|
— |
|
— |
|
— |
|
— |
|
— |
|
— |
|
— |
|
— |
Extensions & Improved Recovery(5) |
|
7,390 |
|
362 |
|
7,752 |
|
5,348 |
|
(725) |
|
4,623 |
|
— |
|
— |
|
— |
|
2,042 |
|
1,087 |
|
3,129 |
Technical Revisions(6) |
|
(14,650) |
|
(15,323) |
|
(29,973) |
|
(14,085) |
|
(15,960) |
|
(30,045) |
|
7 |
|
(1) |
|
6 |
|
(572) |
|
638 |
|
66 |
Acquisitions(7) |
|
25 |
|
(1) |
|
24 |
|
25 |
|
(1) |
|
24 |
|
— |
|
— |
|
— |
|
— |
|
— |
|
— |
Dispositions (9) |
|
(24,296) |
|
(16,924) |
|
(41,220) |
|
(24,296) |
|
(16,924) |
|
(41,220) |
|
— |
|
— |
|
— |
|
— |
|
— |
|
— |
Economic Factors(8) |
|
1,381 |
|
(1,228) |
|
153 |
|
1,427 |
|
(1,246) |
|
181 |
|
— |
|
— |
|
— |
|
(46) |
|
18 |
|
(28) |
Production |
|
(10,025) |
|
— |
|
(10,025) |
|
(9,395) |
|
— |
|
(9,395) |
|
(5) |
|
— |
|
(5) |
|
(625) |
|
— |
|
(625) |
At December 31, 2023 |
|
112,032 |
|
52,290 |
|
164,322 |
|
105,019 |
|
44,021 |
|
149,040 |
|
103 |
|
95 |
|
198 |
|
6,910 |
|
8,174 |
|
15,084 |
Total Company |
|
Total Gas (4) |
|
Conventional Natural Gas |
|
Coal Bed Methane (5) |
|
Shale Gas |
||||||||||||||||
Proved Probable P+P (1) (2) |
|
Proved |
|
Probable |
|
P+P |
|
Proved |
|
Probable |
|
P+P |
|
Proved |
|
Probable |
|
P+P |
|
Proved |
|
Probable |
|
P+P |
Factors |
|
(mmcf) |
|
(mmcf) |
|
(mmcf) |
|
(mmcf) |
|
(mmcf) |
|
(mmcf) |
|
(mmcf) |
|
(mmcf) |
|
(mmcf) |
|
(mmcf) |
|
(mmcf) |
|
(mmcf) |
At December 31, 2022 |
|
712,958 |
|
572,994 |
|
1,285,952 |
|
545,571 |
|
379,879 |
|
925,450 |
|
7,475 |
|
2,643 |
|
10,118 |
|
159,912 |
|
190,472 |
|
350,384 |
Discoveries |
|
— |
|
— |
|
— |
|
— |
|
— |
|
— |
|
— |
|
— |
|
— |
|
— |
|
— |
|
— |
Extensions & Improved Recovery(5) |
|
82,909 |
|
16,234 |
|
99,143 |
|
32,930 |
|
(7,488) |
|
25,442 |
|
— |
|
— |
|
— |
|
49,979 |
|
23,722 |
|
73,701 |
Technical Revisions(6) |
|
(43,785) |
|
(66,481) |
|
(110,265) |
|
(30,081) |
|
(68,796) |
|
(98,876) |
|
(864) |
|
(754) |
|
(1,618) |
|
(12,840) |
|
3,069 |
|
(9,771) |
Acquisitions(7) |
|
86,709 |
|
31,250 |
|
117,961 |
|
86,459 |
|
31,172 |
|
117,632 |
|
250 |
|
78 |
|
329 |
|
— |
|
— |
|
— |
Dispositions |
|
(9,882) |
|
(9,791) |
|
(19,673) |
|
(9,882) |
|
(9,791) |
|
(19,673) |
|
— |
|
— |
|
— |
|
— |
|
— |
|
— |
Economic Factors(8) |
|
(2,227) |
|
(1,739) |
|
(3,969) |
|
(114) |
|
(2,432) |
|
(2,547) |
|
(345) |
|
(35) |
|
(381) |
|
(1,768) |
|
728 |
|
(1,041) |
Production |
|
(98,482) |
|
— |
|
(98,482) |
|
(85,564) |
|
— |
|
(85,564) |
|
(824) |
|
— |
|
(824) |
|
(12,094) |
|
— |
|
(12,094) |
At December 31, 2023 |
|
728,200 |
|
542,468 |
|
1,270,668 |
|
539,320 |
|
322,545 |
|
861,865 |
|
5,692 |
|
1,932 |
|
7,624 |
|
183,188 |
|
217,991 |
|
401,179 |
Total Company |
|
Natural Gas Liquids |
|
BOE |
||||||||
Proved Probable P+P (1) (2) |
|
Proved |
|
Probable |
|
P+P |
|
Proved |
|
Probable |
|
P+P |
Factors |
|
(mbbl) |
|
(mbbl) |
|
(mbbl) |
|
(mboe) |
|
(mboe) |
|
(mboe) |
At December 31, 2022 |
|
42,094 |
|
28,759 |
|
70,853 |
|
313,129 |
|
209,661 |
|
522,790 |
Discoveries |
|
— |
|
— |
|
— |
|
— |
|
— |
|
— |
Extensions & Improved Recovery(5) |
|
3,220 |
|
(191) |
|
3,029 |
|
24,428 |
|
2,877 |
|
27,305 |
Technical Revisions(6) |
|
(5,536) |
|
(8,614) |
|
(14,150) |
|
(27,483) |
|
(35,017) |
|
(62,500) |
Acquisitions(7) |
|
884 |
|
255 |
|
1,139 |
|
15,360 |
|
5,463 |
|
20,823 |
Dispositions |
|
(1,418) |
|
(1,394) |
|
(2,812) |
|
(27,361) |
|
(19,949) |
|
(47,310) |
Economic Factors(8) |
|
(41) |
|
(63) |
|
(104) |
|
969 |
|
(1,581) |
|
(612) |
Production |
|
(4,217) |
|
— |
|
(4,217) |
|
(30,657) |
|
— |
|
(30,657) |
At December 31, 2023 |
|
34,986 |
|
18,752 |
|
53,739 |
|
268,385 |
|
161,453 |
|
429,838 |
Vermilion Energy Inc. ■ Page 32 ■ 2023 Annual Information Form
North America |
|
Total Oil (4) |
|
Light & Medium Crude Oil |
|
Heavy Crude Oil |
|
Tight Oil |
||||||||||||||||
Proved Probable P+P (1) (2) |
|
Proved |
|
Probable |
|
P+P |
|
Proved |
|
Probable |
|
P+P |
|
Proved |
|
Probable |
|
P+P |
|
Proved |
|
Probable |
|
P+P |
Factors |
|
(mbbl) |
|
(mbbl) |
|
(mbbl) |
|
(mbbl) |
|
(mbbl) |
|
(mbbl) |
|
(mbbl) |
|
(mbbl) |
|
(mbbl) |
|
(mbbl) |
|
(mbbl) |
|
(mbbl) |
At December 31, 2022 |
|
109,293 |
|
64,418 |
|
173,710 |
|
103,081 |
|
57,891 |
|
160,971 |
|
101 |
|
96 |
|
197 |
|
6,111 |
|
6,431 |
|
12,542 |
Discoveries |
|
— |
|
— |
|
— |
|
— |
|
— |
|
— |
|
— |
|
— |
|
— |
|
— |
|
— |
|
— |
Extensions & Improved Recovery(5) |
|
6,739 |
|
1,013 |
|
7,752 |
|
4,697 |
|
(74) |
|
4,623 |
|
— |
|
— |
|
— |
|
2,042 |
|
1,087 |
|
3,129 |
Technical Revisions(6) |
|
(15,555) |
|
(13,936) |
|
(29,491) |
|
(14,990) |
|
(14,573) |
|
(29,563) |
|
7 |
|
(1) |
|
6 |
|
(572) |
|
638 |
|
66 |
Acquisitions(7) |
|
25 |
|
(1) |
|
24 |
|
25 |
|
(1) |
|
24 |
|
— |
|
— |
|
— |
|
— |
|
— |
|
— |
Dispositions |
|
(24,296) |
|
(16,923) |
|
(41,220) |
|
(24,296) |
|
(16,923) |
|
(41,220) |
|
— |
|
— |
|
— |
|
— |
|
— |
|
— |
Economic Factors(8) |
|
698 |
|
(61) |
|
637 |
|
744 |
|
(79) |
|
665 |
|
— |
|
— |
|
— |
|
(46) |
|
18 |
|
(28) |
Production |
|
(6,108) |
|
— |
|
(6,108) |
|
(5,478) |
|
— |
|
(5,478) |
|
(5) |
|
— |
|
(5) |
|
(625) |
|
— |
|
(625) |
At December 31, 2023 |
|
70,794 |
|
34,508 |
|
105,303 |
|
63,781 |
|
26,239 |
|
90,021 |
|
103 |
|
95 |
|
198 |
|
6,910 |
|
8,174 |
|
15,084 |
|
|
Total Gas (4) |
|
Conventional Natural Gas |
|
Coal Bed Methane (5) |
|
Shale Gas |
||||||||||||||||
Proved Probable P+P (1) (2) |
|
Proved |
|
Probable |
|
P+P |
|
Proved |
|
Probable |
|
P+P |
|
Proved |
|
Probable |
|
P+P |
|
Proved |
|
Probable |
|
P+P |
Factors |
|
(mbbl) |
|
(mbbl) |
|
(mbbl) |
|
(mbbl) |
|
(mbbl) |
|
(mbbl) |
|
(mbbl) |
|
(mbbl) |
|
(mbbl) |
|
(mbbl) |
|
(mbbl) |
|
(mbbl) |
At December 31, 2022 |
|
559,816 |
|
445,492 |
|
1,005,308 |
|
392,429 |
|
252,377 |
|
644,806 |
|
7,475 |
|
2,643 |
|
10,118 |
|
159,912 |
|
190,472 |
|
350,384 |
Discoveries |
|
— |
|
— |
|
— |
|
— |
|
— |
|
— |
|
— |
|
— |
|
— |
|
— |
|
— |
|
— |
Extensions & Improved Recovery(5) |
|
82,657 |
|
16,339 |
|
98,996 |
|
32,678 |
|
(7,383) |
|
25,295 |
|
— |
|
— |
|
— |
|
49,979 |
|
23,722 |
|
73,701 |
Technical Revisions(6) |
|
(42,374) |
|
(52,635) |
|
(95,009) |
|
(28,670) |
|
(54,950) |
|
(83,620) |
|
(864) |
|
(754) |
|
(1,618) |
|
(12,840) |
|
3,069 |
|
(9,771) |
Acquisitions(7) |
|
11,421 |
|
3,283 |
|
14,705 |
|
11,171 |
|
3,205 |
|
14,376 |
|
250 |
|
78 |
|
329 |
|
— |
|
— |
|
— |
Dispositions |
|
(9,883) |
|
(9,791) |
|
(19,673) |
|
(9,883) |
|
(9,791) |
|
(19,673) |
|
— |
|
— |
|
— |
|
— |
|
— |
|
— |
Economic Factors(8) |
|
(505) |
|
259 |
|
(247) |
|
1,608 |
|
(434) |
|
1,175 |
|
(345) |
|
(35) |
|
(381) |
|
(1,768) |
|
728 |
|
(1,041) |
Production |
|
(61,398) |
|
— |
|
(61,398) |
|
(48,480) |
|
— |
|
(48,480) |
|
(824) |
|
— |
|
(824) |
|
(12,094) |
|
— |
|
(12,094) |
At December 31, 2023 |
|
539,733 |
|
402,946 |
|
942,679 |
|
350,853 |
|
183,023 |
|
533,876 |
|
5,692 |
|
1,932 |
|
7,624 |
|
183,188 |
|
217,991 |
|
401,179 |
|
|
Natural Gas Liquids |
|
BOE |
||||||||
Proved Probable P+P (1) (2) |
|
Proved |
|
Probable |
|
P+P |
|
Proved |
|
Probable |
|
P+P |
Factors |
|
(mbbl) |
|
(mbbl) |
|
(mbbl) |
|
(mbbl) |
|
(mbbl) |
|
(mbbl) |
At December 31, 2022 |
|
42,074 |
|
28,709 |
|
70,784 |
|
244,670 |
|
167,375 |
|
412,044 |
Discoveries |
|
— |
|
— |
|
— |
|
— |
|
— |
|
— |
Extensions & Improved Recovery(5) |
|
3,219 |
|
(191) |
|
3,029 |
|
23,735 |
|
3,544 |
|
27,280 |
Technical Revisions(6) |
|
(5,594) |
|
(8,630) |
|
(14,223) |
|
(28,211) |
|
(31,337) |
|
(59,548) |
Acquisitions(7) |
|
884 |
|
255 |
|
1,139 |
|
2,812 |
|
801 |
|
3,613 |
Dispositions |
|
(1,418) |
|
(1,394) |
|
(2,812) |
|
(27,361) |
|
(19,950) |
|
(47,310) |
Economic Factors(8) |
|
(39) |
|
(62) |
|
(100) |
|
575 |
|
(80) |
|
495 |
Production |
|
(4,191) |
|
— |
|
(4,191) |
|
(20,534) |
|
— |
|
(20,534) |
At December 31, 2023 |
|
34,936 |
|
18,689 |
|
53,624 |
|
195,685 |
|
120,355 |
|
316,040 |
Vermilion Energy Inc. ■ Page 33 ■ 2023 Annual Information Form
|
|
Total Oil (4) |
|
Light & Medium Crude Oil |
|
Heavy Crude Oil |
|
Tight Oil |
||||||||||||||||
International |
|
Proved |
|
Probable |
|
P+P |
|
Proved |
|
Probable |
|
P+P |
|
Proved |
|
Probable |
|
P+P |
|
Proved |
|
Probable |
|
P+P |
Factors |
|
(mbbl) |
|
(mbbl) |
|
(mbbl) |
|
(mbbl) |
|
(mbbl) |
|
(mbbl) |
|
(mbbl) |
|
(mbbl) |
|
(mbbl) |
|
(mbbl) |
|
(mbbl) |
|
(mbbl) |
At December 31, 2022 |
|
42,915 |
|
20,986 |
|
63,901 |
|
42,915 |
|
20,986 |
|
63,901 |
|
— |
|
— |
|
— |
|
— |
|
— |
|
— |
Discoveries |
|
— |
|
— |
|
— |
|
— |
|
— |
|
— |
|
— |
|
— |
|
— |
|
— |
|
— |
|
— |
Extensions & Improved Recovery(5) |
|
650 |
|
(650) |
|
— |
|
650 |
|
(650) |
|
— |
|
— |
|
— |
|
— |
|
— |
|
— |
|
— |
Technical Revisions(6) |
|
905 |
|
(1,388) |
|
(482) |
|
905 |
|
(1,388) |
|
(482) |
|
— |
|
— |
|
— |
|
— |
|
— |
|
— |
Acquisitions(7) |
|
— |
|
— |
|
— |
|
— |
|
— |
|
— |
|
— |
|
— |
|
— |
|
— |
|
— |
|
— |
Dispositions |
|
— |
|
— |
|
— |
|
— |
|
— |
|
— |
|
— |
|
— |
|
— |
|
— |
|
— |
|
— |
Economic Factors(8) |
|
684 |
|
(1,167) |
|
(483) |
|
684 |
|
(1,167) |
|
(483) |
|
— |
|
— |
|
— |
|
— |
|
— |
|
— |
Production |
|
(3,916) |
|
— |
|
(3,916) |
|
(3,916) |
|
— |
|
(3,916) |
|
— |
|
— |
|
— |
|
— |
|
— |
|
— |
At December 31, 2023 |
|
41,237 |
|
17,782 |
|
59,019 |
|
41,237 |
|
17,782 |
|
59,019 |
|
— |
|
— |
|
— |
|
— |
|
— |
|
— |
|
|
Total Gas (4) |
|
Conventional Natural Gas |
|
Coal Bed Methane (5) |
|
Shale Gas |
||||||||||||||||
Proved Probable P+P (1) (2) |
|
Proved |
|
Probable |
|
P+P |
|
Proved |
|
Probable |
|
P+P |
|
Proved |
|
Probable |
|
P+P |
|
Proved |
|
Probable |
|
P+P |
Factors |
|
(mbbl) |
|
(mbbl) |
|
(mbbl) |
|
(mbbl) |
|
(mbbl) |
|
(mbbl) |
|
(mbbl) |
|
(mbbl) |
|
(mbbl) |
|
(mbbl) |
|
(mbbl) |
|
(mbbl) |
At December 31, 2022 |
|
153,142 |
|
127,502 |
|
280,646 |
|
153,142 |
|
127,502 |
|
280,646 |
|
— |
|
— |
|
— |
|
— |
|
— |
|
— |
Discoveries |
|
— |
|
— |
|
— |
|
— |
|
— |
|
— |
|
— |
|
— |
|
— |
|
— |
|
— |
|
— |
Extensions & Improved Recovery(5) |
|
252 |
|
(104) |
|
148 |
|
252 |
|
(104) |
|
148 |
|
— |
|
— |
|
— |
|
— |
|
— |
|
— |
Technical Revisions(6) |
|
(1,410) |
|
(13,846) |
|
(15,257) |
|
(1,410) |
|
(13,846) |
|
(15,257) |
|
— |
|
— |
|
— |
|
— |
|
— |
|
— |
Acquisitions(7) |
|
75,289 |
|
27,968 |
|
103,256 |
|
75,289 |
|
27,968 |
|
103,256 |
|
— |
|
— |
|
— |
|
— |
|
— |
|
— |
Dispositions |
|
— |
|
— |
|
— |
|
— |
|
— |
|
— |
|
— |
|
— |
|
— |
|
— |
|
— |
|
— |
Economic Factors(8) |
|
(1,722) |
|
(1,999) |
|
(3,721) |
|
(1,722) |
|
(1,999) |
|
(3,721) |
|
— |
|
— |
|
— |
|
— |
|
— |
|
— |
Production |
|
(37,083) |
|
— |
|
(37,083) |
|
(37,083) |
|
— |
|
(37,083) |
|
— |
|
— |
|
— |
|
— |
|
— |
|
— |
At December 31, 2023 |
|
188,467 |
|
139,521 |
|
327,988 |
|
188,467 |
|
139,521 |
|
327,988 |
|
— |
|
— |
|
— |
|
— |
|
— |
|
— |
|
|
Natural Gas Liquids |
|
BOE |
||||||||
Proved Probable P+P (1) (2) |
|
Proved |
|
Probable |
|
P+P |
|
Proved |
|
Probable |
|
P+P |
Factors |
|
(mbbl) |
|
(mbbl) |
|
(mbbl) |
|
(mbbl) |
|
(mbbl) |
|
(mbbl) |
At December 31, 2022 |
|
21 |
|
50 |
|
70 |
|
68,461 |
|
42,286 |
|
110,744 |
Discoveries |
|
— |
|
— |
|
— |
|
— |
|
— |
|
— |
Extensions & Improved Recovery(5) |
|
— |
|
— |
|
— |
|
692 |
|
(667) |
|
25 |
Technical Revisions(6) |
|
48 |
|
11 |
|
59 |
|
729 |
|
(3,681) |
|
(2,951) |
Acquisitions(7) |
|
— |
|
— |
|
— |
|
12,548 |
|
4,661 |
|
17,209 |
Dispositions |
|
— |
|
— |
|
— |
|
— |
|
— |
|
— |
Economic Factors(8) |
|
(2) |
|
(2) |
|
(4) |
|
395 |
|
(1,502) |
|
(1,107) |
Production |
|
(26) |
|
— |
|
(26) |
|
(10,122) |
|
— |
|
(10,122) |
At December 31, 2023 |
|
41 |
|
59 |
|
100 |
|
72,699 |
|
41,100 |
|
113,799 |
Notes:
| (1) | "Proved" reserves are those reserves that can be estimated with a high degree of certainty to be recoverable. It is likely that the actual remaining quantities recovered will exceed the estimated proved reserves. |
| (2) | "Probable" reserves are those additional reserves that are less certain to be recovered than proved reserves. It is equally likely that the actual remaining quantities recovered will be greater or less than the sum of the estimated proved plus probable reserves. |
| (3) | The pricing assumptions used in the McDaniel & Associates Report with respect to net present value of future net revenue (forecast) as well as the inflation rates used for operating and capital costs are set forth in “Forecast Prices used in Estimates”. McDaniel & Associates is an independent qualified reserves evaluator appointed pursuant to NI 51-101. |
| (4) | For reporting purposes, “Total Oil” is the sum of Light Crude Oil and Medium Crude Oil, Heavy Crude Oil and Tight Oil and "Total Gas" is the sum of Conventional Natural Gas, Coal Bed Methane and Shale Gas. |
| (5) | “Extensions & Improved Recovery" are additions to booked volumes resulting from a capital expenditure in previously discovered reservoirs |
• |
Canada - Extensions primarily attributed to Mica Shale Gas development. |
• |
USA - Extensions were booked mainly in the Niobrara, based on successful 2023 drilling. |
| (6) | “Technical Revisions" are positive or negative revisions to an estimate resulting from new technical data or revised interpretations on previously assigned volumes, performance, development schedule and operating costs. |
• |
Canada - Negative technical revisions to Light and Medium Crude Oil in Canada are primarily attributable to corporate reallocation of near-term capital to our Mica asset, resulting in the prioritized removal of certain undeveloped locations and associated reserves in the Alberta Cardium and Saskatchewan Mississippian, which precluded their development within the period defined by the COGE handbook. |
• |
Canada - Negative technical revisions in Conventional Gas were primarily related to updated reserve forecasts on producing entities in Alberta. |
Vermilion Energy Inc. ■ Page 34 ■ 2023 Annual Information Form
• |
Canada - Negative technical revisions in Shale Gas were primarily driven by changes to the development plan adjustments in our Mica Asset to accelerate development in the BC portion of the play. These were partially offset by positive technical revisions realized on two 2023 Mica drills from the 16-18 Pad. |
• |
USA - Performance based negative technical revisions were primarily attributed to older unitized gas assets, and additionally impacted by increased costs.Proved and Probable negative technical revisions are reflective of new type curves for the still emerging undeveloped plays in the Parkman and Turner. |
• |
Ireland - The negative technical revision is associated with the cancellation of an undeveloped location, as the latest internal technical evaluation affirms that our current well development will effectively drain the economic reservoir. |
• |
Germany - Positive technical revisions on our light & medium crude oil assets in Germany were primarily related to strong production results on recent drills. These revisions were partially offset by some negative revisions realized on select producing conventional natural gas assets based on historic performance. |
• |
Netherlands - Positive technical revisions were primarily related to new onstream wells, and positive performance revisions on producing wells |
(7) |
"Acquisitions" are positive additions to volume estimates because of purchasing interests in oil and gas properties. |
• |
Canada - Acquisition volume changes are primarily due to a tuck-in acquisition in Alberta. |
• |
Ireland - Acquisition volume is associated with the increased working interest in Corrib. |
(8) |
"Economic factors" are positive or negative revisions resulting from changes in market price outlook, inflation, or regulatory changes. |
(9) |
"Dispositions" are negative changes to volume estimates because of divesting of interests in oil and gas properties. |
• |
USA - Disposition volumes are attributable to the sale of non-core assets in East Finn. |
• |
Canada - Disposition volumes are mainly associated with the sale of select non-core assets in southeast Saskatchewan. |
Vermilion Energy Inc. ■ Page 35 ■ 2023 Annual Information Form Proved undeveloped reserves are those reserves expected to be recovered from known accumulations where a significant expenditure (for example, when compared to the cost of drilling a well) is required to render them capable of production.
Undeveloped reserves
These reserves have a 90% probability of being recovered. Vermilion's current plan is to develop these reserves in the following five years. The pace of development of these reserves is influenced by many factors, including but not limited to, the outcomes of yearly drilling and reservoir evaluations, changes in commodity pricing, changes in capital allocations, changing technical conditions, regulatory changes and impact of future acquisitions and dispositions. As new information becomes available these reserves are reviewed and development plans are revised accordingly.
With Vermilion's extensive portfolio of opportunities, which also include resource plays and longer term projects, it would be impracticable to fully develop the entire portfolio of booked opportunities within two years. The development of these reserves has been based on planned and prioritized capital activity levels. The majority of the proved reserves are planned to be on stream within a three-year time frame, which represents approximately 61% of the net undeveloped location count, as well as 69% of the net total future development capital. All development is estimated to be completed within five years.
Probable undeveloped reserves are those reserves expected to be recovered from known accumulations where a significant expenditure (for example, when compared to the cost of drilling a well) is required to render them capable of production. These reserves have a 50% probability of being recovered. Vermilion's current plan is to develop these reserves over the next seven years. In general, development of these reserves requires additional evaluation data to increase the probability of success to a level that favorably ranks the project against other projects in Vermilion's inventory. This increases the timeline for the development of these reserves. This timetable may be altered depending on outside market forces, changes in capital allocations and impact of future acquisitions and dispositions.
The Proved Plus Probable development is scheduled beyond two years with a balanced development plan to have the majority of locations on stream within five years, representing 82% of the net Probable locations, and 90% of the net future development capital spend.
Timing of initial undeveloped reserves assignment
Undeveloped Reserves Attributed in Current Year
|
|
Light Crude Oil & Medium Crude Oil |
|
Heavy Crude Oil |
|
Tight Oil |
|
Conventional Natural Gas |
||||||||
|
|
First |
|
|
|
First |
|
|
|
First |
|
|
|
First |
|
|
|
|
Attributed (1) |
|
Booked (mbbl) |
|
Attributed (1) |
|
Booked (mbbl) |
|
Attributed (1) |
|
Booked (mbbl) |
|
Attributed (1) |
|
Booked (mbbl) |
Proved |
|
|
|
|
|
|
|
|
|
|
|
|
|
|
|
|
2021 |
|
6,645 |
|
60,945 |
|
— |
|
85 |
|
— |
|
— |
|
21,123 |
|
134,249 |
2022 |
|
3,212 |
|
54,984 |
|
— |
|
84 |
|
3,623 |
|
3,623 |
|
13,303 |
|
117,067 |
2023 |
|
3,509 |
|
30,573 |
|
— |
|
83 |
|
2,042 |
|
4,995 |
|
14,844 |
|
92,475 |
Probable |
|
|
|
|
|
|
|
|
|
|
|
|
|
|
|
|
2021 |
|
1,551 |
|
56,057 |
|
— |
|
24 |
|
— |
|
— |
|
27,387 |
|
226,458 |
2022 |
|
5,564 |
|
52,006 |
|
— |
|
25 |
|
6,060 |
|
6,060 |
|
18,380 |
|
213,689 |
2023 |
|
871 |
|
24,452 |
|
— |
|
90 |
|
1,087 |
|
7,568 |
|
8,435 |
|
153,055 |
|
|
Shale Gas |
|
Coal Bed Methane |
|
Natural Gas Liquids |
|
Total Oil Equivalent |
||||||||
|
|
First |
|
Booked |
|
First |
|
Booked |
|
First |
|
Booked |
|
First |
|
Booked |
|
|
Attributed (1) |
|
(mmcf) |
|
Attributed (1) |
|
(mmcf) |
|
Attributed (1) |
|
(mmcf) |
|
Attributed (1) |
|
(mboe) |
Proved |
|
|
|
|
|
|
|
|
|
|
|
|
|
|
|
|
2021 |
|
— |
|
|
|
— |
|
376 |
|
2,118 |
|
14,502 |
|
12,284 |
|
97,970 |
2022 |
|
100,205 |
|
100,205 |
|
— |
|
428 |
|
3,652 |
|
15,437 |
|
29,405 |
|
110,411 |
2023 |
|
49,979 |
|
128,467 |
|
— |
|
391 |
|
1,847 |
|
10,796 |
|
18,203 |
|
83,336 |
Probable |
|
|
|
|
|
|
|
|
|
|
|
|
|
|
|
|
2021 |
|
|
|
— |
|
— |
|
109 |
|
2,155 |
|
16,293 |
|
8,271 |
|
110,136 |
2022 |
|
179,177 |
|
179,177 |
|
— |
|
120 |
|
6,384 |
|
19,451 |
|
50,934 |
|
143,041 |
2023 |
|
23,722 |
|
200,070 |
|
— |
|
111 |
|
1,041 |
|
11,174 |
|
8,358 |
|
102,157 |
Note:
| (1) | “First Attributed” refers to reserves first attributed at year-end of the corresponding fiscal year. |
Vermilion Energy Inc. ■ Page 36 ■ 2023 Annual Information Form The table below sets out the future development costs deducted in the estimation of future net revenue attributable to total proved reserves and total proved plus probable reserves (using forecast prices and costs).
Future development costs
The future development cost estimates disclosed below are associated with reserves as evaluated by McDaniel & Associates. The future development cost estimates will differ from the costs ultimately incurred by Vermilion due to a number of factors, including costs incurred for properties that do not have associated reserves as evaluated by McDaniel & Associates and economic factors that may alter development pace and project selection.
Vermilion expects to source its capital expenditure requirements from internally generated cash flow and, as appropriate, from Vermilion’s existing credit facility or equity or debt financing. It is anticipated that costs of funding the future development costs will not impact development of its properties or Vermilion’s reserves or future net revenue.
|
|
Total Proved |
|
Total Proved Plus Probable |
($M) |
|
Estimated Using Forecast Prices and Costs(1) |
|
Estimated Using Forecast Prices and Costs (1) |
Australia |
|
|
|
|
2024 |
|
— |
|
4,390 |
2025 |
|
— |
|
12,808 |
2026 |
|
— |
|
71,370 |
2027 |
|
— |
|
— |
2028 |
|
— |
|
— |
Remainder |
|
— |
|
— |
Australia total for all years undiscounted |
|
— |
|
88,569 |
Canada |
|
|
|
|
2024 |
|
256,964 |
|
281,965 |
2025 |
|
201,089 |
|
240,159 |
2026 |
|
223,774 |
|
301,270 |
2027 |
|
192,453 |
|
326,795 |
2028 |
|
102,573 |
|
278,938 |
Remainder |
|
80,267 |
|
197,537 |
Canada total for all years undiscounted |
|
1,057,119 |
|
1,626,664 |
CEE |
|
|
|
|
2024 |
|
714 |
|
714 |
2025 |
|
— |
|
— |
2026 |
|
— |
|
— |
2027 |
|
— |
|
— |
2028 |
|
— |
|
— |
Remainder |
|
— |
|
— |
CEE total for all years undiscounted |
|
714 |
|
714 |
France |
|
|
|
|
2024 |
|
23,131 |
|
23,131 |
2025 |
|
44,876 |
|
71,602 |
2026 |
|
17,779 |
|
40,174 |
2027 |
|
24,972 |
|
74,486 |
2028 |
|
17,652 |
|
36,318 |
Remainder |
|
— |
|
33,319 |
France total for all years undiscounted |
|
128,409 |
|
279,029 |
Germany |
|
|
|
|
2024 |
|
848 |
|
10,544 |
2025 |
|
11,123 |
|
20,400 |
2026 |
|
31,448 |
|
51,622 |
2027 |
|
3,328 |
|
5,448 |
2028 |
|
7,536 |
|
8,194 |
Remainder |
|
717 |
|
4,411 |
Germany for all years undiscounted |
|
55,000 |
|
100,619 |
Vermilion Energy Inc. ■ Page 37 ■ 2023 Annual Information Form
|
|
Total Proved |
|
Total Proved Plus Probable |
($M) |
|
Estimated Using Forecast Prices and Costs(1) |
|
Estimated Using Forecast Prices and Costs (1) |
Ireland |
|
|
|
|
2024 |
|
9,556 |
|
9,556 |
2025 |
|
21,130 |
|
21,130 |
2026 |
|
30,266 |
|
30,266 |
2027 |
|
889 |
|
889 |
2028 |
|
— |
|
— |
Remainder |
|
— |
|
— |
Ireland total for all years undiscounted |
|
61,840 |
|
61,840 |
Netherlands |
|
|
|
|
2024 |
|
15,270 |
|
15,198 |
2025 |
|
449 |
|
449 |
2026 |
|
325 |
|
36,248 |
2027 |
|
328 |
|
10,410 |
2028 |
|
87 |
|
20,980 |
Remainder |
|
82 |
|
794 |
Netherlands total for all years undiscounted |
|
16,541 |
|
84,077 |
United States |
|
|
|
|
2024 |
|
39,792 |
|
39,792 |
2025 |
|
95,641 |
|
95,641 |
2026 |
|
121,196 |
|
158,447 |
2027 |
|
67,908 |
|
140,024 |
2028 |
|
6,878 |
|
46,877 |
Remainder |
|
— |
|
10,218 |
United States total for all years undiscounted |
|
331,414 |
|
490,999 |
Total Company |
|
|
|
|
2024 |
|
346,274 |
|
385,289 |
2025 |
|
374,308 |
|
462,190 |
2026 |
|
424,786 |
|
689,397 |
2027 |
|
289,878 |
|
558,051 |
2028 |
|
134,726 |
|
391,307 |
Remainder |
|
81,066 |
|
246,278 |
Total for all years undiscounted |
|
1,651,038 |
|
2,732,511 |
North America |
|
|
|
|
2024 |
|
296,755 |
|
321,757 |
2025 |
|
296,730 |
|
335,800 |
2026 |
|
344,969 |
|
459,717 |
2027 |
|
260,361 |
|
466,819 |
2028 |
|
109,451 |
|
325,815 |
Remainder |
|
80,267 |
|
207,755 |
North America total for all years undiscounted |
|
1,388,533 |
|
2,117,663 |
International |
|
|
|
|
2024 |
|
49,519 |
|
63,532 |
2025 |
|
77,578 |
|
126,390 |
2026 |
|
79,817 |
|
229,679 |
2027 |
|
29,517 |
|
91,232 |
2028 |
|
25,275 |
|
65,492 |
Remainder |
|
799 |
|
38,524 |
International total for all years undiscounted |
|
262,505 |
|
614,849 |
Note:
| (1) | The pricing assumptions used in the McDaniel & Associates Report with respect to net present value of future net revenue (forecast) as well as the inflation rates used for operating and capital costs are detailed in “Forecast Prices used in Estimates”. |
Vermilion Energy Inc. ■ Page 38 ■ 2023 Annual Information Form The following table sets forth the number of wells (based on wellbores) in which Vermilion held a working interest as at December 31, 2023:
Crude oil and natural gas properties and wells
|
|
Crude Oil |
|
Natural Gas |
||||||||||||
|
|
Producing |
|
Non-Producing (4) |
|
Producing |
|
Non-Producing (4) |
||||||||
|
|
Gross Wells (2) |
|
Net Wells (3) |
|
Gross Wells (2) |
|
Net Wells (3) |
|
Gross Wells (2) |
|
Net Wells (3) |
|
Gross Wells (2) |
|
Net Wells (3) |
Canada |
|
|
|
|
|
|
|
|
|
|
|
|
|
|
|
|
Alberta |
|
413 |
|
284 |
|
147 |
|
97 |
|
634 |
|
479 |
|
378 |
|
270 |
Saskatchewan |
|
1,614 |
|
898 |
|
1,105 |
|
652 |
|
— |
|
— |
|
12 |
|
6 |
British Columbia |
|
16 |
|
15 |
|
— |
|
— |
|
3 |
|
3 |
|
4 |
|
3 |
Total Canada |
|
2,043 |
|
1,197 |
|
1,252 |
|
749 |
|
637 |
|
482 |
|
394 |
|
279 |
Australia (1) |
|
17 |
|
17 |
|
5 |
|
5 |
|
1 |
|
1 |
|
1 |
|
1 |
Croatia |
|
— |
|
— |
|
— |
|
— |
|
— |
|
— |
|
2 |
|
2 |
France |
|
305 |
|
299 |
|
125 |
|
124 |
|
— |
|
— |
|
3 |
|
3 |
Germany |
|
75 |
|
61 |
|
112 |
|
94 |
|
23 |
|
13 |
|
7 |
|
4 |
Ireland (1) |
|
— |
|
— |
|
— |
|
— |
|
6 |
|
3 |
|
— |
|
— |
Netherlands |
|
— |
|
— |
|
— |
|
— |
|
80 |
|
33 |
|
136 |
|
78 |
Hungary |
|
— |
|
— |
|
— |
|
— |
|
1 |
|
1 |
|
— |
|
— |
United States |
|
159 |
|
131 |
|
93 |
|
89 |
|
— |
|
— |
|
— |
|
— |
Total Vermilion |
|
2,599 |
|
1,705 |
|
1,587 |
|
1,061 |
|
748 |
|
533 |
|
543 |
|
367 |
North America |
|
2,202 |
|
1,328 |
|
1,345 |
|
838 |
|
637 |
|
482 |
|
394 |
|
279 |
International |
|
397 |
|
377 |
|
242 |
|
223 |
|
111 |
|
51 |
|
149 |
|
88 |
Notes:
| (1) | Wells for Australia and Ireland are located offshore. |
| (2) | "Gross" refers to the total wells in which Vermilion has an interest, directly or indirectly. |
| (3) | "Net" refers to the total wells in which Vermilion has an interest, directly or indirectly, multiplied by the percentage working interest owned by Vermilion, directly or indirectly, therein. |
| (4) | Non-producing wells include wells which are capable of producing, but which are currently not producing, and are re-evaluated with respect to future commodity prices, proximity to facility infrastructure, design of future exploration and development programs, and access to capital. |
Vermilion Energy Inc. ■ Page 39 ■ 2023 Annual Information Form The following table summarizes the capital expenditures made by Vermilion on oil and gas properties for the year ended December 31, 2023:
Costs incurred
|
|
Acquisition Costs for Proved |
|
Acquisition Costs for Unproved |
|
Exploration |
|
Development |
|
Total |
($M) |
|
Properties |
|
Properties |
|
Costs |
|
Costs |
|
Costs |
Australia |
|
— |
|
— |
|
— |
|
26,005 |
|
26,005 |
Canada |
|
49,582 |
|
— |
|
— |
|
288,223 |
|
337,805 |
Croatia |
|
— |
|
— |
|
9,646 |
|
145 |
|
9,791 |
France |
|
— |
|
— |
|
— |
|
48,297 |
|
48,297 |
Germany |
|
— |
|
— |
|
11,248 |
|
48,463 |
|
59,711 |
Hungary |
|
— |
|
— |
|
187 |
|
1,570 |
|
1,757 |
Ireland |
|
488,893 |
|
— |
|
— |
|
20,283 |
|
509,176 |
Netherlands |
|
— |
|
— |
|
— |
|
44,147 |
|
44,147 |
United States |
|
3,808 |
|
— |
|
— |
|
91,977 |
|
95,785 |
Total |
|
542,283 |
|
— |
|
21,081 |
|
569,110 |
|
1,132,474 |
North America |
|
53,390 |
|
— |
|
— |
|
380,200 |
|
433,590 |
International |
|
488,893 |
|
— |
|
21,081 |
|
188,910 |
|
698,884 |
Acreage
The following table summarizes the acreage for the year ended December 31, 2023:
|
|
Developed (1) |
|
Undeveloped |
|
Total |
||||||
|
|
Gross (2) |
|
Net (3) |
|
Gross (2) |
|
Net (3) |
|
Gross (2)(4) |
|
Net (3)(4) |
Australia |
|
20,164 |
|
20,164 |
|
39,389 |
|
39,389 |
|
59,552 |
|
59,552 |
Canada |
|
721,732 |
|
569,117 |
|
330,154 |
|
265,279 |
|
1,051,886 |
|
834,396 |
Croatia |
|
6,487 |
|
6,487 |
|
508,482 |
|
508,482 |
|
514,969 |
|
514,969 |
France |
|
257,394 |
|
248,142 |
|
63,010 |
|
63,010 |
|
320,404 |
|
311,152 |
Germany |
|
108,675 |
|
55,951 |
|
1,512,617 |
|
693,226 |
|
1,621,292 |
|
749,177 |
Hungary |
|
1,225 |
|
1,225 |
|
299,346 |
|
299,346 |
|
300,571 |
|
300,571 |
Ireland |
|
7,326 |
|
4,151 |
|
— |
|
— |
|
7,326 |
|
4,151 |
Netherlands |
|
159,481 |
|
63,765 |
|
1,444,725 |
|
780,643 |
|
1,604,206 |
|
844,409 |
Slovakia |
|
— |
|
— |
|
97,960 |
|
48,980 |
|
97,960 |
|
48,980 |
United States |
|
76,775 |
|
57,073 |
|
34,910 |
|
26,869 |
|
111,685 |
|
83,942 |
Total |
|
1,359,259 |
|
1,026,075 |
|
4,330,593 |
|
2,725,224 |
|
5,689,851 |
|
3,751,299 |
North America |
|
798,507 |
|
626,190 |
|
365,064 |
|
292,148 |
|
1,163,571 |
|
918,338 |
International |
|
560,752 |
|
399,885 |
|
3,965,529 |
|
2,433,076 |
|
4,526,280 |
|
2,832,961 |
Notes:
| (1) | “Developed” means the acreage assigned to productive wells based on applicable regulations. |
| (2) | “Gross” means the total acreage in which Vermilion has a working interest, directly or indirectly. |
| (3) | “Net” means the total acreage in which Vermilion has a working interest, directly or indirectly, multiplied by the percentage working interest of Vermilion. |
| (4) | When determining gross and net acreage for two or more leases covering the same lands but different rights, the acreage is reported for each lease. Where there are multiple discontinuous rights in a single lease, the acreage is reported only once. |
Vermilion Energy Inc. ■ Page 40 ■ 2023 Annual Information Form The following table sets forth the number of development and exploration wells which Vermilion completed during its 2023 financial year:
Exploration and development activities
|
|
Exploration Wells |
|
Development Wells |
||||
|
|
Gross (1) |
|
Net (2) |
|
Gross (1) |
|
Net (2) |
Australia |
|
|
|
|
|
|
|
|
Oil |
|
— |
|
— |
|
— |
|
— |
Gas |
|
— |
|
— |
|
— |
|
— |
Dry Holes |
|
— |
|
— |
|
— |
|
— |
Total Australia |
|
— |
|
— |
|
— |
|
— |
Canada |
|
|
|
|
|
|
|
|
Oil |
|
— |
|
— |
|
26.0 |
|
18.9 |
Gas |
|
— |
|
— |
|
19.0 |
|
15.9 |
Service |
|
— |
|
— |
|
— |
|
— |
Dry Holes |
|
— |
|
— |
|
— |
|
— |
Total Canada |
|
— |
|
— |
|
45.0 |
|
34.8 |
Croatia |
|
|
|
|
|
|
|
|
Oil |
|
— |
|
— |
|
— |
|
— |
Gas |
|
— |
|
— |
|
— |
|
— |
Dry holes |
|
— |
|
— |
|
— |
|
— |
Total Croatia |
|
— |
|
— |
|
— |
|
— |
France |
|
|
|
|
|
|
|
|
Oil |
|
— |
|
— |
|
— |
|
— |
Gas |
|
— |
|
— |
|
— |
|
— |
Dry Holes |
|
— |
|
— |
|
— |
|
— |
Total France |
|
— |
|
— |
|
— |
|
— |
Germany |
|
|
|
|
|
|
|
|
Oil |
|
— |
|
— |
|
3.0 |
|
3.0 |
Gas |
|
— |
|
— |
|
— |
|
— |
Service |
|
— |
|
— |
|
— |
|
— |
Dry Holes |
|
— |
|
— |
|
— |
|
— |
Total Germany |
|
— |
|
— |
|
3.0 |
|
3.0 |
Hungary |
|
|
|
|
|
|
|
|
Oil |
|
— |
|
— |
|
— |
|
— |
Gas |
|
— |
|
— |
|
— |
|
— |
Dry Holes |
|
— |
|
— |
|
— |
|
— |
Total Hungary |
|
— |
|
— |
|
— |
|
— |
Ireland |
|
|
|
|
|
|
|
|
Oil |
|
— |
|
— |
|
— |
|
— |
Gas |
|
— |
|
— |
|
— |
|
— |
Dry Holes |
|
— |
|
— |
|
— |
|
— |
Total Ireland |
|
— |
|
— |
|
— |
|
— |
Netherlands |
|
|
|
|
|
|
|
|
Oil |
|
— |
|
— |
|
— |
|
— |
Gas |
|
2.0 |
|
1.0 |
|
— |
|
— |
Dry Holes |
|
1.0 |
|
0.5 |
|
— |
|
— |
Total Netherlands |
|
3.0 |
|
1.5 |
|
— |
|
— |
United States |
|
|
|
|
|
|
|
|
Oil |
|
— |
|
— |
|
18.0 |
|
8.1 |
Gas |
|
— |
|
— |
|
— |
|
— |
Dry Holes |
|
— |
|
— |
|
— |
|
— |
Total United States |
|
— |
|
— |
|
18.0 |
|
8.1 |
Vermilion Energy Inc. ■ Page 41 ■ 2023 Annual Information Form
|
|
Exploration Wells |
|
Development Wells |
||||
|
|
Gross (1) |
|
Net (2) |
|
Gross (1) |
|
Net (2) |
Total Company |
|
|
|
|
|
|
|
|
Oil |
|
— |
|
— |
|
47.0 |
|
30.0 |
Gas |
|
2.0 |
|
1.0 |
|
19.0 |
|
15.9 |
Service |
|
— |
|
— |
|
— |
|
— |
Dry Holes |
|
1.0 |
|
0.5 |
|
— |
|
— |
Total Company |
|
3.0 |
|
1.5 |
|
66.0 |
|
45.9 |
North America |
|
|
|
|
|
|
|
|
Oil |
|
— |
|
— |
|
44.0 |
|
27.0 |
Gas |
|
— |
|
— |
|
19.0 |
|
15.9 |
Service |
|
— |
|
— |
|
— |
|
— |
Dry Holes |
|
— |
|
— |
|
— |
|
— |
Total North America |
|
— |
|
— |
|
63.0 |
|
42.9 |
International |
|
|
|
|
|
|
|
|
Oil |
|
— |
|
— |
|
3.0 |
|
3.0 |
Gas |
|
2.0 |
|
1.0 |
|
— |
|
— |
Service |
|
— |
|
— |
|
— |
|
— |
Dry Holes |
|
1.0 |
|
0.5 |
|
— |
|
— |
Total International |
|
3.0 |
|
1.5 |
|
3.0 |
|
3.0 |
Notes:
| (1) | "Gross" refers to the total wells in which Vermilion has an interest, directly or indirectly. |
| (2) | "Net" refers to the total wells in which Vermilion has an interest, directly or indirectly, multiplied by the percentage working interest owned by Vermilion, directly or indirectly therein. |
Vermilion Energy Inc. ■ Page 42 ■ 2023 Annual Information Form The following table sets out Vermilion's properties with no attributed reserves as at December 31, 2023:
Properties with no attributed reserves
Country |
|
Gross Acres (1) |
|
Net Acres (2) |
Australia |
|
39,389 |
|
39,389 |
Canada |
|
384,237 |
|
325,777 |
Croatia |
|
968,888 |
|
968,888 |
France |
|
106,993 |
|
106,993 |
Germany |
|
1,549,929 |
|
706,817 |
Hungary |
|
613,405 |
|
613,405 |
Ireland |
|
— |
|
— |
Netherlands |
|
1,445,624 |
|
781,097 |
Slovakia |
|
97,907 |
|
48,954 |
United States |
|
65,284 |
|
52,955 |
Total |
|
5,271,655 |
|
3,644,273 |
North America |
|
449,521 |
|
378,732 |
International |
|
4,822,135 |
|
3,265,543 |
Notes:
| (1) | "Gross" refers to the total acres in which Vermilion has an interest, directly or indirectly. |
| (2) | "Net" refers to the total acres in which Vermilion has an interest, directly or indirectly, multiplied by the percentage working interest owned by Vermilion, directly or indirectly therein. |
Vermilion expects its rights to explore, develop, and exploit approximately 49,717 (41,024 net) acres in Canada, 502,107 (502,107 net) acres in Croatia, 0 (0 net) acres in Hungary, 43,984 (43,984 net) acres in France, and 405 (405 net) acres in the United States to expire within one year, unless the Company initiates the capital activity necessary to retain the rights. Work commitments on these lands are categorized as seismic acquisition, geophysical studies, or well commitments. No such rights are expected to expire within one year for Australia, Germany, Ireland, the Netherlands, and Slovakia. Vermilion currently has no material work commitments in Australia, Canada, Ireland, the Netherlands and the United States. Vermilion's work commitments with respect to its European lands held are estimated to be $46.4 million in the next year.
Vermilion’s properties with no attributed reserves do not have any significant abandonment and reclamation costs. All properties with no attributed reserves do not have high expected development or operating costs or contractual sales obligations to produce and sell at substantially lower prices than could be realized.
Vermilion Energy Inc. ■ Page 43 ■ 2023 Annual Information Form The following table sets forth the volume of production estimated for the year ended December 31, 2024 as reflected in the estimates of gross proved reserves and gross proved plus probable reserves in the McDaniel & Associates Report:
Production estimates
|
|
Light Crude Oil & |
|
|
|
|
|
Conventional |
|
Shale |
|
Coal Bed |
|
Natural Gas |
|
|
|
|
Medium Crude Oil |
|
Heavy Crude Oil |
|
Tight Oil |
|
Natural Gas |
|
Natural Gas |
|
Methane |
|
Liquids |
|
BOE |
|
|
(bbl/d) |
|
(bbl/d) |
|
(bbl/d) |
|
(mcf/d) |
|
(mcf/d) |
|
(mcf/d) |
|
(bbl/d) |
|
(boe/d) |
Australia |
|
|
|
|
|
|
|
|
|
|
|
|
|
|
|
|
Proved |
|
3,782 |
|
— |
|
— |
|
— |
|
— |
|
— |
|
— |
|
3,782 |
Probable |
|
86 |
|
— |
|
— |
|
— |
|
— |
|
— |
|
— |
|
86 |
Proved Plus Probable |
|
3,867 |
|
— |
|
— |
|
— |
|
— |
|
— |
|
— |
|
3,867 |
Canada |
|
|
|
|
|
|
|
|
|
|
|
|
|
|
|
|
Proved |
|
9,762 |
|
15 |
|
2,366 |
|
105,843 |
|
51,739 |
|
2,069 |
|
10,076 |
|
48,827 |
Probable |
|
748 |
|
1 |
|
348 |
|
11,699 |
|
5,189 |
|
56 |
|
1,194 |
|
5,114 |
Proved Plus Probable |
|
10,510 |
|
15 |
|
2,714 |
|
117,543 |
|
56,927 |
|
2,125 |
|
11,269 |
|
53,941 |
CEE |
|
|
|
|
|
|
|
|
|
|
|
|
|
|
|
|
Proved |
|
— |
|
— |
|
— |
|
7,672 |
|
— |
|
— |
|
— |
|
1,279 |
Probable |
|
— |
|
— |
|
— |
|
2,896 |
|
— |
|
— |
|
— |
|
483 |
Proved Plus Probable |
|
— |
|
— |
|
— |
|
10,568 |
|
— |
|
— |
|
— |
|
1,761 |
France |
|
|
|
|
|
|
|
|
|
|
|
|
|
|
|
|
Proved |
|
7,406 |
|
— |
|
— |
|
— |
|
— |
|
— |
|
— |
|
7,406 |
Probable |
|
194 |
|
— |
|
— |
|
— |
|
— |
|
— |
|
— |
|
194 |
Proved Plus Probable |
|
7,599 |
|
— |
|
— |
|
— |
|
— |
|
— |
|
— |
|
7,599 |
Germany |
|
|
|
|
|
|
|
|
|
|
|
|
|
|
|
|
Proved |
|
1,815 |
|
— |
|
— |
|
21,280 |
|
— |
|
— |
|
— |
|
5,362 |
Probable |
|
126 |
|
— |
|
— |
|
2,095 |
|
— |
|
— |
|
— |
|
475 |
Proved Plus Probable |
|
1,941 |
|
— |
|
— |
|
23,375 |
|
— |
|
— |
|
— |
|
5,837 |
Ireland |
|
|
|
|
|
|
|
|
|
|
|
|
|
|
|
|
Proved |
|
— |
|
— |
|
— |
|
54,524 |
|
— |
|
— |
|
6 |
|
9,093 |
Probable |
|
— |
|
— |
|
— |
|
2,394 |
|
— |
|
— |
|
— |
|
399 |
Proved Plus Probable |
|
— |
|
— |
|
— |
|
56,917 |
|
— |
|
— |
|
6 |
|
9,492 |
Netherlands |
|
|
|
|
|
|
|
|
|
|
|
|
|
|
|
|
Proved |
|
— |
|
— |
|
— |
|
23,078 |
|
— |
|
— |
|
36 |
|
3,882 |
Probable |
|
— |
|
— |
|
— |
|
1,890 |
|
— |
|
— |
|
3 |
|
318 |
Proved Plus Probable |
|
— |
|
— |
|
— |
|
24,969 |
|
— |
|
— |
|
39 |
|
4,200 |
United States |
|
|
|
|
|
|
|
|
|
|
|
|
|
|
|
|
Proved |
|
3,287 |
|
— |
|
— |
|
7,007 |
|
— |
|
— |
|
1,051 |
|
5,506 |
Probable |
|
467 |
|
— |
|
— |
|
586 |
|
— |
|
— |
|
88 |
|
653 |
Proved Plus Probable |
|
3,754 |
|
— |
|
— |
|
7,593 |
|
— |
|
— |
|
1,139 |
|
6,159 |
Corporate |
|
|
|
|
|
|
|
|
|
|
|
|
|
|
|
|
Proved |
|
26,052 |
|
15 |
|
2,366 |
|
219,404 |
|
51,739 |
|
2,069 |
|
11,168 |
|
85,136 |
Probable |
|
1,621 |
|
1 |
|
348 |
|
21,560 |
|
5,189 |
|
56 |
|
1,284 |
|
7,721 |
Proved Plus Probable |
|
27,672 |
|
15 |
|
2,714 |
|
240,964 |
|
56,927 |
|
2,125 |
|
12,453 |
|
92,857 |
North America |
|
|
|
|
|
|
|
|
|
|
|
|
|
|
|
|
Proved |
|
13,049 |
|
15 |
|
2,366 |
|
112,850 |
|
51,739 |
|
2,069 |
|
11,127 |
|
54,333 |
Probable |
|
1,216 |
|
1 |
|
348 |
|
12,285 |
|
5,189 |
|
56 |
|
1,282 |
|
5,767 |
Proved Plus Probable |
|
14,265 |
|
15 |
|
2,714 |
|
125,136 |
|
56,927 |
|
2,125 |
|
12,408 |
|
60,100 |
International |
|
|
|
|
|
|
|
|
|
|
|
|
|
|
|
|
Proved |
|
13,003 |
|
— |
|
— |
|
106,554 |
|
— |
|
— |
|
42 |
|
30,803 |
Probable |
|
405 |
|
— |
|
— |
|
9,274 |
|
— |
|
— |
|
3 |
|
1,954 |
Proved Plus Probable |
|
13,408 |
|
— |
|
— |
|
115,828 |
|
— |
|
— |
|
44 |
|
32,757 |
Vermilion Energy Inc. ■ Page 44 ■ 2023 Annual Information Form The following table sets forth certain information in respect of production, product prices received, royalties paid, production costs, and netbacks received by Vermilion for each quarter of its most recently completed financial year:
Production history
|
|
Three Months Ended March 31, 2023 |
|
Three Months Ended June 31, 2023 |
|
Three Months Ended September 31, 2023 |
|
Three Months Ended December 31, 2023 |
Australia |
|
|
|
|
|
|
|
|
Average Daily Production |
|
|
|
|
|
|
|
|
Light Crude Oil and Medium Crude Oil (bbl/d) |
|
— |
|
— |
|
1,204 |
|
4,715 |
Conventional Natural Gas (mmcf/d) |
|
— |
|
— |
|
— |
|
— |
Natural Gas Liquids (bbl/d) |
|
— |
|
— |
|
— |
|
— |
Average Net Prices Received |
|
|
|
|
|
|
|
|
Light Crude Oil and Medium Crude Oil ($/bbl) |
|
— |
|
— |
|
— |
|
143.69 |
Conventional Natural Gas ($/mcf) |
|
— |
|
— |
|
— |
|
— |
Natural Gas Liquids ($/bbl) |
|
— |
|
— |
|
— |
|
— |
Royalties |
|
|
|
|
|
|
|
|
Light Crude Oil and Medium Crude Oil ($/bbl) |
|
— |
|
— |
|
— |
|
— |
Conventional Natural Gas ($/mcf) |
|
— |
|
— |
|
— |
|
— |
Natural Gas Liquids ($/bbl) |
|
— |
|
— |
|
— |
|
— |
Production Costs |
|
|
|
|
|
|
|
|
Light Crude Oil and Medium Crude Oil ($/bbl) |
|
— |
|
— |
|
— |
|
(40.22) |
Conventional Natural Gas ($/mcf) |
|
— |
|
— |
|
— |
|
— |
Natural Gas Liquids ($/bbl) |
|
— |
|
— |
|
— |
|
— |
Netback Received |
|
|
|
|
|
|
|
|
Light Crude Oil and Medium Crude Oil ($/bbl) |
|
— |
|
— |
|
— |
|
183.91 |
Conventional Natural Gas ($/mcf) |
|
— |
|
— |
|
— |
|
— |
Natural Gas Liquids ($/bbl) |
|
— |
|
— |
|
— |
|
— |
Canada |
|
|
|
|
|
|
|
|
Average Daily Production |
|
|
|
|
|
|
|
|
Light Crude Oil and Medium Crude Oil (bbl/d) |
|
16,674 |
|
12,901 |
|
12,054 |
|
11,614 |
Conventional Natural Gas (mmcf/d) |
|
160.34 |
|
159.26 |
|
163.96 |
|
160.16 |
Natural Gas Liquids (bbl/d) |
|
11,594 |
|
9,019 |
|
10,629 |
|
10,315 |
Average Net Prices Received |
|
|
|
|
|
|
|
|
Light Crude Oil and Medium Crude Oil ($/bbl) |
|
94.93 |
|
93.66 |
|
105.86 |
|
97.79 |
Conventional Natural Gas ($/mcf) |
|
4.14 |
|
2.32 |
|
2.55 |
|
2.65 |
Natural Gas Liquids ($/bbl) |
|
34.97 |
|
53.95 |
|
54.78 |
|
59.68 |
Royalties |
|
|
|
|
|
|
|
|
Light Crude Oil and Medium Crude Oil ($/bbl) |
|
8.74 |
|
17.26 |
|
16.21 |
|
13.47 |
Conventional Natural Gas ($/mcf) |
|
0.36 |
|
(0.39) |
|
— |
|
(0.02) |
Natural Gas Liquids ($/bbl) |
|
17.63 |
|
4.11 |
|
9.03 |
|
12.33 |
Transportation |
|
|
|
|
|
|
|
|
Light Crude Oil and Medium Crude Oil ($/bbl) |
|
2.76 |
|
2.58 |
|
4.25 |
|
4.70 |
Conventional Natural Gas ($/mcf) |
|
0.34 |
|
0.15 |
|
0.14 |
|
0.21 |
Natural Gas Liquids ($/bbl) |
|
4.64 |
|
3.01 |
|
3.91 |
|
3.80 |
Production Costs |
|
|
|
|
|
|
|
|
Light Crude Oil and Medium Crude Oil ($/bbl) |
|
18.45 |
|
23.21 |
|
29.92 |
|
25.01 |
Conventional Natural Gas ($/mcf) |
|
1.69 |
|
1.29 |
|
0.72 |
|
0.68 |
Natural Gas Liquids ($/bbl) |
|
15.76 |
|
9.11 |
|
15.48 |
|
15.19 |
Netback Received |
|
|
|
|
|
|
|
|
Light Crude Oil and Medium Crude Oil ($/bbl) |
|
64.98 |
|
50.61 |
|
55.48 |
|
54.61 |
Conventional Natural Gas ($/mcf) |
|
1.75 |
|
1.27 |
|
1.69 |
|
1.78 |
Natural Gas Liquids ($/bbl) |
|
(3.06) |
|
37.72 |
|
26.36 |
|
28.36 |
Vermilion Energy Inc. ■ Page 45 ■ 2023 Annual Information Form
|
|
Three Months Ended |
|
Three Months Ended |
|
Three Months Ended |
|
Three Months Ended |
|
|
March 31, 2023 |
|
June 31, 2023 |
|
September 31, 2023 |
|
December 31, 2023 |
France |
|
|
|
|
|
|
|
|
Average Daily Production |
|
|
|
|
|
|
|
|
Light Crude Oil and Medium Crude Oil (bbl/d) |
|
7,578 |
|
7,788 |
|
7,578 |
|
7,395 |
Conventional Natural Gas (mmcf/d) |
|
— |
|
— |
|
— |
|
— |
Natural Gas Liquids (bbl/d) |
|
— |
|
— |
|
— |
|
— |
Average Net Prices Received |
|
|
|
|
|
|
|
|
Light Crude Oil and Medium Crude Oil ($/bbl) |
|
108.15 |
|
100.51 |
|
115.36 |
|
116.92 |
Conventional Natural Gas ($/mcf) |
|
— |
|
— |
|
— |
|
— |
Natural Gas Liquids ($/bbl) |
|
— |
|
— |
|
— |
|
— |
Royalties |
|
|
|
|
|
|
|
|
Light Crude Oil and Medium Crude Oil ($/bbl) |
|
11.90 |
|
13.66 |
|
16.02 |
|
15.93 |
Conventional Natural Gas ($/mcf) |
|
— |
|
— |
|
— |
|
— |
Natural Gas Liquids ($/bbl) |
|
— |
|
— |
|
— |
|
— |
Transportation |
|
|
|
|
|
|
|
|
Light Crude Oil and Medium Crude Oil ($/bbl) |
|
10.40 |
|
10.36 |
|
5.64 |
|
12.80 |
Conventional Natural Gas ($/mcf) |
|
— |
|
— |
|
— |
|
— |
Natural Gas Liquids ($/bbl) |
|
— |
|
— |
|
— |
|
— |
Production Costs |
|
|
|
|
|
|
|
|
Light Crude Oil and Medium Crude Oil ($/bbl) |
|
27.76 |
|
31.21 |
|
28.28 |
|
37.93 |
Conventional Natural Gas ($/mcf) |
|
— |
|
— |
|
— |
|
— |
Natural Gas Liquids ($/bbl) |
|
— |
|
— |
|
— |
|
— |
Netback Received |
|
|
|
|
|
|
|
|
Light Crude Oil and Medium Crude Oil ($/bbl) |
|
58.09 |
|
45.28 |
|
65.42 |
|
50.26 |
Conventional Natural Gas ($/mcf) |
|
— |
|
— |
|
— |
|
— |
Natural Gas Liquids ($/bbl) |
|
— |
|
— |
|
— |
|
— |
Germany |
|
|
|
|
|
|
|
|
Average Daily Production |
|
|
|
|
|
|
|
|
Light Crude Oil and Medium Crude Oil (bbl/d) |
|
1,410 |
|
1,715 |
|
1,713 |
|
1,775 |
Conventional Natural Gas (mmcf/d) |
|
25.85 |
|
22.05 |
|
20.30 |
|
19.62 |
Natural Gas Liquids (bbl/d) |
|
— |
|
— |
|
— |
|
— |
Average Net Prices Received |
|
|
|
|
|
|
|
|
Light Crude Oil and Medium Crude Oil ($/bbl) |
|
106.06 |
|
99.54 |
|
108.64 |
|
110.62 |
Conventional Natural Gas ($/mcf) |
|
24.99 |
|
14.17 |
|
11.96 |
|
16.16 |
Natural Gas Liquids ($/bbl) |
|
— |
|
— |
|
— |
|
— |
Royalties |
|
|
|
|
|
|
|
|
Light Crude Oil and Medium Crude Oil ($/bbl) |
|
1.45 |
|
3.50 |
|
7.07 |
|
(3.33) |
Conventional Natural Gas ($/mcf) |
|
1.17 |
|
1.00 |
|
(0.61) |
|
0.66 |
Natural Gas Liquids ($/bbl) |
|
— |
|
— |
|
— |
|
— |
Transportation |
|
|
|
|
|
|
|
|
Light Crude Oil and Medium Crude Oil ($/bbl) |
|
11.51 |
|
17.85 |
|
13.41 |
|
14.56 |
Conventional Natural Gas ($/mcf) |
|
0.57 |
|
0.46 |
|
0.96 |
|
0.84 |
Natural Gas Liquids ($/bbl) |
|
— |
|
— |
|
— |
|
— |
Production Costs |
|
|
|
|
|
|
|
|
Light Crude Oil and Medium Crude Oil ($/bbl) |
|
22.75 |
|
21.18 |
|
40.20 |
|
20.63 |
Conventional Natural Gas ($/mcf) |
|
3.35 |
|
3.99 |
|
4.47 |
|
3.01 |
Natural Gas Liquids ($/bbl) |
|
— |
|
— |
|
— |
|
— |
Netback Received |
|
|
|
|
|
|
|
|
Light Crude Oil and Medium Crude Oil ($/bbl) |
|
70.35 |
|
57.01 |
|
47.96 |
|
78.76 |
Conventional Natural Gas ($/mcf) |
|
19.90 |
|
8.72 |
|
7.14 |
|
11.65 |
Natural Gas Liquids ($/bbl) |
|
— |
|
— |
|
— |
|
— |
Vermilion Energy Inc. ■ Page 46 ■ 2023 Annual Information Form
|
|
Three Months Ended March 31, 2023 |
|
Three Months Ended June 31, 2023 |
|
Three Months Ended September 31, 2023 |
|
Three Months Ended December 31, 2023 |
Hungary |
|
|
|
|
|
|
|
|
Average Daily Production |
|
|
|
|
|
|
|
|
Light Crude Oil and Medium Crude Oil (bbl/d) |
|
— |
|
— |
|
— |
|
— |
Conventional Natural Gas (mmcf/d) |
|
0.64 |
|
0.30 |
|
0.05 |
|
0.54 |
Natural Gas Liquids (bbl/d) |
|
— |
|
— |
|
— |
|
— |
Average Net Prices Received |
|
|
|
|
|
|
|
|
Light Crude Oil and Medium Crude Oil ($/bbl) |
|
— |
|
— |
|
— |
|
— |
Conventional Natural Gas ($/mcf) |
|
31.96 |
|
16.74 |
|
12.98 |
|
18.21 |
Natural Gas Liquids ($/bbl) |
|
— |
|
— |
|
— |
|
— |
Royalties |
|
|
|
|
|
|
|
|
Light Crude Oil and Medium Crude Oil ($/bbl) |
|
— |
|
— |
|
— |
|
— |
Conventional Natural Gas ($/mcf) |
|
17.75 |
|
6.80 |
|
28.37 |
|
7.72 |
Natural Gas Liquids ($/bbl) |
|
— |
|
— |
|
— |
|
— |
Production Costs |
|
|
|
|
|
|
|
|
Light Crude Oil and Medium Crude Oil ($/bbl) |
|
— |
|
— |
|
— |
|
— |
Conventional Natural Gas ($/mcf) |
|
9.29 |
|
10.61 |
|
46.52 |
|
11.00 |
Natural Gas Liquids ($/bbl) |
|
— |
|
— |
|
— |
|
— |
Netback Received |
|
|
|
|
|
|
|
|
Light Crude Oil and Medium Crude Oil ($/bbl) |
|
— |
|
— |
|
— |
|
— |
Conventional Natural Gas ($/mcf) |
|
4.92 |
|
(0.67) |
|
(61.91) |
|
(0.51) |
Natural Gas Liquids ($/bbl) |
|
— |
|
— |
|
— |
|
— |
Ireland |
|
|
|
|
|
|
|
|
Average Daily Production |
|
|
|
|
|
|
|
|
Light Crude Oil and Medium Crude Oil (bbl/d) |
|
— |
|
— |
|
— |
|
— |
Conventional Natural Gas (mmcf/d) |
|
24.58 |
|
67.51 |
|
47.96 |
|
64.04 |
Natural Gas Liquids (bbl/d) |
|
— |
|
— |
|
— |
|
— |
Average Net Prices Received |
|
|
|
|
|
|
|
|
Light Crude Oil and Medium Crude Oil ($/bbl) |
|
— |
|
— |
|
— |
|
— |
Conventional Natural Gas ($/mcf) |
|
22.37 |
|
14.43 |
|
14.46 |
|
17.05 |
Natural Gas Liquids ($/bbl) |
|
— |
|
— |
|
— |
|
— |
Royalties |
|
|
|
|
|
|
|
|
Light Crude Oil and Medium Crude Oil ($/bbl) |
|
— |
|
— |
|
— |
|
— |
Conventional Natural Gas ($/mcf) |
|
— |
|
— |
|
— |
|
— |
Natural Gas Liquids ($/bbl) |
|
— |
|
— |
|
— |
|
— |
Transportation |
|
|
|
|
|
|
|
|
Light Crude Oil and Medium Crude Oil ($/bbl) |
|
— |
|
— |
|
— |
|
— |
Conventional Natural Gas ($/mcf) |
|
0.41 |
|
0.42 |
|
0.58 |
|
0.18 |
Natural Gas Liquids ($/bbl) |
|
— |
|
— |
|
— |
|
— |
Production Costs |
|
|
|
|
|
|
|
|
Light Crude Oil and Medium Crude Oil ($/bbl) |
|
— |
|
— |
|
— |
|
— |
Conventional Natural Gas ($/mcf) |
|
2.09 |
|
1.71 |
|
2.35 |
|
2.37 |
Natural Gas Liquids ($/bbl) |
|
— |
|
— |
|
— |
|
— |
Netback Received |
|
|
|
|
|
|
|
|
Light Crude Oil and Medium Crude Oil ($/bbl) |
|
— |
|
— |
|
— |
|
— |
Conventional Natural Gas ($/mcf) |
|
19.87 |
|
12.30 |
|
11.53 |
|
14.50 |
Natural Gas Liquids ($/bbl) |
|
— |
|
— |
|
— |
|
— |
Vermilion Energy Inc. ■ Page 47 ■ 2023 Annual Information Form
|
|
Three Months Ended March 31, 2023 |
|
Three Months Ended June 31, 2023 |
|
Three Months Ended September 31, 2023 |
|
Three Months Ended December 31, 2023 |
Netherlands |
|
|
|
|
|
|
|
|
Average Daily Production |
|
|
|
|
|
|
|
|
Light Crude Oil and Medium Crude Oil (bbl/d) |
|
— |
|
— |
|
— |
|
— |
Conventional Natural Gas (mmcf/d) |
|
29.07 |
|
27.28 |
|
24.32 |
|
32.06 |
Natural Gas Liquids (bbl/d) |
|
66 |
|
61 |
|
39 |
|
119 |
Average Net Prices Received |
|
|
|
|
|
|
|
|
Light Crude Oil and Medium Crude Oil ($/bbl) |
|
81.48 |
|
— |
|
— |
|
— |
Conventional Natural Gas ($/mcf) |
|
26.22 |
|
15.25 |
|
12.29 |
|
17.12 |
Natural Gas Liquids ($/bbl) |
|
— |
|
71.91 |
|
98.48 |
|
106.81 |
Royalties |
|
|
|
|
|
|
|
|
Light Crude Oil and Medium Crude Oil ($/bbl) |
|
— |
|
— |
|
— |
|
— |
Conventional Natural Gas ($/mcf) |
|
5.67 |
|
2.68 |
|
(9.21) |
|
0.23 |
Natural Gas Liquids ($/bbl) |
|
— |
|
— |
|
— |
|
— |
Production Costs |
|
|
|
|
|
|
|
|
Light Crude Oil and Medium Crude Oil ($/bbl) |
|
— |
|
— |
|
— |
|
— |
Conventional Natural Gas ($/mcf) |
|
4.94 |
|
5.52 |
|
1.51 |
|
3.03 |
Natural Gas Liquids ($/bbl) |
|
— |
|
— |
|
12.14 |
|
18.90 |
Netback Received |
|
|
|
|
|
|
|
|
Light Crude Oil and Medium Crude Oil ($/bbl) |
|
81.48 |
|
— |
|
— |
|
— |
Conventional Natural Gas ($/mcf) |
|
15.61 |
|
7.05 |
|
19.99 |
|
13.86 |
Natural Gas Liquids ($/bbl) |
|
— |
|
71.91 |
|
86.34 |
|
87.91 |
United States |
|
|
|
|
|
|
|
|
Average Daily Production |
|
|
|
|
|
|
|
|
Light Crude Oil and Medium Crude Oil (bbl/d) |
|
2,824 |
|
3,349 |
|
4,404 |
|
3,187 |
Conventional Natural Gas (mmcf/d) |
|
7.14 |
|
7.23 |
|
7.25 |
|
7.49 |
Natural Gas Liquids (bbl/d) |
|
1,041 |
|
1,047 |
|
1,139 |
|
1,158 |
Average Net Prices Received |
|
|
|
|
|
|
|
|
Light Crude Oil and Medium Crude Oil ($/bbl) |
|
100.90 |
|
96.42 |
|
107.13 |
|
104.59 |
Conventional Natural Gas ($/mcf) |
|
3.61 |
|
1.71 |
|
1.93 |
|
2.04 |
Natural Gas Liquids ($/bbl) |
|
44.75 |
|
38.63 |
|
30.04 |
|
45.00 |
Royalties |
|
|
|
|
|
|
|
|
Light Crude Oil and Medium Crude Oil ($/bbl) |
|
26.64 |
|
24.71 |
|
28.31 |
|
31.80 |
Conventional Natural Gas ($/mcf) |
|
1.01 |
|
0.50 |
|
0.93 |
|
0.63 |
Natural Gas Liquids ($/bbl) |
|
12.33 |
|
10.11 |
|
14.68 |
|
6.28 |
Transportation |
|
|
|
|
|
|
|
|
Light Crude Oil and Medium Crude Oil ($/bbl) |
|
0.25 |
|
0.20 |
|
0.40 |
|
1.50 |
Conventional Natural Gas ($/mcf) |
|
— |
|
— |
|
— |
|
— |
Natural Gas Liquids ($/bbl) |
|
0.04 |
|
0.03 |
|
0.05 |
|
0.09 |
Production Costs |
|
|
|
|
|
|
|
|
Light Crude Oil and Medium Crude Oil ($/bbl) |
|
15.10 |
|
12.94 |
|
8.83 |
|
17.67 |
Conventional Natural Gas ($/mcf) |
|
2.24 |
|
2.24 |
|
0.16 |
|
0.35 |
Natural Gas Liquids ($/bbl) |
|
13.56 |
|
13.33 |
|
2.49 |
|
7.69 |
Netback Received |
|
|
|
|
|
|
|
|
Light Crude Oil and Medium Crude Oil ($/bbl) |
|
58.91 |
|
58.57 |
|
69.59 |
|
53.62 |
Conventional Natural Gas ($/mcf) |
|
0.36 |
|
(1.03) |
|
0.84 |
|
1.06 |
Natural Gas Liquids ($/bbl) |
|
18.82 |
|
15.16 |
|
12.82 |
|
30.94 |
Vermilion Energy Inc. ■ Page 48 ■ 2023 Annual Information Form
|
|
Three Months Ended March 31, 2023 |
|
Three Months Ended June 31, 2023 |
|
Three Months Ended September 31, 2023 |
|
Three Months Ended December 31, 2023 |
Total Company |
|
|
|
|
|
|
|
|
Average Daily Production |
|
|
|
|
|
|
|
|
Light Crude Oil and Medium Crude Oil (bbl/d) |
|
28,486 |
|
25,754 |
|
26,953 |
|
28,686 |
Conventional Natural Gas (mmcf/d) |
|
247.61 |
|
283.63 |
|
263.83 |
|
283.91 |
Natural Gas Liquids (bbl/d) |
|
12,700 |
|
10,127 |
|
11,807 |
|
11,592 |
Average Net Prices Received |
|
|
|
|
|
|
|
|
Light Crude Oil and Medium Crude Oil ($/bbl) |
|
98.45 |
|
96.60 |
|
109.25 |
|
108.67 |
Conventional Natural Gas ($/mcf) |
|
10.77 |
|
7.37 |
|
6.32 |
|
8.48 |
Natural Gas Liquids ($/bbl) |
|
36.24 |
|
52.51 |
|
52.53 |
|
58.70 |
Royalties |
|
|
|
|
|
|
|
|
Light Crude Oil and Medium Crude Oil ($/bbl) |
|
10.63 |
|
16.23 |
|
17.64 |
|
13.83 |
Conventional Natural Gas ($/mcf) |
|
1.09 |
|
0.14 |
|
(0.86) |
|
0.09 |
Natural Gas Liquids ($/bbl) |
|
16.94 |
|
4.70 |
|
9.55 |
|
11.60 |
Transportation Costs |
|
|
|
|
|
|
|
|
Light Crude Oil and Medium Crude Oil ($/bbl) |
|
4.48 |
|
5.72 |
|
4.58 |
|
5.99 |
Conventional Natural Gas ($/mcf) |
|
0.32 |
|
0.22 |
|
0.27 |
|
0.22 |
Natural Gas Liquids ($/bbl) |
|
4.05 |
|
2.68 |
|
3.52 |
|
3.39 |
Production Costs |
|
|
|
|
|
|
|
|
Light Crude Oil and Medium Crude Oil ($/bbl) |
|
20.72 |
|
27.99 |
|
28.27 |
|
19.92 |
Conventional Natural Gas ($/mcf) |
|
2.67 |
|
2.14 |
|
1.63 |
|
1.56 |
Natural Gas Liquids ($/bbl) |
|
24.08 |
|
15.31 |
|
13.54 |
|
10.77 |
Netback Received |
|
|
|
|
|
|
|
|
Light Crude Oil and Medium Crude Oil ($/bbl) |
|
62.62 |
|
46.66 |
|
58.76 |
|
68.93 |
Conventional Natural Gas ($/mcf) |
|
6.69 |
|
4.87 |
|
5.28 |
|
6.61 |
Natural Gas Liquids ($/bbl) |
|
(8.83) |
|
29.82 |
|
25.92 |
|
32.94 |
North America |
|
|
|
|
|
|
|
|
Average Daily Production |
|
|
|
|
|
|
|
|
Light Crude Oil and Medium Crude Oil (bbl/d) |
|
19,498 |
|
16,250 |
|
16,458 |
|
14,801 |
Conventional Natural Gas (mmcf/d) |
|
167.48 |
|
166.49 |
|
171.21 |
|
167.65 |
Natural Gas Liquids (bbl/d) |
|
12,635 |
|
10,066 |
|
11,768 |
|
11,473 |
Average Net Prices Received |
|
|
|
|
|
|
|
|
Light Crude Oil and Medium Crude Oil ($/bbl) |
|
95.63 |
|
94.23 |
|
106.20 |
|
99.25 |
Conventional Natural Gas ($/mcf) |
|
4.11 |
|
2.29 |
|
2.52 |
|
2.62 |
Natural Gas Liquids ($/bbl) |
|
36.23 |
|
52.36 |
|
52.38 |
|
58.20 |
Royalties |
|
|
|
|
|
|
|
|
Light Crude Oil and Medium Crude Oil ($/bbl) |
|
10.84 |
|
18.80 |
|
19.45 |
|
17.42 |
Conventional Natural Gas ($/mcf) |
|
0.39 |
|
(0.35) |
|
0.04 |
|
0.01 |
Natural Gas Liquids ($/bbl) |
|
16.94 |
|
4.73 |
|
9.58 |
|
11.72 |
Transportation Costs |
|
|
|
|
|
|
|
|
Light Crude Oil and Medium Crude Oil ($/bbl) |
|
2.47 |
|
2.09 |
|
3.22 |
|
4.01 |
Conventional Natural Gas ($/mcf) |
|
0.33 |
|
0.14 |
|
0.14 |
|
0.20 |
Natural Gas Liquids ($/bbl) |
|
4.05 |
|
2.70 |
|
3.53 |
|
3.42 |
Production Costs |
|
|
|
|
|
|
|
|
Light Crude Oil and Medium Crude Oil ($/bbl) |
|
19.54 |
|
25.38 |
|
26.09 |
|
24.12 |
Conventional Natural Gas ($/mcf) |
|
1.06 |
|
0.63 |
|
0.62 |
|
0.63 |
Natural Gas Liquids ($/bbl) |
|
24.84 |
|
14.28 |
|
12.84 |
|
14.04 |
Netback Received |
|
|
|
|
|
|
|
|
Light Crude Oil and Medium Crude Oil ($/bbl) |
|
62.79 |
|
47.95 |
|
57.45 |
|
53.70 |
Conventional Natural Gas ($/mcf) |
|
2.34 |
|
1.87 |
|
1.72 |
|
1.78 |
Natural Gas Liquids ($/bbl) |
|
(9.60) |
|
30.65 |
|
26.43 |
|
29.01 |
Vermilion Energy Inc. ■ Page 49 ■ 2023 Annual Information Form
|
|
Three Months Ended March 31, 2023 |
|
Three Months Ended June 31, 2023 |
|
Three Months Ended September 31, 2023 |
|
Three Months Ended December 31, 2023 |
International |
|
|
|
|
|
|
|
|
Average Daily Production |
|
|
|
|
|
|
|
|
Light Crude Oil and Medium Crude Oil (bbl/d) |
|
8,988 |
|
9,503 |
|
10,495 |
|
13,885 |
Conventional Natural Gas (mmcf/d) |
|
80.14 |
|
117.14 |
|
92.63 |
|
116.26 |
Natural Gas Liquids (bbl/d) |
|
66 |
|
61 |
|
39 |
|
119 |
Average Net Prices Received |
|
|
|
|
|
|
|
|
Light Crude Oil and Medium Crude Oil ($/bbl) |
|
106.91 |
|
100.37 |
|
114.32 |
|
123.99 |
Conventional Natural Gas ($/mcf) |
|
24.69 |
|
14.58 |
|
13.34 |
|
16.93 |
Natural Gas Liquids ($/bbl) |
|
— |
|
77.22 |
|
98.35 |
|
106.86 |
Royalties |
|
|
|
|
|
|
|
|
Light Crude Oil and Medium Crude Oil ($/bbl) |
|
9.99 |
|
12.14 |
|
14.64 |
|
8.00 |
Conventional Natural Gas ($/mcf) |
|
2.58 |
|
0.83 |
|
(2.54) |
|
0.21 |
Natural Gas Liquids ($/bbl) |
|
— |
|
— |
|
— |
|
— |
Transportation Costs |
|
|
|
|
|
|
|
|
Light Crude Oil and Medium Crude Oil ($/bbl) |
|
10.51 |
|
11.47 |
|
6.84 |
|
9.21 |
Conventional Natural Gas ($/mcf) |
|
0.31 |
|
0.33 |
|
0.51 |
|
0.24 |
Natural Gas Liquids ($/bbl) |
|
— |
|
— |
|
— |
|
— |
Production Costs |
|
|
|
|
|
|
|
|
Light Crude Oil and Medium Crude Oil ($/bbl) |
|
11.73 |
|
16.32 |
|
14.36 |
|
9.18 |
Conventional Natural Gas ($/mcf) |
|
2.71 |
|
2.37 |
|
1.68 |
|
1.25 |
Natural Gas Liquids ($/bbl) |
|
— |
|
12.55 |
|
12.35 |
|
7.91 |
Netback Received |
|
|
|
|
|
|
|
|
Light Crude Oil and Medium Crude Oil ($/bbl) |
|
74.67 |
|
60.43 |
|
78.48 |
|
97.60 |
Conventional Natural Gas ($/mcf) |
|
19.10 |
|
11.05 |
|
13.70 |
|
15.22 |
Natural Gas Liquids ($/bbl) |
|
— |
|
64.66 |
|
85.99 |
|
98.95 |
Marketing
The nature of Vermilion’s operations results in exposure to fluctuations in commodity prices, interest rates, and foreign currency exchange rates. Vermilion monitors and, when appropriate, uses derivative financial instruments to manage its exposure to these fluctuations. All transactions of this nature entered into by Vermilion are related to an underlying financial position or to future crude oil and natural gas production. Vermilion does not use derivative financial instruments for speculative purposes. Vermilion has not obtained collateral or other security to support its financial derivatives as management reviews the creditworthiness of its counterparties prior to entering into derivative contracts.
During the normal course of business, Vermilion may also enter into fixed price arrangements to sell a portion of its production or purchase commodities for operational use.
Vermilion’s outstanding risk management positions as at December 31, 2023 are summarized in Supplemental Table 2: Hedges, included in the Company’s 2023 Management’s Discussion and Analysis, dated March 6, 2024, available on SEDAR+ at www.sedarplus.ca, under Vermilion’s SEDAR+ profile.
Vermilion Energy Inc. ■ Page 50 ■ 2023 Annual Information Form As at January 31, 2024, the directors and officers of Vermilion beneficially owned, or controlled or directed, directly or indirectly, 1,352,650 common shares representing approximately 0.8% of the issued and outstanding common shares.
Set forth below is certain information respecting the current directors and officers of Vermilion. References to Vermilion in the following tables for dates prior to the Conversion Arrangement refer to VRL and to the Company following the date of the Conversion Arrangement.
Board of Directors
Vermilion’s Board of Directors currently consists of ten directors. The directors are nominated by the Company and elected annually by Shareholders and hold office until the next annual meeting of Shareholders, or until their successors are elected or appointed.
|
|
|
|
|
|
Year First |
|
|
|---|---|---|---|---|---|---|---|---|
Name and |
|
|
|
|
|
Elected or |
|
|
Municipality of |
|
|
|
|
|
Appointed |
|
|
Residence |
|
Committee(s) |
|
Office Held |
|
as Director |
|
Principal Occupation During the Past Five Years |
Robert Michaleski |
|
(1) (3) (5) |
|
Director |
|
2016 |
|
2000 to 2020, Director of Pembina Pipeline Corporation 2012 to 2023, Director of Essential Energy Services Ltd., a public oilfield services company Since 2003, Director of Coril Holdings Ltd., a private investment company |
Dion Hatcher |
|
|
|
President & |
|
2023 |
|
Since March 2023, President & Chief Executive Officer of Vermilion January 2022 to March 2023, President of Vermilion November 2020 to December 2021 Vice President North America of Vermilion March 2016 to November 2020, Vice President Canada Business Unit of Vermilion |
James J. Kleckner Jr. |
|
(7) (9) |
|
Director |
|
2021 |
|
Since 2021, Director of Great Western Petroleum, a public oil and gas company 2019 to 2021, Director of Parsley Energy, a public oil and gas company 2018 to 2020, Chief Executive Officer of Jagged Peak Energy Inc., a public oil and gas company 2018 to 2020, Director of Jagged Peak Energy Inc., a public oil and gas company 2016 to 2019, Director of Delonex Energy Ltd., a private oil and gas company |
Carin S. Knickel |
|
(4) (7) (11) |
|
Director |
|
2018 |
|
Since 2015, Director of Hudbay Minerals, Inc., a public mining company 2015 to 2020, Director of Whiting Petroleum, a public oil and gas company Since 2014, Director of National MS Society (Colorado/Wyoming Chapter), a non-profit organization |
Stephen Larke |
|
(3) (5) (10) |
|
Director |
|
2017 |
|
Since 2020, Director of Headwater Exploration Inc., a public oil and gas company Since 2019, Director of Topaz Energy Corp., a public energy company |
Timothy R. Marchant |
|
(6) (9) (11) |
|
Director |
|
2010 |
|
2022 to 2023, Director of Vaalco Energy Inc., a public oil and gas company 2020 to 2022, Director of TransGlobe Energy Corporation, a public oil and gas company Since 2015, Director, Valeura Energy Inc., a public oil and gas company 2013 to 2022, Director of Cub Energy Inc., a public oil and gas company Since 2009, Adjunct Professor of Strategy and Energy Geopolitics, Haskayne School of Business |
William Roby |
|
(7) (8) (11) |
|
Director |
|
2017 |
|
Since 2020, Director of California Resources Corp, a public oil and gas company Since 2015, Chief Executive Officer, Shepherd Energy, LLC., a private energy efficiency services company |
Vermilion Energy Inc. ■ Page 51 ■ 2023 Annual Information Form
|
|
|
|
|
|
Year First |
|
|
|---|---|---|---|---|---|---|---|---|
Name and |
|
|
|
|
|
Elected or |
|
|
Municipality of |
|
|
|
|
|
Appointed |
|
|
Residence |
|
Committee(s) |
|
Office Held |
|
as Director |
|
Principal Occupation During the Past Five Years |
Manjit Sharma |
|
(2) (5) |
|
Director |
|
2021 |
|
Since 2023, Director of TransAlta Corporation, a public utilities company Since 2022, Director of Finning International Inc., a public machinery manufacturing company Since 2020, Director of Export Development Canada, a financial services company 2020 to 2023, Investment Committee of GE Canada Pension Trust, a pension fund 2020 to 2021, Chief Financial Officer of WSP Canada, a civil engineering company 2019 to 2021, Audit Committee of Ontario Chamber of Commerce, a charitable organization 2016 to 2019, Chief Financial Officer of GE Canada, an industrial engineering company 2013 to 2020, Audit and Investment Committee YMCA Greater Toronto, a charitable organization |
Myron Stadnyk |
|
(7) (9) |
|
Director |
|
2022 |
|
Since 2020, Director of Crescent Point Energy Corp. Since 2018, Chair of the University of Saskatchewan Engineering Trust 2018 to 2023, Director of Prairie Sky Royalty Ltd. 2013 to 2020, President, Chief Executive Officer, and Director of ARC Resources Ltd. |
Judy Steele |
|
(3) (5) (11) |
|
Director |
|
2021 |
|
Since 2012, President and Chief Operating Officer of Emera Energy, an energy marketing and trading company Since 2017, Director of Canadian Blood Services, a non-profit organization |
Committees:
(1) |
Chairman (Independent) |
(2) |
Audit Committee Chair (Independent) |
(3) |
Audit Committee Member (Independent) |
(4) |
Governance and Human Resources Committee Chair (Independent) |
(5) |
Governance and Human Resources Committee Member (Independent) |
(6) |
Health, Safety and Environment Committee Chair (Independent) |
(7) |
Health, Safety and Environment Committee Member (Independent) |
(8) |
Technical Committee Chair (Independent) |
(9) |
Technical Committee Member (Independent) |
(10) |
Sustainability Committee Chair (Independent) |
(11) |
Sustainability Committee Member (Independent) |
Vermilion Energy Inc. ■ Page 52 ■ 2023 Annual Information Form
Officers
Name and |
|
Office Held |
|
Principal Occupation During the Past Five Years |
Municipality of |
|
|
|
|
Residence |
|
|
|
|
Dion Hatcher |
|
President |
|
Since March 2023, President & Chief Executive Officer of Vermilion January 2022 to March 2023, President of Vermilion November 2020 to December 2021, Vice President North America of Vermilion March 2016 to November 2020, Vice President Canada Business Unit of Vermilion |
Lars Glemser |
|
Vice President |
|
Since April 2018, Vice President and Chief Financial Officer of Vermilion January 2018 to April 2018, Director, Finance of Vermilion June 2015 to January 2018, Finance Professional of Vermilion |
|
Tamar Epstein Calgary, Alberta Canada |
|
General Counsel |
|
Since August 2023, General Counsel of Vermilion Since 2022, Board of Calgary Economic Development 2021 to 2023, General Counsel & VP ESG of Validere Technologies 2018 to 2021, General Counsel, Corporate Secretary & Director ESG of IPC Canada Ltd. |
Terry Hergott |
|
Vice President |
|
Since April 2012, Vice President, Marketing of Vermilion |
Yvonne Jeffery |
|
Vice President |
|
May 2021, Vice President, Sustainability of Vermilion August 2020 to May 2021, Director, Sustainability of Vermilion April 2018 to August 2020, Manager Communications, Community Investment and Sustainability of Vermilion November 2015 to March 2018, Team Lead, Communications, Community Investment and Sustainability of Vermilion |
Darcy Kerwin |
|
Vice President |
|
Since November 2020, Vice President, International & HSE of Vermilion September 2020 to November 2020, Vice President, Strategic Planning of Vermilion February 2018 to September 2020, Managing Director, Ireland Business Unit of Vermilion March 2014 to February 2018, Managing Director, France Business Unit of Vermilion |
Bryce Kremnica |
|
Vice President |
|
November 2021 to February 2024, Vice President, North America of Vermilion May 2014 to November 2021, Director, Field Operations Canada Business Unit of Vermilion |
Geoff MacDonald |
|
Vice President |
|
Since November 2021, Vice President, Geosciences of Vermilion March 2019 to November 2021, Chief Geoscientist of Vermilion August 2015 to March 2019, Vice President, Exploration of Velvet Energy, a private oil and gas company |
Kyle Preston |
|
Vice President |
|
Since July 2019, Vice President, Investor Relations of Vermilion May 2016 to July 2019, Director, Investor Relations of Vermilion |
Averyl Schraven |
|
Vice President People and Culture |
|
Since November 2021, Vice President, People & Culture of Vermilion December 2020 to November 2021, Director, People and Culture of Vermilion February 2014 to December 2020, Manager, Global Human Resources Services of Vermilion |
|
Gerard Schut Den Haag The Netherlands |
|
Vice President European Operations |
|
Since July 2012, Vice President, European Operations of Vermilion |
Jenson Tan |
|
Vice President Business Development |
|
Since October 2017, Vice President, Business Development of Vermilion July 2016 to October 2017, Director, Business Development of Vermilion |
|
Jamie Gagner Calgary, Alberta Canada |
|
Corporate Secretary |
|
Since January 2023, counsel with Lawson Lundell LLP, a law firm |
Vermilion Energy Inc. ■ Page 53 ■ 2023 Annual Information Form Credit ratings affect the Company's ability to obtain short-term and long-term financing and the cost of such financing.
Description of Capital Structure
Credit ratings
Additionally, the ability of the Company to engage in certain collateralized business activities on a cost effective basis depends on the Company's credit ratings. A reduction in the credit rating of the Company or the Company's debt or a negative change in the Company's ratings outlook could adversely affect the Company's cost of financing and its access to sources of liquidity and capital. In addition, changes in credit ratings may affect the Company's ability to enter into ordinary course hedging arrangements or contracts with customers and suppliers.
Credit ratings are intended to provide investors with an independent measure of the credit quality of an issuer of securities. The credit ratings accorded to the Senior Unsecured Notes and the Company are not recommendations to purchase, hold or sell such securities and are not a comment upon the market price of the Company's securities or their suitability for a particular investor. There is no assurance that any rating will remain in effect for any given period of time or that any rating will not be revised or withdrawn entirely by a rating agency in the future if, in its judgment, circumstances so warrant. A revision or withdrawal of a credit rating could have a material adverse effect on the pricing or liquidity of the Senior Unsecured Notes or the common shares in any secondary markets. Vermilion does not undertake any obligation to maintain the ratings or to advise holders of the Senior Unsecured Notes or the common shares of any change in ratings. Each agency's rating should be evaluated independently of any other agency's rating.
As at March 6, 2024, Vermilion had the following credit ratings from S&P Global Ratings ("S&P"), Moody's Investors Service (“Moody’s”), and Fitch Ratings (“Fitch”):
Rating Agency |
|
Company Rating |
|
Outlook |
|
Senior Unsecured Notes |
S&P (1) |
|
B+ (1) |
|
Stable |
|
BB- (4) |
Moody's (2) |
|
B1 (2) |
|
Stable |
|
B3 (5) |
Fitch (3) |
|
BB- (3) |
|
Stable |
|
BB- (6) |
Notes:
(1) |
S&P rates long-term corporate credit ratings by rating categories ranging from a high of "AAA" to a low of "D". Ratings from AA to CCC may be modified by the addition of a plus (+) or minus (-) sign to show relative standing within the major rating categories. In addition, S&P may add a rating outlook of “positive”, “negative” or “stable” which assesses the potential direction of a long-term credit rating over the intermediate term (typically six months to two years). An obligor rated “B” is within the sixth highest of the ten categories, and is characterized by S&P as more vulnerable in the near term than obligors rated "BB", but has the capacity to meet its financial commitments on the obligation. However, it faces major ongoing uncertainties and exposure to adverse business, financial or economic conditions, which could lead to the obligor’s inadequate capacity to meet its financial commitments. |
(2) |
Moody's corporate family ratings are on a rating scale that ranges from Aaa to C, which represents the highest to lowest opinions of creditworthiness. Moody’s appends numerical modifiers 1, 2, and 3 to each generic rating classification from Aa through Caa, with 3 indicating a ranking in the lower end of the generic rating category. A rating of B1 by Moody’s is within the sixth highest of nine categories. An obliger rated B1 is considered non-investment grade speculative and is subject to high credit risk. |
(3) |
Fitch’s corporate credit rating categories range from “investment grade“ for those with ratings of “AAA” to “BBB”, and “speculative grade” for those with “BB” to “D” ratings. Modifiers may be used by Fitch within these rating categories, either (+) or (-), appended to a rating to indicate relative status within the major rating categories. Rating outlooks may be provided to direct where a rating may potentially move within the next year or two, and fall under four outlooks: “positive”, “stable”, “negative”, or “evolving”. A “BB-” rating for an obliger denotes an increased vulnerability to default risk, especially if experiencing adverse changes in economic or business conditions over time; conversely, there remains a financial or business flexibility that sustains the servicing of financial obligations. |
(4) |
S&P rates long-term debt instruments by rating categories ranging from a high of "AAA" to a low of "D". The ratings from AA to CCC may be modified by the addition of a plus (+) or minus (-) sign to show relative standing within the major rating categories. An obligation rated "B+" is characterized as less vulnerable to nonpayment than other speculative issues. However, an obligation rated "B+" faces major ongoing uncertainties or exposure to adverse business, financial, or economic conditions, which could lead to the obligor's inadequate capacity to meet its financial commitment on the obligation. The "B" category is the sixth highest of the ten available categories. |
(5) |
Moody’s long-term obligations ratings are on a rating scale that ranges from Aaa to C, which represents the highest to lowest opinions of creditworthiness. Moody’s appends numerical modifiers 1, 2, and 3 to each generic rating classification from Aa through Caa, with 3 indicating a ranking in the lower end of the generic rating category. A rating of B3 by Moody’s is within the sixth highest of nine categories. Obligations rated B3 are considered non-investment grade speculative and are subject to high credit risk. |
(6) |
Fitch’s long-term debt instrument ratings are categorized from “investment grade“ for those with ratings of “AAA” to “BBB”, and “speculative grade” for those with “BB” to “D” ratings. Modifiers may be used by Fitch within these rating categories, either (+) or (-), appended to a rating to indicate relative status within the major rating categories. A “BB-” rating for an obliger denotes an increased vulnerability to default risk, especially if experiencing adverse changes in economic or business conditions over time; conversely, there remains a financial or business flexibility that sustains the servicing of financial obligations. |
Vermilion Energy Inc. ■ Page 54 ■ 2023 Annual Information Form The Company is authorized to issue an unlimited number of common shares.
Common shares
Each common share entitles the holder to receive notice of and to attend all meetings of Shareholders and to one vote at any such meeting. The holders of common shares are, at the discretion of the board and subject to applicable legal restrictions, entitled to receive any dividends declared by the board on the common shares. The holders of common shares are entitled to share equally in any distribution of the assets of the Company upon the liquidation, dissolution, bankruptcy or winding-up of the Company or other distribution of its assets among the Shareholders for the purpose of winding-up the Company’s affairs.
Awards pursuant to which a holder may receive Common Shares have been issued under certain Vermilion compensation arrangements. See Vermilion's annual financial statements as at and for the year ended December 31, 2023 (a copy of which is available on SEDAR+ at www.sedarplus.ca under Vermilion’s SEDAR+ profile) for further details regarding the amount and value of such awards.
Dividend history
The Company paid a monthly dividend from January 2003 through March 2020. The dividend was suspended in April 2020 in response to the deterioration in near-term commodity prices and worsening outlook for global oil demand as a result of the COVID-19 pandemic and OPEC+ oil price war. Vermilion has a long history of paying dividends and we remain strong proponents of returning capital to Shareholders and as a result of our focus on financial strength we reinstated the dividend in the first quarter of 2022 and subsequently increased the per share amounts in both the second quarter of 2022, the first quarter of 2023 and the first quarter of 2024.
Solvency tests imposed by the ABCA on corporations for the declaration and payment of dividends must be satisfied prior to the declaration of a dividend. In addition, decisions with respect to the declaration of dividends on the common shares are made by the Board of Directors on the basis of the Company's net earnings, financial requirements, and other conditions.
The following table sets forth the history of Vermilion's dividend per share:
Date |
|
Frequency |
|
Dividend per unit or share |
|
January 2003 to December 2007 |
|
Monthly |
|
$ |
0.170 |
January 2008 to December 2012 |
|
Monthly |
|
$ |
0.190 |
January 2013 to December 2013 |
|
Monthly |
|
$ |
0.200 |
January 2014 to March 2018 |
|
Monthly |
|
$ |
0.215 |
April 2018 to February 2020 |
|
Monthly |
|
$ |
0.230 |
March 2020 |
|
Monthly |
|
$ |
0.115 |
April 2022 to July 2022 |
|
Quarterly |
|
$ |
0.060 |
August 2022 to March 2023 |
|
Quarterly |
|
$ |
0.080 |
April 2023 to March 2024 |
|
Quarterly |
|
$ |
0.100 |
April 2024 onwards |
|
Quarterly |
|
$ |
0.120 |
The following table outlines dividends declared per share for each of the three most recently completed financial years:
Date |
|
Dividends per common share |
|
2021 |
|
$ |
0.00 |
2022 |
|
$ |
0.20 |
2023 |
|
$ |
0.40 |
In the first quarter of 2024, we increased the quarterly dividend 20% to $0.12 per share, aligned with our dividend policy of providing ratable increases while ensuring the annual dividend amount is sustainable at mid-cycle pricing and our continued focus on debt reduction in 2024. The dividend of $0.12 per share for Q1 2024 was declared on March 6, 2024.
Vermilion Energy Inc.
■ Page 55 ■ 2023 Annual Information Form The outstanding common shares of the Company are listed and posted for trading on the Toronto Stock Exchange ("TSX") and the New York Stock Exchange ("NYSE") under the symbol VET. The following table sets forth the closing price range and trading volume of the common shares on the TSX for the periods indicated:
2023 |
|
High |
|
Low |
|
Close |
|
Volume |
|||
January |
|
$ |
23.73 |
|
$ |
19.55 |
|
$ |
20.40 |
|
35,897,397 |
February |
|
$ |
20.28 |
|
$ |
17.49 |
|
$ |
18.28 |
|
22,217,877 |
March |
|
$ |
19.80 |
|
$ |
16.41 |
|
$ |
17.53 |
|
34,101,636 |
April |
|
$ |
18.72 |
|
$ |
16.35 |
|
$ |
17.15 |
|
22,314,758 |
May |
|
$ |
17.27 |
|
$ |
14.65 |
|
$ |
14.77 |
|
19,205,531 |
June |
|
$ |
16.71 |
|
$ |
14.55 |
|
$ |
16.52 |
|
18,937,914 |
July |
|
$ |
18.49 |
|
$ |
15.85 |
|
$ |
18.38 |
|
16,553,365 |
August |
|
$ |
20.75 |
|
$ |
17.48 |
|
$ |
19.68 |
|
18,728,208 |
September |
|
$ |
21.60 |
|
$ |
18.75 |
|
$ |
19.87 |
|
16,467,654 |
October |
|
$ |
21.30 |
|
$ |
17.47 |
|
$ |
20.01 |
|
17,765,306 |
November |
|
$ |
20.39 |
|
$ |
16.92 |
|
$ |
17.14 |
|
16,897,164 |
December |
|
$ |
17.27 |
|
$ |
14.59 |
|
$ |
15.97 |
|
15,351,544 |
Vermilion Energy Inc.
Audit committee charter
■ Page 56 ■ 2023 Annual Information Form Vermilion has established an audit committee (the "Audit Committee") to assist the board of directors in carrying out its oversight responsibilities with respect to, among other things, financial reporting, internal controls, and the external audit process of the Company. The Audit Committee Terms of Reference are set out in Schedule "C" to this annual information form.
Composition of the Audit Committee
The following table sets forth the name of each current member of the Audit Committee, whether pursuant to applicable securities legislation, such member is considered independent, whether pursuant to applicable securities legislation, such member is considered financially literate and the relevant education and experience of such member.
Name |
|
Independent |
|
Financially Literate |
|
Relevant Education and Experience |
Manjit Sharma |
|
Yes |
|
Yes |
|
Ms. Sharma has over 30 years of experience operating in complex global organizations across many industry sectors including power, energy, transportation, oil & gas, financial services, mining, and consulting. While Ms. Sharma most recently served as Chief Financial Officer of WSP Canada, the bulk of her career has been with GE Canada. While at GE, Ms. Sharma held a variety of progressively senior management roles, lastly as its Chief Financial Officer, her responsibilities spanned strategic planning and analysis, mergers and acquisitions, tax oversight, risk, governance, diversity and inclusion. Ms. Sharma serves as a member of the Board of Directors for Export Development Canada, Finning International Inc., TransAlta Corporation, and is a member of the GE Canada Pension Trust Investment Committee. She previously served as a Director of the BGO Prime Canadian Property Fund, the Board of GE Canada Company, the Ontario Chamber of Commerce and the YMCA of the Greater Toronto Area. Ms. Sharma was also recognized as one of Canada’s Top 100 Most Powerful Women in 2019. Ms. Sharma holds a Bachelors of Commerce degree from the University of Toronto, is a FCPA FCA, and has completed both the Institute of Corporate Directors Education Program and the Global Competent Boards Designation. |
Robert Michaleski |
|
Yes |
|
Yes |
|
Mr. Michaleski holds a Bachelor of Commerce (Honours) degree from the University of Manitoba and is a Chartered Accountant. He has over 30 years of experience in various senior management and executive capacities at Pembina Pipeline Corporation. He was Chief Executive Officer from 2000 to 2013 and also President from 2000 to 2012. He was Vice President and Chief Financial Officer from 1997 to 2000, Vice President of Finance from 1992 to 1997, Controller from 1980 to 1992, and Manager of Internal Audit from 1978 to 1980. He was a Director of Pembina from 2000 to 2020, a Director of Essential Energy Services Ltd. since 2012, and a Director of Coril Holdings Ltd. since 2003. He is a member of the Institute of Corporate Directors. |
Stephen Larke |
|
Yes |
|
Yes |
|
Mr. Larke holds a Bachelor of Commerce (Distinction) degree from the University of Calgary and is a Chartered Financial Analyst. He brings over 20 years of experience in energy capital markets, including research, sales, trading, and equity finance. From 2017 to 2018, he was Operating Partner and Advisory Board member with Azimuth Capital Management, an energy-focused private equity fund based in Calgary, Alberta. From 2005 to 2015, Mr. Larke was Managing Director and Executive Committee member with Peters & Co., an independent energy investment firm based in Calgary. From 1997 to 2005, he was Vice-President and Director with TD Newcrest, serving in the role of energy equity analyst. |
Judy Steele |
|
Yes |
|
Yes |
|
Ms. Steele has more than 35 years of experience in various energy businesses including hydro, wind, biomass and natural gas fired electrical generating facilities. Currently, Ms. Steele is the President & Chief Operating Officer of Emera Energy Inc., where she is responsible for commercial performance, operations, business growth and development, risk management, and team leadership and development. She is a member of the Emera Inc. Corporate Leadership Team and Emera’s Sustainability Management Committee and Leadership Safety Advisory Council. Prior to her current role, Ms. Steele held a variety of executive and senior management positions within Emera Inc. Ms. Steele is currently a Board member of Canadian Blood Services and a Governor of St. Francis Xavier University. She previously served as a Director and Chair of the Audit Committee for The Halifax Port Authority and was National Chair of the Canadian Breast Cancer Foundation. Ms. Steele is a recipient of the Chartered Accountant of the Year Award, from the Institute of Chartered Accountants of Nova Scotia, for outstanding community leadership |
External audit service fees
Prior to the commencement of any work, fees for all audit and non-audit services provided by the Company’s auditors must be approved by the Audit Committee.
During the years ended December 31, 2023 and 2022, Deloitte LLP (PCAOB ID No. 1208), the auditors of the Company, received the following fees from the Company:
Item |
|
2023 |
|
2022 |
||
Audit fees (1) |
|
$ |
2,794,556 |
|
$ |
1,497,599 |
Audit-related fees (2) |
|
$ |
42,203 |
|
$ |
68,393 |
Tax fees (3) |
|
$ |
64,164 |
|
$ |
102,385 |
Vermilion Energy Inc.
Notes:
(1) |
Audit fees consisted of professional services rendered by Deloitte LLP for the audit of the Company's financial statements for the years ended December 31, 2023 and 2022. |
(2) |
Audit-related fees billed by Deloitte LLP for other assurance engagements required by management or regulation. |
(3) |
Tax fees consist of fees for tax compliance services in various jurisdictions. |
■ Page 57 ■ 2023 Annual Information Form The directors and officers of Vermilion are engaged in and will continue to engage in other activities in the oil and natural gas industry and, as a result of these and other activities, the directors and officers of Vermilion may become subject to conflicts of interest. The ABCA provides that in the event that a director has an interest in a contract or proposed contract or agreement, the director shall disclose his interest in such contract or agreement and shall refrain from voting on any matter in respect of such contract or agreement unless otherwise provided under the ABCA. To the extent that conflicts of interest arise, such conflicts will be resolved in accordance with the provisions of the ABCA.
As at the date hereof, Vermilion is not aware of any existing or potential material conflicts of interest between Vermilion and a director or officer of Vermilion.
Interest of Management and Others in Material Transactions
No director or officer of the Company, nor any other insider of the Company, nor their associates or affiliates has or has had, at any time within the three most recently completed financial years ending December 31, 2023, any material interest, direct or indirect, in any transaction or proposed transaction that has materially affected or would materially affect the Company.
The Company is not party to any significant legal proceedings as of March 6, 2024.
The Company has not entered into any material contracts outside its normal course of business.
As at the date hereof, principals of McDaniel & Associates, the independent engineers for the Company, personally disclosed in certificates of qualification that they neither had nor expect to receive any common shares. The principals of McDaniel & Associates and their employees (as a group) beneficially own less than one percent of any of the Company’s securities.
Deloitte LLP is the auditor of the Company and is independent within the meaning of the Rules of Professional Conduct of the Chartered Professional Accountants of Alberta.
Vermilion Energy Inc. ■ Page 58 ■ 2023 Annual Information Form The transfer agent and registrar for the Company’s common shares is Odyssey Trust Company at its principal offices in Calgary, Alberta and Toronto, Ontario and Vancouver, British Columbia.
The following is a summary of certain risk factors relating to the business of the Company. The following information is a summary only of certain risk factors and is qualified in its entirety by reference to, and must be read in conjunction with, the detailed information appearing elsewhere in this AIF. Additional risks and uncertainties not currently known to Vermilion that it currently views as immaterial may also materially and adversely affect its business, financial condition and/or results of operations. Shareholders and potential Shareholders should carefully consider the information contained herein and, in particular, the following risk factors.
Market risks
Volatility of oil and gas prices
The Company's reserves, financial performance, financial position, and cash flows are dependent on the prices received for oil and natural gas production. Oil and natural gas prices have fluctuated materially during recent years and are determined by supply and demand factors. Supply factors can include availability (or lack thereof) of transportation capacity and production curtailments by independent producers or by OPEC members. Demand factors can be impacted by general economic conditions, supply chain requirements, environmental and other factors. Environmental and other factors include changes in weather, weather patterns, fuel conservation measures, alternative fuel requirements, increasing consumer demand for alternatives to oil and gas, and technology advances in fuel economy and energy generation devices. Shifts in supply and demand for certain commodities, products, and services may occur as climate-related risks are increasingly taken into account.
Constraints at processing facilities and/or on transportation
The Company delivers its products via gathering and processing facilities, pipeline systems, trucks, rail, and tanker. The amount of crude oi, natural gas, and natural gas liquids that the Company can produce and sell is subject to the availability, proximity, and capacity of these systems and related infrastructure. Unexpected shutdowns or curtailment of capacity of gathering and processing facilities, and pipeline systems, or an inability to secure trucks, rail, or tankers could affect the Company's production, operations, and financial results. The Company's production may flow through third party facilities which the Company does not control and these facilities may discontinue or decrease operations as result of normal course service requirements, unexpected events or otherwise. A discontinuation or decrease of operation of these third party facilities could have a material adverse effect on the Company's ability to process it's production and deliver to market. Midstream and pipeline companies may take actions to maximize their return on investment, which may in turn adversely affect producers and shippers.
Volatility of foreign exchange rates
The Company's reserves, financial performance, financial position, and cash flows are affected by prevailing foreign exchange rates. An increase in the exchange rate for the Canadian dollar versus the U.S. dollar and Euro would reduce the Canadian equivalent cash receipts for Vermilion's production. Conversely, a decrease in the exchange rate for the Canadian dollar versus the U.S. dollar and Euro would increase the Canadian equivalent cash outflows for Vermilion's operating and capital expenditures.
Volatility of market price of Common Shares
The market price of Vermilion's Common Shares may be volatile and this volatility may affect the ability of Shareholders to sell Common Shares at an advantageous price. Market price fluctuations in the common shares may be due to: the Company’s operating results or financial performance failing to meet the expectations of securities analysts or investors in any quarter; downward revision in securities analysts’ estimates; governmental regulatory action; adverse change in general market conditions or economic trends; acquisitions, dispositions or other material public announcements by the Corporation or its competitors, along with a variety of additional factors, including, without limitation, those set forth under “Forward-Looking Statements” in this AIF. In addition, the market price for securities in stock markets including Common Shares may experience significant price and trading fluctuations. These fluctuations may result in volatility in the market prices of securities that may be unrelated or disproportionate to changes in the Company's operating and financial performance.
Vermilion Energy Inc. ■ Page 59 ■ 2023 Annual Information Form Vermilion may enter into agreements to fix commodity prices, interest rates, and foreign exchange rates to offset the risks affecting the business.
Hedging arrangements
To the extent that Vermilion engages in price risk management activities to protect the Company from unfavourable fluctuations in prices and rates, the Company may also be prevented from realizing the full benefits of favourable fluctuations in prices and rates.
To the extent that risk management activities and hedging strategies are employed to address these risks, the Company would also be exposed to risks associated with such activities and strategies, including: counterparty risk, settlement risk, basis risk, liquidity risk and market risk. These risks could impact or negate any benefits of risk management activities and hedging strategies.
In addition, commodity hedging arrangements could expose the Company to the risk of financial loss if: production falls short of the hedged volumes; there is a widening of price-basis differentials between delivery points for production and the delivery point assumed in the hedge arrangements; or a sudden unexpected event materially impacts oil and natural gas prices.
Inflationary pressures
The Company’s financial position, financial performance, and cash flows are impacted by global inflation. An increase in inflation could impact the costs of to operate our business, including future capital expenditures, recurring costs to operate, and commodity prices.
Operational risks
Increase in operating costs or a decline in production level
The Company's financial performance, financial position, and cash flows are affected by the Company's operating costs and production levels. Operating costs may increase and production levels may decline at rates greater than anticipated due to unforeseen circumstances, many of which are beyond Vermilion's control.
Production levels may decline due to an inability for Vermilion to market oil and natural gas production. This could result from the availability, proximity and capacity of gathering systems, pipelines and processing facilities that Vermilion depends on in the jurisdictions in which it operates.
Operating costs could increase as a result of blowouts, environmental damage, unforeseen circumstances related to climate-change, and other unexpected and dangerous conditions which could result from a number of operating and natural hazards associated with Vermilion's operations. In addition to higher costs, Vermilion may have a potential liability to regulators and third parties as a result. Vermilion maintains liability insurance, where available, in amounts consistent with industry standards. Business interruption insurance may also be purchased for selected operations, to the extent that such insurance is commercially viable. Vermilion may become liable for damages arising from such events against which it cannot insure or against which it may elect not to insure because of high premium costs or other reasons.
Operator performance and payment delays
Continuing production from a property are dependent upon the ability of the operator of the property, and the operator may fail to perform these functions properly. Payments from production generally flow through the operator and there is a risk of delay and additional expense in receiving such revenues if the operator becomes insolvent. Although satisfactory title reviews are generally conducted in accordance with industry standards, such reviews do not guarantee or certify that a defect in the chain of title may not arise to defeat the claim of Vermilion or its subsidiaries to certain properties.
In addition to the usual delays in payment by purchasers of oil and natural gas to the operators of the properties, and by the operator to Vermilion, payments between any of such parties may also be delayed by restrictions imposed by lenders, delays in the sale or delivery of products, delays in the connection of wells to a gathering system, blowouts or other accidents, recovery by the operator of expenses incurred in the operation of the properties or the establishment by the operator of reserves for such expenses.
Weather conditions
Vermilion's operations may be impacted by changing weather conditions, which may include: changes in temperature extremes, changes in precipitation patterns (including drought and flooding), rising sea levels, and increased severity of extreme weather events such as cyclones or floods. These events can impact Vermilion's operations, causing shutdowns and increased costs. In the Netherlands, rising water levels could impact facilities below sea level and in Australia a severe cyclonic event could cause damage to the Company's Wandoo platform.
Vermilion Energy Inc. ■ Page 60 ■ 2023 Annual Information Form The oil and natural gas industry is characterized by rapid and significant technological advancements and introductions of new products and services utilizing new technologies.
Cost of new technology
Other oil and natural gas companies may have greater financial, technical and personnel resources that provide them with technological advantages and may in the future allow them to implement new technologies before Vermilion does. There can be no assurance that Vermilion will be able to respond to such competitive pressures and implement such technologies on a timely basis or at an acceptable cost. One or more of the technologies currently utilized by the Company or implemented in the future may become obsolete.
Regulatory and political risks
Tax, royalty, and other government legislation
Income tax laws, royalty and other government legislation relating to the oil and gas industry in the jurisdictions in which the Company operates may change in a manner that adversely affects Vermilion.
Vermilion is exposed to increased taxation and royalties due to windfall taxes on profits. Windfall taxes have been substantively enacted within the European Union for oil and gas companies for 2022 and/or 2023 at a minimum rate of 33% calculated on taxable profits above a 20% increase in the average yearly taxable profits as compared to 2018 to 2021. There is risk that windfall taxes or similar mechanisms will be re-enacted or similar legislation could be enacted in other jurisdictions that Vermilion operates in periods of extraordinary commodity prices.
Government regulations
Vermilion's operations are governed by many levels of governments in which jurisdiction the Company operates. Vermilion is subject to laws and regulations regarding environment, health and safety issues, lease interests, taxes and royalties, among others. Failure to comply with the applicable laws can result in significant increases in costs, penalties and even losses of operating licenses. The regulatory process involved in each of the countries in which Vermilion operates is not uniform and regulatory regimes vary as to complexity, timeliness of access to, and response from, regulatory bodies and other matters specific to each jurisdiction. If regulatory approvals or permits are delayed, not obtained, or revoked, there can also be delays or abandonment of projects, decreases in production and increases in costs, and Vermilion may not be able to fully execute its strategy. Governments may also amend or create new legislation and regulatory bodies may also amend regulations or impose additional requirements which could result in reduced production and increased capital, operating and compliance costs.
Policy and legal risks
Policy actions that attempt to constrain actions that contribute to the adverse effects of climate change or policy actions that seek to promote adaptation to climate change continue to evolve. Policy changes could include implementing carbon-pricing mechanisms to reduce GHG emissions, shifting energy-efficient solutions, and promoting more sustainable land-use practices. The risks and financial impact of policy changes depend on the nature and timing of the policy change.
Vermilion may be exposed to increased litigation risk relating to climate change. The oil and gas industry has seen an increase in climate-related litigation claims being brought before the courts by property owners, municipalities, and public interest organizations. Some of these claims include the failure of organizations to mitigate the impacts of climate change, failure to adapt to climate change, and the insufficiency of disclosure around material financial risks. As the value of loss and damage arising from climate change increases, litigation risk will also grow.
Political events and terrorist attacks
Political events throughout the world that cause disruptions in the supply of oil affect the marketability and price of oil and natural gas acquired or discovered by Vermilion. Political developments arising in the countries in which Vermilion operates have a significant impact on the price of oil and natural gas.
Vermilion’s oil and natural gas properties, wells and facilities could be subject to a terrorist attack. If any of Vermilion’s properties, wells or facilities or any infrastructure on which the Company relies are the subject of a terrorist attack, such attack may have a material adverse effect on Vermilion’s financial performance, financial position, and cash flows.
Vermilion Energy Inc.
Financing risks
Discretionary nature of dividends and share buybacks
■ Page 61 ■ 2023 Annual Information Form The declaration and payment (including the amount thereof) of future cash dividends and the amount of share buybacks under the NCIB, if any, is subject to the discretion of the Board of Directors of the Company and may vary depending on a variety of factors and conditions, including the satisfaction of the liquidity and solvency tests under the ABCA for the declaration and payment of dividends and the amount of the Company's cash flows. The Company's cash flows may be impacted by risks affecting the Company's business including: fluctuations in commodity prices, foreign exchange and interest rates; production and sales volume levels; production costs; capital expenditure requirements; royalty and tax burdens; external financing availability, and debt service requirements.
Depending on these and other factors considered relevant to the declaration and payment of dividends and the authorization of share buybacks by the Board of Directors and management of the Company, the Company may change its dividend policy and (or) approach to the share buybacks from time to time. Any reduction of dividends and (or) share buybacks may adversely affect the market price or value of Common Shares.
Additional financing
Vermilion’s credit facility and any replacement credit facility may not provide sufficient liquidity. The amounts available under Vermilion's credit facility may not be sufficient for future operations, or Vermilion may not be able to obtain additional financing on attractive economic terms, if at all.
To the extent that external sources of capital, including the issuance of additional Common Shares, become limited or unavailable, Vermilion's ability to make the necessary capital investments to maintain or expand its oil and natural gas reserves may be impaired. To the extent the Company is required to use cash flow to finance capital expenditures or property acquisitions, the level of cash available that may be declared payable as dividends will be reduced.
Debt service
Vermilion may finance a significant portion of its operations through debt. Amounts paid in respect of interest and principal on debt incurred by Vermilion may impair Vermilion's ability to satisfy its other obligations. Variations in interest rates and scheduled principal repayments could result in significant changes in the amount required to be applied to debt service before payment by Vermilion of its debt obligations.
Lenders may be provided with security over substantially all of the assets of Vermilion and its Subsidiaries. If Vermilion becomes unable to pay its debt service charges or otherwise commits an event of default such as bankruptcy, a lender may be able to foreclose on or sell the assets of Vermilion and/or its Subsidiaries.
Variations in interest rates and foreign exchange rates
An increase in interest rates could result in a significant increase in the amount the Company pays to service debt. A decrease in the exchange rate of the Canadian dollar versus the US dollar would result in higher interest and ultimate principle payment on the Company's Senior Unsecured Notes.
Environmental risks
Environmental legislation
The oil and natural gas industry is subject to environmental regulation pursuant to local, provincial, state and federal legislation. A breach of such legislation may result in the imposition of fines, the issuance of clean up orders in respect of Vermilion or its assets, or the loss or suspension of regulatory approvals. Such legislation may include carbon taxes, enhanced emissions reporting obligations, mandates on the equipment specifications, and emissions regulations. Such legislation may be changed to impose higher standards and potentially more costly obligations on Vermilion. In addition, such legislation may inhibit Vermilion's ability to operate the Company's assets and may make it more difficult for Vermilion to compete in the acquisition of new property rights. Presently, the Company does not believe the financial impact of these regulations on capital expenditures and earnings will be material. However, the Company actively monitors and assesses its exposure to this legislation.
Vermilion expects to incur abandonment and reclamation costs in the ordinary course of business as existing oil and gas properties are abandoned and reclaimed. These costs may materially differ from the Company's estimates due to changes in environmental regulations.
Vermilion Energy Inc. ■ Page 62 ■ 2023 Annual Information Form Vermilion's exploration and production facilities and other operations and activities emit some amount of greenhouse gases, which may be subject to legislation regulating emissions of greenhouse gases.
This may result in a requirement to reduce emissions or emissions intensity from Vermilion's operations and facilities. It is possible that future regulations may require further reductions of emissions or emissions intensity.
Hydraulic fracturing regulations
Hydraulic fracturing involves the injection of water, sand and small amounts of additives under pressure into rock formations to stimulate oil and natural gas production. Hydraulic fracturing is used to produce commercial quantities of oil and natural gas from reservoirs that were previously unproductive. Hydraulic fracturing has featured prominently in recent political, media and activist commentary on the subject of water usage and environmental damage. Any new laws, regulations or permitting requirements regarding hydraulic fracturing could lead to operational delays, increased operating costs, third party or governmental claims, and could increase Vermilion's costs of compliance and doing business as well as delay the development of oil and natural gas resources from shale formations, which are not commercial without the use of hydraulic fracturing. Restrictions on hydraulic fracturing could also reduce the amount of oil and natural gas that the Company is ultimately able to produce from its reserves, as well as increase costs.
With activist groups expressing concern about the impact of hydraulic fracturing on the environment and water supplies, Vermilion's corporate reputation may be negatively affected by the negative public perception and public protests against hydraulic fracturing. In addition, concerns regarding hydraulic fracturing may result in changes in regulations that delay the development of oil and natural gas resources and adversely affect Vermilion's costs of compliance and reputation. Changes in government may result in new or enhanced regulatory burdens in respect of hydraulic fracturing which could affect Vermilion's business.
Climate change
In addition to other climate-related risks discussed elsewhere in this AIF, Vermilion faces transition risks and physical risks, which are described in detail in the December 31, 2023 MD&A available on SEDAR+ at www.sedarplus.ca.
Transition risks are risks that relate to the transition to a lower-carbon economy. Transition risks impact the volatility of oil and gas prices (as consumer demand for oil and gas may decrease); environmental legislation and hydraulic fracturing regulations (which may delay or restrict the development of oil and gas); the ability to obtain additional financing (as sources of financing for oil and gas development may become more restricted); and the reliance on key personnel, management, and labour (as the workforce may transition to other sources of energy development). Practices and disclosures relating to environmental matters, including climate change, are attracting increasing scrutiny by stakeholders. Vermilion’s response to addressing environmental matters can impact the Company’s reputation and affect the Company's ability to hire and retain employees; to compete for reserve acquisitions, exploration leases, licenses and concessions; and to receive regulatory approvals required to execute operating programs.
Physical risks relate to the physical impact of climate change, which can be event driven (acute) or longer-term shifts (chronic) in climate patterns. Physical risks can have financial implications for the Company, such as direct damage to assets and indirect impacts from production disruptions. Physical risks may also increase Vermilion's operating costs.
Acquisition and expansion risks
Competition
Vermilion actively competes for reserve acquisitions, exploration leases, licenses, concessions and skilled industry personnel with a substantial number of other oil and gas companies, some of which have significantly greater financial resources than Vermilion. Vermilion's competitors include major integrated oil and natural gas companies and numerous other independent oil and natural gas companies and individual producers and operators.
Vermilion's ability to successfully bid on and acquire additional property rights, to discover reserves, to participate in drilling opportunities and to identify and enter into commercial arrangements with customers will be dependent upon developing and maintaining close working relationships with its future industry partners and joint operators and its ability to select and evaluate suitable properties and to consummate transactions in a highly competitive environment.
Vermilion Energy Inc. ■ Page 63 ■ 2023 Annual Information Form The operations and expertise of Vermilion's management are currently focused primarily on oil and natural gas production, exploration and development in three geographical regions, North America, Europe and Australia.
International operations and future geographical/industry expansion
In the future Vermilion may acquire or move into new industry related activities, enter into new geographical areas, or acquire different energy related assets. These actions may result in unexpected risks or alternatively, significantly increase the Company's exposure to one or more existing risk factors.
Acquisition assumptions
When making acquisitions, Vermilion estimates the future performance of the assets to be acquired. These estimates are subject to inherent risks associated with predicting the future performance of those assets. These estimates may not be realized over time. As such, assets acquired may not possess the value Vermilion attributed to them.
Failure to realize anticipated benefits of prior acquisitions
Vermilion may complete one or more acquisitions for various strategic reasons including to strengthen its position in the oil and natural gas industry and to create the opportunity to realize certain benefits. In order to achieve the benefits of any future acquisitions, Vermilion will be dependent upon its ability to successfully consolidate functions and integrate operations, procedures and personnel in a timely and efficient manner and to realize the anticipated growth opportunities and synergies from combining the acquired assets and operations with those of the Company. The integration of acquired assets and operations requires the dedication of management effort, time and resources, which may divert management's focus and resources from other strategic opportunities and from operational matters during the process. The integration process may result in the disruption of ongoing business and customer relationships that may adversely affect Vermilion's ability to achieve the anticipated benefits of such prior acquisitions.
Reserve estimates
Reserves and estimated future net revenue to be derived from reserves are estimates and have been independently evaluated by McDaniel & Associates. The estimation of reserves is a complex process and requires significant judgment. Actual production and ultimate reserves will vary from those estimates and these variations may be material.
Assumptions incorporated into the estimation of reserves are based on information available when the estimate was prepared. These assumptions are subject to change and many are beyond the Company's control. These assumptions include: initial production rates; production decline rates; ultimate recovery of reserves; timing and amount of capital expenditures; marketability of production; future prices of crude oil and natural gas; operating costs; well abandonment costs; royalties, taxes, and other government levies that may be imposed over the producing life of the reserves.
In addition, estimates of reserves that may be developed and produced in the future are often based on methods other than actual production history, including: volumetric calculations, probabilistic methods, and upon analogy to similar types of reserves. Estimates based on these methods are generally less reliable than those based on actual production history. Subsequent evaluation of the same reserves based upon production history will result in variations, which may be material, in the estimated reserves. As such, reserve estimates may require revision based on actual production experience.
The present value of estimated future net revenue referred to in this annual information form should not be construed as the fair market value of estimated crude oil and natural gas reserves attributable to the Company's properties. The estimated discounted future revenue from reserves are based upon price and cost estimates which may vary from actual prices and costs and such variance could be material. Actual future net revenue will also be affected by factors such as the amount and timing of actual production, supply and demand for crude oil and natural gas, curtailments or increases in consumption by purchasers and changes in governmental regulations and taxation.
Other risks
Cyber security
Vermilion manages cyber security risk by ensuring appropriate technologies, processes and practices are effectively designed and implemented to help prevent, detect and respond to threats as they emerge and evolve. The primary risks to Vermilion include, loss of data, destruction or corruption of data, compromising of confidential customer or employee information, leaked information, disruption of business, theft or extortion of funds, regulatory infractions, loss of competitive advantage and damage to the Company's reputation. Vermilion relies upon a variety of advanced controls as protection from such attacks including:
Vermilion Energy Inc. ■ Page 64 ■ 2023 Annual Information Form Incident response processes are in place to isolate and control potential attacks.
a) |
Enterprise class firewall infrastructure, secure network architecture and anti-malware defense systems to protect against network intrusion, malware infection and data loss. |
b) |
Regularly conducted comprehensive third party reviews and vulnerability assessments to ensure that information technology systems are up-to-date and properly configured, to reduce security risks arising from outdated or misconfigured systems and software. |
c) |
Disaster recovery planning, ongoing monitoring of network traffic patterns to identify potential malicious activities or attacks. |
Data backup and recovery processes are in place to minimize risk of data loss and resulting disruption of business. Through ongoing vigilance and regular employee awareness, Vermilion has not experienced a cyber security event of a material nature in the last three years. As it is difficult to quantify the significance of such events, cyber attacks such as, security breaches of company, customer, employee, and vendor information, as well as hardware or software corruption, failure or error, telecommunications system failure, service provider error, intentional or unintentional personnel actions, malicious software, attempts to gain unauthorized access to data and other electronic security breaches that could lead to disruptions in systems, unauthorized release of confidential or otherwise protected information and the corruption of data, may in certain circumstances be material and could have an adverse effect on Vermilion’s business, financial condition and results of operations. As result of the unpredictability of the timing, nature and scope of disruptions from such attacks, Vermilion could potentially be subject to production downtimes, operational delays, the compromising of confidential or otherwise protected information, destruction or corruption of data, security breaches, other manipulation or improper use of its systems and networks or financial losses, any of which could have a material adverse effect on Vermilion’s competitive position, financial condition or results of operations.
Accounting adjustments
The presentation of financial information in accordance with IFRS requires that management apply certain accounting policies and make certain estimates and assumptions which affect reported amounts in Vermilion’s consolidated financial statements. The accounting policies may result in non-cash charges to net income and write-downs of net assets in the consolidated financial statements and such adjustments may be viewed unfavourably by the market and may result in an inability to borrow funds or a decline in price of Common Shares.
Ineffective internal controls
Effective internal controls are necessary for Vermilion to provide reliable financial reports and to help prevent fraud. Although the Company has undertaken and will undertake a number of procedures in order to help ensure the reliability of its financial reports, including those that may be imposed on Vermilion under Canadian Securities Laws and applicable U.S. federal and state securities laws, Vermilion cannot be certain that such measures will ensure that the Company will maintain adequate control over financial processes and reporting. Failure to implement required new or improved controls, or difficulties encountered in their implementation, could harm Vermilion's results of operations or cause the Company to fail to meet its reporting obligations. Additionally, implementing and monitoring effective internal controls can be costly. If Vermilion or its independent auditors discover a material weakness, the disclosure of that fact, even if quickly remedied, could reduce the market's confidence in Vermilion's consolidated financial statements and may result in a decline in the price of Common Shares.
Reliance on key personnel, management, and labour
Vermilion's success depends in large measure on certain key personnel. The loss of the services of such key personnel may have a material adverse effect on the Company's business, financial condition, results of operations and prospects. Vermilion does not have any key person insurance in effect. The contributions of Vermilion's existing management team to immediate and near term operations are likely to be of central importance. In addition, the labour force in certain areas in which the Company operates is limited and the competition for qualified personnel in the oil and natural gas industry is intense. Vermilion expects that similar projects or expansions will proceed in the same area during the same time frame as the Company's projects. Vermilion's projects require experienced employees, and such competition may result in increases in compensation paid to such personnel or in a lack of qualified personnel. There can be no assurance that the Company will be able to continue to attract and retain all personnel necessary for the development and operation of the business.
Potential conflicts of interest
Circumstances may arise where members of the board of directors or officers of Vermilion are directors or officers of companies which compete with Vermilion. No assurances can be given that opportunities identified by such persons will be provided to Vermilion.
Vermilion Energy Inc. ■ Page 65 ■ 2023 Annual Information Form During 2022, Russian military forces invaded Ukraine resulting in a war between the two countries.
Ukraine War / Middle East conflict
The ongoing conflict between countries has impacted the supply of oil and gas from the region and has resulted in countries throughout the world imposing financial and trade sanctions against Russia which have had macroeconomic effects.
The risks disclosed in the Risk Factors section above may be exacerbated as a result of the Ukraine war, including: market risks including volatility of oil and gas prices, volatility of foreign exchange rates, volatility of market price of common shares, hedging arrangements; regulatory and political risks including tax, royalty, and other government legislation; financing risks including additional financing, debt service, variations in interest rates and foreign exchange rates; acquisition and expansion risks including international operations and future geographical/industry expansion, acquisition assumptions, failure to realize anticipated benefits of prior acquisitions.
In addition to the Ukraine war, hostilities in the Middle East could adversely affect the global economy and impact oil and gas prices.
Additional information relating to the Company may be found on SEDAR+ at www.sedarplus.ca under Vermilion’s SEDAR+ profile. Additional information related to the remuneration and indebtedness of the directors and officers of the Company, and the principal holders of common shares and Rights to purchase common shares and securities authorized for issuance under the Company's equity compensation plans, where applicable, are contained in the information circular of the Company in respect of its most recent annual meeting of Shareholders involving the election of directors. Additional financial information is provided in the Company's audited financial statements and management's discussion and analysis for the year ended December 31, 2023.
Vermilion Energy Inc. ■ Page 66 ■ 2023 Annual Information Form To the Board of Directors of Vermilion Energy Inc. (the "Company"):
REPORT ON RESERVES DATA BY INDEPENDENT QUALIFIED RESERVES EVALUATOR OR AUDITOR (FORM 51-101F2)
1. |
We have evaluated the Company’s reserves data as at December 31, 2023. The reserves data are estimates of proved reserves and probable reserves and related future net revenue as at December 31, 2023, estimated using forecast prices and costs. |
2. |
The reserves data are the responsibility of the Company’s management. Our responsibility is to express an opinion on the reserves data based on our evaluation. |
3. |
We carried out our evaluation in accordance with standards set out in the Canadian Oil and Gas Evaluation Handbook as amended from time to time (the "COGE Handbook") maintained by the Society of Petroleum Evaluation Engineers (Calgary Chapter). |
4. |
Those standards require that we plan and perform an evaluation to obtain reasonable assurance as to whether the reserves data are free of material misstatement. An evaluation also includes assessing whether the reserves data are in accordance with principles and definitions presented in the COGE Handbook. |
5. |
The following table shows the net present value of future net revenue (before deduction of income taxes) attributed to proved plus probable reserves, estimated using forecast prices and costs and calculated using a discount rate of 10 percent, included in the reserves data of the Company evaluated for the year ended December 31, 2023, and identifies the respective portions thereof that we have evaluated and reported on to the Company's board of directors: |
|
|
|
|
|
Location of Reserves |
|
|
|
Net Present Value of Future Net Revenue |
||||
Independent Qualified Reserves |
|
Effective Date of |
|
(Country or Foreign |
|
|
|
(before income taxes, 10% discount rate - $M) |
|||||
Evaluator |
|
Evaluation Report |
|
Geographic Area) |
|
Audited |
|
Evaluated |
|
Reviewed |
|
Total |
|
McDaniel & Associates Consultants Ltd |
|
|
December 31, 2023 |
|
Australia |
|
— |
|
418,618 |
|
— |
|
418,618 |
McDaniel & Associates Consultants Ltd |
|
|
December 31, 2023 |
|
Canada |
|
— |
|
2,651,014 |
|
— |
|
2,651,014 |
McDaniel & Associates Consultants Ltd |
|
|
December 31, 2023 |
|
CEE |
|
— |
|
115,814 |
|
— |
|
115,814 |
McDaniel & Associates Consultants Ltd |
|
|
December 31, 2023 |
|
France |
|
— |
|
704,419 |
|
— |
|
704,419 |
McDaniel & Associates Consultants Ltd |
|
|
December 31, 2023 |
|
Germany |
|
— |
|
851,047 |
|
— |
|
851,047 |
McDaniel & Associates Consultants Ltd |
|
|
December 31, 2023 |
|
Ireland |
|
— |
|
1,081,824 |
|
— |
|
1,081,824 |
McDaniel & Associates Consultants Ltd |
|
|
December 31, 2023 |
|
Netherlands |
|
— |
|
271,739 |
|
— |
|
271,739 |
McDaniel & Associates Consultants Ltd |
|
|
December 31, 2023 |
|
United States |
|
— |
|
368,300 |
|
— |
|
368,300 |
Total |
|
|
|
|
|
|
— |
|
6,462,773 |
|
— |
|
6,462,773 |
6. |
In our opinion, the reserves data respectively evaluated by us have, in all material respects, been determined and are in accordance with the COGE Handbook, consistently applied. We express no opinion on the reserves data that we reviewed but did not audit or evaluate. |
7. |
We have no responsibility to update our reports referred to in paragraph 5 for events and circumstances occurring after the effective date of our reports. |
8. |
Because the reserves data are based on judgments regarding future events, actual results will vary and the variations may be material. |
EXECUTED as to our reports referred to above:
McDaniel & Associates Consultants Ltd., Calgary, Alberta, Canada, March 5, 2024
"Michael J. Verney" |
|
|
|
Michael J. Verney, P.Eng. |
|
|
|
Executive Vice President |
|
|
Vermilion Energy Inc.
REPORT OF MANAGEMENT AND DIRECTORS ON OIL AND GAS DISCLOSURE (FORM 51-101F3)
Terms to which a meaning is ascribed in National Instrument 51-101 have the same meaning herein.
■ Page 67 ■ 2023 Annual Information Form Management of Vermilion Energy Inc. (the "Company") are responsible for the preparation and disclosure of information with respect to the Company's oil and gas activities in accordance with securities regulatory requirements. This information includes reserves data and related future net revenue as at December 31, 2023, estimated using forecast prices and costs.
An independent qualified reserves evaluator has evaluated the Company's reserves data. The report of the independent qualified reserves evaluator is presented in Appendix A to the Annual Information Form of the Company for the year ended December 31, 2023.
The Independent Reserves Committee of the Board of Directors of the Company has:
(a) |
reviewed the Company's procedures for providing information to the independent qualified reserves evaluator; |
(b) |
met with the independent qualified reserves evaluator to determine whether any restrictions affected the ability of the independent qualified reserves evaluator to report without reservation; and |
(c) |
reviewed the reserves data with management and the independent qualified reserves evaluator. |
The Independent Reserves Committee of the Board of Directors has reviewed the Company's procedures for assembling and reporting other information associated with oil and gas activities and has reviewed that information with management. The Board of Directors has, on the recommendation of the Audit and Independent Reserves Committees, approved:
(a) |
the content and filing with securities regulatory authorities of Form 51-101F1 containing reserves data and other oil and gas information; |
(b) |
the filing of Form 51-101F2 which is the report of the independent qualified reserves evaluator on the reserves data; and |
(c) |
the content and filing of this report. |
Because the reserves data is based on judgments regarding future events, actual results will vary and the variations may be material.
“Dion Hatcher” |
|
Dion Hatcher, President and Chief Executive Officer |
|
|
|
"Lars Glemser" |
|
Lars Glemser, Vice President and Chief Financial Officer |
|
|
|
“Robert Michaleski” |
|
Robert Michaleski, Director and Chairman of the Board |
|
|
|
“William Roby” |
|
William Roby, Director |
|
|
|
March 6, 2024 |
|
Vermilion Energy Inc. ■ Page 68 ■ 2023 Annual Information Form The primary function of the Audit Committee (the "Committee") is to assist the Board of Directors (the "Board") of Vermilion Energy Inc. (the "Corporation") in its oversight role with respect to matters including:
i. |
the Corporation’s accounting and financing reporting processes and the audit of the Corporation’s financial statements; |
ii. |
the quality and integrity of financial information; |
iii. |
the Corporations’ compliance with legal and regulatory requirements; |
iv. |
the effectiveness of the Corporation’s systems of disclosure controls and internal controls regarding finance, accounting, legal, regulatory compliance and ethics; |
v. |
the effectiveness or risk management and compliance practices; |
vi. |
recommend the independent external auditors’ appointment (the “auditor”) performance, qualifications and independence; |
vii. |
related party transactions; and |
viii. |
the preparation of a report of the Committee to be included in the annual management proxy circular of the Corporation, |
with management of the Corporation responsible for the Corporation's financial reporting, information systems, risk management, disclosure controls, internal controls and compliance.
1. |
Committee Structure and Operations |
1.1 |
The Committee shall consist of not less than three directors and not more than five directors. |
1.2 |
Each member of the Committee shall satisfy the applicable independence(1) and experience requirements of the laws governing the Corporation and the applicable rules of any stock exchange on which the Corporation’s securities are listed. |
1.3 |
All Committee members shall be "financially literate"(2), and at least one member shall have "accounting or related financial expertise" as such terms are interpreted by the Board in its business judgment in light of, and in accordance with, the requirements or guidelines for audit committee service under applicable securities laws and rules of any stock exchange on which the Corporation’s securities are listed. |
1.4 |
No Committee member shall serve on the audit committees of more than two other public issuers without prior determination by the Board that such simultaneous service would not impair the member's independence or the ability of such member to serve effectively on the Committee. |
1.5 |
The Committee shall meet at least four times each year. |
1.6 |
The Committee shall meet in-camera without management present with: (i) the external auditor, (ii) the internal auditor; and (iii) the members of the Committee. |
2. |
Financial Information and Reporting |
2.1 |
The Committee will review and recommend for approval to the Board financial information that will be made publicly available. This includes the responsibility to: |
i. |
Review and recommend approval of the Corporation's annual financial statements and related MD&A and earnings press releases. |
ii. |
Review and recommend approval of the Corporation's quarterly financial statements and related MD&A and earnings press releases. |
iii. |
Ensure adequate procedures are in place for the review of the public disclosure of financial information extracted or derived from the Corporation's filed financial reporting, other than the public disclosure referred to in items (i) and (ii) above, and periodically assess the adequacy of those procedures. |
iv. |
Review and recommend approval by the Board of the Corporation's Annual Information Form and any financing disclosure documents (as required). |
1 |
Committee members must be “independent”, as defined in Sections 1.4 and 1.5 of National Instrument 52-110 and ‘‘independent’’ under the requirements of Rule 10A-3 of the Securities Exchange Act of 1934, as amended, and Section 303A.06 of the NYSE Listed Company Manual. |
2 |
The Board has adopted the NI 52-110 definition of "financial literacy", which is an individual is financially literate if he or she has the ability to read and understand a set of financial statements that present a breadth and level of complexity of accounting issues that are generally comparable to the breadth and complexity of the issues that can reasonably be expected to be raised by the issuer's financial statements. |
Vermilion Energy Inc. ■ Page 69 ■ 2023 Annual Information Form
2.2 |
Review and consider: |
i. |
The critical accounting policies and financial reporting practices used by the Corporation (including the appropriateness thereof). |
ii. |
Issues regarding accounting principles and financial statement presentations, including any significant proposed changes in financial reporting and accounting principles, policies and practices to be adopted by the Corporation. |
iii. |
Financial reporting issues and judgments made in connection with the preparation of the financial statements, including analyses of the effects of alternative International Financial Reporting Standards (the “IFRS”) methods on the financial statements of the Corporation and any other opinions sought by management from an independent or other audit firm or advisor with respect to the accounting treatment of a particular item. |
iv. |
Any management letter or schedule of unadjusted differences provided by the auditor and the Corporation’s response to that letter and other material written communication between auditor and management. |
v. |
Any problems, difficulties or differences encountered in the course of the audit work including any disagreements with management or restrictions on the scope of the auditor’s activities or on access to requested information and management’s response thereto. |
vi. |
Any new or pending developments in accounting and reporting standards that may affect the Corporation. |
vii. |
The effect of regulatory and accounting initiatives, as well as any off-balance sheet structures on the financial statements of the Corporation and other financial disclosures. |
viii. |
Any reserves, accruals, provisions or estimates that may have a material effect upon the financial statements of the Corporation. |
ix. |
The use of special purpose entities and the business purpose and economic effect of off-balance sheet transactions, arrangements, obligations, guarantees and other relationships of Corporation and their impact on the reported financial results of the Corporation. |
x. |
The use of any “pro forma” or “adjusted” information not in accordance with generally accepted accounting principles. |
xi. |
Any litigation, claim or contingency, including tax assessments, that could have a material effect upon the financial position of the Corporation, and the manner in which these matters may be, or have been, disclosed in the financial statements; and |
xii. |
Any other accounting, tax and financial aspects of the operations of the Corporation as the Committee considers appropriate. |
3.Oversight of Independent External Auditor
3.1 |
Recommend to the Board for approval the auditor to be appointed auditor of the Corporation or successor auditor of the Corporation in the event of the termination, resignation or removal of the auditor. |
3.2 |
Recommend to the Board the remuneration of the auditor. |
3.3 |
Review and approve the scope and terms of all audit engagements. |
3.4 |
Satisfy itself that the audit plan proposed by the auditor is risk-based and addresses all the relevant activities. |
3.5 |
Pre-approve all audit services and permitted non-audit services (including fees terms and conditions for the performance of such services) to be provided by the auditor. |
3.6 |
Oversee the performance by the auditor of its engagement and report to the Board on relevant matters, including but not limited to: |
i. |
The Corporation’s quarterly and annual financial statements and the auditor’s reporting in respect thereof including the appropriateness of policies and underlying estimates. |
ii. |
Any significant accounting or financial reporting issues. |
iii. |
Any material issues or potentially material issues, either specific to the Corporation or to the financial reporting environment in general, identified by the auditor. |
iv. |
The resolution of any disagreements between management and the auditor regarding financial reporting. |
3.7 |
Evaluate the qualifications, performance and independence of the auditor, including: |
i. |
Review and evaluate the proposed lead audit partner. |
ii. |
Ensure the rotation of the lead audit partner occurs in accordance with applicable requirements. |
iii. |
Receive on periodic basis a written statement from the auditors confirming its independence, including a list of relationships between the auditor and the Corporation that may reasonably be expected to impact the independence of the auditor. |
iv. |
Discuss with the auditor any relationships or services that the auditor reasonably believes may affect the objectivity and independence of the auditors, and recommend to the Board appropriate action in response thereto. |
v. |
Annually request and review a report from the auditor regarding: |
a) |
the auditor’s quality-control procedures; |
b) |
any material issues raised by the most recent quality-control review, or peer review, of the auditor, or by any inquiry or investigation by governmental or professional authorities within the preceding five years respecting one or more independent audits carried out by the firm; and |
c) |
any steps taken in respect of any such issues. |
3.8 |
Ensure the auditor receives, during its term of office, notice of every meeting of the Committee and, if so requested by the Chair of the Committee, attends such meetings. |
3.9 |
Meet with auditor in camera without management present. |
Vermilion Energy Inc. ■ Page 70 ■ 2023 Annual Information Form
4.Risk Management Oversight
4.1 |
The Committee is responsible for the oversight of management’s identification, and evaluation, of the Corporation’s principal risks, and the implementation of appropriate policies, processes and systems to manage or mitigate the risks within the Corporation’s risk framework. |
4.2 |
The Committee shall: |
i. |
Oversee, and ensure management reports annually to Board in respect of: |
a) |
the Corporation's principal risks and overall risk profile; |
b) |
the Corporation's strategies in addressing its risk profile; |
c) |
the processes, policies, procedures and controls in place to manage or mitigate the Corporation's principal risks; and |
d) |
the overall effectiveness of the enterprise risk management process and program. |
ii. |
Oversee the Corporation's credit and counterparty, market and financial, political and strategic, and repatriation risks. |
iii. |
Receive and review managements' annual risk register update including an update on residual risks. |
iv. |
Review the Corporation's annual insurance program, including the risk retention philosophy, potential exposure and corporate liability protection programs and ensure management reports to the Board in respect thereof. |
5.Internal Controls
5.1 |
Oversee, and review and approve as required: |
i. |
Processes adopted by management for establishing effective internal control over financial reporting (the "ICFR") and disclosure controls and procedures (the "DC&P"). |
ii. |
The adequacy and effectiveness of the Corporation’s accounting, ICFR and DC&P policies and procedures and management information systems. |
iii. |
Changes to the Corporation's ICFR, DC&P and management information systems. |
iv. |
Oversee management's certification of ICFR and DC&P. |
v. |
Spending authority and approval limits. |
6.Information Technology – Cyber Security
6.1 |
Receive annually (or more frequently as the Committee may request) a system status update with respect to the Corporation's core IT operating systems. |
6.2 |
Review annually (or more frequently as the Committee may request) the Corporation's cyber security programs and their effectiveness. |
6.3 |
Receive as frequently as the Committee may request an update on the Corporation's compliance program for cyber threats and security. |
6.4 |
Ensure significant breaches are reported in accordance with best governance practices. |
7. Environment, Social and Governance (“ESG”)
7.1 |
In collaboration with the Sustainability Committee, review and assess ESG-related risks to the Corporation |
7.2 |
Regularly review the Corporations’ risk management policies and processes for, and approach to, addressing ESG-related risks. |
7.3 |
Review ESG disclosure. |
8.General Compliance
8.1Oversee, and periodically review, procedures for:
i. |
The confidential, anonymous submission by employees of concerns regarding questionable accounting or auditing matters or other matters that could negatively affect the Corporation, such as violations of the Code of Business Conduct and Ethics. |
ii. |
Treatment of complaints regarding accounting, internal accounting controls, or auditing matters. |
iii. |
The review and approval of the President and Chairman’s expenses and perquisites. |
iv. |
The review of any transactions involving the Corporation in which directors or officers of the Corporation have a material interest. |
Vermilion Energy Inc. ■ Page 71 ■ 2023 Annual Information Form
Duties and Responsibilities |
Meeting |
|||
|---|---|---|---|---|
|
|
|||
|
Q1 |
Q2 |
Q3 |
Q4 |
2. Financial Information and Reporting |
|
|
|
|
2.1 Responsibilities include: |
|
|
|
|
i. Review and recommend approval of the Corporation's annual financial statements, and related MD&A and earnings press releases. |
✓ |
|
|
|
ii. Review and recommend Board approval of quarterly financial statements, MD&A and press release. |
|
✓ |
✓ |
✓ |
iii. Ensure adequate procedures are in place for the review of the public disclosure of financial information extracted or derived from the Corporation's filed financial reporting, other than the public disclosure referred to in items (i) and (ii) above, and periodically assess the adequacy of those procedures. |
✓ |
✓ |
✓ |
✓ |
iv. Review Annual Information Form |
✓ |
|
|
|
2.2 Review and consider: |
|
|
|
|
i. The critical accounting policies and financial reporting practices used by the Corporation, including the appropriateness thereof. |
As needed. |
|||
iIi. Issues regarding accounting principles and financial statement presentations, including any significant proposed changes in financial reporting and accounting principles, policies and practices to be adopted by the Corporation. |
As needed. |
|||
iii. Financial reporting issues and judgments made in connection with the preparation of the financial statements, including analyses of the effects of alternative IFRS methods on the financial statements of the Corporation and any other opinions sought by management from an independent or other audit firm or advisor with respect to the accounting treatment of a particular item. |
As needed. |
|||
iv. Any management letter or schedule of unadjusted differences provided by the external auditor and the Corporation’s response to that letter and other material written communication between the external auditor and management. |
As needed. |
|||
v. Any problems, difficulties or differences encountered in the course of the audit work including any disagreements with management or restrictions on the scope of the external auditor’s activities or on access to requested information and management’s response thereto. |
As needed. |
|||
vi. Any new or pending developments in accounting and reporting standards that may affect the Corporation. |
As needed. |
|||
vii. The effect of regulatory and accounting initiatives, as well as any off-balance sheet structures on the financial statements of the Corporation and other financial disclosures. |
As needed. |
|||
viii. Any reserves, accruals, provisions or estimates that may have a material effect upon the financial statements of the Corporation. |
As needed. |
|||
ix. The use of special purpose entities and the business purpose and economic effect of off balance sheet transactions, arrangements, obligations, guarantees and other relationships of Corporation and their impact on the reported financial results of the Corporation. |
As needed. |
|||
x. The use of any “pro forma” or “adjusted” information not in accordance with generally accepted accounting principles. |
As needed. |
|||
xi. Any litigation, claim or contingency, including tax assessments, that could have a material effect upon the financial position of the Corporation, and the manner in which these matters may be, or have been, disclosed in the financial statements. |
As needed. |
|||
xii. Any other accounting, tax and financial aspects of the operations of the Corporation as the Committee considers appropriate. |
As needed. |
|||
|
|
|||
3. Independent External Auditor |
|
|
|
|
3.1 Recommend to the Board for approval the independent auditor to be appointed as auditor of the Corporation or successor auditor of the Corporation in the event of the termination, resignation or removal of the auditor. |
✓ |
|
|
|
3.2 Recommend to the Board the remuneration of the independent auditor. |
✓ |
|
|
|
3.3 Review and approve the scope and terms of all audit engagements. |
✓ |
|
|
|
3.4 Satisfy itself that the audit plan proposed by the auditor is risk-based and addresses all the relevant activities. |
As needed. |
|||
3.5 Pre-approve all audit services and permitted non-audit services (including fees terms and conditions for the performance of such services) to be provided by the independent auditor. |
As needed. |
|||
3.6 Oversee the performance of independent external auditor and report to the Board on the relevant items. |
✓ |
✓ |
✓ |
✓ |
i. The Corporation’s quarterly and annual financial statements and the auditor’s reporting in respect thereof including the appropriateness of policies and underlying estimates. |
✓ |
✓ |
✓ |
✓ |
ii. Any significant accounting or financial reporting issues. |
✓ |
✓ |
✓ |
✓ |
iii. Any material issues or potentially material issues, either specific to the Corporation or to the financial reporting environment in general identified by the auditor. |
✓ |
✓ |
✓ |
✓ |
iv. The resolution of any disagreements between management and external auditor regarding financial reporting. |
✓ |
✓ |
✓ |
✓ |
3.7 Evaluate the qualifications, performance and independence of the auditor |
|
|
|
|
i.Review and evaluate the proposed lead audit partner. |
✓ |
✓ |
✓ |
✓ |
ii. Ensure the rotation of the lead audit partner occurs in accordance with applicable requirements. |
✓ |
✓ |
✓ |
✓ |
iii. Receive on periodic basis a written statement from the external auditors confirming its independence, including a list of relationships between the external auditor and the Corporation that may reasonably be expected to impact the independence of the external auditor. |
✓ |
✓ |
✓ |
✓ |
iv. Discuss with the external auditor any relationships or services that the external auditor reasonably believes may affect the objectivity and independence of the external auditors, and recommend to the Board appropriate action in response thereto. |
✓ |
✓ |
✓ |
✓ |
|
v. Annually request and review a report from the external auditor regarding: -Auditor’s quality control procedures. -Any material issues raised by the most recent quality-control review. -Steps taken in respect of any such issues. |
✓ |
|
|
|
3.8 Ensure the external independent auditor receives, during its term of office, notice of every meeting of the Committee and, if so requested by the Chair of the Committee, attends such meetings. |
|
|
|
✓ |
3.9 Meet with auditor in camera without management present. |
✓ |
✓ |
✓ |
✓ |
|
|
|||
Vermilion Energy Inc. ■ Page 72 ■ 2023 Annual Information Form
4. Risk Management |
|
|
|
|
4.2 The Committee shall: |
✓ |
✓ |
✓ |
✓ |
|
i.Oversee, and ensure management reports and reviews annually to the Board in respect of: - the Corporation's principal risks and overall risk profile; - the Corporation's strategies in addressing its risk profile; - the processes, policies, procedures and controls in place to manage or mitigate the Corporation’s principal risks; and - the overall effectiveness of the enterprise risk management process and program. |
|
|
|
|
ii. Oversee the Corporation's credit and counterparty, market and financial, political and strategic, and repatriation risks. |
✓ |
✓ |
✓ |
✓ |
iii. Receive and review managements' annual risk register update including an update on residual risks. |
|
|
✓ |
|
iv. Review the Corporation's annual insurance program, including the risk retention philosophy, potential exposure and corporate liability protection programs and ensure management reports to the Board in respect thereof. |
|
|
|
|
|
|
|||
5. Internal Controls |
|
|
|
|
5.1 The Committee shall review and approve as required: |
|
|
|
|
i.Processes adopted by management for establishing effective internal control over financial reporting ICFR and DC&P. |
✓ |
✓ |
✓ |
✓ |
ii. The adequacy and effectiveness of the Corporation’s accounting, ICFR and DC&P policies and procedures and management information systems. |
✓ |
✓ |
✓ |
✓ |
iii. Changes to the Corporation's ICFR, DC&P and management information systems. |
✓ |
✓ |
✓ |
✓ |
iv. Oversee management's certification of ICFR and DC&P. |
✓ |
✓ |
✓ |
✓ |
v. Spending authority and approval of limits. |
✓ |
✓ |
✓ |
✓ |
|
|
|||
6. Information Technology – Cyber Security |
|
|
|
|
6.1 Receive annually (or more frequently as the Committee may request) a system status update with respect to the Corporation's core IT operating systems. |
|
|
|
✓ |
6.2 Review annually (or more frequently as the Committee may request) the Corporation's cyber security programs and their effectiveness. |
|
|
|
✓ |
6.3 Receive as frequently as the Committee may request an update on the Corporation's compliance program for cyber threats and security. |
As needed. |
|||
6.4 Ensure significant breaches are reported in accordance with best governance practices. |
As needed. |
|||
|
|
|||
7. Environment, Social and Governance (“ESG”) |
|
|
|
|
7.1 In collaboration with the Sustainability Committee, review and assess ESG-related risks to the Corporation. |
✓ |
✓ |
✓ |
✓ |
7.2 Regularly review the Corporations’ risk management policies and processes for, and approach to, addressing ESG-related risks. |
✓ |
✓ |
✓ |
✓ |
7.3 Review ESG disclosure. |
✓ |
✓ |
✓ |
✓ |
|
|
|||
8. General Compliance |
|
|
|
|
8.1 Oversee, and periodically review procedures for: |
As needed. |
|||
i.The confidential, anonymous submission by employees of concerns regarding questionable accounting or auditing matters or other matters that could negatively affect the Corporation, such as violations of the Code of Business Conduct and Ethics. |
As needed. |
|||
ii.Treatment of complaints regarding accounting, internal accounting controls, or auditing matters. |
As needed. |
|||
iii.The review and approval of the President and Chairman’s expenses and perquisites. |
As needed. |
|||
iv.The review of any transactions involving the Corporation in which directors or officers of the Corporation have a material interest. |
As needed. |
|||
8.2 Review this mandate and make recommendations to the Board as appropriate. |
|
|
|
✓ |
Vermilion Energy Inc. ■ Page 73 ■ 2023 Annual Information Form Certain statements included or incorporated by reference in this document may constitute forward-looking statements or information under applicable securities legislation.
Exhibit 99.2
Disclaimer
Such forward-looking statements or information typically contain statements with words such as "anticipate", "believe", "expect", "plan", "intend", "estimate", "propose", or similar words suggesting future outcomes or statements regarding an outlook. Forward looking statements or information in this document may include, but are not limited to: capital expenditures and Vermilion’s ability to fund such expenditures; Vermilion’s additional debt capacity providing it with additional working capital; statements regarding the return of capital, the flexibility of Vermilion’s capital program and operations; business strategies and objectives; operational and financial performance; estimated volumes of reserves and resources; petroleum and natural gas sales; future production levels and the timing thereof, including Vermilion’s 2024 guidance, and rates of average annual production growth; the effect of changes in crude oil and natural gas prices, changes in exchange and inflation rates; significant declines in production or sales volumes due to unforeseen circumstances; the effect of possible changes in critical accounting estimates; statements regarding the growth and size of Vermilion’s future project inventory wells expected to be drilled in 2024; exploration and development plans and the timing thereof; Vermilion’s ability to reduce its debt; statements regarding Vermilion’s hedging program, its plans to add to its hedging positions, and the anticipated impact of Vermilion’s hedging program on project economics and free cash flows; the potential financial impact of climate-related risks; acquisition and disposition plans and the timing thereof; operating and other expenses, including the payment and amount of future dividends; royalty and income tax rates and Vermilion’s expectations regarding future taxes and taxability; and the timing of regulatory proceedings and approvals.
Such forward-looking statements or information are based on a number of assumptions, all or any of which may prove to be incorrect. In addition to any other assumptions identified in this document, assumptions have been made regarding, among other things: the ability of Vermilion to obtain equipment, services and supplies in a timely manner to carry out its activities in Canada and internationally; the ability of Vermilion to market crude oil, natural gas liquids, and natural gas successfully to current and new customers; the timing and costs of pipeline and storage facility construction and expansion and the ability to secure adequate product transportation; the timely receipt of required regulatory approvals; the ability of Vermilion to obtain financing on acceptable terms; foreign currency exchange rates and interest rates; future crude oil, natural gas liquids, and natural gas prices; and management’s expectations relating to the timing and results of exploration and development activities.
Although Vermilion believes that the expectations reflected in such forward-looking statements or information are reasonable, undue reliance should not be placed on forward-looking statements because Vermilion can give no assurance that such expectations will prove to be correct. Financial outlooks are provided for the purpose of understanding Vermilion’s financial position and business objectives, and the information may not be appropriate for other purposes. Forward-looking statements or information are based on current expectations, estimates, and projections that involve a number of risks and uncertainties which could cause actual results to differ materially from those anticipated by Vermilion and described in the forward-looking statements or information. These risks and uncertainties include, but are not limited to: the ability of management to execute its business plan; the risks of the oil and gas industry, both domestically and internationally, such as operational risks in exploring for, developing and producing crude oil, natural gas liquids, and natural gas; risks and uncertainties involving geology of crude oil, natural gas liquids, and natural gas deposits; risks inherent in Vermilion's marketing operations, including credit risk; the uncertainty of reserves estimates and reserves life and estimates of resources and associated expenditures; the uncertainty of estimates and projections relating to production and associated expenditures; potential delays or changes in plans with respect to exploration or development projects; Vermilion's ability to enter into or renew leases on acceptable terms; fluctuations in crude oil, natural gas liquids, and natural gas prices, foreign currency exchange rates, interest rates, and inflation rates; health, safety, and environmental risks; uncertainties as to the availability and cost of financing; the ability of Vermilion to add production and reserves through exploration and development activities; the possibility that government policies or laws may change or governmental approvals may be delayed or withheld; uncertainty in amounts and timing of royalty payments; risks associated with existing and potential future law suits and regulatory actions against or involving Vermilion; and other risks and uncertainties described elsewhere in this document or in Vermilion's other filings with Canadian securities regulatory authorities.
The forward-looking statements or information contained in this document are made as of the date hereof and Vermilion undertakes no obligation to update publicly or revise any forward-looking statements or information, whether as a result of new information, future events, or otherwise, unless required by applicable securities laws.
This document contains references to sustainability/ESG data and performance that reflect metrics and concepts that are commonly used in such frameworks as the Global Reporting Initiative, the Task Force on Climate-related Financial Disclosures, and the Sustainability Accounting Standards Board. Vermilion has used best efforts to align with the most commonly accepted methodologies for ESG reporting, including with respect to climate data and information on potential future risks and opportunities, in order to provide a fuller context for our current and future operations. However, these methodologies are not yet standardized, are frequently based on calculation factors that change over time, and continue to evolve rapidly. Readers are particularly cautioned to evaluate the underlying definitions and measures used by other companies, as these may not be comparable to Vermilion's. While Vermilion will continue to monitor and adapt its reporting accordingly, the Company is not under any duty to update or revise the related sustainability/ESG data or statements except as required by applicable securities laws.
All crude oil and natural gas reserve and resource information contained in this document has been prepared and presented in accordance with National Instrument 51-101 Standards of Disclosure for Oil and Gas Activities and the Canadian Oil and Gas Evaluation Handbook. Reserves
Vermilion Energy Inc. ■ Page 1 ■ 2023 Management's Discussion and Analysis estimates have been made assuming that development of each property in respect of which the estimate is made will occur, without regard to the likely availability of funding required for such development.
The actual crude oil and natural gas reserves and future production will be greater than or less than the estimates provided in this document.
Natural gas volumes have been converted on the basis of six thousand cubic feet of natural gas to one barrel of oil equivalent. Barrels of oil equivalent (boe) may be misleading, particularly if used in isolation. A boe conversion ratio of six thousand cubic feet to one barrel of oil is based on an energy equivalency conversion method primarily applicable at the burner tip and does not represent a value equivalency at the wellhead.
Financial data contained within this document are reported in Canadian dollars unless otherwise stated.
Vermilion Energy Inc. ■ Page 2 ■ 2023 Management's Discussion and Analysis
Abbreviations
$M |
thousand dollars |
$MM |
million dollars |
AECO |
the daily average benchmark price for natural gas at the AECO ‘C’ hub in Alberta |
bbl(s) |
barrel(s) |
bbls/d |
barrels per day |
boe |
barrel of oil equivalent, including: crude oil, condensate, natural gas liquids, and natural gas (converted on the basis of one boe for six mcf of natural gas) |
boe/d |
barrel of oil equivalent per day |
GJ |
gigajoules |
LSB |
light sour blend crude oil reference price |
mbbls |
thousand barrels |
mcf |
thousand cubic feet |
mmcf/d |
million cubic feet per day |
NBP |
the reference price paid for natural gas in the United Kingdom at the National Balancing Point Virtual Trading Point |
NCIB |
normal-course issuer bid |
NGLs |
natural gas liquids, which includes butane, propane, and ethane |
PRRT |
Petroleum Resource Rent Tax, a profit based tax levied on petroleum projects in Australia |
tCO2e |
tonnes of carbon dioxide equivalent |
THE |
the price for natural gas in Germany, quoted in megawatt hours of natural gas, at the Trading Hub Europe |
TTF |
the price for natural gas in the Netherlands, quoted in megawatt hours of natural gas, at the Title Transfer Facility Virtual Trading Point |
WTI |
West Texas Intermediate, the reference price paid for crude oil of standard grade in US dollars at Cushing, Oklahoma |
Vermilion Energy Inc.
Management's Discussion and Analysis
■ Page 3 ■ 2023 Management's Discussion and Analysis The following is Management’s Discussion and Analysis (“MD&A”), dated March 6, 2024, of Vermilion Energy Inc.’s (“Vermilion”, “we”, “our”, “us” or the “Company”) operating and financial results as at and for the three months and year ended December 31, 2023 compared with the corresponding periods in the prior year.
This discussion should be read in conjunction with the audited consolidated financial statements for the year ended December 31, 2023 and 2022, together with the accompanying notes. Additional information relating to Vermilion, including its Annual Information Form, is available on SEDAR+ at www.sedarplus.ca or on Vermilion’s website at www.vermilionenergy.com.
The audited consolidated financial statements for the year ended December 31, 2023 and comparative information have been prepared in Canadian dollars and in accordance with International Financial Reporting Standards (“IFRS” or, alternatively, “GAAP”) as issued by the International Accounting Standards Board ("IASB").
This MD&A includes references to certain financial measures which are not specified, defined, or determined under IFRS and are therefore considered non-GAAP and other specified financial measures. These financial measures are unlikely to be comparable to similar financial measures presented by other issuers. For a full description of these non-GAAP and other specified financial measures and a reconciliation of these measures to their most directly comparable GAAP measures, please refer to “Non-GAAP and Other Specified Financial Measures”.
Product Type Disclosure
Under National Instrument 51-101 "Standards of Disclosure for Oil and Gas Activities", disclosure of production volumes should include segmentation by product type as defined in the instrument. In this report, references to "crude oil" and "light and medium crude oil" mean "light crude oil and medium crude oil" and references to "natural gas" mean "conventional natural gas".
In addition, in Supplemental Table 4 "Production", Vermilion provides a reconciliation from total production volumes to product type and also a reconciliation of "crude oil and condensate" and "NGLs" to the product types "light crude oil and medium crude oil" and "natural gas liquids".
Production volumes reported are based on quantities as measured at the first point of sale.
Guidance
On January 6, 2023, we released our 2023 capital budget and associated production guidance, which incorporated the March 31, 2023 close date of the acquisition of an incremental 36.5% interest in the Corrib Natural Gas Project (“Corrib”) in Ireland. On March 8, 2023, we decreased annual production guidance to 82,000 to 86,000 boe/d to reflect the southeast Saskatchewan asset sale and unplanned downtime in Australia, and decreased operating expense guidance to reflect the southeast Saskatchewan asset sale and lower European gas prices. On May 3, 2023, we updated royalty rate guidance to include Netherlands windfall royalties, which were previously included in windfall tax guidance, and provided revisions to 2023 guidance items to reflect the assumptions used in management's most recent forecast. On November 1, 2023, we increased capital expenditure guidance by $20 million primarily due to the acceleration of some Montney development as a result of the timely receipt of permits, and revised other 2023 guidance items to reflect the assumptions used in management's most recent forecast.
The Company’s guidance and results for 2023 are as follows:
Category |
|
2023 Guidance (1) |
|
2023 Actual (1) |
|
||
Production (boe/d) |
|
|
82,000 - 86,000 |
|
|
83,994 |
|
E&D capital expenditures ($MM) |
|
|
590 |
|
|
590 |
|
Royalty rate, including windfall royalties (% of sales) (2) |
|
|
10 - 12 |
% |
|
9.5 |
% |
Operating ($/boe) |
|
$ |
16.50 - 17.50 |
|
$ |
17.03 |
|
Transportation ($/boe) |
|
$ |
2.75 - 3.25 |
|
$ |
2.95 |
|
General and administration ($/boe) |
|
$ |
2.00 - 2.50 |
|
$ |
2.68 |
|
Cash taxes (% of pre-tax FFO) |
|
|
6 - 8 |
% |
|
5.5 |
% |
Windfall tax, excluding windfall royalties (% of pre-tax FFO) (3) |
|
|
8 - 10 |
% |
|
6.0 |
% |
Vermilion Energy Inc. ■ Page 4 ■ 2023 Management's Discussion and Analysis On December 12, 2023, we released our 2024 capital budget and associated production guidance, which assumes a mid-year startup of the new BC Montney battery and Croatia gas plant.
The Company’s guidance for 2024 is as follows:
Category |
|
2024 Guidance (1) |
|
|
Production (boe/d) |
|
|
82,000 - 86,000 |
|
E&D capital expenditures ($MM) |
|
$ |
600 - 625 |
|
Royalty rate (% of sales) |
|
|
7 - 9 |
% |
Operating ($/boe) |
|
$ |
17.00 - 18.00 |
|
Transportation ($/boe) |
|
$ |
3.00 - 3.50 |
|
General and administration ($/boe) |
|
$ |
2.50 - 3.00 |
|
Cash taxes (% of pre-tax FFO) |
|
|
5 - 7 |
% |
Asset retirement obligations settled ($MM) |
|
$ |
60 |
|
Payments on lease obligations ($MM) (4) |
|
$ |
30 - 60 |
|
| (1) | Final 2023 guidance reflects foreign exchange assumptions of CAD/USD 1.35, CAD/EUR 1.46, and CAD/AUD 0.89. Actual 2023 results reflects foreign exchange rates of CAD/USD 1.35, CAD/EUR 1.46, and CAD/AUD 0.90. Current 2024 guidance reflects foreign exchange assumptions of CAD/USD 1.35, CAD/EUR 1.47, and CAD/AUD 0.89. |
| (2) | Royalty rate guidance includes the temporary windfall royalty that was enacted by the Netherlands in the fourth quarter of 2022. This royalty applies to 2023 and 2024 and, for natural gas sales, is calculated as 65% of the excess of the realized price for a subject year versus the threshold price of €0.50/Nm3 (€13.40/mcf). This royalty is deductible against current income taxes. |
| (3) | Windfall tax guidance incorporates windfall taxes as legislated in EU member states in which Vermilion does business. Windfall royalties in the Netherlands are excluded from windfall tax guidance, and have been included in royalty rate guidance, above. |
| (4) | Payments on lease obligations includes contractual amounts owing on leases, as well as up to $30 million to account for accelerated principal payments that may be made in 2024. |
Vermilion Energy Inc. ■ Page 5 ■ 2023 Management's Discussion and Analysis Vermilion is a Calgary, Alberta-based international oil and gas producer focused on the acquisition, exploration, development, and optimization of producing properties in North America, Europe, and Australia.
Vermilion's Business
We manage our business through our Calgary head office and our international business unit offices.
|
|
| |
| |
Vermilion Energy Inc. ■ Page 6 ■ 2023 Management's Discussion and Analysis
Consolidated Results Overview
|
|
|
|
|
|
Q4/23 vs. |
|
|
|
|
|
2023 vs. |
|
|
|
Q4 2023 |
|
Q4 2022 |
|
Q4/22 |
|
2023 |
|
2022 |
|
2022 |
|
Production (1) |
|
|
|
|
|
|
|
|
|
|
|
|
|
Crude oil and condensate (bbls/d) |
|
32,866 |
|
38,915 |
|
(16) |
% |
31,727 |
|
37,530 |
|
(16) |
% |
NGLs (bbls/d) |
|
7,412 |
|
7,497 |
|
(1) |
% |
7,296 |
|
7,961 |
|
(8) |
% |
Natural gas (mmcf/d) |
|
283.91 |
|
234.23 |
|
21 |
% |
269.83 |
|
238.18 |
|
13 |
% |
Total (boe/d) |
|
87,597 |
|
85,450 |
|
3 |
% |
83,994 |
|
85,187 |
|
(1) |
% |
Build (draw) in inventory (mbbls) |
|
442 |
|
(242) |
|
|
|
513 |
|
39 |
|
|
|
Financial metrics |
|
|
|
|
|
|
|
|
|
|
|
|
|
Fund flows from operations ($M) (2) |
|
372,117 |
|
284,220 |
|
31 |
% |
1,142,611 |
|
1,634,865 |
|
(30) |
% |
Per share ($/basic share) |
|
2.27 |
|
1.74 |
|
31 |
% |
6.98 |
|
10.00 |
|
(30) |
% |
Net (loss) earnings ($M) |
|
(803,136) |
|
395,408 |
|
N/A |
|
(237,587) |
|
1,313,062 |
|
N/A |
|
Per share ($/basic share) |
|
(4.91) |
|
2.42 |
|
N/A |
|
(1.45) |
|
8.03 |
|
N/A |
|
Cash flows from operating activities ($M) |
|
343,831 |
|
495,195 |
|
(31) |
% |
1,024,528 |
|
1,814,220 |
|
(44) |
% |
Free cash flow ($M) (3) |
|
229,230 |
|
114,915 |
|
100 |
% |
552,420 |
|
1,083,048 |
|
(49) |
% |
Long-term debt ($M) |
|
914,015 |
|
1,081,351 |
|
(16) |
% |
914,015 |
|
1,081,351 |
|
(16) |
% |
Net debt ($M) (4) |
|
1,078,567 |
|
1,344,586 |
|
(20) |
% |
1,078,567 |
|
1,344,586 |
|
(20) |
% |
Activity |
|
|
|
|
|
|
|
|
|
|
|
|
|
Capital expenditures ($M) (5) |
|
142,887 |
|
169,305 |
|
(16) |
% |
590,191 |
|
551,817 |
|
7 |
% |
Acquisitions ($M) (6) |
|
25,724 |
|
4,558 |
|
|
|
273,018 |
|
539,713 |
|
|
|
Dispositions ($M) |
|
14,855 |
|
— |
|
|
|
197,007 |
|
— |
|
|
|
(1) |
Please refer to Supplemental Table 4 "Production" for disclosure by product type. |
(2) |
Fund flows from operations (FFO) and FFO per share are a total of segments measure and supplementary financial measure respectively most directly comparable to net (loss) earnings and net (loss) earnings per share, respectively. The measures do not have a standardized meaning under IFRS and therefore may not be comparable to similar measures presented by other issuers. FFO is comprised of sales less royalties, transportation, operating, G&A, corporate income tax, PRRT, windfall taxes, interest expense, and realized loss (gain) on derivatives, plus realized gain (loss) on foreign exchange and realized other income (expense). The measure is used to assess the contribution of each business unit to Vermilion's ability to generate income necessary to pay dividends, repay debt, fund asset retirement obligations and make capital investments. A reconciliation to the primary financial statement measures can be found within the "Non-GAAP and Other Specified Financial Measures" section of this MD&A. |
(3) |
Free cash flow (FCF) is a non-GAAP financial measure most directly comparable to cash flows from operating activities; it does not have a standardized meaning under IFRS and therefore may not be comparable to similar measures presented by other issuers. FCF is comprised of fund flows from operations less drilling and development costs and exploration and evaluation costs. The measure is used to determine the funding available for investing and financing activities including payment of dividends, repayment of long-term debt, reallocation into existing business units and deployment into new ventures. A reconciliation to primary financial statement measures can be found within the "Non-GAAP and Other Specified Financial Measures" section of this MD&A. |
(4) |
Net debt is a capital management measure in accordance with IAS 1 "Presentation of Financial Statements" and is most directly comparable to long-term debt. Net debt is comprised of long-term debt (excluding unrealized foreign exchange on swapped USD borrowings) plus adjusted working capital (defined as current assets less current liabilities, excluding current derivatives and current lease liabilities), and represents Vermilion's net financing obligations after adjusting for the timing of working capital fluctuations. Net debt excludes lease obligations which are secured by a corresponding right-of-use asset. A reconciliation to the primary financial statement measures can be found within the "Financial Position Review" section of this MD&A. |
(5) |
Capital expenditures is a non-GAAP financial measure that does not have a standardized meaning under IFRS and therefore may not be comparable to similar measures presented by other issuers. The measure is calculated as the sum of drilling and development costs and exploration and evaluation costs from the Consolidated Statements of Cash Flows. We consider capital expenditures to be a useful measure of our investment in our existing asset base. Capital expenditures are also referred to as E&D capital. A reconciliation to the primary financial statement measures can be found within the "Non-GAAP and Other Specified Financial Measures" section of this MD&A. |
(6) |
Acquisitions is a non-GAAP financial measure that does not have a standardized meaning under IFRS and therefore may not be comparable to similar measures presented by other issuers. The measure is calculated as the sum of acquisitions, net of cash and acquisitions of securities from the Consolidated Statements of Cash Flows, Vermilion common shares issued as consideration, the estimated value of contingent consideration, the amount of acquiree's outstanding long-term debt assumed, and net acquired working capital deficit or surplus. We believe that including these components provides a useful measure of the economic investment associated with our acquisition activity. A reconciliation to the acquisitions line item in the Consolidated Statements of Cash Flows can be found in "Supplemental Table 3: Capital Expenditures and Acquisitions" section of this MD&A. |
Vermilion Energy Inc. ■ Page 7 ■ 2023 Management's Discussion and Analysis ·We recorded net loss of $803.1 million ($(4.91)/basic share) for Q4 2023 compared to $395.4 million ($2.42/basic share) in Q4 2022.
Financial performance review
Q4 2023 vs. Q4 2022
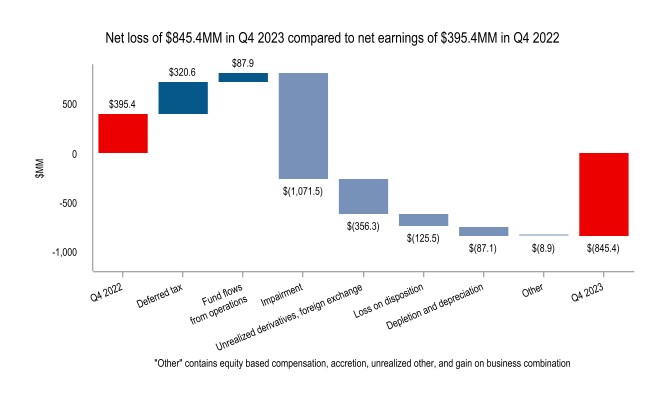
The increase in net loss was primarily due to impairment charges of $1.0 billion and decreases in unrealized derivative gains of $408.6 million due to changes in our mark-to-market position. The increase to net loss was partially offset by higher fund flows from operations primarily driven by a reduction in windfall tax expense in the quarter due to timing of recognition at the end of 2022 compared to throughout 2023.
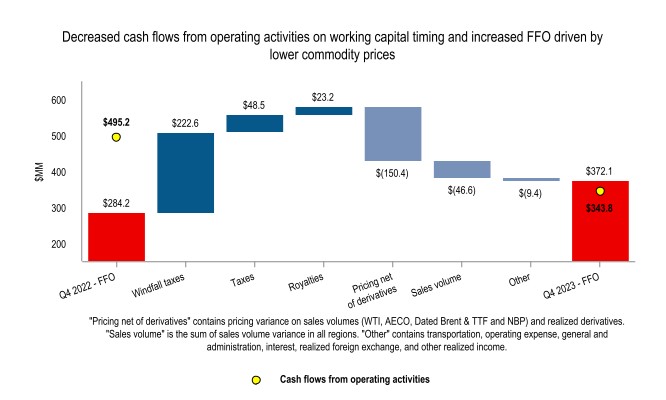
| ● | We generated cash flows from operating activities of $343.8 million in Q4 2023 compared to $495.2 million in Q4 2022 and fund flows from operations of $372.1 million in Q4 2023 compared to $284.2 million in Q4 2022. The increase in fund flows from operations was primarily driven by timing of windfall taxes, and partially offset by lower commodity prices. The variance between cash flows from operating activities and fund flows from operations is primarily due to non-cash working capital impacts of the full year windfall taxes payable recorded on higher pricing in the last quarter of 2022. |
Vermilion Energy Inc. ■ Page 8 ■ 2023 Management's Discussion and Analysis ·For the year ended December 31, 2023, we recorded net loss of $237.6 million compared to net earnings of $1,313.1 million for the comparable period in 2022.
2023 vs. 2022
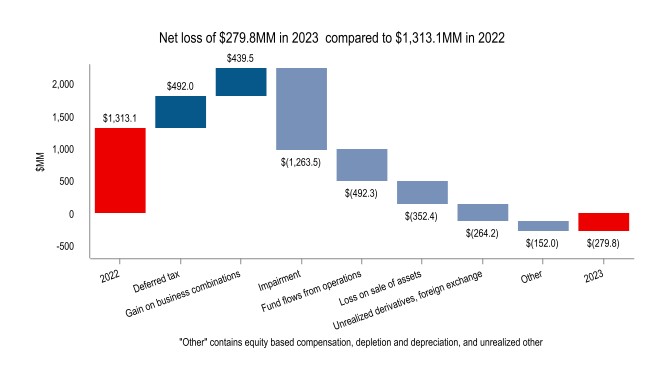
The net loss was primarily due to impairment charges of $1.0 billion compared to impairment reversal of $192.1 million, a decrease in FFO driven by lower commodity prices and lower production, and the loss recognized on the sale of assets. This was partially offset by the gain recognized on the Corrib acquisition.
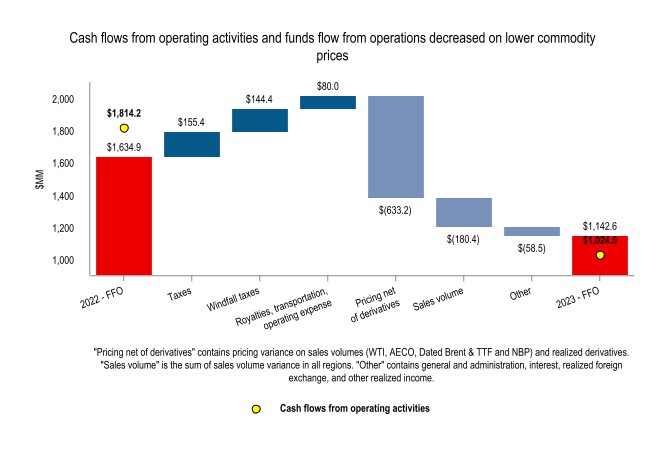
·For the year ended December 31, 2023 as compared to 2022, cash flows from operating activities decreased by $789.7 million to $1,024.5 million and fund flows from operations decreased by $492.3 million to $1,142.6 million. The decrease in fund flows from operations was primarily driven by a 40% decrease in our consolidated realized price from $111.95/boe to $67.10/boe, and a decrease in sales volumes primarily driven by the Australian Wandoo platform shutdown for the first three quarters of the year. This was partially offset by decreases in tax expense, windfall tax expense and royalties due to the pricing and sales volume changes. Variances between cash flows from operating activities and funds flow from operations are primarily driven by working capital timing differences.
Vermilion Energy Inc. ■ Page 9 ■ 2023 Management's Discussion and Analysis
Production review
Q4 2023 vs. Q4 2022
| ● | Consolidated average production of 87,597 boe/d in Q4 2023 increased compared to Q4 2022 production of 85,450 boe/d. Production increased primarily due to the acquired 36.5% interest in the Corrib Natural Gas Project in 2023 and new production from our Mica Montney development, partially offset by the sale of non-core assets in southeast Saskatchewan and natural declines. |
2023 vs. 2022
| ● | Consolidated average production of 83,994 boe/d in the year ended December 31, 2023 decreased compared to the prior year comparative period production of 85,187 boe/d. Production decreased primarily due to unplanned downtime in Australia partially offset by increased production in Ireland due to the acquisition of an additional 36.5% interest in the Corrib Natural Gas Project. Production in Canada was relatively flat as growth in the Mica Montney assets offset unplanned downtime due to wildfires in the Deep Basin and the sale of non-core assets in southeast Saskatchewan. |
Activity review
| ● | For the three months ended December 31, 2023, capital expenditures were $142.9 million. |
| ● | In our North America core region, we invested capital expenditures of $58.7 million. In Canada, capital expenditures totaled $53.8 million as we drilled five (5.0 net), completed five (5.0 net), and brought on production four (4.0 net) Mannville liquids rich conventional natural gas wells in the Deep Basin. At Mica we drilled the initial four (4.0 net) Montney liquids-rich shale gas wells on our BC lands as part of our winter drilling program in advance of the expected start-up of our 8-33 BC battery in mid-2024. In Saskatchewan, we completed and brought on production one (1.0 net) light and medium crude oil well. In the United States, $4.9 million was incurred as we participated in the drilling of six (2.0 net) non- operated light and medium crude oil wells in Wyoming. |
| ● | In our International core region, capital expenditures of $84.2 million were invested during Q4 2023. In the Netherlands and France, we invested $10.8 million and $11.2 million, respectively, primarily on facilities and subsurface maintenance activities. In Germany, we invested $33.0 million as we advanced our deep gas exploration and development plans and commenced drilling activities. In Ireland, $11.9 million was invested on our Corrib plant refrigeration project. In Australia, $9.3 million was invested as we preformed routine maintenance and workover activities. In Central and Eastern Europe, $8.0 million was invested on construction for the gas plant on the SA-10 block and site preparation for the upcoming drilling program on the SA-7 block. |
Financial sustainability review
Free cash flow
| ● | Free cash flow of $552.4 million decreased by $530.6 million for the year ended December 31, 2023 compared to the prior year period primarily driven by decreased fund flows from operations on lower pricing, lower production and sales volumes, and higher expenditures on drilling and development activities. |
Long-term debt and net debt
| ● | Long-term debt decreased to $0.9 billion as at December 31, 2023 from $1.1 billion as at December 31, 2022 primarily as a result of revolving credit facility repayments of $146.3 million. |
| ● | As at December 31, 2023, net debt decreased to $1.1 billion (December 31, 2022 - $1.3 billion), primarily as a result of revolving credit facility net repayments of $146.3 million, funded by the disposition of our southeast Saskatchewan assets for $182.2 million, and $552.4 million of free cash flow generated during the year, and offset by spend on acquisition activities primarily due to the purchase of an additional 36.5% working interest in our operated Corrib project for $192.4 million (net of cash and working capital deficit acquired). |
| ● | The ratio of net debt to four quarter trailing fund flows from operations(1) increased to 0.9 as at December 31, 2023 (December 31, 2022 - 0.8) primarily due to lower four quarter trailing fund flows from operations on lower prices and lower production. |
| (1) | Net debt to four quarter trailing fund flows from operations is a supplementary financial measure that does not have a standardized meaning under IFRS and therefore may not be comparable to similar measures presented by other issuers. It is calculated as net debt (capital measure) over the FFO from the preceding four quarters (total of segments measure). The measure is used to assess our ability to repay debt. |
Vermilion Energy Inc. ■ Page 10 ■ 2023 Management's Discussion and Analysis
Benchmark Commodity Prices
|
|
|
|
|
|
Q4/23 vs. |
|
|
|
|
|
2023 vs. |
|
|
|
Q4 2023 |
|
Q4 2022 |
|
Q4/22 |
|
2023 |
|
2022 |
|
2022 |
|
Crude oil |
|
|
|
|
|
|
|
|
|
|
|
|
|
WTI ($/bbl) |
|
106.67 |
|
112.24 |
|
(5) |
% |
104.77 |
|
122.62 |
|
(15) |
% |
WTI (US $/bbl) |
|
78.32 |
|
82.65 |
|
(5) |
% |
77.63 |
|
94.23 |
|
(18) |
% |
Edmonton Sweet index ($/bbl) |
|
99.60 |
|
109.85 |
|
(9) |
% |
100.37 |
|
120.25 |
|
(17) |
% |
Edmonton Sweet index (US $/bbl) |
|
73.13 |
|
80.89 |
|
(10) |
% |
74.36 |
|
92.41 |
|
(20) |
% |
Saskatchewan LSB index ($/bbl) |
|
97.12 |
|
106.05 |
|
(8) |
% |
97.97 |
|
118.22 |
|
(17) |
% |
Saskatchewan LSB index (US $/bbl) |
|
71.31 |
|
78.09 |
|
(9) |
% |
72.59 |
|
90.85 |
|
(20) |
% |
Canadian C5+ Condensate index ($/bbl) |
|
103.83 |
|
113.19 |
|
(8) |
% |
103.38 |
|
121.96 |
|
(15) |
% |
Canadian C5+ Condensate index (US $/bbl) |
|
76.24 |
|
83.35 |
|
(9) |
% |
76.60 |
|
93.72 |
|
(18) |
% |
Dated Brent ($/bbl) |
|
114.46 |
|
120.47 |
|
(5) |
% |
111.51 |
|
131.68 |
|
(15) |
% |
Dated Brent (US $/bbl) |
|
84.05 |
|
88.71 |
|
(5) |
% |
82.62 |
|
101.19 |
|
(18) |
% |
Natural gas |
|
|
|
|
|
|
|
|
|
|
|
|
|
North America |
|
|
|
|
|
|
|
|
|
|
|
|
|
AECO 5A ($/mcf) |
|
2.30 |
|
4.64 |
|
(50) |
% |
2.64 |
|
5.25 |
|
(50) |
% |
Henry Hub ($/mcf) |
|
3.92 |
|
8.50 |
|
(54) |
% |
4.00 |
|
8.67 |
|
(54) |
% |
Henry Hub (US $/mcf) |
|
2.88 |
|
6.26 |
|
(54) |
% |
2.74 |
|
6.66 |
|
(59) |
% |
Europe(1) |
|
|
|
|
|
|
|
|
|
|
|
|
|
NBP Day Ahead ($/mmbtu) |
|
16.69 |
|
26.09 |
|
(36) |
% |
16.63 |
|
31.78 |
|
(48) |
% |
NBP Month Ahead ($/mmbtu) |
|
18.32 |
|
43.51 |
|
(58) |
% |
19.85 |
|
41.44 |
|
(52) |
% |
NBP Day Ahead (€/mmbtu) |
|
11.38 |
|
18.82 |
|
(40) |
% |
11.39 |
|
23.21 |
|
(51) |
% |
NBP Month Ahead (€/mmbtu) |
|
12.50 |
|
31.38 |
|
(60) |
% |
13.60 |
|
30.26 |
|
(55) |
% |
TTF Day Ahead ($/mmbtu) |
|
17.45 |
|
38.36 |
|
(55) |
% |
17.40 |
|
48.35 |
|
(64) |
% |
TTF Month Ahead ($/mmbtu) |
|
18.51 |
|
49.98 |
|
(63) |
% |
20.52 |
|
52.59 |
|
(61) |
% |
TTF Day Ahead (€/mmbtu) |
|
11.90 |
|
27.67 |
|
(57) |
% |
11.92 |
|
35.30 |
|
(66) |
% |
TTF Month Ahead (€/mmbtu) |
|
12.63 |
|
36.05 |
|
(65) |
% |
14.06 |
|
38.40 |
|
(63) |
% |
Average exchange rates |
|
|
|
|
|
|
|
|
|
|
|
|
|
CDN $/US $ |
|
1.36 |
|
1.36 |
|
— |
% |
1.35 |
|
1.30 |
|
4 |
% |
CDN $/Euro |
|
1.47 |
|
1.39 |
|
6 |
% |
1.46 |
|
1.37 |
|
7 |
% |
Realized prices |
|
|
|
|
|
|
|
|
|
|
|
|
|
Crude oil and condensate ($/bbl) |
|
107.91 |
|
115.02 |
|
(6) |
% |
102.43 |
|
123.89 |
|
(17) |
% |
NGLs ($/bbl) |
|
33.38 |
|
39.93 |
|
(16) |
% |
31.54 |
|
45.95 |
|
(31) |
% |
Natural gas ($/mcf) |
|
8.48 |
|
17.43 |
|
(51) |
% |
8.17 |
|
18.99 |
|
(57) |
% |
Total ($/boe) |
|
68.64 |
|
103.99 |
|
(34) |
% |
67.10 |
|
111.95 |
|
(40) |
% |
(1) |
NBP and TTF pricing can occur on a day-ahead ("DA") or month-ahead ("MA") basis. DA prices in a period reflect the average current day settled price on the next days' delivery and MA prices in a period represent daily one month futures contract prices which are determined at the end of each month. In a rising price environment, the DA price will tend to be greater than the MA price and vice versa. Natural gas in the Netherlands and Germany is benchmarked to the TTF and production is generally equally split between DA and MA contracts. Natural gas in Ireland is benchmarked to the NBP and is sold on DA contracts. |
Vermilion Energy Inc. ■ Page 11 ■ 2023 Management's Discussion and Analysis As an internationally diversified producer, we are exposed to a range of commodity prices.
In our North America core region, our crude oil is sold at benchmarks linked to WTI (including the Edmonton Sweet index, the Saskatchewan LSB index, and the Canadian C5+ index) and our natural gas is sold at benchmarks linked to the AECO index (in Canada) or the Henry Hub ("HH") index (in the United States). In our International core region, our crude oil is sold with reference to Dated Brent and our natural gas is sold with reference to NBP, TTF, or indices highly correlated to TTF.
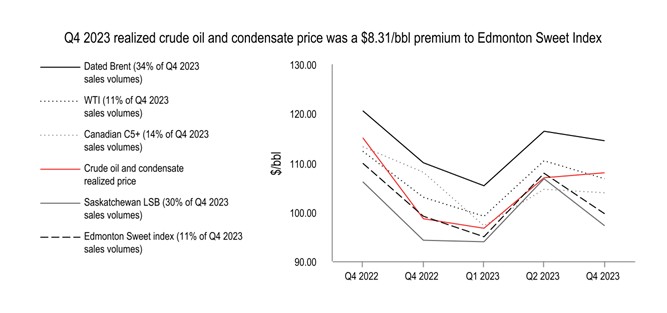
| ● | Crude oil prices decreased in Q4 2023 relative to Q4 2022 after US production rose above expectations, which offset price support from improved demand growth and heightened geopolitical risks. Canadian dollar WTI and Brent prices both decreased by 5% in Q4 2023 relative to Q4 2022. |
| ● | In Canadian dollar terms, year-over-year, the Edmonton Sweet differential widened by $4.68/bbl to a discount of $7.07/bbl against WTI, and the Saskatchewan LSB differential widened by $3.36/bbl to a discount of $9.55/bbl against WTI. |
| ● | Approximately 34% of Vermilion’s Q4 2023 crude oil and condensate production was priced at the Dated Brent index, which averaged a premium to WTI of US$5.73/bbl, while the remainder of our crude oil and condensate production was priced at the Saskatchewan LSB, Canadian C5+, Edmonton Sweet, and WTI indices. |
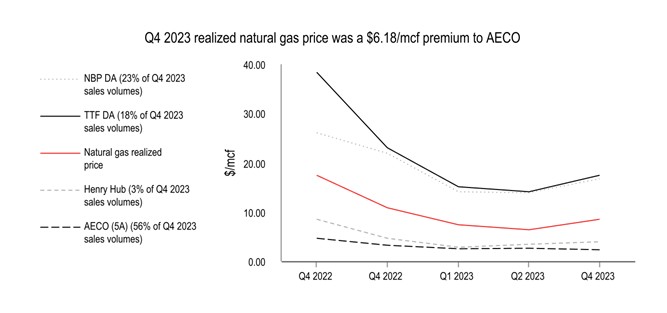
Vermilion Energy Inc. ■ Page 12 ■ 2023 Management's Discussion and Analysis
| ● | In Canadian dollar terms, year-over-year, prices for European natural gas linked to NBP and TTF decreased by 36% and 55% respectively on a day-ahead basis. On a month ahead basis, NBP and TTF decreased by 58% and 63% respectively. Prices declined in response to low seasonal and industrial demand in Europe, strong LNG import volumes and historically high storage levels. While prices are off their Q3 2022 highs, they remained elevated compared to historical levels due to lost Russian pipeline supply, global LNG imports competitiveness, and weather related risk premiums. |
| ● | Year-over-year natural gas prices in Canadian dollar terms at NYMEX HH, and AECO decreased by 54% and 50% respectively. Both NYMEX HH and AECO prices declined due to strong production growth, weak seasonal demand and historically high storage levels. |
| ● | For Q4 2023, average European natural gas prices represented a $15.44/mcf premium to AECO. Approximately 41% of our natural gas production in Q4 2023 benefited from this premium European pricing. |
North America
|
|
Q4 2023 |
|
Q4 2022 |
|
2023 |
|
2022 |
Production (1) |
|
|
|
|
|
|
|
|
Crude oil and condensate (bbls/d) |
|
18,862 |
|
25,291 |
|
20,925 |
|
24,393 |
NGLs (bbls/d) |
|
7,412 |
|
7,497 |
|
7,296 |
|
7,961 |
Natural gas (mmcf/d) |
|
167.65 |
|
154.26 |
|
168.22 |
|
151.30 |
Total production volume (boe/d) |
|
54,216 |
|
58,499 |
|
56,257 |
|
57,571 |
(1)Please refer to Supplemental Table 4 "Production" for disclosure by product type.
|
|
Q4 2023 |
|
Q4 2022 |
|
2023 |
|
2022 |
||||||||
|
|
$M |
|
$/boe |
|
$M |
|
$/boe |
|
$M |
|
$/boe |
|
$M |
|
$/boe |
Sales |
|
236,969 |
|
47.51 |
|
360,295 |
|
66.95 |
|
1,012,549 |
|
49.31 |
|
1,510,517 |
|
71.88 |
Royalties |
|
(36,186) |
|
(7.25) |
|
(50,945) |
|
(9.47) |
|
(144,998) |
|
(7.06) |
|
(240,432) |
|
(11.44) |
Transportation |
|
(12,151) |
|
(2.44) |
|
(13,014) |
|
(2.42) |
|
(43,914) |
|
(2.14) |
|
(45,467) |
|
(2.16) |
Operating |
|
(57,368) |
|
(11.50) |
|
(72,694) |
|
(13.51) |
|
(256,841) |
|
(12.51) |
|
(268,271) |
|
(12.77) |
General and administration (1) |
|
4,338 |
|
0.87 |
|
513 |
|
0.10 |
|
(4,267) |
|
(0.21) |
|
(20,651) |
|
(0.98) |
Corporate income tax expense (1) |
|
1,164 |
|
0.23 |
|
(712) |
|
(0.13) |
|
(20) |
|
— |
|
(1,011) |
|
(0.05) |
Fund flows from operations |
|
136,766 |
|
27.42 |
|
223,443 |
|
41.52 |
|
562,509 |
|
27.39 |
|
934,685 |
|
44.48 |
Drilling and development |
|
(58,704) |
|
|
|
(113,892) |
|
|
|
(380,200) |
|
|
|
(338,556) |
|
|
Free cash flow |
|
78,062 |
|
|
|
109,551 |
|
|
|
182,309 |
|
|
|
596,129 |
|
|
(1)Includes amounts from Corporate segment.
Production from our North American operations averaged 54,216 boe/d in Q4 2023, a decrease of 4% from the previous quarter due to natural declines in both Canada and the United States.
In the Deep Basin, we drilled five (5.0 net), completed five (5.0 net), and brought on production four (4.0 net) Mannville liquids rich conventional natural gas wells. At Mica we drilled the initial four (4.0 net) Montney liquids-rich shale gas wells on our BC lands as part of our winter drilling program in advance of the expected start-up of our 8-33 BC battery in mid-2024. In Saskatchewan, we completed and brought on production one (1.0 net) light and medium crude oil well, while in the United States, we participated in the drilling of six (2.0 net) non-operated light and medium crude oil wells in Wyoming.
Sales
|
|
Q4 2023 |
|
Q4 2022 |
|
2023 |
|
2022 |
||||||||
|
|
$M |
|
$/boe |
|
$M |
|
$/boe |
|
$M |
|
$/boe |
|
$M |
|
$/boe |
Canada |
|
200,102 |
|
44.73 |
|
315,897 |
|
65.13 |
|
861,391 |
|
46.73 |
|
1,344,284 |
|
70.33 |
United States |
|
36,867 |
|
71.65 |
|
44,398 |
|
83.51 |
|
151,158 |
|
71.97 |
|
166,233 |
|
87.46 |
North America |
|
236,969 |
|
47.51 |
|
360,295 |
|
66.95 |
|
1,012,549 |
|
49.31 |
|
1,510,517 |
|
71.88 |
Sales in North America decreased for the three months and year ended December 31, 2023 versus the comparable prior year periods due to lower realized prices and a decrease in production.
Vermilion Energy Inc. ■ Page 13 ■ 2023 Management's Discussion and Analysis
Royalties
|
|
Q4 2023 |
|
Q4 2022 |
|
2023 |
|
2022 |
||||||||
|
|
$M |
|
$/boe |
|
$M |
|
$/boe |
|
$M |
|
$/boe |
|
$M |
|
$/boe |
Canada |
|
(25,759) |
|
(5.76) |
|
(38,747) |
|
(7.99) |
|
(103,511) |
|
(5.62) |
|
(196,005) |
|
(10.26) |
United States |
|
(10,427) |
|
(20.27) |
|
(12,198) |
|
(22.94) |
|
(41,487) |
|
(19.75) |
|
(44,427) |
|
(23.38) |
North America |
|
(36,186) |
|
(7.25) |
|
(50,945) |
|
(9.47) |
|
(144,998) |
|
(7.06) |
|
(240,432) |
|
(11.44) |
Royalties in North America decreased on a dollar and per unit basis for the three months and year ended December 31, 2023 versus the comparable prior year periods primarily due to decreased sliding scale royalties on lower commodity prices and lower production. Royalties as a percentage of sales for the three months and year ended December 31, 2023 were 15.3% and 14.3% respectively, compared to the prior year comparative period of 14.1%. and 15.9% respectively.
Transportation
|
|
Q4 2023 |
|
Q4 2022 |
|
2023 |
|
2022 |
||||||||
|
|
$M |
|
$/boe |
|
$M |
|
$/boe |
|
$M |
|
$/boe |
|
$M |
|
$/boe |
Canada |
|
(11,701) |
|
(2.62) |
|
(12,919) |
|
(2.66) |
|
(43,163) |
|
(2.34) |
|
(44,849) |
|
(2.35) |
United States |
|
(450) |
|
(0.87) |
|
(95) |
|
(0.18) |
|
(751) |
|
(0.36) |
|
(618) |
|
(0.33) |
North America |
|
(12,151) |
|
(2.44) |
|
(13,014) |
|
(2.42) |
|
(43,914) |
|
(2.14) |
|
(45,467) |
|
(2.16) |
Transportation expense in North America remained relatively flat on a dollar and per boe basis for the three months and year ended December 31, 2023 versus the comparable prior periods.
Operating expense
|
|
Q4 2023 |
|
Q4 2022 |
|
2023 |
|
2022 |
||||||||
|
|
$M |
|
$/boe |
|
$M |
|
$/boe |
|
$M |
|
$/boe |
|
$M |
|
$/boe |
Canada |
|
(51,129) |
|
(11.43) |
|
(63,305) |
|
(13.05) |
|
(233,417) |
|
(12.66) |
|
(240,899) |
|
(12.60) |
United States |
|
(6,239) |
|
(12.13) |
|
(9,389) |
|
(17.66) |
|
(23,424) |
|
(11.15) |
|
(27,372) |
|
(14.40) |
North America |
|
(57,368) |
|
(11.50) |
|
(72,694) |
|
(13.51) |
|
(256,841) |
|
(12.51) |
|
(268,271) |
|
(12.77) |
Operating expenses in North America decreased on a dollar and per boe basis for the three months and year ended December 31, 2023 compared to the prior year period primarily the disposition of the properties in southeast Saskatchewan in Q1 2023 combined with lower routine maintenance costs in the United States and lower fuel and electricity costs in Canada.
International
|
|
Q4 2023 |
|
Q4 2022 |
|
2023 |
|
2022 |
Production (1) |
|
|
|
|
|
|
|
|
Crude oil and condensate (bbls/d) |
|
14,004 |
|
13,624 |
|
10,802 |
|
13,135 |
Natural gas (mmcf/d) |
|
116.27 |
|
79.97 |
|
101.61 |
|
86.88 |
Total production volume (boe/d) |
|
33,381 |
|
26,953 |
|
27,737 |
|
27,616 |
Total sales volume (boe/d) |
|
28,598 |
|
29,585 |
|
26,330 |
|
27,506 |
(1)Please refer to Supplemental Table 4 "Production" for disclosure by product type.
Vermilion Energy Inc. ■ Page 14 ■ 2023 Management's Discussion and Analysis
|
|
Q4 2023 |
|
Q4 2022 |
|
2023 |
|
2022 |
||||||||
|
|
$M |
|
$/boe |
|
$M |
|
$/boe |
|
$M |
|
$/boe |
|
$M |
|
$/boe |
Sales |
|
286,000 |
|
108.70 |
|
482,398 |
|
177.23 |
|
1,010,006 |
|
105.09 |
|
1,965,877 |
|
195.81 |
Royalties |
|
(8,962) |
|
(3.41) |
|
(17,358) |
|
(6.38) |
|
(46,696) |
|
(4.86) |
|
(65,585) |
|
(6.53) |
Transportation |
|
(10,290) |
|
(3.91) |
|
(8,962) |
|
(3.29) |
|
(44,942) |
|
(4.68) |
|
(33,429) |
|
(3.33) |
Operating |
|
(59,569) |
|
(22.64) |
|
(63,553) |
|
(23.35) |
|
(256,540) |
|
(26.69) |
|
(220,763) |
|
(21.99) |
General and administration |
|
(24,148) |
|
(9.18) |
|
(13,857) |
|
(5.09) |
|
(76,449) |
|
(7.95) |
|
(37,026) |
|
(3.69) |
Corporate income tax expense |
|
(20,538) |
|
(7.81) |
|
(41,246) |
|
(15.15) |
|
(91,912) |
|
(9.56) |
|
(207,142) |
|
(20.63) |
PRRT |
|
20,860 |
|
7.93 |
|
(5,045) |
|
(1.85) |
|
20,860 |
|
2.17 |
|
(18,318) |
|
(1.82) |
Fund flows from operations |
|
183,353 |
|
69.68 |
|
332,377 |
|
122.12 |
|
514,327 |
|
53.52 |
|
1,383,614 |
|
137.82 |
Drilling and development |
|
(73,604) |
|
|
|
(43,957) |
|
|
|
(188,910) |
|
|
|
(189,500) |
|
|
Exploration and evaluation |
|
(10,579) |
|
|
|
(11,456) |
|
|
|
(21,081) |
|
|
|
(23,761) |
|
|
Free cash flow |
|
99,170 |
|
|
|
276,964 |
|
|
|
304,336 |
|
|
|
1,170,353 |
|
|
Production from our International operations averaged 33,381 boe/d in Q4 2023, an increase of 29% over the previous quarter primarily due to a full quarter of production at our Australia and Ireland operations following maintenance downtime in the prior quarter, as well as increased production in the Netherlands due to new production from our 2023 drilling program.
We continued to advance our deep gas exploration and development plans in Germany, with drilling operations nearly complete on our first well of our program. We expect to reach total depth in the coming weeks and will then move the rig to the next location, where the second well of our program will be drilled during Q2 2024.
Sales
|
|
Q4 2023 |
|
Q4 2022 |
|
2023 |
|
2022 |
||||||||
|
|
$M |
|
$/boe |
|
$M |
|
$/boe |
|
$M |
|
$/boe |
|
$M |
|
$/boe |
Australia |
|
36,381 |
|
143.69 |
|
95,420 |
|
139.95 |
|
36,381 |
|
143.69 |
|
221,187 |
|
148.15 |
France |
|
52,472 |
|
116.92 |
|
77,910 |
|
119.68 |
|
285,626 |
|
109.47 |
|
365,431 |
|
132.90 |
Netherlands |
|
51,661 |
|
102.80 |
|
119,668 |
|
281.75 |
|
186,854 |
|
107.38 |
|
562,857 |
|
279.87 |
Germany |
|
44,150 |
|
101.18 |
|
121,011 |
|
218.13 |
|
195,481 |
|
104.26 |
|
481,260 |
|
231.34 |
Ireland |
|
100,430 |
|
102.28 |
|
64,753 |
|
162.16 |
|
302,404 |
|
97.24 |
|
324,345 |
|
194.05 |
Central and Eastern Europe |
|
906 |
|
109.42 |
|
3,636 |
|
356.05 |
|
3,260 |
|
141.77 |
|
10,797 |
|
313.02 |
International |
|
286,000 |
|
108.70 |
|
482,398 |
|
177.23 |
|
1,010,006 |
|
105.09 |
|
1,965,877 |
|
195.81 |
As a result of changes in inventory levels, our sales volumes for crude oil in Australia, France, and Germany may differ from our production volumes in those business units. The following table provides the crude oil sales volumes (consisting entirely of "light crude oil and medium crude oil") for those jurisdictions.
Crude oil sales volumes (bbls/d) |
|
Q4 2023 |
|
Q4 2022 |
|
2023 |
|
2022 |
Australia |
|
2,752 |
|
7,411 |
|
694 |
|
4,090 |
France |
|
4,878 |
|
7,076 |
|
7,149 |
|
7,533 |
Germany |
|
1,472 |
|
1,721 |
|
1,481 |
|
1,337 |
International |
|
9,102 |
|
16,208 |
|
9,324 |
|
12,960 |
Sales decreased on a dollar and per unit basis for the three months and year ended December 31, 2023 versus the prior year comparable periods due to lower realized prices across all business units combined with lower sales volumes primarily due to downtime in Australia. For the three months ended December 31, 2023, France sales decreased versus the prior year comparable period due to timing of scheduled vessels.
Vermilion Energy Inc. ■ Page 15 ■ 2023 Management's Discussion and Analysis
Royalties
|
|
Q4 2023 |
|
Q4 2022 |
|
2023 |
|
2022 |
||||||||
|
|
$M |
|
$/boe |
|
$M |
|
$/boe |
|
$M |
|
$/boe |
|
$M |
|
$/boe |
France |
|
(7,150) |
|
(15.93) |
|
(9,294) |
|
(14.28) |
|
(37,425) |
|
(14.34) |
|
(40,353) |
|
(14.68) |
Netherlands |
|
(692) |
|
(1.38) |
|
(512) |
|
(1.21) |
|
(1,567) |
|
(0.90) |
|
(512) |
|
(0.25) |
Germany |
|
(736) |
|
(1.69) |
|
(6,403) |
|
(11.54) |
|
(5,993) |
|
(3.20) |
|
(21,232) |
|
(10.21) |
Central and Eastern Europe |
|
(384) |
|
(46.38) |
|
(1,149) |
|
(112.51) |
|
(1,711) |
|
(74.41) |
|
(3,488) |
|
(101.12) |
International |
|
(8,962) |
|
(3.41) |
|
(17,358) |
|
(6.38) |
|
(46,696) |
|
(4.86) |
|
(65,585) |
|
(6.53) |
Royalties in our International core region are primarily incurred in France, Germany and the Netherlands, where royalties include charges based on a percentage of sales and fixed per boe charges. Our production in Australia and Ireland is not subject to royalties.
Royalties decreased on a dollar and per unit basis for the three months and year ended December 31, 2023 versus the comparable prior period primarily due to lower pricing, lower sales volumes, and adjustments for prior period royalties in Germany.
Transportation
|
|
Q4 2023 |
|
Q4 2022 |
|
2023 |
|
2022 |
||||||||
|
|
$M |
|
$/boe |
|
$M |
|
$/boe |
|
$M |
|
$/boe |
|
$M |
|
$/boe |
France |
|
(5,745) |
|
(12.80) |
|
(4,589) |
|
(7.05) |
|
(24,511) |
|
(9.39) |
|
(20,100) |
|
(7.31) |
Germany |
|
(3,486) |
|
(7.99) |
|
(3,621) |
|
(6.53) |
|
(13,333) |
|
(7.11) |
|
(9,751) |
|
(4.69) |
Ireland |
|
(1,059) |
|
(1.08) |
|
(752) |
|
(1.88) |
|
(7,098) |
|
(2.28) |
|
(3,578) |
|
(2.14) |
International |
|
(10,290) |
|
(3.91) |
|
(8,962) |
|
(3.29) |
|
(44,942) |
|
(4.68) |
|
(33,429) |
|
(3.33) |
Transportation expense increased on a dollar and per unit basis for the three months and year ended December 31, 2023 versus the comparable prior periods primarily due to increased volumes in Ireland on acquisition production, and higher vessel costs in France. In addition to the above, for the year ended December 31, 2023, transportation expenses increased due to tariff adjustments in Germany.
Our production in Australia, Netherlands and Central and Eastern Europe is not subject to transportation expense.
Operating expense
|
|
Q4 2023 |
|
Q4 2022 |
|
2023 |
|
2022 |
||||||||
|
|
$M |
|
$/boe |
|
$M |
|
$/boe |
|
$M |
|
$/boe |
|
$M |
|
$/boe |
Australia |
|
(10,677) |
|
(42.17) |
|
(21,291) |
|
(31.23) |
|
(52,360) |
|
(206.80) |
|
(57,478) |
|
(38.50) |
France |
|
(17,021) |
|
(37.93) |
|
(12,638) |
|
(19.41) |
|
(80,134) |
|
(30.71) |
|
(57,588) |
|
(20.94) |
Netherlands |
|
(9,143) |
|
(18.19) |
|
(11,229) |
|
(26.44) |
|
(39,157) |
|
(22.50) |
|
(45,903) |
|
(22.82) |
Germany |
|
(8,233) |
|
(18.87) |
|
(13,292) |
|
(23.96) |
|
(43,857) |
|
(23.39) |
|
(41,523) |
|
(19.96) |
Ireland |
|
(13,948) |
|
(14.20) |
|
(4,687) |
|
(11.74) |
|
(39,464) |
|
(12.69) |
|
(16,580) |
|
(9.92) |
Central and Eastern Europe |
|
(547) |
|
(66.06) |
|
(416) |
|
(40.74) |
|
(1,568) |
|
(68.19) |
|
(1,691) |
|
(49.03) |
International |
|
(59,569) |
|
(22.64) |
|
(63,553) |
|
(23.35) |
|
(256,540) |
|
(26.69) |
|
(220,763) |
|
(21.99) |
Operating expenses decreased for the three months ended December 31, 2023 primarily due to reduced volume driven costs on lower sales in Australia due to downtime and fuel and electricity savings in Germany, partially offset by increased working interest acquired in Ireland, and higher electricity costs in France.
Operating expenses increased for the year ended December 31, 2023 versus the prior comparable periods. On a dollar basis, increases were primarily due to the increased working interest acquired in Ireland, higher electricity costs in France, and increased processing fees in Germany and the Netherlands, partially offset by fuel and electricity savings in Germany and the Netherlands. On a per unit basis, the increase was primarily attributable to the shut-in of our Wandoo platform in Australia for maintenance, resulting in limited production as the platform resumed operations in early September and increased electricity rates in France.
Vermilion Energy Inc. ■ Page 16 ■ 2023 Management's Discussion and Analysis
Consolidated Financial Performance Review
($M except per share) |
|
Dec 31, 2023 |
|
Dec 31, 2022 |
|
Dec 31, 2021 |
Total assets |
|
6,235,821 |
|
6,991,058 |
|
5,905,323 |
Long-term debt |
|
914,015 |
|
1,081,351 |
|
1,651,569 |
Petroleum and natural gas sales |
|
2,022,555 |
|
3,476,394 |
|
2,079,761 |
Net (loss) earnings |
|
(237,587) |
|
1,313,062 |
|
1,148,696 |
Net (loss) earnings per share |
|
|
|
|
|
|
Basic |
|
(1.45) |
|
8.03 |
|
7.13 |
Diluted |
|
(1.45) |
|
7.80 |
|
6.97 |
Cash dividends ($/share) |
|
0.40 |
|
0.28 |
|
— |
Financial performance
|
|
Q4 2023 |
|
Q4 2022 |
|
2023 |
|
2022 |
||||||||
|
|
$M |
|
$/boe |
|
$M |
|
$/boe |
|
$M |
|
$/boe |
|
$M |
|
$/boe |
Sales |
|
522,969 |
|
68.64 |
|
842,693 |
|
103.99 |
|
2,022,555 |
|
67.10 |
|
3,476,394 |
|
111.95 |
Royalties |
|
(45,148) |
|
(5.93) |
|
(68,303) |
|
(8.43) |
|
(191,694) |
|
(6.36) |
|
(306,017) |
|
(9.85) |
Transportation |
|
(22,441) |
|
(2.95) |
|
(21,976) |
|
(2.71) |
|
(88,856) |
|
(2.95) |
|
(78,896) |
|
(2.54) |
Operating |
|
(116,937) |
|
(15.35) |
|
(136,247) |
|
(16.81) |
|
(513,381) |
|
(17.03) |
|
(489,034) |
|
(15.75) |
General and administration |
|
(19,810) |
|
(2.60) |
|
(13,344) |
|
(1.65) |
|
(80,716) |
|
(2.68) |
|
(57,677) |
|
(1.86) |
Corporate income tax expense |
|
(19,374) |
|
(2.54) |
|
(41,958) |
|
(5.18) |
|
(91,932) |
|
(3.05) |
|
(208,153) |
|
(6.70) |
Windfall taxes |
|
(249) |
|
(0.03) |
|
(222,859) |
|
(27.50) |
|
(78,426) |
|
(2.60) |
|
(222,859) |
|
(7.18) |
PRRT |
|
20,860 |
|
2.74 |
|
(5,045) |
|
(0.62) |
|
20,860 |
|
0.69 |
|
(18,318) |
|
(0.59) |
Interest expense |
|
(22,909) |
|
(3.01) |
|
(22,506) |
|
(2.78) |
|
(85,212) |
|
(2.83) |
|
(82,858) |
|
(2.67) |
Realized gain (loss) on derivatives |
|
78,737 |
|
10.33 |
|
(43,940) |
|
(5.42) |
|
234,365 |
|
7.77 |
|
(405,894) |
|
(13.07) |
Realized foreign exchange (loss) gain |
|
(5,529) |
|
(0.73) |
|
18,845 |
|
2.33 |
|
(4,532) |
|
(0.15) |
|
15,195 |
|
0.49 |
Realized other income (expense) |
|
1,948 |
|
0.26 |
|
(1,140) |
|
(0.14) |
|
(420) |
|
(0.01) |
|
12,982 |
|
0.42 |
Fund flows from operations |
|
372,117 |
|
48.83 |
|
284,220 |
|
35.08 |
|
1,142,611 |
|
37.90 |
|
1,634,865 |
|
52.65 |
Equity based compensation |
|
(7,871) |
|
|
|
(5,377) |
|
|
|
(42,756) |
|
|
|
(44,390) |
|
|
Unrealized gain on derivative instruments (1) |
|
141,126 |
|
|
|
549,693 |
|
|
|
179,707 |
|
|
|
540,801 |
|
|
Unrealized foreign exchange gain (loss) (1) |
|
4,834 |
|
|
|
(47,405) |
|
|
|
12,438 |
|
|
|
(84,464) |
|
|
Accretion |
|
(19,469) |
|
|
|
(16,501) |
|
|
|
(78,187) |
|
|
|
(58,170) |
|
|
Depletion and depreciation |
|
(259,012) |
|
|
|
(171,926) |
|
|
|
(712,619) |
|
|
|
(577,134) |
|
|
Deferred tax recovery (expense) |
|
110,758 |
|
|
|
(196,733) |
|
|
|
190,193 |
|
|
|
(288,707) |
|
|
Gain on business combination |
|
(5,607) |
|
|
|
— |
|
|
|
439,487 |
|
|
|
— |
|
|
Loss on disposition |
|
(125,539) |
|
|
|
— |
|
|
|
(352,367) |
|
|
|
— |
|
|
Impairment (expense) reversal |
|
(1,016,094) |
|
|
|
— |
|
|
|
(1,016,094) |
|
|
|
192,094 |
|
|
Unrealized other income (expense) (1) |
|
1,621 |
|
|
|
(563) |
|
|
|
— |
|
|
|
(1,833) |
|
|
Net (loss) earnings |
|
(803,136) |
|
|
|
395,408 |
|
|
|
(237,587) |
|
|
|
1,313,062 |
|
|
| (1) | Unrealized gain on derivative instruments, Unrealized foreign exchange gain (loss), and Unrealized other expense are line items from the respective Consolidated Statements of Cash Flows. |
Fluctuations in fund flows from operations may occur as a result of changes in production levels, commodity prices, and costs to produce petroleum and natural gas. In addition, fund flows from operations may be affected by the timing of crude oil shipments in Australia and France. When crude oil inventory is built up, the related operating expense, royalties, and depletion expense are deferred and carried as inventory on the consolidated balance sheet. When the crude oil inventory is subsequently drawn down, the related expenses are recognized within profit or loss.
General and administration
| ● | General and administration expense increased for the three months and year ended December 31, 2023 versus the prior year comparable periods primarily due to increased activity and expected cash settlement of previously share-based settled expenses. |
Vermilion Energy Inc. ■ Page 17 ■ 2023 Management's Discussion and Analysis
PRRT and corporate income taxes
| ● | PRRT for the three months and year ended December 31, 2023 decreased versus the comparable prior periods due to downtime in Australia resulting in PRRT recoveries from lower taxable income. |
| ● | Corporate income taxes for the three months and year ended December 31, 2023 decreased versus the comparable prior periods primarily due to lower taxable income as a result of decreased commodity prices in 2023. |
Windfall taxes
| ● | Windfall taxes are the temporary taxes levied pursuant to the European Union’s temporary solidarity contribution. The contribution set out minimum amounts to be calculated on taxable profits starting in 2022 and/or 2023, which are above a 20% increase of the average yearly taxable profits for 2018 to 2021. For the two-year period of this policy Vermilion incurred $301 million of incremental taxes. |
Interest expense
| ● | Interest expense was consistent for the three months ended December 31, 2023 versus the comparable prior period. |
| ● | Interest expense increased for the year ended December 31, 2023 versus the comparable prior period primarily due to an increase in the percentage of our debt with fixed interest rates following the issuance of the 2030 senior unsecured notes, combined with the impact of a weaker Canadian Dollar on US Dollar interest payments. |
Realized gain or loss on derivatives
| ● | For the three months and year ended December 31, 2023, we recorded realized gains on our natural gas hedges due to lower commodity pricing compared to the strike prices. |
| ● | A listing of derivative positions as at December 31, 2023 is included in “Supplemental Table 2” of this MD&A. |
Realized other income or expense
| ● | In the 2022 periods, realized other income related to amounts for the funding under the Saskatchewan Accelerated Site Closure program. In the 2023 periods, realized other expense included insurance proceeds received related to insurance claims, offset by miscellaneous transaction costs and other provisional charges. |
Net (loss) earnings
Fluctuations in net (loss) earnings from period-to-period are caused by changes in both cash and non-cash based income and charges. Cash based items are reflected in fund flows from operations. Non-cash items include: equity based compensation expense, unrealized gains and losses on derivative instruments, unrealized foreign exchange gains and losses, accretion, depletion and depreciation expense, and deferred taxes. In addition, non-cash items may also include gains resulting from business combinations or charges resulting from impairment or impairment reversals.
Equity based compensation
Equity based compensation expense relates primarily to non-cash compensation expense attributable to long-term incentives granted to directors, officers, and employees under security-based arrangements. Equity based compensation expense decreased for the year ended December 31, 2023 versus the comparable prior period primarily due to the lower value of LTIP awards outstanding in the current period and lower bonuses under the employee bonus plan in the current period.
Unrealized gain or loss on derivative instruments
Unrealized gain or loss on derivative instruments arises as a result of changes in forecasts for future prices and rates. As Vermilion uses derivative instruments to manage the commodity price exposure of our future crude oil and natural gas production, we will normally recognize unrealized gains on derivative instruments when future commodity price forecasts decline and vice-versa. As derivative instruments are settled, the unrealized gain or loss previously recognized is reversed, and the settlement results in a realized gain or loss on derivative instruments.
For the three months ended December 31, 2023, we recognized a net unrealized gain on derivative instruments of $141.1 million. This consists of unrealized gains of $73.4 million on our European natural gas commodity derivative instruments, $52.8 million on our North American crude oil derivative instruments, $25.9 million on our North American gas commodity derivative instruments and $3.6 million on our USD-to-CAD foreign exchange swaps, partially offset by losses of $14.6 million on our equity swaps.
For the year ended December 31, 2023, we recognized a net unrealized gain on derivative instruments of $179.7 million. This consists of unrealized gains of $154.0 million on our European natural gas commodity derivative instruments, $29.2 million on our North American crude oil derivative instruments, $24.7 million on our North American natural gas commodity derivative instruments and $1.7 million on our USD-to-CAD foreign exchange swaps, partially offset by losses of $29.9 million on our equity swaps.
Vermilion Energy Inc. ■ Page 18 ■ 2023 Management's Discussion and Analysis As a result of Vermilion’s international operations, Vermilion has monetary assets and liabilities denominated in currencies other than the Canadian dollar.
Unrealized foreign exchange gains or losses
These monetary assets and liabilities include cash, receivables, payables, long-term debt, derivative instruments and intercompany loans. Unrealized foreign exchange gains and losses result from translating these monetary assets and liabilities from their underlying currency to the Canadian dollar.
In 2023, unrealized foreign exchange gains and losses primarily resulted from:
| ● | The translation of Euro denominated intercompany loans from our international subsidiaries to Vermilion Energy Inc. An appreciation in the Euro against the Canadian dollar will result in an unrealized foreign exchange loss (and vice-versa). Under IFRS, the offsetting foreign exchange loss or gain is recorded as a currency translation adjustment within other comprehensive income. As a result, consolidated comprehensive income reflects the offsetting of these translation adjustments while net (loss) earnings reflects only the parent company's side of the translation. |
| ● | The translation of our USD denominated 2025 senior unsecured notes and USD denominated 2030 senior unsecured notes. |
For the three months ended December 31, 2023, we recognized a net unrealized foreign exchange gain of $4.8 million, primarily driven by the effects of the US dollar weakening 2% against the Canadian dollar on our USD senior notes partially offset by the Euro strengthening 2% against the Canadian dollar in Q4 2023 on our intercompany loans. For the year ended December 31, 2023, we recognized a net unrealized foreign exchange gain of $12.4 million, primarily driven by an unrealized gain on our USD senior notes.
Accretion
Accretion expense is recognized to update the present value of the asset retirement obligation balance. For the three months and year ended December 31, 2023, accretion expense increased versus the comparable prior periods primarily due to the impact of a higher asset retirement obligation balance at December 31, 2023 and the strengthening of the Euro against the Canadian dollar.
Depletion and depreciation
Depletion and depreciation expense is recognized to allocate the cost of capital assets over the useful life of the respective assets. Depletion and depreciation expense per unit of production is determined for each depletion unit (which are groups of assets within a specific production area that have similar economic lives) by dividing the sum of the net book value of capital assets and future development costs by total proved plus probable reserves.
Fluctuations in depletion and depreciation expense are primarily the result of changes in produced crude oil and natural gas volumes, and changes in depletion and depreciation per unit. Fluctuations in depletion and depreciation per unit are the result of changes in reserves, depletable base (net book value of capital assets and future development costs), and relative production mix.
Depletion and depreciation on a per boe basis for the three months ended December 31, 2023 of $34.00 increased from $21.22 in the comparable prior period primarily due to higher future development costs increasing the depletable base, lower reserve estimates, and the strengthening of the Euro against the Canadian dollar, partially offset by the southeast Saskatchewan disposition completed at the end of Q1 2023 decreasing the depletable base.
Depletion and depreciation on a per boe basis for the year ended December 31, 2023 of $23.64 increased from $18.59 in the comparable prior period primarily due to higher future development costs increasing the depletable base, lower reserve estimates, acquisition activity, and strengthening of the Euro against the Canadian dollar.
Deferred tax
Deferred tax assets arise when the tax basis of an asset exceeds its accounting basis (known as a deductible temporary difference). Conversely, deferred tax liabilities arise when the tax basis of an asset is less than its accounting basis (known as a taxable temporary difference). Deferred tax assets are recognized only to the extent that it is probable that there are future taxable profits against which the deductible temporary difference can be utilized. Deferred tax assets and liabilities are measured at the enacted or substantively enacted tax rate that is expected to apply when the asset is realized, or the liability is settled.
As such, fluctuations in deferred tax expenses and recoveries primarily arise as a result of: changes in the accounting basis of an asset or liability without a corresponding tax basis change (e.g. when derivative assets and liabilities are marked-to-market or when accounting depletion differs from tax depletion), changes in available tax losses (e.g. if they are utilized to offset taxable income), changes in estimated future taxable profits resulting in a derecognition or recognition of deferred tax assets, and changes in enacted or substantively enacted tax rates.
For the year ended December 31, 2023, the Company recorded a deferred tax recovery of $190.2 million compared to a deferred tax expense of $288.7 million in the prior year period. The recovery recorded in the current year is primarily attributable to the Q1 2023 disposition of assets in southeast Saskatchewan and the impairment charges recorded in Saskatchewan, France, and United States cash generating units (“CGUs”).
Vermilion Energy Inc.
Gain on business combination
■ Page 19 ■ 2023 Management's Discussion and Analysis On March 31, 2023, Vermilion purchased Equinor Energy Ireland Limited ("EEIL") from Equinor ASA. The acquisition adds an incremental 36.5% interest in the Corrib Natural Gas Project, increasing Vermilion's operated interest to 56.5%. The acquisition makes Vermilion the largest provider of domestic natural gas in Ireland.
The gain on the business combination primarily resulted from increases in working capital and the fair value of capital assets from when the purchase and sale agreement was entered into in November 2021 and when the acquisition closed in March 2023.
Loss on dispositions
In March 2023, Vermilion sold non-core assets in southeast Saskatchewan for net proceeds of $182.2 million. The book value of the net assets disposed of was $409.0 million resulting in a loss on disposition of $226.8 million.
In December 2023, Vermilion sold non-core assets in Wyoming for net proceeds of $16.3 million and resulted in a loss on disposition of $125.5 million. The book value of the net assets disposed of was $141.8 million and consisted of $142.5 million of capital assets and $0.7 million of asset retirement obligations.
Impairment
In the fourth quarter of 2023, indicators of impairment were present in our France CGU due to changes in forecasted cost assumptions and in our Saskatchewan and United States CGUs due to negative technical revisions. As a result of the indicators of impairment, the Company performed impairment calculations on the identified CGUs and the recoverable amounts were determined using fair value less costs to sell, which considered future after-tax cash flows from proved plus probable reserves and an after-tax discount rate of 13.0% for Saskatchewan and 15.0% for France and United States. Based on the results of the impairment tests completed, the Company recognized non-cash impairment charges of $1.0 billion. Inputs used in the measurement of capital assets are not based on observable market data and fall within level 3 of the fair value hierarchy.
Taxes
Current income tax rates
Vermilion typically pays corporate income taxes in France, Netherlands, Australia and Germany. In addition, Vermilion pays PRRT in Australia which is a profit based tax applied at a rate of 40% on sales less operating expenses, capital expenditures, and other eligible expenditures. PRRT is deductible in the calculation of taxable income in Australia.
For 2023 and 2022, taxable income was subject to corporate income tax at the following statutory rates:
Jurisdiction |
|
2023 |
|
2022 |
|
Canada |
|
24.4 |
% |
24.6 |
% |
United States |
|
21.0 |
% |
21.0 |
% |
France |
|
25.8 |
% |
25.8 |
% |
Netherlands (1) |
|
50.0 |
% |
50.0 |
% |
Germany |
|
31.2 |
% |
31.3 |
% |
Ireland |
|
25.0 |
% |
25.0 |
% |
Australia |
|
30.0 |
% |
30.0 |
% |
(1) |
In the Netherlands, an additional 10% uplift deduction is allowed against taxable income that is applied to operating expenses, eligible general and administration expenses, and tax deductions for depletion and abandonment retirement obligations. |
Windfall Taxes
On October 6, 2022 the Council of the European Union adopted a regulation that implemented a temporary windfall tax on the profits of oil and gas producers resident in the European Union. This windfall tax was referred to as a temporary solidarity contribution and was calculated on the amount by which the taxable profits for the elected years exceeded the greater of zero and 120% of the average taxable profits for the 2018 to 2021 period. The regulation required Member States to implement the temporary solidarity contribution at a minimum rate of 33% while providing Member States with the option to apply the temporary solidarity contribution to fiscal years beginning on or after January 1, 2022, January 1, 2023, or both. The windfall tax does not apply to 2024 or later years.
Vermilion Energy Inc. ■ Page 20 ■ 2023 Management's Discussion and Analysis
The following table summarizes the manner of implementation of the temporary solidarity contribution by the Member States in which Vermilion operates:
Jurisdiction |
|
2023 |
|
2022 |
|
France (1) |
|
N/A |
|
33.0 |
% |
Netherlands (2) |
|
N/A |
|
33.0 |
% |
Germany |
|
33.0 |
% |
33.0 |
% |
Ireland |
|
75.0 |
% |
75.0 |
% |
| (1) | For 2022, France implemented a windfall tax; however, did not extend for 2023. |
| (2) | For 2023 and 2024, Netherlands has implemented a windfall royalty which, for natural gas sales, is calculated as 65% of the excess of the realized price for a subject year versus the threshold price of €0.50/Nm3 (€13.40/mcf). This royalty is deductible against current income taxes. |
Tax legislation changes
In December 2021, the Organization for Economic Co-operation and Development (“OECD”) issued model rules for a new global minimum tax framework (“Pillar Two”). The objective of Pillar Two is to ensure that large multinational enterprises are subjected to a minimum 15% effective tax rate in each jurisdiction in which they operate.
Most of the countries where Vermilion operates are in the process of enacting, or have enacted, tax legislation to comply with Pillar Two with effect from January 1, 2024. The Company expects that Pillar Two will not have a material impact on income tax expense.
In May 2023, the IASB issued amendments to IAS 12, “Income Taxes” (“IAS 12”) to address the impacts and additional disclosure requirements related to Pillar Two. Vermilion has applied the mandatory exception required by IAS 12 and accordingly has not accounted for any related deferred income tax assets or liabilities.
Tax pools
As at December 31, 2023, we had the following tax pools:
($M) |
|
Oil & Gas |
|
Tax Losses |
|
Other |
|
Total |
Canada |
|
1,511,948 |
(1) |
1,385,458 |
(4) |
28,433 |
|
2,925,839 |
United States |
|
335,395 |
(2) |
154,400 |
(6) |
72,309 |
|
562,104 |
France |
|
255,272 |
(2) |
2,461 |
(5) |
— |
|
257,733 |
Netherlands |
|
52,905 |
(3) |
— |
|
— |
|
52,905 |
Germany |
|
242,588 |
(3) |
— |
|
17,045 |
|
259,633 |
Ireland |
|
— |
|
1,512,603 |
(4) |
— |
|
1,512,603 |
Australia |
|
157,455 |
(1) |
133,480 |
(4) |
— |
|
290,935 |
Total |
|
2,555,563 |
|
3,188,402 |
|
117,787 |
|
5,861,752 |
| (1) | Deduction calculated using various declining balance rates. |
| (2) | Deduction calculated using a combination of straight-line over the assets life and unit of production method. |
| (3) | Deduction calculated using a unit of production method. |
| (4) | Tax losses can be carried forward and applied at 100% against taxable income. |
| (5) | Tax losses can be carried forward and are available to offset the first €1 million of taxable income and 50% of taxable profits in excess each taxation year. |
| (6) | Tax losses of $49 million created prior to January 1, 2018 are carried forward and applied at 100% against taxable income, tax losses of $105 million created after January 1, 2018 are carried forward and applied to 80% of taxable income in each taxation year. |
Financial Position Review
Balance sheet strategy
We regularly review whether our forecast of fund flows from operations is sufficient to finance planned capital expenditures, dividends, share buy-backs, and abandonment and reclamation expenditures. To the extent that fund flows from operations forecasts are not expected to be sufficient to fulfill such expenditures, we will evaluate our ability to finance any shortfall by reducing some or all categories of expenditures, with issuances of equity, and/or with debt (including borrowing using the unutilized capacity of our existing revolving credit facility). We have a long-term goal of maintaining a ratio of net debt to four quarter trailing fund flows from operations of approximately 1.0.
Vermilion Energy Inc. ■ Page 21 ■ 2023 Management's Discussion and Analysis As at December 31, 2023, we have a ratio of net debt to four quarter trailing fund flows from operations of 0.9.
We will continue to monitor for changes in forecasted fund flows from operations and, as appropriate, will adjust our exploration, development capital plans (and associated production targets), and return of capital plans to target optimal debt levels.
Maintaining a strong balance sheet is a core principle of Vermilion and will remain a focus going forward. As debt reduction continues, we will plan to increase the amount of free cash flow that is available for the return of capital, while taking into account other capital requirements.
Net debt
Net debt is reconciled to long-term debt, as follows:
|
|
As at |
||
($M) |
|
Dec 31,2023 |
|
Dec 31,2022 |
Long-term debt |
|
914,015 |
|
1,081,351 |
Adjusted working capital deficit (1) |
|
164,552 |
|
265,111 |
Unrealized FX on swapped USD borrowings |
|
— |
|
(1,876) |
Net debt |
|
1,078,567 |
|
1,344,586 |
|
|
|
|
|
Ratio of net debt to four quarter trailing fund flows from operations |
|
0.9 |
|
0.8 |
(1) |
Adjusted working capital is a non-GAAP financial measure that is not standardized under IFRS and may not be comparable to similar measures disclosed by other issuers. It is defined as current assets less current liabilities, excluding current derivatives and current lease liabilities. The measure is used to calculate net debt, a capital measure disclosed above. Reconciliation to the primary financial statement measures can be found in the “Non-GAAP and Other Specified Financial Measures” section of this document. |
As at December 31, 2023, net debt decreased to $1.1 billion (December 31, 2022 - $1.3 billion), due to debt repayments of $146.3 million funded by the disposition of our southeast Saskatchewan assets for $182.2 million and $552.4 million of free cash flow generated during the year offset by the acquisition of an additional 36.5% working interest in our operated Corrib project for $198.0 million (net of cash and working capital deficit acquired). The ratio of net debt to four quarter trailing fund flows from operations as at December 31, 2023 increased to 0.9 (December 31, 2022 - 0.8) due to lower four quarter trailing fund flows from operations, driven primarily by decreased commodity prices.
Long-term debt
The balances recognized on our balance sheet are as follows:
|
|
As at |
||
|
|
Dec 31,2023 |
|
Dec 31,2022 |
Revolving credit facility |
|
— |
|
147,666 |
2025 senior unsecured notes |
|
395,839 |
|
404,463 |
2030 senior unsecured notes |
|
518,176 |
|
529,222 |
Long-term debt |
|
914,015 |
|
1,081,351 |
Revolving Credit Facility
As at December 31, 2023, Vermilion had in place a bank revolving credit facility maturing May 29, 2027 with terms and outstanding positions as follows:
|
|
As at |
||
($M) |
|
Dec 31,2023 |
|
Dec 31,2022 |
Total facility amount |
|
1,600,000 |
|
1,600,000 |
Amount drawn |
|
— |
|
(147,666) |
Letters of credit outstanding |
|
(18,116) |
|
(13,527) |
Unutilized capacity |
|
1,581,884 |
|
1,438,807 |
During the year, the maturity date of the facility was extended to May 28, 2027 (previously May 29, 2026) and the total facility amount of $1.6 billion was unchanged. As at December 31, 2023, there was no draw on the facility.
Vermilion Energy Inc. ■ Page 22 ■ 2023 Management's Discussion and Analysis
As at December 31, 2023, the revolving credit facility was subject to the following financial covenants:
|
|
|
|
As at |
||
Financial covenant |
|
Limit |
|
Dec 31,2023 |
|
Dec 31,2022 |
Consolidated total debt to consolidated EBITDA |
|
Less than 4.0 |
|
0.65 |
|
0.51 |
Consolidated total senior debt to consolidated EBITDA |
|
Less than 3.5 |
|
— |
|
0.07 |
Consolidated EBITDA to consolidated interest expense |
|
Greater than 2.5 |
|
17.33 |
|
27.10 |
Our financial covenants include financial measures defined within our revolving credit facility agreement that are not defined under IFRS. These financial measures are defined by our revolving credit facility agreement as follows:
| ● | Consolidated total debt: Includes all amounts classified as “Long-term debt”, “Current portion of long-term debt”, and “Lease obligations” (including the current portion included within "Accounts payable and accrued liabilities" but excluding operating leases as defined under IAS 17) on our consolidated balance sheet. |
| ● | Consolidated total senior debt: Consolidated total debt excluding unsecured and subordinated debt. |
| ● | Consolidated EBITDA: Consolidated net (loss) earnings before interest, income taxes, depreciation, accretion and certain other non-cash items, adjusted for the impact of the acquisition of a material subsidiary. |
| ● | Total interest expense: Includes all amounts classified as "Interest expense", but excludes interest on operating leases as defined under IAS 17. |
In addition, our revolving credit facility has provisions relating to our liability management ratings in Alberta and Saskatchewan whereby if our security adjusted liability management ratings fall below specified limits in a province, a portion of the asset retirement obligations are included in the definitions of consolidated total debt and consolidated total senior debt. An event of default occurs if our security adjusted liability management ratings breach additional lower limits for a period greater than 90 days. As of December 31, 2023, Vermilion's liability management ratings were higher than the specified levels, and as such, no amounts relating to asset retirement obligations were included in the calculation of consolidated total debt and consolidated total senior debt.
As at December 31, 2023 and December 31, 2022, Vermilion was in compliance with the above covenants.
2025 senior unsecured notes
On March 13, 2017, Vermilion issued US $300.0 million of senior unsecured notes at par. The notes bear interest at a rate of 5.625% per annum, paid semi-annually on March 15 and September 15, and mature on March 15, 2025. As direct senior unsecured obligations of Vermilion, the notes rank equally in right of payment with existing and future senior indebtedness of the Company.
The senior unsecured notes were recognized at amortized cost and include the transaction costs directly related to the issuance.
Subsequent to March 15, 2023, Vermilion may redeem some or all of the senior unsecured notes at a 100.000% redemption price plus any accrued and unpaid interest.
2030 senior unsecured notes
On April 26, 2022, Vermilion closed a private offering of US $400.0 million 8-year senior unsecured notes. The notes were priced at 99.241% of par, mature on May 1, 2030, and bear interest at a rate of 6.875% per annum. Interest is paid semi-annually on May 1 and November 1, commencing on November 1, 2022. The notes are senior unsecured obligations of Vermilion and rank equally with existing and future senior unsecured indebtedness.
The senior unsecured notes were recognized at amortized cost and include the transaction costs directly related to the issuance.
Vermilion may, at its option, redeem the notes prior to maturity as follows:
| ● | On or after May 1, 2025, Vermilion may redeem some or all of the senior unsecured notes at the redemption prices set forth below, together with accrued and unpaid interest. |
| ● | Prior to May 1, 2025, Vermilion may redeem up to 35% of the original principal amount of the notes with an amount of cash not greater than the net cash proceeds of certain equity offerings at a redemption price of 106.875% of the principal amount of the notes, together with accrued and unpaid interest. |
| ● | Prior to May 1, 2025, Vermilion may also redeem some or all of the notes at a price equal to 100% of the principal amount of the notes, plus a “make-whole premium,” together with applicable premium, accrued and unpaid interest. |
Vermilion Energy Inc. ■ Page 23 ■ 2023 Management's Discussion and Analysis
Year |
|
Redemption price |
|
2025 |
|
103.438 |
% |
2026 |
|
102.292 |
% |
2027 |
|
101.146 |
% |
2028 and thereafter |
|
100.000 |
% |
Shareholders' capital
The following table outlines our dividend payment history:
Date |
|
Frequency |
|
Dividend per unit or share |
|
January 2003 to December 2007 |
|
Monthly |
|
$ |
0.170 |
January 2008 to December 2012 |
|
Monthly |
|
$ |
0.190 |
January 2013 to December 2013 |
|
Monthly |
|
$ |
0.200 |
January 2014 to March 2018 |
|
Monthly |
|
$ |
0.215 |
April 2018 to February 2020 |
|
Monthly |
|
$ |
0.230 |
March 2020 |
|
Monthly |
|
$ |
0.115 |
April 2022 to July 2022 |
|
Quarterly |
|
$ |
0.060 |
August 2022 to March 2023 |
|
Quarterly |
|
$ |
0.080 |
April 2023 onwards |
|
Quarterly |
|
$ |
0.100 |
In December 2023, we announced our plan to increase the quarterly dividend by 20% to $0.12 per share effective for the planned Q1 2024 distribution.
The following table reconciles the change in shareholders’ capital:
Shareholders’ Capital |
|
Shares ('000s) |
|
Amount |
Balance at January 1 |
|
163,227 |
|
4,243,794 |
Vesting of equity based awards |
|
3,657 |
|
23,575 |
Shares issued for equity based compensation |
|
655 |
|
11,242 |
Share-settled dividends on vested equity based awards |
|
64 |
|
1,179 |
Repurchase of shares |
|
(5,332) |
|
(137,224) |
Balance at December 31 |
|
162,271 |
|
4,142,566 |
As at December 31, 2023, there were approximately 4.5 million equity based compensation awards outstanding. As at March 6, 2024, there were approximately 160.8 million common shares issued and outstanding.
On July 10, 2023, the Toronto Stock Exchange approved our notice of intention to renew our normal course issuer bid ("the NCIB"). The NCIB renewal allows Vermilion to purchase up to 16,308,587 common shares (representing approximately 10% of outstanding common shares) beginning July 12, 2023 and ending July 11, 2024. Common shares purchased under the NCIB will be cancelled.
In the fourth quarter of 2023, Vermilion purchased 1.7 million common shares under the NCIB for total consideration of $29.0 million. The common shares purchased under the NCIB were cancelled.
Contractual Obligations and Commitments
As at December 31, 2023, we had the following contractual obligations and commitments:
($M) |
|
Less than 1 year |
|
1 - 3 years |
|
3 - 5 years |
|
After 5 years |
|
Total |
Long-term debt (1) |
|
58,690 |
|
480,682 |
|
72,743 |
|
583,597 |
|
1,195,712 |
Lease obligations (2) |
|
58,034 |
|
80,281 |
|
53,839 |
|
43,907 |
|
236,061 |
Processing and transportation agreements |
|
42,127 |
|
54,205 |
|
27,493 |
|
151,777 |
|
275,602 |
Purchase obligations |
|
32,087 |
|
13,519 |
|
2,374 |
|
105 |
|
48,085 |
Drilling and service agreements |
|
18,572 |
|
49,784 |
|
— |
|
— |
|
68,356 |
Total contractual obligations and commitments |
|
209,510 |
|
678,471 |
|
156,449 |
|
779,386 |
|
1,823,816 |
(1) |
Includes interest on senior unsecured notes. |
Vermilion Energy Inc. ■ Page 24 ■ 2023 Management's Discussion and Analysis As at December 31, 2023, asset retirement obligations were $1,159.1 million compared to $1,087.8 million as at December 31, 2022.
(2) |
Includes undiscounted IFRS 16 - Leases obligations of $59.7 million recognized in the financial statements as at December 31, 2023, future undiscounted IFRS 16 - Leases due to commence in 2024 of $117.5 million, and surface lease rental commitments of $56.5 million and other of $2.4 million that are not considered leases under IFRS 16 and are not represented on the balance sheet. |
(3) |
Commitments denominated in foreign currencies have been translated using the related spot rates on December 31, 2023. |
Asset Retirement Obligations
The increase in asset retirement obligations is primarily attributable to the Company's lower credit spread at December 31, 2023 compared to December 31, 2022 and the acquisition of an additional 36.5% working interest in our Corrib project, partially offset by the disposition of our southeast Saskatchewan assets. The credit spread decreased to 3.6% at December 31, 2023 compared to 4.5% at December 31, 2022 due to a lower expected cost of borrowing.
The present value of the obligation is calculated using a credit-adjusted risk-free rate, calculated using a credit spread added to risk-free rates based on long-term, risk-free government bonds. Vermilion's credit spread is determined using the Company's expected cost of borrowing at the end of the reporting period.
The risk-free rates and credit spread used as inputs to discount the obligations were as follows:
|
|
12/31/2023 |
|
12/31/2022 |
|
Change |
|
Credit spread added to below noted risk-free rates |
|
3.6 |
% |
4.5 |
% |
(0.9) |
% |
Country specific risk-free rate |
|
|
|
|
|
|
|
Canada |
|
3.0 |
% |
3.3 |
% |
(0.3) |
% |
United States |
|
4.2 |
% |
4.1 |
% |
0.1 |
% |
France |
|
3.0 |
% |
3.4 |
% |
(0.4) |
% |
Netherlands |
|
2.1 |
% |
2.7 |
% |
(0.6) |
% |
Germany |
|
2.3 |
% |
2.5 |
% |
(0.2) |
% |
Ireland |
|
2.7 |
% |
3.2 |
% |
(0.5) |
% |
Australia |
|
4.0 |
% |
4.2 |
% |
(0.2) |
% |
Current cost estimates are inflated to the estimated time of abandonment using inflation rates of between 1.3% and 5.5% (as at December 31, 2022 - between 1.6% and 4.2%).
Risks and Uncertainties
Crude oil and natural gas exploration, production, acquisition and marketing operations involve a number of risks and uncertainties that have affected the financial statements and are reasonably likely to affect them in the future. These risks and uncertainties are discussed further below.
Commodity prices
Crude oil and natural gas prices have fluctuated significantly in recent years due to supply and demand factors. Changes in crude oil and natural gas prices affect the level of revenue we generate, the amount of proceeds we receive and payments we make on our commodity derivative instruments, and the level of taxes that we pay. In addition, lower crude oil and natural gas prices would reduce the recoverable amount of our capital assets and could result in impairments or impairment reversals.
Exchange rates
Exchange rate changes impact the Canadian dollar equivalent revenue and costs that we recognize. The majority of our crude oil and condensate revenue stream is priced in US dollars and as such an increase in the strength of the Canadian dollar relative to the US dollar would result in the receipt of fewer Canadian dollars for our revenue. We also incur expenses and capital costs in US dollars, Euros and Australian dollars and thus a decrease in strength of the Canadian dollar relative to those currencies may result in the payment of more Canadian dollars for our expenditures.
In addition, exchange rate changes impact the Canadian equivalent carrying balances for our assets and liabilities. For foreign currency denominated monetary assets (such as cash and cash equivalents, long-term debt, and intercompany loans), the impact of changes in exchange rates is recorded in net (loss) earnings as a foreign exchange gain or loss.
Production and sales volumes
Our production and sales volumes affect the level of revenue we generate and correspondingly the royalties and taxes that we pay. In addition, significant declines in production or sales volumes due to unforeseen circumstances may also result in an indicator of impairment and potential impairment charges.
Vermilion Energy Inc. ■ Page 25 ■ 2023 Management's Discussion and Analysis Changes in interest rates impact the amount of interest expense we pay on our variable rate debt and also our ability to obtain fixed rate financing in the future.
Interest rates
Tax and royalty rates
Changes in tax and royalty rates in the jurisdictions that we operate in would impact the amount of current taxes and royalties that we pay. In addition, changes to substantively enacted tax rates would impact the carrying balance of deferred tax assets and liabilities, potentially resulting in a deferred tax recovery or incremental deferred tax expense.
Windfall taxes and royalties
Vermilion is exposed to increased taxation and royalties due to windfall taxes on profits. Windfall taxes have been substantively enacted within the European Union for oil and gas companies for 2022 and/or 2023 at a minimum rate of 33% calculated on taxable profits above a 20% increase in the average yearly taxable profits as compared to 2018 to 2021. There is risk that windfall taxes or similar mechanisms will be re-enacted or similar legislation could be enacted in other jurisdictions that Vermilion operates in periods of extraordinary commodity prices.
Ukraine war / Middle East conflict
During 2022, Russian military forces invaded Ukraine resulting in a war between the two countries. The ongoing conflict between countries has impacted the supply of oil and gas from the region and has resulted in countries throughout the world imposing financial and trade sanctions against Russia which have had macroeconomic effects. The risks disclosed in our Annual Information Form for the year ended December 31, 2023 may be exacerbated as a result of the Ukraine war, including: market risks including volatility of oil and gas prices, volatility of foreign exchange rates, volatility of market price of common shares, hedging arrangements; regulatory and political risks including tax, royalty, and other government legislation; financing risks including additional financing, debt service, variations in interest rates and foreign exchange rates; acquisition and expansion risks including international operations and future geographical/industry expansion, acquisition assumptions, failure to realize anticipated benefits of prior acquisitions.
In addition to the Ukraine war, hostilities in the Middle East could adversely affect the global economy and impact oil and gas prices.
In addition to the above, we are exposed to risk factors that impact our company and business. For further information on these risk factors, please refer to our Annual Information Form, available on SEDAR+ at www.sedarplus.ca or on our website at www.vermilionenergy.com.
There has been no change in Vermilion’s internal control over financial reporting during the period covered by this MD&A that materially affected, or is reasonably likely to materially affect, its internal control over financial reporting.
Financial Risk Management
To mitigate the risks affecting our business whenever possible, we seek to hire personnel with experience in specific areas. In addition, we provide continued training and development to staff to further develop their skills. When appropriate, we use third party consultants with relevant experience to augment our internal capabilities with respect to certain risks.
We consider our commodity price risk management program as a form of insurance that protects our cash flow and rate of return. The primary objective of the risk management program is to support our return of capital and internal capital development programs. The level of commodity price risk management that occurs is dependent on the amount of debt that is carried. When debt levels are higher, we will be more active in protecting our cash flow stream through our commodity price risk management strategy.
When executing our commodity price risk management programs, we use derivative financial instruments encompassing over-the-counter financial structures as well as fixed and collar structures to economically hedge a part of our physical crude oil and natural gas production. We have strict controls and guidelines in relation to these activities and contract principally with counterparties that have investment grade credit ratings.
Critical Accounting Estimates
The preparation of financial statements in accordance with IFRS requires us to make estimates. Critical accounting estimates are those accounting estimates that require us to make assumptions about matters that are highly uncertain at the time the estimate is made and a different estimate could have been made in the current period or the estimate could change period-to-period.
Vermilion Energy Inc. ■ Page 26 ■ 2023 Management's Discussion and Analysis The carrying amount of asset retirement obligations ($1,159.1 million as at December 31, 2023) is the present value of estimated future costs, discounted from the estimated abandonment date using a credit-adjusted risk-free rate.
The carrying amount of asset retirement obligations
Estimated future costs are based on our assessment of regulatory requirements and the present condition of our assets. The estimated abandonment date is based on the reserve life of the associated assets. The credit-adjusted risk-free rate is based on prevailing interest rates for the appropriate term, risk-free government bonds adjusted for our estimated credit spread (determined by reference to the trading prices for debt issued by similarly rated independent oil and gas producers, including our own senior unsecured notes). Changes in these estimates would result in a change in the carrying amount of asset retirement obligations and capital assets and, to a significantly lesser degree, future accretion and depletion expense.
The estimated abandonment date may change from period to period as the estimated abandonment date changes in response to new information, such as changes in reserve life assumptions or regulations. A one year increase or decrease in the estimated abandonment date would decrease or increase asset retirement obligations (with an offsetting increase to capital assets) by approximately $34.0 million.
The estimated credit-adjusted risk-free rate may change from period to period in response to market conditions in Canada and the international jurisdictions that we operate in. A 0.5% increase or decrease in the credit-adjusted risk-free rate would decrease or increase asset retirement obligations by approximately $70.1 million.
The fair value of capital assets acquired in business combinations
In preparing the purchase price allocation for the business combinations completed in 2023, we estimate the fair value of assets acquired. Assets acquired in an acquisition primarily relates to the crude oil and natural gas reserves. The estimated fair value of the crude oil and natural gas reserves acquired is based on the present value of proved plus probable reserves and forecast commodity prices. Changes in these assumptions, including the discount rate used, would change the amount of capital assets recognized and as a result may cause rise to goodwill or gains recognized on the acquisition and future depletion and depreciation expense.
The recognition of deferred tax assets
The extent to which deferred tax assets are recognized are based on estimates of future profitability. These estimates are based on estimated future commodity prices and estimates of reserves. As at December 31, 2023, the deferred tax asset balance of $182.1 million relates to Ireland and Canada for $105.3 million and $76.8 million, respectively.
In Ireland, we have $237.1 million of non-expiring tax loss pools where $59.3 million of deferred tax assets has not been recognized as there is uncertainty on our ability to fully use these losses based on estimated future taxable profits. Estimated future taxable profits are calculated using proved and probable reserves and forecast pricing.
In Canada, we have $136.9 million of non-expiring oil and gas tax pools where $33.4 million of deferred tax assets has not been recognized as there is uncertainty on our ability to fully use these pools based on estimated future taxable profits. Estimated future taxable profits are calculated using proved and probable reserves and forecast pricing.
Depletion and depreciation
Capital assets are grouped into depletion units, which are groups of assets within a specific production area that have similar economic lives. Depletion units represent the lowest level of disaggregation for which costs are accumulated for the purposes of calculating depletion and depreciation.
The net carrying value of each depletion unit is depleted using the unit of production method by reference to the ratio of production in the period to the total proved and probable reserves, taking into account the future development costs necessary to bring the applicable reserves into production.
Key judgments that are made to reserve estimates such as revisions in reserves, changes in forecast commodity prices, foreign exchange rates, capital or operating costs would impact the amount of depletion and depreciation recorded in a period.
The estimated recoverable amount of cash generating units
Each reporting period, we assess our CGUs for indicators of impairment or impairment reversal. If an indicator of impairment or impairment reversal is identified, we estimate the recoverable amount of the CGU. Judgment is required when determining whether indicators of impairment or impairment reversal exist, as well as judgments made when determining the recoverable amount of a CGU. Changes in any of the key judgments, such as a revision in reserves, changes in forecast commodity prices, foreign exchange rates, capital or operating costs would impact the estimated recoverable amount.
In the fourth quarter of 2023, indicators of impairment were present in our France CGU due to changes in forecasted cost assumptions and in our Saskatchewan and United States CGUs due to negative technical revisions. As a result of the indicators of impairment, the Company performed impairment calculations on the identified CGUs and the recoverable amounts were determined using fair value less costs to sell, which considered
Vermilion Energy Inc. ■ Page 27 ■ 2023 Management's Discussion and Analysis future after-tax cash flows from proved plus probable reserves and an after-tax discount rate of 13.0% for Saskatchewan and 15.0% for France and United States.
Based on the results of the impairment tests completed, the Company recognized non-cash impairment charges of $1.0 billion. Inputs used in the measurement of capital assets are not based on observable market data and fall within level 3 of the fair value hierarchy. A 1% increase in the assumed after-tax discount rate would reduce the estimated recoverable amount of assets tested and result in a higher impairment of $80.1 million while a 5% decrease in revenues (due to a decrease in commodity price forecasts or reserve estimates) would reduce the estimated recoverable amount of assets tested and result in higher impairment of $187.8 million.
Off Balance Sheet Arrangements
We have not entered into any guarantee or off balance sheet arrangements that would materially impact our financial position or results of operations.
Cybersecurity
Vermilion has an information security training and compliance program that is completed at least annually. We have not experienced a cybersecurity breach in the last three years.
Recently Adopted Accounting Pronouncements
Vermilion did not adopt any new accounting pronouncements as at December 31, 2023.
Regulatory Pronouncements Not Yet Adopted
Issuance of IFRS Sustainability Standards - IFRS S1 "General Requirements for Disclosure of Sustainability-related Financial Information" and IFRS S2 "Climate-related Disclosures"
In June 2023 the International Sustainability Standards Board (ISSB) issued its inaugural standards - IFRS S1 and IFRS S2. The ISSB was formed as a new standard-setting board within the IFRS Foundation to issue standards that deliver a comprehensive global baseline of sustainability-related financial disclosures, operating alongside the International Accounting Standards Board.
IFRS S1 and IFRS S2 are effective for annual reporting periods beginning on or after January 1, 2024, with earlier application permitted, as long as both standards are applied. IFRS S1 provides a set of disclosure requirements designed to enable companies to communicate to investors about the sustainability-related risks and opportunities, while IFRS S2 sets out specific climate-related disclosures and is designed to be used in conjunction with IFRS S1. Canadian regulators have not yet mandated these standards; however, Vermilion is currently reviewing the impact of the standards on its financial reporting.
Health, Safety and Environment
We are committed to ensuring we conduct our activities in a manner that protects the health and safety of our employees, our contractors and the public. Our HSE Vision is to consistently apply our core values of Excellence, Trust, Respect and Responsibility. Our goal is to create a workplace free of incidents by ensuring our proactive culture and behaviours create a high-reliability organization where HSE is fully integrated into our business – it is our way of life. Our mantra is HSE: Everyone. Everywhere. Everyday.
Vermilion seeks to maintain health, safety and environmental practices and procedures that comply with or exceed regulatory requirements and industry standards. All of our personnel are expected to work safely and in accordance with established regulations and procedures, and we seek to reduce impacts to land, water and air. During 2023 we:
| ● | Maintained clear priorities around 5 key focus areas of HSE Culture, Communication and Knowledge Management, Management Systems, Environmental & Operational Stewardship, and Health; |
| ● | Completed ongoing HSE performance monitoring through key performance indicator development, analysis and reporting; |
| ● | Continued comprehensive investigations of our incidents and near misses to ensure root causes were identified and corrective actions effectively implemented; |
| ● | Worked towards fulfilling our updated 2030 HSE Strategy; |
| ● | Developed a 2023 Top Quartile HSE Performance Plan; |
| ● | Completed Business Unit implementation plans as part of our Process Safety Management System implementation; |
| ● | Continued reinforcement of the “Vermilion High 5”, an individual safety awareness initiative aimed at keeping front-line workers safe; |
Vermilion Energy Inc. ■ Page 28 ■ 2023 Management's Discussion and Analysis
| ● | Advanced our Energy Safety Canada and International Oil and Gas Producers Life-Saving Rules implementation and competency development; |
| ● | Submitted our CDP Climate and Water reports; |
| ● | Managed our waste products by reducing, recycling and recovering; |
| ● | Reduced long-term environmental liabilities through decommissioning, abandoning and reclaiming well leases and facilities; |
| ● | Continued the development of a robust hazard identification and risk mitigation program specific to environmentally sensitive areas; |
| ● | Performed auditing, management inspections and workforce observations to measure compliance and identify potential hazards and apply risk reduction measures; and |
| ● | Assessed the effectiveness of our performance management standards across multiple business units. |
We are a member of several organizations concerned with environment, health and safety, including numerous regional co-operatives and synergy groups. In the area of stakeholder relations, we work to build long-term relationships with environmental stakeholders and communities.
Task Force on Climate-related Financial Disclosure (TCFD)
Environmental, Social and Governance (ESG)
As an international company, Vermilion responsibly produces essential energy while delivering long-term value to our stakeholders. We believe that integrating sustainability principles into our business increases shareholder returns, enhances development opportunities, reduces long-term risks, and supports the well-being of key stakeholders including the communities in which we operate.
Vermilion has established a leadership position in sustainability performance and disclosure, launching our first CDP Climate submission and Sustainability Report in 2014, with data to 2012, aligned with the Global Reporting Initiative (GRI). We have since adopted recommendations from the Task Force on Climate-related Financial Disclosure (TCFD), the Sustainability Accounting Standards Board (SASB), and the International Sustainability Standards Board (ISSB).
In particular, we have applied the TCFD framework in the management of climate- and other sustainability-related risks and opportunities. This recognizes the importance of climate-specific disclosure while reflecting its intersection with other environment-related risks and opportunities, social factors such as safety and community engagement, and governance issues. Our Index follows:
●
Governance
|
Information Circular |
|
●
Strategy
|
Annual Report MD&A |
|
●
Risk Management
|
Annual Report MD&A |
|
●
Metrics and Targets
|
Annual Report MD&A |
|
●
Consolidated Climate (TCFD) Report
|
www.vermilionenergy.com/sustainability/reports/ |
|
Sustainability and Climate-Related Strategy
Vermilion understands our stakeholders’ expectations that we deliver strong financial results in a responsible and ethical way. As a result, we align our strategic priorities in the following order:
| ● | the safety and health of our staff and those involved directly or indirectly in our operations; |
| ● | our responsibility to protect the environment. We follow the Precautionary Principle introduced in 1992 by the United Nations "Rio Declaration on Environment and Development" by using environmental risk as part of our development decision criteria, and by continually seeking improved environmental performance in our operations; and |
| ● | economic success through a focus on operational excellence across our business, which includes technical and process excellence, efficiency, expertise, stakeholder relations, and respectful and fair treatment of staff, contractors, partners and suppliers. |
Reflecting these priorities, we have positioned Vermilion purposefully within the energy transition. Our scenario analysis has consistently demonstrated that Vermilion can best contribute by focusing on producing energy responsibly: safely, reliably and cost-effectively. Our Sustainability Report provides further details at: www.vermilionenergy.com/sustainability.
Vermilion Energy Inc. ■ Page 29 ■ 2023 Management's Discussion and Analysis Given the intersection of environmental and social issues, and their impact over varying timeframes, we have identified climate-related risks and opportunities within short-term (0-3 years), medium-term (3-6 years) and long-term (6-50 years) horizons.
Description of Sustainability- and Climate-related Risks and Opportunities, and Impacts
We describe these below, along with their potential company and financial impact (assessed using processes such as scenario analysis, cost projections and our Emissions Long-Range Planning tool), and our resulting management approach, including operations such as equipment upgrade, and capital allocation. Our annual CDP Climate Change and Water Security submissions provide additional information, including where in the value chain these risks and opportunities occur: see www.vermilionenergy.com/sustainability/reports/.
Category / |
Description of Impacts |
Potential Financial Impact |
Management Approach |
|---|---|---|---|
Short-term Transition Risks (0-3 Years) | |||
|
Policy and Legal: Increased Pricing of GHG Emissions e.g. Carbon Tax |
Short-term impact is primarily in Canada and Ireland. Canadian Federal Greenhouse Gas Pollution Pricing Act has set carbon tax rates at $65 per tCO2e in 2023, rising to $170 by 2030, with provincial responses to keep pace with the federal system. Our Ireland operations are subject to the EU ETS and Ireland Carbon Tax systems. Longer-term impact rests on carbon pricing’s vulnerability to changes in government policy. |
With our recent northeast British Columbia acquisition, our Canadian carbon tax liability is forecast at approximately $1.6MM in the near term. Our Ireland EU ETS liability is forecast at approximately $2.6MM in 2025 and $3.5MM in 2030. The Ireland Carbon Tax liability is expected to be an additional approximately $0.1MM/year over this period. All estimates are net Vermilion. |
Our exposure is mitigated by provincial responses to the Act, including Alberta's Technology Innovation and Emissions Reduction (TIER) regulation and Output-Based Pricing Systems (OBPS) in Saskatchewan and forthcoming in British Columbia. Our ongoing efforts to reduce the energy and emissions intensity of our operations are integral to managing this risk, including our emission reduction targets. Vermilion continues to monitor and comply with taxation requirements. |
|
|
|
|
|
Policy and Legal: Enhanced Emissions & Other ESG Reporting Obligations |
Climate and other ESG reporting obligations are evolving rapidly, with Vermilion potentially subject to the IFRS Sustainability Standards (2025) and European Sustainability Reporting Standards (2028), U.S. Securities and Exchange Commission and Canadian Securities Administrators Climate-Related Disclosure Rules, and Canada's Modern Slavery Act. Although Vermilion's existing sustainability-related disclosure provides a sound foundation for compliance, there are costs to implement these, particularly potential requirements for increased levels of audit. The impact to Vermilion would be a decreased netback per BOE, due to increased expenses for staff time and system development and implementation. |
The financial impact is an increase in operational cost associated with the management and quantification of emissions to meet new reporting requirements, and the administrative costs associated with reporting and audit obligations. This is estimated at $0.8MM annually. |
Regulations in all of our business units are monitored on an ongoing basis, and assumptions/ scenario planning is used annually to assess risk. In Canada, we implemented an external emission data gathering software in 2021 to support the evolving regulatory landscape. Vermilion also engages stakeholders relating to emissions reporting obligations. Management of this risk is built into Vermilion's operations and our ERM. In addition, we expect to automate our emissions data gathering, aggregation and calculation processes in 2024, while ensuring audit-ready processes for all ESG data points to align with proposed regulatory requirements. |
|
|
|
|
Policy and Legal: Changes in Mandates/Regulations re Products - Existing Production or Acquisition Impaired by Regulatory or Political Changes |
Vermilion's operations are subject to regional regulatory changes that result in changes to equipment requirements such as engineering and equipment modifications to reduce carbon emissions and / or emissions of criteria air contaminants. The most likely short-term impact is regulations in Canada to reduce methane emissions, in France to reduce flaring and in Netherlands to reduce NOx. From a macro perspective, geopolitical impacts (e.g. war in Ukraine) have escalated diverging government and consumer viewpoints on the need for energy security vs energy transition. We expect demand for oil and natural gas to remain strong in the short term, while safety and environmental regulations governing its production will increase. |
Operational changes to comply with existing methane reduction regulations are expected at approx. $1.5MM in the short term, with those associated with eliminating routine flaring in France subject to continuing review in 2024. The cost of compliance with proposed regulations, such as Canada's proposed regulatory framework for reducing oil and gas methane emissions to achieve a 75% reduction by 2030 is not yet established, and will depend on the final version of the framework. |
Vermilion is closely monitoring regulatory and market changes to ensure its approach to resilience under evolving conditions remains appropriate. We provide feedback to governments on proposed regulations, as per our lobbying disclosures, and allocate resources, including staff and capital, to ensure that required operational changes can be effectively actioned. In the short term, tying in vented equipment to flaring infrastructure in Canada is an example of projects to address this risk; in Netherlands we have used NOx scrubbers and purchased NOx certificates to comply with new regulations. Our ongoing efforts to proactively reduce the energy and emissions intensity of our operations are integral to managing this risk, including our announcement of two emission reduction targets in 2021, and our work in 2023 to establish a net zero transition plan and 2030 emissions reduction target, which we expect to release in 2024. We are also working with external partners to further implement and develop emission reduction technologies that are economic to the Company, in part due to the potential generation of carbon credits. Based on stakeholder engagement, Vermilion believes that independent assessments of our operations by third parties are an important tool to demonstrate our responsible approach to production of essential energy. As a result, we have sought and achieved Equitable Origin responsible gas producer certification for 4 of our Canadian sites, the AFNOR CSR Committed label in France, and the Business Working Responsibly mark in Ireland. |
Vermilion Energy Inc. ■ Page 30 ■ 2023 Management's Discussion and Analysis
Category / |
Description of Impacts |
Potential Financial Impact |
Management Approach |
|---|---|---|---|
We have identified these risks as interconnected and existing in the short-term; however, they should be seen as medium- to long-term risks as well. |
|||
| |||
Reputation: Shareholder Divestment |
Investors are raising concerns regarding risks related to emissions, environmental and biodiversity protection, water stewardship, and abandonment and reclamation liabilities. |
Impact of divestment is estimated to be equal to 0.25X of 2023E FFO reducing market capitalization by $286MM. This estimate covers all significant sustainability risk scenarios including but not limited to water stewardship, biodiversity, modern slavery, and community relations. |
In addition to our net zero transition plan development, we have set public targets to reduce ARO liabilities and internal targets to maintain freshwater intensity performance via water management plans where higher-intensity freshwater use is, or could become, an issue. We are also prioritizing compliance with incoming sustainability reporting requirements, which are largely investor- and financial institution-driven, and are actively engaging with investors to understand and respond to their concerns. |
| |||
Reputation: Changes in Customer Behaviour and Legal Challenges |
Government and community relationships are strongly linked to both social and regulatory licenses to operate. Communities where we operate also bear potential impacts, including noise, dust, lights, traffic, etc. Legal challenges against oil and gas industry are increasing, while adoption of EVs and opposition to fossil fuels reflects customer sentiment in some areas. Windfall tax/solidarity contributions are possible during times of particularly high commodity prices. |
The impact of delays or shutdowns would be measured in terms of production per day, impacting revenues. The impact of the 2022-2023 EU windfall tax is already decreasing, to $78MM in 2023 under lower commodity pricing, with the EU signalling that it will not be extended. |
We implemented our Non-technical Risk Management Policy and framework in 2023, providing guidelines for community/social impact assessments, along with our well-established strategic community investment program, Ways of Caring. We also implemented our Lobbying policy in 2023, guiding our engagement with governments, including on specific issues such as windfall tax. |
| |||
Medium-term Transition Risks (3-6 Years) | |||
Technology |
Our emission reduction projects and net zero transition plan rely on technologies that are rapidly evolving, but in many cases unproven at larger scales and uneconomic for dispersed assets that are not, for example, near an electrical grid or pipeline gathering system. Assumptions by those outside the industry that broad generalizations on methane reduction are economical for all assets may be proven false. Some technology projects will fail; others will prove uneconomic. |
Based on the capital and/or operating spend required to reduce our near-term carbon tax liability through emission reduction projects, this will be calculated as part of the net zero transition plan. |
We are mitigating this risk through a careful and deliberate approach to new technology adoption. We have established sustainability project criteria that need to be met in order to move into the Vermilion Opportunity Development Process, providing various stage gates and off-ramps. |
| |||
|
Market: Increased costs related to capital and financing |
Pressure from stakeholders to limit access to, or increase the cost of, debt, capital or insurance without the use of sustainability-linked financing arrangements |
A 100 bps increase to total debt would represent $10MM |
We have established 2 emission reduction targets and 1 ARO target, and are developing our net zero transition plan and 2030 emission reduction target, which establish the foundation for sustainability-linked financing should it be required. |
| |||
Vermilion Energy Inc. ■ Page 31 ■ 2023 Management's Discussion and Analysis
Category / |
Description of Impacts |
Potential Financial Impact |
Management Approach |
|---|---|---|---|
Medium-term Physical Risks (3-6 Years) | |||
|
Acute: Increased Severity of Extreme Weather Events such as Cyclones and Floods |
Vermilion's Wandoo field off northwestern Australia, Corrib project off the Irish coast and oil fields in the coastal area of SW France can be impacted by extreme weather events such as cyclones, resulting in down time or damage to infrastructure. Such events can also impact the downstream handling capacity of our partners, resulting in a limitation to the distribution and sale of our products. |
Based on the value of the Wandoo Platform and a 1-in-10,000-year cyclonic event, the financial implications associated with damage due to a severe weather event is estimated at $274MM (total impact before insurance). The third-party costs associated with potential damages from extreme weather events are not tracked. |
Vermilion maintains insurance as a mitigative measure to reduce the financial impact associated with damage to our assets due to severe weather events. We also have a robust asset integrity program that maintains our offshore facilities to their original design specifications of CAT 5 hurricane force. We also have protocols for monitoring and preparing for cyclones, and have invested in our emergency response capabilities in the event of damage to our assets due to severe weather. |
| |||
Long-term Transition Risks (6-50 Years) | |||
|
Technology: Substitution of existing products and services with lower emissions options, including market supply and demand |
Although we see demand for oil and natural gas remaining robust in the short- to mid-term, it is likely that demand for oil and, to a lesser degree, natural gas will eventually fall as the energy transition evolves and various alternatives for renewable energy options become technologically and economically available. This could impact the need for our products in the longer term, post 2030 for oil and even further out for natural gas. As the past several years have demonstrated, it will be critical to maintain adequate supplies of both oil and natural gas during the energy transition, to provide both accessibility and affordability. |
Given the uncertain timeline and progression of the energy transition, and supply-demand dynamics, we are not using a financial forecast for impact. We are, however, using our scenario analysis to identify potential opportunities that would mitigate the risk to our products. |
Based on our scenario analysis, we identified the need to explore new and evolving technologies and processes to identify synergistic fits for our business in both traditional and renewable energy production. We are pursuing this via our established track record in geothermal energy from produced water, for which our internal expertise in engineering, geoscience and drilling is particularly well suited. We are also investing in early R&D in other areas, such as biogas and the conversion of traditional oil and gas assets to geothermal and hydrogen production, to better understand the long-term potential. |
| |||
Long-term Physical Risks (6-50 Years) | |||
|
Chronic: Changes in Temperature Extremes, Including Rising Mean Temperatures; Changes In Precipitation Patterns and Extreme Variability in Weather Patterns |
Chronic Physical: Based on RCP4.5, which limits warming to 3C (overshooting 1.5-2C), our assets and operations could experience climate changes between 2041 and 2070 such as: North America: 2-3C increase, 12-14% increased precipitation, 7-8% increased aridity, >10 fewer frost days and <25% decrease in number of dry spells. Europe: 1-2C increase, 0-5% increased precipitation, 4-12% increased aridity, generally decreased frost days, with several areas seeing <25% increase in number of dry spells. Australia: 1C increase; 8% increased precipitation (SMHI, Climate Information, https://climateinformation.org/, last accessed: 9 July 2023). Overall warming temperatures, greater precipitation and generally drier conditions (due to increased evaporation) may increase capital costs for drilling, completion and workover operations due to increased timelines, equipment breakdown and restricted access in North America (fewer frost days). They may also impact the health and safety of workers, and create variability and potentially more severe weather events such as flooding, drought and wild fires. Flooding could result in limited access to locations; droughts could impact the availability of surface and / or groundwater required for drilling and completion. This could negatively impact growth by increasing timelines and capital costs to bring on new production. |
The financial implications of a single time event (i.e. wildfire) have been assessed on a case-specific basis. Vermilion maintains insurance to mitigate the potential impact of precipitation-related extreme events (i.e. Wild fire, Flooding) |
Each of our assets is assessed for potential risks and hazards, including those associated with weather events, from lightning to flooding to wild fires. These risks are reviewed at least annually on a case-by-case basis as part of our Enterprise Risk Management system. Mitigation approaches such as clearance of vegetation around facilities, and physical barriers to flooding, are implemented as per our HSE Management System, to protect the health and safety of our workers, contractors and the public, and to protect the environment. |
|
|
|
|
Vermilion Energy Inc. ■ Page 32 ■ 2023 Management's Discussion and Analysis
Category / |
Description of Impacts |
Potential Financial Impact |
Management Approach |
|---|---|---|---|
| |||
|
Chronic: Rising Sea Levels |
Chronic Physical: Potential rising sea levels could impact our Netherlands assets and operations due to issues such as flooding, transportation difficulties, supply chain interruptions and salinization of groundwater. |
We have estimated that a rise in sea level could have a financial impact of $571MM before insurance at our main gas processing facility Garijp (GTC) in the Netherlands, caused by an extreme 1-in-10000-years tide/extreme wind event. |
Physical measures such as conventional berms may not provide complete protection. Based on Vermilion's assessment of less than 0.05% probability over the next 5 years we have accepted this level of risk, reviewing it annually. |
| |||
Short-term Opportunities (0-3 Years) | |||
|
Products and Services, and Resilience: Development of New Products and Services through R&D and Innovation; participation in renewable energy programs |
Directly related to the long-term transitional risk associated with the substitution of low-carbon products, we have the opportunity to participate in the development of those products. This has the potential to reuse our current infrastructure to provide alternative products, such as biogas or hydrogen, or to develop new products such as geothermal energy, creating new revenue streams. |
As this opportunity is in the early stage of assessment, it is difficult to quantify the financial impact, but it is estimated at up to $2.0MM per year in revenue and returns on investment. Potential also exists for significant cost adjustments, as assets slated for abandonment would be repurposed to enable them to continue to generate energy. |
We are leveraging our technical experts and partnerships to provide input into alternative and renewable energy projects as they are identified. An example of the development of low emission goods/services is our France-based industry partnership with Avenia to expand the use of geothermal energy production in oil production, and a geothermal association in Germany. We have also developed criteria for approving the move of these ideas into our Vermilion Opportunity Development Process, which provides clear gates and criteria for considering and implementing such projects. |
|
|
|
|
|
Products and Services: Access to New Markets |
More stringent global measures to reduce emissions from individual ships by 30% by 2030, established through amendments to MARPOL Annex VI, came into force on Jan 1 2020, limiting the sulphur content of bunker fuel to a maximum of 0.5%. Vermilion’s Australian Wandoo facility produces 4500 bbl/d of low sulphur crude oil that meets the needs of refineries in the short term to meet IMO regulations. |
Vermilion conservatively foresees achieving a premium of $10/bbl for its Wandoo production over the next three years for cumulative incremental revenue of $49.3MM. |
Vermilion continues to access local markets for our low sulphur production, while exploring regions to expand our operations. Our Marketing group ensures that Vermilion meets its contractual obligation with our buyers in terms of volumes, delivery dates and crude quality. |
| |||
Medium-term Opportunities (3-6 Years) | |||
|
Products and Services: Ability to Diversify Business Activities; Shift in Consumer Preferences |
Vermilion maintains a diverse, stable global portfolio of oil and gas assets. Our strong record of safe and socially conscious development of energy resources has provided opportunities to access and develop these resources. We see our commitment to sustainability as core to our business, which has provided important organizational focus on emissions quantification and management. As consumers become more aware of and involved in the selection of their energy sources and associated carbon intensity, we believe that Vermilion will continue to be a top quartile choice, providing us with opportunities not available to peer organizations. |
The financial impact of changing consumer preferences in difficult to quantify. We foresee revenue opportunities in two distinct areas. (1) In consumers selecting premium energy products, with these products demanding a higher price than other energy sources on the market; commodity pricing volatility now makes this difficult to estimate (2) Access to more stringent markets, supported by our environmental and sustainability performance. Vermilion has entered into German, Hungarian, Croatian and Slovak oil and gas operations, which our sustainability performance has supported. |
Based on stakeholder engagement, Vermilion believes that independent assessments of our operations by third parties are an important tool to demonstrate our responsible approach to production of essential energy, and generate premium. As a result, we have sought and achieved Equitable Origin responsible gas producer certification for 4 of our Canadian sites, the AFNOR CSR Committed label in France, and the Business Working Responsibly Mark in Ireland. We are currently assessing the potential to expand these certifications. |
Vermilion Energy Inc. ■ Page 33 ■ 2023 Management's Discussion and Analysis
Category / |
Description of Impacts |
Potential Financial Impact |
Management Approach |
Long-term Opportunities (6-50 Years) | |||
|
Products and Services: Shift in Consumer Preferences |
Under the Canadian Environmental Protection Act and based on commitments made by the Canadian and Alberta governments and energy utilities relating to COP21, there is a commitment to reduce emissions for coal-fired power generation. Based on this and with a number of power generating facilities in Alberta nearing the end of their service life, the demand for natural gas is likely to increase due to increased use of combined cycle gas turbine (CCGT) power generation. |
The short term impact of this regulatory change on gas pricing is anticipated to be low and increase to medium in the mid- to long-term. As a natural gas and oil producer, Vermilion would benefit from an increase in marketable prices for natural gas in our Canadian operations. |
As we move further into the energy transition, we foresee natural gas playing an impactful role as a less carbon intense fuel than other options (i.e. coal). Vermilion continues to focus on the identification of resources and assets where we have the opportunity to apply our industry leading expertise to optimize production while reducing emissions. An example of our strategy to realize this opportunity is our asset base in Alberta, which currently includes a large liquids rich gas play, and our entry into the Montney in northeast British Columbia. Vermilion's marketing team is also actively pursuing options for our natural gas production that will enable Vermilion to achieve the best netbacks on production. |
|
|
|
|
|
Energy Source: Shift Toward Decentralized Energy Generation |
The carbon intensity of energy used around the world has a direct relationship to where the energy product was generated. Vermilion’s business unit structure supports production and distribution of energy products into local markets. This strategy results in the significant reduction of the carbon footprint of our energy when compared to non-local sources. |
The long-term financial impact of decentralized energy generation will depend on the speed of the energy transition balanced against the need for energy security. As such, we believe it is not possible to predict the financial impact at this time. |
Vermilion continues to assess where we can access local markets for our production, while exploring regions to expand our operations. The actions taken in the past several years to realize this opportunity include alterations to our structure, our strategic objectives and our operational development plans to support Vermilion as a distributed energy provider, and exploration and development programs in regions with relatively low energy production as compared to consumption. |
Resilience of the Company’s Strategy
Countries in all of our operating regions are implementing policies to create a low-carbon future for the world’s economy, consistent with a 1.5-2C or lower scenario. As a global energy producer, we contribute to the supply of safe, reliable and affordable energy during this transition. The Board of Directors and senior leadership therefore responded to our risk and opportunity identification using a robust scenario analysis.
Vermilion initially examined two energy transition scenarios from the World Economic Forum. These compared a Gradual versus Rapid low-carbon transition based on inputs that included the International Energy Agency’s New Policies Scenario (Gradual) and Sustainable Development Scenario (Rapid), which meets the Paris Agreement’s goal to limit global temperature increases to 1.5 to 2ºC. Vermilion examined key factors impacting the speed of the transition – including the influence of new energy technologies; potential speed of their adoption; anticipated changes in policy and regulation; and emerging market pathways such as India – and resulting factors that could impact the company, including economics (demand, supply, consumer behaviour, and costs of energy); technological advancement; capital availability; government policy; and Company reputation. Among these, government policy was seen as most influential in the near to mid-term.
We applied these findings to Vermilion’s strategy to 2050 and beyond, described below. In particular, the scenario analysis led us to develop two emission-related targets that were announced in 2021: an aspirational commitment to net zero emissions in our own operations, including Scope 1 and Scope 2 emissions, by 2050, and a near-term target to reduce Scope 1 emissions intensity from our operations by 15 to 20% by 2025, using a baseline year of 2019. See Metrics and Targets, below, for more information.
In 2023, we augmented this work with a new analysis of both climate-related transition risks and physical risks. It should be noted that these scenarios are neither predictions nor forecasts; while they rely on the work of credible third-party organizations, they are constructions based on circumstances and assumptions that are highly vulnerable to macroeconomic and geopolitical changes. We have used them to inform our discussions on short, mid- and long-term business strategy, along with risk identification and management.
Vermilion Energy Inc. ■ Page 34 ■ 2023 Management's Discussion and Analysis In our scenario analysis, our Executive Committee and Board of Directors reviewed an internally developed comparison of a diverse range of climate-related transition scenarios.
We focused on changes in demand for oil and for natural gas based on a Reference (business as usual) case and a Climate Policy (government support for reduced greenhouse gas emissions) case for Global, Advanced Economy and Emerging Economy scenarios. Specific scenarios included the International Energy Agency (Stated Policy, Announced Pledges and Net Zero), Equinor (Walls, Bridges), and BP (New Momentum, Accelerated), with reference cases from Exxon, OPEC and the Energy Information Administration. The analysis showed the potential for energy demand declines over a 5- to 15-year horizon, but also showed greater impacts on specific assets based on government policies, location and logistics (landlocked vs waterborne), and proximity to petrochemical or carbon capture and sequestration capacities.
For example, our analysis for the Reference case in advanced economies points to strong policy uptake in Europe and Industrialized Asia, as well as energy efficiency improvements in the residential and commercial sectors. Oil demand declines as energy transition policy momentum pushes road transport towards electrification, which is further displaced by biofuels after 2030. Efficiency gains reduce consumption, while demographic trends work against oil demand. Climate Policy scenarios see advanced economies driving a rapid uptake of renewables to a near full phase-out of combustible natural gas use, leading to a finale in the role of natural gas as a transition fuel. Natural gas use in 2050 is mostly consumed by the petrochemical sector and for hydrogen production. Both scenarios rely on assumptions such as a continued improvement in advanced technology development for renewables (for example, battery improvement); and the addressing of supply chain human rights and environmental issues for critical minerals.
We also assessed the physical climate-related risks in each of our major operating regions using the International Panel on Climate Change’s Representative Concentration Pathway (RCP) 4.5 scenario. We selected RCP 4.5 because it reflects the physical risks our operations would face if CO2 emissions do not start declining until approximately 2045, reaching approximately half of 2050 levels by the end of the century. This is more likely than not to result in rising global temperatures above 2C; specific geographic scenarios are summarized above in the Risks table.
While we have set emission reduction targets that are significantly more ambitious than this, using RCP 4.5 enabled us to identify impacts to operations such as rising temperatures, aridity and dry spells in many areas, rising precipitation in some areas, and rising sea levels. Since climate volatility would also increase, RCP 4.5 highlights the need to consider adaptation and mitigation tactics including changing work schedules for daily heat cycles, along with greater wind, storm and wildfire protection for our assets. We note that RCP 2.6 (which requires CO2 emissions to have started declining by 2020) relies not only on reducing emissions, but also on removing significant amounts of greenhouse gases from the atmosphere, and reflects similar physical risks as 4.5 in the next 10-15 years, with lesser effects in the period 2050-2100.
We incorporated the results of the discussions around these scenarios into our business strategy work in 2023, including working on our net zero transition plan (see Targets and Metric section) and our Risk identification and management process.
Overall, our strategy to ensure our resilience under various scenarios continues to rest on three strategic activities:
| ● | Focusing on efficient and responsible production of oil and natural gas, viewing emissions as potential energy sources: |
| ° | Lower carbon fuels. Since 2012, we have shifted our production mix towards natural gas as a cleaner burning fuel than other fossil fuels. We also sell our fuels within the country of production wherever possible, reducing the carbon footprint associated with transportation of the fuel to consumers while increasing national energy security. |
| ° | Socially responsible fuels. We are committed to ensuring that our products are produced in an environmentally and socially responsible manner, respecting worker rights and community engagement. We operate in regions noted for their stable, well-developed fiscal and regulatory policies related to oil and gas exploration and development, and for their robust health, safety, environmental and human rights legislation. |
| ° | Transparency and reporting. We have established a strong record of reporting on greenhouse gas emissions, energy usage and other key environmental metrics, which has supported our emission reduction targets. |
| ● | Implementing technically and economically feasible options for emission reduction, covering combustion, flaring, venting and fugitive emissions: |
| ° | Greater energy efficiency. Many energy and operational efficiency initiatives go hand-in-hand, which in turn helps us minimize our carbon footprint and reduce greenhouse gas emissions. |
| ° | Lower greenhouse gas emission intensity. We are committed to reducing the greenhouse gas emissions associated with our production, with particular focus on methane. |
| ● | Exploring new and evolving technologies and processes to identify synergistic fits for our business in both traditional and renewable energy production: |
| ° | Alternative energy. We are continuing to develop our knowledge and use of alternative energy sources, including geothermal energy, for which our internal expertise in engineering, geoscience and drilling is particularly well suited. This work has begun with the geothermal potential of our produced water, supporting a circular economy model that conserves, reuses and recycles resources to better protect our environment. It is also expanding into areas such as biogas and the conversion of traditional oil and gas assets to geothermal and hydrogen production. |
In addition, we identified two further pillars of our sustainability strategy that are integral to managing sustainability- and climate-related issues:
Vermilion Energy Inc. ■ Page 35 ■ 2023 Management's Discussion and Analysis We are committed to reducing the impact our operations have, beginning with regulatory compliance across all business units.
Conservation
Our conservation efforts are further focused in three areas:
| ● | Water: We recognize water as a basic human right, and as a vital resource that is shared among many stakeholders in our communities. We are therefore committed to protecting both the supply and the quality of water sources in our areas of operation by: |
| ° | Proactively preventing harm and supporting healthy surface and groundwater bodies |
| ° | Reducing potable and freshwater usage to the lowest level practical, and |
| ° | Taking a lifecycle and circular economy approach to water, exploring opportunities to reuse and recycle products such as produced water |
| ● | Asset Retirement Obligations: We are adapting our long-term Asset Retirement Obligation management to include revitalizing or reusing assets to benefit our environment and our communities. |
| ● | Biodiversity: We are focusing on protecting the species and habitats around us by proactively identifying biodiversity risks and opportunities, and implementing associated plans. |
Community
Our communities comprise a wide diversity of people and organizations, but they have one key thing in common: they care deeply about the safety, environmental stewardship and corporate citizenship that we bring to our local operations. In addition, our people care deeply about their communities - whether we work there or live there, these are the places we call home. We therefore steward our operations and relationships to demonstrate our commitment to being a responsible producer and a valued and trusted neighbor and business partner, including:
| ● | Transparency with respect to safe and environmentally responsible operations, including our potential impacts on local communities |
| ● | Maintaining strong, genuine relationships with our communities, with engagement based on respect, listening and openness, and |
| ● | Creating a shared value focused on local economic and social development |
Sustainability and Climate-Related Risk Management
Process for Identifying, Assessing and Managing Sustainability- and Climate-related Risks, and
Integration into the Company’s Enterprise Risk Management (ERM) System
Sustainability-related risks and opportunities, including those related to climate, are integrated into multi-disciplinary Company-wide risk identification, assessment, and management processes as part of our ERM system, based on the Committee of Sponsoring Organizations of the Treadway Commission (COSO) framework. This provides an integrated approach to managing risk as it impacts strategy and performance, and includes Operational, Market & Financial, Credit, Organizational, Political, Regulatory Compliance, Strategic and Reputational, and Sustainability categories.
Risk management is the responsibility of the Board and the Executive Committee based on a Top-Down, Bottom-Up approach to engage all staff. Top-Down begins with our Board and its committees with clear terms of reference, including oversight for identification and management of specific allocations of risk type. This is translated into action by our Executive Committee, which reviews and manages the ERM process through implementation of associated policies and procedures. Within our Executive Committee, the Vice President International and HSE and the Vice President North America have risk management responsibility on an operational level, while the Chief Financial Officer is responsible for overseeing risk management performance. Our staff help develop systems, standards and procedures. Bottom-Up is how staff implement, maintain and improve risk management processes, applying the hazard-risk-mitigation process in every part of our business.
Risks are identified by key staff across our Company, including our Operations, Finance, Health, Safety and Environment, Economics, Government and Public Relations, and Sustainability teams at corporate, business unit and asset levels. These employees have significant experience, and use a wide array of inputs, including operational and facility assessments, technical and research reports, external stakeholder organizations, government policy and regulation changes, industry initiatives, communities and landowners, and non-governmental entities.
The results are incorporated into our Corporate Risk Register, which provides a consistent framework to ensure the effective tracking and communication of our material risks. Using our Risk Matrix as a prioritization tool, teams assess severity, likelihood, speed of onset, and vulnerability using scales from 1 to 5 for each factor, described in terms of human, environment, financial, social license and cybersecurity impacts. In addition, risks such as commodity pricing, production and carbon taxes are stress-tested to identify the impact of changes over time. Our sustainability materiality analysis, which assesses issues with impact for both the Company and our key stakeholders, is integrated into our ERM system using the Corporate Risk Register through a collaboration between Finance, HSE, Operations and Sustainability teams. Every risk case includes whether climate-related risk is a contributing factor.
Vermilion Energy Inc.
■ Page 36 ■ 2023 Management's Discussion and Analysis The results are reviewed annually at minimum by the responsible teams, and provided to the Executive Committee and the Board and its Committees as appropriate, who further review and assess the risks including interdependencies based on the company’s risk tolerance.
Our risk management approach focuses on reducing the risk to a level as low as reasonably practicable, accepting the risk, and/or controlling it (such as insuring it). For example, if direct mitigation is not possible (e.g. changes in temperature extremes), we would adapt our business processes to reduce the potential impact (e.g. changing work hours to avoid extreme mid-day heat). In other situations (e.g. increasing risk of flood), we may take measures to protect against the risk (e.g. flood controls) while also insuring our operations. Financial impact is deemed substantive if it could cause a business loss of more than $10 million CAD (unrisked and before mitigation/recovery instruments).
To support climate risk identification and management, we use our internally developed Emissions Long-Range Planning Tool. This is based on our long-range planning tool for production, and allows us to forecast emissions, carbon taxes and the impact of various emission reduction projects. This supports our decision-making on production, capital allocation, budgeting, target setting, and merger, acquisition and divestment decisions.
Sustainability and Climate-Related Metrics and Targets
Metrics Used to Assess Sustainability- and Climate-Related Risks and Opportunities
Our sustainability reporting (www.vermilionenergy.com/sustainability) describes significant economic, environmental, social and governance measures, which are reported with reference to TCFD, SASB and GRI. These include but are not limited to:
| ● | Climate: energy consumption and intensity; investment in and generation of renewable energy; greenhouse gas emission and intensity, including flaring and venting, and avoided emissions; and water withdrawal, including from areas of high baseline water stress, and discharge. |
| ● | Environment: Waste generation and management; Asset integrity and spills; and Environmental investment |
| ● | Social: Health and Safety; People; and Community investment |
| ● | Governance: Ethics |
These metrics contribute to a sustainability contribution of 10% of the Corporate Performance Scorecard for our Long-term Incentive Plan, comprised of progress towards our 2025 emission intensity reduction target (5%) and 2027 ARO liability reduction target (3%), along with select ESG rating agency scores (2%).
We also track carbon pricing, and have identified actual and likely pricing scenarios for all of our operations based on current government policies and published research relating to the Paris Agreement. For example, in Canada, the 2023 carbon tax was $65 per tCO2e, and in Ireland, carbon pricing was 56.00€ per tCO2e. Further information is available in our CDP Climate submission, available at vermilionenergy.com/sustainability/reports/.
In addition, we benchmark our performance via third-party ESG rating agencies, including:
| ● | CDP Climate Change and Water Security: Note that while we continue to submit these questionnaires, as of 2023 we no longer participate in the scoring process. In 2022, we received a Climate Score of A- and Water score of “B”. |
| ● | ISS ESG QualityScore: Decile rating of “1” for Environmental and “2” for Social practices as of March 2024. |
| ● | MSCI ESG Rating: AAA in 2023. |
| ● | S&P Global Corporate Sustainability Assessment: Top of our peer group in 2023. |
Scope 1, 2 and 3 GHG Emissions Disclosure
We report Scopes 1, 2 and 3 emissions, which are externally verified under ISO 14064-3. Historical, corporate and business unit data can be found in the Energy and Emissions Performance Metric document available at www.vermilionenergy.com/sustainability/, summarized in the charts below. The 2018 increase in emissions was associated with the acquisition of southeast Saskatchewan assets. Our Scope 1 and 2 emissions intensity and methane emissions intensity decreased in 2019 and 2020, primarily related to our first full year of operatorship for the Corrib gas asset in Ireland, and our focus on reducing post-acquisition emissions over time through superior operations, as we did in 2014 to 2017 following the acquisition of previous Saskatchewan assets. This has been achieved through a variety of gas conservation and recovery initiatives including construction of new infrastructure, operational changes and increased infrastructure runtimes. Additional decreases have been achieved through improved measurement and methodologies, projects such as replacing diesel or propane with compressed natural gas for boilers and water heating for the drilling program in Alberta, converting pneumatic devices from high- to low-bleed, installing solar-powered chemical injection pumps, and the purchase of renewable energy certificates for electricity use in Netherlands and Ireland. Emissions intensity flattened and methane intensity increased in 2022 as a result of
Vermilion Energy Inc. ■ Page 37 ■ 2023 Management's Discussion and Analysis lower production; however, our Scope 1 emissions intensity continued to decrease in 2022, to 0.017 t/CO2e, reflecting a 10% decrease from our 2019 baseline of 0.019 t/CO2e and on track to our 2025 target (see below).
|
|
Related Targets and Performance
Vermilion has set two emission-related targets:
| ● | Net zero emissions in our own operations, including Scope 1 and Scope 2 emissions, by 2050. We are transparent that this is an aspirational goal, and that we will build the plan to achieve this target over time. |
| ● | As a first step, we set a near-term target to reduce Scope 1 emissions intensity from our operations by 15 to 20% by 2025, using a baseline year of 2019. We intend to set new targets every five years at minimum, building on this foundation while exploring broader options, including the potential to reduce Scope 3 emissions. |
We developed, and the Board approved, these targets following our climate scenario analysis and extensive internal assessment. There are significant inherent uncertainties in how the energy transition will accelerate over the next three decades. Our intention is to manage these by focusing on responsible production of essential oil and natural gas for as long as these forms of energy are needed, while developing opportunities in other areas that are an economic and synergistic fit for our business.
Committing to an aspirational net zero target was important, but setting a company-wide nearer term target as the first step in creating a clear pathway was even more so. We looked at our own operations – from how we manage emissions data to options for emission reduction – and at how our peers and the majors are approaching this. From this, we identified emissions intensities and opportunities for reduction within our business units, and set our 2025 target.
This is being achieved, starting with our business units with higher emissions intensities, with an initial focus on efficiency, including process changes, venting reductions, instrumentation upgrades from gas to air and power efficiency options, along with improved metering and field measurements.
All of these factors are also being considered as we worked on our Net Zero Transition Plan through 2023. Based on our scenario analyses, we have identified four key pillars to support both a Net Zero by 2050 target for Scope 1 and 2 emissions, and the establishment of our mid-term 2030 Scope and 2 emission intensity reduction target:
| ● | Reduce emissions, with methane a priority, by reducing flaring, venting and fugitive emissions; driving operational and energy efficiencies; electrifying operations where grids are low-intensity; and assessing new technologies as they become viable. |
| ● | Convert higher emitting elements of our portfolio to lower intensity production, considering both divestment and end-of-life fields. |
| ● | Adapt our portfolio to new energy, considering carbon capture and storage, renewable energy associated with our core operations such as biogas, hydrogen and geothermal production, and other new technologies. |
| ● | Offset as a solution for the emissions that cannot be eliminated. |
We anticipate that our plan will be complete in 2024, and that it will constitute a living document - one that will be updated as economic, technological and regulatory landscapes evolve.
For more information on our sustainability- and climate-related performance, please see our 2023 Proxy Statement and Information Circular, online sustainability reporting, particularly the Index and Performance Metrics sections, and 2022 CDP Responses.
Vermilion Energy Inc. ■ Page 38 ■ 2023 Management's Discussion and Analysis We are committed to a high standard of corporate governance practices, a dedication that begins at the Board level and extends throughout the Company.
Corporate Governance
We believe good corporate governance is in the best interest of our shareholders, and that successful companies are those that deliver growth and a competitive return along with a commitment to the environment, to the communities where they operate, and to their employees.
We comply with the objectives and guidelines relating to corporate governance adopted by the Canadian Securities Administrators and the Toronto Stock Exchange ("TSX"). In addition, the Board monitors and considers the implementation of corporate governance standards proposed by various regulatory and non-regulatory authorities in Canada. A discussion of corporate governance policies is included each year in our proxy materials for our annual general meeting of shareholders, copies of which are available on SEDAR+ (www.sedarplus.ca).
As a Canadian reporting issuer with securities listed on the TSX and the New York Stock Exchange (“NYSE”), Vermilion is required to comply with all applicable Canadian requirements adopted by the Canadian Securities Administrators and the TSX, and applicable rules for foreign private issuers adopted by the U.S. Securities and Exchange Commission that give effect to the provisions of the Sarbanes-Oxley Act of 2002.
Our corporate governance practices also incorporate many “best practices” derived from those required to be followed by US domestic companies under the NYSE listing standards. We are required by Section 303A.11 of the NYSE Listed Company Manual to identify any significant ways in which our corporate governance practices differ from those required to be followed by US domestic companies under NYSE listing standards. We believe that there are no such significant differences in our corporate governance practices, except as follows:
| ● | Shareholder Approval of Equity Compensation Plans. Section 303A.8 of the NYSE Listed Company Manual requires shareholder approval of all “equity compensation plans” and material revisions to those plans. The definition of “equity compensation plans” covers plans that provide for the delivery of newly issued securities, and also plans which rely on securities reacquired on the market by the issuing company for the purpose of redistribution to employees and directors. The TSX rules provide that equity compensation plans and material amendments thereto require shareholder approval only if they involve newly issued securities and the amendments are not otherwise addressed in the plan’s amendment procedures. In addition, the TSX rules require that every three years after institution, all unallocated options, rights or other entitlements under equity compensation plans which do not have a fixed maximum aggregate of securities issuable must be approved by shareholders. Vermilion follows the TSX rules with respect to equity compensation plan shareholder approval requirements. |
Disclosure Controls and Procedures
Our officers have established and maintained disclosure controls and procedures and evaluated the effectiveness of these controls in conjunction with our filings.
As of December 31, 2023, we have evaluated the effectiveness of the design and operation of our disclosure controls and procedures. Based on this evaluation, the Chief Executive Officer and the Chief Financial Officer have concluded and certified that our disclosure controls and procedures are effective.
Internal Control Over Financial Reporting
A company's internal control over financial reporting is a process to provide reasonable assurance regarding the reliability of financial reporting and the preparation of financial statements for external purposes in accordance with generally accepted accounting principles. A company's internal control over financial reporting includes those policies and procedures that (1) pertain to the maintenance of records that, in reasonable detail, accurately and fairly reflect the transactions of the company; (2) provide reasonable assurance that transactions are recorded as necessary to permit preparation of financial statements in accordance with generally accepted accounting principles, and that receipts and expenditures of the company are being made only in accordance with authorizations of management and directors of the company; and (3) provide reasonable assurance regarding prevention or timely detection of unauthorized acquisition, use, or disposition of the company's assets that could have a material effect on the financial statements.
The Chief Executive Officer and the Chief Financial Officer of Vermilion have assessed the effectiveness of Vermilion’s internal control over financial reporting as defined in Rule 13a-15 under the US Securities Exchange Act of 1934 and as defined in Canada by National Instrument 52-109, Certification of Disclosure in Issuers’ Annual and Interim Filings. The assessment was based on the framework in Internal Control – Integrated Framework (2013) issued by the Committee of Sponsoring Organizations of the Treadway Commission. The Chief Executive Officer and the Chief Financial Officer of Vermilion have concluded that Vermilion’s internal control over financial reporting was effective as of December 31, 2023. The effectiveness of Vermilion’s internal control over financial reporting as of December 31, 2023 has been audited by Deloitte LLP, as reflected in their report included in the 2023 audited annual financial statements filed with the US Securities and Exchange Commission. No changes were made to
Vermilion Energy Inc. ■ Page 39 ■ 2023 Management's Discussion and Analysis Vermilion’s internal control over financial reporting during the year ended December 31, 2023, that have materially affected, or are reasonably likely to materially affect, the internal controls over financial reporting.
Vermilion has limited the scope of design controls and procedures ("DC&P") and internal controls over financial reporting to exclude controls, policies
and procedures of Equinor Energy Ireland Limited, which was acquired on March 31, 2023. The scope limitation is in accordance with section 3.3(1)(b) of NI 52-109 which allows an issuer to limit the design of DC&P and ICFR to exclude controls, policies, and procedures of a business that the issuer acquired not more than 365 days before the end of the fiscal period.
The tables below present the summary financial information of Equinor Energy Ireland Limited included in Vermilion's financial statements as at and for the year ended December 31, 2023:
($M) |
|
As at Dec 31, 2023 |
Non-current assets |
|
705,276 |
Non-current liabilities |
|
91,954 |
Net assets |
|
552,688 |
($M) |
|
Year Ended Dec 31, 2023 |
Revenue net of royalties |
|
161,663 |
Net earnings |
|
43,581 |
Vermilion Energy Inc. ■ Page 40 ■ 2023 Management's Discussion and Analysis The following table includes financial statement information on a per unit basis by business unit.
Supplemental Table 1: Netbacks
Liquids includes crude oil, condensate, and NGLs. Natural gas sales volumes have been converted on a basis of six thousand cubic feet of natural gas to one barrel of oil equivalent.
|
|
|
|
Q4 2023 |
|
|
|
|
|
2023 |
|
|
|
Q4 2022 |
|
2022 |
|
|
Liquids |
|
Natural Gas |
|
Total |
|
Liquids |
|
Natural Gas |
|
Total |
|
Total |
|
Total |
|
|
$/bbl |
|
$/mcf |
|
$/boe |
|
$/bbl |
|
$/mcf |
|
$/boe |
|
$/boe |
|
$/boe |
Canada |
|
|
|
|
|
|
|
|
|
|
|
|
|
|
|
|
Sales |
|
79.86 |
|
2.65 |
|
44.73 |
|
79.92 |
|
2.91 |
|
46.73 |
|
65.13 |
|
70.33 |
Royalties |
|
(12.93) |
|
0.02 |
|
(5.76) |
|
(12.06) |
|
0.01 |
|
(5.62) |
|
(7.99) |
|
(10.26) |
Transportation |
|
(4.28) |
|
(0.21) |
|
(2.62) |
|
(3.57) |
|
(0.21) |
|
(2.34) |
|
(2.66) |
|
(2.35) |
Operating |
|
(20.41) |
|
(0.68) |
|
(11.43) |
|
(21.66) |
|
(0.79) |
|
(12.66) |
|
(13.05) |
|
(12.60) |
Operating netback |
|
42.24 |
|
1.78 |
|
24.92 |
|
42.63 |
|
1.92 |
|
26.11 |
|
41.43 |
|
45.12 |
General and administration |
|
|
|
|
|
(5.65) |
|
|
|
|
|
(5.22) |
|
(1.37) |
|
(1.50) |
Fund flows from operations ($/boe) |
|
|
|
|
|
19.27 |
|
|
|
|
|
20.89 |
|
40.06 |
|
43.62 |
United States |
|
|
|
|
|
|
|
|
|
|
|
|
|
|
|
|
Sales |
|
88.71 |
|
2.04 |
|
71.65 |
|
87.49 |
|
2.31 |
|
71.97 |
|
83.51 |
|
87.46 |
Royalties |
|
(25.00) |
|
(0.63) |
|
(20.27) |
|
(23.80) |
|
(0.77) |
|
(19.75) |
|
(22.94) |
|
(23.38) |
Transportation |
|
(1.13) |
|
— |
|
(0.87) |
|
(0.45) |
|
— |
|
(0.36) |
|
(0.18) |
|
(0.33) |
Operating |
|
(15.01) |
|
(0.35) |
|
(12.13) |
|
(13.56) |
|
(0.36) |
|
(11.15) |
|
(17.66) |
|
(14.40) |
Operating netback |
|
47.57 |
|
1.06 |
|
38.38 |
|
49.68 |
|
1.18 |
|
40.71 |
|
42.73 |
|
49.35 |
General and administration |
|
|
|
|
|
(5.26) |
|
|
|
|
|
(4.63) |
|
(4.28) |
|
(3.08) |
Fund flows from operations ($/boe) |
|
|
|
|
|
33.12 |
|
|
|
|
|
36.08 |
|
38.45 |
|
46.27 |
France |
|
|
|
|
|
|
|
|
|
|
|
|
|
|
|
|
Sales |
|
116.92 |
|
— |
|
116.92 |
|
109.47 |
|
— |
|
109.47 |
|
119.68 |
|
132.90 |
Royalties |
|
(15.93) |
|
— |
|
(15.93) |
|
(14.34) |
|
— |
|
(14.34) |
|
(14.28) |
|
(14.68) |
Transportation |
|
(12.80) |
|
— |
|
(12.80) |
|
(9.39) |
|
— |
|
(9.39) |
|
(7.05) |
|
(7.31) |
Operating |
|
(37.93) |
|
— |
|
(37.93) |
|
(30.71) |
|
— |
|
(30.71) |
|
(19.41) |
|
(20.94) |
Operating netback |
|
50.26 |
|
— |
|
50.26 |
|
55.03 |
|
— |
|
55.03 |
|
78.94 |
|
89.97 |
General and administration |
|
|
|
|
|
(13.91) |
|
|
|
|
|
(7.91) |
|
(7.73) |
|
(5.98) |
Current income taxes |
|
|
|
|
|
(13.12) |
|
|
|
|
|
(5.49) |
|
(7.69) |
|
(10.87) |
Fund flows from operations ($/boe) |
|
|
|
|
|
23.23 |
|
|
|
|
|
41.63 |
|
63.52 |
|
73.12 |
Netherlands |
|
|
|
|
|
|
|
|
|
|
|
|
|
|
|
|
Sales |
|
106.81 |
|
17.12 |
|
102.80 |
|
83.23 |
|
17.96 |
|
107.38 |
|
281.75 |
|
279.87 |
Royalties |
|
— |
|
(0.23) |
|
(1.38) |
|
— |
|
(0.15) |
|
(0.90) |
|
(1.21) |
|
(0.25) |
Transportation |
|
— |
|
— |
|
— |
|
— |
|
— |
|
— |
|
— |
|
— |
Operating |
|
(18.90) |
|
(3.03) |
|
(18.19) |
|
(17.44) |
|
(3.76) |
|
(22.50) |
|
(26.44) |
|
(22.82) |
Operating netback |
|
87.91 |
|
13.86 |
|
83.23 |
|
65.79 |
|
14.05 |
|
83.98 |
|
254.10 |
|
256.80 |
General and administration |
|
|
|
|
|
(1.15) |
|
|
|
|
|
(4.78) |
|
(4.75) |
|
(2.12) |
Current income taxes |
|
|
|
|
|
(37.33) |
|
|
|
|
|
(27.78) |
|
(86.02) |
|
(74.91) |
Fund flows from operations ($/boe) |
|
|
|
|
|
44.75 |
|
|
|
|
|
51.42 |
|
163.33 |
|
179.77 |
Germany |
|
|
|
|
|
|
|
|
|
|
|
|
|
|
|
|
Sales |
|
110.62 |
|
16.16 |
|
101.18 |
|
106.03 |
|
17.26 |
|
104.26 |
|
218.13 |
|
231.34 |
Royalties |
|
3.33 |
|
(0.66) |
|
(1.69) |
|
(2.34) |
|
(0.59) |
|
(3.20) |
|
(11.54) |
|
(10.21) |
Transportation |
|
(14.56) |
|
(0.84) |
|
(7.99) |
|
(14.39) |
|
(0.69) |
|
(7.11) |
|
(6.53) |
|
(4.69) |
Operating |
|
(20.63) |
|
(3.01) |
|
(18.87) |
|
(23.79) |
|
(3.87) |
|
(23.39) |
|
(23.96) |
|
(19.96) |
Operating netback |
|
78.76 |
|
11.65 |
|
72.63 |
|
65.51 |
|
12.11 |
|
70.56 |
|
176.10 |
|
196.48 |
General and administration |
|
|
|
|
|
(9.16) |
|
|
|
|
|
(6.99) |
|
(5.36) |
|
(3.34) |
Current income taxes |
|
|
|
|
|
5.78 |
|
|
|
|
|
(15.22) |
|
(3.53) |
|
(15.15) |
Fund flows from operations ($/boe) |
|
|
|
|
|
69.25 |
|
|
|
|
|
48.35 |
|
167.21 |
|
177.99 |
Ireland |
|
|
|
|
|
|
|
|
|
|
|
|
|
|
|
|
Sales |
|
— |
|
17.05 |
|
102.28 |
|
— |
|
16.21 |
|
97.24 |
|
162.16 |
|
194.05 |
Transportation |
|
— |
|
(0.18) |
|
(1.08) |
|
— |
|
(0.38) |
|
(2.28) |
|
(1.88) |
|
(2.14) |
Operating |
|
— |
|
(2.37) |
|
(14.20) |
|
— |
|
(2.11) |
|
(12.69) |
|
(11.74) |
|
(9.92) |
Operating netback |
|
— |
|
14.50 |
|
87.00 |
|
— |
|
13.72 |
|
82.27 |
|
148.54 |
|
181.99 |
General and administration |
|
|
|
|
|
(9.25) |
|
|
|
|
|
(6.13) |
|
(0.78) |
|
0.07 |
Current income taxes |
|
|
|
|
|
(0.33) |
|
|
|
|
|
(0.23) |
|
— |
|
— |
Fund flows from operations ($/boe) |
|
|
|
|
|
77.42 |
|
|
|
|
|
75.91 |
|
147.76 |
|
182.06 |
Vermilion Energy Inc. ■ Page 41 ■ 2023 Management's Discussion and Analysis
|
|
|
|
Q4 2023 |
|
|
|
|
|
2023 |
|
|
|
Q4 2022 |
|
2022 |
|
|
Liquids |
|
Natural Gas |
|
Total |
|
Liquids |
|
Natural Gas |
|
Total |
|
Total |
|
Total |
|
|
$/bbl |
|
$/mcf |
|
$/boe |
|
$/bbl |
|
$/mcf |
|
$/boe |
|
$/boe |
|
$/boe |
Australia |
|
|
|
|
|
|
|
|
|
|
|
|
|
|
|
|
Sales |
|
143.69 |
|
— |
|
143.69 |
|
143.69 |
|
— |
|
143.69 |
|
139.95 |
|
148.15 |
Operating |
|
(42.17) |
|
— |
|
(42.17) |
|
(206.80) |
|
— |
|
(206.80) |
|
(31.23) |
|
(38.50) |
PRRT (2) |
|
82.39 |
|
— |
|
82.39 |
|
82.39 |
|
— |
|
82.39 |
|
(7.40) |
|
(12.27) |
Operating netback |
|
183.91 |
|
— |
|
183.91 |
|
19.28 |
|
— |
|
19.28 |
|
101.32 |
|
97.38 |
General and administration |
|
|
|
|
|
(9.91) |
|
|
|
|
|
(32.32) |
|
(2.93) |
|
(3.32) |
Current income taxes |
|
|
|
|
|
7.60 |
|
|
|
|
|
0.05 |
|
3.47 |
|
3.36 |
Fund flows from operations ($/boe) |
|
|
|
|
|
181.60 |
|
|
|
|
|
(12.99) |
|
101.86 |
|
97.42 |
|
|
|
|
|
|
|
|
|
|
|
|
|
|
|
|
|
Total Company |
|
|
|
|
|
|
|
|
|
|
|
|
|
|
|
|
Sales |
|
92.51 |
|
8.46 |
|
68.64 |
|
88.62 |
|
8.18 |
|
67.10 |
|
103.99 |
|
111.95 |
Realized hedging gain (loss) |
|
0.78 |
|
2.92 |
|
10.33 |
|
0.48 |
|
2.31 |
|
7.77 |
|
(5.42) |
|
(13.07) |
Royalties |
|
(13.08) |
|
(0.09) |
|
(5.93) |
|
(13.28) |
|
(0.09) |
|
(6.36) |
|
(8.43) |
|
(9.85) |
Transportation |
|
(5.16) |
|
(0.21) |
|
(2.95) |
|
(4.66) |
|
(0.25) |
|
(2.95) |
|
(2.71) |
|
(2.54) |
Operating |
|
(20.69) |
|
(1.89) |
|
(15.35) |
|
(22.49) |
|
(2.08) |
|
(17.03) |
|
(16.81) |
|
(15.75) |
PRRT (2) |
|
6.39 |
|
— |
|
2.74 |
|
1.52 |
|
— |
|
0.69 |
|
(0.62) |
|
(0.59) |
Operating netback |
|
60.75 |
|
9.19 |
|
57.48 |
|
50.19 |
|
8.07 |
|
49.22 |
|
70.00 |
|
70.15 |
General and administration |
|
|
|
|
|
(2.60) |
|
|
|
|
|
(2.68) |
|
(1.65) |
|
(1.86) |
Interest expense |
|
|
|
|
|
(3.01) |
|
|
|
|
|
(2.83) |
|
(2.78) |
|
(2.67) |
Realized foreign exchange gain (loss) |
|
|
|
|
|
(0.73) |
|
|
|
|
|
(0.15) |
|
2.33 |
|
0.49 |
Other (expense) income |
|
|
|
|
|
0.26 |
|
|
|
|
|
(0.01) |
|
(0.14) |
|
0.42 |
Corporate income taxes |
|
|
|
|
|
(2.54) |
|
|
|
|
|
(3.05) |
|
(5.18) |
|
(6.70) |
Windfall taxes |
|
|
|
|
|
(0.03) |
|
|
|
|
|
(2.60) |
|
(27.50) |
|
(7.18) |
Fund flows from operations ($/boe) |
|
|
|
|
|
48.83 |
|
|
|
|
|
37.90 |
|
35.08 |
|
52.65 |
(1)Vermilion considers Australian PRRT to be an operating item and, accordingly, has included PRRT in the calculation of operating netbacks. Current income taxes presented above excludes PRRT.
Vermilion Energy Inc. ■ Page 42 ■ 2023 Management's Discussion and Analysis The prices in these tables may represent the weighted averages for several contracts with foreign currency amounts translated to the disclosure currency using forward rates as at the month-end date.
Supplemental Table 2: Hedges
The weighted average price for the portfolio of options listed below may not have the same payoff profile as the individual contracts. As such, the presentation of the weighted average prices is purely for indicative purposes.
The following tables outline Vermilion’s outstanding risk management positions as at December 31, 2023:
|
|
|
|
|
|
|
|
|
|
|
|
|
|
|
|
|
|
|
|
|
|
|
|
Weighted |
|
|
|
|
|
|
|
|
Weighted |
|
|
|
Weighted |
|
|
|
Weighted |
|
|
|
Weighted |
|
Daily |
|
Average |
|
|
|
|
|
|
Daily |
|
Average |
|
Daily |
|
Average |
|
Daily |
|
Average |
|
Daily |
|
Average |
|
Bought |
|
Bought |
|
|
|
|
|
|
Bought Put |
|
Bought Put |
|
Sold Call |
|
Sold Call |
|
Sold Put |
|
Sold Put |
|
Sold Swap |
|
Sold Swap |
|
Swap |
|
Swap |
|
|
Unit |
|
Currency |
|
Volume |
|
Price |
|
Volume |
|
Price |
|
Volume |
|
Price |
|
Volume |
|
Price |
|
Volume |
|
Price |
WTI |
|
|
|
|
|
|
|
|
|
|
|
|
|
|
|
|
|
|
|
|
|
|
|
|
Q1 2024 |
|
bbl |
|
USD |
|
— |
|
— |
|
— |
|
— |
|
— |
|
— |
|
12,500 |
|
79.00 |
|
— |
|
— |
Q2 2024 |
|
bbl |
|
USD |
|
— |
|
— |
|
— |
|
— |
|
— |
|
— |
|
9,500 |
|
80.11 |
|
— |
|
— |
Q3 2024 |
|
bbl |
|
USD |
|
— |
|
— |
|
— |
|
— |
|
— |
|
— |
|
9,500 |
|
80.11 |
|
— |
|
— |
AECO |
|
|
|
|
|
|
|
|
|
|
|
|
|
|
|
|
|
|
|
|
|
|
|
|
Q1 2024 |
|
mcf |
|
CAD |
|
4,739 |
|
3.17 |
|
4,739 |
|
4.22 |
|
— |
|
— |
|
4,739 |
|
3.69 |
|
— |
|
— |
Q2 2024 |
|
mcf |
|
CAD |
|
4,739 |
|
3.17 |
|
4,739 |
|
4.22 |
|
— |
|
— |
|
19,904 |
|
3.14 |
|
— |
|
— |
Q3 2024 |
|
mcf |
|
CAD |
|
4,739 |
|
3.17 |
|
4,739 |
|
4.22 |
|
— |
|
— |
|
19,904 |
|
3.14 |
|
— |
|
— |
Q4 2024 |
|
mcf |
|
CAD |
|
4,739 |
|
3.17 |
|
4,739 |
|
4.22 |
|
— |
|
— |
|
9,849 |
|
3.31 |
|
— |
|
— |
Q1 2025 |
|
mcf |
|
CAD |
|
4,739 |
|
3.17 |
|
4,739 |
|
4.22 |
|
— |
|
— |
|
23,695 |
|
3.89 |
|
— |
|
— |
Q2 2025 |
|
mcf |
|
CAD |
|
4,739 |
|
3.17 |
|
4,739 |
|
4.22 |
|
— |
|
— |
|
23,695 |
|
3.89 |
|
— |
|
— |
Q3 2025 |
|
mcf |
|
CAD |
|
4,739 |
|
3.17 |
|
4,739 |
|
4.22 |
|
— |
|
— |
|
23,695 |
|
3.89 |
|
— |
|
— |
Q4 2025 |
|
mcf |
|
CAD |
|
4,739 |
|
3.17 |
|
4,739 |
|
4.22 |
|
— |
|
— |
|
23,695 |
|
3.89 |
|
— |
|
— |
Q1 2026 |
|
mcf |
|
CAD |
|
4,739 |
|
3.17 |
|
4,739 |
|
4.22 |
|
— |
|
— |
|
23,695 |
|
3.89 |
|
— |
|
— |
Q2 2026 |
|
mcf |
|
CAD |
|
4,739 |
|
3.17 |
|
4,739 |
|
4.22 |
|
— |
|
— |
|
23,695 |
|
3.89 |
|
— |
|
— |
Q3 2026 |
|
mcf |
|
CAD |
|
4,739 |
|
3.17 |
|
4,739 |
|
4.22 |
|
— |
|
— |
|
23,695 |
|
3.89 |
|
— |
|
— |
Q4 2026 |
|
mcf |
|
CAD |
|
4,739 |
|
3.17 |
|
4,739 |
|
4.22 |
|
— |
|
— |
|
23,695 |
|
3.89 |
|
— |
|
— |
NYMEX Henry Hub |
|
|
|
|
|
|
|
|
|
|
|
|
|
|
|
|
|
|
|
|
|
|
|
|
Q1 2024 |
|
mcf |
|
USD |
|
20,000 |
|
3.50 |
|
20,000 |
|
4.45 |
|
— |
|
— |
|
4,000 |
|
3.51 |
|
— |
|
— |
Q2 2024 |
|
mcf |
|
USD |
|
20,000 |
|
3.50 |
|
20,000 |
|
4.45 |
|
— |
|
— |
|
4,000 |
|
3.51 |
|
— |
|
— |
Q3 2024 |
|
mcf |
|
USD |
|
20,000 |
|
3.50 |
|
20,000 |
|
4.45 |
|
— |
|
— |
|
4,000 |
|
3.51 |
|
— |
|
— |
Q4 2024 |
|
mcf |
|
USD |
|
20,000 |
|
3.50 |
|
20,000 |
|
4.45 |
|
— |
|
— |
|
4,000 |
|
3.51 |
|
— |
|
— |
Q1 2025 |
|
mcf |
|
USD |
|
24,000 |
|
3.50 |
|
24,000 |
|
4.49 |
|
— |
|
— |
|
— |
|
— |
|
— |
|
— |
Q2 2025 |
|
mcf |
|
USD |
|
24,000 |
|
3.50 |
|
24,000 |
|
4.49 |
|
— |
|
— |
|
— |
|
— |
|
— |
|
— |
Q3 2025 |
|
mcf |
|
USD |
|
24,000 |
|
3.50 |
|
24,000 |
|
4.49 |
|
— |
|
— |
|
— |
|
— |
|
— |
|
— |
Q4 2025 |
|
mcf |
|
USD |
|
24,000 |
|
3.50 |
|
24,000 |
|
4.49 |
|
— |
|
— |
|
— |
|
— |
|
— |
|
— |
Q1 2026 |
|
mcf |
|
USD |
|
24,000 |
|
3.50 |
|
24,000 |
|
4.49 |
|
— |
|
— |
|
— |
|
— |
|
— |
|
— |
Q2 2026 |
|
mcf |
|
USD |
|
24,000 |
|
3.50 |
|
24,000 |
|
4.49 |
|
— |
|
— |
|
— |
|
— |
|
— |
|
— |
Q3 2026 |
|
mcf |
|
USD |
|
24,000 |
|
3.50 |
|
24,000 |
|
4.49 |
|
— |
|
— |
|
— |
|
— |
|
— |
|
— |
Q4 2026 |
|
mcf |
|
USD |
|
24,000 |
|
3.50 |
|
24,000 |
|
4.49 |
|
— |
|
— |
|
— |
|
— |
|
— |
|
— |
Vermilion Energy Inc. ■ Page 43 ■ 2023 Management's Discussion and Analysis
|
|
|
|
|
|
|
|
|
|
|
|
|
|
|
|
|
|
|
|
|
|
|
|
Weighted |
|
|
|
|
|
|
|
|
Weighted |
|
Daily |
|
Weighted |
|
|
|
Weighted |
|
|
|
Weighted |
|
Daily |
|
Average |
|
|
|
|
|
|
Daily |
|
Average |
|
Sold |
|
Average |
|
Daily |
|
Average |
|
Daily |
|
Average |
|
Bought |
|
Bought |
|
|
|
|
|
|
Bought Put |
|
Bought Put |
|
Call |
|
Sold Call |
|
Sold Put |
|
Sold Put |
|
Sold Swap |
|
Sold Swap |
|
Swap |
|
Swap |
|
|
Unit |
|
Currency |
|
Volume |
|
Price |
|
Volume |
|
Price |
|
Volume |
|
Price |
|
Volume |
|
Price |
|
Volume |
|
Price |
NBP |
|
|
|
|
|
|
|
|
|
|
|
|
|
|
|
|
|
|
|
|
|
|
|
|
Q1 2024 |
|
mcf |
|
EUR |
|
4,913 |
|
41.03 |
|
4,913 |
|
84.26 |
|
— |
|
— |
|
— |
|
— |
|
— |
|
— |
Q2 2024 |
|
mcf |
|
EUR |
|
— |
|
— |
|
— |
|
— |
|
— |
|
— |
|
2,457 |
|
14.65 |
|
— |
|
— |
Q3 2024 |
|
mcf |
|
EUR |
|
— |
|
— |
|
— |
|
— |
|
— |
|
— |
|
2,457 |
|
14.65 |
|
— |
|
— |
TTF |
|
|
|
|
|
|
|
|
|
|
|
|
|
|
|
|
|
|
|
|
|
|
|
|
Q1 2024 |
|
mcf |
|
EUR |
|
35,623 |
|
37.85 |
|
35,623 |
|
71.90 |
|
— |
|
— |
|
7,370 |
|
41.19 |
|
— |
|
— |
Q2 2024 |
|
mcf |
|
EUR |
|
7,278 |
|
25.96 |
|
7,278 |
|
45.76 |
|
— |
|
— |
|
30,709 |
|
14.08 |
|
— |
|
— |
Q3 2024 |
|
mcf |
|
EUR |
|
7,278 |
|
25.96 |
|
7,278 |
|
45.76 |
|
— |
|
— |
|
30,709 |
|
14.08 |
|
— |
|
— |
Q4 2024 |
|
mcf |
|
EUR |
|
4,913 |
|
13.19 |
|
4,913 |
|
18.32 |
|
— |
|
— |
|
34,394 |
|
15.13 |
|
— |
|
— |
Q1 2025 |
|
mcf |
|
EUR |
|
4,913 |
|
13.19 |
|
4,913 |
|
18.32 |
|
— |
|
— |
|
34,394 |
|
15.13 |
|
— |
|
— |
Q2 2025 |
|
mcf |
|
EUR |
|
— |
|
— |
|
— |
|
— |
|
— |
|
— |
|
17,197 |
|
14.40 |
|
— |
|
— |
Q3 2025 |
|
mcf |
|
EUR |
|
— |
|
— |
|
— |
|
— |
|
— |
|
— |
|
17,197 |
|
14.40 |
|
— |
|
— |
Q4 2025 |
|
mcf |
|
EUR |
|
— |
|
— |
|
— |
|
— |
|
— |
|
— |
|
12,284 |
|
13.51 |
|
— |
|
— |
Q1 2026 |
|
mcf |
|
EUR |
|
— |
|
— |
|
— |
|
— |
|
— |
|
— |
|
12,284 |
|
13.51 |
|
— |
|
— |
Q2 2026 |
|
mcf |
|
EUR |
|
— |
|
— |
|
— |
|
— |
|
— |
|
— |
|
9,827 |
|
9.67 |
|
— |
|
— |
Q3 2026 |
|
mcf |
|
EUR |
|
— |
|
— |
|
— |
|
— |
|
— |
|
— |
|
9,827 |
|
9.67 |
|
— |
|
— |
Buy TTF, Sell NBP Basis |
|
|
|
|
|
|
|
|
|
|
|
|
|
|
|
|
|
|
|
|
|
|
|
|
Q1 2024 |
|
mcf |
|
EUR |
|
— |
|
— |
|
— |
|
— |
|
— |
|
— |
|
22,111 |
|
(0.26) |
|
— |
|
— |
THE |
|
|
|
|
|
|
|
|
|
|
|
|
|
|
|
|
|
|
|
|
|
|
|
|
Q4 2024 |
|
mcf |
|
EUR |
|
— |
|
— |
|
— |
|
— |
|
— |
|
— |
|
2,457 |
|
14.95 |
|
— |
|
— |
Q1 2025 |
|
mcf |
|
EUR |
|
— |
|
— |
|
— |
|
— |
|
— |
|
— |
|
2,457 |
|
14.95 |
|
— |
|
— |
Q2 2025 |
|
mcf |
|
EUR |
|
— |
|
— |
|
— |
|
— |
|
— |
|
— |
|
2,457 |
|
14.95 |
|
— |
|
— |
Q3 2025 |
|
mcf |
|
EUR |
|
— |
|
— |
|
— |
|
— |
|
— |
|
— |
|
2,457 |
|
14.95 |
|
— |
|
— |
VET Equity Swaps |
|
|
|
Initial Share Price |
|
|
|
Share Volume |
Swap |
|
Jan 2020 - Apr 2025 |
|
20.9788 |
|
CAD |
|
2,250,000 |
Swap |
|
Jan 2020 - Jul 2025 |
|
22.4587 |
|
CAD |
|
1,500,000 |
|
|
|
|
Monthly Bought Put |
|
Weighted Average |
|
Monthly Sold Call |
|
Weighted Average |
|
Monthly Sold Swap |
|
Weighted Average |
|||
Foreign Exchange |
|
|
|
Amount |
|
Bought Put Price |
|
Amount |
|
Sold Call Price |
|
Amount |
|
Sold Swap Price |
|||
Collar |
|
Jan 2024 - Dec 2024 |
|
4,000,000 |
USD |
|
1.3600 |
|
4,000,000 |
USD |
|
1.3963 |
|
— |
|
|
— |
Forward |
|
Jan 2024 - Dec 2024 |
|
— |
|
|
— |
|
— |
|
|
— |
|
4,000,000 |
USD |
|
1.3531 |
The following sold option instruments allow the counterparties, at the specified date, to enter into a derivative instrument contract with Vermilion at the detailed terms:
|
|
|
|
|
|
|
|
|
|
Weighted |
|
|
|
Weighted |
|
|
|
Weighted |
|
|
|
Weighted |
|
|
|
|
|
|
|
|
Daily |
|
Average |
|
|
|
Average |
|
|
|
Average |
|
Daily Sold |
|
Average |
|
|
|
|
|
|
Option Expiration |
|
Bought Put |
|
Bought Put |
|
Daily Sold |
|
Sold Call |
|
Daily Sold |
|
Sold Put |
|
Swap |
|
Sold Swap |
Period if Option Exercised |
|
Unit |
|
Currency |
|
Date |
|
Volume |
|
Price |
|
Call Volume |
|
Price |
|
Put Volume |
|
Price |
|
Volume |
|
Price |
WTI |
|
|
|
|
|
|
|
|
|
|
|
|
|
|
|
|
|
|
|
|
|
|
Oct 2024 - Sep 2025 |
|
bbl |
|
USD |
|
29-Mar-2024 |
|
— |
|
— |
|
— |
|
— |
|
— |
|
— |
|
1,000 |
|
80.00 |
|
|
|
|
|
|
|
|
|
|
|
|
|
|
|
|
|
|
|
|
|
|
|
Vermilion Energy Inc. ■ Page 44 ■ 2023 Management's Discussion and Analysis
Supplemental Table 3: Capital Expenditures and Acquisitions
By classification ($M) |
|
Q4 2023 |
|
Q4 2022 |
|
2023 |
|
2022 |
Drilling and development |
|
132,308 |
|
157,849 |
|
569,110 |
|
528,056 |
Exploration and evaluation |
|
10,579 |
|
11,456 |
|
21,081 |
|
23,761 |
Capital expenditures |
|
142,887 |
|
169,305 |
|
590,191 |
|
551,817 |
|
|
|
|
|
|
|
|
|
Acquisitions, net of cash acquired |
|
2,669 |
|
3,594 |
|
142,281 |
|
510,309 |
Acquisition of securities |
|
17,448 |
|
964 |
|
21,603 |
|
23,282 |
Acquired working capital deficit |
|
5,607 |
|
— |
|
109,134 |
|
6,122 |
Acquisitions |
|
25,724 |
|
4,558 |
|
273,018 |
|
539,713 |
Dispositions ($M) |
|
Q4 2023 |
|
Q4 2022 |
|
2023 |
|
2022 |
Canada |
|
— |
|
— |
|
182,152 |
|
— |
United States |
|
14,855 |
|
— |
|
14,855 |
|
— |
Total dispositions |
|
14,855 |
|
— |
|
197,007 |
|
— |
By category ($M) |
|
Q4 2023 |
|
Q4 2022 |
|
2023 |
|
2022 |
Drilling, completion, new well equip and tie-in, workovers and recompletions |
|
68,285 |
|
112,755 |
|
373,304 |
|
418,284 |
Production equipment and facilities |
|
76,937 |
|
49,286 |
|
198,331 |
|
105,722 |
Seismic, studies, land and other |
|
(2,335) |
|
7,264 |
|
18,556 |
|
27,811 |
Capital expenditures |
|
142,887 |
|
169,305 |
|
590,191 |
|
551,817 |
Acquisitions |
|
25,724 |
|
4,558 |
|
273,018 |
|
539,713 |
Total capital expenditures and acquisitions |
|
168,611 |
|
173,863 |
|
863,209 |
|
1,091,530 |
Capital expenditures by country ($M) |
|
Q4 2023 |
|
Q4 2022 |
|
2023 |
|
2022 |
Canada |
|
53,791 |
|
111,483 |
|
288,223 |
|
275,203 |
United States |
|
4,913 |
|
2,409 |
|
91,977 |
|
63,353 |
France |
|
11,217 |
|
15,704 |
|
48,297 |
|
44,252 |
Netherlands |
|
10,787 |
|
14,232 |
|
44,147 |
|
21,652 |
Germany |
|
33,046 |
|
10,089 |
|
59,711 |
|
26,157 |
Ireland |
|
11,850 |
|
1,323 |
|
20,283 |
|
3,030 |
Australia |
|
9,331 |
|
5,753 |
|
26,005 |
|
95,173 |
Central and Eastern Europe |
|
7,952 |
|
8,312 |
|
11,548 |
|
22,997 |
Total capital expenditures |
|
142,887 |
|
169,305 |
|
590,191 |
|
551,817 |
Acquisitions by country ($M) |
|
Q4 2023 |
|
Q4 2022 |
|
2023 |
|
2022 |
Canada |
|
20,117 |
|
1,985 |
|
71,185 |
|
531,348 |
United States |
|
— |
|
— |
|
3,808 |
|
1,075 |
Netherlands |
|
— |
|
— |
|
— |
|
707 |
Germany |
|
— |
|
(11) |
|
— |
|
3,857 |
Ireland |
|
5,607 |
|
2,584 |
|
198,025 |
|
2,726 |
Acquisitions |
|
25,724 |
|
4,558 |
|
273,018 |
|
539,713 |
Vermilion Energy Inc. ■ Page 45 ■ 2023 Management's Discussion and Analysis
Supplemental Table 4: Production
|
|
Q4/23 |
|
Q3/23 |
|
Q2/23 |
|
Q1/23 |
|
Q4/22 |
|
Q3/22 |
|
Q2/22 |
|
Q1/22 |
|
Q4/21 |
|
Q3/21 |
|
Q2/21 |
|
Q1/21 |
Canada |
|
|
|
|
|
|
|
|
|
|
|
|
|
|
|
|
|
|
|
|
|
|
|
|
Light and medium crude oil (bbls/d) |
|
11,614 |
|
12,054 |
|
12,901 |
|
16,674 |
|
17,448 |
|
16,835 |
|
17,042 |
|
15,980 |
|
16,388 |
|
16,809 |
|
16,868 |
|
17,767 |
Condensate (1) (bbls/d) |
|
4,034 |
|
4,410 |
|
3,506 |
|
4,719 |
|
4,525 |
|
4,204 |
|
4,873 |
|
4,892 |
|
4,785 |
|
4,426 |
|
5,558 |
|
4,556 |
Other NGLs (1) (bbls/d) |
|
6,281 |
|
6,219 |
|
5,513 |
|
6,875 |
|
6,279 |
|
6,870 |
|
7,155 |
|
7,286 |
|
7,073 |
|
6,862 |
|
7,767 |
|
7,016 |
NGLs (bbls/d) |
|
10,315 |
|
10,629 |
|
9,019 |
|
11,594 |
|
10,804 |
|
11,074 |
|
12,028 |
|
12,178 |
|
11,858 |
|
11,288 |
|
13,325 |
|
11,572 |
Conventional natural gas (mmcf/d) |
|
160.16 |
|
163.94 |
|
159.26 |
|
160.34 |
|
146.81 |
|
145.04 |
|
143.94 |
|
140.55 |
|
128.85 |
|
138.42 |
|
146.55 |
|
138.41 |
Total (boe/d) |
|
48,623 |
|
50,007 |
|
48,464 |
|
54,991 |
|
52,720 |
|
52,080 |
|
53,060 |
|
51,584 |
|
49,720 |
|
51,168 |
|
54,618 |
|
52,407 |
United States |
|
|
|
|
|
|
|
|
|
|
|
|
|
|
|
|
|
|
|
|
|
|
|
|
Light and medium crude oil (bbls/d) |
|
3,187 |
|
4,404 |
|
3,349 |
|
2,824 |
|
3,282 |
|
2,824 |
|
2,846 |
|
2,675 |
|
2,647 |
|
3,520 |
|
1,888 |
|
2,322 |
Condensate (1) (bbls/d) |
|
27 |
|
15 |
|
22 |
|
20 |
|
36 |
|
35 |
|
40 |
|
24 |
|
26 |
|
2 |
|
2 |
|
— |
Other NGLs (1) (bbls/d) |
|
1,131 |
|
1,124 |
|
1,025 |
|
1,020 |
|
1,218 |
|
1,031 |
|
958 |
|
1,056 |
|
1,388 |
|
1,206 |
|
928 |
|
1,058 |
NGLs (bbls/d) |
|
1,158 |
|
1,139 |
|
1,047 |
|
1,040 |
|
1,254 |
|
1,066 |
|
998 |
|
1,080 |
|
1,414 |
|
1,208 |
|
930 |
|
1,058 |
Conventional natural gas (mmcf/d) |
|
7.49 |
|
7.25 |
|
7.23 |
|
7.14 |
|
7.45 |
|
7.03 |
|
6.74 |
|
7.56 |
|
9.09 |
|
6.75 |
|
5.51 |
|
5.95 |
Total (boe/d) |
|
5,593 |
|
6,751 |
|
5,601 |
|
5,055 |
|
5,779 |
|
5,062 |
|
4,967 |
|
5,014 |
|
5,575 |
|
5,854 |
|
3,736 |
|
4,373 |
France |
|
|
|
|
|
|
|
|
|
|
|
|
|
|
|
|
|
|
|
|
|
|
|
|
Light and medium crude oil (bbls/d) |
|
7,395 |
|
7,578 |
|
7,788 |
|
7,578 |
|
7,247 |
|
6,818 |
|
8,126 |
|
8,389 |
|
8,453 |
|
8,677 |
|
9,013 |
|
9,062 |
Total (boe/d) |
|
7,395 |
|
7,578 |
|
7,788 |
|
7,578 |
|
7,247 |
|
6,818 |
|
8,126 |
|
8,389 |
|
8,453 |
|
8,677 |
|
9,013 |
|
9,062 |
Netherlands |
|
|
|
|
|
|
|
|
|
|
|
|
|
|
|
|
|
|
|
|
|
|
|
|
Light and medium crude oil (bbls/d) |
|
— |
|
— |
|
— |
|
— |
|
— |
|
— |
|
1 |
|
1 |
|
— |
|
6 |
|
1 |
|
6 |
Condensate (1) (bbls/d) |
|
119 |
|
39 |
|
61 |
|
66 |
|
49 |
|
74 |
|
60 |
|
83 |
|
97 |
|
104 |
|
95 |
|
92 |
NGLs (bbls/d) |
|
119 |
|
39 |
|
61 |
|
66 |
|
49 |
|
74 |
|
60 |
|
83 |
|
97 |
|
104 |
|
95 |
|
92 |
Conventional natural gas (mmcf/d) |
|
32.06 |
|
24.32 |
|
27.28 |
|
29.07 |
|
27.41 |
|
29.15 |
|
35.22 |
|
39.03 |
|
51.98 |
|
42.48 |
|
37.59 |
|
41.45 |
Total (boe/d) |
|
5,462 |
|
4,091 |
|
4,607 |
|
4,910 |
|
4,617 |
|
4,933 |
|
5,930 |
|
6,589 |
|
8,761 |
|
7,190 |
|
6,362 |
|
7,006 |
Germany |
|
|
|
|
|
|
|
|
|
|
|
|
|
|
|
|
|
|
|
|
|
|
|
|
Light and medium crude oil (bbls/d) |
|
1,775 |
|
1,713 |
|
1,715 |
|
1,410 |
|
1,481 |
|
1,764 |
|
1,331 |
|
1,158 |
|
1,127 |
|
1,043 |
|
1,093 |
|
911 |
Conventional natural gas (mmcf/d) |
|
19.62 |
|
20.29 |
|
22.05 |
|
25.85 |
|
25.86 |
|
26.54 |
|
25.36 |
|
26.95 |
|
18.00 |
|
16.19 |
|
15.60 |
|
13.40 |
Total (boe/d) |
|
5,046 |
|
5,095 |
|
5,391 |
|
5,717 |
|
5,791 |
|
6,187 |
|
5,558 |
|
5,650 |
|
4,127 |
|
3,741 |
|
3,694 |
|
3,144 |
Ireland |
|
|
|
|
|
|
|
|
|
|
|
|
|
|
|
|
|
|
|
|
|
|
|
|
Conventional natural gas (mmcf/d) |
|
64.04 |
|
47.96 |
|
67.51 |
|
24.58 |
|
26.04 |
|
25.74 |
|
27.93 |
|
30.26 |
|
30.12 |
|
22.67 |
|
30.19 |
|
34.14 |
Total (boe/d) |
|
10,673 |
|
7,993 |
|
11,251 |
|
4,096 |
|
4,340 |
|
4,290 |
|
4,655 |
|
5,043 |
|
5,020 |
|
3,778 |
|
5,031 |
|
5,690 |
Australia |
|
|
|
|
|
|
|
|
|
|
|
|
|
|
|
|
|
|
|
|
|
|
|
|
Light and medium crude oil (bbls/d) |
|
4,715 |
|
1,204 |
|
— |
|
— |
|
4,847 |
|
4,763 |
|
2,465 |
|
3,888 |
|
2,742 |
|
4,190 |
|
3,835 |
|
4,489 |
Total (boe/d) |
|
4,715 |
|
1,204 |
|
— |
|
— |
|
4,847 |
|
4,763 |
|
2,465 |
|
3,888 |
|
2,742 |
|
4,190 |
|
3,835 |
|
4,489 |
Central and Eastern Europe |
|
|
|
|
|
|
|
|
|
|
|
|
|
|
|
|
|
|
|
|
|
|
|
|
Conventional natural gas (mmcf/d) |
|
0.54 |
|
0.05 |
|
0.30 |
|
0.64 |
|
0.67 |
|
0.63 |
|
0.64 |
|
0.34 |
|
0.12 |
|
0.22 |
|
0.28 |
|
0.63 |
Total (boe/d) |
|
90 |
|
8 |
|
50 |
|
107 |
|
111 |
|
104 |
|
106 |
|
57 |
|
20 |
|
36 |
|
46 |
|
104 |
Consolidated |
|
|
|
|
|
|
|
|
|
|
|
|
|
|
|
|
|
|
|
|
|
|
|
|
Light and medium crude oil (bbls/d) |
|
28,685 |
|
26,952 |
|
25,753 |
|
28,485 |
|
34,305 |
|
33,003 |
|
31,811 |
|
32,091 |
|
31,356 |
|
34,245 |
|
32,698 |
|
34,556 |
Condensate (1) (bbls/d) |
|
4,180 |
|
4,463 |
|
3,589 |
|
4,805 |
|
4,610 |
|
4,312 |
|
4,973 |
|
4,999 |
|
4,908 |
|
4,532 |
|
5,656 |
|
4,648 |
Other NGLs (1) (bbls/d) |
|
7,412 |
|
7,344 |
|
6,538 |
|
7,896 |
|
7,497 |
|
7,901 |
|
8,113 |
|
8,342 |
|
8,461 |
|
8,068 |
|
8,695 |
|
8,074 |
NGLs (bbls/d) |
|
11,592 |
|
11,807 |
|
10,127 |
|
12,701 |
|
12,107 |
|
12,213 |
|
13,086 |
|
13,341 |
|
13,369 |
|
12,600 |
|
14,351 |
|
12,722 |
Conventional natural gas (mmcf/d) |
|
283.92 |
|
263.80 |
|
283.63 |
|
247.61 |
|
234.23 |
|
234.12 |
|
239.83 |
|
244.69 |
|
238.16 |
|
226.73 |
|
235.72 |
|
233.98 |
Total (boe/d) |
|
87,597 |
|
82,727 |
|
83,152 |
|
82,455 |
|
85,450 |
|
84,237 |
|
84,868 |
|
86,213 |
|
84,417 |
|
84,633 |
|
86,335 |
|
86,276 |
Vermilion Energy Inc. ■ Page 46 ■ 2023 Management's Discussion and Analysis
|
|
2023 |
|
2022 |
|
2021 |
|
2020 |
|
2019 |
|
2018 |
Canada |
|
|
|
|
|
|
|
|
|
|
|
|
Light and medium crude oil (bbls/d) |
|
13,293 |
|
16,830 |
|
16,954 |
|
21,106 |
|
23,971 |
|
17,400 |
Condensate (1) (bbls/d) |
|
4,166 |
|
4,621 |
|
4,831 |
|
4,886 |
|
4,295 |
|
3,754 |
Other NGLs (1) (bbls/d) |
|
6,220 |
|
6,895 |
|
7,179 |
|
7,719 |
|
6,988 |
|
5,914 |
NGLs (bbls/d) |
|
10,386 |
|
11,516 |
|
12,010 |
|
12,605 |
|
11,283 |
|
9,668 |
Conventional natural gas (mmcf/d) |
|
160.94 |
|
144.10 |
|
138.03 |
|
151.38 |
|
148.35 |
|
129.37 |
Total (boe/d) |
|
50,503 |
|
52,364 |
|
51,968 |
|
58,942 |
|
59,979 |
|
48,630 |
United States |
|
|
|
|
|
|
|
|
|
|
|
|
Light and medium crude oil (bbls/d) |
|
3,445 |
|
2,908 |
|
2,597 |
|
3,046 |
|
2,514 |
|
1,069 |
Condensate (1) (bbls/d) |
|
21 |
|
34 |
|
8 |
|
5 |
|
18 |
|
8 |
Other NGLs (1) (bbls/d) |
|
1,076 |
|
1,066 |
|
1,146 |
|
1,218 |
|
996 |
|
452 |
NGLs (bbls/d) |
|
1,097 |
|
1,100 |
|
1,154 |
|
1,223 |
|
1,014 |
|
460 |
Conventional natural gas (mmcf/d) |
|
7.28 |
|
7.20 |
|
6.84 |
|
7.47 |
|
6.89 |
|
2.78 |
Total (boe/d) |
|
5,754 |
|
5,207 |
|
4,890 |
|
5,514 |
|
4,675 |
|
1,992 |
France |
|
|
|
|
|
|
|
|
|
|
|
|
Light and medium crude oil (bbls/d) |
|
7,584 |
|
7,639 |
|
8,799 |
|
8,903 |
|
10,435 |
|
11,362 |
Conventional natural gas (mmcf/d) |
|
— |
|
— |
|
— |
|
— |
|
0.19 |
|
0.21 |
Total (boe/d) |
|
7,584 |
|
7,639 |
|
8,799 |
|
8,903 |
|
10,467 |
|
11,396 |
Netherlands |
|
|
|
|
|
|
|
|
|
|
|
|
Light and medium crude oil (bbls/d) |
|
— |
|
— |
|
3 |
|
1 |
|
3 |
|
— |
Condensate (1) (bbls/d) |
|
71 |
|
66 |
|
97 |
|
88 |
|
88 |
|
90 |
NGLs (bbls/d) |
|
71 |
|
66 |
|
97 |
|
88 |
|
88 |
|
90 |
Conventional natural gas (mmcf/d) |
|
28.18 |
|
32.66 |
|
43.40 |
|
46.16 |
|
49.10 |
|
46.13 |
Total (boe/d) |
|
4,768 |
|
5,510 |
|
7,334 |
|
7,782 |
|
8,274 |
|
7,779 |
Germany |
|
|
|
|
|
|
|
|
|
|
|
|
Light and medium crude oil (bbls/d) |
|
1,654 |
|
1,435 |
|
1,044 |
|
968 |
|
917 |
|
1,004 |
Conventional natural gas (mmcf/d) |
|
21.93 |
|
26.18 |
|
15.81 |
|
12.65 |
|
15.31 |
|
15.66 |
Total (boe/d) |
|
5,310 |
|
5,798 |
|
3,679 |
|
3,076 |
|
3,468 |
|
3,614 |
Ireland |
|
|
|
|
|
|
|
|
|
|
|
|
Conventional natural gas (mmcf/d) |
|
51.12 |
|
27.48 |
|
29.25 |
|
37.44 |
|
46.57 |
|
55.17 |
Total (boe/d) |
|
8,520 |
|
4,579 |
|
4,875 |
|
6,240 |
|
7,762 |
|
9,195 |
Australia |
|
|
|
|
|
|
|
|
|
|
|
|
Light and medium crude oil (bbls/d) |
|
1,492 |
|
3,995 |
|
3,810 |
|
4,416 |
|
5,662 |
|
4,494 |
Total (boe/d) |
|
1,492 |
|
3,995 |
|
3,810 |
|
4,416 |
|
5,662 |
|
4,494 |
Central and Eastern Europe |
|
|
|
|
|
|
|
|
|
|
|
|
Conventional natural gas (mmcf/d) |
|
0.38 |
|
0.57 |
|
0.31 |
|
1.90 |
|
0.42 |
|
1.02 |
Total (boe/d) |
|
63 |
|
95 |
|
51 |
|
317 |
|
70 |
|
169 |
Consolidated |
|
|
|
|
|
|
|
|
|
|
|
|
Light and medium crude oil (bbls/d) |
|
27,469 |
|
32,809 |
|
33,208 |
|
38,441 |
|
43,502 |
|
35,329 |
Condensate (1) (bbls/d) |
|
4,258 |
|
4,721 |
|
4,936 |
|
4,980 |
|
4,400 |
|
3,853 |
Other NGLs (1) (bbls/d) |
|
7,296 |
|
7,961 |
|
8,325 |
|
8,937 |
|
7,984 |
|
6,366 |
NGLs (bbls/d) |
|
11,554 |
|
12,682 |
|
13,261 |
|
13,917 |
|
12,384 |
|
10,219 |
Conventional natural gas (mmcf/d) |
|
269.84 |
|
238.18 |
|
233.64 |
|
256.99 |
|
266.82 |
|
250.33 |
Total (boe/d) |
|
83,994 |
|
85,187 |
|
85,408 |
|
95,190 |
|
100,357 |
|
87,270 |
(1)Under National Instrument 51-101 "Standards of Disclosure for Oil and Gas Activities", disclosure of production volumes should include segmentation by product type as defined in the instrument. This table provides a reconciliation from "crude oil and condensate", "NGLs" and "natural gas" to the product types. In this report, references to "crude oil" and "light and medium crude oil" mean "light crude oil and medium crude oil" and references to "natural gas" mean "conventional natural gas". Production volumes reported are based on quantities as measured at the first point of sale.
Vermilion Energy Inc. ■ Page 47 ■ 2023 Management's Discussion and Analysis
Supplemental Table 5: Segmented Financial Results
|
|
Three Months Ended December 31, 2023 |
||||||||||||||||
($M) |
|
Canada |
|
USA |
|
France |
|
Netherlands |
|
Germany |
|
Ireland |
|
Australia |
|
Corporate |
|
Total |
Drilling and development |
|
53,791 |
|
4,913 |
|
11,217 |
|
10,788 |
|
30,018 |
|
11,850 |
|
9,331 |
|
400 |
|
132,308 |
Exploration and evaluation |
|
— |
|
— |
|
— |
|
(1) |
|
3,028 |
|
— |
|
— |
|
7,552 |
|
10,579 |
Crude oil and condensate sales |
|
142,924 |
|
30,892 |
|
52,472 |
|
1,073 |
|
15,028 |
|
42 |
|
36,381 |
|
— |
|
278,812 |
NGL sales |
|
18,196 |
|
4,567 |
|
— |
|
— |
|
— |
|
— |
|
— |
|
— |
|
22,763 |
Natural gas sales |
|
38,982 |
|
1,408 |
|
— |
|
50,588 |
|
29,122 |
|
100,388 |
|
— |
|
906 |
|
221,394 |
Sales of purchased commodities |
|
— |
|
— |
|
— |
|
— |
|
— |
|
— |
|
— |
|
38,458 |
|
38,458 |
Royalties |
|
(25,759) |
|
(10,427) |
|
(7,150) |
|
(692) |
|
(736) |
|
— |
|
— |
|
(384) |
|
(45,148) |
Revenue from external customers |
|
174,343 |
|
26,440 |
|
45,322 |
|
50,969 |
|
43,414 |
|
100,430 |
|
36,381 |
|
38,980 |
|
516,279 |
Purchased commodities |
|
— |
|
— |
|
— |
|
— |
|
— |
|
— |
|
— |
|
(38,458) |
|
(38,458) |
Transportation |
|
(11,701) |
|
(450) |
|
(5,745) |
|
— |
|
(3,486) |
|
(1,059) |
|
— |
|
— |
|
(22,441) |
Operating |
|
(51,129) |
|
(6,239) |
|
(17,021) |
|
(9,143) |
|
(8,233) |
|
(13,948) |
|
(10,677) |
|
(547) |
|
(116,937) |
General and administration |
|
(25,259) |
|
(2,706) |
|
(6,245) |
|
(578) |
|
(3,999) |
|
(9,085) |
|
(2,508) |
|
30,570 |
|
(19,810) |
PRRT |
|
— |
|
— |
|
— |
|
— |
|
— |
|
— |
|
20,860 |
|
— |
|
20,860 |
Corporate income taxes |
|
(53) |
|
— |
|
(5,888) |
|
(18,758) |
|
2,523 |
|
(325) |
|
1,925 |
|
1,202 |
|
(19,374) |
Windfall taxes |
|
— |
|
— |
|
— |
|
— |
|
— |
|
— |
|
— |
|
(249) |
|
(249) |
Interest expense |
|
— |
|
— |
|
— |
|
— |
|
— |
|
— |
|
— |
|
(22,909) |
|
(22,909) |
Realized gain on derivative instruments |
|
— |
|
— |
|
— |
|
— |
|
— |
|
— |
|
— |
|
78,737 |
|
78,737 |
Realized foreign exchange loss |
|
— |
|
— |
|
— |
|
— |
|
— |
|
— |
|
— |
|
(5,529) |
|
(5,529) |
Realized other income |
|
— |
|
— |
|
— |
|
— |
|
— |
|
— |
|
— |
|
1,948 |
|
1,948 |
Fund flows from operations |
|
86,201 |
|
17,045 |
|
10,423 |
|
22,490 |
|
30,219 |
|
76,013 |
|
45,981 |
|
83,745 |
|
372,117 |
Vermilion Energy Inc. ■ Page 48 ■ 2023 Management's Discussion and Analysis
|
|
Year Ended December 31, 2023 |
||||||||||||||||
($M) |
|
Canada |
|
USA |
|
France |
|
Netherlands |
|
Germany |
|
Ireland |
|
Australia |
|
Corporate |
|
Total |
Total assets |
|
1,805,049 |
|
254,884 |
|
587,824 |
|
237,326 |
|
425,532 |
|
1,137,648 |
|
280,532 |
|
1,507,026 |
|
6,235,821 |
Drilling and development |
|
288,223 |
|
91,977 |
|
48,297 |
|
44,147 |
|
48,463 |
|
20,283 |
|
26,005 |
|
1,715 |
|
569,110 |
Exploration and evaluation |
|
— |
|
— |
|
— |
|
— |
|
11,248 |
|
— |
|
— |
|
9,833 |
|
21,081 |
|
|
|
|
|
|
|
|
|
|
|
|
|
|
|
|
|
|
|
Crude oil and condensate sales |
|
621,985 |
|
129,775 |
|
285,626 |
|
2,306 |
|
57,464 |
|
74 |
|
36,381 |
|
— |
|
1,133,611 |
NGL sales |
|
68,753 |
|
15,240 |
|
— |
|
— |
|
— |
|
— |
|
— |
|
— |
|
83,993 |
Natural gas sales |
|
170,653 |
|
6,143 |
|
— |
|
184,548 |
|
138,017 |
|
302,330 |
|
— |
|
3,260 |
|
804,951 |
Sales of purchased commodities |
|
— |
|
— |
|
— |
|
— |
|
— |
|
— |
|
— |
|
177,000 |
|
177,000 |
Royalties |
|
(103,511) |
|
(41,487) |
|
(37,425) |
|
(1,567) |
|
(5,993) |
|
— |
|
— |
|
(1,711) |
|
(191,694) |
Revenue from external customers |
|
757,880 |
|
109,671 |
|
248,201 |
|
185,287 |
|
189,488 |
|
302,404 |
|
36,381 |
|
178,549 |
|
2,007,861 |
Purchased commodities |
|
— |
|
— |
|
— |
|
— |
|
— |
|
— |
|
— |
|
(177,000) |
|
(177,000) |
Transportation |
|
(43,163) |
|
(751) |
|
(24,511) |
|
— |
|
(13,333) |
|
(7,098) |
|
— |
|
— |
|
(88,856) |
Operating |
|
(233,417) |
|
(23,424) |
|
(80,134) |
|
(39,157) |
|
(43,857) |
|
(39,464) |
|
(52,360) |
|
(1,568) |
|
(513,381) |
General and administration |
|
(96,296) |
|
(9,734) |
|
(20,642) |
|
(8,317) |
|
(13,104) |
|
(19,054) |
|
(8,182) |
|
94,613 |
|
(80,716) |
PRRT |
|
— |
|
— |
|
— |
|
— |
|
— |
|
— |
|
20,860 |
|
— |
|
20,860 |
Corporate income taxes |
|
(53) |
|
— |
|
(14,313) |
|
(48,349) |
|
(28,533) |
|
(715) |
|
13 |
|
18 |
|
(91,932) |
Windfall taxes |
|
— |
|
— |
|
— |
|
— |
|
— |
|
— |
|
— |
|
(78,426) |
|
(78,426) |
Interest expense |
|
— |
|
— |
|
— |
|
— |
|
— |
|
— |
|
— |
|
(85,212) |
|
(85,212) |
Realized gain on derivative instruments |
|
— |
|
— |
|
— |
|
— |
|
— |
|
— |
|
— |
|
234,365 |
|
234,365 |
Realized foreign exchange loss |
|
— |
|
— |
|
— |
|
— |
|
— |
|
— |
|
— |
|
(4,532) |
|
(4,532) |
Realized other expense |
|
— |
|
— |
|
— |
|
— |
|
— |
|
— |
|
— |
|
(420) |
|
(420) |
Fund flows from operations |
|
384,951 |
|
75,762 |
|
108,601 |
|
89,464 |
|
90,661 |
|
236,073 |
|
(3,288) |
|
160,387 |
|
1,142,611 |
Vermilion Energy Inc. ■ Page 49 ■ 2023 Management's Discussion and Analysis
Supplemental Table 6: Operational and Financial Data by Core Region
Production volumes (1)
|
|
Q4/23 |
|
Q3/23 |
|
Q2/23 |
|
Q1/23 |
|
Q4/22 |
|
Q3/22 |
|
Q2/22 |
|
Q1/22 |
|
Q4/21 |
|
Q3/21 |
|
Q2/21 |
|
Q1/21 |
North America |
|
|
|
|
|
|
|
|
|
|
|
|
|
|
|
|
|
|
|
|
|
|
|
|
Crude oil and condensate (bbls/d) |
|
18,862 |
|
20,883 |
|
19,778 |
|
24,237 |
|
25,291 |
|
23,898 |
|
24,801 |
|
23,571 |
|
23,846 |
|
24,757 |
|
24,316 |
|
24,645 |
NGLs (bbls/d) |
|
7,412 |
|
7,344 |
|
6,538 |
|
7,895 |
|
7,497 |
|
7,901 |
|
8,113 |
|
8,342 |
|
8,461 |
|
8,068 |
|
8,695 |
|
8,074 |
Natural gas (mmcf/d) |
|
167.65 |
|
171.19 |
|
166.49 |
|
167.48 |
|
154.26 |
|
152.07 |
|
150.68 |
|
148.11 |
|
137.93 |
|
145.18 |
|
152.06 |
|
144.36 |
Total (boe/d) |
|
54,216 |
|
56,758 |
|
54,065 |
|
60,046 |
|
58,499 |
|
57,142 |
|
58,027 |
|
56,598 |
|
55,295 |
|
57,022 |
|
58,354 |
|
56,780 |
|
|
|
|
|
|
|
|
|
|
|
|
|
|
|
|
|
|
|
|
|
|
|
|
|
International |
|
|
|
|
|
|
|
|
|
|
|
|
|
|
|
|
|
|
|
|
|
|
|
|
Crude oil and condensate (bbls/d) |
|
14,004 |
|
10,534 |
|
9,564 |
|
9,054 |
|
13,624 |
|
13,419 |
|
11,983 |
|
13,519 |
|
12,419 |
|
14,020 |
|
14,037 |
|
14,560 |
Natural gas (mmcf/d) |
|
116.27 |
|
92.61 |
|
117.14 |
|
80.13 |
|
79.97 |
|
82.05 |
|
89.15 |
|
96.58 |
|
100.22 |
|
81.55 |
|
83.66 |
|
89.62 |
Total (boe/d) |
|
33,381 |
|
25,969 |
|
29,087 |
|
22,408 |
|
26,953 |
|
27,095 |
|
26,840 |
|
29,616 |
|
29,123 |
|
27,612 |
|
27,981 |
|
29,495 |
|
|
|
|
|
|
|
|
|
|
|
|
|
|
|
|
|
|
|
|
|
|
|
|
|
Consolidated |
|
|
|
|
|
|
|
|
|
|
|
|
|
|
|
|
|
|
|
|
|
|
|
|
Crude oil and condensate (bbls/d) |
|
32,866 |
|
31,416 |
|
29,341 |
|
33,290 |
|
38,915 |
|
37,315 |
|
36,784 |
|
37,090 |
|
36,264 |
|
38,777 |
|
38,354 |
|
39,204 |
NGLs (bbls/d) |
|
7,412 |
|
7,344 |
|
6,538 |
|
7,896 |
|
7,497 |
|
7,901 |
|
8,113 |
|
8,342 |
|
8,461 |
|
8,068 |
|
8,695 |
|
8,074 |
Natural gas (mmcf/d) |
|
283.92 |
|
263.80 |
|
283.63 |
|
247.61 |
|
234.23 |
|
234.12 |
|
239.83 |
|
244.69 |
|
238.16 |
|
226.73 |
|
235.72 |
|
233.98 |
Total (boe/d) |
|
87,597 |
|
82,727 |
|
83,152 |
|
82,455 |
|
85,450 |
|
84,237 |
|
84,868 |
|
86,213 |
|
84,417 |
|
84,633 |
|
86,335 |
|
86,276 |
(1)Please refer to Supplemental Table 4 "Production" for disclosure by product type.
Vermilion Energy Inc. ■ Page 50 ■ 2023 Management's Discussion and Analysis
Sales volumes
|
|
Q4/23 |
|
Q3/23 |
|
Q2/23 |
|
Q1/23 |
|
Q4/22 |
|
Q3/22 |
|
Q2/22 |
|
Q1/22 |
|
Q4/21 |
|
Q3/21 |
|
Q2/21 |
|
Q1/21 |
North America |
|
|
|
|
|
|
|
|
|
|
|
|
|
|
|
|
|
|
|
|
|
|
|
|
Crude oil and condensate (bbls/d) |
|
18,862 |
|
20,883 |
|
19,778 |
|
24,237 |
|
25,291 |
|
23,897 |
|
24,801 |
|
23,571 |
|
23,845 |
|
24,757 |
|
24,316 |
|
24,645 |
NGLs (bbls/d) |
|
7,412 |
|
7,344 |
|
6,538 |
|
7,895 |
|
7,497 |
|
7,901 |
|
8,113 |
|
8,342 |
|
8,461 |
|
8,068 |
|
8,695 |
|
8,074 |
Natural gas (mmcf/d) |
|
167.65 |
|
171.19 |
|
166.49 |
|
167.48 |
|
154.26 |
|
152.07 |
|
150.68 |
|
148.11 |
|
137.93 |
|
145.18 |
|
152.06 |
|
144.36 |
Total (boe/d) |
|
54,216 |
|
56,758 |
|
54,065 |
|
60,046 |
|
58,499 |
|
57,142 |
|
58,027 |
|
56,598 |
|
55,295 |
|
57,022 |
|
58,354 |
|
56,780 |
|
|
|
|
|
|
|
|
|
|
|
|
|
|
|
|
|
|
|
|
|
|
|
|
|
International |
|
|
|
|
|
|
|
|
|
|
|
|
|
|
|
|
|
|
|
|
|
|
|
|
Crude oil and condensate (bbls/d) |
|
9,221 |
|
9,950 |
|
10,302 |
|
8,087 |
|
16,257 |
|
11,493 |
|
11,720 |
|
12,615 |
|
13,985 |
|
15,227 |
|
13,859 |
|
11,421 |
Natural gas (mmcf/d) |
|
116.27 |
|
92.61 |
|
117.14 |
|
80.13 |
|
79.97 |
|
82.05 |
|
89.15 |
|
96.58 |
|
100.22 |
|
81.55 |
|
83.66 |
|
89.62 |
Total (boe/d) |
|
28,598 |
|
25,386 |
|
29,824 |
|
21,442 |
|
29,585 |
|
25,169 |
|
26,578 |
|
28,712 |
|
30,689 |
|
28,820 |
|
27,802 |
|
26,357 |
|
|
|
|
|
|
|
|
|
|
|
|
|
|
|
|
|
|
|
|
|
|
|
|
|
Consolidated |
|
|
|
|
|
|
|
|
|
|
|
|
|
|
|
|
|
|
|
|
|
|
|
|
Crude oil and condensate (bbls/d) |
|
28,083 |
|
30,833 |
|
30,080 |
|
32,324 |
|
41,547 |
|
35,391 |
|
36,522 |
|
36,186 |
|
37,830 |
|
39,985 |
|
38,174 |
|
36,066 |
NGLs (bbls/d) |
|
7,412 |
|
7,344 |
|
6,538 |
|
7,896 |
|
7,497 |
|
7,901 |
|
8,113 |
|
8,342 |
|
8,461 |
|
8,068 |
|
8,695 |
|
8,074 |
Natural gas (mmcf/d) |
|
283.92 |
|
263.80 |
|
283.63 |
|
247.61 |
|
234.23 |
|
234.12 |
|
239.83 |
|
244.69 |
|
238.16 |
|
226.73 |
|
235.72 |
|
233.98 |
Total (boe/d) |
|
82,814 |
|
82,144 |
|
83,889 |
|
81,489 |
|
88,083 |
|
82,312 |
|
84,607 |
|
85,310 |
|
85,984 |
|
85,841 |
|
86,156 |
|
83,138 |
Vermilion Energy Inc. ■ Page 51 ■ 2023 Management's Discussion and Analysis
Financial results
|
|
Q4/23 |
|
Q3/23 |
|
Q2/23 |
|
Q1/23 |
|
Q4/22 |
|
Q3/22 |
|
Q2/22 |
|
Q1/22 |
|
Q4/21 |
|
Q3/21 |
|
Q2/21 |
|
Q1/21 |
North America |
|
|
|
|
|
|
|
|
|
|
|
|
|
|
|
|
|
|
|
|
|
|
|
|
Crude oil and condensate sales ($/bbl) |
|
100.16 |
|
103.46 |
|
94.78 |
|
95.63 |
|
106.66 |
|
114.82 |
|
134.72 |
|
111.42 |
|
92.99 |
|
82.23 |
|
75.43 |
|
66.31 |
NGL sales ($/bbl) |
|
33.38 |
|
27.77 |
|
28.11 |
|
36.24 |
|
39.93 |
|
44.64 |
|
51.86 |
|
46.94 |
|
47.26 |
|
35.55 |
|
25.43 |
|
29.39 |
Natural gas sales ($/mcf) |
|
2.62 |
|
2.52 |
|
2.29 |
|
4.11 |
|
5.96 |
|
6.41 |
|
7.13 |
|
4.80 |
|
5.07 |
|
3.80 |
|
2.72 |
|
3.98 |
Sales ($/boe) |
|
47.51 |
|
49.26 |
|
45.12 |
|
54.84 |
|
66.95 |
|
71.24 |
|
83.34 |
|
65.88 |
|
59.97 |
|
50.40 |
|
42.30 |
|
43.08 |
Royalties ($/boe) |
|
(7.25) |
|
(7.75) |
|
(5.45) |
|
(7.68) |
|
(9.47) |
|
(12.58) |
|
(12.51) |
|
(11.24) |
|
(9.26) |
|
(7.14) |
|
(5.98) |
|
(5.49) |
Transportation ($/boe) |
|
(2.44) |
|
(2.08) |
|
(1.57) |
|
(2.44) |
|
(2.42) |
|
(2.16) |
|
(2.15) |
|
(1.91) |
|
(1.86) |
|
(1.92) |
|
(1.90) |
|
(2.05) |
Operating ($/boe) |
|
(11.50) |
|
(12.09) |
|
(12.22) |
|
(14.10) |
|
(13.51) |
|
(14.00) |
|
(11.58) |
|
(11.95) |
|
(11.68) |
|
(11.02) |
|
(10.89) |
|
(11.21) |
General and administration ($/boe) |
|
0.87 |
|
(0.72) |
|
0.10 |
|
(0.99) |
|
0.10 |
|
(1.27) |
|
(1.52) |
|
(1.26) |
|
(2.01) |
|
(1.14) |
|
(0.91) |
|
(1.34) |
Corporate income taxes ($/boe) |
|
0.23 |
|
(0.01) |
|
(0.10) |
|
(0.12) |
|
(0.13) |
|
(0.03) |
|
— |
|
(0.02) |
|
0.42 |
|
(0.05) |
|
(0.04) |
|
(0.04) |
Fund flows from operations ($/boe) |
|
27.42 |
|
26.61 |
|
25.88 |
|
29.51 |
|
41.52 |
|
41.20 |
|
55.58 |
|
39.50 |
|
35.58 |
|
29.13 |
|
22.58 |
|
22.95 |
|
|
|
|
|
|
|
|
|
|
|
|
|
|
|
|
|
|
|
|
|
|
|
|
|
Fund flows from operations |
|
136,766 |
|
138,958 |
|
127,346 |
|
159,435 |
|
223,443 |
|
216,579 |
|
293,470 |
|
201,193 |
|
180,979 |
|
152,764 |
|
119,916 |
|
117,227 |
Drilling and development |
|
(58,704) |
|
(69,703) |
|
(135,723) |
|
(116,070) |
|
(113,892) |
|
(112,238) |
|
(54,913) |
|
(57,513) |
|
(89,643) |
|
(35,179) |
|
(38,847) |
|
(59,113) |
Free cash flow |
|
78,062 |
|
69,255 |
|
(8,377) |
|
43,365 |
|
109,551 |
|
104,341 |
|
238,557 |
|
143,680 |
|
91,336 |
|
117,585 |
|
81,069 |
|
58,114 |
|
|
|
|
|
|
|
|
|
|
|
|
|
|
|
|
|
|
|
|
|
|
|
|
|
International |
|
|
|
|
|
|
|
|
|
|
|
|
|
|
|
|
|
|
|
|
|
|
|
|
Crude oil and condensate sales ($/bbl) |
|
123.77 |
|
114.26 |
|
100.23 |
|
107.57 |
|
128.02 |
|
140.09 |
|
146.67 |
|
136.69 |
|
103.53 |
|
94.91 |
|
85.41 |
|
81.40 |
Natural gas sales ($/mcf) |
|
16.92 |
|
13.34 |
|
14.58 |
|
24.69 |
|
39.54 |
|
58.55 |
|
32.33 |
|
36.75 |
|
35.54 |
|
18.82 |
|
9.83 |
|
7.98 |
Sales ($/boe) |
|
108.70 |
|
93.46 |
|
91.89 |
|
132.84 |
|
177.23 |
|
254.86 |
|
173.14 |
|
183.66 |
|
163.23 |
|
103.39 |
|
72.16 |
|
62.39 |
Royalties ($/boe) |
|
(3.41) |
|
3.55 |
|
(7.43) |
|
(13.39) |
|
(6.38) |
|
(7.21) |
|
(7.23) |
|
(5.43) |
|
(4.13) |
|
(4.52) |
|
(3.83) |
|
(3.53) |
Transportation ($/boe) |
|
(3.91) |
|
(4.53) |
|
(5.23) |
|
(5.11) |
|
(3.29) |
|
(3.51) |
|
(3.64) |
|
(2.91) |
|
(3.40) |
|
(3.47) |
|
(4.64) |
|
(2.76) |
Operating ($/boe) |
|
(22.64) |
|
(25.58) |
|
(28.24) |
|
(31.41) |
|
(23.35) |
|
(22.63) |
|
(22.11) |
|
(19.86) |
|
(18.86) |
|
(17.55) |
|
(16.56) |
|
(16.42) |
General and administration ($/boe) |
|
(9.18) |
|
(7.37) |
|
(7.58) |
|
(7.52) |
|
(5.09) |
|
(3.34) |
|
(3.16) |
|
(3.02) |
|
(2.53) |
|
(2.40) |
|
(2.61) |
|
(2.06) |
Corporate income taxes ($/boe) |
|
(7.81) |
|
(13.42) |
|
(6.79) |
|
(11.20) |
|
(15.15) |
|
(21.97) |
|
(28.73) |
|
(17.63) |
|
(12.17) |
|
0.64 |
|
(0.19) |
|
0.66 |
PRRT ($/boe) |
|
7.93 |
|
— |
|
— |
|
— |
|
(1.85) |
|
(1.96) |
|
(0.83) |
|
(2.60) |
|
(1.96) |
|
(2.74) |
|
(0.58) |
|
(0.60) |
Fund flows from operations ($/boe) |
|
69.68 |
|
46.12 |
|
36.62 |
|
64.21 |
|
122.12 |
|
194.24 |
|
107.44 |
|
132.21 |
|
120.18 |
|
73.35 |
|
43.75 |
|
37.68 |
|
|
|
|
|
|
|
|
|
|
|
|
|
|
|
|
|
|
|
|
|
|
|
|
|
Fund flows from operations |
|
183,353 |
|
107,704 |
|
99,377 |
|
123,893 |
|
332,377 |
|
449,771 |
|
259,840 |
|
341,626 |
|
339,286 |
|
194,505 |
|
110,654 |
|
89,403 |
Drilling and development |
|
(73,604) |
|
(49,701) |
|
(28,347) |
|
(37,258) |
|
(43,957) |
|
(65,640) |
|
(54,575) |
|
(25,328) |
|
(29,359) |
|
(27,994) |
|
(38,856) |
|
(20,399) |
Exploration and evaluation |
|
(10,579) |
|
(6,235) |
|
(2,775) |
|
(1,492) |
|
(11,456) |
|
(6,137) |
|
(3,665) |
|
(2,503) |
|
(26,805) |
|
(3,277) |
|
(1,473) |
|
(3,851) |
Free cash flow |
|
99,170 |
|
51,768 |
|
68,255 |
|
85,143 |
|
276,964 |
|
377,994 |
|
201,600 |
|
313,795 |
|
283,122 |
|
163,234 |
|
70,325 |
|
65,153 |
|
|
|
|
|
|
|
|
|
|
|
|
|
|
|
|
|
|
|
|
|
|
|
|
|
|
|
Q4/23 |
|
Q3/23 |
|
Q2/23 |
|
Q1/23 |
|
Q4/22 |
|
Q3/22 |
|
Q2/22 |
|
Q1/22 |
|
Q4/21 |
|
Q3/21 |
|
Q2/21 |
|
Q1/21 |
Consolidated |
|
|
|
|
|
|
|
|
|
|
|
|
|
|
|
|
|
|
|
|
|
|
|
|
Crude oil and condensate sales ($/bbl) |
|
107.91 |
|
106.94 |
|
96.64 |
|
98.62 |
|
115.02 |
|
123.02 |
|
138.55 |
|
120.23 |
|
96.88 |
|
87.05 |
|
79.06 |
|
71.09 |
NGL sales ($/bbl) |
|
33.38 |
|
27.77 |
|
28.11 |
|
36.23 |
|
39.93 |
|
44.64 |
|
51.86 |
|
46.94 |
|
47.26 |
|
35.55 |
|
25.43 |
|
29.39 |
Natural gas sales ($/mcf) |
|
8.48 |
|
6.32 |
|
7.37 |
|
10.77 |
|
17.43 |
|
24.68 |
|
16.50 |
|
17.41 |
|
17.89 |
|
9.20 |
|
5.24 |
|
5.51 |
Sales ($/boe) |
|
68.64 |
|
62.92 |
|
61.74 |
|
75.36 |
|
103.99 |
|
127.39 |
|
111.55 |
|
105.52 |
|
96.82 |
|
68.19 |
|
51.93 |
|
49.20 |
Royalties ($/boe) |
|
(5.93) |
|
(4.26) |
|
(6.16) |
|
(9.18) |
|
(8.43) |
|
(10.94) |
|
(10.85) |
|
(9.29) |
|
(7.43) |
|
(6.26) |
|
(5.29) |
|
(4.87) |
Transportation ($/boe) |
|
(2.95) |
|
(2.84) |
|
(2.87) |
|
(3.14) |
|
(2.71) |
|
(2.57) |
|
(2.62) |
|
(2.25) |
|
(2.41) |
|
(2.44) |
|
(2.78) |
|
(2.27) |
Operating ($/boe) |
|
(15.35) |
|
(16.26) |
|
(17.91) |
|
(18.66) |
|
(16.81) |
|
(16.64) |
|
(14.89) |
|
(14.61) |
|
(14.24) |
|
(13.21) |
|
(12.72) |
|
(12.86) |
General and administration ($/boe) |
|
(2.60) |
|
(2.77) |
|
(2.63) |
|
(2.71) |
|
(1.65) |
|
(1.90) |
|
(2.04) |
|
(1.85) |
|
(2.20) |
|
(1.56) |
|
(1.46) |
|
(1.57) |
Corporate income taxes ($/boe) |
|
(2.54) |
|
(4.15) |
|
(2.48) |
|
(3.04) |
|
(5.18) |
|
(6.74) |
|
(9.03) |
|
(5.95) |
|
(4.07) |
|
0.18 |
|
(0.09) |
|
0.18 |
Windfall taxes ($/boe) |
|
(0.03) |
|
(2.90) |
|
(4.56) |
|
(2.92) |
|
(27.50) |
|
— |
|
— |
|
— |
|
— |
|
— |
|
— |
|
— |
PRRT ($/boe) |
|
2.74 |
|
— |
|
— |
|
— |
|
(0.62) |
|
(0.60) |
|
(0.26) |
|
(0.87) |
|
(0.70) |
|
(0.92) |
|
(0.19) |
|
(0.19) |
Interest ($/boe) |
|
(3.01) |
|
(2.68) |
|
(2.65) |
|
(2.98) |
|
(2.78) |
|
(3.23) |
|
(2.74) |
|
(1.93) |
|
(2.06) |
|
(2.37) |
|
(2.41) |
|
(2.57) |
Realized derivatives ($/boe) |
|
10.33 |
|
9.74 |
|
8.86 |
|
1.95 |
|
(5.42) |
|
(18.22) |
|
(10.36) |
|
(18.78) |
|
(23.97) |
|
(9.19) |
|
(5.05) |
|
(3.43) |
Realized foreign exchange ($/boe) |
|
(0.73) |
|
0.28 |
|
0.48 |
|
(0.65) |
|
2.33 |
|
(0.28) |
|
(0.30) |
|
0.10 |
|
(0.30) |
|
0.37 |
|
(0.25) |
|
(0.69) |
Realized other ($/boe) |
|
0.26 |
|
(1.32) |
|
0.53 |
|
0.49 |
|
(0.14) |
|
0.80 |
|
0.36 |
|
0.70 |
|
1.29 |
|
0.48 |
|
0.35 |
|
0.73 |
Fund flows from operations ($/boe) |
|
48.83 |
|
35.74 |
|
32.35 |
|
34.52 |
|
35.08 |
|
67.07 |
|
58.82 |
|
50.79 |
|
40.73 |
|
33.27 |
|
22.04 |
|
21.66 |
|
|
|
|
|
|
|
|
|
|
|
|
|
|
|
|
|
|
|
|
|
|
|
|
|
Fund flows from operations |
|
372,117 |
|
270,214 |
|
247,109 |
|
253,167 |
|
284,220 |
|
507,876 |
|
452,901 |
|
389,868 |
|
322,173 |
|
262,696 |
|
172,942 |
|
162,051 |
Drilling and development |
|
(132,308) |
|
(119,404) |
|
(164,070) |
|
(153,328) |
|
(157,849) |
|
(177,878) |
|
(109,488) |
|
(82,841) |
|
(119,002) |
|
(63,173) |
|
(77,703) |
|
(79,512) |
Exploration and evaluation |
|
(10,579) |
|
(6,235) |
|
(2,775) |
|
(1,492) |
|
(11,456) |
|
(6,137) |
|
(3,665) |
|
(2,503) |
|
(26,805) |
|
(3,277) |
|
(1,473) |
|
(3,851) |
Free cash flow |
|
229,230 |
|
144,575 |
|
80,264 |
|
98,347 |
|
114,915 |
|
323,861 |
|
339,748 |
|
304,524 |
|
176,366 |
|
196,246 |
|
93,766 |
|
78,688 |
Vermilion Energy Inc. ■ Page 52 ■ 2023 Management's Discussion and Analysis This MD&A includes references to certain financial measures which do not have standardized meanings and may not be comparable to similar measures presented by other issuers.
Non-GAAP and Other Specified Financial Measures
These financial measures include fund flows from operations, a total of segments measure of profit or loss in accordance with IFRS 8 “Operating Segments” (please see Segmented Information in the Notes to the condensed Consolidated Financial Statements) and net debt, a capital management measure in accordance with IAS 1 “Presentation of Financial Statements” (please see Capital Disclosures in the Notes to the condensed Consolidated Financial Statements).
In addition, this MD&A includes financial measures which are not specified, defined, or determined under IFRS and are therefore considered non-GAAP financial measures and may not be comparable to similar measures presented by other issuers. These non-GAAP financial measures include:
Total of Segments Measure
Fund flows from operations (FFO): Most directly comparable to net (loss) earnings, FFO is comprised of sales less royalties, transportation, operating, G&A, corporate income tax, PRRT, windfall taxes, interest expense, realized loss on derivatives, realized foreign exchange gain (loss), and realized other income. The measure is used to assess the contribution of each business unit to Vermilion's ability to generate income necessary to pay dividends, repay debt, fund asset retirement obligations and make capital investments. Reconciliation to the primary financial statement measures can be found below.
|
|
Q4 2023 |
|
Q4 2022 |
|
2023 |
|
2022 |
||||||||
|
|
$M |
|
$/boe |
|
$M |
|
$/boe |
|
$M |
|
$/boe |
|
$M |
|
$/boe |
Sales |
|
522,969 |
|
68.64 |
|
842,693 |
|
103.99 |
|
2,022,555 |
|
67.10 |
|
3,476,394 |
|
111.95 |
Royalties |
|
(45,148) |
|
(5.93) |
|
(68,303) |
|
(8.43) |
|
(191,694) |
|
(6.36) |
|
(306,017) |
|
(9.85) |
Transportation |
|
(22,441) |
|
(2.95) |
|
(21,976) |
|
(2.71) |
|
(88,856) |
|
(2.95) |
|
(78,896) |
|
(2.54) |
Operating |
|
(116,937) |
|
(15.35) |
|
(136,247) |
|
(16.81) |
|
(513,381) |
|
(17.03) |
|
(489,034) |
|
(15.75) |
General and administration |
|
(19,810) |
|
(2.60) |
|
(13,344) |
|
(1.65) |
|
(80,716) |
|
(2.68) |
|
(57,677) |
|
(1.86) |
Corporate income tax expense |
|
(19,374) |
|
(2.54) |
|
(41,958) |
|
(5.18) |
|
(91,932) |
|
(3.05) |
|
(208,153) |
|
(6.70) |
Windfall taxes |
|
(249) |
|
(0.03) |
|
(222,859) |
|
(27.50) |
|
(78,426) |
|
(2.60) |
|
(222,859) |
|
(7.18) |
PRRT |
|
20,860 |
|
2.74 |
|
(5,045) |
|
(0.62) |
|
20,860 |
|
0.69 |
|
(18,318) |
|
(0.59) |
Interest expense |
|
(22,909) |
|
(3.01) |
|
(22,506) |
|
(2.78) |
|
(85,212) |
|
(2.83) |
|
(82,858) |
|
(2.67) |
Realized gain (loss) on derivatives |
|
78,737 |
|
10.33 |
|
(43,940) |
|
(5.42) |
|
234,365 |
|
7.77 |
|
(405,894) |
|
(13.07) |
Realized foreign exchange gain (loss) |
|
(5,529) |
|
(0.73) |
|
18,845 |
|
2.33 |
|
(4,532) |
|
(0.15) |
|
15,195 |
|
0.49 |
Realized other (expense) income |
|
1,948 |
|
0.26 |
|
(1,140) |
|
(0.14) |
|
(420) |
|
(0.01) |
|
12,982 |
|
0.42 |
Fund flows from operations |
|
372,117 |
|
48.83 |
|
284,220 |
|
35.08 |
|
1,142,611 |
|
37.90 |
|
1,634,865 |
|
52.65 |
Equity based compensation |
|
(7,871) |
|
|
|
(5,377) |
|
|
|
(42,756) |
|
|
|
(44,390) |
|
|
Unrealized gain on derivative instruments (1) |
|
141,126 |
|
|
|
549,693 |
|
|
|
179,707 |
|
|
|
540,801 |
|
|
Unrealized foreign exchange gain (loss) (1) |
|
4,834 |
|
|
|
(47,405) |
|
|
|
12,438 |
|
|
|
(84,464) |
|
|
Accretion |
|
(19,469) |
|
|
|
(16,501) |
|
|
|
(78,187) |
|
|
|
(58,170) |
|
|
Depletion and depreciation |
|
(259,012) |
|
|
|
(171,926) |
|
|
|
(712,619) |
|
|
|
(577,134) |
|
|
Deferred tax recovery (expense) |
|
110,758 |
|
|
|
(196,733) |
|
|
|
190,193 |
|
|
|
(288,707) |
|
|
Gain on business combination |
|
(5,607) |
|
|
|
— |
|
|
|
439,487 |
|
|
|
— |
|
|
Loss on disposition |
|
(125,539) |
|
|
|
— |
|
|
|
(352,367) |
|
|
|
— |
|
|
Impairment (expense) reversal |
|
(1,016,094) |
|
|
|
— |
|
|
|
(1,016,094) |
|
|
|
192,094 |
|
|
Unrealized other income (expense) (1) |
|
1,621 |
|
|
|
(563) |
|
|
|
— |
|
|
|
(1,833) |
|
|
Net (loss) earnings |
|
(803,136) |
|
|
|
395,408 |
|
|
|
(237,587) |
|
|
|
1,313,062 |
|
|
(1) |
Unrealized gain on derivative instruments, Unrealized foreign exchange gain (loss), and Unrealized other expense are line items from the respective Consolidated Statements of Cash Flows. |
Vermilion Energy Inc. ■ Page 53 ■ 2023 Management's Discussion and Analysis Free cash flow: Most directly comparable to cash flows from operating activities and is comprised of fund flows from operations less drilling and development costs and exploration and evaluation costs.
Non-GAAP Financial Measures and Non-GAAP Ratios
The measure is used to determine the funding available for investing and financing activities including payment of dividends, repayment of long-term debt, reallocation into existing business units and deployment into new ventures. Reconciliation to the primary financial statement measures can be found in the following table.
($M) |
|
Q4 2023 |
|
Q4 2022 |
|
2023 |
|
2022 |
Cash flows from operating activities |
|
343,831 |
|
495,195 |
|
1,024,528 |
|
1,814,220 |
Changes in non-cash operating working capital |
|
(651) |
|
(227,483) |
|
61,117 |
|
(216,869) |
Asset retirement obligations settled |
|
28,937 |
|
16,508 |
|
56,966 |
|
37,514 |
Fund flows from operations |
|
372,117 |
|
284,220 |
|
1,142,611 |
|
1,634,865 |
Drilling and development |
|
(132,308) |
|
(157,849) |
|
(569,110) |
|
(528,056) |
Exploration and evaluation |
|
(10,579) |
|
(11,456) |
|
(21,081) |
|
(23,761) |
Free cash flow |
|
229,230 |
|
114,915 |
|
552,420 |
|
1,083,048 |
Capital expenditures: Calculated as the sum of drilling and development costs and exploration and evaluation costs from the Consolidated Statements of Cash Flows that is most directly comparable to cash flows used in investing activities. We consider capital expenditures to be a useful measure of our investment in our existing asset base. Capital expenditures are also referred to as E&D capital. Reconciliation to the primary financial statement measures can be found below.
($M) |
|
Q4 2023 |
|
Q4 2022 |
|
2023 |
|
2022 |
Drilling and development |
|
132,308 |
|
157,849 |
|
569,110 |
|
528,056 |
Exploration and evaluation |
|
10,579 |
|
11,456 |
|
21,081 |
|
23,761 |
Capital expenditures |
|
142,887 |
|
169,305 |
|
590,191 |
|
551,817 |
Payout and payout % of FFO: A non-GAAP financial measure and non-GAAP ratio respectively, most directly comparable to dividends declared. Payout is comprised of dividends declared plus drilling and development costs, exploration and evaluation costs, and asset retirement obligations settled, and payout % of FFO is calculated as payout over FFO (total of segments measure). The measure is used to assess the amount of cash distributed back to shareholders and reinvested in the business for maintaining production and organic growth. The reconciliation of the measure to the primary financial statement measure can be found below.
($M) |
|
Q4 2023 |
|
Q4 2022 |
|
2023 |
|
2022 |
|
Dividends declared |
|
16,227 |
|
13,058 |
|
65,248 |
|
45,769 |
|
Drilling and development |
|
132,308 |
|
157,849 |
|
569,110 |
|
528,056 |
|
Exploration and evaluation |
|
10,579 |
|
11,456 |
|
21,081 |
|
23,761 |
|
Asset retirement obligations settled |
|
28,937 |
|
16,508 |
|
56,966 |
|
37,514 |
|
Payout |
|
188,051 |
|
198,871 |
|
712,405 |
|
635,100 |
|
% of fund flows from operations |
|
51 |
% |
70 |
% |
62 |
% |
39 |
% |
Return on capital employed (ROCE): A non-GAAP ratio, ROCE is a measure that we use to analyze our profitability and the efficiency of our capital allocation process; the comparable primary financial statement measure is earnings before income taxes. ROCE is calculated by dividing net (loss) earnings before interest and taxes ("EBIT") by average capital employed over the preceding twelve months. Capital employed is calculated as total assets less current liabilities while average capital employed is calculated using the balance sheets at the beginning and end of the twelve-month period.
|
|
Twelve Months Ended |
|
||
($M) |
|
Dec 31, 2023 |
|
Dec 31, 2022 |
|
Net (loss) earnings |
|
(237,587) |
|
1,313,062 |
|
Taxes |
|
(40,695) |
|
738,037 |
|
Interest expense |
|
85,212 |
|
82,858 |
|
EBIT |
|
(193,070) |
|
2,133,957 |
|
Average capital employed |
|
5,819,380 |
|
5,628,762 |
|
Return on capital employed |
|
(3) |
% |
38 |
% |
Vermilion Energy Inc. ■ Page 54 ■ 2023 Management's Discussion and Analysis Adjusted working capital: Defined as current assets less current liabilities, excluding current derivatives and current lease liabilities.
The measure is used to calculate net debt, a capital management measure disclosed below.
|
|
As at |
||
($M) |
|
Dec 31, 2023 |
|
Dec 31, 2022 |
Current assets |
|
823,514 |
|
714,446 |
Current derivative asset |
|
(313,792) |
|
(162,843) |
Current liabilities |
|
(696,074) |
|
(892,045) |
Current lease liability |
|
21,068 |
|
19,486 |
Current derivative liability |
|
732 |
|
55,845 |
Adjusted working capital |
|
(164,552) |
|
(265,111) |
Acquisitions: The sum of acquisitions and acquisitions of securities from the Consolidated Statements of Cash Flows, Vermilion common shares issued as consideration, the estimated value of contingent consideration, the amount of acquiree's outstanding long-term debt assumed, and net acquired working capital deficit or surplus. We believe that including these components provides a useful measure of the economic investment associated with our acquisition activity and is most directly comparable to cash flows used in investing activities. A reconciliation to the acquisitions line items in the Consolidated Statements of Cash Flows can be found below.
($M) |
|
Q4 2023 |
|
Q4 2022 |
|
Q4 2023 |
|
Q4 2022 |
Acquisitions, net of cash acquired |
|
2,669 |
|
3,594 |
|
142,281 |
|
510,309 |
Acquisition of securities |
|
17,448 |
|
964 |
|
21,603 |
|
23,282 |
Acquired working capital deficit |
|
5,607 |
|
— |
|
109,134 |
|
6,122 |
Acquisitions |
|
25,724 |
|
4,558 |
|
273,018 |
|
539,713 |
Capital Management Measure
Net debt: Is in accordance with IAS 1 "Presentation of Financial Statements" that is most directly comparable to long-term debt. Net debt is comprised of long-term debt (excluding unrealized foreign exchange on swapped USD borrowings) plus adjusted working capital (defined as current assets less current liabilities, excluding current derivatives and current lease liabilities), and represents Vermilion's net financing obligations after adjusting for the timing of working capital fluctuations. Net debt excludes lease obligations which are secured by a corresponding right-of-use asset.
|
|
As at |
||
($M) |
|
Dec 31, 2023 |
|
Dec 31, 2022 |
Long-term debt |
|
914,015 |
|
1,081,351 |
Adjusted working capital |
|
164,552 |
|
265,111 |
Unrealized FX on swapped USD borrowings |
|
— |
|
(1,876) |
Net debt |
|
1,078,567 |
|
1,344,586 |
|
|
|
|
|
Ratio of net debt to four quarter trailing fund flows from operations |
|
0.9 |
|
0.8 |
Supplementary Financial Measures
Diluted shares outstanding: The sum of shares outstanding at the period end plus outstanding awards under the LTIP, based on current estimates of future performance factors and forfeiture rates.
('000s of shares) |
|
Q4 2023 |
|
Q4 2022 |
Shares outstanding |
|
162,271 |
|
163,227 |
Potential shares issuable pursuant to the LTIP |
|
4,185 |
|
5,389 |
Diluted shares outstanding |
|
166,456 |
|
168,616 |
Fund flows from operations per basic and diluted share: Management assesses fund flows from operations on a per share basis as we believe this provides a measure of our operating performance after taking into account the issuance and potential future issuance of Vermilion common shares. Fund flows from operations per basic share is calculated by dividing fund flows from operations (total of segments measure) by the basic weighted average shares outstanding as defined under IFRS. Fund flows from operations per diluted share is calculated by dividing fund flows from operations by the sum of basic weighted average shares outstanding and incremental shares issuable under the equity based compensation plans as determined using the treasury stock method.
Vermilion Energy Inc. ■ Page 55 ■ 2023 Management's Discussion and Analysis Operating netback: Most directly comparable to net (loss) earnings that is calculated as sales less royalties, operating expense, transportation costs, PRRT, and realized hedging gains and losses presented on a per unit basis.
Management assesses operating netback as a measure of the profitability and efficiency of our field operations.
Fund flows from operations per boe: Calculated as FFO (total of segments measure) by boe production. Fund flows from operations netback is used by management to assess the profitability of our business units and Vermilion as a whole.
Net debt to four quarter trailing fund flows from operations: Calculated as net debt (capital management measure) over the FFO (total of segments measure) from the preceding four quarters. The measure is used to assess the ability to repay debt.
Cash dividends per share: Represents cash dividends declared per share that is a useful measure of the dividends a common shareholder was entitled to during the period.
Covenants: The financial covenants on our revolving credit facility contain non-GAAP measures. The definitions for these financial covenants are included in Financial Position Review.
Vermilion Energy Inc. ■ Page 56 ■ 2023 Management's Discussion and Analysis
|
DIRECTORS Robert Michaleski 1,3,5 Calgary, Alberta Dion Hatcher Calgary, Alberta James J. Kleckner Jr. 7,9 Edwards, Colorado Carin Knickel 4,7,11 Golden, Colorado Stephen P. Larke 3,5,10 Calgary, Alberta Timothy R. Marchant 6,9,11 Calgary, Alberta William Roby 7,8,11 Katy,Texas Manjit Sharma 2,5 Toronto, Ontario Myron Stadnyk 7,9 Calgary, Alberta Judy Steele 3,5,11 Halifax, Nova Scotia 1 Chairman (Independent) 2 Audit Committee Chair (Independent) 3 Audit Committee Member (Independent) 4 Governance and Human Resources Committee Chair __(Independent) 5 Governance and Human Resources Committee Member __(Independent) 6 Health, Safety and Environment Committee Chair __(Independent) 7 Health, Safety and Environment Committee Member __(Independent) 8 Technical Committee Chair (Independent) 9 Technical Committee Member __(Independent) 10 Sustainability Committee Chair (Independent) 11 Sustainability Committee Member (Independent) |
OFFICERS / CORPORATE SECRETARY Dion Hatcher * President & Chief Executive Officer Lars Glemser * Vice President & Chief Financial Officer Tamar Epstein General Counsel Terry Hergott Vice President Marketing Yvonne Jeffery Vice President Sustainability Darcy Kerwin * Vice President International & HSE Geoff MacDonald Vice President Geosciences Randy McQuaig * Vice President North America Kyle Preston Vice President Investor Relations Averyl Schraven Vice President People & Culture Gerard Schut Vice President European Operations Jenson Tan * Vice President Business Development Jamie Gagner Corporate Secretary * Principal Executive Committee Member |
AUDITORS Deloitte LLP Calgary, Alberta BANKERS The Toronto-Dominion Bank Alberta Treasury Branches Bank of America N.A., Canada Branch Canadian Imperial Bank of Commerce Export Development Canada National Bank of Canada Royal Bank of Canada The Bank of Nova Scotia Wells Fargo Bank N.A., Canadian Branch La Caisse Centrale Desjardins du Québec Citibank N.A., Canadian Branch - Citibank Canada Canadian Western Bank JPMorgan Chase Bank, N.A., Toronto Branch Goldman Sachs Lending Partners LLC EVALUATION ENGINEERS McDaniel & Associates Calgary, Alberta LEGAL COUNSEL Norton Rose Fulbright Canada LLP Calgary, Alberta TRANSFER AGENT Odyssey Trust Company STOCK EXCHANGE LISTINGS The Toronto Stock Exchange (“VET”) The New York Stock Exchange (“VET”) INVESTOR RELATIONS Kyle Preston Vice President Investor Relations 403-476-8431 TEL 403-476-8100 FAX 1-866-895-8101 IR TOLL FREE investor_relations@vermilionenergy.com |
Vermilion Energy Inc.
Exhibit 99.3
Management’s Report to Shareholders
Management’s Responsibility for Financial Statements
■ Page 57 ■ 2023 Management's Discussion and Analysis The accompanying consolidated financial statements of Vermilion Energy Inc. are the responsibility of management and have been approved by the Board of Directors of Vermilion Energy Inc. The consolidated financial statements have been prepared in accordance with the accounting policies detailed in the notes to the consolidated financial statements and are prepared in accordance with International Financial Reporting Standards as issued by the International Accounting Standards Board. Where necessary, management has made informed judgments and estimates of transactions that were not yet completed at the balance sheet date. Financial information throughout the Annual Report is consistent with the consolidated financial statements.
Management ensures the integrity of the consolidated financial statements by maintaining high-quality systems of internal control. Procedures and policies are designed to provide reasonable assurance that assets are safeguarded and transactions are properly recorded, and that the financial records are reliable for preparation of the consolidated financial statements. Deloitte LLP, Vermilion’s Independent Registered Public Accounting Firm, have conducted an audit of the consolidated financial statements in accordance with the standards of the Public Company Accounting Oversight Board (United States) and have provided their report.
The Board of Directors is responsible for ensuring that management fulfills its responsibility for financial reporting and internal control. The Board carries out this responsibility principally through the Audit Committee, which is appointed by the Board and is comprised entirely of independent Directors. The Committee meets periodically with management and Deloitte LLP to satisfy itself that each party is properly discharging its responsibilities and to review the consolidated financial statements, Management’s Discussion and Analysis and the Report of the Independent Registered Public Accounting Firm before they are presented to the Board of Directors.
Management’s Report on Internal Control Over Financial Reporting
Management is responsible for establishing and maintaining an adequate system of internal control over financial reporting. Management, under the supervision and with the participation of the principal executive officer and principle financial officer, conducted an evaluation of the effectiveness of the system of internal control over financial reporting based on the criteria established in “Internal Control - Integrated Framework (2013)” issued by the Committee of Sponsoring Organizations of the Treadway Commission. Based on this evaluation, management has assessed the effectiveness of Vermilion’s internal control over financial reporting as defined in Rule 13a-15(f) and 15d-15(f) under the US Securities Exchange Act of 1934 and as defined in Canada by National Instrument 52-109, Certification of Disclosure in Issuers’ Annual and Interim Filings. Management concluded that Vermilion’s internal control over financial reporting was effective as of December 31, 2023. Vermilion has limited the scope of design controls and procedures ("DC&P") and internal controls over financial reporting to exclude controls, policies and procedures of Equinor Energy Ireland Limited, which was acquired on March 31, 2023. The scope limitation is in accordance with section 3.3(1)(b) of NI 52-109 which allows an issuer to limit the design of DC&P and ICFR to exclude controls, policies, and procedures of a business that the issuer acquired not more than 365 days before the end of the fiscal period. Total assets and revenues excluded from management’s assessment of internal control over financial reporting represents 12% and 8%, respectively, of the related Consolidated Financial Statement amounts as at and for the year ended December 31, 2023.
Because of inherent limitations, internal control over financial reporting may not prevent or detect misstatements and even those systems determined to be effective can provide only reasonable assurance with respect to the financial statement preparation and presentation.
The effectiveness of Vermilion’s internal control over financial reporting as of December 31, 2023 has been audited by Deloitte LLP, the Company’s Independent Registered Public Accounting Firm, who also audited the Company’s consolidated financial statements for the year ended December 31, 2023.
(“Dion Hatcher”) |
(“Lars Glemser”) |
|
|
Dion Hatcher |
Lars Glemser |
President & Chief Executive Officer |
Vice President & Chief Financial Officer |
March 6, 2024 |
|
Vermilion Energy Inc.
Report of Independent Registered Public Accounting Firm
To the Shareholders and the Board of Directors of Vermilion Energy Inc.
Opinion on Internal Control over Financial Reporting
∎ Page 1 ∎ 2023 Financial Statements We have audited the internal control over financial reporting of Vermilion Energy Inc. and subsidiaries (the “Company”) as of December 31, 2023, based on criteria established in Internal Control - Integrated Framework (2013) issued by the Committee of Sponsoring Organizations of the Treadway Commission (COSO). In our opinion, the Company maintained, in all material respects, effective internal control over financial reporting as of December 31, 2023, based on criteria established in Internal Control - Integrated Framework (2013) issued by COSO.
We have also audited, in accordance with the standards of the Public Company Accounting Oversight Board (United States) (PCAOB), the consolidated financial statements as of and for the year ended December 31, 2023, of the Company and our report dated March 6, 2024, expressed an unqualified opinion on those financial statements.
As described in Management’s Report to Shareholders, management excluded from its assessment the internal control over financial reporting at Equinor Energy Ireland Limited (“EEIL”), which was acquired on March 31, 2023, and whose financial statements constitute 12% of total assets and 8% of total revenues of the consolidated financial statement amounts as of and for the year ended December 31, 2023. Accordingly, our audit did not include the internal control over financial reporting at EEIL.
Basis for Opinion
The Company’s management is responsible for maintaining effective internal control over financial reporting and for its assessment of the effectiveness of internal control over financial reporting, included in the accompanying Management’s Report to Shareholders. Our responsibility is to express an opinion on the Company’s internal control over financial reporting based on our audit. We are a public accounting firm registered with the PCAOB and are required to be independent with respect to the Company in accordance with the U.S. federal securities laws and the applicable rules and regulations of the Securities and Exchange Commission and the PCAOB.
We conducted our audit in accordance with the standards of the PCAOB. Those standards require that we plan and perform the audit to obtain reasonable assurance about whether effective internal control over financial reporting was maintained in all material respects. Our audit included obtaining an understanding of internal control over financial reporting, assessing the risk that a material weakness exists, testing and evaluating the design and operating effectiveness of internal control based on the assessed risk, and performing such other procedures as we considered necessary in the circumstances. We believe that our audit provides a reasonable basis for our opinion.
Definition and Limitations of Internal Control over Financial Reporting
A company’s internal control over financial reporting is a process designed to provide reasonable assurance regarding the reliability of financial reporting and the preparation of financial statements for external purposes in accordance with generally accepted accounting principles. A company’s internal control over financial reporting includes those policies and procedures that (1) pertain to the maintenance of records that, in reasonable detail, accurately and fairly reflect the transactions and dispositions of the assets of the company; (2) provide reasonable assurance that transactions are recorded as necessary to permit preparation of financial statements in accordance with generally accepted accounting principles, and that receipts and expenditures of the company are being made only in accordance with authorizations of management and directors of the company; and (3) provide reasonable assurance regarding prevention or timely detection of unauthorized acquisition, use, or disposition of the company’s assets that could have a material effect on the financial statements.
Because of its inherent limitations, internal control over financial reporting may not prevent or detect misstatements. Also, projections of any evaluation of effectiveness to future periods are subject to the risk that controls may become inadequate because of changes in conditions, or that the degree of compliance with the policies or procedures may deteriorate.
/s/ Deloitte LLP |
|
Chartered Professional Accountants |
|
Calgary, Canada | |
March 6, 2024 | |
Vermilion Energy Inc.
Report of Independent Registered Public Accounting Firm
To the Shareholders and the Board of Directors of Vermilion Energy Inc.
Opinion on the Financial Statements
∎ Page 2 ∎ 2023 Financial Statements We have audited the accompanying consolidated balance sheet of Vermilion Energy Inc. and subsidiaries (the "Company") as of December 31, 2023 and 2022, the related consolidated statements of net (loss) earnings and comprehensive (loss) income, consolidated statements of cash flows and consolidated statements of changes in shareholders' equity for each of the two years in the period ended December 31, 2023, and the related notes (collectively referred to as the "financial statements"). In our opinion, the financial statements present fairly, in all material respects, the financial position of the Company as of December 31, 2023 and 2022, and its financial performance and its cash flows for each of the two years in the period ended December 31, 2023, in accordance with International Financial Reporting Standards as issued by the International Accounting Standards Board.
We have also audited, in accordance with the standards of the Public Company Accounting Oversight Board (United States) (PCAOB), the Company’s internal control over financial reporting as of December 31, 2023, based on criteria established in Internal Control — Integrated Framework (2013) issued by the Committee of Sponsoring Organizations of the Treadway Commission and our report dated March 6 2024, expressed an unqualified opinion on the Company’s internal control over financial reporting.
Basis for Opinion
These financial statements are the responsibility of the Company’s management. Our responsibility is to express an opinion on the Company’s financial statements based on our audits. We are a public accounting firm registered with the PCAOB and are required to be independent with respect to the Company in accordance with the U.S. federal securities laws and the applicable rules and regulations of the Securities and Exchange Commission and the PCAOB.
We conducted our audits in accordance with the standards of the PCAOB. Those standards require that we plan and perform the audit to obtain reasonable assurance about whether the financial statements are free of material misstatement, whether due to error or fraud. Our audits included performing procedures to assess the risks of material misstatement of the financial statements, whether due to error or fraud, and performing procedures that respond to those risks. Such procedures included examining, on a test basis, evidence regarding the amounts and disclosures in the financial statements. Our audits also included evaluating the accounting principles used and significant estimates made by management, as well as evaluating the overall presentation of the financial statements. We believe that our audits provide a reasonable basis for our opinion.
Critical Audit Matters
The critical audit matters communicated below are matters arising from the current-period audit of the financial statements that were communicated or required to be communicated to the audit committee and that (1) relate to accounts or disclosures that are material to the financial statements and (2) involved our especially challenging, subjective, or complex judgments. The communication of critical audit matters does not alter in any way our opinion on the financial statements, taken as a whole, and we are not, by communicating the critical audit matters below, providing separate opinions on the critical audit matters or on the accounts or disclosures to which they relate.
Valuation of capital assets acquired from Equinor Energy Ireland Limited. - Refer to Notes 2 and 4 to the financial statements
Critical Audit Matter Description
The Company completed the acquisition of Equinor Energy Ireland Limited (“EEIL”) on March 31, 2023. The Company accounted for the acquisition as a business combination using the acquisition method. The purchase price was allocated to assets acquired, including capital assets and liabilities assumed based on their respective fair value at the date of acquisition. As a result of the fair value of the net assets acquired exceeding the consideration paid, a gain on business combination of $439 million was also recognized. The fair value of capital assets is estimated based on the future after-tax cash flows of the underlying proved and probable natural gas reserves. The Company engaged an independent reserve engineer to estimate these reserves using estimates, assumptions, and engineering data. The development of the Company’s reserves and their future after-tax cash flows required management to make significant estimates and assumptions related to future natural gas prices, discount rate, reserves, and future operating and development costs.
Given the significant judgments made by management related to future natural gas prices, discount rate, reserves, and future operating and development costs, these estimates and assumptions are subject to a high degree of estimation uncertainty. This required a high degree of auditor judgment and resulted in an increased extent of audit effort, including the involvement of fair value specialists.
Vermilion Energy Inc. ∎ Page 3 ∎ 2023 Financial Statements Our audit procedures related to future natural gas prices, discount rate, reserves, and future operating and development costs used to determine the fair value of capital assets included the following, among others:
How the Critical Audit Matter Was Addressed in the Audit
| ● | Evaluated the effectiveness of the relevant controls, including those over the determination of the future natural gas prices, discount rate, reserves, and future operating and development costs. |
| ● | Evaluated the Company’s independent reserve engineer by: |
| ̊ | Examining reports and assessing their scope of work and findings; and |
| ̊ | Assessing the competence, capability, and objectivity by evaluating their relevant professional qualifications and experience. |
| ● | Evaluated the reasonableness of reserves by testing the source financial information underlying the reserves and comparing the reserve volumes to historical production volumes. |
| ● | Evaluated the reasonableness of future operating and development costs by testing the source financial information underlying the estimate as of December 31, 2022, and conducting roll forward procedures up to March 31, 2023, to assesses any significant changes in assumptions, comparing future operating and development costs to historical results, and evaluating whether they are consistent with evidence obtained in other areas of the audit. |
| ● | With the assistance of fair value specialists: |
| ̊ | Evaluated the future natural gas prices by independently developing a reasonable range of forecasts based on reputable third-party forecasts and market data and comparing those to the future prices selected by management; and |
| ̊ | Evaluated the reasonableness of the discount rate by testing the source information underlying the determination of the discount rate and developing a range of independent estimates and comparing those to the discount rate determined by management. |
Impairment of Capital Assets – Refer to Note 2 and 6 to the financial statements
Critical Audit Matter Description
The Company reviews all Cash Generating Units (“CGUs”) for indicators of potential impairment or reversal of impairment at each reporting date. As a result of allocating future capital spending to align with the Company’s long-term capital priorities, indicators of impairment were identified for Saskatchewan, France and US CGUs as of December 31, 2023. An impairment loss is recognized if the carrying amount of the CGU exceeds its recoverable amount. The recoverable amount is determined based on the higher of fair value less cost of disposal and value-in-use, using future after-tax cash flows of the underlying proved and probable oil and natural gas reserves. The Company engages an independent reserve engineer to estimate oil and natural gas reserves using estimates, assumptions, and engineering data. The development of the Company’s reserves and their future after-tax cash flows requires management to make significant estimates and assumptions related to future oil, natural gas liquids and natural gas prices (“future commodity prices”), discount rates, reserves, and future operating and development costs. As at December 31, 2023, the carrying amount of the CGUs exceeded the recoverable amount, which resulted in an impairment charge.
Given the significant judgments made by management related to future commodity prices, discount rates, reserves, and future operating and development costs, these estimates and assumptions are subject to a high degree of estimation uncertainty. This required a high degree of auditor judgment and an increased extent of audit effort, including the involvement of fair value specialists.
How the Critical Audit Matter Was Addressed in the Audit
Our audit procedures related to future commodity prices, discount rates, reserves, and future operating and development costs used to determine the recoverable amount of the CGUs included the following, among others:
| ● | Evaluated the effectiveness of the relevant controls, including those over the determination of the future commodity prices, discount rates, reserves, and future operating and development costs. |
| ● | Evaluated the Company’s independent reservoir engineer by: |
| ̊ | Examining reports and assessing their scope of work and findings; and |
| ̊ | Assessing the competence, capability, and objectivity by evaluating their relevant professional qualifications and experience. |
| ● | Evaluated the reasonableness of reserves by testing the source financial information underlying the reserves and comparing the reserve volumes to historical production volumes. |
| ● | Evaluated the reasonableness of future operating and development costs by testing the source financial information underlying the estimate, comparing future operating and development costs to historical results, and evaluating whether they are consistent with evidence obtained in other areas of the audit. |
| ● | With the assistance of fair value specialists: |
| ̊ | Evaluated the future commodity prices by independently developing a reasonable range of forecasts based on reputable third-party forecasts and market data and comparing those to the future prices selected by management; and |
Vermilion Energy Inc.
| ̊ | Evaluated the reasonableness of the discount rates by testing the source information underlying the determination of the discount rates and developing a range of independent estimates and comparing those to discount rates determined by management. |
Valuation of deferred tax asset - Refer to Notes 2 and 11 to the financial statements
Critical Audit Matter Description
∎ Page 4 ∎ 2023 Financial Statements The Company recognizes deferred income taxes for differences between the financial statement and tax basis of assets and liabilities at substantively enacted statutory tax rates in effect for the years in which the differences are expected to reverse. Deferred income tax assets are reduced to the amounts expected to be realized based on forecasts of future taxable income, specifically forecasts of future revenue (commodity price forecasts and forecasted reserves). The Company recorded a deferred income tax asset for Canada and Ireland primarily arising from past taxable losses in these jurisdictions.
To determine whether it is probable that the deferred income tax assets in these jurisdictions will be realized, management makes assumptions related to the forecasts of future taxable income, specifically forecasts of future revenue (commodity price forecasts and forecasted reserves). Auditing the probability of the deferred income tax assets being realized and management’s commodity price forecasts and forecasted reserves involved a high degree of auditor judgement as the estimations made by management contain significant measurement uncertainty. This resulted in an increased extent of audit effort, which included the need to involve income tax specialists.
How the Critical Audit Matter Was Addressed in the Audit
Our audit procedures related to assessing the probability of the deferred income tax assets being realized and management’s forecasts of taxable income, specifically forecasts of future revenue (commodity price forecasts and forecasted reserves) to evaluate the deferred income tax assets in Canada and Ireland included the following, among others:
| ● | Evaluated the effectiveness of relevant controls, including those over the determination of the forecasts of future revenue, specifically commodity price forecasts and forecasted reserves. |
| ● | Evaluated management’s ability to accurately forecast future taxable income by comparing management’s assumptions to historical data and available market trends. |
| ● | Evaluated the reasonableness of management’s forecasts of future revenue by: |
| ̊ | Comparing the forecasts prepared by management’s expert to third party forecasts; and, |
| ̊ | Evaluating whether management’s estimates of commodity price forecasts and estimated reserves were consistent with the requirements of IAS 12 - Income taxes relating to the probability of forecasted future revenue and the length of the forecast period. |
/s/ Deloitte LLP |
|
Chartered Professional Accountants |
|
Calgary, Canada |
|
March 6, 2024 |
|
We have served as the Company’s auditor since 2000.
Vermilion Energy Inc. ∎ Page 5 ∎ 2023 Financial Statements
Consolidated Financial Statements
Consolidated Balance Sheet
thousands of Canadian dollars
|
|
Note |
|
December 31, 2023 |
|
December 31, 2022 |
Assets |
|
|
|
|
|
|
Current |
|
|
|
|
|
|
Cash and cash equivalents |
|
19 |
|
141,456 |
|
13,836 |
Accounts receivable |
|
19 |
|
242,926 |
|
373,651 |
Crude oil inventory |
|
19 |
|
57,333 |
|
19,657 |
Derivative instruments |
|
9 |
|
313,792 |
|
162,843 |
Prepaid expenses |
|
19 |
|
68,007 |
|
144,459 |
Total current assets |
|
|
|
823,514 |
|
714,446 |
|
|
|
|
|
|
|
Derivative instruments |
|
9 |
|
76,107 |
|
132,598 |
Investment in securities |
|
5 |
|
73,261 |
|
56,366 |
Deferred taxes |
|
11 |
|
182,051 |
|
125,533 |
Exploration and evaluation assets |
|
7 |
|
198,379 |
|
270,593 |
Capital assets |
|
4, 6 |
|
4,882,509 |
|
5,691,522 |
Total assets |
|
|
|
6,235,821 |
|
6,991,058 |
|
|
|
|
|
|
|
Liabilities |
|
|
|
|
|
|
Current |
|
|
|
|
|
|
Accounts payable and accrued liabilities |
|
19 |
|
380,370 |
|
481,444 |
Dividends payable |
|
13 |
|
16,227 |
|
13,058 |
Derivative instruments |
|
9 |
|
732 |
|
55,845 |
Income taxes payable |
|
19 |
|
298,745 |
|
341,698 |
Total current liabilities |
|
|
|
696,074 |
|
892,045 |
|
|
|
|
|
|
|
Derivative instruments |
|
9 |
|
21,050 |
|
— |
Long-term debt |
|
12 |
|
914,015 |
|
1,081,351 |
Lease obligations |
|
10 |
|
33,001 |
|
51,507 |
Asset retirement obligations |
|
8 |
|
1,159,063 |
|
1,087,757 |
Deferred taxes |
|
11 |
|
380,970 |
|
477,340 |
Total liabilities |
|
|
|
3,204,173 |
|
3,590,000 |
|
|
|
|
|
|
|
Shareholders’ Equity |
|
|
|
|
|
|
Shareholders' capital |
|
13 |
|
4,142,566 |
|
4,243,794 |
Contributed surplus |
|
|
|
43,348 |
|
35,409 |
Accumulated other comprehensive income |
|
|
|
109,302 |
|
123,505 |
Deficit |
|
|
|
(1,263,568) |
|
(1,001,650) |
Total shareholders' equity |
|
|
|
3,031,648 |
|
3,401,058 |
Total liabilities and shareholders' equity |
|
|
|
6,235,821 |
|
6,991,058 |
Approved by the Board
(Signed “Manjit Sharma”) |
(Signed “Dion Hatcher”) |
|
|
||
Manjit Sharma, Director |
Dion Hatcher, Director |
Vermilion Energy Inc. ∎ Page 6 ∎ 2023 Financial Statements thousands of Canadian dollars, except share and per share amounts
Consolidated Statements of Net (Loss) Earnings and Comprehensive (Loss) Income
|
|
|
|
Year Ended |
||
|
|
Note |
|
Dec 31, 2023 |
|
Dec 31, 2022 |
Revenue |
|
|
|
|
|
|
Petroleum and natural gas sales |
|
|
|
2,022,555 |
|
3,476,394 |
Royalties |
|
|
|
(191,694) |
|
(306,017) |
Sales of purchased commodities |
|
|
|
177,000 |
|
244,834 |
Petroleum and natural gas revenue |
|
|
|
2,007,861 |
|
3,415,211 |
|
|
|
|
|
|
|
Expenses |
|
|
|
|
|
|
Purchased commodities |
|
|
|
177,000 |
|
244,834 |
Operating |
|
19 |
|
513,381 |
|
489,034 |
Transportation |
|
|
|
88,856 |
|
78,896 |
Equity based compensation |
|
15 |
|
42,756 |
|
44,390 |
Gain on derivative instruments |
|
9 |
|
(414,072) |
|
(134,907) |
Interest expense |
|
|
|
85,212 |
|
82,858 |
General and administration |
|
19 |
|
80,716 |
|
57,677 |
Foreign exchange (gain) loss |
|
|
|
(7,906) |
|
69,269 |
Other expense (income) |
|
|
|
420 |
|
(11,149) |
Accretion |
|
8 |
|
78,187 |
|
58,170 |
Depletion and depreciation |
|
6, 7 |
|
712,619 |
|
577,134 |
Impairment expense (reversal) |
|
6 |
|
1,016,094 |
|
(192,094) |
Gain on business combination |
|
4 |
|
(439,487) |
|
— |
Loss on disposition |
|
6 |
|
352,367 |
|
— |
|
|
|
|
2,286,143 |
|
1,364,112 |
(Loss) earnings before income taxes |
|
|
|
(278,282) |
|
2,051,099 |
|
|
|
|
|
|
|
Income tax (recovery) expense |
|
|
|
|
|
|
Deferred |
|
11 |
|
(190,193) |
|
288,707 |
Current |
|
|
|
71,072 |
|
226,471 |
Windfall taxes |
|
11 |
|
78,426 |
|
222,859 |
|
|
|
|
(40,695) |
|
738,037 |
|
|
|
|
|
|
|
Net (loss) earnings |
|
|
|
(237,587) |
|
1,313,062 |
|
|
|
|
|
|
|
Other comprehensive (loss) income |
|
|
|
|
|
|
Currency translation adjustments |
|
|
|
(16,468) |
|
60,543 |
Hedge accounting reserve, net of tax |
|
|
|
6,357 |
|
5,599 |
Fair value adjustment on investment in securities, net of tax |
|
5 |
|
(4,092) |
|
28,896 |
Comprehensive (loss) income |
|
|
|
(251,790) |
|
1,408,100 |
|
|
|
|
|
|
|
Net (loss) earnings per share |
|
16 |
|
|
|
|
Basic |
|
|
|
(1.45) |
|
8.03 |
Diluted |
|
|
|
(1.45) |
|
7.80 |
|
|
|
|
|
|
|
Weighted average shares outstanding ('000s) |
|
16 |
|
|
|
|
Basic |
|
|
|
163,719 |
|
163,489 |
Diluted |
|
|
|
163,719 |
|
168,426 |
Vermilion Energy Inc. ∎ Page 7 ∎ 2023 Financial Statements
Consolidated Statements of Cash Flows
thousands of Canadian dollars
|
|
|
|
Year Ended |
||
|
|
Note |
|
Dec 31, 2023 |
|
Dec 31, 2022 |
Operating |
|
|
|
|
|
|
Net (loss) earnings |
|
|
|
(237,587) |
|
1,313,062 |
Adjustments: |
|
|
|
|
|
|
Accretion |
|
8 |
|
78,187 |
|
58,170 |
Depletion and depreciation |
|
6, 7 |
|
712,619 |
|
577,134 |
Impairment expense (reversal) |
|
6 |
|
1,016,094 |
|
(192,094) |
Gain on business combination |
|
4 |
|
(439,487) |
|
— |
Loss on disposition |
|
6 |
|
352,367 |
|
— |
Unrealized gain on derivative instruments |
|
9 |
|
(179,707) |
|
(540,801) |
Equity based compensation |
|
15 |
|
42,756 |
|
44,390 |
Unrealized foreign exchange (gain) loss |
|
|
|
(12,438) |
|
84,464 |
Unrealized other expense |
|
|
|
— |
|
1,833 |
Deferred tax (recovery) expense |
|
11 |
|
(190,193) |
|
288,707 |
Asset retirement obligations settled |
|
8 |
|
(56,966) |
|
(37,514) |
Changes in non-cash operating working capital |
|
19 |
|
(61,117) |
|
216,869 |
Cash flows from operating activities |
|
|
|
1,024,528 |
|
1,814,220 |
|
|
|
|
|
|
|
Investing |
|
|
|
|
|
|
Drilling and development |
|
6 |
|
(569,110) |
|
(528,056) |
Exploration and evaluation |
|
7 |
|
(21,081) |
|
(23,761) |
Acquisitions, net of cash acquired |
|
6 |
|
(142,281) |
|
(510,309) |
Acquisition of securities |
|
5 |
|
(21,603) |
|
(23,282) |
Dispositions |
|
6 |
|
197,007 |
|
— |
Changes in non-cash investing working capital |
|
19 |
|
(19,367) |
|
26,116 |
Cash flows used in investing activities |
|
|
|
(576,435) |
|
(1,059,292) |
|
|
|
|
|
|
|
Financing |
|
|
|
|
|
|
Net borrowings (repayments) on the revolving credit facility |
|
12 |
|
(146,324) |
|
(1,121,868) |
Issuance of senior unsecured notes |
|
12 |
|
— |
|
499,037 |
Payments on lease obligations |
|
10 |
|
(17,094) |
|
(21,168) |
Repurchase of shares |
|
13 |
|
(94,838) |
|
(71,659) |
Cash dividends |
|
13 |
|
(62,080) |
|
(32,711) |
Cash flows used in financing activities |
|
|
|
(320,336) |
|
(748,369) |
Foreign exchange (loss) gain on cash held in foreign currencies |
|
|
|
(137) |
|
1,249 |
|
|
|
|
|
|
|
Net change in cash and cash equivalents |
|
|
|
127,620 |
|
7,808 |
Cash and cash equivalents, beginning of period |
|
|
|
13,836 |
|
6,028 |
Cash and cash equivalents, end of period |
|
19 |
|
141,456 |
|
13,836 |
|
|
|
|
|
|
|
Supplementary information for cash flows from operating activities |
|
|
|
|
|
|
Interest paid |
|
|
|
84,471 |
|
75,042 |
Income taxes paid |
|
|
|
306,911 |
|
144,814 |
Vermilion Energy Inc. ∎ Page 8 ∎ 2023 Financial Statements
Consolidated Statements of Changes in Shareholders’ Equity
thousands of Canadian dollars
|
|
|
|
Year Ended |
||
|
|
Note |
|
December 31, 2023 |
|
December 31, 2022 |
Shareholders' capital |
|
13 |
|
|
|
|
Balance, beginning of year |
|
|
|
4,243,794 |
|
4,241,773 |
Vesting of equity based awards |
|
|
|
23,575 |
|
44,811 |
Equity based compensation |
|
|
|
11,242 |
|
13,699 |
Share-settled dividends on vested equity based awards |
|
|
|
1,179 |
|
4,377 |
Repurchase of shares |
|
|
|
(137,224) |
|
(60,866) |
Balance, end of year |
|
|
|
4,142,566 |
|
4,243,794 |
Contributed surplus |
|
13 |
|
|
|
|
Balance, beginning of year |
|
|
|
35,409 |
|
49,529 |
Equity based compensation |
|
|
|
31,514 |
|
30,691 |
Vesting of equity based awards |
|
|
|
(23,575) |
|
(44,811) |
Balance, end of year |
|
|
|
43,348 |
|
35,409 |
Accumulated other comprehensive income |
|
|
|
|
|
|
Balance, beginning of year |
|
|
|
123,505 |
|
28,467 |
Currency translation adjustments |
|
|
|
(16,468) |
|
60,543 |
Hedge accounting reserve, net of tax |
|
|
|
6,357 |
|
5,599 |
Fair value adjustment on investment in securities, net of tax |
|
5 |
|
(4,092) |
|
28,896 |
Balance, end of year |
|
|
|
109,302 |
|
123,505 |
Deficit |
|
|
|
|
|
|
Balance, beginning of year |
|
|
|
(1,001,650) |
|
(2,253,624) |
Net (loss) earnings |
|
|
|
(237,587) |
|
1,313,062 |
Dividends declared |
|
|
|
(65,248) |
|
(45,769) |
Share-settled dividends on vested equity based awards |
|
|
|
(1,179) |
|
(4,377) |
Repurchase of shares |
|
13 |
|
42,096 |
|
(10,942) |
Balance, end of year |
|
|
|
(1,263,568) |
|
(1,001,650) |
|
|
|
|
|
|
|
Total shareholders' equity |
|
|
|
3,031,648 |
|
3,401,058 |
Vermilion Energy Inc. ∎ Page 9 ∎ 2023 Financial Statements Represents the recognized amount for common shares issued (net of equity issuance costs and deferred taxes) less the weighted-average carrying value of shares repurchased.
Description of equity reserves
Shareholders’ capital
The price paid to repurchase common shares is compared to the carrying value of the shares and the difference is recorded against deficit.
Contributed surplus
Represents the recognized value of unvested equity based awards that will be settled in shares. Once vested, the value of the awards are transferred to shareholders’ capital.
Accumulated other comprehensive income
Represents currency translation adjustments, hedge accounting reserve and fair value adjustments on investments.
Currency translation adjustments result from translating the balance sheets of subsidiaries with a foreign functional currency to Canadian dollars at period-end rates. These amounts may be reclassified to net (loss) earnings if there is a disposal or partial disposal of a subsidiary.
The hedge accounting reserve represents the effective portion of the change in fair value related to cash flow and net investment hedges recognized in other comprehensive income, net of tax and reclassified to the consolidated statement of net (loss) earnings in the same period in which the transaction associated with the hedged item occurs.
Fair value adjustment on investment in securities, net of tax, are a result of changes in the fair value of investments that have been elected to be subsequently measured at fair value through other comprehensive income.
Deficit
Represents the cumulative net (loss) earnings less distributed earnings and surplus of the price paid to repurchase common shares of Vermilion Energy Inc. over the weighted-average carrying value of the shares repurchased.
Vermilion Energy Inc. ∎ Page 10 ∎ 2023 Financial Statements tabular amounts in thousands of Canadian dollars, except share and per share amounts
Notes to the Consolidated Financial Statements for the year ended December 31, 2023 and 2022
| 1. | Basis of presentation |
Vermilion Energy Inc. and its subsidiaries (the “Company” or “Vermilion”) are engaged in the business of petroleum and natural gas exploration, development, acquisition, and production.
Vermilion was incorporated in Canada and the Company’s registered office and principal place of business is located at 3500, 520, 3rd Avenue SW, Calgary, Alberta, Canada.
These consolidated financial statements were approved and authorized for issuance by Vermilion’s Board of Directors on March 6, 2024.
2. Material accounting policies
Accounting framework
The consolidated financial statements are prepared in accordance with International Financial Reporting Standards (“IFRS”) as issued by the International Accounting Standards Board (“IASB”).
Principles of consolidation
The consolidated financial statements include the accounts of Vermilion Energy Inc. and its subsidiaries. Vermilion’s subsidiaries include entities in each of the jurisdictions that Vermilion operates as described in Note 3 (Segmented information) including: Canada, France, Netherlands, Germany, Ireland, Australia, the United States, and Central and Eastern Europe (Hungary, Slovakia, and Croatia). Vermilion Energy Inc. directly or indirectly through holding companies owns all of the voting securities of each material subsidiary. Transactions between Vermilion Energy Inc. and its subsidiaries have been eliminated.
Vermilion accounts for joint operations by recognizing the Company’s share of assets, liabilities, income, and expenses.
Exploration and evaluation assets
Vermilion classifies costs as exploration and evaluation (“E&E”) assets when they relate to exploring and evaluating an area for which the Company has the license or right to explore and extract resources. E&E costs may include: geological and geophysical costs; land and license acquisition costs; and costs for the drilling, completion, and testing of exploration wells.
E&E costs are reclassified to capital assets if the technical feasibility and commercial viability of the area can be determined. E&E assets are assessed for impairment prior to any reclassification. The technical feasibility and commercial viability of extracting the reserves is considered to be determinable when proved and probable reserves are identified.
Costs incurred prior to the acquisition of the legal rights to explore an area are expensed as incurred. If reserves are not found within the license area or the area is abandoned, the related E&E costs are depreciated over a period not greater than five years. If an exploration license expires prior to the commencement of exploration activities, the cost of the exploration license is written off through depreciation in the year of expiration.
Capital assets
Vermilion recognizes capital assets at cost less accumulated depletion, depreciation, and impairment losses. Costs include directly attributable costs incurred for the drilling, completion, and tie-in of wells and the construction of production and processing facilities.
When components of capital assets are replaced, disposed of, or no longer in use, they are derecognized. Gains and losses on disposal of capital assets are determined by comparing the proceeds of disposal compared to the carrying amount.
Depletion and depreciation
Capital assets are grouped into depletion units, which are groups of assets within a specific production area that have similar economic lives. Depletion units represent the lowest level of disaggregation for which costs are accumulated for the purposes of calculating depletion and depreciation.
The net carrying value of each depletion unit is depleted using the unit of production method by reference to the ratio of production in the period to the total proved and probable reserves, taking into account the future development costs necessary to bring the applicable reserves into production.
Vermilion Energy Inc.
∎ Page 11 ∎ 2023 Financial Statements For the purposes of the depletion calculations, oil and gas reserves are converted to a common unit of measure on the basis of their relative energy content based on a conversion ratio of six thousand cubic feet of natural gas to one barrel of oil equivalent.
Impairment of capital assets and exploration and evaluation assets
Depletion units are aggregated into cash generating units (“CGUs”) for impairment testing. CGUs are the lowest level for which there are identifiable cash inflows that are largely independent of cash inflows of other groups of assets. CGUs are reviewed for indicators of potential impairment at each reporting date.
E&E assets are tested for impairment when reclassified to capital assets or when indicators of potential impairment are identified. E&E assets are reviewed for indicators of potential impairment at each reporting date. If indicators of potential impairment are identified, E&E assets are tested for impairment as part of the CGU attributable to the jurisdiction in which the exploration area resides.
If an indicator of potential impairment exists, the CGU’s carrying value is compared to its recoverable amount. A CGU’s recoverable amount is the higher of its fair value less costs of disposal and its value-in-use. If the carrying amount of a CGU exceeds its recoverable amount, an impairment loss is recognized to reduce the carrying value of the CGU to its recoverable amount.
If an impairment loss has been recognized in a prior period, an assessment is performed at each reporting date to determine if there are indicators that the circumstances which led to the impairment loss have reversed. If the change in circumstances results in the recoverable amount being higher than the carrying value after the impairment loss, then the impairment loss (net of depletion that would otherwise have been recorded) is reversed.
Lease obligations and right-of-use assets
A contract is, or contains, a lease if the contract conveys the right to control the use of an identified asset for a period of time in exchange for consideration. At the lease commencement date, a lease obligation is recognized at the present value of future lease payments, typically using the applicable incremental borrowing rate. A corresponding right-of-use asset is recognized at the amount of the lease obligation, adjusted for lease incentives received and initial direct costs. Vermilion does not recognize leases for short-term leases with a lease term of 12 months or less, or leases for low-value assets.
Payments are applied against the lease obligation and interest expense is recognized on the lease obligations using the effective interest rate method. Depreciation is recognized on the right-of-use asset over the lease term.
Cash and cash equivalents
Cash and cash equivalents include cash on deposit with financial institutions and guaranteed investment certificates.
Crude oil inventory
Crude oil inventory is valued at the lower of cost or net realizable value. The cost of crude oil inventory produced includes related operating expense, royalties, and depletion determined on a weighted-average basis.
Asset retirement obligations
Vermilion recognizes a provision for asset retirement obligations when an event occurs giving rise to an obligation of uncertain timing or amount. Asset retirement obligations are recognized on the consolidated balance sheet as a long-term liability with a corresponding increase to E&E or capital assets.
Asset retirement obligations reflect the present value of estimated future settlement costs. The discount rate used to calculate the present value is specific to the jurisdiction the obligation relates to and is reflective of current market assessment of the time value of money and risks specific to the liabilities that have not been reflected in the cash flow estimates.
Asset retirement obligations are remeasured at each reporting period to reflect changes in market rates and estimated future settlement costs. Asset retirement obligations are increased each reporting period to reflect the passage of time with a corresponding charge to accretion expense.
Revenue recognition
Revenue associated with the sale of crude oil and condensate, natural gas, and natural gas liquids is measured based on the consideration specified in contracts with customers.
Revenue from contracts with customers is recognized when or as Vermilion satisfies a performance obligation by transferring control of crude oil and condensate, natural gas, or natural gas liquids to a customer at contractually specified transfer points. This transfer coincides with title passing to the customer and the customer taking physical possession of the commodity. Vermilion principally satisfies its performance obligations at a point in time and the amounts of revenue recognized relating to performance obligations satisfied over time are not significant.
Vermilion Energy Inc. ∎ Page 12 ∎ 2023 Financial Statements Vermilion invoices customers for delivered products monthly and payment occurs shortly thereafter.
Vermilion does not have any contracts where the period between the transfer of control of the commodity to the customer and payment by the customer exceeds one year. As a result, Vermilion does not adjust its revenue transactions to reflect significant financing components.
Financial instruments
On initial recognition, financial instruments are measured at fair value. Measurement in subsequent periods depends on the classification of the financial instrument as described below:
| ● | Fair value through profit or loss ("FVTPL"): Financial instruments under this classification include cash and cash equivalents and derivative assets and liabilities. Transaction costs under this classification are expensed as incurred. |
| ● | Fair value through other comprehensive income ("FVTOCI"): Financial instruments under this classification include derivative assets, investment in securities, and liabilities where hedge accounting is applied. Transaction costs under this classification are expensed as incurred. |
| ● | Amortized cost: Financial instruments under this classification include accounts receivable, accounts payable and accrued liabilities, dividends payable, lease obligations, and long-term debt. Transaction costs under this classification are included in the measurement of the financial instrument. |
Accounts receivable are measured net of a loss allowance equal to the lifetime expected credit loss.
Equity based compensation
Equity based compensation expense results from equity-settled awards issued under Vermilion’s long-term share-based compensation plans as well as the grant date fair value of Vermilion common shares issued under the Company’s bonus and employee share savings plans.
Vermilion’s long-term share-based compensation plans consist of the Long-term Incentive Plan (“LTIP”) and the Deferred Share Unit Plan ("DSU"). Equity-settled awards issued under the LTIP vest over a period of one to three years and awards issued under the DSU vest immediately upon granting.
Equity based compensation expense for equity-settled plans is recognized over the vesting period with a corresponding adjustment to contributed surplus. The expense recognized is based on the grant date fair value of the awards, an estimate of the performance factor that will be achieved (if applicable), and an estimate of forfeiture rates based on historical vesting data. Dividends notionally accrue to the LTIP and are excluded in the determination of grant date fair values. When the awards are converted to Vermilion common shares, the amount recognized in contributed surplus is reclassified to shareholders’ capital.
The grant date fair value of awards or Vermilion common shares issued is determined as the closing price of Vermilion’s common shares on the Toronto Stock Exchange on the grant date.
Per share amounts
Basic net (loss) earnings per share is calculated by dividing net (loss) earnings by the weighted-average number of shares outstanding during the period.
Diluted net (loss) earnings per share is calculated by dividing net (loss) earnings by the diluted weighted-average number of shares outstanding during the period. The diluted weighted-average number of shares outstanding is the sum of the basic weighted-average number of shares outstanding and (to the extent inclusion reduces diluted net (loss) earnings per share) the number of shares issuable for equity-settled awards determined using the treasury stock method. The treasury stock method assumes that the unrecognized equity based compensation expense are deemed proceeds used to repurchase Vermilion common shares at the average market price during the period.
Foreign currency translation
Vermilion Energy Inc.’s functional and presentation currency is the Canadian dollar. Vermilion has subsidiaries that transact and operate in countries other than Canada and have functional currencies other than the Canadian dollar.
Foreign currency translation includes the translation of foreign currency transactions and the translation of foreign operations.
Foreign currency transaction translation occurs when translating transactions and balances in foreign currencies to the applicable functional currency of Vermilion Energy Inc. and its subsidiaries. Gains and losses from foreign currency transactions are recorded as foreign exchange gains or losses in the statement of Net (loss) earnings. Foreign currency transaction translation occurs as follows:
| ● | Income and expenses are translated at the prevailing rates on the date of the transaction. |
Vermilion Energy Inc.
| ● | Non-monetary assets or liabilities are carried at the prevailing rates on the date of the transaction. |
| ● | Monetary items, including intercompany loans that are not deemed to represent net investments in a foreign subsidiary, are translated at the prevailing rates at the balance sheet date. |
∎ Page 13 ∎ 2023 Financial Statements Foreign operation translation occurs when translating the financial statements of non-Canadian functional currency subsidiaries to the Canadian dollar and when translating intercompany loans that are deemed to represent net investments in a foreign subsidiary. Gains and losses from foreign operation translations are recorded as currency translation adjustments in the statement of comprehensive income. Foreign operation translation occurs as follows:
| ● | Income and expenses are translated at the average exchange rates for the period. |
| ● | Assets and liabilities are translated at the prevailing rates on the balance sheet date. |
Income taxes
Deferred tax assets and liabilities are calculated using the balance sheet method. Deferred tax assets and liabilities are recognized for the estimated effect of any temporary differences between the amounts recognized on Vermilion’s consolidated balance sheet and the respective tax basis. This calculation uses enacted or substantively enacted tax rates that are expected to be in effect when the temporary differences are expected to reverse. The effect of a change in tax rates on deferred taxes is recognized in the period the related legislation is substantively enacted.
Deferred tax assets are recognized to the extent that it is probable that future taxable profits will be available against which the deductible temporary differences can be used. Deferred tax assets are reviewed at each reporting date and are reduced to the extent it is no longer probable that the related tax benefit will be realized.
Business combinations
Acquisitions of corporations or groups of assets are accounted for as business combinations using the acquisition method if the acquired assets constitute a business. Under the acquisition method, assets acquired and liabilities assumed in a business combination (with the exception of deferred tax assets and liabilities) are measured at their fair values. Deferred tax assets or liabilities arising from the assets acquired and liabilities assumed are measured in accordance with the policies described in "Income taxes" above.
If applicable, the excess or deficiency of the fair value of net assets acquired compared to consideration paid is recognized as a gain on business combination or as goodwill on the consolidated balance sheet. Acquisition-related costs incurred to effect a business combination are expensed in the period incurred.
As part of the assessment to determine if the acquisition constitutes a business, Vermilion may elect to apply the concentration test on a transaction by transaction basis. The test is met if substantially all of the fair value related to the gross assets acquired is concentrated in a single identifiable asset (or group of similar assets) resulting in the acquisition not being deemed a business and recorded as an asset acquisition.
Segmented information
Vermilion has a decentralized business unit structure designed to manage assets in each country the Company operates. Each of Vermilion’s operating segments derives its revenues solely from the production and sale of petroleum and natural gas.
Vermilion’s Corporate segment aggregates costs incurred at the Company’s Corporate head office located in Calgary, Alberta, Canada as well as costs incurred relating to Vermilion’s exploration and production activities in Hungary, Slovakia, and Croatia (Central and Eastern Europe). These operating segments have similar economic characteristics as they do not currently generate material revenue.
Vermilion’s chief operating decision maker regularly reviews fund flows from operations generated by each of Vermilion’s operating segments. Fund flows from operations is a measure of profit or loss that provides the chief operating decision maker with the ability to assess the profitability of each operating segment and, correspondingly, the ability of each operating segment to fund its share of dividends, asset retirement obligations, and capital investments.
Management judgments and estimation uncertainty
The preparation of the consolidated financial statements in accordance with IFRS requires management to make judgments, estimates, and assumptions that affect the reported amount of assets, liabilities, income, and expenses. Actual results could differ significantly from these estimates. Key areas where management has made judgments, estimates, and assumptions are described below.
Vermilion Energy Inc. ∎ Page 14 ∎ 2023 Financial Statements The determination of whether indicators of impairment or impairment reversals:
| ● | Determining whether there are indicators of impairment or impairment reversals are based on management's assessments of the changes in estimates for future commodity prices, costs, discount rates, or reserves. Changes in these estimates and assumptions can directly impact the calculated fair value of capital assets and therefore could be indicators of impairment or impairment reversals. In addition, change in the Vermilion's market capitalization relative to its book value could be an indicator of impairment. |
The measurement of the fair value of capital assets acquired in a business combination and the determination of the recoverable amount of cash generating units ("CGU"):
| ● | Calculating the fair value of capital assets acquired in a business combination and the recoverable amount of CGUs (in the assessment of impairments or reversals of previous impairments if indicators of impairment or impairment reversal are identified) are based on estimated future commodity prices, discount rates and estimated reserves. Reserve estimates are based on: engineering data, estimated future commodity prices, expected future rates of production, and assumptions regarding the timing and amount of future expenditures. Changes in these estimates and assumptions can directly impact the calculated fair value of capital assets acquired (and thus the resulting goodwill or gain on business combination) and the recoverable amount of a CGU (and thus the resulting impairment loss or recovery). |
| ● | In addition, the recoverable amount of a CGU is impacted by the composition of CGUs, which are subject to management’s judgment of the lowest level at which there are identifiable cash inflows that are largely independent of the cash inflows of other groups of assets. The factors used by Vermilion to determine CGUs vary by jurisdiction due to their unique operating and geographic conditions. In general, Vermilion will assess the following factors: geographic proximity of the assets within a group to one another, geographic proximity of the group of assets to other groups of assets, homogeneity of the production from the group of assets and the sharing of infrastructure used to process and/or transport production. Changes in these judgments can directly impact the calculated recoverable amount of a CGU (and thus the resulting impairment loss or recovery). |
The measurement of the carrying value of asset retirement obligations on the balance sheet, including the fair value and subsequent carrying value of asset retirement obligations assumed in a business combination:
| ● | Asset retirement obligations are based on judgments regarding regulatory requirements, estimates of future costs, assumptions on the expected timing of expenditures, and estimates of the underlying risk inherent to the obligation. The carrying balance of asset retirement obligations and accretion expense may differ due to changes in: laws and regulations, technology, the expected timing of expenditures, and market conditions affecting the discount rate applied. |
The recognition and measurement of deferred tax assets and liabilities:
| ● | Tax interpretations, regulations, and legislation in the various jurisdictions in which Vermilion and its subsidiaries operate are subject to change and interpretation. Changes in laws and interpretations can affect the timing of the reversal of temporary tax differences, the tax rates in effect when such differences reverse and Vermilion’s ability to use tax losses and other tax pools in the future. The Company’s income tax filings are subject to audit by taxation authorities in numerous jurisdictions and the results of such audits may increase or decrease the tax liability. The determination of tax amounts recognized in the consolidated financial statements are based on management’s assessment of the tax positions, which includes consideration of their technical merits, communications with tax authorities and management’s view of the most likely outcome. |
| ● | The extent to which deferred tax assets are recognized are based on estimates of future profitability. These estimates are based on estimated future commodity prices and estimates of reserves. Judgments, estimates, and assumptions inherent in reserve estimates are described above. |
The measurement of lease obligations and corresponding right-of-use assets:
| ● | The measurement of lease obligations are subject to management’s judgments of the applicable incremental borrowing rate and the expected lease term. The carrying balance of the right-of-use assets, lease obligations, and the resulting interest and depletion and depreciation expense, may differ due to changes in the market conditions and expected lease terms. Applicable incremental borrowing rates are based on judgments of the economic environment, term, currency, and the underlying risk inherent to the asset. Lease terms are based on assumptions regarding cancellation and extension terms that allow for operational flexibility based on future market conditions. |
Vermilion Energy Inc. ∎ Page 15 ∎ 2023 Financial Statements
3. Segmented information
|
|
Year Ended December 31, 2023 |
||||||||||||||||
|
|
Canada |
|
USA |
|
France |
|
Netherlands |
|
Germany |
|
Ireland |
|
Australia |
|
Corporate |
|
Total |
Total assets |
|
1,805,049 |
|
254,884 |
|
587,824 |
|
237,326 |
|
425,532 |
|
1,137,648 |
|
280,532 |
|
1,507,026 |
|
6,235,821 |
Drilling and development |
|
288,223 |
|
91,977 |
|
48,297 |
|
44,147 |
|
48,463 |
|
20,283 |
|
26,005 |
|
1,715 |
|
569,110 |
Exploration and evaluation |
|
— |
|
— |
|
— |
|
— |
|
11,248 |
|
— |
|
— |
|
9,833 |
|
21,081 |
|
|
|
|
|
|
|
|
|
|
|
|
|
|
|
|
|
|
|
Crude oil and condensate sales |
|
621,985 |
|
129,775 |
|
285,626 |
|
2,306 |
|
57,464 |
|
74 |
|
36,381 |
|
— |
|
1,133,611 |
NGL sales |
|
68,753 |
|
15,240 |
|
— |
|
— |
|
— |
|
— |
|
— |
|
— |
|
83,993 |
Natural gas sales |
|
170,653 |
|
6,143 |
|
— |
|
184,548 |
|
138,017 |
|
302,330 |
|
— |
|
3,260 |
|
804,951 |
Sales of purchased commodities |
|
|
|
— |
|
— |
|
— |
|
— |
|
— |
|
— |
|
177,000 |
|
177,000 |
Royalties |
|
(103,511) |
|
(41,487) |
|
(37,425) |
|
(1,567) |
|
(5,993) |
|
— |
|
— |
|
(1,711) |
|
(191,694) |
Revenue from external customers |
|
757,880 |
|
109,671 |
|
248,201 |
|
185,287 |
|
189,488 |
|
302,404 |
|
36,381 |
|
178,549 |
|
2,007,861 |
Purchased commodities |
|
|
|
— |
|
— |
|
— |
|
— |
|
— |
|
— |
|
(177,000) |
|
(177,000) |
Transportation |
|
(43,163) |
|
(751) |
|
(24,511) |
|
— |
|
(13,333) |
|
(7,098) |
|
— |
|
— |
|
(88,856) |
Operating |
|
(233,417) |
|
(23,424) |
|
(80,134) |
|
(39,157) |
|
(43,857) |
|
(39,464) |
|
(52,360) |
|
(1,568) |
|
(513,381) |
General and administration |
|
(96,296) |
|
(9,734) |
|
(20,642) |
|
(8,317) |
|
(13,104) |
|
(19,054) |
|
(8,182) |
|
94,613 |
|
(80,716) |
PRRT |
|
— |
|
— |
|
— |
|
— |
|
— |
|
— |
|
20,860 |
|
— |
|
20,860 |
Corporate income taxes |
|
(53) |
|
— |
|
(14,313) |
|
(48,349) |
|
(28,533) |
|
(715) |
|
13 |
|
18 |
|
(91,932) |
Windfall taxes |
|
— |
|
— |
|
— |
|
— |
|
— |
|
— |
|
— |
|
(78,426) |
|
(78,426) |
Interest expense |
|
— |
|
— |
|
— |
|
— |
|
— |
|
— |
|
— |
|
(85,212) |
|
(85,212) |
Realized gain on derivative instruments |
|
— |
|
— |
|
— |
|
— |
|
— |
|
— |
|
— |
|
234,365 |
|
234,365 |
Realized foreign exchange loss |
|
— |
|
— |
|
— |
|
— |
|
— |
|
— |
|
— |
|
(4,532) |
|
(4,532) |
Realized other expense |
|
— |
|
— |
|
— |
|
— |
|
— |
|
— |
|
— |
|
(420) |
|
(420) |
Fund flows from operations |
|
384,951 |
|
75,762 |
|
108,601 |
|
89,464 |
|
90,661 |
|
236,073 |
|
(3,288) |
|
160,387 |
|
1,142,611 |
|
|
Year Ended December 31, 2022 |
||||||||||||||||
|
|
Canada |
|
USA |
|
France |
|
Netherlands |
|
Germany |
|
Ireland |
|
Australia |
|
Corporate |
|
Total |
Total assets |
|
3,612,487 |
|
618,116 |
|
823,544 |
|
240,276 |
|
398,612 |
|
465,643 |
|
249,253 |
|
583,127 |
|
6,991,058 |
Drilling and development |
|
275,203 |
|
63,353 |
|
44,250 |
|
21,629 |
|
25,087 |
|
3,030 |
|
95,173 |
|
331 |
|
528,056 |
Exploration and evaluation |
|
— |
|
— |
|
2 |
|
23 |
|
1,070 |
|
— |
|
— |
|
22,666 |
|
23,761 |
|
|
|
|
|
|
|
|
|
|
|
|
|
|
|
|
|
|
|
Crude oil and condensate sales |
|
910,863 |
|
130,150 |
|
365,431 |
|
2,119 |
|
62,464 |
|
15 |
|
221,187 |
|
— |
|
1,692,229 |
NGL sales |
|
114,128 |
|
19,385 |
|
— |
|
— |
|
— |
|
— |
|
— |
|
— |
|
133,513 |
Natural gas sales |
|
319,293 |
|
16,698 |
|
— |
|
560,738 |
|
418,796 |
|
324,330 |
|
— |
|
10,797 |
|
1,650,652 |
Sales of purchased commodities |
|
— |
|
— |
|
— |
|
— |
|
— |
|
— |
|
— |
|
244,834 |
|
244,834 |
Royalties |
|
(196,005) |
|
(44,427) |
|
(40,353) |
|
(512) |
|
(21,232) |
|
— |
|
— |
|
(3,488) |
|
(306,017) |
Revenue from external customers |
|
1,148,279 |
|
121,806 |
|
325,078 |
|
562,345 |
|
460,028 |
|
324,345 |
|
221,187 |
|
252,143 |
|
3,415,211 |
Purchased commodities |
|
— |
|
— |
|
— |
|
— |
|
— |
|
— |
|
— |
|
(244,834) |
|
(244,834) |
Transportation |
|
(44,849) |
|
(618) |
|
(20,100) |
|
— |
|
(9,751) |
|
(3,578) |
|
— |
|
— |
|
(78,896) |
Operating |
|
(240,899) |
|
(27,372) |
|
(57,588) |
|
(45,903) |
|
(41,523) |
|
(16,580) |
|
(57,478) |
|
(1,691) |
|
(489,034) |
General and administration |
|
(28,643) |
|
(5,863) |
|
(16,444) |
|
(4,255) |
|
(6,949) |
|
122 |
|
(4,964) |
|
9,319 |
|
(57,677) |
PRRT |
|
— |
|
— |
|
— |
|
— |
|
— |
|
— |
|
(18,318) |
|
— |
|
(18,318) |
Corporate income taxes |
|
(10) |
|
— |
|
(29,889) |
|
(150,647) |
|
(31,513) |
|
— |
|
5,016 |
|
(1,110) |
|
(208,153) |
Windfall tax |
|
— |
|
— |
|
— |
|
— |
|
— |
|
— |
|
— |
|
(222,859) |
|
(222,859) |
Interest expense |
|
— |
|
— |
|
— |
|
— |
|
— |
|
— |
|
— |
|
(82,858) |
|
(82,858) |
Realized loss on derivative instruments |
|
— |
|
— |
|
— |
|
— |
|
— |
|
— |
|
— |
|
(405,894) |
|
(405,894) |
Realized foreign exchange gain |
|
— |
|
— |
|
— |
|
— |
|
— |
|
— |
|
— |
|
15,195 |
|
15,195 |
Realized other income |
|
— |
|
— |
|
— |
|
— |
|
— |
|
— |
|
— |
|
12,982 |
|
12,982 |
Fund flows from operations |
|
833,878 |
|
87,953 |
|
201,057 |
|
361,540 |
|
370,292 |
|
304,309 |
|
145,443 |
|
(669,607) |
|
1,634,865 |
Vermilion Energy Inc. ∎ Page 16 ∎ 2023 Financial Statements
Reconciliation of fund flows from operations to net (loss) earnings:
|
|
Year Ended |
||
|
|
Dec 31, 2023 |
|
Dec 31, 2022 |
Fund flows from operations |
|
1,142,611 |
|
1,634,865 |
Equity based compensation |
|
(42,756) |
|
(44,390) |
Unrealized gain on derivative instruments |
|
179,707 |
|
540,801 |
Unrealized foreign exchange gain (loss) |
|
12,438 |
|
(84,464) |
Accretion |
|
(78,187) |
|
(58,170) |
Depletion and depreciation |
|
(712,619) |
|
(577,134) |
Deferred tax recovery (expense) |
|
190,193 |
|
(288,707) |
Gain on business combination |
|
439,487 |
|
— |
Loss on disposition |
|
(352,367) |
|
— |
Impairment (expense) reversal |
|
(1,016,094) |
|
192,094 |
Unrealized other expense |
|
— |
|
(1,833) |
Net (loss) earnings |
|
(237,587) |
|
1,313,062 |
4. Business combination
Equinor Energy Ireland Limited
On March 31, 2023, Vermilion purchased 100% of the shares outstanding of Equinor Energy Ireland Limited ("EEIL") from Equinor ASA. The acquisition adds an incremental 36.5% interest in the Corrib Natural Gas Project, increasing Vermilion's operated interest to 56.5%.
The total consideration paid and the fair value of the assets acquired and liabilities assumed at the date of acquisition are detailed in the table below.
|
|
Consideration |
Cash consideration paid |
|
488,893 |
|
|
Allocation of consideration |
Cash acquired |
|
400,002 |
Capital assets |
|
768,026 |
Acquired working capital deficit |
|
(109,134) |
Asset retirement obligations |
|
(42,277) |
Derivative liability |
|
(51,789) |
Deferred tax liability |
|
(36,448) |
Net assets acquired |
|
928,380 |
Gain on business combination |
|
(439,487) |
Total net assets acquired, net of gain on business combination |
|
488,893 |
The gain on the business combination primarily resulted from increases in working capital and the fair value of capital assets from when the purchase and sale agreement was entered into in November 2021 and when the acquisition closed in March 2023 due to significant increases in European natural gas prices throughout 2022 and Q1 2023.
The results of operations from the assets acquired and liabilities assumed have been included in Vermilion's consolidated financial statements beginning March 31, 2023 and have contributed revenues net of royalties of $161.7 million and net earnings of $43.6 million. Had the acquisition occurred on January 1, 2023, consolidated petroleum and natural gas revenue would have been $2,098.2 million and consolidated net loss would have been 182.6 million for the year ended December 31, 2023.
Vermilion Energy Inc. ∎ Page 17 ∎ 2023 Financial Statements The total consideration paid and the fair value of the investments acquired are detailed in the table below:
5. Investment in securities
|
|
2023 |
|
2022 |
Balance at January 1 |
|
56,366 |
|
— |
Acquisition of securities |
|
21,603 |
|
23,282 |
Fair value adjustment (1) |
|
(4,708) |
|
33,084 |
Balance at December 31 |
|
73,261 |
|
56,366 |
| (1) | The investment is classified as a level 1 instrument on the fair value hierarchy and therefore uses observable inputs when making fair value adjustments. |
6. Capital assets
The following table reconciles the change in Vermilion’s capital assets:
|
|
2023 |
|
2022 |
Balance at January 1 |
|
5,691,522 |
|
4,824,195 |
Acquisitions |
|
836,295 |
|
572,535 |
Dispositions |
|
(676,471) |
|
— |
Additions |
|
569,110 |
|
528,056 |
Increase in right-of-use assets |
|
3,103 |
|
13,871 |
Transfers from exploration and evaluation assets |
|
40,521 |
|
1,223 |
Impairment (expense) reversal |
|
(1,016,094) |
|
192,094 |
Depletion and depreciation |
|
(699,343) |
|
(546,381) |
Changes in asset retirement obligations |
|
138,239 |
|
65,462 |
Foreign exchange |
|
(4,373) |
|
40,467 |
Balance at December 31 |
|
4,882,509 |
|
5,691,522 |
|
|
|
|
|
Cost |
|
12,966,256 |
|
12,058,520 |
Accumulated depletion, depreciation, and impairment |
|
(8,083,747) |
|
(6,366,998) |
Balance at December 31 |
|
4,882,509 |
|
5,691,522 |
Impairment
In the fourth quarter of 2023, indicators of impairment were present in our France CGU due to changes in forecasted cost assumptions and in our Saskatchewan and United States CGUs due to negative technical revisions. As a result of the indicators of impairment, the Company performed impairment calculations on the identified CGUs and the recoverable amounts were determined using fair value less costs to sell, which considered future after-tax cash flows from proved plus probable reserves and an after-tax discount rate of 13% for Saskatchewan and 15.0% for France and United States. Based on the results of the impairment tests completed, the Company recognized non-cash impairment charges of $1.0 billion. Inputs used in the measurement of capital assets are not based on observable market data and fall within level 3 of the fair value hierarchy.
The following benchmark price forecasts were used to calculate the recoverable amounts:
|
|
2024 |
|
2025 |
|
2026 |
|
2027 |
|
2028 |
|
2029 |
|
2030 |
|
2031 |
|
2032 |
|
2033 (2) |
Brent Crude ($ US/bbl) (1) |
|
78.00 |
|
79.18 |
|
80.36 |
|
81.79 |
|
83.41 |
|
85.09 |
|
86.79 |
|
88.52 |
|
90.29 |
|
92.10 |
WTI Crude ($ US/bbl) (1) |
|
73.67 |
|
74.98 |
|
76.14 |
|
77.66 |
|
79.22 |
|
80.80 |
|
82.42 |
|
84.06 |
|
85.75 |
|
87.46 |
Light Sour Crude ($/bbl) (1) |
|
93.35 |
|
95.50 |
|
96.53 |
|
98.46 |
|
100.43 |
|
102.44 |
|
104.49 |
|
106.58 |
|
108.71 |
|
110.88 |
SK Plant Gate Gas - Spot Gas ($/MMbtu) (1) |
|
1.98 |
|
3.15 |
|
3.83 |
|
3.91 |
|
3.99 |
|
4.08 |
|
4.16 |
|
4.25 |
|
4.34 |
|
4.43 |
Henry Hub Gas ($ US/MMbtu) (1) |
|
2.75 |
|
3.64 |
|
4.02 |
|
4.10 |
|
4.18 |
|
4.27 |
|
4.35 |
|
4.44 |
|
4.53 |
|
4.62 |
(1) |
The forecast benchmark prices listed are adjusted for quality differentials, heat content, transportation and marketing costs and other factors specific to the Company’s operations when determining recoverable amounts. |
(2) |
In 2033 and beyond, commodity price forecasts are inflated at a rate of 2.0% per annum. |
Vermilion Energy Inc. ∎ Page 18 ∎ 2023 Financial Statements The following are the results of tests completed, recoverable amounts, and sensitivity impacts which would increase the impairments taken:
Operating Segment |
|
CGU |
|
Impairment |
|
Recoverable Amount |
|
1% increase in discount rate |
|
5% decrease in pricing |
Canada |
|
Saskatchewan |
|
542,937 |
|
704,636 |
|
42,657 |
|
79,452 |
France |
|
France (1) |
|
226,858 |
|
523,303 |
|
24,653 |
|
70,035 |
United States |
|
United States |
|
246,299 |
|
239,179 |
|
12,819 |
|
38,290 |
Total |
|
|
|
1,016,094 |
|
1,467,118 |
|
80,129 |
|
187,777 |
| (1) | During 2023, Vermilion finalized an evaluation of the management and organization of Vermilion’s assets in France resulting in a combination of its Neocomian, Chaunoy, Champotran, and Aquitaine Basin CGUs into the France CGU. If these CGUs were not combined, impairment recognized would have increased by $23.2 million. |
Southeast Saskatchewan disposition
In March 2023, Vermilion sold non-core assets in southeast Saskatchewan for net proceeds of $182.2 million and resulted in a loss on disposition of $226.8 million. The book value of the net assets disposed of was $409.0 million and consisted of $534.0 million of capital assets, $25.9 million of exploration and evaluation assets, and $150.9 million of asset retirement obligations.
United States disposition
In December 2023, Vermilion sold non-core assets in Wyoming for net proceeds of $16.3 million and resulted in a loss on disposition of $125.5 million.
Minor acquisition
In March 2023, Vermilion completed a minor acquisition of Alberta assets for total consideration of $19.0 million where $33.9 million of capital assets and $14.9 million of asset retirement obligations were recognized.
Right-of-use assets
The following table discloses the carrying balance and depreciation charge relating to right-of-use assets by class of underlying asset as at and for the year ended December 31, 2023:
|
|
As at Dec 31, 2023 |
|
As at Dec 31, 2022 |
||||
($M) |
|
Depreciation |
|
Balance |
|
Depreciation |
|
Balance |
Office space |
|
8,115 |
|
25,893 |
|
8,328 |
|
31,199 |
Gas processing facilities |
|
7,691 |
|
6,326 |
|
7,691 |
|
13,415 |
Oil storage facilities |
|
2,667 |
|
7,037 |
|
2,429 |
|
8,970 |
Vehicles and equipment |
|
5,433 |
|
9,760 |
|
4,716 |
|
13,944 |
Total |
|
23,906 |
|
49,016 |
|
23,164 |
|
67,528 |
Vermilion Energy Inc. ∎ Page 19 ∎ 2023 Financial Statements The following table reconciles the change in Vermilion’s exploration and evaluation assets:
7. Exploration and evaluation assets
|
|
2023 |
|
2022 |
Balance at January 1 |
|
270,593 |
|
233,290 |
Acquisitions |
|
— |
|
43,227 |
Additions |
|
21,081 |
|
23,761 |
Dispositions |
|
(25,862) |
|
— |
Changes in asset retirement obligations |
|
(980) |
|
646 |
Transfers to capital assets |
|
(40,521) |
|
(1,223) |
Depreciation |
|
(27,386) |
|
(30,503) |
Foreign exchange |
|
1,454 |
|
1,395 |
Balance at December 31 |
|
198,379 |
|
270,593 |
|
|
|
|
|
Cost |
|
432,345 |
|
476,571 |
Accumulated depreciation |
|
(233,966) |
|
(205,978) |
Carrying amount at December 31 |
|
198,379 |
|
270,593 |
8. Asset retirement obligations
The following table reconciles the change in Vermilion’s asset retirement obligations:
|
|
2023 |
|
2022 |
Balance at January 1 |
|
1,087,757 |
|
1,000,554 |
Additional obligations recognized |
|
60,012 |
|
5,184 |
Dispositions |
|
(151,566) |
|
— |
Changes in estimated abandonment timing and costs |
|
1,159 |
|
207,919 |
Obligations settled |
|
(56,966) |
|
(37,514) |
Accretion |
|
78,187 |
|
58,170 |
Changes in rates |
|
133,575 |
|
(145,555) |
Foreign exchange |
|
6,905 |
|
(1,001) |
Balance at December 31 |
|
1,159,063 |
|
1,087,757 |
Vermilion calculated the present value of the obligations using a credit-adjusted risk-free rate, calculated using a credit spread of 3.6% as at December 31, 2023 (December 31, 2022 – 4.5%) added to risk-free rates based on long-term, risk-free government bonds. Vermilion’s credit spread is determined using the Company’s expected cost of borrowing at the end of the reporting period.
The country-specific risk-free rates used as inputs to discount the obligations were as follows:
|
|
Dec 31, 2023 |
|
Dec 31, 2022 |
|
Canada |
|
3.0 |
% |
3.3 |
% |
United States |
|
4.2 |
% |
4.1 |
% |
France |
|
3.0 |
% |
3.4 |
% |
Netherlands |
|
2.1 |
% |
2.7 |
% |
Germany |
|
2.3 |
% |
2.5 |
% |
Ireland |
|
2.7 |
% |
3.2 |
% |
Australia |
|
4.0 |
% |
4.2 |
% |
Vermilion has estimated the asset retirement obligations based on current cost estimates of $2.2 billion (2022 - $2.3 billion). Current cost estimates are inflated to the estimated time of abandonment using inflation rates of between 1.3% and 5.5% (2022 - between 1.6% and 4.2%), resulting in inflated cost estimates of $3.4 billion (2022 - $3.7 billion). These payments are expected to be made over the next 60 years, with the majority of the costs incurred in the first 40 years.
Vermilion Energy Inc. ∎ Page 20 ∎ 2023 Financial Statements A 0.5% increase/decrease in the discount rate applied to asset retirement obligations would decrease/increase asset retirement obligations by approximately $70.1 million.
A one-year increase/decrease in the expected timing of abandonment spend would decrease/increase asset retirement obligations by approximately $34.0 million.
9. Derivative instruments
The following table reconciles the change in the fair value of Vermilion’s derivative instruments:
|
|
Year Ended |
||
|
|
Dec 31, 2023 |
|
Dec 31, 2022 |
Fair value of contracts, beginning of year |
|
239,596 |
|
(300,865) |
Reversal of opening contracts settled during the year |
|
(43,267) |
|
164,208 |
Assumed in acquisitions |
|
51,866 |
|
(339) |
Realized gain (loss) on contracts settled during the year |
|
234,365 |
|
(405,894) |
Unrealized gain during the year on contracts outstanding at the end of the year |
|
171,448 |
|
376,593 |
Unwinding of contracts assumed in acquisitions |
|
(51,526) |
|
— |
Net receipt from counterparties on contract settlements during the year |
|
(234,365) |
|
405,893 |
Fair value of contracts, end of year |
|
368,117 |
|
239,596 |
Comprised of: |
|
|
|
|
Current derivative asset |
|
313,792 |
|
162,843 |
Current derivative liability |
|
(732) |
|
(55,845) |
Non-current derivative asset |
|
76,107 |
|
132,598 |
Non-current derivative liability |
|
(21,050) |
|
— |
Fair value of contracts, end of year |
|
368,117 |
|
239,596 |
The gain on derivative instruments for 2023 and 2022 were comprised of the following:
|
|
Year Ended |
||
|
|
Dec 31, 2023 |
|
Dec 31, 2022 |
Realized (gain) loss on contracts settled during the year |
|
(234,365) |
|
405,894 |
Reversal of opening contracts settled during the year |
|
43,267 |
|
(164,208) |
Unwinding of contracts assumed in acquisitions |
|
(51,526) |
|
— |
Unrealized gain on contracts outstanding at the end of the year |
|
(171,448) |
|
(376,593) |
Gain on derivative instruments |
|
(414,072) |
|
(134,907) |
Vermilion executes derivative instruments where there is an underlying exposure to offset the position. Consistent with our accounting policy we do not match unrealized gains / losses on these contracts with the underlying exposure. Please refer to Note 19 (Supplemental information) for a listing of Vermilion's outstanding derivative instruments as at December 31, 2023.
Vermilion Energy Inc. ∎ Page 21 ∎ 2023 Financial Statements Vermilion had the following future commitments associated with its lease obligations:
10. Leases
|
|
As at |
||
($M) |
|
Dec 31, 2023 |
|
Dec 31, 2022 |
Less than 1 year |
|
24,029 |
|
23,588 |
1 - 3 years |
|
31,077 |
|
40,374 |
3 - 5 years |
|
4,591 |
|
16,246 |
After 5 years |
|
2 |
|
177 |
Total lease payments |
|
59,699 |
|
80,385 |
Amounts representing interest |
|
(5,630) |
|
(9,392) |
Present value of net lease payments |
|
54,069 |
|
70,993 |
Current portion of lease obligations |
|
(21,068) |
|
(19,486) |
Non-current portion of lease obligations |
|
33,001 |
|
51,507 |
|
|
|
|
|
Total cash outflow |
|
21,002 |
|
25,422 |
Interest on lease liabilities |
|
3,908 |
|
4,254 |
11. Taxes
The following table reconciles Vermilion’s deferred tax asset and liability:
|
|
As at |
||
|
|
Dec 31, 2023 |
|
Dec 31, 2022 |
Deferred tax assets: |
|
|
|
|
Non-capital losses |
|
632,870 |
|
200,781 |
Derivative contracts |
|
(89,619) |
|
— |
Other |
|
(437) |
|
39 |
Stock based compensation |
|
6,757 |
|
— |
Asset retirement obligations |
|
77,292 |
|
5,818 |
Capital assets |
|
(447,463) |
|
(81,105) |
Unrealized foreign exchange |
|
2,651 |
|
— |
Deferred tax assets |
|
182,051 |
|
125,533 |
Deferred tax liabilities: |
|
|
|
|
Derivative contracts |
|
— |
|
58,941 |
Asset retirement obligations |
|
105,147 |
|
100,670 |
Capital assets |
|
279,889 |
|
734,146 |
Stock based compensation |
|
— |
|
(5,805) |
Other |
|
6,275 |
|
(16,322) |
Unrealized foreign exchange |
|
— |
|
(4,282) |
Non-capital losses |
|
(10,341) |
|
(390,008) |
Deferred tax liabilities |
|
380,970 |
|
477,340 |
Vermilion Energy Inc. ∎ Page 22 ∎ 2023 Financial Statements Income tax expense differs from the amount that would have been expected if the reported earnings had been subject only to the statutory Canadian income tax rate as follows:
|
|
Year Ended |
|
||
|
|
Dec 31, 2023 |
|
Dec 31, 2022 |
|
(Loss) earnings before income taxes |
|
(278,282) |
|
2,051,099 |
|
Canadian corporate tax rate |
|
24.35 |
% |
24.60 |
% |
Expected tax (recovery) expense |
|
(67,762) |
|
504,570 |
|
(Decrease) increase in taxes resulting from: |
|
|
|
|
|
Petroleum resource rent tax rate (PRRT) differential (1) |
|
(14,177) |
|
13,729 |
|
Foreign tax rate differentials (2) (3) |
|
33,404 |
|
101,701 |
|
Equity based compensation expense |
|
(1,914) |
|
(11,610) |
|
Amended returns and changes to estimated tax pools and tax positions |
|
(7,664) |
|
(5,691) |
|
Statutory rate changes and the estimated reversal rates on temporary differences (3) |
|
(17,474) |
|
14,274 |
|
Derecognition (recognition) of deferred tax assets |
|
202,216 |
|
(118,304) |
|
Non-taxable amounts related to business combinations |
|
(172,692) |
|
— |
|
Windfall taxes (3) |
|
78,426 |
|
222,859 |
|
Other non-deductible items |
|
(73,058) |
|
16,509 |
|
Provision for income taxes |
|
(40,695) |
|
738,037 |
|
| (1) | In Australia, current taxes include both corporate income tax rates and PRRT. For both 2023 and 2022, corporate income tax rates were applied at a rate of 30% and PRRT was applied at a rate of 40%. |
| (2) | The applicable tax rates for 2023 were: 25.8% in France, 50.0% in the Netherlands, 31.2% in Germany, 25.0% in Ireland, and 21.0% in the United States (2022: 25.8% in France, 50.0% in the Netherlands, 31.3% in Germany, 25.0% in Ireland, and 21.0% in the United States). |
| (3) | On October 6, 2022 the Council of the European Union adopted a regulation that implemented a temporary windfall tax on the profits of oil and gas producers resident in the European Union. This windfall tax was referred to as a temporary solidarity contribution and was calculated on the amount by which the taxable profits for the elected years exceeded the greater of zero and 120% of the average taxable profits for the 2018 to 2021 period. The regulation required Member States to implement the temporary solidarity contribution at a minimum rate of 33% while providing Member States with the option to apply the temporary solidarity contribution to fiscal years beginning on or after January 1, 2022, January 1, 2023, or both. The temporary solidarity contribution does not apply to 2024 or later years and is considered a tax pursuant to IAS 12 “Income Taxes”. |
The following table summarizes the manner of implementation of the temporary solidarity contribution by the Member States in which Vermilion operates:
Jurisdiction |
|
2024 |
|
2023 |
|
France (1) |
|
N/A |
|
33.0 |
% |
Netherlands (2) |
|
N/A |
|
33.0 |
% |
Germany |
|
33.0 |
% |
33.0 |
% |
Ireland |
|
75.0 |
% |
75.0 |
% |
| (1) | For 2022, France implemented a windfall tax; however, did not extend for 2023. |
| (2) | For 2023 and 2024, Netherlands has implemented a windfall royalty which, for natural gas sales, is calculated as 65% of the excess of the realized price for a subject year versus the threshold price of €0.50/Nm3 (€13.40/mcf). This royalty is deductible against current income taxes. |
At December 31, 2023, Vermilion had $3.2 billion (2022 - $2.4 billion) of unused tax losses of which $1.4 billion (2022 - $1.4 billion) relates to Vermilion's Canada segment and expire between 2030 and 2042. The majority of the remaining unused tax losses relate to Vermilion's Ireland segment and do not expire.
At December 31, 2023, Vermilion derecognized $202.2 million (2022 - recognized $118.3 million) of deferred income tax assets relating to the Canada, USA, Ireland and Australia segments as there is uncertainty as to the Company's ability to fully utilize such losses based on the forecasted commodity prices in effect as at December 31, 2023.
The aggregate amount of temporary differences associated with investments in subsidiaries for which deferred tax liabilities have not been recognized as at December 31, 2023 is approximately $1.0 billion (2022 – approximately $0.7 billion).
In December 2021, the Organization for Economic Co-operation and Development (“OECD”) issued model rules for a new global minimum tax framework (“Pillar Two”). The objective of Pillar Two is to ensure that large multinational enterprises are subjected to a minimum 15% effective tax rate in each jurisdiction in which they operate.
Most of the countries where Vermilion operates are in the process of enacting, or have enacted, tax legislation to comply with Pillar Two with effect from January 1, 2024. The Company expects that Pillar Two will not have a material impact on income tax expense.
Vermilion Energy Inc. ∎ Page 23 ∎ 2023 Financial Statements The following table summarizes Vermilion’s outstanding long-term debt:
In May 2023, the IASB issued amendments to IAS 12, “Income Taxes” (“IAS 12”) to address the impacts and additional disclosure requirements related to Pillar Two. Vermilion has applied the mandatory exception required by IAS 12 and accordingly has not accounted for any related deferred income tax assets or liabilities.
12. Long-term debt
|
|
As at |
||
|
|
Dec 31, 2023 |
|
Dec 31, 2022 |
Revolving credit facility |
|
— |
|
147,666 |
2025 senior unsecured notes |
|
395,839 |
|
404,463 |
2030 senior unsecured notes |
|
518,176 |
|
529,222 |
Long-term debt |
|
914,015 |
|
1,081,351 |
The fair value of the revolving credit facility is equal to its carrying value due to the use of short-term borrowing instruments at market rates of interest. The fair value of the 2025 senior unsecured notes as at December 31, 2023 was $392.7 million (December 31, 2022 - $391.3 million). The fair value of the 2030 senior unsecured notes as at December 31, 2023 was $511.7 million (December 31, 2022 - $496.8 million).
The following table reconciles the change in Vermilion’s long-term debt:
|
|
2023 |
|
2022 |
Balance at January 1 |
|
1,081,351 |
|
1,651,569 |
Net repayments on the revolving credit facility |
|
(146,324) |
|
(1,121,868) |
Issuance of 2030 senior unsecured notes |
|
— |
|
499,037 |
Amortization of transaction costs |
|
2,182 |
|
1,833 |
Foreign exchange |
|
(23,194) |
|
50,780 |
Balance at December 31 |
|
914,015 |
|
1,081,351 |
Revolving credit facility
As at December 31, 2023, Vermilion had in place a bank revolving credit facility maturing May 29, 2027 with the following terms:
|
|
As at |
||
|
|
Dec 31, 2023 |
|
Dec 31, 2022 |
Total facility amount |
|
1,600,000 |
|
1,600,000 |
Amount drawn |
|
— |
|
(147,666) |
Letters of credit outstanding |
|
(18,116) |
|
(13,527) |
Unutilized capacity |
|
1,581,884 |
|
1,438,807 |
The facility can be extended from time to time at the option of the lenders and upon notice from Vermilion. If no extension is granted by the lenders, the amounts owing pursuant to the facility are due at the maturity date. The facility is secured by various fixed and floating charges against the subsidiaries of Vermilion.
On May 19, 2023, the maturity date of the facility was extended to May 28, 2027 (previously May 29, 2026) and the total facility amount of $1.6 billion was unchanged. As at December 31, 2023, the revolving credit facility was undrawn.
The facility bears interest at a rate applicable to demand loans plus applicable margins.
Vermilion Energy Inc. ∎ Page 24 ∎ 2023 Financial Statements
As at December 31, 2023, the revolving credit facility was subject to the following financial covenants:
|
|
|
|
As at |
||
Financial covenant |
|
Limit |
|
Dec 31, 2023 |
|
Dec 31, 2022 |
Consolidated total debt to consolidated EBITDA |
|
Less than 4.0 |
|
0.65 |
|
0.51 |
Consolidated total senior debt to consolidated EBITDA |
|
Less than 3.5 |
|
— |
|
0.07 |
Consolidated EBITDA to consolidated interest expense |
|
Greater than 2.5 |
|
17.33 |
|
27.10 |
The financial covenants include financial measures defined within the revolving credit facility agreement that are not defined under IFRS. These financial measures are defined by the revolving credit facility agreement as follows:
| ● | Consolidated total debt: Includes all amounts classified as “Long-term debt” and “Lease obligations” (including the current portion included within “Accounts payable and accrued liabilities” but excluding operating leases as defined under IAS 17) on the consolidated balance sheet. |
| ● | Consolidated total senior debt: Consolidated total debt excluding unsecured and subordinated debt. |
| ● | Consolidated EBITDA: Consolidated net (loss) earnings before interest, income taxes, depreciation, accretion and certain other non-cash items, adjusted for the impact of the acquisition of a material subsidiary. |
| ● | Consolidated total interest expense: Includes all amounts classified as “Interest expense”, but excludes interest on operating leases as defined under IAS 17. |
In addition, our revolving credit facility has provisions relating to our liability management ratings in Alberta and Saskatchewan whereby if our security adjusted liability management ratings fall below specified limits in a province, a portion of the asset retirement obligations are included in the definitions of consolidated total debt and consolidated total senior debt. An event of default occurs if our security adjusted liability management ratings breach additional lower limits for a period greater than 90 days. As of December 31, 2023, Vermilion’s liability management ratings were higher than the specified levels, and as such, no amounts relating to asset retirement obligations were included in the calculation of consolidated total debt and consolidated total senior debt.
As at December 31, 2023 and December 31, 2022, Vermilion was in compliance with the above covenants.
2025 senior unsecured notes
On March 13, 2017, Vermilion issued US $300.0 million of senior unsecured notes at par. The notes bear interest at a rate of 5.625% per annum, to be paid semi-annually on March 15 and September 15. The notes mature on March 15, 2025. As direct senior unsecured obligations of Vermilion, the notes rank equally with existing and future senior unsecured indebtedness of the Company.
The senior unsecured notes were recognized at amortized cost and include the transaction costs directly related to the issuance.
Subsequent to March 15, 2023, Vermilion may redeem some or all of the senior unsecured notes at a 100.000% redemption price plus any accrued and unpaid interest.
2030 senior unsecured notes
On April 26, 2022, Vermilion closed a private offering of US $400.0 million 8-year senior unsecured notes. The notes were priced at 99.241% of par, mature on May 1, 2030, and bear interest at a rate of 6.875% per annum. Interest is paid semi-annually on May 1 and November 1, commencing on November 1, 2022. The notes are senior unsecured obligations of Vermilion and rank equally with existing and future senior unsecured indebtedness.
The senior unsecured notes were recognized at amortized cost and include the transaction costs directly related to the issuance.
Vermilion may, at its option, redeem the notes prior to maturity as follows:
| ● | On or after May 1, 2025, Vermilion may redeem some or all of the senior unsecured notes at the redemption prices set forth below, together with accrued and unpaid interest. |
| ● | Prior to May 1, 2025, Vermilion may redeem up to 35% of the original principal amount of the notes with an amount of cash not greater than the net cash proceeds of certain equity offerings at a redemption price of 106.875% of the principal amount of the notes, together with accrued and unpaid interest. |
| ● | Prior to May 1, 2025, Vermilion may also redeem some or all of the notes at a price equal to 100% of the principal amount of the notes, plus a “make-whole premium,” together with applicable premium, accrued and unpaid interest. |
Vermilion Energy Inc. ∎ Page 25 ∎ 2023 Financial Statements The following table reconciles the change in Vermilion’s shareholders’ capital:
Year |
|
Redemption price |
|
2025 |
|
103.438 |
% |
2026 |
|
102.292 |
% |
2027 |
|
101.146 |
% |
2028 and thereafter |
|
100.000 |
% |
13. Shareholders’ capital
|
|
2023 |
2022 |
|||||
Shareholders’ capital |
|
Shares (‘000s) |
|
Amount ($M) |
|
Shares (‘000s) |
|
Amount ($M) |
Balance at January 1 |
|
163,227 |
|
4,243,794 |
|
162,261 |
|
4,241,773 |
Vesting of equity based awards |
|
3,657 |
|
23,575 |
|
2,578 |
|
44,811 |
Shares issued for equity based compensation |
|
655 |
|
11,242 |
|
549 |
|
13,699 |
Share-settled dividends on vested equity based awards |
|
64 |
|
1,179 |
|
178 |
|
4,377 |
Repurchase of shares |
|
(5,332) |
|
(137,224) |
|
(2,339) |
|
(60,866) |
Balance at December 31 |
|
162,271 |
|
4,142,566 |
|
163,227 |
|
4,243,794 |
Vermilion is authorized to issue an unlimited number of common shares with no par value.
Dividends declared to shareholders for the year ended December 31, 2023 were $65.2 million or $0.40 per common share (2022 - $45.8 million or $0.28 per share).
On July 10, 2023, the Toronto Stock Exchange approved our notice of intention to commence a normal course issuer bid ("the NCIB"). The NCIB allows Vermilion to purchase up to 16,308,587 common shares representing approximately 10% of its public float as at July 12, 2023 beginning July 12, 2023 and ending July 11, 2024. Common shares purchased under the NCIB will be cancelled.
In 2023, Vermilion purchased and cancelled 5.33 million common shares under the NCIB for total consideration of $94.8 million (2022 - 2.34 million common shares for total consideration of $71.7 million). The surplus between the total consideration and the carrying value of the shares repurchased was recorded as an increase to deficit.
Subsequent to December 31, 2023 Vermilion purchased and cancelled 1.44 million common shares under the NCIB for total consideration of $21.4 million.
14. Capital disclosures
Vermilion defines capital as net debt (long-term debt (excluding unrealized foreign exchange on swapped USD borrowings) plus adjusted working capital (defined as current assets less current liabilities, excluding current derivatives and current lease liabilities)) and shareholders’ capital. In managing capital, Vermilion reviews whether fund flows from operations is sufficient to fund capital expenditures, dividends, and asset retirement obligations.
Vermilion monitors the ratio of net debt to fund flows from operations. As at December 31, 2023, our ratio of net debt to trailing fund flows from operations is 0.9 (2022 - 0.8). Vermilion manages the ratio of net debt to fund flows from operations (refer to Note 3 - Segmented information) by monitoring capital expenditures, dividends, and asset retirement obligations with expected fund flows from operations. Vermilion intends for the ratio of net debt to fund flows from operations to trend towards 1.0 over time.
Vermilion Energy Inc. ∎ Page 26 ∎ 2023 Financial Statements The following table calculates Vermilion’s ratio of net debt to fund flows from operations:
|
|
Year Ended |
||
|
|
Dec 31, 2023 |
|
Dec 31, 2022 |
Long-term debt |
|
914,015 |
|
1,081,351 |
Adjusted working capital (1) |
|
164,552 |
|
265,111 |
Unrealized FX on swapped USD borrowings |
|
— |
|
(1,876) |
Net debt |
|
1,078,567 |
|
1,344,586 |
|
|
|
|
|
Ratio of net debt to four quarter trailing fund flows from operations |
|
0.9 |
|
0.8 |
(1) |
Adjusted working capital is defined as current assets (excluding current derivatives), less current liabilities (excluding current derivatives and current lease liabilities). |
15. Equity based compensation
The following table summarizes the number of awards outstanding under the LTIP:
Number of LTIP Awards (‘000s) |
|
2023 |
|
2022 |
Opening balance |
|
5,503 |
|
6,405 |
Granted |
|
1,694 |
|
1,108 |
Vested |
|
(2,476) |
|
(1,733) |
Forfeited |
|
(243) |
|
(277) |
Closing balance |
|
4,478 |
|
5,503 |
For the year ended December 31, 2023, the awards had a weighted average grant date fair value of $18.19 (2022 - $25.60). Equity based compensation expense for the awards is calculated based on the number of awards outstanding multiplied by the estimated performance factor that will be realized upon vesting (2023 - 1.0; 2022 - 1.0) adjusted by an estimated annual forfeiture rate (2023 - 5.3%; 2022 - 3.8%). Equity based compensation expense of $29.2 million was recorded during the year ended December 31, 2023 (2022 - $29.2 million) relating to the awards.
As at December 31, 2023, there were 470,952 DSUs outstanding with a weighted average grant date fair value of $14.26. In 2023, there were 106,644 DSUs granted with a weighted average grant date fair value of $21.85. Equity based compensation expense of $2.3 million was recorded during the year ended December 31, 2023 (2022 - $1.5 million) relating to the DSUs.
16. Per share amounts
Basic and diluted net (loss) earnings per share have been determined based on the following:
|
|
Year Ended |
||
|
|
Dec 31, 2023 |
|
Dec 31, 2022 |
Net ( loss) earnings |
|
(237,587) |
|
1,313,062 |
|
|
|
|
|
Basic weighted average shares outstanding (‘000s) |
|
163,719 |
|
163,489 |
Dilutive impact of equity based compensation (‘000s) |
|
— |
|
4,937 |
Diluted weighted average shares outstanding (‘000s) |
|
163,719 |
|
168,426 |
|
|
|
|
|
Basic (loss) earnings per share |
|
(1.45) |
|
8.03 |
Diluted (loss) earnings per share |
|
(1.45) |
|
7.80 |
Vermilion Energy Inc. ∎ Page 27 ∎ 2023 Financial Statements The following table summarizes the carrying value relating to Vermilion’s financial instruments:
17. Financial instruments
Classification of financial instruments
|
|
As at Dec 31, 2023 |
|
As at Dec 31, 2022 |
||||||||||||
|
|
|
|
|
|
Amortized |
|
|
|
|
|
|
|
Amortized |
|
|
($M) |
|
FVTPL |
|
FVTOCI |
|
Cost |
|
Total |
|
FVTPL |
|
FVTOCI |
|
Cost |
|
Total |
Cash and cash equivalents |
|
141,456 |
|
— |
|
— |
|
141,456 |
|
13,836 |
|
— |
|
— |
|
13,836 |
Derivative assets |
|
389,899 |
|
— |
|
— |
|
389,899 |
|
295,441 |
|
— |
|
— |
|
295,441 |
Investment in securities |
|
— |
|
73,261 |
|
— |
|
73,261 |
|
— |
|
56,366 |
|
— |
|
56,366 |
Derivative liabilities |
|
(21,782) |
|
— |
|
— |
|
(21,782) |
|
(55,845) |
|
— |
|
— |
|
(55,845) |
Accounts receivable |
|
— |
|
— |
|
242,926 |
|
242,926 |
|
— |
|
— |
|
373,651 |
|
373,651 |
Accounts payable and accrued liabilities |
|
— |
|
— |
|
(380,370) |
|
(380,370) |
|
— |
|
— |
|
(481,444) |
|
(481,444) |
Dividends payable |
|
— |
|
— |
|
(16,227) |
|
(16,227) |
|
— |
|
— |
|
(13,058) |
|
(13,058) |
Lease obligations |
|
— |
|
— |
|
(33,001) |
|
(33,001) |
|
— |
|
— |
|
(51,507) |
|
(51,507) |
Long-term debt (1) |
|
— |
|
— |
|
(914,015) |
|
(914,015) |
|
— |
|
— |
|
(1,081,351) |
|
(1,081,351) |
| (1) | The carrying value of the above equals fair value except for long-term debt. The fair value of long-term debt was $904,418 (2022 - $1,035,671). |
The carrying value of accounts receivable, accounts payable and accrued liabilities, dividends payable and lease obligations are a reasonable approximation of their fair value due to the short maturity of these financial instruments. The carrying value of long-term debt outstanding on the revolving credit facility approximates its fair value due to the use of short-term borrowing instruments at market rates of interest.
Fair value measurements are categorized into a fair value hierarchy based on the lowest level input that is significant to the fair value measurement:
| ● | Level 1 inputs are determined by reference to unadjusted quoted prices in active markets for identical assets or liabilities. Inputs used in fair value measurement of cash and cash equivalents , investment in securities, the revolving credit facility, and the senior unsecured notes are categorized as Level 1. |
| ● | Level 2 inputs are determined based on inputs other than unadjusted quoted prices that are observable, either directly or indirectly. The fair value of Vermilion’s derivative assets and liabilities are determined using pricing models that incorporate future price forecasts (supported by prices from observable market transactions) and credit risk adjustments. |
| ● | Level 3 inputs are not based on observable market data. Vermilion does not have any financial instruments classified as Level 3. |
There were no transfers between levels in the hierarchy in the years ended December 31, 2023 and 2022.
Nature and extent of risks associated with financial instruments
Vermilion is exposed to financial risks from its financial instruments. These financial risks include: market risk (includes commodity price risk, interest rate risk, and currency risk), credit risk, and liquidity risk.
Commodity price risk
Vermilion is exposed to commodity price risk on its derivative assets and liabilities which are used as part of the Company’s risk management program to mitigate the effects of changes in commodity prices on future cash flows. While transactions of this nature relate to future petroleum and natural gas production, Vermilion does not designate these derivative assets and liabilities as accounting hedges. As such, changes in commodity prices impact the fair value of derivative instruments and the corresponding gains or losses recognized on derivative instruments.
Currency risk
Vermilion is exposed to currency risk on its financial instruments denominated in foreign currencies. These financial instruments include cash and cash equivalents, accounts receivables, accounts payables, lease obligations, long-term debt, derivative assets and derivative liabilities. These financial instruments are primarily denominated in the US dollar and the Euro. Vermilion monitors its exposure to currency risk and reviews whether the use of derivative financial instruments is appropriate to manage potential fluctuations in foreign exchange rates.
Interest rate risk
Vermilion is exposed to interest rate risk on its revolving credit facility, which consists of short-term borrowing instruments that bear interest at market rates. Thus, changes in interest rates could result in an increase or decrease in the amount paid by Vermilion to service this debt.
Vermilion Energy Inc.
∎ Page 28 ∎ 2023 Financial Statements The following table summarizes the increase (positive values) or decrease (negative values) to net (loss) earnings before tax due to a change in the value of Vermilion’s financial instruments as a result of a change in the relevant market risk variable. This analysis does not attempt to reflect any interdependencies between the relevant risk variables.
($M) |
|
Dec 31, 2023 |
|
Dec 31, 2022 |
Currency risk - Euro to Canadian dollar |
|
|
|
|
$0.01 increase in strength of the Canadian dollar against the Euro |
|
5,855 |
|
5,640 |
$0.01 decrease in strength of the Canadian dollar against the Euro |
|
(5,855) |
|
(5,640) |
|
|
|
|
|
Currency risk - US dollar to Canadian dollar |
|
|
|
|
$0.01 increase in strength of the Canadian dollar against the US $ |
|
6,816 |
|
5,441 |
$0.01 decrease in strength of the Canadian dollar against the US $ |
|
(6,816) |
|
(5,441) |
|
|
|
|
|
Commodity price risk - Crude oil |
|
|
|
|
US $5.00/bbl increase in crude oil price used to determine the fair value of derivatives |
|
(27,573) |
|
— |
US $5.00/bbl decrease in crude oil price used to determine the fair value of derivatives |
|
27,573 |
|
— |
|
|
|
|
|
Commodity price risk - European natural gas |
|
|
|
|
€ 5.0/GJ increase in European natural gas price used to determine the fair value of derivatives |
|
(256,731) |
|
(88,524) |
€ 5.0/GJ decrease in European natural gas price used to determine the fair value of derivatives |
|
262,862 |
|
91,828 |
|
|
|
|
|
Share price risk - Equity swaps |
|
|
|
|
$1.00 increase from initial share price of the equity swap |
|
3,750 |
|
3,750 |
$1.00 decrease from initial share price of the equity swap |
|
(3,750) |
|
(3,750) |
Credit risk
Vermilion is exposed to credit risk on accounts receivable and derivative assets in the event that customers, joint operation partners, or counterparties fail to discharge their contractual obligations. As at December 31, 2023, Vermilion’s maximum exposure to receivable credit risk was $632.8 million (December 31, 2022 - $669.1 million) which is the value of accounts receivable and derivative assets on the balance sheet.
Vermilion’s accounts receivable primarily relates to customers and joint operations partners in the petroleum and natural gas industry. These amounts are subject to normal industry payment terms and credit risks. Vermilion manages these risks by monitoring the creditworthiness of customers and joint operations partners and, where appropriate, obtaining assurances such as parental guarantees and letters of credit. Vermilion determines the lifetime expected credit losses recognized on accounts receivable using a provision matrix. In preparing the provision matrix, the Company takes into account historical credit loss experience based on the aging of accounts receivable, adjusted as necessary for current and future petroleum and natural gas prices to the extent that changes in pricing may negatively impact the Company’s customers and joint operations partners. The lifetime expected credit losses on accounts receivable as at December 31, 2023 and 2022 is not material. As at the balance sheet date, approximately 3.7% (2022 –0.5%) of the accounts receivable balance was outstanding for more than 90 days. Vermilion considers the balance of accounts receivable to be collectible.
Vermilion’s derivative assets primarily relates to the fair value of financial instruments used as part of the Company’s risk management program to mitigate the effects of changes in commodity prices on future cash flows. Vermilion manages this risk by monitoring the creditworthiness of counterparties, transacting primarily with counterparties that have investment grade third party credit ratings, and by limiting the concentration of financial exposure to individual counterparties. As a result, Vermilion has not obtained collateral or other security to support its financial derivatives.
Vermilion’s cash deposited in financial institutions and guaranteed investment certificates are also subject to counterparty credit risk. Vermilion mitigates this risk by transacting with financial institutions with high third party credit ratings.
Liquidity risk
Liquidity risk is the risk that Vermilion will encounter difficulty in meeting obligations associated with its financial liabilities. Vermilion does not consider this to be a significant risk as its financial position and available committed borrowing facility provide significant financial flexibility and allow Vermilion to meet its obligations as they come due.
Vermilion Energy Inc. ∎ Page 29 ∎ 2023 Financial Statements The following table summarizes Vermilion’s undiscounted non-derivative financial liabilities and their contractual maturities:
|
|
|
|
1 month to |
|
3 months to |
|
1 year to |
($M) |
|
1 month |
|
3 months |
|
1 year |
|
5 years |
December 31, 2023 |
|
134,381 |
|
235,396 |
|
26,820 |
|
430,993 |
December 31, 2022 |
|
192,572 |
|
278,520 |
|
23,412 |
|
607,796 |
18. Related party disclosures
The compensation of directors and management is reviewed annually by the independent Governance and Human Resources Committee against industry practices for oil and gas companies of similar size and scope.
The following table summarizes the compensation of directors and other members of key management personnel during the years ended December 31, 2023 and 2022:
|
|
Year Ended |
||
|
|
Dec 31, 2023 |
|
Dec 31, 2022 |
Short-term benefits |
|
5,451 |
|
5,124 |
Equity based compensation |
|
8,015 |
|
8,951 |
|
|
13,466 |
|
14,075 |
Number of individuals included in the above amounts |
|
15 |
|
16 |
19. Supplemental information
Changes in non-cash working capital was comprised of the following:
|
|
Year Ended |
||
|
|
Dec 31, 2023 |
|
Dec 31, 2022 |
Changes in: |
|
|
|
|
Accounts receivable |
|
130,725 |
|
(45,067) |
Crude oil inventory |
|
(37,676) |
|
413 |
Prepaid expenses |
|
76,452 |
|
(45,617) |
Accounts payable and accrued liabilities |
|
(101,074) |
|
40,786 |
Income taxes payable |
|
(42,953) |
|
304,516 |
Dividends payable |
|
3,169 |
|
— |
Working capital assumed in acquisitions |
|
(109,134) |
|
— |
Foreign exchange |
|
7 |
|
(12,046) |
Changes in non-cash working capital |
|
(80,484) |
|
242,985 |
|
|
|
|
|
Changes in non-cash operating working capital |
|
(61,117) |
|
216,869 |
Changes in non-cash investing working capital |
|
(19,367) |
|
26,116 |
Changes in non-cash working capital |
|
(80,484) |
|
242,985 |
Cash and cash equivalents was comprised of the following:
|
|
As at |
||
|
|
Dec 31, 2023 |
|
Dec 31, 2022 |
Cash on deposit with financial institutions |
|
140,795 |
|
13,701 |
Guaranteed investment certificates |
|
661 |
|
135 |
Cash and cash equivalents |
|
141,456 |
|
13,836 |
Vermilion Energy Inc. ∎ Page 30 ∎ 2023 Financial Statements Wages and benefits included in operating expenses and general and administration expenses were:
|
|
Year Ended |
||
|
|
Dec 31, 2023 |
|
Dec 31, 2022 |
Operating expense |
|
87,418 |
|
75,165 |
General and administration expense |
|
61,550 |
|
45,525 |
Wages and benefits |
|
148,968 |
|
120,690 |
As at December 31, 2023, we had the following contractual obligations and commitments:
($M) |
|
Less than 1 year |
|
1 - 3 years |
|
3 - 5 years |
|
After 5 years |
|
Total |
Long-term debt(1) |
|
58,690 |
|
480,682 |
|
72,743 |
|
583,597 |
|
1,195,712 |
Lease obligations(2) |
|
58,034 |
|
80,281 |
|
53,839 |
|
43,907 |
|
236,061 |
Processing and transportation agreements |
|
42,127 |
|
54,205 |
|
27,493 |
|
151,777 |
|
275,602 |
Purchase obligations |
|
32,087 |
|
13,519 |
|
2,374 |
|
105 |
|
48,085 |
Drilling and service agreements |
|
18,572 |
|
49,784 |
|
— |
|
— |
|
68,356 |
Total contractual obligations and commitments |
|
209,510 |
|
678,471 |
|
156,449 |
|
779,386 |
|
1,823,816 |
| (1) | Includes interest on senior unsecured notes. |
| (2) | Includes undiscounted IFRS 16 - Leases obligations of $59.7 million recognized in the financial statements as at December 31, 2023, future undiscounted IFRS 16 - leases due to commence in 2024 of $117.5 million, and surface lease rental commitments of $56.5 million and other of $2.4 million that are not considered leases under IFRS 16 and are not represented on the balance sheet. |
| (3) | Commitments denominated in foreign currencies have been translated using the related spot rates on December 31, 2023. |
The following tables summarize Vermilion’s outstanding risk management positions as at December 31, 2023:
|
|
|
|
|
|
|
|
Weighted |
|
|
|
Weighted |
|
|
|
Weighted |
|
|
|
Weighted |
|
Daily |
|
Weighted |
|
|
|
|
|
|
Daily |
|
Average |
|
|
|
Average |
|
|
|
Average |
|
Daily |
|
Average |
|
Bought |
|
Average |
|
|
|
|
|
|
Bought Put |
|
Bought Put |
|
Daily Sold |
|
Sold Call |
|
Daily Sold |
|
Sold Put |
|
Sold Swap |
|
Sold Swap |
|
Swap |
|
Bought |
|
|
Unit |
|
Currency |
|
Volume |
|
Price |
|
Call Volume |
|
Price |
|
Put Volume |
|
Price |
|
Volume |
|
Price |
|
Volume |
|
Swap Price |
WTI | ||||||||||||||||||||||||
Q1 2024 |
|
bbl |
|
USD |
|
— |
|
— |
|
— |
|
— |
|
— |
|
— |
|
12,500 |
|
79.00 |
|
— |
|
— |
Q2 2024 |
|
bbl |
|
USD |
|
— |
|
— |
|
— |
|
— |
|
— |
|
— |
|
9,500 |
|
80.11 |
|
— |
|
— |
Q3 2024 |
|
bbl |
|
USD |
|
— |
|
— |
|
— |
|
— |
|
— |
|
— |
|
9,500 |
|
80.11 |
|
— |
|
— |
AECO |
|
|
|
|
|
|
|
|
|
|
|
|
|
|
|
|
|
|
|
|
|
|
|
|
Q1 2024 |
|
mcf |
|
CAD |
|
4,739 |
|
3.17 |
|
4,739 |
|
4.22 |
|
— |
|
— |
|
4,739 |
|
3.69 |
|
— |
|
— |
Q2 2024 |
|
mcf |
|
CAD |
|
4,739 |
|
3.17 |
|
4,739 |
|
4.22 |
|
— |
|
— |
|
19,904 |
|
3.14 |
|
— |
|
— |
Q3 2024 |
|
mcf |
|
CAD |
|
4,739 |
|
3.17 |
|
4,739 |
|
4.22 |
|
— |
|
— |
|
19,904 |
|
3.14 |
|
— |
|
— |
Q4 2024 |
|
mcf |
|
CAD |
|
4,739 |
|
3.17 |
|
4,739 |
|
4.22 |
|
— |
|
— |
|
9,849 |
|
3.31 |
|
— |
|
— |
Q1 2025 |
|
mcf |
|
CAD |
|
4,739 |
|
3.17 |
|
4,739 |
|
4.22 |
|
— |
|
— |
|
23,695 |
|
3.89 |
|
— |
|
— |
Q2 2025 |
|
mcf |
|
CAD |
|
4,739 |
|
3.17 |
|
4,739 |
|
4.22 |
|
— |
|
— |
|
23,695 |
|
3.89 |
|
— |
|
— |
Q3 2025 |
|
mcf |
|
CAD |
|
4,739 |
|
3.17 |
|
4,739 |
|
4.22 |
|
— |
|
— |
|
23,695 |
|
3.89 |
|
— |
|
— |
Q4 2025 |
|
mcf |
|
CAD |
|
4,739 |
|
3.17 |
|
4,739 |
|
4.22 |
|
— |
|
— |
|
23,695 |
|
3.89 |
|
— |
|
— |
Q1 2026 |
|
mcf |
|
CAD |
|
4,739 |
|
3.17 |
|
4,739 |
|
4.22 |
|
— |
|
— |
|
23,695 |
|
3.89 |
|
— |
|
— |
Q2 2026 |
|
mcf |
|
CAD |
|
4,739 |
|
3.17 |
|
4,739 |
|
4.22 |
|
— |
|
— |
|
23,695 |
|
3.89 |
|
— |
|
— |
Q3 2026 |
|
mcf |
|
CAD |
|
4,739 |
|
3.17 |
|
4,739 |
|
4.22 |
|
— |
|
— |
|
23,695 |
|
3.89 |
|
— |
|
— |
Q4 2026 |
|
mcf |
|
CAD |
|
4,739 |
|
3.17 |
|
4,739 |
|
4.22 |
|
— |
|
— |
|
23,695 |
|
3.89 |
|
— |
|
— |
NYMEX Henry Hub |
|
|
|
|
|
|
|
|
|
|
|
|
|
|
|
|
|
|
|
|
|
|
|
|
Q1 2024 |
|
mcf |
|
USD |
|
20,000 |
|
3.50 |
|
20,000 |
|
4.45 |
|
— |
|
— |
|
4,000 |
|
3.51 |
|
— |
|
— |
Q2 2024 |
|
mcf |
|
USD |
|
20,000 |
|
3.50 |
|
20,000 |
|
4.45 |
|
— |
|
— |
|
4,000 |
|
3.51 |
|
— |
|
— |
Q3 2024 |
|
mcf |
|
USD |
|
20,000 |
|
3.50 |
|
20,000 |
|
4.45 |
|
— |
|
— |
|
4,000 |
|
3.51 |
|
— |
|
— |
Q4 2024 |
|
mcf |
|
USD |
|
20,000 |
|
3.50 |
|
20,000 |
|
4.45 |
|
— |
|
— |
|
4,000 |
|
3.51 |
|
— |
|
— |
Q1 2025 |
|
mcf |
|
USD |
|
24,000 |
|
3.50 |
|
24,000 |
|
4.49 |
|
— |
|
— |
|
— |
|
— |
|
— |
|
— |
Q2 2025 |
|
mcf |
|
USD |
|
24,000 |
|
3.50 |
|
24,000 |
|
4.49 |
|
— |
|
— |
|
— |
|
— |
|
— |
|
— |
Q3 2025 |
|
mcf |
|
USD |
|
24,000 |
|
3.50 |
|
24,000 |
|
4.49 |
|
— |
|
— |
|
— |
|
— |
|
— |
|
— |
Q4 2025 |
|
mcf |
|
USD |
|
24,000 |
|
3.50 |
|
24,000 |
|
4.49 |
|
— |
|
— |
|
— |
|
— |
|
— |
|
— |
Q1 2026 |
|
mcf |
|
USD |
|
24,000 |
|
3.50 |
|
24,000 |
|
4.49 |
|
— |
|
— |
|
— |
|
— |
|
— |
|
— |
Q2 2026 |
|
mcf |
|
USD |
|
24,000 |
|
3.50 |
|
24,000 |
|
4.49 |
|
— |
|
— |
|
— |
|
— |
|
— |
|
— |
Q3 2026 |
|
mcf |
|
USD |
|
24,000 |
|
3.50 |
|
24,000 |
|
4.49 |
|
— |
|
— |
|
— |
|
— |
|
— |
|
— |
Q4 2026 |
|
mcf |
|
USD |
|
24,000 |
|
3.50 |
|
24,000 |
|
4.49 |
|
— |
|
— |
|
— |
|
— |
|
— |
|
— |
Vermilion Energy Inc. ∎ Page 31 ∎ 2023 Financial Statements
|
|
|
|
|
|
|
|
Weighted |
|
|
|
Weighted |
|
|
|
Weighted |
|
|
|
Weighted |
|
Daily |
|
Weighted |
|
|
|
|
|
|
Daily |
|
Average |
|
Daily |
|
Average |
|
Daily |
|
Average |
|
Daily |
|
Average |
|
Bought |
|
Average |
|
|
|
|
|
|
Bought Put |
|
Bought Put |
|
Sold Call |
|
Sold Call |
|
Sold Put |
|
Sold Put |
|
Sold Swap |
|
Sold Swap |
|
Swap |
|
Bought |
|
|
Unit |
|
Currency |
|
Volume |
|
Price |
|
Volume |
|
Price |
|
Volume |
|
Price |
|
Volume |
|
Price |
|
Volume |
|
Swap Price |
NBP | ||||||||||||||||||||||||
Q1 2024 |
|
mcf |
|
EUR |
|
4,913 |
|
41.03 |
|
4,913 |
|
84.26 |
|
— |
|
— |
|
— |
|
— |
|
— |
|
— |
Q2 2024 |
|
mcf |
|
EUR |
|
— |
|
— |
|
— |
|
— |
|
— |
|
— |
|
2,457 |
|
14.65 |
|
— |
|
— |
Q3 2024 |
|
mcf |
|
EUR |
|
— |
|
— |
|
— |
|
— |
|
— |
|
— |
|
2,457 |
|
14.65 |
|
— |
|
— |
TTF | ||||||||||||||||||||||||
Q1 2024 |
|
mcf |
|
EUR |
|
35,623 |
|
37.85 |
|
35,623 |
|
71.90 |
|
— |
|
— |
|
7,370 |
|
41.19 |
|
— |
|
— |
Q2 2024 |
|
mcf |
|
EUR |
|
7,278 |
|
25.96 |
|
7,278 |
|
45.76 |
|
— |
|
— |
|
30,709 |
|
14.08 |
|
— |
|
— |
Q3 2024 |
|
mcf |
|
EUR |
|
7,278 |
|
25.96 |
|
7,278 |
|
45.76 |
|
— |
|
— |
|
30,709 |
|
14.08 |
|
— |
|
— |
Q4 2024 |
|
mcf |
|
EUR |
|
4,913 |
|
13.19 |
|
4,913 |
|
18.32 |
|
— |
|
— |
|
34,394 |
|
15.13 |
|
— |
|
— |
Q1 2025 |
|
mcf |
|
EUR |
|
4,913 |
|
13.19 |
|
4,913 |
|
18.32 |
|
— |
|
— |
|
34,394 |
|
15.13 |
|
— |
|
— |
Q2 2025 |
|
mcf |
|
EUR |
|
— |
|
— |
|
— |
|
— |
|
— |
|
— |
|
17,197 |
|
14.40 |
|
— |
|
— |
Q3 2025 |
|
mcf |
|
EUR |
|
— |
|
— |
|
— |
|
— |
|
— |
|
— |
|
17,197 |
|
14.40 |
|
— |
|
— |
Q4 2025 |
|
mcf |
|
EUR |
|
— |
|
— |
|
— |
|
— |
|
— |
|
— |
|
12,284 |
|
13.51 |
|
— |
|
— |
Q1 2026 |
|
mcf |
|
EUR |
|
— |
|
— |
|
— |
|
— |
|
— |
|
— |
|
12,284 |
|
13.51 |
|
— |
|
— |
Q2 2026 |
|
mcf |
|
EUR |
|
— |
|
— |
|
— |
|
— |
|
— |
|
— |
|
9,827 |
|
9.67 |
|
— |
|
— |
Q3 2026 |
|
mcf |
|
EUR |
|
— |
|
— |
|
— |
|
— |
|
— |
|
— |
|
9,827 |
|
9.67 |
|
— |
|
— |
Buy TTF, Sell NBP Basis | ||||||||||||||||||||||||
Q1 2024 |
|
mcf |
|
EUR |
|
— |
|
— |
|
— |
|
— |
|
— |
|
— |
|
22,111 |
|
(0.26) |
|
— |
|
— |
THE | ||||||||||||||||||||||||
Q4 2024 |
|
mcf |
|
EUR |
|
— |
|
— |
|
— |
|
— |
|
— |
|
— |
|
2,457 |
|
14.95 |
|
— |
|
— |
Q1 2025 |
|
mcf |
|
EUR |
|
— |
|
— |
|
— |
|
— |
|
— |
|
— |
|
2,457 |
|
14.95 |
|
— |
|
— |
Q2 2025 |
|
mcf |
|
EUR |
|
— |
|
— |
|
— |
|
— |
|
— |
|
— |
|
2,457 |
|
14.95 |
|
— |
|
— |
Q3 2025 |
|
mcf |
|
EUR |
|
— |
|
— |
|
— |
|
— |
|
— |
|
— |
|
2,457 |
|
14.95 |
|
— |
|
— |
VET Equity Swaps |
|
Initial Share Price |
|
Share Volume |
|
||||||||||
Swap |
|
Jan 2020 - Apr 2025 |
|
|
|
|
|
|
|
20.9788 |
|
CAD |
|
2,250,000 |
|
Swap |
|
Jan 2020 - Jul 2025 |
|
|
|
|
|
|
|
22.4587 |
|
CAD |
|
1,500,000 |
|
Foreign |
|
|
|
Monthly Bought Put |
|
Weighted Average |
|
Monthly Sold Call |
|
Weighted Average |
|
Monthly Sold Swap |
|
Weighted Average |
||||||
Exchange |
|
|
|
Amount |
|
Bought Put Price |
|
Amount |
|
Sold Call Price |
|
Amount |
|
Sold Swap Price |
||||||
Collar |
|
Jan 2024 - Dec 2024 |
|
4,000,000 |
|
USD |
|
1.3600 |
|
4,000,000 |
|
USD |
|
1.3963 |
|
— |
|
|
|
— |
Forward |
|
Jan 2024 - Dec 2024 |
|
— |
|
|
|
— |
|
— |
|
|
|
— |
|
4,000,000 |
|
USD |
|
1.3531 |
The following sold option instruments allow the counterparties, at the specified date, to enter into a derivative instrument contract with Vermilion at the detailed terms:
|
|
|
|
|
|
|
|
|
|
Weighted |
|
|
|
Weighted |
|
|
|
Weighted |
|
|
|
Weighted |
|
|
|
|
|
|
|
|
Daily |
|
Average |
|
|
|
Average |
|
|
|
Average |
|
Daily Sold |
|
Average |
|
|
|
|
|
|
Option Expiration |
|
Bought Put |
|
Bought Put |
|
Daily Sold |
|
Sold Call |
|
Daily Sold |
|
Sold Put |
|
Swap |
|
Sold Swap |
Period if Option Exercised |
|
Unit |
|
Currency |
|
Date |
|
Volume |
|
Price |
|
Call Volume |
|
Price |
|
Put Volume |
|
Price |
|
Volume |
|
Price |
WTI |
|
|
|
|
|
|
|
|
|
|
|
|
|
|
|
|
|
|
|
|
|
|
Oct 2024 - Sep 2025 |
|
bbl |
|
USD |
|
29-Mar-2024 |
|
— |
|
— |
|
— |
|
— |
|
— |
|
— |
|
1,000 |
|
80.00 |
Vermilion Energy Inc. ∎ Page 32 ∎ 2023 Financial Statements
Vermilion Energy Inc. ∎ Page 33 ∎ 2023 Financial Statements We consent to the incorporation by reference in Registration Statement No.
Exhibit 99.4
CONSENT OF INDEPENDENT REGISTERED PUBLIC ACCOUNTING FIRM
333-232837 on Form S-8 and to the use of our reports dated March 6, 2024 relating to the financial statements of Vermilion Energy Inc. and the effectiveness of Vermilion Energy Inc.'s internal control over financial reporting, appearing in this Annual Report on Form 40-F for the year ended December 31, 2023.
/s/ Deloitte LLP
March 6, 2024
Exhibit 99.5

CONSENT
Chartered Professional Accountants Calgary, Canada We hereby consent to the use of and reference to our name and our reports, and the inclusion of information derived from our reports, evaluating Vermilion Energy Inc.’s (the “Company”) petroleum and natural gas reserves as at December 31, 2023, in the Company’s Annual Information Form, news releases and investor presentations.
Yours truly, |
|
|
|
MCDANIEL & ASSOCIATES CONSULTANTS LTD. |
|
|
|
|
|
|
|
/s/ Michael J. Verney |
|
|
|
Michael J. Verney, P.Eng. |
|
Executive Vice President |
|
Calgary, Alberta
March 5, 2024
2000, Eighth Avenue Place, East Tower, 525 – 8 Avenue SW, Calgary, AB, T2P 1G1 Tel: (403) 262-5506 www.mcdan.com I, Dion Hatcher, President and Chief Executive Officer, certify that:
EXHIBIT 99.6
VERMILION ENERGY INC.
CERTIFICATION OF THE CHIEF EXECUTIVE OFFICER
1.I have reviewed this annual report on Form 40-F of Vermilion Energy Inc.;
2. |
Based on my knowledge, this report does not contain any untrue statement of a material fact or omit to state a material fact necessary to make the statements made, in light of the circumstances under which such statements were made, not misleading with respect to the period covered by this report; |
3. |
Based on my knowledge, the financial statements, and other financial information included in this report, fairly present in all material respects the financial condition, results of operations and cash flows of the issuer as of, and for, the periods presented in this report; |
4. |
The issuer’s other certifying officer and I are responsible for establishing and maintaining disclosure controls and procedures (as defined in Exchange Act Rules 13a-15(e) and 15d-15(e)) and internal control over financial reporting (as defined in Exchange Act Rules 13a-15(f) and 15d-15(f)) for the issuer and have: |
a) |
Designed such disclosure controls and procedures, or caused such disclosure controls and procedures to be designed under our supervision, to ensure that material information relating to the issuer, including its consolidated subsidiaries, is made known to us by others within those entities, particularly during the period in which this report is being prepared; |
b) |
Designed such internal control over financial reporting, or caused such internal control over financial reporting to be designed under our supervision, to provide reasonable assurance regarding the reliability of financial reporting and the preparation of financial statements for external purposes in accordance with generally accepted accounting principles; |
c) |
Evaluated the effectiveness of the issuer’s disclosure controls and procedures and presented in this report our conclusions about the effectiveness of the disclosure controls and procedures, as of the end of the period covered by this report based on such evaluation; |
d) |
Disclosed in this report any change in the issuer’s internal control over financial reporting that occurred during the period covered by the annual report that has materially affected, or is reasonably likely to materially affect, the issuer’s internal control over financial reporting; and |
5. |
The issuer’s other certifying officer and I have disclosed, based on our most recent evaluation of internal control over financial reporting, to the issuer’s auditors and the audit committee of the issuer’s board of directors (or persons performing the equivalent functions): |
a) |
All significant deficiencies and material weaknesses in the design or operation of internal control over financial reporting which are reasonably likely to adversely affect the issuer’s ability to record, process, summarize and report financial information; and |
b) |
Any fraud, whether or not material, that involves management or other employees who have a significant role in the issuer’s internal control over financial reporting. |
Date: March 6, 2024
|
/s/ Dion Hatcher |
|
|
|
[Signature] |
|
|
|
Dion Hatcher, President and Chief Executive Officer |
EXHIBIT 99.6
VERMILION ENERGY INC.
CERTIFICATION OF THE CHIEF FINANCIAL OFFICER
I, Lars Glemser, Vice President and Chief Financial Officer, certify that:
1. |
I have reviewed this annual report on Form 40-F of Vermilion Energy Inc.; |
2. |
Based on my knowledge, this report does not contain any untrue statement of a material fact or omit to state a material fact necessary to make the statements made, in light of the circumstances under which such statements were made, not misleading with respect to the period covered by this report; |
3. |
Based on my knowledge, the financial statements, and other financial information included in this report, fairly present in all material respects the financial condition, results of operations and cash flows of the issuer as of, and for, the periods presented in this report; |
4. |
The issuer’s other certifying officer and I are responsible for establishing and maintaining disclosure controls and procedures (as defined in Exchange Act Rules 13a-15(e) and 15d-15(e)) and internal control over financial reporting (as defined in Exchange Act Rules 13a-15(f) and 15d-15(f)) for the issuer and have: |
a) |
Designed such disclosure controls and procedures, or caused such disclosure controls and procedures to be designed under our supervision, to ensure that material information relating to the issuer, including its consolidated subsidiaries, is made known to us by others within those entities, particularly during the period in which this report is being prepared; |
b) |
Designed such internal control over financial reporting, or caused such internal control over financial reporting to be designed under our supervision, to provide reasonable assurance regarding the reliability of financial reporting and the preparation of financial statements for external purposes in accordance with generally accepted accounting principles; |
c) |
Evaluated the effectiveness of the issuer’s disclosure controls and procedures and presented in this report our conclusions about the effectiveness of the disclosure controls and procedures, as of the end of the period covered by this report based on such evaluation; |
d) |
Disclosed in this report any change in the issuer’s internal control over financial reporting that occurred during the period covered by the annual report that has materially affected, or is reasonably likely to materially affect, the issuer’s internal control over financial reporting; and |
5. |
The issuer’s other certifying officer and I have disclosed, based on our most recent evaluation of internal control over financial reporting, to the issuer’s auditors and the audit committee of the issuer’s board of directors (or persons performing the equivalent functions): |
a) |
All significant deficiencies and material weaknesses in the design or operation of internal control over financial reporting which are reasonably likely to adversely affect the issuer’s ability to record, process, summarize and report financial information; and |
b) |
Any fraud, whether or not material, that involves management or other employees who have a significant role in the issuer’s internal control over financial reporting. |
Date: March 6, 2024
|
|
/s/ Lars Glemser |
|
|
|
|
|
[Signature] |
|
|
|
|
|
Lars Glemser, Vice President and Chief Financial Officer |
EXHIBIT 99.7
VERMILION ENERGY INC.
CERTIFICATE OF THE CHIEF EXECUTIVE OFFICER
Pursuant to Section 906(a) of the Sarbanes-Oxley Act of 2002
Subsections (a) and (b) of Section 1350, Chapter 63 of Title 18 of the United States Code
In connection with the annual report of Vermilion Energy Inc. (the “Corporation”) on Form 40-F for the fiscal year ended December 31, 2023, as filed with the Securities and Exchange Commission on the date hereof (the “Report”), I, Dion Hatcher, President and Chief Executive Officer of the Corporation, certify, pursuant to 18 U.S.C. Section 1350, as adopted pursuant to Section 906 of the Sarbanes-Oxley Act of 2002, that:
1. |
The Report fully complies with the requirements of section 13(a) or 15(d) of the Securities Exchange Act of 1934; and |
2. |
The information contained in the Report fairly presents, in all material respects, the financial condition and results of operations of the Corporation. |
Dated at Calgary, Alberta, Canada this 6th day of March 2024.
|
("Dion Hatcher") |
|
|
|
[Signature] |
|
|
|
Dion Hatcher, President and Chief Executive Officer |
EXHIBIT 99.7
VERMILION ENERGY INC.
CERTIFICATE OF THE CHIEF FINANCIAL OFFICER
Pursuant to Section 906(a) of the Sarbanes-Oxley Act of 2002
Subsections (a) and (b) of Section 1350, Chapter 63 of Title 18 of the United States Code
In connection with the annual report of Vermilion Energy Inc. (the “Corporation”) on Form 40-F for the fiscal year ended December 31, 2023, as filed with the Securities and Exchange Commission on the date hereof (the “Report”), I, Lars Glemser, Vice President and Chief Financial Officer of the Corporation, certify, pursuant to 18 U.S.C. Section 1350, as adopted pursuant to Section 906 of the Sarbanes-Oxley Act of 2002, that:
1. |
The Report fully complies with the requirements of section 13(a) or 15(d) of the Securities Exchange Act of 1934; and |
2. |
The information contained in the Report fairly presents, in all material respects, the financial condition and results of operations of the Corporation. |
Dated at Calgary, Alberta, Canada this 6th day of March 2024.
|
(“Lars Glemser”) |
|
|
|
[Signature] |
|
|
|
Lars Glemser, Vice President and Chief Financial Officer |