UNITED STATES
SECURITIES AND EXCHANGE COMMISSION
Washington, D.C. 20549
FORM 6-K
REPORT OF FOREIGN PRIVATE ISSUER
PURSUANT TO RULE 13a-16 OR 15d-16 UNDER THE
SECURITIES EXCHANGE ACT OF 1934
For the month of March 2024
Commission File Number 001-35286
FRANCO-NEVADA CORPORATION
(Translation of registrant’s name into English)
199 Bay Street, Suite 2000, P.O. Box 285, Commerce Court Postal Station, Toronto, Ontario, Canada M5L 1G9
(Address of principal executive offices)
Indicate by check mark whether the registrant files or will file annual reports under cover of Form 20-F or Form 40-F
Form 20-F ☐ |
Form 40-F ☒ |
Exhibits 99.2, 99.3, and 99.4 of this Form 6-K are hereby incorporated by reference into the registrant’s registration statements on Form F-3 (File No. 333-264906), Form S-8 (File No. 333-176856) and Form F-10 (File No. 333-264971).
INDEX TO EXHIBITS
99.1 |
News Release dated March 5, 2024 – Franco-Nevada Reports 2023 Results |
|
|
99.2 |
Management’s Discussion and Analysis for the fiscal year ended December 31, 2023 |
|
|
99.3 |
|
|
|
99.4 |
|
|
|
101.INS |
XBRL Instance Document - the instance document does not appear in the Interactive Data File because its XBRL tags are embedded within the Inline XBRL document |
|
|
101.SCH |
XBRL Taxonomy Extension Schema Document |
|
|
101.CAL |
XBRL Taxonomy Extension Calculation Linkbase Document |
|
|
101.DEF |
XBRL Taxonomy Extension Definition Linkbase Document |
|
|
101.LAB |
XBRL Taxonomy Extension Labels Linkbase Document |
|
|
101.PRE |
XBRL Taxonomy Extension Presentation Linkbase Document |
|
|
104 |
Coverage Page Interactive Data File (formatted as Inline XBRL and contained in Exhibit 101) |
2
SIGNATURE
Pursuant to the requirements of the Securities Exchange Act of 1934, the registrant has duly caused this report to be signed on its behalf by the undersigned, thereunto duly authorized.
|
FRANCO-NEVADA CORPORATION |
|
|
|
|
|
/s/ Lloyd Hong |
Date: March 5, 2024 |
Lloyd Hong |
|
|
|
Chief Legal Officer & Corporate Secretary |
3
Exhibit 99.1
|
|
NEWS RELEASE
Toronto, March 5, 2024
(in U.S. dollars unless otherwise noted)
Franco-Nevada Reports 2023 Results
Business Remains Robust Despite Production Halt at Cobre Panama
“In late 2023, we were challenged by the unprecedented production halt at Cobre Panama. We are hopeful that the issues can be resolved, although we have taken a prudent approach for the carrying value of the asset”, stated Paul Brink, CEO. “Despite the issue at Cobre Panama, our business remains robust and we continue to benefit from a long-duration, diversified portfolio. We finished the year with no debt and $1.4 billion in cash and cash equivalents. The balance of our business performed well in 2023 and is expected to grow in 2024 with contributions from the completion of the Tocantinzinho, Greenstone and Salares Norte gold mines. Our growth outlook through 2028 is driven by numerous new mines and mine expansions. $2.4 billion of available capital positions us well for attractive acquisitions in an environment where many project developers are capital constrained.”
|
|
|
|
Q4 2023 |
|
|
|
|
2023 |
|
|
|
Q4 results |
|
vs |
|
|
2023 |
|
vs |
|
|
|
|
|
Q4 2022 |
|
|
|
|
2022 |
|
Total GEOs1 sold |
|
152,351 GEOs |
|
-17% |
|
|
627,045 GEOs |
|
-14% |
|
Precious Metal GEOs1 sold |
|
119,581 GEOs |
|
-8% |
|
|
488,189 GEOs |
|
-4% |
|
Revenue |
|
$303.3 million |
|
-5% |
|
|
$1,219.0 million |
|
-7% |
|
Impairment losses |
|
-$1,173.3 million |
|
- |
|
|
-$1,173.3 million |
|
- |
|
Net loss |
|
-$982.5 million (-$5.11/share) |
|
- |
|
|
-$466.4 million (-$2.43/share) |
|
- |
|
Adjusted Net Income2 |
|
$172.9 million ($0.90/share) |
|
+5% |
|
|
$683.1 million ($3.56/share) |
|
-2% |
|
Adjusted Net Income Margin2 |
|
57.0% |
|
+11% |
|
|
56.0% |
|
+6% |
|
Adjusted EBITDA2 |
|
$254.6 million ($1.33/share) |
|
-3% |
|
|
$1,014.7 million ($5.28/share) |
|
-8% |
|
Adjusted EBITDA Margin2 |
|
83.9% |
|
+2.4% |
|
|
83.2% |
|
-1.1% |
|
Strong Financial Position
| ● | No debt and $2.4 billion in available capital as at December 31, 2023 |
| ● | Generated close to $1 billion in operating cash flow in 2023 |
| ● | Quarterly dividend increased 5.88% to $0.36/share effective Q1 2024 |
Sector-Leading ESG
| ● | Rated #1 precious metals company and #1 gold company by Sustainalytics, AA by MSCI and Prime by ISS ESG |
| ● | Committed to the World Gold Council’s Responsible Gold Mining Principles |
| ● | Partnering with our operators on community and ESG initiatives |
| ● | Goal of 40% diverse representation at the Board and top leadership levels as a group by 2025 |
Diverse, Long-Life Portfolio
| ● | Most diverse royalty and streaming portfolio by asset, operator and country |
| ● | Core precious metal streams on world-class copper assets outperforming acquisition expectations |
| ● | Long-life reserves and resources |
Growth and Optionality
| ● | Mine expansions and new mines driving 5-year growth profile |
| ● | Long-term optionality in gold, copper and nickel and exposure to some of the world’s great mineral endowments |
| ● | Strong pipeline of precious metal and diversified opportunities |
Quarterly revenue and GEOs sold by commodity |
|
|
|
||||||||
|
|
Q4 2023 |
|
Q4 2022 |
|
||||||
|
|
GEOs Sold |
|
Revenue |
|
GEOs Sold |
|
Revenue |
|
||
|
|
# |
|
(in millions) |
|
# |
|
(in millions) |
|
||
PRECIOUS METALS |
|
|
|
|
|
|
|
|
|
|
|
Gold |
|
99,998 |
|
$ |
198.7 |
|
102,583 |
|
$ |
178.2 |
|
Silver |
|
15,492 |
|
|
31.2 |
|
18,493 |
|
|
32.7 |
|
PGM |
|
4,091 |
|
|
8.8 |
|
8,566 |
|
|
15.5 |
|
|
|
119,581 |
|
$ |
238.7 |
|
129,642 |
|
$ |
226.4 |
|
DIVERSIFIED |
|
|
|
|
|
|
|
|
|
|
|
Iron ore |
|
5,620 |
|
$ |
11.2 |
|
6,230 |
|
$ |
10.8 |
|
Other mining assets |
|
1,510 |
|
|
2.9 |
|
301 |
|
|
0.5 |
|
Oil |
|
16,406 |
|
|
32.7 |
|
19,619 |
|
|
34.2 |
|
Gas |
|
6,860 |
|
|
13.1 |
|
24,630 |
|
|
42.5 |
|
NGL |
|
2,374 |
|
|
4.7 |
|
3,464 |
|
|
6.0 |
|
|
|
32,770 |
|
$ |
64.6 |
|
54,244 |
|
$ |
94.0 |
|
|
|
152,351 |
|
$ |
303.3 |
|
183,886 |
|
$ |
320.4 |
|
Annual revenue and GEOs sold by commodity |
|
|
|
||||||||
|
|
2023 |
|
2022 |
|
||||||
|
|
GEOs Sold |
|
Revenue |
|
GEOs Sold |
|
Revenue |
|
||
|
|
# |
|
(in millions) |
|
# |
|
(in millions) |
|
||
PRECIOUS METALS |
|
|
|
|
|
|
|
|
|
|
|
Gold |
|
403,177 |
|
$ |
784.4 |
|
401,756 |
|
$ |
723.1 |
|
Silver |
|
64,970 |
|
|
126.7 |
|
77,232 |
|
|
139.9 |
|
PGM |
|
20,042 |
|
|
39.8 |
|
31,397 |
|
|
56.7 |
|
|
|
488,189 |
|
$ |
950.9 |
|
510,385 |
|
$ |
919.7 |
|
DIVERSIFIED |
|
|
|
|
|
|
|
|
|
|
|
Iron ore |
|
24,421 |
|
$ |
47.2 |
|
30,803 |
|
$ |
55.5 |
|
Other mining assets |
|
6,945 |
|
|
13.2 |
|
3,760 |
|
|
6.9 |
|
Oil |
|
71,254 |
|
|
134.9 |
|
86,068 |
|
|
156.0 |
|
Gas |
|
26,659 |
|
|
54.1 |
|
84,227 |
|
|
150.9 |
|
NGL |
|
9,577 |
|
|
18.7 |
|
14,717 |
|
|
26.7 |
|
|
|
138,856 |
|
$ |
268.1 |
|
219,575 |
|
$ |
396.0 |
|
|
|
627,045 |
|
$ |
1,219.0 |
|
729,960 |
|
$ |
1,315.7 |
|
In Q4 2023, we recognized $303.3 million in revenue, down 5.3% from Q4 2022. The decrease in our revenue is primarily attributed to lower gas, oil and PGM prices, partly offset by higher gold prices. Precious Metal revenue accounted for 78.7% of our revenue (65.5% gold, 10.3% silver, 2.9% PGM). Revenue was sourced 86.6% from the Americas (31.9% South America, 23.6% Central America & Mexico, 16.7% U.S. and 14.4% Canada).
Cobre Panama Updates
As previously disclosed, Cobre Panama has been in preservation and safe management (“P&SM”) with production halted since November 2023. On November 28, 2023, following protests and President Cortizo’s call for a mining moratorium, the Supreme Court of Justice of Panama (the “Supreme Court”) released its ruling declaring Law 406 unconstitutional.
In light of these events, we carried out an impairment assessment of our Cobre Panama streams at December 31, 2023. We took a prudent approach in our judgement of the facts and circumstances, and based on the halting of production and the political environment surrounding the ruling by the Supreme Court, we determined the recoverable amount under applicable accounting standards to be nil as at December 31, 2023. As a result, we recognized a full impairment loss of $1,169.2 million. This impairment has been taken without prejudice to, or without at present attributing any specific value to, the legal remedies that may be obtained through any arbitration proceedings or otherwise.
Presidential and national legislative elections are scheduled to take place in May 2024, with a new president, Government of Panama cabinet and National Assembly expected to assume office in July 2024. In the event that there is a change in the facts and circumstances surrounding the halting of production at Cobre Panama and there is a resumption of precious metal stream deliveries to Franco-Nevada, we will assess the recoverable amount of our Cobre Panama streams at that time, which may lead to a reversal of part or all of the impairment loss we have recognized.
We are pursuing legal avenues to protect our investment in Cobre Panama. We have notified the Ministry of Commerce and Industries of Panama (“MICI”) of our intent to initiate arbitration pursuant to the Canada-Panama Free Trade Agreement. As announced to MICI, Franco-Nevada presently and preliminarily estimates its damages to be at least $5 billion, subject to further analysis and development.
While we continue to pursue these legal remedies, we strongly prefer and hope for a resolution with the State of Panama that results in the best outcome for the Panamanian people and all parties involved.
2
2024 Guidance
For both our 2024 guidance and 5-year outlook, when reflecting revenue from gold, silver, platinum, palladium, iron ore, oil and gas commodities to GEOs, we assumed the following prices: $1,950/oz Au, $22.50/oz Ag, $850/oz Pt, $900/oz Pd, $115/tonne Fe 62% CFR China, $75/bbl WTI oil and $2.50/mcf Henry Hub natural gas. In addition, we do not assume any other acquisitions and do not reflect any incremental revenue from additional contributions we may make to the Royalty Acquisition Venture with Continental as part of our remaining commitment of $69.8 million. The 2024 guidance and 5-year outlook are based on public forecasts and other disclosure by the third-party owners and operators of our assets and our assessment thereof. Please see our MD&A for the year ended December 31, 2023 for more details on our guidance and see “Forward-Looking Statements” below.
We present our guidance in reference to GEO sales. For streams, our projected GEOs reflect GEOs we acquire from the operators of our assets and subsequently sell. Our GEO sales may differ from operators’ production based on timing of deliveries, and are presented net of recovery and payability factors.
We assume Cobre Panama will remain in P&SM through 2024 and have not included any contributions from the asset in our guidance. We expect an increase in GEO sales from the balance of our Precious Metal assets in 2024. The net increase reflects initial contributions from new mines including Tocantinzinho, Greenstone and Salares Norte. We are guiding towards lower GEOs from our Energy assets based on lower assumed oil and gas prices.
|
|
|
2024 guidance |
|
|
2023 actual |
|
Cobre Panama GEO sales |
|
|
- |
|
|
128,598 |
|
Precious Metal GEO sales (excluding Cobre Panama) |
|
|
360,000 - 400,000 |
|
|
359,591 |
|
Total GEO sales (excluding Cobre Panama) |
|
|
480,000 - 540,000 |
|
|
498,447 |
|
We estimate depletion expense to be between $230 and $260 million. Our remaining capital commitment to the Royalty Acquisition Venture with Continental is $69.8 million, of which between $10.0 million and $20.0 million is expected to be deployed in 2024. In addition, we expect to fulfill our $75.0 million term loan commitment to G Mining Ventures, of which approximately $42.0 million was advanced in January 2024.
5-Year Outlook
We expect our portfolio to generate sales between 540,000 and 600,000 GEOs in 2028, of which 385,000 to 425,000 GEOs are expected to be generated from Precious Metal assets. This outlook assumes the commencement of production at Valentine Gold, Stibnite Gold, Eskay Creek, Castle Mountain Phase 2, and Copper World. It includes an expected increase in attributable sales from Vale’s Northern and Southeastern systems, higher production from Guadalupe-Palmarejo and Antamina, and continued production from Sudbury through the end of 2028. Production growth from the continued development of our U.S. Energy assets is expected to be partly offset by lower assumed commodity prices when compared to 2023. The outlook anticipates that our Candelaria stream will step down in 2027 from 68% to 40% of gold and silver produced and that our deliveries from Antapaccay will be based on 30% of gold and silver produced rather than indexed to copper production in 2028. At this stage, our outlook does not assume any deliveries from Cobre Panama. Had Cobre Panama remained in production, we would have expected deliveries and sales of between 130,000 and 150,000 GEOs.
Environmental, Social and Governance (ESG) Updates
During the quarter, we partnered with G Mining Ventures at Tocantinzinho to help fund infrastructure and other community initiatives in Para, Brazil and with Endeavour Mining on their Great Green Wall reforestation initiative and ‘Elites de Demain’ educational assistance initiative, both in Senegal. We also renewed our funding support for the Enseña Perú education initiative in Peru. We continue to rank highly with leading ESG rating agencies. We were ranked by Sustainalytics as the #1 precious metals company and the #1 gold company for 2024 and we tied for the second ranked mining company in The Globe and Mail’s 2023 Board Games.
Portfolio Additions
| ● | Financing package with Skeena Resources on the Eskay Creek Gold Project – British Columbia: On December 18, 2023, we acquired an incremental 1.0% NSR on Skeena Resources’ Eskay Creek project for a purchase price of $41.8 million (C$56.0 million). We now hold a 2.5% NSR covering Skeena’s Eskay Creek properties. Additionally, we advanced $18.7 million (C$25.0 million) to Skeena and received a convertible debenture. |
| ● | Acquisition of Additional Natural Gas Royalty in the Haynesville – U.S.: On November 21, 2023, we agreed to acquire a royalty portfolio in the Haynesville gas play in Louisiana and Texas for $125.0 million. The royalties are complementary to our existing Haynesville acreage and provide additional exposure to a diverse set of operators and a basin that is expected to help supply a growing LNG export capacity from the U.S. Gulf Coast. The transaction closed subsequent to year-end, on January 2, 2024. |
3
| ● | Acquisition of Additional Royalty on the Magino Gold Mine – Ontario: As previously announced, we acquired an additional 1.0% NSR on Argonaut’s Magino gold mine for a purchase price of $28.0 million. The transaction closed on November 15, 2023. Inclusive of our initial 2.0% NSR, we now hold an aggregate 3.0% NSR on Magino. |
| ● | Funding of G Mining Ventures Term Loan: Subsequent to year-end, on January 29, 2024, we funded approximately $42.0 million under our term loan commitment to G Mining Ventures. The term loan is part of a financing package we provided to G Mining Ventures in July 2022 in connection with the Tocantinzinho gold project, in Brazil. |
Q4 2023 Portfolio Updates
Precious Metal assets: GEOs sold from our Precious Metal assets were 119,581, compared to 129,642 GEOs in Q4 2022. Higher contributions from Antapaccay, MWS and Hemlo were more than offset by lower deliveries from Cobre Panama, Candelaria and Stillwater.
South America:
| ● | Candelaria (gold and silver stream) – GEOs delivered and sold in Q4 2023 were lower than in Q4 2022. For 2024, we forecast GEO sales of between 72,500 and 82,500 GEOs, an increase compared to 66,710 GEOs sold in 2023, based on higher expected production due to mine sequencing and the mine plan grade profile. Debottlenecking initiatives of the Candelaria plant pebble crushing circuit were also completed in 2023. Lundin Mining received an approval of its Environmental Impact Assessment, allowing the extension of Candelaria's mine life to 2040 and include various measures that will support sustainable social, economic, and environmental development in the Atacama Region. |
| ● | Antapaccay (gold and silver stream) – GEOs delivered and sold were higher in Q4 2023 compared to Q4 2022 due to higher grades. For 2024, we anticipate GEOs sold to decrease from 61,158 GEOs in 2023 to between 50,000 and 60,000 GEOs reflecting lower expected production based on the mining sequence. |
| ● | Antamina (22.5% silver stream) – GEOs delivered and sold were lower in Q4 2023 compared to Q4 2022. For 2024, we anticipate between 2.0 to 2.4 million silver ounces, consistent with silver ounces sold in 2023. We expect this to be equivalent to between 22,500 and 27,500 GEOs based on the commodity prices we assumed for 2024. Teck Resources announced that Antamina’s Modification of Environmental Impact Assessment was approved in February 2024, allowing the extension of the Antamina mine life from 2028 to 2036. |
| ● | Tocantinzinho (gold stream) – G Mining Ventures reported the physical construction of the Tocantinzinho project was 76% complete as of the end of December 2023 and remains on track for commercial production in H2 2024. |
| ● | Salares Norte (1-2% royalties) – Gold Fields announced a delay in first gold production from December 2023 to April 2024, with production in 2024 now expected to be approximately 250,000 gold equivalent ounces. Once steady state production is reached, production is expected to increase to 580,000 gold equivalent ounces in 2025 and 600,000 gold equivalent ounces in 2026. |
| ● | Posse (Mara Rosa) (1% royalty) – Hochschild Mining announced that the first gold pour took place on February 20, 2024, with commercial production expected towards the end of Q2 2024. Mara Rosa is expected to produce between 83,000 to 93,000 gold ounces in 2024 and has reported average annual production of approximately 80,000 gold ounces over an initial mine life of 10 years, with approximately 100,000 gold ounces annually over the first four years. |
| ● | Cascabel (1% royalty) – In February 2024, SolGold announced the completion of a new pre-feasibility study, which outlined reduced initial capital costs and a 28-year mine plan containing 3.2 million tonnes of copper, 9.4 million ounces of gold, and 28 million ounces of silver (540 million tonnes grading 0.60% copper, 0.54 g/t gold, and 1.62 g/t silver). |
| ● | Pascua-Lama (2.9% gold & 0.6% copper royalties) – Barrick reported that it anticipates an updated Pascua preliminary economic assessment in 2024 to outline potential scope options. A closure environmental impact assessment for the existing site was submitted in January 2024 specifically regarding water management. |
Central America & Mexico:
| ● | Cobre Panama (gold and silver stream) – GEOs delivered and sold were lower in Q4 2023 than in Q4 2022. During the quarter, Cobre Panama experienced illegal blockades at the Punta Rincón port and on the roads to the site. Production was halted at the end of November 2023 and the mine is currently on P&SM. At the request of MICI, First Quantum delivered a preliminary draft for the first phase of a formalized P&SM on January 16, 2024. |
| ● | Guadalupe-Palmarejo (50% gold stream) – GEOs sold from Guadalupe-Palmarejo decreased in Q4 2023 compared to the same quarter in 2022 due to lower production at the mine. For 2024, we anticipate gold deliveries to remain relatively consistent with those received in 2023, ranging between 32,500 and 37,500 GEOs. |
U.S.:
| ● | Stillwater (5% royalty) – PGM production improved over the course of 2023, as operations recovered from a shaft incident that occurred in Q1 2023. For 2024, we expect increased PGM production at the mine, offset by the impact of PGM prices. Sibanye-Stillwater also announced a restructuring at its US PGM operations in light of the lower palladium price environment. |
4
| ● | Marigold (0.5-5% royalties) – SSR Mining forecasts lower production in 2024 when compared to the record production achieved at Marigold in 2023. Further, we expect production to take place on ground that carries a lower royalty rate. |
| ● | Stibnite Gold (1.7% royalty) – Perpetua Resources announced that it was conditionally awarded up to $34.6 million in additional funding under the U.S. Defense Production Act. Perpetua anticipates that the U.S. Forest Service will publish a Final Environmental Impact Statement and Draft Record of Decision in Q2 2024 and a Final Record of Decision in Q4 2024. |
| ● | Copper World Project (2.085% royalty) – Hudbay provided an updated pre-feasibility study for the Copper World project in September 2023. The study outlined an extended 20-year mine life for Phase I, where only state and local permits are required, lower initial capital expenditures, and a higher mill feed grade than was previously contemplated. |
Canada:
| ● | Detour Lake (2% royalty) – Agnico Eagle reported it now expects the mill to reach a throughput of 28.0 million tonnes per annum in Q2 2024, previously expected in 2025. Agnico Eagle also reported an initial underground inferred mineral resource totaling 1.56 million ounces of gold (21.8 million tonnes grading 2.23 g/t gold) and continues to evaluate the potential for underground mining, with continued exploration success outside of the mineral resources open pit. Mill optimization to reach 29.0 million tonnes per annum is expected in 2026, with an internal analysis for expansion expected in H1 2024 including potential underground mining scenarios. |
| ● | Hemlo (3% royalty & 50% NPI) – Barrick anticipates production at Hemlo to improve relative to 2023, where production was impacted by interruptions to the underground operations. |
| ● | Brucejack (1.2% royalty) – Newmont, which acquired Brucejack through its acquisition of Newcrest Mining in November 2023, anticipates an increase in production in 2024 compared to 2023, where operations were impacted by a fatality in December 2023. |
| ● | Macassa (Kirkland Lake) (1.5-5.5% royalty & 20% NPI) – Agnico Eagle reported that the Macassa mill is expected to reach full capacity of 1,650 tonnes per day by mid-2024. The AK deposit contributed approximately 160,000 ounces of gold in Mineral Reserves (0.74 million tonnes grading 6.69 g/t gold) to the Macassa complex, and was incorporated in Agnico Eagle’s production guidance for 2024 to 2026 with production expected in H2 2024. |
| ● | Canadian Malartic (1.5% royalty) – Agnico Eagle reported that the planned mining rate of 3,500 tonnes per day at Odyssey South was reached earlier than anticipated and that ramp development also exceeded target. Agnico Eagle also declared an initial mineral reserve in the central portion of the East Gouldie deposit of 5.17 million ounces of gold (47.0 million tonnes grading 3.42 g/t gold). |
| ● | Greenstone (3% royalty) – Equinox Gold reported that construction at Greenstone was on schedule with installation activities effectively completed at December 31, 2023 and commissioning underway to pour first gold in H1 2024. On a 100% basis, Greenstone is expected to produce between approximately 175,000 and 208,000 gold ounces in 2024, and average annual production of approximately 400,000 gold ounces over an initial mine life of 14 years. |
| ● | Magino (3% royalty) – Argonaut anticipates 2024 production guidance at Magino to be between 120,000 and 130,000 gold equivalent ounces, reflecting a full first year of production since achieving commercial production in November 2023. An updated NI 43-101 technical report is expected in H2 2024. |
| ● | Valentine Gold (3% royalty) – Production at Valentine Gold continues to be anticipated in H1 2025. The project is now owned by Calibre Mining, which acquired Marathon Gold in January 2024. Average annual production of approximately 195,000 gold ounces is expected, over an initial mine life of 12 years. |
| ● | Eskay Creek (2.5% royalty) – Skeena Resources filed an updated feasibility study outlining Proven and Probable Mineral Reserves for open-pit mining of 3.3 million ounces of gold and 88.0 million ounces of silver (39.8 million tonnes grading 2.6 g/t gold and 68.7 g/t silver). |
Rest of World:
| ● | MWS (25% stream) – We forecast MWS to deliver slightly fewer GEOs compared to 2023 as we anticipate that the stream will have reached its cap towards the end of 2024. |
| ● | Tasiast (2% royalty) – Kinross reported record annual production at Tasiast as a result of strong grades, higher recoveries and record throughput following the completion of the Tasiast 24k project. For 2024, Tasiast is expected to deliver another strong year of production. |
| ● | Subika (2% royalty) – Newmont reported that production at Subika is expected to increase relative to 2023 due to higher open pit grade, strong underground mining rate, and reaching full processing rates in Q2 2024 after the planned delivery of a replacement girth gear. |
| ● | Seguela (1.2% royalty) – Fortuna Silver Mines reported that Seguela contributed over 78,600 gold ounces in 2023, exceeding the upper range of its 2023 production guidance. Fortuna Silver Mines also indicated that it had reclassified 206,000 ounces of gold related to the Sunbird deposit from Indicated Mineral Resources to Probable Reserves. |
5
Diversified assets: Our Diversified assets, primarily comprising our Iron Ore and Energy interests, generated $64.6 million in revenue, down from $94.0 million in Q4 2022, largely as a result of lower gas and oil prices compared to the relative highs of the prior year.
Iron Ore:
| ● | Vale Royalty (iron ore royalty) – Revenue from the Vale royalty increased compared to Q4 2022 as a result of higher estimated iron ore prices. |
| ● | LIORC – LIORC declared a cash dividend of C$0.45 per common share in Q4 2023 compared to C$0.75 per common share in Q4 2022. |
| ● | Caserones (0.57% effective NSR) – Lundin Mining reported it had launched one of the largest exploration programs at the mine since it began operation in 2013 and announced an increase in copper Proven and Probable Mineral Reserves. At December 31, 2023, Franco-Nevada owned a 0.57% effective NSR interest on Caserones. Subsequent to quarter-end, on January 19, 2024, EMX Corporation exercised an option to acquire a portion of our interest for a sale price of $4.7 million, such that our effective NSR on Caserones is now 0.517%. |
Energy:
| ● | U.S. (various royalty rates) – Revenue from our U.S. Energy interests decreased compared to Q4 2022, largely due to lower realized oil and gas prices. Production was lower in a number of basins, with the Permian Basin assets being the exception due to the completion of new wells. |
| ● | Canada (various royalty rates) – Revenue from our Canadian Energy interests was relatively consistent with Q4 2022. For our Weyburn NRI, the impact of lower prices was partly offset by lower operating and capital expenditures. Production at our Orion asset improved relative to the prior year quarter, more than offsetting the decrease in realized prices. |
Shareholder Information
The complete audited Consolidated Financial Statements and Management’s Discussion and Analysis can be found on our website at www.franco-nevada.com, on SEDAR+ at www.sedarplus.com and on EDGAR at www.sec.gov.
We will host a conference call to review our 2023 results. Interested investors are invited to participate as follows:
Conference Call and Webcast: |
March 6th 10:00 am ET |
Dial-in Numbers: |
Toll-Free: 1-888-390-0546 International: 416-764-8688 |
Conference Call URL (This allows participants to join the conference call by phone without operator assistance. Participants will receive an automated call back after entering their name and phone number): |
https://bit.ly/47FxaLi |
|
|
Webcast: |
www.franco-nevada.com |
Replay (available until March 13th): |
Toll-Free: 1-888-390-0541 International: 416-764-8677 Pass code: 380736 # |
Corporate Summary
Franco-Nevada Corporation is the leading gold-focused royalty and streaming company with the largest and most diversified portfolio of cash-flow producing assets. Its business model provides investors with gold price and exploration optionality while limiting exposure to cost inflation. Franco-Nevada is debt-free and uses its free cash flow to expand its portfolio and pay dividends. It trades under the symbol FNV on both the Toronto and New York stock exchanges.
For more information, please go to our website at www.franco-nevada.com or contact:
Sandip Rana |
|
|
Chief Financial Officer |
|
|
(416) 306-6303 |
|
|
info@franco-nevada.com |
|
|
6
Forward-Looking Statements
This press release contains “forward-looking information” and “forward-looking statements” within the meaning of applicable Canadian securities laws and the United States Private Securities Litigation Reform Act of 1995, respectively, which may include, but are not limited to, statements with respect to future events or future performance, management’s expectations regarding Franco-Nevada’s growth, results of operations, estimated future revenues, performance guidance, carrying value of assets, future dividends and requirements for additional capital, mineral resources and mineral reserves estimates, production estimates, production costs and revenue, future demand for and prices of commodities, expected mining sequences, business prospects and opportunities, the performance and plans of third party operators, audits being conducted by the CRA, the expected exposure for current and future assessments and available remedies, statements with respect to the future status and any potential restart of the Cobre Panama mine and related arbitration proceedings. In addition, statements relating to resources and reserves, GEOs and mine life are forward-looking statements, as they involve implied assessment, based on certain estimates and assumptions, and no assurance can be given that the estimates and assumptions are accurate and that such resources and reserves, GEOs or mine life will be realized. Such forward-looking statements reflect management’s current beliefs and are based on information currently available to management. Often, but not always, forward-looking statements can be identified by the use of words such as “plans”, “expects”, “is expected”, “budgets”, “potential for”, “scheduled”, “estimates”, “forecasts”, “predicts”, “projects”, “intends”, “targets”, “aims”, “anticipates” or “believes” or variations (including negative variations) of such words and phrases or may be identified by statements to the effect that certain actions “may”, “could”, “should”, “would”, “might” or “will” be taken, occur or be achieved. Forward-looking statements involve known and unknown risks, uncertainties and other factors, which may cause the actual results, performance or achievements of Franco-Nevada to be materially different from any future results, performance or achievements expressed or implied by the forward-looking statements. A number of factors could cause actual events or results to differ materially from any forward-looking statement, including, without limitation: fluctuations in the prices of the primary commodities that drive royalty and stream revenue (gold, platinum group metals, copper, nickel, uranium, silver, iron ore and oil and gas); fluctuations in the value of the Canadian and Australian dollar, Mexican peso, and any other currency in which revenue is generated, relative to the U.S. dollar; changes in national and local government legislation, including permitting and licensing regimes and taxation policies and the enforcement thereof; the adoption of a global minimum tax on corporations; regulatory, political or economic developments in any of the countries where properties in which Franco-Nevada holds a royalty, stream or other interest are located or through which they are held; risks related to the operators of the properties in which Franco-Nevada holds a royalty, stream or other interest, including changes in the ownership and control of such operators; relinquishment or sale of mineral properties; influence of macroeconomic developments; business opportunities that become available to, or are pursued by Franco-Nevada; reduced access to debt and equity capital; litigation; title, permit or license disputes related to interests on any of the properties in which Franco-Nevada holds a royalty, stream or other interest; whether or not the Company is determined to have “passive foreign investment company” (“PFIC”) status as defined in Section 1297 of the United States Internal Revenue Code of 1986, as amended; potential changes in Canadian tax treatment of offshore streams; excessive cost escalation as well as development, permitting, infrastructure, operating or technical difficulties on any of the properties in which Franco-Nevada holds a royalty, stream or other interest; access to sufficient pipeline capacity; actual mineral content may differ from the resources and reserves contained in technical reports; rate and timing of production differences from resource estimates, other technical reports and mine plans; risks and hazards associated with the business of development and mining on any of the properties in which Franco-Nevada holds a royalty, stream or other interest, including, but not limited to unusual or unexpected geological and metallurgical conditions, slope failures or cave-ins, sinkholes, flooding and other natural disasters, terrorism, civil unrest or an outbreak of contagious disease; the impact of future pandemics; and the integration of acquired assets. The forward-looking statements contained in this press release are based upon assumptions management believes to be reasonable, including, without limitation: the ongoing operation of the properties in which Franco-Nevada holds a royalty, stream or other interest by the owners or operators of such properties in a manner consistent with past practice; the accuracy of public statements and disclosures made by the owners or operators of such underlying properties; no material adverse change in the market price of the commodities that underlie the asset portfolio; the Company’s ongoing income and assets relating to determination of its PFIC status; no material changes to existing tax treatment; the expected application of tax laws and regulations by taxation authorities; the expected assessment and outcome of any audit by any taxation authority; no adverse development in respect of any significant property in which Franco-Nevada holds a royalty, stream or other interest; the accuracy of publicly disclosed expectations for the development of underlying properties that are not yet in production; integration of acquired assets; and the absence of any other factors that could cause actions, events or results to differ from those anticipated, estimated or intended. However, there can be no assurance that forward-looking statements will prove to be accurate, as actual results and future events could differ materially from those anticipated in such statements. Investors are cautioned that forward-looking statements are not guarantees of future performance. In addition, there can be no assurance as to (i) the outcome of the ongoing audit by the CRA or the Company’s exposure as a result thereof, or (ii) the future status and any potential restart of the Cobre Panama mine or the outcome of any related arbitration proceedings. Franco-Nevada cannot assure investors that actual results will be consistent with these forward-looking statements. Accordingly, investors should not place undue reliance on forward-looking statements due to the inherent uncertainty therein.
For additional information with respect to risks, uncertainties and assumptions, please refer to Franco-Nevada’s most recent Annual Information Form filed with the Canadian securities regulatory authorities on www.sedarplus.com and Franco-Nevada’s most recent Annual Report filed on Form 40-F filed with the SEC on www.sec.gov. The forward-looking statements herein are made as of the date of this press release only and Franco-Nevada does not assume any obligation to update or revise them to reflect new information, estimates or opinions, future events or results or otherwise, except as required by applicable law.
7
ENDNOTES:
| 1 | GEOs: Gold equivalent ounces (“GEOs”) include Franco-Nevada’s attributable share of production from our Mining and Energy assets after applicable recovery and payability factors. GEOs are estimated on a gross basis for NSRs and, in the case of stream ounces, before the payment of the per ounce contractual price paid by the Company. For NPI royalties, GEOs are calculated taking into account the NPI economics. Silver, platinum, palladium, iron ore, oil, gas and other commodities are converted to GEOs by dividing associated revenue, which includes settlement adjustments, by the relevant gold price. The price used in the computation of GEOs varies depending on the royalty or stream agreement of each particular asset, which may make reference to the market price realized by the operator, or the average price for the month, quarter, or year in which the commodity was produced or sold. For Q4 2023, the average commodity prices were as follows: $1,976/oz gold (Q4 2022 - $1,729), $23.23/oz silver (Q4 2022 - $21.20), $912/oz platinum (Q4 2022 - $971) and $1,085/oz palladium (Q4 2022 - $1,940), $127/t Fe 62% CFR China (Q4 2022 - $98), $78.32/bbl WTI oil (Q4 2022 - $82.65) and $2.91/mcf Henry Hub natural gas (Q4 2022 - $6.09). For 2023 prices, the average commodity prices were as follows: $1,943/oz gold (2022 - $1,801), $23.39/oz silver (2022 - $21.75), $967/oz platinum (2022 - $961) and $1,338/oz palladium (2022 - $2,107), $119/t Fe 62% CFR China (2022 - $122), $77.62/bbl WTI oil (2022 - $94.23) and $2.66/mcf Henry Hub natural gas (2022 - $6.51). |
| 2 | NON-GAAP FINANCIAL MEASURES: Adjusted Net Income and Adjusted Net Income per share, Adjusted Net Income Margin, Adjusted EBITDA and Adjusted EBITDA per share, and Adjusted EBITDA Margin are non-GAAP financial measures with no standardized meaning under International Financial Reporting Standards (“IFRS Accounting Standards”) and might not be comparable to similar financial measures disclosed by other issuers. For a quantitative reconciliation of each non-GAAP financial measure to the most directly comparable financial measure under IFRS Accounting Standards, refer to the following tables. Further information relating to these Non-GAAP financial measures is incorporated by reference from the “Non-GAAP Financial Measures” section of Franco-Nevada’s MD&A for the year ended December 31, 2023 dated March 5, 2024 filed with the Canadian securities regulatory authorities on SEDAR+ available at www.sedarplus.com and with the U.S. Securities and Exchange Commission available on EDGAR at www.sec.gov. |
| ● | Adjusted Net Income and Adjusted Net Income per share are non-GAAP financial measures, which exclude the following from net income and earnings per share (“EPS”): impairment charges and reversal related to royalty, stream and working interests and investments; gains/losses on the sale of royalty, stream and working interests and investments; foreign exchange gains/losses and other income/expenses; unusual non-recurring items; and the impact of income taxes on these items. |
| ● | Adjusted Net Income Margin is a non-GAAP financial measure which is defined by the Company as Adjusted Net Income divided by revenue. |
| ● | Adjusted EBITDA and Adjusted EBITDA per share are non-GAAP financial measures, which exclude the following from net income and EPS: income tax expense/recovery; finance expenses and finance income; depletion and depreciation; impairment charges and reversals related to royalty, stream and working interests and investments; gains/losses on the sale of royalty, stream and working interests and investments; foreign exchange gains/losses and other income/expenses; and unusual non-recurring items. |
| ● | Adjusted EBITDA Margin is a non-GAAP financial measure which is defined by the Company as Adjusted EBITDA divided by revenue. |
Reconciliation of Non-GAAP Financial Measures:
|
|
For the three months ended |
|
|
For the year ended |
|
||||||||||
|
|
December 31, |
|
|
December 31, |
|
||||||||||
(expressed in millions, except per share amounts) |
|
2023 |
|
|
2022 |
|
|
2023 |
|
|
2022 |
|
||||
Net (loss) income |
|
$ |
(982.5) |
|
|
$ |
165.0 |
|
|
$ |
(466.4) |
|
|
$ |
700.6 |
|
Impairment losses |
|
|
1,173.3 |
|
|
|
— |
|
|
|
1,173.3 |
|
|
|
— |
|
Gain on sale of royalty interest |
|
|
— |
|
|
|
— |
|
|
|
(3.7) |
|
|
|
— |
|
Foreign exchange gain and other income |
|
|
(12.3) |
|
|
|
(0.1) |
|
|
|
(14.4) |
|
|
|
(3.6) |
|
Finance income related to repayment of Noront Loan |
|
|
— |
|
|
|
— |
|
|
|
— |
|
|
|
(2.2) |
|
Tax effect of adjustments |
|
|
(5.6) |
|
|
|
— |
|
|
|
(4.0) |
|
|
|
2.8 |
|
Other tax related adjustments |
|
|
|
|
|
|
|
|
|
|
|
|
|
|
|
|
Change in unrecognized deductible temporary differences |
|
|
— |
|
|
|
— |
|
|
|
(1.7) |
|
|
|
— |
|
Adjusted Net Income |
|
$ |
172.9 |
|
|
$ |
164.9 |
|
|
$ |
683.1 |
|
|
$ |
697.6 |
|
Basic weighted average shares outstanding |
|
|
192.1 |
|
|
|
191.7 |
|
|
|
192.0 |
|
|
|
191.5 |
|
Adjusted Net Income per share |
|
$ |
0.90 |
|
|
$ |
0.86 |
|
|
$ |
3.56 |
|
|
$ |
3.64 |
|
8
|
|
For the three months ended |
|
|
For the year ended |
|
||||||||||
Adjusted Net Income Margin |
|
December 31, |
|
|
December 31, |
|
||||||||||
(expressed in millions, except Adjusted Net Income Margin) |
|
2023 |
|
|
2022 |
|
|
2023 |
|
|
2022 |
|
||||
Adjusted Net Income |
|
$ |
172.9 |
|
|
$ |
164.9 |
|
|
$ |
683.1 |
|
|
$ |
697.6 |
|
Revenue |
|
|
303.3 |
|
|
|
320.4 |
|
|
|
1,219.0 |
|
|
|
1,315.7 |
|
Adjusted Net Income Margin |
|
|
57.0 |
% |
|
|
51.5 |
% |
|
|
56.0 |
% |
|
|
53.0 |
% |
|
|
For the three months ended |
|
|
For the year ended |
|
||||||||||
|
|
December 31, |
|
|
December 31, |
|
||||||||||
(expressed in millions, except per share amounts) |
|
2023 |
|
|
2022 |
|
|
2023 |
|
|
2022 |
|
||||
Net (loss) income |
|
$ |
(982.5) |
|
|
$ |
165.0 |
|
|
$ |
(466.4) |
|
|
$ |
700.6 |
|
Income tax expense |
|
|
22.7 |
|
|
|
30.0 |
|
|
|
102.2 |
|
|
|
133.1 |
|
Finance expenses |
|
|
0.8 |
|
|
|
0.7 |
|
|
|
2.9 |
|
|
|
3.2 |
|
Finance income |
|
|
(16.3) |
|
|
|
(6.7) |
|
|
|
(52.3) |
|
|
|
(12.6) |
|
Depletion and depreciation |
|
|
68.9 |
|
|
|
73.5 |
|
|
|
273.1 |
|
|
|
286.2 |
|
Impairment losses |
|
|
1,173.3 |
|
|
|
— |
|
|
|
1,173.3 |
|
|
|
— |
|
Gain on sale of royalty interest |
|
|
— |
|
|
|
— |
|
|
|
(3.7) |
|
|
|
— |
|
Foreign exchange gain and other income |
|
|
(12.3) |
|
|
|
(0.1) |
|
|
|
(14.4) |
|
|
|
(3.6) |
|
Adjusted EBITDA |
|
$ |
254.6 |
|
|
$ |
262.4 |
|
|
$ |
1,014.7 |
|
|
$ |
1,106.9 |
|
Basic weighted average shares outstanding |
|
|
192.1 |
|
|
|
191.7 |
|
|
|
192.0 |
|
|
|
191.5 |
|
Adjusted EBITDA per share |
|
$ |
1.33 |
|
|
$ |
1.37 |
|
|
$ |
5.28 |
|
|
$ |
5.78 |
|
|
|
For the three months ended |
|
|
For the year ended |
|
||||||||||
|
|
December 31, |
|
|
December 31, |
|
||||||||||
(expressed in millions, except Adjusted EBITDA Margin) |
|
2023 |
|
|
2022 |
|
|
2023 |
|
|
2022 |
|
||||
Adjusted EBITDA |
|
$ |
254.6 |
|
|
$ |
262.4 |
|
|
$ |
1,014.7 |
|
|
$ |
1,106.9 |
|
Revenue |
|
|
303.3 |
|
|
|
320.4 |
|
|
|
1,219.0 |
|
|
|
1,315.7 |
|
Adjusted EBITDA Margin |
|
|
83.9 |
% |
|
|
81.9 |
% |
|
|
83.2 |
% |
|
|
84.1 |
% |
9
FRANCO-NEVADA CORPORATION
CONSOLIDATED STATEMENTS OF FINANCIAL POSITION
(in millions of U.S. dollars)
|
|
At December 31, |
|
|
At December 31, |
|
||
|
|
2023 |
|
|
2022 |
|
||
ASSETS |
|
|
|
|
|
|
|
|
Cash and Cash equivalents |
|
$ |
1,421.9 |
|
|
$ |
1,196.5 |
|
Receivables |
|
|
111.0 |
|
|
|
135.7 |
|
Gold bullion, prepaid expenses and other current assets |
|
|
82.4 |
|
|
|
50.9 |
|
Current assets |
|
$ |
1,615.3 |
|
|
$ |
1,383.1 |
|
|
|
|
|
|
|
|
|
|
Royalty, stream and working interests, net |
|
$ |
4,027.1 |
|
|
$ |
4,927.5 |
|
Investments |
|
|
254.5 |
|
|
|
227.2 |
|
Loans receivable |
|
|
24.8 |
|
|
|
— |
|
Deferred income tax assets |
|
|
37.0 |
|
|
|
39.9 |
|
Other assets |
|
|
35.4 |
|
|
|
49.1 |
|
Total assets |
|
$ |
5,994.1 |
|
|
$ |
6,626.8 |
|
|
|
|
|
|
|
|
|
|
LIABILITIES |
|
|
|
|
|
|
|
|
Accounts payable and accrued liabilities (Note 11) |
|
$ |
30.9 |
|
|
$ |
43.1 |
|
Current income tax liabilities |
|
|
8.3 |
|
|
|
7.1 |
|
Current liabilities |
|
$ |
39.2 |
|
|
$ |
50.2 |
|
|
|
|
|
|
|
|
|
|
Deferred income tax liabilities |
|
$ |
180.1 |
|
|
$ |
153.0 |
|
Other liabilities |
|
|
5.7 |
|
|
|
6.0 |
|
Total liabilities |
|
$ |
225.0 |
|
|
$ |
209.2 |
|
|
|
|
|
|
|
|
|
|
SHAREHOLDERS’ EQUITY |
|
|
|
|
|
|
|
|
Share capital |
|
$ |
5,728.2 |
|
|
$ |
5,695.3 |
|
Contributed surplus |
|
|
20.6 |
|
|
|
15.6 |
|
Retained earnings |
|
|
212.3 |
|
|
|
940.4 |
|
Accumulated other comprehensive loss |
|
|
(192.0) |
|
|
|
(233.7) |
|
Total shareholders’ equity |
|
$ |
5,769.1 |
|
|
$ |
6,417.6 |
|
Total liabilities and shareholders’ equity |
|
$ |
5,994.1 |
|
|
$ |
6,626.8 |
|
|
|
|
|
|
|
|
|
|
The consolidated financial statements and accompanying notes can be found in our 2023 Annual Report available on our website
10
FRANCO-NEVADA CORPORATION
CONSOLIDATED STATEMENTS OF (LOSS) INCOME AND COMPREHENSIVE (LOSS) INCOME
(in millions of U.S. dollars and shares, except per share amounts)
|
|
2023 |
|
|
2022 |
||
Revenue |
|
$ |
1,219.0 |
|
|
$ |
1,315.7 |
|
|
|
|
|
|
|
|
Costs of sales |
|
|
|
|
|
|
|
Costs of sales |
|
$ |
179.3 |
|
|
$ |
176.9 |
Depletion and depreciation |
|
|
273.1 |
|
|
|
286.2 |
Total costs of sales |
|
$ |
452.4 |
|
|
$ |
463.1 |
Gross profit |
|
$ |
766.6 |
|
|
$ |
852.6 |
|
|
|
|
|
|
|
|
Other operating expenses (income) |
|
|
|
|
|
|
|
General and administrative expenses |
|
$ |
24.5 |
|
|
$ |
22.5 |
Share-based compensation expenses |
|
|
4.4 |
|
|
|
10.1 |
Impairment losses |
|
|
1,173.3 |
|
|
|
— |
Gain on sale of royalty interest |
|
|
(3.7) |
|
|
|
— |
Gain on sale of gold bullion |
|
|
(3.9) |
|
|
|
(0.7) |
Total other operating expenses |
|
$ |
1,194.6 |
|
|
$ |
31.9 |
Operating (loss) income |
|
$ |
(428.0) |
|
|
$ |
820.7 |
Foreign exchange gain and other income |
|
$ |
14.4 |
|
|
$ |
3.6 |
(Loss) income before finance items and income taxes |
|
$ |
(413.6) |
|
|
$ |
824.3 |
|
|
|
|
|
|
|
|
Finance items |
|
|
|
|
|
|
|
Finance income |
|
$ |
52.3 |
|
|
$ |
12.6 |
Finance expenses |
|
|
(2.9) |
|
|
|
(3.2) |
Net (loss) income before income taxes |
|
$ |
(364.2) |
|
|
$ |
833.7 |
|
|
|
|
|
|
|
|
Income tax expense |
|
|
102.2 |
|
|
|
133.1 |
Net (loss) income |
|
$ |
(466.4) |
|
|
$ |
700.6 |
|
|
|
|
|
|
|
|
Other comprehensive income (loss), net of taxes |
|
|
|
|
|
|
|
|
|
|
|
|
|
|
|
Items that may be reclassified subsequently to profit and loss: |
|
|
|
|
|
|
|
Currency translation adjustment |
|
$ |
34.8 |
|
|
$ |
(92.0) |
|
|
|
|
|
|
|
|
Items that will not be reclassified subsequently to profit and loss: |
|
|
|
|
|
|
|
Gain (loss) on changes in the fair value of equity investments |
|
|
|
|
|
|
|
at fair value through other comprehensive income ("FVTOCI"), |
|
|
|
|
|
|
|
net of income tax |
|
|
7.3 |
|
|
|
(36.7) |
Other comprehensive income (loss), net of taxes |
|
$ |
42.1 |
|
|
$ |
(128.7) |
|
|
|
|
|
|
|
|
Comprehensive (loss) income |
|
$ |
(424.3) |
|
|
$ |
571.9 |
|
|
|
|
|
|
|
|
(Loss) earnings per share |
|
|
|
|
|
|
|
Basic |
|
$ |
(2.43) |
|
|
$ |
3.66 |
Diluted |
|
$ |
(2.43) |
|
|
$ |
3.65 |
Weighted average number of shares outstanding |
|
|
|
|
|
|
|
Basic |
|
|
192.0 |
|
|
|
191.5 |
Diluted |
|
|
192.3 |
|
|
|
191.9 |
|
|
|
|
|
|
|
|
The consolidated financial statements and accompanying notes can be found in our 2023 Annual Report available on our website
11
FRANCO-NEVADA CORPORATION
CONSOLIDATED STATEMENTS OF CASH FLOWS
(in millions of U.S. dollars)
|
|
2023 |
|
|
2022 |
|
||
Cash flows from operating activities |
|
|
|
|
|
|
|
|
Net (loss) income |
|
$ |
(466.4) |
|
|
$ |
700.6 |
|
Adjustments to reconcile net (loss) income to net cash provided by operating activities: |
|
|
|
|
|
|
|
|
Depletion and depreciation |
|
|
273.1 |
|
|
|
286.2 |
|
Share-based compensation expenses |
|
|
5.5 |
|
|
|
8.2 |
|
Changes in fair value of financial instruments |
|
|
(11.3) |
|
|
|
(0.4) |
|
Impairment losses |
|
|
1,173.3 |
|
|
|
— |
|
Gain on sale of royalty interest |
|
|
(3.7) |
|
|
|
— |
|
Unrealized foreign exchange (gain) loss |
|
|
(2.8) |
|
|
|
3.3 |
|
Deferred income tax expense |
|
|
26.6 |
|
|
|
37.4 |
|
Other non-cash items |
|
|
(3.7) |
|
|
|
(3.1) |
|
Acquisition of gold bullion |
|
|
(56.2) |
|
|
|
(46.7) |
|
Proceeds from sale of gold bullion |
|
|
36.8 |
|
|
|
51.6 |
|
Changes in other assets |
|
|
13.9 |
|
|
|
(26.7) |
|
Operating cash flows before changes in non-cash working capital |
|
$ |
985.1 |
|
|
$ |
1,010.4 |
|
Changes in non-cash working capital: |
|
|
|
|
|
|
|
|
Decrease (increase) in receivables |
|
$ |
24.7 |
|
|
$ |
(15.9) |
|
Increase in prepaid expenses and other |
|
|
(8.0) |
|
|
|
(3.2) |
|
(Decrease) increase in current liabilities |
|
|
(10.6) |
|
|
|
8.2 |
|
Net cash provided by operating activities |
|
$ |
991.2 |
|
|
$ |
999.5 |
|
|
|
|
|
|
|
|
|
|
Cash flows used in investing activities |
|
|
|
|
|
|
|
|
Acquisition of royalty, stream and working interests |
|
$ |
(520.0) |
|
|
$ |
(139.6) |
|
Proceeds from sale of royalty interest |
|
|
7.0 |
|
|
|
— |
|
Acquisition of investments |
|
|
(9.8) |
|
|
|
(48.5) |
|
Proceeds from sale of investments |
|
|
2.0 |
|
|
|
1.8 |
|
Investment in loan receivable |
|
|
(18.7) |
|
|
|
— |
|
Proceeds from loan receivable |
|
|
— |
|
|
|
42.7 |
|
Acquisition of energy well equipment |
|
|
(1.6) |
|
|
|
(1.9) |
|
Net cash used in investing activities |
|
$ |
(541.1) |
|
|
$ |
(145.5) |
|
|
|
|
|
|
|
|
|
|
Cash flows used in financing activities |
|
|
|
|
|
|
|
|
Payment of dividends |
|
$ |
(233.0) |
|
|
$ |
(197.6) |
|
Proceeds from exercise of stock options |
|
|
2.9 |
|
|
|
9.5 |
|
Credit facility amendment costs |
|
|
— |
|
|
|
(0.9) |
|
Net cash used in financing activities |
|
$ |
(230.1) |
|
|
$ |
(189.0) |
|
Effect of exchange rate changes on cash and cash equivalents |
|
$ |
5.4 |
|
|
$ |
(7.8) |
|
Net change in cash and cash equivalents |
|
$ |
225.4 |
|
|
$ |
657.2 |
|
Cash and cash equivalents at beginning of year |
|
$ |
1,196.5 |
|
|
$ |
539.3 |
|
Cash and cash equivalents at end of year |
|
$ |
1,421.9 |
|
|
$ |
1,196.5 |
|
|
|
|
|
|
|
|
|
|
Supplemental cash flow information: |
|
|
|
|
|
|
|
|
Income taxes paid |
|
$ |
88.1 |
|
|
$ |
95.1 |
|
Dividend income received |
|
$ |
13.2 |
|
|
$ |
19.7 |
|
Interest and standby fees paid |
|
$ |
2.3 |
|
|
$ |
2.4 |
|
The consolidated financial statements and accompanying notes can be found in our 2023 Annual Report available on our website
12
Exhibit 99.2

Management’s Discussion and Analysis |
This Management’s Discussion and Analysis (“MD&A”) of financial position and results of operations of Franco-Nevada Corporation (“Franco-Nevada”, the “Company”, “we” or “our”) has been prepared based upon information available to Franco-Nevada as at March 5, 2024 and should be read in conjunction with Franco-Nevada’s audited consolidated financial statements and related notes as at and for the years ended December 31, 2023 and 2022 (the “financial statements”). The financial statements and this MD&A are presented in U.S. dollars and the financial statements have been prepared in accordance with International Financial Reporting Standards as issued by the International Accounting Standards Board (“IASB”) (“IFRS Accounting Standards”).
Readers are cautioned that the MD&A contains forward-looking statements and that actual events may vary from management’s expectations. Readers are encouraged to read the “Cautionary Statement on Forward-Looking Information” at the end of this MD&A and to consult Franco-Nevada’s financial statements for the years ended December 31, 2023 and 2022 and the corresponding notes to the financial statements which are available on our website at www.franco-nevada.com, on SEDAR+ at www.sedarplus.com and on Form 6-K furnished to the United States Securities and Exchange Commission (“SEC”) on EDGAR at www.sec.gov.
Additional information related to Franco-Nevada, including our Annual Information Form and Form 40-F, are available on SEDAR+ at www.sedarplus.com and on EDGAR at www.sec.gov, respectively. These documents contain descriptions of certain of Franco-Nevada’s producing and advanced royalty and stream assets, as well as a description of risk factors affecting the Company. For additional information, please see our website at www.franco-nevada.com.
Table of Contents
3 |
|
3 |
|
5 |
|
6 |
|
11 |
|
12 |
|
13 |
|
14 |
|
19 |
|
24 |
|
25 |
General and administrative and share-based compensation expenses |
25 |
|
26 |
|
27 |
|
28 |
|
34 |
|
34 |
|
35 |
Internal control over financial reporting and disclosure controls and procedures |
36 |
|
39 |
Abbreviations Used in this Report |
The following abbreviations may be used throughout this MD&A:
Abbreviated Definitions |
|
|
|
|
|
||
Periods under review |
|
Measurement |
|
Interest types |
|||
"Q4" |
The three-month period ended December 31 |
|
"GEO" |
Gold equivalent ounces |
|
"NSR" |
Net smelter return royalty |
"Q3" |
The three-month period ended September 30 |
|
"PGM" |
Platinum group metals |
|
"GR" |
Gross royalty |
"Q2" |
The three-month period ended June 30 |
|
"NGL" |
Natural gas liquids |
|
"ORR" |
Overriding royalty |
"Q1" |
The three-month period ended March 31 |
|
"oz" |
Ounce |
|
"GORR" |
Gross overriding royalty |
"H2" |
The six-month period ended December 31 |
|
"oz Au" |
Ounce of gold |
|
"FH" |
Freehold or lessor royalty |
"H1" |
The six-month period ended June 30 |
|
"oz Ag" |
Ounce of silver |
|
"NPI" |
Net profits interest |
|
|
|
"oz Pt" |
Ounce of platinum |
|
"NRI" |
Net royalty interest |
|
|
|
"oz Pd" |
Ounce of palladium |
|
"WI" |
Working interest |
Places and currencies |
|
|
"62% Fe" |
62% Fe iron ore fines, dry metric |
|
|
|
"U.S." |
United States |
|
|
tonnes CFR China |
|
|
|
"$" or "USD" |
United States dollars |
|
"LBMA" |
London Bullion Market Association |
|
|
|
"C$" or "CAD" |
Canadian dollars |
|
"bbl" |
Barrel |
|
|
|
"R$" or "BRL" |
Brazilian reais |
|
"mcf" |
Thousand cubic feet |
|
|
|
"A$" or "AUD" |
Australian dollars |
|
"WTI" |
West Texas Intermediate |
|
|
|
|
|
|
|
|
|
|
|
For definitions of the various types of agreements, please refer to our most recent Annual Information Form filed on SEDAR+ at www.sedarplus.com or our Form 40-F filed on EDGAR at www.sec.gov.
OVERVIEW
Franco-Nevada is the leading gold-focused royalty and streaming company with the largest and most diversified portfolio of royalties and streams by commodity, geography, operator, revenue type and stage of project.
Our Portfolio (at March 5, 2024) | ||||||||
|
|
Precious Metals |
|
Other Mining |
|
Energy |
|
TOTAL |
Producing |
|
46 |
|
14 |
|
56 |
|
116 |
Advanced |
|
33 |
|
9 |
|
— |
|
42 |
Exploration |
|
161 |
|
86 |
|
27 |
|
274 |
TOTAL |
|
240 |
|
109 |
|
83 |
|
432 |
Our shares are listed on the Toronto and New York stock exchanges under the symbol FNV. An investment in our shares is expected to provide investors with yield and exposure to commodity price and exploration optionality while limiting exposure to cost inflation and other operating risks.
STRATEGY
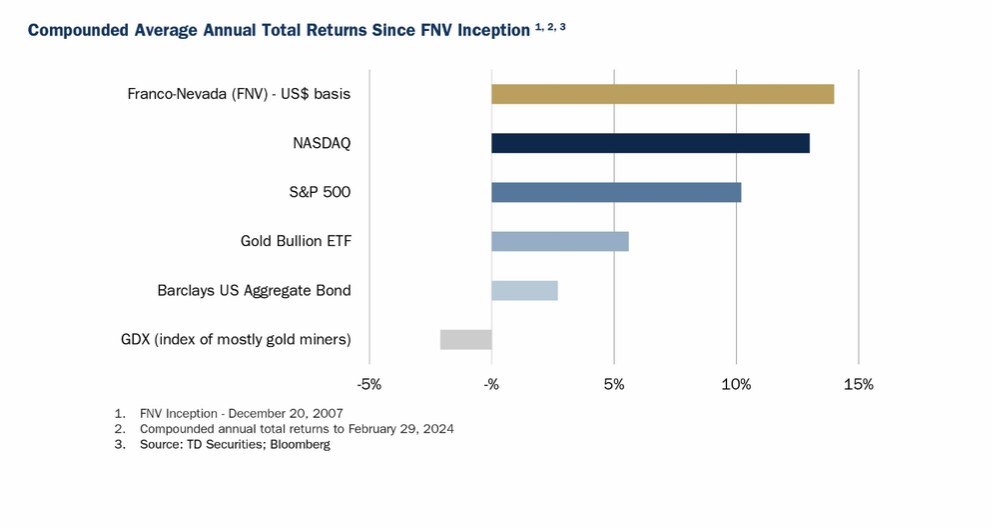
We believe that combining lower risk gold investments with a strong balance sheet, progressively growing dividends and exposure to exploration optionality is the right mix to appeal to investors seeking to hedge market instability. Since our Initial Public Offering over 16 years ago, we have increased our dividend annually and our share price has outperformed the gold price and all relevant gold equity benchmarks. Creating successful long-term partnerships with operators is a core objective. The alignment and the natural flexibility of royalty and stream financing has made it an attractive source of capital for the cyclical resource sector. We also work to be a positive force in all our communities, promoting responsible mining, providing a safe and diverse workplace and contributing to build community support for the operations in which we invest.
Our revenue is generated from various forms of agreements, ranging from net smelter return royalties, streams, net profits interests, net royalty interests, working interests and other types of arrangements. We do not operate mines, develop projects or conduct exploration. Franco-Nevada has a free cash flow generating business with limited future capital commitments and management is focused on managing and growing its portfolio of royalties and streams. We recognize the cyclical nature of the industry and have a long-term investment outlook. We maintain a strong balance sheet to minimize financial risk and so that we can provide capital to the industry when it is otherwise scarce.
2023 Management’s Discussion and Analysis |
3 |
The advantages of this business model are:
| ● | Exposure to commodity price optionality; |
| ● | A perpetual discovery option over large areas of geologically prospective lands; |
| ● | No additional capital requirements other than the initial investment; |
| ● | Limited exposure to cost inflation; |
| ● | A free cash-flow business with limited cash calls; |
| ● | A high-margin business that can generate cash through the entire commodity cycle; |
| ● | A scalable and diversified business in which a large number of assets can be managed with a small stable overhead; and |
| ● | Management that focuses on forward-looking growth opportunities rather than operational or development issues. |
Our short-term financial results are primarily tied to the price of commodities and the amount of production from our portfolio of assets. Our attributable production has typically been supplemented by acquisitions of new assets. Over the longer term, our results are impacted by the amount of exploration and development capital available to operators to expand or extend our producing assets or to progress our advanced and exploration assets into production.
The focus of our business is to create exposure to gold and precious metal resource optionality. This principally involves investments in gold mines and providing capital to copper and other base metal mines to obtain exposure to by-product gold, silver and platinum group metals production. We also invest in other metals and energy to expose our shareholders to additional resource optionality. In 2023, 78.0% of our revenue was earned from precious metals and 83.0% was earned from mining assets.
One of the strengths of Franco-Nevada’s business model is that our margins are not generally impacted when producer costs increase. The majority of our interests are royalty and streams with payments/deliveries that are based on production levels with no adjustments for the operator’s operating costs. In 2023, these interests accounted for 93.3% of our revenue. We also have a small number of WI, NPI and NRI royalties which are based on the profit of the underlying operations.
____________________________________________________
| 1 | GEOs include Franco-Nevada’s attributable share of production from our Mining and Energy assets, after applicable recovery and payability factors. GEOs are estimated on a gross basis for NSRs and, in the case of stream ounces, before the payment of the per ounce contractual price paid by the Company. For NPI royalties, GEOs are calculated taking into account the NPI economics. Silver, platinum, palladium, iron ore, oil, gas and other commodities are converted to GEOs by dividing associated revenue, which includes settlement adjustments, by the relevant gold price. The price used in the computation of GEOs earned from a particular asset varies depending on the royalty or stream agreement, which may make reference to the market price realized by the operator, or the average price for the month, quarter, or year in which the commodity was produced or sold. For illustrative purposes, please refer to the average commodity price tables on pages 14 and 19 of this MD&A for indicative prices which may be used in the calculation of GEOs for the years ended December 31, 2023 and 2022, respectively. |
2023 Management’s Discussion and Analysis |
4 |
SELECTED FINANCIAL INFORMATION
|
|
|
For the three months ended |
|
|
For the year ended |
|
|||||||||||||||
(in millions, except Average Gold Price, GEOs sold, |
|
|
December 31, |
|
|
December 31, |
|
|||||||||||||||
Adjusted EBITDA Margin, per GEO amounts and per share amounts) |
|
|
2023 |
|
|
2022 |
|
|
2023 |
|
|
2022 |
|
2021 |
|
|||||||
|
|
|
|
|
|
|
|
|
|
|
|
|
|
|
|
|
|
|
|
|
||
Statistical Measures |
|
|
|
|
|
|
|
|
|
|
|
|
|
|
|
|
|
|
|
|
||
Average Gold Price |
|
|
$ |
1,976 |
|
|
$ |
1,729 |
|
|
$ |
1,943 |
|
|
$ |
1,801 |
|
$ |
1,800 |
|
||
GEOs sold(1) |
|
|
|
152,351 |
|
|
|
183,886 |
|
|
|
627,045 |
|
|
|
729,960 |
|
|
728,237 |
|
||
|
|
|
|
|
|
|
|
|
|
|
|
|
|
|
|
|
|
|
|
|
||
Statement of Comprehensive Loss (Income) |
|
|
|
|
|
|
|
|
|
|
|
|
|
|
|
|
|
|
|
|
||
Revenue |
|
|
$ |
303.3 |
|
|
$ |
320.4 |
|
|
$ |
1,219.0 |
|
|
$ |
1,315.7 |
|
$ |
1,300.0 |
|
||
Costs of sales |
|
|
|
45.1 |
|
|
|
45.8 |
|
|
|
179.3 |
|
|
|
176.9 |
|
|
178.3 |
|
||
Depletion and depreciation |
|
|
|
68.9 |
|
|
|
73.5 |
|
|
|
273.1 |
|
|
|
286.2 |
|
|
299.6 |
|
||
Impairment losses (reversals) |
|
|
|
1,173.3 |
|
|
|
— |
|
|
|
1,173.3 |
|
|
|
— |
|
|
(68.0) |
|
||
Operating (loss) income |
|
|
|
(987.6) |
|
|
|
188.9 |
|
|
|
(428.0) |
|
|
|
820.7 |
|
|
860.7 |
|
||
Net (loss) income |
|
|
|
(982.5) |
|
|
|
165.0 |
|
|
|
(466.4) |
|
|
|
700.6 |
|
|
733.7 |
|
||
Basic (loss) earnings per share |
|
|
$ |
(5.11) |
|
|
$ |
0.86 |
|
|
$ |
(2.43) |
|
|
$ |
3.66 |
|
$ |
3.84 |
|
||
Diluted (loss) earnings per share |
|
|
$ |
(5.11) |
|
|
$ |
0.86 |
|
|
$ |
(2.43) |
|
|
$ |
3.65 |
|
$ |
3.83 |
|
||
|
|
|
|
|
|
|
|
|
|
|
|
|
|
|
|
|
|
|
|
|
||
Dividends declared per share |
|
|
$ |
0.34 |
|
|
$ |
0.32 |
|
|
$ |
1.36 |
|
|
$ |
1.28 |
|
$ |
1.16 |
|
||
Dividends declared (including DRIP) |
|
|
$ |
65.9 |
|
|
$ |
61.6 |
|
|
$ |
262.1 |
|
|
$ |
245.8 |
|
$ |
221.4 |
|
||
Weighted average shares outstanding |
|
|
|
192.1 |
|
|
|
191.7 |
|
|
|
192.0 |
|
|
|
191.5 |
|
|
191.1 |
|
||
|
|
|
|
|
|
|
|
|
|
|
|
|
|
|
|
|
|
|
|
|
||
Non-GAAP Measures |
|
|
|
|
|
|
|
|
|
|
|
|
|
|
|
|
|
|
|
|
||
Cash Costs(2) |
|
|
$ |
45.1 |
|
|
$ |
45.8 |
|
|
$ |
179.3 |
|
|
$ |
176.9 |
|
$ |
178.3 |
|
||
Cash Costs(2) per GEO sold |
|
|
$ |
296 |
|
|
$ |
249 |
|
|
$ |
286 |
|
|
$ |
242 |
|
$ |
245 |
|
||
Adjusted EBITDA(2) |
|
|
$ |
254.6 |
|
|
$ |
262.4 |
|
|
$ |
1,014.7 |
|
|
$ |
1,106.9 |
|
$ |
1,092.3 |
|
||
Adjusted EBITDA(2) per share |
|
|
$ |
1.33 |
|
|
$ |
1.37 |
|
|
$ |
5.28 |
|
|
$ |
5.78 |
|
$ |
5.72 |
|
||
Adjusted EBITDA Margin(2) |
|
|
|
83.9 |
% |
|
|
81.9 |
% |
|
|
83.2 |
% |
|
|
84.1 |
% |
|
84.0 |
% |
||
Adjusted Net Income(2) |
|
|
$ |
172.9 |
|
|
$ |
164.9 |
|
|
$ |
683.1 |
|
|
$ |
697.6 |
|
$ |
673.6 |
|
||
Adjusted Net Income(2) per share |
|
|
$ |
0.90 |
|
|
$ |
0.86 |
|
|
$ |
3.56 |
|
|
$ |
3.64 |
|
$ |
3.52 |
|
||
Adjusted Net Income Margin(2) |
|
|
$ |
57.0 |
% |
|
$ |
51.5 |
% |
|
$ |
56.0 |
% |
|
$ |
53.0 |
% |
$ |
51.8 |
% |
||
|
|
|
|
|
|
|
|
|
|
|
|
|
|
|
|
|
|
|
|
|
||
Statement of Cash Flows |
|
|
|
|
|
|
|
|
|
|
|
|
|
|
|
|
|
|
|
|
||
Net cash provided by operating activities |
|
|
$ |
283.5 |
|
|
$ |
279.3 |
|
|
$ |
991.2 |
|
|
$ |
999.5 |
|
$ |
955.4 |
|
||
Net cash used in investing activities |
|
|
$ |
(104.2) |
|
|
$ |
(98.2) |
|
|
$ |
(541.1) |
|
|
$ |
(145.5) |
|
$ |
(765.0) |
|
||
Net cash used in financing activities |
|
|
$ |
(59.8) |
|
|
$ |
(43.7) |
|
|
$ |
(230.1) |
|
|
$ |
(189.0) |
|
$ |
(180.2) |
|
||
|
|
|
As at |
|
|
As at |
As at |
|
|||
|
|
|
December 31, |
|
|
December 31, |
December 31, |
|
|||
(expressed in millions) |
|
|
2023 |
|
|
2022 |
2021 |
|
|||
Statement of Financial Position |
|
|
|
|
|
|
|
|
|
|
|
Cash and cash equivalents |
|
|
$ |
1,421.9 |
|
|
$ |
1,196.5 |
$ |
539.3 |
|
Total assets |
|
|
|
5,994.1 |
|
|
|
6,626.8 |
|
6,209.9 |
|
Deferred income tax liabilities |
|
|
|
180.1 |
|
|
|
153.0 |
|
135.4 |
|
Total shareholders’ equity |
|
|
|
5,769.1 |
|
|
|
6,417.6 |
|
6,025.2 |
|
Available capital(3) |
|
|
|
2,402.6 |
|
|
|
2,177.7 |
|
1,621.1 |
|
| 1 | Refer to Note 1 at the bottom of page 4 of this MD&A for the methodology for calculating GEOs and, for illustrative purposes, to the average commodity price tables on pages 14 and 19 of this MD&A for indicative prices which may be used in the calculations of GEOs for the years ended December 31, 2023 and 2022, respectively. |
| 2 | Cash Costs, Cash Costs per GEO sold, Adjusted EBITDA, Adjusted EBITDA per share, Adjusted EBITDA Margin, Adjusted Net Income, Adjusted Net Income per share and Adjusted Net Income Margin are non-GAAP financial measures with no standardized meaning under IFRS Accounting Standards and might not be comparable to similar financial measures disclosed by other issuers. Refer to the “Non-GAAP Financial Measures” section of this MD&A for more information on each non-GAAP financial measure. |
| 3 | Available capital comprises our cash and cash equivalents and the amount available to borrow under our $1 billion revolving credit facility (the “Corporate Revolver”). |
2023 Management’s Discussion and Analysis |
5 |
HIGHLIGHTS
Financial Update –Q4 2023 vs Q4 2022
| ● | 152,351 GEOs sold, a decrease of 17.1%; |
| ● | $303.3 million in revenue, a decrease of 5.3%; |
| ● | $45.1 million, or $296 per GEO sold, in Cash Costs, compared to $45.8 million, or $249 per GEO sold; |
| ● | $254.6 million, or $1.33 per share, of Adjusted EBITDA, a decrease of 3.0% and 2.9%, respectively; |
| ● | 83.9% in Adjusted EBITDA Margin, an increase compared to 81.9%; |
| ● | $982.5 million, or $5.11 per share, in net loss, reflecting an impairment loss of $1,169.2 million related to our Cobre Panama streams, compared to net income of $165.0 million, or $0.86 per share; |
| ● | $172.9 million, or $0.90 per share, in Adjusted Net Income, an increase of 4.9% and 4.7%, respectively; |
| ● | 57.0% in Adjusted Net Income Margin, an increase compared to 51.5%; |
| ● | $283.5 million in net cash provided by operating activities, an increase of 1.5%; |
| ● | $1,421.9 million in cash and cash equivalents as at December 31, 2023 (December 31, 2022 – $1,196.5 million); |
| ● | $2.4 billion in available capital as at December 31, 2023 (December 31, 2022 – $2.2 billion), comprising cash and cash equivalents and the amount available to borrow under our Corporate Revolver. |
Financial Update –2023 vs 2022
| ● | 627,045 GEOs sold, a decrease of 14.1%; |
| ● | $1,219.0 million in revenue, a decrease of 7.3%; |
| ● | $179.3 million, or $286 per GEO sold, in Cash Costs, compared to $176.9 million, or $242 per GEO sold; |
| ● | $1,014.7 million, or $5.28 per share, in Adjusted EBITDA, a decrease of 8.3% and 8.7%, respectively; |
| ● | 83.2% in Adjusted EBITDA Margin, a decrease compared to 84.1%; |
| ● | $466.4 million, or $2.43 per share, in net loss, compared to net income of $700.6 million, or 3.66 per share; |
| ● | $683.1 million, or $3.56 per share, in Adjusted Net Income, a decrease of 2.1% and 2.2%, respectively; |
| ● | 56.0% in Adjusted Net Income Margin, an increase compared to 53.0%; |
| ● | $991.2 million in net cash provided by operating activities, a decrease of 0.8%. |
Corporate Developments
Cobre Panama Updates
As previously disclosed, Cobre Panama has been in preservation and safe management (“P&SM”), with production halted, since November 2023. On November 28, 2023, following protests and President Cortizo’s call for a mining moratorium, the Supreme Court of Justice of Panama (the “Supreme Court”) released its ruling declaring Law 406 unconstitutional.
In light of these events, we carried out an impairment assessment of the recoverable amount of our Cobre Panama streams at December 31, 2023. We took a prudent approach in our judgement of the facts and circumstances, and based on the halting of production and the political environment surrounding the ruling by the Supreme Court, we determined the recoverable amount under applicable accounting standards to be nil as at December 31, 2023. As a result, we recognized a full impairment loss of $1,169.2 million in the year ended December 31, 2023. This impairment has been taken without prejudice to, or without at present attributing any specific value to, the legal remedies that may be obtained through any arbitration proceedings or otherwise.
Presidential and national legislative elections are scheduled to take place in May 2024, with a new president, Government of Panama (the “GOP”) cabinet and National Assembly expected to assume office in July 2024. In the event that there is a change in the facts and circumstances surrounding the halting of production at Cobre Panama, and there is a resumption of precious metal stream deliveries to Franco-Nevada, an assessment of the recoverable amount of the Cobre Panama streams will be performed at that time, which may lead to a reversal of part or all of the impairment loss that has been recognized.
We are pursuing legal avenues to protect our investment in Cobre Panama. We have notified the Ministry of Commerce and Industries of Panama (“MICI”) of our intent to initiate arbitration pursuant to the Canada-Panama Free Trade Agreement. As announced to MICI, Franco-Nevada presently and preliminarily estimates its damages to be at least $5 billion, subject to further analysis and development. Refer to the “Contingencies” section on page 31 of this MD&A for further details.
While we continue to pursue these legal remedies, we strongly prefer and hope for a resolution with the State of Panama that results in the best outcome for the Panamanian people and all parties involved.
2023 Management’s Discussion and Analysis |
6 |
Financing Package with Skeena Resources Ltd. on Eskay Creek Project – British Columbia, Canada
On December 18, 2023, we completed the following transactions with Skeena Resources Ltd. (“Skeena”):
| (a) | Eskay Creek Royalty |
We acquired an incremental 1.0% NSR for a purchase price of $41.8 million (C$56.0 million). Including our initial 1% NSR and the incremental 0.5% NSR we acquired in December 2022 for a purchase price of $19.9 million (C$27.0 million), we now hold a 2.5% NSR covering Skeena’s Eskay Creek properties. The amended royalty agreement also provides contingent consideration of $3.4 million (C$4.5 million) payable by Franco-Nevada upon the achievement of certain conditions relating to materials in the Albino Lake Storage Facility at Eskay Creek.
| (b) | Skeena Convertible Debenture |
We advanced $18.7 million (C$25.0 million) and received a convertible debenture (the “Skeena Convertible Debenture”). The C$25.0 million Skeena Convertible Debenture matures on the earlier of December 19, 2028 or on the completion of a project financing for Eskay Creek approved by the Board of Skeena, carries an interest rate of 7% and is convertible into common shares of Skeena at a conversion price of C$7.70. Skeena may elect to defer interest payments until maturity.
Acquisition of Additional Natural Gas Royalty Interests in Haynesville – U.S.
On November 21, 2023, we agreed to acquire, through wholly-owned subsidiaries, a royalty portfolio in the Haynesville gas play in Louisiana and Texas, for $125.0 million. The royalties are complementary to our existing Haynesville acreage and provide additional exposure to a diverse set of operators and a basin that is expected to help supply a growing LNG export capacity from the U.S. Gulf Coast. The transaction closed on January 2, 2024, subsequent to year-end. Prior to year-end, we advanced $12.5 million as a deposit held in escrow in connection with this transaction.
Funding of Financing Package with G Mining Ventures Corp. on Tocantinzinho Project – Brazil
As previously announced, on July 18, 2022, we acquired, through our wholly-owned subsidiary, Franco-Nevada (Barbados) Corporation (“FNBC”), a gold stream with reference to production from the Tocantinzinho gold project, owned by G Mining Ventures Corp. (“G Mining Ventures”) and located in Pará State, Brazil (the “Tocantinzinho Stream”), for a purchase price of $250.0 million. Additionally, through one of our wholly-owned subsidiaries, we provided G Mining Ventures with a $75.0 million secured term loan (the “G Mining Ventures Term Loan”). We also subscribed for common shares of G Mining Ventures.
| (a) | Tocantinzinho Stream |
The Tocantinzinho Stream deposit of $250.0 million, which was payable in instalments subject to various conditions, was fully funded in the year ended December 31, 2023. Stream deliveries to FNBC are based on gold production from the Tocantinzinho property, according to the following schedule: (i) 12.5% of gold produced until 300,000 ounces of gold have been delivered and, thereafter, (ii) 7.5% of gold produced for the remaining mine life. G Mining Ventures will receive 20% of the spot gold price for each ounce of gold delivered.
| (b) | G Mining Ventures Term Loan |
The G Mining Ventures Term Loan is a $75 million, 6-year term loan with an availability period of 3.5-years, drawable quarterly at G Mining Ventures’ option following full funding of the Tocantinzinho Stream. The loan will bear interest at a rate of 3-Month Term Secured Overnight Financing Rate (“3-Month SOFR”) +5.75% per annum, reducing to 3-Month SOFR +4.75% after completion tests have been achieved at the project. Amortization will begin in December 2025 with equal quarterly repayments followed by a final 25% repayment upon maturity in June 2028. Fees payable to Franco-Nevada’s subsidiary include a standby fee on undrawn amounts of 1.0% per annum and a 2.0% original issue discount payable on principal amounts drawn.
No amounts were advanced under the G Mining Ventures Term Loan during the year ended December 31, 2023. Subsequent to year-end, on January 29, 2024, we funded $41.2 million, net of a 2% original issue discount of $0.8 million.
Pursuant to the loan, on July 18, 2022, Franco-Nevada was granted warrants with a fair value of $0.75 million to purchase 11.5 million G Mining Ventures common shares with a 5-year term and an exercise price of C$1.90 per G Mining Ventures common share.
| (c) | G Mining Ventures Common Shares |
On July 22, 2022, we also subscribed for 44,687,500 G Mining Ventures common shares at a share price of C$0.80 per G Mining Ventures common share for a total cost of $27.5 million (C$35.8 million).
2023 Management’s Discussion and Analysis |
7 |
Acquisition of Additional Royalty on Magino Gold Mine – Ontario, Canada
On November 15, 2023, we acquired, through a wholly-owned subsidiary, an additional 1.0% NSR on Argonaut Gold Inc.’s (“Argonaut”) Magino gold mine in Ontario, Canada, for a purchase price of $28.0 million. Inclusive of our initial 2.0% NSR acquired on October 27, 2022, we now hold an aggregate 3.0% NSR on Magino.
Acquisition of Royalty on Wawa Gold Project – Ontario, Canada
On August 29, 2023, we acquired a 1.5% NSR on Red Pine Exploration Inc.’s Wawa gold project, located in Ontario, Canada, for a purchase price of $5.0 million (C$6.8 million). The agreement provides Franco-Nevada the option to acquire an additional 0.5% NSR based on predetermined conditions.
Acquisition of Royalties on Pascua-Lama Project – Chile
On August 8, 2023, we agreed to acquire, through a wholly-owned subsidiary, a sliding-scale gold royalty and fixed-rate copper royalty from private individuals over property pertaining to the Chilean portion of Barrick Gold Corporation’s Pascua-Lama project for an aggregate purchase price of $75.0 million.
Subsequent to year-end, on January 3, 2024, we acquired, through a wholly-owned subsidiary, an additional interest for a purchase price of $6.7 million.
Including the additional royalty interest acquired in January 2024, at gold prices exceeding $800/ounce, we now hold a 2.941% NSR (gold) and a 0.588% NSR (copper) on the property.
Acquisition of Royalty on Volcan Gold Project – Chile
On July 6, 2023, we agreed to acquire, through a wholly-owned subsidiary, a 1.5% NSR on the Volcan gold project located in the Maricunga Gold Belt in the Atacama region of Chile for a purchase price of $15.0 million. The project is owned by Tiernan Gold Corporation (“Tiernan”), a company privately held by Hochschild Mining plc. The NSR covers the entire land package comprising the Volcan project, as well as a surrounding area of interest extending 1.5 kilometers. The agreement provides Franco-Nevada the option to acquire an additional 1.0% NSR based on predetermined conditions. We already hold an existing 1.5% NSR on the peripheral Ojo de Agua area, which is owned by Tiernan and forms part of the Volcan project.
Acquisition of Additional Royalty Interest on Caserones – Chile
We acquired, through a wholly-owned subsidiary, an incremental effective NSR totaling 0.1120% on the Caserones copper-molybdenum mine, now owned by Lundin Mining Corporation, located in the Atacama region of Chile. The incremental effective 0.1120% NSR was acquired in two transactions: (i) a 0.0260% effective NSR on March 8, 2023, for a purchase price of $2.1 million, and (ii) a 0.0860% NSR on June 29, 2023, for a purchase price of $7.3 million. Inclusive of our interest of 0.4582% acquired in April 2022, we held a 0.5702% effective NSR on Caserones as at December 31, 2023.
Subsequent to year end, on January 19, 2024, EMX Royalty Corporation (“EMX”) exercised an option to acquire a portion of our interest for a sale price of $4.7 million, such that our effective NSR on Caserones is now 0.517%.
Acquisition Agreement for New Royalties with EMX Royalty Corporation
On June 27, 2023, we executed a binding term sheet with EMX for a three-year arrangement for the joint acquisition of newly created precious metals and copper royalties sourced by EMX. Franco-Nevada will contribute 55% (up to $5.5 million) and EMX will contribute 45% (up to $4.5 million) towards the royalty acquisitions, with the resulting royalty interests equally split on a 50/50 basis.
Acquisition of Royalties on Exploration Properties – Nevada and Arizona, U.S.
On June 15, 2023, we acquired, through a wholly-owned subsidiary, a portfolio of eight royalties on exploration properties located in the states of Nevada and Arizona, including a 0.5% NSR on Integra Resources Corp.’s Wildcat and Mountain View gold projects, for a purchase price of $2.5 million.
Acquisition of Additional Royalty on Valentine Gold Project and Private Placement with Marathon Gold Corporation – Newfoundland, Canada
On June 8, 2023, we acquired an additional 1.5% NSR on Marathon Gold Corporation’s (“Marathon”) Valentine Gold project located in Newfoundland for a purchase price of $45.0 million. Inclusive of our initial 1.5% NSR (reduced from 2.0% following Marathon’s buy-back of 0.5%, as described below), we now hold an aggregate 3.0% NSR on the project.
On July 5, 2023, we acquired 6,578,947 common shares of Marathon at a price of C$0.76 per common share for an aggregate of $3.8 million (C$5.0 million), comprising the back-end of a non-brokered charity flow-through offering.
Acquisition of Royalty on Kerr-Addison Property and Share Subscription with Gold Candle Ltd. – Ontario, Canada
On April 14, 2023, we acquired a 1% NSR on Gold Candle Ltd.’s (“Gold Candle”) Kerr-Addison project located in Virginiatown, Ontario, which hosts the formerly producing Kerr-Addison gold mine, for a purchase price of $10.0 million.
On July 26, 2023, we acquired 5,454,546 common shares of Gold Candle, a private company, at a price of C$1.10 per common share for an aggregate purchase price of $4.6 million (C$6.0 million).
2023 Management’s Discussion and Analysis |
8 |
Acquisition of Gold Royalties – Australia
On February 22, 2023, we acquired a portfolio of five primarily gold royalties from Trident Royalties Plc (“Trident”), which includes a 1.5% NSR on Ramelius Resources Limited’s Rebecca gold project (“Rebecca”) located in Western Australia, for total consideration of $15.6 million payable as follows: (i) $14.3 million paid on closing of the transaction, and (ii) $1.3 million in a contingent payment payable upon first gold production at Rebecca.
Receipt of Valentine Gold Royalty Buy-back – Newfoundland, Canada
On February 22, 2023, Marathon exercised its option to buy-back 0.5% of the initial 2.0% NSR on the Valentine Gold project by paying $7.0 million to Franco-Nevada. We acquired the initial 2.0% NSR on February 21, 2019 for $13.7 million (C$18.0 million).
Acquisition of Mineral Rights with Continental Resources, Inc. – U.S.
Through a wholly-owned subsidiary, we have a strategic relationship with Continental Resources, Inc. (“Continental”) to acquire, through a jointly-owned entity (the “Royalty Acquisition Venture”), royalty rights within Continental’s areas of operation. Franco-Nevada recorded contributions to the Royalty Acquisition Venture of $9.6 million for 2023 (2022 – $12.2 million). As at December 31, 2023, Franco-Nevada’s cumulative investment in the Royalty Acquisition Venture totaled $450.2 million and Franco-Nevada has remaining commitments of up to $69.8 million.
Dividends
In Q4 2023, we declared a quarterly dividend of $0.34 per share, an increase compared to the dividend of $0.32 per share in Q4 2022. During the quarter, we paid total dividends of $65.9 million, of which $59.8 was paid in cash and $6.1 million was paid in common shares under our Dividend Reinvestment Plan (the “DRIP”). In 2023, we paid total dividends of $262.1 million, of which $233.0 million was paid in cash and $29.1 million was paid in common shares under our DRIP.
Canada Revenue Agency (“CRA”) Audit
As previously announced, on April 28, 2023, we reached a settlement with the CRA in respect of the Domestic and FAPI Reassessments, which provides for these reassessments to be vacated entirely on a without-cost basis. Under the settlement, the CRA accepts the manner in which we deduct upfront payments made in connection with precious metal stream agreements for Canadian tax purposes. The potential tax exposure related to the vacated reassessments was $20.9 million (C$27.6 million) plus interest and penalties. We had posted security in cash for 50% of the reassessed amounts under the Domestic and FAPI Reassessments totaling $13.9 million (C$17.7 million). During the quarter, the CRA returned the full amount of the deposits to the Company.
With respect to the transfer pricing reassessments in relation to our Mexican and Barbadian subsidiaries, we believe that these reassessments are not supported by Canadian tax law and jurisprudence and continue to defend our tax filing positions. Refer to the “Contingencies” section on page 31 of this MD&A for further details on the CRA Audit.
Barbados Proposed Corporate Tax Reform
On November 7, 2023, the Government of Barbados announced proposed tax measures in response to the Organization for Economic Co-operation and Development’s (“OECD”) Pillar Two global minimum tax initiative, including an increase of the Barbados corporate tax rate to 9% effective January 1, 2024. This increase does not affect the amounts of current or deferred income taxes recognized for the year ended December 31, 2023 as the legislation was not substantively enacted at December 31, 2023. However, this change will increase our income tax charge in future periods. If the new tax rate were applied to the taxable temporary differences recognized at December 31, 2023, it is estimated that our deferred tax liability would increase by approximately $50 million.
The Government has also proposed to introduce a Qualified Domestic Minimum Top-Up Tax for tax years beginning on or after January 1, 2024, which will top-up the Barbados effective tax rate payable by an entity subject to Pillar Two, to 15%.
Global Minimum Tax
On August 4, 2023, the Government of Canada released the draft Global Minimum Tax Act (“GMTA”) for consultation, which would implement key measures of the OECD’s Pillar Two global minimum tax in Canada. The GMTA includes the introduction of a 15% global minimum tax that applies to large multinational enterprise groups with global consolidated revenues over €750 million.
If the GMTA legislation becomes enacted or substantively enacted, we will first become subject to the rules for our 2024 year. Since the legislation was not effective at the reporting date, we have no related current tax exposure for the year ended December 31, 2023. Further, the group has applied the exception to recognizing and disclosing information about deferred taxes arising from Pillar Two, as provided in the amendments to IAS 12. See Note 2 in the financial statements.
Under the Pillar Two legislation, we would be liable to pay a top-up tax when the effective tax rate in a jurisdiction is below the 15% minimum rate. All entities within the Franco-Nevada group, other than its one subsidiary that operates in Barbados have an effective tax rate that exceeds 15%.
We are in the process of assessing our exposure to Pillar Two taxes and will recognize and disclose known or reasonably estimable information related to such exposure when legislation becomes enacted or substantively enacted in Canada and Barbados.
2023 Management’s Discussion and Analysis |
9 |
Portfolio Updates
Additional updates related to our portfolio of assets are available in our News Release issued on March 5, 2024 available on SEDAR+ at www.sedarplus.com and EDGAR at www.sec.gov.
Cobre Panama Updates
| (a) | Revised Concession Contract and Law 406 |
First Quantum Minerals Ltd. (“First Quantum”), its subsidiary, Minera Panama, S.A. (“MPSA”), and the GOP had been engaged in discussions regarding a revised concession contract for Cobre Panama. On March 8, 2023, First Quantum and the GOP announced that an agreement had been reached on the terms and conditions for a revised concession contract (together with subsequent modifications, the “Revised Concession Contract”). The Revised Concession Contract provides for an initial 20-year term with a 20-year extension option and additional extensions for life of mine. On October 20, 2023, the National Assembly of Panama approved the Revised Concession Contract through Law 406 with retroactive effect to December 22, 2021.
| (b) | Constitutional Proceedings and Mining Moratorium |
On and after October 23, 2023, amid protests against the GOP and the Revised Concession Contract, a number of claims were lodged with the Supreme Court asserting that Law 406 (which gave legal effect to the Revised Concession Contract) was unconstitutional. MPSA was not a party to that proceeding.
On October 29, 2023, President Cortizo announced that the GOP would hold a referendum on whether to terminate the Revised Concession Contract approved by Law 406 and impose a national moratorium on mining.
The National Assembly of Panama withdrew the proposal to hold a referendum on Law 406. However, on November 3, 2023, the National Assembly approved, and President Cortizo signed, Law 407, which declared a mining moratorium for an indefinite duration within Panama, including preventing any new mining concession from being granted or any existing mining concessions from being renewed or extended.
On November 27, 2023, the Supreme Court issued a ruling (released publicly the following day) declaring Law 406 unconstitutional and stating that the effect of the ruling was that the Revised Concession Contract purportedly no longer exists. The ruling was subsequently published in the Official Gazette on December 2, 2023. The Supreme Court did not order the closure of the Cobre Panama mine.
| (c) | Preservation and Safe Management |
During the protests, Cobre Panama experienced illegal blockades at the Punta Rincón port and at the roads to the site that prevented the delivery of supplies that were necessary to operate the power plant. The illegal blockades at the roads to the mine site have dissipated, allowing for the delivery by road and at port of necessary supplies to conduct the P&SM program.
On December 19, 2023, the MICI announced plans for Cobre Panama which was followed by a request from MPSA for a P&SM plan for Cobre Panama. In January 2024, First Quantum and MICI had discussions related to a formalized P&SM program and the associated costs for Cobre Panama. At the request of MICI, MPSA delivered a preliminary draft for the first phase of P&SM on January 16, 2024.
Approval of Candelaria 2040 Environmental Impact Assessment
Lundin Mining Corporation announced that Antamina’s Environmental Impact Assessment (“EIA”) for the extension of operations and mine life for the Candelaria mine was approved by the Regional Environmental Commission of Atacama on September 8, 2023. Approval of the EIA will allow for the extension of Candelaria's mine life to 2040 and include various measures that will support sustainable social, economic, and environmental development in the Atacama Region.
Approval of Antamina Modified Environmental Impact Assessment
Teck Resources Limited announced that Antamina’s Modification of Environmental Impact Assessment (“MEIA”) was approved on February 14, 2024. The MEIA allows the extension of the Antamina mine life from 2028 to 2036.
2023 Management’s Discussion and Analysis |
10 |
The following contains forward-looking statements. For a description of material factors that could cause our actual results to differ materially from the forward-looking statements below, please see the “Cautionary Statement on Forward-Looking Information” section at the end of this MD&A and the “Risk Factors” section of our most recent Annual Information Form filed with the Canadian securities regulatory authorities on www.sedarplus.com and our most recent Form 40-F filed with the SEC on www.sec.gov. The Company’s Annual Information Form and Form 40-F for the year ended December 31, 2023 will be filed before March 29, 2024 and will be available on www.sedarplus.com and www.sec.gov, respectively. The 2024 guidance and five-year outlook is based on assumptions including the forecasted state of operations from our assets based on the public statements and other disclosures by the third-party owners and operators of the underlying properties and our assessment thereof.
We present our guidance in reference to GEO sales. For streams, our projected GEOs reflect GEOs we acquire from the operators of our assets and subsequently sell. Our GEO sales may differ from operators’ production based on timing of deliveries, and are presented net of recovery and payability factors.
We assume Cobre Panama will remain on P&SM through 2024 and have not included any contributions from the asset in our guidance. We expect an increase in GEO sales from the balance of our Precious Metal assets in 2024 compared to their GEO sales in 2023 with initial contributions from new mines including Tocantinzinho, Greenstone, and Salares Norte. We are guiding to lower GEOs from our Energy assets based on lower assumed oil and gas prices.
|
|
|
2024 guidance |
|
|
2023 actual |
|
Cobre Panama GEO sales |
|
|
- |
|
|
128,598 |
|
Precious Metal GEO sales (excluding Cobre Panama) |
|
|
360,000 - 400,000 |
|
|
359,591 |
|
Total GEO sales (excluding Cobre Panama) |
|
|
480,000 - 540,000 |
|
|
498,447 |
|
| 1 | We expect our streams to contribute between 240,000 and 280,000 of our GEO sales for 2024. For 2023, we sold 372,882 GEOs from our streams. |
| 2 | For our 2024 guidance, when reflecting revenue earned from gold, silver, platinum, palladium, iron ore, oil and gas commodities as GEOs, we have assumed the following prices: $1,950/oz Au, $22.50/oz Ag, $850/oz Pt, $900/oz Pd, $115/tonne Fe 62% CFR China, $75/bbl WTI oil and $2.50/mcf Henry Hub natural gas. |
| 3 | Total GEO sales guidance does not assume any other acquisitions and does not reflect any incremental revenue from additional contributions we may make to the Royalty Acquisition Venture with Continental as part of our remaining commitment of $69.8 million. |
Precious Metals
| ● | South America: For Candelaria, we forecast between 72,500 and 82,500 GEOs sold, an increase from 66,710 GEOs sold in 2023 due to mine sequencing and the mine plan grade profile. For Antapaccay, we anticipate GEOs sold to decrease from 61,158 GEOs in 2023 to between 50,000 and 60,000 GEOs based on the mining sequence. For Antamina, we anticipate between 2.0 and 2.4 million silver ounces in 2024, consistent with silver ounces sold in 2023. We expect this to be equivalent to between 22,500 and 27,500 GEOs based on the commodity prices we assumed for 2024. We also expect initial contributions from our Tocantinzinho stream and royalties on Salares Norte and Mara Rosa. |
| ● | Central America & Mexico: We assumed no deliveries from our Cobre Panama streams, with the mine currently in a P&SM with production halted. For Guadalupe-Palmarejo, we anticipate deliveries to be relatively consistent with those received in 2023, ranging between 32,500 and 37,500 GEOs, with between 30% and 40% of Palmajero’s gold sales to be covered by our stream. |
| ● | United States: We anticipate improved PGM production at Stillwater following the recovery from a shaft incident in the first half of 2023, offset by the impact of lower forecasted PGM prices which are expected to result in a lower GEO conversion ratio than in 2023. At Marigold, we expect lower royalty payments as production at the mine is expected to decrease following record production in 2023, coupled with production taking place on ground that carries a lower royalty rate. We also anticipate slightly lower production at Goldstrike, Bald Mountain and Gold Quarry. |
| ● | Canada: We expect higher royalty payments from our Canadian assets, with a first full year of production at Magino and the start of production at Greenstone anticipated in mid-2024. Production at Detour is also anticipated to increase as the mill continues to ramp-up to a throughput rate of 28 million tonnes per annum by the end of 2024. Production at Hemlo is also expected to improve relative to 2023, where production was impacted by interruptions to the underground operations during the year. We also expect an increase of production at Brucejack, now owned by Newmont. |
2023 Management’s Discussion and Analysis |
11 |
| ● | Rest of World: Tasiast is expected to deliver another strong year of production after achieving record throughput in Q4 2023. Production at Subika is expected to increase relative to 2023 due to higher open pit grade, strong underground mining rate, and reaching full processing rates in Q2 2024 after the planned delivery of a replacement girth gear. Séguéla will provide a first full year of royalty payments, having poured first gold in May 2023. We forecast MWS to deliver slightly fewer GEOs compared to 2023, as the stream is anticipated to reach its cap towards the end of the year. In Australia, we expect lower royalty payments from Duketon due to lower total production in 2024 as well as a lower proportion of production being sourced from our royalty ground. Payments from our Yandal royalty, which covers the Orelia pit, are anticipated to increase as availability improves at the recently expanded Thunderbox mill. |
Diversified
| ● | Iron ore: For our Iron Ore assets, which comprise our interests in Vale and LIORC, we assumed benchmark prices of $115/tonne 62% Fe. Together with our Other Mining assets, including our interest in Caserones, we expect our Diversified Mining assets to contribute between 25,000 and 40,000 GEOs, compared to 31,366 GEOs in 2023. |
| ● | Energy: For our Energy assets, we expect between 85,000 and 105,000 GEOs, compared to 107,490 GEOs in 2023. The decrease reflects lower assumed commodity prices than in 2023, with $75/bbl WTI for oil and $2.50/mcf Henry Hub for natural gas, and slightly lower anticipated production at our U.S. assets, partly offset by initial contributions from our recently acquired interests in the Haynesville. In 2023, we also benefited from catch-up royalty payments which are not expected to recur in 2024. With respect to our Canadian assets, production from the Weyburn Unit is forecasted to remain relatively stable, but our Weyburn NRI is expected to be impacted by higher capital costs. |
Depletion: We estimate depletion and depreciation expense in 2024 to be between $230.0 million and $260.0 million. In 2023, depletion expense was $273.1 million.
Capital Commitments: As of December 31, 2023, our remaining capital commitment to the Royalty Acquisition Venture with Continental was of $69.8 million, of which between $10.0 million and $20.0 million is expected to be deployed in 2024. In addition, we expect to fulfill our $75.0 million term loan commitment to G Mining Ventures, of which $41.2 million was advanced in January 2024.
5-Year Outlook: We expect our portfolio to produce between 540,000 and 600,000 GEOs in 2028, of which 385,000 to 425,000 GEOs are expected to be generated from Precious Metal assets. This outlook assumes the commencement of production at Valentine Gold, Stibnite Gold, Eskay Creek, Castle Mountain Phase 2, and Copper World. It includes an expected increase in attributable sales from Vale’s Northern and Southeastern systems, higher production from Guadalupe-Palmarejo and Antamina, and continued production from Sudbury through the end of 2028. Production growth from the continued development of our U.S. Energy assets is expected to be partly offset by lower assumed commodity prices when compared to 2023. The outlook anticipates that our Candelaria stream will step down in 2027 from 68% to 40% of gold and silver produced and that our deliveries from Antapaccay will be based on 30% of gold and silver produced rather than indexed to copper production in 2028. At this stage, our outlook does not assume any production from Cobre Panama. Had Cobre Panama remained in production, we would have expected deliveries and sales of between 130,000 and 150,000 GEOs. Refer to the section “Portfolio Updates” for further details.
The prices of gold and other precious metals are the largest factors in determining profitability and cash flow from operations for Franco-Nevada. The price of gold can be volatile and is affected by macroeconomic and industry factors that are beyond our control. Major influences on the gold price include interest rates, fiscal and monetary stimulus, inflation expectations, currency exchange rate fluctuations including the relative strength of the U.S. dollar and supply and demand for gold.
Commodity price volatility also impacts the number of GEOs when reflecting non-gold commodities as GEOs. Silver, platinum, palladium, iron ore, other mining commodities and oil and gas are reflected as GEOs by dividing associated revenue, which includes settlement adjustments, by the relevant gold price. The price used in the computation of GEOs earned from a particular asset varies depending on the royalty or stream agreement, which may make reference to the market price realized by the operator, or the average price for the month, quarter, or year in which the commodity was produced or sold.
Gold prices hit new highs in 2023 but were volatile during the year, impacted by central bank buying, the U.S. interest rate outlook, and the relative strength of the U.S. dollar. After trading at elevated prices in 2022, oil and gas prices declined in 2023, following slower global growth, a moderate European winter, and high levels of North American inventory. Refer to the commodity price tables on pages 14 and 19 of this MD&A for further details.
2023 Management’s Discussion and Analysis |
12 |
REVENUE BY ASSET
Our portfolio is well-diversified with GEOs and revenue being earned from numerous assets in various jurisdictions. The following table details revenue earned from our royalty, stream and working interests for the three months and years ended December 31, 2023 and 2022:
|
|
|
|
|
For the three months ended |
|
|
For the year ended |
|
||||||||||
(expressed in millions) |
|
Interest and % |
|
|
December 31, |
|
|
December 31, |
|
||||||||||
Property |
|
(Gold unless otherwise indicated) |
|
|
2023 |
|
|
2022 |
|
|
2023 |
|
|
2022 |
|
||||
PRECIOUS METALS |
|
|
|
|
|
|
|
|
|
|
|
|
|
|
|
|
|
|
|
South America |
|
|
|
|
|
|
|
|
|
|
|
|
|
|
|
|
|
|
|
Candelaria |
|
Stream 68% Gold & Silver |
|
|
$ |
31.7 |
|
|
$ |
34.0 |
|
|
$ |
130.3 |
|
|
$ |
125.8 |
|
Antapaccay |
|
Stream (indexed) Gold & Silver |
|
|
|
34.3 |
|
|
|
23.2 |
|
|
|
120.1 |
|
|
|
95.2 |
|
Antamina |
|
Stream 22.5% Silver |
|
|
|
12.8 |
|
|
|
14.7 |
|
|
|
50.5 |
|
|
|
68.4 |
|
Condestable |
|
Stream Gold & Silver, Fixed through 2025 then % |
|
|
|
6.2 |
|
|
|
5.7 |
|
|
|
23.7 |
|
|
|
22.4 |
|
Other |
|
|
|
|
|
1.2 |
|
|
|
1.4 |
|
|
|
5.2 |
|
|
|
6.3 |
|
Central America & Mexico |
|
|
|
|
|
|
|
|
|
|
|
|
|
|
|
|
|
|
|
Cobre Panama |
|
Stream (indexed) Gold & Silver |
|
|
$ |
55.4 |
|
|
$ |
56.9 |
|
|
$ |
248.9 |
|
|
$ |
223.3 |
|
Guadalupe-Palmarejo |
|
Stream 50% |
|
|
|
16.1 |
|
|
|
16.0 |
|
|
|
66.8 |
|
|
|
74.2 |
|
United States |
|
|
|
|
|
|
|
|
|
|
|
|
|
|
|
|
|
|
|
Stillwater |
|
NSR 5% PGM |
|
|
$ |
6.3 |
|
|
$ |
9.4 |
|
|
$ |
26.1 |
|
|
$ |
36.8 |
|
Goldstrike |
|
NSR 2-4%, NPI 2.4-6% |
|
|
|
3.7 |
|
|
|
4.4 |
|
|
|
13.1 |
|
|
|
19.2 |
|
Marigold |
|
NSR 1.75-5%, GR 0.5-4% |
|
|
|
2.0 |
|
|
|
2.9 |
|
|
|
11.2 |
|
|
|
7.5 |
|
Bald Mountain |
|
NSR/GR 0.875-5% |
|
|
|
3.1 |
|
|
|
3.2 |
|
|
|
11.7 |
|
|
|
8.4 |
|
Gold Quarry |
|
NSR 7.29% |
|
|
|
— |
|
|
|
— |
|
|
|
3.0 |
|
|
|
4.9 |
|
Other |
|
|
|
|
|
2.3 |
|
|
|
2.4 |
|
|
|
6.9 |
|
|
|
9.5 |
|
Canada |
|
|
|
|
|
|
|
|
|
|
|
|
|
|
|
|
|
|
|
Detour Lake |
|
NSR 2% |
|
|
$ |
7.1 |
|
|
$ |
6.2 |
|
|
$ |
25.9 |
|
|
$ |
26.3 |
|
Sudbury |
|
Stream 50% PGM & Gold |
|
|
|
3.4 |
|
|
|
6.3 |
|
|
|
17.6 |
|
|
|
21.4 |
|
Hemlo |
|
NSR 3%, NPI 50% |
|
|
|
6.8 |
|
|
|
3.8 |
|
|
|
22.7 |
|
|
|
28.2 |
|
Brucejack |
|
NSR 1.2% |
|
|
|
1.1 |
|
|
|
1.2 |
|
|
|
5.9 |
|
|
|
5.8 |
|
Kirkland Lake |
|
NSR 1.5-5.5%, NPI 20% |
|
|
|
1.7 |
|
|
|
1.3 |
|
|
|
6.3 |
|
|
|
5.5 |
|
Other |
|
|
|
|
|
3.8 |
|
|
|
3.6 |
|
|
|
13.9 |
|
|
|
10.4 |
|
Rest of World |
|
|
|
|
|
|
|
|
|
|
|
|
|
|
|
|
|
|
|
MWS |
|
Stream 25% |
|
|
$ |
16.6 |
|
|
$ |
9.8 |
|
|
$ |
50.4 |
|
|
$ |
39.2 |
|
Tasiast |
|
NSR 2% |
|
|
|
6.3 |
|
|
|
4.8 |
|
|
|
24.5 |
|
|
|
18.3 |
|
Subika (Ahafo) |
|
NSR 2% |
|
|
|
4.7 |
|
|
|
6.0 |
|
|
|
19.4 |
|
|
|
18.0 |
|
Sabodala |
|
Stream 6%, Fixed to 105,750 oz |
|
|
|
4.7 |
|
|
|
4.1 |
|
|
|
18.3 |
|
|
|
16.8 |
|
Duketon |
|
NSR 2% |
|
|
|
3.0 |
|
|
|
2.2 |
|
|
|
12.0 |
|
|
|
10.7 |
|
Other |
|
|
|
|
|
4.4 |
|
|
|
2.9 |
|
|
|
16.5 |
|
|
|
17.2 |
|
|
|
|
|
|
$ |
238.7 |
|
|
$ |
226.4 |
|
|
$ |
950.9 |
|
|
$ |
919.7 |
|
DIVERSIFIED |
|
|
|
|
|
|
|
|
|
|
|
|
|
|
|
|
|
|
|
Vale |
|
Various Royalty Rates |
|
|
$ |
9.0 |
|
|
$ |
7.6 |
|
|
$ |
35.1 |
|
|
$ |
40.7 |
|
LIORC |
|
GORR 0.7% Iron Ore, IOC Equity 1.5%(1) |
|
|
|
2.2 |
|
|
|
3.2 |
|
|
|
12.1 |
|
|
|
14.8 |
|
Other mining assets |
|
|
|
|
|
2.9 |
|
|
|
0.5 |
|
|
|
13.2 |
|
|
|
6.9 |
|
United States (Energy) |
|
|
|
|
|
|
|
|
|
|
|
|
|
|
|
|
|
|
|
Marcellus |
|
GORR 1% |
|
|
$ |
6.9 |
|
|
$ |
12.0 |
|
|
$ |
28.0 |
|
|
$ |
56.5 |
|
Haynesville |
|
Various Royalty Rates |
|
|
|
5.9 |
|
|
|
23.7 |
|
|
|
26.0 |
|
|
|
72.9 |
|
SCOOP/STACK |
|
Various Royalty Rates |
|
|
|
8.4 |
|
|
|
13.9 |
|
|
|
33.1 |
|
|
|
57.8 |
|
Permian Basin |
|
Various Royalty Rates |
|
|
|
11.6 |
|
|
|
14.2 |
|
|
|
47.6 |
|
|
|
52.6 |
|
Other |
|
|
|
|
|
— |
|
|
|
0.1 |
|
|
|
0.3 |
|
|
|
0.3 |
|
Canada (Energy) |
|
|
|
|
|
|
|
|
|
|
|
|
|
|
|
|
|
|
|
Weyburn |
|
NRI 11.71%, ORR 0.44%, WI 2.56% |
|
|
$ |
11.9 |
|
|
$ |
12.8 |
|
|
$ |
50.1 |
|
|
$ |
65.0 |
|
Orion |
|
GORR 4% |
|
|
|
3.3 |
|
|
|
2.7 |
|
|
|
13.6 |
|
|
|
15.1 |
|
Other |
|
|
|
|
|
2.5 |
|
|
|
3.3 |
|
|
|
9.0 |
|
|
|
13.4 |
|
|
|
|
|
|
$ |
64.6 |
|
|
$ |
94.0 |
|
|
$ |
268.1 |
|
|
$ |
396.0 |
|
Revenue |
|
|
|
|
$ |
303.3 |
|
|
$ |
320.4 |
|
|
$ |
1,219.0 |
|
|
$ |
1,315.7 |
|
1 Interest attributable to Franco-Nevada’s 9.9% equity ownership of Labrador Iron Ore Royalty Corporation.
2023 Management’s Discussion and Analysis |
13 |
REVIEW OF QUARTERLY FINANCIAL PERFORMANCE
The prices of precious metals, iron ore, and oil and gas and production from our assets are the largest factors in determining our profitability and cash flow from operations. The following table summarizes average commodity prices and average exchange rates during the periods presented.
|
|
|
|
|
|
|
|
|
|
|
|||
Quarterly average prices and rates |
|
|
|
|
Q4 2023 |
|
|
Q4 2022 |
|
Variance |
|||
Gold(1) |
|
($/oz) |
|
|
$ |
1,976 |
|
|
$ |
1,729 |
|
14.3 |
% |
Silver(1) |
|
($/oz) |
|
|
|
23.23 |
|
|
|
21.20 |
|
9.6 |
% |
Platinum(1) |
|
($/oz) |
|
|
|
912 |
|
|
|
971 |
|
(6.1) |
% |
Palladium(1) |
|
($/oz) |
|
|
|
1,085 |
|
|
|
1,940 |
|
(44.1) |
% |
Iron Ore Fines 62% Fe CFR China |
|
($/tonne) |
|
|
|
127 |
|
|
|
98 |
|
29.6 |
% |
|
|
|
|
|
|
|
|
|
|
|
|
|
|
Edmonton Light |
|
(C$/bbl) |
|
|
|
96.68 |
|
|
|
108.41 |
|
(10.8) |
% |
West Texas Intermediate |
|
($/bbl) |
|
|
|
78.32 |
|
|
|
82.65 |
|
(5.2) |
% |
Henry Hub |
|
($/mcf) |
|
|
|
2.91 |
|
|
|
6.09 |
|
(52.2) |
% |
|
|
|
|
|
|
|
|
|
|
|
|
|
|
CAD/USD exchange rate(2) |
|
|
|
|
|
0.7343 |
|
|
|
0.7364 |
|
(0.3) |
% |
| 1 | Based on LBMA PM Fix for gold, platinum and palladium. Based on LBMA Fix for silver. |
| 2 | Based on Bank of Canada daily rates. |
Revenue and GEOs
Revenue and GEO sales by commodity, geographical location and type of interest for the three months ended December 31, 2023 and 2022 were as follows:
|
|
|
Gold Equivalent Ounces(1) |
|
|
Revenue (in millions) |
|
|||||||||||||
For the three months ended December 31, |
|
|
2023 |
|
|
2022 |
|
Variance |
|
|
2023 |
|
|
2022 |
|
Variance |
|
|||
Commodity |
|
|
|
|
|
|
|
|
|
|
|
|
|
|
|
|
|
|
|
|
Gold |
|
|
99,998 |
|
|
102,583 |
|
(2,585) |
|
|
$ |
198.7 |
|
|
$ |
178.2 |
|
$ |
20.5 |
|
Silver |
|
|
15,492 |
|
|
18,493 |
|
(3,001) |
|
|
|
31.2 |
|
|
|
32.7 |
|
|
(1.5) |
|
PGM |
|
|
4,091 |
|
|
8,566 |
|
(4,475) |
|
|
|
8.8 |
|
|
|
15.5 |
|
|
(6.7) |
|
Precious Metals |
|
|
119,581 |
|
|
129,642 |
|
(10,061) |
|
|
$ |
238.7 |
|
|
$ |
226.4 |
|
$ |
12.3 |
|
Iron ore |
|
|
5,620 |
|
|
6,230 |
|
(610) |
|
|
$ |
11.2 |
|
|
$ |
10.8 |
|
$ |
0.4 |
|
Other mining assets |
|
|
1,510 |
|
|
301 |
|
1,209 |
|
|
|
2.9 |
|
|
|
0.5 |
|
|
2.4 |
|
Oil |
|
|
16,406 |
|
|
19,619 |
|
(3,213) |
|
|
|
32.7 |
|
|
|
34.2 |
|
|
(1.5) |
|
Gas |
|
|
6,860 |
|
|
24,630 |
|
(17,770) |
|
|
|
13.1 |
|
|
|
42.5 |
|
|
(29.4) |
|
NGL |
|
|
2,374 |
|
|
3,464 |
|
(1,090) |
|
|
|
4.7 |
|
|
|
6.0 |
|
|
(1.3) |
|
Diversified |
|
|
32,770 |
|
|
54,244 |
|
(21,474) |
|
|
$ |
64.6 |
|
|
$ |
94.0 |
|
$ |
(29.4) |
|
|
|
|
152,351 |
|
|
183,886 |
|
(31,535) |
|
|
$ |
303.3 |
|
|
$ |
320.4 |
|
$ |
(17.1) |
|
Geography |
|
|
|
|
|
|
|
|
|
|
|
|
|
|
|
|
|
|
|
|
South America |
|
|
47,984 |
|
|
49,135 |
|
(1,151) |
|
|
$ |
96.6 |
|
|
$ |
86.0 |
|
$ |
10.6 |
|
Central America & Mexico |
|
|
36,492 |
|
|
42,023 |
|
(5,531) |
|
|
|
71.7 |
|
|
|
73.2 |
|
|
(1.5) |
|
United States |
|
|
25,648 |
|
|
49,814 |
|
(24,166) |
|
|
|
50.6 |
|
|
|
86.5 |
|
|
(35.9) |
|
Canada |
|
|
21,700 |
|
|
25,394 |
|
(3,694) |
|
|
|
43.8 |
|
|
|
44.4 |
|
|
(0.6) |
|
Rest of World |
|
|
20,527 |
|
|
17,520 |
|
3,007 |
|
|
|
40.6 |
|
|
|
30.3 |
|
|
10.3 |
|
|
|
|
152,351 |
|
|
183,886 |
|
(31,535) |
|
|
$ |
303.3 |
|
|
$ |
320.4 |
|
$ |
(17.1) |
|
Type |
|
|
|
|
|
|
|
|
|
|
|
|
|
|
|
|
|
|
|
|
Revenue-based royalties |
|
|
49,316 |
|
|
72,046 |
|
(22,730) |
|
|
$ |
97.0 |
|
|
$ |
124.6 |
|
$ |
(27.6) |
|
Streams |
|
|
90,641 |
|
|
97,370 |
|
(6,729) |
|
|
|
181.4 |
|
|
|
170.6 |
|
|
10.8 |
|
Profit-based royalties |
|
|
8,088 |
|
|
9,742 |
|
(1,654) |
|
|
|
16.1 |
|
|
|
16.8 |
|
|
(0.7) |
|
Other |
|
|
4,306 |
|
|
4,728 |
|
(422) |
|
|
|
8.8 |
|
|
|
8.4 |
|
|
0.4 |
|
|
|
|
152,351 |
|
|
183,886 |
|
(31,535) |
|
|
$ |
303.3 |
|
|
$ |
320.4 |
|
$ |
(17.1) |
|
| 1 | Refer to Note 1 at the bottom of page 4 of this MD&A for the methodology for calculating GEOs and, for illustrative purposes, to the average commodity price table above for indicative prices which may be used in the calculations of GEOs. |
2023 Management’s Discussion and Analysis |
14 |
We earned $303.3 million in revenue in Q4 2023, down 5.3% from Q4 2022. The decrease in our revenue is primarily attributed to lower oil, gas and PGM prices, partly offset by higher gold prices. In Q4 2023, we earned 78.7% of our revenue from Precious Metals, up from 70.7% in Q4 2022. Geographically, 86.6% of our revenue was derived from the Americas in Q4 2023, compared to 90.5% in Q4 2022.

We sold 152,351 GEOs in Q4 2023 compared to 183,886 GEOs in Q4 2022. The decrease in GEOs is primarily due to lower contributions from our Energy assets as a result of a decrease in gas prices compared to the relative highs of the prior year period, coupled with the impact of a less favourable conversion ratio to GEOs for our PGM assets. A comparison of our sources of GEOs in Q4 2023 to Q4 2022 is shown below:
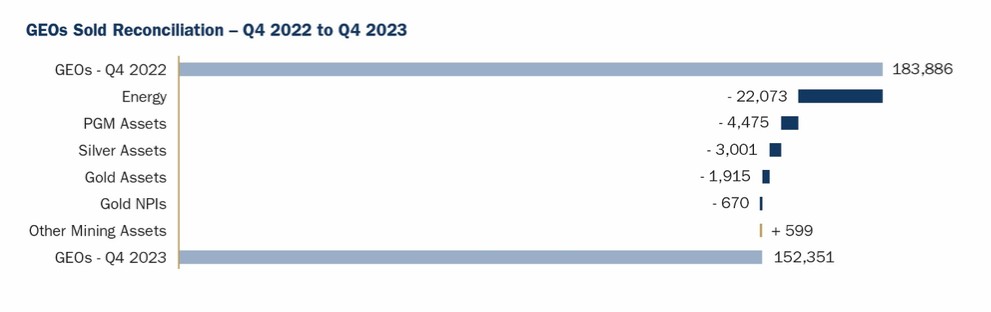
2023 Management’s Discussion and Analysis |
15 |
Precious Metals
Our Precious Metal assets contributed 119,581 GEOs in Q4 2023, compared to 129,642 GEOs in Q4 2022. The decrease is primarily due to the following:
| ● | Cobre Panama – We sold 28,318 GEOs from our Cobre Panama streams in Q4 2023, compared to 32,778 GEOs in Q4 2022. After the successful completion of the CP100 Expansion project, Cobre Panama halted operations in November 2023 and was placed in P&SM. |
| ● | Candelaria – We sold 15,772 GEOs from our Candelaria stream in Q4 2023, compared to 19,591 GEOs in Q4 2022, reflecting lower production at the mine. |
| ● | Stillwater – We sold 3,160 GEOs in Q4 2023, compared to 5,454 GEOs in Q4 2022. While PGM production increased relative to the prior year period, the decrease in palladium and platinum prices has resulted in a less favourable gold conversion ratio. |
| ● | Antamina – We sold 6,267 GEOs in Q4 2023 from our Antamina stream, compared to 8,154 GEOs in Q4 2022. Silver production at the mine was lower than in the prior year period due to a decrease in average silver grades as anticipated based on the life of mine plan. |
The above decreases were partly offset by the following:
| ● | Antapaccay – We sold 17,033 GEOs from our Antapaccay stream in Q4 2023, compared to 13,399 GEOs in Q4 2022, as copper production at the mine benefited from higher average grades. |
| ● | MWS – We sold 8,402 GEOs from our Mine Waste Solution stream in Q4 2023, compared to 5,653 GEOs in Q4 2022, reflecting increased production at the tailings retreatment operation. |
Diversified
Our Diversified assets, primarily comprising our Iron Ore and Energy interests, generated $64.6 million in revenue, down from $94.0 million in Q4 2022, as a result of lower oil and gas prices compared to the relative highs of the prior year period. Our Iron Ore assets generated $11.2 million in Q4 2023, compared to $10.8 million in Q4 2022. Our Energy interests contributed $50.5 million in revenue in Q4 2023, compared to $82.7 million in Q4 2022. When converted to GEOs, Diversified assets contributed 32,770 GEOs, down from 54,244 GEOs in Q4 2022. GEOs from our Energy assets also reflect lower gold conversion ratios due to relative changes in commodity prices compared to the prior year period.
Other Mining
| ● | Vale Royalty – We recorded $9.0 million in revenue from our Vale Royalty in Q4 2023 compared to $7.6 million in Q4 2022, reflecting higher estimated iron ore prices. |
| ● | LIORC – Labrador Iron Ore Royalty Corporation (“LIORC”) contributed $2.2 million in revenue in Q4 2023, compared to $3.2 million in Q4 2022. LIORC declared a cash dividend of C$0.45 per common share in the current period, compared to C$0.75 in Q4 2022. Operations at Iron Ore Company of Canada were impacted by extended plant downtime and conveyor belt failures. |
Energy
| ● | U.S. – Revenue from our U.S. Energy interests decreased to $32.8 million in Q4 2023, compared to $63.9 million in Q4 2022. The decrease is largely a reflection of lower realized prices. Production was lower in a number of basins, with the Permian Basin assets being the exception due to the completion of new wells. |
| ● | Canada – Revenue from our Canadian Energy interests slightly decreased relative to the prior year quarter, with $17.7 million earned in Q4 2023 compared to $18.8 million in Q4 2022. For our Weyburn NRI, the impact of lower prices was partly offset by lower operating and capital expenditures incurred at the Weyburn Unit. Production at our Orion asset improved relative to the prior year quarter, more than offsetting the decrease in realized prices. |
2023 Management’s Discussion and Analysis |
16 |
Costs of Sales
The following table provides a breakdown of costs of sales, excluding depletion and depreciation, incurred in the periods presented:
|
|
|
For the three months ended December 31, |
|
||||||||
(expressed in millions) |
|
|
2023 |
|
|
2022 |
|
Variance |
|
|||
Costs of stream sales |
|
|
$ |
40.9 |
|
|
$ |
39.8 |
|
$ |
1.1 |
|
Mineral production taxes |
|
|
|
0.6 |
|
|
|
0.6 |
|
|
— |
|
Mining costs of sales |
|
|
$ |
41.5 |
|
|
$ |
40.4 |
|
$ |
1.1 |
|
Energy costs of sales |
|
|
|
3.6 |
|
|
|
5.4 |
|
|
(1.8) |
|
|
|
|
$ |
45.1 |
|
|
$ |
45.8 |
|
$ |
(0.7) |
|
Costs of sales related to our streams were higher compared to Q4 2022, reflecting the increase in GEOs sold from Antapaccay and MWS. Starting in H2 2023, our applicable cost per ounce at Cobre Panama also increased compared to the prior year period, as our cost per ounce no longer reflects the discount of $100 per ounce which we received as compensation for the timing of the start and ramp-up of production at the mine. Please refer to the “Liquidity and Capital Resources – Purchase Commitments” section on page 30 of this MD&A for further details on the applicable cost per ounce for our streams.
Our costs of sales related to our Energy assets decreased compared to Q4 2022, as these include royalties payable and production taxes which vary based on revenue earned from our Energy assets.
Costs of sales incurred in Q4 2023 compared to Q4 2022 are shown below:
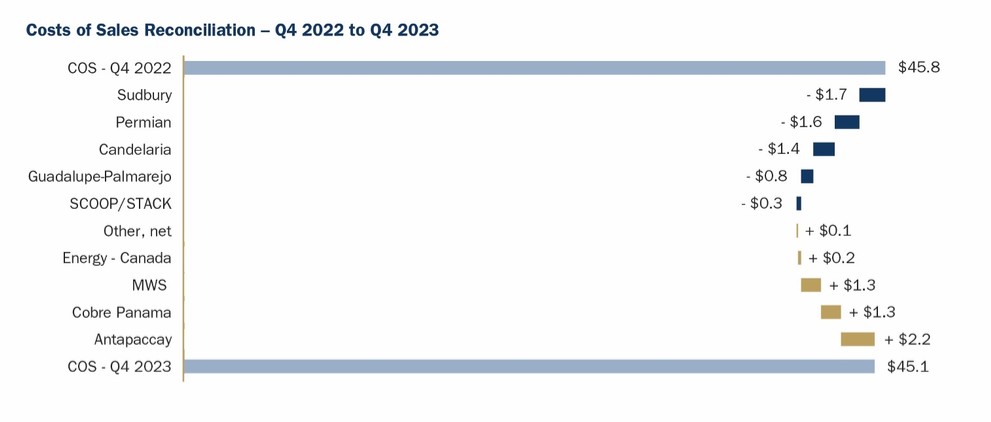
2023 Management’s Discussion and Analysis |
17 |
Depletion and Depreciation
Depletion and depreciation expense totaled $68.9 million in Q4 2023, compared to $73.5 million in Q4 2022. Depletion expense incurred in Q4 2023 compared to Q4 2022 is shown below:
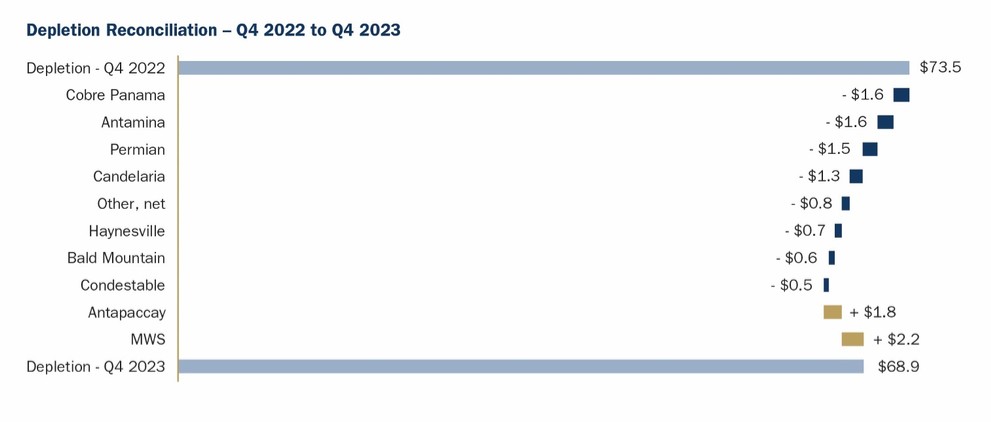
Income Taxes
Income tax expense was $22.7 million in Q4 2023, compared to $30.0 million in Q4 2022, comprised of a current income tax expense of $12.7 million (Q4 2022 – $14.8 million) and a deferred income tax expense of $10.0 million (Q4 2022 – $15.2 million). The decrease in income tax expense was due to changes in the proportion of income earned in each jurisdiction.
Franco-Nevada is undergoing an audit by the CRA of its 2012-2019 taxation years. Refer to the “Contingencies” section of this MD&A for further details.
Net Loss
Net loss for Q4 2023 was $982.5 million, or $5.11 per share, compared to net income of $165.0 million, or $0.86 per share, in Q4 2022. The net loss compared to the net income in the prior year is primarily attributable to the impairment loss of $1,169.2 million recognized in relation to our Cobre Panama asset and lower revenue, partially offset by an increase in finance income earned on our cash and cash equivalents and a decrease in share-based compensation and income tax expenses. Adjusted Net Income was $172.9 million, or $0.90 per share, compared to $164.9 million, or $0.86 per share, in Q4 2022. Please refer to the ”Impairment Losses” section on page 24 of this MD&A for further details on the impairment of Cobre Panama, and to the “Non-GAAP Financial Measures” section of this MD&A for further details on the computation of Adjusted Net Income.
2023 Management’s Discussion and Analysis |
18 |
Review of Annual Financial Performance
The following table summarizes average commodity prices and average exchange rates during the periods presented.
|
|
|
|
|
|
|
|
|
|
|
|||
Average prices and rates |
|
|
|
|
2023 |
|
|
2022 |
|
Variance |
|
||
Gold(1) |
|
($/oz) |
|
|
$ |
1,943 |
|
|
$ |
1,801 |
|
7.9 |
% |
Silver(1) |
|
($/oz) |
|
|
|
23.39 |
|
|
|
21.75 |
|
7.5 |
% |
Platinum(1) |
|
($/oz) |
|
|
|
967 |
|
|
|
961 |
|
0.6 |
% |
Palladium(1) |
|
($/oz) |
|
|
|
1,338 |
|
|
|
2,107 |
|
(36.5) |
% |
Iron Ore Fines 62% Fe CFR China |
|
($/tonne) |
|
|
|
119 |
|
|
|
122 |
|
(2.5) |
% |
|
|
|
|
|
|
|
|
|
|
|
|
|
|
Edmonton Light |
|
(C$/bbl) |
|
|
|
99.55 |
|
|
|
119.73 |
|
(16.9) |
% |
West Texas Intermediate |
|
($/bbl) |
|
|
|
77.62 |
|
|
|
94.23 |
|
(17.6) |
% |
Henry Hub |
|
($/mcf) |
|
|
|
2.66 |
|
|
|
6.51 |
|
(59.1) |
% |
|
|
|
|
|
|
|
|
|
|
|
|
|
|
CAD/USD exchange rate(2) |
|
|
|
|
|
0.7411 |
|
|
|
0.7689 |
|
(3.6) |
% |
| 1 | Based on LBMA PM Fix for gold, platinum and palladium. Based on LBMA Fix for silver. |
| 2 | Based on Bank of Canada daily rates. |
Revenue and GEOs
Revenue and GEO sales by commodity, geographical location and type of interest for the years ended December 31, 2023 and 2022 were as follows:
|
|
|
Gold Equivalent Ounces(1) |
|
|
Revenue (in millions) |
|
|||||||||||||
For the year ended December 31, |
|
|
2023 |
|
|
2022 |
|
Variance |
|
|
2023 |
|
|
2022 |
|
Variance |
|
|||
Commodity |
|
|
|
|
|
|
|
|
|
|
|
|
|
|
|
|
|
|
|
|
Gold |
|
|
403,177 |
|
|
401,756 |
|
1,421 |
|
|
$ |
784.4 |
|
|
$ |
723.1 |
|
$ |
61.3 |
|
Silver |
|
|
64,970 |
|
|
77,232 |
|
(12,262) |
|
|
|
126.7 |
|
|
|
139.9 |
|
|
(13.2) |
|
PGM |
|
|
20,042 |
|
|
31,397 |
|
(11,355) |
|
|
|
39.8 |
|
|
|
56.7 |
|
|
(16.9) |
|
Precious Metals |
|
|
488,189 |
|
|
510,385 |
|
(22,196) |
|
|
$ |
950.9 |
|
|
$ |
919.7 |
|
$ |
31.2 |
|
Iron ore |
|
|
24,421 |
|
|
30,803 |
|
(6,382) |
|
|
$ |
47.2 |
|
|
$ |
55.5 |
|
$ |
(8.3) |
|
Other mining assets |
|
|
6,945 |
|
|
3,760 |
|
3,185 |
|
|
|
13.2 |
|
|
|
6.9 |
|
|
6.3 |
|
Oil |
|
|
71,254 |
|
|
86,068 |
|
(14,814) |
|
|
|
134.9 |
|
|
|
156.0 |
|
|
(21.1) |
|
Gas |
|
|
26,659 |
|
|
84,227 |
|
(57,568) |
|
|
|
54.1 |
|
|
|
150.9 |
|
|
(96.8) |
|
NGL |
|
|
9,577 |
|
|
14,717 |
|
(5,140) |
|
|
|
18.7 |
|
|
|
26.7 |
|
|
(8.0) |
|
Diversified |
|
|
138,856 |
|
|
219,575 |
|
(80,719) |
|
|
$ |
268.1 |
|
|
$ |
396.0 |
|
$ |
(127.9) |
|
|
|
|
627,045 |
|
|
729,960 |
|
(102,915) |
|
|
$ |
1,219.0 |
|
|
$ |
1,315.7 |
|
$ |
(96.7) |
|
Geography |
|
|
|
|
|
|
|
|
|
|
|
|
|
|
|
|
|
|
|
|
South America |
|
|
189,885 |
|
|
200,540 |
|
(10,655) |
|
|
$ |
370.7 |
|
|
$ |
361.8 |
|
$ |
8.9 |
|
Central America & Mexico |
|
|
163,628 |
|
|
165,054 |
|
(1,426) |
|
|
|
316.8 |
|
|
|
298.0 |
|
|
18.8 |
|
United States |
|
|
107,782 |
|
|
181,378 |
|
(73,596) |
|
|
|
208.0 |
|
|
|
327.5 |
|
|
(119.5) |
|
Canada |
|
|
90,464 |
|
|
114,799 |
|
(24,335) |
|
|
|
177.1 |
|
|
|
205.9 |
|
|
(28.8) |
|
Rest of World |
|
|
75,286 |
|
|
68,189 |
|
7,097 |
|
|
|
146.4 |
|
|
|
122.5 |
|
|
23.9 |
|
|
|
|
627,045 |
|
|
729,960 |
|
(102,915) |
|
|
$ |
1,219.0 |
|
|
$ |
1,315.7 |
|
$ |
(96.7) |
|
Type |
|
|
|
|
|
|
|
|
|
|
|
|
|
|
|
|
|
|
|
|
Revenue-based royalties |
|
|
196,885 |
|
|
275,893 |
|
(79,008) |
|
|
$ |
380.0 |
|
|
$ |
496.0 |
|
$ |
(116.0) |
|
Streams |
|
|
372,882 |
|
|
382,510 |
|
(9,628) |
|
|
|
726.7 |
|
|
|
690.0 |
|
|
36.7 |
|
Profit-based royalties |
|
|
33,282 |
|
|
48,241 |
|
(14,959) |
|
|
|
64.9 |
|
|
|
87.1 |
|
|
(22.2) |
|
Other |
|
|
23,996 |
|
|
23,316 |
|
680 |
|
|
|
47.4 |
|
|
|
42.6 |
|
|
4.8 |
|
|
|
|
627,045 |
|
|
729,960 |
|
(102,915) |
|
|
$ |
1,219.0 |
|
|
$ |
1,315.7 |
|
$ |
(96.7) |
|
| 1 | Refer to Note 1 at the bottom of page 4 of this MD&A for the methodology for calculating GEOs and, for illustrative purposes, to the average commodity price table above for indicative prices which may be used in the calculations of GEOs. |
2023 Management’s Discussion and Analysis |
19 |
We earned $1,219.0 million in revenue in 2023, down 7.3% from 2022. The decrease in our revenue is primarily attributed to lower oil and gas prices and PGM prices, partly offset by higher gold prices. We earned 78.0% of our 2023 revenue from Precious Metal assets, compared to 69.9% in 2022. Geographically, we remain heavily invested in the Americas, with 88.0% of revenue in 2023, compared to 90.7% in 2022.
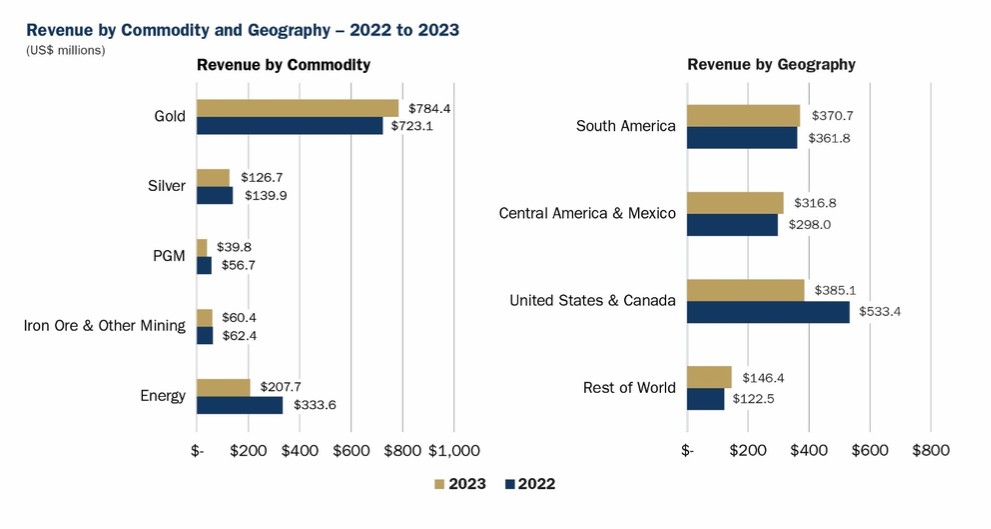
We sold 627,045 GEOs in 2023, compared to 729,960 GEOs in 2022. The decrease in GEOs is primarily due to lower contributions from our Energy assets as a result of a decrease in oil and gas prices compared to the relative highs of the prior year period, coupled with the impact of a less favourable conversion ratio to GEOs for our silver and PGM assets. A comparison of our sources of GEOs in 2023 to 2022 is shown below:
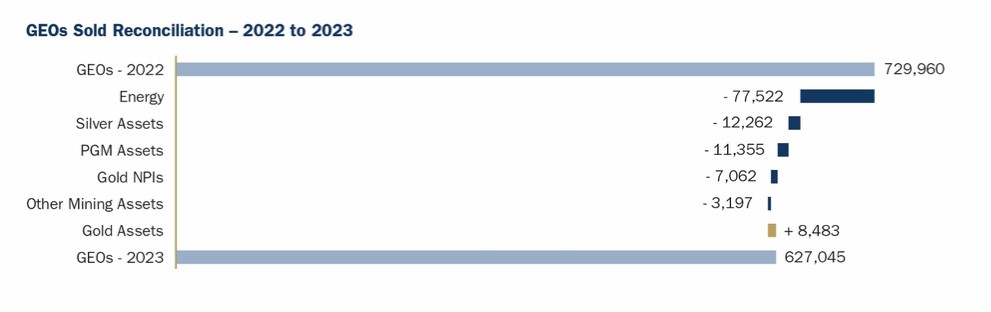
2023 Management’s Discussion and Analysis |
20 |
Precious Metals
Our Precious Metal assets contributed 488,189 GEOs in 2023, down from 510,385 GEOs in 2022. The decrease in GEOs from Precious Metal assets compared to the prior year was primarily due to the following:
| ● | Antamina – We sold 25,843 GEOs in 2023 from our Antamina stream, compared to 37,572 GEOs in 2022. As expected, silver ounces sold decreased in the current period compared to the year period reflecting lower than average silver grades. In addition, production at the mine was also impacted by Cyclone Yaku which constrained logistics in March and April 2023. |
| ● | Stillwater – We earned 13,416 GEOs from Stillwater in 2023, compared to 20,265 GEOs in 2022. Production at the mine has been impacted by ongoing operational challenges, as well as an incident that damaged shaft infrastructure in March 2023. In addition, the decrease in GEOs reflects a lower gold conversion ratio compared to 2022, due to the underperformance of palladium prices relative to gold prices. |
| ● | Guadalupe-Palmarejo – We sold 34,455 GEOs from our Guadalupe-Palmarejo stream in 2023 compared to 41,000 GEOs in 2022 due to lower production at the mine and a lesser proportion of production being sourced from ground covered by our stream. |
| ● | Goldstrike – We earned 6,715 GEOs from our Goldstrike royalties, compared to 10,624 GEOs in 2022. Production at the mine was impacted by a shutdown for the conversion of the Goldstrike autoclave to a conventional carbon-in-leach process in the first quarter of 2023. |
The above decreases were partly offset by the following factors:
| ● | Cobre Panama – We sold 128,598 GEOs in 2023, compared to 123,769 GEOs in 2022. Production at the mine benefited from higher copper grades and recoveries compared to the prior year, as well as the completion of the CP100 Expansion project prior to the halting of production in November 2023. Production was suspended earlier in the year, in February 2023, for 15 days as a result of export restrictions. The mine currently remains in P&SM. |
| ● | Antapaccay – We sold 61,158 GEOs in 2023, compared to 53,023 GEOs in 2022. Production at the mine benefited from higher copper grades and recoveries compared to the prior year. As a result of socio-political tensions in early 2023, logistics were constrained and operations were temporarily suspended in Q1 2023. Operations returned to normalized levels in March 2023. |
| ● | MWS – We sold 25,925 GEOs in 2023, compared to 21,825 GEOs in 2022, reflecting increased production at the tailings retreatment operation. |
Diversified
Our Diversified assets, primarily comprising our Iron Ore and Energy interests, generated $268.1 million in revenue in 2023, compared to $396.0 million in 2022. The decrease was primarily as a result of lower oil and gas prices compared to the relative highs of the prior year. Our Iron Ore assets generated $47.2 million in 2023, compared to $55.5 million in 2022. Our Energy interests contributed $207.7 million in revenue in 2023, compared to $333.6 million in 2022. When converted to GEOs, Diversified assets contributed 138,856 GEOs in 2023, down from 219,575 GEOs in 2022. GEOs from our Energy assets also reflect a lower gold conversion ratio due to relative changes in commodity prices compared to the prior year.
Other Mining
| ● | Vale Royalty – Revenue from Vale was $35.1 million in 2023 compared to $40.7 million in 2022, due to lower estimated iron ore prices and premiums and lagging sales to production. |
| ● | LIORC – LIORC contributed $12.1 million in revenue in 2023 compared to $14.8 million in 2022. Production at Iron Ore Company of Canada in the year was impacted by plant downtime and conveyor belt failures, as well as wildfires in Northern Quebec. |
| ● | Caserones – Revenue from our effective NSR on the Caserones mine was $5.8 million in 2023 compared to $3.0 million in 2022, reflecting both higher production levels and the additional interest we acquired in 2023. |
Energy
| ● | U.S. – Revenue from our U.S. Energy interests decreased to $135.0 million in 2023, compared to $240.1 million in 2022, largely due to lower realized oil and gas prices. Partly offsetting the impact of lower prices was the receipt of approximately $7.0 million in catch-up royalty payments related to new wells from our Permian interests and $1.6 million in lease bonus revenue received in relation to our Haynesville interests. |
| ● | Canada – Revenue from our Canadian Energy interests decreased to $72.7 million in 2023, compared to $93.5 million in 2022, largely due to lower realized oil and gas prices. For our Weyburn NRI, the impact of lower prices was partly offset by lower operating and capital expenditures incurred at the Weyburn Unit. |
2023 Management’s Discussion and Analysis |
21 |
Costs of Sales
The following table provides a breakdown of costs of sales, excluding depletion and depreciation, incurred in the periods presented:
|
|
|
For the year ended December 31, |
|
||||||||
(expressed in millions) |
|
|
2023 |
|
|
2022 |
|
Variance |
|
|||
Costs of stream sales |
|
|
$ |
164.5 |
|
|
$ |
158.2 |
|
$ |
6.3 |
|
Mineral production taxes |
|
|
|
2.1 |
|
|
|
2.1 |
|
|
— |
|
Mining costs of sales |
|
|
$ |
166.6 |
|
|
$ |
160.3 |
|
$ |
6.3 |
|
Energy costs of sales |
|
|
|
12.7 |
|
|
|
16.6 |
|
|
(3.9) |
|
|
|
|
$ |
179.3 |
|
|
$ |
176.9 |
|
$ |
2.4 |
|
Costs of sales related to our streams in 2023 increased relative to 2022, with the increase primarily relating to GEOs sold from Cobre Panama. Starting in H2 2023, our applicable cost per ounce at Cobre Panama no longer reflects the discount of $100 per ounce which we received as compensation for the timing of the start and ramp-up of production at the mine, resulting in an increase in costs of sales compared to the prior year period. Please refer to the “Liquidity and Capital Resources – Purchase Commitments” section on page 30 of this MD&A for further details on the applicable cost per ounce for our streams.
Our costs of sales related to our Energy assets decreased compared to 2022, as these include royalties payable and production taxes which vary based on revenue earned from our Energy assets.
Costs of sales incurred in 2023 compared to 2022 are shown below:
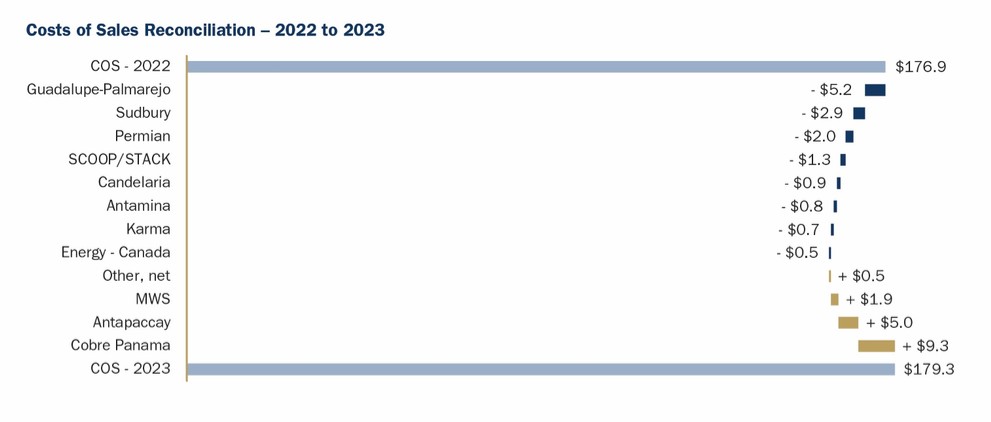
2023 Management’s Discussion and Analysis |
22 |
Depletion and Depreciation
Depletion and depreciation expense totaled $273.1 million in 2023 compared to $286.2 million in 2022, reflecting the decrease in GEOs sold in the current period. Depletion expense incurred in 2023 compared to 2022 is shown below:
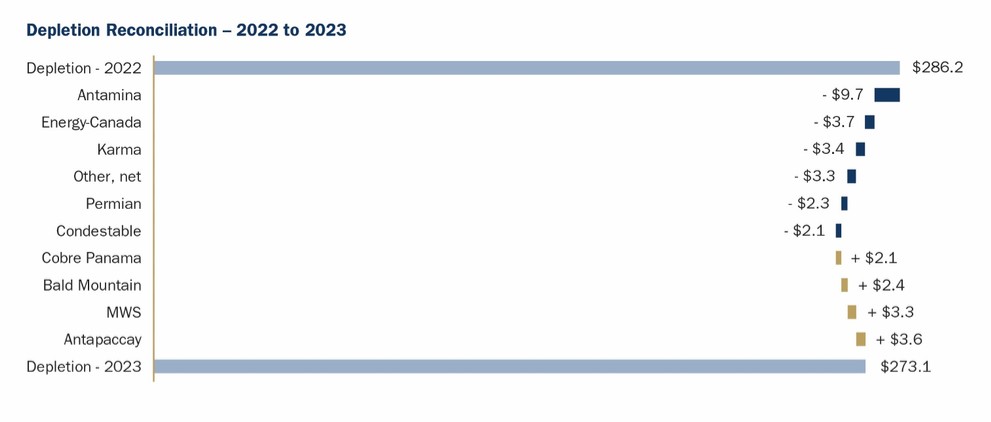
Income Taxes
Income tax expense in 2023 totaled $102.2 million, compared to $133.1 million in 2022, comprised of a current income tax expense of $75.6 million (2022 – $95.7 million) and a deferred income tax expense of $26.6 million (2022 – $37.4 million).
Franco-Nevada is undergoing an audit by the CRA of its 2012-2019 taxation years. Refer to the “Contingencies” section of this MD&A for further details.
Net Loss
Net loss in 2023 was $466.4 million, or $2.43 per share, compared to net income of $700.6 million, or $3.66 per share in 2022. The net loss compared to the net income in the prior year is primarily attributable to the impairment loss of $1,169.2 million we recognized in relation to our Cobre Panama asset, lower GEOs sold and revenue, partly offset by lower depletion and shared-based compensation expenses, and higher finance income earned on our cash and cash equivalents. Adjusted Net Income, which include an adjustment for impairment losses and the gain on the Valentine Gold buy-back, was $683.1 million, or $3.56 per share, compared to $697.6 million, or $3.64 per share, earned in 2022. Please refer to the “Impairment Losses” section on page 24 of this MD&A for further details on the impairment of Cobre Panama, and to the “Non-GAAP Financial Measures” section of this MD&A for further details.
2023 Management’s Discussion and Analysis |
23 |
For the year ended December 31, 2023, we recognized the following impairment losses:
|
|
|
|
2023 |
|
Royalty, stream and working interests, net |
|
|
|
|
|
Cobre Panama |
|
|
$ |
1,169.2 |
|
Energy exploration assets |
|
|
|
4.1 |
|
|
|
|
$ |
1,173.3 |
|
Cobre Panama
We carried out an impairment assessment of our Cobre Panama streams at December 31, 2023. We took a prudent approach in our judgement of the facts and circumstances, and based on the halting of production and the political environment surrounding the ruling by the Supreme Court, we determined the recoverable amount under applicable accounting standards to be nil as at December 31, 2023. As a result, we recognized a full impairment loss of $1,169.2 million in the year ended December 31, 2023. This impairment has been taken without prejudice to, or without at present attributing any specific value to, the legal remedies that may be obtained through any arbitration proceedings or otherwise.
Presidential and national legislative elections are scheduled to take place in May 2024, with a new president, GOP cabinet and National Assembly expected to assume office in July 2024. In the event that there is a change in the facts and circumstances surrounding the halting of production at Cobre Panama, and there is a resumption of precious metal stream deliveries to Franco-Nevada, an assessment of the recoverable amount of the Cobre Panama streams will be performed at that time, which may lead to a reversal of part or all of the impairment loss that has been recognized.
Energy Exploration Assets
During the year ended December 31, 2023, we were notified, pursuant to various royalty agreements, that the explorer/developer of certain of our Energy assets had abandoned tenements, concessions or ground which was subject to royalty rights held by us. As a result, we wrote-off the carrying value of the associated exploration assets to nil. For the year ended December 31, 2023, the total amount written off was $4.1 million.
General and Administrative and Share-Based Compensation Expenses
The following table provides a breakdown of general and administrative expenses and share-based compensation expenses incurred for the periods presented:
|
|
|
For the three months ended December 31, |
|
|
For the year ended December 31, |
|
||||||||||||||||
(expressed in millions) |
|
|
2023 |
|
|
2022 |
|
Variance |
|
|
2023 |
|
|
2022 |
|
Variance |
|
||||||
Salaries and benefits |
|
|
$ |
2.5 |
|
|
$ |
3.0 |
|
$ |
(0.5) |
|
|
$ |
10.2 |
|
|
$ |
9.8 |
|
$ |
0.4 |
|
Professional fees |
|
|
|
2.2 |
|
|
|
1.4 |
|
|
0.8 |
|
|
|
6.2 |
|
|
|
4.8 |
|
|
1.4 |
|
Community contributions |
|
|
|
1.4 |
|
|
|
0.6 |
|
|
0.8 |
|
|
|
1.4 |
|
|
|
1.1 |
|
|
0.3 |
|
Filing fees |
|
|
|
— |
|
|
|
— |
|
|
— |
|
|
|
0.5 |
|
|
|
1.0 |
|
|
(0.5) |
|
Office costs |
|
|
|
0.2 |
|
|
|
0.1 |
|
|
0.1 |
|
|
|
0.7 |
|
|
|
0.6 |
|
|
0.1 |
|
Board of Directors' costs |
|
|
|
0.1 |
|
|
|
0.1 |
|
|
— |
|
|
|
0.5 |
|
|
|
0.4 |
|
|
0.1 |
|
Other |
|
|
|
0.7 |
|
|
|
1.2 |
|
|
(0.5) |
|
|
|
5.0 |
|
|
|
4.8 |
|
|
0.2 |
|
General and administrative expenses |
|
|
$ |
7.1 |
|
|
$ |
6.4 |
|
$ |
0.7 |
|
|
$ |
24.5 |
|
|
$ |
22.5 |
|
$ |
2.0 |
|
Share-based compensation expenses |
|
|
|
(1.9) |
|
|
|
5.4 |
|
|
(7.3) |
|
|
|
4.4 |
|
|
|
10.1 |
|
|
(5.7) |
|
|
|
|
$ |
5.2 |
|
|
$ |
11.8 |
|
$ |
(6.6) |
|
|
$ |
28.9 |
|
|
$ |
32.6 |
|
$ |
(3.7) |
|
General and administrative (“G&A”) and share-based compensation (“SBC”) expenses represented 2.4% of our 2023 revenue, down from 2.5% in 2022.
G&A expenses include business development expenses, which vary based on the level of business development related activities in the period and the timing of the closing of transactions. Included in professional fees are expenses incurred in relation to the intended arbitration proceedings with respect to our investment in the Cobre Panama mine. Community contributions relate to funds we have contributed to various initiatives for the benefit of communities in which we operate, or own assets.
SBC expenses include expenses related to equity-settled stock options, restricted share units (“RSUs”) and deferred share units (“DSUs”), as well as the mark-to-market gain or loss related to the DSUs. Share-based compensation was lower in 2023 than in 2022 owing to the decrease in share price during the period compared to the prior period which resulted in a reduction in the marked-to-market DSU liability, as well as lower expenses related to the vesting of RSUs.
2023 Management’s Discussion and Analysis |
24 |
OTHER INCOME AND EXPENSES
Foreign Exchange and Other Income/Expenses
The following table provides a list of foreign exchange and other income/expenses incurred for the periods presented:
|
|
|
For the three months ended December 31, |
|
|
For the year ended December 31, |
|
||||||||||||||||
(expressed in millions) |
|
|
2023 |
|
|
2022 |
|
Variance |
|
|
2023 |
|
|
2022 |
|
Variance |
|
||||||
Foreign exchange gain |
|
|
$ |
0.2 |
|
|
$ |
0.7 |
|
$ |
(0.5) |
|
|
$ |
2.3 |
|
|
$ |
3.3 |
|
$ |
(1.0) |
|
Changes in fair value of financial instruments |
|
|
|
11.3 |
|
|
|
(0.4) |
|
|
11.7 |
|
|
|
11.3 |
|
|
|
0.3 |
|
|
11.0 |
|
Other income (expense) |
|
|
|
0.8 |
|
|
|
(0.2) |
|
|
1.0 |
|
|
|
0.8 |
|
|
|
— |
|
|
0.8 |
|
|
|
|
$ |
12.3 |
|
|
$ |
0.1 |
|
$ |
12.2 |
|
|
$ |
14.4 |
|
|
$ |
3.6 |
|
$ |
10.8 |
|
Other income (expense) include changes in fair value of financial instruments which relates to the mark-to-market gains or losses of our warrants as well as the fair value revaluation of the Skeena Convertible Debenture.
The parent company’s functional currency is the Canadian dollar, while the functional currency of certain subsidiaries is the U.S. dollar. Under IFRS Accounting Standards, all foreign exchange gains or losses related to monetary assets and liabilities held in a currency other than the functional currency are recorded in net income as opposed to other comprehensive income. In Q4 2023 and 2023, the foreign exchange gain is primarily related to our foreign cash balances and a receivable from our Vale Royalty. The receivable is denominated in Brazilian reais and resulted in a net foreign exchange gain when converted to the Canadian dollar.
Finance Income and Finance Expenses
The following table provides a breakdown of finance income and expenses incurred for the periods presented:
|
|
|
For the three months ended December 31, |
|
|
For the year ended December 31, |
|
||||||||||||||||
(expressed in millions) |
|
|
2023 |
|
|
2022 |
|
Variance |
|
|
2023 |
|
|
2022 |
|
Variance |
|
||||||
Finance income |
|
|
|
|
|
|
|
|
|
|
|
|
|
|
|
|
|
|
|
|
|
|
|
Interest |
|
|
$ |
16.3 |
|
|
$ |
6.7 |
|
$ |
9.6 |
|
|
$ |
52.3 |
|
|
$ |
12.6 |
|
$ |
39.7 |
|
|
|
|
$ |
16.3 |
|
|
$ |
6.7 |
|
$ |
9.6 |
|
|
$ |
52.3 |
|
|
$ |
12.6 |
|
$ |
39.7 |
|
Finance expenses |
|
|
|
|
|
|
|
|
|
|
|
|
|
|
|
|
|
|
|
|
|
|
|
Standby charges |
|
|
$ |
0.6 |
|
|
$ |
0.5 |
|
$ |
0.1 |
|
|
$ |
2.3 |
|
|
$ |
2.2 |
|
$ |
0.1 |
|
Amortization of debt issue costs |
|
|
|
0.1 |
|
|
|
0.2 |
|
|
(0.1) |
|
|
|
0.5 |
|
|
|
0.9 |
|
|
(0.4) |
|
Accretion of lease liabilities |
|
|
|
0.1 |
|
|
|
— |
|
|
0.1 |
|
|
|
0.1 |
|
|
|
0.1 |
|
|
— |
|
|
|
|
$ |
0.8 |
|
|
$ |
0.7 |
|
$ |
0.1 |
|
|
$ |
2.9 |
|
|
$ |
3.2 |
|
$ |
(0.3) |
|
Finance income is earned on our cash and cash equivalents. The increase in finance income earned in the three months and year ended December 31, 2023 is due to the increase in our cash and cash equivalents and the increase in yields compared to the prior year periods. Finance income earned in 2022 also included interest income on the Noront loan receivable which was repaid in May 2022.
Finance expenses consist of standby charges, which represent the costs of maintaining our Corporate Revolver based on the undrawn amounts and the amortization of costs incurred with respect to the initial set-up or subsequent amendments of our Corporate Revolver. In 2023 and 2022, we did not incur interest expense as we did not borrow any amounts under our Corporate Revolver during the periods presented.
2023 Management’s Discussion and Analysis |
25 |
SUMMARY OF QUARTERLY INFORMATION
Selected quarterly financial and statistical information for the most recent eight quarters(1) is set out below:
(in millions, except Average Gold Price, Adjusted EBITDA Margin, GEOs, per GEO amounts and |
|
|
Q4 |
|
|
|
Q3 |
|
|
|
Q2 |
|
|
|
Q1 |
|
|
|
Q4 |
|
|
|
Q3 |
|
|
|
Q2 |
|
|
|
Q1 |
|
per share amounts) |
|
|
2023 |
|
|
|
2023 |
|
|
|
2023 |
|
|
|
2023 |
|
|
|
2022 |
|
|
|
2022 |
|
|
|
2022 |
|
|
|
2022 |
|
Revenue |
|
$ |
303.3 |
|
|
$ |
309.5 |
|
|
$ |
329.9 |
|
|
$ |
276.3 |
|
|
$ |
320.4 |
|
|
$ |
304.2 |
|
|
$ |
352.3 |
|
|
$ |
338.8 |
|
Costs and expenses(2) |
|
|
1,290.9 |
|
|
|
122.5 |
|
|
|
129.4 |
|
|
|
104.2 |
|
|
|
131.5 |
|
|
|
116.0 |
|
|
|
120.7 |
|
|
|
126.8 |
|
Operating (loss) income |
|
|
(987.6) |
|
|
|
187.0 |
|
|
|
200.5 |
|
|
|
172.1 |
|
|
|
188.9 |
|
|
|
188.2 |
|
|
|
231.6 |
|
|
|
212.0 |
|
Other income (expenses) |
|
|
27.8 |
|
|
|
13.0 |
|
|
|
11.0 |
|
|
|
12.0 |
|
|
|
6.1 |
|
|
|
(0.7) |
|
|
|
1.6 |
|
|
|
6.0 |
|
Income tax expense |
|
|
22.7 |
|
|
|
24.9 |
|
|
|
27.0 |
|
|
|
27.6 |
|
|
|
30.0 |
|
|
|
30.4 |
|
|
|
36.7 |
|
|
|
36.0 |
|
Net (loss) income |
|
|
(982.5) |
|
|
|
175.1 |
|
|
|
184.5 |
|
|
|
156.5 |
|
|
|
165.0 |
|
|
|
157.1 |
|
|
|
196.5 |
|
|
|
182.0 |
|
Basic (loss) earnings per share |
|
$ |
(5.11) |
|
|
$ |
0.91 |
|
|
$ |
0.96 |
|
|
$ |
0.82 |
|
|
$ |
0.86 |
|
|
$ |
0.82 |
|
|
$ |
1.03 |
|
|
$ |
0.95 |
|
Diluted (loss) earnings per share |
|
$ |
(5.11) |
|
|
$ |
0.91 |
|
|
$ |
0.96 |
|
|
$ |
0.81 |
|
|
$ |
0.86 |
|
|
$ |
0.82 |
|
|
$ |
1.02 |
|
|
$ |
0.95 |
|
Net cash provided by operating activities |
|
$ |
283.5 |
|
|
$ |
236.0 |
|
|
$ |
261.9 |
|
|
$ |
209.8 |
|
|
$ |
279.3 |
|
|
$ |
232.3 |
|
|
$ |
257.3 |
|
|
$ |
230.6 |
|
Net cash used in investing activities |
|
|
(104.2) |
|
|
|
(173.7) |
|
|
|
(160.6) |
|
|
|
(102.6) |
|
|
|
(98.2) |
|
|
|
(30.9) |
|
|
|
(14.8) |
|
|
|
(1.6) |
|
Net cash used in financing activities |
|
|
(59.8) |
|
|
|
(56.8) |
|
|
|
(56.9) |
|
|
|
(56.6) |
|
|
|
(43.7) |
|
|
|
(49.1) |
|
|
|
(48.6) |
|
|
|
(47.6) |
|
Average Gold Price(3) |
|
$ |
1,976 |
|
|
$ |
1,929 |
|
|
$ |
1,978 |
|
|
$ |
1,889 |
|
|
$ |
1,729 |
|
|
$ |
1,728 |
|
|
$ |
1,872 |
|
|
$ |
1,874 |
|
GEOs sold(4) |
|
|
152,351 |
|
|
|
160,848 |
|
|
|
168,515 |
|
|
|
145,331 |
|
|
|
183,886 |
|
|
|
176,408 |
|
|
|
191,052 |
|
|
|
178,614 |
|
Cash Costs(5) |
|
$ |
45.1 |
|
|
$ |
48.9 |
|
|
$ |
47.1 |
|
|
$ |
38.2 |
|
|
$ |
45.8 |
|
|
$ |
42.0 |
|
|
$ |
45.5 |
|
|
$ |
43.6 |
|
Cash Costs(5) per GEO sold |
|
$ |
296 |
|
|
$ |
304 |
|
|
$ |
280 |
|
|
$ |
263 |
|
|
$ |
249 |
|
|
$ |
238 |
|
|
$ |
238 |
|
|
$ |
244 |
|
Adjusted EBITDA(5) |
|
$ |
254.6 |
|
|
$ |
255.1 |
|
|
$ |
275.6 |
|
|
$ |
229.4 |
|
|
$ |
262.4 |
|
|
$ |
256.7 |
|
|
$ |
301.2 |
|
|
$ |
286.6 |
|
Adjusted EBITDA(5) per share |
|
$ |
1.33 |
|
|
$ |
1.33 |
|
|
$ |
1.44 |
|
|
$ |
1.20 |
|
|
$ |
1.37 |
|
|
$ |
1.34 |
|
|
$ |
1.57 |
|
|
$ |
1.50 |
|
Adjusted EBITDA Margin(5) |
|
|
83.9 |
% |
|
|
82.4 |
% |
|
|
83.5 |
% |
|
|
83.0 |
% |
|
|
81.9 |
% |
|
|
84.4 |
% |
|
|
85.5 |
% |
|
|
84.6 |
% |
Adjusted Net Income(5) |
|
$ |
172.9 |
|
|
$ |
175.1 |
|
|
$ |
182.9 |
|
|
$ |
152.2 |
|
|
$ |
164.9 |
|
|
$ |
159.7 |
|
|
$ |
195.8 |
|
|
$ |
177.2 |
|
Adjusted Net Income(5) per share |
|
$ |
0.90 |
|
|
$ |
0.91 |
|
|
$ |
0.95 |
|
|
$ |
0.79 |
|
|
$ |
0.86 |
|
|
$ |
0.83 |
|
|
$ |
1.02 |
|
|
$ |
0.93 |
|
| 1 | Sum of the quarters may not add up to yearly total due to rounding. |
| 2 | Includes impairment losses on royalty, stream and working interests of $1,173.3 million in Q4 2023. |
| 3 | Based on LBMA Gold Price PM Fix. |
| 4 | GEOs include Franco-Nevada’s attributable share of production from our Mining and Energy assets, after applicable recovery and payability factors. GEOs are estimated on a gross basis for NSR and, in the case of stream ounces, before the payment of the per ounce contractual price paid by the Company. For NPI royalties, GEOs are calculated taking into account the NPI economics. Silver, platinum, palladium, iron ore, oil, gas and other commodities are converted to GEOs by dividing associated revenue, which includes settlement adjustments, by the relevant gold price. The price used in the computation of GEOs earned from a particular asset varies depending on the royalty or stream agreement, which may make reference to the market price realized by the operator, or the average price for the month, quarter, or year in which the commodity was produced or sold. For illustrative purposes, please refer to the average commodity price tables on pages 14 and 19 of this MD&A for indicative prices which may be used in the calculation of GEOs for the years ended December 31, 2023 and 2022, respectively. |
| 5 | Cash Costs, Cash Costs per GEO sold, Adjusted EBITDA, Adjusted EBITDA per share, Adjusted EBITDA Margin, Adjusted Net Income and Adjusted Net Income per share are non-GAAP financial measures with no standardized meaning under IFRS Accounting Standards and might not be comparable to similar financial measures disclosed by other issuers. Refer to the “Non-GAAP Financial Measures” section of this MD&A for more information on each non-GAAP financial measure. |
2023 Management’s Discussion and Analysis |
26 |
BALANCE SHEET REVIEW
Summary Balance Sheet and Key Financial Metrics
|
|
At December 31, |
|
|
At December 31, |
||
(expressed in millions, except debt-to-equity ratio) |
|
2023 |
|
2022 |
|
||
Cash and cash equivalents |
|
$ |
1,421.9 |
|
$ |
1,196.5 |
|
|
|
|
|
|
|
|
|
Current assets |
|
|
1,615.3 |
|
|
1,383.1 |
|
Non-current assets |
|
|
4,378.8 |
|
|
5,243.7 |
|
Total assets |
|
$ |
5,994.1 |
|
$ |
6,626.8 |
|
|
|
|
|
|
|
|
|
Current liabilities |
|
$ |
39.2 |
|
$ |
50.2 |
|
Non-current liabilities |
|
|
185.8 |
|
|
159.0 |
|
Total liabilities |
|
$ |
225.0 |
|
$ |
209.2 |
|
|
|
|
|
|
|
|
|
Total shareholders’ equity |
|
$ |
5,769.1 |
|
$ |
6,417.6 |
|
|
|
|
|
|
|
|
|
Total common shares outstanding |
|
|
192.2 |
|
|
191.9 |
|
Capital management measures |
|
|
|
|
|
|
|
Available capital |
|
$ |
2,402.6 |
|
$ |
2,177.7 |
|
Debt-to-equity |
|
|
— |
|
|
— |
|
Assets
Total assets were $5,994.1 million as at December 31, 2023 compared to $6,626.8 million as at December 31, 2022. Our non-current asset base is primarily comprised of royalty, stream and working interests, and investments, while our current assets are primarily comprised of cash and cash equivalents and receivables. The decrease in assets compared to December 31, 2022 primarily reflects the impairment loss we recognized in relation to our Cobre Panama asset. The decrease in assets was partially offset by higher cash and cash equivalents and acquisitions and funding of our royalty, stream and working interests. Our investments, which are marked-to-market at every period-end, also increased relative to December 31, 2022.
Liabilities
Total liabilities increased compared to December 31, 2022. Total liabilities as at December 31, 2023 are primarily comprised of $30.9 million of accounts payable and accrued liabilities, $8.3 million of current income tax liabilities, and $180.1 million of deferred income tax liabilities.
Shareholders’ Equity
Shareholders’ equity decreased by $648.5 million compared to December 31, 2022, reflecting a net loss of $466.4 million and dividends of $262.1 million. Of those dividends, $29.1 million were settled through the issuance of common shares pursuant to the DRIP. The decrease in shareholders’ equity is partially offset by other comprehensive income, net of tax, of $42.1 million.
2023 Management’s Discussion and Analysis |
27 |
Liquidity and Capital Resources
Cash flow for the years ended December 31, 2023 and 2022 was as follows:
|
|
For the three months ended |
|
|
For the year ended |
|
||||||||||
|
|
December 31, |
|
|
December 31, |
|
||||||||||
(expressed in millions) |
|
2023 |
|
|
2022 |
|
|
2023 |
|
|
2022 |
|
||||
Net cash provided by operating activities |
|
$ |
283.5 |
|
|
$ |
279.3 |
|
|
$ |
991.2 |
|
|
$ |
999.5 |
|
Net cash used in investing activities |
|
|
(104.2) |
|
|
|
(98.2) |
|
|
|
(541.1) |
|
|
|
(145.5) |
|
Net cash used in financing activities |
|
|
(59.8) |
|
|
|
(43.7) |
|
|
|
(230.1) |
|
|
|
(189.0) |
|
Effect of exchange rate changes on cash and cash equivalents |
|
|
5.3 |
|
|
|
1.7 |
|
|
|
5.4 |
|
|
|
(7.8) |
|
Net change in cash and cash equivalents |
|
$ |
124.8 |
|
|
$ |
139.1 |
|
|
$ |
225.4 |
|
|
$ |
657.2 |
|
Operating Cash Flow
Net cash provided by operating activities was $283.5 million in Q4 2023 (Q4 2022 – $279.3 million). Operating cash flow in Q4 2023 was consistent compared to the same period in 2022 due to an increase in finance income and a decrease in receivables offset by a decrease in revenue.
For 2023, net cash provided by operating activities was $991.2 million (2022–$999.5 million). Operating cash flow was consistent compared to 2022 due to a decrease in revenues and net cash flow related to gold bullion we received as settlement for certain of our royalties. These outflows were offset by an increase in finance income, changes in our non-cash working capital and a decrease in income taxes paid. In addition, in 2023, the CRA returned the cash deposits in relation to our CRA audit made in 2022.
Investing Activities
Net cash used in investing activities was $104.2 million in Q4 2023 (Q4 2022 – $98.2 million) and primarily consisted of the acquisition of the additional NSR on the Eskay Creek project of $41.8 million (C$56.0 million), the additional NSR on the Magino gold mine of $28.0 million, and the advance of $18.7 million (C$25.0 million) for the Skeena Convertible Debenture and $12.5 million in escrow in connection to the acquisition of a royalty portfolio in the Haynesville gas play and the funding of our share of royalty acquisitions through the Royalty Acquisition Venture with Continental of $1.6 million. Comparatively, investing activities in Q4 2022 primarily consisted of the acquisition of the royalty on the Magino Gold Project for $52.6 million, the additional NSR on Eskay Creek for $19.9 million (C$27.0 million), the royalties on Spences Bridge for $6.0 million, the Argonaut common shares for $10.0 million (C$13.6 million), the Westhaven common shares for $0.73 million (C$1.0 million) and the funding of our share of royalty acquisitions through the Royalty Acquisition Venture with Continental of $6.7 million
For 2023, net cash used in investing activities was $541.1 million (2022 - $145.5 million) and primarily consisted of the funding of the Tocantinzinho stream deposit of $250.0 million, the acquisition of the Pascua-Lama royalties of $75.0 million, the additional royalty on Valentine Gold for $45.0 million, the additional NSR on the Eskay Creek project of $41.8 million (C$56.0 million), the additional NSR on the Magino gold mine of $28.0 million, the Volcan royalty of $15.0 million, the royalty on Kerr-Addison for $10.0 million, the additional royalty on Caserones for $9.4 million, the royalty on the Wawa gold project for $5.0 million (C$6.8 million), the common shares of Gold Candle for $4.6 million (C$6.0 million), the common shares of Marathon for $3.8 million (C$5.0 million), cash paid on the closing of the acquisition of the portfolio of royalties from Trident for $14.3 million and the funding of our share of royalty acquisitions through the Royalty Acquisition Venture with Continental of $10.0 million. Cash used in investing activities also included the advance of $18.7 million (C$25.0 million) for the Skeena Convertible Debenture to Skeena and $12.5 million in escrow in connection to the acquisition of a royalty portfolio in the Haynesville gas play. We also received $7.0 million from Marathon for the buy-back of 0.5% of the 2.0% NSR on the Valentine Gold project. Comparatively, in 2022, investing activities consisted of the acquisition of the royalty on the Magino Gold Project for $52.6 million, the Caserones royalty for $37.4 million, the G Mining Common Shares for $27.5 million (C$35.8 million), the additional NSR on Eskay Creek for $19.9 million, the Argonaut common shares for $10.0 million (C$13.6 million), the EMX common shares for $10.0 million ($12.6 million), the Castle Mountain royalty for $6.0 million, the royalties on Spences Bridge for $6.0 million and the funding of our share of acquisitions through the Royalty Acquisition Venture with Continental of $13.3 million. These cash outlays were partially offset by the receipt of $42.7 million as repayment of our loan to Noront.
Financing Activities
For Q4 2023, net cash used by financing activities was $59.8 million (Q4 2022 – $43.7 million), reflecting the payment of dividends.
For 2023, net cash used by financing activities was $230.1 million (2022 - $189.0 million), primarily reflecting the payments of dividends.
2023 Management’s Discussion and Analysis |
28 |
Capital Resources
Our cash and cash equivalents totaled $1,421.9 million as at December 31, 2023 (December 31, 2022 – $1,196.5 million). In addition, we held investments and a loan receivable of $254.5 million and $24.8 million, respectively, as at December 31, 2023 (December 31, 2022 – investments of $227.2 million). Of the total investments held, $241.8 million was held in publicly-traded equity instruments (December 31, 2022 – $220.8 million). Of the $241.8 million held in publicly-traded equity instruments, $152.7 million and $47.6 million relates to our holdings of LIORC and G Mining Ventures, respectively (December 31, 2022 – $157.0 million and $22.8 million, respectively).
As at the date of this MD&A, we have one revolving credit facility available. The Corporate Revolver is a $1.0 billion unsecured, revolving credit facility which has a term maturing August 15, 2027. Advances under the Corporate Revolver bear interest depending upon the currency of the advance and Franco-Nevada’s leverage ratio as referenced in Note 12 of the financial statements. As at December 31, 2023, while we have no amounts outstanding against the Corporate Revolver, we have three standby letters of credit in the amount of $19.3 million (C$25.5 million) in relation to the audit by the CRA, as referenced in the “Contingencies” section of this MD&A. These standby letters of credit reduce the available balance under the Corporate Revolver. As at March 5, 2024, we have a total of $980.7 million available under the Corporate Revolver.
Management’s objectives when managing capital are:
| (a) | when capital is not being used for long-term investments, ensure its preservation and availability by investing in low-risk investments with high liquidity; and |
| (b) | to ensure that adequate levels of capital are maintained to meet Franco-Nevada’s operating requirements and other current liabilities. |
As at December 31, 2023, our cash and cash equivalents are held in cash and term deposits with several financial institutions. Certain investments with maturities upon acquisition of 3 months, or 92 days or less, were classified as term deposits within cash and cash equivalents on the statement of financial position.
Our performance is impacted by foreign currency fluctuations of the Canadian dollar and Australian dollar relative to the U.S. dollar. The largest exposure is with respect to the Canadian/U.S. dollar exchange rates as we hold a significant amount of our assets in Canada and report our results in U.S. dollars. The effect of volatility in these currencies against the U.S. dollar impacts our general and administrative expenses and the depletion of our royalty, stream and working interests incurred in our Canadian and Australian entities due to their respective functional currencies. During 2023, the Canadian dollar traded in a range of $0.7207 to $0.7617, ending at $0.7561, and the Australian dollar traded between $0.6294 and $0.7116, ending at $0.6806.
Our near-term cash requirements include our funding commitments towards the royalty portfolio in the Haynesville gas play, the Tocantinzinho Term Loan, the Royalty Acquisition Venture with Continental, commitments for contingent payments under various royalty purchase agreements, various costs under our environmental and social initiatives, corporate administration costs, certain costs of operations, payment of dividends and income taxes directly related to the recognition of royalty, stream and working interest revenues. As a royalty and stream company, we are subject to limited requirements for capital expenditures other than for the acquisition of additional royalties or streams and capital commitments for our working interests. Such acquisitions are entirely discretionary and will be consummated through the use of cash, as available, or through the issuance of common shares or other equity or debt securities, or the use of our Corporate Revolver. We believe that our current cash resources, available credit facility, and future cash flows will be sufficient to cover the costs of our commitments, operating and administrative expenses, and dividend payments for the foreseeable future.
2023 Management’s Discussion and Analysis |
29 |
Purchase Commitments
The following table summarizes Franco-Nevada’s commitments to pay for gold, silver and PGM pursuant to the associated precious metal agreements as at December 31, 2023:
|
|
Attributable payable |
|
|
|
|
|
|
|
|
|
|
|
|
|
|
||||
|
|
production to be purchased |
|
Per ounce cash payment (1),(2) |
|
Term of |
|
Date of |
|
|||||||||||
Interest |
|
Gold |
|
Silver |
|
PGM |
|
Gold |
|
Silver |
|
PGM |
|
agreement(3) |
|
contract |
|
|||
Antamina |
|
— |
% |
22.5 |
% (4) |
— |
% |
|
n/a |
|
|
5 |
% (5) |
|
n/a |
|
40 years |
|
7-Oct-15 |
|
Antapaccay |
|
— |
% (6) |
— |
% (7) |
— |
% |
|
20 |
% (8) |
|
20 |
% (9) |
|
n/a |
|
40 years |
|
10-Feb-16 |
|
Candelaria |
|
68 |
% (10) |
68 |
% (10) |
— |
% |
$ |
400 |
|
$ |
4.00 |
|
|
n/a |
|
40 years |
|
6-Oct-14 |
|
Cobre Panama Fixed Payment Stream |
|
— |
% (11) |
— |
% (12) |
— |
% |
$ |
418 |
(13) |
$ |
6.27 |
(14) |
|
n/a |
|
40 years |
|
19-Jan-18 |
|
Cobre Panama Floating Payment Stream |
|
— |
% (15) |
— |
% (16) |
— |
% |
|
20 |
% (17) |
|
20 |
% (18) |
|
n/a |
|
40 years |
|
19-Jan-18 |
|
Condestable |
|
— |
% (19) |
— |
% (20) |
— |
% |
|
20 |
% (21) |
|
20 |
% (22) |
|
n/a |
|
40 years |
|
8-Mar-21 |
|
Guadalupe-Palmarejo |
|
50 |
% |
— |
% |
— |
% |
$ |
800 |
|
|
n/a |
|
|
n/a |
|
40 years |
|
2-Oct-14 |
|
Karma |
|
4.875 |
% |
— |
% |
— |
% |
|
20 |
% (23) |
|
n/a |
|
|
n/a |
|
40 years |
|
11-Aug-14 |
|
Sabodala |
|
— |
% (24) |
— |
% |
— |
% |
|
20 |
% (25) |
|
n/a |
|
|
n/a |
|
40 years |
|
25-Sep-20 |
|
MWS |
|
25 |
% |
— |
% |
— |
% |
$ |
400 |
|
|
n/a |
|
|
n/a |
|
40 years |
(26) |
2-Mar-12 |
|
Sudbury(27) |
|
50 |
% |
— |
% |
50 |
% |
$ |
400 |
|
|
n/a |
|
$ |
400 |
|
40 years |
|
15-Jul-08 |
|
Tocantinzinho |
|
12.5 |
% (28) |
— |
% |
— |
% |
|
20 |
% (29) |
|
n/a |
|
|
n/a |
|
40 years |
|
18-Jul-22 |
|
Cooke 4 |
|
7.0 |
% |
— |
% |
— |
% |
$ |
400 |
|
|
n/a |
|
|
n/a |
|
40 years |
|
5-Nov-09 |
|
| 1 | Subject to an annual inflationary adjustment except for Antamina, Antapaccay, Karma, Guadalupe-Palmarejo, Sabodala and Tocantinzinho. |
| 2 | Should the prevailing market price for gold be lower than this amount, the per ounce cash payment will be reduced to the prevailing market price. |
| 3 | Subject to successive extensions. |
| 4 | Subject to a fixed payability of 90%. Percentage decreases to 15% after 86 million ounces of silver has been delivered under the agreement. |
| 5 | Purchase price is 5% of the average silver price at the time of delivery. |
| 6 | Gold deliveries are referenced to copper in concentrate shipped with 300 ounces of gold delivered for each 1,000 tonnes of copper in concentrate shipped, until 630,000 ounces of gold has been delivered. Thereafter, percentage is 30% of gold shipped. |
| 7 | Silver deliveries are referenced to copper in concentrate shipped with 4,700 ounces of silver delivered for each 1,000 tonnes of copper in concentrate shipped, until 10.0 million ounces of silver has been delivered. Thereafter, percentage is 30% of silver shipped. |
| 8 | Purchase price is 20% of the spot price of gold until 750,000 ounces of gold have been delivered, thereafter the purchase price is 30% of the spot price of gold. |
| 9 | Purchase price is 20% of the spot price of silver until 12.8 million ounces of silver have been delivered, thereafter the purchase price is 30% of the spot price of silver. |
| 10 | Percentage decreases to 40% after 720,000 ounces of gold and 12.0 million ounces of silver have been delivered under the agreement. |
| 11 | Gold deliveries are indexed to copper in concentrate produced from the project. 120 ounces of gold per every 1 million pounds of copper produced until 808,000 ounces of gold delivered. Thereafter, 81 ounces of gold per 1 million pounds of copper produced until 1,716,188 ounces of gold delivered. Thereafter, 63.4% of the gold in concentrate. |
| 12 | Silver deliveries are indexed to copper in concentrate produced from the project. 1,376 ounces of silver per every 1 million pounds of copper produced until 9,842,000 ounces of silver delivered. Thereafter 1,776 ounces of silver per 1 million pounds of copper produced until 29,731,000 ounces of silver delivered. Thereafter, 62.1% of the silver in concentrate. |
| 13 | After 1,341,000 ounces of gold delivered, purchase price is the greater of 50% of spot and $418.27 per ounce, subject to an annual inflationary adjustment. As the mill throughput for 30 consecutive days commensurate with annual capacity of 58 million tonnes per annum was not reached by January 1, 2019, Franco-Nevada received a reduction of the applicable fixed gold price of $100 per ounce until the end of Q2 2023. |
| 14 | After 21,510,000 ounces of silver delivered, purchase price is the greater of 50% of spot and $6.27 per ounce, subject to an annual inflationary adjustment. |
| 15 | Gold deliveries are indexed to copper in concentrate produced from the project. 30 ounces of gold per every 1 million pounds of copper produced until 202,000 ounces of gold delivered. Thereafter 20.25 ounces of gold per 1 million pounds of copper produced until 429,047 ounces of gold delivered. Thereafter, 15.85% of the gold in concentrate. |
| 16 | Silver deliveries are indexed to copper in concentrate produced from the project. 344 ounces of silver per every 1 million pounds of copper produced until 2,460,500 ounces of silver delivered. Thereafter, 444 ounces of silver per 1 million pounds of copper produced until 7,432,750 ounces of silver delivered. Thereafter 15.53% of the silver in concentrate. |
| 17 | After 604,000 ounces of gold delivered, purchase price is 50% of the spot price of gold. As the mill throughput for 30 consecutive days commensurate with annual capacity of 58 million tonnes per annum was not reached by January 1, 2019, Franco-Nevada received a reduction of the applicable floating gold price of $100 per ounce until the end of Q2 2023. |
| 18 | After 9,618,000 ounces of silver delivered, purchase price is 50% of the spot price of silver. |
| 19 | Gold deliveries are fixed at 8,760 ounces per annum from January 1, 2021 to December 31, 2025. Thereafter, 63% of the gold in concentrate until a cumulative total of 87,600 ounces of gold delivered. Thereafter, 25% of the gold in concentrate. |
| 20 | Silver deliveries are fixed at 291,000 ounces per annum from January 1, 2021 to December 31, 2025. Thereafter, 63% of the silver in concentrate until a cumulative total of 2,910,000 ounces of silver delivered. Thereafter, 25% of the silver in concentrate. |
| 21 | Purchase price is 20% of the spot price of gold at the time of delivery. |
| 22 | Purchase price is 20% of the spot price of silver at the time of delivery. |
| 23 | Purchase price is 20% of the average gold price at the time of delivery. |
| 24 | Based on amended agreement with an effective date of September 1, 2020, gold deliveries are fixed at 783.33 ounces per month until 105,750 ounces of gold is delivered. Thereafter, percentage is 6% of gold production (subject to reconciliation after fixed delivery period to determine if Franco-Nevada would have received more or less than 105,750 ounces of gold under the original 6% variable stream for such period, entitling the operator to a credit for an over-delivery applied against future stream deliveries or a one-time additional delivery to Franco-Nevada for an under-delivery). |
| 25 | Purchase price is 20% of prevailing market price at the time of delivery. |
| 26 | Agreement is capped at 312,500 ounces of gold. |
| 27 | Franco-Nevada is committed to purchase 50% of the precious metals contained in ore from the properties. Payment is based on gold equivalent ounces. For McCreedy West, effective June 1, 2021, purchase price per gold equivalent ounce is determined based on the monthly average gold spot price: (i) when the gold spot price is less than $800 per ounce, the purchase price is the prevailing monthly average gold spot price; (ii) when the gold spot price is greater than $800 per ounce but less than $1,333 per ounce, the purchase price is $800 per ounce; (iii) when the gold spot price is greater than $1,333 per ounce but less than $2,000 per ounce, the purchase price is 60% of the prevailing monthly average gold spot price; and (iv) when the gold spot price is greater than $2,000, the purchase price is $1,200 per ounce. |
| 28 | Percentage decreased to 7.5% after 300,000 ounces of gold have been delivered under the agreement. |
| 29 | Purchase price is 20% of the spot price of gold at the time of delivery. |
2023 Management’s Discussion and Analysis |
30 |
Capital Commitments
As at December 31, 2023, we have the following capital commitments: (i) $75.0 million in connection with the Term Loan for the Tocantinzinho project, (ii) $69.8 million for our share of the acquisition of mineral rights acquired through the Royalty Acquisition Venture with Continental Resources, and (iii) up to $5.5 million for the joint acquisition of newly created precious metals and copper royalties sourced by EMX. Refer to the “Corporate Developments” section for further details.
We also have commitments for contingent payments in relation to various royalty agreements, as follows: (i) $12.5 million in relation to our Copper World 0.585% NSR acquired in November 2021, (ii) $8.0 million in relation to our Rio Baker (Salares Norte) royalty, (iii) $3.4 million (C$4.5 million) in relation to our Eskay Creek royalty, and (iv) $1.3 million in relation to our Rebecca royalty.
Contingencies
| (a) | Cobre Panama |
Cobre Panama has been in P&SM with production halted since November 2023.
First Quantum and its subsidiary, MPSA, and the GOP had been engaged in discussions regarding the Revised Concession Contract for Cobre Panama. On November 27, 2023, the Supreme Court issued a ruling (released publicly the following day) declaring Law 406 unconstitutional and stating that the effect of the ruling was that the Revised Concession Contract purportedly no longer exists. For further details, refer to the “Portfolio Updates – Cobre Panama Updates” section on page 10 of this MD&A.
Franco-Nevada is pursuing legal avenues to protect its investment in Cobre Panama and is of the view that it has rights under international law. On November 23, 2023, we notified MICI of our intent to initiate arbitration to enforce our rights under international law (“Notice of Intent”) pursuant to the Canada-Panama Free Trade Agreement (the “FTA”). On February 22, 2024, we filed an updated Notice of Intent (the “Updated Notice of Intent”) reiterating our intent to commence arbitration under the FTA. The Updated Notice of Intent also specifies that the Company presently and preliminarily estimates its damages to be at least $5 billion, subject to further analysis and development.
While Franco-Nevada is continuing to pursue these legal remedies, the Company strongly prefers and hopes for a resolution with the State of Panama providing the best outcome for the Panamanian people and all parties involved.
| (b) | Canada Revenue Agency Audit |
The CRA is conducting an audit of Franco-Nevada for the 2012-2019 taxation years.
Settlement of Domestic and FAPI Reassessments
In prior years, certain wholly-owned Canadian subsidiaries of the Company received Notices of Reassessment for the 2014 through 2017 taxation years (the “Domestic Reassessments”) in which the CRA increased income by adjusting the timing of the deduction of the upfront payments which were made in connection with precious metal stream agreements. This resulted in the Company being subject to an incremental payment of Federal and provincial income taxes for these years of $15.1 million (C$19.9 million) (after applying available non-capital losses and other deductions) plus interest and penalties.
In addition, in a prior year, the Company received Notices of Reassessment for the 2012 and 2013 taxation years (the “FAPI Reassessments”) in relation to its Barbadian subsidiary. The FAPI Reassessments asserted that a majority of the income relating to precious metal streams earned by the Barbadian subsidiary, in those years, should have been included in the income of its Canadian parent company and subject to tax in Canada as Foreign Accrual Property Income (“FAPI”). The CRA noted that its position may not extend beyond the 2013 taxation year. The FAPI Reassessments resulted in additional Federal and provincial income taxes of $5.8 million (C$7.7 million) plus interest and penalties.
On April 28, 2023, the Company reached a settlement with the CRA in respect of the Domestic and FAPI Reassessments, which provide for these reassessments to be vacated entirely on a without-cost basis. Under the settlement, the CRA accepts the manner in which the Company deducts upfront payments made in connection with precious metal stream agreements for Canadian tax purposes. This would result in no FAPI in 2012 and 2013 as computed under Canadian tax law. While the settlement of the Domestic Reassessment only addresses the taxation years that were reassessed (2014-2017), the Company’s expectation is that the manner in which it deducts upfront payments made in connection with precious metal stream agreements for Canadian tax purposes will now be accepted by the CRA for the subsequent years.
The Company had posted security in cash for 50% of the reassessed amounts under the Domestic and FAPI Reassessments totaling $13.9 million (C$17.7 million). The CRA returned the full amount of the deposits to the Company.
2023 Management’s Discussion and Analysis |
31 |
Transfer Pricing Reassessments
The Company has received reassessments from the CRA made on the basis of the transfer pricing provisions in the Income Tax Act (Canada) (the “Act”). The following table provides a summary of the CRA audit and reassessment matters further detailed below:
|
CRA Position |
Taxation Years Reassessed |
Potential Exposure for Tax, Interest and Penalties (in millions) |
|
Transfer Pricing (Mexico) |
Transfer pricing provisions in the Act apply such that a majority of the income earned by the Company’s Mexican subsidiary should be included in the income of the Company and subject to tax in Canada. |
2013, 2014, 2015, 2016 |
For 2013-2016: Tax: $22.7 (C$29.9) Transfer pricing penalties: $9.1 (C$12.0) Interest and other penalties: $14.6 (C$19.1) The amounts set forth above do not include any potential relief under the Canada-Mexico tax treaty. The Company’s Mexican subsidiary ceased operations after 2016 and no reassessments for this issue are expected for subsequent years. |
|
Transfer Pricing (Barbados) |
Transfer pricing provisions in the Act apply such that a majority of the income relating to certain precious metal streams earned by the Company’s Barbadian subsidiary should be included in the income of the Company and subject to tax in Canada. |
2014, 2015, 2016, 2017, 2018 2019 (proposed) |
For 2014-2018, 2019 (proposed): Tax: $83.8 (C$110.7) Transfer pricing penalties: $13.3 (C$17.6) for 2014-2017; $18.4 (C$24.4) for 2018-2019 under review Interest and other penalties: $29.5 (C$39.1) If the CRA were to reassess the 2020-2023 taxation years on the same basis: Tax: $242.8 (C$321.1) Transfer pricing penalties: $91.8 (C$121.4) Interest and other penalties: $33.4 (C$44.2) |
| (i) | Mexico (2013-2016) |
In December 2018 and December 2019, the Company received Notices of Reassessment from the CRA for the 2013 taxation year (the “2013 Reassessment”) and for the 2014 and 2015 taxation years (the “2014 and 2015 Reassessments”, collectively with the 2013 Reassessment, the “2013-2015 Reassessments”) in relation to its Mexican subsidiary. The reassessments were made on the basis of the transfer pricing provisions in the Act and assert that a majority of the income earned by the Mexican subsidiary should have been included in the income of the Company and subject to tax in Canada. The 2013-2015 Reassessments result in additional Federal and provincial income taxes of $19.2 million (C$25.3 million) plus estimated interest (calculated to December 31, 2023) and other penalties of $13.2 million (C$17.3 million) but before any relief under the Canada-Mexico tax treaty. The Company has filed formal Notices of Objection with the CRA against the 2013-2015 Reassessments and has posted security in the form of a standby letter of credit for 50% of the reassessed amounts, as referenced in Note 12 of the financial statements.
In December 2020, the CRA issued revised 2013-2015 Reassessments to include transfer pricing penalties of $7.8 million (C$10.3 million). The Company has filed formal Notices of Objection with the CRA against these revised reassessments and has posted security in the form of cash for 50% of the reassessed amounts of penalties, as referenced in Note 10 of the financial statements. The Company has commenced an appeal in the Tax Court of Canada with respect to the 2013-2015 Reassessments.
In December 2021, the Company received a Notice of Reassessment for the 2016 taxation year (the “2016 Reassessment”) on the same basis as the 2013-2015 Reassessments, resulting in additional Federal and provincial income taxes of $3.5 million (C$4.6 million) plus estimated interest (calculated to December 31, 2023) and other penalties of $1.4 million (C$1.8 million) but before any relief under the Canada-Mexico tax treaty. The Company has filed a formal Notice of Objection with the CRA against the 2016 Reassessment and has posted security in the form of cash for 50% of the reassessed amounts, as referenced in Note 10 of the financial statements. On October 26, 2023, the Company received a revised 2016 Reassessment to include transfer pricing penalties of $1.3 million (C$1.7 million). Subsequent to year-end, the Company filed a formal Notice of Objection against this revised reassessment and posted security in the form of cash for 50% of the reassessed amounts of penalties. The Company’s Mexican subsidiary ceased operations after 2016 and no reassessments are expected for subsequent years.
For taxation years 2013 through 2016, the Company’s Mexican subsidiary paid a total of $34.1 million (490.3 million Pesos) in cash taxes, at a 30% tax rate, to the Mexican tax authorities on income earned in Mexico. If required, the Company intends to seek relief from double taxation under the Canada-Mexico tax treaty.
2023 Management’s Discussion and Analysis |
32 |
| (ii) | Barbados (2014-2019) |
The 2014 and 2015 Reassessments also reassess the Company in relation to its Barbadian subsidiary. The reassessments were made on the basis of the transfer pricing provisions in the Act and assert that a majority of the income relating to certain precious metal streams earned by the Barbadian subsidiary should have been included in the income of the Company and subject to tax in Canada, resulting in additional Federal and provincial income taxes of $5.1 million (C$6.7 million) plus estimated interest (calculated to December 31, 2023) and other penalties of $3.3 million (C$4.4 million). As noted previously, the Company has filed formal Notices of Objection with the CRA against the 2014 and 2015 Reassessments and has posted security in the form of a standby letter of credit for 50% of the reassessed amounts, as referenced in Note 12 of the financial statements.
As noted above, in December 2020, the CRA issued revised 2014 and 2015 Reassessments to include transfer pricing penalties of $1.9 million (C$2.5 million). The Company has filed formal Notices of Objection with the CRA against these revised reassessments and has posted security in the form of cash for 50% of the reassessed amounts of penalties, as referenced in Note 10 of the financial statements. The Company has commenced an appeal in the Tax Court of Canada with respect to the 2014-2015 Reassessments.
In December 2021, the Company received the 2016 Reassessment as well as a Notice of Reassessment for the 2017 taxation year (the “2017 Reassessment”, and collectively with the 2016 Reassessment, the “2016 and 2017 Reassessments”) that reassess the Company in relation to its Barbadian subsidiary on the same basis as the 2014 and 2015 Reassessments, resulting in additional Federal and provincial income taxes of $30.1 million (C$39.8 million) plus estimated interest (calculated to December 31, 2023) and other penalties of $11.2 million (C$14.8 million). The Company has filed formal Notices of Objection with the CRA against the 2016 and 2017 Reassessments and has posted security in the form of cash for 50% of the reassessed amounts, as referenced in Note 10 of the financial statements. On October 26, 2023, the Company received revised 2016 and 2017 Reassessments to include transfer pricing penalties of $11.4 million (C$15.1 million). Subsequent to year-end, the Company filed formal Notices of Objection against these revised reassessments and posted security in the form of cash for 50% of the reassessed amounts of penalties.
On November 10, 2023, the Company received a letter from the CRA (the “Proposal Letter”) proposing to reassess the 2018 and 2019 taxation years on the same basis as the 2016 and 2017 Reassessments, resulting in additional Federal and provincial income taxes of $17.2 million (C$22.7 million) for 2018 and $31.4 million (C$41.5 million) for 2019 plus estimated interest (calculated to December 31, 2023) and other penalties of $6.5 million (C$8.6 million) for 2018 and $8.5 million (C$11.3 million) for 2019. The Proposal Letter did not include transfer pricing penalties which are currently under review. If the CRA were to apply transfer pricing penalties, the Company estimates that the amounts would be approximately $6.6 million (C$8.8 million) for 2018 and $11.8 million (C$15.6 million) for 2019. On December 6, 2023, the Company received a Notice of Reassessment for the 2018 taxation year (the “2018 Reassessment”, and collectively with the 2013-2015 Reassessments and the 2016 and 2017 Reassessments, the “Transfer Pricing Reassessments”) as proposed. The Company does not agree with the 2018 Reassessment and subsequent to year-end, filed a formal Notice of Objection with the CRA and posted security in the form of cash for 50% of the reassessed amounts. The Company does not agree with the Proposal Letter and intends to file a formal Notice of Objection when the CRA issues a Notice of Reassessment for the 2019 taxation year.
If the CRA were to reassess the Company for taxation years 2020 through 2023 on the same basis and continue to apply transfer pricing penalties, the Company estimates that it would be subject to additional Canadian tax for these years of approximately $242.8 million (C$321.1 million), transfer pricing penalties of approximately $91.8 million (C$121.4 million) plus interest (calculated to December 31, 2023) and other penalties of approximately $33.4 million (C$44.2 million).
Management believes that the Company and its subsidiaries have filed all tax returns and paid all applicable taxes in compliance with Canadian and applicable foreign tax laws and, as a result, no liabilities have been recorded in the financial statements of the Company for the Transfer Pricing Reassessments and the Proposal Letter, or for any potential tax exposure that may arise in respect of these matters. The Company does not believe that the Transfer Pricing Reassessments and the Proposal Letter are supported by Canadian tax law and jurisprudence and intends to vigorously defend its tax filing positions.
The CRA audit is ongoing and there can be no assurance that the CRA will not further challenge the manner in which the Company or any of its subsidiaries has filed its tax returns and reported its income. In the event that the CRA successfully challenges the manner in which the Company or a subsidiary has filed its tax returns and reported its income, this could potentially result in additional income taxes, penalties and interest, which could have a material adverse effect on the Company.
2023 Management’s Discussion and Analysis |
33 |
CRITICAL ACCOUNTING POLICIES AND ESTIMATES
The preparation of consolidated financial statements in accordance with IFRS Accounting Standards requires the Company to make judgments, estimates and assumptions that affect the reported amounts of assets and liabilities and disclosures of contingent assets and liabilities at the date of the consolidated financial statements and the reported amounts of revenues and expenses during the reporting period. Estimates and assumptions are continuously evaluated and are based on management’s best knowledge of the relevant facts and circumstances, having regard to previous experience. However, actual outcomes may differ from the amounts included in the consolidated financial statements.
Our material accounting policies and estimates are disclosed in Notes 2 and 3 of the financial statements.
New and Amended Accounting Standards
The following standards were effective and implemented for the annual period as of January 1, 2023.
Amendments to IAS 1 and IFRS Practice Statement 2 – Disclosure of Accounting Policies
The IASB amended IAS 1 Presentation of Financial Statements (“IAS 1) and IFRS Practice Statement 2 Making Materiality Judgements to require entities to disclose their material rather than their significant accounting policies. The amendments define what is ‘material accounting policy information’ and provides guidance on how entities apply the concept of materiality in making decisions about accounting policy disclosures.
There was no significant impact to the Company’s disclosure of accounting policies as a result of the amendments.
Amendments to IAS 8 Accounting Policies, Changes in Accounting Estimates and Errors – Definition of Accounting Estimates
The IASB amended IAS 8 Accounting Policies, Changes in Accounting Estimates and Errors (“IAS 8”). The amendments replace the definition of a change in accounting estimates with a definition of accounting estimates. Under the new definition, accounting estimates are “monetary amounts in financial statements that are subject to measurement uncertainty”. There was no significant impact to the current period or comparative periods presented as a result of these amendments.
Amendments to IAS 12 Income Taxes – Deferred Tax Related to Assets and Liabilities Arising from a Single Transaction
The IASB amended IAS 12 Income Taxes (“IAS 12”). The amendments introduce a further exception from the initial recognition exemption. Under the amendments, an entity does not apply the initial recognition exemption for transactions that give rise to equal taxable and deductible temporary differences. There was no significant impact on the Company's consolidated financial statements as a result of these amendments.
International Tax Reform – Pillar Two Model Rules – Amendments to IAS 12, Income Taxes
On May 23, 2023, the IASB issued amendments to IAS 12 which introduce a mandatory temporary exception to accounting for deferred taxes arising from the jurisdictional implementation of the OECD Pillar Two model rules, and disclosure requirements for affected entities to help users better understand an entity’s exposure to Pillar Two income taxes, particularly before its effective date.
Upon issuance of the amendment, the Company applied the temporary exception immediately and retrospectively. See Note 18 of the financial statements.
New Accounting Standards Issued But Not Yet Effective
Certain new accounting standards and interpretations have been published that are not mandatory for the current period and have not been early adopted. The amendments are effective for annual reporting periods beginning on or after January 1, 2024, with earlier application permitted.
Amendments to IAS 1 – Classification of Liabilities as Current or Non-current
The IASB issued amendments to IAS 1. The amendments clarify that the classification of liabilities as current or non-current is based on rights that are in existence at the end of the reporting period. Classification is unaffected by the entity’s expectation or events after the reporting date. Covenants of loan arrangements will affect the classification of a liability as current or non-current if the entity must comply with a covenant either before or at the reporting date, even if the covenant is only tested for compliance after the reporting date.
The amendments are not expected to have a significant impact on our consolidated financial statements.
OUTSTANDING SHARE DATA
Franco-Nevada is authorized to issue an unlimited number of common and preferred shares. A detailed description of the rights, privileges, restrictions and conditions attached to each class of authorized shares is included in our most recent Annual Information Form, a copy of which can be found on SEDAR+ at www.sedarplus.com and in our Form 40-F, a copy of which can be found on EDGAR at www.sec.gov.
2023 Management’s Discussion and Analysis |
34 |
As of March 5, 2024, the number of common shares outstanding or issuable pursuant to other outstanding securities is as follows:
Common Shares |
|
Number |
|
Outstanding |
|
192,175,042 |
|
Issuable upon exercise of Franco-Nevada options(1) |
|
669,201 |
|
Issuable upon vesting of Franco-Nevada RSUs(2) |
|
102,104 |
|
Diluted common shares |
|
192,946,347 |
|
| 1 | There were 669,201 stock options under our share compensation plan outstanding to directors, officers, employees and others with exercise prices ranging from C$40.87 to C$194.65 per share. The above table assumes all stock options are exercisable. |
| 2 | There were 31,053 time-based RSUs and 71,051 performance-based RSUs. Vesting of the performance-based RSUs are subject to the achievement of certain performance criteria and a performance multiplier which will range from 0% to 150% of the number granted. The above table assumes a performance multiplier of 100% of performance-based RSUs granted. |
During the year ended December 31, 2023, we did not issue or have any outstanding preferred shares.
INTERNAL CONTROL OVER FINANCIAL REPORTING AND DISCLOSURE CONTROLS AND PROCEDURES
Our management is responsible for establishing and maintaining Franco-Nevada’s internal control over financial reporting and other financial disclosure and our disclosure controls and procedures.
Internal control over financial reporting is a process designed to provide reasonable assurance regarding the reliability of financial reporting and the preparation of financial statements for external purposes in accordance with IFRS Accounting Standards. Franco-Nevada’s internal control over financial reporting includes those policies and procedures that (i) pertain to the maintenance of records that, in reasonable detail, accurately and fairly reflect the transactions and dispositions of the assets of Franco-Nevada; (ii) are designed to provide reasonable assurance that transactions are recorded as necessary to permit preparation of financial statements in accordance with IFRS Accounting Standards, and that receipts and expenditures of Franco-Nevada are being made only in accordance with authorizations of management and directors of Franco-Nevada; and (iii) are designed to provide reasonable assurance regarding prevention or timely detection of unauthorized acquisition, use or disposition of Franco-Nevada’s assets that could have a material effect on Franco-Nevada’s financial statements. Internal control over other financial disclosure is a process designed to ensure that other financial information included in this MD&A, fairly represents in all material respects the financial condition, results of operations and cash flows of Franco-Nevada for the periods presented in this MD&A.
Franco-Nevada’s disclosure controls and procedures are designed to provide reasonable assurance that material information relating to Franco-Nevada, including its consolidated subsidiaries, is made known to management by others within those entities, particularly during the period in which this MD&A is prepared and that information required to be disclosed by Franco-Nevada in its annual filings, interim filings or other reports filed or submitted by it under securities legislation is recorded, processed, summarized and reported within the time periods specified in securities legislation.
Due to its inherent limitations, internal control over financial reporting and other financial disclosure may not prevent or detect all misstatements. Also, projections of any evaluation of effectiveness to future periods are subject to the risk that controls may become inadequate because of changes in conditions, or that the degree of compliance with the policies or procedures may change.
An evaluation was carried out by our management, with the participation of our President & Chief Executive Officer (“CEO”) and Chief Financial Officer (“CFO”), of the effectiveness of the design and operation of Franco-Nevada’s internal control over financial reporting as of the end of the period covered by this report based on the framework and criteria established in Internal Control – Integrated Framework (2013) as issued by the Committee of Sponsoring Organizations (“COSO”) of the Treadway Commission. Based on that evaluation, management, under the supervision of our President & CEO and CFO, has concluded that Franco-Nevada’s internal control over financial reporting was effective as of December 31, 2023.
An evaluation was also carried out under the supervision of the CEO and CFO and with the participation of management, of the effectiveness of the design and operation of Franco-Nevada’s disclosure controls and procedures (as defined under applicable Canadian securities laws and in Rule 13a–15(e) and Rule 15d–15(e) under the U.S. Securities Exchange Act of 1934), and based on this evaluation, management concluded that Franco-Nevada's disclosure controls and procedures were effective as of December 31, 2023.
For the year ended December 31, 2023, there has been no change in Franco-Nevada’s internal control over financial reporting that has materially affected, or is reasonably likely to materially affect, Franco-Nevada’s internal control over financial reporting.
Management’s report on the effectiveness of internal control over financial reporting (as defined in Rule 13a-15(f) or 15d-15(f) under the U.S. Securities Exchange Act of 1934) is included in the Management’s Report on Internal Control over Financial Reporting that accompanies Franco-Nevada’s Annual Consolidated Financial Statements for the fiscal year ended December 31, 2023.
2023 Management’s Discussion and Analysis |
35 |
NON-GAAP FINANCIAL MEASURES
Cash Costs and Cash Costs per GEO
Cash Costs and Cash Costs per GEO sold are non-GAAP financial measures. Cash Costs is defined by Franco-Nevada as total costs of sales less depletion and depreciation expense. Cash Costs per GEO sold are calculated by dividing Cash Costs by the number of GEOs sold in the period, excluding prepaid GEOs.
Management uses Cash Costs and Cash Costs per GEO sold to evaluate Franco-Nevada’s ability to generate positive cash flow from its royalty, stream and working interests. Management and certain investors also use this information to evaluate Franco-Nevada’s performance relative to peers in the mining industry who present this measure on a similar basis. Cash Costs and Cash Costs per GEO are only intended to provide additional information to investors and analysts and should not be considered in isolation or as a substitute for measures of performance prepared in accordance with IFRS Accounting Standards. They do not have any standardized meaning under IFRS Accounting Standards and may not be comparable to similar measures presented by other issuers.
Reconciliation of Cash Costs and Cash Costs per GEO sold:
|
|
For the three months ended |
|
For the year ended |
|
|||||||||||
|
|
December 31, |
|
|
December 31, |
|
||||||||||
(expressed in millions, except per GEO amounts) |
|
2023 |
|
|
2022 |
|
|
2023 |
|
|
2022 |
|
||||
Total costs of sales |
|
$ |
114.0 |
|
|
$ |
119.3 |
|
|
$ |
452.4 |
|
|
$ |
463.1 |
|
Depletion and depreciation |
|
|
(68.9) |
|
|
|
(73.5) |
|
|
|
(273.1) |
|
|
|
(286.2) |
|
Cash Costs |
|
$ |
45.1 |
|
|
$ |
45.8 |
|
|
$ |
179.3 |
|
|
$ |
176.9 |
|
GEOs |
|
|
152,351 |
|
|
|
183,886 |
|
|
|
627,045 |
|
|
|
729,960 |
|
Cash Costs per GEO sold |
|
$ |
296 |
|
|
$ |
249 |
|
|
$ |
286 |
|
|
$ |
242 |
|
Adjusted EBITDA and Adjusted EBITDA per Share
Adjusted EBITDA and Adjusted EBITDA per share are non-GAAP financial measures, which is defined by Franco-Nevada by excluding the following from net income (loss) and earnings (loss) per share (“EPS”):
| ● | Income tax expense/recovery; |
| ● | Finance expenses; |
| ● | Finance income; |
| ● | Depletion and depreciation; |
| ● | Impairment losses and reversals related to royalty, stream and working interests; |
| ● | Impairment of investments; |
| ● | Gains/losses on sale of royalty, stream and working interests; |
| ● | Gains/losses on investments; |
| ● | Foreign exchange gains/losses and other income/expenses; and |
| ● | Unusual non-recurring items. |
Management uses Adjusted EBITDA and Adjusted EBITDA per share to evaluate the underlying operating performance of Franco-Nevada as a whole for the reporting periods presented, to assist with the planning and forecasting of future operating results, and to supplement information in its financial statements. Management believes that in addition to measures prepared in accordance with IFRS Accounting Standards such as net income and EPS, our investors and analysts use Adjusted EBITDA and Adjusted EBITDA per share to evaluate the results of the underlying business of Franco-Nevada, particularly since the excluded items are typically not included in our guidance, with the exception of depletion and depreciation expense. While the adjustments to net income and EPS in these measures include items that are both recurring and non-recurring, management believes that Adjusted EBITDA and Adjusted EBITDA per share are useful measures of Franco-Nevada’s performance because they adjust for items which may not relate to or have a disproportionate effect on the period in which they are recognized, impact the comparability of our core operating results from period to period, are not always reflective of the underlying operating performance of our business and/or are not necessarily indicative of future operating results. Adjusted EBITDA and Adjusted EBITDA per share are only intended to provide additional information to investors and analysts and should not be considered in isolation or as a substitute for measures of performance prepared in accordance with IFRS Accounting Standards. They do not have any standardized meaning under IFRS Accounting Standards and may not be comparable to similar measures presented by other issuers.
2023 Management’s Discussion and Analysis |
36 |
Reconciliation of Net Income to Adjusted EBITDA:
|
|
For the three months ended |
|
|
For the year ended |
|
||||||||||
|
|
December 31, |
|
|
December 31, |
|
||||||||||
(expressed in millions, except per share amounts) |
|
2023 |
|
|
2022 |
|
|
2023 |
|
|
2022 |
|
||||
Net (loss) income |
|
$ |
(982.5) |
|
|
$ |
165.0 |
|
|
$ |
(466.4) |
|
|
$ |
700.6 |
|
Income tax expense |
|
|
22.7 |
|
|
|
30.0 |
|
|
|
102.2 |
|
|
|
133.1 |
|
Finance expenses |
|
|
0.8 |
|
|
|
0.7 |
|
|
|
2.9 |
|
|
|
3.2 |
|
Finance income |
|
|
(16.3) |
|
|
|
(6.7) |
|
|
|
(52.3) |
|
|
|
(12.6) |
|
Depletion and depreciation |
|
|
68.9 |
|
|
|
73.5 |
|
|
|
273.1 |
|
|
|
286.2 |
|
Impairment losses |
|
|
1,173.3 |
|
|
|
— |
|
|
|
1,173.3 |
|
|
|
— |
|
Gain on sale of royalty interest |
|
|
— |
|
|
|
— |
|
|
|
(3.7) |
|
|
|
— |
|
Foreign exchange gain and other income |
|
|
(12.3) |
|
|
|
(0.1) |
|
|
|
(14.4) |
|
|
|
(3.6) |
|
Adjusted EBITDA |
|
$ |
254.6 |
|
|
$ |
262.4 |
|
|
$ |
1,014.7 |
|
|
$ |
1,106.9 |
|
Basic weighted average shares outstanding |
|
|
192.1 |
|
|
|
191.7 |
|
|
|
192.0 |
|
|
|
191.5 |
|
|
|
|
|
|
|
|
|
|
|
|
|
|
|
|
|
|
Basic (loss) earnings per share |
|
$ |
(5.11) |
|
|
$ |
0.86 |
|
|
$ |
(2.43) |
|
|
$ |
3.66 |
|
Income tax expense |
|
|
0.12 |
|
|
|
0.16 |
|
|
|
0.53 |
|
|
|
0.70 |
|
Finance expenses |
|
|
— |
|
|
|
— |
|
|
|
0.02 |
|
|
|
0.02 |
|
Finance income |
|
|
(0.09) |
|
|
|
(0.03) |
|
|
|
(0.27) |
|
|
|
(0.07) |
|
Depletion and depreciation |
|
|
0.36 |
|
|
|
0.38 |
|
|
|
1.42 |
|
|
|
1.49 |
|
Impairment losses |
|
|
6.11 |
|
|
|
— |
|
|
|
6.11 |
|
|
|
— |
|
Gain on sale of royalty interest |
|
|
— |
|
|
|
— |
|
|
|
(0.02) |
|
|
|
— |
|
Foreign exchange gain and other income |
|
|
(0.06) |
|
|
|
— |
|
|
|
(0.08) |
|
|
|
(0.02) |
|
Adjusted EBITDA per share |
|
$ |
1.33 |
|
|
$ |
1.37 |
|
|
$ |
5.28 |
|
|
$ |
5.78 |
|
Adjusted EBITDA Margin
Adjusted EBITDA Margin is a non-GAAP ratio which is defined by Franco-Nevada as Adjusted EBITDA divided by revenue. Franco-Nevada uses Adjusted EBITDA Margin in its annual incentive compensation process to evaluate management’s performance in increasing revenue and containing costs. Management believes that in addition to measures prepared in accordance with IFRS Accounting Standards, our investors and analysts use Adjusted EBITDA Margin to evaluate the Company’s ability to contain costs relative to revenue. Adjusted EBITDA Margin is intended to provide additional information to investors and analysts and should not be considered in isolation or as a substitute for measures of performance prepared in accordance with IFRS Accounting Standards. It does not have any standardized meaning under IFRS Accounting Standards and may not be comparable to similar measures presented by other issuers.
Calculation of Adjusted EBITDA Margin:
|
|
For the three months ended |
|
|
For the year ended |
|
||||||||||
|
|
December 31, |
|
|
December 31, |
|
||||||||||
(expressed in millions, except Adjusted EBITDA Margin) |
|
2023 |
|
|
2022 |
|
|
2023 |
|
|
2022 |
|
||||
Adjusted EBITDA |
|
$ |
254.6 |
|
|
$ |
262.4 |
|
|
$ |
1,014.7 |
|
|
$ |
1,106.9 |
|
Revenue |
|
|
303.3 |
|
|
|
320.4 |
|
|
|
1,219.0 |
|
|
|
1,315.7 |
|
Adjusted EBITDA Margin |
|
|
83.9 |
% |
|
|
81.9 |
% |
|
|
83.2 |
% |
|
|
84.1 |
% |
Adjusted Net Income and Adjusted Net Income per Share
Adjusted Net Income and Adjusted Net Income per share are non-GAAP financial measures, which is defined by Franco-Nevada by excluding the following from net income (loss) and EPS:
| ● | Foreign exchange gains/losses and other income/expenses; |
| ● | Impairment losses and reversals related to royalty, stream and working interests; |
| ● | Impairment of investments; |
| ● | Gains/losses on sale of royalty, stream and working interests; |
| ● | Gains/losses on investments; |
| ● | Unusual non-recurring items; and |
| ● | Impact of income taxes on these items. |
Management uses Adjusted Net Income and Adjusted Net Income per share to evaluate the underlying operating performance of Franco-Nevada as a whole for the reporting periods presented, to assist with the planning and forecasting of future operating results, and to supplement information in its financial statements. Management believes that in addition to measures prepared in accordance with IFRS Accounting Standards such as net income and EPS, our investors and analysts use Adjusted Net Income and Adjusted Net Income per share to evaluate the results of the underlying business of Franco-Nevada, particularly since the excluded items are typically not included in our guidance. While the adjustments to net income and EPS in these measures include items that are both recurring and non-recurring, management believes that Adjusted Net Income and Adjusted Net Income per share are useful measures of Franco-Nevada’s performance because they adjust for items which may not relate to or have a disproportionate effect on the period in which they are recognized, impact the comparability of our core operating results from
2023 Management’s Discussion and Analysis |
37 |
period to period, are not always reflective of the underlying operating performance of our business and/or are not necessarily indicative of future operating results. Adjusted Net Income and Adjusted Net Income per share are intended to provide additional information to investors and analysts and should not be considered in isolation or as a substitute for measures of performance prepared in accordance with IFRS Accounting Standards. They do not have any standardized meaning under IFRS Accounting Standards and may not be comparable to similar measures presented by other issuers.
Reconciliation of Net Income to Adjusted Net Income:
|
|
For the three months ended |
|
For the year ended |
|
|||||||||||
|
|
December 31, |
|
|
December 31, |
|
||||||||||
(expressed in millions, except per share amounts) |
|
2023 |
|
|
2022 |
|
|
2023 |
|
|
2022 |
|
||||
Net (loss) income |
|
$ |
(982.5) |
|
|
$ |
165.0 |
|
|
$ |
(466.4) |
|
|
$ |
700.6 |
|
Impairment losses |
|
|
1,173.3 |
|
|
|
— |
|
|
|
1,173.3 |
|
|
|
— |
|
Gain on sale of royalty interest |
|
|
— |
|
|
|
— |
|
|
|
(3.7) |
|
|
|
— |
|
Foreign exchange gain and other income |
|
|
(12.3) |
|
|
|
(0.1) |
|
|
|
(14.4) |
|
|
|
(3.6) |
|
Finance income related to repayment of Noront Loan |
|
|
— |
|
|
|
— |
|
|
|
— |
|
|
|
(2.2) |
|
Tax effect of adjustments |
|
|
(5.6) |
|
|
|
— |
|
|
|
(4.0) |
|
|
|
2.8 |
|
Other tax related adjustments |
|
|
|
|
|
|
|
|
|
|
|
|
|
|
|
|
Change in unrecognized deductible temporary differences |
|
|
— |
|
|
|
— |
|
|
|
(1.7) |
|
|
|
— |
|
Adjusted Net Income |
|
$ |
172.9 |
|
|
$ |
164.9 |
|
|
$ |
683.1 |
|
|
$ |
697.6 |
|
Basic weighted average shares outstanding |
|
|
192.1 |
|
|
|
191.7 |
|
|
|
192.0 |
|
|
|
191.5 |
|
|
|
|
|
|
|
|
|
|
|
|
|
|
|
|
|
|
Basic (loss) earnings per share |
|
$ |
(5.11) |
|
|
$ |
0.86 |
|
|
$ |
(2.43) |
|
|
$ |
3.66 |
|
Impairment losses |
|
|
6.11 |
|
|
|
— |
|
|
|
6.11 |
|
|
|
— |
|
Gain on sale of royalty interest |
|
|
— |
|
|
|
— |
|
|
|
(0.02) |
|
|
|
— |
|
Foreign exchange gain and other income |
|
|
(0.07) |
|
|
|
— |
|
|
|
(0.07) |
|
|
|
(0.02) |
|
Finance income related to repayment of Noront Loan |
|
|
— |
|
|
|
— |
|
|
|
— |
|
|
|
(0.01) |
|
Tax effect of adjustments |
|
|
(0.03) |
|
|
|
— |
|
|
|
(0.02) |
|
|
|
0.01 |
|
Other tax related adjustments |
|
|
|
|
|
|
|
|
|
|
|
|
|
|
|
|
Change in unrecognized deductible temporary differences |
|
|
— |
|
|
|
— |
|
|
|
(0.01) |
|
|
|
— |
|
Adjusted Net Income per share |
|
$ |
0.90 |
|
|
$ |
0.86 |
|
|
$ |
3.56 |
|
|
$ |
3.64 |
|
Adjusted Net Income Margin
Adjusted Net Income Margin is a non-GAAP ratio which is defined by Franco-Nevada as Adjusted Net Income divided by revenue. Franco-Nevada uses Adjusted Net Income Margin in its annual incentive compensation process to evaluate management’s performance in increasing revenue and containing costs. Management believes that in addition to measures prepared in accordance with IFRS Accounting Standards, our investors and analysts use Adjusted Net Income Margin to evaluate the Company’s ability to contain costs relative to revenue. Adjusted Net Income Margin is intended to provide additional information to investors and analysts and should not be considered in isolation or as a substitute for measures of performance prepared in accordance with IFRS Accounting Standards. It does not have any standardized meaning under IFRS Accounting Standards and may not be comparable to similar measures presented by other issuers.
Calculation of Adjusted Net Income Margin:
|
|
For the three months ended |
|
|
For the year ended |
|
||||||||||
Adjusted Net Income Margin |
|
December 31, |
|
|
December 31, |
|
||||||||||
(expressed in millions, except Adjusted Net Income Margin) |
|
2023 |
|
|
2022 |
|
|
2023 |
|
|
2022 |
|
||||
Adjusted Net Income |
|
$ |
172.9 |
|
|
$ |
164.9 |
|
|
$ |
683.1 |
|
|
$ |
697.6 |
|
Revenue |
|
|
303.3 |
|
|
|
320.4 |
|
|
|
1,219.0 |
|
|
|
1,315.7 |
|
Adjusted Net Income Margin |
|
|
57.0 |
% |
|
|
51.5 |
% |
|
|
56.0 |
% |
|
|
53.0 |
% |
2023 Management’s Discussion and Analysis |
38 |
CAUTIONARY STATEMENT ON FORWARD-LOOKING INFORMATION
THIS MD&A CONTAINS “FORWARD-LOOKING INFORMATION” AND “FORWARD-LOOKING STATEMENTS” WITHIN THE MEANING OF APPLICABLE CANADIAN SECURITIES LAWS AND THE UNITED STATES PRIVATE SECURITIES LITIGATION REFORM ACT OF 1995, RESPECTIVELY, WHICH MAY INCLUDE, BUT ARE NOT LIMITED TO, STATEMENTS WITH RESPECT TO FUTURE EVENTS OR FUTURE PERFORMANCE, MANAGEMENT’S EXPECTATIONS REGARDING FRANCO-NEVADA’S GROWTH, RESULTS OF OPERATIONS, ESTIMATED FUTURE REVENUES, PERFORMANCE GUIDANCE, CARRYING VALUE OF ASSETS, FUTURE DIVIDENDS AND REQUIREMENTS FOR ADDITIONAL CAPITAL, MINERAL RESOURCES AND MINERAL RESERVES ESTIMATES, PRODUCTION ESTIMATES, PRODUCTION COSTS AND REVENUE, FUTURE DEMAND FOR AND PRICES OF COMMODITIES, EXPECTED MINING SEQUENCES, BUSINESS PROSPECTS AND OPPORTUNITIES, THE PERFORMANCE AND PLANS OF THIRD PARTY OPERATORS, AUDITS BEING CONDUCTED BY THE CRA, THE EXPECTED EXPOSURE FOR CURRENT AND FUTURE TAX ASSESSMENTS AND AVAILABLE REMEDIES, STATEMENTS WITH RESPECT TO THE FUTURE STATUS AND ANY POTENTIAL RESTART OF THE COBRE PANAMA MINE AND RELATED ARBITRATION PROCEEDINGS. IN ADDITION, STATEMENTS RELATING TO RESOURCES AND RESERVES, GEOS OR MINE LIFE ARE FORWARD-LOOKING STATEMENTS, AS THEY INVOLVE IMPLIED ASSESSMENT, BASED ON CERTAIN ESTIMATES AND ASSUMPTIONS, AND NO ASSURANCE CAN BE GIVEN THAT THE ESTIMATES AND ASSUMPTIONS ARE ACCURATE AND THAT SUCH RESOURCES AND RESERVES, GEOS OR MINE LIFE WILL BE REALIZED. SUCH FORWARD-LOOKING STATEMENTS REFLECT MANAGEMENT’S CURRENT BELIEFS AND ARE BASED ON INFORMATION CURRENTLY AVAILABLE TO MANAGEMENT. OFTEN, BUT NOT ALWAYS, FORWARD-LOOKING STATEMENTS CAN BE IDENTIFIED BY THE USE OF WORDS SUCH AS “PLANS”, “EXPECTS”, “IS EXPECTED”, “BUDGETS”, “POTENTIAL FOR”, “SCHEDULED”, “ESTIMATES”, “FORECASTS”, “PREDICTS”, “PROJECTS”, “INTENDS”, “TARGETS”, “AIMS”, “ANTICIPATES” OR “BELIEVES” OR VARIATIONS (INCLUDING NEGATIVE VARIATIONS) OF SUCH WORDS AND PHRASES OR MAY BE IDENTIFIED BY STATEMENTS TO THE EFFECT THAT CERTAIN ACTIONS “MAY”, “COULD”, “SHOULD”, “WOULD”, “MIGHT” OR “WILL” BE TAKEN, OCCUR OR BE ACHIEVED. FORWARD-LOOKING STATEMENTS INVOLVE KNOWN AND UNKNOWN RISKS, UNCERTAINTIES AND OTHER FACTORS, WHICH MAY CAUSE THE ACTUAL RESULTS, PERFORMANCE OR ACHIEVEMENTS OF FRANCO-NEVADA TO BE MATERIALLY DIFFERENT FROM ANY FUTURE RESULTS, PERFORMANCE OR ACHIEVEMENTS EXPRESSED OR IMPLIED BY THE FORWARD-LOOKING STATEMENTS. A NUMBER OF FACTORS COULD CAUSE ACTUAL EVENTS OR RESULTS TO DIFFER MATERIALLY FROM ANY FORWARD-LOOKING STATEMENT, INCLUDING, WITHOUT LIMITATION: FLUCTUATIONS IN THE PRICES OF THE PRIMARY COMMODITIES THAT DRIVE ROYALTY AND STREAM REVENUE (GOLD, PLATINUM GROUP METALS, COPPER, NICKEL, URANIUM, SILVER, IRON ORE AND OIL AND GAS); FLUCTUATIONS IN THE VALUE OF THE CANADIAN AND AUSTRALIAN DOLLAR, MEXICAN PESO, AND ANY OTHER CURRENCY IN WHICH REVENUE IS GENERATED, RELATIVE TO THE U.S. DOLLAR; CHANGES IN NATIONAL AND LOCAL GOVERNMENT LEGISLATION, INCLUDING PERMITTING AND LICENSING REGIMES AND TAXATION POLICIES AND THE ENFORCEMENT THEREOF; THE ADOPTION OF A GLOBAL MINIMUM TAX ON CORPORATIONS; REGULATORY, POLITICAL OR ECONOMIC DEVELOPMENTS IN ANY OF THE COUNTRIES WHERE PROPERTIES IN WHICH FRANCO-NEVADA HOLDS A ROYALTY, STREAM OR OTHER INTEREST ARE LOCATED OR THROUGH WHICH THEY ARE HELD; RISKS RELATED TO THE OPERATORS OF THE PROPERTIES IN WHICH FRANCO-NEVADA HOLDS A ROYALTY, STREAM OR OTHER INTEREST, INCLUDING CHANGES IN THE OWNERSHIP AND CONTROL OF SUCH OPERATORS; RELINQUISHMENT OR SALE OF MINERAL PROPERTIES; INFLUENCE OF MACROECONOMIC DEVELOPMENTS; BUSINESS OPPORTUNITIES THAT BECOME AVAILABLE TO, OR ARE PURSUED BY FRANCO-NEVADA; REDUCED ACCESS TO DEBT AND EQUITY CAPITAL; LITIGATION; TITLE, PERMIT OR LICENSE DISPUTES RELATED TO INTERESTS ON ANY OF THE PROPERTIES IN WHICH FRANCO-NEVADA HOLDS A ROYALTY, STREAM OR OTHER INTEREST; WHETHER OR NOT THE COMPANY IS DETERMINED TO HAVE “PASSIVE FOREIGN INVESTMENT COMPANY” (“PFIC”) STATUS AS DEFINED IN SECTION 1297 OF THE UNITED STATES INTERNAL REVENUE CODE OF 1986, AS AMENDED; POTENTIAL CHANGES IN CANADIAN TAX TREATMENT OF OFFSHORE STREAMS; EXCESSIVE COST ESCALATION AS WELL AS DEVELOPMENT, PERMITTING, INFRASTRUCTURE, OPERATING OR TECHNICAL DIFFICULTIES ON ANY OF THE PROPERTIES IN WHICH FRANCO-NEVADA HOLDS A ROYALTY, STREAM OR OTHER INTEREST; ACCESS TO SUFFICIENT PIPELINE CAPACITY; ACTUAL MINERAL CONTENT MAY DIFFER FROM THE RESOURCES AND RESERVES CONTAINED IN TECHNICAL REPORTS; RATE AND TIMING OF PRODUCTION DIFFERENCES FROM RESOURCE ESTIMATES, OTHER TECHNICAL REPORTS AND MINE PLANS; RISKS AND HAZARDS ASSOCIATED WITH THE BUSINESS OF DEVELOPMENT AND MINING ON ANY OF THE PROPERTIES IN WHICH FRANCO-NEVADA HOLDS A ROYALTY, STREAM OR OTHER INTEREST, INCLUDING, BUT NOT LIMITED TO UNUSUAL OR UNEXPECTED GEOLOGICAL AND METALLURGICAL CONDITIONS, SLOPE FAILURES OR CAVE-INS, SINKHOLES, FLOODING AND OTHER NATURAL DISASTERS, TERRORISM, CIVIL UNREST OR AN OUTBREAK OF CONTAGIOUS DISEASE; THE IMPACT OF FUTURE PANDEMICS; AND THE INTEGRATION OF ACQUIRED ASSETS. THE FORWARD-LOOKING STATEMENTS CONTAINED IN THIS MD&A ARE BASED UPON ASSUMPTIONS MANAGEMENT BELIEVES TO BE REASONABLE, INCLUDING, WITHOUT LIMITATION: THE ONGOING OPERATION OF THE PROPERTIES IN WHICH FRANCO-NEVADA HOLDS A ROYALTY, STREAM OR OTHER INTEREST BY THE OWNERS OR OPERATORS OF SUCH PROPERTIES IN A MANNER CONSISTENT WITH PAST PRACTICE; THE ACCURACY OF PUBLIC STATEMENTS AND DISCLOSURES MADE BY THE OWNERS OR OPERATORS OF SUCH UNDERLYING PROPERTIES; NO MATERIAL ADVERSE CHANGE IN THE MARKET PRICE OF THE COMMODITIES THAT UNDERLIE THE ASSET PORTFOLIO; THE COMPANY’S ONGOING INCOME AND ASSETS RELATING TO DETERMINATION OF ITS PFIC STATUS; NO MATERIAL CHANGES TO EXISTING TAX TREATMENT; THE EXPECTED APPLICATION OF TAX LAWS AND REGULATIONS BY TAXATION AUTHORITIES; THE EXPECTED ASSESSMENT AND OUTCOME OF ANY AUDIT BY ANY TAXATION AUTHORITY; NO ADVERSE DEVELOPMENT IN RESPECT OF ANY SIGNIFICANT PROPERTY IN WHICH FRANCO-NEVADA HOLDS A ROYALTY, STREAM OR OTHER INTEREST; THE ACCURACY OF PUBLICLY DISCLOSED EXPECTATIONS FOR THE DEVELOPMENT OF UNDERLYING PROPERTIES THAT ARE NOT YET IN PRODUCTION; INTEGRATION OF ACQUIRED ASSETS; AND THE ABSENCE OF ANY OTHER FACTORS THAT COULD CAUSE ACTIONS, EVENTS OR RESULTS TO DIFFER FROM THOSE ANTICIPATED, ESTIMATED OR INTENDED. HOWEVER, THERE CAN BE NO ASSURANCE THAT FORWARD-LOOKING STATEMENTS WILL PROVE TO BE ACCURATE, AS ACTUAL RESULTS AND FUTURE EVENTS COULD DIFFER MATERIALLY FROM THOSE ANTICIPATED IN SUCH STATEMENTS. INVESTORS ARE CAUTIONED THAT FORWARD-LOOKING STATEMENTS ARE NOT GUARANTEES OF FUTURE PERFORMANCE. IN ADDITION, THERE CAN BE NO ASSURANCE AS TO (I) THE OUTCOME OF THE ONGOING AUDIT BY THE CRA OR THE COMPANY’S EXPOSURE AS A RESULT THEREOF, OR (II) THE FUTURE STATUS AND ANY POTENTIAL RESTART OF THE COBRE PANAMA MINE OR THE OUTCOME OF ANY RELATED ARBITRATION PROCEEDINGS. FRANCO-NEVADA CANNOT ASSURE INVESTORS THAT ACTUAL RESULTS WILL BE CONSISTENT WITH THESE FORWARD-LOOKING STATEMENTS. ACCORDINGLY, INVESTORS SHOULD NOT PLACE UNDUE RELIANCE ON FORWARD-LOOKING STATEMENTS DUE TO THE INHERENT UNCERTAINTY THEREIN.
FOR ADDITIONAL INFORMATION WITH RESPECT TO RISKS, UNCERTAINTIES AND ASSUMPTIONS, PLEASE REFER TO FRANCO-NEVADA’S MOST RECENT ANNUAL INFORMATION FORM FILED WITH THE CANADIAN SECURITIES REGULATORY AUTHORITIES ON WWW.SEDARPLUS.COM AND FRANCO-NEVADA’S MOST RECENT ANNUAL REPORT FILED ON FORM 40-F FILED WITH THE SEC ON WWW.SEC.GOV. THE FORWARD-LOOKING STATEMENTS HEREIN ARE MADE AS OF THE DATE OF THIS MD&A ONLY AND FRANCO-NEVADA DOES NOT ASSUME ANY OBLIGATION TO UPDATE OR REVISE THEM TO REFLECT NEW INFORMATION, ESTIMATES OR OPINIONS, FUTURE EVENTS OR RESULTS OR OTHERWISE, EXCEPT AS REQUIRED BY APPLICABLE LAW.
2023 Management’s Discussion and Analysis |
39 |

Exhibit 99.3
Management’s Report On Internal Control Over Financial Reporting
Franco-Nevada Corporation’s (“Franco-Nevada” or the “Company”) management is responsible for establishing and maintaining adequate internal control over financial reporting, as defined in rules 13a-15(f) and 15d-15(f) under the United States Securities Exchange Act of 1934, as amended.
Franco-Nevada’s management, with the participation of its President & Chief Executive Officer and its Chief Financial Officer, assessed the effectiveness of the Company’s internal control over financial reporting as at December 31, 2023. Franco-Nevada’s management conducted an evaluation of the Company’s internal control over financial reporting based on criteria established in Internal Control - Integrated Framework (2013) issued by the Committee of Sponsoring Organizations of the Treadway Commission (“COSO”). Based on this assessment, management, including the President & Chief Executive Officer and the Chief Financial Officer, concluded that the Company's internal control over financial reporting is effective as of December 31, 2023.
The effectiveness of the Company’s internal control over financial reporting as at December 31, 2023 has been audited by PricewaterhouseCoopers LLP, Independent Registered Public Accounting Firm, as stated in their report appearing herein.
|
/s/Paul Brink |
|
/s/Sandip Rana |
Paul Brink |
Sandip Rana |
||
President & Chief Executive Officer |
Chief Financial Officer |
||
|
|||
|
|
|
|
March 5, 2024
2023 Financial Statements |
2 |

Report of Independent Registered Public Accounting Firm
To the Shareholders and Board of Directors of Franco-Nevada Corporation
Opinions on the Financial Statements and Internal Control over Financial Reporting
We have audited the accompanying consolidated statements of financial position of Franco-Nevada Corporation and its subsidiaries (together, the Company) as of December 31, 2023 and 2022, and the related consolidated statements of (loss) income and comprehensive (loss) income, of changes in shareholders’ equity and of cash flows for the years then ended, including the related notes (collectively referred to as the consolidated financial statements). We also have audited the Company’s internal control over financial reporting as of December 31, 2023, based on criteria established in Internal Control – Integrated Framework (2013) issued by the Committee of Sponsoring Organizations of the Treadway Commission (COSO).
In our opinion, the consolidated financial statements referred to above present fairly, in all material respects, the financial position of the Company as of December 31, 2023 and 2022, and its financial performance and its cash flows for the years then ended in conformity with International Financial Reporting Standards as issued by the International Accounting Standards Board. Also in our opinion, the Company maintained, in all material respects, effective internal control over financial reporting as of December 31, 2023, based on criteria established in Internal Control – Integrated Framework (2013) issued by the COSO.
Basis for Opinions
The Company’s management is responsible for these consolidated financial statements, for maintaining effective internal control over financial reporting, and for its assessment of the effectiveness of internal control over financial reporting, included in the accompanying Management’s Report on Internal Control over Financial Reporting. Our responsibility is to express opinions on the Company’s consolidated financial statements and on the Company’s internal control over financial reporting based on our audits. We are a public accounting firm registered with the Public Company Accounting Oversight Board (United States) (PCAOB) and are required to be independent with respect to the Company in accordance with the U.S. federal securities laws and the applicable rules and regulations of the Securities and Exchange Commission and the PCAOB.
We conducted our audits in accordance with the standards of the PCAOB. Those standards require that we plan and perform the audits to obtain reasonable assurance about whether the consolidated financial statements are free of material misstatement, whether due to error or fraud, and whether effective internal control over financial reporting was maintained in all material respects.
Our audits of the consolidated financial statements included performing procedures to assess the risks of material misstatement of the consolidated financial statements, whether due to error or fraud, and performing procedures that respond to those risks. Such procedures included examining, on a test basis, evidence regarding the amounts and disclosures in the consolidated financial statements. Our audits also
PricewaterhouseCoopers LLP
PwC Tower, 18 York Street, Suite 2500, Toronto, Ontario, Canada M5J 0B2
T: +1 416 863 1133, F: +1 416 365 8215, ca_toronto_18_york_fax@pwc.com included evaluating the accounting principles used and significant estimates made by management, as well as evaluating the overall presentation of the consolidated financial statements.
“PwC” refers to PricewaterhouseCoopers LLP, an Ontario limited liability partnership.
Our audit of internal control over financial reporting included obtaining an understanding of internal control over financial reporting, assessing the risk that a material weakness exists, and testing and evaluating the design and operating effectiveness of internal control based on the assessed risk. Our audits also included performing such other procedures as we considered necessary in the circumstances. We believe that our audits provide a reasonable basis for our opinions.
Definition and Limitations of Internal Control over Financial Reporting
A company’s internal control over financial reporting is a process designed to provide reasonable assurance regarding the reliability of financial reporting and the preparation of financial statements for external purposes in accordance with generally accepted accounting principles. A company’s internal control over financial reporting includes those policies and procedures that (i) pertain to the maintenance of records that, in reasonable detail, accurately and fairly reflect the transactions and dispositions of the assets of the company; (ii) provide reasonable assurance that transactions are recorded as necessary to permit preparation of financial statements in accordance with generally accepted accounting principles, and that receipts and expenditures of the company are being made only in accordance with authorizations of management and directors of the company; and (iii) provide reasonable assurance regarding prevention or timely detection of unauthorized acquisition, use, or disposition of the company’s assets that could have a material effect on the financial statements.
Because of its inherent limitations, internal control over financial reporting may not prevent or detect misstatements. Also, projections of any evaluation of effectiveness to future periods are subject to the risk that controls may become inadequate because of changes in conditions, or that the degree of compliance with the policies or procedures may deteriorate.
Critical Audit Matters
The critical audit matter communicated below is a matter arising from the current period audit of the consolidated financial statements that was communicated or required to be communicated to the audit and risk committee and that (i) relates to accounts or disclosures that are material to the consolidated financial statements and (ii) involved our especially challenging, subjective, or complex judgments. The communication of critical audit matters does not alter in any way our opinion on the consolidated financial statements, taken as a whole, and we are not, by communicating the critical audit matter below, providing a separate opinion on the critical audit matter or on the accounts or disclosures to which it relates.
Assessment of indicators of impairment or impairment reversal of royalty, stream and working interests
As described in Notes 2, 3 and 9 to the consolidated financial statements, the Company’s royalty, stream and working interests carrying value was $4,027.1 million as of December 31, 2023. Management assesses at the end of each reporting period whether there are any indicators that the carrying value may not be recoverable or that an impairment loss previously recognized may no longer exist that gives rise to the requirement to conduct an impairment or impairment reversal analysis. Impairment or impairment reversal is assessed at the cash-generating unit (CGU) level, which is usually at the individual royalty, stream or working interest level for each property from which independent cash inflows are generated. Management uses significant judgment when assessing whether there are indicators of impairment or impairment reversal, including, but not limited to, significant adverse change in operator reserve and resource estimates, operating status, permitting and concession rights, industry or economic trends, current or forecast commodity prices, and other relevant operator information.
For certain energy interests, management uses reserve reports prepared by independent reserve engineers or other qualified parties engaged by the Company (management’s specialists).
The principal considerations for our determination that performing procedures relating to the assessment of indicators of impairment or impairment reversal of royalty, stream and working interests is a critical audit matter are (i) the significant judgment by management when assessing whether there were indicators of impairment or impairment reversal which would require an impairment or impairment reversal analysis to be performed, and (ii) a high degree of auditor judgment, subjectivity and effort in evaluating management’s assessment of indicators of impairment or impairment reversal related to significant adverse change in operator reserve and resource estimates, operating status, permitting and concession rights, industry or economic trends, current or forecast commodity prices and other relevant operator information.
Addressing the matter involved performing procedures and evaluating audit evidence in connection with forming our overall opinion on the consolidated financial statements. These procedures included testing the effectiveness of controls relating to management’s assessment of indicators of impairment or impairment reversal of royalty, stream and working interests. These procedures also included, among others, evaluating the reasonableness of management’s assessment of indicators of impairment or impairment reversal for a sample of royalty, stream and working interests, related to significant adverse change in operator reserve and resource estimates, operating status, permitting and concession rights, industry or economic trends, current or forecast commodity prices and other relevant operator information by considering (i) current and past performance of royalty, stream and working interests; (ii) consistency with external market and industry data; (iii) publicly disclosed or other relevant information by operators of royalty, stream and working interests; and (iv) consistency with evidence obtained in other areas of the audit. For certain energy interests, the work of management’s specialists was used in performing the procedures to evaluate the reasonableness of management’s assessment of indicators of impairment or impairment reversal related to significant changes in reserve estimates. As a basis for using this work, management’s specialists’ qualifications were understood and the Company’s relationship with management’s specialists was assessed. The procedures performed also included evaluation of the methods and assumptions used by management’s specialists, tests of the data used by management’s specialists, and an evaluation of management’s specialists’ findings.
/s/PricewaterhouseCoopers LLP
Chartered Professional Accountants, Licensed Public Accountants
Toronto, Canada
March 5, 2024
We have served as the Company’s auditor since 2007.
Franco-Nevada Corporation
Consolidated Statements of Financial Position |
(in millions of U.S. dollars)
|
|
At December 31, |
|
|
At December 31, |
|
||
|
|
2023 |
|
|
2022 |
|
||
ASSETS |
|
|
|
|
|
|
|
|
Cash and cash equivalents (Note 5) |
|
$ |
1,421.9 |
|
|
$ |
1,196.5 |
|
Receivables |
|
|
111.0 |
|
|
|
135.7 |
|
Gold bullion, prepaid expenses and other current assets (Note 8) |
|
|
82.4 |
|
|
|
50.9 |
|
Current assets |
|
$ |
1,615.3 |
|
|
$ |
1,383.1 |
|
|
|
|
|
|
|
|
|
|
Royalty, stream and working interests, net (Note 9) |
|
$ |
4,027.1 |
|
|
$ |
4,927.5 |
|
Investments (Note 6) |
|
|
254.5 |
|
|
|
227.2 |
|
Loans receivable (Note 7) |
|
|
24.8 |
|
|
|
— |
|
Deferred income tax assets (Note 18) |
|
|
37.0 |
|
|
|
39.9 |
|
Other assets (Note 10) |
|
|
35.4 |
|
|
|
49.1 |
|
Total assets |
|
$ |
5,994.1 |
|
|
$ |
6,626.8 |
|
|
|
|
|
|
|
|
|
|
LIABILITIES |
|
|
|
|
|
|
|
|
Accounts payable and accrued liabilities (Note 11) |
|
$ |
30.9 |
|
|
$ |
43.1 |
|
Current income tax liabilities |
|
|
8.3 |
|
|
|
7.1 |
|
Current liabilities |
|
$ |
39.2 |
|
|
$ |
50.2 |
|
|
|
|
|
|
|
|
|
|
Deferred income tax liabilities (Note 18) |
|
$ |
180.1 |
|
|
$ |
153.0 |
|
Other liabilities |
|
|
5.7 |
|
|
|
6.0 |
|
Total liabilities |
|
$ |
225.0 |
|
|
$ |
209.2 |
|
|
|
|
|
|
|
|
|
|
SHAREHOLDERS’ EQUITY |
|
|
|
|
|
|
|
|
Share capital (Note 19) |
|
$ |
5,728.2 |
|
|
$ |
5,695.3 |
|
Contributed surplus |
|
|
20.6 |
|
|
|
15.6 |
|
Retained earnings |
|
|
212.3 |
|
|
|
940.4 |
|
Accumulated other comprehensive loss |
|
|
(192.0) |
|
|
|
(233.7) |
|
Total shareholders’ equity |
|
$ |
5,769.1 |
|
|
$ |
6,417.6 |
|
Total liabilities and shareholders’ equity |
|
$ |
5,994.1 |
|
|
$ |
6,626.8 |
|
|
|
|
|
|
|
|
|
|
Commitments and contingencies (Notes 24 and 25) |
|
|
|
|
|
|
|
|
Subsequent events (Note 26) |
|
|
|
|
|
|
|
|
The accompanying notes are an integral part of these consolidated financial statements.
Approved by the Board of Directors and authorized for issue on March 5, 2024.
|
/s/David Harquail |
|
/s/Jennifer Maki |
David Harquail |
Jennifer Maki |
||
Director |
Director |
2023 Financial Statements |
6 |
Franco-Nevada Corporation
Consolidated Statements of (Loss) Income and Comprehensive (Loss) Income |
(in millions of U.S. dollars and shares, except per share amounts)
|
|
2023 |
|
|
2022 |
|
||
Revenue (Note 13) |
|
$ |
1,219.0 |
|
|
$ |
1,315.7 |
|
|
|
|
|
|
|
|
|
|
Costs of sales |
|
|
|
|
|
|
|
|
Costs of sales (Note 14) |
|
$ |
179.3 |
|
|
$ |
176.9 |
|
Depletion and depreciation |
|
|
273.1 |
|
|
|
286.2 |
|
Total costs of sales |
|
$ |
452.4 |
|
|
$ |
463.1 |
|
Gross profit |
|
$ |
766.6 |
|
|
$ |
852.6 |
|
|
|
|
|
|
|
|
|
|
Other operating expenses (income) |
|
|
|
|
|
|
|
|
General and administrative expenses |
|
$ |
24.5 |
|
|
$ |
22.5 |
|
Share-based compensation expenses (Note 15) |
|
|
4.4 |
|
|
|
10.1 |
|
Impairment losses (Note 9) |
|
|
1,173.3 |
|
|
|
— |
|
Gain on sale of royalty interest (Note 9) |
|
|
(3.7) |
|
|
|
— |
|
Gain on sale of gold bullion |
|
|
(3.9) |
|
|
|
(0.7) |
|
Total other operating expenses |
|
$ |
1,194.6 |
|
|
$ |
31.9 |
|
Operating (loss) income |
|
$ |
(428.0) |
|
|
$ |
820.7 |
|
Foreign exchange gain and other income |
|
$ |
14.4 |
|
|
$ |
3.6 |
|
(Loss) income before finance items and income taxes |
|
$ |
(413.6) |
|
|
$ |
824.3 |
|
|
|
|
|
|
|
|
|
|
Finance items (Note 17) |
|
|
|
|
|
|
|
|
Finance income |
|
$ |
52.3 |
|
|
$ |
12.6 |
|
Finance expenses |
|
|
(2.9) |
|
|
|
(3.2) |
|
Net (loss) income before income taxes |
|
$ |
(364.2) |
|
|
$ |
833.7 |
|
|
|
|
|
|
|
|
|
|
Income tax expense (Note 18) |
|
|
102.2 |
|
|
|
133.1 |
|
Net (loss) income |
|
$ |
(466.4) |
|
|
$ |
700.6 |
|
|
|
|
|
|
|
|
|
|
Other comprehensive income (loss), net of taxes |
|
|
|
|
|
|
|
|
|
|
|
|
|
|
|
|
|
Items that may be reclassified subsequently to profit and loss: |
|
|
|
|
|
|
|
|
Currency translation adjustment |
|
$ |
34.8 |
|
|
$ |
(92.0) |
|
|
|
|
|
|
|
|
|
|
Items that will not be reclassified subsequently to profit and loss: |
|
|
|
|
|
|
|
|
Gain (loss) on changes in the fair value of equity investments |
|
|
|
|
|
|
|
|
at fair value through other comprehensive income ("FVTOCI"), |
|
|
|
|
|
|
|
|
net of income tax (Note 6) |
|
|
7.3 |
|
|
|
(36.7) |
|
Other comprehensive income (loss), net of taxes |
|
$ |
42.1 |
|
|
$ |
(128.7) |
|
|
|
|
|
|
|
|
|
|
Comprehensive (loss) income |
|
$ |
(424.3) |
|
|
$ |
571.9 |
|
|
|
|
|
|
|
|
|
|
(Loss) earnings per share (Note 20) |
|
|
|
|
|
|
|
|
Basic |
|
$ |
(2.43) |
|
|
$ |
3.66 |
|
Diluted |
|
$ |
(2.43) |
|
|
$ |
3.65 |
|
Weighted average number of shares outstanding (Note 20) |
|
|
|
|
|
|
|
|
Basic |
|
|
192.0 |
|
|
|
191.5 |
|
Diluted |
|
|
192.3 |
|
|
|
191.9 |
|
|
|
|
|
|
|
|
|
|
|
|
|
|
|
|
|
|
|
The accompanying notes are an integral part of these consolidated financial statements.
2023 Financial Statements |
7 |
Franco-Nevada Corporation
Consolidated Statements of Cash Flows |
(in millions of U.S. dollars)
|
|
2023 |
|
|
2022 |
|
||
Cash flows from operating activities |
|
|
|
|
|
|
|
|
Net (loss) income |
|
$ |
(466.4) |
|
|
$ |
700.6 |
|
Adjustments to reconcile net (loss) income to net cash provided by operating activities: |
|
|
|
|
|
|
|
|
Depletion and depreciation |
|
|
273.1 |
|
|
|
286.2 |
|
Share-based compensation expenses |
|
|
5.5 |
|
|
|
8.2 |
|
Changes in fair value of financial instruments |
|
|
(11.3) |
|
|
|
(0.4) |
|
Impairment losses |
|
|
1,173.3 |
|
|
|
— |
|
Gain on sale of royalty interest |
|
|
(3.7) |
|
|
|
— |
|
Unrealized foreign exchange (gain) loss |
|
|
(2.8) |
|
|
|
3.3 |
|
Deferred income tax expense |
|
|
26.6 |
|
|
|
37.4 |
|
Other non-cash items |
|
|
(3.7) |
|
|
|
(3.1) |
|
Acquisition of gold bullion |
|
|
(56.2) |
|
|
|
(46.7) |
|
Proceeds from sale of gold bullion |
|
|
36.8 |
|
|
|
51.6 |
|
Changes in other assets |
|
|
13.9 |
|
|
|
(26.7) |
|
Operating cash flows before changes in non-cash working capital |
|
$ |
985.1 |
|
|
$ |
1,010.4 |
|
Changes in non-cash working capital: |
|
|
|
|
|
|
|
|
Decrease (increase) in receivables |
|
$ |
24.7 |
|
|
$ |
(15.9) |
|
Increase in prepaid expenses and other |
|
|
(8.0) |
|
|
|
(3.2) |
|
(Decrease) increase in current liabilities |
|
|
(10.6) |
|
|
|
8.2 |
|
Net cash provided by operating activities |
|
$ |
991.2 |
|
|
$ |
999.5 |
|
|
|
|
|
|
|
|
|
|
Cash flows used in investing activities |
|
|
|
|
|
|
|
|
Acquisition of royalty, stream and working interests |
|
$ |
(520.0) |
|
|
$ |
(139.6) |
|
Proceeds from sale of royalty interest |
|
|
7.0 |
|
|
|
— |
|
Acquisition of investments |
|
|
(9.8) |
|
|
|
(48.5) |
|
Proceeds from sale of investments |
|
|
2.0 |
|
|
|
1.8 |
|
Investment in loan receivable |
|
|
(18.7) |
|
|
|
— |
|
Proceeds from loan receivable |
|
|
— |
|
|
|
42.7 |
|
Acquisition of energy well equipment |
|
|
(1.6) |
|
|
|
(1.9) |
|
Net cash used in investing activities |
|
$ |
(541.1) |
|
|
$ |
(145.5) |
|
|
|
|
|
|
|
|
|
|
Cash flows used in financing activities |
|
|
|
|
|
|
|
|
Payment of dividends |
|
$ |
(233.0) |
|
|
$ |
(197.6) |
|
Proceeds from exercise of stock options |
|
|
2.9 |
|
|
|
9.5 |
|
Credit facility amendment costs |
|
|
— |
|
|
|
(0.9) |
|
Net cash used in financing activities |
|
$ |
(230.1) |
|
|
$ |
(189.0) |
|
Effect of exchange rate changes on cash and cash equivalents |
|
$ |
5.4 |
|
|
$ |
(7.8) |
|
Net change in cash and cash equivalents |
|
$ |
225.4 |
|
|
$ |
657.2 |
|
Cash and cash equivalents at beginning of year |
|
$ |
1,196.5 |
|
|
$ |
539.3 |
|
Cash and cash equivalents at end of year |
|
$ |
1,421.9 |
|
|
$ |
1,196.5 |
|
|
|
|
|
|
|
|
|
|
Supplemental cash flow information: |
|
|
|
|
|
|
|
|
Income taxes paid |
|
$ |
88.1 |
|
|
$ |
95.1 |
|
Dividend income received |
|
$ |
13.2 |
|
|
$ |
19.7 |
|
Interest and standby fees paid |
|
$ |
2.3 |
|
|
$ |
2.4 |
|
The accompanying notes are an integral part of these consolidated financial statements.
2023 Financial Statements |
8 |
Franco-Nevada Corporation
Consolidated Statements of Changes in Shareholders’ Equity |
(in millions of U.S. dollars)
|
|
|
|
|
|
Accumulated |
|
|
|
|
|
|||||
|
|
|
|
|
|
other |
|
|
|
|
|
|||||
|
|
Share capital |
|
Contributed |
|
comprehensive |
|
Retained |
|
|
|
|||||
|
|
(Note 19) |
|
surplus |
|
loss |
|
earnings |
|
Total equity |
|
|||||
Balance at January 1, 2022 |
|
$ |
5,628.5 |
|
$ |
16.1 |
|
$ |
(104.3) |
|
$ |
484.9 |
|
$ |
6,025.2 |
|
Net income |
|
|
— |
|
|
— |
|
|
— |
|
|
700.6 |
|
|
700.6 |
|
Other comprehensive loss, net of taxes |
|
|
— |
|
|
— |
|
|
(128.7) |
|
|
— |
|
|
(128.7) |
|
Total comprehensive income |
|
|
|
|
|
|
|
|
|
|
|
|
|
$ |
571.9 |
|
|
|
|
|
|
|
|
|
|
|
|
|
|
|
|
|
|
Exercise of stock options |
|
$ |
12.2 |
|
$ |
(2.7) |
|
$ |
— |
|
$ |
— |
|
$ |
9.5 |
|
Share-based payments |
|
|
— |
|
|
8.6 |
|
|
— |
|
|
— |
|
|
8.6 |
|
Vesting of restricted share units |
|
|
6.4 |
|
|
(6.4) |
|
|
— |
|
|
— |
|
|
— |
|
Transfer of gain on disposal of equity investments at FVTOCI |
|
|
— |
|
|
— |
|
|
(0.7) |
|
|
0.7 |
|
|
— |
|
Dividend reinvestment plan |
|
|
48.2 |
|
|
— |
|
|
— |
|
|
— |
|
|
48.2 |
|
Dividends declared |
|
|
— |
|
|
— |
|
|
— |
|
|
(245.8) |
|
|
(245.8) |
|
Balance at December 31, 2022 |
|
$ |
5,695.3 |
|
$ |
15.6 |
|
$ |
(233.7) |
|
$ |
940.4 |
|
$ |
6,417.6 |
|
|
|
|
|
|
|
|
|
|
|
|
|
|
|
|
|
|
Balance at January 1, 2023 |
|
$ |
5,695.3 |
|
$ |
15.6 |
|
$ |
(233.7) |
|
$ |
940.4 |
|
$ |
6,417.6 |
|
Net loss |
|
|
— |
|
|
— |
|
|
— |
|
|
(466.4) |
|
|
(466.4) |
|
Other comprehensive income, net of taxes |
|
|
— |
|
|
— |
|
|
42.1 |
|
|
— |
|
|
42.1 |
|
Total comprehensive loss |
|
|
|
|
|
|
|
|
|
|
|
|
|
$ |
(424.3) |
|
|
|
|
|
|
|
|
|
|
|
|
|
|
|
|
|
|
Exercise of stock options |
|
$ |
3.8 |
|
$ |
(0.9) |
|
$ |
— |
|
$ |
— |
|
$ |
2.9 |
|
Share-based payments |
|
|
— |
|
|
5.9 |
|
|
— |
|
|
— |
|
|
5.9 |
|
Transfer of gain on disposal of equity investments at FVTOCI |
|
|
— |
|
|
— |
|
|
(0.4) |
|
|
0.4 |
|
|
— |
|
Dividend reinvestment plan |
|
|
29.1 |
|
|
— |
|
|
— |
|
|
— |
|
|
29.1 |
|
Dividends declared |
|
|
— |
|
|
— |
|
|
— |
|
|
(262.1) |
|
|
(262.1) |
|
Balance at December 31, 2023 |
|
$ |
5,728.2 |
|
$ |
20.6 |
|
$ |
(192.0) |
|
$ |
212.3 |
|
$ |
5,769.1 |
|
|
|
|
|
|
|
|
|
|
|
|
|
|
|
|
|
|
The accompanying notes are an integral part of these consolidated financial statements.
2023 Financial Statements |
9 |
Franco-Nevada Corporation
Notes to the Consolidated Financial Statements |
For the years ended December 31, 2023 and 2022
(expressed in millions of U.S. dollars, except per share amounts, unless otherwise noted)
Note 1 – Corporate Information
Franco-Nevada Corporation is incorporated under the Canada Business Corporations Act. Franco-Nevada Corporation and its wholly-owned subsidiaries (together “Franco-Nevada” or the “Company”) is a royalty and stream company focused on precious metals (gold, silver, and platinum group metals) and has a diversity of revenue sources. The Company owns a portfolio of royalty, stream and working interests, covering properties at various stages, from production to early exploration located in South America, Central America & Mexico, United States, Canada, Australia, Europe and Africa.
The Company’s shares are listed on the Toronto Stock Exchange and the New York Stock Exchange and the Company is domiciled in Canada. The Company’s head and registered office is located at 199 Bay Street, Suite 2000, Toronto, Ontario, Canada.
Note 2 – Material Accounting Policy Information
(a) |
Statement of Compliance |
These consolidated financial statements have been prepared in accordance with International Financial Reporting Standards as issued by the International Accounting Standards Board (“IASB”) (“IFRS Accounting Standards”) under the historical cost convention, except for equity investments, loans receivable, warrants and receivables from provisionally priced concentrate sales which are measured at fair value. These consolidated financial statements were authorized for issuance by the Board of Directors on March 5, 2024.
(b) |
Principles of Consolidation |
The consolidated financial statements include the accounts of the Company.
| (i) | Subsidiaries |
These consolidated financial statements include the accounts of Franco-Nevada and its subsidiaries. All intercompany accounts, transactions, income and expenses, and profits or losses have been eliminated on consolidation. The Company consolidates subsidiaries where it has the ability to exercise control. Control of an investee is defined to exist when the Company is exposed to variable returns from its involvement in the investee and has the ability to affect those returns through its power over the investee. Specifically, the Company controls an investee if, and only if, it has all of the following: power over the investee (i.e. existing rights that give the Company the current ability to direct the relevant activities of the investee); exposure, or rights, to variable returns from its involvement with the investee; and the ability to use its power over the investee to affect its returns. Control is presumed to exist where the Company owns more than one half of the voting rights unless it can be demonstrated that ownership does not constitute control. The existence and effect of potential voting rights that are currently exercisable or convertible are considered when assessing whether the Company controls another entity. Subsidiaries are fully consolidated from the date on which control is transferred to the Company. They are de-consolidated from the date that control ceases.
The financial statements of the subsidiaries are prepared for the same reporting period as the parent company, using consistent accounting policies. The consolidated financial statements include all assets, liabilities, revenues, expenses and cash flows of the Company and its subsidiaries after eliminating intercompany transactions.
2023 Financial Statements |
10 |
Franco-Nevada Corporation
Notes to the Consolidated Financial Statements |
For the years ended December 31, 2023 and 2022
(expressed in millions of U.S. dollars, except per share amounts, unless otherwise noted)
The principal subsidiaries of the Company and their geographic locations at December 31, 2023 were as follows:
|
|
|
Entity |
Jurisdiction |
Economic |
Franco-Nevada U.S. Corporation |
Delaware |
100% |
Franco-Nevada (Barbados) Corporation |
Barbados |
100% |
Franco-Nevada Australia Pty Ltd. |
Australia |
100% |
Franco-Nevada Delaware LLC |
Delaware |
100% |
Franco-Nevada Texas LP |
Texas |
100% |
Minera Global Copper Chile S.A. |
Chile |
100% |
All the above entities are classified as subsidiaries of the Company. There are no significant restrictions on the Company’s ability to access or use assets or settle liabilities of its subsidiaries.
| (ii) | Joint Arrangements |
A joint arrangement is defined as an arrangement over which two or more parties have joint control, which is the contractually agreed sharing of control over an arrangement. This exists only when the decisions about relevant activities (being those that significantly affect the returns of the arrangement) require unanimous consent of the parties sharing control. There are two types of joint arrangement, joint operations (“JO”) and joint ventures (“JV”).
A JO is a joint arrangement whereby the parties that have joint control of the arrangement have rights to the assets and obligations for the liabilities, relating to the arrangement. In relation to the Company’s interests in any JO, the Company recognizes its share of any assets, liabilities, revenues and expenses of the JO.
The Company’s JO arrangements are as follows:
| ● | The Company participates in a strategic relationship with Continental Resources, Inc. (“Continental”), to jointly acquire mineral rights within Continental’s areas of operation. The mineral interests are acquired through a royalty acquisition entity, The Mineral Resource Company II, LLC (“TMRC II”), in which the Company holds an economic interest of 49.9%. The Company funds 80% of the contributions to TMRC II, with the remainder funded by Continental. The Company determined that it has joint control over TMRC II given that decisions about relevant activities require unanimous consent of the parties to the joint arrangement. The Company further determined that the joint arrangement is a JO, based on the terms of the contractual agreement which specify how revenues and expenses are shared between the parties. |
| ● | The Company also participates in joint operations with respect to energy working interests but does not have joint control. A working interest is an ownership position in the energy property and related operating assets, whereby the Company is liable for its proportionate share of gross costs of capital and operations based on information received from the operator. |
A JV is a joint arrangement whereby the parties that have joint control of the arrangement have rights to the net assets of the joint arrangement. The assets, liabilities, revenues and expenses of a JV are accounted for using the equity method. The Company does not have any JV arrangements.
(c) |
Business Combinations |
On the acquisition of a business, the acquisition method of accounting is used whereby the purchase consideration is allocated to the identifiable assets, liabilities and contingent liabilities (identifiable net assets) of the business on the basis of the fair value at the date of acquisition. Provisional fair values allocated at a reporting date are finalized as soon as the relevant information is available, which period shall not exceed twelve months from the acquisition date and are adjusted to reflect the transaction as of the acquisition date.
The results of businesses acquired during the period are consolidated into the consolidated financial statements from the date on which control commences at the date of acquisition and taken out of the consolidated financial statements from the date on which control ceases.
2023 Financial Statements |
11 |
Franco-Nevada Corporation
Notes to the Consolidated Financial Statements |
For the years ended December 31, 2023 and 2022
(expressed in millions of U.S. dollars, except per share amounts, unless otherwise noted)
When all or part of the purchase consideration is contingent on future events, the cost of the acquisition initially recorded includes an estimate of the fair value of the contingent liability amounts expected to be payable in the future. The cost of acquisition is adjusted when revised estimates are made, with corresponding adjustments made to the consolidated statement of (loss) income and comprehensive (loss) income.
When a business is acquired in a number of stages, the cost of each stage is compared with the fair value of the identifiable net assets at the date of that purchase. When the cost of the acquisition exceeds the fair values of the identifiable net assets acquired, the difference is recorded as goodwill. If the fair value attributable to the Company’s share of the identifiable net assets exceeds the cost of acquisition, the difference is recognized as a gain in the consolidated statement of (loss) income and comprehensive (loss) income. Acquisition costs are expensed.
(d) |
Currency Translation |
| (i) | Functional and Presentation Currency |
The functional currency for each entity within the Franco-Nevada group is the currency of the primary economic environment in which it operates.
These consolidated financial statements are expressed in United States dollars, which is the functional currency of the majority of the subsidiaries. The parent Company’s functional currency is the Canadian dollar. The U.S. dollar is used as the presentation currency of the Company to ensure comparability with the Company’s peers. References herein to C$ are to Canadian dollars.
| (ii) | Foreign Currency Transactions and Balances |
Foreign currency transactions are translated into the functional currency of the respective subsidiary, using the exchange rate prevailing at the dates of the transaction (spot exchange rates). Foreign exchange gains and losses resulting from the settlement of such transactions and the re-measurement of monetary items at the date of the consolidated statements of financial position are recognized in net (loss) income. Non-monetary items measured at historical cost are translated into the functional currency using the exchange rate at the date of the transaction.
The results and financial position of the subsidiaries that have a functional currency different from the presentation currency are translated into U.S. dollars, the group’s presentation currency, as follows:
| ● | assets and liabilities for each subsidiary are translated at the closing exchange rate at the date of the balance sheet; |
| ● | income and expenses for each subsidiary are translated at the average exchange rates during the period; and |
| ● | all resulting exchange differences are charged/credited to the currency translation adjustment in other comprehensive income (loss). |
(e) |
Royalty, Stream and Working Interests |
Royalty, stream and working interests consist of acquired royalty interests, stream metal purchase agreements, and working interests in producing, advanced and exploration stage properties. Royalty, stream and working interests are recorded at cost and capitalized as tangible assets with finite lives. They are subsequently measured at cost less accumulated depletion and accumulated impairment losses and reversals. The cost of royalty, stream and working interests is determined by reference to the cost model under IAS 16 Property, Plant and Equipment (“IAS 16”). The major categories of the Company’s interests are producing, advanced and exploration. Producing assets are those that have generated revenue from steady-state operations for the Company or are expected to in the next year. Advanced assets are interests on projects which are not yet producing, but where in management’s view, the technical feasibility and commercial viability of extracting a mineral resource are demonstrable. Exploration assets represent interests on projects where technical feasibility and commercial viability of extracting a mineral resource are not demonstrable. Royalty, stream and working interests for producing and advanced assets are recorded at cost and capitalized in accordance with IAS 16, while exploration assets are recorded and capitalized in accordance with IFRS 6 Exploration for and Evaluation of Mineral Resources (“IFRS 6”).
2023 Financial Statements |
12 |
Franco-Nevada Corporation
Notes to the Consolidated Financial Statements |
For the years ended December 31, 2023 and 2022
(expressed in millions of U.S. dollars, except per share amounts, unless otherwise noted)
Management uses the following criteria in its assessment of technical feasibility and commercial viability:
| (i) | Geology: there is a known mineral deposit which contains mineral reserves or resources; or the project is adjacent to a mineral deposit that is already being mined or developed and there is sufficient geologic certainty of converting the deposit into mineral reserves or resources. |
| (ii) | Accessibility and authorization: there are no significant unresolved issues impacting the accessibility and authorization to develop or mine the mineral deposit, and social, environmental and governmental permits and approvals to develop or mine the mineral deposit appear obtainable. |
Producing mineral royalty and stream interests are depleted using the units-of-production method over the life of the property to which the interest relates. The life of the property is estimated using life of mine models specifically associated with the mineral royalty or stream properties which include proven and probable reserves and may include a portion of resources expected to be converted into reserves. Where life of mine models are not available, the Company uses publicly available statements of reserves and resources for the mineral royalty or stream properties to estimate the life of the property and portion of resources that the Company expects to be converted into reserves covered by the agreement. Where life of mine models and publicly available reserve and resource statements are not available, depletion is based on the Company’s best estimate of the volumes to be produced and delivered under the contract. The Company relies on information available to it under contracts with operators and/or public disclosures for information on reserves and resources from the operators of the producing mineral and stream interests.
Producing energy interests are depleted using the units-of-production method over the life of the property to which the interest relates, which is estimated using available estimated proved and probable reserves specifically associated with the energy properties. For energy interests, management uses reserve reports prepared by independent reserve engineers or other qualified parties engaged by the Company.
On acquisition of a producing royalty, stream or working interest, an allocation of its fair value is attributed to the exploration potential of the interest. The estimated fair value of this acquired exploration potential is recorded as an asset (non-depletable interest) on the acquisition date. Updated reserve and resource information obtained from the operators of the royalty, stream or working interest properties is used to determine the amount to be converted from non-depletable interest to depletable interest. If the cost of a royalty, stream or working interest includes contingent consideration, the contingent consideration is capitalized as part of the cost of the interest when the underlying obligating event has occurred.
Acquisition costs of advanced and exploration stage royalty, stream and working interests are capitalized and are not depleted until such time as revenue-generating activities begin. The Company may receive advance minimum payments prior to the commencement of production on some of its interests. In these circumstances, the Company would record the advance minimum payments as revenue from contracts with customers and depletion expense as described above, up to a maximum of the total of the advance minimum payment received.
(f) |
Working Interests in Energy Properties |
Acquired energy working interests are accounted for at cost and capitalized as tangible assets of developing or operating properties, or in accordance with IFRS 6 for exploration properties. For each energy property on which the Company has a working interest, the Company bears its proportionate share of the gross costs of capital and operations based on information received from the operator. Such capital costs are capitalized to energy well equipment which is a component of other assets on the statement of financial position.
Capitalized costs, other than those related to energy well equipment, are depreciated when the asset is available for its intended use on a units-of-production basis, whereby the denominator is the proven and probable reserves associated with the energy properties. For energy well equipment, capitalized costs are depreciated by application of a 25% declining balance method.
(g) |
Impairment of Non-Financial Assets |
Producing and advanced mineral, stream and working interests are reviewed for impairment if there is any indication that the carrying amount may not be recoverable. Impairment is assessed at the level of cash-generating units (“CGUs”) which, in accordance with IAS 36 Impairment of Assets (“IAS 36”), are identified as the smallest identifiable group of assets from which independent cash flows are generated. This is usually at the individual royalty, stream, or working interest level for each property from which independent cash inflows are generated.
2023 Financial Statements |
13 |
Franco-Nevada Corporation
Notes to the Consolidated Financial Statements |
For the years ended December 31, 2023 and 2022
(expressed in millions of U.S. dollars, except per share amounts, unless otherwise noted)
An impairment loss is recognized for the amount by which the asset’s carrying value exceeds its recoverable amount, which is the higher of fair value less costs of disposal (“FVLCD”) and value-in-use (“VIU”). The future cash flow expected is derived using estimates of proven and probable reserves, a portion of resources that is expected to be converted into reserves and information regarding the mineral, stream and energy properties, respectively, that could affect the future recoverability of the Company’s interests. Discount factors are determined individually for each asset and reflect their respective risk profiles. In certain circumstances, the Company may use a market approach in determining the recoverable amount which may include an estimate of (i) net present value of estimated future cash flows; (ii) dollar value per ounce or pound of reserve/resource; (iii) cash-flow multiples; and/or (iv) market capitalization of comparable assets. Impairment losses are charged to the royalty, stream or working interest and any associated energy well equipment in the case of working interests. Assets are subsequently reassessed for indications that an impairment loss previously recognized may no longer exist. An impairment loss is reversed if the conditions that gave rise to the recognition of an impairment loss are subsequently reversed and the asset’s recoverable amount exceeds its carrying amount. Impairment losses can be reversed only to the extent that the recoverable amount does not exceed the carrying value that would have been determined had no impairment been recognized previously.
Gold bullion and prepaid expenses are similarly assessed for impairment whenever indicators of impairment exist in accordance with IAS 36. An impairment loss is recognized for the amount by which the asset’s carrying value exceeds its recoverable amount, which is the higher of FVLCD and VIU.
Interests classified as exploration are assessed for impairment whenever indicators of impairment exist in accordance with IFRS 6. An impairment loss is recognized for the amount by which the asset’s carrying value exceeds its recoverable amount, which is the higher of FVLCD and VIU. An interest that has previously been classified as exploration is also assessed for impairment before reclassification to either advanced or producing, and the impairment loss, if any, is recognized in net (loss) income.
(h) |
Financial Instruments |
Financial assets and financial liabilities are recognized on the Company’s statement of financial position when the Company has become a party to the contractual provisions of the instrument. Financial assets are derecognized when the rights to receive cash flows from the assets have expired or have been transferred and the Company has transferred substantially all risks and rewards of ownership. The Company’s financial instruments consist of cash and cash equivalents, receivables, accounts payable, accrued liabilities, debt, and investments, including equity investments, loans receivable, and warrants. Financial instruments are recognized initially at fair value.
Under the IFRS 9 Financial Instruments (“IFRS 9”) model for classification the Company has classified its financial assets as described below.
| (i) | Cash and Cash Equivalents |
Cash and cash equivalents comprise cash on hand, deposits held with banks and other short-term highly liquid investments with original maturities of three months or less. Cash and cash equivalents are recorded at amortized cost using the effective interest method.
| (ii) | Receivables |
Receivables, other than those related to stream agreements with provisional pricing mechanisms, are classified as financial assets at amortized cost and measured using the effective interest method less any impairment loss allowance. The loss allowance for receivables is measured based on lifetime expected credit losses.
| (iii) | Investments |
Investments comprise equity interests in publicly-traded and privately-held entities, warrants, marketable securities with original maturities at the date of the purchase of more than three months and a loan receivable.
The Company’s equity investments are held for strategic purposes and not for trading. The Company made an irrevocable election to designate these investments in common shares at fair value through other comprehensive income (“FVTOCI”). FVTOCI investments are recognized initially at fair value plus transaction costs. Subsequent to initial recognition, FVTOCI investments are measured at fair value and changes in the fair value are recognized directly in other comprehensive income (loss). When an equity investment at FVTOCI is sold, the accumulated gains or losses are reclassified from accumulated other comprehensive income (loss) directly to retained earnings.
Translation differences on equity securities classified as FVTOCI are included in other comprehensive income (loss).
2023 Financial Statements |
14 |
Franco-Nevada Corporation
Notes to the Consolidated Financial Statements |
For the years ended December 31, 2023 and 2022
(expressed in millions of U.S. dollars, except per share amounts, unless otherwise noted)
Derivative instruments, such as warrants and receivables related to stream agreements with provisional pricing mechanisms, are classified as fair value through profit and loss (“FVTPL”) and are recognized initially at fair value. Subsequent to initial recognition, derivatives are measured at fair value. In the case of receivables related to stream agreements with provisional pricing, once the final settlement price is determined the financial instrument is no longer a derivative and is classified as a financial asset at amortized cost. Changes in the fair value of receivables related to stream agreements with provisional pricing mechanisms are recognized in revenue in the statement of (loss) income and comprehensive (loss) income. Changes in fair value of warrants are recognized as other income (expenses) in the statement of (loss) income and comprehensive (loss) income.
Loans receivable that are held for collection of contractual cash flows and where those cash flows represent solely payments of principal and interest are classified as financial assets at amortized cost. Loans are measured at amortized cost using the effective interest method, less any impairment loss allowance. The impairment loss allowance for the loan receivable is measured based on expected credit losses under the general approach. Interest income is recognized by applying the effective interest rate method and presented as finance income in the statement of (loss) income and comprehensive (loss) income.
Loans receivable that are held for collection of contractual cash flows but where those cash flows do not represent solely payments of principal and interest are classified as financial assets at FVTPL. Loans receivable that are classified at FVTPL are initially recognized at the equivalent of cash consideration paid. Subsequent to initial recognition, the loans receivable are measured at fair value. Changes in the fair values of the loans receivable are recognized as other income (expenses) in the statement of (loss) income and comprehensive (loss) income.
| (iv) | Financial Liabilities |
Financial liabilities, including accounts payable, accrued liabilities and debt, are classified as financial liabilities to be subsequently measured at amortized cost using the effective interest method.
(i) |
Revenue Recognition |
The Company generates revenue from contracts with customers under each of its royalty, stream and working interests. The Company has determined that each unit of a commodity that is delivered to a customer under a royalty, stream, or working interest arrangement is a performance obligation for the delivery of a good that is separate from each other unit of the commodity to be delivered under the same arrangement.
| (i) | Stream Arrangements |
Under its stream arrangements, the Company acquires commodities from operators of mining properties on which the Company has stream interests. The Company sells the commodities received under these arrangements to its customers under separate sales contracts.
For those stream arrangements where the Company acquires refined metal from the operator, the Company sells the refined metal to third party financial institutions or brokers. The Company transfers control over the commodity on the date the commodity is delivered to the customer’s metal account, which is the date that title to the commodity and the risks and rewards of ownership transfer to the customer and the customer is able to direct the use of and obtain substantially all of the benefits from the commodity. The transaction price for these sales is fixed at the delivery date based on the spot price for the commodity and payment of the transaction price is generally due immediately when control has been transferred.
For those stream arrangements where the Company acquires the commodities in concentrate form from the operator, the Company sells the concentrate under sales contracts with independent smelting companies. The Company transfers control over the concentrate at the time of shipment, which is when the risks and rewards of ownership and title pass to the independent smelting company. The final prices for metals contained in the concentrate are determined based on the market price for the metals on a specified future date after shipment. Upon transfer of control at shipment, the Company records revenue and a corresponding receivable from these sales based on forward commodity prices at the time of shipment.
Variations between the price recorded at the transfer of control and the actual final price set under the contracts with the smelting companies are caused by changes in market commodity prices, and result in an embedded derivative in the receivable. The embedded derivative is recorded at fair value each period until final settlement occurs, with changes in fair value classified as provisional price adjustments and included as a component of stream revenue. These provisional price adjustments associated with concentrate sales are not considered to be revenue from contracts with customers as they arise from changes in market commodity prices.
2023 Financial Statements |
15 |
Franco-Nevada Corporation
Notes to the Consolidated Financial Statements |
For the years ended December 31, 2023 and 2022
(expressed in millions of U.S. dollars, except per share amounts, unless otherwise noted)
| (ii) | Royalty Arrangements |
For royalty interests, the Company sells commodities to customers under contracts that are established by the operator of each mining or energy property on which the royalty interest is held. The Company recognizes revenue from these sales when control over the commodity transfers to the customer. This transfer of control generally occurs when the operator of the mining or energy property on which the royalty interest is held physically delivers the commodity to the customer. At this point in time, the risks and rewards of ownership have transferred to the customer and the Company has an unconditional right to payment.
Revenue from royalty arrangements is measured at the transaction price agreed in the royalty arrangement with the operator of each mining or energy property. The transaction price will reflect the gross value of the commodity sold less deductions that vary based on the terms of the royalty arrangement.
| (iii) | Working Interest Arrangements |
The Company sells its proportionate share of the crude oil, natural gas and natural gas liquids to third-party customers using the services of a third-party marketing agent. The Company transfers control over the oil and gas at the time it enters the pipeline system, which is when title and the risks and rewards of ownership are transferred to customers and the Company has an unconditional right to payment. Revenue is measured at the transaction price set by reference to monthly market commodity prices plus certain price adjustments. Price adjustments include product quality and transportation adjustments and market differentials.
(j) |
Costs of Sales |
Costs of sales includes various production taxes that are recognized with the related revenues and the Company’s share of the gross operating costs for the working interests in the energy properties.
For stream agreements, the Company purchases gold, silver or platinum group metals for a cash payment of the lesser of a set contractual price, subject to annual inflationary adjustments, and the prevailing market price per ounce of gold and/or silver when purchased. Under certain stream agreements, the Company purchases gold and/or silver for a cash payment that is a fixed percentage of the prevailing market price per ounce of gold and/or silver when purchased.
In certain instances, the Company purchases a fixed amount of gold by providing an initial deposit. The initial deposit is recorded as a prepaid gold asset and classified within current prepaid expenses and other assets or non-current other assets dependent on whether delivery will occur within 12 months of the reporting date. When gold is delivered to the Company it is recorded as inventory until such time as it is sold and the cost of the gold is recorded as a cost of sale.
(k) |
Income Taxes |
The income tax expense or recovery represents the sum of current and deferred income taxes.
Current income tax payable is based on taxable profit for the year. Taxable profit differs from net (loss) income as reported in the consolidated statement of (loss) income and comprehensive (loss) income because it excludes items of income or expense that are taxable or deductible in other years and it further excludes items that are never taxable or deductible. The Company’s liability for current tax is calculated by using tax rates and laws that have been enacted or substantively enacted at the statement of financial position date.
Deferred tax is the tax expected to be payable or recoverable on differences between the carrying amount of assets and liabilities in the consolidated financial statements and the corresponding tax bases used in the computation of taxable profit, and is accounted for using the statement of financial position liability method. Deferred tax liabilities are recognized for all taxable temporary differences and deferred tax assets are recognized to the extent that it is probable that taxable profits will be available against which deductible temporary differences can be utilized. Such assets and liabilities are not recognized if the temporary differences arise from initial recognition of an asset or liability in a transaction that is not a business combination and, at the time of the transaction, affects neither the accounting profit nor taxable profit.
Deferred tax liabilities are recognized for taxable temporary differences arising on investments in subsidiaries, except where the Company is able to control the reversal of the temporary difference and it is probable that the temporary difference will not reverse in the foreseeable future.
2023 Financial Statements |
16 |
Franco-Nevada Corporation
Notes to the Consolidated Financial Statements |
For the years ended December 31, 2023 and 2022
(expressed in millions of U.S. dollars, except per share amounts, unless otherwise noted)
Deferred tax is calculated at the tax rates that are enacted or substantively enacted at the statement of financial position date and are expected to apply to the period when the deferred tax asset is realized or the liability is settled. Deferred tax is charged or credited in the consolidated statement of (loss) income and comprehensive (loss) income, except when it relates to items credited or charged directly to equity, in which case the deferred tax is also accounted for within equity.
The Company is subject to assessments by various taxation authorities, who may interpret tax legislation differently than the Company. The Company evaluates its exposure to uncertain tax positions and where it is probable that such exposure will materialize, recognizes a provision. Tax liabilities for uncertain tax positions are adjusted by the Company to reflect its best estimate of the probable outcome of assessments and in light of changing facts and circumstances, such as the completion of a tax audit, expiration of a statute of limitations, the refinement of an estimate, and interest accruals associated with the tax uncertain tax positions until they are resolved. Some of these adjustments require significant judgment in estimating the timing and amount of any additional tax expense.
(l) |
Stock Options |
The Company may issue equity-settled share-based payments to directors, officers, employees and consultants under the terms of its share compensation plan. Equity-settled share-based payments are measured at fair value at the date of grant. The fair value determined at the date of grant of equity-settled share-based payments is expensed over the expected service period with a corresponding change to contributed surplus and is based on the Company’s estimate of shares that will ultimately vest.
Fair value is measured by use of the Black-Scholes option pricing valuation model. The expected life used in the model is adjusted, based on management’s best estimate, for the effect of non-transferability, exercise restrictions and behavioural considerations. Expected volatility is estimated by considering historic average share price volatility. Any consideration paid or received upon the exercise of the stock options or purchase of shares is credited to share capital.
(m) |
Restricted Share Units |
The Company may grant performance-based or time-based restricted share units (“RSUs”) to officers and employees under the terms of its share compensation plan. When each RSU vests, the Company plans to settle every RSU with one common share of the parent company. The Company recognizes the fair value of the RSUs as share-based compensation expense which is determined with reference to the weighted average trading price of the Company’s common shares over the five trading days immediately preceding the date of issuance. The amount recognized reflects the number of awards for which the related service and non-market performance conditions associated with these awards are expected to be met. The Company expenses the fair value of the RSUs over the applicable service period, with a corresponding change in contributed surplus. Time-based RSUs vest over a three year period on the anniversary of the date of grant. For performance vesting conditions, the grant date fair value of the RSU is measured to reflect such conditions and this estimate is not updated between expected and actual outcomes. Performance-based RSUs vest at the end of a three year period following the achievement of certain performance criteria and are subject to a performance multiplier which may range from 0% to 150% of the value.
(n) |
Deferred Share Units |
Non-executive directors may choose to convert their directors’ fees into deferred share units (“DSUs”) under the terms of the Company’s deferred share unit plan (the “DSU Plan”). Directors must elect to convert their fees prior to January 1 of each year. The Company may also award DSUs to non-executive directors under the DSU Plan as compensation. When dividends are declared by the Company, directors are also credited with dividend equivalents in the form of additional DSUs based on the number of vested DSUs each director holds on the record date for the payment of a dividend. Retainer, conversion and dividend equivalent DSUs vest immediately. The fair value of DSUs at the time of conversion or award, as applicable, is determined with reference to the weighted average trading price of the Company’s common shares over the five trading days immediately preceding the date of conversion or award, as applicable. The fair value of the DSUs, which are settled in cash, is recognized as a share-based compensation expense with a corresponding increase in liabilities, over the service period. The fair value of the DSUs is marked to the quoted market price of the Company’s common shares at each reporting date with a corresponding change in the consolidated statement of (loss) income and comprehensive (loss) income. Participants are not allowed to redeem their DSUs until retirement or termination of directorship. The cash value of the DSUs at the time of redemption is equivalent to the market value of the Company’s common shares when redemption takes place.
2023 Financial Statements |
17 |
Franco-Nevada Corporation
Notes to the Consolidated Financial Statements |
For the years ended December 31, 2023 and 2022
(expressed in millions of U.S. dollars, except per share amounts, unless otherwise noted)
(o) |
Segment Reporting |
The Company is engaged in the management and acquisition of royalties, streams and working interests in the mining and energy sectors. Operating segments are reported in a manner consistent with the internal reporting provided to the Chief Executive Officer (“CEO”) who fulfills the role of the chief operating decision-maker. The CEO is responsible for allocating resources and assessing performance of the Company’s operating segments.
(p) |
Earnings per Share |
Basic earnings per share is computed by dividing the net (loss) income by the weighted average number of common shares outstanding during each period. Diluted earnings per share reflects the effect of all potentially dilutive common share equivalents, which includes dilutive share options and restricted share units granted to employees and warrants computed using the treasury stock method.
New and Amended Standards Adopted by the Company
The following standards were effective and implemented for the annual period as of January 1, 2023.
Amendments to IAS 1 and IFRS Practice Statement 2 – Disclosure of Accounting Policies
The IASB amended IAS 1 Presentation of Financial Statements (“IAS 1) and IFRS Practice Statement 2 Making Materiality Judgements to require entities to disclose their material rather than their significant accounting policies. The amendments define what is ‘material accounting policy information’ and provides guidance on how entities apply the concept of materiality in making decisions about accounting policy disclosures.
There was no significant impact to the Company’s disclosure of accounting policies as a result of the amendments.
Amendments to IAS 8 Accounting Policies, Changes in Accounting Estimates and Errors – Definition of Accounting Estimates
The IASB amended IAS 8 Accounting Policies, Changes in Accounting Estimates and Errors (“IAS 8”). The amendments replace the definition of a change in accounting estimates with a definition of accounting estimates. Under the new definition, accounting estimates are “monetary amounts in financial statements that are subject to measurement uncertainty”. There was no significant impact to the current period or comparative periods presented as a result of these amendments.
Amendments to IAS 12 Income Taxes – Deferred Tax Related to Assets and Liabilities Arising from a Single Transaction
The IASB amended IAS 12 Income Taxes (“IAS 12”). The amendments introduce a further exception from the initial recognition exemption. Under the amendments, an entity does not apply the initial recognition exemption for transactions that give rise to equal taxable and deductible temporary differences. There was no significant impact on the Company’s consolidated financial statements as a result of these amendments.
International Tax Reform – Pillar Two Model Rules – Amendments to IAS 12, Income Taxes
On May 23, 2023, the IASB issued amendments to IAS 12 which introduce a mandatory temporary exception to accounting for deferred taxes arising from the jurisdictional implementation of the Organization for Economic Co-operation and Development (“OECD”) Pillar Two model rules, and disclosure requirements for affected entities to help users better understand an entity’s exposure to Pillar Two income taxes, particularly before its effective date.
Upon issuance of the amendment, the Company applied the temporary exception immediately and retrospectively. See note 18.
New Accounting Standards Issued But Not Yet Effective
Certain new accounting standards and interpretations have been published that are not mandatory for the current period and have not been early adopted. The amendments are effective for annual reporting periods beginning on or after January 1, 2024, with earlier application permitted.
Amendments to IAS 1 – Classification of Liabilities as Current or Non-current
The IASB issued amendments to IAS 1. The amendments clarify that the classification of liabilities as current or non-current is based on rights that are in existence at the end of the reporting period. Classification is unaffected by the entity’s expectation or events after the reporting date. Covenants of loan arrangements will affect the classification of a liability as current or non-current if the entity must comply with a covenant either before or at the reporting date, even if the covenant is only tested for compliance after the reporting date.
The amendments are not expected to have a significant impact on the Company's consolidated financial statements.
2023 Financial Statements |
18 |
Franco-Nevada Corporation
Notes to the Consolidated Financial Statements |
For the years ended December 31, 2023 and 2022
(expressed in millions of U.S. dollars, except per share amounts, unless otherwise noted)
Note 3 – Significant Judgments, Estimates and Assumptions
The preparation of consolidated financial statements in accordance with IFRS Accounting Standards requires the Company to make judgments, estimates and assumptions that affect the reported amounts of assets and liabilities and disclosures of contingent assets and liabilities at the date of the consolidated financial statements and the reported amounts of revenues and expenses during the reporting period. Estimates and assumptions are continuously evaluated and are based on management’s best knowledge of the relevant facts and circumstances, having regard to previous experience. However, actual outcomes may differ from the amounts included in the consolidated financial statements.
In particular, the areas which require management to make significant judgments, estimates and assumptions in determining carrying values are:
Impairment and Reversal of Impairment of Royalty, Stream and Working Interests
Assessment of impairment and reversal of impairment of royalty, stream, working interests and energy well equipment at the end of each reporting period requires the use of judgments, assumptions and estimates when assessing whether there are any indicators that give rise to the requirement to conduct an impairment or impairment reversal analysis on the Company’s royalty, stream and working interests, and/or energy equipment. Indicators which could trigger an impairment or impairment reversal analysis include, but are not limited to, a significant adverse change in operator reserve and resource estimates, operating status, change in permitting and concession rights, industry or economic trends, current or forecast commodity prices, and other relevant operator information. The assessment of fair values requires the use of estimates and assumptions for recoverable production, long-term commodity prices, discount rates, reserve/resource conversion, foreign exchange rates, future capital expansion plans and the associated attributable production implications. In addition, the Company may use other approaches in determining fair value which may include judgment and estimates related to (i) dollar value per ounce or pound of reserve/resource; (ii) cash-flow multiples; and (iii) market capitalization of comparable assets. Changes in any of the assumptions and estimates used in determining the fair value of the royalty, stream or working interests, or energy well equipment could impact the impairment or impairment reversal analysis.
The Company has two precious metal streams in reference to production from the Cobre Panama mine, located in Panama and operated by Minera Panama, S.A. (“MPSA”), a subsidiary of First Quantum Minerals Ltd. (“First Quantum”). At December 31, 2023, the Company carried out an impairment assessment of the recoverable amount of its Cobre Panama CGU. The recoverable amount, in accordance with IAS 36, was determined to be nil at December 31, 2023, based on the halting of production and the political environment surrounding the ruling by the Supreme Court of Justice of Panama (the “Supreme Court”). The Company recognized an impairment loss of $1,169.2 million in the year ended December 31, 2023. Refer to Note 9 (b), Impairments of Royalty, Stream and Working Interests, for further details on the impairment assessment of the Cobre Panama stream interest.
In the event that there is a change in the facts and circumstances surrounding the halting of production at Cobre Panama, and there is a resumption of precious metal stream deliveries to Franco-Nevada, an assessment of the recoverable amount of the Cobre Panama CGU will be performed at that time, which may lead to a reversal of part or all of the impairment loss that has been recognized.
Reserves and Resources
Royalty, stream and working interests comprise a large component of the Company’s assets and, as such, the reserves and resources of the properties to which the interests relate have a significant effect on the Company’s financial statements. These estimates are applied in determining the depletion of and assessing the recoverability of the carrying value of royalty, stream and working interests. For mineral royalty and stream interests, the public disclosures of reserves and resources that are released by the operators of the interests involve assessments of geological and geophysical studies and economic data and the reliance on a number of assumptions, including commodity prices and production costs. For energy interests, the estimated reserves in reserve reports prepared by independent reserve engineers or other qualified parties engaged by the Company reflect similar assessments of geological and geophysical studies and economic data and reliance on assumptions. These assumptions are, by their very nature, subject to interpretation and uncertainty.
The estimates of reserves and resources may change based on additional knowledge gained subsequent to the initial assessment. Changes in the estimates of reserves and resources may materially affect the recorded amounts of depletion and the assessed recoverability of the carrying value of royalty, stream and working interests.
Volatility in Commodity Prices
A number of geopolitical and market factors impacting global energy markets have contributed to extreme volatility in the price of gold, oil and gas. Assumptions about future commodity prices, interest rates and levels of supply and demand of commodities continue to be subject to greater variability than normal and there is heightened potential for impairments or reversals of impairments with respect to the Company’s interests. The continuation of volatile commodity prices for a prolonged period may significantly affect the valuation of the Company’s financial and non-financial assets and have a material adverse impact on Franco-Nevada’s results of operations and financial condition.
2023 Financial Statements |
19 |
Franco-Nevada Corporation
Notes to the Consolidated Financial Statements |
For the years ended December 31, 2023 and 2022
(expressed in millions of U.S. dollars, except per share amounts, unless otherwise noted)
Asset Acquisitions and Business Combinations
The assessment of whether an acquisition meets the definition of a business, or whether assets are acquired is an area of key judgment. If deemed to be a business combination, applying the acquisition method to business combinations requires each identifiable asset and liability to be measured at its acquisition-date fair value. The excess, if any, of the fair value of consideration over the fair value of the net identifiable assets acquired is recognized as goodwill. The determination of the acquisition-date fair values often requires management to make assumptions and estimates about future events. The assumptions and estimates with respect to determining the fair value of royalty, stream or working interests generally require a high degree of judgment, and include estimates of mineral reserves and resources acquired, future metal prices, discount rates and reserve/resource conversion. Changes in any of the assumptions or estimates used in determining the fair value of acquired assets and liabilities could impact the amounts assigned to assets and liabilities.
Joint Arrangements
Judgment is required to determine whether the Company has joint control of a contractual arrangement, which requires continuous assessment of the relevant activities and whether the decisions in relation to those activities require unanimous consent. Judgment is also continually required to classify a joint arrangement as either a joint operation or a joint venture when the arrangement has been structured through a separate vehicle. Classifying the arrangement requires the Company to assess its rights and obligations arising from the arrangement. Specifically, the Company considers the legal form of the separate vehicle, the terms of the contractual arrangement and other relevant facts and circumstances. This assessment often requires significant judgment, and a different conclusion on joint control, or whether the arrangement is a joint operation or a joint venture, may have a material impact on the accounting treatment.
The Company evaluated its joint arrangement with Continental, whereby the Company acquired a 49.9% economic interest in TMRC II, in accordance with IFRS 11 Joint Arrangements (“IFRS 11”). The Company concluded that the arrangement qualified as a joint operation based on the terms of the contractual agreement which specify how revenues and expenses are shared. Under the agreement, revenues generated by the royalty assets of TMRC II are to be distributed based on the performance of the assets against agreed upon development thresholds and the tranche in which the assets were acquired, resulting in the Company receiving distributions ranging between 50-75% of revenue. As a result, the Company has concluded that its rights are tied to the assets of TMRC II, rather than the net results of the entity.
Income Taxes
The interpretation and application of existing tax laws, regulations or rules in Canada, Barbados, the United States, Australia or any of the countries in which the mining operations and energy properties are located or to which shipments of gold, silver or platinum group metals are made requires the use of judgment. The likelihood that tax positions taken will be sustained upon examination by applicable tax authorities is assessed based on facts and circumstances of the relevant tax position considering all available evidence. Differing interpretation of these laws, regulations or rules could result in an increase in the Company’s taxes, or other governmental charges, duties or impositions.
In assessing the probability of realizing deferred income tax assets, the Company makes estimates related to expectations of future taxable income and expected timing of reversals of existing temporary differences. Such estimates are based on forecasted cash flows from operations which require the use of estimates and assumptions such as long-term commodity prices, energy and mineral reserves, and recoverable ounces of gold, silver and platinum group metals. Therefore, the amount of deferred income tax assets recognized on the balance sheet could be reduced if the actual results differ significantly from forecast. The Company reassesses its deferred income tax assets at the end of each reporting period.
Functional Currency
The functional currency for each of the Company’s subsidiaries is the currency of the primary economic environment in which the entity operates. Determination of functional currency may involve certain judgments to determine the primary economic environment and the Company reconsiders the functional currency of its entities if there is a change in events and conditions which determined the primary economic environment.
2023 Financial Statements |
20 |
Franco-Nevada Corporation
Notes to the Consolidated Financial Statements |
For the years ended December 31, 2023 and 2022
(expressed in millions of U.S. dollars, except per share amounts, unless otherwise noted)
Note 4 – Acquisitions and Other Transactions
| (a) | Financing Package with Skeena Resources Ltd. on the Eskay Creek Project – British Columbia, Canada |
On December 18, 2023, the Company completed the following transactions with Skeena Resources Ltd. (“Skeena”):
Eskay Creek Royalty
On December 18, 2023, the Company acquired an incremental royalty of 1.0% NSR for a purchase price of $41.8 million (C$56.0 million) on closing of the transaction, and now holds a 2.5% NSR covering Skeena’s Eskay Creek properties. The amended royalty agreement also provides contingent consideration of $3.4 million (C$4.5 million) payable by Franco-Nevada upon the achievement of certain conditions relating to materials in the Albino Lake Storage Facility at Eskay Creek.
The acquisition of the incremental royalty interests have been accounted for as acquisitions of mineral royalty interests. The contingent payments will be capitalized as part of the cost of the royalty when the underlying obligating event has occurred.
Skeena Convertible Debenture
The Company advanced $18.7 million (C$25.0 million) and received a convertible debenture (the “Skeena Convertible Debenture”). The Skeena Convertible Debenture matures on the earlier of December 19, 2028 or on the completion of a project financing for Eskay Creek approved by the Board of Skeena, carries an interest rate of 7% and is convertible into common shares of Skeena at a conversion price of C$7.70. Skeena may elect to defer interest payments until maturity.
| (b) | Acquisition of Additional Natural Gas Royalty Interests in Haynesville – U.S. |
On November 21, 2023, the Company agreed to acquire, through wholly-owned subsidiaries, a royalty portfolio in the Haynesville gas play in Louisiana and Texas, for $125.0 million. The transaction closed on January 2, 2024, subsequent to year-end. Prior to year-end, the Company advanced $12.5 million as a deposit held in escrow in connection with this transaction and this amount is included in royalty, stream and working interests, net in the statement of financial position as at December 31, 2023.
| (c) | Funding of Financing Package with G Mining Ventures Corp. on the Tocantinzinho Project – Brazil |
As previously announced, on July 18, 2022, the Company acquired, through its wholly-owned subsidiary, Franco-Nevada (Barbados) Corporation (“FNBC”), a gold stream with reference to production from the Tocantinzinho gold project, owned by G Mining Ventures Corp. (“G Mining Ventures”) and located in Pará State, Brazil (the “Tocantinzinho Stream”), for a purchase price of $250.0 million. Additionally, through one of its wholly-owned subsidiaries, provided G Mining Ventures with a $75.0 million secured term loan (the “G Mining Ventures Term Loan”). The Company also subscribed for $27.5 million of G Mining Ventures common shares at C$0.80 per share in July 2022.
Tocantinzinho Stream
The Tocantinzinho Stream deposit of $250.0 million, which was payable in instalments, subject to various conditions, was fully funded in the year ended December 31, 2023. Stream deliveries to FNBC are based on gold production from the Tocantinzinho property, according to the following schedule: (i) 12.5% of gold produced until 300,000 ounces of gold have been delivered and, thereafter, (ii) 7.5% of gold produced for the remaining mine life. G Mining Ventures will receive 20% of the spot gold price for each ounce of gold delivered.
The Tocantinzinho Stream is accounted as an acquisition of a mineral interest.
2023 Financial Statements |
21 |
Franco-Nevada Corporation
Notes to the Consolidated Financial Statements |
For the years ended December 31, 2023 and 2022
(expressed in millions of U.S. dollars, except per share amounts, unless otherwise noted)
G Mining Ventures Term Loan
The G Mining Ventures Term Loan is a $75 million, 6-year term loan with an availability period of 3.5-years, drawable quarterly at G Mining Ventures’ option following full funding of the Tocantinzinho Stream. The loan will bear interest at a rate of 3-Month Term Secured Overnight Financing Rate (“3-Month SOFR”) +5.75% per annum, reducing to 3-Month SOFR +4.75% after completion tests have been achieved at the project. Amortization will begin in December 2025 with equal quarterly repayments followed by a final 25% repayment upon maturity in June 2028. Fees payable to Franco-Nevada’s subsidiary include a standby fee on undrawn amounts of 1.0% per annum and a 2.0% original issue discount payable on principal amounts drawn.
No amounts were advanced under the G Mining Term Loan during the year ended December 31, 2023. Subsequent to year-end, on January 29, 2024, the Company funded $41.2 million, net of a 2% original issue discount of $0.8 million.
Pursuant to the loan, on July 18, 2022, Franco-Nevada was granted warrants with a fair value of $0.75 million to purchase 11.5 million G Mining Ventures common shares with a 5-year term and an exercise price of C$1.90 per G Mining common share. The warrants are included in Investments in the statement of financial position and are accounted for as derivatives designated at FVTPL.
G Mining Ventures Common Shares
On July 22, 2022, Franco-Nevada also subscribed for 44,687,500 G Mining common shares at a share price of C$0.80 per G Mining Common Share for a total cost of $27.5 million (C$35.8 million). The G Mining common shares are accounted for as equity investments designated at FVTOCI.
| (d) | Acquisition of Royalty Interests on Magino Gold Mine – Ontario, Canada |
On November 15, 2023, the Company acquired, through a wholly-owned subsidiary, an additional 1.0% NSR on Argonaut Gold Inc.’s (“Argonaut”) Magino gold mine in Ontario, Canada for a purchase price of $28.0 million. Franco-Nevada acquired an initial 2% NSR on Magino on October 27, 2022, for a purchase price of $52.5 million. The Company now holds an aggregate 3.0% NSR on Magino.
The transactions have been accounted for as an acquisition of mineral royalty interests.
| (e) | Acquisition of Royalty on Wawa Gold Project – Ontario, Canada |
On August 29, 2023, the Company acquired a 1.5% NSR on Red Pine Exploration Inc.’s Wawa gold project, located in Ontario, Canada, for a purchase price of $5.0 million (C$6.8 million). The agreement provides Franco-Nevada the option to acquire an additional 0.5% NSR based on predetermined conditions.
The transaction has been accounted for as an acquisition of mineral royalty interests.
| (f) | Acquisition of Royalties on Pascua-Lama Project – Chile |
On August 8, 2023, the Company agreed to acquire, through a wholly-owned subsidiary, a sliding-scale gold royalty and fixed-rate copper royalty from private individuals over property pertaining to the Chilean portion of Barrick Gold Corporation’s Pascua-Lama project for an aggregate purchase price of $75.0 million. The transaction has been accounted for as acquisitions of a mineral royalty interest.
Subsequent to year-end, on January 3, 2024, the Company acquired an additional royalty interest for a purchase price of $6.7 million. Including the additional royalty interest acquired in January 2024, at gold prices exceeding $800/ounce, the Company now holds an aggregate 2.941% NSR (gold) and 0.588% NSR (copper) on the property.
| (g) | Acquisition of Royalty on Volcan Gold Project – Chile |
On July 6, 2023, the Company agreed to acquire, through a wholly-owned subsidiary, a 1.5% NSR on the Volcan gold project located in the Maricunga Gold Belt in the Atacama region of Chile for a purchase price of $15.0 million. The project is owned by Tiernan Gold Corporation (“Tiernan”), a company privately held by Hochschild Mining plc. The agreement provides Franco-Nevada the option to acquire an additional 1.0% NSR based on pre-determined conditions. The Company already hold an existing 1.5% NSR on the peripheral Ojo de Agua area, which is owned by Tiernan and forms part of the Volcan project.
The transaction has been accounted for as an acquisition of mineral royalty interests.
| (h) | Acquisition of Royalty Interest on Caserones – Chile |
The Company acquired, through a wholly-owned subsidiary, an incremental effective NSR totaling 0.1120% on the Caserones copper-molybdenum mine, now owned by Lundin Mining Corporation, located in the Atacama region of Chile. The incremental effective 0.1120% NSR was acquired in two transactions: (i) a 0.0260% effective NSR on March 8, 2023,
2023 Financial Statements |
22 |
Franco-Nevada Corporation
Notes to the Consolidated Financial Statements |
For the years ended December 31, 2023 and 2022
(expressed in millions of U.S. dollars, except per share amounts, unless otherwise noted)
for a purchase price of $2.1 million, and (ii) a 0.0860% NSR on June 29, 2023, for a purchase price of $7.3 million. Inclusive of the Company’s interest of 0.4582% acquired in April 2022 (as described in Note 4(u)), the Company held a 0.5702% effective NSR on Caserones as at December 31, 2023.
The transaction has been accounted for as an acquisition of mineral royalty interests. To purchase its interest in the Caserones royalty, Franco-Nevada acquired shares in Socieded Legal Minera California Una de la Sierra Peña Negra (“SLM California”). SLM California is a privately held entity whose purpose is to pay Chilean taxes in respect of and distribute proceeds from the Caserones royalty to its shareholders.
Subsequent to year end, on January 19, 2024, EMX Royalty Corporation (“EMX”) exercised an option to acquire a portion of Franco-Nevada’s interest for a sale price of $4.7 million, such that Franco-Nevada’s effective NSR on Caserones is now 0.517%.
| (i) | Acquisition Agreement for New Royalties with EMX Royalty Corporation |
On June 27, 2023, the Company executed a binding term sheet with EMX for a three-year arrangement for the joint acquisition of newly created precious metals and copper royalties sourced by EMX. Franco-Nevada will contribute 55% (up to $5.5 million) and EMX will contribute 45% (up to $4.5 million) towards the royalty acquisitions, with the resulting royalty interests equally split on a 50/50 basis.
| (j) | Acquisition of Royalties on Exploration Properties – Nevada and Arizona, U.S. |
On June 15, 2023, the Company acquired, through a wholly-owned subsidiary, a portfolio of eight royalties on exploration properties located in the states of Nevada and Arizona, including a 0.5% NSR on Integra Resources Corp.’s Wildcat and Mountain View gold projects, for a purchase price of $2.5 million.
The transaction has been accounted for as an acquisition of mineral royalty interests.
| (k) | Acquisition of Additional Royalty on Valentine Gold Project and Private Placement with Marathon Gold Corporation – Newfoundland, Canada |
On June 8, 2023, the Company acquired an additional 1.5% NSR on Marathon Gold Corporation’s (“Marathon”) Valentine Gold project located in Newfoundland for a purchase price of $45.0 million. Inclusive of our initial 1.5% NSR (reduced from 2.0% following Marathon’s buy back of 0.5%, as described in Note 4(n)), the Company now holds an aggregate 3.0% NSR on the project.
The acquisitions of the NSR have been accounted for as acquisitions of a mineral royalty interest.
Marathon Common Shares
On July 5, 2023, Franco-Nevada acquired 6,578,947 common shares of Marathon at a price of C$0.76 per common share for an aggregate of $3.8 million (C$5.0 million), comprising the back-end of a non-brokered charity flow-through offering. The common shares of Marathon are accounted for as an equity investment designated at FVTOCI.
| (l) | Acquisition of Royalty on Kerr-Addison Property and Share Subscription with Gold Candle Ltd. – Ontario, Canada |
On April 14, 2023, the Company acquired a 1% NSR on Gold Candle Ltd.’s (“Gold Candle”) Kerr-Addison project located in Virginiatown, Ontario, which hosts the formerly producing Kerr-Addison gold mine, for a purchase price of $10.0 million.
The acquisition of the 1% NSR has been accounted for as an acquisition of a mineral royalty interest.
Gold Candle Common Shares
On July 26, 2023, Franco-Nevada acquired 5,454,546 common shares of Gold Candle, a private company, at a price of C$1.10 per common share for an aggregate purchase price of $4.6 million (C$6.0 million).
The common shares of Gold Candle has been accounted for as an equity investment designated at FVTOCI.
| (m) | Acquisition of Gold Royalties – Australia |
On February 22, 2023, the Company acquired a portfolio of five primarily gold royalties from Trident Royalties Plc, which includes a 1.5% NSR on Ramelius Resources’ Rebecca gold project (“Rebecca”) located in Western Australia, for total consideration of $15.6 million payable as follows: (i) $14.3 million paid on closing of the transaction, and (ii) $1.3 million in a contingent payment payable upon first gold production at Rebecca.
The transaction has been accounted for as an acquisition of a mineral royalty interest. The contingent payment will be capitalized as part of the cost of the mineral royalty interest if and when the underlying obligating events have occurred.
2023 Financial Statements |
23 |
Franco-Nevada Corporation
Notes to the Consolidated Financial Statements |
For the years ended December 31, 2023 and 2022
(expressed in millions of U.S. dollars, except per share amounts, unless otherwise noted)
| (n) | Receipt of Valentine Gold Royalty Buy-back – Newfoundland, Canada |
On February 22, 2023, Marathon exercised its option to buy-back 0.5% of the initial 2.0% NSR on the Valentine Gold project by paying $7.0 million to Franco-Nevada. We acquired the initial 2.0% NSR on February 21, 2019 for $13.7 million (C$18.0 million).
| (o) | Acquisition of Mineral Rights with Continental Resources, Inc. – U.S. |
The Company, through a wholly-owned subsidiary, has a strategic relationship with Continental to acquire, through a jointly-owned entity (the “Royalty Acquisition Venture”), royalty rights within Continental’s areas of operation.
Franco-Nevada recorded contributions to the Royalty Acquisition Venture of $9.6 million in 2023 (2022 – $12.2 million). In the first half of 2022, following weak commodity prices, Franco-Nevada and Continental agreed to reduce the pace of their capital funding commitments to the Royalty Acquisition Venture. As at December 31, 2023, the total cumulative investment in the Royalty Acquisition Venture totalled $450.2 million and Franco-Nevada has remaining commitments of up to $69.8 million.
The Royalty Acquisition Venture is accounted for as a joint operation in accordance with IFRS 11.
| (p) | Acquisition of Additional Royalty on Eskay Creek – British Columbia, Canada |
On December 30, 2022, Franco-Nevada acquired an additional 0.5% NSR on Skeena’s Eskay Creek project for total consideration of $21.0 million (C$28.5 million) payable as follows: (i) $19.9 million (C$27.0 million) paid on closing of the transaction and (ii) $1.1 million (C$1.5 million) of contingent consideration payable upon the achievement of certain conditions relating to materials in the Albino Lake Storage Facility at Eskay Creek. In connection with this transaction, Skeena and Franco-Nevada terminated the right of first refusal to purchase a 0.5% NSR on Eskay Creek, which was granted to Franco-Nevada on December 24, 2021.
The transaction has been accounted for as an acquisition of a mineral royalty interest. The contingent payment will be capitalized as part of the cost of the royalty when the underlying obligating event has occurred.
| (q) | Acquisition of Royalty on Magino Gold Project – Ontario, Canada |
On October 27, 2022, Franco-Nevada acquired a 2% NSR on Argonaut Gold Inc.’s (“Argonaut”) construction-stage Magino gold project in Ontario for a purchase price of $52.5 million. In addition to the Magino project, the royalty covers all of Argonaut’s regional exploration properties.
The Company also completed a private placement with Argonaut, acquiring 34,693,462 common shares at a price of C$0.39 per share for a total cost of $10.0 million (C$13.5 million).
The transaction has been accounted for as an acquisition of a mineral royalty interest. The Argonaut common shares are accounted for as equity investments designated at FVTOCI.
| (r) | Acquisition of Royalties on Spences Bridge Gold Belt Claims – British Columbia, Canada |
On October 6, 2022, the Company acquired a 2% NSR on all of Westhaven Gold Corp.’s (“Westhaven”) claims across the Spences Bridge Gold Belt in Southern British Columbia, Canada, for $6.0 million. Westhaven has an option to buy-down 0.5% of the NSR for $3.0 million for a period of 5 years from the closing of the transaction. Franco-Nevada also acquired an existing 2.5% NSR from Westhaven on adjoining properties currently owned by Talisker Resources Ltd. for a purchase price of $0.75 million.
In addition, Franco-Nevada also subscribed for 2,500,000 common shares of Westhaven at a price of C$0.40 per share for a total cost of $0.73 million (C$1.0 million).
The transaction has been accounted for as an acquisition of a mineral royalty interest. The Westhaven common shares are accounted for as equity investments designated at FVTOCI.
| (s) | Acquisition of Royalties – Chile |
On July 25, 2022, the Company acquired, through a wholly-owned subsidiary, a portfolio of seven royalties, each with a 2% NSR on precious metals and 1% NSR on base metals, for $1.0 million.
The transaction has been accounted for as an acquisition of a mineral royalty interest.
| (t) | Acquisition of Additional Royalty on Castle Mountain – California, U.S. |
On May 2, 2022, the Company, through a wholly-owned subsidiary, acquired an existing 2% NSR on gold and silver produced from the Pacific Clay claims, which comprise a portion of the JSLA pit of Equinox Gold Corp.’s Castle Mountain
2023 Financial Statements |
24 |
Franco-Nevada Corporation
Notes to the Consolidated Financial Statements |
For the years ended December 31, 2023 and 2022
(expressed in millions of U.S. dollars, except per share amounts, unless otherwise noted)
project in San Bernardino County, California, for $6.0 million. When combined with the Company’s 2.65% NSR on the broader Castle Mountain land position, the Company now has an effective 4.65% NSR on the Pacific Clay claims.
The transaction has been accounted for as an acquisition of a mineral royalty interest.
| (u) | Acquisition of Royalty on Caserones (Chile) and Private Placement with EMX Royalty Corporation |
On April 14, 2022, the Company agreed to acquire, through a wholly-owned subsidiary, an effective 0.4582% NSR on JX Nippon Mining & Metals Group’s producing Caserones copper-molybdenum mine located in the Atacama Region of northern Chile for an aggregate purchase price of approximately $37.4 million. Franco-Nevada was entitled to royalty payments in respect of the period commencing January 1, 2022.
Franco-Nevada has accounted for the transaction as an acquisition of a mineral royalty interest.
The Company also completed a private placement with EMX, acquiring 3,812,121 units of EMX at C$3.30 per unit for a total cost of $10.0 million (C$12.6 million). Each unit consists of one common share of EMX and one warrant to purchase one common share of EMX over five years at an exercise price of C$4.45. EMX used the proceeds from the private placement to acquire an NSR on the Caserones mine on similar terms as Franco-Nevada.
Note 5 – Cash and Cash Equivalents
Cash and cash equivalents comprised the following:
|
|
|
At December 31, |
|
|
At December 31, |
|
||
|
|
|
2023 |
|
|
2022 |
|
||
Cash deposits |
|
|
$ |
571.4 |
|
|
$ |
541.4 |
|
Term deposits |
|
|
|
850.5 |
|
|
|
655.1 |
|
|
|
|
$ |
1,421.9 |
|
|
$ |
1,196.5 |
|
As at December 31, 2023 and 2022, cash and cash equivalents were primarily held in interest-bearing deposits.
Note 6 – Investments
Investments comprised the following:
|
|
|
At December 31, |
|
|
At December 31, |
|
||
|
|
|
2023 |
|
|
2022 |
|
||
Equity investments |
|
|
$ |
246.4 |
|
|
$ |
224.6 |
|
Warrants |
|
|
|
8.1 |
|
|
|
2.6 |
|
|
|
|
$ |
254.5 |
|
|
$ |
227.2 |
|
Equity Investments
Equity investments comprised the following:
|
|
|
At December 31, |
|
|
At December 31, |
|
||
|
|
|
2023 |
|
|
2022 |
|
||
Labrador Iron Ore Royalty Corporation ("LIORC") |
|
|
$ |
152.7 |
|
|
$ |
157.0 |
|
G Mining Ventures |
|
|
|
47.6 |
|
|
|
22.8 |
|
Other |
|
|
|
46.1 |
|
|
|
44.8 |
|
|
|
|
$ |
246.4 |
|
|
$ |
224.6 |
|
During the year ended December 31, 2023, the Company disposed of equity investments with a cost of $1.5 million (2022 - $1.1 million) for gross proceeds of $2.0 million (2022 – $1.8 million).
The change in the fair value of equity investments recognized in other comprehensive income (loss) for the years ended December 31, 2023 and 2022 were as follows:
|
|
|
|
|
|
|
|
|
|
|
|
|
2023 |
|
|
2022 |
|
||
Gain (loss) on changes in the fair value of equity investments at FVTOCI |
|
|
$ |
8.4 |
|
|
$ |
(42.3) |
|
Income tax (expense) recovery in other comprehensive income (loss) |
|
|
|
(1.1) |
|
|
|
5.6 |
|
Gain (loss) on changes in the fair value of equity investments at FVTOCI, net of income tax |
|
|
$ |
7.3 |
|
|
$ |
(36.7) |
|
2023 Financial Statements |
25 |
Franco-Nevada Corporation
Notes to the Consolidated Financial Statements |
For the years ended December 31, 2023 and 2022
(expressed in millions of U.S. dollars, except per share amounts, unless otherwise noted)
Note 7 – Loans Receivable
Changes in loans receivable for the years ended December 31, 2023 and 2022 were as follows:
|
|
Noront Term Loan |
|
|
Skeena Convertible Debenture |
|
|
Total |
|
|||
Balance at January 1, 2022 |
|
$ |
39.7 |
|
|
$ |
— |
|
|
$ |
39.7 |
|
Finance income |
|
|
3.0 |
|
|
|
— |
|
|
|
3.0 |
|
Settlement of loan receivable |
|
|
(42.7) |
|
|
|
— |
|
|
|
(42.7) |
|
Balance at December 31, 2022 |
|
$ |
— |
|
|
$ |
— |
|
|
$ |
— |
|
|
|
|
|
|
|
|
|
|
|
|
|
|
Balance at January 1, 2023 |
|
$ |
— |
|
|
$ |
— |
|
|
$ |
— |
|
Initial Investment |
|
|
— |
|
|
|
18.7 |
|
|
|
18.7 |
|
Fair value adjustment |
|
|
— |
|
|
|
5.9 |
|
|
|
5.9 |
|
Impact of foreign exchange |
|
|
— |
|
|
|
0.2 |
|
|
|
0.2 |
|
Balance at December 31, 2023 |
|
$ |
— |
|
|
$ |
24.8 |
|
|
$ |
24.8 |
|
| (a) | Skeena Convertible Debenture |
On December 18, 2023, the Company advanced $18.7 million (C$25.0 million) to Skeena as a convertible debenture. The Skeena Convertible Debenture carries an interest rate of 7% and matures on the earlier of December 19, 2028, or on the completion of a project financing for Eskay Creek approved by the Board of Skeena. The Skeena Convertible Debenture is convertible into Skeena common shares at a conversion price of C$7.70. Interest payments may be capitalized and deferred until maturity.
The Skeena Convertible Debenture is measured at FVTPL using present value techniques and assumptions concerning the amount of and timing of future cash flows and discount rates which factor in the appropriate credit risk and the Black-Scholes option pricing model to calculate the fair value of the conversion option.
| (b) | Noront Term Loan |
In 2015, the Company advanced $25.0 million to Noront Resources Ltd. (“Noront”) as part of the Company’s acquisition of royalty rights in the Ring of Fire mining district of Ontario, Canada, in April 2015. On May 4, 2022, following the acquisition of Noront by Wyloo Metals Pty Ltd., the Company received $42.7 million as full repayment of the loan. The Noront term loan was measured at amortized cost.
Note 8 – Gold Bullion, Prepaid Expenses and Other Current Assets
Gold bullion, prepaid expenses and other current assets comprised the following:
|
|
|
At December 31, |
|
|
At December 31, |
|
||
|
|
|
2023 |
|
|
2022 |
|
||
Gold bullion |
|
|
$ |
51.3 |
|
|
$ |
28.1 |
|
Prepaid expenses |
|
|
|
30.0 |
|
|
|
22.1 |
|
Stream ounces inventory |
|
|
|
0.5 |
|
|
|
0.1 |
|
Debt issue costs |
|
|
|
0.6 |
|
|
|
0.6 |
|
|
|
|
$ |
82.4 |
|
|
$ |
50.9 |
|
2023 Financial Statements |
26 |
Franco-Nevada Corporation
Notes to the Consolidated Financial Statements |
For the years ended December 31, 2023 and 2022
(expressed in millions of U.S. dollars, except per share amounts, unless otherwise noted)
Note 9 – Royalty, Stream and Working Interests
(a) |
Royalty, Stream and Working Interests |
Royalty, stream and working interests, net of accumulated depletion and impairment losses and reversals, comprised the following:
|
|
|
|
|
|
Impairment |
|
|
|
|||||
|
|
|
|
|
Accumulated |
|
(losses) |
|
|
|
|
|
||
As at December 31, 2023 |
|
Cost |
|
depletion(1) |
|
reversals |
|
|
Carrying value |
|
||||
Mining royalties |
|
$ |
1,709.7 |
|
$ |
(761.0) |
|
$ |
— |
|
|
$ |
948.7 |
|
Streams |
|
|
4,763.6 |
|
|
(2,235.4) |
|
|
(1,169.2) |
|
|
|
1,359.0 |
|
Energy |
|
|
1,976.0 |
|
|
(825.5) |
|
|
(4.1) |
|
|
|
1,146.4 |
|
Advanced |
|
|
444.5 |
|
|
(48.5) |
|
|
— |
|
|
|
396.0 |
|
Exploration |
|
|
194.7 |
|
|
(17.7) |
|
|
— |
|
|
|
177.0 |
|
|
|
$ |
9,088.5 |
|
$ |
(3,888.1) |
|
$ |
(1,173.3) |
|
|
$ |
4,027.1 |
|
| 1. | Accumulated depletion includes previously recognized impairment losses. |
|
|
|
|
|
|
Impairments |
|
|
|
|||||
|
|
|
|
|
Accumulated |
|
(losses) |
|
|
|
|
|
||
As at December 31, 2022 |
|
Cost |
|
depletion(1) |
|
reversals |
|
|
Carrying value |
|
||||
Mining royalties |
|
$ |
1,582.7 |
|
$ |
(716.9) |
|
$ |
— |
|
|
$ |
865.8 |
|
Streams |
|
|
4,513.1 |
|
|
(2,065.7) |
|
|
— |
|
|
|
2,447.4 |
|
Energy |
|
|
1,937.0 |
|
|
(755.5) |
|
|
— |
|
|
|
1,181.5 |
|
Advanced |
|
|
426.6 |
|
|
(55.6) |
|
|
— |
|
|
|
371.0 |
|
Exploration |
|
|
71.7 |
|
|
(9.9) |
|
|
— |
|
|
|
61.8 |
|
|
|
$ |
8,531.1 |
|
$ |
(3,603.6) |
|
$ |
— |
|
|
$ |
4,927.5 |
|
| 1. | Accumulated depletion includes previously recognized impairment losses. |
Changes in royalty, stream and working interests for the years ended December 31, 2023 and December 31, 2022 were as follows:
|
|
Mining |
|
|
|
|
|
|
|
|
|
|
|
||||||
|
|
royalties |
|
Streams |
|
Energy |
|
Advanced |
|
Exploration |
|
Total |
|
||||||
Balance at January 1, 2022 |
|
$ |
903.0 |
|
$ |
2,623.0 |
|
$ |
1,258.3 |
|
$ |
308.8 |
|
$ |
56.2 |
|
$ |
5,149.3 |
|
Additions |
|
|
44.1 |
|
|
1.6 |
|
|
12.1 |
|
|
72.7 |
|
|
7.9 |
|
|
138.4 |
|
Depletion |
|
|
(40.2) |
|
|
(177.2) |
|
|
(66.4) |
|
|
(0.2) |
|
|
— |
|
|
(284.0) |
|
Impact of foreign exchange |
|
|
(41.1) |
|
|
— |
|
|
(22.5) |
|
|
(10.3) |
|
|
(2.3) |
|
|
(76.2) |
|
Balance at December 31, 2022 |
|
$ |
865.8 |
|
$ |
2,447.4 |
|
$ |
1,181.5 |
|
$ |
371.0 |
|
$ |
61.8 |
|
$ |
4,927.5 |
|
|
|
|
|
|
|
|
|
|
|
|
|
|
|
|
|
|
|
|
|
Balance at January 1, 2023 |
|
$ |
865.8 |
|
$ |
2,447.4 |
|
$ |
1,181.5 |
|
$ |
371.0 |
|
$ |
61.8 |
|
$ |
4,927.5 |
|
Additions |
|
|
37.7 |
|
|
250.2 |
|
|
22.2 |
|
|
99.3 |
|
|
110.2 |
|
|
519.6 |
|
Disposals |
|
|
— |
|
|
— |
|
|
— |
|
|
(3.3) |
|
|
— |
|
|
(3.3) |
|
Transfers |
|
|
71.3 |
|
|
— |
|
|
— |
|
|
(75.6) |
|
|
4.3 |
|
|
— |
|
Impairment losses |
|
|
— |
|
|
(1,169.2) |
|
|
(4.1) |
|
|
— |
|
|
— |
|
|
(1,173.3) |
|
Depletion |
|
|
(40.2) |
|
|
(169.4) |
|
|
(60.8) |
|
|
(0.3) |
|
|
— |
|
|
(270.7) |
|
Impact of foreign exchange |
|
|
14.1 |
|
|
— |
|
|
7.6 |
|
|
4.9 |
|
|
0.7 |
|
|
27.3 |
|
Balance at December 31, 2023 |
|
$ |
948.7 |
|
$ |
1,359.0 |
|
$ |
1,146.4 |
|
$ |
396.0 |
|
$ |
177.0 |
|
$ |
4,027.1 |
|
Of the total net book value as at December 31, 2023, $2,990.9 million (December 31, 2022 - $3,980.2 million) is depletable and $1,036.2 million (December 31, 2022 - $947.3 million) is non-depletable.
2023 Financial Statements |
27 |
Franco-Nevada Corporation
Notes to the Consolidated Financial Statements |
For the years ended December 31, 2023 and 2022
(expressed in millions of U.S. dollars, except per share amounts, unless otherwise noted)
| (b) | Impairments of Royalty, Stream and Working Interests |
Royalties, stream and working interests are reviewed for impairment if there is an indication that the carrying amount may not be recoverable. The following impairment losses were recognized in the year ended December 31, 2023:
|
|
|
|
2023 |
|
Royalty, stream and working interests, net |
|
|
|
|
|
Cobre Panama |
|
|
$ |
1,169.2 |
|
Energy exploration assets |
|
|
|
4.1 |
|
|
|
|
$ |
1,173.3 |
|
Cobre Panama
The Company has two precious metal streams in reference to production from the Cobre Panama mine, operated by MPSA, a subsidiary of First Quantum.
Cobre Panama has been in preservation and safe management (“P&SM”) with production halted since November 2023.
First Quantum and its subsidiary, MPSA, and the Government of Panama (the “GOP”) had been engaged in discussions regarding a revised concession contract for Cobre Panama. In March 2023, First Quantum and the GOP announced that an agreement had been reached on the terms and conditions for a revised concession contract (together with subsequent modifications, the “Revised Concession Contract”). On October 20, 2023, the National Assembly of Panama approved the Revised Concession Contract through Law 406. However, amid protests against the GOP and the Revised Concession Contract, a number of claims were lodged with the Supreme Court asserting that Law 406 was unconstitutional. On November 27, 2023, the Supreme Court issued a ruling, released publicly the following day, declaring Law 406 unconstitutional. Further, on December 19, 2023, the Ministry of Commerce and Industries of Panama (“MICI”) announced plans for Cobre Panama which was followed by a request from MPSA for a P&SM plan for Cobre Panama.
In light of these events, the Company assessed the Cobre Panama CGU for indicators of impairment. The Company carried out an impairment assessment to determine the recoverable amount of the Cobre Panama CGU. The recoverable amount, in accordance with IAS 36, was determined to be nil at December 31, 2023 based on the halting of production and political environment surrounding the Supreme Court ruling. As a result, the Company recognized a full impairment loss of $1,169.2 million in the year ended December 31, 2023.
In the event that there is a change in the facts and circumstances surrounding the halting of production at Cobre Panama, and there is a resumption of precious metal stream deliveries to Franco-Nevada, an assessment of the recoverable amount of the Cobre Panama CGU will be performed at that time, which may lead to a reversal of part or all of the impairment loss that has been recognized.
In addition, Franco-Nevada has provided notices of intent to commence international arbitration proceedings. Refer to Note 25, Contingencies, for further details. This impairment has been taken without prejudice to, or without at present attributing any specific value to, the legal remedies that may be obtained through any arbitration proceedings or otherwise.
Energy Exploration Assets
The Company was notified, pursuant to various royalty agreements, that the explorer/developer of certain of the Company’s Energy assets had abandoned tenements, concessions or ground which was subject to royalty rights held by the Company. As a result, the Company wrote-off the carrying value of the associated exploration assets to nil. For the year ended December 31, 2023, the total amount written off was $4.1 million.
| (c) | Disposal of Royalty Interest |
On February 22, 2023, Marathon exercised its option to buy-back 0.5% of Franco-Nevada’s initial 2.0% NSR on the Valentine Gold project by paying $7.0 million to Franco-Nevada. Franco-Nevada acquired the initial NSR on February 21, 2019 for $13.7 million (C$18.0 million). The carrying value of the NSR portion subject to the buy-back was $3.3 million (C$4.5 million). The Company recognized a gain on disposal of $3.7 million in the consolidated statement of (loss) income and comprehensive (loss) income for the year ended December 31, 2023.
2023 Financial Statements |
28 |
Franco-Nevada Corporation
Notes to the Consolidated Financial Statements |
For the years ended December 31, 2023 and 2022
(expressed in millions of U.S. dollars, except per share amounts, unless otherwise noted)
Note 10 – Other Assets
Other assets comprised the following:
|
|
|
At December 31, |
|
|
At December 31, |
|
||
|
|
|
2023 |
|
|
2022 |
|
||
Deposits related to CRA audits |
|
|
$ |
27.7 |
|
|
$ |
40.9 |
|
Energy well equipment, net |
|
|
|
5.8 |
|
|
|
5.6 |
|
Right-of-use assets, net |
|
|
|
0.6 |
|
|
|
0.9 |
|
Debt issue costs |
|
|
|
1.1 |
|
|
|
1.5 |
|
Furniture and fixtures, net |
|
|
|
0.2 |
|
|
|
0.2 |
|
|
|
|
$ |
35.4 |
|
|
$ |
49.1 |
|
Deposits related to CRA audits represent cash on deposit with CRA in connection with the Transfer Pricing Reassessments, as referenced in Note 25 (b). The amount has been classified as non-current as the Company is appealing the reassessments, for which the timing of the completion is uncertain.
Subsequent to year-end, as referenced in Note 25 (b), the Company filed formal Notices of Objection in connection with certain Transfer Pricing Reassessments and posted additional security in the form of cash totaling $18.5 million (C$24.5 million).
Note 11 – Accounts Payable and Accrued Liabilities
Accounts payable and accrued liabilities comprise the following:
|
|
|
At December 31, |
|
|
At December 31, |
|
||
|
|
|
2023 |
|
|
2022 |
|
||
Accounts payable |
|
|
$ |
5.5 |
|
|
$ |
7.0 |
|
Accrued liabilities |
|
|
|
25.4 |
|
|
|
36.1 |
|
|
|
|
$ |
30.9 |
|
|
$ |
43.1 |
|
Note 12 – Debt
Corporate Revolver
The Company has a $1.0 billion unsecured revolving term credit facility (the “Corporate Revolver”). On August 15, 2022, the Company renewed its Corporate Revolver, extending the facility’s maturity date from July 9, 2025 to August 15, 2027.
Advances under the Corporate Revolver can be drawn as follows:
U.S. dollars
· |
Base rate advances with interest payable monthly at the Canadian Imperial Bank of Commerce (“CIBC”) base rate, plus between 0.00% and 1.05% per annum depending upon the Company’s leverage ratio; or |
· |
Secured Overnight Financing Rate (“SOFR”) as administered by the Federal Reserve Bank of New York loans for periods of 1, 3 or 6 months with interest payable at a rate of SOFR, plus between 1.10% and 2.30% per annum, depending on the Company’s leverage ratio. |
Canadian dollars
· |
Prime rate advances with interest payable monthly at the CIBC prime rate, plus between 0.00% and 1.05% per annum, depending on the Company’s leverage ratio; or |
· |
Bankers’ acceptances for a period of 30 to 180 days with a stamping fee calculated on the face amount between 1.00% and 2.05%, depending on the Company’s leverage ratio. |
All loans are readily convertible into loans of other types, described above, on customary terms and upon provision of appropriate notice. Borrowings under the Corporate Revolver are guaranteed by certain of the Company’s subsidiaries and are unsecured.
The Corporate Revolver is subject to a standby fee of 0.20% to 0.41% per annum, depending on the Company’s leverage ratio, even if no amounts are outstanding under the Corporate Revolver.
As at December 31, 2023, no amounts were drawn from the Corporate Revolver. The Company has three standby letters of credit in the amount of $19.3 million (C$25.5 million) against the Corporate Revolver in relation to the audit by the Canada Revenue Agency (“CRA”) of its 2013–2015 taxation years, as referenced in Note 25. These standby letters of credit reduce the available balance under the Corporate Revolver.
2023 Financial Statements |
29 |
Franco-Nevada Corporation
Notes to the Consolidated Financial Statements |
For the years ended December 31, 2023 and 2022
(expressed in millions of U.S. dollars, except per share amounts, unless otherwise noted)
Note 13 – Revenue
Revenue classified by commodity, geography and type comprised the following:
|
|
2023 |
|
|
2022 |
|
||
Commodity |
|
|
|
|
|
|
|
|
Gold(1) |
|
$ |
784.4 |
|
|
$ |
723.1 |
|
Silver |
|
|
126.7 |
|
|
|
139.9 |
|
Platinum group metals(1) |
|
|
39.8 |
|
|
|
56.7 |
|
Iron ore(2) |
|
|
47.2 |
|
|
|
55.5 |
|
Other mining assets |
|
|
13.2 |
|
|
|
6.9 |
|
Mining |
|
$ |
1,011.3 |
|
|
$ |
982.1 |
|
Oil |
|
$ |
134.9 |
|
|
$ |
156.0 |
|
Gas |
|
|
54.1 |
|
|
|
150.9 |
|
Natural gas liquids |
|
|
18.7 |
|
|
|
26.7 |
|
Energy |
|
$ |
207.7 |
|
|
$ |
333.6 |
|
|
|
$ |
1,219.0 |
|
|
$ |
1,315.7 |
|
Geography |
|
|
|
|
|
|
|
|
South America |
|
$ |
370.7 |
|
|
$ |
361.8 |
|
Central America & Mexico |
|
|
316.8 |
|
|
|
298.0 |
|
United States |
|
|
208.0 |
|
|
|
327.5 |
|
Canada(1)(2) |
|
|
177.1 |
|
|
|
205.9 |
|
Rest of World |
|
|
146.4 |
|
|
|
122.5 |
|
|
|
$ |
1,219.0 |
|
|
$ |
1,315.7 |
|
Type |
|
|
|
|
|
|
|
|
Revenue-based royalties |
|
$ |
380.0 |
|
|
$ |
496.0 |
|
Streams(1) |
|
|
726.7 |
|
|
|
690.0 |
|
Profit-based royalties |
|
|
64.9 |
|
|
|
87.1 |
|
Other(2) |
|
|
47.4 |
|
|
|
42.6 |
|
|
|
$ |
1,219.0 |
|
|
$ |
1,315.7 |
|
| 1. | For the year ended December 31, 2023, revenue includes gains of $0.2 million and $0.1 million of provisional pricing adjustments for gold and platinum-group metals, respectively (2022 – loss of $0.4 million and gain of $1.1 million, respectively). |
| 2. | For the year ended December 31, 2023, revenue includes dividend income of $12.1 million from the Company’s equity investment in LIORC (2022 – $14.8 million). |
Note 14 – Costs of Sales
Costs of sales, excluding depletion and depreciation, comprised the following:
|
|
|
|
|
|
|
|
|
|
|
|
|
2023 |
|
|
2022 |
|
||
Costs of stream sales |
|
|
$ |
164.5 |
|
|
$ |
158.2 |
|
Mineral production taxes |
|
|
|
2.1 |
|
|
|
2.1 |
|
Mining costs of sales |
|
|
$ |
166.6 |
|
|
$ |
160.3 |
|
Energy costs of sales |
|
|
|
12.7 |
|
|
|
16.6 |
|
|
|
|
$ |
179.3 |
|
|
$ |
176.9 |
|
2023 Financial Statements |
30 |
Franco-Nevada Corporation
Notes to the Consolidated Financial Statements |
For the years ended December 31, 2023 and 2022
(expressed in millions of U.S. dollars, except per share amounts, unless otherwise noted)
Note 15 – Share-Based Compensation Expenses
Share-based compensation expenses comprised the following:
|
|
|
2023 |
|
|
2022 |
|
||
Stock options and restricted share units |
|
|
$ |
5.5 |
|
|
$ |
8.2 |
|
Deferred share units |
|
|
|
(1.1) |
|
|
|
1.9 |
|
|
|
|
$ |
4.4 |
|
|
$ |
10.1 |
|
Share-based compensation expenses include expenses related to equity-settled stock options, restricted share units (“RSUs”) and deferred share units (“DSUs”), as well as the mark-to-market gain or loss related to the DSUs.
Note 16 – Related Party Disclosures
Key management personnel are those persons having authority and responsibility for planning, directing and controlling the activities of the Company. Key management personnel include the Board of Directors and the executive management team.
Compensation for key management personnel of the Company was as follows:
|
|
|
|
|
|
|
|
|
|
|
|
|
2023 |
|
|
2022 |
|
||
Short-term benefits(1) |
|
|
$ |
3.7 |
|
|
$ |
4.1 |
|
Share-based payments(2) |
|
|
|
1.6 |
|
|
|
8.5 |
|
|
|
|
$ |
5.3 |
|
|
$ |
12.6 |
|
| 1. | Includes salary, benefits and short-term accrued incentives/other bonuses earned during the year. |
| 2. | Represents the expense of stock options and RSUs and mark-to-market charges on DSUs during the year. |
Note 17 – Finance Income and Expenses
Finance income and expenses for the years ended December 31, 2023 and 2022 were as follows:
|
|
|
2023 |
|
|
2022 |
|
||
Finance income |
|
|
|
|
|
|
|
|
|
Interest |
|
|
$ |
52.3 |
|
|
$ |
12.6 |
|
|
|
|
$ |
52.3 |
|
|
$ |
12.6 |
|
Finance expenses |
|
|
|
|
|
|
|
|
|
Standby charges |
|
|
$ |
2.3 |
|
|
$ |
2.2 |
|
Amortization of debt issue costs |
|
|
|
0.5 |
|
|
|
0.9 |
|
Accretion of lease liabilities |
|
|
|
0.1 |
|
|
|
0.1 |
|
|
|
|
$ |
2.9 |
|
|
$ |
3.2 |
|
2023 Financial Statements |
31 |
Franco-Nevada Corporation
Notes to the Consolidated Financial Statements |
For the years ended December 31, 2023 and 2022
(expressed in millions of U.S. dollars, except per share amounts, unless otherwise noted)
Note 18 - Income Taxes
Income tax expense for the years ended December 31, 2023 and 2022 was as follows:
|
|
|
2023 |
|
|
2022 |
|
||
Current income tax expense |
|
|
|
|
|
|
|
|
|
Expense for the year |
|
|
$ |
73.0 |
|
|
$ |
99.8 |
|
Adjustments in respect of prior years |
|
|
|
2.6 |
|
|
|
(4.1) |
|
Current income tax expense |
|
|
$ |
75.6 |
|
|
$ |
95.7 |
|
Deferred income tax expense |
|
|
|
|
|
|
|
|
|
Origination and reversal of temporary differences |
|
|
$ |
22.8 |
|
|
$ |
34.9 |
|
Impact of changes in tax rates |
|
|
|
(0.9) |
|
|
|
1.2 |
|
Change in unrecognized deductible temporary differences |
|
|
|
8.1 |
|
|
|
— |
|
Adjustments in respect of prior years |
|
|
|
(2.9) |
|
|
|
1.6 |
|
Other |
|
|
|
(0.5) |
|
|
|
(0.3) |
|
Deferred income tax expense |
|
|
|
26.6 |
|
|
|
37.4 |
|
Income tax expense |
|
|
$ |
102.2 |
|
|
$ |
133.1 |
|
A reconciliation of the product of net (loss) income before taxes multiplied by the combined Canadian federal and provincial statutory rate to the provision for income taxes as shown in the consolidated statement of (loss) income and comprehensive (loss) income for the years ended December 31, 2023 and 2022, is as follows:
|
|
|
2023 |
|
|
2022 |
|
||
Net (loss) income before income taxes |
|
|
$ |
(364.2) |
|
|
$ |
833.7 |
|
Statutory tax rate |
|
|
|
26.5% |
|
|
|
26.5% |
|
Tax (recovery) expense at statutory rate |
|
|
$ |
(96.5) |
|
|
$ |
220.9 |
|
Reconciling items |
|
|
|
|
|
|
|
|
|
Change in unrecognized deductible temporary differences |
|
|
$ |
8.1 |
|
|
$ |
— |
|
Income not taxable |
|
|
|
(5.5) |
|
|
|
(2.6) |
|
Differences in foreign statutory tax rates |
|
|
|
195.7 |
|
|
|
(85.1) |
|
Differences due to changing future tax rates |
|
|
|
(0.9) |
|
|
|
1.2 |
|
Foreign withholding taxes |
|
|
|
0.6 |
|
|
|
0.9 |
|
Adjustments in respect of prior years |
|
|
|
(0.3) |
|
|
|
(2.5) |
|
Other |
|
|
|
1.0 |
|
|
|
0.3 |
|
Income tax expense |
|
|
$ |
102.2 |
|
|
$ |
133.1 |
|
Income tax recovery (expense) recognized in other comprehensive income (loss) is as follows:
|
|
|
|
2023 |
|
|
|
2022 |
|
||||||||||||||||
|
|
|
|
Income |
|
|
|
|
|
|
|
Income |
|
|
|
Loss |
|
|
|
|
|
|
|
Loss |
|
|
|
|
|
before |
|
|
|
Tax |
|
|
|
after |
|
|
|
before |
|
|
|
Tax |
|
|
|
after |
|
|
|
|
|
tax |
|
|
|
expense |
|
|
|
tax |
|
|
|
tax |
|
|
|
recovery |
|
|
|
tax |
|
Gain (loss) on changes in the fair value of equity investments at FVTOCI |
|
|
$ |
8.4 |
|
|
$ |
(1.1) |
|
|
$ |
7.3 |
|
|
$ |
(42.3) |
|
|
$ |
5.6 |
|
|
$ |
(36.7) |
|
Currency translation adjustment |
|
|
|
34.8 |
|
|
|
— |
|
|
|
34.8 |
|
|
|
(92.0) |
|
|
|
— |
|
|
|
(92.0) |
|
Other comprehensive income (loss) |
|
|
$ |
43.2 |
|
|
$ |
(1.1) |
|
|
$ |
42.1 |
|
|
$ |
(134.3) |
|
|
$ |
5.6 |
|
|
$ |
(128.7) |
|
Income tax (expense) recovery in other comprehensive income (loss) |
|
|
|
|
|
|
$ |
(1.1) |
|
|
|
|
|
|
|
|
|
|
$ |
5.6 |
|
|
|
|
|
2023 Financial Statements |
32 |
Franco-Nevada Corporation
Notes to the Consolidated Financial Statements |
For the years ended December 31, 2023 and 2022
(expressed in millions of U.S. dollars, except per share amounts, unless otherwise noted)
The significant components of deferred income tax assets and liabilities as at December 31, 2023 and 2022 are as follows:
|
|
|
2023 |
|
|
2022 |
|
||
Deferred income tax assets |
|
|
|
|
|
|
|
|
|
Deductible temporary differences relating to |
|
|
|
|
|
|
|
|
|
Royalty, stream and working interests |
|
|
$ |
28.7 |
|
|
$ |
34.1 |
|
Non-capital loss carry-forwards |
|
|
|
7.9 |
|
|
|
6.6 |
|
Other |
|
|
|
0.4 |
|
|
|
(0.8) |
|
|
|
|
$ |
37.0 |
|
|
$ |
39.9 |
|
|
|
|
|
|
|
|
|
|
|
Deferred income tax liabilities |
|
|
|
|
|
|
|
|
|
Taxable temporary differences relating to |
|
|
|
|
|
|
|
|
|
Share issue and debt issue costs |
|
|
$ |
(0.3) |
|
|
$ |
(0.3) |
|
Royalty, stream and working interests |
|
|
|
179.9 |
|
|
|
156.4 |
|
Non-capital loss carry-forwards |
|
|
|
(2.8) |
|
|
|
(2.6) |
|
Investments |
|
|
|
10.1 |
|
|
|
7.5 |
|
Other |
|
|
|
(6.8) |
|
|
|
(8.0) |
|
|
|
|
$ |
180.1 |
|
|
$ |
153.0 |
|
Deferred income tax liabilities, net |
|
|
$ |
143.1 |
|
|
$ |
113.1 |
|
The movement in net deferred tax liabilities during the years ended December 31, 2023 and 2022 is as follows:
|
|
|
|
2023 |
|
|
|
2022 |
|
Balance, beginning of year |
|
|
$ |
113.1 |
|
|
$ |
86.0 |
|
Recognized in net (loss) income |
|
|
|
26.6 |
|
|
|
37.4 |
|
Recognized in other comprehensive income (loss) |
|
|
|
1.1 |
|
|
|
(5.6) |
|
Other |
|
|
|
2.3 |
|
|
|
(4.7) |
|
Balance, end of year |
|
|
$ |
143.1 |
|
|
$ |
113.1 |
|
The Company has recognized deferred tax assets in respect of the following non-capital losses as at December 31, 2023 that can be applied against future taxable profit:
Country |
|
Type |
|
Amount |
|
Expiry date |
|
|
Canada |
|
Non-Capital Losses |
|
$ |
30.1 |
|
2030-2039 |
|
Chile |
|
Non-Capital Losses |
|
|
10.5 |
|
No expiry |
|
|
|
|
|
$ |
40.6 |
|
|
|
Unrecognized Deferred Tax Assets and Liabilities
The aggregate amount of taxable temporary differences associated with investments in subsidiaries, for which deferred tax liabilities have not been recognized as at December 31, 2023 is $729.0 million (December 31, 2022 – $624.7 million). No deferred tax liabilities are recognized on the temporary differences associated with investment in subsidiaries because the Company controls the timing of reversal and it is not probable that they will reverse in the foreseeable future.
The aggregate amount of deductible temporary differences associated with other items, for which deferred tax assets have not been recognized as at December 31, 2023 is $679.3 million (December 31, 2022 – nil). No deferred tax asset is recognized in respect of these items because it is not probable that future taxable profits will be available against which the Company can utilize the benefit.
Deductible temporary differences, losses and unused tax credits for which no deferred tax assets have been recognized are attributable to the following:
|
|
|
2023 |
|
|
|
2022 |
|
|
Royalty, stream and working interests |
|
|
$ |
672.8 |
|
|
$ |
— |
|
Tax losses (expiry dates - 2032-2043) - Canada |
|
|
|
6.5 |
|
|
|
— |
|
|
|
|
$ |
679.3 |
|
|
$ |
— |
|
2023 Financial Statements |
33 |
Franco-Nevada Corporation
Notes to the Consolidated Financial Statements |
For the years ended December 31, 2023 and 2022
(expressed in millions of U.S. dollars, except per share amounts, unless otherwise noted)
Barbados Proposed Corporate Tax Reform:
On November 7, 2023, the Government of Barbados announced proposed tax measures in response to the OECD’s Pillar Two global minimum tax initiative, including an increase of the Barbados corporate tax rate to 9% effective January 1, 2024. This increase does not affect the amounts of current or deferred income taxes recognized for the year ended December 31, 2023 as the legislation was not yet substantively enacted at December 31, 2023. However, this change will increase the Company’s income tax charge in future periods. If the new tax rate were applied to the taxable temporary differences recognized at December 31, 2023, it is estimated that the Company’s deferred tax liability would increase by approximately $50 million.
The Government has also proposed to introduce a Qualified Domestic Minimum Top-Up Tax for tax years beginning on or after January 1, 2024, which will top-up the Barbados effective tax rate payable by an entity subject to Pillar Two, to 15%.
Global Minimum Tax:
On August 4, 2023, the Government of Canada released the draft Global Minimum Tax Act (“GMTA”) for consultation, which would implement key measures of the OECD’s Pillar Two global minimum tax in Canada. The GMTA includes the introduction of a 15% global minimum tax that applies to large multinational enterprise groups with global consolidated revenues over €750 million.
If the GMTA legislation becomes enacted or substantially enacted, the Company will first become subject to the rules for its 2024 year. Since the legislation was not effective at the reporting date, the Company has no related current tax exposure for the year ended December 31, 2023. Further, the group has applied the exception to recognizing and disclosing information about deferred taxes arising from Pillar Two, as provided in the amendments to IAS 12. See Note 2.
Under the Pillar Two legislation, the Company would be liable to pay a top-up tax when the effective tax rate in a jurisdiction is below the 15% minimum rate. All entities within the Franco-Nevada group, other than its one subsidiary that operates in Barbados have an effective tax rate that exceeds 15%.
The Company is in the process of assessing its exposure to Pillar Two taxes and will recognize and disclose known or reasonably estimable information related to such exposure when legislation becomes enacted or substantively enacted in Canada and Barbados.
Canada Revenue Agency Audit:
The Company is undergoing an audit by the Canada Revenue Agency of its 2012-2019 taxation years, as referenced in Note 25.
2023 Financial Statements |
34 |
Franco-Nevada Corporation
Notes to the Consolidated Financial Statements |
For the years ended December 31, 2023 and 2022
(expressed in millions of U.S. dollars, except per share amounts, unless otherwise noted)
Note 19 – Shareholders’ Equity
| (a) | Share Capital |
The Company’s authorized capital stock includes an unlimited number of common shares (192,175,042 common shares issued and outstanding as at December 31, 2023) having no par value and preferred shares issuable in series (issued - nil).
Changes in share capital for the year ended December 31, 2023 and 2022 were as follows:
|
|
|
Number |
|
|
|
|
|
|
|
of shares |
|
|
Amount |
|
Balance at January 1, 2022 |
|
|
191,334,392 |
|
$ |
5,628.5 |
|
Exercise of stock options |
|
|
148,295 |
|
|
12.2 |
|
Vesting of restricted share units |
|
|
49,919 |
|
|
6.4 |
|
Dividend reinvestment plan |
|
|
360,085 |
|
|
48.2 |
|
Balance at December 31, 2022 |
|
|
191,892,691 |
|
$ |
5,695.3 |
|
|
|
|
|
|
|
|
|
Balance at January 1, 2023 |
|
|
191,892,691 |
|
$ |
5,695.3 |
|
Exercise of stock options |
|
|
61,000 |
|
|
3.8 |
|
Dividend reinvestment plan |
|
|
221,351 |
|
|
29.1 |
|
Balance at December 31, 2023 |
|
|
192,175,042 |
|
$ |
5,728.2 |
|
| (b) | Dividends |
In 2023, the Company declared dividends of $1.36 per common share (2022 - $1.28 per common share).
Dividends paid in cash and through the Company’s Dividend Reinvestment Plan (“DRIP”) were as follows:
|
|
|
2023 |
|
|
2022 |
|
||
Cash dividends |
|
|
$ |
233.0 |
|
|
$ |
197.6 |
|
DRIP dividends |
|
|
|
29.1 |
|
|
|
48.2 |
|
|
|
|
$ |
262.1 |
|
|
$ |
245.8 |
|
| (c) | Stock-Based Payments |
On March 7, 2018, the Company’s Board of Directors adopted an amended and restated share compensation plan covering both stock options and RSUs effective May 9, 2018 (the “Plan”), with subsequent modifications on November 8, 2023. Pursuant to the Plan, the Company may grant incentive stock options to directors, officers, employees and consultants at the discretion of the Board of Directors. The exercise price and vesting period of any option is fixed by the Board of Directors on the date of grant. The term of options is at the sole discretion of the Board of Directors but may not exceed ten years from the date of grant. Options expire on the earlier of the expiry date or the date of termination and are non-transferable. The options granted will be adjusted in the event of an amalgamation, rights offering, share consolidation or subdivision or other similar adjustments of the share capital of the Company. The aggregate number of common shares that may be issued under the Plan is limited to 9,700,876 common shares. Within any one-year period, the number of common shares issued to any single insider participant under the Plan shall not exceed 5% of the common shares then issued and outstanding.
2023 Financial Statements |
35 |
Franco-Nevada Corporation
Notes to the Consolidated Financial Statements |
For the years ended December 31, 2023 and 2022
(expressed in millions of U.S. dollars, except per share amounts, unless otherwise noted)
Options to purchase common shares of the Company granted during the years ended December 31, 2023 and 2022 were as follows:
|
|
|
|
|
Weighted |
|
|
|
|
|
|
|
average exercise |
|
|
|
|
|
Number |
|
price |
|
|
Stock options outstanding, at January 1, 2022 |
|
|
822,046 |
|
C$ |
97.88 |
|
Granted |
|
|
67,604 |
|
C$ |
183.61 |
|
Exercised |
|
|
(148,295) |
|
C$ |
82.81 |
|
Forfeited |
|
|
(16,702) |
|
C$ |
168.43 |
|
Stock options outstanding, at December 31, 2022 |
|
|
724,653 |
|
C$ |
107.34 |
|
|
|
|
|
|
|
|
|
Stock options outstanding, at January 1, 2023 |
|
|
724,653 |
|
C$ |
107.34 |
|
Granted |
|
|
5,548 |
|
C$ |
169.78 |
|
Exercised |
|
|
(61,000) |
|
C$ |
64.50 |
|
Stock options outstanding, at December 31, 2023 |
|
|
669,201 |
|
C$ |
111.76 |
|
|
|
|
|
|
|
|
|
Exercisable stock options, at December 31, 2022 |
|
|
584,522 |
|
C$ |
90.84 |
|
Exercisable stock options, at December 31, 2023 |
|
|
570,572 |
|
C$ |
100.51 |
|
Options granted in 2023 and 2022 have a ten-year term and vest over five years in equal portions on the anniversary of the grant date. The fair value of stock options granted in 2023 was $0.2 million (2022 – $2.5 million), based on a weighted average fair value of C$47.02 per stock option (2022 - C$47.35 per stock option) based on the following assumptions:
|
|
|
2023 |
|
|
2022 |
|
Risk-free interest rate |
|
|
4.08 |
% |
|
2.93 |
% |
Expected dividend yield |
|
|
1.10 |
% |
|
0.92 |
% |
Expected price volatility of the Company’s common shares |
|
|
30.9 |
% |
|
30.0 |
% |
Expected life of the option |
|
|
4 years |
|
|
4 years |
|
Forfeiture rate |
|
|
0 |
% |
|
0 |
% |
In the year ended December 31, 2023, an expense of $1.5 million (2022 - $1.8 million) related to stock options has been included in the consolidated statement of (loss) income and comprehensive (loss) income, and $0.1 million (2022 - $0.1 million) was capitalized to royalty, stream and working interests. As at December 31, 2023, there was $1.8 million (2022 – $3.1 million) of total unrecognized non-cash stock-based compensation relating to stock options granted under the Plan, which is expected to be recognized over a weighted average period of 2.4 years (2022 – 2.7 years).
2023 Financial Statements |
36 |
Franco-Nevada Corporation
Notes to the Consolidated Financial Statements |
For the years ended December 31, 2023 and 2022
(expressed in millions of U.S. dollars, except per share amounts, unless otherwise noted)
Options to purchase common shares outstanding at December 31, 2023, exercise prices and weighted average lives to maturity as follows:
|
|
|
|
|
|
|
Weighted |
|
|
Exercise |
|
Options |
|
Options |
|
average life |
|
|
price |
|
outstanding |
|
exercisable |
|
(years) |
|
|
C$40.87 |
|
28,056 |
|
28,056 |
|
0.22 |
|
|
C$58.67 |
|
20,000 |
|
20,000 |
|
1.64 |
|
|
C$59.52 |
|
27,751 |
|
27,751 |
|
0.95 |
|
|
C$65.76 |
|
51,577 |
|
51,577 |
|
1.95 |
|
|
C$75.45 |
|
117,894 |
|
117,894 |
|
2.95 |
|
|
C$88.76 |
|
45,082 |
|
45,082 |
|
4.64 |
|
|
C$94.57 |
|
54,221 |
|
54,221 |
|
4.95 |
|
|
C$100.10 |
|
50,470 |
|
50,470 |
|
3.95 |
|
|
C$129.32 |
|
77,408 |
|
77,408 |
|
5.95 |
|
|
C$164.99 |
|
4,400 |
|
— |
|
— |
|
|
C$168.43 |
|
64,996 |
|
25,998 |
|
7.95 |
|
|
C$168.72 |
|
7,968 |
|
1,594 |
|
8.64 |
|
|
C$171.33 |
|
58,594 |
|
58,594 |
|
6.95 |
|
|
C$178.01 |
|
8,030 |
|
1,606 |
|
8.38 |
|
|
C$181.57 |
|
29,470 |
|
5,894 |
|
8.38 |
|
|
C$185.70 |
|
2,299 |
|
460 |
|
8.88 |
|
|
C$188.13 |
|
1,148 |
|
— |
|
— |
|
|
C$194.65 |
|
19,837 |
|
3,967 |
|
8.95 |
|
|
|
|
669,201 |
|
570,572 |
|
4.71 |
|
| (d) | Restricted Share Units |
Changes in the number of RSUs outstanding during the years ended December 31, 2023 and 2022 were as follows:
|
|
Performance- |
|
Time-based |
|
|
|||
|
|
based RSUs |
|
RSUs |
|
Total RSUs |
|||
Balance at January 1, 2022 |
|
|
66,794 |
|
|
32,100 |
|
|
98,894 |
Granted |
|
|
37,486 |
|
|
15,643 |
|
|
53,129 |
Settled |
|
|
(33,229) |
|
|
(16,690) |
|
|
(49,919) |
Balance at December 31, 2022 |
|
|
71,051 |
|
|
31,053 |
|
|
102,104 |
|
|
|
|
|
|
|
|
|
|
Balance at January 1, 2023 |
|
|
71,051 |
|
|
31,053 |
|
|
102,104 |
Granted |
|
|
— |
|
|
— |
|
|
— |
Settled |
|
|
— |
|
|
— |
|
|
— |
Balance at December 31, 2023 |
|
|
71,051 |
|
|
31,053 |
|
|
102,104 |
There were no grants of RSUs in the year 2023 (2022 - $7.9 million). Included in the Company’s stock-based compensation expense is an amount of $4.1 million (2022 – $6.4 million) relating to RSUs. In addition, $0.2 million related to the RSUs was capitalized to royalty, stream and working interests (2022 – $0.2 million). As at December 31, 2023, there is $5.2 million (2022 – $9.4 million) of total unrecognized non-cash stock-based compensation expense relating to non-vested RSUs granted under the Plan, which is expected to be recognized over a weighted average period of 1.7 years (2022 – 2.2 years).
2023 Financial Statements |
37 |
Franco-Nevada Corporation
Notes to the Consolidated Financial Statements |
For the years ended December 31, 2023 and 2022
(expressed in millions of U.S. dollars, except per share amounts, unless otherwise noted)
| (e) | Deferred Share Unit Plan |
Changes in the number of DSUs outstanding during the years ended December 31, 2023 and 2022 were as follows:
|
|
|
2023 |
|
|
2022 |
|
Balance at beginning of year |
|
|
110,128 |
|
|
107,635 |
|
Granted |
|
|
11,816 |
|
|
14,703 |
|
Settled |
|
|
(2,515) |
|
|
(12,210) |
|
Balance at end of year |
|
|
119,429 |
|
|
110,128 |
|
The value of the DSU liability as at December 31, 2023 was $13.3 million (2022 - $15.0 million) and is included in accounts payable and accrued liabilities on the statement of financial position.
| (f) | Outstanding Stock Options and Restricted Share Units |
The following table sets out the number of common shares outstanding or issuable pursuant to other outstanding securities at December 31, 2023 and 2022:
|
|
|
2023 |
|
|
2022 |
|
Common shares outstanding |
|
|
192,175,042 |
|
|
191,892,691 |
|
Stock options(1) |
|
|
669,201 |
|
|
724,653 |
|
Restricted Share Units(2) |
|
|
102,104 |
|
|
102,104 |
|
|
|
|
192,946,347 |
|
|
192,719,448 |
|
| 1 | There were 669,201 stock options under our share compensation plan outstanding to directors, officers, employees and others with exercise prices ranging from C$40.87 to C$194.65 per share. The above table assumes all stock options are exercisable. |
| 2 | There were 31,053 time-based RSUs and 71,051 performance-based RSUs. Vesting of the performance-based RSUs are subject to the achievement of certain performance criteria and a performance multiplier which will range from 0% to 150% of the number granted. The above table assumes a performance multiplier of 100% of performance-based RSUs granted. |
Note 20 – Earnings per Share (“EPS”)
|
|
2023 |
|
2022 |
|
||||||||||||||||
|
|
|
|
|
Shares |
|
|
Per Share |
|
|
|
|
Shares |
|
|
Per Share |
|
||||
|
|
|
Net loss |
|
(in millions) |
|
|
Amount |
|
|
Net income |
|
(in millions) |
|
|
Amount |
|
||||
Basic (loss) earnings per share |
|
|
$ |
(466.4) |
|
192.0 |
|
|
$ |
(2.43) |
|
|
$ |
700.6 |
|
191.5 |
|
|
$ |
3.66 |
|
Effect of dilutive securities |
|
|
|
— |
|
0.3 |
|
|
|
— |
|
|
|
— |
|
0.4 |
|
|
|
(0.01) |
|
Diluted (loss) earnings per share |
|
|
$ |
(466.4) |
|
192.3 |
|
|
$ |
(2.43) |
|
|
$ |
700.6 |
|
191.9 |
|
|
$ |
3.65 |
|
For the year ended December 31, 2023, no stock options and RSUs (2022 – 134,488 stock options and 2,295 RSUs) were excluded in the computation of diluted EPS due to being anti-dilutive.
2023 Financial Statements |
38 |
Franco-Nevada Corporation
Notes to the Consolidated Financial Statements |
For the years ended December 31, 2023 and 2022
(expressed in millions of U.S. dollars, except per share amounts, unless otherwise noted)
Note 21 – Segment Reporting
The chief operating decision-maker organizes and manages the business under two operating segments, consisting of royalty, stream and working interests in each of the mining and energy sectors.
The Company’s reportable segments for purposes of assessing performance are presented as follows:
|
|
2023 |
|
2022 |
|
|||||||||||||||
|
|
Mining |
|
Energy |
|
Total |
|
|
Mining |
|
Energy |
|
Total |
|
||||||
Revenue |
|
$ |
1,011.3 |
|
$ |
207.7 |
|
$ |
1,219.0 |
|
|
$ |
982.1 |
|
$ |
333.6 |
|
$ |
1,315.7 |
|
|
|
|
|
|
|
|
|
|
|
|
|
|
|
|
|
|
|
|
|
|
Expenses |
|
|
|
|
|
|
|
|
|
|
|
|
|
|
|
|
|
|
|
|
Costs of sales |
|
$ |
166.6 |
|
$ |
12.7 |
|
$ |
179.3 |
|
|
$ |
160.3 |
|
$ |
16.6 |
|
$ |
176.9 |
|
Depletion and depreciation |
|
|
209.9 |
|
|
62.5 |
|
|
272.4 |
|
|
|
217.6 |
|
|
68.0 |
|
|
285.6 |
|
Segment gross profit |
|
$ |
634.8 |
|
$ |
132.5 |
|
$ |
767.3 |
|
|
$ |
604.2 |
|
$ |
249.0 |
|
$ |
853.2 |
|
A reconciliation of total segment gross profit to consolidated net (loss) income before income taxes is presented below:
|
|
|
2023 |
|
|
2022 |
|
||
Total segment gross profit |
|
$ |
767.3 |
|
|
$ |
853.2 |
|
|
|
|
|
|
|
|
|
|
|
|
Other operating expenses (income) |
|
|
|
|
|
|
|
|
|
General and administrative expenses |
|
$ |
24.5 |
|
|
$ |
22.5 |
|
|
Share-based compensation expense |
|
|
4.4 |
|
|
|
10.1 |
|
|
Impairment losses |
|
|
1,173.3 |
|
|
|
— |
|
|
Gain on sale of royalty interest |
|
|
(3.7) |
|
|
|
— |
|
|
Gain on sale of gold bullion |
|
|
(3.9) |
|
|
|
(0.7) |
|
|
Depreciation |
|
|
0.7 |
|
|
|
0.6 |
|
|
Foreign exchange gain and other income |
|
|
(14.4) |
|
|
|
(3.6) |
|
|
(Loss) income before finance items and income taxes |
|
$ |
(413.6) |
|
|
$ |
824.3 |
|
|
|
|
|
|
|
|
|
|
|
|
Finance items |
|
|
|
|
|
|
|
|
|
Finance income |
|
$ |
52.3 |
|
|
$ |
12.6 |
|
|
Finance expenses |
|
|
(2.9) |
|
|
|
(3.2) |
|
|
Net (loss) income before income taxes |
|
$ |
(364.2) |
|
|
$ |
833.7 |
|
|
Revenues earned during the years ended December 31, 2023 and 2022 are presented by geographic area based on the location of the mining operations giving rise to the royalty, stream or working interest:
|
|
2023 |
|
2022 |
|
|||
Latin America |
|
|
|
|
|
|
|
|
Panama |
|
$ |
248.9 |
|
|
$ |
223.3 |
|
Peru |
|
|
194.3 |
|
|
|
186.0 |
|
Chile |
|
|
136.1 |
|
|
|
128.8 |
|
Brazil |
|
|
35.1 |
|
|
|
40.7 |
|
Other |
|
|
73.1 |
|
|
|
81.0 |
|
United States |
|
|
208.0 |
|
|
|
327.5 |
|
Canada |
|
|
177.1 |
|
|
|
205.9 |
|
Rest of World |
|
|
146.4 |
|
|
|
122.5 |
|
|
|
$ |
1,219.0 |
|
|
$ |
1,315.7 |
|
For the year ended December 31, 2023, two interests generated 20% and 11%, respectively, of the Company’s revenue, totaling $379.2 million. Comparatively, for the year ended December 31, 2022, two interests generated revenue of 17% and 10%, respectively, totaling $349.1 million.
2023 Financial Statements |
39 |
Franco-Nevada Corporation
Notes to the Consolidated Financial Statements |
For the years ended December 31, 2023 and 2022
(expressed in millions of U.S. dollars, except per share amounts, unless otherwise noted)
Royalty, stream and working interests as at December 31, 2023 and 2022 are presented by geographic area based on the location of the mining operations giving rise to the royalty, stream or working interest.
|
|
|
2023 |
|
|
|
2022 |
|
Latin America |
|
|
|
|
|
|
|
|
Brazil |
|
$ |
726.2 |
|
|
$ |
476.1 |
|
Peru |
|
|
702.6 |
|
|
|
769.6 |
|
Chile |
|
|
539.1 |
|
|
|
469.0 |
|
Panama |
|
|
- |
|
|
|
1,219.7 |
|
Other |
|
|
139.1 |
|
|
|
138.8 |
|
United States |
|
|
1,109.1 |
|
|
|
1,143.3 |
|
Canada |
|
|
658.8 |
|
|
|
542.6 |
|
Rest of World |
|
|
152.2 |
|
|
|
168.4 |
|
|
|
$ |
4,027.1 |
|
|
$ |
4,927.5 |
|
Investments and a loan receivable of $279.3 million (2022 – Investments of $227.2 million) are held in Canada. Energy well equipment, included in other non-current assets, of $5.8 million (2022 - $5.6 million) is located in Canada.
Note 22 - Fair Value Measurements
Fair value is a market-based measurement, not an entity-specific measurement. For some assets and liabilities, observable market transactions or market information might be available. For other assets and liabilities, observable market transactions and market information might not be available. However, the objective of a fair value measurement in both cases is the same - to estimate the price at which an orderly transaction to sell the asset or to transfer the liability would take place between market participants at the measurement date under current market conditions (i.e. an exit price at the measurement date from the perspective of a market participant that holds the asset or owes the liability).
The fair value hierarchy establishes three levels to classify the inputs to valuation techniques used to measure fair value.
| ● | Level 1 inputs are quoted prices (unadjusted) in active markets for identical assets or liabilities. |
| ● | Level 2 inputs are quoted prices in markets that are not active, quoted prices for similar assets or liabilities in active markets, inputs other than quoted prices observable for the asset or liability (for example, interest rate and yield curves observable at commonly quoted intervals, forward pricing curves used to value currency and commodity contracts and volatility measurements used to value option contracts), or inputs that are derived principally from or corroborated by observable market data or other means. |
| ● | Level 3 inputs are unobservable (supported by little or no market activity). |
The fair value hierarchy gives the highest priority to Level 1 inputs and the lowest priority to Level 3 inputs.
There were no transfers between the levels of the fair value hierarchy during the year ended December 31, 2023.
Assets and Liabilities Measured at Fair Value on a Recurring Basis:
|
|
Quoted prices in |
|
Significant other |
|
Significant |
|
|
|
|
||||
|
|
active markets for |
|
observable |
|
unobservable |
|
|
|
|
||||
|
|
identical assets |
|
inputs |
|
inputs |
|
|
Aggregate |
|
||||
As at December 31, 2023 |
|
(Level 1) |
|
(Level 2) |
|
(Level 3) |
|
|
fair value |
|
||||
Receivables from provisional concentrate sales |
|
$ |
— |
|
$ |
5.7 |
|
$ |
— |
|
|
$ |
5.7 |
|
Equity investments |
|
|
241.8 |
|
|
— |
|
|
4.6 |
|
|
|
246.4 |
|
Loans receivable |
|
|
— |
|
|
— |
|
|
24.8 |
|
|
|
24.8 |
|
Warrants |
|
|
— |
|
|
8.1 |
|
|
— |
|
|
|
8.1 |
|
|
|
$ |
241.8 |
|
$ |
13.8 |
|
$ |
29.4 |
|
|
$ |
285.0 |
|
|
|
Quoted prices in |
|
Significant other |
|
Significant |
|
|
|
|
||||
|
|
active markets for |
|
observable |
|
unobservable |
|
|
|
|
||||
|
|
identical assets |
|
inputs |
|
inputs |
|
|
Aggregate |
|
||||
As at December 31, 2022 |
|
(Level 1) |
|
(Level 2) |
|
(Level 3) |
|
|
fair value |
|
||||
Receivables from provisional concentrate sales |
|
$ |
— |
|
$ |
9.3 |
|
$ |
— |
|
|
$ |
9.3 |
|
Equity investments |
|
|
220.8 |
|
|
— |
|
|
3.8 |
|
|
|
224.6 |
|
Warrants |
|
|
— |
|
|
2.6 |
|
|
— |
|
|
|
2.6 |
|
|
|
$ |
220.8 |
|
$ |
11.9 |
|
$ |
3.8 |
|
|
$ |
236.5 |
|
2023 Financial Statements |
40 |
Franco-Nevada Corporation
Notes to the Consolidated Financial Statements |
For the years ended December 31, 2023 and 2022
(expressed in millions of U.S. dollars, except per share amounts, unless otherwise noted)
The valuation techniques that are used to measure fair value are as follows:
| (a) | Receivables from provision concentrate sales |
The fair values of receivables arising from gold and platinum group metal concentrate sales contracts that contain provisional pricing mechanisms are determined using the appropriate quoted forward prices from the exchange that is the principal active market for the particular metal. As such, these receivables are classified within Level 2 of the fair value hierarchy.
| (b) | Investments |
The fair values of publicly-traded investments are determined based on a market approach reflecting the closing prices of each particular security at the statement of financial position date. The closing prices are quoted market prices obtained from the exchange that is the principal active market for the particular security, and therefore are classified within Level 1 of the fair value hierarchy.
The Company holds two equity investments that do not have a quoted market price in an active market. The Company has assessed the fair value of the instruments based on a valuation technique using unobservable discounted future cash flows. As a result, the fair value is classified within Level 3 of the fair value hierarchy.
The fair values of warrants are estimated using the Black-Scholes pricing model which requires the use of inputs that are observable in the market. As such, these investments are classified within Level 2 of the fair value hierarchy.
| (c) | Convertible debenture receivable |
The Company holds a convertible debenture receivable that does not have a quoted market price in an active market. The Company has assessed the fair value of the instrument using present value techniques and assumptions concerning the amount of and timing of future cash flows and discount rates which factor in the appropriate credit risk that are unobservable and the Black-Scholes option pricing model which requires the use of inputs that are observable in the market. As such, these investments are classified within level 3 of the fair value hierarchy.
The fair values of the Company’s remaining financial assets and liabilities, which include cash and cash equivalents, receivables, accounts payable and accrued liabilities, and debt approximate their carrying values due to their short-term nature and historically negligible credit losses.
The Company has not offset financial assets with financial liabilities.
2023 Financial Statements |
41 |
Franco-Nevada Corporation
Notes to the Consolidated Financial Statements |
For the years ended December 31, 2023 and 2022
(expressed in millions of U.S. dollars, except per share amounts, unless otherwise noted)
Note 23 – Financial Risk Management
The Company’s financial instruments are comprised of financial assets and liabilities. The Company’s principal financial liabilities comprise accounts payable, accrued liabilities and debt. The Company’s principal financial assets are cash and cash equivalents, receivables, loan receivables, and investments. The main purpose of these financial instruments is to manage short-term cash flow and working capital requirements and fund future acquisitions.
The Company is engaged in the business of acquiring, managing and creating resource royalties and streams. Royalties and streams are interests that provide the right to revenue or production from the various properties, after deducting specified costs, if any. These activities expose the Company to a variety of financial risks, which include direct exposure to market risks (which includes commodity price risk, foreign exchange risk and interest rate risk), credit risk, liquidity risk and capital risk management.
Management designs strategies for managing some of these risks, which are summarized below. The Company’s executive management oversees the management of financial risks. The Company’s executive management ensures that financial risk-taking activities are governed by appropriate policies and procedures and that financial risks are identified, measured and managed in accordance with the Company’s policies and risk appetite.
The Company’s overall objective from a risk management perspective is to safeguard its assets and mitigate risk exposure by focusing on security rather than yield.
(a)Market Risks
Market risks are the risks that change in market factors, such as commodity prices, foreign exchange rates or interest rates, will affect the value of the Company’s financial instruments. The Company manages market risks by either accepting it or mitigating it through the use of economic strategies.
Commodity Price Risk
The Company’s royalties, working interests and streams are subject to fluctuations from changes in market prices of the underlying commodities. The market prices of gold, silver, platinum, palladium, iron ore, oil and gas are the primary drivers of the Company’s profitability and ability to generate free cash flow. All of the Company’s future revenue is not hedged in order to provide shareholders with full exposure to changes in the market prices of these commodities.
Foreign Exchange Risk
The functional currencies of the Company’s entities include the Canadian, U.S. and Australian dollars with the reporting currency of the Company being the U.S. dollar. The Company is primarily exposed to currency fluctuations relative to the U.S. dollar on balances and transactions that are denominated and settled in Canadian dollars and Australian dollars. The Company has exposure to the Canadian dollar through its Canadian energy activities and corporate administration costs. Consequently, fluctuations in the U.S. dollar exchange rate against these currencies increase the volatility of depletion, corporate administration costs and overall net earnings, when translated into U.S. dollars.
The Company records currency translation adjustment gains or losses primarily due to the fluctuation of the U.S. dollar in relation to its Canadian assets and liabilities. During the year ended December 31, 2023, the U.S. dollar weakened in relation to the Canadian dollar. As a result, the Company recorded a currency translation adjustment gain of $34.8 million (2022 – loss of $92.0 million).
Interest Rate Risk
Interest rate risk refers to the risk that the value of a financial instrument or cash flows associated with the instrument will fluctuate due to changes in market interest rates. The Company’s interest rate exposure arises mainly from the interest receipts on cash and cash equivalents and loans receivable. The Company may also be exposed to interest rate risk when it has borrowed amounts under its Corporate Revolver.
2023 Financial Statements |
42 |
Franco-Nevada Corporation
Notes to the Consolidated Financial Statements |
For the years ended December 31, 2023 and 2022
(expressed in millions of U.S. dollars, except per share amounts, unless otherwise noted)
The following table shows the approximate interest rate sensitivities of the Company’s financial assets and liabilities as at December 31, 2023 and 2022:
|
|
|
Effect on net (loss) income |
|
|
Effect on equity |
|
||||||||||
|
|
|
2023 |
|
|
2022 |
|
|
2023 |
|
|
2022 |
|
||||
0.5% increase |
|
|
$ |
4.6 |
|
|
$ |
4.6 |
|
|
$ |
4.6 |
|
|
$ |
4.6 |
|
0.5% decrease |
|
|
|
(4.3) |
|
|
|
(0.8) |
|
|
|
(4.3) |
|
|
|
(0.8) |
|
(b)Credit Risk
Credit risk is the risk that a third party might fail to fulfill its performance obligations under the terms of a financial instrument. Credit risk arises from cash and cash equivalents, receivables and loan receivables. The Company closely monitors its financial assets and maintains its cash deposits in several high-quality financial institutions and as such does not have any significant concentration of credit risk.
As at December 31, 2023, the Company is unaware of any information which would cause it to believe that these financial assets are not fully recoverable.
(c)Liquidity Risk
Liquidity risk is the risk of loss from not having access to sufficient funds to meet both expected and unexpected cash demands. The Company manages its exposure to liquidity risk through prudent management of its statement of financial position, including maintaining sufficient cash balances and access to credit facilities. The Company has in place a planning and budgeting process to help determine the funds required to support the Company’s normal operating requirements on an ongoing basis. Management continuously monitors and reviews both actual and forecasted cash flows, including acquisition activities.
As at December 31, 2023, the Company held $1,421.9 million in either cash, cash equivalents or highly-liquid investments (2022 – $1,196.5 million). All of the Company’s financial liabilities are due within one year. The Company’s near-term cash requirements include corporate administration costs, certain costs of sales, including the ore purchase commitments described in Note 24 (a), dividends and income taxes directly related to the recognition of royalty, stream and working interest revenues. In addition, the Company has various capital commitments as described in Note 24 (b).
(d)Capital Risk Management
The Company’s primary objective when managing capital is to provide a sustainable return to shareholders through managing and growing the Company’s resource asset portfolio while ensuring capital protection. The Company defines capital as its cash, cash equivalents, short-term investments and long-term investments which is managed by the Company’s management subject to approved policies and limits by the Board of Directors.
There were no changes in the Company’s approach to capital management during the year ended December 31, 2023 compared to the prior year. The Company is not subject to material externally imposed capital requirements or significant financial covenants or capital requirements with our lenders. The Company is in compliance with all its covenants under its credit facilities as at December 31, 2023.
As at December 31, 2023, the Company has cash and cash equivalents totaling $1,421.9 million (2022 – $1,196.5 million), a loan receivable of $24.8 million (2022 - nil) and investments totaling $254.5 million (2022 – $227.2 million) of which $241.8 million (2022 – $220.8 million) are held in publicly traded securities. The Company also has approximately $1.0 billion (2022 – $1.0 billion) available under its Corporate Revolver. All of these sources of capital are available to the Company to meet its near-term cash requirements and capital commitments.
2023 Financial Statements |
43 |
Franco-Nevada Corporation
Notes to the Consolidated Financial Statements |
For the years ended December 31, 2023 and 2022
(expressed in millions of U.S. dollars, except per share amounts, unless otherwise noted)
Note 24 – Commitments
(a)Commodity purchase commitments
The following table summarizes the Company’s commitments pursuant to the associated precious metals agreements as at December 31, 2023:
|
|
Attributable payable |
|
|
|
|
|
|
|
|
|
|
|
|
|
|
||||
|
|
production to be purchased |
|
Per ounce cash payment (1),(2) |
|
Term of |
|
Date of |
|
|||||||||||
Interest |
|
Gold |
|
Silver |
|
PGM |
|
Gold |
|
Silver |
|
PGM |
|
agreement(3) |
|
contract |
|
|||
Antamina |
|
— |
% |
22.5 |
% (4) |
— |
% |
|
n/a |
|
|
5 |
% (5) |
|
n/a |
|
40 years |
|
7-Oct-15 |
|
Antapaccay |
|
— |
% (6) |
— |
% (7) |
— |
% |
|
20 |
% (8) |
|
20 |
% (9) |
|
n/a |
|
40 years |
|
10-Feb-16 |
|
Candelaria |
|
68 |
% (10) |
68 |
% (10) |
— |
% |
$ |
400 |
|
$ |
4.00 |
|
|
n/a |
|
40 years |
|
6-Oct-14 |
|
Cobre Panama Fixed Payment Stream |
|
— |
% (11) |
— |
% (12) |
— |
% |
$ |
418 |
(13) |
$ |
6.27 |
(14) |
|
n/a |
|
40 years |
|
19-Jan-18 |
|
Cobre Panama Floating Payment Stream |
|
— |
% (15) |
— |
% (16) |
— |
% |
|
20 |
% (17) |
|
20 |
% (18) |
|
n/a |
|
40 years |
|
19-Jan-18 |
|
Condestable |
|
— |
% (19) |
— |
% (20) |
— |
% |
|
20 |
% (21) |
|
20 |
% (22) |
|
n/a |
|
40 years |
|
8-Mar-21 |
|
Guadalupe-Palmarejo |
|
50 |
% |
— |
% |
— |
% |
$ |
800 |
|
|
n/a |
|
|
n/a |
|
40 years |
|
2-Oct-14 |
|
Karma |
|
4.875 |
% |
— |
% |
— |
% |
|
20 |
% (23) |
|
n/a |
|
|
n/a |
|
40 years |
|
11-Aug-14 |
|
Sabodala |
|
— |
% (24) |
— |
% |
— |
% |
|
20 |
% (25) |
|
n/a |
|
|
n/a |
|
40 years |
|
25-Sep-20 |
|
MWS |
|
25 |
% |
— |
% |
— |
% |
$ |
400 |
|
|
n/a |
|
|
n/a |
|
40 years |
(26) |
2-Mar-12 |
|
Sudbury(27) |
|
50 |
% |
— |
% |
50 |
% |
$ |
400 |
|
|
n/a |
|
$ |
400 |
|
40 years |
|
15-Jul-08 |
|
Tocantinzinho |
|
12.5 |
% (28) |
— |
% |
— |
% |
|
20 |
% (29) |
|
n/a |
|
|
n/a |
|
40 years |
|
18-Jul-22 |
|
Cooke 4 |
|
7.0 |
% |
— |
% |
— |
% |
$ |
400 |
|
|
n/a |
|
|
n/a |
|
40 years |
|
5-Nov-09 |
|
| 1 | Subject to an annual inflationary adjustment except for Antamina, Antapaccay, Karma, Guadalupe-Palmarejo, and Sabodala. |
| 2 | Should the prevailing market price for gold be lower than this amount, the per ounce cash payment will be reduced to the prevailing market price. |
| 3 | Subject to successive extensions. |
| 4 | Subject to a fixed payability of 90%. Percentage decreases to 15% after 86 million ounces of silver has been delivered under the agreement. |
| 5 | Purchase price is 5% of the average silver price at the time of delivery. |
| 6 | Gold deliveries are referenced to copper in concentrate shipped with 300 ounces of gold delivered for each 1,000 tonnes of copper in concentrate shipped, until 630,000 ounces of gold has been delivered. Thereafter, percentage is 30% of gold shipped. |
| 7 | Silver deliveries are referenced to copper in concentrate shipped with 4,700 ounces of silver delivered for each 1,000 tonnes of copper in concentrate shipped, until 10.0 million ounces of silver has been delivered. Thereafter, percentage is 30% of silver shipped. |
| 8 | Purchase price is 20% of the spot price of gold until 750,000 ounces of gold have been delivered, thereafter the purchase price is 30% of the spot price of gold. |
| 9 | Purchase price is 20% of the spot price of silver until 12.8 million ounces of silver have been delivered, thereafter the purchase price is 30% of the spot price of silver. |
| 10 | Percentage decreases to 40% after 720,000 ounces of gold and 12.0 million ounces of silver have been delivered under the agreement. |
| 11 | Gold deliveries are indexed to copper in concentrate produced from the project. 120 ounces of gold per every 1 million pounds of copper produced until 808,000 ounces of gold delivered. Thereafter, 81 ounces of gold per 1 million pounds of copper produced until 1,716,188 ounces of gold delivered. Thereafter, 63.4% of the gold in concentrate. |
| 12 | Silver deliveries are indexed to copper in concentrate produced from the project. 1,376 ounces of silver per every 1 million pounds of copper produced until 9,842,000 ounces of silver delivered. Thereafter 1,776 ounces of silver per 1 million pounds of copper produced until 29,731,000 ounces of silver delivered. Thereafter, 62.1% of the silver in concentrate. |
| 13 | After 1,341,000 ounces of gold delivered, purchase price is the greater of 50% of spot and $418.27 per ounce, subject to annual inflationary adjustment. As the mill throughput for 30 consecutive days commensurate with annual capacity of 58 million tonnes per annum was not reached by January 1, 2019, Franco-Nevada received a reduction of the applicable fixed gold price of $100 per ounce until the end of Q2 2023. |
| 14 | After 21,510,000 ounces of silver delivered, purchase price is the greater of 50% of spot and $6.27 per ounce, subject to an annual inflationary adjustment. |
| 15 | Gold deliveries are indexed to copper in concentrate produced from the project. 30 ounces of gold per every 1 million pounds of copper produced until 202,000 ounces of gold delivered. Thereafter 20.25 ounces of gold per 1 million pounds of copper produced until 429,047 ounces of gold delivered. Thereafter, 15.85% of the gold in concentrate. |
| 16 | Silver deliveries are indexed to copper in concentrate produced from the project. 344 ounces of silver per every 1 million pounds of copper produced until 2,460,500 ounces of silver delivered. Thereafter, 444 ounces of silver per 1 million pounds of copper produced until 7,432,750 ounces of silver delivered. Thereafter 15.53% of the silver in concentrate. |
| 17 | After 604,000 ounces of gold delivered, purchase price is 50% of the spot price of gold. As the mill throughput for 30 consecutive days commensurate with annual capacity of 58 million tonnes per annum was not reached by January 1, 2019, Franco-Nevada received a reduction of the applicable floating gold price of $100 per ounce until the end of Q2 2023. |
| 18 | After 9,618,000 ounces of silver delivered, purchase price is 50% of the spot price of silver. |
| 19 | Gold deliveries are fixed at 8,760 ounces per annum from January 1, 2021 to December 31, 2025. Thereafter, 63% of the gold in concentrate until a cumulative total of 87,600 ounces of gold delivered. Thereafter, 25% of the gold in concentrate. |
| 20 | Silver deliveries are fixed at 291,000 ounces per annum from January 1, 2021 to December 31, 2025. Thereafter, 63% of the silver in concentrate until a cumulative total of 2,910,000 ounces of silver delivered. Thereafter, 25% of the silver in concentrate. |
| 21 | Purchase price is 20% of the spot price of gold at the time of delivery. |
| 22 | Purchase price is 20% of the spot price of silver at the time of delivery. |
| 23 | Purchase price is 20% of the average gold price at the time of delivery. |
| 24 | Based on amended agreement with an effective date of September 1, 2020, gold deliveries are fixed at 783.33 ounces per month until 105,750 ounces of gold is delivered. Thereafter, percentage is 6% of gold production (subject to reconciliation after fixed delivery period to determine if Franco-Nevada would have received more or less than 105,750 ounces of gold under the original 6% variable stream for such period, entitling the operator to a credit for an over-delivery applied against future stream deliveries or a one-time additional delivery to Franco-Nevada for an under-delivery). |
| 25 | Purchase price is 20% of prevailing market price at the time of delivery. |
| 26 | Agreement is capped at 312,500 ounces of gold. |
2023 Financial Statements |
44 |
Franco-Nevada Corporation
Notes to the Consolidated Financial Statements |
For the years ended December 31, 2023 and 2022
(expressed in millions of U.S. dollars, except per share amounts, unless otherwise noted)
| 27 | The Company is committed to purchase 50% of the precious metals contained in ore from the properties. Payment is based on gold equivalent ounces. For McCreedy West, effective June 1, 2021, purchase price per gold equivalent ounce is determined based on the monthly average gold spot price: (i) when the gold spot price is less than $800 per ounce, the purchase price is the prevailing monthly average gold spot price; (ii) when the gold spot price is greater than $800 per ounce but less than $1,333 per ounce, the purchase price is $800 per ounce; (iii) when the gold spot price is greater than $1,333 per ounce but less than $2,000 per ounce, the purchase price is 60% of the prevailing monthly average gold spot price; and (iv) when the gold spot price is greater than $2,000, the purchase price is $1,200 per ounce. |
| 28 | Percentage decreased to 7.5% after 300,000 ounces of gold have been delivered under the agreement. |
| 29 | Purchase price is 20% of the spot price of gold at the time of delivery. |
(b)Capital Commitments
As at December 31, 2023, the Company has the following capital commitments: (i) $75.0 million in connection with the Term Loan for the Tocantinzinho project as described in Note 4 (c), (ii) $69.8 million for its share of the acquisition of mineral rights acquired through the Royalty Acquisition Venture with Continental as described in Note 4 (n), and (iii) up to $5.5 million for the joint acquisition of newly created precious metals and copper royalties sourced by EMX as described in Note 4 (j).
The Company also has commitments for contingent payments in relation to various royalty agreements, as follows: (i) $12.5 million in relation to its Copper World royalty, (ii) $8.0 million in relation to its Rio Baker (Salares Norte) royalty, (iii) $3.4 million (C$4.5 million) in relation to its Eskay Creek royalty, and (iv) $1.3 million in relation to its Rebecca royalty.
Note 25 – Contingencies
| (a) | Cobre Panama Arbitration Proceedings |
Cobre Panama has been in P&SM with production halted since November 2023. First Quantum and its subsidiary, MPSA, and the GOP had been engaged in discussions regarding a revised concession contract for Cobre Panama. On November 27, 2023, the Supreme Court issued a ruling, released publicly the following day, declaring Law 406 unconstitutional.
Franco-Nevada is pursuing legal avenues to protect its investment in Cobre Panama and is of the view that it has rights under international law. On November 23, 2023, the Company notified MICI of its intent to initiate arbitration to enforce its rights under international law (the “Notice of Intent”) pursuant to the Canada-Panama Free Trade Agreement (the “FTA”). On February 23, 2024, the Company filed an updated Notice of Intent (the “Updated Notice of Intent”) reiterating its intent to commence arbitration under the FTA. The Updated Notice of Intent also specifies that the Company presently and preliminarily estimates its damages to be at least $5 billion, subject to further analysis and development.
The Company accounts for its Cobre Panama arbitration proceedings in accordance with IAS 37 Provisions, Contingent Liabilities and Contingent Assets.
| (b) | Canada Revenue Agency Audit |
The CRA is conducting an audit of Franco-Nevada for the 2012-2019 taxation years.
Settlement of Domestic and FAPI Reassessments
In prior years, certain wholly-owned Canadian subsidiaries of the Company received Notices of Reassessment for the 2014 through 2017 taxation years (the “Domestic Reassessments”) in which the CRA increased income by adjusting the timing of the deduction of the upfront payments which were made in connection with precious metal stream agreements. This resulted in the Company being subject to an incremental payment of Federal and provincial income taxes for these years of $15.1 million (C$19.9 million) (after applying available non-capital losses and other deductions) plus interest and penalties.
In addition, in a prior year, the Company received Notices of Reassessment for the 2012 and 2013 taxation years (the “FAPI Reassessments”) in relation to its Barbadian subsidiary. The FAPI Reassessments asserted that a majority of the income relating to precious metal streams earned by the Barbadian subsidiary, in those years, should have been included in the income of its Canadian parent company and subject to tax in Canada as Foreign Accrual Property Income (“FAPI”). The CRA noted that its position may not extend beyond the 2013 taxation year. The FAPI Reassessments resulted in additional Federal and provincial income taxes of $5.8 million (C$7.7 million) plus interest and penalties.
On April 28, 2023, the Company reached a settlement with the CRA in respect of the Domestic and FAPI Reassessments, which provide for these reassessments to be vacated entirely on a without-cost basis. Under the settlement, the CRA accepts the manner in which the Company deducts upfront payments made in connection with precious metal stream agreements for Canadian tax purposes. This would result in no FAPI in 2012 and 2013 as computed under Canadian tax law. While the settlement of the Domestic Reassessment only addresses the taxation years that were reassessed (2014-2017), the Company’s expectation is that the manner in which it deducts upfront payments made in connection with precious metal stream agreements for Canadian tax purposes will now be accepted by the CRA for the subsequent years.
The Company had posted security in cash for 50% of the reassessed amounts under the Domestic and FAPI Reassessments totaling $13.9 million (C$17.7 million). The CRA returned the full amount of the deposits to the Company.
2023 Financial Statements |
45 |
Franco-Nevada Corporation
Notes to the Consolidated Financial Statements |
For the years ended December 31, 2023 and 2022
(expressed in millions of U.S. dollars, except per share amounts, unless otherwise noted)
Transfer Pricing Reassessments
The Company has received reassessments from the CRA made on the basis of the transfer pricing provisions in the Income
Tax Act (Canada) (the “Act”). The following table provides a summary of the CRA audit and reassessment matters further detailed below:
|
CRA Position |
Taxation Years Reassessed |
Potential Exposure for Tax, Interest and Penalties (in millions) |
|
Transfer Pricing (Mexico) |
Transfer pricing provisions in the Act apply such that a majority of the income earned by the Company’s Mexican subsidiary should be included in the income of the Company and subject to tax in Canada. |
2013, 2014, 2015, 2016 |
For 2013-2016: Tax: $22.7 (C$29.9) Transfer pricing penalties: $9.1 (C$12.0) Interest and other penalties: $14.6 (C$19.1) The amounts set forth above do not include any potential relief under the Canada-Mexico tax treaty. The Company’s Mexican subsidiary ceased operations after 2016 and no reassessments for this issue are expected for subsequent years. |
|
Transfer Pricing (Barbados) |
Transfer pricing provisions in the Act apply such that a majority of the income relating to certain precious metal streams earned by the Company’s Barbadian subsidiary should be included in the income of the Company and subject to tax in Canada. |
2014, 2015, 2016, 2017, 2018 2019 (proposed) |
For 2014-2018, 2019 (proposed): Tax: $83.8 (C$110.7) Transfer pricing penalties: $13.3 (C$17.6) for 2014-2017; $18.4 (C$24.4) for 2018-2019 under review Interest and other penalties: $29.5 (C$39.1) If the CRA were to reassess the 2020-2023 taxation years on the same basis: Tax: $242.8 (C$321.1) Transfer pricing penalties: $91.8 (C$121.4) Interest and other penalties: $33.4 (C$44.2) |
| (i) | Mexico (2013-2016) |
In December 2018 and December 2019, the Company received Notices of Reassessment from the CRA for the 2013 taxation year (the “2013 Reassessment”) and for the 2014 and 2015 taxation years (the “2014 and 2015 Reassessments”, collectively with the 2013 Reassessment, the “2013-2015 Reassessments”) in relation to its Mexican subsidiary. The reassessments were made on the basis of the transfer pricing provisions in the Act and assert that a majority of the income earned by the Mexican subsidiary should have been included in the income of the Company and subject to tax in Canada. The 2013-2015 Reassessments result in additional Federal and provincial income taxes of $19.2 million (C$25.3 million) plus estimated interest (calculated to December 31, 2023) and other penalties of $13.2 million (C$17.3 million) but before any relief under the Canada-Mexico tax treaty. The Company has filed formal Notices of Objection with the CRA against the 2013-2015 Reassessments and has posted security in the form of a standby letter of credit for 50% of the reassessed amounts, as referenced in Note 12.
In December 2020, the CRA issued revised 2013-2015 Reassessments to include transfer pricing penalties of $7.8 million (C$10.3 million). The Company has filed formal Notices of Objection with the CRA against these revised reassessments and has posted security in the form of cash for 50% of the reassessed amounts of penalties, as referenced in Note 10. The Company has commenced an appeal in the Tax Court of Canada with respect to the 2013-2015 Reassessments.
In December 2021, the Company received a Notice of Reassessment for the 2016 taxation year (the “2016 Reassessment”) on the same basis as the 2013-2015 Reassessments, resulting in additional Federal and provincial income taxes of $3.5 million (C$4.6 million) plus estimated interest (calculated to December 31, 2023) and other penalties of $1.4 million (C$1.8 million) but before any relief under the Canada-Mexico tax treaty. The Company has filed a formal Notice of Objection with the CRA against the 2016 Reassessment and has posted security in the form of cash for 50% of the reassessed amounts, as referenced in Note 10. On October 26, 2023, the Company received a revised 2016 Reassessment to include transfer pricing penalties of $1.3 million (C$1.7 million). Subsequent to year-end, the Company filed a formal Notice of Objection against this revised reassessment and posted security in the form
2023 Financial Statements |
46 |
Franco-Nevada Corporation
Notes to the Consolidated Financial Statements |
For the years ended December 31, 2023 and 2022
(expressed in millions of U.S. dollars, except per share amounts, unless otherwise noted)
of cash for 50% of the reassessed amounts of penalties. The Company’s Mexican subsidiary ceased operations after 2016 and no reassessments are expected for subsequent years.
For taxation years 2013 through 2016, the Company’s Mexican subsidiary paid a total of $34.1 million (490.3 million Pesos) in cash taxes, at a 30% tax rate, to the Mexican tax authorities on income earned in Mexico. If required, the Company intends to seek relief from double taxation under the Canada-Mexico tax treaty.
| (ii) | Barbados (2014-2019) |
The 2014 and 2015 Reassessments also reassess the Company in relation to its Barbadian subsidiary. The reassessments were made on the basis of the transfer pricing provisions in the Act and assert that a majority of the income relating to certain precious metal streams earned by the Barbadian subsidiary should have been included in the income of the Company and subject to tax in Canada, resulting in additional Federal and provincial income taxes of $5.1 million (C$6.7 million) plus estimated interest (calculated to December 31, 2023) and other penalties of $3.3 million (C$4.4 million). As noted previously, the Company has filed formal Notices of Objection with the CRA against the 2014 and 2015 Reassessments and has posted security in the form of a standby letter of credit for 50% of the reassessed amounts, as referenced in Note 12.
As noted above, in December 2020, the CRA issued revised 2014 and 2015 Reassessments to include transfer pricing penalties of $1.9 million (C$2.5 million). The Company has filed formal Notices of Objection with the CRA against these revised reassessments and has posted security in the form of cash for 50% of the reassessed amounts of penalties, as referenced in Note 10. The Company has commenced an appeal in the Tax Court of Canada with respect to the 2014-2015 Reassessments.
In December 2021, the Company received the 2016 Reassessment as well as a Notice of Reassessment for the 2017 taxation year (the “2017 Reassessment”, and collectively with the 2016 Reassessment, the “2016 and 2017 Reassessments”) that reassess the Company in relation to its Barbadian subsidiary on the same basis as the 2014 and 2015 Reassessments, resulting in additional Federal and provincial income taxes of $30.1 million (C$39.8 million) plus estimated interest (calculated to December 31, 2023) and other penalties of $11.2 million (C$14.8 million). The Company has filed formal Notices of Objection with the CRA against the 2016 and 2017 Reassessments and has posted security in the form of cash for 50% of the reassessed amounts, as referenced in Note 10. On October 26, 2023, the Company received revised 2016 and 2017 Reassessments to include transfer pricing penalties of $11.4 million (C$15.1 million). Subsequent to year-end, the Company filed formal Notices of Objection against these revised reassessments and posted security in the form of cash for 50% of the reassessed amounts of penalties.
On November 10, 2023, the Company received a letter from the CRA (the “Proposal Letter”) proposing to reassess the 2018 and 2019 taxation years on the same basis as the 2016 and 2017 Reassessments, resulting in additional Federal and provincial income taxes of $17.2 million (C$22.7 million) for 2018 and $31.4 million (C$41.5 million) for 2019 plus estimated interest (calculated to December 31, 2023) and other penalties of $6.5 million (C$8.6 million) for 2018 and $8.5 million (C$11.3 million) for 2019. The Proposal Letter did not include transfer pricing penalties which are currently under review. If the CRA were to apply transfer pricing penalties, the Company estimates that the amounts would be approximately $6.6 million (C$8.8 million) for 2018 and $11.8 million (C$15.6 million) for 2019. On December 6, 2023, the Company received a Notice of Reassessment for the 2018 taxation year (the “2018 Reassessment”, and collectively with the 2013-2015 Reassessments and the 2016 and 2017 Reassessments, the “Transfer Pricing Reassessments”) as proposed. The Company does not agree with the 2018 Reassessment and subsequent to year-end, filed a formal Notice of Objection with the CRA and posted security in the form of cash for 50% of the reassessed amounts. The Company does not agree with the Proposal Letter and intends to file a formal Notice of Objection when the CRA issues a Notice of Reassessment for the 2019 taxation year.
If the CRA were to reassess the Company for taxation years 2020 through 2023 on the same basis and continue to apply transfer pricing penalties, the Company estimates that it would be subject to additional Canadian tax for these years of approximately $242.8 million (C$321.1 million), transfer pricing penalties of approximately $91.8 million (C$121.4 million) plus interest (calculated to December 31, 2023) and other penalties of approximately $33.4 million (C$44.2 million).
2023 Financial Statements |
47 |
Franco-Nevada Corporation
Notes to the Consolidated Financial Statements |
For the years ended December 31, 2023 and 2022
(expressed in millions of U.S. dollars, except per share amounts, unless otherwise noted)
Management believes that the Company and its subsidiaries have filed all tax returns and paid all applicable taxes in compliance with Canadian and applicable foreign tax laws and, as a result, no liabilities have been recorded in the financial statements of the Company for the Transfer Pricing Reassessments and the Proposal Letter, or for any potential tax exposure that may arise in respect of these matters. The Company does not believe that the Transfer Pricing Reassessments and the Proposal Letter are supported by Canadian tax law and jurisprudence and intends to vigorously defend its tax filing positions.
The CRA audit is ongoing and there can be no assurance that the CRA will not further challenge the manner in which the Company or any of its subsidiaries has filed its tax returns and reported its income. In the event that the CRA successfully challenges the manner in which the Company or a subsidiary has filed its tax returns and reported its income, this could potentially result in additional income taxes, penalties and interest, which could have a material adverse effect on the Company.
Note 26 – Subsequent Events
Acquisitions and Other Transactions
Subsequent to year-end, the Company completed the following transactions:
| ● | On January 29, 2024, the Company funded approximately $42.0 million of the $75.0 million G Mining Ventures Term Loan, as referenced in Note 4 (c); |
| ● | On January 19, 2024, EMX exercised an option to acquire a portion of Franco-Nevada’s effective NSR on the Caserones mine for a sale price of $4.7 million, as referenced in Note 4 (h); |
| ● | On January 3, 2024, the Company acquired an incremental sliding-scale gold royalty and fixed-rate copper royalty on the Pascua-Lama project for $6.7 million, as referenced in Note 4 (f); |
| ● | On January 2, 2024, the Company closed the acquisition of a royalty portfolio in the Haynesville gas play in Louisiana and Texas for a purchase price of $125.0 million, as referenced in Note 4 (b). |
Please refer to the respective notes for further details.
CRA Audit
Subsequent to year-end, the Company filed formal Notices of Objection in connection with certain Transfer Pricing Reassessments and posted security in the form of cash totaling $18.5 million (C$24.5 million), as referenced in Note 10 and Note 25 (b).
2023 Financial Statements |
48 |

Exhibit 99.4

Consent of Independent Registered Public Accounting Firm
We hereby consent to the incorporation by reference in the Registration Statements on Form F-3 (No. 333-264906), on Form S-8 (No. 333-176856) and on Form F-10 (No. 333-264971) of Franco-Nevada Corporation of our report dated March 5, 2024 relating to the consolidated financial statements and the effectiveness of internal control over financial reporting, which appears in Exhibit 99.3 to Franco-Nevada Corporation's Current Report on Form 6-K.
/s/PricewaterhouseCoopers LLP
Chartered Professional Accountants, Licensed Public Accountants
Toronto, Canada
March 5, 2024

PricewaterhouseCoopers LLP
PwC Tower, 18 York Street, Suite 2600, Toronto, Ontario, Canada M5J 0B2
T: +1416 863 1133,, F: +1 +1 416 365 8215, www.pwc.com/ca
“PwC” refers to PricewaterhouseCoopers LLP, an Ontario limited liability partnership.