UNITED STATES
SECURITIES AND EXCHANGE COMMISSION
Washington, D.C. 20549
FORM 10-K
|
|
☒ |
Annual Report Pursuant to Section 13 or 15(d) of the Securities Exchange Act of 1934 |
For the fiscal year ended December 31, 2023 | |
☐ |
Transition Report Pursuant to Section 13 or 15(d) of the Securities Exchange Act of 1934 |
For the transition period from to | |
Commission file number 001-12669

SOUTHSTATE CORPORATION
(Exact name of registrant as specified in its charter)
|
|
South Carolina |
57-0799315 |
|
|
|
1101 First Street South, Suite 202, Winter Haven, FL |
33880 |
(863) 293-4710
(Registrant’s telephone number, including area code)
Not Applicable
(Former name, former address and former fiscal year, if changed since last report)
Securities registered pursuant to Section 12(b) of the Act:
Title of each class: |
|
Trading Symbol |
|
Name of each exchange on which registered: |
Common Stock, $2.50 par value |
|
SSB |
|
The New York Stock Exchange |
Securities registered pursuant to Section 12 (g) of the Act: None.
Indicate by check mark if the registrant is a well-known seasoned issuer, as defined in Rule 405 of the Securities Act. Yes ☒ No ☐.
Indicate by check mark if the registrant is not required to file reports pursuant to Section 13 or Section 15(d) of the Act. Yes ☐ No ☒.
Indicate by check mark whether the registrant (1) has filed all reports required to be filed by Section 13 or 15(d) of the Securities Exchange Act of 1934 during the preceding 12 months (or for such shorter period that the registrant was required to file such reports), and (2) has been subject to such filing requirements for the past 90 days. Yes ☒ No ☐
Indicate by check mark whether the registrant has submitted electronically every Interactive Data File required to be submitted pursuant to Rule 405 of Regulation S-T (§ 232.405 of this chapter) during the preceding 12 months (or for such shorter period that the registrant was required to submit such files). Yes ☒ No ☐
Indicate by check mark whether the registrant is a large accelerated filer, an accelerated filer, a non-accelerated filer, a smaller reporting company, or emerging growth company. See the definitions of “large accelerated filer,” “accelerated filer,” “smaller reporting company,” and “emerging growth company” in Rule 12b-2 of the Exchange Act.
Large accelerated filer ☒ |
Accelerated filer ☐ |
Non-accelerated filer ☐ |
Smaller reporting company ☐ |
Emerging growth company ☐ |
If an emerging growth company, indicate by check mark if the registrant has elected not to use the extended transition period for complying with any new or revised financial accounting standards provided pursuant to Section 13(a) of the Exchange Act. ☐
Indicate by check mark whether the registrant has filed a report on and attestation to its management’s assessment of the effectiveness of its internal control over financial reporting under Section 404(b) of the Sarbanes-Oxley Act (15 U.S.C. 7262 (b)) by the registered public accounting firm that prepared or issued its audit report. ☒
If securities are registered pursuant to Section 12(b) of the Act, indicate by check mark whether the financial statements of the registrant included in the filing reflect the correction of an error to previously issued financial statements. ☐
Indicate by check mark whether any of those error corrections are restatements that required a recovery analysis of incentive-based compensation received by any of the registrant’s executive officers during the relevant recovery period pursuant to §240.10D-1(b) ☐
Indicate by check mark whether the registrant is a shell company (as defined in Rule 12b-2 of the Act). Yes ☐ No ☒.
The aggregate market value of the voting stock of the registrant held by non-affiliates was $4,954,793,000 based on the closing sale price of $65.80 per share on June 30, 2023. For purposes of the foregoing calculation only, all directors and executive officers of the registrant have been deemed affiliates. The number of shares of common stock outstanding as of February 29, 2024 was 76,252,786.
Documents Incorporated by Reference
Portions of the Registrant’s Definitive Proxy Statement for its 2024 Annual Meeting of Shareholders are incorporated by reference into Part III, Items 10 - 14 of this form 10-K.
SouthState Corporation
Index to Form 10-K
|
|
|
|
Page |
|
|
|
|
|
|
|
2 |
||
|
|
23 |
||
|
|
53 |
||
|
|
53 |
||
|
|
55 |
||
|
|
55 |
||
|
|
55 |
||
|
|
|
|
|
|
|
56 |
||
|
|
59 |
||
|
Management’s Discussion and Analysis of Financial Condition and Results of Operations |
|
60 |
|
|
|
102 |
||
|
|
103 |
||
|
Changes in and Disagreements with Accountants on Accounting and Financial Disclosure |
|
103 |
|
|
|
103 |
||
|
|
104 |
||
|
Disclosure Regarding Foreign Jurisdictions that Prevent Inspections |
|
104 |
|
|
|
|
|
|
|
|
104 |
||
|
|
104 |
||
|
Security Ownership of Certain Beneficial Owners and Management and Related Stockholder Matters(1) |
|
105 |
|
|
Certain Relationships and Related Transactions, and Director Independence(1) |
|
105 |
|
|
|
105 |
||
|
|
|
|
|
|
|
106 |
||
|
|
|
|
|
|
|
|
114 |
| (1) | All or portions of this item are incorporated by reference to the Registrant’s Definitive Proxy Statement for its 2024 Annual Meeting of Shareholders. |
1
Forward-Looking Statements
The disclosures set forth in this Report are qualified by Part I, Item 1A. Risk Factors and the section captioned “Forward Looking Statements” in Part II, Item 7. Management’s Discussion and Analysis of Financial Condition and Results of Operations of this Report and other cautionary statements set forth elsewhere in this Report.
PART I
Item 1. Business.
Overview
SouthState Corporation (“We,” “Our,” “SouthState” or the “Company”) is a financial holding company headquartered in Winter Haven, Florida, that incorporated under the laws of South Carolina in 1985. We provide a wide range of banking services and products to our customers through our wholly owned bank subsidiary, SouthState Bank, National Association (the “Bank”), a national banking association, from our headquarters branch in Winter Haven, Florida and, as of December 31, 2023, a 251-branch network located throughout Florida, South Carolina, Alabama, Georgia, North Carolina, and Virginia. In addition, the Company operates SSB Insurance Corp., a captive insurance subsidiary pursuant to Section 831(b) of the U.S. Tax Code. We do not engage in any significant operations other than the ownership of our banking subsidiary.
Through the Bank, we operate a correspondent banking and capital markets service division for over 1,200 small and medium sized community financial institutions throughout the United States. Based primarily in Atlanta, Georgia and Birmingham, Alabama, this division earns commissions on fixed income security sales, fees from hedging services, loan brokerage fees and consulting fees for services related to these activities. In addition, the Bank operates SouthState|DuncanWilliams Securities Corp. (“SouthState|DuncanWilliams”), a full-service broker dealer headquartered in Memphis, Tennessee, which it acquired in February 2021. The services offered by SouthState|DuncanWilliams are complementary to the Bank’s correspondent banking and capital markets businesses and provide additional opportunities to the Bank’s client base. The Bank also operates SouthState Advisory, Inc., a wholly owned registered investment advisor, which offers support to the Bank’s Wealth line of business. The Bank owns Corporate Billing, LLC (“Corporate Billing”), a transaction-based finance company headquartered in Decatur, Alabama that provides factoring, invoicing, collection and accounts receivable management services to transportation companies and automotive parts and service providers nationwide. CBI Holding Company, LLC, Corporate Billing’s previous holding company, and its subsidiary, CBI Real Estate Holding, LLC, were merged into Corporate Billing effective November 30, 2023. In late 2023, the Bank formed SSB First Street Corporation, an investment subsidiary headquartered in Wilmington, Delaware, to hold tax-exempt municipal investment securities as part of the Bank’s investment portfolio.
At December 31, 2023, we had approximately $44.9 billion in assets, $32.4 billion in loans, $37.0 billion in deposits, $5.5 billion in shareholders’ equity, and a market capitalization of approximately $6.4 billion.
On March 1, 2022, the Company acquired all of the outstanding common stock of Atlantic Capital Bancshares, Inc., a Georgia corporation (“Atlantic Capital” or “ACBI”), in a stock transaction. Pursuant to the ACBI Merger Agreement, (i) ACBI merged with and into the Company, with the Company continuing as the surviving corporation (the “ACBI Merger”), and (ii) immediately following the ACBI Merger, Atlantic Capital Bank, N.A. (“ACB”) merged with and into the Bank (the “ACB Bank Merger” and collectively with the ACBI Merger, the “Merger”). The systems conversion was completed in July 2022.
Our principal executive offices are located at, and our mailing address is, 1101 First Street South, Suite 202, Winter Haven, Florida 33880. Our telephone number is (863) 293-4710.
2
Our revenue is primarily derived from interest on, and fees received in connection with, real estate and other loans, interest and dividends from investment securities and short-term investments, commissions on bond sales, fees from deposit accounts, hedging services, and gains from the sale of residential mortgage loans. The principal sources of funds for our lending activities are customer deposits, repayment of loans, and the sale and maturity of investment securities. Our principal expenses are interest paid on deposits and operating and general administrative expenses.
As is the case with banking institutions generally, our operations are materially and significantly influenced by the real estate market, general economic conditions, and by the tax, monetary and fiscal policies of the U.S. and state government and regulatory agencies, including the Federal Reserve. Deposit flows and costs of funds are influenced by interest rates on competing investments and general market rates of interest. Lending activities are affected by the demand for financing of real estate and other types of loans, which in turn is affected by the interest rates at which such financing may be offered and other factors affecting local demand and availability of funds, including tax rates and regulatory structure. We face strong competition in the attraction of deposits (our primary source of lendable funds) and in the origination of loans. See “Competition.”
Products and Services
Lending Activities
Our loan portfolio includes commercial real estate loans, residential real estate loans, commercial and industrial loans and consumer loans. The principal risk associated with each category of loans we make is the creditworthiness of the borrower. Borrower creditworthiness is affected by general economic conditions and the attributes of the borrower and the borrower’s market or industry. Attributes of the relevant business market or industry include the competitive environment, customer and supplier availability, the threat of substitutes and barriers to entry and exit.
Commercial Real Estate Loans. As of December 31, 2023, $17.6 billion, or 54%, of our loan portfolio consisted of loans secured by commercial real estate (including owner occupied and non-owner occupied commercial real estate, other income producing property and construction and land development lending). We offer construction financing, acquisition financing or refinancing of properties, commercial lines of credit and other loans that are secured by commercial real estate.
Residential Real Estate Loans. As of December 31, 2023, $8.0 billion, or 25%, of our loan portfolio consisted of residential real estate loans including home equity loans. We provide one-to-four family residential real estate loans with terms ranging from 10 to 30 years, with either fixed or adjustable interest rates and home equity lines. It is not our normal business practice to originate subprime loans. Our closed-end first lien loans are for purposes of property purchased, or for refinancing existing loans. The majority of our loans are owner occupied, full documentation loans.
Commercial and Industrial (“C&I”) Loans. As of December 31, 2023, $5.5 billion, or 17%, of our loan portfolio consisted of commercial and industrial loans. Our C&I loans include lines of credit, acquisition finance credit facilities and other types of commercial credit, and typically have maturities of five years or less. We also have a SBA 7(a) line of business whereby we routinely sell the government guaranteed portion of the SBA loans to investors with the unguaranteed portion of the loan and the servicing rights retained.
Other Consumer Loans. As of December 31, 2023, $1.2 billion, or 4%, of our loan portfolio consisted of other types of consumer loans. We offer consumer loans to our customers for personal, family and household purposes, including auto, boat and personal installment loans.
We believe we have a strong team of consumer and commercial bankers to execute on our client-centered, relationship-driven banking model. Our commercial banking team consists of experienced professionals that use an advisory approach that emphasizes understanding each client’s business and offering a broad suite of loan, deposit and treasury management products and services. Our consumer banking team consists of experienced professionals that focus on knowing their individual clients in order to best meet their financial needs, offering a full complement of loan, deposit and online banking solutions. We generally do business with clients located in the areas served by our branches, and we focus our marketing efforts on these areas.
3
Deposit Products, Treasury Services and Other Funding Sources
We offer our customers a variety of deposit products and services, including checking accounts, savings accounts, money market accounts, time deposit accounts and treasury and merchant services, through multiple channels, including our extensive network of 251 full-service branches, as of December 31, 2023, and our online, mobile and telephone banking platforms. As of December 31, 2023, our deposit portfolio was comprised of 29% noninterest-bearing deposits and 71% interest bearing deposits. We intend to continue our efforts to provide funding for our business from customer relationship deposits.
Deposit flows are significantly influenced by general and local economic conditions, changes in prevailing interest rates, internal pricing decisions and competition. Our deposits are primarily obtained from depositors located around our branch footprint, and we believe that we have attractive opportunities to capture additional retail and commercial deposits in our markets. In order to attract and retain deposits, we rely on providing quality service, offering a suite of retail and commercial products and services and introducing new products and services that meet our customers’ needs as they evolve.
In addition to traditional banking activities and the other products and services specified above, we provide a broad array of financial services to our customers, including debit card and mobile services, funds transfer products and services, and treasury management services, including merchant services, automated clearing house services, lock-box services, remote deposit capture services and other treasury services.
Correspondent Banking and Capital Markets
We operate a correspondent banking and capital markets business division through the Bank and through SouthState|DuncanWilliams, the Bank’s broker dealer subsidiary acquired in February 2021. This line of business’s primary revenue generating activities are related to the capital markets division, which includes commissions earned on fixed income security sales, fees from hedging services, loan brokerage fees and consulting fees for services related to these activities; and its correspondent banking division, which includes spread income earned on correspondent bank deposits (i.e., federal funds purchased) and correspondent bank checking account deposits and fees from safe-keeping activities, bond accounting services for correspondents, asset/liability consulting related activities, international wires, and other clearing and corporate checking account services. The fees derived from the correspondent banking services are less volatile than those generated through the capital markets group. The customer base includes small to medium size financial institutions located throughout the United States.
Wealth Management
Through the Bank and SouthState Advisory, Inc., we offer wealth management and other fiduciary and private banking services targeted to affluent clients, including individuals, business owners, families and professional service companies. In addition to fiduciary and investment management fee income, we believe these services enable us to build new relationships and expand existing relationships to grow our deposits and loans. Through our wealth management line of business, we offer financial planning, retirement services and trust and investment management for affluent clients as well as clients with more modest resources. We offer a wide range of investment alternatives, including certificates of deposits, mutual funds, annuities, individual retirement accounts, money market accounts and other financial products.
Mortgage Banking
We have a mortgage line of business that originates single-family home loans and either sells into the secondary market or holds in our portfolio those mortgages. We retain servicing rights for those loans we hold in our portfolio and for the majority of the loans that are sold.
4
Acquisition Strategy
Our business growth, profitability and market share have been enhanced by engaging in strategic mergers and acquisitions either within or contiguous to our existing footprint. Our acquisition strategy focuses on banking institutions that:
| ● | are consistent with our guiding principles of soundness, profitability and growth and are a good fit with our culture; |
| ● | are strategically attractive by enhancing our footprint, allowing for cost savings and economies of scale, or providing market diversification, or otherwise strategically compelling; |
| ● | have been determined to meet our risk appetite and profile; and |
| ● | meet our financial criteria. |
We expect to continue to assess future opportunities of financial companies using these criteria, based on market and other conditions.
Competition
Our profitability depends principally on our ability to compete effectively in the markets in which we conduct business. In the financial services industry, market demands, technological and regulatory changes and economic pressures have increased competition among banks, as well as other financial institutions. Competition may further intensify as additional companies enter the markets where we conduct business, and we enter mature markets in accordance with our expansion strategy.
We experience strong competition from both bank and non-bank competitors. We compete with national banks, super-regional banks, smaller community banks, nontraditional internet-based banks, credit unions, insurance companies and government sponsored entities. We also compete with other financial intermediaries and investment alternatives such as mortgage companies, credit card issuers, leasing companies, finance companies, money market mutual funds, brokerage firms, governmental and corporation bonds, and other securities firms.
We encounter strong competition in making loans and attracting deposits. We compete with other financial institutions to offer customers competitive interest rates on deposit accounts, competitive interest rates charged on loans and other credit products and reasonable service charges. In addition, we also compete based on the quality and scope of the services we provide and the convenience of our banking facilities, compared to our competitors. The larger national and super-regional banks may have significantly greater lending limits and may offer additional products. However, by emphasizing customer service and by providing a wide variety of services, we believe that our Bank has generally been able to compete successfully with our competitors, regardless of their size.
Technological advances have made it possible for our competitors, including nonbank competitors, to offer products and services that traditionally were banking products and for financial institutions and other companies to provide electronic and internet-based financial solutions, including online deposit accounts, electronic payment processing and marketplace lending, without having a physical presence where their customers are located. In addition, many of our non-bank competitors are not subject to the same extensive federal regulations that govern bank holding companies and federally insured banks. In many cases, our competitors have substantially greater resources and lending limits and offer certain services that we do not currently provide.
Legislation has continued to heighten the competitive environment in which financial institutions must conduct their business, and the potential for competition among financial institutions of all types has increased significantly. To compete, we rely upon specialized services, responsive handling of customer needs, and personal contacts by our officers, directors, and staff.
5
Human Capital Management
We consider our relationship with our employees instrumental to the success of our business. We value our employees by investing in a healthy work-life balance, competitive compensation and benefit packages, and a team-oriented environment centered on professional service and open communication amongst employees. The Board of Directors oversees the strategic management of our human capital resources. The Human Resources Department’s day-to-day responsibility is managing our human capital resources.
Core Values and Culture
A strategic priority for the Company is to develop a dynamic, high performing team by, in part, facilitating a culture that increases employee engagement, devotes resources to recruiting, developing and retaining talent, and recognizes the benefits of different perspectives and experiences. The Company’s core values, an essential cultural cornerstone, set the course by which we intend to meet this goal through our interactions with each other, our customers and our suppliers:
| ● | Local Market Leadership - Our business model supports the unique character of the communities we serve and encourages decision-making by a banker that is closest to the customer. |
| ● | Long-Term Horizon - We think and act like owners and measure success over entire economic cycles. We prioritize soundness over short-term profitability and growth. |
| ● | Remarkable Experiences - We will make our customers’ lives better by anticipating their needs and responding with a sense of urgency. Each of us has the freedom and responsibility to do the right thing for our customers. |
| ● | Meaningful and Lasting Relationships - We communicate with candor and transparency. The relationship is more valuable than the transaction. |
| ● | Greater Purpose - We enable our team members to pursue their ultimate purpose in life – their personal faith, their family, and their service to the community. |
Because we recognize the importance of encouraging an environment that inspires our employees to act consistently with the Company’s core values, our management-level Culture Council is charged with overseeing the internal and external culture and values messaging, implementing a program for continuing to build and retain a diverse and inclusive employee base, developing a program to recruit, train and retain the leadership and talent necessary to deliver the Company’s vision, and maintaining an employee engagement program with clear objectives.
The Company’s Code of Ethics, which also addresses conflicts of interest and self-dealing, applies to all directors, officers and employees, each of whom are expected to adhere to it in every transaction. The Company believes that each employee is entitled to work in an atmosphere and environment free of discrimination and unlawful harassment. As a result, the Company has established and communicated to all employees a reporting structure for reporting incidents of harassment or discrimination. The Company’s Whistleblower hotline, which is located on our website and governed by our Whistleblower Policy, provides employees, customers, vendors and others with a confidential mechanism to express concerns or complaints regarding the Company’s accounting, internal accounting controls, auditing matters, securities law compliance, or any provision of federal law relating to fraud against shareholders. Other complaints or concerns, such as relating to human resources matters, may also be submitted confidentially through the whistleblower process, and any such matters are referred to our Human Resources Department or other departments, as appropriate, for resolution. Reporting on whistleblower complaints are reviewed by the Audit Committee of the Board.
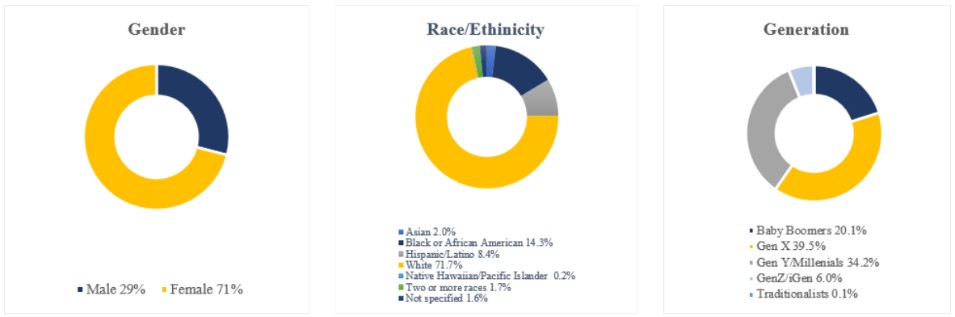
Demographic Information
As of December 31, 2023, we had 5,070 full-time employees (compared to 4,921 as of the same date in 2022) and 214 part-time employees. Over 96% of our employees are located in the Bank’s 6-state branch footprint of South Carolina (33%), Florida (33%), Georgia (16%), North Carolina (7%), Alabama (6%) and Virginia (2%). To date, none of our employees are covered by collective bargaining agreements and all employees live in the United States. During fiscal year 2023, we hired 820 employees, and our voluntary turnover rate was 9.5% for all employees and 0.95% for management-level employees in 2023.
6
Additional workforce demographics by gender, race or ethnicity and generation are reflected in the graphics below.
Corporate Stewardship
We strive to build a powerful and diverse team of employees, knowing we are better together with our combined wisdom and intellect. With a commitment to equality, inclusion and workplace diversity, we focus on understanding, accepting, and valuing the differences between people. Our Director of Corporate Stewardship reports to the CEO and bears primary responsibility for overseeing and directing strategic initiatives related to enterprise diversity, environmental and social governance, community development, management development, and the Employee Sunshine Fund.
In 2021, the Company adopted a three-year diversity and inclusion plan built around three goals:
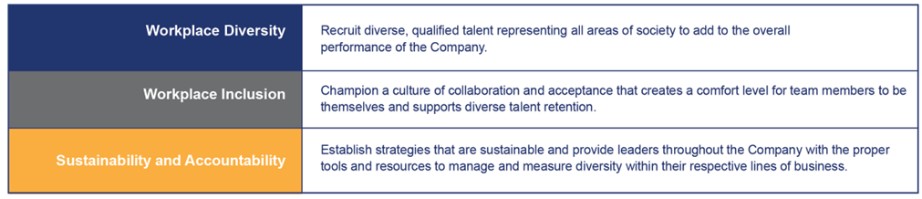
In addition, the Company formed the Diversity and Inclusion Council to provide oversight to its diversity and inclusion strategy, support the implementation of diversity and inclusion initiatives that align with its vision and core values, and promote a diverse and inclusive workplace that represents the communities in which the Bank does business. The Diversity and Inclusion Council is responsible for identifying and addressing barriers that impact recruitment, retention and advancement of diverse candidates, defining benchmarks and metrics for diverse talent acquisition and retention, and identifying and implementing diversity and inclusion training for all Company employees and directors.
7
In 2022, we focused primarily on our implementation strategy for the three-year diversity and inclusion plan, which included discussing the diversity and inclusion plan with leadership throughout the Company to develop a mutual understanding and level of trust with local market leadership that would result in meaningful conversations and assist all stakeholders in viewing diversity from a number of perspectives. In addition, we established a small diversity and inclusion working group to help develop programs and initiatives in support of the action items outlined in the strategic plan. In collaboration with our Corporate Learning Department, in the fourth quarter of 2022, the Company engaged a third party to implement unconscious bias training throughout the Company. The unconscious bias training was first launched to the Board in late 2022, and as of December 31, 2023, it has been completed by over 600 leaders with plans to roll out the training to all team members through 2024.
As part of Corporate Stewardship's strategic plan, we announced several initiatives in 2023, including initiatives that continue to support the Company's Diversity & Inclusion plan. In the third quarter of 2023, the Director of Corporate Stewardship established several diversity metrics that would allow the Company to monitor its progress with recruitment, development, and retention of diverse talent, identify gaps, and allow us to focus our efforts accordingly. Beginning in 2024, SouthState's Diversity Metric Dashboard will track (i) Representation, (ii) Internal Talent Mobility, (iii) Voluntary versus Involuntary Turnover, and (iv) Recruiting Metrics. In addition to these metrics, to further support diversity and inclusion efforts within the Company, SouthState announced the addition of its first Corporate Social Responsibility Officer, who reports directly to the Director of Corporate Stewardship.
Talent Acquisition, Retention and Employee Development
Recruitment is an essential part of managing our human capital resources. We seek to hire well-qualified employees who are also a good fit for our value system. Through our commercial banking internships and management training programs, we recruit from a talented, diverse pool of students from local colleges and universities. To complement other recruitment efforts, our Talent Acquisition team is committed to attending job fairs hosted by Historical Black Colleges and Universities within our footprint. Additionally, the Talent Acquisition team partners closely with regional line of business leadership to network and recruit in-market, experienced and diverse talent in metropolitan markets within our footprint who bring with them a requisite skill set, professional background and aptitude to help grow the Bank and position our teams to support and lead a larger financial institution in the future.
We encourage and support the growth and development of our employees and, when possible, seek to fill positions by promotion and transfer from within the organization. We invest in the growth and development of our employees by providing opportunities to participate in continuing education courses that are relevant to the banking industry and their job function within the Company. Our internal Corporate Learning University offers a suite of leadership development programs to support various levels of leadership experience and expertise with graduated topics designed to engage and develop leaders by improving business acumen and offering 360 degree reviews, individual coaching opportunities and education on topics as varied as culture, communication styles and mentoring. Because the banking industry is highly regulated, we also require employees to complete annual compliance training, the classes for which are selected based on each employee’s actual job responsibilities. In 2023, employees completed on average 30 hours of Company-provided training.
Employee retention helps us operate efficiently. We believe that we offer competitive salaries, and many of our officers and key employees participate in the Company’s incentive program, which offers short-term cash incentives to reward annual performance and long-term incentives designed to reward sustainable shareholder value creation and encourage talent retention. In addition, we provide many of our employees with a comprehensive employee benefit program that includes: group life, health, dental and vision insurance; prescription benefits; flexible spending accounts; educational opportunities; an employee stock purchase plan; deferred compensation plans for officers and key employees; and a 401(k) plan with a Company match. The Company sponsors a broad leave plan that may be used for vacation, personal use and illness of employees and their immediate family members, and it awards paid leave based on tenure of service and title. The Company-sponsored Employee Stock Purchase Plan encourages our employees to invest in the Company by offering shares at a discounted price to participants.
Employee Health, Wellness and Safety
The safety and health of our employees is a top priority. While the COVID-19 pandemic has receded, allowing many of our employees that had worked remotely during that time to return to work locations, we value flexibility and approximately 26% of our employees continue to work effectively from remote locations.
8
In addition, to raise awareness of good health habits, the Company offers employees a robust wellness program that provides extensive wellness resources to include on-site biometric screenings and a health risk assessment program. The Company also provides support through wellness resources and the Employee Assistance Program for mental and financial wellness.
Oversight of Environmental, Social and Governance Issues
The Governance and Nominating Committee of the Company’s Board of Directors oversees the Company’s current and emerging environmental, social and governance matters. The Company issues a Corporate Social Responsibility Report on an annual basis, which highlights the Company’s environmental, social and governance initiatives, including the Company’s commitment to: building vibrant communities where we operate and where our customers live and work; fostering a strong culture that supports and encourages a diverse and inclusive workforce; promoting the highest ethical standards and acting as good stewards; and being environmentally resourceful as we support efficient and sustainable practices. Our commitment to our communities, colleagues, corporate stewardship and the environment will inform our Company’s actions as we strive to meet our vision: investing in the entrepreneurial spirit, pursuing excellence, and inspiring a greater purpose. During 2023, we continued to build out our Corporate Responsibility Programs, focusing on assessing our commitment to the environment by analyzing transition and climate risk within our loan portfolio and determining our Scope 1 and Scope 2 emissions using the expertise and resources of an outside expert consultant in climate matters. A copy of the Company’s 2023 Corporate Social Responsibility Report is available on the Bank’s website at 2023 Corporate Social Responsibility Report.
Effect of Governmental Policies
Our earnings and business are and will be affected by the policies of various regulatory authorities of the United States, especially the Federal Reserve. The Federal Reserve, among other things, seeks to influence interest rates and the supply of money and credit within the United States. Among the traditional methods that have been used to achieve this objective are open market operations in U.S. government securities, changes in the discount rate for bank borrowings, expanded access to funds for non-banks and changes in reserve requirements against bank deposits. The Federal Reserve steeply increased the size of its balance sheet by buying securities in 2020-2021, and since then tapered such purchases and now is gradually reducing its balance sheet, and since the financial crisis has paid interest on excess reserves held by banks at the Federal Reserve. The Federal Reserve has also increased its target federal funds rate four times during 2023 to 5.25% to 5.50% to combat inflation. Both the traditional and more recent methods are used in varying combinations to influence overall growth and distribution of bank loans, investments and deposits, interest rates on loans and securities, and rates paid for deposits. The monetary policies of the Federal Reserve have had a significant effect on the operating results of commercial banks and are expected to continue to do so in the future. The monetary policies of the Federal Reserve are influenced by various factors, including inflation, unemployment, and short-term and long-term changes in the international trade balance and in the fiscal policies of the U.S. Government. Future monetary policies, including whether and when the Federal Reserve will increase or decrease the federal funds rate and whether or at what pace it will reduce or increase the size of its balance sheet, and the effect of such policies on the future business and earnings of the Company and our subsidiary bank cannot be predicted.
Supervision and Regulation
We are extensively regulated under federal and state law. The following is a brief summary of certain aspects of that regulation that are material to us and does not purport to be a complete description of all regulations that affect us or all aspects of those regulations. To the extent particular statutory and regulatory provisions are described, the description is qualified in its entirety by reference to the particular statute or regulation. Proposals to change the laws and regulations governing the banking industry are frequently raised at both the state and federal levels. The likelihood and timing of any changes in these laws and regulations, and the impact such changes may have on the Company and the Bank, are difficult to ascertain. In addition to laws and regulations, bank regulatory agencies may issue policy statements, interpretive letters and similar written guidance applicable to the Company or the Bank. A change in applicable laws, regulations or regulatory guidance, or in the manner such laws, regulations or regulatory guidance are interpreted by regulatory agencies or courts, may have a material adverse effect on the Company’s and the Bank’s business, operations, and earnings. Supervision, regulation, and examination of banks by regulatory agencies are intended primarily for the protection of depositors and customers, the deposit insurance fund and the U.S. banking and financial system rather than shareholders.
9
Both the scope of the laws and regulations and the intensity of the supervision to which we are subject have increased in recent years, initially in response to the financial crisis, and more recently in light of other factors such as the banking turmoil in early 2023 and technological and market changes. As described in further detail below, the Company and the Bank have become subject to additional regulatory requirements as a result of the growth of their assets. Regulatory enforcement and fines have also increased across the banking and financial services sector. Many of these changes occurred as a result of the Dodd-Frank Act Wall Street Reform and Consumer Protection Act (“Dodd-Frank Act”) and its implementing regulations. While there have been some changes in the post financial crisis framework applicable to the Company, the Company expects that its business will remain subject to extensive regulation and supervision. The scope of regulation and the intensity of supervision will likely become higher under the current presidential administration, including increased scrutiny, supervisory discouragement or even possible denials of bank mergers and acquisitions by federal bank regulators.
We are also subject to the disclosure and regulatory requirements of the Securities Act of 1933, as amended, and the Securities Exchange Act of 1934, as amended, both as administered by the SEC, as well as the rules of NYSE that apply to companies with securities listed on the New York Stock Exchange.
Regulation of the Company
We are registered as a bank holding company with the Federal Reserve under the Bank Holding Company Act of 1956 (the “BHC Act”) and have elected to be a financial holding company. As a financial holding company, we are subject to comprehensive regulation, examination and supervision by the Federal Reserve and are subject to its regulatory reporting requirements. Federal law subjects financial holding companies, such as the Company, to particular restrictions on the types of activities in which they may engage, and to a range of supervisory requirements and activities, including regulatory enforcement actions for violations of laws and regulations.
As a financial holding company, we are permitted to engage in, and be affiliated with companies engaging in, a broader range of activities than those permitted for a bank holding company. Bank holding companies are generally restricted to engaging in the business of banking, managing or controlling banks and certain other activities determined by the Federal Reserve to be related closely to banking. Financial holding companies may also engage in activities that are considered to be financial in nature, as well as those incidental or complementary to financial activities, including certain insurance underwriting activities. We and the Bank must each remain “well-capitalized” and “well-managed” and the Bank must receive a Community Reinvestment Act (“CRA”) rating of at least “Satisfactory” at its most recent examination in order for us to maintain our status as a financial holding company. In addition, the Federal Reserve has the power to order a financial holding company or its subsidiaries to terminate any activity or terminate its ownership or control of any subsidiary, when it has reasonable cause to believe that continuation of such activity or such ownership or control constitutes a serious risk to the financial safety, soundness, or stability of any bank subsidiary of that financial holding company.
A financial holding company is required to act as a source of financial and managerial strength to its subsidiary bank and to maintain resources adequate to support its bank. The term “source of financial strength” has been defined as the ability of a company to provide financial assistance to its insured depository institution subsidiaries in the event of financial distress. The appropriate federal banking agency for the depository institution (in this case the Office of the Comptroller of the Currency or “OCC”) may require reports from the Company to assess its ability to serve as a source of strength and to enforce compliance with the source-of-strength requirements by requiring the holding company to provide financial assistance to the Bank if its capital were to become impaired. If the Company fails to provide such assistance within three months, it could be ordered to sell its stock of the Bank to cover the deficiency. Any capital loans by the Company to the Bank would be subordinate in right of payment to deposits and certain other debts of the Bank. In the event of the Company’s bankruptcy, any commitment by the Company to a federal bank regulatory agency to maintain the capital of the Bank would be assumed by the bankruptcy trustee and entitled to a priority of payment.
10
The BHC Act requires that a financial holding company obtain the prior approval of the Federal Reserve before (i) acquiring direct or indirect ownership or control of more than 5% of the voting shares of any additional bank or bank holding company, (ii) taking any action that causes an additional bank or bank holding company to become a subsidiary of the financial holding company, or (iii) merging or consolidating with any other bank holding company. The Federal Reserve may not approve any such transaction that would result in a monopoly or would be in furtherance of any combination or conspiracy to monopolize or attempt to monopolize the business of banking in any section of the United States, or the effect of which may be substantially to lessen competition or to tend to create a monopoly in any section of the country, or that in any other manner would be in restraint of trade, unless the anticompetitive effects of the proposed transaction are clearly outweighed by the public interest in meeting the convenience and needs of the community to be served. The Federal Reserve is also required to consider (1) the financial and managerial resources of the companies involved, including pro forma capital ratios; (2) the risk to the stability of the United States banking or financial system; (3) the convenience and needs of the communities to be served, including the companies’ performance under the CRA; and (4) the effectiveness of the companies in combatting money laundering. We are permitted under applicable federal and state law to make out-of-state acquisitions and mergers of other banks and bank holding companies, subject to the requirements summarized above. The guidelines issued by the Federal Reserve and the OCC with respect to mergers are undergoing a comprehensive interagency review and changes to these requirements may occur as a result.
Federal law restricts the amount of voting stock of a bank holding company and a bank that a person may acquire without the prior approval of banking regulators. The overall effect of such laws is to make it more difficult to acquire a bank holding company and a bank by tender offer or similar means than it might be to acquire control of another type of corporation. Consequently, shareholders of the Company may be less likely to benefit from the rapid increases in stock prices that may result from tender offers or similar efforts to acquire control of other companies. Federal law also imposes restrictions on acquisitions of stock in a bank holding company or a national bank. Under the federal Change in Bank Control Act and the regulations thereunder, a person or group must give advance notice to the Federal Reserve before acquiring control of any bank holding company, such as the Company, and the OCC before acquiring control of any national bank, such as the Bank. Upon receipt of such notice, the bank regulatory agencies may approve or disapprove the acquisition. The Change in Bank Control Act creates a rebuttable presumption of control if a member or group acquires a certain percentage or more of a bank holding company’s or bank’s voting stock, or if one or more other control factors set forth in the Act are present. As a result, a person or entity generally must provide prior notice to the Federal Reserve before acquiring the power to vote 10% or more of our outstanding common stock. Investors should be aware of these requirements when acquiring shares of our stock.
Regulation of the Bank
The Bank is a national bank subject to comprehensive regulation, examination and supervision by the OCC and is subject to its regulatory reporting requirements. The deposits of the Bank are insured by the FDIC and, accordingly, the Bank is also subject to certain FDIC regulations and the FDIC has backup examination authority and some enforcement powers over the Bank. The Bank also is subject to certain Federal Reserve regulations. These regulations include limitations on loans to a single borrower and to its directors, officers and employees; restrictions on the opening and closing of branch offices; the maintenance of required capital and liquidity ratios; the granting of credit under equal and fair conditions; the disclosure of the costs and terms of such credit, requirements to maintain reserves against deposits and loans, limitation on the types of investment that may be made and requirements governing risk management practices.
The Bank also is subject to restrictions on its ability to lend to and engage in other transactions with the Company and the Bank’s other affiliates. Under these provisions, individual loans or other extensions of credit between the Bank and the Company or any nonbank affiliate generally are limited to 10% of the Bank’s capital and surplus, and all such transactions between the Bank and either the Company or any nonbank affiliate are limited to 20% of the Bank’s capital and surplus. Loans and other extensions of credit from the Bank to any affiliate generally are required to be secured by eligible collateral in specified amounts. In addition, any transaction between the Bank and any affiliate is required to be on arm’s length terms and conditions. The definition of “extension of credit” for these purposes includes credit exposures arising from a derivative transaction, a repurchase or reverse repurchase agreement and a securities lending or borrowing transaction. Federal banking laws also place similar restrictions on loans and other extensions of credit by FDIC-insured banks, such as the Bank, to their directors, executive officers and principal shareholders. These restrictions have not had a material impact on the Company or the Bank.
11
Federal Reserve rules require depository institutions, such as the Bank, to maintain reserves against their transaction accounts, primarily NOW and regular checking accounts. Effective March 26, 2020, the reserve was suspended with no reserve requirements. These reserve requirements are subject to annual adjustment by the Federal Reserve.
The Bank is permitted under federal law to branch on a de novo basis across state lines where the laws of the state would permit banks chartered by that state to open a de novo branch.
The OCC has proposed a policy statement on the OCC’s substantive approach to evaluating bank mergers under the Bank Merger Act (“BMA”). The proposed policy statement outlines the general principles the OCC would apply when reviewing bank merger applications and clarifies how the OCC would consider the statutory factors under the BMA. The policy statement would also identify certain indicators consistent with approval and those that would raise concerns. The proposal lists certain indicators as generally consistent with OCC approval, which include, among others, appropriate capital and supervisory ratings, lack of enforcement or fair lending actions, lack of significant CRA or consumer compliance concerns or significant adverse effect on competition, and that the resulting institution would have total assets less than $50 billion. The Company is assessing the proposal and its possible impact on the Company’s strategy.
Supervision, Examination and Enforcement
The Federal Reserve, OCC and FDIC have broad supervisory, examination and enforcement authority with regard to bank holding companies and banks, including the power to impose nonpublic supervisory agreements, issue cease and desist or removal orders, impose fines and other civil and criminal penalties, initiate injunctive actions, terminate deposit insurance and appoint a conservator or receiver. In general, these actions may be initiated for violations of laws and regulations, as well as engagement in unsafe and unsound practices, and certain of these actions also may be taken against an “institution affiliated party” as defined in the law. Specifically, the regulators may direct a bank holding company or bank to, among other things, increase its capital, sell subsidiaries or other assets, limit its dividends and distributions, restrict its growth or remove officers and directors. Supervision and examinations are confidential, and the outcomes of these actions may not be made public.
We also are supervised and examined by the Consumer Financial Protection Bureau (“CFPB”) with respect to consumer protection laws and regulations.
FDIC Insurance Assessments and Depositor Preference
The deposits of the Bank are insured by the FDIC up to the limits under applicable law, which currently are set at $250,000 for accounts under the same name and title. The Bank is subject to deposit insurance premium assessments. The FDIC imposes a risk-based deposit premium assessment system. Under this system, the assessment rates for an insured depository institution vary according to the level of risk incurred in its activities. To arrive at an assessment rate for a banking institution, the FDIC places it in one of four risk categories determined by reference to its capital levels and supervisory ratings. In the case of those institutions in the lowest risk category, the FDIC further determines its assessment rate based on certain specified financial ratios or, if applicable, long-term debt ratings. The assessment rate schedule can change from time to time, at the discretion of the FDIC, subject to certain limits. Under the current system, premiums are assessed quarterly. The FDIC has published guidelines on the adjustment of assessment rates for certain institutions.
The FDIC uses a performance score and loss-severity score to calculate the Bank’s initial FDIC assessment rate. In calculating these scores, the FDIC uses the Bank’s capital level and regulatory supervisory ratings and certain financial measures to assess the Bank’s ability to withstand asset-related and funding related stress, and make certain adjustments based on risk factors that are not adequately captured in these calculations.
12
Insurance of deposits may be terminated by the FDIC upon a finding that the institution has engaged in unsafe and unsound practices, is in an unsafe or unsound condition to continue operations or has violated any applicable law, regulation, rule, order or condition imposed by a bank’s federal regulatory agency. Deposits and certain claims for administrative expenses and employee compensation against insured depository institutions are afforded a priority over other general unsecured claims against the institution, including federal funds and letters of credit, in the liquidation or other resolution of that institution by any receiver appointed by federal authorities. These priority creditors include the FDIC.
In response to the bank failures in early 2023, the FDIC implemented a special assessment to recover the losses to the FDIC’s Deposit Insurance Fund at an annual rate of approximately 13.4 basis points over eight quarterly assessment periods beginning with the first quarterly assessment period of 2024. The base for the special assessment is equal to an insured depository institution’s estimated uninsured deposits reported as of December 31, 2022, adjusted to exclude the first $5 billion. The full amount of approximately $25.7 million for the two-year special assessment period was recognized as of December 31, 2023. The FDIC may impose additional special assessments from time to time based on the actual losses incurred by the FDIC as a result of the March 2023 bank failures or future failures.
Dividend Restrictions
The Company is a legal entity separate and distinct from its banking and other subsidiaries and has in the past relied on dividends from the Bank as its primary source of liquidity. There are limitations on the payment of dividends by the Bank to the Company, as well as by the Company to its shareholders.
The OCC has the general authority to limit the dividends paid by the Bank if such payment may be deemed to constitute an unsafe and unsound practice. The Bank may not pay dividends from its paid-in surplus. All dividends must be paid out of undivided profits then on hand, after deducting expenses, including reserves for losses and bad debts. In addition, a national bank, such as the Bank, is prohibited from declaring a dividend on its shares of common stock until its surplus equals its stated capital, unless there has been a transfer to surplus of no less than one/tenth of the bank’s net profits of the preceding two consecutive half-year periods (in the case of an annual dividend). The approval of the OCC is required if the total of all dividends declared by a national bank in any calendar year exceeds the total of its net profits for that year combined with its retained net profits for the preceding two years, less any required transfers to surplus.
We and the Bank must maintain the applicable common equity Tier 1 (“CET1”) capital conservation buffer of 2.5% to avoid becoming subject to restrictions on capital distributions, including dividends. For more information on the CET1 capital conservation buffer, see Part I Item 1 “Supervision and Regulation – Capital Requirements.”
In addition, Federal Reserve policy provides that bank holding companies, such as the Company, should generally pay dividends to shareholders only if (i) the organization’s net income available to common shareholders over the past year has been sufficient to fully fund the dividends; (ii) the prospective rate of earnings retention appears consistent with the organization’s capital needs, asset quality and overall financial condition; and (iii) the organization will continue to meet minimum capital adequacy ratios. The policy also provides that a bank holding company should inform the Federal Reserve reasonably in advance of declaring or paying a dividend that exceeds earnings for the period for which the dividend is being paid or that could result in a material adverse change to the bank holding company’s capital structure. Bank holding companies also are required to consult with the Federal Reserve before increasing dividends or redeeming or repurchasing capital instruments. Additionally, the Federal Reserve could prohibit or limit the payment of dividends by a bank holding company if it determines that payment of the dividend would constitute an unsafe or unsound practice.
13
Capital Requirements
We are required under federal law to maintain certain minimum capital levels at each of the Company and the Bank. The federal banking agencies have issued substantially similar risk-based and leverage capital requirements to banking organizations they supervise. Under these requirements, the Company and the Bank are required to maintain certain capital standards based on ratios of capital to total assets and capital to risk-weighted assets. The requirements also define the weights assigned to assets and off-balance sheet items to determine the risk-weighted asset components of the risk-based capital rules. The required capital ratios are minimums, and the Federal Reserve and OCC may determine that a banking organization, based on its size, complexity or risk profile, must maintain a higher level of capital in order to operate in a safe and sound manner. Risks such as concentration of credit risks and the risk arising from non-traditional activities, as well as the institution’s exposure to a decline in the economic value of its capital due to changes in interest rates, and an institution’s ability to manage those risks are important factors that are to be taken into account by the federal banking agencies in assessing an institution’s overall capital adequacy.
Under the applicable capital rules, the Company and the Bank are subject to the following risk-based capital ratios: a CET1 risk-based capital ratio, a Tier 1 risk-based capital ratio, which includes CET1 and additional Tier 1 capital, and a total capital ratio, which includes Tier 1 and Tier 2 capital. CET1 is primarily comprised of the sum of common stock instruments and related surplus net of treasury stock, retained earnings, and certain qualifying minority interests, less certain adjustments and deductions, including with respect to goodwill, intangible assets, mortgage servicing assets and deferred tax assets subject to temporary timing differences. Additional Tier 1 capital is primarily comprised of noncumulative perpetual preferred stock, tier 1 minority interests and grandfathered trust preferred securities, if applicable.
Tier 2 capital consists of instruments disqualified from Tier 1 capital, including qualifying subordinated debt, certain trust preferred securities, other preferred stock and certain hybrid capital instruments, and a limited amount of loan loss reserves up to a maximum of 1.25% of risk-weighted assets, subject to certain eligibility criteria. The Company’s trust preferred securities and subordinated debentures qualify as Tier 2 capital. For institutions, such as us, that have exercised an opt-out election regarding the treatment of accumulated other comprehensive income (“AOCI”), up to 45% of net unrealized gains on available for sale equity securities with readily determinable fair market values are also included in Tier 2 capital. The capital rules also define the risk-weights assigned to assets and off-balance sheet items to determine the risk-weighted asset components of the risk-based capital rules, including, for example, “high volatility” commercial real estate, past due assets, structured securities and equity holdings.
The capital rules require a minimum CET1 risk-based capital ratio of 4.5%, a minimum overall Tier 1 risk-based capital ratio of 6.0%, and a total risk-based capital ratio of 8.0%. In addition, the capital rules require a capital conservation buffer of 2.5% above each of the minimum capital ratio requirements (CET1, Tier 1, and total risk-based capital), which must be met for a bank or bank holding company to be able to pay dividends, engage in share buybacks or make discretionary bonus payments to executive management without automatic restriction. The capital conservation buffer is 2.50%, so a banking organization needs to maintain a CET1 capital ratio of at least 7%, a total Tier 1 capital ratio of at least 8.5% and a total risk-based capital ratio of at least 10.5% or it would be subject to restrictions on capital distributions and discretionary bonus payments to its executive management.
The leverage capital ratio, which serves as a minimum capital standard, is the ratio of Tier 1 capital to quarterly average total assets, less goodwill and other disallowed intangible assets. The required minimum leverage ratio for all banks and bank holding companies is 4%.
To be well-capitalized, the Bank must maintain the following capital ratios:
| ● | CET1 risk-based capital ratio of 6.5% or greater; |
| ● | Tier 1 risk-based capital ratio of 8.0% or greater; |
| ● | Total risk-based capital ratio of 10.0% or greater; and |
| ● | Tier 1 leverage ratio of 5.0% or greater. |
14
The Federal Reserve has not yet revised the well-capitalized standard for bank holding companies to reflect the higher capital requirements imposed under the current capital rules. For purposes of the Federal Reserve’s Regulation Y, including determining whether a bank holding company meets the requirements to be a financial holding company, bank holding companies, such as the Company, must maintain a Tier 1 risk-based capital ratio of 6.0% or greater and a total risk-based capital ratio of 10.0% or greater to be well-capitalized. If the Federal Reserve were to apply the same or a very similar well-capitalized standard to bank holding companies as that applicable to the Bank, the Company’s capital ratios as of December 31, 2023, would exceed such revised well-capitalized standard. The Federal Reserve may require bank holding companies, including the Company, to maintain capital ratios substantially in excess of mandated minimum levels, depending upon general economic conditions and a bank holding company’s particular condition, risk profile and growth plans.
Failure to be well-capitalized or to meet minimum capital requirements could result in certain mandatory and possible additional discretionary actions by regulators that, if undertaken, could have an adverse material effect on our operations or financial condition. For example, only a well-capitalized depository institution may accept brokered deposits without prior regulatory approval. Failure to be well-capitalized or to meet minimum capital requirements could also result in restrictions on the Company’s or the Bank’s ability to pay dividends or otherwise distribute capital or to receive regulatory approval of applications or other restrictions on its growth.
As of December 31, 2023, the Company’s and the Bank’s regulatory capital ratios were above the well-capitalized standards and met the fully phased-in capital conservation buffer. Please refer to the table below for a summary of the Company’s and the Bank’s regulatory capital ratios as of December 31, 2023 and 2022, calculated using the regulatory capital methodology applicable to us during 2023.
|
|
|
|
|
|
|
|
|
|
|
|
|
|
|
|
|
|
|
|
|
|
Minimum |
|
|
Minimum Ratio + |
|
|
Well- |
|
|
|
|
|
|
|
|
|
|
|
Regulatory |
|
|
Capital Conservation |
|
|
Capitalized |
|
|
|
|
|
Capital Above |
|
|
|
|
|
Capital Ratio |
|
|
Buffer |
|
|
Minimums (1) |
|
|
Actual |
|
|
Minimums (2) |
|
As of December 31, 2023 |
|
|
|
|
|
|
|
|
|
|
|
|
|
|
|
|
|
Tier 1 leverage ratio |
|
Consolidated |
|
4.00 |
% |
|
N/A |
|
|
N/A |
|
|
9.42 |
% |
|
$ |
2,393,892 |
|
|
Bank |
|
4.00 |
% |
|
N/A |
|
|
5.00 |
% |
|
10.03 |
% |
|
$ |
2,659,730 |
CET 1 risk-based capital ratio |
|
Consolidated |
|
4.50 |
% |
|
7.00 |
% |
|
N/A |
|
|
11.75 |
% |
|
$ |
1,682,261 |
|
|
Bank |
|
4.50 |
% |
|
7.00 |
% |
|
6.50 |
% |
|
12.52 |
% |
|
$ |
1,950,505 |
Tier 1 risk-based capital ratio |
|
Consolidated |
|
6.00 |
% |
|
8.50 |
% |
|
6.00 |
% |
|
11.75 |
% |
|
$ |
1,151,491 |
|
|
Bank |
|
6.00 |
% |
|
8.50 |
% |
|
8.00 |
% |
|
12.52 |
% |
|
$ |
1,420,370 |
Total risk-based capital ratio |
|
Consolidated |
|
8.00 |
% |
|
10.50 |
% |
|
10.00 |
% |
|
14.08 |
% |
|
$ |
1,267,623 |
|
|
Bank |
|
8.00 |
% |
|
10.50 |
% |
|
10.00 |
% |
|
13.75 |
% |
|
$ |
1,147,350 |
|
|
|
|
|
|
|
|
|
|
|
|
|
|
|
|
|
|
As of December 31, 2022 |
|
|
|
|
|
|
|
|
|
|
|
|
|
|
|
|
|
Tier 1 leverage ratio |
|
Consolidated |
|
4.00 |
% |
|
N/A |
|
|
N/A |
|
|
8.72 |
% |
|
$ |
2,051,115 |
|
|
Bank |
|
4.00 |
% |
|
N/A |
|
|
5.00 |
% |
|
9.39 |
% |
|
$ |
2,337,715 |
CET 1 risk-based capital ratio |
|
Consolidated |
|
4.50 |
% |
|
7.00 |
% |
|
N/A |
|
|
10.96 |
% |
|
$ |
1,367,689 |
|
|
Bank |
|
4.50 |
% |
|
7.00 |
% |
|
6.50 |
% |
|
11.80 |
% |
|
$ |
1,656,912 |
Tier 1 risk-based capital ratio |
|
Consolidated |
|
6.00 |
% |
|
8.50 |
% |
|
6.00 |
% |
|
10.96 |
% |
|
$ |
849,029 |
|
|
Bank |
|
6.00 |
% |
|
8.50 |
% |
|
8.00 |
% |
|
11.80 |
% |
|
$ |
1,138,955 |
Total risk-based capital ratio |
|
Consolidated |
|
8.00 |
% |
|
10.50 |
% |
|
10.00 |
% |
|
12.97 |
% |
|
$ |
854,772 |
|
|
Bank |
|
8.00 |
% |
|
10.50 |
% |
|
10.00 |
% |
|
12.69 |
% |
|
$ |
755,636 |
| (1) | Reflects the well-capitalized standard applicable to the Bank and the well-capitalized standard applicable to the Company under Federal Reserve Regulation Y. |
| (2) | Amount greater than the highest of the minimum regulatory capital ratio, the minimum regulatory capital ratio plus the capital conservation buffer and the well-capitalized minimum, as applicable. |
The Company has elected to delay for two years the estimated impact of CECL on regulatory capital, followed by a three-year transition period to phase out the aggregate amount of benefit during the initial two-year delay for a total five-year transition. The estimated impact of CECL on regulatory capital (modified CECL transitional amount) is calculated as the sum of the impact on retained earnings upon adoption of CECL (CECL transitional amount) and the calculated change in the ACL relative to the ACL upon adoption of CECL multiplied by a scaling factor of 25%. The scaling factor is used to approximate the difference in the ACL under CECL relative to the incurred loss methodology. The modified CECL transitional amount was calculated each quarter for the first two years of the five-year transition. This amount was fixed as of December 31, 2021, and the Company began the three-year phase out period with 25% of the total CECL transitional amount being phased out in 2022 and 2023. At December 31, 2023 and 2022, approximately $30.5 million and $45.8 million, respectively, was added to Tier 1 capital at the Company and Bank as a result of the modified CECL transition. Had the Company elected not to apply the modified CECL transitional amount to its Tier 1 capital, the Company and Bank would have still been considered well capitalized as of December 31, 2023 and 2022.
15
On July 27, 2023, the banking agencies released a proposed rule to implement major changes to the capital rules for banking organizations with $100 billion or more in assets intended to bring the U.S. capital rules into conformance with the current international capital standards issued by the Basel Committee on Banking Supervision (“Basel Framework”). It is expected that the proposal, if enacted as proposed, would significantly increase capital requirements for banking organizations with $100 billion or more in assets, which could indirectly impact smaller institutions, such as the Company and the Bank, if larger banking organizations make changes in response to the increased capital requirements. The Company is monitoring the status of the proposed rule and is in the process of evaluating this proposed rulemaking and assessing the scale of its adverse impact on the Company and Bank if adopted as proposed.
Safety and Soundness Guidelines
The federal banking agencies have adopted guidelines prescribing safety and soundness standards relating to internal controls, risk management, information systems, internal audit systems, loan documentation, credit underwriting, interest rate exposure, asset growth and compensation, fees and benefits. These guidelines in general require appropriate systems and practices to identify and manage specified risks and exposures. The guidelines prohibit excessive compensation as an unsafe and unsound practice and characterize compensation as excessive when the amounts paid are unreasonable or disproportionate to the services performed by an executive officer or employee, director or principal shareholder. In addition, the agencies have adopted regulations that authorize but do not require an agency to order an institution that has been given notice by the agency that it is not in compliance with any of the safety and soundness standards to submit a compliance plan. If after being so notified, an institution fails to submit an acceptable compliance plan, the agency must issue an order directing action to correct the deficiency and may issue an order directing other actions of the types, including those that may limit growth or capital distributions.
Lending Standards and Guidance
The federal banking agencies have adopted uniform regulations prescribing standards for extensions of credit that are secured by liens or interests in real estate or made for the purpose of financing permanent improvements to real estate. Under these regulations, all insured depository institutions, such as the Bank, must adopt and maintain written policies establishing appropriate limits and standards for extensions of credit that are secured by liens or interests in real estate or are made for the purpose of financing permanent improvements to real estate. These policies must establish loan portfolio diversification standards, prudent underwriting standards (including loan-to-value limits) that are clear and measurable, loan administration procedures, and documentation, approval and reporting requirements. The real estate lending policies must reflect consideration of the federal bank regulators’ Interagency Guidelines for Real Estate Lending Policies.
16
The federal banking agencies have also jointly issued guidance on “Concentrations in Commercial Real Estate Lending” (the “Guidance”), which defines commercial real estate loans as exposures secured by raw land, land development and construction (including 1-4 family residential construction), multi-family property, and non-farm nonresidential property where the primary or a significant source of repayment is derived from rental income associated with the property (that is, loans for which 50% or more of the source of repayment comes from third-party, non-affiliated, rental income) or the proceeds of the sale, refinancing, or permanent financing of the property. The Guidance requires that appropriate processes be in place to identify, monitor and control risks associated with real estate lending concentrations. If a concentration is present, management must employ heightened risk management practices that address key elements, including board and management oversight and strategic planning, portfolio management, development of underwriting standards, risk assessment and monitoring through market analysis and stress testing, and maintenance of increased capital levels as needed to support the level of commercial real estate lending. The required heightened risk management practices could include enhanced strategic planning, underwriting policies, risk management, internal controls, portfolio stress testing and risk exposure limits as well as appropriately designed compensation and incentive programs. Higher allowances for credit losses and capital levels may also be required. The Guidance states that the following metrics may indicate a concentration of commercial real estate loans, but that these metrics are neither limits nor a safe harbor: (1) total reported loans for construction, land development, and other land represent 100% or more of total risk-based capital; or (2) total reported loans secured by multi-family properties, non-farm non-residential properties (excluding those that are owner-occupied), and loans for construction, land development, and other land represent 300% or more of total risk-based capital and the bank’s commercial real estate loan portfolio has increased 50% or more during the prior 36 months. As of December 31, 2023, our total reported loans for construction, land development, and other land were 60% of the Bank’s total Tier 1 capital less modified CECL transitional amount plus the allowance for credit losses (excluding reserve for unfunded commitments) and our total reported loans secured by multifamily and non-farm nonresidential properties and loans for construction, land development, and other land were 237% of the Bank’s total Tier 1 capital less modified CECL transitional amount plus the allowance for credit losses.
Consumer Protection Laws
The Bank is subject to a number of federal laws designed to protect its customers. These consumer protection laws apply to a broad range of our activities and to various aspects of our business and include laws relating to interest rates, fair lending, disclosures of credit terms and estimated transaction costs to consumer borrowers, debt collection practices, the use of and the provision of information to consumer reporting agencies, and the prohibition of unfair, deceptive or abusive acts or practices in connection with the offer, sale or provision of consumer financial products and services. Administration of many of these consumer protection rules are the responsibility of the CFPB, which has exclusive supervisory authority over insured depository institutions with more than $10 billion in total assets and any affiliates thereof. The CFPB also has authority to define and prevent unfair, deceptive and abusive practices in the consumer financial area, and expanded data collecting powers for purposes of determining bank compliance with the fair lending laws.
The CFPB has promulgated many mortgage-related final rules, including rules related to the ability to repay and qualified mortgage standards, mortgage servicing standards, loan originator compensation standards, high-cost mortgage requirements, Home Mortgage Disclosure Act requirements and appraisal and escrow standards for higher priced mortgages. In addition, several proposed revisions to mortgage-related rules are pending finalization. The mortgage-related final rules issued by the CFPB have materially restructured the origination, servicing and securitization of residential mortgages in the United States. These rules have impacted, and will continue to impact, the business practices of mortgage lenders, including the Company. For example, under the CFPB’s Ability to Repay and Qualified Mortgage rule, before making a mortgage loan, a lender must establish that a borrower has the ability to repay the mortgage. “Qualified mortgages”, as defined in the rule, are presumed to comply with this requirement and, as a result, present less litigation risk to lenders. For a loan to qualify as a qualified mortgage, the loan must satisfy certain limits on terms and conditions, pricing and a maximum debt-to-income ratio. Loans eligible for purchase, guarantee or insurance by a government agency or government-sponsored enterprise are exempt from some of these requirements. Satisfying the qualified mortgage standards, ensuring correct calculations are made for individual loans, recordkeeping and monitoring, as well as understanding the effect of the qualified mortgage standards on CRA obligations, impose significant new compliance obligations on, and involve compliance costs for, mortgage lenders, including the Company.
17
Under applicable law, the Bank, as a debit card issuer, may receive a maximum permissible interchange fee equal to no more than $0.21 plus 5 basis points of the transaction value for many types of debit interchange transactions. Further, a debit card issuer may also recover $0.01 per transaction for fraud prevention purposes if the issuer complies with certain fraud-related requirements required by the Federal Reserve. In addition, the Federal Reserve rules governing routing and exclusivity require debit card issuers to offer two unaffiliated networks for routing transactions on each debit or prepaid product.
In March 2023, the CFPB issued the “Small Business Lending Rule” to implement Section 1071 of the Dodd-Frank Act for the stated purpose of increasing transparency in small business lending, promoting economic development, and combating unlawful discrimination. Under this rule, covered lenders, including the Bank, are required to collect and report information about the small business credit applications they receive, including geographic and demographic data, lending decisions, and the price of credit. As finalized, the Small Business Lending Rule requires compliance by covered lenders as early as October 2024. However, on October 26, 2023, a federal district court issued a nationwide injunction prohibiting the CFPB from implementing or enforcing the Small Business Lending Rule pending the U.S. Supreme Court’s decision in an appeal of a Fifth Circuit decision finding that the CFPB’s funding structure is unconstitutional. If the Supreme Court reverses the Fifth Circuit’s finding, the CFPB will be required to extend all compliance deadlines for the Small Business Lending Rule to compensate for the period in which its implementation and enforcement of the rule was stayed by the district court. It is anticipated that the Bank will be required to update its systems and train its lenders to comply with this small business data collection rule, although it is unclear at this time what impact this rule may have on the Company’s financial statements.
In October 2023, the Federal Reserve released a notice of proposed rulemaking that would lower the maximum interchange fee that a large debit card issuer can receive on a debit card transaction. Under the proposal, initially the base component would decrease from 21.0 cents to 14.4 cents, the ad valorem component would decrease from 5.0 basis points to 4.0 basis points multiplied by the value of the transaction, and the fraud-prevention adjustment would increase from 1.0 cents to 1.3 cents for debit card transactions performed from the effective date of the final rule to June 30, 2025. In addition, the proposal would adopt an approach for future adjustments to the interchange fee cap, which would occur every other year based on issuer cost data gathered from large debit card issuers. We will continue to monitor the status of the proposed rule and are in the process of evaluating this proposed rulemaking and assessing the scale of its adverse impact on the Company and Bank if adopted as proposed.
In addition, in October 2023, the CFPB proposed a rule to implement Section 1033 of the Dodd-Frank Act, which would require certain entities, including the Company and the Bank, to, among other things, make available to a consumer, upon request, information in its control or possession concerning the consumer financial product or service that the consumer obtained from that entity. In general, the proposed rule also would require, among other things, data providers holding a consumer account, such as the Bank, to establish a developer interface satisfying certain data security specifications and other standards, through which the data provider can receive requests for, and provide, specific types of data covered by the rule in electronic, usable form to authorized third parties, including data aggregators. Under the proposed rule, data providers would be prohibited from, among other things, charging consumers or third parties fees for processing these consumer data requests. The proposed rule would also place certain data security, authorization and other obligations on third parties accessing covered data from data providers, which could include the Company and the Bank when acting in certain capacities. The proposed rule would also require third parties to limit their collection, use, and retention of the data received to only what is reasonably necessary to provide the consumers’ requested product or service. Under the proposal, the first compliance date would be effective six months after publication of the final rule. We continue to evaluate this proposal and the potential impacts, if adopted as proposed, on the Company and the Bank.
18
In January 2024, the CFPB issued two rule proposals as part of its approach to protect consumers by reducing so-called “junk fees”. The first proposal would remove an exception for overdraft lending services from longstanding provisions of the Truth in Lending Act (“TILA”) and other consumer financial protection laws by requiring banks with assets greater than or equal to $10 billion to treat overdraft loans like credit cards and other loans, including providing clear disclosures, to the extent the bank charges customer fees in excess of the direct costs of providing the service or in accordance with established benchmarks by the CFPB. While the Bank is still assessing the proposal, if adopted as proposed, this rule will likely have a material impact on the Bank by reducing revenue from overdraft lending services. The second proposal would prohibit nonsufficient funds fees on transactions that financial institutions decline in real time. These types of transactions include declined debit card purchases and ATM withdrawals, as well as some declined peer-to-peer payments. While the Bank is still assessing this proposal, with the Bank’s elimination of nonsufficient funds fees in 2022, this proposed rule, if implemented as proposed, will likely have limited impact on the Bank.
Community Reinvestment Act
The CRA requires the appropriate federal banking agency, in connection with its examination of a bank, to assess the bank’s record in meeting the credit needs of the communities served by the institution, including low- and moderate-income neighborhoods. Furthermore, the relevant federal bank regulatory agency is required to consider a bank’s CRA assessment when considering the bank’s application to, among other things, merge or consolidate with or acquire the assets or assume the liabilities of an insured depository institution or open or relocate a branch office. The relevant federal banking agency, the OCC in the Bank’s case, examines each bank and assigns it a public CRA rating. Under the CRA, institutions are assigned a rating of “outstanding,” “satisfactory,” “needs to improve,” or “unsatisfactory.” The Bank received a “satisfactory” rating at its most recent CRA evaluation.
On October 24, 2023, the Federal Reserve, the FDIC, and the OCC issued a final rule amending the agencies’ CRA regulations. In developing the final rule, the agencies’ objectives included the following: (i) update the CRA regulations to strengthen the achievement of the core purpose of the statute, (ii) adapt to changes in the banking industry, including the expanded role of mobile and online banking, (iii) provide greater clarity and consistency in the application of the regulations, (iv) tailor performance standards to account for differences in bank size, business models, and local conditions, (v) tailor data collection and reporting requirements and use existing data whenever possible, (vi) promote transparency and public engagement, (vii) confirm that CRA and fair lending responsibilities are mutually reinforcing, and (viii) promote a consistent regulatory approach that applies to banks regulated by all three agencies. The final rule is effective April 1, 2024. The Bank will be required to comply with operative provisions of the final rule’s new requirements beginning January 1, 2026, but will have until January 1, 2027, to comply with data and disclosure reporting requirements. It is anticipated that the Bank will require a material effort to update its systems as the new rule will impact several lines of business and require new compliance with data collection and reporting rules. This effort necessitates training for lenders and other stakeholders. Under the new rule, large banks will be subject to four tests versus the existing three tests, and performance evaluations will involve a more quantitative approach with complex data analytics. The Bank does expect increased expense to comply with the new rule, including expenses to enhance systems, training, and possible product enhancements.
Anti-Money Laundering Rules
The Bank Secrecy Act, as amended by the USA PATRIOT Act of 2001, (together, the “BSA”) and its implementing regulations require financial institutions to, among other duties, implement and maintain an effective anti-money laundering (“AML”) compliance program and file suspicious activity and currency transaction reports when appropriate.
The Anti-Money Laundering Act of 2020, enacted on January 1, 2021 as part of the National Defense Authorization Act (“AMLA”), amends the BSA but does not directly impose new requirements on banks. However, AMLA requires the U.S. Treasury Department to, among other things, issue National Anti-Money Laundering and Countering the Financing of Terrorism Priorities and implementing regulations, and conduct studies and issue regulations that may, over the next few years, significantly alter certain due diligence, recordkeeping and reporting requirements that the BSA and its implementing regulations impose on banks. AMLA also contains provisions that increase penalties for violations of the BSA and includes whistleblower incentives, both of which could increase regulatory enforcement against banks. Implementation of AMLA is ongoing and is anticipated to impact the Bank’s AML compliance program.
19
In an effort to increase transparency in the U.S. financial system and prevent shell entities from being used to launder money or hide assets, AMLA includes the Corporate Transparency Act (the “CTA”), which requires the U.S. Treasury Department’s Financial Crimes Enforcement Network (“FinCEN”) to, among other things, establish a national beneficial ownership information registry. In September 2022, FinCEN issued the final Beneficial Ownership Information Reporting Requirements rule (the “BOI Reporting Rule”), the first of three rulemakings that would implement the requirements of the CTA. Effective as of January 1, 2024, the BOI Reporting Rule requires certain “reporting companies” to file beneficial ownership information reports with FinCEN that will be stored in the national beneficial ownership registry and will detail the reporting company’s beneficial owners. In December 2023, FinCEN issued the final Beneficial Ownership Information Access and Safeguards rule—the second of three rulemakings that would implement the CTA—which governs access to the national beneficial ownership registry. FinCEN has not yet issued the third CTA-implementing regulation, which will amend the beneficial ownership requirements applicable to banks and other covered financial institutions under FinCEN’s existing Customer Due Diligence (“CDD”) rule. While it is not clear what impact the new rules will have on the Bank, our compliance costs will likely increase as we develop enhanced CDD procedures and recalibrate customer information collection and reporting systems to effectively respond to the CTA’s new requirements.
Violations of the BSA and its implementing regulations can result in substantial civil and criminal penalties, and the federal banking agencies are required to consider the effectiveness of a financial institution’s AML compliance program when reviewing bank mergers and bank holding company acquisitions. In addition to the federal banking agencies, FinCEN is authorized to impose significant civil monetary penalties for violations of the BSA and its implementing regulations and has recently engaged in coordinated enforcement actions with state and federal law enforcement agencies and banking regulators.
OFAC Regulation
The U.S. Treasury Department’s Office of Foreign Assets Control (“OFAC”) is responsible for administering U.S. economic sanctions, which can which prohibit certain transactions with designated foreign countries, nationals and others. OFAC-administered sanctions take on many different forms. For example, sanctions may include: (1) restrictions on trade with or investment in a sanctioned country, including prohibitions against direct or indirect imports from and exports to a sanctioned country and prohibitions on U.S. persons engaging in financial transactions relating to, making investments in, or providing investment-related advice or assistance to, a sanctioned country; and (2) blocking assets in which certain sanctioned foreign governments, entities or individuals have an interest, by prohibiting transfers of property subject to U.S. jurisdiction, including property in the possession or control of U.S. persons. OFAC also maintains a lists of designated persons, groups or entities that are the target of sanctions, including the “Specially Designated Nationals and Blocked Persons List.” The assets of designated persons, groups or entities are blocked and U.S. persons are generally prohibited from dealing with any such persons. Moreover, blocked assets, for example property and bank deposits, cannot be paid out, withdrawn, set off or transferred in any manner without a license from OFAC. If we find a name on any transaction, account or wire transfer associated with a sanctioned person, we must freeze or block such account or transaction, file a suspicious activity report and notify the appropriate authorities. Failure to comply with these sanctions could have serious legal and reputational consequences.
Data Privacy and Cybersecurity
Various federal, state and local laws, rules, regulations and standards contain extensive data privacy and cybersecurity provisions, and the regulatory framework for data privacy and cybersecurity is in considerable flux and rapidly evolving. For example, current federal law, including the Gramm-Leach-Bliley Act, requires financial institutions to, among other things, periodically disclose their privacy policies and practices relating to sharing such information and enables retail customers to opt out of our ability to share information with unaffiliated third parties under certain circumstances. Other federal and state laws and regulations impact our ability to share certain information with affiliates and non-affiliates for marketing and/or non-marketing purposes, or to contact customers with marketing offers. Current federal law also requires financial institutions to implement a comprehensive information security program that includes administrative, technical and physical safeguards to ensure the security and confidentiality of customer records and information. Federal law also makes it a criminal offense, except in limited circumstances, to obtain or attempt to obtain customer information of a financial nature by fraudulent or deceptive means.
20
We also are subject to federal regulations that, among other things, require a banking organization to notify its primary federal regulators as soon as possible and within 36 hours after identifying a “computer-security incident” that the banking organization believes in good faith is reasonably likely to materially disrupt or degrade its business or operations in a manner that would, among other things, jeopardize the viability of its operations, result in customers being unable to access their deposit and other accounts, result in a material loss of revenue, profit or franchise value, or pose a threat to the financial stability of the U.S. Additionally, the federal banking regulators, as well as the SEC and related self-regulatory organizations, regularly issue guidance regarding cybersecurity that is intended to enhance cyber risk management among financial institutions. The federal government also is considering, and may pass, data privacy and cybersecurity legislation, to which we may become subject if passed. The Bank is also subject to rules and regulations issued by the Federal Trade Commission, which regulates unfair or deceptive acts or practices, including with respect to data privacy and cybersecurity. Additionally, like other lenders, the Bank uses credit bureau data in its underwriting activities. Use of such data is regulated under the Fair Credit Reporting Act, which also regulates reporting information to credit bureaus, prescreening individuals for credit offers, sharing of information between affiliates, and using affiliate data for marketing purposes. Similar state laws may impose additional requirements on us and our subsidiaries.
Data privacy and cybersecurity are also areas of increasing state legislative focus. For example, the California Consumer Privacy Act of 2018, as amended by the California Privacy Rights Act of 2020 (collectively, “CCPA”), among other things, gives California residents the right to request access to or correct personal information collected about them, and whether that information has been sold or shared with others, the right to request deletion of personal information (subject to certain exceptions), the right to opt out of the sale of their personal information, and the right not to be discriminated against for exercising these rights. The CCPA contains several exemptions, including that many, but not all, requirements of the CCPA are inapplicable to personal information that is collected, processed, sold, or disclosed subject to certain federal laws. Similar laws have been or may be adopted by other states where we do business or collect personal information. In addition, laws in all 50 U.S. states generally require businesses to provide notice under certain circumstances to individuals whose personal information has been disclosed as a result of a data breach.
For further information regarding the risks associated with data privacy and cybersecurity laws, please see Part I – Item 1A – Risk Factors – “We are subject to complex and evolving laws, regulations, rules, standards and contractual obligations regarding data privacy and cybersecurity, which could increase the cost of doing business, compliance risks and potential liability” and “We face cybersecurity risks from cyber-attacks, information security breaches and other similar incidents that could result in the disclosure of confidential and other information (including personal information), adversely affect our business or reputation, and create significant legal and financial exposure.”
Broker Dealer and Investment Adviser Regulation
Our broker dealer subsidiary and investment adviser subsidiary are subject to regulation by the SEC. FINRA is the primary self-regulatory organization for our registered broker-dealer subsidiary. The broker dealer and investment adviser subsidiaries also are subject to additional regulation by states or local jurisdictions. The SEC and FINRA have active enforcement functions that oversee broker dealers and investment advisers and can bring actions that result in fines, restitution, a limitation on permitted activities, disqualification to continue to conduct certain activities and an inability to rely on certain favorable exemptions. Certain types of infractions and violations also can affect the Company’s ability to issue new securities expeditiously. In addition, certain changes in the activities of a broker dealer require approval from FINRA, and FINRA takes into account a variety of considerations in acting upon applications for such approval, including internal controls, capital levels, management experience and quality, prior enforcement and disciplinary history, and supervisory concerns.
Future Legislation and Regulation
Banking statutes, regulations and policies are continually under review by Congress, state legislatures and federal and state regulatory agencies. In addition to laws and regulations, state and federal bank regulatory agencies may issue policy statements, interpretive letters and similar written guidance applicable to us and our subsidiaries. We cannot predict the substance or impact of pending or future legislation or regulation or the application of those laws or regulations, although enactment of any significant proposal could affect how we operate and could significantly increase our costs, impede the efficiency of internal business processes or limit our ability to pursue business opportunities in an efficient manner, any of which could materially and adversely affect our business, financial condition and results of operations.
21
Availability of Reports Furnished or Filed with the Securities and Exchange Commission
We make available at no cost all of our reports filed electronically with the United States Securities and Exchange Commission (“SEC”), including our Annual Report on Form 10-K, quarterly reports on Form 10-Q, and current reports on Form 8-K, and the annual proxy statement, as well as amendments to those reports, through the Investor Relations page of our website at www.SouthStatebank.com. These filings are also accessible on the SEC’s website at www.sec.gov.
We also will provide without charge a copy of our Annual Report on Form 10-K to any shareholder by mail. Requests should be sent to SouthState Corporation, Attention: Corporate Secretary, 1101 First Street South, Winter Haven, Florida 33880.
Information with respect to the Company’s Board of Directors, Executive Officers and corporate governance policies and principles is presented on the Company’s website, www.SouthStatebank.com, on the Investor Relations page. We encourage our employees to take initiative and be responsible for their actions. We have implemented a Whistleblower program and adopted a Code of Ethics, and information about both is available under Corporate Overview/Governance Documents on the Investor Relations page of our website located at www.SouthStatebank.com. We also adopted a formal corporate governance policy, a copy of which is available under Corporate Overview/Governance Documents/Corporate Governance Guidelines on the Investor Relations page of our website located at www.SouthStatebank.com.
22
Item 1A. Risk Factors.
Summary of Risk Factors
Below is a summary of the principal factors that make an investment in our common stock speculative or risky. This summary does not address all of the risks that we face. Additional discussion of the risks summarized in this risk factor summary, and other risks that we face, can be found below under the heading “Risk Factors” and should be carefully considered, together with other information in this Form 10-K and our other filings with the SEC, before making an investment decision regarding our common stock. These risks include, but are not limited to, the following:
Risks related to our Business and Business Strategy:
| ● | our ability to grow or to manage our growth effectively; |
| ● | our ability to adequately anticipate and respond to changes in market interest rates; |
| ● | a decrease in our net interest income due to the interest rate environment; |
| ● | the negative impact of inflation on our business, profitability and stock price; |
| ● | an increase in the cost of funds as a result of general economic conditions, FDIC insurance assessments, interest rates, and competitive pressures on deposits; |
| ● | the implementation of new lines of business or new products and services; |
| ● | our ability to realize the benefits expected from strategic initiatives; |
| ● | the impact of technological changes, including artificial intelligence and online and mobile banking, on our business model, and that we may have fewer resources than many competitors to invest in technological improvements; |
| ● | a significant portion of our loan portfolio being secured by real estate; |
| ● | our loan portfolio including commercial and commercial real estate loans that may have higher risks; |
| ● | our ability to effectively manage credit risk and interest rate risk; |
| ● | lack of liquidity or inability to effectively manage liquidity rate risk; |
| ● | the results of our most recent stress tests not accurately predicting the impact on our financial condition if the economy were to deteriorate; |
| ● | the impact of the Current Expected Credit Loss standard and global events on our allowance for credit losses; |
| ● | our size and continued pace of growth requiring us to raise additional capital in the future that may not be available when it is needed; |
| ● | our processes for managing risk not being effective to mitigate risk or losses; |
| ● | rising mortgage rates and adverse changes in mortgage conditions; |
| ● | our recent results not being indicative of our future results; |
| ● | environmental risks in our lending activities; |
| ● | appraisals used in deciding whether to make a loan that is secured by real estate not ensuring the value of the real property collateral; |
| ● | losses due to errors, omissions or fraudulent behavior by employees, clients, counterparties and third parties; |
| ● | the adoption of artificial intelligence tools by us and our third-party vendors and service providers; |
| ● | environmental, social and governance risks that adversely affect our reputation, the trading price of our common stock and/or our business, operations and earnings; |
| ● | our ability to maintain our culture and attract and retain experienced people; |
| ● | our ability to offer our key management personnel long term incentive compensation and our ability to retain such personnel; |
| ● | our reliance on the performance of highly skilled personnel and our ability to attract, retain, develop and motivate our human capital in the form of well-qualified employees; |
| ● | our ability to implement information technology and cybersecurity system enhancements and operational initiatives; |
| ● | changes and instability in global economic conditions and geopolitical matters; |
| ● | a failure of disruption to our operational or security systems or infrastructure, or those of our third-party service providers; |
| ● | risks from cyber-attacks, information security breaches, and other similar incidents; |
| ● | future expansion; |
| ● | the availability of attractive acquisition opportunities in the future; |
| ● | our disclosure controls and procedures not preventing or detecting all errors or acts of fraud; |
23
| ● | our accounting policies and processes; |
| ● | the value of the securities in our investment portfolio; |
| ● | consumers opting not to use banks to complete their financial transactions; and |
| ● | our ability to maintain our reputation. |
Risks relating to the Regulatory Environment:
| ● | government regulations that could limit or restrict our activities; |
| ● | recent regulatory proposals that may increase capital and liquidity risks; |
| ● | the heightened expectations of regulatory agencies exposing the Company to risk as it grows; |
| ● | our obligation to maintain capital to meet regulatory requirements; |
| ● | periodic examination and scrutiny by a number of banking agencies and any adjustments to our business resulting from such examination; |
| ● | our obligation to comply with the Bank Secrecy Act and other anti-money laundering statutes and regulations; |
| ● | our obligation to comply with numerous laws designed to protect consumers, including the CRA and fair lending laws; |
| ● | increases in FDIC deposit insurance premiums and assessments; |
| ● | changes to our requirement to commit capital resources to support the Bank; |
| ● | changes in tax laws, regulations, and interpretations or challenges to our income tax provision; and |
| ● | complex and evolving laws, regulations, rules, standards, and contractual obligations regarding data privacy and cybersecurity. |
Risks relating to our Common Stock:
| ● | state law and provisions in our articles of incorporation or bylaws that make it more difficult for another company to purchase us; |
| ● | shares of our Common Stock not being insured deposits and losing value; |
| ● | future capital needs resulting in dilution of shareholder investment; |
| ● | trading volume in our common stock and the sale of substantial amounts of our common stock in the public market that could depress the price of our common stock; |
| ● | our ability to pay dividends; |
| ● | rights of our holders of our junior subordinated debentures that are senior to those of our common shareholders; |
| ● | volatility of our stock price; and |
| ● | our institutional shareholders, which own approximately 29% of our common stock, exercising significant influence over us and having interests that differ from our other shareholders. |
Risks relating to Economic Conditions and Other Outside Forces:
| ● | changes to the political and economic environment and uncertainty surrounding the potential legal, regulatory, and policy changes resulting from a possible new U.S. presidential administration and congressional seat turnover; |
| ● | a slowdown in economic growth or a resumption of recessionary economic conditions; |
| ● | the soundness of other financial institutions; |
| ● | the success of the local economies where we operate; |
| ● | adverse weather or manmade events; |
| ● | physical and financial risks associated with climate change and other weather and natural disaster impacts; |
| ● | market volatility that could adversely affect our operations or ability to access capital; |
| ● | competition; |
| ● | changes in the fiscal and monetary policies of the federal government and its agencies; and |
| ● | suits, legal proceedings, information-gathering requests, investigations, and proceedings by governmental and self-regulatory agencies. |
24
Risk Factors
An investment in our common stock is subject to risks inherent in our business. The following discussion highlights the risks that management believes are material for our Company, but do not necessarily include all the risks that we may face. You should carefully consider the risk factors and uncertainties described below and elsewhere in this Annual Report on Form 10-K (“Report”) in evaluating an investment in our common stock.
Risks relating to our Business and Business Strategy
Our business strategy includes continued growth, and our financial condition and results of operations could be negatively affected if we fail to grow or fail to manage our growth effectively.
We intend to continue to pursue a growth strategy for our business. Our prospects must be considered in light of the risks, expenses and difficulties frequently encountered by companies in pursuing such growth strategies. Our ability to continue to grow successfully will depend on a variety of factors, including economic conditions in the markets in which we operate as well as in the U.S. and globally, continued availability of desirable business opportunities, the competitive responses from other financial and non-financial institution competitors in our market areas, our ability to continue to implement and improve our operational, credit, financial, management and other risk controls and processes and our reporting systems and procedures to manage a growing number of client relationships, and our ability to integrate any acquisitions and develop consistent policies throughout our various businesses. While we believe our market areas are among the highest growth areas in the country, and that we have the management and other resources and internal systems in place to successfully manage our future growth, there can be no assurance growth opportunities will be available or growth will be successfully managed. In addition, if we are unable to manage future expansion in our operations, we may experience compliance and operational problems, have to slow the pace of growth, or have to incur additional expenditures beyond current projections to support such growth, any of which could adversely affect our business. Particularly in light of prevailing economic and competitive conditions, we cannot assure you we will be able to expand our market presence in our existing markets or successfully enter new markets or that any such expansion will not adversely affect our results of operations. Failure to manage our growth effectively could have a material adverse effect on our business, future prospects, financial condition or results of operations, and could adversely affect our ability to successfully implement our business strategy. Also, if our growth occurs more slowly than anticipated or declines, our operating results could be materially adversely affected.
We may not be able to adequately anticipate and respond to changes in market interest rates.
We may be unable to anticipate changes in market interest rates, which are affected by many factors beyond our control including but not limited to inflation, monetary policy, money supply, recessionary pressures, unemployment, and other changes that affect domestic and foreign financial markets. Our net interest income is affected not only by the level and direction of interest rates but also by the shape of the yield curve and relationships between interest sensitive instruments and key driver rates, as well as balance sheet growth, customer loan and deposit preferences, and the timing of changes in these variables. In the event rates increase, our interest costs on liabilities may increase more rapidly than our income on interest earning assets, thus resulting in a deterioration of net interest margins. As such, fluctuations in interest rates could have significant adverse effects on our financial condition and results of operations.
Our net interest income may decline based on the interest rate environment.
We depend on our net interest income to drive our profitability. Net interest income is the difference between the interest income we receive from interest earning assets (e.g., loans and investment securities) and the interest expense we pay on interest-bearing liabilities (e.g., deposits and borrowings). We are exposed to changes in general interest rate levels and other economic factors beyond our control, and an increase in our cost of funds could negatively impact our net interest income. Net interest income will decline in a particular period if:
| ● | in a rising interest rate environment, more interest-bearing liabilities than interest earning assets re price or mature, |
| ● | in a declining interest rate environment, more interest earning assets than interest bearing liabilities re price or mature, or |
| ● | for acquired loans, expected total cash flows decline as our loan balances decline. |
25
Our net interest income may decline based on our exposure to a difference in short-term and long-term interest rates. If the difference between the interest rates shrinks or disappears, the difference between rates paid on deposits and received on loans could narrow significantly resulting in a decrease in net interest income. In addition to these factors, if market interest rates rise rapidly, interest rate adjustment caps may limit increases in the interest rates on adjustable rate loans, thus reducing our net interest income. In addition, certain adjustable rate loans re price based on lagging interest rate indices. This lagging effect may also negatively impact our net interest income when general interest rates continue to rise periodically.
The Federal Reserve’s interest rate increases have impacted the rates we charge borrowers and depositors and our net interest margin. We cannot predict the nature or timing of future changes in monetary policies or the precise effects that they may have on our activities and financial results.
In addition, our net interest income may be adversely affected by resurgent inflationary pressures and new global supply chain challenges, geopolitical matters, weather events or other developments. While the rate of inflation for 2023 was lower than that experienced in either 2021 and 2022, it continued to exceed the Federal Reserve’s two percent (2%) annual target. There is a risk that inflation may become higher or persist for longer periods of time and not decrease. We have increased rates in response to the Federal Reserve’s interest rate increases, and loan demand has subsequently decreased. As interest rates have risen, competition for deposits has increased, leading to higher deposit costs and reduced liquidity. Any further increase in interest rates to address inflationary pressures could result in declines in demand for our banking products and services and could negatively impact, among other things, our liquidity, regulatory capital, goodwill and our growth strategy.
Inflation could negatively impact our business, our profitability and our stock price.
Continued inflation may impact our profitability by negatively impacting our fixed costs and expenses, including increasing funding costs and expense related to talent acquisition and retention, and negatively impacting the demand for our products and services. Additionally, inflation may lead to a decrease in consumer and clients purchasing power and negatively affect the need or demand for our products and services. If significant inflation continues, our business could be negatively affected by, among other things, increased default rates leading to credit losses which could decrease our appetite for new credit extensions. These inflationary pressures could result in missed earnings and budgetary projections causing our stock price to suffer.
Our cost of funds may increase as a result of general economic conditions, FDIC insurance assessments, interest rates and competitive pressures.
Our cost of funds may increase as a result of increases in interest rates, competitive pressures, general economic conditions and FDIC insurance assessments. We have traditionally obtained funds principally through local deposits and we have a base of lower cost transaction deposits. Generally, we believe local deposits are a less expensive and more stable source of funds than other borrowings because interest rates paid for local deposits are typically lower than interest rates charged for borrowings from other institutional lenders and reflect a mix of transaction and time deposits, whereas brokered deposits typically are higher cost time deposits. Our costs of funds and our profitability and liquidity are likely to be adversely affected, if and to the extent we have to rely upon higher cost borrowings from other institutional lenders or brokers to fund loan demand or liquidity needs, and changes in our deposit mix and growth could adversely affect our profitability and the ability to expand our loan portfolio.
In addition, recent events impacting the banking industry, including the bank failures in early 2023, have resulted in significant disruption and volatility in the capital markets, reduced current valuations of securities portfolios and bank stocks, and decreased confidence in banks among depositors and other counterparties as well as investors. These events occurred in the context of rapidly rising interest rates which, among other things, have resulted in unrealized losses in longer duration debt securities and loans held by banks, increased competition for deposits and potentially increased the risk of a recession. A decrease in the supply of deposits or significant increase in competition for deposits could result in substantial increases in costs to retain and service deposits. Increased adoption of consumer banking technology can result in reduced deposit stickiness due to the relative ease with which depositors may transfer deposits to a different depository institution in the event that confidence is lost in the Bank. The cost of resolving the bank failures in early 2023 has also prompted the FDIC to issue a special assessment to recover costs to the Deposit Insurance Fund, and such special assessments may continue to be imposed. Please see Item I – Part 1 – “Supervision and Regulation – FDIC Insurance Assessments and Depositor Preference” for further information.
26
The implementation of new lines of business or new products and services may subject us to additional risk.
We continuously evaluate our service offerings and may implement new lines of business or offer new products and services within existing lines of business in new sales channels such as online and mobile banking in the future. There are substantial risks and uncertainties associated with these efforts. In developing and marketing new lines of business and/or new products and services, we undergo a new product process to assess the risks of, and resources needed for, the initiative and invest significant time and resources to build internal controls, policies and procedures to mitigate those risks, including hiring experienced management to oversee the implementation of the initiative. Initial timetables for the introduction and development of new lines of business and/or new products or services and/or new sales channels may not be achieved, and price and profitability targets may not prove feasible. External factors, such as compliance with regulations, competitive alternatives, and shifting market preferences, may also impact the successful implementation of a new line of business and/or a new product or service and/or sales channels. Furthermore, any new line of business and/or new product or service could require the establishment of new key and other controls and have a significant impact on our existing system of internal controls. Failure to successfully manage these risks in the development and implementation of new lines of business and/or new products or services could have a material adverse effect on our business and, in turn, our financial condition and results of operations.
We may not realize the expected benefits from our strategic initiatives, either in whole or in part, which could negatively impact our future profitability.
Our current strategic plan contains growth, investment, risk management and efficiency initiatives in order to create a better and more profitable Company and remain competitive with other bank and non-bank financial services providers. To achieve our strategic goals, we must successfully execute these initiatives. Our current initiatives include, but are not limited to, building upon our digital banking initiatives, implementing real time payments, growing our middle market and larger corporate banking and correspondent divisions, and continuing to enhance our technology and cybersecurity infrastructure. While we have met our strategic initiatives in the past, there is no guarantee that these initiatives will be successful in supporting growth or achieving the expected efficiencies and revenue enhancements that we anticipate.
Furthermore, our strategic initiatives may result in an increase in expense, divert management attention, take away from other opportunities, negatively impact operational effectiveness or impact employee morale. In addition, management expects to continue to make strategic investments in technology and talent that are expected to improve our client experience and support future growth which will require an increase in our expenditures. There can be no assurance that we will ultimately realize the anticipated benefits of these strategic initiatives, or that these strategic initiatives will not negatively impact our organization. These initiatives may fail to meet our own or our clients’ expectations and may fail to keep pace with bank and non-bank competition and we may realize significant losses as a result.
Technological changes, including artificial intelligence and online and mobile banking, have the potential of disrupting our business model, and we may have fewer resources than many competitors to invest in technological improvements.
The financial services industry continues to undergo rapid technological changes with frequent introductions of new technology-driven products and services, including artificial intelligence tools to enhance efficiencies, as well as mobile and online banking services. Changes in customer behaviors have increased the need to offer these options to our customers. The past several years accelerated technological change as our employees and the customers and communities to which we provide products and services converted to remote work, shopping and banking as we experienced supply chain interruptions.
In addition to serving clients better, investments in, and the effective use of, technology, including artificial intelligence, may increase efficiency and may enable financial institutions to reduce costs. Although we are making focused investments in automation and other technology solutions to improve both our customer facing and back-office services and have strategically introduced artificial intelligence tools for internal efficiencies, investments may not be sufficient or provide the anticipated benefits or desired return. We can make no assurance that investments will be sufficient to increase efficiencies, retain existing customers or attract new customers in the future.
27
Our future success will depend, in part, upon our ability to invest in and use technology to provide products and services that provide convenience to customers and to create additional efficiencies in operations. One of our strategic goals is to continue to focus on technological change and digital transformation of our product and service channels, which will impact how we deliver our products and services in the future as well as make our internal processes more efficient. We need to make significant additional capital investments in technology in the future to achieve this strategic goal, and we may not be able to implement effectively new technology-driven products and services in a timely manner in response to changes in customer behaviors, thus adversely impacting our operations. Many competitors have substantially greater resources to invest in technological improvements than the Company.
A significant portion of our loan portfolio is secured by real estate, and events that negatively impact the real estate market could hurt our business.
A significant portion of our loan portfolios are secured by real estate. As of December 31, 2023, approximately 79.2% of such loans had real estate as a primary or secondary component of collateral. The real estate collateral in each case provides an alternate source of repayment in the event of default by the borrower and may deteriorate in value during the time the credit is extended. There can be no assurance that our local markets will not experience another economic decline. A decline in local economic conditions may have a greater effect on our earnings and capital than on the earnings and capital of other financial institutions whose real estate loan portfolios are more geographically diverse. Any weakening of the real estate market may increase the likelihood of default of these loans, which could negatively impact our loan portfolio’s performance and asset quality. Such a determination may lead to an additional increase in our allowance for credit losses, which could also adversely affect our business, financial condition, and results of operations.
Our loan portfolio includes commercial and commercial real estate loans that may have higher risks.
Our commercial industrial, construction and land development and commercial real estate loans at December 31, 2023 and 2022 were $23.2 billion and $22.4 billion, respectively, or 71% and 74%, respectively, of total loans. Commercial and commercial real estate loans generally carry larger loan balances and can involve a greater degree of financial and credit risk than other loans. The increased financial and credit risk associated with these types of loans are a result of several factors, including the concentration of principal in a limited number of loans and borrowers, the size of loan balances, the effects of general economic conditions on income-producing properties and the increased difficulty of evaluating and monitoring these types of loans. Any formal or informal action by our supervisors may require us to take increased reserves on these loans and could affect our share price.
As a result, banking regulators give greater scrutiny to lenders with a high concentration of commercial real estate loans in their portfolios, and such lenders are expected to implement stricter underwriting, internal controls, risk management policies and portfolio stress testing, as well as maintain higher capital levels and loss allowances. Concentrations in commercial real estate are monitored by regulatory agencies and subject to especially heightened scrutiny both on a public and confidential basis. The Guidance states that the following metrics may indicate a concentration of commercial real estate loans, but that these metrics are neither limits nor a safe harbor:
| 1) | total reported loans for construction, land development, and other land equal 100% or more of total risk-based capital (as of December 31, 2023, our bank ratio was 60%); and |
| 2) | total reported loans secured by multifamily and non-farm nonresidential properties and loans for construction, land development, and other land equal 300% or more of total risk-based capital (as of December 31, 2023, our bank ratio was 237%). |
Regulators may require banks to maintain elevated levels of capital or liquidity due to commercial real estate loan concentrations, and could do so, especially if there is a downturn in our local real estate markets. See Part I Item 1 “Supervision and Regulation – Lending Standards and Guidance” for further details on the Guidance.
Furthermore, the repayment of loans secured by commercial real estate is typically dependent upon the successful operation of the related real estate or commercial project. If the cash flows from the project are reduced, a borrower’s ability to repay the loan may be impaired. This cash flow shortage may result in the failure to make loan payments. In such cases, we may be compelled to modify the terms of the loan. In addition, the nature of these loans is such that they are generally less predictable and more difficult to evaluate and monitor. As a result, repayment of these loans may, to a greater extent than residential loans, be subject to adverse conditions in the real estate market or economy.
28
If we fail to effectively manage credit risk and interest rate risk, our business and financial condition will suffer.
We must effectively manage credit risk. There are risks inherent in making any loan, including risks with respect to the period of time over which the loan may be repaid, risks relating to proper loan underwriting and guidelines, risks resulting from changes in economic and industry conditions, risks inherent in dealing with individual borrowers and risks resulting from uncertainties as to the future value of collateral. There is no assurance that our credit risk monitoring and loan approval procedures are or will be adequate or will reduce the inherent risks associated with lending. Our credit administration personnel, policies and procedures may not adequately adapt to changes in economic or any other conditions affecting customers and the quality of our loan portfolio. Any failure to manage such credit risks may adversely affect our business, financial condition, and results of operations.
We must also effectively manage interest rate risk. Because mortgage loans typically have much longer maturities than deposits or other types of funding, rising interest rates can raise the cost of funding relative to the value of the mortgage loan. We manage this risk in part by holding adjustable rate mortgages in portfolios and through other means. Conversely, the value of our mortgage servicing assets may fall when interest rates fall, as borrowers refinance into lower rate loans. Given current rates, material reductions in rates may not be probable, but as rates rise, this risk increases, as evidenced by the March 2023 bank failures. There can be no assurance that we will successfully manage the lending and servicing businesses through all future interest rate environments.
A lack of liquidity and/or ineffective liquidity management practices could affect our operations and jeopardize our financial condition.
Liquidity is essential to our business. An inability to raise funds through deposits, borrowings, the sale of loans and other sources could have a substantial negative effect on our liquidity. Our funding sources include core deposits, federal funds purchased, securities sold under repurchase agreements, non-core deposits, and short- and long-term debt. Other sources of liquidity are available to us should they be needed, including our ability to acquire additional non-core deposits, the issuance and sale of debt securities, a secured line of credit we have with U.S. Bank, advances from the Federal Home Loan Bank of Atlanta and the Federal Reserve Discount Window, and the issuance and sale of preferred or common securities in public or private transactions. Our access to funding sources in amounts adequate to finance or capitalize our activities or on terms that are acceptable to us could be impaired by factors that affect us specifically or the financial services industry or economy in general, as evidenced by the March 2023 bank failures. Our ability to borrow could be impaired by factors that are not specific to us, such as further disruption in the financial markets or negative views and expectations about the prospects for the financial services industry in light of the recent turmoil faced by banking organizations and the continued deterioration in credit markets.
Further, effective management of liquidity risk includes, among other practices, establishing liquidity key risk indicators and related risk tolerances, maintaining a portfolio of high-quality liquid assets, building and maintaining loan collateral at the Federal Home Loan Bank of Atlanta and Federal Reserve Discount Window, cash flow forecasting, diversifying funding sources, designing and using stress testing scenarios, and implementing an operational contingency funding plan. Our failure to effectively manage our liquidity risk through one or more of these practices could lead to operational disruptions, financial losses, and reputational damage, resulting in an adverse effect on our business, financial condition, and results of operations.
The results of our most recent stress tests may not accurately predict the impact on our financial condition if the economy were to deteriorate.
We perform capital stress testing on an annual basis using the stress testing assumptions provided by the regulators for the CCAR stress tests. We perform liquidity stress testing and credit stress testing on a quarterly basis. Under the capital stress test, we estimate our loan losses (loan charge-offs), resources available to absorb those losses and any necessary additions to capital that would be required under the “severely adverse” stress test scenario. The results of these stress tests involve many assumptions about the economy and future loan losses and default rates and may not accurately reflect the impact on our financial condition if the economy were to deteriorate. Any deterioration of the economy could result in credit losses significantly higher, with a corresponding impact on our financial condition and capital, than those predicted by our internal stress test.
29
The Current Expected Credit Loss (“CECL”) standard may result in increased volatility and further increases in our allowance for credit losses (“ACL”).
The measure of our ACL is dependent on the interpretation of applicable accounting standards, as well as external events, including the amount and pace of interest rate increases, market conditions, including recession risk and the possible impact on the unemployment rate and the performance of our loan portfolio, and other factors including the conflict in Ukraine, the escalating conflict between Israel and Hamas, supply chain disruptions, and pandemics such as the COVID-19 pandemic, among others. We adopted the Financial Accounting Standards Board’s Current Expected Credit Loss, or CECL standard, in the first quarter of 2020. Under the CECL model, we are required to present certain financial assets carried at amortized cost, such as loans held for investment and held to maturity debt securities, at the net amount expected to be collected. The measurement of expected credit losses is based on information about past events, including historical experience, current conditions, and reasonable and supportable forecasts that affect the collectability of the reported amount and certain management judgments over the life of the loan. This initial measurement took place as of January 1, 2020 at the time of our adoption of CECL.
The CECL model has resulted in and may continue to result in more volatility in the level of our ACL, as compared to the “incurred loss” standard that we previously applied in determining our ACL. The CECL model requires us to estimate the lifetime “expected credit loss” with respect to loans and other applicable financial assets, which may change more rapidly than the level of “incurred losses” that would have been used to determine our allowance for loan losses under the prior incurred loss standard. The potentially material effects of the continuation of the COVID-19 pandemic on lifetime expected credit loss, and the challenges associated with estimating lifetime credit losses in view of the uncertain ultimate impacts of the pandemic, has resulted and may continue to result in increased volatility and significant additions to our ACL in the future, which could have a material and adverse effect on our business, financial condition and results of operations. The Company’s estimate of its ACL involves a high degree of judgment; therefore, the Company's process for determining expected credit losses may result in a range of expected credit losses. It is possible that others, given the same information, may at any point in time reach a different reasonable conclusion. Further, if management’s assumptions and judgments prove to be incorrect and the allowance for credit losses is inadequate to absorb losses going forward, or if bank regulatory authorities require us to increase the allowance for credit losses as a part of their examination process, our earnings and capital could be significantly and adversely affected.
Our size and continued pace of growth may require us to raise additional capital in the future, but that capital may not be available when it is needed.
We are required by federal and state regulatory authorities to maintain adequate levels of capital to support our operations. Our ability to raise capital, if needed, in the future to meet capital requirements or otherwise will depend on conditions in the capital markets at that time, which are outside our control, and on our financial performance. Accordingly, there is no assurance as to our ability to raise additional capital if needed on terms acceptable to us. If we cannot raise additional capital when needed, our ability to further expand our operations through internal growth and acquisitions could be materially impaired.
Our ability to access the capital markets, if needed, will depend on a number of factors, including the state of the financial markets. Rising interest rates, disruptions in financial markets, negative perceptions of our business or our financial strength, or other factors may impact our ability to raise additional capital, if needed, on terms acceptable to us. For example, in the event of future turmoil in the banking industry or other idiosyncratic events, there is no guarantee that the U.S. government will invoke the systemic risk exception, create additional liquidity programs, or take any other action to stabilize the banking industry or provide liquidity. Any diminished ability to access short-term funding or capital markets to raise additional capital, if needed, could subject us to liability, restrict our ability to grow, require us to take actions that would affect our earnings negatively or otherwise affect our business and our ability to implement our business plan, capital plan and strategic goals adversely.
30
Our processes for managing risk may not be effective in mitigating risk or losses to us.
The objectives of our risk management program and processes are to mitigate risk and loss to our organization. We have established an enterprise risk framework and program that are intended to identify, measure, monitor, report and analyze the types of risks to which we are subject across the organization and business lines, including liquidity risk, credit risk, strategic risk, market risk, interest rate risk, operational risk (including payments risk, BSA/AML risk, and model risk), cybersecurity risk, corporate governance and legal risk, compliance risk, strategic risk, and reputational risk (including environmental and social risks), among others. We also assess new and emerging risks on our existing programs. However, this framework will evolve as we expect to become subject to heightened expectations from the OCC as we grow above $50 billion in assets. In addition, as with any risk management process, there are inherent limitations to our risk management strategies as there may exist, or develop in the future, risks that we have not appropriately anticipated or identified. The ongoing developments in the financial institutions industry continue to highlight both the importance and some of the limitations of managing unanticipated risks. Any potential new regulations or modifications to existing regulations would also likely necessitate changes to our existing regulatory compliance and risk management infrastructure. If our risk management processes prove ineffective, we could suffer unexpected losses and could be materially adversely affected.
Rising mortgage rates and adverse changes in mortgage market conditions could adversely impact our mortgage line of business.
Our mortgage line of business contributes significantly to our results of operations. The residential real estate mortgage lending business is sensitive to changes in interest rates, especially long-term interest rates. As interest rates increased during 2022 and 2023, the demand for mortgages has decreased materially, and our mortgage volume has substantially decreased as well. While we have adjusted our business model to sell a larger percentage of our originations into the secondary market, the gain on sale opportunities have been smaller than in previous years. Further, the portion of our mortgage loans that are originated for our portfolio subjects the Company to increased interest rate risk. Additionally, the fair value of our mortgage servicing rights is sensitive to changes in interest rates and interest rate volatility. Any change in the fair value of our mortgage servicing rights may negatively impact earnings. As a result of these and other factors, our price and profitability targets for this business may not be met, reducing our results of operations in the line of business and our net income. Further, risk in the mortgage business is heightened due to external factors, such as compliance with regulations, historically low housing inventories restraining home sales, competitive alternatives, changing tax rates and strategies, economic conditions, and shifting market preferences, which could impact the profitability of these lines of business and have a material adverse effect on our businesses, and, in turn, our financial condition and results of operations.
Our recent results may not be indicative of our future results.
We may not be able to sustain our historical rate of growth or may not even be able to grow our business at all. In addition, our recent growth may distort some of our historical financial ratios and statistics. Various factors, such as economic conditions, regulatory and legislative considerations and competition, may also impede or prohibit our ability to expand our market presence. If we experience a significant decrease in our historical rate of growth, our results of operations and financial condition may be adversely affected due to a high percentage of our operating costs being fixed expenses.
31
We are subject to environmental risks in our lending activities.
Because a significant portion of our loan portfolio is secured by real property, we may foreclose upon and take title to such property in the ordinary course of business. If hazardous substances were discovered on any of these properties, we may be liable to governmental agencies or third parties for the full costs of remediation, as well as for related personal injury and property damage. Environmental laws might require us to incur substantial expenses, materially reduce the property’s value, or limit our ability to use or sell the property. Although our management has policies requiring environmental reviews before loans secured by real property are made and before foreclosure is commenced, it is still possible that environmental risks might not be detected and that the associated costs might have a material adverse effect on our financial condition and results of operations. Many environmental laws impose liability regardless of whether the Company knew of, or was responsible for, the contamination. In addition, banks’ credit and underwriting policies that result in funding fossil fuel projects may impact climate change and lead to increased greenhouse gas emissions. Banks have very limited control over the actions of their clients, and while banks can monitor client emissions and environmental profiles, information currently available is insufficient to assess both climate risk and the financial risk inherent in making lending decisions. Accordingly, the Bank may be unable to assess how our lending decisions affect both our risk profile and our profitability as well as our clients’ efforts to address climate change.
While we use appraisals in deciding whether to make a loan that is secured by real estate, they do not ensure the value of the real property collateral.
In deciding whether to make a loan secured by real property, we generally require an appraisal. However, an appraisal is only an estimate of the value of the property at the time the appraisal is made. If the appraisal amount does not reflect the amount that may be obtained upon a sale or foreclosure of the property, we may not realize an amount equal to the indebtedness secured by the property.
We are subject to losses due to errors, omissions or fraudulent behavior by our employees, clients, counterparties or other third parties.
We are exposed to many types of operational risk, including the risk of fraud by third parties, customers and employees, clerical recordkeeping errors and transactional errors. Like the financial services industry overall, we have seen an increase in fraudulent attempts on accounts, online transactions, and debit cards during 2023, and these attempts may continue to accelerate with the increased use of artificial intelligence to produce sophisticated malware, phishing schemes, and other fraudulent activities. While (i) our procedures are designed to follow customary, industry-specific security precautions, (ii) we provide employees with ongoing training, table-top exercises and regular communications and guidance to combat fraud, and (iii) we have adopted additional cybersecurity tools and solutions designed to identify fraudulent attempts, our efforts might not be successful in mitigating or reducing fraudulent attempts resulting in financial losses, increased litigation risk and reputational harm.
Our business also is dependent on our employees as well as third-party service providers to process a large number of increasingly larger and more complex transactions. These risks will increase as we implement a real time payments platform. We could be materially and adversely affected if employees, clients, counterparties or other third parties caused an operational breakdown or failure, either as a result of human error, fraudulent manipulation or purposeful damage to any of our operations or systems.
In deciding whether to extend credit or enter into other transactions with clients and counterparties, we may rely on information furnished to us by or on behalf of clients and counterparties, including financial statements and other financial information. We also may rely on representations of clients and counterparties as to the accuracy and completeness of that information and, with respect to financial statements, on reports of independent auditors. For example, in deciding whether to extend credit to clients, we may assume that a customer’s audited financial statements conform to GAAP and present fairly, in all material respects, the financial condition, results of operations and cash flows of the customer. Our earnings are significantly affected by our ability to properly originate, underwrite and service loans. Our financial condition and results of operations could be negatively impacted to the extent we incorrectly assess the creditworthiness of our borrowers, fail to detect or respond to deterioration in asset quality in a timely manner, or rely on financial statements that do not comply with GAAP or are materially misleading.
32
The adoption of artificial intelligence tools by us and our third-party vendors and service providers may increase the risk of errors, omissions, unfair treatment or fraudulent behavior by our employees, clients, or counterparties, or other third parties.
Our adoption of artificial intelligence, including generative artificial intelligence, machine learning, and similar tools and technologies that collect, aggregate, analyze or generate data or other materials or content (collectively, “AI”), for limited internal use has increased our efficiency, and we expect to continue to adopt such tools as appropriate. In addition, we expect our third-party vendors and service providers to increasingly develop and incorporate AI into their product offerings faster than we are able to do so independently. There are significant risks involved in utilizing AI and no assurance can be provided that our or our third-party vendors’ or service providers’ use of AI will enhance our or our third-party vendors’ or service providers’ products or services or produce the intended results. The adoption and incorporation of such tools can lead to concerns around safety and soundness, fair access to financial services, fair treatment of consumers, and compliance with applicable laws and regulations. Such risk can result from models being poorly designed or faulty data being used, inadequate model testing or validation, narrow or limited human oversight, inadequate planning or due diligence, inappropriate or controversial data practices by developers or end-users, and other factors adversely affecting public opinion of AI and the acceptance of AI solutions. We have implemented an AI governance function and risk management framework that includes a risk assessment of internal and vendor AI solutions, due diligence, model validation, and controls. However, given the pace of rapid adoption of such tools by vendors and service providers, we may not be aware of the addition of AI solutions prior to such tools being introduced into our environment. Failure to adequately manage AI risks can result in erroneous results and decisions made by misinformation, unwanted forms of bias, unauthorized access to sensitive, confidential, proprietary or personal information, and violations of applicable laws and regulations, leading to operational inefficiencies, competitive harm, reputational harm, ethical challenges, legal liability, losses, fines, and other adverse impacts on our business and financial results. If we do not have sufficient rights to use the data or other material or content on which the AI tools we use rely, or to use the output of such AI tools, we also may incur liability through the violation of applicable laws and regulations, third-party intellectual property, privacy or other rights, or contracts to which we are a party.
In addition, regulation of AI is rapidly evolving as legislators and regulators are increasingly focused on these powerful emerging technologies. The technologies underlying AI and its uses are subject to a variety of laws and regulations, including intellectual property, data privacy and cybersecurity, consumer protection, competition, equal opportunity, and fair lending laws, and are expected to be subject to increased regulation and new laws or new applications of existing laws and regulations. AI is the subject of ongoing review by various U.S. governmental and regulatory agencies, and various U.S. states are applying, or are considering applying, existing laws and regulations to AI or are considering general legal frameworks for AI. We may not be able to anticipate how to respond to these rapidly evolving frameworks, and we may need to expend resources to adjust our operations or offerings in certain jurisdictions if the legal frameworks are inconsistent across jurisdictions. Furthermore, because AI technology itself is highly complex and rapidly developing, it is not possible to predict all of the legal, operational or technological risks that may arise relating to the use of AI.
We are subject to environmental, social and governance (“ESG”) risks that could adversely affect our reputation, the trading price of our common stock and/or our business, operations, and earnings.
Governments, investors, customers, and the general public are increasingly focused on ESG practices and disclosures. For us and others in the financial services industry, this focus extends to the practices and disclosures of the customers, counterparties, and service providers with whom we choose to do business. In addition, certain organizations that provide corporate governance and other corporate risk information to investors and shareholders have developed scores and ratings to evaluate companies based upon ESG metrics. Currently, there are no universal standards for such scores or ratings, and views about ESG are diverse, dynamic, and rapidly changing. If we were to fail to maintain an appropriate ESG program, practices and disclosures, we could face potential negative ESG-related publicity in traditional and social media, including based on the identity of those we choose to do business with and the public’s view of those customers. In addition, certain states, including Florida, have enacted laws that would impair our ability to conduct certain business in the state if the Bank’s policies were to result in account closures due to factors that could be seen as promoting an ESG framework. If we or our relationships with customers, vendors and suppliers were to become the subject of negative publicity due to a perception of our ESG program, our ability to attract and retain customers and employees may be negatively impacted and our stock price may also be impacted.
33
Additionally, investors have begun to consider how corporations are addressing ESG matters when making investment decisions. For example, certain investors incorporate the business risks of climate change and the adequacy of companies’ responses to climate change and other ESG matters as part of their investment theses. During 2022, the SEC issued a proposal that would require disclosures regarding the Company’s climate risk management, and would require various reporting on the Company’s direct and indirect emissions, including what is called Scope 1, 2 and 3 emissions, as well as transition risk, which proposal is still pending. California has passed a similar disclosure law applicable to companies (such as the Company) that have more than $1 billion in annual revenues and operations in California. While the Company has established an ESG program and a climate risk steering committee and is in the process of determining its Scope 1 and 2 emissions, these rules will require material investment by the Company to fully implement. Any negative publicity regarding ESG or shifts in investing priorities or in required disclosures may result in adverse effects on the trading price of our common stock and/or our business, operations and earnings if investors, shareholders or other stakeholders determine that we have not adequately considered or addressed ESG matters.
Our business could suffer if we fail to maintain our culture and attract and retain experienced people.
Our success depends, in large part, on our ability to attract and retain competent, experienced people. Our strategic goals in particular require that we be able to attract qualified and experienced retail, commercial and corporate banking officers, mortgage loan officers, and SBA lenders in our existing markets as well as those markets in which we may want to expand who share our relationship banking philosophy and have those customer relationships that will allow us to grow successfully. We also need to attract and retain qualified and experienced technology, risk and back-office personnel to operate our business. Many of our competitors are pursuing the same relationship banking strategy in our markets and are looking to hire and retain qualified technology, risk and back-office personnel, which increases the competition to identify, hire and retain talented employees.
The Company’s recent mergers and the continued integration of the Company’s operations and employees into one bank creates an additional risk to the Company’s culture. If we fail to consider and account for corporate cultural differences across the companies due to various mergers, we will face increased difficulty in creating a cohesive culture.
We have focused, and will continue to focus, our strategic attention on our employees and our corporate culture, including enhancing our employee orientation, ongoing general credit and management training, leadership training and mentoring, and employee work environment as well as diversity and employee advancement. Our failure to maintain our culture and attractive working environment, through competitive compensation packages that reward initiative, as well as mentoring, training, and advancement opportunities in order to successfully compete for experienced, qualified employees may have an adverse effect on our ability to meet our financial goals and thus adversely affect our future results of operations.
If we are unable to offer our key management personnel long term incentive compensation, including restricted stock units and performance share units, as part of their total compensation package, we may have difficulty retaining such personnel, which would adversely affect our operations and financial performance.
We have a management team that has substantial experience in banking and financial services in the markets we serve. We rely on our management team to achieve and sustain our profitability. Our future success and profitability are substantially dependent upon this management and banking abilities of our senior executives. Although we currently have employment agreements in place with our executive management team and our regional presidents, we cannot guarantee that our executives will remain with us. Changes in key personnel and their responsibilities may be disruptive to our business because of their skills, customer relationship and/or the potential difficulty of promptly replacing them with successors.
We have historically granted equity awards under an equity compensation plan, which includes granting performance share units and restricted stock awards or restricted stock units, to key management personnel as part of a competitive compensation package. Our ability to grant these awards has been vital to attracting, retaining and aligning shareholder interest with a talented management team in a highly competitive marketplace.
34
Shareholder advisory groups have implemented guidelines and issued voting recommendations related to how much equity companies should be able to grant to employees. The factors used to formulate these guidelines and voting recommendations include the volatility of a company’s share price and are influenced by broader macroeconomic conditions that can change year to year. The variables used by shareholder advisory groups to formulate equity plan recommendations may limit our ability to adopt new equity plans in the future. In addition, the federal banking regulators have issued guidance on executive compensation and have also, along with the SEC, proposed rules that would prohibit certain incentive compensation arrangements. We do not believe that the guidance or proposal will impact our current compensation arrangements.
If we are limited in our ability to grant equity compensation awards, we would need to explore offering other compelling alternatives to supplement our compensation, including long-term cash compensation plans or significantly increased short-term cash compensation, in order to continue to attract and retain key management personnel. If we used these alternatives to long-term equity awards, our compensation costs could increase, and our financial performance could be adversely affected. If we are unable to offer key management personnel long-term incentive compensation, including stock options, restricted stock or restricted stock units, or performance share units, as part of their total compensation package, we may have difficulty attracting and retaining such personnel, which would adversely affect our operations and financial performance.
We rely on the performance of highly skilled personnel and if we are unable to attract, retain, develop and motivate our human capital in the form of well-qualified employees, our business and results of operations could be harmed.
We believe our success has depended, continues to and in the future will depend, on the efforts and talents of our management team and our highly skilled employees and workers. Our future success depends on our continuing ability to attract, develop, motivate and retain highly qualified and skilled employees. The loss of any of our senior management or key employees could materially and adversely affect our ability to build on the efforts that they have undertaken and to execute our business plan, and we may not be able to find adequate replacements. Despite our current efforts, we cannot ensure that we will be able to retain the services of any members of our senior management or other key employees. If we do not succeed in attracting well-qualified employees or developing, retaining, and motivating our employees, our business and results of operations could be harmed.
We may not be able to successfully implement current or future information technology and cybersecurity system enhancements and operational initiatives, which could adversely affect our business operations and profitability.
We continue to invest significant resources in our information technology and cybersecurity systems, including by deepening and expanding our use of cloud-based applications, in order to provide enhanced functionality and security at an appropriate level, improve our operating efficiency, and streamline our client experience. These initiatives significantly increase the complexity of our relationships with third-party service providers, and such relationships may be difficult to unwind. We may not be able to successfully implement and integrate such system enhancements and initiatives, which could adversely impact our ability to enhance our product and service offerings and meet the expectations of our customers. In addition, these projects could have higher than expected costs and/or result in operating inefficiencies, which could increase the costs associated with the implementation as well as ongoing operations. Failure to properly adopt system enhancements could result in impairment charges that adversely impact our financial condition and results of operations, could result in significant costs to remediate or replace the defective components and could impact our ability to compete. In addition, we may incur significant training, licensing, maintenance, consulting and amortization expense during and after implementation, and any such costs may continue for an extended period of time. As such, we cannot guarantee that the anticipated long-term benefits of these system enhancements and operational initiatives will be realized.
35
A failure of or disruption to our operational or security systems or infrastructure, or those of our third-party service providers, could disrupt our business, damage our reputation, increase our costs and cause losses.
The potential for operational risk exposure exists throughout our business and, as a result of our interactions with, and reliance on, third parties, is not limited to our own internal operational functions. We depend on our ability to process, record and monitor a large number of client transactions on a continuous basis. Further, third parties provide key components of our business infrastructure, such as our core processing, underwriting and servicing software, data collection and analysis, loan and deposit documents, compliance and risk software, product and service offerings, and internet connections and network access. As client, public and regulatory expectations regarding operational and information and cyber security have increased, we and our third-party service providers must continue to safeguard and monitor our operational and security systems and infrastructure for potential failures, disruptions and breakdowns. Our business, financial, accounting, data processing, or other operating systems and facilities, or those of our third-party service providers, may stop operating properly or become disabled or damaged as a result of a number of factors, including events that are wholly or partially beyond our control. Although we have information and cybersecurity policies and procedures, business continuity plans and other safeguards in place, our business operations may be adversely affected by significant and widespread failure of or disruption to our operational and security systems and infrastructure that support our businesses and clients. Any disruption or failure in our operational or security systems or infrastructure or the services provided by third parties, or any failure by us or these third parties to handle current or higher volumes of use, could adversely affect our ability to deliver products and services to our clients, process transactions and otherwise to conduct business.
For example, our financial, accounting, data processing, backup or other operational or security systems or infrastructure, or those of our third-party service providers, may fail to operate properly or become disabled or damaged as a result of a number of factors, including: sudden increases in customer transaction volume; electrical, telecommunications or other major physical infrastructure outages; cyber-attacks, information security breaches or other similar incidents; natural disasters such as earthquakes, tornadoes, hurricanes and floods; pandemics; and events arising from local or larger scale political or social matters, including wars and terrorist acts. In addition, we rely on our employees and third parties in our day-to-day and ongoing operations, who may, as a result of human error, misconduct, malfeasance or failure, expose us to risk. Moreover, technological or financial difficulties of one of our third-party service providers or their sub-contractors could adversely affect our business to the extent those difficulties result in the interruption or discontinuation of services provided by that party. In the event that backup systems are utilized, they may not process data as quickly as our primary systems and some data might not have been saved to backup systems, potentially resulting in a temporary or permanent loss of such data. Further, our ability to implement backup systems and other safeguards with respect to third-party systems is more limited than with respect to our own systems. Our business recovery plan may not be adequate and may not prevent significant interruptions of our operations or substantial losses. While we have policies and procedures designed to prevent or limit the effect of a disruption to or failure of the operation of our operational and security systems and infrastructure, there could be no assurance that any such disruptions or failures will not occur or, if they do, that they will be adequately addressed. Any failure or interruption in the operation of our communications and information systems and networks could impair or prevent the effective operation of our customer relationship management, general ledger, deposit, lending or other functions. We frequently update our systems to support our operations and growth and to remain compliant with all applicable laws, rules and regulations. This updating entails significant costs and creates risks associated with implementing new systems and integrating them with existing ones, including business interruptions. Implementation and testing of controls related to our computer systems, security monitoring and retaining and training personnel required to operate our systems also entail significant costs.
We may not be insured against all types of losses as a result of disruptions to or failures of our operational and security systems and infrastructure or those of our third-party service providers, and our insurance coverage may not be available on reasonable terms, or at all, or may be inadequate to cover all losses resulting from such disruptions or failures. Disruptions or failures in our business structure or in the structure of one or more of our third-party service providers could interrupt the operations or increase the cost of doing business. The occurrence of any disruptions or failures impacting our or our third-party service providers’ operational or security systems or infrastructure could damage our reputation, result in a loss of customer business, and expose us to additional regulatory scrutiny, civil litigation, and possible financial liability, any of which could have a material adverse effect on our liquidity, financial condition and results of operations.
36
We face cybersecurity risks from cyber-attacks, information security breaches and other similar incidents that could result in the disclosure of confidential and other information (including personal information), adversely affect our business or reputation, and create significant legal and financial exposure.
Our computer systems and network infrastructure and those of third parties, on which we are highly dependent, are subject to cybersecurity risks and could be susceptible to cyber-attacks, information security breaches and other similar incidents. Our business relies on the secure processing, transmission, storage, retrieval and other processing of confidential, proprietary, personal and other information in our computer and data management systems and networks, and in the computer and data management systems and networks of third parties. In addition, to access our network, products and services, our customers and other third parties may use personal mobile devices or computing devices that are outside of our network environment and are subject to their own cybersecurity risks.
We, our customers, regulators and other third parties, including other financial services institutions and companies engaged in data processing, have been subject to, and are likely to continue to be the target of, cyber-attacks, information security breaches, and other similar incidents. These may include hacking, terrorist activities, identity theft, computer viruses, malicious or destructive code, phishing attacks, denial of service attacks, ransomware, improper access by employees or third parties, social engineering, attacks on personal email of employees, or other information security breaches or similar incidents that could result in the unauthorized release, gathering, monitoring, misuse, misappropriation, loss, disclosure or destruction of confidential, proprietary, personal and other information of ours, our employees, our customers or of third parties, damage our systems or otherwise materially disrupt our or our customers’ or other third parties’ network access or business operations. As cyber threats continue to evolve, we may be required to expend significant additional resources to continue to modify or enhance our protective measures or to investigate and remediate any cyber-attacks, information security breaches or vulnerabilities or other similar incidents. Despite efforts to ensure the integrity of our systems and implement controls, processes, policies and other protective measures, we may not be able to anticipate or detect all cyber-attacks, information security breaches or other similar incidents, nor may we be able to implement guaranteed preventive measures against such security breaches. Cyber threats are increasing and rapidly evolving, and we may not be able to anticipate or prevent all such attacks and could be held liable for any security breach or loss.
Cybersecurity risks for banking organizations have significantly increased in recent years, in part because of the proliferation of new technologies and the use of the internet and telecommunications technologies to conduct financial transactions. For example, cybersecurity risks may increase in the future as we continue to increase our mobile payment and other internet-based product offerings and expand our internal usage of web-based products and applications and as artificial intelligence tools are increasingly used for purposes of cyber-attacks, information security breaches, and other similar incidents, including for targeted social engineering attacks. In addition, cybersecurity risks have significantly increased in recent years in part due to the increased sophistication and activities of organized crime affiliates, terrorist organizations, hostile foreign governments, disgruntled employees, service providers, activists and other external parties, including those involved in corporate espionage. Even the most advanced internal control environment may be vulnerable to compromise. For example, targeted social engineering attacks and “spear phishing” attacks are becoming more sophisticated and are extremely difficult to prevent. In such an attack, an attacker will attempt to fraudulently induce colleagues, customers or other users of our systems to disclose sensitive information in order to gain access to its data or that of its clients. Persistent attackers may succeed in penetrating defenses given enough resources, time, and motive. The techniques used by cyber criminals change frequently and may not be recognized until launched or until well after a breach has occurred.
The risk of a security breach caused by a cyber-attack at a service provider or by unauthorized service provider access has also increased in recent years. Additionally, the existence of cyber-attacks, information security breaches, or other similar incidents at third-party service providers with access to our confidential, proprietary, personal and other information may not be disclosed to us in a timely manner. While we have processes in place to monitor our third-party service providers’ data and information security safeguards, we do not control such service providers’ day to day operations and a successful cyber-attack, information security breach, or other similar incident at one or more of such third-party service providers is not within our control. The occurrence of any such cyber-attacks, information security breaches, or other incidents could damage our reputation, result in a loss of customer business, and expose us to additional regulatory scrutiny, civil litigation, and possible financial liability, any of which could have a material adverse effect on our financial condition and results of operations. Further, in some instances we may be responsible for the failure of such third parties to comply with government regulations.
37
We also face indirect technology, cybersecurity and operational risks relating to the customers, clients and other third parties with whom we do business or upon whom we rely to facilitate or enable our business activities, including, for example, financial counterparties, regulators, and providers of critical infrastructure such as internet access and electrical power. As a result of increasing consolidation, interdependence and complexity of financial entities and technology systems, a technology failure, cyber-attack, information security breach or other similar incident that significantly degrades, deletes or compromises the systems or data of one or more financial entities could have a material impact on counterparties or other market participants, including us. This consolidation, interconnectivity and complexity increases the risk of operational failure, on both individual and industry-wide bases, as disparate systems need to be integrated, often on an accelerated basis. Any third-party technology failure, cyber-attack, information security breach, or other similar incident could, among other things, adversely affect our ability to effect transactions, service our clients, manage our exposure to risk or expand our business. In addition, we, our employees, and our customers are increasingly transitioning our and their computing infrastructure to cloud-based computing, storage, data processing, networking and other services, which may increase our cybersecurity risk.
Cyber-attacks, information security breaches, and other similar incidents, whether directed at us or third parties, may result in a material loss or have material consequences. Furthermore, the public perception that a cyber-attack on our systems has been successful, whether or not this perception is correct, may damage our reputation with customers and third parties with whom we do business. Hacking or other unauthorized disclosure of personal information and identity theft risks, in particular, could cause serious reputational harm. A successful penetration or circumvention of system security could cause us serious negative consequences, including our loss of customers and business opportunities, significant business disruption to our operations and business, misappropriation or destruction of our confidential, proprietary, personal or other information and/or that of our customers or other third parties, or damage to our or our customers’ and/or third parties’ computers or systems, and could result in a violation of applicable data privacy and cybersecurity laws and other laws, litigation exposure, regulatory fines, penalties or intervention, loss of confidence in our security measures, reputational damage, reimbursement or other compensatory costs, additional compliance costs, and could adversely impact our results of operations, liquidity and financial condition. We may not be insured against all types of losses as a result of cyber-attacks, information security breaches and other similar incidents, and our insurer may deny coverage as to any future claim or insurance coverage may not be available on reasonable terms, or at all, or may be inadequate to cover all losses resulting from such incidents.
Although to date we have not experienced any material losses related to cyber-attacks, information security breaches, or other similar incidents, there can be no assurance that we will not suffer such losses in the future.
We may face risks with respect to future expansion.
Our business growth, profitability and market share has been enhanced by us engaging in strategic mergers and acquisitions and de novo branching either within or contiguous to our existing footprint. We may acquire other financial institutions or parts of financial institutions in the future and engage in lift outs of our banking teams or de novo branching. We may also consider and enter into or acquire new lines of business or offer new products or services, which may also use new sales channels, such as online and mobile banking. As part of our acquisition strategy, we seek companies that are culturally similar to us, have experienced management, and are in markets in which we operate or close to those markets so we can achieve economies of scale.
We expect to continue to evaluate merger and acquisition opportunities that are presented to us in our current and expected markets and conduct due diligence related to those opportunities, as well as negotiate to acquire or merge with other institutions. If we announce a transaction, we may issue equity securities, including common stock and securities convertible into shares of our common stock in connection with future acquisitions. We also may issue debt to finance one or more transactions, including subordinated debt issuances. Generally, acquisitions of financial institutions involve the payment of a premium over book and market values, resulting in dilution of our tangible book value and fully diluted earnings per share, as well as dilution to our existing shareholders. We also face litigation risks with respect to potential mergers and acquisitions, and such litigation is common. We may incur substantial costs to expand, and we can give no assurance such expansion will result in the levels of profits we seek.
38
Given the OCC’s recent proposed policy statement on bank mergers and continued uncertainty around the regulatory approval process generally, there is no assurance that bank regulators will consider applications along historic timelines or will affirmatively act on an acquisition proposal, increasing the risk that market conditions will adversely affect the financial feasibility of completing an acquisition, obtaining cost savings and operational efficiencies, or realizing merger synergies upon integration. Failure to achieve or delays in achieving anticipated benefits could result in a share price reduction as well as increased costs, decreases in the amount of expected revenues, and diversion of management’s time and energy and could materially and adversely affect the Company’s financial condition, results of operations, business and prospects. Further, there is no assurance that, following any future mergers or acquisitions, our integration efforts will be successful or our Company, after giving effect to the acquisition, will achieve increased revenues comparable to or better than our historical experience, and failure to realize such expected revenue increases, cost savings, increases in market presence or other benefits could have a material adverse effect on our financial conditions and results of operations.
Attractive acquisition opportunities may not be available to us in the future.
While we seek continued organic growth, we anticipate continuing to evaluate merger and acquisition opportunities presented to us in our core markets, contiguous markets, and beyond. The number of financial institutions headquartered in our market areas in the Southeastern United States and across the country continues to decline through merger and other activity. We expect that other banking and financial companies, many of which have significantly greater resources, will compete with us to acquire financial services businesses. This competition, as the number of appropriate merger targets decreases, could increase prices for potential acquisitions which could reduce our potential returns, and reduce the attractiveness of these opportunities to us. In addition, acquisitions are subject to various regulatory approvals, and if we fail to receive the appropriate regulatory approvals, we will not be able to consummate an acquisition that we believe is in our best interests. Among other things, our regulators consider our capital, liquidity, profitability, risk management, regulatory and fair lending compliance, including with respect to BSA and AML obligations, consumer protection laws, CRA obligations, and levels of goodwill and intangibles when considering acquisition and expansion proposals.
The standards by which bank and financial institution acquisitions will be evaluated are currently in flux and some banking organizations, including us, are experiencing delays in the processing of applications. In July 2021, President Biden issued an executive order on competition that requires the banking agencies to review the standards for bank mergers. This review is still ongoing for bank mergers and may change how the financial stability factor and community convenience and needs factor are evaluated. The OCC has proposed a policy statement on bank mergers designed to clarify the agency’s consideration of the statutory factors in the Bank Merger Act for approval of a bank merger, listing the indicators the OCC finds to be consistent with approval. See Part I Item 1 “Supervision and Regulation - Regulation of the Bank” for further details on the OCC’s proposed policy statement. In addition, some in Congress have called for a moratorium of any bank merger and acquisition of greater than $100 billion in assets. These proposals imply that we may be subject to higher antitrust standards, enhanced scrutiny under the Bank Merger Act guidelines, potentially delaying regulatory processing of applications. Any delay in approvals increases costs and uncertainties in the ability to successfully merge and integrate the target. Any acquisition could be dilutive to our earnings and shareholders' equity per share of our common stock.
Our disclosure controls and procedures may not prevent or detect all errors or acts of fraud.
Our disclosure controls and procedures are designed to provide reasonable assurance that information required to be disclosed by us in reports we file or submit with the SEC is accurately accumulated and communicated to management, and recorded, processed, summarized, and reported within the time periods specified in the SEC’s rules and forms. We believe that any disclosure controls and procedures or controls and procedures, no matter how well conceived or operated, can provide only reasonable, not absolute, assurance that the objectives of the controls systems are met.
39
These inherent limitations include the reality that judgments and decision making can be faulty, that alternative reasoned judgments can be drawn, and that breakdowns can occur because of a simple error or mistake. Controls can be circumvented by the individual acts of some persons, by collusion of two or more people or by an authorized override of the controls. In addition, properly integrating our acquisitions into our disclosure controls and procedures in a timely manner presents challenges. Accordingly, because of the inherent limitations in our controls systems, misstatements due to error or fraud may occur and not be detected, which could result in a material weakness in our internal controls over financial reporting and the restatement of previously filed financial statements.
Our accounting policies and processes are critical to how we report our financial condition and results of operations and require our management to make estimates about matters that are uncertain.
Accounting policies and processes are fundamental to how we record and report our financial condition and results of operations. Some of these policies require the use of estimates and assumptions that may affect the value of our assets or liabilities and financial results. Several of our accounting policies are critical because they require management to make difficult, subjective and complex judgments about matters that are inherently uncertain and because it is likely that materially different amounts would be reported under different conditions or using different assumptions. Pursuant to generally accepted accounting principles, we are required to make certain assumptions and estimates in preparing our financial statements, including determining credit loss reserves, reserves related to litigation and the fair value of certain assets and liabilities, among other items. If the assumptions or estimates underlying our financial statements are incorrect, we may experience material losses.
Certain of our financial instruments, including trading assets and liabilities, derivatives, securities, and certain loans, among other items, require a determination of their fair value in order to prepare our financial statements. Where quoted market prices are not available, we may make fair value determinations based on internally developed models or other means which ultimately rely to some degree on management judgment. Some of these and other assets and liabilities may have no direct observable price levels, making their valuation particularly subjective, being based on significant estimation and judgment. In addition, some illiquidity in markets and declines in prices of certain loans and securities may make it more difficult to value certain balance sheet items, which may lead to the possibility that such valuations will be subject to further change or adjustment, it could lead to declines in our earnings.
The value of securities in our investment portfolio may decline in the future.
As of December 31, 2023, we owned $7.5 billion of investment securities, which included $2.5 billion in held-to-maturity securities, $4.8 billion in available for sale securities and $192.0 million in other investments. The fair value of our investment securities may be adversely affected by market conditions, including changes in interest rates, and the occurrence of any events adversely affecting the issuer of particular securities in our investments portfolio. For available-for-sale securities, the unrealized gains and losses are recorded in equity, net of tax, in accumulated other comprehensive income (“AOCI”). The Company has elected to exclude AOCI from its regulatory capital calculations, however, after the failure of a few financial institutions in the first quarter of 2023, many investors are taking into consideration losses in available for sale securities included in AOCI along with losses in held to maturity securities, which are not included in our financial statements, in looking at the valuations of financial institutions. If we experience further declines in the fair value of our available for sale and held to maturity securities, our stock price could be negatively impacted.
40
With adoption of Accounting Standards Codification (“ASC”) 326 effective January 1, 2020, we no longer evaluate securities for other-than-temporary impairments as the new accounting guidance changes the accounting for recognizing impairment on available for sale and held to maturity securities. We analyze each available for sale security on a quarterly on an individual basis to determine if there has been a decline in fair value below the amortized cost basis of the security to determine whether there is a credit loss associated with the decline in fair value. We consider the nature of the collateral, potential future changes in collateral values, default rates, delinquency rates, third-party guarantees, credit ratings, interest rate changes since purchase, volatility of the security’s fair value and historical loss information for financial assets secured with similar collateral among other factors. We use a systematic methodology to determine the ACL for investment securities held to maturity. The ACL is a valuation account that is deducted from the amortized cost basis to present the net amount expected to be collected on the held to maturity portfolio. We consider the effects of past events, current conditions, and reasonable and supportable forecasts on the collectability of the loan portfolio. Our estimate of the ACL involves a high degree of judgment; therefore, our process for determining expected credit losses my result in a range of expected credit losses. We monitor the held to maturity portfolio on a quarterly basis to determine whether a valuation account needs to be recorded. Because of changing economic and market conditions affecting issuers, we may be required to recognize expected credit losses on securities in future periods, which could have a material adverse effect on our business, financial condition or results of operations.
Consumers may decide not to use banks to complete their financial transactions.
Technology and other changes are allowing parties to complete financial transactions that historically have involved banks through alternative methods. For example, consumers can now maintain funds that would have historically been held as bank deposits in brokerage accounts, mutual funds or general purpose reloadable prepaid cards. Consumers can also complete transactions such as paying bills and/or transferring funds directly without the assistance of banks. The process of eliminating banks as intermediaries, known as “disintermediation,” could result in the loss of fee income, as well as the loss of customer deposits and the related income generated from those deposits. The loss of these revenue streams and the lower cost of deposits as a source of funds could have a material adverse effect on our financial condition and results of operations.
Our ability to maintain our reputation is critical to the success of our business, and the failure to do so may materially adversely affect our performance.
Our reputation is one of the most valuable components of our business. As such, we strive to conduct our business in a manner that enhances our reputation. This is done, in part, by recruiting, hiring, and retaining and providing growth opportunities for employees who share our core values of being an integral part of the communities we serve, delivering superior service to our customers, and caring about our customers and employees. If our reputation is negatively affected by the actions of our employees or otherwise, including as a result of a successful cyber-attack, information security breach or other similar incident we experience or any other unauthorized release or loss of customer information (including personal information), our business and, therefore, our operating results, may be materially adversely affected.
Actions by the financial service industry generally or by institutions or individuals in the industry can adversely affect our reputation indirectly by association. The proliferation of social media may increase the likelihood that negative public opinion from any of the real or perceived events in the financial services industry could impact our reputation and business. Negative public opinion could adversely affect the Company’s ability to attract and retain clients and teammates and can result in litigation and regulatory actions. All of these could adversely affect our growth, results of operation, and financial conditions.
41
Risks relating to the Regulatory Environment
We are subject to extensive regulation that could limit or restrict our activities.
We operate in a highly regulated industry and are subject to examination, supervision, and comprehensive regulation by various agencies, including the Federal Reserve, the OCC, CFPB, and the FDIC. These laws, regulations, and rules are imposed primarily to protect depositors, the FDIC Deposit Insurance Fund, consumers, and the banking system as a whole. We also are regulated by the SEC and the Financial Industry Regulatory Authority, or FINRA, whose regulations are designed to protect investors. Our compliance with these regulations is costly and potentially restricts certain of our activities, including payment of dividends, mergers and acquisitions, investments, loans and interest rates charged, interest rates paid and deposits and locations of our offices. We are also subject to capital guidelines established by our regulators, which require us to maintain sufficient capital to support our growth. Regulation of the financial services industry has increased significantly since the global financial crisis. The laws and regulations applicable to the banking industry could change at any time. The extent and timing of any regulatory reform as well as any effect on our business and financial results, are uncertain. Additionally, legislation or regulation may impose unexpected or unintended consequences, the impact of which is difficult to predict. Because government regulation greatly affects the business and financial results of all commercial banks and bank holding companies, our cost of compliance could adversely affect our ability to operate profitably.
In addition, the Biden Administration has sought to implement a more stringent regulatory agenda that is focused on fair lending issues, bank fees, and climate change. This agenda also has included a heightened focus on the regulation of loan portfolios and credit concentrations to borrowers impacted by climate change, heightened scrutiny on Bank Secrecy Act and anti-money laundering requirements, topics related to social equity, executive compensation, and increased capital and liquidity, as well as limits on share buybacks and dividends. In addition, mergers and acquisitions have been dampened by increased antitrust and regulatory scrutiny. The issuance of proposed rules and guidance in these areas, particularly around debit card fees and other consumer fees, if implemented as proposed, would have a material impact on our business, financial condition and results of operations.
Regulatory responses in connection with severe market downturns or unforeseen stress events may alter or disrupt our planned future strategies and actions. Adverse developments affecting the overall strength and soundness of other financial institutions, the financial services industry as a whole and the general economic climate and the U.S. Treasury market could have a negative impact on perceptions about the strength and soundness of our business even if we are not subject to the same adverse developments. For example, during 2023, the FDIC took control and was appointed receiver of Silicon Valley Bank, Signature Bank, and First Republic Bank, respectively. The failure of other banks and financial institutions and the measures taken by governments and regulators in response to these events could adversely impact our business, financial condition and results of operations.
Recent regulatory proposals may increase capital and liquidity risks.
If the changes to the capital rules issued by the banking regulators intended to bring the U.S. capital rules into conformance with the Basel Framework are adopted as proposed, banking organizations with assets of $100 billion or more may face significantly increased capital requirements. While the proposed rule does not affect the Company directly because it applies only to banking organizations with $100 billion or more in assets, it may adversely impact the Company due to general regulatory and investor expectations for the Company and the Bank to hold additional capital or as a result of larger banking organizations making changes in response to the increased capital requirements, which could have a material impact on the Company’s financial results and business mix. Please see Item I – Part 1 – “Supervision and Regulation – Capital Requirements” for further information regarding the capital rule proposal.
42
As the Company grows, the heightened expectations of regulatory agencies may expose us to additional regulatory risk.
As the Company grows above $50 billion in assets, the Company will be expected to bolster its risk management and governance framework to support a larger company. These expectations include established minimum standards for the design and implementation of the risk management framework and increased oversight and credible challenge by the board of directors over the Company’s risk profile and risk management practices. Our existing enterprise risk framework and program may not be easily scalable to meet such heightened expectations, thereby requiring lengthy or costly modifications to meet such expectations. Further, the Company’s existing workforce may not be sufficient or have the requisite skillset to design, operate and manage the bolstered framework, thereby requiring the Company to expend financial resources to hire and/or train the necessary staff. The Company’s failure to meet such heightened expectations may expose it to regulatory enforcement actions and civil penalties which could have an adverse material impact on the Company’s business, financial condition, operations and reputation and could jeopardize the Company’s ability to pursue acquisition opportunities.
We are required to maintain capital to meet regulatory requirements, and if we fail to maintain sufficient capital, whether due to losses, an inability to raise additional capital or otherwise, our financial condition, liquidity and results of operations, as well as our ability to maintain regulatory compliance, would be adversely affected.
The Company and the Bank each must meet regulatory capital requirements and maintain sufficient liquidity. Banking organizations experiencing growth, especially those making acquisitions, are expected to hold additional capital above regulatory minimums. From time to time, the regulators implement changes to these regulatory capital adequacy guidelines. In recent years, these market and regulatory expectations have increased substantially and have resulted in higher and more stringent capital requirements for us and the Bank.
Actions (if necessary) to increase capital, may adversely affect us. Our ability to raise additional capital, when and if needed, will depend on conditions in the capital markets, economic conditions and a number of other factors, including investor perceptions regarding the banking industry and market condition, and governmental activities, many of which are outside our control, and on our financial condition and performance. Accordingly, we cannot assure you that we will be able to raise additional capital if needed or on terms acceptable to us. If we fail to meet these capital and other regulatory requirements, our financial condition, liquidity and results of operations would be materially and adversely affected.
Our failure to remain “well capitalized” for bank regulatory purposes could affect customer confidence, our ability to grow, our costs of funds, and FDIC insurance costs, our ability to pay dividends on common stock and make distributions on our trust preferred securities, our ability to make acquisitions, and our business, results of operations and financial condition. Under FDIC rules, if our subsidiary bank ceases to be a “well capitalized” institution for bank regulatory purposes, the interest rates that it pays and its ability to accept brokered deposits may be restricted. At December 31, 2023, we had approximately $719.7 million in wholesale brokered deposits, $29.1 million of in-market CDARs deposits, $2.1 billion of ICS deposits and approximately $59.5 million of deposits related to our prepaid card business, which are considered brokered deposits for regulatory purposes.
We are subject to examination and scrutiny by a number of banking agencies and, depending upon the findings and determinations of these agencies, we may be required to make adjustments to our business that could adversely affect us.
The banking agencies regularly conduct examinations of our business, including compliance with applicable laws and regulations. If, as a result of an examination, a banking agency were to determine that the financial condition, capital resources, asset quality, asset concentration, earning prospects, management, liquidity, sensitivity to market risk, consumer compliance, or other aspects of any of our operations has become unsatisfactory, or that we or our management is in violation of any law or regulation, it could take a number or different remedial actions as it deems appropriate. These actions include the power to enjoin “unsafe or unsound” practices, to require affirmative actions to correct any conditions resulting from any violation or practice, to issue an administrative order that can be judicially enforced, to direct an increase in our capital, to restrict our growth, to change the asset composition of our portfolio or balance sheet, to assess civil money penalties against our officers or directors, to remove officers and directors and, if it is concluded that such conditions cannot be corrected or there is an imminent risk of loss to depositors, to terminate our deposit insurance. If we become subject to such regulatory actions, our business, results of operations and reputation may be negatively impacted.
43
The Company and other large banking organizations are becoming subject to increased scrutiny, more intense supervision and regulation, and a higher risk of enforcement action, with increased fines and penalties, which we expect to continue. We expect that our businesses will remain subject to extensive regulation and supervision.
The Bank is subject to the Bank Secrecy Act and other anti-money laundering statutes and regulations, and any deemed deficiency by the Bank with respect to these laws could result in significant liability and have material impact on our business strategy.
The BSA and its implementing regulations require financial institutions to, among other duties, implement and maintain an effective AML compliance program and file suspicious activity and currency transaction reports when appropriate. The Bank is also subject to increased scrutiny from OFAC with respect to its compliance with the U.S. economic sanctions laws and regulations, which include, among other things, the prohibition against dealing with, and the need to block or freeze assets of, persons that are the subject of U.S. economic sanctions. Please see Item I – Part 1 – “Supervision and Regulation - Anti-Money Laundering Rules” and Item 1 – Part 1 – “Supervision and Regulation - OFAC Regulation” for further information regarding the Bank’s obligations under the BSA and its implementing regulations and U.S. economic sanctions laws and regulations, respectively.
If the Bank’s policies, procedures, and systems are deemed deficient, or the policies, procedures and systems of the financial institutions that we have already acquired or may acquire in the future are deficient, the Bank could be subject to liability, including fines and regulatory actions, which may include restrictions on its ability to pay dividends and the necessity and ability to obtain regulatory approvals to proceed with certain aspects of its business plan, including acquisition plans. Failure to maintain and implement an effective AML compliance program could also have serious reputational consequences for the Bank. Any of these results could have a material adverse effect on the Bank’s business, financial condition, results of operations, and future prospects.
The Bank is subject to numerous laws designed to protect consumers, including the Community Reinvestment Act and fair lending laws, and failure to comply with these laws could lead to material penalties and other sanctions.
The CRA, the Equal Credit Opportunity Act, the Fair Housing Act, and other fair lending laws and regulations impose nondiscriminatory lending requirements on financial institutions. The U.S. Department of Justice and other federal agencies are responsible for enforcing these laws and regulations. A successful regulatory challenge to an institution’s performance under the CRA or fair lending laws and regulations could result in a wide variety of sanctions, including damages and civil money penalties, injunctive relief, restrictions on mergers and acquisitions activity, restrictions on expansion, and restrictions on entering new business lines. Private parties may also have the ability to challenge an institution’s performance under fair lending laws in private class action litigation. Such actions could have a material adverse effect on the Bank’s business, financial condition, results of operations, and future prospects.
Higher FDIC deposit insurance premiums and assessments could adversely affect our financial condition.
The FDIC insures deposits at FDIC-insured depository institutions, such as our subsidiary Bank, up to applicable limits. The amount of a particular institution’s deposit insurance assessment is based on that institution’s risk classification under an FDIC risk-based assessment system. The assessment base on which the Bank’s deposit insurance premiums is paid to the FDIC has been calculated based on its average consolidated total assets less its average equity. However, effective January 1, 2019, which was following the fourth consecutive quarter where the Bank’s total consolidated assets exceeded $10 billion, the FDIC started to use a performance score and loss-severity score to calculate the Bank’s initial FDIC assessment rate. An institution’s risk classification is assigned based on its capital levels and the level of supervisory concern the institution poses to its regulators. While our risk management processes are designed to reduce risk by maintaining capital levels and mitigating any supervisory concerns, we may be unable to control the amount of premiums that we are required to pay for FDIC insurance in the event of a new economic downturn and an increase in financial institution failures. For example, we incurred a special assessment of $26 million by the FDIC to help recoup losses to the Deposit Insurance Fund resulting from the bank failures 2023. Any future increases in assessments or required prepayments in FDIC insurance premiums may materially adversely affect results of operations, including by reducing our profitability or limiting our ability to pursue business opportunities.
44
The Federal Reserve may require us to commit capital resources to support the Bank.
Applicable law and the Federal Reserve require a bank holding company to act as a source of financial and managerial strength to a subsidiary bank and to commit resources to support such subsidiary bank. Under the “source of strength” doctrine, the Federal Reserve may require a bank holding company to make capital injections into a troubled subsidiary bank and may charge the bank holding company with engaging in unsafe and unsound practices for failure to commit resources to such a subsidiary bank. Under these requirements, in the future, we could be required to provide financial assistance to our Bank if it experiences financial distress.
A capital injection may be required at times when we do not have the resources to provide it, and therefore we may be required to borrow the funds. In the event of a bank holding company’s bankruptcy, the bankruptcy trustee will assume any commitment by the holding company to a federal bank regulatory agency to maintain the capital of a subsidiary bank. Moreover, bankruptcy law provides that claims based on any such commitment will be entitled to a priority of payment over the claims of the holding company’s general unsecured creditors, including the holders of its note obligations. Thus, any borrowing that must be done by any holding company in order to make the required capital injection into a bank is difficult and expensive and will adversely impact the holding company’s cash flows, financial condition, results of operations and prospects.
We could be subject to changes in tax laws, regulations and interpretations or challenges to our income tax provision.
We compute our income tax provision based on enacted tax rates in the jurisdictions in which we operate. Any change in enacted tax laws, rules or regulatory or judicial interpretations, or any change in the pronouncements relating to accounting for income taxes could adversely affect our effective tax rate, tax payments and results of operations. The taxing authorities in the jurisdictions in which we operate may challenge our tax positions, which could increase our effective tax rate and harm our financial position and results of operations. We are subject to audit and review by U.S. federal and state tax authorities. Any adverse outcome of such a review or audit could have a negative effect on our financial position and results of operations. In addition, changes in enacted tax laws, such as adoption of a lower income tax rate in any of the jurisdictions in which we operate, could impact our ability to obtain the future tax benefits represented by our deferred tax assets. In addition, the determination of our provision for income taxes and other liabilities requires significant judgment by management. Although we believe that our estimates are reasonable, the ultimate tax outcome may differ from the amounts recorded in our financial statements and could have a material adverse effect on our financial results in the period or periods for which such determination is made.
We are subject to complex and evolving laws, regulations, rules, standards and contractual obligations regarding data privacy and cybersecurity, which could increase the cost of doing business, compliance risks and potential liability.
We are subject to complex and evolving laws, regulations, rules, standards and contractual obligations relating to the data privacy and cybersecurity of the personal information of customers, employees or others, and any failure to comply with these laws, regulations, rules, standards and contractual obligations could expose us to liability and reputational damage. As new data privacy and cybersecurity-related laws, regulations, rules and standards are implemented, the time and resources needed for us to comply with such laws, regulations, rules and standards as well as our potential liability for non-compliance and reporting obligations in the case of cyber-attacks, information security breaches or other similar incidents, may significantly increase. Compliance with these laws, regulations, rules and standards may require us to change our policies, procedures and technology for information security and segregation of data, which could, among other things, make us more vulnerable to operational failures and to monetary penalties for breach of such laws, regulations, rules and standards.
45
For example, we are subject to federal law, including the Gramm-Leach-Bliley Act, which requires financial institutions to, among other things, periodically disclose their privacy policies and practices relating to sharing such information and enables retail customers to opt out of our ability to share information with unaffiliated third parties under certain circumstances. We also are subject to federal regulations that, among other things, require a banking organization to notify its primary federal regulators as soon as possible and within 36 hours after identifying a “computer-security incident” that the banking organization believes in good faith is reasonably likely to materially disrupt or degrade its business or operations in a manner that would, among other things, jeopardize the viability of its operations, result in customers being unable to access their deposit and other accounts, result in a material loss of revenue, profit or franchise value, or pose a threat to the financial stability of the U.S. The federal government also is considering, and may pass, data privacy and cybersecurity legislation, to which we may become subject if passed. The Bank is also subject to rules and regulations issued by the Federal Trade Commission, which regulates unfair or deceptive acts or practices, including with respect to data privacy and cybersecurity. Additionally, like other lenders, the Bank uses credit bureau data in its underwriting activities. Use of such data is regulated under the Fair Credit Reporting Act, which also regulates reporting information to credit bureaus, prescreening individuals for credit offers, sharing of information between affiliates, and using affiliate data for marketing purposes.
Data privacy and cybersecurity are also areas of increasing state legislative focus. For example, the CCPA, among other things, gives California residents certain rights with respect to their personal information. Similar laws have been or may be adopted by other states where we do business or from which we collect personal information. In addition, laws in all 50 U.S. states generally require businesses to provide notice under certain circumstances to individuals whose personal information has been disclosed as a result of a data breach.
Certain state laws and regulations may be more stringent, broader in scope, or offer greater individual rights, with respect to personal information than federal or other state laws and regulations, and such laws and regulations may differ from each other, which may complicate compliance efforts and increase compliance costs. Aspects of the CCPA and other federal and state laws and regulations relating to data privacy and cybersecurity, as well as their enforcement, remain unclear, and we may be required to modify our practices in an effort to comply with them.
Further, while we strive to publish and prominently display privacy policies that are accurate, comprehensive, and compliant with applicable laws, regulations, rules and industry standards, we cannot ensure that our privacy policies and other statements regarding our practices will be sufficient to protect us from claims, proceedings, liability or adverse publicity relating to data privacy or cybersecurity. Although we endeavor to comply with our privacy policies, we may at times fail to do so or be alleged to have failed to do so. The publication of our privacy policies and other documentation that provide promises and assurances about data privacy and cybersecurity can subject us to potential federal or state action if they are found to be deceptive, unfair, or misrepresentative of our actual practices. Additional risks could arise in connection with any failure or perceived failure by us, our service providers or other third parties with which we do business to provide adequate disclosure or transparency to our customers about the personal information collected from them and its use, to receive, document or honor the privacy preferences expressed by our customers, to protect personal information from unauthorized disclosure, or to maintain proper training on privacy practices for all employees or third parties who have access to personal information in our possession or control.
Any failure or perceived failure by us to comply with our privacy policies, or applicable data privacy and cybersecurity laws, regulations, rules, standards or contractual obligations, or any compromise of security that results in unauthorized access to, or unauthorized loss, destruction, use, modification, acquisition, disclosure, release or transfer of personal information, may result in requirements to modify or cease certain operations or practices, the expenditure of substantial costs, time and other resources, proceedings or actions against us, legal liability, governmental investigations, enforcement actions, claims, fines, judgments, awards, penalties, sanctions and costly litigation (including class actions). Any of the foregoing could harm our reputation, distract our management and technical personnel, increase our costs of doing business, adversely affect the demand for our products and services, and ultimately result in the imposition of liability, any of which could have a material adverse effect on our business, financial condition and results of operations. For further discussion of the data privacy and cybersecurity laws, regulations, rules and standards we are, or may in the future become, subject to, see Part I – Item 1 – “Supervision and Regulation – Data Privacy and Cybersecurity.”
46
Risks relating to our Common Stock
State law and provisions in our articles of incorporation or bylaws could make it more difficult for another company to purchase us, even though such a purchase may increase shareholder value.
In many cases, shareholders may receive a premium for their shares if we are purchased by another company. State law and our articles of incorporation and bylaws could make it difficult for anyone to purchase us without the approval of our board of directors.
Our articles of incorporation provide that a merger, exchange or consolidation of the Company with, or the sale, exchange or lease of all or substantially all of our assets to, any person or entity (referred to herein as a “Fundamental Change”), must be approved by the holders of at least 80% of our outstanding voting stock if the board of directors does not recommend a vote in favor of the Fundamental Change. The articles of incorporation further provide that a Fundamental Change involving a shareholder that owns or controls 20% or more of our voting stock at the time of the proposed transaction (a “Controlling Party”) must be approved by the holders of at least (i) 80% of our outstanding voting stock, and (ii) 67% of our outstanding voting stock held by shareholders other than the Controlling Party, unless (a) the transaction has been recommended to the shareholders by a majority of the entire board of directors or (b) the consideration per share to be received by our shareholders generally is not less than the highest price per share paid by the Controlling Party in the acquisition of its holdings of our common stock during the preceding three years. The approval by the holders of at least 80% of our outstanding voting stock is required to amend or repeal these provisions contained in our articles of incorporation. Finally, in the event that any such Fundamental Change is not recommended by the board of directors, the holders of at least 80% of our outstanding voting stock must attend a meeting called to address such transaction, in person or by proxy, in order for a quorum for the conduct of business to exist. If the 80% and 67% vote requirements described above do not apply because the board of directors recommends the transaction or the consideration is deemed fair, as applicable, then pursuant to the provisions of the South Carolina Business Corporation Act, the Fundamental Change generally must be approved by two thirds of the votes entitled to be cast with respect thereto.
Consequently, a takeover attempt may prove difficult, and shareholders may not realize the highest possible price for their securities.
Shares of our Common Stock are not insured deposits and may lose value.
Shares of our common stock are not savings or deposit accounts and are not insured by the FDIC, or any other agency or private entity. Such shares are subject to investment risk, including the possible loss of some or all of the value of your investment.
Future capital needs could result in dilution of shareholder investment.
Our board of directors may determine from time to time that there is a need to obtain additional capital through the issuance of additional shares of our common stock or other securities. These issuances would dilute the ownership interest of our shareholders and may dilute the per share book value of our common stock. New investors also may have rights, preferences and privileges senior to our shareholders which may adversely impact our shareholders.
The trading volume in our common stock and the sale of substantial amounts of our common stock in the public market could depress the price of our common stock.
We cannot predict the effect, if any, that future sales of our common stock in the market, or availability of shares of our common stock for sale in the market, will have on the market price of our common stock. Our stock price can fluctuate widely in response to a variety of factors. General market fluctuations, industry factors, and general economic and political conditions and events, such as terrorist attacks, economic slowdowns or recessions, interest rate changes, tax rate changes, credit loss trends, or currency fluctuations, also could cause our stock price to decrease regardless of operating results. We therefore can give no assurance that sales of substantial amounts of our common stock in the market, or the potential for large amounts of sales in the market, or any of the other factors discussed above, would not cause the price of our common stock to decline or impair our ability to raise capital through sales of our common stock.
47
Our ability to pay dividends is limited and we may be unable to pay future dividends.
Our ability to pay dividends is limited by regulatory restrictions and the need to maintain sufficient consolidated capital. The ability of the Bank to pay dividends to us is limited by its obligations to maintain sufficient capital and by other general restrictions on its dividends that are applicable to national banks that are regulated by the OCC. For information on these regulatory restrictions on the right of the Bank to pay dividends to us and on the right of the Company to pay dividends to its shareholders, see Part I - Item 1 – “Supervision and Regulation - Dividend Restrictions.” If we do not satisfy these regulatory requirements, or if the Bank does not have sufficient earnings to make payments to us while maintaining adequate capital levels, we will be unable to pay dividends on our common stock.
Holders of our junior subordinated debentures have rights that are senior to those of our common shareholders.
We have helped support our continued growth through the issuance of, and the acquisition of, through prior mergers, trust preferred securities from special purpose trusts and accompanying junior subordinated debentures. As of December 31, 2023, we had outstanding trust preferred securities and accompanying junior subordinated debentures totaling $117.6 million, net of fair value adjustments. Payments of the principal and interest on these debt instruments are conditionally guaranteed by us. Further, the accompanying junior subordinated debentures we issued to the special purpose trusts are senior to our shares of common stock. As a result, we must make payments on the junior subordinated debentures before any dividends can be paid on our common stock and, in the event of our bankruptcy, dissolution or liquidation, the holders of the junior subordinated debentures must be satisfied before any distributions can be made on our common stock. We have the right to defer distributions on our junior subordinated debentures (and the related trust preferred securities) for up to five years, during which time no dividends may be paid on our common stock.
Our stock price may be volatile, which could result in losses to our investors and litigation against us.
Our stock price has been volatile in the past and several factors could cause the price to fluctuate substantially in the future. These factors include but are not limited to: actual or anticipated variations in earnings; changes in analysts’ recommendations or projections; our announcement of developments related to our businesses, operations and stock performance of other companies deemed to be peers; new technology used or services offered by traditional and non-traditional competitors; news reports of trends, concerns, irrational exuberance on the part of investors, and other issues related to the financial services industry. Our stock price may fluctuate significantly in the future, and these fluctuations may be unrelated to our performance. General market declines or market volatility in the future, especially in the financial institutions sector, could adversely affect the price of the Company’s common stock, and the current market price may not be indicative of future market prices.
Stock price volatility may make it more difficult for our investors to resell their common stock when they desire and at prices they find attractive. Moreover, in the past, securities class action lawsuits have been instituted against some companies following periods of volatility in the market price of its securities. We could in the future be the target of similar litigation. Securities litigation could result in substantial costs and divert management’s attention and resources from our normal business.
At December 31, 2023, our shareholders included three funds owning approximately 29% of our common stock and they may exercise significant influence over us and their interests may be different from our other shareholders.
Based on their 13G forms filed for the year end December 31, 2023, our shareholders include three funds that collectively own approximately 29% of the outstanding shares of our common stock. The top ten institutional owners collectively own approximately 50% of our outstanding shares of common stock, as reported by S&P Global. While the federal banking laws require prior bank regulatory approval if shareholders owning in excess of 9.9% of a financial holding company’s outstanding voting shares desire to act in concert, these institutional owners nonetheless could vote the same way on matters submitted to our shareholders without being deemed to be acting in concert and, if so, could exercise significant influence over us and actions taken by our shareholders. Interests of institutional funds may be different from our other shareholders. Accordingly, given their collective ownership, the funds could have significant influence over whether or not a proposal submitted to our shareholders receives required shareholder approval.
48
Risks relating to Economic Conditions and other Outside Forces
The political and economic environment could materially impact our business operations and financial performance, and uncertainty surrounding the potential legal, regulatory and policy changes by a possible new U.S. presidential administration may directly affect financial institutions and the global economy
The political and economic environment in the United States and elsewhere has resulted in and will continue to result in some uncertainty. Changing regulatory policies because of the changing political environment, could impact our regulatory and compliance costs and expected revenues, all of which could materially and adversely affect our business, financial condition and operating results. Additionally, financial markets may be adversely affected by fiscal or monetary policies established by central banks and financial regulators, uncertainty concerning government shutdowns, debt ceilings or funding for the government, actual or perceived instability in the U.S. banking system, and the current or anticipated impact of geopolitical instability of conflict, including in the Middle East, Ukraine, and Taiwan, as well as terrorism and other geopolitical events.
Further, a possible change in the U.S. presidential administration and congressional seat turnover following the 2024 election cycle may result in increased regulatory uncertainty. Changes in federal policy by the executive branch and regulatory agencies may occur over time through the new presidential administration’s and/or Congress’s policy and personnel changes, which could lead to changes involving the level of oversight and focus on the financial services industry; however, the nature, timing and economic and political effects of such potential changes remain highly uncertain. At this time, it is unclear what laws, regulations and policies may change and whether future changes or uncertainty surrounding future changes will adversely affect our operating environment and therefore our business, financial condition and results of operations.
Changes and instability in global economic conditions and geopolitical matters could have a material adverse effect on our business, financial condition and results of operations.
Our business, financial condition and results of operations have been in the past and may, in the future, be materially affected by global economic conditions and geopolitical matters, including, both directly and indirectly, through the impact on client activity levels. The macroeconomic environment in the United States is susceptible to global events and volatility in the financial markets. Global economic and political developments, such as the Ukraine conflict, the Hamas attack on Israel and related events in the Middle East, increased global trade and other multinational tensions, and other global events, have adverse consequences that impact the macroeconomic environment, and these impacts may persist for some time, including disruptions of global supply chains, cross-border migration trends, labor gluts or shortages, increased energy prices, inflationary pressures and higher interest rates. Changes in the global economic and geopolitical environment have resulted in significant adverse effects for many different types of businesses nationwide and in the regions in which we operate, which could adversely impact economic and market conditions for the Company and its clients and counterparties.
The impacts of the Federal Reserve’s interest rate increases have dampened loan demand, and global events and geopolitical tensions could cause economic disruption which may result in further declines in demand for our banking products and services, and could negatively impact, among other things, our liquidity, regulatory capital, goodwill and our growth strategy. Developments related to the U.S. federal debt ceiling, including the possibility of a government shutdown, default by the U.S. government on its debt obligations, or related credit-rating downgrades, could have adverse effects on the broader economy, disrupt access to capital markets, and contribute to, or worsen, an economic recession. In addition, our net interest margin has been flat to decreasing in 2023 in response to competitive pressure to increase interest rates on deposits in order to retain our funding base faster than increasing the interest rate on our loans, thereby increasing our costs and reducing our revenues. In addition, increases in our loan pricing impacts our borrowers’ ability to repay existing loans or refinance loans as they become due, which could influence the recognition of credit losses on loans and securities and increase the allowance for credit losses, result in additional lost revenue, cause additional increases in expenses, result in goodwill impairment charges, result in the impairment of other financial and nonfinancial assets, and increase the Company’s cost of capital. Any one or more of these developments could have a material adverse effect on our business, financial condition and results of operations.
49
A slowdown in economic growth or a resumption of recessionary economic conditions could have an adverse effect on our business in the future.
The economy is subject to worldwide events, such as the COVID-19 pandemic and geopolitical tensions in the Middle East and Europe, as well as domestic events, any or all of which could impact inflationary pressures and interest rates to dampen demand, and these and other political and market developments are affecting and could continue to affect consumer confidence levels and cause adverse changes in loan payment patterns, causing increases in delinquencies and default rates, which may impact our charge-offs and the provision for credit losses. Changes in the financial services industry and the effects of current and future law and regulations that may be imposed in response to future market developments also could negatively affect us by restricting our business operations, including our ability to originate or sell loans, and adversely impact our financial performance.
The soundness of other financial institutions could adversely affect us.
Our ability to engage in routine funding and other transactions could be adversely affected by the actions and commercial soundness of other financial institutions. Financial services institutions are interrelated as a result of trading, clearing, counterparty or other relationships. Defaults by, or even rumors or questions about, one or more financial services institutions, or the financial services industry generally, have led to market-wide liquidity problems and losses of depositor, creditor and counterparty confidence and could lead to losses or defaults by us or by other institutions. We could experience increases in deposits and assets as a result of other banks’ difficulties or failure, which would increase the capital we need to support our growth.
We may be impacted by actual or perceived soundness of other financial institutions, including as a result of the financial or operational failure of a major financial institution, or concerns about the creditworthiness of such a financial institution or its ability to fulfill its obligations, which can cause substantial and cascading disruption within the financial markets and increased expenses, including FDIC insurance premiums, and could affect our ability to attract and retain depositors and to borrow or raise capital. For example, during 2023 the FDIC took control and was appointed receiver of Silicon Valley Bank, Signature Bank, and First Republic Bank. In addition, adverse developments with respect to third parties with whom we have important relationships could also negatively impact perceptions about us. These perceptions about us could cause our business to be negatively affected and exacerbate the other risks that we face. The failure of other banks and financial institutions and the measures taken by governments, businesses and other organizations in response to these events could adversely impact the Company’s business, financial condition and results of operations.
Our business is subject to the success of the local economies where we operate.
Our success significantly depends upon the growth in population, income levels, deposits and housing starts in our primary and secondary markets. If the communities in which we operate do not grow or if prevailing economic conditions locally or nationally become challenging, our business may be adversely affected. We are less able than a larger institution to spread the risks of unfavorable local economic conditions across a large number of diversified economies. We cannot give any assurance we will continue to benefit from market growth or favorable economic conditions in our primary market areas if they do occur.
50
Adverse weather or manmade events could negatively affect our local economies or disrupt our operations, which would have an adverse effect on our business or results of operations.
Our market areas in Florida, South Carolina, North Carolina, Georgia, Virginia and Alabama are susceptible to hurricanes, tropical storms and related flooding and wind damage as well as tornados and other types of strong storms. While only one storm in 2023 impacted a branch in our market area with little disruption in business, these type of storms may do so in the future and may increase in intensity because of changes in weather patterns and other factors including climate change. Such weather events and manmade events can disrupt operations, result in damage to properties and negatively affect the local economies in the markets where they operate. We cannot predict whether or to what extent damage that may be caused by future natural disasters or manmade events will affect our operations or the economies in our current or future market areas. Such events could result in a decline in loan originations, a decline in the value or destruction of properties securing our loans, as well as our own properties, and an increase in delinquencies, bankruptcies, foreclosures or loan losses that could result in a higher level of non-performing assets, net charge-offs, and provision for loan losses. Our business or results of operations may be adversely affected by these and other negative effects of future hurricanes, tropical storms, tornados or other extreme weather events, including flooding and wind damage, or manmade events. Many of our customers have incurred significantly higher property and casualty insurance premiums on their properties located in our markets, which may adversely affect real estate sales and values in those markets.
We are subject to physical and financial risks associated with climate change and other weather and natural disaster impacts.
The current and anticipated effects of climate change are creating an increasing level of concern for the state of the global environment. As a result, political and social attention to the issue of climate change has increased. In recent years, governments across the world have entered into international agreements to attempt to reduce global temperatures, in part by limiting greenhouse gas emissions. Although the U.S. rejoined the Paris Agreement, effective as of February 19, 2021, and the U.S. Congress, state legislatures and federal and state regulatory agencies have continued to propose and advance numerous legislative and regulatory initiatives seeking to mitigate the effects of climate change, each of which may result in the imposition of taxes and fees, the required purchase of emission credits, and the implementation of significant operational changes, which may require us to expend significant capital and incur compliance, operating, maintenance and remediation costs. Given the lack of empirical data on the credit and other financial risks posed by climate change, it is impossible to predict how climate change may impact our financial condition and operations; however, as a banking organization, the physical effects of climate change on the Bank may present certain unique risks.
The physical risks of climate change include discrete events, such as flooding, hurricanes, tornadoes, and wildfires, and longer-term shifts in climate patterns, such as extreme heat, sea level rise, and more frequent and prolonged drought. Physical risks may alter the Company’s strategic direction in order to mitigate certain financial risks. A significant portion of our operations is located in the areas bordering the Gulf of Mexico and the Atlantic Ocean, regions that are susceptible to hurricanes, or in areas of the Southeastern U.S. that are susceptible to tornadoes and other severe weather events including severe droughts, floods, and sea level rise. Any of these, or any other severe weather event, could cause disruption to our operations and could have a material adverse effect on our overall business, results of operations or financial condition. We have taken certain preemptive measures that we believe will mitigate these adverse effects; however, such measures cannot prevent the disruption that a catastrophic earthquake, fire, hurricane, tornado or other severe weather event could cause to the markets that we serve and any resulting adverse impact on our customers, such as hindering our borrowers’ ability to timely repay their loans, diminishing the value of any collateral held by us, interrupting supply chains, causing significant property damage, causing us to incur additional expense or resulting in a loss of revenue, and affecting the stability of our deposit base. The severity and impact of future earthquakes, fires, hurricanes, tornadoes, droughts, sea level rise, floods and other weather-related events are difficult to predict and may be exacerbated by global climate change. Man-made disasters and other events connected with the Gulf of Mexico or Atlantic Ocean, such as oil spills, could have similar effects. Such events may also cause reductions in regional and local economic activity that may have an adverse effect on our customers, which could limit our ability to raise and invest capital in these areas and communities, each of which could have a material adverse effect on our financial condition and results of operations.
51
Climate change may worsen the frequency and severity of future earthquakes, fires, hurricanes, tornadoes, droughts, sea level rise, floods and other extreme weather-related events that could cause disruption to our business and operations. Chronic results of climate change such as shifting weather patterns could also cause disruption to our business and operations. Climate change may also result in new and/or more stringent regulatory requirements for the Company, which could materially affect the Company’s results of operations by requiring the Company to take costly measures to comply with any new laws or regulations related to climate change that may be forthcoming. New regulations, shift in customer behaviors, supply chain collapse or breakthrough technologies that accelerate the transition to a lower carbon economy may negatively affect certain sectors and borrowers in our loan portfolio, impacting their ability to timely repay their loans or decreasing the value of any collateral held by us.
Transition risk resulting from our customers retooling their businesses to transition from reliance on fossil fuels to cleaner energy also may impact the Bank. While loan demand to facilitate that transition may increase, some businesses may not have the financial capacity to make those changes, impacting their ability to timely repay their loans or decreasing the value of any collateral held by us, which may adversely impact our results of operations.
In addition, the Company faces potential reputational risks as a result of its practices related to climate change, including as a result of the Company’s direct or indirect involvement in certain industries, as well as any decisions management makes in response to managing climate risk, especially as views on climate-related matters become subject to increased polarization. Further, there is increased scrutiny of climate change-related policies, goals, and disclosures, which could result in litigation and regulatory investigations and actions. We may incur additional costs and require additional resources as we evolve our strategy, practices and related disclosures with respect to these matters.
Market volatility could adversely affect our operations or ability to access capital.
The capital and credit markets have experienced volatility and disruption from time to time during the past several years. In some cases, the markets have produced downward pressure on stock prices and credit availability for certain issuers without regard to those issuers’ underlying financial condition or performance. If these periodic market disruptions and volatility continue or worsen, we may experience adverse effects, which may be material, on our ability to maintain or access capital and on our business, financial condition and results of operations.
Competition from financial institutions and other financial service providers may adversely affect our profitability.
The banking business is highly competitive and we experience competition in our markets from many other financial institutions. We compete with commercial banks, credit unions, mortgage banking firms, consumer finance companies, securities brokerage firms, insurance companies, money market funds, and other mutual funds, as well as other super-regional, national and international financial institutions and fintech or e-commerce companies that operate in our primary market areas and elsewhere. Some of these competitors may have a long history of successful operation in our markets, greater ties to local businesses and more expansive banking relationships, as well as better established depositor bases. Competitors with greater resources or more advanced technology may possess an advantage by being capable of maintaining numerous and more convenient banking locations, easy to use and available mobile and computer apps or Internet platforms, operating more ATMs and conducting extensive promotional and advertising campaigns.
We compete with these institutions both in attracting deposits and in making loans. In addition, we have to attract our customer base from other existing financial institutions and from new residents. Many of our competitors are well-established, larger financial institutions and credit unions. While we believe we can and do successfully compete with these other financial institutions in our primary markets, we may face a competitive disadvantage as a result of our smaller size, lack of geographic diversification, sophisticated online or mobile applications, and inability to spread our marketing costs across a broader market. Although we compete by concentrating our marketing efforts in our primary markets with local advertisements, personal contacts, and greater flexibility and responsiveness in working with local customers, we can give no assurance this strategy will be successful.
52
The fiscal and monetary policies of the federal government and its agencies could have a material adverse effect on our earnings.
The Federal Reserve regulates the supply of money and credit in the U.S. as its policies determine in large part the cost of funds for lending and investing and return earned on those loans and investments, both of which affect our net interest margin. They can also materially decrease the value of financial assets we hold. Federal Reserve policies also can adversely affect borrowers, potentially increasing the risk that they may fail to repay their loans, or could result in volatile markets and rapid declining collateral values. Changes in Federal Reserve policies are beyond our control and difficult to predict. Accordingly, the impact of these changes on our activities and results of operations is difficult to predict.
We are or may become involved from time to time in suits, legal proceedings, information-gathering requests, investigations, and proceedings by governmental and self-regulatory agencies that may lead to adverse consequences.
Many aspects of the banking business involve a substantial risk of legal liability. The Company and the Bank have been named or threatened to be named as defendants in various lawsuits arising from our business activities (and in some cases from the activities of companies that we have acquired). In addition, from time to time, we are, or may become, the subject of information-gathering requests, reviews, investigations and proceedings, and other forms of regulatory inquiry, including by bank regulatory agencies, the SEC, self-regulatory organizations and law enforcement authorities. The results of such proceedings could lead to significant civil or criminal penalties, including monetary penalties, damages, adverse judgments, settlements, fines, injunctions, restrictions on the way the Company and the Bank conduct their business, or reputational harm.
Item 1B. Unresolved Staff Comments.
None.
Item 1C. Cybersecurity
Cybersecurity risk management is an integral part of our overall enterprise risk management system. We have a cross-departmental approach to identifying, assessing, and managing cybersecurity risk, including input from employees and our Board of Directors (the "Board"). The Board and its Risk Committee and Audit Committee (respectively, the “Risk Committee” and the “Audit Committee”), as well as senior management in, among other areas, the information security, information technology, operations, and risk management (including enterprise and operational risk) areas, devote significant resources to cybersecurity and risk management processes to adapt to the changing cybersecurity landscape and to identify and respond to cybersecurity threats and incidents in a timely and effective manner. Our cybersecurity risk management program leverages the National Institute of Standards and Technology (NIST) framework, which organizes cybersecurity risks into five categories: identify, protect, detect, respond and recover. We regularly assess the threat landscape and take a holistic view of cybersecurity risks, with a layered cybersecurity strategy based on prevention, identification, and remediation. Our information technology and information security areas review enterprise risk management-level cybersecurity risks continually, and key cybersecurity risks are incorporated into the Company’s Enterprise Risk Management Framework that supports its Risk Appetite Statement. In addition, we have a set of Company-wide policies and procedures concerning cybersecurity matters , such as policies related to encryption standards, antivirus protection, remote access, multifactor authentication, confidential information, and the use of the internet, social media, email and wireless devices. These policies go through an internal review process and are approved by appropriate members of management. On an annual basis, the Board approves the Company’s Information Security Policy and Program which provides a layered approach to cybersecurity, and includes administrative, technical, and physical safeguards designed to protect the security, confidentiality, and integrity of customer information in accordance with applicable law.
53
The Company’s Chief Information Security Officer (“CISO”) is responsible for developing and implementing our information security program and reporting on cybersecurity matters to the Company’s Chief Risk Officer (“CRO”), who oversees and supervises the risk function, including the information security, compliance, legal, operational (which includes business continuity, model risk, and third party risk functions) and enterprise risk areas. Our CISO has over 18 years of experience in information technology leadership, eight years of which is experience in leading information security oversight, and others on our information security team have various information security degrees and certifications within applicable disciplines. Our CISO receives reports from our information security team on a regular basis and monitors the prevention, detection, mitigation and remediation of cybersecurity incidents.
Our information security team regularly monitors alerts and meets to discuss threat levels, trends and remediation. The team also regularly collects data on cybersecurity threats and risk areas and conducts an annual risk assessment. Further, we conduct periodic external and internal control validations to assess our processes and procedures and the threat landscape, and we maintain a vulnerability management program designed to identify vulnerabilities and coordinate remediation efforts for any identified vulnerabilities in the environment. We regularly test defenses by performing simulations and drills at both a technical level (including through penetration tests) and by reviewing our operational policies and procedures with third-party experts. These tests and assessments are useful tools for maintaining a robust cybersecurity program to protect our investors, customers, employees, and vendors. Results of these ongoing activities are reported quarterly to management through the Cyber and Information Technology Steering Committee. In addition, we periodically perform simulations and tabletop exercises at the management level and incorporate external resources and advisors as needed. All employees are required to complete information security training at least once every year, and we require employees in certain roles to complete additional role-based, specialized cybersecurity trainings.
We have continued to expand investments in information security and cybersecurity, including providing additional end-user training, using layered defenses, identifying and protecting critical assets, strengthening monitoring and alerting, and engaging third-party cybersecurity experts. For example, in 2023, the Bank engaged a third-party cybersecurity consultant to conduct a review of the Company’s information security and cybersecurity program in relation to overall threat trends and specific factors affecting the Bank’s cyber risk profile. The review assisted management in enhancing the Company’s cyber-risk reduction efforts, including updating Bank’s cybersecurity strategy and program. The Company also maintains cybersecurity insurance provided by carriers that can provide additional technical, legal, and consultation services in the event of a security event that requires additional staff or expertise, including attorneys, forensic accountants, and public relations professionals, among others.
In addition to assessing our own cybersecurity preparedness, we also identify, evaluate and manage cybersecurity risks associated with use of third-party vendors and service providers. Our third-party risk function conducts an annual review of third-party hosted applications with a specific focus on any sensitive data shared with third parties. Our information security area regularly reviews third-party vendors and service providers, including their System and Organization Controls (SOC) 1 or SOC 2 report. If a third-party vendor or service provider is not able to provide a SOC 1 or SOC 2 report, we take additional steps to assess its cybersecurity preparedness and assess our relationship on that basis. The frequency and granularity of our review of third-party vendors and service providers is based on an assigned risk rating for each third-party vendor and service provider. Our assessment of risks associated with use of third-party vendors and service providers is part of our overall cybersecurity risk management framework.
54
The Board has ultimate oversight responsibility for the Company’s risk management and recognizes the importance of protecting the data provided by the Company’s customers and employees and devotes considerable time and attention to overseeing the strategies the Company employs to protect our data and systems and to mitigate against cybersecurity risk. A cybersecurity expert chairs the Risk Committee and provides technology-related insight and guidance to the Company. As part of the Risk Committee’s responsibility for monitoring key business and regulatory risks, the Risk Committee receives from our CISO quarterly reports and materials which include a review of cybersecurity and information technology key risk indicators, test results and related remediation, and any recent cybersecurity threats or incidents and how the Company is managing those threats or incidents. The Risk Committee also periodically reviews reports on the threat environment, vulnerability assessments, results of penetration testing, and potential cybersecurity and data privacy incidents, as well as information on ongoing employee training relating to data privacy and cybersecurity and how to protect data against cyber threats. Further, on a quarterly basis, our CRO presents to the Risk Committee updates from our Director of Enterprise and Operational Management on the Company’s business continuity program, which covers, among other things, outages and incidences and disaster recovery and business continuity testing. The Risk Committee also approves the annual risk assessment required by the Gramm-Leach-Bliley Act. Moreover, the CISO follows a risk-based escalation process to notify the Risk Committee outside of the cycle of regular updates when management has identified an emerging risk or material issue related to cybersecurity. The Risk Committee also reports material cybersecurity risks to the full Board, based on our CISO’s assessment of risk. In addition, the Audit Committee reviews reports of the Company’s internal audit department’s periodic audits of our information security area and various components thereof.
We face a number of cybersecurity risks in connection with our business and we have, from time to time, experienced threats to and incidents involving our data and systems. For more information about the cybersecurity risks we face, see the risk factors captioned “We are subject to complex and evolving laws, regulations, rules, standards and contractual obligations regarding data privacy and cybersecurity, which could increase the cost of doing business, compliance risks and potential liability” and “We face cybersecurity risks from cyber-attacks, information security breaches and other similar incidents that could result in the disclosure of confidential and other information (including personal information), adversely affect our business or reputation, and create significant legal and financial exposure.” in Item 1A- Risk Factors.
Item 2. Properties.
Our corporate headquarters are located in a branch located at 1101 First Street South, Suite 202, Winter Haven, Florida 33880. Our bank owns 204 properties and leases 106 properties, most of which are used as branch locations, mortgage loan production offices, wealth management offices or for housing operational units in Alabama, Florida, Georgia, North Carolina, South Carolina, and Virginia. We also operate a correspondent banking and capital markets division within our national bank subsidiary, of which the majority of its bond salesmen, traders and operational personnel are housed in facilities located in Georgia, Tennessee, and Alabama. In addition, we lease some space in California, Colorado, Montana, New York and Texas related to the correspondent banking and capital markets division, and occupy a space in Tennessee related to SouthState|DuncanWilliams. Although the properties owned and leased are generally considered adequate, we have a continuing program of modernization, expansion, and when necessary, occasional replacement of facilities. For additional information relating to the Company’s premises, equipment and lease commitments, see accompanying Note 7—Premises and Equipment and Note 21—Lease Commitments to our audited consolidated financial statements.
Item 3. Legal Proceedings.
We or our Bank subsidiary is periodically a party to or otherwise involved in legal proceedings arising in the normal course of business, such as claims to enforce liens, claims involving the making and servicing of real property loans, and other issues incident to our products and services and our businesses. We do not believe any pending or threatened legal proceedings in the ordinary course against the Bank would have a material adverse effect on our consolidated results of operations or consolidated financial position.
Item 4. Mine Safety Disclosures.
Not applicable.
55
PART II
Item 5. Market for the Registrant’s Common Equity, Related Stockholder Matters and Issuer Purchases of Equity Securities.
As of February 29, 2024, we had issued and outstanding 76,252,786 shares of common stock which were held by approximately 6,800 registered shareholders. Our common stock trades on the New York Stock Exchange (“NYSE”) under the symbol “SSB.” As of December 18, 2023, SouthState voluntarily withdrew the principal listing and trading of its common stock from Nasdaq and transferred such listing to the NYSE. The listing and trading of its common stock on the NYSE began at market open on December 19, 2023.
The table below describes historical information regarding our common stock for the last five fiscal years:
|
|
|
|
|
|
|
|
|
|
|
|
|
|
|
|
|
|
|
2023 |
|
2022 |
|
2021 |
|
2020 |
|
2019 |
|
|||||
Stock Performance |
|
|
|
|
|
|
|
|
|
|
|
|
|
|
|
|
Dividends per share |
|
$ |
2.04 |
|
$ |
1.98 |
|
$ |
1.92 |
|
$ |
1.88 |
|
$ |
1.67 |
|
Dividend payout ratio |
|
|
31.34 |
% |
|
29.54 |
% |
|
28.43 |
% |
|
81.45 |
% |
|
30.94 |
% |
Dividend yield (based on the average of the high and low for the year) |
|
|
2.77 |
% |
|
2.39 |
% |
|
2.46 |
% |
|
2.93 |
% |
|
2.27 |
% |
Price/earnings ratio (based on year‑end stock price and diluted earnings per share) |
|
|
13.07x |
|
|
11.57x |
|
|
11.94x |
|
|
33.01x |
|
|
16.18x |
|
Price/book ratio (end of year) |
|
|
1.16x |
|
|
1.14x |
|
|
1.16x |
|
|
1.10x |
|
|
1.23x |
|
Common Stock Statistics |
|
|
|
|
|
|
|
|
|
|
|
|
|
|
|
|
Stock price ranges: |
|
|
|
|
|
|
|
|
|
|
|
|
|
|
|
|
High |
|
$ |
87.77 |
|
$ |
93.34 |
|
$ |
93.26 |
|
$ |
87.98 |
|
$ |
88.10 |
|
Low |
|
|
59.51 |
|
|
72.26 |
|
|
62.60 |
|
|
40.42 |
|
|
58.87 |
|
Close |
|
|
84.45 |
|
|
76.36 |
|
|
80.11 |
|
|
72.30 |
|
|
86.75 |
|
Volume traded on exchanges |
|
|
142,642,700 |
|
|
90,603,400 |
|
|
88,780,100 |
|
|
86,495,680 |
|
|
39,218,800 |
|
As a percentage of average shares outstanding |
|
|
187.50 |
% |
|
121.44 |
% |
|
126.11 |
% |
|
157.85 |
% |
|
113.19 |
% |
Earnings per share, basic |
|
$ |
6.50 |
|
$ |
6.65 |
|
$ |
6.76 |
|
$ |
2.20 |
|
$ |
5.40 |
|
Earnings per share, diluted |
|
|
6.46 |
|
|
6.60 |
|
|
6.71 |
|
|
2.19 |
|
|
5.36 |
|
Book value per share |
|
|
72.78 |
|
|
67.04 |
|
|
69.27 |
|
|
65.49 |
|
|
70.32 |
|
Quarterly Common Stock Price Ranges and Dividends
The table below describes the high and low trading price and dividends paid on our common stock for each quarterly period within the two most recent fiscal years.
|
|
|
|
|
|
|
|
|
|
|
|
|
|
|
|
|
|
|
|
|
|
Year Ended December 31, |
|
||||||||||||||||
|
|
2023 |
|
2022 |
|
||||||||||||||
Quarter |
|
High |
|
Low |
|
Dividend |
|
High |
|
Low |
|
Dividend |
|
||||||
1st |
|
$ |
85.38 |
|
$ |
66.56 |
|
$ |
0.50 |
|
$ |
93.34 |
|
$ |
80.22 |
|
$ |
0.49 |
|
2nd |
|
|
72.98 |
|
|
59.51 |
|
|
0.50 |
|
|
84.09 |
|
|
72.49 |
|
|
0.49 |
|
3rd |
|
|
79.46 |
|
|
64.21 |
|
|
0.52 |
|
|
86.57 |
|
|
72.26 |
|
|
0.50 |
|
4th |
|
|
87.77 |
|
|
63.36 |
|
|
0.52 |
|
|
91.74 |
|
|
74.21 |
|
|
0.50 |
|
Dividends
We currently intend to continue to pay comparable quarterly cash dividends on our common stock, subject to approval by our Board of Directors, although we may elect not to pay dividends or to change the amount of such dividends. The payment of dividends is a decision by our Board of Directors based upon then-existing circumstances, including our rate of growth, profitability, financial condition, existing and anticipated capital requirements, the amount of funds legally available for the payment of cash dividends, regulatory constraints and such other factors as the Board of Directors determines relevant.
56
The Company is a legal entity separate and distinct from the Bank. Federal Reserve policy provides that bank holding companies, such as the Company, should generally pay dividends to shareholders only if (i) the organization’s net income available to common shareholders over the past year has been sufficient to fully fund the dividends; (ii) the prospective rate of earnings retention appears consistent with the organization’s capital needs, asset quality and overall financial condition; and (iii) the organization will continue to meet minimum capital adequacy ratios. The policy also provides that a bank holding company should inform the Federal Reserve reasonably in advance of declaring or paying a dividend that exceeds earnings for the period for which the dividend is being paid or that could result in a material adverse change to the bank holding company’s capital structure. Bank holding companies also are required to consult with the Federal Reserve, who could prohibit or limit the payment of dividends by a bank holding company if it determines that payment of the dividend would constitute an unsafe or unsound practice.
We pay cash dividends to our shareholders from our assets, which are provided primarily by dividends paid to SouthState by our Bank. Certain restrictions exist regarding the ability of the Bank to transfer funds to SouthState in the form of cash dividends, loans or advances, as described under Part I - Item 1 – “Supervision and Regulation – Dividend Restrictions.” Federal bank regulators have stated that paying dividends that deplete a bank’s capital base to an inadequate level would be an unsafe and unsound banking practice and that banking organizations should generally pay dividends only out of current earnings. The approval of the OCC is required if the total of all dividends declared by the Bank in any calendar year exceeds the total of its net profits for that year combined with its retained net profits for the preceding two years, less any required transfers to surplus. During 2023, the Bank paid dividends to SouthState totaling $180.0 million. We used these funds primarily to pay dividends to shareholders of approximately $154.9 million in 2023.
57
Stock Performance Graph
The following stock performance graph compares SouthState’s cumulative total shareholder return on our common stock over the most recent five-year period with the NASDAQ Composite and the KBW NASDAQ Regional Banking Index, an index that comprises performance of U.S. companies that do business as regional banks or thrifts. The stock performance graph assumes $100 was invested in our common stock and the above indexes on December 31, 2018. The cumulative total return on each investment assumed the reinvestment of dividends.
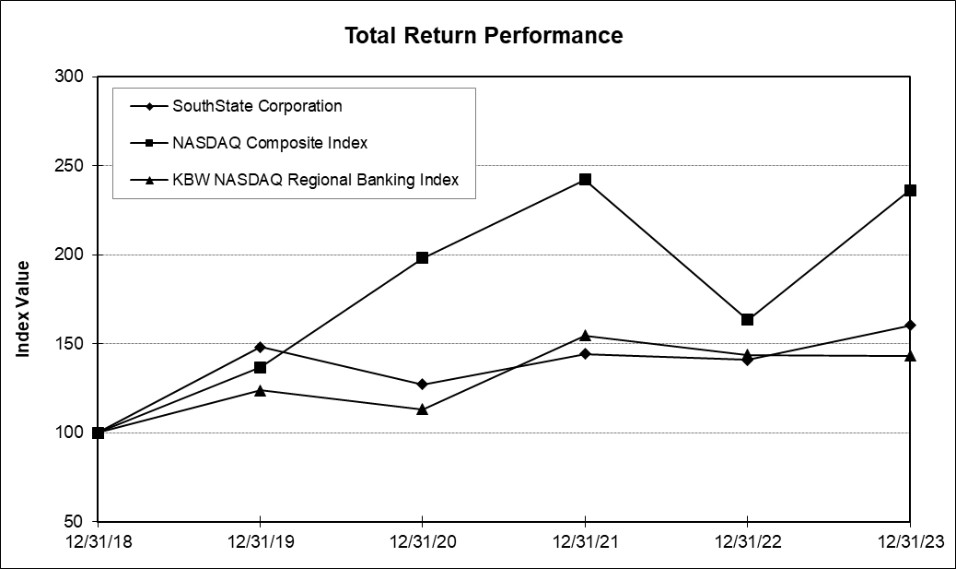
|
|
|
|
|
|
|
|
|
|
|
|
|
|
|
|
|
|
|
|
|
|
Period Ending |
|
||||||||||||||||
|
|
12/31/2018 |
|
12/31/2019 |
|
12/31/2020 |
|
12/31/2021 |
|
12/31/2022 |
|
12/31/2023 |
|
||||||
SouthState Corporation |
|
$ |
100.00 |
|
$ |
147.99 |
|
$ |
127.07 |
|
$ |
144.23 |
|
$ |
140.79 |
|
$ |
160.20 |
|
NASDAQ Composite Index |
|
$ |
100.00 |
|
$ |
136.69 |
|
$ |
198.10 |
|
$ |
242.03 |
|
$ |
163.28 |
|
$ |
236.17 |
|
KBW NASDAQ Regional Bank Index |
|
$ |
100.00 |
|
$ |
123.81 |
|
$ |
113.03 |
|
$ |
154.45 |
|
$ |
143.75 |
|
$ |
143.17 |
|
Repurchases of Equity Securities
In January 2021, the Board of Directors of the Company approved the authorization of a 3,500,000 share Company stock repurchase plan (the “2021 Stock Repurchase Plan”). During 2021 and through December 31, 2022, we repurchased 3,129,979 shares under the 2021 Stock Repurchase Plan, at an average price of $81.97 per share (excluding cost of commissions) for a total of $256.6 million. Of this amount, we repurchased 1,312,038 shares, at an average price of $83.99 per share (excluding cost of commissions) for a total of $110.2 million during 2022.
58
On April 27, 2022, the Company’s Board of Directors approved a new stock repurchase program (“2022 Stock Repurchase Program”) authorizing the Company to repurchase up to 3,750,000 of the Company’s common shares along with the remaining authorized shares of 370,021 from the 2021 Stock Repurchase Plan for a total authorization of 4,120,021 shares. On June 7, 2022, the Company received Federal Reserve Board’s supervisory nonobjection on the 2022 Stock Repurchase Program. Shares of common stock under the 2022 Stock Repurchase Program may be repurchased periodically in open market transactions at prevailing market prices, in privately negotiated transactions, or by other means in accordance with federal securities laws. The actual means and timing of any repurchases, target number of shares and prices or range of prices under the 2022 Stock Repurchase Program may be determined by us in our discretion and depend on a number of factors, including the market price of our common stock, share issuances under our equity plans, general market and economic conditions, and applicable legal and regulatory requirements. In 2022, the Company did not repurchase any shares through the 2022 Stock Repurchase Program. During 2023, the Company repurchased a total of 100,000 shares at a weighted average price of $67.48 per share pursuant to the 2022 Stock Repurchase Program. As of December 31, 2023, there is a total of 4,020,021 shares authorized to be repurchased.
The following table reflects our share repurchase activity during the fourth quarter of 2023:
|
|
|
|
|
|
|
|
|
|
|
|
|
|
|
|
|
|
|
|
(d) Maximum |
|
|
|
|
|
|
|
|
(c) Total |
|
Number (or |
|
|
|
|
|
|
|
|
Number of |
|
Approximate |
|
|
|
|
|
|
|
|
Shares (or |
|
Dollar Value) of |
|
|
|
|
|
|
|
|
Units) |
|
Shares (or |
|
|
|
(a) Total |
|
|
|
|
Purchased as |
|
Units) that May |
|
|
|
Number of |
|
|
|
|
Part of Publicly |
|
Yet Be |
|
|
|
Shares (or |
|
(b) Average |
|
Announced |
|
Purchased |
|
|
|
|
Units) |
|
Price Paid per |
|
Plans or |
|
Under the Plans |
|
|
Period |
|
Purchased |
|
Share (or Unit) |
|
Programs |
|
or Programs |
|
|
October 1 ‑ October 31 |
|
27,159 |
* |
$ |
65.72 |
|
— |
|
4,120,021 |
|
November 1 ‑ November 30 |
|
100,212 |
* |
|
67.47 |
|
100,000 |
|
4,020,021 |
|
December 1 ‑ December 31 |
|
1,266 |
* |
|
84.27 |
|
— |
|
4,020,021 |
|
Total |
|
128,637 |
|
|
|
|
100,000 |
|
4,020,021 |
|
* |
For the months ended October 31, 2023, November 30, 2023 and December 31, 2023, total number of shares purchased includes 27,159 shares, 212 shares and 1,266 shares, respectively, that were repurchased under arrangements, authorized by our stock based compensation plans and Board of Directors, whereby officers or directors may sell previously owned shares to SouthState in order to pay for the exercises of stock options or for income taxes owed on vesting shares of restricted stock. These shares were not repurchased under the 2022 Stock Repurchase Program. |
Item 6. Selected Financial Data.
Pursuant to the November 2020 Amendments, we elect to provide disclosures consistent with the amendments to Regulation S-K, Item 301, which eliminate the requirement to provide selected financial data in comparative tabular form for each of the last five fiscal years.
59
Item 7. Management’s Discussion and Analysis of Financial Condition and Results of Operations.
Forward-Looking Statements
Statements included in this Report, which are not historical in nature are intended to be, and are hereby identified as, forward-looking statements for purposes of the safe harbor provided by Section 27A of the Securities Act of 1933 and Section 21E of the Securities Exchange Act of 1934. Forward looking statements are based on, among other things, management’s beliefs, assumptions, current expectations, estimates and projections about the financial services industry, and the economy. Words and phrases such as “may,” “approximately,” “continue,” “should,” “expects,” “projects,” “anticipates,” “is likely,” “look ahead,” “look forward,” “believes,” “will,” “intends,” “estimates,” “strategy,” “plan,” “could,” “potential,” “possible” and variations of such words and similar expressions are intended to identify such forward-looking statements. We caution readers that forward-looking statements are subject to certain risks, uncertainties and assumptions that are difficult to predict with regard to, among other things, timing, extent, likelihood and degree of occurrence, which could cause actual results to differ materially from anticipated results. Such risks, uncertainties and assumptions, include, among others, those risks listed under “Summary of Risk Factors” starting on page 23 of this Report.
For any forward-looking statements made in this Report or in any documents incorporated by reference into this Report, we claim the protection of the safe harbor for forward looking statements contained in the Private Securities Litigation Reform Act of 1995. All forward-looking statements speak only as of the date they are made and are based on information available at that time. We do not undertake any obligation to update or otherwise revise any forward-looking statements, whether as a result of new information, future events, or otherwise, except as required by federal securities laws. As forward-looking statements involve significant risks and uncertainties, caution should be exercised against placing undue reliance on such statements. All subsequent written and oral forward-looking statements by us or any person acting on our behalf are expressly qualified in their entirety by the cautionary statements contained or referred to in this Report.
Additional information with respect to factors that may cause actual results to differ materially from those contemplated by our forward looking statements may also be included in other reports that we file with the SEC. We caution that the foregoing list of risk factors is not exclusive and not to place undue reliance on forward looking statements.
Introduction
The following Management’s Discussion and Analysis of Financial Condition and Results of Operations (“MD&A”) describes SouthState Corporation and its subsidiary’s results of operations for the year ended December 31, 2023 as compared to the year ended December 31, 2022, and the year ended December 31, 2022 as compared to the year ended December 31, 2021, and also analyzes our financial condition as of December 31, 2023 as compared to December 31, 2022. Like most banking institutions, we derive most of our income from interest we receive on our loans and investments. Our primary source of funds for making these loans and investments is our deposits, on most of which we pay interest. Consequently, one of the key measures of our success is the amount of net interest income, or the difference between the income on our interest-earning assets, such as loans and investments, and the expense on our interest-bearing liabilities, such as deposits. Another key measure is the spread between the yield we earn on these interest-earning assets and the rate we pay on our interest-bearing liabilities.
There are risks inherent in all loans, so we maintain an allowance for credit losses to absorb our estimate of probable losses on existing loans that may become uncollectible. We establish and maintain this allowance by recording a provision or recovery for credit losses against our earnings. In the following section, we have included a detailed discussion of this process.
In addition to earning interest on our loans and investments, we earn income through fees and other services we charge to our customers. We incur costs in addition to interest expense on deposits and other borrowings, the largest of which is salaries and employee benefits. We describe the various components of this noninterest income and noninterest expense in the following discussion.
60
The following section also identifies significant factors that have affected our financial position and operating results during the periods included in the accompanying financial statements. We encourage you to read this discussion and analysis in conjunction with the financial statements and the related notes and the other information included in this Report.
Overview
SouthState is a financial holding company headquartered in Winter Haven, Florida, and was incorporated under the laws of South Carolina in 1985. We provide a wide range of banking services and products to our customers through our Bank. The Bank operates SouthState|Duncan-Williams, a registered broker-dealer headquartered in Memphis, Tennessee that serves primarily institutional clients across the U.S. in the fixed income business. The Bank also operates SouthState Advisory, Inc., a wholly owned registered investment advisor, and Corporate Billing, a transaction-based finance company headquartered in Decatur, Alabama that provides factoring, invoicing, collection and accounts receivable management services to transportation companies and automotive parts and service providers nationwide. Corporate Billing’s previous holding company CBI Holding Company, LLC and its subsidiary CBI Real Estate Holding, LLC were merged into Corporate Billing effective November 30, 2023. The holding company also owns SSB Insurance Corp., a captive insurance subsidiary pursuant to Section 831(b) of the U.S. Tax Code. In late 2023, the Bank formed SSB First Street Corporation, an investment subsidiary headquartered in Wilmington, Delaware, to hold tax-exempt municipal investment securities as part of the Bank’s investment portfolio.
At December 31, 2023, we had $44.9 billion in assets and 5,184 full-time equivalent employees. Through our Bank branches, ATMs and online banking platforms, we provide our customers with a wide range of financial products and services, through a six (6) state footprint in Alabama, Florida, Georgia, North Carolina, South Carolina and Virginia. These financial products and services include deposit accounts such as checking accounts, savings and time deposits of various types, safe deposit boxes, bank money orders, wire transfer and ACH services, brokerage services and alternative investment products such as annuities and mutual funds, trust and asset management services, loans of all types, including business loans, agriculture loans, real estate-secured (mortgage) loans, personal use loans, home improvement loans, automobile loans, manufactured housing loans, boat loans, credit cards, letters of credit, home equity lines of credit, treasury management services, and merchant services.
We also operate a correspondent banking and capital markets division within our national bank subsidiary, of which the majority of its bond salesmen, traders and operational personnel are housed in facilities located in Atlanta, Georgia, Memphis, Tennessee, Walnut Creek, California, and Birmingham, Alabama. This division’s primary revenue generating activities are related to its capital markets division, which includes commissions earned on fixed income security sales, fees from hedging services, loan brokerage fees and consulting fees for services related to these activities; and its correspondent banking division, which includes spread income earned on correspondent bank deposits (i.e., federal funds purchased) and correspondent bank checking account deposits and fees from safe-keeping activities, bond accounting services for correspondents, asset/liability consulting related activities, international wires, and other clearing and corporate checking account services.
We earned net income of $494.3 million, or $6.46 diluted earnings per share (“EPS”), during 2023 compared to net income of $496.0 million, or $6.60 diluted EPS, in 2022. Net income available to the common shareholders was down $1.7 million, or 0.4%, in 2023 compared to 2022. For further discussion of the Company’s results of operations for the year ended December 31, 2023 as compared to the year ended December 31, 2022, and the year ended December 31, 2022 as compared to the year ended December 31, 2021, see Results of Operations section of this MD&A starting on page 66.
At December 31, 2023, we had total assets of approximately $44.9 billion compared to approximately $43.9 billion at December 31, 2022. See the Financial Condition section of this MD&A starting on page 76 for a more detailed description of the change in our balance sheet.
61
With high inflation and a rising interest rate environment, there was some deterioration in asset quality in 2023. However, our overall asset quality results remained strong during the year. Net charge offs as a percentage of average loans increased to 0.08% compared to 0.02% for the year ended December 31, 2022. The total nonperforming assets (“NPAs”) increased $74.4 million to $184.1 million at December 31, 2023 from $109.7 million at December 31, 2022. Non-acquired NPAs increased $75.2 million to $122.5 million at December 31, 2023 from $47.3 million at December 31, 2022, which was related to an increase in non-acquired nonperforming loans of $74.7 million. Non-acquired OREO and other NPAs increased by $466,000 to $711,000 as of December 31, 2023 compared to $245,000 as of December 31, 2022. Acquired NPAs decreased $827,000 to $61.6 million at December 31, 2023 from $62.5 million at December 31, 2022. Acquired nonperforming loans decreased $617,000 and acquired OREO and other nonperforming assets decreased $210,000. Total NPAs as a percentage of total assets increased 16 basis points to 0.41% at December 31, 2023 compared to 0.25% at December 31, 2022. While net charge-offs totaled $29.1 million, the Company recorded a total of $195.9 million of provision for credit losses for the trailing eight quarters. Our NPA ratios remained historically low.
Our efficiency ratio was 55.5% for the year ended December 31, 2023 compared to 54.2% for the same period in 2022. The increase in our efficiency ratio was due to the effects of a 7.0% increase in noninterest expense being greater than the effects of a 5.8% increase in the total net interest income and noninterest income. The increase in noninterest expense was mainly due to an increase in salaries and employee benefits of $28.6 million, an increase in FDIC regulatory and other regulatory charges of $10.0 million and the recording of the FDIC special assessment expense of $25.7 million in 2023.
We continue to remain well-capitalized with a total risk-based capital ratio of 14.1% and a Tier 1 leverage ratio of 9.4%, as of December 31, 2023, compared to 13.0% and 8.7%, respectively, at December 31, 2022. The improvement in the total risk-based capital ratio was mainly due to total risk-based capital increasing 11.1% with the increase in equity resulting from net income of $494.3 million recognized in 2023, along with the increase in the allowance for credit losses and unfunded commitments of $126.5 million includable in Tier 2 capital. Total risk-weighted assets increased $807.3 million, or 2.3%, in 2023. The improvement in the Tier 1 leverage ratio was due to the increase in Tier 1 capital of 9.8% with the increase in equity resulting from net income of $494.3 million recognized in 2023. Regulatory average assets used to calculate the Tier 1 leverage ratio only increased $707.6 million, or 1.6%, in 2023. We believe our current capital ratios position us well to grow both organically and through certain strategic opportunities. For further discussion of the Company’s financial condition as of December 31, 2023 compared to December 31, 2022, see Financial Condition section of this MD&A starting on page 76.
Recent Events
Capital Management
In April 2022, the Company’s Board of Directors approved a new stock repurchase program (“2022 Stock Repurchase Program”) authorizing the Company to repurchase up to 3,750,000 of the Company’s common shares along with the remaining authorized shares of 370,021 from the 2021 Stock Repurchase Program for a total authorization of 4,120,021 shares. During 2023, the Company repurchased a total of 100,000 shares at a weighted average price of $67.45, excluding cost of commissions, per share pursuant to the 2022 Stock Repurchase Program. During 2022, the Company did not repurchase any shares pursuant to the 2022 Stock Repurchase Program. During the first quarter of 2022, before the approval of the 2022 Stock Repurchase Program, the Company repurchased a total of 1,312,038 shares at a weighted average price of $83.99 per share pursuant to the 2021 Stock Repurchase Plan.
62
Critical Accounting Policies and Estimates
Our consolidated financial statements are prepared based on the application of accounting policies in accordance with generally accepted accounting principles (“GAAP”) and follow general practices within the banking industry. Our financial position and results of operations are affected by management’s application of accounting policies, including estimates, assumptions and judgments made to arrive at the carrying value of assets and liabilities and amounts reported for revenues and expenses. Differences in the application of these policies could result in material changes in our consolidated financial position and consolidated results of operations and related disclosures. Understanding our accounting policies is fundamental to understanding our consolidated financial position and consolidated results of operations. Accordingly, our significant accounting policies and changes in accounting principles and effects of new accounting pronouncements are discussed in Note 1 of our audited consolidated financial statements.
The following is a summary of our critical accounting policies that are highly dependent on estimates, assumptions and judgments.
Business Combinations
We account for acquisitions under FASB ASC Topic 805, Business Combinations, which requires the use of the acquisition method of accounting. All identifiable assets acquired, including loans, and liabilities assumed, are recorded at fair value. We adopted ASU 2016-13, Financial Instruments – Credit Losses (Topic 326): Measurement of Credit Losses on Financial Instruments, on January 1, 2020 which requires us to record purchased financial assets with credit deterioration (PCD assets), defined as a more-than-insignificant deterioration in credit quality since origination or issuance, at the purchase price plus the allowance for credit losses expected at the time of acquisition. Under this method, there is no provision for credit losses affecting net income on acquisition of PCD assets. Changes in estimates of expected credit losses after acquisition are recognized as provision for credit loss expense (or recovery of credit losses) in subsequent periods as they arise. Any non-credit discount or premium resulting from acquiring a pool of purchased financial assets with credit deterioration shall be allocated to each individual asset. At the acquisition date, the initial allowance for credit losses determined on a collective basis shall be allocated to individual assets to appropriately allocate any non-credit discount or premium. The non-credit discount or premium, after the adjustment for the allowance for credit losses, shall be accreted into interest income using the interest method based on the effective interest rate determined after the adjustment for credit losses at the adoption date.
A purchased financial asset that does not qualify as a PCD asset is accounted for similar to an originated financial asset. Generally, this means that an entity recognizes the allowance for credit losses for non-PCD assets through net income at the time of acquisition. In addition, both the credit discount and non-credit discount or premium resulting from acquiring a pool of purchased financial assets that do not qualify as PCD assets shall be allocated to each individual asset. This combined discount or premium shall be accreted into interest income using the effective yield method.
For further discussion of our loan accounting and acquisitions, see Note 1—Summary of Significant Accounting Policies, Note 2—Mergers and Acquisitions, Note 4—Loans and Note 5—Allowance for Credit Losses to the audited condensed consolidated financial statements.
Allowance for Credit Losses or ACL
The ACL reflects management’s estimate of the portion of the amortized cost of loans and unfunded commitments that it does not expect to collect. Management has a methodology determining its ACL for loans held for investment and certain off-balance-sheet credit exposures. Management considers the effects of past events, current conditions, and reasonable and supportable forecasts on the collectability of the loan portfolio. The Company’s estimate of its ACL involves a high degree of judgment; therefore, management’s process for determining expected credit losses may result in a range of expected credit losses. It is possible that others, given the same information, may at any point in time reach a different reasonable conclusion. The Company’s ACL recorded on the balance sheet reflects management’s best estimate within the range of expected credit losses. The Company recognizes in net income the amount needed to adjust the ACL for management’s current estimate of expected credit losses. See Note 1—Summary of Significant Accounting Policies for further detailed descriptions of our estimation process and methodology related to the ACL. See also Note 5—Allowance for Credit Losses and “Provision for Credit Losses” in this MD&A.
63
One of the most significant judgments influencing the ACL is the macroeconomic forecasts from the third-party service provider. Changes in the economic forecasts may significantly affect the estimated credit losses which may potentially lead to materially different quantitatively modeled allowance levels from one reporting period to the next. Given the dynamic relationship between macroeconomic variables, it is difficult to estimate the impact of a change in any one individual variable on the ACL. SouthState uses a third-party service provider to support the economic forecast assumptions under CECL forecast by providing various levels of economic scenarios. These scenarios are weighted in accordance with management assessment of scenarios as well as expectations of the general market and industry conditions. To illustrate the sensitivity of these scenarios, if a 100% probability weighting was applied to the adverse scenario rather than using the probability-weighted three scenario approach, this would result in an increase in the ACL by approximately $263.8 million. Conversely, if a 100% probability weighting was applied to the upside scenario, this would result in a decrease in the ACL by approximately $137.3 million. The adverse scenario includes assumptions including, but not limited to, an extended shutdown of the federal government, inflation, global events such as the Russian-Ukrainian conflict, tensions between China and Taiwan, tensions in the Middle east, political risks, increased unemployment and the U.S. economy falling into recession in 2024. Conversely, the upside scenario includes assumptions such as a swift resolution of international conflicts, stabilization of consumer confidence, more than full employment, reduced political tensions, resolution of congressional gridlock, and other favorable assumptions. This sensitivity analysis and related impact on the ACL is a hypothetical analysis and is not intended to represent management’s judgments or assumptions of qualitative loss factors that were utilized at December 31, 2023
Mortgage Servicing Rights (“MSRs”)
The Company has a mortgage loan servicing portfolio with related mortgage servicing rights. MSRs represent the present value of the future net servicing fees from servicing mortgage loans. Servicing assets and servicing liabilities must be initially measured at fair value, if practicable. For subsequent measurements, an entity can choose to measure servicing assets and liabilities either based on fair value or lower of cost or market. The Company uses the fair value measurement option for MSRs. MSRs are carried at fair value with changes in fair value recorded as a component of Mortgage Banking Income in the Consolidated Statements of Income.
The methodology used to determine the fair value of MSRs is subjective and requires the development of a number of assumptions, including anticipated prepayments of loan principal. Fair value is determined by estimating the present value of the asset’s future cash flows utilizing estimated market-based prepayment rates and discount rates, interest rates and other economic factors and assumptions validated through comparison to trade information, industry surveys and with the use of independent third-party appraisals. Risks inherent in the MSRs valuation include higher than expected prepayment rates and/or delayed receipt of cash flows. The value of MSRs is significantly affected by interest rates available in the marketplace, which influence loan prepayment speeds. In general, during periods of declining interest rates, the value of mortgage servicing rights declines due to increasing prepayments attributable to increased mortgage refinance activity. Conversely, during periods of rising interest rates, the value of servicing rights generally increases due to reduced refinance activity.
Goodwill and Other Intangible Assets
Goodwill represents the excess of the purchase price over the sum of the estimated fair values of the tangible and identifiable intangible assets acquired less the estimated fair value of the liabilities assumed in a business combination. As of December 31, 2023 and 2022, the balance of goodwill was $1.9 billion. Goodwill has an indefinite useful life and is evaluated for impairment annually or more frequently if events and circumstances indicate that the asset might be impaired. An impairment loss is recognized to the extent that the carrying amount exceeds the asset’s fair value.
In January 2017, the FASB issued ASU No. 2017-04, which simplified the accounting for goodwill impairment for all entities by requiring impairment charges to be based on Step 1 of the previous accounting guidance’s two-step impairment test under ASC Topic 350. Under the guidance, if a reporting unit’s carrying amount exceeds its fair value, an entity will record an impairment charge based on that difference. The impairment charge will be limited to the amount of goodwill allocated to that reporting unit. The standard eliminated the requirement to calculate a goodwill impairment charge using Step 2, which involved calculating an implied fair value of goodwill for each reporting unit for which the first step indicated impairment. The standard does not change the guidance on completing Step 1 of the goodwill impairment test. An entity is able to perform an optional qualitative goodwill impairment assessment before proceeding to the quantitative step of determining whether the reporting unit’s carrying amount exceeds it fair value.
64
We evaluated the carrying value of goodwill as of October 31, 2023, our annual test date, and determined that no impairment charge was necessary as the fair value of the entity exceeded the carrying value. We will continue to monitor the impact of current economic conditions and other events on the Company’s business, operating results, cash flows and financial condition. If the current economic conditions and other events were to deteriorate and our stock price falls below current levels, we will have to reevaluate the impact on our financial condition and potential impairment of goodwill.
Core deposit intangibles and client list intangibles consist primarily of amortizing assets established during the acquisition of other banks. This includes whole bank acquisitions and the acquisition of certain assets and liabilities from other financial institutions. Core deposit intangibles represent the estimated value of long-term deposit relationships acquired in these transactions. Client list intangibles represent the value of long-term client relationships for the correspondent banking and wealth and trust management business. These costs are amortized over the estimated useful lives, such as deposit accounts in the case of core deposit intangible, on a method that we believe reasonably approximates the anticipated benefit stream from this intangible. The estimated useful lives are periodically reviewed for reasonableness.
Income Taxes and Deferred Tax Assets
Income taxes are provided for the tax effects of the transactions reported in our consolidated financial statements and consist of taxes currently due plus deferred taxes related to differences between the tax basis and accounting basis of certain assets and liabilities. The deferred tax assets and liabilities represent the future tax return consequences of those differences, which will either be taxable or deductible when the assets and liabilities are recovered or settled. Deferred tax assets and liabilities are reflected at income tax rates applicable to the period in which the deferred tax assets or liabilities are expected to be realized or settled. The Company determines the realization of deferred tax assets by considering all positive and negative evidence available, including the impact of recent operating results, future reversals of taxable temporary differences, future taxable income exclusive of reversing temporary differences and carryforwards and tax planning strategies. Determining whether deferred tax assets are realizable is subjective and requires the use of significant judgment. A valuation allowance is provided when it is more-likely-than-not that some portion of the deferred tax asset will not be realized. As changes in tax laws or rates are enacted, deferred tax assets and liabilities are adjusted through the provision for income taxes. The Company and its subsidiaries file a consolidated federal income tax return. Additionally, income tax returns are filed by the Company or its subsidiaries in various state and local jurisdictions based on the Company’s footprint. The tax laws and regulations in each jurisdiction are complex and may be subject to different interpretations by the Company and the relevant taxing authorities. Therefore, the Company is required to exercise judgment in determining tax accruals and evaluating the Company’s tax positions, including evaluating uncertain tax positions. See Note 1 “Summary of Significant Accounting Policies and Note 12 “Income Taxes” to the consolidated financial statements for further details and discussion.
Recent Accounting Standards and Pronouncements
For information relating to recent accounting standards and pronouncements, see Note 1 to our audited consolidated financial statements entitled “Summary of Significant Accounting Policies.”
65
Results of Operations
Consolidated net income available to common shareholders decreased by $1.7 million, or 0.4%, to $494.3 million for the year ended December 31, 2023 compared to $496.0 million for the year ended December 31, 2022 and increased $18.8 million, or 3.9%, compared to $475.5 million in 2021. Below are key highlights of our results of operations during 2023:
| ● | A $547.4 million increase in interest income, resulting from a $538.4 million increase in interest income from loans and loans held for sale, a $14.2 million increase in interest income from investment securities, slightly offset by a $5.2 million decrease in interest income on federal funds sold, securities purchased under agreement to resell and interest-bearing deposits. The increases in interest income in loans and investment securities were mainly due to the increase in yield in the rising rate environment in 2022 and in 2023 as the Federal Reserve Bank has raised its federal funds rate 525 basis points. The increase in interest income from loans is also due to the increase in the average balance of loans of $3.9 billion through organic loan growth. The decline in interest income from federal funds sold, securities purchased under agreements to resell and interest-bearing deposits was due to a decline in average balance of $3.1 billion as liquidity tightened in 2023 with a more competitive deposit market in the rising rate environment; |
| ● | A $430.4 million increase in interest expense, resulted from a $403.3 million increase in interest expense from deposits, a $16.1 million increase in interest expense from corporate and subordinated debentures and other borrowings, and a $7.7 million and $3.4 million increase in interest expense in federal funds purchased and securities sold under agreements to repurchase, respectively. The rise in interest expense is attributed primarily to increased costs across all categories of interest-bearing liabilities as interest rates have increased in 2022 and 2023. The increase in average cost of interest-bearing liabilities was particularly felt in 2023 with the stress in financial markets and liquidity along with the increased competition for deposits. The average cost of interest-bearing liabilities increased 164 basis point in 2023 compared to the prior year; |
| ● | A $22.3 million decrease in noninterest income, which resulted primarily from a $29.7 million decrease in correspondent banking and capital markets income, a $4.4 million decline in mortgage banking income, a $1.9 million decrease in debit, prepaid, ATM and merchant card related income, and a $1.7 million decrease in SBA income. These decreases were offset by a $6.4 million increase in other noninterest income, a $6.1 million increase in service charges on deposit accounts, a $2.4 million increase in Bank Owned Life Insurance (“BOLI”) income, and a $428,000 increase in trust and investment services income (See Noninterest Income section on page 71 for further discussion); |
| ● | A $64.9 million increase in noninterest expense, resulted primarily from a $28.7 million increase in salaries and employee benefits expense, the $25.7 million accrual for the FDIC special assessment in 2023, a $10.0 million increase in FDIC assessment and other regulatory charges, a $7.7 million increase in other noninterest expense, a $6.0 million increase in business development and staff related expense, a $4.8 million increase information services expenses, a $3.2 million increase in professional fees, and a $1.3 million increase in OREO expense and loan related expense. These increases were partially offset by a $17.7 million decrease in merger, branch consolidation and severance related expense and a $5.6 million decrease in amortization expense of intangible assets (See Noninterest Expense section on page 74 for further discussion); |
| ● | A $32.2 million increase in the provision for allowance for credit losses, as the Company recorded provision for credit losses of $114.1 million during 2023 compared to recording a provision for credit losses of $81.9 million in 2022. During 2023, we recorded a higher provision for credit losses as economic forecasts reflected the continued stress of inflation and rising interest rates that began in 2022 along with tight labor markets and global uncertainty; and |
| ● | Lower income tax provision of $769,000 primarily due to the change in pretax book income between the two years. The Company recorded pretax book income of $630.9 million in 2023 compared to pretax book income of $633.4 million in 2022. The Company’s effective tax rate was 21.64% for the year ended December 31, 2023 compared to 21.68% for the year ended December 31, 2022. |
| ● | Basic earnings per common share decreased 2.3% to $6.50 in 2023, from $6.65 in 2022 and decreased 3.8% from $6.76 in 2021. |
| ● | Diluted earnings per common share decreased 2.1% to $6.46 in 2023, from $6.60 in 2022, and decreased 3.7% from $6.71 in 2021. |
66
| ● | Return on average assets was 1.11% in 2023, a slight decrease compared to 1.12% in 2022 and a decrease compared to 1.19% in 2021. The decrease in 2023 compared to 2022 was driven by both the increase in total average assets of $175.5 million, or 0.4%, to $44.7 billion in 2023 along with the decrease in net income of $1.7 million, or 0.4%, to $494.3 million. The increase in average assets mainly resulted from the increase in non-acquired loans through organic growth partially offset by declines in investment securities and federal funds sold, securities purchased under agreements to resell and other interest-earning deposit as liquidity declined in 2023. The increase in 2022 compared to 2021 was driven by both increases in loans and investment securities through both the Atlantic Capital acquisition and organic growth. |
| ● | Return on average common shareholders’ equity decreased to 9.37% in 2023, compared to 9.84% in 2022, and decreased from 10.01% in 2021. The decrease in 2023 compared to 2022 was driven by the growth in average common shareholders’ equity of 4.7%, or $237.1 million, while net income declined by 0.4%, or $1.7 million, to $494.3 million. The increase in average common shareholders’ equity was mainly due to net income in 2023. The decrease in 2022 compared to 2021 was driven by the higher growth in average common shareholders’ equity of 6.1%, or $291.4 million, compared to the growth in net income of 4.3%, or $20.5 million, to $496.0 million. The increase in average equity in 2022 was primarily resulted from the Atlantic Capital acquisition. |
| ● | Our dividend payout ratio was 31.34% for 2023 compared with 29.54% in 2022 and 28.43% in 2021. The increase in the dividend payout ratio in 2023 compared to 2022 was due to the increase in total dividends paid during 2023 of 5.8%, or $8.4 million, while the net income available to common shareholders decreased 0.4%, or $1.7 million. The increase in the dividend payout ratio in 2022 compared to 2021 was due to the increase in total dividends paid during 2022 of 8.3%, or $11.3 million, being greater than the increase in net income available to common shareholders, which increased 4.3%, or $20.5 million. |
Net Interest Income
Net interest income is the largest component of our net income. Net interest income is the difference between income earned on interest-earning assets and interest paid on deposits and borrowings. Net interest income is determined by the yields earned on interest-earning assets, rates paid on interest-bearing liabilities, the relative balances of interest-earning assets and interest-bearing liabilities, the degree of mismatch, and the maturity and repricing characteristics of interest-earning assets and interest-bearing liabilities. Net interest income divided by average interest-earning assets represents our net interest margin.
The Federal Reserve made four 25 basis-point rate increases in 2023, the most recent in late July 2023, resulting in a range of 5.25% to 5.50% at December 31, 2023. As a result, the Company operated under an increasing rate environment for the majority of the year in 2023 while it operated under a comparatively lower rate environment in 2022.
2023 compared to 2022
Net interest income and net interest margin are highlighted for the year ended December 31, 2023, compared to 2022:
| ● | The non-tax equivalent and the tax equivalent net interest margin increased by 27 basis points and 26 basis points, respectively, in 2023 compared to 2022. The net interest margin increased primarily due to the rising rate environment in effect during 2023. Despite the 164 basis points increase in the cost of interest-bearing liabilities being greater than the 135 basis points increase in the yield on interest-earning assets, our net interest margin increased due to average interest-earning assets of $40.1 billion being greater than average interest-bearing liabilities of $26.0 million during 2023. |
| o | Overall, our yield on interest-earning assets in 2023 increased 135 basis points from 2022, primarily due to higher yields on all interest-earning assets as the Federal Reserve Bank raised interest rates 525 basis points starting late in first quarter of 2022. The increase in interest rates, in combination with the increase in the average balance of the higher yielding loan portfolio of $3.9 billion, along with the decline in the average balances of lower yielding federal funds sold, securities purchased under agreements to resell and other interest-earning deposits of $3.1 billion and investment securities of $615.6 million, affected the overall yield increase in interest-earning assets between the comparable periods. |
67
| o | The average cost of interest-bearing liabilities in 2023 compared to 2022 increased 164 basis points. This increase was driven by the effects from the rising rate environment on the repricing of all deposit accounts, federal funds purchased and securities purchased with agreement to repurchase and other borrowings. The average cost of interest-bearing deposits increased 162 basis points as the increase occurred in all deposit categories. The average cost of federal funds purchased and securities purchased with agreements to repurchase increased 373 basis points and 111 basis points, respectively, while the average cost of other borrowings increased 66 basis points. The increase in the average cost of other borrowings was due to the variable rate trust preferred debt. The increase in overall average cost of interest-bearing liabilities for the 2023 from the same period in 2022 was also a result of the change in the mix of deposit balances, shifting from lower-costing savings and transaction deposit accounts to higher-costing certificates and other time deposits and money market accounts. |
| ● | Our net interest income increased by $116.9 million, or 8.8%, to $1.5 billion during 2023, compared to 2022 as our interest income increased $547.4 million while interest expense increased $430.4 million. |
| o | Our interest income increased by $547.4 million due to higher non-acquired loan interest income of $542.7 million attributable to both a higher average balance of $5.7 billion through organic loan growth and renewals of matured acquired loans that are moved to our non-acquired loan portfolio along with a higher yield of 126 basis points due to the rising rate environment. Investment securities interest income was higher by $14.2 million because of an increase in the yield of 34 basis points due to the rising rate environment. |
| o | These increases in interest income were partially offset by lower federal funds sold and repurchase agreements interest income of $5.2 million and lower interest income on acquired loans of $3.7 million due to lower average balances by $3.1 billion and $1.8 billion, respectively. Interest income on loans held for sale also declined by $643,000 due to a lower average balance of $33.9 million. The effects from the declines in average balance were partially offset by the increases in yields of 125 basis points on acquired loans, 378 basis on federal funds sold and repurchase agreements, and 248 basis points on loans held for sale from the effects of the rising rate environment. |
| o | Our interest expense increased by of $430.4 million in 2023 compared to 2022 due primarily to interest expense on interest-bearing deposits increasing $403.3 million, which was attributable to an increase in the average cost of 162 basis points as well as an increase in the average balance of $1.1 billion. As noted above, the increase in expense on interest-bearing deposit was significantly impacted by the change in mix from lower costing savings and transaction deposit accounts to higher costing certificate and other time deposit accounts and money market accounts as customer sought higher yields in the competitive deposit market in 2023. Interest expense related to other borrowings increased $16.1 million due to an increase in average cost of 66 basis points along with an increase in the average balance of $238.0 million. Interest expense on federal funds purchased and repurchased agreements increased $7.7 million and $3.4 million, respectively, due to increases in the average costs of 373 basis points and 111 basis points, respectively. |
| ● | Average interest-earning assets increased $216.5 million, or 0.5%, to $40.1 billion in 2023 compared to 2022. |
| o | The increase in the average balance on non-acquired loan portfolio of $5.7 billion was due to organic growth and renewals of matured acquired loans that are moved to our non-acquired loan portfolio. |
| o | The decrease in the average balance on the acquired loan portfolio of $1.8 billion was due to paydowns, pay-offs and renewals of acquired loans that are moved to our non-acquired loan portfolio. |
| o | The average balance in investment securities decreased by $615.6 million. The decrease in average was primarily a result of maturities, calls and paydowns on available for sale and held to maturity securities of $590.8 million, and $190.8 million, respectively, during the year, along with sales of available for sale securities of $129.6 million. These decreases were partially offset by an increase in market value on available for sale securities of $112.7 million and purchases of available for sale securities of $80.4 million. |
| o | The average balance on federal funds sold, securities purchased under agreements to resell and other interest earning deposits decreased $3.1 billion as the liquidity tightened in 2023 with the more competitive market for deposits with costumers seeking higher yields. |
| ● | Average interest-bearing liabilities increased $1.2 billion, or 5.0%, to $26.0 billion in 2023 compared to 2022. |
| o | The average balance of interest-bearing deposits increased $1.1 billion primarily due to an increase in the average balance of higher costing time deposits of $1.4 billion. Of this increase in time deposits, $769.0 million was due to an increase in the use of brokered time deposits during 2023. The average balance of transaction and money market accounts increased $328.3 million during 2023 as lower costing savings account deposits declined $567.5 million. Within transaction and money market accounts, there was a shift to the higher costing money market account accounts in 2023 as customers sought higher yields driving the increase in balance. |
68
| o | The average balance of federal funds purchased decreased $52.6 million and repurchase agreements decreased $77.3 million. |
| o | The average balance of other borrowings increased by $238.0 million due to the increased use of short-term FHLB advance during 2023 as deposits markets became more competitive. |
2022 compared to 2021
Net interest income and net interest margin are highlighted for the year ended December 31, 2022, compared to 2021:
| ● | Both the non-tax equivalent and the tax equivalent net interest margin increased by 45 basis points in 2022 compared to 2021. While the yield on interest-earning assets increased 45 basis points, the cost of interest-bearing liabilities marginally increased 3 basis points. The increase in the net interest margin was primarily due to the rising rate environment in effect during 2022 as our interest-earning assets have repriced more quickly than our interest-bearing liabilities. The increase was also due to a change in asset mix as the lower yielding interest-bearing deposit and federal funds sold declined in 2022, while our higher yielding loan portfolio and investments increased. |
| o | Overall, our yield on interest-earning assets in 2022 increased 45 basis points from 2021, primarily due to higher yields on all interest-earning assets as the Federal Reserve Bank raised interest rates 425 basis points starting late in first quarter of 2022. The increases in interest rates, in combination with the increase in the average balance of the higher yielding loan portfolio of $3.3 billion and the investment portfolio of $2.7 billion, along with the decline in the average balance of lower yielding interest-earning deposits and federal funds sold of $1.6 billion, affected the overall yield increase between the comparable periods. |
| o | The average cost of interest-bearing liabilities in 2022 compared to 2021 increased 3 basis points. This increase was driven by the effects from the rising rate environment on the repricing of variable rate products, including interest-bearing and savings deposits, federal funds purchased and trust preferred corporate debt. The cost of interest-bearing and savings deposits increased 5 basis points, while the cost of federal funds purchased increased 126 basis points and the cost of corporate and subordinated debentures increased 12 basis points. Overall, interest-bearing deposits have been slower to reprice in the rising rate environment. |
| ● | Our net interest income increased by $302.5 million, or 29.3%, to $1.3 billion during 2022, compared to 2021, as interest income increased $312.2 million and interest expense only increased $9.7 million. |
| o | Our interest income increased by $312.2 million due to – |
| ◾ | Higher non-acquired loan interest income of $235.2 million due to a higher average balance of $5.0 billion, higher investment securities interest income of $84.6 million because of a higher average balance of $2.7 billion, and higher federal funds sold and repurchase agreements interest income of $40.1 million due to the rising rate environment in effect during the current year even though the average balance was lower by $1.6 billion. |
| ◾ | These increases in interest income were partially offset by lower interest income on acquired loans of $43.6 million due to a lower average balance of $1.6 billion resulting from paydowns, pay-offs and renewals of acquired loans that are moved to our non-acquired loan portfolio. Interest income on loans held for sale also declined by $4.1 million due to a lower average balance of $177.9 million. |
| o | Our interest expense increased by of $9.7 million in 2022 compared to 2021 due to – |
| ◾ | Interest expense on interest-bearing deposits increasing $3.8 million because of a slight increase in the average cost of 1 basis point along with a $1.7 billion increase in the average balance, interest expense on federal funds purchased increasing $3.3 million because of an increase in the average cost of 126 basis points, and interest expense related to other borrowings increasing $2.6 million because of an increase in the average cost of 14 basis points. |
| ● | Average interest-earning assets increased $4.3 billion, or 12.0%, to $39.9 billion in 2022 compared to 2021. |
| o | The increase in the average balance on non-acquired loan portfolio of $5.0 billion was due to organic growth and renewals of matured acquired loans that are moved to our non-acquired loan portfolio. |
| o | The decrease in the average balance on the acquired loan portfolio of $1.6 billion was due to paydowns, pay-offs and renewals of acquired loans that are moved to our non-acquired loan portfolio. |
69
| o | The increase in the average balance in investment securities of $2.7 billion was a result of the Bank using a portion of the excess funds to increase the size of its investment securities, along with the Bank’s strategy on replacing lower yielding securities with higher yielding securities as interest rates started to increase in the first quarter of 2022, in addition to retaining a portion of the investment securities acquired from Atlantic Capital on March 1, 2022. The excess liquidity was from the growth in deposits in 2021 and during the first half of 2022. |
| ● | Average interest-bearing liabilities increased $1.6 billion, or 6.8%, to $24.8 billion in 2022 compared to 2021. |
| o | The average balance of interest-bearing deposits increased $1.7 billion, primarily due to the interest-bearing deposits of $1.6 billion assumed from the Atlantic Capital acquisition on March 1, 2022. The average balance of lower costing interest-bearing transaction accounts, money market accounts and savings accounts increased $2.4 billion, while the average balance of higher costing time deposits declined $631.7 million in 2022 compared to 2021. |
| o | The average balance of federal funds purchased decreased $204.2 million and repurchase agreements decreased $357,000. |
| o | The average balance of other borrowings increased by $42.3 million due to $78.4 million of subordinated debentures assumed from Atlantic Capital on March 1, 2022, partially offset by the redemption of $13.0 million of subordinated debentures in late June 2022. |
Table 1—Yields on Average Interest-Earning Assets and Rates on Average Interest-Bearing Liabilities
|
|
|
|
|
|
|
|
|
|
|
|
|
|
|
|
|
|
|
|
|
|
|
|
|
|
|
|
Year Ended December 31, |
|
||||||||||||||||||||||
|
|
2023 |
|
2022 |
|
2021 |
|
||||||||||||||||||
|
|
|
|
|
Interest |
|
Average |
|
|
|
|
Interest |
|
Average |
|
|
|
|
Interest |
|
Average |
|
|||
|
|
Average |
|
Earned/ |
|
Yield/ |
|
Average |
|
Earned/ |
|
Yield/ |
|
Average |
|
Earned/ |
|
Yield/ |
|
||||||
(Dollars in thousands) |
|
Balance |
|
Paid |
|
Rate |
|
Balance |
|
Paid |
|
Rate |
|
Balance |
|
Paid |
|
Rate |
|
||||||
Assets |
|
|
|
|
|
|
|
|
|
|
|
|
|
|
|
|
|
|
|
|
|
|
|
|
|
Interest‑earning assets: |
|
|
|
|
|
|
|
|
|
|
|
|
|
|
|
|
|
|
|
|
|
|
|
|
|
Non‑acquired loans, net of unearned income(1) |
|
$ |
24,813,599 |
|
$ |
1,312,452 |
|
5.29 |
% |
$ |
19,094,680 |
|
$ |
769,766 |
|
4.03 |
% |
$ |
14,121,233 |
|
$ |
534,565 |
|
3.79 |
% |
Acquired loans, net |
|
|
6,589,692 |
|
|
401,914 |
|
6.10 |
% |
|
8,361,454 |
|
|
405,578 |
|
4.85 |
% |
|
9,997,279 |
|
|
449,153 |
|
4.49 |
% |
Loans held for sale |
|
|
30,740 |
|
|
2,039 |
|
6.63 |
% |
|
64,684 |
|
|
2,682 |
|
4.15 |
% |
|
242,584 |
|
|
6,801 |
|
2.80 |
% |
Investment securities(2): |
|
|
|
|
|
|
|
|
|
|
|
|
|
|
|
|
|
|
|
|
|
|
|
|
|
Taxable |
|
|
7,014,604 |
|
|
162,907 |
|
2.32 |
% |
|
7,569,603 |
|
|
149,790 |
|
1.98 |
% |
|
5,208,857 |
|
|
76,850 |
|
1.48 |
% |
Tax‑exempt |
|
|
813,695 |
|
|
23,455 |
|
2.88 |
% |
|
874,255 |
|
|
22,361 |
|
2.56 |
% |
|
569,676 |
|
|
10,715 |
|
1.88 |
% |
Federal funds sold and securities purchased under agreements to resell and time deposits |
|
|
836,068 |
|
|
41,639 |
|
4.98 |
% |
|
3,917,233 |
|
|
46,848 |
|
1.20 |
% |
|
5,481,018 |
|
|
6,720 |
|
0.12 |
% |
Total interest‑earning assets |
|
|
40,098,398 |
|
|
1,944,406 |
|
4.85 |
% |
|
39,881,909 |
|
|
1,397,025 |
|
3.50 |
% |
|
35,620,647 |
|
|
1,084,804 |
|
3.05 |
% |
Noninterest‑earning assets: |
|
|
|
|
|
|
|
|
|
|
|
|
|
|
|
|
|
|
|
|
|
|
|
|
|
Cash and due from banks |
|
|
471,418 |
|
|
|
|
|
|
|
550,733 |
|
|
|
|
|
|
|
495,910 |
|
|
|
|
|
|
Other assets |
|
|
4,486,196 |
|
|
|
|
|
|
|
4,361,927 |
|
|
|
|
|
|
|
4,112,373 |
|
|
|
|
|
|
Allowance for loan losses |
|
|
(400,051) |
|
|
|
|
|
|
|
(314,094) |
|
|
|
|
|
|
|
(381,244) |
|
|
|
|
|
|
Total noninterest‑earning assets |
|
|
4,557,563 |
|
|
|
|
|
|
|
4,598,566 |
|
|
|
|
|
|
|
4,227,039 |
|
|
|
|
|
|
Total assets |
|
$ |
44,655,961 |
|
|
|
|
|
|
$ |
44,480,475 |
|
|
|
|
|
|
$ |
39,847,686 |
|
|
|
|
|
|
Liabilities |
|
|
|
|
|
|
|
|
|
|
|
|
|
|
|
|
|
|
|
|
|
|
|
|
|
Interest‑bearing liabilities: |
|
|
|
|
|
|
|
|
|
|
|
|
|
|
|
|
|
|
|
|
|
|
|
|
|
Deposits |
|
|
|
|
|
|
|
|
|
|
|
|
|
|
|
|
|
|
|
|
|
|
|
|
|
Transaction and money market accounts |
|
$ |
17,843,581 |
|
$ |
307,692 |
|
1.72 |
% |
$ |
17,515,277 |
|
$ |
27,408 |
|
0.16 |
% |
$ |
15,639,103 |
|
$ |
15,240 |
|
0.10 |
% |
Savings deposits |
|
|
2,961,654 |
|
|
7,514 |
|
0.25 |
% |
|
3,529,142 |
|
|
1,781 |
|
0.05 |
% |
|
3,043,977 |
|
|
1,262 |
|
0.04 |
% |
Certificates and other time deposits |
|
|
4,042,052 |
|
|
125,051 |
|
3.09 |
% |
|
2,673,000 |
|
|
7,795 |
|
0.29 |
% |
|
3,304,673 |
|
|
16,680 |
|
0.50 |
% |
Federal funds purchased |
|
|
225,642 |
|
|
11,457 |
|
5.08 |
% |
|
278,251 |
|
|
3,744 |
|
1.35 |
% |
|
482,471 |
|
|
411 |
|
0.09 |
% |
Securities sold with agreements to repurchase |
|
|
317,879 |
|
|
4,132 |
|
1.30 |
% |
|
395,141 |
|
|
759 |
|
0.19 |
% |
|
395,498 |
|
|
778 |
|
0.20 |
% |
Other borrowings |
|
|
635,113 |
|
|
35,952 |
|
5.66 |
% |
|
397,113 |
|
|
19,867 |
|
5.00 |
% |
|
354,799 |
|
|
17,258 |
|
4.86 |
% |
Total interest‑bearing liabilities |
|
|
26,025,921 |
|
|
491,798 |
|
1.89 |
% |
|
24,787,924 |
|
|
61,354 |
|
0.25 |
% |
|
23,220,521 |
|
|
51,629 |
|
0.22 |
% |
Noninterest‑bearing liabilities: |
|
|
|
|
|
|
|
|
|
|
|
|
|
|
|
|
|
|
|
|
|
|
|
|
|
Noninterest‑bearing deposits |
|
|
11,777,053 |
|
|
|
|
|
|
|
13,481,876 |
|
|
|
|
|
|
|
11,026,104 |
|
|
|
|
|
|
Other liabilities |
|
|
1,575,621 |
|
|
|
|
|
|
|
1,170,394 |
|
|
|
|
|
|
|
852,135 |
|
|
|
|
|
|
Total noninterest‑bearing liabilities |
|
|
13,352,674 |
|
|
|
|
|
|
|
14,652,270 |
|
|
|
|
|
|
|
11,878,239 |
|
|
|
|
|
|
Shareholders’ equity |
|
|
5,277,366 |
|
|
|
|
|
|
|
5,040,281 |
|
|
|
|
|
|
|
4,748,926 |
|
|
|
|
|
|
Total noninterest‑bearing liabilities and shareholders’ equity |
|
|
18,630,040 |
|
|
|
|
|
|
|
19,692,551 |
|
|
|
|
|
|
|
16,627,165 |
|
|
|
|
|
|
Total liabilities and shareholders’ equity |
|
$ |
44,655,961 |
|
|
|
|
|
|
$ |
44,480,475 |
|
|
|
|
|
|
$ |
39,847,686 |
|
|
|
|
|
|
Net interest spread |
|
|
|
|
|
|
|
2.96 |
% |
|
|
|
|
|
|
3.25 |
% |
|
|
|
|
|
|
2.83 |
% |
Net interest income and margin (non‑taxable equivalent) |
|
|
|
|
$ |
1,452,608 |
|
3.62 |
% |
|
|
|
$ |
1,335,671 |
|
3.35 |
% |
|
|
|
$ |
1,033,175 |
|
2.90 |
% |
TEFRA (included in net interest margin, tax equivalent) |
|
|
|
|
|
3,023 |
|
|
|
|
|
|
|
8,876 |
|
|
|
|
|
|
|
5,921 |
|
|
|
Net interest income and margin (taxable equivalent) |
|
|
|
|
$ |
1,455,631 |
|
3.63 |
% |
|
|
|
$ |
1,344,547 |
|
3.37 |
% |
|
|
|
$ |
1,039,096 |
|
2.92 |
% |
Total Deposit Cost (without other borrowings) |
|
|
|
|
|
|
|
1.20 |
% |
|
|
|
|
|
|
0.10 |
% |
|
|
|
|
|
|
0.10 |
% |
Overall Cost of Funds (including interest-bearing deposits) |
|
|
|
|
|
|
|
1.30 |
% |
|
|
|
|
|
|
0.16 |
% |
|
|
|
|
|
|
0.15 |
% |
| (1) | Nonaccrual loans are included in the above analysis. |
| (2) | Investment securities (taxable and tax-exempt) include trading securities. |
70
Table 2—Volume and Rate Variance Analysis
|
|
|
|
|
|
|
|
|
|
|
|
|
|
|
|
|
|
|
|
|
|
2023 Compared to 2022 |
|
2022 Compared to 2021 |
|
||||||||||||||
|
|
Increase (Decrease) due to |
|
Increase (Decrease) due to |
|
||||||||||||||
(Dollars in thousands) |
|
Volume(1) |
|
Rate(1) |
|
Total |
|
Volume(1) |
|
Rate(1) |
|
Total |
|
||||||
Interest income on: |
|
|
|
|
|
|
|
|
|
|
|
|
|
|
|
|
|
|
|
Non‑acquired loans, net of unearned income(2) |
|
$ |
230,547 |
|
$ |
312,139 |
|
$ |
542,686 |
|
$ |
188,272 |
|
$ |
46,929 |
|
$ |
235,201 |
|
Acquired loans(2) |
|
|
(85,941) |
|
|
82,277 |
|
|
(3,664) |
|
|
(73,494) |
|
|
29,919 |
|
|
(43,575) |
|
Loans held for sale |
|
|
(1,407) |
|
|
764 |
|
|
(643) |
|
|
(4,988) |
|
|
869 |
|
|
(4,119) |
|
Investment securities: |
|
|
|
|
|
|
|
|
|
|
|
|
|
|
|
|
|
|
|
Taxable |
|
|
(10,983) |
|
|
24,100 |
|
|
13,117 |
|
|
34,830 |
|
|
38,110 |
|
|
72,940 |
|
Tax exempt(3) |
|
|
(1,549) |
|
|
2,643 |
|
|
1,094 |
|
|
5,729 |
|
|
5,917 |
|
|
11,646 |
|
Federal funds sold and securities purchased under agreements to resell and time deposits |
|
|
(36,849) |
|
|
31,640 |
|
|
(5,209) |
|
|
(1,917) |
|
|
42,045 |
|
|
40,128 |
|
Total interest income |
|
|
93,818 |
|
|
453,563 |
|
|
547,381 |
|
|
148,432 |
|
|
163,789 |
|
|
312,221 |
|
Interest expense on: |
|
|
|
|
|
|
|
|
|
|
|
|
|
|
|
|
|
|
|
Deposits |
|
|
|
|
|
|
|
|
|
|
|
|
|
|
|
|
|
|
|
Transaction and money market accounts |
|
|
514 |
|
|
279,770 |
|
|
280,284 |
|
|
1,828 |
|
|
10,340 |
|
|
12,168 |
|
Savings deposits |
|
|
(286) |
|
|
6,019 |
|
|
5,733 |
|
|
201 |
|
|
318 |
|
|
519 |
|
Certificates and other time deposits |
|
|
3,992 |
|
|
113,264 |
|
|
117,256 |
|
|
(3,188) |
|
|
(5,697) |
|
|
(8,885) |
|
Federal funds purchased |
|
|
(708) |
|
|
8,421 |
|
|
7,713 |
|
|
(174) |
|
|
3,507 |
|
|
3,333 |
|
Securities sold under agreements to repurchase |
|
|
(149) |
|
|
3,522 |
|
|
3,373 |
|
|
(1) |
|
|
(18) |
|
|
(19) |
|
Other borrowings |
|
|
11,907 |
|
|
4,178 |
|
|
16,085 |
|
|
2,058 |
|
|
551 |
|
|
2,609 |
|
Total interest expense |
|
|
15,270 |
|
|
415,174 |
|
|
430,444 |
|
|
724 |
|
|
9,001 |
|
|
9,725 |
|
Net interest income |
|
$ |
78,548 |
|
$ |
38,389 |
|
$ |
116,937 |
|
$ |
147,708 |
|
$ |
154,788 |
|
$ |
302,496 |
|
| (1) | The rate/volume variance for each category has been allocated on the same basis between rate and volumes. |
| (2) | Nonaccrual loans are included in the above analysis. |
| (3) | Tax exempt income is not presented on a taxable-equivalent basis in the above analysis. |
Noninterest Income and Expense
Noninterest income provides us with additional revenues that are significant sources of income. In 2023, 2022, and 2021, noninterest income comprised 16.5%, 18.8%, and 25.5%, respectively, of total net interest income and noninterest income.
Table 3—Noninterest Income for the Three Years
|
|
|
Year Ended December 31, |
|
|||||||
(Dollars in thousands) |
|
|
2023 |
|
2022 |
|
2021 |
|
|||
Service charges on deposit accounts |
|
|
$ |
88,271 |
|
$ |
82,165 |
|
$ |
65,973 |
|
Debit, prepaid, ATM and merchant card related income |
|
|
|
40,744 |
|
|
42,645 |
|
|
36,783 |
|
Mortgage banking income |
|
|
|
13,355 |
|
|
17,790 |
|
|
64,599 |
|
Trust and investment services income |
|
|
|
39,447 |
|
|
39,019 |
|
|
36,981 |
|
Correspondent banking and capital markets income |
|
|
|
49,101 |
|
|
78,755 |
|
|
110,048 |
|
Securities gains, net |
|
|
|
43 |
|
|
30 |
|
|
102 |
|
SBA income |
|
|
|
13,929 |
|
|
15,636 |
|
|
11,865 |
|
Bank owned life insurance income |
|
|
|
26,690 |
|
|
24,311 |
|
|
18,410 |
|
Other |
|
|
|
15,326 |
|
|
8,896 |
|
|
9,491 |
|
Total noninterest income |
|
|
$ |
286,906 |
|
$ |
309,247 |
|
$ |
354,252 |
|
2023 compared to 2022
Our noninterest income decreased $22.3 million, or 7.2%, for the year ended December 31, 2023 compared to 2022. This change in total noninterest income resulted from the following:
| ● | Service charges on deposit accounts were higher in 2023 by $6.1 million, or 7.4%, compared to 2022. The increase was mainly attributable to a $3.9 million increase in account maintenance fees and a $2.4 million increase in Non-Sufficient Fund (“NSF”) fees, slightly offset by approximately $181,000 decrease in other services charges in 2023 compared to 2022. The majority of the increase in the account maintenance fees and the NSF fees in 2023 was related to business accounts as there was a full year of activity from the accounts acquired in the Atlantic Capital acquisition and the Company reduced that amount of business fees waived and charged off in 2023. |
71
| ● | Debit, prepaid, ATM and merchant card related income decreased by $1.9 million, or 4.5%, in 2023 compared to 2022. The decrease in debit, ATM, prepaid and merchant card related income was driven by a decrease in debit/ATM fee income, net of card expense, of $2.0 million, due mainly to a higher card expense of $2.2 million. |
| ● | Mortgage banking income decreased by $4.4 million, or 24.9%, which comprised of a $6.6 million, or 44.9%, decrease in secondary market mortgage income, offset by a $2.2 million, or 72.9%, increase in mortgage servicing related income. Mortgage production declined from $4.5 billion in 2022 to $2.2 billion in 2023 with the rise in mortgage rates continuing during 2023. The reduction in mortgage production resulted in lower mortgage income from the secondary market in 2023. We allocated a slightly higher percentage of mortgage production to the secondary market in 2023 compared to 2022. The allocation of mortgage production between portfolio and secondary market depends on the Company’s liquidity, market spreads and rate changes during each period and will fluctuate year to year. |
| o | During 2023, mortgage income from the secondary market comprised of a $16.9 million decline in gain on sale of mortgage loans, which is net of the commission expense related to mortgage production, offset by a $10.2 million increase in the change in fair value of the pipeline, loans held for sale and MBS forward trades. Mortgage commission expense was $8.6 million during 2023 compared to $12.8 million during 2022. The declines in the gain on sale of mortgage loans and mortgage commission expense was mainly due to the reduction in mortgage production. |
| o | The increase in mortgage servicing related income, net of the hedge, during 2023 was due to a $1.9 million increase in the change in fair value of the MSR including decay and a $290,000 increase in servicing fee income. The increase in fair value of the MSR in 2023 was primarily due to an increase in gains on the MSR hedge of $16.8 million and a $1.4 million increase due to a decline in MSR decay, offset by a decrease in the change in fair value from interest rates of $16.2 million. |
| ● | Trust and investment services income increased $428,000, or 1.1%, in 2023 compared to 2022. The increase was primarily due to an increase in fee earnings as the average assets under management increased $870.0 million, or 13.0%, and an increase in number of relationships under management from December 31, 2022 to December 31, 2023. |
| ● | Correspondent banking and capital markets income decreased by $29.7 million, or 37.7%, from 2022. The decline was due to the expense attributable to the variation margin payments for centrally cleared swaps, along with lower commissions and fees earned on fixed income security sales of $12.1 million during 2023 as the volume in sales declined compared to the same period in 2022 due to the volatility in financial markets and interest rate environment. We recorded an expense of $41.5 million related to variation margin payments in 2023 compared to an expense of $14.2 million in 2022. These declines in income were partially offset by an increase of $7.6 million in income generated from the customer swap ARC hedging program in 2023 compared to 2022. |
| ● | SBA income decreased by $1.7 million, or 10.9%, compared to 2022. SBA income includes changes in fair value of the servicing asset, loan servicing fees, and gains on sale of SBA loans. The decrease was attributable to a decrease in gains on sale of SBA loans of $922,000 and a decline in the fair value of the SBA servicing asset of $911,000, partially offset by an increase in SBA servicing fee income of $126,000. |
| ● | Bank owned life insurance income increased $2.4 million, or 9.8%, in 2023 compared to 2022. This increase was due to having a full year effect from the purchase of $86.0 million of new policies in March of 2022 and the addition of $74.6 million in BOLI resulting from the acquisition of Atlantic Capital in the first quarter of 2022 along with the purchase of $6.0 million of new policies purchased in 2023. In addition, the Company saw an increase of $296,000 in income received from the payout on BOLI policies during 2023 compared to 2022. |
| ● | Other income increased by $6.4 million, or 72.3%, in 2023 compared to 2022. This increase was primarily due to approximately $3.7 million in income for tax refunds, income from a legal settlement of approximately $960,000, and an increase in income generated from prepaid cards of $766,000. Income from VISA merchant sponsorship program, in which the Bank earns fees by aiding merchants in processing transactions through VISA, also increased $729,000. The Bank also recorded a total of $486,000 in income from assisting small business customers with Employee Retention Credit (“ERC”) filings in 2023. |
72
2022 compared to 2021
Our noninterest income decreased 12.7% for the year ended December 31, 2022 compared to 2021. This change in total noninterest income resulted from the following:
| ● | Service charges on deposit accounts were higher in 2022 by $16.2 million, or 24.5%, compared to 2021. During the third quarter of 2022, the Company modified its consumer overdraft program to eliminate Non-Sufficient Funds (“NSF”) fees as well as transfer fees to cover overdrafts. We also started offering a deposit product with no overdraft fees. However, mainly due to the increase in numbers of customers and activity through the Atlantic Capital merger completed during the first quarter of 2022, service charge account maintenance fees increased $9.8 million, NSF and Automated Overdraft Privilege (“AOP”) charges increased $4.1 million, and commissions from sales of checks increased $1.7 million. |
| ● | Debit, prepaid, ATM and merchant card related income was higher by $5.9 million, or 15.9%, in 2022 compared to 2021. The increase in debit, prepaid, ATM and merchant card related income was mainly driven by higher debit card income and credit card sales incentive income resulting from the increase in activity related to the acquisition of Atlantic Capital completed in the first quarter of 2022. Debit card income (net of debit card expenses) and credit card sales incentive increased by $4.1 million and $1.7 million, respectively. |
| ● | Mortgage banking income decreased by $46.8 million, or 72.5%, which was comprised of $45.5 million, or 75.5%, decrease from mortgage income in the secondary market and a $1.3 million, or 30.1%, decrease from mortgage servicing related income, net of the hedge. Starting in the second quarter of 2021, the Company allocated a lower percentage of its mortgage production and pipeline to the secondary market, which resulted in a decrease in mortgage income from the secondary market. The allocation of mortgage production between portfolio and secondary market depends on the Company’s liquidity, market spreads and rate changes during each period and will fluctuate year to year. |
| o | During 2022, mortgage income from the secondary market comprised of a $4.8 million increase in the change in fair value of the pipeline, loans held for sale and MBS forward trades and a $50.4 million decrease in the net gain on sale of mortgage loans due to overall lower mortgage production in 2022, along with the lower allocation of mortgage production going to the secondary market. Mortgage commission expense was $12.8 million during 2022 compared to $27.2 million during 2021. |
| o | The decrease in mortgage servicing related income, net of the hedge during 2022 was due to a $3.4 million decrease in the change in fair value of the MSR including decay, which was partially offset by a $2.1 million increase from servicing fee income. The decrease in the change in fair value of the MSR was primarily due to an increase in losses on the MSR hedge of $13.3 million, offset by an increase in the change in fair value from interest rates of $5.0 million and a $5.0 million decline in MSR decay as interest rates have increased since 2021. The increase in the servicing fee income is due to the increase in size of the servicing portfolio. |
| ● | Trust and investment services income increased $2.0 million, or 5.5%, in 2022 compared to 2021. The increase was primarily due to an increase in fees earnings as the assets under management increased $53.9 million, or 0.8%, and increases in numbers of accounts and relationships under management from December 31, 2021 to December 31, 2022. |
| ● | Correspondent banking and capital markets income for 2022 decreased by $31.3 million, or 28.4%, from 2021. The decline was due to lower commissions and fees earned on fixed income security sales during 2022 as the volume in sales declined from 2021 and due to expense attributable to the variation margin payments for the centrally cleared swaps. During 2022, the Company determined the variation margin payments for its interest rate swaps centrally cleared through London Clearing House (“LCH”) and Chicago Mercantile Exchange (“CME”) met the legal characteristics of daily settlements of the derivatives rather than collateral. The expense or income attributable to the variation margin payments for the centrally cleared swaps is now reported in noninterest income, specifically within Correspondent and Capital Markets Income, as opposed to interest income or interest expense. We recorded expense of $14.0 million related to variation margin payments in 2022 compared to income of $43,000 in 2021. The increase in expense in 2022 was due to the rise in interest rates which caused a decline in value in our centrally cleared interest rate swaps with LCH and CME. Refer to Note 1—Summary of Significant Accounting Policies, section titled “Derivative Financial Instruments” for a detailed discussion. |
| ● | SBA income, including the impact from the change to fair value accounting during 2022, increased by $3.8 million, or 31.8% compared to 2021. SBA income includes changes in fair value of the servicing asset, loan servicing fees and gains on sale of SBA loans. The increase is mainly attributable to additional business resulting from the acquisition of Atlantic Capital. |
73
| ● | Bank owned life insurance income increased $5.9 million, or 32.1%, in 2022 compared to 2021. This increase was due to the purchase of $86.0 million of new policies since March 2022 and the addition of $74.6 million in bank owned life insurance through the acquisition of Atlantic Capital completed in the first quarter of 2022, along with an increase in income from the payout of bank owned life insurance policies of $1.1 million in 2022 compared to 2021. |
Noninterest expense represents the largest expense category for our company. Our expenses in 2023 increased $64.9 million or 7.0% from 2022. Our noninterest expenses in 2022 decreased $18.7 million or 2.0% from 2021.
Table 4—Noninterest Expense for the Three Years
|
|
Year Ended December 31, |
|
|||||||
(Dollars in thousands) |
|
2023 |
|
2022 |
|
2021 |
|
|||
Salaries and employee benefits |
|
$ |
583,398 |
|
$ |
554,704 |
|
$ |
552,030 |
|
Occupancy expense |
|
|
88,695 |
|
|
89,501 |
|
|
92,225 |
|
Information services expense |
|
|
84,472 |
|
|
79,701 |
|
|
74,417 |
|
OREO expense and loan related expense |
|
|
1,716 |
|
|
369 |
|
|
2,029 |
|
Amortization of intangibles |
|
|
27,558 |
|
|
33,205 |
|
|
35,192 |
|
Business development and staff related expense |
|
|
25,055 |
|
|
19,015 |
|
|
14,571 |
|
Supplies and printing |
|
|
3,575 |
|
|
2,871 |
|
|
3,246 |
|
Postage expense |
|
|
7,003 |
|
|
6,750 |
|
|
6,413 |
|
Professional fees |
|
|
18,547 |
|
|
15,331 |
|
|
10,629 |
|
FDIC assessment and other regulatory charges |
|
|
33,070 |
|
|
23,033 |
|
|
17,982 |
|
FDIC special assessment |
|
|
25,691 |
|
|
— |
|
|
— |
|
Advertising and marketing |
|
|
9,474 |
|
|
8,888 |
|
|
7,959 |
|
Merger, branch consolidation and severance related expense |
|
|
13,162 |
|
|
30,888 |
|
|
67,242 |
|
Extinguishment of debt cost |
|
|
— |
|
|
— |
|
|
11,706 |
|
Other |
|
|
73,164 |
|
|
65,445 |
|
|
52,780 |
|
Total noninterest expense |
|
$ |
994,580 |
|
$ |
929,701 |
|
$ |
948,421 |
|
2023 compared to 2022
Noninterest expense increased $64.9 million, or 7.0%, for the year ended December 31, 2023 compared to 2022. The change in total noninterest expense resulted from the following:
| ● | Salaries and employee benefits increased $28.7 million, or 5.2%, in 2023 compared to 2022. The increase was primarily due to an increase in salaries of $39.9 million resulting from merit increases and increase in numbers of employees. The increase was partially offset by a decrease in commissions of $2.5 million, mainly attributable to lower commissions related to lower bond sales within the correspondent division and loan sales with the SBA division along with declines in employee benefits of $2.2 million, and a decrease in incentives of $9.0 million. |
| ● | Information services expense increased $4.8 million, or 6.0%, in 2023 compared to 2022. The increase was due to additional cost associated with the Company updating systems and software as it grows in size and complexity. |
| ● | OREO expense and loan related expense increased $1.3 million, or 365.0%, in 2023 compared to 2022, which was primarily due to approximately a $1.1 million increase in Shared Appreciation Mortgage (“SAM”) related expenses including legal, tax and other costs. |
| ● | Amortization of intangibles, which is related to the Company’s prior mergers, decreased $5.6 million, or 17.0%. |
| ● | Business development and staff related expense increased $6.0 million, or 31.8%, in 2023 compared to 2022. This increase was mainly due to an increase in employee expenses including employee travel expense, convention and meeting expense, recruitment and relocation costs associated with the Company investing in new talent and employee education and training related costs. |
| ● | Professional fees increased $3.2 million, or 21.0%, in 2023 compared to 2022. This increase was primarily due to increases in consulting and audit related fees totaling $6.2 million, offset by a decrease in non-loan and loan legal and advisory related fees of $3.0 million. |
| ● | FDIC assessment and other regulatory charges increased $10.0 million, or 43.6%. This increase was primarily due to an increase in FDIC assessment of $10.6 million, slightly offset by declines from other regulatory fees of $599,000. The increase in the FDIC assessment was primarily due to an increase in the FDIC assessment rate in 2023 to bring the overall FDIC fund to 1.35x total deposit by the end of 2028. The increase also reflects |
74
| changes in the Company’s size and complexity, along with the resulting effects on the Company’s liquidity compared to 2022. |
| ● | The Company incurred a total of $25.7 million of the FDIC’s special assessment for the two-year special assessment period, with the entire assessed amount being recorded during the fourth quarter of 2023. The special assessment was introduced to recover losses to the FDIC’s Deposit Insurance Fund resulting from bank failures that occurred during early 2023. |
| ● | Merger, branch consolidation and severance related expense decreased $17.7 million, or 57.4% in 2023 compared to 2022. The decrease was primarily due to a $21.9 million decrease in merger expenses pertaining to the Atlantic Capital and CenterState mergers and a $4.7 million decrease in branch consolidation related expense in 2023 compared to 2022. These decreases were offset by severance related payments totaling $8.0 million related to restructuring costs recorded in 2023. |
| ● | Other noninterest expense increased $7.7 million, or 11.8%, compared to 2022. This increase was mainly attributable to a $10.1 million increase in earnings credit expense to Homeowners Association (“HOA”) customers. The Bank provides a credit to HOA customers based on the average deposit balances held that reduces fees for other services provided. There was a $2.8 million increase in state franchise and occupation tax payments, and a $2.7 million increase related to a new subscription to a system that provides real-time financial market data analysis services. These increases were partially offset by a decrease in fraud charge-offs, tax penalties, digital banking losses, and other insurance and miscellaneous operational charge-off related expenses totaling approximately $9.0 million. |
2022 compared to 2021
Noninterest expense decreased $18.7 million, or 2.0% for the year ended December 31, 2022 compared to 2021. The change in total noninterest expense resulted from the following:
| ● | Salary and employee benefits increased by $2.7 million, or 0.5%, primarily due to the addition of Atlantic Capital employees during the year, annual salary increases, and higher 2022 incentive costs. This increase was partially offset by a $7.3 million decline in commission expense and higher deferred loan costs due to increased loan production volumes and the late 2021 update of the Company’s standard loan costs. During 2022, we recorded a total of $383.6 million in salary expense and $(88.2) million in net deferred loan costs, compared to $366.2 million and $(46.5) million, respectively, during 2021. During 2022, we recorded a total of $35.5 million in commission expense and $96.8 million in incentive expense, compared to $42.8 million and $71.8 million, respectively, during 2021. |
| ● | Occupancy expense decreased $2.7 million, or 3.0%. The decrease was related to the cost savings associated with Atlantic Capital and branch consolidations that occurred during 2022. The number of branches declined in 2022 to 251 from 281 at the end of 2021. |
| ● | Information services expense increased $5.3 million, or 7.1%. The increase was due to additional cost associated with systems added through our acquisition of Atlantic Capital, along with the cost of the Company updating systems as it grows in size and complexity. |
| ● | Business development and staff related expense increased $4.4 million, or 30.5%, due mainly to the increase in employees resulting from the merger with Atlantic Capital and additional employee travel and entertainment as the COVID-19 pandemic receded. |
| ● | Professional fees increased $4.7 million, or 44.2%, in 2022 compared to 2021. This increase was primarily due to increases in non-loan legal, advisory and consulting related fees. |
| ● | FDIC assessment and other regulatory charges increased $5.1 million, or 28.1%. This increase was due to an increase in FDIC assessments and other regulatory charges. The FDIC assessment increased $4.3 million and OCC examination fee increased $761,000 as the Company continues to grow in size and complexity. |
| ● | Merger and branch consolidation related expense decreased $36.4 million, or 54.1% in 2022 compared to 2021. The expense in 2022 consists mainly of costs associated with branch consolidations and the merger related costs pertaining to the Atlantic Capital acquisition. The expense in 2021 mainly consisted of costs related to the merger with CenterState. Merger and branch consolidation expense of $18.5 million in 2022 and $1.7 million in 2021 was related primarily to the merger with Atlantic Capital while $64.4 million in merger and branch consolidation expense was related to the merger with CenterState in 2021. |
75
| ● | The Company had extinguishment of debt cost of $11.7 million in 2021. This cost was from the write-off of the unamortized fair market value adjustment recorded on the trust preferred securities assumed in the CenterState merger. All of the trust preferred securities assumed in the CenterState merger were redeemed in June 2021. |
| ● | Other noninterest expense increased by $12.7 million, or 24.0%. This increase was mainly due to a general increase in expenses due to the merger with Atlantic Capital, an increase in fraud, digital banking and miscellaneous operational charge-off related expenses of $6.5 million, expense related to the settlement of lawsuits of $2.6 million, increases in donations of $1.5 million, increases in tax penalties of $1.3 million, and increases in incurred but not reported insurance loss reserves of $1.1 million. |
Income Tax Expense
Our effective tax rate held consistent at 21.64% at December 31, 2023, mirroring the 21.68% rate for the year-ended December 31, 2022. The slight decrease was due to a slight decrease in pre-tax book income, an increase in tax-exempt income, an increase in federal tax credits, offset partially by an increase in TEFRA interest expense disallowance and an increase in non-deductible FDIC premiums compared to December 31, 2022. For additional information refer to Note 12—Income Taxes in the consolidated financial statements.
Financial Condition
Overview
At December 31, 2023, we had total assets of approximately $44.9 billion, consisting principally of $32.4 billion in total loans, before taking into account the allowance for credit losses of $456.6 million, $7.5 billion in investment securities, $1.0 billion in cash and cash equivalents and $1.9 billion in goodwill. Our liabilities at December 31, 2023 totaled $39.4 billion, consisting principally of deposits of $37.0 billion ($10.6 billion in noninterest-bearing and $26.4 billion in interest-bearing), $804.5 million derivative liabilities and $981.1 million of short-term and long-term borrowings. At December 31, 2023, our shareholders’ equity was $5.5 billion.
At December 31, 2022, we had total assets of approximately $43.9 billion, consisting principally of $30.2 billion in total loans, before taking into account the allowance for credit losses of $356.4 million, $8.2 billion in investment securities, $1.3 billion in cash and cash equivalents and $1.9 billion in goodwill. Our liabilities at December 31, 2022 totaled $38.8 billion, consisting principally of deposits of $36.4 billion ($13.2 billion in noninterest-bearing and $23.2 in interest-bearing) and short-term and long-term borrowings of $948.7 million. At December 31, 2022, our shareholders’ equity was $5.1 billion.
Book value per common share was $72.78 at the end of 2023, an increase from $67.04 at the end of 2022. Book value per common share increased in 2023 as shareholder equity increased by 9.0% while common shares outstanding only increased by 0.4%. The primary reasons for an increase in shareholder’s equity of $458.2 December 31, 2023 were due to net income of $494.3 million and a $94.6 million increase in AOCI related to unrealized gains on available for sale securities and post-retirement benefit plans. These increases were partially offset by declines resulting from dividends paid to shareholders of $154.9 million, common stock repurchased from officers and directors for income taxes owed on their vested shares of restricted stock of $9.3 million, and common stock repurchased in the open market of $6.7 million.
Our common equity to assets ratio increased to 12.3% in 2023, compared to 11.6% in 2022. The improvement during 2023 was due to an increase in shareholders’ equity of 9.0%, resulting from the items noted above, while total assets had a moderate increase of 2.2%.
76
Trading Securities
We have a trading portfolio associated with our Correspondent Bank Division and its subsidiary SouthState|Duncan-Williams. This portfolio is carried at fair value and realized and unrealized gains and losses are included in trading securities revenue, a component of Correspondent Banking and Capital Markets Income in our Consolidated Statements of Income. Securities purchased for this portfolio have primarily been municipal bonds, treasuries and mortgage-backed agency securities, which are held for short periods of time and totaled $31.3 million at December 31, 2023 and 2022.
Investment Securities
We use investment securities, our second largest category of earning assets, to generate interest income, provide liquidity, fund loan demand or deposit liquidation, and pledge as collateral for public funds deposits, repurchase agreements, derivative exposures and to augment borrowing capacity at the Federal Reserve Bank of Atlanta, and the Federal Home Loan Bank of Atlanta. At December 31, 2023 and 2022, investment securities totaled $7.5 billion and $8.2 billion, respectively. For the year ended December 31, 2023, average investment securities were $7.7 billion, or 19.5% of average earning assets, compared with $8.4 billion, or 21.2% of average earning assets for the year ended December 31, 2022. The expected average life of the investment portfolio at December 31, 2023 was approximately 7.87 years, compared with 7.96 years at December 31, 2022. See Note 1—Summary of Significant Accounting Policies in the audited consolidated financial statements for our accounting policy on investment securities.
As securities are purchased, they are designated as held to maturity or available for sale based upon our intent, which considers liquidity needs, interest rate expectations, asset/liability management strategies, and capital requirements.
The following table presents the reported values of investment securities for the past two years:
Table 5—Values of Investment Securities
|
|
December 31, |
|
||||
(Dollars in thousands) |
|
2023 |
|
2022 |
|
||
Held to Maturity (amortized cost): |
|
|
|
|
|
|
|
U.S. Government agencies |
|
$ |
197,267 |
|
$ |
197,262 |
|
Residential mortgage-backed securities issued by U.S. government |
|
|
|
|
|
|
|
agencies or sponsored enterprises |
|
|
1,438,102 |
|
|
1,591,646 |
|
Residential collateralized mortgage-obligations issued by U.S. government |
|
|
|
|
|
|
|
agencies or sponsored enterprises |
|
|
444,883 |
|
|
474,660 |
|
Commercial mortgage-backed securities issued by U.S. government |
|
|
|
|
|
|
|
agencies or sponsored enterprises |
|
|
354,055 |
|
|
362,586 |
|
Small Business Administration loan-backed securities |
|
|
53,133 |
|
|
57,087 |
|
Total held to maturity |
|
$ |
2,487,440 |
|
$ |
2,683,241 |
|
Available for Sale (fair value): |
|
|
|
|
|
|
|
U.S. Treasuries |
|
|
73,890 |
|
|
265,638 |
|
U.S. Government agencies |
|
|
224,706 |
|
|
219,088 |
|
Residential mortgage-backed securities issued by U.S. government |
|
|
|
|
|
|
|
agencies or sponsored enterprises |
|
|
1,558,306 |
|
|
1,698,353 |
|
Residential collateralized mortgage-obligations issued by U.S. government |
|
|
|
|
|
|
|
agencies or sponsored enterprises |
|
|
527,422 |
|
|
601,045 |
|
Commercial mortgage-backed securities issued by U.S. government |
|
|
|
|
|
|
|
agencies or sponsored enterprises |
|
|
1,024,170 |
|
|
1,000,398 |
|
State and municipal obligations |
|
|
977,461 |
|
|
1,064,852 |
|
Small Business Administration loan-backed securities |
|
|
371,686 |
|
|
444,810 |
|
Corporate securities |
|
|
26,747 |
|
|
32,638 |
|
Total available for sale |
|
|
4,784,388 |
|
|
5,326,822 |
|
Total other investments |
|
|
192,043 |
|
|
179,717 |
|
Total investment securities |
|
$ |
7,463,871 |
|
$ |
8,189,780 |
|
77
During 2023, our total investment securities decreased $725.9 million, or 8.9%, from December 31, 2022. During 2023, we purchased $307.1 million of securities, $80.4 million classified as available for sale and $226.7 million classified as other investments. These purchases were offset by maturities, paydowns, sales and calls of investment securities totaling $1.1 billion. Net amortization of premiums were $20.1 million for the year ended December 31, 2023. During 2022, the Atlantic Capital acquisition added $691.7 million of investment securities available for sale to our portfolio. We immediately sold $414.4 million in securities, after principal paydowns, and retained $273.7 million in our portfolio. The Atlantic Capital securities retained were mostly state and municipal obligations.
At December 31, 2023, the unrealized net loss of the available for sale investment securities portfolio was $776.6 million, or 14.0%, below its amortized cost basis. Comparable valuations at December 31, 2022 reflected an unrealized net loss of the available for sale investment portfolio of $889.3 million, or 14.3%, below its amortized cost basis. The increase in fair value in the available for sale investment portfolio at December 31, 2023 compared to December 31, 2022 was attributable to the Federal Reserve’s decision during their latest policy meeting held in December 2023 to hold the rates steady with indications of potential rate cuts in 2024. At December 31, 2023, the unrealized net loss of the held to maturity investment securities portfolio was $402.7 million, or 16.2%, below its amortized cost basis. At December 31, 2022, the unrealized net loss of the held to maturity investment securities portfolio was $433.1 million, or 16.1%, below its amortized cost basis.
Table 6—Credit Ratings of Investment Securities
|
|
|
|
|
|
|
|
|
|
|
|
|
|
|
|
|
|
|
Amortized |
|
Fair |
|
Unrealized |
|
|
|
|
|
|
|
|||
(Dollars in thousands) |
|
Cost |
|
Value |
|
Net Loss |
|
AAA – A |
|
Not Rated |
|
|||||
December 31, 2023 |
|
|
|
|
|
|
|
|
|
|
|
|
|
|
|
|
U.S. Treasuries |
|
$ |
74,720 |
|
$ |
73,890 |
|
$ |
(830) |
|
$ |
74,720 |
|
$ |
— |
|
U.S. Government agencies |
|
|
443,356 |
|
|
397,366 |
|
|
(45,990) |
|
|
443,356 |
|
|
— |
|
Residential mortgage-backed securities issued by U.S. government |
|
|
|
|
|
|
|
|
|
|
|
|
|
|
|
|
agencies or sponsored enterprises* |
|
|
3,260,206 |
|
|
2,769,096 |
|
|
(491,110) |
|
|
94 |
|
|
3,260,112 |
|
Residential collateralized mortgage-obligations issued by U.S. government |
|
|
|
|
|
|
|
|
|
|
|
|
|
|
|
|
agencies or sponsored enterprises* |
|
|
1,071,618 |
|
|
904,166 |
|
|
(167,452) |
|
|
— |
|
|
1,071,618 |
|
Commercial mortgage-backed securities issued by U.S. government |
|
|
|
|
|
|
|
|
|
|
|
|
|
|
|
|
agencies or sponsored enterprises* |
|
|
1,571,180 |
|
|
1,306,898 |
|
|
(264,282) |
|
|
20,991 |
|
|
1,550,189 |
|
State and municipal obligations |
|
|
1,129,750 |
|
|
977,461 |
|
|
(152,289) |
|
|
1,129,078 |
|
|
672 |
|
Small Business Administration loan-backed securities |
|
|
467,083 |
|
|
413,500 |
|
|
(53,583) |
|
|
467,083 |
|
|
— |
|
Corporate securities |
|
|
30,533 |
|
|
26,747 |
|
|
(3,786) |
|
|
— |
|
|
30,533 |
|
|
|
$ |
8,048,446 |
|
$ |
6,869,124 |
|
$ |
(1,179,322) |
|
$ |
2,135,322 |
|
$ |
5,913,124 |
|
* |
Agency mortgage-backed securities (“MBS”), agency collateralized mortgage-obligations (“CMO”) and agency commercial mortgage-backed securities (“CMBS”) are guaranteed by the issuing government-sponsored enterprise (“GSE”) as to the timely payments of principal and interest. Except for Government National Mortgage Association securities, which have the full faith and credit backing of the United States Government, the GSE alone is responsible for making payments on this guaranty. While the rating agencies have not rated any of the MBS, CMO and CMBS issued, senior debt securities issued by GSEs are rated consistently as “Triple-A.” Most market participants consider agency MBS, CMOs and CMBSs as carrying an implied Aaa rating (S&P rating of AA+) because of the guarantees of timely payments and selection criteria of mortgages backing the securities. We do not own any private label mortgage-backed securities. The balances presented under the ratings above reflect the amortized cost of the investment securities. |
Held to maturity
As described above, the Company elected to classify some of its securities purchased as held to maturity at the time of purchase. The securities designated as held to maturity are securities the Company does not intend to sell and expects to hold through maturity. The securities consist of $197.3 million of agency securities, $2.2 billion of residential and commercial mortgage-backed securities issued by U.S government agencies or sponsored enterprises and $53.1 million of Small Business Administration loan-backed securities. The following are highlights of our held to maturity portfolio:
| ● | Total amortized cost of held to maturity portfolio totaled $2.5 billion |
| ● | The balance of securities held to maturity represented 5.5% of total assets at December 31, 2023. |
| ● | No purchases or sales of held to maturity investment securities in 2023; maturities, calls and paydowns totaled $190.8 million in 2023. |
78
Available for sale
Securities available for sale consist of debentures of government sponsored entities, state and municipal bonds, residential and commercial mortgage-backed securities issued by U.S government agencies or sponsored enterprises, Small Business Administration loan-backed securities and corporate securities. At December 31, 2023, investment securities with a fair value and amortized cost of $4.8 billion and $5.6 billion, respectively, were classified as available for sale. The adjustment for net unrealized losses of $776.6 million between the carrying value of these securities and their amortized cost has been reflected, net of tax, in the Consolidated Balance Sheet as a component of Accumulated Other Comprehensive Loss. The following are highlights of our available for sale securities:
| ● | Total securities available for sale decreased $542.4 million, or 10.2%, from the balance at December 31, 2022. The unrealized gain/loss position on the investment portfolio increased $112.7 million and net amortization of premiums was $15.2 million during 2023. We purchased $80.4 million of available for sale investment securities in 2023, partially offset by maturities, calls and paydowns totaling $590.8 million and sales totaling $129.6 million in 2023. The sales in 2023 were mainly related to restructuring our portfolio to fit our investment strategy and risk profile. |
| ● | The balance of securities available for sale represented 10.7% of total assets at December 31, 2023 and 12.1% of total assets at December 31, 2022. |
| ● | Interest income earned on all investment securities in 2023 was $186.4 million, an increase of $14.2 million, or 8.3%, from $172.2 million in 2022. The increase was due to an increase in the yield on investment securities while the total average balance decreased $615.6 million. The yield on investment securities increased 34 basis points during 2023, to 2.4%. The improvement in the yield was due the maturities, calls and sales of lower yielding securities. |
At December 31, 2023, we had 1,232 investment securities (including both available for sale and held to maturity) in an unrealized loss position, which totaled $1.2 billion, compares to 1,311 investment securities in an unrealized loss position, which totaled $1.3 billion at December 31, 2022. See Note 1—Summary of Significant Accounting Policies and Note 3—Investment Securities in the consolidated financial statements for additional information.
Management evaluates securities for impairment where there has been a decline in fair value below the amortized cost basis of a security to determine whether there is a credit loss associated with the decline in fair value on at least a quarterly basis, and more frequently when economic or market concerns warrant such evaluation. For securities designated as held for sale, credit losses are calculated individually, rather than collectively, using a discounted cash flow method, whereby management compares the present value of expected cash flows with the amortized cost basis of the security. The credit loss component would be recognized through the provision for credit losses. Consideration is given to (1) the financial condition and near-term prospects of the issuer including looking at default and delinquency rates, (2) the outlook for receiving the contractual cash flows of the investments, (3) the extent to which the fair value has been less than cost, (4) our intent to hold the security as well as there being no requirement to sell the security, (5) the anticipated outlook for changes in the general level of interest rates, (6) credit ratings, (7) third-party guarantees, and (8) collateral values. In analyzing an issuer’s financial condition, management considers whether the securities are issued by the federal government or its agencies, whether downgrades by bond rating agencies have occurred, the results of reviews of the issuer’s financial condition, and the issuer’s anticipated ability to pay the contractual cash flows of the investments. The Company performed an analysis that determined that the following securities have a zero expected credit loss: U.S. Treasury Securities, Agency-Backed Securities including securities issued by Ginnie Mae, Fannie Mae, FHLB, FFCB and SBA. All of the U.S. Treasury and Agency-Backed Securities have the full faith and credit backing of the United States Government or one of its agencies. Municipal securities and all other securities that do not have a zero expected credit loss are evaluated quarterly to determine whether there is a credit loss associated with a decline in fair value. All debt securities in an unrealized loss position as of December 31, 2023 continue to perform as scheduled and we do not believe there is a credit loss or a provision for credit losses is necessary. Also, as part of our evaluation of our intent and ability to hold investments, we consider our investment strategy, cash flow needs, liquidity position, capital adequacy and interest rate risk position. We do not currently intend to sell the securities within the portfolio and it is not more-likely-than-not that we will be required to sell the debt securities.
79
Also, as part of our evaluation of our intent and ability to hold investments for a period of time sufficient to allow for any anticipated recovery in the market, we consider our investment strategy, cash flow needs, liquidity position, capital adequacy and interest rate risk position. We do not currently intend to sell the securities within the portfolio and it is not more-likely-than-not that we will be required to sell the debt securities. Changes in the above considerations may affect our intent in the future. See Note 1—Summary of Significant Account Policies for further discussion.
Other Investments
Other investment securities include primarily our investments in FHLB and FRB stock with no readily determinable market value. Accordingly, when evaluating these securities for impairment, management considers the ultimate recoverability of the par value rather than recognizing temporary declines in value. As of December 31, 2023, other investment securities represented approximately $192.0 million, or 0.43% of total assets and primarily consisted of FRB and FHLB stock, which totaled $150.3 million and $22.8 million, respectively. There were no gains or losses on the sales of these securities during 2023 or 2022.
Table 7—Maturity Distribution and Yields of Investment Securities
|
|
|
|
|
|
|
|
|
|
|
|
|
|
|
|
|
|
|
|
|
|
|
|
|
|
|
|
|
Due In |
|
Due After |
|
Due After |
|
Due After |
|
|
|
|
|
|
||||||||||||
|
|
1 Year or Less |
|
1 Thru 5 Years |
|
5 Thru 10 Years |
|
10 Years |
|
Total |
|
|||||||||||||||
(Dollars in thousands) |
|
Amount |
|
Yield |
|
Amount |
|
Yield |
|
Amount |
|
Yield |
|
Amount |
|
Yield |
|
Amount |
|
Yield |
|
|||||
Held to Maturity (amortized cost) |
|
|
|
|
|
|
|
|
|
|
|
|
|
|
|
|
|
|
|
|
|
|
|
|
|
|
U.S. Government agencies |
|
$ |
50,000 |
|
2.05 |
% |
$ |
14,365 |
|
2.32 |
|
$ |
132,902 |
|
1.73 |
% |
$ |
— |
|
— |
% |
$ |
197,267 |
|
1.86 |
% |
Residential mortgage-backed securities issued by U.S. government |
|
|
|
|
|
|
|
|
|
|
|
|
|
|
|
|
|
|
|
|
|
|
|
|
|
|
agencies or sponsored enterprises |
|
|
— |
|
— |
|
|
— |
|
— |
|
|
176,988 |
|
1.98 |
|
|
1,261,114 |
|
1.80 |
|
|
1,438,102 |
|
1.82 |
|
Residential collateralized mortgage-obligations issued by U.S. government |
|
|
|
|
|
|
|
|
|
|
|
|
|
|
|
|
|
|
|
|
|
|
|
|
|
|
agencies or sponsored enterprises |
|
|
— |
|
— |
|
|
— |
|
— |
|
|
— |
|
— |
|
|
444,883 |
|
2.50 |
|
|
444,883 |
|
2.50 |
|
Commercial mortgage-backed securities issued by U.S. government |
|
|
|
|
|
|
|
|
|
|
|
|
|
|
|
|
|
|
|
|
|
|
|
|
|
|
agencies or sponsored enterprises |
|
|
— |
|
— |
|
|
36,590 |
|
0.94 |
|
|
170,916 |
|
1.49 |
|
|
146,549 |
|
1.58 |
|
|
354,055 |
|
1.47 |
|
Small Business Administration loan-backed securities |
|
|
— |
|
— |
|
|
— |
|
— |
|
|
— |
|
— |
|
|
53,133 |
|
1.25 |
|
|
53,133 |
|
1.25 |
|
Total held to maturity |
|
$ |
50,000 |
|
2.05 |
% |
$ |
50,955 |
|
1.33 |
% |
$ |
480,806 |
|
1.74 |
% |
$ |
1,905,679 |
|
1.93 |
% |
$ |
2,487,440 |
|
1.88 |
% |
Available for Sale (fair value) |
|
|
|
|
|
|
|
|
|
|
|
|
|
|
|
|
|
|
|
|
|
|
|
|
|
|
U.S. Government treasuries |
|
$ |
73,890 |
|
1.84 |
% |
$ |
— |
|
— |
% |
$ |
— |
|
— |
% |
$ |
— |
|
— |
% |
$ |
73,890 |
|
1.84 |
% |
U.S. Government agencies |
|
|
75,939 |
|
2.82 |
|
|
48,525 |
|
2.35 |
|
|
100,242 |
|
1.68 |
|
|
— |
|
— |
|
|
224,706 |
|
2.17 |
|
Residential mortgage-backed securities issued by U.S. government |
|
|
|
|
|
|
|
|
|
|
|
|
|
|
|
|
|
|
|
|
|
|
|
|
|
|
agencies or sponsored enterprises |
|
|
— |
|
— |
|
|
2,202 |
|
2.33 |
|
|
154,985 |
|
2.39 |
|
|
1,401,119 |
|
1.97 |
|
|
1,558,306 |
|
2.00 |
|
Residential collateralized mortgage-obligations issued by U.S. government |
|
|
|
|
|
|
|
|
|
|
|
|
|
|
|
|
|
|
|
|
|
|
|
|
|
|
agencies or sponsored enterprises |
|
|
— |
|
— |
|
|
7,713 |
|
2.54 |
|
|
12,093 |
|
2.28 |
|
|
507,616 |
|
2.19 |
|
|
527,422 |
|
2.19 |
|
Commercial mortgage-backed securities issued by U.S. government |
|
|
|
|
|
|
|
|
|
|
|
|
|
|
|
|
|
|
|
|
|
|
|
|
|
|
agencies or sponsored enterprises |
|
|
81 |
|
5.91 |
|
|
145,454 |
|
2.89 |
|
|
630,308 |
|
1.99 |
|
|
248,327 |
|
1.78 |
|
|
1,024,170 |
|
2.05 |
|
State and municipal obligations |
|
|
2,006 |
|
3.65 |
|
|
29,281 |
|
3.32 |
|
|
118,037 |
|
2.56 |
|
|
828,137 |
|
2.64 |
|
|
977,461 |
|
2.65 |
|
Small Business Administration loan-backed securities |
|
|
4,343 |
|
2.64 |
|
|
21,413 |
|
4.31 |
|
|
123,899 |
|
4.14 |
|
|
222,031 |
|
2.77 |
|
|
371,686 |
|
3.29 |
|
Corporate securities |
|
|
— |
|
— |
|
|
480 |
|
8.29 |
|
|
25,578 |
|
3.96 |
|
|
689 |
|
4.50 |
|
|
26,747 |
|
4.04 |
|
Total available for sale |
|
$ |
156,259 |
|
2.36 |
% |
$ |
255,068 |
|
2.95 |
% |
$ |
1,165,142 |
|
2.35 |
% |
$ |
3,207,919 |
|
2.21 |
% |
$ |
4,784,388 |
|
2.28 |
% |
Total other investments |
|
$ |
— |
|
— |
% |
$ |
— |
|
— |
% |
$ |
— |
|
— |
% |
$ |
192,043 |
|
4.35 |
% |
$ |
192,043 |
|
4.35 |
% |
Total investment securities |
|
$ |
206,259 |
|
2.29 |
% |
$ |
306,023 |
|
2.68 |
% |
$ |
1,645,948 |
|
2.17 |
% |
$ |
5,305,641 |
|
2.19 |
% |
$ |
7,463,871 |
|
2.20 |
% |
Percent of total |
|
|
3 |
% |
|
|
|
4 |
% |
|
|
|
22 |
% |
|
|
|
71 |
% |
|
|
|
|
|
|
|
Cumulative percent of total |
|
|
3 |
% |
|
|
|
7 |
% |
|
|
|
29 |
% |
|
|
|
100 |
% |
|
|
|
|
|
|
|
| (1) | The expected average life for U.S. Government agencies is 4.48 years; 5.58 years for held to maturity and 3.61 years for available for sale. |
| (2) | The expected average life for residential mortgage-backed securities issued by U.S. government agencies or sponsored enterprises is 7.40 years; 7.55 years for held to maturity and 7.28 years for available for sale. |
| (3) | The expected average life for residential collateralized mortgage-obligations securities issued by U.S. government agencies or sponsored enterprises is 7.72 years; 8.43 years for held to maturity and 7.21 years for available for sale. |
| (4) | The expected average life for commercial mortgage-backed securities issued by U.S. government agencies or sponsored enterprises is 5.70 years; 5.54 years for held to maturity and 5.75 years for available for sale. |
| (5) | Weighted average yields on tax-exempt income have been presented on a taxable-equivalent basis, assuming a federal tax rate of 21.00% and a state tax rate of 4.95%, which is net of federal tax benefit in the above table. These yields were calculated using coupon interest and adjusting for discount accretion and premium amortization, where applicable. |
| (6) | The expected average life for state and municipal obligations is 15.01 years. |
| (7) | The expected average life for Small Business Administration loan-backed securities is 6.08 years; 7.64 years for held to maturity and 5.88 years for available for sale. |
| (8) | The expected average life for corporate securities is 6.23 years. |
| (9) | The expected average life for US Treasuries is 0.36 years. |
| (10) | FRB, FHLB and other non-marketable equity securities have no set maturity date and are classified in “Due after 10 Years.” |
| (11) | The expected average life for the total investment securities portfolio is 7.87 years (not including FRB, FHLB and corporate stock with no maturity date). |
| (12) | The total values presented in the table above represent the total fair value of available for sale securities and amortized cost for held to maturity. |
Approximately 85.4% of the investment portfolio is comprised of U.S. Treasury securities, U.S. Government agency securities, and U.S. Government Agency Mortgage-backed securities. These securities may be pledged to the Federal Home Loan Bank of Atlanta or the Federal Reserve Bank of Atlanta Discount Window or Bank Term Funding Program. Approximately 14.2% of the investment portfolio is comprised of municipal securities. A portion of the municipal bond portfolio may be pledged to the Federal Home Loan Bank of Atlanta subject to their credit approval. Approximately 95% of the municipal bond portfolio has ratings in the Double A or Triple A category.
80
During 2023, we sold approximately $125.3 million of municipal securities given advantageous market conditions. The primary rationale for the sale was to reduce municipal and portfolio duration/price risk at an opportune moment in fixed income markets. As of December 31, 2023, the portfolio had an effective duration of 5.74 years. We continue to monitor duration risk and seek to align actual duration with the target range.
The following table presents a summary of our investment portfolio duration for the periods presented:
Table 8—Investment Portfolio Duration
|
|
|
|
|
|
|
|
|
|
|
|
|
|
December 31, 2023 |
|
December 31, 2022 |
|
||||||
(Dollars in thousands, duration in years) |
|
Amount |
|
Duration |
|
Amount |
|
Duration |
|
||
Held to Maturity (amortized cost) |
|
|
|
|
|
|
|
|
|
|
|
U.S. Government agencies |
|
$ |
197,267 |
|
5.03 |
|
$ |
197,262 |
|
5.81 |
|
Residential mortgage-backed securities issued by U.S. government |
|
|
|
|
|
|
|
|
|
|
|
agencies or sponsored enterprises |
|
|
1,438,102 |
|
6.40 |
|
|
1,591,646 |
|
6.13 |
|
Residential collateralized mortgage-obligations issued by U.S. government |
|
|
|
|
|
|
|
|
|
|
|
agencies or sponsored enterprises |
|
|
444,883 |
|
6.24 |
|
|
474,660 |
|
6.52 |
|
Commercial mortgage-backed securities issued by U.S. government |
|
|
|
|
|
|
|
|
|
|
|
agencies or sponsored enterprises |
|
|
354,055 |
|
4.06 |
|
|
362,586 |
|
5.00 |
|
Small Business Administration loan-backed securities |
|
|
53,133 |
|
6.95 |
|
|
57,087 |
|
6.76 |
|
Total held to maturity |
|
$ |
2,487,440 |
|
5.94 |
|
$ |
2,683,241 |
|
6.04 |
|
Available for Sale (fair value) |
|
|
|
|
|
|
|
|
|
|
|
U.S. Treasuries |
|
$ |
73,890 |
|
0.35 |
|
$ |
265,638 |
|
0.87 |
|
U.S. Government agencies |
|
|
224,706 |
|
3.41 |
|
|
219,088 |
|
4.27 |
|
Residential mortgage-backed securities issued by U.S. government |
|
|
|
|
|
|
|
|
|
|
|
agencies or sponsored enterprises |
|
|
1,558,306 |
|
6.12 |
|
|
1,698,353 |
|
5.80 |
|
Residential collateralized mortgage-obligations issued by U.S. government |
|
|
|
|
|
|
|
|
|
|
|
agencies or sponsored enterprises |
|
|
527,422 |
|
5.69 |
|
|
601,045 |
|
5.95 |
|
Commercial mortgage-backed securities issued by U.S. government |
|
|
|
|
|
|
|
|
|
|
|
agencies or sponsored enterprises |
|
|
1,024,170 |
|
3.73 |
|
|
1,000,398 |
|
4.34 |
|
State and municipal obligations |
|
|
977,461 |
|
8.62 |
|
|
1,064,852 |
|
8.74 |
|
Small Business Administration loan-backed securities |
|
|
371,686 |
|
3.81 |
|
|
444,810 |
|
3.55 |
|
Corporate securities |
|
|
26,747 |
|
2.45 |
|
|
32,638 |
|
2.94 |
|
Total available for sale |
|
$ |
4,784,388 |
|
5.65 |
|
$ |
5,326,822 |
|
5.66 |
|
Loan Portfolio
Our loan portfolio remains our largest category of interest-earning assets. At December 31, 2023, total loans, excluding held for sale loans, were $32.4 billion, which was an overall increase of $2.2 billion, or 7.3%, from the balance at the end of 2022. Non-acquired loan growth was $3.7 billion, or 16.1% for 2023, driven by organic growth. The loan growth was made up of a 32.5% increase in consumer real estate loans, a 13.5% increase in non-owner occupied real estate loans (including construction and land development loans), a 9.2% increase in commercial owner occupied real estate loans, a 11.7% increase in commercial and industrial loans, a 5.5% increase in other income producing property and a 1.8% increase in consumer non real estate loans. Total acquired loans decreased by $1.5 billion, or 19.9% from the balance at the end of 2022. The decrease in acquired loans was due to paydowns and payoffs in both the PCD and Non-PCD loan categories along with renewals of acquired loans that were moved to our non-acquired loan portfolio.
Average total loans outstanding during 2023 were $31.4 billion, an increase of $3.9 billion, or 14.4%, over the 2022 average of $27.5 billion. (For further discussion of the Company’s acquired loan accounting, see Note 1—Summary of Significant Accounting Policies, Note 2—Mergers and Acquisitions, Note 4—Loans and Note 5—Allowance for Credit Losses in the consolidated financial statements.)
81
The following table presents a summary of the loan portfolio by category (excludes loans held for sale):
Table 9—Distribution of Loans by Type
|
|
December 31, |
|
||||
(Dollars in thousands) |
|
2023 |
|
2022 |
|
||
Acquired loans: |
|
|
|
|
|
|
|
Acquired - non-purchased credit deteriorated loans: |
|
|
|
|
|
|
|
Non‑owner occupied real estate(1) |
|
$ |
1,866,809 |
|
$ |
2,250,428 |
|
Consumer real estate(2) |
|
|
724,463 |
|
|
902,271 |
|
Commercial owner occupied real estate |
|
|
1,115,539 |
|
|
1,332,942 |
|
Commercial and industrial |
|
|
863,584 |
|
|
1,128,280 |
|
Other income producing property |
|
|
148,361 |
|
|
195,265 |
|
Consumer |
|
|
77,930 |
|
|
133,679 |
|
Other |
|
|
227 |
|
|
227 |
|
Total acquired - non-purchased credit deteriorated loans |
|
|
4,796,913 |
|
|
5,943,092 |
|
Acquired - purchased credit deteriorated loans (PCD): |
|
|
|
|
|
|
|
Non‑owner occupied real estate(3) |
|
|
454,776 |
|
|
599,522 |
|
Consumer real estate(2) |
|
|
197,162 |
|
|
233,740 |
|
Commercial owner occupied real estate |
|
|
349,755 |
|
|
435,650 |
|
Commercial and industrial |
|
|
39,951 |
|
|
66,891 |
|
Other income producing property |
|
|
35,358 |
|
|
52,827 |
|
Consumer |
|
|
31,811 |
|
|
41,101 |
|
Total acquired ‑ purchased credit deteriorated loans (PCD) |
|
|
1,108,813 |
|
|
1,429,731 |
|
Total acquired loans |
|
|
5,905,726 |
|
|
7,372,823 |
|
Non-acquired loans: |
|
|
|
|
|
|
|
Non‑owner occupied real estate(4) |
|
|
9,173,563 |
|
|
8,083,369 |
|
Consumer real estate(2) |
|
|
7,071,825 |
|
|
5,339,199 |
|
Commercial owner occupied real estate |
|
|
4,032,377 |
|
|
3,691,601 |
|
Commercial and industrial |
|
|
4,601,004 |
|
|
4,118,312 |
|
Other income producing property |
|
|
472,615 |
|
|
448,150 |
|
Consumer |
|
|
1,123,909 |
|
|
1,103,646 |
|
Other loans |
|
|
7,470 |
|
|
20,762 |
|
Total non‑acquired loans |
|
|
26,482,763 |
|
|
22,805,039 |
|
Total loans (net of unearned income) |
|
$ |
32,388,489 |
|
$ |
30,177,862 |
|
| (1) | Includes $135.8 million and $258.5 million of construction and land development loans at December 31, 2023 and 2022, respectively. |
| (2) | Includes loans on both 1-4 family owner occupied property, as well as loans collateralized by 1-4 family owner occupied property with a business intent. |
| (3) | Includes $9.5 million and $46.5 million of construction and land development loans at December 31, 2023 and 2022, respectively. |
| (4) | Includes $2.8 billion and $2.6 billion of construction and land development loans at December 31, 2023 and 2022, respectively. |
The following highlights of our loan portfolio as of December 31, 2023 compared to December 31, 2022:
| ● | Non-acquired loans were $26.5 billion, or 81.8% of total loans of total loans at December 31, 2023. This compares to non-acquired loans of $22.8 billion, or 75.6% at December 31, 2022. The increase in non-acquired loans of $3.7 billion was due to organic growth and renewals of acquired loans that were moved to the non-acquired loan portfolio. Acquired loans were $5.9 billion, or 18.2% of total loans at December 31, 2023. This compares to acquired loans of $7.4 billion, or 24.4%, at December 31, 2022. The $1.5 billion decrease in acquired loans was due to principal payments, charge offs, foreclosures and renewals of acquired loans that were moved to our non-acquired loan portfolio. |
| o | Non-acquired loans secured by non-owner occupied and consumer real estate were $16.2 billion and comprised 50.2% of the total loan portfolio at December 31, 2023. This was an increase of $2.8 billion, or 21.0%, over December 31, 2022. At December 31, 2023, acquired loans secured by non-owner occupied and consumer real estate were $3.2 billion and comprised 10.0% of the total loan portfolio. This was a decrease of $742.8 million, or 18.6%, over December 31, 2022. Between both the non-acquired and acquired portfolios, 60.2% of loans were non-owner occupied and consumer real estate loans. |
| ◾ | Of the non-acquired real estate loans at December 31, 2023, $9.2 billion, or 28.3% of the loan portfolio were secured by non-owner occupied real estate. Loans secured by consumer real estate were $7.1 billion, or 21.8% of the total loan portfolio at December 31, 2023. This compared to loans secured by non-owner occupied real estate of $8.1 billion, or 26.8%, and loans secured by consumer real estate of $5.3 billion, or 17.7% of the loan portfolio at December 31, 2022. |
82
| ◾ | Of the acquired real estate loans, $2.3 billion, or 7.2% of the loan portfolio were secured by non-owner occupied real estate at December 31, 2023. Loans secured by consumer real estate were $921.6 million, or 2.8% of the loan portfolio. This compared to acquired loans secured by non-owner occupied real estate of $2.8 billion, or 9.4%, and loans secured by consumer real estate of $1.1 billion, or 3.8% of the loan portfolio at December 31, 2022. |
| o | Included within loans secured by non-owner occupied real estate noted above are construction and land development loans. Total construction and land development loans were $2.9 billion at December 31, 2023 compared to $2.9 billion at December 31, 2022. Construction and land development loans are more susceptible to a risk of loss during a downturn in the business cycle. |
| ◾ | Non-acquired construction and land development loans increased $222.8 million to $2.8 billion in 2023 from $2.6 billion at December 31, 2022. |
| ◾ | Acquired construction and land development loans declined $159.6 million to $145.3 million in 2023 from $304.9 million at December 31, 2022. |
| o | Total consumer real estate loans were comprised of $6.6 billion in consumer owner occupied loans and $1.4 billion in home equity line loans at December 31, 2023. This compares to $5.2 billion in consumer owner occupied loans and $1.3 billion in home equity lines loans at December 31, 2022. During 2023, the consumer real estate loan portfolio increased by $1.5 billion from December 31, 2022 through organic growth. |
| ◾ | Non-acquired loans secured by consumer real estate were comprised of $5.9 billion in consumer owner occupied loans and $1.1 billion in home equity loans at December 31, 2023. At December 31, 2022, we had $4.4 billion in consumer owner occupied loans and $958.2 million in home equity loans in the non-acquired loan portfolio. The Company made the decision to hold more 1-4 family mortgage production in its portfolio in 2023 rather than sell the loans into the secondary market. |
| ◾ | Acquired loans secured by consumer real estate are comprised of $666.6 million in consumer owner occupied loans and $255.0 million in home equity loans at December 31, 2023. At December 31, 2022, we had $781.0 million in consumer owner occupied loans and $355.0 million in home equity loans in the acquired loan portfolio. |
| o | Non-acquired and acquired commercial owner-occupied real estate loans were $4.0 billion, or 12.5%, and $1.5 billion, or 4.5%, respectively, of the total loan portfolio at December 31, 2023 compared to $3.7 billion, or 12.2%, and $1.8 billion, or 5.9%, respectively, of the loan portfolio at December 31, 2022. |
| ◾ | Non-acquired commercial owner-occupied real estate loans increased $340.8 million through organic growth and renewals of acquired loans. |
| ◾ | Acquired commercial owner-occupied real estate loans decreased $303.3 million due to principal payments, charge offs, foreclosures and renewals of acquired loans that were moved to our non-acquired loan portfolio from December 31, 2022 compared to December 31, 2023. |
| o | Non-acquired and acquired commercial and industrial loans were $4.6 billion, or 14.2%, and $903.5 million, or 2.8%, respectively, of the total loan portfolio at December 31, 2023 compared to $4.1 billion, or 13.6%, and $1.2 billion, or 4.0%, respectively, of the loan portfolio at December 31, 2022. |
| ◾ | Non-acquired commercial and industrial loans increased $482.7 million from December 31, 2022 compared to December 31, 2023. |
| ◾ | Acquired commercial and industrial loans decreased $291.6 million from December 31, 2022 compared to December 31, 2023. |
Total loan interest income, including interest income on held for sale loans, was $1.7 billion in 2023, an increase of $538.4 million, or 45.7%, compared to $1.2 billion in 2022. This increase was mainly due to a 126-basis point increase in the yield on the non-acquired portfolio and a 125-basis point increase in the yield on the acquired portfolio. The yield on the non-acquired loan portfolio increased from 4.03% in 2022 to 5.29% in 2023 and the yield on the acquired loan portfolio increased from 4.85% in 2022 to 6.10% in 2023. The increase in the yields on the non-acquired loan portfolio and the acquired loan portfolio was due to the rise in interest rates starting in March 2022. The effects on interest income from the overall increase in the yields on loans was enhanced by a $5.7 billion increase in the average balance of our non-acquired loan portfolio, offset by a $1.8 billion decrease in the average balance of our acquired loan portfolio. The growth in the non-acquired loan portfolio average balance was due to normal organic growth and renewals of acquired loans. The decline in the acquired loan portfolio was due to paydowns and payoffs, along with renewals of acquired loans that were moved to our non-acquired loan portfolio.
83
The table below shows the contractual maturity of the non-acquired loan portfolio at December 31, 2023.
Table 10—Maturity Distribution of Non-acquired Loans
|
|
|
|
|
|
|
|
|
|
|
|
|
|
|
|
|
December 31, 2023 |
|
|
|
|
1 Year |
|
Maturity |
|
Maturity |
|
Over |
|
||||
(Dollars in thousands) |
|
Total |
|
or Less |
|
1 to 5 Years |
|
5 to 15 Years |
|
15 Years |
|
|||||
Non‑owner occupied real estate |
|
$ |
9,173,563 |
|
$ |
766,968 |
|
$ |
4,219,615 |
|
$ |
3,510,378 |
|
$ |
676,602 |
|
Consumer real estate |
|
|
7,071,825 |
|
|
54,432 |
|
|
211,521 |
|
|
1,060,848 |
|
|
5,745,024 |
|
Commercial owner occupied real estate |
|
|
4,032,377 |
|
|
186,278 |
|
|
1,231,568 |
|
|
2,489,662 |
|
|
124,869 |
|
Commercial and industrial |
|
|
4,601,004 |
|
|
861,950 |
|
|
1,750,331 |
|
|
1,278,066 |
|
|
710,657 |
|
Other income producing property |
|
|
472,615 |
|
|
37,527 |
|
|
271,071 |
|
|
87,278 |
|
|
76,739 |
|
Consumer |
|
|
1,123,909 |
|
|
99,672 |
|
|
438,458 |
|
|
318,843 |
|
|
266,936 |
|
Other loans |
|
|
7,470 |
|
|
7,470 |
|
|
— |
|
|
— |
|
|
— |
|
Total non‑acquired loans |
|
$ |
26,482,763 |
|
$ |
2,014,297 |
|
$ |
8,122,564 |
|
$ |
8,745,075 |
|
$ |
7,600,827 |
|
Table 11—Non-Acquired Loans Due After One Year - Fixed or Floating
December 31, 2023 |
|
|
|
|
|
|
|
(Dollars in thousands) |
|
Fixed Rate |
|
Variable Rate |
|
||
Non‑owner occupied real estate |
|
$ |
3,253,783 |
|
$ |
5,152,812 |
|
Consumer real estate |
|
|
2,956,223 |
|
|
4,061,170 |
|
Commercial owner occupied real estate |
|
|
2,515,847 |
|
|
1,330,252 |
|
Commercial and industrial |
|
|
2,578,811 |
|
|
1,160,243 |
|
Other income producing property |
|
|
295,826 |
|
|
139,262 |
|
Consumer |
|
|
1,003,747 |
|
|
20,490 |
|
Total non‑acquired loans |
|
$ |
12,604,237 |
|
$ |
11,864,229 |
|
The table below shows the contractual maturity of the acquired non-purchased credit deteriorated loan portfolio at December 31, 2023.
Table 12—Maturity Distribution of Acquired Non-purchased Credit Deteriorated Loans
|
|
|
|
|
|
|
|
|
|
|
|
|
|
|
|
|
December 31, 2023 |
|
|
|
|
1 Year |
|
Maturity |
|
Maturity |
|
Over |
|
||||
(Dollars in thousands) |
|
Total |
|
or Less |
|
1 to 5 Years |
|
5 to 15 Years |
|
15 Years |
|
|||||
Non‑owner occupied real estate |
|
$ |
1,866,809 |
|
$ |
317,109 |
|
$ |
812,197 |
|
$ |
674,463 |
|
$ |
63,040 |
|
Consumer real estate |
|
|
724,463 |
|
|
23,138 |
|
|
133,855 |
|
|
181,107 |
|
|
386,363 |
|
Commercial owner occupied real estate |
|
|
1,115,539 |
|
|
71,078 |
|
|
412,292 |
|
|
542,635 |
|
|
89,534 |
|
Commercial and industrial |
|
|
863,584 |
|
|
108,755 |
|
|
378,573 |
|
|
259,861 |
|
|
116,395 |
|
Other income producing property |
|
|
148,361 |
|
|
16,015 |
|
|
49,909 |
|
|
54,791 |
|
|
27,646 |
|
Consumer |
|
|
77,930 |
|
|
6,811 |
|
|
14,306 |
|
|
48,728 |
|
|
8,085 |
|
Other |
|
|
227 |
|
|
227 |
|
|
— |
|
|
— |
|
|
— |
|
Total acquired - non-purchased credit deteriorated loans |
|
$ |
4,796,913 |
|
$ |
543,133 |
|
$ |
1,801,132 |
|
$ |
1,761,585 |
|
$ |
691,063 |
|
Table 13— Acquired Non-PCD Loans Due After One Year - Fixed or Floating
December 31, 2023 |
|
|
|
|
|
|
|
(Dollars in thousands) |
|
Fixed Rate |
|
Variable Rate |
|
||
Non‑owner occupied real estate |
|
$ |
479,469 |
|
$ |
1,070,231 |
|
Consumer real estate |
|
|
219,344 |
|
|
481,981 |
|
Commercial owner occupied real estate |
|
|
410,169 |
|
|
634,292 |
|
Commercial and industrial |
|
|
455,250 |
|
|
299,579 |
|
Other income producing property |
|
|
39,578 |
|
|
92,768 |
|
Consumer |
|
|
67,818 |
|
|
3,301 |
|
Total acquired - non-purchased credit deteriorated loans |
|
$ |
1,671,628 |
|
$ |
2,582,152 |
|
84
The table below shows the contractual maturity of the acquired purchased credit deteriorated loan portfolio at December 31, 2023.
Table 14—Maturity Distribution of Acquired Purchased Credit Deteriorated Loans
December 31, 2023 |
|
|
|
|
1 Year |
|
Maturity |
|
Maturity |
|
Over |
|
||||
(Dollars in thousands) |
|
Total |
|
or Less |
|
1 to 5 Years |
|
5 to 15 Years |
|
15 Years |
|
|||||
Non‑owner occupied real estate |
|
$ |
454,776 |
|
$ |
40,844 |
|
$ |
168,802 |
|
$ |
218,923 |
|
$ |
26,207 |
|
Consumer real estate |
|
|
197,162 |
|
|
7,016 |
|
|
26,838 |
|
|
44,086 |
|
|
119,222 |
|
Commercial owner occupied real estate |
|
|
349,755 |
|
|
32,249 |
|
|
135,100 |
|
|
155,546 |
|
|
26,860 |
|
Commercial and industrial |
|
|
39,951 |
|
|
9,675 |
|
|
14,867 |
|
|
12,707 |
|
|
2,702 |
|
Other income producing property |
|
|
35,358 |
|
|
5,654 |
|
|
6,099 |
|
|
15,991 |
|
|
7,614 |
|
Consumer |
|
|
31,811 |
|
|
625 |
|
|
5,879 |
|
|
24,823 |
|
|
484 |
|
Total acquired ‑ purchased credit deteriorated loans (PCD) |
|
$ |
1,108,813 |
|
$ |
96,063 |
|
$ |
357,585 |
|
$ |
472,076 |
|
$ |
183,089 |
|
Table 15— Acquired PCD Loans Due After One Year - Fixed or Floating
December 31, 2023 |
|
|
|
|
|
|
|
(Dollars in thousands) |
|
Fixed Rate |
|
Variable Rate |
|
||
Non‑owner occupied real estate |
|
$ |
72,137 |
|
$ |
341,795 |
|
Consumer real estate |
|
|
87,042 |
|
|
103,104 |
|
Commercial owner occupied real estate |
|
|
135,430 |
|
|
182,076 |
|
Commercial and industrial |
|
|
20,239 |
|
|
10,037 |
|
Other income producing property |
|
|
7,584 |
|
|
22,120 |
|
Consumer |
|
|
31,170 |
|
|
16 |
|
Total acquired ‑ purchased credit deteriorated loans (PCD) |
|
$ |
353,602 |
|
$ |
659,148 |
|
85
Nonperforming Assets (“NPAs”)
The level of risk elements in the loan portfolio, OREO and other nonperforming assets for the past two years is shown below:
Table 16—Nonperforming Assets
|
|
|
December 31, |
|
||||
(Dollars in thousands) |
|
|
2023 |
|
2022 |
|
||
Non-acquired: |
|
|
|
|
|
|
|
|
Nonaccrual loans |
|
|
$ |
110,467 |
|
$ |
40,517 |
|
Accruing loans past due 90 days or more |
|
|
|
11,305 |
|
|
2,358 |
|
Restructured loans – nonaccrual |
|
|
|
— |
|
|
4,154 |
|
Total non-acquired nonperforming loans |
|
|
|
121,772 |
|
|
47,029 |
|
Other real estate owned (“OREO”) (1) (2) |
|
|
|
228 |
|
|
141 |
|
Other nonperforming assets (3) |
|
|
|
483 |
|
|
104 |
|
Total OREO and other nonperforming assets excluding acquired assets |
|
|
|
711 |
|
|
245 |
|
Total nonperforming assets excluding acquired assets |
|
|
|
122,483 |
|
|
47,274 |
|
Acquired: |
|
|
|
|
|
|
|
|
Nonaccrual loans (4) |
|
|
|
58,916 |
|
|
55,808 |
|
Accruing loans past due 90 days or more |
|
|
|
1,174 |
|
|
1,992 |
|
Restructured loans – nonaccrual |
|
|
|
839 |
|
|
3,746 |
|
Total acquired nonperforming loans |
|
|
|
60,929 |
|
|
61,546 |
|
Acquired OREO and other nonperforming assets: |
|
|
|
|
|
|
|
|
Acquired OREO (1) (5) |
|
|
|
609 |
|
|
882 |
|
Other acquired nonperforming assets (3) |
|
|
|
103 |
|
|
40 |
|
Total acquired OREO and other nonperforming assets |
|
|
|
712 |
|
|
922 |
|
Total acquired nonperforming assets |
|
|
|
61,641 |
|
|
62,468 |
|
Total nonperforming assets |
|
|
$ |
184,124 |
|
$ |
109,742 |
|
Excluding acquired assets: |
|
|
|
|
|
|
|
|
Total nonperforming assets as a percentage of total loans and repossessed assets (6) |
|
|
|
0.46 |
% |
|
0.21 |
% |
Total nonperforming assets as a percentage of total assets (7) |
|
|
|
0.27 |
% |
|
0.11 |
% |
Nonperforming loans as a percentage of period end loans (6) |
|
|
|
0.46 |
% |
|
0.21 |
% |
Including acquired assets: |
|
|
|
|
|
|
|
|
Total nonperforming assets as a percentage of total loans and repossessed assets (6) |
|
|
|
0.57 |
% |
|
0.36 |
% |
Total nonperforming assets as a percentage of total assets (7) |
|
|
|
0.41 |
% |
|
0.25 |
% |
Nonperforming loans as a percentage of period end loans (6) |
|
|
|
0.56 |
% |
|
0.36 |
% |
| (1) | Consists of real estate acquired as a result of foreclosure. Excludes certain property no longer intended for bank use. |
| (2) | Excludes non-acquired bank premises held for sale of $9.0 million and $14.3 million as of December 31, 2023 and 2022, respectively, that is now separately disclosed on the balance sheet. |
| (3) | Consists of non-real estate foreclosed assets, such as repossessed vehicles. |
| (4) | Includes nonaccrual loans that are purchase credit deteriorated (PCD loans). |
| (5) | Excludes acquired bank premises held for sale of $3.4 million as of December 31, 2023 and 2022, that is now separately disclosed on the balance sheet. |
| (6) | Loan data excludes mortgage loans held for sale. |
| (7) | For purposes of this calculation, total assets include all assets (both acquired and non-acquired). |
Total non-acquired nonperforming loans were $121.8 million, or 0.46% of total non-acquired loans, an increase of approximately $74.7 million, or 158.9%, from December 31, 2022. The increase in nonperforming loans was driven primarily by an increase in commercial nonaccrual loans of $59.0 million, an increase in consumer nonaccrual loans of $10.9 million and an increase in accruing loans past due 90 days or more of $8.9 million, offset by a decrease in restructured nonaccrual loans of $4.1 million. The increase in commercial nonaccrual loans from December 31, 2022, was primarily due to three commercial and industrial relationships totaling $41.4 million, six commercial owner-occupied loans totaling $9.8 million, and three commercial non owner occupied loans totaling $4.2 million. The increase in accruing loans past due 90 days or more are deemed to be low risk and greater than 70% of these loans have been brought current since the year-end 2023. Acquired nonperforming loans were $60.9 million, or 1.03% of total acquired loans, a decrease of $617,000, or 1.0% from December 31, 2022. The decrease in acquired nonperforming loans was mainly driven by a decrease in consumer nonaccrual loans of $3.3 million, a decrease in restructured loans of $2.9 million and a decrease in accruing loans past due 90 days or more of $818,000, offset by an increase in commercial nonaccrual loans of $6.4 million.
86
The top ten nonaccrual loans at December 31, 2023 totaled $61.3 million and consisted of four loans located in South Carolina, two in North Carolina, three in Georgia, and one in Florida. These loans comprise 36.0% of total nonaccrual loans at December 31, 2023, with around 50% being real estate collateral dependent and the other 50% being non real estate. We currently hold a specific reserve against one of these ten loans, totaling $6.9 million. The remaining nine loans do not carry a specific reserve due to carrying balances being below current collateral values.
The decline in restructured nonaccrual loans over both the nonacquired and acquired loan portfolios was due to the adoption of ASU 2022-02 effective January 1, 2023, which extinguishes the former troubled debt restructuring (TDR) guidance and issues new requirements for determining modified loans to borrowers experiencing financial difficulty. As of December 31, 2023, the Bank had a total of $12.1 million loans to borrowers experiencing financial difficulty. Of the $12.1 million, $9.9 million loans were current and $2.2 million loans were 30 to 89 days past due.
Allowance for Credit Losses (“ACL”) on Loans and Certain Off-Balance-Sheet Credit Exposure
As stated previously, the ACL reflects management’s estimate of the portion of the amortized cost of loans and unfunded commitments that it does not expect to collect. The Company records loans charged off against the ACL and subsequent recoveries, if any, increase the ACL when they are recognized.
Management considers forward-looking information in estimating expected credit losses. The Company subscribes to a third-party service which provides a quarterly macroeconomic baseline outlook and alternative scenarios for the United States economy. The baseline, along with the evaluation of alternative scenarios, is used by management to determine the best estimate within the range of expected credit losses. Management evaluates the appropriateness of the reasonable and supportable forecast scenarios and takes into consideration the scenarios in relation to actual economic and other data, such as gross domestic product growth, monetary and fiscal policy, inflation, supply chain issues and global events like the Russian/Ukraine conflict, as well as the volatility and magnitude of changes within those scenarios quarter over quarter, and consideration of conditions within the Bank’s operating environment and geographic area. Additional forecast scenarios may be weighted along with the baseline forecast to arrive at the final reserve estimate. While periods of relative economic stability should generally lead to stability in forecast scenarios and weightings to estimate credit losses, periods of instability can likewise require management to adjust the selection of scenarios and weightings, in accordance with the accounting standards. For the contractual term that extends beyond the reasonable and supportable forecast period, the Company reverts to the long term mean of historical factors within four quarters using a straight-line approach. The Company generally uses a four-quarter forecast and a four-quarter reversion period.
In spite of the rapid interest rate hikes experienced cycle-to-date, the U.S. has thus far avoided a recession, although an inverted yield curve such as observed in the current interest rate environment often portends a coming recession. Management continues to use a blended forecast scenario of the baseline, upside, and more severe scenario, depending on the circumstances and economic outlook As of December 31, 2023, management selected a baseline weighting of 60%, a 20% weighting for an upside scenario and a 20% weighting for the more severe scenario compared to a baseline weighting of 75% and the more severe scenario of 25% at the end of the fourth quarter of 2022. While the December Federal Open Market Committee Meeting brought some clarity around the path of interest rates and condition of the economy, the scenario weightings reflect continued recognition of downside risks in the economic forecast from persistent levels of inflation, rising interest rates, and tightening credit conditions conducive of a mild recession. While employment figures still showed resilience and actual loan losses remain at low levels, continued downward shifts in the forecasted commercial real estate price index elevated modeled expected losses for the Commercial Real Estate and Commercial Construction and Land Development, which excludes Residential Construction, loan segments. As a result of the continued pressures in the market and tightening credit conditions, the Company recorded provision for credit losses of $114.1 million and net charge-offs of $24.9 million during 2023.
As disclosed previously, the longstanding TDR accounting rules were replaced with ASU No. 2022-02, Financial Instruments – Credit Losses (Topic 326): Troubled Debt Restructurings and Vintage Disclosures. The Company adopted the retirement of TDR guidance, effective January 1, 2023. Please see Note 1 — Summary of Significant Accounting Policies in this Form 10-K for further detailed descriptions of how we determine expected losses from modifications of receivables to borrowers experiencing financial difficulty.
87
Atlantic Capital was acquired and merged with and into the Bank on March 1, 2022, requiring that a closing date ACL be prepared for Atlantic Capital on a standalone basis and that the acquired portfolio be included in the Bank’s first quarter ACL. Atlantic Capital’s loans represented approximately 8% of the total Bank’s portfolio at March 31, 2022. Given the relative size and complexity of the acquired portfolio, similarities of the loan characteristics, and similar loss history to the existing portfolio, reserve calculations were performed using the Bank's existing CECL model, loan segmentation, and forecast weighting as the first quarter end reserve. As a result of the merger with Atlantic Capital on March 1, 2022, the Company identified approximately $137.9 million of loans as PCD. The acquisition date ACL totaled $27.5 million, consisting of a non-PCD pooled reserve of $13.7 million, PCD pooled reserve of $5.7 million, and PCD individually evaluated reserve of $8.1 million. It represented about 8% of the combined Bank’s ACL reserve at March 31, 2022. The acquisition date reserve for unfunded commitments totaled $3.4 million, or 11% of the combined Bank’s total at March 31, 2022.
The Company has a variety of assets that have a component that qualifies as an off-balance sheet exposure. These primarily include undrawn portions of revolving lines of credit and standby letters of credit. The expected losses associated with these exposures within the unfunded portion of the expected credit loss will be recorded as a liability on the balance sheet. Management has determined that a majority of the Company’s off-balance-sheet credit exposures are not unconditionally cancellable. Management completes funding studies based on historical data to estimate the percentage of unfunded loan commitments that will ultimately be funded to calculate the reserve for unfunded commitments. Management applies this funding rate, along with the loss factor rate determined for each pooled loan segment, to unfunded loan commitments, excluding unconditionally cancellable exposures and letters of credit, to arrive at the reserve for unfunded loan commitments. As of December 31, 2023 and 2022, the liabilities recorded for expected credit losses on unfunded commitments were $56.3 million and $67.2 million, respectively. The current adjustment to the ACL for unfunded commitments is recognized through the Provision (Recovery) for Credit Losses in the Consolidated Statements of Income.
As of December 31, 2023, the balance of the ACL was $456.6 million, or 1.41%, of total loans. For the year ended December 31, 2023, the ACL increased $100.1 million from the balance of $356.4 million at December 31, 2022. The increase in ACL of $100.1 million included $125.0 million of provision for credit losses, and $24.9 million in net charge-offs. For both the three and twelve months ended December 31, 2023, the Company recorded provision for credit losses due to loan growth and current forecasts applied to our modeling to adequately capture growing economic recessionary risks. As of December 31, 2022, the balance of the ACL was $356.4 million or 1.18% of total loans. For the year ended December 31, 2022, the ACL increased $54.6 million from the balance of $301.8 million at December 31, 2021. The increase in ACL of $54.6 million was due a provision for credit losses of $45.2 million, $13.7 million due to the initial allowance for PCD loans acquired in the Atlantic Capital acquisition, along with net charge-offs of $4.3 million in 2022. For both the three and twelve months ended December 31, 2022, the Company recorded provision for credit losses due to loan growth and current forecasts applied to our modeling to adequately capture growing economic recessionary risks.
At December 31, 2023, the Company had a reserve on unfunded commitments of $56.3 million, which was recorded as a liability on the Consolidated Balance Sheet, compared to $67.2 million at December 31, 2022. During the three and twelve months ended December 31, 2023, the Company recorded a release in the reserve for unfunded commitments of $6.0 million and $10.9 million, respectively. For the prior comparative period, the Company recorded a provision for credit losses on unfunded commitments of $14.2 million and $36.7 million, respectively. The provision of $36.7 million recorded in 2022 includes the initial provision for credit losses for unfunded commitments acquired from Atlantic Capital, which the Company recorded during the first quarter of 2022. The provision for credit losses for unfunded commitments is based on the growth in unfunded loan commitments, production mix, and current forecast scenarios applied to our modeling to adequately capture growing economic recessionary risks. This amount was recorded in Provision (Recovery) for Credit Losses on the Consolidated Statements of Income. The Company did not have an allowance for credit losses or record a provision for credit losses on investment securities or other financials asset during 2023.
The ACL provides 2.50 times coverage of nonperforming loans at December 31, 2023. Net charge offs to total average loans during the year ended December 31, 2023 were 0.08%, compared to 0.02% during the year ended December 31, 2022. ACL, including reserve for unfunded commitments, as a percentage of loans were 1.58% and 1.40%, respectively, as of December 31, 2023 and 2022.
88
The following table provides the allocation, by segment, for expected credit losses for the year ended December 31, 2023. While non-owner occupied CRE is the largest segment of our loan portfolio, the risk profile of the non-owner occupied CRE portfolio remains low and stable. We have a granular loan portfolio where the average loan size of the non-owner occupied CRE portfolio is less than $5 million. The weighted average loan to value for the non-owner occupied CRE portfolio was less than 60% as of December 31, 2023. Loans for the commercial office space, which are included in the non-owner occupied CRE portfolio, represent approximately 4% of the total outstanding portfolio with an average loan size of less than $2 million as of December 31, 2023. Over 95% of these office spaces are located in the Company’s southeast footprint, of which approximately 91% mature in 2025 or later.
Table 17—Allocation of the Allowance by Segment
|
|
|
December 31, 2023 |
|
December 31, 2022 |
|
||||||
(Dollars in thousands) |
|
|
Amount |
|
%* |
|
Amount |
|
%* |
|
||
Residential Mortgage Senior |
|
|
$ |
78,052 |
|
21.8 |
% |
$ |
72,188 |
|
18.8 |
% |
Residential Mortgage Junior |
|
|
|
745 |
|
0.0 |
% |
|
405 |
|
0.0 |
% |
Revolving Mortgage |
|
|
|
10,942 |
|
4.6 |
% |
|
14,886 |
|
4.6 |
% |
Residential Construction |
|
|
|
5,024 |
|
2.1 |
% |
|
8,974 |
|
2.9 |
% |
Other Construction and Development |
|
|
|
65,772 |
|
6.8 |
% |
|
45,410 |
|
6.5 |
% |
Consumer |
|
|
|
23,331 |
|
3.8 |
% |
|
22,767 |
|
4.2 |
% |
Multifamily |
|
|
|
13,766 |
|
2.7 |
% |
|
3,684 |
|
2.4 |
% |
Municipal |
|
|
|
900 |
|
2.3 |
% |
|
849 |
|
2.4 |
% |
Owner Occupied Commercial Real Estate |
|
|
|
71,580 |
|
16.9 |
% |
|
58,083 |
|
18.1 |
% |
Non-Owner Occupied Commercial Real Estate |
|
|
|
137,055 |
|
23.8 |
% |
|
78,485 |
|
24.5 |
% |
Commercial and Industrial |
|
|
|
49,406 |
|
15.1 |
% |
|
50,713 |
|
15.7 |
% |
Total |
|
|
$ |
456,573 |
|
100.0 |
% |
$ |
356,444 |
|
100.0 |
% |
* Loan balance in each category expressed as a percentage of total loans excluding PPP loans.
The following table presents a summary of net charge off ratios by loan segment, for the year ended December 31, 2023 and 2022:
Table 18—Disaggregated Net Recovery (Charge Off) Ratio by Segment
|
|
Year Ended |
||||||||||||||||
|
|
December 31, 2023 |
|
December 31, 2022 |
||||||||||||||
(Dollars in thousands) |
|
Net Recovery (Charge Off) |
|
Average Balance |
|
Net Recovery (Charge Off) Ratio |
|
Net Recovery (Charge Off) |
|
Average Balance |
|
Net Recovery (Charge Off) Ratio |
||||||
Residential Mortgage Senior |
|
$ |
735 |
|
$ |
6,399,401 |
|
0.01 |
% |
|
$ |
1,036 |
|
$ |
4,792,864 |
|
0.02 |
% |
Residential Mortgage Junior |
|
|
108 |
|
|
12,142 |
|
0.89 |
% |
|
|
212 |
|
|
13,835 |
|
1.53 |
% |
Revolving Mortgage |
|
|
1,073 |
|
|
1,422,717 |
|
0.08 |
% |
|
|
3,536 |
|
|
1,294,044 |
|
0.27 |
% |
Residential Construction |
|
|
128 |
|
|
823,952 |
|
0.02 |
% |
|
|
(13) |
|
|
756,730 |
|
(0.00) |
% |
Other Construction and Development |
|
|
462 |
|
|
1,981,715 |
|
0.02 |
% |
|
|
1,100 |
|
|
1,669,834 |
|
0.07 |
% |
Consumer |
|
|
(9,795) |
|
|
1,253,419 |
|
(0.78) |
% |
|
|
(7,788) |
|
|
1,151,578 |
|
(0.68) |
% |
Multifamily |
|
|
41 |
|
|
857,100 |
|
0.00 |
% |
|
|
— |
|
|
588,305 |
|
— |
% |
Municipal |
|
|
— |
|
|
733,406 |
|
— |
% |
|
|
— |
|
|
685,538 |
|
— |
% |
Owner Occupied Commercial Real Estate |
|
|
812 |
|
|
5,531,908 |
|
0.01 |
% |
|
|
(649) |
|
|
5,330,711 |
|
(0.01) |
% |
Non-Owner Occupied Commercial Real Estate |
|
|
658 |
|
|
7,608,018 |
|
0.01 |
% |
|
|
213 |
|
|
6,998,540 |
|
0.00 |
% |
Commercial and Industrial |
|
|
(19,088) |
|
|
4,779,513 |
|
(0.40) |
% |
|
|
(1,920) |
|
|
4,174,155 |
|
(0.05) |
% |
Total |
|
$ |
(24,866) |
|
$ |
31,403,291 |
|
(0.08) |
% |
|
$ |
(4,273) |
|
$ |
27,456,134 |
|
(0.02) |
% |
89
The following table presents a summary of the changes in the ACL, for the years ended December 31, 2023, 2022 and 2021:
Table 19—Summary of the Changes in ACL
|
|
Year Ended December 31, |
|
|||||||||||||||||||||||||
|
|
2023 |
|
2022 |
|
2021 |
|
|||||||||||||||||||||
|
|
Non-PCD |
|
PCD |
|
|
|
Non-PCD |
|
PCD |
|
|
|
Non-PCD |
|
PCD |
|
|
|
|||||||||
(Dollars in thousands) |
|
Loans |
|
Loans |
|
Total |
|
Loans |
|
Loans |
|
Total |
|
Loans |
|
Loans |
|
Total |
|
|||||||||
Allowance for credit losses at January 1 |
|
$ |
309,606 |
|
$ |
46,838 |
|
$ |
356,444 |
|
$ |
225,227 |
|
$ |
76,580 |
|
$ |
301,807 |
|
$ |
315,470 |
|
$ |
141,839 |
|
$ |
457,309 |
|
ACL - PCD loans for ACBI merger |
|
|
— |
|
|
— |
|
|
— |
|
|
— |
|
|
13,758 |
|
|
13,758 |
|
|
— |
|
|
— |
|
|
— |
|
Loans charged-off |
|
|
(39,077) |
|
|
(1,571) |
|
|
(40,648) |
|
|
(17,332) |
|
|
(6,114) |
|
|
(23,446) |
|
|
(14,391) |
|
|
(2,508) |
|
|
(16,899) |
|
Recoveries of loans previously charged off |
|
|
9,987 |
|
|
5,795 |
|
|
15,782 |
|
|
12,140 |
|
|
7,033 |
|
|
19,173 |
|
|
7,778 |
|
|
6,022 |
|
|
13,800 |
|
Net (charge-offs) recoveries |
|
|
(29,090) |
|
|
4,224 |
|
|
(24,866) |
|
|
(5,192) |
|
|
919 |
|
|
(4,273) |
|
|
(6,613) |
|
|
3,514 |
|
|
(3,099) |
|
Initial provision for credit losses - ACBI |
|
|
— |
|
|
— |
|
|
— |
|
|
13,697 |
|
|
— |
|
|
13,697 |
|
|
— |
|
|
— |
|
|
— |
|
Provision (recovery) for credit losses |
|
|
143,360 |
|
|
(18,365) |
|
|
124,995 |
|
|
75,874 |
|
|
(44,419) |
|
|
31,455 |
|
|
(83,630) |
|
|
(68,773) |
|
|
(152,403) |
|
Balance at end of period |
|
$ |
423,876 |
|
$ |
32,697 |
|
$ |
456,573 |
|
$ |
309,606 |
|
$ |
46,838 |
|
$ |
356,444 |
|
$ |
225,227 |
|
$ |
76,580 |
|
$ |
301,807 |
|
|
|
|
|
|
|
|
|
|
|
|
|
|
|
|
|
|
|
|
|
|
|
|
|
|
|
|
|
|
Total loans, net of unearned income: |
|
|
|
|
|
|
|
|
|
|
|
|
|
|
|
|
|
|
|
|
|
|
|
|
|
|
|
|
At period end |
|
$ |
32,388,489 |
|
|
|
|
|
|
|
$ |
30,177,862 |
|
|
|
|
|
|
|
$ |
23,928,166 |
|
|
|
|
|
|
|
Average |
|
|
31,403,291 |
|
|
|
|
|
|
|
|
27,456,134 |
|
|
|
|
|
|
|
|
24,118,512 |
|
|
|
|
|
|
|
Net charge-offs as a percentage of average loans (annualized) |
|
|
0.08 |
% |
|
|
|
|
|
|
|
0.02 |
% |
|
|
|
|
|
|
|
0.01 |
% |
|
|
|
|
|
|
Allowance for credit losses as a percentage of period end loans |
|
|
1.41 |
% |
|
|
|
|
|
|
|
1.18 |
% |
|
|
|
|
|
|
|
1.26 |
% |
|
|
|
|
|
|
Allowance for credit losses as a percentage of period end non-performing loans (“NPLs”) |
|
|
249.90 |
% |
|
|
|
|
|
|
|
328.29 |
% |
|
|
|
|
|
|
|
375.94 |
% |
|
|
|
|
|
|
* Net charge-offs at December 31, 2023, 2022 and 2021 include automated overdraft protection (“AOP”) and insufficient fund (“NSF”) principal net charge-offs of $6.8 million, $6.5 million and $4.6 million, respectively, that are included in the consumer classification above.
** Average loans, net of unearned income does not include loans held for sale.3
Deposits
We rely on deposits by our customers as the primary source of funds for the continued growth of our loan and investment securities portfolios. Customer deposits are categorized as either noninterest-bearing deposits or interest-bearing deposits. Noninterest-bearing deposits (or demand deposits) are transaction accounts that provide us with “interest-free” sources of funds. Interest-bearing deposits include savings deposit, interest-bearing transaction accounts, certificates of deposits, and other time deposits. Interest-bearing transaction accounts include NOW, HSA, IOLTA, and Market Rate checking accounts. The Company uses brokered time deposits as a secondary source of deposits to supplement its primary source through organic growth of deposits from our customers.
During 2023, overall deposits increased $698.3 million, or 1.9%, to $37.0 billion from 2022. The increase was driven by growth in money market accounts of $3.2 billion, including $1.2 billion in reciprocal insured money market deposits and time deposits of $1.8 billion, including an increase in brokered deposits of $569.6 million. These increases were partially offset by declines in noninterest-bearing checking deposits of $2.5 billion, interest-bearing checking deposits of $976.7 million and savings deposits of $832.1 million. As customers moved funds from noninterest-bearing checking, interest-bearing checking and savings accounts, seeking higher yields in the rising rate environment, the Company increased its balance in higher yielding money market accounts including reciprocal insured money market deposits along with in-market time deposits and brokered deposits in 2023. The Company raised interest rates on most interest-bearing deposit products (in particular money market accounts and time deposit specials) during 2023 due to competitive pressures to retain deposits. The Company also increased its use of brokered time deposits in the first quarter of 2023 with the financial turmoil caused by the few regional banks failing to provide the Company with excess liquidity. The balance at the end of the first quarter was $1.4 billion. As the financial markets settled, the Company has allowed the brokered time deposits to run off to an ending balance of $719.7 million at December 31, 2023. The declines in noninterest-bearing, interest-bearing and savings accounts were also due to customers having less excess cash as funds from government support programs related to the COVID-19 pandemic declined.
90
The following table presents total deposits for the two years at December 31:
Table 20—Total Deposits
|
|
December 31, |
|
||||
(Dollars in thousands) |
|
2023 |
|
2022 |
|
||
Noninterest-bearing deposits |
|
$ |
10,649,274 |
|
$ |
13,168,656 |
|
Savings deposits |
|
|
2,632,212 |
|
|
3,464,351 |
|
Interest‑bearing demand deposits |
|
|
19,517,470 |
|
|
17,297,630 |
|
Total savings and interest‑bearing demand deposits |
|
|
22,149,682 |
|
|
20,761,981 |
|
Certificates of deposit |
|
|
4,245,382 |
|
|
2,413,963 |
|
Other time deposits |
|
|
4,571 |
|
|
6,023 |
|
Total time deposits |
|
|
4,249,953 |
|
|
2,419,986 |
|
Total deposits |
|
$ |
37,048,909 |
|
$ |
36,350,623 |
|
The following are key highlights regarding overall changes in total deposits:
| ● | Total deposits increased $698.3 million, or 1.9%, for the year ended December 31, 2023, compared to 2022. |
| o | Noninterest-bearing deposits (demand deposits) decreased by $2.5 billion, or 19.1%, for the year ended December 31, 2023, when compared with December 31, 2022. |
| o | Money market (Market Rate Checking) and other interest-bearing demand deposits increased $2.2 billion, or 12.8%, for the year ended December 31, 2023 |
| o | Savings deposits decreased $832.1 million, or 24.0%, when compared with December 31, 2022. |
| o | At December 31, 2023, core deposits (total deposits excluding time deposits) represented 89% of total deposits compared with 93% at the end of 2022. |
The following are key highlights regarding overall growth in average total deposits:
| ● | Total deposits averaged $36.6 billion in 2023, a decrease of $575.0 billion, or 1.5%, from 2022. |
| o | Average interest-bearing deposits increased by $1.1 billion, or 4.8%, to $24.8 billion in 2023 compared to 2022. |
| o | Average noninterest-bearing demand deposits decreased by $1.7 billion, or 12.6%, to $11.8 billion in 2023 compared to 2022. |
The following table provides a maturity distribution of certificates of deposit of $250,000 or more for the next twelve months as of December 31:
Table 21—Maturity Distribution of Certificates of Deposits of $250 Thousand or More
|
|
December 31, |
|
December 31, |
|
|
|
||
(Dollars in thousands) |
|
2023 |
|
2022 |
|
% Change |
|
||
Within three months |
|
$ |
549,888 |
|
$ |
115,528 |
|
376.0 |
% |
After three through six months |
|
|
166,344 |
|
|
118,511 |
|
40.4 |
% |
After six through twelve months |
|
|
165,126 |
|
|
168,785 |
|
(2.2) |
% |
After twelve months |
|
|
45,855 |
|
|
84,361 |
|
(45.6) |
% |
|
|
$ |
927,213 |
|
$ |
487,185 |
|
90.3 |
% |
At December 31, 2023 and 2022, the Company estimates that is has approximately $14.2 billion and $14.6 billion, respectively, in uninsured deposits. The amounts above are estimates and are based on the same methodologies and assumptions used for the Bank’s regulatory reporting requirements by the FDIC for the Call Report.
The following table provides a maturity distribution of uninsured time deposits for the next twelve months as of December 31:
Table 22—Maturity Distribution of Uninsured Time Deposits
|
|
December 31, |
|
|
|
||||
(Dollars in thousands) |
|
2023 |
|
2022 |
|
% Change |
|
||
Within three months |
|
$ |
285,760 |
|
$ |
57,302 |
|
398.7 |
% |
After three through six months |
|
|
77,094 |
|
|
71,261 |
|
8.2 |
% |
After six through twelve months |
|
|
84,876 |
|
|
91,785 |
|
(7.5) |
% |
After twelve months |
|
|
29,855 |
|
|
42,361 |
|
(29.5) |
% |
|
|
$ |
477,585 |
|
$ |
262,709 |
|
81.8 |
% |
91
Short-Term Borrowed Funds
Our short-term borrowed funds consist of federal funds purchased and securities sold under repurchase agreements, FRB borrowings on a secured line of credit, short-term FHLB Advances and the U.S. Bank line of credit. Note 10—Federal Funds Purchased and Securities Sold Under Agreements to Repurchase in our audited financial statements provides a profile of these funds at each year-end, the average amounts outstanding during each period, the maximum amounts outstanding at any month-end, and the weighted average interest rates on year-end and average balances in each category. Federal funds purchased and securities sold under agreements to repurchase most typically have maturities within one to three days from the transaction date. Certain of these borrowings have no defined maturity date. Note 11—Other Borrowings in our audited financial statements provide provides a profile of short-term FHLB advances, FRB borrowings and the U.S. Bank line of credit at each year-end, the average amount outstanding during each period and the weighted average interest rates on year-end and average balances. Short-term FHLB advances has a maturity of less than one year and the FRB borrowings and U.S. Bank line of credit has a daily maturity.
Long-Term Borrowed Funds
Our long-term borrowed funds consist of trust preferred junior subordinated debt and corporate subordinated debt. Note 11—Other Borrowings in our audited financial statements provides a profile of these funds at each year-end, the balance at year end, the interest rate at year end and the weighted average interest rate for long-term borrowings. Each issuance of trust preferred junior subordinated debt has a maturity of 30 years, but we can call the debt at any time without penalty.
Capital and Dividends
Our ongoing capital requirements have been met primarily through retained earnings, less the payment of cash dividends. As of December 31, 2023, shareholders’ equity was $5.5 billion, an increase of $458.2 million, or 9.0%, compared to the balance at December 31, 2022. The change from year-end 2022 was mainly attributable to net income of $494.3 million, an increase in the market value of securities available for sale, net of tax, of $93.3 million recorded through AOCI and the recognition of equity based compensation of $35.9 million. These increases were mainly offset by dividends paid on common shares of $154.9 million and common stock repurchased under our stock repurchase plan and equity plans of $16.1 million.
The following shows the changes in shareholders’ equity during 2023:
Table 23—Changes in Shareholders’ Equity
(Dollars in thousands) |
|
|
|
Total shareholders' equity at December 31, 2022 |
|
$ |
5,074,927 |
Net income |
|
|
494,308 |
Dividends paid on common shares ($2.04 per share) |
|
|
(154,919) |
Dividends paid on restricted stock units |
|
|
(1,265) |
Net increase in market value of securities available for sale, net of deferred taxes |
|
|
93,252 |
Net increase in market value of post retirement plan, net of deferred taxes |
|
|
1,300 |
Stock options exercised |
|
|
2,926 |
Employee stock purchases |
|
|
2,772 |
Equity based compensation |
|
|
35,861 |
Common stock repurchased pursuant to stock repurchase plan |
|
|
(6,748) |
Common stock repurchased - equity plans |
|
|
(9,316) |
Total shareholders' equity at December 31, 2023 |
|
$ |
5,533,098 |
Our equity-to-assets ratio increased to 12.3% at December 31, 2023 from 11.6% at December 31, 2022. The increase from December 31, 2022 was due to the percentage increase in equity of 9.0% being higher than the percentage increase in total assets of 2.2%. The higher percentage growth in capital was mainly due to the Company’s net income of $494.3 million. The increase in assets in 2023 was mainly due to organic loan growth funded through deposit growth.
92
On April 27, 2022, the Company’s Board of Directors approved 2022 Stock Repurchase Program authorizing the Company to repurchase up to 3,750,000 of the Company’s common shares along with the remaining authorized shares of 370,021 from the Company’s 2021 Stock Repurchase Plan. Our Board of Directors approved the program after considering, among other things, our liquidity needs and capital resources as well as the estimated current value of our net assets. The aggregate number of shares of common stocks authorized to be repurchased totals 4.12 million shares. The number of shares to be purchased and the timing of the purchases are based on a variety of factors, including, but not limited to, the level of cash balances, general business conditions, regulatory requirements, the market price of our common stock, and the availability of alternative investment opportunities. During 2023, the Company repurchased a total of 100,000 shares at a weighted average price of $67.48 per share pursuant to the 2022 Stock Repurchase Program. As of December 31, 2023, there is a total of 4,020,021 shares authorized to be repurchased.
We are subject to regulations with respect to certain risk-based capital ratios. These risk-based capital ratios measure the relationship of capital to a combination of balance sheet and off-balance sheet risks. The values of both balance sheet and off-balance sheet items are adjusted based on the rules to reflect categorical credit risk. In addition to the risk-based capital ratios, the regulatory agencies have also established a leverage ratio for assessing capital adequacy. The leverage ratio is equal to Tier 1 capital divided by total consolidated on-balance sheet assets (minus amounts deducted from Tier 1 capital). The leverage ratio does not involve assigning risk weights to assets.
Specifically, we are required to maintain the following minimum capital ratios:
| ● | a CET1, risk-based capital ratio of 4.5%; |
| ● | a Tier 1 risk-based capital ratio of 6%; |
| ● | a total risk-based capital ratio of 8%; and |
| ● | a leverage ratio of 4%. |
Under the current capital rules, Tier 1 capital includes two components: CET1 capital and additional Tier 1 capital. The highest form of capital, CET1 capital, consists solely of common stock (plus related surplus), retained earnings, accumulated other comprehensive income, otherwise referred to as AOCI, and limited amounts of minority interests that are in the form of common stock. Additional Tier 1 capital is primarily comprised of noncumulative perpetual preferred stock and Tier 1 minority interests. Tier 2 capital generally includes the allowance for loan losses up to 1.25% of risk-weighted assets, qualifying preferred stock, subordinated debt, trust preferred securities and qualifying tier 2 minority interests, less any deductions in Tier 2 instruments of an unconsolidated financial institution. AOCI is presumptively included in CET1 capital and often would operate to reduce this category of capital. When the current capital rules were first implemented, the Bank exercised its one-time opportunity at the end of the first quarter of 2015 for covered banking organizations to opt out of much of this treatment of AOCI, allowing us to retain our pre-existing treatment for AOCI.
In order to avoid restrictions on capital distributions or discretionary bonus payments to executives, a banking organization must maintain a “capital conservation buffer” on top of its minimum risk-based capital requirements. This buffer must consist solely of Tier 1 Common Equity, but the buffer applies to all three risk-based measurements (CET1, Tier 1 capital and total capital), resulting in the following effective minimum capital plus capital conservation buffer ratios: (i) a CET1 capital ratio of 7.0%, (ii) a Tier 1 risk-based capital ratio of 8.5%, and (iii) a total risk-based capital ratio of 10.5%.
The Bank is also subject to the regulatory framework for prompt corrective action, which identifies five capital categories for insured depository institutions (well capitalized, adequately capitalized, undercapitalized, significantly undercapitalized, and critically undercapitalized) and is based on specified thresholds for each of the three risk-based regulatory capital ratios (CET1, Tier 1 capital and total capital) and for the leverage ratio.
93
The federal banking agencies revised their regulatory capital rules to (i) address the implementation of CECL; (ii) provide an optional three-year phase-in period for the adoption date adverse regulatory capital effects that banking organizations are expected to experience upon adopting CECL; and (iii) require the use of CECL in stress tests beginning with the 2020 capital planning and stress testing cycle for certain banking organizations that are subject to stress testing. CECL became effective for us on January 1, 2020 and the Company applied the provisions of the standard using the modified retrospective method as a cumulative-effect adjustment to retained earnings. Related to the implementation of ASU 2016-13, we recorded additional allowance for credit losses for loans of $54.4 million, deferred tax assets of $12.6 million, an additional reserve for unfunded commitments of $6.4 million and an adjustment to retained earnings of $44.8 million. Instead of recognizing the effects on regulatory capital from ASU 2016-13 at adoption, the Company initially elected the option for recognizing the adoption date effects on the Company’s regulatory capital calculations over a three-year phase-in.
In response to the COVID-19 pandemic in 2020, the federal banking agencies issued a final rule for additional transitional relief to regulatory capital related to the impact of the adoption of CECL. The Company chose the five-year transition method and is deferring the recognition of the effects from the adoption date and the CECL difference for the first two years of application. The modified CECL transitional amount was fixed as of December 31, 2021, and that amount began the three-year phase out in the first quarter of 2022 with 50% phased out in 2023. At December 31, 2023 and 2022, approximately $30.5 million and $45.8 million, respectively, was added to Tier 1 capital at the Company and Bank as a result of the modified CECL transition. Had the Company elected not to apply the modified CECL transitional amount to its Tier 1 capital, the Company and Bank would have still been considered well capitalized as of December 31, 2023 and 2022.
Table 24—Capital Adequacy Ratios
The following table presents our consolidated capital ratios under the applicable capital rules:
|
|
December 31, |
|
||||
(In percent) |
|
2023 |
|
2022 |
|
2021 |
|
Common equity Tier 1 risk-based capital |
|
11.75 |
% |
10.96 |
% |
11.76 |
% |
Tier 1 risk‑based capital |
|
11.75 |
% |
10.96 |
% |
11.76 |
% |
Total risk‑based capital |
|
14.08 |
% |
12.97 |
% |
13.57 |
% |
Tier 1 leverage |
|
9.42 |
% |
8.72 |
% |
8.08 |
% |
The Company’s and Bank’s Common equity Tier 1 risk-based capital, Tier 1 risk-based capital and total risk-based capital and Tier 1 leverage ratios all improved compared to December 31, 2022. All of these ratios mainly improved due to net income recognized during 2023 of $494.3 million. Tier 1 capital increased 8.6% and 9.8% at the Bank and Company, respectively, with the increase in equity resulting from the net income recognized during the current period. Total risk-based capital increased 10.9% and 11.1% at both the Bank and Company, respectively, with the increase in equity resulting from the net income recognized during the current period, along with the increase in the allowance for credit losses and unfunded commitments includable in Tier 2 capital. Both regulatory risk-based assets and quarterly average assets remained reasonably flat in the fourth quarter of 2023 compared to the fourth quarter of 2022 with average assets for the both Company and Bank increasing 1.6% and risk-based assets increasing 2.3%. Our capital ratios are currently well in excess of the minimum standards and continue to be in the “well capitalized” regulatory classification. Should the Company need to sell its available for sale and held to maturity securities for liquidity purposes and recognize the unrealized losses as of December 31, 2023 through earnings, all else equal, our capital ratios would remain well in excess of the minimum standards and continue to be in the “well capitalized” regulatory classification.
The Company pays cash dividends to shareholders from its assets, which are mainly provided by dividends from its banking subsidiary. However, certain restrictions exist regarding the ability of its banking subsidiary to transfer funds to the Company in the form of cash dividends, loans or advances. The approval of the OCC is required if the total of all dividends declared by the Bank in any calendar year exceeds the total of its net profits for that year combined with its retained net profits for the preceding two years, less any required transfers to surplus. The federal banking agencies have issued policy statements which provide that bank holding companies and insured banks should generally pay dividends only out of current earnings.
During 2023, the Bank paid dividends to SouthState totaling $180.0 million. The Bank was not required to obtain approval of the OCC to pay these dividends. We used these funds and excess cash to pay our dividend to shareholders of $154.9 million and repurchase shares of our common stock on the open market totaling $6.7 million.
94
The following table provides the amount of dividends and payout ratios for the years ended December 31:
Table 25—Dividends Paid to Common Shareholders
|
|
Year Ended December 31, |
|
|||||||
(Dollars in thousands) |
|
2023 |
|
2022 |
|
2021 |
|
|||
Dividend payments to common shareholders |
|
$ |
154,919 |
|
$ |
146,486 |
|
$ |
135,201 |
|
Dividend payout ratios |
|
|
31.34 |
% |
|
29.54 |
% |
|
28.43 |
% |
We retain earnings to have capital sufficient to grow our loan and investment portfolios and to support certain acquisitions or other business expansion opportunities. The dividend payout ratio is calculated by dividing dividends paid during the year by net income for the year.
Liquidity
Liquidity refers to our ability to generate sufficient cash to meet our financial obligations, which arise primarily from the withdrawal of deposits, extension of credit and payment of operating expenses. Liquidity risk is the risk that the Bank’s financial condition or overall safety and soundness is adversely affected by an inability (or perceived inability) to meet its obligations. Our Asset Liability Management Committee (“ALCO”) is charged with the responsibility of monitoring policies designed to ensure acceptable composition of our asset/liability mix. Two critical areas of focus for ALCO are interest rate sensitivity and liquidity risk management. We have employed our funds in a manner to provide liquidity from both assets and liabilities sufficient to meet our cash needs.
The ALCO has established key risk indicators to monitor liquidity and interest rate risk. The key risk indicators are reviewed and approved by the ALCO on an annual basis. The liquidity key risk indicators include the loan to deposit ratio, net noncore funding dependence ratio, On-hand liquidity to total liabilities ratio, the percentage of securities pledged to total securities, and the ratio of brokered deposits to total deposits. As of December 31, 2023, the Company was operating within its liquidity policy limits.
Asset liquidity is maintained by the maturity structure of loans, investment securities and other short-term investments. Management has policies and procedures governing the length of time to maturity on loans and investments. Normally, changes in the earning asset mix are of a longer-term nature and are not used for day-to-day corporate liquidity needs.
Our liabilities provide liquidity on a day-to-day basis. Daily liquidity needs are met from deposit levels or from our use of federal funds purchased, securities sold under agreements to repurchase, interest-bearing deposits at other banks and other short-term borrowings. We engage in routine activities to retain deposits intended to enhance our liquidity position. These routine activities include various measures, such as the following:
| ● | Emphasizing relationship banking to new and existing customers, where borrowers are encouraged and normally expected to maintain deposit accounts with our Bank; |
| ● | Pricing deposits, including certificates of deposit, at rate levels that will attract and /or retain balances of deposits that will enhance our Bank’s asset/liability management and net interest margin requirements; and |
| ● | Continually working to identify and introduce new products that will attract customers or enhance our Bank’s appeal as a primary provider of financial services. |
Our non-acquired loan portfolio increased by approximately $3.7 billion, or approximately 16.1%, compared to the balance at December 31, 2022. The increase in the non-acquired loan portfolio was due to organic growth and renewals of acquired loans that are moved to our non-acquired loan portfolio. The acquired loan portfolio decreased by $1.5 billion, or 19.9%, from the balance at December 31, 2022 through principal paydowns, charge-offs, foreclosures and renewals of acquired loans. For more detail around the changes in the loan portfolio see the Loan Portfolio section in MDA starting on page 81.
95
Our investment securities portfolio (excluding trading securities) decreased $725.9 million, or approximately 8.9%, compared to the balance at December 31, 2022. The decrease in investment securities from December 31, 2022 was a result of maturities, calls, sales and paydowns of investment securities totaling $1.1 billion and a reduction from the net amortization of premiums of $20.1 million. These decreases were partially offset by purchases of available for sale investment securities totaling $80.4 million and other investment securities of $226.7 million and an increase in the market value of the available for sale investment securities portfolio of $112.7 million. There were no purchases or sales of held to maturity securities during the year. For the purchases of other investment securities, $222.1 million of the purchases were related to capital stock with the Federal Home Loan Bank of which we sold back $214.4 million during 2023. The activity in the purchases and sales of the Federal Home Loan Bank Capital Stock was due to activity with FHLB borrowings during the year. The Bank pledges a portion of its investment portfolio for a variety of purposes, including, but not limited to, collateral for public funds and credit with the Federal Home Loan Bank of Atlanta. As of December 31, 2023, the bank pledged 49.6% of the market value of its investment portfolio. As of December 31, 2023, the Bank had unpledged securities with a market value of $3.5 billion. These securities included Treasury, Agency, Agency MBS, Municipals and Corporate securities. Total cash and cash equivalents declined $313.7 million in 2023 to $1.0 billion at December 31, 2023, compared to $1.3 billion at December 31, 2022. Liquidity has tightened in 2023 with the rising rate environment and turmoil in the financial markets. Competition for in-market deposits has increased throughout 2023 resulting in increases in deposit rates to retain local deposits. While the Company has increased its use of brokered time deposits since December 31, 2022, the ratio of brokered time deposits to total deposits at December 31, 2023 was only 1.9% compared to the Company’s internal limit of 15%. During 2023, the Company has also borrowed funds from the FHLB on a short-term basis. The outstanding borrowings from the FHLB were $100.0 million at December 31, 2023. See below for further discussion around brokered deposits and FHLB borrowings.
At December 31, 2023 and December 31, 2022, we had $719.7 million and $150.0 million of traditional, out–of-market brokered time deposits, respectively. At December 31, 2023 and December 31, 2022, we had $2.2 billion and $637.0 million, respectively, of reciprocal deposits. Total deposits were $37.0 billion at December 31, 2023, an increase of $698.3 million from $36.4 billion at December 31, 2022. Our deposit growth since December 31, 2022 included an increase in money market accounts of $3.2 billion and an increase in certificates of deposit of $1.8 billion. These increases were offset by declines in demand deposit, interest-bearing checking and savings accounts of $2.5 billion, $976.7 million and $832.1 million, respectively. As customers moved funds from noninterest bearing checking, interest bearing checking and savings accounts, seeking higher yields in the rising rate environment along with insurance coverage, the Company’s balance in higher costing in-market time deposits, brokered time deposits and in money market deposit accounts including reciprocal insured money market accounts, increased. The Company raised interest rates on most interest-bearing deposit products (in particular time deposit specials and money market accounts) during 2023 due to competitive pressures to retain deposits. Total short-term borrowings at December 31, 2023 were $589.2 million consisting of $248.2 million in federal funds purchased, $241.0 million in securities sold under agreements to repurchase and $100.0 million in short-term FHLB advances. Total long-term borrowings at December 31, 2023 were $391.9 million and consisted of trust preferred securities and subordinated debentures. To the extent that we employ other types of non-deposit funding sources, typically to accommodate retail and correspondent customers, we continue to take in shorter maturities of such funds. Our current approach may provide an opportunity to sustain a low funding rate or possibly lower our cost of funds but could also increase our cost of funds if interest rates rise.
The Bank has a granular deposit base comprised of over 1.4 million accounts, with an average deposit size of $27,000. The top ten and twenty deposit relationships comprise approximately three and four percent of total deposits. Approximately 29% of total deposits are non-interest bearing. The Bank’s deposit beta, which represents the change in the Bank’s cost of deposits over the change in the federal funds target rate, during this cycle (from March 2022 through December 2023) is approximately 30%.
The Bank supplements its in-market deposits with brokered deposits. While the Bank has a policy limit for brokered time deposits of no more than 15% of total deposits, it has operated well below this policy limit. At December 31, 2023, the percentage of brokered time deposits to total deposits was 1.9%. During calendar years 2022 and 2023, the highest ratio of brokered time deposits to total deposits was 3.8% on March 31, 2023. During the first quarter of 2023, the Company sought to increase liquidity with the turmoil in the financial markets after the few regional banks failed and increased the balance in brokered time deposits to $1.4 billion. As the financial markets stabilized during 2023, the Company has let the brokered time deposits run-off to an ending balance of $719.7 million at December 31, 2023.
96
As discussed below, the Bank maintains credit facilities with the Federal Home Loan Bank of Atlanta and the Federal Reserve Bank of Atlanta. The table below compares Primary Funding Sources to uninsured deposits as of December 31, 2023.
Table 26—Primary Funding Sources to Uninsured Deposits
(Dollars in millions) |
|
Available Capacity |
|
|
Federal Home Loan Bank of Atlanta |
|
$ |
6,986 |
|
Federal Reserve Discount Window of Atlanta |
|
|
1,882 |
|
Cash and cash equivalents |
|
|
999 |
|
Par value of securities that can be pledged to BTFP |
|
|
3,638 |
|
Total primary sources |
|
$ |
13,505 |
|
Uninsured deposits, excluding collateralized deposits |
|
$ |
11,814 |
|
Uninsured and collateralized deposits |
|
$ |
14,239 |
|
Coverage ratio, uninsured deposits |
|
|
114.3% |
|
Coverage ratio, uninsured and collateralized deposits |
|
|
94.8% |
|
Ratio of uninsured and collateralized deposits to total deposits |
|
|
38.4% |
|
Through the operations of our Bank, we have made contractual commitments to extend credit in the ordinary course of our business activities. These commitments are legally binding agreements to lend money to our customers at predetermined interest rates for a specified period of time. We manage the credit risk on these commitments by subjecting them to normal underwriting and risk management processes. We believe that we have adequate sources of liquidity to fund commitments that are drawn upon by the borrowers. In addition to commitments to extend credit, we also issue standby letters of credit, which are assurances to third parties that they will not suffer a loss if our customer fails to meet its contractual obligation to the third-party. Although our experience indicates that many of these standby letters of credit will expire unused, through our various sources of liquidity, we believe that we will have the resources to meet these obligations should the need arise.
Our ongoing philosophy is to remain in a liquid position, as reflected by such indicators as the composition of our earning assets, typically including some level of reverse repurchase agreements; federal funds sold; balances at the Federal Reserve Bank; and/or other short-term investments; asset quality; well-capitalized position; and profitable operating results. Cyclical and other economic trends and conditions can disrupt our desired liquidity position at any time. We expect that these conditions would generally be of a short-term nature. Under such circumstances, we expect our reverse repurchase agreements and federal funds sold positions, or balances at the Federal Reserve Bank, if any, to serve as the primary source of immediate liquidity. We could draw on additional alternative immediate funding sources from lines of credit extended to us from our correspondent banks. The Bank may also access funds from borrowing facilities established with the Federal Home Loan Bank of Atlanta and the discount window of the Federal Reserve Bank of Atlanta. At December 31, 2023, the Bank had a total FHLB credit facility of $7.1 billion, with $100.0 million in short-term FHLB advances and $2.9 million FHLB letters of credit outstanding at year-end, leaving $7.0 billion in availability on the FHLB credit facility. At December 31, 2023, the Bank had $1.9 billion of credit available at the Federal Reserve Bank’s discount window and federal funds credit lines of $300.0 million with no balances outstanding at quarter-end. The Bank also has an internal limit on brokered deposits of 15% of total deposits, which would allow capacity of $5.6 billion at December 31, 2023. The Bank had $719.7 million of outstanding brokered deposits at the end of the year leaving $4.8 billion in available capacity as per the internal policy limit of 15% of total deposits. All of these resources would provide an additional $14.0 billion in funding if we needed additional liquidity. The Bank also has $3.5 billion in market value of unpledged securities at December 31, 2023 that can be pledged to attain additional funds if necessary. We can also consider actions such as deposit promotions to increase core deposits. The Company has a $100.0 million unsecured line of credit with U.S. Bank National Association with no balance outstanding at December 31, 2023. We believe that our liquidity position continues to be adequate and readily available.
Our contingency funding plan describes several potential stages based on stressed liquidity levels. Liquidity key risk indicators are reported to the Board of Directors on a quarterly basis. We maintain various wholesale sources of funding. If our deposit retention efforts were to be unsuccessful, we would use these alternative sources of funding. Under such circumstances, depending on the external source of funds, our interest cost would vary based on the range of interest rates charged. This could increase our cost of funds, impacting our net interest margin and net interest spread.
97
Asset-Liability Management and Market Risk Sensitivity
Our earnings and the economic value of equity vary in relation to the behavior of interest rates and the accompanying fluctuations in market prices of certain of our financial instruments. We define interest rate risk as the risk to earnings and equity arising from the behavior of interest rates. These behaviors include increases and decreases in interest rates as well as continuation of the current interest rate environment.
Our interest rate risk principally consists of reprice, option, basis, and yield curve risk. Reprice risk results from differences in the maturity or repricing characteristics of asset and liability portfolios. Option risk arises from embedded options in the investment and loan portfolios such as investment securities calls and loan prepayment options. Option risk also exists since deposit customers may withdraw funds at their discretion in response to general market conditions, competitive alternatives to existing accounts or other factors. The exercise of such options may result in higher costs or lower revenue. Basis risk refers to the potential for changes in the underlying relationship between market rates or indices, which subsequently result in narrowing spreads on interest-earning assets and interest-bearing liabilities. Basis risk also exists in administered rate liabilities, such as interest-bearing checking accounts, savings accounts, and money market accounts where the price sensitivity of such products may vary relative to general markets rates. Yield curve risk refers to adverse consequences of nonparallel shifts in the yield curves of various market indices that impact our assets and liabilities.
We use simulation analysis as a primary method to assess earnings at risk and equity at risk due to assumed changes in interest rates. Management uses the results of its various simulation analyses in combination with other data and observations to formulate strategies designed to maintain interest rate risk within risk tolerances.
Simulation analysis involves the use of several assumptions including, but not limited to, the timing of cash flows such as the terms of contractual agreements, investment security calls, loan prepayment speeds, deposit attrition rates, the interest rate sensitivity of loans and deposits relative to general market rates, and the behavior of interest rates and spreads. The assumptions for loan prepayments, deposit decay, and nonstable deposit balances are derived from models that use historical bank data. These models are independently validated. Equity at risk simulation uses assumptions regarding discount rates that value cash flows. Simulation analysis is highly dependent on model assumptions that may vary from actual outcomes. Key simulation assumptions are subject to sensitivity analysis to assess the impact of assumption changes on earnings at risk and equity at risk. Model assumptions are reviewed by our Assumptions Committee. While the Bank is continuously refining its modeling methodology, the core principles of the methodology have remained stable over the past two years.
Earnings at risk is defined as the percentage change in net interest income due to assumed changes in interest rates. Earnings at risk is generally used to assess interest rate risk over relatively short time horizons.
Equity at risk is defined as the percentage change in the net economic value of assets and liabilities due to changes in interest rates compared to a base net economic value. The discounted present value of all cash flows represents our economic value of equity. Equity at risk is generally considered a measure of the long-term interest rate exposures of the balance sheet at a point in time.
The earnings simulation models consider our contractual agreements with regard to investments, loans, deposits, borrowings, and derivatives as well as a number of behavioral assumptions applied to certain assets and liabilities.
Mortgage banking derivatives used in the ordinary course of business consist of forward sales contracts and interest rate lock commitments on residential mortgage loans. These derivatives involve underlying items, such as interest rates, and are designed to mitigate risk. Derivatives are also used to hedge mortgage servicing rights. For additional information see Note 28—Derivative Financial Instruments in the consolidated financial statements.
98
From time to time, we execute interest rate swaps to hedge some of our interest rate risks. Under these arrangements, the Company enters into a variable rate loan with a client in addition to a swap agreement. The swap agreement effectively converts the client’s variable rate loan into a fixed rate loan. The Company then enters into a matching swap agreement with a third-party dealer to offset its exposure on the customer swap. The Company may also execute interest rate swap agreements that are not specific to client loans. As of December 31, 2023, the Company had a series of short-term interest rate hedges to address monthly accrual mismatches related to the Company’s ARC program and its transition from LIBOR to SOFR after June 30, 2023. For additional information on these derivatives refer to Note 28—Derivative Financial Instruments in the consolidated financial statements.
Our interest rate risk key indicators are applied to a static balance sheet using forward rates from the Moody’s Baseline Scenario. The Company will also use other rate forecasts, including, but not limited to, Moody’s Consensus Scenario. This Base Case Scenario assumes the maturity composition of asset and liability rollover volumes is modeled to approximately replicate current consolidated balance sheet characteristics throughout the simulation. These treatments are consistent with the Company’s goal of assessing current interest rate risk embedded in its current balance sheet. The Base Case Scenario assumes that maturing or repricing assets and liabilities are replaced at prices referencing forward rates derived from the selected rate forecast consistent with current balance sheet pricing characteristics. Key rate drivers are used to price assets and liabilities with sensitivity assumptions used to price non-maturity deposits. The sensitivity assumptions for the pricing of non-maturity deposits are subjected to sensitivity analysis no less frequently than on an annual basis.
Interest rate shocks are applied to the Base Case on an instantaneous basis. Our policy establishes the use of upward and downward interest rate shocks applied in 100 basis point increments through 400 basis points. We calculate smaller rate shocks as needed. At times, market conditions may result in assumed rate movements that will be deemphasized. For example, during a period of ultra-low interest rates, certain downward rate shocks may be impractical. The model simulation results produced from the Base Case Scenario and related instantaneous shocks for changes in net interest income and changes in the economic value of equity are referred to as the Core Scenario Analysis and constitute the policy key risk indicators for interest rate risk when compared to risk tolerances. As of December 31, 2023, the Company was operating within it interest rate key risk indicator policy limits.
During 2023, the beta assumption applied to total deposits increased to reflect changes in deposit mix. From the beginning of the upward rate cycle, our deposit costs have increased from five basis points to one hundred sixty basis points. During this period, the federal funds rate has increased 525 basis points. Accordingly, our cycle to date beta has been approximately 30%. Management recognizes the difficulty using historical data to forecast deposit betas in the current environment. For internal purposes, and based on the deposit mix as of December 31, 2023, the total deposit beta assumption was 35.0%. For internal forecasting, Management will apply overlays to certain assumptions to adjust for current market conditions rather than use assumptions modeled over longer periods of time.
The following interest rate risk metrics are derived from analysis using the Moody’s Consensus Scenario published in January 2024 as the Base Case. As of December 31, 2023, the earnings simulations indicated that the year 1 impact of an instantaneous 100 basis point parallel increase / decrease in rates would result in an estimated 1.0% increase (up 100) and 1.7% decrease (down 100) in net interest income.
We use Economic Value of Equity (“EVE”) analysis as an indicator of the extent to which the present value of our capital could change, given potential changes in interest rates. This measure also assumes a static balance sheet (Base Case Scenario) with rate shocks applied as described above. At December 31, 2023, the percentage change in EVE due to a 100-basis point increase or decrease in interest rates was 2.6% decrease and 1.0% increase, respectively. The percentage changes in EVE due to a 200-basis point increase or decrease in interest rates were 6.3% decrease and 0.1% increase, respectively. The interest rate shock analysis results for EVE sensitivities are unusual as the benefits of repricing assets are mitigated by increasing deposit costs, and downward shocks are constrained on various balance sheet categories due to the inability to price products below floors or zero. This is particularly meaningful given the cost of deposits as of December 31, 2023.
99
The analysis below reflects a Base Case and shocked scenarios that assume a static balance sheet projection where volume is added to maintain balances consistent with current levels. Base Case assumes new and repricing volumes reference forward rates derived from the Moody’s Consensus rate forecast. Instantaneous, parallel, and sustained interest rate shocks are applied to the Base Case scenario over a one-year time horizon.
Table 26—Rate Shock Analysis – Net Interest Income and Economic Value of Equity
Percentage Change in Net Interest Income over One Year |
|
||
Up 100 basis points |
|
1.0% |
|
Up 200 basis points |
|
1.5% |
|
Up 300 basis points |
|
1.7% |
|
Up 400 basis points |
|
1.7% |
|
Down 100 basis points |
|
(1.7%) |
|
Down 200 basis points |
|
(4.5%) |
|
Down 300 basis points |
|
(8.8%) |
|
Down 400 basis points |
|
(11.8%) |
|
LIBOR Transition
The publication of all tenors of U.S. dollar LIBOR on a representative basis ceased as of December 31, 2023. As previously noted, we established a cross-functional LIBOR transition working group that (1) assessed the Company's exposure to LIBOR indexed instruments and the data, systems and processes that were impacted; (2) established a detailed implementation plan; and (3) developed a formal governance structure for the transition. The Company developed and implemented various proactive steps to facilitate the transition on behalf of customers up through December 31, 2023, which included:
| ● | The adoption and implementation of fallback provisions that provided for the determination of replacement rates for LIBOR-linked financial products. |
| ● | The adoption of new products linked to alternative reference rates, such as adjustable-rate mortgages, consistent with guidance provided by the U.S. regulators, the Alternative Reference Rates Committee, and GSEs. |
| ● | The selection of SOFR indices as the replacement indices, and successful completion of systems testing using the SOFR replacement indices. |
| ● | Successful transition of Libor-exposed instruments to SOFR and other indices as appropriate for contracts that provided for a specific replacement index other than SOFR. |
We utilized the provisions of the Adjustable Interest Rate (LIBOR) Act passed by Congress and signed into law by the President in March 2022 for certain contracts referencing LIBOR. The Act provides for the use of SOFR as the replacement index with a spread adjustment when the remaining LIBOR indices are discontinued. The Act applies when there is no contract provision addressing the loss of LIBOR and may be used otherwise as well, provided the contract does not provide for a specific replacement index.
In addition, the Company developed and implemented processes to educate client-facing associates and coordinate communications with customers regarding the transition.
As of December 31, 2023, the Company’s LIBOR-indexed loans, derivatives, and trust preferred securities have migrated to SOFR and other indices.
Asset Credit Risk and Concentrations
The quality of our interest-earning assets is maintained through our management of certain concentrations of credit risk. We review each individual earning asset including investment securities and loans for credit risk. To facilitate this review, we have established credit and investment policies that include credit limits, documentation, periodic examination, and follow-up. In addition, we examine these portfolios for exposure to concentration in any one industry, government agency, or geographic location.
100
Deposit Concentrations
At December 31, 2023 and 2022, we have no material concentration of deposits from any single customer or group of customers. We have no significant portion of our deposits concentrated within a single industry or group of related industries. We do not believe there are any material seasonal factors that would have a material adverse effect on us. The total deposit balances held by top 10 and 20 deposit holders were below 5% of the Company’s average total deposit balances at December 31, 2023 and 2022. We do not have any foreign deposits.
Concentration of Credit Risk
Each category of earning assets has a certain degree of credit risk. We use various techniques to measure credit risk. Credit risk in the investment portfolio can be measured through bond ratings published by independent agencies. In the investment securities portfolio, the investments consist of U.S. government-sponsored entity securities, tax-free securities, or other securities having ratings of “AAA” to “Not Rated”. All securities, with the exception of those that are not rated, were rated by at least one of the nationally recognized statistical rating organizations. The credit risk of the loan portfolio can be measured by historical experience. We maintain our loan portfolio in accordance with credit policies that we have established. Although the Bank has a diversified loan portfolio, a substantial portion of our borrowers’ abilities to honor their contracts is dependent upon economic conditions within our geographic footprint and the surrounding regions.
We consider concentrations of credit to exist when, pursuant to regulatory guidelines, the amounts loaned to a multiple number of borrowers engaged in similar business activities which would cause them to be similarly impacted by general economic conditions represents 25% of total Tier 1 capital plus regulatory adjusted allowance for credit losses of the Company, or $1.2 billion at December 31, 2023. Based on this criteria, we had eight such credit concentrations at December 31, 2023, including loans to lessors of nonresidential buildings (except mini-warehouses) of $6.2 billion, loans secured by owner occupied office buildings (including medical office buildings) of $1.9 billion, loans secured by owner occupied nonresidential buildings (excluding office buildings) of $1.8 billion, loans to lessors of residential buildings (investment properties and multi-family) of $2.4 billion, loans secured by 1st mortgage 1-4 family owner occupied residential property (including condos and home equity lines) of $8.8 billion, loans secured by jumbo (original loans greater than $726,200) 1st mortgage 1-4 family owner occupied residential property of $2.6 billion, loans secured by business assets including accounts receivable, inventory and equipment of $2.2 billion, and loans to consumers secured by non-real estate of $1.2 billion. The risk for these loans and for all loans is managed collectively through the use of credit underwriting practices developed and updated over time. The loss estimate for these loans is determined using our standard ACL methodology.
After the adoption of CECL in the first quarter of 2020, banking regulators established guidelines for calculating credit concentrations. Banking regulators set the guidelines for construction, land development and other land loans to total less than 100% of total Tier 1 capital less modified CECL transitional amount plus ACL (CDL concentration ratio) and for total commercial real estate loans (construction, land development and other land loans along with other non-owner occupied commercial real estate and multifamily loans) to total less than 300% of total Tier 1 capital less modified CECL transitional amount plus ACL (CRE concentration ratio). Both ratios are calculated by dividing certain types of loan balances for each of the two categories by the Bank’s total Tier 1 capital less modified CECL transitional amount plus ACL. At December 31, 2023, the Bank’s CDL concentration ratio was 59.7% and its CRE concentration ratio was 236.5%. At December 31, 2022, the Bank’s CDL concentration ratio was 64.8% and its CRE concentration ratio was 249.0%. As of December 31, 2023 and 2022, the Bank was below the established regulatory guidelines. When a bank’s ratios are in excess of one or both of these loan concentration ratios guidelines, banking regulators generally require an increased level of monitoring in these lending areas by bank management. Therefore, we monitor these two ratios as part of our concentration management processes.
101
Effect of Inflation and Changing Prices
The consolidated financial statements have been prepared in accordance with accounting principles generally accepted in the United States of America, which require the measure of financial position and results of operations in terms of historical dollars, without consideration of changes in the relative purchasing power over time due to inflation. Unlike most other industries, the majority of the assets and liabilities of a financial institution are monetary in nature. As a result, interest rates generally have a more significant effect on a financial institution’s performance than does the effect of inflation. Interest rates do not necessarily change in the same magnitude as the prices of goods and services.
While the effect of inflation on banks is normally not as significant as is its influence on those businesses which have large investments in plant and inventories, it does have an effect. During periods of high inflation, there are normally corresponding increases in money supply, and banks will normally experience above average growth in assets, loans and deposits. Also, general increases in the prices of goods and services will result in increased operating expenses. Inflation also affects our Bank’s customers and may result in an indirect effect on our Bank’s business.
Contractual Obligations
The following table presents payment schedules for certain of our contractual obligations as of December 31, 2023. Long-term debt obligations totaling $391.9 million include trust preferred junior subordinated debt and corporate subordinated debt. Operating and finance lease obligations of $126.6 million and $2.2 million, respectively, pertain to banking facilities. Certain lease agreements include payment of property taxes and insurance and contain various renewal options. Additional information regarding leases is contained in Note 21— Lease Commitments of the audited consolidated financial statements.
Table 27—Obligations
|
|
|
|
|
|
|
|
|
|
|
|
|
|
|
|
|
|
|
|
|
|
Less Than |
|
1 to 3 |
|
3 to 5 |
|
More Than |
|
||||
(Dollars in thousands) |
|
Total |
|
1 Year |
|
Years |
|
Years |
|
5 Years |
|
|||||
Long‑term debt obligations* |
|
$ |
391,904 |
|
$ |
— |
|
$ |
— |
|
$ |
— |
|
$ |
391,904 |
|
Short-term debt obligations* |
|
|
100,000 |
|
|
100,000 |
|
|
— |
|
|
— |
|
|
— |
|
Finance lease obligations |
|
|
2,239 |
|
|
511 |
|
|
1,022 |
|
|
706 |
|
|
— |
|
Operating lease obligations |
|
|
126,567 |
|
|
15,970 |
|
|
28,850 |
|
|
25,657 |
|
|
56,090 |
|
Total |
|
$ |
620,710 |
|
$ |
116,481 |
|
$ |
29,872 |
|
$ |
26,363 |
|
$ |
447,994 |
|
* Represents principal maturities.
Item 7A. Quantitative and Qualitative Disclosures about Market Risk.
See “Asset-Liability Management and Market Risk Sensitivity” on page 98 in Management’s Discussion and Analysis of Financial Condition and Results of Operations for quantitative and qualitative disclosures about market risk.
102
Item 8. Financial Statements and Supplementary Data.
Index to Financials Statements |
Page |
|
|
Management’s Report on Internal Control Over Financial Reporting |
|
Report of Independent Registered Public Accounting Firm (Ernst & Young LLP, Birmingham, Alabama, PCAOB Firm ID No. 42) |
|
SouthState Corporation Consolidated Financial Statements |
|
Consolidated Balance Sheets at December 31, 2023 and December 31, 2022 |
|
Consolidated Statements of Income for the Years Ended December 31, 2023, 2022 and 2021 |
|
Consolidated Statements of Cash Flows for the Years Ended December 31, 2023, 2022 and 2021 |
|
Item 9. Changes in and Disagreements with Accountants on Accounting and Financial Disclosure.
None.
Item 9A. Controls and Procedures.
Evaluation of Disclosure Controls and Procedures
SouthState’s management, with the participation of its Chief Executive Officer and Chief Financial Officer, has evaluated the effectiveness of the design and operation of SouthState’s disclosure controls and procedures as of December 31, 2023, in accordance with Rule 13a-15 of the Securities Exchange Act of 1934. We applied our judgment in the process of reviewing these controls and procedures, which, by their nature, can provide only reasonable assurance regarding our control objectives. Based upon that evaluation, our Chief Executive Officer and the Chief Financial Officer concluded that SouthState’s disclosure controls and procedures as of December 31, 2023, were effective to provide reasonable assurance regarding our control objectives.
Management’s Report on Internal Control over Financial Reporting is included on page F-1 of this Report. The report of SouthState’s independent registered public accounting firm regarding SouthState’s internal control over financial reporting begins on page F-2 of this Report.
Changes in Internal Controls
There were no changes in our internal controls over financial reporting that occurred during our most recent fiscal quarter that materially affected, or are reasonably likely to materially affect, our internal controls over financial reporting.
103
Management’s Report on Internal Controls over Financial Reporting
We are responsible for establishing and maintaining adequate internal control over financial reporting. Management’s assessment of the effectiveness of the Company’s internal control over financial reporting as of December 31, 2023 is included in Item 8 of this Report under the heading “Management’s Report on Internal Controls Over Financial Reporting.”
Our independent auditors have issued an audit report on management’s assessment of internal controls over financial reporting. This Report entitled “Report of Independent Registered Public Accounting Firm” appears in Item 8.
Item 9B. Other Information.
During the three months ended December 31, 2023, no directors or officers adopted or terminated a “Rule 10b5-1 trading arrangement” or a “non-Ruel 10b5-1 trading arrangement”, as each term is defined in Item 408(a) of Regulation S-K.
Item 9C. Disclosure Regarding Foreign Jurisdictions that Prevent Inspections.
None.
PART III
Item 10. Directors, Executive Officers and Corporate Governance.
The information required to be disclosed by this item will be disclosed in the Company’s definitive proxy statement to be filed no later than 120 days after December 31, 2023 and in connection with our 2024 Annual Meeting of Shareholders under the caption “Election of Directors,” under the caption “The Board of Directors and Committees,” in the subsection titled “Audit Committee” under the caption “The Board of Directors and Committees,” in the subsection titled “Governance Committee” under the caption “The Board of Directors and Committees,” and under the caption “Delinquent Section 16(a) Reports.” We incorporate such required information herein by reference.
Item 11. Executive Compensation.
The information required to be disclosed by this item will be disclosed in our definitive proxy statement to be filed no later than 120 days after December 31, 2023 and in connection with our 2024 Annual Meeting of Shareholders under the captions “Compensation Discussion and Analysis,” “Director Compensation,” and “Executive Compensation,” including the sections titled “Summary Compensation Table,” “Grants of Plan-Based Awards Table,” “Year-end Equity Values and Equity Exercised or Vested Table,” “Nonqualified Deferred Compensation Table,” “Pension Benefits Table,” and “Potential Payments Upon Termination or Change of Control.” We incorporate such required information herein by reference.
104
Item 12. Security Ownership of Certain Beneficial Owners and Management and Related Stockholder Matters.
The following table contains certain information as of December 31, 2023, relating to securities authorized for issuance under our equity compensation plans:
|
|
|
|
|
|
|
|
|
|
|
|
A |
|
B |
|
C |
|
||
|
|
|
|
|
|
|
Number of |
|
|
|
|
|
|
|
|
|
Securities |
|
|
|
|
|
|
|
|
|
remaining |
|
|
|
|
Number of |
|
|
|
|
available for |
|
|
|
|
securities to be |
|
Weighted- |
|
future issuance |
|
||
|
|
issued upon |
|
average exercise |
|
under equity |
|
||
|
|
exercise of |
|
price of |
|
Compensation |
|
||
|
|
Outstanding |
|
Outstanding |
|
plans (excluding |
|
||
|
|
options, |
|
options, |
|
Securities |
|
||
|
|
warrants, and |
|
warrants, and |
|
reflected in |
|
||
Plan Category |
|
Rights |
|
Rights |
|
column “A”) |
|
||
Equity compensation plans approved by security holders |
|
107,592 |
|
$ |
72.60 |
|
2,217,147 |
|
|
Equity compensation plans not approved by security holders |
|
None |
|
|
n/a |
|
n/a |
|
|
Included within the 2,217,147 number of securities available for future issuance in Column C of the table above are 914,169 shares remaining for future grant from the 2,072,245 of authorized shares under our 2020 Omnibus Incentive Plan and 1,302,978 shares remaining for future grant from the 1,763,825 of authorized shares under our 2002 Employee Stock Purchase Plan. Shares issued in respect of restricted stock and restricted stock units granted under the 2020 Omnibus Incentive Plan count as one share for every share/unit granted under the plan.
Other information required to be disclosed by this item will be disclosed under the captions “Stock Ownership of Directors, Executive Officers and Certain Beneficial Owners” in our definitive proxy statement to be filed no later than 120 days after December 31, 2023 and in connection with our 2024 Annual Meeting of Shareholders. We incorporate such required other information herein by reference.
Item 13. Certain Relationships and Related Transactions, and Director Independence.
The information required to be disclosed by this item will be disclosed under the caption “Certain Relationships and Related Transactions” in our definitive proxy statement to be filed no later than 120 days after December 31, 2023 and in connection with our 2024 Annual Meeting of Shareholders. We incorporate such required information herein by reference.
Item 14. Principal Accounting Fees and Services.
The information required to be disclosed by this item will be disclosed under the caption “Audit and Other Fees” in our definitive proxy statement to be filed no later than 120 days after December 31, 2023 and in connection with our 2024 Annual Meeting of Shareholders. We incorporate such required information herein by reference.
105
PART IV
Item 15. Exhibits, Financial Statement Schedules.
(a) |
1. The financial statements and independent auditors’ report referenced in “Item 8—Financial Statements and Supplementary Data” are listed below: |
SouthState Corporation and Subsidiaries
Report of Independent Registered Public Accounting Firm
Consolidated Balance Sheets
Consolidated Statements of Income
Consolidated Statements of Comprehensive Income (Loss)
Consolidated Statements of Changes in Shareholders’ Equity
Consolidated Statements of Cash Flows
Notes to Consolidated Financial Statements
2. |
Financial Schedules Filed: Not applicable. All of the schedules for which provision is made in the applicable accounting regulations of the SEC are either not required under the related instruction, the required information is contained elsewhere in the Form 10-K, or the schedules are inapplicable and therefore have been omitted. |
3. |
Exhibits |
In most cases, documents incorporated by reference to exhibits that have been filed with our reports or proxy statements under the Securities Exchange Act of 1934 are available to the public over the Internet from the SEC’s web site at www.sec.gov. You may also read and copy any such document at the SEC’s public reference room located at 100 F Street, N.E., Room 1580, Washington, D.C. 20549 under our SEC file number (001-12669).
|
|
|
|
|
|
|
|
|
|
|||
|---|---|---|---|---|---|---|---|---|---|---|---|---|
|
|
Incorporated by Reference |
||||||||||
Exhibit No. |
|
Description of Exhibit |
|
Form |
|
Commission File No. |
|
Exhibit |
|
Filing Date |
|
Filed Herewith |
2.1 |
|
|
8-K |
|
001-12669 |
|
2.1 |
|
7/26/2021 |
|
|
|
|
|
|
|
|
|
|
|
|
|
|
|
|
3.1 |
|
Amended and Restated Articles of Incorporation of the Company filed October 24, 2014 |
|
8-K |
|
001-12669 |
|
3.1 |
|
10/28/2014 |
|
|
|
|
|
|
|
|
|
|
|
|
|
|
|
3.2 |
|
|
8-K |
|
001-12669 |
|
3.1 |
|
10/26/2017 |
|
|
|
|
|
|
|
|
|
|
|
|
|
|
|
|
3.3 |
|
|
8-K |
|
001-12669 |
|
3.1 |
|
6/8/2020 |
|
|
|
|
|
|
|
|
|
|
|
|
|
|
|
|
3.4 |
|
|
S-8 |
|
001-12669 |
|
4.5 |
|
11/30/2020 |
|
|
|
|
|
|
|
|
|
|
|
|
|
|
||
3.5 |
|
|
8-K |
|
001-12669 |
|
3.1 |
|
9/3/2021 |
|
|
|
|
|
|
|
|
|
|
|
|
|
|
|
|
106
|
|
|
|
|
|
|
|
|
|
|||
|---|---|---|---|---|---|---|---|---|---|---|---|---|
|
|
Incorporated by Reference |
||||||||||
Exhibit No. |
|
Description of Exhibit |
|
Form |
|
Commission File No. |
|
Exhibit |
|
Filing Date |
|
Filed Herewith |
3.6 |
|
Amended and Restated Bylaws of SouthState Corporation dated February 24, 2022 |
|
8-K |
|
001-12669 |
|
3.1 |
|
2/24/2022 |
|
|
|
|
|
|
|
|
|
|
|
|
|
|
|
3.7 |
|
Amended and Restated Bylaws of SouthState Corporation dated May 26, 2022 |
|
8-K |
|
001-12669 |
|
3.1 |
|
5/31/2022 |
|
|
|
|
|
|
|
|
|
|
|
|
|
|
|
4.1 |
|
|
10-K |
|
001-12669 |
|
4.1 |
|
2/27/2015 |
|
|
|
|
|
|
|
|
|
|
|
|
|
|
||
4.2 |
|
|
|
|
001-12669 |
|
|
|
|
|
|
|
|
|
|
|
|
|
|
|
|
|
|
||
4.3 |
|
Bylaws (see Exhibit 3.7) |
|
|
|
001-12669 |
|
|
|
|
|
|
|
|
|
|
|
|
|
|
|
|
|
|
|
4.4 |
|
|
10-K |
|
001-12669 |
|
4.4 |
|
2/26/2021 |
|
|
|
|
|
|
|
|
|
|
|
|
|
|
|
|
4.5 |
|
|
8-K |
|
001-12669 |
|
4.1 |
|
6/8/2020 |
|
|
|
|
|
|
|
|
|
|
|
|
|
|
|
|
4.6 |
|
|
8-K |
|
001-12669 |
|
4.2 |
|
6/8/2020 |
|
|
|
|
|
|
|
|
|
|
|
|
|
|
|
|
4.7 |
|
|
8-K |
|
001-12669 |
|
4.3 |
|
6/8/2020 |
|
|
|
|
|
|
|
|
|
|
|
|
|
|
|
|
4.8 |
|
|
8-K |
|
001-37615 |
|
4.1 |
|
8/2/2020 |
|
|
|
|
|
|
|
|
|
|
|
|
|
|
|
|
4.9 |
|
Form of 5.50% Fixed-to-Floating Subordinated Note due 2030 of Atlantic Capital Bancshares, Inc. |
|
8-K |
|
001-37615 |
|
4.2 |
|
8/2/2020 |
|
|
|
|
|
|
|
|
|
|
|
|
|
|
|
4.10 |
|
|
8-K |
|
001-37615 |
|
10.1 |
|
8/2/2020 |
|
|
|
|
|
|
|
|
|
|
|
|
|
|
|
|
4.11 |
|
|
8-K |
|
001-37615 |
|
10.2 |
|
8/2/2020 |
|
|
|
|
|
|
|
|
|
|
|
|
|
|
|
|
10.1 |
|
|
DEF 14A |
|
001-12669 |
|
Appendix A |
|
3/12/2004 |
|
|
|
|
|
|
|
|
|
|
|
|
|
|
|
|
107
|
|
|
|
|
|
|
|
|
|
|||
|---|---|---|---|---|---|---|---|---|---|---|---|---|
|
|
Incorporated by Reference |
||||||||||
Exhibit No. |
|
Description of Exhibit |
|
Form |
|
Commission File No. |
|
Exhibit |
|
Filing Date |
|
Filed Herewith |
10.2 |
|
Form of Split-Dollar Agreement of CenterState Bank Corporation * |
|
8-K |
|
001-32017 |
|
10.1 |
|
1/11/2006 |
|
|
|
|
|
|
|
|
|
|
|
|
|
|
|
10.3 |
|
Employment Agreement between CenterState Bank Corporation and John C. Corbett * |
|
8-K |
|
001-32017 |
|
10.4 |
|
7/14/2010 |
|
|
|
|
|
|
|
|
|
|
|
|
|
|
|
10.4 |
|
|
8-K |
|
001-12669 |
|
10.1 |
|
12/6/2010 |
|
|
|
|
|
|
|
|
|
|
|
|
|
|
|
|
10.5 |
|
Employment Agreement between CenterState Bank Corporation and Stephen D. Young * |
|
10-K |
|
001-32017 |
|
10.10 |
|
3/16/2011 |
|
|
|
|
|
|
|
|
|
|
|
|
|
|
|
|
|
|
|
|
|
|
|
|
|
|
||
10.6 |
|
Form of Stock Option Agreement under the SouthState Corporation Omnibus Stock and Performance Plan * |
|
8-K |
|
001-12669 |
|
10.2 |
|
1/22/2013 |
|
|
|
|
|
|
|
|
|
|
|
|
|
|
|
10.7 |
|
|
8-K |
|
001-36878 |
|
10.1A |
|
12/22/2015 |
|
|
|
|
|
|
|
|
|
|
|
|
|
|
|
|
10.8 |
|
|
8-K |
|
001-36878 |
|
10.2A |
|
12/22/2015 |
|
|
|
|
|
|
|
|
|
|
|
|
|
|
|
|
10.9 |
|
|
8-K |
|
001-36878 |
|
10.1B |
|
12/22/2015 |
|
|
|
|
|
|
|
|
|
|
|
|
|
|
|
|
10.10 |
|
|
8-K |
|
001-36878 |
|
10.2B |
|
12/22/2015 |
|
|
|
|
|
|
|
|
|
|
|
|
|
|
|
|
10.11 |
|
|
DEF 14A |
|
001-12669 |
|
Appendix A |
|
3/6/2017 |
|
|
|
|
|
|
|
|
|
|
|
|
|
|
|
|
10.12 |
|
|
S-8 |
|
000-32017 |
|
10.1 |
|
5/1/2017 |
|
|
|
|
|
|
|
|
|
|
|
|
|
|
|
|
10.13 |
|
HCBF Holding Company, Inc. Amended and Restated 2010 Stock Incentive Plan * |
|
S-8 |
|
000-32017 |
|
10.1 |
|
1/2/2018 |
|
|
|
|
|
|
|
|
|
|
|
|
|
|
|
10.14 |
|
|
8-K |
|
001-12669 |
|
10.1 |
|
3/27/2018 |
|
|
|
|
|
|
|
|
|
|
|
|
|
|
|
|
10.15 |
|
|
8-K |
|
001-36878 |
|
10.1A |
|
9/17/2018 |
|
|
|
108
|
|
|
|
|
|
|
|
|
|
|||
|---|---|---|---|---|---|---|---|---|---|---|---|---|
|
|
Incorporated by Reference |
||||||||||
Exhibit No. |
|
Description of Exhibit |
|
Form |
|
Commission File No. |
|
Exhibit |
|
Filing Date |
|
Filed Herewith |
10.16 |
|
|
8-K |
|
001-36878 |
|
10.2A |
|
9/17/2018 |
|
|
|
|
|
|
|
|
|
|
|
|
|
|
|
|
10.17 |
|
|
8-K |
|
001-36878 |
|
10.1B |
|
9/17/2018 |
|
|
|
|
|
|
|
|
|
|
|
|
|
|
|
|
10.18 |
|
|
8-K |
|
001-36878 |
|
10.2B |
|
9/17/2018 |
|
|
|
|
|
|
|
|
|
|
|
|
|
|
|
|
10.19 |
|
Employment Agreement between CenterState Bank Corporation and Richard Murray IV * |
|
8-K |
|
000-32017 |
|
10.1 |
|
11/26/2018 |
|
|
|
|
|
|
|
|
|
|
|
|
|
|
|
10.20 |
|
Employment Agreement between CenterState Bank Corporation and William E. Matthews V * |
|
8-K |
|
000-32017 |
|
10.2 |
|
11/26/2018 |
|
|
|
|
|
|
|
|
|
|
|
|
|
|
|
|
|
|
|
|
|
|
|
|
|
|
|
|
10.21 |
|
|
8-K |
|
001-36878 |
|
10.1A |
|
12/18/2018 |
|
|
|
|
|
|
|
|
|
|
|
|
|
|
|
|
10.22 |
|
|
8-K |
|
001-36878 |
|
10.1B |
|
12/18/2018 |
|
|
|
|
|
|
|
|
|
|
|
|
|
|
|
|
10.23 |
|
|
8-K |
|
001-36878 |
|
10.2A |
|
12/18/2018 |
|
|
|
|
|
|
|
|
|
|
|
|
|
|
|
|
10.24 |
|
|
8-K |
|
001-36878 |
|
10.2B |
|
12/18/2018 |
|
|
|
|
|
|
|
|
|
|
|
|
|
|
|
|
10.25 |
|
|
8-K |
|
001-36878 |
|
10.1C |
|
12/18/2018 |
|
|
|
|
|
|
|
|
|
|
|
|
|
|
|
|
10.26 |
|
|
8-K |
|
001-36878 |
|
10.1D |
|
12/18/2018 |
|
|
|
|
|
|
|
|
|
|
|
|
|
|
|
|
10.27 |
|
|
8-K |
|
001-36878 |
|
10.2C |
|
12/18/2018 |
|
|
|
109
|
|
|
|
|
|
|
|
|
|
|||
|---|---|---|---|---|---|---|---|---|---|---|---|---|
|
|
Incorporated by Reference |
||||||||||
Exhibit No. |
|
Description of Exhibit |
|
Form |
|
Commission File No. |
|
Exhibit |
|
Filing Date |
|
Filed Herewith |
10.28 |
|
|
8-K |
|
001-36878 |
|
10.2D |
|
12/18/2018 |
|
|
|
|
|
|
|
|
|
|
|
|
|
|
|
|
10.29 |
|
|
10-K |
|
001-12669 |
|
10.17 |
|
2/22/2019 |
|
|
|
|
|
|
|
|
|
|
|
|
|
|
|
|
10.30 |
|
|
DEF 14A |
|
001-12669 |
|
Appendix A |
|
3/6/2019 |
|
|
|
|
|
|
|
|
|
|
|
|
|
|
|
|
10.31 |
|
|
S-8 POS |
|
000-32017 |
|
10.10 |
|
4/1/2019 |
|
|
|
|
|
|
|
|
|
|
|
|
|
|
|
|
10.32 |
|
|
S-8 POS |
|
000-32017 |
|
10.12 |
|
4/1/2019 |
|
|
|
|
|
|
|
|
|
|
|
|
|
|
|
|
10.33 |
|
|
S-8 POS |
|
000-32017 |
|
10.4 |
|
4/1/2019 |
|
|
|
|
|
|
|
|
|
|
|
|
|
|
|
|
10.34 |
|
|
S-8 POS |
|
000-32017 |
|
10.7 |
|
4/1/2019 |
|
|
|
|
|
|
|
|
|
|
|
|
|
|
|
|
10.35 |
|
|
8-K |
|
001-12669 |
|
10.1 |
|
5/1/2019 |
|
|
|
|
|
|
|
|
|
|
|
|
|
|
|
|
|
|
|
|
|
|
|
|
|
|
|
|
|
10.36 |
|
|
8-K |
|
001-12669 |
|
10.2 |
|
5/1/2019 |
|
|
|
|
|
|
|
|
|
|
|
|
|
|
|
|
10.37 |
|
|
8-K |
|
001-12669 |
|
10.3 |
|
5/1/2019 |
|
|
|
|
|
|
|
|
|
|
|
|
|
|
|
|
10.38 |
|
|
10-K |
|
001-12669 |
|
10.29 |
|
2/21/2020 |
|
|
|
|
|
|
|
|
|
|
|
|
|
|
|
|
110
|
|
|
|
|
|
|
|
|
|
|||
|---|---|---|---|---|---|---|---|---|---|---|---|---|
|
|
Incorporated by Reference |
||||||||||
Exhibit No. |
|
Description of Exhibit |
|
Form |
|
Commission File No. |
|
Exhibit |
|
Filing Date |
|
Filed Herewith |
10.39 |
|
Employment Agreement between SouthState Bank and for Renee R. Brooks dated January 25, 2020 * |
|
10-K |
|
001-12669 |
|
10.31 |
|
2/21/2020 |
|
|
|
|
|
|
|
|
|
|
|
|
|
|
|
10.40 |
|
Employment Agreement between SouthState Bank and Greg A. Lapointe dated January 25, 2020 * |
|
10-K/A |
|
001-12669 |
|
10.32 |
|
3/6/2020 |
|
|
|
|
|
|
|
|
|
|
|
|
|
|
|
10.41 |
|
Employment Agreement between SouthState Bank and John S. Goettee dated January 25, 2020 * |
|
10-K/A |
|
001-12669 |
|
10.33 |
|
3/6/2020 |
|
|
|
|
|
|
|
|
|
|
|
|
|
|
|
10.42 |
|
Employment Agreement between South State Bank and Jonathan Kivett, dated January 25, 2020 * |
|
10-K/A |
|
001-12669 |
|
10.34 |
|
3/6/2020 |
|
|
|
|
|
|
|
|
|
|
|
|
|
|
|
10.43 |
|
|
8-K |
|
001-12669 |
|
10.3 |
|
3/1/2022 |
|
|
|
|
|
|
|
|
|
|
|
|
|
|
|
|
10.44 |
|
|
8-K |
|
001-12669 |
|
10.4 |
|
3/1/2022 |
|
|
|
|
|
|
|
|
|
|
|
|
|
|
|
|
10.45 |
|
Employment Agreement dated July 22, 2021, by and among SouthState Bank, N.A. and Kurt A. Shreiner * |
|
8-K |
|
001-12669 |
|
10.5 |
|
3/1/2022 |
|
|
|
|
|
|
|
|
|
|
|
|
|
|
|
10.46 |
|
|
10-Q |
|
001-12669 |
|
10.1 |
|
08/05/2022 |
|
|
|
|
|
|
|
|
|
|
|
|
|
|
|
|
|
|
|
|
|
|
|
|
|
|
|
|
|
10.47 |
|
Separation Agreement between SouthState Corporation and its Subsidiaries and Robert R. Hill, Jr. * |
|
10-Q |
|
001-12669 |
|
10.1 |
|
05/05/2023 |
|
|
|
|
|
|
|
|
|
|
|
|
|
|
|
10.48 |
|
|
S-8 |
|
001-12669 |
|
4.7 |
|
6/9/2020 |
|
|
|
|
|
|
|
|
|
|
|
|
|
|
|
|
10.49 |
|
|
S-8 |
|
001-12669 |
|
4.11 |
|
6/9/2020 |
|
|
|
|
|
|
|
|
|
|
|
|
|
|
|
|
10.50 |
|
|
S-8 |
|
001-12669 |
|
4.4 |
|
8/3/2020 |
|
|
|
|
|
|
|
|
|
|
|
|
|
|
|
|
10.51 |
|
|
DEF 14A |
|
001-12669 |
|
Annex C |
|
8/12/2020 |
|
|
|
|
|
|
|
|
|
|
|
|
|
|
|
|
10.52 |
|
SouthState Corporation Non-Employee Directors Deferred Income Plan * |
|
S-8 |
|
001-12669 |
|
4.6 |
|
9/30/2020 |
|
|
|
|
|
|
|
|
|
|
|
|
|
|
|
111
|
|
|
|
|
|
|
|
|
|
|||
|---|---|---|---|---|---|---|---|---|---|---|---|---|
|
|
Incorporated by Reference |
||||||||||
Exhibit No. |
|
Description of Exhibit |
|
Form |
|
Commission File No. |
|
Exhibit |
|
Filing Date |
|
Filed Herewith |
10.53 |
|
Form of Stock Option Agreement under the |
|
10-K |
|
001-12669 |
|
10.47 |
|
2/26/2021 |
|
|
|
|
|
|
|
|
|
|
|
|
|
|
|
10.54 |
|
|
10-Q |
|
001-12669 |
|
10.1 |
|
5/7/2021 |
|
|
|
|
|
|
|
|
|
|
|
|
|
|
|
|
10.55 |
|
|
10-Q |
|
001-12669 |
|
10.2 |
|
5/7/2021 |
|
|
|
|
|
|
|
|
|
|
|
|
|
|
|
|
10.56 |
|
SouthState Corporation 2002 Employee Stock Purchase Plan (Amended and Restated) * |
|
10-K |
|
001-12669 |
|
10.49 |
|
2/25/2022 |
|
|
|
|
|
|
|
|
|
|
|
|
|
|
|
10.57 |
|
|
S-8 |
|
001-12669 |
|
99.1 |
|
3/1/2022 |
|
|
|
|
|
|
|
|
|
|
|
|
|
|
|
|
10.58 |
|
Form of Performance Share Unit Agreement (Annual Incentive Plan) |
|
|
|
001-12699 |
|
|
|
|
|
X |
|
|
|
|
|
|
|
|
|
|
|
|
|
10.59 |
|
|
8-K |
|
001-12669 |
|
10.1 |
|
11/16/2021 |
|
|
|
|
|
|
|
|
|
|
|
|
|
|
|
|
10.60 |
|
|
10-K |
|
001-12699 |
|
10.57 |
|
2/24/2023 |
|
|
|
|
|
|
|
|
|
|
|
|
|
|
|
|
10.61 |
|
|
|
|
001-12699 |
|
|
|
|
|
X |
|
|
|
|
|
|
|
|
|
|
|
|
|
|
21 |
|
|
|
|
|
|
|
|
|
|
X |
|
|
|
|
|
|
|
|
|
|
|
|
||
23.1 |
|
|
|
|
|
|
|
|
|
|
X |
|
|
|
|
|
|
|
|
|
|
|
|
||
23.2 |
|
|
|
|
|
|
|
|
|
|
X |
|
|
|
|
|
|
|
|
|
|
|
|
|
|
24.1 |
|
Power of Attorney (contained herein as part of Annual Report on Form 10-K) |
|
|
|
|
|
|
|
|
|
X |
|
|
|
|
|
|
|
|
|
|
|
||
112
|
|
|
|
|
|
|
|
|
|
|||
|---|---|---|---|---|---|---|---|---|---|---|---|---|
|
|
Incorporated by Reference |
||||||||||
Exhibit No. |
|
Description of Exhibit |
|
Form |
|
Commission File No. |
|
Exhibit |
|
Filing Date |
|
Filed Herewith |
31.1 |
|
Rule 13a-14(a) Certification of the Principal Executive Officer |
|
|
|
|
|
|
|
|
|
X |
|
|
|
|
|
|
|
|
|
|
|
||
31.2 |
|
Rule 13a-14(a) Certification of the Principal Financial Officer |
|
|
|
|
|
|
|
|
|
X |
|
|
|
|
|
|
|
|
|
|
|
||
32 |
|
|
|
|
|
|
|
|
|
|
X |
|
|
|
|
|
|
|
|
|
|
|
|
|
|
97.1 |
|
|
|
|
|
|
|
|
|
|
X |
|
|
|
|
|
|
|
|
|
|
|
|
|
|
101 |
|
The following financial statements from the Annual Report on Form 10-K of SouthState Corporation, formatted in inline eXtensible Business Reporting Language (iXBRL): (i) Consolidated Balance Sheets as of December 31, 2023 and 2022, (ii) Consolidated Statements of Income for the years ended December 31, 2023, 2022 and 2021, (iii) Consolidated Statements of Comprehensive Income for the years ended December 31, 2023, 2022 and 2021, (iv) Consolidated Statements of Changes in Shareholders’ Equity and Comprehensive Income for the years ended December 31, 2023, 2022 and 2021, (v) Consolidated Statement of Cash Flows for the years ended December 31, 2023, 2022 and 2021 and (vi) Notes to Consolidated Financial Statements. |
|
|
|
|
|
|
|
|
|
X |
|
|
|
|
|
|
|
|
|
|
|
|
|
104 |
|
Cover Page Interactive Data File (embedded within the Inline XBRL document). |
|
|
|
|
|
|
|
|
|
X |
† |
Pursuant to Item 601(b)(2) of Regulation S-K, certain schedules and similar attachments have been omitted. The registrant hereby agrees to furnish a copy of any omitted schedule or similar attachment to the Securities and Exchange Commission upon request. |
* Denotes a management compensatory plan or arrangement.
| (b) | Not Applicable. |
SouthState Corporation and certain of its consolidated subsidiaries are parties to long-term debt instruments with respect to trust preferred securities under which the total amount of securities authorized does not exceed 10% of the total assets of SouthState Corporation and its subsidiaries on a consolidated basis. Pursuant to paragraph (b)(4)(iii)(A) of Item 601 of Regulation S-K, SouthState Corporation agrees to furnish a copy of such instruments to the Securities and Exchange Commission upon request.
113
SIGNATURES
Pursuant to the requirements of Section 13 or 15(d) of the Securities Exchange Act of 1934, the Registrant has duly caused this Report to be signed on its behalf by the undersigned, thereunto duly authorized, in the City of Winter Haven, State of Florida, on the 4th day of March 2024.
|
SouthState Corporation |
|
|
|
|
|
|
|
|
By: |
/s/ John c. Corbett |
|
|
John C. Corbett |
|
Chief Executive Officer |
|
KNOW ALL MEN BY THESE PRESENTS, that each person whose signature appears below constitutes and appoints John C. Corbett, his true and lawful attorney in fact and agent, with full power of substitution and resubstitution, for him and in his name, place and stead, in any and all capacities, to sign any and all amendments to this Annual Report on Form 10 K, and to file the same, with all exhibits thereto, and other documents in connection therewith, with the Securities and Exchange Commission, granting unto attorney in fact and agent full power and authority to do and perform each and every act and thing requisite or necessary to be done in and about the premises, as fully to all intents and purposes as he might or could do in person, hereby ratifying and confirming all that attorney in fact and agent, or his substitute or substitutes, may lawfully do or cause to be done by virtue hereof.
Pursuant to the requirements of Section 13 or 15(d) of the Securities Exchange Act of 1934, this Report has been signed below by the following persons in the capacities indicated.
|
|
|||
|---|---|---|---|---|
Signature |
|
Title |
|
Date |
/s/ John C. Corbett |
|
|
|
|
John C. Corbett |
|
Chief Executive Officer and Director |
|
March 4, 2024 |
|
|
|
|
|
/s/ William E. Matthews, v |
|
Senior Executive Vice President, |
|
|
William E. Matthews, V |
|
Chief Financial Officer |
|
March 4, 2024 |
|
|
|
|
|
/s/ Sara G. Arana |
|
Executive Vice President and Principal |
|
|
Sara G. Arana |
|
Accounting Officer |
|
March 4, 2024 |
|
|
|
|
|
/s/ Douglas J. Hertz |
|
|
|
|
Douglas J. Hertz |
|
Independent Chairman of the Board of Directors |
|
March 4, 2024 |
|
|
|
|
|
/s/ Ronald M. Cofield, Sr. |
|
|
|
|
Ronald M. Cofield, Sr. |
|
Director |
|
March 4, 2024 |
|
|
|
|
|
/s/ Shantella E. Cooper |
|
|
|
|
Shantella E. Cooper |
|
Director |
|
March 4, 2024 |
|
|
|
|
|
/s/ Jean E. Davis |
|
|
|
|
Jean E. Davis |
|
Director |
|
March 4, 2024 |
|
|
|
|
|
/s/ Martin B. Davis |
|
|
|
|
Martin B. Davis |
|
Director |
|
March 4, 2024 |
|
|
|
|
|
|
|
|
|
|
|
|
|
|
|
114
|
|
|||
|---|---|---|---|---|
Signature |
|
Title |
|
Date |
|
|
|
|
|
/s/ G. Ruffner Page, Jr. |
|
|
|
|
G. Ruffner Page, Jr. |
|
Director |
|
March 4, 2024 |
|
|
|
|
|
/s/ William Knox Pou, Jr. |
|
|
|
|
William Knox Pou, Jr. |
|
Director |
|
March 4, 2024 |
|
|
|
|
|
/s/ James W. Roquemore |
|
|
|
|
James W. Roquemore |
|
Director |
|
March 4, 2024 |
|
|
|
|
|
/s/ David G. Salyers |
|
|
|
|
David G. Salyers |
|
Director |
|
March 4, 2024 |
|
|
|
|
|
/s/ Joshua A. Snively |
|
|
|
|
Joshua A. Snively |
|
Director |
|
March 4, 2024 |
115
MANAGEMENT’S REPORT ON INTERNAL CONTROL OVER FINANCIAL REPORTING
Management of SouthState Corporation (the “Company”) is responsible for establishing and maintaining adequate internal control over financial reporting. Management has assessed the effectiveness of internal control over financial reporting using the criteria established in Internal Control—Integrated Framework (2013) issued by the Committee of Sponsoring Organizations of the Treadway Commission (COSO).
The Company’s internal control over financial reporting is a process designed to provide reasonable assurance regarding the reliability of financial reporting and the preparation of financial statements for external purposes in accordance with generally accepted accounting principles. The Company’s internal control over financial reporting includes those policies and procedures that (1) pertain to the maintenance of records that, in reasonable detail, accurately and fairly reflect the transactions and dispositions of the assets of the Company; (2) provide reasonable assurance that transactions are recorded as necessary to permit preparation of financial statements in accordance with generally accepted accounting principles, and that receipts and expenditures of the Company are being made only in accordance with authorizations of management and directors of the Company; and (3) provide reasonable assurance regarding prevention or timely detection of unauthorized acquisitions, use, or disposition of the Company’s assets that could have a material effect on the financial statements.
Because of its inherent limitations, internal control over financial reporting may not prevent or detect misstatements. Therefore, even those systems determined to be effective can provide only reasonable assurance with respect to financial statement preparation and presentation. Also, projections of any evaluation of effectiveness to future periods are subject to the risk that controls may become inadequate because of changes in conditions, or that the degree of compliance with the policies or procedures may deteriorate.
Based on the testing performed using the criteria established in Internal Control—Integrated Framework (2013) issued by the Committee of Sponsoring Organizations of the Treadway Commission (COSO), management of the Company believes that the Company’s internal control over financial reporting was effective as of December 31, 2023.
The effectiveness of our internal control over financial reporting as of December 31, 2023, has been audited by Ernst & Young LLP, an independent registered public accounting firm, as stated in their report which is included herein.
/s/ SouthState Corporation
Winter Haven, Florida
March 4, 2024
www.SouthStateBank.com
(863) 293-4710 | Winter Haven, Florida | 33880
F-1
Report of Independent Registered Public Accounting Firm
To the Shareholders and the Board of Directors of SouthState Corporation
Opinion on Internal Control Over Financial Reporting
We have audited SouthState Corporation and subsidiaries internal control over financial reporting as of December 31, 2023, based on criteria established in Internal Control—Integrated Framework issued by the Committee of Sponsoring Organizations of the Treadway Commission (2013 framework) (the COSO criteria). In our opinion, SouthState Corporation and subsidiaries (the Company) maintained, in all material respects, effective internal control over financial reporting as of December 31, 2023, based on the COSO criteria.
We also have audited, in accordance with the standards of the Public Company Accounting Oversight Board (United States) (PCAOB), the consolidated balance sheet of the Company as of December 31, 2023, the related consolidated statements of income, comprehensive income (loss), changes in shareholders’ equity and cash flows for the year ended December 31, 2023, and the related notes and our report dated March 4, 2024 expressed an unqualified opinion thereon.
Basis for Opinion
The Company’s management is responsible for maintaining effective internal control over financial reporting and for its assessment of the effectiveness of internal control over financial reporting included in the accompanying Management’s Report on Internal Control over Financial Reporting. Our responsibility is to express an opinion on the Company’s internal control over financial reporting based on our audit. We are a public accounting firm registered with the PCAOB and are required to be independent with respect to the Company in accordance with the U.S. federal securities laws and the applicable rules and regulations of the Securities and Exchange Commission and the PCAOB.
We conducted our audit in accordance with the standards of the PCAOB. Those standards require that we plan and perform the audit to obtain reasonable assurance about whether effective internal control over financial reporting was maintained in all material respects.
Our audit included obtaining an understanding of internal control over financial reporting, assessing the risk that a material weakness exists, testing and evaluating the design and operating effectiveness of internal control based on the assessed risk, and performing such other procedures as we considered necessary in the circumstances. We believe that our audit provides a reasonable basis for our opinion.
Definition and Limitations of Internal Control Over Financial Reporting
A company’s internal control over financial reporting is a process designed to provide reasonable assurance regarding the reliability of financial reporting and the preparation of financial statements for external purposes in accordance with generally accepted accounting principles. A company’s internal control over financial reporting includes those policies and procedures that (1) pertain to the maintenance of records that, in reasonable detail, accurately and fairly reflect the transactions and dispositions of the assets of the company; (2) provide reasonable assurance that transactions are recorded as necessary to permit preparation of financial statements in accordance with generally accepted accounting principles, and that receipts and expenditures of the company are being made only in accordance with authorizations of management and directors of the company; and (3) provide reasonable assurance regarding prevention or timely detection of unauthorized acquisition, use, or disposition of the company’s assets that could have a material effect on the financial statements.
Because of its inherent limitations, internal control over financial reporting may not prevent or detect misstatements. Also, projections of any evaluation of effectiveness to future periods are subject to the risk that controls may become inadequate because of changes in conditions, or that the degree of compliance with the policies or procedures may deteriorate.
/s/ Ernst & Young LLP
Birmingham, Alabama
March 4, 2024
F-2
Report of Independent Registered Public Accounting Firm
To the Shareholders and the Board of Directors of SouthState Corporation
Opinion on the Financial Statements
We have audited the accompanying consolidated balance sheet of SouthState Corporation and subsidiaries (the Company) as of December 31, 2023, the related consolidated statements of income, comprehensive income (loss), changes in shareholders' equity and cash flows for the year ended December 31, 2023, and the related notes (collectively referred to as the “consolidated financial statements”). In our opinion, the consolidated financial statements present fairly, in all material respects, the financial position of the Company at December 31, 2023 and the results of its operations and its cash flows for the year ended December 31, 2023, in conformity with U.S. generally accepted accounting principles.
We also have audited, in accordance with the standards of the Public Company Accounting Oversight Board (United States) (PCAOB), the Company's internal control over financial reporting as of December 31, 2023, based on criteria established in Internal Control-Integrated Framework issued by the Committee of Sponsoring Organizations of the Treadway Commission (2013 framework) and our report dated March 4, 2024 expressed an unqualified opinion thereon.
Basis for Opinion
These financial statements are the responsibility of the Company's management. Our responsibility is to express an opinion on the Company’s financial statements based on our audits. We are a public accounting firm registered with the PCAOB and are required to be independent with respect to the Company in accordance with the U.S. federal securities laws and the applicable rules and regulations of the Securities and Exchange Commission and the PCAOB.
We conducted our audits in accordance with the standards of the PCAOB. Those standards require that we plan and perform the audit to obtain reasonable assurance about whether the financial statements are free of material misstatement, whether due to error or fraud. Our audits included performing procedures to assess the risks of material misstatement of the financial statements, whether due to error or fraud, and performing procedures that respond to those risks. Such procedures included examining, on a test basis, evidence regarding the amounts and disclosures in the financial statements. Our audits also included evaluating the accounting principles used and significant estimates made by management, as well as evaluating the overall presentation of the financial statements. We believe that our audits provide a reasonable basis for our opinion.
Critical Audit Matter
The critical audit matter communicated below is a matter arising from the current period audit of the financial statements that was communicated or required to be communicated to the audit committee and that: (1) relates to accounts or disclosures that are material to the financial statements and (2) involved our especially challenging, subjective, or complex judgments. The communication of the critical audit matter does not alter in any way our opinion on the consolidated financial statements, taken as a whole, and we are not, by communicating the critical audit matter below, providing a separate opinion on the critical audit matter or on the accounts or disclosures to which it relates.
|
Allowance for credit losses |
Description of the Matter |
As of December 31, 2023, the Company’s loan portfolio was $32.4 billion and the associated allowance for credit losses (“ACL”), inclusive of the reserve for unfunded commitments, was $512.9 million. As described in Notes 1 and 5 to the consolidated financial statements, the Company’s ACL recorded on the balance sheet reflects management’s best estimate of the portion of the amortized cost of loans and unfunded commitments that it does not expect to collect. Management considers the effects of past events, current conditions, and reasonable and supportable forecasts on the collectability of the loan portfolio. The ACL is measured on a collective pool basis when similar risk characteristics exist, and the Discounted Cash Flow method (“DCF”) is utilized and aggregated at the pool level. A probability of default (PD) and absolute loss given default (LGD) are applied to a projective model of the loan’s cash flow while considering prepayment and principal curtailment effects. The Company’s assumptions for PD and LGD are determined by the historical default and loss experience of the Company and adjusted for expected economic conditions and the Company’s prepayment and curtailment rates. Management considers the need to qualitatively adjust expected credit losses for information not already captured in the loss estimation model. |
F-3
|
Auditing management’s ACL estimate and related provision for credit losses involved a high degree of complexity and the need for involvement of professionals with specialized skills and knowledge in evaluating the expected loss forecasting models and subjectivity in evaluating management’s selection and weighting of economic forecast scenarios used during the reasonable and supportable period and the qualitative factors. |
|
|
|
How We Addressed the Matter in Our Audit |
We obtained an understanding, evaluated the design and tested the operating effectiveness of the Company’s internal controls over establishing the ACL, including, controls that address: 1) the governance of the credit loss methodology, including management’s review and approval of the ACL; 2) the completeness and accuracy of key inputs and assumptions used in the models; 3) the selection and challenge of the economic forecasts, including the selected weightings of the economic forecasts applied by management; 4) the identification and measurement of qualitative factors, among others. With respect to expected loss forecasting models, with the support of EY specialists, we evaluated the conceptual soundness of the model methodology and recalculated the model output. We also tested the appropriateness of key inputs and assumptions used in these models by agreeing a sample of inputs to supporting documentation. Regarding the reasonable and supportable economic forecasts used in the models, we evaluated the reasonableness of management’s selection and weighting of the forecasts scenarios used, tested the completeness and accuracy of data used in the forecast to supporting documentation and searched for and evaluated information that corroborated or contradicted the forecast. Regarding measurement of the qualitative factors, we evaluated the methodology applied and data utilized by management to estimate the appropriate level of the qualitative factors. We also considered if qualitative adjustments were consistent with external macroeconomic factors and current credit metrics. We evaluated the overall ACL amount, including model estimates and qualitative factor adjustments, and whether the recorded ACL appropriately reflects expected credit losses on the loan portfolio and unfunded credit commitments. We considered overall trends in credit quality, historical loss statistics, peer-bank information, subsequent events and determined whether they corroborate or contradict the Company’s measurement of the ACL. |
/s/ Ernst & Young LLP
We have served as the Company’s auditor since 2023.
Birmingham, Alabama
March 4, 2024
F-4
Report of Independent Registered Public Accounting Firm
Shareholders and the Board of Directors
SouthState Corporation
Opinion on the Consolidated Financial Statements
We have audited the accompanying consolidated balance sheet of SouthState Corporation and Subsidiaries (the “Company”) as of December 31, 2022, the related consolidated statements of income, comprehensive income (loss), changes in shareholders’ equity, and cash flows for each of the years in the two-year period ended December 31, 2022, and the related notes (collectively referred to as the “financial statements”). In our opinion, the financial statements referred to above present fairly, in all material respects, the financial position of the Company as of December 31, 2022, and the results of their operations and their cash flows for each of the years in the two-year period ended December 31, 2022, in conformity with accounting principles generally accepted in the United States of America.
Basis for Opinion
These financial statements are the responsibility of the Company’s management. Our responsibility is to express an opinion on the Company’s financial statements based on our audits.
We are a public accounting firm registered with the PCAOB and are required to be independent with respect to the Company in accordance with the U.S. federal securities laws and the applicable rules and regulations of the Securities and Exchange Commission and the PCAOB.
We conducted our audits in accordance with the standards of the PCAOB. Those standards require that we plan and perform the audits to obtain reasonable assurance about whether the financial statements are free of material misstatement, whether due to error or fraud.
Our audits included performing procedures to assess the risks of material misstatement of the financial statements, whether due to error or fraud, and performing procedures that respond to those risks. Such procedures include examining, on a test basis, evidence regarding the amounts and disclosures in the financial statements. Our audits also included evaluating the accounting principles used and significant estimates made by management, as well as evaluating the overall presentation of the financial statements. We believe that our audits provide a reasonable basis for our opinion.
/s/ FORVIS, LLP
We served as the Company's auditor from 2007 to 2022.
Atlanta, Georgia
February 24, 2023
F-5
SouthState Corporation and Subsidiaries
Consolidated Balance Sheets
(Dollars in thousands, except share and par value)
|
|
December 31, |
|
||||
|
|
2023 |
|
2022 |
|
||
ASSETS |
|
|
|
|
|
|
|
Cash and cash equivalents: |
|
|
|
|
|
|
|
Cash and due from banks |
|
$ |
510,922 |
|
$ |
548,387 |
|
Federal funds sold and interest-earning deposits with banks |
|
|
236,435 |
|
|
580,491 |
|
Deposits in other financial institutions (restricted cash) |
|
|
251,520 |
|
|
183,685 |
|
Total cash and cash equivalents |
|
|
998,877 |
|
|
1,312,563 |
|
Trading securities, at fair value |
|
|
31,321 |
|
|
31,263 |
|
Investment securities: |
|
|
|
|
|
|
|
Securities held to maturity (fair value of $2,084,736 and $2,250,168) |
|
|
2,487,440 |
|
|
2,683,241 |
|
Securities available for sale, at fair value |
|
|
4,784,388 |
|
|
5,326,822 |
|
Other investments |
|
|
192,043 |
|
|
179,717 |
|
Total investment securities |
|
|
7,463,871 |
|
|
8,189,780 |
|
Loans held for sale |
|
|
50,888 |
|
|
28,968 |
|
Loans: |
|
|
|
|
|
|
|
Acquired - non-purchased credit deteriorated loans |
|
|
4,796,913 |
|
|
5,943,092 |
|
Acquired - purchased credit deteriorated loans |
|
|
1,108,813 |
|
|
1,429,731 |
|
Non-acquired loans |
|
|
26,482,763 |
|
|
22,805,039 |
|
Less allowance for credit losses |
|
|
(456,573) |
|
|
(356,444) |
|
Loans, net |
|
|
31,931,916 |
|
|
29,821,418 |
|
Other real estate owned |
|
|
837 |
|
|
1,023 |
|
Bank property held for sale |
|
|
12,401 |
|
|
17,754 |
|
Premises and equipment, net |
|
|
519,197 |
|
|
520,635 |
|
Bank owned life insurance (“BOLI”) |
|
|
991,454 |
|
|
964,708 |
|
Deferred tax assets |
|
|
164,354 |
|
|
177,801 |
|
Derivatives assets |
|
|
172,939 |
|
|
211,016 |
|
Mortgage servicing rights |
|
|
85,164 |
|
|
86,610 |
|
Core deposit and other intangibles |
|
|
88,776 |
|
|
116,450 |
|
Goodwill |
|
|
1,923,106 |
|
|
1,923,106 |
|
Other assets |
|
|
466,923 |
|
|
515,601 |
|
Total assets |
|
$ |
44,902,024 |
|
$ |
43,918,696 |
|
LIABILITIES AND SHAREHOLDERS’ EQUITY |
|
|
|
|
|
|
|
Deposits: |
|
|
|
|
|
|
|
Noninterest-bearing |
|
$ |
10,649,274 |
|
$ |
13,168,656 |
|
Interest-bearing |
|
|
26,399,635 |
|
|
23,181,967 |
|
Total deposits |
|
|
37,048,909 |
|
|
36,350,623 |
|
Federal funds purchased |
|
|
248,162 |
|
|
213,597 |
|
Securities sold under agreements to repurchase |
|
|
241,023 |
|
|
342,820 |
|
Corporate and subordinated debentures |
|
|
391,904 |
|
|
392,275 |
|
Other borrowings |
|
|
100,000 |
|
|
— |
|
Reserve for unfunded commitments |
|
|
56,303 |
|
|
67,215 |
|
Derivative liabilities |
|
|
804,486 |
|
|
1,034,143 |
|
Other liabilities |
|
|
478,139 |
|
|
443,096 |
|
Total liabilities |
|
|
39,368,926 |
|
|
38,843,769 |
|
Shareholders’ equity: |
|
|
|
|
|
|
|
Common stock - $2.50 par value; authorized 160,000,000 shares; 76,022,039 and 75,704,563 shares issued and outstanding, respectively |
|
|
190,055 |
|
|
189,261 |
|
Surplus |
|
|
4,240,413 |
|
|
4,215,712 |
|
Retained earnings |
|
|
1,685,166 |
|
|
1,347,042 |
|
Accumulated other comprehensive loss |
|
|
(582,536) |
|
|
(677,088) |
|
Total shareholders’ equity |
|
|
5,533,098 |
|
|
5,074,927 |
|
Total liabilities and shareholders’ equity |
|
$ |
44,902,024 |
|
$ |
43,918,696 |
|
The Accompanying Notes are an Integral Part of the Consolidated Financial Statements.
F-6
SouthState Corporation and Subsidiaries
Consolidated Statements of Income
(in thousands, except per share data)
|
|
|
|
|
|
|
|
|
|
|
|
|
Year Ended December 31, |
|
|||||||
|
|
2023 |
|
2022 |
|
2021 |
|
|||
Interest income: |
|
|
|
|
|
|
|
|
|
|
Loans, including fees |
|
$ |
1,716,405 |
|
$ |
1,178,026 |
|
$ |
990,519 |
|
Investment securities: |
|
|
|
|
|
|
|
|
|
|
Taxable |
|
|
162,907 |
|
|
149,790 |
|
|
76,850 |
|
Tax-exempt |
|
|
23,455 |
|
|
22,361 |
|
|
10,715 |
|
Federal funds sold, securities purchased under agreements to resell and interest-bearing deposits with banks |
|
|
41,639 |
|
|
46,848 |
|
|
6,720 |
|
Total interest income |
|
|
1,944,406 |
|
|
1,397,025 |
|
|
1,084,804 |
|
Interest expense: |
|
|
|
|
|
|
|
|
|
|
Deposits |
|
|
440,257 |
|
|
36,984 |
|
|
33,182 |
|
Federal funds purchased and securities sold under agreements to repurchase |
|
|
15,589 |
|
|
4,503 |
|
|
1,189 |
|
Corporate and subordinated debentures |
|
|
23,617 |
|
|
19,294 |
|
|
17,214 |
|
Other borrowings |
|
|
12,335 |
|
|
573 |
|
|
44 |
|
Total interest expense |
|
|
491,798 |
|
|
61,354 |
|
|
51,629 |
|
Net interest income |
|
|
1,452,608 |
|
|
1,335,671 |
|
|
1,033,175 |
|
Provision (recovery) for credit losses |
|
|
114,082 |
|
|
81,855 |
|
|
(165,273) |
|
Net interest income after provision (recovery) for credit losses |
|
|
1,338,526 |
|
|
1,253,816 |
|
|
1,198,448 |
|
Noninterest income: |
|
|
|
|
|
|
|
|
|
|
Fees on deposit accounts |
|
|
129,015 |
|
|
124,810 |
|
|
102,756 |
|
Mortgage banking income |
|
|
13,355 |
|
|
17,790 |
|
|
64,599 |
|
Trust and investment services income |
|
|
39,447 |
|
|
39,019 |
|
|
36,981 |
|
Correspondent banking and capital markets income |
|
|
49,101 |
|
|
78,755 |
|
|
110,048 |
|
SBA income |
|
|
13,929 |
|
|
15,636 |
|
|
11,865 |
|
Securities gains, net |
|
|
43 |
|
|
30 |
|
|
102 |
|
Other income |
|
|
42,016 |
|
|
33,207 |
|
|
27,901 |
|
Total noninterest income |
|
|
286,906 |
|
|
309,247 |
|
|
354,252 |
|
Noninterest expense: |
|
|
|
|
|
|
|
|
|
|
Salaries and employee benefits |
|
|
583,398 |
|
|
554,704 |
|
|
552,030 |
|
Occupancy expense |
|
|
88,695 |
|
|
89,501 |
|
|
92,225 |
|
Information services expense |
|
|
84,472 |
|
|
79,701 |
|
|
74,417 |
|
OREO and loan related expense |
|
|
1,716 |
|
|
369 |
|
|
2,029 |
|
Amortization of intangibles |
|
|
27,558 |
|
|
33,205 |
|
|
35,192 |
|
Supplies, printing and postage expense |
|
|
10,578 |
|
|
9,621 |
|
|
9,659 |
|
Professional fees |
|
|
18,547 |
|
|
15,331 |
|
|
10,629 |
|
FDIC assessment and other regulatory charges |
|
|
33,070 |
|
|
23,033 |
|
|
17,982 |
|
FDIC special assessment |
|
|
25,691 |
|
|
— |
|
|
— |
|
Advertising and marketing |
|
|
9,474 |
|
|
8,888 |
|
|
7,959 |
|
Extinguishment of debt cost |
|
|
— |
|
|
— |
|
|
11,706 |
|
Merger, branch consolidation and severance related expense |
|
|
13,162 |
|
|
30,888 |
|
|
67,242 |
|
Other expense |
|
|
98,219 |
|
|
84,460 |
|
|
67,351 |
|
Total noninterest expense |
|
|
994,580 |
|
|
929,701 |
|
|
948,421 |
|
Earnings: |
|
|
|
|
|
|
|
|
|
|
Income before provision for income taxes |
|
|
630,852 |
|
|
633,362 |
|
|
604,279 |
|
Provision for income taxes |
|
|
136,544 |
|
|
137,313 |
|
|
128,736 |
|
Net income |
|
$ |
494,308 |
|
$ |
496,049 |
|
$ |
475,543 |
|
Earnings per common share: |
|
|
|
|
|
|
|
|
|
|
Basic |
|
$ |
6.50 |
|
$ |
6.65 |
|
$ |
6.76 |
|
Diluted |
|
$ |
6.46 |
|
$ |
6.60 |
|
$ |
6.71 |
|
Weighted average common shares outstanding: |
|
|
|
|
|
|
|
|
|
|
Basic |
|
|
76,051 |
|
|
74,551 |
|
|
70,393 |
|
Diluted |
|
|
76,480 |
|
|
75,181 |
|
|
70,889 |
|
The Accompanying Notes are an Integral Part of the Consolidated Financial Statements.
F-7
SouthState Corporation and Subsidiaries
Consolidated Statements of Comprehensive Income (Loss)
(Dollars in thousands)
|
|
|
|
|
|
|
|
|
|
|
|
|
Year Ended December 31, |
|
|||||||
|
|
2023 |
|
2022 |
|
2021 |
|
|||
Net income |
|
$ |
494,308 |
|
$ |
496,049 |
|
$ |
475,543 |
|
Other comprehensive income (loss): |
|
|
|
|
|
|
|
|
|
|
Unrealized holding gains (losses) on available for sale securities: |
|
|
|
|
|
|
|
|
|
|
Unrealized holding gains (losses) arising during period |
|
|
112,743 |
|
|
(861,470) |
|
|
(90,350) |
|
Tax effect |
|
|
(19,458) |
|
|
206,281 |
|
|
21,485 |
|
Reclassification adjustment for gains included in net income |
|
|
(43) |
|
|
(30) |
|
|
(102) |
|
Tax effect |
|
|
10 |
|
|
7 |
|
|
24 |
|
Net of tax amount |
|
|
93,252 |
|
|
(655,212) |
|
|
(68,943) |
|
Change in the retiree medical plan obligation: |
|
|
|
|
|
|
|
|
|
|
Change in the retiree medical plan obligation during period |
|
|
1,442 |
|
|
(1,110) |
|
|
98 |
|
Tax effect |
|
|
(356) |
|
|
272 |
|
|
(23) |
|
Reclassification adjustment for changes included in net income |
|
|
285 |
|
|
143 |
|
|
174 |
|
Tax effect |
|
|
(71) |
|
|
(35) |
|
|
(41) |
|
Net of tax amount |
|
|
1,300 |
|
|
(730) |
|
|
208 |
|
Other comprehensive income (loss), net of tax |
|
|
94,552 |
|
|
(655,942) |
|
|
(68,735) |
|
Comprehensive income (loss) |
|
$ |
588,860 |
|
$ |
(159,893) |
|
$ |
406,808 |
|
The Accompanying Notes are an Integral Part of the Consolidated Financial Statements.
F-8
SouthState Corporation and Subsidiaries
Consolidated Statements of Changes in Shareholders’ Equity
(Dollars in thousands, except share and per share data)
|
|
|
|
|
|
|
|
|
|
|
|
|
|
|
|
|
|
|
|
|
|
|
|
|
|
|
|
|
|
|
|
Accumulated |
|
|
|
|
|
|
|
|
|
|
|
|
|
|
|
|
|
|
Other |
|
|
|
|
|
|
|
Common Stock |
|
|
|
|
Retained |
|
Comprehensive |
|
|
|
|
|||||
|
|
Shares |
|
Amount |
|
Surplus |
|
Earnings |
|
(Loss) Gain |
|
Total |
|
|||||
Balance, December 31, 2020 |
|
70,973,477 |
|
$ |
177,434 |
|
$ |
3,765,406 |
|
$ |
657,451 |
|
$ |
47,589 |
|
$ |
4,647,880 |
|
Comprehensive income: |
|
|
|
|
|
|
|
|
|
|
|
|
|
|
|
|
|
|
Net income |
|
— |
|
|
— |
|
|
— |
|
|
475,543 |
|
|
— |
|
|
475,543 |
|
Other comprehensive income, net of tax effects |
|
— |
|
|
— |
|
|
— |
|
|
— |
|
|
(68,735) |
|
|
(68,735) |
|
Total comprehensive income |
|
|
|
|
|
|
|
|
|
|
|
|
|
|
|
|
406,808 |
|
Cash dividends declared on common stock at $1.92 per share |
|
— |
|
|
— |
|
|
— |
|
|
(135,201) |
|
|
— |
|
|
(135,201) |
|
Cash dividend equivalents paid on restricted stock units |
|
— |
|
|
— |
|
|
— |
|
|
(136) |
|
|
— |
|
|
(136) |
|
Employee stock purchases |
|
33,013 |
|
|
83 |
|
|
2,301 |
|
|
— |
|
|
— |
|
|
2,384 |
|
Stock options exercised |
|
64,075 |
|
|
160 |
|
|
2,745 |
|
|
— |
|
|
— |
|
|
2,905 |
|
Stock issued pursuant to restricted stock units |
|
93,085 |
|
|
233 |
|
|
(233) |
|
|
— |
|
|
— |
|
|
— |
|
Common stock repurchased - buyback plan |
|
(1,817,941) |
|
|
(4,545) |
|
|
(141,823) |
|
|
— |
|
|
— |
|
|
(146,368) |
|
Common stock repurchased |
|
(13,412) |
|
|
(34) |
|
|
(1,019) |
|
|
— |
|
|
— |
|
|
(1,053) |
|
Share-based compensation expense |
|
— |
|
|
— |
|
|
25,721 |
|
|
— |
|
|
— |
|
|
25,721 |
|
Balance, December 31, 2021 |
|
69,332,297 |
|
$ |
173,331 |
|
$ |
3,653,098 |
|
$ |
997,657 |
|
$ |
(21,146) |
|
$ |
4,802,940 |
|
Comprehensive loss: |
|
|
|
|
|
|
|
|
|
|
|
|
|
|
|
|
|
|
Net income |
|
— |
|
|
— |
|
|
— |
|
|
496,049 |
|
|
— |
|
|
496,049 |
|
Other comprehensive loss, net of tax effects |
|
— |
|
|
— |
|
|
— |
|
|
— |
|
|
(655,942) |
|
|
(655,942) |
|
Total comprehensive loss |
|
|
|
|
|
|
|
|
|
|
|
|
|
|
|
|
(159,893) |
|
Cash dividends declared on common stock at $1.98 per share |
|
— |
|
|
— |
|
|
— |
|
|
(146,486) |
|
|
— |
|
|
(146,486) |
|
Cash dividend equivalents paid on restricted stock units |
|
— |
|
|
— |
|
|
— |
|
|
(178) |
|
|
— |
|
|
(178) |
|
Employee stock purchases |
|
38,491 |
|
|
96 |
|
|
2,762 |
|
|
— |
|
|
— |
|
|
2,858 |
|
Stock options exercised |
|
39,020 |
|
|
97 |
|
|
1,488 |
|
|
— |
|
|
— |
|
|
1,585 |
|
Restricted stock awards (forfeits) |
|
(5,368) |
|
|
(13) |
|
|
13 |
|
|
— |
|
|
— |
|
|
— |
|
Stock issued pursuant to restricted stock units |
|
393,747 |
|
|
984 |
|
|
(983) |
|
|
— |
|
|
— |
|
|
1 |
|
Common stock repurchased - buyback plan |
|
(1,312,038) |
|
|
(3,280) |
|
|
(106,924) |
|
|
— |
|
|
— |
|
|
(110,204) |
|
Common stock repurchased |
|
(112,389) |
|
|
(281) |
|
|
(8,845) |
|
|
— |
|
|
— |
|
|
(9,126) |
|
Share-based compensation expense |
|
— |
|
|
— |
|
|
35,638 |
|
|
— |
|
|
— |
|
|
35,638 |
|
Common stock issued for Atlantic Capital merger |
|
7,330,803 |
|
|
18,327 |
|
|
641,445 |
|
|
— |
|
|
— |
|
|
659,772 |
|
Net fair value of unvested equity awards assumed in the Atlantic Capital acquisition |
|
— |
|
|
— |
|
|
(1,980) |
|
|
— |
|
|
— |
|
|
(1,980) |
|
Balance, December 31, 2022 |
|
75,704,563 |
|
$ |
189,261 |
|
$ |
4,215,712 |
|
$ |
1,347,042 |
|
$ |
(677,088) |
|
$ |
5,074,927 |
|
Comprehensive income: |
|
|
|
|
|
|
|
|
|
|
|
|
|
|
|
|
|
|
Net income |
|
— |
|
|
— |
|
|
— |
|
|
494,308 |
|
|
— |
|
|
494,308 |
|
Other comprehensive income, net of tax effects |
|
— |
|
|
— |
|
|
— |
|
|
— |
|
|
94,552 |
|
|
94,552 |
|
Total comprehensive income |
|
|
|
|
|
|
|
|
|
|
|
|
|
|
|
|
588,860 |
|
Cash dividends declared on common stock at $2.04 per share |
|
— |
|
|
— |
|
|
— |
|
|
(154,919) |
|
|
— |
|
|
(154,919) |
|
Cash dividend equivalents paid on restricted stock units |
|
— |
|
|
— |
|
|
— |
|
|
(1,265) |
|
|
— |
|
|
(1,265) |
|
Employee stock purchases |
|
43,356 |
|
|
108 |
|
|
2,664 |
|
|
— |
|
|
— |
|
|
2,772 |
|
Stock options exercised |
|
53,225 |
|
|
133 |
|
|
2,793 |
|
|
— |
|
|
— |
|
|
2,926 |
|
Restricted stock awards (forfeits) |
|
(2,721) |
|
|
(8) |
|
|
8 |
|
|
— |
|
|
— |
|
|
— |
|
Stock issued pursuant to restricted stock units |
|
455,443 |
|
|
1,140 |
|
|
(1,140) |
|
|
— |
|
|
— |
|
|
— |
|
Common stock repurchased - buyback plan |
|
(100,000) |
|
|
(250) |
|
|
(6,498) |
|
|
— |
|
|
— |
|
|
(6,748) |
|
Common stock repurchased – equity plans |
|
(131,827) |
|
|
(329) |
|
|
(8,987) |
|
|
— |
|
|
— |
|
|
(9,316) |
|
Share-based compensation expense |
|
— |
|
|
— |
|
|
35,861 |
|
|
— |
|
|
— |
|
|
35,861 |
|
Balance, December 31, 2023 |
|
76,022,039 |
|
$ |
190,055 |
|
$ |
4,240,413 |
|
$ |
1,685,166 |
|
$ |
(582,536) |
|
$ |
5,533,098 |
|
The Accompanying Notes are an Integral Part of the Consolidated Financial Statements.
F-9
SouthState Corporation and Subsidiaries
Consolidated Statements of Cash Flows
(Dollars in thousands)
|
|
Year Ended December 31, |
|
|||||||
|
|
2023 |
|
2022 |
|
2021 |
|
|||
Cash flows from operating activities: |
|
|
|
|
|
|
|
|
|
|
Net income |
|
$ |
494,308 |
|
$ |
496,049 |
|
$ |
475,543 |
|
Adjustments to reconcile net income to net cash provided by operating activities: |
|
|
|
|
|
|
|
|
|
|
Depreciation and amortization |
|
|
58,826 |
|
|
64,591 |
|
|
63,137 |
|
Provision (recovery) for credit losses |
|
|
114,082 |
|
|
81,855 |
|
|
(165,273) |
|
Deferred income taxes |
|
|
1,950 |
|
|
123,540 |
|
|
67,850 |
|
Gains on sale of securities, net |
|
|
(43) |
|
|
(30) |
|
|
(102) |
|
Share-based compensation expense |
|
|
35,861 |
|
|
35,638 |
|
|
25,721 |
|
Accretion of discount related to acquired loans |
|
|
(20,801) |
|
|
(36,411) |
|
|
(29,658) |
|
Extinguishment of debt cost - fair value marks |
|
|
— |
|
|
— |
|
|
11,706 |
|
Losses on disposal of premises and equipment |
|
|
66 |
|
|
2,876 |
|
|
856 |
|
Gains on sale of bank properties held for sale and repossessed real estate |
|
|
(1,733) |
|
|
(4,467) |
|
|
(2,329) |
|
Net amortization of premiums and discounts on investment securities |
|
|
20,136 |
|
|
27,303 |
|
|
38,025 |
|
Bank properties held for sale and repossessed real estate write downs |
|
|
1,571 |
|
|
273 |
|
|
2,067 |
|
Fair value adjustment for loans held for sale |
|
|
(833) |
|
|
6,052 |
|
|
6,920 |
|
Originations and purchases of loans held for sale |
|
|
(881,017) |
|
|
(1,411,770) |
|
|
(3,045,145) |
|
Proceeds from sales of loans held for sale |
|
|
863,464 |
|
|
1,565,809 |
|
|
3,209,094 |
|
(Gains) losses on sales of loans held for sale |
|
|
(3,535) |
|
|
2,663 |
|
|
(72,124) |
|
Increase in cash surrender value of BOLI |
|
|
(25,141) |
|
|
(23,058) |
|
|
(18,221) |
|
Net change in: |
|
|
|
|
|
|
|
|
|
|
Accrued interest receivable |
|
|
(19,806) |
|
|
(32,829) |
|
|
17,083 |
|
Prepaid assets |
|
|
1,967 |
|
|
(3,090) |
|
|
(1,250) |
|
Operating leases |
|
|
322 |
|
|
142 |
|
|
2,053 |
|
Bank owned life insurance |
|
|
(1,595) |
|
|
(1,290) |
|
|
(202) |
|
Trading securities |
|
|
(57) |
|
|
46,425 |
|
|
(35,154) |
|
Derivative assets |
|
|
38,077 |
|
|
207,682 |
|
|
399,157 |
|
Miscellaneous other assets |
|
|
(6,259) |
|
|
147 |
|
|
(79,312) |
|
Accrued interest payable |
|
|
50,590 |
|
|
2,609 |
|
|
(3,759) |
|
Accrued income taxes |
|
|
62,509 |
|
|
(17,218) |
|
|
(53,843) |
|
Derivative liabilities |
|
|
(229,657) |
|
|
741,583 |
|
|
(516,271) |
|
Miscellaneous other liabilities |
|
|
(6,495) |
|
|
(144,181) |
|
|
119,120 |
|
Net cash provided by operating activities |
|
|
546,757 |
|
|
1,730,893 |
|
|
415,689 |
|
Cash flows from investing activities: |
|
|
|
|
|
|
|
|
|
|
Proceeds from sales of investment securities available for sale |
|
|
129,614 |
|
|
482,028 |
|
|
151,314 |
|
Proceeds from maturities and calls of investment securities held to maturity |
|
|
190,825 |
|
|
230,003 |
|
|
104,958 |
|
Proceeds from maturities and calls of investment securities available for sale |
|
|
590,758 |
|
|
575,877 |
|
|
805,342 |
|
Proceeds from sales and redemptions of other investment securities |
|
|
214,375 |
|
|
13,226 |
|
|
1,533 |
|
Purchases of investment securities available for sale |
|
|
(80,354) |
|
|
(1,381,980) |
|
|
(2,941,888) |
|
Purchases of investment securities held to maturity |
|
|
— |
|
|
(1,099,691) |
|
|
(975,266) |
|
Purchases of other investment securities |
|
|
(226,701) |
|
|
(20,359) |
|
|
(1,659) |
|
Net (increase) decrease in loans |
|
|
(2,234,274) |
|
|
(3,855,268) |
|
|
745,085 |
|
Net cash (paid in) received from acquisitions |
|
|
— |
|
|
250,115 |
|
|
(39,929) |
|
Recoveries of loans previously charged off |
|
|
15,782 |
|
|
19,173 |
|
|
13,800 |
|
Purchase of bank owned life insurance |
|
|
(5,966) |
|
|
(85,966) |
|
|
(205,566) |
|
Purchases of premises and equipment |
|
|
(38,885) |
|
|
(17,670) |
|
|
(28,418) |
|
Proceeds from redemption and payout of bank owned life insurance policies |
|
|
5,956 |
|
|
3,267 |
|
|
307 |
|
Proceeds from sale of bank properties held for sale and repossessed real estate |
|
|
11,575 |
|
|
20,706 |
|
|
42,657 |
|
Proceeds from sale of premises and equipment |
|
|
856 |
|
|
6,143 |
|
|
8,469 |
|
Net cash used in investing activities |
|
|
(1,426,439) |
|
|
(4,860,396) |
|
|
(2,319,261) |
|
Cash flows from financing activities: |
|
|
|
|
|
|
|
|
|
|
Net increase (decrease) in deposits |
|
|
699,778 |
|
|
(1,780,132) |
|
|
4,367,662 |
|
Net (decrease) increase in federal funds purchased and securities sold under agreements to repurchase and other short-term borrowings |
|
|
(67,232) |
|
|
(224,822) |
|
|
1,573 |
|
Proceeds from borrowings |
|
|
6,050,200 |
|
|
— |
|
|
25,000 |
|
Repayment of borrowings |
|
|
(5,950,200) |
|
|
(13,000) |
|
|
(100,878) |
|
Common stock issuance |
|
|
2,772 |
|
|
2,858 |
|
|
2,384 |
|
Common stock repurchases |
|
|
(16,064) |
|
|
(119,330) |
|
|
(147,421) |
|
Dividends paid |
|
|
(156,184) |
|
|
(146,664) |
|
|
(135,337) |
|
Stock options exercised |
|
|
2,926 |
|
|
1,585 |
|
|
2,905 |
|
Net cash provided by (used in) financing activities |
|
|
565,996 |
|
|
(2,279,505) |
|
|
4,015,888 |
|
Net increase (decrease) in cash and cash equivalents |
|
|
(313,686) |
|
|
(5,409,008) |
|
|
2,112,316 |
|
Cash and cash equivalents at beginning of period |
|
|
1,312,563 |
|
|
6,721,571 |
|
|
4,609,255 |
|
Cash and cash equivalents at end of period |
|
$ |
998,877 |
|
$ |
1,312,563 |
|
$ |
6,721,571 |
|
Supplemental Disclosures: |
|
|
|
|
|
|
|
|
|
|
Cash Flow Information: |
|
|
|
|
|
|
|
|
|
|
Cash paid for: |
|
|
|
|
|
|
|
|
|
|
Interest |
|
$ |
441,208 |
|
$ |
67,126 |
|
$ |
55,387 |
|
Income taxes |
|
$ |
74,725 |
|
$ |
35,144 |
|
$ |
126,207 |
|
Recognition of operating lease assets in exchange for lease liabilities |
|
$ |
1,160 |
|
$ |
12,635 |
|
$ |
9,623 |
|
Schedule of Noncash Investing Transactions: |
|
|
|
|
|
|
|
|
|
|
Acquisitions: |
|
|
|
|
|
|
|
|
|
|
Fair value of tangible assets acquired |
|
$ |
— |
|
$ |
3,500,692 |
|
$ |
34,838 |
|
Other intangible assets acquired |
|
|
— |
|
|
20,791 |
|
|
— |
|
Liabilities assumed |
|
|
— |
|
|
3,205,694 |
|
|
2,343 |
|
Net identifiable assets acquired over liabilities assumed |
|
|
— |
|
|
342,021 |
|
|
15,816 |
|
Common stock issued in acquisition |
|
|
— |
|
|
659,772 |
|
|
— |
|
Real estate acquired in full or in partial settlement of loans |
|
|
3,801 |
|
|
1,972 |
|
|
3,642 |
|
The Accompanying Notes are an Integral Part of the Consolidated Financial Statements.
F-10
Note 1—Summary of Significant Accounting Policies
Nature of Operations
SouthState Corporation is a financial holding company headquartered in Winter Haven, Florida, and was incorporated under the laws of South Carolina in 1985. We provide a wide range of banking services and products to our customers through our Bank. The Bank operates SouthState Advisory, Inc., a wholly owned registered investment advisor. The Bank also operates SouthState|Duncan-Williams, Securities Corp. (“SouthState|DuncanWilliams”), a registered broker-dealer, headquartered in Memphis, Tennessee that serves primarily institutional clients across the U.S. in the fixed income business. The Bank also operates SouthState Advisory, Inc., a wholly owned registered investment advisor, and Corporate Billing, LLC (“Corporate Billing”), a transaction-based finance company headquartered in Decatur, Alabama that provides factoring, invoicing, collection and accounts receivable management services to transportation companies and automotive parts and service providers nationwide. Corporate Billing’s previous holding company CBI Holding Company, LLC and its subsidiary CBI Real Estate Holding, LLC were merged into CBI Billing effective November 30, 2023. The Company also owns SSB Insurance Corp., a captive insurance subsidiary pursuant to Section 831(b) of the U.S. Tax Code. In addition, the Company operates a correspondent banking and capital markets division within the national bank subsidiary, of which the majority of its bond salesmen, traders and operational personnel are housed in facilities located in in facilities located in Atlanta, Georgia, Memphis, Tennessee, Walnut Creek, California, and Birmingham, Alabama. The Bank provides general banking services within a six (6) state footprint in Alabama, Florida, Georgia, North Carolina, South Carolina and Virginia. In late 2023, the Bank formed SSB First Street Corporation, an investment subsidiary headquartered in Wilmington, Delaware, to hold tax-exempt municipal investment securities as part of the Bank’s investment portfolio.
The accounting and reporting policies of the Company and its consolidated subsidiary conform to accounting principles generally accepted in the United States of America (“U.S. GAAP”). There are 13 unconsolidated subsidiaries of the Company that were established for the purpose of issuing in the aggregate approximately $118.6 million of trust preferred securities at December 31, 2023. See Note 11—Other Borrowings for further detailed descriptions of our trust preferred securities.
Unless otherwise mentioned or unless the context requires otherwise, references herein to “SouthState,” the “Company” “we,” “us,” “our” or similar references mean SouthState Corporation and its consolidated subsidiaries. References to the “Bank” means SouthState Bank, National Association.
Basis of Consolidation
The consolidated financial statements include the accounts of the Company and other entities in which it has a controlling financial interest. All significant intercompany balances and transactions have been eliminated in consolidation. Assets held by the Company in trust are not assets of the Company and are not included in the accompanying consolidated financial statements.
Reportable Segment
The Company, through the Bank, provides a broad range of financial services to individuals and companies primarily in South Carolina, North Carolina, Florida, Alabama, Georgia and Virginia. These services include, but not limited to, demand, time and savings deposits; lending and credit card servicing; ATM processing; mortgage banking services; correspondent banking services and wealth management and trust services. The Company’s operations are managed and financial performance is evaluated on an organization-wide basis. Accordingly, the Company’s banking and finance operations are not considered by management to constitute more than one reportable operating segment.
F-11
Use of Estimates
The preparation of consolidated financial statements in conformity with accounting principles generally accepted in the United States of America requires management to make estimates and assumptions that affect the reported amounts of assets and liabilities as of the date of the consolidated balance sheet and the reported amounts of revenues and expenses during the reporting period. Actual results could differ from those estimates. Material estimates that are particularly susceptible to significant change in the near term relate to the determination of the allowance for credit losses for loans and investment securities held to maturity, fair value of financial instruments, fair values of assets and liabilities acquired in business combinations, evaluating impairment of investment securities, goodwill and other intangible impairment tests and valuation of deferred tax assets.
In connection with the determination of the allowance for credit losses, management has identified specific loans as well as adopted a policy of providing amounts for loan valuation purposes which are not identified with any specific loan but are derived from models based on macroeconomic factors and forecasts. Management believes that the allowance for credit losses is appropriate. While management uses available information to recognize losses on loans, future additions or reductions to the allowance for credit losses may be necessary based on changes in economic forecasts. In addition, regulatory agencies, as an integral part of the examination process, periodically review the banking subsidiary’s allowance for credit losses. Such agencies may require additions to the allowance for credit losses based on their judgments about information available to them at the time of their examination.
Concentrations of Credit Risk
The Bank provides agribusiness, commercial, and residential and other consumer loans to customers primarily throughout South Carolina, North Carolina, Florida, Alabama, Virginia and Georgia. Although the Bank has a diversified loan portfolio, a substantial portion of their borrowers’ abilities to honor their contracts is dependent upon economic conditions within South Carolina, North Carolina, Florida, Alabama, Virginia, Georgia and the surrounding regions.
The Company considers concentrations of credit to exist when, pursuant to regulatory guidelines, the amounts loaned to a multiple number of borrowers engaged in similar business activities which would cause them to be similarly impacted by general economic conditions represents 25% of total Tier 1 capital plus regulatory adjusted allowance for credit losses of the Company, or $1.2 billion at December 31, 2023. Based on this criteria, we had eight such credit concentrations at December 31, 2023, including loans to lessors of nonresidential buildings (except mini warehouses) of $6.2 billion, loans secured by owner occupied office buildings (including medical office buildings) of $1.9 billion, loans secured by owner occupied nonresidential buildings (excluding office buildings) of $1.8 billion, loans to lessors of residential buildings (investment properties and multi-family) of $2.4 billion, loans secured by 1st mortgage 1-4 family owner occupied residential property (including condos and home equity lines) of $8.8 billion, loans secured by jumbo (original loans greater than $726,200) 1st mortgage 1-4 family owner occupied residential property of $2.6 billion, loans secured by business assets including accounts receivable, inventory and equipment of $2.2 billion, and loans to consumers secured by non-real estate of $1.2 billion. The risk for these loans and for all loans is managed collectively through the use of credit underwriting practices developed and updated over time. The loss estimate for these loans is determined using our standard ACL methodology.
With some financial institutions adopting CECL in the first quarter of 2020, banking regulators established new guidelines for calculating credit concentrations. Banking regulators set the guidelines for construction, land development and other land loans to total less than 100% of total Tier 1 capital less modified CECL transitional amount plus ACL (CDL concentration ratio) and for total commercial real estate loans (construction, land development and other land loans along with other non-owner occupied commercial real estate and multifamily loans) to total less than 300% of total Tier 1 capital less modified CECL transitional amount plus ACL (CRE concentration ratio). Both ratios are calculated by dividing certain types of loan balances for each of the two categories by the Bank’s total Tier 1 capital less modified CECL transitional amount plus ACL. At December 31, 2023 and 2022, the Bank’s CDL concentration ratio was 59.7% and 64.8%, respectively, and its CRE concentration ratio was 236.5% and 249.0%, respectively. As of December 31, 2023, the Bank was below the established regulatory guidelines and we monitor these two ratios as part of our concentration management processes.
F-12
Cash and Cash Equivalents
For the purpose of presentation in the consolidated statements of cash flows, cash and cash equivalents include cash on hand, cash items in process of collection, amounts due from banks including restricted pledged cash, interest bearing deposits with banks, purchases of securities under agreements to resell, and federal funds sold. The restricted cash is used as collateral on the counterparty for the interest rate swap contracts with loan customers of respondent bank customers of the Correspondent Banking Division. Due from bank balances are maintained at other financial institutions. Federal funds sold are generally purchased and sold for one-day periods, but may, from time to time, have longer terms.
The Company enters from time to time into purchases of securities under agreements to resell substantially identical securities. When the Company enters into such repurchase agreements, the securities purchased under agreements to resell generally consist of U.S. government-sponsored entities and agency mortgage-backed securities. The Company may elect to use other asset classes at its discretion. It is the Company’s practice to take possession of securities purchased under agreements to resell. The securities are delivered into the Company’s account maintained by a third-party custodian designated by the Company under a written custodial agreement that explicitly recognizes the Company’s interest in the securities. The Company monitors the market value of the underlying securities, including accrued interest, which collateralizes the related receivable on agreements to resell. These agreements were considered to be cash equivalents with maturities within less than one year. The Company held $2.5 million in securities under agreements to resell at December 31, 2023.
Trading Securities
Through its Correspondent Banking Department and the Bank’s wholly owned broker dealer SouthState|Duncan-Williams, the Company purchases trading securities and subsequently sells them to their customers to take advantage of market opportunities, when presented, for short-term revenue gains. Securities purchased for this portfolio are primarily municipals, treasuries and mortgage-backed agency securities and are held for short periods of time. This portfolio is carried at fair value and realized and unrealized gains and losses are included in trading securities revenue, a component of Correspondent Banking and Capital Market Income in our Consolidated Statements of Income.
Investment Securities
Debt securities that management has the positive intent and ability to hold to maturity are classified as “held to maturity” and carried at amortized cost. Securities not classified as held to maturity, including equity securities with readily determinable fair values, are classified as “available for sale” and carried at fair value with unrealized gains and losses excluded from earnings and reported in Other Comprehensive Income.
Purchase premiums and discounts are recognized in interest income using methods approximating the interest method over the terms of the securities. Gains and losses realized on sales of securities available for sale are determined using the specific identification method.
F-13
In accordance with as ASC Subtopic 326-30, Financial Instruments—Credit Losses—Available for sale Debt Securities, Management evaluates securities for impairment where there has been a decline in fair value below the amortized cost basis of a security to determine whether there is a credit loss associated with the decline in fair value on at least a quarterly basis, and more frequently when economic or market concerns warrant such evaluation. For securities designated as held for sale, credit losses are calculated individually, rather than collectively, using a discounted cash flow method, whereby management compares the present value of expected cash flows with the amortized cost basis of the security. The credit loss component would be recognized through the provision for credit losses. Consideration is given to (1) the financial condition and near-term prospects of the issuer including looking at default and delinquency rates, (2) the outlook for receiving the contractual cash flows of the investments, (3) the extent to which the fair value has been less than cost, (4) our intent to hold the security as well as there being no requirement to sell the security, (5) the anticipated outlook for changes in the general level of interest rates, (6) credit ratings, (7) third-party guarantees, and (8) collateral values. In analyzing an issuer’s financial condition, management considers whether the securities are issued by the federal government or its agencies, whether downgrades by bond rating agencies have occurred, the results of reviews of the issuer’s financial condition, and the issuer’s anticipated ability to pay the contractual cash flows of the investments. The Company performed an analysis that determined that the following securities have a zero expected credit loss: U.S. Treasury Securities, Agency-Backed Securities including securities issued by Ginnie Mae, Fannie Mae, FHLB, FFCB and SBA. All of the U.S. Treasury and Agency-Backed Securities have the full faith and credit backing of the United States Government or one of its agencies. Municipal securities and all other securities that do not have a zero expected credit loss are evaluated quarterly to determine whether there is a credit loss associated with a decline in fair value. All debt securities in an unrealized loss position as of December 31, 2023 continue to perform as scheduled and we do not believe there is a credit loss or a provision for credit losses is necessary. Also, as part of our evaluation of our intent and ability to hold investments, we consider our investment strategy, cash flow needs, liquidity position, capital adequacy and interest rate risk position. We do not currently intend to sell the securities within the portfolio and it is not more-likely-than-not that we will be required to sell the debt securities.
Other investments include stock acquired for regulatory purposes, investments in unconsolidated subsidiaries and other nonmarketable investment securities. Stock acquired for regulatory purposes include Federal Home Loan Bank of Atlanta (“FHLB”) stock and Federal Reserve Bank (“FRB”) stock. These securities do not have a readily determinable fair value because their ownership is restricted and they lack a market for trading. As a result, these securities are carried at cost and are periodically evaluated for impairment. Investments in unconsolidated subsidiaries represent a minority investment in SCBT Capital Trust I, SCBT Capital Trust II, SCBT Capital Trust III, TSB Statutory Trust I, SAVB Capital Trust I, SAVB Capital Trust II, Southeastern Bank Financial Statutory Trust I, Southeastern Bank Financial Statutory Trust II, Provident Community Bancshares Capital Trust I, FCRV Statutory Trust I, Community Capital Statutory Trust I, CSBC Statutory Trust I, and Provident Community Bancshares Capital Trust II. These investments are recorded at cost and the Company receives quarterly dividend payments on these investments. Other nonmarketable investment securities consist of Business Development Corporation stock and stock in Banker’s Banks. These investments also do not have a readily determinable fair value because their ownership is restricted and they lack a market for trading. As a result, these securities are carried at cost and are periodically evaluated for impairment.
Loans Held for Sale
The Company sells residential mortgages to government sponsored entities (“GSEs”) and mortgage and third-party investors, who may issue securities backed by pools of such loans. The Company retains no beneficial interests in these sales, but may retain the servicing rights for the loans sold. The Company is obligated to subsequently repurchase a loan if the purchaser discovers a representation or warranty violation such as noncompliance with eligibility or servicing requirements, or customer fraud, that should have been identified in a loan file review. Mortgage loans held for sale are accounted for at fair value on an individual loan basis. Estimated fair value is determined on the basis of existing forward commitments, or the current market value of similar loans. Changes in the fair value, and realized gains and losses on the sales of mortgage loans, are reported in Mortgage Banking Income, a component of Noninterest Income in our Consolidated Statements of Income.
F-14
Loans
Loans that management has originated and has the intent and ability to hold for the foreseeable future or until maturity or pay off generally are reported at their unpaid principal balances, less unearned income and net of any deferred loan fees and costs. Unearned income on installment loans is recognized as income over the terms of the loans by methods that approximate the interest method. Interest on other loans is calculated by using the simple interest method on daily balances of the principal amount outstanding.
Premiums and discounts on purchased loans and non-refundable loan origination and commitment fees, net of direct costs of originating or acquiring loans, are deferred and recognized over the contractual or estimated lives of the related loans as an adjustment to the loans’ constant effective yield, which is included in interest income on loans.
We place loans on nonaccrual once reasonable doubt exists about the collectability of all principal and interest due. Generally, this occurs when principal or interest is 90 days or more past due, unless the loan is well secured and in the process of collection and excludes factored receivables. For factored receivables, which are commercial trade credits rather than promissory notes, the Company’s practice, in most cases, is to charge-off unpaid recourse receivables when they become 90 days past due from the invoice due date and the nonrecourse receivables when they become 120 days past due from the statement due date. Past due status is based on the contractual terms of the loan. In all cases, loans are placed on non-accrual or charged-off at an earlier date if collection of principal or interest is considered doubtful.
A loan is evaluated individually for loss when it is on nonaccrual and has a net book balance over $1 million. Large pools of homogeneous loans are collectively evaluated for loss and reserved at the pool level. Loans that experience insignificant payment delays and payment shortfalls generally are not classified as nonaccrual, provided that management expects to collect all amounts due, including interest accrued at the contractual interest rate for the period of delay.
Modifications to Troubled Borrowers
As of January 1, 2023, the Company adopted and applied prospectively ASU No. 2022-02, Financial Instruments – Credit Losses (Topic 326): Troubled Debt Restructurings and Vintage Disclosures, that requires the elimination of designation of loans as TDRs. Management measures expected credit losses over the contractual term of a loan. When determining the contractual term, the Company considers expected prepayments but is precluded from considering expected extensions, renewals, or modifications. Longstanding TDR accounting rules were replaced as of January 1, 2023 with ASU No. 2022-02, Financial Instruments – Credit Losses (Topic 326): Troubled Debt Restructurings and Vintage Disclosures (See Recent Accounting and Regulatory Pronouncements section of this Note 1). In accordance with the adoption of ASU 2022-02, any loans modified to a borrower experiencing financial difficulty are reviewed by the Bank to determine if an interest rate reduction, a term extension, an other-than-insignificant payment delay, a principal forgiveness, or any combination of these has occurred.
Allowance for Credit Losses (“ACL”)
The Company complies with the requirements of Accounting Standards Update (“ASU”) No. 2016-13, Financial Instruments-Credit Losses (Topic 326): Measurement of Credit Losses on Financial Instruments, sometimes referred to herein as ASU 2016-13. Topic 326 was subsequently amended by ASU No. 2019-11, Codification Improvements to Topic 326, Financial Instruments-Credit Losses; ASU No. 2019-05, Codification Improvements to Topic 326, Financial Instruments-Credit Losses; and ASU No. 2019-04, Codification Improvements to Topic 326, Financial Instruments-Credit Losses, Topic 815, Derivatives and Hedging, and Topic 825, Financial Instruments. This standard applies to all financial assets measured at amortized cost and off balance sheet credit exposures, including loans, investment securities and unfunded commitments.
F-15
ACL – Investment Securities
Management uses a systematic methodology to determine its ACL for investment securities held to maturity. The ACL is a valuation account that is deducted from the amortized cost basis to present the net amount expected to be collected on the held to maturity portfolio. Management considers the effects of past events, current conditions, and reasonable and supportable forecasts on the collectability of the loan portfolio. The Company’s estimate of its ACL involves a high degree of judgment; therefore, management’s process for determining expected credit losses may result in a range of expected credit losses. Management monitors the held to maturity portfolio to determine whether a valuation account should be recorded. As of December 31, 2023, the Company had $2.5 billion of held to maturity securities and no related valuation account. As of December 31, 2023, the held to maturity portfolio consisted of U.S. Government Agency, U.S. Government Agency Residential and Commercial Mortgage-backed securities, and Small Business Administration loan-backed securities. At December 31, 2023, management does not believe that a fair value below amortized cost is due to credit related factors.
ASC Subtopic 326-30, Financial Instruments—Credit Losses—Available for sale Debt Securities, changed the accounting for recognizing impairment on available for sale debt securities. Each quarter, management evaluates impairment where there has been a decline in fair value below the amortized cost basis of a security to determine whether there is a credit loss associated with the decline in fair value. Management considers the nature of the collateral, potential future changes in collateral values, default rates, delinquency rates, third-party guarantees, credit ratings, interest rate changes since purchase, volatility of the security’s fair value and historical loss information for financial assets secured with similar collateral among other factors. Credit losses are calculated individually, rather than collectively, using a discounted cash flow method, whereby management compares the present value of expected cash flows with the amortized cost basis of the security. The credit loss component would be recognized through the Provision for Credit Losses in the Consolidated Statements of Income. Management excludes the accrued interest receivable balance from the amortized cost basis in measuring expected credit losses on the investment securities and does not record an allowance for credit losses on accrued interest receivable as the Company reverses any accrued interest against interest income if an investment is placed on nonaccrual status. As of December 31, 2023 and December 31, 2022, the accrued interest receivables for investment securities recorded in Other Assets were $26.5 million and $28.2 million, respectively.
ACL – Loans
The ACL for loans held for investment reflects management’s estimate of losses that will result from the inability of our borrowers to make required loan payments. The Company established the incremental increase in the ACL at adoption through equity and subsequent adjustments through a provision for or recovery of credit losses recorded to earnings. The Company records loans charged off against the ACL and subsequent recoveries, if any, increase the ACL when they are recognized.
Management uses systematic methodologies to determine its ACL for loans held for investment and certain off-balance-sheet credit exposures. The ACL is a valuation account that is deducted from the amortized cost basis to present the net amount expected to be collected on the loan portfolio. Management considers the effects of past events, current conditions, and reasonable and supportable forecasts on the collectability of the loan portfolio. The Company’s estimate of its ACL involves a high degree of judgment; therefore, management’s process for determining expected credit losses may result in a range of expected credit losses. The Company’s ACL recorded in the balance sheet reflects management’s best estimate within the range of expected credit losses. The Company recognizes in net income the amount needed to adjust the ACL for management’s current estimate of expected credit losses. The Company’s ACL is calculated using collectively evaluated and individually evaluated loans.
F-16
The allowance for credit losses is measured on a collective pool basis when similar risk characteristics exist. Loans with similar risk characteristics are grouped into homogenous segments, or pools, for analysis. The Discounted Cash Flow (“DCF”) method is used for each loan in a pool, and the results are aggregated at the pool level. A probability of default and absolute loss given default are applied to a projective model of the loan’s cash flow while considering prepayment and principal curtailment effects. The analysis produces expected cash flows for each instrument in the pool by pairing loan-level term information (e.g., maturity date, payment amount, interest rate, etc.) with top-down pool assumptions (e.g., default rates and prepayment speeds). The Company has identified the following portfolio segments: Owner-Occupied Commercial Real Estate, Non-Owner Occupied Commercial Real Estate, Multifamily, Municipal, Commercial and Industrial, Commercial Construction and Land Development, Residential Construction, Residential Senior Mortgage, Residential Junior Mortgage, Revolving Mortgage, and Consumer and Other.
In determining the proper level of the ACL, management has determined that the loss experience of the Bank provides the best basis for its assessment of expected credit losses. The Company therefore used its own historical credit loss experience by each loan segment over an economic cycle, while excluding loss experience from certain acquired institutions (i.e., failed banks). For most of the segment models for collectively evaluated loans, the Company incorporated two or more macroeconomic drivers using a statistical regression modeling methodology.
Management considers forward-looking information in estimating expected credit losses. The Company subscribes to a third-party service which provides a quarterly macroeconomic baseline outlook and alternative scenarios for the United States economy. The baseline, along with the evaluation of alternative scenarios, is used by management to determine the best estimate within the range of expected credit losses. Management has evaluated the appropriateness of the reasonable and supportable forecast scenarios and has made adjustments as needed. For the contractual term that extends beyond the reasonable and supportable forecast period, the Company reverts to the long term mean of historical factors within four quarters using a straight-line approach. The Company generally uses a four-quarter forecast and a four-quarter reversion period.
Included in its systematic methodology to determine its ACL, management considers the need to qualitatively adjust expected credit losses for information not already captured in the loss estimation model. These qualitative adjustments either increase or decrease the quantitative model estimation (i.e., formulaic model results). Each period, the Company considers qualitative factors that are relevant within the qualitative framework that adhere to the Interagency Policy Statement on Allowances for Credit Losses.
When a loan no longer shares similar risk characteristics with its segment, the asset is assessed to determine whether it should be included in another pool or should be individually evaluated. The Company’s threshold for individually evaluated loans includes all non-accrual loans with a net book balance in excess of $1.0 million. Management will monitor the credit environment and make adjustments to this threshold in the future if warranted. Based on the threshold above, consumer financial assets will generally remain in pools unless they meet the dollar threshold. The expected credit losses on individually evaluated loans will be estimated based on discounted cash flow analysis unless the loan meets the criteria for use of the fair value of collateral, either by virtue of an expected foreclosure or through meeting the definition of collateral-dependent. Financial assets that have been individually evaluated can be returned to a pool for purposes of estimating the expected credit loss insofar as their credit profile improves and that the repayment terms were not considered to be unique to the asset.
Management measures expected credit losses over the contractual term of a loan. Effective January 1, 2023, the ACL includes expected losses on modifications of non-accrual loans over $1 million to borrowers experiencing financial difficulty estimated on an individual basis. Otherwise, a change to the ACL is not recorded upon modification because the effect of most modifications made to borrowers experiencing financial difficulty is already included in the allowance historical data.
F-17
For purchased credit-deteriorated, otherwise referred to herein as PCD, assets are defined as acquired individual financial assets (or acquired groups of financial assets with similar risk characteristics) that, as of the date of acquisition, have experienced a more-than-insignificant deterioration in credit quality since origination, as determined by the Company’s assessment. The Company records acquired PCD loans by adding the expected credit losses (i.e., allowance for credit losses) to the purchase price of the financial assets rather than recording through the provision for credit losses in the income statement. The expected credit loss, as of the acquisition day, of a PCD loan is added to the allowance for credit losses. The non-credit discount or premium is the difference between the unpaid principal balance and the amortized cost basis as of the acquisition date. Subsequent to the acquisition date, the change in the ACL on PCD loans is recognized through the Provision for Credit Losses in the Consolidated Statements of Income. The non-credit discount or premium is accreted or amortized, respectively, into interest income over the remaining life of the PCD loan on a level-yield basis.
The Company follows its nonaccrual policy by reversing contractual interest income in the income statement when the Company places a loan on nonaccrual status. Therefore, management excludes the accrued interest receivable balance from the amortized cost basis in measuring expected credit losses on the portfolio and does not record an allowance for credit losses on accrued interest receivable. As of December 31, 2023 and December 31, 2022, the accrued interest receivables for loans recorded in Other Assets were $127.0 million and $105.4 million, respectively.
The Company has a variety of assets that have a component that qualifies as an off-balance sheet exposure. These primarily include undrawn portions of revolving lines of credit and standby letters of credit. The expected losses associated with these exposures within the unfunded portion of the expected credit loss will be recorded as a liability on the balance sheet. Management has determined that a majority of the Company’s off-balance sheet credit exposures are not unconditionally cancellable. Management completes funding studies based on historical data to estimate the percentage of unfunded loan commitments that will ultimately be funded to calculate the reserve for unfunded commitments. Management applies this funding rate, along with the loss factor rate determined for each pooled loan segment, to unfunded loan commitments, excluding unconditionally cancellable exposures and letters of credit, to arrive at the reserve for unfunded loan commitments. As of December 31, 2023 and December 31, 2022, the liability recorded for expected credit losses on unfunded commitments was $56.3 million and $67.2 million, respectively. The current adjustment to the ACL for unfunded commitments is recognized through the Provision for Credit Losses in the Consolidated Statements of Income.
Other Real Estate Owned and Bank Property Held For Sale
Other real estate owned (“OREO”) consists of properties obtained through foreclosure or through a deed in lieu of foreclosure in satisfaction of loans. The Company discloses former branch site assets as bank property held for sale and reports on a separate line on the Consolidated Balance Sheet. Both OREO and bank property held for sale are recorded at the lower of cost or fair value and the fair value was determined on the basis of current valuations obtained principally from independent sources, adjusted for estimated selling costs. At the time of foreclosure or initial possession of collateral, for OREO, any excess of the loan balance over the fair value of the real estate held as collateral is treated as a charge against the ACL. At the time a bank property is no longer in service and is moved to held for sale, any excess of the current book value over fair value is recorded as an expense in the Consolidated Statements of Income in the merger and branch consolidation related expense line item. The property is then actively marketed for sale at a price that is reasonable in relation to its current fair value. Subsequent adjustments to the value for those being held for sale are described in the following paragraph.
F-18
The Company reports subsequent declines in the fair value of OREO and bank properties held for sale below the new cost basis through valuation adjustments. Significant judgments and complex estimates are required in estimating the fair value of these properties, and the period of time within which such estimates can be considered current is significantly shortened during periods of market volatility. In response to market conditions and other economic factors, management may utilize liquidation sales as part of its problem asset disposition strategy. As a result of the significant judgments required in estimating fair value and the variables involved in different methods of disposition, the net proceeds realized from sales transactions could differ significantly from the current valuations used to determine the fair value of these properties. Management reviews the value of these properties periodically and adjusts the values as appropriate. Revenue and expenses from OREO operations, as well as gains or losses on sales and any subsequent adjustments to the value, are recorded as OREO Expense and Loan Related Expense, a component of Noninterest Expense in the Consolidated Statements of Income. Expenses related to bank property held for sale, as well as gains or losses on sales and any subsequent adjustments to the value, are recorded in Other Expenses, a component of Noninterest Expense in the Consolidated Statements of Income.
Business Combinations and Method of Accounting for Loans Acquired
The Company accounts for its acquisitions under FASB ASC Topic 805, Business Combinations, which requires the use of the acquisition method of accounting. All identifiable assets acquired, including loans, are recorded at fair value, which now requires us to record purchased financial assets with credit deterioration (PCD assets), defined as a more-than-insignificant deterioration in credit quality since origination or issuance, at the purchase price plus the allowance for credit losses expected at the time of acquisition. Under this method, there is no credit loss expense affecting net income on acquisition of PCD assets. Changes in estimates of expected credit losses after acquisition are recognized as provision for credit losses (or recovery for credit losses) in subsequent periods as they arise. Any non-credit discount or premium resulting from acquiring a pool of purchased financial assets with credit deterioration shall be allocated to each individual asset. At the acquisition date, the initial allowance for credit losses determined on a collective basis shall be allocated to individual assets to appropriately allocate any non-credit discount or premium. The non-credit discount or premium, after the adjustment for the allowance for credit losses, shall be accreted to interest income using the interest method based on the effective interest rate determined after the adjustment for credit losses at the adoption date.
A purchased financial asset that does not qualify as a PCD asset is accounted for similar to an originated financial asset. Generally, this means that an entity recognizes the allowance for credit losses for non-PCD assets through net income at the time of acquisition. In addition, both the credit discount and non-credit discount or premium resulting from acquiring a pool of purchased financial assets that do not qualify as PCD assets shall be allocated to each individual asset. This combined discount or premium shall be accreted to interest income using the effective yield method.
For further discussion of our loan accounting and acquisitions, see Note 2—Mergers and Acquisitions, Note 4—Loans and Note 5—Allowance for Credit Losses to the audited condensed consolidated financial statements.
Premises and Equipment
Land is carried at cost. Office equipment, furnishings, and buildings are carried at cost less accumulated depreciation computed principally on the declining-balance and straight-line methods over the estimated useful lives of the assets. Leasehold improvements are amortized on the straight-line method over the shorter of the estimated useful lives of the improvements or the terms of the related leases including lease renewals only when the Company is reasonably assured of the aggregate term of the lease. Additions to premises and equipment and major replacements are added to the accounts at cost. Maintenance and repairs and minor replacements are charged to expense when incurred. Gains and losses on routine dispositions are reflected in current operations.
F-19
Leases
Right-of-Use (“ROU”) assets represent our right to use an underlying asset for the lease term and lease liabilities represent our obligation to make lease payments arising from the lease. We determined that we do not have any leases classified as finance leases, and that all of our leases are operating leases, with the exception of the two minor finance leases acquired through the merger with CenterState. ROU assets and liabilities for operating leases are recognized at commencement date based on present value of lease payments not yet paid, discounted using the discount rate for the lease at the lease commencement date over the lease term. For operating leases, lease expense is determined by the sum of the lease payments to be recognized on a straight-line basis over the lease term.
As of December 31, 2023 and 2022, we had operating ROU assets of $100.3 million and $108.0 million, respectively, recorded within Premises and Equipment on the Consolidated Balance Sheets and a lease liability of $108.3 million and $115.6 million, respectively, recorded within Other Liabilities on the Consolidated Balance Sheets.
Bank Owned Life Insurance
BOLI is comprised of long-term life insurance contracts on the lives of certain current and past employees where the insurance policy benefits and ownership are retained by the employer. Its cash surrender value is an asset that the Company uses to partially offset the future cost of employee benefits. The cash value accumulation on BOLI is permanently tax deferred if the policy is held to the insured person’s death and certain other conditions are met.
Intangible Assets
Intangible assets consist of goodwill, core deposit intangibles and client list intangibles that result from the acquisition of other banks or branches from other financial institutions. Core deposit intangibles represent the value of long-term deposit relationships acquired in these transactions. Client list intangibles represent the value of long-term client relationships for the wealth and trust management business. Goodwill represents the excess of the purchase price over the sum of the estimated fair values of the tangible and identifiable intangible assets acquired less the estimated fair value of the liabilities assumed in a business combination. At December 31, 2023 and December 31, 2022, the balance of goodwill was $1.9 billion. Goodwill has an indefinite useful life and is evaluated for impairment annually or more frequently if events and circumstances indicate that the asset might be impaired. An impairment loss is recognized to the extent that the carrying amount exceeds the asset’s fair value.
ASU No. 2017-04 simplifies the accounting for goodwill impairment for all entities by requiring impairment charges to be based on Step 1 of the previous accounting guidance’s two-step impairment test under ASC Topic 350. Under this guidance, if a reporting unit’s carrying amount exceeds its fair value, an entity will record an impairment charge based on that difference. The impairment charge will be limited to the amount of goodwill allocated to that reporting unit. The standard eliminates the requirement to calculate a goodwill impairment charge using Step 2 which involved calculating an implied fair value of goodwill for each reporting unit for which the first step indicated impairment. The standard does not change the guidance on completing Step 1 of the goodwill impairment test. An entity will still be able to perform today’s optional qualitative goodwill impairment assessment before determining whether to proceed to the quantitative step of determining whether the reporting unit’s carrying amount exceeds it fair value.
The Company evaluated the carrying value of goodwill as of October 31, 2023, our annual test date, considering the effects of the bank failures in early 2023 and other market conditions and determined that no impairment charge was necessary.
F-20
Core deposit intangibles and client list intangibles consist primarily of amortizing assets established during the acquisition of other banks. This includes whole bank acquisitions and the acquisition of certain assets and liabilities from other financial institutions. Core deposit intangibles, included in Core Deposit and Other Intangibles in the Consolidated Balance Sheets, are amortized over the estimated useful lives of the deposit accounts acquired (generally 10 to 13 years) on an accelerated basis method which reasonably approximates the anticipated benefit stream from the accounts. The estimated useful lives are periodically reviewed for by comparing current balances to the initial estimates calculated at the time of merger or acquisition. Client list intangibles, included in Core Deposit and Other Intangibles in the Consolidated Balance Sheets, are amortized over the estimated useful lives of the client lists acquired (generally 15 years) on the straight-line method. The estimated useful lives are periodically reviewed for reasonableness.
Mortgage Servicing Rights (“MSRs”)
The Company has a mortgage loan servicing portfolio with related mortgage servicing rights. MSRs represent the present value of the future net servicing fees from servicing mortgage loans. Servicing assets and servicing liabilities must be initially measured at fair value, if practicable. For subsequent measurements, an entity can choose to measure servicing assets and liabilities either based on fair value or lower of cost or market. The Company uses the fair value measurement option for MSRs.
The methodology used to determine the fair value of MSRs is subjective and requires the development of a number of assumptions, including anticipated prepayments of loan principal. Fair value is determined by estimating the present value of the asset’s future cash flows utilizing estimated market-based prepayment rates and discount rates, interest rates and other economic factors and assumptions validated through comparison to trade information, industry surveys and with the use of independent third-party appraisals. Risks inherent in the MSRs valuation include higher than expected prepayment rates and/or delayed receipt of cash flows. The value of MSRs is significantly affected by interest rates available in the marketplace, which influence loan prepayment speeds. In general, during periods of declining interest rates, the value of mortgage servicing rights declines due to increasing prepayments attributable to increased mortgage refinance activity. Conversely, during periods of rising interest rates, the value of servicing rights generally increases due to reduced refinance activity. MSRs are carried at fair value with changes in fair value recorded as a component of Mortgage Banking Income.
Transfer of Financial Assets
Transfers of financial assets are accounted for as sales when control over the assets has been surrendered. Control over the transferred assets is deemed to be surrendered when: (1) the assets have been isolated from the Company, (2) the transferee obtains the right (free of conditions that constrain it from taking advantage of that right) to pledge or exchange the transferred assets, and (3) the Company does not maintain effective control over the transferred assets through an agreement to repurchase them before their maturity. The Company reviews all sales of loans by evaluating specific terms in the sales documents and believes that the criteria discussed above to qualify for sales treatment have been met as loans have been transferred for cash and the notes and mortgages for all loans in each sale are endorsed and assigned to the transferee. Investors perform quality control reviews of mortgage loans purchased including post-purchase, early payment default, servicing, and post-foreclosure reviews. If a loan level deficiency cannot be remedied and breaches a term contained in the Investor agreement in effect at the time of loan delivery, the reviews may result in loan repurchase demands, or other alternative remedies. In certain sales, mortgage servicing rights may be retained and in other programs potential loss exposure from the credit enhancement obligation may be retained, both of which are evaluated and appropriately measured at the date of sale.
The Company maintains a risk management program to manage interest rate risk and pricing risk associated with its mortgage lending activities. This program includes the use of forward contracts and other derivatives that are used to offset changes in value of the mortgage inventory due to changes in market interest rates. Forward contracts to sell primarily fixed-rate mortgage loans are entered into to reduce the exposure to market risk arising from potential changes in interest rates. This could affect the fair value of mortgage loans held for sale and outstanding interest rate lock commitments which guarantee a certain interest rate if the loan is ultimately funded by the Company as a mortgage loan held for sale. The commitments to sell mortgage loans are at fixed prices and are schedule to settle on specific dates.
F-21
The Company enters into interest rate lock commitments for residential mortgage loans which commits it to lend funds to a potential borrower at a specific interest rate and within a specified time period. Interest rate lock commitments that relate to origination of mortgage loans that, if originated, will be held for sale, are considered derivative financial instruments under applicable accounting guidance. Outstanding interest rate lock commitments expose the Company to the risk that the price of the mortgage loans underlying the commitments may decline due to increases in mortgage interest rates from the inception of the rate lock to the funding of the loan and the eventual commitment for sale into the secondary market.
The Company packages the fixed rate conforming mortgage loans to be sold to investors. The Company records the sale when the transferred loans are purchased by the investor and the accounting criteria for the sale are met. Gains or losses recorded depend in part on the net carrying amount of the loans sold, which is allocated between the loans sold and retained interests based on their relative fair values at the date of sale. Since quoted market prices are not typically available, the fair value of retained interests is estimated through the services of a third-party service provider to determine the net present value of expected future cash flows. Such models incorporate management’s best estimates of key variables, such as prepayment speeds and discount rates that would be used by market participants and are appropriate for the risks involved. The Company generally retains mortgage servicing rights on residential loans sold in the secondary market to Fannie Mae and Freddie Mac. Loans sold to other third-party investors are sold servicing released. Gains and losses incurred on loans sold to third-party investors are included in Mortgage Banking Income in the Consolidated Statements of Income.
Revenue from Contracts with Customers
The majority of our revenue is derived primarily from interest income from receivables (loans) and securities. Other revenues are derived from fees received in connection with deposit accounts, mortgage banking activities including gains from the sale of loans and loan origination fees, correspondent banking activities including revenue from the sale of fixed income securities and fees from hedging services, and trust and investment advisory services. We recognize revenue to depict the transfer of promised goods or services to customers in an amount that reflects the consideration to which the entity expects to be entitled in exchange for those goods or services.
We report network costs associated with debit card and ATM transactions netted against the related fees from such transactions. For years 2023, 2022, and 2021, gross interchange and debit card transaction fees totaled $41.3 million, $40.7 million, and $38.3 million, respectively, while related network costs totaled $20.7 million, $18.5 million, and $20.3 million, respectively. On a net basis, the Company reported $20.6 million, $22.2 million, and $18.0 million, respectively, as interchange and debit card transactions fees in the accompanying Consolidated Statements of Income within Noninterest Income for the years ended December 31, 2023, 2022, and 2021.
The Company maintains contracts to provide services, primarily for investment advisory and/or custody of assets. Through the Company’s wholly owned subsidiaries, the Bank, and SouthState Advisory, Inc., the Company contracts with its customers to perform IRA, Trust, and/or Custody and Agency advisory services. Total revenue recognized from these contracts with customers was $39.4 million, $39.0 million, and $37.0 million, respectively, for the years ended December 31, 2023, 2022 and 2021. The Bank has contracts with its customers to perform deposit account services. Total revenue recognized from these contracts with customers is $134.6 million, $129.7 million, and $107.3 million, respectively, for the years ended December 31, 2023, 2022 and 2021. Due to the nature of our relationship with the customers that we provide services, we do not incur costs to obtain contracts and there are no material incremental costs to fulfill these contracts that should be capitalized.
Disaggregation of Revenue - The portfolio of services provided to the Company’s customers which generates revenue for which the revenue recognition standard applies consists of approximately 1.1 million active contracts at December 31, 2023. The Company has disaggregated revenue according to the timing of the transfer of service. Total revenue derived from contracts in which services are transferred at a point in time was $237.3 million, $266.8 million, and $255.4 million, respectively, for the years ended December 31, 2023, 2022 and 2021. Total revenue derived from contracts in which services are transferred over time was $20.9 million, $20.2 million, and $19.9 million, respectively, for the years ended December 31, 2023, 2022 and 2021. Revenue is recognized as the services are provided to the customers. Economic factors impacting the customers could affect the nature, amount, and timing of these cash flows, as unfavorable economic conditions could impair the customers’ ability to provide payment for services. This risk is mitigated as we generally deduct payments from customers’ accounts as services are rendered.
F-22
Contract Balances - The timing of revenue recognition, billings, and cash collections results in billed accounts receivable on our balance sheet. Most contracts call for payment by a charge or deduction to the respective customer account but there are some that require a receipt of payment from the customer. For fee per transaction contracts, the customers are billed as the transactions are processed. For hourly rate and monthly service contracts related to trust and some investment revenues, the customers are billed monthly (generally as a percentage basis point of the market value of the investment account). In some cases, specific to SouthState Advisory, Inc., customers are billed in advance for quarterly services to be performed based on the past quarter’s average account balance. These do create contract liabilities or deferred revenue, as the customers pay in advance for service. Neither the contract liabilities nor the accounts receivables balances are material to the Company’s Consolidated Balance Sheets.
Performance Obligations - A performance obligation is a promise in a contract to transfer a distinct good or service to the customer, and is the unit of account for revenue recognition. A contract’s transaction price is allocated to each distinct performance obligation and recognized as revenue when, or as, the performance obligation is satisfied. The performance obligations for these contracts are satisfied as the service is provided to the customer (either over time or at a point in time). The payment terms of the contracts are typically based on a basis point percentage of the investment account market value, fee per hour of service, or fee for service incurred. There are no significant financing components in the contracts. Excluding deposit services revenues, which are mostly billed at a point in time as a fee for services incurred, all other contracts contain variable consideration in that fees earned are derived from market values of accounts or from hours worked for services performed which determines the amount of consideration to which we are entitled. The variability is resolved when the hours are incurred or services are provided. The contracts do not include obligations for returns, refunds, or warranties. The contracts are specific to the amounts owed to the Company for services performed during a period should the contracts be terminated.
Significant Judgments - All of the contracts create performance obligations that are satisfied at a point in time excluding the contracts billed in advance through SouthState Advisory, Inc. and some immaterial deposit revenues. Revenue is recognized as services are billed to the customers. Variable consideration does exist for contracts related to our trust and investment services as revenues are based on market values and services performed. The Company has adopted the right-to-invoice practical expedient for trust management contracts through SouthState Bank, which we contract with our customers to perform IRA, Trust, and/or Custody services.
Advertising Costs
The Company expenses advertising costs as they are incurred and advertising communication costs the first time the advertising takes place. The Company may establish accruals for anticipated advertising expenses within the course of a fiscal year.
Comprehensive Income (Loss)
Accounting principles generally require that recognized revenue, expenses, gains and losses be included in net income. Certain changes in assets and liabilities, such as (1) unrealized gains and losses on available for sale securities (2) unrealized gains and losses on effective portions of derivative financial instruments accounted for as cash flow hedges and (3) net change in unrecognized amounts related to pension and post-retirement benefits, are reported as a separate component of the equity section of the Consolidated Balance Sheets. Such items, along with net income, are components of total comprehensive (loss) income (see Consolidated Statements of Comprehensive Income (Loss) on page F-8).
Employee Benefit Plans
The Company’s post retirement plans are accounted for in accordance with FASB ASC 715, Compensation—Retirement Benefits, which requires the Company to recognize the funded status in its statement of financial position. See Note 18—Post-Retirement Benefits for information regarding our post-retirement benefit plans. The expected costs of the post retirement benefit plans are expensed over the period that employees provide service.
F-23
The Employee Stock Purchase Plan (“ESPP”) allows for a look-back option which establishes the purchase price as an amount based on the lesser of the stock’s market price at the grant date or its market price at the exercise (or purchase) date. For the shares issued in exchange for employee services under the plan, the Company accounts for the plan under the FASB ASC 718, Compensation—Stock Compensation, in which the fair value measurement method is used to estimate the fair value of the equity instruments, based on the share price and other measurement assumptions at the grant date. See Note 19—Share-Based Compensation for the amount the Company recognized as expense for the years ended December 31, 2023, 2022 and 2021.
Income Taxes
Income taxes are provided for the tax effects of the transactions reported in the accompanying consolidated financial statements and consist of taxes currently due plus deferred taxes related primarily to differences between the tax basis and financial statement. The deferred tax assets and liabilities represent the future tax return consequences of those differences, which will either be taxable or deductible when the assets and liabilities are recovered or settled. Deferred tax assets and liabilities are reflected at income tax rates applicable to the period in which the deferred tax assets or liabilities are expected to be realized or settled. As changes in tax laws or rates are enacted, deferred tax assets and liabilities are adjusted through the Provision for Income Taxes in the Consolidated Statements of Income.
The Company will evaluate and recognize income tax benefits related to any uncertain tax positions using the recognition and measurement thresholds outlined in the applicable guidance. If the Company does not believe that it is more likely than not that an uncertain tax position will be sustained, the Company records a liability for the uncertain tax positions. If a tax benefit is more-likely-than not of being sustained based on the applicable authority, the Company records an income tax benefit that is greater than 50 percent likely to be realized upon ultimate settlement with a taxing authority. The Company recognizes interest and penalties related to unrecognized tax benefits on other expense line in the accompanying consolidated statements of income. Accrued interest and penalties are included on the related liability lines in the consolidated balance sheet.
See Note 12—Income Taxes to the consolidated financial statements for further details and discussion.
Earnings Per Share
Basic earnings per share (“EPS”) represents income available to common shareholders divided by the weighted-average number of shares outstanding during the year. Diluted earnings per share reflects additional shares that would have been outstanding if dilutive potential shares had been issued. Potential shares that may be issued by the Company relate solely to outstanding stock options, restricted stock and restricted stock units (non-vested shares and vested shares subject to a holding period), and are determined using the treasury stock method. Under the treasury stock method, the number of incremental shares is determined by assuming the issuance of stock for the outstanding stock options, reduced by the number of shares assumed to be repurchased from the issuance proceeds, using the average market price for the year of the Company’s stock. Weighted-average shares for the basic and diluted EPS calculations have been reduced by the average number of unvested restricted shares.
Derivative Financial Instruments
The Company’s interest rate risk management strategy incorporates the use of derivative financial instruments. Historically, the Company has used interest rate swaps to essentially convert a portion of its variable-rate debt to a fixed rate. Cash flows related to variable-rate debt will fluctuate with changes in an underlying rate index. When effectively hedged, the increases or decreases in cash flows related to the variable-rate debt will generally be offset by changes in cash flows of the derivative instrument designated as a hedge. This strategy is referred to as a cash flow hedge. For derivatives designated as hedging exposure to variable cash flows of a forecasted transaction (cash flow hedge), the derivative’s entire unrealized gain or loss is initially reported as a component of other comprehensive income and subsequently reclassified into earnings when the forecasted transaction affects earnings or when the hedged instrument and related swap are terminated before maturity. For derivatives that are not designated as hedging instruments, changes in the fair value of the derivatives are recognized in earnings immediately. The Company did not use cash flow hedges for the years ended December 31, 2023 or December 31, 2022.
F-24
The Company maintains loan swaps which are accounted for as a fair value hedge. This derivative protects the Company from interest rate risk caused by changes in the SOFR curve in relation to a certain designated fixed rate loan. Fair value hedges convert the fixed rate to a floating rate. For discussion related to Reference Rate Reform, please refer to the caption “Accounting Standards Adopted” within this Note 1—Summary of Significant Accounting Policies.
The Company’s risk management strategy for its mortgage banking activities incorporates derivative instruments used to economically hedge both the value of the mortgage servicing rights and the mortgage pipeline. These derivative instruments are not designated as hedges and are not speculative in nature. The derivative instruments that are used to hedge the value of the mortgage servicing rights include financial forwards, futures contracts, and options written and purchased. When-issued securities and mandatory cash forward trades are typically used to hedge the mortgage pipeline. These instruments derive their cash flows, and therefore their values, by reference to an underlying instrument, index or referenced interest rate.
During 2023, management began executing a series of short-term interest rate hedges to address monthly accrual mismatches related to the Company’s Assumable Rate Conversion (“ARC”) program and its transition from LIBOR to SOFR after June 30, 2023. The Company is required to execute the correspondent side of its back-to-back swaps with customers with the central clearinghouses, London Clearing House (“LCH”) and Chicago Mercantile Exchange (“CME”). Term SOFR was not available to execute through CME and LCH, and therefore, management elected to convert to the CME-eligible daily SOFR. Because many of the respondent bank customers converted to term SOFR, this created interest rate basis risk. To address this risk, monthly interest rate hedges were executed to minimize the impact of accrual mismatches between the monthly term SOFR used by the customer and the daily SOFR rates used by the central clearinghouses. As these economic interest rate hedges do not meet the strict hedge accounting requirements, changes in the fair value of the swaps are recognized directly in earnings.
The Company’s risk management strategy also incorporates the use of interest rate swap contracts that help in managing interest rate risk within the loan portfolio and foreign currency exchange. These derivatives are not designated as hedges and are not speculative, and result from a service the Company provides to certain customers. The Company executes interest rate swaps with commercial banking customers to facilitate their respective risk management strategies. Those interest rate swaps are simultaneously economically hedged by offsetting interest rate swaps that the Company executes with a third-party, such that the Company minimizes its net risk exposure resulting from such transactions. As the interest rate swaps associated with this program do not meet the strict hedge accounting requirements, changes in the fair value of both the customer swaps and the offsetting swaps are recognized directly in earnings.
The Company determined the variation margin payments for the Company’s interest rate swaps centrally cleared through LCH and CME meet the legal characteristics of daily settlements of the derivatives (settle-to-market) rather than collateral (collateralize-to-market). As a result, the variation margin payment and the related derivative instruments are considered a single unit of account for accounting and financial reporting purposes. Depending on the net position, the fair value of the single unit of account is reported in Derivative Assets or Derivative Liabilities on the Consolidated Balance Sheets, as opposed to interest-earning deposits (restricted cash) within Cash and Cash Equivalents or interest-bearing deposits within Total Deposits. In addition, the expense or income attributable to the variation margin payments for the centrally cleared swaps is reported in Noninterest Income, specifically within Correspondent and Capital Markets Income, as opposed to Interest Income or Interest Expense. The daily settlement of the derivative exposure does not change or reset the contractual terms of the instrument.
By using derivative instruments, the Company is exposed to credit and market risk. If the counterparty fails to perform, credit risk is equal to the fair value gain in a derivative. When the fair value of a derivative contract is positive, this situation generally indicates that the counterparty is obligated to pay the Company, and, therefore, creates a repayment risk for the Company. When the fair value of a derivative contract is negative, the Company is obligated to pay the counterparty and, therefore, has no repayment risk. The Company minimizes the credit risk in derivative instruments by entering into transactions with high-quality counterparties that are reviewed periodically by the Company.
F-25
The Company’s derivative activities are monitored by its Asset-Liability Management Committee (“ALCO”) as part of that committee’s oversight of the Company’s asset/liability and treasury functions. The Company’s ALCO is responsible for implementing various hedging strategies that are developed through its analysis of data from financial simulation models and other internal and industry sources. The resulting hedging strategies are then incorporated into the overall interest-rate risk management process.
The Company recognizes the fair value of derivatives as assets or liabilities in the financial statements. The accounting for the changes in the fair value of a derivative depends on the intended use of the derivative instrument at inception. The change in fair value of the effective portion of cash flow hedges is accounted for in Other Comprehensive Income rather than Net Income. Gains and losses recognized from changes in fair value on derivatives are reported in Derivative Assets and Derivatives Liabilities lines under cash flows from operating activities section in the Consolidated Statements of Cash Flows. Changes in fair value of derivative instruments that are not intended as a hedge are accounted for in Net Income in the period of the change.
See Note 28—Derivative Financial Instruments for further disclosure.
Reclassification
Certain amounts previously reported have been reclassified to conform to the current year’s presentation. Such reclassifications are immaterial and had no effect on net income, comprehensive income (loss), total assets or total shareholders’ equity as previously reported.
Recent Accounting and Regulatory Pronouncements
Accounting Standards Adopted
In March 2022, FASB issued ASU No. 2022-02, Financial Instruments – Credit Losses (Topic 326): Troubled Debt Restructurings and Vintage Disclosures. The amendments in this ASU eliminate the long-standing accounting guidance for Troubled Debt Restructurings (“TDRs”) by creditors in Subtopic 310-40, Receivables – Troubled Debt Restructurings by Creditors, as it is no longer meaningful due to the introduction of Topic 326, which requires an entity to consider lifetime expected credit losses on loans when establishing an allowance for credit losses. Thus, most losses that would have been realized for a TDR under Subtopic 310-40 are now captured by the accounting required under Topic 326. The amendments in this ASU also require that an entity disclose current-period gross write offs by year of origination for financing receivables and net investments in leases within the scope of Subtopic 326-20, Financial Instruments – Credit Losses Measured at Amortized Cost. The Company adopted ASU No. 2022-02 effective January 1, 2023. We elected to apply a prospective transition method, which applies only to modifications occurring after the adoption date. For loans meeting the Bank’s materiality criteria, which includes loans in excess of $250,000, an assessment of whether a borrower is experiencing financial difficulty is made on the date of the modification. On the transition date, the former TDR loans as of December 31, 2022 were designated as individually evaluated loans on January 1, 2023 and retained the allowance for credit losses allocated to these loans at the adoption date as the credit risk of these loans did not change. Aside from the changes to the disclosures required by ASU No. 2022-02, the ASU did not have a material impact on our consolidated financial statements.
In March 2020, FASB issued ASU No. 2020-04, Reference Rate Reform (Topic 848 – Facilitation of the Effects of Reference Rate Reform on Financial Reporting and subsequently expanded the scope of ASU No. 2020-04 with the issuance of ASU No. 2021-01 and extended the sunset date to December 31, 2024 with ASU No. 2022-06. This update provides companies with optional guidance to ease the potential accounting burden associated with transitioning away from reference rates that will be discontinued. The amendments in this update provide optional expedients and exceptions for applying GAAP to contracts, hedging relationships, and other transactions affected by reference rate reform if certain criteria are met. The main provisions for contract modifications include optional relief by allowing the modification as a continuation of the existing contract without additional analysis and other optional expedients regarding embedded features. The amendments in this update were effective for all entities as of March 12, 2020 and may be applied through December 31, 2022. In January 2021, the FASB issued ASU 2021-01 which clarified that certain optional expedients and exceptions in Topic 848 for contract modifications and hedge accounting apply to derivatives that are affected by the discounting transition. ASU 2022-06 extended the effective date through December 31, 2024. The amendments are effective as of March 12, 2020 through December 31, 2024 and can be adopted at the instrument level on an ongoing basis. Management adopted these optional expedients beginning April 1, 2023 to coincide with the transition and modification of our LIBOR-exposed instruments.
F-26
Most of the loan modifications met the requirements of these practical expedients, as most were subject to the Adjustable Interest Rate (LIBOR) Act which permits a replacement index with a spread adjustment. These modifications did not have a material impact on the consolidated financial statements.
Issued But Not Yet Adopted Accounting Standards
In March 2023, FASB issued ASU No. 2023-02, Investments—Equity Method and Joint Ventures (Topic 323): Accounting for Investments in Tax Credit Structures Using the Proportional Amortization Method. The Proportional Amortization method was introduced by ASU No. 2014-01, but limited this amortization method to investments in low-income housing tax credit structures. The amendments in ASU 2023-02 will allow entities the option to elect whether they account for tax equity investments using the proportional amortization method if certain conditions are met, regardless of the program from which the income tax credits are received. The election would be on a program-by-program basis. The ASU would also require disclosures to be transparent about an entity’s investments that generate income tax credits and other income tax benefits. The amendments are effective for fiscal years beginning after December 15, 2023, including interim periods within those fiscal years with early adoption permitted. The Company maintains investments in low-income housing tax structures and has elected to apply the proportional amortization method for its low-income housing tax credits effective January 1, 2024 and will apply the changes to the accounting treatment under the modified retrospective method. The Company estimates it will record a cumulative adjustment to retained earnings of approximately $10 million as a result of the adoption of ASU No. 2023-02.
In November 2023, the FASB issued ASU No. 2023-07, Segment Reporting (Topic 280): Improvements to Reportable Segment Disclosures, to improve disclosures about a public entity’s reportable segments and address requests from investors and other allocators of capital for additional, more detailed information about a reportable segment’s expenses. Segment information gives investors an understanding of overall performance and is key to assessing potential future cash flows. In addition, although information about a segment’s revenue and measure of profit or loss is disclosed in an entity’s financial statements, there is limited information disclosed about a segment’s expenses. The key amendments include annual and interim disclosures of significant expenses and other segment items that are regularly provided to the chief operating decision maker and included within each reported measure of profit or loss, as well as any other key measure of performance used for segment management decisions. This ASU also requires disclosure of key profitability measures used in assessing performance and how to allocate resources. The amendments in this ASU are effective for fiscal years beginning after December 15, 2023, and for interim periods within fiscal years beginning after December 15, 2024, with early adoption permitted. The Company does not anticipate this ASU will have a material impact on its financial statements.
In December 2023, the FASB issued ASU No. 2023-09, Income Taxes (Topic 740): Improvements to Income Tax Disclosures, which aims to address requests for improved income tax disclosures from investors, lenders, creditors and other allocators of capital (collectively, “investors”) that use the financial statements to make capital allocation decisions. The amendments in this ASU address investor requests for more transparency about income tax information, including jurisdictional information, by requiring consistent categories and greater disaggregation of information in both the rate reconciliation and income taxes paid disaggregated by jurisdiction. The amendments are effective for annual periods beginning after December 15, 2024. The Company does not anticipate this ASU will have a material impact on its financial statements.
F-27
Note 2—Mergers and Acquisitions
Atlantic Capital Bancshares, Inc. (“Atlantic Capital” or “ACBI”)
On March 1, 2022, the Company acquired all of the outstanding common stock of Atlantic Capital in a stock transaction. Upon the terms and subject to the conditions set forth therein, Atlantic Capital merged with and into the Company, with the Company continuing as the surviving corporation in the merger. Immediately following the merger, Atlantic Capital’s wholly owned banking subsidiary, Atlantic Capital Bank, N.A. (“ACB”) merged with and into the Bank, which continues as the surviving bank. Shareholders of Atlantic Capital received 0.36 shares of the Company’s common stock for each share of Atlantic Capital common stock they owned. In total, the purchase price for Atlantic Capital was $657.8 million.
In the acquisition, the Company acquired $2.4 billion of loans, including PPP loans, at fair value, net of $54.3 million, or 2.24%, estimated discount to the outstanding principal balance, representing 10.0% of the Company’s total loans at December 31, 2021. Of the total loans acquired, management identified $137.9 million that had more than insignificantly deteriorated since origination and were thus determined to be PCD loans.
The acquisition was accounted for under the acquisition method of accounting in accordance with ASC Topic 805. The Company recognized goodwill on this acquisition of $342.0 million. The goodwill was calculated based on the fair values of the assets acquired and liabilities assumed as of the acquisition date.
During the years ended December 31, 2023 and 2022, the Company incurred approximately $2.4 million and $18.5 million, respectively, of acquisition costs related to this transaction. These acquisition costs are reported in Merger and Branch Consolidation Related Expenses on the Company’s Consolidated Statements of Net Income.
F-28
|
|
|
|
Initial |
|
Subsequent |
|
|
|
||||
|
|
As Recorded |
|
Fair Value |
|
Fair Value |
|
As Recorded by |
|
||||
(Dollars in thousands) |
|
by Atlantic Capital |
|
Adjustments |
|
Adjustments |
|
the Company |
|
||||
Assets |
|
|
|
|
|
|
|
|
|
|
|
|
|
Cash and cash equivalents |
|
$ |
250,134 |
|
$ |
24 |
(a) |
$ |
— |
|
$ |
250,158 |
|
Investment securities |
|
|
717,332 |
|
|
(13,622) |
(b) |
|
— |
|
|
703,710 |
|
Loans, net of allowance and mark |
|
|
2,394,256 |
|
|
(18,964) |
(c) |
|
(5,614) |
(c) |
|
2,369,678 |
|
Premises and equipment |
|
|
16,892 |
|
|
2,608 |
(d) |
|
— |
|
|
19,500 |
|
Intangible assets |
|
|
22,572 |
|
|
(1,781) |
(e) |
|
— |
|
|
20,791 |
|
Bank owned life insurance |
|
|
74,613 |
|
|
— |
|
|
— |
|
|
74,613 |
|
Deferred tax asset |
|
|
30,231 |
|
|
2,273 |
(f) |
|
(1,025) |
(f) |
|
31,479 |
|
Other assets |
|
|
45,274 |
|
|
(1,277) |
(g) |
|
7,557 |
(g) |
|
51,554 |
|
Total assets |
|
$ |
3,551,304 |
|
$ |
(30,739) |
|
$ |
918 |
|
$ |
3,521,483 |
|
|
|
|
|
|
|
|
|
|
|
|
|
|
|
Liabilities |
|
|
|
|
|
|
|
|
|
|
|
|
|
Deposits: |
|
|
|
|
|
|
|
|
|
|
|
|
|
Noninterest-bearing |
|
$ |
1,411,671 |
|
$ |
— |
|
$ |
— |
|
$ |
1,411,671 |
|
Interest-bearing |
|
|
1,616,970 |
|
|
— |
|
|
— |
|
|
1,616,970 |
|
Total deposits |
|
|
3,028,641 |
|
|
— |
|
|
— |
|
|
3,028,641 |
|
Federal funds purchased and securities sold under agreements to repurchase |
|
|
50,000 |
|
|
— |
|
|
— |
|
|
50,000 |
|
Other borrowings |
|
|
74,131 |
|
|
4,286 |
(h) |
|
— |
|
|
78,417 |
|
Other liabilities |
|
|
50,711 |
|
|
(2,075) |
(i) |
|
— |
|
|
48,636 |
|
Total liabilities |
|
|
3,203,483 |
|
|
2,211 |
|
|
— |
|
|
3,205,694 |
|
Net identifiable assets acquired over (under) liabilities assumed |
|
|
347,821 |
|
|
(32,950) |
|
|
918 |
|
|
315,789 |
|
Goodwill |
|
|
— |
|
|
342,939 |
|
|
(918) |
|
|
342,021 |
|
Net assets acquired over liabilities assumed |
|
$ |
347,821 |
|
$ |
309,989 |
|
$ |
— |
|
$ |
657,810 |
|
|
|
|
|
|
|
|
|
|
|
|
|
|
|
Consideration: |
|
|
|
|
|
|
|
|
|
|
|
|
|
SouthState Corporation common shares issued |
|
|
|
|
|
|
|
|
|
|
|
7,330,803 |
|
Purchase price per share of the Company's common stock |
|
|
|
|
|
|
|
|
|
|
$ |
90.00 |
|
|
|
|
|
|
|
|
|
|
|
|
|
|
|
Company common stock issued ($659,772) and cash exchanged for fractional shares ($19) |
|
|
|
|
|
|
|
|
|
|
$ |
659,791 |
|
Stock option conversion |
|
|
|
|
|
|
|
|
|
|
|
1,135 |
|
Restricted stock unit conversion |
|
|
|
|
|
|
|
|
|
|
|
2,870 |
|
Restricted stock awards conversion (unvested awards) |
|
|
|
|
|
|
|
|
|
|
|
(5,986) |
|
Fair value of total consideration transferred |
|
|
|
|
|
|
|
|
|
|
$ |
657,810 |
|
Explanation of fair value adjustments:
(a)— Represents an adjustment to record time deposits with financial institutions at fair value (premium).
(b)— Represents the reversal of Atlantic Capital 's existing fair value adjustments of $17.2 million and the adjustment to record securities at fair value (discount) totaling $30.9 million (includes reclassification of all securities held as HTM to AFS totaling $237.6 million).
(c)— Represents approximately 1.40%, or $34.0 million, net credit discount of the loan portfolio and 2.24% total net discount, or $54.3 million, including non-credit discount, based on a third-party valuation. Also, includes a reversal of Atlantic Capital's ending allowance for credit losses of $22.1 million and $7.6 million of existing Atlantic Capital’s deferred fees and costs.
(d)— Represents the preliminary fair value adjustments of $2.6 million on fixed assets and leased assets.
(e)— Represents approximately $17.5 million, or 0.63%, of CDI amount and $3.2 million for SBA servicing asset based on a third-party valuation. Atlantic Capital’s pre-merger goodwill and servicing asset of $19.9 million and $2.6 million, respectively, were written-off.
(f)— Represents deferred tax asset related to fair value adjustments with effective tax rate of 23.9%, which includes an adjustment from Atlantic Capital’s effective tax rate to the Company’s effective tax rate. The difference in effective tax rates relates to state income taxes.
(g)— Represents the fair value adjustment (decrease) for low-income housing investments of $1.1 million, write-off of prepaid assets of $233,000, adjustments to receivables of $154,000 and fair value adjustment for Small Business Investment Company (“SBIC”) investments of $7.4 million.
(h)— Represents the reversal of the existing Atlantic Capital’s issuance costs on subordinated debt of $0.9 million and recording the fair value adjustment (premium) of $3.4 million, based on a third-party valuation.
(i)— Represents the reversal of $2.8 million of unfunded commitment liability at purchase date and the fair value adjustment to increase lease liabilities associated with rental facilities totaling $1.4 million. Also includes the reversal of uncertain tax liability of $0.7 million.
F-29
Note 3—Securities
Investment Securities
The following is the amortized cost and fair value of investment securities held to maturity:
|
|
|
|
|
|
|
|
|
|
|
|
|
|
|
|
|
|
Gross |
|
Gross |
|
|
|
||||
|
|
Amortized |
|
Unrealized |
|
Unrealized |
|
Fair |
|
||||
(Dollars in thousands) |
|
Cost |
|
Gains |
|
Losses |
|
Value |
|
||||
December 31, 2023: |
|
|
|
|
|
|
|
|
|
|
|
|
|
U.S. Government agencies |
|
$ |
197,267 |
|
$ |
— |
|
$ |
(24,607) |
|
$ |
172,660 |
|
Residential mortgage-backed securities issued by U.S. government |
|
|
|
|
|
|
|
|
|
|
|
|
|
agencies or sponsored enterprises |
|
|
1,438,102 |
|
|
— |
|
|
(227,312) |
|
|
1,210,790 |
|
Residential collateralized mortgage-obligations issued by U.S. government |
|
|
|
|
|
|
|
|
|
|
|
|
|
agencies or sponsored enterprises |
|
|
444,883 |
|
|
— |
|
|
(68,139) |
|
|
376,744 |
|
Commercial mortgage-backed securities issued by U.S. government |
|
|
|
|
|
|
|
|
|
|
|
|
|
agencies or sponsored enterprises |
|
|
354,055 |
|
|
— |
|
|
(71,327) |
|
|
282,728 |
|
Small Business Administration loan-backed securities |
|
|
53,133 |
|
|
— |
|
|
(11,319) |
|
|
41,814 |
|
|
|
$ |
2,487,440 |
|
$ |
— |
|
$ |
(402,704) |
|
$ |
2,084,736 |
|
December 31, 2022: |
|
|
|
|
|
|
|
|
|
|
|
|
|
U.S. Government agencies |
|
$ |
197,262 |
|
$ |
— |
|
$ |
(29,787) |
|
$ |
167,475 |
|
Residential mortgage-backed securities issued by U.S. government |
|
|
|
|
|
|
|
|
|
|
|
|
|
agencies or sponsored enterprises |
|
|
1,591,646 |
|
|
— |
|
|
(255,093) |
|
|
1,336,553 |
|
Residential collateralized mortgage-obligations issued by U.S. government |
|
|
|
|
|
|
|
|
|
|
|
|
|
agencies or sponsored enterprises |
|
|
474,660 |
|
|
— |
|
|
(69,664) |
|
|
404,996 |
|
Commercial mortgage-backed securities issued by U.S. government |
|
|
|
|
|
|
|
|
|
|
|
|
|
agencies or sponsored enterprises |
|
|
362,586 |
|
|
— |
|
|
(66,304) |
|
|
296,282 |
|
Small Business Administration loan-backed securities |
|
|
57,087 |
|
|
— |
|
|
(12,225) |
|
|
44,862 |
|
|
|
$ |
2,683,241 |
|
$ |
— |
|
$ |
(433,073) |
|
$ |
2,250,168 |
|
The following is the amortized cost and fair value of investment securities available for sale:
|
|
|
|
|
Gross |
|
Gross |
|
|
|
|
||
|
|
Amortized |
|
Unrealized |
|
Unrealized |
|
Fair |
|
||||
(Dollars in thousands) |
|
Cost |
|
Gains |
|
Losses |
|
Value |
|
||||
December 31, 2023: |
|
|
|
|
|
|
|
|
|
|
|
|
|
U.S. Treasuries |
|
$ |
74,720 |
|
$ |
— |
|
$ |
(830) |
|
$ |
73,890 |
|
U.S. Government agencies |
|
|
246,089 |
|
|
— |
|
|
(21,383) |
|
|
224,706 |
|
Residential mortgage-backed securities issued by U.S. government |
|
|
|
|
|
|
|
|
|
|
|
|
|
agencies or sponsored enterprises |
|
|
1,822,104 |
|
|
294 |
|
|
(264,092) |
|
|
1,558,306 |
|
Residential collateralized mortgage-obligations issued by U.S. government |
|
|
|
|
|
|
|
|
|
|
|
|
|
agencies or sponsored enterprises |
|
|
626,735 |
|
|
— |
|
|
(99,313) |
|
|
527,422 |
|
Commercial mortgage-backed securities issued by U.S. government |
|
|
|
|
|
|
|
|
|
|
|
|
|
agencies or sponsored enterprises |
|
|
1,217,125 |
|
|
1,516 |
|
|
(194,471) |
|
|
1,024,170 |
|
State and municipal obligations |
|
|
1,129,750 |
|
|
2 |
|
|
(152,291) |
|
|
977,461 |
|
Small Business Administration loan-backed securities |
|
|
413,950 |
|
|
86 |
|
|
(42,350) |
|
|
371,686 |
|
Corporate securities |
|
|
30,533 |
|
|
— |
|
|
(3,786) |
|
|
26,747 |
|
|
|
$ |
5,561,006 |
|
$ |
1,898 |
|
$ |
(778,516) |
|
$ |
4,784,388 |
|
December 31, 2022: |
|
|
|
|
|
|
|
|
|
|
|
|
|
U.S. Treasuries |
|
$ |
272,416 |
|
$ |
— |
|
$ |
(6,778) |
|
$ |
265,638 |
|
U.S. Government agencies |
|
|
245,972 |
|
|
— |
|
|
(26,884) |
|
|
219,088 |
|
Residential mortgage-backed securities issued by U.S. government |
|
|
|
|
|
|
|
|
|
|
|
|
|
agencies or sponsored enterprises |
|
|
1,996,405 |
|
|
— |
|
|
(298,052) |
|
|
1,698,353 |
|
Residential collateralized mortgage-obligations issued by U.S. government |
|
|
|
|
|
|
|
|
|
|
|
|
|
agencies or sponsored enterprises |
|
|
708,337 |
|
|
— |
|
|
(107,292) |
|
|
601,045 |
|
Commercial mortgage-backed securities issued by U.S. government |
|
|
|
|
|
|
|
|
|
|
|
|
|
agencies or sponsored enterprises |
|
|
1,196,700 |
|
|
2,542 |
|
|
(198,844) |
|
|
1,000,398 |
|
State and municipal obligations |
|
|
1,269,525 |
|
|
1,210 |
|
|
(205,883) |
|
|
1,064,852 |
|
Small Business Administration loan-backed securities |
|
|
491,203 |
|
|
302 |
|
|
(46,695) |
|
|
444,810 |
|
Corporate securities |
|
|
35,583 |
|
|
— |
|
|
(2,945) |
|
|
32,638 |
|
|
|
$ |
6,216,141 |
|
$ |
4,054 |
|
$ |
(893,373) |
|
$ |
5,326,822 |
|
F-30
The following is the amortized cost and carrying value of other investment securities:
|
|
Carrying |
|
|
(Dollars in thousands) |
|
Value |
|
|
December 31, 2023: |
|
|
|
|
Federal Home Loan Bank stock |
|
$ |
22,836 |
|
Federal Reserve Bank stock |
|
|
150,261 |
|
Investment in unconsolidated subsidiaries |
|
|
3,563 |
|
Other nonmarketable investment securities |
|
|
15,383 |
|
|
|
$ |
192,043 |
|
December 31, 2022: |
|
|
|
|
Federal Home Loan Bank stock |
|
$ |
15,085 |
|
Federal Reserve Bank stock |
|
|
150,261 |
|
Investment in unconsolidated subsidiaries |
|
|
3,563 |
|
Other nonmarketable investment securities |
|
|
10,808 |
|
|
|
$ |
179,717 |
|
The Company’s other investment securities consist of non-marketable equity securities that have no readily determinable market value. Accordingly, when evaluating these securities for impairment, management considers the ultimate recoverability of the par value rather than recognizing temporary declines in value. As of December 31, 2023, the Company has determined that there was no impairment on its other investment securities.
The amortized cost and fair value of debt and equity securities at December 31, 2023 by contractual maturity are detailed below. Expected maturities will differ from contractual maturities because borrowers may have the right to call or prepay obligations with or without prepayment penalties.
|
|
|
|
|
|
|
|
|
|
|
|
|
|
|
|
Securities |
|
Securities |
|
||||||||
|
|
Held to Maturity |
|
Available for Sale |
|
||||||||
|
|
Amortized |
|
Fair |
|
Amortized |
|
Fair |
|
||||
(Dollars in thousands) |
|
Cost |
|
Value |
|
Cost |
|
Value |
|
||||
Due in one year or less |
|
$ |
50,000 |
|
$ |
49,222 |
|
$ |
158,338 |
|
$ |
156,418 |
|
Due after one year through five years |
|
|
50,955 |
|
|
46,440 |
|
|
267,073 |
|
|
254,908 |
|
Due after five years through ten years |
|
|
480,806 |
|
|
414,831 |
|
|
1,343,076 |
|
|
1,165,142 |
|
Due after ten years |
|
|
1,905,679 |
|
|
1,574,243 |
|
|
3,792,519 |
|
|
3,207,920 |
|
|
|
$ |
2,487,440 |
|
$ |
2,084,736 |
|
$ |
5,561,006 |
|
$ |
4,784,388 |
|
The following table summarizes information with respect to sales of available for sale securities:
|
|
|
|
|
|
|
|
|
|
|
|
|
Year Ended December 31, |
|
|||||||
(Dollars in thousands) |
|
2023 |
|
2022 |
|
2021 |
|
|||
Securities Available for Sale: |
|
|
|
|
|
|
|
|
|
|
Sale proceeds |
|
$ |
129,614 |
|
$ |
482,028 |
|
$ |
151,314 |
|
Gross realized gains |
|
|
1,335 |
|
|
103 |
|
|
750 |
|
Gross realized losses |
|
|
(1,292) |
|
|
(73) |
|
|
(648) |
|
Net realized gain |
|
$ |
43 |
|
$ |
30 |
|
$ |
102 |
|
There were no sales of held to maturity securities for years ended December 31, 2023, 2022 or 2021.
F-31
The Company had 1,232 securities with gross unrealized losses at December 31, 2023. Information pertaining to securities with gross unrealized losses at December 31, 2023 and 2022, aggregated by investment category and length of time that individual securities have been in a continuous loss position follows:
|
|
Less Than |
|
Twelve Months |
|
||||||||
|
|
Twelve Months |
|
or More |
|
||||||||
|
|
Gross Unrealized |
|
Fair |
|
Gross Unrealized |
|
Fair |
|
||||
(Dollars in thousands) |
|
Losses |
|
Value |
|
Losses |
|
Value |
|
||||
December 31, 2023: |
|
|
|
|
|
|
|
|
|
|
|
|
|
Securities Held to Maturity |
|
|
|
|
|
|
|
|
|
|
|
|
|
U.S. Government agencies |
|
$ |
— |
|
$ |
— |
|
$ |
24,607 |
|
$ |
172,660 |
|
Residential mortgage-backed securities issued by U.S. government |
|
|
|
|
|
|
|
|
|
|
|
|
|
agencies or sponsored enterprises |
|
|
— |
|
|
— |
|
|
227,312 |
|
|
1,210,790 |
|
Residential collateralized mortgage-obligations issued by U.S. government |
|
|
|
|
|
|
|
|
|
|
|
|
|
agencies or sponsored enterprises |
|
|
— |
|
|
— |
|
|
68,139 |
|
|
376,745 |
|
Commercial mortgage-backed securities issued by U.S. government |
|
|
|
|
|
|
|
|
|
|
|
|
|
agencies or sponsored enterprises |
|
|
— |
|
|
— |
|
|
71,327 |
|
|
282,728 |
|
Small Business Administration loan-backed securities |
|
|
— |
|
|
— |
|
|
11,319 |
|
|
41,814 |
|
|
|
$ |
— |
|
$ |
— |
|
$ |
402,704 |
|
$ |
2,084,737 |
|
Securities Available for Sale |
|
|
|
|
|
|
|
|
|
|
|
|
|
U.S. Treasuries |
|
$ |
— |
|
$ |
— |
|
$ |
830 |
|
$ |
73,890 |
|
U.S. Government agencies |
|
|
— |
|
|
— |
|
|
21,383 |
|
|
224,706 |
|
Residential mortgage-backed securities issued by U.S. government |
|
|
|
|
|
|
|
|
|
|
|
|
|
agencies or sponsored enterprises |
|
|
122 |
|
|
9,358 |
|
|
263,970 |
|
|
1,539,208 |
|
Residential collateralized mortgage-obligations issued by U.S. government |
|
|
|
|
|
|
|
|
|
|
|
|
|
agencies or sponsored enterprises |
|
|
— |
|
|
— |
|
|
99,313 |
|
|
527,422 |
|
Commercial mortgage-backed securities issued by U.S. government |
|
|
|
|
|
|
|
|
|
|
|
|
|
agencies or sponsored enterprises |
|
|
91 |
|
|
7,959 |
|
|
194,380 |
|
|
955,059 |
|
State and municipal obligations |
|
|
177 |
|
|
6,340 |
|
|
152,114 |
|
|
967,305 |
|
Small Business Administration loan-backed securities |
|
|
128 |
|
|
42,447 |
|
|
42,222 |
|
|
304,770 |
|
Corporate securities |
|
|
18 |
|
|
480 |
|
|
3,768 |
|
|
26,267 |
|
|
|
$ |
536 |
|
$ |
66,584 |
|
$ |
777,980 |
|
$ |
4,618,627 |
|
December 31, 2022: |
|
|
|
|
|
|
|
|
|
|
|
|
|
Securities Held to Maturity |
|
|
|
|
|
|
|
|
|
|
|
|
|
U.S. Government agencies |
|
$ |
5,514 |
|
$ |
78,833 |
|
$ |
24,273 |
|
$ |
88,642 |
|
Residential mortgage-backed securities issued by U.S. government |
|
|
|
|
|
|
|
|
|
|
|
|
|
agencies or sponsored enterprises |
|
|
65,181 |
|
|
513,086 |
|
|
189,912 |
|
|
823,467 |
|
Residential collateralized mortgage-obligations issued by U.S. government |
|
|
|
|
|
|
|
|
|
|
|
|
|
agencies or sponsored enterprises |
|
|
30,284 |
|
|
277,868 |
|
|
39,380 |
|
|
127,128 |
|
Commercial mortgage-backed securities issued by U.S. government |
|
|
|
|
|
|
|
|
|
|
|
|
|
agencies or sponsored enterprises |
|
|
14,318 |
|
|
82,895 |
|
|
51,986 |
|
|
213,387 |
|
Small Business Administration loan-backed securities |
|
|
— |
|
|
— |
|
|
12,225 |
|
|
44,862 |
|
|
|
$ |
115,297 |
|
$ |
952,682 |
|
$ |
317,776 |
|
$ |
1,297,486 |
|
Securities Available for Sale |
|
|
|
|
|
|
|
|
|
|
|
|
|
U.S. Treasuries |
|
$ |
6,778 |
|
$ |
265,638 |
|
$ |
— |
|
$ |
— |
|
U.S. Government agencies |
|
|
8,193 |
|
|
138,807 |
|
|
18,691 |
|
|
80,281 |
|
Residential mortgage-backed securities issued by U.S. government |
|
|
|
|
|
|
|
|
|
|
|
|
|
agencies or sponsored enterprises |
|
|
42,767 |
|
|
459,773 |
|
|
255,285 |
|
|
1,238,580 |
|
Residential collateralized mortgage-obligations issued by U.S. government |
|
|
|
|
|
|
|
|
|
|
|
|
|
agencies or sponsored enterprises |
|
|
21,450 |
|
|
274,082 |
|
|
85,842 |
|
|
326,963 |
|
Commercial mortgage-backed securities issued by U.S. government |
|
|
|
|
|
|
|
|
|
|
|
|
|
agencies or sponsored enterprises |
|
|
17,156 |
|
|
206,228 |
|
|
181,688 |
|
|
767,002 |
|
State and municipal obligations |
|
|
97,084 |
|
|
616,631 |
|
|
108,799 |
|
|
391,848 |
|
Small Business Administration loan-backed securities |
|
|
2,152 |
|
|
92,535 |
|
|
44,543 |
|
|
264,933 |
|
Corporate securities |
|
|
2,209 |
|
|
28,374 |
|
|
736 |
|
|
4,264 |
|
|
|
$ |
197,789 |
|
$ |
2,082,068 |
|
$ |
695,584 |
|
$ |
3,073,871 |
|
Each quarter, management evaluates impairment where there has been a decline in fair value below the amortized cost basis of a security to determine whether there is a credit loss associated with the decline in fair value. Management continues to monitor all of our securities with a high degree of scrutiny. There can be no assurance that we will not conclude in future periods that conditions existing at that time indicate some or all of its securities may be sold or would require a charge to earnings as a provision for credit losses in such periods. See Note 1—Summary of Significant Account Policies for further discussion.
F-32
At December 31, 2023, investment securities with a market value of $3.0 billion and a carrying value of $3.2 billion were pledged to secure public funds deposits and for other purposes required and permitted by law (excluding securities pledged to secure repurchase agreement disclosed in Note 11 — Other Borrowings, under the “Short-Term Borrowings”, “Securities Sold Under Agreements to Repurchase (“Repurchase agreements”)” section). Of the $3.2 billion carrying value of investment securities pledged, $2.4 billion were pledged to secure public funds deposits, $729.4 million were pledged to secure FHLB advances and $115.0 million were pledged to secure interest rate swap positions with correspondents. At December 31, 2022, investment securities with a market value of $2.7 billion and a carrying value of $2.9 billion were pledged to secure public funds deposits and for other purposes required and permitted by law. Of the $2.9 million carrying value of investment securities pledged, $2.1 billion were pledged to secure public funds deposits, $630.0 million were pledged to secure FHLB advances and $149.2 million were pledged to secure interest rate swap positions with correspondents.
Trading Securities
At December 31, 2023 and 2022, trading securities, at estimated fair value, were as follows:
|
|
December 31, |
|
December 31, |
|
||
(Dollars in thousands) |
|
2023 |
|
2022 |
|
||
U.S. Government agencies |
|
$ |
1,537 |
|
$ |
11,190 |
|
Residential mortgage pass-through securities issued or guaranteed by U.S. |
|
|
|
|
|
|
|
government agencies or sponsored enterprises |
|
|
14,461 |
|
|
— |
|
Commercial mortgage-backed securities issued by U.S. government |
|
|
|
|
|
|
|
agencies or sponsored enterprises |
|
|
— |
|
|
4,589 |
|
State and municipal obligations |
|
|
14,620 |
|
|
13,993 |
|
Other debt securities |
|
|
703 |
|
|
1,491 |
|
|
|
$ |
31,321 |
|
$ |
31,263 |
|
Net gains (losses) on trading securities for the years ended December 31, 2023, 2022 and 2021 were as follows:
|
|
Year Ended December 31, |
|
|||||||
(Dollars in thousands) |
|
2023 |
|
2022 |
|
2021 |
|
|||
Net gains (losses) on sales transaction |
|
$ |
289 |
|
$ |
(1,326) |
|
$ |
1,326 |
|
Net mark to mark gains (losses) |
|
|
278 |
|
|
(237) |
|
|
(273) |
|
Net gains (losses) on trading securities |
|
$ |
567 |
|
$ |
(1,563) |
|
$ |
1,053 |
|
Note 4—Loans
The following is a summary of total loans:
|
|
December 31, |
|
||||
(Dollars in thousands) |
|
2023 |
|
2022 |
|
||
Loans: |
|
|
|
|
|
|
|
Construction and land development (1) |
|
$ |
2,923,514 |
|
$ |
2,860,360 |
|
Commercial non-owner occupied |
|
|
8,571,634 |
|
|
8,072,959 |
|
Commercial owner occupied real estate |
|
|
5,497,671 |
|
|
5,460,193 |
|
Consumer owner occupied (2) |
|
|
6,595,005 |
|
|
5,162,042 |
|
Home equity loans |
|
|
1,398,445 |
|
|
1,313,168 |
|
Commercial and industrial |
|
|
5,504,539 |
|
|
5,313,483 |
|
Other income producing property |
|
|
656,334 |
|
|
696,242 |
|
Consumer |
|
|
1,233,650 |
|
|
1,278,426 |
|
Other loans |
|
|
7,697 |
|
|
20,989 |
|
Total loans |
|
|
32,388,489 |
|
|
30,177,862 |
|
Less allowance for credit losses |
|
|
(456,573) |
|
|
(356,444) |
|
Loans, net |
|
$ |
31,931,916 |
|
$ |
29,821,418 |
|
(1) |
Construction and land development includes loans for both commercial construction and development, as well as loans for 1-4 family construction and lot loans. |
(2) |
Consumer owner occupied real estate includes loans on both 1-4 family owner occupied property, as well as loans collateralized by 1-4 family owner occupied properties with a business intent. |
The above table reflects the loan portfolio at the amortized cost basis for the years ended December 31, 2023 and 2022, to include net deferred costs of $68.0 million compared to net deferred costs of $49.7 million, respectively, and unamortized discount total related to loans acquired of $51.3 million compared to $72.1 million, respectively.
F-33
Accrued interest receivable of $127.0 million and $105.4 million are accounted for separately and reported in other assets for the periods December 31, 2023 and 2022.
The Company purchased loans through its acquisition of Atlantic Capital in the first quarter of 2022, for which there was, at acquisition, evidence of more than an insignificant deterioration of credit quality since origination. The carrying amount of those loans is as follows:
(Dollars in thousands) |
|
March 1, 2022 |
|
|
Book value of acquired loans at acquisition |
|
$ |
137,874 |
|
Allowance for credit losses at acquisition |
|
|
(13,758) |
|
Non-credit discount at acquisition |
|
|
(5,943) |
|
Carrying value or book value of acquired loans at acquisition |
|
$ |
118,173 |
|
As part of the ongoing monitoring of the credit quality of our loan portfolio, management tracks certain credit quality indicators, including trends related to (i) the level of classified loans, (ii) net charge-offs, (iii) non-performing loans (see details below), and (iv) the general economic conditions of the markets that we serve.
The Company utilizes a risk grading matrix to assign a risk grade to each commercial loan. Classified loans are assessed at a minimum every six months. A description of the general characteristics of the risk grades is as follows:
| ● | Pass—These loans range from minimal credit risk to average, however, still acceptable credit risk. |
| ● | Special mention—A special mention loan has potential weaknesses that deserve management’s close attention. If left uncorrected, these potential weaknesses may result in deterioration of the repayment prospects for the loan or the institution’s credit position at some future date. |
| ● | Substandard—A substandard loan is inadequately protected by the current sound worth and paying capacity of the obligor or of the collateral pledged, if any. Loans so classified must have a well-defined weakness, or weaknesses, that may jeopardize the liquidation of the debt. A substandard loan is characterized by the distinct possibility that the Bank will sustain some loss if the deficiencies are not corrected. |
| ● | Doubtful—A doubtful loan has all of the weaknesses inherent in one classified as substandard with the added characteristic that the weaknesses make collection or liquidation in full, on the basis of the currently existing facts, conditions and values, highly questionable and improbable. |
Construction and land development loans in the following table are on commercial and speculative real estate. Consumer owner occupied loans are collateralized by 1-4 family owner occupied properties with a business intent.
F-34
The following table presents the credit risk profile by risk grade of commercial loans by origination year:
|
|
|
Term Loans |
|||||||||||||||||||||
(Dollars in thousands) |
|
|
Amortized Cost Basis by Origination Year |
|||||||||||||||||||||
As of December 31, 2023 |
|
2023 |
|
2022 |
|
2021 |
|
2020 |
|
2019 |
|
Prior |
|
Revolving |
|
Total |
||||||||
Construction and land development |
|
|
|
|
|
|
|
|
|
|
|
|
|
|
|
|
|
|
|
|
|
|
|
|
Risk rating: |
|
|
|
|
|
|
|
|
|
|
|
|
|
|
|
|
|
|
|
|
|
|
|
|
Pass |
|
$ |
480,860 |
|
$ |
1,036,691 |
|
$ |
503,433 |
|
$ |
19,626 |
|
$ |
5,585 |
|
$ |
19,200 |
|
$ |
49,191 |
|
$ |
2,114,586 |
Special mention |
|
|
1,683 |
|
|
35,790 |
|
|
2,922 |
|
|
— |
|
|
— |
|
|
458 |
|
|
— |
|
|
40,853 |
Substandard |
|
|
390 |
|
|
46,311 |
|
|
765 |
|
|
— |
|
|
4,285 |
|
|
767 |
|
|
— |
|
|
52,518 |
Doubtful |
|
|
— |
|
|
— |
|
|
— |
|
|
3 |
|
|
— |
|
|
5 |
|
|
— |
|
|
8 |
Total Construction and land development |
|
$ |
482,933 |
|
$ |
1,118,792 |
|
$ |
507,120 |
|
$ |
19,629 |
|
$ |
9,870 |
|
$ |
20,430 |
|
$ |
49,191 |
|
$ |
2,207,965 |
Construction and land development |
|
|
|
|
|
|
|
|
|
|
|
|
|
|
|
|
|
|
|
|
|
|
|
|
Current-period gross charge-offs |
|
$ |
— |
|
$ |
— |
|
$ |
— |
|
$ |
204 |
|
$ |
— |
|
$ |
2 |
|
$ |
— |
|
$ |
206 |
|
|
|
|
|
|
|
|
|
|
|
|
|
|
|
|
|
|
|
|
|
|
|
|
|
Commercial non-owner occupied |
|
|
|
|
|
|
|
|
|
|
|
|
|
|
|
|
|
|
|
|
|
|
|
|
Risk rating: |
|
|
|
|
|
|
|
|
|
|
|
|
|
|
|
|
|
|
|
|
|
|
|
|
Pass |
|
$ |
759,501 |
|
$ |
2,501,611 |
|
$ |
1,878,889 |
|
$ |
674,470 |
|
$ |
706,794 |
|
$ |
1,535,248 |
|
$ |
104,698 |
|
$ |
8,161,211 |
Special mention |
|
|
3,376 |
|
|
38,854 |
|
|
19,899 |
|
|
10,044 |
|
|
9,872 |
|
|
12,976 |
|
|
93 |
|
|
95,114 |
Substandard |
|
|
73,282 |
|
|
11,928 |
|
|
35,692 |
|
|
61,893 |
|
|
78,976 |
|
|
53,388 |
|
|
149 |
|
|
315,308 |
Doubtful |
|
|
— |
|
|
— |
|
|
1 |
|
|
— |
|
|
— |
|
|
— |
|
|
— |
|
|
1 |
Total Commercial non-owner occupied |
|
$ |
836,159 |
|
$ |
2,552,393 |
|
$ |
1,934,481 |
|
$ |
746,407 |
|
$ |
795,642 |
|
$ |
1,601,612 |
|
$ |
104,940 |
|
$ |
8,571,634 |
Commercial non-owner occupied |
|
|
|
|
|
|
|
|
|
|
|
|
|
|
|
|
|
|
|
|
|
|
|
|
Current-period gross charge-offs |
|
$ |
— |
|
$ |
— |
|
$ |
51 |
|
$ |
— |
|
$ |
— |
|
$ |
253 |
|
$ |
— |
|
$ |
304 |
|
|
|
|
|
|
|
|
|
|
|
|
|
|
|
|
|
|
|
|
|
|
|
|
|
Commercial Owner Occupied |
|
|
|
|
|
|
|
|
|
|
|
|
|
|
|
|
|
|
|
|
|
|
|
|
Risk rating: |
|
|
|
|
|
|
|
|
|
|
|
|
|
|
|
|
|
|
|
|
|
|
|
|
Pass |
|
$ |
556,192 |
|
$ |
1,015,236 |
|
$ |
1,088,976 |
|
$ |
635,694 |
|
$ |
648,082 |
|
$ |
1,176,796 |
|
$ |
88,298 |
|
$ |
5,209,274 |
Special mention |
|
|
1,976 |
|
|
31,484 |
|
|
15,777 |
|
|
1,435 |
|
|
7,776 |
|
|
22,551 |
|
|
690 |
|
|
81,689 |
Substandard |
|
|
24,240 |
|
|
37,922 |
|
|
26,810 |
|
|
26,308 |
|
|
20,310 |
|
|
63,220 |
|
|
7,890 |
|
|
206,700 |
Doubtful |
|
|
3 |
|
|
— |
|
|
— |
|
|
1 |
|
|
— |
|
|
4 |
|
|
— |
|
|
8 |
Total commercial owner occupied |
|
$ |
582,411 |
|
$ |
1,084,642 |
|
$ |
1,131,563 |
|
$ |
663,438 |
|
$ |
676,168 |
|
$ |
1,262,571 |
|
$ |
96,878 |
|
$ |
5,497,671 |
Commercial owner occupied |
|
|
|
|
|
|
|
|
|
|
|
|
|
|
|
|
|
|
|
|
|
|
|
|
Current-period gross charge-offs |
|
$ |
— |
|
$ |
126 |
|
$ |
— |
|
$ |
— |
|
$ |
— |
|
$ |
— |
|
$ |
— |
|
$ |
126 |
|
|
|
|
|
|
|
|
|
|
|
|
|
|
|
|
|
|
|
|
|
|
|
|
|
Commercial and industrial |
|
|
|
|
|
|
|
|
|
|
|
|
|
|
|
|
|
|
|
|
|
|
|
|
Risk rating: |
|
|
|
|
|
|
|
|
|
|
|
|
|
|
|
|
|
|
|
|
|
|
|
|
Pass |
|
$ |
1,187,836 |
|
$ |
1,140,702 |
|
$ |
669,188 |
|
$ |
367,668 |
|
$ |
182,519 |
|
$ |
413,271 |
|
$ |
1,313,978 |
|
$ |
5,275,162 |
Special mention |
|
|
2,395 |
|
|
7,624 |
|
|
3,604 |
|
|
2,762 |
|
|
3,870 |
|
|
898 |
|
|
18,300 |
|
|
39,453 |
Substandard |
|
|
26,780 |
|
|
29,515 |
|
|
23,423 |
|
|
4,001 |
|
|
5,472 |
|
|
15,226 |
|
|
85,409 |
|
|
189,826 |
Doubtful |
|
|
2 |
|
|
11 |
|
|
68 |
|
|
1 |
|
|
— |
|
|
13 |
|
|
3 |
|
|
98 |
Total commercial and industrial |
|
$ |
1,217,013 |
|
$ |
1,177,852 |
|
$ |
696,283 |
|
$ |
374,432 |
|
$ |
191,861 |
|
$ |
429,408 |
|
$ |
1,417,690 |
|
$ |
5,504,539 |
Commercial and industrial |
|
|
|
|
|
|
|
|
|
|
|
|
|
|
|
|
|
|
|
|
|
|
|
|
Current-period gross charge-offs |
|
$ |
7,272 |
|
$ |
3,171 |
|
$ |
13,169 |
|
$ |
429 |
|
$ |
765 |
|
$ |
1,637 |
|
$ |
1,144 |
|
$ |
27,587 |
|
|
|
|
|
|
|
|
|
|
|
|
|
|
|
|
|
|
|
|
|
|
|
|
|
Other income producing property |
|
|
|
|
|
|
|
|
|
|
|
|
|
|
|
|
|
|
|
|
|
|
|
|
Risk rating: |
|
|
|
|
|
|
|
|
|
|
|
|
|
|
|
|
|
|
|
|
|
|
|
|
Pass |
|
$ |
58,012 |
|
$ |
129,858 |
|
$ |
96,743 |
|
$ |
51,615 |
|
$ |
40,988 |
|
$ |
105,810 |
|
$ |
39,701 |
|
$ |
522,727 |
Special mention |
|
|
517 |
|
|
266 |
|
|
347 |
|
|
69 |
|
|
288 |
|
|
2,296 |
|
|
203 |
|
|
3,986 |
Substandard |
|
|
693 |
|
|
5,062 |
|
|
2,634 |
|
|
588 |
|
|
630 |
|
|
5,772 |
|
|
2,121 |
|
|
17,500 |
Doubtful |
|
|
— |
|
|
— |
|
|
— |
|
|
— |
|
|
— |
|
|
— |
|
|
— |
|
|
— |
Total other income producing property |
|
$ |
59,222 |
|
$ |
135,186 |
|
$ |
99,724 |
|
$ |
52,272 |
|
$ |
41,906 |
|
$ |
113,878 |
|
$ |
42,025 |
|
$ |
544,213 |
Other income producing property |
|
|
|
|
|
|
|
|
|
|
|
|
|
|
|
|
|
|
|
|
|
|
|
|
Current-period gross charge-offs |
|
$ |
— |
|
$ |
— |
|
$ |
— |
|
$ |
— |
|
$ |
— |
|
$ |
— |
|
$ |
— |
|
$ |
— |
|
|
|
|
|
|
|
|
|
|
|
|
|
|
|
|
|
|
|
|
|
|
|
|
|
Consumer owner occupied |
|
|
|
|
|
|
|
|
|
|
|
|
|
|
|
|
|
|
|
|
|
|
|
|
Risk rating: |
|
|
|
|
|
|
|
|
|
|
|
|
|
|
|
|
|
|
|
|
|
|
|
|
Pass |
|
$ |
18,908 |
|
$ |
4,509 |
|
$ |
2,746 |
|
$ |
1,293 |
|
$ |
287 |
|
$ |
315 |
|
$ |
25,635 |
|
$ |
53,693 |
Special mention |
|
|
236 |
|
|
339 |
|
|
18 |
|
|
41 |
|
|
271 |
|
|
— |
|
|
— |
|
|
905 |
Substandard |
|
|
24 |
|
|
— |
|
|
— |
|
|
927 |
|
|
1,560 |
|
|
182 |
|
|
150 |
|
|
2,843 |
Doubtful |
|
|
— |
|
|
— |
|
|
— |
|
|
— |
|
|
— |
|
|
1 |
|
|
1 |
|
|
2 |
Total Consumer owner occupied |
|
$ |
19,168 |
|
$ |
4,848 |
|
$ |
2,764 |
|
$ |
2,261 |
|
$ |
2,118 |
|
$ |
498 |
|
$ |
25,786 |
|
$ |
57,443 |
Consumer owner occupied |
|
|
|
|
|
|
|
|
|
|
|
|
|
|
|
|
|
|
|
|
|
|
|
|
Current-period gross charge-offs |
|
$ |
— |
|
$ |
— |
|
$ |
— |
|
$ |
— |
|
$ |
— |
|
$ |
— |
|
$ |
— |
|
$ |
— |
|
|
|
|
|
|
|
|
|
|
|
|
|
|
|
|
|
|
|
|
|
|
|
|
|
Other loans |
|
|
|
|
|
|
|
|
|
|
|
|
|
|
|
|
|
|
|
|
|
|
|
|
Risk rating: |
|
|
|
|
|
|
|
|
|
|
|
|
|
|
|
|
|
|
|
|
|
|
|
|
Pass |
|
$ |
7,697 |
|
$ |
— |
|
$ |
— |
|
$ |
— |
|
$ |
— |
|
$ |
— |
|
$ |
— |
|
$ |
7,697 |
Special mention |
|
|
— |
|
|
— |
|
|
— |
|
|
— |
|
|
— |
|
|
— |
|
|
— |
|
|
— |
Substandard |
|
|
— |
|
|
— |
|
|
— |
|
|
— |
|
|
— |
|
|
— |
|
|
— |
|
|
— |
Doubtful |
|
|
— |
|
|
— |
|
|
— |
|
|
— |
|
|
— |
|
|
— |
|
|
— |
|
|
— |
Total other loans |
|
$ |
7,697 |
|
$ |
— |
|
$ |
— |
|
$ |
— |
|
$ |
— |
|
$ |
— |
|
$ |
— |
|
$ |
7,697 |
Other loans |
|
|
|
|
|
|
|
|
|
|
|
|
|
|
|
|
|
|
|
|
|
|
|
|
Current-period gross charge-offs |
|
$ |
— |
|
$ |
— |
|
$ |
— |
|
$ |
— |
|
$ |
— |
|
$ |
— |
|
$ |
— |
|
$ |
— |
|
|
|
|
|
|
|
|
|
|
|
|
|
|
|
|
|
|
|
|
|
|
|
|
|
Total Commercial Loans |
|
|
|
|
|
|
|
|
|
|
|
|
|
|
|
|
|
|
|
|
|
|
|
|
Risk rating: |
|
|
|
|
|
|
|
|
|
|
|
|
|
|
|
|
|
|
|
|
|
|
|
|
Pass |
|
$ |
3,069,006 |
|
$ |
5,828,607 |
|
$ |
4,239,975 |
|
$ |
1,750,366 |
|
$ |
1,584,255 |
|
$ |
3,250,640 |
|
$ |
1,621,501 |
|
$ |
21,344,350 |
Special mention |
|
|
10,183 |
|
|
114,357 |
|
|
42,567 |
|
|
14,351 |
|
|
22,077 |
|
|
39,179 |
|
|
19,286 |
|
|
262,000 |
Substandard |
|
|
125,409 |
|
|
130,738 |
|
|
89,324 |
|
|
93,717 |
|
|
111,233 |
|
|
138,555 |
|
|
95,719 |
|
|
784,695 |
Doubtful |
|
|
5 |
|
|
11 |
|
|
69 |
|
|
5 |
|
|
— |
|
|
23 |
|
|
4 |
|
|
117 |
Total Commercial Loans |
|
$ |
3,204,603 |
|
$ |
6,073,713 |
|
$ |
4,371,935 |
|
$ |
1,858,439 |
|
$ |
1,717,565 |
|
$ |
3,428,397 |
|
$ |
1,736,510 |
|
$ |
22,391,162 |
Total Commercial Loans |
|
|
|
|
|
|
|
|
|
|
|
|
|
|
|
|
|
|
|
|
|
|
|
|
Current-period gross charge-offs |
|
$ |
7,272 |
|
$ |
3,297 |
|
$ |
13,220 |
|
$ |
633 |
|
$ |
765 |
|
$ |
1,892 |
|
$ |
1,144 |
|
$ |
28,223 |
F-35
|
|
|
Term Loans |
|||||||||||||||||||||
(Dollars in thousands) |
|
|
Amortized Cost Basis by Origination Year |
|||||||||||||||||||||
As of December 31, 2022 |
|
2022 |
|
2021 |
|
2020 |
|
2019 |
|
2018 |
|
Prior |
|
Revolving |
|
Total |
||||||||
Construction and land development |
|
|
|
|
|
|
|
|
|
|
|
|
|
|
|
|
|
|
|
|
|
|
|
|
Risk rating: |
|
|
|
|
|
|
|
|
|
|
|
|
|
|
|
|
|
|
|
|
|
|
|
|
Pass |
|
$ |
875,751 |
|
$ |
742,985 |
|
$ |
134,996 |
|
$ |
63,439 |
|
$ |
14,521 |
|
$ |
29,442 |
|
$ |
65,656 |
|
$ |
1,926,790 |
Special mention |
|
|
1,643 |
|
|
988 |
|
|
268 |
|
|
76 |
|
|
7,219 |
|
|
2,068 |
|
|
— |
|
|
12,262 |
Substandard |
|
|
214 |
|
|
10,409 |
|
|
11 |
|
|
2,326 |
|
|
— |
|
|
4,282 |
|
|
— |
|
|
17,242 |
Doubtful |
|
|
— |
|
|
— |
|
|
— |
|
|
— |
|
|
— |
|
|
6 |
|
|
— |
|
|
6 |
Total Construction and land development |
|
$ |
877,608 |
|
$ |
754,382 |
|
$ |
135,275 |
|
$ |
65,841 |
|
$ |
21,740 |
|
$ |
35,798 |
|
$ |
65,656 |
|
$ |
1,956,300 |
Construction and land development |
|
|
|
|
|
|
|
|
|
|
|
|
|
|
|
|
|
|
|
|
|
|
|
|
Current-period gross charge-offs |
|
$ |
— |
|
$ |
— |
|
$ |
— |
|
$ |
— |
|
$ |
— |
|
$ |
— |
|
$ |
— |
|
$ |
— |
|
|
|
|
|
|
|
|
|
|
|
|
|
|
|
|
|
|
|
|
|
|
|
|
|
Commercial non-owner occupied |
|
|
|
|
|
|
|
|
|
|
|
|
|
|
|
|
|
|
|
|
|
|
|
|
Risk rating: |
|
|
|
|
|
|
|
|
|
|
|
|
|
|
|
|
|
|
|
|
|
|
|
|
Pass |
|
$ |
2,245,943 |
|
$ |
1,849,079 |
|
$ |
816,791 |
|
$ |
959,707 |
|
$ |
506,350 |
|
$ |
1,417,397 |
|
$ |
108,759 |
|
$ |
7,904,026 |
Special mention |
|
|
7,579 |
|
|
4,225 |
|
|
936 |
|
|
11,036 |
|
|
24,067 |
|
|
32,110 |
|
|
5,000 |
|
|
84,953 |
Substandard |
|
|
13,256 |
|
|
25,557 |
|
|
609 |
|
|
9,383 |
|
|
6,472 |
|
|
26,366 |
|
|
2,257 |
|
|
83,900 |
Doubtful |
|
|
— |
|
|
1 |
|
|
— |
|
|
79 |
|
|
— |
|
|
— |
|
|
— |
|
|
80 |
Total Commercial non-owner occupied |
|
$ |
2,266,778 |
|
$ |
1,878,862 |
|
$ |
818,336 |
|
$ |
980,205 |
|
$ |
536,889 |
|
$ |
1,475,873 |
|
$ |
116,016 |
|
$ |
8,072,959 |
Commercial non-owner occupied |
|
|
|
|
|
|
|
|
|
|
|
|
|
|
|
|
|
|
|
|
|
|
|
|
Current-period gross charge-offs |
|
$ |
8 |
|
$ |
— |
|
$ |
— |
|
$ |
— |
|
$ |
— |
|
$ |
360 |
|
$ |
— |
|
$ |
368 |
|
|
|
|
|
|
|
|
|
|
|
|
|
|
|
|
|
|
|
|
|
|
|
|
|
Commercial Owner Occupied |
|
|
|
|
|
|
|
|
|
|
|
|
|
|
|
|
|
|
|
|
|
|
|
|
Risk rating: |
|
|
|
|
|
|
|
|
|
|
|
|
|
|
|
|
|
|
|
|
|
|
|
|
Pass |
|
$ |
1,046,562 |
|
$ |
1,136,289 |
|
$ |
725,040 |
|
$ |
709,669 |
|
$ |
446,497 |
|
$ |
1,080,522 |
|
$ |
75,506 |
|
$ |
5,220,085 |
Special mention |
|
|
3,620 |
|
|
25,263 |
|
|
3,383 |
|
|
7,934 |
|
|
7,160 |
|
|
34,724 |
|
|
1,294 |
|
|
83,378 |
Substandard |
|
|
12,861 |
|
|
34,210 |
|
|
19,962 |
|
|
16,502 |
|
|
9,487 |
|
|
62,808 |
|
|
895 |
|
|
156,725 |
Doubtful |
|
|
— |
|
|
— |
|
|
1 |
|
|
— |
|
|
— |
|
|
4 |
|
|
— |
|
|
5 |
Total commercial owner occupied |
|
$ |
1,063,043 |
|
$ |
1,195,762 |
|
$ |
748,386 |
|
$ |
734,105 |
|
$ |
463,144 |
|
$ |
1,178,058 |
|
$ |
77,695 |
|
$ |
5,460,193 |
Commercial owner occupied |
|
|
|
|
|
|
|
|
|
|
|
|
|
|
|
|
|
|
|
|
|
|
|
|
Current-period gross charge-offs |
|
$ |
— |
|
$ |
— |
|
$ |
— |
|
$ |
1,143 |
|
$ |
— |
|
$ |
833 |
|
$ |
— |
|
$ |
1,976 |
|
|
|
|
|
|
|
|
|
|
|
|
|
|
|
|
|
|
|
|
|
|
|
|
|
Commercial and industrial |
|
|
|
|
|
|
|
|
|
|
|
|
|
|
|
|
|
|
|
|
|
|
|
|
Risk rating: |
|
|
|
|
|
|
|
|
|
|
|
|
|
|
|
|
|
|
|
|
|
|
|
|
Pass |
|
$ |
1,566,203 |
|
$ |
895,368 |
|
$ |
506,655 |
|
$ |
274,446 |
|
$ |
212,522 |
|
$ |
333,286 |
|
$ |
1,386,678 |
|
$ |
5,175,158 |
Special mention |
|
|
5,885 |
|
|
3,782 |
|
|
3,401 |
|
|
1,859 |
|
|
3,378 |
|
|
1,316 |
|
|
24,347 |
|
|
43,968 |
Substandard |
|
|
6,308 |
|
|
27,974 |
|
|
4,770 |
|
|
6,591 |
|
|
6,783 |
|
|
8,476 |
|
|
32,876 |
|
|
93,778 |
Doubtful |
|
|
— |
|
|
— |
|
|
— |
|
|
— |
|
|
155 |
|
|
422 |
|
|
2 |
|
|
579 |
Total commercial and industrial |
|
$ |
1,578,396 |
|
$ |
927,124 |
|
$ |
514,826 |
|
$ |
282,896 |
|
$ |
222,838 |
|
$ |
343,500 |
|
$ |
1,443,903 |
|
$ |
5,313,483 |
Commercial and industrial |
|
|
|
|
|
|
|
|
|
|
|
|
|
|
|
|
|
|
|
|
|
|
|
|
Current-period gross charge-offs |
|
$ |
4 |
|
$ |
2,825 |
|
$ |
198 |
|
$ |
630 |
|
$ |
2,214 |
|
$ |
2,589 |
|
$ |
1,742 |
|
$ |
10,202 |
|
|
|
|
|
|
|
|
|
|
|
|
|
|
|
|
|
|
|
|
|
|
|
|
|
Other income producing property |
|
|
|
|
|
|
|
|
|
|
|
|
|
|
|
|
|
|
|
|
|
|
|
|
Risk rating: |
|
|
|
|
|
|
|
|
|
|
|
|
|
|
|
|
|
|
|
|
|
|
|
|
Pass |
|
$ |
149,793 |
|
$ |
92,887 |
|
$ |
60,473 |
|
$ |
46,189 |
|
$ |
47,155 |
|
$ |
107,436 |
|
$ |
46,179 |
|
$ |
550,112 |
Special mention |
|
|
952 |
|
|
957 |
|
|
1,257 |
|
|
378 |
|
|
190 |
|
|
3,652 |
|
|
2,328 |
|
|
9,714 |
Substandard |
|
|
876 |
|
|
359 |
|
|
1,281 |
|
|
300 |
|
|
214 |
|
|
11,214 |
|
|
1,065 |
|
|
15,309 |
Doubtful |
|
|
401 |
|
|
— |
|
|
— |
|
|
— |
|
|
— |
|
|
136 |
|
|
— |
|
|
537 |
Total other income producing property |
|
$ |
152,022 |
|
$ |
94,203 |
|
$ |
63,011 |
|
$ |
46,867 |
|
$ |
47,559 |
|
$ |
122,438 |
|
$ |
49,572 |
|
$ |
575,672 |
Other income producing property |
|
|
|
|
|
|
|
|
|
|
|
|
|
|
|
|
|
|
|
|
|
|
|
|
Current-period gross charge-offs |
|
$ |
— |
|
$ |
— |
|
$ |
— |
|
$ |
— |
|
$ |
— |
|
$ |
46 |
|
$ |
50 |
|
$ |
96 |
|
|
|
|
|
|
|
|
|
|
|
|
|
|
|
|
|
|
|
|
|
|
|
|
|
Consumer owner occupied |
|
|
|
|
|
|
|
|
|
|
|
|
|
|
|
|
|
|
|
|
|
|
|
|
Risk rating: |
|
|
|
|
|
|
|
|
|
|
|
|
|
|
|
|
|
|
|
|
|
|
|
|
Pass |
|
$ |
5,947 |
|
$ |
3,124 |
|
$ |
1,811 |
|
$ |
418 |
|
$ |
68 |
|
$ |
332 |
|
$ |
15,910 |
|
$ |
27,610 |
Special mention |
|
|
537 |
|
|
20 |
|
|
136 |
|
|
284 |
|
|
— |
|
|
— |
|
|
66 |
|
|
1,043 |
Substandard |
|
|
13 |
|
|
95 |
|
|
12 |
|
|
1,614 |
|
|
— |
|
|
202 |
|
|
151 |
|
|
2,087 |
Doubtful |
|
|
— |
|
|
— |
|
|
— |
|
|
— |
|
|
1 |
|
|
— |
|
|
— |
|
|
1 |
Total Consumer owner occupied |
|
$ |
6,497 |
|
$ |
3,239 |
|
$ |
1,959 |
|
$ |
2,316 |
|
$ |
69 |
|
$ |
534 |
|
$ |
16,127 |
|
$ |
30,741 |
Consumer owner occupied |
|
|
|
|
|
|
|
|
|
|
|
|
|
|
|
|
|
|
|
|
|
|
|
|
Current-period gross charge-offs |
|
$ |
— |
|
$ |
— |
|
$ |
— |
|
$ |
— |
|
$ |
— |
|
$ |
— |
|
$ |
— |
|
$ |
— |
|
|
|
|
|
|
|
|
|
|
|
|
|
|
|
|
|
|
|
|
|
|
|
|
|
Other loans |
|
|
|
|
|
|
|
|
|
|
|
|
|
|
|
|
|
|
|
|
|
|
|
|
Risk rating: |
|
|
|
|
|
|
|
|
|
|
|
|
|
|
|
|
|
|
|
|
|
|
|
|
Pass |
|
$ |
20,989 |
|
$ |
— |
|
$ |
— |
|
$ |
— |
|
$ |
— |
|
$ |
— |
|
$ |
— |
|
$ |
20,989 |
Special mention |
|
|
— |
|
|
— |
|
|
— |
|
|
— |
|
|
— |
|
|
— |
|
|
— |
|
|
— |
Substandard |
|
|
— |
|
|
— |
|
|
— |
|
|
— |
|
|
— |
|
|
— |
|
|
— |
|
|
— |
Doubtful |
|
|
— |
|
|
— |
|
|
— |
|
|
— |
|
|
— |
|
|
— |
|
|
— |
|
|
— |
Total other loans |
|
$ |
20,989 |
|
$ |
— |
|
$ |
— |
|
$ |
— |
|
$ |
— |
|
$ |
— |
|
$ |
— |
|
$ |
20,989 |
Other loans |
|
|
|
|
|
|
|
|
|
|
|
|
|
|
|
|
|
|
|
|
|
|
|
|
Current-period gross charge-offs |
|
$ |
— |
|
$ |
— |
|
$ |
— |
|
$ |
— |
|
$ |
— |
|
$ |
— |
|
$ |
— |
|
$ |
— |
|
|
|
|
|
|
|
|
|
|
|
|
|
|
|
|
|
|
|
|
|
|
|
|
|
Total Commercial Loans |
|
|
|
|
|
|
|
|
|
|
|
|
|
|
|
|
|
|
|
|
|
|
|
|
Risk rating: |
|
|
|
|
|
|
|
|
|
|
|
|
|
|
|
|
|
|
|
|
|
|
|
|
Pass |
|
$ |
5,911,188 |
|
$ |
4,719,732 |
|
$ |
2,245,766 |
|
$ |
2,053,868 |
|
$ |
1,227,113 |
|
$ |
2,968,415 |
|
$ |
1,698,688 |
|
$ |
20,824,770 |
Special mention |
|
|
20,216 |
|
|
35,235 |
|
|
9,381 |
|
|
21,567 |
|
|
42,014 |
|
|
73,870 |
|
|
33,035 |
|
|
235,318 |
Substandard |
|
|
33,528 |
|
|
98,604 |
|
|
26,645 |
|
|
36,716 |
|
|
22,956 |
|
|
113,348 |
|
|
37,244 |
|
|
369,041 |
Doubtful |
|
|
401 |
|
|
1 |
|
|
1 |
|
|
79 |
|
|
156 |
|
|
568 |
|
|
2 |
|
|
1,208 |
Total Commercial Loans |
|
$ |
5,965,333 |
|
$ |
4,853,572 |
|
$ |
2,281,793 |
|
$ |
2,112,230 |
|
$ |
1,292,239 |
|
$ |
3,156,201 |
|
$ |
1,768,969 |
|
$ |
21,430,337 |
Total Commercial Loans |
|
|
|
|
|
|
|
|
|
|
|
|
|
|
|
|
|
|
|
|
|
|
|
|
Current-period gross charge-offs |
|
$ |
12 |
|
$ |
2,825 |
|
$ |
198 |
|
$ |
1,773 |
|
$ |
2,214 |
|
$ |
3,828 |
|
$ |
1,792 |
|
$ |
12,642 |
F-36
For the consumer segment, delinquency of a loan is determined by past due status. Consumer loans are automatically placed on nonaccrual status once the loan is 90 days past due. Construction and land development loans are on 1-4 properties and lots.
The following table presents the credit risk profile by past due status of consumer loans by origination year:
|
|
Term Loans |
||||||||||||||||||||||
(Dollars in thousands) |
|
Amortized Cost Basis by Origination Year |
||||||||||||||||||||||
As of December 31, 2023 |
|
2023 |
|
2022 |
|
2021 |
|
2020 |
|
2019 |
|
Prior |
|
Revolving |
|
Total |
||||||||
Consumer owner occupied |
|
|
|
|
|
|
|
|
|
|
|
|
|
|
|
|
|
|
|
|
|
|
|
|
Days past due: |
|
|
|
|
|
|
|
|
|
|
|
|
|
|
|
|
|
|
|
|
|
|
|
|
Current |
|
$ |
1,019,956 |
|
$ |
2,125,156 |
|
$ |
1,641,518 |
|
$ |
628,107 |
|
$ |
288,304 |
|
$ |
809,419 |
|
$ |
— |
|
$ |
6,512,460 |
30 days past due |
|
|
1,589 |
|
|
2,268 |
|
|
1,524 |
|
|
654 |
|
|
707 |
|
|
4,012 |
|
|
— |
|
|
10,754 |
60 days past due |
|
|
— |
|
|
766 |
|
|
528 |
|
|
680 |
|
|
— |
|
|
813 |
|
|
— |
|
|
2,787 |
90 days past due |
|
|
1,280 |
|
|
2,538 |
|
|
1,089 |
|
|
1,689 |
|
|
315 |
|
|
4,650 |
|
|
— |
|
|
11,561 |
Total Consumer owner occupied |
|
$ |
1,022,825 |
|
$ |
2,130,728 |
|
$ |
1,644,659 |
|
$ |
631,130 |
|
$ |
289,326 |
|
$ |
818,894 |
|
$ |
— |
|
$ |
6,537,562 |
Consumer owner occupied |
|
|
|
|
|
|
|
|
|
|
|
|
|
|
|
|
|
|
|
|
|
|
|
|
Current-period gross charge-offs |
|
$ |
68 |
|
$ |
90 |
|
$ |
27 |
|
$ |
— |
|
$ |
— |
|
$ |
2 |
|
$ |
— |
|
$ |
187 |
|
|
|
|
|
|
|
|
|
|
|
|
|
|
|
|
|
|
|
|
|
|
|
|
|
Home equity loans |
|
|
|
|
|
|
|
|
|
|
|
|
|
|
|
|
|
|
|
|
|
|
|
|
Days past due: |
|
|
|
|
|
|
|
|
|
|
|
|
|
|
|
|
|
|
|
|
|
|
|
|
Current |
|
$ |
6,551 |
|
$ |
6,454 |
|
$ |
2,887 |
|
$ |
1,396 |
|
$ |
1,003 |
|
$ |
11,518 |
|
$ |
1,358,829 |
|
$ |
1,388,638 |
30 days past due |
|
|
60 |
|
|
— |
|
|
132 |
|
|
21 |
|
|
44 |
|
|
539 |
|
|
5,860 |
|
|
6,656 |
60 days past due |
|
|
— |
|
|
— |
|
|
12 |
|
|
104 |
|
|
— |
|
|
458 |
|
|
1,268 |
|
|
1,842 |
90 days past due |
|
|
117 |
|
|
— |
|
|
27 |
|
|
194 |
|
|
1 |
|
|
672 |
|
|
298 |
|
|
1,309 |
Total Home equity loans |
|
$ |
6,728 |
|
$ |
6,454 |
|
$ |
3,058 |
|
$ |
1,715 |
|
$ |
1,048 |
|
$ |
13,187 |
|
$ |
1,366,255 |
|
$ |
1,398,445 |
Home equity loans |
|
|
|
|
|
|
|
|
|
|
|
|
|
|
|
|
|
|
|
|
|
|
|
|
Current-period gross charge-offs |
|
$ |
— |
|
$ |
— |
|
$ |
— |
|
$ |
64 |
|
$ |
— |
|
$ |
29 |
|
$ |
84 |
|
$ |
177 |
|
|
|
|
|
|
|
|
|
|
|
|
|
|
|
|
|
|
|
|
|
|
|
|
|
Consumer |
|
|
|
|
|
|
|
|
|
|
|
|
|
|
|
|
|
|
|
|
|
|
|
|
Days past due: |
|
|
|
|
|
|
|
|
|
|
|
|
|
|
|
|
|
|
|
|
|
|
|
|
Current |
|
$ |
299,871 |
|
$ |
305,283 |
|
$ |
141,369 |
|
$ |
75,213 |
|
$ |
60,265 |
|
$ |
143,725 |
|
$ |
182,608 |
|
$ |
1,208,334 |
30 days past due |
|
|
443 |
|
|
321 |
|
|
247 |
|
|
142 |
|
|
137 |
|
|
1,384 |
|
|
10,757 |
|
|
13,431 |
60 days past due |
|
|
64 |
|
|
254 |
|
|
152 |
|
|
4 |
|
|
4 |
|
|
973 |
|
|
6,420 |
|
|
7,871 |
90 days past due |
|
|
93 |
|
|
395 |
|
|
174 |
|
|
196 |
|
|
110 |
|
|
1,108 |
|
|
1,938 |
|
|
4,014 |
Total consumer |
|
$ |
300,471 |
|
$ |
306,253 |
|
$ |
141,942 |
|
$ |
75,555 |
|
$ |
60,516 |
|
$ |
147,190 |
|
$ |
201,723 |
|
$ |
1,233,650 |
Consumer |
|
|
|
|
|
|
|
|
|
|
|
|
|
|
|
|
|
|
|
|
|
|
|
|
Current-period gross charge-offs |
|
$ |
373 |
|
$ |
1,586 |
|
$ |
571 |
|
$ |
280 |
|
$ |
217 |
|
$ |
537 |
|
$ |
8,478 |
|
$ |
12,042 |
|
|
|
|
|
|
|
|
|
|
|
|
|
|
|
|
|
|
|
|
|
|
|
|
|
Construction and land development |
|
|
|
|
|
|
|
|
|
|
|
|
|
|
|
|
|
|
|
|
|
|
|
|
Days past due: |
|
|
|
|
|
|
|
|
|
|
|
|
|
|
|
|
|
|
|
|
|
|
|
|
Current |
|
$ |
135,739 |
|
$ |
425,276 |
|
$ |
111,205 |
|
$ |
20,322 |
|
$ |
8,555 |
|
$ |
14,265 |
|
$ |
— |
|
$ |
715,362 |
30 days past due |
|
|
— |
|
|
— |
|
|
— |
|
|
111 |
|
|
— |
|
|
— |
|
|
— |
|
|
111 |
60 days past due |
|
|
— |
|
|
— |
|
|
— |
|
|
— |
|
|
— |
|
|
— |
|
|
— |
|
|
— |
90 days past due |
|
|
— |
|
|
— |
|
|
— |
|
|
1 |
|
|
— |
|
|
75 |
|
|
— |
|
|
76 |
Total Construction and land development |
|
$ |
135,739 |
|
$ |
425,276 |
|
$ |
111,205 |
|
$ |
20,434 |
|
$ |
8,555 |
|
$ |
14,340 |
|
$ |
— |
|
$ |
715,549 |
Construction and land development |
|
|
|
|
|
|
|
|
|
|
|
|
|
|
|
|
|
|
|
|
|
|
|
|
Current-period gross charge-offs |
|
$ |
— |
|
$ |
— |
|
$ |
— |
|
$ |
— |
|
$ |
— |
|
$ |
19 |
|
$ |
— |
|
$ |
19 |
|
|
|
|
|
|
|
|
|
|
|
|
|
|
|
|
|
|
|
|
|
|
|
|
|
Other income producing property |
|
|
|
|
|
|
|
|
|
|
|
|
|
|
|
|
|
|
|
|
|
|
|
|
Days past due: |
|
|
|
|
|
|
|
|
|
|
|
|
|
|
|
|
|
|
|
|
|
|
|
|
Current |
|
$ |
6,310 |
|
$ |
43,022 |
|
$ |
18,536 |
|
$ |
4,331 |
|
$ |
2,537 |
|
$ |
36,911 |
|
$ |
280 |
|
$ |
111,927 |
30 days past due |
|
|
— |
|
|
— |
|
|
— |
|
|
— |
|
|
— |
|
|
67 |
|
|
— |
|
|
67 |
60 days past due |
|
|
— |
|
|
— |
|
|
— |
|
|
— |
|
|
— |
|
|
— |
|
|
— |
|
|
— |
90 days past due |
|
|
— |
|
|
— |
|
|
— |
|
|
— |
|
|
— |
|
|
127 |
|
|
— |
|
|
127 |
Total other income producing property |
|
$ |
6,310 |
|
$ |
43,022 |
|
$ |
18,536 |
|
$ |
4,331 |
|
$ |
2,537 |
|
$ |
37,105 |
|
$ |
280 |
|
$ |
112,121 |
Other income producing property |
|
|
|
|
|
|
|
|
|
|
|
|
|
|
|
|
|
|
|
|
|
|
|
|
Current-period gross charge-offs |
|
$ |
— |
|
$ |
— |
|
$ |
— |
|
$ |
— |
|
$ |
— |
|
$ |
— |
|
$ |
— |
|
$ |
— |
|
|
|
|
|
|
|
|
|
|
|
|
|
|
|
|
|
|
|
|
|
|
|
|
|
Total Consumer Loans |
|
|
|
|
|
|
|
|
|
|
|
|
|
|
|
|
|
|
|
|
|
|
|
|
Days past due: |
|
|
|
|
|
|
|
|
|
|
|
|
|
|
|
|
|
|
|
|
|
|
|
|
Current |
|
$ |
1,468,427 |
|
$ |
2,905,191 |
|
$ |
1,915,515 |
|
$ |
729,369 |
|
$ |
360,664 |
|
$ |
1,015,838 |
|
$ |
1,541,717 |
|
$ |
9,936,721 |
30 days past due |
|
|
2,092 |
|
|
2,589 |
|
|
1,903 |
|
|
928 |
|
|
888 |
|
|
6,002 |
|
|
16,617 |
|
|
31,019 |
60 days past due |
|
|
64 |
|
|
1,020 |
|
|
692 |
|
|
788 |
|
|
4 |
|
|
2,244 |
|
|
7,688 |
|
|
12,500 |
90 days past due |
|
|
1,490 |
|
|
2,933 |
|
|
1,290 |
|
|
2,080 |
|
|
426 |
|
|
6,632 |
|
|
2,236 |
|
|
17,087 |
Total Consumer Loans |
|
$ |
1,472,073 |
|
$ |
2,911,733 |
|
$ |
1,919,400 |
|
$ |
733,165 |
|
$ |
361,982 |
|
$ |
1,030,716 |
|
$ |
1,568,258 |
|
$ |
9,997,327 |
|
|
|
|
|
|
|
|
|
|
|
|
|
|
|
|
|
|
|
|
|
|
|
|
|
Current-period gross charge-offs |
|
$ |
441 |
|
$ |
1,676 |
|
$ |
598 |
|
$ |
344 |
|
$ |
217 |
|
$ |
587 |
|
$ |
8,562 |
|
$ |
12,425 |
The following table presents total loans by origination year as of December 31, 2023:
|
|
|
|
|
|
|
|
|
|
|
|
|
|
|
|
|
|
|
|
|
|
|
|
|
|
|
Term Loans |
||||||||||||||||||||||
(Dollars in thousands) |
|
Amortized Cost Basis by Origination Year |
||||||||||||||||||||||
As of December 31, 2023 |
|
2023 |
|
2022 |
|
2021 |
|
2020 |
|
2019 |
|
Prior |
|
Revolving |
|
Total |
||||||||
Total Loans |
|
$ |
4,676,676 |
|
$ |
8,985,446 |
|
$ |
6,291,335 |
|
$ |
2,591,604 |
|
$ |
2,079,547 |
|
$ |
4,459,113 |
|
$ |
3,304,768 |
|
$ |
32,388,489 |
|
|
|
|
|
|
|
|
|
|
|
|
|
|
|
|
|
|
|
|
|
|
|
|
|
Current-period gross charge-offs |
|
$ |
7,713 |
|
$ |
4,973 |
|
$ |
13,818 |
|
$ |
977 |
|
$ |
982 |
|
$ |
2,479 |
|
$ |
9,706 |
|
$ |
40,648 |
F-37
The following table presents the credit risk profile by past due status of consumer loans by origination year as of December 31, 2022:
|
|
Term Loans |
||||||||||||||||||||||
(Dollars in thousands) |
|
Amortized Cost Basis by Origination Year |
||||||||||||||||||||||
As of December 31, 2022 |
|
2022 |
|
2021 |
|
2020 |
|
2019 |
|
2018 |
|
Prior |
|
Revolving |
|
Total |
||||||||
Consumer owner occupied |
|
|
|
|
|
|
|
|
|
|
|
|
|
|
|
|
|
|
|
|
|
|
|
|
Days past due: |
|
|
|
|
|
|
|
|
|
|
|
|
|
|
|
|
|
|
|
|
|
|
|
|
Current |
|
$ |
1,695,454 |
|
$ |
1,467,080 |
|
$ |
657,005 |
|
$ |
315,458 |
|
$ |
187,580 |
|
$ |
792,572 |
|
$ |
— |
|
$ |
5,115,149 |
30 days past due |
|
|
1,316 |
|
|
1,254 |
|
|
1,681 |
|
|
664 |
|
|
272 |
|
|
2,028 |
|
|
— |
|
|
7,215 |
60 days past due |
|
|
255 |
|
|
337 |
|
|
579 |
|
|
— |
|
|
242 |
|
|
1,650 |
|
|
— |
|
|
3,063 |
90 days past due |
|
|
— |
|
|
944 |
|
|
776 |
|
|
454 |
|
|
664 |
|
|
3,036 |
|
|
— |
|
|
5,874 |
Total Consumer owner occupied |
|
$ |
1,697,025 |
|
$ |
1,469,615 |
|
$ |
660,041 |
|
$ |
316,576 |
|
$ |
188,758 |
|
$ |
799,286 |
|
$ |
— |
|
$ |
5,131,301 |
Consumer owner occupied |
|
|
|
|
|
|
|
|
|
|
|
|
|
|
|
|
|
|
|
|
|
|
|
|
Current-period gross charge-offs |
|
$ |
25 |
|
$ |
— |
|
$ |
— |
|
$ |
6 |
|
$ |
23 |
|
$ |
66 |
|
$ |
— |
|
$ |
120 |
|
|
|
|
|
|
|
|
|
|
|
|
|
|
|
|
|
|
|
|
|
|
|
|
|
Home equity loans |
|
|
|
|
|
|
|
|
|
|
|
|
|
|
|
|
|
|
|
|
|
|
|
|
Days past due: |
|
|
|
|
|
|
|
|
|
|
|
|
|
|
|
|
|
|
|
|
|
|
|
|
Current |
|
$ |
5,921 |
|
$ |
5,231 |
|
$ |
3,282 |
|
$ |
1,560 |
|
$ |
1,955 |
|
$ |
17,941 |
|
$ |
1,272,848 |
|
$ |
1,308,738 |
30 days past due |
|
|
— |
|
|
— |
|
|
155 |
|
|
77 |
|
|
418 |
|
|
422 |
|
|
1,586 |
|
|
2,658 |
60 days past due |
|
|
— |
|
|
— |
|
|
19 |
|
|
36 |
|
|
70 |
|
|
26 |
|
|
540 |
|
|
691 |
90 days past due |
|
|
— |
|
|
— |
|
|
60 |
|
|
87 |
|
|
— |
|
|
611 |
|
|
323 |
|
|
1,081 |
Total Home equity loans |
|
$ |
5,921 |
|
$ |
5,231 |
|
$ |
3,516 |
|
$ |
1,760 |
|
$ |
2,443 |
|
$ |
19,000 |
|
$ |
1,275,297 |
|
$ |
1,313,168 |
Home equity loans |
|
|
|
|
|
|
|
|
|
|
|
|
|
|
|
|
|
|
|
|
|
|
|
|
Current-period gross charge-offs |
|
$ |
— |
|
$ |
— |
|
$ |
— |
|
$ |
19 |
|
$ |
— |
|
$ |
280 |
|
$ |
146 |
|
$ |
445 |
|
|
|
|
|
|
|
|
|
|
|
|
|
|
|
|
|
|
|
|
|
|
|
|
|
Consumer |
|
|
|
|
|
|
|
|
|
|
|
|
|
|
|
|
|
|
|
|
|
|
|
|
Days past due: |
|
|
|
|
|
|
|
|
|
|
|
|
|
|
|
|
|
|
|
|
|
|
|
|
Current |
|
$ |
407,825 |
|
$ |
206,003 |
|
$ |
111,210 |
|
$ |
86,008 |
|
$ |
44,303 |
|
$ |
141,053 |
|
$ |
248,314 |
|
$ |
1,244,716 |
30 days past due |
|
|
718 |
|
|
194 |
|
|
78 |
|
|
174 |
|
|
63 |
|
|
1,255 |
|
|
17,471 |
|
|
19,953 |
60 days past due |
|
|
55 |
|
|
103 |
|
|
107 |
|
|
36 |
|
|
144 |
|
|
557 |
|
|
9,836 |
|
|
10,838 |
90 days past due |
|
|
126 |
|
|
60 |
|
|
58 |
|
|
66 |
|
|
165 |
|
|
1,660 |
|
|
784 |
|
|
2,919 |
Total consumer |
|
$ |
408,724 |
|
$ |
206,360 |
|
$ |
111,453 |
|
$ |
86,284 |
|
$ |
44,675 |
|
$ |
144,525 |
|
$ |
276,405 |
|
$ |
1,278,426 |
Consumer |
|
|
|
|
|
|
|
|
|
|
|
|
|
|
|
|
|
|
|
|
|
|
|
|
Current-period gross charge-offs |
|
$ |
254 |
|
$ |
653 |
|
$ |
337 |
|
$ |
265 |
|
$ |
62 |
|
$ |
664 |
|
$ |
7,979 |
|
$ |
10,214 |
|
|
|
|
|
|
|
|
|
|
|
|
|
|
|
|
|
|
|
|
|
|
|
|
|
Construction and land development |
|
|
|
|
|
|
|
|
|
|
|
|
|
|
|
|
|
|
|
|
|
|
|
|
Days past due: |
|
|
|
|
|
|
|
|
|
|
|
|
|
|
|
|
|
|
|
|
|
|
|
|
Current |
|
$ |
466,475 |
|
$ |
351,485 |
|
$ |
50,472 |
|
$ |
14,053 |
|
$ |
7,006 |
|
$ |
13,588 |
|
$ |
379 |
|
$ |
903,458 |
30 days past due |
|
|
2 |
|
|
— |
|
|
— |
|
|
57 |
|
|
23 |
|
|
43 |
|
|
— |
|
|
125 |
60 days past due |
|
|
— |
|
|
— |
|
|
— |
|
|
— |
|
|
— |
|
|
— |
|
|
— |
|
|
— |
90 days past due |
|
|
— |
|
|
— |
|
|
436 |
|
|
— |
|
|
— |
|
|
41 |
|
|
— |
|
|
477 |
Total Construction and land development |
|
$ |
466,477 |
|
$ |
351,485 |
|
$ |
50,908 |
|
$ |
14,110 |
|
$ |
7,029 |
|
$ |
13,672 |
|
$ |
379 |
|
$ |
904,060 |
Construction and land development |
|
|
|
|
|
|
|
|
|
|
|
|
|
|
|
|
|
|
|
|
|
|
|
|
Current-period gross charge-offs |
|
$ |
— |
|
$ |
— |
|
$ |
21 |
|
$ |
— |
|
$ |
— |
|
$ |
4 |
|
$ |
— |
|
$ |
25 |
|
|
|
|
|
|
|
|
|
|
|
|
|
|
|
|
|
|
|
|
|
|
|
|
|
Other income producing property |
|
|
|
|
|
|
|
|
|
|
|
|
|
|
|
|
|
|
|
|
|
|
|
|
Days past due: |
|
|
|
|
|
|
|
|
|
|
|
|
|
|
|
|
|
|
|
|
|
|
|
|
Current |
|
$ |
45,717 |
|
$ |
21,421 |
|
$ |
4,937 |
|
$ |
2,663 |
|
$ |
4,322 |
|
$ |
40,680 |
|
$ |
624 |
|
$ |
120,364 |
30 days past due |
|
|
— |
|
|
— |
|
|
— |
|
|
— |
|
|
— |
|
|
62 |
|
|
— |
|
|
62 |
60 days past due |
|
|
— |
|
|
— |
|
|
— |
|
|
— |
|
|
— |
|
|
23 |
|
|
— |
|
|
23 |
90 days past due |
|
|
— |
|
|
— |
|
|
— |
|
|
— |
|
|
— |
|
|
121 |
|
|
— |
|
|
121 |
Total other income producing property |
|
$ |
45,717 |
|
$ |
21,421 |
|
$ |
4,937 |
|
$ |
2,663 |
|
$ |
4,322 |
|
$ |
40,886 |
|
$ |
624 |
|
$ |
120,570 |
Other income producing property |
|
|
|
|
|
|
|
|
|
|
|
|
|
|
|
|
|
|
|
|
|
|
|
|
Current-period gross charge-offs |
|
$ |
— |
|
$ |
— |
|
$ |
— |
|
$ |
— |
|
$ |
— |
|
$ |
— |
|
$ |
— |
|
$ |
— |
|
|
|
|
|
|
|
|
|
|
|
|
|
|
|
|
|
|
|
|
|
|
|
|
|
Total Consumer Loans |
|
|
|
|
|
|
|
|
|
|
|
|
|
|
|
|
|
|
|
|
|
|
|
|
Days past due: |
|
|
|
|
|
|
|
|
|
|
|
|
|
|
|
|
|
|
|
|
|
|
|
|
Current |
|
$ |
2,621,392 |
|
$ |
2,051,220 |
|
$ |
826,906 |
|
$ |
419,742 |
|
$ |
245,166 |
|
$ |
1,005,834 |
|
$ |
1,522,165 |
|
$ |
8,692,425 |
30 days past due |
|
|
2,036 |
|
|
1,448 |
|
|
1,914 |
|
|
972 |
|
|
776 |
|
|
3,810 |
|
|
19,057 |
|
|
30,013 |
60 days past due |
|
|
310 |
|
|
440 |
|
|
705 |
|
|
72 |
|
|
456 |
|
|
2,256 |
|
|
10,376 |
|
|
14,615 |
90 days past due |
|
|
126 |
|
|
1,004 |
|
|
1,330 |
|
|
607 |
|
|
829 |
|
|
5,469 |
|
|
1,107 |
|
|
10,472 |
Total Consumer Loans |
|
$ |
2,623,864 |
|
$ |
2,054,112 |
|
$ |
830,855 |
|
$ |
421,393 |
|
$ |
247,227 |
|
$ |
1,017,369 |
|
$ |
1,552,705 |
|
$ |
8,747,525 |
|
|
|
|
|
|
|
|
|
|
|
|
|
|
|
|
|
|
|
|
|
|
|
|
|
Current-period gross charge-offs |
|
$ |
279 |
|
$ |
653 |
|
$ |
358 |
|
$ |
290 |
|
$ |
85 |
|
$ |
1,014 |
|
$ |
8,125 |
|
$ |
10,804 |
The following table presents total loans by origination year as of December 31, 2022:
|
|
Term Loans |
||||||||||||||||||||||
(Dollars in thousands) |
|
Amortized Cost Basis by Origination Year |
||||||||||||||||||||||
As of December 31, 2022 |
|
2022 |
|
2021 |
|
2020 |
|
2019 |
|
2018 |
|
Prior |
|
Revolving |
|
Total |
||||||||
Total Loans |
|
$ |
8,589,197 |
|
$ |
6,907,684 |
|
$ |
3,112,648 |
|
$ |
2,533,623 |
|
$ |
1,539,466 |
|
$ |
4,173,570 |
|
$ |
3,321,674 |
|
$ |
30,177,862 |
|
|
|
|
|
|
|
|
|
|
|
|
|
|
|
|
|
|
|
|
|
|
|
|
|
Current-period gross charge-offs |
|
$ |
291 |
|
$ |
3,478 |
|
$ |
556 |
|
$ |
2,063 |
|
$ |
2,299 |
|
$ |
4,842 |
|
$ |
9,917 |
|
$ |
23,446 |
F-38
The following table presents an aging analysis of past due accruing loans, segregated by class:
|
|
|
|
|
|
|
|
|
|
|
|
|
|
|
|
|
|
|
|
|
|
|
|
30 - 59 Days |
|
60 - 89 Days |
|
90+ Days |
|
Total |
|
|
|
Non- |
|
Total |
|||||||
(Dollars in thousands) |
|
Past Due |
|
Past Due |
|
Past Due |
|
Past Due |
|
Current |
|
Accruing |
|
Loans |
|||||||
December 31, 2023 |
|
|
|
|
|
|
|
|
|
|
|
|
|
|
|
|
|
|
|
|
|
Construction and land development |
|
$ |
624 |
|
$ |
— |
|
$ |
— |
|
$ |
624 |
|
$ |
2,921,457 |
|
$ |
1,433 |
|
$ |
2,923,514 |
Commercial non-owner occupied |
|
|
2,194 |
|
|
123 |
|
|
1,378 |
|
|
3,695 |
|
|
8,546,630 |
|
|
21,309 |
|
|
8,571,634 |
Commercial owner occupied |
|
|
3,852 |
|
|
1,141 |
|
|
988 |
|
|
5,981 |
|
|
5,446,803 |
|
|
44,887 |
|
|
5,497,671 |
Consumer owner occupied |
|
|
7,903 |
|
|
552 |
|
|
920 |
|
|
9,375 |
|
|
6,560,359 |
|
|
25,271 |
|
|
6,595,005 |
Home equity loans |
|
|
6,500 |
|
|
1,326 |
|
|
— |
|
|
7,826 |
|
|
1,385,687 |
|
|
4,932 |
|
|
1,398,445 |
Commercial and industrial |
|
|
25,231 |
|
|
7,194 |
|
|
9,193 |
|
|
41,618 |
|
|
5,399,390 |
|
|
63,531 |
|
|
5,504,539 |
Other income producing property |
|
|
569 |
|
|
570 |
|
|
— |
|
|
1,139 |
|
|
651,993 |
|
|
3,202 |
|
|
656,334 |
Consumer |
|
|
13,212 |
|
|
7,370 |
|
|
— |
|
|
20,582 |
|
|
1,207,411 |
|
|
5,657 |
|
|
1,233,650 |
Other loans |
|
|
— |
|
|
— |
|
|
— |
|
|
— |
|
|
7,697 |
|
|
— |
|
|
7,697 |
|
|
$ |
60,085 |
|
$ |
18,276 |
|
$ |
12,479 |
|
$ |
90,840 |
|
$ |
32,127,427 |
|
$ |
170,222 |
|
$ |
32,388,489 |
December 31, 2022 |
|
|
|
|
|
|
|
|
|
|
|
|
|
|
|
|
|
|
|
|
|
Construction and land development |
|
$ |
2,146 |
|
$ |
3,653 |
|
$ |
— |
|
$ |
5,799 |
|
$ |
2,853,734 |
|
$ |
827 |
|
$ |
2,860,360 |
Commercial non-owner occupied |
|
|
1,158 |
|
|
978 |
|
|
77 |
|
|
2,213 |
|
|
8,050,321 |
|
|
20,425 |
|
|
8,072,959 |
Commercial owner occupied |
|
|
10,748 |
|
|
2,059 |
|
|
2,231 |
|
|
15,038 |
|
|
5,410,066 |
|
|
35,089 |
|
|
5,460,193 |
Consumer owner occupied |
|
|
6,001 |
|
|
744 |
|
|
40 |
|
|
6,785 |
|
|
5,137,950 |
|
|
17,307 |
|
|
5,162,042 |
Home equity loans |
|
|
2,527 |
|
|
361 |
|
|
— |
|
|
2,888 |
|
|
1,303,964 |
|
|
6,316 |
|
|
1,313,168 |
Commercial and industrial |
|
|
24,500 |
|
|
11,677 |
|
|
1,704 |
|
|
37,881 |
|
|
5,258,473 |
|
|
17,129 |
|
|
5,313,483 |
Other income producing property |
|
|
1,623 |
|
|
1,480 |
|
|
298 |
|
|
3,401 |
|
|
690,107 |
|
|
2,734 |
|
|
696,242 |
Consumer |
|
|
19,713 |
|
|
10,655 |
|
|
— |
|
|
30,368 |
|
|
1,243,660 |
|
|
4,398 |
|
|
1,278,426 |
Other loans |
|
|
— |
|
|
— |
|
|
— |
|
|
— |
|
|
20,989 |
|
|
— |
|
|
20,989 |
|
|
$ |
68,416 |
|
$ |
31,607 |
|
$ |
4,350 |
|
$ |
104,373 |
|
$ |
29,969,264 |
|
$ |
104,225 |
|
$ |
30,177,862 |
The following table is a summary of information pertaining to nonaccrual loans by class, including loans modified for borrowers with financial difficulty as of December 31, 2023 and the information pertaining to nonaccrual loans by class, including restructured loans as of December 31, 2022:
|
|
December 31, |
|
Greater than |
|
Non-accrual |
|
December 31, |
|
|
||||
(Dollars in thousands) |
|
2023 |
|
90 Days Accruing(1) |
|
with no allowance(1) |
|
2022 |
|
|
||||
Construction and land development |
|
$ |
1,433 |
|
$ |
— |
|
$ |
— |
|
$ |
827 |
|
|
Commercial non-owner occupied |
|
|
21,309 |
|
|
1,378 |
|
|
13,608 |
|
|
20,425 |
|
|
Commercial owner occupied real estate |
|
|
44,887 |
|
|
988 |
|
|
20,843 |
|
|
35,089 |
|
|
Consumer owner occupied |
|
|
25,271 |
|
|
920 |
|
|
— |
|
|
17,307 |
|
|
Home equity loans |
|
|
4,932 |
|
|
— |
|
|
— |
|
|
6,316 |
|
|
Commercial and industrial |
|
|
63,531 |
|
|
9,193 |
|
|
27,591 |
|
|
17,129 |
|
|
Other income producing property |
|
|
3,202 |
|
|
— |
|
|
— |
|
|
2,734 |
|
|
Consumer |
|
|
5,657 |
|
|
— |
|
|
— |
|
|
4,398 |
|
|
Total loans on nonaccrual status |
|
$ |
170,222 |
|
$ |
12,479 |
|
$ |
62,042 |
|
$ |
104,225 |
|
|
(1) |
Greater than 90 days accruing and non-accrual with no allowance loans at December 31, 2023. |
There is no interest income recognized during the period on nonaccrual loans. The Company follows its nonaccrual policy by reversing contractual interest income in the income statement when the Company places a loan on nonaccrual status. Loans on nonaccrual status in which there is no allowance assigned are individually evaluated loans that do not carry a specific reserve. See Note 1—Summary of Significant Accounting Policies for further detailed on individually evaluated loans.
The following is a summary of collateral dependent loans, by type of collateral, and the extent to which they are collateralized during the period:
|
|
December 31, |
|
Collateral |
|
|
December 31, |
|
Collateral |
|
|
||||
(Dollars in thousands) |
|
2023 |
|
Coverage |
% |
|
2022 |
|
Coverage |
% |
|
||||
Commercial owner occupied real estate |
|
|
|
|
|
|
|
|
|
|
|
|
|
|
|
Church |
|
$ |
3,537 |
|
$ |
6,705 |
190% |
|
$ |
— |
|
$ |
— |
|
|
Industrial |
|
|
7,172 |
|
|
15,273 |
213% |
|
|
— |
|
|
— |
|
|
Other |
|
|
12,231 |
|
|
23,747 |
194% |
|
|
14,638 |
|
|
38,900 |
266% |
|
Commercial non-owner occupied real estate |
|
|
|
|
|
|
|
|
|
|
|
|
|
|
|
Retail |
|
|
3,216 |
|
|
4,208 |
131% |
|
|
— |
|
|
— |
|
|
Other |
|
|
12,607 |
|
|
29,182 |
231% |
|
|
6,450 |
|
|
10,900 |
169% |
|
Commercial and industrial |
|
|
|
|
|
|
|
|
|
|
|
|
|
|
|
Other |
|
|
44,116 |
|
|
46,114 |
105% |
|
|
4,808 |
|
|
5,591 |
116% |
|
Home equity loans |
|
|
|
|
|
|
|
|
|
|
|
|
|
|
|
Residential 1-4 family dwelling |
|
|
— |
|
|
— |
|
|
|
1,523 |
|
|
1,671 |
110% |
|
Total collateral dependent loans |
|
$ |
82,879 |
|
$ |
125,229 |
|
|
$ |
27,419 |
|
$ |
57,062 |
|
|
F-39
The Bank designates individually evaluated loans on non-accrual with a net book balance exceeding the designated threshold as collateral dependent loans. Collateral dependent loans are loans for which the repayment is expected to be provided substantially through the operation or sale of the collateral and the borrower is experiencing financial difficulty. These loans do not share common risk characteristics and are not included within the collectively evaluated loans for determining ACL. Under ASC 326-20-35-6, the Bank has adopted the collateral maintenance practical expedient to measure the ACL based on the fair value of collateral. The ACL is calculated on an individual loan basis based on the shortfall between the fair value of the loan's collateral, which is adjusted for selling costs, and amortized cost. If the fair value of the collateral exceeds the amortized cost, no allowance is required. The Bank’s threshold for individually evaluated loans is $1.0 million. The significant changes above in collateral percentage are due to appraisal value updates or changes in the number of loans within the asset class and collateral type. Overall collateral dependent loans increased by $55.5 million from December 31, 2022 compared to the balance at December 31, 2023.
Loans on nonaccrual status at the date of modification are initially classified as nonaccrual. Loans on accruing status at the date of modification are initially classified as accruing if the note is reasonably assured of repayment and performance is expected in accordance with its modified terms. Such loans may be designated as nonaccrual loans subsequent to the modification date if reasonable doubt exists as to the collection of interest or principal under the modification agreement. Nonaccrual loans are returned to accruing status when there is economic substance to the modification, there is documented credit evaluation of the borrower’s financial condition, the remaining balance is reasonably assured of repayment in accordance with its modified terms, and the borrower has demonstrated sustained repayment performance in accordance with the modified terms for a reasonable period of time (generally a minimum of six months). See Note 1—Summary of Significant Accounting Policies for how such modifications are factored into the determination of the ACL for the periods presented above.
The following tables present loans designated as modifications made to borrowers experiencing financial difficulty during the year ended December 31, 2023 resulting from the adoption of ASU 2022-02, segregated by type of modification and asset class, and indicating the financial effect of the modifications. The amortized cost balance for the modified loans presented below exclude accrued interest receivable of approximately $59,000 as of December 31, 2023.
|
|
Year Ended December 31, |
|
||||||
|
|
2023 |
|
||||||
|
|
|
|
|
|
Reduction in Weighted |
|
||
|
|
Amortized |
|
% of Total |
|
Average Contractual |
|
||
(Dollars in thousands) |
|
Cost |
|
Asset Class |
|
Interest Rate |
|
||
Interest rate reduction |
|
|
|
|
|
|
|
|
|
Commercial owner occupied real estate |
|
$ |
839 |
|
|
0.02% |
|
9.50 to 6.00% |
|
Total interest rate reductions |
|
$ |
839 |
|
|
|
|
|
|
|
|
Year Ended December 31, |
|
||||||
|
|
2023 |
|
||||||
|
|
|
|
|
|
Increase in |
|
||
|
|
Amortized |
|
% of Total |
|
Weighted Average |
|
||
(Dollars in thousands) |
|
Cost |
|
Asset Class |
|
Life of Loan |
|
||
Term extension |
|
|
|
|
|
|
|
|
|
Construction and land development |
|
$ |
251 |
|
|
0.01% |
|
12 months |
|
Commercial non-owner occupied |
|
|
1,246 |
|
|
0.01% |
|
24 months |
|
Commercial owner occupied real estate |
|
|
7,511 |
|
|
0.14% |
|
23 months |
|
Commercial and industrial |
|
|
1,674 |
|
|
0.03% |
|
6 months |
|
Other income producing property |
|
|
339 |
|
|
0.05% |
|
60 months |
|
Total term extensions |
|
$ |
11,021 |
|
|
|
|
|
|
|
|
Year Ended December 31, |
|
|||||
|
|
2023 |
|
|||||
|
|
|
|
Reduction in Weighted |
|
Increase in |
|
|
|
|
Amortized |
|
Average Contractual |
|
Weighted Average |
|
|
(Dollars in thousands) |
|
Cost |
|
Interest Rate |
|
Life of Loan |
|
|
Combination- Term Extension and Interest Rate Reduction |
|
|
|
|
|
|
|
|
Consumer owner occupied |
|
$ |
259 |
|
3.63 to 3.00% |
|
20 months |
|
Total |
|
$ |
259 |
|
|
|
|
|
F-40
The Bank on occasion will enter into modification agreements which extend the maturity payoff on a loan or reduce the interest rate, for borrowers willing to continue to pay, to minimize losses for the Bank. At December 31, 2023, the Company had $1.9 million remaining in commitments to lend additional funds on loans to borrowers experiencing financial difficulty and modified during the current reporting period.
The following table presents loans designated as TDRs segregated by class and type of concession that were restructured, for the comparative period, prior to the adoption of ASU 2022-02:
|
|
Year Ended December 31, |
|
||||||
|
|
2022 |
|
||||||
|
|
|
|
Pre-Modification |
|
Post-Modification |
|
||
|
|
Number |
|
Amortized |
|
Amortized |
|
||
(Dollars in thousands) |
|
of loans |
|
Cost |
|
Cost |
|
||
Interest rate modification |
|
|
|
|
|
|
|
|
|
Commercial non-owner occupied |
|
5 |
|
$ |
3,643 |
|
$ |
3,643 |
|
Commercial owner occupied |
|
5 |
|
|
3,937 |
|
|
3,937 |
|
Consumer owner occupied |
|
1 |
|
|
95 |
|
|
95 |
|
Commercial and industrial |
|
4 |
|
|
305 |
|
|
305 |
|
Other income producing property |
|
1 |
|
|
71 |
|
|
71 |
|
Total interest rate modifications |
|
16 |
|
$ |
8,051 |
|
$ |
8,051 |
|
Term modification |
|
|
|
|
|
|
|
|
|
Construction and land development |
|
1 |
|
$ |
129 |
|
$ |
129 |
|
Commercial non-owner occupied |
|
1 |
|
|
367 |
|
|
367 |
|
Commercial owner occupied |
|
3 |
|
|
1,426 |
|
|
1,426 |
|
Commercial and industrial |
|
3 |
|
|
3,059 |
|
|
3,059 |
|
Total term modifications |
|
8 |
|
$ |
4,981 |
|
$ |
4,981 |
|
|
|
24 |
|
$ |
13,032 |
|
$ |
13,032 |
|
At December 31, 2022, the balance of accruing TDRs was $13.5 million. The Company had $582,000 remaining availability under commitments to lend additional funds on restructured loans at December 31, 2022. The amount of specific reserve associated with restructured loans was $14.7 million at December 31, 2022.
The following table presents the changes in status of loans modified within the previous twelve months to borrowers experiencing financial difficulty, as of December 31, 2023 by type of modification. There were no subsequent defaults.
|
|
Paying Under |
|
Converted to |
|
Foreclosures |
|
|||
|
|
Restructured Terms |
|
Nonaccrual |
|
and Defaults |
|
|||
|
|
Amortized |
|
Amortized |
|
Amortized |
|
|||
(Dollars in thousands) |
|
Cost |
|
Cost |
|
Cost |
|
|||
Interest Rate Reduction |
|
|
|
|
|
|
|
|
|
|
Commercial owner occupied real estate |
|
$ |
839 |
|
$ |
— |
|
$ |
— |
|
Total Interest Rate Reductions |
|
$ |
839 |
|
$ |
— |
|
$ |
— |
|
Term extension |
|
|
|
|
|
|
|
|
|
|
Construction and land development |
|
$ |
251 |
|
$ |
— |
|
$ |
— |
|
Commercial non-owner occupied |
|
|
1,246 |
|
|
— |
|
|
— |
|
Commercial owner occupied real estate |
|
|
7,511 |
|
|
— |
|
|
— |
|
Commercial and industrial |
|
|
1,674 |
|
|
— |
|
|
— |
|
Other income producing property |
|
|
339 |
|
|
— |
|
|
— |
|
Total term extensions |
|
$ |
11,021 |
|
$ |
— |
|
$ |
— |
|
Term Extension and Interest Rate Reduction |
|
|
|
|
|
|
|
|
|
|
Consumer owner occupied |
|
$ |
259 |
|
$ |
— |
|
$ |
— |
|
Total combinations |
|
$ |
259 |
|
$ |
— |
|
$ |
— |
|
|
|
$ |
12,119 |
|
$ |
— |
|
$ |
— |
|
The following table presents the changes in status of TDR loans within the previous twelve months as of December 31, 2022 by type of concession, for the comparative period, prior to the adoption of ASU 2022-02. The subsequent defaults in this case had no impact on the expected credit losses.
|
|
Paying Under |
|
Converted to |
|
Foreclosures and |
|
|||||||||
|
|
Restructured Terms |
|
Nonaccrual |
|
Defaults |
|
|||||||||
|
|
Number |
|
Recorded |
|
Number |
|
Recorded |
|
Number |
|
Recorded |
|
|||
(Dollars in thousands) |
|
of Loans |
|
Investment |
|
of Loans |
|
Investment |
|
of Loans |
|
Investment |
|
|||
Interest rate modification |
|
16 |
|
$ |
8,051 |
|
— |
|
$ |
— |
|
— |
|
$ |
— |
|
Term modification |
|
5 |
|
|
3,900 |
|
— |
|
|
— |
|
3 |
|
|
1,081 |
|
|
|
21 |
|
$ |
11,951 |
|
— |
|
$ |
— |
|
3 |
|
$ |
1,081 |
|
F-41
The following table depicts the performance of loans modified within the previous twelve months to borrowers experiencing financial difficulty, as of December 31, 2023:
|
|
Payment Status (Amortized Cost Basis) |
|
|||||||
|
|
|
|
30-89 Days |
|
90+ Days |
|
|||
(Dollars in thousands) |
|
Current |
|
Past Due |
|
Past Due |
|
|||
Construction and land development |
|
$ |
251 |
|
$ |
— |
|
$ |
— |
|
Commercial non-owner occupied |
|
|
— |
|
|
1,246 |
|
|
— |
|
Commercial owner occupied real estate |
|
|
8,350 |
|
|
— |
|
|
— |
|
Consumer owner occupied |
|
|
— |
|
|
259 |
|
|
— |
|
Commercial and industrial |
|
|
1,275 |
|
|
399 |
|
|
— |
|
Other income producing property |
|
|
— |
|
|
339 |
|
|
— |
|
Total |
|
$ |
9,876 |
|
$ |
2,243 |
|
$ |
— |
|
Note 5—Allowance for Credit Losses (ACL)
See Note 1—Summary of Significant Accounting Policies for further detailed descriptions of our estimation process and methodology related to the allowance for credit losses.
The following table presents a disaggregated analysis of activity in the allowance for credit losses as follows:
|
|
|
|
|
|
|
|
|
|
|
|
|
|
|
|
|
|
|
|
|
|
|
|
|
|
|
|
|
|
|
|
|
|
|
|
|
|
|
Residential |
|
Residential |
|
|
|
Residential |
|
Comm Constr. |
|
|
|
|
|
|
|
CRE Owner |
|
Non Owner |
|
|
|
|
|
|||||||||||
(Dollars in thousands) |
|
Mortgage Sr. |
|
Mortgage Jr. |
|
HELOC |
|
Construction |
|
& Dev. |
|
Consumer |
|
Multifamily |
|
Municipal |
|
Occupied |
|
Occupied CRE |
|
C & I |
|
Total |
||||||||||||
Year Ended December 31, 2023 |
|
|
|
|
|
|
|
|
|
|
|
|
|
|
|
|
|
|
|
|
|
|
|
|
|
|
|
|
|
|
|
|
|
|
|
|
Allowance for credit losses: |
|
|
|
|
|
|
|
|
|
|
|
|
|
|
|
|
|
|
|
|
|
|
|
|
|
|
|
|
|
|
|
|
|
|
|
|
Balance at end of period December 31, 2022 |
|
$ |
72,188 |
|
$ |
405 |
|
$ |
14,886 |
|
$ |
8,974 |
|
$ |
45,410 |
|
$ |
22,767 |
|
$ |
3,684 |
|
$ |
849 |
|
$ |
58,083 |
|
$ |
78,485 |
|
$ |
50,713 |
|
$ |
356,444 |
Charge-offs |
|
|
(187) |
|
|
— |
|
|
(177) |
|
|
— |
|
|
(225) |
|
|
(12,042) |
|
|
— |
|
|
— |
|
|
(126) |
|
|
(304) |
|
|
(27,587) |
|
|
(40,648) |
Recoveries |
|
|
922 |
|
|
108 |
|
|
1,250 |
|
|
128 |
|
|
687 |
|
|
2,247 |
|
|
41 |
|
|
— |
|
|
938 |
|
|
962 |
|
|
8,499 |
|
|
15,782 |
Net (charge offs) recoveries |
|
|
735 |
|
|
108 |
|
|
1,073 |
|
|
128 |
|
|
462 |
|
|
(9,795) |
|
|
41 |
|
|
— |
|
|
812 |
|
|
658 |
|
|
(19,088) |
|
|
(24,866) |
Provision (benefit) (1) |
|
|
5,129 |
|
|
232 |
|
|
(5,017) |
|
|
(4,078) |
|
|
19,900 |
|
|
10,359 |
|
|
10,041 |
|
|
51 |
|
|
12,685 |
|
|
57,912 |
|
|
17,781 |
|
|
124,995 |
Balance at end of period December 31, 2023 |
|
$ |
78,052 |
|
$ |
745 |
|
$ |
10,942 |
|
$ |
5,024 |
|
$ |
65,772 |
|
$ |
23,331 |
|
$ |
13,766 |
|
$ |
900 |
|
$ |
71,580 |
|
$ |
137,055 |
|
$ |
49,406 |
|
$ |
456,573 |
|
|
|
|
|
|
|
|
|
|
|
|
|
|
|
|
|
|
|
|
|
|
|
|
|
|
|
|
|
|
|
|
|
|
|
|
|
Year Ended December 31, 2022 |
|
|
|
|
|
|
|
|
|
|
|
|
|
|
|
|
|
|
|
|
|
|
|
|
|
|
|
|
|
|
|
|
|
|
|
|
Allowance for credit losses: |
|
|
|
|
|
|
|
|
|
|
|
|
|
|
|
|
|
|
|
|
|
|
|
|
|
|
|
|
|
|
|
|
|
|
|
|
Balance at end of period December 31, 2021 |
|
$ |
47,036 |
|
$ |
611 |
|
$ |
13,325 |
|
$ |
4,997 |
|
$ |
37,593 |
|
$ |
23,149 |
|
$ |
4,921 |
|
$ |
565 |
|
$ |
61,794 |
|
$ |
79,649 |
|
$ |
28,167 |
|
$ |
301,807 |
Initial Allowance for PCD loans acquired during period |
|
|
811 |
|
|
— |
|
|
— |
|
|
— |
|
|
86 |
|
|
— |
|
|
— |
|
|
— |
|
|
2,409 |
|
|
— |
|
|
10,452 |
|
|
13,758 |
Initial Allowance for Non PCD loans acquired during period |
|
|
352 |
|
|
26 |
|
|
132 |
|
|
2 |
|
|
1,887 |
|
|
51 |
|
|
426 |
|
|
— |
|
|
2,519 |
|
|
2,697 |
|
|
5,605 |
|
|
13,697 |
Charge-offs |
|
|
(197) |
|
|
(19) |
|
|
(445) |
|
|
(21) |
|
|
(4) |
|
|
(10,214) |
|
|
— |
|
|
— |
|
|
(1,976) |
|
|
(368) |
|
|
(10,202) |
|
|
(23,446) |
Recoveries |
|
|
1,233 |
|
|
231 |
|
|
3,981 |
|
|
8 |
|
|
1,104 |
|
|
2,426 |
|
|
— |
|
|
— |
|
|
1,327 |
|
|
581 |
|
|
8,282 |
|
|
19,173 |
Net recoveries (charge offs) |
|
|
1,036 |
|
|
212 |
|
|
3,536 |
|
|
(13) |
|
|
1,100 |
|
|
(7,788) |
|
|
— |
|
|
— |
|
|
(649) |
|
|
213 |
|
|
(1,920) |
|
|
(4,273) |
Provision (benefit) (1) |
|
|
22,953 |
|
|
(444) |
|
|
(2,107) |
|
|
3,988 |
|
|
4,744 |
|
|
7,355 |
|
|
(1,663) |
|
|
284 |
|
|
(7,990) |
|
|
(4,074) |
|
|
8,409 |
|
|
31,455 |
Balance at end of period December 31, 2022 |
|
$ |
72,188 |
|
$ |
405 |
|
$ |
14,886 |
|
$ |
8,974 |
|
$ |
45,410 |
|
$ |
22,767 |
|
$ |
3,684 |
|
$ |
849 |
|
$ |
58,083 |
|
$ |
78,485 |
|
$ |
50,713 |
|
$ |
356,444 |
|
|
|
|
|
|
|
|
|
|
|
|
|
|
|
|
|
|
|
|
|
|
|
|
|
|
|
|
|
|
|
|
|
|
|
|
|
Year Ended December 31, 2021 |
|
|
|
|
|
|
|
|
|
|
|
|
|
|
|
|
|
|
|
|
|
|
|
|
|
|
|
|
|
|
|
|
|
|
|
|
Allowance for credit losses: |
|
|
|
|
|
|
|
|
|
|
|
|
|
|
|
|
|
|
|
|
|
|
|
|
|
|
|
|
|
|
|
|
|
|
|
|
Balance at end of period December 31, 2020 |
|
$ |
63,561 |
|
$ |
1,238 |
|
$ |
16,698 |
|
$ |
4,914 |
|
$ |
67,197 |
|
$ |
26,562 |
|
$ |
7,887 |
|
$ |
1,510 |
|
$ |
97,104 |
|
$ |
124,421 |
|
$ |
46,217 |
|
$ |
457,309 |
Charge-offs |
|
|
(204) |
|
|
— |
|
|
(1,002) |
|
|
(29) |
|
|
(87) |
|
|
(8,809) |
|
|
— |
|
|
— |
|
|
(2,052) |
|
|
(863) |
|
|
(3,853) |
|
|
(16,899) |
Recoveries |
|
|
1,547 |
|
|
146 |
|
|
2,256 |
|
|
60 |
|
|
1,861 |
|
|
2,075 |
|
|
3 |
|
|
— |
|
|
970 |
|
|
1,070 |
|
|
3,812 |
|
|
13,800 |
Net recoveries (charge offs) |
|
|
1,343 |
|
|
146 |
|
|
1,254 |
|
|
31 |
|
|
1,774 |
|
|
(6,734) |
|
|
3 |
|
|
— |
|
|
(1,082) |
|
|
207 |
|
|
(41) |
|
|
(3,099) |
Provision (benefit) (1) |
|
|
(17,868) |
|
|
(773) |
|
|
(4,627) |
|
|
52 |
|
|
(31,378) |
|
|
3,321 |
|
|
(2,969) |
|
|
(945) |
|
|
(34,228) |
|
|
(44,979) |
|
|
(18,009) |
|
|
(152,403) |
Balance at end of period December 31, 2021 |
|
$ |
47,036 |
|
$ |
611 |
|
$ |
13,325 |
|
$ |
4,997 |
|
$ |
37,593 |
|
$ |
23,149 |
|
$ |
4,921 |
|
$ |
565 |
|
$ |
61,794 |
|
$ |
79,649 |
|
$ |
28,167 |
|
$ |
301,807 |
|
|
|
|
|
|
|
|
|
|
|
|
|
|
|
|
|
|
|
|
|
|
|
|
|
|
|
|
|
|
|
|
|
|
|
|
|
| (1) | A negative provision (recovery) for credit losses of $10.9 million was recorded during 2023 compared to a provision for credit losses of $36.7 million recorded during 2022 and a negative provision (recovery) for credit losses of $12.9 million during 2021 for the release for unfunded commitments, which is not included in the table above. |
F-42
Note 6—Other Real Estate Owned and Bank Premises Held for Sale
The following is a summary of the changes in the carrying value of OREO and Bank Premises Held for Sale:
|
|
|
|
|
|
|
|
|
|
|
|
|
|
|
|
|
|
|
|
|
|
(Dollars in thousands) |
|
OREO |
|
Bank Properties Held for Sale |
|
Total |
|
|||
Balance, December 31, 2021 |
|
$ |
2,736 |
|
$ |
9,578 |
|
$ |
12,314 |
|
Additions, net |
|
|
1,972 |
|
|
21,003 |
|
|
22,975 |
|
Writedowns |
|
|
(114) |
|
|
(159) |
|
|
(273) |
|
Sold |
|
|
(3,571) |
|
|
(12,668) |
|
|
(16,239) |
|
Balance, December 31, 2022 |
|
$ |
1,023 |
|
$ |
17,754 |
|
$ |
18,777 |
|
Additions, net |
|
|
3,801 |
|
|
2,073 |
|
|
5,874 |
|
Writedowns |
|
|
— |
|
|
(1,571) |
|
|
(1,571) |
|
Sold |
|
|
(3,987) |
|
|
(5,855) |
|
|
(9,842) |
|
Balance, December 31, 2023 |
|
$ |
837 |
|
$ |
12,401 |
|
$ |
13,238 |
|
At December 31, 2023, there were a total of seven properties included in OREO compared to six properties included in OREO at December 31, 2022. At December 31, 2023, there were a total of 11 properties included in bank premises held for sale compared to 17 properties included in premises held for sale at December 31, 2022. At December 31, 2023, the Company had $526,000 in residential real estate included in OREO and $5.7 million in residential real estate consumer mortgage loans in the process of foreclosure.
Note 7—Premises and Equipment
Premises and equipment consisted of the following:
|
|
|
|
|
|
|
|
|
|
|
|
|
|
|
|
|
|
|
|
December 31, |
|
||||
(Dollars in thousands) |
|
Useful Life |
|
2023 |
|
2022 |
|
|||||
Land |
|
|
|
|
|
|
$ |
132,717 |
|
$ |
133,105 |
|
Buildings and leasehold improvements |
|
15 |
- |
40 |
years |
|
|
401,989 |
|
|
395,360 |
|
Equipment and furnishings |
|
3 |
- |
10 |
years |
|
|
201,153 |
|
|
178,676 |
|
Lease right of use assets |
|
|
|
|
|
|
|
100,331 |
|
|
107,979 |
|
Construction in process |
|
|
|
|
|
|
|
7,770 |
|
|
4,145 |
|
Total |
|
|
|
|
|
|
|
843,960 |
|
|
819,265 |
|
Less accumulated depreciation |
|
|
|
|
|
|
|
(324,763) |
|
|
(298,630) |
|
|
|
|
|
|
|
|
$ |
519,197 |
|
$ |
520,635 |
|
Depreciation expense charged to operations was $28.2 million, $29.4 million, and $29.2 million for the years ended December 31, 2023, 2022, and 2021, respectively.
At December 31, 2023 and 2022, computer software with an original cost of $24.6 million and $23.2 million, respectively, were being amortized using the straight-line method over thirty-six months. The unamortized balance remaining of the original computer software cost was $4.3 and $7.8, respectively, at December 31, 2023 and 2022. Amortization expense totaled $4.9 million, $4.9 million, and $4.8 million for the years ended December 31, 2023, 2022, and 2021, respectively. There were no capitalized implementation costs in 2023 related to internal use software.
See Note 21—Lease Commitments for further details on lease right of use assets.
Note 8—Goodwill and Other Intangible Assets
The carrying amount of goodwill was $1.9 billion at December 31, 2023 and December 31, 2022. The Company added $342.0 million in goodwill related to the Atlantic Capital acquisition in 2022.
F-43
The Company evaluated the carrying value of goodwill as of October 31, 2023, its annual test date, and concluded that no impairment charge was necessary. The Company will continue to monitor the other market conditions on the Company’ business, operating results, cash flows and/or financial condition. The following is a summary of changes in the carrying amounts of goodwill:
|
|
|
|
|
|
|
|
|
|
Year Ended |
|
||||
|
|
December 31, |
|
||||
(Dollars in thousands) |
|
2023 |
|
2022 |
|
||
Balance at beginning of period |
|
$ |
1,923,106 |
|
$ |
1,581,085 |
|
Additions: |
|
|
|
|
|
|
|
Goodwill from Atlantic Capital acquisition |
|
|
— |
|
|
342,021 |
|
Balance at end of period |
|
$ |
1,923,106 |
|
$ |
1,923,106 |
|
The Company’s other intangible assets, consisting of core deposit intangibles, noncompete intangibles, and client list intangibles are included on the face of the balance sheet. The Company added $17.5 million in core deposit intangibles related to the Atlantic Capital transaction during the first quarter of 2022. The following is a summary of gross carrying amounts and accumulated amortization of other intangible assets:
|
|
December 31, |
|
December 31, |
|
||
(Dollars in thousands) |
|
2023 |
|
2022 |
|
||
Gross carrying amount |
|
$ |
274,753 |
|
$ |
274,869 |
|
Accumulated amortization |
|
|
(185,977) |
|
|
(158,419) |
|
|
|
$ |
88,776 |
|
$ |
116,450 |
|
Amortization expense totaled $27.6 million, $33.2 million and $35.2 million for the years ended December 31, 2023, 2022, and 2021, respectively. Other intangibles are amortized using either the straight-line method or an accelerated basis over their estimated useful lives, with lives generally between 10 and 15 years for core deposit intangibles and between 10 and 15 years for customer lists.
The Company elected to apply fair value accounting to the Company’s SBA servicing asset. The change in fair value of the SBA servicing asset is recorded in SBA Income, a component of Noninterest Income on the Consolidated Statements of Income, during each applicable reporting period. As a result of the fair value accounting treatment, the Company does not amortize the SBA servicing asset and therefore excluded the SBA servicing asset from the future amortization expense table presented below. The fair value of the SBA servicing asset was $6.0 million and $6.1 million, respectively, at December 31, 2023 and 2022.
Estimated amortization expense for other intangibles, excluding the SBA servicing asset, for each of the next five years is as follows:
(Dollars in thousands) |
|
|
|
|
Year ended December 31: |
|
|
|
|
2024 |
|
$ |
22,395 |
|
2025 |
|
|
18,766 |
|
2026 |
|
|
15,232 |
|
2027 |
|
|
11,756 |
|
2028 |
|
|
8,020 |
|
Thereafter |
|
|
6,655 |
|
|
|
$ |
82,824 |
|
Note 9—Deposits
The Company’s total deposits are comprised of the following:
|
|
|
|
|
|
|
|
|
|
December 31, |
|
||||
(Dollars in thousands) |
|
2023 |
|
2022 |
|
||
Noninterest-bearing checking |
|
$ |
10,649,274 |
|
$ |
13,168,656 |
|
Interest-bearing checking |
|
|
7,978,799 |
|
|
8,955,519 |
|
Savings |
|
|
2,632,212 |
|
|
3,464,351 |
|
Money market |
|
|
11,538,671 |
|
|
8,342,111 |
|
Time deposits |
|
|
4,249,953 |
|
|
2,419,986 |
|
Total deposits |
|
$ |
37,048,909 |
|
$ |
36,350,623 |
|
At December 31, 2023 and 2022, the Company had $927.2 million and $487.2 million in certificates of deposits greater than $250,000, respectively.
F-44
At December 31, 2023, the scheduled maturities of time deposits (includes $4.6 million of other time deposits) of all denominations are as follow:
|
|
|
|
|
(Dollars in thousands) |
|
|
|
|
Year ended December 31: |
|
|
|
|
2024 |
|
$ |
3,910,857 |
|
2025 |
|
|
241,279 |
|
2026 |
|
|
47,855 |
|
2027 |
|
|
30,510 |
|
2028 |
|
|
17,212 |
|
Thereafter |
|
|
2,240 |
|
|
|
$ |
4,249,953 |
|
Note 10—Federal Funds Purchased and Securities Sold Under Agreements to Repurchase
Federal funds purchased and securities sold under agreements to repurchase generally mature within one to three days from the transaction date, but may have maturities as long as nine months per our policies. Certain of the borrowings have no defined maturity date.
Federal Funds Purchased
Information concerning federal funds purchased is summarized below:
|
|
|
|
|
|
|
|
|
|
|
|
|
|
|
|
|
Federal Funds Purchased |
|
December 31, |
|
|||||||||||||
|
|
2023 |
|
2022 |
|
2021 |
|
|||||||||
(Dollars in thousands) |
|
Amount |
|
Rate |
|
Amount |
|
Rate |
|
Amount |
|
Rate |
|
|||
At period-end: |
|
|
|
|
|
|
|
|
|
|
|
|
|
|
|
|
Federal funds purchased |
|
$ |
248,162 |
|
5.32% |
|
$ |
213,597 |
|
4.31% |
|
$ |
381,195 |
|
0.08% |
|
Average for the year: |
|
|
|
|
|
|
|
|
|
|
|
|
|
|
|
|
Federal funds purchased |
|
$ |
225,642 |
|
5.08% |
|
$ |
278,251 |
|
1.35% |
|
$ |
482,471 |
|
0.09% |
|
Maximum month-end balance: |
|
|
|
|
|
|
|
|
|
|
|
|
|
|
|
|
Federal funds purchased |
|
$ |
268,346 |
|
|
|
$ |
370,876 |
|
|
|
$ |
508,248 |
|
|
|
Securities Sold Under Agreements to Repurchase
Securities sold under agreements to repurchase (“repurchase agreements”) represent funds received from customers, generally on an overnight or continuous basis, which are collateralized by investment securities owned or, at times, borrowed and re-hypothecated by the Company. Repurchase agreements are subject to terms and conditions of the master repurchase agreements between the Company and the client and are accounted for as secured borrowings. The Company monitors the fair value of the underlying securities on a daily basis. Some securities underlying these agreements include arrangements to resell securities from broker-dealers approved by the Company. Repurchase agreements are reflected at the amount of cash received in connection with the transaction and included in federal funds purchased and securities sold under agreements to repurchase on the consolidated balance sheets.
At December 31, 2023 and December 31, 2022, the Company’s repurchase agreements totaled $241.0 million and $342.8 million, respectively. All of the Company’s repurchase agreements were overnight or continuous (until-further-notice) agreements at December 31, 2023 and December 31, 2022. These borrowings were collateralized with government, government-sponsored enterprise, or state and political subdivision-issued securities with a carrying value of $410.4 million and $443.2 million at December 31, 2023 and December 31, 2022, respectively. Declines in the value of the collateral would require the Company to increase the amounts of securities pledged. Information concerning securities sold under agreements to repurchase is summarized below:
|
|
|
|
|
|
|
|
|
|
|
|
|
|
|
|
|
Securities Sold Under Repurchase Agreements |
|
December 31, |
|
|||||||||||||
|
|
2023 |
|
2022 |
|
2021 |
|
|||||||||
(Dollars in thousands) |
|
Amount |
|
Rate |
|
Amount |
|
Rate |
|
Amount |
|
Rate |
|
|||
At period-end: |
|
|
|
|
|
|
|
|
|
|
|
|
|
|
|
|
Securities sold under repurchase agreements |
|
$ |
241,022 |
|
2.10% |
|
$ |
342,820 |
|
0.40% |
|
$ |
400,044 |
|
0.16% |
|
Average for the year: |
|
|
|
|
|
|
|
|
|
|
|
|
|
|
|
|
Securities sold under repurchase agreements |
|
$ |
317,879 |
|
1.30% |
|
$ |
395,141 |
|
0.19% |
|
$ |
395,498 |
|
0.20% |
|
Maximum month-end balance: |
|
|
|
|
|
|
|
|
|
|
|
|
|
|
|
|
Securities sold under repurchase agreements |
|
$ |
386,627 |
|
|
|
$ |
458,580 |
|
|
|
$ |
435,302 |
|
|
|
F-45
Note 11—Other Borrowings
The Company’s other borrowings were as follows:
|
|
|
|
|
|
2023 |
|
|
|
2022 |
|
||||||||||||
|
|
|
|
|
|
|
|
|
|
|
Weighted |
|
|
|
|
|
|
|
|
Weighted |
|
||
|
|
|
|
Interest |
|
|
|
|
|
|
Average |
|
Interest |
|
|
|
|
|
|
Average |
|
||
|
|
|
|
Rate at |
|
|
|
Average |
|
Interest |
|
Rate at |
|
|
|
Average |
|
Interest |
|
||||
(Dollars in thousands) |
|
Maturity |
|
12/31/2023 |
|
Balance |
|
Balance |
|
Rate(5) |
|
12/31/2022 |
|
Balance |
|
Balance |
|
Rate(5) |
|
||||
Short-term borrowings: |
|
|
|
|
|
|
|
|
|
|
|
|
|
|
|
|
|
|
|
|
|
|
|
FHLB Advances |
|
Various |
|
5.57 |
% |
$ |
100,000 |
|
|
|
|
|
|
— |
% |
$ |
— |
|
|
|
|
|
|
FRB Borrowings |
|
Various |
|
— |
% |
|
— |
|
|
|
|
|
|
— |
% |
|
— |
|
|
|
|
|
|
US Bank Line of Credit |
|
Daily |
|
— |
% |
|
— |
|
|
|
|
|
|
— |
% |
|
— |
|
|
|
|
|
|
Total short-term borrowings |
|
|
|
— |
% |
$ |
100,000 |
|
$ |
243,014 |
|
5.08 |
% |
— |
% |
$ |
— |
|
$ |
10,959 |
|
5.22 |
% |
|
|
|
|
|
|
|
|
|
|
|
|
|
|
|
|
|
|
|
|
|
|
|
|
Long-term borrowings |
|
|
|
|
|
|
|
|
|
|
|
|
|
|
|
|
|
|
|
|
|
|
|
SCBT Capital Trust I junior subordinated debt(1) |
|
6/15/2035 |
|
7.44 |
% |
$ |
12,372 |
|
|
|
|
|
|
6.56 |
% |
$ |
12,372 |
|
|
|
|
|
|
SCBT Capital Trust II junior subordinated debt(1) |
|
6/15/2035 |
|
7.44 |
% |
|
8,248 |
|
|
|
|
|
|
6.56 |
% |
|
8,248 |
|
|
|
|
|
|
SCBT Capital Trust III junior subordinated debt(1) |
|
7/18/2035 |
|
7.24 |
% |
|
20,619 |
|
|
|
|
|
|
6.36 |
% |
|
20,619 |
|
|
|
|
|
|
SAVB Capital Trust I junior subordinated debt(1) |
|
10/7/2033 |
|
8.51 |
% |
|
6,186 |
|
|
|
|
|
|
6.93 |
% |
|
6,186 |
|
|
|
|
|
|
SAVB Capital Trust II junior subordinated debt(1) |
|
12/15/2034 |
|
7.85 |
% |
|
4,124 |
|
|
|
|
|
|
6.97 |
% |
|
4,124 |
|
|
|
|
|
|
TSB Statutory Trust I junior subordinated debt(1) |
|
3/14/2037 |
|
7.37 |
% |
|
3,093 |
|
|
|
|
|
|
6.49 |
% |
|
3,093 |
|
|
|
|
|
|
Southeastern Bank Financial Statutory Trust I junior subordinated debt(1) |
|
12/15/2035 |
|
7.05 |
% |
|
10,310 |
|
|
|
|
|
|
6.17 |
% |
|
10,310 |
|
|
|
|
|
|
Southeastern Bank Financial Statutory Trust II junior subordinated debt(1) |
|
6/15/2036 |
|
7.05 |
% |
|
10,310 |
|
|
|
|
|
|
6.17 |
% |
|
10,310 |
|
|
|
|
|
|
CSBC Statutory Trust I junior subordinated debt(1) |
|
12/15/2035 |
|
7.22 |
% |
|
15,464 |
|
|
|
|
|
|
6.34 |
% |
|
15,464 |
|
|
|
|
|
|
Community Capital Statutory Trust I junior subordinated debt(1) |
|
6/15/2036 |
|
7.20 |
% |
|
10,310 |
|
|
|
|
|
|
6.32 |
% |
|
10,310 |
|
|
|
|
|
|
FCRV Statutory Trust I junior subordinated debt(1) |
|
12/15/2036 |
|
7.35 |
% |
|
5,155 |
|
|
|
|
|
|
6.47 |
% |
|
5,155 |
|
|
|
|
|
|
Provident Community Bancshares Capital Trust I junior subordinated debt(1) |
|
3/1/2037 |
|
7.40 |
% |
|
4,124 |
|
|
|
|
|
|
5.48 |
% |
|
4,124 |
|
|
|
|
|
|
Provident Community Bancshares Capital Trust II junior subordinated debt(1) |
|
10/1/2036 |
|
7.38 |
% |
|
8,248 |
|
|
|
|
|
|
6.50 |
% |
|
8,248 |
|
|
|
|
|
|
Fair Market Value Discount Trust Preferred Debt Acquired |
|
|
|
|
|
|
(926) |
|
|
|
|
|
|
|
|
|
(1,162) |
|
|
|
|
|
|
Total Junior Subordinated Debt |
|
|
|
7.34 |
% |
$ |
117,637 |
|
$ |
117,514 |
|
7.05 |
% |
6.39 |
% |
$ |
117,401 |
|
$ |
117,277 |
|
3.49 |
% |
|
|
|
|
|
|
|
|
|
|
|
|
|
|
|
|
|
|
|
|
|
|
|
|
Landmark Bancshares subordinated debt(2) |
|
6/30/2027 |
|
— |
% |
$ |
— |
|
|
|
|
|
|
— |
% |
$ |
— |
|
|
|
|
|
|
CenterState Bank Corporation subordinated debt(3) |
|
6/1/2030 |
|
5.75 |
% |
|
200,000 |
|
|
|
|
|
|
5.75 |
% |
|
200,000 |
|
|
|
|
|
|
Atlantic Capital Bancshares, Inc. subordinated debt(4) |
|
9/1/2030 |
|
5.50 |
% |
|
75,000 |
|
|
|
|
|
|
5.50 |
% |
|
75,000 |
|
|
|
|
|
|
Fair Market Value Premium subordinated debt acquired |
|
|
|
|
|
|
1,627 |
|
|
|
|
|
|
|
|
|
2,604 |
|
|
|
|
|
|
Long-term subordinated debt costs |
|
|
|
|
|
|
(2,360) |
|
|
|
|
|
|
|
|
|
(2,730) |
|
|
|
|
|
|
Total Subordinated Debt |
|
|
|
5.68 |
% |
$ |
274,267 |
|
$ |
274,585 |
|
5.68 |
% |
5.68 |
% |
$ |
274,874 |
|
$ |
268,877 |
|
5.70 |
% |
|
|
|
|
|
|
|
|
|
|
|
|
|
|
|
|
|
|
|
|
|
|
|
|
Total long-term borrowings |
|
|
|
6.18 |
% |
$ |
391,904 |
|
$ |
392,099 |
|
6.09 |
% |
5.89 |
% |
$ |
392,275 |
|
$ |
386,154 |
|
5.03 |
% |
|
|
|
|
|
|
|
|
|
|
|
|
|
|
|
|
|
|
|
|
|
|
|
|
Total borrowings |
|
|
|
6.06 |
% |
$ |
491,904 |
|
$ |
635,113 |
|
5.71 |
% |
5.89 |
% |
$ |
392,275 |
|
$ |
397,113 |
|
5.03 |
% |
(1) All of the junior subordinated debt above is adjustable rate based on three-month CME SOFR plus a spread adjustment with the transition from LIBOR of 0.26161% plus a spread ranging from 140 basis points to 285 basis points. All of the Company's junior subordinated debt transitioned to SOFR from LIBOR for repricing dates after June 30, 2023.
(2) The Notes bored interest at a fixed rate of 6.5% per year, to, but excluding, June 30, 2022. On June 30, 2022, the Notes would have converted to a floating rate equal to three-month LIBOR plus 467 basis points. The Notes were redeemed by the Company on June 30, 2022.
(3) The $200 million in Notes bear interest at a fixed rate of 5.75% per year to, but excluding, June 1, 2025. On June 1, 2025, the Notes convert to a floating rate equal to SOFR plus 562 basis points. The Notes may be redeemed by the Company after June 1, 2025. The balance in the table above is net of debt issuance costs.
(4) The Notes bear interest at a fixed rate of 5.50% per year to, but excluding, September 1, 2025. On September 1, 2025, the Notes convert to a floating rate equal to three-month LIBOR plus 536 basis points. The Notes may be redeemed by the Company on or after September 1, 2025. These notes were acquired in the ACBI acquisition on March 1, 2022 and are net of the fair value discount noted in the table above.
(5) The weighted average interest rate calculation does not include the effects of fair value marks and debt issuance costs.
FHLB and FRB Borrowings
The Company has from time-to-time entered into borrowing agreements with the FHLB and FRB. Borrowings under these agreements are collateralized by stock in the FHLB, qualifying first and second mortgage residential loans, investment securities, and commercial real estate loans under a blanket-floating lien.
F-46
As of December 31, 2023 and 2022, there were $100.0 million and $0, respectively in short-term borrowings. The borrowings at December 31, 2023 consisted of FHLB advance daily credits. For the years ended December 31, 2023 and 2022, the average balance for short-term borrowings $243.0 million and $11.0 million, respectively and consisted of borrowing from the FHLB, FRB Discount Window and US bank line of credit. The year-to-date weighted average cost for the years ended December 31, 2023 and 2022 was 5.08% and 5.22%, respectively. Net eligible loans of the Company pledged via a blanket lien to the FHLB for advances and letters of credit at December 31, 2023, were approximately $11.4 billion (collateral value of $6.5 billion) and investment securities and cash pledged were approximately $729.4 million (collateral value of $617.6 million). This allows the Company a total borrowing capacity at the FHLB of approximately $7.1 billion. After accounting for $100.0 million in FHLB advances outstanding and letters of credit totaling $2.9 million, the Company had unused net credit available with the FHLB in the amount of approximately $7.0 billion at December 31, 2023. The Company also has a total borrowing capacity at the FRB of $1.9 billion at December 31, 2023 secured by a blanket lien on $2.7 billion (collateral value of $1.9 billion) in net eligible loans of the Company. The Company had no outstanding borrowings with the FRB at December 31, 2023 or December 31, 2022.
Junior Subordinated Debt
The obligations of the Company with respect to the issuance of the capital securities constitute a full and unconditional guarantee by the Company of the trusts’ obligations with respect to the capital securities. Subject to certain exceptions and limitations, the Company may elect from time to time to defer interest payments on the junior subordinated debt securities, which would result in a deferral of distribution payments on the related capital securities.
All of the Company’s junior subordinated debt is callable after five years from issuance. Therefore, all of the junior subordinated debt is callable at December 31, 2023.
As of December 31, 2023, the sole assets of the trusts were an aggregate of $118.6 million of the Company’s junior subordinated debt securities with like maturities and like interest rates to the trust preferred securities.
As of December 31, 2023, the Company had a $117.6 million liability for the junior subordinated debt securities, net of a $926,000 discount recorded on Citizens South Banking Corporation Statutory Trust I, Community Capital Statutory Trust I, FCRV Statutory Trust I and Provident Community Bancshares Capital Trust I and II. The Company, as issuer, can call any of these subordinated debt securities without penalty. If the Company were to call the securities, the amount paid to the holders would be $118.6 million and the Company would fully amortize any remaining discount into interest expense. The remaining discount is being amortized over a four-year period.
As of December 31, 2023, and 2022, there was $117.6 million (net of discount of $0.9 million) and $117.4 million (net of discount of $1.2 million), respectively, in junior subordinated debt. The weighted average cost of the junior subordinated debt at period end December 31, 2023 was 7.34% and the weighted average cost year-to-date for the year ended December 31, 2023 was 7.05%. This does not take into account the unamortized discount at period end or the discount amortization recorded during the year. If the discount were taken into account, the weighted average cost year-to-date for the period ending December 31, 2023 would be 7.32%. The weighted average cost of the junior subordinated debt at period end December 31, 2022 was 6.39% and the weighted average cost year to date for the year ended December 31, 2022 was 3.49%. If the discount were taken into account, the weighted average cost year-to-date would be 3.73% for the period ending December 31, 2022.
The Company’s trust preferred securities are included in Tier 2 capital for regulatory capital purposes.
Subordinated Debt and Notes
As of December 31, 2023, the Company had a $274.2 million liability for subordinated debt. The Company assumed $78.4 million of subordinated debentures from Atlantic Capital on March 1, 2022, which was partially offset by the redemption of $13.0 million in subordinated debentures in late June 2022.
F-47
The weighted average cost of the subordinated debt at period end December 31, 2023 was 5.68% and the weighted average cost year to date for the year ended December 31, 2023 was 5.68%. The weighted average cost of the subordinated debt at period end December 31, 2022 was 5.68% and the weighted average cost year to date for the year ended December 31, 2022 was 5.70%. This does not take into account unamortized debt issuance costs and the unaccreted premium and the amortization of the debt issuance costs and the premium accretion recorded during the year. If the debt issuance costs and premium accretion were taken into account, the weighted average cost year to date for the year ended December 31, 2023 and 2022 would be 5.47% and 5.55%, respectively.
Qualifying subordinated debt can be included in Tier 2 capital for regulatory capital purposes. At December 31, 2023, all of the Company’s subordinated debentures totaling $275.0 million qualified for Tier 2 capital treatment.
Line of Credit
On November 13, 2023, the Company entered into an amendment and restatement to its Credit Agreement (the “Agreement”) with U.S. Bank National Association (the “Lender”). The Agreement provides for a $100 million unsecured line of credit by the Lender to the Company. The maturity date of the Agreement is November 11, 2024, provided that the Agreement may be extended subject to the approval of the Lender. Borrowings by the Company under the Agreement will bear interest at a rate per annum equal to 1.50% plus monthly reset term SOFR Rate. As of December 31, 2023 and 2022, there was no outstanding balance associated with the line of credit. The average balance outstanding during 2023 was less than $1,000 for the U.S. Bank line of credit.
Principal maturities of other borrowings, net of unamortized discount or debt issuance costs, are summarized below:
|
Junior |
|
|
|
|
|
|
|
||||
|
Subordinated |
|
FHLB |
|
Subordinated |
|
|
|
||||
(Dollars in thousands) |
Debt |
|
Advances |
|
Debt |
|
Total |
|
||||
Year Ended December 31, |
|
|
|
|
|
|
|
|
|
|
|
|
2024 |
$ |
— |
|
$ |
100,000 |
|
$ |
— |
|
$ |
100,000 |
|
2025 |
|
— |
|
|
— |
|
|
— |
|
|
— |
|
2026 |
|
— |
|
|
— |
|
|
— |
|
|
— |
|
2027 |
|
— |
|
|
— |
|
|
— |
|
|
— |
|
2028 |
|
— |
|
|
— |
|
|
— |
|
|
— |
|
Thereafter |
|
117,637 |
|
|
— |
|
|
274,267 |
|
|
391,904 |
|
|
$ |
117,637 |
|
$ |
100,000 |
|
$ |
274,267 |
|
$ |
491,904 |
|
Note 12—Income Taxes
The provision for income taxes consists of the following:
|
|
|
|
|
|
|
|
|
|
|
|
|
Year Ended December 31, |
|
|||||||
(Dollars in thousands) |
|
2023 |
|
2022 |
|
2021 |
|
|||
Current: |
|
|
|
|
|
|
|
|
|
|
Federal |
|
$ |
111,433 |
|
$ |
5,940 |
|
$ |
43,959 |
|
State |
|
|
23,157 |
|
|
7,044 |
|
|
16,512 |
|
Total current tax expense |
|
|
134,590 |
|
|
12,984 |
|
|
60,471 |
|
Deferred: |
|
|
|
|
|
|
|
|
|
|
Federal |
|
|
738 |
|
|
103,875 |
|
|
61,521 |
|
State |
|
|
1,216 |
|
|
20,454 |
|
|
6,744 |
|
Total deferred tax expense |
|
|
1,954 |
|
|
124,329 |
|
|
68,265 |
|
Provision for income taxes |
|
$ |
136,544 |
|
$ |
137,313 |
|
$ |
128,736 |
|
F-48
The provision for income taxes differs from that computed by applying the federal statutory income tax rate of 21% in 2023, 2022 and 2021 to income before provision for income taxes, as indicated in the following analysis:
|
|
|
|
|
|
|
|
|
|
|
|
|
Year Ended December 31, |
|
|||||||
(Dollars in thousands) |
|
2023 |
|
2022 |
|
2021 |
|
|||
Income taxes at federal statutory rate |
|
$ |
132,479 |
|
$ |
133,006 |
|
$ |
126,899 |
|
Increase (reduction) of taxes resulting from: |
|
|
|
|
|
|
|
|
|
|
State income taxes, net of federal tax benefit |
|
|
19,123 |
|
|
21,491 |
|
|
18,372 |
|
Non-deductible merger expenses |
|
|
— |
|
|
415 |
|
|
— |
|
Increase in cash surrender value of BOLI policies |
|
|
(5,605) |
|
|
(5,105) |
|
|
(3,866) |
|
Tax-exempt interest |
|
|
(7,016) |
|
|
(7,828) |
|
|
(5,450) |
|
Income tax credits |
|
|
(14,253) |
|
|
(13,667) |
|
|
(11,759) |
|
Non-deductible FDIC premiums |
|
|
5,330 |
|
|
3,287 |
|
|
2,380 |
|
Non-deductible executive compensation |
|
|
4,745 |
|
|
4,319 |
|
|
530 |
|
Other, net |
|
|
1,741 |
|
|
1,395 |
|
|
1,630 |
|
|
|
$ |
136,544 |
|
$ |
137,313 |
|
$ |
128,736 |
|
The deferred tax assets and liabilities represent the future tax return consequences of those differences, which will either be taxable or deductible when the assets and liabilities are recovered or settled. Deferred tax assets and liabilities are reflected at income tax rates applicable to the period in which the deferred tax assets or liabilities are expected to be realized or settled. As changes in tax laws or rates are enacted, deferred tax assets and liabilities are adjusted through the provision for income taxes.
The components of the net deferred tax asset are as follows:
|
|
December 31, |
|
||||
(Dollars in thousands) |
|
2023 |
|
2022 |
|
||
Allowance for credit losses |
|
$ |
123,496 |
|
$ |
101,416 |
|
Share-based compensation |
|
|
10,425 |
|
|
10,509 |
|
Pension plan and post-retirement benefits |
|
|
371 |
|
|
1,157 |
|
Deferred compensation |
|
|
14,039 |
|
|
14,583 |
|
Purchase accounting adjustments |
|
|
1,439 |
|
|
1,484 |
|
Capitalized research and development costs |
|
|
4,524 |
|
|
— |
|
Accrued expenses |
|
|
14,470 |
|
|
6,953 |
|
Other real estate owned |
|
|
— |
|
|
877 |
|
FDIC special assessment |
|
|
6,168 |
|
|
— |
|
Net operating loss and tax credit carryforwards |
|
|
20,263 |
|
|
27,271 |
|
Nonaccrual Interest |
|
|
1,773 |
|
|
566 |
|
Lease liability |
|
|
26,076 |
|
|
27,675 |
|
Unrealized losses on investment securities available for sale |
|
|
142,543 |
|
|
215,013 |
|
Other |
|
|
2,201 |
|
|
1,277 |
|
Total deferred tax assets |
|
|
367,788 |
|
|
408,781 |
|
Depreciation |
|
|
10,439 |
|
|
22,442 |
|
Intangible assets |
|
|
17,764 |
|
|
23,558 |
|
Net deferred loan costs |
|
|
16,468 |
|
|
10,431 |
|
Right of use assets |
|
|
24,161 |
|
|
25,848 |
|
Prepaid expense |
|
|
809 |
|
|
836 |
|
Mark to market liabilities |
|
|
92,505 |
|
|
110,122 |
|
Tax deductible goodwill |
|
|
12,398 |
|
|
9,090 |
|
Mortgage servicing rights |
|
|
20,863 |
|
|
21,371 |
|
Other real estate owned |
|
|
192 |
|
|
— |
|
Other |
|
|
3,950 |
|
|
1,776 |
|
Total deferred tax liabilities |
|
|
199,549 |
|
|
225,474 |
|
Net deferred tax assets before valuation allowance |
|
|
168,239 |
|
|
183,307 |
|
Less, valuation allowance |
|
|
(3,885) |
|
|
(5,506) |
|
Net deferred tax assets |
|
$ |
164,354 |
|
$ |
177,801 |
|
F-49
The Company had federal NOL and realized built-in loss carryforwards of $61.0 million and $78.5 million for the years ended December 31, 2023 and 2022, respectively, which expire in varying amounts between 2026 to 2036. All of the Company's loss carryforwards are subject to Section 382 of the Internal Revenue Code, which places an annual limitation on the amount of federal net operating loss carryforwards which the Company may utilize after a change in control, and also limits the Company's ability to utilize certain tax deductions (realized built-in losses or RBIL) due to the existence of a Net Unrealized Built-in Loss (“NUBIL”) at the time of the change in control. The Company acquired federal net operating loss carryforwards of $48.4 million in the acquisition of Atlantic Capital Bank in 2022. Of that amount $40.6 million was from previous acquisitions by Atlantic Capital, and $7.8 million was generated on the final tax return filing. The NOL of $7.8 million was fully utilized in 2022 by SouthState. The other acquired NOLs from Atlantic Capital are subject to a combined annual Section 382 limitation of $4.8 million. In total, the allowable deduction for all loss carryforwards on an annual basis is $17.5 million as of December 31, 2023. The Company is allowed to carry forward any such limited RBIL under terms similar to those related to NOLs. The Company also has an immaterial amount of credit carryforwards, which it expects to fully utilize within the carryforward period.
The Company also has acquired state net operating losses in Georgia, Florida and Alabama. These are also subject to annual limitations under Section 382, similar to the federal NOLs. The company also has immaterial state credit carryforwards. The company expects all Section 382 limited state carryforwards and all state credit carryforwards to be realized within the applicable carryforward period.
The Company has state net operating loss carryforwards of $115.4 million and $160.4 million for the years ended December 31, 2023 and 2022, respectively, most of which expire in varying amounts through 2040. There is a valuation allowance of $3.9 million on $96.8 million of state operating loss carryforwards at the parent company for which realizability is uncertain.
In assessing the realizability of deferred tax assets, management considers whether it is more likely than not that some portion or all of the deferred tax assets will not be realized. The ultimate realization of deferred tax assets is dependent upon the generation of future taxable income during periods in which those temporary differences become deductible. Management considers the scheduled reversal of deferred tax liabilities, projected future taxable income, taxable income in carryback years, and tax planning strategies in making this assessment. Based on the level of historical taxable income and projections for future taxable income over the periods in which the deferred tax assets are deductible, management believes it is more likely than not that the Company will realize the benefits of these deferred tax assets, net of the valuation allowance at December 31, 2023.
A reconciliation of the beginning balance and ending amount of unrecognized tax benefits is as follows:
|
|
Year Ended December 31, |
|
|
(Dollars in thousands) |
|
2023 |
|
|
Balance at beginning of year |
|
$ |
— |
|
Increases related to prior year tax positions |
|
|
12,352 |
|
Increases related to current year tax positions |
|
|
693 |
|
Balance at end of year |
|
$ |
13,045 |
|
Accrued interest and penalties on unrecognized tax benefits totaled $1.7 million and $0 as of December 31, 2023 and 2022, respectively. In prior years the Company had no unrecognized tax benefits. Interest and penalties related to unrecognized tax benefits are recorded in interest expense and penalties. Unrecognized tax benefits as of December 31, 2023 and December 31, 2022, that, if recognized, would impact the effective tax rate totaled $0 for each period.
The Company’s unrecognized tax benefit relates to accrual deductions, which if challenged by taxing authorities, may be reduced. The Company intends to remediate the uncertainty by filing a change in accounting method with the taxing authority during the period ended December 31, 2024. Upon filing such change, the Company will no longer have any uncertainty regarding its tax position and expects the above amounts to reverse in their entirety.
Generally, the Company's federal and state income tax returns are no longer subject to examination by taxing authorities for years prior to 2020.
F-50
Note 13—Other Expense
The following is a summary of the components of other noninterest expense:
|
|
Year Ended December 31, |
|
|||||||
(Dollars in thousands) |
|
2023 |
|
2022 |
|
2021 |
|
|||
Business development and staff related |
|
$ |
25,055 |
|
$ |
19,015 |
|
$ |
14,571 |
|
Bankcard expense |
|
|
2,789 |
|
|
3,576 |
|
|
3,459 |
|
Other loan expense |
|
|
7,838 |
|
|
8,646 |
|
|
7,562 |
|
Director and shareholder expense |
|
|
4,753 |
|
|
4,382 |
|
|
5,486 |
|
Armored carrier and courier expense |
|
|
2,366 |
|
|
2,650 |
|
|
3,081 |
|
Property and sales tax |
|
|
4,173 |
|
|
4,037 |
|
|
3,487 |
|
Bank service charge expense |
|
|
3,002 |
|
|
2,472 |
|
|
2,147 |
|
Fraud and operational charge-off expense |
|
|
4,965 |
|
|
11,202 |
|
|
4,727 |
|
Low income housing tax credit partnership amortization |
|
|
9,629 |
|
|
9,722 |
|
|
9,986 |
|
Donations |
|
|
3,975 |
|
|
4,112 |
|
|
2,563 |
|
Deposit earnings credit expense |
|
|
14,619 |
|
|
4,507 |
|
|
2,809 |
|
Correspondent bank service and processing expense |
|
|
5,663 |
|
|
1,229 |
|
|
1,344 |
|
Other |
|
|
9,392 |
|
|
8,910 |
|
|
6,129 |
|
|
|
$ |
98,219 |
|
$ |
84,460 |
|
$ |
67,351 |
|
Note 14—Earnings Per Common Share
The following table sets forth the computation of basic and diluted earnings per common share:
|
|
Year Ended December 31, |
|||||||
(Dollars and shares in thousands, except for per share amounts) |
|
2023 |
|
2022 |
|
2021 |
|||
Basic earnings per common share: |
|
|
|
|
|
|
|
|
|
Net income |
|
$ |
494,308 |
|
$ |
496,049 |
|
$ |
475,543 |
Weighted-average basic common shares |
|
|
76,051 |
|
|
74,551 |
|
|
70,393 |
Basic earnings per common share |
|
$ |
6.50 |
|
$ |
6.65 |
|
$ |
6.76 |
Diluted earnings per common share: |
|
|
|
|
|
|
|
|
|
Net income |
|
$ |
494,308 |
|
$ |
496,049 |
|
$ |
475,543 |
Weighted-average basic common shares |
|
|
76,051 |
|
|
74,551 |
|
|
70,393 |
Effect of dilutive securities |
|
|
429 |
|
|
630 |
|
|
496 |
Weighted-average dilutive shares |
|
|
76,480 |
|
|
75,181 |
|
|
70,889 |
Diluted earnings per common share |
|
$ |
6.46 |
|
$ |
6.60 |
|
$ |
6.71 |
The calculation of diluted earnings per common share excludes outstanding stock options for which the results would have been antidilutive under the treasury stock method as follows:
|
|
Year Ended December 31, |
|
||||||||||||||||
|
|
2023 |
|
2022 |
|
2021 |
|
||||||||||||
Number of shares |
|
|
|
|
|
57,169 |
|
|
|
|
|
57,169 |
|
|
|
|
|
57,169 |
|
Range of exercise prices |
|
$ |
87.30 |
to |
$ |
91.35 |
|
$ |
87.30 |
to |
$ |
91.35 |
|
$ |
87.30 |
to |
$ |
91.35 |
|
F-51
Note 15—Accumulated Other Comprehensive (Loss) Income
The changes in each component of accumulated other comprehensive (loss) income, net of tax, were as follows:
|
|
|
|
|
|
|
|
|
|
|
|
|
|
|
Unrealized Gains and |
|
|
|
|
|
|
Benefit |
|
(Losses) on Securities |
|
|
|
||
(Dollars in thousands) |
|
Plans |
|
Available for Sale |
|
Total |
|||
Balance at December 31, 2020 |
|
$ |
(151) |
|
$ |
47,740 |
|
$ |
47,589 |
Other comprehensive income (loss) before reclassifications |
|
|
75 |
|
|
(68,865) |
|
|
(68,790) |
Amounts reclassified from accumulated other comprehensive loss |
|
|
133 |
|
|
(78) |
|
|
55 |
Net comprehensive income (loss) |
|
|
208 |
|
|
(68,943) |
|
|
(68,735) |
Balance at December 31, 2021 |
|
|
57 |
|
|
(21,203) |
|
|
(21,146) |
Other comprehensive loss before reclassifications |
|
|
(838) |
|
|
(655,189) |
|
|
(656,027) |
Amounts reclassified from accumulated other comprehensive loss |
|
|
108 |
|
|
(23) |
|
|
85 |
Net comprehensive loss |
|
|
(730) |
|
|
(655,212) |
|
|
(655,942) |
Balance at December 31, 2022 |
|
|
(673) |
|
|
(676,415) |
|
|
(677,088) |
Other comprehensive income before reclassifications |
|
|
1,086 |
|
|
93,285 |
|
|
94,371 |
Amounts reclassified from accumulated other comprehensive loss |
|
|
214 |
|
|
(33) |
|
|
181 |
Net comprehensive gain |
|
|
1,300 |
|
|
93,252 |
|
|
94,552 |
Balance at December 31, 2023 |
|
$ |
627 |
|
$ |
(583,163) |
|
$ |
(582,536) |
The table below presents the reclassifications out of accumulated other comprehensive income, net of tax:
|
|
Amount Reclassified from Accumulated |
|
|
|
|||||||
|
|
Other Comprehensive Income (Loss) |
|
|
|
|||||||
(Dollars in thousands) |
|
For the Years Ended December 31, |
|
|
|
|||||||
Accumulated Other Comprehensive Income (Loss) Component |
|
2023 |
|
2022 |
|
2021 |
|
|
Income Statement |
|||
Gains on sales of available for sale securities: |
|
|
|
|
|
|
|
|
|
|
|
|
|
|
$ |
(43) |
|
$ |
(30) |
|
$ |
(102) |
|
|
Securities gains, net |
|
|
|
10 |
|
|
7 |
|
|
24 |
|
|
Provision for income taxes |
|
|
|
(33) |
|
|
(23) |
|
|
(78) |
|
|
Net income |
Losses and amortization of defined benefit pension: |
|
|
|
|
|
|
|
|
|
|
|
|
Actuarial losses |
|
$ |
285 |
|
$ |
143 |
|
$ |
174 |
|
|
Salaries and employee benefits |
|
|
|
(71) |
|
|
(35) |
|
|
(41) |
|
|
Provision for income taxes |
|
|
|
214 |
|
|
108 |
|
|
133 |
|
|
Net income |
Total reclassifications for the period |
|
$ |
181 |
|
$ |
85 |
|
$ |
55 |
|
|
|
Note 16—Restrictions on Subsidiary Dividends, Loans, or Advances
The Company pays cash dividends to shareholders from its assets, which are mainly provided by dividends from its banking subsidiary. However, certain restrictions exist regarding the ability of its banking subsidiary to transfer funds to the Company in form of cash dividends, loans or advances. The approval of the OCC is required if the total of all dividends declared by the Bank in any calendar year exceeds the total of its net profits for that year combined with its retained net profits for the preceding two years, less any required transfers to surplus. The federal banking agencies have issued policy statements which provide that bank holding companies and insured banks should generally pay dividends only out of current earnings.
During 2023, the Bank paid dividends to the Company of $180.0 million. These funds were used to pay dividends to shareholders of approximately $154.9 million during 2023.
Under Federal Reserve regulations, the Bank is also limited as to the amount it may lend to the Company. The maximum amount available for transfer from the Bank to the Company in the form of loans or advances was approximately $579.8 million and $536.1 million at December 31, 2023 and 2022, respectively. There were no outstanding loans or advances at December 31, 2023 and 2022.
F-52
Note 17—Retirement Plans
The Company has an Employee saving plan/401(k), supplemental executive retirement plans and post-retirement benefits plans. The effect to income from operations with regard to all of the Company’s retirement plans were as follows:
|
|
|
|
|
|
|
|
|
|
|
|
|
Year Ended December 31, |
|
|||||||
(Dollars in thousands) |
|
2023 |
|
2022 |
|
2021 |
|
|||
Employee savings plan/ 401(k) |
|
$ |
16,528 |
|
$ |
15,357 |
|
$ |
14,991 |
|
Supplemental executive retirement plan |
|
|
(3,252) |
|
|
(1,510) |
|
|
3,475 |
|
Split dollar plan |
|
|
(753) |
|
|
(105) |
|
|
(785) |
|
Post-retirement benefits |
|
|
312 |
|
|
(108) |
|
|
67 |
|
|
|
$ |
12,835 |
|
$ |
13,634 |
|
$ |
17,748 |
|
The Company and its subsidiaries have a Safe Harbor plan. Under the plan, electing employees are eligible to participate after attaining age 18. Plan participants elect to contribute portions of their annual base compensation, or commissions, in any combination of pre-tax deferrals or Roth post-tax deferrals subject to the annual IRS limit. Employer contributions may be made from current or accumulated net profits. Participants may elect to contribute 1% to 50% of eligible compensation as a pre-tax contribution. Employees participating in the plan receive matching contributions from the Company in an amount equal to 100% of the first 4% of eligible compensation, contributed to the plan as deferral contributions.
Employees can enter the savings plan on or after the first day of each month. The employee may enter into a salary deferral agreement at any time to select an alternative deferral amount or to elect not to defer in the Plan. If the employee does not elect an investment allocation, the plan administrator will select a retirement-based portfolio according to the employee’s number of years until normal retirement age. The plan’s investment valuations are generally provided on a daily basis.
Note 18—Post-Retirement Benefits
At December 31, 2023, the Company and its subsidiary have three post-retirement health and life insurance benefit plans, SouthState Bank Retiree Medical Plan (the “retiree medical plan”), First Federal Retiree Welfare Plan (the “retiree welfare plan”) and the Georgia Bank & Trust Retiree Medical Plan. We do not disclose in the tables below the Georgia Bank & Trust Retiree Medical Plan due to the plan being immaterial. The Benefit obligation for this plan was less than $1,000 in the years reported.
Retiree Medical Plan
Under the retiree medical plan, post-retirement health and life insurance benefits are provided to eligible employees, such benefits being limited to those employees of the Company eligible for early retirement under the pension plan on or before December 31, 1993, and former employees who are currently receiving benefits. The plan was unfunded at December 31, 2023, and the liability for future benefits has been recorded in the Consolidated Balance Sheets.
The following sets forth the retiree medical plan’s funded status and amounts recognized in the Company’s accompanying Consolidated Balance Sheets:
|
|
|
|
|
|
|
|
|
|
|
|
|
December 31, |
|
|||||||
(Dollars in thousands) |
|
2023 |
|
2022 |
|
2021 |
|
|||
Change in benefit obligation: |
|
|
|
|
|
|
|
|
|
|
Benefit obligation at beginning of year |
|
$ |
157 |
|
$ |
195 |
|
$ |
209 |
|
Interest cost |
|
|
7 |
|
|
4 |
|
|
3 |
|
Actuarial (gain) loss |
|
|
(14) |
|
|
(14) |
|
|
11 |
|
Benefits paid |
|
|
(25) |
|
|
(28) |
|
|
(28) |
|
Benefit obligation at end of year |
|
|
125 |
|
|
157 |
|
|
195 |
|
Change in plan assets: |
|
|
|
|
|
|
|
|
|
|
Fair value of plan assets at beginning of year |
|
|
— |
|
|
— |
|
|
— |
|
Employer contribution |
|
|
25 |
|
|
28 |
|
|
28 |
|
Benefits paid |
|
|
(25) |
|
|
(28) |
|
|
(28) |
|
Fair value of plan assets at end of year |
|
|
— |
|
|
— |
|
|
— |
|
Funded status |
|
$ |
(125) |
|
$ |
(157) |
|
$ |
(195) |
|
F-53
Weighted-average assumptions used to determine benefit obligations and net periodic benefit cost are as follows:
|
|
|
|
|
|
|
|
|
|
|
Year Ended December 31, |
|
||||
|
|
2023 |
|
2022 |
|
2021 |
|
Weighted-average assumptions used to determine benefit obligation at December 31: |
|
|
|
|
|
|
|
Discount rate |
|
4.60 |
% |
4.80 |
% |
2.10 |
% |
Weighted-average assumptions used to determine net periodic benefit cost for years ended December 31: |
|
|
|
|
|
|
|
Discount rate |
|
4.80 |
% |
2.10 |
% |
1.60 |
% |
Assumed health care cost trend rates at December 31: |
|
|
|
|
|
|
|
Health care cost trend rate assumed for next year |
|
5.00 |
% |
5.00 |
% |
5.00 |
% |
Components of net periodic benefit cost and other amounts recognized in other comprehensive (loss) income are as follows:
|
|
|
|
|
|
|
|
|
|
|
|
|
Year Ended December 31, |
|
|||||||
(Dollars in thousands) |
|
2023 |
|
2022 |
|
2021 |
|
|||
Interest cost |
|
$ |
7 |
|
$ |
4 |
|
$ |
3 |
|
Recognized net actuarial loss |
|
|
— |
|
|
1 |
|
|
— |
|
Net periodic benefit cost |
|
|
7 |
|
|
5 |
|
|
3 |
|
Net (gain) loss |
|
|
(14) |
|
|
(14) |
|
|
11 |
|
Amortization of loss |
|
|
— |
|
|
(1) |
|
|
— |
|
Total amount recognized in other comprehensive income |
|
|
(14) |
|
|
(15) |
|
|
11 |
|
Total recognized in net periodic benefit cost and other comprehensive income |
|
$ |
(7) |
|
$ |
(10) |
|
$ |
14 |
|
No estimated net gain/loss for the retiree welfare plan will be amortized from other comprehensive income into periodic benefit cost over the next fiscal year.
Estimated future benefit payments (including expected future service as appropriate):
(Dollars in thousands) |
|
|
|
|
2024 |
|
$ |
22 |
|
2025 |
|
|
20 |
|
2026 |
|
|
18 |
|
2027 |
|
|
16 |
|
2028 |
|
|
14 |
|
2029-2033 |
|
|
45 |
|
|
|
$ |
135 |
|
The Company expects to contribute approximately $22,000 to the retiree medical plan in 2024.
Retiree Welfare Plan
Under the retiree welfare plan, post-retirement health and life insurance benefits are provided to eligible employees, such benefits being limited to retired First Financial Holdings, Inc. employees who are currently receiving benefits. The plan was unfunded at December 31, 2023, and the liability for future benefits has been recorded in the consolidated financial statements.
F-54
The following sets forth the retiree welfare plan’s funded status and amounts recognized in the Company’s accompanying Consolidated Balance Sheets:
|
|
|
|
|
|
|
|
|
|
|
|
|
December 31, |
|
|||||||
(Dollars in thousands) |
|
2023 |
|
2022 |
|
2021 |
|
|||
Change in benefit obligation: |
|
|
|
|
|
|
|
|
|
|
Benefit obligation at beginning of year |
|
$ |
2,508 |
|
$ |
1,754 |
|
$ |
2,070 |
|
Interest cost |
|
|
112 |
|
|
35 |
|
|
31 |
|
Actuarial loss (gain) |
|
|
(1,428) |
|
|
1,124 |
|
|
(110) |
|
Benefits paid |
|
|
(179) |
|
|
(416) |
|
|
(246) |
|
Less: Federal subsidy on benefits paid |
|
|
4 |
|
|
11 |
|
|
9 |
|
Benefit obligation at end of year |
|
|
1,017 |
|
|
2,508 |
|
|
1,754 |
|
Change in plan assets: |
|
|
|
|
|
|
|
|
|
|
Fair value of plan assets at beginning of year |
|
|
— |
|
|
— |
|
|
— |
|
Employer contribution |
|
|
175 |
|
|
405 |
|
|
236 |
|
Participants’ contributions |
|
|
4 |
|
|
11 |
|
|
10 |
|
Benefits paid |
|
|
(179) |
|
|
(416) |
|
|
(246) |
|
Fair value of plan assets at end of year |
|
|
— |
|
|
— |
|
|
— |
|
Funded status |
|
$ |
(1,017) |
|
$ |
(2,508) |
|
$ |
(1,754) |
|
Weighted-average assumptions used to determine benefit obligations and net periodic benefit cost are as follows:
|
|
|
|
|
|
|
|
|
|
Year Ended December 31, |
|
||||
|
|
2023 |
|
2022 |
|
2021 |
|
Weighted-average assumptions used to determine benefit obligation at December 31: |
|
|
|
|
|
|
|
Discount rate |
|
4.60 |
% |
4.80 |
% |
2.10 |
% |
Weighted-average assumptions used to determine net periodic benefit cost for years ended December 31: |
|
|
|
|
|
|
|
Discount rate |
|
4.80 |
% |
2.10 |
% |
1.60 |
% |
Assumed health care cost trend rates at December 31: |
|
|
|
|
|
|
|
Health care cost trend rate assumed for next year |
|
5.00 |
% |
5.00 |
% |
5.00 |
% |
Components of net periodic benefit cost and other amounts recognized in other comprehensive (loss) income are as follows:
|
|
|
|
|
|
|
|
|
|
|
|
|
Year Ended December 31, |
|
|||||||
(Dollars in thousands) |
|
2023 |
|
2022 |
|
2021 |
|
|||
Interest cost |
|
$ |
112 |
|
$ |
35 |
|
$ |
31 |
|
Recognized net actuarial loss |
|
|
285 |
|
|
141 |
|
|
174 |
|
Net periodic benefit cost |
|
|
397 |
|
|
176 |
|
|
205 |
|
Net (gain) loss |
|
|
(1,428) |
|
|
1,124 |
|
|
(110) |
|
Amortization of loss |
|
|
(285) |
|
|
(141) |
|
|
(174) |
|
Total amount recognized in other comprehensive income |
|
|
(1,713) |
|
|
983 |
|
|
(284) |
|
Total recognized in net periodic benefit cost and other comprehensive income |
|
$ |
(1,316) |
|
$ |
1,159 |
|
$ |
(79) |
|
The estimated net loss for the retiree welfare plan that will be amortized from other comprehensive income into periodic benefit cost over the next fiscal year is $45,000. The actuarial gains and losses are amortized over the average life expectancy of all participants.
Estimated future benefit payments (including expected future service as appropriate):
(Dollars in thousands) |
|
|
|
|
2024 |
|
$ |
149 |
|
2025 |
|
|
140 |
|
2026 |
|
|
129 |
|
2027 |
|
|
119 |
|
2028 |
|
|
108 |
|
2029-2033 |
|
|
386 |
|
|
|
$ |
1,031 |
|
The Company expects to contribute approximately $149,000 to the retiree welfare plan in 2024.
F-55
Note 19—Share-Based Compensation
Compensation cost is recognized for stock options, restricted stock awards and restricted stock units (“RSUs”) issued to employees. Compensation cost is measured as the fair value of these awards on their date of grant. A Black-Scholes model is utilized to estimate the fair value of stock options, while the market price of the Company’s common stock at the date of grant is used as the fair value of restricted stock awards and RSUs. Compensation cost is recognized over the required service period, generally defined as the vesting period for stock option awards and RSUs, and as the restriction period for restricted stock awards. For awards with graded vesting, compensation cost is recognized on a straight-line basis over the requisite service period for the entire award.
Our 2004, 2012, 2019 and 2020 share-based compensation plans are long-term retention plans intended to attract, retain, and provide incentives for key employees and non-employee directors in the form of incentive and non-qualified stock options, restricted stock, and RSUs. Our 2020 plan was adopted by our shareholders at our annual meeting on October 29, 2020. The Company also assumed the obligations of Atlantic Capital under various equity incentive plans pursuant to the acquisition of Atlantic Capital on March 1, 2022 and the obligations of CenterState Bank Corporation (“CenterState”) under various equity incentive plans pursuant to the merger with CenterState on June 7, 2020.
Stock Options
With the exception of non-qualified stock options granted to directors under the 2004 and 2012 plans, which in some cases may be exercised at any time prior to expiration and in some other cases may be exercised at intervals less than a year following the grant date, incentive stock options granted under our 2004, 2012, 2019 and 2020 plans may not be exercised in whole or in part within a year following the date of the grant, as these incentive stock options become exercisable in 25% increments pro ratably over the four-year period following the grant date. The options are granted at an exercise price at least equal to the fair value of the common stock at the date of grant and expire ten years from the date of grant. No options were granted under the 2004, 2012 or 2019 plans after January 26, 2012, February 1, 2019, and October 29, 2020, respectively, and the plans are closed other than for any options still unexercised and outstanding. The 2020 plan is the only plan from which new share-based compensation grants may be issued. It is the Company’s policy to grant options out of the 2,072,245 shares registered under the 2020 plan.
Activity in the Company’s stock option plans is summarized in the following table. All information has been retroactively adjusted for stock dividends and stock splits.
|
|
|
|
|
|
|
|
|
|
|
|
|
|
|
|
|
|
|
|
|
Year Ended December 31, |
|
|||||||||||||
|
|
|
2023 |
|
2022 |
|
2020 |
|
|||||||||
|
|
|
|
|
Weighted |
|
|
|
Weighted |
|
|
|
Weighted |
|
|||
|
|
|
|
|
Average |
|
|
|
Average |
|
|
|
Average |
|
|||
|
|
|
|
|
Exercise |
|
|
|
Exercise |
|
|
|
Exercise |
|
|||
|
|
|
Shares |
|
Price |
|
Shares |
|
Price |
|
Shares |
|
Price |
|
|||
Outstanding at January 1, 2023 |
|
|
161,832 |
|
$ |
66.20 |
|
185,125 |
|
$ |
63.03 |
|
256,425 |
|
$ |
59.01 |
|
Assumed stock options and warrants from ACBI merger |
|
|
— |
|
|
— |
|
23,410 |
|
|
40.73 |
|
— |
|
|
— |
|
Exercised |
|
|
(48,749) |
|
|
55.88 |
|
(43,525) |
|
|
41.16 |
|
(64,075) |
|
|
45.35 |
|
Forfeited |
|
|
— |
|
|
— |
|
(356) |
|
|
38.31 |
|
(6,250) |
|
|
85.42 |
|
Expired |
|
|
(5,491) |
|
|
32.25 |
|
(2,822) |
|
|
36.98 |
|
(975) |
|
|
24.37 |
|
Outstanding at December 31, 2023 |
|
|
107,592 |
|
|
72.60 |
|
161,832 |
|
|
66.20 |
|
185,125 |
|
|
63.03 |
|
Exercisable at December 31, 2023 |
|
|
107,592 |
|
|
72.60 |
|
161,832 |
|
|
66.20 |
|
185,125 |
|
|
63.03 |
|
The aggregate intrinsic value of 107,592, 161,832, and 185,125 stock options outstanding and exercisable at December 31, 2023, 2022, and 2021 was $1.7 million, $2.5 million, and $3.8 million, respectively. The aggregate intrinsic value of 48,749, 43,525, and 64,075 stock options exercised for the years ended December 31, 2023, 2022, and 2021 was $1.1 million, $1.7 million and $2.3 million, respectively.
F-56
Information pertaining to options outstanding at December 31, 2023 is as follows:
|
|
|
|
|
|
Options Outstanding |
|
Options Exercisable |
|
||||||||||||
|
|
|
|
|
|
|
|
Weighted |
|
|
|
|
|
|
Weighted |
|
|
|
|
||
|
|
|
|
|
|
|
|
Average |
|
|
|
|
|
|
Average |
|
|
|
|
||
|
|
|
|
|
|
|
|
Remaining |
|
Weighted |
|
|
|
Remaining |
|
Weighted |
|
||||
Range of |
|
Number |
|
Contractual |
|
Average |
|
Number |
|
Contractual |
|
Average |
|
||||||||
Exercise Prices |
|
Outstanding |
|
Life |
|
Exercise Price |
|
Outstanding |
|
Life |
|
Exercise Price |
|
||||||||
$ |
37.72 |
- |
$ |
40.00 |
|
4,348 |
|
1.1 |
years |
|
$ |
38.32 |
|
4,348 |
|
1.1 |
years |
|
$ |
38.32 |
|
$ |
40.01 |
- |
$ |
55.00 |
|
27,539 |
|
2.9 |
years |
|
$ |
45.42 |
|
27,539 |
|
2.9 |
years |
|
$ |
45.42 |
|
$ |
55.01 |
- |
$ |
70.00 |
|
18,536 |
|
1.2 |
years |
|
$ |
63.93 |
|
18,536 |
|
1.2 |
years |
|
$ |
63.93 |
|
$ |
85.01 |
- |
$ |
91.35 |
|
57,169 |
|
3.6 |
years |
|
$ |
91.12 |
|
57,169 |
|
3.6 |
years |
|
$ |
91.12 |
|
|
|
|
|
|
|
107,592 |
|
2.7 |
years |
|
$ |
72.60 |
|
107,592 |
|
2.7 |
years |
|
$ |
72.60 |
|
The fair value of options is estimated at the date of grant using the Black-Scholes option pricing model and expensed over the options’ vesting periods. We have not granted any stock options for the years ended December 31, 2023, 2022 and 2021, and therefore, we have not used the Black-Scholes option pricing model to fair value options.
As of December 31, 2023, 2022 and 2021, there were no unrecognized compensation costs related to non-vested stock option grants under the plans. There was no fair value of shares vesting during the years ended December 31, 2023, 2022 and 2021 and no compensation expense was recorded in 2023, 2022, and 2021.
Restricted Stock
From time-to-time, we grant shares of restricted stock to key employees. These awards help align the interests of these employees with the interests of our shareholders by providing economic value directly related to increases in the value of our stock. The value of the stock awarded is established as the fair market value of the stock at the time of the grant. We recognize expenses equal to the total value of such awards, ratably over the vesting period of the stock grants. Restricted stock grants to employees generally vest ratably over a two to four-year vesting period.
All restricted stock agreements are conditioned upon continued employment. Termination of employment prior to a vesting date, as described below, would terminate any interest in non-vested shares. Prior to vesting of the shares, as long as employed by the Company, the employees will have the right to vote such shares and to receive dividends paid with respect to such shares. All restricted shares will fully vest in the event of change in control of the Company or upon the death of the recipient.
Non-vested restricted stock for the year ended December 31, 2023 is summarized in the following table. All information has been retroactively adjusted for stock dividends and stock splits.
|
|
|
|
Weighted- |
|
|
|
|
|
|
Average |
|
|
|
|
|
|
Grant-Date |
|
|
Restricted Stock |
|
Shares |
|
Fair Value |
|
|
Nonvested at January 1, 2023 |
|
50,506 |
|
$ |
89.12 |
|
Vested |
|
(31,537) |
|
|
89.29 |
|
Forfeited |
|
(2,721) |
|
|
90.00 |
|
Nonvested at December 31, 2023 |
|
16,248 |
|
$ |
88.63 |
|
The Company granted no restricted stock shares for the years ended December 31, 2023, 2022, and 2021. Due to the acquisition of ACBI, effective March 1, 2022, a total of 84,224 restricted stock awards were assumed by the Company. Compensation expense of $1.8 million, $3.8 million and $370,000 was recorded in 2023, 2022, and 2021, respectively.
The vesting schedule of these shares as of December 31, 2023 is as follows:
|
|
Shares |
|
2024 |
|
11,373 |
|
2025 |
|
4,875 |
|
|
|
16,248 |
|
F-57
As of December 31, 2023, there was $598,000 of total unrecognized compensation cost related to non-vested restricted stock granted under the plans. The cost is expected to be recognized over a weighted-average period of 0.75 years as of December 31, 2023. The total fair value of shares vested during the years ended December 31, 2023, 2022 and 2021 was approximately $2.4 million, $2.5 million, and $448,000, respectively.
Restricted Stock Units (“RSU”)
From time-to-time, we also grant performance RSUs and time-vested RSUs to key employees, and time-vested RSUs to non-employee directors. These awards help align the interests of these employees with the interests of our shareholders by providing economic value directly related to our performance. Some performance RSU grants contain a three-year performance period while others contain a one to two-year performance period and a time-vested requirement (generally two to four years from the grant date). The performance-based awards for our long-term incentive plans are dependent on the achievement of tangible book value growth and return on average tangible common equity relative to the Company’s peer group during each three-year performance period. In December 2022, the Company’s Compensation Committee approved a modification to the long-term incentive plans to exclude the changes in accumulated other comprehensive income from the calculation of tangible book value growth per share. Grants to non-employee directors typically vest within a 12-month period. We communicate threshold, target, and maximum performance RSU awards and performance targets to the applicable key employees at the beginning of a performance period. Due to the merger with CenterState on June 7, 2020, all legacy and assumed performance-based restricted stock units converted to a time-vesting requirement. With respect to some long-term incentive awards, dividend equivalents are accrued at the same rate as cash dividends paid for each share of the Company’s common stock during the performance or time-vested period, and subsequently paid when the shares are issued on the vesting or settlement date. The value of the RSUs awarded is established as the fair market value of the stock at the time of the grant. We recognize expense on a straight-line basis typically over the performance or time-vesting periods based upon the probable performance target, as applicable, that will be met. For the year ended December 31, 2023, we accrued for 100% of the RSUs granted.
Nonvested RSUs at target for the year ended December 31, 2023 is summarized in the following table.
|
|
|
|
Weighted- |
|
|
|
|
|
|
Average |
|
|
|
|
|
|
Grant-Date |
|
|
Restricted Stock Units |
|
Shares |
|
Fair Value |
|
|
Outstanding at January 1, 2023 |
|
940,512 |
|
$ |
73.82 |
|
Granted |
|
398,655 |
|
|
74.45 |
|
Vested |
|
(455,443) |
|
|
71.65 |
|
Forfeited |
|
(10,676) |
|
|
76.15 |
|
Outstanding at December 31, 2023 |
|
873,048 |
|
$ |
75.22 |
|
The nonvested shares of 873,048 at December 31, 2023 includes 241,219 shares that have fully vested but have not been released. Of these shares that have not been released, 86,659 shares are subject to a two-year holding period, which commenced at the end of their respective vesting period. These vested shares will be released and issued into shares of common stock at the end of their respective two-year holding period, the last of which will end by March 31, 2025. The majority of the remaining shares of 154,560 that have fully vested but not yet released are related to the 2021 LTI performance-based RSU grants and will be released in the first quarter of 2024 with the finalization of 2023 results. If maximum performance is achieved pursuant to the 2022 and 2023 LTI performance-based RSU grants, an additional 93,576 shares in total may be issued by the Company at the end of the three-year performance periods. The Company granted 398,655, 338,500, and 301,230 shares for the year ended December 31, 2023, 2022, and 2021, respectively. The weighted-average grant-date fair value of restricted stock units granted in 2023 was $74.45. Due to the acquisition of Atlantic Capital, effective March 1, 2022, a total of 55,736 RSUs were assumed by the Company. Compensation expense of $34.0 million, $31.7 million, and $25.2 million was recorded in 2023, 2022, and 2021, respectively.
As of December 31, 2023, there was $23.2 million of total unrecognized compensation cost related to nonvested RSUs granted under the plan. This cost is expected to be recognized over a weighted-average period of 1.43 years as of December 31, 2023. The total fair value of restricted stock units that vested during the years ended December 31, 2023, 2022, and 2021 was approximately $32.6 million, $30.0 million, and $6.0 million, respectively.
F-58
Employee Stock Purchase Plan
The Company previously registered 363,825 shares of common stock in connection with the establishment of the 2002 Employee Stock Purchase Plan. At the annual shareholders meeting on October 29, 2020, a proposal was adopted to increase the shares of common stock that may be issued under the plan by up to 1,400,000 shares. The plan is available to all employees who have attained age 21 and completed six months of service. The Company currently has approximately 1.3 million shares available for issuances under the plan. The price at which common stock may be purchased for each quarterly option period is the lesser of 95% of the common stock’s fair value on either the first or last day of the quarter. Employees purchased 43,356, 38,491 and 33,013 shares in 2023, 2022 and 2021, respectively, through the Employee Stock Purchase Plan. The Company recognized $163,000, $165,000 and $126,000 in share-based compensation expense for the years ended December 31, 2023, 2022 and 2021, respectively.
Note 20—Stock Repurchase Program
On April 27, 2022, the Company’s Board of Directors approved a stock repurchase program (“2022 Stock Repurchase Program”) authorizing the Company to repurchase up to 3,750,000 of the Company’s common shares along with the remaining authorized shares of 370,021 from the Company’s 2021 stock repurchase program (“2021 Stock Repurchase Plan”) for a total authorization of 4,120,021 shares. During 2023, the Company repurchased a total of 100,000 shares at a weighted average price of $67.48 per share pursuant to the 2022 Stock Repurchase Program. As of December 31, 2023, there is a total of 4,020,021 shares authorized to be repurchased. During 2022, the Company did not repurchase any shares through the 2022 Stock Repurchase Program. The Company repurchased a total of 1,312,038 shares during 2022 at a weighted average price of $83.99 per share pursuant to the 2021 Stock Repurchase Plan.
The Company repurchased 131,827, 112,389, and 13,412 shares at a cost of $9.3 million, $9.1 million, and $1.1 million in 2023, 2022, and 2021, respectively, under other arrangements whereby directors or officers surrender currently owned shares to the Company to cover the option cost for stock option exercises or tax liabilities resulting from the vesting of restricted stock awards or restricted stock units.
Note 21—Leases
Our outstanding lease agreements are for real estate properties, including retail branch locations, operations and administration locations and stand-alone ATM locations. We have determined the number and dollar amount of our equipment leases is not material.
As of December 31, 2023 and 2022, we had operating ROU assets of $100.3 million and $108.0 million, respectively, and operating lease liabilities of $108.3 million and $115.6 million, respectively. We maintain operating leases on land and buildings for our operating centers, branch facilities and ATM locations. Most leases include one or more options to renew, with renewal terms extending up to 21 years. The exercise of renewal options is based on the sole judgment of management and what they consider to be reasonably certain given the environment today. Factors in determining whether an option is reasonably certain of exercise include, but are not limited to, the value of leasehold improvements, the value of renewal rates compared to market rates, and the presence of factors that would cause a significant economic penalty to us if the option is not exercised. Leases with an initial term of 12 months or less are not recorded on the balance sheet and instead are recognized in lease expense on a straight-line basis over the lease term.
F-59
|
|
|
|
|
|
|
|
|
|
|
(Dollars in thousands) |
|
Year Ended December 31, |
|
|||||||
|
|
2023 |
|
2022 |
|
2021 |
|
|||
Lease Cost Components: |
|
|
|
|
|
|
|
|
|
|
Amortization of ROU assets – finance leases |
|
$ |
466 |
|
$ |
466 |
|
$ |
466 |
|
Interest on lease liabilities – finance leases |
|
|
41 |
|
|
49 |
|
|
56 |
|
Operating lease cost (cost resulting from lease payments) |
|
|
17,123 |
|
|
17,782 |
|
|
17,236 |
|
Short-term lease cost |
|
|
429 |
|
|
820 |
|
|
446 |
|
Variable lease cost (cost excluded from lease payments) |
|
|
3,196 |
|
|
2,399 |
|
|
2,768 |
|
Total lease cost |
|
$ |
21,255 |
|
$ |
21,516 |
|
$ |
20,972 |
|
Supplemental Cash Flow and Other Information Related to Leases: |
|
|
|
|
|
|
|
|
|
|
Finance lease – operating cash flows |
|
$ |
41 |
|
$ |
49 |
|
$ |
56 |
|
Finance lease – financing cash flows |
|
|
449 |
|
|
434 |
|
|
427 |
|
Operating lease – operating cash flows (fixed payments) |
|
|
16,710 |
|
|
17,253 |
|
|
16,435 |
|
Operating lease – operating cash flows (net change asset/liability) |
|
|
(13,414) |
|
|
(13,723) |
|
|
(12,790) |
|
New ROU assets – operating leases |
|
|
1,160 |
|
|
12,635 |
|
|
9,623 |
|
Weighted – average remaining lease term (years) – finance leases |
|
|
4.43 |
|
|
5.42 |
|
|
6.41 |
|
Weighted – average remaining lease term (years) – operating leases |
|
|
9.29 |
|
|
10.03 |
|
|
10.95 |
|
Weighted – average discount rate - finance leases |
|
|
1.7% |
|
|
1.7% |
|
|
1.7% |
|
Weighted – average discount rate - operating leases |
|
|
3.1% |
|
|
3.0% |
|
|
3.2% |
|
|
|
|
|
|
|
|
|
|
|
|
Operating lease payments due: |
|
|
|
|
|
|
|
|
|
|
2024 |
|
$ |
15,970 |
|
|
|
|
|
|
|
2025 |
|
|
14,640 |
|
|
|
|
|
|
|
2026 |
|
|
14,210 |
|
|
|
|
|
|
|
2027 |
|
|
13,155 |
|
|
|
|
|
|
|
2028 |
|
|
12,502 |
|
|
|
|
|
|
|
Thereafter |
|
|
56,090 |
|
|
|
|
|
|
|
Total undiscounted cash flows |
|
|
126,567 |
|
|
|
|
|
|
|
Discount on cash flows |
|
|
(18,283) |
|
|
|
|
|
|
|
Total operating lease liabilities |
|
$ |
108,284 |
|
|
|
|
|
|
|
As of December 31, 2023, the Company held a small number of finance leases assumed in connection to the CenterState merger completed in 2020. These leases were all real estate leases. Terms and conditions are similar to those real estate operating leases described above. Lease classifications from the acquired institutions were retained. At December 31, 2023, we did not maintain any leases with related parties, and determined that the number and dollar amount of equipment leases was immaterial. As of December 31, 2023, we had additional operating leases that had not yet commenced of $2.7 million.
Equipment Lessor
SouthState has an Equipment Finance Group which goes to market through intermediaries. The Equipment Finance Group is primarily focused on serving the construction and utility segments. Lease terms typically range from 24 months to 120 months. At the end of the lease term, the lessee has the option to renew the lease, return the equipment, or purchase the equipment. In the event the equipment is returned, there is a remarketing agreement with the intermediary to sell the equipment. The Equipment Finance Group offers the following lease products: TRAC Leases, Split-TRAC Leases, and FMV Leases. Direct finance equipment leases are included in commercial and industrial loans on the Consolidated Balance Sheet.
The estimated residual values for direct finance leases are established by approved intermediary who utilizes internally developed analyses, external studies, and/or third-party appraisals to establish a residual position. FMV and Split TRAC leases have residual risk due to their unguaranteed residual value whereas TRAC leases have a guaranteed residual value. Expected credit losses on direct financing leases and the related estimated residual values are included in the Commercial and Industrial loan segment for the ACL.
F-60
The following table summarizes lease receivables and investment in operating leases and their corresponding balance sheet location at December 31, 2023:
(Dollars in thousands) |
|
Year Ended December 31, |
|
|
|
|
2023 |
|
|
Direct financing leases: |
|
|
|
|
Lease receivables |
|
$ |
4,839 |
|
Guaranteed residual values |
|
|
510 |
|
Unguaranteed residual values |
|
|
501 |
|
Initial direct costs |
|
|
155 |
|
Unearned income |
|
|
1,165 |
|
Total net investment in direct financing leases |
|
$ |
7,170 |
|
Direct financing lease income: |
|
|
|
|
Interest income |
|
$ |
30 |
|
|
|
|
|
|
Remaining lease payments receivable: |
|
|
|
|
2024 |
|
$ |
958 |
|
2025 |
|
|
958 |
|
2026 |
|
|
958 |
|
2027 |
|
|
971 |
|
2028 |
|
|
1,533 |
|
Thereafter |
|
|
626 |
|
Total undiscounted cash flows |
|
|
6,004 |
|
Less: unearned interest income |
|
|
(1,165) |
|
Total operating lease liabilities |
|
$ |
4,839 |
|
See further discussion in Note 1—Summary of Significant Accounting Policies on page F-20 on accounting for leases.
Note 22—Contingent Liabilities
The Company has been named as defendant in various legal actions, arising from its normal business activities, in which damages in various amounts are claimed. The Company is also exposed to litigation risk related to the prior business activities of banks acquired through whole bank acquisitions. Although the amount of any ultimate liability with respect to such matters cannot be determined, in the opinion of management, any such liability will not have a material effect on the Company’s consolidated financial statements.
The Company and its subsidiary are involved at times in certain litigation arising in the normal course of business. In the opinion of management as of December 31, 2023, there were no pending or threatened litigation that will have a material effect on the Company’s consolidated financial position, results of operations or cash flows.
Note 23—Related Party Transactions
During 2023 and 2022, the Company’s banking subsidiary had loan and deposit relationships with certain related parties, principally directors and executive officers, their immediate families and their business interests. All of these relationships were in the ordinary course of business at rates and terms substantially consistent with similar transactions with unrelated parties. Loans outstanding to this group (including immediate families and business interests) totaled $9.4 million and $5.8 million at December 31, 2023 and 2022, respectively. During 2023, $5.2 million of new loans were made to this group while repayments of $1.8 million were received during the year. There were also additions to related party loans of $652,000 due to the addition of new related parties in 2023, and reductions to related party loans of $488,000 due to the removal of related parties in 2023. During 2022, $122.2 million of new loans were made to this group while repayments of $119.1 million were received during the year. There were also additions to related party loans of $1.2 million due to the addition of new related parties in 2022, and reductions to related party loans of $8.6 million due to the removal of related parties in 2022. Related party deposits totaled approximately $31.9 million and $28.0 million at December 31, 2023 and 2022, respectively.
F-61
Note 24—Financial Instruments with Off-Balance Sheet Risk
The Bank is a party to credit related financial instruments with off-balance sheet risks, which are carried out in the normal course of business to meet the financing needs of the Bank’s customers. These financial instruments include commitments to extend credit, standby letters of credit and financial guarantees. Such commitments involve, to varying degrees, elements of credit, interest rate, or liquidity risk in excess of the amounts recognized in the consolidated balance sheets. The contract amounts of these instruments express the extent of involvement the banking subsidiary has in particular classes of financial instruments.
The Bank’s exposure to credit loss in the event of nonperformance by the other party to the financial instrument for commitments to extend credit, standby letters of credit, and financial guarantees is represented by the contractual amount of those instruments. The Bank uses the same credit policies in making commitments and conditional obligations as it does for on-balance sheet instruments. At December 31, 2023 and 2022, the following financial instruments, whose contract amounts represent credit risk, were outstanding:
|
|
Year Ended December 31, |
|
||||
(Dollars in thousands) |
|
2023 |
|
2022 |
|
||
Commitments to extend credit |
|
$ |
9,626,864 |
|
$ |
11,109,260 |
|
Standby letters of credit and financial guarantees |
|
|
109,927 |
|
|
93,882 |
|
|
|
$ |
9,736,791 |
|
$ |
11,203,142 |
|
As of December 31, 2023 and December 31, 2022, the Bank had recorded a liability for expected credit losses on unfunded commitments, excluding unconditionally cancellable exposures and letters of credit, of $56.3 million and $67.2 million, respectively, which was recorded in Other Liabilities on the Consolidated Balance Sheets. See Note 1—Summary of Significant Accounting Policies for discussion related to reserve for unfunded commitments.
Commitments to Extend Credit
Commitments to extend credit are agreements to lend to a customer as long as there is no violation of any condition established in the contract. Commitments generally have fixed expiration dates or other termination clauses and may require payment of a fee. Since many of the commitments are expected to expire without being drawn upon, the total commitment amounts do not necessarily represent future liquidity requirements. The Bank evaluates each customer’s credit worthiness on a case-by-case basis. The amount of collateral obtained, if deemed necessary by the bank upon extension of credit, is based on management’s credit evaluation of the customer. Collateral held varies but may include accounts receivable, inventory, property, plant and equipment, and personal guarantees. Unfunded commitments under commercial lines-of-credit, revolving credit lines and overdraft protection agreements are commitments for possible future extensions of credit to existing customers. These lines-of-credit are uncollateralized and usually do not contain a specified maturity date and may not be drawn to the extent to which the banking subsidiary is committed.
Standby Letters of Credit and Financial Guarantees
Standby letters of credit and financial guarantees are conditional commitments issued by the banking subsidiary to guarantee the performance of a customer to a third-party. Those letters of credit and guarantees are primarily issued to support public and private borrowing arrangements. Essentially, all standby letters of credit have expiration dates within one year. The credit risk involved in issuing letters of credit is essentially the same as that involved in extending loan facilities to customers. The amount of collateral obtained, if deemed necessary, is based on management’s credit evaluation of the customer.
Note 25—Fair Value
GAAP defines fair value and establishes a framework for measuring and disclosing fair value. Fair value should be based on the assumptions market participants would use when pricing an asset or liability and establishes a fair value hierarchy that prioritizes the information used to develop those assumptions.
F-62
The Company uses fair value measurements to record fair value adjustments to certain assets and liabilities and to determine fair value disclosures. Available for sale and trading securities, derivative contracts, mortgage loans held for sale, SBA servicing rights, and mortgage servicing rights (“MSRs”) are recorded at fair value on a recurring basis. Additionally, from time to time, we may be required to record at fair value other assets on a nonrecurring basis, such as impaired loans, OREO, bank properties held for sale, and certain other assets. These nonrecurring fair value adjustments typically involve application of lower of cost or market accounting or write-downs of individual assets.
FASB ASC 820 establishes a three-tier fair value hierarchy which prioritizes the inputs used in measuring fair value as follows:
|
|
Level 1 |
Observable inputs such as quoted prices in active markets; |
Level 2 |
Inputs, other than the quoted prices in active markets, that are observable either directly or indirectly; and |
Level 3 |
Unobservable inputs in which there is little or no market data, which require the reporting entity to develop its own assumptions. |
The following is a description of valuation methodologies used for assets recorded at fair value.
Trading Securities
The fair values of trading securities are determined as follows: (1) for those securities that have traded prior to the date of the Consolidated Balance Sheets but have not settled (date of sale) until after such date, the sales price is used as the fair value; and, (2) for those securities which have not traded as of the date of the Consolidated Balance Sheets, the fair value was determined by broker price indications of similar or same securities.
Investment Securities
Securities available for sale are valued on a recurring basis at quoted market prices where available. If quoted market prices are not available, fair values are based on quoted market prices of comparable securities. Level 1 securities include those traded on an active exchange, such as the New York Stock Exchange and The NASDAQ Stock Market. Level 2 securities include mortgage-backed securities and debentures issued by government agencies or sponsored entities, municipal bonds and corporate debt securities, or U.S. Treasury securities that are traded by dealers or brokers in active over-the-counter markets and money market funds. Securities held to maturity are valued at quoted market prices or dealer quotes similar to securities available for sale. The carrying value of FHLB and FRB stock approximates fair value based on the redemption provisions.
Mortgage Loans Held for Sale
Mortgage loans held for sale are carried at fair value with changes in fair value recognized in current period earnings. The fair values of mortgage loans held for sale are based on commitments on hand from investors within the secondary market for loans with similar characteristics. As such, the fair value adjustments for mortgage loans held for sale are recurring Level 2.
Loans
We do not record loans at fair value on a recurring basis. However, from time to time, a loan may be individually evaluated for expected credit losses if it no longer shares similar risk characteristics with other pooled loans. Once a loan is identified as an individually evaluated loan, management measures expected credit losses using estimated fair value methodologies. The fair value of the individually evaluated loans is estimated using one of several methods, including collateral value, market value of similar debt, enterprise value, liquidation value and discounted cash flows. Those individually evaluated loans not requiring an ACL represent loans for which the fair value of the expected repayments or collateral exceed the recorded investments in such loans. Individually evaluated loans, where an allowance is established based on the fair value of collateral, requires classification in the fair value hierarchy. When the fair value of the collateral is based on an observable market price or a current appraised value, we consider the impaired loan as nonrecurring Level 2. When an appraised value is not available or management determines the fair value of the collateral is further impaired below the appraised value and there is no observable market price, we consider the individually evaluated loan as nonrecurring Level 3.
F-63
Other Real Estate Owned (“OREO”)
OREO, consisting of properties obtained through foreclosure or in satisfaction of loans, is typically reported at fair value, determined on the basis of current appraisals, comparable sales, and other estimates of value obtained principally from independent sources, and adjusted for estimated selling costs (Level 2). However, OREO is considered Level 3 in the fair value hierarchy because management has qualitatively applied a discount due to the size, supply of inventory, and the incremental discounts applied to the appraisals. Management also considers other factors, including changes in absorption rates, length of time the property has been on the market and anticipated sales values, which have resulted in adjustments to the collateral value estimates indicated in certain appraisals. At the time of foreclosure, any excess of the loan balance over the fair value of the real estate held as collateral is treated as a charge against the ACL. Gains or losses on sale and generally any subsequent adjustments to the value are recorded as a component of OREO Expense and Loan Related Expense in the Consolidated Statements of Income.
Bank Property Held for Sale
Bank property held for sale consists of locations that management has identified as no longer needed and reclassified from bank premises. These properties are typically reported at fair value, determined on the basis of current appraisals, comparable sales, and other estimates of value obtained principally from independent sources, and adjusted for estimated selling costs (Level 2). However, bank property held for sale is considered Level 3 in the fair value hierarchy because management has qualitatively applied a discount due to the size, supply of inventory, restrictions and the incremental discounts applied to the appraisals. Management also considers other factors, including changes in absorption rates, length of time the property has been on the market and anticipated sales values, which have resulted in adjustments to the collateral value estimates indicated in certain appraisals. At the time a property is identified as held for sale, any excess of the book balance over the fair value of the real estate is treated as a charge against earnings. Gains or losses on sale and generally any subsequent write-downs to the value are recorded as a component in Other Expense in the Consolidated Statements of Income.
Derivative Financial Instruments
Fair value is estimated using pricing models of derivatives with similar characteristics or discounted cash flow models where future floating cash flows are projected and discounted back; and accordingly, these derivatives are classified within Level 2 of the fair value hierarchy. See Note 28—Derivative Financial Instruments for additional information.
Mortgage servicing rights (“MSRs”) and SBA Servicing Asset
The estimated fair value of MSRs and SBA servicing asset is obtained through a third-party vendor analysis of future cash flows. The valuations for the servicing asset use assumptions market participants would use in determining fair value including market discount rates, prepayment speeds, servicing income, servicing costs, default rates and other market driven data, as well as the market’s perception of future interest rate movements. MSRs and SBA servicing asset are classified as Level 3.
F-64
Assets and Liabilities Recorded at Fair Value on a Recurring Basis
The tables below present the recorded amount of assets and liabilities measured at fair value on a recurring basis.
|
|
|
|
|
|
|
|
|
|
|
|
|
|
|
|
|
|
Quoted Prices |
|
|
|
|
|
|
|
|
|
|
|
|
In Active |
|
Significant |
|
|
|
||
|
|
|
|
|
Markets |
|
Other |
|
Significant |
|||
|
|
|
|
|
for Identical |
|
Observable |
|
Unobservable |
|||
|
|
|
|
|
Assets |
|
Inputs |
|
Inputs |
|||
(Dollars in thousands) |
|
Fair Value |
|
(Level 1) |
|
(Level 2) |
|
(Level 3) |
||||
December 31, 2023: |
|
|
|
|
|
|
|
|
|
|
|
|
Assets |
|
|
|
|
|
|
|
|
|
|
|
|
Derivative financial instruments |
|
$ |
172,939 |
|
$ |
— |
|
$ |
172,939 |
|
$ |
— |
Loans held for sale |
|
|
50,888 |
|
|
— |
|
|
50,888 |
|
|
— |
Trading securities |
|
|
31,321 |
|
|
— |
|
|
31,321 |
|
|
— |
Securities available for sale: |
|
|
|
|
|
|
|
|
|
|
|
|
U.S. Treasuries |
|
|
73,890 |
|
|
— |
|
|
73,890 |
|
|
— |
U.S. Government agencies |
|
|
224,706 |
|
|
— |
|
|
224,706 |
|
|
— |
Residential mortgage-backed securities issued by U.S. government |
|
|
|
|
|
|
|
|
|
|
|
|
agencies or sponsored enterprises |
|
|
1,558,306 |
|
|
— |
|
|
1,558,306 |
|
|
— |
Residential collateralized mortgage-obligations issued by U.S. government |
|
|
|
|
|
|
|
|
|
|
|
|
agencies or sponsored enterprises |
|
|
527,422 |
|
|
— |
|
|
527,422 |
|
|
— |
Commercial mortgage-backed securities issued by U.S. government |
|
|
|
|
|
|
|
|
|
|
|
|
agencies or sponsored enterprises |
|
|
1,024,170 |
|
|
— |
|
|
1,024,170 |
|
|
— |
State and municipal obligations |
|
|
977,461 |
|
|
— |
|
|
977,461 |
|
|
— |
Small Business Administration loan-backed securities |
|
|
371,686 |
|
|
— |
|
|
371,686 |
|
|
— |
Corporate securities |
|
|
26,747 |
|
|
— |
|
|
26,747 |
|
|
— |
Total securities available for sale |
|
|
4,784,388 |
|
|
— |
|
|
4,784,388 |
|
|
— |
Mortgage servicing rights |
|
|
85,164 |
|
|
— |
|
|
— |
|
|
85,164 |
SBA servicing asset |
|
|
5,952 |
|
|
— |
|
|
— |
|
|
5,952 |
|
|
$ |
5,130,652 |
|
$ |
— |
|
$ |
5,039,536 |
|
$ |
91,116 |
Liabilities |
|
|
|
|
|
|
|
|
|
|
|
|
Derivative financial instruments |
|
$ |
804,486 |
|
$ |
— |
|
$ |
804,486 |
|
$ |
— |
|
|
|
|
|
|
|
|
|
|
|
|
|
December 31, 2022: |
|
|
|
|
|
|
|
|
|
|
|
|
Assets |
|
|
|
|
|
|
|
|
|
|
|
|
Derivative financial instruments |
|
$ |
211,016 |
|
$ |
— |
|
$ |
211,016 |
|
$ |
— |
Loans held for sale |
|
|
28,968 |
|
|
— |
|
|
28,968 |
|
|
— |
Trading securities |
|
|
31,263 |
|
|
— |
|
|
31,263 |
|
|
— |
Securities available for sale: |
|
|
|
|
|
|
|
|
|
|
|
|
U.S. Treasuries |
|
|
265,638 |
|
|
— |
|
|
265,638 |
|
|
— |
U.S. Government agencies |
|
|
219,088 |
|
|
— |
|
|
219,088 |
|
|
— |
Residential mortgage-backed securities issued by U.S. government |
|
|
|
|
|
|
|
|
|
|
|
|
agencies or sponsored enterprises |
|
|
1,698,353 |
|
|
— |
|
|
1,698,353 |
|
|
— |
Residential collateralized mortgage-obligations issued by U.S. government |
|
|
|
|
|
|
|
|
|
|
|
|
agencies or sponsored enterprises |
|
|
601,045 |
|
|
— |
|
|
601,045 |
|
|
— |
Commercial mortgage-backed securities issued by U.S. government |
|
|
|
|
|
|
|
|
|
|
|
|
agencies or sponsored enterprises |
|
|
1,000,398 |
|
|
— |
|
|
1,000,398 |
|
|
— |
State and municipal obligations |
|
|
1,064,852 |
|
|
— |
|
|
1,064,852 |
|
|
— |
Small Business Administration loan-backed securities |
|
|
444,810 |
|
|
— |
|
|
444,810 |
|
|
— |
Corporate securities |
|
|
32,638 |
|
|
— |
|
|
32,638 |
|
|
— |
Total securities available for sale |
|
|
5,326,822 |
|
|
— |
|
|
5,326,822 |
|
|
— |
Mortgage servicing rights |
|
|
86,610 |
|
|
— |
|
|
— |
|
|
86,610 |
SBA servicing asset |
|
|
6,068 |
|
|
— |
|
|
— |
|
|
6,068 |
|
|
$ |
5,690,747 |
|
$ |
— |
|
$ |
5,598,069 |
|
$ |
92,678 |
Liabilities |
|
|
|
|
|
|
|
|
|
|
|
|
Derivative financial instruments |
|
$ |
1,034,143 |
|
$ |
— |
|
$ |
1,034,143 |
|
$ |
— |
Fair Value Option
The Company has elected the fair value option for mortgage loans held for sale primarily to ease the operational burden required to maintain hedge accounting for these loans. The Company also has opted for the fair value option for the SBA servicing asset, as it is the industry-preferred method for valuing such assets.
F-65
The following table summarizes the difference between the fair value and the unpaid principal balance of mortgage loans held for sale and the changes in fair value of these loans.
|
|
|
|
|
|
|
|
|
|
December 31, |
|
December 31, |
|
||
(Dollars in thousands) |
|
2023 |
|
2022 |
|
||
Fair value |
|
$ |
50,888 |
|
$ |
28,968 |
|
Unpaid principal balance |
|
|
49,025 |
|
|
27,937 |
|
Fair value less aggregated unpaid principal balance |
|
$ |
1,863 |
|
$ |
1,031 |
|
|
|
|
|
|
|
|
|
|
|
|
|
|
|
|
Year Ended December 31, |
|
|
|
|||||||
(Dollars in thousands) |
|
2023 |
|
2022 |
|
2021 |
|
Income Statement Location |
|
|||
Mortgage loans held for sale |
|
$ |
833 |
|
$ |
(6,052) |
|
$ |
(6,920) |
|
Mortgage banking income |
|
Changes in Level 3 Fair Value Measurements
When a determination is made to classify a financial instrument within Level 3 of the valuation hierarchy, the determination is based upon the significance of the unobservable factors to the overall fair value measurement. However, since Level 3 financial instruments typically include, in addition to the unobservable or Level 3 components, observable components (that is, components that are actively quoted and can be validated to external sources), the gains and losses below include changes in fair value due in part to observable factors that are part of the valuation methodology.
There were no changes in hierarchy classifications of Level 3 assets or liabilities for the year ended December 31, 2023. A reconciliation of the beginning and ending balances of the MSRs recorded at fair value on a recurring basis for the years ended December 31, 2023 and 2022 is as follows. The changes in fair value of the MSRs are recorded in Mortgage Banking Income on the Consolidated Statements of Income.
(Dollars in thousands) |
|
MSRs |
|
|
Fair value, January 1, 2023 |
|
$ |
86,610 |
|
Servicing assets that resulted from transfers of financial assets |
|
|
8,444 |
|
Changes in fair value due to valuation inputs or assumptions |
|
|
(1,350) |
|
Changes in fair value due to decay |
|
|
(8,540) |
|
Fair value, December 31, 2023 |
|
$ |
85,164 |
|
|
|
|
|
|
Fair value, January 1, 2022 |
|
$ |
65,620 |
|
Servicing assets that resulted from transfers of financial assets |
|
|
16,002 |
|
Changes in fair value due to valuation inputs or assumptions |
|
|
14,886 |
|
Changes in fair value due to decay |
|
|
(9,898) |
|
Fair value, December 31, 2022 |
|
$ |
86,610 |
|
A reconciliation of the beginning and ending balances of the SBA servicing asset recorded at fair value on a recurring basis for the periods ending December 31, 2023 and 2022 is as follows. The changes in fair value of the SBA servicing asset are recorded in in SBA Income on the Consolidated Statements of Income.
(Dollars in thousands) |
|
SBA Servicing Asset |
|
|
Fair value, January 1, 2023 |
|
$ |
6,068 |
|
Servicing assets that resulted from transfers of financial assets |
|
|
1,621 |
|
Changes in fair value due to decay |
|
|
(2,244) |
|
Changes in fair value due to valuation inputs or assumptions |
|
|
507 |
|
Fair value, December 31, 2023 |
|
$ |
5,952 |
|
|
|
|
|
|
Beginning Balance, June 30, 2022 |
|
$ |
7,369 |
|
Servicing assets that resulted from transfers of financial assets |
|
|
1,273 |
|
Changes in fair value due to decay |
|
|
(1,845) |
|
Changes in fair value due to valuation inputs or assumptions |
|
|
(729) |
|
Fair value, December 31, 2022 |
|
$ |
6,068 |
|
There were no unrealized losses included in accumulated other comprehensive (losses) income related to Level 3 financial assets and liabilities at December 31, 2023 or 2022.
See Note 29—Mortgage Loan Servicing, Obligation, and Loans Held for Sale for information about recurring Level 3 fair value measurements of mortgage servicing rights.
F-66
Assets and Liabilities Recorded at Fair Value on a Nonrecurring Basis
The tables below present the recorded amount of assets and liabilities measured at fair value on a nonrecurring basis:
|
|
|
|
|
|
|
|
|
|
|
|
|
|
|
|
|
|
|
Quoted Prices |
|
|
|
|
|
|
|
|
|
|
|
|
|
In Active |
|
Significant |
|
|
|
|
||
|
|
|
|
|
Markets |
|
Other |
|
Significant |
|
|||
|
|
|
|
|
for Identical |
|
Observable |
|
Unobservable |
|
|||
|
|
|
|
|
Assets |
|
Inputs |
|
Inputs |
|
|||
(Dollars in thousands) |
|
Fair Value |
|
(Level 1) |
|
(Level 2) |
|
(Level 3) |
|
||||
December 31, 2023: |
|
|
|
|
|
|
|
|
|
|
|
|
|
OREO |
|
$ |
837 |
|
$ |
— |
|
$ |
— |
|
$ |
837 |
|
Bank properties held for sale |
|
|
12,401 |
|
|
— |
|
|
— |
|
|
12,401 |
|
Individually evaluated loans |
|
|
73,518 |
|
|
— |
|
|
— |
|
|
73,518 |
|
December 31, 2022: |
|
|
|
|
|
|
|
|
|
|
|
|
|
OREO |
|
$ |
1,023 |
|
$ |
— |
|
$ |
— |
|
$ |
1,023 |
|
Bank properties held for sale |
|
|
17,754 |
|
|
— |
|
|
— |
|
|
17,754 |
|
Individually evaluated loans |
|
|
56,719 |
|
|
— |
|
|
— |
|
|
56,719 |
|
For an individually evaluated loan, the fair value of collateral is measured based on appraisal or third-party valuation when the loan is placed on nonaccrual. For OREO and bank properties held for sale, the fair value is initially recorded based on external appraisals at the time of transfer. These assets recorded at fair value on a nonrecurring basis are updated on at least an annual basis.
Quantitative Information about Level 3 Fair Value Measurements
|
|
|
|
|
|
Weighted Average Discount |
||||
|
|
|
|
|
|
December 31, |
|
December 31, |
||
|
|
Valuation Technique |
|
Unobservable Input |
|
2023 |
|
2022 |
||
Nonrecurring measurements: |
|
|
|
|
|
|
|
|
|
|
Individually evaluated loans |
|
Discounted appraisals and discounted cash flows |
|
Collateral discounts |
|
13 |
% |
|
31 |
% |
OREO and Bank properties held for sale |
|
Discounted appraisals |
|
Collateral discounts and estimated costs to sell |
|
12 |
% |
|
16 |
% |
Fair Value of Financial Instruments
We used the following methods and assumptions in estimating our fair value disclosures for financial instruments. In cases where quoted market prices are not available, fair values are based on estimates using present value or other valuation techniques. Those models are significantly affected by the assumptions used, including the discount rates and estimates of future cash flows. In that regard, the derived fair value estimates cannot be substantiated by comparison to independent markets and, in many cases, could not be realized in immediate settlement of the instrument. The use of different methodologies may have a material effect on the estimated fair value amounts. The fair value estimates presented herein are based on pertinent information available to management as of December 31, 2023 and 2022. Such amounts have not been revalued for purposes of these consolidated financial statements since those dates and, therefore, current estimates of fair value may differ significantly from the amounts presented herein.
The following methods and assumptions were used to estimate the fair value of each class of financial instruments for which it is practicable to estimate that value:
Cash and Cash Equivalents—The carrying amount is a reasonable estimate of fair value.
Trading Securities — The fair values of trading securities are determined as follows: (1) for those securities that have traded prior to the date of the Consolidated Balance Sheets but have not settled (date of sale) until after such date, the sales price is used as the fair value; and, (2) for those securities which have not traded as of the date of the consolidated balance sheet, the fair value was determined by broker price indications of similar or same securities.
Investment Securities—Securities available for sale are valued at quoted market prices or dealer quotes. Securities held to maturity are valued at quoted market prices or dealer quotes similar to securities available for sale. The carrying value of FHLB and FRB stock approximates fair value based on the redemption provisions. The carrying value of our investment in unconsolidated subsidiaries approximates fair value.
F-67
See Note 3—Securities for additional information, as well as page F-63 regarding fair value.
Loans held for sale — The fair values disclosed for loans held for sale are based on commitments from investors for loans with similar characteristics.
Loans — The fair value of loans is based on an exit price. To estimate an exit price, all loans (fixed and variable) are being valued with a discounted cash flow analyses for loans that includes our estimate of future credit losses expected to be incurred over the life of the loans. Fair values for certain mortgage loans (e.g., one-to-four family residential) and other consumer loans are estimated using discounted cash flow analyses based on our current rates offered for new loans of the same type, structure and credit quality. Fair values for other loans (e.g., commercial real estate and investment property mortgage loans, commercial and industrial loans) are estimated using discounted cash flow analyses-using interest rates we currently offer for loans with similar terms to borrowers of similar credit quality. Fair values for non-performing loans are estimated using a discounted cash flow analysis.
Deposit Liabilities—The fair values disclosed for demand deposits (e.g., interest and non-interest bearing checking, passbook savings, and certain types of money market accounts) are, by definition, equal to the amount payable on demand at the reporting date (i.e., their carrying amounts). The carrying amounts of variable-rate, fixed-term money market accounts, and certificates of deposit approximate their fair values at the reporting date. Fair values for fixed-rate certificates of deposit are estimated using a discounted cash flow calculation that applies interest rates currently being offered on certificates to a schedule of aggregated expected monthly maturities on time deposits. The methodology used for deposit liabilities therefore are resulting in a Level 2 classification.
Federal Funds Purchased and Securities Sold Under Agreements to Repurchase—The carrying amount of federal funds purchased, borrowings under repurchase agreements, and other short-term borrowings maturing within ninety days approximate their fair values.
Other Borrowings—The fair value of other borrowings is estimated using discounted cash flow analysis on our current incremental borrowing rates for similar types of instruments.
Accrued Interest—The carrying amounts of accrued interest approximate fair value. The accrued interest receivable for available for sale and held to maturity securities and accrued interest payable for deposits and other borrowings are considered Level 2. The accrued interest receivable for loans is considered Level 3.
Derivative Financial Instruments—The fair value of derivative financial instruments (including interest rate swaps) is estimated using pricing models of derivatives with similar characteristics or discounted cash flow models where future floating cash flows are projected and discounted back.
F-68
The estimated fair value, and related carrying amount, of the Company’s financial instruments are as follows:
|
|
|
|
|
|
|
|
|
|
|
|
|
|
|
|
|
|
|
Carrying |
|
Fair |
|
|
|
|
|
|
|
|
|
|
||
(Dollars in thousands) |
|
Amount |
|
Value |
|
Level 1 |
|
Level 2 |
|
Level 3 |
|
|||||
December 31, 2023 |
|
|
|
|
|
|
|
|
|
|
|
|
|
|
|
|
Financial assets: |
|
|
|
|
|
|
|
|
|
|
|
|
|
|
|
|
Cash and cash equivalents |
|
$ |
998,877 |
|
$ |
998,877 |
|
$ |
998,877 |
|
$ |
— |
|
$ |
— |
|
Trading securities |
|
|
31,321 |
|
|
31,321 |
|
|
— |
|
|
31,321 |
|
|
— |
|
Investment securities |
|
|
7,463,871 |
|
|
7,061,167 |
|
|
192,043 |
|
|
6,869,124 |
|
|
— |
|
Loans held for sale |
|
|
50,888 |
|
|
50,888 |
|
|
— |
|
|
50,888 |
|
|
— |
|
Loans, net of allowance for credit losses |
|
|
31,931,916 |
|
|
30,709,513 |
|
|
— |
|
|
— |
|
|
30,709,513 |
|
Accrued interest receivable |
|
|
154,400 |
|
|
154,400 |
|
|
— |
|
|
26,706 |
|
|
127,694 |
|
Mortgage servicing rights |
|
|
85,164 |
|
|
85,164 |
|
|
— |
|
|
— |
|
|
85,164 |
|
SBA servicing asset |
|
|
5,952 |
|
|
5,952 |
|
|
— |
|
|
— |
|
|
5,952 |
|
Interest rate swap – non-designated hedge |
|
|
169,180 |
|
|
169,180 |
|
|
— |
|
|
169,180 |
|
|
— |
|
Other derivative financial instruments (mortgage banking related) |
|
|
3,759 |
|
|
3,759 |
|
|
— |
|
|
3,759 |
|
|
— |
|
Financial liabilities: |
|
|
|
|
|
|
|
|
|
|
|
|
|
|
|
|
Deposits |
|
|
|
|
|
|
|
|
|
|
|
|
|
|
|
|
Noninterest-bearing |
|
|
10,649,274 |
|
|
10,649,274 |
|
|
— |
|
|
10,649,274 |
|
|
— |
|
Interest-bearing other than time deposits |
|
|
22,149,682 |
|
|
22,149,682 |
|
|
— |
|
|
22,149,682 |
|
|
— |
|
Time deposits |
|
|
4,249,953 |
|
|
4,208,498 |
|
|
— |
|
|
4,208,498 |
|
|
|
|
Federal funds purchased and securities sold under agreements to repurchase |
|
|
489,185 |
|
|
489,185 |
|
|
— |
|
|
489,185 |
|
|
— |
|
Corporate and subordinated debentures |
|
|
391,904 |
|
|
388,909 |
|
|
— |
|
|
388,909 |
|
|
— |
|
Other borrowings |
|
|
100,000 |
|
|
100,000 |
|
|
— |
|
|
100,000 |
|
|
— |
|
Accrued interest payable |
|
|
56,808 |
|
|
56,808 |
|
|
— |
|
|
56,808 |
|
|
— |
|
Interest rate swap – non-designated hedge |
|
|
803,539 |
|
|
803,539 |
|
|
— |
|
|
803,539 |
|
|
— |
|
Other derivative financial instruments (mortgage banking related) |
|
|
947 |
|
|
947 |
|
|
— |
|
|
947 |
|
|
— |
|
December 31, 2022 |
|
|
|
|
|
|
|
|
|
|
|
|
|
|
|
|
Financial assets: |
|
|
|
|
|
|
|
|
|
|
|
|
|
|
|
|
Cash and cash equivalents |
|
$ |
1,312,563 |
|
$ |
1,312,563 |
|
$ |
1,312,563 |
|
$ |
— |
|
$ |
— |
|
Trading securities |
|
|
31,263 |
|
|
31,263 |
|
|
— |
|
|
31,263 |
|
|
— |
|
Investment securities |
|
|
8,189,780 |
|
|
7,756,707 |
|
|
179,717 |
|
|
7,576,990 |
|
|
— |
|
Loans held for sale |
|
|
28,968 |
|
|
28,968 |
|
|
— |
|
|
28,968 |
|
|
— |
|
Loans, net of allowance for credit losses |
|
|
29,821,418 |
|
|
29,329,499 |
|
|
— |
|
|
— |
|
|
29,329,499 |
|
Accrued interest receivable |
|
|
134,594 |
|
|
134,594 |
|
|
— |
|
|
28,449 |
|
|
106,145 |
|
Mortgage servicing rights |
|
|
86,610 |
|
|
86,610 |
|
|
— |
|
|
— |
|
|
86,610 |
|
SBA servicing asset |
|
|
6,068 |
|
|
— |
|
|
— |
|
|
— |
|
|
6,068 |
|
Interest rate swap – non-designated hedge |
|
|
210,216 |
|
|
210,216 |
|
|
— |
|
|
210,216 |
|
|
— |
|
Other derivative financial instruments (mortgage banking related) |
|
|
800 |
|
|
800 |
|
|
— |
|
|
800 |
|
|
— |
|
Financial liabilities: |
|
|
|
|
|
|
|
|
|
|
|
|
|
|
|
|
Deposits |
|
|
|
|
|
|
|
|
|
|
|
|
|
|
|
|
Noninterest-bearing |
|
|
13,168,656 |
|
|
13,168,656 |
|
|
— |
|
|
13,168,656 |
|
|
— |
|
Interest-bearing other than time deposits |
|
|
20,761,981 |
|
|
20,761,981 |
|
|
— |
|
|
20,761,981 |
|
|
— |
|
Time deposits |
|
|
2,419,986 |
|
|
2,333,764 |
|
|
— |
|
|
2,333,764 |
|
|
|
|
Federal funds purchased and securities sold under agreements to repurchase |
|
|
556,417 |
|
|
556,417 |
|
|
— |
|
|
556,417 |
|
|
— |
|
Corporate and subordinated debentures |
|
|
392,275 |
|
|
377,360 |
|
|
— |
|
|
377,360 |
|
|
— |
|
Accrued interest payable |
|
|
6,218 |
|
|
6,218 |
|
|
— |
|
|
6,218 |
|
|
— |
|
Interest rate swap – non-designated hedge |
|
|
1,033,980 |
|
|
1,033,980 |
|
|
— |
|
|
1,033,980 |
|
|
— |
|
Other derivative financial instruments (mortgage banking related) |
|
|
163 |
|
|
163 |
|
|
— |
|
|
163 |
|
|
— |
|
Note 26—Regulatory Matters
The Company is subject to regulations with respect to certain risk-based capital ratios. These risk-based capital ratios measure the relationship of capital to a combination of balance sheet and off-balance sheet risks. The values of both balance sheet and off-balance sheet items are adjusted based on the rules to reflect categorical credit risk. In addition to the risk-based capital ratios, the regulatory agencies have also established a leverage ratio for assessing capital adequacy. The leverage ratio is equal to Tier 1 capital divided by total consolidated on-balance sheet assets (minus amounts deducted from Tier 1 capital). The leverage ratio does not involve assigning risk weights to assets.
Under current regulations, the Company and the Bank are subject to a minimum ratio of common equity Tier 1 capital (“CET1”) to risk-weighted assets of 4.5% and a minimum required ratio of Tier 1 capital to risk-weighted assets of 6%. The minimum required leverage ratio is 4%. The minimum required total capital to risk-weighted assets ratio is 8%.
F-69
In order to avoid restrictions on capital distributions and discretionary bonus payments to executives, under the new rules a covered banking organization is also required to maintain a “capital conservation buffer” in addition to its minimum risk-based capital requirements. This buffer is required to consist solely of CET1, and the buffer applies to all three risk-based measurements (CET1, Tier 1 capital and total capital). The capital conservation buffer became fully phased-in on January 1, 2019 and consists of an additional amount of Tier 1 common equity equal to 2.5% of risk-weighted assets.
The Bank is also subject to the regulatory framework for prompt corrective action, which identifies five capital categories for insured depository institutions (well capitalized, adequately capitalized, undercapitalized, significantly undercapitalized, and critically undercapitalized) and is based on specified thresholds for each of the three risk-based regulatory capital ratios (CET1, Tier 1 capital and total capital) and for the leverage ratio.
The following table presents actual and required capital ratios as of December 31, 2023 and December 31, 2022 for the Company and the Bank under the current capital rules. Capital levels required to be considered well capitalized are based upon prompt corrective action regulations.
|
|
|
|
|
|
|
|
|
|
|
|
|
|
|
|
|
|
|
|
|
|
|
|
|
|
Required to be |
|
||||||
|
|
|
|
|
|
|
Minimum Capital |
|
Considered Well |
|
||||||
|
|
Actual |
|
Required – Basel III |
|
Capitalized |
|
|||||||||
(Dollars in thousands) |
|
Amount |
|
Ratio |
|
Capital Amount |
|
Ratio |
|
Capital Amount |
|
Ratio |
|
|||
December 31, 2023: |
|
|
|
|
|
|
|
|
|
|
|
|
|
|
|
|
Common equity Tier 1 to risk-weighted assets: |
|
|
|
|
|
|
|
|
|
|
|
|
|
|
|
|
Consolidated |
|
$ |
4,159,187 |
|
11.75 |
% |
$ |
2,476,926 |
|
7.00 |
% |
$ |
2,300,003 |
|
6.50 |
% |
SouthState Bank (the Bank) |
|
|
4,424,466 |
|
12.52 |
% |
|
2,473,961 |
|
7.00 |
% |
|
2,297,250 |
|
6.50 |
% |
Tier 1 capital to risk-weighted assets: |
|
|
|
|
|
|
|
|
|
|
|
|
|
|
|
|
Consolidated |
|
|
4,159,187 |
|
11.75 |
% |
|
3,007,696 |
|
8.50 |
% |
|
2,830,773 |
|
8.00 |
% |
SouthState Bank (the Bank) |
|
|
4,424,466 |
|
12.52 |
% |
|
3,004,096 |
|
8.50 |
% |
|
2,827,384 |
|
8.00 |
% |
Total capital to risk-weighted assets: |
|
|
|
|
|
|
|
|
|
|
|
|
|
|
|
|
Consolidated |
|
|
4,983,012 |
|
14.08 |
% |
|
3,715,389 |
|
10.50 |
% |
|
3,538,466 |
|
10.00 |
% |
SouthState Bank (the Bank) |
|
|
4,858,292 |
|
13.75 |
% |
|
3,710,942 |
|
10.50 |
% |
|
3,534,230 |
|
10.00 |
% |
Tier 1 capital to average assets (leverage ratio): |
|
|
|
|
|
|
|
|
|
|
|
|
|
|
|
|
Consolidated |
|
|
4,159,187 |
|
9.42 |
% |
|
1,765,295 |
|
4.00 |
% |
|
2,206,619 |
|
5.00 |
% |
SouthState Bank (the Bank) |
|
|
4,424,466 |
|
10.03 |
% |
|
1,764,736 |
|
4.00 |
% |
|
2,205,921 |
|
5.00 |
% |
December 31, 2022: |
|
|
|
|
|
|
|
|
|
|
|
|
|
|
|
|
Common equity Tier 1 to risk-weighted assets: |
|
|
|
|
|
|
|
|
|
|
|
|
|
|
|
|
Consolidated |
|
$ |
3,788,106 |
|
10.96 |
% |
$ |
2,420,417 |
|
7.00 |
% |
$ |
2,247,530 |
|
6.50 |
% |
SouthState Bank (the Bank) |
|
|
4,074,045 |
|
11.80 |
% |
|
2,417,133 |
|
7.00 |
% |
|
2,244,481 |
|
6.50 |
% |
Tier 1 capital to risk-weighted assets: |
|
|
|
|
|
|
|
|
|
|
|
|
|
|
|
|
Consolidated |
|
|
3,788,106 |
|
10.96 |
% |
|
2,939,077 |
|
8.50 |
% |
|
2,766,190 |
|
8.00 |
% |
SouthState Bank (the Bank) |
|
|
4,074,045 |
|
11.80 |
% |
|
2,935,090 |
|
8.50 |
% |
|
2,762,438 |
|
8.00 |
% |
Total capital to risk-weighted assets: |
|
|
|
|
|
|
|
|
|
|
|
|
|
|
|
|
Consolidated |
|
|
4,485,397 |
|
12.97 |
% |
|
3,630,625 |
|
10.50 |
% |
|
3,457,738 |
|
10.00 |
% |
SouthState Bank (the Bank) |
|
|
4,381,336 |
|
12.69 |
% |
|
3,625,700 |
|
10.50 |
% |
|
3,453,047 |
|
10.00 |
% |
Tier 1 capital to average assets (leverage ratio): |
|
|
|
|
|
|
|
|
|
|
|
|
|
|
|
|
Consolidated |
|
|
3,788,106 |
|
8.72 |
% |
|
1,736,991 |
|
4.00 |
% |
|
2,171,239 |
|
5.00 |
% |
SouthState Bank (the Bank) |
|
|
4,074,045 |
|
9.39 |
% |
|
1,736,330 |
|
4.00 |
% |
|
2,170,412 |
|
5.00 |
% |
As of December 31, 2023 and 2022, the capital ratios of the Company and the Bank were well in excess of the minimum regulatory requirements and exceeded the thresholds for the “well capitalized” regulatory classification.
F-70
In accordance with ASU No. 2016-13, the Company applied the provisions of the standard using the modified retrospective method as a cumulative-effect adjustment to retained earnings. Related to the implementation of ASU 2016-13, the Company recorded additional allowance for credit losses for loans of $54.4 million, deferred tax assets of $12.6 million, an additional reserve for unfunded commitments of $6.4 million and an adjustment to retained earnings of $44.8 million. Instead of recognizing the effects from ASU 2016-13 at adoption, the standard included a transitional method option for recognizing the adoption date effects on the Company’s regulatory capital calculations over a three-year phase-in. In March 2020, in response to the COVID-19 pandemic, the regulatory agencies provided an additional transitional method option of a two-year deferral for the start of the three-year phase-in of the recognition of the adoption date effects of ASU 2016-13 along with an option to defer the current impact on regulatory capital calculations of ASU 2016-13 during the first two years (“5-year method”). Under this 5-year method, the Company would recognize an estimate of the previous incurred loss method for determining the allowance for credit losses in regulatory capital calculations and the difference from the CECL method would be deferred for two years. After two years, the effects from adoption date and the deferral difference from the first two years of applying CECL would be phased-in over three years using the straight-line method. The regulatory rules provided a one-time opportunity at the end of the first quarter of 2020 for covered banking organizations to choose its transition option for CECL. The Company chose the 5-year method and is deferring the recognition of the effects from adoption date and the CECL difference from the first two years of application. This amount was fixed as of December 31, 2021, and that amount began the three-year phase out in the first quarter of 2022 with 50% being phased out in 2023.
In addition, the Company must adhere to various U.S. Department of Housing and Urban Development (“HUD”) regulatory guidelines including required minimum capital to maintain their HUD approved status. Failure to comply with the HUD guidelines could result in withdrawal of this certification. As of December 31, 2023, the Company was in compliance with HUD guidelines. The Company is also subject to various capital requirements by secondary market investors.
Note 27—Condensed Financial Statements of Parent Company
Financial information pertaining only to SouthState Corporation is as follows:
Condensed Balance Sheets
|
|
December 31, |
|
||||
(Dollars in thousands) |
|
2023 |
|
2022 |
|
||
ASSETS |
|
|
|
|
|
|
|
Cash |
|
$ |
110,001 |
|
$ |
89,069 |
|
Investment in subsidiaries |
|
|
5,808,108 |
|
|
5,368,525 |
|
Other assets |
|
|
10,016 |
|
|
12,555 |
|
Total assets |
|
$ |
5,928,125 |
|
$ |
5,470,149 |
|
LIABILITIES AND SHAREHOLDERS’ EQUITY |
|
|
|
|
|
|
|
Corporate and subordinated debentures |
|
$ |
391,904 |
|
$ |
392,275 |
|
Other Liabilities |
|
|
3,123 |
|
|
2,947 |
|
Shareholders’ equity |
|
|
5,533,098 |
|
|
5,074,927 |
|
Total liabilities and shareholders’ equity |
|
$ |
5,928,125 |
|
$ |
5,470,149 |
|
Condensed Statements of Income
|
|
|
|
|
|
|
|
|
|
|
|
|
Year Ended December 31, |
|
|||||||
(Dollars in thousands) |
|
2023 |
|
2022 |
|
2021 |
|
|||
Income: |
|
|
|
|
|
|
|
|
|
|
Dividends from subsidiaries |
|
$ |
180,251 |
|
$ |
220,124 |
|
$ |
200,083 |
|
Operating (loss) income |
|
|
1 |
|
|
(68) |
|
|
25 |
|
Total income |
|
|
180,252 |
|
|
220,056 |
|
|
200,108 |
|
Operating expenses |
|
|
39,151 |
|
|
30,514 |
|
|
40,727 |
|
Income before income tax benefit and equity in undistributed earnings of subsidiaries |
|
|
141,101 |
|
|
189,542 |
|
|
159,381 |
|
Applicable income tax benefit |
|
|
8,177 |
|
|
6,649 |
|
|
9,053 |
|
Equity in undistributed earnings of subsidiaries |
|
|
345,030 |
|
|
299,858 |
|
|
307,109 |
|
Net income available to common shareholders |
|
$ |
494,308 |
|
$ |
496,049 |
|
$ |
475,543 |
|
F-71
Condensed Statements of Cash Flows
|
|
Year Ended December 31, |
|
|||||||
(Dollars in thousands) |
|
2023 |
|
2022 |
|
2021 |
|
|||
Cash flows from operating activities: |
|
|
|
|
|
|
|
|
|
|
Net income |
|
$ |
494,308 |
|
$ |
496,049 |
|
$ |
475,543 |
|
Adjustments to reconcile net income to net cash provided by operating activities: |
|
|
|
|
|
|
|
|
|
|
Depreciation and amortization |
|
|
(371) |
|
|
(208) |
|
|
1,382 |
|
Share-based compensation |
|
|
35,861 |
|
|
35,638 |
|
|
25,721 |
|
Extinguishment of debt cost |
|
|
— |
|
|
— |
|
|
11,706 |
|
Decrease (increase) in other assets |
|
|
2,539 |
|
|
(375) |
|
|
5,690 |
|
(Decrease) increase in other liabilities |
|
|
175 |
|
|
(243) |
|
|
(3,648) |
|
Undistributed earnings of subsidiaries |
|
|
(345,030) |
|
|
(299,858) |
|
|
(307,109) |
|
Net cash provided by operating activities |
|
|
187,482 |
|
|
231,003 |
|
|
209,285 |
|
Cash flows from investing activities: |
|
|
|
|
|
|
|
|
|
|
Repayment of investments in and advances to subsidiaries |
|
|
— |
|
|
— |
|
|
93,591 |
|
Net cash inflow from acquisitions |
|
|
— |
|
|
51,566 |
|
|
— |
|
Net cash provided by investing activities |
|
|
— |
|
|
51,566 |
|
|
93,591 |
|
Cash flows from financing activities: |
|
|
|
|
|
|
|
|
|
|
Proceeds of other borrowings |
|
|
100 |
|
|
|
|
|
|
|
Repayment of other borrowings |
|
|
(100) |
|
|
(13,000) |
|
|
(75,878) |
|
Common stock issuance |
|
|
2,772 |
|
|
2,858 |
|
|
2,384 |
|
Common stock repurchased |
|
|
(16,064) |
|
|
(119,330) |
|
|
(147,421) |
|
Dividends paid on common stock |
|
|
(156,184) |
|
|
(146,664) |
|
|
(135,337) |
|
Stock options exercised |
|
|
2,926 |
|
|
1,585 |
|
|
2,905 |
|
Net cash used in financing activities |
|
|
(166,550) |
|
|
(274,551) |
|
|
(353,347) |
|
Net (decrease) increase in cash and cash equivalents |
|
|
20,932 |
|
|
8,018 |
|
|
(50,471) |
|
Cash and cash equivalents at beginning of period |
|
|
89,069 |
|
|
81,051 |
|
|
131,522 |
|
Cash and cash equivalents at end of period |
|
$ |
110,001 |
|
$ |
89,069 |
|
$ |
81,051 |
|
Note 28—Derivative Financial Instruments
The Company uses certain derivative instruments to meet the needs of customers as well as to manage the interest rate risk associated with certain transactions. The following table summarizes the derivative financial instruments used by the Company:
|
|
|
|
|
|
|
December 31, 2023 |
|
|
|
|
December 31, 2022 |
||||||||
|
|
Balance Sheet |
|
Notional |
|
Estimated Fair Value |
|
Notional |
|
Estimated Fair Value |
||||||||||
(Dollars in thousands) |
|
Location |
|
Amount |
|
Gain |
|
Loss |
|
Amount |
|
Gain |
|
Loss |
||||||
Fair value hedge of interest rate risk: |
|
|
|
|
|
|
|
|
|
|
|
|
|
|
|
|
|
|
|
|
Pay fixed rate swap with counterparty |
|
Other Assets |
|
$ |
9,188 |
|
$ |
220 |
|
$ |
— |
|
$ |
12,289 |
|
$ |
414 |
|
$ |
— |
|
|
|
|
|
|
|
|
|
|
|
|
|
|
|
|
|
|
|
|
|
Not designated hedges of interest rate risk: |
|
|
|
|
|
|
|
|
|
|
|
|
|
|
|
|
|
|
|
|
Customer related interest rate contracts: |
|
|
|
|
|
|
|
|
|
|
|
|
|
|
|
|
|
|
|
|
Matched interest rate swaps with borrowers |
|
Other Assets and Other Liabilities |
|
|
11,327,419 |
|
|
60,145 |
|
|
803,539 |
|
|
10,480,171 |
|
|
8,539 |
|
|
1,033,980 |
Matched interest rate swaps with counterparty (1) |
|
Other Assets |
|
|
11,235,952 |
|
|
108,820 |
|
|
— |
|
|
10,400,733 |
|
|
201,263 |
|
|
— |
|
|
|
|
|
|
|
|
|
|
|
|
|
|
|
|
|
|
|
|
|
Economic hedges of interest rate risk: |
|
|
|
|
|
|
|
|
|
|
|
|
|
|
|
|
|
|
|
|
Pay floating rate swap with counterparty |
|
Other Assets |
|
|
1,660,000 |
|
|
(5) |
|
|
— |
|
|
— |
|
|
— |
|
|
— |
|
|
|
|
|
|
|
|
|
|
|
|
|
|
|
|
|
|
|
|
|
Not designated hedges of interest rate risk – mortgage banking activities: |
|
|
|
|
|
|
|
|
|
|
|
|
|
|
|
|
|
|
|
|
Contracts used to hedge mortgage servicing rights |
|
Other Assets and Other Liabilities |
|
|
142,000 |
|
|
2,605 |
|
|
— |
|
|
35,000 |
|
|
— |
|
|
163 |
Contracts used to hedge mortgage pipeline |
|
Other Assets and Other Liabilities |
|
|
77,500 |
|
|
1,154 |
|
|
947 |
|
|
51,000 |
|
|
800 |
|
|
— |
Total derivatives |
|
|
|
$ |
24,452,059 |
|
$ |
172,939 |
|
$ |
804,486 |
|
$ |
20,979,193 |
|
$ |
211,016 |
|
$ |
1,034,143 |
(1) |
The fair value of the interest rate swap derivative assets was reduced by $635.3 million in variation margin payments applicable to swaps centrally cleared through LCH and CME. |
Cash Flow Hedges of Interest Rate Risk
The Company is exposed to interest rate risk in the course of its business operations and manages a portion of this risk through the use of derivative financial instruments, in the form of interest rate swaps. We account for interest rate swaps that are classified as cash flow hedges on the balance sheet at fair value. We had no cash flow hedges as of December 31, 2023 and 2022. For more information regarding the fair value of the Company’s derivative financial instruments, see Note 25—Fair Value, to these financial statements.
F-72
The Company did not maintain any cash flow hedges on the balance sheet throughout the years ended December 31, 2023 and 2022 (See Note 15—Accumulated Other Comprehensive Income (Loss) for activity in accumulated comprehensive income (loss) and the amounts reclassified into earnings). With the Company not maintaining any cash flow hedges at December 31, 2023 and 2022, there was no collateral pledged.
Balance Sheet Fair Value Hedge
As of December 31, 2023 and 2022, the Company maintained loan swaps, with an aggregate notional amount of $9.2 million and $12.3 million, respectively, accounted for as a fair value hedge. The amortized cost basis of the loans being hedged were $9.7 million and $10.3 million, respectively, as of December 31, 2023 and 2022. This derivative protects us from interest rate risk caused by changes in the SOFR curve in relation to a certain designated fixed rate loan. The derivative converts the fixed rate loan to a floating rate. Settlement occurs in any given period where there is a difference in the stated fixed rate and variable rate and the difference is recorded in net interest income. The fair value of this hedge is recorded in either other assets or in other liabilities depending on the position of the hedge with the offset recorded in loans.
Non-designated Hedges of Interest Rate Risk
Customer Swap
The Company maintains interest rate swap contracts with loan customers of respondent bank customers of the Correspondent Banking Division, in addition to loan customers of the Bank, that are classified as non-designated hedges and are not speculative in nature. These agreements are designed to convert customer’s variable rate loans with the Company and respondent bank customers to fixed rate. These interest rate swaps are executed with loan customers to facilitate a respective risk management strategy and allow the customer to pay a fixed rate of interest to the Company. These interest rate swaps are simultaneously hedged by executing offsetting interest rate swaps with unrelated market counterparties to minimize the net risk exposure to the Company resulting from the transactions and allow the Company to receive a variable rate of interest. The interest rate swaps pay and receive interest based on a one-month SOFR floating rate plus a credit spread, with payments being calculated on the notional amount. During the second quarter of 2023, the Company transitioned the majority of these interest rate swap contracts to SOFR as the reference rate. For discussion related to reference rate reform, please refer to Accounting Standards Adopted within Note 1—Summary of Significant Accounting Policies. The interest rate swaps are settled monthly with varying maturities.
The variation margin settlement payment and the related derivative instruments fair value are considered a single unit of account for accounting and financial reporting purposes. Depending on the net position of the swaps with LCH and CME, the fair value, net of the variation margin, is reported in Derivative Assets or Derivative Liabilities on the Consolidated Balance Sheets. In addition, the expense or income attributable to the variation margin for the centrally cleared swaps with LCH and CME is reported in Noninterest Income, specifically within Correspondent and Capital Markets Income. The daily settlement of the derivative exposure does not change or reset the contractual terms of the instrument.
F-73
As the interest rate swaps associated with this program do not meet the strict hedge accounting requirements, changes in the fair value of both the customer swaps and the offsetting swaps are recognized directly in earnings. As of December 31, 2023 and 2022, the interest rate swaps had an aggregate notional amount of approximately $22.6 billion and $20.9 billion, respectively. At December 31, 2023, the fair value of the interest rate swap derivatives is recorded in Other Assets at $169.0 million in Other Liabilities at $803.5 million. The fair value of derivative assets at December 31, 2023 was reduced by $635.3 million in variation margin payments applicable to swaps centrally cleared through LCH and CME. At December 31, 2022, the fair value of the interest rate swap derivatives was recorded in Other Assets at $209.8 million and Other Liabilities at $1.0 billion. The fair value of derivative liabilities at December 31, 2022 was reduced by $824.3 million in variation margin payments applicable to swaps centrally cleared through LCH and CME. All changes in fair value are recorded through earnings within Correspondent and Capital Markets Income, a component of Noninterest Income on the Consolidated Statements of Net Income. There was a net gain of $596,000 and $174,000 recorded on these derivatives for the years ended December 31, 2023 and 2022, respectively. As of December 31, 2023, we provided $251.5 million of cash collateral on the counterparty, which is included in Cash and Cash Equivalents on the Consolidated Balance Sheets as Deposits in Other Financial Institutions (Restricted Cash). The Company also provided $104.1 million in investment securities at market value as collateral on the counterparty, which is included in Investment Securities – Available for Sale. Counterparties provided $45.2 million of cash collateral to the Company to secure swap asset positions that were not centrally cleared, which is included in Interest-bearing Deposits within Total Liabilities on the Consolidated Balance Sheets.
Balance Sheet Economic Hedge
During 2023, management began executing a series of short-term interest rate hedges to address monthly accrual mismatches related to the Company’s Assumable Rate Conversion (“ARC”) program and its transition from LIBOR to SOFR after June 30, 2023. The Company is required to execute the correspondent side of its back-to-back swaps with customers with the central clearinghouses (CME or LCH). Term SOFR was not available to execute through CME and LCH, and therefore, management elected to convert to the CME-eligible daily SOFR. Because many of the respondent bank customers converted to Term SOFR, this created interest rate basis risk. To address this risk, monthly interest rate hedges were executed to minimize the impact of accrual mismatches between the monthly Term SOFR used by the customer and the daily SOFR rates used by the central clearinghouses.
As of December 31, 2023, the Company maintained an aggregate notional amount of $1.7 billion short-term interest rate hedges that were accounted for as economic hedges. As noted above, the derivatives protect the Company from interest rate risk caused by changes in the term and daily SOFR accrual mismatches. The fair value of these hedges is recorded in either Other Assets or in Other Liabilities depending on the position of the hedge with the offset recorded in Correspondent Banking and Capital Market Income, a component of Noninterest Income on the Consolidated Statements of Net Income. There was a net loss of $5,000 for these derivatives for the year ended December 31, 2023. The Company did not have any of these short-term interest rate hedges at December 31, 2022.
Foreign Exchange
The Company may enter into foreign exchange contracts with customers to accommodate their need to convert certain foreign currencies into U.S. Dollars. To offset the foreign exchange risk, the Company may enter into substantially identical agreements with an unrelated market counterparty to hedge these foreign exchange contracts. At December 31, 2023 and 2022, there were no outstanding contracts or agreements related to foreign currency. There was no gain or loss recorded related to the foreign exchange derivative for the years ended December 31, 2023 or 2022.
Mortgage Banking
The Company also has derivatives contracts that are not classified as accounting hedges to mitigate risks related to the Company’s mortgage banking activities. These instruments may include financial forwards, futures contracts, and options written and purchased, which are used to hedge MSRs; while forward sales commitments are typically used to hedge the mortgage pipeline. Such instruments derive their cash flows, and therefore their values, by reference to an underlying instrument, index or referenced interest rate. The Company does not elect hedge accounting treatment for any of these derivative instruments and as a result, changes in fair value of the instruments (both gains and losses) are recorded in the Company’s Consolidated Statements of Net Income in Mortgage Banking Income.
F-74
Mortgage Servicing Rights (“MSRs”)
Derivatives contracts related to MSRs are used to help offset changes in fair value and are written in amounts referred to as notional amounts. Notional amounts provide a basis for calculating payments between counterparties but do not represent amounts to be exchanged between the parties and are not a measure of financial risk. On December 31, 2023, the Company had derivative financial instruments outstanding with notional amounts totaling $142.0 million related to MSRs, compared to $35.0 million on December 31, 2022. The estimated net fair value of the open contracts related to the MSRs was recorded as a gain of $2.6 million at December 31, 2023, compared to a loss of $163,000 at December 31, 2022.
The following table presents the Company’s notional value of forward sale commitments and the fair value of those obligations along with the fair value of the mortgage loan pipeline.
(Dollars in thousands) |
|
|
2023 |
|
2022 |
|
||
Mortgage loan pipeline |
|
|
$ |
65,051 |
|
$ |
40,850 |
|
Expected closures |
|
|
|
54,993 |
|
|
37,210 |
|
Fair value of mortgage loan pipeline commitments |
|
|
|
1,154 |
|
|
524 |
|
Forward sales commitments |
|
|
|
77,500 |
|
|
51,000 |
|
Fair value of forward commitments |
|
|
|
(947) |
|
|
276 |
|
Note 29—Mortgage Loan Servicing, Origination, and Loans Held for Sale
The portfolio of residential mortgages serviced for others, which is not included in the accompanying Consolidated Balance Sheets, was $6.6 billion and $6.6 billion at December 31, 2023 and 2022, respectively. Servicing loans for others generally consists of collecting mortgage payments, maintaining escrow accounts and disbursing payments to investors. The amounts of contractually specified servicing fees earned by the Company during the years ended December 31, 2023 and 2022 were $16.5 million and $16.2 million, respectively. Servicing fees are recorded in Mortgage Banking Income in the Company’s Consolidated Statements of Income.
At December 31, 2023 and 2022, MSRs were $85.2 million and $86.6 million, respectively, on the Company’s Consolidated Balance Sheets. MSRs are recorded at fair value with changes in fair value recorded as a component of Mortgage Banking Income in the Consolidated Statements of Net Income. The market value adjustments related to MSRs recorded in Mortgage Banking Income for the years ended December 31, 2023 and 2022 were loss of $1.3 million and gain of $14.9 million, respectively. The Company has used various free standing derivative instruments to mitigate the income statement effect of changes in fair value resulting from changes in market value adjustments, in addition to changes in valuation inputs and assumptions related to MSRs.
The following table presents the changes in the fair value of MSRs and its offsetting hedge.
|
|
Year Ended December 31, |
|
|||||||
(Dollars in thousands) |
|
2023 |
|
2022 |
|
2021 |
|
|||
(Decrease)/increase in fair value of MSRs |
|
$ |
(1,350) |
|
$ |
14,886 |
|
$ |
9,930 |
|
Decay of MSRs |
|
|
(8,540) |
|
|
(9,897) |
|
|
(14,863) |
|
Loss related to derivatives |
|
|
(1,420) |
|
|
(18,212) |
|
|
(4,892) |
|
Net effect on Consolidated Statements of Net Income |
|
$ |
(11,310) |
|
$ |
(13,223) |
|
$ |
(9,825) |
|
The fair value of MSRs is highly sensitive to changes in assumptions and is determined by estimating the present value of the asset’s future cash flows utilizing market-based prepayment rates, discount rates and other assumptions validated through comparison to trade information, industry surveys and with the use of independent third-party appraisals. Changes in prepayment speed assumptions have the most significant impact on the fair value of MSRs. Generally, as interest rates decline, mortgage loan prepayments accelerate due to increased refinance activity, which results in a decrease in the fair value of the MSR. Measurement of fair value is limited to the conditions existing and the assumptions utilized as of a particular point in time, and those assumptions may not be appropriate if applied at a different time. See Note 25—Fair Value for additional information regarding fair value.
F-75
The characteristics and sensitivity analysis of the MSRs are included in the following table.
|
December 31, |
|
||||
(Dollars in thousands) |
2023 |
|
2022 |
|
||
Composition of residential loans serviced for others |
|
|
|
|
|
|
Fixed-rate mortgage loans |
|
100.0 |
% |
|
100.0 |
% |
Adjustable-rate mortgage loans |
|
— |
% |
|
— |
% |
Total |
|
100.0 |
% |
|
100.0 |
% |
Weighted average life |
|
8.03 |
years |
|
8.37 |
years |
Constant Prepayment rate (CPR) |
|
7.0 |
% |
|
6.4 |
% |
Estimated impact on fair value of a 10% increase |
$ |
(522) |
|
$ |
(129) |
|
Estimated impact on fair value of a 20% increase |
|
(1,014) |
|
|
(266) |
|
Estimated impact on fair value of a 10% decrease |
|
551 |
|
|
118 |
|
Estimated impact on fair value of a 20% decrease |
|
1,128 |
|
|
219 |
|
Weighted average discount rate |
|
10.7 |
% |
|
10.0 |
% |
Estimated impact on fair value of a 10% increase |
$ |
(3,270) |
|
$ |
(2,554) |
|
Estimated impact on fair value of a 20% increase |
|
(6,458) |
|
|
(5,321) |
|
Estimated impact on fair value of a 10% decrease |
|
3,242 |
|
|
2,158 |
|
Estimated impact on fair value of a 20% decrease |
|
6,283 |
|
|
3,831 |
|
Effect on fair value due to change in interest rates |
|
|
|
|
|
|
25 basis point increase |
$ |
1,647 |
|
$ |
774 |
|
50 basis point increase |
|
3,189 |
|
|
1,428 |
|
25 basis point decrease |
|
(1,723) |
|
|
(902) |
|
50 basis point decrease |
|
(3,501) |
|
|
(1,938) |
|
The sensitivity calculations above are hypothetical and should not be considered to be predictive of future performance. Changes in fair value based on changes in assumptions generally cannot be extrapolated because the relationship of the change in assumption to the change in fair value may not be linear. Also, the effect of a variation in a particular assumption on the fair value of the residential MSRs is calculated without changing any other assumption, while in reality changes in one factor may result in changes in another, which may either magnify or counteract the effect of the change. The derivative instruments utilized by the Company would serve to reduce the estimated impacts to fair value included in the table above.
Whole loan sales were $859.9 million and $1.6 billion, respectively, for the years ended December 31, 2023 and 2022, of which $679.8 million and $1.2 billion, respectively, or 79.1% and 76.7%, respectively, were sold with servicing rights retained by the Company.
The Company retains no beneficial interests in these sales but may retain the servicing rights for the loans sold. The risks related to the sold loans with the retained servicing rights due to a representation or warranty violation such as noncompliance with eligibility or servicing requirements, or customer fraud, that should have been identified in a loan file review are disclosed in Note 1 — Summary of Significant Accounting Policies, under the “Loans Held for Sale” section. The Company is obligated to subsequently repurchase a loan if such representation or warranty violation is identified by the purchaser. The aggregated principal balances of loans repurchased for the years ended December 31, 2023 and 2022 were approximately $1.6 million and $7.7 million, respectively. There were approximately $8,000 and $82,000 in loss reimbursement and settlement claims paid during the years ended December 31, 2023 and 2022, respectively.
Loans held for sale have historically been comprised of residential mortgage loans awaiting sale in the secondary market, which generally settle in 15 to 45 days. At December 31, 2023, loans held for sale were $50.9 million, compared to $29.0 million at December 31, 2022. Please see Note 25 — Fair Value, under the “Fair Value Option”, section in this Form 10-K for summary of the fair value and the unpaid principal balance of loans held for sale and the changes in fair value of these loans.
F-76
Note 30—Investments in Qualified Affordable Housing Projects
The Company has investments in qualified affordable housing projects (“QAHPs”) that provide low income housing tax credits and operating loss benefits over an extended period. The tax credits and the operating loss tax benefits that are generated by each of the properties are expected to exceed the total value of the investment made by the Company. For the year ended December 31, 2023, tax credits and other tax benefits of $16.4 million and amortization of $9.6 million were recorded. For the year ended December 31, 2022, the Company recorded tax credits and other tax benefits of $16.1 million and amortization of $9.7 million. At December 31, 2023 and 2022, the Company’s carrying value of QAHPs was $101.8 million and $100.0 million, respectively, with an original investment of $170.7 million and $159.2 million respectively. The Company had $12.5 million and $7.1 million in remaining funding obligations related to these QAHPs recorded in Other Liabilities on the Consolidated Balance Sheets at December 31, 2023 and 2022, respectively. None of the original investment will be repaid. The investment in QAHPs was accounted for using the equity method. Effective January 1, 2024, the Company has elected to adopt ASU No. 2023-02 and apply the proportional amortization method for its low-income housing tax credits and will apply the changes to the accounting treatment under the modified retrospective transition method. See Recent Accounting and Regulatory Pronouncements under Note 1—Summary of Significant Accounting Policies for additional information regarding ASU No. 2023-02.
Note 31—Subsequent Events
On January 25, 2024, the Company announced the declaration of a quarterly cash dividend on its common stock at $0.52 per share. The dividend was paid on February 16, 2024 to shareholders of record as of February 9, 2024.
F-77
Exhibit 10.58
[Form of]
Performance Share Unit Agreement
(Annual Incentive Plan)
This Performance Share Unit Agreement (this “Agreement”) is made and entered into as of , , 202 (the “Grant Date”) by and between SouthState Corporation, a South Carolina corporation (“SSC”), and __________________ (the “Participant”). Capitalized terms that are used but not defined herein have the meanings ascribed to them in the 2020 Omnibus Incentive Plan (the “Plan”). SSC and each respective Employer (defined in Section 3.2 below) are collectively referred to as the “Company.”
WHEREAS, SSC has adopted the Plan pursuant to which Restricted Share Units may be granted upon the attainment of performance goals and the continued service of the Participant (“Performance Share Units” or “PSUs”); and
WHEREAS the Committee (as defined in the Plan) has determined that it is in the best interests of SSC and its shareholders to grant the award of PSUs provided for herein.
NOW, THEREFORE, the parties hereto, intending to be legally bound, agree as follows:
(a)If the Participant signs a standard two-year non-competition, non-solicitation agreement, the PSUs granted under this Agreement shall vest on the PSU Vesting Date, subject to the Credit Quality Adjustment set forth in Exhibit A.
(b)If the Participant does not sign a standard two-year non-competition, non-solicitation agreement, PSUs granted under this Agreement will vest pro rata as of the retirement date.
(c) “Retirement” means either (i) reaching the age of 65 or (ii) reaching the age of 55 plus having at least ten (10) years of Continuous Service with SSC, Employer, or any predecessor. “Continuous Service” means the absence of any interruption or Termination of Service as an employee of SSC or Employer or the predecessor of either. Service will not be considered interrupted in the case of sick leave, military leave, family leave or any other leave of absence approved by SSC or Employer or in the case of a Participant’s transfer between SSC and Employer or any successor to SSC or Employer. With respect to any Award subject to Section 409A (and not exempt therefrom), a termination of Continuous Service occurs when a Participant experiences a “separation of service” (as such term is defined under Section 409A of the Code).
Page 2 of 13
4.1 If the Participant is employed with SSC or Employer upon the occurrence of a Change of Control (as defined in the Plan), all unvested PSUs that are not (a) assumed and continued under the terms and conditions as set forth under this Agreement, or (b) replaced with another award that has a value at least equal to value of the PSUs being replaced and its terms and conditions are not less favorable to the Participant than the terms and conditions of the PSUs being replaced (collectively, a “Replacement Award”), by the successor to SSC in such Change of Control or an Affiliate of such successor (a “Surviving Entity”), shall vest in an amount equal to the full value of the Award and will be payable in accordance with Section 8 of this Agreement. Any Replacement Awards shall be adjusted as to the Shares into which such PSUs shall convert in accordance with Section 11.2 of the Plan. The Compensation Committee and/or the Board’s determination with respect to any adjustments will be conclusive. Any Replacement Award will be subject to the same terms and conditions as set forth under this Agreement and in the manner provided in Section 11.2 of the Plan.
The first of 8.1(a), (b), and (c) to occur shall be the “Settlement Date.”
Page 3 of 13
Page 4 of 13
Page 5 of 13
In the event a court determines that Section 13.2 must contain a territorial limitation in order to be enforceable, the applicable territorial limitation shall be (i) the counties in which the Participant performed services, supervised or managed employees, or engaged in business on behalf of Employer during the two years prior to the end of the Participant’s employment with Employer, (ii) the counties in which the Participant had Material Interaction with an employee of Employer during the two years prior to the end of the Participant’s employment with Employer and (iii) the counties (including those in adjacent states, if any) that are immediately contiguous to the counties referenced in subparts (i) and (ii).
For purposes of clarification, the Parties intend through Section 13.3 that the Participant shall not solicit the Financial Products or Services business of, accept such business from or do such business with any customer or prospective customer with whom Participant had Material Contact, regardless of which party first initiated contact.
Participant specifically acknowledges that the covenants set forth in Section 13.3 are a less restrictive alternative to a non-compete restriction, which SSC could have required as a condition for the consideration set forth herein.
Page 6 of 13
| i. | with whom or which the Participant dealt on behalf of Employer; |
| ii. | whose dealings with Employer were coordinated or supervised by the Participant; |
| iii. | about whom the Participant obtained Confidential Information in the ordinary course of business as a result of the Participant’s employment with Employer; and/or |
| iv. | who receives products or services authorized by Employer, the sale or provision of which results or resulted in compensation, commissions, or earnings for the Participant; |
in each case within the two years prior to the end of the Participant’s employment with Employer.
13.5 Computer Authorization. Participant agrees that Participant is not authorized to use Employer’s computer system or any of Employer’s IT hardware or software for any purpose in actual or contemplated competition with Employer. This includes: (a) transferring information relating to Employer’s business from Employer’s system, hardware, or software to an external device or account in advance of the end of Employee’s employment; or (b) deleting information relating to Employer’s business from Employer’s system, hardware, or software in advance of the end of Participant’s employment with Employer.
Page 7 of 13
13.6Understanding of Covenants. The Participant represents that the Participant (a) is familiar with the foregoing confidentiality and non-solicitation covenants, (b) is fully aware of the obligations hereunder, (c) agrees to the reasonableness of the length of time, scope and coverage of the foregoing covenants, and (d) agrees that such covenants are necessary to protect Employer’s confidential and proprietary information, good will, stable workforce, and customer relations. The Participant acknowledges and agrees that the covenants contained in this Agreement are reasonable in time, scope and in all other respects and that such covenants shall be construed as agreements independent of each other and of any provision of this or any other contract between the parties hereto. Finally, the Participant acknowledges that he has been given the opportunity to consult with a lawyer regarding the covenants set forth herein.
13.7 Enforceability; Certain Limitations.
13.8 Remedy for Breach. The Participant agrees that a breach of any of the covenants of this Section 13 would cause material and irreparable harm to Employer that would be difficult or impossible to measure, and that damages or other legal remedies available to Employer for any such injury would, therefore, be an inadequate remedy for any such breach. Accordingly, the Participant agrees that if the Participant breaches any term of this Section 13, SSC and Employer shall be entitled, in addition to and without limitation upon all other remedies SSC and Employer may have under this Agreement, at law or otherwise, to obtain injunctive or other appropriate equitable relief, without bond or other security, to restrain any such breach.
Page 8 of 13
Claims for damages and equitable relief in any court shall be available to SSC and Employer in lieu of, or prior to or pending determination in any arbitration proceeding. In the event the enforceability of any of the terms of this Agreement shall be challenged in court and the Participant is not enjoined from breaching any of the protective covenants, then if a court of competent jurisdiction finds that the challenged protective covenant is enforceable, the time periods shall be deemed tolled upon the filing of the lawsuit challenging the enforceability of this Agreement until the dispute is finally resolved and all periods of appeal have expired.
13.9 Providing Copy of Agreement. Participant shall provide a copy of Section 13 of this Agreement to any person or entity with whom the Participant interviews during the Restricted Period and consents to the disclosure of this Agreement by SSC or Employer to any such potential employer.
13.10 Attorneys’ Fees & Costs. Participant agrees that if SSC and/or Employer is required to take legal action against the Participant or to defend against legal action by the Participant, either related to the enforcement and/or interpretation of the restrictions in Section 13, the Participant will pay all costs incurred by SSC and/or Employer (including reasonable attorneys’ fees, expenses, and costs) if SSC and/or Employer prevails in such action.
13.11 Obligations Survive. Participant’s obligations under Section 13 shall survive termination of the Participant’s employment with Employer regardless of reason.
Page 9 of 13
Page 10 of 13
SOUTHSTATE CORPORATION
By:
Susan Bagwell
Director Human Resources
Accepted and Agreed by:
PARTICIPANT
Name:
By clicking the applicable acceptance box on the Shareworks website (www.shareworks.com), the Participant acknowledges receipt of this Agreement and agrees to its terms and conditions.
Page 11 of 13
EXHIBIT A
Vesting Schedule
The PSUs granted under this Agreement shall vest after December 31, 2025 but not later than March 31, 2026, subject to the Credit Quality Adjustment.
Credit Quality Adjustment
| 1. | If SSC’s NPA ratio (defined as non-performing assets divided by the sum of loans plus OREO and ORA, and excluding purchased credit impaired loans and acquired OREO) is less than or equal to 1% on December 31, 2025, then the PSUs that otherwise would vest and be payable as of that date under this Agreement will be issued without any reduction. |
| 2. | If SSC’s NPA ratio is greater than 1% on December 31, 2025, then SSC’s eight quarter average NPA ratio (as defined above) is compared to the average NPA ratio of SSC’s Peer Group, as defined below. If SSC’s ratio falls within the top 75% of the Peer Group (i.e., those with the lowest NPA ratios), then the total number of PSUs that otherwise would vest and be payable under this Agreement are issued without reduction. If SSC’s ratio falls within the bottom 24.9% of the Peer Group, (i.e., those with the highest NPA ratios) then no PSUs will be issued. If SSC’s ratio is between the 25th and 74.9th percentile of the Peer Group, the number of PSUs awarded are then reduced on a pro-rata basis as per the below schedule: |
Credit Quality Adjustment: NPA ratio – average over 8 quarter period ending on 12/31 of contingent payment date | ||
75th percentile of Peer Group or better |
= |
100% of PSU Award |
74.9th -50th percentile of Peer Group |
= |
66.67% of PSU Award |
49.9th -25th percentile of Peer Group |
= |
33.37% of PSU Award |
Less than 25th percentile |
= |
0% of PSU Award |
2022 Peer Group (approved as of April 25, 2023)
Company Name |
Ticker |
City |
State |
Asset Size |
Ameris Bank |
ABCB |
Atlanta |
GA |
25b |
Associated Banc-Corp |
ASB |
Green Bay |
WI |
39.4 |
BankUnited, Inc. |
BKU |
Miami Lakes |
FL |
37 |
Cadence Bank |
CADE |
Tupelo |
MS |
48 |
Comerica Inc. |
CMA |
Dallas |
TX |
85.4 |
Commerce Bancshares |
CBSH |
Kansas City |
MO |
31.9 |
Cullen/Frost Bankers |
CFR |
San Antonio |
TX |
52.8 |
East West Bancorp. |
EWBC |
Pasadena |
CA |
64.1 |
F.N.B. Corp. |
FNB |
Pittsburg |
PA |
43.7 |
Page 12 of 13
First Horizon Corp. |
FHN |
Memphis |
TN |
78.9 |
Hancock Whitney Corp. |
HWC |
Gulfport |
MS |
35.2 |
New York Community Bancorp. |
NYCB |
Hicksville |
NY |
90.1 |
PacWest Bancorp |
PACW |
Beverly Hills |
CA |
41.2 |
Pinnacle Financial |
PNFP |
Nashville |
TN |
41.9 |
Prosperity Bancshares |
PB |
Houston |
TX |
37.7 |
Synovus Financial Corp. |
SNV |
Columbus |
GA |
59.7 |
United Community Banks, Inc. |
UCBI |
Blairsville |
GA |
24.0 |
UMB Financial Corp. |
UMBF |
Kansas City |
MO |
38.5 |
Valley National Bancorp |
VLY |
New York |
NY |
57.5 |
Webster Financial Corp. |
WBS |
Stamford |
CT |
71.3 |
Western Alliance Bancorp. |
WAL |
Phoenix |
AZ |
67.7 |
Wintrust Financial Corp. |
WTFC |
Rosemont |
IL |
52.3 |
Zions Bancorporation |
ZION |
Salt Lake City |
UT |
89.5 |
|
|
Page 13 of 13
Exhibit 10.61
AMENDMENT NO. 2
Dated as of November 13, 2023
to and under
Credit Agreement
Dated as of November 15, 2021
Each of SOUTHSTATE CORPORATION (the “Company”), and U.S. BANK NATIONAL ASSOCIATION (the “Lender”) agree as follows:
i)1)Credit Agreement.
Reference is made to the Credit Agreement, dated as of November 15, 2021, between the Company and the Lender (the “Credit Agreement”). Terms used but not defined in this Amendment No. 2 (this “Amendment”) shall have the meanings ascribed to them in the Credit Agreement.
ii)2)Amendments. On and after the Effective Date (as defined in Section 5 below), the Credit Agreement shall be amended as hereinafter set forth.
iii)3)The following definitions in Section 1.1(a) of the Credit Agreement shall be amended in their entirety to read as follows:
“Applicable Margin” means 1.50%.
“Commitment Fee Percentage” shall mean, for any Fiscal Quarter (or portion thereof), (a) 0.42%, if the Investment Balance for such Fiscal Quarter is less than $50,000,000, (b) 0.20%, if the Investment Balance for such Fiscal Quarter is equal to or greater than $50,000,000 but less than $100,000,000, and (c) 0.00%, if the Investment Balance for such Fiscal Quarter is equal to or greater than $100,000,000.
“Termination Date” shall mean November 11, 2024, or, in any case, such earlier date on which the Obligations shall terminate as provided in this Agreement.
3.Continuing Effect of Credit Agreement. The provisions of the Credit Agreement, as amended by the amendments in Section 2 hereof, are and shall remain in full force and effect and are hereby in all respects confirmed, approved and ratified.
4.Representations and Warranties. In order to induce the Lender to agree to the amendment contained herein, the Company hereby represents and warrants as follows:
(a)The Company has the power, and has taken all necessary action to authorize it, to execute, deliver and perform in accordance with their respective terms, this Amendment and the Credit Agreement as amended by this Amendment. This Amendment has been duly executed and delivered by the duly authorized officers of the Company and is, and the Credit Agreement as amended by this Amendment is, the legal, valid and binding obligation of the Company enforceable in accordance with its terms.
(b)Each of the representations and warranties set forth in Section 3 of the Credit Agreement, after giving effect to this Amendment, shall be made at and as of the Effective Date, except to the extent that any such representations or warranties are made as of a specified date or with respect to a specified period of time, in which case such representations and warranties shall be made as of such specified date or with respect to such specified period.
5.Conditions to Effectiveness. This Amendment shall be effective as of November 13, 2023 (the “Effective Date”), but only after the Lender, in its sole discretion, shall have determined that each of the following conditions has been satisfied by the Company or waived by the Lender:
(a)The Lender shall have received each of the following in form and substance satisfactory to it:
| (i) | this Amendment duly executed by the Company and the Lender. |
| (ii) | an incumbency certificate, dated the Effective Date, executed by the secretary or assistant secretary of the Company, which shall identify by name and title, and bear the signature of, each officer of the Company authorized to sign this Amendment and the documents delivered by the Company hereunder and to effect the amendments contemplated hereby (each such officer, an “Authorized Officer”); |
| (iii) | either a copy of the by-laws of the Company, certified on the Effective Date by the secretary or assistant secretary of the Company, or a certificate, dated the Effective Date, of the secretary or assistant secretary of the Company certifying that the by-laws of the Company, as delivered to the Lender under Section 4.1 of the Credit Agreement, remain in full force and effect without amendment or modification of any kind; |
| (iv) | either a copy of the by-laws of SouthState Bank, N.A. certified on the Effective Date by the secretary or assistant secretary of the SouthState Bank, or a certificate, dated the Effective Date, of the secretary or assistant secretary of SouthState Bank certifying that the by-laws of SouthState Bank, as delivered to the Lender under Section 4.1 of the Credit Agreement, remain in full force and effect without amendment or modification of any kind; |
| (v) | a Certificate of Existence for the Company, issued by the Office of the Secretary of State of South Carolina, and either certified copies of the Articles of Incorporation of the Company, issued by the Office of the Secretary of State of South Carolina, or a certificate, dated the Effective Date, of the secretary or assistant secretary of the Company certifying that |
2
| the Articles of Incorporation of the Company, as delivered to the Lender under Section 4.1 of the Credit Agreement, remain in full force and effect without amendment or modification of any kind; |
| (vi) | a Certificate of Existence for SouthState Bank, N.A., issued by the Office of the Comptroller of the Currency, and either certified copies of the Articles of Incorporation of SouthState Bank, issued by the Office of the Comptroller of the Currency, or a certificate, dated the Effective Date, of the secretary or assistant secretary of SouthState Bank, N.A. certifying that the Articles of Incorporation of SouthState Bank, N.A., as delivered to the Lender under Section 4.1 of the Credit Agreement, remain in full force and effect without amendment or modification of any kind; |
| (vii) | copies, certified on the Effective Date by the secretary or assistant secretary of the Company, of resolutions of the Company authorizing the execution and delivery of this Amendment; |
| (viii) | a certificate, dated the Effective Date, of an Authorized Officer certifying that (i) each representation made or deemed made under Section 4 of this Amendment is true and correct on and as of such date or, in the case of any such representation or warranty that is made as of a specified date or with respect to a specified period of time, as of such specified date or with respect to such specified period, and that (ii) all conditions precedent to the Effective Date have been satisfied by the Company; and |
| (9) | such other information, documents or materials as the Lender may have reasonably requested. |
6.Governing Law. This Amendment shall, pursuant to New York General Obligations Law 5-1401, be construed in accordance with and governed by the law of the State of New York.
7.Counterparts. This Amendment may be signed in any number of counterparts, each of which shall be an original, with the same effect as if the signatures thereto were upon the same instrument.
8.Headings. Section headings in this Amendment are included herein for convenience and reference only and shall not constitute a part of this Amendment for any other purpose.
[Signature page follows.]
3
IN WITNESS WHEREOF, the parties hereto have caused this Amendment to be executed by their duly authorized officers all as of the date hereinabove set forth.
SOUTHSTATE CORPORATION | |
| |
|
|
U.S. BANK NATIONAL ASSOCIATION | |
| |
4
Exhibit 21
SUBSIDIARIES OF THE REGISTRANT
SouthState Bank, National Association, organized under the laws of the United States
SSB Insurance Corp.
SCBT Capital Trust I
SCBT Capital Trust II
SCBT Capital Trust III
TSB Statutory Trust I
SAVB Capital Trust I
SAVB Capital Trust II
Southeastern Bank Financial Statutory Trust I
Southeastern Bank Financial Statutory Trust II
Community Capital Statutory Trust I
CSBC Statutory Trust I
FCRV Statutory Trust I
Provident Community Bancshares Capital Trust I
Provident Community Bancshares Capital Trust II We consent to the incorporation by reference in the following Registration Statements:
Exhibit 23.1
Consent of Independent Registered Public Accounting Firm
•Form S-3 No. 333-223489
•Form S-8 No. 333-231176
•Form S-8 No. 333-251017
•Form S-8 No. 333-249759
•Form S-8 No. 333-249167
•Form S-8 No. 333-240317
•Form S-8 No. 333-239028
•Form S-8 No. 333-263173
of our reports dated March 4, 2024, with respect to the consolidated financial statements of SouthState Corporation and the effectiveness of internal control over financial reporting of SouthState Corporation included in this Annual Report (Form 10-K) of SouthState Corporation for the year ended December 31, 2023.
/s/ Ernst & Young LLP
Birmingham, Alabama
March 4, 2024
Exhibit 23.2
Consent of Independent Registered Public Accounting Firm
We consent to the incorporation by reference in the Registration Statements on Forms S-8 and S-3 (Nos. 333-231176, 333-251017, 333-249759, 333-249167, 333-240317, 333-239028, 333-223489, and 333-263173) of SouthState Corporation and subsidiaries of our report dated February 24, 2023, with respect to the consolidated financial statements of SouthState Corporation and subsidiaries as of December 31, 2022, and for each of the years in the two year period ended December 31, 2022, which report appears in this Annual Report on Form 10-K.
/s/ FORVIS, LLP
Atlanta, Georgia
March 4, 2024
EXHIBIT 31.1
RULE 13A-14(A) CERTIFICATION OF PRINCIPAL EXECUTIVE OFFICER
I, John C. Corbett, Chief Executive Officer, certify that:
1. |
I have reviewed this annual report on Form 10-K of SouthState Corporation; |
2. |
Based on my knowledge, this report does not contain any untrue statement of a material fact or omit to state a material fact necessary to make the statements made, in light of the circumstances under which such statements were made, not misleading with respect to the period covered by this report; |
3. |
Based on my knowledge, the financial statements, and other financial information included in this report, fairly present in all material respects the financial condition, results of operations and cash flows of the registrant as of, and for, the periods presented in this report; |
4. |
The registrant’s other certifying officer(s) and I are responsible for establishing and maintaining disclosure controls and procedures (as defined in Exchange Act Rules 13a-15(e) and 15d-15(e)) and internal control over financial reporting (as defined in Exchange Act Rules 13a-15(f) and 15d-15(f)) for the registrant and have: |
a) |
Designed such disclosure controls and procedures, or caused such disclosure controls and procedures to be designed under our supervision, to ensure that material information relating to the registrant, including its consolidated subsidiary, is made known to us by others within those entities, particularly during the period in which this annual report is being prepared; |
b) |
Designed such internal control over financial reporting, or caused such internal control over financial reporting to be designed under our supervision, to provide reasonable assurance regarding the reliability of financial reporting and the preparation of financial statements for external purposes in accordance with generally accepted accounting principles; |
c) |
Evaluated the effectiveness of the registrant’s disclosure controls and procedures and presented in this report our conclusions about the effectiveness of the disclosure controls and procedures, as of the end of the period covered by this report based on such evaluation; |
d) |
Disclosed in this report any change in the registrant’s internal control over financial reporting that occurred during the registrant’s fourth fiscal quarter that has materially affected, or is reasonably likely to materially affect, the registrant’s internal control over financial reporting; and |
5. |
The registrant’s other certifying officer(s) and I have disclosed, based on our most recent evaluation of internal control over financial reporting, to the registrant’s auditors and the audit committee of registrant’s board of directors (or persons performing the equivalent functions): |
a) |
All significant deficiencies and material weaknesses in the design or operation of internal controls over financial reporting which are reasonably likely to adversely affect the registrant’s ability to record, process, summarize and report financial information; and |
b) |
Any fraud, whether or not material, that involves management or other employees who have a significant role in the registrant’s internal controls over financial reporting. |
/s/ John C. Corbett |
|
John C. Corbett |
|
Date: March 4, 2024
EXHIBIT 31.2
RULE 13A-14(A) CERTIFICATION OF PRINCIPAL FINANCIAL OFFICER
I, William E. Matthews, V, Chief Financial Officer, certify that:
1. |
I have reviewed this annual report on Form 10-K of SouthState Corporation; |
2. |
Based on my knowledge, this report does not contain any untrue statement of a material fact or omit to state a material fact necessary to make the statements made, in light of the circumstances under which such statements were made, not misleading with respect to the period covered by this report; |
3. |
Based on my knowledge, the financial statements, and other financial information included in this report, fairly present in all material respects the financial condition, results of operations and cash flows of the registrant as of, and for, the periods presented in this report; |
4. |
The registrant’s other certifying officer(s) and I are responsible for establishing and maintaining disclosure controls and procedures (as defined in Exchange Act Rules 13a-15(e) and 15d-15(e)) and internal control over financial reporting (as defined in Exchange Act Rules 13a-15(f) and 15d-15(f)) for the registrant and have: |
a) |
Designed such disclosure controls and procedures, or caused such disclosure controls and procedures to be designed under our supervision, to ensure that material information relating to the registrant, including its consolidated subsidiary, is made known to us by others within those entities, particularly during the period in which this annual report is being prepared; |
b) |
Designed such internal control over financial reporting, or caused such internal control over financial reporting to be designed under our supervision, to provide reasonable assurance regarding the reliability of financial reporting and the preparation of financial statements for external purposes in accordance with generally accepted accounting principles; |
c) |
Evaluated the effectiveness of the registrant’s disclosure controls and procedures and presented in this report our conclusions about the effectiveness of the disclosure controls and procedures, as of the end of the period covered by this report based on such evaluation; |
d) |
Disclosed in this report any change in the registrant’s internal control over financial reporting that occurred during the registrant’s fourth fiscal quarter that has materially affected, or is reasonably likely to materially affect, the registrant’s internal control over financial reporting; and |
5. |
The registrant’s other certifying officer(s) and I have disclosed, based on our most recent evaluation of internal control over financial reporting, to the registrant’s auditors and the audit committee of registrant’s board of directors (or persons performing the equivalent functions): |
a) |
All significant deficiencies and material weaknesses in the design or operation of internal controls over financial reporting which are reasonably likely to adversely affect the registrant’s ability to record, process, summarize and report financial information; and |
b) |
Any fraud, whether or not material, that involves management or other employees who have a significant role in the registrant’s internal controls over financial reporting. |
/s/ William E. Matthews, V |
|
William E. Matthews, V |
|
Date: March 4, 2024
Exhibit 32
CERTIFICATION OF THE CHIEF EXECUTIVE OFFICER PURSUANT TO 18 U.S.C.
SECTION 1350, AS ADOPTED PURSUANT TO SECTION 906 OF
THE SARBANES-OXLEY ACT OF 2002
In connection with the Annual Report of SouthState Corporation (“the Company”) on Form 10-K for the year ended December 31, 2023 as filed with the Securities and Exchange Commission on the date hereof (the “Report”), I, John C. Corbett, Chief Executive Officer of the Company, certify, pursuant to 18 U.S.C. Section 1350, as adopted pursuant to Section 906 of the Sarbanes-Oxley Act of 2002, that, to my knowledge:
1. |
The Report fully complies with the requirements of section 13(a) or 15(d) of the Securities Exchange Act of 1934; and |
2. |
The information contained in the Report fairly presents, in all materials respects, the financial condition and results of operations of the Company as of the dates and for the periods expressed in the Report. |
/s/ John C. Corbett |
|
John C. Corbett |
|
|
|
March 4, 2024 |
|
CERTIFICATION OF THE CHIEF FINANCIAL OFFICER PURSUANT TO 18 U.S.C.
SECTION 1350, AS ADOPTED PURSUANT TO SECTION 906 OF
THE SARBANES-OXLEY ACT OF 2002
In connection with the Annual Report of SouthState Corporation (the “Company”) on Form 10-K for the year ended December 31, 2023 as filed with the Securities and Exchange Commission on the date hereof (the “Report”), I, William E. Matthews, V, Chief Financial Officer of the Company, certify, pursuant to 18 U.S.C. Section 1350, as adopted pursuant to Section 906 of the Sarbanes-Oxley Act of 2002, that, to my knowledge:
1. |
The Report fully complies with the requirements of section 13(a) or 15(d) of the Securities Exchange Act of 1934; and |
2. |
The information contained in the Report fairly presents, in all material respects, the financial condition and results of operations of the Company as of the dates and for the periods expressed in the Report. |
/s/ William E. Matthews, V |
|
William E. Matthews, V |
|
|
|
March 4, 2024 |
|
Exhibit 97.1
1. Overview
This Compensation Recoupment Policy (the “Policy”) provides for the recoupment of certain executive compensation paid by SouthState Corporation or SouthState Bank, National Association (individually and collectively, the “Company”) in the event of an accounting restatement made by SouthState Corporation resulting from material noncompliance with financial reporting requirements under (i) Section 10D of the Securities Exchange Act of 1934 (the “Exchange Act”) and (ii) Nasdaq-listing rule 5608. This Policy is not intended to and expressly does not apply to any officer other than Executive Officers (as defined below) of the Company.
2. Governance and Oversight
2.1 Compensation Committee
The Compensation Committee (the “Committee”) of the Board of Directors (the “Board”) has the responsibility to oversee and supervise the administration of any Company policies regarding the recoupment, repayment or forfeiture of compensation for Executive Officers, including any such policies required to be adopted pursuant to applicable law or stock exchange requirement.
2.2 Director of Human Resources
The Director of Human Resources shall be responsible for the daily administration of this Policy, including collaborating with the Finance Department in the event of a Financial Restatement to determine the amount of Erroneously Awarded Compensation, maintaining a list of the Covered Executives affected by a Financial Restatement, and implementing a process by which the Company will collect from them the Erroneously Awarded Compensation.
2.3 Finance Department
The Company’s Finance Department, under the oversight and authority of the Chief Financial Officer and the Principal Accounting Officer, shall be responsible for determining when a Financial Restatement is required, preparing the financial statements and supporting documentation (including notes to the financial statements) that include the necessary revisions, calculating the Erroneously Awarded Compensation to be recouped from each Executive Officer, and filing such financial statements and the disclosures required by Section 10D in accordance with the Exchange Act.
3. Risk Assessment
A listed company that does not comply with Section 10D of the Exchange Age by, either, (i) failing to adopt a clawback policy for Executive Officers, (ii) failing to enforce that clawback policy, or (ii) failing to make the required clawback disclosure, may be delisted. Implementation of this Policy will provide the necessary compliance framework, thereby mitigating the risk of the Company’s securities being delisted.
4. Policy Elements
4.1 Recoupment of Erroneously Awarded Compensation
| (a) | In the event of a Financial Restatement, if the amount of any Covered Compensation Received by an Executive Officer (the “Awarded Compensation”) exceeds the amount of such Covered Compensation that would have otherwise been Received by such Executive Officer if calculated based on the Financial Restatement (the “Adjusted Compensation”), the Company shall reasonably promptly recover from each Executive Officer an amount equal to the excess of the Awarded Compensation over the Adjusted Compensation, each calculated on a pre-tax basis (such excess amount, the “Erroneously Awarded Compensation”). For purposes of clarity, any Executive Officer that the Finance Department determines has Received Erroneously Awarded Compensation as a result of a Financial Restatement will be subject to recoupment under this Policy. |
| (b) | If (i) the Financial Reporting Measure applicable to the relevant Covered Compensation is stock price or total shareholder return (or any measure derived wholly or in part from either of such measures) and (ii) the amount of Erroneously Awarded Compensation is not subject to mathematical recalculation directly from the information in the Financial Restatement, then the amount of Erroneously Awarded Compensation shall be determined (on a pre-tax basis) based on the Company’s reasonable estimate of the effect of the Financial Restatement on the Company’s stock price or total shareholder return (or the derivative measure thereof) upon which such Covered Compensation was Received and the Company must maintain documentation of the determination of that reasonable estimate and provide such documentation to the Nasdaq. |
| (c) | For the avoidance of doubt, the Company’s obligation to recover Erroneously Awarded Compensation is not dependent on (i) if or when the restated financial statements are filed or (ii) any fault of any Executive Officer for the accounting errors or other actions leading to a Financial Restatement. |
| (d) | Notwithstanding anything to the contrary in Sections 2(a) through (c) hereof, the Company shall not be required to recover any Erroneously Awarded Compensation if both (x) the conditions set forth in either of the following clauses (i) or (ii) are satisfied and (y) the Committee (or a majority of the independent directors serving on the Board) has determined that recovery of the Erroneously Awarded Compensation would be impracticable: |
| (i) | the direct expense paid to a third party to assist in enforcing the recovery of the Erroneously Awarded Compensation under this Policy would exceed the amount of such Erroneously Awarded Compensation to be recovered; provided that, before concluding that it would be impracticable to recover any amount of Erroneously Awarded Compensation pursuant to this Section 2(d), the Company shall have first made a reasonable attempt to recover such Erroneously Awarded Compensation, |
2
| document such reasonable attempt(s) to make such recovery and provide that documentation to the Nasdaq; |
| (ii) | recovery of the Erroneously Awarded Compensation would likely cause an otherwise tax-qualified retirement plan, under which benefits are broadly available to employees of the Company, to fail to meet the requirements of Sections 401(a)(13) or 411(a) of the U.S. Internal Revenue Code of 1986, as amended (the “Code”). |
| (e) | The Company shall not indemnify any Executive Officer, directly or indirectly, for any losses that such Executive Officer may incur in connection with the recovery of Erroneously Awarded Compensation pursuant to this Policy, including through the payment of insurance premiums or gross-up payments. |
| (f) | The Committee shall determine, in its sole discretion, the manner and timing in which any Erroneously Awarded Compensation shall be recovered from the Executive Officers in accordance with applicable law, including, without limitation, by (i) requiring reimbursement of Covered Compensation previously paid in cash; (ii) seeking recovery of any gain realized on the vesting, exercise, settlement, sale, transfer or other disposition of any equity or equity-based awards; (iii) offsetting the Erroneously Awarded Compensation amount from any compensation otherwise owed by the Company or any of its affiliates to the Executive Officer; (iv) cancelling outstanding vested or unvested equity or equity-based awards; and/or (v) taking any other remedial and recovery action permitted by applicable law. For the avoidance of doubt, except as set forth in Section 2(d), in no event may the Company accept an amount that is less than the amount of Erroneously Awarded Compensation; provided that, to the extent necessary to avoid any adverse tax consequences to the Executive Officer pursuant to Section 409A of the Code, any offsets against amounts under any nonqualified deferred compensation plans (as defined under Section 409A of the Code) shall be made in compliance with Section 409A of the Code. |
4.2 Administration
This Policy shall be administered by the Committee. All decisions of the Committee shall be final, conclusive and binding upon the Company and the Executive Officers, their beneficiaries, executors, administrators and any other legal representative.
| 4.3 | Amendment/Termination |
Subject to Section 10D of the Exchange Act and Section 5608 of the Nasdaq Listing Rules, the Company may amend or terminate this Policy at any time. To the extent that any applicable law, or stock market or exchange rules or regulations require recovery of Erroneously Awarded Compensation in circumstances in addition to those specified herein, nothing in this Policy shall be deemed to limit or restrict the rigr obligation of the Company to recover Erroneously Awarded Compensation to the fullest extent required by such applicable law, stock market or exchange rules and regulations. Unless otherwise required by applicable law, this Policy shall no longer be effective from and after the date that the Company no longer has a class of securities publicly listed on the Nasdaq or any other United States national securities exchange.
| 4.4 | Interpretation |
Notwithstanding anything to the contrary herein, this Policy is intended to comply with the requirements of Section 10D of the Exchange Act and Section 5608 of the Nasdaq Listing Rules (and any applicable regulations, administrative interpretations or stock market or exchange rules and regulations adopted in connection therewith). The provisions of this Policy shall be interpreted in a manner that satisfies such requirements, and this Policy shall be operated accordingly.
3
If any provision of this Policy would otherwise frustrate or conflict with this intent, the provision shall be interpreted and deemed amended so as to avoid such conflict.
| 4.5 | Other Compensation Clawback/Recoupment Rights |
Only Executive Officers receiving Erroneously Awarded Compensation shall be subject to recoupment under this Policy. This Policy is in addition to any other policies or requirements with respect to the clawback or recoupment of any compensation available to the Company pursuant to the terms of: (a) any other clawback policy or practice in effect at the Company from time to time; (b) the terms of any employment agreement, offer letter, equity plan, equity award agreement or similar plan or agreement; (c) any other legal remedies available to the Company; (d) any applicable law; and (e) stock market or exchange rules, listing standards or regulations. Any amounts recouped under clauses (a) through (e) above shall reduce any required recoupment under this Policy, and any amount recouped under this Policy shall likewise reduce any amounts recouped under clauses (a) through (e) above.
| 4.6 | Exempt Compensation |
Notwithstanding anything to the contrary herein, the Company has no obligation to seek recoupment of amounts paid to a Executive Officer which are granted, vested or earned based solely upon the occurrence or non-occurrence of nonfinancial events. Such exempt compensation includes, without limitation, base salary, time-vesting awards, compensation awarded on the basis of the achievement of metrics that are not Financial Reporting Measures or compensation awarded solely at the discretion of the Committee or the Board, provided that such amounts are in no way contingent on, and were not in any way granted on the basis of, the achievement of any Financial Reporting Measure performance goal.
| 4.7 | Miscellaneous |
Any applicable award agreement or other document setting forth the terms and conditions of any compensation covered by this Policy shall be deemed to include the restrictions imposed herein and incorporate this Policy by reference and, in the event of any inconsistency, the terms of this Policy will govern. For the avoidance of doubt, this Policy applies to all compensation that is Received on or after the Effective Date, regardless of the date on which the award agreement or other document setting forth the terms and conditions of the Executive Officer’s compensation became effective, including, without limitation, compensation Received under Company Incentive Plans.
5. Definitions
For the purposes of this Policy, the following terms shall have the meanings set forth below.
| 5.1 | “Committee” means the Compensation Committee of the Board of Directors (“the Board”) of |
SouthState Corporation or any successor committee thereof.
| 5.2 | “Company Incentive Plans” means those plans identified on Exhibit A attached hereto and any successor plans thereto. |
| 5.3 | “Covered Compensation” means any Incentive-based Compensation “Received” by a Executive Officer during the applicable Recoupment Period; provided that: |
4
| (a) | such Covered Compensation was Received by such Executive Officer (i) after the Effective Date, (ii) after he or she commenced service as an Executive Officer and (iii) while the Company had a class of securities publicly listed on the Nasdaq or any other United States national securities exchange; and |
| (b) | such Executive Officer served as an Executive Officer at any time during the performance period applicable to such Incentive-based Compensation. |
For purposes of this Policy, Incentive-based Compensation is “Received” by a Executive Officer during the fiscal period in which the Financial Reporting Measure applicable to such Incentive-based Compensation (or portion thereof) is attained, even if the payment or grant of such Incentive-based Compensation is made thereafter.
| 5.4 | “Effective Date” means October 2, 2023. |
| 5.5 | “Exchange Act” means the U.S. Securities Exchange Act of 1934, as amended. |
| 5.6 | “Executive Officer” means, with respect to the Company, (i) its president, (ii) its principal financial officer, (iii) its principal accounting officer (or if there is no such accounting officer, its controller), (iv) any vice-president in charge of a principal business unit, division or function (such as sales, administration or finance), (v) any other officer who performs a policy-making function for the Company (including any officer of the Company’s parent(s) or subsidiaries if they perform policy-making functions for the Company) and (vi) any other person who performs similar policy-making functions for the Company, in each case, as identified by the Company from time to time as a “Section 16 Officer”. Policy-making function is not intended to include policy-making functions that are not significant. The determination as to an individual’s status as an Executive Officer shall be made by the Committee and such determination shall be final, conclusive and binding on such individual and all other interested persons. Both current and former Executive Officers are subject to this Policy. |
| 5.7 | “Financial Reporting Measure” means any (i) measure that is determined and presented in accordance with the accounting principles used in preparing the Company’s financial statements, (ii) stock price measure or (iii) total shareholder return measure (and any measures that are derived wholly or in part from any measure referenced in clause (i), (ii) or (iii) above). For the avoidance of doubt, any such measure does not need to be presented within the Company’s financial statements or included in a filing with the U.S. Securities and Exchange Commission to constitute a Financial Reporting Measure. |
| 5.8 | “Financial Restatement” means a restatement of the Company’s financial statements due to the Company’s material noncompliance with any financial reporting requirement under U.S. federal securities laws that is required in order to correct: |
| (a) | an error in previously issued financial statements that is material to the previously issued financial statements; or |
| (b) | an error that would result in a material misstatement if (A) the error were corrected in the current period or (B) left uncorrected in the current period. |
5
For purposes of this Policy, a Financial Restatement shall not be deemed to occur in the event of a revision of the Company’s financial statements due to an out-of-period adjustment (i.e., when the error is immaterial to the previously issued financial statements and the correction of the error is also immaterial to the current period) or a retrospective (1) application of a change in accounting principles; (2) revision to reportable segment information due to a change in the structure of the Company’s internal organization; (3) reclassification due to a discontinued operation; (4) application of a change in reporting entity, such as from a reorganization of entities under common control; or (5) revision for stock splits, reverse stock splits, stock dividends or other changes in capital structure.
| 5.9 | “Incentive-based Compensation” means any compensation (including, for the avoidance of doubt, any cash or equity or equity-based compensation, whether deferred or current) that is granted, earned and/or vested based wholly or in part upon the achievement of a Financial Reporting Measure. For purposes of this Policy, “Incentive-based Compensation” shall also be deemed to include any amounts which were determined based on (or were otherwise calculated by reference to) Incentive-based Compensation (including, without limitation, any amounts under any long-term disability, life insurance or supplemental retirement or severance plan or agreement or any notional account that is based on Incentive-based Compensation, as well as any earnings accrued thereon). For purposes of clarity, annual cash incentive and performance-based long-term incentive awarded by the Company to Executive Officers under the Company Incentive Plans shall be subject to recoupment under this Policy. |
| 5.10 | “Nasdaq” means the Nasdaq Stock Market, or any successor thereof. |
| 5.11 | “Recoupment Period” means the three fiscal years completed immediately preceding the date of any applicable Recoupment Trigger Date. Notwithstanding the foregoing, the Recoupment Period additionally includes any transition period (that results from a change in the Company’s fiscal year) within or immediately following those three completed fiscal years, provided that a transition period between the last day of the Company’s previous fiscal year end and the first day of its new fiscal year that comprises a period of nine (9) to twelve (12) months would be deemed a completed fiscal year. |
| 5.12 | “Recoupment Trigger Date” means the earlier of (i) the date that the Board (or a committee thereof or the officer(s) of the Company authorized to take such action if Board action is not required) concludes, or reasonably should have concluded, that the Company is required to prepare a Financial Restatement, and (ii) the date on which a court, regulator or other legally authorized body directs the Company to prepare a Financial Restatement. |
6. Policy Exceptions
Except as otherwise specified herein, no exceptions to this Policy will be permitted.
7. Revision History
Revision History | ||
Revision Number |
Changes |
Revision Date/Author |
1.0 |
Initial Policy |
Nici Comer, 07.14.2023 |
6
EXHIBIT A
Company Incentive Plans
| 1. | SouthState Corporation 2020 Omnibus Incentive Plan. |
| 2. | Atlantic Capital Bankshares, Inc. 2015 Stock Incentive Plan, as amended and restated effective May 16, 2018. |
7