UNITED STATES
SECURITIES AND EXCHANGE COMMISSION
Washington, D.C. 20549
FORM 8-K
CURRENT REPORT
Pursuant to Section 13 or 15(d)
of the Securities Exchange Act of 1934
Date of Report (Date of earliest event reported): February 27, 2024
FLUSHING FINANCIAL CORPORATION
(Exact name of registrant as specified in its charter)
001-33013
(Commission File Number)
Delaware
(State or Other Jurisdiction of Incorporation)
11-3209278
(I.R.S. Employer Identification No.)
220 RXR Plaza, Uniondale, NY 11556
(Address of principal executive offices)
(718) 961-5400
(Registrant's telephone number, including area code)
Check the appropriate box below if the Form 8-K filing is intended to simultaneously satisfy the filing obligation of the registrant under any of the following provisions:
☐ Written communications pursuant to Rule 425 under the Securities Act (17 CFR 230.425)
☐ Soliciting material pursuant to Rule 14a-12 under the Exchange Act (17 CFR 240.14a-12)
☐ Pre-commencement communications pursuant to Rule 14d-2(b) under the Exchange Act (17 CFR 240.14d-2(b))
☐ Pre-commencement communications pursuant to Rule 13e-4(c) under the Exchange Act (17 CFR 240.13e-4(c))
Securities registered pursuant to Section 12(b) of the Act:
Common Stock, $0.01 par value |
FFIC |
The Nasdaq Stock Market LLC |
Indicate by check mark whether the registrant is an emerging growth company as defined in Rule 405 of the Securities Act of 1933 (§230.405 of this chapter) or Rule 12b-2 of the Securities Exchange Act of 1934 (§240.12b-2 of this chapter).
Emerging growth company ☐
If an emerging growth company, indicate by check mark if the registrant has elected not to use the extended transition period for complying with any new or revised financial accounting standards provided pursuant to Section 13(a) of the Exchange Act. ☐
Item 7.01. Regulation FD Disclosure.
On February 27, 2024, Flushing Financial Corp. (the “Company”) announced that it will be meeting with institutional investors including attending the 2024 RBC Capital Markets Financial Institutions Conference on March 6, 2024. The press release announcing the meeting with institutional investors and the presentation for these meetings are being made available to investors, as Exhibit 99.1 and Exhibit 99.2, respectively. Additionally, the presentation will be available on the Company’s website.
Item 9.01. Financial Statements and Exhibits.
|
Exhibit 99.1. Press release dated February 27, 2024. Exhibit 99.2. Presentation dated February 27, 2024. |
104 Cover Page Interactive Data File (embedded within the Inline XBRL document) |
SIGNATURE
Pursuant to the requirements of the Securities Exchange Act of 1934, the registrant has duly caused this report to be signed on its behalf by the undersigned hereunto duly authorized.
|
FLUSHING FINANCIAL CORPORATION |
|
|
|
|
|
|
|
Date: February 27, 2024 |
By: |
/s/ SUSAN K. CULLEN |
|
|
Susan K. Cullen |
|
|
Senior Executive Vice President, Chief Financial Officer |
|
|
and Treasurer |
Exhibit 99.1

CONTACT:
Susan K. Cullen
Senior Executive Vice President,
Chief Financial Officer and Treasurer
Flushing Financial Corporation
(718) 961-5400
FOR IMMEDIATE RELEASE
FLUSHING FINANCIAL CORPORATION TO MEET WITH INSTUTIONAL INVESTORS
Uniondale, NY – February 27, 2024 – Flushing Financial Corporation (the “Company”) (Nasdaq-GS: FFIC), the parent holding company for Flushing Bank (the “Bank”), today announced that the Company has made available through its website, FlushingBank.com, and from the 8-K filed today, a presentation for several upcoming investor events, including attending the 2024 RBC Capital Markets Financial Institutions Conference on March 6, 2024. The presentation materials include further details on our underwriting and management of our multifamily lending portfolio. John R. Buran, the Company’s President and Chief Executive Officer and Susan K. Cullen, the Company’s Senior Executive Vice President, Chief Financial Officer and Treasurer will represent the Company at these meetings.
FLUSHING FINANCIAL CORPORATION (Nasdaq: FFIC) is the holding company for Flushing Bank®, an FDIC insured, New York State—chartered commercial bank that operates banking offices in Queens, Brooklyn, Manhattan, and on Long Island. The Bank has been building relationships with families, business owners, and communities since 1929. Today, it offers the products, services, and conveniences associated with large commercial banks, including a full complement of deposit, loan, equipment finance, and cash management services. Rewarding customers with personalized attention and bankers that can communicate in the languages prevalent within these multicultural markets is what makes the Bank uniquely different. As an Equal Housing Lender and leader in real estate lending, the Bank’s experienced lending teams create mortgage solutions for real estate owners and property managers both within and outside the New York City metropolitan area. The Bank also fosters relationships with consumers nationwide through its online banking division with the iGObanking® and BankPurely® brands. Additional information on Flushing Financial Corporation and Flushing Bank may be obtained by visiting the Company’s web site at FlushingBank.com.
“Safe Harbor” Statement under the Private Securities Litigation Reform Act of 1995: Statements in this Press Release relating to plans, strategies, economic performance and trends, projections of results of specific activities or investments and other statements that are not descriptions of historical facts may be forward-looking statements within the meaning of the Private Securities Litigation Reform Act of 1995, Section 27A of the Securities Act of 1933 and Section 21E of the Securities Exchange Act of 1934. Forward-looking information is inherently subject to risks and uncertainties, and actual results could differ materially from those currently anticipated due to a number of factors, which include, but are not limited to, risk factors discussed in the Company’s Annual Report on Form 10-K for the fiscal year ended December 31, 2022 and in other documents filed by the Company with the Securities and Exchange Commission from time to time. Forward-looking statements may be identified by terms such as “may”, “will”, “should”, “could”, “expects”, “plans”, “intends”, “anticipates”, “believes”, “estimates”, “predicts”, “forecasts”, “goals”, “potential” or “continue” or similar terms or the negative of these terms. Although we believe that the expectations reflected in the forward-looking statements are reasonable, we cannot guarantee future results, levels of activity, performance or achievements. The Company has no obligation to update these forward-looking statements.
#FF
# # #
|
1Q24 Investor Presentation February 27, 2024 |
|
Safe Harbor Statement 2 “Safe Harbor” Statement under the Private Securities Litigation Reform Act of 1995: Statements in this Presentation relating to plans, strategies, economic performance and trends, projections of results of specific activities or investments and other statements that are not descriptions of historical facts may be forward-looking statements within the meaning of the Private Securities Litigation Reform Act of 1995, Section 27A of the Securities Act of 1933 and Section 21E of the Securities Exchange Act of 1934. Forward-looking information is inherently subject to risks and uncertainties, and actual results could differ materially from those currently anticipated due to a number of factors, which include, but are not limited to, risk factors discussed in the Company’s Annual Report on Form 10-K for the fiscal year ended December 31, 2022, and in other documents filed by the Company with the Securities and Exchange Commission from time to time. Forward-looking statements may be identified by terms such as “may”, “will”, “should”, “could”, “expects”, “plans”, “intends”, “anticipates”, “believes”, “estimates”, “predicts”, “forecasts”, “goals”, “potential” or “continue” or similar terms or the negative of these terms. Although we believe that the expectations reflected in the forward-looking statements are reasonable, we cannot guarantee future results, levels of activity, performance or achievements. The Company has no obligation to update these forward-looking statements. |
|
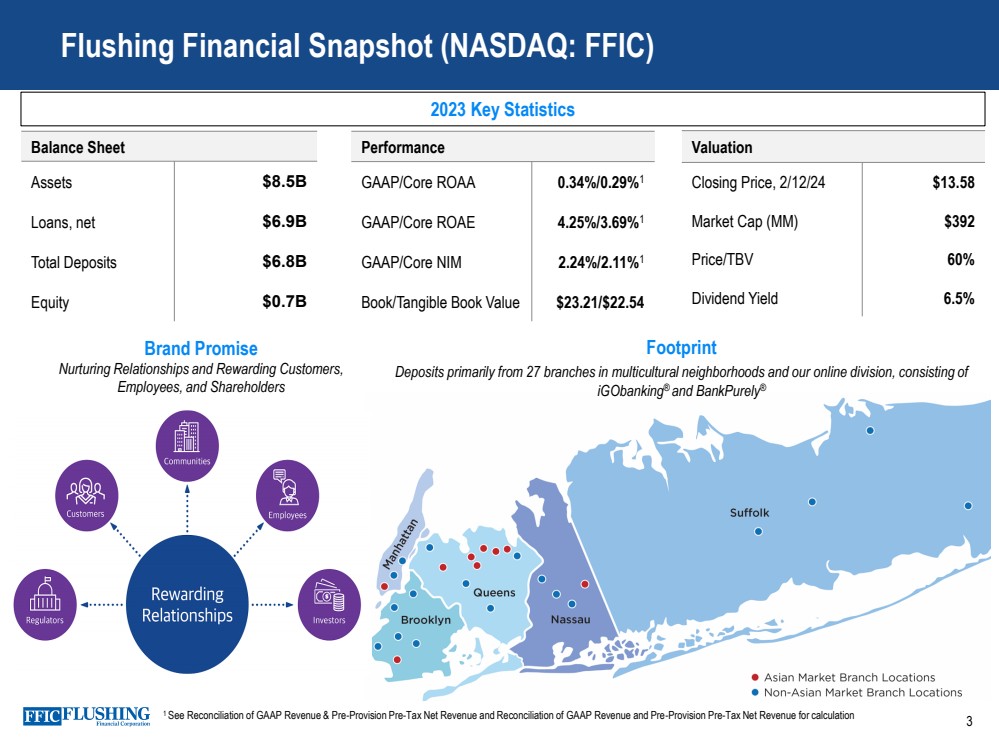
Flushing Financial Snapshot (NASDAQ: FFIC) Balance Sheet Assets $8.5B Loans, net $6.9B Total Deposits $6.8B Equity $0.7B Performance GAAP/Core ROAA 0.34%/0.29%1 GAAP/Core ROAE 4.25%/3.69%1 GAAP/Core NIM 2.24%/2.11%1 Book/Tangible Book Value $23.21/$22.54 2023 Key Statistics Footprint Deposits primarily from 27 branches in multicultural neighborhoods and our online division, consisting of iGObanking® and BankPurely® 1 See Reconciliation of GAAP Revenue & Pre-Provision Pre-Tax Net Revenue and Reconciliation of GAAP Revenue and Pre-Provision Pre-Tax Net Revenue for calculation 3 Brand Promise Nurturing Relationships and Rewarding Customers, Employees, and Shareholders Valuation Closing Price, 2/12/24 $13.58 Market Cap (MM) $392 Price/TBV 60% Dividend Yield 6.5% |
|
4 Key Messages Small enough to know you. Large enough to help you. ► Leading Community Bank in the Greater NYC Area ► Well Diversified and Low Risk Loan Portfolio with Sound Credit Quality ► Growing Asian Banking Niche ► Beneficiary of a Steepening Yield Curve and Fed Rate Cuts ► Executing on Action Plan to improve profitability |
|
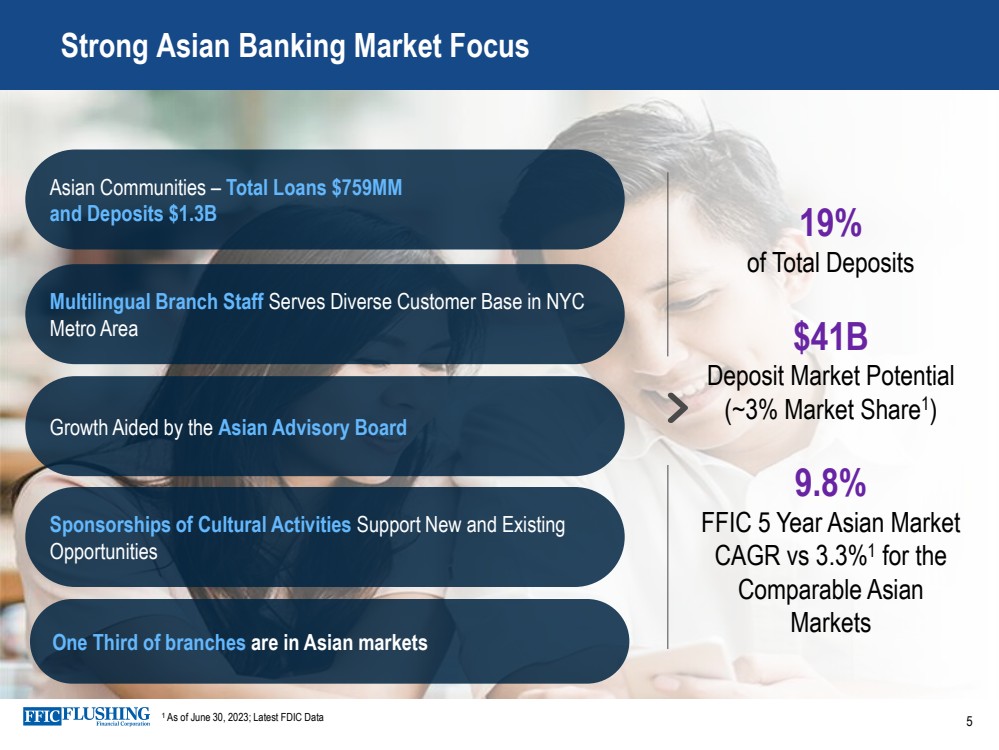
Strong Asian Banking Market Focus 19% of Total Deposits $41B Deposit Market Potential (~3% Market Share1 ) 9.8% FFIC 5 Year Asian Market CAGR vs 3.3%1 for the Comparable Asian Markets Asian Communities – Total Loans $759MM and Deposits $1.3B Multilingual Branch Staff Serves Diverse Customer Base in NYC Metro Area Growth Aided by the Asian Advisory Board Sponsorships of Cultural Activities Support New and Existing Opportunities 1 As of June 30, 2023; Latest FDIC Data One Third of branches are in Asian markets 5 |
|
6 Areas of Focus ► Increase Net Interest Margin and Reduce Volatility ► Maintain Credit Discipline ► Preserve Strong Capital and Liquidity ► Bend the Expense Curve |
|
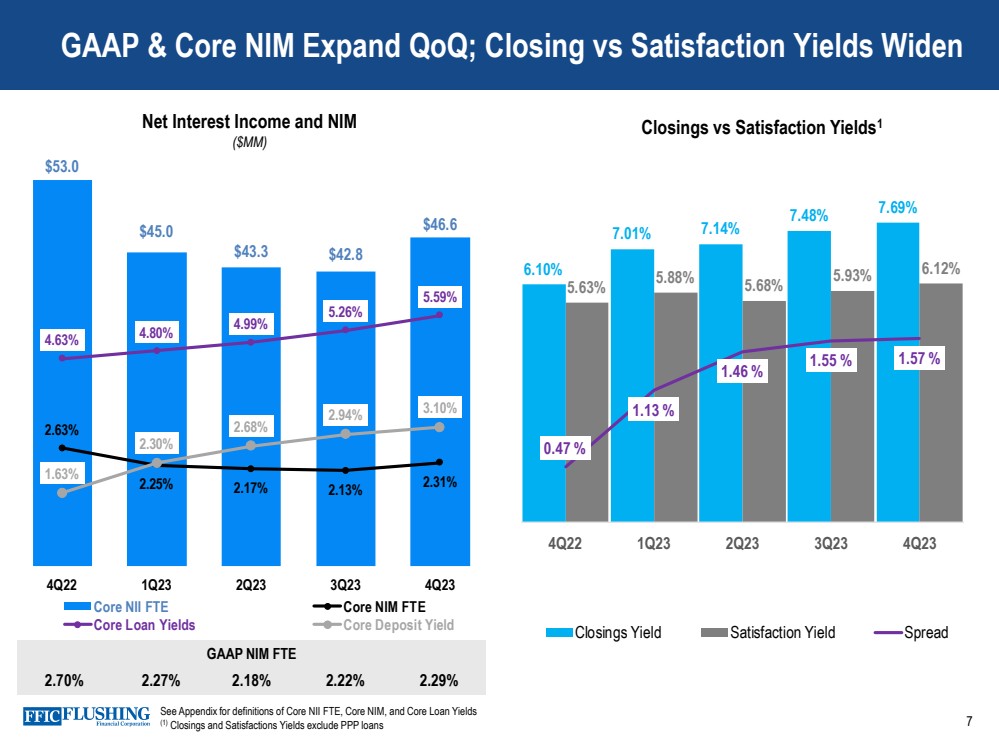
GAAP & Core NIM Expand QoQ; Closing vs Satisfaction Yields Widen 7 GAAP NIM FTE 2.70% 2.27% 2.18% 2.22% 2.29% See Appendix for definitions of Core NII FTE, Core NIM, and Core Loan Yields (1) Closings and Satisfactions Yields exclude PPP loans Closings vs Satisfaction Yields1 6.10% 7.01% 7.14% 7.48% 7.69% 5.63% 5.88% 5.68% 5.93% 6.12% 0.47 % 1.13 % 1.46 % 1.55 % 1.57 % 0.00 % 0.50 % 1.00 % 1.50 % 2.00 % 2.50 % 3.00 % 0.00% 1.00% 2.00% 3.00% 4.00% 5.00% 6.00% 7.00% 8.00% 9.00% 4Q22 1Q23 2Q23 3Q23 4Q23 Closings Yield Satisfaction Yield Spread $53.0 $45.0 $43.3 $42.8 $46.6 2.63% 2.25% 2.17% 2.13% 2.31% 4.63% 4.80% 4.99% 5.26% 5.59% 1.63% 2.30% 2.68% 2.94% 3.10% 0.00% 1.00% 2.00% 3.00% 4.00% 5.00% 6.00% 7.00% 8.00% 9.00% 10.00% $10.0 $15.0 $20.0 $25.0 $30.0 $35.0 $40.0 $45.0 $50.0 $55.0 $60.0 4Q22 1Q23 2Q23 3Q23 4Q23 Core NII FTE Core NIM FTE Core Loan Yields Core Deposit Yield Net Interest Income and NIM ($MM) |
|
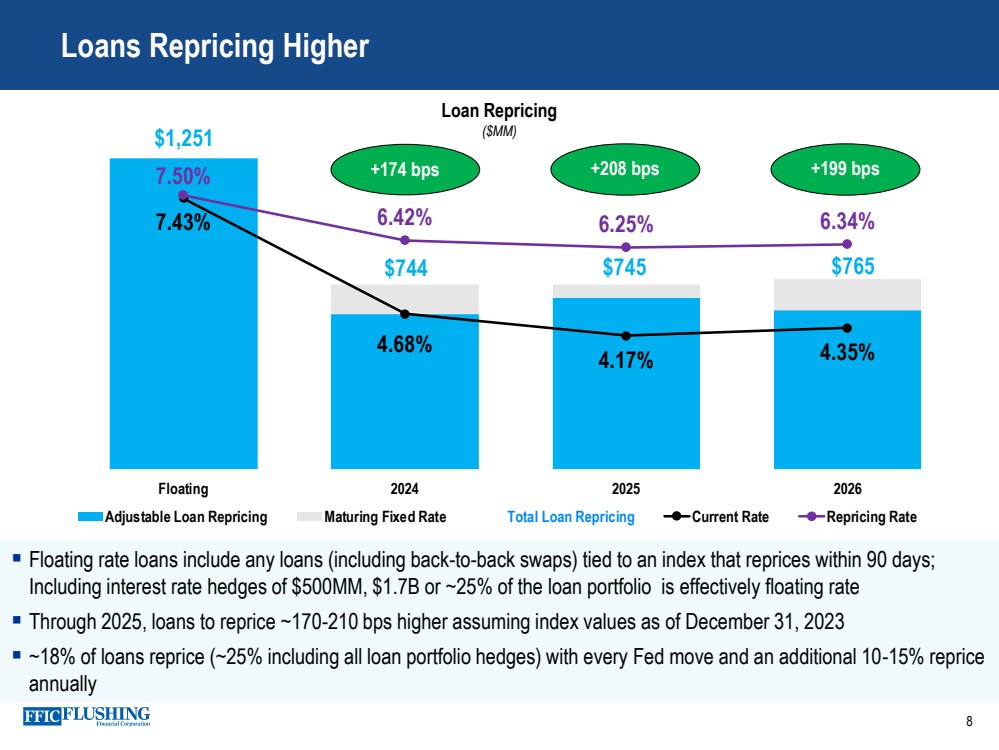
▪ Floating rate loans include any loans (including back-to-back swaps) tied to an index that reprices within 90 days; Including interest rate hedges of $500MM, $1.7B or ~25% of the loan portfolio is effectively floating rate ▪ Through 2025, loans to reprice ~170-210 bps higher assuming index values as of December 31, 2023 ▪ ~18% of loans reprice (~25% including all loan portfolio hedges) with every Fed move and an additional 10-15% reprice annually $1,251 $744 $745 $765 7.43% 4.68% 4.17% 4.35% 7.50% 6.42% 6.25% 6.34% - 20 0 40 0 60 0 80 0 1,0 00 1,2 00 1,4 00 Floating 2024 2025 2026 Adjustable Loan Repricing Maturing Fixed Rate Total Loan Repricing Current Rate Repricing Rate Loans Repricing Higher 8 Loan Repricing ($MM) +174 bps +208 bps +199 bps |
|
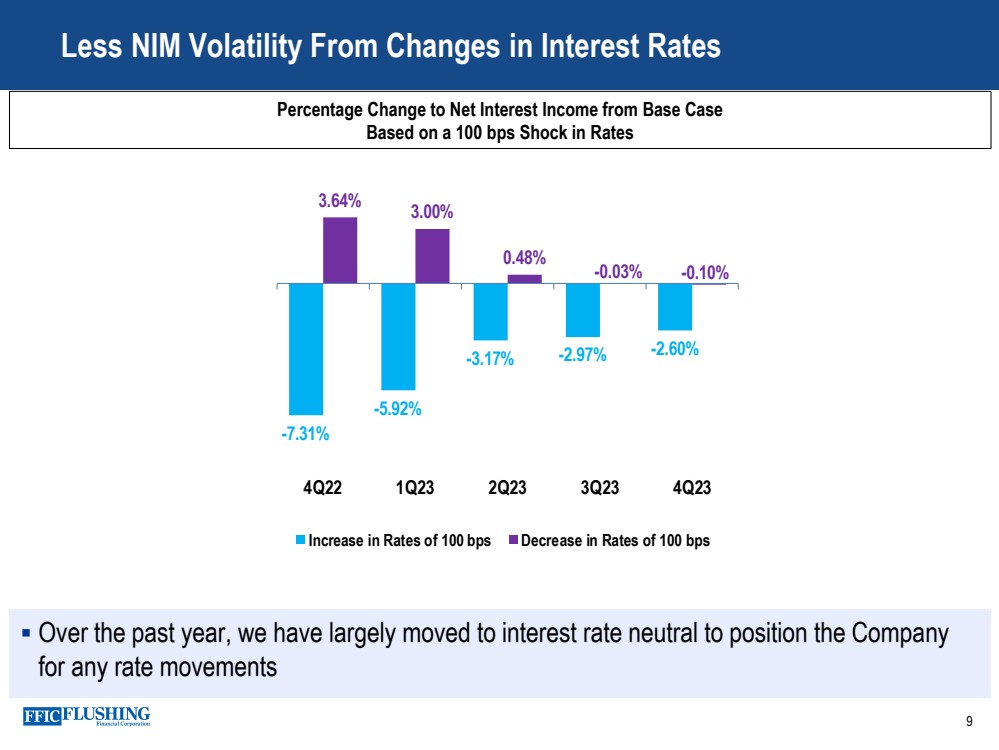
▪ Over the past year, we have largely moved to interest rate neutral to position the Company for any rate movements Less NIM Volatility From Changes in Interest Rates Percentage Change to Net Interest Income from Base Case Based on a 100 bps Shock in Rates 9 -7.31% -5.92% -3.17% -2.97% -2.60% 3.64% 3.00% 0.48% -0.03% -0.10% 4Q22 1Q23 2Q23 3Q23 4Q23 Increase in Rates of 100 bps Decrease in Rates of 100 bps |
|
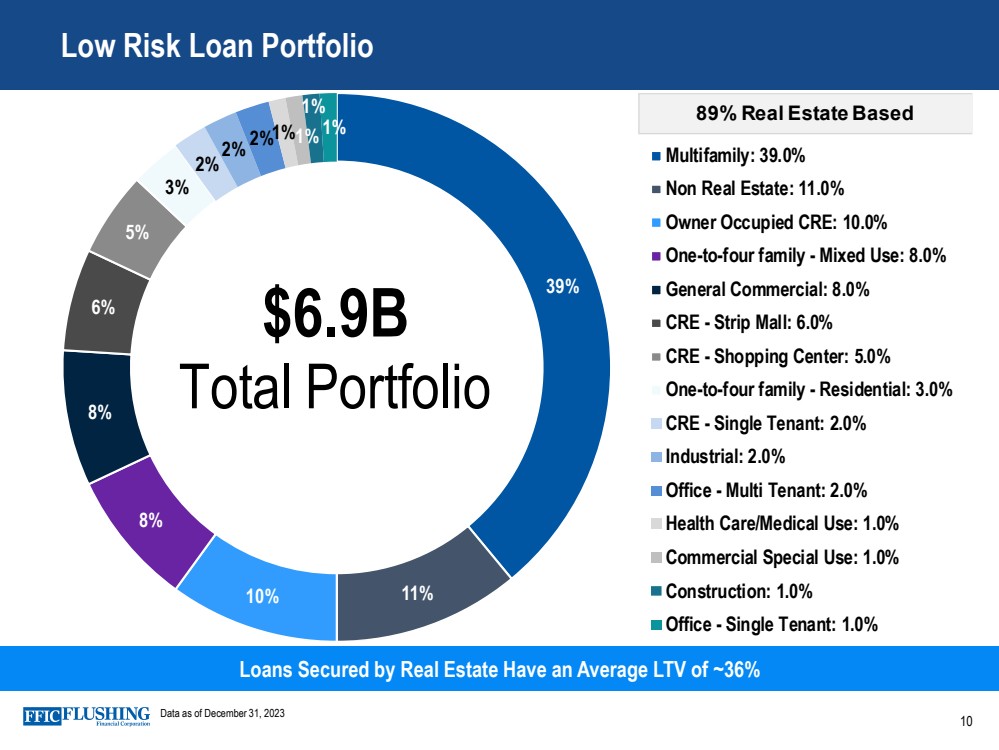
Low Risk Loan Portfolio Loans Secured by Real Estate Have an Average LTV of ~36% Data as of December 31, 2023 39% 10% 11% 8 % 8 % 6 % 5 % 3 % 2 %2 % 2 %1 %1 % 1 % 1 % Multifamily: 39.0% Non Real Estate: 11.0% Owner Occupied CRE: 10.0% One-to-four family - Mixed Use: 8.0% General Commercial: 8.0% CRE - Strip Mall: 6.0% CRE - Shopping Center: 5.0% One-to-four family - Residential: 3.0% CRE - Single Tenant: 2.0% Industrial: 2.0% Office - Multi Tenant: 2.0% Health Care/Medical Use: 1.0% Commercial Special Use: 1.0% Construction: 1.0% Office - Single Tenant: 1.0% $6.9B Total Portfolio 89% Real Estate Based 10 |
|
Approach to Real Estate Lending: Low Leverage & Shared Philosophy 11 Our Conservative Lending Profile Has Served Us Well Over Many Cycles ▪ Since 1929, we have a long history of lending in metro New York City – Historically, credit quality has outperformed the industry and peers • From 2001-2023, median NCOs to average loans has been 4 bps compared to 52 bps for the industry • Median noncurrent loans to total loans has been 37 bps compared to 130 bps for the industry over the same period ▪ The key to our success is shared client philosophy – Our clients tend to have low leverage (average LTV is <36%) and strong cash flows (DCR is 1.8x for multifamily and CRE1 ) – Multigenerational– our clients tend to build portfolio of properties; generally, buy and hold – Borrowers are not transaction oriented – average real estate loan seasoning is over 8 years, which is generally passed the 5-year reset for multifamily and investor CRE loans – We do not attract clients who are short term borrowers, who want funds on future cash flows, or who are aggressively trying to covert rent regulated units into market rents 1 Based on annual loan reviews |
|
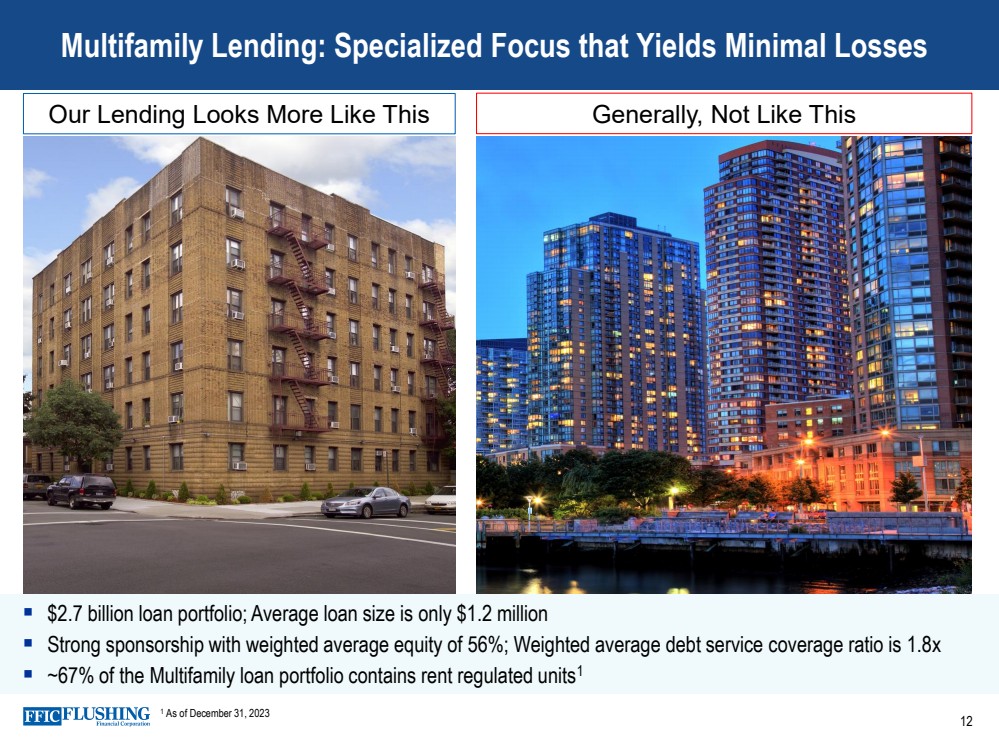
Multifamily Lending: Specialized Focus that Yields Minimal Losses Our Lending Looks More Like This Generally, Not Like This 12 1 As of December 31, 2023 ▪ $2.7 billion loan portfolio; Average loan size is only $1.2 million ▪ Strong sponsorship with weighted average equity of 56%; Weighted average debt service coverage ratio is 1.8x ▪ ~67% of the Multifamily loan portfolio contains rent regulated units1 |
|
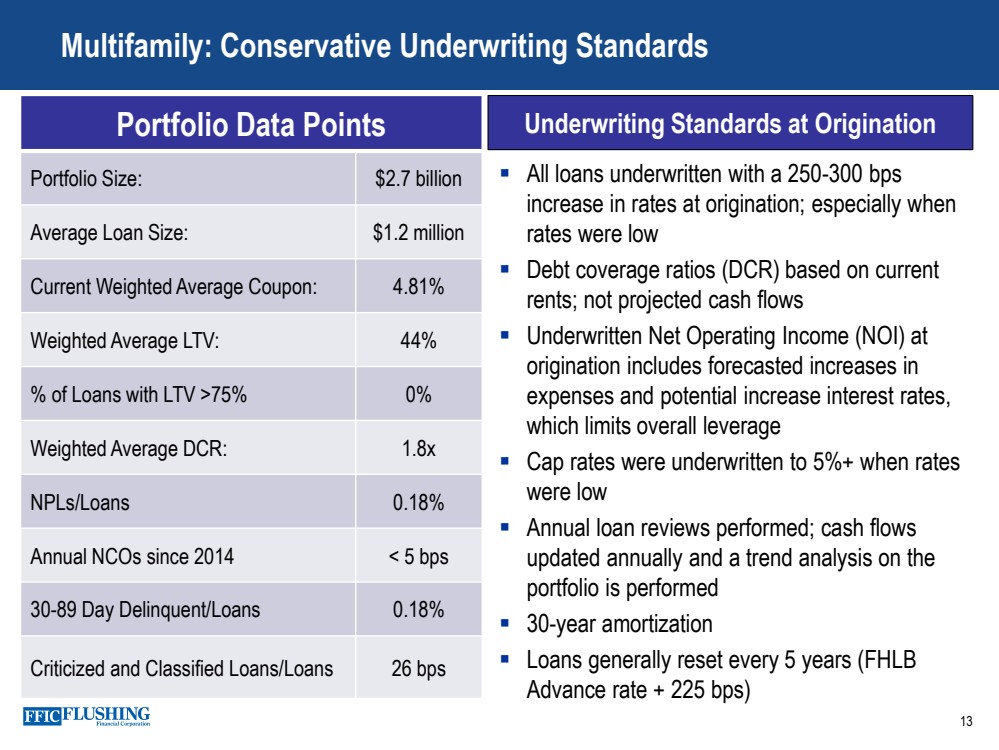
▪ All loans underwritten with a 250-300 bps increase in rates at origination; especially when rates were low ▪ Debt coverage ratios (DCR) based on current rents; not projected cash flows ▪ Underwritten Net Operating Income (NOI) at origination includes forecasted increases in expenses and potential increase interest rates, which limits overall leverage ▪ Cap rates were underwritten to 5%+ when rates were low ▪ Annual loan reviews performed; cash flows updated annually and a trend analysis on the portfolio is performed ▪ 30-year amortization ▪ Loans generally reset every 5 years (FHLB Advance rate + 225 bps) 13 Multifamily: Conservative Underwriting Standards Portfolio Data Points Portfolio Size: $2.7 billion Average Loan Size: $1.2 million Current Weighted Average Coupon: 4.81% Weighted Average LTV: 44% % of Loans with LTV >75% 0% Weighted Average DCR: 1.8x NPLs/Loans 0.18% Annual NCOs since 2014 < 5 bps 30-89 Day Delinquent/Loans 0.18% Criticized and Classified Loans/Loans 26 bps Underwriting Standards at Origination |
|
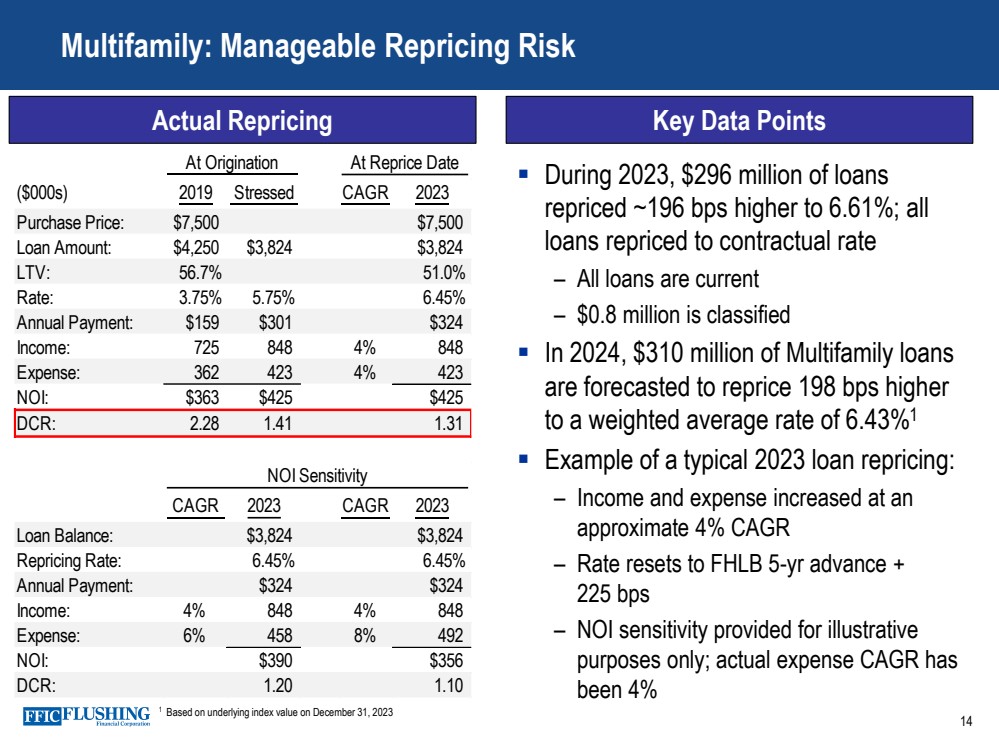
Actual Repricing 14 Multifamily: Manageable Repricing Risk ▪ During 2023, $296 million of loans repriced ~196 bps higher to 6.61%; all loans repriced to contractual rate – All loans are current – $0.8 million is classified ▪ In 2024, $310 million of Multifamily loans are forecasted to reprice 198 bps higher to a weighted average rate of 6.43%1 ▪ Example of a typical 2023 loan repricing: – Income and expense increased at an approximate 4% CAGR – Rate resets to FHLB 5-yr advance + 225 bps – NOI sensitivity provided for illustrative purposes only; actual expense CAGR has been 4% 1 Based on underlying index value on December 31, 2023 Key Data Points At Origination At Reprice Date ($000s) 2019 Stressed CAGR 2023 Purchase Price: $7,500 $7,500 Loan Amount: $4,250 $3,824 $3,824 LTV: 56.7% 51.0% Rate: 3.75% 5.75% 6.45% Annual Payment: $159 $301 $324 Income: 725 848 4% 848 Expense: 362 423 4% 423 NOI: $363 $425 $425 DCR: 2.28 1.41 1.31 NOI Sensitivity CAGR 2023 CAGR 2023 Loan Balance: $3,824 $3,824 Repricing Rate: 6.45% 6.45% Annual Payment: $324 $324 Income: 4% 848 4% 848 Expense: 6% 458 8% 492 NOI: $390 $356 DCR: 1.20 1.10 |
|
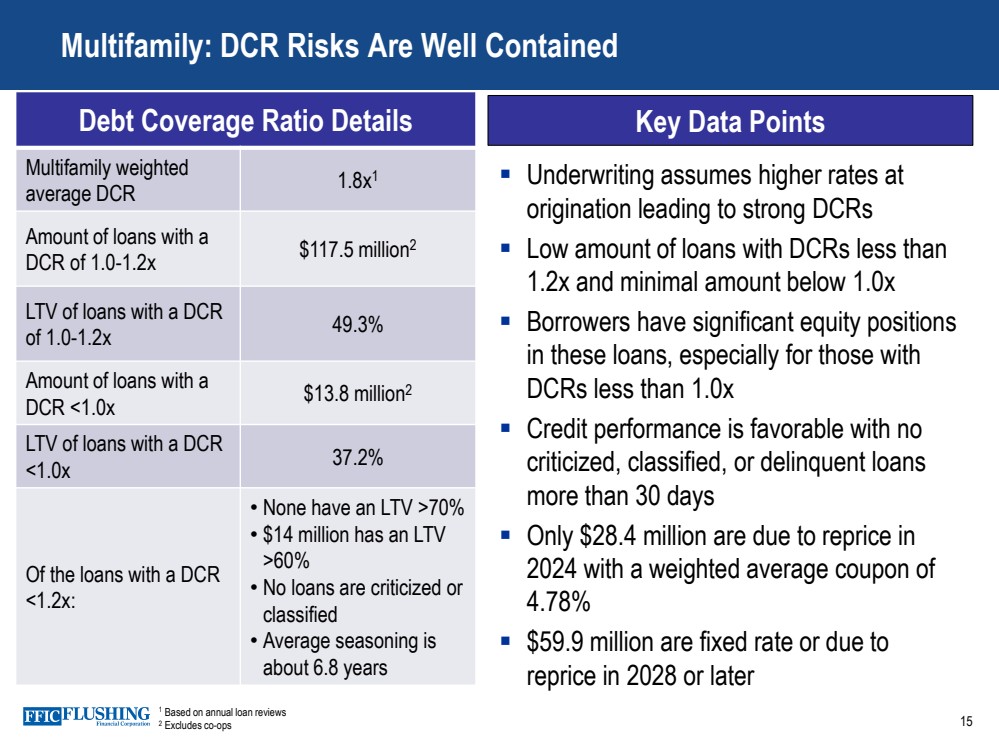
Debt Coverage Ratio Details Multifamily weighted average DCR 1.8x1 Amount of loans with a DCR of 1.0-1.2x $117.5 million2 LTV of loans with a DCR of 1.0-1.2x 49.3% Amount of loans with a DCR <1.0x $13.8 million2 LTV of loans with a DCR <1.0x 37.2% Of the loans with a DCR <1.2x: • None have an LTV >70% • $14 million has an LTV >60% • No loans are criticized or classified • Average seasoning is about 6.8 years 15 Multifamily: DCR Risks Are Well Contained 1 Based on annual loan reviews 2 Excludes co-ops ▪ Underwriting assumes higher rates at origination leading to strong DCRs ▪ Low amount of loans with DCRs less than 1.2x and minimal amount below 1.0x ▪ Borrowers have significant equity positions in these loans, especially for those with DCRs less than 1.0x ▪ Credit performance is favorable with no criticized, classified, or delinquent loans more than 30 days ▪ Only $28.4 million are due to reprice in 2024 with a weighted average coupon of 4.78% ▪ $59.9 million are fixed rate or due to reprice in 2028 or later Key Data Points |
|
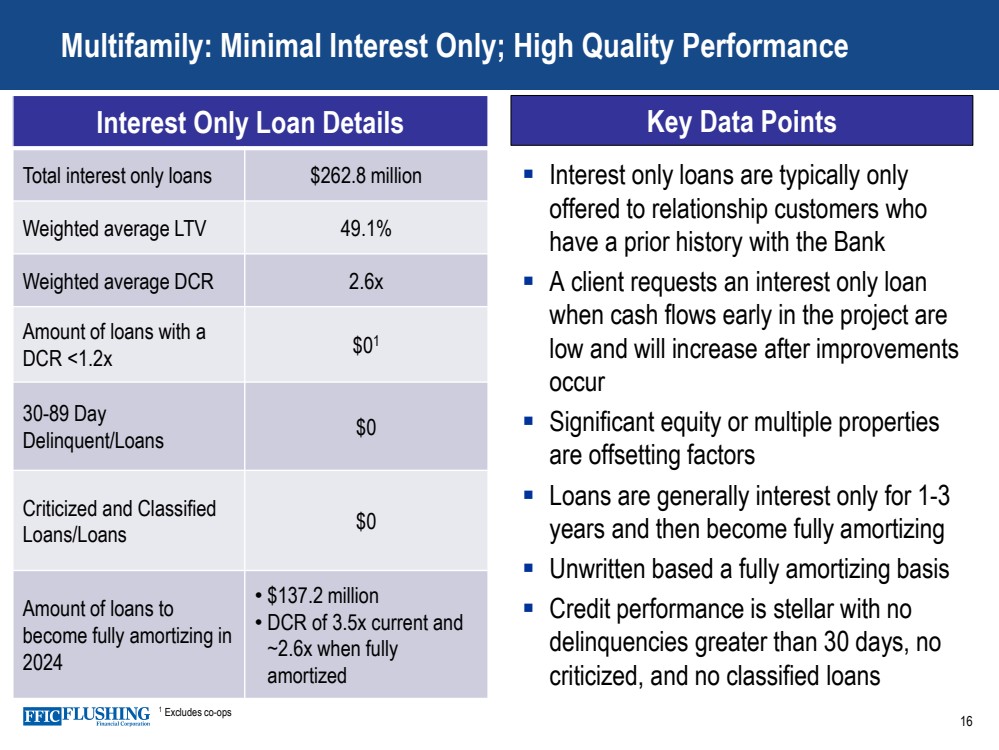
16 Multifamily: Minimal Interest Only; High Quality Performance 1 Excludes co-ops ▪ Interest only loans are typically only offered to relationship customers who have a prior history with the Bank ▪ A client requests an interest only loan when cash flows early in the project are low and will increase after improvements occur ▪ Significant equity or multiple properties are offsetting factors ▪ Loans are generally interest only for 1-3 years and then become fully amortizing ▪ Unwritten based a fully amortizing basis ▪ Credit performance is stellar with no delinquencies greater than 30 days, no criticized, and no classified loans Interest Only Loan Details Key Data Points Total interest only loans $262.8 million Weighted average LTV 49.1% Weighted average DCR 2.6x Amount of loans with a DCR <1.2x $01 30-89 Day Delinquent/Loans $0 Criticized and Classified Loans/Loans $0 Amount of loans to become fully amortizing in 2024 • $137.2 million • DCR of 3.5x current and ~2.6x when fully amortized |
|
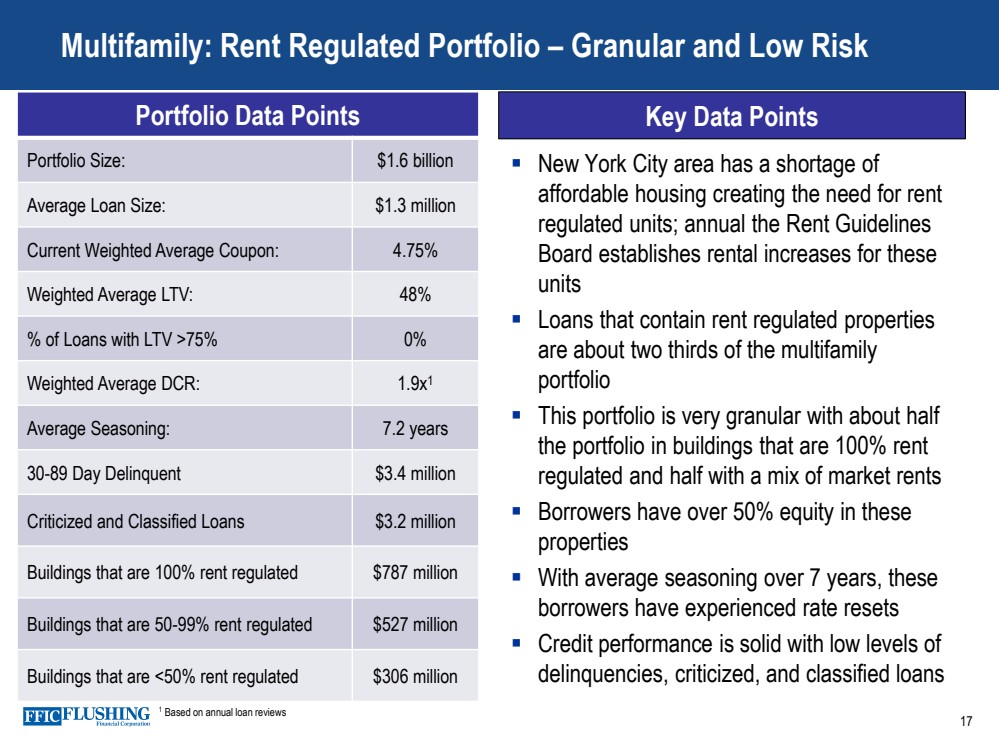
Key Data Points 17 Multifamily: Rent Regulated Portfolio – Granular and Low Risk Portfolio Data Points Portfolio Size: $1.6 billion Average Loan Size: $1.3 million Current Weighted Average Coupon: 4.75% Weighted Average LTV: 48% % of Loans with LTV >75% 0% Weighted Average DCR: 1.9x1 Average Seasoning: 7.2 years 30-89 Day Delinquent $3.4 million Criticized and Classified Loans $3.2 million Buildings that are 100% rent regulated $787 million Buildings that are 50-99% rent regulated $527 million Buildings that are <50% rent regulated $306 million ▪ New York City area has a shortage of affordable housing creating the need for rent regulated units; annual the Rent Guidelines Board establishes rental increases for these units ▪ Loans that contain rent regulated properties are about two thirds of the multifamily portfolio ▪ This portfolio is very granular with about half the portfolio in buildings that are 100% rent regulated and half with a mix of market rents ▪ Borrowers have over 50% equity in these properties ▪ With average seasoning over 7 years, these borrowers have experienced rate resets ▪ Credit performance is solid with low levels of delinquencies, criticized, and classified loans 1 Based on annual loan reviews |
|
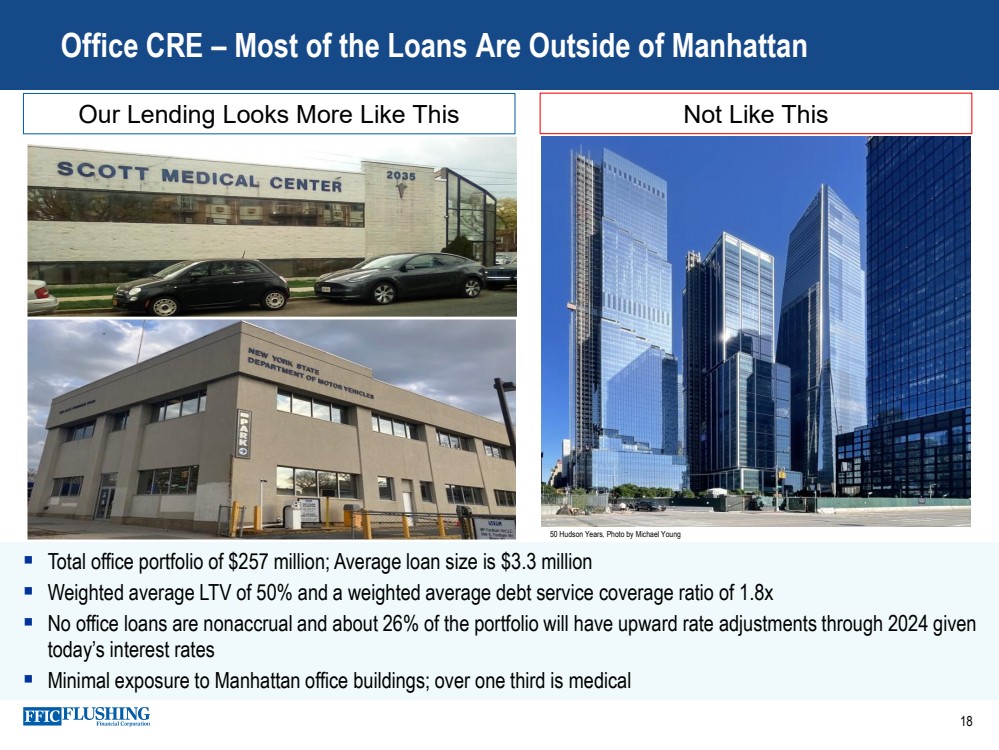
Office CRE – Most of the Loans Are Outside of Manhattan Our Lending Looks More Like This Not Like This 18 50 Hudson Years, Photo by Michael Young ▪ Total office portfolio of $257 million; Average loan size is $3.3 million ▪ Weighted average LTV of 50% and a weighted average debt service coverage ratio of 1.8x ▪ No office loans are nonaccrual and about 26% of the portfolio will have upward rate adjustments through 2024 given today’s interest rates ▪ Minimal exposure to Manhattan office buildings; over one third is medical |
|
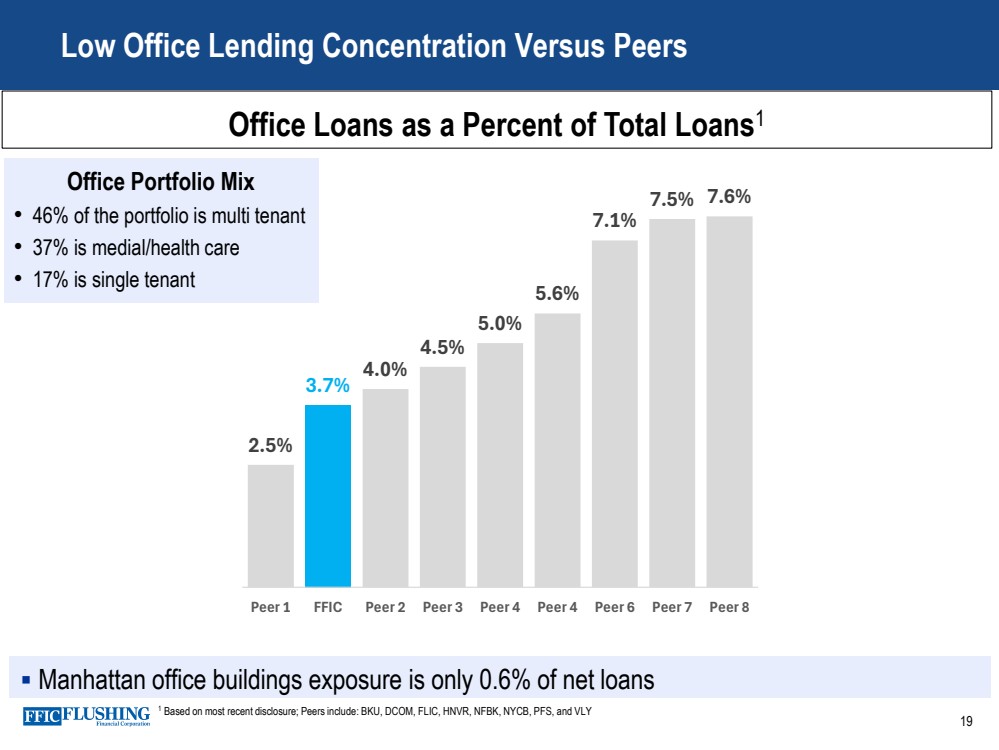
▪ Manhattan office buildings exposure is only 0.6% of net loans Low Office Lending Concentration Versus Peers 1 Based on most recent disclosure; Peers include: BKU, DCOM, FLIC, HNVR, NFBK, NYCB, PFS, and VLY 19 Office Loans as a Percent of Total Loans1 2.5% 3.7% 4.0% 4.5% 5.0% 5.6% 7.1% 7.5% 7.6% Peer 1 FFIC Peer 2 Peer 3 Peer 4 Peer 4 Peer 6 Peer 7 Peer 8 Office Portfolio Mix • 46% of the portfolio is multi tenant • 37% is medial/health care • 17% is single tenant |
|
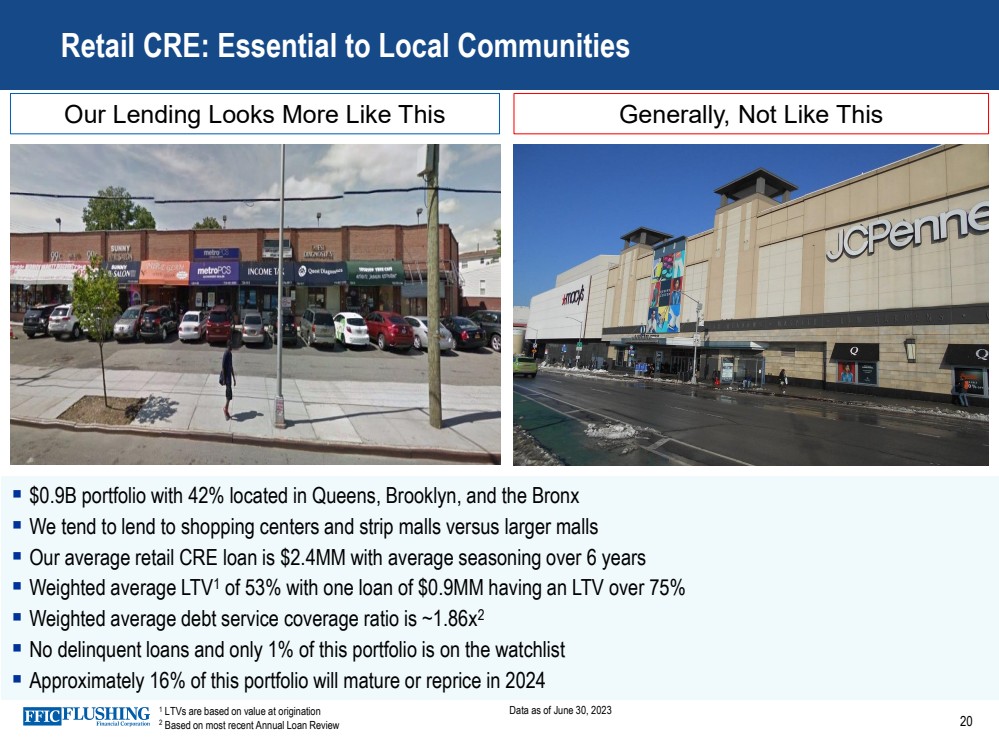
20 Retail CRE: Essential to Local Communities Our Lending Looks More Like This Generally, Not Like This ▪ $0.9B portfolio with 42% located in Queens, Brooklyn, and the Bronx ▪ We tend to lend to shopping centers and strip malls versus larger malls ▪ Our average retail CRE loan is $2.4MM with average seasoning over 6 years ▪ Weighted average LTV1 of 53% with one loan of $0.9MM having an LTV over 75% ▪ Weighted average debt service coverage ratio is ~1.86x2 ▪ No delinquent loans and only 1% of this portfolio is on the watchlist ▪ Approximately 16% of this portfolio will mature or reprice in 2024 1 LTVs are based on value at origination 2 Based on most recent Annual Loan Review Data as of June 30, 2023 |
|
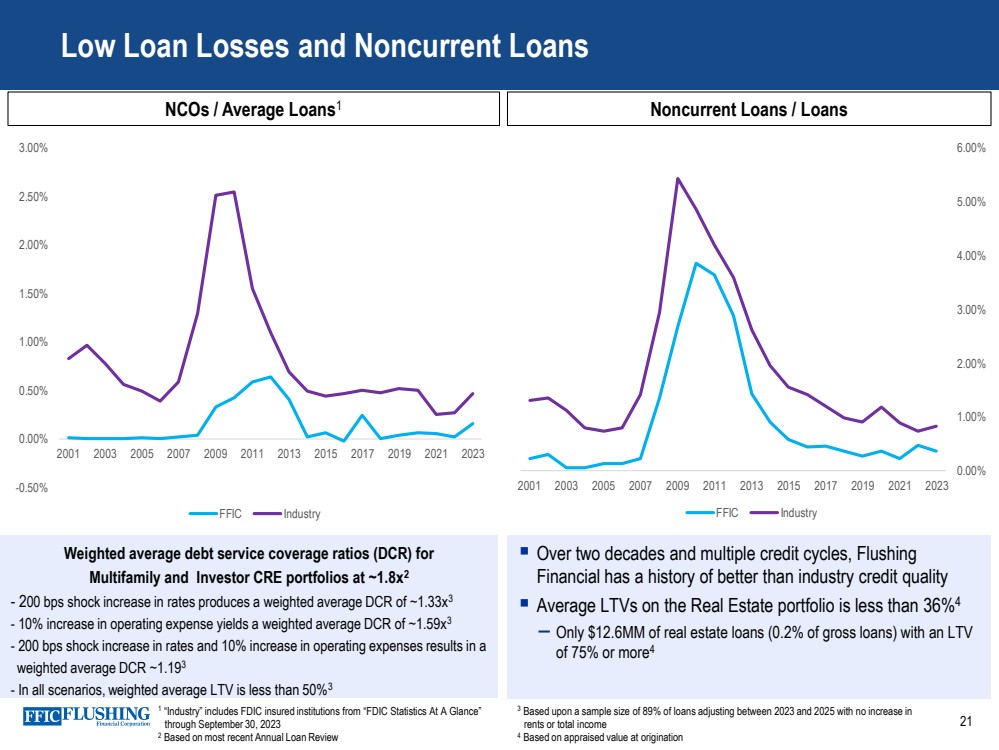
▪ Over two decades and multiple credit cycles, Flushing Financial has a history of better than industry credit quality ▪ Average LTVs on the Real Estate portfolio is less than 36%4 – Only $12.6MM of real estate loans (0.2% of gross loans) with an LTV of 75% or more4 Low Loan Losses and Noncurrent Loans NCOs / Average Loans1 1 “Industry” includes FDIC insured institutions from “FDIC Statistics At A Glance” through September 30, 2023 2 Based on most recent Annual Loan Review 3 Based upon a sample size of 89% of loans adjusting between 2023 and 2025 with no increase in rents or total income 4 Based on appraised value at origination 21 Noncurrent Loans / Loans -0.50% 0.00% 0.50% 1.00% 1.50% 2.00% 2.50% 3.00% 2001 2003 2005 2007 2009 2011 2013 2015 2017 2019 2021 2023 FFIC Industry 0.00% 1.00% 2.00% 3.00% 4.00% 5.00% 6.00% 0.00% 20.00% 40.00% 60.00% 80.00% 100. 0% 120. 0% 2001 2003 2005 2007 2009 2011 2013 2015 2017 2019 2021 2023 FFIC Industry Weighted average debt service coverage ratios (DCR) for Multifamily and Investor CRE portfolios at ~1.8x2 - 200 bps shock increase in rates produces a weighted average DCR of ~1.33x3 - 10% increase in operating expense yields a weighted average DCR of ~1.59x3 - 200 bps shock increase in rates and 10% increase in operating expenses results in a weighted average DCR ~1.193 - In all scenarios, weighted average LTV is less than 50%3 |
|
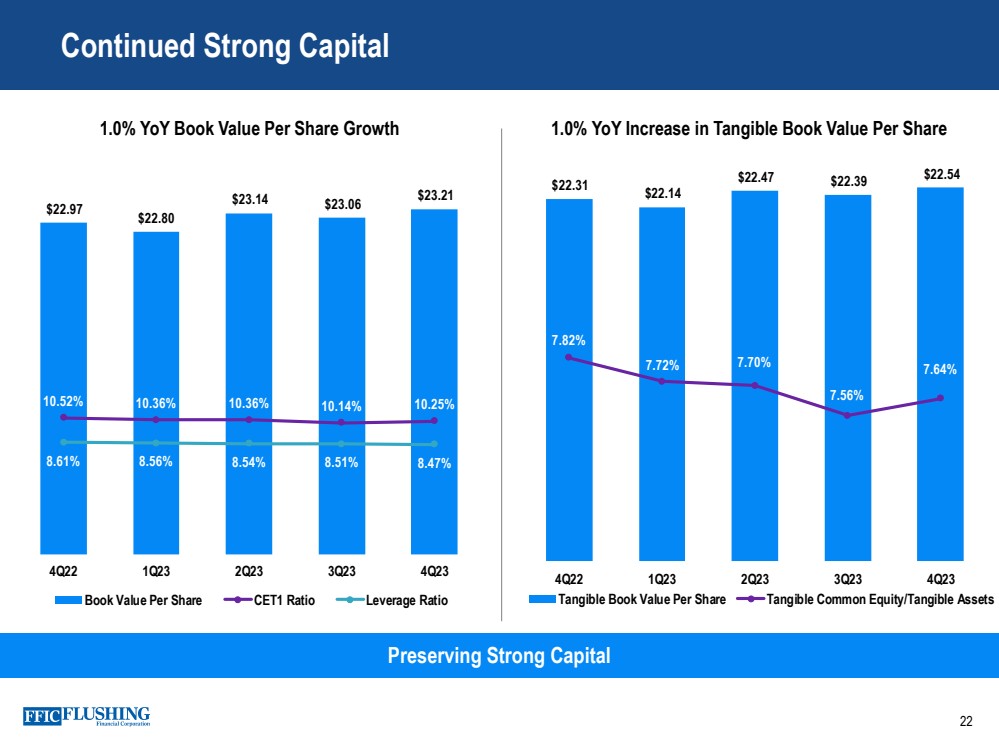
$22.97 $22.80 $23.14 $23.06 $23.21 10.52% 10.36% 10.36% 10.14% 10.25% 8.61% 8.56% 8.54% 8.51% 8.47% 0.00% 5.00% 10.00% 15.00% 20.00% 25.00% 30.00% $17. 00 $18. 00 $19. 00 $20. 00 $21. 00 $22. 00 $23. 00 $24. 00 4Q22 1Q23 2Q23 3Q23 4Q23 Book Value Per Share CET1 Ratio Leverage Ratio Continued Strong Capital 22 Preserving Strong Capital 1.0% YoY Book Value Per Share Growth 1.0% YoY Increase in Tangible Book Value Per Share $22.31 $22.14 $22.47 $22.39 $22.54 7.82% 7.72% 7.70% 7.56% 7.64% 6.90% 7.10% 7.30% 7.50% 7.70% 7.90% 8.10% 8.30% 8.50% 8.70% $15. 00 $16. 00 $17. 00 $18. 00 $19. 00 $20. 00 $21. 00 $22. 00 $23. 00 4Q22 1Q23 2Q23 3Q23 4Q23 Tangible Book Value Per Share Tangible Common Equity/Tangible Assets |
|
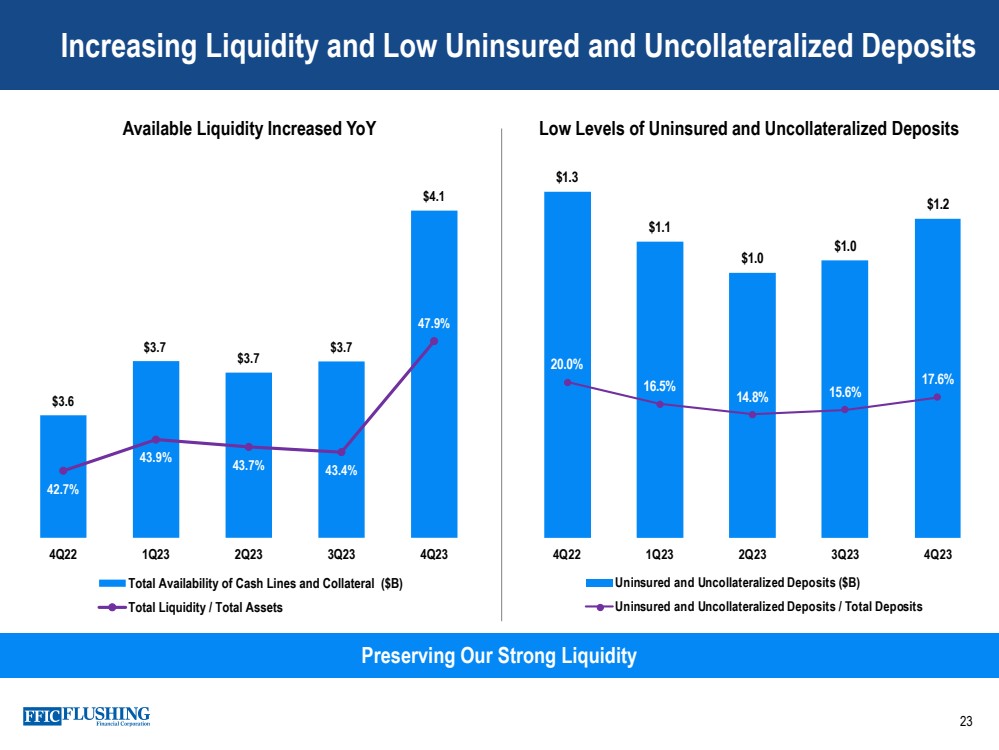
Increasing Liquidity and Low Uninsured and Uncollateralized Deposits 23 Preserving Our Strong Liquidity Available Liquidity Increased YoY Low Levels of Uninsured and Uncollateralized Deposits $3.6 $3.7 $3.7 $3.7 $4.1 42.7% 43.9% 43.7% 43.4% 47.9% 40.0% 42.0% 44.0% 46.0% 48.0% 50.0% 52.0% 54.0% 3.3 3.4 3.5 3.6 3.7 3.8 3.9 4.0 4.1 4.2 4Q22 1Q23 2Q23 3Q23 4Q23 Total Availability of Cash Lines and Collateral ($B) Total Liquidity / Total Assets $1.3 $1.1 $1.0 $1.0 $1.2 20.0% 16.5% 14.8% 15.6% 17.6% -5. 0% 5.0% 15. 0% 25. 0% 35. 0% 45. 0% 55. 0% $0. 0 $0. 2 $0. 4 $0. 6 $0. 8 $1. 0 $1. 2 $1. 4 4Q22 1Q23 2Q23 3Q23 4Q23 Uninsured and Uncollateralized Deposits ($B) Uninsured and Uncollateralized Deposits / Total Deposits |
|
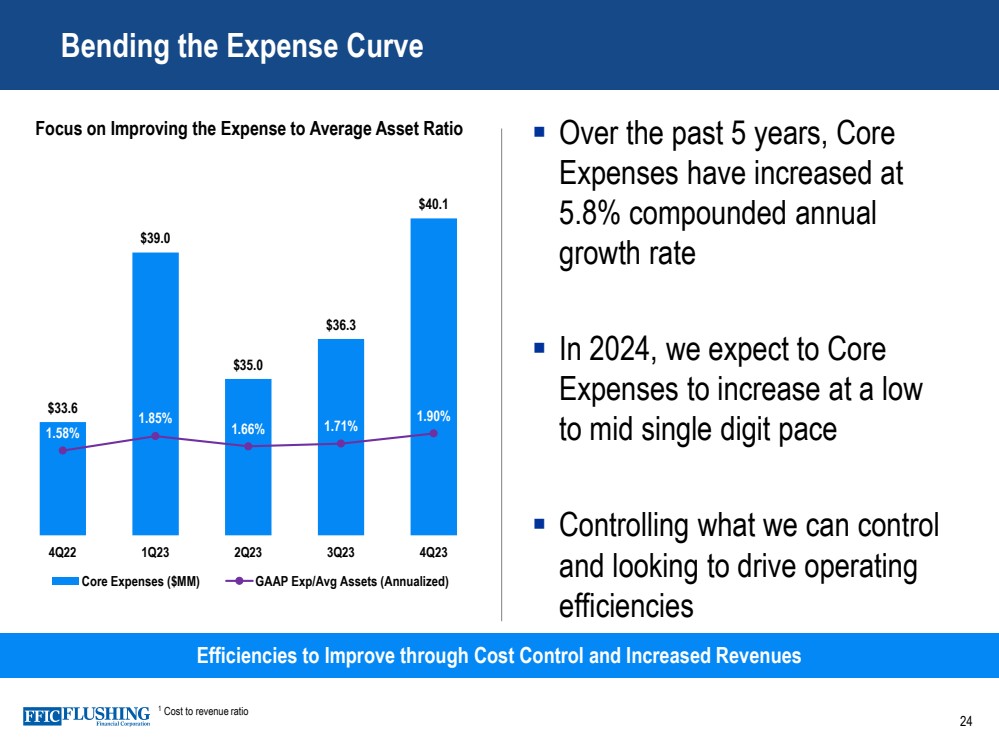
▪ Over the past 5 years, Core Expenses have increased at 5.8% compounded annual growth rate ▪ In 2024, we expect to Core Expenses to increase at a low to mid single digit pace ▪ Controlling what we can control and looking to drive operating efficiencies 24 Bending the Expense Curve Efficiencies to Improve through Cost Control and Increased Revenues Focus on Improving the Expense to Average Asset Ratio 1 Cost to revenue ratio $33.6 $39.0 $35.0 $36.3 $40.1 1.58% 1.85% 1.66% 1.71% 1.90% 0.00% 1.00% 2.00% 3.00% 4.00% 5.00% 6.00% 7.00% $30.0 $32.0 $34.0 $36.0 $38.0 $40.0 $42.0 4Q22 1Q23 2Q23 3Q23 4Q23 Core Expenses ($MM) GAAP Exp/Avg Assets (Annualized) |
|
25 Key Messages Small enough to know you. Large enough to help you. ► Leading Community Bank in the Greater NYC Area ► Well Diversified and Low Risk Loan Portfolio with Sound Credit Quality ► Growing Asian Banking Niche ► Beneficiary of a Steepening Yield Curve and Fed Rate Cuts ► Executing on Action Plan to improve profitability |
|
Appendix 26 |
|
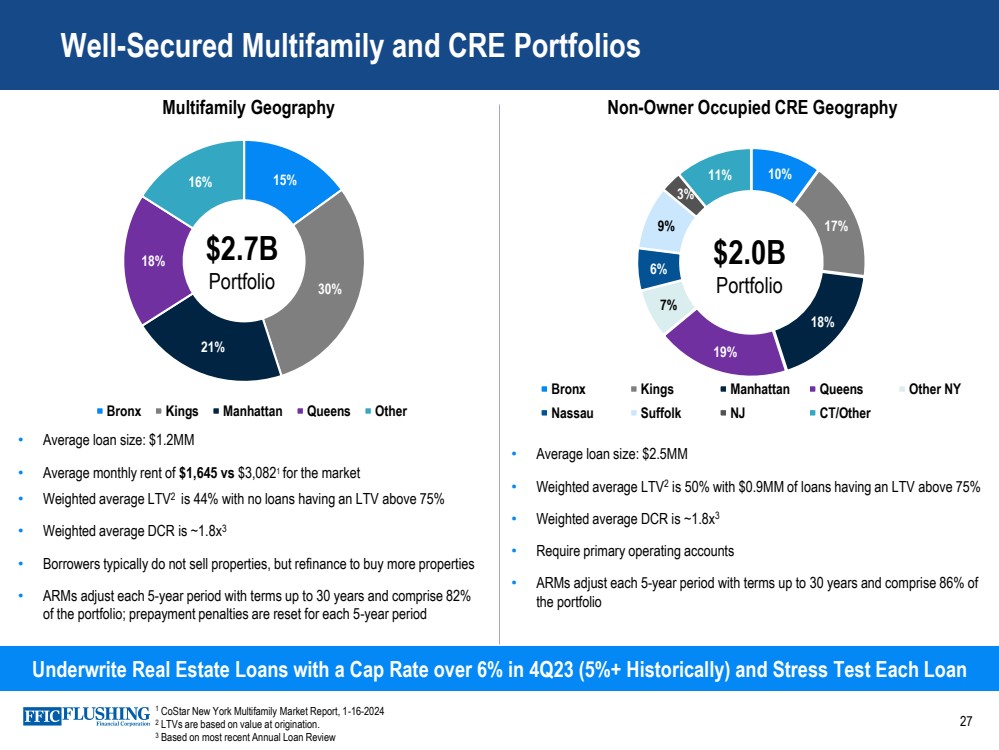
Well-Secured Multifamily and CRE Portfolios 27 Underwrite Real Estate Loans with a Cap Rate over 6% in 4Q23 (5%+ Historically) and Stress Test Each Loan Multifamily Geography 15% 30% 21% 18% 16% Bronx Kings Manhattan Queens Other $2.7B Portfolio • Average loan size: $1.2MM • Average monthly rent of $1,645 vs $3,0821 for the market • Weighted average LTV2 is 44% with no loans having an LTV above 75% • Weighted average DCR is ~1.8x3 • Borrowers typically do not sell properties, but refinance to buy more properties • ARMs adjust each 5-year period with terms up to 30 years and comprise 82% of the portfolio; prepayment penalties are reset for each 5-year period • Average loan size: $2.5MM • Weighted average LTV2 is 50% with $0.9MM of loans having an LTV above 75% • Weighted average DCR is ~1.8x3 • Require primary operating accounts • ARMs adjust each 5-year period with terms up to 30 years and comprise 86% of the portfolio Non-Owner Occupied CRE Geography 10% 17% 18% 19% 7% 6% 9% 3% 11% Bronx Kings Manhattan Queens Other NY Nassau Suffolk NJ CT/Other $2.0B Portfolio 1 CoStar New York Multifamily Market Report, 1-16-2024 2 LTVs are based on value at origination. 3 Based on most recent Annual Loan Review |
|
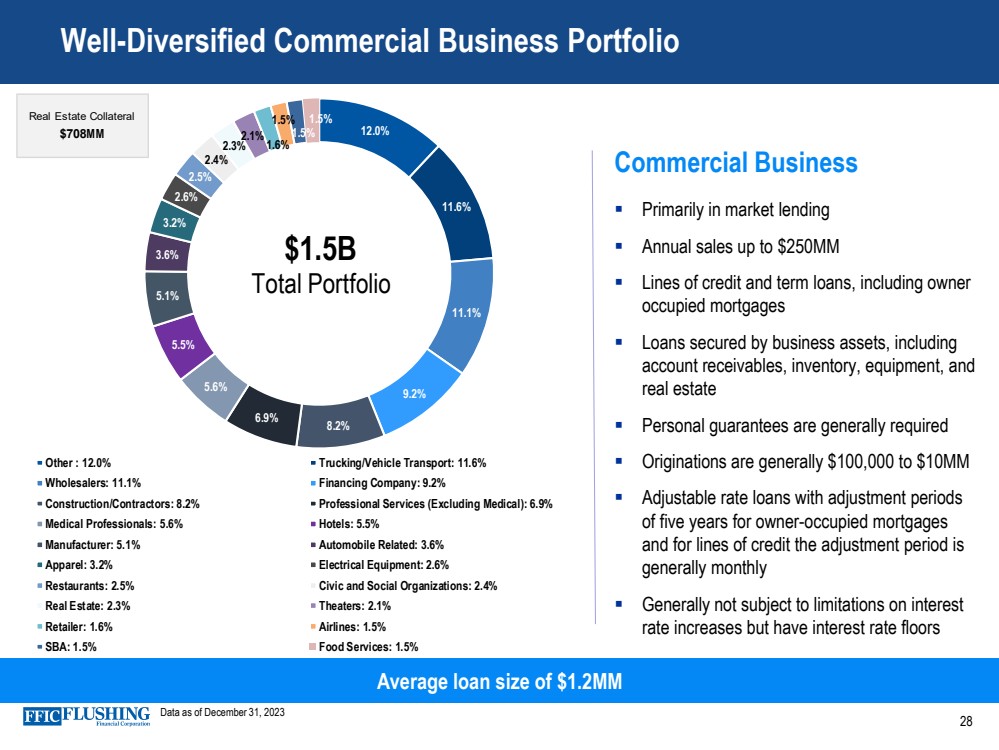
28 Well-Diversified Commercial Business Portfolio Commercial Business ▪ Primarily in market lending ▪ Annual sales up to $250MM ▪ Lines of credit and term loans, including owner occupied mortgages ▪ Loans secured by business assets, including account receivables, inventory, equipment, and real estate ▪ Personal guarantees are generally required ▪ Originations are generally $100,000 to $10MM ▪ Adjustable rate loans with adjustment periods of five years for owner-occupied mortgages and for lines of credit the adjustment period is generally monthly ▪ Generally not subject to limitations on interest rate increases but have interest rate floors Average loan size of $1.2MM Data as of December 31, 2023 12.0% 11.6% 11.1% 9.2% 8.2% 6.9% 5.6% 5.5% 5.1% 3.6% 3.2% 2.6% 2.5% 2.4% 2.3% 2.1% 1.6% 1.5% 1.5% 1.5% Other : 12.0% Trucking/Vehicle Transport: 11.6% Wholesalers: 11.1% Financing Company: 9.2% Construction/Contractors: 8.2% Professional Services (Excluding Medical): 6.9% Medical Professionals: 5.6% Hotels: 5.5% Manufacturer: 5.1% Automobile Related: 3.6% Apparel: 3.2% Electrical Equipment: 2.6% Restaurants: 2.5% Civic and Social Organizations: 2.4% Real Estate: 2.3% Theaters: 2.1% Retailer: 1.6% Airlines: 1.5% SBA: 1.5% Food Services: 1.5% $1.5B Total Portfolio Real Estate Collateral $708M M |
|
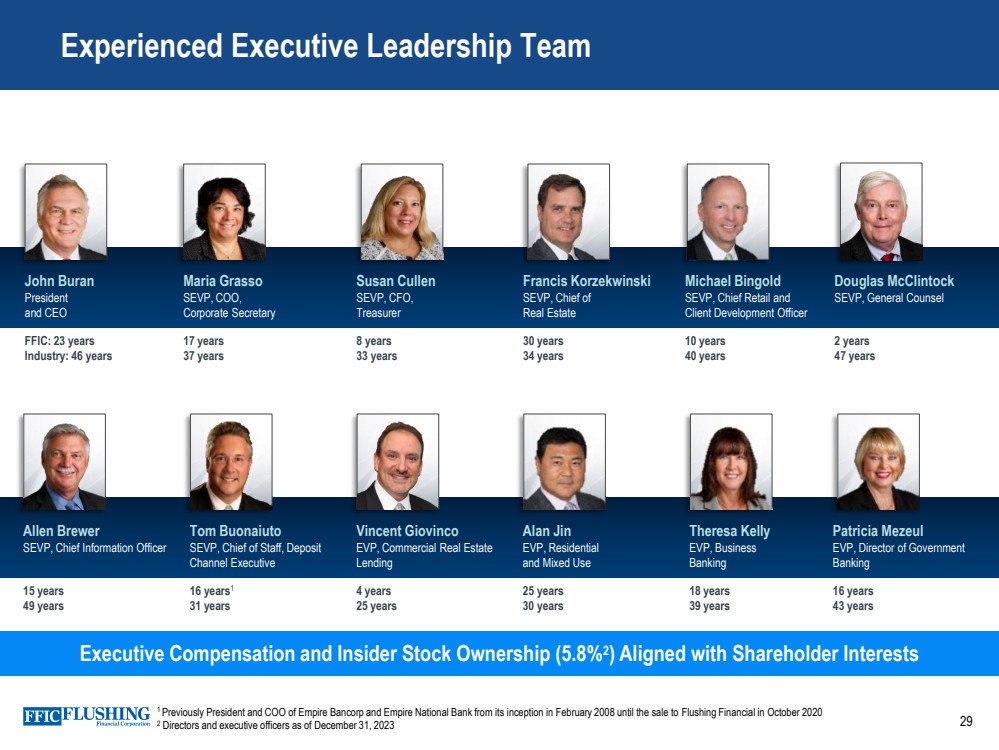
Experienced Executive Leadership Team Executive Compensation and Insider Stock Ownership (5.8%2 ) Aligned with Shareholder Interests John Buran President and CEO Maria Grasso SEVP, COO, Corporate Secretary Susan Cullen SEVP, CFO, Treasurer Francis Korzekwinski SEVP, Chief of Real Estate Michael Bingold SEVP, Chief Retail and Client Development Officer Douglas McClintock SEVP, General Counsel FFIC: 23 years Industry: 46 years 17 years 37 years 8 years 33 years 30 years 34 years 10 years 40 years 2 years 47 years Allen Brewer SEVP, Chief Information Officer Tom Buonaiuto SEVP, Chief of Staff, Deposit Channel Executive Vincent Giovinco EVP, Commercial Real Estate Lending Alan Jin EVP, Residential and Mixed Use Theresa Kelly EVP, Business Banking Patricia Mezeul EVP, Director of Government Banking 15 years 49 years 16 years1 31 years 4 years 25 years 25 years 30 years 18 years 39 years 16 years 43 years 1 Previously President and COO of Empire Bancorp and Empire National Bank from its inception in February 2008 until the sale to Flushing Financial in October 2020 2 Directors and executive officers as of December 31, 2023 29 |
|
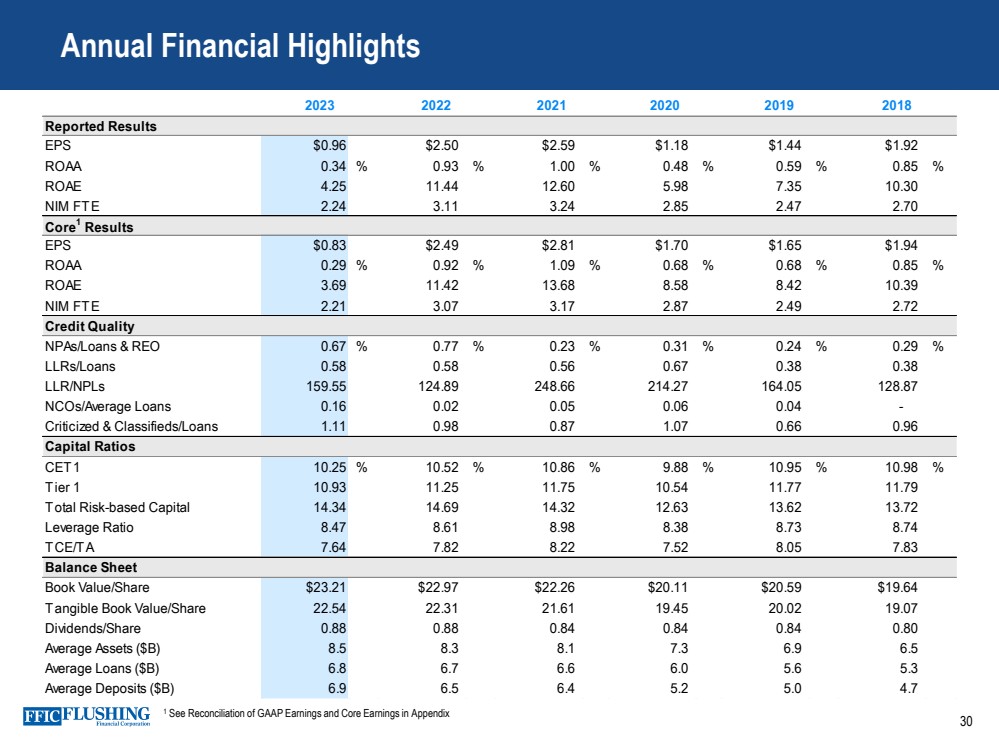
Reported Results EPS $0.96 $2.50 $2.59 $1.18 $1.44 $1.92 ROAA 0.34 % 0.93 % 1.00 % 0.48 % 0.59 % 0.85 % ROAE 4.25 11.44 12.60 5.98 7.35 10.30 NIM FTE 2.24 3.11 3.24 2.85 2.47 2.70 Core1 Results EPS $0.83 $2.49 $2.81 $1.70 $1.65 $1.94 ROAA 0.29 % 0.92 % 1.09 % 0.68 % 0.68 % 0.85 % ROAE 3.69 11.42 13.68 8.58 8.42 10.39 NIM FTE 2.21 3.07 3.17 2.87 2.49 2.72 Credit Quality NPAs/Loans & REO 0.67 % 0.77 % 0.23 % 0.31 % 0.24 % 0.29 % LLRs/Loans 0.58 0.58 0.56 0.67 0.38 0.38 LLR/NPLs 159.55 124.89 248.66 214.27 164.05 128.87 NCOs/Average Loans 0.16 0.02 0.05 0.06 0.04 - Criticized & Classifieds/Loans 1.11 0.98 0.87 1.07 0.66 0.96 Capital Ratios CET1 10.25 % 10.52 % 10.86 % 9.88 % 10.95 % 10.98 % Tier 1 10.93 11.25 11.75 10.54 11.77 11.79 Total Risk-based Capital 14.34 14.69 14.32 12.63 13.62 13.72 Leverage Ratio 8.47 8.61 8.98 8.38 8.73 8.74 TCE/TA 7.64 7.82 8.22 7.52 8.05 7.83 Balance Sheet Book Value/Share $23.21 $22.97 $22.26 $20.11 $20.59 $19.64 Tangible Book Value/Share 22.54 22.31 21.61 19.45 20.02 19.07 Dividends/Share 0.88 0.88 0.84 0.84 0.84 0.80 Average Assets ($B) 8.5 8.3 8.1 7.3 6.9 6.5 Average Loans ($B) 6.8 6.7 6.6 6.0 5.6 5.3 Average Deposits ($B) 6.9 6.5 6.4 5.2 5.0 4.7 2023 2022 2021 2020 2019 2018 30 Annual Financial Highlights 1 See Reconciliation of GAAP Earnings and Core Earnings in Appendix |
|
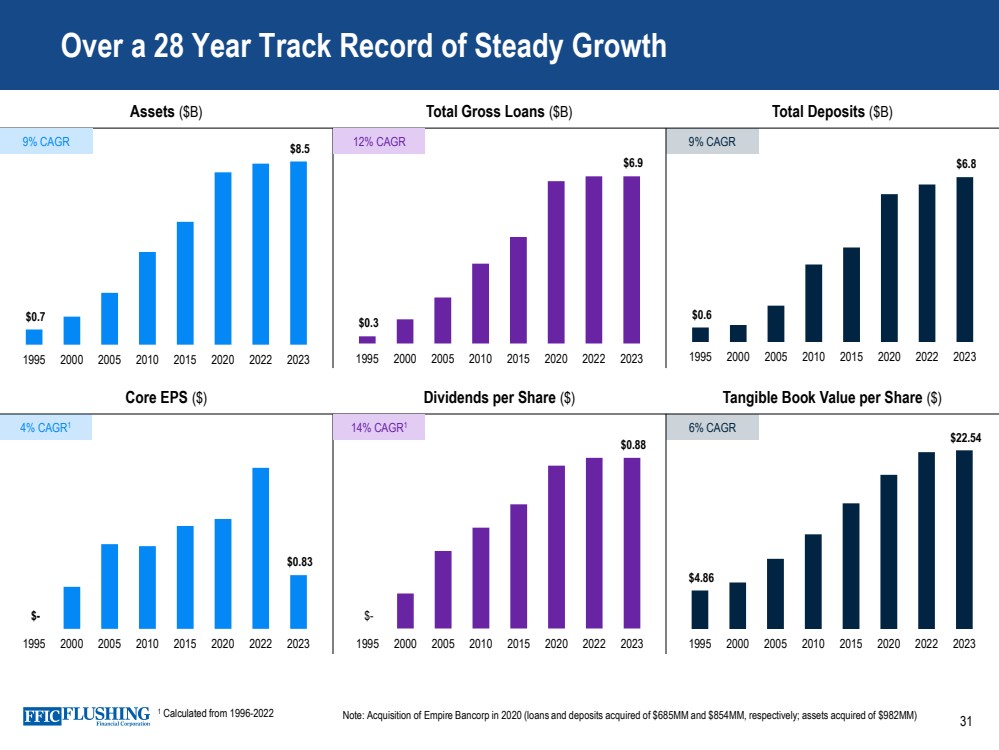
Over a 28 Year Track Record of Steady Growth Core EPS ($) Dividends per Share ($) Tangible Book Value per Share ($) Assets ($B) Total Gross Loans ($B) Total Deposits ($B) $- $0.88 1995 2000 2005 2010 2015 2020 2022 2023 $- $0.83 1995 2000 2005 2010 2015 2020 2022 2023 $0.6 $6.8 1995 2000 2005 2010 2015 2020 2022 2023 $0.3 $6.9 1995 2000 2005 2010 2015 2020 2022 2023 $0.7 $8.5 1995 2000 2005 2010 2015 2020 2022 2023 9% CAGR 12% CAGR 9% CAGR 4% CAGR1 14% CAGR1 $4.86 $22.54 1995 2000 2005 2010 2015 2020 2022 2023 6% CAGR Note: Acquisition of Empire Bancorp in 2020 (loans and deposits acquired of $685MM and $854MM, respectively; assets acquired of $982MM) 31 1 Calculated from 1996-2022 |
|
32 Environmental, Social, and Governance Environmental – reduction of carbon footprint and assessing climate change through underwriting Social - Building rewarding relationships with communities, customers, and employees See more details in our ESG Report under Investor Relations at FlushingBank.com Governance - Corporate governance is a strength through oversight and risk management |
|
Reconciliation of GAAP Earnings and Core Earnings 33 Non-cash Fair Value Adjustments to GAAP Earnings The variance in GAAP and core earnings is partly driven by the impact of non-cash net gains and losses from fair value adjustments. These fair value adjustments relate primarily to borrowings carried at fair value under the fair value option. Core Net Income, Core Diluted EPS, Core ROAE, Core ROAA, Pre-provision, Pre-tax Net Revenue, Core Net Interest Income FTE, Core Net Interest Margin FTE, Core Interest Income and Yield on Total Loans, Core Noninterest Income, Core Noninterest Expense and Tangible Book Value per common share are each non-GAAP measures used in this presentation. A reconciliation to the most directly comparable GAAP financial measures appears below in tabular form. The Company believes that these measures are useful for both investors and management to understand the effects of certain interest and noninterest items and provide an alternative view of the Company's performance over time and in comparison, to the Company's competitors. These measures should not be viewed as a substitute for net income. The Company believes that tangible book value per common share is useful for both investors and management as this measure is commonly used by financial institutions, regulators and investors to measure the capital adequacy of financial institutions. The Company believes this measure facilitates comparison of the quality and composition of the Company's capital over time and in comparison, to its competitors. This measure should not be viewed as a substitute for total shareholders' equity. These non-GAAP measures have inherent limitations, are not required to be uniformly applied and are not audited. They should not be considered in isolation or as a substitute for analysis of results reported under GAAP. These non-GAAP measures may not be comparable to similarly titled measures reported by other companies. |
|
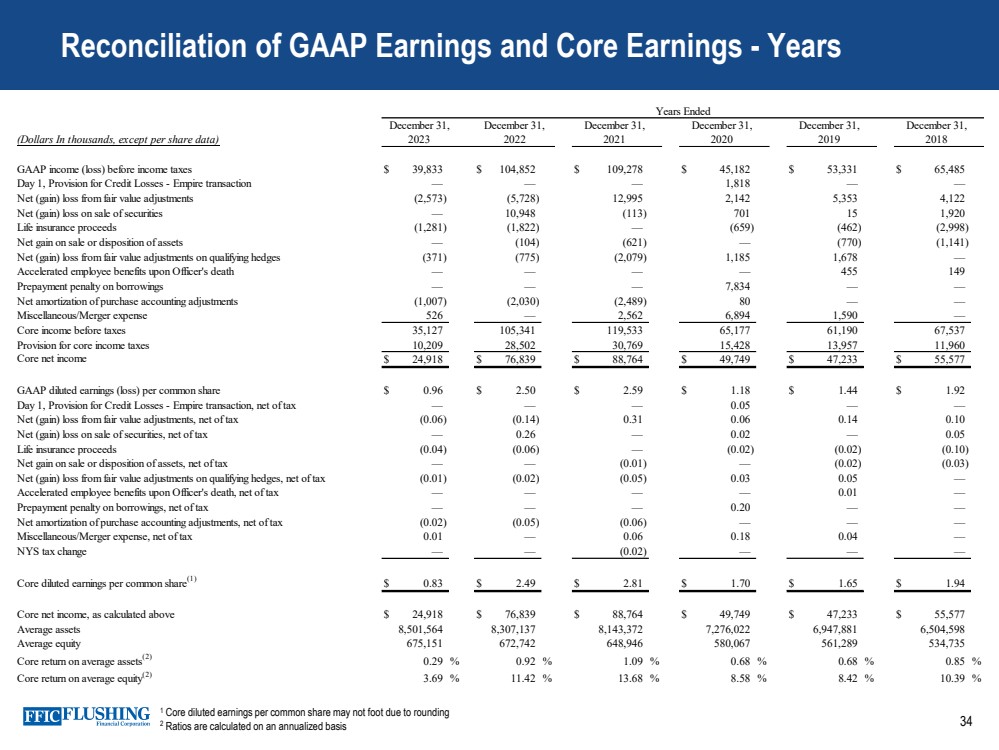
34 Reconciliation of GAAP Earnings and Core Earnings - Years 1 Core diluted earnings per common share may not foot due to rounding 2 Ratios are calculated on an annualized basis December 31, December 31, December 31, December 31, (Dollars In thousands, except per share data) 2021 2020 2019 2018 GAAP income (loss) before income taxes $ 39,833 $ 104,852 $ 109,278 $ 45,182 $ 53,331 $ 65,485 Day 1, Provision for Credit Losses - Empire transaction — — — 1,818 — — Net (gain) loss from fair value adjustments (2,573) (5,728) 12,995 2,142 5,353 4,122 Net (gain) loss on sale of securities — 10,948 (113) 701 15 1,920 Life insurance proceeds (1,281) (1,822) — (659) (462) (2,998) Net gain on sale or disposition of assets — (104) (621) — (770) (1,141) Net (gain) loss from fair value adjustments on qualifying hedges (371) (775) (2,079) 1,185 1,678 — Accelerated employee benefits upon Officer's death — — — — 455 149 Prepayment penalty on borrowings — — — 7,834 — — Net amortization of purchase accounting adjustments (1,007) (2,030) (2,489) 80 — — Miscellaneous/Merger expense 526 — 2,562 6,894 1,590 — Core income before taxes 35,127 105,341 119,533 65,177 61,190 67,537 Provision for core income taxes 10,209 28,502 30,769 15,428 13,957 11,960 Core net income $ 24,918 $ 76,839 $ 88,764 $ 49,749 $ 47,233 $ 55,577 GAAP diluted earnings (loss) per common share $ 0.96 $ 2.50 $ 2.59 $ 1.18 $ 1.44 $ 1.92 Day 1, Provision for Credit Losses - Empire transaction, net of tax — — — 0.05 — — Net (gain) loss from fair value adjustments, net of tax (0.06) (0.14) 0.31 0.06 0.14 0.10 Net (gain) loss on sale of securities, net of tax — 0.26 — 0.02 — 0.05 Life insurance proceeds (0.04) (0.06) — (0.02) (0.02) (0.10) Net gain on sale or disposition of assets, net of tax — — (0.01) — (0.02) (0.03) Net (gain) loss from fair value adjustments on qualifying hedges, net of tax (0.01) (0.02) (0.05) 0.03 0.05 — Accelerated employee benefits upon Officer's death, net of tax — — — — 0.01 — Prepayment penalty on borrowings, net of tax — — — 0.20 — — Net amortization of purchase accounting adjustments, net of tax (0.02) (0.05) (0.06) — — — Miscellaneous/Merger expense, net of tax 0.01 — 0.06 0.18 0.04 — NYS tax change — — (0.02) — — — Core diluted earnings per common share(1) $ 0.83 $ 2.49 $ 2.81 $ 1.70 $ 1.65 $ 1.94 Core net income, as calculated above $ 24,918 $ 76,839 $ 88,764 $ 49,749 $ 47,233 $ 55,577 Average assets 8,501,564 8,307,137 8,143,372 7,276,022 6,947,881 6,504,598 Average equity 675,151 672,742 648,946 580,067 561,289 534,735 Core return on average assets(2) 0.29 % 0.92 % 1.09 % 0.68 % 0.68 % 0.85 % Core return on average equity(2) 3.69 % 11.42 % 13.68 % 8.58 % 8.42 % 10.39 % December 31, 2023 December 31, 2022 Years Ended |
|
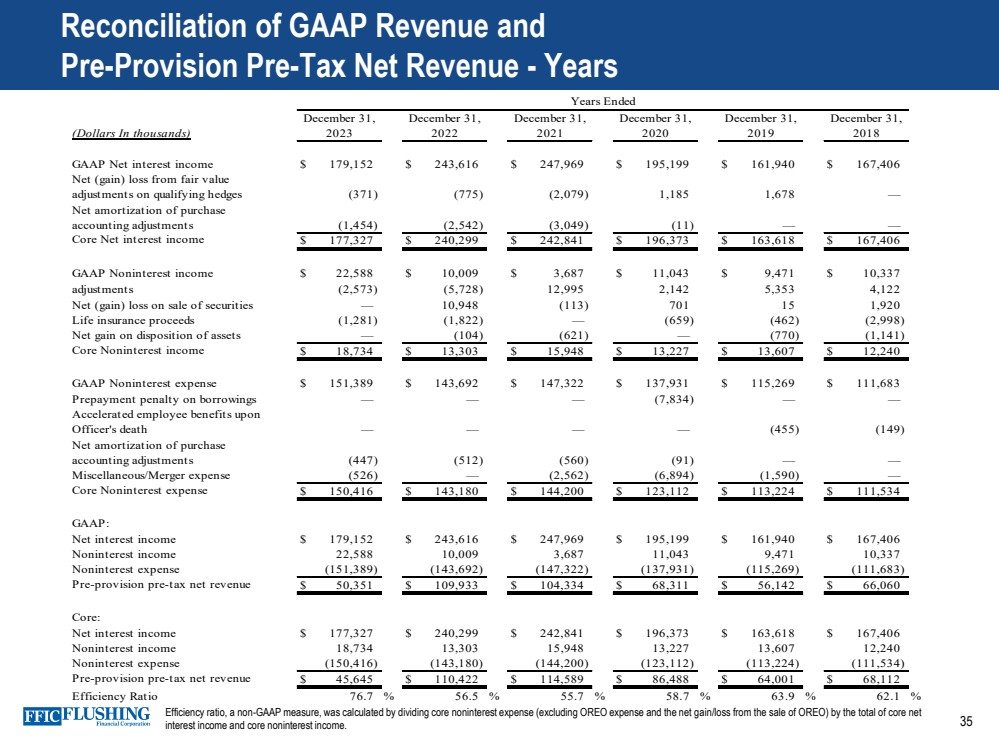
35 Reconciliation of GAAP Revenue and Pre-Provision Pre-Tax Net Revenue - Years Efficiency ratio, a non-GAAP measure, was calculated by dividing core noninterest expense (excluding OREO expense and the net gain/loss from the sale of OREO) by the total of core net interest income and core noninterest income. (Dollars In thousands) GAAP Net interest income $ 179,152 $ 243,616 $ 247,969 $ 195,199 $ 161,940 $ 167,406 Net (gain) loss from fair value adjustments on qualifying hedges (371) (775) (2,079) 1,185 1,678 — Net amortization of purchase accounting adjustments (1,454) (2,542) (3,049) (11) — — Core Net interest income $ 177,327 $ 240,299 $ 242,841 $ 196,373 $ 163,618 $ 167,406 GAAP Noninterest income Net (gain) loss from fair value $ 22,588 $ 10,009 $ 3,687 $ 11,043 $ 9,471 $ 10,337 adjustments (2,573) (5,728) 12,995 2,142 5,353 4,122 Net (gain) loss on sale of securities — 10,948 (113) 701 1 5 1,920 Life insurance proceeds (1,281) (1,822) — (659) (462) (2,998) Net gain on disposition of assets — (104) (621) — (770) (1,141) Core Noninterest income $ 18,734 $ 13,303 $ 15,948 $ 13,227 $ 13,607 $ 12,240 GAAP Noninterest expense $ 151,389 $ 143,692 $ 147,322 $ 137,931 $ 115,269 $ 111,683 Prepayment penalty on borrowings — — — (7,834) — — Accelerated employee benefits upon Officer's death — — — — (455) (149) Net amortization of purchase accounting adjustments (447) (512) (560) (91) — — Miscellaneous/Merger expense (526) — (2,562) (6,894) (1,590) — Core Noninterest expense $ 150,416 $ 143,180 $ 144,200 $ 123,112 $ 113,224 $ 111,534 GAAP: Net interest income $ 179,152 $ 243,616 $ 247,969 $ 195,199 $ 161,940 $ 167,406 Noninterest income 22,588 10,009 3,687 11,043 9,471 10,337 Noninterest expense (151,389) (143,692) (147,322) (137,931) (115,269) (111,683) Pre-provision pre-tax net revenue $ 50,351 $ 109,933 $ 104,334 $ 68,311 $ 56,142 $ 66,060 Core: Net interest income $ 177,327 $ 240,299 $ 242,841 $ 196,373 $ 163,618 $ 167,406 Noninterest income 18,734 13,303 15,948 13,227 13,607 12,240 Noninterest expense (150,416) (143,180) (144,200) (123,112) (113,224) (111,534) Pre-provision pre-tax net revenue $ 45,645 $ 110,422 $ 114,589 $ 86,488 $ 64,001 $ 68,112 Efficiency Ratio 76.7 % 56.5 % 55.7 % 58.7 % 63.9 % 62.1 % 2020 December 31, 2023 December 31, 2022 December 31, 2021 December 31, 2019 December 31, 2018 Years Ended December 31, |
|
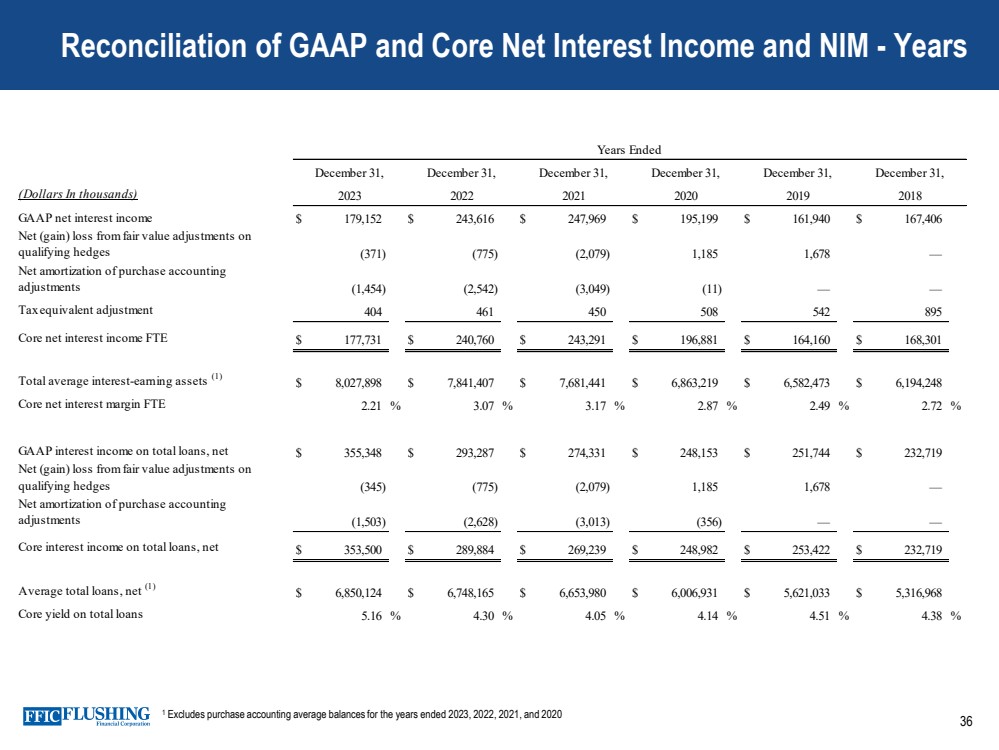
36 Reconciliation of GAAP and Core Net Interest Income and NIM - Years 1 Excludes purchase accounting average balances for the years ended 2023, 2022, 2021, and 2020 (Dollars In thousands) GAAP net interest income $ 179,152 $ 243,616 $ 247,969 $ 195,199 $ 161,940 $ 167,406 Net (gain) loss from fair value adjustments on qualifying hedges (371) (775) (2,079) 1,185 1,678 — Net amortization of purchase accounting adjustments (1,454) (2,542) (3,049) (11) — — Tax equivalent adjustment 404 461 450 508 542 895 Core net interest income FTE $ 177,731 $ 240,760 $ 243,291 $ 196,881 $ 164,160 $ 168,301 Total average interest-earning assets (1) $ 8,027,898 $ 7,841,407 $ 7,681,441 $ 6,863,219 $ 6,582,473 $ 6,194,248 Core net interest margin FTE 2.21 % 3.07 % 3.17 % 2.87 % 2.49 % 2.72 % GAAP interest income on total loans, net $ 355,348 $ 293,287 $ 274,331 $ 248,153 $ 251,744 $ 232,719 Net (gain) loss from fair value adjustments on qualifying hedges (345) (775) (2,079) 1,185 1,678 — Net amortization of purchase accounting adjustments (1,503) (2,628) (3,013) (356) — — Core interest income on total loans, net $ 353,500 $ 289,884 $ 269,239 $ 248,982 $ 253,422 $ 232,719 Average total loans, net (1) $ 6,850,124 $ 6,748,165 $ 6,653,980 $ 6,006,931 $ 5,621,033 $ 5,316,968 Core yield on total loans 5.16 % 4.30 % 4.05 % 4.14 % 4.51 % 4.38 % 2019 December 31, Years Ended December 31, 2020 December 31, 2023 December 31, 2022 December 31, 2021 December 31, 2018 |
|
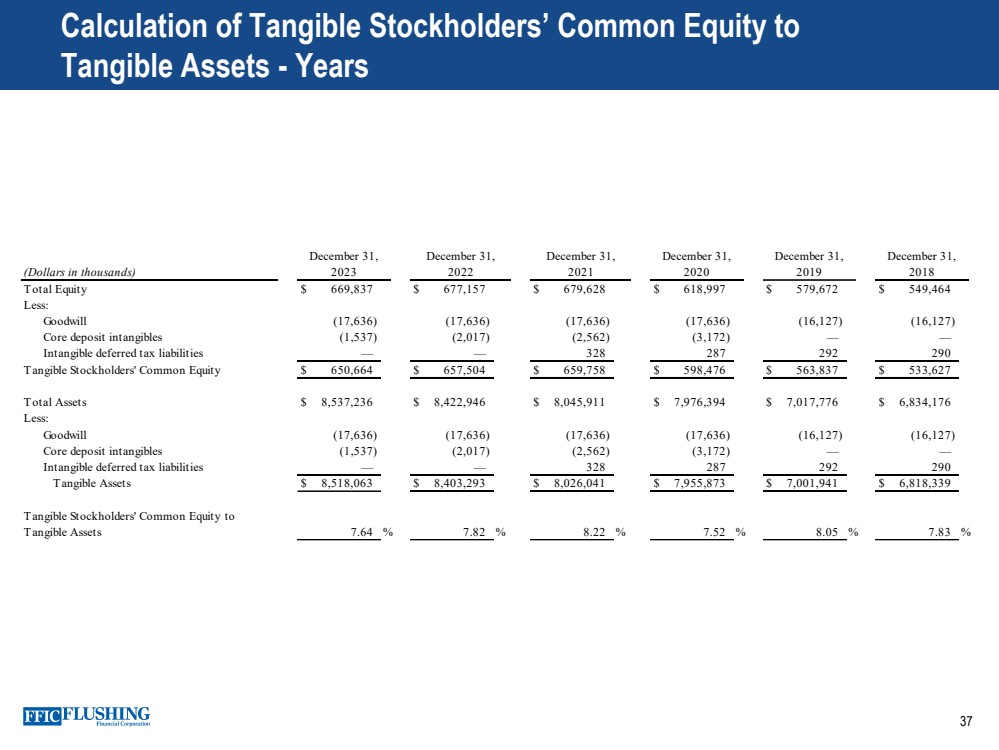
37 Calculation of Tangible Stockholders’ Common Equity to Tangible Assets - Years (Dollars in thousands) Total Equity $ 669,837 $ 677,157 $ 679,628 $ 618,997 $ 579,672 $ 549,464 Less: Goodwill (17,636) (17,636) (17,636) (17,636) (16,127) (16,127) Core deposit intangibles (1,537) (2,017) (2,562) (3,172) — — Intangible deferred tax liabilities — — 328 287 292 290 Tangible Stockholders' Common Equity $ 650,664 $ 657,504 $ 659,758 $ 598,476 $ 563,837 $ 533,627 Total Assets $ 8,537,236 $ 8,422,946 $ 8,045,911 $ 7,976,394 $ 7,017,776 $ 6,834,176 Less: Goodwill (17,636) (17,636) (17,636) (17,636) (16,127) (16,127) Core deposit intangibles (1,537) (2,017) (2,562) (3,172) — — Intangible deferred tax liabilities — — 328 287 292 290 Tangible Assets $ 8,518,063 $ 8,403,293 $ 8,026,041 $ 7,955,873 $ 7,001,941 $ 6,818,339 Tangible Stockholders' Common Equity to Tangible Assets 7.64 % 7.82 % 8.22 % 7.52 % 8.05 % 7.83 % 2021 2020 2019 2018 December 31, December 31, December 31, December 31, December 31, 2023 December 31, 2022 |
|
38 Contact Details Susan K. Cullen SEVP, CFO & Treasurer Phone: (718) 961-5400 Email: scullen@flushingbank.com Al Savastano, CFA Director of Investor Relations Phone: (516) 820-1146 Email: asavastano@flushingbank.com |
|