UNITED STATES
SECURITIES AND EXCHANGE COMMISSION
Washington, D.C. 20549
|
FORM 8-K |
|
CURRENT REPORT
Pursuant to Section 13 OR 15(d) of the Securities Exchange Act of 1934
Date of Report: February 15, 2024
(Date of earliest event reported)
DEERE & COMPANY
(Exact name of registrant as specified in its charter)
Delaware |
|
1-4121 |
|
36-2382580 |
(State or other jurisdiction of incorporation) |
|
(Commission File Number) |
|
(IRS Employer Identification No.) |
One John Deere Place
Moline, Illinois 61265
(Address of principal executive offices and zip code)
(309) 765-8000
(Registrant’s telephone number, including area code)
___________________________________________________
(Former name or former address, if changed since last report.)
Check the appropriate box below if the Form 8-K filing is intended to simultaneously satisfy the filing obligation of the registrant under any of the following provisions:
☐ Written communications pursuant to Rule 425 under the Securities Act (17 CFR 230.425)
☐ Soliciting material pursuant to Rule 14a-12 under the Exchange Act (17 CFR 240.14a-12)
☐ Pre-commencement communications pursuant to Rule 14d-2(b) under the Exchange Act (17 CFR 240.14d-2(b))
☐ Pre-commencement communications pursuant to Rule 13e-4(c) under the Exchange Act (17 CFR 240.13e-4(c))
SECURITIES REGISTERED PURSUANT TO SECTION 12(b) OF THE ACT:
Title of each class |
|
Trading symbol |
|
Name of each exchange on which registered |
Common stock, $1 par value |
|
DE |
|
New York Stock Exchange |
6.55% Debentures Due 2028 |
|
DE28 |
|
New York Stock Exchange |
Indicate by check mark whether the registrant is an emerging growth company as defined in Rule 405 of the Securities Act of 1933 (§230.405 of this chapter) or Rule 12b-2 of the Securities Exchange Act of 1934 (§240.12b-2 of this chapter).
Emerging growth company ☐
If an emerging growth company, indicate by check mark if the registrant has elected not to use the extended transition period for complying with any new or revised financial accounting standards provided pursuant to Section 13(a) of the Exchange Act. ☐
Item 2.02Results of Operations and Financial Condition
On Thursday, February 15, 2024, Deere & Company (the “Company”) issued a press release announcing its results of operations for the first quarter of fiscal 2024. A copy of the press release is furnished herewith as Exhibit 99.1 and is incorporated herein by reference.
Item 7.01Regulation FD
On Thursday, February 15, 2024, the Company made available a presentation providing a review of its first quarter of fiscal 2024 in connection with its investor earnings call. A copy of the presentation is furnished herewith as Exhibit 99.2 and is incorporated herein by reference.
Item 9.01Financial Statements and Exhibits
(d)Exhibits
Number |
Description of Exhibit |
99.1 |
Press Release and Supplemental Financial Information (Furnished herewith) |
99.2 |
First Quarter 2024 Earnings Conference Call Information (Furnished herewith) |
104 |
Cover Page Interactive Data File (the cover page XBRL tags are imbedded in the Inline XBRL document) |
2
Signature
Pursuant to the requirements of the Securities Exchange Act of 1934, the Registrant has duly caused this report to be signed on its behalf by the undersigned hereunto duly authorized.
|
DEERE & COMPANY |
|
|
|
|
|
|
|
|
By: |
/s/ Edward R. Berk |
|
|
Edward R. Berk |
|
|
Secretary |
|
|
|
|
|
|
Dated: February 15, 2024 |
|
|
3
Exhibit 99.1
(Furnished herewith)
News Release |
|
|
|
Contact:
Jen Hartmann
Director, Public Relations
HartmannJenniferA@JohnDeere.com
Deere Reports First Quarter Net Income of $1.751 Billion
| ● | Strong quarterly operating margins from equipment operations demonstrate structural improvement near mid-cycle volumes. |
| ● | Fleet replenishment moderating as agricultural fundamentals normalize. |
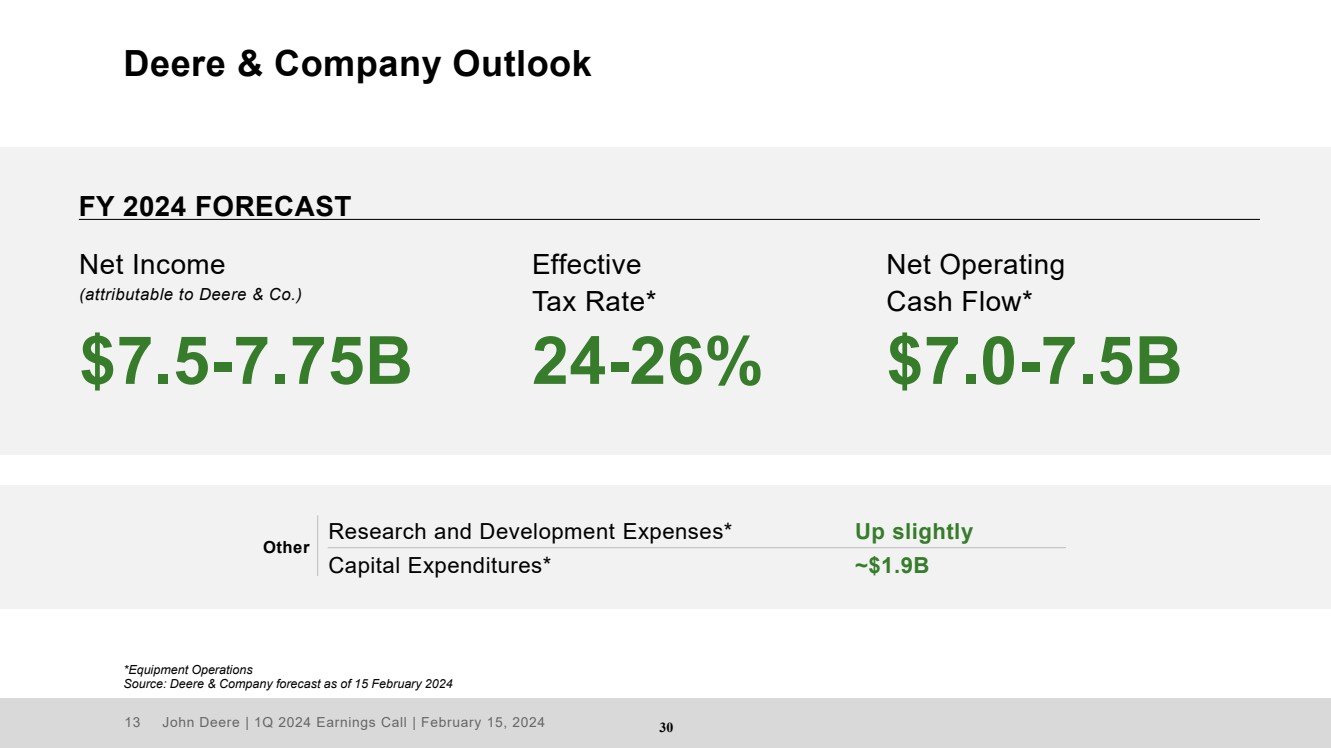
| ● | Full-year net income now forecasted to be $7.50 to $7.75 billion. |
MOLINE, Illinois (February 15, 2024) — Deere & Company reported net income of $1.751 billion for the first quarter ended January 28, 2024, or $6.23 per share, compared with net income of $1.959 billion, or $6.55 per share, for the quarter ended January 29, 2023.
Worldwide net sales and revenues decreased 4 percent, to $12.185 billion, in the most recent quarter. Net sales were $10.486 billion for the quarter, compared with $11.402 billion in 2023.
“Deere's first-quarter performance underscores the effectiveness of our Smart Industrial operating model and the dedication of our workforce, enabling improved performance across economic cycles that surpasses historical benchmarks,” said John C. May, chairman and chief executive officer. “Moreover, we remain committed to empowering our customers to improve their productivity and sustainability through ongoing investment in the next generation of solutions, as evidenced by our partnership on satellite communications to expand rural connectivity announced this quarter.”
Company Outlook & Summary
Net income attributable to Deere & Company for fiscal 2024 is forecasted to be in a range of $7.50 billion to $7.75 billion.
“Moving forward, we expect fleet replenishment to moderate as agricultural fundamentals normalize from record levels in 2022 and 2023,” May said. “Regardless of where we are in the cycle, demand is accelerating for products and solutions that empower our customers to do more with less, and we are uniquely positioned to deliver unparalleled value to our customers.”
Deere & Company |
|
First Quarter |
|
||||||
$ in millions, except per share amounts |
|
2024 |
|
2023 |
|
% Change |
|
||
Net sales and revenues |
|
$ |
12,185 |
|
$ |
12,652 |
|
-4% |
|
Net income |
|
$ |
1,751 |
|
$ |
1,959 |
|
-11% |
|
Fully diluted EPS |
|
$ |
6.23 |
|
$ |
6.55 |
|
|
|
4
Production & Precision Agriculture |
|
First Quarter |
|
||||||
$ in millions |
|
2024 |
|
2023 |
|
% Change |
|
||
Net sales |
|
$ |
4,849 |
|
$ |
5,198 |
|
-7% |
|
Operating profit |
|
$ |
1,045 |
|
$ |
1,208 |
|
-13% |
|
Operating margin |
|
|
21.6% |
|
|
23.2% |
|
|
|
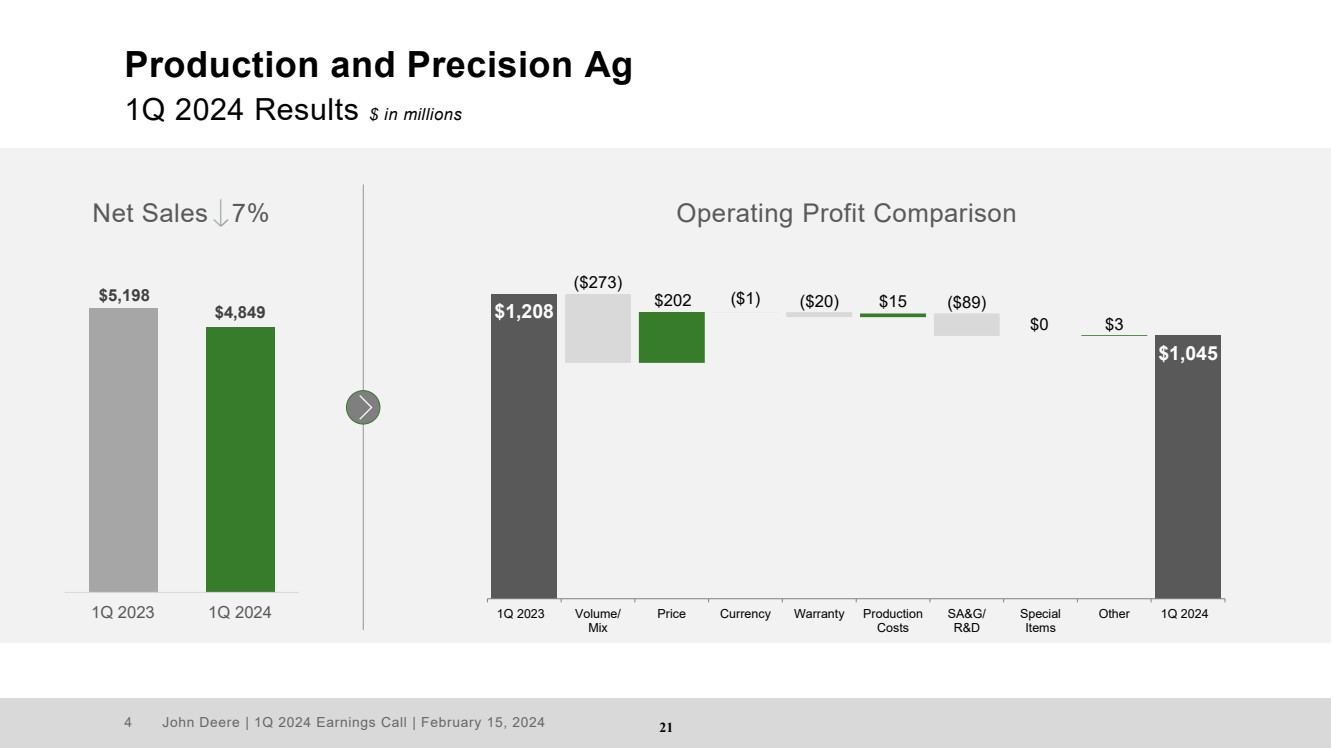
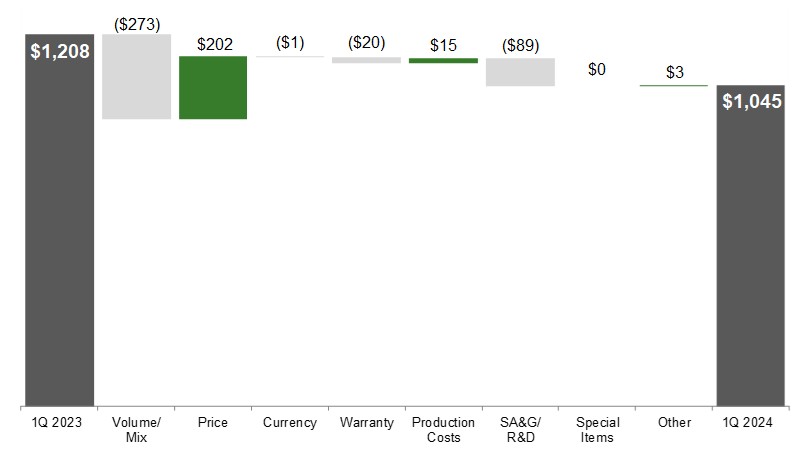
Production and precision agriculture sales decreased for the quarter as a result of lower shipment volumes, partially offset by price realization. Operating profit decreased due to lower shipment volumes and higher SA&G and R&D expenses, partially offset by price realization.
Production & Precision Agriculture Operating Profit
First Quarter 2024 Compared to First Quarter 2023
$ in millions
5
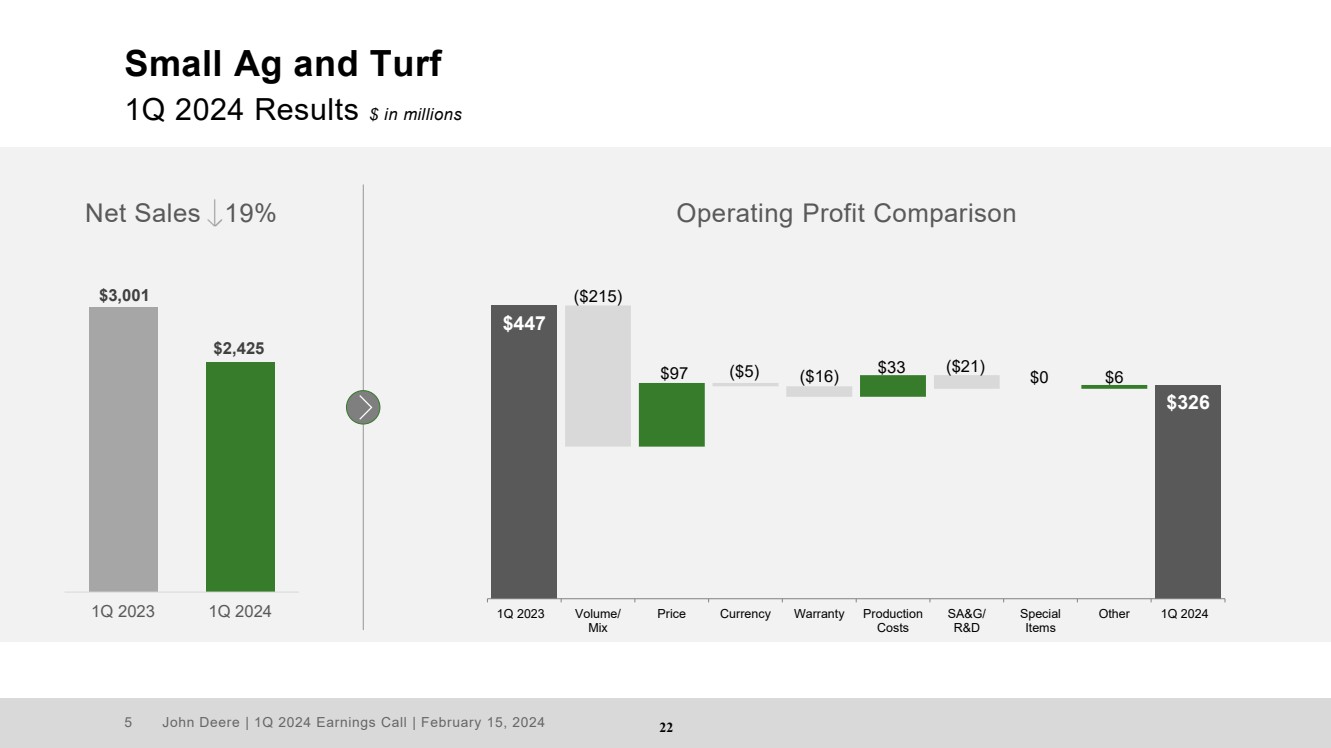
Small Agriculture & Turf |
|
First Quarter |
|
||||||
$ in millions |
|
2024 |
|
2023 |
|
% Change |
|
||
Net sales |
|
$ |
2,425 |
|
$ |
3,001 |
|
-19% |
|
Operating profit |
|
$ |
326 |
|
$ |
447 |
|
-27% |
|
Operating margin |
|
|
13.4% |
|
|
14.9% |
|
|
|
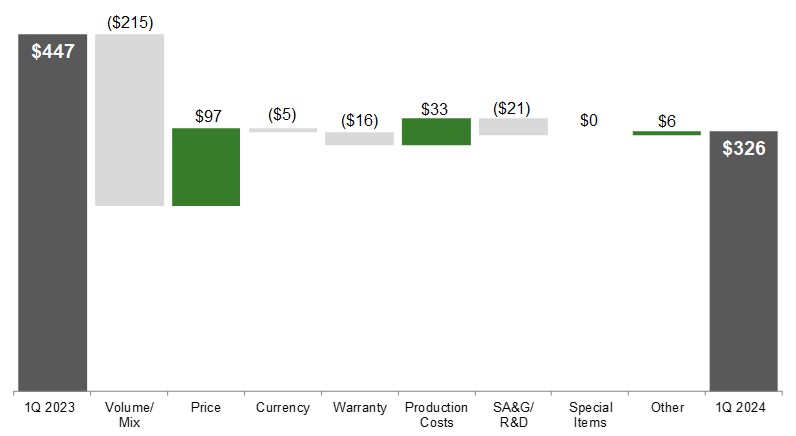
Small agriculture and turf sales decreased for the quarter as a result of lower shipment volumes, partially offset by price realization. Operating profit decreased due to lower shipment volumes and higher SA&G and R&D expenses. These items were partially offset by price realization and lower production costs.
Small Agriculture & Turf Operating Profit
First Quarter 2024 Compared to First Quarter 2023
$ in millions
6
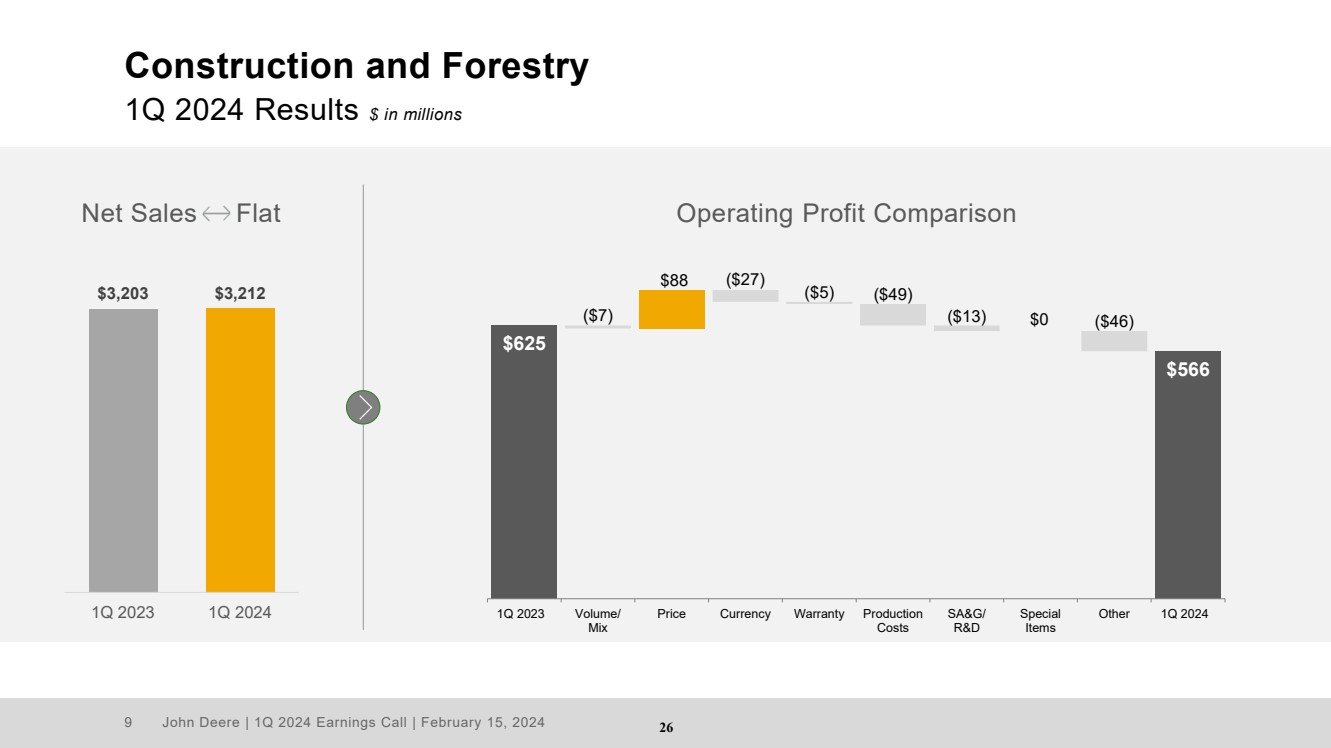
Construction & Forestry |
|
First Quarter |
|
||||||
$ in millions |
|
2024 |
|
2023 |
|
% Change |
|
||
Net sales |
|
$ |
3,212 |
|
$ |
3,203 |
|
|
|
Operating profit |
|
$ |
566 |
|
$ |
625 |
|
-9% |
|
Operating margin |
|
|
17.6% |
|
|
19.5% |
|
|
|
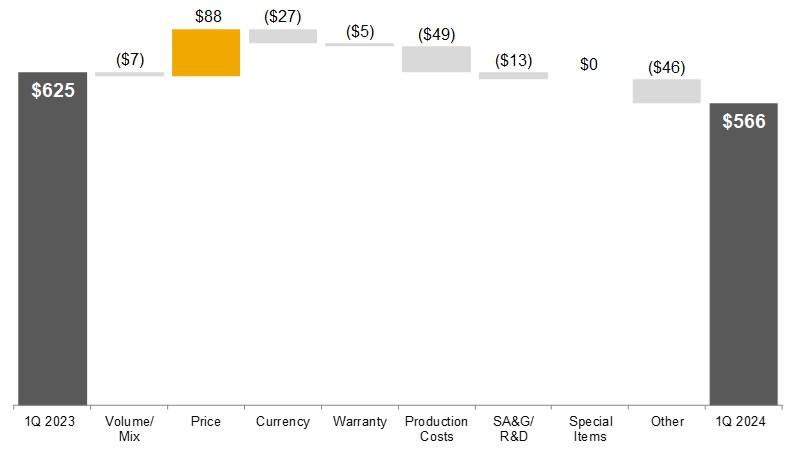
Construction and forestry sales were flat for the quarter, with positive price realization offset by lower shipment volumes. Operating profit decreased primarily due to higher production costs, lower shipment volumes, the unfavorable effects of currency translation, and higher SA&G and R&D expenses. These items were partially offset by price realization and a favorable sales mix.
Construction & Forestry Operating Profit
First Quarter 2024 Compared to First Quarter 2023
$ in millions
7
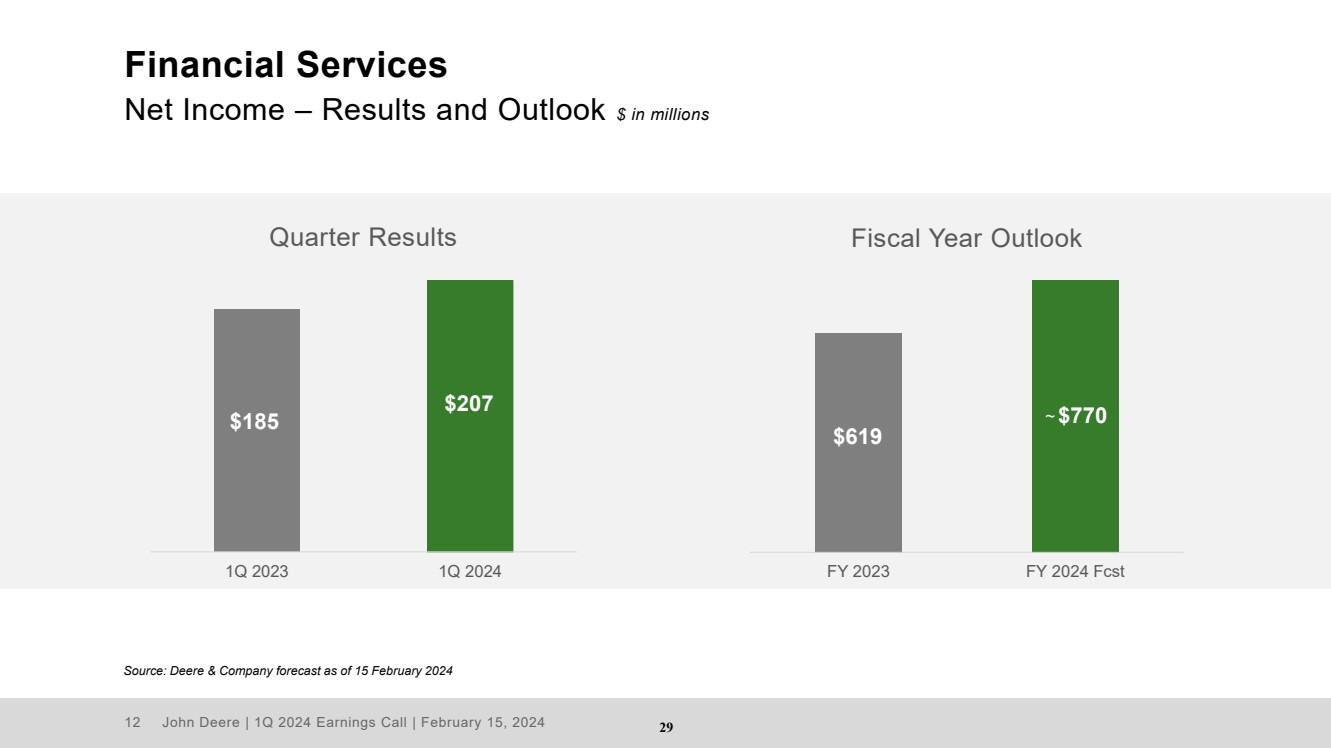
Financial Services |
|
First Quarter |
|
||||||
$ in millions |
|
2024 |
|
2023 |
|
% Change |
|
||
Net income |
|
$ |
207 |
|
$ |
185 |
|
12% |
|
Financial services net income for the quarter increased due to income earned on higher average portfolio balances, partially offset by less-favorable financing spreads.
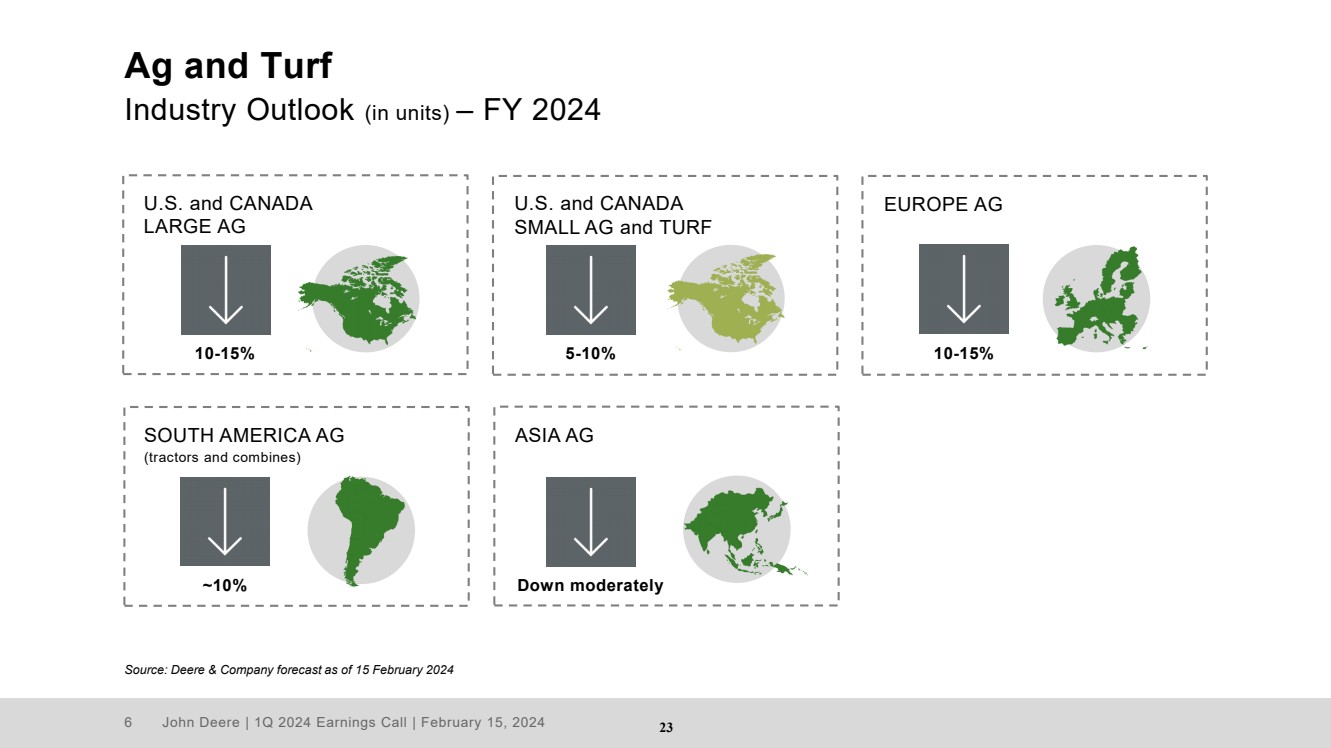
Industry Outlook for Fiscal 2024 |
|
|
|
|
|
||
Agriculture & Turf |
|
|
|
|
|
|
|
U.S. & Canada: |
|
|
|
|
|
|
|
Large Ag |
|
|
|
|
|
Down 10 to 15% |
|
Small Ag & Turf |
|
|
|
|
|
Down 5 to 10% |
|
Europe |
|
|
|
|
|
Down 10 to 15% |
|
South America (Tractors & Combines) |
|
|
|
|
|
Down ~ 10% |
|
Asia |
|
|
|
|
|
Down moderately |
|
|
|
|
|
|
|
|
|
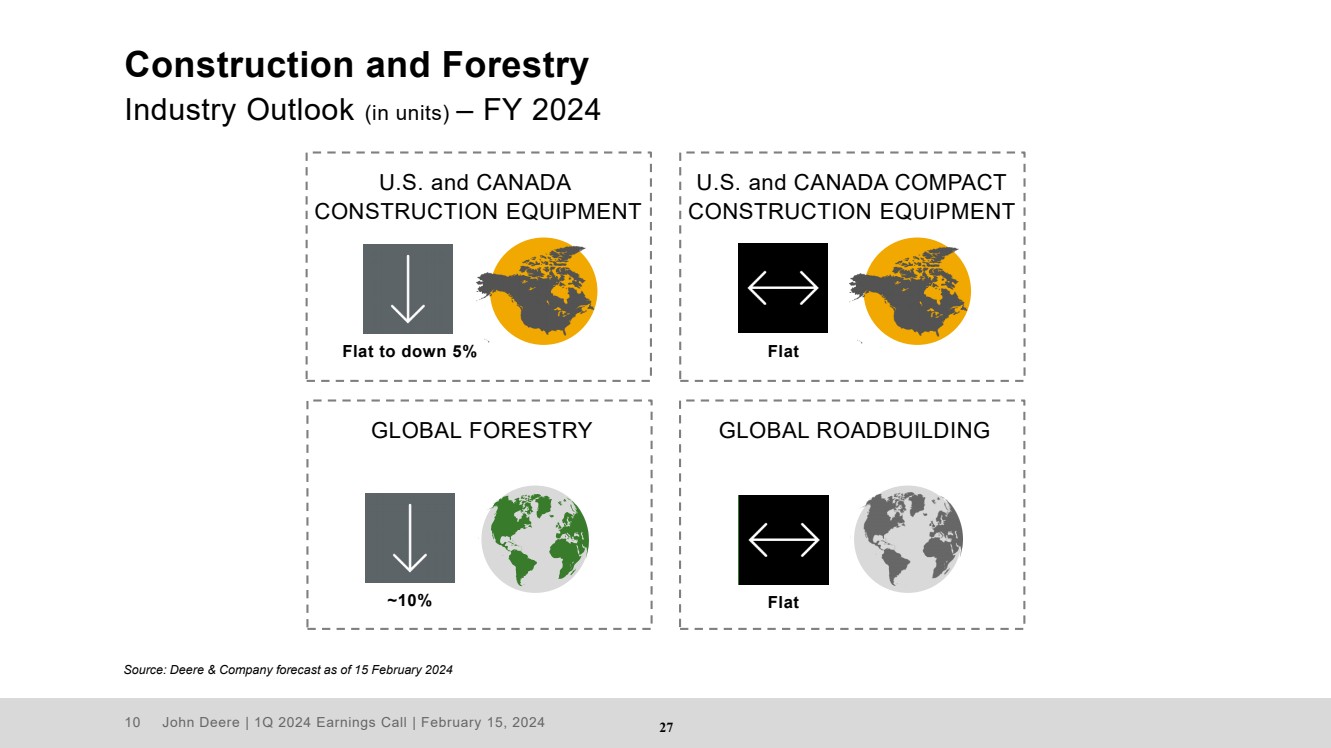
Construction & Forestry |
|
|
|
|
|
|
|
U.S. & Canada: |
|
|
|
|
|
|
|
Construction Equipment |
|
|
|
|
|
Flat to Down 5% |
|
Compact Construction Equipment |
|
|
|
|
|
Flat |
|
Global Forestry |
|
|
|
|
|
Down ~ 10% |
|
Global Roadbuilding |
|
|
|
|
|
Flat |
|
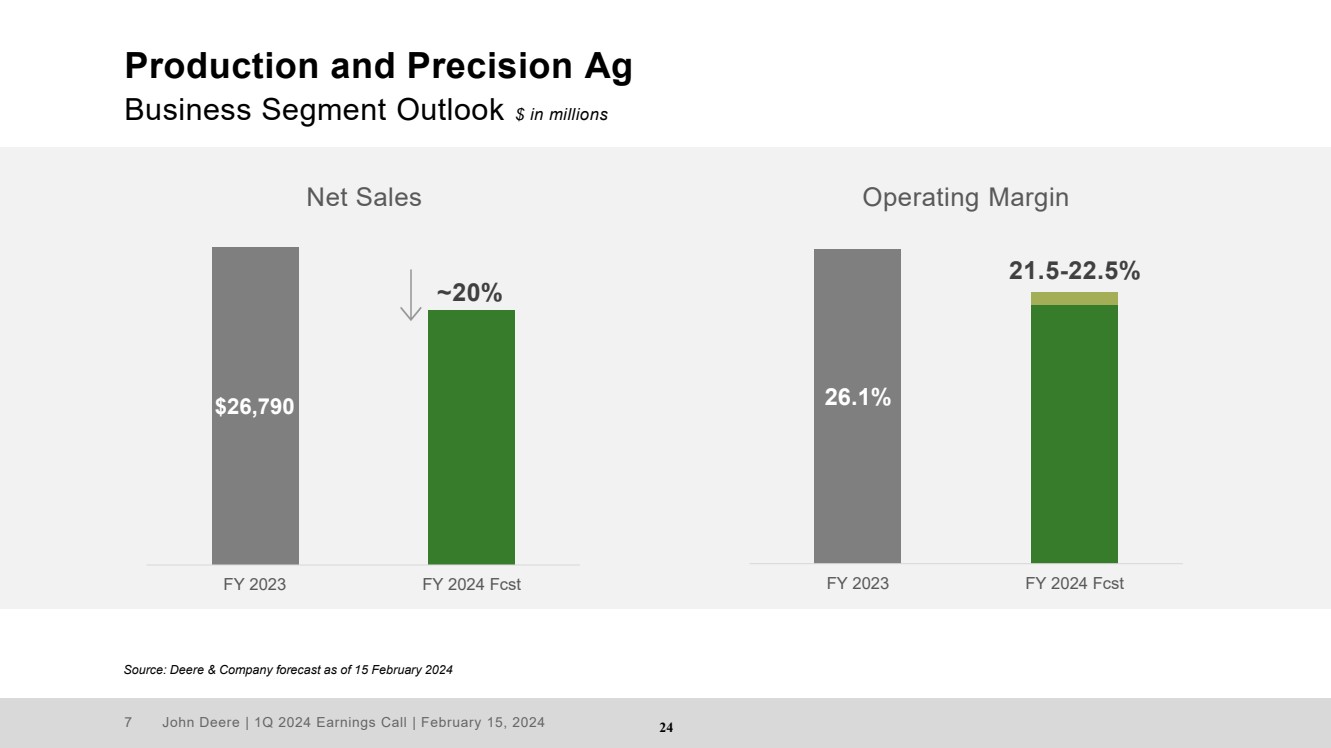
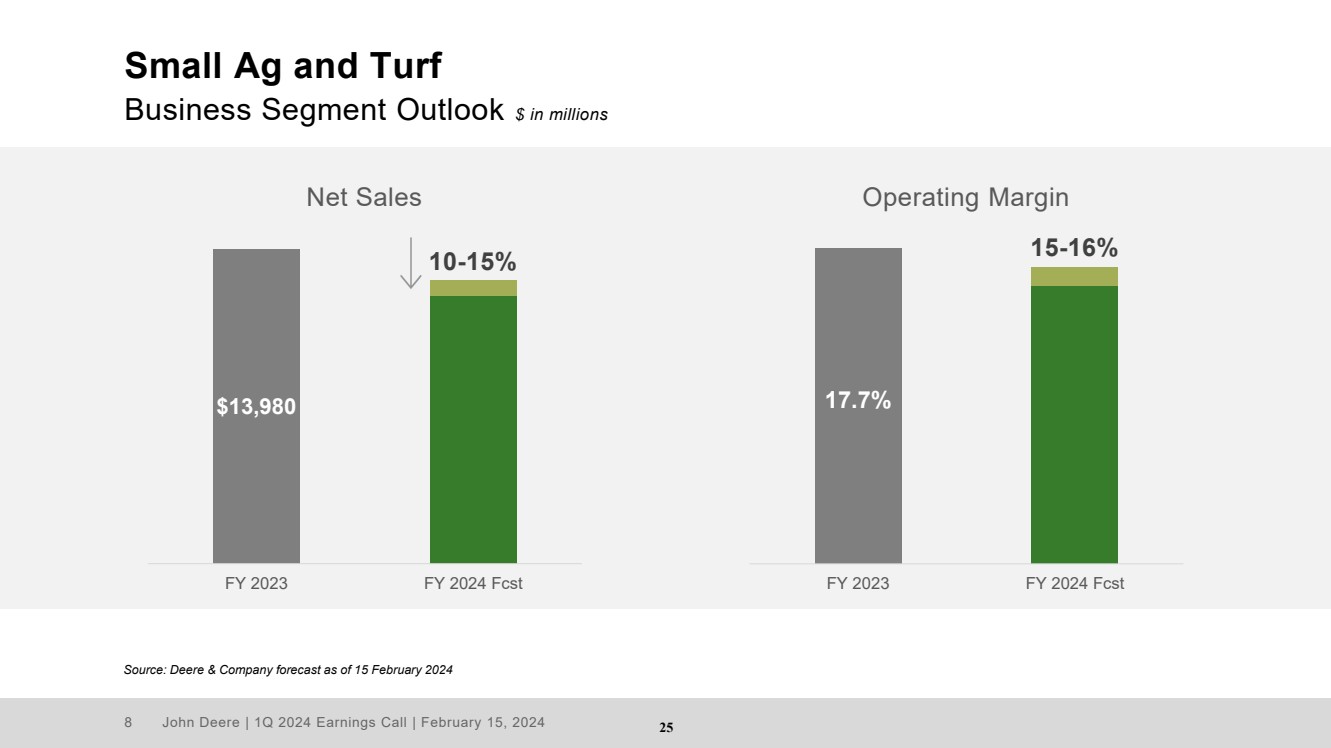
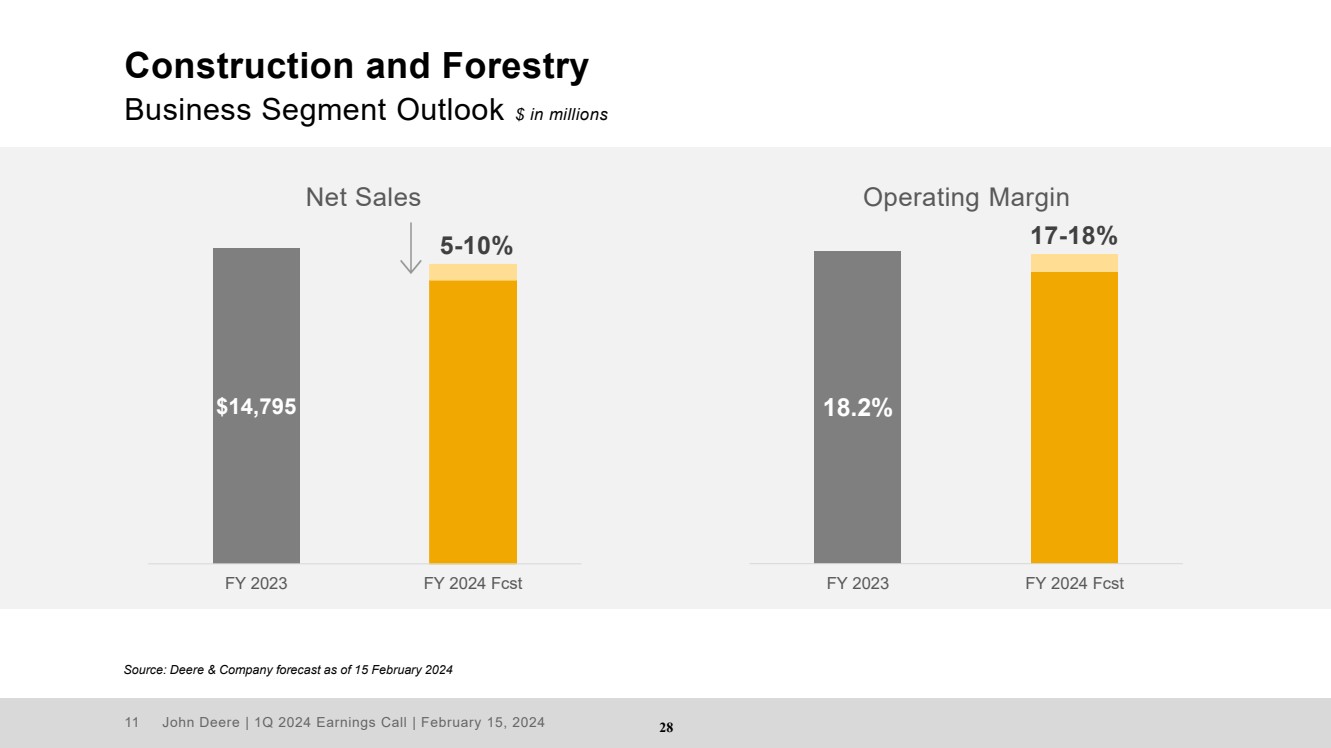
Deere Segment Outlook for Fiscal 2024 |
|
Currency |
|
Price |
|
||
$ in millions |
|
Net Sales |
|
Translation |
|
Realization |
|
Production & Precision Ag |
|
Down ~ 20% |
|
~ Flat |
|
+1.5% |
|
Small Ag & Turf |
|
Down 10 to 15% |
|
~ Flat |
|
+1.5% |
|
Construction & Forestry |
|
Down 5 to 10% |
|
~ Flat |
|
+1.5% |
|
|
|
|
|
|
|
|
|
Financial Services |
|
Net Income |
|
~$ 770 |
|
|
|
Financial Services. Fiscal-year 2024 net income attributable to Deere & Company for the financial services operations is forecast to be approximately $770 million. Results are expected to be higher than fiscal year 2023 due to income earned on a higher average portfolio, partially offset by less-favorable financing spreads. A correction of the accounting treatment for financing incentives offered to John Deere dealers impacted 2023 financial results. The cumulative effect of this correction, $173 million pretax ($135 million after-tax), was recorded in the second quarter of 2023.
FORWARD-LOOKING STATEMENTS
Certain statements contained herein, including in the section entitled “Company Outlook & Summary,” “Industry Outlook,” and “Deere Segment Outlook,” relating to future events, expectations, and trends constitute “forward-looking statements” as defined in the Private Securities Litigation Reform Act of 1995 and involve factors that are subject to change, assumptions, risks, and uncertainties that could cause actual results to differ materially. Some of these risks and uncertainties could affect all lines of the company’s operations generally while others could more heavily affect a particular line of business.
Forward-looking statements are based on currently available information and current assumptions, expectations, and projections about future events and should not be relied upon. Except as required by law, the company expressly disclaims any obligation to update or revise its forward-looking statements. Many factors, risks, and uncertainties could cause actual results to differ materially from these forward-looking statements. Among these factors are risks related to:
| ● | changes and compliance with U.S., foreign and international laws, regulations, and policies relating to trade, economic sanctions, data privacy, spending, taxing, banking, monetary, environmental (including climate change and engine emission), and farming policies; |
8
| ● | political, economic, and social instability of the geographies in which the company operates, including the ongoing war between Russia and Ukraine and the war between Israel and Hamas; |
| ● | adverse macroeconomic conditions, including unemployment, inflation, rising interest rates, changes in consumer practices due to slower economic growth, and regional or global liquidity constraints; |
| ● | worldwide demand for food and different forms of renewable energy; |
| ● | the ability to execute business strategies, including the company’s Smart Industrial Operating Model, Leap Ambitions, and mergers and acquisitions; |
| ● | the ability to understand and meet customers’ changing expectations and demand for John Deere products and solutions; |
| ● | accurately forecasting customer demand for products and services and adequately managing inventory; |
| ● | the ability to integrate new technology, including automation and machine learning, and deliver precision technology and solutions to customers; |
| ● | changes to governmental communications channels (radio frequency technology); |
| ● | the ability to adapt in highly competitive markets; |
| ● | dealer practices and their ability to manage distribution of John Deere products and support and service precision technology solutions; |
| ● | changes in climate patterns, unfavorable weather events, and natural disasters; |
| ● | governmental and other actions designed to address climate change in connection with a transition to a lower-carbon economy; |
| ● | higher interest rates and currency fluctuations which could adversely affect the U.S. dollar, customer confidence, access to capital, and demand for John Deere products and solutions; |
| ● | availability and price of raw materials, components, and whole goods; |
| ● | delays or disruptions in the company’s supply chain; |
| ● | our equipment fails to perform as expected, which could result in warranty claims, post-sales repairs or recalls, product liability litigation, and regulatory investigations; |
| ● | the ability to attract, develop, engage, and retain qualified personnel; |
| ● | security breaches, cybersecurity attacks, technology failures, and other disruptions to John Deere information technology infrastructure and products; |
| ● | loss of or challenges to intellectual property rights; |
| ● | legislation introduced or enacted that could affect the company’s business model and intellectual property, such as right to repair or right to modify legislation; |
| ● | investigations, claims, lawsuits, or other legal proceedings; |
| ● | events that damage the company’s reputation or brand; |
| ● | world grain stocks, available farm acres, soil conditions, harvest yields, prices for commodities and livestock, input costs, and availability of transport for crops; and |
| ● | housing starts and supply, real estate and housing prices, levels of public and non-residential construction, and infrastructure investment. |
Further information concerning the company and its businesses, including factors that could materially affect the financial results, is included in the company’s filings with the SEC (including, but not limited to, the factors discussed in Item 1A. “Risk Factors” of our most recent Annual Report on Form 10-K and subsequent Quarterly Reports on Form 10-Q). There also may be other factors that the company cannot anticipate or that are not described herein because the company does not currently perceive them to be material.
9
DEERE & COMPANY
FIRST QUARTER 2024 PRESS RELEASE
(In millions of dollars) Unaudited
|
|
Three Months Ended |
|
||||||
|
|
January 28 |
|
January 29 |
|
% |
|
||
|
|
2024 |
|
2023 |
|
Change |
|
||
Net sales and revenues: |
|
|
|
|
|
|
|
|
|
Production & precision ag net sales |
|
$ |
4,849 |
|
$ |
5,198 |
|
-7 |
|
Small ag & turf net sales |
|
|
2,425 |
|
|
3,001 |
|
-19 |
|
Construction & forestry net sales |
|
|
3,212 |
|
|
3,203 |
|
|
|
Financial services revenues |
|
|
1,376 |
|
|
1,040 |
|
+32 |
|
Other revenues |
|
|
323 |
|
|
210 |
|
+54 |
|
Total net sales and revenues |
|
$ |
12,185 |
|
$ |
12,652 |
|
-4 |
|
|
|
|
|
|
|
|
|
|
|
Operating profit: * |
|
|
|
|
|
|
|
|
|
Production & precision ag |
|
$ |
1,045 |
|
$ |
1,208 |
|
-13 |
|
Small ag & turf |
|
|
326 |
|
|
447 |
|
-27 |
|
Construction & forestry |
|
|
566 |
|
|
625 |
|
-9 |
|
Financial services |
|
|
257 |
|
|
238 |
|
+8 |
|
Total operating profit |
|
|
2,194 |
|
|
2,518 |
|
-13 |
|
Reconciling items ** |
|
|
26 |
|
|
(22) |
|
|
|
Income taxes |
|
|
(469) |
|
|
(537) |
|
-13 |
|
Net income attributable to Deere & Company |
|
$ |
1,751 |
|
$ |
1,959 |
|
-11 |
|
* Operating profit is income from continuing operations before corporate expenses, certain external interest expense, certain foreign exchange gains and losses, and income taxes. Operating profit for financial services includes the effect of interest expense and foreign exchange gains or losses.
** Reconciling items are primarily corporate expenses, certain interest income and expenses, certain foreign exchange gains and losses, pension and postretirement benefit costs excluding the service cost component, equity in income of unconsolidated affiliates, and net income attributable to noncontrolling interests.
10
DEERE & COMPANY
STATEMENTS OF CONSOLIDATED INCOME
For the Three Months Ended January 28, 2024 and January 29, 2023
(In millions of dollars and shares except per share amounts) Unaudited
|
|
2024 |
|
2023 |
||
Net Sales and Revenues |
|
|
|
|
|
|
Net sales |
|
$ |
10,486 |
|
$ |
11,402 |
Finance and interest income |
|
|
1,360 |
|
|
994 |
Other income |
|
|
339 |
|
|
256 |
Total |
|
|
12,185 |
|
|
12,652 |
|
|
|
|
|
|
|
Costs and Expenses |
|
|
|
|
|
|
Cost of sales |
|
|
7,200 |
|
|
7,934 |
Research and development expenses |
|
|
533 |
|
|
495 |
Selling, administrative and general expenses |
|
|
1,066 |
|
|
952 |
Interest expense |
|
|
802 |
|
|
479 |
Other operating expenses |
|
|
369 |
|
|
299 |
Total |
|
|
9,970 |
|
|
10,159 |
|
|
|
|
|
|
|
Income of Consolidated Group before Income Taxes |
|
|
2,215 |
|
|
2,493 |
Provision for income taxes |
|
|
469 |
|
|
537 |
|
|
|
|
|
|
|
Income of Consolidated Group |
|
|
1,746 |
|
|
1,956 |
Equity in income of unconsolidated affiliates |
|
|
2 |
|
|
1 |
|
|
|
|
|
|
|
Net Income |
|
|
1,748 |
|
|
1,957 |
Less: Net loss attributable to noncontrolling interests |
|
|
(3) |
|
|
(2) |
Net Income Attributable to Deere & Company |
|
$ |
1,751 |
|
$ |
1,959 |
|
|
|
|
|
|
|
Per Share Data |
|
|
|
|
|
|
Basic |
|
$ |
6.25 |
|
$ |
6.58 |
Diluted |
|
|
6.23 |
|
|
6.55 |
Dividends declared |
|
|
1.47 |
|
|
1.20 |
Dividends paid |
|
|
1.35 |
|
|
1.13 |
|
|
|
|
|
|
|
Average Shares Outstanding |
|
|
|
|
|
|
Basic |
|
|
279.9 |
|
|
297.6 |
Diluted |
|
|
281.1 |
|
|
299.1 |
See Condensed Notes to Interim Consolidated Financial Statements.
11
DEERE & COMPANY
CONDENSED CONSOLIDATED BALANCE SHEETS
(In millions of dollars) Unaudited
|
|
January 28 |
|
October 29 |
|
January 29 |
|||
|
|
2024 |
|
2023 |
|
2023 |
|||
Assets |
|
|
|
|
|
|
|
|
|
Cash and cash equivalents |
|
$ |
5,137 |
|
$ |
7,458 |
|
$ |
3,976 |
Marketable securities |
|
|
1,136 |
|
|
946 |
|
|
852 |
Trade accounts and notes receivable – net |
|
|
7,795 |
|
|
7,739 |
|
|
7,609 |
Financing receivables – net |
|
|
43,708 |
|
|
43,673 |
|
|
36,882 |
Financing receivables securitized – net |
|
|
6,400 |
|
|
7,335 |
|
|
5,089 |
Other receivables |
|
|
2,017 |
|
|
2,623 |
|
|
1,992 |
Equipment on operating leases – net |
|
|
6,751 |
|
|
6,917 |
|
|
6,502 |
Inventories |
|
|
8,937 |
|
|
8,160 |
|
|
10,056 |
Property and equipment – net |
|
|
6,914 |
|
|
6,879 |
|
|
6,212 |
Goodwill |
|
|
3,966 |
|
|
3,900 |
|
|
3,891 |
Other intangible assets – net |
|
|
1,112 |
|
|
1,133 |
|
|
1,255 |
Retirement benefits |
|
|
3,087 |
|
|
3,007 |
|
|
3,793 |
Deferred income taxes |
|
|
1,833 |
|
|
1,814 |
|
|
914 |
Other assets |
|
|
2,578 |
|
|
2,503 |
|
|
2,597 |
Total Assets |
|
$ |
101,371 |
|
$ |
104,087 |
|
$ |
91,620 |
|
|
|
|
|
|
|
|
|
|
Liabilities and Stockholders’ Equity |
|
|
|
|
|
|
|
|
|
|
|
|
|
|
|
|
|
|
|
Liabilities |
|
|
|
|
|
|
|
|
|
Short-term borrowings |
|
$ |
17,117 |
|
$ |
17,939 |
|
$ |
14,129 |
Short-term securitization borrowings |
|
|
6,116 |
|
|
6,995 |
|
|
4,864 |
Accounts payable and accrued expenses |
|
|
13,361 |
|
|
16,130 |
|
|
13,108 |
Deferred income taxes |
|
|
550 |
|
|
520 |
|
|
519 |
Long-term borrowings |
|
|
39,933 |
|
|
38,477 |
|
|
35,071 |
Retirement benefits and other liabilities |
|
|
2,115 |
|
|
2,140 |
|
|
2,493 |
Total liabilities |
|
|
79,192 |
|
|
82,201 |
|
|
70,184 |
|
|
|
|
|
|
|
|
|
|
Redeemable noncontrolling interest |
|
|
100 |
|
|
97 |
|
|
100 |
|
|
|
|
|
|
|
|
|
|
Stockholders’ Equity |
|
|
|
|
|
|
|
|
|
Total Deere & Company stockholders’ equity |
|
|
22,075 |
|
|
21,785 |
|
|
21,332 |
Noncontrolling interests |
|
|
4 |
|
|
4 |
|
|
4 |
Total stockholders’ equity |
|
|
22,079 |
|
|
21,789 |
|
|
21,336 |
Total Liabilities and Stockholders’ Equity |
|
$ |
101,371 |
|
$ |
104,087 |
|
$ |
91,620 |
See Condensed Notes to Interim Consolidated Financial Statements.
12
DEERE & COMPANY
STATEMENTS OF CONSOLIDATED CASH FLOWS
For the Three Months Ended January 28, 2024 and January 29, 2023
(In millions of dollars) Unaudited
|
|
2024 |
|
2023 |
||
Cash Flows from Operating Activities |
|
|
|
|
|
|
Net income |
|
$ |
1,748 |
|
$ |
1,957 |
Adjustments to reconcile net income to net cash used for operating activities: |
|
|
|
|
|
|
Provision (credit) for credit losses |
|
|
31 |
|
|
(130) |
Provision for depreciation and amortization |
|
|
520 |
|
|
494 |
Share-based compensation expense |
|
|
46 |
|
|
23 |
Provision (credit) for deferred income taxes |
|
|
27 |
|
|
(56) |
Changes in assets and liabilities: |
|
|
|
|
|
|
Receivables related to sales |
|
|
(277) |
|
|
(1,015) |
Inventories |
|
|
(723) |
|
|
(1,279) |
Accounts payable and accrued expenses |
|
|
(2,327) |
|
|
(1,577) |
Accrued income taxes payable/receivable |
|
|
183 |
|
|
199 |
Retirement benefits |
|
|
(129) |
|
|
(48) |
Other |
|
|
(7) |
|
|
186 |
Net cash used for operating activities |
|
|
(908) |
|
|
(1,246) |
|
|
|
|
|
|
|
Cash Flows from Investing Activities |
|
|
|
|
|
|
Collections of receivables (excluding receivables related to sales) |
|
|
7,752 |
|
|
7,198 |
Proceeds from sales of equipment on operating leases |
|
|
506 |
|
|
497 |
Cost of receivables acquired (excluding receivables related to sales) |
|
|
(6,447) |
|
|
(6,322) |
Purchases of property and equipment |
|
|
(362) |
|
|
(315) |
Cost of equipment on operating leases acquired |
|
|
(454) |
|
|
(497) |
Collateral on derivatives – net |
|
|
310 |
|
|
345 |
Other |
|
|
(88) |
|
|
(146) |
Net cash provided by investing activities |
|
|
1,217 |
|
|
760 |
|
|
|
|
|
|
|
Cash Flows from Financing Activities |
|
|
|
|
|
|
Net proceeds (payments) in short-term borrowings (original maturities three months or less) |
|
|
(2,951) |
|
|
697 |
Proceeds from borrowings issued (original maturities greater than three months) |
|
|
5,287 |
|
|
2,505 |
Payments of borrowings (original maturities greater than three months) |
|
|
(3,237) |
|
|
(1,925) |
Repurchases of common stock |
|
|
(1,328) |
|
|
(1,257) |
Dividends paid |
|
|
(386) |
|
|
(341) |
Other |
|
|
(30) |
|
|
(18) |
Net cash used for financing activities |
|
|
(2,645) |
|
|
(339) |
|
|
|
|
|
|
|
Effect of Exchange Rate Changes on Cash, Cash Equivalents, and Restricted Cash |
|
|
16 |
|
|
62 |
|
|
|
|
|
|
|
Net Decrease in Cash, Cash Equivalents, and Restricted Cash |
|
|
(2,320) |
|
|
(763) |
Cash, Cash Equivalents, and Restricted Cash at Beginning of Period |
|
|
7,620 |
|
|
4,941 |
Cash, Cash Equivalents, and Restricted Cash at End of Period |
|
$ |
5,300 |
|
$ |
4,178 |
See Condensed Notes to Interim Consolidated Financial Statements.
13
DEERE & COMPANY |
|
Condensed Notes to Interim Consolidated Financial Statements |
|
(In millions of dollars) Unaudited |
|
| (1) | The consolidated financial statements represent the consolidation of all Deere & Company’s subsidiaries. The supplemental consolidating data is presented for informational purposes. Transactions between the equipment operations and financial services have been eliminated to arrive at the consolidated financial statements. In the supplemental consolidating data in Note 2 to the financial statements, the “Equipment Operations” represents the enterprise without “Financial Services”, which include the company’s production and precision agriculture operations, small agriculture and turf operations, and construction and forestry operations, and other corporate assets, liabilities, revenues, and expenses not reflected within “Financial Services.” |
14
DEERE & COMPANY
(2) SUPPLEMENTAL CONSOLIDATING DATA
STATEMENTS OF INCOME
For the Three Months Ended January 28, 2024 and January 29, 2023
(In millions of dollars) Unaudited
|
|
EQUIPMENT |
|
FINANCIAL |
|
|
|
|
|
|
||||||||||||||||
|
|
OPERATIONS |
|
SERVICES |
|
ELIMINATIONS |
|
CONSOLIDATED |
|
|
||||||||||||||||
|
|
2024 |
|
2023 |
|
2024 |
|
2023 |
|
2024 |
|
2023 |
|
2024 |
|
2023 |
|
|
||||||||
Net Sales and Revenues |
|
|
|
|
|
|
|
|
|
|
|
|
|
|
|
|
|
|
|
|
|
|
|
|
|
|
Net sales |
|
$ |
10,486 |
|
$ |
11,402 |
|
|
|
|
|
|
|
|
|
|
|
|
|
$ |
10,486 |
|
$ |
11,402 |
|
|
Finance and interest income |
|
|
157 |
|
|
114 |
|
$ |
1,433 |
|
$ |
1,067 |
|
$ |
(230) |
|
$ |
(187) |
|
|
1,360 |
|
|
994 |
1 |
|
Other income |
|
|
289 |
|
|
234 |
|
|
119 |
|
|
177 |
|
|
(69) |
|
|
(155) |
|
|
339 |
|
|
256 |
2, 3 |
|
Total |
|
|
10,932 |
|
|
11,750 |
|
|
1,552 |
|
|
1,244 |
|
|
(299) |
|
|
(342) |
|
|
12,185 |
|
|
12,652 |
|
|
|
|
|
|
|
|
|
|
|
|
|
|
|
|
|
|
|
|
|
|
|
|
|
|
|
|
|
Costs and Expenses |
|
|
|
|
|
|
|
|
|
|
|
|
|
|
|
|
|
|
|
|
|
|
|
|
|
|
Cost of sales |
|
|
7,207 |
|
|
7,940 |
|
|
|
|
|
|
|
|
(7) |
|
|
(6) |
|
|
7,200 |
|
|
7,934 |
4 |
|
Research and development expenses |
|
|
533 |
|
|
495 |
|
|
|
|
|
|
|
|
|
|
|
|
|
|
533 |
|
|
495 |
|
|
Selling, administrative and general expenses |
|
|
876 |
|
|
783 |
|
|
192 |
|
|
172 |
|
|
(2) |
|
|
(3) |
|
|
1,066 |
|
|
952 |
4 |
|
Interest expense |
|
|
108 |
|
|
101 |
|
|
762 |
|
|
442 |
|
|
(68) |
|
|
(64) |
|
|
802 |
|
|
479 |
1 |
|
Interest compensation to Financial Services |
|
|
162 |
|
|
123 |
|
|
|
|
|
|
|
|
(162) |
|
|
(123) |
|
|
|
|
|
|
1 |
|
Other operating expenses |
|
|
90 |
|
|
53 |
|
|
339 |
|
|
392 |
|
|
(60) |
|
|
(146) |
|
|
369 |
|
|
299 |
3, 5 |
|
Total |
|
|
8,976 |
|
|
9,495 |
|
|
1,293 |
|
|
1,006 |
|
|
(299) |
|
|
(342) |
|
|
9,970 |
|
|
10,159 |
|
|
|
|
|
|
|
|
|
|
|
|
|
|
|
|
|
|
|
|
|
|
|
|
|
|
|
|
|
Income before Income Taxes |
|
|
1,956 |
|
|
2,255 |
|
|
259 |
|
|
238 |
|
|
|
|
|
|
|
|
2,215 |
|
|
2,493 |
|
|
Provision for income taxes |
|
|
416 |
|
|
483 |
|
|
53 |
|
|
54 |
|
|
|
|
|
|
|
|
469 |
|
|
537 |
|
|
|
|
|
|
|
|
|
|
|
|
|
|
|
|
|
|
|
|
|
|
|
|
|
|
|
|
|
Income after Income Taxes |
|
|
1,540 |
|
|
1,772 |
|
|
206 |
|
|
184 |
|
|
|
|
|
|
|
|
1,746 |
|
|
1,956 |
|
|
Equity in income of unconsolidated affiliates |
|
|
1 |
|
|
|
|
|
1 |
|
|
1 |
|
|
|
|
|
|
|
|
2 |
|
|
1 |
|
|
|
|
|
|
|
|
|
|
|
|
|
|
|
|
|
|
|
|
|
|
|
|
|
|
|
|
|
Net Income |
|
|
1,541 |
|
|
1,772 |
|
|
207 |
|
|
185 |
|
|
|
|
|
|
|
|
1,748 |
|
|
1,957 |
|
|
Less: Net loss attributable to noncontrolling interests |
|
|
(3) |
|
|
(2) |
|
|
|
|
|
|
|
|
|
|
|
|
|
|
(3) |
|
|
(2) |
|
|
Net Income Attributable to Deere & Company |
|
$ |
1,544 |
|
$ |
1,774 |
|
$ |
207 |
|
$ |
185 |
|
|
|
|
|
|
|
$ |
1,751 |
|
$ |
1,959 |
|
|
1 Elimination of intercompany interest income and expense.
2 Elimination of Equipment Operations’ margin from inventory transferred to equipment on operating leases.
3 Elimination of income and expense between Equipment Operations and Financial Services related to intercompany guarantees of investments in certain international markets and intercompany service revenues and expenses.
4 Elimination of intercompany service fees.
5 Elimination of Financial Services’ lease depreciation expense related to inventory transferred to equipment on operating leases.
15
DEERE & COMPANY
SUPPLEMENTAL CONSOLIDATING DATA (Continued)
CONDENSED BALANCE SHEETS
(In millions of dollars) Unaudited
|
|
EQUIPMENT |
|
FINANCIAL |
|
|
|
|
|
|
||||||||||||||||||||||||||||
|
|
OPERATIONS |
|
SERVICES |
|
ELIMINATIONS |
|
CONSOLIDATED |
|
|
||||||||||||||||||||||||||||
|
|
Jan 28 |
|
Oct 29 |
|
Jan 29 |
|
Jan 28 |
|
Oct 29 |
|
Jan 29 |
|
Jan 28 |
|
Oct 29 |
|
Jan 29 |
|
Jan 28 |
|
Oct 29 |
|
Jan 29 |
|
|
||||||||||||
|
|
2024 |
|
2023 |
|
2023 |
|
2024 |
|
2023 |
|
2023 |
|
2024 |
|
2023 |
|
2023 |
|
2024 |
|
2023 |
|
2023 |
|
|
||||||||||||
Assets |
|
|
|
|
|
|
|
|
|
|
|
|
|
|
|
|
|
|
|
|
|
|
|
|
|
|
|
|
|
|
|
|
|
|
|
|
|
|
Cash and cash equivalents |
|
$ |
3,467 |
|
$ |
5,720 |
|
$ |
2,665 |
|
$ |
1,670 |
|
$ |
1,738 |
|
$ |
1,311 |
|
|
|
|
|
|
|
|
|
|
$ |
5,137 |
|
$ |
7,458 |
|
$ |
3,976 |
|
|
Marketable securities |
|
|
147 |
|
|
104 |
|
|
18 |
|
|
989 |
|
|
842 |
|
|
834 |
|
|
|
|
|
|
|
|
|
|
|
1,136 |
|
|
946 |
|
|
852 |
|
|
Receivables from Financial Services |
|
|
4,296 |
|
|
4,516 |
|
|
5,348 |
|
|
|
|
|
|
|
|
|
|
$ |
(4,296) |
|
$ |
(4,516) |
|
$ |
(5,348) |
|
|
|
|
|
|
|
|
|
6 |
|
Trade accounts and notes receivable – net |
|
|
1,093 |
|
|
1,320 |
|
|
1,342 |
|
|
9,167 |
|
|
8,687 |
|
|
7,827 |
|
|
(2,465) |
|
|
(2,268) |
|
|
(1,560) |
|
|
7,795 |
|
|
7,739 |
|
|
7,609 |
7 |
|
Financing receivables – net |
|
|
72 |
|
|
64 |
|
|
51 |
|
|
43,636 |
|
|
43,609 |
|
|
36,831 |
|
|
|
|
|
|
|
|
|
|
|
43,708 |
|
|
43,673 |
|
|
36,882 |
|
|
Financing receivables securitized – net |
|
|
|
|
|
|
|
|
|
|
|
6,400 |
|
|
7,335 |
|
|
5,089 |
|
|
|
|
|
|
|
|
|
|
|
6,400 |
|
|
7,335 |
|
|
5,089 |
|
|
Other receivables |
|
|
1,515 |
|
|
1,813 |
|
|
1,583 |
|
|
559 |
|
|
869 |
|
|
489 |
|
|
(57) |
|
|
(59) |
|
|
(80) |
|
|
2,017 |
|
|
2,623 |
|
|
1,992 |
7 |
|
Equipment on operating leases – net |
|
|
|
|
|
|
|
|
|
|
|
6,751 |
|
|
6,917 |
|
|
6,502 |
|
|
|
|
|
|
|
|
|
|
|
6,751 |
|
|
6,917 |
|
|
6,502 |
|
|
Inventories |
|
|
8,937 |
|
|
8,160 |
|
|
10,056 |
|
|
|
|
|
|
|
|
|
|
|
|
|
|
|
|
|
|
|
|
8,937 |
|
|
8,160 |
|
|
10,056 |
|
|
Property and equipment – net |
|
|
6,879 |
|
|
6,843 |
|
|
6,178 |
|
|
35 |
|
|
36 |
|
|
34 |
|
|
|
|
|
|
|
|
|
|
|
6,914 |
|
|
6,879 |
|
|
6,212 |
|
|
Goodwill |
|
|
3,966 |
|
|
3,900 |
|
|
3,891 |
|
|
|
|
|
|
|
|
|
|
|
|
|
|
|
|
|
|
|
|
3,966 |
|
|
3,900 |
|
|
3,891 |
|
|
Other intangible assets – net |
|
|
1,112 |
|
|
1,133 |
|
|
1,255 |
|
|
|
|
|
|
|
|
|
|
|
|
|
|
|
|
|
|
|
|
1,112 |
|
|
1,133 |
|
|
1,255 |
|
|
Retirement benefits |
|
|
3,013 |
|
|
2,936 |
|
|
3,728 |
|
|
75 |
|
|
72 |
|
|
67 |
|
|
(1) |
|
|
(1) |
|
|
(2) |
|
|
3,087 |
|
|
3,007 |
|
|
3,793 |
8 |
|
Deferred income taxes |
|
|
2,133 |
|
|
2,133 |
|
|
1,015 |
|
|
72 |
|
|
68 |
|
|
53 |
|
|
(372) |
|
|
(387) |
|
|
(154) |
|
|
1,833 |
|
|
1,814 |
|
|
914 |
9 |
|
Other assets |
|
|
2,058 |
|
|
1,948 |
|
|
1,936 |
|
|
546 |
|
|
559 |
|
|
684 |
|
|
(26) |
|
|
(4) |
|
|
(23) |
|
|
2,578 |
|
|
2,503 |
|
|
2,597 |
|
|
Total Assets |
|
$ |
38,688 |
|
$ |
40,590 |
|
$ |
39,066 |
|
$ |
69,900 |
|
$ |
70,732 |
|
$ |
59,721 |
|
$ |
(7,217) |
|
$ |
(7,235) |
|
$ |
(7,167) |
|
$ |
101,371 |
|
$ |
104,087 |
|
$ |
91,620 |
|
|
|
|
|
|
|
|
|
|
|
|
|
|
|
|
|
|
|
|
|
|
|
|
|
|
|
|
|
|
|
|
|
|
|
|
|
|
|
|
|
Liabilities and Stockholders’ Equity |
|
|
|
|
|
|
|
|
|
|
|
|
|
|
|
|
|
|
|
|
|
|
|
|
|
|
|
|
|
|
|
|
|
|
|
|
|
|
|
|
|
|
|
|
|
|
|
|
|
|
|
|
|
|
|
|
|
|
|
|
|
|
|
|
|
|
|
|
|
|
|
|
|
|
|
|
|
Liabilities |
|
|
|
|
|
|
|
|
|
|
|
|
|
|
|
|
|
|
|
|
|
|
|
|
|
|
|
|
|
|
|
|
|
|
|
|
|
|
Short-term borrowings |
|
$ |
1,203 |
|
$ |
1,230 |
|
$ |
969 |
|
$ |
15,914 |
|
$ |
16,709 |
|
$ |
13,160 |
|
|
|
|
|
|
|
|
|
|
$ |
17,117 |
|
$ |
17,939 |
|
$ |
14,129 |
|
|
Short-term securitization borrowings |
|
|
|
|
|
|
|
|
|
|
|
6,116 |
|
|
6,995 |
|
|
4,864 |
|
|
|
|
|
|
|
|
|
|
|
6,116 |
|
|
6,995 |
|
|
4,864 |
|
|
Payables to Equipment Operations |
|
|
|
|
|
|
|
|
|
|
|
4,296 |
|
|
4,516 |
|
|
5,348 |
|
$ |
(4,296) |
|
$ |
(4,516) |
|
$ |
(5,348) |
|
|
|
|
|
|
|
|
|
6 |
|
Accounts payable and accrued expenses |
|
|
12,677 |
|
|
14,862 |
|
|
11,819 |
|
|
3,232 |
|
|
3,599 |
|
|
2,952 |
|
|
(2,548) |
|
|
(2,331) |
|
|
(1,663) |
|
|
13,361 |
|
|
16,130 |
|
|
13,108 |
7 |
|
Deferred income taxes |
|
|
478 |
|
|
452 |
|
|
404 |
|
|
444 |
|
|
455 |
|
|
269 |
|
|
(372) |
|
|
(387) |
|
|
(154) |
|
|
550 |
|
|
520 |
|
|
519 |
9 |
|
Long-term borrowings |
|
|
7,270 |
|
|
7,210 |
|
|
8,155 |
|
|
32,663 |
|
|
31,267 |
|
|
26,916 |
|
|
|
|
|
|
|
|
|
|
|
39,933 |
|
|
38,477 |
|
|
35,071 |
|
|
Retirement benefits and other liabilities |
|
|
2,006 |
|
|
2,032 |
|
|
2,384 |
|
|
110 |
|
|
109 |
|
|
111 |
|
|
(1) |
|
|
(1) |
|
|
(2) |
|
|
2,115 |
|
|
2,140 |
|
|
2,493 |
8 |
|
Total liabilities |
|
|
23,634 |
|
|
25,786 |
|
|
23,731 |
|
|
62,775 |
|
|
63,650 |
|
|
53,620 |
|
|
(7,217) |
|
|
(7,235) |
|
|
(7,167) |
|
|
79,192 |
|
|
82,201 |
|
|
70,184 |
|
|
|
|
|
|
|
|
|
|
|
|
|
|
|
|
|
|
|
|
|
|
|
|
|
|
|
|
|
|
|
|
|
|
|
|
|
|
|
|
|
Redeemable noncontrolling interest |
|
|
100 |
|
|
97 |
|
|
100 |
|
|
|
|
|
|
|
|
|
|
|
|
|
|
|
|
|
|
|
|
100 |
|
|
97 |
|
|
100 |
|
|
|
|
|
|
|
|
|
|
|
|
|
|
|
|
|
|
|
|
|
|
|
|
|
|
|
|
|
|
|
|
|
|
|
|
|
|
|
|
|
Stockholders’ Equity |
|
|
|
|
|
|
|
|
|
|
|
|
|
|
|
|
|
|
|
|
|
|
|
|
|
|
|
|
|
|
|
|
|
|
|
|
|
|
Total Deere & Company stockholders’ equity |
|
|
22,075 |
|
|
21,785 |
|
|
21,332 |
|
|
7,125 |
|
|
7,082 |
|
|
6,101 |
|
|
(7,125) |
|
|
(7,082) |
|
|
(6,101) |
|
|
22,075 |
|
|
21,785 |
|
|
21,332 |
10 |
|
Noncontrolling interests |
|
|
4 |
|
|
4 |
|
|
4 |
|
|
|
|
|
|
|
|
|
|
|
|
|
|
|
|
|
|
|
|
4 |
|
|
4 |
|
|
4 |
|
|
Financial Services' equity |
|
|
(7,125) |
|
|
(7,082) |
|
|
(6,101) |
|
|
|
|
|
|
|
|
|
|
|
7,125 |
|
|
7,082 |
|
|
6,101 |
|
|
|
|
|
|
|
|
|
10 |
|
Adjusted total stockholders' equity |
|
|
14,954 |
|
|
14,707 |
|
|
15,235 |
|
|
7,125 |
|
|
7,082 |
|
|
6,101 |
|
|
|
|
|
|
|
|
|
|
|
22,079 |
|
|
21,789 |
|
|
21,336 |
|
|
Total Liabilities and Stockholders’ Equity |
|
$ |
38,688 |
|
$ |
40,590 |
|
$ |
39,066 |
|
$ |
69,900 |
|
$ |
70,732 |
|
$ |
59,721 |
|
$ |
(7,217) |
|
$ |
(7,235) |
|
$ |
(7,167) |
|
$ |
101,371 |
|
$ |
104,087 |
|
$ |
91,620 |
|
|
6 Elimination of receivables / payables between Equipment Operations and Financial Services.
7 Primarily reclassification of sales incentive accruals on receivables sold to Financial Services.
8 Reclassification of net pension assets / liabilities.
9 Reclassification of deferred tax assets / liabilities in the same taxing jurisdictions.
10 Elimination of Financial Services’ equity.
16
DEERE & COMPANY
SUPPLEMENTAL CONSOLIDATING DATA (Continued)
STATEMENTS OF CASH FLOWS
For the Three Months Ended January 28, 2024 and January 29, 2023
(In millions of dollars) Unaudited
|
|
EQUIPMENT |
|
FINANCIAL |
|
|
|
|
|
|
||||||||||||||||
|
|
OPERATIONS |
|
SERVICES |
|
ELIMINATIONS |
|
CONSOLIDATED |
|
|
||||||||||||||||
|
|
2024 |
|
2023 |
|
2024 |
|
2023 |
|
2024 |
|
2023 |
|
2024 |
|
2023 |
|
|
||||||||
Cash Flows from Operating Activities |
|
|
|
|
|
|
|
|
|
|
|
|
|
|
|
|
|
|
|
|
|
|
|
|
|
|
Net income |
|
$ |
1,541 |
|
$ |
1,772 |
|
$ |
207 |
|
$ |
185 |
|
|
|
|
|
|
|
$ |
1,748 |
|
$ |
1,957 |
|
|
Adjustments to reconcile net income to net cash provided by (used for) operating activities: |
|
|
|
|
|
|
|
|
|
|
|
|
|
|
|
|
|
|
|
|
|
|
|
|
|
|
Provision (credit) for credit losses |
|
|
(2) |
|
|
1 |
|
|
33 |
|
|
(131) |
|
|
|
|
|
|
|
|
31 |
|
|
(130) |
|
|
Provision for depreciation and amortization |
|
|
302 |
|
|
279 |
|
|
254 |
|
|
252 |
|
$ |
(36) |
|
$ |
(37) |
|
|
520 |
|
|
494 |
11 |
|
Share-based compensation expense |
|
|
|
|
|
|
|
|
|
|
|
|
|
|
46 |
|
|
23 |
|
|
46 |
|
|
23 |
12 |
|
Distributed earnings of Financial Services |
|
|
233 |
|
|
3 |
|
|
|
|
|
|
|
|
(233) |
|
|
(3) |
|
|
|
|
|
|
13 |
|
Provision (credit) for deferred income taxes |
|
|
48 |
|
|
(39) |
|
|
(21) |
|
|
(17) |
|
|
|
|
|
|
|
|
27 |
|
|
(56) |
|
|
Changes in assets and liabilities: |
|
|
|
|
|
|
|
|
|
|
|
|
|
|
|
|
|
|
|
|
|
|
|
|
|
|
Receivables related to sales |
|
|
209 |
|
|
(23) |
|
|
|
|
|
|
|
|
(486) |
|
|
(992) |
|
|
(277) |
|
|
(1,015) |
14, 16 |
|
Inventories |
|
|
(687) |
|
|
(1,254) |
|
|
|
|
|
|
|
|
(36) |
|
|
(25) |
|
|
(723) |
|
|
(1,279) |
15 |
|
Accounts payable and accrued expenses |
|
|
(2,155) |
|
|
(1,458) |
|
|
25 |
|
|
145 |
|
|
(197) |
|
|
(264) |
|
|
(2,327) |
|
|
(1,577) |
16 |
|
Accrued income taxes payable/receivable |
|
|
165 |
|
|
192 |
|
|
18 |
|
|
7 |
|
|
|
|
|
|
|
|
183 |
|
|
199 |
|
|
Retirement benefits |
|
|
(127) |
|
|
(49) |
|
|
(2) |
|
|
1 |
|
|
|
|
|
|
|
|
(129) |
|
|
(48) |
|
|
Other |
|
|
(46) |
|
|
17 |
|
|
61 |
|
|
163 |
|
|
(22) |
|
|
6 |
|
|
(7) |
|
|
186 |
11, 12, 15 |
|
Net cash provided by (used for) operating activities |
|
|
(519) |
|
|
(559) |
|
|
575 |
|
|
605 |
|
|
(964) |
|
|
(1,292) |
|
|
(908) |
|
|
(1,246) |
|
|
|
|
|
|
|
|
|
|
|
|
|
|
|
|
|
|
|
|
|
|
|
|
|
|
|
|
|
Cash Flows from Investing Activities |
|
|
|
|
|
|
|
|
|
|
|
|
|
|
|
|
|
|
|
|
|
|
|
|
|
|
Collections of receivables (excluding receivables related to sales) |
|
|
|
|
|
|
|
|
8,007 |
|
|
7,495 |
|
|
(255) |
|
|
(297) |
|
|
7,752 |
|
|
7,198 |
14 |
|
Proceeds from sales of equipment on operating leases |
|
|
|
|
|
|
|
|
506 |
|
|
497 |
|
|
|
|
|
|
|
|
506 |
|
|
497 |
|
|
Cost of receivables acquired (excluding receivables related to sales) |
|
|
|
|
|
|
|
|
(6,513) |
|
|
(6,375) |
|
|
66 |
|
|
53 |
|
|
(6,447) |
|
|
(6,322) |
14 |
|
Purchases of property and equipment |
|
|
(362) |
|
|
(315) |
|
|
|
|
|
|
|
|
|
|
|
|
|
|
(362) |
|
|
(315) |
|
|
Cost of equipment on operating leases acquired |
|
|
|
|
|
|
|
|
(503) |
|
|
(531) |
|
|
49 |
|
|
34 |
|
|
(454) |
|
|
(497) |
15 |
|
Decrease in investment in Financial Services |
|
|
10 |
|
|
|
|
|
|
|
|
|
|
|
(10) |
|
|
|
|
|
|
|
|
|
17 |
|
Increase in trade and wholesale receivables |
|
|
|
|
|
|
|
|
(871) |
|
|
(1,499) |
|
|
871 |
|
|
1,499 |
|
|
|
|
|
|
14 |
|
Collateral on derivatives – net |
|
|
|
|
|
|
|
|
310 |
|
|
345 |
|
|
|
|
|
|
|
|
310 |
|
|
345 |
|
|
Other |
|
|
10 |
|
|
(9) |
|
|
(98) |
|
|
(137) |
|
|
|
|
|
|
|
|
(88) |
|
|
(146) |
|
|
Net cash provided by (used for) investing activities |
|
|
(342) |
|
|
(324) |
|
|
838 |
|
|
(205) |
|
|
721 |
|
|
1,289 |
|
|
1,217 |
|
|
760 |
|
|
|
|
|
|
|
|
|
|
|
|
|
|
|
|
|
|
|
|
|
|
|
|
|
|
|
|
|
Cash Flows from Financing Activities |
|
|
|
|
|
|
|
|
|
|
|
|
|
|
|
|
|
|
|
|
|
|
|
|
|
|
Net proceeds (payments) in short-term borrowings (original maturities three months or less) |
|
|
78 |
|
|
(136) |
|
|
(3,029) |
|
|
833 |
|
|
|
|
|
|
|
|
(2,951) |
|
|
697 |
|
|
Change in intercompany receivables/payables |
|
|
288 |
|
|
1,469 |
|
|
(288) |
|
|
(1,469) |
|
|
|
|
|
|
|
|
|
|
|
|
|
|
Proceeds from borrowings issued (original maturities greater than three months) |
|
|
11 |
|
|
1 |
|
|
5,276 |
|
|
2,504 |
|
|
|
|
|
|
|
|
5,287 |
|
|
2,505 |
|
|
Payments of borrowings (original maturities greater than three months) |
|
|
(40) |
|
|
|
|
|
(3,197) |
|
|
(1,925) |
|
|
|
|
|
|
|
|
(3,237) |
|
|
(1,925) |
|
|
Repurchases of common stock |
|
|
(1,328) |
|
|
(1,257) |
|
|
|
|
|
|
|
|
|
|
|
|
|
|
(1,328) |
|
|
(1,257) |
|
|
Capital investment from Equipment Operations |
|
|
|
|
|
|
|
|
(10) |
|
|
|
|
|
10 |
|
|
|
|
|
|
|
|
|
17 |
|
Dividends paid |
|
|
(386) |
|
|
(341) |
|
|
(233) |
|
|
(3) |
|
|
233 |
|
|
3 |
|
|
(386) |
|
|
(341) |
13 |
|
Other |
|
|
(22) |
|
|
(6) |
|
|
(8) |
|
|
(12) |
|
|
|
|
|
|
|
|
(30) |
|
|
(18) |
|
|
Net cash used for financing activities |
|
|
(1,399) |
|
|
(270) |
|
|
(1,489) |
|
|
(72) |
|
|
243 |
|
|
3 |
|
|
(2,645) |
|
|
(339) |
|
|
|
|
|
|
|
|
|
|
|
|
|
|
|
|
|
|
|
|
|
|
|
|
|
|
|
|
|
Effect of Exchange Rate Changes on Cash, Cash Equivalents, and Restricted Cash |
|
|
11 |
|
|
48 |
|
|
5 |
|
|
14 |
|
|
|
|
|
|
|
|
16 |
|
|
62 |
|
|
|
|
|
|
|
|
|
|
|
|
|
|
|
|
|
|
|
|
|
|
|
|
|
|
|
|
|
Net Increase (Decrease) in Cash, Cash Equivalents, and Restricted Cash |
|
|
(2,249) |
|
|
(1,105) |
|
|
(71) |
|
|
342 |
|
|
|
|
|
|
|
|
(2,320) |
|
|
(763) |
|
|
Cash, Cash Equivalents, and Restricted Cash at Beginning of Period |
|
|
5,755 |
|
|
3,781 |
|
|
1,865 |
|
|
1,160 |
|
|
|
|
|
|
|
|
7,620 |
|
|
4,941 |
|
|
Cash, Cash Equivalents, and Restricted Cash at End of Period |
|
$ |
3,506 |
|
$ |
2,676 |
|
$ |
1,794 |
|
$ |
1,502 |
|
|
|
|
|
|
|
$ |
5,300 |
|
$ |
4,178 |
|
|
11 Elimination of depreciation on leases related to inventory transferred to equipment on operating leases.
12 Reclassification of share-based compensation expense.
13 Elimination of dividends from Financial Services to the Equipment Operations, which are included in the Equipment Operations operating activities.
14 Primarily reclassification of receivables related to the sale of equipment.
15 Reclassification of direct lease agreements with retail customers.
16 Reclassification of sales incentive accruals on receivables sold to Financial Services.
17 Elimination of change in investment from Equipment Operations to Financial Services.
17
|
1Q 2024 Earnings Call 15 February 2024 Exhibit 99.2 (Furnished herewith) |
|
2 John Deere | 1Q 2024 Earnings Call | February 15, 2024 Forward-Looking Statements This earnings call and accompanying materials may include forward-looking statements within the meaning of the safe harbor provisions of the U.S. Private Securities Litigation Reform Act of 1995. Forward-looking statements may be identified by words such as “forecast,” “guidance,” “project,” “target,” “outlook,” “prospects,” “expect,” “estimate,” “will,” “goal,” “plan,” “anticipate,” “intend,” “predict,” “believe,” “likely,” “future,” “could,” “may,” or other similar words or phrases, including the negative variations of such words or phrases. Examples of forward-looking statements include, among others, comments and information concerning the company’s plans and projections for the future, including estimates and assumptions with respect to economic, political, technological, weather, market acceptance, acquisitions and divestitures of businesses, anticipated transaction costs, the integration of new businesses, anticipated benefits of acquisitions, and other factors that impact the company’s businesses and customers. Forward-looking statements are neither historical facts nor assurances of future performance. Instead, they are based only on management’s current beliefs, expectations and assumptions regarding the future of the company’s business, future plans and strategies, projections, anticipated events and trends, the economy, and other future conditions. Because forward-looking statements relate to the future, they are subject to inherent uncertainties, risks, changes in circumstances, and other factors that are difficult to predict and many of which are outside of the Company’s control causing actual results to differ materially from those projected in these forward-looking statements. Among these factors are risks related to changes in U.S. and international laws and regulations, the political and economic geographies in which we operate, international conflicts, adverse macroeconomic conditions impacting consumer practices, including demand for John Deere products, and changes in climate patterns. For a discussion of some of these risks and uncertainties see “Item 1A Risk Factors” in our most recent Annual Report on Form 10-K, as updated by our subsequent filings with the U.S. Securities and Exchange Commission. Investors should refer to and consider the information on risks and uncertainties in addition to the information presented here. All forward-looking statements made in this earnings call and accompanying materials are based only on information currently available and speaks only as of the date on which it is made. You should not place undue reliance on forward-looking statements. The Company, except as required by law, undertakes no obligation to update or revise any forward-looking statements whether as a result of new developments or otherwise. This earnings call and accompanying materials may contain non-GAAP financial measures. Non-GAAP measures should be viewed as a supplement to, and not in isolation from, or as a substitute for the Company’s GAAP measures of performance and the financial results calculated in accordance with GAAP and reconciliations from these results should be carefully evaluated. 19 |
|
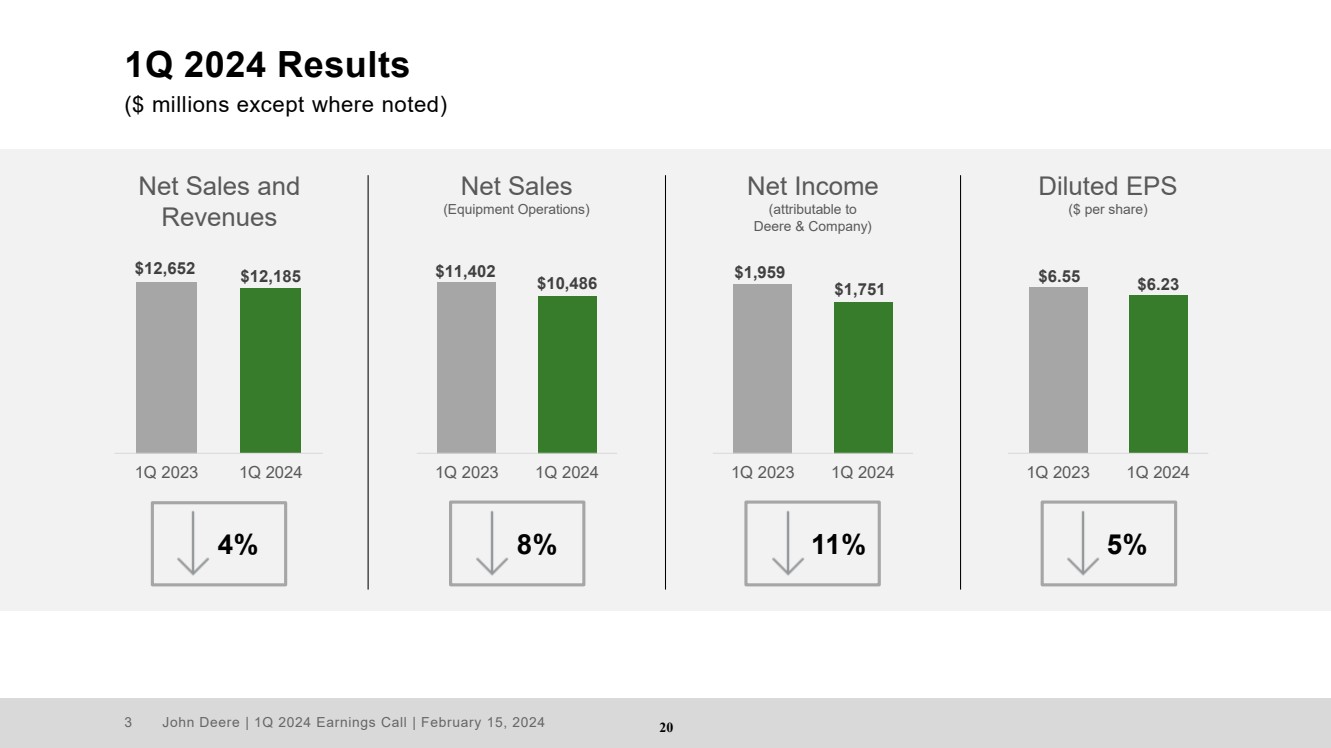
3 John Deere | 1Q 2024 Earnings Call | February 15, 2024 1Q 2024 Results ($ millions except where noted) $12,652 $12,185 1Q 2023 1Q 2024 $11,402 $10,486 1Q 2023 1Q 2024 $1,959 $1,751 1Q 2023 1Q 2024 $6.55 $6.23 1Q 2023 1Q 2024 8% Net Sales and Revenues Net Sales (Equipment Operations) Net Income (attributable to Deere & Company) Diluted EPS ($ per share) 4% 11% 5% 20 |
|
4 John Deere | 1Q 2024 Earnings Call | February 15, 2024 Production and Precision Ag 1Q 2024 Results $ in millions $5,198 $4,849 1Q 2023 1Q 2024 Net Sales 7% Operating Profit Comparison $1,045 ($273) ($1) ($20) ($89) $0 $1,208 $202 $15 $3 1Q 2023 Volume/ Mix Price Currency Warranty Production Costs SA&G/ R&D Special Items Other 1Q 2024 21 |
|
5 John Deere | 1Q 2024 Earnings Call | February 15, 2024 Small Ag and Turf 1Q 2024 Results $ in millions $3,001 $2,425 1Q 2023 1Q 2024 Net Sales 19% Operating Profit Comparison $326 ($215) ($5) ($16) ($21) $0 $447 $97 $33 $6 1Q 2023 Volume/ Mix Price Currency Warranty Production Costs SA&G/ R&D Special Items Other 1Q 2024 22 |
|
6 John Deere | 1Q 2024 Earnings Call | February 15, 2024 Ag and Turf Industry Outlook (in units) – FY 2024 Source: Deere & Company forecast as of 15 February 2024 U.S. and CANADA LARGE AG 10-15% EUROPE AG 10-15% SOUTH AMERICA AG (tractors and combines) ~10% U.S. and CANADA SMALL AG and TURF 5-10% ASIA AG Down moderately 23 |
|
7 John Deere | 1Q 2024 Earnings Call | February 15, 2024 Production and Precision Ag Business Segment Outlook $ in millions Source: Deere & Company forecast as of 15 February 2024 26.1% FY 2023 FY 2024 Fcst $26,790 FY 2023 FY 2024 Fcst Net Sales Operating Margin ~20% 21.5-22.5% 24 |
|
8 John Deere | 1Q 2024 Earnings Call | February 15, 2024 $13,980 FY 2023 FY 2024 Fcst Small Ag and Turf Business Segment Outlook $ in millions Source: Deere & Company forecast as of 15 February 2024 17.7% FY 2023 FY 2024 Fcst Net Sales Operating Margin 10-15% 15-16% 25 |
|
9 John Deere | 1Q 2024 Earnings Call | February 15, 2024 Construction and Forestry 1Q 2024 Results $ in millions $3,203 $3,212 1Q 2023 1Q 2024 Net Sales Flat Operating Profit Comparison $566 ($7) ($27) ($5) ($49) ($13) $0 ($46) $625 $88 1Q 2023 Volume/ Mix Price Currency Warranty Production Costs SA&G/ R&D Special Items Other 1Q 2024 26 |
|
10 John Deere | 1Q 2024 Earnings Call | February 15, 2024 Construction and Forestry Industry Outlook (in units) – FY 2024 Source: Deere & Company forecast as of 15 February 2024 U.S. and CANADA COMPACT CONSTRUCTION EQUIPMENT Flat GLOBAL FORESTRY ~10% U.S. and CANADA CONSTRUCTION EQUIPMENT Flat to down 5% GLOBAL ROADBUILDING Flat 27 |
|
11 John Deere | 1Q 2024 Earnings Call | February 15, 2024 Construction and Forestry Business Segment Outlook $ in millions Source: Deere & Company forecast as of 15 February 2024 18.2% FY 2023 FY 2024 Fcst $14,795 FY 2023 FY 2024 Fcst Net Sales Operating Margin 5-10% 17-18% 28 |
|
12 John Deere | 1Q 2024 Earnings Call | February 15, 2024 Financial Services Net Income – Results and Outlook $ in millions Source: Deere & Company forecast as of 15 February 2024 $185 $207 1Q 2023 1Q 2024 Quarter Results Fiscal Year Outlook $619 $770 FY 2023 FY 2024 Fcst ~ 29 |
|
13 John Deere | 1Q 2024 Earnings Call | February 15, 2024 Deere & Company Outlook Effective Tax Rate* Net Income (attributable to Deere & Co.) $7.5-7.75B 24-26% FY 2024 FORECAST Net Operating Cash Flow* $7.0-7.5B *Equipment Operations Source: Deere & Company forecast as of 15 February 2024 Other Research and Development Expenses* Capital Expenditures* Up slightly ~$1.9B 30 |
|
14 John Deere | 1Q 2024 Earnings Call | February 15, 2024 Appendix 31 |
|
15 John Deere | 1Q 2024 Earnings Call | February 15, 2024 January 2024 Retail Sales (Rolling 3 Months) and Dealer Inventories Retail Sales U.S. and Canada Ag Industry* Deere** 2WD Tractors (< 40 PTO hp) 12% In line with the industry 2WD Tractors (40 < 100 PTO hp) 11% Less than the industry 2WD Tractors (100+ PTO hp) 5% More than the industry 4WD Tractors 18% A high single digit Combines 11% More than the industry Deere Dealer Inventories*** U.S. and Canada Ag 2024 2023 2WD Tractors (100+ PTO hp) 30% 25% Combines 16% 16% * As reported by the Association of Equipment Manufacturers ** As reported to the Association of Equipment Manufacturers *** In units as a % of trailing 12 months retail sales, as reported to the Association of Equipment Manufacturers 32 |
|
16 John Deere | 1Q 2024 Earnings Call | February 15, 2024 Retail Sales U.S. and Canada Deere* Selected Turf and Utility Equipment Up double digits Construction and Forestry First-in-the-Dirt Settlements High single digit Single digit January 2024 Retail Sales (Rolling 3 Months) Retail Sales Europe Ag Deere* Tractors Double digits Combines Double digits * Based on internal sales reports 33 |
|
17 John Deere | 1Q 2024 Earnings Call | February 15, 2024 Deere Use-of-Cash Priorities SHARE REPURCHASE Manage the balance sheet, including liquidity, to support a rating that provides access to low-cost and readily available short- and long-term funding mechanisms (reflects the strategic nature of our financial services operation) Fund value-creating investments in our businesses Consistently and moderately raise dividend targeting a 25-35% payout ratio of mid-cycle earnings Consider share repurchase as a means to deploy excess cash to shareholders, once above requirements are met COMMITTED TO “A” RATING FUND OPERATING & GROWTH NEEDS COMMON STOCK DIVIDEND CASH FROM OPERATIONS 34 |
|
18 John Deere | 1Q 2024 Earnings Call | February 15, 2024 Great Leaps. For the Good of Everyone. View the 2023 Business Impact Report https://about.deere.com/en-us/sustainability 35 |
|
19 John Deere | 1Q 2024 Earnings Call | February 15, 2024 Deere & Company’s 2Q 2024 earnings call is scheduled for 9:00 a.m. Central Time on Thursday, 16 May 2024. 36 |
|