UNITED STATES
SECURITIES AND EXCHANGE COMMISSION
Washington, D.C. 20549
FORM 8-K
CURRENT REPORT
PURSUANT TO SECTION 13 OR 15(d) OF
THE SECURITIES EXCHANGE ACT OF 1934
February 6, 2024
Date of Report
(Date of earliest event reported)
BRIDGEWATER BANCSHARES, INC.
(Exact name of registrant as specified in its charter)
|
Minnesota (State or other jurisdiction of incorporation) |
001-38412 (Commission File Number) |
26-0113412 (I.R.S. Employer Identification No.) |
|
4450 Excelsior Boulevard, Suite 100 St. Louis Park, Minnesota (Address of principal executive offices) |
55416 (Zip Code) |
Registrant’s telephone number, including area code: (952) 893-6868
Not Applicable
(Former name or former address, if changed since last report.)
Check the appropriate box below if the Form 8-K filing is intended to simultaneously satisfy the filing obligation of the registrant under any of the following provisions:
☐ Written communications pursuant to Rule 425 under the Securities Act (17 CFR 230.425)
☐ Soliciting material pursuant to Rule 14a-12 under the Exchange Act (17 CFR 240.14a-12)
☐ Pre-commencement communications pursuant to Rule 14d-2(b) under the Exchange Act (17 CFR 240.14d-2(b))
☐ Pre-commencement communications pursuant to Rule 13e-4(c) under the Exchange Act (17 CFR 240.13e-4(c))
Securities registered pursuant to Section 12(b) of the Act:
Title of each class: |
|
Trading Symbol |
|
Name of each exchange on which registered: |
|
Common Stock, $0.01 Par Value Depositary Shares, each representing a 1/100th interest in a share of 5.875% Non-Cumulative Perpetual Preferred Stock, Series A, $0.01 par value per share |
|
BWB BWBBP |
|
The NASDAQ Stock Market LLC The NASDAQ Stock Market LLC |
Indicate by check mark whether the registrant is an emerging growth company as defined in Rule 405 of the Securities Act of 1933 (§230.405 of this chapter) or Rule 12b-2 of the Securities Exchange Act of 1934 (§240.12b-2 of this chapter).
Emerging growth Company ☒
If an emerging growth company, indicate by check mark if the registrant has elected not to use the extended transition period for complying with any new or revised financial accounting standards provided pursuant to Section 13(a) of the Exchange Act. ☐
Item 7.01 Regulation FD Disclosure.
Bridgewater Bancshares, Inc. (the “Company”) is furnishing an Investor Presentation, which will be used, in whole or in part, from time to time by executives of the Company in meetings with investors and analysts. A copy of the Investor Presentation is attached as Exhibit 99.1 to this Current Report on Form 8-K and is incorporated herein by reference.
The information furnished in this item of this Form 8-K, and the related exhibits, shall not be deemed “filed” for purposes of Section 18 of the Exchange Act, or incorporated by reference in any filing under the Securities Act of 1933, as amended, or the Exchange Act, except as may be expressly set forth by specific reference in such filing.
Item 9.01 Financial Statements and Exhibits.
(d) Exhibits
Exhibit 99.1 |
Exhibit 104 |
Cover Page Interactive Data File (embedded within the Inline XBRL document) |
2
SIGNATURES
Pursuant to the requirements of the Securities Exchange Act of 1934, the registrant has duly caused this report to be signed on its behalf by the undersigned thereunto duly authorized.
|
Bridgewater Bancshares, Inc. |
|
|
|
|
Date: February 6, 2024 |
|
|
By: /s/ Jerry Baack |
|
Name: Jerry Baack |
|
Title: Chairman, Chief Executive Officer and President |
3
|
|
Disclaimer 2 Forward-Looking Statements This presentation contains “forward-looking statements” within the meaning of the safe harbor provisions of the U.S. Private Securities Litigation Reform Act of 1995. Forward-looking statements include, without limitation, statements concerning plans, estimates, calculations, forecasts and projections with respect to the anticipated future performance of the Company. These statements are often, but not always, identified by words such as “may”, “might”, “should”, “could”, “predict”, “potential”, “believe”, “expect”, “continue”, “will”, “anticipate”, “seek”, “estimate”, “intend”, “plan”, “projection”, “would”, “annualized”, “target” and “outlook”, or the negative version of those words or other comparable words of a future or forward-looking nature. Forward-looking statements are neither historical facts nor assurances of future performance. Instead, they are based only on our current beliefs, expectations and assumptions regarding our business, future plans and strategies, projections, anticipated events and trends, the economy and other future conditions. Because forward-looking statements relate to the future, they are subject to inherent uncertainties, risks and changes in circumstances that are difficult to predict and many of which are outside of our control. Our actual results and financial condition may differ materially from those indicated in the forward-looking statements. Therefore, you should not rely on any of these forward-looking statements. Important factors that could cause our actual results and financial condition to differ materially from those indicated in the forward-looking statements include, among others, the following: interest rate risk, including the effects of recent and potential additional rate increases by the Federal Reserve; fluctuations in the values of the securities held in our securities portfolio, including as the result of changes in interest rates; business and economic conditions generally and in the financial services industry, nationally and within our market area, including rising rates of inflation and possible recession; the effects of recent developments and events in the financial services industry, including the large-scale deposit withdrawals over a short period of time at Silicon Valley Bank, Signature Bank and First Republic Bank that resulted in the failure of those institutions; loan concentrations in our portfolio; the overall health of the local and national real estate market; our ability to successfully manage credit risk; our ability to maintain an adequate level of allowance for credit losses; new or revised accounting standards; the concentration of large loans to certain borrowers; the concentration of large deposits from certain clients, who have balances above current FDIC insurance limits; our ability to successfully manage liquidity risk, which may increase our dependence on non-core funding sources such as brokered deposits, and negatively impact our cost of funds; our ability to raise additional capital to implement our business plan; our ability to implement our growth strategy and manage costs effectively; the composition of our senior leadership team and our ability to attract and retain key personnel; talent and labor shortages and high rates of employee turnover; the occurrence of fraudulent activity, breaches or failures of our or our third-party vendors’ information security controls or cybersecurity-related incidents, including as a result of sophisticated attacks using artificial intelligence and similar tools; interruptions involving our information technology and telecommunications systems or third-party servicers; competition in the financial services industry, including from nonbank competitors such as credit unions and “fintech” companies; the effectiveness of our risk management framework; the commencement and outcome of litigation and other legal proceedings and regulatory actions against us; the impact of recent and future legislative and regulatory changes, including in response to the recent failures of Silicon Valley Bank, Signature Bank and First Republic Bank in 2023; risks related to climate change and the negative impact it may have on our customers and their businesses; the imposition of other governmental policies impacting the value of products produced by our commercial borrowers; severe weather, natural disasters, wide spread disease or pandemics, acts of war or terrorism or other adverse external events, including the Israeli-Palestinian conflict and the Russian invasion of Ukraine; potential impairment to the goodwill the Company recorded in connection with our past acquisition; changes to U.S. or state tax laws, regulations and guidance, including the new 1% excise tax on stock buybacks by publicly traded companies; potential changes in federal policy and at regular agencies as a result of the upcoming 2024 presidential election; and any other risks described in the “Risk Factors” sections of reports filed by the Company with the Securities and Exchange Commission. Any forward-looking statement made by us in this presentation is based only on information currently available to us and speaks only as of the date on which it is made. The Company undertake no obligation to publicly update any forward-looking statement, whether written or oral, that may be made from time to time, whether as a result of new information, future developments or otherwise. Certain of the information contained in this presentation is derived from information provided by industry sources. Although the Company believe that such information is accurate and that the sources from which it has been obtained are reliable, the Company cannot guarantee the accuracy of, and have not independently verified, such information. Use of Non-GAAP financial measures In addition to the results presented in accordance with U.S. General Accepted Accounting Principles (“GAAP”), the Company routinely supplements its evaluation with an analysis of certain non-GAAP financial measures. The Company believes these non-GAAP financial measures, in addition to the related GAAP measures, provide meaningful information to investors to help them understand the Company’s operating performance and trends, and to facilitate comparisons with the performance of peers. These disclosures should not be viewed as a substitute for operating results determined in accordance with GAAP, nor are they necessarily comparable to non-GAAP performance measures that may be presented by other companies. Reconciliations of non-GAAP disclosures to the comparable GAAP measures are provided in this presentation. |
|
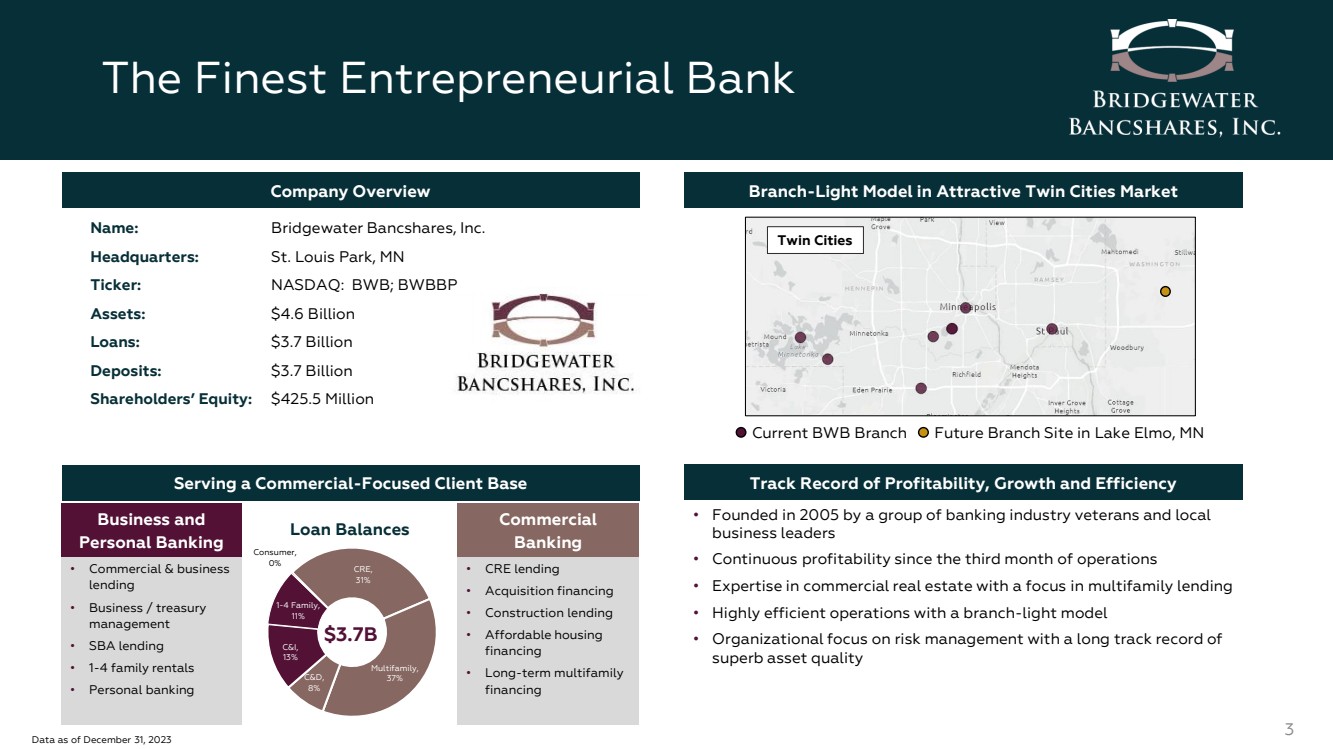
The Finest Entrepreneurial Bank 3 Company Overview Branch-Light Model in Attractive Twin Cities Market Twin Cities Name: Bridgewater Bancshares, Inc. Headquarters: St. Louis Park, MN Ticker: NASDAQ: BWB; BWBBP Assets: $4.6 Billion Loans: $3.7 Billion Deposits: $3.7 Billion Shareholders’ Equity: $425.5 Million Serving a Commercial-Focused Client Base Track Record of Profitability, Growth and Efficiency • CRE lending • Acquisition financing • Construction lending • Affordable housing financing • Long-term multifamily financing • Commercial & business lending • Business / treasury management • SBA lending • 1-4 family rentals • Personal banking CRE, 31% Multifamily, C&D, 37% 8% C&I, 13% 1-4 Family, 11% Consumer, 0% $3.7B Business and Personal Banking Commercial Banking Loan Balances • Founded in 2005 by a group of banking industry veterans and local business leaders • Continuous profitability since the third month of operations • Expertise in commercial real estate with a focus in multifamily lending • Highly efficient operations with a branch-light model • Organizational focus on risk management with a long track record of superb asset quality Data as of December 31, 2023 Current BWB Branch Future Branch Site in Lake Elmo, MN |
|
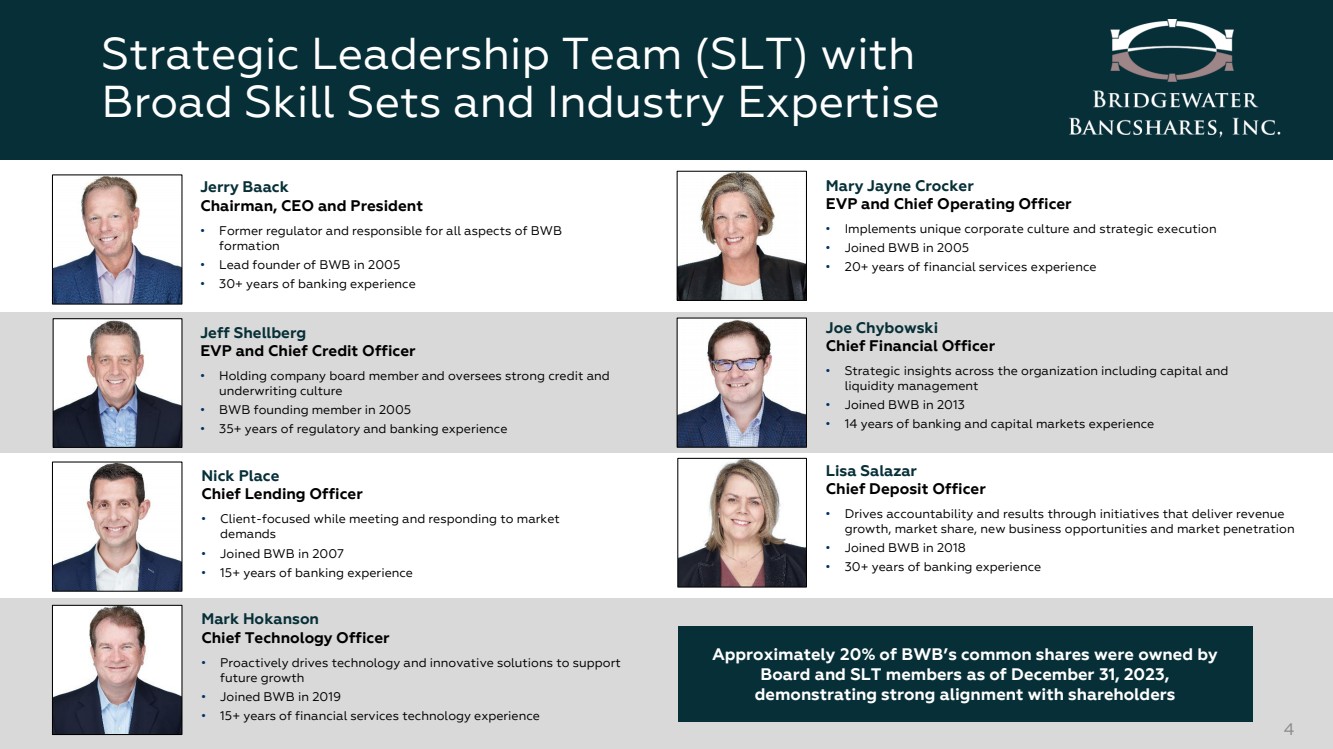
Jerry Baack Chairman, CEO and President • Former regulator and responsible for all aspects of BWB formation • Lead founder of BWB in 2005 • 30+ years of banking experience Jeff Shellberg EVP and Chief Credit Officer • Holding company board member and oversees strong credit and underwriting culture • BWB founding member in 2005 • 35+ years of regulatory and banking experience Nick Place Chief Lending Officer • Client-focused while meeting and responding to market demands • Joined BWB in 2007 • 15+ years of banking experience Mark Hokanson Chief Technology Officer • Proactively drives technology and innovative solutions to support future growth • Joined BWB in 2019 • 15+ years of financial services technology experience Mary Jayne Crocker EVP and Chief Operating Officer • Implements unique corporate culture and strategic execution • Joined BWB in 2005 • 20+ years of financial services experience Joe Chybowski Chief Financial Officer • Strategic insights across the organization including capital and liquidity management • Joined BWB in 2013 • 14 years of banking and capital markets experience Lisa Salazar Chief Deposit Officer • Drives accountability and results through initiatives that deliver revenue growth, market share, new business opportunities and market penetration • Joined BWB in 2018 • 30+ years of banking experience Strategic Leadership Team (SLT) with Broad Skill Sets and Industry Expertise 4 Approximately 20% of BWB’s common shares were owned by Board and SLT members as of December 31, 2023, demonstrating strong alignment with shareholders |
|
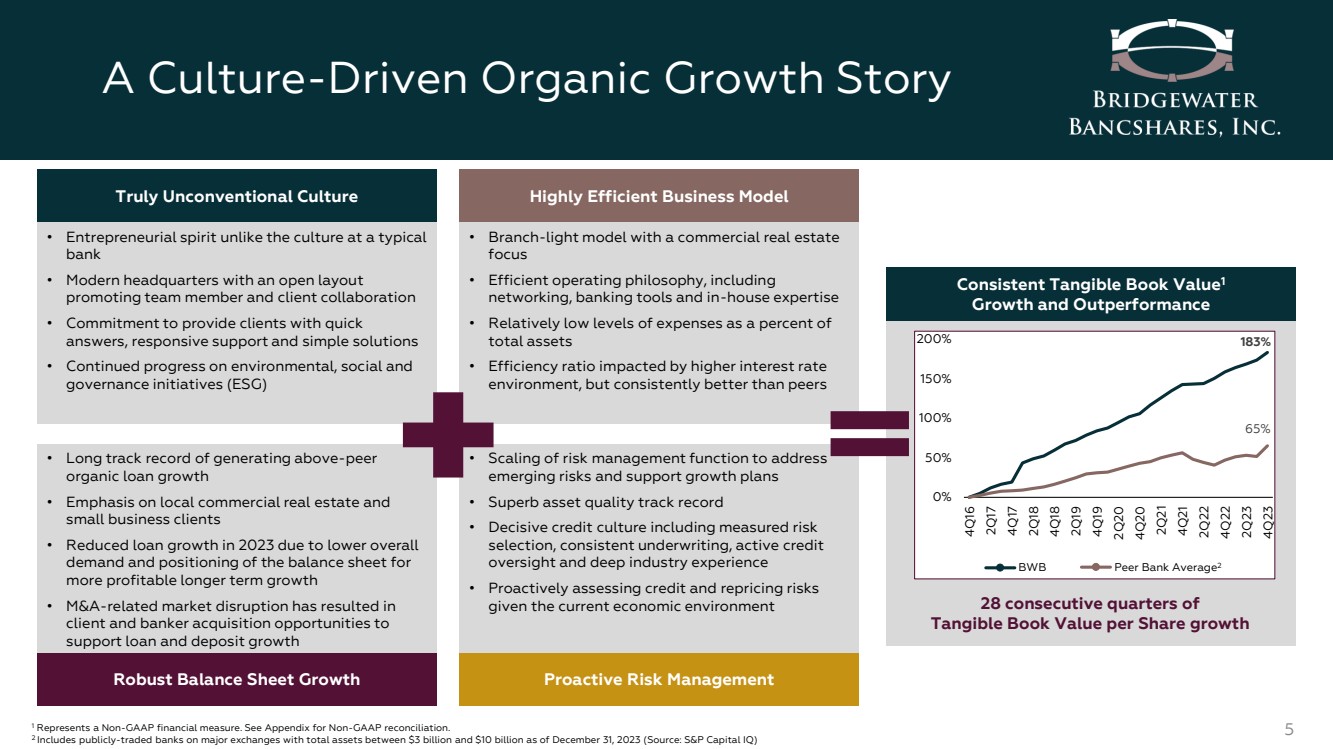
A Culture-Driven Organic Growth Story 5 Truly Unconventional Culture Highly Efficient Business Model Robust Balance Sheet Growth Proactive Risk Management • Entrepreneurial spirit unlike the culture at a typical bank • Modern headquarters with an open layout promoting team member and client collaboration • Commitment to provide clients with quick answers, responsive support and simple solutions • Continued progress on environmental, social and governance initiatives (ESG) • Long track record of generating above-peer organic loan growth • Emphasis on local commercial real estate and small business clients • Reduced loan growth in 2023 due to lower overall demand and positioning of the balance sheet for more profitable longer term growth • M&A-related market disruption has resulted in client and banker acquisition opportunities to support loan and deposit growth • Branch-light model with a commercial real estate focus • Efficient operating philosophy, including networking, banking tools and in-house expertise • Relatively low levels of expenses as a percent of total assets • Efficiency ratio impacted by higher interest rate environment, but consistently better than peers • Scaling of risk management function to address emerging risks and support growth plans • Superb asset quality track record • Decisive credit culture including measured risk selection, consistent underwriting, active credit oversight and deep industry experience • Proactively assessing credit and repricing risks given the current economic environment 1 Represents a Non-GAAP financial measure. See Appendix for Non-GAAP reconciliation. 2 Includes publicly-traded banks on major exchanges with total assets between $3 billion and $10 billion as of December 31, 2023 (Source: S&P Capital IQ) Consistent Tangible Book Value1 Growth and Outperformance 28 consecutive quarters of Tangible Book Value per Share growth 183% 65% 0% 50% 100% 150% 200% 4Q16 2Q17 4Q17 2Q18 4Q18 2Q19 4Q19 2Q20 4Q20 2Q21 4Q21 2Q22 4Q22 2Q23 4Q23 BWB Peer Bank Average2 |
|
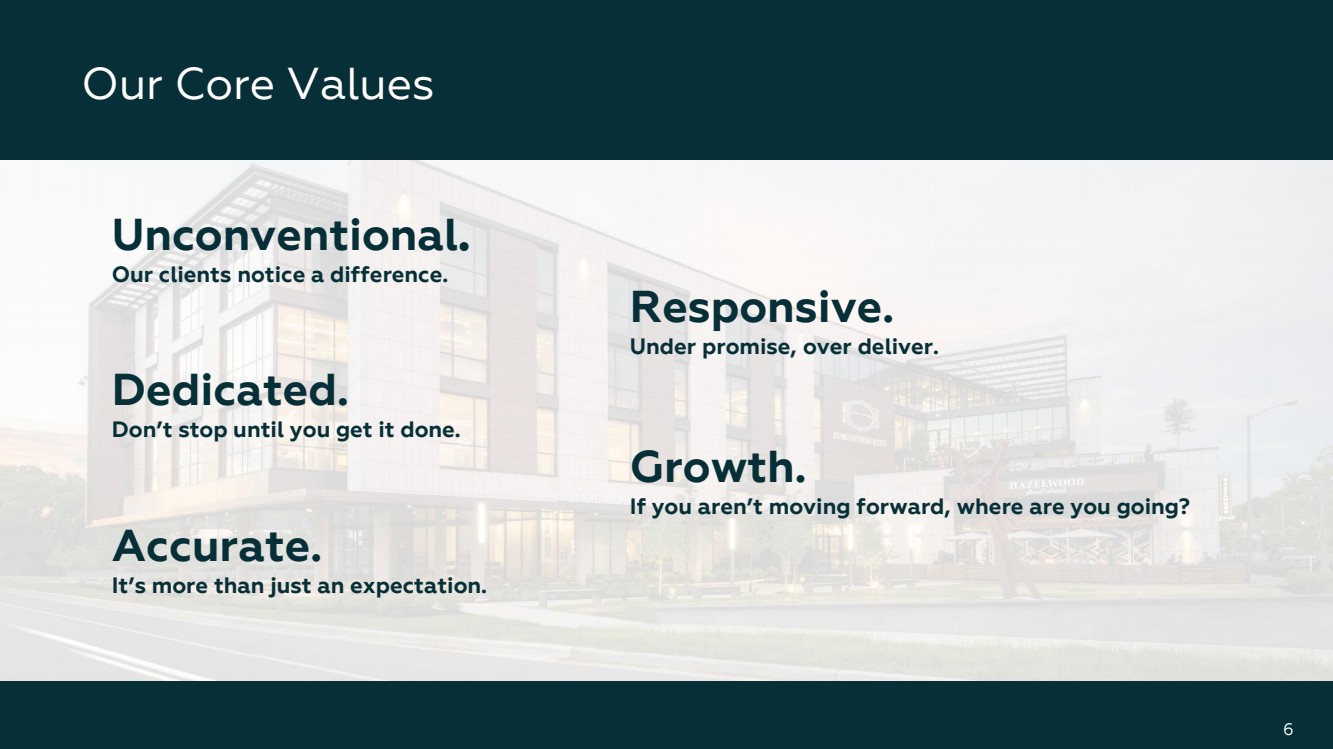
Our Core Values 6 Unconventional. Our clients notice a difference. Responsive. Under promise, over deliver. Dedicated. Don’t stop until you get it done. Growth. If you aren’t moving forward, where are you going? Accurate. It’s more than just an expectation. 6 Our Core Values |
|
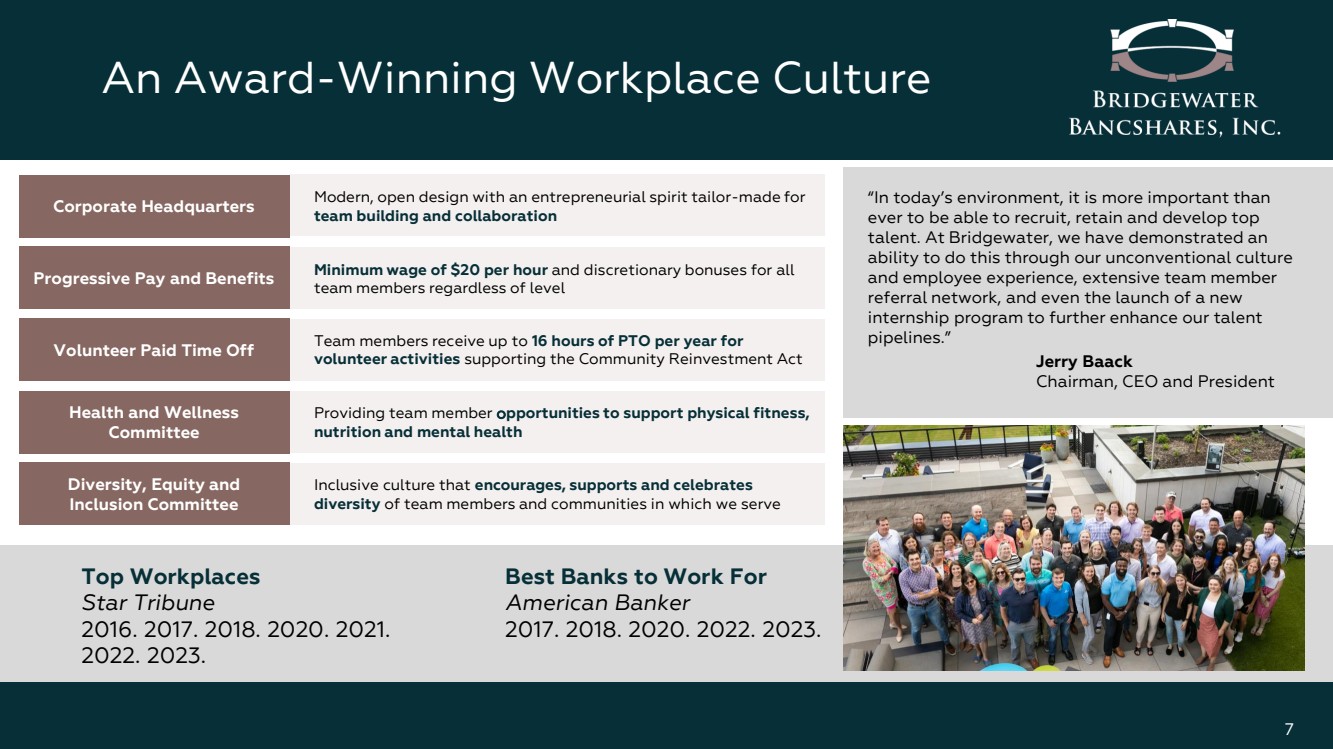
An Award-Winning Workplace Culture “In today’s environment, it is more important than ever to be able to recruit, retain and develop top talent. At Bridgewater, we have demonstrated an ability to do this through our unconventional culture and employee experience, extensive team member referral network, and even the launch of a new internship program to further enhance our talent pipelines.” Jerry Baack Chairman, CEO and President Top Workplaces Star Tribune 2016. 2017. 2018. 2020. 2021. 2022. 2023. Best Banks to Work For American Banker 2017. 2018. 2020. 2022. 2023. Corporate Headquarters Progressive Pay and Benefits Health and Wellness Committee Diversity, Equity and Inclusion Committee Volunteer Paid Time Off Modern, open design with an entrepreneurial spirit tailor-made for team building and collaboration Minimum wage of $20 per hour and discretionary bonuses for all team members regardless of level Providing team member opportunities to support physical fitness, nutrition and mental health Inclusive culture that encourages, supports and celebrates diversity of team members and communities in which we serve Team members receive up to 16 hours of PTO per year for volunteer activities supporting the Community Reinvestment Act 7 |
|
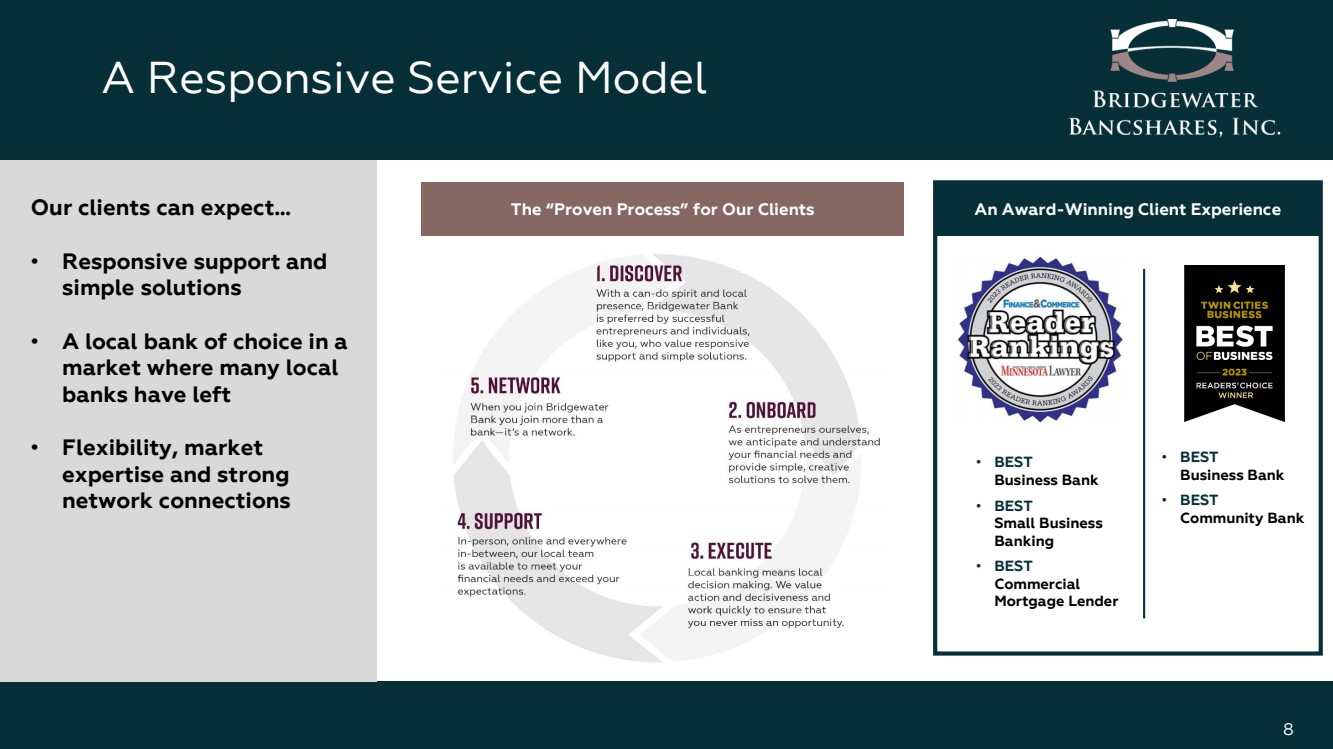
A Responsive Service Model 8 Our clients can expect… • Responsive support and simple solutions • A local bank of choice in a market where many local banks have left • Flexibility, market expertise and strong network connections The “Proven Process” for Our Clients • BEST Business Bank • BEST Small Business Banking • BEST Commercial Mortgage Lender An Award-Winning Client Experience • BEST Business Bank • BEST Community Bank |
|
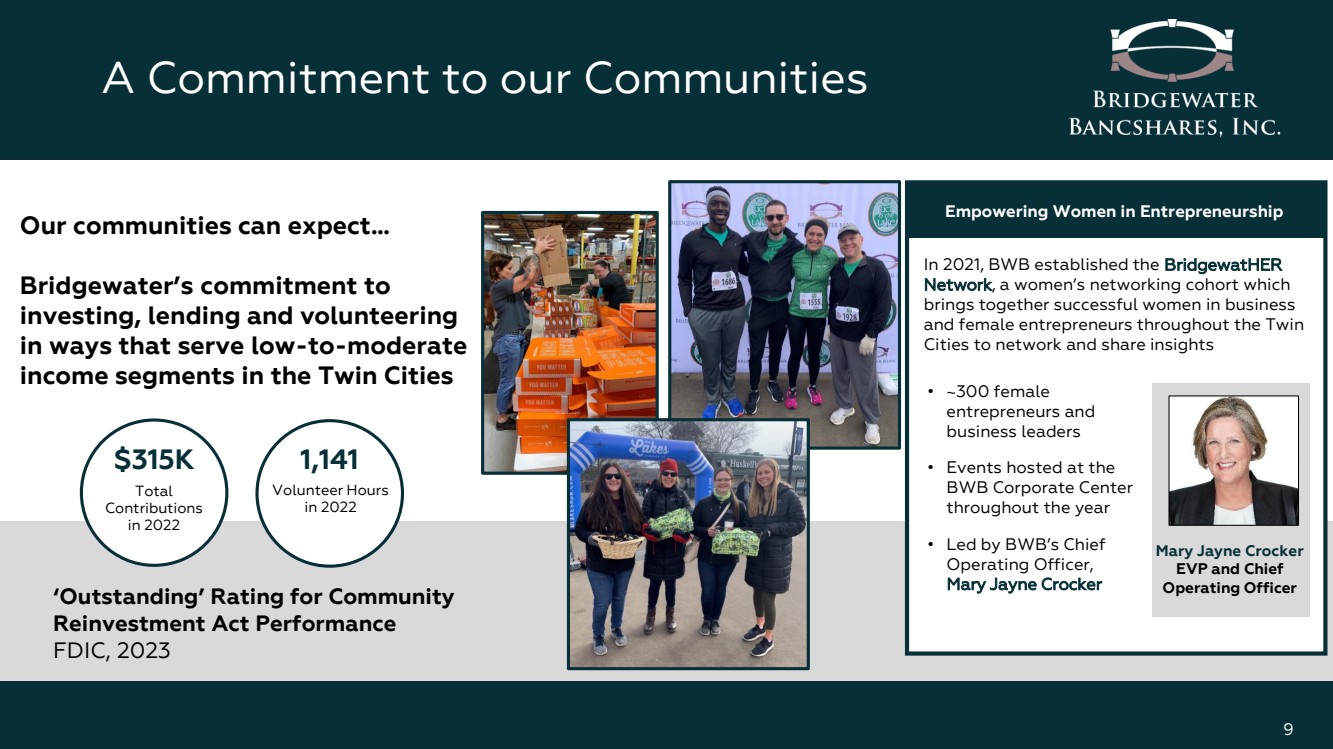
A Commitment to our Communities 9 Our communities can expect… Bridgewater’s commitment to investing, lending and volunteering in ways that serve low-to-moderate income segments in the Twin Cities ‘Outstanding’ Rating for Community Reinvestment Act Performance FDIC, 2023 $315K Total Contributions in 2022 1,141 Volunteer Hours in 2022 Empowering Women in Entrepreneurship In 2021, BWB established the BridgewatHER Network, a women’s networking cohort which brings together successful women in business and female entrepreneurs throughout the Twin Cities to network and share insights • ~300 female entrepreneurs and business leaders • Events hosted at the BWB Corporate Center throughout the year • Led by BWB’s Chief Operating Officer, Mary Jayne Crocker Mary Jayne Crocker EVP and Chief Operating Officer |
|
Environmental, Social and Governance (ESG) 10 We are committed to establishing and advancing impactful initiatives that support our corporate responsibility as one of the largest locally-led banks in the Twin Cities, while regularly sharing our progress with our stakeholders Our ESG Commitment Our ESG Priorities Team Members, Clients and Communities Diversity, Equity and Inclusion Leverage our unconventional corporate culture to leave a positive lasting impact on our team members, clients and communities Ensure strong corporate governance oversight including an effective risk management framework to support a growing organization Create a diverse, equitable and inclusive work environment and community Contribute to a healthier natural environment in the communities in which we live and work Corporate Governance Environmental ESG Oversight • Board-level Nominating and ESG Committee oversees Bridgewater's strategy and practices related to ESG • Management-level ESG Committee focuses on developing, implementing and growing a formal ESG program For more about Bridgewater’s commitment, priorities and initiatives related to ESG, please visit our ESG webpage at www.BWBMN.com/about-Bridgewater/esg |
|
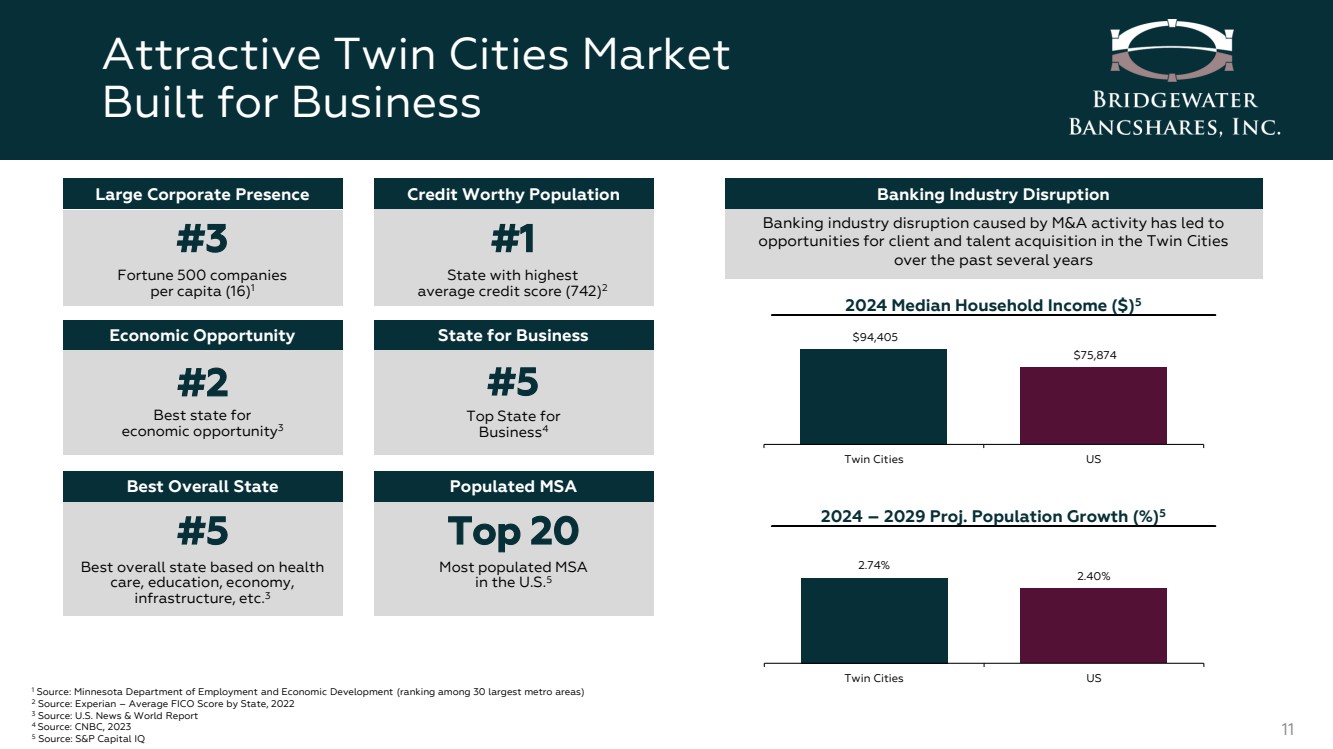
Attractive Twin Cities Market Built for Business 11 #3 Fortune 500 companies per capita (16)1 Large Corporate Presence #1 State with highest average credit score (742)2 Credit Worthy Population #2 Best state for economic opportunity3 Economic Opportunity #5 Top State for Business4 State for Business #5 Best overall state based on health care, education, economy, infrastructure, etc.3 Best Overall State Top 20 Most populated MSA in the U.S.5 Populated MSA 2.74% 2.40% Twin Cities US $94,405 $75,874 Twin Cities US Banking industry disruption caused by M&A activity has led to opportunities for client and talent acquisition in the Twin Cities over the past several years Banking Industry Disruption 2024 Median Household Income ($)5 2024 – 2029 Proj. Population Growth (%)5 1 Source: Minnesota Department of Employment and Economic Development (ranking among 30 largest metro areas) 2 Source: Experian – Average FICO Score by State, 2022 3 Source: U.S. News & World Report 4 Source: CNBC, 2023 5 Source: S&P Capital IQ |
|
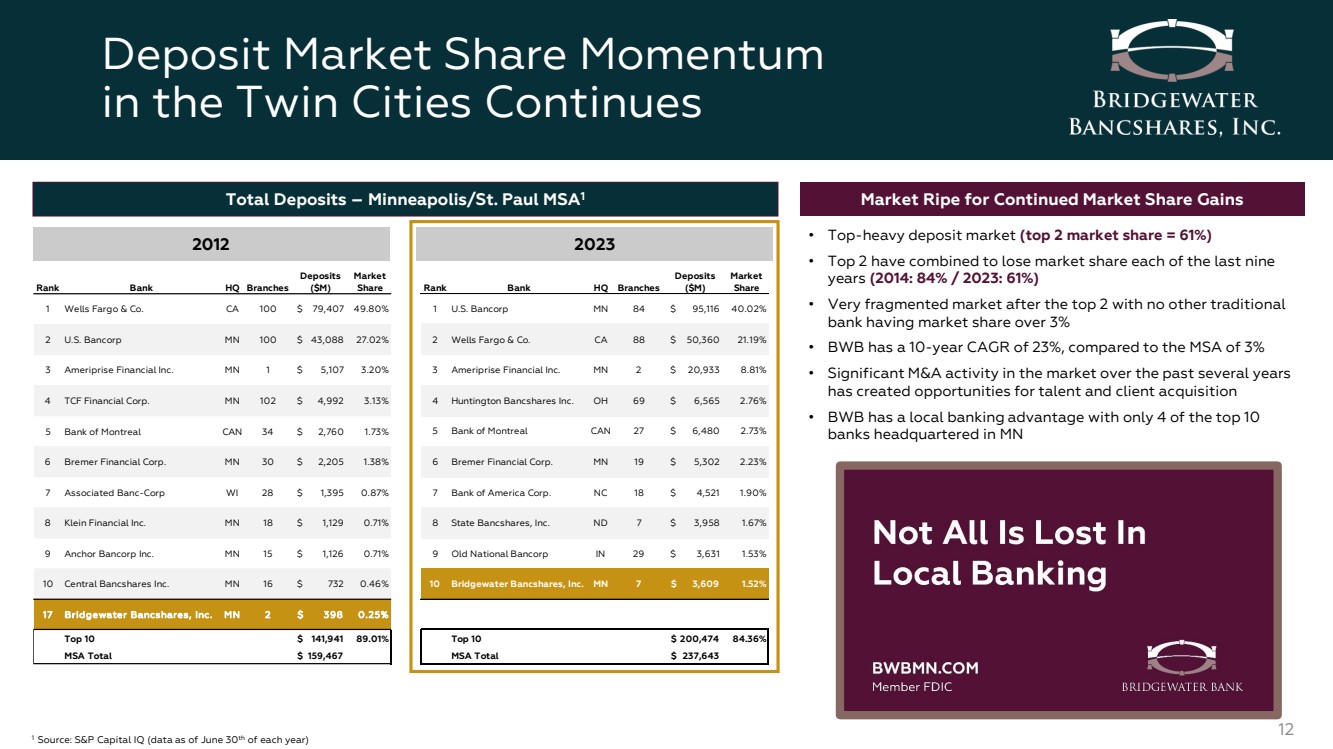
Rank Bank HQ Branches Deposits ($M) Market Share 1 U.S. Bancorp MN 84 $ 95,116 40.02% 2 Wells Fargo & Co. CA 88 $ 50,360 21.19% 3 Ameriprise Financial Inc. MN 2 $ 20,933 8.81% 4 Huntington Bancshares Inc. OH 69 $ 6,565 2.76% 5 Bank of Montreal CAN 27 $ 6,480 2.73% 6 Bremer Financial Corp. MN 19 $ 5,302 2.23% 7 Bank of America Corp. NC 18 $ 4,521 1.90% 8 State Bancshares, Inc. ND 7 $ 3,958 1.67% 9 Old National Bancorp IN 29 $ 3,631 1.53% 10 Bridgewater Bancshares, Inc. MN 7 $ 3,609 1.52% Top 10 $ 200,474 84.36% MSA Total $ 237,643 Deposit Market Share Momentum in the Twin Cities Continues 12 Total Deposits – Minneapolis/St. Paul MSA1 2012 2023 Market Ripe for Continued Market Share Gains • Top-heavy deposit market (top 2 market share = 61%) • Top 2 have combined to lose market share each of the last nine years (2014: 84% / 2023: 61%) • Very fragmented market after the top 2 with no other traditional bank having market share over 3% • BWB has a 10-year CAGR of 23%, compared to the MSA of 3% • Significant M&A activity in the market over the past several years has created opportunities for talent and client acquisition • BWB has a local banking advantage with only 4 of the top 10 banks headquartered in MN 1 Source: S&P Capital IQ (data as of June 30th of each year) Rank Bank HQ Branches Deposits ($M) Market Share 1 Wells Fargo & Co. CA 100 $ 79,407 49.80% 2 U.S. Bancorp MN 100 $ 43,088 27.02% 3 Ameriprise Financial Inc. MN 1 $ 5,107 3.20% 4 TCF Financial Corp. MN 102 $ 4,992 3.13% 5 Bank of Montreal CAN 34 $ 2,760 1.73% 6 Bremer Financial Corp. MN 30 $ 2,205 1.38% 7 Associated Banc-Corp WI 28 $ 1,395 0.87% 8 Klein Financial Inc. MN 18 $ 1,129 0.71% 9 Anchor Bancorp Inc. MN 15 $ 1,126 0.71% 10 Central Bancshares Inc. MN 16 $ 732 0.46% 1 7 Bridgewater Bancshares, Inc. M N 2 $ 398 0.25% Top 10 $ 141,941 89.01% MSA Total $ 159,467 |
|
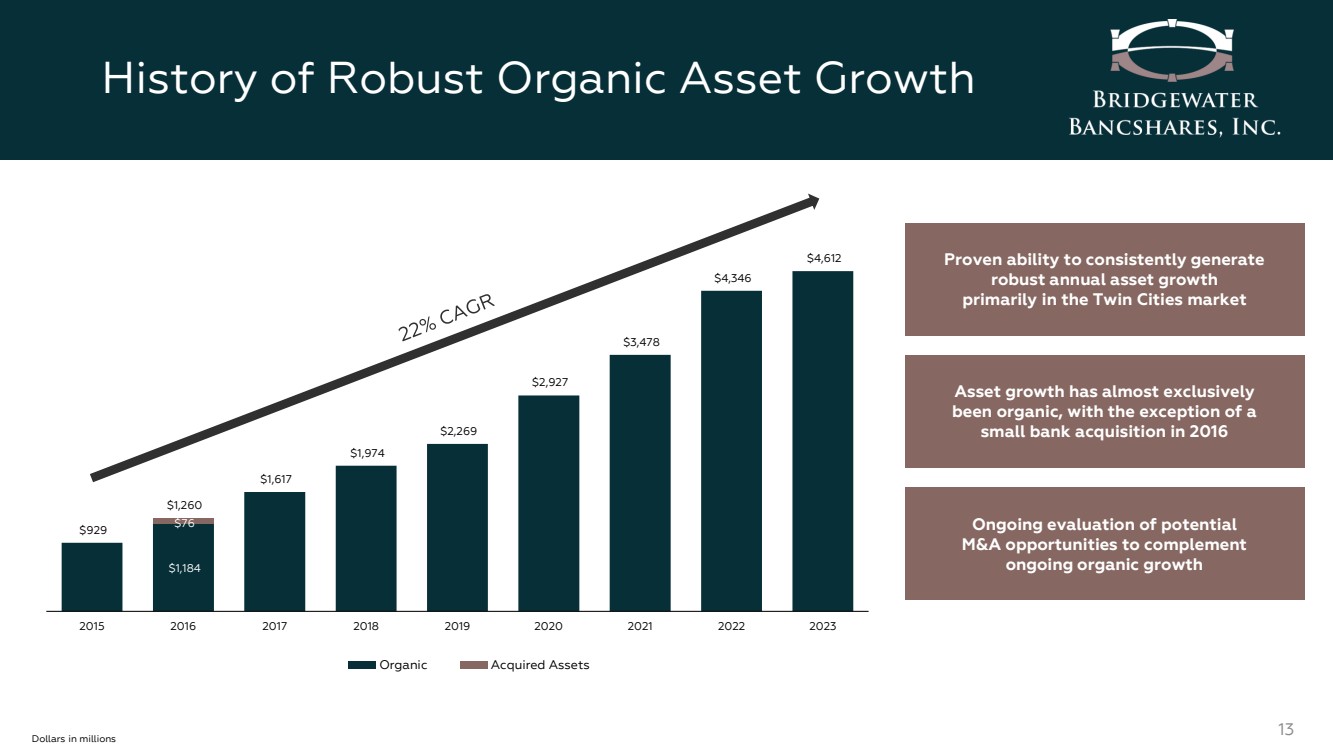
History of Robust Organic Asset Growth 13 $1,184 $76 $929 $1,260 $1,617 $1,974 $2,269 $2,927 $3,478 $4,346 $4,612 2015 2016 2017 2018 2019 2020 2021 2022 2023 Organic Acquired Assets Proven ability to consistently generate robust annual asset growth primarily in the Twin Cities market Asset growth has almost exclusively been organic, with the exception of a small bank acquisition in 2016 Dollars in millions Ongoing evaluation of potential M&A opportunities to complement ongoing organic growth |
|
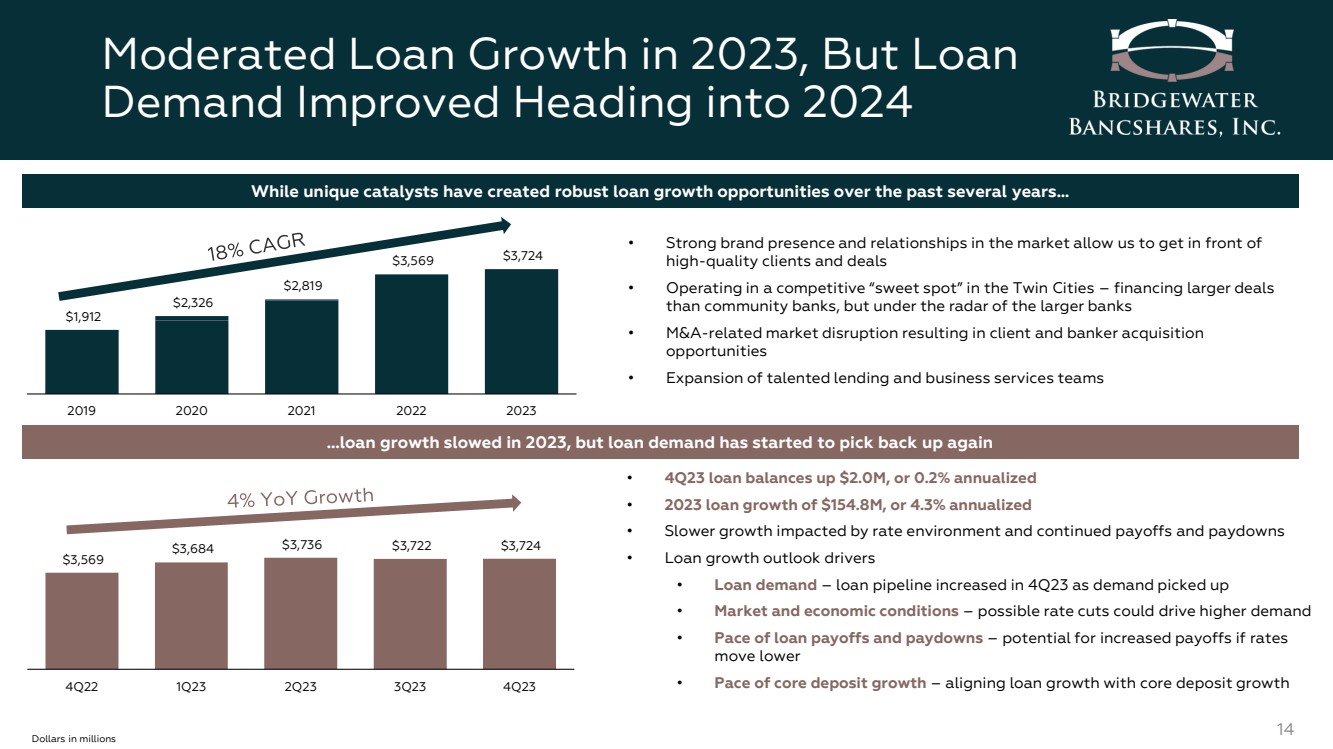
Moderated Loan Growth in 2023, But Loan Demand Improved Heading into 2024 14 $3,569 $3,684 $3,736 $3,722 $3,724 4Q22 1Q23 2Q23 3Q23 4Q23 Dollars in millions $1,912 $2,326 $2,819 $3,569 $3,724 2019 2020 2021 2022 2023 ...loan growth slowed in 2023, but loan demand has started to pick back up again • 4Q23 loan balances up $2.0M, or 0.2% annualized • 2023 loan growth of $154.8M, or 4.3% annualized • Slower growth impacted by rate environment and continued payoffs and paydowns • Loan growth outlook drivers • Loan demand – loan pipeline increased in 4Q23 as demand picked up • Market and economic conditions – possible rate cuts could drive higher demand • Pace of loan payoffs and paydowns – potential for increased payoffs if rates move lower • Pace of core deposit growth – aligning loan growth with core deposit growth While unique catalysts have created robust loan growth opportunities over the past several years… • Strong brand presence and relationships in the market allow us to get in front of high-quality clients and deals • Operating in a competitive “sweet spot” in the Twin Cities – financing larger deals than community banks, but under the radar of the larger banks • M&A-related market disruption resulting in client and banker acquisition opportunities • Expansion of talented lending and business services teams |
|
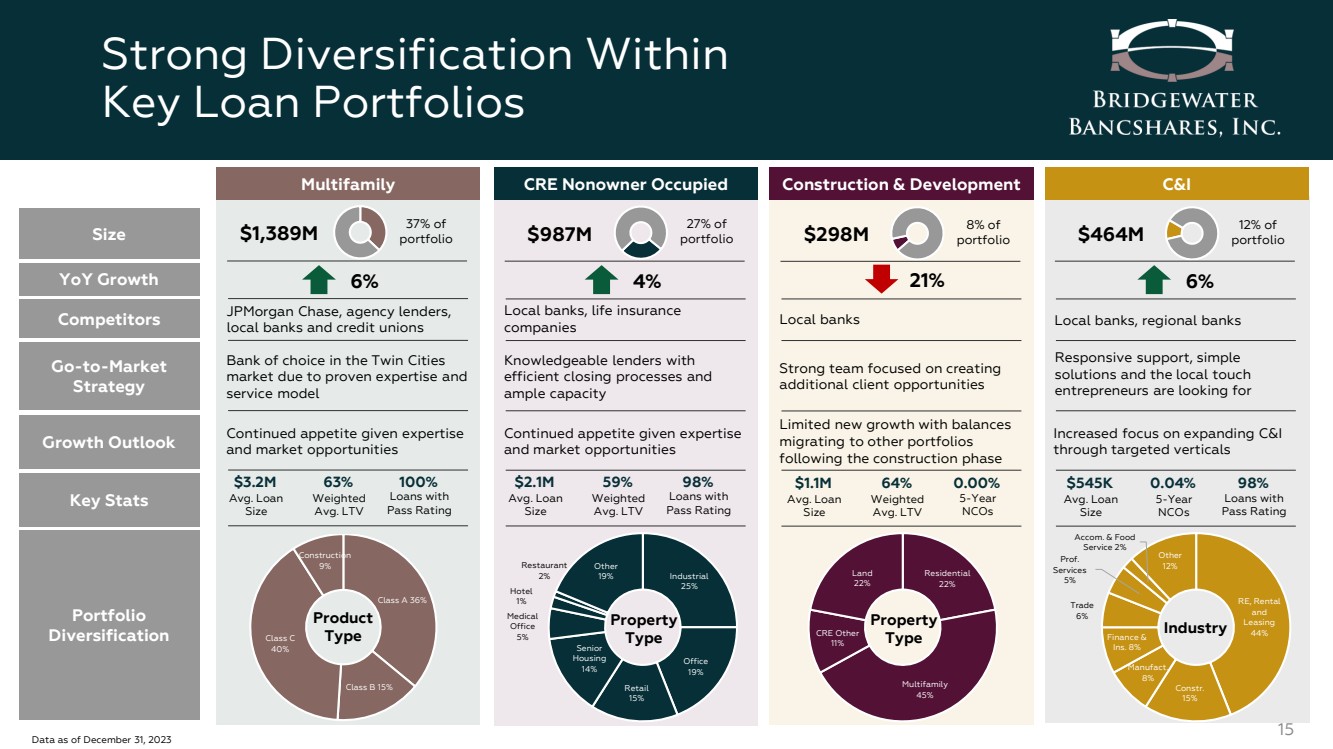
Class A 36% Class B 15% Class C 40% Construction 9% Strong Diversification Within Key Loan Portfolios 15 Size YoY Growth Go-to-Market Strategy Competitors Growth Outlook Key Stats Portfolio Diversification Multifamily CRE Nonowner Occupied Construction & Development C&I Bank of choice in the Twin Cities market due to proven expertise and service model Knowledgeable lenders with efficient closing processes and ample capacity Responsive support, simple solutions and the local touch entrepreneurs are looking for Strong team focused on creating additional client opportunities JPMorgan Chase, agency lenders, local banks and credit unions Local banks, life insurance companies Local banks Local banks, regional banks Continued appetite given expertise and market opportunities Continued appetite given expertise and market opportunities Increased focus on expanding C&I through targeted verticals Limited new growth with balances migrating to other portfolios following the construction phase $3.2M Avg. Loan Size 63% Weighted Avg. LTV 100% Loans with Pass Rating $2.1M Avg. Loan Size 59% Weighted Avg. LTV 98% Loans with Pass Rating $545K Avg. Loan Size 0.04% 5-Year NCOs 98% Loans with Pass Rating $1.1M Avg. Loan Size 64% Weighted Avg. LTV 0.00% 5-Year NCOs Product Type Industrial 25% Office 19% Retail 15% Senior Housing 14% Medical Office 5% Restaurant 2% Hotel 1% Other 19% Property Type RE, Rental and Leasing 44% Constr. 15% Manufact. 8% Finance & Ins. 8% Trade 6% Prof. Services 5% Accom. & Food Service 2% Other 12% Industry Residential 22% Multifamily 45% CRE Other 11% Land 22% Property Type Data as of December 31, 2023 $1,389M 37% of portfolio $987M 27% of portfolio $464M 12% of $298M portfolio 8% of portfolio 6% 4% 21% 6% |
|
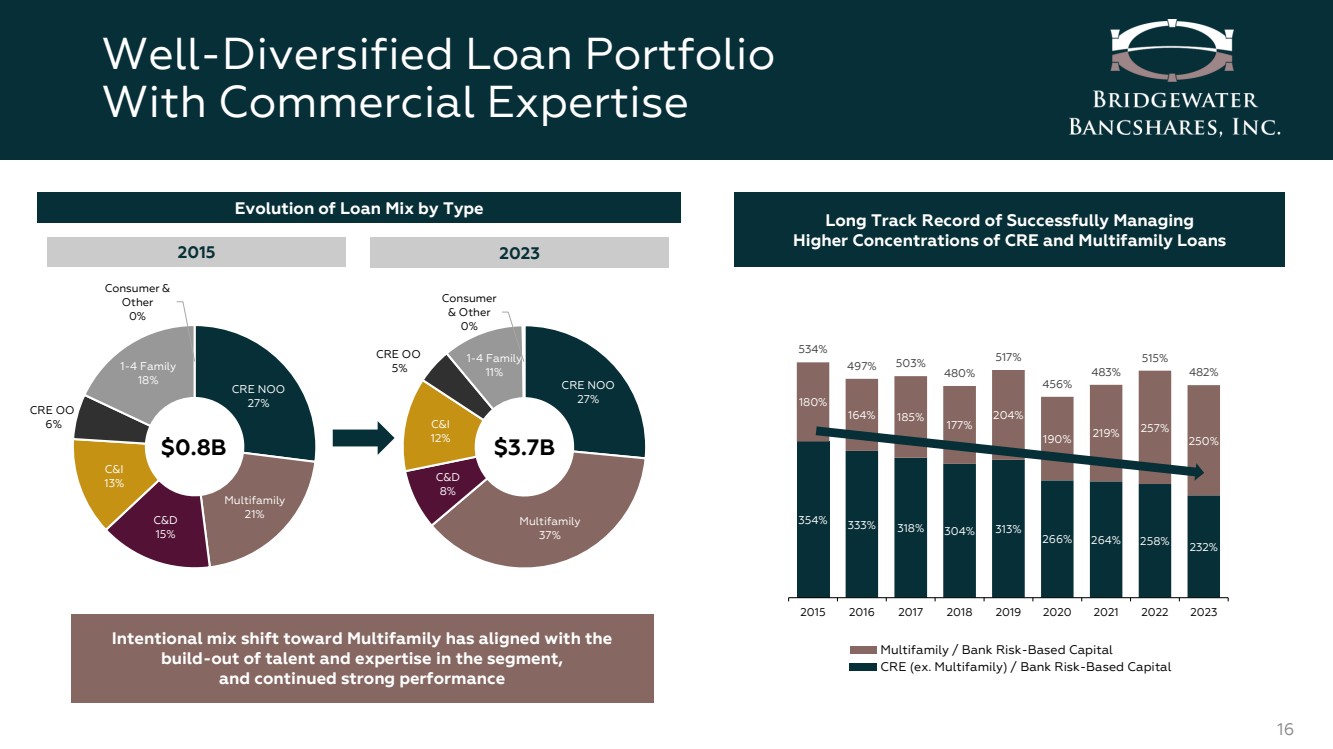
CRE NOO 27% Multifamily 37% C&D 8% C&I 12% CRE OO 5% 1-4 Family 11% Consumer & Other 0% Well-Diversified Loan Portfolio With Commercial Expertise 16 CRE NOO 27% Multifamily 21% C&D 15% C&I 13% CRE OO 6% 1-4 Family 18% Consumer & Other 0% $0.8B Evolution of Loan Mix by Type 2015 2023 Intentional mix shift toward Multifamily has aligned with the build-out of talent and expertise in the segment, and continued strong performance Long Track Record of Successfully Managing Higher Concentrations of CRE and Multifamily Loans Multifamily / Bank Risk-Based Capital CRE (ex. Multifamily) / Bank Risk-Based Capital $3.7B 354% 333% 318% 304% 313% 266% 264% 258% 232% 180% 164% 185% 177% 204% 190% 219% 257% 250% 534% 497% 503% 480% 517% 456% 483% 515% 482% 2015 2016 2017 2018 2019 2020 2021 2022 2023 |
|
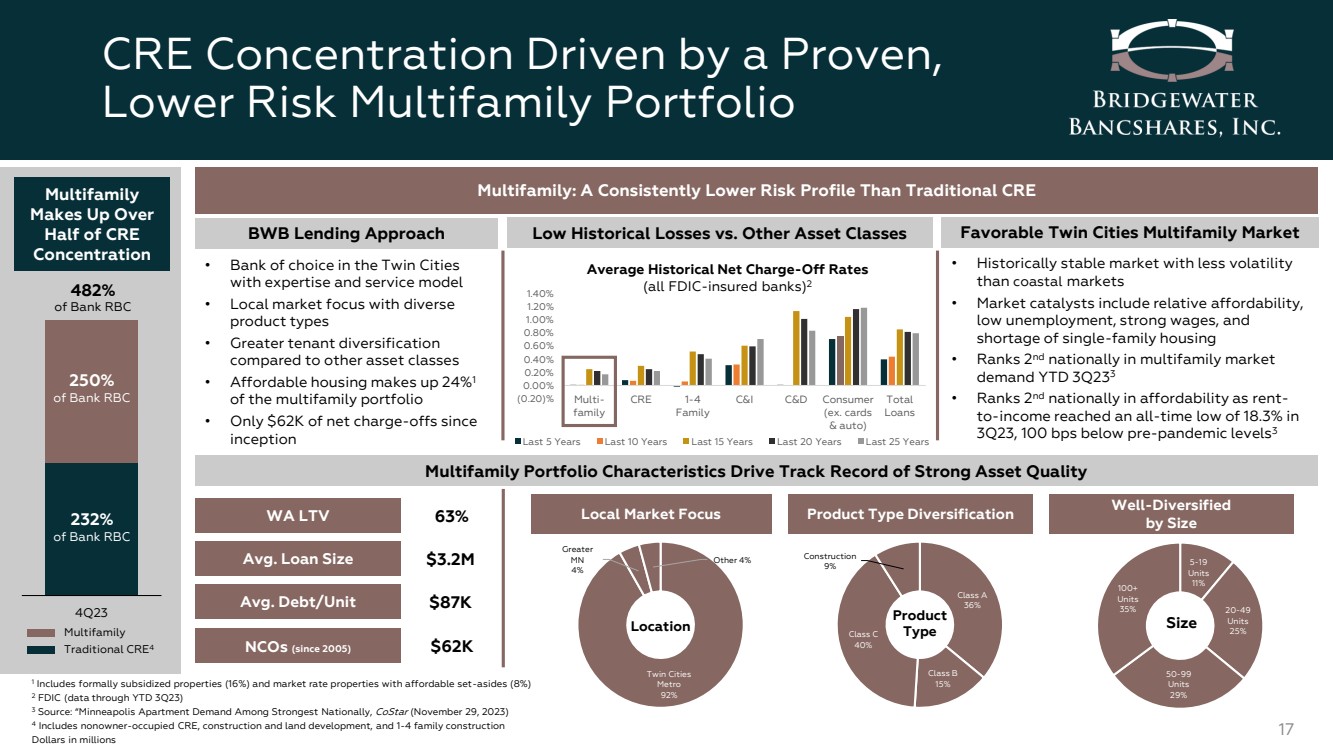
(0.20)% 0.00% 0.20% 0.40% 0.60% 0.80% 1.00% 1.20% 1.40% Multi-family CRE 1-4 Family C&I C&D Consumer (ex. cards & auto) Total Loans Last 5 Years Last 10 Years Last 15 Years Last 20 Years Last 25 Years CRE Concentration Driven by a Proven, Lower Risk Multifamily Portfolio 17 4Q23 250% of Bank RBC Multifamily Traditional CRE4 232% of Bank RBC 482% of Bank RBC Multifamily Makes Up Over Half of CRE Concentration Multifamily: A Consistently Lower Risk Profile Than Traditional CRE BWB Lending Approach Multifamily Portfolio Characteristics Drive Track Record of Strong Asset Quality Favorable Twin Cities Multifamily Market WA LTV Avg. Loan Size Avg. Debt/Unit NCOs (since 2005) 63% $3.2M $87K $62K Local Market Focus Twin Cities Metro 92% Greater MN 4% Other 4% Location • Historically stable market with less volatility than coastal markets • Market catalysts include relative affordability, low unemployment, strong wages, and shortage of single-family housing • Ranks 2nd nationally in multifamily market demand YTD 3Q233 • Ranks 2nd nationally in affordability as rent-to-income reached an all-time low of 18.3% in 3Q23, 100 bps below pre-pandemic levels3 Product Type Diversification Well-Diversified by Size 5-19 Units 11% 20-49 Units 25% 50-99 Units 29% 100+ Units 35% Size 1 Includes formally subsidized properties (16%) and market rate properties with affordable set-asides (8%) 2 FDIC (data through YTD 3Q23) 3 Source: “Minneapolis Apartment Demand Among Strongest Nationally, CoStar (November 29, 2023) 4 Includes nonowner-occupied CRE, construction and land development, and 1-4 family construction Dollars in millions • Bank of choice in the Twin Cities with expertise and service model • Local market focus with diverse product types • Greater tenant diversification compared to other asset classes • Affordable housing makes up 24%1 of the multifamily portfolio • Only $62K of net charge-offs since inception Low Historical Losses vs. Other Asset Classes Average Historical Net Charge-Off Rates (all FDIC-insured banks)2 Class A 36% Class B 15% Class C 40% Construction 9% Product Type |
|
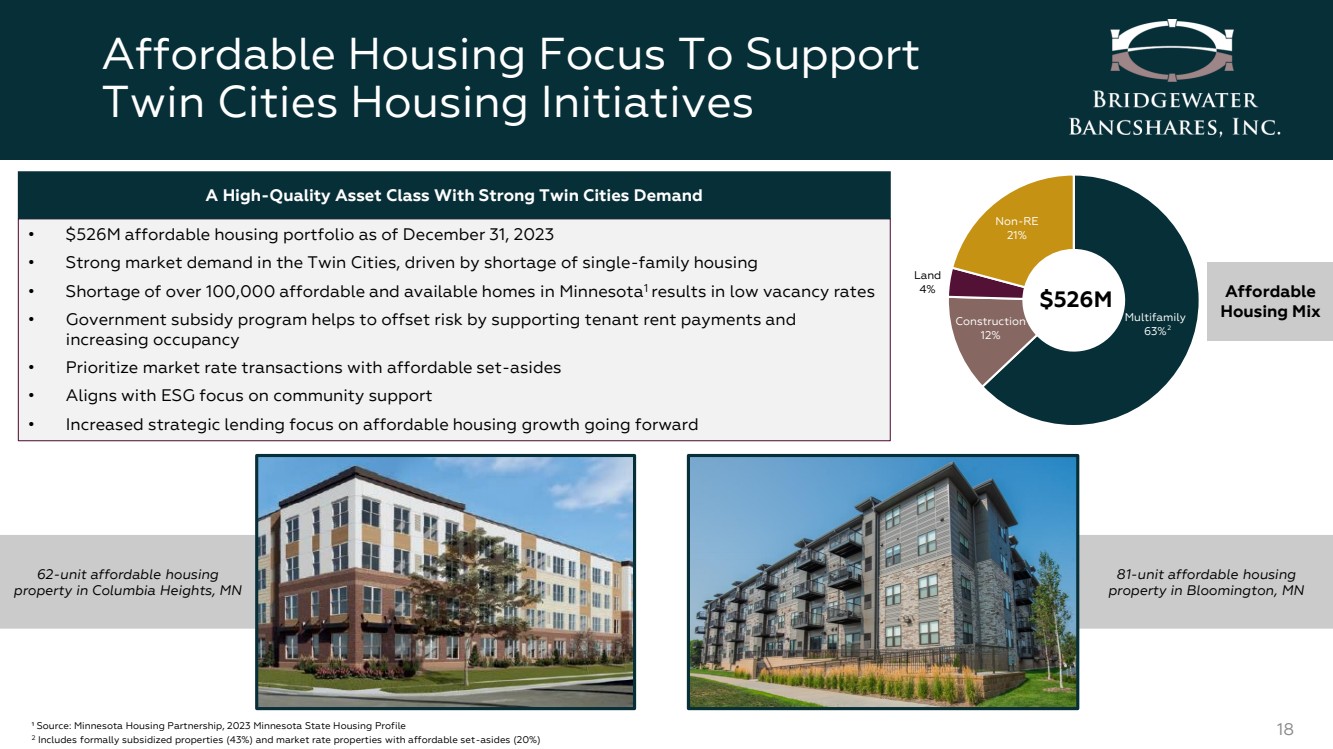
81-unit affordable housing property in Bloomington, MN Affordable Housing Focus To Support Twin Cities Housing Initiatives 18 • $526M affordable housing portfolio as of December 31, 2023 • Strong market demand in the Twin Cities, driven by shortage of single-family housing • Shortage of over 100,000 affordable and available homes in Minnesota1 results in low vacancy rates • Government subsidy program helps to offset risk by supporting tenant rent payments and increasing occupancy • Prioritize market rate transactions with affordable set-asides • Aligns with ESG focus on community support • Increased strategic lending focus on affordable housing growth going forward A High-Quality Asset Class With Strong Twin Cities Demand ¹ Source: Minnesota Housing Partnership, 2023 Minnesota State Housing Profile 2 Includes formally subsidized properties (43%) and market rate properties with affordable set-asides (20%) Multifamily 63% Construction 12% Land 4% Non-RE 21% $526M 62-unit affordable housing property in Columbia Heights, MN Affordable Housing Mix 2 |
|
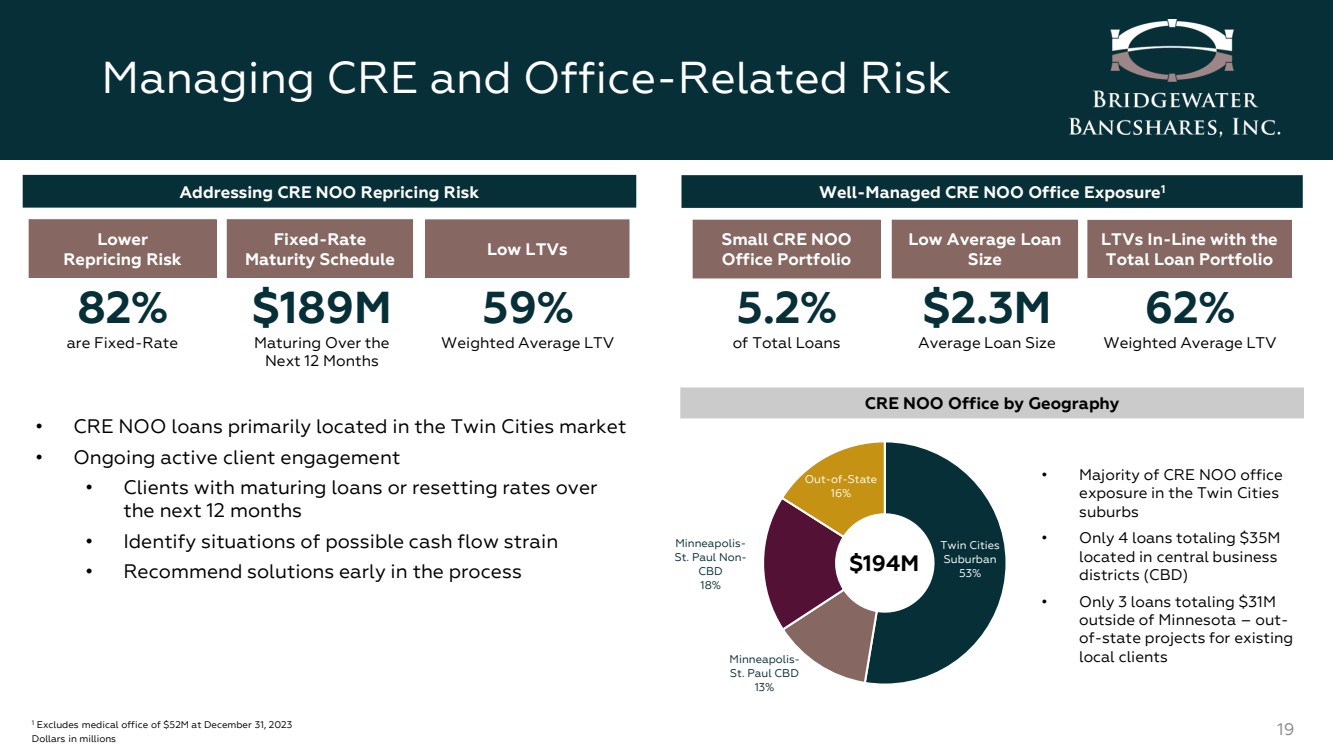
Managing CRE and Office-Related Risk 19 1 Excludes medical office of $52M at December 31, 2023 Dollars in millions Addressing CRE NOO Repricing Risk • CRE NOO loans primarily located in the Twin Cities market • Ongoing active client engagement • Clients with maturing loans or resetting rates over the next 12 months • Identify situations of possible cash flow strain • Recommend solutions early in the process Well-Managed CRE NOO Office Exposure1 Small CRE NOO Office Portfolio Low Average Loan Size LTVs In-Line with the Total Loan Portfolio 5.2% of Total Loans $2.3M Average Loan Size 62% Weighted Average LTV CRE NOO Office by Geography Twin Cities Suburban 53% Minneapolis-St. Paul CBD 13% Minneapolis-St. Paul Non-CBD 18% Out-of-State 16% $194M • Majority of CRE NOO office exposure in the Twin Cities suburbs • Only 4 loans totaling $35M located in central business districts (CBD) • Only 3 loans totaling $31M outside of Minnesota – out-of-state projects for existing local clients Lower Repricing Risk Fixed-Rate Maturity Schedule Low LTVs 82% are Fixed-Rate $189M Maturing Over the Next 12 Months 59% Weighted Average LTV |
|
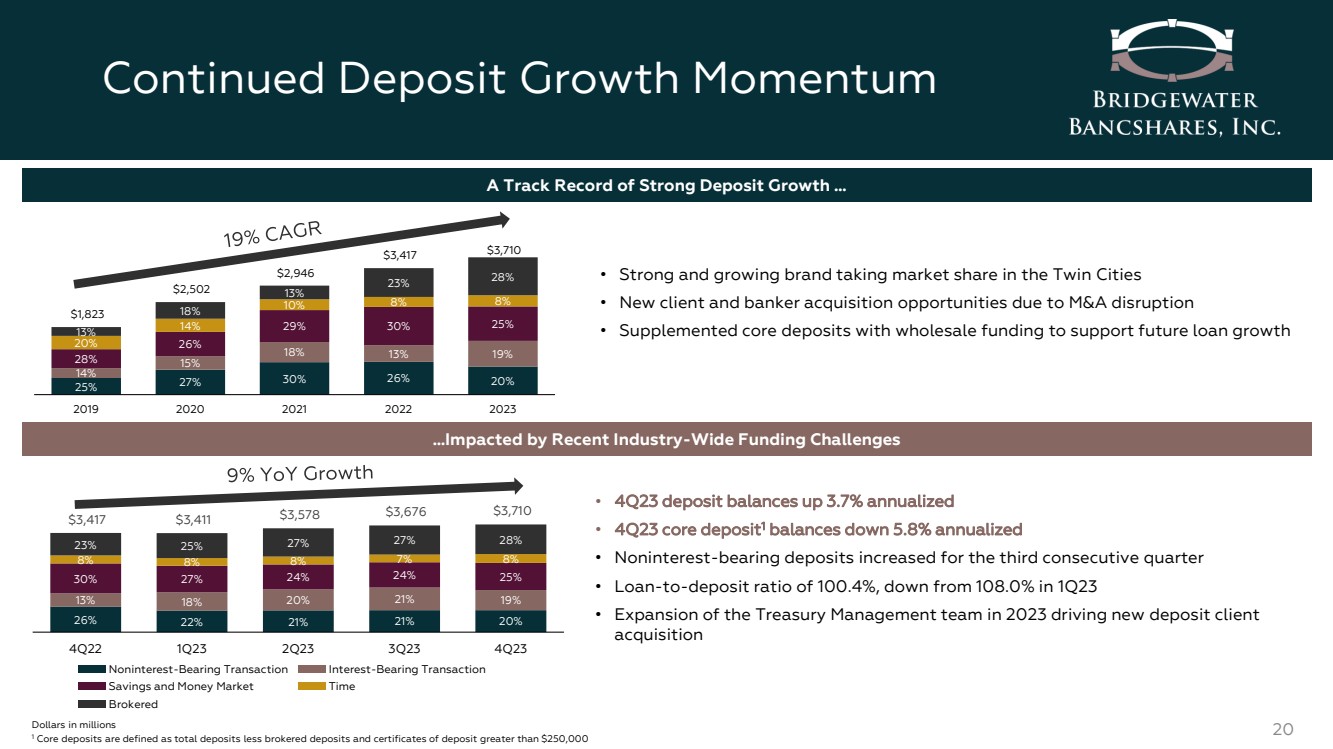
Continued Deposit Growth Momentum 20 Dollars in millions 1 Core deposits are defined as total deposits less brokered deposits and certificates of deposit greater than $250,000 25% 27% 30% 26% 20% 14% 15% 18% 13% 19% 28% 26% 29% 30% 25% 20% 14% 10% 8% 8% 13% 18% 13% 23% 28% $1,823 $2,502 $2,946 $3,417 $3,710 2019 2020 2021 2022 2023 Noninterest-Bearing Transaction Interest-Bearing Transaction Savings and Money Market Time Brokered A Track Record of Strong Deposit Growth … • Strong and growing brand taking market share in the Twin Cities • New client and banker acquisition opportunities due to M&A disruption • Supplemented core deposits with wholesale funding to support future loan growth • 4Q23 deposit balances up 3.7% annualized • 4Q23 core deposit1 balances down 5.8% annualized • Noninterest-bearing deposits increased for the third consecutive quarter • Loan-to-deposit ratio of 100.4%, down from 108.0% in 1Q23 • Expansion of the Treasury Management team in 2023 driving new deposit client acquisition …Impacted by Recent Industry-Wide Funding Challenges 26% 22% 21% 21% 20% 13% 18% 20% 21% 19% 30% 27% 24% 24% 25% 8% 8% 8% 7% 8% 23% 25% 27% 27% 28% $3,417 $3,411 $3,578 $3,676 $3,710 4Q22 1Q23 2Q23 3Q23 4Q23 |
|
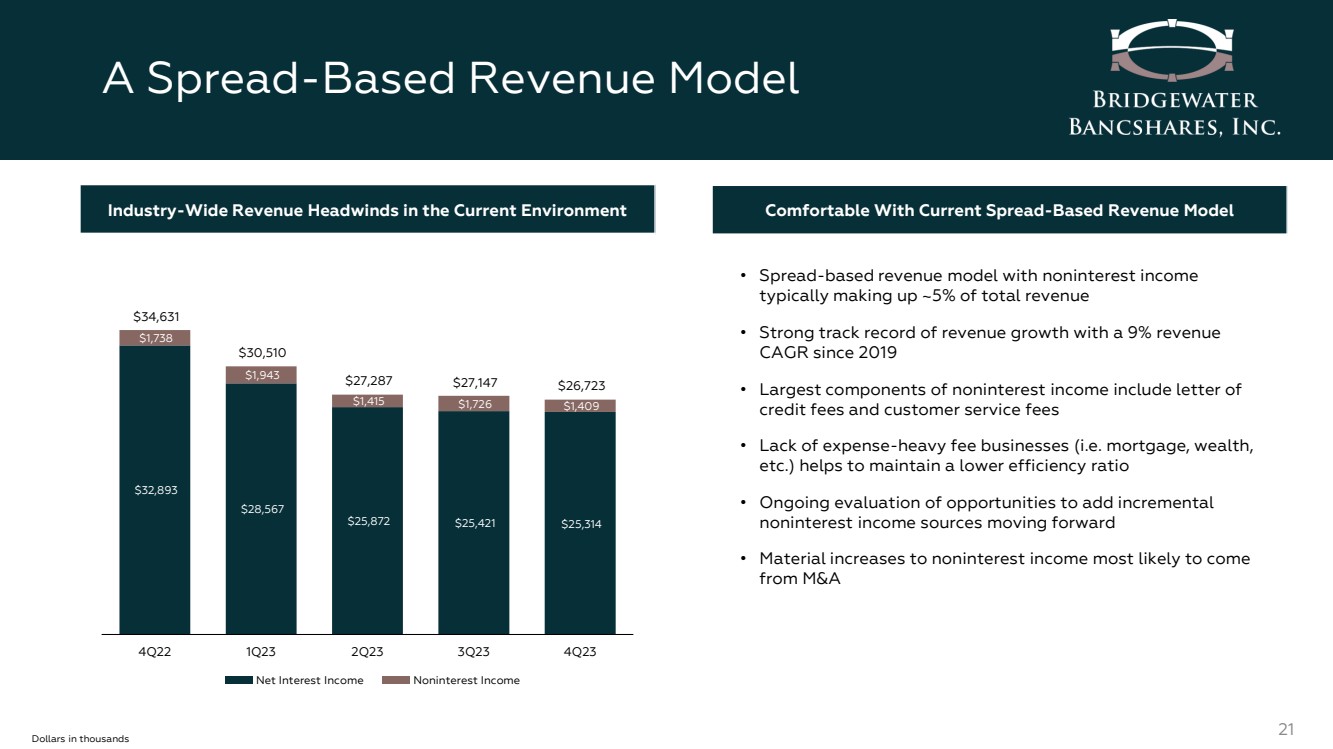
A Spread-Based Revenue Model 21 Industry-Wide Revenue Headwinds in the Current Environment $32,893 $28,567 $25,872 $25,421 $25,314 $1,738 $1,943 $1,415 $1,726 $1,409 $34,631 $30,510 $27,287 $27,147 $26,723 4Q22 1Q23 2Q23 3Q23 4Q23 Net Interest Income Noninterest Income Dollars in thousands • Spread-based revenue model with noninterest income typically making up ~5% of total revenue • Strong track record of revenue growth with a 9% revenue CAGR since 2019 • Largest components of noninterest income include letter of credit fees and customer service fees • Lack of expense-heavy fee businesses (i.e. mortgage, wealth, etc.) helps to maintain a lower efficiency ratio • Ongoing evaluation of opportunities to add incremental noninterest income sources moving forward • Material increases to noninterest income most likely to come from M&A Comfortable With Current Spread-Based Revenue Model |
|
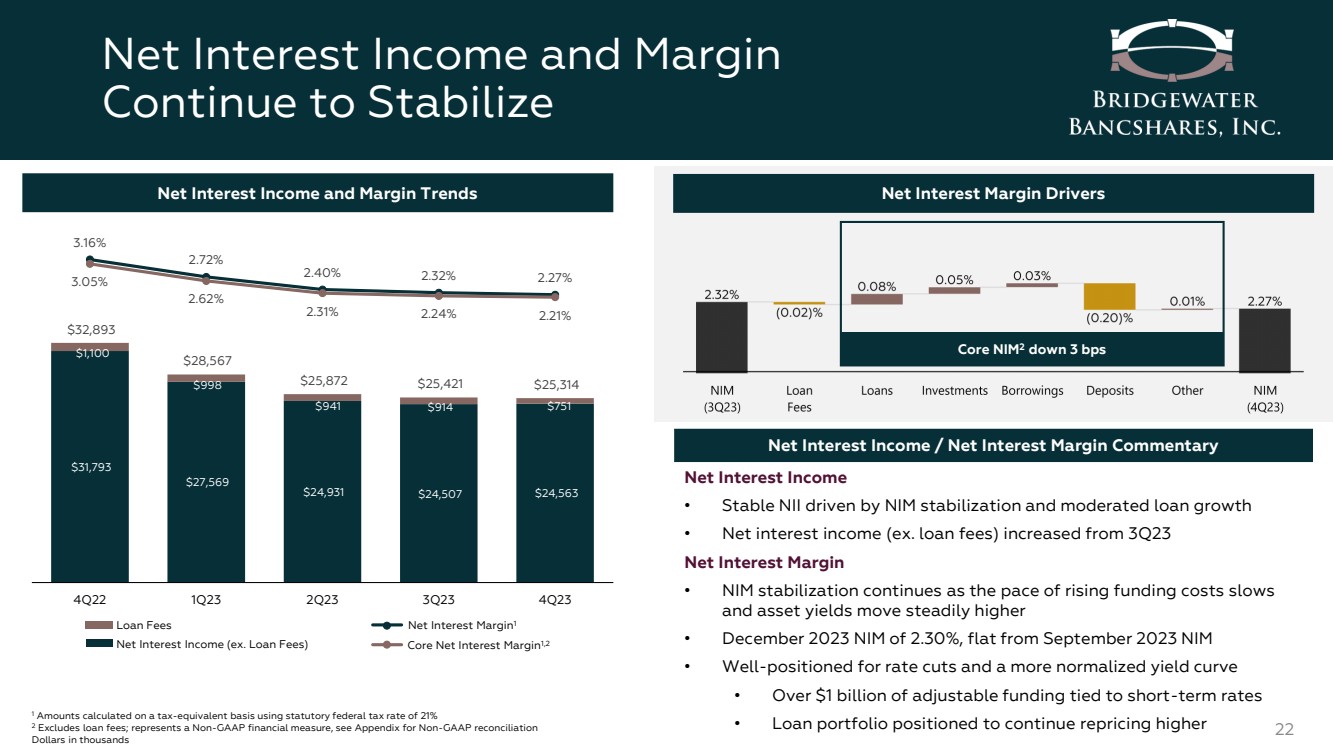
Net Interest Income and Margin Continue to Stabilize 22 $31,793 $27,569 $24,931 $24,507 $24,563 $1,100 $998 $941 $914 $751 $32,893 $28,567 $25,872 $25,421 $25,314 3.16% 2.72% 3.05% 2.40% 2.32% 2.27% 2.62% 2.31% 2.24% 2.21% 4Q22 1Q23 2Q23 3Q23 4Q23 Core Net Interest Margin1,2 Net Interest Margin1 Net Interest Income (ex. Loan Fees) Loan Fees Net Interest Income and Margin Trends Net Interest Margin Drivers Core NIM2 down 3 bps Net Interest Income / Net Interest Margin Commentary 1 Amounts calculated on a tax-equivalent basis using statutory federal tax rate of 21% 2 Excludes loan fees; represents a Non-GAAP financial measure, see Appendix for Non-GAAP reconciliation Dollars in thousands Net Interest Income • Stable NII driven by NIM stabilization and moderated loan growth • Net interest income (ex. loan fees) increased from 3Q23 Net Interest Margin • NIM stabilization continues as the pace of rising funding costs slows and asset yields move steadily higher • December 2023 NIM of 2.30%, flat from September 2023 NIM • Well-positioned for rate cuts and a more normalized yield curve • Over $1 billion of adjustable funding tied to short-term rates • Loan portfolio positioned to continue repricing higher |
|
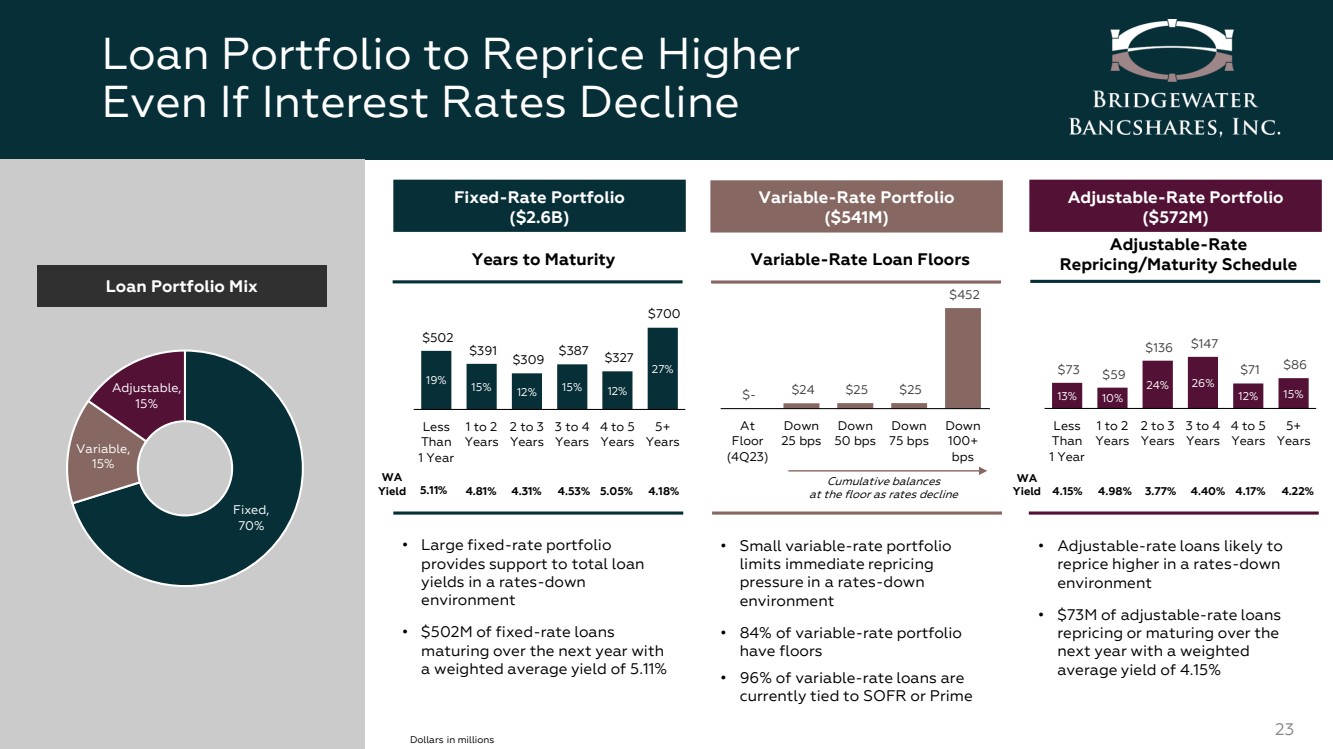
13% 10% 24% 26% 12% 15% $73 $59 $136 $147 $71 $86 Less Than 1 Year 1 to 2 Years 2 to 3 Years 3 to 4 Years 4 to 5 Years 5+ Years 19% 15% 12% 15% 12% 27% $502 $391 $309 $387 $327 $700 Less Than 1 Year 1 to 2 Years 2 to 3 Years 3 to 4 Years 4 to 5 Years 5+ Years Loan Portfolio to Reprice Higher Even If Interest Rates Decline 23 Fixed, 70% Variable, 15% Adjustable, 15% Loan Portfolio Mix Fixed-Rate Portfolio ($2.6B) Variable-Rate Portfolio ($541M) Adjustable-Rate Portfolio ($572M) Years to Maturity • Large fixed-rate portfolio provides support to total loan yields in a rates-down environment • $502M of fixed-rate loans maturing over the next year with a weighted average yield of 5.11% Variable-Rate Loan Floors $- $24 $25 $25 $452 At Floor (4Q23) Down 25 bps Down 50 bps Down 75 bps Down 100+ bps Cumulative balances at the floor as rates decline • Small variable-rate portfolio limits immediate repricing pressure in a rates-down environment • 84% of variable-rate portfolio have floors • 96% of variable-rate loans are currently tied to SOFR or Prime Adjustable-Rate Repricing/Maturity Schedule • Adjustable-rate loans likely to reprice higher in a rates-down environment • $73M of adjustable-rate loans repricing or maturing over the next year with a weighted average yield of 4.15% Dollars in millions WA Yield 5.11% 4.81% 4.31% 4.53% 5.05% 4.18% WA Yield 4.15% 4.98% 3.77% 4.40% 4.17% 4.22% |
|
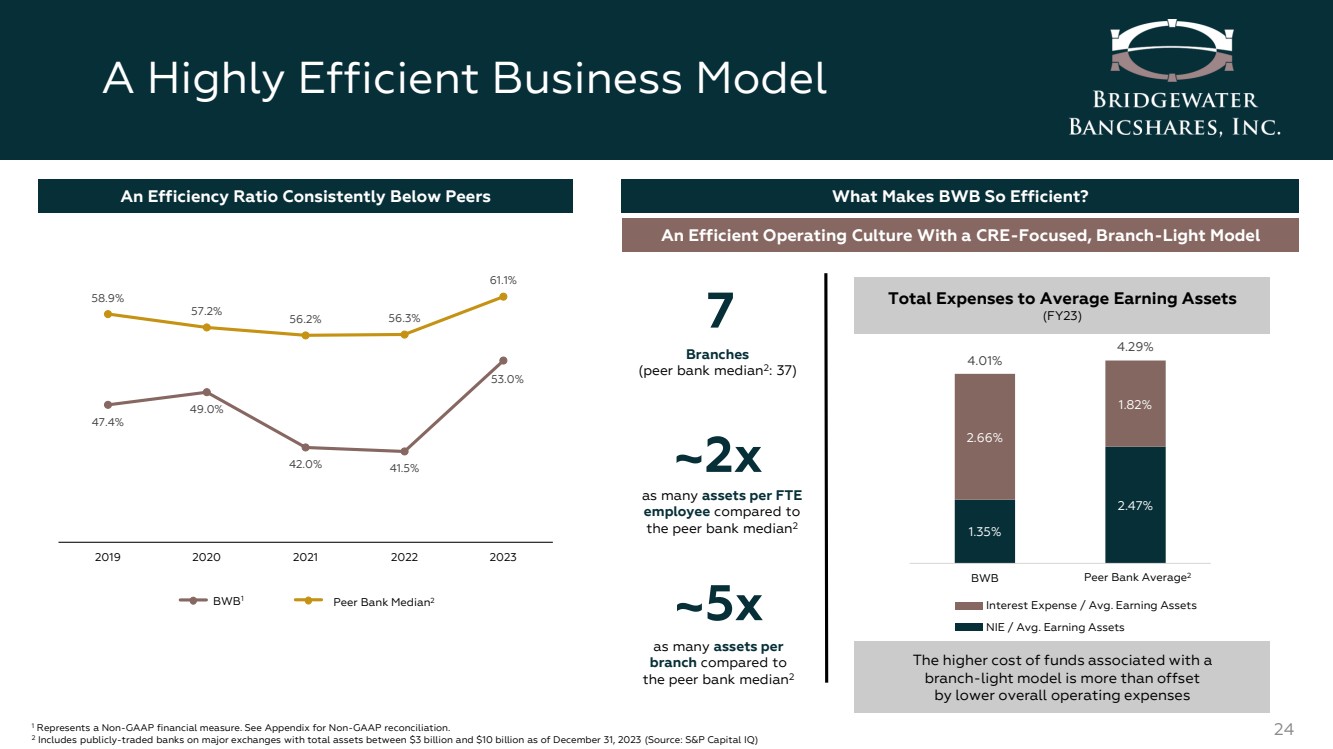
A Highly Efficient Business Model 24 47.4% 49.0% 42.0% 41.5% 53.0% 58.9% 57.2% 56.2% 56.3% 61.1% 2019 2020 2021 2022 2023 BWB1 An Efficiency Ratio Consistently Below Peers 1 Represents a Non-GAAP financial measure. See Appendix for Non-GAAP reconciliation. 2 Includes publicly-traded banks on major exchanges with total assets between $3 billion and $10 billion as of December 31, 2023 (Source: S&P Capital IQ) What Makes BWB So Efficient? An Efficient Operating Culture With a CRE-Focused, Branch-Light Model ~2x as many assets per FTE employee compared to the peer bank median2 7 Branches (peer bank median2 : 37) ~5x as many assets per branch compared to the peer bank median2 The higher cost of funds associated with a branch-light model is more than offset by lower overall operating expenses Total Expenses to Average Earning Assets (FY23) 1.35% 2.47% 2.66% 1.82% 4.01% 4.29% BWB Peer Bank Average Peer Bank Median2 2 Interest Expense / Avg. Earning Assets NIE / Avg. Earning Assets |
|
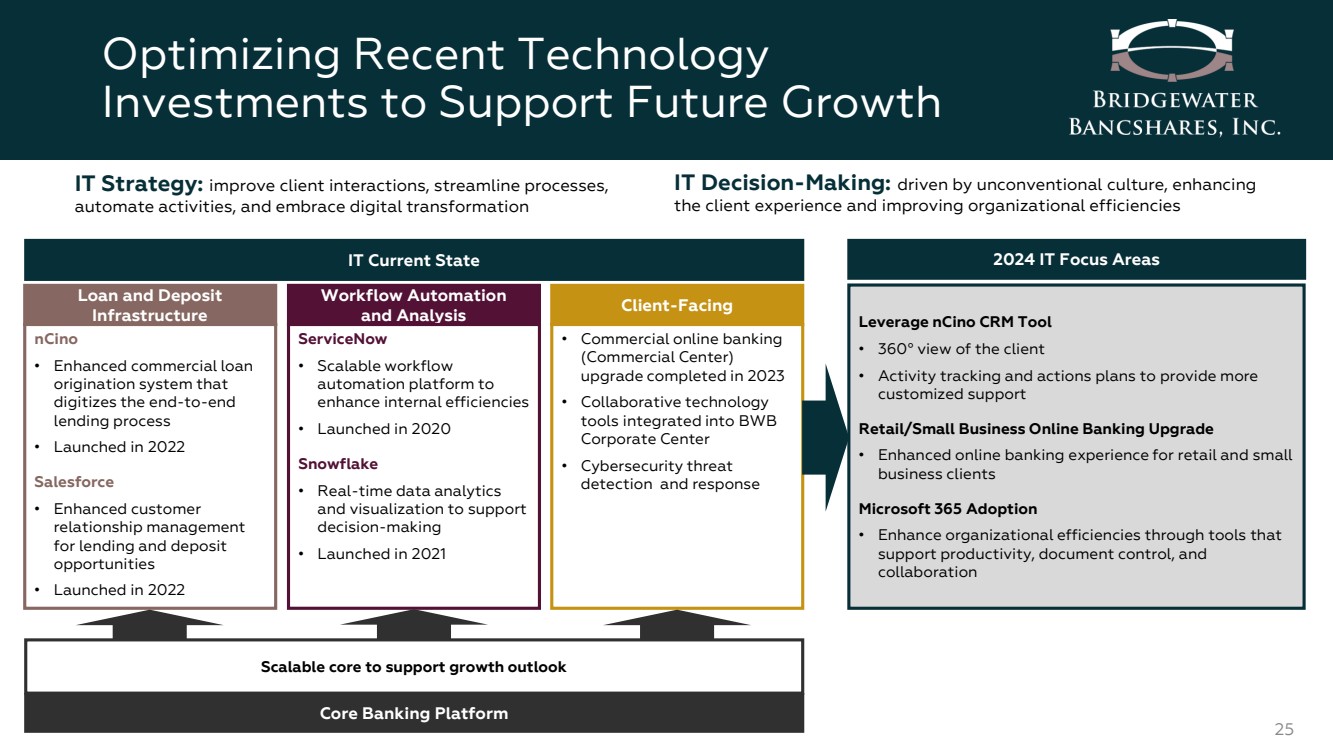
Optimizing Recent Technology Investments to Support Future Growth 25 Client-Facing • Commercial online banking (Commercial Center) upgrade completed in 2023 • Collaborative technology tools integrated into BWB Corporate Center • Cybersecurity threat detection and response Scalable core to support growth outlook Core Banking Platform IT Strategy: improve client interactions, streamline processes, automate activities, and embrace digital transformation IT Decision-Making: driven by unconventional culture, enhancing the client experience and improving organizational efficiencies IT Current State Loan and Deposit Infrastructure nCino • Enhanced commercial loan origination system that digitizes the end-to-end lending process • Launched in 2022 Salesforce • Enhanced customer relationship management for lending and deposit opportunities • Launched in 2022 Workflow Automation and Analysis ServiceNow • Scalable workflow automation platform to enhance internal efficiencies • Launched in 2020 Snowflake • Real-time data analytics and visualization to support decision-making • Launched in 2021 2024 IT Focus Areas Leverage nCino CRM Tool • 360° view of the client • Activity tracking and actions plans to provide more customized support Retail/Small Business Online Banking Upgrade • Enhanced online banking experience for retail and small business clients Microsoft 365 Adoption • Enhance organizational efficiencies through tools that support productivity, document control, and collaboration |
|
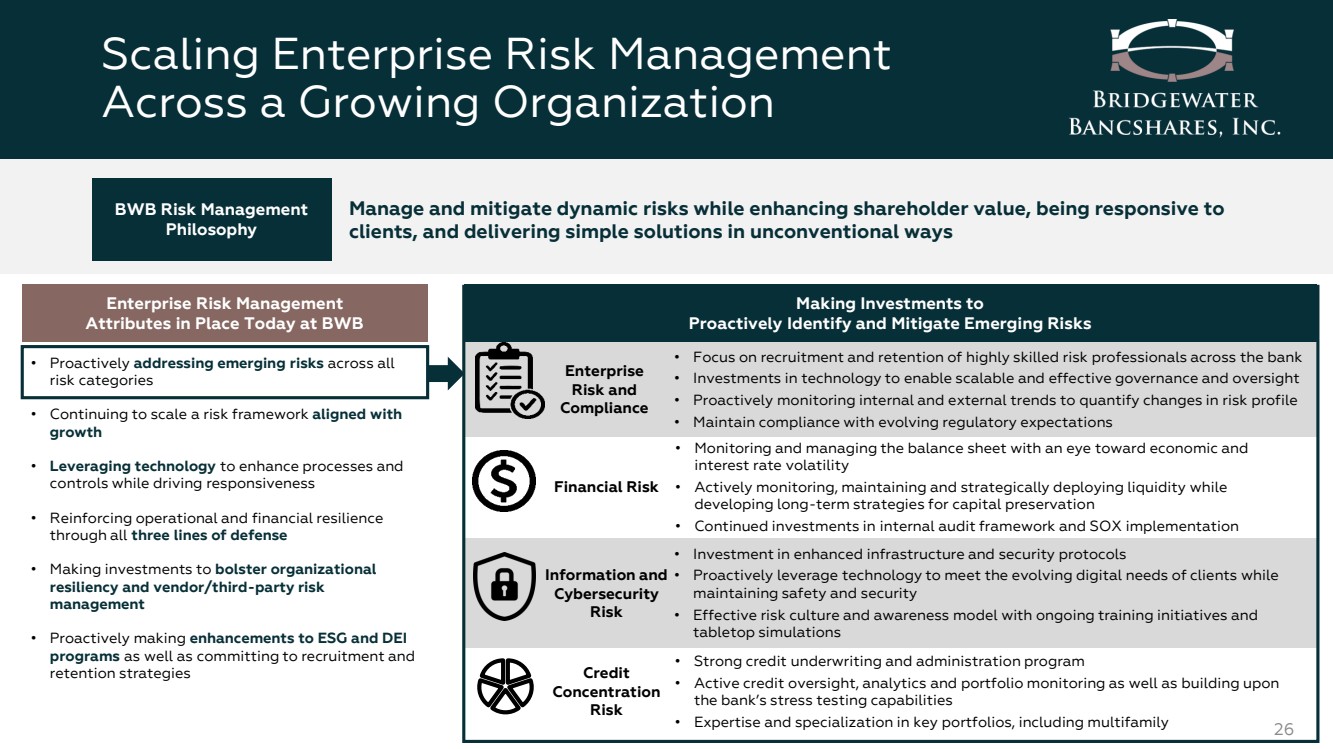
Scaling Enterprise Risk Management Across a Growing Organization 26 Manage and mitigate dynamic risks while enhancing shareholder value, being responsive to clients, and delivering simple solutions in unconventional ways BWB Risk Management Philosophy Enterprise Risk Management Attributes in Place Today at BWB • Proactively addressing emerging risks across all risk categories • Continuing to scale a risk framework aligned with growth • Leveraging technology to enhance processes and controls while driving responsiveness • Reinforcing operational and financial resilience through all three lines of defense • Making investments to bolster organizational resiliency and vendor/third-party risk management • Proactively making enhancements to ESG and DEI programs as well as committing to recruitment and retention strategies Making Investments to Proactively Identify and Mitigate Emerging Risks Credit Concentration Risk Information and Cybersecurity Risk Enterprise Risk and Compliance Financial Risk • Strong credit underwriting and administration program • Active credit oversight, analytics and portfolio monitoring as well as building upon the bank’s stress testing capabilities • Expertise and specialization in key portfolios, including multifamily • Investment in enhanced infrastructure and security protocols • Proactively leverage technology to meet the evolving digital needs of clients while maintaining safety and security • Effective risk culture and awareness model with ongoing training initiatives and tabletop simulations • Focus on recruitment and retention of highly skilled risk professionals across the bank • Investments in technology to enable scalable and effective governance and oversight • Proactively monitoring internal and external trends to quantify changes in risk profile • Maintain compliance with evolving regulatory expectations • Monitoring and managing the balance sheet with an eye toward economic and interest rate volatility • Actively monitoring, maintaining and strategically deploying liquidity while developing long-term strategies for capital preservation • Continued investments in internal audit framework and SOX implementation |
|
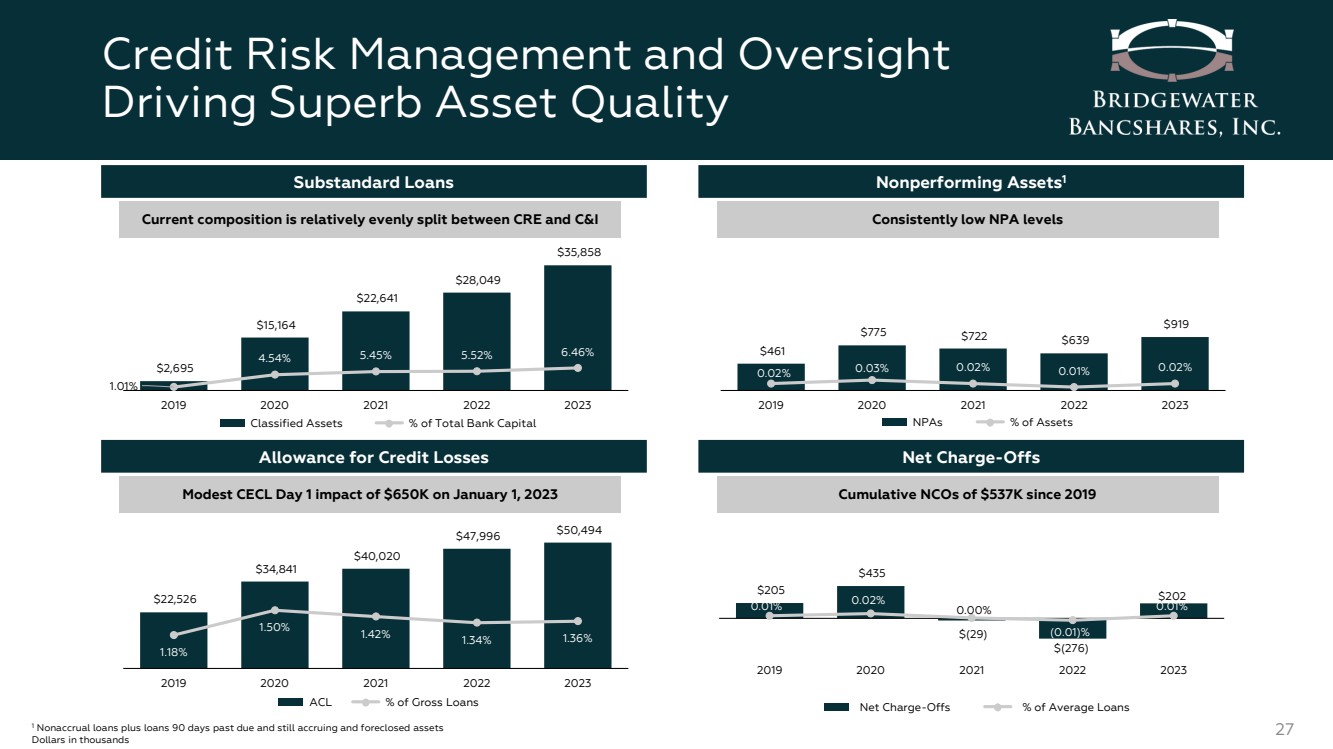
$22,526 $34,841 $40,020 $47,996 $50,494 1.18% 1.50% 1.42% 1.34% 1.36% 2019 2020 2021 2022 2023 Credit Risk Management and Oversight Driving Superb Asset Quality 27 1 Nonaccrual loans plus loans 90 days past due and still accruing and foreclosed assets Dollars in thousands $461 $775 $722 $639 $919 0.02% 0.03% 0.02% 0.01% 0.02% 2019 2020 2021 2022 2023 Nonperforming Assets1 Consistently low NPA levels NPAs % of Assets Allowance for Credit Losses Modest CECL Day 1 impact of $650K on January 1, 2023 $205 $435 $(29) $(276) $202 0.01% 0.02% 0.00% (0.01)% 0.01% 2019 2020 2021 2022 2023 Net Charge-Offs Cumulative NCOs of $537K since 2019 Net Charge-Offs % of Average Loans $2,695 $15,164 $22,641 $28,049 $35,858 1.01% 4.54% 5.45% 5.52% 6.46% 2019 2020 2021 2022 2023 Substandard Loans Current composition is relatively evenly split between CRE and C&I Classified Assets % of Total Bank Capital ACL % of Gross Loans |
|
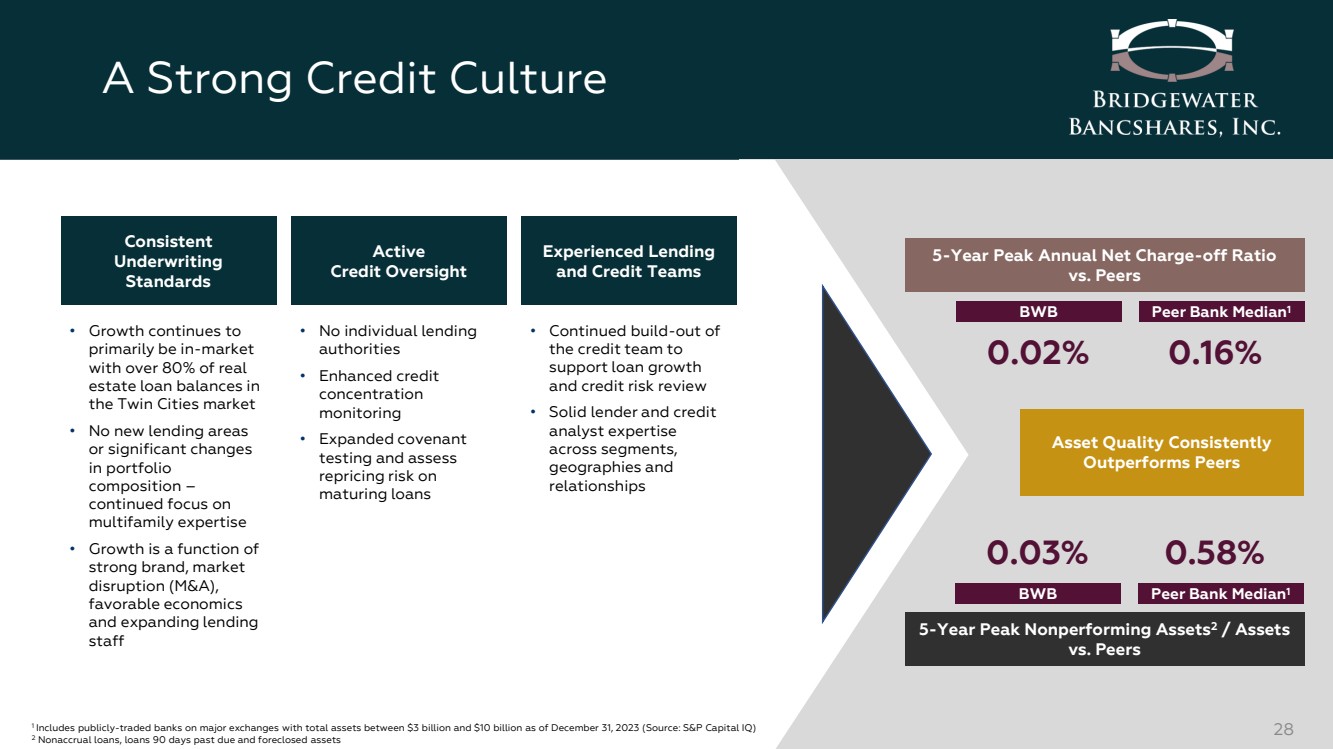
A Strong Credit Culture 28 5-Year Peak Annual Net Charge-off Ratio vs. Peers 5-Year Peak Nonperforming Assets2 / Assets vs. Peers 0.02% BWB Peer Bank Median1 0.16% 0.03% BWB Peer Bank Median1 0.58% 1 Includes publicly-traded banks on major exchanges with total assets between $3 billion and $10 billion as of December 31, 2023 (Source: S&P Capital IQ) 2 Nonaccrual loans, loans 90 days past due and foreclosed assets Asset Quality Consistently Outperforms Peers Consistent Underwriting Standards Active Credit Oversight Experienced Lending and Credit Teams • Growth continues to primarily be in-market with over 80% of real estate loan balances in the Twin Cities market • No new lending areas or significant changes in portfolio composition – continued focus on multifamily expertise • Growth is a function of strong brand, market disruption (M&A), favorable economics and expanding lending staff • No individual lending authorities • Enhanced credit concentration monitoring • Expanded covenant testing and assess repricing risk on maturing loans • Continued build-out of the credit team to support loan growth and credit risk review • Solid lender and credit analyst expertise across segments, geographies and relationships |
|
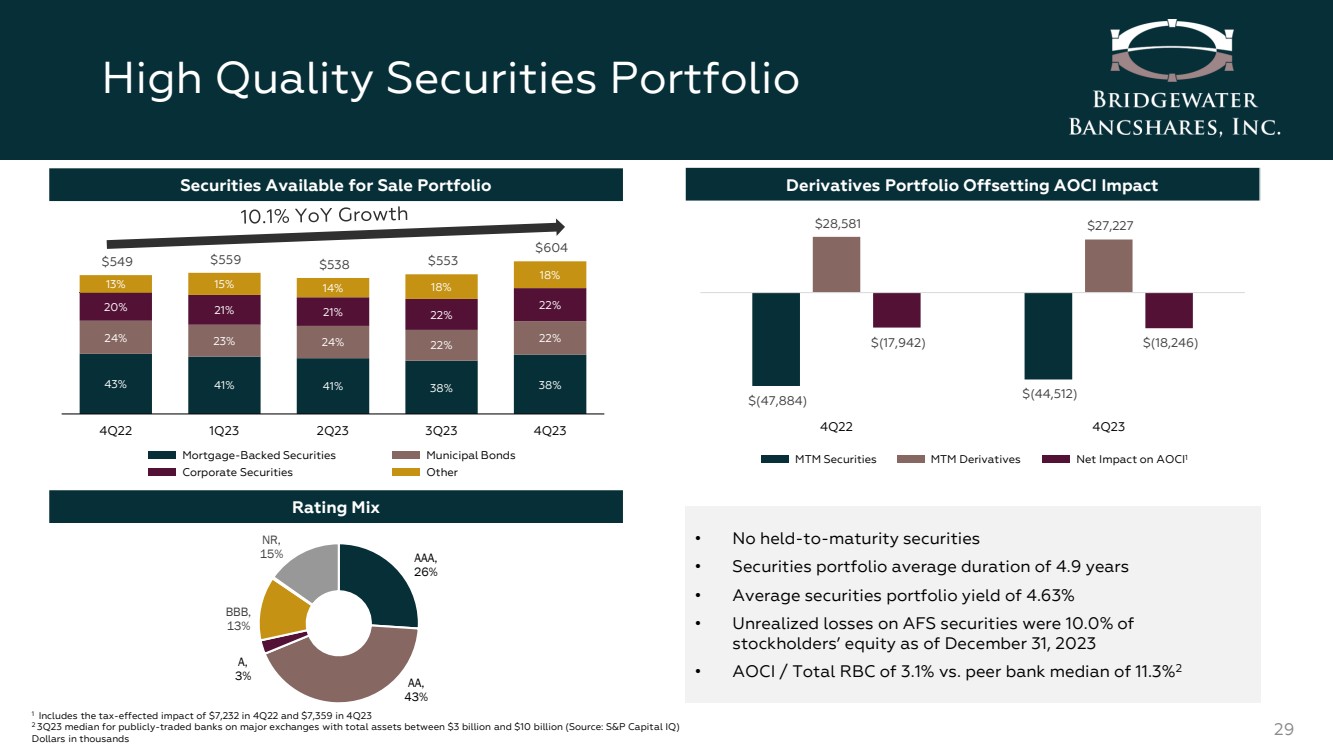
High Quality Securities Portfolio 29 43% 41% 41% 38% 38% 24% 23% 24% 22% 22% 20% 21% 21% 22% 22% 13% 15% 14% 18% 18% $549 $559 $538 $553 $604 4Q22 1Q23 2Q23 3Q23 4Q23 Mortgage-Backed Securities Municipal Bonds Corporate Securities Other Securities Available for Sale Portfolio AAA, 26% AA, 43% A, 3% BBB, 13% NR, 15% Rating Mix Derivatives Portfolio Offsetting AOCI Impact $(47,884) $(44,512) $28,581 $27,227 $(17,942) $(18,246) 4Q22 4Q23 MTM Securities MTM Derivatives Net Impact on AOCI1 • No held-to-maturity securities • Securities portfolio average duration of 4.9 years • Average securities portfolio yield of 4.63% • Unrealized losses on AFS securities were 10.0% of stockholders’ equity as of December 31, 2023 • AOCI / Total RBC of 3.1% vs. peer bank median of 11.3%2 1 Includes the tax-effected impact of $7,232 in 4Q22 and $7,359 in 4Q23 2 3Q23 median for publicly-traded banks on major exchanges with total assets between $3 billion and $10 billion (Source: S&P Capital IQ) Dollars in thousands |
|
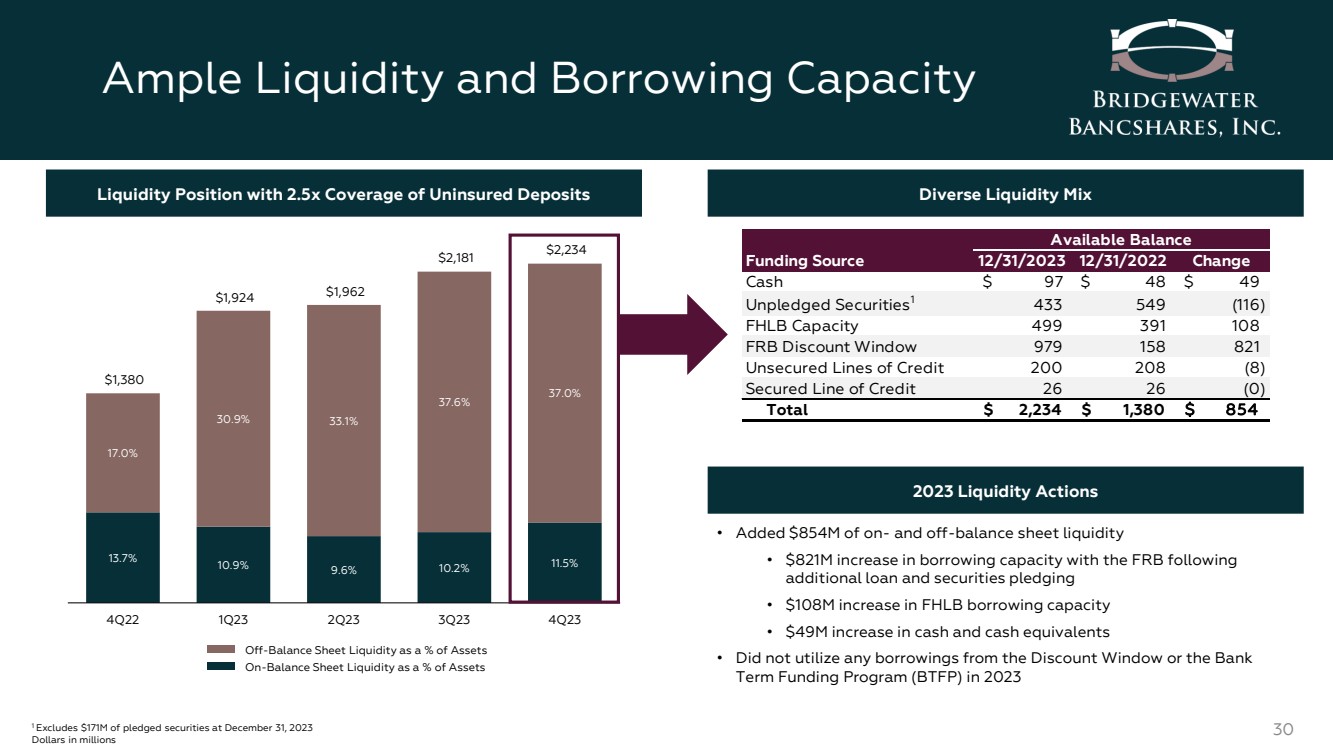
Ample Liquidity and Borrowing Capacity 30 1 Excludes $171M of pledged securities at December 31, 2023 Dollars in millions 13.7% 10.9% 9.6% 10.2% 11.5% 17.0% 30.9% 33.1% 37.6% 37.0% $1,380 $1,924 $1,962 $2,181 $2,234 4Q22 1Q23 2Q23 3Q23 4Q23 Off-Balance Sheet Liquidity as a % of Assets On-Balance Sheet Liquidity as a % of Assets Liquidity Position with 2.5x Coverage of Uninsured Deposits Diverse Liquidity Mix 2023 Liquidity Actions • Added $854M of on- and off-balance sheet liquidity • $821M increase in borrowing capacity with the FRB following additional loan and securities pledging • $108M increase in FHLB borrowing capacity • $49M increase in cash and cash equivalents • Did not utilize any borrowings from the Discount Window or the Bank Term Funding Program (BTFP) in 2023 Funding Source 12/31/2023 12/31/2022 Change Cash $ 9 7 $ 4 8 $ 4 9 Unpledged Securities1 433 549 (116) FHLB Capacity 499 391 108 FRB Discount Window 979 158 821 Unsecured Lines of Credit 200 208 (8) Secured Line of Credit 26 26 (0) Total $ 2,234 $ 1,380 $ 854 Available Balance |
|
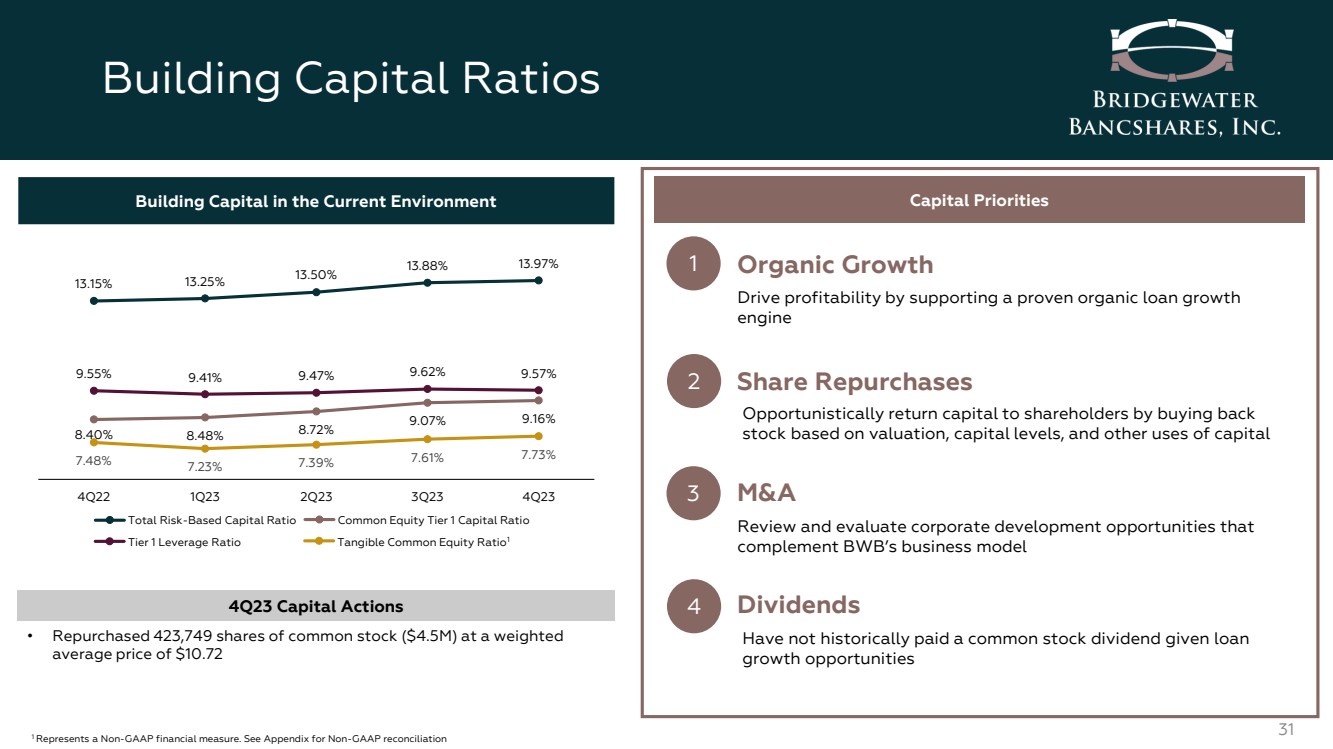
Building Capital Ratios 31 9.55% 9.41% 9.47% 9.62% 9.57% 8.40% 8.48% 8.72% 9.07% 9.16% 13.15% 13.25% 13.50% 13.88% 13.97% 7.48% 7.23% 7.39% 7.61% 7.73% 4Q22 1Q23 2Q23 3Q23 4Q23 Total Risk-Based Capital Ratio Common Equity Tier 1 Capital Ratio Tier 1 Leverage Ratio Building Capital in the Current Environment Tangible Common Equity Ratio1 1 Represents a Non-GAAP financial measure. See Appendix for Non-GAAP reconciliation 4Q23 Capital Actions • Repurchased 423,749 shares of common stock ($4.5M) at a weighted average price of $10.72 Capital Priorities 1 3 2 Organic Growth Share Repurchases M&A 4 Dividends Drive profitability by supporting a proven organic loan growth engine Opportunistically return capital to shareholders by buying back stock based on valuation, capital levels, and other uses of capital Review and evaluate corporate development opportunities that complement BWB’s business model Have not historically paid a common stock dividend given loan growth opportunities |
|
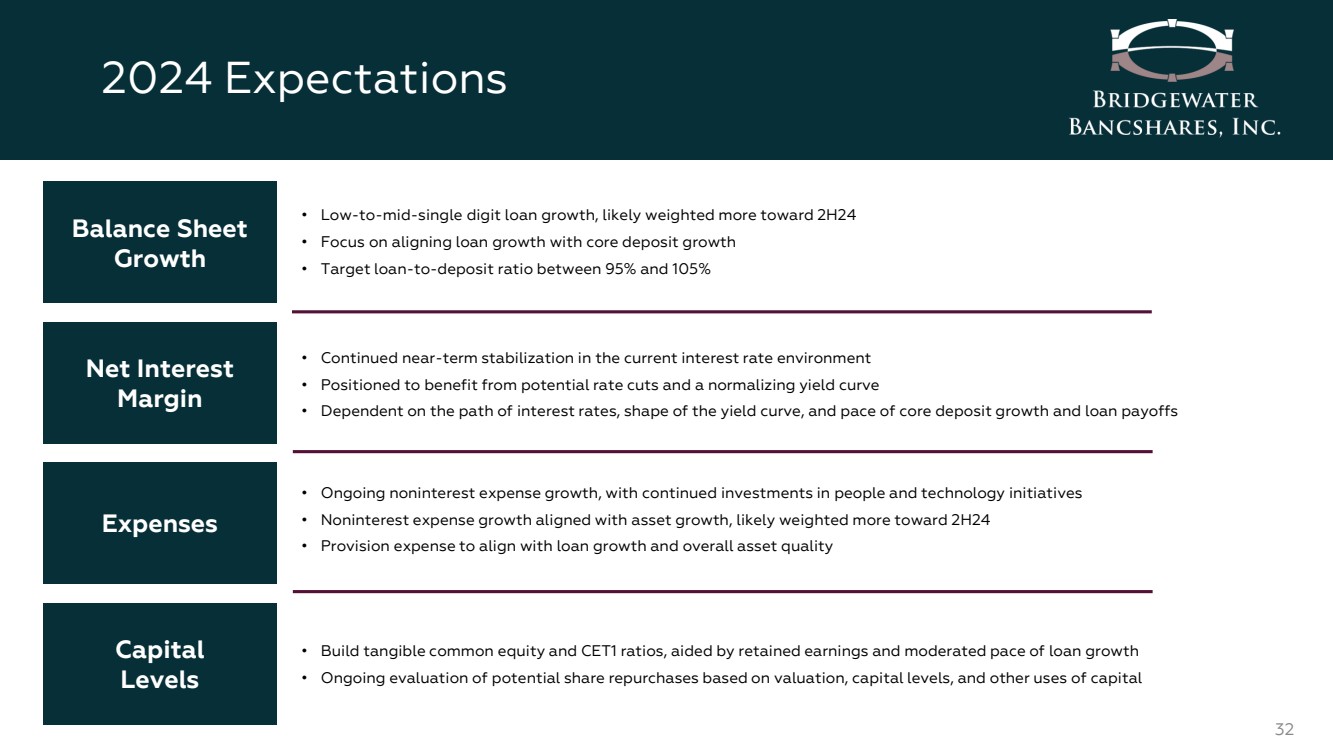
2024 Expectations 32 • Low-to-mid-single digit loan growth, likely weighted more toward 2H24 • Focus on aligning loan growth with core deposit growth • Target loan-to-deposit ratio between 95% and 105% Balance Sheet Growth • Continued near-term stabilization in the current interest rate environment • Positioned to benefit from potential rate cuts and a normalizing yield curve • Dependent on the path of interest rates, shape of the yield curve, and pace of core deposit growth and loan payoffs Net Interest Margin • Ongoing noninterest expense growth, with continued investments in people and technology initiatives • Noninterest expense growth aligned with asset growth, likely weighted more toward 2H24 • Provision expense to align with loan growth and overall asset quality Expenses • Build tangible common equity and CET1 ratios, aided by retained earnings and moderated pace of loan growth • Ongoing evaluation of potential share repurchases based on valuation, capital levels, and other uses of capital Capital Levels |
|
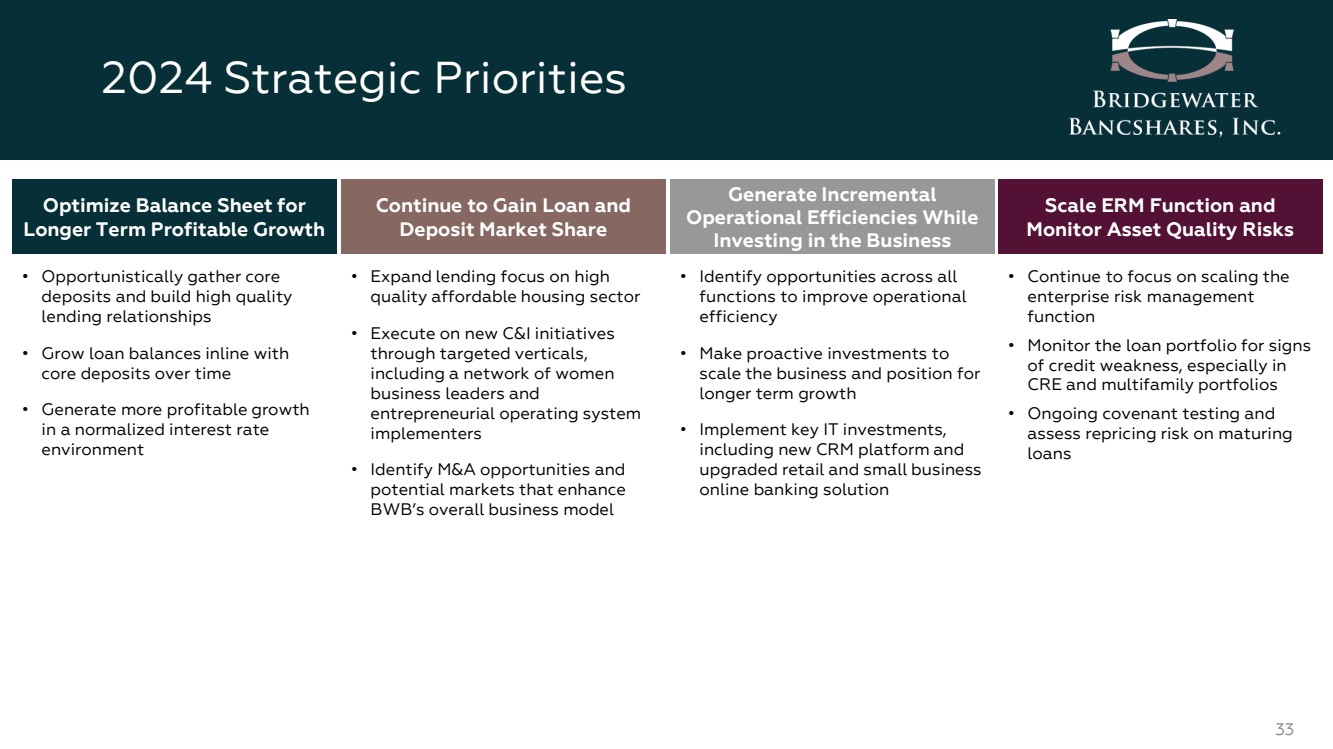
2024 Strategic Priorities 33 Optimize Balance Sheet for Longer Term Profitable Growth Continue to Gain Loan and Deposit Market Share Generate Incremental Operational Efficiencies While Investing in the Business Scale ERM Function and Monitor Asset Quality Risks • Opportunistically gather core deposits and build high quality lending relationships • Grow loan balances inline with core deposits over time • Generate more profitable growth in a normalized interest rate environment • Expand lending focus on high quality affordable housing sector • Execute on new C&I initiatives through targeted verticals, including a network of women business leaders and entrepreneurial operating system implementers • Identify M&A opportunities and potential markets that enhance BWB’s overall business model • Identify opportunities across all functions to improve operational efficiency • Make proactive investments to scale the business and position for longer term growth • Implement key IT investments, including new CRM platform and upgraded retail and small business online banking solution • Continue to focus on scaling the enterprise risk management function • Monitor the loan portfolio for signs of credit weakness, especially in CRE and multifamily portfolios • Ongoing covenant testing and assess repricing risk on maturing loans |
|
APPENDIX 34 |
|
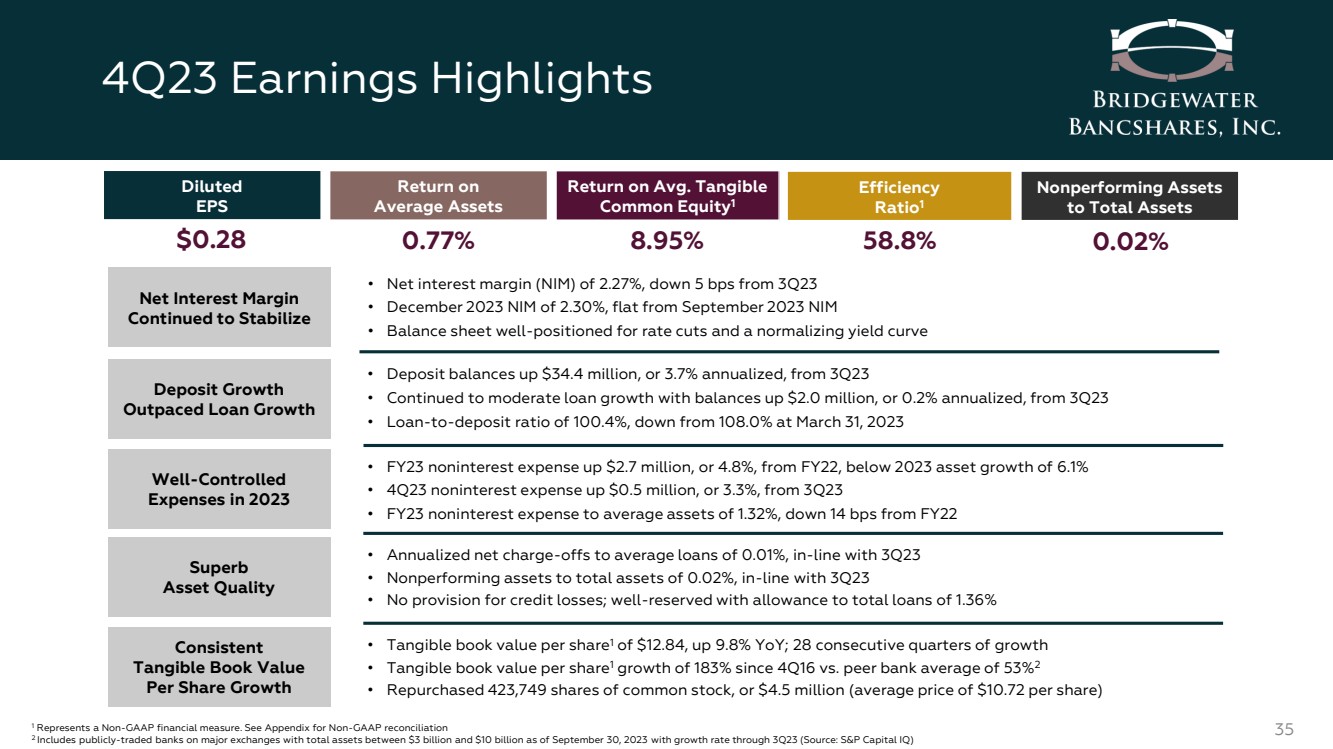
0.02% 4Q23 Earnings Highlights 35 • Deposit balances up $34.4 million, or 3.7% annualized, from 3Q23 • Continued to moderate loan growth with balances up $2.0 million, or 0.2% annualized, from 3Q23 • Loan-to-deposit ratio of 100.4%, down from 108.0% at March 31, 2023 • Net interest margin (NIM) of 2.27%, down 5 bps from 3Q23 • December 2023 NIM of 2.30%, flat from September 2023 NIM • Balance sheet well-positioned for rate cuts and a normalizing yield curve • FY23 noninterest expense up $2.7 million, or 4.8%, from FY22, below 2023 asset growth of 6.1% • 4Q23 noninterest expense up $0.5 million, or 3.3%, from 3Q23 • FY23 noninterest expense to average assets of 1.32%, down 14 bps from FY22 • Annualized net charge-offs to average loans of 0.01%, in-line with 3Q23 • Nonperforming assets to total assets of 0.02%, in-line with 3Q23 • No provision for credit losses; well-reserved with allowance to total loans of 1.36% Net Interest Margin Continued to Stabilize Well-Controlled Expenses in 2023 Superb Asset Quality $0.28 Diluted EPS Nonperforming Assets to Total Assets Efficiency Ratio1 Return on Average Assets Return on Avg. Tangible Common Equity1 0.77% 8.95% 58.8% 1 Represents a Non-GAAP financial measure. See Appendix for Non-GAAP reconciliation 2 Includes publicly-traded banks on major exchanges with total assets between $3 billion and $10 billion as of September 30, 2023 with growth rate through 3Q23 (Source: S&P Capital IQ) • Tangible book value per share1 of $12.84, up 9.8% YoY; 28 consecutive quarters of growth • Tangible book value per share1 growth of 183% since 4Q16 vs. peer bank average of 53%2 • Repurchased 423,749 shares of common stock, or $4.5 million (average price of $10.72 per share) Consistent Tangible Book Value Per Share Growth Deposit Growth Outpaced Loan Growth |
|
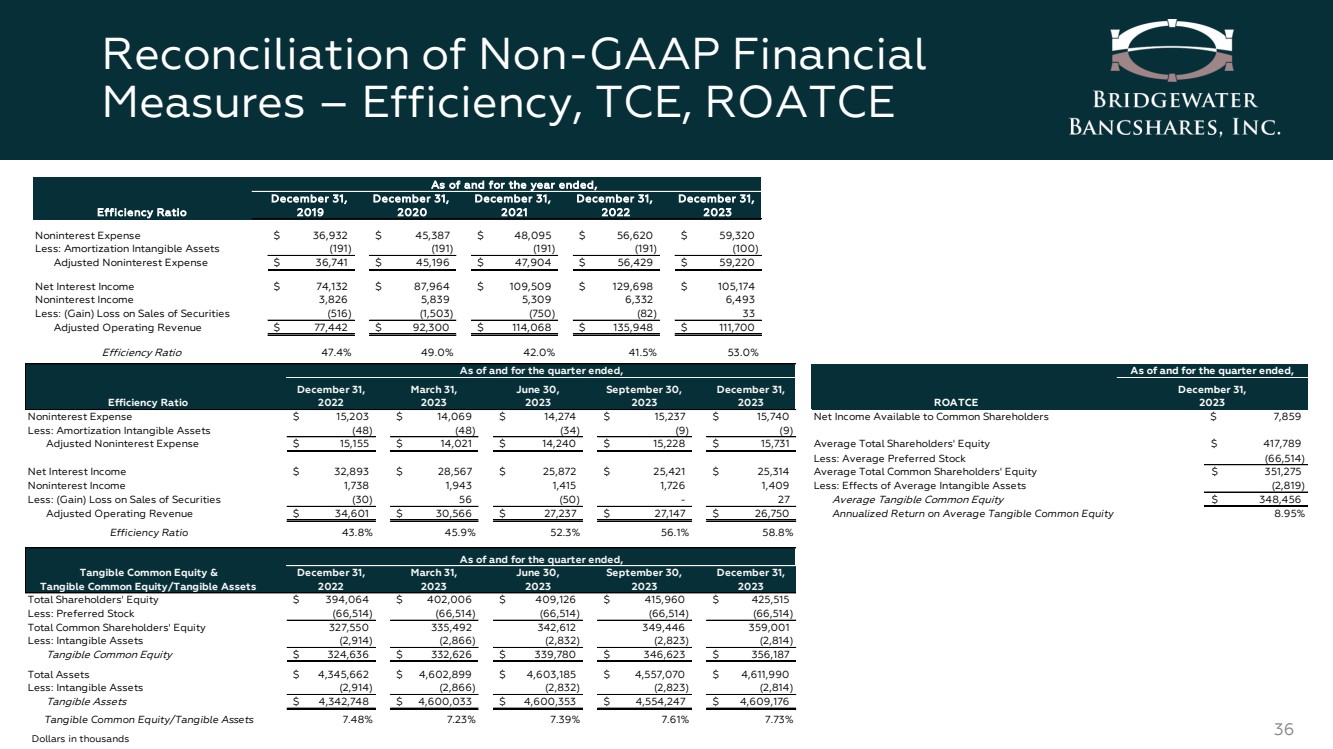
Efficiency Ratio December 31, 2022 March 31, 2023 June 30, 2023 September 30, 2023 December 31, 2023 Noninterest Expense $ 15,203 $ 14,069 $ 14,274 $ 15,237 $ 15,740 Net Income Available to Common Shareholders Less: Amortization Intangible Assets (48) (48) (34) (9) (9) Adjusted Noninterest Expense $ 15,155 $ 14,021 $ 14,240 $ 15,228 $ 15,731 Average Total Shareholders' Equity Less: Average Preferred Stock Net Interest Income $ 32,893 $ 28,567 $ 25,872 $ 25,421 $ 25,314 Average Total Common Shareholders' Equity Noninterest Income 1,738 1,943 1,415 1,726 1,409 Less: Effects of Average Intangible Assets Less: (Gain) Loss on Sales of Securities (30) 56 (50) - 2 7 Average Tangible Common Equity Adjusted Operating Revenue $ 34,601 $ 30,566 $ 27,237 $ 27,147 $ 26,750 Annualized Return on Average Tangible Common Equity Efficiency Ratio 43.8% 45.9% 52.3% 56.1% 58.8% Tangible Common Equity & Tangible Common Equity/Tangible Assets December 31, 2022 March 31, 2023 June 30, 2023 September 30, 2023 December 31, 2023 Total Shareholders' Equity $ 394,064 $ 402,006 $ 409,126 $ 415,960 $ 425,515 Less: Preferred Stock (66,514) (66,514) (66,514) (66,514) (66,514) Total Common Shareholders' Equity 327,550 335,492 342,612 349,446 359,001 Less: Intangible Assets (2,914) (2,866) (2,832) (2,823) (2,814) Tangible Common Equity $ 324,636 $ 332,626 $ 339,780 $ 346,623 $ 356,187 Total Assets $ 4,345,662 $ 4,602,899 $ 4,603,185 $ 4,557,070 $ 4,611,990 Less: Intangible Assets (2,914) (2,866) (2,832) (2,823) (2,814) Tangible Assets $ 4,342,748 $ 4,600,033 $ 4,600,353 $ 4,554,247 $ 4,609,176 Tangible Common Equity/Tangible Assets 7.48% 7.23% 7.39% 7.61% 7.73% As of and for the quarter ended, As of and for the quarter ended, ROATCE As of and for the quarter ended, December 31, 2023 $ 7,859 $ 417,789 (66,514) $ 351,275 (2,819) $ 348,456 8.95% Reconciliation of Non-GAAP Financial Measures – Efficiency, TCE, ROATCE 36 Dollars in thousands December 31, December 31, December 31, December 31, December 31, Efficiency Ratio 2019 2020 2021 2022 2023 Noninterest Expense $ 36,932 $ 45,387 $ 48,095 $ 56,620 $ 59,320 Less: Amortization Intangible Assets (191) (191) (191) (191) (100) Adjusted Noninterest Expense $ 36,741 $ 45,196 $ 47,904 $ 56,429 $ 59,220 Net Interest Income $ 74,132 $ 87,964 $ 109,509 $ 129,698 $ 105,174 Noninterest Income 3,826 5,839 5,309 6,332 6,493 Less: (Gain) Loss on Sales of Securities (516) (1,503) (750) (82) 3 3 Adjusted Operating Revenue $ 77,442 $ 92,300 $ 114,068 $ 135,948 $ 111,700 Efficiency Ratio 47.4% 49.0% 42.0% 41.5% 53.0% As of and for the year ended, |
|
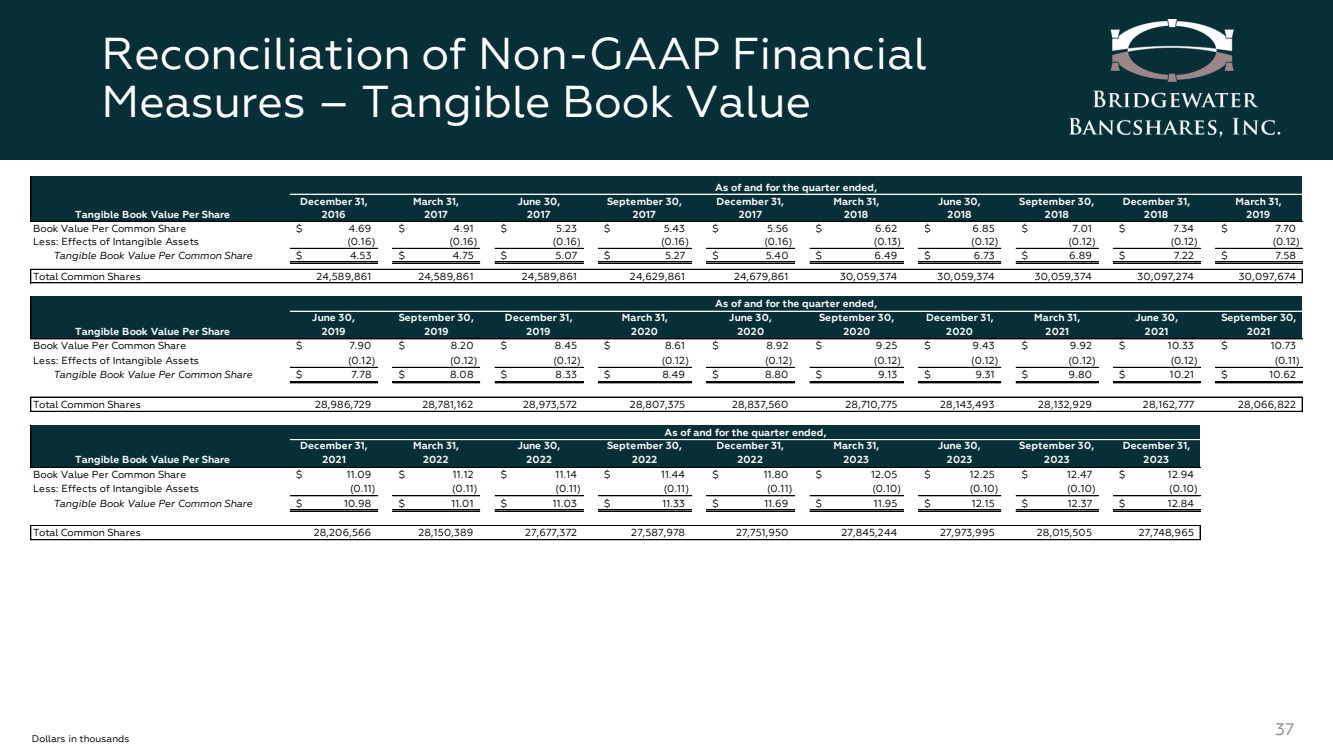
Reconciliation of Non-GAAP Financial Measures – Tangible Book Value 37 Dollars in thousands Tangible Book Value Per Share December 31, 2016 March 31, 2017 June 30, 2017 September 30, 2017 December 31, 2017 March 31, 2018 June 30, 2018 September 30, 2018 December 31, 2018 March 31, 2019 Book Value Per Common Share $ 4.69 $ 4.91 $ 5.23 $ 5.43 $ 5.56 $ 6.62 $ 6.85 $ 7.01 $ 7.34 $ 7.70 Less: Effects of Intangible Assets (0.16) (0.16) (0.16) (0.16) (0.16) (0.13) (0.12) (0.12) (0.12) (0.12) Tangible Book Value Per Common Share $ 4.53 $ 4.75 $ 5.07 $ 5.27 $ 5.40 $ 6.49 $ 6.73 $ 6.89 $ 7.22 $ 7.58 Total Common Shares 24,589,861 24,589,861 24,589,861 24,629,861 24,679,861 30,059,374 30,059,374 30,059,374 30,097,274 30,097,674 Tangible Book Value Per Share June 30, 2019 September 30, 2019 December 31, 2019 March 31, 2020 June 30, 2020 September 30, 2020 December 31, 2020 March 31, 2021 June 30, 2021 September 30, 2021 Book Value Per Common Share $ 7.90 $ 8.20 $ 8.45 $ 8.61 $ 8.92 $ 9.25 $ 9.43 $ 9.92 $ 10.33 $ 10.73 Less: Effects of Intangible Assets (0.12) (0.12) (0.12) (0.12) (0.12) (0.12) (0.12) (0.12) (0.12) (0.11) Tangible Book Value Per Common Share $ 7.78 $ 8.08 $ 8.33 $ 8.49 $ 8.80 $ 9.13 $ 9.31 $ 9.80 $ 10.21 $ 10.62 Total Common Shares 28,986,729 28,781,162 28,973,572 28,807,375 28,837,560 28,710,775 28,143,493 28,132,929 28,162,777 28,066,822 Tangible Book Value Per Share December 31, 2021 March 31, 2022 June 30, 2022 September 30, 2022 December 31, 2022 March 31, 2023 June 30, 2023 September 30, 2023 December 31, 2023 Book Value Per Common Share $ 11.09 $ 11.12 $ 11.14 $ 11.44 $ 11.80 $ 12.05 $ 12.25 $ 12.47 $ 12.94 Less: Effects of Intangible Assets (0.11) (0.11) (0.11) (0.11) (0.11) (0.10) (0.10) (0.10) (0.10) Tangible Book Value Per Common Share $ 10.98 $ 11.01 $ 11.03 $ 11.33 $ 11.69 $ 11.95 $ 12.15 $ 12.37 $ 12.84 Total Common Shares 28,206,566 28,150,389 27,677,372 27,587,978 27,751,950 27,845,244 27,973,995 28,015,505 27,748,965 As of and for the quarter ended, As of and for the quarter ended, As of and for the quarter ended, |