UNITED STATES SECURITIES AND EXCHANGE COMMISSION
Washington, D.C. 20549
Form 10-K
(Mark One)
☑ |
ANNUAL REPORT PURSUANT TO SECTION 13 OR 15(d) OF THE SECURITIES EXCHANGE ACT OF 1934 |
|
For fiscal year ended September 30, 2023 |
|
or |
☐ |
TRANSITION REPORT PURSUANT TO SECTION 13 OR 15(d) OF THE SECURITIES EXCHANGE ACT OF 1934 |
|
For the transition period from to . |
Commission File Number: 0-25434
Azenta, Inc.
(Exact name of Registrant as Specified in Its Charter)
Delaware |
|
04-3040660 |
|
(State or Other Jurisdiction of Incorporation or Organization) |
|
(I.R.S. Employer Identification No.) |
|
|
|
|
200 Summit Drive 6th Floor Burlington, Massachusetts (Address of Principal Executive Offices) |
|
01803 (Zip Code) |
978-262-2626
(Registrant’s telephone number, including area code)
Securities registered pursuant to Section 12(b) of the Act:
Title of Each Class |
Trading Symbols |
Name of Each Exchange on Which Registered |
Common Stock, $0.01 par value |
AZTA |
The Nasdaq Stock Market LLC |
Securities registered pursuant to Section 12(g) of the Act:
None
Indicate by check mark if the registrant is a well-known seasoned issuer, as defined in Rule 405 of the Securities Act. Yes ☑ No ☐
Indicate by check mark if the registrant is not required to file reports pursuant to Section 13 or 15(d) of the Securities Exchange Act of 1934. Yes ☐ No ☑
Indicate by check mark whether the registrant (1) has filed all reports required to be filed by Section 13 or 15(d) of the Securities Exchange Act of 1934 during the preceding 12 months (or for such shorter period that the registrant was required to file such reports), and (2) has been subject to such filing requirements for the past 90 days. Yes ☑ No ☐
Indicate by check mark whether the registrant has submitted electronically every Interactive Data File required to be submitted pursuant to Rule 405 of Regulation S-T (§232.405 of this chapter) during the preceding 12 months (or for such shorter period that the registrant was required to submit such files). Yes ☑ No ☐
Indicate by check mark whether the registrant is a large accelerated filer, an accelerated filer, a non-accelerated filer, a smaller reporting company, or an emerging growth company. See the definitions of “large accelerated filer,” “accelerated filer,” “smaller reporting company,” and “emerging growth company” in Rule 12b-2 of the Exchange Act.
Large accelerated filer ☑ |
Accelerated filer ☐ |
|
|
|
|
Non-accelerated filer ☐ |
Smaller reporting company ☐ |
|
|
|
|
|
Emerging growth company ☐ |
|
If an emerging growth company, indicate by check mark if the registrant has elected not to use the extended transition period for complying with any new or revised financial accounting standards provided pursuant to Section 13(a) of the Exchange Act. ☐
Indicate by check mark whether the registrant has filed a report on and attestation to its management’s assessment of the effectiveness of its internal control over financial reporting under Section 404(b) of the Sarbanes-Oxley Act (15 U.S.C. 7262(b)) by the registered public accounting firm that prepared or issued its audit report. ☑
If securities are registered pursuant to Section 12(b) of the Act, indicate by check mark whether the financial statements of the registrant included in the filing reflect the correction of an error to previously issued financial statements. ☐
Indicate by check mark whether any of those error corrections are restatements that required a recovery analysis of incentive-based compensation received by any of the registrant’s executive officers during the relevant recovery period pursuant to §240.10D-1(b). ☐
Indicate by check mark whether the registrant is a shell company (as defined in Exchange Act Rule 12b-2). Yes ☐ No ☑
The aggregate market value of the registrant’s Common Stock, $0.01 par value, held by non-affiliates of the registrant as of March 31, 2023, was approximately $2,382,039,057 based on the closing price per share of $44.62 on March 31, 2023 on the Nasdaq Stock Market. As of March 31, 2023, 69,147,387 shares of the registrant’s Common Stock, $0.01 par value, were outstanding. As of November 13, 2023, 56,112,190 shares of the registrant’s Common Stock, $0.01, par value, were outstanding.
DOCUMENTS INCORPORATED BY REFERENCE
Portions of the registrant’s Proxy Statement involving the election of directors, which is expected to be filed within 120 days after the end of the registrant’s fiscal year, are incorporated by reference in Part III of this Annual Report on Form 10-K.
AZENTA, INC.
TABLE OF CONTENTS
2
Information Related to Forward-Looking Statements
This Annual Report on Form 10-K contains statements that are, or may be considered to be, forward-looking statements within the meaning of The Private Securities Litigation Reform Act of 1995, as amended, Section-27A of the Securities Act of 1933, as amended, or the Securities Act, and Section-21E of the Securities Exchange Act of 1934, as amended, or the Exchange Act. All statements that are not historical facts, including statements about our beliefs or expectations, are forward-looking statements. These statements may be identified by such forward-looking, terminology as “expect,” “estimate,” “intend,” “believe,” “anticipate,” “may,” “will,” “should,” “could,” “continue,” “likely” or similar statements or variations of such terms. Forward-looking statements include, but are not limited to, statements that relate to our future revenue, margins, costs, operating expenses, tax expenses, capital expenditures, earnings, profitability, product development, demand, acceptance and market share, competitiveness, market opportunities and performance, levels of research and development, the success of our marketing, sales and service efforts, outsourced activities, anticipated manufacturing, customer and technical requirements, the ongoing viability of the solutions that we offer and our customers’ success, our management’s plans and objectives for our current and future operations and business focus, our share repurchase authorization, litigation, our ability to retain, hire and integrate skilled personnel, our ability to identify and address increased cybersecurity risks, including as a result of employees continuing to work remotely, the anticipated growth prospects of our business, the expected benefits and other statements relating to our divestitures and acquisitions, the adequacy, effectiveness and success of our business transformation initiatives, our ability to continue to identify acquisition targets and successfully acquire and integrate desirable products and services and realize expected revenues and revenue synergies, our adoption of newly issued accounting guidance, the levels of customer spending, our dependence on key suppliers or vendors to obtain services for our business on acceptable terms, including the impact of supply chain disruptions, general economic conditions, the impact of inflation, and the sufficiency of financial resources to support future operations. Such statements are based on current expectations and involve risks, uncertainties, and other factors which may cause the actual results, our performance or our achievements to be materially different from any future results, performance or achievements expressed or implied by such forward-looking statements. Such factors include those which are set forth in Part I, Item 1A “Risk Factors” in this Annual Report on Form 10-K and other documents we file from time to time with the Securities and Exchange Commission (“SEC”) such as our quarterly reports on Form 10-Q and our current reports on Form 8-K. Readers are cautioned not to place undue reliance on these forward-looking statements, which speak only as of the date hereof and are based on information currently and reasonably known to us. We do not undertake any obligation to release revisions to these forward-looking statements, to reflect events or circumstances that occur after the date of this Annual Report on Form 10-K or to reflect the occurrence or effect of anticipated or unanticipated events. Precautionary statements made herein should be read as being applicable to all related forward-looking statements wherever they appear in this Annual Report on Form 10-K.
Unless the context indicates otherwise, references in this Annual Report on Form 10-K to “we”, “us”, “our”, “the Company” and other similar references refer to Azenta, Inc. and its consolidated subsidiaries.
TRADEMARKS, TRADE NAMES AND SERVICE MARKS
This Annual Report on Form 10-K includes our trademarks, trade names and service marks, which are our property and are protected under applicable intellectual property laws. Solely for convenience, trademarks, trade names and service marks may appear in this Annual Report on Form 10-K without the ®, TM and SM symbols, but such references are not intended to indicate, in any way, that we or the applicable owner forgo or will not assert, to the fullest extent permitted under applicable law, our rights or the rights of any applicable licensors to these trademarks, trade names and service marks. We do not intend our use or display of other parties’ trademarks, trade names or service marks to imply, and such use or display should not be construed to imply a relationship with, or endorsement or sponsorship of us by, these other parties.
INDUSTRY AND OTHER DATA
Unless otherwise indicated, information contained in this Annual Report on Form 10-K concerning our industry and the markets in which we operate, including our general expectations, market position and market opportunity, is based on management’s estimates and research, as well as industry and general publications and research, surveys and studies conducted by third parties.
3
We believe the information from these third-party publications, research, surveys and studies included in this Annual Report on Form 10-K is reliable. Management’s estimates are derived from publicly available information, their knowledge of our industry and their assumptions based on such information and knowledge, which we believe to be reasonable. This data involves a number of assumptions and limitations which are necessarily subject to a high degree of uncertainty and risk due to a variety of factors, including those described in this Annual Report on Form 10-K under “Information Related to Forward-Looking Statements” above and Part I, Item 1A “Risk Factors” below. These and other factors could cause our future performance to differ materially from our assumptions and estimates.
PART I
Item 1. Business
Overview
We are a leading global provider of biological and chemical compound sample exploration and management solutions for the life sciences industry. We entered the life sciences market in 2011, leveraging our in-house precision automation and cryogenics capabilities that we were then applying in the semiconductor manufacturing market. This led us to provide solutions for automated ultra-cold storage. Since then, we have expanded our life sciences offerings through internal investments and through a series of acquisitions. We now support our customers from research and clinical development to commercialization with our sample management, automated storage, and genomic services expertise to help our customers bring impactful therapies to the market faster. We understand the importance of sample integrity and offer a broad portfolio of products and services supporting customers at every stage of the life cycle of samples, including procurement and sourcing, automated storage systems, genomic services and a multitude of sample consumables, informatics and data software, along with sample repository solutions, referred to as SRS. Our expertise, global footprint, and leadership positions enable us to be a trusted global partner to pharmaceutical, biotechnology, and life sciences research institutions. In total, we employ approximately 3,500 full-time employees, part-time employees and contingent workers worldwide as of September 30, 2023 and have sales in approximately 150 countries. We are headquartered in Burlington, Massachusetts and have operations in North America, Asia and Europe.
Our Company was founded in 1978 and became a leading automation provider and partner to the global semiconductor manufacturing industry. We divested the last of our semiconductor businesses in February 2022 for $2.9 billion in cash and since operate solely as a life sciences company. On December 1, 2021, we changed our corporate name from “Brooks Automation, Inc.” to “Azenta, Inc.” and our common stock started to trade on the Nasdaq Global Select Market under the symbol “AZTA”. The semiconductor automation results are classified as discontinued operations, and, unless otherwise noted, the description of our business in this Annual Report on Form 10-K relates solely to our continuing operations.
Our portfolio includes product and service offerings developed by us internally, as well as through acquisitions, designed to bring together comprehensive capabilities to service our customers’ needs in sample exploration and management, automated storage, and genomic solutions. We continue to develop new product and service offerings and enhance existing and acquired offerings through the expertise of our research and development resources. We believe our acquisition, investment, and integration approach has allowed us to accelerate internal development and significantly accelerate time to market for our life sciences solutions.
For further information on our acquisitions, please refer to Note 4, Business Combinations to our Consolidated Financial Statements included under Part II, Item 8, “Financial Statements and Supplementary Data” of this Annual Report on Form 10-K.
Life Sciences Market
Our businesses serve a broad range of end markets within the life sciences industry to help our customers advance the development of therapies to improve people’s lives and cure diseases. With the advent of biologics and personalized medicine, biological samples have become critical assets to the success of drug and therapy pipelines, and the proper management and protection of these samples are of increased importance to our customers.
4
We believe this trend has created a sizable market opportunity for us to provide comprehensive sample management and genomic solutions.
Since the successful mapping of the full human genome at the turn of this century, the market for genomic services has grown in support of research in biologic drug development, personalized medicine and cell and gene therapy (“CGT”). Top pharmaceutical and biotechnology companies and institutions can use their in-house laboratory resources to sequence millions of genes as part of their research workflow. Many companies and institutions, however, look to outsource all or a part of their gene sequencing to independent laboratories that provide expedited results and expert consultative services. We participate in this market as a value-added laboratory services provider, offering high quality genetic testing services with fast turnaround times.
We have approximately 13,000 customers globally and believe we are well positioned to expand our customer base. We serve top pharmaceutical and biotechnology companies, the most advanced research hospitals performing clinical research and therapy development, as well as some of the newest and leading-edge start-ups in the biotech space. In addition, we also serve academic and government institutions. We believe that the sample-based services and products businesses will continue to demonstrate a growth trajectory and we do not observe cyclical demand for these offerings.
Segments
Our business is comprised of two reportable segments: Life Sciences Products and Life Sciences Services. For further information on our reportable and operating segments, please refer to Note 19, Segment and Geographic Information to our Consolidated Financial Statements included under Part II, Item 8, “Financial Statements and Supplementary Data” of this Annual Report on Form 10-K.
Life Sciences Products
Our Life Sciences Products business is a leading provider of automated cold storage solutions for biological and chemical compound samples. We have a complete line of automated storage systems from ambient temperatures to -190°C. Our sample management solutions include consumable vials and tubes, polymerase chain reaction (“PCR”), plates, instruments for supporting workflows, and informatics. This portfolio provides customers with a high level of sample quality, security, availability, intelligence, and integrity throughout the lifecycle of samples providing customers with complete end-to-end “cold-chain of custody” capabilities. On July 1, 2022, we acquired Barkey Holding GmbH and its subsidiaries (“Barkey”), a leading provider of controlled rate thawing devices for customers in the medical, biotech and pharmaceutical industries, headquartered in Leopoldshöhe, Germany. On October 3, 2022, we acquired B Medical Systems S.á r.l and its subsidiaries (“B Medical”), a market leader in temperature-controlled storage and transportation solutions that enable the delivery of life-saving treatments to more than 150 countries worldwide. This acquisition complements our cold-chain capabilities, adding differentiated solutions for reliable and traceable transport of temperature-sensitive samples. Additionally, on February 2, 2023, we acquired Ziath Ltd. and its subsidiaries (“Ziath”), a leading provider of 2D barcode readers for life sciences applications to complement our product offerings.
Life Sciences Products Offerings
The principal offerings of the Life Sciences Products segment include the following:
Automated cold storage solutions – includes stand-alone systems that store over 20 million samples in temperature ranges from ambient to -80°C to cryogenic storage at -190°C. Our automated storage systems have a unique design that allows controlled temperature storage down to -80°C with the industry’s highest throughput of sample retrieval. Our systems provide high throughput capability and optimized storage of multi-format tubes and plates while maintaining consistent temperature profiles across stored samples. We also offer a portfolio of service products designed to optimize productivity of our storage system offerings.
Consumables and instruments - includes a complete range of consumables, including multiple formats of racks, tubes, caps, plates and foils, which are used for storage and handling of samples in ambient and ultra-cold storage environments. A comprehensive range of instruments used for labeling, bar coding, capping, de-capping, auditing, sealing, peeling, and piercing tubes and plates complement our consumables. Our offerings include a range of products aimed at the genomic sample preparation and services market for PCR and sequencing, imaging, plate sealing, liquid handling, and sample processing.
5
Controlled rate thawing devices – includes a range of products for automated thawing of plasma, blood and stem cells as well as in CGT applications. Our products are used for controlled rate thawing of cryopreserved samples and therapies, and are used in research and development, clinical trials, good manufacturing practices and in the hospital setting. Our Barkey plasmatherm product is the only automated blood and plasma thawing device approved by the U.S. Food and Drug Administration (“FDA”) as a medical device for use in patient care.
Temperature-controlled storage and transportation solutions – includes temperature-controlled storage and transportation solutions that enable the delivery of life-saving treatments to more than 150 countries worldwide. Acquired through our B Medical acquisition, these products complement our cold-chain capabilities, adding differentiated solutions for reliable and traceable transport of temperature-sensitive samples.
Life Sciences Services
Our Life Sciences Services business is a leading provider of solutions addressing the many needs of customers in the area of genomic analysis and the management and care of biological samples used in pharmaceutical, biotech, healthcare, clinical, and academic research, and development markets. We process millions of samples annually, each containing valuable information that must be preserved with the sample. Our genomic services provide a broad capability to customers for gene sequencing, synthesis, editing and related services. We offer a comprehensive, global portfolio that we believe has both broad appeal in the life sciences industry and enables customers to select the best solution for their research and development challenges. This portfolio also offers unique solutions for key markets such as CGT, antibody development and biomarker discovery by addressing genomic complexity and throughput challenges. Our sample management services include off-site storage services, transport services, laboratory services, and interactive informatics solutions. We also offer expert-level consultation services to our clients throughout their experimental design and implementation processes. Our services also include short- and long-term sample storage and management of the “cold-chain of custody” from collection, to storage, to retrieving the sample which ultimately may go back into the research workflow.
Life Sciences Services Offerings
The principal offerings of the Life Sciences Services segment include the following:
Genomic services - includes gene sequencing and gene synthesis services, enabling the expanding research and development of gene-based healthcare discoveries and therapies. These service offerings include Next-Generation sequencing (“NGS”), Sanger sequencing, gene synthesis, bioinformatics, and good laboratory practices (“GLP”) regulatory services. The sequencing services are available with both standard and custom services for extraction, library preparation, sequencing, and bioinformatics, supported by Ph.D.-level project managers providing consultations, updates, and post-delivery assistance. Our gene synthesis offerings provide production of a wide range of sequence lengths and structural complexity, DNA cloning, gene fragment synthesis, oligo synthesis, and plasmid purification.
Sample repository solutions (SRS) - includes a complete range of services consisting of on-site and off-site sample storage, cold chain logistics, sample transport and collection relocation, bio-processing solutions (inclusive of sample preparation, and laboratory-based sample analysis), disaster recovery and business continuity, biospecimen procurement services, as well as project management and consulting. Our informatics solutions provides sample intelligence software solutions, and support laboratory workflow scheduling for life science tools and instrument work cells, sample inventory and logistics, environmental and temperature monitoring, clinical trial and consent management, and planning, data management, virtualization, and visualization of sample collections. We offer enhanced on-site and off-site management of biological sample inventories and integration solutions to our customers for their increasingly distributed workflows.
We believe the combination of our broad sample-based offerings, including genomic analysis, sample management solutions, automated storage systems, informatic solutions and sample sourcing and procurement services has enabled us to better serve our customers with an integrated and comprehensive portfolio of products and services across our segments.
6
Sales, Marketing and Customer Support
Most of our sales are completed through our direct sales force, particularly our store systems, storage services, and genomic services. We supplement the sale of consumables and instruments with distributors that reach a broad range of customers. In regions with emerging Life Sciences industries, we leverage local distributors to assist with the sales process for automated stores, and utilize the capabilities of international procurement agencies, including UNICEF.
The sales process for our SRS and larger automated store systems takes months to complete and may involve a team from sales, marketing, and engineering. Sales of genomic services are generally generated with on-line orders from the customer laboratory and delivered to and from our customers using a courier service, with the simplest of genomics and synthesis requests completed in less than 24 hours and more complex projects within weeks.
Participation in trade shows, seminars, and industry forums are just a few of our marketing initiatives. We also produce and distribute sales brochures, webinars, and white papers, and we publish press releases and articles in business and industry publications. We maintain sales and service centers in Asia, Europe, the Middle East, and North America to enhance support of, and communication with, customers.
We typically provide product warranties for a period of one to five years depending on the product type, with some warranties of up to ten years for our solar powered cold chain products, as they are connected to real-time monitoring services. Customer support capabilities include utilization of offsite technicians and in country support provided by local agents.
Competition
Given the breadth of the sample management solutions and genomic services offered by our Life Sciences Products and Life Sciences Services segments, we believe we have a unique portfolio of products and services. Each of the business lines within the two segments, however, has unique competitors in their area of offerings. In the Life Sciences Products segment, our main competitors include Hamilton Company and Liconic AG for automation systems, Thermo Fisher Scientific Inc. for consumables and services, and Vestfrost Solutions and Haier Biomedical for B Medical. In the Life Sciences Services segment, our main competitors include Laboratory Corporation of America Holdings and Thermo Fisher Scientific Inc. for storage services, and BGI Genomics Co., Ltd., Eurofins, Scientific S.E., GenScript Biotech Corporation, Integrated DNA Technologies, Inc., Novogene Co., Ltd., and Twist Bioscience Corporation for genomic services.
Research and Development
Our research and development efforts are focused on developing new products and enhancing the functionality, degree of integration, reliability and performance of our existing products and service offerings. Our engineering, marketing, operations, and management personnel leverage their close collaborative relationships with their counterparts in customer organizations to proactively identify market demands that help us refocus our research and development investments to match our customers’ demands.
Within our Life Sciences Products segment, we have developed and continue to develop automated biological sample storage solutions for operating in ultra-low temperature environments. We have a complete line up of automated stores from ambient temperatures to -190°C. Our automated storage systems offer improved data management and sample security for vaccines and biologics and have a unique design, which allows controlled temperature storage down to -80°C with the industry’s highest throughput of sample retrieval. Within our Life Sciences Services segment, our genomics services business advances research and development activities in gene sequencing, synthesis, editing, and related services to meet market demands. We invest in research and development to develop protocols and efficiencies in our own laboratories and to provide proprietary offerings to our customers. As an example, in our genomic services business, we enriched our portfolio by adding regulated services targeting analysis of adeno-associated virus, a common vector used in CGT. Furthermore, we continue to add value to drug discovery and development research by expanding our portfolio to include proteomics solutions. We will continue to focus on developing processes and technologies that can streamline sample to data workflows.
7
Manufacturing and Services
Our manufacturing operations include product assembly, integration, and testing. We implement quality assurance procedures that include standard design practices, reliability testing and analysis, supplier and component selection procedures, vendor controls, manufacturing process controls, and service processes that ensure high-quality performance of our products. Our major manufacturing facilities are in Manchester and Wotton, United Kingdom, Hosingen, Luxembourg, and Billerica, Massachusetts. Our manufacturing operations are designed to provide high quality, optimal cost, differentiated products to our customers in short lead times through responsive and flexible processes and sourcing strategies. We utilize lean manufacturing techniques for a large portion of our manufacturing.
We have service and support locations near our customers to provide rapid response to their service needs. Our principal product service and support locations include Burlington, Massachusetts, and Manchester, United Kingdom.
We provide sample management storage and transportation services in Indianapolis and Plainfield, Indiana; Fresno, California; Cleveland, Ohio; Griesheim, Germany; Montreal, Canada; Singapore; Beijing, China and various locations throughout the United States. We have a network of 14 laboratories that provide genomic services, including eight in the United States, three in China, and one each in Japan, Germany, and the United Kingdom.
Patents and Proprietary Rights
We rely on patents, trade secret laws, confidentiality agreements and procedures, copyrights, trademarks and licensing agreements to protect our technology. Due to the rapid technological change that characterizes the life sciences and related process equipment industries, we believe that the improvement of existing technology, reliance upon trade secrets, unpatented proprietary know-how, and the development of new products may be as important as patent protection in establishing and maintaining a competitive advantage. Our policy is to require all employees to enter into proprietary information and nondisclosure agreements to protect trade secrets and know-how. We cannot guarantee that these efforts will meaningfully protect our trade secrets.
As of September 30, 2023, we owned approximately 94 issued U.S. patents, with various corresponding patents issued in foreign jurisdictions. We also had approximately 37 pending U.S. patent applications, with foreign counterparts of some of these applications having been filed or which may be filed at the appropriate time. Our patents will expire at various dates beginning in 2024 and running through 2039.
Environmental Matters and Government Regulations
Environmental Regulations
We are subject to various laws and governmental regulations concerning environmental matters and employee safety and health in the United States and other countries. Federal environmental legislation in the United States that affects us includes the Resource Conservation and Recovery Act, the Clean Air Act, the Clean Water Act, the Safe Drinking Water Act, and the Comprehensive Environmental Response Compensation and Liability Act. We are also subject to regulation by the Occupational Safety and Health Administration (“OSHA”), concerning employee safety and health matters. The United States Environmental Protection Agency (“EPA”), OSHA, and other federal agencies have the authority to promulgate regulations that have an effect on our operations.
In addition to these federal laws and regulations, various states have been delegated certain authority under the federal statutes and have authority over these matters under state laws. Many state and local governments have adopted environmental and employee safety and health laws and regulations, some of which are similar to federal requirements.
Other Laws and Regulations
Our operations are also subject to other government regulations. While most of our products are not regulated, our acquisitions of Barkey and B Medical include certain products that are regulated by the FDA under the Federal Food, Drug, and Cosmetic Act.
8
Our businesses also include export and import activities, we are subject to pertinent laws enforced by the U.S. Departments of Commerce, State and Treasury. In addition, our logistics activities must comply with the rules and regulations of the Department of Transportation, the Federal Aviation Administration, and similar foreign agencies.
We believe we are in compliance in all material respects with all applicable environmental, employee health and safety and other government regulations, and such compliance has not had, and is not expected to have, an adverse effect on our capital expenditures, competitive position, financial condition, or results of operations.
Human Capital
In total, we employ approximately 3,500 full-time employees, part-time employees and contingent workers worldwide as of September 30, 2023, primarily in the United States. We understand that our success depends on our highly talented associates, and our human capital management practices focus on attracting and retaining a diverse and engaged workforce.
Diversity, Equity and Inclusion. We are committed to attracting, developing, and retaining diverse talent that is inclusive of every age, gender, gender identity, race, sexual orientation, physical capability, neurological difference, ethnicity, belief and perspective. Our goal is to develop cultural competency by seeking knowledge, increasing awareness, developing sensitivity, modeling respect and promoting inclusion and unity. Approximately 46% of our employees are gender diverse, and 42% of our U.S.-based employees identify as being racially diverse. Additional detail on our gender and racial diversity can be found on our website in our environmental, social, and governance (“ESG”) governance reports.
Employee Engagement. We are committed to fostering a culture and environment where every employee feels valued. Our success depends in large part on our hiring and retaining top talent across the entire organization, with primary emphasis on our management team and our employees who interface directly with our customers. We compete for talent with other companies both smaller and larger, and both in our market and in other industries.
Compensation and Benefits. In order to attract and retain top talent, we focus on having a diverse, inclusive, and safe workplace, while offering competitive compensation, benefits, and health and wellness programs. A majority of employees also have incentive compensation opportunities, which are primarily focused on meeting financial, sales, operational, and/or customer focused metrics. In addition, our long-term equity compensation is intended to align management interests with those of our stockholders and to encourage the creation of long-term value.
Training and Development. We provide training and learning opportunities, rotational assignment opportunities, and continuous performance feedback to further our employee development. Our learning culture is built on: formal curriculums, communities of practice, peer-to-peer learning, experiential development, support tools and ongoing assessment. We listen to our employees to better understand their training and development needs, and ensure our offerings cater to both technical learning and leadership development. We offer a generous tuition reimbursement program that encourages employees to pursue undergraduate and graduate degrees in fields associated with their current or aspirational positions. In 2023, 21 employees were enrolled in this benefit with 33% being female.
Employee Health and Safety. Compliance with environmental, health and safety (“EH&S”) laws and regulations underlies the basis of the EH&S programs we have in place. As part of our EH&S programs, we:
| ● | help build a culture of safety that emphasizes safe operations, procedures, behaviors, and attitudes |
| ● | provide compliance training on general safety principles and job-specific requirements |
| ● | equip employees to recognize and execute their responsibilities for safety through numerous training events |
| ● | provide appropriate personal protective equipment and training in the safe use of that equipment |
| ● | help ensure all employees are aware of their surroundings and that everyone works to maintain a safe workplace |
9
| ● | hold recurring, monthly corporate-wide safety committee meetings for employees at all levels, including executive management |
| ● | encourage employees to conduct job hazard analysis with the purpose of recognizing workplace hazards and reducing risk |
Purpose and Core Values. Our Company Purpose is to enable life sciences organizations around the world to bring impactful and breakthrough therapies to market – faster. We are committed to making sure that every team member understands our core values of Customer Focus, Achievement, Accountability, Teamwork, Employee Value, and Integrity. These core values are the foundation from which we act and base our decisions and are embodied in our Standards of Conduct, which outline our commitment to our customers, our investors, our communities, and to one another. Our Standards of Conduct also outline what is expected of our employees and ensure we continue to foster a culture of high integrity. We adhere to the governance requirements established by federal and state law, the SEC and the Nasdaq Global Select Market, and we strive to establish appropriate risk management methods and control procedures to adequately manage, monitor, and control the major risks we may face day to day.
Available Information
We file annual, quarterly, and current reports, proxy statements and other information with the SEC. Our SEC filings are available to the public over the internet at the SEC’s website at http://www.sec.gov. We also maintain a website at www.azenta.com, through which you can access our SEC filings. The information found on our website is not part of this or any other report we file with, or furnish to, the SEC.
Item 1A. Risk Factors
Factors That May Affect Future Results
You should carefully consider the risks described below and the other information in this Annual Report on Form 10-K before deciding to invest in shares of our common stock. These are the risks and uncertainties applicable to our businesses that we believe are most important for you to consider. Additional risks and uncertainties not presently known to us, which we currently deem immaterial or which are similar to those faced by other companies in our industry or business in general, may also impair our business operations. If any of the following risks or uncertainties actually occur, our business, financial condition and operating results would likely suffer. In that event, the market price of our common stock could decline, and you could lose all or part of your investment.
Macroeconomic and External Risks
We are subject to risks associated with public health threats and epidemics, including COVID-19.
We are subject to risks associated with public health threats and epidemics, including the ongoing global health concerns relating to COVID-19. Public health threats, whether global or not, may adversely impact our business and markets, including our workforce and operations and the operations of our customers, suppliers, and business partners. In particular, we may experience material financial or operational impacts, including:
| ● | significant volatility or reductions in demand for our products and/or services; or |
| ● | the inability to meet our customers’ needs or other obligations due to disruptions to our operations or the operations of our third-party partners, suppliers, contractors, logistics partners, or customers. |
These impacts may be of greater magnitude in certain jurisdictions in which we and our customers operate that are impacted by these threats or react to the threats with more stringent policies.
For example, the COVID-19 pandemic impacted the world economy and our business results and operations since 2020.
10
The depth and extent to which the COVID-19 pandemic or other public health threats may directly or indirectly impact our business, results of operations, financial condition and individual markets in the future is dependent upon various factors, including the spread of additional COVID-19 variants or other health threats, the availability of vaccinations and other medical interventions, and government interventions to reduce the spread of COVID-19 or other health threats.
While we have developed and implemented and continue to develop and implement health and safety protocols, business continuity plans and crisis management protocols in an effort to try to mitigate the negative impact of COVID-19 and other health threats on our employees and our business, there can be no assurance that we will be successful in our efforts or that such efforts may not have detrimental unintended consequences, and as a result, our business, financial condition and results of operations may be materially and adversely affected.
A prolonged downturn in macroeconomic conditions may materially adversely affect our business.
An economic downturn in the United States and elsewhere, including as a result of continued or future outbreaks of COVID-19 or a similar infectious disease, reductions in the level of government funding for scientific research, increases in interest rates, inflation, among other factors, may cause our current or potential customers to delay or reduce purchases, which could, in turn, result in reductions in sales of our products, materially and adversely affecting our results of operations and cash flows. Volatility and disruption of global financial markets could limit our customers’ ability to obtain adequate financing to maintain operations and proceed with planned or new capital spending initiatives, leading to a reduction in sales volume that could materially and adversely affect our results of operations and cash flow. In addition, a decline in our customers’ ability to pay as a result of an economic downturn may lead to increased difficulties in the collection of our accounts receivable, higher levels of reserves for doubtful accounts and write-offs of accounts receivable, and higher operating costs as a percentage of revenues.
Global climate change and related legal and regulatory developments could negatively affect our business, financial condition and results of operations.
Climate change presents risks to us and to our customers, with the risks expected to increase over time. Our products and services are subject to and affected by environmental regulation by federal, state, and local authorities in the United States and regulatory authorities with jurisdiction over our international operations. Future regulations or voluntary actions on our part in response to climate change could result in costly changes to our facilities to reduce carbon emissions and could increase energy costs as a result of switching to less carbon-intensive, but more expensive, sources of energy to operate our facilities and to transport and ship products and samples. There can be no assurance that climate change or environmental regulation and response will not have a negative competitive impact on our ability to provide sample management, automated storage, and genomic services or that economic returns will match the investments that we are making in the development of new products and services. We will likely face increasing complexity related to product design, the use of regulated materials, energy consumption and efficiency, and the reuse, recycling, or disposal of products and their components at end-of-use or useful life. There continues to be a lack of consistent climate legislation, which creates economic and regulatory uncertainty regarding future incentives for energy-efficiency and costs of compliance, which may impact the demand for our products and services, our costs associated with providing our products and services, and our results of operations and financial condition. In addition, the potential physical impacts of climate change on our operations are highly uncertain and would be particular to the geographic circumstances in areas in which we operate. These may include changes in global weather patterns, which could include local changes in rainfall and storm patterns and intensities, water shortages, changing sea levels, and changing temperature averages or extremes. These impacts may also adversely affect our properties, our business, financial condition and results of operations.
Unfavorable currency exchange rate fluctuations may impact our significant foreign currency holdings, lead to lower operating margins, or may cause us to raise prices for our products and services, which could result in reduced sales.
Currency exchange rate fluctuations could have an adverse effect on our sales, cost of sales and results of operations, and we could experience losses with respect to forward exchange contracts into which we may enter. Unfavorable currency fluctuations could require us to increase prices for our products and services to customers, which could result in lower net sales. Alternatively, if we do not adjust the prices for our products and services in response to unfavorable currency fluctuations, our results of operations, including our margins, could be materially and adversely affected.
11
In addition, most sales made by our foreign subsidiaries are denominated in the currency of the country in which these products are sold or these services are provided and the currency received in payment for such sales could be less valuable as compared to the U.S. dollar at the time of receipt as a result of exchange rate fluctuations. From time to time, we enter into forward exchange contracts to reduce currency exposure. However, we cannot be certain that our efforts will be adequate to protect us against significant currency fluctuations or that such efforts will not expose us to additional exchange rate risks, which could materially and adversely affect our results of operations.
We hold approximately $546 million of cash and cash equivalents that is denominated in foreign currency, which represents a substantial portion of our current cash and cash equivalents balance. As a result of our significant foreign currency holdings, our financial results and capital ratios may be impacted by the movements in exchange rates, and a significant portion of our assets must be translated into U.S. dollars for external reporting purposes or converted into U.S. dollars to meet our strategic needs, including with respect to our share repurchase authorization, and service obligations such as any future U.S. dollar-denominated indebtedness or dividends. We may seek to mitigate our exposure to currency exchange rate fluctuations, but our efforts may not be successful.
Our business could be negatively impacted by environmental, social and governance (ESG) matters.
There has been an increased focus from investors, customers, employees and other stakeholders concerning ESG matters, including addressing climate change, which may result in increases in our costs to operate our business or restrict certain aspects of our activities. The standards by which ESG efforts and related matters are measured are developing and evolving, and certain areas are subject to assumptions that could change over time and the extent and severity of climate change impacts are unknown. In addition, we could be criticized for the scope of such initiatives or goals or perceived as not acting responsibly in connection with these matters. Any such matters could have a material adverse impact on our future results of operations, financial position and cash flows.
Risks Relating to Our Operations
Our operating results could fluctuate significantly, which could negatively impact our business.
Our revenue, operating margins and other operating results could fluctuate significantly from quarter-to-quarter and year-to-year depending upon a variety of factors, including:
| ● | changes in the timing and terms of product orders and service contracts by our customers as a result of our customer concentration or otherwise; |
| ● | changes in the demand for the mix of products and services that we offer; |
| ● | the timing and amount of any repurchases of our common stock under our share repurchase authorization; |
| ● | timing and market acceptance of our new product and service introductions; |
| ● | delays or problems in the planned introduction of new products or services, or in the performance of any such products following delivery to customers or the quality of such services; |
| ● | new products, services or technological innovations by our competitors, which can, among other things, render our products and services less competitive due to the rapid technological changes in the markets in which we provide products and services; |
| ● | the timing and related costs of any acquisitions, divestitures or other strategic transactions; |
| ● | our ability to reduce our costs in response to decreased demand for our products and services; |
| ● | our ability to accurately estimate customer demand, including the accuracy of demand forecasts used by us; |
| ● | disruptions in our manufacturing process or in the supply of components to us; |
12
| ● | write-offs for excess or obsolete inventory; |
| ● | competitive pricing pressures; and |
| ● | increased investment into our infrastructure to support our growth, including capital equipment, research and development, as well as selling and marketing initiatives to support continuous product and services innovation, technological capability enhancements and sales efforts. The timing of revenue generation coupled with the increased amount of investment may result in operating losses. |
As a result of these risks, we believe that reference to past performance for comparisons of our revenue and operating results may not be meaningful, and that these comparisons may not be an accurate indicator of our future performance.
If we do not continue to introduce new products and services that reflect advances in technology in a timely and effective manner, our products and services may become obsolete and our operating results will suffer.
Our success is dependent on our ability to respond to the technological changes present in the markets we serve. The success of our product development and introduction of products and services to market depends on our ability to:
| ● | identify and define new market opportunities, products and services in an accurate manner; |
| ● | obtain market acceptance of our products and services; |
| ● | innovate, develop, acquire and commercialize new technologies and applications in a timely and cost effective manner; |
| ● | adjust to changing market conditions; |
| ● | differentiate our offerings from our competitors’ offerings; |
| ● | obtain and maintain intellectual property rights where necessary; |
| ● | continue to develop a comprehensive, integrated product and service strategy; |
| ● | price our products and services appropriately; and |
| ● | design our products to high standards of manufacturability so that they meet customer requirements. |
If we cannot succeed in responding in a timely and cost effective manner to technological and/or market changes or if the new products and services that we introduce do not achieve market acceptance, our competitive position would diminish which could materially harm our business and our prospects.
The global nature of our business exposes us to multiple risks.
During fiscal years ended September 30, 2023, 2022 and 2021, approximately 46%, 33% and 38% of our revenue was derived from sales outside of North America. We expect that international sales, including increased sales in Asia and Africa, will continue to account for a significant portion of our revenue for the foreseeable future, and that in particular, the proportion of our sales to customers in China will increase, due in large part to our significant genomic services operation in China. Additionally, we intend to invest additional resources in facilities in China, which will increase our global footprint of sales, service and repair operations. As a result of our international operations, we are exposed to many risks and uncertainties, including:
| ● | longer sales-cycles and time to collection; |
| ● | tariff and international trade barriers; |
13
| ● | fewer or less certain legal protections for intellectual property and contract rights abroad; |
| ● | different and changing legal and regulatory requirements in the jurisdictions in which we operate; |
| ● | government currency control and restrictions on repatriation of earnings; |
| ● | a diverse workforce with different experience levels, languages, cultures, customs, business practices and worker expectations, and differing employment practices and labor issues; |
| ● | an increased reliance on third-party agents and distributors to transact business in jurisdictions where we do not have a presence; |
| ● | fluctuations in foreign currency exchange and interest rates, particularly in Asia and Europe; |
| ● | political and economic instability, changes, hostilities and other disruptions in regions where we operate; and |
| ● | intervention or attempts to control our international operations by foreign governments, including our Suzhou China facility by the government of China. |
Moreover, in many foreign countries, particularly in those with developing economies, there is an increased risk of corruption and/or bribery, which could lead to violations of various laws and regulations, including the Foreign Corrupt Practices Act. While such business practices are prohibited by our internal policies and procedures, there can be no assurance that all our employees, contractors and agents, as well as those companies to which we outsource certain of our business operations, will comply with these policies and procedures, or the applicable anti-bribery laws and regulations. Any such violations could subject us to fines and other penalties, which could have a material adverse effect on our business, operating results, financial condition and cash flows.
Negative developments in any of these areas in one or more countries could result in a reduction in demand for our products, the cancellation or delay of orders already placed, threats to our intellectual property, difficulty in collecting receivables, and a higher cost of doing business, any of which could materially harm our business and profitability.
We hold approximately $569 million of cash outside the United States and our ability to repatriate any of the funds for use in the United States or elsewhere in our business may be limited based on local country statutory requirements, which could negatively impact our opportunities to deploy capital, including for our share repurchase authorization.
Our business could be materially harmed if we fail to adequately integrate the operations of the businesses that we have acquired or may acquire.
We have made in the past, and may make in the future, acquisitions or significant investments in businesses with complementary products, services and/or technologies. Our acquisitions, present numerous risks, including:
| ● | difficulties in integrating the operations, technologies, products and personnel of the acquired companies and realizing the anticipated synergies of the combined businesses; |
| ● | defining and executing a comprehensive product and services strategy; |
| ● | managing the risks of entering markets or types of businesses in which we have limited or no direct experience; |
| ● | the potential loss of key employees, customers and strategic partners of ours or of acquired companies; |
| ● | unanticipated problems or latent liabilities, such as problems with the quality of the installed base of the target company’s products or infringement of another company’s intellectual property by a target company’s activities, products or services; |
| ● | problems associated with compliance with the acquired company’s existing contracts; |
14
| ● | difficulties in managing geographically dispersed operations; |
| ● | the diversion of management’s attention from normal daily operations of the business; and |
| ● | difficulties in accurately estimating the expected demand for any acquired product, service or technology and the timing and regularity thereof. |
If we acquire a new business, we may expend significant funds, incur additional debt or issue additional securities, which may negatively affect our operations and be dilutive to our stockholders. In periods following an acquisition, we will be required to evaluate goodwill and acquisition-related intangible assets for impairment. If such assets are found to be impaired, they will be written down to estimated fair value, with a charge against earnings. The failure to adequately address these risks or the impairment of any assets could materially harm our business and financial results.
Expanding within current markets introduces new competitors and commercial risks.
A key part of our growth strategy is to continue expanding within the life sciences sample management and genomic services markets. As part of this strategy, we expect to diversify our product sales and service revenue by leveraging our core technologies and making acquisitions of select businesses, products, services or technologies, which requires investments and resources which may not be available on favorable terms or at all. We cannot guarantee that we will be successful in leveraging our capabilities into the life sciences sample management and genomic services markets or identifying and successfully acquiring other businesses, products, services or technologies to meet all the needs of new customers and to compete favorably with other products and services. Because a significant portion of our growth potential may be dependent on our ability to increase sales within each of the Life Sciences Product and Life Sciences Services segments, our inability to successfully expand within the markets serviced by these segments may adversely impact future financial results.
Changes in key personnel could impair our ability to execute our business strategy.
The continuing service of our executive officers and essential engineering, scientific and management personnel, together with our ability to attract and retain such personnel, is an important factor in our continuing ability to execute our strategy. There is substantial competition to attract such employees and the loss of any such key employees could have a material adverse effect on our business and operating results. The same could be true if we were to experience a high turnover rate among engineering and scientific personnel and we were unable to replace them. Our ability to attract and retain employees may be negatively impacted by employees’ reactions to our health and safety policies, including those related to COVID-19 vaccinations, masks, and/or flexibility to work remotely, particularly in the United States. Any failure to attract, recruit, train, retain, motivate and integrate qualified personnel could materially harm our operating results and growth prospects.
Unexpected events could disrupt our sample storage operations and adversely affect our reputation and results of operations.
Unexpected events, including fires or explosions at our facilities, natural disasters, such as tornadoes, hurricanes and earthquakes, war or terrorist activities, unplanned power outages, supply disruptions and failure of equipment or systems, could adversely affect our reputation and results of operations. Our Life Sciences Services customers rely on us to securely store and timely retrieve and transport their critical samples, and these events could result in service disruptions, physical damage to one or more key storage facilities and the customer samples stored in those facilities, the temporary closure of one or more key operating facilities or the temporary disruption of service, each of which could negatively impact our reputation and results of operations. Our primary storage facility is located in Indianapolis, Indiana, an area of the United States that can be prone to tornadoes and other severe weather events.
If our facilities were to experience a significant disruption in operations, our business could be materially harmed, while the failure to estimate customer demand accurately could result in excess or obsolete inventory.
We have a limited number of manufacturing facilities for our products and laboratories for our service offerings. If the operations at any one of these facilities were disrupted as a result of a natural disaster, fire, power or other utility outage, work stoppage, war or terrorist activities or other similar event, our business could be seriously harmed because we may be unable to manufacture and ship products and parts, or provide services, to our customers in a timely fashion.
15
The impact of any disruption at one of our facilities may be exacerbated if the disruption occurs at a time when we need to rapidly increase our capabilities to meet increased demand or expedited shipment schedules.
Moreover, if actual demand for our products or services is different than expected, we may purchase more/fewer component parts or other supplies than necessary or incur costs for canceling, postponing or expediting delivery of such parts or supplies. If we purchase inventory in anticipation of customer demand that does not materialize, or if our customers reduce or delay orders, we may incur excess inventory charges. Any or all of these factors could materially and adversely affect our business, financial condition and results of operations.
Our business relies on certain critical information systems and a failure or breach of such a system could harm our business and results of operations and, in the event of unauthorized access to a customer’s data or our data, incur significant legal and financial exposure and liabilities.
We maintain and rely upon certain critical information systems for the effective operation of our business. These information systems include telecommunications, the internet, our corporate intranet, various computer hardware and software applications, network communications and e-mail. These information systems may be owned and maintained by us, our outsource providers or third parties such as vendors and contractors. These information systems are subject to attacks, failures, and access denials from a number of potential sources including viruses, destructive or inadequate code, power failures, and physical damage to computers, hard drives, communication lines and networking equipment. To the extent that these information systems are under our control, we have implemented security procedures, such as virus protection software and emergency recovery processes, to mitigate the outlined risks. However, security procedures for information systems cannot be guaranteed to be failsafe and our inability to use or access these information systems at critical points in time, or unauthorized releases of confidential information, could unfavorably impact the timely and efficient operation of our business.
Confidential information stored on these information systems could also be compromised. If a third party gains unauthorized access to our data, including any information regarding our customers, such security breach could expose us to a risk of loss of this information, loss of business, litigation and possible liability. These security measures may be breached as a result of third-party action, including intentional misconduct by computer hackers, employee error, malfeasance or otherwise. Additionally, third parties may fraudulently attempt to induce employees or customers into disclosing sensitive information such as user names, passwords or other information in order to gain access to our customers’ data or our data, including our intellectual property and other confidential business information, or our information technology systems. Because the techniques used to obtain unauthorized access, or to sabotage systems, change frequently and generally are not recognized until launched against a target, we may be unable to anticipate these techniques or to implement adequate preventative measures. Any security breach could result in a loss of confidence by our customers, damage our reputation, disrupt our business, lead to legal liability and negatively impact our future sales.
Our goodwill and intangible assets may become impaired.
As of September 30, 2023, we had $784.3 million of goodwill and $294.3 million in net intangible assets as a result of our acquisitions. We periodically review our goodwill and the estimated useful lives of our identifiable intangible assets, taking into consideration any events or circumstances that might result in either a diminished fair value, or for intangible assets, a revised useful life. These events and circumstances include significant changes in the business climate, legal factors, operating performance indicators, advances in technology and competition. Any impairment or revised useful life could have a material and adverse effect on our financial position and results of operations and could harm the trading price of our common stock.
As of October 1, 2023, the company reorganized the business under three operating segments, and as a result, reallocated goodwill to the newly defined reporting units. Subsequent to this reallocation, as of October 1, 2023, the fair value of the B Medical reporting unit approximates carrying value. In the event the performance of any of the Company’s reporting units does not meet management expectations in the future, the Company experiences a prolonged macroeconomic or market downturn, or there are other negative revisions to key assumptions used in the analyses used to estimate fair value, the Company may be required to perform an impairment analysis which could result in an impairment charge.
16
For further details refer to Note 21, Subsequent Events to our Consolidated Financial Statements included under Part II, Item 8, “Financial Statements and Supplementary Data” of this Annual Report on Form 10-K.
Changes in tax rates or tax regulation could affect results of operations.
As a global company, we are subject to taxation in the United States and various other countries. Significant judgment is required to determine and estimate worldwide tax liabilities. Our future annual and quarterly effective tax rates could be affected by numerous factors, including changes in the following: applicable tax laws; composition of pre-tax income in countries with differing tax rates; and/or establishment of a valuation allowance against deferred tax assets based on the assessment of their realizability prior to expiration. Changes in applicable tax laws could significantly impact the estimates of our tax assets and liabilities, as well as expectations of future effective tax rates. Changes in tax laws could also negatively impact our ability to move our cash balances between the jurisdictions in which we operate. In addition, we are subject to regular examination by the U.S. Internal Revenue Service and state, local and foreign tax authorities. We regularly assess the likelihood of favorable or unfavorable outcomes resulting from these examinations to determine the adequacy of our expense for income taxes. Although we believe our tax estimates are reasonable, there can be no assurance that any final determination will not be materially different from the treatment reflected in our historical income tax (benefits) expenses and accruals, which could materially and adversely affect our financial condition and results of operations.
International trade disputes could result in additional or increased tariffs, export controls or other trade restrictions that may have a material impact on our business.
We sell a significant number of products outside the United States, including in China and Africa. Based on the complex relationships among these countries and the United States, there is inherent risk that political, diplomatic and national security influences might lead to trade disputes, impacts and/or disruptions. The United States and other countries have imposed and may continue to impose trade restrictions and have also levied tariffs and taxes on certain goods. Increases in tariffs, additional taxes or other trade restrictions and retaliatory measures may increasingly impact customer demand and customer investment in manufacturing equipment, increase our manufacturing costs, decrease margins, reduce the competitiveness of our products, or inhibit our ability to sell products or purchase necessary equipment and supplies, which could have a material adverse effect on our business, results of operations, or financial condition.
We are subject to numerous governmental regulations.
We are subject to federal, state, local and foreign regulations, including environmental regulations, regulations relating to the design and operation of our products and control systems and regulations relating to certain of our service offerings, including those described above under Item 1 “Business-Environmental Matters and Governance Regulations” above. We might incur significant costs as we seek to ensure that our products meet safety and emissions standards, many of which vary across the states and countries in which our products are used. In the past, we have invested significant resources to redesign our products to comply with these directives. Compliance with future regulations, directives, and standards could require us to modify or redesign some products, change our service offerings, make capital expenditures, or incur substantial costs. If we do not comply with current or future regulations, directives, and standards:
| ● | we could be subject to fines; |
| ● | our production or shipments could be suspended; and |
| ● | we could be prohibited from offering particular products or services in specified markets. |
Any of these events could materially and adversely affect our business, financial condition and results of operations.
Regulations and customer demands related to conflict minerals may adversely affect us.
The Dodd-Frank Wall Street Reform and Consumer Protection Act imposes disclosure requirements regarding the use in components of our products of “conflict minerals” mined from the Democratic Republic of Congo and adjoining countries, whether the components of our products are manufactured by us or third parties.
17
This requirement could affect the pricing, sourcing and availability of minerals used in the manufacture of components we use in our products. In addition, there are additional costs associated with complying with the disclosure requirements and customer requests, such as costs related to our due diligence to determine the source of any conflict minerals used in our products and preparing and filing required reports with respect thereto with the SEC. We may face difficulties in satisfying customers who may require that all of the components of our products are certified as conflict mineral free and/or free of numerous other hazardous materials.
Our failure to protect our intellectual property could adversely affect our future operations.
Our ability to compete is significantly affected by our ability to protect our intellectual property. We rely upon patents, trade secret laws, confidentiality agreements and procedures, copyrights, trademarks and licensing agreements to protect our technology. Existing trade secret, trademark and copyright laws offer only limited protection. Our success depends in part on our ability to obtain and enforce patent protection for our products and services both in the United States and in other countries. We own numerous U.S. and foreign patents, and we intend to file additional applications, as appropriate, for patents covering our products, services, and technology. Any issued patents owned by or licensed to us may be challenged, invalidated or circumvented, and the rights under these patents may not provide us with competitive advantages. In addition, the laws of some countries in which our products and services are or may be developed, manufactured, provided, or sold may not fully protect our products and services. Due to the rapid technological change that characterizes the life sciences and related process equipment industries, we believe that the improvement of existing technology, reliance upon trade secrets, unpatented proprietary know-how and the development of new products or services may be as important as patent protection in establishing and maintaining a competitive advantage. To protect trade secrets and know-how, it is our policy to require all technical and management personnel to enter into nondisclosure agreements.
We cannot guarantee that the steps we have taken to protect our intellectual property will be adequate to prevent the misappropriation of our technology. Other companies could independently develop similar or superior technology without violating our intellectual property rights. In the future, it may be necessary to engage in litigation or like activities to enforce our intellectual property rights, to protect our trade secrets or to determine the validity and scope of proprietary rights of others, including our customers. This could require us to incur significant expenses and to divert the efforts and attention of our management and technical personnel from our business operations.
The expiration of our patents over time could lead to an increase in competition and a decline in our revenue.
One of our main competitive strengths is our technology, and we are dependent on our patent rights and other intellectual property rights to maintain our competitive position. Our current patents will expire from time to time beginning in 2024 and running through 2039 which could result in increased competition and declines in product and service revenue.
We may be subject to claims of infringement of third-party intellectual property rights, or demands that we license third-party technology, which could result in significant expense and prevent us from using our technology.
There has been substantial litigation regarding patent and other intellectual property rights in the industries in which we do business. We have in the past been, and may in the future be, notified that we may be infringing intellectual property rights possessed by third parties. We cannot guarantee that infringement claims by third parties or other claims for indemnification by customers or end-users of our products and services resulting from infringement claims will not be asserted in the future or that such assertions, whether or not proven to be true, will not materially and adversely affect our business, financial condition and results of operations.
We cannot predict the extent to which we might be required to seek licenses or alter our products or services so that they no longer infringe the rights of others. We also cannot guarantee that licenses will be available or the terms of any licenses we may be required to obtain will be reasonable. Similarly, changing our products, services or processes to avoid infringing the rights of others may be costly or impractical and could detract from the value of our products and services. If a judgment of infringement were obtained against us, we could be required to pay substantial damages and a court could issue an order preventing us from selling one or more of our products or offering certain of our services.
18
Further, the cost and diversion of management attention brought about by such litigation could be substantial, even if we were to prevail. Any of these events could result in significant expense to us and may materially harm our business and our prospects.
Risks Related to Reliance on Third Parties
Our business could be materially harmed if one or more key suppliers fail to continuously deliver key components of acceptable cost and quality.
We currently obtain many of our key components on an as-needed, purchase order basis from numerous suppliers. In some cases, we have only a single source of supply for key components and materials used in the manufacturing of our products. Further, a portion of our supply is sourced from Asia, including China and we do not always have a previous history of dealing with these suppliers. Our inability to obtain components or materials in required quantities or of acceptable cost and quality and with the necessary continuity of supply could result in delays or reductions in product shipments to our customers. In addition, if a supplier or sub-supplier suffers a production stoppage or delay for any reason, including natural disasters or health-related threats, this could result in a delay or reduction in our product shipments to our customers. Any of these contingencies could cause us to lose customers, result in delayed or lost revenue and otherwise materially harm our business.
Our business could be adversely affected by a decline in the availability of raw materials.
We are dependent on the availability of certain key raw materials and natural resources used in our products and various manufacturing processes, and we rely on third parties to supply us with these materials in a cost-effective and timely manner. Our access to raw materials may be adversely affected if our suppliers’ operations were disrupted as a result of limited or delayed access to key raw materials and natural resources which may result in increased cost of these items.
Our external service providers may fail to perform as we expect.
Our external service providers have played and will continue to play a key role in many of our transactional and administrative functions, such as information technology and facilities management. Many of these service providers, including certain hosted software applications that we use for confidential data storage, employ cloud computing technology for such storage. These providers’ cloud computing systems may be susceptible to “cyber incidents,” such as intentional cyber-attacks aimed at theft of sensitive data or inadvertent cyber-security compromises, which are outside of our control. Although we attempt to select reputable providers and secure their performance on terms documented in written contracts, it is possible that one or more of these providers could fail to perform or adequately protect our data from cyber-related security breaches as we expect and any such failure could have an adverse impact on our business.
Risks Relating to Our Customers
Customers generally do not make long term commitments to purchase our products and our customers may cease purchasing our products at any time.
Sales of our products are often made pursuant to individual purchase orders and not under long-term commitments and contracts. Our customers frequently do not provide any assurance of minimum or future sales and are not prohibited from purchasing products from our competitors at any time. Accordingly, we are exposed to competitive pricing pressures on each order.
We may face claims for liability related to damages of customer materials attributed to the failure of our products or services, exposing us to significant financial or reputational harm.
Our automated cold storage systems for the life sciences sample management market are used in the handling, movement and storage of biological and chemical samples. We also provide sample storage services to customers where we store their biological and chemical samples or perform genomics services at our facilities. In any case, in addition to product warranty claims, inaccurate or faulty testing services or damage to our customers’ materials attributed to a failure of our products or services could lead to additional claims for damages made by our customers and could also harm our relationship with our customers and damage our reputation, resulting in material harm to our business.
19
Risks Relating to Owning Our Securities
Our stock price is volatile.
The market price of our common stock has fluctuated widely. From the beginning of fiscal year 2022 through the end of fiscal year 2023, our stock price fluctuated between a high of $124.15 per share and a low of $36.45 per share. Consequently, the current market price of our common stock may not be indicative of future market prices, and we may be unable to sustain or increase the value of an investment in our common stock. Factors affecting our stock price may include:
| ● | variations in operating results from quarter-to-quarter and year-to-year; |
| ● | changes in earnings estimates by analysts or our failure to meet analysts’ expectations; |
| ● | changes in the market price per share of our public company customers and competitors; |
| ● | the timing and amount of any repurchases of our common stock under our share repurchase authorization; |
| ● | market conditions in the life sciences sample management and genomic services and other industries into which we sell products and services; |
| ● | global economic conditions; |
| ● | political changes, hostilities, public health threats, including the COVID-19 pandemic, or similar events, or natural disasters such as hurricanes and floods; |
| ● | low trading volume of our common stock; |
| ● | the number of firms making a market in our common stock; and |
| ● | actions of activist stockholders and our response(s) thereto. |
In addition, the stock market has in the past experienced significant price and volume fluctuations. These fluctuations have particularly affected the market prices of the securities of life sciences companies like ours. These market fluctuations could adversely affect the market price of our common stock.
Although we have initiated share repurchases under our share repurchase authorization, we cannot guarantee that our share repurchases will not limit our ability to further develop our business or whether the share repurchase authorization will be fully implemented or that it will enhance long-term stockholder value.
On November 4, 2022, our Board of Directors approved a new share repurchase authorization for the repurchase of up to $1.5 billion of our common stock (the “2022 Repurchase Authorization”). Repurchases under the 2022 Repurchase Authorization may be made in the open market or through privately negotiated transactions (including under an accelerated share repurchase (“ASR”) agreement), or by other means, including through the use of trading plans intended to qualify under Rule 10b5-1 under the Exchange Act, subject to market and business conditions, legal requirements, and other factors. We are not obligated to acquire any particular amount of common stock under the 2022 Repurchase Authorization, and share repurchases may be commenced or suspended at any time at our discretion.
On November 23, 2022, as part of the 2022 Repurchase Authorization, we entered into an ASR agreement with JPMorgan Chase Bank, National Association for the repurchase of up to $500.0 million of our common stock. Approximately 6.1 million initial shares of common stock were received by us and retired in connection with entering into the ASR agreement in November 2022 and, in April 2023, the transactions under the ASR agreement terminated and we received final settlement of an additional 4.0 million shares of common stock for a total of 10.1 million shares of common stock repurchased under the ASR agreement.
20
Following the final termination of the ASR agreement, other arrangements under the 2022 Repurchase Authorization commenced under which we expect to repurchase up to an additional $500.0 million shares of our common stock in open market purchases, intended to qualify under Rule 10b5-1 under the Exchange Act, subject to market and business conditions, legal requirements, and other factors. We repurchased 17.5 million shares of common stock for $838.5 million (excluding fees, commissions, and excise tax) in the fiscal year ending September 30, 2023 under the ASR agreement and these other arrangements. In addition, in November 2023, we announced that we intend to repurchase the remaining $500.0 million of shares of common stock available under the 2022 Repurchase Authorization in 2024. Our ability to continue to repurchase common stock, including under the other arrangements that commenced after termination of the ASR agreement and any of the remaining $500.0 million of the intended repurchases announced in November 2023, will depend upon, among other factors, our cash balances and potential future capital requirements for strategic investments, whether organic or through acquisitions, our results of operations, our financial condition and other factors beyond our control that we may deem relevant to a decision to repurchase common stock under the current arrangements.
Repurchases pursuant to the 2022 Repurchase Authorization could affect the price of our common stock and increase its volatility. The existence of the 2022 Repurchase Authorization could also cause the price of our common stock to be higher than it would be in the absence of such an authorization and could reduce the market liquidity for our common stock. Additionally, repurchases under the 2022 Repurchase Authorization will diminish our cash reserves, which could impact our ability to further develop our business organically or through acquisitions or service any indebtedness we may incur in the future as a result of the reduction of our cash balances from the repurchases or otherwise. There can be no assurance that any repurchases will enhance shareholder value because the market price of our common stock may decline below the levels at which we repurchased such shares. Any failure to repurchase shares after we have announced our intention to do so may negatively impact our reputation and investor confidence in us and may negatively impact our stock price. Although the 2022 Repurchase Authorization is intended to enhance long-term stockholder value, short-term price fluctuations could reduce the program’s effectiveness.
Our business and operations could be negatively affected by securities litigation or stockholder activism, which could impact the trading price and volatility of our common stock and may constrain capital deployment opportunities and adversely impact our ability to expand our business.
Our business and operations could be negatively affected if we become subject to any securities litigation or from continued stockholder activism, which could cause us to incur significant expenses, hinder the execution of our business and growth strategy, constrain our capital deployment opportunities, and impact the price of our common stock. Stockholder activism, which can take many forms or arise in a variety of situations, has been increasing recently. Volatility in the price of our common stock, our cash balance, our financial performance or other reasons may cause us to become the target of securities litigation or continue to be the target of stockholder activism.
We have been and may continue to be subject to stockholder activism, including relating to the actions of Politan Capital Management LP described in the Schedule 13D that it initially filed with the SEC on September 14, 2023, as amended, and may be subject to continued and other stockholder activism in the future. Securities litigation and stockholder activism, including potential proxy contests, could result in substantial costs and divert management’s and our Board of Director’s attention and resources from our business. Additionally, such securities litigation and stockholder activism could give rise to perceived uncertainties as to our future, adversely affect our relationships with service providers and make it more difficult to attract and retain qualified personnel. Also, we have and may be required to incur significant legal fees and other expenses related to any securities litigation and activist stockholder matters. Further, the price of our common stock could be subject to significant fluctuation or otherwise be adversely affected by the events, risks and uncertainties of any securities litigation and stockholder activism. In addition, stockholder activism may constrain our capital deployment opportunities and may limit the types of investments that are available to us.
Provisions in our charter documents and Delaware law may delay or prevent an acquisition of us, which could decrease the value of your shares.
Our restated certificate of incorporation and by-laws and Delaware law contain provisions that could make it harder for a third party to acquire us without the consent of our Board of Directors.
21
These provisions include limitations on actions by our stockholders by written consent, the inability of stockholders to call special meetings, requiring advance notice in accordance with our by-laws for stockholder proposals that can only be acted upon at annual stockholder meetings and nominations to our Board of Directors, limiting the approval of changes in the number of directors to our Board of Directors or by a super majority vote of our stockholders and the potential for super majority votes of our stockholders in certain other circumstances. In addition, as discussed below, our Board of Directors has the right to issue preferred stock without stockholder approval, which could be used to dilute the stock ownership of a potential hostile acquirer.
Our restated certificate of incorporation makes us subject to the anti-takeover provisions of Section 203 of the Delaware General Corporation Law. In general, Section 203 prohibits publicly held Delaware corporations to which it applies from engaging in a “business combination” with an “interested stockholder” for a period of three years after the date of the transaction in which the person became an interested stockholder, unless the business combination is approved in a prescribed manner. This provision could discourage others from bidding for our shares of common stock and could, as a result, reduce the likelihood of an increase in the price of our common stock that would otherwise occur if a bidder sought to buy our common stock.
Although we believe these provisions provide for an opportunity to receive a higher bid by requiring potential acquirers to negotiate with our Board of Directors, these provisions apply even if the offer may be considered beneficial by stockholders. If a change of control or change in management is delayed or prevented by these provisions, the market price of our common stock could decline.
Our restated certificate of incorporation authorizes the issuance of shares of blank check preferred stock.
Our restated certificate of incorporation provides that our Board of Directors is authorized to designate and issue from time to time, without further stockholder approval, up to 1,000,000 shares of preferred stock in one or more series and to fix and designate the rights, preferences, privileges and restrictions of the preferred stock, including dividend rights, conversion rights, voting rights, redemption rights and terms of redemption and liquidation preferences. Such shares of preferred stock could have preferences over our common stock with respect to dividends and liquidation rights. Our designation and issuance of preferred stock, including in connection with the adoption of a stockholders rights plan, or “poison pill,” may have the effect of delaying or preventing a change in control. Our issuance of preferred stock could decrease the amount of earnings and assets available for distribution to the holders of common stock or could adversely affect the rights and powers, including voting rights, of the holders of common stock. The issuance of preferred stock could have the effect of decreasing the market price of our common stock.
Our by-laws designate the state courts in the State of Delaware as the sole and exclusive forum for certain types of actions and proceedings that may be initiated by our stockholders, which could discourage lawsuits against the company and our directors, officers and employees.
Our by-laws provide that, unless we consent in writing to the selection of an alternative forum, the Court of Chancery of the State of Delaware (or, if the Court of Chancery of the State of Delaware does not have jurisdiction, the federal district court for the District of Delaware) will be the sole and exclusive forum for the following types of proceedings:
| ● | any derivative action or proceeding brought on our behalf; |
| ● | any action asserting a claim of breach of a fiduciary duty owed by any of our directors, officers, employees or stockholders to our company or our stockholders; |
| ● | any action asserting a claim arising pursuant to any provision of the Delaware General Corporation Law, our certificate of incorporation or our by-laws; or |
| ● | any action asserting a claim governed by the internal affairs doctrine of the law of the State of Delaware. |
These choice of forum provisions will not apply to causes of action arising under the Securities Act of 1933, as amended, or the Securities Act or the Exchange Act or any other claim for which federal courts have exclusive jurisdiction. Furthermore, our by-laws provide that, unless we consent in writing to the selection of an alternative forum, the federal district courts of the United States of America shall be the exclusive forum for the resolution of any claims under the Securities Act.
22
These exclusive forum provisions may limit the ability of our stockholders to bring a claim in a judicial forum that such stockholders find favorable for disputes with us or our directors, officers or employees, which may discourage such lawsuits against us and our directors, officers and employees. Alternatively, if a court were to find the choice of forum provisions contained in our by-laws to be inapplicable or unenforceable in an action, we may incur additional costs associated with resolving such action in other jurisdictions, which could materially adversely affect our business, financial condition and operating results.
Item 1B. Unresolved Staff Comments
None.
Item 2. Properties
Our corporate headquarters are currently located in Burlington, Massachusetts. We maintained the following principal facilities as of September 30, 2023:
|
|
|
|
|
|
Square Footage |
|
Ownership Status/ |
Location |
|
Functions |
|
Segment |
|
(Approx.) |
|
Lease Expiration |
Suzhou, China |
|
Laboratory & office |
|
Services |
|
240,000 |
|
Owned |
Hosingen, Luxembourg |
|
B Medical headquarters & manufacturing |
|
Products |
|
228,000 |
|
Owned |
Indianapolis, Indiana |
|
Sample storage, sales & support |
|
Services |
|
116,700 |
|
September 2033 |
South Plainfield, New Jersey |
|
Laboratory & office |
|
Services |
|
73,300 |
|
January 2030 |
Plainfield, Indiana |
|
Manufacturing, R&D and sales & support |
|
Services |
|
67,900 |
|
August 2032 |
Springfield, Missouri |
|
Manufacturing, R&D and sales & support |
|
Products |
|
50,100 |
|
December 2028 |
Manchester, United Kingdom |
|
Manufacturing & office |
|
Products |
|
45,000 |
|
December 2029 |
Burlington, Massachusetts |
|
Corporate headquarters, training, R&D and sales & support |
|
Products & Services |
|
42,500 |
|
October 2025 |
In addition to the principal facilities listed above, we maintain additional laboratories, biorepositories, and sales and support offices throughout North America, Europe, and Asia. The Company believes that its facilities are in good physical condition, are suitable and adequate for the operations conducted at those facilities and are generally fully utilized and operating at normal capacity.
Item 3. Legal Proceedings
We are subject to various legal proceedings, both asserted and unasserted, that arise in the ordinary course of business. We cannot predict the ultimate outcome of such legal proceedings or in certain instances provide reasonable ranges of potential losses. However, as of the date of this Annual Report on Form 10-K, we believe that none of these claims will have a material adverse effect on our consolidated financial condition or results of operations. In the event of unexpected subsequent developments and given the inherent unpredictability of these legal proceedings, there can be no assurance that our assessment of any claim will reflect the ultimate outcome and an adverse outcome in certain matters could, from time-to-time, have a material adverse effect on our consolidated financial condition or results of operations in particular quarterly or annual periods.
Item 4. Mine Safety Disclosures
Not applicable.
23
PART II
Item 5. Market for Registrant’s Common Equity, Related Stockholder Matters and Issuer Purchases of Equity Securities
Our common stock is traded on the Nasdaq Stock Market LLC, or Nasdaq under the symbol “AZTA.”
Number of Holders
As of November 13, 2023, there were 476 holders of record of our common stock.
Dividend Policy
Dividends are declared at the discretion of our Board of Directors and depend on actual cash flow from operations, our financial condition, capital requirements and any other factors our Board of Directors may consider relevant. Future dividend declarations, as well as the record and payment dates for such dividends, will be determined by our Board of Directors on a quarterly basis.
Since the completion of the sale of the semiconductor automation business on February 1, 2022, we have not paid a quarterly dividend and do not have plans to pay any dividends at this time.
Comparative Stock Performance
The following graph compares the cumulative total shareholder return (assuming reinvestment of dividends) from investing $100 on September 30, 2018, and plotted at the last trading day of each of the fiscal years ended September 30, 2019, 2020, 2021, 2022 and 2023, in each of (i) our Common Stock; (ii) the Nasdaq/NYSE American/NYSE Index of companies; and (iii) a peer group for the fiscal year ended September 30, 2023.
The 2023 peer group for the year ended September 30, 2023 is comprised of Angiodynamics Inc, Caredx Inc, Certara Inc, Haemonetics Corp, Icu Medical Inc, Integra Lifesciences Holdings Corp, Maravai Lifesciences Holdings Inc, Medpace Holdings Inc, Neogenomics Inc, Orasure Technologies Inc, Repligen Corp, Sotera Health Co, and Varex Imaging Corp. Nuvasive Inc. was removed from the Company’s peer group in 2023 as the result of its sale to another company in 2023.
The stock price performance on the graph below is not necessarily indicative of future price performance.
24
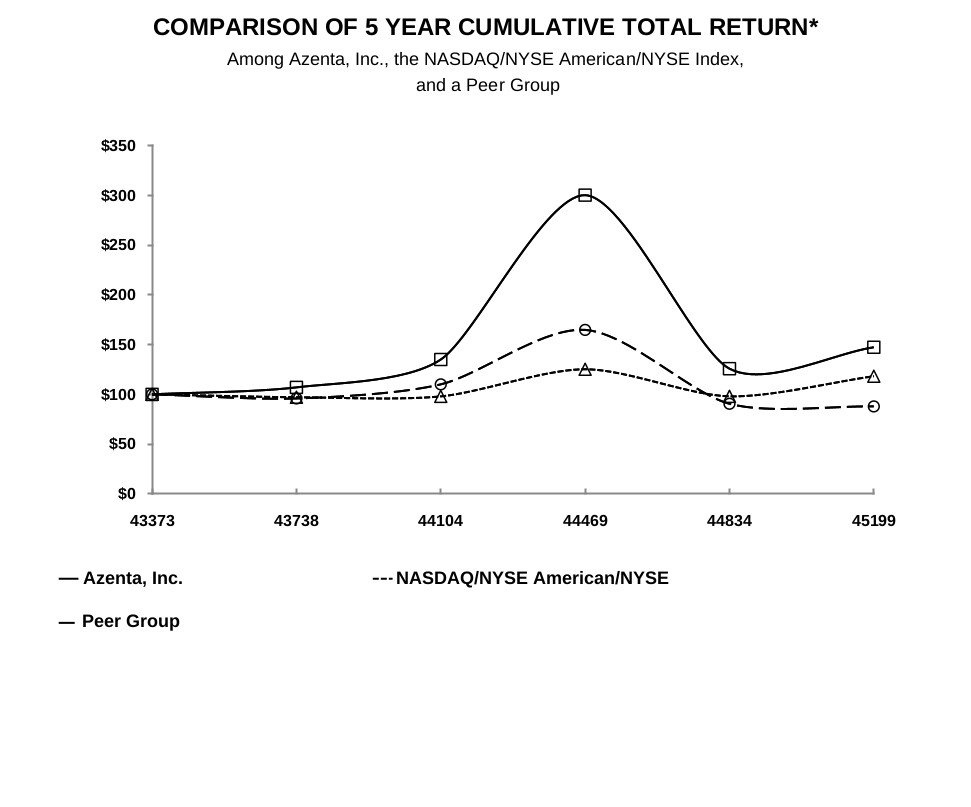
|
|
9/30/2018 |
|
9/30/2019 |
|
9/30/2020 |
|
9/30/2021 |
|
9/30/2022 |
|
9/30/2023 |
||||||
Azenta, Inc. |
|
$ |
100.00 |
|
$ |
106.99 |
|
$ |
134.96 |
|
$ |
300.06 |
|
$ |
125.77 |
|
$ |
147.28 |
Nasdaq/NYSE American/NYSE |
|
|
100.00 |
|
|
97.10 |
|
|
97.93 |
|
|
125.19 |
|
|
98.02 |
|
|
118.20 |
Peer Group |
|
|
100.00 |
|
|
95.85 |
|
|
110.03 |
|
|
164.73 |
|
|
90.53 |
|
|
87.86 |
The information included under the heading “Comparative Stock Performance” in this Item 5 of this Annual Report on Form 10-K shall not be deemed to be “soliciting material” or subject to Regulation 14A, shall not be deemed “filed” for purposes of Section 18 of the Exchange Act or otherwise subject to the liabilities of that section, nor shall it be deemed incorporated by reference in any filing under the Securities Act.
25
Issuer Purchases of Equity Securities
The following provides information about our fourth quarter 2023 repurchases of our common stock:
|
|
|
|
|
|
|
|
|
|
|
|
|
|
|
|
|
Total |
|
|
|
|
Total Number of Shares |
|
Approximate Dollar Value |
|
|
|
|
|
Number of |
|
Average |
|
Purchased As Part of |
|
Of Shares That May |
||
|
|
|
|
Shares |
|
Price Paid |
|
Publicly Announced |
|
Yet Be Purchased |
||
|
|
|
|
Purchased |
|
Per Share |
|
Plans or Programs |
|
(in millions) |
||
Period of Repurchase |
|
Repurchase Program |
|
(#) (1) |
|
($) (1) |
|
(1) |
|
($) |
||
July 1 - 31, 2023 |
|
Open market repurchase |
|
1,481,897 |
|
$ |
46.00 |
|
15,526,586 |
|
$ |
760 |
August 1-31, 2023 |
|
Open market repurchase |
|
1,399,128 |
|
|
51.58 |
|
16,925,714 |
|
|
688 |
September 1-30, 2023 |
|
Open market repurchase |
|
529,297 |
|
|
49.13 |
|
17,455,011 |
|
|
662 |
Total |
|
|
|
3,410,322 |
|
$ |
48.78 |
|
|
|
|
|
On November 4, 2022, our Board of Directors approved a share repurchase authorization for the repurchase of up to $1.5 billion of our common stock (the “2022 Repurchase Authorization”) and terminated our previously authorized $50.0 million share repurchase authorization. In November 2022, as part of the 2022 Repurchase Authorization, we entered into an accelerated share repurchase agreement (the “ASR Agreement”) with JPMorgan Chase Bank, National Association for the repurchase of up to $500.0 million of our common stock which terminated and settled in April 2023. Following the termination of the ASR Agreement, other arrangements under the 2022 Repurchase Authorization commenced under which we expect to repurchase up to an additional $500.0 million shares of our common stock in open market purchases, intended to qualify under Rule 10b5-1 under the Exchange Act, subject to market and business conditions, legal requirements, and other factors. During the three months ended September 30, 2023, we repurchased approximately 3.4 million shares of common stock for approximately $166.3 million (excluding fees, commissions, and excise tax) through open market repurchases under these other arrangements.
Item 6. [Reserved]
Item 7. Management’s Discussion and Analysis of Financial Condition and Results of Operations
You should read the following discussion and analysis of our financial condition and results of operations together with our Consolidated Financial Statements and related notes appearing elsewhere in this Annual Report on Form 10-K. In addition to historical information, this discussion and analysis contains forward-looking statements that involve risks, uncertainties and assumptions. Our actual results may differ materially from those discussed below and in the forward-looking statements. Factors that could cause or contribute to these differences include, without limitation, those discussed in “Information Related to Forward-Looking Statements” and Part I, Item 1A, “Risk Factors” included above in this Annual Report on Form 10-K.
This Management’s Discussion and Analysis of Financial Condition and Results of Operations, or MD&A, describes principal factors affecting the results of our operations, financial condition and liquidity, as well as our critical accounting policies and estimates that require significant judgment and thus have the most significant potential impact on our Consolidated Financial Statements included elsewhere in this Annual Report on Form 10-K. All dollar amounts in the below MD&A are presented in U.S. dollars, unless otherwise noted or the context otherwise provides.
Our MD&A is organized as follows:
| ● | Overview. This section provides a general description of our business and operating segments as well as a brief discussion and overall analysis of our business and financial performance, including key developments affecting us during fiscal years ended September 30, 2023 and 2022. |
| ● | Critical Accounting Policies and Estimates. This section discusses accounting policies and estimates that require us to exercise subjective or complex judgments in their application. We believe these accounting |
26
| policies and estimates are important to understanding the assumptions and judgments incorporated in our reported financial results. |
| ● | Results of Operations. This section provides an analysis of our financial results for the fiscal year ended September 30, 2023 compared to the fiscal year ended September 30, 2022. |
| ● | Liquidity and Capital Resources. This section provides an analysis of our liquidity and changes in cash flows, as well as a discussion of contractual commitments. |
OVERVIEW
General
We are a leading global provider of biological and chemical compound sample exploration and management solutions for the life sciences industry. We entered the life sciences market in 2011, leveraging our in-house precision automation and cryogenics capabilities that we were then applying in the semiconductor manufacturing market. This led us to provide solutions for automated ultra-cold storage. Since then, we have expanded our life sciences offerings through internal investments and through a series of acquisitions. We now support our customers from research and clinical development to commercialization with our sample management, automated storage, and genomic services expertise to help our customers bring impactful therapies to the market faster. We understand the importance of sample integrity and offer a broad portfolio of products and services supporting customers at every stage of the life cycle of samples including procurement and sourcing, automated storage systems, genomic services and a multitude of sample consumables, informatics and data software, along with sample repository solutions (“SRS”). Our expertise, global footprint and leadership positions enable us to be a trusted global partner to pharmaceutical, biotechnology and life sciences research institutions. In total, we employ approximately 3,500 full-time employees, part-time employees and contingent workers worldwide as of September 30, 2023 and have sales in approximately 150 countries. We are headquartered in Burlington, Massachusetts and have operations in North America, Asia, and Europe.
Our portfolio includes product and service offerings developed by us internally, as well as through acquisitions, designed to bring together comprehensive capabilities to service our customers’ needs in sample exploration and management, automated storage, and genomic solutions. We continue to develop new product and service offerings and enhance existing and acquired offerings through the expertise of our research and development resources. We believe our acquisition, investment and integration approach has allowed us to accelerate internal development and significantly accelerate time to market for our life sciences solutions.
Segments
Our business is comprised of two reportable segments, our Life Sciences Products segment and our Life Sciences Services segment. For further information on our reportable and operating segments, please refer to Note 19, Segment and Geographic Information to our Consolidated Financial Statements included under Part II, Item 8, “Financial Statements and Supplementary Data” of this Annual Report on Form 10-K.
Our Life Sciences Products business is a leading provider of automated cold storage solutions for biological and chemical compound samples. We have a complete line of automated storage systems from ambient temperatures to -190°C. Our sample management solutions include consumable vials and tubes, polymerase chain reaction (“PCR”) plates, instruments for supporting workflows, and informatics. This portfolio provides customers with a high level of sample quality, security, availability, intelligence and integrity throughout the lifecycle of samples providing customers with complete end-to-end “cold-chain of custody” capabilities. On July 1, 2022, we acquired Barkey Holding GmbH and its subsidiaries (“Barkey”), a leading provider of controlled rate thawing devices for customers in the medical, biotech and pharmaceutical industries, headquartered in Leopoldshöhe, Germany. On October 3, 2022, we acquired B Medical Systems S.á r.l and its subsidiaries (“B Medical”), a market leader in temperature-controlled storage and transportation solutions that enable the delivery of life-saving treatments to more than 150 countries worldwide. This acquisition complements our cold-chain capabilities, adding differentiated solutions for reliable and traceable transport of temperature-sensitive samples. Additionally, on February 2, 2023, we acquired Ziath Ltd. and its subsidiaries (“Ziath”), a leading provider of 2D barcode readers for life sciences applications to complement our product offerings.
27
Our Life Sciences Services business is a leading provider of solutions addressing the many needs of customers in the area of genomic analysis and the management and care of biological samples used in pharmaceutical, biotech, healthcare, clinical, and academic research and development markets. We process millions of samples annually, each containing valuable information that must be preserved with the sample. Our genomic services provide a broad capability to customers for gene sequencing, synthesis, editing and related services. We offer a comprehensive, global portfolio that we believe has both broad appeal in the life sciences industry and enables customers to select the best solution for their research and development challenges. This portfolio also offers unique solutions for key markets such as cell and gene therapy (“CGT”), antibody development and biomarker discovery by addressing genomic complexity and throughput challenges. Our sample management services include off-site storage services, transport services, laboratory services, sample procurement, and interactive informatics solutions. We also offer expert-level consultation services to our clients throughout their experimental design and implementation processes. Our services also include short- and long-term sample storage and management of the “cold-chain of custody” from collection, to storage, to retrieving the sample which ultimately may go back into the research workflow.
Sale of the Semiconductor Automation Business
On February 1, 2022, we completed the sale of our semiconductor automation business to Thomas H. Lee, Partners, L.P., for $2.9 billion in cash. In connection with the divestiture of the semiconductor automation business and our continued focus on our life sciences businesses, we changed our corporate name from “Brooks Automation, Inc.” to “Azenta, Inc.” and our common stock began trading on the Nasdaq Global Select Market under the symbol “AZTA” on December 1, 2021.
Since our founding in 1978, we had been a leading automation provider and partner to the global semiconductor manufacturing industry. With the completion of the sale of the semiconductor automation business, we no longer serve the semiconductor market. The semiconductor automation business is classified as a discontinued operation and, unless otherwise noted, this MD&A relates solely to our continuing operations and does not include the operations of our semiconductor automation business.
Business and Financial Performance
Our performance for the twelve months ended September 30, 2023, 2022 and 2021 is as follows:
|
|
Year Ended September 30, |
|||||||
Dollars in thousands |
|
2023 |
|
2022 |
|
2021 |
|||
Revenue |
|
$ |
665,072 |
|
$ |
555,498 |
|
$ |
513,703 |
Cost of revenue |
|
|
401,932 |
|
|
299,914 |
|
|
269,894 |
Gross profit |
|
|
263,140 |
|
|
255,584 |
|
|
243,809 |
Operating expenses |
|
|
|
|
|
|
|
|
|
Research and development |
|
|
33,956 |
|
|
27,542 |
|
|
22,412 |
Selling, general and administrative |
|
|
316,282 |
|
|
251,465 |
|
|
252,101 |
Contingent consideration - fair value adjustments |
|
|
(18,549) |
|
|
600 |
|
|
— |
Restructuring charges |
|
|
4,577 |
|
|
712 |
|
|
385 |
Total operating expenses |
|
|
336,266 |
|
|
280,319 |
|
|
274,898 |
Operating loss |
|
|
(73,126) |
|
|
(24,735) |
|
|
(31,089) |
Other income (expense) |
|
|
|
|
|
|
|
|
|
Interest income |
|
|
43,735 |
|
|
20,286 |
|
|
632 |
Interest expense |
|
|
— |
|
|
(4,589) |
|
|
(2,037) |
Loss on extinguishment of debt |
|
|
— |
|
|
(632) |
|
|
— |
Other, net |
|
|
(1,042) |
|
|
(266) |
|
|
(16,475) |
Loss before income taxes |
|
|
(30,433) |
|
|
(9,936) |
|
|
(48,969) |
Income tax (benefit) expense |
|
|
(17,550) |
|
|
1,350 |
|
|
(20,100) |
Loss from continuing operations |
|
$ |
(12,883) |
|
$ |
(11,286) |
|
$ |
(28,869) |
Income (loss) from discontinued operations, net of tax |
|
|
(1,374) |
|
|
2,144,145 |
|
|
139,616 |
Net income (loss) |
|
$ |
(14,257) |
|
$ |
2,132,859 |
|
$ |
110,747 |
28
Results of Operations
Fiscal Year Ended September 30, 2023 Compared to Fiscal Year Ended September 30, 2022
Revenue increased 20% in fiscal year 2023 compared to the prior fiscal year, driven by revenue growth in our Life Sciences Products segment of 53% primarily due to acquisitions (largely B Medical), partially offset by the decline in COVID-related revenues in our Consumables and Instruments business. Gross margin was 39.6% for fiscal year 2023 compared to 46.0% in the prior fiscal year, primarily due to the higher costs resulting from the amortization of purchase accounting adjustments and intangibles associated with the acquisition of B Medical, and unfavorable mix in the Life Sciences Products segment, inclusive of margin dilution attributable to lower margins in the acquired B Medical business in the current year. Operating expenses increased $55.9 million in fiscal year 2023 compared to the prior fiscal year. Selling, general and administrative expenses increased $64.8 million in fiscal year 2023 compared to the prior fiscal year, primarily due to the acquisitions of B Medical and Barkey, partially offset by an $18.5 million reduction in the fair value of contingent consideration related to B Medical. We generated an operating loss of $73.1 million for fiscal year 2023 compared to an operating loss of $24.7 million for fiscal year 2022, driven by a reduction in gross margin and an increase in operating expenses. Loss from continuing operations was $12.9 million during fiscal year 2023 as compared to a loss from continuing operations of $11.3 million in fiscal year 2022. Loss from discontinued operations was $1.4 million during fiscal year 2023 as compared to income from discontinued operations of $2.1 billion in fiscal year 2022. The results for discontinued operations for fiscal year 2023 were due to adjustments to and/or settlements of assets and liabilities associated with the discontinued operations. Please refer to the “Results of Operations” section below for a detailed discussion of our financial results for fiscal year 2023 compared to fiscal year 2022.
CRITICAL ACCOUNTING POLICIES AND ESTIMATES
The preparation of the Consolidated Financial Statements requires us to make estimates and judgments that affect the reported amounts of assets, liabilities, revenue and expenses, and related disclosure of contingent assets and liabilities. On an ongoing basis, we evaluate our estimates, including those related to revenue, intangible assets, goodwill, inventories, income taxes, and stock-based compensation. We base our estimates on historical experience and various other assumptions that are believed to be reasonable under the circumstances. We evaluate current and anticipated worldwide economic conditions, both in general and specifically in relation to the life sciences industry, that serve as a basis for making judgments about the carrying values of assets and liabilities that are not readily determinable based on information from other sources. Actual results may differ from these estimates under different assumptions or conditions that could have a material impact on our financial condition and results of operations.
We believe that the assumptions and estimates associated with the following critical accounting policies involve significant judgment and thus have the most significant potential impact on our Consolidated Financial Statements.
Revenue Recognition
We generate revenue from the sale of products and services. A description of our revenue recognition policies is included in Note 2, Summary of Significant Accounting Policies in the Notes to the Consolidated Financial Statements included in Part II, Item 8, “Financial Statements and Supplementary Data” of this Annual Report on Form 10-K.
Although most of our sales agreements contain standard terms and conditions, certain agreements contain multiple performance obligations or non-standard terms and conditions. For customer contracts that contain more than one performance obligation, we allocate the total transaction consideration to each performance obligation based on the relative stand-alone selling price of each performance obligation within the contract. We rely on either observable standalone sales or an expected cost-plus margin approach to determine the standalone selling price of offerings, depending on the nature of the performance obligation. Performance obligations whose standalone selling price is estimated using an expected cost-plus margin approach relate to the sale of customized automated cold sample management systems and service-type warranties within the Life Sciences Products segment.
Revenue from the sales of certain products that involve significant customization, which primarily include automated cold sample management systems, is recognized over time as the asset created by our performance does not have alternative use to us and an enforceable right to payment for performance completed to date is present.
29
We recognize revenue as work progresses based on a percentage of actual labor hours incurred on the project to-date and total estimated labor hours expected to be incurred on the project. The selection of the method to measure progress towards completion requires judgment. We have concluded that using the percentage of labor hours incurred to estimated labor hours needed to complete the project most appropriately depicts our efforts towards satisfaction of the performance obligation. We develop profit estimates for long-term contracts based on total revenue expected to be generated from the project and total costs anticipated to be incurred in the project. These estimates are based on a number of factors, including the degree of required product customization and the work required to be able to install the product in the customer’s existing environment, as well as our historical experience, project plans and an assessment of the risks and uncertainties inherent in the contract related to implementation delays or performance issues that may or may not be within our control. We estimate a loss on a contract by comparing total estimated contract revenue to the total estimated contract costs and recognize a loss during the period in which it becomes probable and can be reasonably estimated. We review profit estimates for long-term contracts during each reporting period and revise the estimate based on changes in circumstances.
If our judgment regarding revenue recognition proves incorrect, our revenue in particular periods may be adversely affected and could have a material impact on our financial condition and results of operations.
Business Combinations
We account for business acquisitions using the purchase method of accounting, in accordance with which assets acquired and liabilities assumed are recorded at their respective fair values at the acquisition date.
Significant judgment is used in determining fair values of assets acquired, liabilities assumed, and contingent consideration, as well as intangibles and their estimated useful lives. Fair value and useful life determinations may be based on, among other factors, estimates of revenue growth rates, operating expenses, integration costs, obsolescence factor and discount rate among others attributable to completed technology and other acquired intangible assets used in computing present values. These judgments may materially impact the estimates used in allocating acquisition date fair values to assets acquired and liabilities assumed, as well as our current and future operating results. Actual results may vary from these estimates and may result in adjustments to goodwill and acquisition date fair values of assets and liabilities during a measurement period or upon a final determination of asset and liability fair values, whichever occurs first. Adjustments to fair values of assets and liabilities made after the end of the measurement period are recorded within our operating results.
Contingent consideration is recorded at fair value as measured on the date of acquisition using an appropriate valuation model, such as the Monte Carlo simulation model. The value recorded is based on estimates of future financial projections under various potential scenarios, in which the model runs many simulations based on comparable companies’ growth rates and their implied volatility. Our estimates of forecasted revenues in the earn-out period include a consideration of current industry information, market and economic trends, historical results of the acquired business and other relevant factors. These cash flow projections are discounted with a risk adjusted rate. Each quarter until such contingent amounts are earned, the fair value of the liability is remeasured at each reporting period based on changes to the underlying assumptions. The estimates used to determine the fair value of the contingent consideration liability are subject to significant judgment and given the inherent uncertainties in making these estimates, actual results are likely to differ from the amounts originally recorded and could be materially different.
Intangible Assets, Goodwill and Other Long-Lived Assets
We have identified intangible assets and generated significant goodwill as a result of our acquisitions. Intangible assets other than goodwill are valued based on estimated future cash flows and amortized over their estimated useful lives. Goodwill is tested for impairment annually or more often if impairment indicators are present, at the reporting unit level. Intangible assets other than goodwill and long-lived assets are subject to impairment testing if events and circumstances indicate that the carrying amount of an asset or a group of assets may not be recoverable.
In performing a quantitative test for impairment, either annually, or if required after initially assessing qualitative factors to determine whether events occurred indicating possible impairment (as described further in Note 2 Summary of Significant Accounting Policies in the Notes to the Consolidated Financial Statements included in Part II, Item 8, “Financial Statements and Supplementary Data” of this Annual Report on Form 10-K), we determine fair values of our reporting units based on an income approach in accordance with the discounted cash flow method, (the “DCF Method”).
30
The DCF Method is based on projected future cash flows and terminal value estimates discounted to their present values. The key inputs used in the DCF Method include revenue growth rates, gross margin percentages, selling, general and administrative expense percentages and discount rates that are at or above our weighted average cost of capital. We derive discount rates that are commensurate with the risks and uncertainties inherent in the respective reporting units and our internally developed projections of future cash flows.
Application of the goodwill impairment test requires judgment based on market and operational conditions at the time of the evaluation, including management’s best estimates of the reporting unit’s future business activity and the related estimates and assumptions of future cash flows from the assets that include the associated goodwill. Different assumptions of revenue growth rates, gross margin percentages, selling, general and administrative expense percentages and the discount rate used in accordance with the DCF Method could result in different estimates of the reporting units’ fair value as of each testing date.
In the event the financial performance of either of the segments does not meet our expectations in the future, we experience a prolonged macro or market downturn, or there are other negative revisions to key assumptions used in our DCF Method, we may be required to perform additional impairment analyses and could be required to recognize a non-cash impairment charge.
We are required to test long-lived assets, other than goodwill, for impairment when impairment indicators are present. For purposes of this test, long-lived assets are grouped with other assets and liabilities at the lowest level for which identifiable cash flows are largely independent of the cash flows of other assets and liabilities. If we determine that indicators of potential impairment are present, we assess the recoverability of the long-lived asset group by comparing its undiscounted future cash flows to its carrying value. If the carrying value of the long-lived asset group exceeds its future cash flows, we determine fair values of the individual net assets within the long-lived asset group to assess potential impairment. If the aggregate fair values of the individual net assets of the group are less than their carrying values, an impairment loss is recognized for an amount in excess of the group’s aggregate carrying value over its fair value. The loss is allocated to the assets within the group based on their relative carrying values, with no asset reduced below its fair value.
We were not required to test our long-lived assets for impairment during fiscal years 2023 or 2022 since no events indicating impairment occurred during the periods then ended.
Inventory
We state our inventory at the lower of cost or market and make adjustments to reduce the inventory cost to its net realizable value by providing estimated reserves for excess or obsolete inventory. The reserves are established for the difference between the cost of inventory and its estimated market value based on assumptions related to future demand and market conditions to reduce the carrying value to its net realizable value. We fully reserve for inventories and non-cancelable purchase orders for inventory deemed obsolete. We perform periodic reviews of our inventory to identify excess inventories on hand. We compare on-hand inventory balances to anticipated inventory usage based on our recent historical activity and anticipated or forecasted demand for our products developed through our planning systems and sales and marketing inputs.
We adjust the reserves for excess or obsolete inventory and record additional inventory write downs based on unfavorable changes in estimated customer demand or actual market conditions that may differ from management projections.
Deferred Income Taxes
We record a valuation allowance to reduce our deferred tax assets to the amount that is more likely than not to be realized. We consider recent historical income, estimated future taxable income, carry-forward periods of tax attributes, and ongoing tax planning strategies in assessing the need for the valuation allowance. We evaluate the realizability of our deferred tax assets by tax-paying component and assess the need for a valuation allowance on a quarterly basis.
31
We evaluate the profitability of each tax-paying component on a historic cumulative basis and on a forward-looking basis while performing this analysis. We continue to hold a U.S. valuation allowance related to the realizability of certain state tax credits and net operating loss carry-forwards. We also maintain valuation allowances against net deferred tax assets in certain foreign tax-paying components as of the end of fiscal year 2023.
Stock-Based Compensation
We measure compensation cost for all employee stock awards at fair value on the date of grant and recognize compensation expense over the service period for awards expected to vest. The fair value of restricted stock units is determined based on the number of shares granted and the closing price of our common stock quoted on the Nasdaq Global Select Market on the date of grant. In addition, for stock-based awards where vesting is dependent upon achieving certain operating performance goals, we estimate the likelihood of achieving the performance goals. Actual results, and future changes in estimates, may differ from our current estimates.
Recently Issued Accounting Pronouncements
For a summary of recently issued accounting pronouncements applicable to our Consolidated Financial Statements which is incorporated here by reference, please refer to Note 2, Summary of Significant Accounting Policies in the Notes to the Consolidated Financial Statements included in Part II, Item 8, “Financial Statements and Supplementary Data” of this Annual Report on Form 10-K.
RESULTS OF OPERATIONS
Please refer to the commentary provided below for further discussion and analysis of the factors contributing to our results from operations for the twelve months ended September 30, 2023 and 2022. A comparison of our results for the fiscal year ended September 30, 2022 to the fiscal year ended September 30, 2021 is included in Part II, Item 7, “Management’s Discussion and Analysis of Financial Condition and Results of Operations” in our Annual Report on Form 10-K for fiscal year ended September 30, 2022, filed with the SEC on November 25, 2022.
Non-GAAP Financial Measures
Non-GAAP financial measures are used in addition to and in conjunction with results presented in accordance with GAAP and should not be relied upon to the exclusion of GAAP financial measures. Management adjusts the GAAP results for the impact of amortization of intangible assets, restructuring charges, purchase price accounting adjustments, and charges related to M&A to provide investors better perspective on the results of operations which the Company believes is more comparable to the similar analysis provided by its peers. Management also excludes special charges and gains, such as impairment losses, gains and losses from the sale of assets, certain tax benefits and charges, as well as other gains and charges that are not representative of the normal operations of the business. Management strongly encourages investors to review our financial statements and publicly filed reports in their entirety and not rely on any single measure.
Revenue
Our revenue performance for the twelve months ended September 30, 2023, 2022, and 2021 is as follows:
|
|
Year Ended September 30, |
|||||||||||||
|
|
|
|
|
|
|
|
|
|
|
% Change |
||||
Dollars in thousands |
|
2023 |
|
2022 |
|
2021 |
|
2023 v. 2022 |
|
2023 v. 2021 |
|||||
Life Sciences Products |
|
$ |
305,184 |
|
$ |
199,230 |
|
$ |
199,606 |
|
53.2 |
% |
|
52.9 |
% |
Life Sciences Services |
|
|
359,888 |
|
|
356,268 |
|
|
314,097 |
|
1.0 |
% |
|
14.6 |
% |
Total revenue |
|
$ |
665,072 |
|
$ |
555,498 |
|
$ |
513,703 |
|
19.7 |
% |
|
29.5 |
% |
32
Fiscal Year Ended September 30, 2023 Compared to Fiscal Year Ended September 30, 2022
Revenue increased 20% in fiscal year 2023 compared to the prior fiscal year, driven by a 53% increase in our Life Sciences Products segment and a 1% increase in our Life Sciences Services segment.
Our Life Sciences Products segment revenue increased 53% year-over-year, primarily due to acquisitions (largely B Medical). Excluding these acquisitions, we experienced a decline in revenue of approximately 9% year-over-year, primarily due to the decreased demand and associated revenue for COVID-19 related to our Consumables and Instruments business of approximately 28% year-over-year, which was partially offset by increased revenue in Automated Store Systems of approximately 20% year-over-year.
Our Life Sciences Services segment revenue increased 1% year-over-year, primarily due to growth in our SRS business, partially offset by a decline in the Genomics Services business.
We estimate that revenue related to the COVID-19 pandemic for the fiscal year ended September 30, 2023 was approximately $7.7 million in the aggregate, including $4.1 million from B Medical, as compared to COVID-related revenue of $22 million for the year ended September 30, 2022. The decrease in this revenue was primarily due to lower demand for Consumables and Instruments related to COVID-19 testing.
We anticipate continued growth in revenue from our Life Sciences Products and Services businesses through our internally developed products and services and through our acquired businesses and potential future acquisitions.
Revenue generated outside the United States amounted to $310.0 million, or 47% of total revenue, for fiscal year 2023 compared to $197.3 million, or 36% of total revenue, for fiscal year 2022. There was one customer with more than 10% of our consolidated revenue for fiscal year 2023. This individual customer is a distributor shipping to end users in approximately 50 countries. No individual customer accounted for more than 10% of our consolidated revenue for the fiscal year ending 2022.
33
Operating Income (Loss)
Our operating performance for the twelve months ended September 30, 2023, 2022 and 2021 is as follows:
|
|
Life Science Products |
|
|
Life Science Services |
|
||||||||||||||
|
|
Year Ended September 30, |
|
|
Year Ended September 30, |
|
||||||||||||||
Dollars in thousands |
|
2023 |
|
2022 |
|
2021 |
|
|
2023 |
|
2022 |
|
2021 |
|
||||||
Revenue: |
|
$ |
305,184 |
|
$ |
199,230 |
|
$ |
199,606 |
|
|
$ |
359,888 |
|
$ |
356,268 |
|
$ |
314,097 |
|
|
|
|
|
|
|
|
|
|
|
|
|
|
|
|
|
|
|
|
|
|
Operating income (loss): |
|
|
|
|
|
|
|
|
|
|
|
|
|
|
|
|
|
|
|
|
Operating income (loss) |
|
$ |
(30,321) |
|
$ |
11,033 |
|
$ |
21,971 |
|
|
$ |
(14,722) |
|
$ |
10,784 |
|
$ |
10,289 |
|
Amortization of completed technology |
|
|
13,194 |
|
|
1,122 |
|
|
1,117 |
|
|
|
5,300 |
|
|
6,202 |
|
|
6,957 |
|
Purchase accounting impact on inventory |
|
|
9,664 |
|
|
— |
|
|
— |
|
|
|
— |
|
|
— |
|
|
— |
|
Amortization of other intangibles |
|
|
1,567 |
|
|
— |
|
|
— |
|
|
|
110 |
|
|
— |
|
|
— |
|
Tariff adjustment |
|
|
— |
|
|
— |
|
|
— |
|
|
|
— |
|
|
(484) |
|
|
5,497 |
|
Other adjustments |
|
|
(1) |
|
|
— |
|
|
6 |
|
|
|
— |
|
|
345 |
|
|
(84) |
|
Total adjusted operating income (loss) |
|
$ |
(5,897) |
|
$ |
12,155 |
|
$ |
23,094 |
|
|
$ |
(9,312) |
|
$ |
16,847 |
|
$ |
22,659 |
|
Operating margin |
|
|
(9.9) |
% |
|
5.5 |
% |
|
11.0 |
% |
|
|
(4.1) |
% |
|
3.0 |
% |
|
3.3 |
% |
Adjusted operating margin |
|
|
(1.9) |
% |
|
6.1 |
% |
|
11.6 |
% |
|
|
(2.6) |
% |
|
4.7 |
% |
|
7.2 |
% |
|
|
|
|
|
|
|
|
|
|
|
|
|
|
|
|
|
|
|
|
|
|
|
|
||||||||||||||||||
|
|
Corporate |
|
|
Azenta Total |
|
||||||||||||||
|
|
Year Ended September 30, |
|
|
Year Ended September 30, |
|
||||||||||||||
Dollars in thousands |
|
2023 |
|
2022 |
|
2021 |
|
|
2023 |
|
2022 |
|
2021 |
|
||||||
Revenue: |
|
$ |
— |
|
$ |
— |
|
$ |
— |
|
|
$ |
665,072 |
|
$ |
555,498 |
|
$ |
513,703 |
|
|
|
|
|
|
|
|
|
|
|
|
|
|
|
|
|
|
|
|
|
|
Operating income (loss): |
|
|
|
|
|
|
|
|
|
|
|
|
|
|
|
|
|
|
|
|
Operating income (loss) |
|
$ |
(28,083) |
|
$ |
(46,552) |
|
$ |
(63,349) |
|
|
$ |
(73,126) |
|
$ |
(24,735) |
|
$ |
(31,089) |
|
Amortization of completed technology |
|
|
— |
|
|
— |
|
|
(1) |
|
|
|
18,494 |
|
|
7,324 |
|
|
8,073 |
|
Purchase accounting impact on inventory |
|
|
— |
|
|
— |
|
|
— |
|
|
|
9,664 |
|
|
— |
|
|
— |
|
Impairment of intangible assets |
|
|
— |
|
|
— |
|
|
13,364 |
|
|
|
— |
|
|
— |
|
|
13,364 |
|
Amortization of other intangibles |
|
|
28,207 |
|
|
24,965 |
|
|
29,299 |
|
|
|
29,884 |
|
|
24,965 |
|
|
29,299 |
|
Tariff adjustment |
|
|
— |
|
|
— |
|
|
— |
|
|
|
— |
|
|
(484) |
|
|
5,497 |
|
Rebranding and transformation costs |
|
|
(49) |
|
|
2,741 |
|
|
827 |
|
|
|
(49) |
|
|
2,741 |
|
|
827 |
|
Restructuring charges |
|
|
4,577 |
|
|
712 |
|
|
385 |
|
|
|
4,577 |
|
|
712 |
|
|
385 |
|
Contingent consideration - fair value adjustments |
|
|
(18,549) |
|
|
600 |
|
|
— |
|
|
|
(18,549) |
|
|
600 |
|
|
— |
|
Merger and acquisition costs and costs related to share repurchase(1) |
|
|
13,842 |
|
|
17,329 |
|
|
20,662 |
|
|
|
13,842 |
|
|
17,329 |
|
|
20,662 |
|
Other adjustments |
|
|
— |
|
|
(345) |
|
|
(5) |
|
|
|
(1) |
|
|
— |
|
|
(83) |
|
Total adjusted operating income (loss) |
|
$ |
(55) |
|
$ |
(550) |
|
$ |
1,182 |
|
|
$ |
(15,264) |
|
$ |
28,452 |
|
$ |
46,935 |
|
Operating margin |
|
|
|
|
|
|
|
|
|
|
|
|
(11.0) |
% |
|
(4.5) |
% |
|
(6.1) |
% |
Adjusted operating margin |
|
|
|
|
|
|
|
|
|
|
|
|
(2.3) |
% |
|
5.1 |
% |
|
9.1 |
% |
| (1) | Includes expenses related to governance-related matters. |
We generated an operating loss of $73.1 million for fiscal year 2023 compared to an operating loss of $24.7 million in the prior fiscal year. The increase in operating loss year-over-year was driven by lower gross margin at Life Sciences Services primarily due to macroeconomic uncertainty and pricing in the Genomics business, as well lower gross margin at Life Sciences Products primarily due to the acquisition of B Medical driving increased selling, general and administrative expenses and lower gross margin for the segment overall. Fiscal year 2023 included the impact of amortization of intangible assets and purchase accounting impact on inventory due to the addition of B Medical. Within operating expenses, research and development expenses increased $6.4 million and selling, general, and administrative expenses increased $64.8 million. Selling, general and administrative expenses increased due to the addition of B Medical, higher labor costs, and continued investment in the business. These increased expenses were partially offset by an adjustment to the fair value of contingent consideration related to B Medical of $18.5 million and savings from cost reduction actions.
Operating loss for our Life Sciences Products segment was $30.3 million for fiscal year 2023 compared to operating income of $11.0 million in the prior fiscal year. The Life Science Products segment adjusted operating income decreased $18.1 million and adjusted operating margin decreased 8.0 percentage points compared to the prior year. The decrease in adjusted operating income was driven by an increase in operating expenses of $53.0 million (primarily due to the addition of B Medical), partially offset by higher adjusted gross profit of $33.9 million driven by increased revenues. Adjusted operating income for our Life Sciences Products segment excludes charges for amortization related to completed technology of $13.2 million and $1.1 million for fiscal years 2023 and 2022, respectively, a $9.7 million charge related to the purchase accounting impact on inventory, and a $1.6 million charge related to amortization of other intangibles for fiscal year 2023. Please refer to Note 19, Segment and Geographic Information in the Notes to the Consolidated Financial Statements included in Part II, Item 8, “Financial Statements and Supplementary Data” of this Annual Report on Form 10 K.
34
Operating loss for our Life Sciences Services segment was $14.7 million for fiscal year 2023 as compared to operating income of $10.8 million in the prior fiscal year. The Life Sciences Services segment adjusted operating income decreased $26.2 million and adjusted operating margin decreased 7.3 percentage points compared to the prior year. The decrease in adjusted operating income was driven by lower adjusted gross profit of $5.3 million and an increase in adjusted operating expenses of $20.8 million. Adjusted operating income for our Life Sciences Services segment excludes charges for amortization related to completed technology of $5.3 million and $6.2 million for fiscal years 2023 and 2022, respectively, and a $0.5 million benefit from a tariff adjustment for fiscal year 2022. Please refer to Note 19, Segment and Geographic Information in the Notes to the Consolidated Financial Statements included in Part II, Item 8, “Financial Statements and Supplementary Data” of this Annual Report on Form 10 K.
Gross Margin
Our gross margin performance for the twelve months ended September 30, 2023, 2022 and 2021 is as follows:
|
|
Life Science Products |
|
Life Science Services |
|
Azenta Total |
|
|||||||||||||||||||||||||||
|
|
Year Ended September 30, |
|
Year Ended September 30, |
|
Year Ended September 30, |
|
|||||||||||||||||||||||||||
Dollars in thousands |
|
2023 |
|
2022 |
|
2021 |
|
2023 |
|
|
2022 |
|
|
2021 |
|
2023 |
|
|
2022 |
|
|
2021 |
|
|||||||||||
Revenue |
|
$ |
305,184 |
|
|
$ |
199,230 |
|
|
$ |
199,606 |
|
$ |
359,888 |
|
|
$ |
356,268 |
|
|
$ |
314,097 |
|
$ |
665,072 |
|
|
$ |
555,498 |
|
|
$ |
513,703 |
|
|
|
|
|
|
|
|
|
|
|
|
|
|
|
|
|
|
|
|
|
|
|
|
|
|
|
|
|
|
|
|
|
|
|
|
Gross profit |
|
|
101,192 |
|
|
|
89,074 |
|
|
|
92,560 |
|
|
161,948 |
|
|
|
166,523 |
|
|
|
151,246 |
|
|
263,140 |
|
|
|
255,597 |
|
|
|
243,806 |
|
Adjustments: |
|
|
|
|
|
|
|
|
|
|
|
|
|
|
|
|
|
|
|
|
|
|
|
|
|
|
|
|
|
|
|
|
|
|
Amortization of completed technology |
|
|
13,194 |
|
|
|
1,122 |
|
|
|
1,117 |
|
|
5,300 |
|
|
|
6,202 |
|
|
|
6,957 |
|
|
18,494 |
|
|
|
7,324 |
|
|
|
8,074 |
|
Purchase accounting impact on inventory |
|
|
9,664 |
|
|
|
— |
|
|
|
— |
|
|
— |
|
|
|
— |
|
|
|
— |
|
|
9,664 |
|
|
|
— |
|
|
|
— |
|
Tariff adjustment |
|
|
— |
|
|
|
— |
|
|
|
— |
|
|
— |
|
|
|
(484) |
|
|
|
5,497 |
|
|
— |
|
|
|
(484) |
|
|
|
5,497 |
|
Other unallocated corporate expenses |
|
|
— |
|
|
|
— |
|
|
|
— |
|
|
(1) |
|
|
|
289 |
|
|
|
(83) |
|
|
(1) |
|
|
|
289 |
|
|
|
(83) |
|
Adjusted gross profit |
|
$ |
124,050 |
|
|
$ |
90,196 |
|
|
$ |
93,677 |
|
$ |
167,247 |
|
|
$ |
172,530 |
|
|
$ |
163,617 |
|
$ |
291,297 |
|
|
$ |
262,726 |
|
|
$ |
257,294 |
|
Gross margin |
|
|
33.2 |
% |
|
|
44.7 |
% |
|
|
46.4 |
% |
|
45.0 |
% |
|
|
46.7 |
% |
|
|
48.2 |
% |
|
39.6 |
% |
|
|
46.0 |
% |
|
|
47.5 |
% |
Adjusted gross margin |
|
|
40.6 |
% |
|
|
45.3 |
% |
|
|
46.9 |
% |
|
46.5 |
% |
|
|
48.4 |
% |
|
|
52.1 |
% |
|
43.8 |
% |
|
|
47.3 |
% |
|
|
50.1 |
% |
|
|
|
|
|
|
|
|
|
|
|
|
|
|
|
|
|
|
|
|
|
|
|
|
|
|
|
|
|
|
|
|
|
|
|
We reported a gross margin of 39.6% for fiscal year 2023 compared to 46.0% in the prior fiscal year, a decrease of 6.4 percentage points. Gross margin decreased 11.6 percentage points in the Life Sciences Products segment and 1.7 percentage points in the Life Sciences Services segment for fiscal year 2023 compared to the prior fiscal year.
Our Life Sciences Products segment reported gross margin of 33.2% for fiscal year 2023 compared to 44.7% in the prior fiscal year. The decrease was primarily driven by the impact of amortization of purchase accounting adjustments and intangibles associated with the acquisition of B Medical. Cost of revenue in fiscal years 2023 and 2022 included $13.2 million and $1.1 million, respectively, of amortization related to completed technology. Fiscal year 2023 also included $9.7 million of purchase accounting impact on inventory. Excluding these charges, adjusted gross margin decreased 4.6 percentage points in fiscal year 2023 compared to the prior year, primarily due to the mix of products sold in our Cryogenics business, and margin dilution attributable to lower margins in the acquired B Medical business in the current year. Please refer to Note 19, Segment and Geographic Information in the Notes to the Consolidated Financial Statements included in Part II, Item 8, “Financial Statements and Supplementary Data” of this Annual Report on Form 10 K.
Our Life Sciences Services segment reported gross margin of 45.0% for fiscal year 2023 compared to 46.7% in the prior fiscal year primarily driven by a decline in the Genomic Services business due to the impact of lower sales, higher labor costs and continued investment in the business. Please refer to Note 19, Segment and Geographic Information in the Notes to the Consolidated Financial Statements included in Part II, Item 8, “Financial Statements and Supplementary Data” of this Annual Report on Form 10K.
35
Research and Development Expenses
Our research and development expense for the twelve months ended September 30, 2023, 2022, and 2021 is as follows:
|
|
Year Ended September 30, |
|
|||||||||
Dollars in thousands |
|
2023 |
|
|
2022 |
|
|
2021 |
|
|||
Life Sciences Products |
|
$ |
20,934 |
|
|
$ |
14,633 |
|
|
$ |
10,866 |
|
Life Sciences Services |
|
$ |
13,022 |
|
|
$ |
12,909 |
|
|
$ |
11,523 |
|
Corporate |
|
$ |
— |
|
|
$ |
— |
|
|
$ |
23 |
|
Total research and development expense |
|
$ |
33,956 |
|
|
$ |
27,542 |
|
|
$ |
22,412 |
|
|
|
|
|
|
|
|
|
|
|
|
|
|
Life Sciences Products Percent-Segment Revenue |
|
|
6.9 |
% |
|
|
7.3 |
% |
|
|
5.4 |
% |
Life Sciences Services Percent-Segment Revenue |
|
|
3.6 |
% |
|
|
3.6 |
% |
|
|
3.7 |
% |
Corporate Percent Revenue |
|
|
— |
% |
|
|
— |
% |
|
|
0.0 |
% |
Total Percent-Total Revenue |
|
|
5.1 |
% |
|
|
5.0 |
% |
|
|
4.4 |
% |
Research and development expenses increased $6.4 million in fiscal year 2023 as compared fiscal year 2022, primarily driven by a $6.3 million increase in our Life Sciences Products segments due to the addition of B Medical as well as an increase in product development expenses.
Selling, General and Administrative Expenses
Our selling, general and administrative expense for the twelve months ended September 30, 2023, 2022, and 2021 is as follows:
|
|
Year Ended September 30, |
|
|||||||||
Dollars in thousands |
|
2023 |
|
2022 |
|
2021 |
|
|||||
Life Sciences Products |
|
$ |
110,579 |
|
|
$ |
63,408 |
|
|
$ |
59,723 |
|
Life Sciences Services |
|
$ |
163,648 |
|
|
$ |
142,830 |
|
|
$ |
129,398 |
|
Corporate |
|
$ |
42,055 |
|
|
$ |
45,227 |
|
|
$ |
62,980 |
|
Total selling, general and administrative expense |
|
$ |
316,282 |
|
|
$ |
251,465 |
|
|
$ |
252,101 |
|
|
|
|
|
|
|
|
|
|
|
|
|
|
Life Sciences Products Percent-Segment Revenue |
|
|
36.2 |
% |
|
|
31.8 |
% |
|
|
29.9 |
% |
Life Sciences Services Percent-Segment Revenue |
|
|
45.5 |
% |
|
|
40.1 |
% |
|
|
41.2 |
% |
Corporate Percent-Total Revenue |
|
|
6.3 |
% |
|
|
8.1 |
% |
|
|
12.3 |
% |
Percent-Total Revenue |
|
|
47.6 |
% |
|
|
45.3 |
% |
|
|
49.1 |
% |
Selling, general and administrative expenses increased $64.8 million in fiscal year 2023 as compared to fiscal year 2022, driven by higher costs in both our segments (largely in Life Sciences Products due to $41.5 million associated with B Medical), partially offset by savings from cost reduction actions.
Within our segment expense, discussed below, we allocate certain corporate general and administrative expenses including costs related to shared corporate functions which include finance, information technology, human resources, legal, executive, governance, and compliance. In total, corporate general and administrative expense allocated to segments increased $12.2 million year-over-year, primarily due to higher labor costs and investment in the business.
Selling, general and administrative expenses in our Life Sciences Products segment increased $47.2 million year-over-year, primarily due to the addition of B Medical.
Selling, general and administrative expenses in our Life Sciences Services segment increased $20.8 million year-over-year, primarily due to investments in the commercial organization.
36
Corporate expenses decreased $3.2 million year-over-year primarily due to lower external professional service cost related to merger, rebranding, and transformation costs.
Non-Operating Income (Expenses)
Interest income – During fiscal years 2023 and 2022, we recorded interest income of $43.7 million and $20.3 million, respectively, which primarily represented interest earned on our cash and cash equivalents, marketable securities, and net investment hedge. The increase in interest income in fiscal year 2023 from the prior fiscal year is due to higher interest rates on the investment of the proceeds from the sale of the semiconductor automation business, including interest accrued on a net investment hedge during fiscal year ended 2023.
Interest expense – During fiscal years 2023 and 2022, we recorded interest expense of $0.0 million and $4.6 million, respectively. The interest expense for fiscal year 2022 is primarily related to interest on cash held in one of our German subsidiaries that is denominated in EUR, which carries a negative interest rate. There is no interest expense in 2023 as the interest rate was positive.
Other expenses, net – During fiscal years 2023 and 2022, we recorded other expenses, net of $1.0 million and $0.3 million, respectively, primarily due to foreign exchange loss.
Income Tax (Benefit) Expense
We recorded an income tax benefit on continuing operations of $17.6 million in fiscal year 2023 compared to an income tax expense of $1.4 million in fiscal year 2022. The increased tax benefit for the year was driven by the increased global pre-tax loss from operations recorded in fiscal year 2023. In addition to the tax benefit driven by the loss from operations, we also recorded a $1.4 million tax benefit from the reversal of tax reserves, a $1.4 million deferred tax benefit resulting from a tax rate reduction extension in our China business, and a $6.1 million tax benefit related to the outside basis difference in a German subsidiary. The benefit includes $8.1 million related to anticipated U.S. foreign exchange losses on the future repatriation calculated at foreign exchange rates as of September 30, 2023. This benefit is offset by $2.0 million of state income taxes, net of the federal benefit. During the fourth quarter of fiscal year 2023, it became apparent that the outside basis difference with regard to $450 million of foreign cash maintained in the German subsidiary would be reversed within the next twelve months. These additional tax benefits drove the effective tax rate on our loss higher than ordinary statutory tax rates.
Discontinued Operations
Discontinued operations in fiscal year 2022 consisted of the semiconductor automation business. On February 1, 2022, the Company completed the sale of the semiconductor automation business for $2.9 billion in cash.
There was no revenue from discontinued operations for fiscal year 2023. Revenue from discontinued operations was $264.4 million for fiscal year 2022. Net loss from discontinued operations was $1.4 million for fiscal year ended 2023 and net income was $2.1 billion for fiscal year 2022. The net loss from discontinued operations was primarily driven by adjustments to liabilities related to discontinued operations, particularly the accrued liability for the litigation with Edwards Vacuum LLC which was recorded during second quarter of 2023 and is discussed in Note 20, Commitments and Contingencies in the Notes to the Consolidated Financial Statements included in Part II, Item 8, “Financial Statements and Supplementary Data” of this Annual Report on Form 10 K. Net income from fiscal year 2022 is comprised of the gain on the sale of the semiconductor business. The income from discontinued operations only includes direct operating expenses incurred that (1) are clearly identifiable as costs being disposed of upon completion of the sale and (2) will not be continued by our company on an ongoing basis. Indirect expenses which supported the semiconductor automation business and semiconductor cryogenics business, and which remained as part of the continuing operations, are not reflected in income from discontinued operations.
LIQUIDITY AND CAPITAL RESOURCES
As of September 30, 2023, we had cash and cash equivalents of $678.9 million, marketable securities of $450.2 million, and stockholders’ equity of $2.5 billion. Net cash provided by (used in) operating activities was $17.5 million and ($466.0) million for fiscal years ending 2023 and 2022, respectively. We incurred a net loss of $14.3 million, and earned net income of $2.1 billion for fiscal years ending 2023 and 2022, respectively.
37
We believe that our current cash and cash equivalents will enable us to fund our operating expenses and capital expenditure requirements for at least one year from the date of this Annual Report on Form-10K and for the foreseeable future. The current global economic environment makes it difficult for us to predict longer-term liquidity requirements with sufficient certainty. We may be unable to obtain any required additional financing on terms favorable to us, if at all. If adequate funds are not available to us on acceptable terms or otherwise, we may be unable to successfully develop or enhance products and services, respond to competitive pressure or take advantage of acquisition opportunities, any of which could have a material adverse effect on our business, financial condition and operating results.
Overview of Cash Flows and Liquidity
The discussion of our cash flows and liquidity that follows is stated on a total company consolidated basis and excludes the impact of discontinued operations.
Our cash and cash equivalents, restricted cash and marketable securities as of September 30, 2023 and 2022 consist of the following (in thousands):
|
|
|
|
|
|
|
|
|
September 30, 2023 |
|
September 30, 2022 |
||
Cash and cash equivalents |
|
$ |
678,910 |
|
$ |
658,274 |
Restricted cash |
|
|
5,135 |
|
|
383,023 |
Short-term marketable securities |
|
|
338,873 |
|
|
911,764 |
Long-term marketable securities |
|
|
111,338 |
|
|
352,020 |
|
|
$ |
1,134,256 |
|
$ |
2,305,081 |
|
|
|
|
|
|
|
Our cash and cash equivalents, restricted cash and marketable securities were $1.1 billion as of September 30, 2023. As of September 30, 2023, we had cash, cash equivalents and restricted cash of $684.0 million, of which approximately $569 million was held outside of the United States. If these funds are needed for U.S. operations, we would need to repatriate these funds. As a result of recent changes in U.S. tax legislation, any repatriation in the future would likely not result in significant U.S. federal income tax impacts. We had marketable securities of $450.2 million and $1.3 billion as of September 30, 2023 and 2022, respectively. Our marketable securities are generally readily convertible to cash without an adverse impact.
Fiscal Year Ended September 30, 2023 Compared to Fiscal Year Ended September 30, 2022
Overview
|
|
Year Ended September 30, |
||||
Dollars in thousands |
|
2023 |
|
2022 |
||
|
|
|
|
|
|
|
Net cash provided by (used in) operating activities |
|
$ |
17,490 |
|
$ |
(466,046) |
Net cash provided by investing activities |
|
|
431,384 |
|
|
1,465,590 |
Net cash used in financing activities |
|
|
(844,080) |
|
|
(62,762) |
Effects of exchange rate changes on cash and cash equivalents |
|
|
37,955 |
|
|
(180,819) |
Net (decrease) increase in cash, cash equivalents and restricted cash |
|
$ |
(357,251) |
|
$ |
755,963 |
Cash Flows and Liquidity
Cash and cash equivalents and restricted cash were $684.0 million as of September 30, 2023 compared to $1.0 billion as of September 30, 2022. The decrease of $357.3 million was attributable to $844.1 million of cash outflows from financing activities, partially offset by $431.4 million of cash inflows from investing activities, and $17.5 million of cash inflows from operating activities.
38
Operating Activities
Cash flows from operating activities can fluctuate significantly from period to period as earnings, working capital needs and the timing of payments for income taxes, restructuring activities and other charges impact reported cash flows.
Cash inflows from operating activities of $17.5 million for the fiscal year ended September 30, 2023, resulted from collections on accounts receivable, and efficient working capital management partially offset by payment of retention bonuses and cash settled stock-based awards, as well as state income taxes resulting from the sale of the semiconductor automation business.
Cash outflows from operating activities of $466.0 million for the fiscal year ended September 30, 2022, resulted from net income of $2.1 billion, adjusted to exclude the effect of non-operating items of $2.5 billion, and an increase in net operating assets of $507 million. This includes $431.6 million of taxes and $52.5 million of fees related to the sale of the semiconductor automation business. $72.1 million of cash outflows from the increase in net operating assets were primarily driven by increases in accounts receivable, inventory, and prepaids and other assets partially offset by increases in accrued expenses, and accrued compensation and tax withholdings.
Investing Activities
Cash flows provided by investing activities consist primarily of proceeds from divestitures, cash used for acquisitions, capital expenditures and purchase of marketable securities as well as cash proceeds generated from sales and maturities of marketable securities.
Cash provided by investing activities was $431.4 million during fiscal year 2023 and consisted of $1.1 billion of sales and maturities of marketable securities, partially offset by $236.2 million for purchases of marketable securities and $386.5 million paid for the acquisition of B Medical and Ziath.
Cash provided by investing activities was $1.5 billion during fiscal year 2022 and consisted of $2.9 billion of proceeds from the sale of the semiconductor automation business on February 1, 2022, net of the cash transferred, and $705.4 million of sales and maturities of marketable securities; offset by $2.0 billion of purchases of marketable securities, $125.9 million of acquisitions, and $73.4 million of capital expenditures. The acquisitions comprised the purchase of a technology intangible of $4 million related to the semiconductor automation business, $84 million for Barkey and $43 million to prepay the debt for the B Medical acquisition prior to September 30, 2022. Capital expenditures were made primarily to increase capacity, support new product development, and enhance information technology infrastructure.
Financing Activities
Cash outflows for financing activities were $844.1 million for the year ended September 30, 2023 which primarily consisted of cash outflows for our share repurchase authorization.
Cash outflows for financing activities were $62.8 million for the year ended September 30, 2022 which primarily consisted of cash outflows of $49.7 million to extinguish the term loan, $10.4 million for the payments of acquisition related contingent consideration, $7.5 million related to dividend payments, $0.4 million payment of finance leases, partially offset by $5.2 million of proceeds from the issuance of common stock.
China Facility
In April 2019, we committed to construct a facility in Suzhou China, to consolidate the Suzhou operations of our genomic services business and provide infrastructure to support future growth. The facility is being constructed in two phases. As of fiscal year end 2023, we have completed the construction of phase one of the facility with a total cost of $43.0 million. Construction of phase two of the facility is expected to begin in the second fiscal quarter of 2024 and be completed over several years with a total estimated cost of $30.0 million.
39
Capital Resources
As of September 30, 2023 and September 30, 2022, we have no outstanding debt on our balance sheet.
Dividends
Dividends are declared at the discretion of our Board of Directors and depend on actual cash flow from operations, our financial condition, debt service and capital requirements and any other factors our Board of Directors may consider relevant.
Since the completion of the sale of the semiconductor automation business on February 1, 2022, we have not paid a quarterly dividend and do not have plans to pay any dividends at this time. During fiscal year 2022, prior to the sale, we paid a $0.10 per share quarterly dividend totaling $7.5 million in December 2021.
Share Repurchase Program
On September 29, 2015, our Board of Directors approved an authorization to repurchase up to $50.0 million of our common stock. On November 4, 2022, our Board of Directors terminated the existing share repurchase authorization and approved a new authorization to repurchase up to $1.5 billion of our common stock (the “2022 Repurchase Authorization”). Repurchases under the 2022 Repurchase Authorization may be made in the open market or through privately negotiated transactions (including under an accelerated share repurchase (“ASR”) agreement), or by other means, including through the use of trading plans intended to qualify under Rule 10b5-1 of the Exchange Act, subject to market and business conditions, legal requirements, and other factors. We are not obligated to acquire any specific amount of common stock under the 2022 Repurchase Authorization, and share repurchases may be commenced or suspended at any time at management’s discretion. As part of the 2022 Repurchase Authorization, we entered into an ASR agreement for the repurchase of $500.0 million of our common stock on November 23, 2022, and received delivery of, and retired, 10.1 million shares of common stock under the ASR agreement, which terminated on April 3, 2023. In April 2023, other arrangements commenced under the 2022 Repurchase Authorization under which we expect to repurchase up to an additional $500.0 million of shares of our common stock in open market purchases, subject to market and business conditions, legal requirements, and other factors. In addition, in November 2023, we announced that we intend to repurchase the remaining $500.0 million shares of common stock available under the 2022 Repurchase Authorization in 2024. We repurchased 17.5 million shares of common stock for $838.5 million (excluding fees, commissions, and excise tax) in the fiscal year ending September 30, 2023 under the ASR and these other arrangements. As of September 30, 2023, $662.0 million of the 2022 Repurchase Authorization remained available for additional repurchases.
See Note 13, Stockholders’ Equity in the Notes to the consolidated financial statements included in the section titled "Financial Statements and Supplementary Data" in Part II, Item 8 of this Annual Report on Form 10-K for additional information about the share repurchase authorization.
Contractual Obligations and Requirements
At September 30, 2023, we had non-cancelable commitments of $73.5 million, including purchase orders for inventory of $51.3 million, and information technology related commitments of $22.2 million.
40
Off-Balance Sheet Arrangements
As of September 30, 2023, we had no obligation, assets or liabilities which would be considered off-balance sheet arrangements.
Item 7A. Quantitative and Qualitative Disclosures About Market Risk
We are exposed to a variety of market risks, including changes in interest rates affecting the return on our cash and cash equivalents, restricted cash and short-term and long-term investments and fluctuations in foreign currency exchange rates.
Interest Rate Exposure
Our cash and cash equivalents and restricted cash consist principally of money market securities which are short-term in nature. At September 30, 2023 and 2022, our aggregate short-term and long-term investments were $450.2 million and $1.3 billion, respectively, and consisted mostly of highly rated corporate debt securities, and U.S. government backed securities. At September 30, 2023 and 2022 the unrealized loss position on marketable securities was $6.9 million, and $14.7 million, respectively, which is included in “Accumulated other comprehensive income (loss)” in the Consolidated Balance Sheets. A hypothetical 100 basis point change in interest rates would result in a $11.7 million annual change in interest income earned in fiscal year 2023.
As of September 30, 2023 and September 30, 2022, we had no outstanding debt on our balance sheet.
Currency Rate Exposure
We have transactions and balances denominated in currencies other than the functional currency of the transacting entity. Most of these transactions carrying foreign exchange risk are in Germany, the United Kingdom, Luxembourg, and China. Sales in currencies other than the U.S. dollar were 24% and 36%, respectively, of our total sales for fiscal years ended September 30, 2023 and 2022. These sales were made primarily by our foreign subsidiaries, which have cost structures that substantially align with the currency of sale.
In the normal course of our business, we have liquid assets denominated in non-functional currencies which include cash, short-term advances between our legal entities and accounts receivable which are subject to foreign currency exposure. Such balances were approximately $157.8 million and $80.4 million, respectively, at September 30, 2023 and 2022, and primarily relate to the Euro, British Pound, and the Chinese yuan. We mitigate the impact of potential currency translation losses on these short-term intercompany advances by the timely settlement of each transaction, generally within 30 days. We also utilize forward contracts to mitigate our exposures to currency movement. We incurred foreign currency losses of $4.2 million and $1.7 million, respectively, in fiscal years 2023 and 2022, which related to the currency fluctuation on these balances between the time the transaction occurred and the ultimate settlement of the transaction. A hypothetical 10% change in foreign exchange rates would result in an approximate change of $9.0 million in our net income during the fiscal year ending September 30, 2023.
41
Item 8. Financial Statements and Supplementary Data
42
Report of Independent Registered Public Accounting Firm
To the Board of Directors and Stockholders of Azenta, Inc.
Opinions on the Financial Statements and Internal Control over Financial Reporting
We have audited the accompanying consolidated balance sheets of Azenta, Inc. and its subsidiaries (the “Company”) as of September 30, 2023 and 2022, and the related consolidated statements of operations, of comprehensive income, of stockholders’ equity and of cash flows for each of the three years in the period ended September 30, 2023, including the related notes (collectively referred to as the “consolidated financial statements”). We also have audited the Company's internal control over financial reporting as of September 30, 2023, based on criteria established in Internal Control - Integrated Framework (2013) issued by the Committee of Sponsoring Organizations of the Treadway Commission (COSO).
In our opinion, the consolidated financial statements referred to above present fairly, in all material respects, the financial position of the Company as of September 30, 2023 and 2022, and the results of its operations and its cash flows for each of the three years in the period ended September 30, 2023 in conformity with accounting principles generally accepted in the United States of America. Also in our opinion, the Company maintained, in all material respects, effective internal control over financial reporting as of September 30, 2023, based on criteria established in Internal Control - Integrated Framework (2013) issued by the COSO.
Basis for Opinions
The Company's management is responsible for these consolidated financial statements, for maintaining effective internal control over financial reporting, and for its assessment of the effectiveness of internal control over financial reporting, included in Management’s Report on Internal Control over Financial Reporting appearing under Item 9A. Our responsibility is to express opinions on the Company’s consolidated financial statements and on the Company's internal control over financial reporting based on our audits. We are a public accounting firm registered with the Public Company Accounting Oversight Board (United States) (PCAOB) and are required to be independent with respect to the Company in accordance with the U.S. federal securities laws and the applicable rules and regulations of the Securities and Exchange Commission and the PCAOB.
We conducted our audits in accordance with the standards of the PCAOB. Those standards require that we plan and perform the audits to obtain reasonable assurance about whether the consolidated financial statements are free of material misstatement, whether due to error or fraud, and whether effective internal control over financial reporting was maintained in all material respects.
Our audits of the consolidated financial statements included performing procedures to assess the risks of material misstatement of the consolidated financial statements, whether due to error or fraud, and performing procedures that respond to those risks. Such procedures included examining, on a test basis, evidence regarding the amounts and disclosures in the consolidated financial statements. Our audits also included evaluating the accounting principles used and significant estimates made by management, as well as evaluating the overall presentation of the consolidated financial statements. Our audit of internal control over financial reporting included obtaining an understanding of internal control over financial reporting, assessing the risk that a material weakness exists, and testing and evaluating the design and operating effectiveness of internal control based on the assessed risk. Our audits also included performing such other procedures as we considered necessary in the circumstances. We believe that our audits provide a reasonable basis for our opinions.
As described in Management’s Report on Internal Control over Financial Reporting, management has excluded B Medical Systems S.á r.l. and its subsidiaries (“B Medical”) from its assessment of internal control over financial reporting as of September 30, 2023, because it was acquired by the Company in a purchase business combination during fiscal year 2023. We have also excluded B Medical from our audit of internal control over financial reporting.
43
B Medical is a wholly-owned subsidiary whose total assets and total revenues excluded from management’s assessment and our audit of internal control over financial reporting represent 5% and 17%, respectively, of the related consolidated financial statement amounts as of and for the year ended September 30, 2023.
Definition and Limitations of Internal Control over Financial Reporting
A company’s internal control over financial reporting is a process designed to provide reasonable assurance regarding the reliability of financial reporting and the preparation of financial statements for external purposes in accordance with generally accepted accounting principles. A company’s internal control over financial reporting includes those policies and procedures that (i) pertain to the maintenance of records that, in reasonable detail, accurately and fairly reflect the transactions and dispositions of the assets of the company; (ii) provide reasonable assurance that transactions are recorded as necessary to permit preparation of financial statements in accordance with generally accepted accounting principles, and that receipts and expenditures of the company are being made only in accordance with authorizations of management and directors of the company; and (iii) provide reasonable assurance regarding prevention or timely detection of unauthorized acquisition, use, or disposition of the company’s assets that could have a material effect on the financial statements.
Because of its inherent limitations, internal control over financial reporting may not prevent or detect misstatements. Also, projections of any evaluation of effectiveness to future periods are subject to the risk that controls may become inadequate because of changes in conditions, or that the degree of compliance with the policies or procedures may deteriorate.
Critical Audit Matters
The critical audit matter communicated below is a matter arising from the current period audit of the consolidated financial statements that was communicated or required to be communicated to the audit committee and that (i) relates to accounts or disclosures that are material to the consolidated financial statements and (ii) involved our especially challenging, subjective, or complex judgments. The communication of critical audit matters does not alter in any way our opinion on the consolidated financial statements, taken as a whole, and we are not, by communicating the critical audit matter below, providing a separate opinion on the critical audit matter or on the accounts or disclosures to which it relates.
Acquisition of B Medical Systems S.á.r.l. - Valuation of One Certain Completed Technology
As described in Notes 2 and 4 to the consolidated financial statements, on October 3, 2022, the Company acquired B Medical for a purchase price of $432.2 million including contingent consideration. Of the acquired intangible assets, $100.6 million of completed technology was recorded, of which the majority was related to one certain completed technology. The fair value of the intangible assets was estimated using the income approach, specifically the multi-period excess earnings method. Significant judgment is used by management in determining fair value of assets acquired and liabilities assumed. Fair value may be based on valuations that utilize among other factors, revenue growth rates, operating expenses, integration costs, obsolescence factor, and discount rate.
The principal considerations for our determination that performing procedures relating to the valuation of one certain completed technology acquired in the acquisition of B Medical is a critical audit matter are (i) the significant judgment by management when developing the fair value estimate of the one certain completed technology; (ii) a high degree of auditor judgment, subjectivity, and effort in performing procedures and evaluating management’s significant assumptions related to revenue growth rates, operating expenses, integration costs, obsolescence factor, and discount rate; and (iii) the audit effort involved the use of professionals with specialized skill and knowledge.
Addressing the matter involved performing procedures and evaluating audit evidence in connection with forming our overall opinion on the consolidated financial statements. These procedures included testing the effectiveness of controls relating to the acquisition accounting, including controls over management’s valuation of the completed technology acquired.
44
These procedures also included, among others (i) reading the purchase agreement; (ii) testing management’s process for developing the fair value estimate of one certain completed technology acquired; (iii) evaluating the appropriateness of the multi-period excess earnings method used by management; (iv) testing the completeness and accuracy of the underlying data used in the multi-period excess earnings method; and (v) evaluating the reasonableness of the significant assumptions used by management related to revenue growth rates, operating expenses, integration costs, obsolescence factor, and discount rate. Evaluating management’s assumptions related to revenue growth rates, operating expenses, and integration costs involved considering (i) the current and past performance of the B Medical business; (ii) the consistency with external market and industry data; and (iii) whether the assumptions were consistent with evidence obtained in other areas of the audit. Professionals with specialized skill and knowledge were used to assist in evaluating (i) the appropriateness of the multi-period excess earnings method and (ii) the reasonableness of the obsolescence factor and discount rate assumptions.
/s/ PricewaterhouseCoopers LLP
Boston, Massachusetts
November 20, 2023
We have served as the Company’s auditor since 2016.
45
AZENTA, INC.
CONSOLIDATED BALANCE SHEETS
(IN THOUSANDS, EXCEPT SHARE AND PER SHARE DATA)
|
|
|
|
|
|
|
|
|
September 30, |
|
September 30, |
||
|
|
2023 |
|
2022 |
||
|
|
|
||||
Assets |
|
|
|
|
|
|
Current assets |
|
|
|
|
|
|
Cash and cash equivalents |
|
$ |
678,910 |
|
$ |
658,274 |
Short-term marketable securities |
|
|
338,873 |
|
|
911,764 |
Accounts receivable, net of allowance for expected credit losses ($8,057 and $5,162, respectively) |
|
|
156,535 |
|
|
163,758 |
Inventories |
|
|
128,198 |
|
|
85,544 |
Derivative asset |
|
|
13,036 |
|
|
124,789 |
Short-term restricted cash |
|
|
4,650 |
|
|
382,596 |
Prepaid expenses and other current assets |
|
|
98,754 |
|
|
132,621 |
Total current assets |
|
|
1,418,956 |
|
|
2,459,346 |
Property, plant and equipment, net |
|
|
205,744 |
|
|
154,470 |
Long-term marketable securities |
|
|
111,338 |
|
|
352,020 |
Long-term deferred tax assets |
|
|
571 |
|
|
1,169 |
Goodwill |
|
|
784,339 |
|
|
513,623 |
Intangible assets, net |
|
|
294,301 |
|
|
178,401 |
Other assets |
|
|
70,471 |
|
|
57,093 |
Total assets |
|
$ |
2,885,720 |
|
$ |
3,716,122 |
Liabilities and stockholders' equity |
|
|
|
|
|
|
Current liabilities |
|
|
|
|
|
|
Accounts payable |
|
$ |
35,796 |
|
$ |
38,654 |
Deferred revenue |
|
|
34,614 |
|
|
39,748 |
Accrued warranty and retrofit costs |
|
|
10,223 |
|
|
2,890 |
Accrued compensation and benefits |
|
|
33,911 |
|
|
41,898 |
Accrued customer deposits |
|
|
17,707 |
|
|
13,447 |
Accrued VAT payable |
|
|
20,595 |
|
|
16,418 |
Accrued income taxes payable |
|
|
7,378 |
|
|
28,419 |
Accrued expenses and other current liabilities |
|
|
50,704 |
|
|
49,072 |
Total current liabilities |
|
|
210,928 |
|
|
230,546 |
Long-term tax reserves |
|
|
380 |
|
|
1,684 |
Long-term deferred tax liabilities |
|
|
67,301 |
|
|
64,555 |
Long-term operating lease liabilities |
|
|
60,436 |
|
|
49,227 |
Other long-term liabilities |
|
|
12,175 |
|
|
6,724 |
Total liabilities |
|
|
351,220 |
|
|
352,736 |
|
|
|
|
|
|
|
Stockholders' equity |
|
|
|
|
|
|
Preferred stock, $0.01 par value - 1,000,000 shares authorized, no shares issued or outstanding |
|
|
— |
|
|
— |
Common stock, $0.01 par value - 125,000,000 shares authorized, 71,294,247 shares issued and 57,832,378 shares outstanding at September 30, 2023, 88,482,125 shares issued and 75,020,256 shares outstanding at September 30, 2022 |
|
|
713 |
|
|
885 |
Additional paid-in capital |
|
|
1,156,160 |
|
|
1,992,017 |
Accumulated other comprehensive income (loss) |
|
|
(62,426) |
|
|
(83,916) |
Treasury stock, at cost - 13,461,869 shares at September 30, 2023 and September 30, 2022 |
|
|
(200,956) |
|
|
(200,956) |
Retained earnings |
|
|
1,641,009 |
|
|
1,655,356 |
Total stockholders' equity |
|
|
2,534,500 |
|
|
3,363,386 |
Total liabilities and stockholders' equity |
|
$ |
2,885,720 |
|
$ |
3,716,122 |
The accompanying notes are an integral part of these consolidated financial statements.
46
AZENTA, INC.
CONSOLIDATED STATEMENTS OF OPERATIONS
(IN THOUSANDS, EXCEPT PER SHARE DATA)
|
|
|
|
|
|
|
|
|
|
|
|
Year Ended September 30, |
|||||||
|
|
2023 |
|
2022 |
|
2021 |
|||
Revenue |
|
|
|
|
|
|
|
|
|
Products |
|
$ |
277,191 |
|
$ |
180,950 |
|
$ |
181,036 |
Services |
|
|
387,881 |
|
|
374,548 |
|
|
332,667 |
Total revenue |
|
|
665,072 |
|
|
555,498 |
|
|
513,703 |
Cost of revenue |
|
|
|
|
|
|
|
|
|
Products |
|
|
186,090 |
|
|
100,044 |
|
|
96,678 |
Services |
|
|
215,842 |
|
|
199,870 |
|
|
173,216 |
Total cost of revenue |
|
|
401,932 |
|
|
299,914 |
|
|
269,894 |
Gross profit |
|
|
263,140 |
|
|
255,584 |
|
|
243,809 |
Operating expenses |
|
|
|
|
|
|
|
|
|
Research and development |
|
|
33,956 |
|
|
27,542 |
|
|
22,412 |
Selling, general and administrative |
|
|
316,282 |
|
|
251,465 |
|
|
252,101 |
Contingent consideration - fair value adjustments |
|
|
(18,549) |
|
|
600 |
|
|
— |
Restructuring charges |
|
|
4,577 |
|
|
712 |
|
|
385 |
Total operating expenses |
|
|
336,266 |
|
|
280,319 |
|
|
274,898 |
Operating loss |
|
|
(73,126) |
|
|
(24,735) |
|
|
(31,089) |
Other income (expense) |
|
|
|
|
|
|
|
|
|
Interest income |
|
|
43,735 |
|
|
20,286 |
|
|
632 |
Interest expense |
|
|
— |
|
|
(4,589) |
|
|
(2,037) |
Loss on extinguishment of debt |
|
|
— |
|
|
(632) |
|
|
— |
Other, net |
|
|
(1,042) |
|
|
(266) |
|
|
(16,475) |
Loss before income taxes |
|
|
(30,433) |
|
|
(9,936) |
|
|
(48,969) |
Income tax (benefit) expense |
|
|
(17,550) |
|
|
1,350 |
|
|
(20,100) |
Loss from continuing operations |
|
|
(12,883) |
|
|
(11,286) |
|
|
(28,869) |
Income (loss) from discontinued operations, net of tax |
|
|
(1,374) |
|
|
2,144,145 |
|
|
139,616 |
Net income (loss) |
|
$ |
(14,257) |
|
$ |
2,132,859 |
|
$ |
110,747 |
Basic net income (loss) per share: |
|
|
|
|
|
|
|
|
|
Loss from continuing operations |
|
$ |
(0.19) |
|
$ |
(0.15) |
|
$ |
(0.39) |
Income (loss) from discontinued operations, net of tax |
|
|
(0.02) |
|
|
28.63 |
|
|
1.88 |
Net income (loss) per share |
|
$ |
(0.22) |
|
$ |
28.48 |
|
$ |
1.49 |
Diluted net income (loss) per share: |
|
|
|
|
|
|
|
|
|
Loss from continuing operations |
|
$ |
(0.19) |
|
$ |
(0.15) |
|
$ |
(0.39) |
Income (loss) from discontinued operations, net of tax |
|
|
(0.02) |
|
|
28.63 |
|
|
1.88 |
Diluted net income (loss) per share |
|
$ |
(0.22) |
|
$ |
28.48 |
|
$ |
1.49 |
Weighted average shares used in computing net income (loss) per share: |
|
|
|
|
|
|
|
|
|
Basic |
|
|
66,253 |
|
|
74,897 |
|
|
74,229 |
Diluted |
|
|
66,253 |
|
|
74,897 |
|
|
74,455 |
The accompanying notes are an integral part of these consolidated financial statements.
47
AZENTA, INC.
CONSOLIDATED STATEMENTS OF COMPREHENSIVE INCOME
(IN THOUSANDS)
|
|
|
|
|
|
|
|
|
|
|
|
Year Ended September 30, |
|||||||
|
|
2023 |
|
2022 |
|
2021 |
|||
Net income (loss) |
|
$ |
(14,257) |
|
$ |
2,132,859 |
|
$ |
110,747 |
Other comprehensive income (loss), net of tax: |
|
|
|
|
|
|
|
|
|
Foreign currency translation reclassification adjustments included in income from discontinued operations (Note 2) |
|
|
— |
|
|
(16,567) |
|
|
— |
Net investment hedge currency translation adjustment, net of tax effects of $(21,228) and $31,769 for the fiscal years 2023 and 2022, respectively |
|
|
(61,533) |
|
|
93,020 |
|
|
— |
Foreign currency translation adjustments |
|
|
77,246 |
|
|
(169,266) |
|
|
(2,922) |
Changes in unrealized gains (losses) on marketable securities, net of tax effects of $1,992 and $(3,729) for the fiscal years 2023 and 2022, respectively |
|
|
5,774 |
|
|
(10,908) |
|
|
— |
Actuarial gains, net of tax effects of $(1), $(121), and $(77) for the fiscal years 2023, 2022, and 2021, respectively |
|
|
3 |
|
|
454 |
|
|
354 |
Total other comprehensive income (loss), net of tax |
|
|
21,490 |
|
|
(103,267) |
|
|
(2,568) |
Comprehensive income |
|
$ |
7,233 |
|
$ |
2,029,592 |
|
$ |
108,179 |
The accompanying notes are an integral part of these consolidated financial statements.
48
AZENTA, INC.
CONSOLIDATED STATEMENTS OF CASH FLOWS
(In thousands)
|
Year Ended September 30, |
|
|||||||
|
2023 |
|
2022 |
|
2021 |
|
|||
Cash flows from operating activities |
|
|
|
|
|
|
|
|
|
Net income (loss) |
$ |
(14,257) |
|
$ |
2,132,859 |
|
$ |
110,747 |
|
Adjustments to reconcile net income (loss) to net cash provided by operating activities: |
|
|
|
|
|
|
|
|
|
Depreciation and amortization |
|
85,584 |
|
|
53,702 |
|
|
65,333 |
|
Impairment of intangible assets |
|
— |
|
|
— |
|
|
13,364 |
|
Stock-based compensation |
|
9,376 |
|
|
10,666 |
|
|
27,456 |
|
Contingent consideration adjustment |
|
(18,549) |
|
|
600 |
|
|
— |
|
Amortization and accretion on marketable securities |
|
(7,870) |
|
|
(1,894) |
|
|
225 |
|
Deferred income taxes |
|
(28,654) |
|
|
24,469 |
|
|
(17,265) |
|
Loss on extinguishment of debt |
|
— |
|
|
632 |
|
|
— |
|
Purchase accounting impact on inventory |
|
9,664 |
|
|
— |
|
|
— |
|
(Gain) loss on disposals of property, plant and equipment |
|
43 |
|
|
(21) |
|
|
260 |
|
(Gain) loss on divestiture, net of tax |
|
— |
|
|
(2,130,265) |
|
|
948 |
|
Fees paid stemming from divestiture |
|
— |
|
|
(52,461) |
|
|
— |
|
Taxes paid stemming from divestiture |
|
— |
|
|
(431,600) |
|
|
— |
|
Changes in operating assets and liabilities: |
|
|
|
|
|
|
|
|
|
Accounts receivable |
|
33,992 |
|
|
(31,397) |
|
|
(69,643) |
|
Inventories |
|
8,253 |
|
|
(66,629) |
|
|
(50,443) |
|
Accounts payable |
|
(14,710) |
|
|
(3,926) |
|
|
30,967 |
|
Deferred revenue |
|
(7,564) |
|
|
16,599 |
|
|
(3,939) |
|
Accrued warranty and retrofit costs |
|
4,560 |
|
|
303 |
|
|
54 |
|
Accrued compensation and tax withholdings |
|
(15,434) |
|
|
11,404 |
|
|
7,298 |
|
Other current assets and liabilities |
|
(26,944) |
|
|
913 |
|
|
34,495 |
|
Net cash provided by (used in) operating activities |
|
17,490 |
|
|
(466,046) |
|
|
149,857 |
|
Cash flows from investing activities |
|
|
|
|
|
|
|
|
|
Purchases of property, plant and equipment |
|
(39,436) |
|
|
(73,435) |
|
|
(52,805) |
|
Purchases of technology intangibles |
|
— |
|
|
(4,000) |
|
|
— |
|
Purchases of marketable securities |
|
(236,194) |
|
|
(1,975,599) |
|
|
(151) |
|
Sales and maturities of marketable securities |
|
1,064,209 |
|
|
705,384 |
|
|
121 |
|
Proceeds from divestiture, net of cash transferred |
|
— |
|
|
2,939,116 |
|
|
— |
|
Adjustment to proceeds from divestiture |
|
— |
|
|
— |
|
|
(1,802) |
|
Net Investment hedge settlement |
|
29,313 |
|
|
— |
|
|
— |
|
Acquisitions, net of cash acquired |
|
(386,508) |
|
|
(125,876) |
|
|
(93,712) |
|
Settlement (issuance) of note receivables |
|
— |
|
|
— |
|
|
2,000 |
|
Net cash provided by (used in) investing activities |
|
431,384 |
|
|
1,465,590 |
|
|
(146,349) |
|
Cash flows from financing activities |
|
|
|
|
|
|
|
|
|
Proceeds from issuance of common stock |
|
— |
|
|
5,245 |
|
|
5,812 |
|
Principal payments on debt |
|
— |
|
|
(49,725) |
|
|
(828) |
|
Payments of finance leases |
|
(578) |
|
|
(388) |
|
|
(1,164) |
|
Payment for contingent consideration related to acquisition |
|
— |
|
|
(10,400) |
|
|
— |
|
Withholding tax payments on net share settlements on equity awards |
|
(4,988) |
|
|
— |
|
|
— |
|
Stock repurchase |
|
(838,514) |
|
|
— |
|
|
— |
|
Common stock dividends |
|
— |
|
|
(7,494) |
|
|
(29,726) |
|
Net cash used in financing activities |
|
(844,080) |
|
|
(62,762) |
|
|
(25,906) |
|
Effects of exchange rate changes on cash and cash equivalents |
|
37,955 |
|
|
(180,819) |
|
|
5,205 |
|
Net (decrease) increase in cash, cash equivalents and restricted cash |
|
(357,251) |
|
|
755,963 |
|
|
(17,193) |
|
Cash, cash equivalents and restricted cash, beginning of period |
|
1,041,296 |
|
|
285,333 |
|
|
302,526 |
|
Cash, cash equivalents and restricted cash, end of period |
$ |
684,045 |
|
$ |
1,041,296 |
|
$ |
285,333 |
|
Supplemental disclosures: |
|
|
|
|
|
|
|
|
|
Cash paid for interest |
$ |
— |
|
$ |
469 |
|
$ |
1,435 |
|
Cash paid for income taxes, net |
|
43,073 |
|
|
452,461 |
|
|
38,020 |
|
Reconciliation of cash, cash equivalents, and restricted cash to the consolidated balance sheets |
|
|
|
|
|
|
|
|
|
Cash and cash equivalents of continuing operations |
$ |
678,910 |
|
$ |
658,274 |
|
$ |
227,427 |
|
Cash and cash equivalents included in assets held for sale |
|
— |
|
|
— |
|
|
45,000 |
|
Short-term restricted cash |
|
4,650 |
|
|
382,596 |
|
|
7,145 |
|
Long-term restricted cash included in other assets |
|
485 |
|
|
426 |
|
|
5,761 |
|
Total cash, cash equivalents and restricted cash shown in the consolidated statements of cash flows |
$ |
684,045 |
|
$ |
1,041,296 |
|
$ |
285,333 |
|
The accompanying notes are an integral part of these consolidated financial statements.
49
AZENTA, INC.
CONSOLIDATED STATEMENTS OF CHANGES IN STOCKHOLDERS’ EQUITY
(IN THOUSANDS, EXCEPT SHARE AND PER SHARE DATA)
|
|
|
|
|
|
|
|
|
|
|
|
|
|
|
|
|
|
|
|
|
|
|
|
|
Common |
|
|
|
Accumulated |
|
|
|
|
|
|
|
|
|
|||
|
|
Common |
|
Stock at |
|
Additional |
|
Other |
|
|
|
|
|
|
||||||
|
|
Stock |
|
Par |
|
Paid-In |
|
Comprehensive |
|
Retained |
|
Treasury |
|
Total |
||||||
|
|
Shares |
|
Value |
|
Capital |
|
Income (Loss) |
|
Earnings |
|
Stock |
|
Stockholders’ Equity |
||||||
Balance September 30, 2020 |
|
87,293,710 |
|
|
873 |
|
|
1,942,850 |
|
|
21,919 |
|
|
(551,072) |
|
|
(200,956) |
|
|
1,213,614 |
Shares issued under restricted stock and purchase plans, net of shares withheld for employee taxes |
|
515,212 |
|
|
5 |
|
|
5,806 |
|
|
— |
|
|
— |
|
|
— |
|
|
5,811 |
Stock-based compensation |
|
— |
|
|
— |
|
|
27,456 |
|
|
— |
|
|
— |
|
|
— |
|
|
27,456 |
Common stock dividends declared, at $0.40 per share |
|
— |
|
|
— |
|
|
— |
|
|
— |
|
|
(29,726) |
|
|
— |
|
|
(29,726) |
Foreign currency translation adjustments |
|
— |
|
|
— |
|
|
— |
|
|
(2,922) |
|
|
— |
|
|
— |
|
|
(2,922) |
Actuarial gain (loss) arising in the year, net of tax |
|
— |
|
|
— |
|
|
— |
|
|
354 |
|
|
— |
|
|
— |
|
|
354 |
Net income (loss) |
|
— |
|
|
— |
|
|
— |
|
|
— |
|
|
110,747 |
|
|
— |
|
|
110,747 |
Balance September 30, 2021 |
|
87,808,922 |
|
|
878 |
|
|
1,976,112 |
|
|
19,351 |
|
|
(470,051) |
|
|
(200,956) |
|
|
1,325,334 |
Shares issued under restricted stock and purchase plans, net of shares withheld for employee taxes |
|
673,203 |
|
|
7 |
|
|
5,239 |
|
|
— |
|
|
— |
|
|
— |
|
|
5,246 |
Stock-based compensation |
|
— |
|
|
— |
|
|
10,666 |
|
|
— |
|
|
— |
|
|
— |
|
|
10,666 |
Common stock dividends declared, at $0.10 per share |
|
— |
|
|
— |
|
|
— |
|
|
— |
|
|
(7,494) |
|
|
— |
|
|
(7,494) |
Unrealized gain on derivative asset, net of tax |
|
— |
|
|
— |
|
|
— |
|
|
93,020 |
|
|
— |
|
|
— |
|
|
93,020 |
Foreign currency translation adjustments reclassed out of accumulated other comprehensive income related to discontinued operations |
|
— |
|
|
— |
|
|
— |
|
|
(16,567) |
|
|
— |
|
|
— |
|
|
(16,567) |
Foreign currency translation adjustments |
|
— |
|
|
— |
|
|
— |
|
|
(169,266) |
|
|
— |
|
|
— |
|
|
(169,266) |
Changes in unrealized gains (losses) on marketable securities, net of tax |
|
— |
|
|
— |
|
|
— |
|
|
(10,908) |
|
|
— |
|
|
— |
|
|
(10,908) |
Actuarial gain (loss) arising in the year, net of tax |
|
— |
|
|
— |
|
|
— |
|
|
454 |
|
|
— |
|
|
— |
|
|
454 |
Net income (loss) |
|
— |
|
|
— |
|
|
— |
|
|
— |
|
|
2,132,859 |
|
|
— |
|
|
2,132,859 |
Other |
|
— |
|
|
— |
|
|
— |
|
|
— |
|
|
42 |
|
|
— |
|
|
42 |
Balance September 30, 2022 |
|
88,482,125 |
|
|
885 |
|
|
1,992,017 |
|
|
(83,916) |
|
|
1,655,356 |
|
|
(200,956) |
|
|
3,363,386 |
Shares issued under restricted stock and purchase plans, net of shares withheld for employee taxes |
|
267,133 |
|
|
3 |
|
|
(1,371) |
|
|
— |
|
|
— |
|
|
— |
|
|
(1,368) |
Accelerated share repurchase |
|
(10,072,055) |
|
|
— |
|
|
— |
|
|
— |
|
|
— |
|
|
(501,637) |
|
|
(501,637) |
Open market repurchases |
|
(7,382,956) |
|
|
— |
|
|
— |
|
|
— |
|
|
— |
|
|
(342,400) |
|
|
(342,400) |
Retirement of treasury shares |
|
— |
|
|
(175) |
|
|
(843,862) |
|
|
— |
|
|
— |
|
|
844,037 |
|
|
— |
Stock-based compensation |
|
— |
|
|
— |
|
|
9,376 |
|
|
— |
|
|
— |
|
|
— |
|
|
9,376 |
Net investment hedge currency translation adjustment, net of tax |
|
— |
|
|
— |
|
|
— |
|
|
(61,533) |
|
|
— |
|
|
— |
|
|
(61,533) |
Foreign currency translation adjustments |
|
— |
|
|
— |
|
|
— |
|
|
77,246 |
|
|
— |
|
|
— |
|
|
77,246 |
Changes in unrealized gains (losses) on marketable securities, net of tax |
|
— |
|
|
— |
|
|
— |
|
|
5,774 |
|
|
— |
|
|
— |
|
|
5,774 |
Net income (loss) |
|
— |
|
|
— |
|
|
— |
|
|
— |
|
|
(14,257) |
|
|
— |
|
|
(14,257) |
Actuarial gain (loss) arising in the year, net of tax |
|
— |
|
|
— |
|
|
— |
|
|
3 |
|
|
— |
|
|
— |
|
|
3 |
Other |
|
— |
|
|
— |
|
|
— |
|
|
— |
|
|
(90) |
|
|
— |
|
|
(90) |
Balance September 30, 2023 |
|
71,294,247 |
|
$ |
713 |
|
$ |
1,156,160 |
|
$ |
(62,426) |
|
$ |
1,641,009 |
|
$ |
(200,956) |
|
$ |
2,534,500 |
The accompanying notes are an integral part of these consolidated financial statements.
50
AZENTA, INC.
NOTES TO CONSOLIDATED FINANCIAL STATEMENTS
1. Nature of Operations
Azenta, Inc. (“Azenta”, or the “Company”) is a leading global provider of sample exploration and management solutions for the life sciences industry. The Company supports its customers from research and clinical development to commercialization with its sample management, automated storage, vaccine cold storage and transport, as well as genomic services expertise to help bring impactful therapies to market faster.
Discontinued Operations
In the fourth quarter of fiscal year 2021, the Company entered into a definitive agreement to sell its semiconductor automation business to Thomas H. Lee Partners, L.P. (“THL”). The Company determined that the semiconductor automation business met the “held for sale” criteria and the “discontinued operations” criteria in accordance with Financial Accounting Standard Boards (“FASB”) Accounting Standards Codification (“ASC”) 205, Presentation of Financial Statements, (“FASB ASC 205”) as of September 30, 2021. Please refer to Note 3, “Discontinued Operations” for further information about the discontinued businesses. The Consolidated Financial Statements were restated for all periods presented to reflect the discontinuation of the semiconductor automation business and the semiconductor cryogenics business in accordance with FASB ASC 205. The discussion in the notes to these Consolidated Financial Statements, unless otherwise noted, relate solely to the Company's continuing operations.
On February 1, 2022, the Company completed the sale of the semiconductor automation business for $2.9 billion in cash.
2. Summary of Significant Accounting Policies
Principles of Consolidation and Basis of Presentation
The accompanying Consolidated Financial Statements include the accounts of the Company and all entities where it has a controlling financial interest and have been prepared in accordance with accounting principles generally accepted in the United States (“GAAP”). All intercompany balances and transactions have been eliminated in consolidation.
Use of Estimates
The preparation of financial statements in accordance with GAAP requires management to make certain estimates and assumptions that affect amounts reported in the financial statements and notes thereto. Although these estimates are based on the Company’s knowledge of current events and actions it may undertake in the future, actual results may differ from these estimates. Estimates are associated with recording accounts receivable, inventories, goodwill, intangible assets other than goodwill, contingent consideration liabilities related to business combinations, long-lived assets, derivative financial instruments, deferred income taxes, warranty obligations, revenue over time, stock-based compensation expense, and other accounts. The Company assesses the estimates on an ongoing basis and records changes in estimates in the period they occur and become known.
Business Combinations
The Company accounts for business acquisitions using the purchase method of accounting, in accordance with which, assets acquired (including identifiable intangible assets), and liabilities assumed are recorded at their respective fair values at the acquisition date. The fair value of the consideration paid, including contingent consideration, is assigned to the assets acquired and liabilities assumed based on their respective fair values. Goodwill represents the excess of the purchase price over the estimated fair values of the assets acquired and liabilities assumed.
Significant judgment is used in determining fair values of assets acquired and liabilities assumed and contingent consideration, as well as identified intangible assets and their estimated useful lives. Fair value and useful life determinations may be based on valuations that utilize among other factors, estimates of revenue growth rates, operating expenses, integration costs, obsolescence factors, future expected cash flows and discount rates attributable to completed technology and other acquired intangible assets.
51
When estimating the assumptions to be used in the valuation, the Company includes a consideration of current industry information, market and economic trends, historical results of the acquired business, and other relevant factors. These assumptions are forward-looking and could be affected by future economic and market conditions. Adjustments to fair values of assets and liabilities made after the end of the measurement period are recorded within our operating results.
Changes in the fair value of contingent consideration resulting from a change in the underlying inputs are recognized in results of operations until the arrangement is settled.
Foreign Currency Translation
Certain transactions of the Company and its subsidiaries are denominated in currencies other than their functional currency. Foreign currency exchange gains (losses) generated from the settlement and remeasurement of these transactions are recognized in earnings and presented within “Other income (expense)” in the Company’s Consolidated Statements of Operations. Net foreign currency transaction and remeasurement losses totaled $4.2 million, $1.7 million and $1.8 million for the fiscal years ended September 30, 2023, 2022 and 2021, respectively.
The determination of the functional currency of the Company’s subsidiaries is based on their financial and operational environment and is the local currency of the Company’s foreign subsidiaries. The subsidiaries’ assets and liabilities are translated into the reporting currency at period-end exchange rates, while revenue, expenses, gains and losses are translated at the average exchange rates during the period. Gains and losses from foreign currency translations are recorded in “Accumulated other comprehensive income (loss)” in the Company’s Consolidated Balance Sheets and presented as “Foreign currency translation adjustments” in the Company’s Consolidated Statements of Comprehensive Income.
The semiconductor automation business had foreign operations which had a cumulative translation adjustment balance of $16.6 million at the date of disposal of this business. This amount was removed from “Accumulated other comprehensive income (loss)” in the Company’s Consolidated Balance Sheet during the three months ended March 31, 2022, and included within the gain on the sale of the semiconductor automation business in “Income (loss) from discontinued operations, net of tax” in the Company’s Consolidated Statement of Operations. As a result, the Company presented a $16.6 million reclassification adjustment in “Accumulated other comprehensive income (loss)” in the Company’s Consolidated Balance Sheet at September 30, 2022.
Derivative Financial Instruments
The Company has transactions and balances denominated in currencies other than the functional currency of the transacting entity. Most of these transactions carry foreign exchange risk in Germany, the United Kingdom and China. The Company enters into foreign exchange contracts to reduce its exposure to currency fluctuations. The arrangements typically mature in three months or less and they do not qualify for hedge accounting. Net gains and losses related to foreign exchange contracts are recorded as a component of “Other income (expense)” in the accompanying Consolidated Statements of Operations.
The fair values of the forward contracts are recorded in the accompanying Consolidated Balance Sheets as “Prepaid expenses and other current assets” and “Accrued expenses and other current liabilities”. Foreign exchange contract assets and liabilities are measured and reported at fair value based on observable market inputs and classified within Level 2 of the fair value hierarchy described below due to a lack of an active market for these contracts.
All derivatives, whether designated as a hedging relationship or not, are recorded in the Consolidated Balance Sheets at fair value. The accounting for changes in fair value of a derivative instrument depends on whether it has been designated and qualifies as part of a hedging relationship and the type of hedging relationship. For those derivative instruments that are designated and qualify as hedging instruments, the Company must designate the hedging instrument as a fair value hedge, cash flow hedge or a hedge of a net investment in a foreign operation based on the exposure being hedged. Certain derivatives held by the Company are not designated as hedges but are used in managing exposure to changes in foreign exchange rates.
52
A fair value hedge is a derivative instrument designated for the purpose of hedging the exposure to changes in fair value of an asset or a liability resulting from a particular risk. If the derivative is designated as a fair value hedge, the changes in the fair value of the derivative and of the hedged item attributable to the hedged risk are both recognized in the results of operations and presented in the same caption in the Consolidated Statements of Operations and Consolidated Statements of Comprehensive Income.
A cash flow hedge is a derivative instrument designated for the purpose of hedging the exposure to variability in future cash flows resulting from a particular risk. If the derivative is designated as a cash flow hedge, the effective portions of changes in the fair value of the derivative are recorded in accumulated other comprehensive income (loss) and recognized in the results of operations when the hedged item affects earnings. Ineffective portions of changes in the fair value of cash flow hedges are recognized in the results of operations.
A hedge of a net investment in a foreign operation is achieved through a derivative instrument designated for the purpose of hedging the exposure of changes in value of investments in foreign subsidiaries. If the derivative is designated as a hedge of a net investment in a foreign operation, the effective portions of changes in the fair value of the derivative are recorded in other comprehensive income (loss) as a part of the foreign currency translation adjustment. Ineffective portions of net investment hedges are recognized in the results of operations.
For derivative instruments not designated as hedging instruments, changes in fair value are recognized in the Consolidated Statements of Operations as gains or losses consistent with the classification of the underlying risk.
Concentration of Credit Risk
Financial instruments that potentially subject the Company to concentrations of credit risk consist of cash deposits and cash equivalents, marketable securities, derivative instruments, and accounts receivable. All of the Company’s cash and cash equivalents, restricted cash, marketable securities and derivative instruments are maintained by major financial institutions.
The Company invests cash not used in operations in investment grade, high credit quality securities in accordance with the Company’s investment policy which provides guidelines and limits regarding investments type, concentration, credit quality and maturity terms aimed at maintaining liquidity and reducing risk of capital loss.
The Company regularly monitors the creditworthiness of its customers and believes that it has adequately provided for exposure to potential credit losses. The Company’s ten largest customers accounted for approximately 30%, 20% and 19% of its consolidated revenue for the fiscal years ended September 30, 2023, 2022 and 2021, respectively. One customer accounted for more than 10% of the Company’s consolidated revenue for fiscal year 2023. This customer is related to the Life Science Products segment and is a distributor shipping to end users in approximately 50 countries. No customers accounted for more than 10% of the Company’s consolidated revenue for fiscal years 2022 and 2021.
Marketable Securities
The Company invests in marketable securities that are classified as available-for-sale and records them at fair value in the Consolidated Balance Sheets. Marketable securities reported as current assets represent investments that mature within one year from the balance sheet date. Long-term marketable securities represent investments with maturity dates greater than one year from the balance sheet date.
Unrealized gains and losses are excluded from earnings and reported as a separate component of “Accumulated other comprehensive income (loss)” in the Consolidated Balance Sheets until the security is sold or matures. Gains or losses realized from sales of marketable securities are computed based on the specific identification method and recognized as a component of “Other income (expense)” in the accompanying Consolidated Statements of Operations.
The Company reviews the marketable securities for impairment at each reporting date to determine if any of the securities have experienced an other-than-temporary decline in fair value. The Company considers factors, such as the length of time and extent to which the market value has been less than the cost, the financial condition and near-term prospects of the issuer, the Company’s intent to sell, or whether it is more likely than not it will be required to sell the investment before recovery of its amortized cost basis. If the Company believes that an other-than-temporary decline in fair value has occurred, it writes down the investment to its fair value and recognizes the credit loss in earnings and the non-credit loss in accumulated other comprehensive income (loss).
53
Fair Value Measurement
The Company measures certain financial assets and liabilities, including cash equivalents, available-for-sale securities, accounts receivable, accounts payable, contingent consideration liability, and derivative instruments at fair value. The Company applies a fair value hierarchy that requires an entity to maximize the use of observable inputs and minimize the use of unobservable inputs when measuring fair value. The following levels of inputs may be used to measure fair value:
| ● | Level 1: Quoted prices (unadjusted) in active markets for identical assets or liabilities that are accessible as of the reporting date. Active markets are those in which transactions for the asset and liability occur in sufficient frequency and volume to provide pricing information on an ongoing basis. The fair value hierarchy gives the highest priority to Level 1 inputs. |
| ● | Level 2: Observable inputs other than prices included in Level 1, including quoted prices for similar assets or liabilities in active markets and quoted prices in markets that are not active; or other inputs that are observable or can be corroborated by observable market data for substantially the full term of the assets or liabilities. |
| ● | Level 3: Unobservable inputs that are significant to the fair value of the assets or liabilities and reflect an entity’s own assumptions in pricing assets or liabilities since they are supported by little or no market activity. |
In determining fair value, the Company utilizes valuation techniques that maximize the use of observable inputs and minimize the use of unobservable inputs, as well as considering counterparty credit risk in its assessment of fair value.
The Company measures certain assets, including the cost and equity method investments, at fair value on a nonrecurring basis when they are deemed to be other-than-temporarily impaired. The fair values of these investments are determined based on valuation techniques using the best information available, and may include quoted market prices, market comparable prices, and discounted cash flow projections. An impairment charge is recorded when the cost of the investment exceeds its fair value and this condition is determined to be other-than-temporary
Cash and Cash Equivalents, and Restricted Cash
Cash and cash equivalents consist of cash and highly liquid investments with original maturities of three months or less that are readily convertible to known amounts of cash. Cash equivalents are reported at fair value.
The Company classifies long-term restricted cash balances within “Other assets” on the accompanying Consolidated Balance Sheets based upon the term of the remaining restrictions.
Accounts Receivable and Allowance for Expected Credit Losses
Trade accounts receivable do not bear interest and are recorded at the invoiced amount. The Company maintains an allowance for expected credit losses representing its best estimate of expected credit losses related to its existing accounts receivable and their net realizable value. The Company determines the allowance based on several factors, including an evaluation of customer credit worthiness, the age of the outstanding receivables, economic trends, historical experience and other information over the payment periods. The Company reviews and adjusts the allowance for expected credit losses on a quarterly basis. Accounts receivable balances are written off against the allowance for expected credit losses when the Company determines that the balances are not recoverable. Provisions for expected credit losses are recorded in “Selling, general and administrative” expenses in the Consolidated Statements of Operations. The Company does not have any off-balance-sheet credit exposure related to its customers.
Inventories
Inventories are stated at the lower of cost or net realizable value determined on a first-in, first-out basis and include the cost of materials, labor and manufacturing overhead. The Company reports inventories at their net realizable value and provides reserves for excess, obsolete or damaged inventory based on changes in customer demand, technology and other economic factors.
54
Fixed Assets, Intangible Assets and Impairment of Long-lived Assets
Property, plant and equipment are stated at cost, net of accumulated depreciation. Depreciation expense is computed based on the straight-line method and charged to results of operations to allocate the cost of the assets over their estimated useful lives, as follows:
Buildings |
|
10 - 40 years |
Computer equipment and software |
|
3 - 5 years |
Machinery and equipment |
|
2 - 7 years |
Furniture and fixtures |
|
5 years |
Vehicles |
|
3 - 7 years |
Leasehold improvements are amortized over the shorter of their estimated useful lives or the remaining terms of the respective leases. Equipment used for demonstrations to customers is included in machinery and equipment and depreciated over its estimated useful life. Repair and maintenance costs are expensed as incurred.
The Company has developed software for internal use. Internal and external labor costs incurred during the application development stage of a project are capitalized. Costs incurred prior to application development and post implementation are expensed as incurred. Training and data conversion costs are expensed as incurred.
Long lived assets and their associated accumulated depreciation are derecognized upon their retirement or at the time of disposal, and the resulting gain or loss is included in the Company’s results of operations.
The Company identified finite-lived intangible assets other than goodwill as a result of acquisitions. Finite-lived intangible assets are valued based on estimated future cash flows and amortized over their estimated useful lives based on methods that approximate the pattern in which the economic benefits are expected to be realized.
Finite-lived intangibles assets and fixed assets are tested for impairment when indicators of impairment are present. For purposes of this test, long-lived assets are grouped with other assets and liabilities at the lowest level for which identifiable cash flows are largely independent of the cash flows of other assets and liabilities. If the Company determines that indicators of potential impairment are present, it assesses the recoverability of long-lived asset group by comparing its undiscounted future cash flows to its carrying value, and an impairment loss is recognized in operating results to the extent any finite-lived intangible asset’s carrying value exceeds its calculated fair value. The future cash flow period is based on the future service life of the primary asset within the long-lived asset group.
Finite-lived intangible assets are amortized over their useful lives, as follows:
Trademarks |
|
5 - 13 years |
Patents |
|
8 years |
Completed technology |
|
7 - 15 years |
Customer relationships |
|
10 - 16 years |
Non-competition agreements |
|
5 years |
Leases
The Company has operating leases for real estate and non-real estate and finance leases for non-real estate. The classification of a lease as operating or finance and the determination of the right-of-use asset (“ROU asset”) and lease liability are determined at lease inception. The ROU asset represents the Company’s right to use an underlying asset for the lease term and the lease liability represents the Company’s obligation to make lease payments arising from the lease. Operating lease ROU assets and liabilities are recognized at the commencement date of the lease based on the present value of lease payments over the lease term. As most of the Company’s leases do not provide an implicit rate, an incremental borrowing rate is used based on the estimated rate of interest for collateralized borrowing over a similar term of the lease payments at commencement date.
55
Lease terms may include options to extend or terminate the lease when it is reasonably certain that the option will be exercised. Lease expense is recognized on a straight-line basis over the lease term.
The Company’s lease agreements may contain lease and non-lease components. Non-lease components primarily include payments for maintenance and utilities. Fixed payments for non-lease components are combined with lease payments and accounted for as a single lease component which increases the amount of the ROU asset and liability.
The ROU asset for operating leases is included within “Other assets” and the ROU asset for finance leases is included within “Property, plant and equipment, net” in the Consolidated Balance Sheets. The short-term lease liabilities for both operating leases and finance leases are included within “Accrued expenses and other current liabilities” in the Consolidated Balance Sheets. The long-term lease liabilities for operating leases and finance leases are included within “Long-term operating lease liabilities”, and “Other long-term liabilities”, respectively, in the Consolidated Balance Sheets.
Goodwill
Goodwill represents the excess of purchase price over the fair value of net tangible and identifiable intangible assets of businesses acquired by the Company. Goodwill is tested for impairment annually or more often if impairment indicators are present at the reporting unit level. The Company elected April 1st as its annual goodwill impairment assessment date. If the existence of events or circumstances indicates that it is more likely than not that fair values of the reporting units are below their carrying values, the Company performs additional impairment tests during interim periods to evaluate goodwill for impairment.
Application of the goodwill impairment test requires significant judgment based on market and operational conditions at the time of the evaluation, including management’s best estimate of future business activity and the related estimates of future cash flows from the reporting units that include the associated goodwill. These periodic evaluations could cause management to conclude that impairment factors exist, requiring an adjustment of these assets to their then-current fair market values. Future business conditions and/or activity could differ materially from the projections made by management which could result in impairment charges.
The goodwill impairment test is performed at the reporting unit level. A reporting unit is either an operating segment or one level below it, which is referred to as a “component”. The level at which the impairment test is performed requires an assessment of whether the operations below an operating segment constitute a self-sustaining business, in which case testing is generally performed at this level.
The Company first assesses qualitative factors to determine whether the existence of events or circumstances indicates that it is more likely than not that the fair value of a reporting unit is less than its carrying value. If the Company determines, based on this assessment, that it is more likely than not that the fair value of the reporting unit is less than its carrying value, management performs a quantitative goodwill impairment test by comparing the reporting unit’s fair value with its carrying value. An impairment loss is recognized for the amount by which the reporting unit’s carrying value exceeds its fair value, up to the total amount of goodwill allocated to the reporting unit.
We determine fair values of our reporting units based on an income approach in accordance with the discounted cash flow method, (the “DCF Method”). The DCF Method is based on projected future cash flows and terminal value estimates discounted to their present values. Terminal value represents the present value an investor would pay on the valuation date for the rights to the cash flows of the business for the years subsequent to the discrete cash flow projection period. We consider the DCF Method to be the most appropriate valuation technique since it is based on management’s long-term financial projections. In addition to determining the fair value of our reporting units based on the DCF Method, we also compare the aggregate values of our net corporate assets and reporting unit fair values to our overall market capitalization and use certain market-based valuation techniques to assess the reasonableness of the reporting unit fair values determined in accordance with the DCF Method.
56
Warranty Obligations
The Company establishes reserves for estimated costs of product warranties based on historical information. Product warranty reserves are recorded at the time product revenue is recognized, and retrofit accruals are recorded at the time retrofit programs are established. The Company’s warranty obligation is affected by product failure rates, utilization levels, material usage, service delivery costs incurred in correcting a product failure and supplier warranties on parts delivered by the Company.
Revenue Recognition
The Company generates revenue from the following sources:
| ● | Products, including sales of automated cold sample management systems, vaccine cold storage and transport systems, consumables, instruments, spare parts, and software. |
| ● | Services, including repairs, upgrades, diagnostic support, installation, as well as biological sample services such as DNA sequencing, gene synthesis, molecular biology, bioinformatics, biological sample storage, sample acquisition, and other support services. |
The Company recognizes revenue for the transfer of such promised products or services to customers in an amount that reflects the consideration to which the Company expects to be entitled to in exchange for those products or services. Under ASC 606, Revenue from Contracts with Customers (“ASC 606”), revenue is recognized when, or as, the transfer of control of the underlying performance obligation occurs. To determine the amount of consideration the Company expects to be entitled to and whether transfer of control has occurred, the Company applies the following five-step model:
| ● | Identify the contract with a customer. Contracts are accounted for when approval and commitment has been received from both parties, the rights of each party are identified, payment terms are identified, the contract has commercial substance and collectability of the consideration to which the Company is entitled is probable. Contracts are generally evidenced through receipt of an approved purchase order or execution of a binding arrangement and can be both short and long-term. Long-term contracts within the segments relate to the sale of products with attached service-type warranty contracts that generally have a stated contract term that is greater than one year. Contracts may contain acceptance provisions where the Company is required to obtain technical acceptance from the customer upon completion of installation services and evidence of the system’s functional performance within the customer’s operating environment. The Company has concluded that acceptance criteria within its contracts can be objectively evaluated and will not impact the Company’s transfer of control assessment under ASC 606. |
| ● | Identify the performance obligations in the contract. Performance obligations include the sale of products and services. Certain customer arrangements related to the sale of automated cold sample management systems generally include more than one performance obligation and may include a combination of goods and or services, such as products with installation services or service-type warranty obligations. These contracts include multiple promises and as a result, the Company is required to evaluate each promise and determine whether the promise qualifies as a performance obligation within the contract. Contracts may contain the option to acquire additional products or services at defined prices. The Company reviews the pricing of these options to determine whether the option would exist independently of the current contract. If the pricing of contract options provides a material right to the customer that it would not receive without entering into the current contract, the Company accounts for the option as a separate performance obligation. |
| ● | Determine the transaction price. The transaction price of the Company’s contracts with its customer is generally fixed, based on the amounts to be contractually billed to the customer. Although uncommon, certain contracts may contain variable consideration in the form of customer allowances and rebates that consist primarily of retrospective volume-based discounts and other incentive programs. Variable consideration is estimated at contract inception and included in the transaction price if it is probable that a subsequent change in the estimate would not result in a significant revenue reversal. The period between transfer of control of the |
57
| performance obligations within a customer contract and timing of payment is generally within one year. As a result, the Company’s contracts typically do not include significant financing components. |
| ● | Allocate the transaction price to the performance obligations in the contract. For customer contracts that contain more than one performance obligation, the Company allocates the total transaction consideration to each performance obligation based on the relative stand-alone selling price of each performance obligation within the contract. The Company relies on either observable standalone sales or an expected cost-plus margin approach to determine the standalone selling price of offerings, depending on the nature of the performance obligation. Performance obligations whose standalone selling price is estimated using an expected cost-plus margin approach relate to the sale of customized automated cold sample management systems, services, and service-type warranties. |
| ● | Recognize revenue when or as the Company satisfies a performance obligation. The Company satisfies its performance obligations by transferring a product or service either at a point in time or over time, when the transfer of control of the underlying performance obligation has occurred. Control is evidenced by the customer’s ability to direct the use of and obtain substantially all the remaining benefits from the performance obligation. Revenue from third-party sales for which the Company does not meet the criteria for gross revenue recognition is recognized on a net basis. All other revenue is recognized on a gross basis. The Company excludes from the transaction price all sales taxes assessed by governmental authorities and as a result, revenue is presented net of tax. |
As a result of applying this five-step model under ASC 606, the Company recognizes revenues from its sale of products and services as follows:
| ● | Products: Revenue from the sale of standard products is recognized upon their transfer of control to the customer, which is considered complete at either the time of shipment or arrival at destination, based on the agreed upon terms within the contract. The Company’s payment terms for the sale of standard products are typically 30 to 60 days. |
Revenue from the sales of certain products that involve significant customization, which include primarily automated cold sample management systems is recognized over time as the asset created by the Company’s performance does not have alternative use to the Company and an enforceable right to payment for performance completed to date is present. The Company recognizes revenue as work progresses based on a percentage of actual labor hours incurred on the project to-date and total estimated labor hours expected to be incurred on the project. The selection of the method to measure progress towards completion requires judgment. The Company has concluded that using the percentage of labor hours incurred to estimated labor hours needed to complete the project most appropriately depicts the Company’s efforts towards satisfaction of the performance obligation. The Company develops profit estimates for long-term contracts based on total revenue expected to be generated from the project and total costs anticipated to be incurred in the project. These estimates are based on a number of factors, including the degree of required product customization and the work required to be able to install the product in the customer’s existing environment, as well as the Company’s historical experience, project plans and an assessment of the risks and uncertainties inherent in the contract related to implementation delays or performance issues that may or may not be within the Company’s control. The Company estimates a loss on a contract by comparing total estimated contract revenue to the total estimated contract costs and recognizes a loss during the period in which it becomes probable and can be reasonably estimated. The Company reviews profit estimates for long-term contracts during each reporting period and revises the estimate based on changes in circumstances. Revenue for certain arrangements that involve significant product customization but do not provide the Company with an enforceable right to payment for performance completed to date are recognized at a point in time, upon completion or substantial completion of the project, provided transfer of control has occurred. The project is considered substantially complete when the Company receives acceptance from the customer and remaining tasks are perfunctory or inconsequential and in control of the Company. Generally, the terms of long-term contracts provide for progress billings based on completion of milestones or other defined phases of work. In certain instances, payments collected from customers in advance of recognizing the related revenue are recorded and presented as contract liabilities within “Deferred revenue” on the Company’s Consolidated Balance Sheet.
58
Additionally, due to certain billing constraints within contracts, the customer may retain a portion of the contract price until completion of the contract. In these contracts, an unbilled receivable is recorded when revenue recognized may exceed billings, which the Company presents as a contract asset on the balance sheet, which is included within the “Prepaid expenses and other current assets” on the Company’s Consolidated Balance Sheet.
| ● | Services: Service revenue is generally recognized ratably over time or on an output method, as the customer simultaneously receives and consumes the benefit of these services as they are performed. Payments related to service-type warranties may be made up front or proportionally over the contract term. Revenue for sample management and storage are recognized over the period the services are rendered or samples are stored. Revenue from genomic services is recognized over time and is based upon the fact that transfer of control takes place over time as determined using the input method of costs incurred. Payment due or received from the customers prior to rendering the associated services are recorded as a contract liability. |
Government Assistance
The Company receives government assistance from various domestic and foreign, local, regional and national governments which vary in size and duration in the form of cash grants or refundable tax credits. The government assistance typically specifies conditions that must be met in order for it to be earned, such as employee retention targets, completion of employee training, or the construction or acquisition of property and equipment and are often time bound. If conditions are not satisfied or if the duration period for the arrangement is not met, the government assistance is often subject to reduction, repayment, or termination.
The Company’s policy is to recognize a benefit in the Consolidated Statements of Operations in “Other, net” over the life of the asset or duration of the program when the Company has reasonable assurance that it will comply with the conditions under the government assistance and the government assistance will be received, refundable tax credits may also result in a reduction in “Accrued income taxes payable” in the Consolidated Balance Sheets. If government assistance is received or is probable of receipt and the amount is determinable by the Company in advance of completion of the conditions, the government assistance is recognized in “Accrued expenses and other current liabilities” or “Other long-term liabilities” in the Consolidated Balance Sheets, as appropriate.
In fiscal year 2023, approximately $4.3 million of government assistance was recognized in “Other, net” and approximately $0.9 million was recognized as a reduction to “Cost of Revenue – Products” in the Company’s Consolidated Statement of Operations. The Company also received advance cash government assistance of $6.6 million, of which $4.7 million is recognized within “Other long-term liabilities”, and $1.9 million is recognized within “Accrued expenses and other current liabilities” in the Consolidated Balance Sheet. Furthermore, the Company anticipates receipt of $0.6 million of additional government assistance, recorded within “Prepaid expenses and other current assets” in the Consolidated Balance Sheet.
Research and Development Expense
Research and development costs are expensed as incurred. Research and development costs consist primarily of personnel expenses related to development of new products, as well as enhancements and engineering changes to existing products and development of hardware and software components.
Stock-Based Compensation
The fair value of restricted stock units is determined based on the number of shares granted and the closing price of the Company’s common stock quoted on the Nasdaq Stock Market on the date of grant. For awards that vest based on service conditions, the Company recognizes stock-based compensation expense on a straight-line basis over the requisite service period. For awards that vest subject to performance conditions, the Company recognizes stock-based compensation expense ratably over the performance period if it is probable that performance condition will be met and adjusts for the percentage of shares probable of achieving the performance goals. Each quarter, management assesses the probability of achieving the performance goals. The Company makes estimates of stock award forfeitures and the number of awards expected to vest. The Company considers many factors in developing forfeiture estimates, including The Company records income taxes using the asset and liability method.
59
award types, employee classes and historical experience. Current estimates may differ from actual results and future changes in estimates.
Income Taxes
Deferred income tax assets and liabilities are recognized for the future tax differences between the financial statement carrying amounts of existing assets and liabilities and their respective income tax bases, as well as operating loss and tax credit carryforwards. The Company’s Consolidated Financial Statements contain certain deferred tax assets that were recorded as a result of operating losses, as well as other temporary differences between financial and tax accounting. A valuation allowance is established against deferred tax assets if, based upon the evaluation of positive and negative evidence and the extent to which that evidence is objectively verifiable, it is more likely than not that some or all of the deferred tax assets will not be realized.
Significant management judgment is required in determining the Company’s income tax (benefit) expense, the Company’s deferred tax assets and liabilities and any valuation allowance recorded against those net deferred tax assets. The Company evaluates the weight of all available evidence to determine whether it is more likely than not that some portion or all of the net deferred income tax assets will not be realized.
The calculation of the Company’s income tax liabilities involves consideration of uncertainties in the application of complex tax regulations. The Company recognizes liabilities for uncertain tax positions based on a two-step process. The first step is to evaluate the tax position for recognition by determining if the weight of available evidence indicates that it is more likely than not that the position will be sustained upon an audit conducted by taxing authorities, including resolution of related appeals or litigation processes, if any. If the Company determines that a tax position will more likely than not be sustained, the second step requires the Company to estimate and measure the tax benefit as the largest amount that is more likely than not to be realized upon ultimate settlement. It is inherently difficult and subjective to estimate such amounts, as the Company must determine the probability of various possible outcomes. The Company re-evaluates these uncertain tax positions on a quarterly basis. This evaluation is based on factors, such as changes in facts or circumstances, tax law, new audit activity and effectively settled issues. Determining whether an uncertain tax position is effectively settled requires judgment. A change in recognition or measurement may result in the recognition of a tax benefit or an additional charge to the tax expense.
Net Income (Loss) per Share
Basic income or loss per share is determined by dividing net income by the weighted average common shares outstanding during the period. Diluted income or loss per share is determined by dividing net income by diluted weighted average shares outstanding during the period. Diluted weighted average shares reflect the dilutive effect, if any, of potential common shares. To the extent their effect is dilutive, employee equity awards and other commitments to be settled in common stock are included in the calculation of diluted income or loss per share based on the treasury stock method. Potential common shares are excluded from the calculation of dilutive weighted average shares outstanding if their effect would be anti-dilutive at the balance sheet date based on a treasury stock method or due to a net loss.
Recently Adopted Accounting Pronouncements
In March 2020, the Financial Accounting Standards Board (“FASB”) issued Accounting Standards Update (“ASU”) 2020-04, Facilitation of the Effects of Reference Rate Reform on Financial Reporting. In January 2021, the FASB issued ASU 2021-01, Reference Rate Reform (Topic 848): Scope. The ASUs provide temporary optional expedients and exceptions to the GAAP guidance on contract modifications and hedge accounting to ease the financial reporting burdens related to the expected market transition from the London Interbank Offered Rate (“LIBOR”) and other interbank offered rates to alternative reference rates. The provisions of the ASUs were only available until December 31, 2022, when the reference rate replacement activity was expected to be completed. In December 2022, the FASB issued ASU 2022-06, Reference Rate Reform (Topic 848): Deferral of the Sunset Date of Topic 848, extending the relief offered in this series of ASUs through December 31, 2024. The Company adopted this guidance for the fiscal year ended September 30, 2023. There is no significant accounting impact on the Company’s consolidated financial statements and related disclosures as a result of the adoption of these ASUs.
60
In November 2021, the FASB issued ASU 2021-10, Government Assistance (Topic 832) – Disclosures by Business Entities about Government Assistance. The amendment in this ASU requires disclosures to increase the transparency of transactions with a government accounted for by applying a grant or contribution accounting model by analogy, including (1) the types of transactions, (2) the accounting for those transactions, and (3) the effect of those transactions on an entity’s financial statements. This ASU is effective for annual periods beginning after December 15, 2021. The Company adopted this guidance for the fiscal year ended September 30, 2023 on a prospective basis. The adoption of the ASU did not impact the Company’s recording or reporting of such amounts in the Company’s consolidated financial statements. See “Government Assistance” for the required disclosures resulting from adoption of this ASU.
In June 2020, the FASB issued ASU No. 2020-06, Debt with Conversion and Other Options (Subtopic 470-20) and Derivatives and Hedging - Contracts in Entity’s Own Equity (Subtopic 815-40). This ASU simplifies the accounting for certain financial instruments with characteristics of liabilities and equity, including convertible instruments and contracts on an entity’s own equity. This ASU is effective for annual periods beginning after December 15, 2021. The adoption of this ASU on October 1, 2022 did not have a material impact on the Company’s consolidated financial statements or disclosures.
3. Discontinued Operations
Disposition of the Semiconductor Automation Business
On September 20, 2021, the Company entered into a definitive agreement to sell its semiconductor automation business to Thomas H. Lee Partners, L.P. (“THL”) and the Company determined that the semiconductor automation business met the criteria to be classified as a discontinued operation and, as a result, its historical financial results are reflected in the consolidated financial statements as a discontinued operation, and assets and liabilities were classified as assets and liabilities held for sale. On February 1, 2022, the Company completed the sale of the semiconductor automation business for $2.9 billion in cash. As part of the transaction, the Company recorded an $18.1 million liability related to retention bonuses and cash settled stock-based awards for former employees of the Company that were conveyed with the transaction. The Company paid $0.6 million of these payments during the year ended September 30, 2022 and remitted the remaining payments to THL in November 2022, and THL directly paid the Company’s former employees. Following the completion of the sale, the Company no longer serves the semiconductor market.
In connection with the closing of the sale, the Company and THL entered into a transition services agreement under which both the Company and THL provide each other certain transition services related to finance and accounting, information technology, human resources, compliance, facilities, legal and research and development support, for time periods ranging from three to 24 months. In addition, the Company agreed to lease back a portion of the facilities in Chelmsford, Massachusetts, that were sold to THL as part of the sale agreement. The leases are 24 months but may be terminated earlier by the Company upon 90 days’ notice to THL. As of September 30, 2023, one of the two original leases is still in effect. The transition services and lease agreements approximate fair value and do not have a material impact on the Company’s financial results or operations.
61
During the twelve months ended September 30, 2023, the Company recorded a $1.4 million loss on divestiture. The following table presents the financial results of automation business discontinued operations with respect to the automation business (in thousands):
|
|
Year Ended September 30, |
||||
|
|
2022 |
|
2021 |
||
Revenue |
|
|
|
|
|
|
Products |
|
$ |
244,962 |
|
$ |
624,358 |
Services |
|
|
19,468 |
|
|
55,698 |
Total revenue |
|
|
264,430 |
|
|
680,056 |
Cost of revenue |
|
|
|
|
|
|
Products |
|
|
141,165 |
|
|
354,786 |
Services |
|
|
11,159 |
|
|
29,750 |
Total cost of revenue |
|
|
152,324 |
|
|
384,536 |
Gross profit |
|
|
112,106 |
|
|
295,520 |
Operating expenses |
|
|
|
|
|
|
Research and development |
|
|
18,486 |
|
|
48,647 |
Selling, general and administrative |
|
|
30,622 |
|
|
70,634 |
Restructuring charges |
|
|
- |
|
|
230 |
Total operating expenses |
|
|
49,108 |
|
|
119,511 |
Operating income |
|
|
62,998 |
|
|
176,009 |
Gain on divestiture |
|
|
2,561,820 |
|
|
133 |
Income before income taxes |
|
|
2,624,818 |
|
|
176,142 |
Income tax expense |
|
|
480,673 |
|
|
35,357 |
Net income from discontinued operations |
|
$ |
2,144,145 |
|
$ |
140,785 |
The following table presents the significant non-cash items and capital expenditures for the discontinued operations with respect to the semiconductor automation business that are included in the Consolidated Statements of Cash Flows (in thousands):
|
|
Year Ended September 30, |
||||
|
|
|
2022 |
|
|
2021 |
Depreciation and amortization |
|
$ |
- |
|
$ |
8,472 |
Capital expenditures |
|
|
2,862 |
|
|
6,414 |
Stock-based compensation |
|
|
- |
|
|
7,405 |
There were no significant non-cash items and or capital expenditures related to discontinued operations in 2023.
4. Business Combinations
The Company recorded the assets acquired and liabilities assumed related to the following acquisitions at their fair values as of the acquisition date, from a market participant’s perspective. While the Company uses its best estimates and assumptions as part of the purchase price allocation process to value the assets acquired and liabilities assumed on the acquisition date, its estimates and assumptions are subject to refinement. Fair value estimates are based on a complex series of judgments about future events and uncertainties and rely heavily on estimates and assumptions. The judgments used to determine the estimated fair value assigned to each class of assets acquired and liabilities assumed, as well as asset lives, can materially impact the Company’s results of operations. The measurement period to finalize the fair values is completed within one year after the respective acquisition date.
62
Acquisitions Completed in Fiscal Year 2023
Ziath Ltd
On February 2, 2023, the Company acquired Ziath, Ltd. and its subsidiaries (“Ziath”). Based in Cambridge, United Kingdom, Ziath is a leading provider of 2D barcode readers for life science applications. Founded in 2005, Ziath’s innovative 2D barcode readers are a key component of the laboratory automation workflow serving pharmaceutical, biotechnology and academic customers worldwide. Ziath will enhance the Company’s offerings, which support the entire lifecycle of sample management from specimen collection to sample registration, storage and processing. The acquisition was completed at a purchase price of $16.0 million, net of cash acquired. The acquired business is included in the Life Sciences Products segment.
The allocation of the consideration included $12.0 million of goodwill, $4.1 million of technology, $1.1 million of deferred tax liability, $0.6 million of customer relationships, $0.3 million of trademarks, and several other assets and liabilities. The weighted average life of completed technology is 10 years, customer relationships is 13 years, and trademarks is 13 years. The goodwill represents the Company’s ability to provide a differentiated technology enabling high throughput scanning of varied formats of consumables. The goodwill is not expected to be deductible for income tax purposes.
The Company did not present pro forma financial information for its consolidated results of operations for the acquisition because such results are immaterial.
B Medical Systems S.á. r.l.
On October 3, 2022, the Company acquired B Medical Systems S.á r.l. and its subsidiaries ("B Medical"), for a purchase price of $432.2 million including contingent consideration, which the Company estimated to be $17.0 million as of the measurement date. B Medical is a market leader in temperature-controlled storage and transportation solutions that enables the delivery of life-saving treatments to more than 150 countries worldwide. B Medical’s results of operations are reported in the Company’s Life Sciences Products segment from the date of acquisition. The Company paid a total initial cash purchase price at closing of $424.0 million, as adjusted for cash acquired and other items pursuant to the acquisition agreement. B Medical Systems Holdings S.A (the “Seller”) was eligible to earn up to €50.0 million in contingent consideration based upon achievement of certain financial metrics by B Medical. The Company repaid B Medical’s outstanding debt of $43.1 million prior to September 30, 2022 which was included in the purchase price and was classified in prepaid assets as of September 30, 2022. In addition, the Company recorded $381.0 million in short-term restricted cash as of September 30, 2022, which was reserved to complete the acquisition which occurred on October 3, 2022.
The contingent consideration payment from the Company to the Seller was based on achievement of certain revenue targets over the one-year period from October 3, 2022 to September 30, 2023. The Company recorded the estimated fair value of the contingent consideration liability utilizing a Monte Carlo simulation that incorporates revenue projections, revenue growth rates of comparable companies, implied volatility and a risk adjusted discount rate. Each quarter, the Company was required to remeasure the fair value of this liability as assumptions changed over time and any resulting adjustments in the fair value of this liability were recorded in “Operating expenses” in the Consolidated Statements of Operations. This fair value measurement was based on significant inputs not observable in the market and thus represented a Level 3 measurement. This fair value measurement was directly impacted by the Company’s estimate of future incremental revenue growth of the business. Accordingly, if actual revenue growth was higher or lower than the estimates within the fair value measurement, the Company would record additional charges or gains. This liability was revalued from $18.5 million as of December 31, 2022 to zero as of June 30, 2023.
63
The purchase price was allocated to B Medical’s tangible and identifiable intangible assets acquired and liabilities assumed based on the estimated fair values as of October 3, 2022, as set forth below (in thousands):
|
|
|
|
|
|
|
|
|
|
Fair Value |
|
Accounts receivable |
|
$ |
19,549 |
Inventory |
|
|
51,978 |
Other assets |
|
|
10,769 |
Property plant and equipment |
|
|
54,149 |
Identifiable Intangible Assets: |
|
|
|
Completed technology |
|
|
100,600 |
Trademarks |
|
|
5,500 |
Customer relationships |
|
|
36,700 |
Backlog |
|
|
600 |
Other liabilities |
|
|
(32,533) |
Deferred income taxes, net |
|
|
(43,393) |
Goodwill |
|
|
228,241 |
Total purchase price, net of cash acquired |
|
$ |
432,160 |
During the twelve months ended September 30, 2023 the Company recorded adjustments which resulted in a net increase to goodwill of $9.2 million since the initial preliminary purchase price allocation. These adjustments include a $1.0 million decrease to property, plant and equipment, a $0.4 million increase to intangible assets, a $9.6 million decrease to other assets, a $2.3 million increase to inventory, a $0.8 decrease in other liabilities, and a $0.4 million decrease to deferred taxes.
In performing the purchase price allocation, the Company considered, among other factors, the intended future use of acquired assets, and historical financial performance and estimates of future performance of B Medical’s business. As part of the purchase price allocations, the Company determined the identifiable intangible assets were completed technology value, trademarks, customer relationships and backlog. The fair value of the intangible assets was estimated using the income approach, specifically the multi-period excess earnings method, and the cash flow projections were discounted using a rate of 13%. The cash flows were based on estimates used to price the transaction, and the discount rate applied was benchmarked to the implied rate of return from the transaction and the weighted average cost of capital. The weighted average life of completed technology is 10 years, customer relationships is 16 years, trademarks is five years and backlog is one year. The intangible assets acquired are amortized over their respective weighted average life using methods that approximate the pattern in which the economic benefits are expected to be realized. The calculation of the excess of the purchase price over the estimated fair value of the tangible net assets and intangible assets acquired was recorded to goodwill. Goodwill of $228.2 million largely reflects the potential expansion of the Company's cold chain capabilities in the Company’s Life Sciences Products segment by adding differentiated solutions for reliable and traceable transport of temperature-controlled specimens. The goodwill is not deductible for income tax purposes.
The following financial information reflects our consolidated results from B Medical (in thousands):
|
|
Year Ended September 30, |
||
|
|
2023 |
|
|
|
|
|
|
|
Revenue |
|
$ |
113,122 |
|
Net loss |
|
$ |
(26,463) |
|
64
The Company incurred $4.9 million and $4.0 million in transaction costs recognized in earnings and presented within “Selling, general and administrative” in the Company’s Consolidated Statements of Operations related to the acquisition for fiscal years ending 2023 and 2022, respectively.
The following unaudited pro forma financial information reflects our consolidated results of operations as if the acquisition had taken place on October 1, 2021 (in thousands). The unaudited pro forma financial information is not necessarily indicative of the results of operations that we would have reported had the transaction occurred at the beginning of these periods nor is it necessarily indicative of future results.
|
|
|
|
|
|
|
|
|
Year Ended September 30, |
||||
|
|
2023 |
|
2022 |
||
|
|
|
|
|
|
|
Revenue |
|
$ |
665,072 |
|
$ |
672,151 |
Net income (loss) |
|
$ |
(5,356) |
|
$ |
2,111,185 |
To present our consolidated results of operations as if the acquisition had taken place on October 1, 2021, the unaudited pro forma earnings for the fiscal years ended 2023 and 2022 have been adjusted to exclude $5.3 million and include $23.2 million, respectively, of property, plant and equipment, inventory, and intangible asset step-up depreciation and amortization expense. Non-recurring acquisition related items and significant GAAP adjustments in the fiscal years ending 2023 and 2022 exclude $3.6 million and include $4.9 million, respectively, of transaction costs, net. Additional adjustments for fiscal year ended 2022 exclude $6.1 million of debt interest expense, include $1.1 million expense of capitalized research and development costs, and include a $6.4 million tax benefit adjustment. The pro forma financial information does not include any anticipated cost savings or other effects of the integration of B Medical. Accordingly, the unaudited pro forma financial information does not necessarily reflect the actual results that would have occurred, nor is it necessarily indicative of future results of operations.
Acquisition Completed in Fiscal Year 2022
Barkey Holding GmbH
On July 1, 2022, the Company acquired Barkey Holding GmbH and its subsidiaries (“Barkey”), a leading provider of controlled-rate thawing devices for customers in the medical, biotechonlogy and pharmaceutical industries, head quartered in Leopoldshöhe, Germany. The financial results for Barkey are included within the Life Sciences Products segment. The total cash purchase price of the acquisition was $84.8 million, net of cash acquired. The acquisition added innovative products and capabilities that extend the Company’s extensive cold chain of condition portfolio of products and services, while also expanding the Company’s customer reach in the fast-growing cell and gene therapy (“CGT”) space. The allocation of the consideration included $3.0 million of customer relationships, $29.0 million of technology, $60.5 million of goodwill, $9.8 million of deferred tax liabilities, and several other assets and liabilities. The weighted useful life of all the intangible assets acquired is 15 years. The goodwill and intangibles are not tax deductible.
During the twelve months ended September 30, 2023 the Company recorded an adjustment which resulted in an increase to goodwill of $2.7 million since the initial preliminary purchase price allocation due to a $2.7 million increase to accrued liabilities.
The Company did not present pro forma financial information for its consolidated results of operations for the acquisition because such results are immaterial.
Acquisitions Completed in Fiscal Year 2021
Abeyatech LLC
On April 2, 2021, the Company acquired Abeyatech LLC. The Company has included the financial results of the acquired operations within the Life Sciences Products segment. The purchase price includes $9.9 million cash payment and $9.4 million in contingent consideration, at present value, based on the acquired business’ performance for the twelve-month period ending December 31, 2021, subject to customary working capital adjustments and other adjustments.
65
The acquisition enhances the breadth and depth of the Company’s offerings and expands its expertise in the Life Sciences Products segment. The allocation of the consideration included $11.9 million of technology, $4.4 million of goodwill, and several other assets and liabilities for $3.0 million. The weighted useful life of all the intangible assets acquired is 12 years. The goodwill and intangibles are tax deductible. During the three months ended March 31, 2022, the Company paid $10.0 million related to the contingent consideration recorded at the time of acquisition based on the achievement of business performance targets set forth in the purchase agreement.
The Company did not present pro forma financial information for its consolidated results of operations for the acquisition because such results are immaterial.
Trans-Hit Biomarkers, Inc.
On December 3, 2020, the Company acquired Trans-Hit Biomarkers Inc. (“THB”), a worldwide biospecimen procurement service provider based in Montreal, Canada. THB has an extensive collection capability for biospecimens and clinical samples through a worldwide partner network of clinical sites and biobanks. The total cash purchase price of the acquisition was approximately $15.1 million, net of cash acquired. The acquisition enhances the breadth and depth of the Company’s offerings and expands its expertise in the Life Sciences Services segment. The allocation of the consideration included $7.8 million of customer relationships, $9.3 million of goodwill, $2.4 million of deferred tax liabilities, and several other assets and liabilities. The weighted useful life of all intangibles acquired is 11 years. The Company has included the financial results of the acquired operations in the Life Sciences Services segment. The goodwill and intangibles are not tax deductible.
The Company did not present pro forma financial information for its consolidated results of operations for the acquisition because such results are immaterial.
5. Marketable Securities
During fiscal years 2023 and 2022, the Company had sales and maturities of marketable securities of $1.1 billion and $705.4 million, respectively. Realized losses on the sale of marketable securities were $0.8 million for the fiscal year ended September 30, 2023, and realized gains on the sale of marketable securities were $0.2 million for the fiscal year ended September 30, 2022.
The following is a summary of the amortized cost and the fair value, including accrued interest receivable, as well as unrealized gains (losses) on the short-term and long-term marketable securities as of September 30, 2023 and 2022 (in thousands):
|
|
|
|
Gross |
|
Gross |
|
|
||||
|
|
Amortized |
|
Unrealized |
|
Unrealized |
|
|
||||
|
|
Cost |
|
Losses |
|
Gains |
|
Fair Value |
||||
September 30, 2023: |
|
|
|
|
|
|
|
|
|
|
|
|
U.S. Treasury securities and obligations of U.S. government agencies |
|
$ |
227,804 |
|
$ |
(2,573) |
|
$ |
— |
|
$ |
225,231 |
Bank certificates of deposits |
|
|
8,122 |
|
|
(170) |
|
|
— |
|
|
7,952 |
Corporate securities |
|
|
221,155 |
|
|
(4,127) |
|
|
— |
|
|
217,028 |
Municipal securities |
|
|
— |
|
|
— |
|
|
— |
|
|
— |
|
|
$ |
457,081 |
|
$ |
(6,870) |
|
$ |
— |
|
$ |
450,211 |
September 30, 2022: |
|
|
|
|
|
|
|
|
|
|
|
|
U.S. Treasury securities and obligations of U.S. government agencies |
|
$ |
804,774 |
|
$ |
(6,163) |
|
$ |
21 |
|
$ |
798,632 |
Bank certificates of deposits |
|
|
8,335 |
|
|
(158) |
|
|
1 |
|
|
8,178 |
Corporate securities |
|
|
406,270 |
|
|
(8,113) |
|
|
— |
|
|
398,157 |
Municipal securities |
|
|
59,043 |
|
|
(226) |
|
|
— |
|
|
58,817 |
|
|
$ |
1,278,422 |
|
$ |
(14,660) |
|
$ |
22 |
|
$ |
1,263,784 |
66
The fair values of the marketable securities by contractual maturities at September 30, 2023 are presented below (in thousands).
|
|
|
|
|
|
|
|
|
Amortized |
|
|
|
|
|
|
Cost |
|
|
Fair Value |
|
Due in one year or less |
|
$ |
342,901 |
|
$ |
338,873 |
Due after one year through five years |
|
|
111,121 |
|
|
108,279 |
Due after five years through ten years |
|
|
— |
|
|
— |
Due after ten years |
|
|
3,059 |
|
|
3,059 |
Total marketable securities |
|
$ |
457,081 |
|
$ |
450,211 |
Expected maturities could differ from contractual maturities because the security issuers may have the right to prepay obligations without prepayment penalties.
Unrealized losses from fixed-income securities are primarily attributable to changes in interest rates. Management does not believe any unrealized losses represent impairments based on our evaluation of the available evidence.
6. Derivative Instruments
Net gains and losses related to foreign exchange contracts are recorded as a component of “Other income (expense)” in the accompanying Consolidated Statements of Operations and are as follows for the fiscal years ended September 30, 2023, 2022 and 2021 (in thousands):
|
|
|
|
|
|
|
|
|
|
|
|
Year Ended September 30, |
|||||||
|
|
2023 |
|
2022 |
|
2021 |
|||
Realized gains (losses) on derivatives not designated as hedging instruments |
|
$ |
(1,174) |
|
$ |
991 |
|
$ |
(7,781) |
The notional amounts of the Company’s derivative instruments as of September 30, 2023 and 2022 were as follows (in thousands):
|
|
|
|
|
Year Ended September 30, |
|||
|
|
Hedge Designation |
|
|
2023 |
|
|
2022 |
|
|
|
|
|
|
|
|
|
Cross-currency swap |
|
Net Investment Hedge |
|
$ |
436,360 |
|
$ |
960,000 |
Foreign exchange contracts |
|
Undesignated |
|
|
184,800 |
|
|
585,800 |
The fair value of derivative instruments are as follows at September 30, 2023 and 2022 (in thousands):
|
|
|
Fair Value of Assets |
|
|
Fair Value of Liabilities |
||||||
As of September 30, |
|
|
2023 |
|
|
2022 |
|
|
2023 |
|
|
2022 |
Derivatives not designated as hedging instruments |
|
|
|
|
|
|
|
|
|
|
|
|
Foreign exchange contracts |
|
$ |
44 |
|
$ |
634 |
|
$ |
(421) |
|
$ |
(230) |
Total fair value |
|
$ |
44 |
|
$ |
634 |
|
$ |
(421) |
|
$ |
(230) |
67
Hedging Activities
On February 1, 2022, the Company entered into a cross-currency swap agreement to hedge the variability of exchange rate impacts between the U. S. dollar and the Euro. Under the terms of the cross-currency swap agreement, the Company notionally exchanged $1.0 billion for €915.0 million at a weighted average interest rate of 1.20%. The designated notional amount was $960.0 million, and the actual interest rate was 1.28%. The 1.28% rate was in the range of the market value for that day and was the true interest rate on the notional amount. The Company designated the cross-currency swap as a hedge of net investments against one of its Euro denominated subsidiaries requiring an exchange of the notional amounts at maturity. At the maturity of the cross currency-swap on February 1, 2023, the Company delivered a notional amount of €852.0 million and received a notional amount of $960.0 million at an USD/EUR exchange rate of 1.13, which included realization of a gain of $29.3 million recorded in “Accumulated other comprehensive income (loss)” in the Consolidated Balance Sheets.
On February 1, 2023, the Company entered into another cross-currency swap agreement to hedge the variability of exchange rate impacts between the U.S. dollar and the Euro. Under the terms of the cross-currency swap agreement, the Company notionally exchanged $436.0 million for €400.0 million at a weighted average interest rate of 1.66%. The Company designated the cross-currency swap as a hedge of net investments against one of its Euro denominated subsidiaries, which requires an exchange of the notional amounts at maturity on February 1, 2024.
Cross-currency swaps are marked to market at each reporting period, representing the fair values of the cross-currency swap and any changes in fair value are recognized as a component of “Accumulated other comprehensive income (loss)” in the Consolidated Balance Sheets.
Interest earned on the cross-currency swap is recorded within “Interest income” in the Consolidated Statements of Operations. For the fiscal years ended September 30, 2023 and 2022, the Company recorded “Interest income” of $8.9 million and $8.2 million, respectively, on this instrument.
7. Property, Plant and Equipment
Property, plant and equipment were as follows as of September 30, 2023 and 2022 (in thousands):
|
|
September 30, |
||||
|
|
2023 |
|
2022 |
||
Buildings, land, and land use right |
|
$ |
41,870 |
|
$ |
29,581 |
Computer equipment and software |
|
|
38,623 |
|
|
35,814 |
Machinery and equipment |
|
|
139,858 |
|
|
90,700 |
Furniture and fixtures |
|
|
7,426 |
|
|
5,806 |
Leasehold improvements |
|
|
52,670 |
|
|
37,495 |
Capital projects in process |
|
|
33,915 |
|
|
36,644 |
Right-of-use asset |
|
|
4,718 |
|
|
2,476 |
Vehicles |
|
|
1,540 |
|
|
— |
Property, plant and equipment, gross |
|
|
320,620 |
|
|
238,516 |
Less: accumulated depreciation and amortization |
|
|
(114,876) |
|
|
(84,046) |
Property, plant and equipment, net |
|
$ |
205,744 |
|
$ |
154,470 |
Depreciation expense, which includes amortization expense on finance leases, was $37.2 million, $21.9 million and $19.5 million, respectively, for the fiscal years ended September 30, 2023, 2022, and 2021. The Company recorded $13.5 million of additions to property, plant and equipment for which cash payments had not yet been made as of September 30, 2023.
As of September 30, 2023 and 2022, the Company had cumulative capitalized direct costs of $30.5 million and $26.9 million, respectively, associated with the development of software for its internal use. As of September 30, 2023, this balance included $4.9 million associated with software still in the development stage included within "Property, plant and equipment, net" in the accompanying Consolidated Balance Sheets.
68
During fiscal year 2023, the Company capitalized direct costs of $3.6 million associated with the development of software for its internal use.
8. Goodwill and Intangible Assets
On April 1, 2023, in accordance with the Company’s policy, the Company performed the annual quantitative goodwill impairment test. As of the annual impairment test date, the estimated fair value of the Life Sciences Services and Life Sciences Products reporting units exceeded their respective carrying values by approximately 24% and 17%, respectively. The Company qualitatively evaluated goodwill for impairment during the remainder of fiscal 2023 and determined that there were no events or circumstances during the period to indicate an additional quantitative goodwill impairment assessment was required.
In the event of financial performance of the reporting units does not meet management’s expectations in the future, there is a change to the Company’s reportable segments, the Company experiences a prolonged macroeconomic or market downturn, declines in the Company’s stock price, or there are other negative revisions to key assumptions used in the DCF Method, the Company may be required to perform additional impairment analyses and could be required to recognize an impairment charge.
The following table sets forth the changes in the carrying amount of goodwill by reportable segment since September 30, 2021 (in thousands):
|
|
|
|
|
|
|
|
|
|
|
|
Life Sciences |
|
Life Sciences |
|
|
|
||
|
|
Products |
|
Services |
|
Total |
|||
Balance - September 30, 2021 |
|
$ |
110,138 |
|
$ |
359,218 |
|
$ |
469,356 |
Acquisitions |
|
|
57,854 |
|
|
— |
|
|
57,854 |
Currency translation adjustments |
|
|
(13,380) |
|
|
(207) |
|
|
(13,587) |
Balance - September 30, 2022 |
|
$ |
154,612 |
|
$ |
359,011 |
|
$ |
513,623 |
Acquisitions |
|
|
242,789 |
|
|
— |
|
|
242,789 |
Currency translation adjustments |
|
|
27,903 |
|
|
24 |
|
|
27,927 |
Balance - September 30, 2023 |
|
$ |
425,304 |
|
$ |
359,035 |
|
$ |
784,339 |
The components of the Company’s identifiable intangible assets as of September 30, 2023 and 2022 are as follows (in thousands):
|
|
September 30, 2023 |
|
September 30, 2022 |
||||||||||||||
|
|
|
|
Accumulated |
|
Net Book |
|
|
|
Accumulated |
|
Net Book |
||||||
|
|
Cost |
|
Amortization |
|
Value |
|
Cost |
|
Amortization |
|
Value |
||||||
Patents |
|
$ |
1,226 |
|
$ |
1,175 |
|
$ |
51 |
|
$ |
1,225 |
|
$ |
1,106 |
|
$ |
119 |
Completed technology |
|
|
215,430 |
|
|
56,021 |
|
|
159,409 |
|
|
99,525 |
|
|
37,991 |
|
|
61,534 |
Trademarks and trade names |
|
|
6,630 |
|
|
1,445 |
|
|
5,185 |
|
|
400 |
|
|
41 |
|
|
359 |
Non-competition agreements |
|
|
681 |
|
|
568 |
|
|
113 |
|
|
681 |
|
|
439 |
|
|
242 |
Customer relationships |
|
|
290,800 |
|
|
161,257 |
|
|
129,543 |
|
|
246,949 |
|
|
130,802 |
|
|
116,147 |
Other intangibles |
|
|
869 |
|
|
869 |
|
|
— |
|
|
202 |
|
|
202 |
|
|
— |
Total |
|
$ |
515,636 |
|
$ |
221,335 |
|
$ |
294,301 |
|
$ |
348,982 |
|
$ |
170,581 |
|
$ |
178,401 |
For further details regarding the increase in the goodwill and intangibles balances from September 30, 2022 to September 30, 2023, which were primarily a result of the B Medical and Ziath acquisitions, please refer to Note 4, Business Combinations.
Amortization expense for intangible assets was $48.4 million, $32.3 million, and $37.4 million, respectively, for the fiscal years ended September 30, 2023, 2022 and 2021.
69
Estimated future amortization expense for the intangible assets as of September 30, 2023 is as follows (in thousands):
2024 |
|
$ |
49,750 |
2025 |
|
|
48,308 |
2026 |
|
|
44,952 |
2027 |
|
|
36,877 |
2028 |
|
|
30,533 |
Thereafter |
|
|
83,881 |
Total |
|
$ |
294,301 |
9. Restructuring
2023 Cost Savings Plan
In the second and third quarters of 2023, the Company announced cost savings plans to position the Company to meet the needs of their customers and accelerate growth of the business.
The majority of the restructuring expenses for fiscal years 2023, 2022, and 2021 are related to severance and related costs. Additional costs to complete these cost savings plans are expected to approximate $0.6 million. Costs from these actions are expected to be fully realized by the end of calendar 2023.
Restructuring Reserve
|
Year Ended September 30, |
||||
(In thousands) |
2023 |
|
2022 |
||
Balance at beginning of period |
$ |
462 |
|
$ |
304 |
Provisions |
|
4,577 |
|
|
712 |
Payments |
|
(4,028) |
|
|
(554) |
Balance at end of period |
$ |
1,011 |
|
$ |
462 |
The change in the accrual balance was primarily due to accruals offset by payments related to the separation of personnel due to reorganization and cost reduction efforts.
10. Leases
The Company has operating leases for real estate and non-real estate and finance leases for non-real estate in North America, Europe, and Asia. Non-real estate leases are primarily related to vehicles and office equipment. Lease expiration dates range between 2023 and 2043.
70
The components of operating lease expense for fiscal years 2023 and 2022 were as follows (in thousands):
|
|
Year Ended September 30, |
|
||||
|
|
2023 |
|
2022 |
|
||
|
|
|
|
|
|
|
|
Operating lease costs |
|
$ |
12,435 |
|
$ |
9,396 |
|
Finance lease costs: |
|
|
|
|
|
|
|
Amortization of assets |
|
|
620 |
|
|
182 |
|
Interest on lease liabilities |
|
|
40 |
|
|
5 |
|
Total finance lease costs |
|
|
660 |
|
|
187 |
|
Total operating and finance lease costs |
|
|
13,095 |
|
|
9,583 |
|
Variable lease costs |
|
|
3,251 |
|
|
3 |
|
Short-term lease costs |
|
|
1,920 |
|
|
1,411 |
|
Total lease costs |
|
$ |
18,266 |
|
$ |
10,997 |
|
Supplemental balance sheet information related to leases is as follows (in thousands, except lease term and discount rate):
|
|
September 30, 2023 |
|
September 30, 2022 |
|
||
Operating Leases: |
|
|
|
|
|
|
|
Operating lease right-of-use assets |
|
$ |
66,580 |
|
$ |
54,059 |
|
|
|
|
|
|
|
|
|
Accrued expenses and other current liabilities |
|
$ |
9,499 |
|
$ |
6,924 |
|
Long-term operating lease liabilities |
|
|
60,436 |
|
|
49,227 |
|
Total operating lease liabilities |
|
$ |
69,935 |
|
$ |
56,151 |
|
|
|
|
|
|
|
|
|
Finance Leases: |
|
|
|
|
|
|
|
Property, plant and equipment, at cost |
|
$ |
4,718 |
|
$ |
2,476 |
|
Accumulated amortization |
|
|
(2,780) |
|
|
(2,276) |
|
Property, plant and equipment, net |
|
$ |
1,938 |
|
$ |
200 |
|
|
|
|
|
|
|
|
|
Accrued expenses and other current liabilities |
|
$ |
677 |
|
$ |
96 |
|
Other long-term liabilities |
|
|
1,361 |
|
|
98 |
|
Total finance lease liabilities |
|
$ |
2,038 |
|
$ |
194 |
|
|
|
|
|
|
|
|
|
Weighted average remaining lease term (in years): |
|
|
|
|
|
|
|
Operating leases |
|
|
10.92 |
|
|
10.82 |
|
Finance leases |
|
|
3.41 |
|
|
2.19 |
|
|
|
|
|
|
|
|
|
Weighted average discount rate: |
|
|
|
|
|
|
|
Operating leases |
|
|
4.26 |
% |
|
3.93 |
% |
Finance leases |
|
|
2.76 |
% |
|
1.29 |
% |
71
Supplemental cash flow information related to leases is as follows (in thousands):
|
|
Year Ended September 30, |
|
||||
|
|
2023 |
|
2022 |
|
||
Cash paid for amounts included in measurement of liabilities: |
|
|
|
|
|
|
|
Operating cash flows - operating leases |
|
$ |
10,949 |
|
$ |
7,977 |
|
Operating cash flows - finance leases |
|
$ |
40 |
|
$ |
5 |
|
Financing cash flows - finance leases |
|
$ |
578 |
|
$ |
393 |
|
|
|
|
|
|
|
|
|
ROU assets obtained in exchange for lease liabilities: |
|
|
|
|
|
|
|
Operating leases |
|
$ |
15,038 |
|
$ |
10,842 |
|
Finance leases |
|
$ |
1,813 |
|
$ |
68 |
|
Future lease payments for operating leases as of September 30, 2023 were as follows for the subsequent five fiscal years and thereafter (in thousands):
|
|
|
Finance Leases |
Operating Leases |
|
||
2024 |
|
$ |
724 |
|
$ |
12,175 |
|
2025 |
|
|
635 |
|
|
11,838 |
|
2026 |
|
|
474 |
|
|
8,238 |
|
2027 |
|
|
238 |
|
|
7,807 |
|
2028 |
|
|
57 |
|
|
7,482 |
|
Thereafter |
|
|
9 |
|
|
42,531 |
|
Total future lease payments |
|
|
2,137 |
|
|
90,071 |
|
Less imputed interest |
|
|
(99) |
|
|
(20,136) |
|
Total lease liability balance |
|
$ |
2,038 |
|
$ |
69,935 |
|
As of September 30, 2023, in addition to the amounts disclosed above, the Company has lease commitments of approximately $4.2 million for leases where the Company has not taken possession of the underlying asset, and anticipates lease commencement in the first quarter of fiscal year 2024. As such, the related ROU assets and lease liabilities have not been recognized in the Company’s Consolidated Balance Sheet as of September 30, 2023.
11. Supplementary Balance Sheet Information
The following is a summary of accounts receivable at September 30, 2023 and 2022 (in thousands):
|
|
September 30, |
||||
|
|
2023 |
|
2022 |
||
Accounts receivable |
|
$ |
164,592 |
|
$ |
168,920 |
Less allowance for expected credit losses |
|
|
(8,057) |
|
|
(5,162) |
Accounts receivable, net |
|
$ |
156,535 |
|
$ |
163,758 |
72
The allowance for expected credit losses for the fiscal years ended September 30, 2023, 2022 and 2021 is as follows (in thousands):
|
|
Year Ended September 30, |
|||||||
|
|
2023 |
|
2022 |
|
2021 |
|||
|
|
|
|
|
|
|
|
|
|
Balance at beginning of period |
|
$ |
5,162 |
|
$ |
4,318 |
|
$ |
7,146 |
Provisions |
|
|
8,849 |
|
|
3,536 |
|
|
3,445 |
Payments received |
|
|
(5,884) |
|
|
(2,278) |
|
|
(5,481) |
Write-offs and adjustments |
|
|
(70) |
|
|
(414) |
|
|
(792) |
Balance at end of period |
|
$ |
8,057 |
|
$ |
5,162 |
|
$ |
4,318 |
The following is a summary of inventories at September 30, 2023 and 2022 (in thousands):
|
|
September 30, |
||||
|
|
2023 |
|
2022 |
||
|
|
|
|
|
|
|
Raw materials and purchased parts |
|
$ |
59,861 |
|
$ |
39,685 |
Work-in-process |
|
|
11,400 |
|
|
4,816 |
Finished goods |
|
|
56,937 |
|
|
41,043 |
Total inventories |
|
$ |
128,198 |
|
$ |
85,544 |
The activity for excess and obsolete inventory reserves is as follows for the fiscal years ended September 30, 2023, 2022 and 2021 (in thousands):
|
|
Year Ended September 30, |
|||||||
|
|
2023 |
|
2022 |
|
2021 |
|||
|
|
|
|
|
|
|
|
|
|
Balance at beginning of period |
|
$ |
4,082 |
|
$ |
3,681 |
|
$ |
3,136 |
Provisions |
|
|
3,324 |
|
|
1,752 |
|
|
1,522 |
Inventory disposals and adjustments |
|
|
(2,415) |
|
|
(1,351) |
|
|
(977) |
Balance at end of period |
|
$ |
4,991 |
|
$ |
4,082 |
|
$ |
3,681 |
The activity for valuation allowance for deferred tax assets is as follows for the fiscal years ended September 30, 2023, 2022 and 2021 (in thousands):
|
|
Year Ended September 30, |
|||||||
|
|
2023 |
|
2022 |
|
2021 |
|||
|
|
|
|
|
|
|
|
|
|
Balance at beginning of period |
|
$ |
5,927 |
|
$ |
8,592 |
|
$ |
10,623 |
Charge to income tax provision (benefit) |
|
|
1,137 |
|
|
1,337 |
|
|
(3,247) |
Charged to other accounts |
|
|
1,284 |
|
|
(4,002) |
|
|
1,216 |
Balance at end of period |
|
$ |
8,348 |
|
$ |
5,927 |
|
$ |
8,592 |
73
The following is a summary of product warranty and retrofit activity on a gross basis for the fiscal years ended September 30, 2023, 2022 and 2021 (in thousands):
|
|
Year Ended September 30, |
|||||||
|
|
2023 |
|
2022 |
|
2021 |
|||
|
|
|
|
|
|
|
|
|
|
Balance at beginning of period |
|
$ |
2,890 |
|
$ |
2,330 |
|
$ |
2,211 |
Adjustments for acquisitions and divestitures |
|
|
2,475 |
|
|
254 |
|
|
— |
Accruals for warranties during the year |
|
|
8,198 |
|
|
2,438 |
|
|
2,300 |
Costs incurred during the year |
|
|
(3,340) |
|
|
(2,132) |
|
|
(2,181) |
Balance at end of period |
|
$ |
10,223 |
|
$ |
2,890 |
|
$ |
2,330 |
12. Debt and Line of Credit
As of September 30, 2021, the Company had approximately $49.7 million of debt outstanding on a term loan. On February 1, 2022, the Company completed the sale of its semiconductor automation business and utilized a portion of the proceeds from the sale to extinguish the outstanding balance of the term loan. The Company also terminated its revolving line of credit which had no borrowings outstanding. The Company recorded a loss on debt and line of credit extinguishment of $0.6 million.
During the fiscal years ended September 30, 2022 and 2021, the weighted average stated interest rate paid on all outstanding debt was 2.7% and 2.8%, respectively. During the year ended September 30, 2022 and 2021, the Company incurred aggregate interest expense of $0.5 million and $1.7 million, respectively, in connection with the borrowings.
The deferred financing costs were accreted over the term of the loan using the effective interest rate method and are included in “Interest expense” in the accompanying Consolidated Statements of Operations.
13. Stockholders’ Equity
Share Repurchases
On November 4, 2022, the Company’s Board of Directors terminated the Company’s then existing $50.0 million share repurchase authorization and approved a new authorization to repurchase up to $1.5 billion of shares of the Company’s common stock from time to time through open market purchases or through privately negotiated transactions (including under an accelerated share repurchase (“ASR”) agreement), or by other means, including through the use of trading plans intended to qualify under Rule 10b5-1 under the Securities Exchange Act of 1934, as amended, subject to market and business conditions, legal requirements, and other factors. The repurchase authorization can be discontinued at any time.
On November 23, 2022, the Company executed an ASR agreement (the “ASR Agreement”) with JPMorgan Chase Bank, National Association (the “Dealer”) to repurchase an aggregate of up to $500.0 million of the Company’s common stock. Under the terms of the ASR Agreement, the Company made a payment of $500.0 million to the Dealer on November 28, 2022 and received an initial delivery of 6.1 million shares of common stock from the Dealer, representing approximately 70% of the total shares of common stock that were expected to be repurchased under the ASR Agreement. The final number of shares repurchased by the Company was based on the average of the daily volume-weighted average price of the Company’s common stock during the term of the ASR Agreement, less a discount and subject to adjustments pursuant to the terms and conditions of the ASR Agreement. The final settlement of the transactions under the ASR Agreement occurred in April 2023, and the Company received 4.0 million additional shares of common stock from the Dealer as of the settlement date. The Company evaluated the nature of the forward contract aspect of the ASR Agreement and concluded equity classification was appropriate. The shares of common stock repurchased by the Company under the ASR Agreement were retired, accounted for as a reduction to stockholders’ equity in the Consolidated Balance Sheets, and treated as a repurchase of common stock for purposes of calculating earnings per share as of the applicable settlement date.
74
After giving effect to the ASR Agreement, $1.0 billion of the amount authorized remained available for additional repurchases of the Company’s common stock. Following the final termination of the ASR Agreement in April 2023, other arrangements commenced under which the Company expects to repurchase up to an additional $500.0 million shares of common stock in open market purchases, subject to market and business conditions, legal requirements, and other factors. As of September 30, 2023, the Company has acquired 7.4 million shares of its common stock through open market purchases totaling $338.5 million (excluding fees, commissions, and excise tax) under these other arrangements. These shares of common stock repurchased by the Company were retired, accounted for as a reduction to stockholders’ equity in the Consolidated Balance Sheets and treated as a repurchase of common stock for purposes of calculating earnings per share as of the applicable settlement dates.
Effective January 1, 2023, all corporate share repurchases are subject to a one percent excise tax on the value of the repurchase, net of share issuances, subject to certain exclusions. The excise tax was part of The Inflation Reduction Act passed by the U.S. government in 2022. The Company accrued $5.0 million for excise tax related to share repurchases settled in fiscal 2023, which is considered an additional cost of the share repurchases and a reduction to stockholders’ equity in the Consolidated Balance Sheets.
Preferred Stock
Total number of shares of preferred stock authorized for issuance was 1,000,000 shares at September 30, 2023 and 2022. Preferred stock has a par value of $0.01 per share and may be issued at the discretion of the Board of Directors without stockholder approval with such designations, rights and preferences as the Board of Directors may determine. There were no shares of preferred stock issued or outstanding at September 30, 2023 or 2022.
Accumulated Other Comprehensive Income (Loss)
The following is a summary of the components of accumulated other comprehensive income (loss), net of tax, at September 30, 2023, 2022 and 2021 (in thousands):
|
|
|
|
|
Unrealized |
|
|
|
|
|
|
|
|
||
|
|
|
|
|
Gains (Losses) |
|
|
|
|
|
|
|
|
|
|
|
|
|
|
|
on Available- |
|
|
|
|
|
|
|
|
||
|
|
Currency |
|
for-Sale |
|
Gains (Losses) |
|
Pension |
|
|
|
||||
|
|
Translation |
|
Securities |
|
on Derivative asset |
|
Liability |
|
|
|
||||
|
|
Adjustments |
|
Net of tax |
|
Net of tax |
|
Adjustments |
|
Total |
|||||
Balance at September 30, 2020 |
|
$ |
23,061 |
|
|
(1) |
|
|
— |
|
|
(1,141) |
|
|
21,919 |
Other comprehensive income (loss) before reclassifications |
|
|
(2,922) |
|
|
— |
|
|
— |
|
|
333 |
|
|
(2,589) |
Amounts reclassified from accumulated other comprehensive income (loss) |
|
|
— |
|
|
— |
|
|
— |
|
|
21 |
|
|
21 |
Balance at September 30, 2021 |
|
|
20,139 |
|
|
(1) |
|
|
— |
|
|
(787) |
|
|
19,351 |
Other comprehensive income (loss) before reclassifications |
|
|
(169,266) |
|
|
(10,908) |
|
|
93,020 |
|
|
412 |
|
|
(86,742) |
Amounts reclassified from accumulated other comprehensive income (loss) |
|
|
(16,567) |
|
|
— |
|
|
— |
|
|
42 |
|
|
(16,525) |
Balance at September 30, 2022 |
|
|
(165,694) |
|
|
(10,909) |
|
|
93,020 |
|
|
(333) |
|
|
(83,916) |
Other comprehensive income (loss) before reclassifications |
|
|
77,246 |
|
|
5,774 |
|
|
(61,533) |
|
|
(104) |
|
|
21,383 |
Amounts reclassified from accumulated other comprehensive income (loss) |
|
|
— |
|
|
— |
|
|
— |
|
|
107 |
|
|
107 |
Balance at September 30, 2023 |
|
$ |
(88,448) |
|
$ |
(5,135) |
|
$ |
31,487 |
|
$ |
(330) |
|
$ |
(62,426) |
Unrealized gains (losses) on available-for-sale marketable securities are reclassified from accumulated other comprehensive income (loss) into results of operations at the time of the securities’ sale, as described in Note 5, Marketable Securities. Amounts reclassified from accumulated other comprehensive income (loss) related to pension liability adjustments represent amortization of actuarial gains and losses. Defined benefit pension plan curtailments are recognized as reclassifications from accumulated other comprehensive income (loss) and corresponding reductions in pension liabilities and net pension cost.
75
14. REVENUE FROM CONTRACTS WITH CUSTOMERS
Disaggregated Revenue
The Company disaggregates revenue from contracts with customers in a manner that depicts how the nature, amount, timing, and uncertainty of revenue and cash flows are affected by economic factors. The following is revenue by significant business line for the fiscal years ended September 30, 2023, 2022 and 2021 (in thousands):
|
|
|
|||||||
|
|
|
2023 |
|
2022 |
|
2021 |
||
Significant Business Line |
|
|
|
|
|
|
|
|
|
Life Sciences Products, excluding B Medical |
|
$ |
192,061 |
|
$ |
199,230 |
|
$ |
199,606 |
B Medical |
|
|
113,122 |
|
|
- |
|
|
- |
Sample Repository Solutions |
|
|
111,593 |
|
|
105,331 |
|
|
88,922 |
Genomic Services |
|
|
248,296 |
|
|
250,937 |
|
|
225,175 |
Total revenue |
|
$ |
665,072 |
|
$ |
555,498 |
|
$ |
513,703 |
Contract Balances
Accounts Receivable, Net. Accounts receivable represent rights to consideration in exchange for products or services that have been transferred by the Company, when payment is unconditional and only the passage of time is required before payment is due. Accounts receivable do not bear interest and are recorded at the invoiced amount. The Company maintains an allowance for expected credit losses representing its best estimate of probable credit losses related to its existing accounts receivable and their net realizable value. The Company determines the allowance for expected credit losses based on a number of factors, including an evaluation of customer credit worthiness, the age of the outstanding receivables, economic trends, historical experience, and other information through the payment periods. Accounts receivable, net were $156.5 million and $163.8 million at September 30, 2023 and September 30, 2022, respectively.
Contract Assets. Contract assets represent rights to consideration in exchange for products or services that have been transferred by the Company, when payment is conditional on something other than the passage of time. These amounts typically relate to contracts where the right to invoice the customer is not present until completion of the contract or the achievement of specified milestones and the value of the products or services transferred exceed this constraint. Contract assets are classified as current as they are expected to convert to cash within one year. Contract asset balances which are included within “Prepaid expenses and other current assets” on the Company’s Consolidated Balance Sheet, were $24.2 million and $18.2 million at September 30, 2023 and September 30, 2022, respectively.
Contract Liabilities. Contract liabilities represent the Company’s obligation to transfer products or services to a customer for which consideration has been received, or for which an amount of consideration is due from the customer. Contract assets and liabilities are reported on a net basis at the contract level, depending on the contracts position at the end of each reporting period. Contract liabilities are included within “Deferred revenue” on the Company’s Consolidated Balance Sheet. Contract liabilities were $34.6 million and $39.7 million at September 30, 2023 and September 30, 2022, respectively. Revenue recognized from the contract liability balance at September 30, 2022 was $34.9 million for the year ended September 30, 2023.
Remaining Performance Obligations. Remaining performance obligations represent the transaction price of unsatisfied or partially satisfied performance obligations within contracts with an original expected contract term that is greater than one year and for which fulfillment of the contract has started as of the end of the reporting period. The aggregate amount of transaction consideration allocated to remaining performance obligations as of September 30, 2023 was $78.4 million. The following table summarizes when the Company expects to recognize the remaining performance obligations as revenue, the Company will recognize revenue associated with these performance obligations as transfer of control occurs (in thousands):
76
|
|
As of September 30, 2023 |
|||||||
|
|
Less than 1 Year |
|
Greater than 1 Year |
|
Total |
|||
Remaining performance obligations |
|
$ |
54,159 |
|
$ |
24,228 |
|
$ |
78,387 |
Cost to Obtain and Fulfill a Contract
The Company capitalizes sales commissions when incurred if they are (i) incremental costs of obtaining a contract, (ii) expected to be recovered and (iii) have an expected amortization period that is greater than one year. These amounts primarily relate to sales commissions and are being amortized over a 60-month period, which represents the average period of contract performance. The Company capitalized $0.5 million and $0.7 million of sales commissions during the fiscal years ended September 30, 2023 and 2022, respectively. All other sales commissions incurred during the reporting period have been expensed as incurred. These costs are recorded within “Selling, general and administrative” expenses on the Company’s Consolidated Statement of Operations. The Company accounts for shipping and handling activities as fulfillment activities and recognize the associated expense when control of the product has transferred to the customer.
15. Stock Based Compensation
The Company may issue options to eligible employees to purchase shares of the Company’s common stock, restricted stock units, and other equity incentives, which vest upon the satisfaction of a performance condition and/or service condition. In addition, the Company issues common stock to participating employees pursuant to an employee stock purchase plan, and also issues common stock awards and deferred restricted stock units to members of its board of directors in accordance with its board of director compensation program.
2020 Equity Incentive Plan
In accordance with the 2020 Equity Incentive Plan (the “2020 Plan”), the Company may grant (i) restricted stock and other stock-based awards, (ii) nonqualified stock options, and (iii) options intended to qualify as incentive stock options under Section 422 of the Internal Revenue Code. All employees of the Company or any affiliate of the Company, independent directors, consultants and advisors are eligible to participate in the 2020 Plan. The 2020 Plan provides for the issuance of an aggregate of 2,800,000 shares of common stock, including 2,500,000 shares reserved for issuance pursuant to the 2020 Plan, and up to 300,000 additional shares which may be issued pursuant to the 2020 Plan if outstanding awards granted under the 2000 Plan or the 2015 Plan are forfeited, expire or are cancelled.
The following table reflects stock-based compensation expense recorded during the fiscal years ended September 30, 2023, 2022 and 2021 (in thousands):
|
|
Year Ended September 30, |
|||||||
|
|
2023 |
|
2022 |
|
2021 |
|||
Restricted stock units |
|
$ |
8,027 |
|
$ |
10,597 |
|
$ |
18,923 |
Employee stock purchase plan |
|
|
1,349 |
|
|
1,846 |
|
|
1,128 |
Total stock-based compensation expense for continuing and discontinued operations |
|
$ |
9,376 |
|
$ |
12,443 |
|
$ |
20,051 |
Income tax benefit |
|
|
(1,406) |
|
|
(1,929) |
|
|
(3,208) |
Total compensation expense included in the statement of operations |
|
|
7,970 |
|
|
10,514 |
|
|
16,843 |
77
Restricted Stock Unit Activity
The following table summarizes restricted stock unit activity for the fiscal year ended September 30, 2023 (in thousands, except for weighted average grant-date fair value):
|
|
|
|
Weighted |
|
|
|
|
|
Average |
|
|
|
|
|
Grant-Date |
|
|
|
Shares |
|
Fair Value |
|
Outstanding as of September 30, 2022 |
|
538,238 |
|
$ |
71.99 |
Granted |
|
590,066 |
|
$ |
57.22 |
Vested |
|
(267,834) |
|
$ |
55.86 |
Forfeited |
|
(141,516) |
|
$ |
72.04 |
Outstanding as of September 30, 2023 |
|
718,954 |
|
$ |
67.40 |
The fair value of restricted stock units vested during fiscal years 2023, 2022 and 2021 was $14.8 million, $66.9 million, and $28.4 million, respectively. During fiscal years 2023, 2022 and 2021, the Company remitted $5.0 million, $25.2 million, and $9.8 million, respectively, collected from employees to satisfy their tax obligations as a result of share issuances.
As of September 30, 2023, the future unrecognized stock-based compensation expense related to restricted stock units expected to vest is $12.1 million, and is expected to be recognized over an estimated weighted average amortization period of 1.4 years.
Restricted stock units granted with performance goals may also have a required service period following the achievement of all or a portion of the performance goals. The following table reflects restricted stock units and stock awards granted during fiscal years ended September 30, 2023, 2022 and 2021 (in thousands):
|
|
Year Ended September 30, |
||||
|
|
2023 |
|
2022 |
|
2021 |
Time-based restricted stock units |
|
311,609 |
|
120,066 |
|
166,570 |
Common stock awards |
|
— |
|
18,471 |
|
14,713 |
Performance-based restricted stock units |
|
278,457 |
|
111,148 |
|
168,647 |
Total units |
|
590,066 |
|
249,685 |
|
349,930 |
Among the total restricted stock units granted 98,783 shares were granted to the employees who belong to the discontinued operations in the year ended September 30, 2021, all of which were settled upon the sale of the discontinued operations. No shares have subsequently been granted to employees who belong to the discontinued operations.
Time-Based Restricted Stock Unit Grants
Restricted stock units granted with a required service period typically have three-year vesting schedules in which one-third of awards vest at each annual anniversary of grant date, subject to the award holders meeting service requirements.
Certain members of the Board of Directors have elected to defer receiving their annual stock awards and related quarterly dividends, if any, until they attain a certain age or cease to provide services as a member of the Company’s Board of Directors. Annual deferred stock awards granted during fiscal years 2023, 2022, and 2021 vested upon issuance.
78
Performance-Based Restricted Stock Unit Grants
Performance-based restricted stock units are earned based on the achievement of performance criteria established by the Human Resources and Compensation Committee and approved by the Board of Directors. The criteria for performance-based awards are weighted and have threshold, target and maximum performance goals.
Performance-based restricted stock unit awards granted in fiscal year 2023, 2022 and 2021 allow participants to earn 100% of restricted stock units if the Company’s performance meets or exceeds its target goal for each applicable financial metric, and up to a maximum of 200% if the Company’s performance for such metrics meets or exceeds the maximum or stretch goal. Performance below the minimum threshold for each financial metric results in award forfeiture. Performance goals are measured over a three-year period for each year’s restricted stock unit awards and at the end of the period to determine the number of restricted stock units earned, if any, by recipients who continue to meet the service requirement. Upon the third anniversary of each year’s restricted stock unit awards’ grant date, the Company’s Board of Directors determines the number of restricted stock units earned for participants who continue to meet the service requirements on the vest date.
Awards Granted to the Board of Directors
The stock-based compensation granted to members of the Company’s Board of Directors includes common stock awards, restricted stock unit awards and deferred common stock and restricted stock unit awards.
Employee Stock Purchase Plan
The Company maintains an employee stock purchase plan that allows its employees to purchase shares of common stock at a price equal to 85% of the fair market value of the Company’s stock at the beginning or the end of the semi-annual offering period, whichever is lower. On February 8, 2017, the stockholders approved the 2017 Employee Stock Purchase Plan (the “2017 Plan”). The 2017 Plan allows for purchases by employees of up to 1,250,000 shares of the Company’s common stock. As of September 30, 2023, 586,421 shares of common stock remain available for purchase under the Plan. During the fiscal year ended September 30, 2023 and 2022, the Company issued 83,715 shares and 82,035 shares, respectively, under the Plan.
Valuation Assumptions for an Employee Stock Purchase Plan
The fair value of shares issued under the employee stock purchase plan is estimated on the commencement date of each offering period using the Black-Scholes option-pricing model with the following weighted average assumptions for the fiscal years ended September 30, 2023, 2022 and 2021:
|
|
Year Ended September 30, |
|
||||
|
|
2023 |
|
2022 |
|
2021 |
|
Risk-free interest rate |
|
5.2 |
% |
1.7 |
% |
0.3 |
% |
Volatility |
|
57 |
% |
49 |
% |
53 |
% |
Expected life |
|
6 months |
|
6 months |
|
6 months |
|
Dividend yield |
|
— |
% |
— |
% |
0.6 |
% |
The risk-free rate is based on the U.S. Treasury yield curve for notes with terms approximating the expected life of the shares granted. The expected stock price volatility is determined based on the Company’s historic stock prices over a period commensurate with the expected life of the shares granted. The expected life represents the weighted average period over which the shares are expected to be purchased. Dividend yields are projected based on the Company’s history of dividend declarations and management’s intention for future dividend declarations.
79
16. Fair Value Measurements
Financial Assets and Liabilities Measured at Fair Value on a Recurring Basis
The following tables summarize assets and liabilities measured and recorded at fair value on a recurring basis in the accompanying Consolidated Balance Sheets as of September 30, 2023 and 2022 (in thousands):
|
|
As of September 30, 2023 |
||||||||||
Description |
|
Total Fair Value |
|
Level 1 |
|
Level 2 |
|
Level 3 |
||||
Assets: |
|
|
|
|
|
|
|
|
|
|
|
|
Cash equivalents |
|
$ |
525,952 |
|
$ |
525,952 |
|
$ |
— |
|
$ |
— |
Available-for-sale securities |
|
|
450,211 |
|
|
85,949 |
|
|
364,262 |
|
|
— |
Foreign exchange contracts |
|
|
44 |
|
|
— |
|
|
44 |
|
|
— |
Net investment hedge |
|
|
13,036 |
|
|
— |
|
|
13,036 |
|
|
— |
Total assets |
|
$ |
989,243 |
|
$ |
611,901 |
|
$ |
377,342 |
|
$ |
— |
Liabilities: |
|
|
|
|
|
|
|
|
|
|
|
|
Foreign exchange contracts |
|
|
421 |
|
|
— |
|
|
421 |
|
|
— |
Total liabilities |
|
$ |
421 |
|
$ |
— |
|
$ |
421 |
|
$ |
— |
|
|
As of September 30, 2022 |
||||||||||
Description |
|
Total Fair Value |
|
Level 1 |
|
Level 2 |
|
Level 3 |
||||
Assets: |
|
|
|
|
|
|
|
|
|
|
|
|
Cash equivalents |
|
$ |
374,804 |
|
$ |
374,055 |
|
$ |
749 |
|
$ |
— |
Available-for-sale securities |
|
|
1,263,782 |
|
|
651,800 |
|
|
611,982 |
|
|
— |
Foreign exchange contracts |
|
|
634 |
|
|
— |
|
|
634 |
|
|
— |
Net investment hedge |
|
|
124,789 |
|
|
— |
|
|
124,789 |
|
|
— |
Total assets |
|
$ |
1,764,009 |
|
$ |
1,025,855 |
|
$ |
738,154 |
|
$ |
— |
Liabilities: |
|
|
|
|
|
|
|
|
|
|
|
|
Foreign exchange contracts |
|
|
230 |
|
$ |
— |
|
|
230 |
|
|
— |
Total liabilities |
|
$ |
230 |
|
$ |
— |
|
$ |
230 |
|
$ |
— |
Cash Equivalents
Cash equivalents consist of money market funds and are classified within Level 1 of the fair value hierarchy because they are valued using quoted market prices in active markets. The Company considers all highly liquid interest-earning investments with a maturity of three months or less at the date of purchase to be cash equivalents. The fair values of these investments approximate their carrying values.
Available-For-Sale Securities
Available-for-sale securities primarily consist of highly rated corporate debt securities and U.S. government backed securities which are classified as Level 1. Investments classified as Level 2 consist of debt securities that are valued using matrix pricing and benchmarking because they are not actively traded, and bank certificates of deposit. Matrix pricing is a mathematical technique used to value securities by relying on the securities’ relationship to other benchmark quoted prices.
Foreign Exchange Contracts & Net Investment Hedge
Our foreign exchange contract assets and liabilities, and our net investment hedge assets are measured and reported at fair value using the market method valuation technique. The inputs to this technique utilize current foreign currency exchange forward market rates published by third-party leading financial news and data providers. These are observable data that represent the rates that the financial institution uses for contracts entered into at that date; however, they are not based on actual transactions, so they are classified as Level 2.
80
Contingent Consideration Liability
The contingent consideration liability related to the acquisition of B Medical is measured and reported at fair value using the real options method based on the unobservable inputs that are significant to the fair value and classified with Level 3 of the fair value hierarchy. The contingency was based on the acquired business’ performance through September 30, 2023. Please refer to Note 4, Business Combinations for further details. Changes in the fair value of contingent consideration resulting from a change in the underlying inputs are recognized in results of operations until the arrangement is settled. This liability was revalued from $18.5 million as of December 31, 2022 to zero as of June 30, 2023, with the offset to the changes in fair value recorded in the Consolidated Statements of Operations. There were no changes to the measurement of the contingent consideration liability in the fourth quarter.
Assets and Liabilities Measured at Fair Value on a Nonrecurring Basis
During fiscal year 2023 and 2022, the Company did not record any material fair value measurements for assets or liabilities on a nonrecurring basis.
17. Income Taxes
The components of the income tax (benefit) expense from continuing operations for the fiscal years are as follows (in thousands):
|
|
Year Ended September 30, |
|||||||
|
|
2023 |
|
2022 |
|
2021 |
|||
Current income tax (benefit) expense |
|
|
|
|
|
|
|
|
|
Federal |
|
$ |
(599) |
|
$ |
(4,826) |
|
$ |
(14,247) |
State |
|
|
1,528 |
|
|
607 |
|
|
(867) |
Foreign |
|
|
9,757 |
|
|
4,627 |
|
|
15,484 |
Total current income tax (benefit) expense |
|
|
10,686 |
|
|
408 |
|
|
370 |
Deferred income tax (benefit) expense: |
|
|
|
|
|
|
|
|
|
Federal |
|
|
(18,684) |
|
|
(815) |
|
|
(11,469) |
State |
|
|
(402) |
|
|
(180) |
|
|
(2,283) |
Foreign |
|
|
(9,150) |
|
|
1,937 |
|
|
(6,718) |
Total deferred income tax (benefit) expense |
|
|
(28,236) |
|
|
942 |
|
|
(20,470) |
Income tax (benefit) expense |
|
$ |
(17,550) |
|
$ |
1,350 |
|
$ |
(20,100) |
The components of income (loss) from continuing operations before income taxes for the fiscal years are as follows (in thousands):
|
|
Year Ended September 30, |
|||||||
|
|
2023 |
|
2022 |
|
2021 |
|||
Domestic |
|
$ |
(58,065) |
|
$ |
(39,392) |
|
$ |
(88,763) |
Foreign |
|
|
27,632 |
|
|
29,456 |
|
|
39,794 |
Loss before income taxes |
|
$ |
(30,433) |
|
$ |
(9,936) |
|
$ |
(48,969) |
81
The differences between the income tax (benefit) expense on income (loss) from continuing operations and income taxes computed using the applicable U.S. statutory federal tax rates for the fiscal years ended September 30, 2023, 2022 and 2021 are as follows (in thousands):
|
|
Year Ended September 30, |
|||||||
|
|
2023 |
|
2022 |
|
2021 |
|||
Income tax benefit computed at federal statutory rate |
|
$ |
(6,331) |
|
$ |
(2,086) |
|
$ |
(10,284) |
State income taxes, net of federal benefit |
|
|
(851) |
|
|
(776) |
|
|
(1,005) |
Foreign income taxed at different rates |
|
|
(22) |
|
|
(1,182) |
|
|
(2,594) |
Impact of investments in subsidiaries |
|
|
(6,058) |
|
|
— |
|
|
7,128 |
Nontaxable gain from acquisition earn-out liability reversal |
|
|
(3,959) |
|
|
— |
|
|
— |
Change in deferred tax asset valuation allowance |
|
|
1,137 |
|
|
1,337 |
|
|
(3,247) |
Impact of change in uncertain tax positions |
|
|
(1,321) |
|
|
(358) |
|
|
(10,607) |
Global intangible low taxed income, net of foreign tax credits |
|
|
— |
|
|
4,060 |
|
|
4,051 |
Impact of tax rate changes |
|
|
(1,391) |
|
|
1,531 |
|
|
165 |
Compensation |
|
|
1,598 |
|
|
(1,199) |
|
|
462 |
Tax credits |
|
|
(1,434) |
|
|
(2,102) |
|
|
(4,050) |
Merger costs |
|
|
1,056 |
|
|
1,629 |
|
|
20 |
Other non-deductible expenses and other taxes |
|
|
1,304 |
|
|
643 |
|
|
591 |
Impact of effective state tax rate change |
|
|
— |
|
|
763 |
|
|
— |
Research and development expense deduction |
|
|
(1,278) |
|
|
(910) |
|
|
(730) |
Income tax (benefit) expense |
|
$ |
(17,550) |
|
$ |
1,350 |
|
$ |
(20,100) |
The Company recorded net deferred tax assets in the amount of $6.1 million related to its outside basis difference in a German subsidiary. The benefit includes $8.1 million related to U.S. foreign exchange losses on the future repatriation calculated at foreign exchange rates as of the balance sheet date. This benefit is offset by $2.0 million of state income taxes, net of the federal benefit. During the fourth quarter of fiscal year 2023, it became apparent that the basis difference with regard to $450 million of foreign cash maintained in the German subsidiary would reverse within the next twelve months based on significant capital needs.
The Company has not provided deferred income taxes on the outside basis differences of any other foreign subsidiary and maintains its general assertion of indefinite reinvestment regarding those subsidiaries and the remaining earnings of its German subsidiary as of September 30, 2023. The remaining foreign earnings are expected to be reinvested in foreign operations and acquisitions. Including the expected remittance noted previously, unremitted foreign earnings total approximately $1.3 billion. The Company did not calculate estimated deferred tax liabilities on the remaining earnings because such calculations would not be practicable due to the complexity of its hypothetical calculation. The taxes on these earnings would primarily consist of foreign withholding taxes, taxes on foreign exchange gains and losses resulting from potential future distributions, and U.S. state income taxes. Substantially all of the unremitted earnings of the Company have been taxed in the U.S. based on the international tax regulations.
82
The significant components of the net deferred tax assets and liabilities as of September 30, 2023 and 2022 are as follows (in thousands):
|
|
September 30, |
||||
|
|
2023 |
|
2022 |
||
Accruals and reserves not currently deductible |
|
$ |
10,426 |
|
$ |
9,704 |
Federal, state and foreign tax credits |
|
|
157 |
|
|
— |
Other assets |
|
|
613 |
|
|
1,095 |
Equity compensation |
|
|
2,183 |
|
|
3,508 |
Net operating loss carryforwards |
|
|
9,692 |
|
|
7,397 |
Lease liabilities |
|
|
17,513 |
|
|
14,700 |
Capitalized research and development |
|
|
6,807 |
|
|
— |
Deferred revenue |
|
|
3,672 |
|
|
3,609 |
Outside basis differences in subsidiaries |
|
|
6,058 |
|
|
|
Deferred tax assets |
|
|
57,121 |
|
|
40,013 |
Depreciation and intangible amortization |
|
|
(97,572) |
|
|
(56,856) |
Right-of-use assets |
|
|
(16,632) |
|
|
(14,146) |
Other liabilities |
|
|
(317) |
|
|
(402) |
Net unrealized gain on hedging and investments |
|
|
(1,574) |
|
|
(27,144) |
Deferred tax liabilities |
|
|
(116,095) |
|
|
(98,548) |
Valuation allowance |
|
|
(8,348) |
|
|
(5,927) |
Net deferred tax asset (liability) |
|
$ |
(67,322) |
|
$ |
(64,462) |
The deferred tax assets on the balance sheets for September 30, 2023 and 2022 also include $0.6 million and $1.1 million deferred tax charge related to the company’s intercompany profit elimination, respectively.
ASC Topic 740 requires that all available evidence, both positive and negative, be considered in determining, based on the weight of that evidence, whether a valuation allowance is needed. The weight given to the potential effect of negative and positive evidence should be commensurate with the extent to which it can be objectively verified. The more negative evidence that exists, (a) the more positive evidence is necessary and (b) the more difficult it is to support a conclusion that a valuation allowance is not needed for some portion or the entire deferred tax asset. A cumulative loss in recent years is considered a significant piece of negative evidence that is difficult to overcome in assessing the need for a valuation allowance.
The Company evaluates the realizability of its deferred tax assets by tax-paying component and assesses the need for a valuation allowance on an annual and quarterly basis. The Company evaluates the profitability of each tax-paying component on a historical cumulative basis and a forward-looking basis in the course of performing this analysis.
After evaluating all the relevant positive and negative evidence, the Company is not recording any additional valuation allowance against deferred tax assets in the United States. The Company is in a net deferred tax liability position and has sufficient future taxable income from the reversal of taxable temporary difference to offset the deductible temporary differences. The Company continued to hold a United States valuation allowance related to the realizability of certain state tax credits and net operating loss carry-forwards. The Company also maintains valuation allowances against net deferred tax assets in certain foreign tax-paying components as of the end of fiscal year 2023.
It is reasonably possible in future years that the Company may not generate sufficient taxable income to realize the benefit of the deferred assets and recording a valuation allowance may be necessary. The Company has recognized pre-tax losses in the United States from continuing operations in recent years. If the Company continues to recognize losses in the United States and uses those losses to offset the future taxable temporary differences, it may become necessary to record a valuation allowance against future losses.
As of September 30, 2023, the Company has tax-effected federal, state and foreign net operating loss carry-forwards of approximately $0.4 million, $2.1 million and $7.2 million, respectively. The federal net operating loss carry-forwards expire at various dates through 2030. The state of net operating loss carry-forwards will begin to expire in 2026. The majority of the foreign net operating loss carryovers have an indefinite carry-forward in Germany.
83
The Company has performed studies to determine if there are any annual limitations on the federal net operating losses under Section 382 of the Internal Revenue Code of 1986, as amended, or the Internal Revenue Code. As a result of these studies, the Company has determined that ownership changes have occurred primarily in connection with acquisitions when the Company has issued stock to the sellers, as well as ownership changes in the subsidiaries acquired by the Company. The benefits of the net operating losses that will expire before utilization have not been recorded as deferred tax assets in the accompanying Consolidated Balance Sheets. Limitations on the current year use of net operating loss carryovers have also been recorded in the tax expense.
The Company maintains liabilities for unrecognized tax benefits. These liabilities involve judgment and estimation, and they are monitored based on the best information available. A reconciliation of the beginning and ending amount of the consolidated liability for unrecognized income tax benefits during the fiscal years ended September 30, 2023, 2022 and 2021 is as follows (in thousands):
|
Year Ended September 30, |
|||||||
|
2023 |
|
2022 |
|
2021 |
|||
|
|
|
|
|
|
|
|
|
Balance at beginning of period |
$ |
1,679 |
|
$ |
2,006 |
|
$ |
16,722 |
Reductions from lapses in statutes of limitation |
|
(1,381) |
|
|
(327) |
|
|
(14,716) |
Balance at end of period |
$ |
298 |
|
$ |
1,679 |
|
$ |
2,006 |
All of the unrecognized tax benefits for the fiscal year ended September 30, 2023 would impact the effective tax rate if recognized. The Company recognizes interest related to unrecognized benefits as a component of the income tax (benefit) expense, of which $0.1 million, $0.0 million and $1.1 million, respectively, was recognized for the fiscal years ended September 30, 2023, 2022 and 2021.
The Company is subject to U.S. federal, state, local and foreign income taxes in various jurisdictions. The amount of income taxes paid is subject to the Company’s interpretation of applicable tax laws in the jurisdictions in which it files.
In the normal course of business, the Company is subject to income tax audits in various global jurisdictions in which it operates. The years subject to examination vary for the United States and international jurisdictions, with the earliest tax year being 2018. Based on the outcome of these examinations or the expiration of statutes of limitations for specific jurisdictions, it is reasonably possible that the related unrecognized tax benefits could change from those recorded in the Company’s Consolidated Balance Sheets. The Company currently does not anticipate it is reasonably possible that the unrecognized tax benefits and accrued interest on those benefits will be reduced in the next 12 months.
84
18. Net Income (Loss) per Share
The calculations of basic and diluted net income (loss) per share and basic and diluted weighted average shares outstanding are as follows for the fiscal years ended September 30, 2023, 2022 and 2021 (in thousands, except per share data):
|
|
|
|
|
|
|
|
|
|
|
|
Year Ended September 30, |
|||||||
|
|
2023 |
|
2022 |
|
2021 |
|||
Loss from continuing operations |
|
$ |
(12,883) |
|
$ |
(11,286) |
|
$ |
(28,869) |
Income (loss) from discontinued operations, net of tax |
|
|
(1,374) |
|
|
2,144,145 |
|
|
139,616 |
Net income (loss) |
|
|
(14,257) |
|
|
2,132,859 |
|
|
110,747 |
|
|
|
|
|
|
|
|
|
|
Weighted average common shares outstanding used in computing basic income (loss) per share |
|
|
66,253 |
|
|
74,897 |
|
|
74,229 |
Dilutive restricted stock units |
|
|
— |
|
|
— |
|
|
226 |
Weighted average common shares outstanding used in computing basic and diluted income (loss) per share |
|
|
66,253 |
|
|
74,897 |
|
|
74,455 |
|
|
|
|
|
|
|
|
|
|
Basic net income (loss) per share: |
|
|
|
|
|
|
|
|
|
Loss from continuing operations |
|
$ |
(0.19) |
|
$ |
(0.15) |
|
$ |
(0.39) |
Income (loss) from discontinued operations, net of tax |
|
|
(0.02) |
|
|
28.63 |
|
|
1.88 |
Basic net income (loss) per share |
|
$ |
(0.22) |
|
$ |
28.48 |
|
$ |
1.49 |
|
|
|
|
|
|
|
|
|
|
Diluted net income (loss) per share: |
|
|
|
|
|
|
|
|
|
Loss from continuing operations |
|
$ |
(0.19) |
|
$ |
(0.15) |
|
$ |
(0.39) |
Income (loss) from discontinued operations, net of tax |
|
|
(0.02) |
|
|
28.63 |
|
|
1.88 |
Diluted net income (loss) per share |
|
$ |
(0.22) |
|
$ |
28.48 |
|
$ |
1.49 |
Restricted stock units of 332,029, 64,122 and 24,012, respectively, during fiscal year 2023, 2022 and 2021 were excluded from the computation of diluted earnings per share as their effect would be anti-dilutive under the treasury stock method.
19. Segment and Geographic Information
Operating segments are defined as components of an enterprise that engage in business activities for which discrete financial information is available and regularly reviewed by the chief operating decision maker in deciding how to allocate resources and to assess performance. The Company’s Chief Executive Officer is the Company’s chief operating decision maker.
The Company operates in two reportable segments: the Life Sciences Products segment, and the Life Sciences Services segment. These reportable segments also represent the Company’s operating segments. The Company previously operated in three reportable segments, the Semiconductor Solutions Group segment, the Life Sciences Products segment, and the Life Sciences Services segment. As discussed in Note 3, Discontinued Operations, the sale of the semiconductor automation business, which comprised the Semiconductor Solutions Group segment, was completed on February 1, 2022. Historical information has been adjusted to reflect the new reportable segments.
The Company’s Life Sciences Products segment provides automated cold storage solutions for biological and chemical compound samples. The Company’s storage systems provide reliable automation and sample inventory management at temperatures down to -190°C and can store anywhere from one to millions of samples. The Company’s sample management solutions include consumable vials and tubes, polymerase chain reaction, plates, instruments for supporting workflows, and informatics. This portfolio provides customers with a high level of sample quality, security, availability, intelligence, and integrity throughout the lifecycle of samples providing customers with complete end-to-end “cold chain of custody” capabilities.
85
The Company also provides controlled rate thawing devices and transportation solutions that enable the delivery of life-saving treatments for customers in the medical, biotechnology and pharmaceutical industries adding differentiated solutions for reliable and traceable transport of temperature-sensitive samples. The Company also provides vaccine cold storage and transport, as well as 2D barcode readers for life sciences applications.
The Company’s Life Sciences Services business is a leading provider of solutions addressing the many needs of customers in genomic analysis and the management and care of biological samples used in pharmaceutical, biotechnology, healthcare, clinical, and academic research and development markets. The Company processes millions of samples annually, each containing valuable information that must be delivered or preserved with the sample. The Company’s genomic services provide a broad capability to customers for gene sequencing, synthesis, editing and related services. The Company’s sample management services include off-site storage, transport services, laboratory services, sample procurement, and interactive informatics solutions. The Company also offers expert-level consultation services to clients throughout their experimental design and implementation process. The storage services include short- and long-term sample storage and management of the “cold chain of custody” from collection, to storage, to retrieving the sample which ultimately may go back into the research workflow.
Management considers operating income, which excludes charges related to amortization of intangible assets other than completed technology, restructuring and related charges, contingent consideration fair value adjustments, merger and acquisition costs and costs related to share repurchase, and other unallocated corporate expenses, as the primary performance metric when evaluating the Company’s operations.
86
The following is the summary of the financial information for the Company’s reportable segments for the fiscal years ended September 30, 2023, 2022 and 2021 (in thousands):
|
|
|
Year Ended September 30, |
||||||
|
|
|
2023 |
|
2022 |
|
2021 |
||
Revenue: |
|
|
|
|
|
|
|
|
|
Life Sciences Products |
|
$ |
305,184 |
|
$ |
199,230 |
|
$ |
199,606 |
Life Sciences Services |
|
|
359,888 |
|
|
356,268 |
|
|
314,097 |
Total revenue |
|
$ |
665,072 |
|
$ |
555,498 |
|
$ |
513,703 |
|
|
|
|
|
|
|
|
|
|
Operating income (loss): |
|
|
|
|
|
|
|
|
|
Life Sciences Products |
|
$ |
(30,321) |
|
$ |
11,033 |
|
$ |
23,094 |
Life Sciences Services |
|
|
(14,722) |
|
|
10,784 |
|
|
22,659 |
Segment operating income (loss) |
|
|
(45,043) |
|
|
21,817 |
|
|
45,753 |
|
|
|
|
|
|
|
|
|
|
Amortization of intangible assets other than completed technology |
|
|
28,207 |
|
|
24,965 |
|
|
29,299 |
Restructuring and restructuring related charges |
|
|
4,577 |
|
|
712 |
|
|
13,749 |
Contingent consideration - fair value adjustments |
|
|
(18,549) |
|
|
600 |
|
|
— |
Merger and acquisition costs and costs related to share repurchase(1) |
|
|
13,842 |
|
|
17,329 |
|
|
20,662 |
Other unallocated corporate expenses |
|
|
6 |
|
|
2,946 |
|
|
13,132 |
Total operating loss |
|
|
(73,126) |
|
|
(24,735) |
|
|
(31,089) |
Interest income |
|
|
43,735 |
|
|
20,286 |
|
|
632 |
Interest expense |
|
|
— |
|
|
(4,589) |
|
|
(2,037) |
Loss on extinguishment of debt |
|
|
— |
|
|
(632) |
|
|
— |
Other, net |
|
|
(1,042) |
|
|
(266) |
|
|
(16,475) |
Loss before income taxes |
|
$ |
(30,433) |
|
$ |
(9,936) |
|
$ |
(48,969) |
(1) Includes expenses related to governance-related matters. |
|
|
|
|
|
|
|
|
|
|
|
|
|
|
|
|
|
||
|
|
|
|
|
|
|
|
|
|
Assets: |
|
September 30, 2023 |
|
September 30, 2022 |
|
|
|
||
Life Sciences Products |
|
$ |
927,033 |
|
$ |
378,790 |
|
|
|
Life Sciences Services |
|
|
794,752 |
|
|
849,603 |
|
|
|
Total assets |
|
$ |
1,721,785 |
|
$ |
1,228,393 |
|
|
|
Prior year amounts in the “Operating income (loss)” table above have been reclassified to conform to the current presentation.
The following is a reconciliation of the Company’s reportable segments’ assets to the amounts presented in the accompanying Consolidated Balance Sheets as of September 30, 2023 and 2022 (in thousands):
|
|
September 30, |
|
September 30, |
||
|
|
2023 |
|
2022 |
||
Segment assets |
|
$ |
1,721,785 |
|
$ |
1,228,393 |
Cash and cash equivalents, restricted cash, and marketable securities |
|
|
1,134,256 |
|
|
2,305,081 |
Deferred tax assets |
|
|
571 |
|
|
1,169 |
Other assets |
|
|
29,108 |
|
|
181,479 |
Total assets |
|
$ |
2,885,720 |
|
$ |
3,716,122 |
87
Revenue from external customers is attributed to geographic areas based on locations in which customer orders are placed. Revenue by geographic area for the fiscal years ended September 30, 2023, 2022 and 2021 are as follows (in thousands):
|
|
Year Ended September 30, |
|||||||
|
|
2023 |
|
2022 |
|
2021 |
|||
Geographic Location: |
|
|
|
|
|
|
|
|
|
North America |
|
$ |
359,417 |
|
$ |
361,105 |
|
$ |
323,982 |
Africa |
|
|
65,092 |
|
|
1,331 |
|
|
688 |
China |
|
|
51,787 |
|
|
53,867 |
|
|
45,743 |
United Kingdom |
|
|
26,764 |
|
|
30,258 |
|
|
31,539 |
Rest of Europe |
|
|
109,856 |
|
|
79,005 |
|
|
77,266 |
Asia Pacific/ Other |
|
|
52,156 |
|
|
29,932 |
|
|
34,485 |
Total revenue |
|
$ |
665,072 |
|
$ |
555,498 |
|
$ |
513,703 |
The above table has been updated to reflect a misclassification of revenue between North America and other locations for the fiscal year ended 2022.
The majority of the Company’s revenue in North America is generated in the United States which amounted to $355.1 million, $358.2 million, and $320.8 million, respectively, during fiscal years ended September 30, 2023, 2022 and 2021.
Net property, plant and equipment by geographic area as of September 30, 2023 and 2022 is as follows (in thousands):
|
|
September 30, |
||||
|
|
2023 |
|
2022 |
||
United States |
|
$ |
78,533 |
|
$ |
84,809 |
China |
|
|
53,146 |
|
|
56,585 |
Europe |
|
|
70,654 |
|
|
11,610 |
Asia Pacific/ Other |
|
|
3,411 |
|
|
1,466 |
Total property, plant, and equipment, net |
|
$ |
205,744 |
|
$ |
154,470 |
Significant Customers
The Company had one individual customer that accounted for 10% or more of its consolidated revenue for the fiscal year ended September 30, 2023. This customer is related to the Life Science Products segment and is a distributor shipping to end users in approximately 50 countries. The Company had no individual customer that accounted for more than 10% of its consolidated revenue for each of the fiscal years ended September 30, 2022 and 2021. There was no customer that accounted for more than 10% of the Company’s accounts receivable balance for each of the fiscal years ended September 30, 2023 and 2022.
20. Commitments and Contingencies
Contingencies
The Company is subject to various legal proceedings, both asserted and unasserted, that arise in the ordinary course of business. The Company cannot predict the ultimate outcome of such legal proceedings or, in certain instances, provide reasonable ranges of potential losses.
The Company may also have certain indemnification obligations pursuant to claims made under the definitive agreement it entered into with Edwards Vacuum LLC (a member of the Atlas Copco Group) in connection with the Company’s sale of its semiconductor cryogenics business in the fourth quarter of fiscal year 2018.
88
In the third quarter of fiscal year 2020, Edwards asserted claims for indemnification under the definitive agreement relating to alleged breaches of representations and warranties relating to customer warranty claims and inventory (the “2020 Claim”). In addition, in January 2023, Edwards filed a lawsuit against the Company in the Supreme Court of the State of New York in the County of New York seeking indemnification from the Company under such definitive agreement for $1.0 million and other related damages, including interest and attorney’s fees, arising from a third-party claim that was included as part of their initial claims (the “2023 Claim”).
In the second quarter of fiscal 2023, the Company accrued a liability of $2.5 million for the litigation with Edwards related to the 2020 and 2023 Claim of which $0.8 million was paid during the third quarter of 2023.
In April 2023, the Company responded to and filed a counterclaim against Edwards for the 2023 Claim alleging breach of the definitive agreements by Edwards and seeking a declaratory judgment. During the third quarter of fiscal 2023, the Company and Edwards entered into a settlement agreement related to the 2023 Claim to avoid the costs and uncertainties of potential litigation. Under the settlement agreement, the Company paid Edwards $0.8 million from one of the indemnification escrows established at closing of the sale in return for the release of the 2023 Claim and any residual funds in this escrow. The 2020 Claim remains outstanding and $1.7 million remains in the balance of the accrued liability.
The Company cannot determine the probability of any losses or outcome of the 2020 Claim including the amount of any indemnifiable losses, if any, resulting from these claims. However, the Company does not believe that this claim will have a material adverse effect on its consolidated financial position or results of operations. If the resolution of the 2020 Claim results in indemnifiable losses in excess of the applicable indemnification deductibles established under the definitive agreement, Edwards would be required to seek recovery under the representation and warranty insurance Edwards obtained in connection with the closing of the sale of the semiconductor cryogenics business. Management believes that any indemnifiable losses in excess of the applicable deductibles established in the definitive agreement would be covered by such insurance. For indemnifiable claims other than those arising from breaches of representations and warranties and for indemnifiable claims arising from breaches of representations and warranties exceeding the maximum coverage of the representations and warranties insurance policy, Edwards could seek recovery of such indemnifiable losses, if any, directly from the Company. In the event of unexpected subsequent developments and given the inherent unpredictability of these matters, there can be no assurance that the Company’s assessment of any claim will reflect the ultimate outcome, and an adverse outcome in certain matters could, from time to time, have a material adverse effect on the Company’s consolidated financial position or results of operations in particular quarterly or annual periods.
Tariff Matter
With the assistance of a third-party consultant, during the first quarter of fiscal year 2021 the Company initiated a review of the transaction value it used to calculate tariffs on inter-company imports of samples shipped from its GENEWIZ business. As a result, this review and a new interpretation surrounding the valuation method used to calculate the estimated transaction value, the Company revised its estimate of the tariffs owed and recorded a liability of $6.1 million in the second quarter of fiscal 2021. The Company submitted a payment in the amount of $5.9 million to the customs authorities during fiscal 2022, related to November 2021 and prior periods. The customs authorities are in process of reviewing the Company’s calculation of tariffs for these periods to determine if any further tariffs are owed. The company is currently in process of revising its tariff calculation methodology to align with the interpretation provided by customs authorities. The estimated amount owed to customs authorities under this revised methodology has been accrued in the Consolidated Balance Sheets.
Purchase Commitments
At September 30, 2023, the Company had non-cancellable commitments of $73.5 million, comprised of purchase orders for inventory of $51.3 million, and information technology related commitments of $22.2 million.
89
21. Subsequent Events
Segment Change
Effective October 1, 2023, the Company realigned its organizational structure from two principal business segments to three principal business segments to enhance its commercial strategy for accelerating growth and to enable additional profitability initiatives. The three new principal business segments are aligned with industry end-users and purchase decision-makers: Multiomics and Synthesis Solutions, Sample Management Solutions, and B Medical Systems.
| ● | Multiomics and Synthesis Solutions. The Multiomics and Synthesis Solutions business resources will operate under a single structure that aligns scientists, marketing resources, and decision-making around the customer, with a full embodiment of the GENEWIZ heritage of “solid science, superior service.” |
| ● | Sample Management Solutions (SMS). Sample & Repository Solutions (SRS), Ultracold Systems and Consumables and Instruments resources will operate as a single business unit offering end-to-end sample management services and products. |
| ● | B Medical Systems (BMS). BMS will continue under its current management structure, focused on the manufacturing and distribution of temperature-controlled storage and transportation solutions in international markets to governments, health institutions, and non-government organizations. |
As a result of the segment change, the Company utilized a relative fair value approach to allocate goodwill to the reporting units existing under the new organizational structure as of the first quarter of fiscal 2024. The book value of the B Medical reporting unit approximates fair value and is expected to include approximately $107 million of goodwill as of October 1, 2023. In the event the financial performance of any of the reporting units does not meet management’s expectations in the future, the Company experiences a prolonged macroeconomic or market downturn, or there are other negative revisions to key assumptions used in the DCF Method, the Company may be required to perform additional impairment analyses with respect to such reporting unit and could be required to recognize an impairment charge.
Share Repurchases
The Company repurchased an additional 2.1 million shares of common stock for $103.9 million (excluding fees, commissions, and excise tax) under the 2022 Repurchase Authorization subsequent to September 30, 2023 through the date of the filing of this Annual Report on Form 10-K.
On November 13, 2023, the Company announced its intention in fiscal 2024 to repurchase the remaining $500 million in shares of common stock available under the 2022 Repurchase Authorization.
Please refer to Note 13, Stockholders’ Equity for further detail regarding the 2022 Repurchase Authorization.
90
Item 9. Changes in and Disagreements with Accountants on Financial Accounting and Financial Disclosure
Not applicable.
Item 9A. Controls and Procedures
Evaluation of Disclosure Controls and Procedures
Under the supervision and with the participation of our management, including our chief executive officer and chief financial officer, we conducted an evaluation of our disclosure controls and procedures, as such term is defined under Rule 13a-15(e) promulgated under the Exchange Act. Disclosure controls and procedures are designed to ensure that information required to be disclosed by us in the reports we file or submit under the Exchange Act is recorded, processed, summarized and reported within the time periods specified in the SEC’s rules and forms and that such information is accumulated and communicated to management, including the chief executive officer and chief financial officer, as appropriate, to allow timely decisions regarding required disclosure. Based upon this evaluation, our chief executive officer and our chief financial officer concluded that our disclosure controls and procedures were effective as of September 30, 2023, the end of the period covered by this Annual Report on Form 10-K.
Management’s Report on Internal Control Over Financial Reporting
Our management is responsible for establishing and maintaining adequate internal control over financial reporting. Internal control over financial reporting is defined in Rules 13a-15(f) and 15d-15(f) under the Exchange Act, as a process designed by, or under the supervision of our chief executive and chief financial officers and effected by our board of directors, management and other personnel to provide reasonable assurance regarding the reliability of financial reporting and the preparation of financial statements for external purposes in accordance with generally accepted accounting principles in the United Sates, or GAAP and includes those policies and procedures that:
| ● | pertain to the maintenance of records that in reasonable detail accurately and fairly reflect the transactions and disposition of our assets; |
| ● | provide reasonable assurance that transactions are recorded as necessary to permit preparation of financial statements in accordance with GAAP, and that our receipts and expenditures are being made only in accordance with authorization of our management and directors; and |
| ● | provide reasonable assurance regarding prevention or timely detection of unauthorized acquisition, use or disposition of our assets that could have a material effect on the financial statements. |
Because of its inherent limitations, internal control over financial reporting may not prevent or detect misstatements. Projections of any evaluation of effectiveness to future periods are subject to the risks that controls may become inadequate because of changes in conditions, or that the degree of compliance with the policies or procedures may deteriorate.
Under the supervision and with the participation of our management, including our chief executive officer and chief financial officer, we conducted an assessment of the effectiveness of our internal control over financial reporting as of September 30, 2023. In making this assessment, we used the criteria set forth in Internal Control - Integrated Framework (2013) issued by the Committee of Sponsoring Organizations (COSO) of the Treadway Commission. Based on this evaluation, management concluded that the Company's internal control over financial reporting was effective as of September 30, 2023.
In October 2022, we completed our acquisition of B Medical Systems S.á r.l. and its subsidiaries (“B Medical”). We have excluded B Medical from our assessment of internal control over financial reporting as of September 30, 2023. B Medical is a wholly-owned subsidiary whose total revenue and assets represented approximately 17% of our consolidated revenue and 5% of our consolidated assets for the year ended and as of September 30, 2023.
91
The effectiveness of our internal control over financial reporting as of September 30, 2023 has been audited by PricewaterhouseCoopers LLP, an independent registered public accounting firm, as stated in their report which appears in Part II, Item 8, “Financial Statements and Supplementary Data” of this Annual Report on Form 10-K.
Changes in Internal Control Over Financial Reporting
There were no changes in internal control over financial reporting (as defined in Rules 13a-15(f) and 15d-15(f) under the Exchange Act) during the fiscal fourth quarter ended September 30, 2023, that have materially affected, or are reasonably likely to materially affect, our internal control over financial reporting.
Item 9B. Other Information
Rule 10b5-1 Trading Arrangements
During the three months ended September 30, 2023, no director nor officer of the Company adopted, modified or terminated a Rule 10b5-1 trading arrangement or non-Rule 10b5-1 trading arrangement, as each term is defined in Item 408(a) of Regulation S-K, except that on July 17, 2023, Lindon Robertson, the Company’s former Chief Financial Officer, terminated a non-Rule 10b5-1 trading arrangement that had been entered into on December 8, 2022, for the sale of up to 43,213 shares during the time period from December 8, 2022 through December 8, 2023, of which 0 shares were sold under this trading arrangement before its termination.
Appointment of Principal Financial Officer
In connection with the previously announced retirement of Lindon Robertson, the Company’s former Chief Financial Officer, on November 20, 2023, the Company appointed Herman Cueto, the Company’s Executive Vice President and Chief Financial Officer, to act as the Company’s Principal Financial Officer.
Item 9C. Disclosure Regarding Foreign Jurisdictions that Prevent Inspections The information required by this Item 10 is contained in our definitive proxy statement for our 2024 annual meeting of stockholders to be filed by us within 120 days after the close of our fiscal year, or the 2023 Proxy Statement, under the captions “Proposal No.
Not applicable.
92
PART III
Item 10. Directors, Executive Officers and Corporate Governance
1 Election of Directors,” “Other Matters-Delinquent Section 16(a) Reports,” “Other Matters-Standards of Conduct,” “Other Matters-Stockholder Proposals and Recommendations for Director” and “Corporate Governance” and is incorporated herein by reference.
Item 11. Executive Compensation
The information required by this Item 11 is contained under the captions “Corporate Governance,” “Compensation of Directors” and “Executive Officers” in the 2023 Proxy Statement to be filed by us within 120 days after the close of our fiscal year and is incorporated herein by reference.
Item 12. Security Ownership of Certain Beneficial Owners and Management and Related Stockholder Matters
The information required by this Item 12 is contained under the captions “Security Ownership of Certain Beneficial Owners and Management” and “Equity Compensation Plan Information” in the 2023 Proxy Statement to be filed by us within 120 days after the close of our fiscal year and is incorporated herein by reference.
Item 13. Certain Relationships and Related Transactions, and Director Independence
The information required by this Item 13 is contained under the captions “Related Party Transactions,” “Corporate Governance” and “Compensation of Directors” in the 2023 Proxy Statement to be filed by us within 120 days after the close of our fiscal year and is incorporated herein by reference.
Item 14. Principal Accountant Fees and Services
The information required by this Item 14 is contained under the caption “Independent Auditor Fees and Other Matters” in the 2023 Proxy Statement to be filed by us within 120 days after the close of our fiscal year and is incorporated herein by reference.
93
PART IV
Item 15. Exhibits and Financial Statement Schedules
| ● | Consolidated Financial Statements of the Company and the related notes are included under Part II, Item 8, “Financial Statements and Supplementary Data” of this Annual Report on Form 10-K. |
| ● | Other financial statement schedules are omitted because of the absence of conditions under which they are required or because the required information is given in the supplementary Consolidated Financial Statements or notes thereto. |
Exhibit |
|
Description |
|
|
|
2.01* |
|
|
|
|
|
2.02 |
|
|
|
|
|
2.03* |
|
|
|
|
|
2.04* |
|
|
|
|
|
2.05 |
|
|
|
|
|
2.06*+ |
|
|
|
|
|
3.01 |
|
|
|
|
|
3.02 |
|
|
|
|
|
3.03 |
|
|
|
|
|
94
4.01 |
|
|
|
|
|
4.02 |
|
|
|
|
|
10.01** |
|
|
|
|
|
10.02** |
|
|
|
|
|
10.03** |
|
|
|
|
|
10.04** |
|
|
|
|
|
10.05** |
|
|
|
|
|
10.06** |
|
Offer Letter, dated September 21, 2023, between the Company and Herman Cueto. |
|
|
|
10.07** |
|
|
|
|
|
10.08** |
|
|
|
|
|
10.09** |
|
|
|
|
|
10.10** |
|
|
|
|
|
10.11** |
|
|
|
|
|
10.12** |
|
|
|
|
|
10.13** |
|
|
|
|
|
10.14** |
|
|
|
|
|
95
10.15** |
|
|
|
|
|
10.16** |
|
|
|
|
|
10.17** |
|
|
|
|
|
10.18** |
|
|
|
|
|
10.19 |
|
|
|
|
|
10.20 |
|
|
|
|
|
21.01 |
|
|
|
|
|
23.01 |
|
|
|
|
|
31.01 |
|
|
|
|
|
31.02 |
|
|
|
|
|
32 |
|
|
|
|
|
101 |
|
The following material from the Company’s Annual Report on Form 10-K, for the year ended September 30, 2023, formatted in iXBRL (Inline eXtensible Business Reporting Language): (i) the Consolidated Balance Sheets; (ii) the Consolidated Statements of Operations; (iii) the Consolidated Statements of Comprehensive Income; (iv) the Consolidated Statements of Cash Flows; (v) the Consolidated Statements of Changes in Stockholders’ Equity; and (vi) the Notes to Consolidated Financial Statements. The instance document does not appear in the Interactive Data File because XBRL tags are embedded in the iXBRL document. |
|
|
|
104 |
|
Cover Page Interactive Data File (formatted as iXBRL and contained in Exhibit 101). |
|
|
|
* Certain schedules and exhibits have been omitted from this Exhibit pursuant to Item 601(a)(5) of Regulation S-K. Azenta, Inc. will furnish a copy of any omitted schedule or exhibit to the U.S. Securities and Exchange Commission or its staff upon request. | ||
| ||
|
** Management contract, compensatory plan or agreement. + Certain confidential portions (indicated by brackets and asterisk) have been omitted from this Exhibit. | ||
|
|
|
96
SIGNATURES
Pursuant to the requirements of Section 13 or 15(d) of the Securities Exchange Act of 1934, the registrant has duly caused this report to be signed on its behalf by the undersigned, thereunto duly authorized.
|
AZENTA, INC. |
|
|
|
|
|
|
|
By: |
/S/ STEPHEN S. SCHWARTZ |
|
|
|
Stephen S. Schwartz |
|
Date: November 20, 2023
Pursuant to the requirements of the Securities Exchange Act of 1934, this report has been signed below by the following persons on behalf of the registrant and in the capacities and on the dates indicated.
Signature |
Title |
Date |
|
|
|
/S/ STEPHEN S. SCHWARTZ |
Director, President and Chief Executive Officer (Principal Executive Officer) |
November 20, 2023 |
Stephen S. Schwartz |
||
|
|
|
/S/ HERMAN CUETO |
Executive Vice President and Chief Financial Officer (Principal Financial Officer) |
November 20, 2023 |
Herman Cueto |
||
|
||
|
|
|
/S/ VIOLETTA A. HUGHES |
Vice President and Chief Accounting Officer (Principal Accounting Officer) |
November 20, 2023 |
Violetta A. Hughes |
||
|
||
|
|
|
/S/ FRANK E. CASAL |
Director |
November 20, 2023 |
Frank E. Casal |
||
|
|
|
/S/ ROBYN C. DAVIS |
Director |
November 20, 2023 |
Robyn C. Davis |
|
|
|
|
|
/S/ JOSEPH R. MARTIN |
Director |
November 20, 2023 |
Joseph R. Martin |
||
|
|
|
/S/ ERICA J. MCLAUGHLIN |
Director |
November 20, 2023 |
Erica J. McLaughlin |
||
|
|
|
/S/ TINA S. NOVA |
Director |
November 20, 2023 |
Tina S. Nova |
||
|
|
|
/S/ KRISHNA G. PALEPU |
Director |
November 20, 2023 |
Krishna G. Palepu |
||
|
|
|
/S/ DOROTHY PUHY |
Director |
November 20, 2023 |
Dorothy Puhy |
||
|
|
|
/S/ MICHAEL ROSENBLATT |
Director |
November 20, 2023 |
Michael Rosenblatt |
||
|
|
|
/S/ ELLEN M. ZANE |
Director |
November 20, 2023 |
Ellen M. Zane |
98
Exhibit 4.02
DESCRIPTION OF THE REGISTRANT’S SECURITIES
REGISTERED PURSUANT TO SECTION 12 OF THE
SECURITIES EXCHANGE ACT OF 1934
As of September 30, 2023, Azenta, Inc. (referred to herein as “we”, “our”, “us” or “the Company”) has one class of securities registered under Section 12 of the Securities Exchange Act of 1934, as amended: our common stock.
The following description of our capital stock summarizes the material terms of our capital stock. It may not contain all the information that is important to you. For the complete terms of our capital stock, please refer to our Restated Certificate of Incorporation, as amended (“restated certificate of incorporation”), and our Amended and Restated Bylaws (“amended and restated bylaws”) which are incorporated by reference as exhibits to the Annual Report on Form 10-K of which this Exhibit 4.02 is a part, which may be further amended and/or restated from time to time. The Delaware General Corporation Law may also affect the terms of these securities.
Authorized Capital Stock
Under our restated certificate of incorporation our authorized capital stock consists of 125,000,000 shares of common stock, $0.01 par value per share, and 1,000,000 shares of preferred stock, $0.01 par value per share, of which 126,500 shares have been designated Series A Junior Participating Preferred Stock. We designated the Series A Junior Participating Preferred Stock in connection with a stockholder rights plan that has expired.
Common Stock
Voting
The holders of common stock are entitled to one vote for each share held of record on all matters submitted to a vote of our stockholders. Our common stock does not have cumulative voting rights.
Dividends
If our board of directors declares a dividend, holders of our common stock will receive payments from our funds that are legally available to pay dividends.
Liquidation and Dissolution
If we are liquidated, dissolved or our affairs are wound up, the holders of our common stock will be entitled to share ratably in all the assets that remain after payment of our liabilities and the liquidation preference of any then outstanding preferred stock.
Other Rights and Restrictions
Holders of our common stock have no preemptive or other subscription or conversion rights. There are no redemption or sinking fund provisions applicable to our common stock. The outstanding shares of our common stock are fully paid and nonassessable.
Listing
Our common stock is listed on the Nasdaq Global Select Market under the symbol “AZTA.”
Transfer Agent and Registrar
The transfer agent and registrar for our common stock is Computershare, Inc.
1
Preferred Stock
Under our restated certificate of incorporation, we have authority, subject to any limitations prescribed by law and without further stockholder approval, to issue from time to time up to 1,000,000 shares of preferred stock, $0.01 par value per share, in one or more classes or series. Our board of directors, without further approval of the stockholders, is authorized to fix the dividend rights and terms, conversion rights, voting rights, redemption rights and terms, liquidation preferences, and any other rights, preferences, privileges and restrictions applicable to each class or series of the preferred stock. The issuance of preferred stock, while providing flexibility in connection with possible acquisitions and other corporate purposes could, among other things, adversely affect the voting power or rights of the holders of our common stock and, under certain circumstances, make it more difficult for a third party to gain control of us, discourage bids for our common stock at a premium or otherwise adversely affect the market price of the common stock. Of the 1,000,000 shares of preferred stock, 126,500 shares have been designated Series A Junior Participating Preferred Stock. We designated the Series A Junior Participating Preferred Stock in connection with a stockholder rights plan that has expired.
Certain Effects of Authorized but Unissued Stock
We have shares of common stock and preferred stock available for future issuance without stockholder approval. We may issue these additional shares for a variety of corporate purposes, including future public offerings to raise additional capital, facilitating corporate acquisitions, for paying a dividend on our capital stock or in connection with the adoption of a stockholder rights plan. The existence of unissued and unreserved common stock and preferred stock may enable our board of directors to issue shares to persons friendly to current management or to issue preferred stock with terms that could render more difficult or discourage a third-party attempt to obtain control of us by means of a merger, tender offer, proxy contest or otherwise, thereby protecting the continuity of our management. In addition, if we issue preferred stock, the issuance could adversely affect the voting power of holders of common stock and the likelihood that such holders will receive dividend payments and payments upon liquidation.
Delaware Law and Certificate of Incorporation and By-law Provisions
Stockholder Action; Special Meeting of Stockholders; Advance Notice Requirements for Stockholder Proposals and Director Nominations
Our restated certificate of incorporation and amended and restated bylaws also provide that:
· |
stockholder action may be taken only at a duly called and convened annual or special meeting of stockholders; |
· |
stockholder action may not be taken by written consent in lieu of a meeting; |
· |
special meetings of stockholders may be called only by our chief executive officer, president or by our board of directors and that business transacted at any special meeting of stockholders shall be limited only to that business references in the notice of such meeting; and |
· |
stockholders must comply with advance notice procedures for stockholder proposals to be brought before an annual meeting of stockholders, including proposed nominations of candidates for election to our board of directors. |
These provisions could delay, until the next stockholders’ meeting, actions which are favored by the holders of a majority of our outstanding voting securities. These provisions may also discourage another person or entity from making a tender offer for our common stock, because a person or entity, even if it acquired a majority of our outstanding voting securities, would be able to take action as a stockholder only at a duly called stockholders’ meeting, and not by written consent.
Supermajority Votes Required
The Delaware General Corporation Law provides that the vote of a majority of the shares outstanding and entitled to vote on any matter is required to amend a corporation’s certificate of incorporation or by-laws, unless a corporation’s certificate of incorporation or by-laws, as the case may be, requires a greater percentage.
2
Our restated certificate of incorporation provides that, except as otherwise provided in our amended and restated bylaws, any vote required by stockholders pursuant to the Delaware General Corporation Law, other than the election of directors, requires the vote of the holders of a majority of each class of stock outstanding and entitled to vote thereon, if recommended by a majority of the continuing directors (as defined in our restated certificate of incorporation) or, if not so recommended, 80% of each class of stock outstanding and entitled to vote thereon. In addition, our amended and restated bylaws provide that (a) any director or the entire board of directors may be removed, with or without cause, by the holders of a majority of the shares then entitled to vote at the election of directors, (b) stockholders may only change the number of our board of directors by vote of 80% of the shares of our voting stock outstanding and (c) in the case of an amendment to our amended and restated bylaws that reduces any voting requirement, such amendment shall require the vote that would have been required by such provision before such proposed amendment.
Business Combinations
Section 203 of the Delaware General Corporation Law is applicable to us. Section 203 restricts some types of transactions and business combinations between a corporation and a 15% stockholder. A 15% stockholder is generally considered by Section 203 to be a person owning 15% or more of the corporation’s outstanding voting stock. Section 203 refers to a 15% stockholder as an “interested stockholder.” Section 203 restricts these transactions for a period of three years from the date the stockholder acquires 15% or more of our outstanding voting stock. With some exceptions, unless the transaction is approved by our board of directors and the holders of at least two-thirds of our outstanding voting stock, Section 203 prohibits significant business transactions such as:
· |
a merger with, disposition of significant assets to or receipt of disproportionate financial benefits by the interested stockholder; and |
· |
any other transaction that would increase the interested stockholder’s proportionate ownership of any class or series of our capital stock. |
The shares held by the interested stockholder are not counted as outstanding when calculating the two-thirds of the outstanding voting stock needed for approval.
The prohibition against these transactions does not apply if:
· |
prior to the time that any stockholder became an interested stockholder, our board of directors approved either the business combination or the transaction in which such stockholder acquired 15% or more of our outstanding voting stock; or |
· |
the interested stockholder owns at least 85% of our outstanding voting stock as a result of a transaction in which such stockholder acquired 15% or more of our outstanding voting stock. Shares held by persons who are both directors and officers or by some types of employee stock plans are not counted as outstanding when making this calculation. |
Exclusive Forum Provision
Our amended and restated bylaws provide that, unless we consent in writing to the selection of an alternative forum, the Court of Chancery of the State of Delaware (or, if the Court of Chancery of the State of Delaware does not have jurisdiction, the federal district court for the District of Delaware) will be the sole and exclusive forum for the following types of proceedings:
· |
any derivative action or proceeding brought on our behalf; |
· |
any action asserting a claim of breach of a fiduciary duty owed by any of our directors, officers, employees or stockholders to our company or our stockholders; |
· |
any action asserting a claim arising pursuant to any provision of the Delaware General Corporation Law, our certificate of incorporation or our by-laws; or |
3
· |
any action asserting a claim governed by the internal affairs doctrine of the law of the State of Delaware. |
These choice of forum provisions will not apply to causes of action arising under the Securities Act of 1933, as amended, or the Securities Exchange Act of 1934, as amended, or any other claim for which federal courts have exclusive jurisdiction. Furthermore, our by-laws provide that, unless we consent in writing to the selection of an alternative forum, the federal district courts of the United States of America shall be the exclusive forum for the resolution of any claims under the Securities Act of 1933, as amended. Although our amended and restated bylaws contains the choice of forum provisions described above, it is possible that a court could rule that such provisions are inapplicable for a particular claim or action or that such provisions are unenforceable.
Indemnification
Our restated certificate of incorporation provides that no director of our company shall be personally liable for any monetary damages for any breach of fiduciary duty as a director, except for liability (i) for any breach of the director’s duty of loyalty to the company or its stockholders, (ii) for acts or omissions not in good faith or which involve intentional misconduct or a knowing violation of law, (iii) under Section 174 of the Delaware General Corporation Law, or (iv) for any transaction from which the director derived an improper personal benefit. Our restated certificate of incorporation further provides for the indemnification of our directors and officers to the fullest extent permitted by Section 145 of the Delaware General Corporation Law.
Our amended and restated bylaws provide that we may indemnify, and may advance expenses, to each covered person who is a party to, or was or is threatened to be made a party to, or is otherwise involved in any proceeding, as provided in our amended and restated bylaws and to the fullest extent permitted by applicable law.
4
Exhibit 10.06

September 21, 2023
Mr. Herman Cueto
855 Boulevard
Westfield, NJ 07090
Dear Herman:
I am very happy to extend an offer to become part of Azenta (the “Company”) and our executive team. Our numerous discussions have only solidified my strong impressions that you will provide the strategic leadership necessary to continue Azenta’s growth while enabling our customers to bring impactful breakthroughs and therapies to market faster. Our directors and executive management team share my belief that you will be a natural complement to the organization as we continue our ambitious growth as a premier life sciences company. I am fully confident your decision to join Azenta will result in a very rewarding personal and professional expenence.
On behalf of Azenta, I am pleased to provide you the terms of our offer to become Executive Vice President and Chief Financial Officer. In this executive officer role, you will report to me and have responsibility for all financial and fiscal management aspects of the company to include building and executing a business plan while establishing long range strategic and financial objectives to expand the scope and profitability of Azenta. You will work with our executive leadership team to establish positive relationships with our customers, shareholders, and our employees.
A summary of the terms are as follows:
1. |
Your base salary will be set initially at $520,000 annually and paid biweekly (“Base Salary”). Subsequent salary reviews for executive positions are normally conducted annually and adjustments become effective in January. Your base salary will first be reviewed after the completion of fiscal year (FY) 2024. |
2. |
You are eligible to participate in the annual Performance Based Variable Compensation Plan for FY 2024 (Plan year beginning October 1, 2023) and each fiscal year thereafter, with an annual target of 80% of base salary paid with an upside potential to 120% of annual target. Payment of variable compensation is subject to meeting aggressive but achievable corporate financial goals for FY 2024 and subsequent years. Your annual bonus payment will be calculated based on actual base salary paid during the applicable fiscal year. |
3. |
You will become, subject to final Board approval, a participant in the Company’s Long Term Incentive Plan (LTIP) for the FY 2024-2026 period and you will receive, subject to Board approval, a grant at our upcoming meeting in November 2023. This grant will have a |
value of $1,250,000 of which 75% of the value will be provided as performance share units (PSUs) and 25% in time based restricted stock units (RSUs) that will vest annually over three years. You will be eligible for any subsequent LTIP grants as approved by the Board as part of our annual stock grant allocation.
4. |
In recognition of equity vesting to occur in November 2023 at your current employer, Azenta will pay you a new hire cash bonus in the amount of $740,000 with $500,000 payable within 30 days after your Start Date, and the remaining $240,000 paid on the first anniversary of your Start Date. This bonus will be subject to a claw back of 100% of the amount paid if you voluntarily resign prior to the first year anniversary of your Start Date and 50% of the amount paid if you voluntarily resign before the second year anniversary of your Start Date. |
5. |
Additionally, and in partial recognition of your equity entitlements at your current employer, you will be eligible for a separate equity grant subject to Board approval at our upcoming November 2023 meeting. This grant will have a value of $500,000 consisting of 100% time based RSUs that will vest 50% on each of the first two yearly anniversary dates of your Start Date, subject to a continuing service requirement. |
6. |
Azenta equity grant documents provide for accelerated vesting of unvested equity grants if there is a qualifying termination within one year following a change in control of Azenta. Except as set forth herein, all terms relating to your equity awards will be governed exclusively by the Company’s Amended and Restated 2020 Equity Incentive Plan (or any subsequent equity plan) and related award agreements or notices. |
7. |
You will be eligible to participate in our Company sponsored benefit plans which are available to any other executive level employees of the Company. Azenta currently pays a majority (approximately 70%) of the cost of medical, dental and vision insurance and 100% of the cost of life and disability insurance. The Company also offers a 401(k) savings and retirement plan with a 4.5% company match, an Employee Stock Purchase Plan with a minimum 15% discount, a non-qualified Deferred Compensation Plan, and a Flexible Leave time off policy. Enclosed is a summary of these plans. |
8. |
The following is the basis for salary continuation eligibility in the unlikely event we separate our employment relationship. |
| ● | If you should voluntarily terminate employment in the future, Azenta will provide you with your pro-rata base salary up to your termination date. |
| ● | If Azenta terminates your employment without “cause” (“cause” as defined in Azenta’s equity plan document), you will be eligible for salary continuation payments at your then current base salary for a period of up to twelve months from your termination date if you are not able to find a comparable position. In addition, you will continue to be covered under the Company’s medical, dental and vision plans at the same contribution level as current active employees while you are receiving salary continuation payments. Any salary continuation or benefits will be conditioned upon your signing the Company’s customary Separation Agreement and Waiver of Claims. |
| ● | If Azenta terminates your employment for cause, you will receive your pro-rata base salary up to your termination date. |
| ● | For purposes of Section 409A of the Internal Revenue Code (“Section 409A”), each installment of salary continuation or other payment shall be deemed to be a “separate payment” (within the meaning of Section 409A), and each payment shall be deemed exempt from the definition of nonqualified deferred compensation to the fullest extent possible under the short-term deferral exception and the involuntary separation pay exception of the Section 409A regulations. |
9. |
Azenta will provide you with relocation benefits and professional support to transfer to the greater Boston, MA area within one year of your hire date. These benefits will provide reimbursement or direct payment of eligible relocation expenses associated with your move up to $200,000 (subject to further reasonable accommodation based on unanticipated circumstances). |
Eligible relocation expenses as required will include:
| ● | Actual cost of moving household goods. |
| ● | House hunting trip(s) prior to your move. |
| ● | Temporary living and storage expenses for up to 3 months for you and your family. |
| ● | Travel expenses associated with moving your family to the new residence. |
| ● | Assistance with the sale of your current home under the Company’s arrangement with its relocation vendor. Assistance will include the reimbursement of a broker’s commission and eligible seller expenses and fees up to the $200,000 cap. |
| ● | Assistance with the rental or purchase of a new residence in the greater Boston, MA area to include eligible fees and expenses associated with the purchase at closing or rental acquisition up to the $200,000 cap. Mortgage discount points are specifically excluded. |
| ● | Miscellaneous expense allowance of $10,000. |
| ● | Non-deductible expenses, except for the expense allowance, are eligible for gross-up of federal and state tax. |
As part of our customary relocation policy, if you should voluntarily terminate employment with Azenta within one year of your relocation date, 100% of relocation assistance payments must be reimbursed to the Company. If you should voluntarily terminate employment during the second year following relocation, 50% of relocation assistance benefits must be reimbursed to Azenta.
You will be required to successfully complete the Company’s customary background check process following acceptance. This offer will remain open until September 25, 2023. If accepted, you will also be required to execute our standard Employee Non-Solicitation and Proprietary Information Agreement and agree to the Company’s claw back terms. Both forms are enclosed.
Herman, we are truly excited with the prospect of you joining Azenta and working with you to realize the full value of our Company. We believe we have assembled an outstanding team of people that will certainly benefit from your leadership and prior accomplishments. Your experience, intellect and skills will be critical in helping lead as we seek to grow Azenta for the benefit of its shareholders, customers, employees, and you personally.
We look forward to your acceptance of this offer of employment and your start date at the beginning of our FY 2024 on October 16, 2023 (the “Start Date”). Please sign and return one copy of this letter in the enclosed envelope provided or you may scan a copy of your acceptance to Olga Pirogova in Human Resources at olga.pirogova@azenta.com. Thank you.
Sincerely yours, |
|
|
|
/s/ Stephen S. Schwartz |
|
Stephen S. Schwartz |
|
President and Chief Executive Officer |
|
cc: |
Olga Pirogova SVP, CHRO |
|
|
William T. Montone, Human Resources |
|
|
Trisha Clifford, Spencer Stuart Associates |
|
|
File |
|
Enclosures |
|
|
|
|
|
|
|
Acceptance: |
/s/ Herman Cueto |
|
Sept. 22, 2023 |
|
Signature |
|
Date |
|
|
|
|
|
Oct. 16, 2023 |
|
|
|
Start Date |
|
|
EXHIBIT 21.01
AZENTA, INC.
SUBSIDIARIES OF THE REGISTRANT
Legal Entity |
Jurisdiction |
||
Abeyatech LLC |
USA |
||
Azenta Beijing Technologies Limited |
China |
|
|
Azenta (Guangzhou) Life Science Co., Ltd. |
China |
|
|
Azenta Germany GmbH |
Germany |
||
Azenta Japan Corp. |
Japan |
||
Azenta Life Sciences Canada, Inc. |
Canada |
||
Azenta Luxembourg SARL |
Luxembourg |
||
Azenta (Nanjing) Life Science Technologies Co., Ltd. |
China |
|
|
Azenta Switzerland AG |
Switzerland |
||
Azenta (Shanghai) Life Science Co. Ltd. |
China |
|
|
Azenta Singapore Pte Ltd. |
Singapore |
|
|
Azenta (Tianjin) Biotechnology Co., Ltd. |
China |
|
|
Azenta UK Ltd |
UK |
||
Azenta US, Inc. |
USA |
||
B Medical Systems India Private Limited |
India |
|
|
B Medical Systems North America LLC |
USA |
|
|
B Medical Systems SARL |
Luxembourg |
|
|
Barkey Beteiligungsgesellschaft mbH |
Germany |
|
|
Barkey Corporation |
USA |
|
|
Barkey GmbH & Co. KG |
Germany |
|
|
Barkey Holding GmbH |
Germany |
|
|
Barkey (Shanghai) Electronic Technology Co. Ltd. |
China |
|
|
BioSpeciman Corporation |
Canada |
||
Cedrex AS |
Denmark |
||
GENEWIZ Germany GmbH |
Germany |
||
GENEWIZ Group |
USA |
||
GENEWIZ France Ltd. |
France |
||
GENEWIZ Inc. |
USA |
||
GENEWIZ LLC |
USA |
||
GENEWIZ (Suzhou), Ltd. |
China |
||
GENEWIZ UK Ltd. |
UK |
|
|
RURO, Inc. |
USA |
||
Ziath B.V. |
Netherlands |
|
|
Ziath Inc. |
USA |
|
|
Ziath Ltd. |
UK |
|
|
Exhibit 23.01
CONSENT OF INDEPENDENT REGISTERED PUBLIC ACCOUNTING FIRM
We hereby consent to the incorporation by reference in the Registration Statements on Form S-8 (Nos. 333-252725, 333-202005, 333-216312, 333-221826 and 333-123242) of Azenta, Inc. of our report dated November 20, 2023 relating to the financial statements and the effectiveness of internal control over financial reporting, which appears in this Form 10-K.
/s/ PricewaterhouseCoopers LLP
Boston, Massachusetts
November 20, 2023
EXHIBIT 31.01
CERTIFICATION PURSUANT TO SECTION 302 OF THE SARBANES-OXLEY ACT OF 2002
I, Stephen S. Schwartz, certify that:
1. I have reviewed this annual report on Form 10-K of Azenta, Inc.;
2. Based on my knowledge, this report does not contain any untrue statement of a material fact or omit to state a material fact necessary to make the statements made, in light of the circumstances under which such statements were made, not misleading with respect to the period covered by this report;
3. Based on my knowledge, the financial statements, and other financial information included in this report, fairly present in all material respects the financial condition, results of operations and cash flows of the registrant as of, and for, the periods presented in this report;
4. The registrant’s other certifying officer(s) and I are responsible for establishing and maintaining disclosure controls and procedures (as defined in Exchange Act Rules 13a-15(e) and 15d-15(e)) and internal control over financial reporting (as defined in Exchange Act Rules 13a-15(f) and 15d-15(f)) for the registrant and have:
a. Designed such disclosure controls and procedures, or caused such disclosure controls and procedures to be designed under our supervision, to ensure that material information relating to the registrant, including its consolidated subsidiaries, is made known to us by others within those entities, particularly during the period in which this report is being prepared;
b. Designed such internal control over financial reporting, or caused such internal control over financial reporting to be designed under our supervision, to provide reasonable assurance regarding the reliability of financial reporting and the preparation of financial statements for external purposes in accordance with generally accepted accounting principles;
c. Evaluated the effectiveness of the registrant’s disclosure controls and procedures and presented in this report our conclusions about the effectiveness of the disclosure controls and procedures, as of the end of the period covered by this report based on such evaluation; and
d. Disclosed in this report any change in the registrant’s internal control over financial reporting that occurred during the registrant’s most recent fiscal quarter (the registrant’s fourth fiscal quarter in the case of an annual report) that has materially affected, or is reasonably likely to materially affect, the registrant’s internal control over financial reporting; and
5. The registrant’s other certifying officer(s) and I have disclosed, based on our most recent evaluation of internal control over financial reporting, to the registrant’s auditors and the audit committee of the registrant’s board of directors (or persons performing the equivalent functions):
a. All significant deficiencies and material weaknesses in the design or operation of internal control over financial reporting which are reasonably likely to adversely affect the registrant’s ability to record, process, summarize and report financial information; and
b. Any fraud, whether or not material, that involves management or other employees who have a significant role in the registrant’s internal control over financial reporting.
/s/ STEPHEN S. SCHWARTZ |
|
Stephen S. Schwartz |
|
Chief Executive Officer |
|
|
|
Date: November 20, 2023 |
|
EXHIBIT 31.02
CERTIFICATION PURSUANT TO SECTION 302 OF THE SARBANES-OXLEY ACT OF 2002
I, Herman Cueto, certify that:
1. I have reviewed this annual report on Form 10-K of Azenta, Inc.;
2. Based on my knowledge, this report does not contain any untrue statement of a material fact or omit to state a material fact necessary to make the statements made, in light of the circumstances under which such statements were made, not misleading with respect to the period covered by this report;
3. Based on my knowledge, the financial statements, and other financial information included in this report, fairly present in all material respects the financial condition, results of operations and cash flows of the registrant as of, and for, the periods presented in this report;
4. The registrant’s other certifying officer(s) and I are responsible for establishing and maintaining disclosure controls and procedures (as defined in Exchange Act Rules 13a-15(e) and 15d-15(e)) and internal control over financial reporting (as defined in Exchange Act Rules 13a-15(f) and 15d-15(f)) for the registrant and have:
a. Designed such disclosure controls and procedures, or caused such disclosure controls and procedures to be designed under our supervision, to ensure that material information relating to the registrant, including its consolidated subsidiaries, is made known to us by others within those entities, particularly during the period in which this report is being prepared;
b. Designed such internal control over financial reporting, or caused such internal control over financial reporting to be designed under our supervision, to provide reasonable assurance regarding the reliability of financial reporting and the preparation of financial statements for external purposes in accordance with generally accepted accounting principles;
c. Evaluated the effectiveness of the registrant’s disclosure controls and procedures and presented in this report our conclusions about the effectiveness of the disclosure controls and procedures, as of the end of the period covered by this report based on such evaluation; and
d. Disclosed in this report any change in the registrant’s internal control over financial reporting that occurred during the registrant’s most recent fiscal quarter (the registrant’s fourth fiscal quarter in the case of an annual report) that has materially affected, or is reasonably likely to materially affect, the registrant’s internal control over financial reporting; and
5. The registrant’s other certifying officer(s) and I have disclosed, based on our most recent evaluation of internal control over financial reporting, to the registrant’s auditors and the audit committee of the registrant’s board of directors (or persons performing the equivalent functions):
a. All significant deficiencies and material weaknesses in the design or operation of internal control over financial reporting which are reasonably likely to adversely affect the registrant’s ability to record, process, summarize and report financial information; and
b. Any fraud, whether or not material, that involves management or other employees who have a significant role in the registrant’s internal control over financial reporting.
/s/ HERMAN CUETO |
|
Herman Cueto |
|
Executive Vice President and Chief Financial Officer |
|
|
|
Date: November 20, 2023 |
|
EXHIBIT 32
CERTIFICATION
PURSUANT TO SECTION 906 OF THE SARBANES-OXLEY ACT OF 2002 (SUBSECTIONS (A)
AND (B) OF SECTION 1350, CHAPTER 63 OF TITLE 18, UNITED STATES CODE)
Pursuant to Section 906 of the Sarbanes-Oxley Act of 2002 (subsections (a) and (b) of Section 1350, Chapter 63 of Title 18, United States Code), the undersigned officer of Azenta, Inc., a Delaware corporation (the “Company”), does hereby certify that:
(1) The Annual Report on Form 10-K for the year ended September 30, 2023 of the Company fully complies with the requirements of Section 13(a) or 15(d) of the Securities Exchange Act of 1934; and
(2) The information contained in the Annual Form 10-K fairly presents, in all material respects, the financial condition and results of operations of the Company.
/s/ STEPHEN S. SCHWARTZ |
|
Stephen S. Schwartz |
|
Director and Chief Executive Officer |
|
(Principal Executive Officer) |
|
|
|
Dated: November 20, 2023 |
|
|
|
/s/ HERMAN CUETO |
|
Herman Cueto |
|
Executive Vice President and Chief Financial Officer |
|
(Principal Financial Officer) |
|
|
|
Dated: November 20, 2023 |
|
A signed original of this written statement required by Section 906 has been provided to Azenta, Inc. and will be retained by Azenta, Inc. and furnished to the Securities and Exchange Commission or its staff upon request.