UNITED STATES
SECURITIES AND EXCHANGE COMMISSION
Washington, D.C. 20549
FORM 6-K
REPORT OF FOREIGN PRIVATE ISSUER PURSUANT TO RULE 13a-16
OR 15d-16 UNDER THE SECURITIES EXCHANGE ACT OF 1934
For the month of November 2023
Commission File Number: 001-39519
Vitru Limited
(Exact name of registrant as specified in its charter)
Rodovia José Carlos Daux, 5500, Torre Jurerê A,
2nd floor, Saco Grande, Florianópolis, State of
Santa Catarina, 88032-005, Brazil
+55 (47) 3281-9500
(Address of principal executive office)
Indicate by check mark whether the registrant files or will file annual reports under cover of Form 20-F or Form 40-F:
Form 20-F |
X |
Form 40-F |
|
Indicate by check mark if the registrant is submitting the Form 6-K in paper as permitted by Regulation S-T Rule 101(b)(1):
Yes |
|
No |
X |
Indicate by check mark if the registrant is submitting the Form 6-K in paper as permitted by Regulation S-T Rule 101(b)(7):
Yes |
|
No |
X |
TABLE OF CONTENTS
Exhibit No. |
Description |
99.1 |
Earnings Release dated November 14, 2023 – Vitru Limited Third Quarter 2023 Financial Results |
99.2 |
SIGNATURE
Pursuant to the requirements of the Securities Exchange Act of 1934, the registrant has duly caused this report to be signed on its behalf by the undersigned, thereunto duly authorized.
|
Vitru Limited |
|
|
|
|
|
|
|
|
By: |
/s/ Carlos Henrique Boquimpani de Freitas |
|
Name: |
Carlos Henrique Boquimpani de Freitas |
|
Title: |
Chief Financial and Investor Relations Officer |
|
|
|
Date: November 14, 2023 |
|
|

Exhibit 99.1
Vitru Limited
announces
Third Quarter 2023
Financial Results

Florianópolis, Brazil, November 14, 2023 – Vitru Limited, or Vitru (Nasdaq: VTRU), the leading pure-player in the post-secondary digital education market in Brazil, today reported financial and operating results for the three-month period ended September 30, 2023 (“third quarter 2023” or “3Q23”) and nine-month periods ended September 30, 2023 (“9M23”). Financial results are expressed in Brazilian reais (R$) and are presented in accordance with International Financial Reporting Standards (IFRS). Vitru operates its hubs under the Uniasselvi and UniCesumar brands with 860.7 thousand students enrolled in digital education undergraduate and graduate courses, and 2,385 hubs distributed throughout Brazil, in each case as of September 30, 2023.
Co-CEOs LETTER
Vitru, delivering consistent growth and scale
Dear valued shareholders,
This quarter, we celebrate our third anniversary as a listed company, and we are proud to share our consistent, sustainable, and responsible trajectory reflected both in the quality of our services and the value added to all our stakeholders.
It is important to highlight that the third quarter of 2023 (3Q23) reflected for the first time a complete or fully comparable performance between quarters of consecutive years, since we started consolidating Unicesumar on May 20, 2022. In this regard, in 3Q23 our digital student base expanded 15.6% when compared to the same period of last year, reaching a total of 837.6 thousand enrolled students in Digital Education courses as of September 30, 2023. In addition, while the intake of the second semester for both companies is still ongoing, the combined intake increase amounted to 35% during the 3Q23 versus the same period of 2022. This growth can be attributed to our robust marketing efforts, the ongoing enhancement of our course offerings, and the trust and engagement of our students.
Our Net Revenue for the quarter amounted to R$ 488.0 million, an increase of 21.8% compared to the same period in 2022. Reflecting our ability to manage the integration with Unicesumar and deliver the expected synergies, Vitru’s Adj. EBITDA in 3Q23 increased 29.4% vs 3Q22, amounting to R$ 185.7 million in 3Q23 with a 2.2 p.p. increase in Adj. EBITDA margin (reaching 38.1%) when compared to the same period of last year. We believe this growth demonstrates our ability to capitalize on the increasing demand for digital education solutions, positioning us as a market leader in Brazil.
Furthermore, we recently announced our third issuance of unsecured debentures in an aggregate principal amount of up to R$600 million (R$ 500 million plus an additional amount of R$100 million that may be issued). The proceeds of this new debentures issuance will be used to pay in advance the sellers’ financing contracted by Vitru in connection with the business combination with Unicesumar.
As we think about the future, we are confident about Vitru’s prospects. We believe the digital education market in Brazil will keep experiencing sustained growth, driven by advancements in new technologies, including A.I. Additionally, the rise of active methodologies is emerging as a potent pedagogical strategy, where the student takes center stage in the learning process, becoming the lead protagonist of their own educational journey. We believe that being the leading digital education company in Brazil puts us in a great position to benefit from these opportunities.
As we move towards the last quarter of 2023, we believe our commitment to excellence will continue to drive our growth and deliver long-term value for all our stakeholders. Our mission to democratize access to quality education in Brazil is still underway, empowering individuals and shaping future generations.
|
3Q23 Results |
2 |
Thank you for your continued support.
Sincerely,
William Matos & Pedro Graça
Vitru's Co-CEOs
|
3Q23 Results |
3 |
WEBCAST INFORMATION
Vitru will discuss its third quarter 2023 results via live webcast
When: Thursday, November 14, 2023, at 8:30 a.m. EST (10:30 a.m. BRT)
Webcast: https://investors.vitru.com.br/
Replay: available on our website
Carlos Freitas |
|
Chief Financial and Investor Relations Officer |
|
|
|
|
|
Maria Carolina de Freitas Gonçalves |
Investor Relations Contact |
Investor Relations Manager |
ir@vitru.com.br |
|
3Q23 Results |
4 |
HIGHLIGHTS OF 3Q23 AND THEREAFTER
| ◾ | Most recent INEP Census report confirms Vitru as the top player in Digital Education in Brazil; |
| ◾ | 860.7k students as of the end of 3Q23, with a 15.6% increase in Digital Education Undergraduate enrolled students; |
| ◾ | Average ticket in the DE Undergraduate segment increased 13.1% in 3Q23 when compared to 3Q22, confirming Vitru’s pricing discipline and product differentiation; |
| ◾ | Net revenue in the core Digital Education Undergraduate segment increased by 20.1% in 3Q23 compared to 3Q22, with Consolidated Net Revenue up 21.8%; |
| ◾ | Adjusted EBITDA increased 29.4% in 3Q23 compared to 3Q22, with Adjusted EBITDA Margin increasing 2.3 percentage points (p.p.) to 38.1% in 3Q23 compared to 3Q22; |
| ◾ | Adjusted Net Income down 41.2% in 3Q23 compared to 3Q22, reaching R$38.6 million; |
| ◾ | Adjusted Cash Flow from Operations increased 76.3% to R$259.9 million in 3Q23 compared to 3Q22, with an Adjusted Cash Flow Conversion from Operations of 169.2% compared to 109.8% in 3Q22. |
Table 1: Key financial highlights
R$ million |
|
3Q23 |
3Q22 |
% Chg |
9M23 |
9M22 |
% Chg |
Net Revenue |
|
488.0 |
400.8 |
21.8% |
1,453.7 |
886.6 |
64.0% |
DE Undergraduate Net Revenue |
|
339.3 |
282.5 |
20.1% |
1,044.9 |
682.4 |
53.1% |
Adjusted EBITDA1 |
|
185.7 |
143.5 |
29.4% |
556.6 |
307.8 |
80.8% |
Adjusted EBITDA Margin |
|
38.1% |
35.8% |
2.3 p.p. |
38.3% |
34.7% |
3.6 p.p. |
Adjusted Net Income2 |
|
38.6 |
65.7 |
(41.2)% |
243.1 |
155.5 |
56.3% |
Adjusted Cash Flow from Operations3 |
|
259.9 |
147.4 |
76.3% |
548.5 |
267.5 |
105.0% |
Adjusted Cash Flow Conversion from Operations3 |
|
169.2% |
109.8% |
59.4 p.p. |
109.9% |
101.9% |
8.0 p.p. |
| (1) | For a reconciliation of Adjusted EBITDA, see “—Reconciliations of Non-GAAP Financial Measures—Reconciliation of Adjusted EBITDA” at the end of this document. |
| (2) | For a reconciliation of Adjusted Net Income, see “—Reconciliations of Non-GAAP Financial Measures—Reconciliation of Adjusted Net Income” at the end of this document. |
| (3) | For a reconciliation of Adjusted Cash Flow from Operations and Adjusted Cash Flow Conversion from Operations, see “—Reconciliations of Non-GAAP Financial Measures—Reconciliation of Adjusted Cash Flow Conversion from Operations” at the end of this document. |
|
3Q23 Results |
5 |
OPERATING RESULTS
Student base and hubs
We consider the number of enrolled students an important operational metric for Vitru. As of September 30, 2023, Vitru had 860.7 thousand students enrolled in the courses it provides, an increase of 15.6% compared to the number of enrolled students as of September 30, 2022.
The percentage of digital education students to total enrolled students is also a relevant metric that we believe best demonstrates our focus on digital education (comprising both undergraduate courses and continuing education courses) and its relevance to the services offered. As of September 30, 2023, students enrolled in digital education courses represented 97.3% of the total number of enrolled students, slightly up from the percentage achieved on September 30, 2022.
The number of hubs is one of the main drivers that enables the Company to increase its student base. A material portion of Vitru’s growth is driven by the expansion and subsequent maturation of these hubs.
Vitru has expanded its operations and geographic presence throughout Brazil with the opening of hubs in the last years. In fact, 92.9% of the current 2,385 hubs are still ramping up, representing a substantial growth avenue: the current average maturation ratio of hubs in expansion is only 43.4%. The Company estimates that a typical hub reaches its full capacity in terms of the number of students (and hence is deemed to be mature) after seven or eight years of operations.
Table 2: Student base and Hubs
'000 |
|
3Q23 |
3Q22 |
2Q23 |
Δ 3Q23 x 3Q22 |
Δ 3Q23 x 2Q23 |
Total enrolled students |
|
860.7 |
744.8 |
919.6 |
15.6% |
(6.4)% |
% Digital education to total enrolled students |
|
97.3% |
97.1% |
97.5% |
0.2 p.p. |
(0.2) p.p. |
Number of digital education students |
|
837.6 |
722.8 |
896.4 |
15.9% |
(6.6)% |
Undergraduate students |
|
780.8 |
672.5 |
837.4 |
16.1% |
(6.8)% |
Graduate students |
|
56.8 |
50.4 |
59.0 |
12.7% |
(3.8)% |
Number of on-campus students |
|
23.1 |
21.9 |
23.2 |
5.4% |
(0.5)% |
Undergraduate students |
|
22.7 |
21.3 |
22.9 |
6.5% |
(0.9)% |
Graduate students |
|
0.399 |
0.593 |
0.320 |
(32.7)% |
24.7% |
Number of hubs1 |
|
2,385 |
2,108 |
2,301 |
13.1% |
3.7% |
% of Expansion hubs (i.e., excluding Base hubs) |
|
92.9% |
91.0% |
92.7% |
1.9 p.p. |
0.2 p.p. |
Theoretical maturation index2 |
|
43.4% |
41.2% |
47.8% |
2.2 p.p. |
(4.4) p.p. |
| (1) | Consolidates the number of hubs of UniCesumar, excluding its four international hubs. |
| (2) | The Company calculates the theoretical maturation index as the actual number of students per hub of the Expansion hubs divided by the theoretical number of students it expects to achieve as of the maturity of the same hubs. The index comprises all Expansion hubs as of the end of each period, and hence it can actually decrease in a given quarter as new Expansion hubs are opened. |
|
3Q23 Results |
6 |
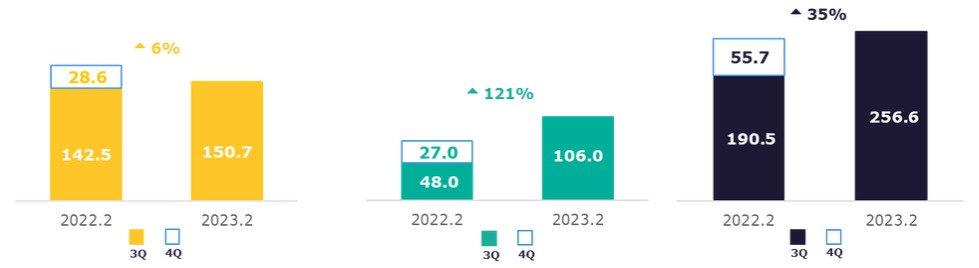
The intake process of Uniasselvi and UniCesumar in the second semester of 2023 (2023.2) is still ongoing (considering new students for our DE undergraduate courses). However, as of September, 30, 2023, it had increased by 34.7% when compared to September, 30, 2022, primarily due to the performance of UniCesumar.

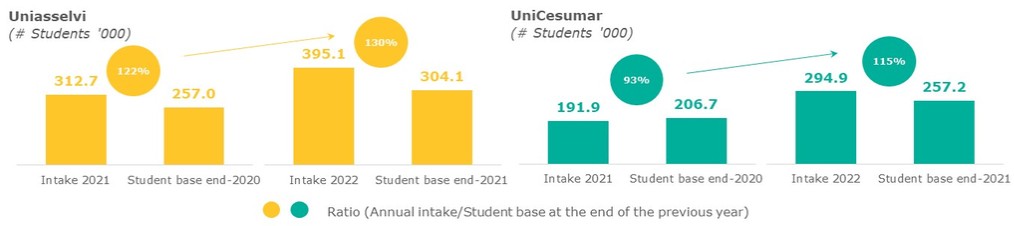
Furthermore, it is important to mention that the Company has achieved positive results in the 2022 intake cycles (40.3% growth in 2022.1 versus 2021.1 intake cycle and 30.8% growth in 2022.2 versus 2021.2 intake cycle, considering the combined intakes of Uniasselvi and UniCesumar). This performance has led to a shift in the student base composition, characterized by a higher proportion of freshman students. Consequently, the contracts of these students are now undergoing their first annual ticket readjustment. In particular, UniCesumar follows a contract anniversary-based readjustment criteria, resulting in a positive impact on tuition fees and tickets.
It is essential to highlight that the number of hubs is one of the drivers that enable the Company to increase its enrolled student base. A material portion of Vitru’s growth is driven by the expansion and subsequent maturation of the hubs.
Table 3: Key operational highlights
'000 |
|
3Q23 |
3Q22 |
% Chg |
Total DE undergraduate intake |
|
256.6 |
190.5 |
34.7% |
Uniasselvi DE undergraduate intake |
|
150.7 |
142.5 |
5.7% |
UniCesumar DE undergraduate intake |
|
106.0 |
48.0 |
120.6% |
DE undergraduate retention rate |
|
73.4% |
74.9% |
(1.5) p.p. |
Uniasselvi DE undergraduate retention rate |
|
69.6% |
71.4% |
(1.8) p.p. |
UniCesumar DE undergraduate retention rate |
|
77.4% |
79.0% |
(1.6) p.p. |
|
3Q23 Results |
7 |
Tuitions and Ticket
Table 4: Tuitions1
R$ million |
|
3Q23 |
3Q22 |
% Chg |
9M23 |
9M22 |
% Chg |
Uniasselvi DE undergraduate tuitions |
|
310.8 |
254.0 |
22.4% |
962.5 |
791.4 |
21.6% |
Average ticket Uniasselvi DE undergraduate (R$/month)2 |
|
323.9 |
287.6 |
12.6% |
- |
- |
n.a. |
UniCesumar DE undergraduate tuitions |
|
262.6 |
204.9 |
28.2% |
727.5 |
618.7 |
17.6% |
Average ticket UniCesumar DE undergraduate (R$/month)2 |
|
246.7 |
216.0 |
14.2% |
- |
- |
n.a. |
Total DE undergraduate tuitions |
|
573.4 |
458.9 |
25.0% |
1,690.0 |
1,410.1 |
19.8% |
Average ticket Vitru DE undergraduate (R$/month)2 |
|
283.3 |
250.5 |
13.1% |
- |
- |
n.a. |
| (1) | Tuitions are net of cancellations. The consolidation of UniCesumar within Vitru’s financial statements started on May 20, 2022. |
| (2) | In the second quarter of each year, the Company calculates the “Average Ticket DE undergraduate (R$/month)” as the sum of the Digital Education Undergraduate Tuitions net of cancellations of the semester divided by the average number of students between the beginning and the end of the semester. |
The strength of Vitru’s model and the sustainability of its growth can be demonstrated by the total amount charged for course tuitions from digital education undergraduate students (which is the sum of gross revenue and the hub partners’ portion of the tuitions less other academic revenue and cancellations).
DE Undergraduate tuitions for 3Q23 amounted to R$573.4 million, an increase of 25.0% compared to the R$458.9 million recorded in 3Q22. This growth rate primarily reflects the maturation of expansion hubs (i.e. hubs that are not yet deemed to be mature) through the organic increase in the number of students enrolled in digital education undergraduate courses.
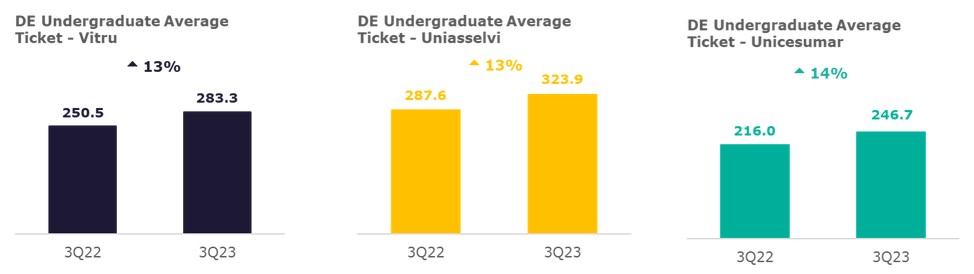
The average monthly ticket for Uniasselvi DE Undergraduate courses increased by 12.6%, from R$287.6 in 3Q22 to R$323.9 in 3Q23. We believe that this increase, despite the challenging macroeconomic conditions in Brazil, is indicative of the resilience of Vitru’s organic academic model, as well as the pricing discipline being applied over the recent years. Going forward, we believe that new courses with higher monthly tickets, such as nursing that were only launched in the second semester of 2021, have the potential for additional contribution.
The average monthly ticket for UniCesumar DE Undergraduate courses increased by 14.2% to R$246.7 in 3Q23 compared to R$216.0 in 3Q22. As part of the best practices currently being exchanged between the entities, we have been working to improve UniCesumar’s average tickets in line with the pricing strategies being applied by Uniasselvi in the recent years, which has differentiated it from the other players in the market. With that in mind, it is important to highlight that the first annual renovation of 2022.2 freshman students of UniCesumar is taking place under these new pricing strategies, which explains part of the average ticket increase for the brand, during this quarter.
|
3Q23 Results |
8 |
FINANCIAL RESULTS
Net Revenue
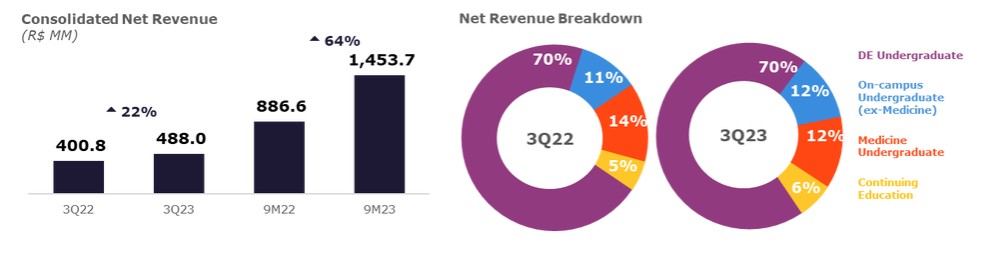
Consolidated Net Revenue in 3Q23 was R$488.0 million, up 21.8% from 3Q22. This growth was mainly driven by the increase in the number of enrolled students in the DE Undergraduate segment as well as higher average tickets in this segment plus the business combination with UniCesumar.
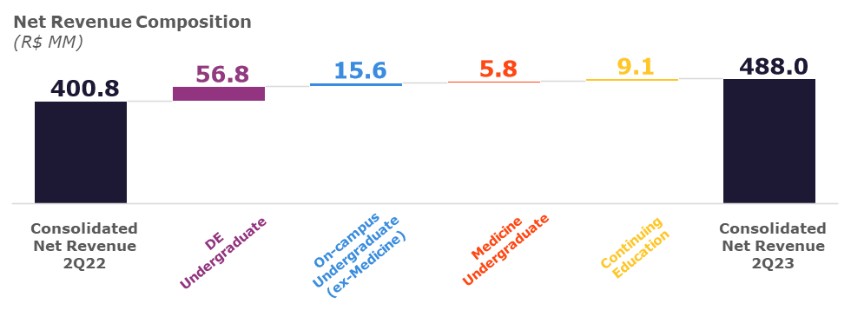
Net Revenue from digital education undergraduate courses in 3Q23 was R$339.3 million, up 20.1% from R$282.5 million in 3Q22. This achievement was primarily driven by the results of the aforementioned expansion and maturation of operational hubs, and a higher consolidated average ticket in this segment as previously presented.
Net Revenue from on-campus undergraduate courses (excluding medical courses) in 3Q23 amounted to R$58.1 million, an increase of 36.6% from R$42.5 million in 3Q22. Despite the fact that the on-campus has been decreasing over time as a segment within the education market, this quarter our revenues reflect the student base growth due to the slight recovery of the segment due to the end of the Covid-19 pandemic. Net Revenue from the whole on-campus undergraduate segment (including UniCesumar’s medical courses) reached R$118.9 million in 3Q23, an increase of 21.9% from R$97.5 million in 3Q22, given the significance of UniCesumar’s medical education activities to its overall business, which are growing less given the maturation of the Maringá campus.
Net Revenue from continuing education courses in 3Q23 was R$29.9 million, up 43.8% from R$20.8 million in 3Q22. In addition to graduate courses, our continuing education business includes technical courses and professional qualification courses. We believe this is a potential growth area and is part of our strategy to expand complementary offerings throughout our students’ lifelong journey.
|
3Q23 Results |
9 |
Table 5: Net Revenue Breakdown1
R$ million |
|
3Q23 |
3Q22 |
% Chg |
9M23 |
9M22 |
% Chg |
Digital education undergraduate |
|
339.3 |
282.5 |
20.1% |
1,044.9 |
682.4 |
53.1% |
On-campus undergraduate |
|
118.9 |
97.5 |
21.9% |
329.3 |
155.2 |
112.2% |
Continuing education |
|
29.9 |
20.8 |
43.8% |
79.5 |
49.0 |
62.2% |
Net Revenue |
|
488.0 |
400.8 |
21.8% |
1,453.7 |
886.6 |
64.0% |
| (1) | Our results reflect the consolidation of UniCesumar from May 20, 2022 onwards. |
Cost of Services
Cost of services in 3Q23 amounted to R$167.5 million, a reduction of 0.8% compared to R$168.9 million in 3Q22, particularly due to the synergies impact of the integration of UniCesumar into Vitru. As a percentage of Net Revenue, a reduction of 7.8 p.p. is notable when comparing 3Q23 with 3Q22, mainly due to a decrease in the cost of payroll and academic materials over Net Revenue, as a result of the continuous effort from the company to improve the combined operations of DE segments and implementation of best practices of one brand to another. We note that the cost of services includes certain restructuring costs, which combined with depreciation and amortization expenses amounted to R$19.9 million in 3Q23 and R$21.0 million in 3Q22.
Cost of services as reported in the Adjusted EBITDA calculation (without the aforementioned restructuring
expenses and depreciation and amortization expenses) was stable at R$146.6 million in 3Q23 and in 3Q22 with a decrease of 6.5 p.p. as a percentage of Net Revenue, mainly due to the aforementioned reduction in the ratio between both payroll and academic materials costs over Net Revenue, which was accomplished due the gains of scale after the business combination with UniCesumar. It is also important to mention the reduction in the amount of new own hubs opened in 3Q23 vs 3Q22, which also contributed to lower personnel costs.
Table 6: Cost of Services1
R$ million |
|
3Q23 |
3Q22 |
% Chg |
9M23 |
9M22 |
% Chg |
Cost of Services |
|
167.5 |
168.9 |
(0.8)% |
494.4 |
351.9 |
40.5% |
(-) Depreciation and amortization |
|
(19.9) |
(21.0) |
(5.2)% |
(59.3) |
(51.2) |
15.8% |
(-) Restructuring expenses |
|
(1.0) |
(1.3) |
(23.1)% |
(4.0) |
(4.2) |
(4.8)% |
Cost of Services for Adj. EBITDA calculation |
|
146.6 |
146.6 |
0.0% |
431.1 |
296.5 |
45.4% |
as % of Net Revenue |
|
30.1% |
36.6% |
(6.5) p.p. |
29.7% |
33.4% |
(3.7) p.p. |
| (1) | Our results reflect the consolidation of UniCesumar from May 20, 2022 onwards. |
|
3Q23 Results |
10 |
Gross Profit and Gross Margin
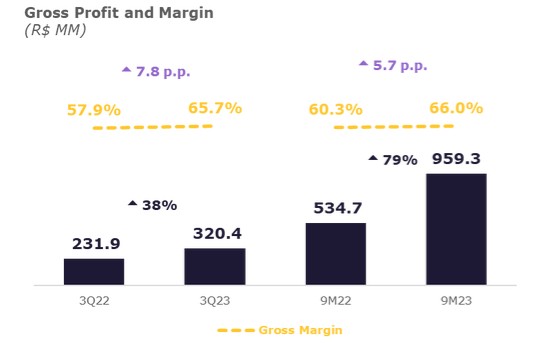
Gross Profit in 3Q23 was R$320.4 million, an increase of 38.2% compared to R$231.9 million in 3Q22, which was primarily due to the consistent growth of our business, and the combination with UniCesumar. Gross Margin increased 7.8 p.p. from 57.9% in 3Q22 to 65.7% in 3Q23, which was primarily attributable to the decrease in overall Cost of Services as a percentage of Net Revenue, for the aforementioned reasons including a decrease in the payroll cost ratio.
Operating Expenses
Selling Expenses
Selling expenses in 3Q23 amounted to R$93.2 million, an increase of 33.9% compared to R$69.6 million in 3Q22. This increase is primarily attributable to the increased intake this quarter, given that most of our selling expenses are aimed at attracting new students.
Selling expenses as reported in the Adjusted EBITDA calculation (i.e., excluding depreciation and amortization expenses) amounted to R$79.4 million in 3Q23 and R$55.7 million in 3Q22, representing an increase of 42.5%. As a percentage of Net Revenue, consolidated Selling Expenses for Adjusted EBITDA calculation increased from 13.9% in 3Q22 to 16.3% in 3Q23, mainly due to the aforementioned increase in intake this quarter.
Table 7: Selling Expenses1
R$ million |
|
3Q23 |
3Q22 |
% Chg |
9M23 |
9M22 |
% Chg |
Selling Expenses |
|
93.2 |
69.6 |
33.9% |
262.0 |
159.4 |
64.4% |
(-) Depreciation and amortization |
|
(13.8) |
(13.9) |
(0.7)% |
(41.3) |
(20.0) |
106.5% |
(-) M&A and pre-offering expenses |
|
- |
- |
n.a. |
- |
(0.2) |
n.a. |
Selling Expenses for Adj. EBITDA calculation |
|
79.4 |
55.7 |
42.5% |
220.7 |
139.2 |
58.5% |
as % of Net Revenue |
|
16.3% |
13.9% |
2.4 p.p. |
15.2% |
15.7% |
(0.5) p.p. |
| (1) | Our results reflect the consolidation of UniCesumar from May 20, 2022 onwards. |
|
3Q23 Results |
11 |
General and Administrative Expenses
General and Administrative (G&A) expenses in 3Q23 amounted to R$76.8 million, an increase of 100.5%, compared to 3Q22. This increase was mainly caused by certain one-off M&A expenses (earn-out payments in the context of the UniCesumar acquisition that have been accounted as expenses) incurred in 3Q23, for a total amount of R$ 31.2 million, and higher payroll expenses, reflecting an increase in personnel.
G&A expenses as reported in the Adjusted EBITDA calculation amounted to R$32.1 million in 3Q23 and R$22.8 million in 3Q22, representing an increase of 40.4%, mainly driven by the aforementioned increase in payroll expenses. G&A expenses as reported in the Adjusted EBITDA calculation reached 6.6% of Net Revenue in 3Q23, an expansion of 0.9 p.p. compared to 5.7% of Net Revenue in 3Q22.
Table 8: G&A Expenses1
R$ million |
|
3Q23 |
3Q22 |
% Chg |
9M23 |
9M22 |
% Chg |
General and Administrative (G&A) Expenses |
|
76.8 |
38.3 |
100.5% |
191.9 |
123.0 |
56.0% |
(-) Depreciation and amortization expenses |
|
(17.2) |
(17.0) |
1.2% |
(56.2) |
(26.8) |
109.7% |
(-) Share-based compensation plan |
|
3.6 |
9.5 |
(62.1)% |
5.0 |
1.7 |
194.1% |
(-) M&A, pre-offering expenses and restructuring expenses |
|
(31.1) |
(8.0) |
288.8% |
(53.4) |
(40.8) |
30.9% |
G&A Expenses for Adj. EBITDA calculation |
|
32.1 |
22.8 |
40.8% |
87.3 |
57.1 |
52.9% |
as % of Net Revenue |
|
6.6% |
5.7% |
0.9 p.p. |
6.0% |
6.4% |
(0.4) p.p. |
| (1) | Our results reflect the consolidation of UniCesumar from May 20, 2022 onwards. |
Net Impairment Losses on Financial Assets
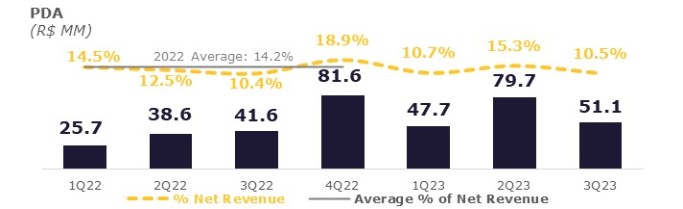
Net impairment losses on financial assets represent the provisions for doubtful accounts (PDA). In 3Q23, PDA expenses were R$51.1 million, which represents 10.5% of the Net Revenue in the period, while in 3Q22 PDA expenses amounted to R$41.6 million, equivalent to 10.4% of the Net Revenue. This slight increase of 0.1 p.p. in our PDA expenses as a percentage of Net Revenue in 3Q23 compared to 3Q22 was primarily due to the high intake growth in previous quarters since most of our bad debt is related to newly enrolled students, and the provision is recognized in the 12 months after the revenue recognition. It is important to highlight that UniCesumar has more effective onboarding and retention processes and procedures than Uniasselvi, which we believe represent a solid opportunity in the medium term for synergies via the broader use of such best practices for both brands, improving our consolidated PDA levels. Besides, the current macroeconomic environment in Brazil has also impacted the consumption and payment capacity of our target clientele, comprised of the low-to-middle income brackets of the country.
|
3Q23 Results |
12 |
Adjusted EBITDA
Adjusted EBITDA in 3Q23 amounted to R$185.7 million, an increase of 29.4% from R$143.5 million in 3Q22. Adjusted EBITDA Margin was 38.1%, a 2.3 p.p. increase when compared to 35.8% for 3Q22. This increase in the Adjusted EBITDA reflects mainly the improvement of our operational results reflecting the success of the combined operations of Uniasselvi and UniCesumar, including our ability to manage the growth on students base, hubs maturation and average tickets.
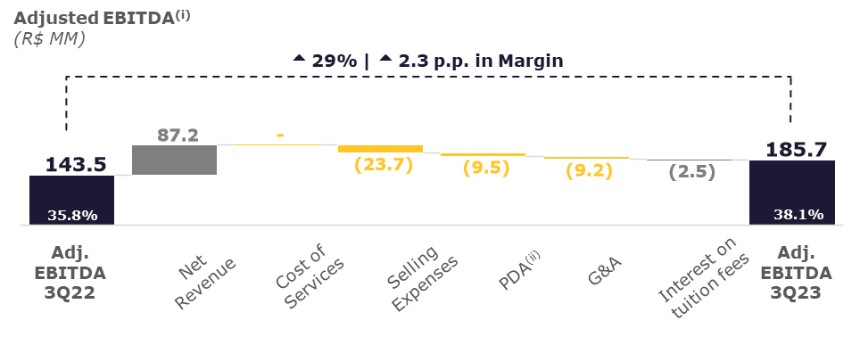
Notes: (i) all figures in this graph include the adjustments applied in our definition of Adjusted EBITDA; (ii) PDA is defined as “Net impairment losses on financial assets” in our Financial Statements.
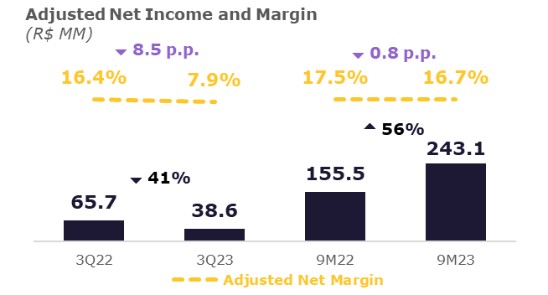
Adjusted Net Income
Adjusted Net Income in 3Q23 was R$38.6 million, a decrease of 41.2% compared to 3Q22. This decrease reflects the growth in Adjusted EBITDA in 3Q23 compared to 3Q22 as previously described, combined with two non-cash one-off impacts in 3Q23: (i) a R$52.1 million provision in the Deferred Tax Asset account, leading to a decrease of the Deferred Tax Income and ultimately of the Net Income for the period, which was due to revised calculations of the effective recoverability, over the next ten years, of such tax assets within our wholly-owned subsidiary Vitru Brasil Empreendimentos, Participações e Comércio S.A., an intermediate holding company which holds our equity interests in both Uniasselvi and UniCesumar, and which also bears the indebtedness of the Vitru group; and (ii) a write-off of R$38.4 million in certain assets of UniCesumar, as a result of the first inventory exercise conducted after the closing of the business combination with Vitru.
|
3Q23 Results |
13 |
Cash Flow and Cash Conversion from Operations
Adjusted Cash Flow from Operations amounted to R$271.9 million in 3Q23, an increase of 77.6% compared to 3Q22. This improvement in cash flow generation was primarily a result of the more positive working capital dynamics in both Uniasselvi and Unicesumar, in particular improvements in collection and bad debt management and extended payment periods to certain suppliers.
Adjusted Cash Flow Conversion from Operations amounted to 169.3% in 3Q23, representing an increase of 59.4 p.p. compared to the conversion ratio achieved in 3Q22. This performance was mainly caused by a general improvement in our organic operating results and the lower increase, in 3Q23 vs 3Q22, of trade receivables (net of PDA) when compared to the increase in Net Revenue over the last twelve months, which may signal a reversal of the negative trend in collection observed throughout the last quarters (due mainly to the macroeconomic environment).
Table 9: Cash Flow & Cash Conversion1
R$ million |
|
3Q23 |
3Q22 |
% Chg |
9M23 |
9M22 |
% Chg |
Cash Flow from Operations |
|
271.9 |
153.1 |
77.6% |
580.5 |
283.6 |
104.7% |
(+) Income tax paid |
|
(12.1) |
(5.7) |
112.3% |
(32.1) |
(16.1) |
99.4% |
Adjusted Cash Flow from Operations |
|
259.9 |
147.4 |
76.3% |
548.5 |
267.5 |
105.0% |
Adjusted EBITDA |
|
185.7 |
143.5 |
29.4% |
556.6 |
307.8 |
80.8% |
(-) M&A, pre-offering expenses and restructuring expenses |
|
(32.1) |
(9.3) |
245.2% |
(57.4) |
(45.2) |
27.0% |
Adjusted EBITDA excluding M&A, pre-offering expenses and restructuring expenses |
|
153.6 |
134.2 |
14.5% |
499.2 |
262.6 |
90.1% |
Adjusted Cash Flow Conversion from Operations2 |
|
169.2% |
109.8% |
59.4 p.p. |
109.9% |
101.9% |
8.0 p.p. |
| (1) | Our results reflect the consolidation of UniCesumar from May 20, 2022 onwards. |
| (2) | The Company calculates Adjusted Cash Flow Conversion from Operations as adjusted cash flow from operations (which we calculate as cash from operations plus income tax paid) divided by Adjusted EBITDA (as defined above but without taking non-recurring expenses, related to M&A, pre-offering expenses and restructuring expenses, into consideration). Adjusted Cash Flow Conversion from Operations is a non-GAAP measure. The calculation of Adjusted Cash Flow Conversion from Operations may be different from the calculation used by other companies, including competitors in the industry, and therefore, the Company’s measures may not be comparable to those of other companies. For further information see “Reconciliations of Non-GAAP Financial Measures”. |
Indebtedness
In May 2022, Vitru Brasil Empreendimentos, Participações e Comércio S.A. (Vitru Brasil), a wholly owned subsidiary of Vitru Ltd., completed the issuance of two series of simple, secured, non-convertible debentures (Brazilian bonds denominated in R$) in an offering with restricted distribution efforts directed solely at professional investors in Brazil. The two series of debentures amounted to R$1.95 billion at interest rates indexed to the CDI (Certificado de Depósito Interbancário) for a five-year term in total, in connection with the business combination with UniCesumar, as follows:
| ◾ | Series 1 1st Debentures: R$0.5 billion (final maturity on May 15, 2024); and |
| ◾ | Series 2 1st Debentures: R$1.45 billion (final maturity on May 15, 2027). |
On May 5, 2023, we announced the issuance by Vitru Brasil of its second secured, non-convertible debentures in an offering with restricted distribution efforts directed solely at professional investors in Brazil. The series of debentures amounted to R$190 million at interest rates indexed to the CDI (Certificado de Depósito Interbancário) for a five-year term in total (final maturity on May 5, 2028). The amount raised with this new debentures issuance will be used for extending the Company’s average maturity term in its indebtedness, as well as for general working capital purposes.
|
3Q23 Results |
14 |
Among our obligations under the indenture governing since the 1st issuance, one of the main covenants to which we are subject is to maintain our Net Debt to Adjusted EBITDA ratio ( ) at a figure no greater than the following:
| ◾ | 4.5x in June 2023; |
| ◾ | 4.0x in December 2023; |
| ◾ | 3.5x in June 2024; and |
| ◾ | 3.0x in December 2024. |
Once the covenant began to apply (from June 2023 onwards), the figures for this calculation are on an ex-IFRS 16 basis. The following table summarizes our net debt position as of September 30, 2023 and 2022:
Table 10: Net Debt
R$ million |
|
September 30, |
December 31, |
September 30, |
Net Debt (ex-IFRS 16)1 |
|
1,874.0 |
2,054.0 |
2,484.8 |
Lease Liabilities |
|
329.5 |
323.3 |
333.8 |
Total Net Debt (IFRS 16) |
|
2,203.5 |
2,377.4 |
2,818.6 |
| (1) | Including Loans & financing and Payables from acquisition of subsidiaries. For a reconciliation of Net Debt (ex-IFRS 16), see "—Reconciliations of Non-GAAP Financial Measures—Reconciliation of Net Debt" at the end of this document. |
Furthermore, on October 27, 2023, we announced the issuance by Vitru Brasil of its third unsecured, non-convertible debentures in a private offering directed solely at professional investors in Brazil. The series of debentures are expected to initially amount an aggregate principal of R$500 million and an additional amount of R$100 million may be issued at interest rates indexed to the CDI (Certificado de Depósito Interbancário). It is expected that the Debentures will be issued on or around November 16. The first series will have a maturity period of 5 (five) years and the second series will have a maturity period of 7 (seven) years, counting of the date of issuance. The amount raised with this new debentures issuance will be used to pre-payment of the financing contracted by the Company with sellers within the scope of the acquisition of UniCesumar (Sellers’ Financing).
CAPEX
Capital Expenditures (CAPEX) in 3Q23 totaled R$31.8 million, an increase of 22.8% compared to the amount spent in 3Q22. This increase was mainly due to stronger investments in intangible assets like content production and learning systems, aligned with the expansion of our business throughout Unicesumar and Uniasselvi brands, alongside a reduction in Property Plant and Equipment (PP&E) expenditures mainly due to a smaller number of own hubs opened in 2023 vs 2022.
Table 11: CAPEX1
R$ million |
|
3Q23 |
3Q22 |
% Chg |
9M23 |
9M22 |
% Chg |
Property and equipment |
|
11.8 |
13.9 |
(15.1)% |
26.9 |
23.1 |
16.5% |
Intangible assets |
|
20.1 |
12.1 |
66.1% |
59.4 |
27.9 |
112.9% |
Investing activities |
|
31.8 |
25.9 |
22.8% |
86.3 |
51.0 |
69.2% |
as % of Net Revenue |
|
6.5% |
6.5% |
0.0 p.p. |
5.9% |
5.8% |
0.1 p.p. |
| (1) | Our results reflect the consolidation of UniCesumar from May 20, 2022 onwards. |
|
3Q23 Results |
15 |
ABOUT VITRU (NASDAQ: VTRU)
VITRU is the leading pure-player in the private post-secondary digital education market in Brazil based on the number of enrolled undergraduate students, according to the most recent INEP census released by the Brazilian Ministry of Education (Ministério da Educação), in February 2022.
Vitru has been listed on the Nasdaq stock exchange in the United States (ticker symbol: VTRU) since September 18, 2020, and its mission is to democratize access to education in Brazil through a digital ecosystem and empower every student to create their own successful story.
Through its subsidiaries, Vitru provides a complete pedagogical ecosystem focused on a hybrid distance learning experience for undergraduate and continuing education students. All the academic content is delivered in multiple formats (videos, eBooks, podcasts and html text, among others) through its proprietary Virtual Learning Environment, or VLE. The pedagogical model also incorporates in-person weekly meetings hosted by dedicated tutors who are mostly local working professionals in the subject area they teach. The Company believes that this unique tutor-centric learning experience sets it apart, creating a stronger sense of community and belonging and contributing to higher engagement and retention rates of its student base.
The Company’s results are based on three operating segments:
| ◾ | Digital education undergraduate courses. What differentiates Vitru’s digital education model are the higher quality and its hybrid methodology with synchronous learning, which consists of weekly in-person or online meetings with tutors for Uniasselvi, and weekly online classes for UniCesumar students, alongside the benefit of the virtual learning environment, where students are able to study where and when they prefer. The Company’s portfolio of courses is composed mainly of pedagogy, business administration, accounting, physical education, vocational, engineering, and health-related courses. |
| ◾ | On-campus undergraduate courses. Vitru (through Uniasselvi and UniCesumar) has several campuses that offer traditional on-campus undergraduate courses, including medical, engineering, law, and health-related courses. On-campus students experience a complete learning ecosystem, mixing theory with practical applications as well as access to sports activities and cultural events. |
| ◾ | Continuing education courses. Vitru (through Uniasselvi and UniCesumar) offers continuing education and graduate courses predominantly in pedagogy, finance, and business, but also in other subjects such as law, engineering, IT and health-related courses. Courses are offered in three different versions, consisting of (i) hybrid model, (ii) 100% online, and (iii) on-campus. This also includes technical courses and professional qualification courses. |
FORWARD-LOOKING STATEMENTS
This press release contains forward-looking statements within the meaning of the Private Securities Litigation Reform Act of 1995, which statements involve substantial risks and uncertainties. All statements, other than statements of historical fact, could be deemed forward-looking, including risks and uncertainties related to statements about the proposed business combination, including the benefits of the business combination, integration plans, expected synergies and revenue opportunities, anticipated future financial and operating performance and results, including estimates for growth, the expected management and governance of the combined company, and the expected timing of the business combination; the effect of the COVID-19 outbreak on general economic and business conditions in Brazil and globally, and any restrictive measures imposed by governmental authorities in response to the outbreak; our ability to implement, in a timely and efficient manner, any measure necessary to respond to, or reduce the effects of, the COVID-19 outbreak on our business, operations, cash flow, prospects, liquidity and financial condition; our ability to efficiently predict, and react to, temporary or long-lasting changes in consumer behavior resulting from the COVID-19 outbreak, including after the outbreak has been sufficiently controlled; our competition; our ability to implement our business strategy; our ability to adapt to
|
3Q23 Results |
16 |
technological changes in the educational sector; the availability of government authorizations on terms and conditions and within periods acceptable to us; our ability to continue attracting and retaining new students; our ability to maintain the academic quality of our programs; our ability to maintain the relationships with our hub partners; our ability to collect tuition fees; the availability of qualified personnel and the ability to retain such personnel; changes in government regulations applicable to the education industry in Brazil; government interventions in education industry programs, which affect the economic or tax regime, the collection of tuition fees or the regulatory framework applicable to educational institutions; a decline in the number of students enrolled in our programs or the amount of tuition we can charge; our ability to compete and conduct our business in the future; the success of operating initiatives, including advertising and promotional efforts and new product, service and concept development by us and our competitors; changes in consumer demands and preferences and technological advances, and our ability to innovate to respond to such changes; changes in labor, distribution and other operating costs; our compliance with, and changes to, government laws, regulations and tax matters that currently apply to us; general market, political, economic and business conditions; and our financial targets. Forward-looking statements by their nature address matters that are, to different degrees, uncertain, such as statements about the potential effects of the COVID-19 pandemic on our business operations, financial results and financial position and on the Brazilian economy.
The forward-looking statements can be identified, in certain cases, through the use of words such as “believe,” “may,” “might,” “can,” “could,” “is designed to,” “will,” “aim,” “estimate,” “continue,” “anticipate,” “intend,” “expect,” “forecast,” “plan,” “predict,” “potential,” “aspiration,” “should,” “purpose,” “belief,” and similar, or variations of, or the negative of, such words and expressions. Forward-looking statements speak only as of the date they are made, and the Company does not undertake any obligation to update them in light of new information or future developments or to release publicly any revisions to these statements in order to reflect later events or circumstances or to reflect the occurrence of unanticipated events. The achievement or success of the matters covered by such forward-looking statements involves known and unknown risks, uncertainties and assumptions. If any such risks or uncertainties materialize or if any of the assumptions prove incorrect, our results could differ materially from the results expressed or implied by the forward-looking statements we make. Readers should not rely upon forward-looking statements as predictions of future events. Forward-looking statements represent management’s beliefs and assumptions only as of the date such statements are made. Further information on these and other factors that could affect the Company’s financial results is included in filings made with the U.S. Securities and Exchange Commission (“SEC”) from time to time, including the section titled “Item 3. Key Information—D. Risk Factors” in the most recent Annual Report on Form 20-F of the Company. These documents are available on the SEC Filings section of the investor relations section of our website at investors.vitru.com.br.
NON-GAAP FINANCIAL MEASURES
To supplement the Company’s consolidated financial statements, which are prepared and presented in accordance with International Financial Reporting Standards as issued by the International Accounting Standards Board—IASB, VITRU uses Adjusted EBITDA, Adjusted Net Income, Adjusted Cash Flow Conversion from Operations, and Net Debt information which are non-GAAP financial measures, for the convenience of the investment community. A non-GAAP financial measure is generally defined as one that purports to measure financial performance but excludes or includes amounts that would not be so adjusted in the most comparable GAAP measure.
VITRU calculates Adjusted EBITDA as the net income (loss) for the period plus:
| ◾ | deferred and current income tax, which is calculated based on income, adjusted based on certain additions and exclusions provided for in applicable legislation. The income taxes in Brazil consist of corporate income tax (Imposto de Renda Pessoa Jurídica), or IRPJ, and CSLL, which are social contribution taxes; |
| ◾ | financial results, which consist of interest expenses less interest income; |
| ◾ | depreciation and amortization; |
|
3Q23 Results |
17 |
| ◾ | interest on tuition fees paid in arrears, which refers to interest received from students on late payments of monthly tuition fees and which is added back; |
| ◾ | impairment of non-current assets, which consists of impairment charges associated with the on-campus undergraduate courses segment, given the deterioration in the prospects of this business; |
| ◾ | share-based compensation plan, which consists of non-cash expenses related to the grant of share-based compensation, as well as fair value adjustments for share-based compensation expenses classified as a liability in the consolidated financial statements; |
| ◾ | other income (expenses), net, which consists of other expenses such as contractual indemnities and deductible donations among others; and |
| ◾ | M&A, pre-offering expenses and restructuring expenses, which consists of adjustments that the Company believes are appropriate to provide additional information to investors about certain material non-recurring items. Such M&A, pre-offering expenses and restructuring expenses comprise: mergers and acquisitions, or M&A, and pre-offering expenses, which are expenses related to mergers, acquisitions and divestments (including due diligence, transaction and integration costs), as well as the expenses related to the preparation of offerings; and restructuring expenses, which refers to expenses related to employee severance costs in connection with organizational and academic restructurings. |
VITRU calculates Adjusted Net Income as net income (loss) for the period plus:
| ◾ | share-based compensation plan, as defined above; |
| ◾ | M&A, pre-offering expenses, and restructuring expenses, as defined above; |
| ◾ | impairment of non-current assets, as defined above; |
| ◾ | amortization of intangible assets recognized as a result of business combinations, which refers to the amortization of the following intangible assets from business combinations: software, trademark, distance learning operation licenses, non-compete agreements, customer relationship, teaching-learning material, licenses to operate medical courses, and leasing contracts. For more information, see notes to the unaudited interim condensed consolidated financial statements in the Company’s filings with the U.S. Securities and Exchange Commission; |
| ◾ | interest accrued at the original effective interest rate (excluding restatement as a result of inflation) on the accounts payable from the acquisition of subsidiaries. See notes to the unaudited interim condensed consolidated financial statements in the Company’s filings with the U.S. Securities and Exchange Commission; and |
| ◾ | corresponding tax effects on adjustments, which represents the tax effect of pre-tax items excluded from adjusted net income (loss). The tax effect of pre-tax items excluded from adjusted net income (loss) is computed using the statutory rate related to the jurisdiction that was affected by the adjustment after taking into account the effect of permanent differences and valuation allowances. |
VITRU calculates Adjusted Cash Flow Conversion from Operations as adjusted cash flow from operations (which is calculated as cash from operations plus income tax paid) divided by Adjusted EBITDA (as defined above but without taking M&A, pre-offering expenses, and restructuring expenses into consideration).
VITRU calculates Net Debt (ex-IFRS 16) as the sum of loans and financing, payables from acquisition of subsidiaries, and lease liabilities less cash and cash equivalents and short-term investments.
Adjusted EBITDA, Adjusted Net Income, Adjusted Cash Flow Conversion from Operations, and Net Debt are the key performance indicators used by Vitru to measure the financial performance and condition of its core operations, and Vitru believes that these measures facilitate period-to-period comparisons on a consistent basis. As a result, its management believes that these non-GAAP financial measures provide useful information to the investment community. These summarized, non-audited, or non-GAAP financial measures are in addition to, and not a substitute for, or superior to, measures of financial performance prepared in accordance with IFRS. Additionally, the calculations of Adjusted EBITDA, Adjusted Net Income, Adjusted Cash Flow Conversion from Operations, and Net Debt may be different from the calculations used by other companies, including competitors in the education services industry, and therefore, Vitru’s measures may not be comparable to those of other companies. For a reconciliation of Adjusted EBITDA, Adjusted Net Income, Adjusted Cash Flow Conversion from Operations, and Net Debt to the most directly comparable IFRS measure, see the tables at the end of this document.
|
3Q23 Results |
18 |
FINANCIAL TABLES
Unaudited interim condensed consolidated statements of profit or loss and other comprehensive income for the three- and six-month period ended June 30, 2023 and 2022
|
|
Three Months Ended September 30, |
Nine Months Ended September 30, |
||
R$ million (except earnings per share) |
|
2023 |
2022 |
2023 |
2022 |
|
|
|
|
|
|
NET REVENUE |
|
488.0 |
400.8 |
1,453.7 |
886.6 |
|
|
|
|
|
|
Cost of services rendered |
|
(167.5) |
(168.9) |
(494.4) |
(351.9) |
|
|
|
|
|
|
GROSS PROFIT |
|
320.4 |
231.9 |
959.3 |
534.7 |
|
|
|
|
|
|
General and administrative expenses |
|
(76.8) |
(38.3) |
(191.9) |
(123.0) |
Selling expenses |
|
(93.2) |
(69.6) |
(262.1) |
(159.4) |
Net impairment losses on financial assets |
|
(51.1) |
(41.6) |
(178.5) |
(105.9) |
Other income (expenses), net |
|
(2.2) |
(2.8) |
(2.9) |
(1.8) |
Operating expenses |
|
(223.4) |
(152.3) |
(635.3) |
(390.1) |
|
|
|
|
|
|
OPERATING PROFIT |
|
97.0 |
79.6 |
323.9 |
144.6 |
|
|
|
|
|
|
Financial income |
|
21.1 |
19.6 |
45.8 |
49.1 |
Financial expenses |
|
(86.8) |
(90.8) |
(250.0) |
(167.5) |
Financial results |
|
(65.7) |
(71.2) |
(204.3) |
(118.4) |
|
|
|
|
|
|
PROFIT BEFORE TAXES |
|
31.4 |
8.4 |
119.6 |
26.2 |
|
|
|
|
|
|
Current income taxes |
|
(16.6) |
(5.8) |
(33.9) |
(13.5) |
Deferred income taxes |
|
(17.5) |
33.2 |
54.8 |
68.0 |
Income taxes |
|
(34.2) |
27.4 |
20.9 |
54.5 |
|
|
|
|
|
|
NET INCOME FOR THE PERIOD |
|
(2.8) |
35.8 |
140.5 |
80.7 |
|
|
|
|
|
|
Other comprehensive income |
|
- |
- |
- |
- |
|
|
|
|
|
|
TOTAL COMPREHENSIVE INCOME |
|
(2.8) |
35.8 |
140.5 |
80.7 |
|
|
|
|
|
|
Basic earnings per share (R$) |
|
(0.1) |
1.3 |
4.2 |
3.1 |
Diluted earnings per share (R$) |
|
- |
1.1 |
4.0 |
2.9 |
|
3Q23 Results |
19 |
Unaudited interim condensed consolidated statements of financial position as of June 30, 2023 and December 31, 2022
|
|
September 30, |
December 31, |
R$ million |
|
2023 |
2022 |
ASSETS |
|
|
|
|
|
|
|
CURRENT ASSETS |
|
|
|
|
|
|
|
Cash and cash equivalents |
|
20.0 |
47.2 |
Short-term investments |
|
486.0 |
26.4 |
Trade receivables |
|
264.2 |
224.1 |
Income taxes recoverable |
|
5.1 |
7.0 |
Prepaid expenses |
|
29.2 |
20.0 |
Receivables from hub partners |
|
25.3 |
32.0 |
Other current assets |
|
23.6 |
14.9 |
|
|
|
|
TOTAL CURRENT ASSETS |
|
853.5 |
371.5 |
|
|
|
|
NON-CURRENT ASSETS |
|
|
|
|
|
|
|
Trade receivables |
|
48.9 |
47.0 |
Indemnification assets |
|
18.3 |
9.9 |
Deferred tax assets |
|
226.0 |
203.0 |
Receivables from hub partners |
|
56.8 |
48.1 |
Other non-current assets |
|
25.1 |
6.9 |
Right-of-use assets |
|
354.3 |
350.4 |
Property and equipment |
|
195.1 |
194.6 |
Intangible assets |
|
4,372.1 |
4,427.6 |
|
|
|
|
TOTAL NON-CURRENT ASSETS |
|
5,296.6 |
5,287.5 |
|
|
|
|
TOTAL ASSETS |
|
6,150.1 |
5,659.1 |
|
3Q23 Results |
20 |
|
|
September 30, |
December 31, |
R$ million |
|
2023 |
2022 |
LIABILITIES |
|
|
|
|
|
|
|
CURRENT LIABILITIES |
|
|
|
|
|
|
|
Trade payables |
|
88.0 |
99.7 |
Loans and financing |
|
289.2 |
131.2 |
Lease liabilities |
|
51.6 |
51.3 |
Labor and social obligations |
|
131.0 |
43.1 |
Payables from acquisition of subsidiaries |
|
532.2 |
- |
Taxes payable |
|
15.3 |
16.0 |
Prepayments from customers |
|
53.7 |
43.6 |
Other current liabilities |
|
1.6 |
7.5 |
|
|
|
|
TOTAL CURRENT LIABILITIES |
|
1,162.6 |
392.4 |
|
|
|
|
NON-CURRENT |
|
|
|
|
|
|
|
Trade payables |
|
2.4 |
- |
Loans and financing |
|
1,558.7 |
1,489.1 |
Lease liabilities |
|
277.9 |
272.0 |
Payables from acquisition of subsidiaries |
|
- |
507.4 |
Taxes payable |
|
11.0 |
- |
Provisions for contingencies |
|
38.9 |
29.2 |
Deferred tax liabilities |
|
741.5 |
773.4 |
Share-based compensation |
|
7.7 |
19.8 |
Other non-current liabilities |
|
23.0 |
1.5 |
|
|
|
|
TOTAL NON-CURRENT LIABILITIES |
|
2,661.0 |
3,092.3 |
|
|
|
|
TOTAL LIABILITIES |
|
3,823.6 |
3,484.7 |
|
|
|
|
EQUITY |
|
|
|
|
|
|
|
Share capital |
|
0.008 |
0.008 |
Capital reserves |
|
2,066.1 |
2,054.5 |
Retained earnings |
|
260.3 |
119.9 |
|
|
|
|
TOTAL EQUITY |
|
2,326.5 |
2,174.4 |
|
|
|
|
TOTAL LIABILITIES AND EQUITY |
|
6,150.1 |
5,659.1 |
|
3Q23 Results |
21 |
Unaudited interim condensed consolidated statements of cash flows for the six-month period ended June 30, 2023 and 2022
|
|
Nine Months Ended September 30, |
|
R$ million |
|
2023 |
2022 |
Cash flows from operating activities |
|
|
|
Profit before taxes |
|
119.6 |
26.1 |
Adjustments to reconcile income before taxes to cash provided on operating activities |
|
|
|
Depreciation and amortization |
|
156.7 |
98.0 |
Net impairment losses on financial assets |
|
178.5 |
105.9 |
Provision for revenue cancellation |
|
0.9 |
0.6 |
Provision for contingencies |
|
5.9 |
2.9 |
Accrued interests |
|
227.6 |
148.0 |
Share-based compensation |
|
(5.0) |
(1.7) |
Loss on sale or disposal of non-current assets |
|
38.5 |
2.2 |
Modification of lease contracts |
|
- |
(0.6) |
Rent concessions |
|
- |
- |
Changes in operating assets and liabilities |
|
|
|
Trade receivables |
|
(221.3) |
(154.5) |
Prepayments |
|
(9.2) |
(1.0) |
Other assets |
|
(26.2) |
(5.4) |
Trade payables |
|
(9.3) |
21.6 |
Labor and social obligations |
|
87.9 |
34.8 |
Other taxes payable |
|
10.2 |
(0.2) |
Prepayments from customers |
|
10.1 |
9.1 |
Other payables |
|
15.7 |
(2.2) |
Cash from operations |
|
580.5 |
283.6 |
|
|
|
|
Income tax paid |
|
(32.1) |
(16.1) |
Interest paid |
|
(155.0) |
(19.4) |
Contingencies paid |
|
(7.7) |
(3.4) |
Net cash provided by operating activities |
|
385.7 |
244.7 |
|
|
|
|
Cash flows from investing activities |
|
|
|
Purchase of property and equipment |
|
(26.9) |
(23.1) |
Purchase and capitalization of intangible assets |
|
(59.4) |
(27.9) |
Payments for the acquisition of interests in subsidiaries, net of cash |
|
- |
(2,200.8) |
Acquisition of short-term investments, net |
|
(459.7) |
189.6 |
Net cash used in investing activities |
|
(546.0) |
(2,062.2) |
|
|
|
|
Cash flows from financing activities |
|
|
|
Payments of lease liabilities |
|
(51.6) |
(10.0) |
Proceeds from loans and financing, net of transaction costs |
|
367.5 |
1,905.8 |
Costs related to future issuances |
|
- |
16.8 |
Capital contributions net of treasury shares |
|
5.1 |
18.3 |
Net cash provided by financing activities |
|
133.1 |
1,931.0 |
|
|
|
|
Net increase in cash and cash equivalents |
|
(27.2) |
113.5 |
Cash and cash equivalents at the beginning of the period |
|
47.2 |
75.6 |
Cash and cash equivalents at the end of the period |
|
20.0 |
189.0 |
|
3Q23 Results |
22 |
Reconciliations of Non-GAAP Financial Measures
Reconciliation of Adjusted EBITDA
|
|
Three Months Ended September 30, |
Nine Months Ended September 30, |
||
R$ million |
|
2023 |
2022 |
2023 |
2022 |
Net income for the period |
|
(2.8) |
35.8 |
140.5 |
80.6 |
(+) Deferred and current income tax |
|
34.2 |
(27.4) |
(20.9) |
(54.5) |
(+) Financial result |
|
65.7 |
71.2 |
204.3 |
118.4 |
(+) Depreciation and amortization |
|
50.9 |
51.9 |
156.9 |
98.0 |
(+) Interest on tuition fees paid in arrears |
|
6.9 |
9.4 |
20.5 |
20.0 |
(+) Share-based compensation plan |
|
(3.6) |
(9.5) |
(5.0) |
(1.7) |
(+) Other income (expenses), net |
|
2.2 |
2.8 |
2.9 |
1.8 |
(+) M&A, pre-offering expenses and restructuring expenses |
|
32.1 |
9.3 |
57.4 |
45.2 |
Adjusted EBITDA |
|
185.7 |
143.5 |
556.6 |
307.8 |
Reconciliation of Adjusted Net Income
|
|
Three Months Ended September 30, |
Nine Months Ended September 30, |
||
R$ million |
|
2023 |
2022 |
2023 |
2022 |
Net income for the period |
|
(2.8) |
35.8 |
140.6 |
80.6 |
(+) M&A, pre-offering expenses and restructuring expenses |
|
32.1 |
9.3 |
57.4 |
45.2 |
(+) Share-based compensation plan |
|
(3.6) |
(9.5) |
(5.0) |
(1.7) |
(+) Amortization of intangible assets from business combinations |
|
31.5 |
31.3 |
94.1 |
46.5 |
(+) Interest accrued on accounts payable from the acquisition of subsidiaries |
|
1.8 |
9.4 |
5.9 |
15.5 |
(-) Corresponding tax effects on adjustments |
|
(20.4) |
(10.6) |
(49.8) |
(30.6) |
Adjusted Net Income |
|
38.6 |
65.7 |
243.1 |
155.5 |
Reconciliation of Adjusted Cash Flow Conversion from Operations
|
|
Three Months Ended September 30, |
Nine Months Ended September 30, |
||
R$ million |
|
2023 |
2022 |
2023 |
2022 |
Cash from Operations |
|
271.9 |
153.1 |
580.5 |
283.6 |
(+) Income tax paid |
|
(12.1) |
(5.7) |
(32.1) |
(16.1) |
Adjusted Cash Flow from Operations |
|
259.9 |
147.4 |
548.5 |
267.5 |
|
|
|
|
|
|
Adjusted EBITDA |
|
185.7 |
143.5 |
556.6 |
307.8 |
(-) M&A, pre-offering expenses and restructuring expenses |
|
(32.1) |
(9.3) |
(57.4) |
(45.2) |
Adjusted EBITDA excluding M&A, pre-offering expenses and restructuring expenses |
|
153.6 |
134.2 |
499.2 |
262.6 |
|
|
|
|
|
|
Adjusted Cash Flow Conversion from Operations |
|
169.2% |
109.8% |
109.9% |
101.9% |
|
3Q23 Results |
23 |
Reconciliation of M&A, Pre-offering and Restructuring Expenses
R$ million |
|
3Q23 |
3Q22 |
% Chg |
9M23 |
9M22 |
% Chg |
Integration UniCesumar (pre- and post-closing) |
|
1.1 |
5.8 |
(80.9)% |
8.7 |
35.1 |
(75.2)% |
UniCesumar earn-out payments (accounted as expenses) |
|
28.7 |
- |
- |
28.7 |
- |
- |
Other M&A expenses (including advisors' fees) |
|
0.7 |
0.6 |
23.6% |
6.3 |
1.2 |
413.0% |
Others |
|
1.6 |
3.0 |
(47.1)% |
13.7 |
8.9 |
53.9% |
Total M&A, pre-offering expenses and restructuring expenses |
|
32.1 |
9.4 |
243.1% |
57.4 |
45.2 |
26.9% |
Reconciliation of Net Debt
R$ million |
|
September 30, |
December 31, |
September 30, |
Net Debt (ex-IFRS 16) |
|
1,874.0 |
2,054.0 |
2,484.8 |
Loans and financing |
|
1,847.9 |
1,620.2 |
2,007.7 |
Payables from acquisition of subsidiaries |
|
532.2 |
507.4 |
729.5 |
(-) Cash and cash equivalents |
|
(20.0) |
(47.2) |
(189.0) |
(-) Short-term investments |
|
(486.0) |
(26.4) |
(63.4) |
Lease Liabilities |
|
329.5 |
323.3 |
333.8 |
Total Net Debt (IFRS 16) |
|
2,203.5 |
2,377.4 |
2,818.6 |
|
3Q23 Results |
24 |

Exhibit 99.2
Vitru Limited
Unaudited interim
condensed consolidated
financial statements
September 30, 2023

Vitru Limited
(In thousands of Brazilian Reais)
|
|
|
|
|
|
|
|
|
Note |
|
September 30, 2023 |
|
December 31, 2022 |
ASSETS |
|
|
|
|
|
|
|
|
|
|
|
|
|
CURRENT ASSETS |
|
|
|
|
|
|
Cash and cash equivalents |
|
6 |
|
20,018 |
|
47,187 |
Short-term investments |
|
6 |
|
486,046 |
|
26,389 |
Trade receivables |
|
7 |
|
264,211 |
|
224,128 |
Income taxes recoverable |
|
|
|
5,145 |
|
6,994 |
Prepaid expenses |
|
9 |
|
29,165 |
|
20,010 |
Receivables from hub partners |
|
10 |
|
25,324 |
|
31,979 |
Other current assets |
|
|
|
23,607 |
|
14,853 |
TOTAL CURRENT ASSETS |
|
|
|
853,516 |
|
371,540 |
|
|
|
|
|
|
|
NON-CURRENT ASSETS |
|
|
|
|
|
|
Trade receivables |
|
7 |
|
48,854 |
|
47,012 |
Indemnification assets |
|
|
|
18,291 |
|
9,853 |
Deferred tax assets |
|
8 |
|
226,003 |
|
203,043 |
Receivables from hub partners |
|
10 |
|
56,829 |
|
48,117 |
Other non-current assets |
|
|
|
25,100 |
|
6,903 |
Right-of-use assets |
|
11 |
|
354,333 |
|
350,393 |
Property and equipment |
|
12 |
|
195,057 |
|
194,575 |
Intangible assets |
|
13 |
|
4,372,124 |
|
4,427,643 |
TOTAL NON-CURRENT ASSETS |
|
|
|
5,296,591 |
|
5,287,539 |
|
|
|
|
|
|
|
TOTAL ASSETS |
|
|
|
6,150,107 |
|
5,659,079 |
The accompanying notes are an integral part of the unaudited interim condensed consolidated financial statements.

 1
1
Vitru Limited
(In thousands of Brazilian Reais)
Consolidated Balance Sheet
|
|
Note |
|
September 30, 2023 |
|
December 31, 2022 |
LIABILITIES |
|
|
|
|
|
|
|
|
|
|
|
|
|
CURRENT LIABILITIES |
|
|
|
|
|
|
Trade payables |
|
|
|
87,993 |
|
99,697 |
Loans and financing |
|
14 |
|
289,177 |
|
131,158 |
Lease liabilities |
|
11 |
|
51,595 |
|
51,310 |
Labor and social obligations |
|
15 |
|
131,012 |
|
43,105 |
Payables from acquisition of subsidiaries |
|
16 |
|
532,209 |
|
- |
Taxes payable |
|
|
|
15,258 |
|
16,006 |
Prepayments from customers |
|
|
|
53,749 |
|
43,606 |
Other current liabilities |
|
|
|
1,642 |
|
7,484 |
TOTAL CURRENT LIABILITIES |
|
|
|
1,162,635 |
|
392,366 |
|
|
|
|
|
|
|
NON-CURRENT |
|
|
|
|
|
|
Trade payables |
|
|
|
2,355 |
|
- |
Loans and financing |
|
14 |
|
1,558,725 |
|
1,489,088 |
Lease liabilities |
|
11 |
|
277,890 |
|
272,029 |
Payables from acquisition of subsidiaries |
|
16 |
|
- |
|
507,361 |
Taxes payable |
|
|
|
10,965 |
|
- |
Provisions for contingencies |
|
17 |
|
38,870 |
|
29,182 |
Deferred tax liabilities |
|
8 |
|
741,520 |
|
773,394 |
Share-based compensation |
|
5 |
|
7,650 |
|
19,805 |
Other non-current liabilities |
|
|
|
23,003 |
|
1,465 |
TOTAL NON-CURRENT LIABILITIES |
|
|
|
2,660,978 |
|
3,092,324 |
|
|
|
|
|
|
|
TOTAL LIABILITIES |
|
|
|
3,823,613 |
|
3,484,690 |
|
|
|
|
|
|
|
EQUITY |
|
18 |
|
|
|
|
Share capital |
|
|
|
8 |
|
8 |
Capital reserves |
|
|
|
2,066,141 |
|
2,054,527 |
Retained earnings |
|
|
|
260,345 |
|
119,854 |
TOTAL EQUITY |
|
|
|
2,326,494 |
|
2,174,389 |
|
|
|
|
|
|
|
TOTAL LIABILITIES AND EQUITY |
|
|
|
6,150,107 |
|
5,659,079 |
The accompanying notes are an integral part of the unaudited interim condensed consolidated financial statements.
2
Vitru Limited
Unaudited interim condensed consolidated statements of profit or loss and other comprehensive income for the three and nine months periods ended September 30 2023 and 2022.
(In thousands of Brazilian Reais, except earnings per share)
Consolidated Statement of lncome
|
|
|
|
Three Months Ended |
|
Nine Months Ended |
||||
|
|
|
|
September 30, |
|
September 30, |
||||
|
|
Note |
|
2023 |
|
2022 |
|
2023 |
|
2022 |
NET REVENUE |
|
22 |
|
487,965 |
|
400,827 |
|
1,453,684 |
|
886,633 |
|
|
|
|
|
|
|
|
|
|
|
Cost of services rendered |
|
23 |
|
(167,546) |
|
(168,859) |
|
(494,401) |
|
(351,909) |
|
|
|
|
|
|
|
|
|
|
|
GROSS PROFIT |
|
|
|
320,419 |
|
231,968 |
|
959,283 |
|
534,724 |
|
|
|
|
|
|
|
|
|
|
|
General and administrative expenses |
|
23 |
|
(76,800) |
|
(38,262) |
|
(191,859) |
|
(122,975) |
Selling expenses |
|
23 |
|
(93,212) |
|
(69,604) |
|
(262,083) |
|
(159,402) |
Net impairment losses on financial assets |
|
7 |
|
(51,138) |
|
(41,565) |
|
(178,489) |
|
(105,898) |
Other income (expenses), net |
|
24 |
|
(2,223) |
|
(2,805) |
|
(2,933) |
|
(1,827) |
Operating expenses |
|
|
|
(223,373) |
|
(152,236) |
|
(635,364) |
|
(390,102) |
|
|
|
|
|
|
|
|
|
|
|
OPERATING PROFIT |
|
|
|
97,046 |
|
79,732 |
|
323,919 |
|
144,622 |
|
|
|
|
|
|
|
|
|
|
|
Financial income |
|
25 |
|
21,077 |
|
19,574 |
|
45,744 |
|
49,052 |
Financial expenses |
|
25 |
|
(86,753) |
|
(90,833) |
|
(250,060) |
|
(167,573) |
Financial results |
|
|
|
(65,676) |
|
(71,259) |
|
(204,316) |
|
(118,521) |
|
|
|
|
|
|
|
|
|
|
|
PROFIT BEFORE TAXES |
|
|
|
31,370 |
|
8,473 |
|
119,603 |
|
26,101 |
|
|
|
|
|
|
|
|
|
|
|
Current income taxes |
|
8 |
|
(16,644) |
|
(5,844) |
|
(33,946) |
|
(13,488) |
Deferred income taxes |
|
8 |
|
(17,511) |
|
33,177 |
|
54,834 |
|
67,990 |
Income taxes |
|
|
|
(34,155) |
|
27,333 |
|
20,888 |
|
54,502 |
|
|
|
|
|
|
|
|
|
|
|
NET INCOME (LOSS) FOR THE PERIOD |
|
|
|
(2,785) |
|
35,806 |
|
140,491 |
|
80,603 |
|
|
|
|
|
|
|
|
|
|
|
Other comprehensive income (loss) |
|
|
|
- |
|
- |
|
- |
|
- |
|
|
|
|
|
|
|
|
|
|
|
TOTAL COMPREHENSIVE INCOME (LOSS) |
|
|
|
(2,785) |
|
35,806 |
|
140,491 |
|
80,603 |
|
|
|
|
|
|
|
|
|
|
|
Basic earnings per share (R$) |
|
19 |
|
(0.08) |
|
125 |
|
4.16 |
|
3.13 |
Diluted earnings per share (R$) |
|
19 |
|
(0.08) |
|
113 |
|
3.94 |
|
2.89 |
The accompanying notes are an integral part of the unaudited interim condensed consolidated financial statements.
3
Vitru Limited
Unaudited interim condensed consolidated statement of changes in equity for the nine months period ended September 30, 2023 and 2022.
(In thousands of Brazilian Reais)
Consolidated Statement of Changes in Equity
|
|
|
|
Capital reserves |
|
|
|
|
||||
|
|
Share capital |
|
Additional paid-in capital |
|
Share-based compensation |
|
Treasury Shares |
|
Retained earnings |
|
Total |
DECEMBER 31, 2021 |
|
6 |
|
1,030,792 |
|
8,796 |
|
- |
|
26,534 |
|
1,066,128 |
|
|
|
|
|
|
|
|
|
|
|
|
|
Profit for the period |
|
- |
|
- |
|
- |
|
- |
|
80,603 |
|
80,603 |
Issuance of shares for business combination |
|
2 |
|
560,544 |
|
|
|
|
|
|
|
560,546 |
Employee share program |
|
|
|
|
|
|
|
|
|
|
|
- |
Capital contributions |
|
|
|
18,329 |
|
|
|
|
|
|
|
18,329 |
Issue of shares to employees |
|
|
|
17,770 |
|
(17,770) |
|
- |
|
|
|
- |
Value of employee services |
|
- |
|
- |
|
21,471 |
|
- |
|
- |
|
21,471 |
|
|
|
|
|
|
|
|
|
|
|
|
|
SEPTEMBER 30, 2022 |
|
8 |
|
1,627,435 |
|
12,497 |
|
- |
|
107,137 |
|
1,747,077 |
|
|
|
|
|
|
|
|
|
|
|
|
|
|
|
|
|
|
|
|
|
|
|
|
|
|
DECEMBER 31, 2022 |
|
8 |
|
2,041,564 |
|
12,963 |
|
- |
|
119,854 |
|
2,174,389 |
|
|
|
|
|
|
|
|
|
|
|
|
|
Profit for the period |
|
- |
|
- |
|
- |
|
- |
|
140,491 |
|
140,491 |
Treasury Shares |
|
- |
|
- |
|
- |
|
(5,332) |
|
|
|
(5,332) |
Employee share program |
|
- |
|
- |
|
- |
|
- |
|
- |
|
- |
Capital contributions |
|
- |
|
10,397 |
|
- |
|
- |
|
- |
|
10,397 |
Issue of shares to employees |
|
- |
|
5,083 |
|
(5,083) |
|
- |
|
- |
|
- |
Value of employee services |
|
- |
|
- |
|
6,549 |
|
- |
|
- |
|
6,549 |
SEPTEMBER 30, 2023 |
|
8 |
|
2,057,044 |
|
14,429 |
|
(5,332) |
|
260,345 |
|
2,326,494 |
The accompanying notes are an integral part of the unaudited interim condensed consolidated financial statements.
4
Vitru Limited
Unaudited interim condensed consolidated statement of cash flows for the nine months period ended September 30 2023 and 2022.
(In thousands of Brazilian Reais)
Consolidated Statement of Cash Flows
|
|
|
|
Nine Months Ended September 30, |
||
|
|
Note |
|
2023 |
|
2022 |
Cash flows from operating activities |
|
|
|
|
|
|
Profit before taxes |
|
|
|
119,603 |
|
26,101 |
Adjustments to reconcile income before taxes to cash provided on operating activities |
|
|
|
|
|
|
Depreciation and amortization |
|
11 / 12 / 13 |
|
156,669 |
|
98,007 |
Net impairment losses on financial assets |
|
7 |
|
178,489 |
|
105,898 |
Provision for revenue cancellation |
|
7 |
|
928 |
|
616 |
Provision for contingencies |
|
17 |
|
5,908 |
|
2,930 |
Accrued interests |
|
|
|
227,564 |
|
147,950 |
Share-based compensation |
|
20 |
|
(5,034) |
|
(1,743) |
Loss on sale or disposal of non-current assets |
|
12 / 13 |
|
38,481 |
|
2,246 |
Modification of lease contracts |
|
|
|
- |
|
(554) |
Changes in operating assets and liabilities: |
|
|
|
|
|
|
Trade receivables |
|
|
|
(221,342) |
|
(154,484) |
Prepayments |
|
|
|
(9,155) |
|
(1,028) |
Other assets |
|
|
|
(26,177) |
|
(5,425) |
Trade payables |
|
|
|
(9,349) |
|
21,576 |
Labor and social obligations |
|
|
|
87,907 |
|
34,780 |
Other taxes payable |
|
|
|
10,217 |
|
(234) |
Prepayments from customers |
|
|
|
10,143 |
|
9,095 |
Other payables |
|
|
|
15,696 |
|
(2,160) |
Cash from operations |
|
|
|
580,548 |
|
283,571 |
|
|
|
|
|
|
|
Income tax paid |
|
|
|
(32,097) |
|
(16,061) |
Interest paid |
|
11 / 14 / 16 |
|
(154,977) |
|
(19,391) |
Contingencies paid |
|
|
|
(7,734) |
|
(3,404) |
Net cash provided by operating activities |
|
|
|
385,740 |
|
244,715 |
|
|
|
|
|
|
|
Cash flows from investing activities |
|
|
|
|
|
|
Purchase of property and equipment |
|
12 |
|
(26,925) |
|
(23,131) |
Purchase and capitalization of intangible assets |
|
13 |
|
(59,415) |
|
(27,907) |
Payments for the acquisition of interests in subsidiaries, net of cash |
|
16 |
|
- |
|
(2,200,823) |
Acquisition of short-term investments, net |
|
|
|
(459,657) |
|
189,621 |
Net cash used in investing activities |
|
|
|
(545,997) |
|
(2,062,240) |
|
|
|
|
|
|
|
Cash flows from financing activities |
|
|
|
|
|
|
Payments of lease liabilities |
|
11 |
|
(51,567) |
|
(10,010) |
Proceeds from loans and financing , net of transaction costs |
|
|
|
179,590 |
|
1,905,851 |
Costs related to future issuances |
|
9 |
|
- |
|
16,815 |
Capital contributions net of treasury shares |
|
|
|
5,065 |
|
18,329 |
Net cash provided by financing activities |
|
|
|
133,088 |
|
1,930,985 |
|
|
|
|
|
|
|
Net increase (decrease) in cash and cash equivalents |
|
|
|
(27,169) |
|
113,460 |
|
|
|
|
|
|
|
Cash and cash equivalents at the beginning of the period |
|
|
|
47,187 |
|
75,587 |
Cash and cash equivalents at the end of the period |
|
|
|
20,018 |
|
189,047 |
|
|
|
|
(27,169) |
|
113,460 |
See Note 26 for the main transactions in investing and financing activities not affecting cash.
The accompanying notes are an integral part of the unaudited interim condensed consolidated financial statements.
5
Vitru Limited
Notes to the unaudited interim condensed consolidated financial statements.
September 30, 2023 and 2022.
(In thousands of Brazilian Reais, except as otherwise indicated)
| 1. | Corporate information |
Vitru Limited (“Vitru”) and its subsidiaries (collectively, the “Company” or “Group”) is a holding company incorporated under the laws of the Cayman Islands on March 05, 2020 and whose shares are publicly traded on the National Association of Securities Dealers Automated Quotations exchange (NASDAQ) under the ticker symbol “VTRU”.
Until the contribution of Vitru Brasil shares to Vitru Limited, in September 2020, Vitru Limited did not have commenced operations and had only nominal assets and liabilities and no material contingent liabilities or commitments. Accordingly, Vitru Limited’s consolidated financial information substantially reflect the operations of Vitru Brasil, which contained only Uniasselvi's operations on the date of the corporate restructuring for the IPO and today, after the business combination carried out last year, also contains Unicesumar's operations.
Vitru is a holding company jointly controlled by Vinci Partners, through the investments funds “Vinci Capital Partners II FIP Multiestratégia”, “Agresti Investments LLC”, “Botticelli Investments LLC”, Caravaggio Investments LLC”, Raffaello Investments LLC”, the SPX Carlyle Group, through the investment fund “Mundi Holdings I LLC”, “Mundi Holdings II LLC”, Neuberger Berman, through the investment fund “NB Verrochio LP”, and Crescera, through the investment fund “Crescera Growth Capital Master V Fundo de Investimento em Participações Multiestratégia”, and “Crescera Growth Capital Coinvestimento III Fundo de Investimento em Participações Multiestratégia”.
The Company is principally engaged in providing educational services in Brazil, mainly undergraduate and continuing education courses, presentially through campuses, or via distance learning, through 2,389 (December 31, 2022 –2,170) learning centers (“hubs”) across the country.
These unaudited interim consolidated financial statements were authorized for issue by the Board of Directors on November, 7th, 2023.
As of September 30, 2023, the Company short-term liabilities are R$ 309,119 higher than its short-term assets, hence presenting a negative net working capital position. The Group's capital structure was impacted by its growth strategy, both organically and through acquisitions, in particular the acquisition of Unicesumar.
The Company is confident in its ability to keep serving its operational and financial responsibilities, given the resilience of its business model, the robust generation of operational cash flow, the strength of its credit capacity and its strong relationship with top-tier banks, including approved and available credit lines.
1.1.Significant events during the period
| a) | Seasonality |
The distance learning undergraduate courses are structured around separate monthly modules. This enables students to enroll in distance learning courses at any time during a semester. Despite this flexibility, generally a higher number of enrollments in distance learning courses occurs in the first and third quarters of each year. These periods coincide with the beginning of academic semesters in Brazil. Furthermore, there is a higher number of enrollments at the beginning of the first semester of each year than at the beginning of the second semester of each year. In order to attract and encourage potential new students to enroll in undergraduate courses later in the semester, the Group often offers discounts, generally equivalent to the number of months that have passed in the semester. As a result, given revenue from semiannual contracts are recorded over the time in a semester, revenue is generally higher in the second and fourth quarters of each year, as additional students enroll in later in the semester. Revenue is also higher later in the semester due to lower dropout rates during that same period.
| b) | Share-based compensation (Note 20) |
In the period between February and September 2023, Stock Options Program (SOP) participants exercised 138,986 share options. The impact caused by this operation was a reversal of R$ 12,155 in liabilities and a constitution of reserve in equity of R$ 2,321, which is included in the amount of R$ 5,083 on the Statements of Changes in Equity. The capital contribution from the participants (exercise price) was R$ 10.397.
| c) | Issuance of debenture (Note 14) |
On May 5th, 2023, the Company issued a new series of debentures through its subsidiary Vitru Brasil, in the amount of R$ 190,000 comprising 190,000 bonds maturing between May 2025 and May 2028 The nominal value of the bonds is R$ 1,000.00.
6
Vitru Limited
Notes to the unaudited interim condensed consolidated financial statements.
September 30, 2023 and 2022.
(In thousands of Brazilian Reais, except as otherwise indicated)
| 2. | Basis of preparation of the unaudited interim condensed consolidated financial statements |
The unaudited interim condensed consolidated financial statements of the Group as of September 30, 2023, and for the three and nine months ended September 30, 2023 have been prepared in accordance with IAS 34 – Interim Financial Reporting as issued by the International Accounting Standards Board (“IASB”). The information does not meet all disclosure requirements for the presentation of full annual consolidated financial statements and thus should be read in conjunction with the Group’s consolidated financial statements for the year ended December 31, 2022, prepared in accordance with International Financial Reporting Standards (“IFRS”).
The accounting policies adopted are consistent with those of the previous fiscal year and corresponding interim reporting period. The Group has not early adopted any other standard, interpretation or amendment that has been issued but is not yet effective.
The unaudited interim condensed consolidated financial statements are presented in Brazilian reais (“R$”), and all amounts disclosed in the financial statements and notes have been rounded off to the nearest thousand currency units unless otherwise stated.
There were no changes since December 31, 2022 in the accounting practices adopted for consolidation and in the direct and indirect interests of the Company in its subsidiaries for the purposes of these unaudited interim condensed consolidated financial statements.
2.1.Significant accounting estimates and assumptions
The preparation of unaudited interim condensed consolidated financial statements of the Group requires management to make judgments and estimates and to adopt assumptions that affect the amounts presented referring to revenues, expenses, assets and liabilities at the reporting date. Actual results may differ from these estimates.
In preparing these unaudited interim condensed consolidated financial statements, the significant judgements and estimates made by management in applying the Group’s accounting policies and the key sources of estimation uncertainty were the same as those that are set the consolidated financial statements for the year ended December 31, 2022.
2.2.Financial instruments risk management objectives and policies
The unaudited interim condensed consolidated financial statements do not include all financial risk management information and disclosures required in the annual consolidated financial statements; they should be read in conjunction with the Group’s annual consolidated financial statements as of December 31, 2022. There have been no changes in the risk management department or in any risk management policies since the year-end.
| 3. | Business combinations |
On August 23, 2021, we entered into a purchase agreement with the shareholders of CESUMAR - Centro de Ensino Superior de Maringá Ltda, or “Unicesumar”, to acquire the entire share capital of Unicesumar transaction. The transaction was closed on May 20, 2022 (transaction date), when the consideration provided for in the purchase and sale agreement was transferred and control of Unicesumar was transferred to the Company, after usual precedent conditions, which included appreciation by a antitrust regulatory agency and other regulatory approvals.
Unicesumar is a leading and fast-growing higher education institution in Brazil focused on the distance learning market, founded 30 years ago in Maringá - Paraná. At acquisition date Unicesumar had 999 hubs and approximately 331 thousand students, of which 314 thousand are in digital education. Unicesumar also has significant on-site courses in the health area, mainly Medicine, with more than 1,600 students in the 348 courses.
The acquisition was accounted for using the acquisition method where the consideration transferred and the identifiable assets and liabilities acquired were measured at fair value, while goodwill is measured as the excess of consideration paid over those items.
7
Vitru Limited
Notes to the unaudited interim condensed consolidated financial statements.
September 30, 2023 and 2022.
(In thousands of Brazilian Reais, except as otherwise indicated)
ASSETS |
|
494,439 |
Cash and cash equivalents |
|
62,017 |
Trade receivables |
|
78,929 |
Financial assets |
|
62,385 |
Income taxes recoverable |
|
3,617 |
Prepaid expenses |
|
3,918 |
Deferred tax assets |
|
17,580 |
Other assets |
|
4,984 |
Right-of-use assets |
|
170,980 |
Property and equipment |
|
78,096 |
Intangible assets |
|
11,933 |
LIABILITIES |
|
357,389 |
Trade payables |
|
70,067 |
Lease liabilities |
|
171,829 |
Labor and social obligations |
|
37,781 |
Income taxes payable |
|
11,556 |
Prepayments from customers |
|
17,731 |
Dividends |
|
30,000 |
Provisions for contingencies |
|
12,510 |
Other liabilities |
|
5,915 |
Total acquired net assets at book value |
|
137,050 |
Total identifiable net assets at fair value |
|
1,516,987 |
Purchase consideration |
|
3,210,373 |
Goodwill arising on acquisition |
|
1,556,336 |
Purchase consideration
The total of consideration transferred was calculated based on the terms of the agreement with the former owners of Unicesumar shares, they received cash and Vitru Ltd shares just like determined in the terms of the business combination agreement.
The consideration consists of R$ 2,688,181 paid in cash, 7,182 thousand Vitru’s Shares, of which 5,387 thousand were issued on the Closing Date and 1,795 thousand of which 898 thousand have been retained for a period of 3 years and 897 thousand have been retained for a period of 6 years (“holdback period”), and a contingent consideration where an additional of R$ 1,000 will be paid for each new license to operate medical courses get in the next 5 years, with a maximum value of R$ 50,000:
Purchase consideration |
|
3,210,373 |
|
% |
Cash payable at the acquisition date |
|
2,162,500 |
|
67.36% |
Payable after 12 months (i) |
|
456,721 |
|
14.23% |
Contingent consideration (ii) |
|
30,608 |
|
0.95% |
Payable through the issuance of new Vitru shares |
|
560,544 |
|
17.46% |
(i) In September, 2022, there was a contractual amendment in the amount of R$ 73,134 and the payment period was changed from 12 months to 24 months.
(ii) The contingent consideration was estimated through a technical analysis by an education professional in the area of medicine, which concluded that it is possible to authorize 40 additional licenses by the MEC according to the proportion of new license to operate medical courses available in the region of Corumbá in the period of 5 years. The amount of 30,608 recognized corresponds to the present value of the authorization of 40 additional license in the next 5 years.
8
Vitru Limited
Notes to the unaudited interim condensed consolidated financial statements.
September 30, 2023 and 2022.
(In thousands of Brazilian Reais, except as otherwise indicated)
Goodwill allocation
Fair value adjustments |
|
1,516,987 |
Customer relationships (i) |
|
294,525 |
Brand (ii) |
|
352,189 |
Non-compete agreement (iii) |
|
272,416 |
Software (iv) |
|
33,379 |
Teaching-learning material (TLM) (v) |
|
26,584 |
Operation licenses for distance learning (vi) |
|
1,206,641 |
Leasing contracts (vii) |
|
57,278 |
Licenses to operate medical courses (viii) |
|
55,454 |
Deferred taxes |
|
(781,479) |
Goodwill |
|
1,556,336 |
Total acquired net assets at book value |
|
137,050 |
Total fair value of the identifiable net assets + goodwill |
|
3,210,373 |
The assumptions, critical judgments, methods and hypotheses used by the Company to determine the fair value of the intangible assets identified in the business combination were as follows:
| i. | Customer relationships: Valued using the MEEM method (“Multi-period Excess Earnings Method”), which is based on a calculation of discounting cash flows from future economic benefits attributable to the customer base, net of eliminations of the implied contribution obligations. The remaining useful life of the customer base was estimated by analyzing the average duration of courses of each segment. |
The main assumptions used in assessing the customer relationships were:
| a. | Revenue: Projected in accordance with historical data obtained by the Company, and expectations observed in competition tendencies related to course offering and geographic coverage. |
| b. | Costs and expenses: Projected in accordance with historical data obtained by the Company and expectations of normalization of the operating margin in the long term and operating synergies to be realized by the merger of Unicesumar’s operations within the Company. |
| c. | Tax rate: 34%, pursuant to Brazilian tax legislation; and |
| d. | After-tax discount rate: the after-tax discount rate was applied properly on each Cash Generating Unit (“CGU”), due to their differences in regards to risk assessment and each CGU’s discount rate. |
| ii. | Brand: Valued using the Relief from Royalty method. The method determines the value of an intangible asset based on the value of hypothetical royalty payments that would be saved through owning the asset, compared to licensing the asset to a third party. It involves the estimation of generating future cash flows to the business for the greatest possible deadline. |
The main assumptions used in assessing the brand were:
| a. | Remaining useful life: Adopted as the point where the discounted cash flows reach 90% of the total projected value. |
| b. | Royalties’ percentage: Estimated as 3.48%, but applied for each segment, depending on the expected margin of each CGU. |
| iii. | Non-Compete Agreement: Valued using the With-or-Without method. This method uses the profit or loss originated from the projection of the business as a whole. |
The main assumptions used in assessing the brand were:
| a. | Revenue: Considers a revenue loss for the first 4 years. For the following years, it’s expected that the sellers are already part of the market. |
| b. | Competition probability: Different assumptions for each CGU: |
• Digital and Continuing Education – 85% due to the relative easiness to reach the student (virtually).
• On-Campus Undergraduate Courses – 50%, due to the necessity of a more robust physical structure to accommodate the students.
| iv. | Software: Valued using the Replacement Cost method. Management estimated the costs related to the development of systems with similar characteristics using providers external to Unicesumar. Because it is an auxiliary asset in generating cash from other intangible assets when applying the MEEM approach (in this case, only Customer Relationships), through the Costs of Contributing Assets. |
The main assumptions used in assessing the software were:
| a. | Remaining useful life: 5 years. |
| b. | Taxes: Applied the effective average rate of income taxes for the Company. |
| v. | Teaching-Learning Material: Valued using the Replacement Cost method. Management estimated the costs related to the development of similar products, as well as the degree of obsolescence (75)%. Because it is an auxiliary asset in generating cash |
9
Vitru Limited
Notes to the unaudited interim condensed consolidated financial statements.
September 30, 2023 and 2022.
(In thousands of Brazilian Reais, except as otherwise indicated)
| from other intangible assets when applying the MEEM approach (in this case, only Customer Relationships), through the Costs of Contributing Assets. |
The main assumptions used in assessing the teaching-learning material were:
| a. | Remaining useful life: 3 years. |
| b. | Taxes: Applied the effective average rate of income taxes for the Company. |
| vi. | Operation licenses for distance learning: Valued using the With-or-Without method. This method uses the profit or loss originated from the projection of the business as a whole. |
The main assumptions used in assessing the operation licenses for distance learning were:
| a. | Discount rate: The applied discount rate was WACC for each CGU. |
| b. | Estimated useful life: It’s assumed that the effects of not relying on the operation licenses from the beginning, having the need to construct the network, will be seen indefinitely. |
| c. | Operation: The operating licenses is given through authorization, that gives to Unicesumar the right to operate in a determined geographical area, which, in some cases, comes through a local partner. However, each authorization allows Unicesumar to change partner in each area, if necessary, substituting the structure for an equivalent one. Partners are not attached to the authorizations. |
| vii. | Leasing contracts: Valued using the Cost Savings method, that consists of calculating the savings measured by the Company, corrected by the duration of the contract by a discount rate. |
The main assumptions used in assessing the leasing contracts were:
| a. | After-tax discount rate: the after-tax discount rate was applied properly on each Cash Generating Unit (“CGU”), due to their differences regarding risk assessment and each CGU’s discount rate. |
| b. | Remaining useful life: Based on the duration of the leasing contract: 20 years. |
| viii. | Licenses to operate medical courses: Valued using the Income Approach method, with an emphasis on marginal fluctuations to the projected CGUs. |
The main assumptions used in assessing the licenses to operate medical courses include the initial process of enrolling a student (duration, new students, evasion, graduation), amount of the course, profitability, investments and working capital, as well as growth in perpetuity.
The goodwill amount is based mainly on the workforce and its synergies from academic, commercial, and costs perspectives, considering that we are adding up the 15-year experience and track-record of both institutions as leading players in Digital Education, which is allowing us to improve even further the high-quality services to our students and to sustain our differentiated academic delivery.
Acquisition of Rede Enem
On September 1, 2022, the Company acquired 100% of the share capital of Rede Enem Serviços de Internet Ltda through its subsidiary Vitru Brasil Empreendimentos, Participações e Comércio e S.A. or “Vitru Brasil”. Rede Enem it’s a platform that provides free content through an ecosystem that includes blogs, free preparatory courses, and social media profiles. The aggregate purchase price of R$ 1,400 was paid in cash at the closing date. The following table presents the assets acquired and liabilities assumed at book value in the business combination:
ASSETS |
|
90 |
Cash and cash equivalents |
|
23 |
Trade receivables |
|
32 |
Other assets |
|
7 |
Property and equipment |
|
28 |
LIABILITIES |
|
97 |
Loans and financing |
|
12 |
Labor and social obligations |
|
41 |
Prepayments from customers |
|
25 |
Other liabilities |
|
19 |
Total acquired net assets at book value |
|
(7) |
Purchase consideration |
|
1,400 |
Goodwill arising on acquisition |
|
1,407 |
10
Vitru Limited
Notes to the unaudited interim condensed consolidated financial statements.
September 30, 2023 and 2022.
(In thousands of Brazilian Reais, except as otherwise indicated)
| 4. | Segment reporting |
Segment information is presented consistently with the internal reports provided to the Senior management team, consisting of the chief executive officer, the chief financial officer and other executives, which is the Chief Operating Decision Maker (CODM) and is responsible for allocating resources, assessing the performance of the Company's operating segments, and making the Company’s strategic decisions.
In reviewing the operational performance of the Company and allocating resources, the CODM reviews selected items of the statement of profit or loss and of comprehensive income, based on relevant financial data for each of the Company’s operating segments, represented by the Company’s main lines of service from which it generates revenue, as follows:
| ● | Digital education undergraduate courses |
| ● | Continuing education courses |
| ● | On-campus undergraduate courses |
Segment performance is primarily evaluated based on net revenue and on adjusted earnings before interest, tax, depreciation and amortization (Adjusted EBITDA). The Adjusted EBITDA is calculated as operating profit plus depreciation and amortization plus interest received on late payments of monthly tuition fees and adjusted by the elimination of effects from share-based compensation plus/minus exceptional expenses. General and administrative expenses (except for intangible assets’ amortization and impairment expenses), finance results (other than interest on tuition fees paid in arrears) and income taxes are managed on a Company’s consolidated basis and are not allocated to operating segments.
There were no inter-segment revenues in the period ended September 30, 2023 and 2022. There were no adjustments or eliminations in the profit or loss between segments.
The CODM do not make strategic decisions or evaluate performance based on geographic regions. Currently, the Company operates solely in Brazil and all the assets, liabilities and results are located in Brazil.
| a) | Measures of performance |
|
|
Digital |
|
|
|
|
|
|
|
|
education |
|
Continuing |
|
On-campus |
|
|
|
|
undergraduate |
|
education |
|
undergraduate |
|
|
Three Months Ended September 30, |
|
courses |
|
courses |
|
courses |
|
Total allocated |
2023 |
|
|
|
|
|
|
|
|
Net revenue |
|
339,254 |
|
29,906 |
|
118,805 |
|
487,965 |
Adjusted EBITDA |
|
135,828 |
|
18,719 |
|
58,526 |
|
213,073 |
% Adjusted EBITDA margin |
|
40.04% |
|
62.59% |
|
49.26% |
|
43.67% |
|
|
|
|
|
|
|
|
|
2022 |
|
|
|
|
|
|
|
|
Net revenue |
|
282,486 |
|
20,860 |
|
97,481 |
|
400,827 |
Adjusted EBITDA |
|
113,890 |
|
11,415 |
|
42,237 |
|
167,542 |
% Adjusted EBITDA margin |
|
40.32% |
|
54.72% |
|
43.33% |
|
41.80% |
|
|
Digital |
|
|
|
|
|
|
|
|
education |
|
Continuing |
|
On-campus |
|
|
|
|
undergraduate |
|
education |
|
undergraduate |
|
|
Nine Months Ended September 30, |
|
courses |
|
courses |
|
courses |
|
Total allocated |
2023 |
|
|
|
|
|
|
|
|
Net revenue |
|
1,045,404 |
|
79,029 |
|
329,251 |
|
1,453,684 |
Adjusted EBITDA |
|
441,309 |
|
45,839 |
|
159,571 |
|
646,719 |
% Adjusted EBITDA margin |
|
42.21% |
|
58.00% |
|
48.46% |
|
44.49% |
|
|
|
|
|
|
|
|
|
2022 |
|
|
|
|
|
|
|
|
Net revenue |
|
682,383 |
|
49,037 |
|
155,213 |
|
886,633 |
Adjusted EBITDA |
|
277,352 |
|
28,947 |
|
62,292 |
|
368,591 |
% Adjusted EBITDA margin |
|
40.64% |
|
59.03% |
|
40.13% |
|
41.57% |
11
Vitru Limited
Notes to the unaudited interim condensed consolidated financial statements.
September 30, 2023 and 2022.
(In thousands of Brazilian Reais, except as otherwise indicated)
The total of the reportable segments’ net revenues represents the Company’s net revenue. A reconciliation of the Company’s income / (expense) before taxes to the allocated Adjusted EBITDA is shown below:
|
|
Three Months Ended |
|
Nine Months Ended |
||||
|
|
September 30, |
|
September 30, |
||||
|
|
2023 |
|
2022 |
|
2023 |
|
2022 |
Income/(expenses) before taxes |
|
31,370 |
|
8,473 |
|
119,603 |
|
26,101 |
(+) Financial result |
|
65,676 |
|
71,259 |
|
204,316 |
|
118,521 |
(+) Depreciation and amortization |
|
50,727 |
|
51,900 |
|
156,669 |
|
98,007 |
(+) Interest on tuition fees paid in arrears |
|
6,831 |
|
9,351 |
|
20,393 |
|
19,997 |
(+) Share-based compensation plan |
|
(3,609) |
|
(9,576) |
|
(5,034) |
|
(1,743) |
(+) Other income (expenses), net |
|
2,223 |
|
2,805 |
|
2,933 |
|
1,827 |
(+) Restructuring expenses |
|
2,745 |
|
8,618 |
|
16,268 |
|
20,122 |
(+) M&A and Offering Expenses (i) |
|
29,387 |
|
733 |
|
41,198 |
|
25,085 |
(+) Unallocated Operational expenses |
|
27,723 |
|
23,979 |
|
90,373 |
|
60,674 |
Adjusted EBITDA allocated to segments |
|
213,073 |
|
167,542 |
|
646,719 |
|
368,591 |
(i) M&A and Offering Expenses for the three and nine months period ended September 2023 include earn-out provisions of R$ 28,667 regarding Unicesumar business combination.
| b) | Other profit and loss disclosure |
|
|
Digital |
|
|
|
|
|
|
|
|
|
|
education |
|
Continuing |
|
On-campus |
|
|
|
|
|
|
undergraduate |
|
education |
|
undergraduate |
|
|
|
|
Three Months Ended September 30, |
|
courses |
|
courses |
|
courses |
|
Unallocated |
|
Total |
2023 |
|
|
|
|
|
|
|
|
|
|
Net impairment losses on financial assets |
|
47,744 |
|
3,404 |
|
(10) |
|
- |
|
51,138 |
Depreciation and amortization |
|
14,272 |
|
1,041 |
|
29,731 |
|
5,683 |
|
50,727 |
Interest on tuition fees paid in arrears |
|
5,944 |
|
323 |
|
564 |
|
- |
|
6,831 |
|
|
|
|
|
|
|
|
|
|
|
2022 |
|
|
|
|
|
|
|
|
|
|
Net impairment losses on financial assets |
|
34,410 |
|
2,345 |
|
4,810 |
|
- |
|
41,565 |
Depreciation and amortization |
|
15,067 |
|
610 |
|
19,214 |
|
17,009 |
|
51,900 |
Interest on tuition fees paid in arrears |
|
6,120 |
|
276 |
|
2,955 |
|
- |
|
9,351 |
|
|
Digital |
|
|
|
|
|
|
|
|
|
|
education |
|
Continuing |
|
On-campus |
|
|
|
|
|
|
undergraduate |
|
education |
|
undergraduate |
|
|
|
|
Nine Months Ended September 30, |
|
courses |
|
courses |
|
courses |
|
Unallocated |
|
Total |
2023 |
|
|
|
|
|
|
|
|
|
|
Net impairment losses on financial assets |
|
158,374 |
|
10,786 |
|
9,329 |
|
- |
|
178,489 |
Depreciation and amortization |
|
67,573 |
|
2,796 |
|
66,802 |
|
19,498 |
|
156,669 |
Interest on tuition fees paid in arrears |
|
17,666 |
|
891 |
|
1,836 |
|
- |
|
20,393 |
|
|
|
|
|
|
|
|
|
|
|
2022 |
|
|
|
|
|
|
|
|
|
|
Net impairment losses on financial assets |
|
88,246 |
|
6,534 |
|
11,118 |
|
- |
|
105,898 |
Depreciation and amortization |
|
40,101 |
|
967 |
|
30,171 |
|
26,768 |
|
98,007 |
Interest on tuition fees paid in arrears |
|
14,870 |
|
736 |
|
4,391 |
|
- |
|
19,997 |
12
Vitru Limited
Notes to the unaudited interim condensed consolidated financial statements.
September 30, 2023 and 2022.
(In thousands of Brazilian Reais, except as otherwise indicated)
| 5. | Fair value measurement |
As of September 30, 2023, the Company has only Share-based compensation liabilities measured at fair value, in the amount of R$ 7,650, which are classified in Level 3 of fair value measurement hierarchy given significant unobservable inputs used.
There were no transfers between Levels during the nine months ended September 30, 2023.
The following table presents the changes in level 3 items for the nine months ended September 30, 2023 and 2022 for recurring fair value measurements:
|
|
Share-based compensation |
||
|
|
2023 |
|
2022 |
At the beginning of the year |
|
19,805 |
|
52,283 |
Adjusted through profit and loss – general and administrative |
|
(12,155) |
|
(23,274) |
As of September 30, |
|
7,650 |
|
29,009 |
The Company assessed that the fair values of financial instruments at amortized cost such as cash and cash equivalents, short-term investments, current trade receivables and trade payables approximate their carrying amounts largely due to the short-term maturities of these instruments. Non-current trade receivables, lease liabilities, accounts payable from acquisition of subsidiaries and loans and financing have their carrying amount adjusted by their respective effective interest rate in order to be presented as close as possible to its fair value.
| 6. | Cash and cash equivalents and short-term investments |
|
|
September 30, |
|
December 31, |
|
|
2023 |
|
2022 |
Cash equivalents and bank deposits in foreign currency (i) |
|
2,293 |
|
12,057 |
Cash and cash equivalents (ii) |
|
17,725 |
|
35,130 |
|
|
20,018 |
|
47,187 |
|
|
|
|
|
Investment funds (iii) |
|
486,046 |
|
26,389 |
(i) Short-term deposits maintained in U.S. dollar.
(ii) Cash equivalents are comprised of short-term deposits with a maturity of three months or less, which are subject to an insignificant risk of changes in value, readily convertible into cash.
(iii) Short-term investments, increased by the proceeds from the debentures, correspond to financial investments in Investment Funds, with highly rated financial institutions. As of September 30, 2023, the average interest on these Investment Funds is 12.37% p.a., corresponding to 124.70% of CDI. Despite the fact these investments have high liquidity and have insignificant risk of changes in value, they do not qualify as cash equivalents given the nature of investment portfolio and their maturity. Due to the short-term nature of these investments, their carrying amount is the same as their fair value.
| 7. | Trade receivables |
|
|
September 30, |
|
December 31, |
|
|
2023 |
|
2022 |
Tuition fees |
|
471,074 |
|
410,393 |
FIES and UNIEDU Guaranteed Credits |
|
39,396 |
|
27,710 |
PEP - Special Installment Payment (i) |
|
12,560 |
|
22,365 |
CREDIN - Internal Educational Credit (ii) |
|
39,781 |
|
29,170 |
Provision for revenue cancellation |
|
(7,440) |
|
(6,512) |
Allowance for expected credit losses of trade receivables |
|
(242,306) |
|
(211,986) |
Total trade receivables |
|
313,065 |
|
271,140 |
|
|
|
|
|
Current |
|
264,211 |
|
224,128 |
Non-current |
|
48,854 |
|
47,012 |
| (i) | In 2015, a special private installment payment program (PEP) was introduced to facilitate the entry of students who could not qualify for FIES, due to changes occurred to the program at the time. These receivables bear interests of 1.34% and, given the long term of the installments, they have been discounted at an interbank rate of 2.76%. |
| (ii) | CREDIN is an installment payment program from Unicesumar where the undergraduate students receive a deduction from gross “tuition” The deduction is based on a fixed percentage determined at the beginning of the contract and, after graduation, the students |
13
Vitru Limited
Notes to the unaudited interim condensed consolidated financial statements.
September 30, 2023 and 2022.
(In thousands of Brazilian Reais, except as otherwise indicated)
| pay back the deduction applied during the student’s undergraduate program, by applying the same percentage on the current value of tuition. |
The aging list of trade receivables is as follows:
|
|
September 30, |
|
December 31, |
|
|
2023 |
|
2022 |
Receivables falling due |
|
170,909 |
|
99,088 |
|
|
|
|
|
Receivables past due |
|
|
|
|
From 1 to 30 days |
|
55,955 |
|
59,718 |
From 31 to 60 days |
|
32,723 |
|
44,827 |
From 61 to 90 days |
|
24,010 |
|
47,174 |
From 91 to 180 days |
|
107,587 |
|
85,358 |
From 181 to 365 days |
|
171,627 |
|
153,473 |
Provision for revenue cancellation |
|
(7,440) |
|
(6,512) |
Allowance for estimated credit losses |
|
(242,306) |
|
(211,986) |
|
|
313,065 |
|
271,140 |
Cancellations consist of deductions of the revenue to adjust it to the extension it is probable that it will not be reversed, generally related to students that have not attended classes and do not recognize the service provided or are dissatisfied with the services being provided. A provision for cancellation is estimated using the expected value method, which considers accumulated experience and is updated at the end of each period for changes in expectations.
Changes in the Company’s revenue cancellation provision are as follows:
|
|
2023 |
At the beginning of the year |
|
(6,512) |
Additions |
|
(17,220) |
Reversals |
|
16,292 |
As of September 30, |
|
(7,440) |
The Company records the allowance for expected credit losses of trade receivables on a monthly basis by analyzing the amounts invoiced in the month, the monthly volume of receivables and the respective outstanding amounts by late payment range, calculating the recovery performance. Under this methodology, the monthly billed amount and each late payment range is assigned a percentage of probability of loss that is accrued for on a recurring basis.
When the delay exceeds 365 days, the receivable is written-off. Even for written-off receivables, collection efforts continue, and their receipt is recognized directly in the statement of profit or loss, when incurred, as recovery of losses.
Changes in the Company’s allowance for expected credit losses are as follows:
|
|
2023 |
At the beginning of the year |
|
(211,986) |
Write-off of uncollectible receivables |
|
144,718 |
Reversal |
|
8,666 |
Allowance for expected credit losses |
|
(183,704) |
As of September 30, |
|
(242,306) |
14
Vitru Limited
Notes to the unaudited interim condensed consolidated financial statements.
September 30, 2023 and 2022.
(In thousands of Brazilian Reais, except as otherwise indicated)
| 8. | Current and deferred income tax |
| a) | Reconciliation of income tax in the statement of profit or loss |
Income taxes differs from the theoretical amount that would have been obtained by using the nominal income tax rates applicable to the income of the Company entities, as follows:
|
|
Nine Months Ended September 30, |
||
|
|
2023 |
|
2022 |
Earnings before taxes |
|
119,603 |
|
26,101 |
Statutory combined income tax rate - % |
|
34% |
|
34% |
Income tax at statutory rates |
|
(40,665) |
|
(8,874) |
|
|
|
|
|
Income exempt from taxation - ProUni benefit (i) |
|
127,668 |
|
69,713 |
Unrecognized deferred tax asset on tax losses (ii) |
|
(59,835) |
|
(1,377) |
Difference on tax rates from offshore companies (iii) |
|
(2,446) |
|
1,348 |
Non-deductible expenses |
|
(3,582) |
|
(6,132) |
Other |
|
(252) |
|
(176) |
Total income tax and social contribution |
|
20,888 |
|
54,502 |
Effective tax rate - % |
|
(17)% |
|
(209)% |
|
|
|
|
|
Current income tax expense |
|
(33,946) |
|
(13,488) |
Deferred income tax income |
|
54,834 |
|
67,990 |
(i) The University for All Program - ProUni, establishes, through Law 11,096, dated January 13, 2005, exemption from certain federal taxes for higher education institutions that provide full and partial scholarships to low-income students enrolled in traditional undergraduate and technological undergraduate programs. The Company's higher education companies are included in this program.
(ii) The Company had unused tax loss carryforwards and temporary differences previously unrecognized. Given the continuous growth in Continuing Education activities and changes to the structure of its operations, the Company reviewed previously unrecognized tax losses and temporary differences, determining that it is now probable that taxable profits will be available, the tax losses can be utilized and temporary differences can be realized, and that are now expected to be used and realized until 2033.
(iii) Considering that the Company is domiciled in Cayman and there is no income tax in that jurisdiction, the combined tax rate of 34% demonstrated above is the current rate applied to all Company’s subsidiaries, operating entities in Brazil.
| b) | Deferred income tax |
|
|
Balance sheet |
|
Profit or loss |
||||
|
|
September 30, |
|
December 31, |
|
September 30, |
|
September 30, |
|
|
2023 |
|
2022 |
|
2023 |
|
2022 |
Tax loss carryforward |
|
110,890 |
|
93,242 |
|
17,648 |
|
49,864 |
Allowance for expected credit losses |
|
82,384 |
|
59,739 |
|
22,645 |
|
8,397 |
Labor provisions |
|
2,601 |
|
2,303 |
|
298 |
|
(6,883) |
Lease contracts |
|
8,448 |
|
7,147 |
|
1,301 |
|
182 |
Provision for revenue cancellation |
|
2,530 |
|
990 |
|
1,540 |
|
208 |
Provision for contingencies |
|
6,997 |
|
923 |
|
6,074 |
|
356 |
Other provisions |
|
12,153 |
|
38,699 |
|
(26,546) |
|
49 |
Total |
|
226,003 |
|
203,043 |
|
22,960 |
|
52,173 |
|
|
|
|
|
|
|
|
|
Deferred tax assets |
|
226,003 |
|
203,043 |
|
|
|
|
|
|
|
|
|
|
|
|
|
|
|
Balance sheet |
|
Profit or loss |
||||
|
|
September 30, |
|
December 31, |
|
September 30, |
|
September 30, |
|
|
2023 |
|
2022 |
|
2023 |
|
2022 |
Intangible assets on business combinations |
|
(741,520) |
|
(773,394) |
|
31,874 |
|
15,817 |
Total |
|
(741,520) |
|
(773,394) |
|
31,874 |
|
15,817 |
|
|
|
|
|
|
|
|
|
Deferred tax liabilities |
|
(741,520) |
|
(773,394) |
|
|
|
|
The above deferred taxes were recorded at the nominal rate of 34%. Under Brazilian tax law, temporary differences and tax losses can be carried forward indefinitely, however tax loss carryforwards can only be used to offset up to 30% of taxable profit for the year.
15
Vitru Limited
Notes to the unaudited interim condensed consolidated financial statements.
September 30, 2023 and 2022.
(In thousands of Brazilian Reais, except as otherwise indicated)
| 9. | Prepaid expenses |
|
|
September 30, |
|
December 31, |
|
|
2023 |
|
2022 |
Costs related to future issuances |
|
9,265 |
|
8,514 |
Prepayments to employees |
|
1,675 |
|
- |
Prepayments to suppliers |
|
8,226 |
|
4,303 |
Prepayments to hub partners |
|
6,327 |
|
5,109 |
Software licensing |
|
1,918 |
|
389 |
Insurance |
|
290 |
|
208 |
Others |
|
1,464 |
|
1,487 |
Prepaid expenses |
|
29,165 |
|
20,010 |
| 10. | Receivables from hub partners |
The receivables from hub partners are amounts of cash transferred to hub partners centers as follows:
|
|
|
|
|
|
|
September 30, 2023 |
|
December 31, 2022 |
Credit to hub partners – distance learning centers |
|
88,159 |
|
82,650 |
Allowance for expected credit losses |
|
(6,006) |
|
(2,554) |
Receivables from hub partners |
|
82,153 |
|
80,096 |
|
|
|
|
|
Current |
|
25,324 |
|
31,979 |
Non-current |
|
56,829 |
|
48,117 |
| 11. | Leases |
Set out below, are the carrying amounts of the Company’s right-of-use assets related to buildings used as offices and hubs and lease liabilities and the movements during the period:
|
|
Right-of-use assets |
|
Lease Liabilities |
|
|
2023 |
|
2023 |
As of December 31, 2022 |
|
350,393 |
|
323,339 |
|
|
|
|
|
New contracts |
|
8,262 |
|
8,262 |
Re-measurement by index (i) |
|
36,453 |
|
36,453 |
Lease modification (ii) |
|
12,998 |
|
12,998 |
Depreciation expense |
|
(53,773) |
|
- |
Accrued interest |
|
- |
|
25,251 |
Payment of principal |
|
- |
|
(51,567) |
Payment of interest |
|
- |
|
(25,251) |
As of September 30, 2023 |
|
354,333 |
|
329,485 |
|
|
|
|
|
Current |
|
- |
|
51,595 |
Non-current |
|
354,333 |
|
277,890 |
(i) Lease liabilities and right-of-use assets were incremented with respect to variable lease payments that depend on an index or a rate, as a result of annual rental prices contractually adjusted by market inflation rate General Market Price Index (Índice Geral de Preços do Mercado), or IGP-M.
(ii) During the nine months period ended on September 30, 2023, the Company increased scope of one lease contract with a corresponding liability in the amount of R$ 12,998.
The Group recognized rent expense from short-term leases and low-value assets of R$ 5,779 for three and nine months ended September 30, 2023 (2022 - R$ 2,801), mainly represented by leased equipment.
16
Vitru Limited
Notes to the unaudited interim condensed consolidated financial statements.
September 30, 2023 and 2022.
(In thousands of Brazilian Reais, except as otherwise indicated)
| 12. | Property and equipment |
|
|
IT equipment |
|
Furniture, equipment and facilities |
|
Library books |
|
Vehicles |
|
Lands |
|
Construction in progress |
|
Leasehold improvements |
|
TOTAL |
As of December 31, 2022 |
|
|
|
|
|
|
|
|
|
|
|
|
|
|
|
|
Net book value |
|
33,287 |
|
79,990 |
|
4,208 |
|
1,160 |
|
4,566 |
|
10,648 |
|
60,716 |
|
194,575 |
Cost |
|
90,947 |
|
156,004 |
|
37,719 |
|
5,215 |
|
4,566 |
|
10,648 |
|
85,432 |
|
390,531 |
Accumulated depreciation |
|
(57,660) |
|
(76,014) |
|
(33,511) |
|
(4,055) |
|
— |
|
— |
|
(24,716) |
|
(195,956) |
|
|
|
|
|
|
|
|
|
|
|
|
|
|
|
|
|
Purchases |
|
7,840 |
|
11,328 |
|
454 |
|
— |
|
— |
|
6,842 |
|
461 |
|
26,925 |
Transfers |
|
49 |
|
618 |
|
— |
|
— |
|
— |
|
(8,159) |
|
7,492 |
|
— |
Disposals |
|
(19,389) |
|
(18,401) |
|
— |
|
(81) |
|
— |
|
(13) |
|
— |
|
(37,884) |
Depreciation |
|
11,337 |
|
6,393 |
|
(1,130) |
|
(150) |
|
— |
|
— |
|
(5,009) |
|
11,441 |
As of September 30, 2023 |
|
|
|
|
|
|
|
|
|
|
|
|
|
|
|
|
Net book value |
|
33,124 |
|
79,928 |
|
3,532 |
|
929 |
|
4,566 |
|
9,318 |
|
63,660 |
|
195,057 |
Cost |
|
78,890 |
|
149,197 |
|
38,175 |
|
5,134 |
|
4,566 |
|
9,318 |
|
93,384 |
|
378,664 |
Accumulated depreciation |
|
(45,766) |
|
(69,269) |
|
(34,643) |
|
(4,205) |
|
— |
|
— |
|
(29,724) |
|
(183,607) |
The Group performs its impairment test when circumstances indicates that the carrying value may be impaired or annually when required. The Group’s impairment tests are based on value-in-use calculations. The key assumptions used to determine the recoverable amount for the cash generating units were disclosed in the annual consolidated financial statements for the year ended December 31, 2022.
As of September 30, 2023, there are no significant changes to the assumptions used for the impairment test in the annual consolidated financial statements for the year ended December 31, 2022. Also, there has been no evidence that the carrying amounts of property and equipment exceed their recoverable amounts as of September 30, 2023.
17
Vitru Limited
Notes to the unaudited interim condensed consolidated financial statements.
September 30, 2023 and 2022.
(In thousands of Brazilian Reais, except as otherwise indicated)
| 13. | Intangible assets |
|
|
Software |
|
Internal project development |
|
Trademarks |
|
Operation licenses for distance learning |
|
Licenses to operate medical courses |
|
Non-compete agreements |
|
Customer relationship |
|
Teaching/ learning material - TLM |
|
Goodwill |
|
TOTAL |
As of December 31, 2022 |
|
|
|
|
|
|
|
|
|
|
|
|
|
|
|
|
|
|
|
|
Net book value |
|
60,071 |
|
64,721 |
|
393,863 |
|
1,458,209 |
|
55,454 |
|
250,378 |
|
261,190 |
|
21,168 |
|
1,862,589 |
|
4,427,643 |
Cost |
|
141,237 |
|
97,306 |
|
437,390 |
|
1,458,209 |
|
55,454 |
|
283,242 |
|
395,220 |
|
33,928 |
|
1,930,042 |
|
4,832,028 |
Accumulated amortization and impairment |
|
(81,166) |
|
(32,585) |
|
(43,527) |
|
— |
|
— |
|
(32,864) |
|
(134,030) |
|
(12,760) |
|
(67,453) |
|
(404,385) |
|
|
|
|
|
|
|
|
|
|
|
|
|
|
|
|
|
|
|
|
|
Purchase and capitalization |
|
23,945 |
|
35,470 |
|
— |
|
— |
|
— |
|
— |
|
— |
|
— |
|
— |
|
59,415 |
Transfer |
|
20,873 |
|
(20,873) |
|
— |
|
— |
|
— |
|
— |
|
— |
|
— |
|
— |
|
— |
Disposals |
|
(550) |
|
(47) |
|
— |
|
— |
|
— |
|
— |
|
— |
|
— |
|
— |
|
(597) |
Amortization |
|
(14,422) |
|
(11,898) |
|
(13,414) |
|
— |
|
— |
|
(27,046) |
|
(40,912) |
|
(6,645) |
|
— |
|
(114,337) |
As of September 30, 2023 |
|
|
|
|
|
|
|
|
|
|
|
|
|
|
|
|
|
|
|
|
Net book value |
|
89,917 |
|
67,373 |
|
380,449 |
|
1,458,209 |
|
55,454 |
|
223,332 |
|
220,278 |
|
14,523 |
|
1,862,589 |
|
4,372,124 |
Cost |
|
185,375 |
|
111,857 |
|
437,390 |
|
1,458,209 |
|
55,454 |
|
283,242 |
|
395,220 |
|
33,928 |
|
1,930,042 |
|
4,890,717 |
Accumulated amortization and impairment |
|
(95,458) |
|
(44,484) |
|
(56,941) |
|
— |
|
— |
|
(59,910) |
|
(174,942) |
|
(19,405) |
|
(67,453) |
|
(518,593) |
Impairment test of indefinite-lived intangible assets
Goodwill, licenses for distance learning operation and licenses to operate medical courses are tested annually, and the last test was performed in December, 2022.
No evidence of the need to carry out a new test was identified during the nine months ended on September 30, 2023.
18
Vitru Limited
Notes to the unaudited interim condensed consolidated financial statements.
September 30, 2023 and 2022.
(In thousands of Brazilian Reais, except as otherwise indicated)
| 14. | Loans and financing |
On May 19, 2022, the company issued through its subsidiary Vitru Brasil, two series of debentures, the first series containing 500,000 bonds maturing between November 2023 and May 2024, and the second series containing 1,450,000 bonds maturing between May 2025 and May 2027. The nominal value of each bond of both series is R$ 1,000.00. The costs of transaction of this issue were R$ 44,149, the debentures are not convertible into shares.
On May 5, 2023, the Company granted, through its subsidiary Vitru Brasil, another series of debentures, containing 190,000 bonds maturing between May 2025 and May 2028. The face value of each bond is also R$ 1,000.00. The costs of transaction of this new issue were R$ 2,271, the debentures are not convertible into shares.
| a) | Breakdown |
|
|
|
|
|
|
September 30, |
|
December 31, |
Type |
|
Interest rate |
|
Maturity |
|
2023 |
|
2022 |
Debentures |
|
CDI +2.9% and CDI +3.2% p.a |
|
Nov/23 to May/28 |
|
1,847,902 |
|
1,620,246 |
|
|
|
|
|
|
|
|
|
Current |
|
|
|
|
|
289,177 |
|
131,158 |
Non-current |
|
|
|
|
|
1,558,725 |
|
1,489,088 |
| b) | Variation |
|
|
Loans and |
|
|
financing |
As of December 31, 2022 |
|
1,620,246 |
New issuances |
|
179,590 |
Accrued interest |
|
177,792 |
Payments |
|
(129,726) |
As of September 30, 2023 |
|
1,847,902 |
| c) | Maturity |
|
|
Loans and |
|
|
financing |
Maturity |
|
|
2023 |
|
188,307 |
2024 |
|
100,869 |
2025 |
|
602,865 |
2026 |
|
602,865 |
2027 |
|
327,214 |
2028 |
|
25,782 |
As of September 30, 2023 |
|
1,847,902 |
| 15. | Labor and social obligations |
|
|
September 30, |
|
December 31, |
|
|
2023 |
|
2022 |
Salaries payable |
|
26,087 |
|
10,374 |
Social charges payable (i) |
|
15,477 |
|
15,675 |
Accrued vacation and 13th salary |
|
58,991 |
|
6,883 |
Accrual for bonus |
|
29,713 |
|
9,522 |
Other |
|
744 |
|
651 |
Total |
|
131,012 |
|
43,105 |
(i) Comprised of contributions to Social Security (“INSS”) and to Government Severance Indemnity Fund for Employees (“FGTS”) as well as withholding income tax (“IRRF”) over salaries.
19
Vitru Limited
Notes to the unaudited interim condensed consolidated financial statements.
September 30, 2023 and 2022.
(In thousands of Brazilian Reais, except as otherwise indicated)
| 16. | Accounts payable from acquisition of subsidiaries |
|
|
2023 |
At the beginning of the year |
|
507,361 |
Accrued Interest |
|
24,848 |
As of September 30 |
|
532,209 |
|
|
|
Current |
|
532,209 |
Non-current |
|
- |
On May 20, 2022, the Company completed the acquisition of 100% of Unicesumar and the amount paid in cash was R$ 2,162,500. The outstanding amount will be paid in one last installment, payable on May 20, 2024, and adjusted by the IPCA inflation rate in the first year and CDI + 3% in the second year.
| 17. | Contingencies |
| a) | Provision for contingencies |
The provisions related to labor and civil proceedings whose likelihood of loss is assessed as probable are as follows:
Liabilities |
|
Civil |
|
Labor |
|
Total |
As of December 31, 2022 |
|
4,539 |
|
24,643 |
|
29,182 |
Additions (i) |
|
3,524 |
|
24,012 |
|
27,536 |
Accrued interest |
|
22 |
|
223 |
|
245 |
Payments |
|
(4,414) |
|
(3,320) |
|
(7,734) |
Reversals |
|
(147) |
|
(10,212) |
|
(10,359) |
As of September 30, 2023 |
|
3,524 |
|
35,346 |
|
38,870 |
| b) | Indemnification assets |
The expected reimbursement for the provisions presented above are as follows:
Assets |
|
Civil |
|
Labor |
|
Total |
As of December 31, 2022 |
|
1,540 |
|
8,313 |
|
9,853 |
Additions (i) |
|
677 |
|
18,153 |
|
18,830 |
Accrued interest |
|
13 |
|
115 |
|
128 |
Realized |
|
- |
|
(2,831) |
|
(2,831) |
Reversals |
|
- |
|
(7,689) |
|
(7,689) |
As of September 30, 2023 |
|
2,230 |
|
16,061 |
|
18,291 |
(i) The additions to labor provisions mainly refer to labor lawsuits sentenced in the first instance during 2023, which had their risk reassessed from possible to probable. The net labor additions, considering the value of the provisioned risk and the expected reimbursement, is R$ 5.859.
| c) | Possible losses, not provided for in the balance sheet |
No provision has been recorded for proceedings classified as possible losses, based on the opinion of the Company's legal counsel. The breakdown of existing contingencies as of September 30, 2023, and December 31, 2022 as follows:
|
|
|
|
|
Possible losses |
|
September 30, 2023 |
|
December 31, 2022 |
Civil |
|
12,284 |
|
23,210 |
Labor |
|
38,757 |
|
28,284 |
Tax |
|
51,491 |
|
59,916 |
Total |
|
102,532 |
|
111,410 |
20
Vitru Limited
Notes to the unaudited interim condensed consolidated financial statements.
September 30, 2023 and 2022.
(In thousands of Brazilian Reais, except as otherwise indicated)
| 18. | Equity |
| a) | Authorized capital |
The Company is authorized to increase capital up to the limit of 1 billion shares, subject to approval of the Administration.
| b) | Share capital |
In 2023, the Company recognized the amount of R$ 10,397 and transferred the amount of R$ 5,083 from shared-based compensation reserves due to the issuance of 138,986 new shares regarding the exercise of SOP options.
As of September 30, 2023, the Company’s share capital is represented by 34,309,304 common shares of par value of US$ 0.00005 each. The Company has issued only common shares, entitled to one vote per share.
| c) | Capital reserve |
Additional paid-in capital
The additional paid-in capital refers to the difference between the purchase price that the shareholders pay for the shares and their par value. Under Cayman Law, the amount in this type of account may be applied by the Company to pay distributions or dividends to members, pay up unissued shares to be issued as fully paid, for redemptions and repurchases of own shares, for writing off preliminary expenses, recognized expenses, commissions or for other reasons. All distributions are subject to the Cayman Solvency Test which addresses the Company’s ability to pay debts as they fall due in the ordinary course of business.
Share based compensation
The capital reserve contains the reserve for share-based compensation programs, classified as settled with equity instruments, as detailed in Note 20.
The share-based payments reserve is used to recognize:
| • | the grant date fair value of options issued to employees but not exercised. |
| • | the grant date fair value of shares issued to employees upon exercise of options. |
Treasury shares:
Buyback program
On May 11, 2023, the Company’s board of directors approved a share buyback program. The Company may repurchase up to 500,000 of its outstanding common shares in the open market, based on prevailing market prices, beginning on May 11, 2023, until the earlier of the completion of the repurchase, depending upon market conditions.
During the nine month period ended September 30, 2023, the Company repurchased 68,672 shares with a cash outflow of R$ 5,332.
| d) | Dividends |
The Company currently intends to retain all available funds and any future earnings, if any, to fund the development and expansion of the business and did not pay any cash dividends in the nine months ended September 30, 2023, and do not anticipate paying any in the foreseeable future.
21
Vitru Limited
Notes to the unaudited interim condensed consolidated financial statements.
September 30, 2023 and 2022.
(In thousands of Brazilian Reais, except as otherwise indicated)
| 19. | Earnings per share |
| 19.1. | Basic |
Basic earnings per share is calculated by dividing the net income attributable to the holders of Company’s common shares by the weighted average number of common shares held by stockholders during the year.
The following table contains the earnings (loss) per share of the Company for three and nine months ended September 30, 2023 and 2022 (in thousands except per share amounts):
|
|
Three Months Ended September 30, |
|
Nine Months Ended September 30, |
||||
Basic earnings per share |
|
2023 |
|
2022 |
|
2023 |
|
2022 |
Net income (loss) attributable to the shareholders of the Company |
|
(2,785) |
|
35,806 |
|
140,491 |
|
80,603 |
Weighted average number of outstanding common shares (thousands) |
|
33,821 |
|
28,612 |
|
33,774 |
|
25,769 |
Basic earnings (loss) per common share (R$) |
|
(0.08) |
|
1.25 |
|
4.16 |
|
3.13 |
| 19.2. | Diluted |
As of September 30, 2023, the Company had outstanding and unexercised options to purchase – 1,858 thousand (2022 –- 2,152 thousand) common shares which are included in diluted earnings per share calculation.
|
|
Three Months Ended September 30, |
|
Nine Months Ended September 30, |
||||
Diluted earnings per share |
|
2023 |
|
2022 |
|
2023 |
|
2022 |
Net income (loss) attributable to the shareholders of the Company |
|
(2,785) |
|
35,806 |
|
140,491 |
|
80,603 |
Weighted average number of outstanding common shares (thousands) |
|
33,821 |
|
31,615 |
|
35,632 |
|
27,921 |
Diluted earnings (loss) per common share (R$) |
|
(0.08) |
|
1.13 |
|
3.94 |
|
2.89 |
| 20. | Shared-based compensation |
The Group offers to its managers and executives two Share Option Plans with general conditions for the granting of share options issued by the Company to the participants appointed by the Board of Directors who, at its discretion, fulfill the conditions for participation, thereby aligning the interests of the participants to the interests of its stockholders, so as to maximize the Group's results and increase the economic value of its shares, thus generating benefits for the participants and other stockholders. It also provides participants with a long-term incentive, increasing their motivation and enabling the Group to retain quality human capital.
Participants from both plans have the right to turn all vested options into shares upon payment in cash, paying the Option Exercise Price as defined in the respective program that each participant is associated. The difference between the stipulated price in the program and the fair value of the share at the measurement date is recorded as equity.
Participants from the first plan shall have the right to require the Company to acquire all shares under its ownership to be held in treasury or for cancellation, upon payment, in cash, of the Put Option Exercise Price, for a given period as from the last Vesting Date, provided that no exit event has occurred up to the end of said period.
When all conditions applicable to the buyback of shares provided for in applicable laws and/or regulations are met, the Company shall pay the Participant the price equivalent to a certain amount of multiples of the Company's EBITDA minus the Net Debt, as set forth in each grant program, recorded as a liability.
The expense recognized for employee services received during the period is as follows:
|
|
Nine Months Ended September 30, |
||
|
|
|
|
|
Expense arising from share-based payment transactions |
|
2023 |
|
2022 |
Cash-settled - first plan |
|
(12,155) |
|
(8,296) |
Equity-settled - first plan |
|
2,321 |
|
13,548 |
Equity-settled - second plan |
|
4,800 |
|
2,581 |
Total |
|
(5,034) |
|
7,833 |
The fair value of cash-settled transactions was calculated based on discounted cash flows. They are classified as level 3 fair values in the fair value hierarchy due to the inclusion of unobservable inputs.
22
Vitru Limited
Notes to the unaudited interim condensed consolidated financial statements.
September 30, 2023 and 2022.
(In thousands of Brazilian Reais, except as otherwise indicated)
| 21. | Related parties |
|
|
Balance Sheet |
|
Profit or loss |
||||
|
|
September 30, |
|
December 31, |
|
Nine months ended September 30, |
||
|
|
2023 |
|
2022 |
|
2023 |
|
2022 |
Leases |
|
|
|
|
|
|
|
|
SOEDMAR - Sociedade Educacional De Maringa Ltda. |
|
|
|
|
|
|
|
|
Right-of-use assets |
|
164,195 |
|
160,230 |
|
|
|
|
Depreciation expense |
|
|
|
|
|
(4,298) |
|
(5,054) |
Lease liabilities |
|
169,294 |
|
165,089 |
|
|
|
|
Interest on lease |
|
|
|
|
|
(9,477) |
|
(13,061) |
WM Administração e Participações Ltda |
|
|
|
|
|
|
|
|
Right-of-use assets |
|
164,843 |
|
2,845 |
|
|
|
|
Depreciation expense |
|
|
|
|
|
(2,825) |
|
(255) |
Lease liabilities |
|
171,650 |
|
2,942 |
|
|
|
|
Interest on lease |
|
|
|
|
|
(13,117) |
|
(268) |
As a result of the business combination with Unicesumar, the Company has a lease agreement with companies related to members of the administration: The object of the contract is the Unicesumar Campus located in the city of Maringá-PR and is valid for 20 years from the closing date of the business combination:
In addition to the lease, as a result of the business combination with Unicesumar, the Company has a liability to pay for the acquisition of subsidiaries from members of the Company's management and board. The debt value was adjusted by the IPCA inflation rate until May 2023 and is currently updated by CDI + 3% and matures in May 2024.
|
|
Balance Sheet |
|
Profit or loss |
||||
|
|
September 30, |
|
December 31, |
|
Nine months ended September 30, |
||
|
|
2023 |
|
2022 |
|
2023 |
|
2022 |
Payables from acquisition of subsidiaries |
|
|
|
|
|
|
|
|
Accounts payable to selling shareholders |
|
154,554 |
|
147,338 |
|
|
|
|
Financial expenses |
|
|
|
|
|
(7,216) |
|
(1,458) |
The Company also make monthly donations to ICETI – Instituto Cesumar de Ciência, Tecnologia e Inovação.
The Institute has, among its institutional purposes and objectives, the support, development and promotion of education, research, development, innovation and technology projects, bringing together actions, programs and activities for this purpose. Some management members form the Company also help administrate the ICETI.
|
|
Balance Sheet |
|
Profit or loss |
||||
|
|
September 30, |
|
December 31, |
|
Nine months ended September 30, |
||
|
|
2023 |
|
2022 |
|
2023 |
|
2022 |
Donations |
|
|
|
|
|
|
|
|
ICETI - Instituto Cesumar de Ciência, Tecnologia e Inovação |
|
|
|
|
|
|
|
|
Other income (expenses), net |
|
|
|
|
|
(2,671) |
|
- |
23
Vitru Limited
Notes to the unaudited interim condensed consolidated financial statements.
September 30, 2023 and 2022.
(In thousands of Brazilian Reais, except as otherwise indicated)
| 22. | Revenue |
|
|
Three Months Ended September 30, |
|
Nine Months Ended September 30, |
||||
|
|
2023 |
|
2022 |
|
2023 |
|
2022 |
Gross amount from services provided |
|
653,047 |
|
512,857 |
|
1,908,071 |
|
1,138,703 |
(-) Cancellation |
|
(24,847) |
|
(5,511) |
|
(70,359) |
|
(13,648) |
(-) Discounts |
|
(51,091) |
|
(33,658) |
|
(132,800) |
|
(68,287) |
(-) ProUni scholarships (i) |
|
(72,457) |
|
(59,585) |
|
(202,228) |
|
(141,180) |
(-) Taxes and contributions on revenue |
|
(16,687) |
|
(13,276) |
|
(49,000) |
|
(28,955) |
Net revenue |
|
487,965 |
|
400,827 |
|
1,453,684 |
|
886,633 |
|
|
|
|
|
|
|
|
|
Timing of revenue recognition |
|
|
|
|
|
|
|
|
Transferred over time |
|
482,863 |
|
397,623 |
|
1,437,448 |
|
872,911 |
Transferred at a point in time (ii) |
|
5,102 |
|
3,204 |
|
16,236 |
|
13,722 |
Net revenue |
|
487,965 |
|
400,827 |
|
1,453,684 |
|
886,633 |
(i) Scholarships granted by the federal government to students under the ProUni program are based on a fixed percentage approved by the government upon each student’s request and deducted from tuition gross amount from services provided during the entire duration of such student's undergraduate studies (regardless of the tuition fee set out in the service contract) and as long as the student continues to comply with the scholarship requirements imposed by the government for each semester during the undergraduate course. The Group recognizes the economic benefits from the ProUni scholarships as tax deductions, as applicable, following the policies described in Note 7.
(ii) Revenue recognized at a point in time relates to revenue from student fees and certain education-related activities.
The Company`s revenues from contracts with customers are all provided in Brazil.
In three and nine months ended September 30, 2023, the amounts billed to students for the portion to be transferred to the hub partner, in respect to the joint operations, are R$ 136,934 and R$ 383,896896 (2022 – R$ 102,862 and 235,135). As of September 30, 2023, the balance payable to the hub partners is R$ 32,492 (December 31, 2022 - R$ 43,676).
| 23. | Costs and expenses by nature |
|
|
Three Months Ended September 30, |
|
Nine Months Ended September 30, |
||||
|
|
2023 |
|
2022 |
|
2023 |
|
2022 |
Payroll (i) |
|
173,753 |
|
133,173 |
|
439,815 |
|
290,859 |
Sales and marketing |
|
66,620 |
|
45,498 |
|
184,178 |
|
119,753 |
Depreciation and amortization (ii) |
|
50,727 |
|
51,900 |
|
156,669 |
|
98,007 |
Consulting and advisory services |
|
18,481 |
|
8,617 |
|
60,866 |
|
45,735 |
Material |
|
5,063 |
|
11,675 |
|
24,769 |
|
23,905 |
Maintenance |
|
6,132 |
|
9,676 |
|
23,804 |
|
22,074 |
Utilities, cleaning and security |
|
8,564 |
|
3,970 |
|
30,781 |
|
9,613 |
Other expenses |
|
8,218 |
|
12,216 |
|
27,461 |
|
24,340 |
Total |
|
337,558 |
|
276,725 |
|
948,343 |
|
634,286 |
|
|
|
|
|
|
|
|
|
Costs of services |
|
167,546 |
|
168,859 |
|
494,401 |
|
351,909 |
General and administrative expenses |
|
76,800 |
|
38,262 |
|
191,859 |
|
122,975 |
Selling expenses |
|
93,212 |
|
69,604 |
|
262,083 |
|
159,402 |
Total |
|
337,558 |
|
276,725 |
|
948,343 |
|
634,286 |
(i) Payroll expenses include for nine months ended September 30,2023, was R$ 444,849 (2022 – R$ 292,602) related to salaries, bonuses, short-term benefits, related social charges and other employee related expenses, and R$ (5,034) (2022 – R$ (1,743)) related to share-based compensation.
|
|
Three Months Ended September 30, |
|
Nine Months Ended September 30, |
||||
Depreciation and amortization (ii) |
|
2023 |
|
2022 |
|
2023 |
|
2022 |
Costs of services |
|
19,821 |
|
20,970 |
|
59,251 |
|
51,191 |
General and administrative expenses |
|
17,160 |
|
17,009 |
|
56,160 |
|
26,768 |
Selling expenses |
|
13,746 |
|
13,921 |
|
41,258 |
|
20,048 |
24
Vitru Limited
Notes to the unaudited interim condensed consolidated financial statements.
September 30, 2023 and 2022.
(In thousands of Brazilian Reais, except as otherwise indicated)
Total |
|
50,727 |
|
51,900 |
|
156,669 |
|
98,007 |
| 24. | Other income (expenses), net |
|
|
Three Months Ended September 30, |
|
Nine Months Ended September 30, |
||||
|
|
2023 |
|
2022 |
|
2023 |
|
2022 |
Deductible donations |
|
(2,671) |
|
(775) |
|
(2,671) |
|
(1,217) |
Contractual indemnities |
|
(3) |
|
(184) |
|
(1) |
|
(208) |
Modification of lease contracts |
|
185 |
|
297 |
|
353 |
|
554 |
Other revenues |
|
2,045 |
|
1,755 |
|
2,420 |
|
3,220 |
Other expenses |
|
(1,779) |
|
(3,898) |
|
(3,034) |
|
(4,176) |
Total |
|
(2,223) |
|
(2,805) |
|
(2,933) |
|
(1,827) |
| 25. | Financial results |
|
|
Three Months Ended September 30, |
|
Nine Months Ended September 30, |
||||
|
|
2023 |
|
2022 |
|
2023 |
|
2022 |
Financial income |
|
|
|
|
|
|
|
|
Interest on tuition fees paid in arrears |
|
6,831 |
|
9,351 |
|
20,393 |
|
19,997 |
Financial investment yield |
|
13,728 |
|
9,028 |
|
21,951 |
|
23,974 |
Foreign exchange gain |
|
(35) |
|
1,173 |
|
2,598 |
|
4,895 |
Other |
|
553 |
|
22 |
|
802 |
|
186 |
Total |
|
21,077 |
|
19,574 |
|
45,744 |
|
49,052 |
|
|
|
|
|
|
|
|
|
Financial expenses |
|
|
|
|
|
|
|
|
Interest on accounts payable from acquisition of subsidiaries |
|
(5,383) |
|
(7,449) |
|
(24,848) |
|
(26,715) |
Interest on lease |
|
(9,823) |
|
(9,123) |
|
(25,250) |
|
(19,391) |
Interest on loans and financing |
|
(63,710) |
|
(68,506) |
|
(177,792) |
|
(101,877) |
Foreign exchange loss |
|
(1,360) |
|
(812) |
|
(3,564) |
|
(4,586) |
Other |
|
(6,477) |
|
(4,943) |
|
(18,606) |
|
(15,004) |
Total |
|
(86,753) |
|
(90,833) |
|
(250,060) |
|
(167,573) |
|
|
|
|
|
|
|
|
|
Financial results |
|
(65,676) |
|
(71,259) |
|
(204,316) |
|
(118,521) |
| 26. | Other disclosures on cash flows |
Non-cash transactions
In the nine months ended September 30, 2023:
The amount of R$ 57,713 (2022 - R$ 18,040) regarding additions (new contracts and re-measurement by index) on right-of-use assets, was also added in the lease liabilities line item.
***
25