+
UNITED STATES
SECURITIES AND EXCHANGE COMMISSION
Washington, D.C. 20549
FORM 6-K
Report of Foreign Issuer
Pursuant to Rule 13a-16 or 15d-16 of the Securities Exchange Act of 1934
For the month of November 2023
Commission File Number 001-35286
FRANCO-NEVADA CORPORATION
(Translation of registrant’s name into English)
199 Bay Street, Suite 2000, P.O. Box 285, Commerce Court Postal Station, Toronto, Ontario, Canada M5L 1G9
(Address of principal executive offices)
Indicate by check mark whether the registrant files or will file annual reports under cover of Form 20-F or Form 40-F
Form 20-F ◻ |
Form 40-F ⌧ |
Indicate by check mark if the registrant is submitting the Form 6-K in paper as permitted by Regulation S-T Rule 101(b)(1): ◻
Indicate by check mark if the registrant is submitting the Form 6-K in paper as permitted by Regulation S-T Rule 101(b)(7): ◻
Exhibits 99.2 and 99.3 of this Form 6-K are hereby incorporated by reference into the registrant’s registration statements on Form F-3 (File No. 333-264906), Form S-8 (File No. 333-176856) and Form F-10 (File No. 333-264971).
INDEX TO EXHIBITS
2
SIGNATURE
Pursuant to the requirements of the Securities Exchange Act of 1934, the registrant has duly caused this report to be signed on its behalf by the undersigned, thereunto duly authorized.
|
FRANCO-NEVADA CORPORATION |
|
|
|
|
|
/s/ Lloyd Hong |
Date: November 8, 2023 |
Lloyd Hong |
|
|
|
Chief Legal Officer & Corporate Secretary |
3
Exhibit 99.1

NEWS RELEASE
Toronto, November 8, 2023
(in U.S. dollars unless otherwise noted)
Franco-Nevada Reports Q3 2023 Results
Precious Metal Assets Performed Well
“Our core precious metal assets anchored the quarter, resulting in increased revenue and earnings over the prior year period,” stated Paul Brink, CEO. We are looking forward to added precious metal contributions from a number of new mines in 2024 and, in particular, from the Tocantinzinho stream where G Mining Ventures is progressing construction on time and budget. Franco-Nevada is debt-free and is growing its cash balances.”
The Panamanian National Assembly approved the revised Cobre Panama concession agreement in October 2023. In response to protests that followed the approval, the Government proposed but did not proceed with a popular consultation on the revised concession contract. The Panamanian Supreme Court is, however, considering a number of lawsuits challenging the constitutionality of the law pertaining to the contract. Production at the Cobre Panama mine has not been impacted and we, along with the operator, First Quantum, are closely monitoring the unfolding situation.
|
|
|
|
Q3 2023 |
|
|
|
|
YTD 2023 |
|
|
|
Q3 results |
|
vs |
|
|
YTD results |
|
vs |
|
|
|
|
|
Q3 2022 |
|
|
|
|
YTD 2022 |
|
Total GEOs1 sold (including Energy) |
|
160,848 GEOs |
|
-9% |
|
|
474,694 GEOs |
|
-13% |
|
Precious Metal GEOs1 sold |
|
125,337 GEOs |
|
+4% |
|
|
368,608 GEOs |
|
-3% |
|
Revenue |
|
$309.5 million |
|
+2% |
|
|
$915.7 million |
|
-8% |
|
Net income |
|
$175.1 million ($0.91/share) |
|
+11% |
|
|
$516.1 million ($2.69/share) |
|
-4% |
|
Adjusted Net Income2 |
|
$175.1 million ($0.91/share) |
|
+10% |
|
|
$510.2 million ($2.66/share) |
|
-4% |
|
Adjusted EBITDA2 |
|
$255.1 million ($1.33/share) |
|
-1% |
|
|
$760.1 million ($3.96/share) |
|
-10% |
|
Adjusted EBITDA Margin2 |
|
82.4% |
|
-2.4% |
|
|
83.0% |
|
-2.1% |
|
Strong Financial Position
| ● | No debt and $2.3 billion in available capital as at September 30, 2023 |
| ● | Generated $236.0 million in operating cash flow during the quarter |
| ● | 16 consecutive annual dividend increases. Quarterly dividend of $0.34/share |
Sector-Leading ESG
| ● | Global 50 Top Rated and #1 gold company by Sustainalytics, AA by MSCI and Prime by ISS ESG |
| ● | Committed to the World Gold Council’s Responsible Gold Mining Principles |
| ● | Partnering with our operators on community and ESG initiatives |
| ● | Goal of 40% diverse representation at the Board and top leadership levels as a group by 2025 |
Diverse, Long-Life Portfolio
| ● | Most diverse royalty and streaming portfolio by asset, operator and country |
| ● | Core precious metal streams on world-class copper assets outperforming acquisition expectations |
| ● | Long-life reserves and resources |
Growth and Optionality
| ● | Mine expansions and new mines driving 5-year growth profile |
| ● | Long-term optionality in gold, copper and nickel and exposure to some of the world’s great mineral endowments |
| ● | Strong pipeline of precious metal and diversified opportunities |
Quarterly revenue and GEOs sold by commodity |
|
|
|
||||||||
|
|
Q3 2023 |
|
Q3 2022 |
|
||||||
|
|
GEOs Sold |
|
Revenue |
|
GEOs Sold |
|
Revenue |
|
||
|
|
# |
|
(in millions) |
|
# |
|
(in millions) |
|
||
PRECIOUS METALS |
|
|
|
|
|
|
|
|
|
|
|
Gold |
|
103,641 |
|
$ |
199.5 |
|
96,628 |
|
$ |
166.6 |
|
Silver |
|
16,526 |
|
|
31.6 |
|
17,883 |
|
|
30.3 |
|
PGM |
|
5,170 |
|
|
9.7 |
|
6,031 |
|
|
9.8 |
|
|
|
125,337 |
|
$ |
240.8 |
|
120,542 |
|
$ |
206.7 |
|
DIVERSIFIED |
|
|
|
|
|
|
|
|
|
|
|
Iron ore |
|
6,619 |
|
$ |
12.8 |
|
6,311 |
|
$ |
10.8 |
|
Other mining assets |
|
1,677 |
|
|
3.2 |
|
1,574 |
|
|
2.9 |
|
Oil |
|
20,926 |
|
|
38.2 |
|
20,930 |
|
|
36.6 |
|
Gas |
|
4,098 |
|
|
9.9 |
|
23,516 |
|
|
40.9 |
|
NGL |
|
2,191 |
|
|
4.6 |
|
3,535 |
|
|
6.3 |
|
|
|
35,511 |
|
$ |
68.7 |
|
55,866 |
|
$ |
97.5 |
|
|
|
160,848 |
|
$ |
309.5 |
|
176,408 |
|
$ |
304.2 |
|
Year-to-date revenue and GEOs sold by commodity |
|
|
|
||||||||
|
|
YTD 2023 |
|
YTD 2022 |
|
||||||
|
|
GEOs Sold |
|
Revenue |
|
GEOs Sold |
|
Revenue |
|
||
|
|
# |
|
(in millions) |
|
# |
|
(in millions) |
|
||
PRECIOUS METALS |
|
|
|
|
|
|
|
|
|
|
|
Gold |
|
303,179 |
|
$ |
585.7 |
|
299,173 |
|
$ |
544.9 |
|
Silver |
|
49,478 |
|
|
95.5 |
|
58,740 |
|
|
107.2 |
|
PGM |
|
15,951 |
|
|
31.0 |
|
22,830 |
|
|
41.2 |
|
|
|
368,608 |
|
$ |
712.2 |
|
380,743 |
|
$ |
693.3 |
|
DIVERSIFIED |
|
|
|
|
|
|
|
|
|
|
|
Iron ore |
|
18,801 |
|
$ |
36.0 |
|
24,573 |
|
$ |
44.7 |
|
Other mining assets |
|
5,435 |
|
|
10.3 |
|
3,459 |
|
|
6.4 |
|
Oil |
|
54,847 |
|
|
102.2 |
|
66,448 |
|
|
121.8 |
|
Gas |
|
19,800 |
|
|
41.0 |
|
59,597 |
|
|
108.3 |
|
NGL |
|
7,203 |
|
|
14.0 |
|
11,254 |
|
|
20.8 |
|
|
|
106,086 |
|
$ |
203.5 |
|
165,331 |
|
$ |
302.0 |
|
|
|
474,694 |
|
$ |
915.7 |
|
546,074 |
|
$ |
995.3 |
|
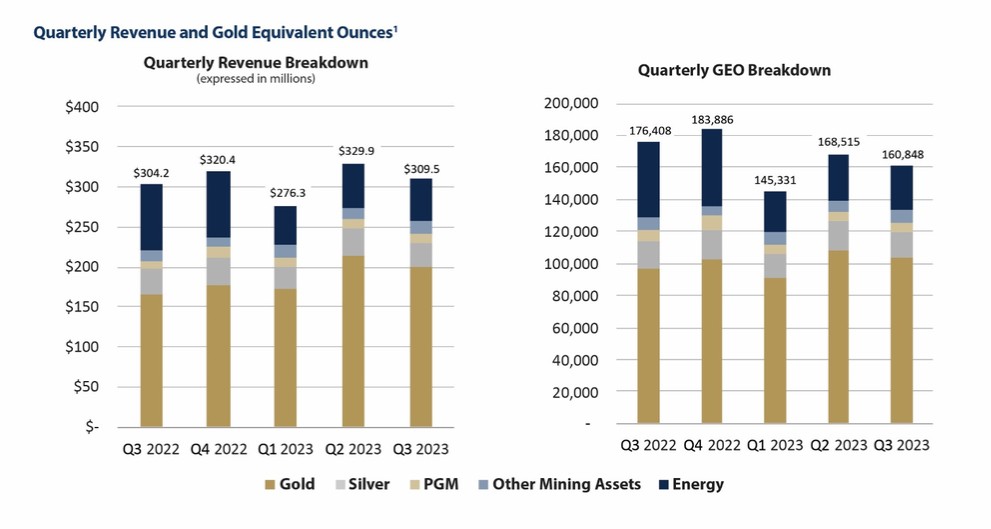
In Q3 2023, we earned $309.5 million in revenue, up 1.7% from Q3 2022. We benefited from an increase in GEOs from our Precious Metal assets as well as higher gold prices. This more than offset the decrease in revenue from our Diversified assets, which reflect lower oil and gas prices when compared to the relative highs of the prior year quarter.
Precious Metal revenue accounted for 77.8% of our revenue (64.5% gold, 10.2% silver, 3.1% PGM). Revenue was sourced 88.0% from the Americas (28.7% South America, 28.4% Central America & Mexico, 15.9% U.S. and 15.0% Canada).
Environmental, Social and Governance (ESG) Updates
We continue to rank highly with leading ESG rating agencies. During the quarter, we expanded the Franco-Nevada Diversity Scholarship program by awarding five new diversity scholarships to mining engineering students at Queens, University of Toronto, UBC, and École Polytechnique. We also supported industry initiatives with a strategic partnership level funding to the Canadian Institute of Mining, Metallurgy and Petroleum (CIM).
2
Revised Concession Contract for the Cobre Panama Mine
As previously disclosed, on October 29, 2023, President Laurentino Cortizo announced the Panamanian government’s intention to hold a popular consultation regarding Law 406 on December 17, 2023. Law 406, which approved the revised mining concession contract for the Cobre Panama mine, was enacted into law in Panama on October 20, 2023.
During the week commencing October 30, 2023, the National Assembly of Panama held sessions concerning two bills that included a popular consultation regarding Law 406, the repeal of Law 406 and a moratorium on the granting of new mining concession contracts in Panama. Bill 1110 provided for a moratorium on the granting of new concession contracts related to mining in Panama and was approved in the third debate on November 3, 2023. The proposed popular consultation and repeal of Law 406 were not ultimately approved, and the Company understands that no further debates on these issues are currently scheduled. As of the date of this release, Law 406 and the revised concession contract are still in effect. A number of lawsuits challenging the constitutionality of Law 406 have, however, been submitted to the Supreme Court of Justice, a number of which have been admitted for adjudication. We continue to closely monitor the unfolding situation regarding Law 406 and the revised concession contract and are assessing our available protections.
Production at the Cobre Panama mine remains uninterrupted at this time, however, protests, including blockades of key roads, have caused disruptions on site as well as shortages in certain supplies.
Portfolio Additions
| ● | Acquisition of Additional Royalty on Magino Gold Mine – Ontario, Canada: Subsequent to quarter-end, on November 2, 2023, we agreed to acquire an additional 1.0% NSR on Argonaut’s Magino gold mine in Ontario and a portfolio comprised of Argonaut’s existing royalty holdings in Canada and Mexico, for an aggregate purchase price of approximately $29.5 million, with closing of such transactions subject to satisfaction of closing conditions. Inclusive of our initial 2.0% NSR, we will hold an aggregate 3.0% NSR on Magino. |
| ● | Acquisition of Royalty on Wawa Gold Project – Ontario, Canada: On August 29, 2023, we acquired a 1.5% NSR on Red Pine Exploration Inc.’s Wawa gold project, located in Ontario, Canada, for a purchase price of $5.0 million (C$6.8 million). The agreement provides Franco-Nevada the option to acquire an additional 0.5% NSR based on pre-determined conditions. |
| ● | Acquisition of Royalties on Pascua-Lama Project – Chile: As previously announced, on August 8, 2023, we agreed to acquire a sliding-scale gold royalty and fixed-rate copper royalty from private individuals pertaining to the Chilean portion of Barrick’s Pascua-Lama project for a purchase price of $75.0 million. At gold prices exceeding $800/ounce, we will hold a 2.70% NSR (gold) and 0.54% NSR (copper) on the property. |
| ● | Acquisition of Royalty on Volcan Gold Project – Chile: As previously announced, on July 6, 2023, we agreed to acquire a 1.5% NSR on the Volcan gold project located in Chile for a purchase price of $15.0 million. The project is owned by Tiernan Gold Corporation, a company privately held by Hochschild Mining plc. The NSR covers the entire land package comprising the Volcan project, as well as a surrounding area of interest extending 1.5 kilometers. We already hold an existing 1.5% NSR on the peripheral Ojo de Agua area, which is owned by Tiernan and forms part of the Volcan project. |
Q3 2023 Portfolio Updates
Precious Metal assets: GEOs sold from our Precious Metal assets were 125,337, compared to 120,542 GEOs in Q3 2022, driven by strong contributions from Cobre Panama, Guadalupe-Palmarejo and MWS.
South America:
| ● | Antapaccay (gold and silver stream) – GEOs delivered and sold were slightly higher in Q3 2023 compared to Q3 2022. Production at Antapaccay during the period benefited from higher copper grades and recoveries based on mine sequencing. |
| ● | Candelaria (gold and silver stream) – GEOs delivered and sold in the quarter were relatively consistent with Q3 2022. Lundin Mining announced that its environmental impact assessment for the extension of operations and mine life from 2030 to 2040 was approved by the regional Chilean authorities. This would also allow for the potential development of the Candelaria Underground Expansion Project. |
| ● | Antamina (22.5% silver stream) – GEOs delivered and sold were lower in Q3 2023 compared to Q3 2022, reflecting an anticipated decrease in average silver grades based on the life of mine plan. Production at the mine was also impacted by Cyclone Yaku which constrained logistics in March and April 2023. This was reflected in the deliveries we received in Q3 2023. |
| ● | Tocantinzinho (gold stream) – G Mining Ventures reported the physical construction of the Tocantinzinho project was 52% complete as of the end of September 2023 and remains on track for commercial production in H2 2024. In Q3 2023, we disbursed an additional $66.2 million under our stream agreement and have now fully funded our $250.0 million stream deposit. |
3
| ● | Salares Norte (1-2% royalty) – Gold Fields reported that total project completion was 96% as of the end of August 2023. While first production is anticipated in December 2023, we do not expect meaningful royalty payments to Franco-Nevada until 2024. |
Central America & Mexico:
| ● | Cobre Panama (gold and silver stream) – GEOs delivered and sold in the quarter were significantly higher than in Q3 2022, driven by higher average copper grades and the continued ramp-up of the CP100 Expansion project. First Quantum reported that a new quarterly record for copper production at Cobre Panama was achieved in Q3 2023. |
| ● | Guadalupe-Palmarejo (50% gold stream) – GEOs sold from Guadalupe-Palmarejo increased in Q3 2023 compared to the same quarter in 2022. Production at the Palmarejo mine benefited from higher average grades. |
U.S.:
| ● | Stillwater (5% royalty) – Production of PGMs at the mine increased compared to Q3 2022, but continued to be impacted by a shortage of critical skills and geotechnical challenges. Sibanye-Stillwater reported that operations resumed planned mine production run rate in October 2023, driving improved outlook for production for Q4 2023. The decrease in GEOs also reflects a lower PGM to gold GEO conversion ratio. |
| ● | Goldstrike (2-6% royalties) – GEOs from our Goldstrike royalties decreased in Q3 2023 compared to Q3 2022 as a lesser proportion of the ore processed at Goldstrike was sourced from our royalty ground. |
| ● | Marigold (0.5-5% royalties) – Production at Marigold was higher in Q3 2023 compared to Q3 2022 as a result of mine sequencing. In addition, our GEOs earned were higher than in the prior year period primarily due to mining occurring on ground with a higher royalty rate. |
| ● | Copper World Project (2.085% royalty) – Hudbay provided an updated pre-feasibility study for the Copper World project. The study outlined an extended 20-year mine life for Phase I, where only state and local permits are required, lower initial capital expenditures, and a higher mill feed grade than was previously contemplated. |
Canada:
| ● | Detour Lake (2% royalty) – Agnico Eagle reported that production during the quarter was impacted by unscheduled mill downtime in August 2023 due to a temporary transformer issue powering the SAG mill. The mill returned to normal operating levels in September 2023. Mill optimization initiatives continued through the quarter with the objective of continuing to increase throughput to 28.0 million tonnes per annum by 2025 and is targeting production of 1 million ounces per year. |
| ● | Kirkland Lake (1.5-5.5% royalty & 20% NPI) – Agnico Eagle reported that the Macassa mill is expected to reach full capacity of 1,650 tonnes per day by mid-2024, driven by the Shaft # 4 commissioning and increased productivity from the Macassa deep mine. Exploration drilling during the quarter targeted the Lower/West South Mine Complex (“SMC”), SMC East and Main Break. Production from the AK deposit is also expected to begin in H2 2024. |
| ● | Canadian Malartic (1.5% royalty) – Agnico Eagle reported that production via the ramp at the Odyssey South deposit increased through the quarter, with underground development and surface activities at the Odyssey project progressing well and shaft pre-sinking activities advancing. Drilling activities were focused on infilling the internal zones at the Odyssey South deposit and mineral resource expansion of the East Gouldie deposit to the east and west. |
| ● | Magino (2% royalty) – Magino poured first gold in June 2023 and achieved commercial production on November 1, 2023, with the plant largely operating at nameplate capacity despite 20 days of unplanned downtime in September 2023. Franco-Nevada earned 230 GEOs from its royalty in Q3 2023. |
| ● | Island Gold (0.62% royalty) – Alamos Gold reported that the Phase 3+ Expansion is progressing well with construction of the headframe largely complete and shaft sinking on track to begin by the end of the year. The Phase 3+ Expansion is expected to more than double gold production to an average of 287,000 ounces per year starting in 2026. |
| ● | Greenstone (3% royalty) – Equinox Gold reported that construction of the project is on schedule and budget, with construction 92% complete as of the end of September 2023 and first gold pour expected in H1 2024. |
| ● | Valentine Gold (3% royalty) – Marathon reported that overall project completion was 50% as at the end of September 2023 and that the project remains on schedule for first gold production in Q1 2025. Marathon also reported that the Berry Expansion was released from the provincial environmental assessment process and that it did not require a new federal impact assessment. Marathon now anticipates the Berry deposit being fully permitted earlier than had previously been anticipated. |
| ● | Wawa (1.5% royalty) – Red Pine continues to report success expanding mineralization within, and in the footwall of, the Jubilee shear zone at its Wawa project. Highlights of the assay results include 8.01 g/t gold over 32.95 meters at the intersection of the Minto B/Jubilee Shears. |
4
Rest of World:
| ● | Tasiast (2% royalty) – In October 2023, Kinross indicated that its Tasiast 24k expansion project was progressing as planned, with mill modifications complete and throughput of 24,000 tonnes per day being achieved for sustained periods of time. Kinross also indicated it was evaluating underground potential to supplement low-grade stockpile ore with high-grade underground ore once open-pit mining ceases. |
| ● | Subika (Ahafo) (2% royalty) – Newmont reported that mill throughput at Ahafo has been reduced to approximately 80 percent of its full capacity since October 2023 in order to replace a mill girth gear. Processing rates are expected to return to full levels in Q2 2024 once the gear has been replaced. |
| ● | Séguéla (1.2% royalty) – Séguéla poured first gold in May 2023. Fortuna Silver Mines reported that throughput exceeded nameplate capacity in Q3 2023 and production for H2 2023 was expected to be between 60,000 to 75,000 gold ounces. Fortuna Silver Mines also indicated that the Sunbird deposit will be incorporated into an updated Mineral Resource and Mineral Reserve estimate to be released in Q4 2023. The Sunbird deposit has an Indicated Mineral Resource of 279,000 gold ounces (3.3 million tonnes grading at 2.66 g/t) and an Inferred Mineral Resource of 506,000 gold ounces (4.2 million tonnes grading at 3.73 g/t). |
| ● | Yandal (Bronzewing) (2% royalty) – Northern Star Resources reported the Thunderbox mill continued to ramp-up towards its 6 million tonnes per annum nameplate capacity, achieving 501,000 tonnes milled in August 2023. Mining continued at the Orelia open pit mine, where the ore will be used as feed for the expanded Thunderbox mill. |
Diversified assets: Our Diversified assets, primarily comprising our Iron Ore and Energy interests, generated $68.7 million in revenue, down from $97.5 million in Q3 2022. The decrease is primarily due to lower oil and gas prices compared to the relative highs of the prior year period.
Iron Ore & Other Mining:
| ● | Vale Royalty (iron ore royalty) – Revenue from the Vale royalty increased compared to Q3 2022, reflecting higher estimated iron ore prices than in the prior year quarter. |
| ● | LIORC – Revenue from our attributable interest in LIORC was relatively consistent with Q3 2022. Rio Tinto reported that operations at Iron Ore Company of Canada were impacted by extended plant downtime and a conveyor belt failure in Q3 2023, while also recovering from wildfires which took place in Northern Quebec in Q2 2023. |
| ● | Caserones (0.57% effective NSR) – Lundin Mining, which now owns a 51% majority interest in the mine, reported that it had launched one of the largest exploration programs at the mine since it began operation in 2013. The initial phase of the drilling program is expected to be over 10,000 meters and results are expected in H1 2024. |
| ● | Crawford Nickel (2% royalty) – Canada Nickel Company announced a feasibility study for its Crawford Nickel Sulphide project. The feasibility study outlined 3.8 million tonnes of contained nickel (1.7 billion tonnes of ore grading 0.22% nickel) in Proven & Probable Mineral Reserves. |
Energy:
| ● | U.S. (various royalty rates) – Revenue from our U.S. Energy interests decreased compared to Q3 2022, largely due to lower realized oil and gas prices. Partly offsetting the impact of lower prices, we received approximately $1.3 million in lease bonus revenue in relation to our Haynesville interests. We also benefited from higher production at our Permian assets due to the completion of new wells. |
| ● | Canada (various royalty rates) – Revenue from our Canadian Energy interests was relatively consistent with Q3 2022. For our Weyburn NRI, the impact of lower prices was partly offset by lower operating and capital expenditures incurred at the Weyburn Unit. |
5
Dividend Declaration
Franco-Nevada is pleased to announce that its Board of Directors has declared a quarterly dividend of US$0.34 per share. The dividend will be paid on December 21, 2023, to shareholders of record on December 7, 2023 (the “Record Date”). The dividend has been declared in U.S. dollars and the Canadian dollar equivalent will be determined based on the daily average rate posted by the Bank of Canada on the Record Date. Under Canadian tax legislation, Canadian resident individuals who receive “eligible dividends” are entitled to an enhanced gross-up and dividend tax credit on such dividends.
The Company has a Dividend Reinvestment Plan (the “DRIP”) which allows shareholders of Franco-Nevada to reinvest dividends to purchase additional common shares at the Average Market Price, as defined in the DRIP, subject to a discount from the Average Market Price in the case of treasury acquisitions. Pursuant to the terms of the DRIP, the Company has changed the discount applicable to the Average Market Price from 3% to 1%, effective from the dividend payable on March 30, 2023. The Company may, from time to time, in its discretion, further change or eliminate the discount applicable to treasury acquisitions or direct that such common shares be purchased in market acquisitions at the prevailing market price, any of which would be publicly announced. Participation in the DRIP is optional. The DRIP and enrollment forms are available on the Company’s website at www.franco-nevada.com. Canadian and U.S. registered shareholders may also enroll in the DRIP online through the plan agent’s self-service web portal at www.investorcentre.com/franco-nevada. Canadian and U.S. beneficial shareholders should contact their financial intermediary to arrange enrollment. Non-Canadian and non-U.S. shareholders may potentially participate in the DRIP, subject to the satisfaction of certain conditions. Non-Canadian and non-U.S. shareholders should contact the Company to determine whether they satisfy the necessary conditions to participate in the DRIP.
This press release is not an offer to sell or a solicitation of an offer for securities. A registration statement relating to the DRIP has been filed with the U.S. Securities and Exchange Commission and may be obtained under the Company’s profile on the U.S. Securities and Exchange Commission’s website at www.sec.gov.
Shareholder Information
The complete unaudited Condensed Consolidated Interim Financial Statements and Management’s Discussion and Analysis can be found on our website at www.franco-nevada.com, on SEDAR+ at www.sedarplus.com and on EDGAR at www.sec.gov.
We will host a conference call to review our Q3 2023 results. Interested investors are invited to participate as follows:
Conference Call and Webcast: |
November 9th 8:00 am ET |
Dial-in Numbers: |
Toll-Free: 1-888-390-0546 International: 416-764-8688 |
|
Conference Call URL (This allows participants to join the conference call by phone without operator assistance. Participants will receive an automated call back after entering their name and phone number): |
https://bit.ly/3Y3uYt8 |
Webcast: |
www.franco-nevada.com |
Replay (available until November 16th): |
Toll-Free: 1-888-390-0541 International: 416-764-8677 Passcode: 208501 # |
Corporate Summary
Franco-Nevada Corporation is the leading gold-focused royalty and streaming company with the largest and most diversified portfolio of cash-flow producing assets. Its business model provides investors with gold price and exploration optionality while limiting exposure to cost inflation. Franco-Nevada is debt-free and uses its free cash flow to expand its portfolio and pay dividends. It trades under the symbol FNV on both the Toronto and New York stock exchanges. Franco-Nevada is the gold investment that works.
For more information, please go to our website at www.franco-nevada.com or contact:
Sandip Rana |
|
|
Chief Financial Officer |
|
|
(416) 306-6303 |
|
|
info@franco-nevada.com |
|
|
6
Forward-Looking Statements
This press release contains “forward-looking information” and “forward-looking statements” within the meaning of applicable Canadian securities laws and the United States Private Securities Litigation Reform Act of 1995, respectively, which may include, but are not limited to, statements with respect to future events or future performance, management’s expectations regarding Franco-Nevada’s growth, results of operations, estimated future revenues, performance guidance, carrying value of assets, future dividends and requirements for additional capital, mineral resource and mineral reserve estimates, production estimates, production costs and revenue, future demand for and prices of commodities, expected mining sequences, business prospects and opportunities, the performance and plans of third party operators, audits being conducted by the CRA, the expected exposure for current and future assessments and available remedies, statements with respect to Law 406, the law that approved the revised concession contract for the Cobre Panama mine, including, but not limited to constitutional challenges, popular consultations or any Government of Panama bills relating to Law 406, and statements relating to the continued operation of and protests impacting the Cobre Panama mine. In addition, statements relating to resources and reserves, gold equivalent ounces (“GEOs”) and mine life are forward-looking statements, as they involve implied assessment, based on certain estimates and assumptions, and no assurance can be given that the estimates and assumptions are accurate and that such resources and reserves, GEOs or mine life will be realized. Such forward-looking statements reflect management’s current beliefs and are based on information currently available to management. Often, but not always, forward-looking statements can be identified by the use of words such as “plans”, “expects”, “is expected”, “budgets”, “potential for”, “scheduled”, “estimates”, “forecasts”, “predicts”, “projects”, “intends”, “targets”, “aims”, “anticipates” or “believes” or variations (including negative variations) of such words and phrases or may be identified by statements to the effect that certain actions “may”, “could”, “should”, “would”, “might” or “will” be taken, occur or be achieved. Forward-looking statements involve known and unknown risks, uncertainties and other factors, which may cause the actual results, performance or achievements of Franco-Nevada to be materially different from any future results, performance or achievements expressed or implied by the forward-looking statements. A number of factors could cause actual events or results to differ materially from any forward-looking statement, including, without limitation: fluctuations in the prices of the primary commodities that drive royalty and stream revenue (gold, platinum group metals, copper, nickel, uranium, silver, iron ore and oil and gas); fluctuations in the value of the Canadian and Australian dollar, Mexican peso, and any other currency in which revenue is generated, relative to the U.S. dollar; changes in national and local government legislation, including permitting and licensing regimes and taxation policies and the enforcement thereof; the adoption of a global minimum tax on corporations; regulatory, political or economic developments in any of the countries where properties in which Franco-Nevada holds a royalty, stream or other interest are located or through which they are held; risks related to the operators of the properties in which Franco-Nevada holds a royalty, stream or other interest, including changes in the ownership and control of such operators; relinquishment or sale of mineral properties; influence of macroeconomic developments; business opportunities that become available to, or are pursued by Franco-Nevada; reduced access to debt and equity capital; litigation; title, permit or license disputes related to interests on any of the properties in which Franco-Nevada holds a royalty, stream or other interest; whether or not the Company is determined to have “passive foreign investment company” (“PFIC”) status as defined in Section 1297 of the United States Internal Revenue Code of 1986, as amended; potential changes in Canadian tax treatment of offshore streams; excessive cost escalation as well as development, permitting, infrastructure, operating or technical difficulties on any of the properties in which Franco-Nevada holds a royalty, stream or other interest; access to sufficient pipeline capacity; actual mineral content may differ from the resources and reserves contained in technical reports; rate and timing of production differences from resource estimates, other technical reports and mine plans; risks and hazards associated with the business of development and mining on any of the properties in which Franco-Nevada holds a royalty, stream or other interest, including, but not limited to unusual or unexpected geological and metallurgical conditions, slope failures or cave-ins, sinkholes, flooding and other natural disasters, terrorism, civil unrest or an outbreak of contagious disease; the impact of COVID-19 (coronavirus); and the integration of acquired assets. The forward-looking statements contained in this press release are based upon assumptions management believes to be reasonable, including, without limitation: the ongoing operation of the properties in which Franco-Nevada holds a royalty, stream or other interest by the owners or operators of such properties in a manner consistent with past practice; the accuracy of public statements and disclosures made by the owners or operators of such underlying properties; no material adverse change in the market price of the commodities that underlie the asset portfolio; the Company’s ongoing income and assets relating to determination of its PFIC status; no material changes to existing tax treatment; the expected application of tax laws and regulations by taxation authorities; the expected assessment and outcome of any audit by any taxation authority; no adverse development in respect of any significant property in which Franco-Nevada holds a royalty, stream or other interest; the accuracy of publicly disclosed expectations for the development of underlying properties that are not yet in production; integration of acquired assets; and the absence of any other factors that could cause actions, events or results to differ from those anticipated, estimated or intended. However, there can be no assurance that forward-looking statements will prove to be accurate, as actual results and future events could differ materially from those anticipated in such statements. Investors are cautioned that forward-looking statements are not guarantees of future performance. In addition, there can be no assurance as to the outcome of the ongoing audit by the CRA or the Company’s exposure as a result thereof. Franco-Nevada cannot assure investors that actual results will be consistent with these forward-looking statements. Accordingly, investors should not place undue reliance on forward-looking statements due to the inherent uncertainty therein.
For additional information with respect to risks, uncertainties and assumptions, please refer to Franco-Nevada’s most recent Annual Information Form filed with the Canadian securities regulatory authorities on www.sedarplus.com and Franco-Nevada’s most recent Annual Report filed on Form 40-F filed with the SEC on www.sec.gov. The forward-looking statements herein are made as of the date of this press release only and Franco-Nevada does not assume any obligation to update or revise them to reflect new information, estimates or opinions, future events or results or otherwise, except as required by applicable law.
7
ENDNOTES:
| 1 | GEOs: GEOs include Franco-Nevada’s attributable share of production from our Mining and Energy assets after applicable recovery and payability factors. GEOs are estimated on a gross basis for NSRs and, in the case of stream ounces, before the payment of the per ounce contractual price paid by the Company. For NPI royalties, GEOs are calculated taking into account the NPI economics. Silver, platinum, palladium, iron ore, oil, gas and other commodities are converted to GEOs by dividing associated revenue, which includes settlement adjustments, by the relevant gold price. The price used in the computation of GEOs earned from a particular asset varies depending on the royalty or stream agreement, which may make reference to the market price realized by the operator, or the average price for the month, quarter, or year in which the commodity was produced or sold. For Q3 2023, the average commodity prices were as follows: $1,929/oz gold (Q3 2022 - $1,728), $23.57/oz silver (Q3 2022 - $19.22), $931/oz platinum (Q3 2022 - $886) and $1,251/oz palladium (Q3 2022 - $2,074), $113/t Fe 62% CFR China (Q3 2022 - $105), $82.26/bbl WTI oil (Q3 2022 - $91.56) and $2.66/mcf Henry Hub natural gas (Q3 2022 - $7.91). For YTD 2023 prices, the average commodity prices were as follows: $1,932/oz gold (YTD 2022 - $1,825), $23.44/oz silver (YTD 2022 - $21.94), $985/oz platinum (YTD 2022 - $958) and $1,422/oz palladium (YTD 2022 - $2,163), $116/t Fe 62% CFR China (YTD 2022 - $129), $77.39/bbl WTI oil (YTD 2022 - $98.09) and $2.58/mcf Henry Hub natural gas (YTD 2022 - $6.65). |
| 2 | NON-GAAP FINANCIAL MEASURES: Adjusted Net Income and Adjusted Net Income per share, Adjusted EBITDA and Adjusted EBITDA per share, and Adjusted EBITDA Margin are non-GAAP financial measures with no standardized meaning under International Financial Reporting Standards (“IFRS”) and might not be comparable to similar financial measures disclosed by other issuers. For a quantitative reconciliation of each non-GAAP financial measure to the most directly comparable IFRS financial measure, refer to the following tables. Further information relating to these Non-GAAP financial measures is incorporated by reference from the “Non-GAAP Financial Measures” section of Franco-Nevada’s MD&A for the three and nine months ended September 30, 2023 dated November 8, 2023 filed with the Canadian securities regulatory authorities on SEDAR+ available at www.sedarplus.com and with the U.S. Securities and Exchange Commission available on EDGAR at www.sec.gov. |
| ● | Adjusted Net Income and Adjusted Net Income per share are non-GAAP financial measures, which exclude the following from net income and earnings per share (“EPS”): impairment charges and reversal related to royalty, stream and working interests and investments; gains/losses on the sale of royalty, stream and working interests and investments; foreign exchange gains/losses and other income/expenses; unusual non-recurring items; and the impact of income taxes on these items. |
| ● | Adjusted EBITDA and Adjusted EBITDA per share are non-GAAP financial measures, which exclude the following from net income and EPS: income tax expense/recovery; finance expenses and finance income; depletion and depreciation; non-cash costs of sales; impairment charges and reversals related to royalty, stream and working interests and investments; gains/losses on the sale of royalty, stream and working interests and investments; foreign exchange gains/losses and other income/expenses; and unusual non-recurring items. |
| ● | Adjusted EBITDA Margin is a non-GAAP financial measure which is defined by the Company as Adjusted EBITDA divided by revenue. |
8
Reconciliation of Non-GAAP Financial Measures:
|
|
For the three months ended |
|
|
For the nine months ended |
|
||||||||||
|
|
September 30, |
|
|
September 30, |
|
||||||||||
(expressed in millions, except per share amounts) |
|
2023 |
|
|
2022 |
|
|
2023 |
|
|
2022 |
|
||||
Net income |
|
$ |
175.1 |
|
|
$ |
157.1 |
|
|
$ |
516.1 |
|
|
$ |
535.6 |
|
Gain on sale of royalty interest |
|
|
— |
|
|
|
— |
|
|
|
(3.7) |
|
|
|
— |
|
Foreign exchange loss (gain) and other (income) expenses |
|
|
1.8 |
|
|
|
2.3 |
|
|
|
(2.1) |
|
|
|
(3.5) |
|
Finance income related to repayment of Noront Loan |
|
|
— |
|
|
|
— |
|
|
|
— |
|
|
|
(2.2) |
|
Tax effect of adjustments |
|
|
(1.8) |
|
|
|
0.3 |
|
|
|
(0.1) |
|
|
|
2.8 |
|
Adjusted Net Income |
|
$ |
175.1 |
|
|
$ |
159.7 |
|
|
$ |
510.2 |
|
|
$ |
532.7 |
|
Basic weighted average shares outstanding |
|
|
192.1 |
|
|
|
191.6 |
|
|
|
192.0 |
|
|
|
191.5 |
|
Adjusted Net Income per share |
|
$ |
0.91 |
|
|
$ |
0.83 |
|
|
$ |
2.66 |
|
|
$ |
2.78 |
|
|
|
For the three months ended |
|
|
For the nine months ended |
|
||||||||||
|
|
September 30, |
|
|
September 30, |
|
||||||||||
(expressed in millions, except per share amounts) |
|
2023 |
|
|
2022 |
|
|
2023 |
|
|
2022 |
|
||||
Net income |
|
$ |
175.1 |
|
|
$ |
157.1 |
|
|
$ |
516.1 |
|
|
$ |
535.6 |
|
Income tax expense |
|
|
24.9 |
|
|
|
30.4 |
|
|
|
79.5 |
|
|
|
103.1 |
|
Finance expenses |
|
|
0.7 |
|
|
|
0.8 |
|
|
|
2.1 |
|
|
|
2.5 |
|
Finance income |
|
|
(15.5) |
|
|
|
(2.4) |
|
|
|
(36.0) |
|
|
|
(5.9) |
|
Depletion and depreciation |
|
|
68.1 |
|
|
|
68.5 |
|
|
|
204.2 |
|
|
|
212.7 |
|
Gain on sale of royalty interest |
|
|
— |
|
|
|
— |
|
|
|
(3.7) |
|
|
|
— |
|
Foreign exchange loss (gain) and other (income) expenses |
|
|
1.8 |
|
|
|
2.3 |
|
|
|
(2.1) |
|
|
|
(3.5) |
|
Adjusted EBITDA |
|
$ |
255.1 |
|
|
$ |
256.7 |
|
|
$ |
760.1 |
|
|
$ |
844.5 |
|
Basic weighted average shares outstanding |
|
|
192.1 |
|
|
|
191.6 |
|
|
|
192.0 |
|
|
|
191.5 |
|
Adjusted EBITDA per share |
|
$ |
1.33 |
|
|
$ |
1.34 |
|
|
$ |
3.96 |
|
|
$ |
4.41 |
|
|
|
For the three months ended |
|
|
For the nine months ended |
|
||||||||||
|
|
September 30, |
|
|
September 30, |
|
||||||||||
(expressed in millions, except Adjusted EBITDA Margin) |
|
2023 |
|
|
2022 |
|
|
2023 |
|
|
2022 |
|
||||
Adjusted EBITDA |
|
$ |
255.1 |
|
|
$ |
256.7 |
|
|
$ |
760.1 |
|
|
$ |
844.5 |
|
Revenue |
|
|
309.5 |
|
|
|
304.2 |
|
|
|
915.7 |
|
|
|
995.3 |
|
Adjusted EBITDA Margin |
|
|
82.4 |
% |
|
|
84.4 |
% |
|
|
83.0 |
% |
|
|
84.8 |
% |
9
FRANCO-NEVADA CORPORATION
CONDENSED CONSOLIDATED STATEMENTS OF FINANCIAL POSITION
(in millions of U.S. dollars)
|
|
At September 30, |
|
|
At December 31, |
|
||
|
|
2023 |
|
|
2022 |
|
||
ASSETS |
|
|
|
|
|
|
|
|
Cash and Cash equivalents |
|
$ |
1,297.1 |
|
|
$ |
1,196.5 |
|
Receivables |
|
|
134.8 |
|
|
|
135.7 |
|
Gold bullion, prepaid expenses and other current assets |
|
|
84.6 |
|
|
|
50.9 |
|
Current assets |
|
$ |
1,516.5 |
|
|
$ |
1,383.1 |
|
|
|
|
|
|
|
|
|
|
Royalty, stream and working interests, net |
|
$ |
5,156.9 |
|
|
$ |
4,927.5 |
|
Investments |
|
|
239.7 |
|
|
|
227.2 |
|
Deferred income tax assets |
|
|
37.9 |
|
|
|
39.9 |
|
Other assets |
|
|
34.9 |
|
|
|
49.1 |
|
Total assets |
|
$ |
6,985.9 |
|
|
$ |
6,626.8 |
|
|
|
|
|
|
|
|
|
|
LIABILITIES |
|
|
|
|
|
|
|
|
Accounts payable and accrued liabilities |
|
$ |
35.0 |
|
|
$ |
43.1 |
|
Current income tax liabilities |
|
|
5.2 |
|
|
|
7.1 |
|
Current liabilities |
|
$ |
40.2 |
|
|
$ |
50.2 |
|
|
|
|
|
|
|
|
|
|
Deferred income tax liabilities |
|
$ |
168.7 |
|
|
$ |
153.0 |
|
Other liabilities |
|
|
5.7 |
|
|
|
6.0 |
|
Total liabilities |
|
$ |
214.6 |
|
|
$ |
209.2 |
|
|
|
|
|
|
|
|
|
|
SHAREHOLDERS’ EQUITY |
|
|
|
|
|
|
|
|
Share capital |
|
$ |
5,722.1 |
|
|
$ |
5,695.3 |
|
Contributed surplus |
|
|
19.9 |
|
|
|
15.6 |
|
Retained earnings |
|
|
1,260.7 |
|
|
|
940.4 |
|
Accumulated other comprehensive loss |
|
|
(231.4) |
|
|
|
(233.7) |
|
Total shareholders’ equity |
|
$ |
6,771.3 |
|
|
$ |
6,417.6 |
|
Total liabilities and shareholders’ equity |
|
$ |
6,985.9 |
|
|
$ |
6,626.8 |
|
|
|
|
|
|
|
|
|
|
The unaudited condensed consolidated interim financial statements and accompanying notes can be found in our Q3 2023 Quarterly Report available on our website
10
FRANCO-NEVADA CORPORATION
CONDENSED CONSOLIDATED STATEMENTS OF INCOME AND COMPREHENSIVE INCOME
(in millions of U.S. dollars and shares, except per share amounts)
|
|
For the three months ended |
|
|
For the nine months ended |
||||||||||
|
|
September 30, |
|
|
September 30, |
||||||||||
|
|
2023 |
|
|
2022 |
|
|
2023 |
|
|
2022 |
||||
Revenue |
|
$ |
309.5 |
|
|
$ |
304.2 |
|
|
$ |
915.7 |
|
|
$ |
995.3 |
|
|
|
|
|
|
|
|
|
|
|
|
|
|
|
|
Costs of sales |
|
|
|
|
|
|
|
|
|
|
|
|
|
|
|
Costs of sales |
|
$ |
48.9 |
|
|
$ |
42.0 |
|
|
$ |
134.2 |
|
|
$ |
131.1 |
Depletion and depreciation |
|
|
68.1 |
|
|
|
68.5 |
|
|
|
204.2 |
|
|
|
212.7 |
Total costs of sales |
|
$ |
117.0 |
|
|
$ |
110.5 |
|
|
$ |
338.4 |
|
|
$ |
343.8 |
Gross profit |
|
$ |
192.5 |
|
|
$ |
193.7 |
|
|
$ |
577.3 |
|
|
$ |
651.5 |
|
|
|
|
|
|
|
|
|
|
|
|
|
|
|
|
Other operating expenses (income) |
|
|
|
|
|
|
|
|
|
|
|
|
|
|
|
General and administrative expenses |
|
$ |
5.0 |
|
|
$ |
4.7 |
|
|
$ |
17.4 |
|
|
$ |
16.1 |
Share-based compensation expenses |
|
|
0.7 |
|
|
|
0.4 |
|
|
|
6.3 |
|
|
|
4.7 |
Gain on sale of royalty interest |
|
|
— |
|
|
|
— |
|
|
|
(3.7) |
|
|
|
— |
(Gain) loss on sale of gold bullion |
|
|
(0.2) |
|
|
|
0.4 |
|
|
|
(2.3) |
|
|
|
(1.1) |
Total other operating expenses |
|
$ |
5.5 |
|
|
$ |
5.5 |
|
|
$ |
17.7 |
|
|
$ |
19.7 |
Operating income |
|
$ |
187.0 |
|
|
$ |
188.2 |
|
|
$ |
559.6 |
|
|
$ |
631.8 |
Foreign exchange (loss) gain and other income (expenses) |
|
$ |
(1.8) |
|
|
$ |
(2.3) |
|
|
$ |
2.1 |
|
|
$ |
3.5 |
Income before finance items and income taxes |
|
$ |
185.2 |
|
|
$ |
185.9 |
|
|
$ |
561.7 |
|
|
$ |
635.3 |
|
|
|
|
|
|
|
|
|
|
|
|
|
|
|
|
Finance items |
|
|
|
|
|
|
|
|
|
|
|
|
|
|
|
Finance income |
|
$ |
15.5 |
|
|
$ |
2.4 |
|
|
$ |
36.0 |
|
|
$ |
5.9 |
Finance expenses |
|
|
(0.7) |
|
|
|
(0.8) |
|
|
|
(2.1) |
|
|
|
(2.5) |
Net income before income taxes |
|
$ |
200.0 |
|
|
$ |
187.5 |
|
|
$ |
595.6 |
|
|
$ |
638.7 |
|
|
|
|
|
|
|
|
|
|
|
|
|
|
|
|
Income tax expense |
|
|
24.9 |
|
|
|
30.4 |
|
|
|
79.5 |
|
|
|
103.1 |
Net income |
|
$ |
175.1 |
|
|
$ |
157.1 |
|
|
$ |
516.1 |
|
|
$ |
535.6 |
|
|
|
|
|
|
|
|
|
|
|
|
|
|
|
|
Other comprehensive (loss) income, net of taxes |
|
|
|
|
|
|
|
|
|
|
|
|
|
|
|
|
|
|
|
|
|
|
|
|
|
|
|
|
|
|
|
Items that may be reclassified subsequently to profit and loss: |
|
|
|
|
|
|
|
|
|
|
|
|
|
|
|
Currency translation adjustment |
|
$ |
(31.7) |
|
|
$ |
(83.4) |
|
|
$ |
(1.8) |
|
|
$ |
(110.4) |
|
|
|
|
|
|
|
|
|
|
|
|
|
|
|
|
Items that will not be reclassified subsequently to profit and loss: |
|
|
|
|
|
|
|
|
|
|
|
|
|
|
|
Gain (loss) on changes in the fair value of equity investments |
|
|
|
|
|
|
|
|
|
|
|
|
|
|
|
at fair value through other comprehensive income ("FVTOCI"), |
|
|
|
|
|
|
|
|
|
|
|
|
|
|
|
net of income tax |
|
|
3.5 |
|
|
|
(2.5) |
|
|
|
4.5 |
|
|
|
(59.6) |
Other comprehensive (loss) income, net of taxes |
|
$ |
(28.2) |
|
|
$ |
(85.9) |
|
|
$ |
2.7 |
|
|
$ |
(170.0) |
|
|
|
|
|
|
|
|
|
|
|
|
|
|
|
|
Comprehensive income |
|
$ |
146.9 |
|
|
$ |
71.2 |
|
|
$ |
518.8 |
|
|
$ |
365.6 |
|
|
|
|
|
|
|
|
|
|
|
|
|
|
|
|
Earnings per share |
|
|
|
|
|
|
|
|
|
|
|
|
|
|
|
Basic |
|
$ |
0.91 |
|
|
$ |
0.82 |
|
|
$ |
2.69 |
|
|
$ |
2.80 |
Diluted |
|
$ |
0.91 |
|
|
$ |
0.82 |
|
|
$ |
2.68 |
|
|
$ |
2.79 |
Weighted average number of shares outstanding |
|
|
|
|
|
|
|
|
|
|
|
|
|
|
|
Basic |
|
|
192.1 |
|
|
|
191.6 |
|
|
|
192.0 |
|
|
|
191.5 |
Diluted |
|
|
192.4 |
|
|
|
191.9 |
|
|
|
192.3 |
|
|
|
191.9 |
|
|
|
|
|
|
|
|
|
|
|
|
|
|
|
|
The unaudited condensed consolidated interim financial statements and accompanying notes can be found in our Q3 2023 Quarterly Report available on our website
11
FRANCO-NEVADA CORPORATION
CONDENSED CONSOLIDATED STATEMENTS OF CASH FLOWS
(in millions of U.S. dollars)
|
|
For the nine months ended |
|
|||||
|
|
September 30, |
|
|||||
|
|
2023 |
|
|
2022 |
|
||
Cash flows from operating activities |
|
|
|
|
|
|
|
|
Net income |
|
$ |
516.1 |
|
|
$ |
535.6 |
|
Adjustments to reconcile net income to net cash provided by operating activities: |
|
|
|
|
|
|
|
|
Depletion and depreciation |
|
|
204.2 |
|
|
|
212.7 |
|
Share-based compensation expenses |
|
|
4.7 |
|
|
|
4.6 |
|
Gain on sale of royalty interest |
|
|
(3.7) |
|
|
|
— |
|
Unrealized foreign exchange (gain) loss |
|
|
(1.7) |
|
|
|
1.4 |
|
Deferred income tax expense |
|
|
16.6 |
|
|
|
22.2 |
|
Other non-cash items |
|
|
(2.2) |
|
|
|
(4.4) |
|
Acquisition of gold bullion |
|
|
(41.1) |
|
|
|
(34.7) |
|
Proceeds from sale of gold bullion |
|
|
20.5 |
|
|
|
36.1 |
|
Changes in other assets |
|
|
13.9 |
|
|
|
(26.7) |
|
Operating cash flows before changes in non-cash working capital |
|
$ |
727.3 |
|
|
$ |
746.8 |
|
Changes in non-cash working capital: |
|
|
|
|
|
|
|
|
Decrease (increase) in receivables |
|
$ |
0.9 |
|
|
$ |
(30.2) |
|
Increase in prepaid expenses and other |
|
|
(10.5) |
|
|
|
(3.7) |
|
(Decrease) increase in current liabilities |
|
|
(10.0) |
|
|
|
7.3 |
|
Net cash provided by operating activities |
|
$ |
707.7 |
|
|
$ |
720.2 |
|
|
|
|
|
|
|
|
|
|
Cash flows used in investing activities |
|
|
|
|
|
|
|
|
Acquisition of royalty, stream and working interests |
|
$ |
(435.8) |
|
|
$ |
(15.3) |
|
Proceeds from sale of royalty interest |
|
|
7.0 |
|
|
|
— |
|
Proceeds from sale of investments |
|
|
2.0 |
|
|
|
1.7 |
|
Acquisition of investments |
|
|
(8.9) |
|
|
|
(75.2) |
|
Acquisition of energy well equipment |
|
|
(1.2) |
|
|
|
(1.2) |
|
Proceeds from settlement of loan receivable from Noront Resources Ltd. |
|
|
— |
|
|
|
42.7 |
|
Net cash used in investing activities |
|
$ |
(436.9) |
|
|
$ |
(47.3) |
|
|
|
|
|
|
|
|
|
|
Cash flows used in financing activities |
|
|
|
|
|
|
|
|
Payment of dividends |
|
$ |
(173.2) |
|
|
$ |
(149.6) |
|
Credit facility amendment costs |
|
|
— |
|
|
|
(0.9) |
|
Proceeds from exercise of stock options |
|
|
2.9 |
|
|
|
5.2 |
|
Net cash used in financing activities |
|
$ |
(170.3) |
|
|
$ |
(145.3) |
|
Effect of exchange rate changes on cash and cash equivalents |
|
$ |
0.1 |
|
|
$ |
(9.5) |
|
Net change in cash and cash equivalents |
|
$ |
100.6 |
|
|
$ |
518.1 |
|
Cash and cash equivalents at beginning of period |
|
$ |
1,196.5 |
|
|
$ |
539.3 |
|
Cash and cash equivalents at end of period |
|
$ |
1,297.1 |
|
|
$ |
1,057.4 |
|
|
|
|
|
|
|
|
|
|
Supplemental cash flow information: |
|
|
|
|
|
|
|
|
Income taxes paid |
|
$ |
67.0 |
|
|
$ |
80.3 |
|
Dividend income received |
|
$ |
8.7 |
|
|
$ |
15.1 |
|
Interest and standby fees paid |
|
$ |
1.8 |
|
|
$ |
1.8 |
|
The unaudited condensed consolidated interim financial statements and accompanying notes can be found in our Q3 2023 Quarterly Report available on our website
12
Exhibit 99.2

Management’s Discussion and Analysis |
This Management’s Discussion and Analysis (“MD&A”) of financial position and results of operations of Franco-Nevada Corporation (“Franco-Nevada”, the “Company”, “we” or “our”) has been prepared based upon information available to Franco-Nevada as at November 8, 2023 and should be read in conjunction with Franco-Nevada’s unaudited condensed consolidated interim financial statements and related notes as at and for the three and nine months ended September 30, 2023 and 2022 (the “financial statements”). The financial statements and this MD&A are presented in U.S. dollars and the financial statements have been prepared in accordance with International Financial Reporting Standards (“IFRS”) as issued by the International Accounting Standards Board (“IASB”) applicable to the preparation of condensed interim financial statements, including IAS 34, Interim Financial Reporting.
Readers are cautioned that the MD&A contains forward-looking statements and that actual events may vary from management’s expectations. Readers are encouraged to read the “Cautionary Statement on Forward-Looking Information” at the end of this MD&A and to consult Franco-Nevada’s financial statements for the three and nine months ended September 30, 2023 and 2022 and the corresponding notes to the financial statements which are available on our website at www.franco-nevada.com, on SEDAR+ at www.sedarplus.com and on Form 6-K furnished to the United States Securities and Exchange Commission (“SEC”) on EDGAR at www.sec.gov.
Additional information related to Franco-Nevada, including our Annual Information Form and Form 40-F, are available on SEDAR+ at www.sedarplus.com and on EDGAR at www.sec.gov, respectively. These documents contain descriptions of certain of Franco-Nevada’s producing and advanced royalty and stream assets, as well as a description of risk factors affecting the Company. For additional information, please see our website at www.franco-nevada.com.
Table of Contents
3 |
|
3 |
|
5 |
|
6 |
|
9 |
|
9 |
|
10 |
|
11 |
|
16 |
|
21 |
General and administrative and share-based compensation expenses |
21 |
|
22 |
|
23 |
|
24 |
|
29 |
|
29 |
|
30 |
|
31 |
Internal control over financial reporting and disclosure controls and procedures |
31 |
|
34 |
Abbreviations Used in this Report |
The following abbreviations may be used throughout this MD&A:
Abbreviated Definitions |
|
|
|
|
|
||
Periods under review |
|
Measurement |
|
Interest types |
|||
"Q4" |
The three-month period ended December 31 |
|
"GEO" |
Gold equivalent ounces |
|
"NSR" |
Net smelter return royalty |
"Q3" |
The three-month period ended September 30 |
|
"PGM" |
Platinum group metals |
|
"GR" |
Gross royalty |
"Q2" |
The three-month period ended June 30 |
|
"NGL" |
Natural gas liquids |
|
"ORR" |
Overriding royalty |
"Q1" |
The three-month period ended March 31 |
|
"oz" |
Ounce |
|
"GORR" |
Gross overriding royalty |
"H2" |
The six-month period ended December 31 |
|
"oz Au" |
Ounce of gold |
|
"FH" |
Freehold or lessor royalty |
"H1" |
The six-month period ended June 30 |
|
"oz Ag" |
Ounce of silver |
|
"NPI" |
Net profits interest |
|
|
|
"oz Pt" |
Ounce of platinum |
|
"NRI" |
Net royalty interest |
|
|
|
"oz Pd" |
Ounce of palladium |
|
"WI" |
Working interest |
Places and currencies |
|
|
"62% Fe" |
62% Fe iron ore fines, dry metric |
|
|
|
"U.S." |
United States |
|
|
tonnes CFR China |
|
|
|
"$" or "USD" |
United States dollars |
|
"LBMA" |
London Bullion Market Association |
|
|
|
"C$" or "CAD" |
Canadian dollars |
|
"bbl" |
Barrel |
|
|
|
"R$" or "BRL" |
Brazilian reais |
|
"mcf" |
Thousand cubic feet |
|
|
|
"A$" or "AUD" |
Australian dollars |
|
"WTI" |
West Texas Intermediate |
|
|
|
|
|
|
|
|
|
|
|
For definitions of the various types of agreements, please refer to our most recent Annual Information Form filed on SEDAR+ at www.sedarplus.com or our Form 40-F filed on EDGAR at www.sec.gov.
2023 Third Quarter Management’s Discussion and Analysis |
2 |
OVERVIEW
Franco-Nevada is the leading gold-focused royalty and streaming company with the largest and most diversified portfolio of royalties and streams by commodity, geography, operator, revenue type and stage of project.
Our Portfolio (at November 8, 2023) | ||||||||
|
|
Precious Metals |
|
Other Mining |
|
Energy |
|
TOTAL |
Producing |
|
46 |
|
14 |
|
55 |
|
115 |
Advanced |
|
37 |
|
8 |
|
— |
|
45 |
Exploration |
|
158 |
|
86 |
|
27 |
|
271 |
TOTAL |
|
241 |
|
108 |
|
82 |
|
431 |
Our shares are listed on the Toronto and New York stock exchanges under the symbol FNV. An investment in our shares is expected to provide investors with yield and exposure to commodity price and exploration optionality while limiting exposure to cost inflation and other operating risks.
STRATEGY
Our tag-line is “Franco-Nevada is the gold investment that works” and we are committed to ensuring it does work, for our shareholders, our operating partners and our communities:
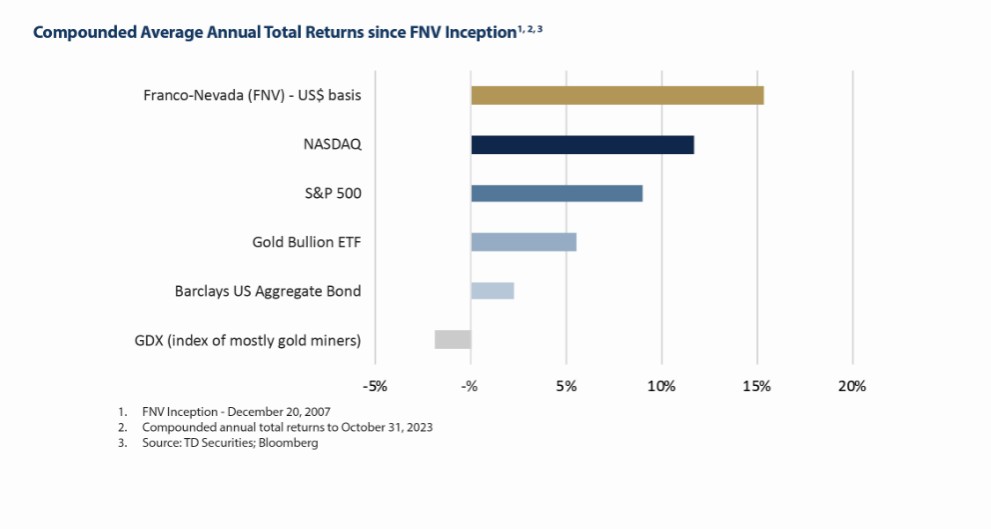
| ● | We believe that combining lower risk gold investments with a strong balance sheet, progressively growing dividends and exposure to exploration optionality is the right mix to appeal to investors seeking to hedge market instability. Since our Initial Public Offering over 15 years ago, we have increased our dividend annually and our share price has outperformed the gold price and all relevant gold equity benchmarks. |
| ● | We build long-term alignment with our operating partners. This alignment and the natural flexibility of our royalties and streams is an attractive source of capital for the cyclical resource sector. |
| ● | We work to be a positive force in all our communities, promoting responsible mining, providing a safe and diverse workplace and contributing to build community support for the operations in which we invest. |
Our revenue is generated from various forms of agreements, ranging from net smelter return royalties, streams, net profits interests, net royalty interests, working interests and other types of arrangements. We do not operate mines, develop projects or conduct exploration. Franco-Nevada has a free cash flow generating business with limited future capital commitments and management is focused on managing and growing its portfolio of royalties and streams. We recognize the cyclical nature of the industry and have a long-term investment outlook. We maintain a strong balance sheet to minimize financial risk and so that we can provide capital to the industry when it is otherwise scarce.
2023 Third Quarter Management’s Discussion and Analysis |
3 |
The advantages of this business model are:
| ● | Exposure to commodity price optionality; |
| ● | A perpetual discovery option over large areas of geologically prospective lands; |
| ● | No additional capital requirements other than the initial investment; |
| ● | Limited exposure to cost inflation; |
| ● | A free cash-flow business with limited cash calls; |
| ● | A high-margin business that can generate cash through the entire commodity cycle; |
| ● | A scalable and diversified business in which a large number of assets can be managed with a small stable overhead; and |
| ● | Management that focuses on forward-looking growth opportunities rather than operational or development issues. |
Our short-term financial results are primarily tied to the price of commodities and the amount of production from our portfolio of assets. Our attributable production has typically been supplemented by acquisitions of new assets. Over the longer term, our results are impacted by the amount of exploration and development capital available to operators to expand or extend our producing assets or to progress our advanced and exploration assets into production.
The focus of our business is to create exposure to gold and precious metal resource optionality. This principally involves investments in gold mines and providing capital to copper and other base metal mines to obtain exposure to by-product gold, silver and platinum group metals production. We also invest in other metals and energy to expose our shareholders to additional resource optionality. In YTD 2023, 77.8% of our revenue was earned from precious metals and 82.8% was earned from mining assets.
One of the strengths of Franco-Nevada’s business model is that our margins are not generally impacted when producer costs increase. The majority of our interests are royalty and streams with payments/deliveries that are based on production levels with no adjustments for the operator’s operating costs. In YTD 2023, these interests accounted for 93.3% of our revenue. We also have a small number of WI, NPI and NRI royalties which are based on the profit of the underlying operations.
____________________________________________________
| 1 | GEOs include Franco-Nevada’s attributable share of production from our Mining and Energy assets, after applicable recovery and payability factors. GEOs are estimated on a gross basis for NSRs and, in the case of stream ounces, before the payment of the per ounce contractual price paid by the Company. For NPI royalties, GEOs are calculated taking into account the NPI economics. Silver, platinum, palladium, iron ore, oil, gas and other commodities are converted to GEOs by dividing associated revenue, which includes settlement adjustments, by the relevant gold price. The price used in the computation of GEOs earned from a particular asset varies depending on the royalty or stream agreement, which may make reference to the market price realized by the operator, or the average price for the month, quarter, or year in which the commodity was produced or sold. For illustrative purposes, please refer to the average commodity price tables on pages 11 and 16 of this MD&A for indicative prices which may be used in the calculation of GEOs for the three and nine months ended September 30, 2023 and 2022, respectively. |
2023 Third Quarter Management’s Discussion and Analysis |
4 |
SELECTED FINANCIAL INFORMATION
|
|
|
For the three months ended |
|
|
For the nine months ended |
|
||||||||||
(in millions, except Average Gold Price, GEOs sold, |
|
|
September 30, |
|
|
September 30, |
|
||||||||||
Adjusted EBITDA Margin, per GEO amounts and per share amounts) |
|
|
2023 |
|
|
2022 |
|
|
2023 |
|
|
2022 |
|
||||
|
|
|
|
|
|
|
|
|
|
|
|
|
|
|
|
|
|
Statistical Measures |
|
|
|
|
|
|
|
|
|
|
|
|
|
|
|
|
|
Average Gold Price |
|
|
$ |
1,929 |
|
|
$ |
1,728 |
|
|
$ |
1,932 |
|
|
$ |
1,825 |
|
GEOs sold(1) |
|
|
|
160,848 |
|
|
|
176,408 |
|
|
|
474,694 |
|
|
|
546,074 |
|
|
|
|
|
|
|
|
|
|
|
|
|
|
|
|
|
|
|
Statement of Comprehensive Income |
|
|
|
|
|
|
|
|
|
|
|
|
|
|
|
|
|
Revenue |
|
|
$ |
309.5 |
|
|
$ |
304.2 |
|
|
$ |
915.7 |
|
|
$ |
995.3 |
|
Costs of sales |
|
|
|
48.9 |
|
|
|
42.0 |
|
|
|
134.2 |
|
|
|
131.1 |
|
Depletion and depreciation |
|
|
|
68.1 |
|
|
|
68.5 |
|
|
|
204.2 |
|
|
|
212.7 |
|
Operating income |
|
|
|
187.0 |
|
|
|
188.2 |
|
|
|
559.6 |
|
|
|
631.8 |
|
Net income |
|
|
|
175.1 |
|
|
|
157.1 |
|
|
|
516.1 |
|
|
|
535.6 |
|
Basic earnings per share |
|
|
$ |
0.91 |
|
|
$ |
0.82 |
|
|
$ |
2.69 |
|
|
$ |
2.80 |
|
Diluted earnings per share |
|
|
$ |
0.91 |
|
|
$ |
0.82 |
|
|
$ |
2.68 |
|
|
$ |
2.79 |
|
|
|
|
|
|
|
|
|
|
|
|
|
|
|
|
|
|
|
Dividends declared per share |
|
|
$ |
0.34 |
|
|
$ |
0.32 |
|
|
$ |
1.02 |
|
|
$ |
0.96 |
|
Dividends declared (including DRIP) |
|
|
$ |
65.3 |
|
|
$ |
61.0 |
|
|
$ |
196.2 |
|
|
$ |
184.2 |
|
Weighted average shares outstanding |
|
|
|
192.1 |
|
|
|
191.6 |
|
|
|
192.0 |
|
|
|
191.5 |
|
|
|
|
|
|
|
|
|
|
|
|
|
|
|
|
|
|
|
Non-GAAP Measures |
|
|
|
|
|
|
|
|
|
|
|
|
|
|
|
|
|
Cash Costs(2) |
|
|
$ |
48.9 |
|
|
$ |
42.0 |
|
|
$ |
134.2 |
|
|
$ |
131.1 |
|
Cash Costs(2) per GEO sold |
|
|
$ |
304 |
|
|
$ |
238 |
|
|
$ |
283 |
|
|
$ |
240 |
|
Adjusted EBITDA(2) |
|
|
$ |
255.1 |
|
|
$ |
256.7 |
|
|
$ |
760.1 |
|
|
$ |
844.5 |
|
Adjusted EBITDA(2) per share |
|
|
$ |
1.33 |
|
|
$ |
1.34 |
|
|
$ |
3.96 |
|
|
$ |
4.41 |
|
Adjusted EBITDA Margin(2) |
|
|
|
82.4 |
% |
|
|
84.4 |
% |
|
|
83.0 |
% |
|
|
84.8 |
% |
Adjusted Net Income(2) |
|
|
$ |
175.1 |
|
|
$ |
159.7 |
|
|
$ |
510.2 |
|
|
$ |
532.7 |
|
Adjusted Net Income(2) per share |
|
|
$ |
0.91 |
|
|
$ |
0.83 |
|
|
$ |
2.66 |
|
|
$ |
2.78 |
|
|
|
|
|
|
|
|
|
|
|
|
|
|
|
|
|
|
|
Statement of Cash Flows |
|
|
|
|
|
|
|
|
|
|
|
|
|
|
|
|
|
Net cash provided by operating activities |
|
|
$ |
236.0 |
|
|
$ |
232.3 |
|
|
$ |
707.7 |
|
|
$ |
720.2 |
|
Net cash used in investing activities |
|
|
$ |
(173.7) |
|
|
$ |
(30.9) |
|
|
$ |
(436.9) |
|
|
$ |
(47.3) |
|
Net cash used in financing activities |
|
|
$ |
(56.8) |
|
|
$ |
(49.1) |
|
|
$ |
(170.3) |
|
|
$ |
(145.3) |
|
|
|
|
|
|
|
|
|
|
|
|
|
|
As at |
|
|
As at |
|
||
|
|
|
September 30, |
|
|
December 31, |
|
||
(expressed in millions) |
|
|
2023 |
|
|
2022 |
|
||
Statement of Financial Position |
|
|
|
|
|
|
|
|
|
Cash and cash equivalents |
|
|
$ |
1,297.1 |
|
|
$ |
1,196.5 |
|
Total assets |
|
|
|
6,985.9 |
|
|
|
6,626.8 |
|
Deferred income tax liabilities |
|
|
|
168.7 |
|
|
|
153.0 |
|
Total shareholders’ equity |
|
|
|
6,771.3 |
|
|
|
6,417.6 |
|
Available capital(3) |
|
|
|
2,278.2 |
|
|
|
2,177.7 |
|
| 1 | Refer to Note 1 at the bottom of page 4 of this MD&A for the methodology for calculating GEOs and, for illustrative purposes, to the average commodity price tables on pages 11 and 16 of this MD&A for indicative prices which may be used in the calculations of GEOs for the three and nine months ended September 30, 2023 and 2022, respectively. |
| 2 | Cash Costs, Cash Costs per GEO sold, Adjusted EBITDA, Adjusted EBITDA per share, Adjusted EBITDA Margin, Adjusted Net Income and Adjusted Net Income per share are non-GAAP financial measures with no standardized meaning under IFRS and might not be comparable to similar financial measures disclosed by other issuers. Refer to the “Non-GAAP Financial Measures” section of this MD&A for more information on each non-GAAP financial measure. |
| 3 | Available capital comprises our cash and cash equivalents and the amount available to borrow under our revolving credit facility. |
2023 Third Quarter Management’s Discussion and Analysis |
5 |
HIGHLIGHTS
Financial Update – Q3 2023 vs Q3 2022
| ● | 160,848 GEOs sold, a decrease of 8.8%; |
| ● | $309.5 million in revenue, an increase of 1.7%; |
| ● | $48.9 million, or $304 per GEO sold, in Cash Costs, compared to $42.0 million, or $238 per GEO sold; |
| ● | $255.1 million, or $1.33 per share, of Adjusted EBITDA, a decrease of 0.6% and 0.7%, respectively; |
| ● | 82.4% in Adjusted EBITDA Margin, a decrease compared to 84.4%; |
| ● | $175.1 million, or $0.91 per share, in net income, an increase of 11.5% and 11.0%, respectively; |
| ● | $175.1 million, or $0.91 per share, in Adjusted Net Income, an increase of 9.6% and 9.6%, respectively; |
| ● | $236.0 million in net cash provided by operating activities, an increase of 1.6%; |
| ● | $1,297.1 million in cash and cash equivalents as at September 30, 2023 (December 31, 2022 – $1,196.5 million); |
| ● | $2.3 billion in available capital as at September 30, 2023 (December 31, 2022 – $2.2 billion), comprising cash and cash equivalents and the amount available to borrow under our revolving credit facility. |
Financial Update – YTD 2023 vs YTD 2022
| ● | 474,694 GEOs sold, a decrease of 13.1%; |
| ● | $915.7 million in revenue, a decrease of 8.0%; |
| ● | $134.2 million, or $283 per GEO sold, in Cash Costs, compared to $131.1 million, or $240 per GEO sold; |
| ● | $760.1 million, or $3.96 per share, in Adjusted EBITDA, a decrease of 10.0% and 10.2%, respectively; |
| ● | 83.0% in Adjusted EBITDA Margin, compared to 84.8%; |
| ● | $516.1 million, or $2.69 per share, in net income, a decrease of 3.6% and 3.9%, respectively; |
| ● | $510.2 million, or $2.66 per share, in Adjusted Net Income, a decrease of 4.2% and 4.3%, respectively; |
| ● | $707.7 million in net cash provided by operating activities, a decrease of 1.7%. |
Corporate Developments
Acquisition of Additional Royalty on Magino Gold Mine – Ontario, Canada
Subsequent to quarter-end, on November 2, 2023, we agreed to acquire an additional 1.0% NSR on Argonaut Gold Inc.’s (“Argonaut”) Magino gold mine in Ontario, Canada, and a portfolio comprised of Argonaut’s existing royalty holdings in Canada and Mexico, for an aggregate purchase price of approximately $29.5 million, with closing of such transactions subject to satisfaction of closing conditions. Inclusive of our initial 2.0% NSR acquired on October 27, 2022, once the transaction closes, we will hold an aggregate 3.0% NSR on Magino.
Acquisition of Royalty on Wawa Gold Project – Ontario, Canada
On August 29, 2023, we acquired a 1.5% NSR on Red Pine Exploration Inc.’s Wawa gold project, located in Ontario, Canada, for a purchase price of $5.0 million (C$6.8 million). The agreement provides Franco-Nevada the option to acquire an additional 0.5% NSR based on pre-determined conditions.
Acquisition of Royalties on Pascua-Lama Project – Chile
On August 8, 2023, we agreed to acquire, through a wholly-owned subsidiary, a sliding-scale gold royalty and fixed-rate copper royalty from private individuals over property pertaining to the Chilean portion of Barrick Gold Corp.’s Pascua-Lama project for an aggregate purchase price of $75.0 million. At gold prices exceeding $800/ounce, we will hold a 2.70% NSR (gold) and 0.54% NSR (copper) on the property.
Acquisition of Royalty on Volcan Gold Project – Chile
On July 6, 2023, we agreed to acquire, through a wholly-owned subsidiary, a 1.5% NSR on the Volcan gold project located in the Maricunga Gold Belt in the Atacama region of Chile for a purchase price of $15.0 million. The project is owned by Tiernan Gold Corporation (“Tiernan”), a company privately held by Hochschild Mining plc. The NSR covers the entire land package comprising the Volcan project, as well as a surrounding area of interest extending 1.5 kilometers. The agreement provides Franco-Nevada the option to acquire an additional 1.0% NSR based on pre-determined conditions. We already hold an existing 1.5% NSR on the peripheral Ojo de Agua area, which is owned by Tiernan and forms part of the Volcan project.
Funding of the Tocantinzinho Stream – Brazil
On September 29, 2023, our wholly-owned subsidiary, Franco-Nevada (Barbados) Corporation (“FNBC”), funded $66.2 million in relation to the Tocantinzinho project, for a total of $250.0 million disbursed in the nine months ended September 30, 2023, thereby fulfilling its stream deposit funding towards the project. The stream, which is in reference to production from the Tocantinzinho project, located in Pará State, Brazil, and owned by G Mining Ventures Corp. (“G Mining Ventures”), was acquired on July 18, 2022 for a purchase price of $250.0 million and was payable in instalments, subject to the satisfaction of various conditions.
Additionally, through one of our wholly-owned subsidiaries, we provided G Mining Ventures with a $75.0 million secured term loan facility (the “Term Loan”). As at September 30, 2023, no funding has been provided to G Mining Ventures in connection with the Term Loan.
2023 Third Quarter Management’s Discussion and Analysis |
6 |
Acquisition of Additional Royalty Interest on Caserones – Chile
We acquired, through a wholly-owned subsidiary, an incremental effective NSR totaling 0.1120% on the Caserones copper-molybdenum mine, now owned by Lundin Mining Corporation, located in the Atacama region of Chile. The incremental effective 0.1120% NSR was acquired in two transactions: (i) a 0.0260% effective NSR on March 8, 2023, for a purchase price of $2.1 million, and (ii) a 0.0860% NSR on June 29, 2023, for a purchase price of $7.3 million. Inclusive of our interest of 0.4582% acquired in April 2022, we now hold a 0.5702% effective NSR on Caserones.
Acquisition Agreement for New Royalties with EMX Royalty Corporation
On June 27, 2023, we executed a binding term sheet with EMX Royalty Corporation (“EMX”) for a three-year arrangement for the joint acquisition of newly created precious metals and copper royalties sourced by EMX. Franco-Nevada will contribute 55% (up to $5.5 million) and EMX will contribute 45% (up to $4.5 million) towards the royalty acquisitions, with the resulting royalty interests equally split on a 50/50 basis.
Acquisition of Royalties on Exploration Properties – Nevada and Arizona, U.S.
On June 15, 2023, we acquired, through a wholly-owned subsidiary, a portfolio of eight royalties on exploration properties located in the states of Nevada and Arizona, including a 0.5% NSR on Integra Resources Corp.’s Wildcat and Mountain View gold projects, for a purchase price of $2.5 million.
Acquisition of Additional Royalty on Valentine Gold Project and Private Placement with Marathon Gold Corporation – Newfoundland, Canada
On June 8, 2023, we acquired an additional 1.5% NSR on Marathon Gold Corporation’s (“Marathon”) Valentine Gold project located in Newfoundland for a purchase price of $45.0 million. Inclusive of our initial 1.5% NSR (reduced from 2.0% following Marathon’s buy-back of 0.5%, as described below), we now hold an aggregate 3.0% NSR on the project.
On July 5, 2023, we acquired 6,578,947 common shares of Marathon at a price of C$0.76 per common share for an aggregate of $3.8 million (C$5.0 million), comprising the back-end of a non-brokered charity flow-through offering.
Acquisition of Royalty on Kerr-Addison Property and Share Subscription with Gold Candle Ltd. – Ontario, Canada
On April 14, 2023, we acquired a 1% NSR on Gold Candle Ltd.’s (“Gold Candle”) Kerr-Addison project located in Virginiatown, Ontario, which hosts the formerly producing Kerr-Addison gold mine, for a purchase price of $10.0 million.
On July 26, 2023, we acquired 5,454,546 common shares of Gold Candle, a private company, at a price of C$1.10 per common share for an aggregate purchase price of $4.6 million (C$6.0 million).
Acquisition of Gold Royalties – Australia
On February 22, 2023, we acquired a portfolio of five primarily gold royalties from Trident Royalties Plc (“Trident”), which includes a 1.5% NSR on Ramelius Resources’ Rebecca gold project (“Rebecca”) located in Western Australia, for total consideration of $15.6 million payable as follows: (i) $14.3 million paid on closing of the transaction, and (ii) $1.3 million in a contingent payment payable upon first gold production at Rebecca.
Receipt of Valentine Gold Royalty Buy-back – Newfoundland, Canada
On February 22, 2023, Marathon exercised its option to buy-back 0.5% of the initial 2.0% NSR on the Valentine Gold project by paying $7.0 million to Franco-Nevada. We acquired the initial 2.0% NSR on February 21, 2019 for $13.7 million (C$18.0 million).
Acquisition of Mineral Rights with Continental Resources, Inc. – U.S.
Through a wholly-owned subsidiary, we have a strategic relationship with Continental Resources, Inc. (“Continental”) to acquire, through a jointly-owned entity (the “Royalty Acquisition Venture”), royalty rights within Continental’s areas of operation. Franco-Nevada recorded contributions to the Royalty Acquisition Venture of $2.5 million for Q3 2023 (Q3 2022 – $4.4 million) and of $8.4 million for YTD 2023 (YTD 2022 – $8.0 million). As at September 30, 2023, Franco-Nevada’s cumulative investment in the Royalty Acquisition Venture totaled $449.0 million and Franco-Nevada has remaining commitments of up to $71.0 million.
Dividends
In Q3 2023, we declared a quarterly dividend of $0.34 per share, an increase compared to the dividend of $0.32 per share in Q3 2022. During the quarter, we paid total dividends of $65.3 million, of which $56.8 was paid in cash and $8.5 million was paid in common shares under our Dividend Reinvestment Plan (the “DRIP”). In YTD 2023, we paid total dividends of $196.2 million, of which $173.2 million was paid in cash and $23.0 million was paid in common shares under our DRIP.
Canada Revenue Agency (“CRA”) Audit
As previously announced, on April 28, 2023, we reached a settlement with the CRA with respect to the Domestic Reassessments and FAPI Reassessments (as defined in the “Contingencies” section on page 27 of this MD&A), which provides for these reassessments to be vacated entirely on a without-cost basis. Under the settlement, the CRA accepts the manner in which we deduct upfront payments made in connection with precious metal stream agreements for Canadian tax purposes. The potential tax exposure related to the vacated reassessments was $20.4 million (C$27.6 million) plus interest and penalties.
2023 Third Quarter Management’s Discussion and Analysis |
7 |
We had posted security in cash for 50% of the reassessed amounts under the Domestic and FAPI Reassessments, totaling $13.9 million (C$17.7 million). Subsequent to quarter-end, in October 2023, the CRA returned $9.9 million (C$12.5 million) of these deposits. We expect the remainder of the deposits to be fully recovered.
With respect to the transfer pricing reassessments in relation to our Mexican and Barbadian subsidiaries, we continue to believe that these reassessments are not supported by Canadian tax law and jurisprudence and continue to defend our tax filing positions. Refer to the “Contingencies” section on page 27 of this MD&A for further details on the CRA Audit.
Portfolio Updates
Additional updates related to our portfolio of assets are available in our News Release issued on November 8, 2023 available on SEDAR+ at www.sedarplus.com and EDGAR at www.sec.gov.
Revised Concession Contract for the Cobre Panama Mine
First Quantum Minerals Ltd. (“First Quantum”), its subsidiary, Minera Panama, S.A. (“MPSA”), and the Government of Panama (the “GOP”) have been engaged in discussions regarding a revised concession contract to secure the long-term future of the Cobre Panama mine.
On March 8, 2023, First Quantum and the GOP issued a press release announcing that an agreement had been reached on the terms and conditions for a revised concession contract (the “Revised Concession Contract”). The Revised Concession Contract provided for an initial 20-year term with a 20-year extension option and additional extensions for life of mine, and was subject to a public consultation and approval by the National Assembly of Panama.
The GOP, with the participation of First Quantum, held three open forums in surrounding communities, with the last one occurring on April 24, 2023. After having gone through the public consultation process, the Revised Concession Contract was signed by the GOP and First Quantum on June 26, 2023. The Revised Concession Contract was countersigned by the National Comptroller of Panama and presented before the Commerce Committee of the National Assembly of Panama, who recommended the amendment of certain terms of the contract. First Quantum and the GOP agreed to modifications to the agreement based on these recommendations, and after a brief period of negotiation, the GOP cabinet approved the amended terms of the Revised Concession Contract on October 10, 2023.
The Revised Concession Contract, with amended terms, was resubmitted to and approved by the Commerce Committee of the National Assembly of Panama on October 17, 2023. On October 20, 2023, the National Assembly in Panama approved Bill 1100, being the proposal for approval of the Revised Concession Contract for the Cobre Panama mine, in the third debate of the plenary session with a vote of 47 in favour out of a total of 55 votes registered. On the same day, Panama’s President Laurentino Cortizo sanctioned Bill 1100 into Law 406.
On October 29, 2023, in response to protests and social unrest in the country, President Laurentino Cortizo announced the GOP’s intention to hold a popular consultation regarding Law 406. During the week commencing October 30, 2023, the National Assembly of Panama held ordinary and extraordinary sessions concerning Bill 1109 and Bill 1110. Bill 1109 related to the initially proposed popular consultation regarding Law 406. Bill 1110 proposed a moratorium on the granting of new concession contracts related to mining in Panama as well as the repeal of Law 406.
With respect to Bill 1109, the bill was approved at the first of three required debates that took place during the final ordinary session of the National Assembly on October 31, 2023, but ultimately did not progress to a second or third debate. It is the Company’s understanding that no further debates of Bill 1109 are currently scheduled.
With respect to Bill 1110, the National Assembly ultimately removed the proposal to repeal Law 406. The bill, in its final form, prohibits new concessions for the exploration, extraction, transportation, and beneficiation of metallic mining throughout the country, and was approved by the National Assembly on November 3, 2023. On the same day, the bill was subsequently enacted into Law 407.
As of the date of this MD&A, Law 406 and the Revised Concession Contract currently remain in effect. However, a number of lawsuits challenging the constitutionality of Law 406 have been submitted to the Supreme Court of Justice, a number of which have been admitted for adjudication.
We continue to closely monitor the unfolding situation regarding Law 406 and the Revised Concession Contract and are assessing our available protections. While Franco-Nevada’s streams have contractual protections aimed at protecting its interests and mitigating risks associated with government action and may also benefit from international investment treaties, the ultimate outcome of these protections cannot be assured.
Production at the Cobre Panama mine remains uninterrupted at this time, however, like many businesses across Panama, protests, including blockades of key roads, have caused disruptions on site as well as shortages in certain supplies.
Cobre Panama CP100 Expansion
First Quantum reported that the CP100 Expansion project was completed and commissioned in Q1 2023 and is operational. Copper production at Cobre Panama in Q3 2023 reached a new quarterly record, driven by the continued ramp-up of the CP100 Expansion project, as well as higher head grades and recoveries.
2023 Third Quarter Management’s Discussion and Analysis |
8 |
Approval of Candelaria 2040 Environmental Impact Assessment
Lundin Mining Corporation announced that its Environmental Impact Assessment (“EIA”) for the extension of operations and mine life for the Candelaria mine (the “Candelaria Optimization and Operational Continuity 2040 EIA”) was approved by the Regional Environmental Commission of Atacama (“COEVA”) on September 8, 2023. Issuance of the Resolución de Calificación Ambiental (“RCA”) by Servicio de Evaluación Ambiental de la República de Chile (“SEA”) is anticipated before the end of 2023.
The Candelaria Optimization and Operational Continuity 2040 EIA considers several enhancements to the current operation that will enable the extension of the mine life to 2040, from 2030 under the previous EIA. It also allows for the potential development of the Candelaria Underground Expansion Project.
The following contains forward-looking statements. For a description of material factors that could cause our actual results to differ materially from the forward-looking statements below, please see the “Cautionary Statement on Forward-Looking Information” section at the end of this MD&A and the “Risk Factors” section of our most recent Annual Information Form filed with the Canadian securities regulatory authorities on www.sedarplus.com and our most recent Form 40-F filed with the SEC on www.sec.gov. The 2023 guidance is based on assumptions including the forecasted state of operations from our assets based on the public statements and other disclosures by the third-party owners and operators of the underlying properties and our assessment thereof.
Our Total GEO sales guidance remains unchanged for 2023. However, we expect results to be near the lower end of the range, reflecting our revised commodity price assumptions which affect the GEO conversion of revenues from our non-gold assets. Our guidance also assumes that production and stream deliveries from Cobre Panama will remain uninterrupted for the remainder of 2023.
|
|
|
2023 guidance |
|
|
YTD 2023 actual |
|
|
YTD 2022 actual |
|
Total GEO sales |
|
|
640,000 - 700,000 |
|
|
474,694 |
|
|
546,074 |
|
Precious Metal GEO sales |
|
|
490,000 - 530,000 |
|
|
368,608 |
|
|
380,743 |
|
| 1 | We expect our streams to contribute between 360,000 and 400,000 of our GEO sales for 2023. For YTD 2023, we sold 282,240 GEOs from our streams. |
| 2 | For our 2023 guidance, when reflecting revenue earned from gold, silver, platinum, palladium, iron ore, oil and gas commodities as GEOs, we have assumed the following prices: $1,925/oz Au, $22.50/oz Ag, $900/oz Pt, $1,100/oz Pd, $115/tonne Fe 62% CFR China, $85/bbl WTI oil and $2.75/mcf Henry Hub natural gas. |
| 3 | Total GEO sales guidance does not assume any other acquisitions and does not reflect any incremental revenue from additional contributions we may make to the Royalty Acquisition Venture with Continental as part of our remaining commitment of $71.0 million. |
We estimate depletion and depreciation expense in 2023 to be between $275.0 million and $305.0 million. In YTD 2023, depletion expense was $204.2 million.
As at September 30, 2023, we have fully funded $250.0 million with respect to the stream deposit funding for the Tocantinzinho project. We also have remaining capital commitments of $71.0 million with respect to the Royalty Acquisition Venture with Continental.
The prices of gold and other precious metals are the largest factors in determining profitability and cash flow from operations for Franco-Nevada. The price of gold can be volatile and is affected by macroeconomic and industry factors that are beyond our control. Major influences on the gold price include interest rates, fiscal and monetary stimulus, inflation expectations, currency exchange rate fluctuations including the relative strength of the U.S. dollar and supply and demand for gold.
Commodity price volatility also impacts the number of GEOs when reflecting non-gold commodities as GEOs. Silver, platinum, palladium, iron ore, other mining commodities and oil and gas are reflected as GEOs by dividing associated revenue, which includes settlement adjustments, by the relevant gold price. The price used in the computation of GEOs earned from a particular asset varies depending on the royalty or stream agreement, which may make reference to the market price realized by the operator, or the average price for the month, quarter, or year in which the commodity was produced or sold.
Gold prices were elevated but volatile in the nine months ended September 30, 2023, impacted by central bank buying, the U.S. interest rate outlook, and the relative strength of the U.S. dollar. Gold prices ranged from $1,811/oz to $2,048/oz, averaging $1,932/oz in YTD 2023, an increase of 5.9% compared to $1,825/oz in YTD 2022, ending the period at $1,871/oz. Silver prices averaged $23.44/oz in YTD 2023, an increase of 6.8% compared to $21.94/oz in YTD 2022, and ending the period at $23.08/oz. Platinum and palladium prices averaged $985/oz and $1,422/oz, respectively, in YTD 2023, compared to $958/oz and $2,163/oz, respectively, in YTD 2022, an increase of 2.8% for platinum and a decrease of 34.3% for palladium, ending the period at $923/oz and $1,289/oz, respectively. With respect to iron ore, prices for 62% iron ore fines averaged $116/tonne in YTD 2023 compared to $129/tonne in YTD 2022, a decrease of 10.1%, ending the period at $121/tonne.
After trading at elevated prices in 2022, oil and gas prices declined in YTD 2023, following slower global growth, a moderate European winter, and high levels of North American inventory. During the nine months ended September 30, 2023, WTI prices averaged $77.39/bbl, a 21.1% decrease from YTD 2022 ending the period at $90.79/bbl. Edmonton Light prices averaged C$100.50/bbl in YTD 2023, a decrease of 18.6% compared to YTD 2022, ending the period at C$118.45/bbl. Henry Hub natural gas prices averaged $2.58/mcf in YTD 2023 compared to $6.65/mcf in YTD 2022, a decrease of 61.2%, ending the period at $2.93/mcf.
2023 Third Quarter Management’s Discussion and Analysis |
9 |
REVENUE BY ASSET
Our portfolio is well-diversified with GEOs and revenue being earned from numerous assets in various jurisdictions. The following table details revenue earned from our royalty, stream and working interests for the three and nine months ended September 30, 2023 and 2022:
|
|
|
|
|
For the three months ended |
|
|
For the nine months ended |
|
||||||||||
(expressed in millions) |
|
Interest and % |
|
|
September 30, |
|
|
September 30, |
|
||||||||||
Property |
|
(Gold unless otherwise indicated) |
|
|
2023 |
|
|
2022 |
|
|
2023 |
|
|
2022 |
|
||||
PRECIOUS METALS |
|
|
|
|
|
|
|
|
|
|
|
|
|
|
|
|
|
|
|
South America |
|
|
|
|
|
|
|
|
|
|
|
|
|
|
|
|
|
|
|
Candelaria |
|
Stream 68% Gold & Silver |
|
|
$ |
33.0 |
|
|
$ |
30.4 |
|
|
$ |
98.6 |
|
|
$ |
91.8 |
|
Antapaccay |
|
Stream (indexed) Gold & Silver |
|
|
|
27.9 |
|
|
|
23.8 |
|
|
|
85.8 |
|
|
|
72.0 |
|
Antamina |
|
Stream 22.5% Silver |
|
|
|
11.7 |
|
|
|
15.2 |
|
|
|
37.7 |
|
|
|
53.7 |
|
Condestable |
|
Stream Gold & Silver, Fixed through 2025 then % |
|
|
|
5.9 |
|
|
|
5.0 |
|
|
|
17.5 |
|
|
|
16.7 |
|
Other |
|
|
|
|
|
0.9 |
|
|
|
1.4 |
|
|
|
4.0 |
|
|
|
4.9 |
|
Central America & Mexico |
|
|
|
|
|
|
|
|
|
|
|
|
|
|
|
|
|
|
|
Cobre Panama |
|
Stream (indexed) Gold & Silver |
|
|
$ |
67.3 |
|
|
$ |
45.2 |
|
|
$ |
193.5 |
|
|
$ |
166.4 |
|
Guadalupe-Palmarejo |
|
Stream 50% |
|
|
|
20.3 |
|
|
|
15.7 |
|
|
|
50.7 |
|
|
|
58.2 |
|
United States |
|
|
|
|
|
|
|
|
|
|
|
|
|
|
|
|
|
|
|
Stillwater |
|
NSR 5% PGM |
|
|
$ |
7.1 |
|
|
$ |
5.5 |
|
|
$ |
19.8 |
|
|
$ |
27.4 |
|
Goldstrike |
|
NSR 2-4%, NPI 2.4-6% |
|
|
|
3.8 |
|
|
|
3.6 |
|
|
|
9.4 |
|
|
|
14.8 |
|
Marigold |
|
NSR 1.75-5%, GR 0.5-4% |
|
|
|
1.8 |
|
|
|
1.9 |
|
|
|
9.2 |
|
|
|
4.6 |
|
Bald Mountain |
|
NSR/GR 0.875-5% |
|
|
|
3.7 |
|
|
|
3.3 |
|
|
|
8.6 |
|
|
|
5.2 |
|
Gold Quarry |
|
NSR 7.29% |
|
|
|
0.6 |
|
|
|
— |
|
|
|
3.0 |
|
|
|
4.9 |
|
Other |
|
|
|
|
|
1.4 |
|
|
|
2.8 |
|
|
|
4.6 |
|
|
|
7.1 |
|
Canada |
|
|
|
|
|
|
|
|
|
|
|
|
|
|
|
|
|
|
|
Detour Lake |
|
NSR 2% |
|
|
$ |
6.3 |
|
|
$ |
5.8 |
|
|
$ |
18.8 |
|
|
$ |
20.1 |
|
Sudbury |
|
Stream 50% PGM & Gold |
|
|
|
3.7 |
|
|
|
5.0 |
|
|
|
14.2 |
|
|
|
15.1 |
|
Hemlo |
|
NSR 3%, NPI 50% |
|
|
|
4.6 |
|
|
|
6.4 |
|
|
|
15.9 |
|
|
|
24.4 |
|
Brucejack |
|
NSR 1.2% |
|
|
|
1.6 |
|
|
|
1.9 |
|
|
|
4.8 |
|
|
|
4.6 |
|
Kirkland Lake |
|
NSR 1.5-5.5%, NPI 20% |
|
|
|
1.3 |
|
|
|
1.3 |
|
|
|
4.6 |
|
|
|
4.2 |
|
Other |
|
|
|
|
|
2.4 |
|
|
|
2.4 |
|
|
|
10.1 |
|
|
|
6.8 |
|
Rest of World |
|
|
|
|
|
|
|
|
|
|
|
|
|
|
|
|
|
|
|
MWS |
|
Stream 25% |
|
|
$ |
12.6 |
|
|
$ |
9.6 |
|
|
$ |
33.8 |
|
|
$ |
29.4 |
|
Tasiast |
|
NSR 2% |
|
|
|
6.4 |
|
|
|
4.5 |
|
|
|
18.2 |
|
|
|
13.5 |
|
Subika (Ahafo) |
|
NSR 2% |
|
|
|
5.2 |
|
|
|
5.0 |
|
|
|
14.7 |
|
|
|
12.0 |
|
Sabodala |
|
Stream 6%, Fixed to 105,750 oz |
|
|
|
4.5 |
|
|
|
3.9 |
|
|
|
13.6 |
|
|
|
12.7 |
|
Duketon |
|
NSR 2% |
|
|
|
3.0 |
|
|
|
4.0 |
|
|
|
9.0 |
|
|
|
8.5 |
|
Other |
|
|
|
|
|
3.8 |
|
|
|
3.1 |
|
|
|
12.1 |
|
|
|
14.3 |
|
|
|
|
|
|
$ |
240.8 |
|
|
$ |
206.7 |
|
|
$ |
712.2 |
|
|
$ |
693.3 |
|
DIVERSIFIED |
|
|
|
|
|
|
|
|
|
|
|
|
|
|
|
|
|
|
|
Vale |
|
Various Royalty Rates |
|
|
$ |
8.3 |
|
|
$ |
6.2 |
|
|
$ |
26.1 |
|
|
$ |
33.1 |
|
LIORC |
|
GORR 0.7% Iron Ore, IOC Equity 1.5%(1) |
|
|
|
4.5 |
|
|
|
4.6 |
|
|
|
9.9 |
|
|
|
11.6 |
|
Other mining assets |
|
|
|
|
|
3.2 |
|
|
|
2.9 |
|
|
|
10.3 |
|
|
|
6.4 |
|
United States (Energy) |
|
|
|
|
|
|
|
|
|
|
|
|
|
|
|
|
|
|
|
Marcellus |
|
GORR 1% |
|
|
$ |
6.5 |
|
|
$ |
16.1 |
|
|
$ |
21.1 |
|
|
$ |
44.5 |
|
Haynesville |
|
Various Royalty Rates |
|
|
|
5.5 |
|
|
|
17.7 |
|
|
|
20.1 |
|
|
|
49.2 |
|
SCOOP/STACK |
|
Various Royalty Rates |
|
|
|
8.0 |
|
|
|
16.2 |
|
|
|
24.7 |
|
|
|
43.9 |
|
Permian Basin |
|
Various Royalty Rates |
|
|
|
10.6 |
|
|
|
12.0 |
|
|
|
36.0 |
|
|
|
38.4 |
|
Other |
|
|
|
|
|
0.1 |
|
|
|
0.1 |
|
|
|
0.3 |
|
|
|
0.2 |
|
Canada (Energy) |
|
|
|
|
|
|
|
|
|
|
|
|
|
|
|
|
|
|
|
Weyburn |
|
NRI 11.71%, ORR 0.44%, WI 2.56% |
|
|
$ |
15.0 |
|
|
$ |
15.1 |
|
|
$ |
38.2 |
|
|
$ |
52.2 |
|
Orion |
|
GORR 4% |
|
|
|
4.9 |
|
|
|
3.7 |
|
|
|
10.3 |
|
|
|
12.4 |
|
Other |
|
|
|
|
|
2.1 |
|
|
|
2.9 |
|
|
|
6.5 |
|
|
|
10.1 |
|
|
|
|
|
|
$ |
68.7 |
|
|
$ |
97.5 |
|
|
$ |
203.5 |
|
|
$ |
302.0 |
|
Revenue |
|
|
|
|
$ |
309.5 |
|
|
$ |
304.2 |
|
|
$ |
915.7 |
|
|
$ |
995.3 |
|
1 Interest attributable to Franco-Nevada’s 9.9% equity ownership of Labrador Iron Ore Royalty Corporation.
2023 Third Quarter Management’s Discussion and Analysis |
10 |
REVIEW OF QUARTERLY FINANCIAL PERFORMANCE
The prices of precious metals, iron ore, and oil and gas and production from our assets are the largest factors in determining our profitability and cash flow from operations. The following table summarizes average commodity prices and average exchange rates during the periods presented.
|
|
|
|
|
|
|
|
|
|
|
|||
Quarterly average prices and rates |
|
|
|
|
Q3 2023 |
|
|
Q3 2022 |
|
Variance |
|||
Gold(1) |
|
($/oz) |
|
|
$ |
1,929 |
|
|
$ |
1,728 |
|
11.6 |
% |
Silver(1) |
|
($/oz) |
|
|
|
23.57 |
|
|
|
19.22 |
|
22.6 |
% |
Platinum(1) |
|
($/oz) |
|
|
|
931 |
|
|
|
886 |
|
5.1 |
% |
Palladium(1) |
|
($/oz) |
|
|
|
1,251 |
|
|
|
2,074 |
|
(39.7) |
% |
Iron Ore Fines 62% Fe CFR China |
|
($/tonne) |
|
|
|
113 |
|
|
|
105 |
|
7.6 |
% |
|
|
|
|
|
|
|
|
|
|
|
|
|
|
Edmonton Light |
|
(C$/bbl) |
|
|
|
106.98 |
|
|
|
116.51 |
|
(8.2) |
% |
West Texas Intermediate |
|
($/bbl) |
|
|
|
82.26 |
|
|
|
91.56 |
|
(10.2) |
% |
Henry Hub |
|
($/mcf) |
|
|
|
2.66 |
|
|
|
7.91 |
|
(66.4) |
% |
|
|
|
|
|
|
|
|
|
|
|
|
|
|
CAD/USD exchange rate(2) |
|
|
|
|
|
0.7457 |
|
|
|
0.7659 |
|
(2.6) |
% |
| 1 | Based on LBMA PM Fix for gold, platinum and palladium. Based on LBMA Fix for silver. |
| 2 | Based on Bank of Canada daily rates. |
Revenue and GEOs
Revenue and GEO sales by commodity, geographical location and type of interest for the three months ended September 30, 2023 and 2022 were as follows:
|
|
|
Gold Equivalent Ounces(1) |
|
|
Revenue (in millions) |
|
|||||||||||||
For the three months ended September 30, |
|
|
2023 |
|
|
2022 |
|
Variance |
|
|
2023 |
|
|
2022 |
|
Variance |
|
|||
Commodity |
|
|
|
|
|
|
|
|
|
|
|
|
|
|
|
|
|
|
|
|
Gold |
|
|
103,641 |
|
|
96,628 |
|
7,013 |
|
|
$ |
199.5 |
|
|
$ |
166.6 |
|
$ |
32.9 |
|
Silver |
|
|
16,526 |
|
|
17,883 |
|
(1,357) |
|
|
|
31.6 |
|
|
|
30.3 |
|
|
1.3 |
|
PGM |
|
|
5,170 |
|
|
6,031 |
|
(861) |
|
|
|
9.7 |
|
|
|
9.8 |
|
|
(0.1) |
|
Precious Metals |
|
|
125,337 |
|
|
120,542 |
|
4,795 |
|
|
$ |
240.8 |
|
|
$ |
206.7 |
|
$ |
34.1 |
|
Iron ore |
|
|
6,619 |
|
|
6,311 |
|
308 |
|
|
$ |
12.8 |
|
|
$ |
10.8 |
|
$ |
2.0 |
|
Other mining assets |
|
|
1,677 |
|
|
1,574 |
|
103 |
|
|
|
3.2 |
|
|
|
2.9 |
|
|
0.3 |
|
Oil |
|
|
20,926 |
|
|
20,930 |
|
(4) |
|
|
|
38.2 |
|
|
|
36.6 |
|
|
1.6 |
|
Gas |
|
|
4,098 |
|
|
23,516 |
|
(19,418) |
|
|
|
9.9 |
|
|
|
40.9 |
|
|
(31.0) |
|
NGL |
|
|
2,191 |
|
|
3,535 |
|
(1,344) |
|
|
|
4.6 |
|
|
|
6.3 |
|
|
(1.7) |
|
Diversified |
|
|
35,511 |
|
|
55,866 |
|
(20,355) |
|
|
$ |
68.7 |
|
|
$ |
97.5 |
|
$ |
(28.8) |
|
|
|
|
160,848 |
|
|
176,408 |
|
(15,560) |
|
|
$ |
309.5 |
|
|
$ |
304.2 |
|
$ |
5.3 |
|
Geography |
|
|
|
|
|
|
|
|
|
|
|
|
|
|
|
|
|
|
|
|
South America |
|
|
46,278 |
|
|
49,137 |
|
(2,859) |
|
|
$ |
88.9 |
|
|
$ |
84.4 |
|
$ |
4.5 |
|
Central America & Mexico |
|
|
45,730 |
|
|
35,696 |
|
10,034 |
|
|
|
87.9 |
|
|
|
61.1 |
|
|
26.8 |
|
United States |
|
|
25,548 |
|
|
45,178 |
|
(19,630) |
|
|
|
49.3 |
|
|
|
79.4 |
|
|
(30.1) |
|
Canada |
|
|
24,144 |
|
|
28,878 |
|
(4,734) |
|
|
|
46.4 |
|
|
|
49.1 |
|
|
(2.7) |
|
Rest of World |
|
|
19,148 |
|
|
17,519 |
|
1,629 |
|
|
|
37.0 |
|
|
|
30.2 |
|
|
6.8 |
|
|
|
|
160,848 |
|
|
176,408 |
|
(15,560) |
|
|
$ |
309.5 |
|
|
$ |
304.2 |
|
$ |
5.3 |
|
Type |
|
|
|
|
|
|
|
|
|
|
|
|
|
|
|
|
|
|
|
|
Revenue-based royalties |
|
|
47,645 |
|
|
68,479 |
|
(20,834) |
|
|
$ |
91.7 |
|
|
$ |
119.3 |
|
$ |
(27.6) |
|
Streams |
|
|
97,275 |
|
|
90,237 |
|
7,038 |
|
|
|
186.8 |
|
|
|
153.9 |
|
|
32.9 |
|
Profit-based royalties |
|
|
8,400 |
|
|
10,337 |
|
(1,937) |
|
|
|
16.3 |
|
|
|
17.9 |
|
|
(1.6) |
|
Other |
|
|
7,528 |
|
|
7,355 |
|
173 |
|
|
|
14.7 |
|
|
|
13.1 |
|
|
1.6 |
|
|
|
|
160,848 |
|
|
176,408 |
|
(15,560) |
|
|
$ |
309.5 |
|
|
$ |
304.2 |
|
$ |
5.3 |
|
| 1 | Refer to Note 1 at the bottom of page 4 of this MD&A for the methodology for calculating GEOs and, for illustrative purposes, to the average commodity price table above for indicative prices which may be used in the calculations of GEOs. |
2023 Third Quarter Management’s Discussion and Analysis |
11 |
We earned $309.5 million in revenue in Q3 2023, up 1.7% from Q3 2022. The impact of the decrease in oil and gas prices was more than offset by generally higher prices for our Precious Metal assets. In Q3 2023, we earned 77.8% of our revenue from Precious Metals, up from 68.0% in Q3 2022. Geographically, 88.0% of our revenue was derived from the Americas in Q3 2023, compared to 90.0% in Q3 2022.
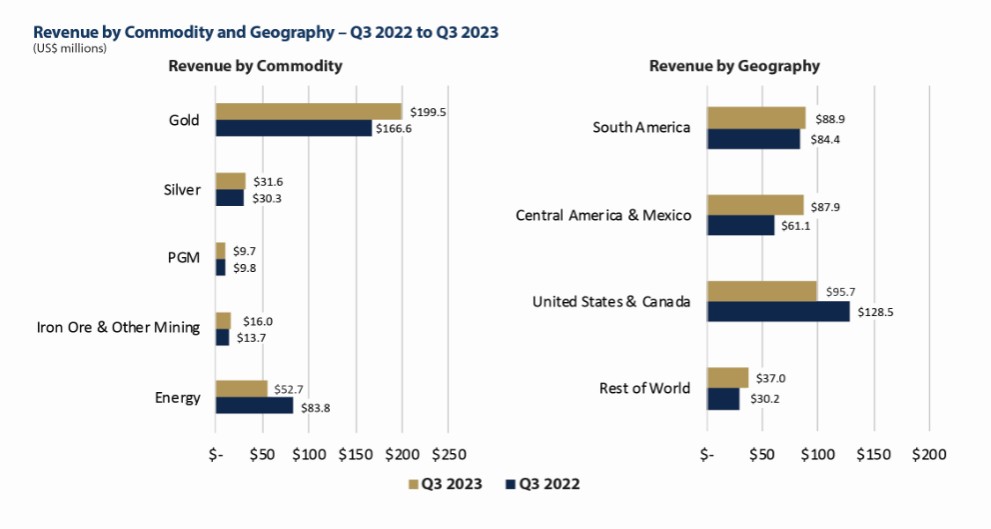
We sold 160,848 GEOs in Q3 2023 compared to 176,408 GEOs in Q3 2022. The decrease in GEOs is due to our Energy assets contributions fewer GEOs as a result of the decrease in oil and gas prices compared to the relative highs of the prior year period, coupled with the impact of a less favourable conversion ratio to GEOs. A comparison of our sources of GEOs in Q3 2023 to Q3 2022 is shown below:

2023 Third Quarter Management’s Discussion and Analysis |
12 |
Precious Metals
Our Precious Metal assets contributed 125,337 GEOs in Q3 2023, compared to 120,542 GEOs in Q3 2022. The increase is primarily due to the following:
| ● | Cobre Panama – We sold 34,967 GEOs from our Cobre Panama streams in Q3 2023, compared to 26,352 GEOs in Q3 2022, driven by higher average copper grades and the continued ramp-up of the CP100 Expansion project. GEOs sold in the prior year period were also lower due to the timing of shipments. |
| ● | Guadalupe-Palmarejo – We sold 10,589 GEOs from our Guadalupe-Palmarejo stream in Q3 2023, compared to 9,254 GEOs in Q3 2022, as production at the mine benefited from higher average grades. |
| ● | MWS – We sold 6,521 GEOs from our Mine Waste Solution stream in Q3 2023, compared to 5,580 GEOs in Q3 2022, reflecting increased production at the tailings retreatment operation. |
The above increases were partly offset by the following:
| ● | Antamina – We sold 6,182 GEOs in Q3 2023 from our Antamina stream, compared to 9,064 GEOs in Q3 2022, reflecting an anticipated decrease in average silver grades based on the life of mine plan. Production at the mine was also impacted by Cyclone Yaku which constrained logistics in March and April 2023. This was reflected in the deliveries we received in Q3 2023. |
| ● | Sudbury – We sold 2,031 GEOs from our Sudbury stream in Q3 2023, compared to 3,297 GEOs in Q3 2022. The decrease in GEOs reflects a lower gold conversion ratio, as palladium prices have decreased while gold prices increased relative to Q3 2022. |
Diversified
Our Diversified assets, primarily comprising our Iron Ore and Energy interests, generated $68.7 million in revenue, down from $97.5 million in Q3 2022, as a result of lower oil and gas prices compared to the relative highs of the prior year period. Our Iron Ore assets generated $12.8 million in Q3 2023, compared to $10.8 million in Q3 2022. Our Energy interests contributed $52.7 million in revenue in Q3 2023, compared to $83.8 million in Q3 2022. When converted to GEOs, Diversified assets contributed 35,511 GEOs, down from 55,866 GEOs in Q3 2022. GEOs from our Iron Ore and Energy assets reflect lower gold conversion ratios due to relative changes in commodity prices compared to the prior year period.
Other Mining
| ● | Vale Royalty – We recorded $8.3 million in revenue from our Vale Royalty in Q3 2023 compared to $6.2 million in Q3 2022, reflecting higher estimated iron ore prices. |
| ● | LIORC – Labrador Iron Ore Royalty Corporation (“LIORC”) contributed $4.5 million in revenue in Q3 2023, relatively consistent with Q3 2022. LIORC declared a cash dividend of C$0.95 per common share in the current period, compared to C$1.00 in Q3 2022. Operations at Iron Ore Company of Canada were impacted by extended plant downtime and conveyor belt failures. |
Energy
| ● | U.S. – Revenue from our U.S. Energy interests decreased to $30.7 million in Q3 2023, compared to $62.1 million in Q3 2022, largely due to lower realized oil and gas prices. Partly offsetting the impact of lower prices, we received approximately $1.3 million in lease bonus revenue in relation to our Haynesville interests. We also benefited from higher production at our Permian assets due to the completion of new wells. |
| ● | Canada – Revenue from our Canadian Energy interests was relatively consistent with prior year quarter, with $22.0 million earned in Q3 2023 compared to $21.7 million in Q3 2022. For our Weyburn NRI, the impact of lower prices was partly offset by lower operating and capital expenditures incurred at the Weyburn Unit. |
2023 Third Quarter Management’s Discussion and Analysis |
13 |
Costs of Sales
The following table provides a breakdown of costs of sales, excluding depletion and depreciation, incurred in the periods presented:
|
|
|
For the three months ended September 30, |
|
||||||||
(expressed in millions) |
|
|
2023 |
|
|
2022 |
|
Variance |
|
|||
Costs of stream sales |
|
|
$ |
45.4 |
|
|
$ |
37.1 |
|
$ |
8.3 |
|
Mineral production taxes |
|
|
|
0.5 |
|
|
|
0.6 |
|
|
(0.1) |
|
Mining costs of sales |
|
|
$ |
45.9 |
|
|
$ |
37.7 |
|
$ |
8.2 |
|
Energy costs of sales |
|
|
|
3.0 |
|
|
|
4.3 |
|
|
(1.3) |
|
|
|
|
$ |
48.9 |
|
|
$ |
42.0 |
|
$ |
6.9 |
|
Costs of sales related to our streams were higher compared to Q3 2022, with the increase primarily relating to GEOs sold from Cobre Panama. Starting in Q3 2023, our applicable cost per ounce at Cobre Panama no longer reflects the discount of $100 per ounce which we received as compensation for the timing of the start and ramp-up of production at the mine, resulting in an increase in costs of sales compared to the prior year period. Please refer to the “Liquidity and Capital Resources – Purchase Commitments” section on page 26 of this MD&A for further details on the applicable cost per ounce for our streams.
Our costs of sales related to our Energy assets decreased compared to Q3 2022, as these include royalties payable and production taxes which vary based on revenue earned from our Energy assets.
Costs of sales incurred in Q3 2023 compared to Q3 2022 are shown below:
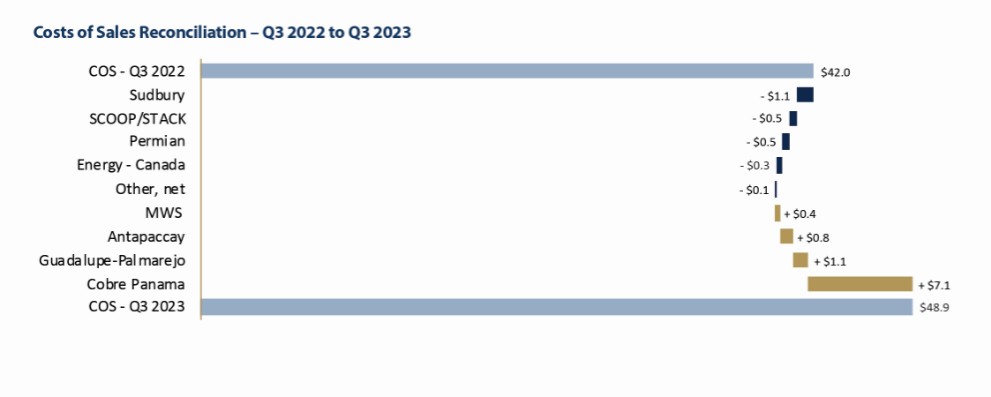
2023 Third Quarter Management’s Discussion and Analysis |
14 |
Depletion and Depreciation
Depletion and depreciation expense totaled $68.1 million in Q3 2023, compared to $68.5 million in Q3 2022. Depletion expense incurred in Q3 2023 compared to Q3 2022 is shown below:
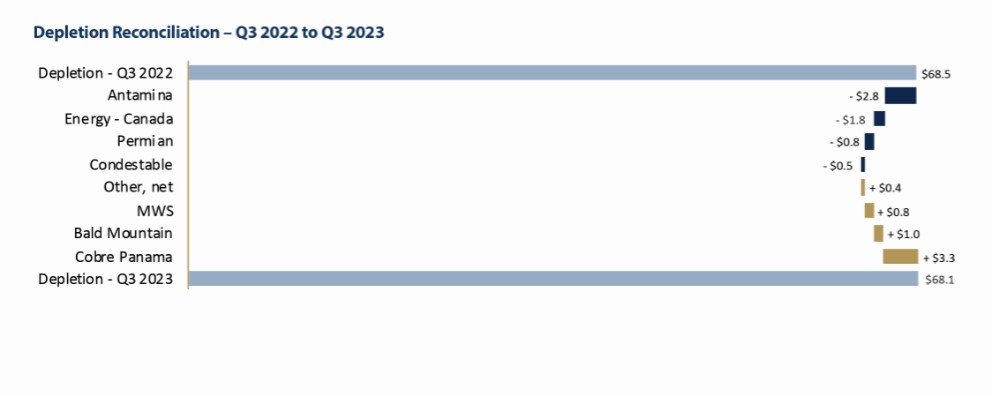
Income Taxes
Income tax expense was $24.9 million in Q3 2023, compared to $30.4 million in Q3 2022, comprised of a current income tax expense of $23.4 million (Q3 2022 – $21.4 million) and a deferred income tax expense of $1.5 million (Q3 2022 – $9.0 million). The decrease in income tax expense was due to changes in the proportion of income earned in each jurisdiction.
Franco-Nevada is undergoing an audit by the CRA of its 2012-2019 taxation years. Refer to the “Contingencies” section of this MD&A for further details.
Net Income
Net income for Q3 2023 was $175.1 million, or $0.91 per share, compared to $157.1 million, or $0.82 per share, in Q3 2022. The increase in net income is primarily attributable to higher revenue earned from our Precious Metal assets, an increase in finance income earned on our cash and cash equivalents, and a lower income tax expense. Adjusted Net Income was $175.1 million, or $0.91 per share, compared to $159.7 million, or $0.83 per share, in Q3 2022. Please refer to the “Non-GAAP Financial Measures” section of this MD&A for further details on the computation of Adjusted Net Income.
2023 Third Quarter Management’s Discussion and Analysis |
15 |
Review of Year-to-Date Financial Performance
The following table summarizes average commodity prices and average exchange rates during the periods presented.
|
|
|
|
|
|
|
|
|
|
|
|||
Average prices and rates |
|
|
|
|
YTD 2023 |
|
|
YTD 2022 |
|
Variance |
|
||
Gold(1) |
|
($/oz) |
|
|
$ |
1,932 |
|
|
$ |
1,825 |
|
5.9 |
% |
Silver(1) |
|
($/oz) |
|
|
|
23.44 |
|
|
|
21.94 |
|
6.8 |
% |
Platinum(1) |
|
($/oz) |
|
|
|
985 |
|
|
|
958 |
|
2.8 |
% |
Palladium(1) |
|
($/oz) |
|
|
|
1,422 |
|
|
|
2,163 |
|
(34.3) |
% |
Iron Ore Fines 62% Fe CFR China |
|
($/tonne) |
|
|
|
116 |
|
|
|
129 |
|
(10.1) |
% |
|
|
|
|
|
|
|
|
|
|
|
|
|
|
Edmonton Light |
|
(C$/bbl) |
|
|
|
100.50 |
|
|
|
123.51 |
|
(18.6) |
% |
West Texas Intermediate |
|
($/bbl) |
|
|
|
77.39 |
|
|
|
98.09 |
|
(21.1) |
% |
Henry Hub |
|
($/mcf) |
|
|
|
2.58 |
|
|
|
6.65 |
|
(61.2) |
% |
|
|
|
|
|
|
|
|
|
|
|
|
|
|
CAD/USD exchange rate(2) |
|
|
|
|
|
0.7434 |
|
|
|
0.7797 |
|
(4.7) |
% |
| 1 | Based on LBMA PM Fix for gold, platinum and palladium. Based on LBMA Fix for silver. |
| 2 | Based on Bank of Canada daily rates. |
Revenue and GEOs
Revenue and GEO sales by commodity, geographical location and type of interest for the nine months ended September 30, 2023 and 2022 were as follows:
|
|
|
Gold Equivalent Ounces(1) |
|
|
Revenue (in millions) |
|
|||||||||||||
For the nine months ended September 30, |
|
|
2023 |
|
|
2022 |
|
Variance |
|
|
2023 |
|
|
2022 |
|
Variance |
|
|||
Commodity |
|
|
|
|
|
|
|
|
|
|
|
|
|
|
|
|
|
|
|
|
Gold |
|
|
303,179 |
|
|
299,173 |
|
4,006 |
|
|
$ |
585.7 |
|
|
$ |
544.9 |
|
$ |
40.8 |
|
Silver |
|
|
49,478 |
|
|
58,740 |
|
(9,262) |
|
|
|
95.5 |
|
|
|
107.2 |
|
|
(11.7) |
|
PGM |
|
|
15,951 |
|
|
22,830 |
|
(6,879) |
|
|
|
31.0 |
|
|
|
41.2 |
|
|
(10.2) |
|
Precious Metals |
|
|
368,608 |
|
|
380,743 |
|
(12,135) |
|
|
$ |
712.2 |
|
|
$ |
693.3 |
|
$ |
18.9 |
|
Iron ore |
|
|
18,801 |
|
|
24,573 |
|
(5,772) |
|
|
$ |
36.0 |
|
|
$ |
44.7 |
|
$ |
(8.7) |
|
Other mining assets |
|
|
5,435 |
|
|
3,459 |
|
1,976 |
|
|
|
10.3 |
|
|
|
6.4 |
|
|
3.9 |
|
Oil |
|
|
54,847 |
|
|
66,448 |
|
(11,601) |
|
|
|
102.2 |
|
|
|
121.8 |
|
|
(19.6) |
|
Gas |
|
|
19,800 |
|
|
59,597 |
|
(39,797) |
|
|
|
41.0 |
|
|
|
108.3 |
|
|
(67.3) |
|
NGL |
|
|
7,203 |
|
|
11,254 |
|
(4,051) |
|
|
|
14.0 |
|
|
|
20.8 |
|
|
(6.8) |
|
Diversified |
|
|
106,086 |
|
|
165,331 |
|
(59,245) |
|
|
$ |
203.5 |
|
|
$ |
302.0 |
|
$ |
(98.5) |
|
|
|
|
474,694 |
|
|
546,074 |
|
(71,380) |
|
|
$ |
915.7 |
|
|
$ |
995.3 |
|
$ |
(79.6) |
|
Geography |
|
|
|
|
|
|
|
|
|
|
|
|
|
|
|
|
|
|
|
|
South America |
|
|
141,901 |
|
|
151,405 |
|
(9,504) |
|
|
$ |
274.1 |
|
|
$ |
275.8 |
|
$ |
(1.7) |
|
Central America & Mexico |
|
|
127,136 |
|
|
123,031 |
|
4,105 |
|
|
|
245.1 |
|
|
|
224.8 |
|
|
20.3 |
|
United States |
|
|
82,134 |
|
|
131,564 |
|
(49,430) |
|
|
|
157.4 |
|
|
|
241.0 |
|
|
(83.6) |
|
Canada |
|
|
68,764 |
|
|
89,405 |
|
(20,641) |
|
|
|
133.3 |
|
|
|
161.5 |
|
|
(28.2) |
|
Rest of World |
|
|
54,759 |
|
|
50,669 |
|
4,090 |
|
|
|
105.8 |
|
|
|
92.2 |
|
|
13.6 |
|
|
|
|
474,694 |
|
|
546,074 |
|
(71,380) |
|
|
$ |
915.7 |
|
|
$ |
995.3 |
|
$ |
(79.6) |
|
Type |
|
|
|
|
|
|
|
|
|
|
|
|
|
|
|
|
|
|
|
|
Revenue-based royalties |
|
|
147,569 |
|
|
203,847 |
|
(56,278) |
|
|
$ |
283.0 |
|
|
$ |
371.5 |
|
$ |
(88.5) |
|
Streams |
|
|
282,240 |
|
|
285,140 |
|
(2,900) |
|
|
|
545.3 |
|
|
|
519.4 |
|
|
25.9 |
|
Profit-based royalties |
|
|
25,195 |
|
|
38,499 |
|
(13,304) |
|
|
|
48.8 |
|
|
|
70.3 |
|
|
(21.5) |
|
Other |
|
|
19,690 |
|
|
18,588 |
|
1,102 |
|
|
|
38.6 |
|
|
|
34.1 |
|
|
4.5 |
|
|
|
|
474,694 |
|
|
546,074 |
|
(71,380) |
|
|
$ |
915.7 |
|
|
$ |
995.3 |
|
$ |
(79.6) |
|
| 1 | Refer to Note 1 at the bottom of page 4 of this MD&A for the methodology for calculating GEOs and, for illustrative purposes, to the average commodity price table above for indicative prices which may be used in the calculations of GEOs. |
2023 Third Quarter Management’s Discussion and Analysis |
16 |
We earned $915.7 million in revenue in YTD 2023, down 8.0% from YTD 2022. The decrease in our revenue is primarily attributed to lower oil, gas and iron ore prices, as well as lower GEOs from our Precious Metal assets. We earned 77.8% of our YTD 2023 revenue from Precious Metal assets, compared to 69.7% in YTD 2022. Geographically, we remain heavily invested in the Americas, with 88.5% of revenue in YTD 2023, compared to 90.7% in YTD 2022.
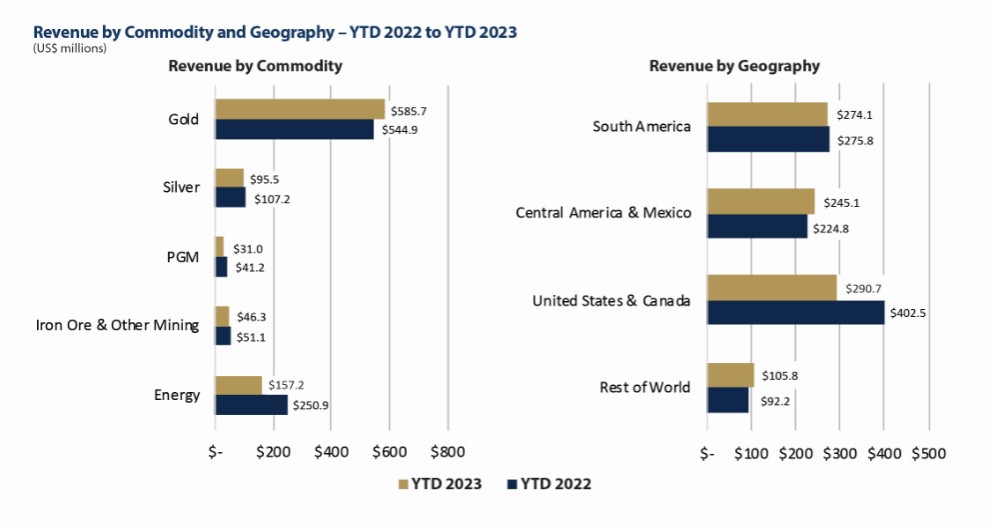
We sold 474,694 GEOs in YTD 2023, compared to 546,074 GEOs in YTD 2022. The decrease in GEOs earned from our Diversified assets reflects the decrease in oil, gas and iron ore prices, coupled with the impact of a lower gold conversion ratio for our Diversified assets. A comparison of our sources of GEOs in YTD 2023 to YTD 2022 is shown below:
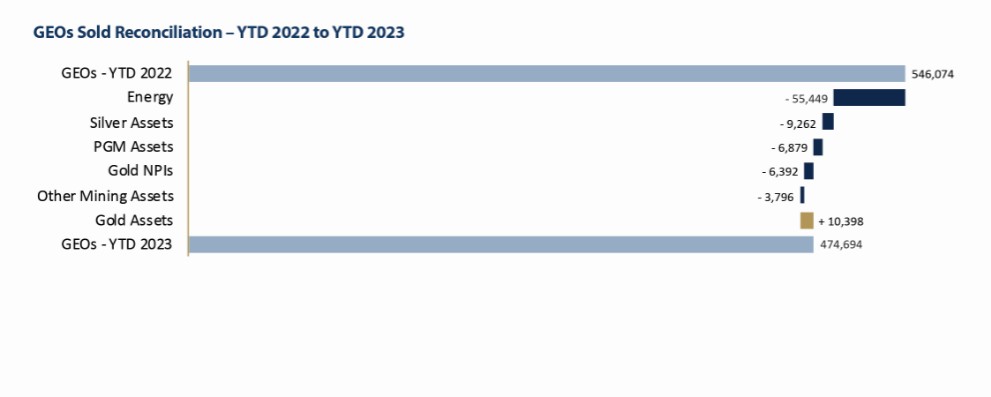
2023 Third Quarter Management’s Discussion and Analysis |
17 |
Precious Metals
Our Precious Metal assets contributed 368,608 GEOs in YTD 2023, down from 380,743 GEOs in YTD 2022. The decrease in GEOs from Precious Metal assets compared to the prior year was primarily due to the following:
| ● | Antamina – We sold 19,576 GEOs in YTD 2023 from our Antamina stream, down from 29,418 GEOs in YTD 2022. As expected, silver ounces sold decreased in the current period compared to the prior year period reflecting lower than average silver grades. In addition, operations at Antamina were constrained in March and early April 2023 due to logistics issues caused by Cyclone Yaku. |
| ● | Guadalupe-Palmarejo – We sold 26,408 GEOs from our Guadalupe-Palmarejo stream in YTD 2023 compared to 31,950 GEOs in YTD 2022 due to lower production at the mine and a lesser proportion of production being sourced from ground covered by our stream. |
| ● | Hemlo – We earned 8,220 GEOs from our Hemlo royalties in YTD 2023, compared to 13,327 GEOs in YTD 2022. While production at Hemlo was relatively consistent compared to the prior year period, a lesser proportion was sourced from ground covered by our royalties. |
| ● | Stillwater – We earned 10,256 GEOs from Stillwater in YTD 2023, compared to 14,811 GEOs in YTD 2022. Production at the mine has been impacted by ongoing operational challenges, as well as an incident that damaged shaft infrastructure in March 2023. In addition, the decrease in GEOs reflects a lower gold conversion ratio compared to the 2022 period, as palladium prices have decreased while gold prices increased relative to the 2022 period. |
The above decreases were partly offset by the following factors:
| ● | Cobre Panama – We sold 100,280 GEOs in YTD 2023, compared to 90,991 GEOs in YTD 2022. Production at the mine during the period benefited from higher copper grades and recoveries compared to the prior year period, as well as the continued ramp-up of the CP100 Expansion project. Ore processing and concentrate loading operations at the mine were impacted by export restrictions in the first quarter of 2023, but returned to full production levels in March 2023. |
| ● | Antapaccay – We sold 44,125 GEOs in YTD 2023, compared to 39,624 GEOs in YTD 2022. Production at the mine benefited from higher copper grades and recoveries compared to the prior year period. As a result of socio-political tensions in early 2023, logistics were constrained and operations were temporarily suspended in Q1 2023. Operations returned to normalized levels in March 2023. |
| ● | Marigold – We earned 4,817 GEOs from Marigold in YTD 2023 compared to 2,562 GEOs in YTD 2022, reflecting higher production as a result of mine sequencing, as well as an increase in mining occurring on higher royalty ground. |
Diversified
Our Diversified assets, primarily comprising our Iron Ore and Energy interests, generated $203.5 million in revenue in YTD 2023, down from $302.0 million in YTD 2022. The decrease was primarily as a result of lower oil and gas prices compared to the relative highs of the prior year period. Our Iron Ore assets generated $36.0 million in YTD 2023, compared to $44.7 million in YTD 2022. Our Energy interests contributed $157.2 million in revenue in YTD 2023, compared to $250.9 million in YTD 2022. When converted to GEOs, Diversified assets contributed 106,086 GEOs in YTD 2023, down from 165,331 GEOs in YTD 2022. GEOs from our Iron Ore and Energy assets reflect lower gold conversion ratios due to relative changes in commodity prices compared to the prior year period.
Other Mining
| ● | Vale Royalty – Revenue from Vale was $26.1 million in YTD 2023 compared to $33.1 million in YTD 2022, due to lower estimated iron ore prices and premiums, and lagging sales to production which are expected to normalize in the second half of 2023. |
| ● | LIORC – LIORC contributed $9.9 million in revenue in YTD 2023 compared to $11.6 million in YTD 2022. Production at Iron Ore Company of Canada in the first nine months of the current year has been impacted by plant downtime and conveyor belt failures, as well as wildfires in Northern Quebec. |
| ● | Caserones – Revenue from our effective NSR on the Caserones mine was $4.4 million in YTD 2023 compared to $3.6 million in YTD 2022, reflecting the additional interest we acquired in the first half of 2023. |
Energy
| ● | U.S. – Revenue from our U.S. Energy interests decreased to $102.2 million in YTD 2023, compared to $176.2 million in YTD 2022, largely due to lower realized oil and gas prices. Partly offsetting the impact of lower prices was the receipt of approximately $7.0 million in catch-up royalty payments related to new wells from our Permian interests in Q2 2023, as well as $1.3 million in lease bonus revenue received in Q3 2023 in relation to our Haynesville interests. |
| ● | Canada – Revenue from our Canadian Energy interests decreased to $55.0 million in YTD 2023, compared to $74.7 million in YTD 2022, largely due to lower realized oil and gas prices. For our Weyburn NRI, the impact of lower prices was partly offset by lower operating and capital expenditures incurred at the Weyburn Unit. |
2023 Third Quarter Management’s Discussion and Analysis |
18 |
Costs of Sales
The following table provides a breakdown of costs of sales, excluding depletion and depreciation, incurred in the periods presented:
|
|
|
For the nine months ended September 30, |
|
||||||||
(expressed in millions) |
|
|
2023 |
|
|
2022 |
|
Variance |
|
|||
Costs of stream sales |
|
|
$ |
123.6 |
|
|
$ |
118.4 |
|
$ |
5.2 |
|
Mineral production taxes |
|
|
|
1.5 |
|
|
|
1.5 |
|
|
— |
|
Mining costs of sales |
|
|
$ |
125.1 |
|
|
$ |
119.9 |
|
$ |
5.2 |
|
Energy costs of sales |
|
|
|
9.1 |
|
|
|
11.2 |
|
|
(2.1) |
|
|
|
|
$ |
134.2 |
|
|
$ |
131.1 |
|
$ |
3.1 |
|
Costs of sales related to our streams in YTD 2023 increased relative to YTD 2022, with the increase primarily relating to GEOs sold from Cobre Panama. Starting in Q3 2023, our applicable cost per ounce at Cobre Panama no longer reflects the discount of $100 per ounce which we received as compensation for the timing of the start and ramp-up of production at the mine, resulting in an increase in costs of sales compared to the prior year period. Please refer to the “Liquidity and Capital Resources – Purchase Commitments” section on page 26 of this MD&A for further details on the applicable cost per ounce for our streams.
Our costs of sales related to our Energy assets decreased compared to YTD 2022, as these include royalties payable and production taxes which vary based on revenue earned from our Energy assets.
Costs of sales incurred in YTD 2023 compared to YTD 2022 are shown below:
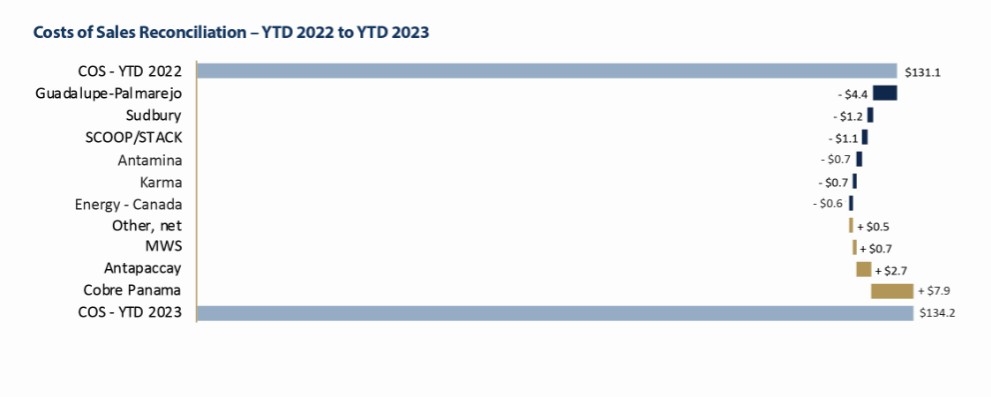
2023 Third Quarter Management’s Discussion and Analysis |
19 |
Depletion and Depreciation
Depletion and depreciation expense totaled $204.2 million in YTD 2023 compared to $212.7 million in YTD 2022, reflecting the decrease in GEOs sold in the current period. Depletion expense incurred in YTD 2023 compared to YTD 2022 is shown below:
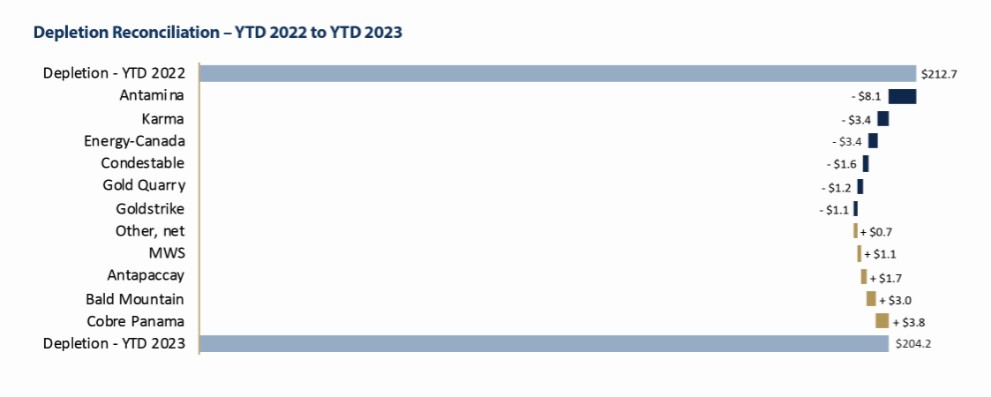
Income Taxes
Income tax expense in YTD 2023 totaled $79.5 million, compared to $103.1 million in YTD 2022, comprised of a current income tax expense of $62.9 million (YTD 2022 – $80.9 million) and a deferred income tax expense of $16.6 million (YTD 2022 – $22.2 million).
Franco-Nevada is undergoing an audit by the CRA of its 2012-2019 taxation years. Refer to the “Contingencies” section of this MD&A for further details.
Net Income
Net income in YTD 2023 was $516.1 million, or $2.69 per share, compared to $535.6 million, or $2.80 per share in YTD 2022. The decrease in net income is primarily attributable to lower GEOs sold and revenue, partly offset by a decrease in costs of sales and depletion and depreciation expense, higher finance income earned on our cash and cash equivalents, and a gain of $3.7 million in relation to the Valentine Gold royalty buy-back by Marathon in February 2023. Adjusted Net Income, which include an adjustment for the gain on the Valentine Gold buy-back, was $510.2 million, or $2.66 per share, compared to $532.7 million, or $2.78 per share, earned in YTD 2022. Please refer to the “Non-GAAP Financial Measures” section of this MD&A for further details.
2023 Third Quarter Management’s Discussion and Analysis |
20 |
General and Administrative and Share-Based Compensation Expenses
The following table provides a breakdown of general and administrative expenses and share-based compensation expenses incurred for the periods presented:
|
|
|
For the three months ended September 30, |
|
|
For the nine months ended September 30, |
|
||||||||||||||||
(expressed in millions) |
|
|
2023 |
|
|
2022 |
|
Variance |
|
|
2023 |
|
|
2022 |
|
Variance |
|
||||||
Salaries and benefits |
|
|
$ |
2.4 |
|
|
$ |
2.4 |
|
$ |
— |
|
|
$ |
7.7 |
|
|
$ |
6.8 |
|
$ |
0.9 |
|
Professional fees |
|
|
|
0.9 |
|
|
|
0.7 |
|
|
0.2 |
|
|
|
4.0 |
|
|
|
2.8 |
|
|
1.2 |
|
Filing fees |
|
|
|
0.1 |
|
|
|
0.2 |
|
|
(0.1) |
|
|
|
0.5 |
|
|
|
1.0 |
|
|
(0.5) |
|
Office costs |
|
|
|
0.2 |
|
|
|
0.2 |
|
|
— |
|
|
|
0.5 |
|
|
|
0.4 |
|
|
0.1 |
|
Board of Directors' costs |
|
|
|
0.1 |
|
|
|
— |
|
|
0.1 |
|
|
|
0.4 |
|
|
|
0.2 |
|
|
0.2 |
|
Other |
|
|
|
1.3 |
|
|
|
1.2 |
|
|
0.1 |
|
|
|
4.3 |
|
|
|
4.9 |
|
|
(0.6) |
|
General and administrative expenses |
|
|
$ |
5.0 |
|
|
$ |
4.7 |
|
$ |
0.3 |
|
|
$ |
17.4 |
|
|
$ |
16.1 |
|
$ |
1.3 |
|
Share-based compensation expenses |
|
|
|
0.7 |
|
|
|
0.4 |
|
|
0.3 |
|
|
|
6.3 |
|
|
|
4.7 |
|
|
1.6 |
|
|
|
|
$ |
5.7 |
|
|
$ |
5.1 |
|
$ |
0.6 |
|
|
$ |
23.7 |
|
|
$ |
20.8 |
|
$ |
2.9 |
|
General and administrative and share-based compensation expenses represented 2.6% of our YTD 2023 revenue, up from 2.1% in YTD 2022. Our general and administrative expenses include business development costs. These costs vary depending upon the level of business development related activity and the timing of completing transactions.
Share-based compensation expenses include expenses related to equity-settled stock options, restricted share units (“RSUs”) and deferred share units (“DSUs”), as well as the mark-to-market gain or loss related to the DSUs. Share-based compensation was higher in YTD 2023 than in YTD 2022 owing to the lower decrease in share price during the period compared to the prior period which resulted in a lower reduction from the mark-to-market adjustment on the DSU liability.
OTHER INCOME AND EXPENSES
Foreign Exchange and Other Income/Expenses
The following table provides a list of foreign exchange and other income/expenses incurred for the periods presented:
|
|
|
For the three months ended September 30, |
|
|
For the nine months ended September 30, |
|
||||||||||||||||
(expressed in millions) |
|
|
2023 |
|
|
2022 |
|
Variance |
|
|
2023 |
|
|
2022 |
|
Variance |
|
||||||
Foreign exchange (loss) gain |
|
|
$ |
(1.8) |
|
|
$ |
(1.4) |
|
$ |
(0.4) |
|
|
$ |
2.1 |
|
|
$ |
2.6 |
|
$ |
(0.5) |
|
Mark-to-market gain on warrants |
|
|
|
0.1 |
|
|
|
0.7 |
|
|
(0.6) |
|
|
|
— |
|
|
|
0.7 |
|
|
(0.7) |
|
Other (expense) income |
|
|
|
(0.1) |
|
|
|
(1.6) |
|
|
1.5 |
|
|
|
— |
|
|
|
0.2 |
|
|
(0.2) |
|
|
|
|
$ |
(1.8) |
|
|
$ |
(2.3) |
|
$ |
0.5 |
|
|
$ |
2.1 |
|
|
$ |
3.5 |
|
$ |
(1.4) |
|
The parent company’s functional currency is the Canadian dollar, while the functional currency of certain subsidiaries is the U.S. dollar. Under IFRS, all foreign exchange gains or losses related to monetary assets and liabilities held in a currency other than the functional currency are recorded in net income as opposed to other comprehensive income. In Q3 2023 and YTD 2023, the foreign exchange loss/gain is primarily related to our foreign cash balances and a receivable from our Vale Royalty. The receivable is denominated in Brazilian reais and resulted in a net foreign exchange gain when converted to the Canadian dollar.
Finance Income and Finance Expenses
The following table provides a breakdown of finance income and expenses incurred for the periods presented:
|
|
|
For the three months ended September 30, |
|
|
For the nine months ended September 30, |
|
||||||||||||||||
(expressed in millions) |
|
|
2023 |
|
|
2022 |
|
Variance |
|
|
2023 |
|
|
2022 |
|
Variance |
|
||||||
Finance income |
|
|
|
|
|
|
|
|
|
|
|
|
|
|
|
|
|
|
|
|
|
|
|
Interest |
|
|
$ |
15.5 |
|
|
$ |
2.4 |
|
$ |
13.1 |
|
|
$ |
36.0 |
|
|
$ |
5.9 |
|
$ |
30.1 |
|
|
|
|
$ |
15.5 |
|
|
$ |
2.4 |
|
$ |
13.1 |
|
|
$ |
36.0 |
|
|
$ |
5.9 |
|
$ |
30.1 |
|
Finance expenses |
|
|
|
|
|
|
|
|
|
|
|
|
|
|
|
|
|
|
|
|
|
|
|
Standby charges |
|
|
$ |
0.5 |
|
|
$ |
0.6 |
|
$ |
(0.1) |
|
|
$ |
1.7 |
|
|
$ |
1.7 |
|
$ |
— |
|
Amortization of debt issue costs |
|
|
|
0.2 |
|
|
|
0.1 |
|
|
0.1 |
|
|
|
0.4 |
|
|
|
0.7 |
|
|
(0.3) |
|
Accretion of lease liabilities |
|
|
|
— |
|
|
|
0.1 |
|
|
(0.1) |
|
|
|
— |
|
|
|
0.1 |
|
|
(0.1) |
|
|
|
|
$ |
0.7 |
|
|
$ |
0.8 |
|
$ |
(0.1) |
|
|
$ |
2.1 |
|
|
$ |
2.5 |
|
$ |
(0.4) |
|
Finance income is earned on our cash and cash equivalents. The increase in finance income earned in the three and nine months ended September 30, 2023 is due to the increase in our cash and cash equivalents and the increase in yields compared to the prior year periods. Income earned in YTD 2022 also included interest income on the Noront loan receivable which was repaid in May 2022.
Finance expenses consist of standby charges, which represent the costs of maintaining our credit facility based on the undrawn amounts and the amortization of costs incurred with respect to the initial set-up or subsequent amendments of our credit facility. In YTD 2023 and YTD 2022, we did not incur interest expense as we have not borrowed any amounts under our credit facility during the periods.
2023 Third Quarter Management’s Discussion and Analysis |
21 |
SUMMARY OF QUARTERLY INFORMATION
Selected quarterly financial and statistical information for the most recent eight quarters(1) is set out below:
(in millions, except Average Gold Price, Adjusted EBITDA Margin, GEOs, per GEO amounts and |
|
|
Q3 |
|
|
|
Q2 |
|
|
|
Q1 |
|
|
|
Q4 |
|
|
|
Q3 |
|
|
|
Q2 |
|
|
|
Q1 |
|
|
|
Q4 |
|
per share amounts) |
|
|
2023 |
|
|
|
2023 |
|
|
|
2023 |
|
|
|
2022 |
|
|
|
2022 |
|
|
|
2022 |
|
|
|
2022 |
|
|
|
2021 |
|
Revenue |
|
$ |
309.5 |
|
|
$ |
329.9 |
|
|
$ |
276.3 |
|
|
$ |
320.4 |
|
|
$ |
304.2 |
|
|
$ |
352.3 |
|
|
$ |
338.8 |
|
|
$ |
327.7 |
|
Costs and expenses(2) |
|
|
122.5 |
|
|
|
129.4 |
|
|
|
104.2 |
|
|
|
131.5 |
|
|
|
116.0 |
|
|
|
120.7 |
|
|
|
126.8 |
|
|
|
60.6 |
|
Operating income |
|
|
187.0 |
|
|
|
200.5 |
|
|
|
172.1 |
|
|
|
188.9 |
|
|
|
188.2 |
|
|
|
231.6 |
|
|
|
212.0 |
|
|
|
267.1 |
|
Other income (expenses) |
|
|
13.0 |
|
|
|
11.0 |
|
|
|
12.0 |
|
|
|
6.1 |
|
|
|
(0.7) |
|
|
|
1.6 |
|
|
|
6.0 |
|
|
|
(1.5) |
|
Income tax expense |
|
|
24.9 |
|
|
|
27.0 |
|
|
|
27.6 |
|
|
|
30.0 |
|
|
|
30.4 |
|
|
|
36.7 |
|
|
|
36.0 |
|
|
|
44.7 |
|
Net income |
|
|
175.1 |
|
|
|
184.5 |
|
|
|
156.5 |
|
|
|
165.0 |
|
|
|
157.1 |
|
|
|
196.5 |
|
|
|
182.0 |
|
|
|
220.9 |
|
Basic earnings per share |
|
$ |
0.91 |
|
|
$ |
0.96 |
|
|
$ |
0.82 |
|
|
$ |
0.86 |
|
|
$ |
0.82 |
|
|
$ |
1.03 |
|
|
$ |
0.95 |
|
|
$ |
1.16 |
|
Diluted earnings per share |
|
$ |
0.91 |
|
|
$ |
0.96 |
|
|
$ |
0.81 |
|
|
$ |
0.86 |
|
|
$ |
0.82 |
|
|
$ |
1.02 |
|
|
$ |
0.95 |
|
|
$ |
1.15 |
|
Net cash provided by operating activities |
|
$ |
236.0 |
|
|
$ |
261.9 |
|
|
$ |
209.8 |
|
|
$ |
279.3 |
|
|
$ |
232.3 |
|
|
$ |
257.3 |
|
|
$ |
230.6 |
|
|
$ |
279.0 |
|
Net cash used in investing activities |
|
|
(173.7) |
|
|
|
(160.6) |
|
|
|
(102.6) |
|
|
|
(98.2) |
|
|
|
(30.9) |
|
|
|
(14.8) |
|
|
|
(1.6) |
|
|
|
(36.4) |
|
Net cash used in financing activities |
|
|
(56.8) |
|
|
|
(56.9) |
|
|
|
(56.6) |
|
|
|
(43.7) |
|
|
|
(49.1) |
|
|
|
(48.6) |
|
|
|
(47.6) |
|
|
|
(46.1) |
|
Average Gold Price(3) |
|
$ |
1,929 |
|
|
$ |
1,978 |
|
|
$ |
1,889 |
|
|
$ |
1,729 |
|
|
$ |
1,728 |
|
|
$ |
1,872 |
|
|
$ |
1,874 |
|
|
$ |
1,795 |
|
GEOs sold(4) |
|
|
160,848 |
|
|
|
168,515 |
|
|
|
145,331 |
|
|
|
183,886 |
|
|
|
176,408 |
|
|
|
191,052 |
|
|
|
178,614 |
|
|
|
182,543 |
|
Cash Costs(5) |
|
$ |
48.9 |
|
|
$ |
47.1 |
|
|
$ |
38.2 |
|
|
$ |
45.8 |
|
|
$ |
42.0 |
|
|
$ |
45.5 |
|
|
$ |
43.6 |
|
|
$ |
48.4 |
|
Cash Costs(5) per GEO sold |
|
$ |
304 |
|
|
$ |
280 |
|
|
$ |
263 |
|
|
$ |
249 |
|
|
$ |
238 |
|
|
$ |
238 |
|
|
$ |
244 |
|
|
$ |
265 |
|
Adjusted EBITDA(5) |
|
$ |
255.1 |
|
|
$ |
275.6 |
|
|
$ |
229.4 |
|
|
$ |
262.4 |
|
|
$ |
256.7 |
|
|
$ |
301.2 |
|
|
$ |
286.6 |
|
|
$ |
269.8 |
|
Adjusted EBITDA(5) per share |
|
$ |
1.33 |
|
|
$ |
1.44 |
|
|
$ |
1.20 |
|
|
$ |
1.37 |
|
|
$ |
1.34 |
|
|
$ |
1.57 |
|
|
$ |
1.50 |
|
|
$ |
1.41 |
|
Adjusted EBITDA Margin(5) |
|
|
82.4 |
% |
|
|
83.5 |
% |
|
|
83.0 |
% |
|
|
81.9 |
% |
|
|
84.4 |
% |
|
|
85.5 |
% |
|
|
84.6 |
% |
|
|
82.3 |
% |
Adjusted Net Income(5) |
|
$ |
175.1 |
|
|
$ |
182.9 |
|
|
$ |
152.2 |
|
|
$ |
164.9 |
|
|
$ |
159.7 |
|
|
$ |
195.8 |
|
|
$ |
177.2 |
|
|
$ |
163.7 |
|
Adjusted Net Income(5) per share |
|
$ |
0.91 |
|
|
$ |
0.95 |
|
|
$ |
0.79 |
|
|
$ |
0.86 |
|
|
$ |
0.83 |
|
|
$ |
1.02 |
|
|
$ |
0.93 |
|
|
$ |
0.86 |
|
| 1 | Sum of the quarters may not add up to yearly total due to rounding. |
| 2 | Includes impairment reversals on royalty, stream and working interests of $75.5 million in Q4 2021. |
| 3 | Based on LBMA Gold Price PM Fix. |
| 4 | GEOs include Franco-Nevada’s attributable share of production from our Mining and Energy assets, after applicable recovery and payability factors. GEOs are estimated on a gross basis for NSR and, in the case of stream ounces, before the payment of the per ounce contractual price paid by the Company. For NPI royalties, GEOs are calculated taking into account the NPI economics. Silver, platinum, palladium, iron ore, oil, gas and other commodities are converted to GEOs by dividing associated revenue, which includes settlement adjustments, by the relevant gold price. The price used in the computation of GEOs earned from a particular asset varies depending on the royalty or stream agreement, which may make reference to the market price realized by the operator, or the average price for the month, quarter, or year in which the commodity was produced or sold. For illustrative purposes, please refer to the average commodity price tables on pages 11 and 16 of this MD&A for indicative prices which may be used in the calculation of GEOs for the three and nine months ended September 30, 2023 and 2022, respectively. |
| 5 | Cash Costs, Cash Costs per GEO sold, Adjusted EBITDA, Adjusted EBITDA per share, Adjusted EBITDA Margin, Adjusted Net Income and Adjusted Net Income per share are non-GAAP financial measures with no standardized meaning under IFRS and might not be comparable to similar financial measures disclosed by other issuers. Refer to the “Non-GAAP Financial Measures” section of this MD&A for more information on each non-GAAP financial measure. |
2023 Third Quarter Management’s Discussion and Analysis |
22 |
BALANCE SHEET REVIEW
Summary Balance Sheet and Key Financial Metrics
|
|
At September 30, |
|
|
At December 31, |
||
(expressed in millions, except debt to equity ratio) |
|
2023 |
|
2022 |
|
||
Cash and cash equivalents |
|
$ |
1,297.1 |
|
$ |
1,196.5 |
|
|
|
|
|
|
|
|
|
Current assets |
|
|
1,516.5 |
|
|
1,383.1 |
|
Non-current assets |
|
|
5,469.4 |
|
|
5,243.7 |
|
Total assets |
|
$ |
6,985.9 |
|
$ |
6,626.8 |
|
|
|
|
|
|
|
|
|
Current liabilities |
|
$ |
40.2 |
|
$ |
50.2 |
|
Non-current liabilities |
|
|
174.4 |
|
|
159.0 |
|
Total liabilities |
|
$ |
214.6 |
|
$ |
209.2 |
|
|
|
|
|
|
|
|
|
Total shareholders’ equity |
|
$ |
6,771.3 |
|
$ |
6,417.6 |
|
|
|
|
|
|
|
|
|
Total common shares outstanding |
|
|
192.1 |
|
|
191.9 |
|
Capital management measures |
|
|
|
|
|
|
|
Available capital |
|
$ |
2,278.2 |
|
$ |
2,177.7 |
|
Debt-to-equity |
|
|
— |
|
|
— |
|
Assets
Total assets were $6,985.9 million as at September 30, 2023 compared to $6,626.8 million as at December 31, 2022. Our non-current asset base is primarily comprised of royalty, stream and working interests, and investments, while our current assets are primarily comprised of cash and cash equivalents and receivables. The increase in assets compared to December 31, 2022 primarily reflects our higher cash and cash equivalents and an increase in our royalty, stream and working interests due to our funding of the Tocantinzinho stream deposit of $250.0 million. Our investments, which are marked-to-market at every period-end, also increased relative to December 31, 2022.
Liabilities
Total liabilities increased compared to December 31, 2022. Total liabilities as at September 30, 2023 are primarily comprised of $35.0 million of accounts payable and accrued liabilities, $5.2 million of current income tax liabilities, and $168.7 million of deferred income tax liabilities.
Shareholders’ Equity
Shareholders’ equity increased by $353.7 million compared to December 31, 2022, reflecting net income of $516.1 million. We also recorded other comprehensive income, net of tax, of $2.7 million. The increase in shareholders’ equity is partially offset by dividends of $196.2 million in YTD 2023. Of those dividends, $23.0 million were settled through the issuance of common shares pursuant to the DRIP.
2023 Third Quarter Management’s Discussion and Analysis |
23 |
Liquidity and Capital Resources
Cash flow for the three and nine months ended September 30, 2023 and 2022 was as follows:
|
|
For the three months ended |
|
|
For the nine months ended |
|
||||||||||
|
|
September 30, |
|
|
September 30, |
|
||||||||||
(expressed in millions) |
|
2023 |
|
|
2022 |
|
|
2023 |
|
|
2022 |
|
||||
Net cash provided by operating activities |
|
$ |
236.0 |
|
|
$ |
232.3 |
|
|
$ |
707.7 |
|
|
$ |
720.2 |
|
Net cash used in investing activities |
|
|
(173.7) |
|
|
|
(30.9) |
|
|
|
(436.9) |
|
|
|
(47.3) |
|
Net cash used in financing activities |
|
|
(56.8) |
|
|
|
(49.1) |
|
|
|
(170.3) |
|
|
|
(145.3) |
|
Effect of exchange rate changes on cash and cash equivalents |
|
|
(3.5) |
|
|
|
(5.5) |
|
|
|
0.1 |
|
|
|
(9.5) |
|
Net change in cash and cash equivalents |
|
$ |
2.0 |
|
|
$ |
146.8 |
|
|
$ |
100.6 |
|
|
$ |
518.1 |
|
Operating Cash Flow
Net cash provided by operating activities was $236.0 million in Q3 2023 (Q3 2022 – $232.3 million). Operating cash flow in Q3 2023 was higher compared to the same period in 2022 due to an increase in revenue and finance income, partially offset by an increase in cost of sales and non-cash working capital and a decrease in net cash flow related to gold bullion we receive as settlement for certain of our royalties.
For YTD 2023, net cash provided by operating activities was $707.7 million (YTD 2022–$720.2 million). Operating cash flow was lower compared to YTD 2022 due to a decrease revenues and net cash flow related to gold bullion we received as settlement for certain of our royalties, and cash outflows associated with the funding of cash deposits in relation to our CRA audit. These outflows were partially offset by an increase in finance income and changes in our non-cash working capital.
Investing Activities
Net cash used in investing activities was $173.7 million in Q3 2023 (Q3 2022 – $30.9 million) and primarily consisted of the acquisition of the Pascua-Lama royalties of $75.0 million, the Volcan royalty of $15.0 million, the royalty on the Wawa gold project for $5.0 million (C$6.8 million), the common shares of Gold Candle for $4.6 million (C$6.0 million), the common shares of Marathon for $3.8 million (C$5.0 million) and the funding of the Tocantinzinho stream deposit of $66.2 million and our share of royalty acquisitions through the Royalty Acquisition Venture with Continental of $3.9 million. Comparatively, investing activities in Q3 2022 primarily consisted of the acquisition of G Mining Common Shares for $27.8 million (C$35.8 million) and the funding of our share of royalty acquisitions through the Royalty Acquisition Venture with Continental of $1.9 million.
For YTD 2023, net cash used in investing activities was $436.9 million (YTD 2022 - $47.3 million) and primarily consisted of the funding of the Tocantinzinho stream deposit of $250.0 million, the acquisition of the Pascua-Lama royalties of $75.0 million, the additional royalty on Valentine Gold for $45.0 million, the Volcan royalty of $15.0 million, the royalty on Kerr-Addison for $10.0 million, the additional royalty on Caserones for $9.4 million, the royalty on the Wawa gold project for $5.0 million (C$6.8 million), the common shares of Gold Candle for $4.6 million (C$6.0 million), the common shares of Marathon for $3.8 million (C$5.0 million), cash paid on the closing of the acquisition of the portfolio of royalties from Trident for $14.3 million and the funding of our share of royalty acquisitions through the Royalty Acquisition Venture with Continental of $8.4 million. We also received $7.0 million from Marathon for the buy-back of 0.5% of the 2.0% NSR on the Valentine Gold project. Comparatively, in YTD 2022, investing activities consisted of the acquisition of the Caserones royalty for $37.4 million, G Mining Common Shares for $27.8 million (C$35.8 million), shares of EMX for $10.0 million (C$12.6 million), and the Castle Mountain royalty for $6.0 million and the funding of our share of royalty acquisitions through the Royalty Acquisition Venture with Continental of $6.6 million. These cash outlays were partially offset by the receipt of $42.7 million as repayment of our loan to Noront.
Financing Activities
For Q3 2023, net cash used by financing activities was $56.8 million (Q3 2022 – $49.1 million), reflecting the payment of dividends.
For YTD 2023, net cash used by financing activities was $170.3 million (YTD 2022 - $145.3 million), primarily reflecting the payments of dividends.
Capital Resources
Our cash and cash equivalents totaled $1,297.1 million as at September 30, 2023 (December 31, 2022 – $1,196.5 million). In addition, we held investments of $239.7 million as at September 30, 2023 (December 31, 2022 – investments of $227.2 million), of which $228.8 million was held in publicly-traded equity instruments (December 31, 2022 – $220.8 million). Of the $228.8 million held in publicly-traded equity instruments, $150.6 million relates to our holdings of LIORC (December 31, 2022 – $157.0 million).
As at the date of this MD&A, we have one revolving credit facility available. The Corporate Revolver is a $1.0 billion unsecured, revolving credit facility which has a term maturing August 15, 2027. Advances under the Corporate Revolver bear interest depending upon the currency of the advance and Franco-Nevada’s leverage ratio as referenced in Note 11 (a) of our 2022 audited consolidated financial statements. As at September 30, 2023, while we have no amounts outstanding against the Corporate Revolver, we have three standby letters of credit in the amount of $18.9 million (C$25.5 million) in relation to the audit by the
2023 Third Quarter Management’s Discussion and Analysis |
24 |
CRA, as referenced in the “Contingencies” section of this MD&A. These standby letters of credit reduce the available balance under the Corporate Revolver. As at November 8, 2023, we have a total of $981.1 million available under the Corporate Revolver.
Management’s objectives when managing capital are:
| (a) | when capital is not being used for long-term investments, ensure its preservation and availability by investing in low-risk investments with high liquidity; and |
| (b) | to ensure that adequate levels of capital are maintained to meet Franco-Nevada’s operating requirements and other current liabilities. |
As at September 30, 2023, our cash and cash equivalents are held in cash and term deposits with several financial institutions. Certain investments with maturities upon acquisition of 3 months, or 92 days or less, were classified as term deposits within cash and cash equivalents on the statement of financial position.
Our performance is impacted by foreign currency fluctuations of the Canadian dollar and Australian dollar relative to the U.S. dollar. The largest exposure is with respect to the Canadian/U.S. dollar exchange rates as we hold a significant amount of our assets in Canada and report our results in U.S. dollars. The effect of volatility in these currencies against the U.S. dollar impacts our general and administrative expenses and the depletion of our royalty, stream and working interests incurred in our Canadian and Australian entities due to their respective functional currencies. During Q3 2023, the Canadian dollar traded in a range of $0.7313 to $0.7617, ending at $0.7396, and the Australian dollar traded between $0.6371 and $0.6862, ending at $0.6426.
Our near-term cash requirements include our funding commitments towards the Tocantinzinho Term Loan, the Royalty Acquisition Venture with Continental, commitments for contingent payments under various royalty purchase agreements, various costs under our environmental and social initiatives, corporate administration costs, certain costs of operations, payment of dividends and income taxes directly related to the recognition of royalty, stream and working interest revenues. As a royalty and stream company, we are subject to limited requirements for capital expenditures other than for the acquisition of additional royalties or streams and capital commitments for our working interests. Such acquisitions are entirely discretionary and will be consummated through the use of cash, as available, or through the issuance of common shares or other equity or debt securities, or the use of our credit facility. We believe that our current cash resources, available credit facility, and future cash flows will be sufficient to cover the costs of our commitments, operating and administrative expenses, and dividend payments for the foreseeable future.
2023 Third Quarter Management’s Discussion and Analysis |
25 |
Purchase Commitments
The following table summarizes Franco-Nevada’s commitments to pay for gold, silver and PGM pursuant to the associated precious metal agreements as at September 30, 2023:
|
|
Attributable payable |
|
|
|
|
|
|
|
|
|
|
|
|
|
|
||||
|
|
production to be purchased |
|
Per ounce cash payment (1),(2) |
|
Term of |
|
Date of |
|
|||||||||||
Interest |
|
Gold |
|
Silver |
|
PGM |
|
Gold |
|
Silver |
|
PGM |
|
agreement(3) |
|
contract |
|
|||
Antamina |
|
— |
% |
22.5 |
% (4) |
— |
% |
|
n/a |
|
|
5 |
% (5) |
|
n/a |
|
40 years |
|
7-Oct-15 |
|
Antapaccay |
|
— |
% (6) |
— |
% (7) |
— |
% |
|
20 |
% (8) |
|
20 |
% (9) |
|
n/a |
|
40 years |
|
10-Feb-16 |
|
Candelaria |
|
68 |
% (10) |
68 |
% (10) |
— |
% |
$ |
400 |
|
$ |
4.00 |
|
|
n/a |
|
40 years |
|
6-Oct-14 |
|
Cobre Panama Fixed Payment Stream |
|
— |
% (11) |
— |
% (12) |
— |
% |
$ |
418 |
(13) |
$ |
6.27 |
(14) |
|
n/a |
|
40 years |
|
19-Jan-18 |
|
Cobre Panama Floating Payment Stream |
|
— |
% (15) |
— |
% (16) |
— |
% |
|
20 |
% (17) |
|
20 |
% (18) |
|
n/a |
|
40 years |
|
19-Jan-18 |
|
Condestable |
|
— |
% (19) |
— |
% (20) |
— |
% |
|
20 |
% (21) |
|
20 |
% (22) |
|
n/a |
|
40 years |
|
8-Mar-21 |
|
Guadalupe-Palmarejo |
|
50 |
% |
— |
% |
— |
% |
$ |
800 |
|
|
n/a |
|
|
n/a |
|
40 years |
|
2-Oct-14 |
|
Karma |
|
4.875 |
% |
— |
% |
— |
% |
|
20 |
% (23) |
|
n/a |
|
|
n/a |
|
40 years |
|
11-Aug-14 |
|
Sabodala |
|
— |
% (24) |
— |
% |
— |
% |
|
20 |
% (25) |
|
n/a |
|
|
n/a |
|
40 years |
|
25-Sep-20 |
|
MWS |
|
25 |
% |
— |
% |
— |
% |
$ |
400 |
|
|
n/a |
|
|
n/a |
|
40 years |
(26) |
2-Mar-12 |
|
Sudbury(27) |
|
50 |
% |
— |
% |
50 |
% |
$ |
400 |
|
|
n/a |
|
$ |
400 |
|
40 years |
|
15-Jul-08 |
|
Tocantinzinho |
|
12.5 |
% (28) |
— |
% |
— |
% |
|
20 |
% (29) |
|
n/a |
|
|
n/a |
|
40 years |
|
18-Jul-22 |
|
Cooke 4 |
|
7.0 |
% |
— |
% |
— |
% |
$ |
400 |
|
|
n/a |
|
|
n/a |
|
40 years |
|
5-Nov-09 |
|
| 1 | Subject to an annual inflationary adjustment except for Antamina, Antapaccay, Karma, Guadalupe-Palmarejo, Sabodala and Tocantinzinho. |
| 2 | Should the prevailing market price for gold be lower than this amount, the per ounce cash payment will be reduced to the prevailing market price. |
| 3 | Subject to successive extensions. |
| 4 | Subject to a fixed payability of 90%. Percentage decreases to 15% after 86 million ounces of silver has been delivered under the agreement. |
| 5 | Purchase price is 5% of the average silver price at the time of delivery. |
| 6 | Gold deliveries are referenced to copper in concentrate shipped with 300 ounces of gold delivered for each 1,000 tonnes of copper in concentrate shipped, until 630,000 ounces of gold has been delivered. Thereafter, percentage is 30% of gold shipped. |
| 7 | Silver deliveries are referenced to copper in concentrate shipped with 4,700 ounces of silver delivered for each 1,000 tonnes of copper in concentrate shipped, until 10.0 million ounces of silver has been delivered. Thereafter, percentage is 30% of silver shipped. |
| 8 | Purchase price is 20% of the spot price of gold until 750,000 ounces of gold have been delivered, thereafter the purchase price is 30% of the spot price of gold. |
| 9 | Purchase price is 20% of the spot price of silver until 12.8 million ounces of silver have been delivered, thereafter the purchase price is 30% of the spot price of silver. |
| 10 | Percentage decreases to 40% after 720,000 ounces of gold and 12.0 million ounces of silver have been delivered under the agreement. |
| 11 | Gold deliveries are indexed to copper in concentrate produced from the project. 120 ounces of gold per every 1 million pounds of copper produced until 808,000 ounces of gold delivered. Thereafter, 81 ounces of gold per 1 million pounds of copper produced until 1,716,188 ounces of gold delivered. Thereafter, 63.4% of the gold in concentrate. |
| 12 | Silver deliveries are indexed to copper in concentrate produced from the project. 1,376 ounces of silver per every 1 million pounds of copper produced until 9,842,000 ounces of silver delivered. Thereafter 1,776 ounces of silver per 1 million pounds of copper produced until 29,731,000 ounces of silver delivered. Thereafter, 62.1% of the silver in concentrate. |
| 13 | After 1,341,000 ounces of gold delivered, purchase price is the greater of 50% of spot and $418.27 per ounce, subject to an annual inflationary adjustment. As the mill throughput for 30 consecutive days commensurate with annual capacity of 58 million tonnes per annum was not reached by January 1, 2019, Franco-Nevada received a reduction of the applicable fixed gold price of $100 per ounce until the end of Q2 2023. |
| 14 | After 21,510,000 ounces of silver delivered, purchase price is the greater of 50% of spot and $6.27 per ounce, subject to an annual inflationary adjustment. |
| 15 | Gold deliveries are indexed to copper in concentrate produced from the project. 30 ounces of gold per every 1 million pounds of copper produced until 202,000 ounces of gold delivered. Thereafter 20.25 ounces of gold per 1 million pounds of copper produced until 429,047 ounces of gold delivered. Thereafter, 15.85% of the gold in concentrate. |
| 16 | Silver deliveries are indexed to copper in concentrate produced from the project. 344 ounces of silver per every 1 million pounds of copper produced until 2,460,500 ounces of silver delivered. Thereafter, 444 ounces of silver per 1 million pounds of copper produced until 7,432,750 ounces of silver delivered. Thereafter 15.53% of the silver in concentrate. |
| 17 | After 604,000 ounces of gold delivered, purchase price is 50% of the spot price of gold. As the mill throughput for 30 consecutive days commensurate with annual capacity of 58 million tonnes per annum was not reached by January 1, 2019, Franco-Nevada received a reduction of the applicable floating gold price of $100 per ounce until the end of Q2 2023. |
| 18 | After 9,618,000 ounces of silver delivered, purchase price is 50% of the spot price of silver. |
| 19 | Gold deliveries are fixed at 8,760 ounces per annum from January 1, 2021 to December 31, 2025. Thereafter, 63% of the gold in concentrate until a cumulative total of 87,600 ounces of gold delivered. Thereafter, 25% of the gold in concentrate. |
| 20 | Silver deliveries are fixed at 291,000 ounces per annum from January 1, 2021 to December 31, 2025. Thereafter, 63% of the silver in concentrate until a cumulative total of 2,910,000 ounces of silver delivered. Thereafter, 25% of the silver in concentrate. |
| 21 | Purchase price is 20% of the spot price of gold at the time of delivery. |
| 22 | Purchase price is 20% of the spot price of silver at the time of delivery. |
| 23 | Purchase price is 20% of the average gold price at the time of delivery. |
| 24 | Based on amended agreement with an effective date of September 1, 2020, gold deliveries are fixed at 783.33 ounces per month until 105,750 ounces of gold is delivered. Thereafter, percentage is 6% of gold production (subject to reconciliation after fixed delivery period to determine if Franco-Nevada would have received more or less than 105,750 ounces of gold under the original 6% variable stream for such period, entitling the operator to a credit for an over-delivery applied against future stream deliveries or a one-time additional delivery to Franco-Nevada for an under-delivery). |
| 25 | Purchase price is 20% of prevailing market price at the time of delivery. |
| 26 | Agreement is capped at 312,500 ounces of gold. |
| 27 | Franco-Nevada is committed to purchase 50% of the precious metals contained in ore from the properties. Payment is based on gold equivalent ounces. For McCreedy West, effective June 1, 2021, purchase price per gold equivalent ounce is determined based on the monthly average gold spot price: (i) when the gold spot price is less than $800 per ounce, the purchase price is the prevailing monthly average gold spot price; (ii) when the gold spot price is greater than $800 per ounce but less than $1,333 per ounce, the purchase price is $800 per ounce; (iii) when the gold spot price is greater than $1,333 per ounce but less than $2,000 per ounce, the purchase price is 60% of the prevailing monthly average gold spot price; and (iv) when the gold spot price is greater than $2,000, the purchase price is $1,200 per ounce. |
| 28 | Percentage decrease to 7.5% after 300,000 ounces of gold have been delivered under the agreement. |
| 29 | Purchase price is 20% of the spot price of gold at the time of delivery. |
2023 Third Quarter Management’s Discussion and Analysis |
26 |
Capital Commitments
As at September 30, 2023, we have the following capital commitments: (i) $75.0 million in connection with the Term Loan for the Tocantinzinho project, (ii) $71.0 million for our share of the acquisition of mineral rights acquired through the Royalty Acquisition Venture with Continental Resources, and (iii) up to $5.5 million for the joint acquisition of newly created precious metals and copper royalties sourced by EMX. Refer to the “Corporate Developments” section for further details.
We also have commitments for contingent payments in relation to various royalty agreements, as follows: (i) $12.5 million in relation to our Copper World 0.585% NSR acquired in November 2021, (ii) $8.0 million in relation to our Rio Baker (Salares Norte) royalty, (iii) $1.1 million (C$1.5 million) in relation to our Eskay Creek royalty, and (iv) $1.3 million in relation to our Rebecca royalty.
Contingencies
Canada Revenue Agency Audit
The CRA is conducting an audit of Franco-Nevada for the 2012-2019 taxation years.
Settlement of Domestic and FAPI Reassessments
In prior years, certain wholly-owned Canadian subsidiaries of the Company received Notices of Reassessment for the 2014 through 2017 taxation years (the “Domestic Reassessments”) in which the CRA increased income by adjusting the timing of the deduction of the upfront payments which were made in connection with precious metal stream agreements. This resulted in the Company being subject to an incremental payment of Federal and provincial income taxes for these years of $14.7 million (C$19.9 million) (after applying available non-capital losses and other deductions) plus interest and penalties.
In addition, in a prior year, the Company received Notices of Reassessment for the 2012 and 2013 taxation years (the “FAPI Reassessments”) in relation to its Barbadian subsidiary. The FAPI Reassessments asserted that a majority of the income relating to precious metal streams earned by the Barbadian subsidiary, in those years, should have been included in the income of its Canadian parent company and subject to tax in Canada as Foreign Accrual Property Income (“FAPI”). The CRA noted that its position may not extend beyond the 2013 taxation year. The FAPI Reassessments resulted in additional Federal and provincial income taxes of $5.7 million (C$7.7 million) plus interest and penalties.
On April 28, 2023, the Company reached a settlement with the CRA in respect of the Domestic and FAPI Reassessments, which provide for these reassessments to be vacated entirely on a without-cost basis. Under the settlement, the CRA accepts the manner in which the Company deducts upfront payments made in connection with precious metal stream agreements for Canadian tax purposes. This would result in no FAPI in 2012 and 2013 as computed under Canadian tax law. While the settlement of the Domestic Reassessment only addresses the taxation years that were reassessed (2014-2017), the Company’s expectation is that the manner in which it deducts upfront payments made in connection with precious metal stream agreements for Canadian tax purposes will now be accepted by the CRA for the subsequent years.
The Company had posted security in cash for 50% of the reassessed amounts under the Domestic and FAPI Reassessments and expects this amount totaling $13.9 million (C$17.7 million), as referenced in Note 6 of the financial statements, to be fully recovered. Subsequent to quarter-end, in October 2023, the CRA returned $9.9 million (C$12.5 million) of these deposits.
2023 Third Quarter Management’s Discussion and Analysis |
27 |
Transfer Pricing Reassessments
The Company has received reassessments from the CRA made on the basis of the transfer pricing provisions in the Income Tax Act (Canada) (the “Act”). The following table provides a summary of the CRA audit and reassessment matters further detailed below:
|
CRA Position |
Taxation Years Reassessed |
Potential Exposure for Tax, Interest and Penalties (in millions) |
|
Transfer Pricing (Mexico) |
Transfer pricing provisions in the Act apply such that a majority of the income earned by the Company’s Mexican subsidiary should be included in the income of the Company and subject to tax in Canada. |
2013, 2014, 2015, 2016 |
For 2013-2016: Tax: $22.1 (C$29.9) Transfer pricing penalties: $9.0 (C$12.0) Interest and other penalties: $13.4 (C$18.1) The amounts set forth above do not include any potential relief under the Canada-Mexico tax treaty. The Company’s Mexican subsidiary ceased operations after 2016 and no reassessments for this issue are expected for subsequent years. |
|
Transfer Pricing (Barbados) |
Transfer pricing provisions in the Act apply such that a majority of the income relating to certain precious metal streams earned by the Company’s Barbadian subsidiary should be included in the income of the Company and subject to tax in Canada. |
2014, 2015, 2016, 2017 |
For 2014-2017: Tax: $34.5 (C$46.5) Transfer pricing penalties: $13.0 (C$17.6) Interest and other penalties: $13.2 (C$18.0) If the CRA were to reassess the 2018-2022 taxation years on the same basis: Tax: $217.2 (C$293.7) Transfer pricing penalties: $82.0 (C$110.9) Interest and other penalties: $38.5 (C$52.0) |
| a) | Mexico (2013-2016) |
In December 2018 and December 2019, the Company received Notices of Reassessment from the CRA for the 2013 taxation year (the “2013 Reassessment”) and for the 2014 and 2015 taxation years (the “2014 and 2015 Reassessments”, collectively with the 2013 Reassessment, the “2013-2015 Reassessments”) in relation to its Mexican subsidiary. The reassessments were made on the basis of the transfer pricing provisions in the Act and assert that a majority of the income earned by the Mexican subsidiary should have been included in the income of the Company and subject to tax in Canada. The 2013-2015 Reassessments result in additional Federal and provincial income taxes of $18.7 million (C$25.3 million) plus estimated interest (calculated to September 30, 2023) and other penalties of $12.1 million (C$16.4 million) but before any relief under the Canada-Mexico tax treaty. The Company has filed formal Notices of Objection with the CRA against the 2013-2015 Reassessments and has posted security in the form of a standby letter of credit for 50% of the reassessed amounts, as referenced in Note 9 of the financial statements.
In December 2020, the CRA issued revised 2013-2015 Reassessments to include transfer pricing penalties of $7.7 million (C$10.3 million). The Company has filed formal Notices of Objection with the CRA against these revised reassessments and has posted security in the form of cash for 50% of the reassessed amounts of penalties, as referenced in Note 8 of the financial statements. The Company has commenced an appeal in the Tax Court of Canada with respect to the 2013-2015 Reassessments.
In December 2021, the Company received a Notice of Reassessment for the 2016 taxation year (the “2016 Reassessment”) on the same basis as the 2013-2015 Reassessments, resulting in additional Federal and provincial income taxes of $3.4 million (C$4.6 million) plus estimated interest (calculated to September 30, 2023) and other penalties of $1.3 million (C$1.7 million) but before any relief under the Canada-Mexico tax treaty.
The Company has filed a formal Notice of Objection with the CRA against the 2016 Reassessment and has posted security in the form of cash for 50% of the reassessed amounts, as referenced in Note 8 of the financial statements. Subsequent to quarter-end on October 26, 2023, the Company received a revised 2016 Reassessment to include transfer pricing penalties of $1.3 million (C$1.7 million). The Company disagrees and intends to file a Notice of Objection against this revised reassessment. The Company’s Mexican subsidiary ceased operations after 2016 and no reassessments are expected for subsequent years.
For taxation years 2013 through 2016, the Company’s Mexican subsidiary paid a total of $34.1 million (490.3 million Pesos) in cash taxes, at a 30% tax rate, to the Mexican tax authorities on income earned in Mexico. If required, the Company intends to seek relief from double taxation under the Canada-Mexico tax treaty.
| b) | Barbados (2014-2017) |
The 2014 and 2015 Reassessments also reassess the Company in relation to its Barbadian subsidiary. The reassessments were made on the basis of the transfer pricing provisions in the Act and assert that a majority of the income relating to certain precious metal streams earned by the Barbadian subsidiary should have been included in the income of the Company and subject to tax in Canada, resulting in additional Federal and provincial income taxes of $5.0 million (C$6.7 million) plus estimated interest (calculated to September 30, 2023) and other penalties of $3.0 million (C$4.1 million). As
2023 Third Quarter Management’s Discussion and Analysis |
28 |
noted previously, the Company has filed formal Notices of Objection with the CRA against the 2014 and 2015 Reassessments and has posted security in the form of a standby letter of credit for 50% of the reassessed amounts, as referenced in Note 9 of the financial statements.
As noted above, in December 2020, the CRA issued revised 2014 and 2015 Reassessments to include transfer pricing penalties of $1.8 million (C$2.5 million). The Company has filed formal Notices of Objection with the CRA against these revised reassessments and has posted security in the form of cash for 50% of the reassessed amounts of penalties, as referenced in Note 8 of the financial statements. The Company has commenced an appeal in the Tax Court of Canada with respect to the 2014-2015 Reassessments.
In December 2021, the Company received the 2016 Reassessment as well as a Notice of Reassessment for the 2017 taxation year (the “2017 Reassessment”, collectively with the 2016 Reassessment, the “2016 and 2017 Reassessments” and collectively with the 2013-2015 Reassessments, the “Transfer Pricing Reassessments”) that reassess the Company in relation to its Barbadian subsidiary on the same basis as the 2014 and 2015 Reassessments, resulting in additional Federal and provincial income taxes of $29.5 million (C$39.8 million) plus estimated interest (calculated to September 30, 2023) and other penalties of $10.2 million (C$13.9 million). The Company has filed formal Notices of Objection with the CRA against the 2016 and 2017 Reassessments and has posted security in the form of cash for 50% of the reassessed amounts, as referenced in Note 8 of the financial statements. Subsequent to quarter-end, on October 26, 2023, the Company received revised 2016 and 2017 Reassessments to include transfer pricing penalties of $11.2 million (C$15.1 million). The Company disagrees and intends to file Notices of Objection against these revised reassessments.
If the CRA were to reassess the Company for taxation years 2018 through 2022 on the same basis and continue to apply transfer pricing penalties, the Company estimates that it would be subject to additional Canadian tax for these years of approximately $217.2 million (C$293.7 million), transfer pricing penalties of approximately $82.0 million (C$110.9 million) plus interest (calculated to September 30, 2023) and other penalties of approximately $38.5 million (C$52.0 million).
Management believes that the Company and its subsidiaries have filed all tax returns and paid all applicable taxes in compliance with Canadian and applicable foreign tax laws and, as a result, no liabilities have been recorded in the financial statements of the Company for the Transfer Pricing Reassessments, or for any potential tax exposure that may arise in respect of these matters. The Company does not believe that the Transfer Pricing Reassessments are supported by Canadian tax law and jurisprudence and intends to vigorously defend its tax filing positions.
The CRA audit is ongoing and there can be no assurance that the CRA will not further challenge the manner in which the Company or any of its subsidiaries has filed its tax returns and reported its income. In the event that the CRA successfully challenges the manner in which the Company or a subsidiary has filed its tax returns and reported its income, this could potentially result in additional income taxes, penalties and interest, which could have a material adverse effect on the Company.
CRITICAL ACCOUNTING POLICIES AND ESTIMATES
The preparation of consolidated financial statements in accordance with IFRS requires the Company to make judgments, estimates and assumptions that affect the reported amounts of assets and liabilities and disclosures of contingent assets and liabilities at the date of the consolidated financial statements and the reported amounts of revenues and expenses during the reporting period. Estimates and assumptions are continuously evaluated and are based on management’s best knowledge of the relevant facts and circumstances, having regard to previous experience. However, actual outcomes may differ from the amounts included in the consolidated financial statements.
Our significant accounting policies and estimates are disclosed in Notes 2 and 3 of our 2022 audited consolidated financial statements, and Note 2 of our unaudited condensed consolidated interim financial statements for the three and nine months ended September 30, 2023.
New and Amended Accounting Standards
International Tax Reform – Pillar Two Model Rules – Amendments to IAS 12, Income Taxes
On May 23, 2023, the IASB issued International Tax Reform – Pillar Two Model Rules – Amendments to IAS 12. The amendments introduce a mandatory temporary exception to the accounting for deferred taxes arising from the jurisdictional implementation of the Pillar Two model rules, and disclosure requirements for affected entities to help users of the financial statements better understand an entity’s exposure to Pillar Two income taxes arising from that legislation.
The temporary exception from recognition and disclosure of information about deferred taxes and the requirement to disclose the application of the exception, apply immediately and retrospectively upon issue of the amendments. The disclosure of the current tax expense related to Pillar Two income taxes and the disclosures in relation to periods before the legislation is effective are required for annual reporting periods beginning on or after January 1, 2023, but are not required for any interim period ending on or before December 31, 2023.
The Company is assessing the impact of the amendments on its consolidated financial statements.
RISKS AND UNCERTAINTIES
Additional information related to Franco-Nevada, including our Annual Information Form and Form 40-F, are available on SEDAR+ at www.sedarplus.com and on EDGAR at www.sec.gov, respectively. These documents contain descriptions of certain of Franco-Nevada’s producing and advanced royalty and stream assets, as well as a description of risk factors affecting the Company.
2023 Third Quarter Management’s Discussion and Analysis |
29 |
Revised Concession Contract for the Cobre Panama Mine
First Quantum, MPSA and the GOP have been engaged in discussions regarding a revised concession contract to secure the long-term future of the Cobre Panama mine. On March 8, 2023, First Quantum and the GOP announced that an agreement had been reached on the terms and conditions for a revised concession contract, with subsequent modifications. The Revised Concession Contract provides for an initial 20-year term with a 20-year extension option and additional extensions for life of mine. On October 20, 2023, the Revised Concession Contract was enacted into Law 406.
In response to protests and social unrest in the country of Panama, on October 29, 2023, President Laurentino Cortizo announced the GOP’s intention to hold a popular consultation on December 17, 2023, concerning Law 406. The proposal to hold a popular consultation was debated at the National Assembly on October 31, 2023. However, while the bill proposing the popular consultation, Bill 1109, was approved at the first debate, it did not ultimately progress to a second or third debate.
On November 3, 2023, the National Assembly approved Bill 1110, prohibiting new concessions for the exploration, extraction, transportation, and beneficiation of metallic mining throughout the country, and the bill was subsequently enacted into Law 407. The bill did not include a repeal of Law 406.
As of the date of this MD&A, Law 406 and the Revised Concession Contract currently remain in effect. However, a number of lawsuits challenging the constitutionality of Law 406 have been submitted to the Supreme Court of Justice, a number of which have been admitted for adjudication.
The outcome of these matters could have a material adverse impact on the revenue Franco-Nevada derives from its streaming arrangements relating to Cobre Panama and on Franco-Nevada’s results of operations, financial condition, and the valuation of Franco-Nevada’s stream interest in Cobre Panama. As at September 30, 2023, the carrying value of the Company’s stream interest in Cobre Panama was $1,180.3 million.
Changes in tax legislation or accounting rules could affect the profitability of Franco-Nevada
Canada, together with approximately 140 other countries comprising the OECD/G20 Inclusive Framework on BEPS (Base Erosion and Profit Shifting) (the “Inclusive Framework”), agreed to in principle in 2021, certain base erosion tax initiatives, including the introduction of a 15% global minimum tax (“Pillar Two”) that applies to large multinational enterprise groups with global consolidated revenues over €750 million.
On March 28, 2023, the Government of Canada reaffirmed its intention to implement Pillar Two effective for fiscal years that begin on or after December 31, 2023. On August 4, 2023, the government released for consultation draft legislation, which is intended to closely follow the detailed model rules, commentary, and administrative guidance agreed to by the Inclusive Framework. Subsequent to the quarter-end, on November 7, 2023, the Government of Barbados announced proposed rules in response to Pillar Two. Management has been evaluating the Pillar Two proposals, and is reviewing the Canadian draft legislation and the Barbados proposed rules and assessing their impact to the Company.
If the draft rules are enacted or substantively enacted, it would result in Franco-Nevada’s profits being subject to additional taxation.
Changes to, or differing interpretation of, taxation laws or regulations in any of Canada, the United States, Mexico, Barbados, Australia, Chile, Peru, Brazil or any of the countries in which Franco-Nevada’s assets or relevant contracting parties are located could result in some or all of Franco-Nevada’s profits being subject to additional taxation. No assurance can be given that new taxation rules or accounting policies will not be enacted or that existing rules will not be applied in a manner which could result in Franco-Nevada’s profits being subject to additional taxation or which could otherwise have a material adverse effect on Franco-Nevada’s profitability, results of operations, financial condition and the trading price of Franco-Nevada securities. In addition, the introduction of new tax rules or accounting policies, or changes to, or differing interpretations of, or application of, existing tax rules or accounting policies could make royalties, streams or other investments by Franco-Nevada less profitable to Franco-Nevada and/or less attractive to counterparties. Such changes could adversely affect Franco-Nevada’s after-tax income and/or its ability to acquire new assets or make future investments.
OUTSTANDING SHARE DATA
Franco-Nevada is authorized to issue an unlimited number of common and preferred shares. A detailed description of the rights, privileges, restrictions and conditions attached to each class of authorized shares is included in our most recent Annual Information Form, a copy of which can be found on SEDAR+ at www.sedarplus.com and in our Form 40-F, a copy of which can be found on EDGAR at www.sec.gov.
As of November 8, 2023, the number of common shares outstanding or issuable pursuant to other outstanding securities is as follows:
Common Shares |
|
Number |
|
Outstanding |
|
192,119,414 |
|
Issuable upon exercise of Franco-Nevada options(1) |
|
663,653 |
|
Issuable upon vesting of Franco-Nevada RSUs |
|
102,104 |
|
Diluted common shares |
|
192,885,171 |
|
| 1 | There were 663,653 stock options under our share compensation plan outstanding to directors, officers, employees and others with exercise prices ranging from C$40.87 to C$194.65 per share. |
During the nine months ended September 30, 2023, we did not issue or have any outstanding preferred shares.
2023 Third Quarter Management’s Discussion and Analysis |
30 |
INTERNAL CONTROL OVER FINANCIAL REPORTING AND DISCLOSURE CONTROLS AND PROCEDURES
Our management is responsible for establishing and maintaining Franco-Nevada’s internal control over financial reporting and other financial disclosure and our disclosure controls and procedures.
Internal control over financial reporting is a process designed to provide reasonable assurance regarding the reliability of financial reporting and the preparation of financial statements for external purposes in accordance with IFRS. Franco-Nevada’s internal control over financial reporting includes those policies and procedures that (i) pertain to the maintenance of records that, in reasonable detail, accurately and fairly reflect the transactions and dispositions of the assets of Franco-Nevada; (ii) are designed to provide reasonable assurance that transactions are recorded as necessary to permit preparation of financial statements in accordance with IFRS, and that receipts and expenditures of Franco-Nevada are being made only in accordance with authorizations of management and directors of Franco-Nevada; and (iii) are designed to provide reasonable assurance regarding prevention or timely detection of unauthorized acquisition, use or disposition of Franco-Nevada’s assets that could have a material effect on Franco-Nevada’s financial statements. Internal control over other financial disclosure is a process designed to ensure that other financial information included in this MD&A, fairly represents in all material respects the financial condition, results of operations and cash flows of Franco-Nevada for the periods presented in this MD&A.
Franco-Nevada’s disclosure controls and procedures are designed to provide reasonable assurance that material information relating to Franco-Nevada, including its consolidated subsidiaries, is made known to management by others within those entities, particularly during the period in which this MD&A is prepared and that information required to be disclosed by Franco-Nevada in its annual filings, interim filings or other reports filed or submitted by it under securities legislation is recorded, processed, summarized and reported within the time periods specified in securities legislation.
Due to its inherent limitations, internal control over financial reporting and other financial disclosure may not prevent or detect all misstatements. Also, projections of any evaluation of effectiveness to future periods are subject to the risk that controls may become inadequate because of changes in conditions, or that the degree of compliance with the policies or procedures may change.
For the three and nine months ended September 30, 2023, there has been no change in Franco-Nevada’s internal control over financial reporting that has materially affected, or is reasonably likely to materially affect, Franco-Nevada’s internal control over financial reporting.
NON-GAAP FINANCIAL MEASURES
Cash Costs and Cash Costs per GEO
Cash Costs and Cash Costs per GEO sold are non-GAAP financial measures. Cash Costs is defined by Franco-Nevada as total costs of sales less depletion and depreciation expense. Cash Costs per GEO sold are calculated by dividing Cash Costs by the number of GEOs sold in the period, excluding prepaid GEOs.
Management uses Cash Costs and Cash Costs per GEO sold to evaluate Franco-Nevada’s ability to generate positive cash flow from its royalty, stream and working interests. Management and certain investors also use this information to evaluate Franco-Nevada’s performance relative to peers in the mining industry who present this measure on a similar basis. Cash Costs and Cash Costs per GEO are only intended to provide additional information to investors and analysts and should not be considered in isolation or as a substitute for measures of performance prepared in accordance with IFRS. They do not have any standardized meaning under IFRS and may not be comparable to similar measures presented by other issuers.
Reconciliation of Cash Costs and Cash Costs per GEO sold:
|
|
For the three months ended |
|
For the nine months ended |
|
|||||||||||
|
|
September 30, |
|
|
September 30, |
|
||||||||||
(expressed in millions, except per GEO amounts) |
|
2023 |
|
|
2022 |
|
|
2023 |
|
|
2022 |
|
||||
Total costs of sales |
|
$ |
117.0 |
|
|
$ |
110.5 |
|
|
$ |
338.4 |
|
|
$ |
343.8 |
|
Depletion and depreciation |
|
|
(68.1) |
|
|
|
(68.5) |
|
|
|
(204.2) |
|
|
|
(212.7) |
|
Cash Costs |
|
$ |
48.9 |
|
|
$ |
42.0 |
|
|
$ |
134.2 |
|
|
$ |
131.1 |
|
GEOs |
|
|
160,848 |
|
|
|
176,408 |
|
|
|
474,694 |
|
|
|
546,074 |
|
Cash Costs per GEO sold |
|
$ |
304 |
|
|
$ |
238 |
|
|
$ |
283 |
|
|
$ |
240 |
|
2023 Third Quarter Management’s Discussion and Analysis |
31 |
Adjusted EBITDA and Adjusted EBITDA per Share
Adjusted EBITDA and Adjusted EBITDA per share are non-GAAP financial measures, which is defined by Franco-Nevada by excluding the following from net income (loss) and earnings (loss) per share (“EPS”):
| ● | Income tax expense/recovery; |
| ● | Finance expenses; |
| ● | Finance income; |
| ● | Depletion and depreciation; |
| ● | Impairment charges and reversals related to royalty, stream and working interests; |
| ● | Impairment of investments; |
| ● | Gains/losses on sale of royalty, stream and working interests; |
| ● | Gains/losses on investments; |
| ● | Foreign exchange gains/losses and other income/expenses; and |
| ● | Unusual non-recurring items. |
Management uses Adjusted EBITDA and Adjusted EBITDA per share to evaluate the underlying operating performance of Franco-Nevada as a whole for the reporting periods presented, to assist with the planning and forecasting of future operating results, and to supplement information in its financial statements. Management believes that in addition to measures prepared in accordance with IFRS such as net income and EPS, our investors and analysts use Adjusted EBITDA and Adjusted EBITDA per share to evaluate the results of the underlying business of Franco-Nevada, particularly since the excluded items are typically not included in our guidance, with the exception of depletion and depreciation expense. While the adjustments to net income and EPS in these measures include items that are both recurring and non-recurring, management believes that Adjusted EBITDA and Adjusted EBITDA per share are useful measures of Franco-Nevada’s performance because they adjust for items which may not relate to or have a disproportionate effect on the period in which they are recognized, impact the comparability of our core operating results from period to period, are not always reflective of the underlying operating performance of our business and/or are not necessarily indicative of future operating results. Adjusted EBITDA and Adjusted EBITDA per share are only intended to provide additional information to investors and analysts and should not be considered in isolation or as a substitute for measures of performance prepared in accordance with IFRS. They do not have any standardized meaning under IFRS and may not be comparable to similar measures presented by other issuers.
Reconciliation of Net Income to Adjusted EBITDA:
|
|
For the three months ended |
|
|
For the nine months ended |
|
||||||||||
|
|
September 30, |
|
|
September 30, |
|
||||||||||
(expressed in millions, except per share amounts) |
|
2023 |
|
|
2022 |
|
|
2023 |
|
|
2022 |
|
||||
Net income |
|
$ |
175.1 |
|
|
$ |
157.1 |
|
|
$ |
516.1 |
|
|
$ |
535.6 |
|
Income tax expense |
|
|
24.9 |
|
|
|
30.4 |
|
|
|
79.5 |
|
|
|
103.1 |
|
Finance expenses |
|
|
0.7 |
|
|
|
0.8 |
|
|
|
2.1 |
|
|
|
2.5 |
|
Finance income |
|
|
(15.5) |
|
|
|
(2.4) |
|
|
|
(36.0) |
|
|
|
(5.9) |
|
Depletion and depreciation |
|
|
68.1 |
|
|
|
68.5 |
|
|
|
204.2 |
|
|
|
212.7 |
|
Gain on sale of royalty interest |
|
|
— |
|
|
|
— |
|
|
|
(3.7) |
|
|
|
— |
|
Foreign exchange loss (gain) and other (income) expenses |
|
|
1.8 |
|
|
|
2.3 |
|
|
|
(2.1) |
|
|
|
(3.5) |
|
Adjusted EBITDA |
|
$ |
255.1 |
|
|
$ |
256.7 |
|
|
$ |
760.1 |
|
|
$ |
844.5 |
|
Basic weighted average shares outstanding |
|
|
192.1 |
|
|
|
191.6 |
|
|
|
192.0 |
|
|
|
191.5 |
|
|
|
|
|
|
|
|
|
|
|
|
|
|
|
|
|
|
Basic earnings per share |
|
$ |
0.91 |
|
|
$ |
0.82 |
|
|
$ |
2.69 |
|
|
$ |
2.80 |
|
Income tax expense |
|
|
0.13 |
|
|
|
0.16 |
|
|
|
0.41 |
|
|
|
0.54 |
|
Finance expenses |
|
|
— |
|
|
|
— |
|
|
|
0.01 |
|
|
|
0.01 |
|
Finance income |
|
|
(0.08) |
|
|
|
(0.01) |
|
|
|
(0.19) |
|
|
|
(0.03) |
|
Depletion and depreciation |
|
|
0.35 |
|
|
|
0.36 |
|
|
|
1.06 |
|
|
|
1.11 |
|
Gain on sale of royalty interest |
|
|
— |
|
|
|
— |
|
|
|
(0.02) |
|
|
|
— |
|
Foreign exchange loss (gain) and other (income) expenses |
|
|
0.02 |
|
|
|
0.01 |
|
|
|
— |
|
|
|
(0.02) |
|
Adjusted EBITDA per share |
|
$ |
1.33 |
|
|
$ |
1.34 |
|
|
$ |
3.96 |
|
|
$ |
4.41 |
|
2023 Third Quarter Management’s Discussion and Analysis |
32 |
Adjusted EBITDA Margin
Adjusted EBITDA Margin is a non-GAAP ratio which is defined by Franco-Nevada as Adjusted EBITDA divided by revenue. Franco-Nevada uses Adjusted EBITDA Margin in its annual incentive compensation process to evaluate management’s performance in increasing revenue and containing costs. Management believes that in addition to measures prepared in accordance with IFRS, our investors and analysts use Adjusted EBITDA Margin to evaluate the Company’s ability to contain costs relative to revenue. Adjusted EBITDA Margin is intended to provide additional information to investors and analysts and should not be considered in isolation or as a substitute for measures of performance prepared in accordance with IFRS. It does not have any standardized meaning under IFRS and may not be comparable to similar measures presented by other issuers.
Calculation of Adjusted EBITDA Margin:
|
|
For the three months ended |
|
|
For the nine months ended |
|
||||||||||
|
|
September 30, |
|
|
September 30, |
|
||||||||||
(expressed in millions, except Adjusted EBITDA Margin) |
|
2023 |
|
|
2022 |
|
|
2023 |
|
|
2022 |
|
||||
Adjusted EBITDA |
|
$ |
255.1 |
|
|
$ |
256.7 |
|
|
$ |
760.1 |
|
|
$ |
844.5 |
|
Revenue |
|
|
309.5 |
|
|
|
304.2 |
|
|
|
915.7 |
|
|
|
995.3 |
|
Adjusted EBITDA Margin |
|
|
82.4 |
% |
|
|
84.4 |
% |
|
|
83.0 |
% |
|
|
84.8 |
% |
Adjusted Net Income and Adjusted Net Income per Share
Adjusted Net Income and Adjusted Net Income per share are non-GAAP financial measures, which is defined by Franco-Nevada by excluding the following from net income (loss) and EPS:
| ● | Foreign exchange gains/losses and other income/expenses; |
| ● | Impairment charges and reversals related to royalty, stream and working interests; |
| ● | Impairment of investments; |
| ● | Gains/losses on sale of royalty, stream and working interests; |
| ● | Gains/losses on investments; |
| ● | Unusual non-recurring items; and |
| ● | Impact of income taxes on these items. |
Management uses Adjusted Net Income and Adjusted Net Income per share to evaluate the underlying operating performance of Franco-Nevada as a whole for the reporting periods presented, to assist with the planning and forecasting of future operating results, and to supplement information in its financial statements. Management believes that in addition to measures prepared in accordance with IFRS such as net income and EPS, our investors and analysts use Adjusted Net Income and Adjusted Net Income per share to evaluate the results of the underlying business of Franco-Nevada, particularly since the excluded items are typically not included in our guidance. While the adjustments to net income and EPS in these measures include items that are both recurring and non-recurring, management believes that Adjusted Net Income and Adjusted Net Income per share are useful measures of Franco-Nevada’s performance because they adjust for items which may not relate to or have a disproportionate effect on the period in which they are recognized, impact the comparability of our core operating results from period to period, are not always reflective of the underlying operating performance of our business and/or are not necessarily indicative of future operating results. Adjusted Net Income and Adjusted Net Income per share are intended to provide additional information to investors and analysts and should not be considered in isolation or as a substitute for measures of performance prepared in accordance with IFRS. They do not have any standardized meaning under IFRS and may not be comparable to similar measures presented by other issuers.
Reconciliation of Net Income to Adjusted Net Income:
|
|
For the three months ended |
|
For the nine months ended |
|
|||||||||||
|
|
September 30, |
|
|
September 30, |
|
||||||||||
(expressed in millions, except per share amounts) |
|
2023 |
|
|
2022 |
|
|
2023 |
|
|
2022 |
|
||||
Net income |
|
$ |
175.1 |
|
|
$ |
157.1 |
|
|
$ |
516.1 |
|
|
$ |
535.6 |
|
Gain on sale of royalty interest |
|
|
— |
|
|
|
— |
|
|
|
(3.7) |
|
|
|
— |
|
Foreign exchange loss (gain) and other (income) expenses |
|
|
1.8 |
|
|
|
2.3 |
|
|
|
(2.1) |
|
|
|
(3.5) |
|
Finance income related to repayment of Noront Loan |
|
|
— |
|
|
|
— |
|
|
|
— |
|
|
|
(2.2) |
|
Tax effect of adjustments |
|
|
(1.8) |
|
|
|
0.3 |
|
|
|
(0.1) |
|
|
|
2.8 |
|
Adjusted Net Income |
|
$ |
175.1 |
|
|
$ |
159.7 |
|
|
$ |
510.2 |
|
|
$ |
532.7 |
|
Basic weighted average shares outstanding |
|
|
192.1 |
|
|
|
191.6 |
|
|
|
192.0 |
|
|
|
191.5 |
|
|
|
|
|
|
|
|
|
|
|
|
|
|
|
|
|
|
Basic earnings per share |
|
$ |
0.91 |
|
|
$ |
0.82 |
|
|
$ |
2.69 |
|
|
$ |
2.80 |
|
Gain on sale of royalty interest |
|
|
— |
|
|
|
— |
|
|
|
(0.02) |
|
|
|
— |
|
Foreign exchange loss (gain) and other (income) expenses |
|
|
0.01 |
|
|
|
0.01 |
|
|
|
(0.01) |
|
|
|
(0.02) |
|
Finance income related to repayment of Noront Loan |
|
|
— |
|
|
|
— |
|
|
|
— |
|
|
|
(0.01) |
|
Tax effect of adjustments |
|
|
(0.01) |
|
|
|
— |
|
|
|
— |
|
|
|
0.01 |
|
Adjusted Net Income per share |
|
$ |
0.91 |
|
|
$ |
0.83 |
|
|
$ |
2.66 |
|
|
$ |
2.78 |
|
2023 Third Quarter Management’s Discussion and Analysis |
33 |
CAUTIONARY STATEMENT ON FORWARD-LOOKING INFORMATION
THIS MD&A CONTAINS “FORWARD-LOOKING INFORMATION” AND “FORWARD-LOOKING STATEMENTS” WITHIN THE MEANING OF APPLICABLE CANADIAN SECURITIES LAWS AND THE UNITED STATES PRIVATE SECURITIES LITIGATION REFORM ACT OF 1995, RESPECTIVELY, WHICH MAY INCLUDE, BUT ARE NOT LIMITED TO, STATEMENTS WITH RESPECT TO FUTURE EVENTS OR FUTURE PERFORMANCE, MANAGEMENT’S EXPECTATIONS REGARDING FRANCO-NEVADA’S GROWTH, RESULTS OF OPERATIONS, ESTIMATED FUTURE REVENUES, PERFORMANCE GUIDANCE, CARRYING VALUE OF ASSETS, FUTURE DIVIDENDS AND REQUIREMENTS FOR ADDITIONAL CAPITAL, MINERAL RESOURCE AND MINERAL RESERVE ESTIMATES, PRODUCTION ESTIMATES, PRODUCTION COSTS AND REVENUE, FUTURE DEMAND FOR AND PRICES OF COMMODITIES, EXPECTED MINING SEQUENCES, BUSINESS PROSPECTS AND OPPORTUNITIES, THE PERFORMANCE AND PLANS OF THIRD PARTY OPERATORS, AUDITS BEING CONDUCTED BY THE CRA, THE EXPECTED EXPOSURE FOR CURRENT AND FUTURE TAX ASSESSMENTS AND AVAILABLE REMEDIES, STATEMENTS WITH RESPECT TO LAW 406, THE LAW THAT APPROVED THE REVISED CONCESSION CONTRACT FOR THE COBRE PANAMA MINE, INCLUDING, BUT NOT LIMITED TO CONSTITUTIONAL CHALLENGES, POPULAR CONSULTATIONS OR ANY GOVERNMENT OF PANAMA BILLS RELATING TO LAW 406, AND STATEMENTS RELATING TO THE CONTINUED OPERATION OF AND PROTESTS IMPACTING THE COBRE PANAMA MINE. IN ADDITION, STATEMENTS RELATING TO RESOURCES AND RESERVES, GEOS OR MINE LIFE ARE FORWARD-LOOKING STATEMENTS, AS THEY INVOLVE IMPLIED ASSESSMENT, BASED ON CERTAIN ESTIMATES AND ASSUMPTIONS, AND NO ASSURANCE CAN BE GIVEN THAT THE ESTIMATES AND ASSUMPTIONS ARE ACCURATE AND THAT SUCH RESOURCES AND RESERVES, GEOS OR MINE LIFE WILL BE REALIZED. SUCH FORWARD-LOOKING STATEMENTS REFLECT MANAGEMENT’S CURRENT BELIEFS AND ARE BASED ON INFORMATION CURRENTLY AVAILABLE TO MANAGEMENT. OFTEN, BUT NOT ALWAYS, FORWARD-LOOKING STATEMENTS CAN BE IDENTIFIED BY THE USE OF WORDS SUCH AS “PLANS”, “EXPECTS”, “IS EXPECTED”, “BUDGETS”, “POTENTIAL FOR”, “SCHEDULED”, “ESTIMATES”, “FORECASTS”, “PREDICTS”, “PROJECTS”, “INTENDS”, “TARGETS”, “AIMS”, “ANTICIPATES” OR “BELIEVES” OR VARIATIONS (INCLUDING NEGATIVE VARIATIONS) OF SUCH WORDS AND PHRASES OR MAY BE IDENTIFIED BY STATEMENTS TO THE EFFECT THAT CERTAIN ACTIONS “MAY”, “COULD”, “SHOULD”, “WOULD”, “MIGHT” OR “WILL” BE TAKEN, OCCUR OR BE ACHIEVED. FORWARD-LOOKING STATEMENTS INVOLVE KNOWN AND UNKNOWN RISKS, UNCERTAINTIES AND OTHER FACTORS, WHICH MAY CAUSE THE ACTUAL RESULTS, PERFORMANCE OR ACHIEVEMENTS OF FRANCO-NEVADA TO BE MATERIALLY DIFFERENT FROM ANY FUTURE RESULTS, PERFORMANCE OR ACHIEVEMENTS EXPRESSED OR IMPLIED BY THE FORWARD-LOOKING STATEMENTS. A NUMBER OF FACTORS COULD CAUSE ACTUAL EVENTS OR RESULTS TO DIFFER MATERIALLY FROM ANY FORWARD-LOOKING STATEMENT, INCLUDING, WITHOUT LIMITATION: FLUCTUATIONS IN THE PRICES OF THE PRIMARY COMMODITIES THAT DRIVE ROYALTY AND STREAM REVENUE (GOLD, PLATINUM GROUP METALS, COPPER, NICKEL, URANIUM, SILVER, IRON ORE AND OIL AND GAS); FLUCTUATIONS IN THE VALUE OF THE CANADIAN AND AUSTRALIAN DOLLAR, MEXICAN PESO, AND ANY OTHER CURRENCY IN WHICH REVENUE IS GENERATED, RELATIVE TO THE U.S. DOLLAR; CHANGES IN NATIONAL AND LOCAL GOVERNMENT LEGISLATION, INCLUDING PERMITTING AND LICENSING REGIMES AND TAXATION POLICIES AND THE ENFORCEMENT THEREOF; THE ADOPTION OF A GLOBAL MINIMUM TAX ON CORPORATIONS; REGULATORY, POLITICAL OR ECONOMIC DEVELOPMENTS IN ANY OF THE COUNTRIES WHERE PROPERTIES IN WHICH FRANCO-NEVADA HOLDS A ROYALTY, STREAM OR OTHER INTEREST ARE LOCATED OR THROUGH WHICH THEY ARE HELD; RISKS RELATED TO THE OPERATORS OF THE PROPERTIES IN WHICH FRANCO-NEVADA HOLDS A ROYALTY, STREAM OR OTHER INTEREST, INCLUDING CHANGES IN THE OWNERSHIP AND CONTROL OF SUCH OPERATORS; RELINQUISHMENT OR SALE OF MINERAL PROPERTIES; INFLUENCE OF MACROECONOMIC DEVELOPMENTS; BUSINESS OPPORTUNITIES THAT BECOME AVAILABLE TO, OR ARE PURSUED BY FRANCO-NEVADA; REDUCED ACCESS TO DEBT AND EQUITY CAPITAL; LITIGATION; TITLE, PERMIT OR LICENSE DISPUTES RELATED TO INTERESTS ON ANY OF THE PROPERTIES IN WHICH FRANCO-NEVADA HOLDS A ROYALTY, STREAM OR OTHER INTEREST; WHETHER OR NOT THE COMPANY IS DETERMINED TO HAVE “PASSIVE FOREIGN INVESTMENT COMPANY” (“PFIC”) STATUS AS DEFINED IN SECTION 1297 OF THE UNITED STATES INTERNAL REVENUE CODE OF 1986, AS AMENDED; POTENTIAL CHANGES IN CANADIAN TAX TREATMENT OF OFFSHORE STREAMS; EXCESSIVE COST ESCALATION AS WELL AS DEVELOPMENT, PERMITTING, INFRASTRUCTURE, OPERATING OR TECHNICAL DIFFICULTIES ON ANY OF THE PROPERTIES IN WHICH FRANCO-NEVADA HOLDS A ROYALTY, STREAM OR OTHER INTEREST; ACCESS TO SUFFICIENT PIPELINE CAPACITY; ACTUAL MINERAL CONTENT MAY DIFFER FROM THE RESOURCES AND RESERVES CONTAINED IN TECHNICAL REPORTS; RATE AND TIMING OF PRODUCTION DIFFERENCES FROM RESOURCE ESTIMATES, OTHER TECHNICAL REPORTS AND MINE PLANS; RISKS AND HAZARDS ASSOCIATED WITH THE BUSINESS OF DEVELOPMENT AND MINING ON ANY OF THE PROPERTIES IN WHICH FRANCO-NEVADA HOLDS A ROYALTY, STREAM OR OTHER INTEREST, INCLUDING, BUT NOT LIMITED TO UNUSUAL OR UNEXPECTED GEOLOGICAL AND METALLURGICAL CONDITIONS, SLOPE FAILURES OR CAVE-INS, SINKHOLES, FLOODING AND OTHER NATURAL DISASTERS, TERRORISM, CIVIL UNREST OR AN OUTBREAK OF CONTAGIOUS DISEASE; THE IMPACT OF THE COVID-19 (CORONAVIRUS); AND THE INTEGRATION OF ACQUIRED ASSETS. THE FORWARD-LOOKING STATEMENTS CONTAINED IN THIS MD&A ARE BASED UPON ASSUMPTIONS MANAGEMENT BELIEVES TO BE REASONABLE, INCLUDING, WITHOUT LIMITATION: THE ONGOING OPERATION OF THE PROPERTIES IN WHICH FRANCO-NEVADA HOLDS A ROYALTY, STREAM OR OTHER INTEREST BY THE OWNERS OR OPERATORS OF SUCH PROPERTIES IN A MANNER CONSISTENT WITH PAST PRACTICE; THE ACCURACY OF PUBLIC STATEMENTS AND DISCLOSURES MADE BY THE OWNERS OR OPERATORS OF SUCH UNDERLYING PROPERTIES; NO MATERIAL ADVERSE CHANGE IN THE MARKET PRICE OF THE COMMODITIES THAT UNDERLIE THE ASSET PORTFOLIO; THE COMPANY’S ONGOING INCOME AND ASSETS RELATING TO DETERMINATION OF ITS PFIC STATUS; NO MATERIAL CHANGES TO EXISTING TAX TREATMENT; THE EXPECTED APPLICATION OF TAX LAWS AND REGULATIONS BY TAXATION AUTHORITIES; THE EXPECTED ASSESSMENT AND OUTCOME OF ANY AUDIT BY ANY TAXATION AUTHORITY; NO ADVERSE DEVELOPMENT IN RESPECT OF ANY SIGNIFICANT PROPERTY IN WHICH FRANCO-NEVADA HOLDS A ROYALTY, STREAM OR OTHER INTEREST; THE ACCURACY OF PUBLICLY DISCLOSED EXPECTATIONS FOR THE DEVELOPMENT OF UNDERLYING PROPERTIES THAT ARE NOT YET IN PRODUCTION; INTEGRATION OF ACQUIRED ASSETS; AND THE ABSENCE OF ANY OTHER FACTORS THAT COULD CAUSE ACTIONS, EVENTS OR RESULTS TO DIFFER FROM THOSE ANTICIPATED, ESTIMATED OR INTENDED. HOWEVER, THERE CAN BE NO ASSURANCE THAT FORWARD-LOOKING STATEMENTS WILL PROVE TO BE ACCURATE, AS ACTUAL RESULTS AND FUTURE EVENTS COULD DIFFER MATERIALLY FROM THOSE ANTICIPATED IN SUCH STATEMENTS. INVESTORS ARE CAUTIONED THAT FORWARD-LOOKING STATEMENTS ARE NOT GUARANTEES OF FUTURE PERFORMANCE. IN ADDITION, THERE CAN BE NO ASSURANCE AS TO THE OUTCOME OF THE ONGOING AUDIT BY THE CRA OR THE COMPANY’S EXPOSURE AS A RESULT THEREOF. FRANCO-NEVADA CANNOT ASSURE INVESTORS THAT ACTUAL RESULTS WILL BE CONSISTENT WITH THESE FORWARD-LOOKING STATEMENTS. ACCORDINGLY, INVESTORS SHOULD NOT PLACE UNDUE RELIANCE ON FORWARD-LOOKING STATEMENTS DUE TO THE INHERENT UNCERTAINTY THEREIN.
FOR ADDITIONAL INFORMATION WITH RESPECT TO RISKS, UNCERTAINTIES AND ASSUMPTIONS, PLEASE REFER TO FRANCO-NEVADA’S MOST RECENT ANNUAL INFORMATION FORM FILED WITH THE CANADIAN SECURITIES REGULATORY AUTHORITIES ON WWW.SEDARPLUS.COM AND FRANCO-NEVADA’S MOST RECENT ANNUAL REPORT FILED ON FORM 40-F FILED WITH THE SEC ON WWW.SEC.GOV. THE FORWARD-LOOKING STATEMENTS HEREIN ARE MADE AS OF THE DATE OF THIS MD&A ONLY AND FRANCO-NEVADA DOES NOT ASSUME ANY OBLIGATION TO UPDATE OR REVISE THEM TO REFLECT NEW INFORMATION, ESTIMATES OR OPINIONS, FUTURE EVENTS OR RESULTS OR OTHERWISE, EXCEPT AS REQUIRED BY APPLICABLE LAW.
2023 Third Quarter Management’s Discussion and Analysis |
34 |

Exhibit 99.3
Franco-Nevada Corporation
Condensed Consolidated Statements of Financial Position |
(unaudited, in millions of U.S. dollars)
|
|
At September 30, |
|
|
At December 31, |
|
||
|
|
2023 |
|
|
2022 |
|
||
ASSETS |
|
|
|
|
|
|
|
|
Cash and cash equivalents (Note 4) |
|
$ |
1,297.1 |
|
|
$ |
1,196.5 |
|
Receivables |
|
|
134.8 |
|
|
|
135.7 |
|
Gold bullion, prepaid expenses and other current assets (Note 6) |
|
|
84.6 |
|
|
|
50.9 |
|
Current assets |
|
$ |
1,516.5 |
|
|
$ |
1,383.1 |
|
|
|
|
|
|
|
|
|
|
Royalty, stream and working interests, net (Note 7) |
|
$ |
5,156.9 |
|
|
$ |
4,927.5 |
|
Investments (Note 5) |
|
|
239.7 |
|
|
|
227.2 |
|
Deferred income tax assets |
|
|
37.9 |
|
|
|
39.9 |
|
Other assets (Note 8) |
|
|
34.9 |
|
|
|
49.1 |
|
Total assets |
|
$ |
6,985.9 |
|
|
$ |
6,626.8 |
|
|
|
|
|
|
|
|
|
|
LIABILITIES |
|
|
|
|
|
|
|
|
Accounts payable and accrued liabilities |
|
$ |
35.0 |
|
|
$ |
43.1 |
|
Current income tax liabilities |
|
|
5.2 |
|
|
|
7.1 |
|
Current liabilities |
|
$ |
40.2 |
|
|
$ |
50.2 |
|
|
|
|
|
|
|
|
|
|
Deferred income tax liabilities |
|
$ |
168.7 |
|
|
$ |
153.0 |
|
Other liabilities |
|
|
5.7 |
|
|
|
6.0 |
|
Total liabilities |
|
$ |
214.6 |
|
|
$ |
209.2 |
|
|
|
|
|
|
|
|
|
|
SHAREHOLDERS’ EQUITY |
|
|
|
|
|
|
|
|
Share capital (Note 16) |
|
$ |
5,722.1 |
|
|
$ |
5,695.3 |
|
Contributed surplus |
|
|
19.9 |
|
|
|
15.6 |
|
Retained earnings |
|
|
1,260.7 |
|
|
|
940.4 |
|
Accumulated other comprehensive loss |
|
|
(231.4) |
|
|
|
(233.7) |
|
Total shareholders’ equity |
|
$ |
6,771.3 |
|
|
$ |
6,417.6 |
|
Total liabilities and shareholders’ equity |
|
$ |
6,985.9 |
|
|
$ |
6,626.8 |
|
|
|
|
|
|
|
|
|
|
Commitments and contingencies (Notes 20 and 21) |
|
|
|
|
|
|
|
|
Subsequent events (Note 22) |
|
|
|
|
|
|
|
|
The accompanying notes are an integral part of these condensed consolidated financial statements.
2023 Third Quarter Financial Statements |
2 |
Franco-Nevada Corporation
Condensed Consolidated Statements of Income and Comprehensive Income |
(unaudited, in millions of U.S. dollars and shares, except per share amounts)
|
|
For the three months ended |
|
|
For the nine months ended |
|
||||||||||
|
|
September 30, |
|
|
September 30, |
|
||||||||||
|
|
2023 |
|
|
2022 |
|
|
2023 |
|
|
2022 |
|
||||
Revenue (Note 10) |
|
$ |
309.5 |
|
|
$ |
304.2 |
|
|
$ |
915.7 |
|
|
$ |
995.3 |
|
|
|
|
|
|
|
|
|
|
|
|
|
|
|
|
|
|
Costs of sales |
|
|
|
|
|
|
|
|
|
|
|
|
|
|
|
|
Costs of sales (Note 11) |
|
$ |
48.9 |
|
|
$ |
42.0 |
|
|
$ |
134.2 |
|
|
$ |
131.1 |
|
Depletion and depreciation |
|
|
68.1 |
|
|
|
68.5 |
|
|
|
204.2 |
|
|
|
212.7 |
|
Total costs of sales |
|
$ |
117.0 |
|
|
$ |
110.5 |
|
|
$ |
338.4 |
|
|
$ |
343.8 |
|
Gross profit |
|
$ |
192.5 |
|
|
$ |
193.7 |
|
|
$ |
577.3 |
|
|
$ |
651.5 |
|
|
|
|
|
|
|
|
|
|
|
|
|
|
|
|
|
|
Other operating expenses (income) |
|
|
|
|
|
|
|
|
|
|
|
|
|
|
|
|
General and administrative expenses |
|
$ |
5.0 |
|
|
$ |
4.7 |
|
|
$ |
17.4 |
|
|
$ |
16.1 |
|
Share-based compensation expenses (Note 12) |
|
|
0.7 |
|
|
|
0.4 |
|
|
|
6.3 |
|
|
|
4.7 |
|
Gain on sale of royalty interest (Note 7) |
|
|
— |
|
|
|
— |
|
|
|
(3.7) |
|
|
|
— |
|
(Gain) loss on sale of gold bullion |
|
|
(0.2) |
|
|
|
0.4 |
|
|
|
(2.3) |
|
|
|
(1.1) |
|
Total other operating expenses |
|
$ |
5.5 |
|
|
$ |
5.5 |
|
|
$ |
17.7 |
|
|
$ |
19.7 |
|
Operating income |
|
$ |
187.0 |
|
|
$ |
188.2 |
|
|
$ |
559.6 |
|
|
$ |
631.8 |
|
Foreign exchange (loss) gain and other income (expenses) |
|
$ |
(1.8) |
|
|
$ |
(2.3) |
|
|
$ |
2.1 |
|
|
$ |
3.5 |
|
Income before finance items and income taxes |
|
$ |
185.2 |
|
|
$ |
185.9 |
|
|
$ |
561.7 |
|
|
$ |
635.3 |
|
|
|
|
|
|
|
|
|
|
|
|
|
|
|
|
|
|
Finance items (Note 14) |
|
|
|
|
|
|
|
|
|
|
|
|
|
|
|
|
Finance income |
|
$ |
15.5 |
|
|
$ |
2.4 |
|
|
$ |
36.0 |
|
|
$ |
5.9 |
|
Finance expenses |
|
|
(0.7) |
|
|
|
(0.8) |
|
|
|
(2.1) |
|
|
|
(2.5) |
|
Net income before income taxes |
|
$ |
200.0 |
|
|
$ |
187.5 |
|
|
$ |
595.6 |
|
|
$ |
638.7 |
|
|
|
|
|
|
|
|
|
|
|
|
|
|
|
|
|
|
Income tax expense (Note 15) |
|
|
24.9 |
|
|
|
30.4 |
|
|
|
79.5 |
|
|
|
103.1 |
|
Net income |
|
$ |
175.1 |
|
|
$ |
157.1 |
|
|
$ |
516.1 |
|
|
$ |
535.6 |
|
|
|
|
|
|
|
|
|
|
|
|
|
|
|
|
|
|
Other comprehensive (loss) income, net of taxes |
|
|
|
|
|
|
|
|
|
|
|
|
|
|
|
|
|
|
|
|
|
|
|
|
|
|
|
|
|
|
|
|
|
Items that may be reclassified subsequently to profit and loss: |
|
|
|
|
|
|
|
|
|
|
|
|
|
|
|
|
Currency translation adjustment |
|
$ |
(31.7) |
|
|
$ |
(83.4) |
|
|
$ |
(1.8) |
|
|
$ |
(110.4) |
|
|
|
|
|
|
|
|
|
|
|
|
|
|
|
|
|
|
Items that will not be reclassified subsequently to profit and loss: |
|
|
|
|
|
|
|
|
|
|
|
|
|
|
|
|
Gain (loss) on changes in the fair value of equity investments |
|
|
|
|
|
|
|
|
|
|
|
|
|
|
|
|
at fair value through other comprehensive income ("FVTOCI"), |
|
|
|
|
|
|
|
|
|
|
|
|
|
|
|
|
net of income tax (Note 5) |
|
|
3.5 |
|
|
|
(2.5) |
|
|
|
4.5 |
|
|
|
(59.6) |
|
Other comprehensive (loss) income, net of taxes |
|
$ |
(28.2) |
|
|
$ |
(85.9) |
|
|
$ |
2.7 |
|
|
$ |
(170.0) |
|
|
|
|
|
|
|
|
|
|
|
|
|
|
|
|
|
|
Comprehensive income |
|
$ |
146.9 |
|
|
$ |
71.2 |
|
|
$ |
518.8 |
|
|
$ |
365.6 |
|
|
|
|
|
|
|
|
|
|
|
|
|
|
|
|
|
|
Earnings per share (Note 17) |
|
|
|
|
|
|
|
|
|
|
|
|
|
|
|
|
Basic |
|
$ |
0.91 |
|
|
$ |
0.82 |
|
|
$ |
2.69 |
|
|
$ |
2.80 |
|
Diluted |
|
$ |
0.91 |
|
|
$ |
0.82 |
|
|
$ |
2.68 |
|
|
$ |
2.79 |
|
Weighted average number of shares outstanding (Note 17) |
|
|
|
|
|
|
|
|
|
|
|
|
|
|
|
|
Basic |
|
|
192.1 |
|
|
|
191.6 |
|
|
|
192.0 |
|
|
|
191.5 |
|
Diluted |
|
|
192.4 |
|
|
|
191.9 |
|
|
|
192.3 |
|
|
|
191.9 |
|
|
|
|
|
|
|
|
|
|
|
|
|
|
|
|
|
|
|
|
|
|
|
|
|
|
|
|
|
|
|
|
|
|
|
The accompanying notes are an integral part of these condensed consolidated financial statements.
2023 Third Quarter Financial Statements |
3 |
Franco-Nevada Corporation
Condensed Consolidated Statements of Cash Flows |
(unaudited, in millions of U.S. dollars)
|
|
For the nine months ended |
|
|||||
|
|
September 30, |
|
|||||
|
|
2023 |
|
|
2022 |
|
||
Cash flows from operating activities |
|
|
|
|
|
|
|
|
Net income |
|
$ |
516.1 |
|
|
$ |
535.6 |
|
Adjustments to reconcile net income to net cash provided by operating activities: |
|
|
|
|
|
|
|
|
Depletion and depreciation |
|
|
204.2 |
|
|
|
212.7 |
|
Share-based compensation expenses |
|
|
4.7 |
|
|
|
4.6 |
|
Gain on sale of royalty interest |
|
|
(3.7) |
|
|
|
— |
|
Unrealized foreign exchange (gain) loss |
|
|
(1.7) |
|
|
|
1.4 |
|
Deferred income tax expense |
|
|
16.6 |
|
|
|
22.2 |
|
Other non-cash items |
|
|
(2.2) |
|
|
|
(4.4) |
|
Acquisition of gold bullion |
|
|
(41.1) |
|
|
|
(34.7) |
|
Proceeds from sale of gold bullion |
|
|
20.5 |
|
|
|
36.1 |
|
Changes in other assets |
|
|
13.9 |
|
|
|
(26.7) |
|
Operating cash flows before changes in non-cash working capital |
|
$ |
727.3 |
|
|
$ |
746.8 |
|
Changes in non-cash working capital: |
|
|
|
|
|
|
|
|
Decrease (increase) in receivables |
|
$ |
0.9 |
|
|
$ |
(30.2) |
|
Increase in prepaid expenses and other |
|
|
(10.5) |
|
|
|
(3.7) |
|
(Decrease) increase in current liabilities |
|
|
(10.0) |
|
|
|
7.3 |
|
Net cash provided by operating activities |
|
$ |
707.7 |
|
|
$ |
720.2 |
|
|
|
|
|
|
|
|
|
|
Cash flows used in investing activities |
|
|
|
|
|
|
|
|
Acquisition of royalty, stream and working interests |
|
$ |
(435.8) |
|
|
$ |
(15.3) |
|
Proceeds from sale of royalty interest |
|
|
7.0 |
|
|
|
— |
|
Proceeds from sale of investments |
|
|
2.0 |
|
|
|
1.7 |
|
Acquisition of investments |
|
|
(8.9) |
|
|
|
(75.2) |
|
Acquisition of energy well equipment |
|
|
(1.2) |
|
|
|
(1.2) |
|
Proceeds from settlement of loan receivable from Noront Resources Ltd. |
|
|
— |
|
|
|
42.7 |
|
Net cash used in investing activities |
|
$ |
(436.9) |
|
|
$ |
(47.3) |
|
|
|
|
|
|
|
|
|
|
Cash flows used in financing activities |
|
|
|
|
|
|
|
|
Payment of dividends |
|
$ |
(173.2) |
|
|
$ |
(149.6) |
|
Credit facility amendment costs |
|
|
— |
|
|
|
(0.9) |
|
Proceeds from exercise of stock options |
|
|
2.9 |
|
|
|
5.2 |
|
Net cash used in financing activities |
|
$ |
(170.3) |
|
|
$ |
(145.3) |
|
Effect of exchange rate changes on cash and cash equivalents |
|
$ |
0.1 |
|
|
$ |
(9.5) |
|
Net change in cash and cash equivalents |
|
$ |
100.6 |
|
|
$ |
518.1 |
|
Cash and cash equivalents at beginning of period |
|
$ |
1,196.5 |
|
|
$ |
539.3 |
|
Cash and cash equivalents at end of period |
|
$ |
1,297.1 |
|
|
$ |
1,057.4 |
|
|
|
|
|
|
|
|
|
|
Supplemental cash flow information: |
|
|
|
|
|
|
|
|
Income taxes paid |
|
$ |
67.0 |
|
|
$ |
80.3 |
|
Dividend income received |
|
$ |
8.7 |
|
|
$ |
15.1 |
|
Interest and standby fees paid |
|
$ |
1.8 |
|
|
$ |
1.8 |
|
The accompanying notes are an integral part of these condensed consolidated financial statements.
2023 Third Quarter Financial Statements |
4 |
Franco-Nevada Corporation
Condensed Consolidated Statements of Changes in Shareholders’ Equity |
(unaudited, in millions of U.S. dollars)
|
|
|
|
|
|
Accumulated |
|
|
|
|
|
|||||
|
|
|
|
|
|
other |
|
|
|
|
|
|||||
|
|
Share capital |
|
Contributed |
|
comprehensive |
|
Retained |
|
|
|
|||||
|
|
(Note 16) |
|
surplus |
|
loss |
|
earnings |
|
Total equity |
|
|||||
Balance at January 1, 2022 |
|
$ |
5,628.5 |
|
$ |
16.1 |
|
$ |
(104.3) |
|
$ |
484.9 |
|
$ |
6,025.2 |
|
Net income |
|
|
— |
|
|
— |
|
|
— |
|
|
535.6 |
|
|
535.6 |
|
Other comprehensive loss, net of taxes |
|
|
— |
|
|
— |
|
|
(170.0) |
|
|
— |
|
|
(170.0) |
|
Total comprehensive income |
|
|
|
|
|
|
|
|
|
|
|
|
|
$ |
365.6 |
|
|
|
|
|
|
|
|
|
|
|
|
|
|
|
|
|
|
Exercise of stock options |
|
$ |
6.7 |
|
$ |
(1.5) |
|
$ |
— |
|
$ |
— |
|
$ |
5.2 |
|
Share-based payments |
|
|
— |
|
|
5.0 |
|
|
— |
|
|
— |
|
|
5.0 |
|
Transfer of gain on disposal of equity investments at FVTOCI |
|
|
— |
|
|
— |
|
|
(0.6) |
|
|
0.6 |
|
|
— |
|
Dividend reinvestment plan |
|
|
34.6 |
|
|
— |
|
|
— |
|
|
— |
|
|
34.6 |
|
Dividends declared |
|
|
— |
|
|
— |
|
|
— |
|
|
(184.2) |
|
|
(184.2) |
|
Balance at September 30, 2022 |
|
$ |
5,669.8 |
|
$ |
19.6 |
|
$ |
(274.9) |
|
$ |
836.9 |
|
$ |
6,251.4 |
|
|
|
|
|
|
|
|
|
|
|
|
|
|
|
|
|
|
Balance at January 1, 2023 |
|
$ |
5,695.3 |
|
$ |
15.6 |
|
$ |
(233.7) |
|
$ |
940.4 |
|
$ |
6,417.6 |
|
Net income |
|
|
— |
|
|
— |
|
|
— |
|
|
516.1 |
|
|
516.1 |
|
Other comprehensive income, net of taxes |
|
|
— |
|
|
— |
|
|
2.7 |
|
|
— |
|
|
2.7 |
|
Total comprehensive income |
|
|
|
|
|
|
|
|
|
|
|
|
|
$ |
518.8 |
|
|
|
|
|
|
|
|
|
|
|
|
|
|
|
|
|
|
Exercise of stock options |
|
$ |
3.8 |
|
$ |
(0.9) |
|
$ |
— |
|
$ |
— |
|
$ |
2.9 |
|
Share-based payments |
|
|
— |
|
|
5.2 |
|
|
— |
|
|
— |
|
|
5.2 |
|
Transfer of gain on disposal of equity investments at FVTOCI |
|
|
— |
|
|
— |
|
|
(0.4) |
|
|
0.4 |
|
|
— |
|
Dividend reinvestment plan |
|
|
23.0 |
|
|
— |
|
|
— |
|
|
— |
|
|
23.0 |
|
Dividends declared |
|
|
— |
|
|
— |
|
|
— |
|
|
(196.2) |
|
|
(196.2) |
|
Balance at September 30, 2023 |
|
$ |
5,722.1 |
|
$ |
19.9 |
|
$ |
(231.4) |
|
$ |
1,260.7 |
|
$ |
6,771.3 |
|
|
|
|
|
|
|
|
|
|
|
|
|
|
|
|
|
|
The accompanying notes are an integral part of these condensed consolidated financial statements.
2023 Third Quarter Financial Statements |
5 |
Franco-Nevada Corporation
Notes to the Condensed Consolidated Financial Statements |
For the three and nine months ended September 30, 2023 and 2022
(unaudited, expressed in millions of U.S. dollars, except per share amounts, unless otherwise noted)
Note 1 - Corporate Information
Franco-Nevada Corporation (“Franco-Nevada” or the “Company”) is incorporated under the Canada Business Corporations Act. The Company is a royalty and stream company focused on precious metals (gold, silver, and platinum group metals) and has a diversity of revenue sources. The Company owns a portfolio of royalty, stream and working interests, covering properties at various stages, from production to early exploration located in South America, Central America & Mexico, United States, Canada, Australia, Europe and Africa.
The Company’s shares are listed on the Toronto Stock Exchange and the New York Stock Exchange and the Company is domiciled in Canada. The Company’s head and registered office is located at 199 Bay Street, Suite 2000, Toronto, Ontario, Canada.
Note 2 - Significant Accounting Policies
(a) Basis of Presentation
These unaudited condensed consolidated interim financial statements include the accounts of Franco-Nevada and its wholly-owned subsidiaries (its “subsidiaries”) (hereinafter together with Franco-Nevada, the “Company”). These condensed consolidated interim financial statements have been prepared in accordance with International Financial Reporting Standards (“IFRS”) as issued by the International Accounting Standards Board (“IASB”) applicable to the preparation of condensed interim financial statements, including IAS 34 Interim Financial Reporting. These condensed consolidated interim financial statements should be read in conjunction with the Company’s annual consolidated financial statements for the year ended December 31, 2022 and were prepared using the same accounting policies, method of computation and presentation as were applied in the annual consolidated financial statements for the year ended December 31, 2022. These condensed consolidated interim financial statements were authorized for issuance by the Board of Directors on November 8, 2023.
The financial statements included herein reflects all adjustments, consisting only of normal recurring adjustments which, in the opinion of management, are necessary for a fair presentation of the results for the interim periods presented. The results of operations for the three and nine months ended September 30, 2023 are not necessarily indicative of the results to be expected for the full year. Seasonality is not considered to have a significant impact over the condensed consolidated interim financial statements. Taxes on income in the interim period have been accrued using the tax rates that would be applicable to expected total annual income.
(b) Significant Judgments, Estimates and Assumptions
The preparation of consolidated financial statements in accordance with IFRS requires the Company to make judgments, estimates and assumptions that affect the reported amounts of assets and liabilities and disclosures of contingent assets and liabilities at the date of the consolidated financial statements and the reported amounts of revenues and expenses during the reporting period. The areas of judgment and estimation are consistent with those reported in the annual consolidated financial statements for the year ended December 31, 2022 and include measurement uncertainty in assessments of impairment of royalty, stream and working interests which are impacted by the following developments subsequent to September 30, 2023.
Revised Concession Contract for the Cobre Panama Mine
First Quantum Minerals Ltd. (“First Quantum”), its subsidiary, Minera Panama, S.A. (“MPSA”), and the Government of Panama (the “GOP”) have been engaged in discussions regarding a revised concession contract to secure the long-term future of the Cobre Panama mine. On March 8, 2023, First Quantum and the GOP announced that an agreement had been reached on the terms and conditions for a revised concession contract (the “Revised Concession Contract”) with subsequent modifications. The Revised Concession Contract provides for an initial 20-year term with a 20-year extension option and additional extensions for life of mine. On October 20, 2023, the Revised Concession Contract was enacted into Law 406.
In response to protests and social unrest in the country of Panama, on October 29, 2023, President Laurentino Cortizo announced the GOP’s intention to hold a popular consultation on December 17, 2023, concerning Law 406. The proposal to hold a popular consultation was debated at the National Assembly on October 31, 2023. However, while the bill proposing the popular consultation, Bill 1109, was approved at the first debate, it did not ultimately progress to a second or third debate.
On November 3, 2023, the National Assembly approved Bill 1110, prohibiting new concessions for the exploration, extraction, transportation, and beneficiation of metallic mining throughout the country, and the bill was subsequently enacted into Law 407. The bill did not include a repeal of Law 406.
2023 Third Quarter Financial Statements |
6 |
Franco-Nevada Corporation
Notes to the Condensed Consolidated Financial Statements |
For the three and nine months ended September 30, 2023 and 2022
(unaudited, expressed in millions of U.S. dollars, except per share amounts, unless otherwise noted)
As of the date of these financial statements, Law 406 and the Revised Concession Contract currently remain in effect. However, a number of lawsuits challenging the constitutionality of Law 406 have been submitted to the Supreme Court of Justice, a number of which have been admitted for adjudication.
The outcome of these matters could have a material adverse impact on the revenue Franco-Nevada derives from its streaming arrangements relating to Cobre Panama and on Franco-Nevada’s results of operations, financial condition, and the valuation of Franco-Nevada’s stream interest in Cobre Panama. As at September 30, 2023, the carrying value of the Company’s stream interest in Cobre Panama was $1,180.3 million.
(c) New and Amended Accounting Standards
International Tax Reform – Pillar Two Model Rules – Amendments to IAS 12, Income Taxes
On May 23, 2023, the IASB issued International Tax Reform – Pillar Two Model Rules – Amendments to IAS 12. The amendments introduce a mandatory temporary exception to the accounting for deferred taxes arising from the jurisdictional implementation of the Pillar Two model rules, and disclosure requirements for affected entities to help users of the financial statements better understand an entity’s exposure to Pillar Two income taxes arising from that legislation.
The temporary exception from recognition and disclosure of information about deferred taxes and the requirement to disclose the application of the exception, apply immediately and retrospectively upon issue of the amendments. The disclosure of the current tax expense related to Pillar Two income taxes and the disclosures in relation to periods before the legislation is effective are required for annual reporting periods beginning on or after January 1, 2023, but are not required for any interim period ending on or before December 31, 2023.
The Company is assessing the impact of the amendments on its consolidated financial statements.
Note 3 - Acquisitions and Other Transactions
| (a) | Acquisition of Additional Royalty Interest on Magino Gold Mine – Ontario, Canada |
Subsequent to quarter-end, on November 2, 2023, Franco-Nevada agreed to acquire an additional 1.0% NSR on Argonaut Gold Inc.’s (“Argonaut”) Magino gold mine in Ontario, Canada, and a portfolio comprised of Argonaut’s existing royalty holdings in Canada and Mexico, for an aggregate purchase price of approximately $29.5 million, with closing of such transactions subject to satisfaction of closing conditions. Inclusive of its initial 2.0% NSR acquired on October 27, 2022, once the transaction closes, the Company will hold an aggregate 3.0% NSR on Magino.
| (b) | Acquisition of Royalty on Wawa Gold Project – Ontario, Canada |
On August 29, 2023, Franco-Nevada acquired a 1.5% NSR on Red Pine Exploration Inc.’s Wawa gold project, located in Ontario, Canada, for a purchase price of $5.0 million (C$6.8 million). The agreement provides Franco-Nevada the option to acquire an additional 0.5% NSR based on pre-determined conditions.
The transaction has been accounted for as an acquisition of mineral royalty interests.
| (c) | Acquisition of Royalties on Pascua-Lama Project – Chile |
On August 8, 2023, Franco-Nevada, through a wholly-owned subsidiary, agreed to acquire a sliding-scale gold royalty and fixed-rate copper royalty from private individuals over property pertaining to the Chilean portion of Barrick Gold Corp.’s Pascua-Lama project for an aggregate purchase price of $75.0 million. At gold prices exceeding $800/ounce, the Company will hold a 2.70% NSR (gold) and 0.54% NSR (copper) on the property.
The transaction has been accounted for as an acquisition of mineral royalty interests.
| (d) | Acquisition of Royalty on Volcan Gold Project – Chile |
On July 6, 2023, Franco-Nevada, through a wholly-owned subsidiary, agreed to acquire a 1.5% NSR on the Volcan gold project located in the Maricunga Gold Belt in the Atacama region of Chile for a purchase price of $15.0 million. The project is owned by Tiernan Gold Corporation, a company privately held by Hochschild Mining plc. The agreement provides Franco-Nevada the option to acquire an additional 1.0% NSR based on pre-determined conditions.
The transaction has been accounted for as an acquisition of mineral royalty interests.
| (e) | Funding of the Tocantinzinho Stream – Brazil |
On September 29, 2023, the Company’s wholly-owned subsidiary, Franco-Nevada (Barbados) Corporation (“FNBC”), funded $66.2 million in relation to the Tocantinzinho project, for a total of $250.0 million disbursed in the nine months ended September 30, 2023, thereby fulfilling its stream towards the project. The stream, which is in reference to production from the Tocantinzinho project, located in Pará State, Brazil, and owned by G Mining Ventures Corp. (“G Mining Ventures”), was
2023 Third Quarter Financial Statements |
7 |
Franco-Nevada Corporation
Notes to the Condensed Consolidated Financial Statements |
For the three and nine months ended September 30, 2023 and 2022
(unaudited, expressed in millions of U.S. dollars, except per share amounts, unless otherwise noted)
acquired on July 18, 2022 for a purchase price of $250.0 million and was payable in instalments, subject to the satisfaction of various conditions. The stream agreement is accounted for as an acquisition of a stream interest.
Additionally, through one of its wholly-owned subsidiaries, Franco-Nevada provided G Mining Ventures with a $75.0 million secured term loan facility (the “Term Loan”). As at September 30, 2023, no funding has been provided to G Mining Ventures in connection with the Term Loan.
| (f) | Acquisition of Additional Royalty Interest on Caserones – Chile |
Franco-Nevada, through a wholly-owned subsidiary, acquired an incremental effective NSR totaling 0.1120% on the Caserones copper-molybdenum mine, now owned by Lundin Mining Corporation, located in the Atacama region of Chile. The incremental effective 0.1120% NSR was acquired in two transactions: (i) a 0.0260% effective NSR on March 8, 2023, for a purchase price of $2.1 million, and (ii) a 0.0860% NSR on June 29, 2023, for a purchase price of $7.3 million. Inclusive of the Company’s interest of 0.4582% acquired in April 2022, Franco-Nevada now holds a 0.5702% effective NSR on Caserones.
The transactions have been accounted for as an acquisition of a mineral royalty interest.
| (g) | Acquisition Agreement for New Royalties with EMX Royalty Corporation |
On June 27, 2023, Franco-Nevada executed a binding term sheet with EMX Royalty Corporation (“EMX”) for a three-year arrangement for the joint acquisition of newly created precious metals and copper royalties sourced by EMX. Franco-Nevada will contribute 55% (up to $5.5 million) and EMX will contribute 45% (up to $4.5 million) towards the royalty acquisitions, with the resulting royalty interests equally split on a 50/50 basis.
| (h) | Acquisition of Royalties on Exploration Properties – Nevada and Arizona, U.S. |
On June 15, 2023, Franco-Nevada, through a wholly-owned subsidiary, acquired a portfolio of eight royalties on exploration properties located in the states of Nevada and Arizona, including a 0.5% NSR on Integra Resources Corp.’s Wildcat and Mountain View gold projects, for a purchase price of $2.5 million.
The transaction has been accounted for as an acquisition of mineral royalty interests.
| (i) | Acquisition of Additional Royalty on Valentine Gold Project and Private Placement with Marathon Gold Corporation – Newfoundland, Canada |
On June 8, 2023, Franco-Nevada acquired an additional 1.5% NSR on Marathon Gold Corporation’s (“Marathon”) Valentine Gold project located in Newfoundland for a purchase price of $45.0 million. Inclusive of Franco-Nevada’s initial 1.5% NSR (reduced from 2.0% following Marathon’s buy-back of 0.5%, as described below), the Company now holds an aggregate 3.0% NSR on the project.
On July 5, 2023, Franco-Nevada acquired 6,578,947 common shares of Marathon at a price of C$0.76 per common share for an aggregate of $3.8 million (C$5.0 million), comprising the back-end of a non-brokered charity flow-through offering.
The additional 1.5% NSR has been accounted for as an acquisition of a mineral royalty interest. The common shares of Marathon has been accounted for as an equity investment designated at FVTOCI.
| (j) | Acquisition of Royalty on Kerr-Addison Property and Share Subscription with Gold Candle Ltd. – Ontario, Canada |
On April 14, 2023, Franco-Nevada acquired a 1% NSR on Gold Candle Ltd.’s (“Gold Candle”) Kerr-Addison project located in Virginiatown, Ontario, which hosts the formerly producing Kerr-Addison gold mine, for a purchase price of $10.0 million.
On July 26, 2023, Franco-Nevada acquired 5,454,546 common shares of Gold Candle, a private company, at a price of C$1.10 per common share for an aggregate purchase price of $4.6 million (C$6.0 million).
The acquisition of the 1% NSR has been accounted for as an acquisition of a mineral royalty interest. The common shares of Gold Candle has been accounted for as an equity investment designated at FVTOCI.
| (k) | Acquisition of Gold Royalties – Australia |
On February 22, 2023, Franco-Nevada acquired a portfolio of five primarily gold royalties from Trident Royalties Plc (“Trident”), which includes a 1.5% NSR on Ramelius Resources’ Rebecca gold project (“Rebecca”) located in Western Australia, for total consideration of $15.6 million payable as follows: (i) $14.3 million paid on closing of the transaction, and (ii) $1.3 million in a contingent payment payable upon first gold production at Rebecca.
The transaction has been accounted for as an acquisition of a mineral royalty interest. The contingent payment will be capitalized as part of the cost of the royalty interest if and when the underlying obligating events have occurred.
2023 Third Quarter Financial Statements |
8 |
Franco-Nevada Corporation
Notes to the Condensed Consolidated Financial Statements |
For the three and nine months ended September 30, 2023 and 2022
(unaudited, expressed in millions of U.S. dollars, except per share amounts, unless otherwise noted)
| (l) | Receipt of Valentine Gold Royalty Buy-back – Newfoundland, Canada |
On February 22, 2023, Marathon exercised its option to buy-back 0.5% of Franco-Nevada’s initial 2.0% NSR on the Valentine Gold project by paying $7.0 million to Franco-Nevada. The Company acquired the initial 2.0% NSR on February 21, 2019 for $13.7 million (C$18.0 million).
The transaction has been accounted for as a disposal of royalty mineral interest as referenced in Note 7(b).
| (m) | Acquisition of Mineral Rights with Continental Resources, Inc. – U.S. |
During the three and nine months ended September 30, 2023, Franco-Nevada recorded contributions to the Royalty Acquisition Venture of $2.5 million and $8.4 million, respectively (Q3 2022 and YTD 2022 – $4.4 million and $8.0 million, respectively). As at September 30, 2023, Franco-Nevada’s total cumulative investment in the Royalty Acquisition Venture totaled $449.0 million and Franco-Nevada has remaining commitments of up to $71.0 million.
The Royalty Acquisition Venture is accounted for as a joint operation in accordance with IFRS 11 Joint Arrangements.
Note 4 - Cash and Cash Equivalents
Cash and cash equivalents comprised the following:
|
|
|
At September 30, |
|
|
At December 31, |
|
||
|
|
|
2023 |
|
|
2022 |
|
||
Cash deposits |
|
|
$ |
413.3 |
|
|
$ |
541.4 |
|
Term deposits |
|
|
|
883.8 |
|
|
|
655.1 |
|
|
|
|
$ |
1,297.1 |
|
|
$ |
1,196.5 |
|
As at September 30, 2023 and December 31, 2022, cash and cash equivalents were primarily held in interest-bearing deposits.
Note 5 - Investments
Investments comprised the following:
|
|
|
At September 30, |
|
|
At December 31, |
|
||
|
|
|
2023 |
|
|
2022 |
|
||
Equity investments |
|
|
$ |
237.1 |
|
|
$ |
224.6 |
|
Warrants |
|
|
|
2.6 |
|
|
|
2.6 |
|
|
|
|
$ |
239.7 |
|
|
$ |
227.2 |
|
| (a) | Equity investments |
Equity investments comprised the following:
|
|
|
At September 30, |
|
|
At December 31, |
|
||
|
|
|
2023 |
|
|
2022 |
|
||
Labrador Iron Ore Royalty Corporation ("LIORC") |
|
|
$ |
150.6 |
|
|
$ |
157.0 |
|
Other |
|
|
|
86.5 |
|
|
|
67.6 |
|
|
|
|
$ |
237.1 |
|
|
$ |
224.6 |
|
During the nine months ended September 30, 2023, the Company disposed of equity investments with a cost of $1.4 million (YTD 2022 –$1.1 million) for gross proceeds of $2.0 million (YTD 2022 –$1.7 million).
2023 Third Quarter Financial Statements |
9 |
Franco-Nevada Corporation
Notes to the Condensed Consolidated Financial Statements |
For the three and nine months ended September 30, 2023 and 2022
(unaudited, expressed in millions of U.S. dollars, except per share amounts, unless otherwise noted)
The change in the fair value of equity investments recognized in other comprehensive income for the periods ended September 30, 2023 and 2022 were as follows:
|
|
For the three months ended |
|
For the nine months ended |
|
||||||||||
|
|
September 30, |
|
September 30, |
|
||||||||||
|
|
2023 |
|
2022 |
|
|
2023 |
|
|
2022 |
|
||||
Gain (loss) on changes in the fair value of equity investments at FVTOCI |
|
$ |
4.0 |
|
$ |
(3.0) |
|
|
$ |
5.2 |
|
|
$ |
(68.8) |
|
Income tax (expense) recovery in other comprehensive income |
|
|
(0.5) |
|
|
0.5 |
|
|
|
(0.7) |
|
|
|
9.2 |
|
Gain (loss) on changes in the fair value of equity investments at FVTOCI, net of income tax |
|
$ |
3.5 |
|
$ |
(2.5) |
|
|
$ |
4.5 |
|
|
$ |
(59.6) |
|
Note 6 – Gold Bullion, Prepaid Expenses and Other Current Assets
Gold bullion, prepaid expenses and other current assets comprised the following:
|
|
|
At September 30, |
|
|
At December 31, |
|
||
|
|
|
2023 |
|
|
2022 |
|
||
Gold bullion |
|
|
$ |
50.9 |
|
|
$ |
28.1 |
|
Prepaid expenses |
|
|
|
18.6 |
|
|
|
22.1 |
|
Deposits related to Canada Revenue Agency ("CRA") audits |
|
|
|
13.9 |
|
|
|
— |
|
Stream ounces inventory |
|
|
|
0.7 |
|
|
|
0.1 |
|
Debt issue costs |
|
|
|
0.5 |
|
|
|
0.6 |
|
|
|
|
$ |
84.6 |
|
|
$ |
50.9 |
|
Deposits related to CRA audits represent cash on deposit with CRA in connection with the Domestic and FAPI Reassessments, as referenced in Note 21, which have been vacated. Subsequent to quarter-end, in October 2023, the CRA returned $9.9 million (C$12.5 million) of these deposits.
Note 7 - Royalty, Stream and Working Interests
(a) |
Royalty, Stream and Working Interests |
Royalty, stream and working interests, net of accumulated depletion and impairment charges and reversals, comprised the following:
|
|
|
|
|
|
Impairment |
|
|
|
|||||
|
|
|
|
|
Accumulated |
|
(charges) |
|
|
|
|
|
||
As at September 30, 2023 |
|
Cost |
|
depletion(1) |
|
reversals |
|
|
Carrying value |
|
||||
Mining royalties |
|
$ |
1,662.2 |
|
$ |
(746.2) |
|
$ |
— |
|
|
$ |
916.0 |
|
Streams |
|
|
4,763.8 |
|
|
(2,192.4) |
|
|
— |
|
|
|
2,571.4 |
|
Energy |
|
|
1,946.6 |
|
|
(802.1) |
|
|
— |
|
|
|
1,144.5 |
|
Advanced |
|
|
408.9 |
|
|
(55.4) |
|
|
— |
|
|
|
353.5 |
|
Exploration |
|
|
181.3 |
|
|
(9.8) |
|
|
— |
|
|
|
171.5 |
|
|
|
$ |
8,962.8 |
|
$ |
(3,805.9) |
|
$ |
— |
|
|
$ |
5,156.9 |
|
| 1. | Accumulated depletion includes previously recognized impairment charges and reversals. |
|
|
|
|
|
|
Impairments |
|
|
|
|||||
|
|
|
|
|
Accumulated |
|
(charges) |
|
|
|
|
|
||
As at December 31, 2022 |
|
Cost |
|
depletion(1) |
|
reversals |
|
|
Carrying value |
|
||||
Mining royalties |
|
$ |
1,582.7 |
|
$ |
(716.9) |
|
$ |
— |
|
|
$ |
865.8 |
|
Streams |
|
|
4,513.1 |
|
|
(2,065.7) |
|
|
— |
|
|
|
2,447.4 |
|
Energy |
|
|
1,937.0 |
|
|
(755.5) |
|
|
— |
|
|
|
1,181.5 |
|
Advanced |
|
|
426.6 |
|
|
(55.6) |
|
|
— |
|
|
|
371.0 |
|
Exploration |
|
|
71.7 |
|
|
(9.9) |
|
|
— |
|
|
|
61.8 |
|
|
|
$ |
8,531.1 |
|
$ |
(3,603.6) |
|
$ |
— |
|
|
$ |
4,927.5 |
|
| 1. | Accumulated depletion includes previously recognized impairment charges and reversals. |
2023 Third Quarter Financial Statements |
10 |
Franco-Nevada Corporation
Notes to the Condensed Consolidated Financial Statements |
For the three and nine months ended September 30, 2023 and 2022
(unaudited, expressed in millions of U.S. dollars, except per share amounts, unless otherwise noted)
Changes in royalty, stream and working interests for the periods ended September 30, 2023 and December 31, 2022 were as follows:
|
|
Mining |
|
|
|
|
|
|
|
|
|
|
|
||||||
|
|
royalties |
|
Streams |
|
Energy |
|
Advanced |
|
Exploration |
|
Total |
|
||||||
Balance at January 1, 2022 |
|
$ |
903.0 |
|
$ |
2,623.0 |
|
$ |
1,258.3 |
|
$ |
308.8 |
|
$ |
56.2 |
|
$ |
5,149.3 |
|
Additions |
|
|
44.1 |
|
|
1.6 |
|
|
12.1 |
|
|
72.7 |
|
|
7.9 |
|
|
138.4 |
|
Depletion |
|
|
(40.2) |
|
|
(177.2) |
|
|
(66.4) |
|
|
(0.2) |
|
|
— |
|
|
(284.0) |
|
Impact of foreign exchange |
|
|
(41.1) |
|
|
— |
|
|
(22.5) |
|
|
(10.3) |
|
|
(2.3) |
|
|
(76.2) |
|
Balance at December 31, 2022 |
|
$ |
865.8 |
|
$ |
2,447.4 |
|
$ |
1,181.5 |
|
$ |
371.0 |
|
$ |
61.8 |
|
$ |
4,927.5 |
|
|
|
|
|
|
|
|
|
|
|
|
|
|
|
|
|
|
|
|
|
Balance at January 1, 2023 |
|
$ |
865.8 |
|
$ |
2,447.4 |
|
$ |
1,181.5 |
|
$ |
371.0 |
|
$ |
61.8 |
|
$ |
4,927.5 |
|
Additions |
|
|
9.6 |
|
|
250.2 |
|
|
8.4 |
|
|
57.4 |
|
|
110.2 |
|
|
435.8 |
|
Disposals |
|
|
— |
|
|
— |
|
|
— |
|
|
(3.3) |
|
|
— |
|
|
(3.3) |
|
Transfers |
|
|
70.1 |
|
|
— |
|
|
— |
|
|
(70.1) |
|
|
— |
|
|
— |
|
Depletion |
|
|
(30.2) |
|
|
(126.2) |
|
|
(46.0) |
|
|
(0.2) |
|
|
— |
|
|
(202.6) |
|
Impact of foreign exchange |
|
|
0.7 |
|
|
— |
|
|
0.6 |
|
|
(1.3) |
|
|
(0.5) |
|
|
(0.5) |
|
Balance at September 30, 2023 |
|
$ |
916.0 |
|
$ |
2,571.4 |
|
$ |
1,144.5 |
|
$ |
353.5 |
|
$ |
171.5 |
|
$ |
5,156.9 |
|
Of the total net book value as at September 30, 2023, $4,165.8 million (December 31, 2022 - $3,980.2 million) is depletable and $991.1 million (December 31, 2022 - $947.3 million) is non-depletable.
| (b) | Disposal of Royalty Interest |
On February 22, 2023, Marathon exercised its option to buy-back 0.5% of Franco-Nevada’s initial 2.0% NSR on the Valentine Gold project by paying $7.0 million to Franco-Nevada. Franco-Nevada acquired the initial NSR on February 21, 2019 for $13.7 million (C$18.0 million). The carrying value of the NSR portion subject to the buy-back was $3.3 million (C$4.5 million). The Company recognized a gain on disposal of $3.7 million in the consolidated statement of income and comprehensive income for the nine months ended September 30, 2023.
Note 8 - Other Assets
Other assets comprised the following:
|
|
|
At September 30, |
|
|
At December 31, |
|
||
|
|
|
2023 |
|
|
2022 |
|
||
Deposits related to CRA audits |
|
|
$ |
27.1 |
|
|
$ |
40.9 |
|
Energy well equipment, net |
|
|
|
5.7 |
|
|
|
5.6 |
|
Right-of-use assets, net |
|
|
|
0.8 |
|
|
|
0.9 |
|
Debt issue costs |
|
|
|
1.2 |
|
|
|
1.5 |
|
Furniture and fixtures, net |
|
|
|
0.1 |
|
|
|
0.2 |
|
|
|
|
$ |
34.9 |
|
|
$ |
49.1 |
|
Deposits related to CRA audits represent cash on deposit with CRA in connection with the Transfer Pricing Reassessments, as referenced in Note 21. The amount has been classified as non-current as the Company is appealing the reassessments, for which the timing of the completion is uncertain.
Note 9 – Debt
Corporate Revolver
The Company has a $1.0 billion unsecured revolving term credit facility (the “Corporate Revolver”). As at September 30, 2023, no amounts were drawn from the Corporate Revolver. The Company has three standby letters of credit in the amount of $18.9 million (C$25.5 million) against the Corporate Revolver in relation to the audit by the CRA of its 2013-2015 taxation years, as referenced in Note 21. These standby letters of credit reduce the available balance under the Corporate Revolver.
2023 Third Quarter Financial Statements |
11 |
Franco-Nevada Corporation
Notes to the Condensed Consolidated Financial Statements |
For the three and nine months ended September 30, 2023 and 2022
(unaudited, expressed in millions of U.S. dollars, except per share amounts, unless otherwise noted)
Note 10 - Revenue
Revenue classified by commodity, geography and type comprised the following:
|
|
For the three months ended |
|
|
For the nine months ended |
|
||||||||||
|
|
September 30, |
|
|
September 30, |
|
||||||||||
|
|
2023 |
|
|
2022 |
|
|
2023 |
|
|
2022 |
|
||||
Commodity |
|
|
|
|
|
|
|
|
|
|
|
|
|
|
|
|
Gold(1) |
|
$ |
199.5 |
|
|
$ |
166.6 |
|
|
$ |
585.7 |
|
|
$ |
544.9 |
|
Silver |
|
|
31.6 |
|
|
|
30.3 |
|
|
|
95.5 |
|
|
|
107.2 |
|
Platinum group metals(1) |
|
|
9.7 |
|
|
|
9.8 |
|
|
|
31.0 |
|
|
|
41.2 |
|
Iron ore(2) |
|
|
12.8 |
|
|
|
10.8 |
|
|
|
36.0 |
|
|
|
44.7 |
|
Other mining assets |
|
|
3.2 |
|
|
|
2.9 |
|
|
|
10.3 |
|
|
|
6.4 |
|
Mining |
|
$ |
256.8 |
|
|
$ |
220.4 |
|
|
$ |
758.5 |
|
|
$ |
744.4 |
|
Oil |
|
$ |
38.2 |
|
|
$ |
36.6 |
|
|
$ |
102.2 |
|
|
$ |
121.8 |
|
Gas |
|
|
9.9 |
|
|
|
40.9 |
|
|
|
41.0 |
|
|
|
108.3 |
|
Natural gas liquids |
|
|
4.6 |
|
|
|
6.3 |
|
|
|
14.0 |
|
|
|
20.8 |
|
Energy |
|
$ |
52.7 |
|
|
$ |
83.8 |
|
|
$ |
157.2 |
|
|
$ |
250.9 |
|
|
|
$ |
309.5 |
|
|
$ |
304.2 |
|
|
$ |
915.7 |
|
|
$ |
995.3 |
|
Geography |
|
|
|
|
|
|
|
|
|
|
|
|
|
|
|
|
South America |
|
$ |
88.9 |
|
|
$ |
84.4 |
|
|
$ |
274.1 |
|
|
$ |
275.8 |
|
Central America & Mexico |
|
|
87.9 |
|
|
|
61.1 |
|
|
|
245.1 |
|
|
|
224.8 |
|
United States |
|
|
49.3 |
|
|
|
79.4 |
|
|
|
157.4 |
|
|
|
241.0 |
|
Canada(1)(2) |
|
|
46.4 |
|
|
|
49.1 |
|
|
|
133.3 |
|
|
|
161.5 |
|
Rest of World |
|
|
37.0 |
|
|
|
30.2 |
|
|
|
105.8 |
|
|
|
92.2 |
|
|
|
$ |
309.5 |
|
|
$ |
304.2 |
|
|
$ |
915.7 |
|
|
$ |
995.3 |
|
Type |
|
|
|
|
|
|
|
|
|
|
|
|
|
|
|
|
Revenue-based royalties |
|
$ |
91.7 |
|
|
$ |
119.3 |
|
|
$ |
283.0 |
|
|
$ |
371.5 |
|
Streams(1) |
|
|
186.8 |
|
|
|
153.9 |
|
|
|
545.3 |
|
|
|
519.4 |
|
Profit-based royalties |
|
|
16.3 |
|
|
|
17.9 |
|
|
|
48.8 |
|
|
|
70.3 |
|
Other(2) |
|
|
14.7 |
|
|
|
13.1 |
|
|
|
38.6 |
|
|
|
34.1 |
|
|
|
$ |
309.5 |
|
|
$ |
304.2 |
|
|
$ |
915.7 |
|
|
$ |
995.3 |
|
| 1. | For Q3 2023, revenue includes a loss of $0.1 million and a gain of $0.1 million for provisional pricing adjustments for gold and platinum group metals, respectively (Q3 2022 – a loss of $0.1 million and a gain of $0.7 million, respectively). For YTD 2023, revenue include gains of $0.1 million and $0.4 million of provisional pricing adjustments for gold and platinum group metals, respectively (YTD 2022 – a loss of $0.4 million and a gain of $1.1 million, respectively). |
| 2. | For Q3 2023, revenue includes dividend income of $4.5 million from the Company’s equity investment in LIORC (Q3 2022 – $4.6 million). For YTD 2023, revenue includes dividend income of $9.9 million from the Company’s equity investment in LIORC (YTD 2022 – $11.6 million). |
Note 11 - Costs of Sales
Costs of sales, excluding depletion and depreciation, comprised the following:
|
|
For the three months ended |
|
|
For the nine months ended |
|
||||||||||
|
|
September 30, |
|
|
September 30, |
|
||||||||||
|
|
2023 |
|
|
2022 |
|
|
2023 |
|
|
2022 |
|
||||
Costs of stream sales |
|
$ |
45.4 |
|
|
$ |
37.1 |
|
|
$ |
123.6 |
|
|
$ |
118.4 |
|
Mineral production taxes |
|
|
0.5 |
|
|
|
0.6 |
|
|
|
1.5 |
|
|
|
1.5 |
|
Mining costs of sales |
|
$ |
45.9 |
|
|
$ |
37.7 |
|
|
$ |
125.1 |
|
|
$ |
119.9 |
|
Energy costs of sales |
|
|
3.0 |
|
|
|
4.3 |
|
|
|
9.1 |
|
|
|
11.2 |
|
|
|
$ |
48.9 |
|
|
$ |
42.0 |
|
|
$ |
134.2 |
|
|
$ |
131.1 |
|
2023 Third Quarter Financial Statements |
12 |
Franco-Nevada Corporation
Notes to the Condensed Consolidated Financial Statements |
For the three and nine months ended September 30, 2023 and 2022
(unaudited, expressed in millions of U.S. dollars, except per share amounts, unless otherwise noted)
Note 12 - Share-Based Compensation Expenses
Share-based compensation expenses comprised the following:
|
|
For the three months ended |
|
|
For the nine months ended |
|
|||||||||
|
|
September 30, |
|
|
September 30, |
|
|||||||||
|
|
2023 |
|
2022 |
|
|
2023 |
|
|
2022 |
|
||||
Stock options and restricted share units |
|
$ |
1.5 |
|
$ |
1.6 |
|
|
$ |
4.7 |
|
|
$ |
4.6 |
|
Deferred share units |
|
|
(0.8) |
|
|
(1.2) |
|
|
|
1.6 |
|
|
|
0.1 |
|
|
|
$ |
0.7 |
|
$ |
0.4 |
|
|
$ |
6.3 |
|
|
$ |
4.7 |
|
Share-based compensation expenses include expenses related to equity-settled stock options, restricted share units (“RSUs”) and deferred share units (“DSUs”), as well as the mark-to-market gain or loss related to the DSUs.
Note 13 - Related Party Disclosures
Key management personnel are those persons having authority and responsibility for planning, directing and controlling the activities of the Company. Key management personnel include the Board of Directors and the executive management team.
Compensation for key management personnel of the Company was as follows:
|
|
For the three months ended |
|
|
For the nine months ended |
|
|||||||||
|
|
September 30, |
|
|
September 30, |
|
|||||||||
|
|
2023 |
|
2022 |
|
|
2023 |
|
|
2022 |
|
||||
Short-term benefits(1) |
|
$ |
0.9 |
|
$ |
0.9 |
|
|
$ |
2.7 |
|
|
$ |
2.8 |
|
Share-based payments(2) |
|
|
0.4 |
|
|
(0.4) |
|
|
|
4.3 |
|
|
|
3.1 |
|
|
|
$ |
1.3 |
|
$ |
0.5 |
|
|
$ |
7.0 |
|
|
$ |
5.9 |
|
| 1. | Includes salary, benefits and short-term accrued incentives/other bonuses earned in the period. |
| 2. | Represents the expense of stock options and RSUs and mark-to-market charges on DSUs during the period. |
Note 14 - Finance Income and Expenses
Finance income and expenses for the periods ended September 30, 2023 and 2022 were as follows:
|
|
|
For the three months ended |
|
|
For the nine months ended |
|
||||||||||
|
|
|
September 30, |
|
|
September 30, |
|
||||||||||
|
|
|
2023 |
|
|
2022 |
|
|
2023 |
|
|
2022 |
|
||||
Finance income |
|
|
|
|
|
|
|
|
|
|
|
|
|
|
|
|
|
Interest |
|
|
$ |
15.5 |
|
|
$ |
2.4 |
|
|
$ |
36.0 |
|
|
$ |
5.9 |
|
|
|
|
$ |
15.5 |
|
|
$ |
2.4 |
|
|
$ |
36.0 |
|
|
$ |
5.9 |
|
Finance expenses |
|
|
|
|
|
|
|
|
|
|
|
|
|
|
|
|
|
Standby charges |
|
|
$ |
0.5 |
|
|
$ |
0.6 |
|
|
$ |
1.7 |
|
|
$ |
1.7 |
|
Amortization of debt issue costs |
|
|
|
0.2 |
|
|
|
0.1 |
|
|
|
0.4 |
|
|
|
0.7 |
|
Accretion of lease liabilities |
|
|
|
— |
|
|
|
0.1 |
|
|
|
— |
|
|
|
0.1 |
|
|
|
|
$ |
0.7 |
|
|
$ |
0.8 |
|
|
$ |
2.1 |
|
|
$ |
2.5 |
|
2023 Third Quarter Financial Statements |
13 |
Franco-Nevada Corporation
Notes to the Condensed Consolidated Financial Statements |
For the three and nine months ended September 30, 2023 and 2022
(unaudited, expressed in millions of U.S. dollars, except per share amounts, unless otherwise noted)
Note 15 - Income Taxes
Income tax expense for the periods ended September 30, 2023 and 2022 was as follows:
|
|
|
|
|
|
|
|
|
|
|
|
|
|
|
|
|
|
For the three months ended |
|
|
For the nine months ended |
|
|||||||||
|
|
September 30, |
|
|
September 30, |
|
|||||||||
|
|
2023 |
|
2022 |
|
|
2023 |
|
|
2022 |
|
||||
Current income tax expense |
|
$ |
23.4 |
|
$ |
21.4 |
|
|
$ |
62.9 |
|
|
$ |
80.9 |
|
Deferred income tax expense |
|
|
1.5 |
|
|
9.0 |
|
|
|
16.6 |
|
|
|
22.2 |
|
Income tax expense |
|
$ |
24.9 |
|
$ |
30.4 |
|
|
$ |
79.5 |
|
|
$ |
103.1 |
|
Canada Revenue Agency Audit
The Company is undergoing an audit by the CRA of its 2012-2019 taxation years, as referenced in Note 21.
Global Minimum Tax
Canada, together with approximately 140 other countries comprising the OECD/G20 Inclusive Framework on BEPS (Base Erosion and Profit Shifting) (the “Inclusive Framework”), agreed to in principle in 2021, certain base erosion tax initiatives, including the introduction of a 15% global minimum tax (“Pillar Two”) that applies to large multinational enterprise groups with global consolidated revenues over €750 million.
On March 28, 2023, the Government of Canada reaffirmed its intention to implement Pillar Two effective for fiscal years that begin on or after December 31, 2023. On August 4, 2023, the government released for consultation draft legislation, which is intended to closely follow the detailed model rules, commentary, and administrative guidance agreed to by the Inclusive Framework. Subsequent to the quarter-end, on November 7, 2023, the Government of Barbados announced proposed rules in response to Pillar Two. Management has been evaluating the Pillar Two proposals, and is reviewing the Canadian draft legislation and the Barbados proposed rules and assessing their impact to the Company.
If the draft rules are enacted or substantively enacted, it would result in the Company’s profits being subject to additional taxation.
2023 Third Quarter Financial Statements |
14 |
Franco-Nevada Corporation
Notes to the Condensed Consolidated Financial Statements |
For the three and nine months ended September 30, 2023 and 2022
(unaudited, expressed in millions of U.S. dollars, except per share amounts, unless otherwise noted)
Note 16 - Shareholders’ Equity
| (a) | Share Capital |
The Company’s authorized capital stock includes an unlimited number of common shares (192,119,414 common shares issued and outstanding as at September 30, 2023) having no par value and preferred shares issuable in series (issued - nil).
Changes in share capital for the periods ended September 30, 2023 and December 31, 2022 were as follows:
|
|
|
|
|
|
|
|
|
|
|
Number |
|
|
|
|
|
|
|
of shares |
|
|
Amount |
|
Balance at January 1, 2022 |
|
|
191,334,392 |
|
$ |
5,628.5 |
|
Exercise of stock options |
|
|
148,295 |
|
|
12.2 |
|
Vesting of restricted share units |
|
|
49,919 |
|
|
6.4 |
|
Dividend reinvestment plan |
|
|
360,085 |
|
|
48.2 |
|
Balance at December 31, 2022 |
|
|
191,892,691 |
|
$ |
5,695.3 |
|
|
|
|
|
|
|
|
|
Balance at January 1, 2023 |
|
|
191,892,691 |
|
$ |
5,695.3 |
|
Exercise of stock options |
|
|
61,000 |
|
|
3.8 |
|
Dividend reinvestment plan |
|
|
165,723 |
|
|
23.0 |
|
Balance at September 30, 2023 |
|
|
192,119,414 |
|
$ |
5,722.1 |
|
| (b) | Dividends |
For the three months ended September 30, 2023, the Company declared dividends of $0.34 per common share (Q3 2022– $0.32). For the nine months ended September 30, 2023, the Company declared dividends of $1.02 per common share (YTD 2022 - $0.96). Dividends paid in cash and through the Company’s Dividend Reinvestment Plan (“DRIP”) were as follows:
|
|
|
|
|
|
|
|
|
|
|
|
|
|
|
|
|
|
For the three months ended |
|
|
For the nine months ended |
|
|||||||||
|
|
September 30, |
|
|
September 30, |
|
|||||||||
|
|
2023 |
|
2022 |
|
|
2023 |
|
|
2022 |
|
||||
Cash dividends |
|
$ |
56.8 |
|
$ |
48.2 |
|
|
$ |
173.2 |
|
|
$ |
149.6 |
|
DRIP dividends |
|
|
8.5 |
|
|
12.8 |
|
|
|
23.0 |
|
|
|
34.6 |
|
|
|
$ |
65.3 |
|
$ |
61.0 |
|
|
$ |
196.2 |
|
|
$ |
184.2 |
|
Note 17 - Earnings per Share ("EPS")
|
|
For the three months ended September 30, |
|
||||||||||||||||||
|
|
2023 |
|
2022 |
|
||||||||||||||||
|
|
|
|
|
Shares |
|
|
Per Share |
|
|
|
|
Shares |
|
|
Per Share |
|
||||
|
|
|
Net income |
|
(in millions) |
|
|
Amount |
|
|
Net income |
|
(in millions) |
|
|
Amount |
|
||||
Basic earnings per share |
|
|
$ |
175.1 |
|
192.1 |
|
|
$ |
0.91 |
|
|
$ |
157.1 |
|
191.6 |
|
|
$ |
0.82 |
|
Effect of dilutive securities |
|
|
|
— |
|
0.3 |
|
|
|
— |
|
|
|
— |
|
0.3 |
|
|
|
— |
|
Diluted earnings per share |
|
|
$ |
175.1 |
|
192.4 |
|
|
$ |
0.91 |
|
|
$ |
157.1 |
|
191.9 |
|
|
$ |
0.82 |
|
|
|
For the nine months ended September 30, |
|
||||||||||||||||||
|
|
2023 |
|
2022 |
|
||||||||||||||||
|
|
|
|
|
Shares |
|
|
Per Share |
|
|
|
|
Shares |
|
|
Per Share |
|
||||
|
|
|
Net income |
|
(in millions) |
|
|
Amount |
|
|
Net income |
|
(in millions) |
|
|
Amount |
|
||||
Basic earnings per share |
|
|
$ |
516.1 |
|
192.0 |
|
|
$ |
2.69 |
|
|
$ |
535.6 |
|
191.5 |
|
|
$ |
2.80 |
|
Effect of dilutive securities |
|
|
|
— |
|
0.3 |
|
|
|
(0.01) |
|
|
|
— |
|
0.4 |
|
|
|
(0.01) |
|
Diluted earnings per share |
|
|
$ |
516.1 |
|
192.3 |
|
|
$ |
2.68 |
|
|
$ |
535.6 |
|
191.9 |
|
|
$ |
2.79 |
|
For the three months ended September 30, 2023, 48,316 stock options (Q3 2022– 109,948 stock options) were excluded from the computation of diluted EPS as their impact would have been anti-dilutive. For the nine months ended September 30, 2023, 47,952 stock options (YTD 2022 – 109,948 stock options) were excluded from the computation of diluted EPS as their impact would have been anti-dilutive.
2023 Third Quarter Financial Statements |
15 |
Franco-Nevada Corporation
Notes to the Condensed Consolidated Financial Statements |
For the three and nine months ended September 30, 2023 and 2022
(unaudited, expressed in millions of U.S. dollars, except per share amounts, unless otherwise noted)
Note 18 - Segment Reporting
The chief operating decision-maker organizes and manages the business under two operating segments, consisting of royalty, stream and working interests in each of the mining and energy sectors.
The Company’s reportable segments for purposes of assessing performance are presented as follows:
|
|
For the three months ended September 30, |
|
|||||||||||||||||
|
|
2023 |
|
2022 |
|
|||||||||||||||
|
|
Mining |
|
Energy |
|
Total |
|
|
Mining |
|
Energy |
|
Total |
|
||||||
Revenue |
|
$ |
256.8 |
|
$ |
52.7 |
|
$ |
309.5 |
|
|
$ |
220.4 |
|
$ |
83.8 |
|
$ |
304.2 |
|
|
|
|
|
|
|
|
|
|
|
|
|
|
|
|
|
|
|
|
|
|
Expenses |
|
|
|
|
|
|
|
|
|
|
|
|
|
|
|
|
|
|
|
|
Costs of sales |
|
$ |
45.9 |
|
$ |
3.0 |
|
$ |
48.9 |
|
|
$ |
37.7 |
|
$ |
4.3 |
|
$ |
42.0 |
|
Depletion and depreciation |
|
|
53.2 |
|
|
14.8 |
|
|
68.0 |
|
|
|
51.4 |
|
|
16.6 |
|
|
68.0 |
|
Segment gross profit |
|
$ |
157.7 |
|
$ |
34.9 |
|
$ |
192.6 |
|
|
$ |
131.3 |
|
$ |
62.9 |
|
$ |
194.2 |
|
|
|
For the nine months ended September 30, |
|
|||||||||||||||||
|
|
2023 |
|
2022 |
|
|||||||||||||||
|
|
Mining |
|
Energy |
|
Total |
|
|
Mining |
|
Energy |
|
Total |
|
||||||
Revenue |
|
$ |
758.5 |
|
$ |
157.2 |
|
$ |
915.7 |
|
|
$ |
744.4 |
|
$ |
250.9 |
|
$ |
995.3 |
|
|
|
|
|
|
|
|
|
|
|
|
|
|
|
|
|
|
|
|
|
|
Expenses |
|
|
|
|
|
|
|
|
|
|
|
|
|
|
|
|
|
|
|
|
Costs of sales |
|
$ |
125.1 |
|
$ |
9.1 |
|
$ |
134.2 |
|
|
$ |
119.9 |
|
$ |
11.2 |
|
$ |
131.1 |
|
Depletion and depreciation |
|
|
156.5 |
|
|
47.2 |
|
|
203.7 |
|
|
|
162.2 |
|
|
48.9 |
|
|
211.1 |
|
Segment gross profit |
|
$ |
476.9 |
|
$ |
100.9 |
|
$ |
577.8 |
|
|
$ |
462.3 |
|
$ |
190.8 |
|
$ |
653.1 |
|
A reconciliation of total segment gross profit to consolidated net income before income taxes is presented below:
|
|
|
|
|
|
|
|
|
|
|
|
|
|
|
|
|
|
|
|
|
For the three months ended |
|
|
For the nine months ended |
|
||||||||||
|
|
|
September 30, |
|
|
September 30, |
|
||||||||||
|
|
|
2023 |
|
|
2022 |
|
|
2023 |
|
|
2022 |
|
||||
Total segment gross profit |
|
$ |
192.6 |
|
|
$ |
194.2 |
|
|
$ |
577.8 |
|
|
$ |
653.1 |
|
|
|
|
|
|
|
|
|
|
|
|
|
|
|
|
|
|
|
|
Other operating expenses (income) |
|
|
|
|
|
|
|
|
|
|
|
|
|
|
|
|
|
General and administrative expenses |
|
$ |
5.0 |
|
|
$ |
4.7 |
|
|
$ |
17.4 |
|
|
$ |
16.1 |
|
|
Share-based compensation expense |
|
|
0.7 |
|
|
|
0.4 |
|
|
|
6.3 |
|
|
|
4.7 |
|
|
Gain on sale of royalty interest |
|
|
— |
|
|
|
— |
|
|
|
(3.7) |
|
|
|
— |
|
|
(Gain) loss on sale of gold bullion |
|
|
(0.2) |
|
|
|
0.4 |
|
|
|
(2.3) |
|
|
|
(1.1) |
|
|
Depreciation |
|
|
0.1 |
|
|
|
0.5 |
|
|
|
0.5 |
|
|
|
1.6 |
|
|
Foreign exchange loss (gain) and other expenses (income) |
|
|
1.8 |
|
|
|
2.3 |
|
|
|
(2.1) |
|
|
|
(3.5) |
|
|
Income before finance items and income taxes |
|
$ |
185.2 |
|
|
$ |
185.9 |
|
|
$ |
561.7 |
|
|
$ |
635.3 |
|
|
|
|
|
|
|
|
|
|
|
|
|
|
|
|
|
|
|
|
Finance items |
|
|
|
|
|
|
|
|
|
|
|
|
|
|
|
|
|
Finance income |
|
$ |
15.5 |
|
|
$ |
2.4 |
|
|
$ |
36.0 |
|
|
$ |
5.9 |
|
|
Finance expenses |
|
|
(0.7) |
|
|
|
(0.8) |
|
|
|
(2.1) |
|
|
|
(2.5) |
|
|
Net income before income taxes |
|
$ |
200.0 |
|
|
$ |
187.5 |
|
|
$ |
595.6 |
|
|
$ |
638.7 |
|
|
2023 Third Quarter Financial Statements |
16 |
Franco-Nevada Corporation
Notes to the Condensed Consolidated Financial Statements |
For the three and nine months ended September 30, 2023 and 2022
(unaudited, expressed in millions of U.S. dollars, except per share amounts, unless otherwise noted)
Note 19 - Fair Value Measurements
Fair value is a market-based measurement, not an entity-specific measurement. For some assets and liabilities, observable market transactions or market information might be available. For other assets and liabilities, observable market transactions and market information might not be available. However, the objective of a fair value measurement in both cases is the same - to estimate the price at which an orderly transaction to sell the asset or to transfer the liability would take place between market participants at the measurement date under current market conditions (i.e. an exit price at the measurement date from the perspective of a market participant that holds the asset or owes the liability).
The fair value hierarchy establishes three levels to classify the inputs to valuation techniques used to measure fair value.
| ● | Level 1 inputs are quoted prices (unadjusted) in active markets for identical assets or liabilities. |
| ● | Level 2 inputs are quoted prices in markets that are not active, quoted prices for similar assets or liabilities in active markets, inputs other than quoted prices observable for the asset or liability (for example, interest rate and yield curves observable at commonly quoted intervals, forward pricing curves used to value currency and commodity contracts and volatility measurements used to value option contracts), or inputs that are derived principally from or corroborated by observable market data or other means. |
| ● | Level 3 inputs are unobservable (supported by little or no market activity). |
The fair value hierarchy gives the highest priority to Level 1 inputs and the lowest priority to Level 3 inputs.
There were no transfers between the levels of the fair value hierarchy during the three and nine months ended September 30, 2023.
Assets and Liabilities Measured at Fair Value on a Recurring Basis:
|
|
Quoted prices in |
|
Significant other |
|
Significant |
|
|
|
|
||||
|
|
active markets for |
|
observable |
|
unobservable |
|
|
|
|
||||
|
|
identical assets |
|
inputs |
|
inputs |
|
|
Aggregate |
|
||||
As at September 30, 2023 |
|
(Level 1) |
|
(Level 2) |
|
(Level 3) |
|
|
fair value |
|
||||
Receivables from provisional concentrate sales |
|
$ |
— |
|
$ |
7.3 |
|
$ |
— |
|
|
$ |
7.3 |
|
Equity investments |
|
|
228.8 |
|
|
— |
|
|
8.3 |
|
|
|
237.1 |
|
Warrants |
|
|
— |
|
|
2.6 |
|
|
— |
|
|
|
2.6 |
|
|
|
$ |
228.8 |
|
$ |
9.9 |
|
$ |
8.3 |
|
|
$ |
247.0 |
|
|
|
Quoted prices in |
|
Significant other |
|
Significant |
|
|
|
|
||||
|
|
active markets for |
|
observable |
|
unobservable |
|
|
|
|
||||
|
|
identical assets |
|
inputs |
|
inputs |
|
|
Aggregate |
|
||||
As at December 31, 2022 |
|
(Level 1) |
|
(Level 2) |
|
(Level 3) |
|
|
fair value |
|
||||
Receivables from provisional concentrate sales |
|
$ |
— |
|
$ |
9.3 |
|
$ |
— |
|
|
$ |
9.3 |
|
Equity investments |
|
|
220.8 |
|
|
— |
|
|
3.8 |
|
|
|
224.6 |
|
Warrants |
|
|
— |
|
|
2.6 |
|
|
— |
|
|
|
2.6 |
|
|
|
$ |
220.8 |
|
$ |
11.9 |
|
$ |
3.8 |
|
|
$ |
236.5 |
|
2023 Third Quarter Financial Statements |
17 |
Franco-Nevada Corporation
Notes to the Condensed Consolidated Financial Statements |
For the three and nine months ended September 30, 2023 and 2022
(unaudited, expressed in millions of U.S. dollars, except per share amounts, unless otherwise noted)
The valuation techniques that are used to measure fair value are as follows:
| (a) | Receivables from provisional concentrate sales |
The fair values of receivables arising from gold and platinum group metal concentrate sales contracts that contain provisional pricing mechanisms are determined using the appropriate quoted forward prices from the exchange that is the principal active market for the particular metal. As such, these receivables are classified within Level 2 of the fair value hierarchy.
| (b) | Investments |
The fair values of publicly-traded investments are determined based on a market approach reflecting the closing prices of each particular security at the statement of financial position date. The closing prices are quoted market prices obtained from the exchange that is the principal active market for the particular security, and therefore are classified within Level 1 of the fair value hierarchy.
The Company holds two equity investment that do not have a quoted market price in an active market. The Company has assessed the fair value of the instruments based on a valuation technique using unobservable discounted future cash flows. As a result, the fair value is classified within Level 3 of the fair value hierarchy.
The fair values of warrants are estimated using the Black-Scholes pricing model which requires the use of inputs that are observable in the market. As such, these investments are classified within Level 2 of the fair value hierarchy.
The fair values of the Company’s remaining financial assets and liabilities, which include cash and cash equivalents, receivables, accounts payable and accrued liabilities approximate their carrying values due to their short-term nature and historically negligible credit losses.
The Company has not offset financial assets with financial liabilities.
2023 Third Quarter Financial Statements |
18 |
Franco-Nevada Corporation
Notes to the Condensed Consolidated Financial Statements |
For the three and nine months ended September 30, 2023 and 2022
(unaudited, expressed in millions of U.S. dollars, except per share amounts, unless otherwise noted)
Note 20 - Commitments
(a)Commodity purchase commitments
The following table summarizes the Company’s commitments pursuant to the associated precious metals agreements as at September 30, 2023:
|
|
Attributable payable |
|
|
|
|
|
|
|
|
|
|
|
|
|
|
||||
|
|
production to be purchased |
|
Per ounce cash payment (1),(2) |
|
Term of |
|
Date of |
|
|||||||||||
Interest |
|
Gold |
|
Silver |
|
PGM |
|
Gold |
|
Silver |
|
PGM |
|
agreement(3) |
|
contract |
|
|||
Antamina |
|
— |
% |
22.5 |
% (4) |
— |
% |
|
n/a |
|
|
5 |
% (5) |
|
n/a |
|
40 years |
|
7-Oct-15 |
|
Antapaccay |
|
— |
% (6) |
— |
% (7) |
— |
% |
|
20 |
% (8) |
|
20 |
% (9) |
|
n/a |
|
40 years |
|
10-Feb-16 |
|
Candelaria |
|
68 |
% (10) |
68 |
% (10) |
— |
% |
$ |
400 |
|
$ |
4.00 |
|
|
n/a |
|
40 years |
|
6-Oct-14 |
|
Cobre Panama Fixed Payment Stream |
|
— |
% (11) |
— |
% (12) |
— |
% |
$ |
418 |
(13) |
$ |
6.27 |
(14) |
|
n/a |
|
40 years |
|
19-Jan-18 |
|
Cobre Panama Floating Payment Stream |
|
— |
% (15) |
— |
% (16) |
— |
% |
|
20 |
% (17) |
|
20 |
% (18) |
|
n/a |
|
40 years |
|
19-Jan-18 |
|
Condestable |
|
— |
% (19) |
— |
% (20) |
— |
% |
|
20 |
% (21) |
|
20 |
% (22) |
|
n/a |
|
40 years |
|
8-Mar-21 |
|
Guadalupe-Palmarejo |
|
50 |
% |
— |
% |
— |
% |
$ |
800 |
|
|
n/a |
|
|
n/a |
|
40 years |
|
2-Oct-14 |
|
Karma |
|
4.875 |
% |
— |
% |
— |
% |
|
20 |
% (23) |
|
n/a |
|
|
n/a |
|
40 years |
|
11-Aug-14 |
|
Sabodala |
|
— |
% (24) |
— |
% |
— |
% |
|
20 |
% (25) |
|
n/a |
|
|
n/a |
|
40 years |
|
25-Sep-20 |
|
MWS |
|
25 |
% |
— |
% |
— |
% |
$ |
400 |
|
|
n/a |
|
|
n/a |
|
40 years |
(26) |
2-Mar-12 |
|
Sudbury(27) |
|
50 |
% |
— |
% |
50 |
% |
$ |
400 |
|
|
n/a |
|
$ |
400 |
|
40 years |
|
15-Jul-08 |
|
Tocantinzinho |
|
12.5 |
% (28) |
— |
% |
— |
% |
|
20 |
% (29) |
|
n/a |
|
|
n/a |
|
40 years |
|
18-Jul-22 |
|
Cooke 4 |
|
7.0 |
% |
— |
% |
— |
% |
$ |
400 |
|
|
n/a |
|
|
n/a |
|
40 years |
|
5-Nov-09 |
|
| 1 | Subject to an annual inflationary adjustment except for Antamina, Antapaccay, Karma, Guadalupe-Palmarejo, and Sabodala. |
| 2 | Should the prevailing market price for gold be lower than this amount, the per ounce cash payment will be reduced to the prevailing market price. |
| 3 | Subject to successive extensions. |
| 4 | Subject to a fixed payability of 90%. Percentage decreases to 15% after 86 million ounces of silver has been delivered under the agreement. |
| 5 | Purchase price is 5% of the average silver price at the time of delivery. |
| 6 | Gold deliveries are referenced to copper in concentrate shipped with 300 ounces of gold delivered for each 1,000 tonnes of copper in concentrate shipped, until 630,000 ounces of gold has been delivered. Thereafter, percentage is 30% of gold shipped. |
| 7 | Silver deliveries are referenced to copper in concentrate shipped with 4,700 ounces of silver delivered for each 1,000 tonnes of copper in concentrate shipped, until 10.0 million ounces of silver has been delivered. Thereafter, percentage is 30% of silver shipped. |
| 8 | Purchase price is 20% of the spot price of gold until 750,000 ounces of gold have been delivered, thereafter the purchase price is 30% of the spot price of gold. |
| 9 | Purchase price is 20% of the spot price of silver until 12.8 million ounces of silver have been delivered, thereafter the purchase price is 30% of the spot price of silver. |
| 10 | Percentage decreases to 40% after 720,000 ounces of gold and 12.0 million ounces of silver have been delivered under the agreement. |
| 11 | Gold deliveries are indexed to copper in concentrate produced from the project. 120 ounces of gold per every 1 million pounds of copper produced until 808,000 ounces of gold delivered. Thereafter, 81 ounces of gold per 1 million pounds of copper produced until 1,716,188 ounces of gold delivered. Thereafter, 63.4% of the gold in concentrate. |
| 12 | Silver deliveries are indexed to copper in concentrate produced from the project. 1,376 ounces of silver per every 1 million pounds of copper produced until 9,842,000 ounces of silver delivered. Thereafter 1,776 ounces of silver per 1 million pounds of copper produced until 29,731,000 ounces of silver delivered. Thereafter, 62.1% of the silver in concentrate. |
| 13 | After 1,341,000 ounces of gold delivered, purchase price is the greater of 50% of spot and $418.27 per ounce, subject to annual inflationary adjustment. As the mill throughput for 30 consecutive days commensurate with annual capacity of 58 million tonnes per annum was not reached by January 1, 2019, Franco-Nevada received a reduction of the applicable fixed gold price of $100 per ounce until the end of Q2 2023. |
| 14 | After 21,510,000 ounces of silver delivered, purchase price is the greater of 50% of spot and $6.27 per ounce, subject to an annual inflationary adjustment. |
| 15 | Gold deliveries are indexed to copper in concentrate produced from the project. 30 ounces of gold per every 1 million pounds of copper produced until 202,000 ounces of gold delivered. Thereafter 20.25 ounces of gold per 1 million pounds of copper produced until 429,047 ounces of gold delivered. Thereafter, 15.85% of the gold in concentrate. |
| 16 | Silver deliveries are indexed to copper in concentrate produced from the project. 344 ounces of silver per every 1 million pounds of copper produced until 2,460,500 ounces of silver delivered. Thereafter, 444 ounces of silver per 1 million pounds of copper produced until 7,432,750 ounces of silver delivered. Thereafter 15.53% of the silver in concentrate. |
| 17 | After 604,000 ounces of gold delivered, purchase price is 50% of the spot price of gold. As the mill throughput for 30 consecutive days commensurate with annual capacity of 58 million tonnes per annum was not reached by January 1, 2019, Franco-Nevada received a reduction of the applicable floating gold price of $100 per ounce until the end of Q2 2023. |
| 18 | After 9,618,000 ounces of silver delivered, purchase price is 50% of the spot price of silver. |
| 19 | Gold deliveries are fixed at 8,760 ounces per annum from January 1, 2021 to December 31, 2025. Thereafter, 63% of the gold in concentrate until a cumulative total of 87,600 ounces of gold delivered. Thereafter, 25% of the gold in concentrate. |
| 20 | Silver deliveries are fixed at 291,000 ounces per annum from January 1, 2021 to December 31, 2025. Thereafter, 63% of the silver in concentrate until a cumulative total of 2,910,000 ounces of silver delivered. Thereafter, 25% of the silver in concentrate. |
| 21 | Purchase price is 20% of the spot price of gold at the time of delivery. |
| 22 | Purchase price is 20% of the spot price of silver at the time of delivery. |
| 23 | Purchase price is 20% of the average gold price at the time of delivery. |
| 24 | Based on amended agreement with an effective date of September 1, 2020, gold deliveries are fixed at 783.33 ounces per month until 105,750 ounces of gold is delivered. Thereafter, percentage is 6% of gold production (subject to reconciliation after fixed delivery period to determine if Franco-Nevada would have received more or less than 105,750 ounces of gold under the original 6% variable stream for such period, entitling the operator to a credit for an over-delivery applied against future stream deliveries or a one-time additional delivery to Franco-Nevada for an under-delivery). |
| 25 | Purchase price is 20% of prevailing market price at the time of delivery. |
| 26 | Agreement is capped at 312,500 ounces of gold. |
2023 Third Quarter Financial Statements |
19 |
Franco-Nevada Corporation
Notes to the Condensed Consolidated Financial Statements |
For the three and nine months ended September 30, 2023 and 2022
(unaudited, expressed in millions of U.S. dollars, except per share amounts, unless otherwise noted)
| 27 | The Company is committed to purchase 50% of the precious metals contained in ore from the properties. Payment is based on gold equivalent ounces. For McCreedy West, effective June 1, 2021, purchase price per gold equivalent ounce is determined based on the monthly average gold spot price: (i) when the gold spot price is less than $800 per ounce, the purchase price is the prevailing monthly average gold spot price; (ii) when the gold spot price is greater than $800 per ounce but less than $1,333 per ounce, the purchase price is $800 per ounce; (iii) when the gold spot price is greater than $1,333 per ounce but less than $2,000 per ounce, the purchase price is 60% of the prevailing monthly average gold spot price; and (iv) when the gold spot price is greater than $2,000, the purchase price is $1,200 per ounce. |
| 28 | Percentage decreases to 7.5% after 300,000 ounces of gold have been delivered under the agreement. |
| 29 | Purchase price is 20% of the spot price of gold at the time of delivery. |
(b)Capital commitments
As at September 30, 2023, the Company has the following capital commitments: (i) $75.0 million in connection with the Term Loan for the Tocantinzinho project as described in Note 3 (e), (ii) $71.0 million for its share of the acquisition of mineral rights acquired through the Royalty Acquisition Venture with Continental as described in Note 3 (m), and (iii) up to $5.5 million for the joint acquisition of newly created precious metals and copper royalties sourced by EMX as described in Note 3 (g).
The Company also has commitments for contingent payments in relation to various royalty agreements, as follows: (i) $12.5 million in relation to its Copper World royalty, (ii) $8.0 million in relation to its Rio Baker (Salares Norte) royalty, (iii) $1.1 million (C$1.5 million) in relation to its Eskay Creek royalty, and (iv) $1.3 million in relation to its Rebecca royalty.
Note 21 - Contingencies
Canada Revenue Agency Audit
The CRA is conducting an audit of Franco-Nevada for the 2012-2019 taxation years.
Settlement of Domestic and FAPI Reassessments
In prior years, certain wholly-owned Canadian subsidiaries of the Company received Notices of Reassessment for the 2014 through 2017 taxation years (the “Domestic Reassessments”) in which the CRA increased income by adjusting the timing of the deduction of the upfront payments which were made in connection with precious metal stream agreements. This resulted in the Company being subject to an incremental payment of Federal and provincial income taxes for these years of $14.7 million (C$19.9 million) (after applying available non-capital losses and other deductions) plus interest and penalties.
In addition, in a prior year, the Company received Notices of Reassessment for the 2012 and 2013 taxation years (the “FAPI Reassessments”) in relation to its Barbadian subsidiary. The FAPI Reassessments asserted that a majority of the income relating to precious metal streams earned by the Barbadian subsidiary, in those years, should have been included in the income of its Canadian parent company and subject to tax in Canada as Foreign Accrual Property Income (“FAPI”). The CRA noted that its position may not extend beyond the 2013 taxation year. The FAPI Reassessments resulted in additional Federal and provincial income taxes of $5.7 million (C$7.7 million) plus interest and penalties.
On April 28, 2023, the Company reached a settlement with the CRA in respect of the Domestic and FAPI Reassessments, which provide for these reassessments to be vacated entirely on a without-cost basis. Under the settlement, the CRA accepts the manner in which the Company deducts upfront payments made in connection with precious metal stream agreements for Canadian tax purposes. This would result in no FAPI in 2012 and 2013 as computed under Canadian tax law. While the settlement of the Domestic Reassessment only addresses the taxation years that were reassessed (2014-2017), the Company’s expectation is that the manner in which it deducts upfront payments made in connection with precious metal stream agreements for Canadian tax purposes will now be accepted by the CRA for the subsequent years.
The Company had posted security in cash for 50% of the reassessed amounts under the Domestic and FAPI Reassessments and expects this amount totaling $13.9 million (C$17.7 million), as referenced in Note 6, to be fully recovered. Subsequent to quarter-end, in October 2023, the CRA returned $9.9 million (C$12.5 million) of these deposits.
2023 Third Quarter Financial Statements |
20 |
Franco-Nevada Corporation
Notes to the Condensed Consolidated Financial Statements |
For the three and nine months ended September 30, 2023 and 2022
(unaudited, expressed in millions of U.S. dollars, except per share amounts, unless otherwise noted)
Transfer Pricing Reassessments
The Company has received reassessments from the CRA made on the basis of the transfer pricing provisions in the Income Tax Act (Canada) (the “Act”). The following table provides a summary of the CRA audit and reassessment matters further detailed below:
|
|||
|
CRA Position |
Taxation Years Reassessed |
Potential Exposure for Tax, Interest and Penalties (in millions) |
|
Transfer Pricing (Mexico) |
Transfer pricing provisions in the Act apply such that a majority of the income earned by the Company’s Mexican subsidiary should be included in the income of the Company and subject to tax in Canada. |
2013, 2014, 2015, 2016 |
For 2013-2016: Tax: $22.1 (C$29.9) Transfer pricing penalties: $9.0 (C$12.0) Interest and other penalties: $13.4 (C$18.1) The amounts set forth above do not include any potential relief under the Canada-Mexico tax treaty. The Company’s Mexican subsidiary ceased operations after 2016 and no reassessments for this issue are expected for subsequent years. |
|
Transfer Pricing (Barbados) |
Transfer pricing provisions in the Act apply such that a majority of the income relating to certain precious metal streams earned by the Company’s Barbadian subsidiary should be included in the income of the Company and subject to tax in Canada. |
2014, 2015, 2016, 2017 |
For 2014-2017: Tax: $34.5 (C$46.5) Transfer pricing penalties: $13.0 (C$17.6) Interest and other penalties: $13.2 (C$18.0) If the CRA were to reassess the 2018-2022 taxation years on the same basis: Tax: $217.2 (C$293.7) Transfer pricing penalties: $82.0 (C$110.9) Interest and other penalties: $38.5 (C$52.0) |
| (a) | Mexico (2013-2016) |
In December 2018 and December 2019, the Company received Notices of Reassessment from the CRA for the 2013 taxation year (the “2013 Reassessment”) and for the 2014 and 2015 taxation years (the “2014 and 2015 Reassessments”, collectively with the 2013 Reassessment, the “2013-2015 Reassessments”) in relation to its Mexican subsidiary. The reassessments were made on the basis of the transfer pricing provisions in the Act and assert that a majority of the income earned by the Mexican subsidiary should have been included in the income of the Company and subject to tax in Canada. The 2013-2015 Reassessments result in additional Federal and provincial income taxes of $18.7 million (C$25.3 million) plus estimated interest (calculated to September 30, 2023) and other penalties of $12.1 million (C$16.4 million) but before any relief under the Canada-Mexico tax treaty. The Company has filed formal Notices of Objection with the CRA against the 2013-2015 Reassessments and has posted security in the form of a standby letter of credit for 50% of the reassessed amounts, as referenced in Note 9.
In December 2020, the CRA issued revised 2013-2015 Reassessments to include transfer pricing penalties of $7.7 million (C$10.3 million). The Company has filed formal Notices of Objection with the CRA against these revised reassessments and has posted security in the form of cash for 50% of the reassessed amounts of penalties, as referenced in Note 8. The Company has commenced an appeal in the Tax Court of Canada with respect to the 2013-2015 Reassessments.
In December 2021, the Company received a Notice of Reassessment for the 2016 taxation year (the “2016 Reassessment”) on the same basis as the 2013-2015 Reassessments, resulting in additional Federal and provincial income taxes of $3.4 million (C$4.6 million) plus estimated interest (calculated to September 30, 2023) and other penalties of $1.3 million (C$1.7 million) but before any relief under the Canada-Mexico tax treaty.
The Company has filed a formal Notice of Objection with the CRA against the 2016 Reassessment and has posted security in the form of cash for 50% of the reassessed amounts, as referenced in Note 8. Subsequent to quarter-end, on October 26, 2023, the Company received a revised 2016 Reassessment to include transfer pricing penalties of $1.3 million (C$1.7 million). The Company disagrees and intends to file a Notice of Objection against this revised reassessment. The Company’s Mexican subsidiary ceased operations after 2016 and no reassessments are expected for subsequent years.
2023 Third Quarter Financial Statements |
21 |
Franco-Nevada Corporation
Notes to the Condensed Consolidated Financial Statements |
For the three and nine months ended September 30, 2023 and 2022
(unaudited, expressed in millions of U.S. dollars, except per share amounts, unless otherwise noted)
For taxation years 2013 through 2016, the Company’s Mexican subsidiary paid a total of $34.1 million (490.3 million Pesos) in cash taxes, at a 30% tax rate, to the Mexican tax authorities on income earned in Mexico. If required, the Company intends to seek relief from double taxation under the Canada-Mexico tax treaty.
| (b) | Barbados (2014-2017) |
The 2014 and 2015 Reassessments also reassess the Company in relation to its Barbadian subsidiary. The reassessments were made on the basis of the transfer pricing provisions in the Act and assert that a majority of the income relating to certain precious metal streams earned by the Barbadian subsidiary should have been included in the income of the Company and subject to tax in Canada, resulting in additional Federal and provincial income taxes of $5.0 million (C$6.7 million) plus estimated interest (calculated to September 30, 2023) and other penalties of $3.0 million (C$4.1 million). As noted previously, the Company has filed formal Notices of Objection with the CRA against the 2014 and 2015 Reassessments and has posted security in the form of a standby letter of credit for 50% of the reassessed amounts, as referenced in Note 9.
As noted above, in December 2020, the CRA issued revised 2014 and 2015 Reassessments to include transfer pricing penalties of $1.8 million (C$2.5 million). The Company has filed formal Notices of Objection with the CRA against these revised reassessments and has posted security in the form of cash for 50% of the reassessed amounts of penalties, as referenced in Note 8. The Company has commenced an appeal in the Tax Court of Canada with respect to the 2014-2015 Reassessments.
In December 2021, the Company received the 2016 Reassessment as well as a Notice of Reassessment for the 2017 taxation year (the “2017 Reassessment”, collectively with the 2016 Reassessment, the “2016 and 2017 Reassessments” and collectively with the 2013-2015 Reassessments, the “Transfer Pricing Reassessments”) that reassess the Company in relation to its Barbadian subsidiary on the same basis as the 2014 and 2015 Reassessments, resulting in additional Federal and provincial income taxes of $29.5 million (C$39.8 million) plus estimated interest (calculated to September 30, 2023) and other penalties of $10.2 million (C$13.9 million). The Company has filed formal Notices of Objection with the CRA against the 2016 and 2017 Reassessments and has posted security in the form of cash for 50% of the reassessed amounts, as referenced in Note 8. Subsequent to quarter-end, on October 26, 2023, the Company received revised 2016 and 2017 Reassessments to include transfer pricing penalties of $11.2 million (C$15.1 million). The Company disagrees and intends to file Notices of Objection against these revised reassessments.
If the CRA were to reassess the Company for taxation years 2018 through 2022 on the same basis and continue to apply transfer pricing penalties, the Company estimates that it would be subject to additional Canadian tax for these years of approximately $217.2 million (C$293.7 million), transfer pricing penalties of approximately $82.0 million (C$110.9 million) plus interest (calculated to September 30, 2023) and other penalties of approximately $38.5 million (C$52.0 million).
Management believes that the Company and its subsidiaries have filed all tax returns and paid all applicable taxes in compliance with Canadian and applicable foreign tax laws and, as a result, no liabilities have been recorded in the financial statements of the Company for the Transfer Pricing Reassessments, or for any potential tax exposure that may arise in respect of these matters. The Company does not believe that the Transfer Pricing Reassessments are supported by Canadian tax law and jurisprudence and intends to vigorously defend its tax filing positions.
The CRA audit is ongoing and there can be no assurance that the CRA will not further challenge the manner in which the Company or any of its subsidiaries has filed its tax returns and reported its income. In the event that the CRA successfully challenges the manner in which the Company or a subsidiary has filed its tax returns and reported its income, this could potentially result in additional income taxes, penalties and interest, which could have a material adverse effect on the Company.
2023 Third Quarter Financial Statements |
22 |
Franco-Nevada Corporation
Notes to the Condensed Consolidated Financial Statements |
For the three and nine months ended September 30, 2023 and 2022
(unaudited, expressed in millions of U.S. dollars, except per share amounts, unless otherwise noted)
Note 22 – Subsequent Events
Revised Concession Contract for the Cobre Panama Mine
First Quantum, Minera Panama, S.A., and the Government of Panama have been engaged in discussions regarding a revised concession contract to secure the long-term future of the Cobre Panama mine.
Subsequent to quarter-end, on October 20, 2023, the Revised Concession Contract between First Quantum and the GOP was enacted into Law 406. In response to protests and social unrest in the country of Panama, on October 29, 2023, President Laurentino Cortizo announced the GOP’s intention to hold a popular consultation concerning Law 406. In addition, several lawsuits challenging the constitutionality of Law 406 have been submitted to the Supreme Court of Justice, a number of which have been admitted for adjudication. Refer to Note 2 (b) for further details.
Acquisitions and Other Transactions
Subsequent to quarter-end, on November 2, 2023, the Company acquired from Argonaut an additional 1.0% NSR on the Magino gold mine and a portfolio comprised of Argonaut’s existing royalty holdings in Canada and Mexico for an aggregate purchase price of approximately $29.5 million, as referenced in Note 3 (a).
CRA Audits
Subsequent to quarter-end, in October 2023, the Company received $9.9 million (C$12.5 million) of the cash on deposit with CRA in connection with the now vacated Domestic and FAPI Reassessments, as referenced in Notes 6 and 21.
2023 Third Quarter Financial Statements |
23 |

***
Exhibit 99.4
FORM 52-109F2
CERTIFICATION OF INTERIM FILINGS
FULL CERTIFICATE
I, Paul Brink, President & Chief Executive Officer of Franco-Nevada Corporation, certify the following:
1. Review: I have reviewed the interim financial report and interim MD&A (together, the “interim filings”) of Franco-Nevada Corporation (the “issuer”) for the interim period ended September 30, 2023.
2. No misrepresentations: Based on my knowledge, having exercised reasonable diligence, the interim filings do not contain any untrue statement of a material fact or omit to state a material fact required to be stated or that is necessary to make a statement not misleading in light of the circumstances under which it was made, with respect to the period covered by the interim filings.
3. Fair presentation: Based on my knowledge, having exercised reasonable diligence, the interim financial report together with the other financial information included in the interim filings fairly present in all material respects the financial condition, financial performance and cash flows of the issuer, as of the date of and for the periods presented in the interim filings.
4. Responsibility: The issuer’s other certifying officer(s) and I are responsible for establishing and maintaining disclosure controls and procedures (DC&P) and internal control over financial reporting (ICFR), as those terms are defined in National Instrument 52-109 Certification of Disclosure in Issuers’ Annual and Interim Filings, for the issuer.
5. Design: Subject to the limitations, if any, described in paragraphs 5.2 and 5.3, the issuer’s other certifying officer(s) and I have, as at the end of the period covered by the interim filings:
(a) designed DC&P, or caused it to be designed under our supervision, to provide reasonable assurance that:
(i) material information relating to the issuer is made known to us by others, particularly during the period in which the interim filings are being prepared; and
(ii) information required to be disclosed by the issuer in its annual filings, interim filings or other reports filed or submitted by it under securities legislation is recorded, processed, summarized and reported within the time periods specified in securities legislation; and
(b) designed ICFR, or caused it to be designed under our supervision, to provide reasonable assurance regarding the reliability of financial reporting and the preparation of financial statements for external purposes in accordance with the issuer’s GAAP.
5.1 Control framework: The control framework the issuer’s other certifying officer(s) and I used to design the issuer’s ICFR is Internal Control — Integrated Framework published by the Committee of Sponsoring Organizations of the Treadway Commission (“COSO”).
5.2 N/A
5.3 N/A
6. Reporting changes in ICFR: The issuer has disclosed in its interim MD&A any change in the issuer’s ICFR that occurred during the period beginning on July 1, 2023 and ended on September 30, 2023 that has materially affected, or is reasonably likely to materially affect, the issuer’s ICFR.
Date: November 8, 2023
|
|
||
|
|
||
/s/ Paul Brink |
|
||
Paul Brink, President & Chief Executive Officer |
|
||
Franco-Nevada Corporation |
|
||
Exhibit 99.5
FORM 52-109F2
CERTIFICATION OF INTERIM FILINGS
FULL CERTIFICATE
I, Sandip Rana, Chief Financial Officer of Franco-Nevada Corporation, certify the following:
1. Review: I have reviewed the interim financial report and interim MD&A (together, the “interim filings”) of Franco-Nevada Corporation (the “issuer”) for the interim period ended September 30, 2023.
2. No misrepresentations: Based on my knowledge, having exercised reasonable diligence, the interim filings do not contain any untrue statement of a material fact or omit to state a material fact required to be stated or that is necessary to make a statement not misleading in light of the circumstances under which it was made, with respect to the period covered by the interim filings.
3. Fair presentation: Based on my knowledge, having exercised reasonable diligence, the interim financial report together with the other financial information included in the interim filings fairly present in all material respects the financial condition, financial performance and cash flows of the issuer, as of the date of and for the periods presented in the interim filings.
4. Responsibility: The issuer’s other certifying officer(s) and I are responsible for establishing and maintaining disclosure controls and procedures (DC&P) and internal control over financial reporting (ICFR), as those terms are defined in National Instrument 52-109 Certification of Disclosure in Issuers’ Annual and Interim Filings, for the issuer.
5. Design: Subject to the limitations, if any, described in paragraphs 5.2 and 5.3, the issuer’s other certifying officer(s) and I have, as at the end of the period covered by the interim filings:
(a) designed DC&P, or caused it to be designed under our supervision, to provide reasonable assurance that:
(i) material information relating to the issuer is made known to us by others, particularly during the period in which the interim filings are being prepared; and
(ii) information required to be disclosed by the issuer in its annual filings, interim filings or other reports filed or submitted by it under securities legislation is recorded, processed, summarized and reported within the time periods specified in securities legislation; and
(b) designed ICFR, or caused it to be designed under our supervision, to provide reasonable assurance regarding the reliability of financial reporting and the preparation of financial statements for external purposes in accordance with the issuer’s GAAP.
5.1 Control framework: The control framework the issuer’s other certifying officer(s) and I used to design the issuer’s ICFR is Internal Control — Integrated Framework published by the Committee of Sponsoring Organizations of the Treadway Commission (“COSO”).
5.2 N/A
5.3 N/A
6. Reporting changes in ICFR: The issuer has disclosed in its interim MD&A any change in the issuer’s ICFR that occurred during the period beginning on July 1, 2023 and ended on September 30, 2023 that has materially affected, or is reasonably likely to materially affect, the issuer’s ICFR.
Date: November 8, 2023
|
|
|
|
|
|
/s/ Sandip Rana |
|
|
Sandip Rana, Chief Financial Officer |
|
|
Franco-Nevada Corporation |
|
|