UNITED STATES
SECURITIES AND EXCHANGE COMMISSION
Washington, D.C. 20549
FORM 8-K
CURRENT REPORT
Pursuant to Section 13 or 15(d) of The Securities Exchange Act of 1934
Date of Report (Date of earliest event reported): November 7, 2023
READY CAPITAL CORPORATION
(Exact name of registrant as specified in its charter)
Maryland |
001-35808 |
90-0729143 |
(State or other jurisdiction |
(Commission File Number) |
(IRS Employer |
of incorporation) |
|
Identification No.) |
1251 Avenue of the Americas, 50th Floor
New York, NY 10020
(Address of principal executive offices)
(Zip Code)
Registrant's telephone number, including area code: (212) 257-4600
n/a
(Former name or former address, if changed since last report.)
Check the appropriate box below if the Form 8-K filing is intended to simultaneously satisfy the filing obligation of the registrant under any of the following provisions (see General Instruction A.2. below):
|
☐ |
Written communications pursuant to Rule 425 under the Securities Act (17 CFR 230.425) |
|
|
|
|
☐ |
Soliciting material pursuant to Rule 14a-12 under the Exchange Act (17 CFR 240.14a-12) |
|
|
|
|
☐ |
Pre-commencement communications pursuant to Rule 14d-2(b) under the Exchange Act (17 CFR 240.14d-2(b)) |
|
|
|
|
☐ |
Pre-commencement communications pursuant to Rule 13e-4(c) under the Exchange Act (17 CFR 240.13e-4(c)) |
Indicate by check mark whether the registrant is an emerging growth company as defined in Rule 405 of the Securities Act of 1933 (§230.405 of this chapter) or Rule 12b-2 of the Securities Exchange Act of 1934 (§240.12b-2 of this chapter).
Emerging growth company ☐
If an emerging growth company, indicate by check mark if the registrant has elected not to use the extended transition period for complying with any new or revised financial accounting standards provided pursuant to Section 13(a) of the Exchange Act. ☐
Securities registered pursuant to Section 12(b) of the Exchange Act:
Title of each class |
Trading Symbol(s) |
Name of each exchange on which registered |
Common Stock, $0.0001 par value per share |
RC |
New York Stock Exchange |
Preferred Stock, 6.25% Series C Cumulative Convertible, par value $0.0001 per share |
RC PRC |
New York Stock Exchange |
Preferred Stock, 6.50% Series E Cumulative Redeemable, par value $0.0001 per share |
RC PRE |
New York Stock Exchange |
|
6.20% Senior Notes due 2026 5.75% Senior Notes due 2026 |
RCB RCC |
New York Stock Exchange New York Stock Exchange |
Item 2.02. |
Results of Operations and Financial Condition |
On November 7, 2023, Ready Capital Corporation (the “Company”) issued an earnings release announcing the financial results for the quarter ended September 30, 2023. A copy of the earnings release is attached as Exhibit 99.1 hereto and incorporated herein by reference.
On November 7, 2023, the Company posted supplemental financial information on the Investor Relations section of its website (www.readycapital.com). A copy of the supplemental financial information is furnished as Exhibit 99.2 hereto and incorporated herein by reference.
The information in Item 2.02 of this Current Report, including Exhibits 99.1 and 99.2, is being furnished and shall not be deemed “filed” for purposes of Section 18 of the Securities Exchange Act of 1934, as amended, or otherwise subject to the liabilities of that Section. The information in this Current Report shall not be incorporated by reference into any registration statement or other document pursuant to the Securities Act of 1933, as amended, unless it is specifically incorporated by reference therein.
Item 9.01 Financial Statements and Exhibits
|
(d) |
Exhibits |
Exhibit No. |
|
Description |
|
|
|
99.1 |
|
|
|
|
|
99.2 |
|
Supplemental Financial Information for the quarter ended September 30, 2023 |
|
|
|
104 |
|
Cover Page Interactive Data File (embedded within the Inline XBRL document). |
SIGNATURES
Pursuant to the requirements of the Securities Exchange Act of 1934, the registrant has duly caused this report to be signed on its behalf by the undersigned hereunto duly authorized.
|
READY CAPITAL CORPORATION |
|
|
|
|
|
|
|
|
|
|
|
By: |
/s/ Andrew Ahlborn |
|
|
|
Name: Andrew Ahlborn |
|
|
|
Title: Chief Financial Officer |
|
Date: November 7, 2023
Exhibit 99.1
READY CAPITAL CORPORATION REPORTS THIRD QUARTER 2023 RESULTS
| - | GAAP EARNINGS PER COMMON SHARE OF $0.25 - |
| - | DISTRIBUTABLE EARNINGS PER COMMON SHARE OF $0.28 - |
| - | DISTRIBUTABLE RETURN ON AVERAGE STOCKHOLDERS’ EQUITY OF 8.0% - |
New York, New York, November 7, 2023 / Globe Newswire / – Ready Capital Corporation (“Ready Capital” or the “Company”) (NYSE: RC), a multi-strategy real estate finance company that originates, acquires, finances, and services small-to-medium balance commercial (“SBC”) loans, today reported financial results for the quarter ended September 30, 2023.
“Our broad suite of origination channels allows Ready Capital to remain a consistent source of capital for our customers despite a challenging macro environment,” stated Thomas Capasse, Ready Capital’s Chairman and Chief Executive Officer. “We expect the short-term earnings pressure from the Broadmark acquisition to abate in the upcoming quarters and our well positioned balance sheet, strong liquidity and origination platform to drive earnings growth into the new year.”
Third Quarter Highlights
| ● | Total investments of $984 million, including $464 million of SBC originations, $391 million of residential mortgage loans, and $129 million of U.S. Small Business Administration 7(a) loans |
| ● | Repaid $115 million of 7.00% Convertible Senior Notes that matured on August 15, 2023 |
| ● | Declared and paid dividend of $0.36 per share in cash |
| ● | Net book value of $14.42 per share of common stock as of September 30, 2023 |
| ● | On October 25th, introduced the Small Balance Construction and Residential Finance program, providing loans ranging from $5 million to $20 million to expand the Company’s construction lending platform |
Use of Non-GAAP Financial Information
In addition to the results presented in accordance with U.S. GAAP, this press release includes distributable earnings, formerly referred to as core earnings, which is a non-U.S. GAAP financial measure. The Company defines distributable earnings as net income adjusted for unrealized gains and losses related to certain mortgage backed securities (“MBS”) not retained by us as part of our loan origination business, realized gains and losses on sales of certain MBS, unrealized gains and losses related to residential mortgage servicing rights (“MSR”), unrealized current non-cash provision for credit losses and one-time non-recurring gains or losses, such as gains or losses on discontinued operations, bargain purchase gains, merger related expenses, or other one-time items.
The Company believes that this non-U.S. GAAP financial information, in addition to the related U.S. GAAP measures, provides investors greater transparency into the information used by management in its financial and operational decision-making, including the determination of dividends. However, because Distributable Earnings is an incomplete measure of the Company's financial performance and involves differences from net income computed in accordance with U.S. GAAP, it should be considered along with, but not as an alternative to, the Company's net income computed in accordance with U.S. GAAP as a measure of the Company's financial performance. In addition, because not all companies use identical calculations, the Company's presentation of Distributable Earnings may not be comparable to other similarly-titled measures of other companies.
In calculating Distributable Earnings, Net Income (in accordance with U.S. GAAP) is adjusted to exclude unrealized gains and losses on MBS acquired by the Company in the secondary market but is not adjusted to exclude unrealized gains and losses on MBS retained by Ready Capital as part of its loan origination businesses, where the Company transfers originated loans into an MBS securitization and the Company retains an interest in the securitization. In calculating Distributable Earnings, the Company does not adjust Net Income (in accordance with U.S. GAAP) to take into account unrealized gains and losses on MBS retained by us as part of the loan origination businesses because the unrealized gains and losses that are generated in the loan origination and securitization process are considered to be a fundamental part of this business and an indicator of the ongoing performance and credit quality of the Company’s historical loan originations. In calculating Distributable Earnings, Net Income (in accordance with U.S. GAAP) is adjusted to exclude realized gains and losses on certain MBS securities considered to be non-distributable. Certain MBS positions are considered to be non-distributable due to a variety of reasons which may include collateral type, duration, and size.
In addition, in calculating Distributable Earnings, Net Income (in accordance with U.S. GAAP) is adjusted to exclude unrealized gains or losses on residential MSRs, held at fair value. The Company treats its commercial MSRs and residential MSRs as two separate classes based on the nature of the underlying mortgages and the treatment of these assets as two separate pools for risk management purposes.
Servicing rights relating to the Company’s small business commercial business are accounted for under ASC 860, Transfer and Servicing, while the Company’s residential MSRs are accounted for under the fair value option under ASC 825, Financial Instruments. In calculating Distributable Earnings, the Company does not exclude realized gains or losses on either commercial MSRs or residential MSRs, held at fair value, as servicing income is a fundamental part of Ready Capital’s business and is an indicator of the ongoing performance.
To qualify as a REIT, the Company must distribute to its stockholders each calendar year at least 90% of its REIT taxable income (including certain items of non-cash income), determined without regard to the deduction for dividends paid and excluding net capital gain. There are certain items, including net income generated from the creation of MSRs, that are included in distributable earnings but are not included in the calculation of the current year’s taxable income. These differences may result in certain items that are recognized in the current period’s calculation of distributable earnings not being included in taxable income, and thus not subject to the REIT dividend distribution requirement until future years.
The table below reconciles Net Income computed in accordance with U.S. GAAP to Distributable Earnings.
(in thousands) |
Three Months Ended September 30, 2023 |
|
Net Income |
$ |
47,179 |
Reconciling items: |
|
|
Unrealized gain on MSR |
|
(2,563) |
Decrease in CECL reserve |
|
(12,151) |
Non-cash compensation |
|
2,275 |
Merger transaction costs and other non-recurring expenses |
|
2,536 |
Loss on bargain purchase |
|
14,862 |
Total reconciling items |
$ |
4,959 |
Income tax adjustments |
|
26 |
Distributable earnings |
$ |
52,164 |
Less: Distributable earnings attributable to non-controlling interests |
|
1,566 |
Less: Income attributable to participating shares |
|
2,334 |
Distributable earnings attributable to common stockholders |
$ |
48,264 |
Distributable earnings per common share - basic |
$ |
0.28 |
Distributable earnings per common share - diluted |
$ |
0.28 |
U.S. GAAP return on equity is based on U.S. GAAP net income, while distributable return on equity is based on distributable earnings, which adjusts U.S. GAAP net income for the items in the distributable earnings reconciliation above.
Webcast and Earnings Conference Call
Management will host a webcast and conference call on Wednesday, November 8, 2023 at 8:30am ET to provide a general business update and discuss the financial results for the quarter ended September 30, 2023.
The Company encourages use of the webcast due to potential extended wait times to access the conference call via dial-in. The webcast of the conference call will be available in the Investor Relations section of the Company’s website at www.readycapital.com. To listen to a live broadcast, go to the site at least 15 minutes prior to the scheduled start time in order to register, download and install any necessary audio software.
To Participate in the Telephone Conference Call:
Dial in at least five minutes prior to start time.
Domestic: 1-877-407-0792
International: 1-201-689-8263
Conference Call Playback:
Domestic: 1-844-512-2921
International: 1-412-317-6671
Replay Pin #: 13740194
The playback can be accessed through November 22, 2023.
Safe Harbor Statement
This press release contains statements that constitute "forward-looking statements," as such term is defined in Section 27A of the Securities Act of 1933, as amended, and Section 21E of the Securities Exchange Act of 1934, as amended, and such statements are intended to be covered by the safe harbor provided by the same. These statements are based on management's current expectations and beliefs and are subject to a number of trends and uncertainties that could cause actual results to differ materially from those described in the forward-looking statements; the Company can give no assurance that its expectations will be attained. Factors that could cause actual results to differ materially from the Company's expectations include, but are not limited to, applicable regulatory changes; general volatility of the capital markets; changes in the Company’s investment objectives and business strategy; the availability of financing on acceptable terms or at all; the availability, terms and deployment of capital; the availability of suitable investment opportunities; changes in the interest rates or the general economy; increased rates of default and/or decreased recovery rates on investments; changes in interest rates, interest rate spreads, the yield curve or prepayment rates; changes in prepayments of Company’s assets; the degree and nature of competition, including competition for the Company's target assets; and other factors, including those set forth in the Risk Factors section of the Company's most recent Annual Report on Form 10-K filed with the SEC, and other reports filed by the Company with the SEC, copies of which are available on the SEC's website, www.sec.gov. The Company undertakes no obligation to update these statements for revisions or changes after the date of this release, except as required by law.
About Ready Capital Corporation
Ready Capital Corporation (NYSE: RC) is a multi-strategy real estate finance company that originates, acquires, finances and services small- to medium-sized balance commercial loans. The Company specializes in loans backed by commercial real estate, including agency multifamily, investor, construction, and bridge as well as U.S. Small Business Administration loans under its Section 7(a) program. Headquartered in New York, New York, the Company employs over 600 professionals nationwide.
Contact
Investor Relations
Ready Capital Corporation
212-257-4666
InvestorRelations@readycapital.com
Additional information can be found on the Company’s website at www.readycapital.com
READY CAPITAL CORPORATION
UNAUDITED CONSOLIDATED BALANCE SHEETS
(in thousands) |
|
September 30, 2023 |
|
December 31, 2022 |
||
Assets |
|
|
|
|
|
|
Cash and cash equivalents |
|
$ |
181,913 |
|
$ |
163,041 |
Restricted cash |
|
|
36,576 |
|
|
55,927 |
Loans, net (including $9,221 and $9,786 held at fair value) |
|
|
4,151,923 |
|
|
3,576,310 |
Loans, held for sale, at fair value |
|
|
184,989 |
|
|
258,377 |
Paycheck Protection Program loans (including $168 and $576 held at fair value) |
|
|
58,145 |
|
|
186,985 |
Mortgage-backed securities, at fair value |
|
|
33,339 |
|
|
32,041 |
Loans eligible for repurchase from Ginnie Mae |
|
|
72,401 |
|
|
66,193 |
Investment in unconsolidated joint ventures (including $7,547 and $8,094 held at fair value) |
|
|
136,113 |
|
|
118,641 |
Derivative instruments |
|
|
8,620 |
|
|
12,963 |
Servicing rights (including $207,495 and $192,203 held at fair value) |
|
|
307,779 |
|
|
279,320 |
Real estate owned, held for sale |
|
|
281,941 |
|
|
117,098 |
Other assets |
|
|
265,428 |
|
|
201,321 |
Assets of consolidated VIEs |
|
|
7,080,266 |
|
|
6,552,760 |
Total Assets |
|
$ |
12,799,433 |
|
$ |
11,620,977 |
Liabilities |
|
|
|
|
|
|
Secured borrowings |
|
|
2,385,070 |
|
|
2,846,293 |
Paycheck Protection Program Liquidity Facility (PPPLF) borrowings |
|
|
76,333 |
|
|
201,011 |
Securitized debt obligations of consolidated VIEs, net |
|
|
5,264,037 |
|
|
4,903,350 |
Convertible notes, net |
|
|
— |
|
|
114,397 |
Senior secured notes, net |
|
|
344,684 |
|
|
343,355 |
Corporate debt, net |
|
|
763,828 |
|
|
662,665 |
Guaranteed loan financing |
|
|
886,916 |
|
|
264,889 |
Contingent consideration |
|
|
13,408 |
|
|
28,500 |
Liabilities for loans eligible for repurchase from Ginnie Mae |
|
|
72,401 |
|
|
66,193 |
Derivative instruments |
|
|
— |
|
|
1,586 |
Dividends payable |
|
|
64,777 |
|
|
47,177 |
Loan participations sold |
|
|
57,465 |
|
|
54,641 |
Due to third parties |
|
|
2,436 |
|
|
11,805 |
Accounts payable and other accrued liabilities |
|
|
168,298 |
|
|
176,520 |
Total Liabilities |
|
$ |
10,099,653 |
|
$ |
9,722,382 |
Preferred stock Series C, liquidation preference $25.00 per share |
|
|
8,361 |
|
|
8,361 |
|
|
|
|
|
|
|
Commitments & contingencies |
|
|
|
|
|
|
|
|
|
|
|
|
|
Stockholders’ Equity |
|
|
|
|
|
|
Preferred stock Series E, liquidation preference $25.00 per share |
|
|
111,378 |
|
|
111,378 |
Common stock, $0.0001 par value, 500,000,000 shares authorized, 172,023,871 and 110,523,641 shares issued and outstanding, respectively |
|
|
17 |
|
|
11 |
Additional paid-in capital |
|
|
2,318,109 |
|
|
1,684,074 |
Retained earnings |
|
|
168,539 |
|
|
4,994 |
Accumulated other comprehensive loss |
|
|
(5,928) |
|
|
(9,369) |
Total Ready Capital Corporation equity |
|
|
2,592,115 |
|
|
1,791,088 |
Non-controlling interests |
|
|
99,304 |
|
|
99,146 |
Total Stockholders’ Equity |
|
$ |
2,691,419 |
|
$ |
1,890,234 |
Total Liabilities, Redeemable Preferred Stock, and Stockholders’ Equity |
|
$ |
12,799,433 |
|
$ |
11,620,977 |
READY CAPITAL CORPORATION
UNAUDITED CONSOLIDATED STATEMENTS OF INCOME
|
|
Three Months Ended September 30, |
|
Nine Months Ended September 30, |
||||||||
(in thousands, except share data) |
|
2023 |
|
2022 |
|
2023 |
|
2022 |
||||
Interest income |
|
$ |
250,590 |
|
$ |
186,026 |
|
$ |
701,047 |
|
$ |
464,102 |
Interest expense |
|
|
(191,612) |
|
|
(115,495) |
|
|
(524,540) |
|
|
(257,339) |
Net interest income before recovery of (provision for) loan losses |
|
$ |
58,978 |
|
$ |
70,531 |
|
$ |
176,507 |
|
$ |
206,763 |
Recovery of (provision for) loan losses |
|
|
12,151 |
|
|
(3,431) |
|
|
(542) |
|
|
(583) |
Net interest income after recovery of (provision for) loan losses |
|
$ |
71,129 |
|
$ |
67,100 |
|
$ |
175,965 |
|
$ |
206,180 |
Non-interest income |
|
|
|
|
|
|
|
|
|
|
|
|
Residential mortgage banking activities |
|
|
7,059 |
|
|
12,053 |
|
|
26,112 |
|
|
23,424 |
Net realized gain (loss) on financial instruments and real estate owned |
|
|
14,402 |
|
|
21,117 |
|
|
49,855 |
|
|
50,238 |
Net unrealized gain (loss) on financial instruments |
|
|
17,684 |
|
|
16,460 |
|
|
13,363 |
|
|
58,522 |
Servicing income, net of amortization and impairment of $324 and $4,495 for the three and nine months ended September 30, 2023, and $4,123 and $13,128 for the three and nine months ended September 30, 2022, respectively |
|
|
16,033 |
|
|
12,189 |
|
|
44,468 |
|
|
37,282 |
Income on purchased future receivables, net of allowance for (recovery of) credit losses of $2,658 and $6,890 for the three and nine months ended September 30, 2023, and $(941) and $(1,381) for the three and nine months ended September 30, 2022, respectively |
|
|
904 |
|
|
1,162 |
|
|
1,530 |
|
|
5,490 |
Gain (loss) on bargain purchase |
|
|
(14,862) |
|
|
— |
|
|
215,032 |
|
|
— |
Income (loss) on unconsolidated joint ventures |
|
|
56 |
|
|
(603) |
|
|
745 |
|
|
11,160 |
Other income |
|
|
18,315 |
|
|
16,150 |
|
|
56,767 |
|
|
30,985 |
Total non-interest income |
|
$ |
59,591 |
|
$ |
78,528 |
|
$ |
407,872 |
|
$ |
217,101 |
Non-interest expense |
|
|
|
|
|
|
|
|
|
|
|
|
Employee compensation and benefits |
|
|
(24,868) |
|
|
(25,941) |
|
|
(77,716) |
|
|
(79,998) |
Allocated employee compensation and benefits from related party |
|
|
(3,001) |
|
|
(1,745) |
|
|
(7,827) |
|
|
(6,549) |
Variable expenses on residential mortgage banking activities |
|
|
(4,091) |
|
|
(9,061) |
|
|
(16,150) |
|
|
(5,508) |
Professional fees |
|
|
(7,810) |
|
|
(3,865) |
|
|
(19,183) |
|
|
(12,842) |
Management fees – related party |
|
|
(7,229) |
|
|
(5,410) |
|
|
(18,070) |
|
|
(14,071) |
Incentive fees – related party |
|
|
— |
|
|
(949) |
|
|
(1,791) |
|
|
(949) |
Loan servicing expense |
|
|
(15,818) |
|
|
(10,697) |
|
|
(38,896) |
|
|
(29,913) |
Transaction related expenses |
|
|
(2,329) |
|
|
(1,535) |
|
|
(17,188) |
|
|
(8,606) |
Other operating expenses |
|
|
(14,368) |
|
|
(15,396) |
|
|
(39,927) |
|
|
(42,421) |
Total non-interest expense |
|
$ |
(79,514) |
|
$ |
(74,599) |
|
$ |
(236,748) |
|
$ |
(200,857) |
Income before provision for income taxes |
|
|
51,206 |
|
|
71,029 |
|
|
347,089 |
|
|
222,424 |
Income tax provision |
|
|
(4,027) |
|
|
(4,776) |
|
|
(9,559) |
|
|
(32,943) |
Net income |
|
$ |
47,179 |
|
$ |
66,253 |
|
$ |
337,530 |
|
$ |
189,481 |
Less: Dividends on preferred stock |
|
|
1,999 |
|
|
1,999 |
|
|
5,998 |
|
|
5,997 |
Less: Net income attributable to non-controlling interest |
|
|
1,517 |
|
|
3,023 |
|
|
7,842 |
|
|
6,672 |
Net income attributable to Ready Capital Corporation |
|
$ |
43,663 |
|
$ |
61,231 |
|
$ |
323,690 |
|
$ |
176,812 |
|
|
|
|
|
|
|
|
|
|
|
|
|
Earnings per common share - basic |
|
$ |
0.25 |
|
$ |
0.53 |
|
$ |
2.33 |
|
$ |
1.66 |
Earnings per common share - diluted |
|
$ |
0.25 |
|
$ |
0.50 |
|
$ |
2.30 |
|
$ |
1.56 |
|
|
|
|
|
|
|
|
|
|
|
|
|
Weighted-average shares outstanding |
|
|
|
|
|
|
|
|
|
|
|
|
Basic |
|
|
171,973,933 |
|
|
114,371,160 |
|
|
138,323,878 |
|
|
105,576,826 |
Diluted |
|
|
174,440,869 |
|
|
125,666,609 |
|
|
140,628,545 |
|
|
116,865,770 |
|
|
|
|
|
|
|
|
|
|
|
|
|
Dividends declared per share of common stock |
|
$ |
0.36 |
|
$ |
0.42 |
|
$ |
1.16 |
|
$ |
1.26 |
READY CAPITAL CORPORATION
UNAUDITED SEGMENT REPORTING
FOR THE THREE MONTHS ENDED SEPTEMBER 30, 2023
|
|
|
|
|
Small |
|
Residential |
|
|
|
|
|
|
||
|
|
SBC Lending |
|
Business |
|
Mortgage |
|
Corporate- |
|
|
|||||
(in thousands) |
|
and Acquisitions |
|
Lending |
|
Banking |
|
Other |
|
Consolidated |
|||||
Interest income |
|
$ |
219,414 |
|
$ |
29,297 |
|
$ |
1,879 |
|
$ |
— |
|
$ |
250,590 |
Interest expense |
|
|
(169,008) |
|
|
(20,769) |
|
|
(1,835) |
|
|
— |
|
|
(191,612) |
Net interest income before recovery of (provision for) loan losses |
|
$ |
50,406 |
|
$ |
8,528 |
|
$ |
44 |
|
$ |
— |
|
$ |
58,978 |
Recovery of (provision for) loan losses |
|
|
14,465 |
|
|
(2,314) |
|
|
— |
|
|
— |
|
|
12,151 |
Net interest income after recovery of (provision for) loan losses |
|
$ |
64,871 |
|
$ |
6,214 |
|
$ |
44 |
|
$ |
— |
|
$ |
71,129 |
Non-interest income |
|
|
|
|
|
|
|
|
|
|
|
|
|
|
|
Residential mortgage banking activities |
|
$ |
— |
|
$ |
— |
|
$ |
7,059 |
|
$ |
— |
|
$ |
7,059 |
Net realized gain (loss) on financial instruments and real estate owned |
|
|
7,053 |
|
|
7,349 |
|
|
— |
|
|
— |
|
|
14,402 |
Net unrealized gain (loss) on financial instruments |
|
|
14,515 |
|
|
606 |
|
|
2,563 |
|
|
— |
|
|
17,684 |
Servicing income, net |
|
|
1,198 |
|
|
5,669 |
|
|
9,166 |
|
|
— |
|
|
16,033 |
Income on purchased future receivables, net |
|
|
— |
|
|
904 |
|
|
— |
|
|
— |
|
|
904 |
Loss on bargain purchase |
|
|
— |
|
|
— |
|
|
— |
|
|
(14,862) |
|
|
(14,862) |
Income on unconsolidated joint ventures |
|
|
56 |
|
|
— |
|
|
— |
|
|
— |
|
|
56 |
Other income |
|
|
8,570 |
|
|
8,863 |
|
|
43 |
|
|
839 |
|
|
18,315 |
Total non-interest income (loss) |
|
$ |
31,392 |
|
$ |
23,391 |
|
$ |
18,831 |
|
$ |
(14,023) |
|
$ |
59,591 |
Non-interest expense |
|
|
|
|
|
|
|
|
|
|
|
|
|
|
|
Employee compensation and benefits |
|
$ |
(10,224) |
|
$ |
(8,507) |
|
$ |
(4,890) |
|
$ |
(1,247) |
|
$ |
(24,868) |
Allocated employee compensation and benefits from related party |
|
|
(99) |
|
|
— |
|
|
— |
|
|
(2,902) |
|
|
(3,001) |
Variable expenses on residential mortgage banking activities |
|
|
— |
|
|
— |
|
|
(4,091) |
|
|
— |
|
|
(4,091) |
Professional fees |
|
|
(1,264) |
|
|
(3,456) |
|
|
(144) |
|
|
(2,946) |
|
|
(7,810) |
Management fees – related party |
|
|
— |
|
|
— |
|
|
— |
|
|
(7,229) |
|
|
(7,229) |
Loan servicing expense |
|
|
(12,204) |
|
|
(337) |
|
|
(3,277) |
|
|
— |
|
|
(15,818) |
Transaction related expenses |
|
|
— |
|
|
— |
|
|
— |
|
|
(2,329) |
|
|
(2,329) |
Other operating expenses |
|
|
(5,890) |
|
|
(5,222) |
|
|
(1,608) |
|
|
(1,648) |
|
|
(14,368) |
Total non-interest expense |
|
$ |
(29,681) |
|
$ |
(17,522) |
|
$ |
(14,010) |
|
$ |
(18,301) |
|
$ |
(79,514) |
Income (loss) before provision for income taxes |
|
$ |
66,582 |
|
$ |
12,083 |
|
$ |
4,865 |
|
$ |
(32,324) |
|
$ |
51,206 |
Total assets |
|
$ |
10,595,201 |
|
$ |
1,409,761 |
|
$ |
396,073 |
|
$ |
398,398 |
|
$ |
12,799,433 |
READY CAPITAL CORPORATION
UNAUDITED SEGMENT REPORTING
FOR THE NINE MONTHS ENDED SEPTEMBER 30, 2023
|
|
|
|
|
Small |
|
Residential |
|
|
|
|
|
|
||
|
|
SBC Lending |
|
Business |
|
Mortgage |
|
Corporate- |
|
|
|||||
(in thousands) |
|
and Acquisitions |
|
Lending |
|
Banking |
|
Other |
|
Consolidated |
|||||
Interest income |
|
$ |
629,686 |
|
$ |
65,997 |
|
$ |
5,364 |
|
$ |
— |
|
$ |
701,047 |
Interest expense |
|
|
(479,006) |
|
|
(39,861) |
|
|
(5,673) |
|
|
— |
|
|
(524,540) |
Net interest income before recovery of (provision for) loan losses |
|
$ |
150,680 |
|
$ |
26,136 |
|
$ |
(309) |
|
$ |
— |
|
$ |
176,507 |
Recovery of (provision for) loan losses |
|
|
5,179 |
|
|
(5,721) |
|
|
— |
|
|
— |
|
|
(542) |
Net interest income after recovery of (provision for) loan losses |
|
$ |
155,859 |
|
$ |
20,415 |
|
$ |
(309) |
|
$ |
— |
|
$ |
175,965 |
Non-interest income |
|
|
|
|
|
|
|
|
|
|
|
|
|
|
|
Residential mortgage banking activities |
|
$ |
— |
|
$ |
— |
|
$ |
26,112 |
|
$ |
— |
|
$ |
26,112 |
Net realized gain (loss) on financial instruments and real estate owned |
|
|
27,234 |
|
|
22,621 |
|
|
— |
|
|
— |
|
|
49,855 |
Net unrealized gain (loss) on financial instruments |
|
|
7,727 |
|
|
348 |
|
|
5,288 |
|
|
— |
|
|
13,363 |
Servicing income, net |
|
|
4,181 |
|
|
12,367 |
|
|
27,920 |
|
|
— |
|
|
44,468 |
Income on purchased future receivables, net |
|
|
— |
|
|
1,530 |
|
|
— |
|
|
— |
|
|
1,530 |
Gain on bargain purchase |
|
|
— |
|
|
— |
|
|
— |
|
|
215,032 |
|
|
215,032 |
Income on unconsolidated joint ventures |
|
|
745 |
|
|
— |
|
|
— |
|
|
— |
|
|
745 |
Other income |
|
|
25,829 |
|
|
29,390 |
|
|
98 |
|
|
1,450 |
|
|
56,767 |
Total non-interest income |
|
$ |
65,716 |
|
$ |
66,256 |
|
$ |
59,418 |
|
$ |
216,482 |
|
$ |
407,872 |
Non-interest expense |
|
|
|
|
|
|
|
|
|
|
|
|
|
|
|
Employee compensation and benefits |
|
$ |
(25,153) |
|
$ |
(31,396) |
|
$ |
(15,598) |
|
$ |
(5,569) |
|
$ |
(77,716) |
Allocated employee compensation and benefits from related party |
|
|
(581) |
|
|
— |
|
|
— |
|
|
(7,246) |
|
|
(7,827) |
Variable expenses on residential mortgage banking activities |
|
|
— |
|
|
— |
|
|
(16,150) |
|
|
— |
|
|
(16,150) |
Professional fees |
|
|
(3,380) |
|
|
(7,863) |
|
|
(441) |
|
|
(7,499) |
|
|
(19,183) |
Management fees – related party |
|
|
— |
|
|
— |
|
|
— |
|
|
(18,070) |
|
|
(18,070) |
Incentive fees – related party |
|
|
— |
|
|
— |
|
|
— |
|
|
(1,791) |
|
|
(1,791) |
Loan servicing expense |
|
|
(31,008) |
|
|
(582) |
|
|
(7,306) |
|
|
— |
|
|
(38,896) |
Transaction related expenses |
|
|
— |
|
|
— |
|
|
— |
|
|
(17,188) |
|
|
(17,188) |
Other operating expenses |
|
|
(16,221) |
|
|
(14,003) |
|
|
(5,001) |
|
|
(4,702) |
|
|
(39,927) |
Total non-interest expense |
|
$ |
(76,343) |
|
$ |
(53,844) |
|
$ |
(44,496) |
|
$ |
(62,065) |
|
$ |
(236,748) |
Income before provision for income taxes |
|
$ |
145,232 |
|
$ |
32,827 |
|
$ |
14,613 |
|
$ |
154,417 |
|
$ |
347,089 |
Total assets |
|
$ |
10,595,201 |
|
$ |
1,409,761 |
|
$ |
396,073 |
|
$ |
398,398 |
|
$ |
12,799,433 |
|
SUPPLEMENTAL FINANCIAL DATA Q3 2023 |
|
2 Disclaimer This presentation contains statements that constitute “forward-looking statements,” as such term is defined in Section 27A of the Securities Act of 1933, as amended, and Section 21E of the Securities Exchange Act of 1934, as amended, and such statements are intended to be covered by the safe harbor provided by the same. These statements are based on management’s current expectations and beliefs and are subject to a number of trends and uncertainties that could cause actual results to differ materially from those described in the forward-looking statements; Ready Capital Corporation (the “Company”) can give no assurance that its expectations will be attained. Factors that could cause actual results to differ materially from the Company’s expectations include those set forth in the Risk Factors section of the most recent Annual Report on Form 10-K filed with the SEC and other reports filed by the Company with the SEC, copies of which are available on the SEC’s website, www.sec.gov. The Company undertakes no obligation to update these statements for revisions or changes after the date of this release, except as required by law. This presentation includes certain non-GAAP financial measures, including Distributable earnings. These non-GAAP financial measures should be considered only as supplemental to, and not as superior to, financial measures in accordance with GAAP. Please refer to the Appendix for the most recent GAAP information. This presentation also contains market statistics and industry data which are subject to uncertainty and are not necessarily reflective of market conditions. These have been derived from third party sources and have not been independently verified by the Company or its affiliates. All material presented is compiled from sources believed to be reliable and current, but accuracy cannot be guaranteed. All data is as of September 30, 2023, unless otherwise noted. |
|
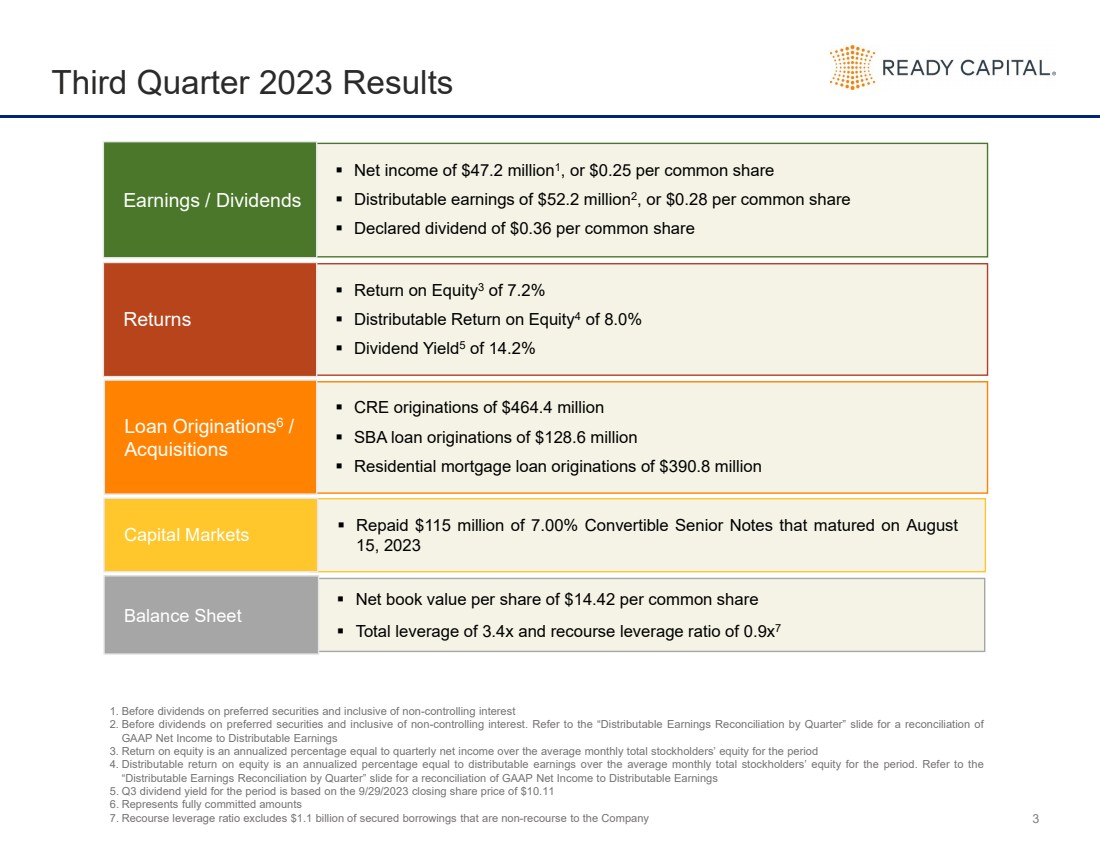
3 Third Quarter 2023 Results Net income of $47.2 million1, or $0.25 per common share Distributable earnings of $52.2 million2, or $0.28 per common share Declared dividend of $0.36 per common share Earnings / Dividends Return on Equity3 of 7.2% Distributable Return on Equity4 of 8.0% Dividend Yield5 of 14.2% Returns CRE originations of $464.4 million SBA loan originations of $128.6 million Residential mortgage loan originations of $390.8 million Loan Originations6 / Acquisitions 1. Before dividends on preferred securities and inclusive of non-controlling interest 2. Before dividends on preferred securities and inclusive of non-controlling interest. Refer to the “Distributable Earnings Reconciliation by Quarter” slide for a reconciliation of GAAP Net Income to Distributable Earnings 3. Return on equity is an annualized percentage equal to quarterly net income over the average monthly total stockholders’ equity for the period 4. Distributable return on equity is an annualized percentage equal to distributable earnings over the average monthly total stockholders’ equity for the period. Refer to the “Distributable Earnings Reconciliation by Quarter” slide for a reconciliation of GAAP Net Income to Distributable Earnings 5. Q3 dividend yield for the period is based on the 9/29/2023 closing share price of $10.11 6. Represents fully committed amounts 7. Recourse leverage ratio excludes $1.1 billion of secured borrowings that are non-recourse to the Company Repaid $115 million of 7.00% Convertible Senior Notes that matured on August 15, 2023 Capital Markets Net book value per share of $14.42 per common share Total leverage of 3.4x and recourse leverage ratio of 0.9x7 Balance Sheet |
|
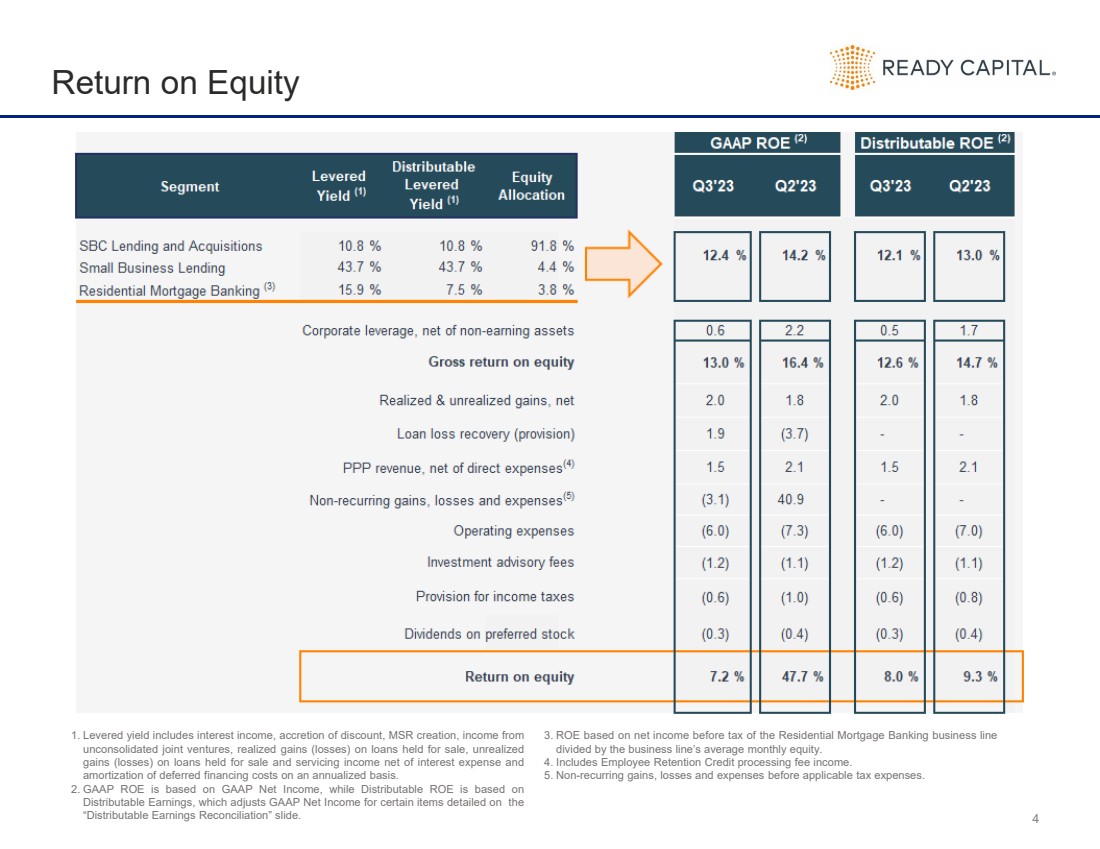
4 Return on Equity 1. Levered yield includes interest income, accretion of discount, MSR creation, income from unconsolidated joint ventures, realized gains (losses) on loans held for sale, unrealized gains (losses) on loans held for sale and servicing income net of interest expense and amortization of deferred financing costs on an annualized basis. 2. GAAP ROE is based on GAAP Net Income, while Distributable ROE is based on Distributable Earnings, which adjusts GAAP Net Income for certain items detailed on the “Distributable Earnings Reconciliation” slide. 3. ROE based on net income before tax of the Residential Mortgage Banking business line divided by the business line’s average monthly equity. 4. Includes Employee Retention Credit processing fee income. 5. Non-recurring gains, losses and expenses before applicable tax expenses. |
|
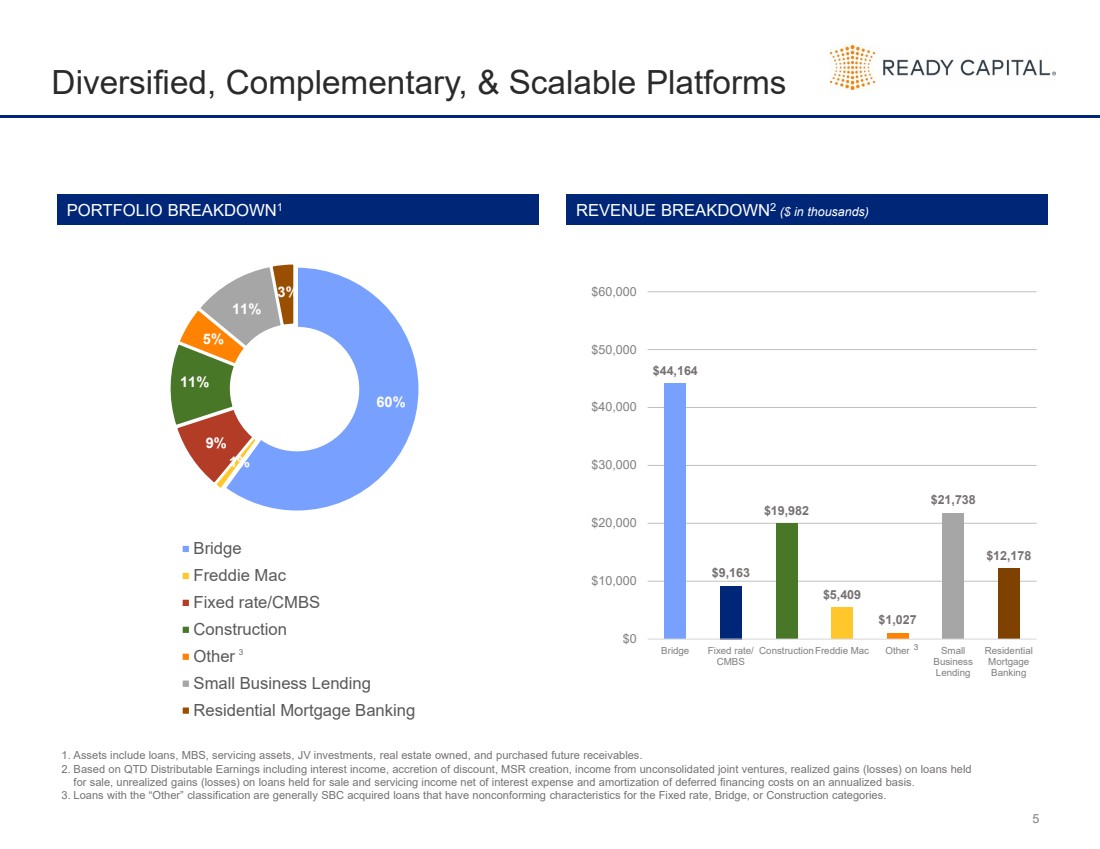
5 Diversified, Complementary, & Scalable Platforms 60% 1% 9% 11% 5% 11% 3% Bridge Freddie Mac Fixed rate/CMBS Construction Other Small Business Lending Residential Mortgage Banking PORTFOLIO BREAKDOWN1 REVENUE BREAKDOWN2 ($ in thousands) $44,164 $9,163 $19,982 $5,409 $1,027 $21,738 $12,178 $0 $10,000 $20,000 $30,000 $40,000 $50,000 $60,000 Bridge Fixed rate/ CMBS ConstructionFreddie Mac Other Small Business Lending Residential Mortgage Banking 3 1. Assets include loans, MBS, servicing assets, JV investments, real estate owned, and purchased future receivables. 2. Based on QTD Distributable Earnings including interest income, accretion of discount, MSR creation, income from unconsolidated joint ventures, realized gains (losses) on loans held for sale, unrealized gains (losses) on loans held for sale and servicing income net of interest expense and amortization of deferred financing costs on an annualized basis. 3. Loans with the “Other” classification are generally SBC acquired loans that have nonconforming characteristics for the Fixed rate, Bridge, or Construction categories. 3 |
|
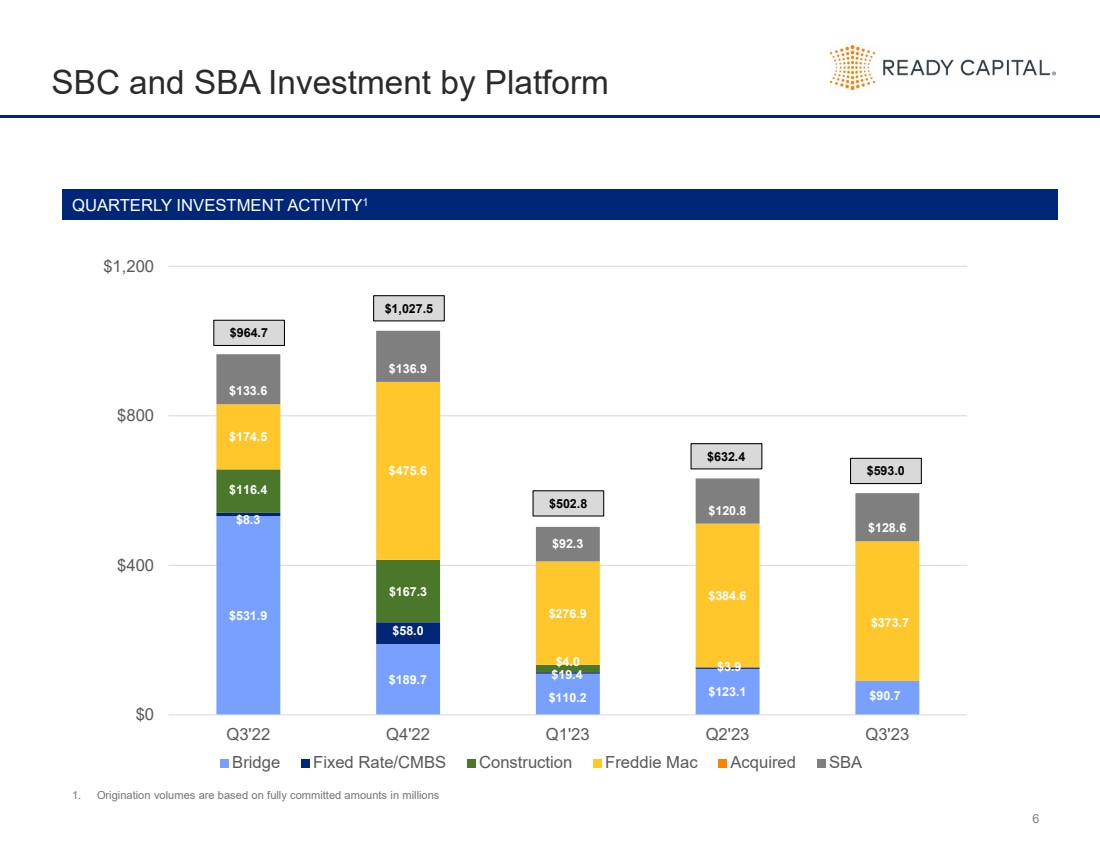
6 SBC and SBA Investment by Platform $531.9 $189.7 $110.2 $123.1 $90.7 $8.3 $58.0 $4.0 $3.9 $116.4 $167.3 $19.4 $174.5 $475.6 $276.9 $384.6 $373.7 $133.6 $136.9 $92.3 $120.8 $128.6 $0 $400 $800 $1,200 Q3'22 Q4'22 Q1'23 Q2'23 Q3'23 Bridge Fixed Rate/CMBS Construction Freddie Mac Acquired SBA $1,027.5 $964.7 $502.8 $632.4 $593.0 1. Origination volumes are based on fully committed amounts in millions QUARTERLY INVESTMENT ACTIVITY1 |
|
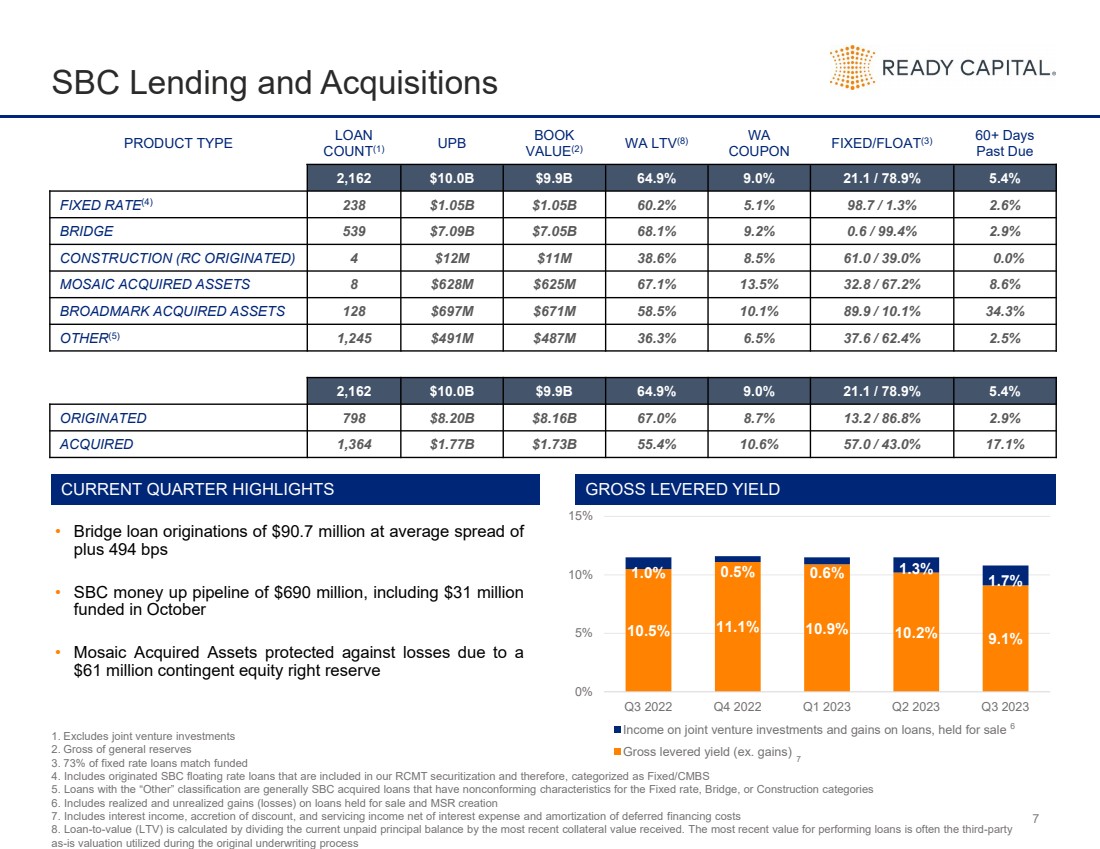
10.5% 11.1% 10.9% 10.2% 9.1% 1.0% 0.5% 0.6% 1.3% 1.7% 0% 5% 10% 15% Q3 2022 Q4 2022 Q1 2023 Q2 2023 Q3 2023 Income on joint venture investments and gains on loans, held for sale Gross levered yield (ex. gains) 6 7 SBC Lending and Acquisitions 1. Excludes joint venture investments 2. Gross of general reserves 3. 73% of fixed rate loans match funded 4. Includes originated SBC floating rate loans that are included in our RCMT securitization and therefore, categorized as Fixed/CMBS 5. Loans with the “Other” classification are generally SBC acquired loans that have nonconforming characteristics for the Fixed rate, Bridge, or Construction categories 6. Includes realized and unrealized gains (losses) on loans held for sale and MSR creation 7. Includes interest income, accretion of discount, and servicing income net of interest expense and amortization of deferred financing costs 8. Loan-to-value (LTV) is calculated by dividing the current unpaid principal balance by the most recent collateral value received. The most recent value for performing loans is often the third-party as-is valuation utilized during the original underwriting process GROSS LEVERED YIELD PRODUCT TYPE LOAN COUNT(1) UPB BOOK VALUE(2) WA LTV(8) WA COUPON FIXED/FLOAT(3) 60+ Days Past Due 2,162 $10.0B $9.9B 64.9% 9.0% 21.1 / 78.9% 5.4% FIXED RATE(4) 238 $1.05B $1.05B 60.2% 5.1% 98.7 / 1.3% 2.6% BRIDGE 539 $7.09B $7.05B 68.1% 9.2% 0.6 / 99.4% 2.9% CONSTRUCTION (RC ORIGINATED) 4 $12M $11M 38.6% 8.5% 61.0 / 39.0% 0.0% MOSAIC ACQUIRED ASSETS 8 $628M $625M 67.1% 13.5% 32.8 / 67.2% 8.6% BROADMARK ACQUIRED ASSETS 128 $697M $671M 58.5% 10.1% 89.9 / 10.1% 34.3% OTHER(5) 1,245 $491M $487M 36.3% 6.5% 37.6 / 62.4% 2.5% 2,162 $10.0B $9.9B 64.9% 9.0% 21.1 / 78.9% 5.4% ORIGINATED 798 $8.20B $8.16B 67.0% 8.7% 13.2 / 86.8% 2.9% ACQUIRED 1,364 $1.77B $1.73B 55.4% 10.6% 57.0 / 43.0% 17.1% CURRENT QUARTER HIGHLIGHTS 7 • Bridge loan originations of $90.7 million at average spread of plus 494 bps • SBC money up pipeline of $690 million, including $31 million funded in October • Mosaic Acquired Assets protected against losses due to a $61 million contingent equity right reserve |
|
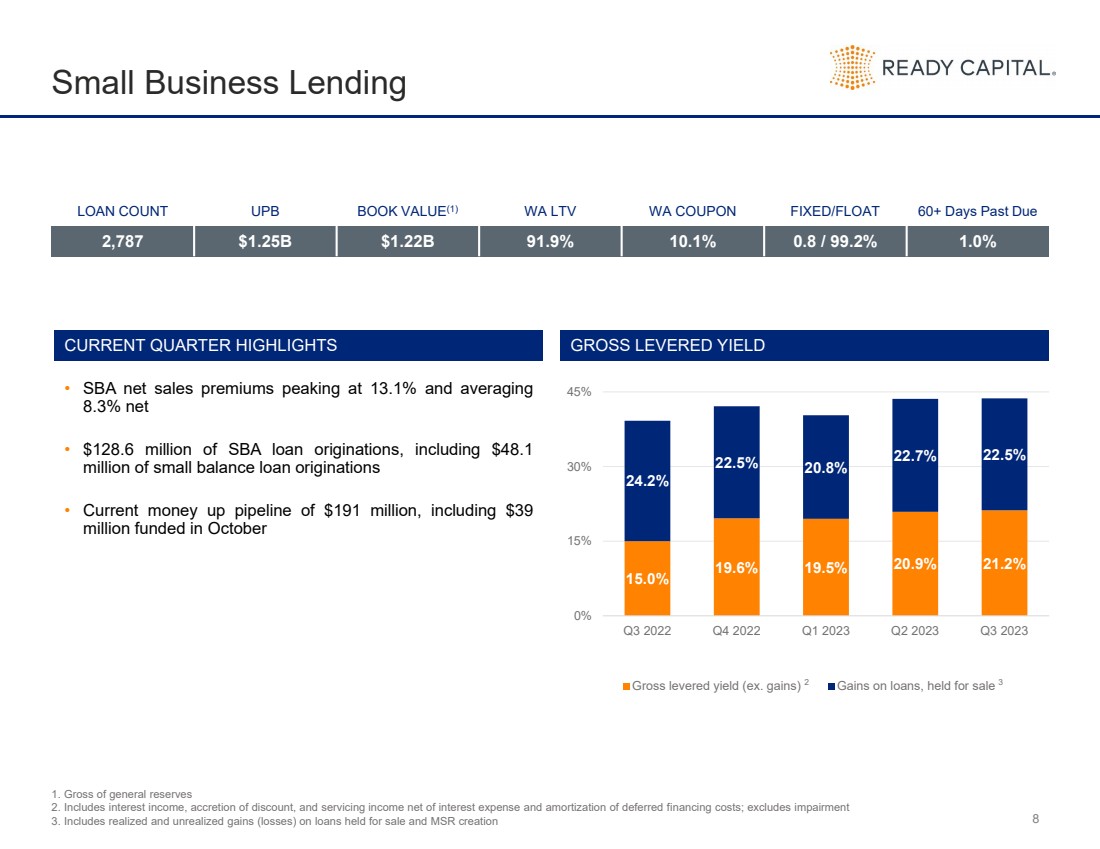
8 Small Business Lending GROSS LEVERED YIELD LOAN COUNT UPB BOOK VALUE(1) WA LTV WA COUPON FIXED/FLOAT 60+ Days Past Due 2,787 $1.25B $1.22B 91.9% 10.1% 0.8 / 99.2% 1.0% CURRENT QUARTER HIGHLIGHTS 15.0% 19.6% 19.5% 20.9% 21.2% 24.2% 22.5% 20.8% 22.7% 22.5% 0% 15% 30% 45% Q3 2022 Q4 2022 Q1 2023 Q2 2023 Q3 2023 Gross levered yield (ex. gains) Gains on loans, held for sale 1. Gross of general reserves 2. Includes interest income, accretion of discount, and servicing income net of interest expense and amortization of deferred financing costs; excludes impairment 3. Includes realized and unrealized gains (losses) on loans held for sale and MSR creation 2 3 • SBA net sales premiums peaking at 13.1% and averaging 8.3% net • $128.6 million of SBA loan originations, including $48.1 million of small balance loan originations • Current money up pipeline of $191 million, including $39 million funded in October |
|
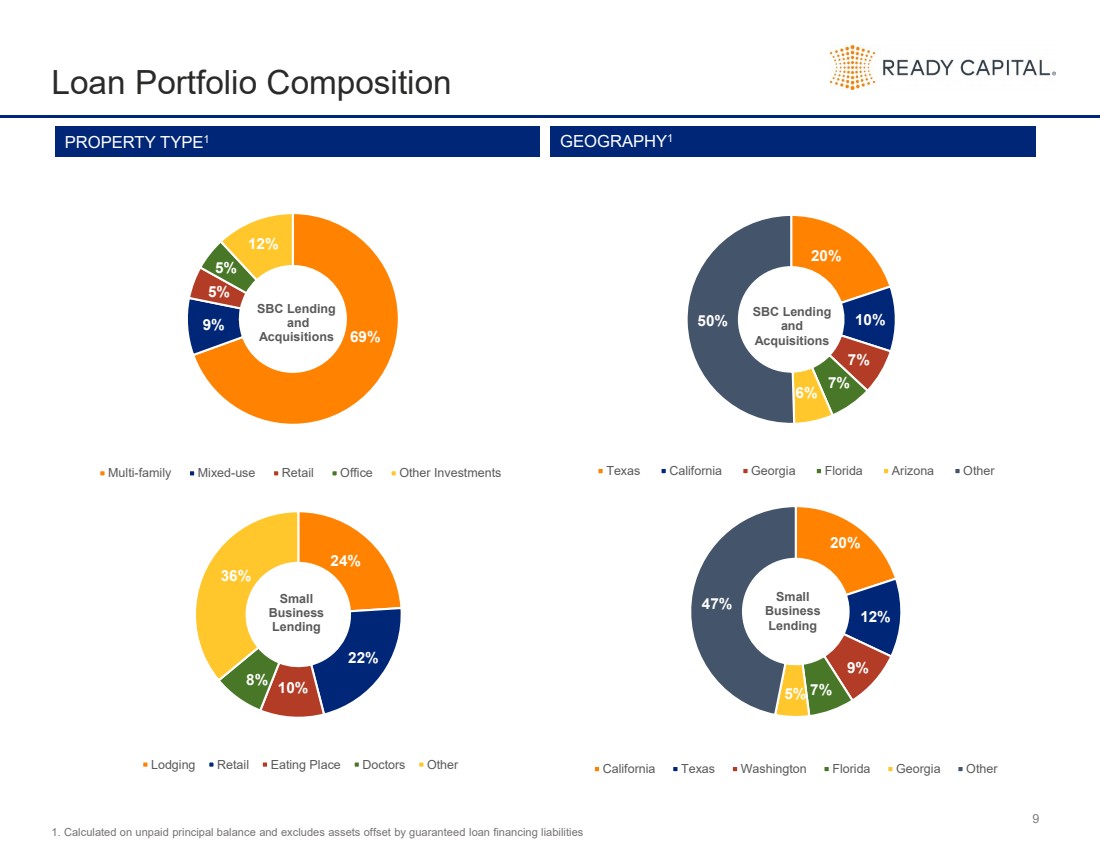
9 Loan Portfolio Composition 24% 22% 10% 8% 36% Small Business Lending Lodging Retail Eating Place Doctors Other 1. Calculated on unpaid principal balance and excludes assets offset by guaranteed loan financing liabilities 69% 9% 5% 5% 12% SBC Lending and Acquisitions Multi-family Mixed-use Retail Office Other Investments PROPERTY TYPE1 GEOGRAPHY1 20% 10% 7% 7% 6% 50% SBC Lending and Acquisitions Texas California Georgia Florida Arizona Other 20% 12% 9% 5% 7% 47% Small Business Lending California Texas Washington Florida Georgia Other |
|
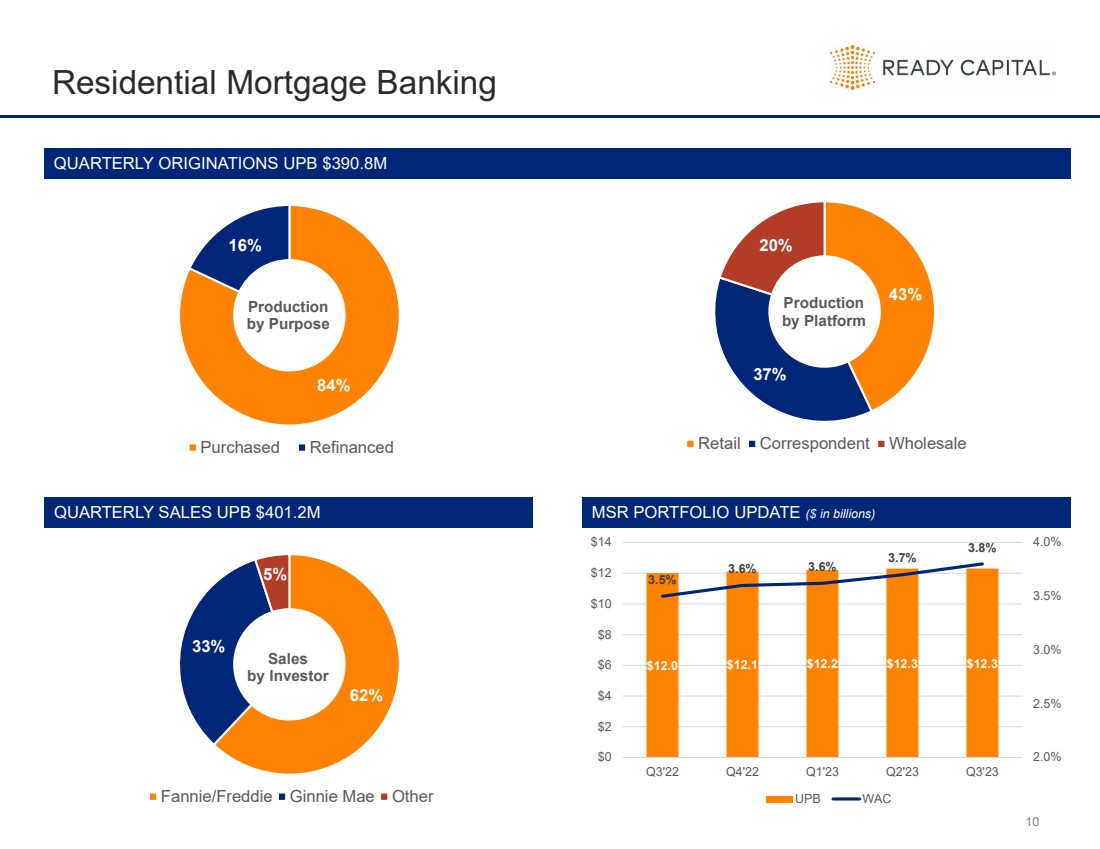
10 QUARTERLY ORIGINATIONS UPB $390.8M Residential Mortgage Banking 84% 16% Production by Purpose Purchased Refinanced QUARTERLY SALES UPB $401.2M 62% 33% 5% Sales by Investor Fannie/Freddie Ginnie Mae Other MSR PORTFOLIO UPDATE ($ in billions) 43% 37% 20% Production by Platform Retail Correspondent Wholesale $12.0 $12.1 $12.2 $12.3 $12.3 3.5% 3.6% 3.6% 3.7% 3.8% 2.0% 2.5% 3.0% 3.5% 4.0% $0 $2 $4 $6 $8 $10 $12 $14 Q3'22 Q4'22 Q1'23 Q2'23 Q3'23 UPB WAC |
|
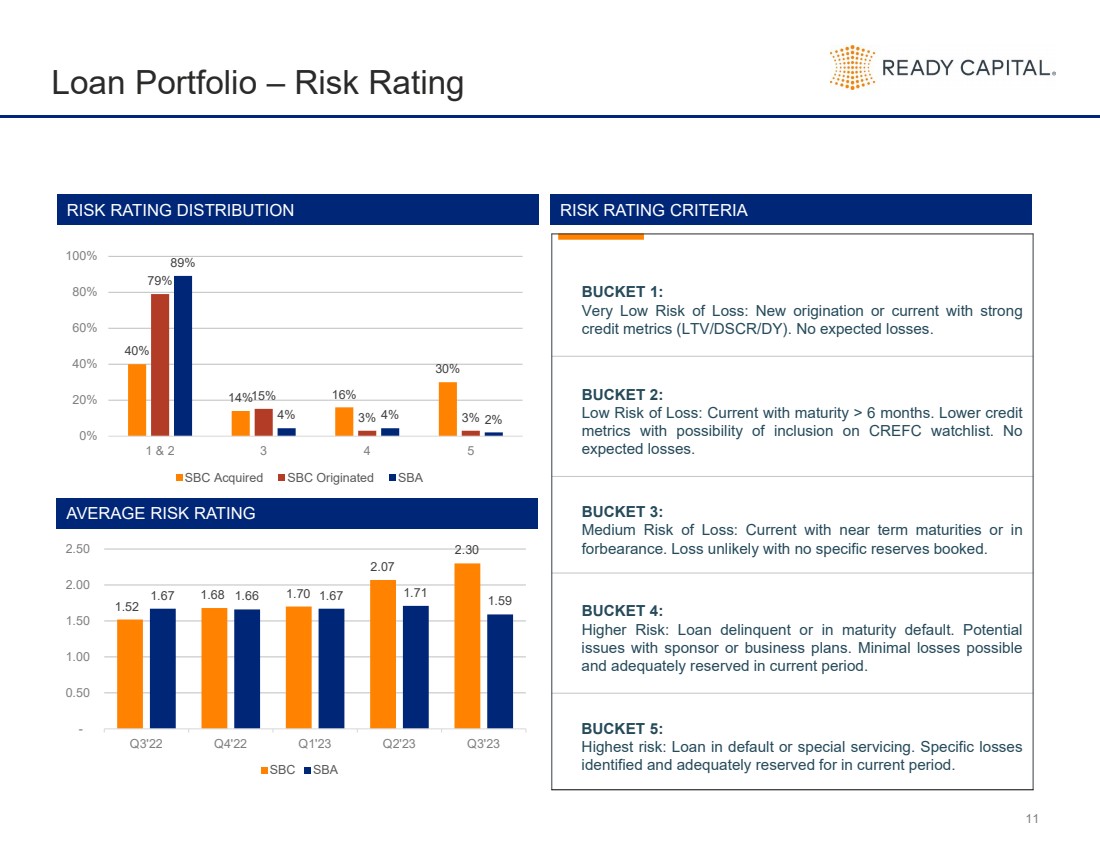
11 Loan Portfolio – Risk Rating BUCKET 1: Very Low Risk of Loss: New origination or current with strong credit metrics (LTV/DSCR/DY). No expected losses. BUCKET 2: Low Risk of Loss: Current with maturity > 6 months. Lower credit metrics with possibility of inclusion on CREFC watchlist. No expected losses. BUCKET 3: Medium Risk of Loss: Current with near term maturities or in forbearance. Loss unlikely with no specific reserves booked. BUCKET 4: Higher Risk: Loan delinquent or in maturity default. Potential issues with sponsor or business plans. Minimal losses possible and adequately reserved in current period. BUCKET 5: Highest risk: Loan in default or special servicing. Specific losses identified and adequately reserved for in current period. RISK RATING DISTRIBUTION RISK RATING CRITERIA 40% 14% 16% 30% 89% 4% 4% 2% 79% 15% 3% 3% 0% 20% 40% 60% 80% 100% 1 & 2 3 4 5 SBC Acquired SBC Originated SBA 1.52 1.68 1.70 2.07 2.30 1.67 1.66 1.67 1.71 1.59 - 0.50 1.00 1.50 2.00 2.50 Q3'22 Q4'22 Q1'23 Q2'23 Q3'23 SBC SBA AVERAGE RISK RATING |
|
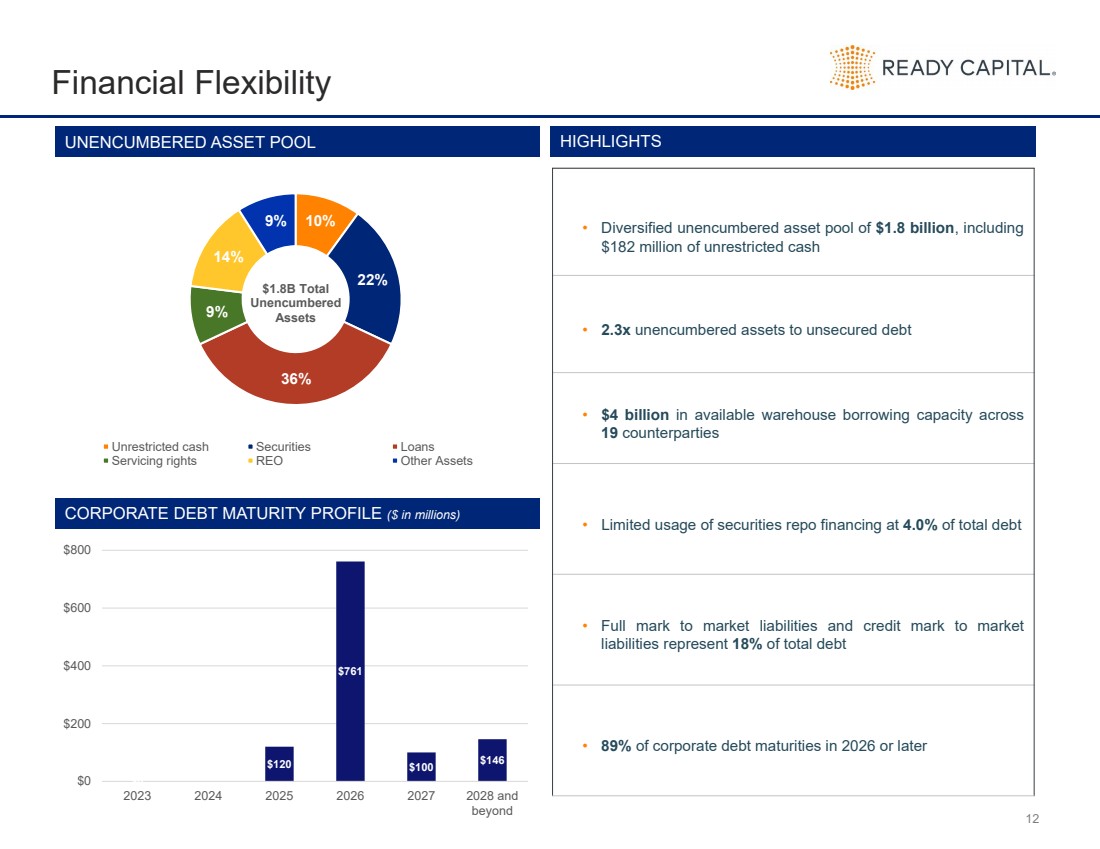
12 Financial Flexibility 10% 22% 36% 9% 14% 9% $1.8B Total Unencumbered Assets Unrestricted cash Securities Loans Servicing rights REO Other Assets UNENCUMBERED ASSET POOL HIGHLIGHTS $0 $120 $761 $100 $146 $0 $200 $400 $600 $800 2023 2024 2025 2026 2027 2028 and beyond CORPORATE DEBT MATURITY PROFILE ($ in millions) • Diversified unencumbered asset pool of $1.8 billion, including $182 million of unrestricted cash • 2.3x unencumbered assets to unsecured debt • $4 billion in available warehouse borrowing capacity across 19 counterparties • Limited usage of securities repo financing at 4.0% of total debt • Full mark to market liabilities and credit mark to market liabilities represent 18% of total debt • 89% of corporate debt maturities in 2026 or later |
|
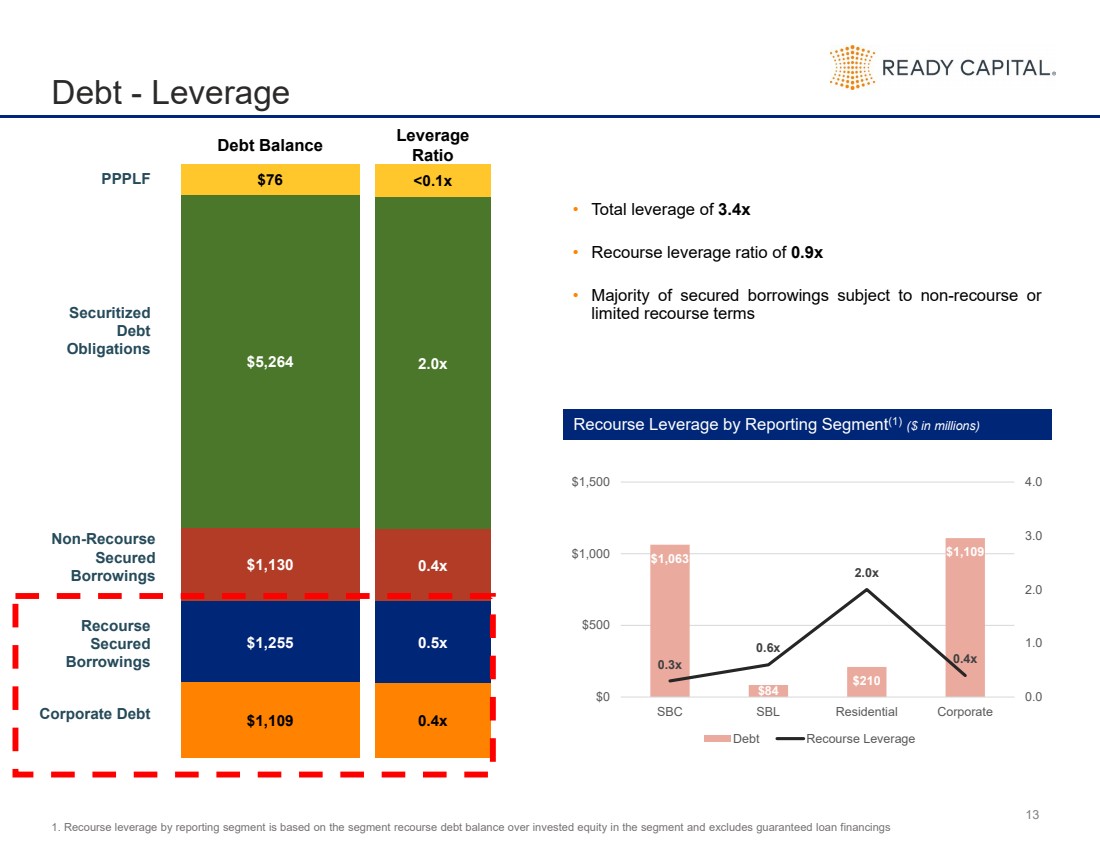
13 Debt - Leverage Corporate Debt PPPLF Securitized Debt Obligations Non-Recourse Secured Borrowings Recourse Secured Borrowings <0.1x 2.0x 0.4x 0.5x 0.4x Debt Balance Leverage Ratio • Total leverage of 3.4x • Recourse leverage ratio of 0.9x • Majority of secured borrowings subject to non-recourse or limited recourse terms Recourse Leverage by Reporting Segment(1) ($ in millions) $1,063 $84 $210 $1,109 0.3x 0.6x 2.0x 0.4x 0.0 1.0 2.0 3.0 4.0 $0 $500 $1,000 $1,500 SBC SBL Residential Corporate Debt Recourse Leverage 1. Recourse leverage by reporting segment is based on the segment recourse debt balance over invested equity in the segment and excludes guaranteed loan financings $76 $5,264 $1,130 $1,255 $1,109 |
|
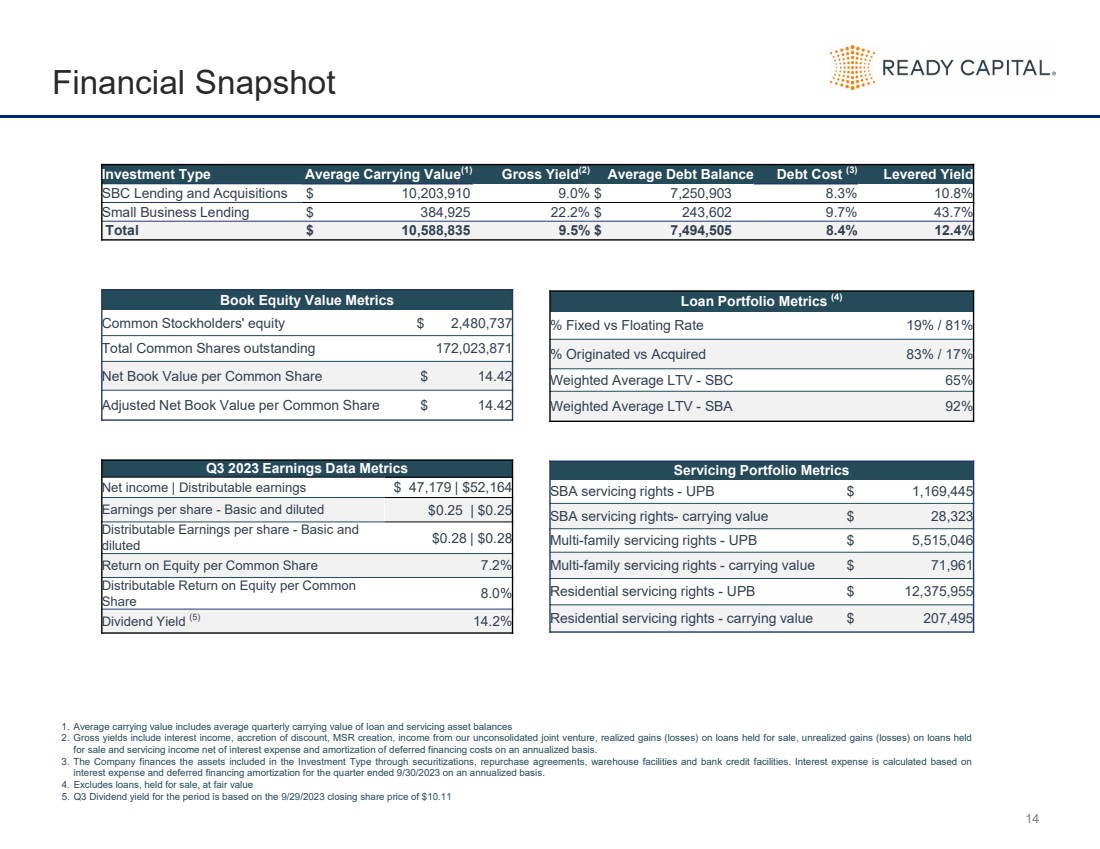
14 Financial Snapshot Investment Type Average Carrying Value(1) Gross Yield(2) Average Debt Balance Debt Cost (3) Levered Yield SBC Lending and Acquisitions $ 10,203,910 9.0% $ 7,250,903 8.3% 10.8% Small Business Lending $ 384,925 22.2% $ 243,602 9.7% 43.7% Total $ 10,588,835 9.5% $ 7,494,505 8.4% 12.4% Book Equity Value Metrics Common Stockholders' equity $ 2,480,737 Total Common Shares outstanding 172,023,871 Net Book Value per Common Share $ 14.42 Adjusted Net Book Value per Common Share $ 14.42 Loan Portfolio Metrics (4) % Fixed vs Floating Rate 19% / 81% % Originated vs Acquired 83% / 17% Weighted Average LTV - SBC 65% Weighted Average LTV - SBA 92% Q3 2023 Earnings Data Metrics Net income | Distributable earnings $ 47,179 | $52,164 Earnings per share - Basic and diluted $0.25 | $0.25 Distributable Earnings per share - Basic and diluted $0.28 | $0.28 Return on Equity per Common Share 7.2% Distributable Return on Equity per Common Share 8.0% Dividend Yield (5) 14.2% Servicing Portfolio Metrics SBA servicing rights - UPB $ 1,169,445 SBA servicing rights- carrying value $ 28,323 Multi-family servicing rights - UPB $ 5,515,046 Multi-family servicing rights - carrying value $ 71,961 Residential servicing rights - UPB $ 12,375,955 Residential servicing rights - carrying value $ 207,495 1. Average carrying value includes average quarterly carrying value of loan and servicing asset balances 2. Gross yields include interest income, accretion of discount, MSR creation, income from our unconsolidated joint venture, realized gains (losses) on loans held for sale, unrealized gains (losses) on loans held for sale and servicing income net of interest expense and amortization of deferred financing costs on an annualized basis. 3. The Company finances the assets included in the Investment Type through securitizations, repurchase agreements, warehouse facilities and bank credit facilities. Interest expense is calculated based on interest expense and deferred financing amortization for the quarter ended 9/30/2023 on an annualized basis. 4. Excludes loans, held for sale, at fair value 5. Q3 Dividend yield for the period is based on the 9/29/2023 closing share price of $10.11 |
|
APPENDIX Additional Financial Information |
|
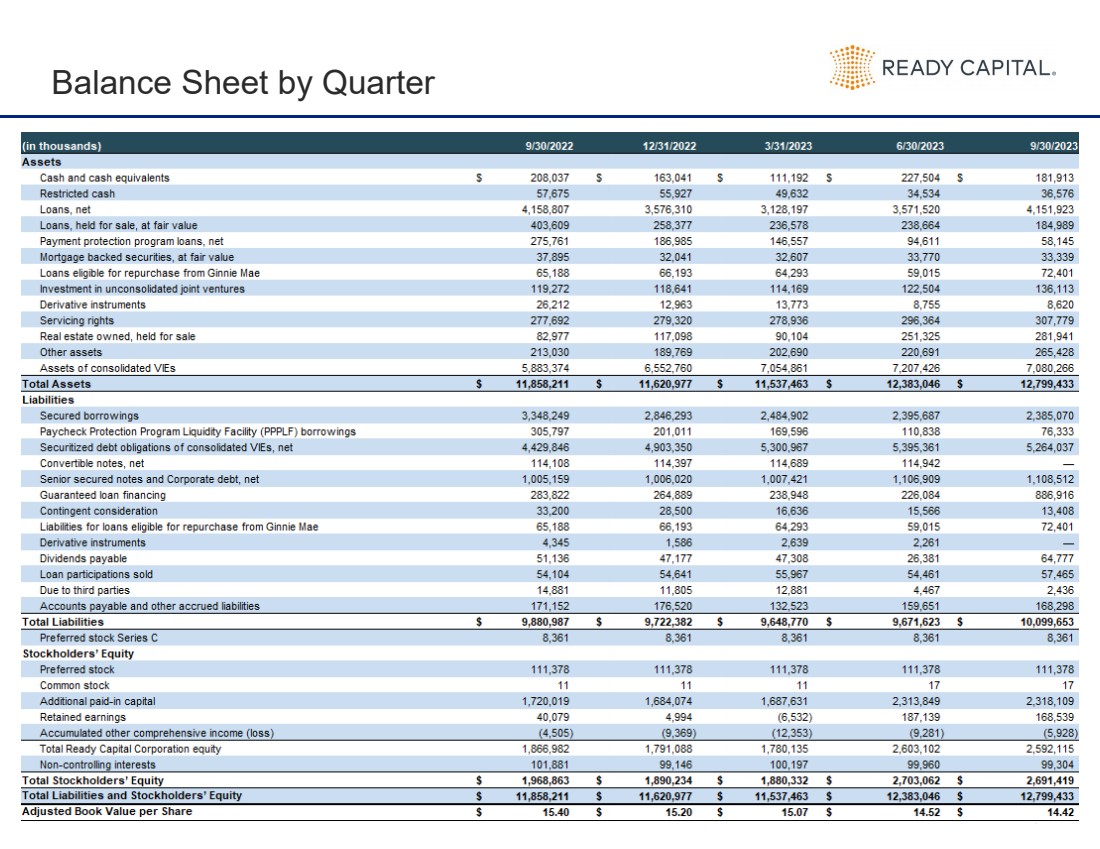
16 Balance Sheet by Quarter |
|
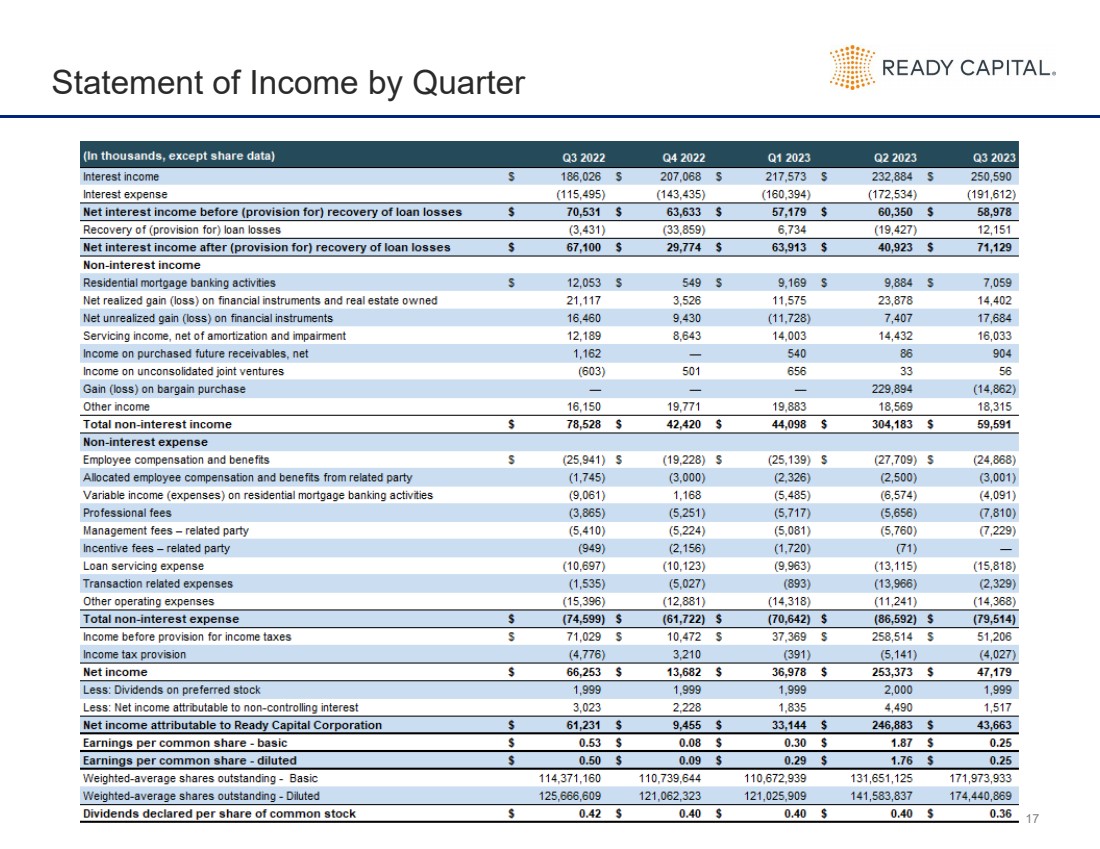
17 Statement of Income by Quarter |
|
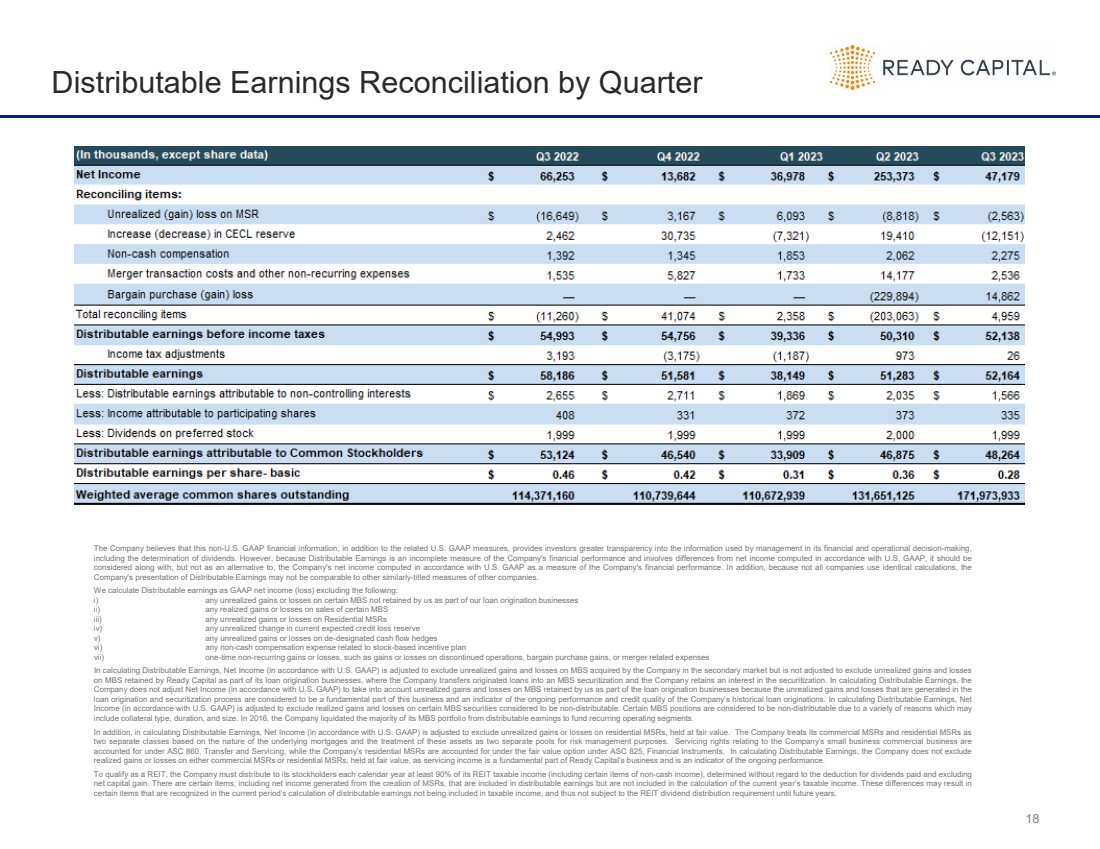
18 Distributable Earnings Reconciliation by Quarter The Company believes that this non-U.S. GAAP financial information, in addition to the related U.S. GAAP measures, provides investors greater transparency into the information used by management in its financial and operational decision-making, including the determination of dividends. However, because Distributable Earnings is an incomplete measure of the Company's financial performance and involves differences from net income computed in accordance with U.S. GAAP, it should be considered along with, but not as an alternative to, the Company's net income computed in accordance with U.S. GAAP as a measure of the Company's financial performance. In addition, because not all companies use identical calculations, the Company's presentation of Distributable Earnings may not be comparable to other similarly-titled measures of other companies. We calculate Distributable earnings as GAAP net income (loss) excluding the following: i) any unrealized gains or losses on certain MBS not retained by us as part of our loan origination businesses ii) any realized gains or losses on sales of certain MBS iii) any unrealized gains or losses on Residential MSRs iv) any unrealized change in current expected credit loss reserve v) any unrealized gains or losses on de-designated cash flow hedges vi) any non-cash compensation expense related to stock-based incentive plan vii) one-time non-recurring gains or losses, such as gains or losses on discontinued operations, bargain purchase gains, or merger related expenses In calculating Distributable Earnings, Net Income (in accordance with U.S. GAAP) is adjusted to exclude unrealized gains and losses on MBS acquired by the Company in the secondary market but is not adjusted to exclude unrealized gains and losses on MBS retained by Ready Capital as part of its loan origination businesses, where the Company transfers originated loans into an MBS securitization and the Company retains an interest in the securitization. In calculating Distributable Earnings, the Company does not adjust Net Income (in accordance with U.S. GAAP) to take into account unrealized gains and losses on MBS retained by us as part of the loan origination businesses because the unrealized gains and losses that are generated in the loan origination and securitization process are considered to be a fundamental part of this business and an indicator of the ongoing performance and credit quality of the Company’s historical loan originations. In calculating Distributable Earnings, Net Income (in accordance with U.S. GAAP) is adjusted to exclude realized gains and losses on certain MBS securities considered to be non-distributable. Certain MBS positions are considered to be non-distributable due to a variety of reasons which may include collateral type, duration, and size. In 2016, the Company liquidated the majority of its MBS portfolio from distributable earnings to fund recurring operating segments. In addition, in calculating Distributable Earnings, Net Income (in accordance with U.S. GAAP) is adjusted to exclude unrealized gains or losses on residential MSRs, held at fair value. The Company treats its commercial MSRs and residential MSRs as two separate classes based on the nature of the underlying mortgages and the treatment of these assets as two separate pools for risk management purposes. Servicing rights relating to the Company’s small business commercial business are accounted for under ASC 860, Transfer and Servicing, while the Company’s residential MSRs are accounted for under the fair value option under ASC 825, Financial Instruments. In calculating Distributable Earnings, the Company does not exclude realized gains or losses on either commercial MSRs or residential MSRs, held at fair value, as servicing income is a fundamental part of Ready Capital’s business and is an indicator of the ongoing performance. To qualify as a REIT, the Company must distribute to its stockholders each calendar year at least 90% of its REIT taxable income (including certain items of non-cash income), determined without regard to the deduction for dividends paid and excluding net capital gain. There are certain items, including net income generated from the creation of MSRs, that are included in distributable earnings but are not included in the calculation of the current year’s taxable income. These differences may result in certain items that are recognized in the current period’s calculation of distributable earnings not being included in taxable income, and thus not subject to the REIT dividend distribution requirement until future years. |
|