UNITED STATES
SECURITIES AND EXCHANGE COMMISSION
Washington, D.C. 20549
FORM 8-K
CURRENT REPORT
Pursuant to Section 13 or 15(d) of
the Securities Exchange Act of 1934
Date of Report (Date of earliest event reported): November 1, 2023
CPI CARD GROUP INC.
(Exact name of registrant as specified in its charter)
|
Delaware (State or other jurisdiction |
001-37584 (Commission |
26-0344657 (I.R.S. Employer |
|
|
|
|
CPI Card Group Inc. Littleton, CO (Address of principal executive offices) |
80127 (Zip Code) |
(720) 681-6304
(Registrant’s telephone number, including area code)
N/A
(Former name or former address, if changed since last report)
Check the appropriate box below if the Form 8-K filing is intended to simultaneously satisfy the filing obligation of the registrant under any of the following provisions:
☐ Written communications pursuant to Rule 425 under the Securities Act (17 CFR 230.425)
☐ Soliciting material pursuant to Rule 14a-12 under the Exchange Act (17 CFR 240.14a-12)
☐ Pre-commencement communications pursuant to Rule 14d-2(b) under the Exchange Act (17 CFR 240.14d-2(b))
☐ Pre-commencement communications pursuant to Rule 13e-4(c) under the Exchange Act (17 CFR 240.13e-4(c))
Securities registered pursuant to Section 12(b) of the Act:
Title of each class |
Trading Symbol(s) |
Name of each exchange on which registered |
Common Stock, $0.001 par value |
PMTS |
Nasdaq Global Market |
Indicate by check mark whether the registrant is an emerging growth company as defined in Rule 405 of the Securities Act of 1933 (§230.405 of this chapter) or Rule 12b-2 of the Securities Exchange Act of 1934 (§240.12b-2 of this chapter).
Emerging growth company ☐
If an emerging growth company, indicate by check mark if the registrant has elected not to use the extended transition period for complying with any new or revised financial accounting standards provided pursuant to Section 13(a) of the Exchange Act. ☐
Item 2.02 Results of Operations and Financial Condition.*
On November 7, 2023, CPI Card Group Inc. (the “Company”) issued a press release announcing financial results for its fiscal quarter ended September 30, 2023 (the “Earnings Release”). A copy of the Earnings Release is attached hereto as Exhibit 99.1.
Item 5.02 Departure of Directors or Certain Officers; Election of Directors; Appointment of Certain Officers; Compensatory Arrangements of Certain Officers.
(d) On November 1, 2023, the Board of Directors (the “Board”) of the Company appointed Ravi Mallela to serve on the Board of Directors effective November 15, 2023 to fill the current vacancy on the Board. Mr. Mallela was also named to the Audit Committee of the Board.
There is no arrangement or understanding between Mr. Mallela and any other persons pursuant to which Mr. Mallela was selected as a director. There are no transactions involving Mr. Mallela requiring disclosure under Item 404(a) of Regulation S-K.
Mr. Mallela’s compensation for services as a non-employee director will be consistent with that of the Company’s other non-employee directors, as described in the Company’s Proxy Statement dated April 13, 2023, prorated for his service during 2023. A copy of the press release announcing Mr. Mallela’s appointment is attached hereto as Exhibit 99.2.
Item 7.01 Regulation FD Disclosure. *
In connection with the issuance of the Earnings Release, the Company is holding a public conference call on November 7, 2023, during which Scott Scheirman, President and Chief Executive Officer, and Jeffrey Hochstadt, Chief Financial Officer, will provide the presentation attached hereto as Exhibit 99.3. Information regarding access to the conference call and webcast is set forth in the Earnings Release.
Item 8.01 Other Events.
On November 2, 2023, the Company's Board of Directors approved a share repurchase plan authorizing the Company to repurchase up to $20 million of the Company's common stock, par value $0.001 per share (“Common Stock”). This authorization expires on December 31, 2024.
Repurchases of shares of Common Stock under the stock repurchase plan will be made in accordance with applicable securities laws and may be made through open market purchases or through privately negotiated transactions, subject to market conditions, applicable legal requirements and other relevant factors. Open market repurchases may be structured to occur in accordance with the requirements of Rule 10b-18. The Company may also, from time to time, enter into Rule 10b5-1 plans to facilitate repurchases of its shares under this authorization.
The extent to which the Company repurchases shares of Common Stock, and the timing of such repurchases, will depend upon a variety of factors, including market conditions, regulatory requirements and other corporate considerations, as determined by the Company. The stock repurchase program does not obligate the Company to acquire any particular amount of Common Stock, and it may be suspended or terminated at any time at the Company’s discretion.
*The information furnished under Item 2.02 and Item 7.01 of this Current Report on Form 8-K, including Exhibits 99.1 and 99.2, is being furnished and shall not be deemed to be “filed” for the purposes of Section 18 of the Securities Exchange Act of 1934, as amended (the “Exchange Act”), or incorporated by reference in any filing under the Securities Act of 1933, as amended, or the Exchange Act, except as shall be expressly set forth by specific reference in such a filing.
Item 9.01 Financial Statements and Exhibits.
(d) Exhibits:
Exhibit Number |
Exhibit Description |
99.1* |
Press release issued November 7, 2023, announcing the third quarter results. |
99.2* |
Press release issued November 7, 2023, announcing appointment of Ravi Mallela to Board of Directors. |
99.3* |
|
104 |
Cover Page Interactive Data File (formatted as Inline XBRL). |
*The information furnished under Item 2.02 and Item 7.01 of this Current Report on Form 8-K, including Exhibits 99.1 and 99.2, is being furnished and shall not be deemed to be “filed” for the purposes of Section 18 of the Securities Exchange Act of 1934, as amended (the “Exchange Act”), or incorporated by reference in any filing under the Securities Act of 1933, as amended, or the Exchange Act, except as shall be expressly set forth by specific reference in such a filing.
SIGNATURES
Pursuant to the requirements of the Securities Exchange Act of 1934, the registrant has duly caused this report to be signed on its behalf by the undersigned hereunto duly authorized.
|
CPI CARD GROUP INC. |
|
|
|
|
|
|
|
Dated: November 7, 2023 |
By: |
/s/ Jessica Browne |
|
Name: |
Jessica Browne |
|
Title: |
Deputy General Counsel |
Exhibit 99.1
CPI Card Group Inc. Reports Third Quarter 2023 Results
Date: November 7, 2023
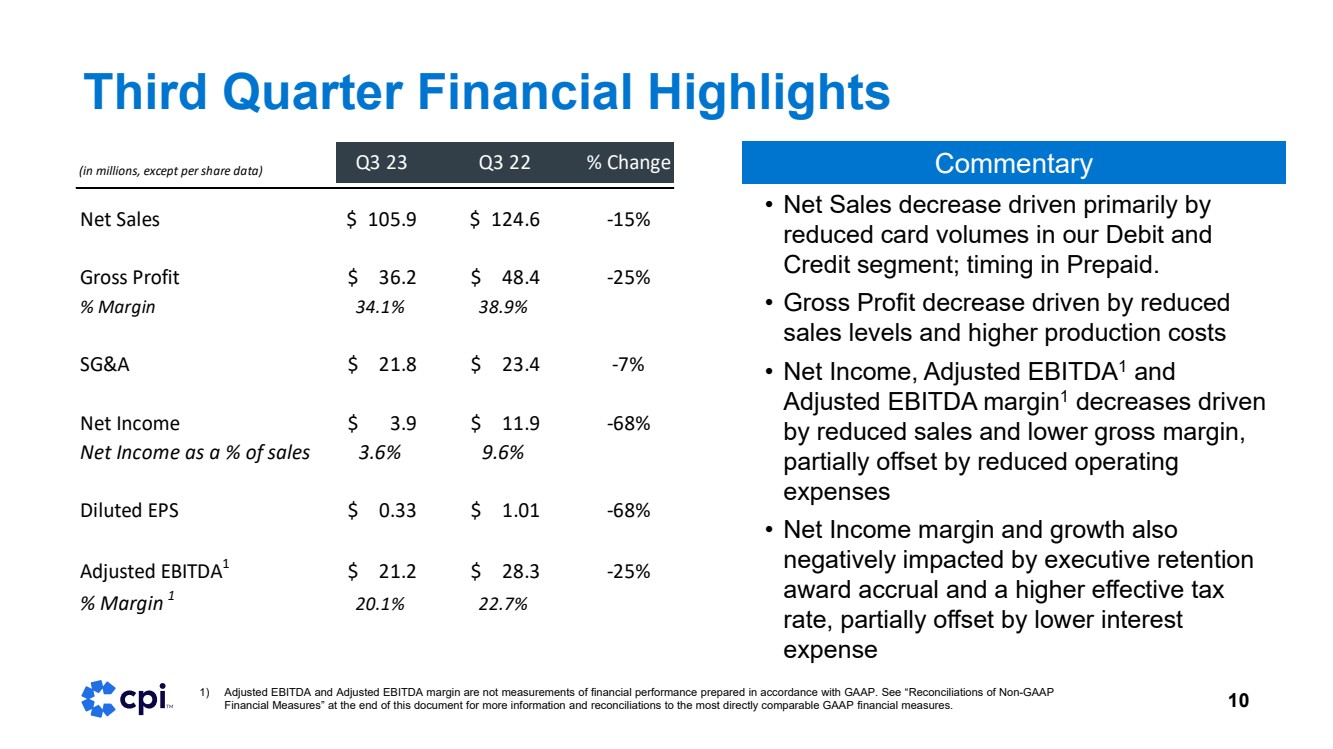
Third Quarter Net Sales Decreased 15% to $106 Million; Net Income Decreased 68% to $4 Million; Adjusted EBITDA Decreased 25% to $21 Million
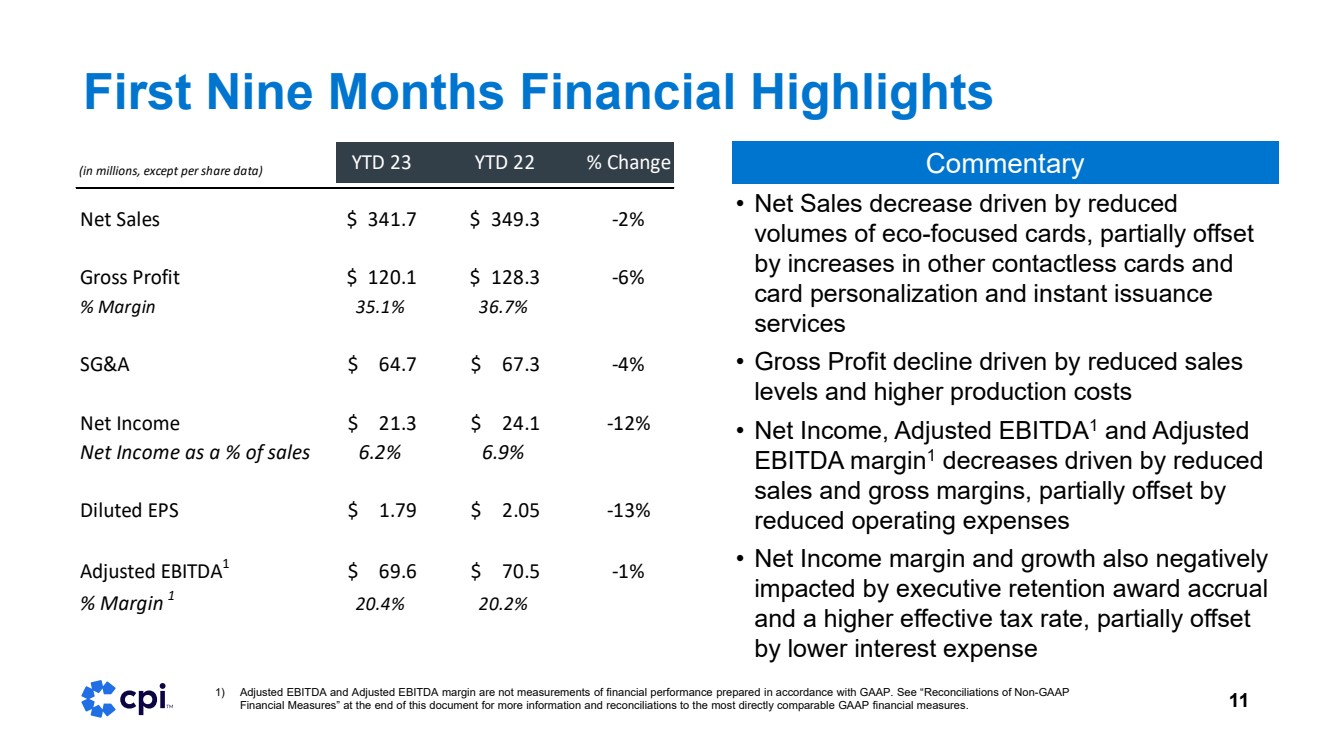
First Nine Months Net Sales Decreased 2%; Net Income Decreased 12%; Adjusted EBITDA Decreased 1%
Company Updates 2023 Outlook; Announces $20 Million Share Repurchase Authorization
Littleton, CO. November 7, 2023 -- CPI Card Group Inc. (Nasdaq: PMTS) (“CPI” or the “Company”), a payment technology company and leading provider of credit, debit, and prepaid solutions, today reported financial results for the third quarter ended September 30, 2023 and updated its financial outlook for 2023.
As anticipated, third quarter sales and earnings declined compared to prior year levels, with net sales decreasing 15% to $105.9 million, net income decreasing 68% to $3.9 million and Adjusted EBITDA decreasing 25% to $21.2 million. Sales declines reflect cautious spending and inventory rationalization by certain customers and were also impacted by comparisons with the 2022 third quarter, when the Company posted net sales growth of 25%.
“We believe the card production market has been affected by cautious customer spending due to a variety of factors, including a focus on managing inventory levels following robust purchases in a challenging supply-chain environment last year,” said Scott Scheirman, President and Chief Executive Officer. “Although the production side of the market has been relatively softer, card issuance to end users has continued to grow and we believe the long-term growth trends for the industry remain intact.”
The Company expects fourth quarter sales and Adjusted EBITDA to be similar to the third quarter levels as customer demand remains lower than anticipated and new sales initiatives are not expected to significantly impact the current year. As a result, the Company’s updated full year outlook for 2023 projects mid-single digit declines for both net sales and Adjusted EBITDA, with Free Cash Flow projected to be approximately double the 2022 level.
The Company believes long-term growth trends for the U.S. card market remain strong, led by consumer card growth, widespread adoption of eco-focused cards and the ongoing conversion to contactless cards. Based on figures released by the networks, Visa and Mastercard® U.S. debit and credit cards in circulation increased at a compound annual growth rate of 10% for the three-year period ending June 30, 2023.
The Company also announced that its Board of Directors approved a $20 million share repurchase authorization, expiring December 31, 2024.
Scheirman added, “We believe repurchasing our shares is a great investment for our shareholders, as the Company is well-positioned for the future with innovative, high-quality products and services and strong customer focus.”
CPI is a top payment solutions provider in the U.S. serving thousands of banks, credit unions and fintechs. The Company is a leader in the U.S. markets for eco-focused payment cards, personalization and Software-as-a-Service-based instant issuance solutions for small and medium U.S. financial institutions and retail prepaid debit card solutions, and maintains longstanding customer relationships.
2023 Business Highlights
| ● | A leading provider of eco-focused payment card solutions in the U.S. market, with more than 100 million eco-focused cards sold since launch in late 2019. |
| ● | A leading provider of Software-as-a-Service-based instant issuance solutions in the U.S., with more than 15,000 Card@Once® installations across more than 2,000 financial institutions. |
| ● | Financial position improvement, with the outstanding balance on the Company’s 8.625% Senior Secured Notes reduced by $17 million in the first nine months of the year through open market repurchases and a Net Leverage Ratio of 2.9x at September 30, 2023. |
Third Quarter 2023 Financial Highlights
Net sales decreased 15% year-over-year to $105.9 million in the third quarter of 2023.
| ● | Debit and Credit segment net sales decreased 16% to $83.8 million, primarily due to volume declines in eco-focused and other contactless cards and contact cards. Services sales increased due to growth in Card@Once® instant issuance solutions processing fees. |
| ● | Prepaid Debit segment net sales decreased 12% to $22.3 million, primarily due to timing of sales between quarters. |
Third quarter gross profit decreased 25% to $36.2 million and gross profit margin was 34.1%, which compared to 38.9% in the prior year third quarter.
Third quarter income from operations decreased 45% to $13 million; net income decreased 68% to $3.9 million, or $0.33 diluted earnings per share; and Adjusted EBITDA decreased 25% to $21.2 million. Income from operations, net income and Adjusted EBITDA declines were driven by the sales decrease, partially offset by lower operating expenses. The net income decrease was also impacted by a higher effective tax rate compared to prior year, partially offset by lower interest expense. Income from operations and net income were negatively impacted by approximately $3 million of pre-tax operating expenses related to executive retention, which are not included in Adjusted EBITDA.
Year-to-date 2023 Financial Highlights
Net sales decreased 2% year-over-year to $341.7 million in the first nine months of 2023.
| ● | Debit and Credit segment net sales decreased 2% to $279 million, primarily due to volume declines in eco-focused contactless cards compared to strong orders in 2022 and lower |
| contact card sales, partially offset by increases in sales of other contactless cards and services related to card personalization and Card@Once® instant issuance solutions. |
| ● | Prepaid Debit segment net sales decreased 1% to $63.3 million. |
Year-to-date gross profit decreased 6% to $120.1 million and gross profit margin was 35.1%, which compared to 36.7% in the prior year.
Year-to-date income from operations decreased 10% to $51.1 million; net income decreased 12% to $21.3 million, or $1.79 diluted earnings per share; and Adjusted EBITDA decreased 1% to $69.6 million. Income from operations, net income and Adjusted EBITDA declines were driven by lower net sales, partially offset by lower operating expenses, while the net income decline also reflects a higher effective tax rate, partially offset by lower interest expense. Income from operations and net income were negatively impacted by approximately $4 million of pre-tax operating expenses related to executive retention, which are not included in Adjusted EBITDA.
Balance Sheet, Liquidity and Cash Flow
The Company generated cash flow from operating activities of $22.3 million in the first nine months of the year, which compared to $11.7 million in the prior year period, and Free Cash Flow of $16.2 million, which compared to a usage of $2.7 million in the first nine months of 2022. The increase in cash generation compared to the prior year was driven by working capital improvement.
As of September 30, 2023, cash and cash equivalents was $10.5 million. There were $268 million of 8.625% Senior Secured Notes due 2026 and $8 million of borrowings from the ABL revolving credit facility outstanding at quarter-end. The Company retired $17 million of notes during the first nine months of 2023, utilizing cash balances and revolving credit facility proceeds.
The Company’s capital structure and allocation priorities are to maintain ample liquidity; invest in the business, including strategic acquisitions; deleverage the balance sheet; and return funds to stockholders.
“We are managing operating expenses tightly as we deal with the softer customer demand in 2023,” said Jeff Hochstadt, Chief Financial Officer of CPI. “We are also keenly focused on optimizing working capital to generate strong free cash flow improvement in 2023.”
Outlook
The Company projects the following full-year outlook for 2023:
| ● | Net sales to decline mid-single digits (previous outlook: flat to low single-digit growth) |
| ● | Adjusted EBITDA to decline mid-single digits (previous outlook: mid-to-high single-digit growth) |
| ● | Free Cash Flow to be approximately double the 2022 level (previous outlook: more than double the 2022 level) |
| ● | Net Leverage Ratio of approximately 3x (previous outlook: 2.5x to 3x) |
Conference Call and Webcast
CPI Card Group Inc. will hold a conference call on November 7, 2023 at 9:00 a.m. Eastern Time (ET) to review its third quarter results. To participate in the Company's conference call via telephone or online:
U.S. dial-in number (toll-free): 888-330-3573
International: 646-960-0677
Conference ID: 8062733
Webcast Link: CPI Q3 Webcast or at https://investor.cpicardgroup.com
Participants are advised to login for the webcast 10 minutes prior to the scheduled start time.
A replay of the conference call will be available until November 21, 2023 at:
U.S. dial-in number (toll free): 800-770-2030
International: 647-362-9199
Conference ID: 8062733
A webcast replay of the conference call will also be available on CPI Card Group Inc.’s Investor Relations web site: https://investor.cpicardgroup.com
Non-GAAP Financial Measures
In addition to financial results reported in accordance with U.S. generally accepted accounting principles (“GAAP”), we have provided the following non-GAAP financial measures in this release, all reported on a continuing operations basis: EBITDA, Adjusted EBITDA, Adjusted EBITDA margin, Free Cash Flow, LTM Adjusted EBITDA and Net Leverage Ratio. These non-GAAP financial measures are utilized by management in comparing our operating performance on a consistent basis between fiscal periods. We believe that these financial measures are appropriate to enhance an overall understanding of our underlying operating performance trends compared to historical and prospective periods and our peers. Management also believes that these measures are useful to investors in their analysis of our results of operations and provide improved comparability between fiscal periods. Non-GAAP financial measures should not be considered in isolation from, or as a substitute for, financial information calculated in accordance with GAAP. Our non-GAAP measures may be different from similarly titled measures of other companies. Investors are encouraged to review the reconciliation of these historical non-GAAP measures to their most directly comparable GAAP financial measures included in Exhibit E to this press release.
Adjusted EBITDA
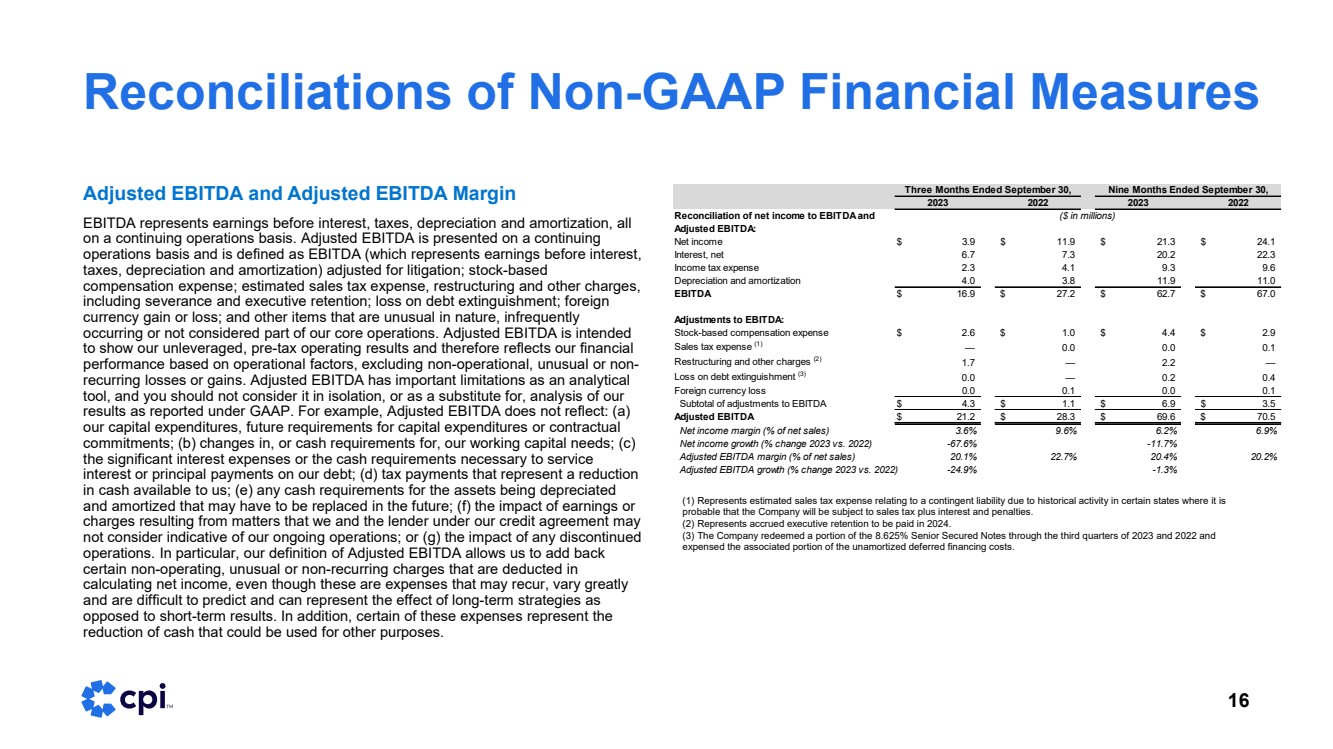
Adjusted EBITDA is presented on a continuing operations basis and is defined as EBITDA (which represents earnings before interest, taxes, depreciation and amortization) adjusted for litigation; stock-based compensation expense; estimated sales tax expense; restructuring and other charges, including severance and executive retention; loss on debt extinguishment; foreign currency gain or loss; and other items that are unusual in nature, infrequently occurring or not considered part of our core operations, as set forth in the reconciliation in Exhibit E. Adjusted EBITDA is intended to show our unleveraged, pre-tax operating results and therefore reflects our financial performance based on operational factors, excluding non-operational, unusual or non-recurring losses or gains. Adjusted EBITDA has important limitations as an analytical tool, and you should not consider it in isolation, or as a substitute for, analysis of our results as reported under GAAP.
For example, Adjusted EBITDA does not reflect: (a) our capital expenditures, future requirements for capital expenditures or contractual commitments; (b) changes in, or cash requirements for, our working capital needs; (c) the significant interest expenses or the cash requirements necessary to service interest or principal payments on our debt; (d) tax payments that represent a reduction in cash available to us; (e) any cash requirements for the assets being depreciated and amortized that may have to be replaced in the future; (f) the impact of earnings or charges resulting from matters that we and the lenders under our credit agreement may not consider indicative of our ongoing operations; or (g) the impact of any discontinued operations. In particular, our definition of Adjusted EBITDA allows us to add back certain non-operating, unusual or non-recurring charges that are deducted in calculating net income, even though these are expenses that may recur, vary greatly and are difficult to predict and can represent the effect of long-term strategies as opposed to short-term results. In addition, certain of these expenses represent the reduction of cash that could be used for other purposes. Adjusted EBITDA margin percentage as shown in Exhibit E is computed as Adjusted EBITDA divided by total net sales.
We define LTM Adjusted EBITDA as Adjusted EBITDA (defined previously) for the last twelve months. LTM Adjusted EBITDA is used in the computation of Net Leverage Ratio, and is reconciled in Exhibit E.
Free Cash Flow
We define Free Cash Flow as cash flow provided by (used in) operating activities less capital expenditures. We use this metric in analyzing our ability to service and repay our debt. However, this measure does not represent funds available for investment or other discretionary uses since it does not deduct cash used to service our debt. Free Cash Flow should not be considered in isolation, or as a substitute for, cash (used in) provided by operating activities or any other measures of liquidity derived in accordance with GAAP.
Financial Expectations for 2023
We have provided Adjusted EBITDA expectations for 2023 on a non-GAAP basis because certain reconciling items are dependent on future events that either cannot be controlled or cannot be reliably predicted because they are not part of the Company’s routine activities, any of which could be significant.
Net Leverage Ratio
Management and various investors use the ratio of debt principal outstanding, plus finance lease obligations, less cash, divided by LTM Adjusted EBITDA, or “Net Leverage Ratio”, as a measure of our financial strength when making key investment decisions and evaluating us against peers.
About CPI Card Group Inc.
CPI Card Group is a payment technology company providing a comprehensive range of credit, debit, and prepaid card solutions, complementary digital solutions, and Software-as-a-Service (SaaS) instant issuance. With a focus on building personal relationships and earning trust, we help our customers navigate the constantly evolving world of payments, while delivering innovative solutions that spark connections and support their brands. We serve clients across industry, size, and scale through our team of experienced, dedicated employees and our network of high-security production and card services facilities located in the United States. CPI is committed to exceeding our customers’ expectations, transforming our industry, and enhancing the way people pay every day. Learn more at www.CPIcardgroup.com.
Forward-Looking Statements
Certain statements and information in this release (as well as information included in other written or oral statements we make from time to time) may contain or constitute “forward-looking statements” within the meaning of the Private Securities Litigation Reform Act of 1995, Section 27A of the Securities Act of 1933, as amended, and Section 21E of the Securities Exchange Act of 1934, as amended. The words “believe,” “estimate,” “project,” “expect,” “anticipate,” “plan,” “intend,” “foresee,” “should,” “would,” “could,” “continue,” “committed,” “attempt,” “target,” “objective,” “guides,” “seek,” “focus,” “provides guidance,” “provides outlook” or other similar expressions are intended to identify forward-looking statements, which are not historical in nature. These forward-looking statements, including statements about our strategic initiatives and market opportunities, are based on our current expectations and beliefs concerning future developments and their potential effect on us and other information currently available. Such forward-looking statements, because they relate to future events, are by their very nature subject to many important risks and uncertainties that could cause actual results or other events to differ materially from those contemplated.
These risks and uncertainties include, but are not limited to: a deterioration in general economic conditions, including inflationary conditions and resulting in reduced consumer confidence and business spending, and a decline in consumer credit worthiness impacting demand for our products; the unpredictability of our operating results, including an inability to anticipate changes in customer inventory management practices and its impact on our business; adverse conditions in the banking system and financial markets, including the failure of banks and financial institutions; a disruption or other failure in our supply chain, including as a result of the Russia-Ukraine or other foreign conflicts and with respect to single source suppliers, or the failure or inability of suppliers to comply with our code of conduct or contractual requirements, or political unrest in countries in which our suppliers operate, resulting in increased costs and inability to pass those costs on to our customers and extended production lead times and difficulty meeting customers’ delivery expectations; our failure to retain our existing customers or identify and attract new customers; our status as an accelerated filer and complying with Section 404 of the Sarbanes-Oxley Act of 2002 and the costs associated with such compliance and implementation of procedures thereunder; our failure to maintain effective internal control over financial reporting; our inability to recruit, retain and develop qualified personnel, including key personnel; the potential effects of COVID-19 and responses thereto on our business, including our supply chain, customer demand, workforce, operations; system security risks, data protection breaches and cyber-attacks; interruptions in our operations, including our information technology systems, or in the operations of the third parties that operate computing infrastructure on which we rely; our inability to develop, introduce and commercialize new products; our substantial indebtedness, including inability to make debt service payments or refinance such indebtedness; the restrictive terms of our indebtedness and covenants of future agreements governing indebtedness and the resulting restraints on our ability to pursue our business strategies; disruptions in production at one or more of our facilities; defects in our software; environmental, social and governance preferences and demands of various stakeholders and our ability to conform to such preferences and demands and to comply with any related regulatory requirements; the effects of climate change, negative perceptions of our products due to the impact of our products and production processes on the environment and other ESG-related risks; disruptions in production due to weather conditions, climate change, political instability or social unrest; our inability to adequately protect our trade secrets and intellectual property rights from misappropriation, infringement claims brought against us and risks related to open source software; our limited ability to raise capital; problems in production quality, materials and process; costs and impacts to our financial results relating to the obligatory collection of sales tax and claims for uncollected sales tax in states that impose sales tax collection requirements on out-of-state businesses or unclaimed property, as well as potential new U.S.
tax legislation increasing the corporate income tax rate and challenges to our income tax positions; our inability to successfully execute on our divestitures or acquisitions; our inability to realize the full value of our long-lived assets; costs relating to product defects and any related product liability and/or warranty claims; our inability to renew licenses with key technology licensors; the highly competitive, saturated and consolidated nature of our marketplace; the effects of restrictions, delays or interruptions in our ability to source raw materials and components used in our products from foreign countries; the effects on the global economy of the ongoing military action by Russia in Ukraine and other foreign conflicts; costs and potential liabilities associated with compliance or failure to comply with regulations, customer contractual requirements and evolving industry standards regarding consumer privacy and data use and security; new and developing technologies that make our existing technology solutions and products obsolete or less relevant or our failure to introduce new products and services in a timely manner; quarterly variation in our operating results; our failure to operate our business in accordance with the Payment Card Industry Security Standards Council security standards or other industry standards; our failure to comply with environmental, health and safety laws and regulations that apply to our products and the raw materials we use in our production processes; risks associated with the majority stockholders’ ownership of our stock; potential conflicts of interest that may arise due to our board of directors being comprised in part of directors who are principals of our majority stockholders; the influence of securities analysts over the trading market for and price of our common stock; failure to meet the continued listing standards of the Nasdaq Global Market; the impact of stockholder activism or securities litigation on the trading price and volatility of our common stock; certain provisions of our organizational documents and other contractual provisions that may delay or prevent a change in control and make it difficult for stockholders other than our majority stockholders to change the composition of our board of directors; our ability to comply with a wide variety of complex laws and regulations and the exposure to liability for any failure to comply; the effect of legal and regulatory proceedings; and other risks that are described in Part I, Item 1A – Risk Factors in our Annual Report on Form 10-K for the year ended December 31, 2022 filed with the SEC on March 8, 2023, in Part II, Item 1A – Risk Factors of this Quarterly Report on Form 10-Q and our other reports filed from time to time with the SEC.
We caution and advise readers not to place undue reliance on forward-looking statements, which speak only as of the date hereof. These statements are based on assumptions that may not be realized and involve risks and uncertainties that could cause actual results or other events to differ materially from the expectations and beliefs contained herein. We undertake no obligation to publicly update or revise any forward-looking statements after the date they are made, whether as a result of new information, future events or otherwise.
####
For more information:
CPI encourages investors to use its investor relations website as a way of easily finding information about the Company. CPI promptly makes available on this website the reports that the Company files or furnishes with the SEC, corporate governance information and press releases.
CPI Card Group Inc. Investor Relations:
(877) 369-9016
InvestorRelations@cpicardgroup.com
CPI Card Group Inc. Media Relations:
Media@cpicardgroup.com
CPI Card Group Inc. Earnings Release Supplemental Financial Information
Exhibit A |
Condensed Consolidated Statements of Operations and Comprehensive Income - Unaudited for the three and nine months ended September 30, 2023 and 2022 |
|
|
Exhibit B |
Condensed Consolidated Balance Sheets – Unaudited as of September 30, 2023 and December 31, 2022 |
|
|
Exhibit C |
Condensed Consolidated Statements of Cash Flows - Unaudited for the nine months ended September 30, 2023 and 2022 |
|
|
Exhibit D |
Segment Summary Information – Unaudited for the three and nine months ended September 30, 2023 and 2022 |
|
|
Exhibit E |
Supplemental GAAP to Non-GAAP Reconciliations - Unaudited for the three and nine months ended September 30, 2023 and 2022 |

EXHIBIT A
CPI Card Group Inc. and Subsidiaries
Condensed Consolidated Statements of Operations and Comprehensive Income
(in thousands, except share and per share amounts)
(Unaudited)
|
|
|
|
|
|
|
|
|
|
|
|
|
|
|
Three Months Ended September 30, |
|
Nine Months Ended September 30, |
||||||||
|
|
2023 |
|
2022 |
|
2023 |
|
2022 |
||||
Net sales: |
|
|
|
|
|
|
|
|
|
|
|
|
Products |
|
$ |
55,689 |
|
$ |
71,606 |
|
$ |
195,425 |
|
$ |
208,867 |
Services |
|
|
50,174 |
|
|
52,971 |
|
|
146,250 |
|
|
140,442 |
Total net sales |
|
|
105,863 |
|
|
124,577 |
|
|
341,675 |
|
|
349,309 |
Cost of sales: |
|
|
|
|
|
|
|
|
|
|
|
|
Products (exclusive of depreciation and amortization shown below) |
|
|
37,540 |
|
|
42,702 |
|
|
124,828 |
|
|
128,851 |
Services (exclusive of depreciation and amortization shown below) |
|
|
29,574 |
|
|
31,190 |
|
|
89,192 |
|
|
85,625 |
Depreciation and amortization |
|
|
2,597 |
|
|
2,245 |
|
|
7,584 |
|
|
6,564 |
Total cost of sales |
|
|
69,711 |
|
|
76,137 |
|
|
221,604 |
|
|
221,040 |
Gross profit |
|
|
36,152 |
|
|
48,440 |
|
|
120,071 |
|
|
128,269 |
Operating expenses: |
|
|
|
|
|
|
|
|
|
|
|
|
Selling, general and administrative (exclusive of depreciation and amortization shown below) |
|
|
21,783 |
|
|
23,403 |
|
|
64,734 |
|
|
67,335 |
Depreciation and amortization |
|
|
1,408 |
|
|
1,592 |
|
|
4,286 |
|
|
4,454 |
Total operating expenses |
|
|
23,191 |
|
|
24,995 |
|
|
69,020 |
|
|
71,789 |
Income from operations |
|
|
12,961 |
|
|
23,445 |
|
|
51,051 |
|
|
56,480 |
Other expense, net: |
|
|
|
|
|
|
|
|
|
|
|
|
Interest, net |
|
|
(6,714) |
|
|
(7,323) |
|
|
(20,235) |
|
|
(22,334) |
Other expense, net |
|
|
(53) |
|
|
(63) |
|
|
(245) |
|
|
(474) |
Total other expense, net |
|
|
(6,767) |
|
|
(7,386) |
|
|
(20,480) |
|
|
(22,808) |
Income before income taxes |
|
|
6,194 |
|
|
16,059 |
|
|
30,571 |
|
|
33,672 |
Income tax expense |
|
|
(2,337) |
|
|
(4,149) |
|
|
(9,318) |
|
|
(9,609) |
Net income |
|
$ |
3,857 |
|
$ |
11,910 |
|
$ |
21,253 |
|
$ |
24,063 |
|
|
|
|
|
|
|
|
|
|
|
|
|
Basic and diluted earnings per share: |
|
|
|
|
|
|
|
|
|
|
|
|
Basic earnings per share |
|
$ |
0.34 |
|
$ |
1.06 |
|
$ |
1.86 |
|
$ |
2.14 |
Diluted earnings per share |
|
$ |
0.33 |
|
$ |
1.01 |
|
$ |
1.79 |
|
$ |
2.05 |
|
|
|
|
|
|
|
|
|
|
|
|
|
Basic weighted-average shares outstanding |
|
|
11,432,794 |
|
|
11,265,767 |
|
|
11,418,372 |
|
|
11,259,655 |
Diluted weighted-average shares outstanding |
|
|
11,827,816 |
|
|
11,788,921 |
|
|
11,861,868 |
|
|
11,730,668 |
|
|
|
|
|
|
|
|
|
|
|
|
|
Comprehensive income: |
|
|
|
|
|
|
|
|
|
|
|
|
Net income |
|
$ |
3,857 |
|
$ |
11,910 |
|
$ |
21,253 |
|
$ |
24,063 |
Total comprehensive income |
|
$ |
3,857 |
|
$ |
11,910 |
|
$ |
21,253 |
|
$ |
24,063 |
|
|
|
|
EXHIBIT B |
|
CPI Card Group Inc. and Subsidiaries | |||||
Condensed Consolidated Balance Sheets | |||||
(in thousands, except share and per share amounts) | |||||
(Unaudited) | |||||
|
|
|
|
|
|
|
September 30, |
|
December 31, |
||
|
2023 |
|
2022 |
||
Assets |
|
|
|
|
|
Current assets: |
|
|
|
|
|
Cash and cash equivalents |
$ |
10,473 |
|
$ |
11,037 |
Accounts receivable, net |
|
67,546 |
|
|
80,583 |
Inventories, net |
|
74,080 |
|
|
68,399 |
Prepaid expenses and other current assets |
|
8,747 |
|
|
7,551 |
Total current assets |
|
160,846 |
|
|
167,570 |
Plant, equipment, leasehold improvements and operating lease right-of-use assets, net |
|
62,643 |
|
|
57,178 |
Intangible assets, net |
|
15,088 |
|
|
17,988 |
Goodwill |
|
47,150 |
|
|
47,150 |
Other assets |
|
6,388 |
|
|
6,780 |
Total assets |
$ |
292,115 |
|
$ |
296,666 |
Liabilities and stockholders’ deficit |
|
|
|
|
|
Current liabilities: |
|
|
|
|
|
Accounts payable |
$ |
16,876 |
|
$ |
24,371 |
Accrued expenses |
|
27,967 |
|
|
40,070 |
Deferred revenue and customer deposits |
|
787 |
|
|
3,571 |
Total current liabilities |
|
45,630 |
|
|
68,012 |
Long-term debt |
|
272,669 |
|
|
285,522 |
Deferred income taxes |
|
7,920 |
|
|
6,808 |
Other long-term liabilities |
|
22,616 |
|
|
18,401 |
Total liabilities |
|
348,835 |
|
|
378,743 |
Commitments and contingencies |
|
|
|
|
|
Series A Preferred Stock; $0.001 par value—100,000 shares authorized; 0 shares issued and outstanding at September 30, 2023 and December 31, 2022 |
|
— |
|
|
— |
Stockholders’ deficit: |
|
|
|
|
|
Common stock; $0.001 par value—100,000,000 shares authorized; 11,453,549 and 11,390,355 shares issued and outstanding at September 30, 2023 and December 31, 2022, respectively |
|
11 |
|
|
11 |
Capital deficiency |
|
(104,275) |
|
|
(108,379) |
Accumulated earnings |
|
47,544 |
|
|
26,291 |
Total stockholders’ deficit |
|
(56,720) |
|
|
(82,077) |
Total liabilities and stockholders’ deficit |
$ |
292,115 |
|
$ |
296,666 |
|
|
|
|
|
EXHIBIT C |
CPI Card Group Inc. and Subsidiaries | |||||
Condensed Consolidated Statements of Cash Flows | |||||
(in thousands) | |||||
(Unaudited) | |||||
|
|
|
|
|
|
|
Nine Months Ended September 30, |
||||
|
2023 |
|
2022 |
||
Operating activities |
|
|
|
|
|
Net income |
$ |
21,253 |
|
$ |
24,063 |
Adjustments to reconcile net income to net cash provided by operating activities: |
|
|
|
|
|
Depreciation expense |
|
8,970 |
|
|
8,118 |
Amortization expense |
|
2,900 |
|
|
2,900 |
Stock-based compensation expense |
|
4,431 |
|
|
2,928 |
Amortization of debt issuance costs and debt discount |
|
1,397 |
|
|
1,449 |
Loss on debt extinguishment |
|
243 |
|
|
395 |
Deferred income taxes |
|
1,112 |
|
|
1,192 |
Other, net |
|
(156) |
|
|
437 |
Changes in operating assets and liabilities: |
|
|
|
|
|
Accounts receivable |
|
12,988 |
|
|
(14,862) |
Inventories |
|
(5,806) |
|
|
(13,916) |
Prepaid expenses and other assets |
|
422 |
|
|
1,501 |
Income taxes, net |
|
(1,616) |
|
|
(1,577) |
Accounts payable |
|
(7,805) |
|
|
(440) |
Accrued expenses and other liabilities |
|
(13,283) |
|
|
(3,208) |
Deferred revenue and customer deposits |
|
(2,784) |
|
|
2,733 |
Cash provided by operating activities |
|
22,266 |
|
|
11,713 |
Investing activities |
|
|
|
|
|
Capital expenditures for plant, equipment and leasehold improvements, net |
|
(6,076) |
|
|
(14,440) |
Other |
|
183 |
|
|
95 |
Cash used in investing activities |
|
(5,893) |
|
|
(14,345) |
Financing activities |
|
|
|
|
|
Principal payments on Senior Notes |
|
(16,954) |
|
|
(20,000) |
Principal payments on ABL Revolver |
|
(10,000) |
|
|
(10,000) |
Proceeds from ABL Revolver |
|
13,000 |
|
|
35,000 |
Payments on debt extinguishment and other |
|
(327) |
|
|
(1,093) |
Proceeds from finance lease financing |
|
— |
|
|
2,074 |
Payments on finance lease obligations |
|
(2,655) |
|
|
(2,457) |
Cash (used in) provided by financing activities |
|
(16,936) |
|
|
3,524 |
Effect of exchange rates on cash |
|
(1) |
|
|
(68) |
Net (decrease) increase in cash and cash equivalents |
|
(564) |
|
|
824 |
Cash and cash equivalents, beginning of period |
|
11,037 |
|
|
20,683 |
Cash and cash equivalents, end of period |
$ |
10,473 |
|
$ |
21,507 |
Supplemental disclosures of cash flow information |
|
|
|
|
|
Cash paid (refunded) during the period for: |
|
|
|
|
|
Interest |
$ |
25,307 |
|
$ |
27,026 |
Income taxes paid |
$ |
9,994 |
|
$ |
10,859 |
Income taxes refunded |
$ |
(25) |
|
$ |
(449) |
Right-of-use assets obtained in exchange for lease obligations: |
|
|
|
|
|
Operating leases |
$ |
2,641 |
|
$ |
816 |
Financing leases |
$ |
6,989 |
|
$ |
7,783 |
Accounts payable and accrued expenses for capital expenditures for plant, equipment and leasehold improvements |
$ |
977 |
|
$ |
1,781 |
EXHIBIT D | ||||||||||||
CPI Card Group Inc. and Subsidiaries | ||||||||||||
Segment Summary Information | ||||||||||||
For the Three Months Ended September 30, 2023 and 2022 | ||||||||||||
(dollars in thousands) | ||||||||||||
(Unaudited) | ||||||||||||
|
|
|
|
|
|
|
|
|
|
|
|
|
|
|
|
|
|
|
|
|
|
|
|
|
|
|
|
|
|
|
|
|
|
|
|
|
|
|
Net Sales |
|
|
|
|
|
|
|
|
|
|
|
|
|
|
Three Months Ended September 30, |
||||||||||
|
|
2023 |
|
2022 |
|
$ Change |
|
% Change |
||||
Net sales by segment: |
|
|
|
|
|
|
|
|
|
|
|
|
Debit and Credit |
|
$ |
83,780 |
|
$ |
99,512 |
|
$ |
(15,732) |
|
(15.8) |
% |
Prepaid Debit |
|
|
22,335 |
|
|
25,335 |
|
|
(3,000) |
|
(11.8) |
% |
Eliminations |
|
|
(252) |
|
|
(270) |
|
|
18 |
|
* |
% |
Total |
|
$ |
105,863 |
|
$ |
124,577 |
|
$ |
(18,714) |
|
(15.0) |
% |
* Calculation not meaningful |
|
|
|
|
|
|
|
|
|
|
|
|
|
|
Nine Months Ended September 30, |
||||||||||
|
|
2023 |
|
2022 |
|
$ Change |
|
% Change |
||||
Net sales by segment: |
|
|
|
|
|
|
|
|
|
|
|
|
Debit and Credit |
|
$ |
278,959 |
|
$ |
285,708 |
|
$ |
(6,749) |
|
(2.4) |
% |
Prepaid Debit |
|
|
63,286 |
|
|
64,010 |
|
|
(724) |
|
(1.1) |
% |
Eliminations |
|
|
(570) |
|
|
(409) |
|
|
(161) |
|
* |
% |
Total |
|
$ |
341,675 |
|
$ |
349,309 |
|
$ |
(7,634) |
|
(2.2) |
% |
Gross Profit |
|
|
|
|
|
|
|
|
|
|
|
|
|
|
|
|
|
|
|
Three Months Ended September 30, |
|
||||||||||||||
|
|
2023 |
|
% of Net |
|
2022 |
|
% of Net |
|
$ Change |
|
% Change |
|||||
Gross profit by segment: |
|
|
|
|
|
|
|
|
|
|
|
|
|
|
|
|
|
Debit and Credit |
|
$ |
28,381 |
|
|
33.9 |
% |
$ |
38,071 |
|
38.3 |
% |
$ |
(9,690) |
|
(25.5) |
% |
Prepaid Debit |
|
|
7,771 |
|
|
34.8 |
% |
|
10,369 |
|
40.9 |
% |
|
(2,598) |
|
(25.1) |
% |
Total |
|
$ |
36,152 |
|
|
34.1 |
% |
$ |
48,440 |
|
38.9 |
% |
$ |
(12,288) |
|
(25.4) |
% |
|
|
Nine Months Ended September 30, |
|
||||||||||||||
|
|
2023 |
|
% of Net |
|
2022 |
|
% of Net |
|
$ Change |
|
% Change |
|||||
Gross profit by segment: |
|
|
|
|
|
|
|
|
|
|
|
|
|
|
|
|
|
Debit and Credit |
|
$ |
99,603 |
|
|
35.7 |
% |
$ |
104,389 |
|
36.5 |
% |
$ |
(4,786) |
|
(4.6) |
% |
Prepaid Debit |
|
|
20,468 |
|
|
32.3 |
% |
|
23,880 |
|
37.3 |
% |
|
(3,412) |
|
(14.3) |
% |
Total |
|
$ |
120,071 |
|
|
35.1 |
% |
$ |
128,269 |
|
36.7 |
% |
$ |
(8,198) |
|
(6.4) |
% |
Income from Operations |
|
|
|
|
|
|
|
|
|
|
|
|
|
|
|
|
|
|
|
|
Three Months Ended September 30, |
|
|||||||||||||
|
|
|
2023 |
|
% of Net |
|
|
2022 |
|
% of Net |
|
|
$ Change |
|
% Change |
||
Income (loss) from operations by segment: |
|
|
|
|
|
|
|
|
|
|
|
|
|
|
|
|
|
Debit and Credit |
|
$ |
20,791 |
|
|
24.8 |
% |
$ |
29,418 |
|
29.6 |
% |
$ |
(8,627) |
|
(29.3) |
% |
Prepaid Debit |
|
|
6,631 |
|
|
29.7 |
% |
|
9,109 |
|
36.0 |
% |
|
(2,478) |
|
(27.2) |
% |
Other |
|
|
(14,461) |
|
|
* |
% |
|
(15,082) |
|
* |
% |
|
621 |
|
(4.1) |
% |
Total |
|
$ |
12,961 |
|
|
12.2 |
% |
$ |
23,445 |
|
18.8 |
% |
$ |
(10,484) |
|
(44.7) |
% |
|
|
|
Nine Months Ended September 30, |
|
|||||||||||||
|
|
|
2023 |
|
% of Net |
|
|
2022 |
|
% of Net |
|
|
$ Change |
|
% Change |
||
Income (loss) from operations by segment: |
|
|
|
|
|
|
|
|
|
|
|
|
|
|
|
|
|
Debit and Credit |
|
$ |
75,898 |
|
|
27.2 |
% |
$ |
78,847 |
|
27.6 |
% |
$ |
(2,949) |
|
(3.7) |
% |
Prepaid Debit |
|
|
17,936 |
|
|
28.3 |
% |
|
20,393 |
|
31.9 |
% |
|
(2,457) |
|
(12.0) |
% |
Other |
|
|
(42,783) |
|
|
* |
% |
|
(42,760) |
|
* |
% |
|
(23) |
|
0.1 |
% |
Total |
|
$ |
51,051 |
|
|
14.9 |
% |
$ |
56,480 |
|
16.2 |
% |
$ |
(5,429) |
|
(9.6) |
% |
EBITDA |
|
|
|
|
|
|
|
|
|
|
|
|
|
|
|
|
|
|
|
Three Months Ended September 30, |
|
||||||||||||||
|
|
2023 |
|
% of Net |
|
2022 |
|
% of Net |
|
$ Change |
|
% Change |
|||||
EBITDA by segment: |
|
|
|
|
|
|
|
|
|
|
|
|
|
|
|
|
|
Debit and Credit |
|
$ |
23,086 |
|
|
27.6 |
% |
$ |
31,675 |
|
31.8 |
% |
$ |
(8,589) |
|
(27.1) |
% |
Prepaid Debit |
|
|
7,304 |
|
|
32.7 |
% |
|
9,638 |
|
38.0 |
% |
|
(2,334) |
|
(24.2) |
% |
Other |
|
|
(13,477) |
|
|
* |
% |
|
(14,094) |
|
* |
% |
|
617 |
|
(4.4) |
% |
Total |
|
$ |
16,913 |
|
|
16.0 |
% |
$ |
27,219 |
|
21.8 |
% |
$ |
(10,306) |
|
(37.9) |
% |
|
|
Nine Months Ended September 30, |
|
||||||||||||||
|
|
2023 |
|
% of Net |
|
2022 |
|
% of Net |
|
$ Change |
|
% Change |
|||||
EBITDA by segment: |
|
|
|
|
|
|
|
|
|
|
|
|
|
|
|
|
|
Debit and Credit |
|
$ |
82,733 |
|
|
29.7 |
% |
$ |
85,042 |
|
29.8 |
% |
$ |
(2,309) |
|
(2.7) |
% |
Prepaid Debit |
|
|
19,938 |
|
|
31.5 |
% |
|
22,101 |
|
34.5 |
% |
|
(2,163) |
|
(9.8) |
% |
Other |
|
|
(39,995) |
|
|
* |
% |
|
(40,119) |
|
* |
% |
|
124 |
|
(0.3) |
% |
Total |
|
$ |
62,676 |
|
|
18.3 |
% |
$ |
67,024 |
|
19.2 |
% |
$ |
(4,348) |
|
(6.5) |
% |
Reconciliation of Income (loss) from |
|
|
|
|
|
|
|
|
|
|
|
Operations by Segment to EBITDA by Segment |
|
|
|
|
|
|
|
|
|
|
|
|
Three Months Ended September 30, 2023 |
||||||||||
|
Debit and Credit |
|
Prepaid Debit |
|
Other |
|
Total |
||||
EBITDA by segment: |
|
|
|
|
|
|
|
|
|
|
|
Income (loss) from operations |
$ |
20,791 |
|
$ |
6,631 |
|
$ |
(14,461) |
|
$ |
12,961 |
Depreciation and amortization |
|
2,322 |
|
|
675 |
|
|
1,008 |
|
|
4,005 |
Other expenses |
|
(27) |
|
|
(2) |
|
|
(24) |
|
|
(53) |
EBITDA |
$ |
23,086 |
|
$ |
7,304 |
|
$ |
(13,477) |
|
$ |
16,913 |
|
|
|
|
|
|
|
|
|
|
|
|
|
|
|
|
|
|
|
|
|
|
|
|
|
Three Months Ended September 30, 2022 |
||||||||||
|
Debit and Credit |
|
Prepaid Debit |
|
Other |
|
Total |
||||
EBITDA by segment: |
|
|
|
|
|
|
|
|
|
|
|
Income (loss) from operations |
$ |
29,418 |
|
$ |
9,109 |
|
$ |
(15,082) |
|
$ |
23,445 |
Depreciation and amortization |
|
2,271 |
|
|
529 |
|
|
1,037 |
|
|
3,837 |
Other expenses |
|
(14) |
|
|
— |
|
|
(49) |
|
|
(63) |
EBITDA |
$ |
31,675 |
|
$ |
9,638 |
|
$ |
(14,094) |
|
$ |
27,219 |
|
|
|
|
|
|
|
|
|
|
|
|
|
|
|
|
|
|
|
|
|
|
|
|
|
Nine Months Ended September 30, 2023 |
||||||||||
|
Debit and Credit |
|
Prepaid Debit |
|
Other |
|
Total |
||||
EBITDA by segment: |
|
|
|
|
|
|
|
|
|
|
|
Income (loss) from operations |
$ |
75,898 |
|
$ |
17,936 |
|
$ |
(42,783) |
|
$ |
51,051 |
Depreciation and amortization |
|
6,836 |
|
|
2,003 |
|
|
3,031 |
|
|
11,870 |
Other expenses |
|
(1) |
|
|
(1) |
|
|
(243) |
|
|
(245) |
EBITDA |
$ |
82,733 |
|
$ |
19,938 |
|
$ |
(39,995) |
|
$ |
62,676 |
|
|
|
|
|
|
|
|
|
|
|
|
|
|
|
|
|
|
|
|
|
|
|
|
|
Nine Months Ended September 30, 2022 |
||||||||||
|
Debit and Credit |
|
Prepaid Debit |
|
Other |
|
Total |
||||
EBITDA by segment: |
|
|
|
|
|
|
|
|
|
|
|
Income (loss) from operations |
$ |
78,847 |
|
$ |
20,393 |
|
$ |
(42,760) |
|
$ |
56,480 |
Depreciation and amortization |
|
6,202 |
|
|
1,711 |
|
|
3,105 |
|
|
11,018 |
Other expenses |
|
(7) |
|
|
(3) |
|
|
(464) |
|
|
(474) |
EBITDA |
$ |
85,042 |
|
$ |
22,101 |
|
$ |
(40,119) |
|
$ |
67,024 |
|
|
|
|
|
|
|
|
|
|
|
EXHIBIT E |
CPI Card Group Inc. and Subsidiaries | |||||||||||
Supplemental GAAP to Non-GAAP Reconciliation | |||||||||||
(dollars in thousands) | |||||||||||
(Unaudited) | |||||||||||
|
|
|
|
|
|
|
|
|
|
|
|
|
|
|
|
|
|
|
|
|
|
|
|
|
|
|
|
|
|
|
|
|
|
|
|
|
Three Months Ended September 30, |
|
Nine Months Ended September 30, |
||||||||
|
2023 |
|
2022 |
|
2023 |
|
2022 |
||||
EBITDA and Adjusted EBITDA: |
|
|
|
|
|
|
|
|
|
|
|
Net income |
$ |
3,857 |
|
$ |
11,910 |
|
$ |
21,253 |
|
$ |
24,063 |
Interest, net |
|
6,714 |
|
|
7,323 |
|
|
20,235 |
|
|
22,334 |
Income tax expense |
|
2,337 |
|
|
4,149 |
|
|
9,318 |
|
|
9,609 |
Depreciation and amortization |
|
4,005 |
|
|
3,837 |
|
|
11,870 |
|
|
11,018 |
EBITDA |
$ |
16,913 |
|
$ |
27,219 |
|
$ |
62,676 |
|
$ |
67,024 |
|
|
|
|
|
|
|
|
|
|
|
|
Adjustments to EBITDA: |
|
|
|
|
|
|
|
|
|
|
|
Stock-based compensation expense |
$ |
2,600 |
|
$ |
966 |
|
$ |
4,431 |
|
$ |
2,928 |
Sales tax expense (1) |
|
— |
|
|
22 |
|
|
35 |
|
|
74 |
Restructuring and other charges (2) |
|
1,672 |
|
|
— |
|
|
2,229 |
|
|
— |
Loss on debt extinguishment (3) |
|
25 |
|
|
— |
|
|
243 |
|
|
395 |
Foreign currency loss |
|
28 |
|
|
64 |
|
|
2 |
|
|
79 |
Subtotal of adjustments to EBITDA |
$ |
4,325 |
|
$ |
1,052 |
|
$ |
6,940 |
|
$ |
3,476 |
Adjusted EBITDA |
$ |
21,238 |
|
$ |
28,271 |
|
$ |
69,616 |
|
$ |
70,500 |
Net income margin (% of Net sales) |
|
3.6% |
|
|
9.6% |
|
|
6.2% |
|
|
6.9% |
Net income growth (% Change 2023 vs. 2022) |
|
(67.6)% |
|
|
|
|
|
(11.7)% |
|
|
|
Adjusted EBITDA margin (% of Net sales) |
|
20.1% |
|
|
22.7% |
|
|
20.4% |
|
|
20.2% |
Adjusted EBITDA growth (% Change 2023 vs. 2022) |
|
(24.9)% |
|
|
|
|
|
(1.3)% |
|
|
|
|
|
|
|
|
|
|
|
|
|
|
|
|
|
|
|
|
|
|
|
|
|
|
|
|
Three Months Ended September 30, |
|
Nine Months Ended September 30, |
||||||||
|
2023 |
|
2022 |
|
2023 |
|
2022 |
||||
Free Cash Flow: |
|
|
|
|
|
|
|
|
|
|
|
Cash provided by operating activities |
$ |
11,944 |
|
$ |
19,861 |
|
$ |
22,266 |
|
$ |
11,713 |
Capital expenditures for plant, equipment and leasehold improvements, net |
|
518 |
|
|
(6,261) |
|
|
(6,076) |
|
|
(14,440) |
Free Cash Flow |
$ |
12,462 |
|
$ |
13,600 |
|
$ |
16,190 |
|
$ |
(2,727) |
| (1) | Represents estimated sales tax (benefit) expense relating to a contingent liability due to historical activity in certain states where it is probable that the Company will be subject to sales tax plus interest and penalties. |
| (2) | The 2023 amount represents accrued executive retention to be paid in 2024. |
| (3) | The Company redeemed a portion of the 8.625% Senior Secured Notes through the third quarters of 2023 and 2022 and expensed the associated portion of the unamortized deferred financing costs. |
|
Last Twelve Months Ended |
||||
|
September 30, |
|
December 31, |
||
|
2023 |
|
2022 |
||
Reconciliation of net income to LTM EBITDA and Adjusted EBITDA: |
|
|
|
|
|
Net income |
$ |
33,730 |
|
$ |
36,540 |
Interest, net |
|
27,517 |
|
|
29,616 |
Income tax expense |
|
12,316 |
|
|
12,607 |
Depreciation and amortization |
|
15,738 |
|
|
14,886 |
EBITDA |
$ |
89,301 |
|
$ |
93,649 |
|
|
|
|
|
|
Adjustments to EBITDA: |
|
|
|
|
|
Stock-based compensation expense |
$ |
4,982 |
|
$ |
3,479 |
Sales tax (benefit) expense(1) |
|
(21) |
|
|
18 |
Restructuring and other charges (2) |
|
2,229 |
|
|
— |
Loss on debt extinguishment (3) |
|
322 |
|
|
474 |
Foreign currency loss |
|
6 |
|
|
83 |
Subtotal of adjustments to EBITDA |
$ |
7,518 |
|
$ |
4,054 |
LTM Adjusted EBITDA |
$ |
96,819 |
|
$ |
97,703 |
|
As of |
||||
|
September 30, |
|
December 31, |
||
|
2023 |
|
2022 |
||
Calculation of Net Leverage Ratio: |
|
|
|
|
|
Senior Notes |
$ |
267,897 |
|
$ |
285,000 |
ABL revolver |
|
8,000 |
|
|
5,000 |
Finance lease obligations |
|
15,027 |
|
|
10,697 |
Total debt |
|
290,924 |
|
|
300,697 |
Less: Cash and cash equivalents |
|
(10,473) |
|
|
(11,037) |
Total net debt (a) |
$ |
280,451 |
|
$ |
289,660 |
LTM Adjusted EBITDA (b) |
$ |
96,819 |
|
$ |
97,703 |
Net Leverage Ratio (a)/(b) |
|
2.9 |
|
|
3.0 |
Exhibit 99.2
CPI Card Group Announces Appointment of Ravi Mallela to its Board of Directors
Littleton, CO – November 7, 2023 -- CPI Card Group Inc. (Nasdaq: PMTS) (“CPI” or the “Company”), a payment technology company and leading provider of credit, debit and prepaid solutions, today announced that Ravi Mallela has been appointed to its Board of Directors as an independent member, effective November 15, 2023.
Mallela currently serves as the Chief Financial Officer of NMI Holdings Inc. (Nasdaq: NMIH), a publicly-traded mortgage insurance company. Previously, Mr. Mallela served as Executive Vice President and Chief Financial Officer of First Hawaiian Group and First Hawaiian Bank from 2018 until 2022 and Senior Vice President, Head of Finance and Treasury of First Republic Bank from 2013 to 2018. He holds an MBA from the UCLA Anderson School of Management and a Bachelor of Science degree in Economics from the University of San Francisco.
“We are very pleased to have Ravi join the CPI Board,” said H. Sanford Riley, Chair of the Board of Directors. “His strong financial and business experience complements the skill sets of our other Board members nicely, and he will be a great asset as we work with the management team to drive long-term shareholder value.”
"I am excited to join the CPI Board of Directors,” said Mallela. “The Company has established itself as a leader in the U.S. payments space and I am looking forward to contributing to its future success.”
Mallela will serve on the CPI Board’s Audit Committee. With the addition of Mallela, CPI’s Board consists of seven members, including six independent members.
About CPI Card Group Inc.
CPI Card Group is a payment technology company providing a comprehensive range of credit, debit, and prepaid card solutions, complementary digital solutions, and Software-as-a-Service (SaaS) instant issuance. With a focus on building personal relationships and earning trust, we help our customers navigate the constantly evolving world of payments, while delivering innovative solutions that spark connections and support their brands. We serve clients across industry, size, and scale through our team of experienced, dedicated employees and our network of high-security production and card services facilities—located in the United States. CPI is committed to exceeding our customers’ expectations, transforming our industry, and enhancing the way people pay every day. Learn more at www.CPIcardgroup.com.
####
For more information:
CPI encourages investors to use its investor relations website as a way of easily finding information about the Company. CPI promptly makes available on this website the reports that the Company files or furnishes with the SEC, corporate governance information and press releases.
CPI Card Group Inc. Investor Relations:
(877) 369-9016
InvestorRelations@cpicardgroup.com
CPI Card Group Inc. Media Relations:
Media@cpicardgroup.com
|
Third Quarter 2023 Investor Presentation November 7, 2023 |
|
Cautionary Statements 2 Forward Looking Statements Certain statements and information in this presentation (as well as information included in other written or oral statements we make from time to time) may contain or constitute “forward-looking statements” within the meaning of the Private Securities Litigation Reform Act of 1995, Section 27A of the Securities Act of 1933, as amended, and Section 21E of the Securities Exchange Act of 1934, as amended. The words “believe,” “estimate,” “project,” “expect,” “anticipate,” “plan,” “intend,” “foresee,” “should,” “would,” “could,” “continue,” “committed,” “attempt,” “target,” “objective,” “guides,” “seek,” “focus,” “provides guidance,” “provides outlook” or other similar expressions are intended to identify forward-looking statements, which are not historical in nature. These forward-looking statements, including statements about our strategic initiatives and market opportunities, are based on our current expectations and beliefs concerning future developments and their potential effect on us and other information currently available. Such forward-looking statements, because they relate to future events, are by their very nature subject to many important risks and uncertainties that could cause actual results or other events to differ materially from those contemplated. These risks and uncertainties include, but are not limited to: a deterioration in general economic conditions, including inflationary conditions and resulting in reduced consumer confidence and business spending, and a decline in consumer credit worthiness impacting demand for our products; the unpredictability of our operating results, including an inability to anticipate changes in customer inventory management practices and its impact on our business; adverse conditions in the banking system and financial markets, including the failure of banks and financial institutions; a disruption or other failure in our supply chain, including as a result of the Russia-Ukraine or other foreign conflicts and with respect to single source suppliers, or the failure or inability of suppliers to comply with our code of conduct or contractual requirements, or political unrest in countries in which our suppliers operate, resulting in increased costs and inability to pass those costs on to our customers and extended production lead times and difficulty meeting customers’ delivery expectations; our failure to retain our existing customers or identify and attract new customers; our status as an accelerated filer and complying with Section 404 of the Sarbanes-Oxley Act of 2002 and the costs associated with such compliance and implementation of procedures thereunder; our failure to maintain effective internal control over financial reporting; our inability to recruit, retain and develop qualified personnel, including key personnel; the potential effects of COVID-19 and responses thereto on our business, including our supply chain, customer demand, workforce, operations; system security risks, data protection breaches and cyber-attacks; interruptions in our operations, including our information technology systems, or in the operations of the third parties that operate computing infrastructure on which we rely; our inability to develop, introduce and commercialize new products; our substantial indebtedness, including inability to make debt service payments or refinance such indebtedness; the restrictive terms of our indebtedness and covenants of future agreements governing indebtedness and the resulting restraints on our ability to pursue our business strategies; disruptions in production at one or more of our facilities; defects in our software; environmental, social and governance preferences and demands of various stakeholders and our ability to conform to such preferences and demands and to comply with any related regulatory requirements; the effects of climate change, negative perceptions of our products due to the impact of our products and production processes on the environment and other ESG-related risks; disruptions in production due to weather conditions, climate change, political instability or social unrest; our inability to adequately protect our trade secrets and intellectual property rights from misappropriation, infringement claims brought against us and risks related to open source software; our limited ability to raise capital; problems in production quality, materials and process; costs and impacts to our financial results relating to the obligatory collection of sales tax and claims for uncollected sales tax in states that impose sales tax collection requirements on out-of-state businesses or unclaimed property, as well as potential new U.S. tax legislation increasing the corporate income tax rate and challenges to our income tax positions; our inability to successfully execute on our divestitures or acquisitions; our inability to realize the full value of our long-lived assets; costs relating to product defects and any related product liability and/or warranty claims; our inability to renew licenses with key technology licensors; the highly competitive, saturated and consolidated nature of our marketplace; the effects of restrictions, delays or interruptions in our ability to source raw materials and components used in our products from foreign countries; the effects on the global economy of the ongoing military action by Russia in Ukraine and other foreign conflicts; costs and potential liabilities associated with compliance or failure to comply with regulations, customer contractual requirements and evolving industry standards regarding consumer privacy and data use and security; new and developing technologies that make our existing technology solutions and products obsolete or less relevant or our failure to introduce new products and services in a timely manner; quarterly variation in our operating results; our failure to operate our business in accordance with the Payment Card Industry Security Standards Council security standards or other industry standards; our failure to comply with environmental, health and safety laws and regulations that apply to our products and the raw materials we use in our production processes; risks associated with the majority stockholders’ ownership of our stock; potential conflicts of interest that may arise due to our board of directors being comprised in part of directors who are principals of our majority stockholders; the influence of securities analysts over the trading market for and price of our common stock; failure to meet the continued listing standards of the Nasdaq Global Market; the impact of stockholder activism or securities litigation on the trading price and volatility of our common stock; certain provisions of our organizational documents and other contractual provisions that may delay or prevent a change in control and make it difficult for stockholders other than our majority stockholders to change the composition of our board of directors; our ability to comply with a wide variety of complex laws and regulations and the exposure to liability for any failure to comply; the effect of legal and regulatory proceedings; and other risks that are described in Part I, Item 1A – Risk Factors in our Annual Report on Form 10-K for the year ended December 31, 2022 filed with the SEC on March 8, 2023, in Part II, Item 1A – Risk Factors of this Quarterly Report on Form 10-Q and our other reports filed from time to time with the SEC. We caution and advise readers not to place undue reliance on forward-looking statements, which speak only as of the date hereof. These statements are based on assumptions that may not be realized and involve risks and uncertainties that could cause actual results or other events to differ materially from the expectations and beliefs contained herein. We undertake no obligation to publicly update or revise any forward-looking statements after the date they are made, whether as a result of new information, future events or otherwise. Non-GAAP Financial Measures In addition to financial results reported in accordance with U.S. generally accepted accounting principles (“GAAP”), we have provided the following non-GAAP financial measures in this presentation, all reported on a continuing operations basis: EBITDA, Adjusted EBITDA, Adjusted EBITDA margin, Free Cash Flow, LTM Adjusted EBITDA and Net Leverage Ratio. These non-GAAP financial measures are utilized by management in comparing our operating performance on a consistent basis between fiscal periods. We believe that these financial measures are appropriate to enhance an overall understanding of our underlying operating performance trends compared to historical and prospective periods and our peers. Management also believes that these measures are useful to investors in their analysis of our results of operations and provide improved comparability between fiscal periods. Non-GAAP financial measures should not be considered in isolation from, or as a substitute for, financial information calculated in accordance with GAAP. Our non-GAAP measures may be different from similarly titled measures of other companies. Investors are encouraged to review the reconciliation of these historical non-GAAP measures to their most directly comparable GAAP financial measures included in the appendix to this presentation. |
|
3 Agenda Overview and Strategy Review 2023 Q3 Highlights 2023 Expectations Financial Review Summary 1 2 3 4 5 |
|
4 As anticipated, sales and profit declined in Q3 • Customers remain cautious and continue to work down inventory levels after stocking up in 2022 Full year outlook updated • Market has not yet normalized Long-term trends remain intact • Cards in circulation continue to grow New share repurchase program announced • $20 million authorization expires December 31, 2024 Overview |
|
Strategy Review Key Strategic Priorities 5 Deep Customer Focus Market-Leading Quality Products and Customer Service Continuous Innovation Market-Competitive Business Model The Contactless Indicator mark, consisting of four graduating arcs, is a trademark owned by and used with permission of EMVCo, LLC. |
|
Visa and Mastercard U.S. Cards in Circulation 6 Cards in circulation have grown at a 10% CAGR over the last three years to 1.9 billion, up from 1.5 billion Cards in Millions Sources: Visa and Mastercard Quarterly Operational Performance Data 896 906 944 987 1,021 1,063 1,078 1,113 1,135 1,163 1,207 1,222 1,235 576 577 599 600 606 616 636 645 656 677 682 698 710 1,472 1,483 1,543 1,587 1,627 1,679 1,714 1,758 1,791 1,840 1,889 1,920 1,945 Q2'20 Q3'20 Q4'20 Q1'21 Q2'21 Q3'21 Q4'21 Q1'22 Q2'22 Q3'22 Q4'22 Q1'23 Q2'23 Debit Credit |
|
2023 Q3 Highlights Market demand soft as customers remain cautious and work down inventory levels 7 Challenging comparisons with prior year also affected Q3 growth; strong cash flow improvement year-to-date • Net Sales decreased 15% to $105.9 million • Net Income decreased 68% to $3.9 million; Net Income margin decreased from 9.6% to 3.6% • Adjusted EBITDA¹ decreased 25% to $21.2 million; Adjusted EBITDA margin¹ decreased from 22.7% to 20.1% First Nine Months: Net Sales (2%), Net Income (12%), Adjusted EBITDA¹ (1%) • YTD Cash Provided by Operating Activities of $22.3 million compared to $11.7 million in the prior year period; Free Cash Flow¹ generation $16.2 million compared to a usage of $2.7 million in the prior year period 1) Adjusted EBITDA, Adjusted EBITDA margin and Free Cash Flow are not measurements of financial performance prepared in accordance with GAAP. See “Reconciliations of Non-GAAP Financial Measures” at the end of this document for more information and reconciliations to the most directly comparable GAAP financial measures. |
|
8 2023 Expectations Q4 Net Sales and Adjusted EBITDA expected to be similar to Q3 levels Full-year outlook 2023 Mid-single digit Net Sales decline (previously flat to low single-digit growth) Mid-single digit Adjusted EBITDA¹ decline (previously mid-to-high single-digit growth) Free Cash Flow approximately double the 2022 level (previously more than double) Net Leverage Ratio at year-end of approximately 3x (previously between 2.5x and 3.0x) Long-term growth trends remain intact Growth in card issuance Recurring nature of business Trends toward adoption of higher-priced contactless and eco-focused cards 1) We have provided Adjusted EBITDA expectations for 2023 on a non-GAAP basis because certain reconciling items are dependent on future events that either cannot be controlled or cannot be reliably predicted because they are not part of the Company’s routine activities, any of which could be significant. |
|
Financial Review 9 |
|
Third Quarter Financial Highlights 10 • Net Sales decrease driven primarily by reduced card volumes in our Debit and Credit segment; timing in Prepaid. • Gross Profit decrease driven by reduced sales levels and higher production costs • Net Income, Adjusted EBITDA1 and Adjusted EBITDA margin1 decreases driven by reduced sales and lower gross margin, partially offset by reduced operating expenses • Net Income margin and growth also negatively impacted by executive retention award accrual and a higher effective tax rate, partially offset by lower interest expense (in millions, except per share data) Q3 23 Q3 22 % Change Commentary Net Sales $ 105.9 $ 124.6 -15% Gross Profit $ 36.2 $ 48.4 -25% % Margin 34.1% 38.9% SG&A $ 21.8 $ 23.4 -7% Net Income $ 3.9 $ 11.9 -68% Net Income as a % of sales 3.6% 9.6% Diluted EPS $ 0.33 $ 1.01 -68% Adjusted EBITDA1 $ 21.2 $ 28.3 -25% % Margin 1 20.1% 22.7% 1) Adjusted EBITDA and Adjusted EBITDA margin are not measurements of financial performance prepared in accordance with GAAP. See “Reconciliations of Non-GAAP Financial Measures” at the end of this document for more information and reconciliations to the most directly comparable GAAP financial measures. |
|
First Nine Months Financial Highlights 11 • Net Sales decrease driven by reduced volumes of eco-focused cards, partially offset by increases in other contactless cards and card personalization and instant issuance services • Gross Profit decline driven by reduced sales levels and higher production costs • Net Income, Adjusted EBITDA1 and Adjusted EBITDA margin1 decreases driven by reduced sales and gross margins, partially offset by reduced operating expenses • Net Income margin and growth also negatively impacted by executive retention award accrual and a higher effective tax rate, partially offset by lower interest expense (in millions, except per share data) YTD 23 YTD 22 % Change Commentary Net Sales $ 341.7 $ 349.3 -2% Gross Profit $ 120.1 $ 128.3 -6% % Margin 35.1% 36.7% SG&A $ 64.7 $ 67.3 -4% Net Income $ 21.3 $ 24.1 -12% Net Income as a % of sales 6.2% 6.9% Diluted EPS $ 1.79 $ 2.05 -13% Adjusted EBITDA1 $ 69.6 $ 70.5 -1% % Margin 1 20.4% 20.2% 1) Adjusted EBITDA and Adjusted EBITDA margin are not measurements of financial performance prepared in accordance with GAAP. See “Reconciliations of Non-GAAP Financial Measures” at the end of this document for more information and reconciliations to the most directly comparable GAAP financial measures. |
|
Financial Highlights - Segments Debit and Credit Q3 Net Sales & Operating Income First Nine Months Net Sales & Operating Income Q3 Net Sales & Operating Income First Nine Months Net Sales & Operating Income Prepaid Debit ($ in millions) 24.0% 29.8% Net Sales Operating Income & Margin 26.8% 28.2% 37.0% 27.7% 31.4% 34.0% Operating Income & Margin Net Sales Net Sales Operating Income & Margin Operating Income & Margin $20.4 $19.2 $39.8 $38.7 34.0% 29.7% $15.9 $22.1 24.3% 23.4% Net Sales $94.2 $93.2 $93.2 $94.2 26.9% 26.9% 2022 2023 $99.5 $83.8 2022 2023 29.6% 24.8% $29.4 $20.8 $279.0 $285.7 2022 2023 2022 2023 27.6% 27.2% $78.8 $75.9 2022 2023 $25.3 $22.3 2022 2023 36.0% 29.7% $6.6 $9.1 2022 2023 $64.0 $63.3 2022 2023 31.9% 28.3% $20.4 $17.9 |
|
Balance Sheet, Liquidity, Net Leverage and Cash Flow ($ in millions, except ratios) 13 Balance Sheet, Liquidity and Net Leverage Ratio Sep. 30, 2023 Dec. 31, 2022 Cash on hand $ 10.5 $ 11.0 Available Liquidity1 $ 77 $ 81 Total Debt1 $ 290.9 $ 300.7 Adjusted EBITDA (LTM)2 $ 96.8 $ 97.7 Net Leverage Ratio1 2.9x 3.0x Cash Flow YTD 2023 YTD 2022 Cash provided by operating activities $ 22.3 $ 11.7 Capital Expenditures $ (6.1) $ (14.4) Free Cash Flow2 $ 16.2 $ (2.7) Our capital structure and allocation strategies are focused on maintaining ample liquidity; investing in the business, including strategic acquisitions; de-leveraging the balance sheet; and returning funds to stockholders. 2023 Highlights: • Retired $17 million of 8.625% Senior Notes • Net Leverage Ratio of 2.9x at Sep. 30, 2023 • Announced $20 million share repurchase authorization 1) “Available Liquidity” is cash plus borrowing available on our ABL Revolver. “Net Leverage Ratio” is a Supplemental Financial Measure, see “Supplemental Financial Measures” at the end of this document for more information. “Total Debt” includes finance leases. 2) Adjusted EBITDA (LTM) and Free Cash Flow are not measurements of financial performance prepared in accordance with GAAP. See “Reconciliations of Non-GAAP Financial Measures” at the end of this document for more information and reconciliations to the most directly comparable GAAP financial measures. |
|
14 Sales and profit declines in Q3 in soft market • Net Sales decreased 15% • Net Income decreased 68% • Adjusted EBITDA1 decreased 25% Updated 2023 outlook • Net Sales mid-single digit decrease • Adjusted EBITDA1 mid-single digit decrease • Net Leverage Ratio of approximately 3x at year-end • Free Cash Flow approximately double 2022 levels Long-term secular trends remain intact • CPI well-positioned with innovative and high-quality products and strong customer focus Summary 1) Adjusted EBITDA is not a measurement of financial performance prepared in accordance with GAAP. See “Reconciliations of Non-GAAP Financial Measures” at the end of this document for more information and reconciliations to the most directly comparable GAAP financial measures. |
|
Contact (877) 369-9016 INVESTORRELATIONS@CPICARDGROUP.COM www.CPIcardgroup.com 15 |
|
Reconciliations of Non-GAAP Financial Measures 16 Adjusted EBITDA and Adjusted EBITDA Margin EBITDA represents earnings before interest, taxes, depreciation and amortization, all on a continuing operations basis. Adjusted EBITDA is presented on a continuing operations basis and is defined as EBITDA (which represents earnings before interest, taxes, depreciation and amortization) adjusted for litigation; stock-based compensation expense; estimated sales tax expense, restructuring and other charges, including severance and executive retention; loss on debt extinguishment; foreign currency gain or loss; and other items that are unusual in nature, infrequently occurring or not considered part of our core operations. Adjusted EBITDA is intended to show our unleveraged, pre-tax operating results and therefore reflects our financial performance based on operational factors, excluding non-operational, unusual or non-recurring losses or gains. Adjusted EBITDA has important limitations as an analytical tool, and you should not consider it in isolation, or as a substitute for, analysis of our results as reported under GAAP. For example, Adjusted EBITDA does not reflect: (a) our capital expenditures, future requirements for capital expenditures or contractual commitments; (b) changes in, or cash requirements for, our working capital needs; (c) the significant interest expenses or the cash requirements necessary to service interest or principal payments on our debt; (d) tax payments that represent a reduction in cash available to us; (e) any cash requirements for the assets being depreciated and amortized that may have to be replaced in the future; (f) the impact of earnings or charges resulting from matters that we and the lender under our credit agreement may not consider indicative of our ongoing operations; or (g) the impact of any discontinued operations. In particular, our definition of Adjusted EBITDA allows us to add back certain non-operating, unusual or non-recurring charges that are deducted in calculating net income, even though these are expenses that may recur, vary greatly and are difficult to predict and can represent the effect of long-term strategies as opposed to short-term results. In addition, certain of these expenses represent the reduction of cash that could be used for other purposes. (1) Represents estimated sales tax expense relating to a contingent liability due to historical activity in certain states where it is probable that the Company will be subject to sales tax plus interest and penalties. (2) Represents accrued executive retention to be paid in 2024. (3) The Company redeemed a portion of the 8.625% Senior Secured Notes through the third quarters of 2023 and 2022 and expensed the associated portion of the unamortized deferred financing costs. Reconciliation of net income to EBITDA and Adjusted EBITDA: Net income $ 3.9 $ 11.9 $ 21.3 $ 24.1 Interest, net 6.7 7.3 20.2 22.3 Income tax expense 2.3 4.1 9.3 9.6 Depreciation and amortization 4.0 3.8 11.9 11.0 EBITDA $ 16.9 $ 27.2 $ 62.7 $ 67.0 Adjustments to EBITDA: Stock-based compensation expense $ 2.6 $ 1.0 $ 4.4 $ 2.9 Sales tax expense (1) — 0.0 0.0 0.1 Restructuring and other charges (2) 1.7 — 2.2 — Loss on debt extinguishment (3) 0.0 — 0.2 0.4 Foreign currency loss 0.0 0.1 0.0 0.1 Subtotal of adjustments to EBITDA $ 4.3 $ 1.1 $ 6.9 $ 3.5 Adjusted EBITDA $ 21.2 $ 28.3 $ 69.6 $ 70.5 Net income margin (% of net sales) 3.6% 9.6% 6.2% 6.9% Net income growth (% change 2023 vs. 2022) -67.6% -11.7% Adjusted EBITDA margin (% of net sales) 20.1% 22.7% 20.4% 20.2% Adjusted EBITDA growth (% change 2023 vs. 2022) -24.9% -1.3% Three Months Ended September 30, 2023 2022 Nine Months Ended September 30, 2023 2022 ($ in millions) |
|
Reconciliations of Non-GAAP Financial Measures 17 LTM Adjusted EBITDA We define LTM Adjusted EBITDA as adjusted EBITDA (defined previously) for the last twelve months. Free Cash Flow We define Free Cash Flow as cash flow from operating activities less capital expenditures. We use this metric in analyzing our ability to service and repay our debt. However, this measure does not represent funds available for investment or other discretionary uses since it does not deduct cash used to service our debt. Reconciliation of net income to LTM EBITDA and Adjusted EBITDA: Net income $ 33.7 $ 36.5 Interest, net 27.5 29.6 Income tax expense 12.3 12.6 Depreciation and amortization 15.7 14.9 EBITDA $ 89.3 $ 93.6 Adjustments to EBITDA: Stock-based compensation expense $ 5.0 $ 3.5 Sales tax (benefit) expense (1) (0.0) 0.0 Restructuring and other charges (2) 2.2 — Loss on debt extinguishment (3) 0.3 0.5 Foreign currency loss 0.0 0.1 Subtotal of adjustments to EBITDA $ 7.5 $ 4.1 LTM Adjusted EBITDA $ 96.8 $ 97.7 September 30, 2023 December 31, 2022 Last Twelve Months Ended ($ in millions) Reconciliation of cash provided by (used in) operating activities - (GAAP) to Free Cash Flow: Cash provided by operating activities $ 11.9 $ 19.9 $ 22.3 $ 11.7 Capital expenditures for plant, equipment and leasehold improvements, net 0.5 (6.3) (6.1) (14.4) Free Cash Flow $ 12.5 $ 13.6 $ 16.2 $ (2.7) ($ in millions) Nine Months Ended September 30, 2023 2022 Three Months Ended September 30, 2023 2022 (1) Represents estimated sales tax (benefit) expense relating to a contingent liability due to historical activity in certain states where it is probable that the Company will be subject to sales tax plus interest and penalties. (2) Represents accrued executive retention to be paid in 2024. (3) The Company redeemed a portion of the 8.625% Senior Secured Notes through the third quarters of 2023 and 2022 and expensed the associated portion of the unamortized deferred financing costs. |
|
Supplemental Financial Measures 18 Net Leverage Ratio Management and various investors use the ratio of debt principal outstanding, plus finance lease obligations, less cash divided by LTM Adjusted EBITDA, or “Net Leverage Ratio,” as a measure of our financial strength when making key investment decisions and evaluating us against peers. Calculation of Net Leverage Ratio: Senior Notes $ 267.9 $ 285.0 ABL revolver 8.0 5.0 Finance lease obligations 15.0 10.7 Total Debt 290.9 300.7 Less: Cash and cash equivalents (10.5) (11.0) Total Net Debt (a) $ 280.5 $ 289.7 LTM Adjusted EBITDA (b) $ 96.8 $ 97.7 Net Leverage Ratio (a)/(b) 2.9 3.0 ($ in millions) As of September 30, 2023 December 31, 2022 |