UNITED STATES
SECURITIES AND EXCHANGE COMMISSION
Washington, D.C. 20549
FORM 10-Q
(Mark One)
☒QUARTERLY REPORT PURSUANT TO SECTION 13 OR 15(d) OF THE SECURITIES
EXCHANGE ACT OF 1934
For the quarterly period ended September 30, 2023
or
☐TRANSITION REPORT PURSUANT TO SECTION 13 OR 15(d) OF THE SECURITIES
EXCHANGE ACT OF 1934
For the transition period from to
Commission File Number: 001-39292
Butterfly Network, Inc.
(Exact name of registrant as specified in its charter)
|
|
|
|
Delaware |
|
84-4618156 |
(State or other jurisdiction of incorporation or organization) |
|
(IRS Employer Identification No.) |
|
|
|
|
1600 District Avenue Burlington, Massachusetts |
|
01803 |
(Address of principal executive offices) |
|
(Zip Code) |
(781) 557-4800
(Registrant’s telephone number, including area code)
Securities registered pursuant to Section 12(b) of the Act:
|
|
|
|
|
Title of each class |
|
Trading Symbol(s) |
|
Name of each exchange on which registered |
Class A common stock, par value $0.0001 per share |
|
BFLY |
|
The New York Stock Exchange |
Warrants to purchase one share of Class A common stock, each at an exercise price of $11.50 per share |
|
BFLY WS |
|
The New York Stock Exchange |
Indicate by check mark whether the registrant (1) has filed all reports required to be filed by Section 13 or 15(d) of the Securities Exchange Act of 1934 during the preceding 12 months (or for such shorter period that the registrant was required to file such reports), and (2) has been subject to such filing requirements for the past 90 days. Yes ☒ No ☐
Indicate by check mark whether the registrant has submitted electronically every Interactive Data File required to be submitted pursuant to Rule 405 of Regulation S-T (§232.405 of this chapter) during the preceding 12 months (or for such shorter period that the registrant was required to submit such files). Yes ☒ No ☐
Indicate by check mark whether the registrant is a large accelerated filer, an accelerated filer, a non-accelerated filer, a smaller reporting company, or an emerging growth company. See the definitions of “large accelerated filer,” “accelerated filer,” “smaller reporting company,” and “emerging growth company” in Rule 12b-2 of the Exchange Act.
|
|
|||
Large accelerated filer |
☐ |
Accelerated filer |
☐ |
|
|
|
|
Non-accelerated filer |
☒ |
Smaller reporting company |
☒ |
|
|
|
|
Emerging growth company |
☐ |
If an emerging growth company, indicate by check mark if the registrant has elected not to use the extended transition period for complying with any new or revised financial accounting standards provided pursuant to Section 13(a) of the Exchange Act. ☐
Indicate by check mark whether the registrant is a shell company (as defined in Rule 12b-2 of the Exchange Act). Yes ☐ No ☒
As of October 27, 2023, the registrant had 180,696,581 shares of Class A common stock outstanding and 26,426,937 shares of Class B common stock outstanding.
TABLE OF CONTENTS
|
|
|
|
Page |
|---|---|---|---|---|
|
|
|
|
|
|
|
|
3 |
|
|
|
|
|
|
|
|
4 |
||
|
|
|
|
|
|
|
4 |
||
|
|
|
|
|
|
|
|
4 |
|
|
|
|
|
|
|
|
Condensed Consolidated Statements of Operations and Comprehensive Loss (Unaudited) |
|
5 |
|
|
|
|
|
|
|
Condensed Consolidated Statements of Changes in Stockholders’ Equity (Unaudited) |
|
6 |
|
|
|
|
|
|
|
|
7 |
|
|
|
|
|
|
|
|
Notes to Condensed Consolidated Financial Statements (Unaudited) |
|
8 |
|
|
|
|
|
|
Management’s Discussion and Analysis of Financial Condition and Results of Operations |
|
19 |
|
|
|
|
|
|
|
|
27 |
||
|
|
|
|
|
|
|
28 |
||
|
|
|
|
|
|
|
28 |
||
|
|
|
|
|
|
|
28 |
||
|
|
|
|
|
|
|
28 |
||
|
|
|
|
|
|
|
28 |
||
|
|
|
|
|
|
|
29 |
||
|
|
|
|
|
|
|
29 |
||
|
|
|
|
|
|
|
|
32 |
|
|
|
|
|
|
In this Quarterly Report on Form 10-Q, the terms “we,” “us,” “our,” the “Company,” and “Butterfly” mean Butterfly Network, Inc. and our subsidiaries.
2
CAUTIONARY STATEMENT REGARDING FORWARD-LOOKING STATEMENTS
This Quarterly Report on Form 10-Q includes forward-looking statements within the meaning of Section 27A of the Securities Act of 1933, as amended (the “Securities Act”), and Section 21E of the Securities Exchange Act of 1934, as amended (the “Exchange Act”), that relate to future events or our future financial performance regarding, among other things, the plans, strategies, and prospects, both business and financial, of the Company. These statements are based on the beliefs and assumptions of the Company’s management team. Generally, statements that are not historical facts, including statements concerning possible or assumed future actions, business strategies, events, or results of operations, are forward-looking statements. Forward-looking statements contained in this Quarterly Report on Form 10-Q include, but are not limited to, statements about:
| ● | the commercialization of our products and services; |
| ● | the success, cost, and timing of our product development activities; |
| ● | the potential attributes and benefits of our products and services; |
| ● | our ability to obtain and maintain regulatory approval for our products, and any related restrictions and limitations of any authorized product; |
| ● | our ability to identify, in-license, or acquire additional technology; |
| ● | our ability to maintain our existing license, manufacturing, and supply agreements; |
| ● | our ability to compete with other companies currently marketing or engaged in the development of ultrasound imaging devices, many of which have greater financial and marketing resources than us; |
| ● | the size and growth potential of the markets for our products and services, and the ability of each to serve those markets, either alone or in partnership with others; |
| ● | our estimates regarding expenses, revenue, capital requirements, and needs for additional financing; |
| ● | our ability to raise financing in the future; and |
| ● | our financial performance. |
These statements may be preceded by, followed by, or include the words “believes,” “estimates,” “expects,” “projects,” “forecasts,” “may,” “will,” “should,” “seeks,” “plans,” “scheduled,” “anticipates,” “intends,” similar expressions or phrases, or the negative of those expressions or phrases. The forward-looking statements are based on projections prepared by, and are the responsibility of, the Company’s management. Although the Company believes that its plans, intentions, and expectations reflected in or suggested by these forward-looking statements are reasonable, the Company cannot assure you that it will achieve or realize these plans, intentions, or expectations. Forward-looking statements are inherently subject to risks, uncertainties, and assumptions relating to, among other things:
| ● | our rapid growth may not be sustainable and depends on our ability to attract and retain customers; |
| ● | our business could be harmed if we fail to manage our growth effectively; |
| ● | our projections are subject to risks, assumptions, estimates, and uncertainties; |
| ● | our business is subject to a variety of U.S. and foreign laws, which are subject to change and could adversely affect our business; |
| ● | the pricing of our products and services, and reimbursement for medical procedures conducted using our products and services; |
| ● | changes in applicable laws or regulations; |
| ● | failure to protect or enforce our intellectual property rights could harm our business, results of operations, and financial condition; |
| ● | the ability to maintain the listing of our Class A common stock on the New York Stock Exchange; and |
| ● | economic downturns and political and market conditions beyond our control could adversely affect our business, financial condition, and results of operations. |
These and other risks and uncertainties are described in greater detail under the caption “Risk Factors” in Item 1A of Part I of our Annual Report on Form 10-K for the year ended December 31, 2022 (the “2022 Annual Report on Form 10-K”), in Item 1A of Part II of this Quarterly Report on Form 10-Q, and in other filings that we make with the Securities and Exchange Commission (“SEC”). The risks described under the caption “Risk Factors” are not exhaustive. New risk factors emerge from time to time, and it is not possible to predict all such risk factors, nor can the Company assess the impact of all such risk factors on its business or the extent to which any factor or combination of factors may cause actual results to differ materially from those contained in any forward-looking statements. Forward-looking statements are not guarantees of performance. You should not put undue reliance on these statements, which speak only as of the date hereof. All forward-looking statements attributable to the Company or persons acting on its behalf are expressly qualified in their entirety by the foregoing cautionary statements. The Company undertakes no obligations to update or revise publicly any forward-looking statements, whether as a result of new information, future events, or otherwise, except as required by law.
3
PART I — FINANCIAL INFORMATION
Item 1. Financial Statements
BUTTERFLY NETWORK, INC.
CONDENSED CONSOLIDATED BALANCE SHEETS
(In thousands, except share and per share amounts)
(Unaudited)
|
|
September 30, |
|
December 31, |
|
||
|
|
2023 |
|
2022 |
|
||
Assets |
|
|
|
|
|
|
|
Current assets: |
|
|
|
|
|
|
|
Cash and cash equivalents |
|
$ |
150,006 |
|
$ |
162,561 |
|
Marketable securities |
|
|
— |
|
|
75,250 |
|
Accounts receivable, net |
|
|
13,646 |
|
|
14,685 |
|
Inventories |
|
|
94,016 |
|
|
59,970 |
|
Current portion of vendor advances |
|
|
2,728 |
|
|
35,182 |
|
Prepaid expenses and other current assets |
|
|
8,189 |
|
|
9,489 |
|
Total current assets |
|
|
268,585 |
|
|
357,137 |
|
Property and equipment, net |
|
|
26,362 |
|
|
31,331 |
|
Non-current portion of vendor advances |
|
|
16,808 |
|
|
— |
|
Operating lease assets |
|
|
16,016 |
|
|
21,567 |
|
Other non-current assets |
|
|
6,451 |
|
|
7,535 |
|
Total assets |
|
$ |
334,222 |
|
$ |
417,570 |
|
Liabilities and stockholders’ equity |
|
|
|
|
|
|
|
Current liabilities: |
|
|
|
|
|
|
|
Accounts payable |
|
$ |
8,097 |
|
$ |
7,211 |
|
Deferred revenue, current |
|
|
15,117 |
|
|
15,856 |
|
Accrued purchase commitments, current |
|
|
212 |
|
|
2,146 |
|
Accrued expenses and other current liabilities |
|
|
21,933 |
|
|
26,116 |
|
Total current liabilities |
|
|
45,359 |
|
|
51,329 |
|
Deferred revenue, non-current |
|
|
5,273 |
|
|
4,957 |
|
Warrant liabilities |
|
|
1,446 |
|
|
5,370 |
|
Operating lease liabilities |
|
|
23,409 |
|
|
29,966 |
|
Other non-current liabilities |
|
|
1,316 |
|
|
588 |
|
Total liabilities |
|
|
76,803 |
|
|
92,210 |
|
Commitments and contingencies (Note 13) |
|
|
|
|
|
|
|
Stockholders’ equity: |
|
|
|
|
|
|
|
Class A common stock $.0001 par value; 600,000,000 shares authorized at September 30, 2023 and December 31, 2022; 180,633,155 and 174,459,956 shares issued and outstanding at September 30, 2023 and December 31, 2022, respectively |
|
|
18 |
|
|
17 |
|
Class B common stock $.0001 par value; 27,000,000 shares authorized at September 30, 2023 and December 31, 2022; 26,426,937 shares issued and outstanding at September 30, 2023 and December 31, 2022 |
|
|
3 |
|
|
3 |
|
Additional paid-in capital |
|
|
942,915 |
|
|
921,278 |
|
Accumulated deficit |
|
|
(685,517) |
|
|
(595,938) |
|
Total stockholders’ equity |
|
|
257,419 |
|
|
325,360 |
|
Total liabilities and stockholders’ equity |
|
$ |
334,222 |
|
$ |
417,570 |
|
The accompanying notes are an integral part of these condensed consolidated financial statements.
4
BUTTERFLY NETWORK, INC.
CONDENSED CONSOLIDATED STATEMENTS OF OPERATIONS AND COMPREHENSIVE LOSS
(In thousands, except share and per share amounts)
(Unaudited)
|
|
Three months ended September 30, |
|
Nine months ended September 30, |
|
||||||||
|
|
2023 |
|
2022 |
|
2023 |
|
2022 |
|
||||
Revenue: |
|
|
|
|
|
|
|
|
|
|
|
|
|
Product |
|
$ |
8,753 |
|
$ |
13,164 |
|
$ |
29,874 |
|
$ |
37,607 |
|
Software and other services |
|
|
6,668 |
|
|
6,454 |
|
|
19,510 |
|
|
16,800 |
|
Total revenue |
|
|
15,421 |
|
|
19,618 |
|
|
49,384 |
|
|
54,407 |
|
Cost of revenue: |
|
|
|
|
|
|
|
|
|
|
|
|
|
Product |
|
|
3,929 |
|
|
6,534 |
|
|
13,765 |
|
|
19,481 |
|
Software and other services |
|
|
2,110 |
|
|
2,095 |
|
|
6,226 |
|
|
5,022 |
|
Total cost of revenue |
|
|
6,039 |
|
|
8,629 |
|
|
19,991 |
|
|
24,503 |
|
Gross profit |
|
|
9,382 |
|
|
10,989 |
|
|
29,393 |
|
|
29,904 |
|
Operating expenses: |
|
|
|
|
|
|
|
|
|
|
|
|
|
Research and development |
|
|
12,130 |
|
|
22,040 |
|
|
44,409 |
|
|
68,883 |
|
Sales and marketing |
|
|
9,012 |
|
|
15,481 |
|
|
28,776 |
|
|
47,121 |
|
General and administrative |
|
|
11,560 |
|
|
16,603 |
|
|
37,239 |
|
|
54,080 |
|
Other |
|
|
9,243 |
|
|
2,897 |
|
|
17,848 |
|
|
3,838 |
|
Total operating expenses |
|
|
41,945 |
|
|
57,021 |
|
|
128,272 |
|
|
173,922 |
|
Loss from operations |
|
|
(32,563) |
|
|
(46,032) |
|
|
(98,879) |
|
|
(144,018) |
|
Interest income |
|
|
1,903 |
|
|
1,304 |
|
|
5,714 |
|
|
1,574 |
|
Interest expense |
|
|
— |
|
|
(2) |
|
|
— |
|
|
(2) |
|
Change in fair value of warrant liabilities |
|
|
3,511 |
|
|
(9,087) |
|
|
3,924 |
|
|
8,881 |
|
Other income (expense), net |
|
|
(217) |
|
|
(898) |
|
|
(256) |
|
|
(1,387) |
|
Loss before provision for income taxes |
|
|
(27,366) |
|
|
(54,715) |
|
|
(89,497) |
|
|
(134,952) |
|
Provision for income taxes |
|
|
2 |
|
|
27 |
|
|
82 |
|
|
68 |
|
Net loss and comprehensive loss |
|
$ |
(27,368) |
|
$ |
(54,742) |
|
$ |
(89,579) |
|
$ |
(135,020) |
|
Net loss per common share attributable to Class A and B common stockholders, basic and diluted |
|
$ |
(0.13) |
|
$ |
(0.27) |
|
$ |
(0.44) |
|
$ |
(0.68) |
|
Weighted-average shares used to compute net loss per share attributable to Class A and B common stockholders, basic and diluted |
|
|
206,740,234 |
|
|
200,172,683 |
|
|
204,749,108 |
|
|
199,528,394 |
|
The accompanying notes are an integral part of these condensed consolidated financial statements.
5
BUTTERFLY NETWORK, INC.
CONDENSED CONSOLIDATED STATEMENTS OF CHANGES IN STOCKHOLDERS’ EQUITY
(In thousands, except share amounts)
(Unaudited)
Three months ended September 30, 2023 | |||||||||||||||||||
|
|
|
|
|
|
|
|
|
|
|
|
|
|
|
|
|
|
|
|
|
|
Class A |
|
Class B |
|
|
|
|
|
|
|
|
|
||||||
|
|
Common |
|
Common |
|
Additional |
|
|
|
|
Total |
||||||||
|
|
Stock |
|
Stock |
|
Paid-In |
|
Accumulated |
|
Stockholders’ |
|||||||||
|
|
Shares |
|
Amount |
|
Shares |
|
Amount |
|
Capital |
|
Deficit |
|
Equity |
|||||
June 30, 2023 |
|
179,720,918 |
|
$ |
18 |
|
26,426,937 |
|
$ |
3 |
|
$ |
935,833 |
|
$ |
(658,149) |
|
$ |
277,705 |
Net loss |
|
— |
|
|
— |
|
— |
|
|
— |
|
|
— |
|
|
(27,368) |
|
|
(27,368) |
Common stock issued upon exercise of stock options |
|
55,807 |
|
|
— |
|
— |
|
|
— |
|
|
92 |
|
|
— |
|
|
92 |
Common stock issued upon vesting of restricted stock units |
|
856,430 |
|
|
— |
|
— |
|
|
— |
|
|
— |
|
|
— |
|
|
— |
Stock-based compensation expense |
|
— |
|
|
— |
|
— |
|
|
— |
|
|
6,990 |
|
|
— |
|
|
6,990 |
September 30, 2023 |
|
180,633,155 |
|
$ |
18 |
|
26,426,937 |
|
$ |
3 |
|
$ |
942,915 |
|
$ |
(685,517) |
|
$ |
257,419 |
Three months ended September 30, 2022 | |||||||||||||||||||
|
|
|
|
|
|
|
|
|
|
|
|
|
|
|
|
|
|
|
|
|
|
Class A |
|
Class B |
|
|
|
|
|
|
|
|
|
||||||
|
|
Common |
|
Common |
|
Additional |
|
|
|
|
Total |
||||||||
|
|
Stock |
|
Stock |
|
Paid-In |
|
Accumulated |
|
Stockholders’ |
|||||||||
|
|
Shares |
|
Amount |
|
Shares |
|
Amount |
|
Capital |
|
Deficit |
|
Equity |
|||||
June 30, 2022 |
|
172,816,532 |
|
$ |
17 |
|
26,426,937 |
|
$ |
3 |
|
$ |
894,162 |
|
$ |
(507,493) |
|
$ |
386,689 |
Net loss |
|
— |
|
|
— |
|
— |
|
|
— |
|
|
— |
|
|
(54,742) |
|
|
(54,742) |
Common stock issued upon exercise of stock options and warrants |
|
691,907 |
|
|
— |
|
— |
|
|
— |
|
|
2,034 |
|
|
— |
|
|
2,034 |
Common stock issued upon vesting of restricted stock units, net |
|
566,163 |
|
|
— |
|
— |
|
|
— |
|
|
— |
|
|
— |
|
|
— |
Stock-based compensation expense |
|
— |
|
|
— |
|
— |
|
|
— |
|
|
9,656 |
|
|
— |
|
|
9,656 |
September 30, 2022 |
|
174,074,602 |
|
$ |
17 |
|
26,426,937 |
|
$ |
3 |
|
$ |
905,852 |
|
$ |
(562,235) |
|
$ |
343,637 |
Nine months ended September 30, 2023 | |||||||||||||||||||
|
|
|
|
|
|
|
|
|
|
|
|
|
|
|
|
|
|
|
|
|
|
Class A |
|
Class B |
|
|
|
|
|
|
|
|
|
||||||
|
|
Common |
|
Common |
|
Additional |
|
|
|
|
Total |
||||||||
|
|
Stock |
|
Stock |
|
Paid-In |
|
Accumulated |
|
Stockholders’ |
|||||||||
|
|
Shares |
|
Amount |
|
Shares |
|
Amount |
|
Capital |
|
Deficit |
|
Equity (Deficit) |
|||||
December 31, 2022 |
|
174,459,956 |
|
$ |
17 |
|
26,426,937 |
|
$ |
3 |
|
$ |
921,278 |
|
$ |
(595,938) |
|
$ |
325,360 |
Net loss |
|
— |
|
|
— |
|
— |
|
|
— |
|
|
— |
|
|
(89,579) |
|
|
(89,579) |
Common stock issued upon exercise of stock options |
|
180,467 |
|
|
— |
|
— |
|
|
— |
|
|
228 |
|
|
— |
|
|
228 |
Common stock issued upon vesting of restricted stock units |
|
5,992,732 |
|
|
1 |
|
— |
|
|
— |
|
|
— |
|
|
— |
|
|
1 |
Stock-based compensation expense |
|
— |
|
|
— |
|
— |
|
|
— |
|
|
21,409 |
|
|
— |
|
|
21,409 |
September 30, 2023 |
|
180,633,155 |
|
$ |
18 |
|
26,426,937 |
|
$ |
3 |
|
$ |
942,915 |
|
$ |
(685,517) |
|
$ |
257,419 |
Nine months ended September 30, 2022 | |||||||||||||||||||
|
|
|
|
|
|
|
|
|
|
|
|
|
|
|
|
|
|
|
|
|
|
Class A |
|
Class B |
|
|
|
|
|
|
|
|
|
||||||
|
|
Common |
|
Common |
|
Additional |
|
|
|
|
Total |
||||||||
|
|
Stock |
|
Stock |
|
Paid-In |
|
Accumulated |
|
Stockholders’ |
|||||||||
|
|
Shares |
|
Amount |
|
Shares |
|
Amount |
|
Capital |
|
Deficit |
|
Equity |
|||||
December 31, 2021 |
|
171,613,049 |
|
$ |
17 |
|
26,426,937 |
|
$ |
3 |
|
$ |
874,886 |
|
$ |
(427,215) |
|
$ |
447,691 |
Net loss |
|
— |
|
|
— |
|
— |
|
|
— |
|
|
— |
|
|
(135,020) |
|
|
(135,020) |
Common stock issued upon exercise of stock options and warrants |
|
1,035,574 |
|
|
— |
|
— |
|
|
— |
|
|
2,844 |
|
|
— |
|
|
2,844 |
Common stock issued upon vesting of restricted stock units, net |
|
1,425,979 |
|
|
— |
|
— |
|
|
— |
|
|
(106) |
|
|
— |
|
|
(106) |
Stock-based compensation expense |
|
— |
|
|
— |
|
— |
|
|
— |
|
|
28,228 |
|
|
— |
|
|
28,228 |
September 30, 2022 |
|
174,074,602 |
|
$ |
17 |
|
26,426,937 |
|
$ |
3 |
|
$ |
905,852 |
|
$ |
(562,235) |
|
$ |
343,637 |
The accompanying notes are an integral part of these condensed consolidated financial statements.
6
BUTTERFLY NETWORK, INC.
CONDENSED CONSOLIDATED STATEMENTS OF CASH FLOWS
(In thousands)
(Unaudited)
|
|
Nine months ended September 30, |
||||
|
|
2023 |
|
2022 |
||
Cash flows from operating activities: |
|
|
|
|
|
|
Net loss |
|
$ |
(89,579) |
|
$ |
(135,020) |
Adjustments to reconcile net loss to net cash used in operating activities: |
|
|
|
|
|
|
Depreciation, amortization, and impairments |
|
|
8,332 |
|
|
4,066 |
Stock-based compensation expense |
|
|
20,924 |
|
|
27,428 |
Change in fair value of warrant liabilities |
|
|
(3,924) |
|
|
(8,881) |
Gain on lease termination |
|
|
(214) |
|
|
— |
Other |
|
|
(478) |
|
|
750 |
Changes in operating assets and liabilities: |
|
|
|
|
|
|
Accounts receivable |
|
|
711 |
|
|
(39) |
Inventories |
|
|
(34,046) |
|
|
(21,421) |
Prepaid expenses and other assets |
|
|
2,354 |
|
|
(498) |
Vendor advances |
|
|
15,646 |
|
|
9,555 |
Accounts payable |
|
|
1,092 |
|
|
(3,121) |
Deferred revenue |
|
|
(423) |
|
|
971 |
Accrued purchase commitments |
|
|
(1,934) |
|
|
(15,578) |
Change in operating lease assets and liabilities |
|
|
(671) |
|
|
1,772 |
Accrued expenses and other liabilities |
|
|
(3,509) |
|
|
(240) |
Net cash used in operating activities |
|
|
(85,719) |
|
|
(140,256) |
|
|
|
|
|
|
|
Cash flows from investing activities: |
|
|
|
|
|
|
Purchases of marketable securities |
|
|
(297) |
|
|
(75,118) |
Sales of marketable securities |
|
|
76,484 |
|
|
— |
Purchases of property and equipment, including capitalized software |
|
|
(3,271) |
|
|
(16,180) |
Sales of property and equipment |
|
|
10 |
|
|
— |
Net cash provided by (used in) investing activities |
|
|
72,926 |
|
|
(91,298) |
|
|
|
|
|
|
|
Cash flows from financing activities: |
|
|
|
|
|
|
Proceeds from exercise of stock options and warrants |
|
|
228 |
|
|
2,844 |
Other financing activities |
|
|
— |
|
|
(100) |
Net cash provided by financing activities |
|
|
228 |
|
|
2,744 |
Net decrease in cash, cash equivalents, and restricted cash |
|
|
(12,565) |
|
|
(228,810) |
Cash, cash equivalents, and restricted cash, beginning of period |
|
|
166,828 |
|
|
426,841 |
Cash, cash equivalents, and restricted cash, end of period |
|
$ |
154,263 |
|
$ |
198,031 |
The accompanying notes are an integral part of these condensed consolidated financial statements.
7
BUTTERFLY NETWORK, INC.
NOTES TO CONDENSED CONSOLIDATED FINANCIAL STATEMENTS
Note 1. Organization and Description of Business
The Company is an innovative digital health business transforming care with handheld, whole-body ultrasound. Powered by its proprietary Ultrasound-on-Chip™ technology, the solution enables the acquisition of imaging information from an affordable, powerful device that fits in a healthcare professional’s pocket with a combination of cloud-connected software and hardware technology.
The Company was incorporated in Delaware on February 4, 2020 as Longview Acquisition Corp. (“Longview”). Following a business combination between the Company and BFLY Operations, Inc. (formerly Butterfly Network, Inc.) on February 12, 2021 (the “Business Combination”), the Company’s legal name became Butterfly Network, Inc.
The Company operates wholly-owned subsidiaries in Australia, Germany, the Netherlands, Taiwan, and the United Kingdom.
Although the Company has incurred recurring losses in each year since inception, the Company expects its cash and cash equivalents will be sufficient to fund operations for at least the next twelve months.
Note 2. Summary of Significant Accounting Policies
Basis of Presentation and Principles of Consolidation
The accompanying condensed consolidated financial statements include the accounts of the Company and its wholly-owned subsidiaries and have been prepared in accordance with U.S. generally accepted accounting principles (“U.S. GAAP”) and the accounting disclosure rules and regulations of the SEC regarding interim financial reporting. Certain information and note disclosures normally included in the annual financial statements prepared in accordance with U.S. GAAP have been condensed or omitted pursuant to such rules and regulations. Therefore, these condensed consolidated financial statements should be read in conjunction with the consolidated financial statements and notes included in the 2022 Annual Report on Form 10-K. All intercompany balances and transactions are eliminated upon consolidation.
The condensed consolidated balance sheet as of December 31, 2022, included herein, was derived from the audited consolidated financial statements as of that date but does not include all disclosures, including certain notes, required by U.S. GAAP for annual reporting.
Certain prior period amounts presented on the condensed consolidated statements of operations and comprehensive loss for the three and nine months ended September 30, 2022 have been reclassified to conform to the current period presentation. See the Operating Expenses – Other section of this note for additional information regarding these reclassifications.
In the opinion of management, the accompanying condensed consolidated financial statements reflect all normal and recurring adjustments necessary to present fairly the financial position, results of operations, and cash flows for the interim periods. The results for the three and nine months ended September 30, 2023 are not necessarily indicative of the results to be expected for any subsequent quarter, the year ending December 31, 2023, or any other period.
Concentration of Credit Risk
Financial instruments that potentially subject the Company to concentration of credit risk consist principally of cash and cash equivalents and accounts receivable. As of September 30, 2023, substantially all of the Company’s cash and cash equivalents were invested in money market accounts with one financial institution. The Company also maintains balances in various operating accounts above federally insured limits. The Company has not experienced any significant losses on such accounts and does not believe it is exposed to any significant credit risk of its cash and cash equivalents.
8
As of September 30, 2023 and December 31, 2022, no customer accounted for more than 10% of the Company’s accounts receivable. No customer accounted for more than 10% of the Company’s total revenue for the three and nine months ended September 30, 2023. One customer accounted for more than 10% of the Company’s total revenue for the three months ended September 30, 2022, and no customer accounted for more than 10% of the Company’s total revenue for the nine months ended September 30, 2022.
Segment Reporting
The Company’s Chief Operating Decision Maker (“CODM”), its Chief Executive Officer, reviews the Company’s financial information on a consolidated basis for purposes of allocating resources and evaluating its financial performance. Accordingly, the Company has determined that it operates as a single reportable segment. Substantially all of the Company’s long-lived assets are located in the United States. Since the Company operates as a single reporting segment, all required segment reporting disclosures can be found in the condensed consolidated financial statements.
Use of Estimates
The Company makes estimates and assumptions about future events that affect the amounts reported in its condensed consolidated financial statements and accompanying notes. Future events and their effects cannot be determined with certainty. On an ongoing basis, management evaluates these estimates, judgments, and assumptions.
The Company bases its estimates on historical and anticipated results and trends and on various other assumptions that the Company believes are reasonable under the circumstances, including assumptions as to future events. Changes in estimates are recorded in the period in which they become known. Actual results could differ from those estimates, and any such differences may be material to the Company’s condensed consolidated financial statements. There have been no material changes to the Company’s use of estimates as described in the consolidated financial statements for the year ended December 31, 2022.
Operating Expenses – Other
The Company classifies certain operating expenses that are not representative of the Company’s ongoing operations as other on the condensed consolidated statements of operations and comprehensive loss. These include costs related to the Company’s reductions in force, litigation, and legal settlements. To conform to current period presentation of the condensed consolidated statements of operations and comprehensive loss, the Company reclassified certain expenses presented as research and development, sales and marketing, and general and administrative in its Quarterly Report on Form 10-Q for the quarterly period ended September 30, 2022 as other in this Quarterly Report on Form 10-Q. The following table summarizes the Company’s operating expenses reclassified as other from research and development, sales and marketing, and general and administrative (in thousands):
|
|
Three months ended |
|
Nine months ended |
||
|
|
September 30, 2022 |
|
September 30, 2022 |
||
Reclassified from: |
|
|
|
|
|
|
Research and development |
|
$ |
1,114 |
|
$ |
1,114 |
Sales and marketing |
|
|
330 |
|
|
330 |
General and administrative |
|
|
1,453 |
|
|
2,394 |
Total reclassified as other |
|
$ |
2,897 |
|
$ |
3,838 |
The following table summarizes the types of expenses classified as other in the Company’s condensed consolidated statements of operations and comprehensive loss (in thousands):
|
|
Three months ended September 30, |
|
Nine months ended September 30, |
||||||||
|
|
2023 |
|
2022 |
|
2023 |
|
2022 |
||||
Employment-related expenses |
|
$ |
4,755 |
|
$ |
1,860 |
|
$ |
8,634 |
|
$ |
1,860 |
Legal-related expenses |
|
|
4,488 |
|
|
1,037 |
|
|
9,214 |
|
|
1,978 |
Total other |
|
$ |
9,243 |
|
$ |
2,897 |
|
$ |
17,848 |
|
$ |
3,838 |
9
See Note 12 “Reductions in Force” for additional information regarding the employment-related expenses classified as other in the condensed consolidated statements of operations and comprehensive loss.
Note 3. Revenue Recognition
Disaggregation of Revenue
The Company disaggregates revenue from contracts with customers by product type and by geographical market. The Company believes that these categories aggregate the payor types by nature, amount, timing, and uncertainty of its revenue streams. The following table summarizes the Company’s disaggregated revenue (in thousands):
|
|
Pattern of |
|
Three months ended September 30, |
|
Nine months ended September 30, |
|
||||||||
|
|
Recognition |
|
2023 |
|
2022 |
|
2023 |
|
2022 |
|
||||
By product type: |
|
|
|
|
|
|
|
|
|
|
|
|
|
|
|
Devices and accessories |
|
Point-in-time |
|
$ |
8,753 |
|
$ |
13,164 |
|
$ |
29,874 |
|
$ |
37,607 |
|
Software and other services |
|
Over time |
|
|
6,668 |
|
|
6,454 |
|
|
19,510 |
|
|
16,800 |
|
Total revenue |
|
|
|
$ |
15,421 |
|
$ |
19,618 |
|
$ |
49,384 |
|
$ |
54,407 |
|
|
|
|
|
|
|
|
|
|
|
|
|
|
|
|
|
By geographical market: |
|
|
|
|
|
|
|
|
|
|
|
|
|
|
|
United States |
|
|
|
$ |
12,230 |
|
$ |
13,582 |
|
$ |
39,726 |
|
$ |
37,881 |
|
International |
|
|
|
|
3,191 |
|
|
6,036 |
|
|
9,658 |
|
|
16,526 |
|
Total revenue |
|
|
|
$ |
15,421 |
|
$ |
19,618 |
|
$ |
49,384 |
|
$ |
54,407 |
|
Contract Balances
Contract balances represent amounts presented in the condensed consolidated balance sheets when the Company has either transferred goods or services to the customer or the customer has paid consideration to the Company under the contract. These contract balances include accounts receivable and deferred revenue. The Company recognizes a receivable when it has an unconditional right to payment, and payment terms are typically 60 days for sales on credit of product, software, and other services. The allowance for doubtful accounts was $0.7 million and $0.5 million as of September 30, 2023 and December 31, 2022, respectively. For the three months ended September 30, 2023 and 2022, the Company recognized $6.7 million and $5.1 million, respectively, of revenue that was included in the deferred revenue balance at the beginning of the period. For the nine months ended September 30, 2023 and 2022, the Company recognized $15.2 million and $11.2 million, respectively, of revenue that was included in the deferred revenue balance at the beginning of the period.
Transaction Price Allocated to Remaining Performance Obligations
As of September 30, 2023 and December 31, 2022, the Company had $32.0 million and $23.9 million, respectively, of remaining performance obligations. As of September 30, 2023, the Company expects to recognize 55% of its remaining performance obligations as revenue in the next twelve months and an additional 45% thereafter.
Note 4. Fair Value of Financial Instruments
Fair value estimates of financial instruments are made at a specific point in time, based on relevant information about financial markets and specific financial instruments. As these estimates are subjective in nature, involving uncertainties and matters of significant judgment, they cannot be determined with precision. Changes in assumptions can significantly affect estimated fair value.
The Company measures fair value as the price that would be received to sell an asset or paid to transfer a liability (an exit price) in an orderly transaction between market participants at the reporting date. The Company utilizes a three-tier hierarchy, which prioritizes the inputs used in the valuation methodologies in measuring fair value:
| ● | Level 1 — Valuations based on quoted prices in active markets for identical assets or liabilities that an entity has the ability to access. |
10
| ● | Level 2 — Valuations based on quoted prices for similar assets or liabilities, quoted prices for identical assets or liabilities in markets that are not active, or other inputs that are observable or can be corroborated by observable data for substantially the full term of the assets or liabilities. |
| ● | Level 3 — Valuations based on inputs that are supported by little or no market activity and that are significant to the fair value of the assets or liabilities. The Company has no assets or liabilities valued with Level 3 inputs. |
The carrying values of cash and cash equivalents, accounts receivable, accounts payable, and accrued liabilities approximate their fair values due to the short-term or on-demand nature of these instruments.
There were no transfers between fair value measurement levels during the periods ended September 30, 2023 and December 31, 2022.
The Company’s outstanding warrants include publicly traded warrants (the “Public Warrants”) which were issued as one-third of a warrant per unit during Longview’s initial public offering and warrants sold in a private placement to Longview’s sponsor (the “Private Warrants”). As of September 30, 2023, there were an aggregate of 13,799,357 and 6,853,333 outstanding Public Warrants and Private Warrants, respectively. Each whole warrant entitles the registered holder to purchase one share of Class A common stock at an exercise price of $11.50 per share, subject to adjustment per the warrant agreements. The warrants will expire on February 12, 2026 or earlier upon redemption or liquidation. The Company recognizes the change in fair value of warrant liabilities in the condensed consolidated statements of operations and comprehensive loss. During the three and nine months ended September 30, 2023 and 2022, the number of exercises and the amount reclassified into equity upon the exercise of the Public Warrants and Private Warrants were not significant.
The Company’s investments in marketable securities were ownership interests in mutual funds. The Company measured the equity securities using Level 1 fair value inputs based on the quoted prices in active markets for identical securities. As the securities had readily determinable fair value, unrealized gains and losses were reported as other income (expense), net on the consolidated statements of operations and comprehensive loss. Subsequent gains or losses realized upon redemption or sale of these securities were also recorded as other income (expense), net on the condensed consolidated statements of operations and comprehensive loss. The Company considered all of its investments in marketable securities as available for use in current operations and therefore classified these securities within current assets on the condensed consolidated balance sheets. The Company did not hold any equity securities as of September 30, 2023. For the three and nine months ended September 30, 2022, the Company recognized $0.6 million of unrealized losses related to equity securities still held as of September 30, 2022.
The Company measures its Public Warrants using Level 1 fair value inputs based on quoted prices in active markets for the Public Warrants. Because any transfer of Private Warrants from the initial holder of the Private Warrants would result in the Private Warrants having substantially the same terms as the Public Warrants, management determined that the fair value of each Private Warrant is the same as that of a Public Warrant. Accordingly, the Company measures its Private Warrants using Level 2 fair value inputs based on quoted prices in active markets for the Public Warrants.
11
The following table summarizes the Company’s assets and liabilities that are measured at fair value on a recurring basis, by level within the fair value hierarchy (in thousands):
|
|
|
|
|
Fair Value Measurement Level |
|||||||
|
|
Total |
|
Level 1 |
|
Level 2 |
|
Level 3 |
||||
September 30, 2023: |
|
|
|
|
|
|
|
|
|
|
|
|
Warrants: |
|
|
|
|
|
|
|
|
|
|
|
|
Public Warrants |
|
$ |
966 |
|
$ |
966 |
|
$ |
— |
|
$ |
— |
Private Warrants |
|
|
480 |
|
|
— |
|
|
480 |
|
|
— |
Total liabilities at fair value on a recurring basis |
|
$ |
1,446 |
|
$ |
966 |
|
$ |
480 |
|
$ |
— |
|
|
|
|
|
|
|
|
|
|
|
|
|
December 31, 2022: |
|
|
|
|
|
|
|
|
|
|
|
|
Marketable securities: |
|
|
|
|
|
|
|
|
|
|
|
|
Mutual funds |
|
$ |
75,250 |
|
$ |
75,250 |
|
$ |
— |
|
$ |
— |
Total assets at fair value on a recurring basis |
|
$ |
75,250 |
|
$ |
75,250 |
|
$ |
— |
|
$ |
— |
|
|
|
|
|
|
|
|
|
|
|
|
|
Warrants: |
|
|
|
|
|
|
|
|
|
|
|
|
Public Warrants |
|
$ |
3,588 |
|
$ |
3,588 |
|
$ |
— |
|
$ |
— |
Private Warrants |
|
|
1,782 |
|
|
— |
|
|
1,782 |
|
|
— |
Total liabilities at fair value on a recurring basis |
|
$ |
5,370 |
|
$ |
3,588 |
|
$ |
1,782 |
|
$ |
— |
Note 5. Inventories
The following table summarizes the Company’s inventories (in thousands):
|
|
September 30, |
|
December 31, |
||
|
|
2023 |
|
2022 |
||
Raw materials |
|
$ |
72,256 |
|
|
41,265 |
Work-in-progress |
|
|
905 |
|
|
1,962 |
Finished goods |
|
|
20,855 |
|
|
16,743 |
Total inventories |
|
$ |
94,016 |
|
$ |
59,970 |
Work-in-progress represents inventory items in intermediate stages of production by third-party manufacturers. For the three and nine months ended September 30, 2023, net realizable value inventory adjustments and excess and obsolete inventory charges were not significant and were recognized in product cost of revenue. See Note 13 “Commitments and Contingencies” for additional information regarding the Company’s inventory supply arrangements.
Note 6. Property and Equipment, Net
The following table summarizes the Company’s property and equipment, net (in thousands):
|
|
September 30, |
|
December 31, |
||
|
|
2023 |
|
2022 |
||
Property and equipment, gross |
|
$ |
42,947 |
|
$ |
42,385 |
Less: accumulated depreciation and amortization |
|
|
(16,585) |
|
|
(11,054) |
Property and equipment, net |
|
$ |
26,362 |
|
$ |
31,331 |
As of September 30, 2023 and 2022, the Company excluded $0.2 million and $0.8 million, respectively, of accrued property and equipment from the cash used in investing activities on the condensed consolidated statements of cash flows.
The Company fully impaired its leasehold improvements related to a lease that was terminated during the third quarter of 2023. The Company recognized an impairment loss of $1.8 million for the three and nine months ended September 30, 2023 in operating expenses on the condensed consolidated statements of operations and comprehensive loss. See Note 13, “Commitments and Contingencies” for further discussion of the terminated lease.
12
Note 7. Restricted Cash
The following table reconciles cash, cash equivalents, and restricted cash from the condensed consolidated balance sheets to the condensed consolidated statements of cash flows (in thousands):
|
|
September 30, |
||||
|
|
2023 |
|
2022 |
||
Reconciliation of cash, cash equivalents and restricted cash: |
|
|
|
|
|
|
Cash and cash equivalents |
|
$ |
150,006 |
|
$ |
193,313 |
Restricted cash included within prepaid expenses and other current assets |
|
|
243 |
|
|
704 |
Restricted cash included within other non-current assets |
|
|
4,014 |
|
|
4,014 |
Total cash, cash equivalents and restricted cash shown in the condensed consolidated statements of cash flows |
|
$ |
154,263 |
|
$ |
198,031 |
Restricted cash included within prepaid expenses and other current assets is restricted by an agreement with the Bill & Melinda Gates Foundation (“Gates Foundation”). The restriction on these funds lapses as the Company fulfills its obligations in the agreement. Restricted cash included within other non-current assets is held as collateral to secure a letter of credit for one of our office leases and is expected to be maintained as a security deposit throughout the duration of the lease.
Note 8. Accrued Expenses and Other Current Liabilities
The following table summarizes the Company’s accrued expenses and other current liabilities (in thousands):
|
|
September 30, |
|
December 31, |
||
|
|
2023 |
|
2022 |
||
Employee compensation |
|
$ |
9,202 |
|
$ |
12,166 |
Customer deposits |
|
|
1,281 |
|
|
1,135 |
Accrued warranty liability |
|
|
269 |
|
|
287 |
Non-income tax |
|
|
1,042 |
|
|
1,442 |
Professional fees |
|
|
2,523 |
|
|
3,450 |
Current portion of operating lease liabilities |
|
|
1,923 |
|
|
1,926 |
Estimated liability for legal contingencies |
|
|
1,630 |
|
|
— |
Other |
|
|
4,063 |
|
|
5,710 |
Total accrued expenses and other current liabilities |
|
$ |
21,933 |
|
$ |
26,116 |
The following table summarizes warranty expense activity (in thousands):
|
|
Three months ended September 30, |
|
Nine months ended September 30, |
|
||||||||
|
|
2023 |
|
2022 |
|
2023 |
|
2022 |
|
||||
Balance, beginning of period |
|
$ |
787 |
|
$ |
975 |
|
$ |
873 |
|
$ |
1,116 |
|
Warranty provision charged to operations |
|
|
227 |
|
|
76 |
|
|
176 |
|
|
241 |
|
Warranty claims |
|
|
(293) |
|
|
(135) |
|
|
(328) |
|
|
(441) |
|
Balance, end of period |
|
$ |
721 |
|
$ |
916 |
|
$ |
721 |
|
$ |
916 |
|
The Company classifies its accrued warranty liability based on the timing of expected warranty activity. The future costs of expected activity greater than one year are recorded within other non-current liabilities on the condensed consolidated balance sheets.
Note 9. Equity Incentive Plans
For the three and nine months ended September 30, 2023, there were no significant changes to the Company’s 2012 Employee, Director and Consultant Equity Incentive Plan, as amended, (the “2012 Plan”) and the Company’s Amended and Restated 2020 Equity Incentive Plan (the “2020 Plan”). On January 1, 2023, pursuant to the terms of the 2020 Plan, the number of shares reserved for issuance was increased automatically by 4% of the number of outstanding shares of common stock as of January 1, 2023.
13
Stock Option Activity
The following table summarizes the changes in the Company’s outstanding stock options:
|
|
Number of |
|
|
Options |
Outstanding at December 31, 2022 |
|
12,571,912 |
Granted |
|
— |
Exercised |
|
(180,467) |
Forfeited |
|
(3,797,376) |
Outstanding at September 30, 2023 |
|
8,594,069 |
Generally, each award vests based on continued service per the award agreement. The grant date fair value of the award is recognized as stock-based compensation expense over the requisite service period. The grant date fair value was determined using similar methods and assumptions as those previously disclosed by the Company.
Restricted Stock Unit Activity
The following table summarizes the changes in the Company’s outstanding restricted stock units (“RSUs”):
|
|
Number of |
|
|
RSUs |
Outstanding at December 31, 2022 |
|
9,961,291 |
Granted |
|
15,563,473 |
Vested |
|
(4,830,193) |
Forfeited |
|
(4,721,808) |
Outstanding at September 30, 2023 |
|
15,972,763 |
Generally, each award vests based on continued service per the award agreement. The grant date fair value of the award is recognized as stock-based compensation expense over the requisite service period. The grant date fair value was determined based on the fair market value of the Company’s Class A common stock on the grant date.
Included in the table above are market-based RSUs that include a service condition. The market-based conditions for these awards are objective metrics related to the Company’s stock price defined in the award agreement. The service condition for these awards is satisfied by providing service to the Company through the achievement date of the market-based conditions. The grant date fair value of the awards is recognized as stock-based compensation expense over the derived service period. The grant date fair value and derived service period were determined by using a Monte Carlo simulation with similar risk-free interest rate, expected dividend yield, and expected volatility assumptions as those used by the Company for determining the grant date fair value of its stock options.
The following table summarizes the Company’s stock-based compensation expense (in thousands):
|
|
Three months ended September 30, |
|
Nine months ended September 30, |
||||||||
|
|
2023 |
|
2022 |
|
2023 |
|
2022 |
||||
Research and development |
|
$ |
2,158 |
|
$ |
3,180 |
|
$ |
7,549 |
|
$ |
9,596 |
Sales and marketing |
|
|
1,109 |
|
|
2,021 |
|
|
3,046 |
|
|
5,920 |
General and administrative |
|
|
3,548 |
|
|
4,212 |
|
|
10,329 |
|
|
11,912 |
Total stock-based compensation expense |
|
$ |
6,815 |
|
$ |
9,413 |
|
$ |
20,924 |
|
$ |
27,428 |
Prior period stock-based compensation expense that was classified as cost of revenue is now included in research and development due to the amounts being insignificant.
14
Note 10. Net Loss Per Share
We compute net loss per share of Class A and Class B common stock using the two-class method. Basic net loss per share is computed by dividing the net loss by the weighted-average number of shares of each class of the Company’s common stock outstanding during the period. Diluted net loss per share is computed by giving effect to all potential shares of the Company’s common stock, including those presented in the table below, to the extent dilutive. Basic and diluted net loss per share were the same for each period presented as the inclusion of all potential shares of the Company’s common stock outstanding would have been anti-dilutive.
As the Company uses the two-class method required for companies with multiple classes of common stock, the following tables present the calculation of basic and diluted net loss per share for each class of the Company’s common stock outstanding (in thousands, except share and per share amounts):
Three months ended September 30, 2023 |
|
|
|
|
|
|
|
|
|
|
|
|
|
|
|
|
|
|
Total |
|
|
|
|
Class A |
|
Class B |
|
Common Stock |
|
|||
Numerator: |
|
|
|
|
|
|
|
|
|
|
Allocation of undistributed earnings |
|
$ |
(23,870) |
|
$ |
(3,498) |
|
$ |
(27,368) |
|
Numerator for basic and diluted net loss per share – loss available to common stockholders |
|
$ |
(23,870) |
|
$ |
(3,498) |
|
$ |
(27,368) |
|
Denominator: |
|
|
|
|
|
|
|
|
|
|
Weighted-average common shares outstanding |
|
|
180,313,297 |
|
|
26,426,937 |
|
|
206,740,234 |
|
Denominator for basic and diluted net loss per share – weighted-average common stock |
|
|
180,313,297 |
|
|
26,426,937 |
|
|
206,740,234 |
|
Basic and diluted net loss per share |
|
$ |
(0.13) |
|
$ |
(0.13) |
|
$ |
(0.13) |
|
Three months ended September 30, 2022 |
|
|
|
|
|
|
|
|
|
|
|
|
|
|
|
|
|
|
Total |
|
|
|
|
Class A |
|
Class B |
|
Common Stock |
|
|||
Numerator: |
|
|
|
|
|
|
|
|
|
|
Allocation of undistributed earnings |
|
$ |
(47,515) |
|
$ |
(7,227) |
|
$ |
(54,742) |
|
Numerator for basic and diluted net loss per share – loss available to common stockholders |
|
$ |
(47,515) |
|
$ |
(7,227) |
|
$ |
(54,742) |
|
Denominator: |
|
|
|
|
|
|
|
|
|
|
Weighted-average common shares outstanding |
|
|
173,745,746 |
|
|
26,426,937 |
|
|
200,172,683 |
|
Denominator for basic and diluted net loss per share – weighted-average common stock |
|
|
173,745,746 |
|
|
26,426,937 |
|
|
200,172,683 |
|
Basic and diluted net loss per share |
|
$ |
(0.27) |
|
$ |
(0.27) |
|
$ |
(0.27) |
|
Nine months ended September 30, 2023 |
|
|
|
|
|
|
|
|
|
|
|
|
|
|
|
|
|
|
Total |
|
|
|
|
Class A |
|
Class B |
|
Common Stock |
|
|||
Numerator: |
|
|
|
|
|
|
|
|
|
|
Allocation of undistributed earnings |
|
$ |
(78,017) |
|
$ |
(11,562) |
|
$ |
(89,579) |
|
Numerator for basic and diluted net loss per share – loss available to common stockholders |
|
$ |
(78,017) |
|
$ |
(11,562) |
|
$ |
(89,579) |
|
Denominator: |
|
|
|
|
|
|
|
|
|
|
Weighted-average common shares outstanding |
|
|
178,322,171 |
|
|
26,426,937 |
|
|
204,749,108 |
|
Denominator for basic and diluted net loss per share – weighted-average common stock |
|
|
178,322,171 |
|
|
26,426,937 |
|
|
204,749,108 |
|
Basic and diluted net loss per share |
|
$ |
(0.44) |
|
$ |
(0.44) |
|
$ |
(0.44) |
|
15
Nine months ended September 30, 2022 |
|
|
|
|
|
|
|
|
|
|
|
|
|
|
|
|
|
|
Total |
|
|
|
|
Class A |
|
Class B |
|
Common Stock |
|
|||
Numerator: |
|
|
|
|
|
|
|
|
|
|
Allocation of undistributed earnings |
|
$ |
(117,137) |
|
$ |
(17,883) |
|
$ |
(135,020) |
|
Numerator for basic and diluted net loss per share – loss available to common stockholders |
|
$ |
(117,137) |
|
$ |
(17,883) |
|
$ |
(135,020) |
|
Denominator: |
|
|
|
|
|
|
|
|
|
|
Weighted-average common shares outstanding |
|
|
173,101,457 |
|
|
26,426,937 |
|
|
199,528,394 |
|
Denominator for basic and diluted net loss per share – weighted-average common stock |
|
|
173,101,457 |
|
|
26,426,937 |
|
|
199,528,394 |
|
Basic and diluted net loss per share |
|
$ |
(0.68) |
|
$ |
(0.68) |
|
$ |
(0.68) |
|
For the periods presented above, the net loss per share amounts are the same for Class A and Class B common stock because the holders of each class are entitled to equal per share dividends or distributions in liquidation in accordance with the Certificate of Incorporation. The undistributed earnings for each year are allocated based on the contractual participation rights of the Class A and Class B common stock as if the earnings for the year had been distributed. As the liquidation and dividend rights are identical, the undistributed earnings are allocated on a proportionate basis.
The following table summarizes the Company’s anti-dilutive common equivalent shares:
|
|
September 30, |
|
||
|
|
2023 |
|
2022 |
|
Outstanding options to purchase common stock |
|
8,594,069 |
|
13,740,728 |
|
Outstanding restricted stock units |
|
15,972,763 |
|
11,578,865 |
|
Outstanding warrants |
|
20,652,690 |
|
20,652,690 |
|
Total anti-dilutive common equivalent shares |
|
45,219,522 |
|
45,972,283 |
|
Note 11. 401(k) Retirement Plan
The Company sponsors a 401(k) defined contribution plan covering all eligible U.S. employees. Contributions to the 401(k) plan are discretionary. For the three months ended September 30, 2023 and 2022, expenses for matching 401(k) contributions were $0.2 million and $0.3 million, respectively. For the nine months ended September 30, 2023 and 2022, expenses for matching 401(k) contributions were $0.6 million and $1.1 million, respectively.
Note 12. Reductions in Force
During 2022 and 2023, the Company implemented plans designed to better align the Company’s commercial objectives and prioritization with its existing strengths and offerings as well as improve the Company’s efficiency by reducing operating expenses and extending liquidity. In addition to decreasing other operating expenses, these plans included reductions in force announced in July 2022, January 2023, and July 2023 representing approximately 10%, 25%, and 25% of the Company’s workforce at each announcement date, respectively. For the three months ended September 30, 2023 and 2022, the Company incurred $4.8 million and $1.9 million, respectively, of employee severance and benefit costs related to the reductions in force. For the nine months ended September 30, 2023 and 2022, the Company incurred $8.6 million and $1.9 million, respectively, of employee severance and benefit costs related to the reductions in force. As of September 30, 2023, $2.2 million of accrued employee severance and benefit costs related to the reductions in force were included in accrued expenses and other current liabilities on the condensed consolidated balance sheets. As of December 31, 2022, the amount of accrued employee severance and benefit costs related to the reductions in force included in accrued expenses and other current liabilities on the condensed consolidated balance sheets was not significant.
16
Note 13. Commitments and Contingencies
Commitments
Leases:
The Company primarily enters into leases for office space that are classified as operating leases. For the three months ended September 30, 2023 and 2022, total lease cost was $0.6 million and $1.2 million, respectively. For the nine months ended September 30, 2023 and 2022, total lease cost was $2.5 million and $3.5 million, respectively. Total lease cost was primarily composed of operating lease costs.
The Company terminated one of its operating leases for office space and modified another during the third quarter of 2023 that increased its lease payments by $0.2 million. The Company recognized a total decrease of $4.2 million to operating lease assets, $0.7 million to the current portion of operating lease liabilities included in accrued expenses and other current liabilities, and $4.7 million to the non-current portion of operating lease liabilities on the condensed consolidated balance sheets for the lease termination and lease modification. As part of the lease termination, the Company agreed to forfeit a $0.9 million security deposit included in other non-current assets on the condensed consolidated balance sheets. The Company recognized a $0.2 million gain on lease termination within operating expenses on the condensed consolidated statements of operations and comprehensive loss for the three and nine months ended September 30, 2023.
Purchase Commitments:
The Company enters into inventory purchase commitments with third-party manufacturers in the ordinary course of business, including a non-cancellable inventory supply agreement with a certain third-party manufacturing vendor. The provisions of the agreement allowed the Company, once it reached a certain cumulative purchase threshold in the fourth quarter of 2021, to pay for a portion of the subsequent inventory purchases using an advance previously paid to the vendor. As of September 30, 2023, the aggregate amount of minimum inventory purchase commitments is $22.4 million, and the Company has a vendor advance asset of $2.2 million, net of write-downs, and an accrued purchase commitment liability of $0.2 million related to the agreement. The portion of the balances that is expected to be utilized in the next 12 months is included in current assets and current liabilities in the accompanying condensed consolidated balance sheets.
The Company applied the guidance in Topic 330, Inventory to assess the purchase commitment and related loss, using such factors as Company-specific forecasts which are reliant on the Company’s limited sales history, agreement-specific provisions, macroeconomic factors, and market and industry trends. For the three and nine months ended September 30, 2023 and 2022, the Company did not recognize any additions to the accrued purchase commitment liability, or any related losses, based on its purchase commitment assessment as there were no significant changes to the assessment factors.
The Company reviews its inventory on hand, including inventory acquired under the purchase commitments, for excess and obsolescence (“E&O”) on a quarterly basis. Any E&O inventory acquired that was previously accounted for as a purchase commitment liability accrual or vendor advance write down is recorded at zero value. During the three months ended September 30, 2023, the Company did not acquire such E&O inventory. During the three months ended September 30, 2023, the Company utilized $0.3 million of the accrued purchase commitment liability and $0.3 million of the vendor advance that was previously written down to acquire such E&O inventory. During the nine months ended September 30, 2023, the Company utilized $1.9 million of the accrued purchase commitment liability and $4.8 million of the vendor advance that was previously written down to acquire such E&O inventory. During the three and nine months ended September 30, 2022, the Company utilized $15.6 million of the accrued purchase commitment liability and $7.6 million of the vendor advance that was previously written down to acquire such E&O inventory.
Contingencies
The Company is involved in litigation and legal matters from time to time, which have arisen in the normal course of business. Although the ultimate results of these matters are not currently determinable, management does not expect that they will have a material effect on the Company’s condensed consolidated balance sheets, statements of operations and comprehensive loss, or statements of cash flows. The Company accrues an estimated liability for legal contingencies when the Company considers a potential loss probable and can reasonably estimate the amount of the potential loss.
17
On February 16, 2022, a putative class action lawsuit, styled Rose v. Butterfly Network, Inc., et al. (Case No. 2:22-cv-00854) was filed in the United States District Court for the District of New Jersey and was amended on November 1, 2022. The claims are against the Company and certain of its directors and previous management as well as Longview and member of its then board of directors, alleging that the defendants made false and misleading statements and/or omissions about its post-Business Combination business and financial prospects. The alleged class consists of all persons or entities who purchased or otherwise acquired the Company’s stock between January 12, 2021 and November 15, 2021, persons who exchanged Longview shares for the Company’s common stock, and persons who purchased Longview stock pursuant, or traceable to, the Proxy/Registration Statement filed with the SEC on November 27, 2020 or any amendment thereto. The Company intends to vigorously defend against this action. The lawsuit seeks unspecified damages, together with interest thereon, as well as the costs and expenses of litigation. There is no assurance that the Company will be successful in the defense of the litigation or that insurance will be available or adequate to fund any potential settlement or judgment or the litigation costs of the action. The Company is unable to predict the outcome or reasonably estimate a range of possible loss at this time.
On March 9, 2022, Fujifilm Sonosite, Inc. (“Fujifilm”) filed a complaint against the Company, styled Fujifilm Sonosite, Inc. v. Butterfly Network, Inc. (Case No. 1:22-cv-00309) in the United States District Court for the District of Delaware. The complaint alleged that the Butterfly iQ and iQ+ ultrasound probes, hard carrying case, and mobile device application software infringe certain patents purportedly owned by Fujifilm. The lawsuit seeks unspecified damages including compensatory damages, lost profits, reasonable royalty damages, a preliminary and/or permanent injunction, pre- and post-judgment interest, and the fees and costs of litigation. There is no assurance that the Company will be successful in the defense of the litigation or that insurance will be available or adequate to fund any potential settlement or judgment or the litigation costs of the action. The Company expects to resolve the complaint with Fujifilm within one year, with no resulting impact to the Company’s existing patents and intellectual property. During the third quarter of 2023, the Company recognized an estimated liability of $1.6 million for the potential loss in accrued liabilities and other current expenses on the condensed consolidated balance sheets with the potential loss recognized in other on the condensed consolidated statements of operations and comprehensive loss.
On June 21, 2022, a stockholder derivative action, styled Koenig v. Todd M. Fruchterman, et al. (Case No. 1:22-cv-00825) was filed in the United States District Court for the District of Delaware against the Company’s Board of Directors and the Company as nominal defendant, alleging violation of Section 14(a) of the Exchange Act, as amended, and Rule 14a-9 promulgated thereunder, and claims for breach of fiduciary duty, contribution and indemnification, aiding and abetting, and gross mismanagement. The lawsuit is premised upon allegedly inadequate internal controls and purportedly misleading representations regarding the Company’s financial condition, business prospects, and the Company’s November 2021 earnings announcement. The Company intends to vigorously defend against this action. The lawsuit seeks unspecified damages, disgorgement, and restitution, together with interest thereon, as well as the costs and expenses of litigation. There is no assurance that the Company will be successful in the defense of the litigation or that insurance will be available or adequate to fund any potential settlement or judgment or the litigation costs of the action. The Company is unable to predict the outcome or reasonably estimate a range of possible loss at this time.
The Company, as well as certain current and former directors and executive officers, is also involved in other legal matters for employment-related claims that have not been fully resolved and for which it is unable to predict the outcome.
18
Item 2. Management’s Discussion and Analysis of Financial Condition and Results of Operations
The following discussion and analysis provides information which management believes is relevant to an assessment and understanding of our condensed consolidated results of operations and financial condition. The discussion should be read in conjunction with the unaudited condensed consolidated financial statements and notes thereto contained in this Quarterly Report on Form 10-Q and the consolidated financial statements and notes thereto contained in our 2022 Annual Report on Form 10-K. This discussion contains forward-looking statements and involves numerous risks and uncertainties, including, but not limited to, those described under the caption “Risk Factors” in Item 1A of Part I of our 2022 Annual Report on Form 10-K and in Item 1A of Part II of this Quarterly Report on Form 10-Q as filed with the SEC. Actual results may differ materially from those contained in any forward-looking statements.
Overview
We are an innovative digital health business transforming care with hand-held, whole-body ultrasound. Powered by our proprietary Ultrasound-on-Chip™ technology, our solution enables the acquisition of imaging information from an affordable, powerful device that fits in a healthcare professional’s pocket with a unique combination of cloud-connected software and hardware technology that is easily accessed through a mobile app.
Butterfly iQ+ is an ultrasound device that can perform whole-body imaging in a single handheld probe using semiconductor technology. Our Ultrasound-on-Chip™ makes ultrasound more accessible outside of large healthcare institutions, while our software is intended to make the product easy to use, fully integrated with the clinical workflow, and accessible on a user’s smartphone, tablet, and almost any hospital computer system connected to the Internet. We aim to enable the delivery of imaging information anywhere at point-of-care to drive earlier detection throughout the body and remote management of health conditions. We market and sell the Butterfly system, which includes probes, related accessories, and software subscriptions, to healthcare systems, physicians, and healthcare providers through a direct sales force, distributors, and our eCommerce channel.
Key Performance Measures
We review the key performance measures discussed below to evaluate the business and measure performance, identify trends, formulate plans, and make strategic decisions. Our key performance measures may fluctuate over time as the adoption of our devices increases, which may shift the revenue mix more toward software and other services. The quarterly metrics may be impacted by the timing of device sales.
Units fulfilled
We define units fulfilled as the number of devices whereby control is transferred to a customer. We do not adjust this measure for returns as our volume of returns has historically been low. We view units fulfilled as a key indicator of the growth of our business. We believe that this metric is useful to investors because it presents our core growth and the performance of our business period over period.
19
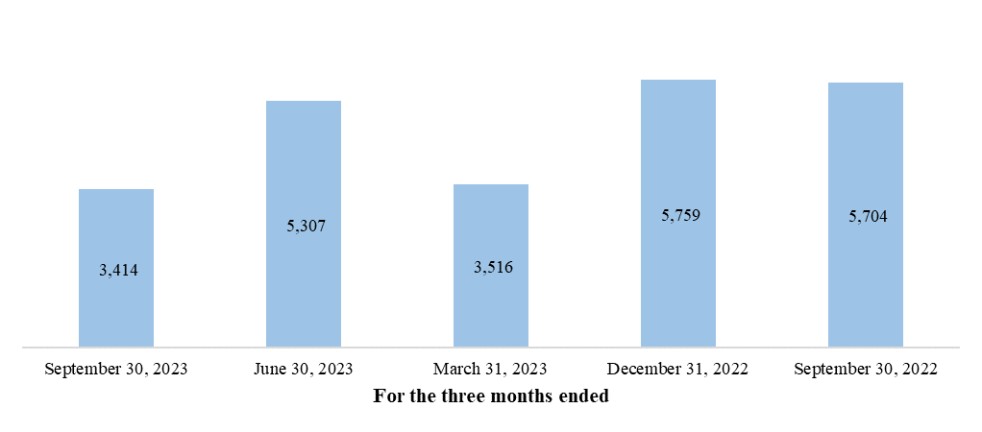
Units fulfilled decreased by 2,290 units, or 40.1%, for the three months ended September 30, 2023 compared to the three months ended September 30, 2022, primarily due to the large deployments to the University of Rochester Medical Center and the Gates Foundation in the prior year as well as decreased device sales volume across all of our sales channels, as we believe existing and potential customers await the upcoming release of our next-generation probe in 2024.
Software and other services mix
We define software and other services mix as a percentage of our total revenue recognized in a reporting period that is based on software subscriptions and other related services, consisting primarily of our software as a service (“SaaS”) offering. We view software and other services mix as a key indicator of the profitability of our business, and thus we believe that this measure is useful to investors.
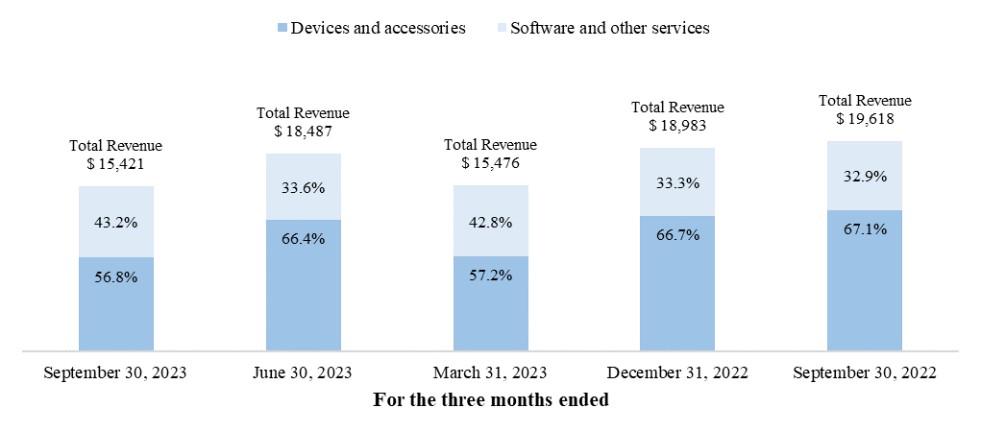
For the three months ended September 30, 2023, software and services mix was 43.2% of revenue and increased by 10.3 percentage points from the three months ended September 30, 2022. This increase was due to a higher installed base of product with the accompanying subscription software, renewals on the existing base of software users, and software implementations completed during the quarter.
20
Description of Certain Components of Financial Data
Revenue
Revenue consists of revenue from the sale of products, such as medical devices and accessories, and the sale of software and related services, consisting of SaaS subscriptions and product support and maintenance (“Support”). SaaS subscriptions include licenses for teams and individuals as well as enterprise-level subscriptions. For sales of products, revenue is recognized at a point in time upon transfer of control to the customer. SaaS subscriptions and Support are generally recognized ratably over time.
Over time, as the adoption of our devices increases through further market penetration, and as practitioners continue using our devices and software platform, we expect our annual revenue mix to shift more toward software and other services. The quarterly revenue mix may be impacted by the timing of device sales.
To date, we have invested heavily in growing adoption at large-scale healthcare systems. As we expand our healthcare system software offerings and develop relationships with larger healthcare systems, we continue to expect a higher proportion of our revenue to come from direct sales to healthcare systems compared to eCommerce.
Cost of revenue
Cost of product revenue consists of product costs, including manufacturing costs, personnel costs and benefits, inbound freight, packaging, warranty replacement costs, payment processing fees, and inventory obsolescence and write-offs. We expect our cost of product revenue to fluctuate over time due to the level of units fulfilled in any given period, and we expect it to fluctuate as a percentage of product revenue over time as our focus on operational efficiencies in our supply chain may be offset by increased prices of certain inventory components.
Cost of software and other services revenue consists of personnel costs and benefits, cloud hosting costs and payment processing fees. Because the costs and associated expenses to deliver our SaaS offerings are less than the costs and associated expenses of manufacturing and selling our device, we anticipate an improvement in profitability and margin expansion over time as our revenue mix shifts increasingly towards software and other services. We plan to continue to invest resources to expand and further develop our SaaS and other service offerings.
Research and development
Research and development expenses primarily consist of personnel costs and benefits, facilities-related expenses and depreciation, fabrication services, and software costs. Most of our research and development expenses are related to developing new products and services that have not reached the point of commercialization and improving our products and services that have been commercialized. Fabrication services include certain third-party engineering costs, product testing, and test boards. Research and development expenses are expensed as incurred. We expect to continue to make substantial investments in our product and software development, clinical, and regulatory capabilities.
Sales and marketing
Sales and marketing expenses primarily consist of personnel costs and benefits, advertising, conferences and events, facilities-related expenses, and software costs. We expect to continue to make substantial investments in our sales capabilities.
General and administrative
General and administrative expenses primarily consist of personnel costs and benefits, outside services, insurance, software costs, and facilities-related expenses and depreciation. Outside services consist of professional services, legal fees, and other professional fees.
Other
Operating expenses classified as other are expenses which we do not consider representative of our ongoing operations. These other expenses primarily consist of employee severance and benefits costs related to our reductions in force, litigation costs, and legal settlements.
21
Results of Operations
We operate as a single reportable segment to reflect the way our CODM reviews and assesses the performance of the business. The accounting policies are described in Note 2 “Summary of Significant Accounting Policies” in our condensed consolidated financial statements included in this Quarterly Report on Form 10-Q.
|
|
Three months ended September 30, |
|
|
Nine months ended September 30, |
|||||||||||||||||||
|
|
2023 |
|
|
2022 |
|
|
2023 |
|
|
2022 |
|
||||||||||||
|
|
|
|
|
% of |
|
|
|
|
|
% of |
|
|
|
|
|
% of |
|
|
|
|
|
% of |
|
(in thousands) |
|
Dollars |
|
revenue |
|
|
Dollars |
|
revenue |
|
|
Dollars |
|
revenue |
|
|
Dollars |
|
revenue |
|
||||
Revenue: |
|
|
|
|
|
|
|
|
|
|
|
|
|
|
|
|
|
|
|
|
|
|
|
|
Product |
|
$ |
8,753 |
|
56.8 |
% |
|
$ |
13,164 |
|
67.1 |
% |
|
$ |
29,874 |
|
60.5 |
% |
|
$ |
37,607 |
|
69.1 |
% |
Software and other services |
|
|
6,668 |
|
43.2 |
|
|
|
6,454 |
|
32.9 |
|
|
|
19,510 |
|
39.5 |
|
|
|
16,800 |
|
30.9 |
|
Total revenue |
|
|
15,421 |
|
100.0 |
|
|
|
19,618 |
|
100.0 |
|
|
|
49,384 |
|
100.0 |
|
|
|
54,407 |
|
100.0 |
|
Cost of revenue: |
|
|
|
|
|
|
|
|
|
|
|
|
|
|
|
|
|
|
|
|
|
|
|
|
Product |
|
|
3,929 |
|
25.5 |
|
|
|
6,534 |
|
33.3 |
|
|
|
13,765 |
|
27.9 |
|
|
|
19,481 |
|
35.8 |
|
Software and other services |
|
|
2,110 |
|
13.7 |
|
|
|
2,095 |
|
10.7 |
|
|
|
6,226 |
|
12.6 |
|
|
|
5,022 |
|
9.2 |
|
Total cost of revenue |
|
|
6,039 |
|
39.2 |
|
|
|
8,629 |
|
44.0 |
|
|
|
19,991 |
|
40.5 |
|
|
|
24,503 |
|
45.0 |
|
Gross profit |
|
|
9,382 |
|
60.8 |
|
|
|
10,989 |
|
56.0 |
|
|
|
29,393 |
|
59.5 |
|
|
|
29,904 |
|
55.0 |
|
Operating expenses: |
|
|
|
|
|
|
|
|
|
|
|
|
|
|
|
|
|
|
|
|
|
|
|
|
Research and development |
|
|
12,130 |
|
78.7 |
|
|
|
22,040 |
|
112.3 |
|
|
|
44,409 |
|
89.9 |
|
|
|
68,883 |
|
126.6 |
|
Sales and marketing |
|
|
9,012 |
|
58.4 |
|
|
|
15,481 |
|
78.9 |
|
|
|
28,776 |
|
58.3 |
|
|
|
47,121 |
|
86.6 |
|
General and administrative |
|
|
11,560 |
|
75.0 |
|
|
|
16,603 |
|
84.6 |
|
|
|
37,239 |
|
75.4 |
|
|
|
54,080 |
|
99.4 |
|
Other |
|
|
9,243 |
|
59.9 |
|
|
|
2,897 |
|
14.8 |
|
|
|
17,848 |
|
36.1 |
|
|
|
3,838 |
|
7.1 |
|
Total operating expenses |
|
|
41,945 |
|
272.0 |
|
|
|
57,021 |
|
290.7 |
|
|
|
128,272 |
|
259.7 |
|
|
|
173,922 |
|
319.7 |
|
Loss from operations |
|
|
(32,563) |
|
(211.2) |
|
|
|
(46,032) |
|
(234.6) |
|
|
|
(98,879) |
|
(200.2) |
|
|
|
(144,018) |
|
(264.7) |
|
Interest income |
|
|
1,903 |
|
12.3 |
|
|
|
1,304 |
|
6.6 |
|
|
|
5,714 |
|
11.6 |
|
|
|
1,574 |
|
2.9 |
|
Interest expense |
|
|
— |
|
— |
|
|
|
(2) |
|
(0.0) |
|
|
|
— |
|
— |
|
|
|
(2) |
|
(0.0) |
|
Change in fair value of warrant liabilities |
|
|
3,511 |
|
22.8 |
|
|
|
(9,087) |
|
(46.3) |
|
|
|
3,924 |
|
7.9 |
|
|
|
8,881 |
|
16.3 |
|
Other income (expense), net |
|
|
(217) |
|
(1.4) |
|
|
|
(898) |
|
(4.6) |
|
|
|
(256) |
|
(0.5) |
|
|
|
(1,387) |
|
(2.5) |
|
Loss before provision for income taxes |
|
|
(27,366) |
|
(177.5) |
|
|
|
(54,715) |
|
(278.9) |
|
|
|
(89,497) |
|
(181.2) |
|
|
|
(134,952) |
|
(248.0) |
|
Provision for income taxes |
|
|
2 |
|
0.0 |
|
|
|
27 |
|
0.1 |
|
|
|
82 |
|
0.2 |
|
|
|
68 |
|
0.1 |
|
Net loss and comprehensive loss |
|
$ |
(27,368) |
|
(177.5) |
% |
|
$ |
(54,742) |
|
(279.0) |
% |
|
$ |
(89,579) |
|
(181.4) |
% |
|
$ |
(135,020) |
|
(248.2) |
% |
Comparison of the three months ended September 30, 2023 and 2022
Revenue
|
|
Three months ended September 30, |
|
|
|
|
|
|
||||
(in thousands) |
|
2023 |
|
2022 |
|
Change |
|
% Change |
|
|||
Product |
|
$ |
8,753 |
|
$ |
13,164 |
|
$ |
(4,411) |
|
(33.5) |
% |
Software and other services |
|
|
6,668 |
|
|
6,454 |
|
|
214 |
|
3.3 |
% |
|
|
$ |
15,421 |
|
$ |
19,618 |
|
$ |
(4,197) |
|
(21.4) |
% |
For the three months ended September 30, 2023, total revenue of $15.4 million was down from $19.6 million for the three months ended September 30, 2022. In the U.S., we realized $10.4 million in total sales for the three months ended September 30, 2023, down 15.1% from the three months ended September 30, 2022, driven by lower probe sales largely as a result of a large deployment to the University of Rochester Medical Center in the prior year, which was partially offset by higher subscription revenue and higher average selling prices. Compared to the three months ended September 30, 2022, total International sales declined 36.0% to $3.8 million for the three months ended September 30, 2023. This decline is a result of the deployment under the Gates Foundation agreement in the prior year as well as several initial orders from distributors that occurred in the prior year as we entered new markets.
For the three months ended September 30, 2023, product revenue was $8.8 million, a decrease of 33.5% from the three months ended September 30, 2022. This decrease was driven by the two large deployments in the prior year and lower volume spread across all of our sales channels.
22
For the three months ended September 30, 2023, software and other services revenue was $6.7 million, growing by 3.3% from the three months ended September 30, 2022.
Cost of revenue
|
|
Three months ended September 30, |
|
|
|
|
|
|
||||
(in thousands) |
|
2023 |
|
2022 |
|
Change |
|
% Change |
|
|||
Product |
|
$ |
3,929 |
|
$ |
6,534 |
|
$ |
(2,605) |
|
(39.9) |
% |
Software and other services |
|
|
2,110 |
|
|
2,095 |
|
|
15 |
|
0.7 |
% |
|
|
$ |
6,039 |
|
$ |
8,629 |
|
$ |
(2,590) |
|
(30.0) |
% |
Percentage of revenue |
|
|
39.2 |
% |
|
44.0 |
% |
|
|
|
|
|
Cost of product revenue decreased by $2.6 million, or 39.9%, for the three months ended September 30, 2023 compared to the three months ended September 30, 2022. This decrease was primarily driven by the decrease in devices sold. Cost of software and other services revenue was not significantly different for the three months ended September 30, 2023 compared to the three months ended September 30, 2022.
Research and development
|
|
Three months ended September 30, |
|
|
|
|
|
|
||||
(in thousands) |
|
2023 |
|
2022 |
|
Change |
|
% Change |
|
|||
Research and development |
|
$ |
12,130 |
|
$ |
22,040 |
|
$ |
(9,910) |
|
(45.0) |
% |
Percentage of revenue |
|
|
78.7 |
% |
|
112.3 |
% |
|
|
|
|
|
Research and development expenses decreased by $9.9 million, or 45.0%, for the three months ended September 30, 2023 compared to the three months ended September 30, 2022. This decrease was primarily driven by reductions of $7.3 million in personnel costs resulting from our reductions in force over the past year, $1.3 million in engineering and testing costs as we approach the launch of our next-generation probe in 2024, and $1.1 million in consulting fees as we developed our internal capabilities to perform previously outsourced functions.
Sales and marketing
|
|
Three months ended September 30, |
|
|
|
|
|
|
||||
(in thousands) |
|
2023 |
|
2022 |
|
Change |
|
% Change |
|
|||
Sales and marketing |
|
$ |
9,012 |
|
$ |
15,481 |
|
$ |
(6,469) |
|
(41.8) |
% |
Percentage of revenue |
|
|
58.4 |
% |
|
78.9 |
% |
|
|
|
|
|
Sales and marketing expenses decreased by $6.5 million, or 41.8%, for the three months ended September 30, 2023 compared to the three months ended September 30, 2022. This decrease was primarily driven by reductions of $4.8 million in personnel costs resulting from our reductions in force over the past year. Reductions of $1.2 million in marketing expenses and other non-personnel costs also contributed to the decrease. We have started to reinvest in direct sales cost to drive top-line growth.
General and administrative
|
|
Three months ended September 30, |
|
|
|
|
|
|
||||
(in thousands) |
|
2023 |
|
2022 |
|
Change |
|
% Change |
|
|||
General and administrative |
|
$ |
11,560 |
|
$ |
16,603 |
|
$ |
(5,043) |
|
(30.4) |
% |
Percentage of revenue |
|
|
75.0 |
% |
|
84.6 |
% |
|
|
|
|
|
General and administrative expenses decreased by $5.0 million, or 30.4%, for the three months ended September 30, 2023 compared to the three months ended September 30, 2022. This decrease was primarily driven by reductions of $4.0 million in personnel costs resulting from our reductions in force over the past year and $0.9 million in professional service fees for legal and other administrative services.
23
Other
|
|
Three months ended September 30, |
|
|
|
|
|
|
||||
(in thousands) |
|
2023 |
|
2022 |
|
Change |
|
% Change |
|
|||
Other |
|
$ |
9,243 |
|
$ |
2,897 |
|
$ |
6,346 |
|
219.1 |
% |
Percentage of revenue |
|
|
59.9 |
% |
|
14.8 |
% |
|
|
|
|
|
Other increased by $6.3 million for the three months ended September 30, 2023 compared to the three months ended September 30, 2022. This increase was primarily driven by $2.9 million of higher employee severance and benefits costs resulting from our reduction in force in July 2023 and $3.5 million of higher legal costs due to litigation and other legal matters. These costs are not representative of our ongoing operations.
Comparison of the nine months ended September 30, 2023 and 2022
Revenue
|
|
Nine months ended September 30, |
|
|
|
|
|
|
||||
(in thousands) |
|
2023 |
|
2022 |
|
Change |
|
% Change |
|
|||
Product |
|
$ |
29,874 |
|
$ |
37,607 |
|
$ |
(7,733) |
|
(20.6) |
% |
Software and other services |
|
|
19,510 |
|
|
16,800 |
|
|
2,710 |
|
16.1 |
|
|
|
$ |
49,384 |
|
$ |
54,407 |
|
$ |
(5,023) |
|
(9.2) |
% |
For the nine months ended September 30, 2023, total revenue of $49.4 million was down from $54.4 million for the nine months ended September 30, 2022. In the U.S., we realized $35.0 million in total sales for the nine months ended September 30, 2023, up 1.5% from the nine months ended September 30, 2022, driven by higher subscription revenue and higher average selling prices, which was partially offset by lower probe sales and a large deployment to the University of Rochester Medical Center in the prior year. Compared to the nine months ended September 30, 2022, total International sales declined 30.9% to $10.8 million for the nine months ended September 30, 2023. This decline is a result of the deployment under the Gates Foundation agreement in the prior year as well as several initial orders from distributors that occurred in the prior year as we entered new markets. Other revenue declined by $0.7 million for the nine months ended September 30, 2023 compared to the nine months ended September 30, 2022, due to two large sales in Vet that occurred in the prior year.
For the nine months ended September 30, 2023, product revenue was $29.9 million, a decrease of 20.6% from the nine months ended September 30, 2022. This decrease was driven by the two large deployments in the prior year and lower volume spread across all of our sales channels. For the nine months ended September 30, 2023, software and other services revenue was $19.5 million, growing by 16.1% from the nine months ended September 30, 2022.
Cost of revenue
|
|
Nine months ended September 30, |
|
|
|
|
|
|
||||
(in thousands) |
|
2023 |
|
2022 |
|
Change |
|
% Change |
|
|||
Product |
|
$ |
13,765 |
|
$ |
19,481 |
|
$ |
(5,716) |
|
(29.3) |
% |
Software and other services |
|
|
6,226 |
|
|
5,022 |
|
|
1,204 |
|
24.0 |
|
|
|
$ |
19,991 |
|
$ |
24,503 |
|
$ |
(4,512) |
|
(18.4) |
% |
Percentage of revenue |
|
|
40.5 |
% |
|
45.0 |
% |
|
|
|
|
|
Cost of product revenue decreased by $5.7 million, or 29.3%, for the nine months ended September 30, 2023 compared to the nine months ended September 30, 2022. This decrease was primarily driven by the decrease in devices sold and a reduction of $0.8 million in inbound freight costs resulting from increased operational efficiencies in our supply chain.
Cost of software and other services revenue increased by $1.2 million, or 24.0%, for the nine months ended September 30, 2023 compared to the nine months ended September 30, 2022. This increase was primarily driven by $2.0 million of higher amortization expenses for internally-developed software supporting our SaaS offerings as we continued deploying new software over the past year, which was partially offset by reductions of $0.8 million in service delivery costs for our cloud platform and education services as a result of increased efficiencies.
24
Research and development
|
|
Nine months ended September 30, |
|
|
|
|
|
|
||||
(in thousands) |
|
2023 |
|
2022 |
|
Change |
|
% Change |
|
|||
Research and development |
|
$ |
44,409 |
|
$ |
68,883 |
|
$ |
(24,474) |
|
(35.5) |
% |
Percentage of revenue |
|
|
89.9 |
% |
|
126.6 |
% |
|
|
|
|
|
Research and development expenses decreased by $24.5 million, or 35.5%, for the nine months ended September 30, 2023 compared to the nine months ended September 30, 2022. This decrease was primarily driven by reductions of $18.2 million in personnel costs resulting from our reductions in force over the past year, $3.8 million in consulting fees, $1.6 million in engineering and testing costs as we approach the launch of our next-generation probe in 2024, and $1.0 million in software costs due to our lower headcount.
Sales and marketing
|
|
Nine months ended September 30, |
|
|
|
|
|
|
||||
(in thousands) |
|
2023 |
|
2022 |
|
Change |
|
% Change |
|
|||
Sales and marketing |
|
$ |
28,776 |
|
$ |
47,121 |
|
$ |
(18,345) |
|
(38.9) |
% |
Percentage of revenue |
|
|
58.3 |
% |
|
86.6 |
% |
|
|
|
|
|
Sales and marketing expenses decreased by $18.3 million, or 38.9%, for the nine months ended September 30, 2023 compared to the nine months ended September 30, 2022. This decrease was primarily driven by reductions of $12.7 million in personnel costs resulting from our reductions in force over the past year and $0.8 million in consulting fees as we developed our internal capabilities to perform previously outsourced functions. Reductions of $4.8 million in marketing expenses and other non-personnel costs also contributed to the decrease.
General and administrative
|
|
Nine months ended September 30, |
|
|
|
|
|
|
||||
(in thousands) |
|
2023 |
|
2022 |
|
Change |
|
% Change |
|
|||
General and administrative |
|
$ |
37,239 |
|
$ |
54,080 |
|
$ |
(16,841) |
|
(31.1) |
% |
Percentage of revenue |
|
|
75.4 |
% |
|
99.4 |
% |
|
|
|
|
|
General and administrative expenses decreased by $16.8 million, or 31.1%, for the nine months ended September 30, 2023 compared to the nine months ended September 30, 2022. This decrease was primarily driven by reductions of $11.1 million in personnel costs resulting from our reductions in force over the past year, $5.0 million in professional service fees for legal and other administrative services, and $0.7 million in insurance costs.
Other
|
|
Nine months ended September 30, |
|
|
|
|
|
|
||||
(in thousands) |
|
2023 |
|
2022 |
|
Change |
|
% Change |
|
|||
Other |
|
$ |
17,848 |
|
$ |
3,838 |
|
$ |
14,010 |
|
365.0 |
% |
Percentage of revenue |
|
|
36.1 |
% |
|
7.1 |
% |
|
|
|
|
|
Other increased by $14.0 million for the nine months ended September 30, 2023 compared to the nine months ended September 30, 2022. This increase was primarily driven by $6.8 million of higher employee severance and benefits costs resulting from our reductions in force in 2023 and $7.3 million of higher legal costs due to litigation and other legal matters. These costs are not representative of our ongoing operations.
Liquidity and Capital Resources
Since our inception, our primary sources of liquidity are cash flows from operations, proceeds from the Business Combination, and issuances of preferred stock and convertible notes. Our primary uses of liquidity are operating expenses, working capital requirements, and capital expenditures. Cash flows from operations have historically been negative as we continue to expand our customer base and develop new products and software offerings.
25
We expect to have negative cash flows on an annual basis, but our quarter-to-quarter results may fluctuate.
We expect that our existing cash, cash equivalents, and cash flows from operations will be sufficient to fund our operations and meet our working capital, capital expenditure, and other liquidity needs for at least the next 12 months.
Our cash and cash equivalents balance as of September 30, 2023 was $150.0 million, consisting of cash on deposit and money market funds. Our future spending on capital resources may vary from those currently planned and will depend on various factors, including our rate of revenue growth and the timing and extent of our spending on strategic business initiatives.
Our restricted cash balance as of September 30, 2023 was $4.3 million, consisting of $4.0 million held as collateral to secure a letter of credit for one of our office leases and $0.2 million restricted by our agreement with the Gates Foundation. The $4.0 million held as collateral is expected to be maintained as a security deposit throughout the duration of the lease. The restriction on the $0.2 million from our agreement with the Gates Foundation is expected to lapse as we fulfill our obligations in the agreement.
Our material cash requirements include contractual obligations with third parties for office leases and inventory supply agreements. Our fixed office lease payment obligations were $32.2 million as of September 30, 2023, with $3.3 million payable within the next 12 months. During the third quarter of 2023, we terminated one of our office leases and modified another resulting in a net decrease of $6.0 million in fixed office lease payment obligations. Our fixed purchase obligations for inventory supply agreements were $22.4 million as of September 30, 2023, with $6.8 million payable within the next 12 months. We expect to pay for approximately 25% of the amount payable within the next 12 months using vendor advances.
On July 11, 2023, we announced a plan designed to realign our strategy, including a 25% reduction in our work force and other savings. Going forward, we expect this plan will reduce our cash requirements for operating expenses by an average of approximately $2 million per month and extend our cash resources.
We had no obligations, assets, or liabilities which would be considered off-balance sheet arrangements as of September 30, 2023.
Cash flows
Comparison of the nine months ended September 30, 2023 and 2022
The following table summarizes our sources and uses of cash for the nine months ended September 30, 2023 and 2022:
|
|
Nine months ended September 30, |
||||
(in thousands) |
|
2023 |
|
2022 |
||
Net cash used in operating activities |
|
$ |
(85,719) |
|
$ |
(140,256) |
Net cash provided by (used in) investing activities |
|
|
72,926 |
|
|
(91,298) |
Net cash provided by financing activities |
|
|
228 |
|
|
2,744 |
Net decrease in cash, cash equivalents and restricted cash |
|
$ |
(12,565) |
|
$ |
(228,810) |
Net cash used in operating activities
Net cash used in operating activities represents the cash receipts and disbursements related to our activities other than investing and financing activities. We expect cash provided by historical financing activities will continue to be our primary source of funds to support operating and capital expenditure needs for the foreseeable future.
Net cash used in operating activities decreased by $54.5 million, or 38.9%, for the nine months ended September 30, 2023 compared to the nine months ended September 30, 2022. The decrease was driven by reductions of $46.7 million in net loss adjusted for certain noncash items and $7.8 million in net working capital cash usage. The decrease in net loss adjusted for certain noncash items was primarily driven by a reduction of $45.4 million in net loss and lower noncash adjustments for the change in fair value of warrant liabilities and stock-based compensation expense. The decrease in net working capital cash usage was primarily driven by a reduction in cash used for changes in our inventory and the related vendor advances and accrued purchase commitments.
26
Net cash used in investing activities
Net cash provided by investing activities increased by $164.2 million for the nine months ended September 30, 2023 compared to the nine months ended September 30, 2022. The increase was driven by $76.5 million of cash provided by sales of investments in marketable securities earlier this year as well as reductions of $74.8 million in cash used to purchase marketable securities and $12.9 million in cash used to purchase property and equipment.
Net cash provided by financing activities
Net cash provided by financing activities decreased by $2.5 million, or 91.7%, for the nine months ended September 30, 2023 compared to the nine months ended September 30, 2022. The decrease was primarily driven by a reduction of $2.6 million in cash provided by exercises of stock options and warrants.
Critical Accounting Policies and Significant Judgments and Estimates
This discussion and analysis of our financial condition and results of operations are based on our condensed consolidated financial statements which have been prepared in accordance with U.S. GAAP. The preparation of these condensed consolidated financial statements requires us to make estimates and assumptions that affect the reported amounts of assets, liabilities, revenue, contingent assets and liabilities, and related disclosures. Our estimates are based on our historical experience and various other factors that we believe are reasonable under the circumstances, and these form the basis for making judgments about items that are not readily apparent from other sources. Actual results may differ from these estimates under different assumptions or conditions.
For our condensed consolidated financial statements included in this Quarterly Report on Form 10-Q, there have been no material changes to the critical accounting policies and estimates disclosed in our 2022 Annual Report on Form 10-K.
Recently Adopted Accounting Pronouncements
The Company did not identify any significant recently issued accounting pronouncements that may potentially impact our financial position and results of operations.
Item 3. Quantitative and Qualitative Disclosures About Market Risk
Interest Rate Risk
We did not have any floating rate debt as of September 30, 2023. Our cash and cash equivalents are comprised primarily of bank deposits and money market accounts. The primary objective of our investments is the preservation of capital to fulfill liquidity needs. We do not enter into investments for trading or speculative purposes. Due to the short-term nature and low risk profile of these investments, we do not expect cash flows to be affected to any significant degree by a sudden change in market interest rates, including an immediate change of 100 basis points, or one percentage point. Declines in interest rates, however, would reduce future investment income.
Inflation Risk
We do not believe that inflation has had a material effect on our business, financial condition, or results of operations, other than its impact on the general economy. Nonetheless, to the extent our costs are impacted by general inflationary pressures, we may not be able to fully offset such higher costs through price increases or manufacturing efficiencies. Our inability or failure to do so could harm our business, financial condition, and results of operations.
Foreign Exchange Risk
We operate our business primarily within the United States and currently execute the majority of our transactions in U.S. dollars. We have not utilized hedging strategies with respect to such foreign exchange exposure. This limited foreign currency translation risk is not expected to have a material impact on our condensed consolidated financial statements.
27
Item 4. Controls and Procedures
Evaluation of Disclosure Controls and Procedures
Under the supervision and with the participation of our management, including our principal executive officer and principal financial officer, we conducted an evaluation of the effectiveness of the design and operation of our disclosure controls and procedures, as defined in Rules 13a-15(e) and 15d-15(e) under the Exchange Act as of the end of the period covered by this Quarterly Report on Form 10-Q.
Disclosure controls and procedures are controls and other procedures that are designed to ensure that information required to be disclosed in our reports filed or submitted under the Exchange Act is recorded, processed, summarized, and reported within the time periods specified in the SEC’s rules and forms. Disclosure controls and procedures include controls and procedures designed to ensure that information required to be disclosed in our company’s reports filed under the Exchange Act is accumulated and communicated to management, including our Chief Executive Officer and Chief Financial & Operating Officer, to allow timely decisions regarding required disclosure. Management recognizes that any controls and procedures, no matter how well designed and operated, can provide only reasonable assurance of achieving the desired control objectives, and management necessarily applies its judgment in evaluating the cost-benefit relationship of possible controls and procedures.
Based on the evaluation of our disclosure controls and procedures, our Chief Executive Officer and Chief Financial & Operating Officer concluded that our disclosure controls and procedures were effective as of September 30, 2023.
Changes in Internal Control over Financial Reporting
There were no changes in our internal control over financial reporting identified in connection with the evaluation required by Rules 13a-15(d) and 15d-15(d) of the Exchange Act that occurred during the three months ended September 30, 2023 that have materially affected, or are reasonably likely to materially affect, our internal control over financial reporting.
PART II — OTHER INFORMATION
Item 1. Legal Proceedings
We are currently and may in the future be subject to legal proceedings, claims, and regulatory actions arising in the ordinary course of business. The outcome of any such matters, regardless of the merits, is inherently uncertain.
For more information about our legal proceedings and this item, see Note 13 “Commitments and Contingencies” in the Notes to Condensed Consolidated Financial Statements in Part I, Item 1 “Financial Statements” of this Quarterly Report on Form 10-Q, which is incorporated herein by reference.
Item 1A. Risk Factors
Our business, results of operations, and financial condition are subject to various risks and uncertainties including the risk factors described under the caption “Risk Factors” in our 2022 Annual Report on Form 10-K. There have been no material changes to the risk factors described in the 2022 Annual Report on Form 10-K.
Item 2. Unregistered Sales of Equity Securities and Use of Proceeds
Unregistered Sales of Equity Securities
Not applicable.
Issuer Purchases of Equity Securities
We did not repurchase any of our equity securities during the three months ended September 30, 2023.
28
29
EXHIBIT INDEX
Exhibit Number |
|
Exhibit Description |
|
Filed Herewith |
|
Incorporated by Reference herein from Form or Schedule |
|
Filing Date |
|
SEC File/ Reg. Number |
|---|---|---|---|---|---|---|---|---|---|---|
3.1 |
|
Second Amended and Restated Certificate of Incorporation of Butterfly Network, Inc. |
|
|
|
Form 8-K (Exhibit 3.1) |
|
2/16/2021 |
|
001-39292 |
3.2 |
|
|
|
|
Form 8-K (Exhibit 3.2) |
|
2/16/2021 |
|
001-39292 |
|
31.1 |
|
|
X |
|
|
|
|
|
|
|
31.2 |
|
|
X |
|
|
|
|
|
|
|
32.1* |
|
|
X |
|
|
|
|
|
|
|
101.INS |
|
Inline XBRL Instance Document - The instance document does not appear in the Interactive Data File because its Inline XBRL tags are embedded within the Inline XBRL document. |
|
X |
|
|
|
|
|
|
101.SCH |
|
Inline XBRL Taxonomy Extension Schema Document. |
|
X |
|
|
|
|
|
|
101.CAL |
|
Inline XBRL Taxonomy Extension Calculation Linkbase Document. |
|
X |
|
|
|
|
|
|
30
Exhibit Number |
|
Exhibit Description |
|
Filed Herewith |
|
Incorporated by Reference herein from Form or Schedule |
|
Filing Date |
|
SEC File/ Reg. Number |
|---|---|---|---|---|---|---|---|---|---|---|
101.DEF |
|
Inline XBRL Taxonomy Extension Definition Linkbase Document. |
|
X |
|
|
|
|
|
|
101.LAB |
|
Inline XBRL Taxonomy Extension Label Linkbase Document. |
|
X |
|
|
|
|
|
|
101.PRE |
|
Inline XBRL Taxonomy Extension Presentation Linkbase Document. |
|
X |
|
|
|
|
|
|
104 |
|
Cover Page Interactive Data File (formatted in Inline XBRL and contained in Exhibit 101) |
|
X |
|
|
|
|
|
|
+ |
Management contract or compensatory plan or arrangement. |
* |
Furnished herewith. |
31
SIGNATURES
Pursuant to the requirements of the Securities Exchange Act of 1934, the registrant has duly caused this report to be signed on its behalf by the undersigned thereunto duly authorized.
|
BUTTERFLY NETWORK, INC. |
|
|
|
|
|
|
|
Date: November 6, 2023 |
By: |
/s/ Joseph DeVivo |
|
|
Joseph DeVivo |
|
|
President, Chief Executive Officer, and Chairman of the Board |
|
|
|
|
|
|
Date: November 6, 2023 |
By: |
/s/ Heather C. Getz, CPA |
|
|
Heather C. Getz, CPA |
|
|
Executive Vice President and Chief Financial & Operations Officer |
32
Exhibit 31.1
CERTIFICATIONS UNDER SECTION 302
I, Joseph DeVivo, certify that:
| 1. | I have reviewed this Quarterly Report on Form 10-Q of Butterfly Network, Inc.; |
| 2. | Based on my knowledge, this report does not contain any untrue statement of a material fact or omit to state a material fact necessary to make the statements made, in light of the circumstances under which such statements were made, not misleading with respect to the period covered by this report; |
| 3. | Based on my knowledge, the financial statements, and other financial information included in this report, fairly present in all material respects the financial condition, results of operations and cash flows of the registrant as of, and for, the periods presented in this report; |
| 4. | The registrant’s other certifying officer(s) and I are responsible for establishing and maintaining disclosure controls and procedures (as defined in Exchange Act Rules 13a-15(e) and 15d-15(e)) and internal control over financial reporting (as defined in Exchange Act Rules 13a-15(f) and 15d-15(f)) for the registrant and have: |
| (a) | Designed such disclosure controls and procedures, or caused such disclosure controls and procedures to be designed under our supervision, to ensure that material information relating to the registrant, including its consolidated subsidiaries, is made known to us by others within those entities, particularly during the period in which this report is being prepared; |
| (b) | Designed such internal control over financial reporting, or caused such internal control over financial reporting to be designed under our supervision, to provide reasonable assurance regarding the reliability of financial reporting and the preparation of financial statements for external purposes in accordance with generally accepted accounting principles; |
| (c) | Evaluated the effectiveness of the registrant’s disclosure controls and procedures and presented in this report our conclusions about the effectiveness of the disclosure controls and procedures, as of the end of the period covered by this report based on such evaluation; and |
| (d) | Disclosed in this report any change in the registrant's internal control over financial reporting that occurred during the registrant's most recent fiscal quarter (the registrant's fourth fiscal quarter in the case of an annual report) that has materially affected, or is reasonably likely to materially affect, the registrant's internal control over financial reporting; and |
| 5. | The registrant’s other certifying officer(s) and I have disclosed, based on our most recent evaluation of internal control over financial reporting, to the registrant’s auditors and the audit committee of the registrant’s board of directors (or persons performing the equivalent functions): |
| (a) | All significant deficiencies and material weaknesses in the design or operation of internal control over financial reporting which are reasonably likely to adversely affect the registrant’s ability to record, process, summarize and report financial information; and |
| (b) | Any fraud, whether or not material, that involves management or other employees who have a significant role in the registrant’s internal control over financial reporting. |
Date: November 6, 2023
/s/ Joseph DeVivo |
|
Joseph DeVivo |
|
President, Chief Executive Officer, and Chairman of the Board |
|
Exhibit 31.2
CERTIFICATIONS UNDER SECTION 302
I, Heather C. Getz, CPA, certify that:
| 1. | I have reviewed this Quarterly Report on Form 10-Q of Butterfly Network, Inc.; |
| 2. | Based on my knowledge, this report does not contain any untrue statement of a material fact or omit to state a material fact necessary to make the statements made, in light of the circumstances under which such statements were made, not misleading with respect to the period covered by this report; |
| 3. | Based on my knowledge, the financial statements, and other financial information included in this report, fairly present in all material respects the financial condition, results of operations and cash flows of the registrant as of, and for, the periods presented in this report; |
| 4. | The registrant’s other certifying officer(s) and I are responsible for establishing and maintaining disclosure controls and procedures (as defined in Exchange Act Rules 13a-15(e) and 15d-15(e)) and internal control over financial reporting (as defined in Exchange Act Rules 13a-15(f) and 15d-15(f)) for the registrant and have: |
| (a) | Designed such disclosure controls and procedures, or caused such disclosure controls and procedures to be designed under our supervision, to ensure that material information relating to the registrant, including its consolidated subsidiaries, is made known to us by others within those entities, particularly during the period in which this report is being prepared; |
| (b) | Designed such internal control over financial reporting, or caused such internal control over financial reporting to be designed under our supervision, to provide reasonable assurance regarding the reliability of financial reporting and the preparation of financial statements for external purposes in accordance with generally accepted accounting principles; |
| (c) | Evaluated the effectiveness of the registrant’s disclosure controls and procedures and presented in this report our conclusions about the effectiveness of the disclosure controls and procedures, as of the end of the period covered by this report based on such evaluation; and |
| (d) | Disclosed in this report any change in the registrant's internal control over financial reporting that occurred during the registrant's most recent fiscal quarter (the registrant's fourth fiscal quarter in the case of an annual report) that has materially affected, or is reasonably likely to materially affect, the registrant's internal control over financial reporting; and |
| 5. | The registrant’s other certifying officer(s) and I have disclosed, based on our most recent evaluation of internal control over financial reporting, to the registrant’s auditors and the audit committee of the registrant’s board of directors (or persons performing the equivalent functions): |
| (a) | All significant deficiencies and material weaknesses in the design or operation of internal control over financial reporting which are reasonably likely to adversely affect the registrant’s ability to record, process, summarize and report financial information; and |
| (b) | Any fraud, whether or not material, that involves management or other employees who have a significant role in the registrant’s internal control over financial reporting. |
Date: November 6, 2023
/s/ Heather C. Getz, CPA |
|
Heather C. Getz, CPA |
|
Executive Vice President and Chief Financial & Operations Officer |
|
Exhibit 32.1
CERTIFICATIONS UNDER SECTION 906
Pursuant to section 906 of the Sarbanes-Oxley Act of 2002 (subsections (a) and (b) of section 1350, chapter 63 of title 18, United States Code), each of the undersigned officers of Butterfly Network, Inc., a Delaware corporation (the “Company”), does hereby certify, to such officer’s knowledge, that:
The Quarterly Report for the quarter ended September 30, 2023 (the “Form 10-Q”) of the Company fully complies with the requirements of Section 13(a) or 15(d) of the Securities Exchange Act of 1934, and the information contained in the Form 10-Q fairly presents, in all material respects, the financial condition and results of operations of the Company.
Dated: November 6, 2023 |
/s/ Joseph DeVivo |
|
Joseph DeVivo |
|
President, Chief Executive Officer, and Chairman of the Board |
Dated: November 6, 2023 |
/s/ Heather C. Getz, CPA |
|
Heather C. Getz, CPA |
|
Executive Vice President and Chief Financial & Operations Officer |