UNITED STATES
SECURITIES AND EXCHANGE COMMISSION
Washington, D.C. 20549
FORM 8-K
CURRENT REPORT
Pursuant to Section 13 or 15(d) of the Securities Exchange Act of 1934
Date of Report (Date of earliest event reported): October 26, 2023
GOLD RESOURCE CORPORATION
(Exact name of registrant as specified in its charter)
Colorado |
001-34857 |
84-1473173 |
|
(State or other jurisdiction of incorporation) |
(Commission File Number) |
(I.R.S. Employer Identification Number) |
7900 E. Union Ave, Suite 320 |
|
|
Denver, Colorado |
|
80237 |
(Address of principal executive offices) |
|
(Zip Code) |
Registrant’s telephone number including area code: (303) 320-7708
(Former name or former address, if changed since last report)
Check the appropriate box below if the Form 8-K filing is intended to simultaneously satisfy the filing obligation of the registrant under any of the following provisions:
☐ |
Written communications pursuant to Rule 425 under the Securities Act (17 CFR 230.425) |
☐ |
Soliciting material pursuant to Rule 14a-12 under the Exchange Act (17 CFR 240.14a-12) |
☐ |
Pre-commencement communications pursuant to Rule 14d-2(b) under the Exchange Act (17 CFR 240.14d-2(b)) |
☐ |
Pre-commencement communications pursuant to Rule 13e-4(c) under the Exchange Act (17 CFR 240.13e-4(c)) |
Securities registered pursuant to Section 12(b) of the Act:
Title of each class |
Trading Symbol(s) |
Name of each exchange on which |
Common Stock |
GORO |
NYSE American |
Indicate by check mark whether the registrant is an emerging growth company as defined in Rule 405 of the Securities Act of 1933 (§230.405 of this chapter) or Rule 12b-2 of the Securities Exchange Act of 1934 (§240.12b-2 of this chapter).
Emerging growth company ☐
If an emerging growth company, indicate by check mark if the registrant has elected not to use the extended transition period for complying with any new or revised financial accounting standards provided pursuant to Section 13(a) of the Exchange Act. ◻ On October 26, 2023, Gold Resource Corporation (the “Company”) provided an updated Mineral Resource Estimate for its Back Forty Mine Project (the “Back Forty Project”) located in the Upper Peninsula of Michigan.
1.01
Item 7.01 Regulation FD Disclosure.
A copy of the Company’s press release dated October 26, 2023 relating to such update is attached as Exhibit 99.1 to this Form 8-K.
In accordance with General Instruction B.2 of Form 8-K, the information in this Item 7.01, including Exhibit 99.1, shall not be deemed to be “filed” for purposes of Section 18 of the Securities Exchange Act of 1934, as amended (the “Exchange Act”), or otherwise subject to the liability of that section, and shall not be incorporated by reference into any of the Company’s filings or other document filed under the Securities Act of 1933, as amended, or the Exchange Act, except as shall be expressly set forth by specific reference in such filing.
Item 8.01 Other Events.
On October 26, 2023, the Company made available its SK1300 Technical Report Summary on the Back Forty Mine Project, Michigan, USA, which has an effective date of September 30, 2023. A copy of such Technical Report Summary is attached as Exhibit 96.1 to this Form 8-K.
Item 9.01Financial Statements and Exhibits
(d) Exhibits. The following exhibits are furnished with this report:
23.1Consent of Qualified Person (M. Iund)
23.2Consent of Qualified Person (C. Pelletier)
23.3Consent of Qualified Person (S. Boudreau)
23.4Consent of Qualified Person (E. Kinnan)
23.5Consent of Qualified Person (A. Martin)
23.6Consent of Qualified Person (M. Foley)
23.7Consent of Qualified Person (R. Simidu)
23.8Consent of Qualified Person (C. Laroche)
23.9Consent of Qualified Person (P. Frenette)
99.1News Release dated October 26, 2023
| 104 | Cover Page Interactive Data File (formatted in Inline XBRL and contained in Exhibit 101) |
2
SIGNATURE
Pursuant to the requirements of the Securities Exchange Act of 1934, the registrant has duly caused this report to be signed on its behalf by the undersigned hereunto duly authorized.
|
|
|
|
|
|
GOLD RESOURCE CORPORATION |
|
|
|
|
|
Date: October 26, 2023 |
By: |
/s/ Allen Palmiere |
|
Name: |
Allen Palmiere |
||
Title: |
Chief Executive Officer and President |
||
3
Exhibit 23.1
CONSENT OF QUALIFIED PERSON
I, Marina Iund, P. Geo., in connection with the SK-1300 Technical Report Summary on the Back Forty Project, Michigan, USA and any amendments or supplements and/or exhibits thereto, consent to:
| ● | the filing and use of the Technical Report Summary for the Back Forty Project with an effective date of September 30, 2023, as an exhibit to the Form 8-K; |
| ● | the use of and references to my name, including my status as an expert or “qualified person” (as defined in Subpart 1300 of Regulation S-K promulgated by the U.S. Securities and Exchange Commission), in connection with the Form 8-K and the Technical Report Summary; and |
| ● | the use of information derived, summarized, quoted, or referenced from the Technical Report Summary, or portions thereof, that was prepared by me, that I supervised the preparation of and/or that was reviewed and approved by me, that is included or incorporated by reference in the Form 8-K. |
I am the qualified person responsible for authoring the following sections of the Technical Report Summary: 3, 4, 5, 6, 7, 8, 9, 11, 22, and 23.
I also consent to the incorporation by reference of the above items in the registration statements of Gold Resource Corporation filed on Form S-3 (No. 333-235312) and Form S-8 (Nos. 333-214958 and 333-171779).
Dated October 26, 2023
By: |
/s/ InnovExplo |
/s/ Marina Iundu |
Name: |
InnovExplo |
Marina Iund, P. Geo. |
Title: |
|
Senior Resource Geologist |
Exhibit 23.2
CONSENT OF QUALIFIED PERSON
I, Carl Pelletier, P. Geo., in connection with the SK-1300 Technical Report Summary on the Back Forty Project, Michigan, USA and any amendments or supplements and/or exhibits thereto, consent to:
| ● | the filing and use of the Technical Report Summary for the Back Forty Project with an effective date of September 30, 2023; |
| ● | the use of and references to my name, including my status as an expert or “qualified person” (as defined in Subpart 1300 of Regulation S-K promulgated by the U.S. Securities and Exchange Commission), in connection with the Form 8-K and the Technical Report Summary; and |
| ● | the use of information derived, summarized, quoted, or referenced from the Technical Report Summary, or portions thereof, that was prepared by me, that I supervised the preparation of and/or that was reviewed and approved by me, that is included or incorporated by reference in the Form 8-K. |
I am the qualified person responsible for authoring the following sections of the Technical Report Summary: 3, 4, 5, 6, 7, 8, 9, 11, 22, and 23.
I also consent to the incorporation by reference of the above items in the registration statements of Gold Resource Corporation filed on Form S-3 (No. 333-235312) and Form S-8 (Nos. 333-214958 and 333-171779).
Dated October 26, 2023
By: |
/s/ InnovExplo |
/s/ Carl Pelletier |
||
Name: |
InnovExplo |
Carl Pelletier, P. Geo. |
||
Title: |
|
Co-President and Founder |
||
Exhibit 23.3
CONSENT OF QUALIFIED PERSON
I, Simon Boudreau, P. Eng., in connection with the SK-1300 Technical Report Summary on the Back Forty Project, Michigan, USA and any amendments or supplements and/or exhibits thereto, consent to:
| ● | the filing and use of the Technical Report Summary for the Back Forty Project with an effective date of September 30, 2023; |
| ● | the use of and references to my name, including my status as an expert or “qualified person” (as defined in Subpart 1300 of Regulation S-K promulgated by the U.S. Securities and Exchange Commission), in connection with the Form 8-K and the Technical Report Summary; and |
| ● | the use of information derived, summarized, quoted, or referenced from the Technical Report Summary, or portions thereof, that was prepared by me, that I supervised the preparation of and/or that was reviewed and approved by me, that is included or incorporated by reference in the Form 8-K. |
I am the qualified person responsible for authoring the following sections of the Technical Report Summary:
| ● | 11.13 Economical Parameters and Cut-Off Grade. |
I also consent to the incorporation by reference of the above items in the registration statements of Gold Resource Corporation filed on Form S-3 (No. 333-235312) and Form S-8 (Nos. 333-214958 and 333-171779).
Dated October 26, 2023
By: |
/s/ InnovExplo |
/s/ Simon Boudreau |
Name: |
InnovExplo |
Simon Boudreau, P. Eng. |
Title: |
|
Sr Mine Engineer |
Exhibit 23.4
CONSENT OF QUALIFIED PERSON
I, Eric Kinnan, P. Geo., in connection with the SK-1300 Technical Report Summary on the Back Forty Project, Michigan, USA and any amendments or supplements and/or exhibits thereto, consent to:
| ● | the filing and use of the Technical Report Summary for the Back Forty Project with an effective date of September 30, 2023; |
| ● | the use of and references to my name, including my status as an expert or “qualified person” (as defined in Subpart 1300 of Regulation S-K promulgated by the U.S. Securities and Exchange Commission), in connection with the Form 8-K and the Technical Report Summary; and |
| ● | the use of information derived, summarized, quoted, or referenced from the Technical Report Summary, or portions thereof, that was prepared by me, that I supervised the preparation of and/or that was reviewed and approved by me, that is included or incorporated by reference in the Form 8-K. |
I am the qualified person responsible for authoring the following sections of the Technical Report Summary: 9 and 22.
I also consent to the incorporation by reference of the above items in the registration statements of Gold Resource Corporation filed on Form S-3 (No. 333-235312) and Form S-8 (Nos. 333-214958 and 333-171779).
Dated October 26, 2023
By: |
/s/ InnovExplo |
/s/ Eric Kinnan |
Name: |
InnovExplo |
Eric Kinnan, P. Geo. |
Title: |
|
Sr Geologist |
Exhibit 23.5
CONSENT OF QUALIFIED PERSON
I, Andrea K. Martin, P. E., in connection with the SK-1300 Technical Report Summary on the Back Forty Project, Michigan, USA and any amendments or supplements and/or exhibits thereto, consent to:
| ● | the filing and use of the Technical Report Summary for the Back Forty Project with an effective date of September 30, 2023; |
| ● | the use of and references to my name, including my status as an expert or “qualified person” (as defined in Subpart 1300 of Regulation S-K promulgated by the U.S. Securities and Exchange Commission), in connection with the Form 8-K and the Technical Report Summary; and |
| ● | the use of information derived, summarized, quoted, or referenced from the Technical Report Summary, or portions thereof, that was prepared by me, that I supervised the preparation of and/or that was reviewed and approved by me, that is included or incorporated by reference in the Form 8-K. |
I am the qualified person responsible for authoring the following sections of the Technical Report Summary: 17 and 22.
I also consent to the incorporation by reference of the above items in the registration statements of Gold Resource Corporation filed on Form S-3 (No. 333-235312) and Form S-8 (Nos. 333-214958 and 333-171779).
Dated October 26, 2023
By: |
/s/ Foth Infrastructure & Environment |
/s/ Andrea K. Martin |
||
Name: |
Foth Infrastructure & Environment |
Andrea K. Martin, P. E. |
||
Title: |
|
Lead Environmental Engineer |
||
Exhibit 23.6
CONSENT OF QUALIFIED PERSON
I, Michael J. Foley, P. E., in connection with the SK-1300 Technical Report Summary on the Back Forty Project, Michigan, USA and any amendments or supplements and/or exhibits thereto, consent to:
| ● | the filing and use of the Technical Report Summary for the Back Forty Project with an effective date of September 30, 2023; |
| ● | the use of and references to my name, including my status as an expert or “qualified person” (as defined in Subpart 1300 of Regulation S-K promulgated by the U.S. Securities and Exchange Commission), in connection with the Form 8-K and the Technical Report Summary; and |
| ● | the use of information derived, summarized, quoted, or referenced from the Technical Report Summary, or portions thereof, that was prepared by me, that I supervised the preparation of and/or that was reviewed and approved by me, that is included or incorporated by reference in the Form 8-K. |
I am the qualified person responsible for authoring the following sections of the Technical Report Summary: 15 and 22.
I also consent to the incorporation by reference of the above items in the registration statements of Gold Resource Corporation filed on Form S-3 (No. 333-235312) and Form S-8 (Nos. 333-214958 and 333-171779).
Dated October 26, 2023
By: |
|
/s/ Michael J. Foleyn |
||
Name: |
|
Michael J. Foley, P. E. |
||
Title: |
|
Formerly Director of Environment and Infrastructures, GRC |
||
Exhibit 23.7
CONSENT OF QUALIFIED PERSON
I, Rodrigo Simidu, in connection with the Current Report on Form 8-K for the year ended September 30, 2023 and any amendments or supplements and/or exhibits thereto (collectively, the Form 8-K), consent to:
| ● | the filing and use of the Technical Report Summary for the Back Forty Project with an effective date of September 30, 2023, 2022, as an exhibit to the Form 8-K; |
| ● | the use of and references to my name, including my status as an expert or “qualified person” (as defined in Subpart 1300 of Regulation S-K promulgated by the U.S. Securities and Exchange Commission), in connection with the Form 8-K and the Technical Report Summary; and |
| ● | the use of information derived, summarized, quoted, or referenced from the Technical Report Summary, or portions thereof, that was prepared by me, that I supervised the preparation of and/or that was reviewed and approved by me, that is included or incorporated by reference in the Form 8-K. |
I am the qualified person responsible for authoring the following sections of the Technical Report Summary: 13 and 22.
I also consent to the incorporation by reference of the above items in the registration statements of Gold Resource Corporation filed on Form S-3 (No. 333-235312) and Form S-8 (Nos. 333-214958 and 333-171779).
Dated October 26, 2023
By: |
/s/ Rodrigo Simidu |
Name: |
Rodrigo Simidu, P.Eng. |
Title: |
Principal Mining Engineer, GRC |
Exhibit 23.8
CONSENT OF QUALIFIED PERSON
I, Christian Laroche, P. Eng., in connection with the SK-1300 Technical Report Summary on the Back Forty Project, Michigan, USA and any amendments or supplements and/or exhibits thereto, consent to:
| ● | the filing and use of the Technical Report Summary for the Back Forty Project with an effective date of September 30, 2023; |
| ● | the use of and references to my name, including my status as an expert or “qualified person” (as defined in Subpart 1300 of Regulation S-K promulgated by the U.S. Securities and Exchange Commission), in connection with the Form 8-K and the Technical Report Summary; and |
| ● | the use of information derived, summarized, quoted, or referenced from the Technical Report Summary, or portions thereof, that was prepared by me, that I supervised the preparation of and/or that was reviewed and approved by me, that is included or incorporated by reference in the Form 8-K. |
I am the qualified person responsible for authoring the following sections of the Technical Report Summary: 10, 14, 16, 22, and 23.
I also consent to the incorporation by reference of the above items in the registration statements of Gold Resource Corporation filed on Form S-3 (No. 333-235312) and Form S-8 (Nos. 333-214958 and 333-171779).
Dated October 26, 2023
By: |
/s/ Christian Laroche |
Name: |
Christian Laroche, P. Eng. |
Title: |
Metallurgist, GRC |
Exhibit 23.9
CONSENT OF QUALIFIED PERSON
I, Patrick Frenette, P. Eng., in connection with the SK-1300 Technical Report Summary on the Back Forty Project, Michigan, USA and any amendments or supplements and/or exhibits thereto, consent to:
| ● | the filing and use of the Technical Report Summary for the Back Forty Project with an effective date of September 30, 2023; |
| ● | the use of and references to my name, including my status as an expert or “qualified person” (as defined in Subpart 1300 of Regulation S-K promulgated by the U.S. Securities and Exchange Commission), in connection with the Form 8-K and the Technical Report Summary; and |
| ● | the use of information derived, summarized, quoted, or referenced from the Technical Report Summary, or portions thereof, that was prepared by me, that I supervised the preparation of and/or that was reviewed and approved by me, that is included or incorporated by reference in the Form 8-K. |
I am the qualified person responsible for authoring the following sections of the Technical Report Summary: 1, 2, 13, 18, 19, 20, 21, 22, 23, 24, and 25.
I also consent to the incorporation by reference of the above items in the registration statements of Gold Resource Corporation filed on Form S-3 (No. 333-235312) and Form S-8 (Nos. 333-214958 and 333-171779).
Dated October 26, 2023
By: |
/s/ Patrick Frenette |
Name: |
Patrick Frenette, P. Eng. |
Title: |
VP Technical Services, GRC |
Exhibit 96

SK1300 Technical Report Summary on the
Back Forty Mine Project, Michigan, USA
Report prepared by: |
|
Report Date: |
GOLD RESOURCE CORPORATION |
|
October 26th, 2023 |
|
|
|
Report prepared by: |
|
Effective Date: |
Marina Iund, P. Geo, InnovExplo |
|
September 30th, 2023 |
|
Andrea K. Martin, P. Eng, Foth Patrick Frenette, P. Eng., Gold Resource Corporation Christian Laroche, P. Eng, Gold Resource Corporation Michael J. Foley, P. Eng, Gold Resource Corporation |
|
|
|
|
|
Gold Resource Corporation |
|
Table of Contents
1.0 |
EXECUTIVE SUMMARY |
1-1 |
|
|
1.1 |
Introduction |
1-1 |
|
1.2 |
Qualified Persons (QPs) |
1-1 |
|
1.3 |
Property Description and Ownership |
1-5 |
|
1.4 |
Accessibility, Climate, Local Resources |
1-5 |
|
1.5 |
History |
1-5 |
|
1.6 |
Geological Setting |
1-6 |
|
1.7 |
Status of Exploration |
1-7 |
|
1.8 |
Sample Preparation |
1-7 |
|
1.9 |
Data Verification |
1-8 |
|
1.10 |
Mineral Processing and Metallurgical Testing |
1-8 |
|
1.11 |
Mineral Resource Estimate |
1-8 |
|
1.12 |
Mineral Reserve Estimate |
1-10 |
|
1.13 |
Mining Methods |
1-10 |
|
1.14 |
Processing and Recovery Methods |
1-13 |
|
1.15 |
Infrastructures |
1-14 |
|
1.16 |
Market Studies |
1-15 |
|
1.17 |
Environmental Studies and Permitting |
1-16 |
|
1.18 |
Capital and Operating Costs |
1-18 |
|
1.19 |
Economic Analysis |
1-20 |
|
1.20 |
Qualified Person’s Conclusions and Recommendations |
1-21 |
2.0 |
INTRODUCTION |
2-1 |
|
|
2.1 |
Registrant Information |
2-1 |
|
2.2 |
Terms Of Reference and Purpose |
2-1 |
|
2.3 |
Sources of Information |
2-5 |
|
2.4 |
Personal Inspection Summary |
2-5 |
Back Forty Project |
TOC-i |
Gold Resource Corporation |
|
|
2.5 |
Previously Filed Technical Report Summary Reports |
2-5 |
3.0 |
PROPERTY DESCRIPTION |
3-1 |
|
|
3.1 |
Project Location |
3-1 |
|
3.2 |
Mineral Rights |
3-2 |
|
3.3 |
Description of the Property |
3-6 |
|
3.4 |
Peripheral Properties |
3-8 |
|
3.5 |
State of Michigan Metallic Mineral Leases |
3-9 |
|
3.6 |
Summary of Royalties |
3-10 |
|
3.7 |
Permits |
3-11 |
|
3.8 |
Other Significant Factors and Risks Affecting Access |
3-11 |
4.0 |
ACCESSIBILITY, CLIMATE, LOCAL RESOURCES, INFRASTRUCTURE AND PHYSIOGRAPHY |
4-12 |
|
|
4.1 |
Access to the Property |
4-12 |
|
4.2 |
Climate Description |
4-12 |
|
4.3 |
Availability of Required Infrastructure |
4-13 |
|
4.4 |
Physiography |
4-13 |
5.0 |
HISTORY |
5-14 |
|
|
5.1 |
Regional/District History |
5-14 |
|
5.1.1 |
1950s to 1970s |
5-14 |
|
5.1.2 |
1970s to 1990s |
5-14 |
|
5.1.3 |
1990s to 2001 |
5-14 |
|
5.2 |
Property History |
5-14 |
|
5.2.1 |
2001 to 2003 – Back Forty Joint Venture |
5-14 |
|
5.2.2 |
2004 to 2006 – Aquila Resources Corporation |
5-15 |
|
5.2.3 |
2007 to 2008 – Aquila Resources Inc. |
5-15 |
|
5.2.4 |
2009 to 2010 – Aquila and Hudbay |
5-16 |
|
5.2.5 |
2011 – Aquila Drill Program |
5-16 |
|
5.2.6 |
2014 – Aquila and REBgold Corporation |
5-17 |
|
5.2.7 |
2014 – PEA NI 43-101 Compliant Technical Report |
5-17 |
Back Forty Project |
TOC-ii |
Gold Resource Corporation |
|
|
5.2.8 |
2015 – Aquila and Orion Mine Finance Transaction |
5-17 |
|
5.2.9 |
2015 – Aquila Drilling Programs |
5-18 |
|
5.2.10 |
2016 – Aquila Geotechnical, Resource and Exploration Drill Programs |
5-18 |
|
5.2.11 |
2017 – Aquila and Osisko Bermuda Limited Transaction |
5-19 |
|
5.2.12 |
2017 – Aquila Geotechnical, Resource and Exploration Drill Programs |
5-20 |
|
5.2.13 |
2018 – P&E Mineral Resource Estimates |
5-21 |
|
5.2.14 |
2018 – P&E Open Pit Feasibility Study Technical Report |
5-21 |
|
5.2.15 |
2018 – Aquila Exploration Drill Program |
5-21 |
|
5.2.16 |
2019 – Aquila, Orion Mine, and Osisko Gold Royalties Transaction |
5-21 |
|
5.2.17 |
2019 – Aquila Geo-mechanical and Metallurgy Drill Program |
5-21 |
|
5.2.18 |
2019 – P&E Mineral Resource Estimates |
5-22 |
|
5.2.19 |
2020 – PEA NI 43-101 & 43-101F Technical Report |
5-22 |
|
5.2.20 |
2020 – Stream Agreement Amendments |
5-22 |
|
5.2.21 |
2021 - Stream Agreement Amendments |
5-22 |
|
5.2.22 |
2021 – Gold Resource Corporation |
5-22 |
6.0 |
GEOLOGICAL SETTING, MINERALIZATION, AND DEPOSIT |
6-1 |
|
|
6.1 |
Regional Geology |
6-1 |
|
6.2 |
Local and Property Geology |
6-5 |
|
6.2.1 |
Local Geology |
6-5 |
|
6.2.2 |
Property Geology |
6-7 |
|
6.2.2.1 |
Lithology |
6-8 |
|
6.3 |
Mineralization |
6-12 |
|
6.3.1 |
Massive Sulfide Mineralization |
6-13 |
|
6.3.1.1 |
Main Zone Massive Sulfide |
6-15 |
|
6.3.1.2 |
Pinwheel Zone Massive Sulfide |
6-16 |
|
6.3.1.3 |
Deep Zone Massive Sulfide |
6-16 |
|
6.3.1.4 |
Tuff Zone Massive Sulfide |
6-17 |
|
6.3.2 |
Stockwork and Peripheral Sulfide Mineralization |
6-17 |
|
6.3.3 |
Copper Mineralization Associated with Sulfide Mineralization |
6-17 |
Back Forty Project |
TOC-iii |
Gold Resource Corporation |
|
|
6.3.4 |
Precious Metal-rich Low Sulfide Mineralization |
6-18 |
|
6.3.4.1 |
90 Gold Zone |
6-18 |
|
6.3.4.2 |
NS Gold Zone |
6-18 |
|
6.3.4.3 |
PM Gold Zone |
6-19 |
|
6.3.5 |
Gossan (Supergene) Mineralization |
6-19 |
|
6.3.6 |
Mineralization Encountered at Depth |
6-19 |
|
6.4 |
Deposit Type |
6-20 |
7.0 |
EXPLORATION |
7-1 |
|
|
7.1 |
Drilling |
7-1 |
|
7.2 |
Introduction |
7-1 |
|
7.2.1 |
2002-2003 Drilling Program |
7-3 |
|
7.2.2 |
2006 Drilling Program |
7-3 |
|
7.2.3 |
2007 Drilling Program |
7-3 |
|
7.2.4 |
2008 Drilling Program |
7-4 |
|
7.2.5 |
2009-2010 Drilling Program |
7-4 |
|
7.2.6 |
2011 Drilling Program |
7-4 |
|
7.2.7 |
2015 Drilling Program |
7-5 |
|
7.2.8 |
2015 Metallurgical Drilling Program |
7-5 |
|
7.2.9 |
2015 Mineral Resource Drilling Program |
7-5 |
|
7.2.10 |
2015 Exploration Drilling Program |
7-6 |
|
7.2.11 |
2016 Drilling Program |
7-6 |
|
7.2.11.1 |
2016 Geotechnical Drilling Program |
7-6 |
|
7.2.11.2 |
2016 Resource Drilling Program |
7-6 |
|
7.2.11.3 |
2016 Exploration Drilling Program |
7-7 |
|
7.2.12 |
2017 Drilling Program |
7-8 |
|
7.2.12.1 |
2017 Geotechnical Drilling Program |
7-8 |
|
7.2.13 |
2017 Mineral Resource Drilling Program |
7-10 |
|
7.2.14 |
2017 Exploration Drilling Program |
7-11 |
|
7.2.15 |
2018 Exploration Drilling Program |
7-13 |
Back Forty Project |
TOC-iv |
Gold Resource Corporation |
|
|
7.2.16 |
2019 Drilling |
7-13 |
|
7.2.16.1 |
2019 Geomechanical Drilling Program |
7-13 |
|
7.2.16.2 |
2019 Metallurgy Drilling Program |
7-13 |
|
7.3 |
Ground Conditions and Survey Data |
7-13 |
8.0 |
SAMPLE PREPARATION, ANALYSES, AND SECURITY |
8-1 |
|
|
8.1 |
Site Sample Preparation Methods and Security |
8-1 |
|
8.1.1 |
Core Handling, Sampling, and Security |
8-1 |
|
8.1.2 |
Laboratory Accreditation and Certification |
8-1 |
|
8.2 |
Laboratory Sample Preparation Methods and Analytical Procedures |
8-2 |
|
8.3 |
Quality Control and Quality Assurance Programs |
8-4 |
|
8.3.1 |
Certified Reference Materials (Standards) |
8-5 |
|
8.3.2 |
Blanks |
8-12 |
|
8.3.3 |
Duplicate Samples |
8-13 |
|
8.3.4 |
Check Samples |
8-13 |
|
8.4 |
Qualified Person’s Opinion |
8-14 |
9.0 |
DATA VERIFICATION |
9-1 |
|
|
9.1 |
Mineral Resources |
9-1 |
|
9.1.1 |
Site Visit |
9-1 |
|
9.2 |
Core Review |
9-1 |
|
9.3 |
Drill Hole Database |
9-2 |
|
9.4 |
Drill Hole Locations |
9-2 |
|
9.5 |
Downhole Survey |
9-4 |
|
9.6 |
Assays |
9-4 |
|
9.7 |
Independent Resampling |
9-4 |
|
9.8 |
Conclusion |
9-6 |
10.0 |
MINERAL PROCESSING AND METALLURGICAL TESTING |
10-7 |
|
|
10.1 |
Previous Testwork |
10-7 |
|
10.1.1 |
Comminution Testwork (SGS) |
10-8 |
|
10.1.1.1 |
Comminution Circuit Characterization Testwork |
10-8 |
Back Forty Project |
TOC-v |
Gold Resource Corporation |
|
|
10.1.1.2 |
Additional Comminution Testing |
10-10 |
|
10.1.1.3 |
Regrinding Testing |
10-10 |
|
10.1.2 |
Concentrate Solid-Liquid Separation and Rheology Testwork (SGS) |
10-10 |
|
10.1.2.1 |
Sample Preparation and Characterization |
10-11 |
|
10.1.2.2 |
Flocculant Selection and Flocculant Response Confirmation |
10-11 |
|
10.1.2.3 |
Static Settling |
10-11 |
|
10.1.2.4 |
Rheology |
10-12 |
|
10.1.2.5 |
Pressure Filtration |
10-15 |
|
10.2 |
Metallurgical Testing and Analytical Procedures (2022) |
10-16 |
|
10.2.1 |
SGS |
10-16 |
|
10.2.1.1 |
Sample Characterization and Mineralogical Analysis |
10-16 |
|
10.2.1.2 |
Gravity Separation |
10-18 |
|
10.2.1.3 |
Flotation Testwork |
10-20 |
|
10.2.1.4 |
Cyanidation Testwork |
10-27 |
|
10.2.1.4.1 |
Cyanide Leach (CN) |
10-27 |
|
10.2.1.4.2 |
GlyCatTM Tests |
10-30 |
|
10.2.1.4.3 |
Carbon-in-Leach (CIL) Cyanidation Tests |
10-30 |
|
10.2.1.4.4 |
Diagnostic Leach Test (DLT) |
10-32 |
|
10.2.1.4.5 |
Carbon-in-Pulp (CIP) Tests |
10-32 |
|
10.2.1.5 |
Cyanide Destruction Tests |
10-33 |
|
10.2.2 |
Alternate Gold Recovery Agent Testing at Clean Mining |
10-35 |
|
10.2.3 |
GlyCatTM Test at Mining & Process Solutions (MPS) Pty Limited |
10-35 |
|
10.2.4 |
Filtration and Cyanide Wash on CIP Tailings at Diemme Filtration Lab |
10-36 |
|
10.2.4.1 |
Sample Preparation and Characterization |
10-36 |
|
10.2.4.2 |
Filtration Testing |
10-37 |
|
10.2.5 |
Pre-Leach and Leach Residue Dewatering at FLSmidth |
10-38 |
|
10.2.5.1 |
Sample Preparation and Characterization |
10-38 |
|
10.2.5.2 |
Flocculant Screening |
10-39 |
|
10.2.5.3 |
Flux Testing |
10-39 |
|
10.2.5.4 |
Continuous Fill Deep Tube Thickener Tests |
10-39 |
Back Forty Project |
TOC-vi |
Gold Resource Corporation |
|
|
10.2.5.5 |
Thickening Sizing Parameters |
10-41 |
|
10.2.5.6 |
Underflow Rheology Testing |
10-41 |
|
10.2.5.7 |
Filter Press Testing |
10-41 |
|
10.2.5.8 |
Pneumapress® Testing |
10-44 |
|
10.2.6 |
Bench Scale SART Testing at BQE Water |
10-47 |
|
10.2.6.1 |
Sample Characterization |
10-47 |
|
10.2.6.2 |
SART |
10-48 |
|
10.2.7 |
Paste Backfill Testwork |
10-53 |
|
10.2.7.1 |
Material Characterization |
10-53 |
|
10.2.7.1.1 |
Particle Size Distribution and Specific Gravity |
10-53 |
|
10.2.7.1.2 |
Compaction Characteristics |
10-54 |
|
10.2.7.1.3 |
Chemistry and Mineralogy |
10-55 |
|
10.2.7.2 |
Viscosity and Dynamic Yield Stress Determination |
10-55 |
|
10.2.7.3 |
Unconfined Compressive Strength Testing |
10-56 |
|
10.3 |
Testwork Campaign 2023 |
10-56 |
|
10.3.1 |
Sample Selection and Compositing |
10-56 |
|
10.3.2 |
Composite Characterization |
10-58 |
|
10.3.3 |
Base Metallurgical Laboratories Ltd. |
10-59 |
|
10.3.3.1 |
Gravity Testwork |
10-59 |
|
10.3.3.2 |
Flotation Testwork |
10-59 |
|
10.3.3.3 |
Leaching Testwork |
10-63 |
|
10.3.3.4 |
Diagnostic Leach |
10-69 |
|
10.3.3.5 |
Reverse Osmosis, SART and Cyanide Destruction Testwork. |
10-69 |
|
10.3.3.5.1 |
Project Background and Planning |
10-69 |
|
10.3.3.5.2 |
Test Planning |
10-70 |
|
10.3.3.5.3 |
Initial Results |
10-70 |
|
10.3.3.5.3.1 |
RO Performance on Mix 1 |
10-71 |
|
10.3.3.5.3.2 |
SART Performance on Mix 1 |
10-71 |
|
10.3.3.5.4 |
Ongoing Work |
10-72 |
|
10.4 |
Qualified Person’s Opinion on the Adequacy of Metallurgical Testing |
10-72 |
Back Forty Project |
TOC-vii |
Gold Resource Corporation |
|
11.0 |
MINERAL RESOURCE ESTIMATES |
11-1 |
|
|
11.1 |
Methodology |
11-1 |
|
11.2 |
Drill Hole Database |
11-2 |
|
11.3 |
Geological Model |
11-4 |
|
11.4 |
High-grade Capping |
11-6 |
|
11.5 |
Compositing |
11-10 |
|
11.6 |
Density |
11-11 |
|
11.7 |
Block Model |
11-13 |
|
11.8 |
Variography and Search Ellipsoids |
11-13 |
|
11.9 |
Grade Interpolation |
11-20 |
|
11.10 |
Block Model Validation |
11-23 |
|
11.11 |
Mineral Resource Classification |
11-25 |
|
11.12 |
NSR Calculation |
11-26 |
|
11.13 |
Economical Parameters and Cut-Off Grade |
11-30 |
|
11.14 |
Mineral Resource Estimate |
11-30 |
|
11.15 |
Mineral Resource Uncertainty Discussion |
11-34 |
|
11.16 |
Qualified Person’s Opinion on Factors that are Likely to Influence the Prospect of Economic Extraction |
11-35 |
12.0 |
MINERAL RESERVE ESTIMATES |
12-1 |
|
13.0 |
MINING METHODS |
13-1 |
|
|
13.1 |
Introduction |
13-1 |
|
13.1.1 |
Open Pit |
13-1 |
|
13.1.2 |
Underground |
13-1 |
|
13.2 |
Data Acquisition |
13-2 |
|
13.2.1 |
Density |
13-2 |
|
13.2.2 |
Swell Factor |
13-2 |
|
13.2.3 |
Moisture Content |
13-2 |
|
13.3 |
Geotechnical |
13-3 |
|
13.3.1 |
Geomechanical Domain Definition |
13-3 |
Back Forty Project |
TOC-viii |
Gold Resource Corporation |
|
|
13.3.2 |
Open Pit |
13-4 |
|
13.3.3 |
Underground |
13-5 |
|
13.4 |
Hydrological |
13-5 |
|
13.5 |
Open Pit Optimization |
13-6 |
|
13.6 |
Pit Design Selection |
13-9 |
|
13.6.1 |
Mining Methods |
13-9 |
|
13.6.2 |
Haul Road and Ramp Design |
13-10 |
|
13.6.2.1 |
In-Pit Dual-Lane Traffic on Rock |
13-10 |
|
13.6.2.2 |
In-Pit Single-Lane Traffic on Rock |
13-10 |
|
13.7 |
Mine Dilution and Mining Recovery |
13-10 |
|
13.8 |
Final Pit Design |
13-10 |
|
13.8.1 |
Pinwheel Pit |
13-11 |
|
13.8.2 |
Main Pit |
13-12 |
|
13.9 |
Equipment Fleet |
13-14 |
|
13.9.1 |
Loading |
13-14 |
|
13.9.2 |
Hauling |
13-15 |
|
13.9.3 |
Drilling and Blasting |
13-15 |
|
13.10 |
Auxiliary Fleet |
13-15 |
|
13.11 |
Manpower Requirement |
13-15 |
|
13.12 |
Mine Design Underground |
13-16 |
|
13.12.1 |
Stope Design |
13-17 |
|
13.12.2 |
Mechanized Cut and Fill |
13-19 |
|
13.12.3 |
Lateral and Vertical Development |
13-22 |
|
13.12.4 |
Underground Mining Equipment |
13-25 |
|
13.12.5 |
Underground Mine Personnel Requirements |
13-26 |
|
13.12.6 |
Mine Services |
13-27 |
|
13.12.6.1 |
Ventilation |
13-27 |
|
13.12.6.2 |
Airflow Requirements |
13-28 |
|
13.12.6.3 |
Overall Ventilation Stages |
13-29 |
Back Forty Project |
TOC-ix |
Gold Resource Corporation |
|
|
13.12.6.4 |
Ventilation Controls |
13-30 |
|
13.12.6.5 |
Backfill |
13-31 |
|
13.13 |
Mining schedule |
13-32 |
14.0 |
PROCESSING AND RECOVERY METHODS |
14-1 |
|
|
14.1 |
Summary/Introduction |
14-1 |
|
14.2 |
Design Criteria |
14-4 |
|
14.3 |
Process Description |
14-5 |
|
14.3.1 |
Crushing |
14-5 |
|
14.3.2 |
Ore Handling and Grinding |
14-5 |
|
14.3.3 |
Copper Flotation |
14-6 |
|
14.3.4 |
Zinc Flotation |
14-8 |
|
14.3.5 |
Concentrate Dewatering |
14-9 |
|
14.3.6 |
Cyanide Leaching |
14-10 |
|
14.3.7 |
Solution Dewatering |
14-11 |
|
14.3.8 |
Reverse-Osmosis (RO) System |
14-11 |
|
14.3.8.1 |
RO Unit |
14-11 |
|
14.3.8.2 |
RO Retentate Desaturation Circuit |
14-12 |
|
14.3.9 |
Cyanide Recovery (SART) |
14-12 |
|
14.3.10 |
Precious Metal Recovery/Gold Room |
14-13 |
|
14.3.11 |
Cyanide Destruction |
14-13 |
|
14.3.12 |
Reagent Systems |
14-14 |
|
14.3.13 |
Air & Water Services |
14-15 |
|
14.4 |
Process Plant Personnel |
14-15 |
|
14.5 |
Metal Recovery Projections |
14-16 |
15.0 |
INFRASTRUCTURE |
15-1 |
|
|
15.1 |
Surface Infrastructure and Mine Support Facilities |
15-3 |
|
15.1.1 |
Site Access Roads |
15-3 |
|
15.1.2 |
Buildings and Other Facilities |
15-3 |
|
15.1.3 |
Communications |
15-3 |
Back Forty Project |
TOC-x |
Gold Resource Corporation |
|
|
15.1.4 |
Power Supply |
15-4 |
|
15.1.5 |
Power Distribution |
15-4 |
|
15.2 |
Water Supply, Distribution and Treatment |
15-5 |
|
15.2.1 |
Fresh Water Supply to Mill |
15-5 |
|
15.2.2 |
Potable Water Supply |
15-5 |
|
15.2.3 |
Contact Water Collection System |
15-5 |
|
15.2.4 |
Wastewater Treatment |
15-6 |
|
15.2.5 |
Sewage Treatment |
15-7 |
|
15.2.6 |
Open Pit Dewatering |
15-7 |
|
15.3 |
Mine Waste Management |
15-8 |
|
15.3.1 |
Tailings Management Facility |
15-8 |
|
15.3.2 |
Waste Rock Management Facility |
15-10 |
|
15.3.3 |
Ore Stockpile |
15-12 |
|
15.4 |
Concentrate Transport |
15-13 |
|
15.5 |
Underground Infrastructure |
15-13 |
|
15.5.1 |
Underground Mine Dewatering |
15-13 |
|
15.5.2 |
Electrical Power Distribution |
15-13 |
|
15.5.3 |
Communications |
15-14 |
|
15.6 |
Paste Backfill Plant |
15-14 |
16.0 |
MARKET STUDIES |
16-1 |
|
|
16.1 |
Metal Prices Assumptions |
16-1 |
|
16.2 |
Base Metal Markets and Costs Assumptions |
16-1 |
|
16.2.1 |
Zinc Concentrate Market |
16-1 |
|
16.2.1.1 |
Market for Back Forty Zinc Concentrates |
16-2 |
|
16.2.2 |
Copper Concentrate Market |
16-5 |
|
16.2.2.1 |
Market for Back Forty Copper Concentrates |
16-6 |
17.0 |
ENVIRONMENTAL STUDIES, PERMITTING, AND PLANS, NEGOTIATIONS, OR AGREEMENTS WITH LOCAL INDIVIDUALS OR GROUPS |
17-10 |
|
|
17.1 |
Environmental Studies Addressed in Previous Project Proposals |
17-11 |
Back Forty Project |
TOC-xi |
Gold Resource Corporation |
|
|
17.1.1 |
Environment and Social Impact Assessments |
17-12 |
|
17.1.2 |
Area of Direct Influence |
17-12 |
|
17.1.3 |
Groundwater |
17-14 |
|
17.1.4 |
Wetlands |
17-14 |
|
17.1.5 |
Surface Water |
17-15 |
|
17.1.6 |
Air Quality |
17-15 |
|
17.1.7 |
Flora and Fauna |
17-15 |
|
17.1.8 |
Aesthetic Resource and Recreation |
17-15 |
|
17.1.9 |
Biodiversity |
17-16 |
|
17.1.10 |
Archaeological and Speleological Studies |
17-16 |
|
17.1.11 |
Socio-Economic Study |
17-16 |
|
17.2 |
Protective Measures of Facility Design |
17-17 |
|
17.2.1 |
Mine Development and Mine Closure |
17-17 |
|
17.2.2 |
Water Management |
17-18 |
|
17.2.3 |
Air Quality Management |
17-19 |
|
17.3 |
Waste Management |
17-20 |
|
17.3.1 |
Waste Rock Management |
17-20 |
|
17.3.2 |
Tailings Management Facility |
17-20 |
|
17.3.3 |
Other Waste |
17-20 |
|
17.4 |
Site Monitoring |
17-21 |
|
17.5 |
Permitting Requirements |
17-21 |
|
17.6 |
Financial Assurance |
17-21 |
|
17.7 |
Plans, Negotiations, or Agreements with Local Individuals or Groups |
17-22 |
|
17.8 |
Descriptions of Any Commitments to Ensure Local Procurement and Hiring |
17-22 |
|
17.9 |
Qualified Person’s Opinion on the Adequacy of Current Plans to Address Any Issues Related to Environmental Compliance, Permitting, and Local Individuals or Group |
17-22 |
18.0 |
CAPITAL AND OPERATING COSTS |
18-1 |
|
|
18.1 |
Capital Costs |
18-1 |
|
18.1.1 |
Summary |
18-1 |
Back Forty Project |
TOC-xii |
Gold Resource Corporation |
|
|
18.1.2 |
Scope and structure of Capital Cost Estimate |
18-2 |
|
18.1.3 |
Exclusions |
18-3 |
|
18.1.4 |
Initial Capital Cost |
18-3 |
|
18.1.4.1 |
Initial Capital Costs Summary |
18-3 |
|
18.1.4.2 |
Surface Mobile Equipment |
18-4 |
|
18.1.4.3 |
Open Pit Mine |
18-5 |
|
18.1.4.4 |
Capitalized OPEX |
18-5 |
|
18.1.4.5 |
Electrical and Communications |
18-5 |
|
18.1.4.6 |
Site Infrastructures |
18-6 |
|
18.1.4.7 |
Process Plant |
18-6 |
|
18.1.4.8 |
Rock and Tailings Management |
18-7 |
|
18.1.4.9 |
Water Treatment and Management |
18-8 |
|
18.1.4.10 |
Construction Indirect Costs |
18-8 |
|
18.1.4.11 |
General Services |
18-9 |
|
18.1.4.12 |
Contingency |
18-9 |
|
18.1.5 |
Sustaining Capital Costs |
18-9 |
|
18.1.5.1 |
Sustaining Capital Summary |
18-9 |
|
18.1.5.2 |
Mobile Equipment |
18-10 |
|
18.1.5.3 |
Underground Mine |
18-11 |
|
18.1.5.4 |
Capitalized OPEX |
18-12 |
|
18.1.5.5 |
Site Infrastructure |
18-12 |
|
18.1.5.6 |
Processing Plant |
18-12 |
|
18.1.5.7 |
Contingency |
18-12 |
|
18.1.5.8 |
Site Reclamation and Closure |
18-13 |
|
18.1.5.9 |
Salvage Value |
18-13 |
|
18.2 |
Operating Costs |
18-14 |
|
18.2.1 |
Summary |
18-14 |
|
18.2.2 |
Basis of Operating Cost Estimate |
18-14 |
|
18.2.3 |
Mining |
18-14 |
|
18.2.3.1 |
Overburden |
18-14 |
|
18.2.3.2 |
Open Pit |
18-15 |
Back Forty Project |
TOC-xiii |
Gold Resource Corporation |
|
|
18.2.3.3 |
Underground |
18-16 |
|
18.2.4 |
Material Rehandling |
18-17 |
|
18.2.5 |
Processing |
18-17 |
|
18.2.6 |
Tailings Disposition |
18-18 |
|
18.2.7 |
WRMF Reclamation |
18-19 |
|
18.2.8 |
General and Administration |
18-19 |
|
18.2.9 |
Concentrate Transportation |
18-19 |
19.0 |
ECONOMIC ANALYSIS |
19-1 |
|
|
19.1 |
Disclaimer on Mineral Resource and Financial Analysis |
19-1 |
|
19.2 |
Demonstration of Economic Viability |
19-2 |
|
19.3 |
Principal Assumptions |
19-3 |
|
19.3.1 |
Metal Prices |
19-3 |
|
19.3.2 |
Discount Rate |
19-3 |
|
19.3.3 |
Taxes |
19-3 |
|
19.3.4 |
Revenues |
19-3 |
|
19.3.4.1 |
Copper Concentrate |
19-3 |
|
19.3.4.2 |
Zinc Concentrate |
19-4 |
|
19.3.4.3 |
Doré |
19-4 |
|
19.3.4.4 |
SART |
19-4 |
|
19.3.5 |
Gold and Silver Streams with Osisko |
19-4 |
|
19.3.6 |
Metallurgical Recoveries |
19-4 |
|
19.3.7 |
Royalties |
19-5 |
|
19.4 |
Cashflow Forecast |
19-5 |
|
19.4.1 |
Base Case with Inferred Material |
19-5 |
|
19.4.1.1 |
Results of Economic Analysis |
19-5 |
|
19.4.1.2 |
Net Present Value, Internal Rate of Return, and Payback Period |
19-8 |
|
19.4.1.3 |
Taxes, Royalties, Other Government Levies, or Interests |
19-8 |
|
19.4.2 |
Base Case without Inferred Material |
19-8 |
|
19.4.2.1 |
Results of Economic Analysis |
19-9 |
Back Forty Project |
TOC-xiv |
Gold Resource Corporation |
|
|
19.4.2.2 |
Net Present Value, Internal Rate of Return, and Payback Period |
19-12 |
|
19.4.2.3 |
Taxes, Royalties, Other Government Levies, or Interests |
19-12 |
|
19.5 |
Sensitivity Analysis |
19-13 |
20.0 |
ADJACENT PROPERTIES |
20-1 |
|
21.0 |
OTHER RELEVANT DATA AND INFORMATION |
21-1 |
|
22.0 |
INTERPRETATION AND CONCLUSIONS |
22-1 |
|
|
22.1 |
Property Description and Accessibility |
22-1 |
|
22.2 |
Geology, Mineralization, Exploration, Drilling, and Sampling |
22-2 |
|
22.3 |
Mineral Processing and Metallurgical Testing |
22-2 |
|
22.4 |
Mineral Resources |
22-3 |
|
22.5 |
Mining Methods |
22-3 |
|
22.6 |
Processing and Recovery Methods |
22-4 |
|
22.7 |
Infrastructures |
22-4 |
|
22.8 |
Market Studies |
22-5 |
|
22.9 |
Environmental Studies, Permitting, and Social Impacts |
22-5 |
|
22.10 |
Capital and Operating Costs |
22-6 |
|
22.11 |
Economic Analysis |
22-6 |
|
22.12 |
Significant Risks and Uncertainties |
22-7 |
23.0 |
RECOMMENDATIONS |
23-1 |
|
24.0 |
REFERENCES |
24-1 |
|
25.0 |
RELIANCE ON INFORMATION PROVIDED BY THE REGISTRANT |
25-1 |
|
26.0 |
DATE AND SIGNATURE PAGE |
26-1 |
|
Back Forty Project |
TOC-xv |
Gold Resource Corporation |
|
TABLES |
|
|
Table 1-1: |
Summary of QP Qualifications |
1-2 |
Table 1-2: |
Back Forty Project 2023 Mineral Resource Estimate by Mining Method |
1-9 |
Table 1-3: |
Back Forty Project Mining Schedule |
1-12 |
Table 1-4: |
Metal prices assumptions |
1-16 |
Table 1-5: |
Previously Permitted Mine Configurations |
1-17 |
Table 1-6: |
Back Forty Project Capital Costs |
1-19 |
Table 1-7: |
Operating Costs Summary |
1-19 |
Table 1-8: |
Economic Results for the Back Forty Project |
1-20 |
Table 2-1: |
List of Abbreviations |
2-1 |
Table 2-2 : |
List of Units |
2-3 |
Table 2-3: |
Conversion Factors for Measurements |
2-4 |
Table 3-1: |
List of Back Forty Project Land Tenure |
3-3 |
Table 3-2: |
State of Michigan Mineral Royalty Schedule |
3-10 |
Table 7-1: |
Yearly Summary of Drilling |
7-2 |
Table 7-2: |
2015 Mineral Resource Drilling - Significant Results |
7-5 |
Table 7-3: |
2016 Mineral Resource Drilling - Significant Results |
7-7 |
Table 7-4: |
2016 Exploration Drilling - Significant Results |
7-8 |
Table 7-5: |
2017 Geotechnical Drilling - Significant Results |
7-9 |
Table 7-6: |
2017 Resource Drilling - Significant Results |
7-10 |
Table 7-7: |
2017 Exploration Drilling - Significant Results |
7-12 |
Table 8-1: |
Summary of Assay Samples by Year |
8-2 |
Table 8-2: |
Gold Results of Standards Used in the 2002 to 2017 Drill Programs (CRM Quantity>25) |
8-7 |
Table 8-3: |
Silver Results of Standards Used in the 2002 to 2017 Drill Programs (CRM Quantity>25) |
8-8 |
Table 8-4: |
Copper Results of Standards used in the 2002 to 2017 Drill Programs (CRM Quantity>25) |
8-9 |
Table 8-5: |
Lead Results of Standards used in the 2002 to 2017 Drill Programs (CRM Quantity>25) |
8-10 |
Table 8-6: |
Zinc Results of Standards Used in the 2002 to 2017 Drill Programs (CRM Quantity>25) |
8-11 |
Table 8-7: |
Results of Blanks Used in the Back Forty Project Between 2002 and 2017 |
8-12 |
Table 9-1: |
Summary of Independent Resampling |
9-5 |
Table 10-1: |
Previous Testwork Programs |
10-7 |
Table 10-2: |
Summary of Grindability Test Statistics (2016 Results) |
10-8 |
Table 10-3: |
Grindability Test Overview (2016 Results) |
10-9 |
Back Forty Project |
TOC-xvi |
Gold Resource Corporation |
|
Table 10-4: |
Summary of Grindability Test Statistics, 2017 Results |
10-10 |
Table 10-5: |
Test Summary |
10-10 |
Table 10-6: |
Sample Characterization |
10-11 |
Table 10-7: |
Static Settling Results Summary |
10-12 |
Table 10-8: |
Rheology Sample Characterization |
10-13 |
Table 10-9: |
Pressure Filtration Results Summary – PP-07 Zn Clnr Conc Underflow |
10-15 |
Table 10-10: |
Pressure Filtration Results Summary – PP-13 Bulk Clnr Conc Underflow |
10-16 |
Table 10-11: |
Head Assay Major Element Summary |
10-17 |
Table 10-12: |
Summary of E-GRG Results |
10-19 |
Table 10-13: |
Gravity Separation Test Results – Comp SU and Comp OX |
10-19 |
Table 10-14: |
Flotation Conditions Summary |
10-21 |
Table 10-15: |
Locked Cycle Tests Summarized Conditions |
10-25 |
Table 10-16: |
Locked Cycle Final Concentrates Summary |
10-27 |
Table 10-17: |
Cyanidation Leaching Conditions |
10-28 |
Table 10-18: |
Direct Cyanidation Leaching Results Summary |
10-29 |
Table 10-19: |
CIL Summary |
10-31 |
Table 10-20: |
Bulk CIP Test Summary |
10-31 |
Table 10-21: |
Wash Water Volumes |
10-33 |
Table 10-22: |
Cyanide Destruction Test Summary |
10-34 |
Table 10-23: |
Sample Characterization |
10-36 |
Table 10-24: |
Sample Particle Size Distribution Measured by Laser Diffraction |
10-37 |
Table 10-25: |
Particle Size Distribution |
10-38 |
Table 10-26: |
As-Received Sample Characteristic Summary |
10-39 |
Table 10-27: |
Evaluated Flocculants |
10-39 |
Table 10-28: |
Continuous Fill Test Results – Pre-Leach |
10-40 |
Table 10-29: |
Thickener Sizing Parameters – Pre-leach Thickener |
10-41 |
Table 10-30: |
Filter Press Test Conditions and Results |
10-42 |
Table 10-31: |
Pressure Filtration Sizing Summary |
10-44 |
Table 10-32 |
Summary of Pneumapress® Filtration Testing Parameters |
10-45 |
Table 10-33: |
Summary of Sizing and Operating Pneumapress® Filter |
10-46 |
Table 10-34: |
Chemical Composition of BLS Samples |
10-48 |
Table 10-35: |
Summary of SART Tests Results on Oxide BLS |
10-50 |
Back Forty Project |
TOC-xvii |
Gold Resource Corporation |
|
Table 10-36: |
Summary of SART Reagent Consumptions on Oxide BLS |
10-50 |
Table 10-37: |
Summary of SART Tests Results on Sulfide BLS |
10-51 |
Table 10-38: |
Summary of SART Reagent Consumptions on Sulfide BLS |
10-52 |
Table 10-39: |
Effect of SART on Matrix of Leach Solutions |
10-52 |
Table 10-40: |
Specific Gravity Results |
10-54 |
Table 10-41: |
Tailings Optimum Moisture Content and Maximum Dry Density Results |
10-54 |
Table 10-42: |
Semi-Quantitative Mineralogical Composition – 21460140 Combined Tailings (Paste) |
10-55 |
Table 10-43: |
Bingham Viscosity and Yield Stress Summary – 21460140 Combined Tailings (Paste) |
10-55 |
Table 10-44: |
UCS Test Results |
10-56 |
Table 10-45: |
Material Type Proportion |
10-57 |
Table 10-46: |
Sample Composite Description |
10-57 |
Table 10-47: |
Sample Composite Head Assays |
10-58 |
Table 10-48: |
Gravity Result Summary |
10-59 |
Table 10-49: |
LCT Conditions |
10-61 |
Table 10-50: |
LCT Results Summary |
10-62 |
Table 10-51: |
Leaching Testwork Conditions |
10-63 |
Table 10-52: |
Cyanide Leaching Test Results |
10-64 |
Table 10-53: |
Diagnostic Leach Test Gold Proportion |
10-69 |
Table 10-54: |
Concentration of the Key Species in the Received Filtrate Sample |
10-70 |
Table 10-55: |
RO Treatments Results with Mix 1 Water @ 50% Water Recovery |
10-71 |
Table 10-56: |
Summary of SART Tests Results on Mix 1 Retentate |
10-72 |
Table 11-1: |
Summary of Univariate Statistics on Raw Assays for Gold and Silver |
11-7 |
Table 11-2: |
Summary of Univariate Statistics on Raw Assays for Copper, Lead, and Zinc |
11-7 |
Table 11-3: |
Summary Statistics for the Composites |
11-10 |
Table 11-4: |
Coefficient of Variation for Assays and Composites |
11-11 |
Table 11-5: |
Block Model Properties |
11-13 |
Table 11-6: |
Parameters of the Ellipsoid Use for Interpolation |
11-14 |
Table 11-7: |
Composite Search Specifications |
11-21 |
Table 11-8: |
Comparison of The Block and Composite Mean Grades |
11-25 |
Table 11-9: |
Input Parameters Used for The NSR Estimation |
11-26 |
Table 11-10: |
NSR Calculations |
11-28 |
Table 11-11: |
Input Parameters Used for the Cut-Off Grade Estimation |
11-30 |
Back Forty Project |
TOC-xviii |
Gold Resource Corporation |
|
Table 11-12: |
Back Forty Project 2023 Mineral Resource Estimate by Mining Method |
11-33 |
Table 11-13: |
Back Forty Project 2022 Mineral Resource Estimate, Cut-Off Sensitivity |
11-34 |
Table 13-1: |
Material Density |
13-2 |
Table 13-2: |
Open Pit Geotechnical Parameters |
13-4 |
Table 13-3: |
Hydrological parameters |
13-6 |
Table 13-4: |
Input Criteria for Pit Optimizations |
13-7 |
Table 13-5: |
Whittle Pit Optimization Results |
13-8 |
Table 13-6: |
Pinwheel Pit Production |
13-12 |
Table 13-7: |
Main Pit Production |
13-13 |
Table 13-8: |
Open Pit Mining Fleet |
13-14 |
Table 13-9: |
Projected Mining Roster |
13-15 |
Table 13-10: |
Stope parameters |
13-17 |
Table 13-11: |
Underground Production (Includes Long Hole Stopes, Cut and Fill Stopes, and Development) |
13-17 |
Table 13-12: |
Lateral and Vertical Underground Mine Development |
13-23 |
Table 13-13: |
Projected Underground Mine Equipment Fleet |
13-25 |
Table 13-14: |
Proposed Underground Mine Roster |
13-26 |
Table 13-15: |
Airflow requirements calculations |
13-28 |
Table 13-16: |
Back Forty Mining Schedule |
13-1 |
Table 14-1: |
Process Design Criteria |
14-4 |
Table 14-2: |
Crushing Unit Specifications |
14-5 |
Table 14-3: |
Grinding Unit Specifications |
14-6 |
Table 14-4: |
Copper Flotation Cell Dimensions |
14-6 |
Table 14-5: |
Copper Regrind Equipment Specifications |
14-7 |
Table 14-6: |
Zinc Flotation Cell Dimensions |
14-8 |
Table 14-7: |
Concentrate Dewatering Equipment Specifications |
14-10 |
Table 14-8: |
Leaching & CIP Equipment Sizing |
14-10 |
Table 14-9: |
Tailings Dewatering Equipment Specifications |
14-11 |
Table 14-10: |
SART Equipment Specifications |
14-12 |
Table 14-11: |
Cyanide Destruction Tank Sizing |
14-14 |
Table 14-12: |
Reagents Dosing Rates |
14-14 |
Table 14-13: |
Water Tank Sizing |
14-15 |
Table 14-14: |
Mill Operations Manpower |
14-16 |
Back Forty Project |
TOC-xix |
Gold Resource Corporation |
|
Table 14-15: |
Metallurgical Cu Concentrate Grade |
14-17 |
Table 14-16: |
Metallurgical Zn Concentrate Grade |
14-17 |
Table 14-17: |
Metallurgical Leaching Recovery |
14-17 |
Table 16-1: |
Metal Prices Assumptions |
16-1 |
Table 16-2: |
Expected Tonnage and Grade of Back Forty Zinc Concentrate- 2027- 2034 |
16-3 |
Table 16-3: |
Back Forty Copper Concentrates Expected Mine life Analysis |
16-7 |
Table 16-4: |
Copper Concentrate Treatment Charge & Refining Charges (US $) |
16-8 |
Table 16-5: |
Copper Concentrate Penalties |
16-8 |
Table 17-1: |
Previously Permitted Mine Configurations |
17-10 |
Table 18-1: |
Back Forty Project Capital Costs |
18-2 |
Table 18-2: |
Initial Capital Costs |
18-4 |
Table 18-3: |
Initial Capital Costs for Mobile Equipment |
18-4 |
Table 18-4: |
Initial Capital Costs for the Open Pit Mine |
18-5 |
Table 18-5: |
Initial Capital Costs for Capitalized OPEX |
18-5 |
Table 18-6: |
Initial Capital Costs for Electrical and Communication |
18-5 |
Table 18-7: |
Initial Capital Costs for Site Infrastructures |
18-6 |
Table 18-8: |
Initial Capital Costs for Process Plant |
18-7 |
Table 18-9: |
Initial Capital Costs for Rock and Tailings Management |
18-8 |
Table 18-10: |
Initial Capital Costs for Water Treatment and Management |
18-8 |
Table 18-11: |
Initial Capital Costs for Construction Indirect Costs |
18-8 |
Table 18-12: |
Initial Capital Costs for General Services |
18-9 |
Table 18-13: |
Initial Capital Costs for Contingency |
18-9 |
Table 18-14: |
Sustaining Capital Costs Summary |
18-10 |
Table 18-15: |
Sustaining Capital Costs for Mobile Equipment |
18-11 |
Table 18-16: |
Sustaining Capital Costs for Underground Mine |
18-11 |
Table 18-17: |
Sustaining Capital Costs for Capitalized OPEX |
18-12 |
Table 18-18: |
Sustaining Capital Costs for Site Infrastructures |
18-12 |
Table 18-19: |
Sustaining Capital Costs for Processing Plant |
18-12 |
Table 18-20: |
Sustaining Capital Costs for Contingency |
18-13 |
Table 18-21: |
Sustaining Capital Costs for Rehabilitation and Closure |
18-13 |
Table 18-22: |
Sustaining Capital Costs for Salvage Value |
18-13 |
Table 18-23: |
Operating Costs Summary |
18-14 |
Back Forty Project |
TOC-xx |
Gold Resource Corporation |
|
Table 18-24: |
Operating Costs for Overburden |
18-15 |
Table 18-25: |
Operating Costs for Open Pit Mine |
18-15 |
Table 18-26: |
Operating Costs for Underground Mine |
18-16 |
Table 18-27: |
Operating Costs for Material Rehandling |
18-17 |
Table 18-28: |
Operating Costs for Process Plant |
18-17 |
Table 18-29: |
Operating Costs for Tailings Disposition |
18-18 |
Table 18-30: |
Operating Costs for WRMF reclamation |
18-19 |
Table 18-31: |
Operating Costs for General and Administration |
18-19 |
Table 18-32: |
Operating Costs for Concentrate Transportation |
18-20 |
Table 19-1: |
Metal Prices for Different Economic Analysis Scenarios |
19-1 |
Table 19-2: |
Economic Results for Back Forty Project |
19-2 |
Table 19-3: |
Metallurgical Recoveries from the Different Circuits |
19-5 |
Table 19-4: |
Cash Flow Forecast with Inferred Resource |
19-6 |
Table 19-5: |
Taxes, Royalties, and Streams Payments |
19-8 |
Table 19-6: |
Cash Flow Forecast Without Inferred Resource |
19-10 |
Table 19-7: |
Taxes, Royalties, and Streams Payments for Case Without Inferred Material |
19-12 |
Table 19-8: |
Sensitivity to Different Metal Prices |
19-13 |
Table 20-1: |
Non-Ferrous Properties of the Great Lakes Region |
20-2 |
Table 22-1: |
Risks for the Project |
22-7 |
Table 22-2: |
Opportunities for the Project |
22-8 |
Table 23-1: |
Estimated Costs for the Recommended Work Program |
23-1 |
FIGURES |
|
|
Figure 1-1: |
Back Forty Project Layout |
1-10 |
Figure 1-2: |
Isometric View of the Back Forty Open Pit and Underground Mine Layout |
1-11 |
Figure 1-3: |
Back Forty Project Mining Schedule |
1-11 |
Figure 1-4: |
Process Flow Diagram (Processing section) |
1-13 |
Figure 1-5: |
Infrastructure and Site Access Layout |
1-15 |
Figure 3-1: |
Location of the Back Forty Project |
3-1 |
Figure 3-2: |
Map of Back Forty Project Land Tenure |
3-2 |
Figure 4-1: |
Access Map to Back Forty Property |
4-12 |
Figure 4-2: |
Typical Landscape of Back Forty Property |
4-13 |
Back Forty Project |
TOC-xxi |
Gold Resource Corporation |
|
Figure 5-1: |
Expanded Detailed Gravity Survey Showing Newly Discovered 2016 Zone |
5-19 |
Figure 6-1: |
Location Map of The Back Forty VMS Deposit Within PVB In Relation to the Geological Provinces of the Canadian Shield |
6-1 |
Figure 6-2: |
Geological Map of Northern Wisconsin and Western Michigan |
6-2 |
Figure 6-3: |
Geological Map of The Penokean Volcanic Belt with Location and Distribution of the VMS Districts |
6-4 |
Figure 6-4: |
Classification of VMS Deposits in the PVB Based on Cu and Zn Ratios |
6-5 |
Figure 6-5: |
Geologic Map of the Back Forty Area |
6-6 |
Figure 6-6: |
Geological Map of the Back Forty Deposit |
6-7 |
Figure 6-7: |
Typical Cross-Section through the Eastern Portion of The Back Forty Deposit |
6-9 |
Figure 6-8: |
N-S Cross-Section through the Central Portion of the Back Forty Deposit |
6-10 |
Figure 6-9: |
Typical Cross-Section through the Western Portion of the Back Forty Deposit |
6-11 |
Figure 6-10: |
3D Model of the Mineralized Zones of the Back Forty Deposit |
6-12 |
Figure 6-11: |
Back Forty Massive Sulfide Stratigraphic Column |
6-14 |
Figure 6-12: |
Zr‐Ti Versus Al‐Ti Ratios of Rhyolites at the Back Forty Project |
6-15 |
Figure 6-13: |
Principal Characteristics of an Idealized VMS Deposit |
6-21 |
Figure 7-1: |
Drill Hole Plan Map Showing Drill Hole Traces Projected to Surface |
7-3 |
Figure 8-1: |
2002-2017 Gold Results for Blanks (n=562) Assayed for the Project |
8-13 |
Figure 8-2: |
Linear Regression Graphs Comparing IAC versus SGS Assay Results |
8-14 |
Figure 9-1: |
Photographs Taken During the Drill Core Review |
9-2 |
Figure 9-2: |
Examples of Onsite Collar Location Verifications |
9-3 |
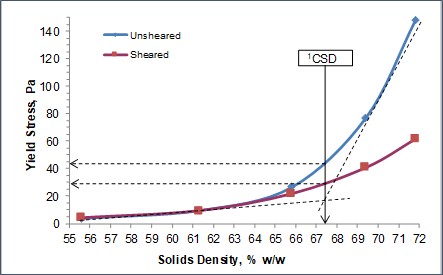
Figure 10-1: |
Solids Content Versus Yield Stress for PP-07 Zn Clnr Conc Underflow |
10-14 |
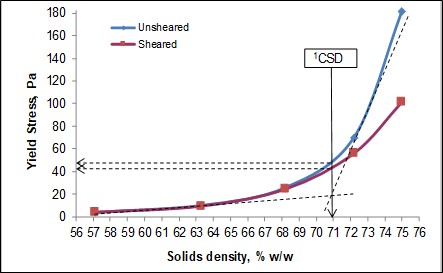
Figure 10-2: |
Solids Content Versus Yield Stress for PP-13 Bulk Clnr Conc Underflow |
10-14 |
Figure 10-3: |
Modal Mineral Distribution |
10-17 |
Figure 10-4: |
Au and Ag Recoveries Versus Grind Size |
10-19 |
Figure 10-5: |
Copper Rougher Recovery Versus Weight Recovery – All Composites |
10-22 |
Figure 10-6: |
Copper Rougher Stage – Au Recovery Versus Cu Recovery |
10-22 |
Figure 10-7: |
Copper Rougher Stage – Au Recovery Versus Cu Recovery |
10-23 |
Figure 10-8: |
Copper Rougher Stage - Cu Versus Zn Selectivity |
10-23 |
Figure 10-9: |
Zinc Rougher Stage Performance |
10-24 |
Figure 10-10: |
Locked Cycle Test Flowsheet |
10-26 |
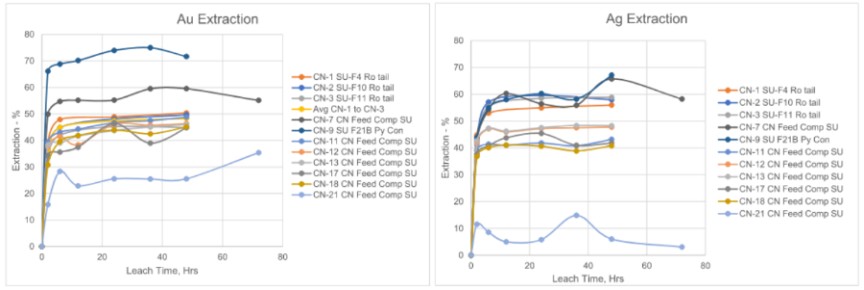
Figure 10-11: |
Comp SU Direct Cyanidation Extraction |
10-30 |
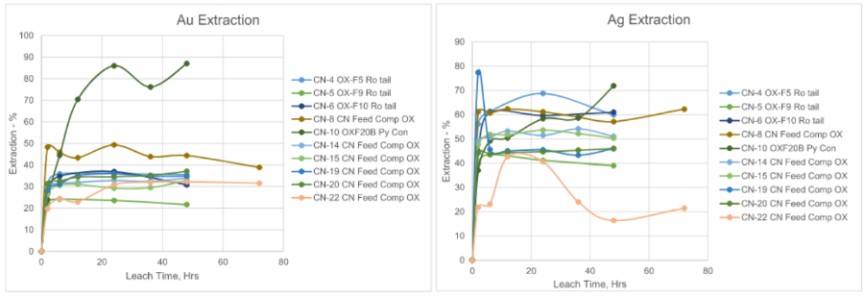
Figure 10-12: |
Comp OX Direct Cyanidation Extraction |
10-30 |
Back Forty Project |
TOC-xxii |
Gold Resource Corporation |
|
Figure 10-13: |
Metal Extraction Results – RLTs Round 3 |
10-35 |
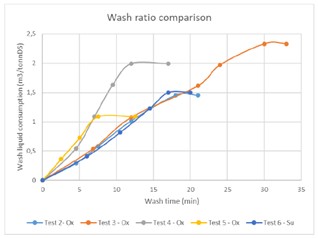
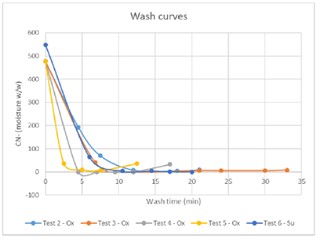
Figure 10-14: |
Wash Ratio Comparison and Wash Curves |
10-38 |
Figure 10-15: |
Underflow Solids Concentration Versus Retention Time – Aquila Resources – Back Forty |
10-40 |
Figure 10-16: |
Cake Wash Time Versus Cake Wash Ratio Time – Aquila Resources – Back Forty – Leach Residue |
10-43 |
Figure 10-17: |
Cake Wash Time Versus Cake Weight x Wash Volume – Aquila Resources – Back Forty Leach Residue |
10-46 |
Figure 10-18: |
Block Diagram of the Overall Experimental Plan |
10-47 |
Figure 10-19: |
Schematic of Bench Scale SART Apparatus |
10-49 |
Figure 10-20: |
Particle Size Distribution |
10-54 |
Figure 10-21: |
Testwork Flow Diagram |
10-58 |
Figure 10-22: |
LCT Flowsheet |
10-60 |
Figure 10-23: |
Leaching Performance Under Different Cyanide Concentrations |
10-67 |
Figure 10-24: |
Leaching Performance Under Air and Oxygen Sparge |
10-68 |
Figure 11-1: |
Surface Plan View (A) and Vertical Cross-Section Looking North (B) of the Validated DDH Used in the 2023 MRE |
11-3 |
Figure 11-2: |
Mineralized Solids of the Back Forty Project |
11-5 |
Figure 11-3: |
Example of Graphs Supporting the None Capping of Zinc for the 1010 Zone |
11-8 |
Figure 11-4: |
Example of Graphs Supporting a Capping Value of 50 G/T Au for the 1010 Zone |
11-9 |
Figure 11-5: |
Correlation Between Bulk Density and Sulfur |
11-12 |
Figure 11-6: |
Variography Study for Zinc in the Main MS1 Zone |
11-14 |
Figure 11-7: |
Gold Grade Distribution for Section 435140E |
11-22 |
Figure 11-8: |
Validation Swath Plot of Zone 2010 for Gold (East Direction) |
11-23 |
Figure 11-9: |
Validation Swath Plot of Zone 2010 for Zinc (East Direction) |
11-24 |
Figure 11-10: |
Isometric, Longitudinal and Plan Views Showing the Classified Mineral Resources and the Interpolated NSR Constrained in Optimized Pit-shells and DSO Stope Designs |
11-32 |
Figure 13-1: |
Back Forty Underground Mine Looking West |
13-2 |
Figure 13-2 : |
Whittle Pit Optimization Shells |
13-8 |
Figure 13-3: |
Revenue Factor 1 Pit Shell |
13-9 |
Figure 13-4: |
Ultimate Pit, Overburden Stockpile and Waste Rock Dump |
13-11 |
Figure 13-5: |
Pinwheel Pit Views |
13-12 |
Figure 13-6: |
Main Pit Views |
13-13 |
Figure 13-7: |
Open Pit and Underground Workings Looking North |
13-18 |
Figure 13-8: |
Underground Infrastructures Looking North |
13-18 |
Back Forty Project |
TOC-xxiii |
Gold Resource Corporation |
|
Figure 13-9: |
Underground Infrastructures Looking NW |
13-19 |
Figure 13-10: |
Cross-section of Typical Cut-and-Fill Stope |
13-20 |
Figure 13-11: |
Sectional View of Longitudinal Longhole Stope |
13-21 |
Figure 13-12: |
Sectional View of a Typical Transverse Longhole Stope |
13-22 |
Figure 13-13: |
Typical Lateral Development Heading |
13-24 |
Figure 13-14: |
Typical Level Development |
13-24 |
Figure 13-15: |
Ventilation Network Isometric View |
13-27 |
Figure 13-16: |
Plan View of Second Stage of Ventilation System |
13-29 |
Figure 13-17: |
Plan View of Typical Production Level Ventilation System |
13-30 |
Figure 13-18: |
Paste Backfill Network |
13-31 |
Figure 14-1: |
Process Flow Diagram (Crushing section) |
14-2 |
Figure 14-2: |
Process Flow Diagram (Processing section) |
14-3 |
Figure 14-3: |
Copper Flotation Circuit |
14-7 |
Figure 14-4: |
Zinc Flotation Circuit |
14-9 |
Figure 15-1: |
Infrastructure and Site Access Layout |
15-1 |
Figure 15-2: |
Site Infrastructure Layout |
15-2 |
Figure 15-3: |
Plan View of the TMF |
15-9 |
Figure 15-4: |
Typical Section of the TMF |
15-9 |
Figure 15-5: |
The Double Liner System of the TMF |
15-10 |
Figure 15-6: |
Plan View of WRMF |
15-11 |
Figure 15-7: |
Typical Cross-Section of the WRMF |
15-11 |
Figure 15-8: |
The Double Liner System of the WRMF |
15-12 |
Figure 16-1: |
10 Year Chart- Zinc Spot and Benchmark TCs versus LME Zinc Price |
16-2 |
Figure 16-2: |
20 Year Treatment and Copper Refining Charge History |
16-5 |
Figure 16-3: |
Projected Annual Copper Concentrate Production |
16-6 |
Figure 17-1: |
Back Forty Project Area of Influence |
17-13 |
Figure 17-2: |
Back Forty Project Infrastructures |
17-14 |
Figure 19-1: |
Materialized Material Processed and Grade Profiles for Gold and Zinc |
19-7 |
Figure 19-2: |
Recovered Metal Profile |
19-7 |
Figure 19-3: |
Cash Flow Profile |
19-8 |
Figure 19-4: |
Materialized Material Processed and Grade Profiles for Gold and Zinc for Case Without Inferred Material |
19-11 |
Figure 19-5: |
Recovered Metal Profile for Case Without Inferred Material |
19-11 |
Back Forty Project |
TOC-xxiv |
Gold Resource Corporation |
|
Figure 19-6: |
Cash Flow Profile for Case Without Inferred Material |
19-12 |
Figure 19-7: |
Spider Chart for Variation of Metal and Expenses on NPV |
19-14 |
Figure 19-8: |
Spider Chart for Variation of Metal and Expenses on IRR |
19-14 |
Back Forty Project |
TOC-xxv |
Gold Resource Corporation |
|
1.0 |
EXECUTIVE SUMMARY |
1.1 |
Introduction |
GOLD RESOURCE CORPORATION (NYSE American: GORO) is a registrant with the United States Securities and Exchange Commission (“SEC”). GORO must report its exploration results, Mineral Resources, and Mineral Reserves using the mining disclosure standards of Subpart 229.1300 of Regulation S-K Disclosure by Registrants Engaged in Mining Operations (“SK1300”).
This report is an Initial Assessment (“IA”) in accordance with the SEC SK1300 for the Back Forty Project (“Back Forty” or “Back Forty Project” or the “Project”), a wholly-owned project of Gold Resource Corporation (“GRC” or “the Company”). Back Forty is a gold, silver, and base-metal advanced exploration stage in the Upper Peninsula of Michigan, USA. This report supports the historical, scientific, and technical information concerning the Project effective as of September 30th, 2023. This report does not purport to reflect new information regarding the Project arising after such date.
This IA incorporates all the studies and work done for the Back Forty Project in the Upper Peninsula of Michigan. Since the latest study published in 2020 by Aquila Resources Inc., the focus has been to reduce as much as possible any impact the Project may have on the local environment. As such, great efforts have been made to reduce the footprint of the infrastructures, to nullify direct impact to wetlands and use filtered tailings for storage. The reduction in footprint is most significant by the reduction in size of the open pit section of the mine from 61.9Mt extracted to 9.7Mt extracted. This change in design significantly reduces the area required to store waste rock. The mill flowsheet was also modified to have a single stream instead of two distinct ones for flotation and oxides and to process at a nominal 2,500 tonnes per day (tpd). This modification both reduces the overall footprint of the buildings required and the need for numerous stockpiles. The increased underground section of the mine reduces the quantity of tailings stored on the surface by using it as paste backfill. Finally, the storage of filtered tailings instead of thickened tailings reduces water consumption and the risk associated with dams.
1.2 |
Qualified Persons (QPs) |
The Qualified Persons (“QPs”) preparing this report are mining industry professionals and specialists trained in diverse technical backgrounds including but not limited to geology, exploration, environmental, cost estimation, and mineral economics. A QP defined under SEC SK1300 instructions is a mineral industry professional with at least five years of relevant work experience in the type of mineralization and deposit similar to Back Forty and an eligible member or licensee in good standing of a recognized professional organization.
By their education, experience, and professional association, the following individuals are considered QPs for this report and are members in good standing of relevant professional institutions/organizations. As noted below, four of the QPs are employees or ex-employees of GRC, and therefore, such individuals are not independent of GRC.
Back Forty Project |
1-1 |
Gold Resource Corporation |
|
Table 1-1: Summary of QP Qualifications
QP NAME & BIOGRAPHY |
SITE VISIT |
RESPONSIBLE SECTIONS |
Marina Iund, P. Geo (InnovExplo) | ||
Ms. Iund graduated with a Bachelor’s degree in Geology from Université de Besançon (Besançon, France) in 2008. In addition, obtained a Master's degree in Resources and Geodynamics from Université d’Orléans, as well as a DESS’s degree in Exploration and Management of Non-renewable Resources from Université du Quebec à Montréal (Montreal, Quebec) in 2010. Ms. Iund practiced her profession in mineral exploration, mine geology and resource geology for a total of 13 years since graduating from university. She acquired her expertise with Richmont Mines Inc. and Goldcorp. She has been a project geologist and then a senior geologist in mineral resources estimation for InnovExplo Inc. since September 2018. Member of the Ordre des Géologues du Québec (OGQ No. 1525), the Association of Professional Geoscientists of Ontario (PGO, No. 3123), and the Northwest Territories and Nunavut Association of Professional Engineers and Professional Geoscientists (NAPEG licence No. L4431). |
|
3, 4, 5, 6, 7, 8, 9, 11, 22, and 23 |
Carl Pelletier, P. Geo (InnovExplo) | ||
Mr. Pelletier graduated with a Bachelor’s degree in Geology from Université du Québec à Montréal (Montreal, Quebec) in 1992. He initiated a master's degree at the same university for which he completed the course program but not the thesis. His relevant experience includes a total of 31 years since graduation from university. Mining expertise acquired at the Silidor, Sleeping Giant, Bousquet II, Sigma-Lamaque and Beaufor mines. Exploration experience acquired with Cambior Inc. and McWatters Mining Inc. He has been a consulting geologist for InnovExplo Inc. since February 2004 where he contributes to multiple mandates of mineral resources estimation. He has relevant experience in various types of mineral deposits ((precious metals (Au, Ag), base metals (Cu, Zn, Ni), industrial and high technology (graphite, Li, Be, Ta, U, Sc and REE)) as well as for different types of operation (underground and open pit mines). Mr. Pelletier is a Member of the Ordre des Géologues du Québec (OGQ, No. 384), the Association of Professional Geoscientists of Ontario (PGO, No. 1713), the Association of Professional Engineers and Geoscientists of British Columbia (EGBC, No. 43167), the Northwest Territories Association of Professional Engineers and Geoscientists (NAPEG, No. L4160), and the Canadian Institute of Mines (CIM). |
3, 4, 5, 6, 7, 8, 9, 11, 22, and 23 |
|
Back Forty Project |
1-2 |
Gold Resource Corporation |
|
Simon Boudreau, P. Eng (InnovExplo) | ||
Mr. Boudreau graduated with a Bachelor’s degree in Mining Engineering from Université Laval (Quebec City, Quebec) in 2003. His relevant experience includes a total of 20 years since graduation from university. He has been involved in mine engineering and production at the Troilus mine for four years, at HRG Taparko mine for four years, and at Dumas Contracting for three years. He has also worked as an independent consultant for the mining industry for five years and with InnovExplo for four years. As a consultant, he has been involved in many base metal and gold mining projects. Mr. Boudreau is a member in good standing of the Ordre des Ingénieurs du Québec (No:132 338) and the Northwest Territories and Nunavut Association of Professional Engineers and Professional Geoscientists (NAPEG licence No. L5047). |
|
11.13 |
Eric Kinnan, P. Geo (InnovExplo) | ||
Mr. Kinnan graduated with a Bachelor’s degree in Geology in 1995 from Université du Québec à Montréal (Montreal, Québec). He has worked as a geologist for a total of 27 years since graduating from university in 1995. His expertise was acquired while working as an exploration geologist and manager for several companies in West Africa and South America since 1994 and as a geological consultant for clients in Guyana, Mali, Ivory Coast, Gabon, Guinea and the USA. The companies he has worked for include: InnovExplo, Barrick Gold (Guyana), Crucible Gold Ltd./Major Star CI (Ivory Coast, Burkina Faso and Ghana); Golden Star Resources (Suriname, Ghana, Ivory Coast, Burkina Faso, Niger), Vannessa Ventures Ltd, Vannessa Guyana Inc., and Vanarde Mining Ltd. (Guyana). Mr. Kennan is a member of the Ordre des Géologues du Québec (OGQ licence No. 00788). |
July 5 to 7, 2021 |
9 and 22 |
Patrick Frenette, P. Eng. (GRC employee) | ||
Mr. Patrick Frenette graduated with a Bachelor’s degree in Mining Engineering from Ecole Polytechnique de Montreal in 2001. He also holds a Master’s in Rock Mechanics (2003) and a Master’s in Business Administration (2021). Mr. Frenette has over 20 years of experience in open pit and underground operations as well as in consulting where he worked for different projects in Canada, USA and Mexico for companies such as Cambior, Agnico Eagle, Osisko, Canadian Malartic, InnovExplo and Wesdome. He is currently the Vice-President of Technical Services for GRC. Prior to joining GRC, he was Director of Operational Support for Osisko |
October 11 to 13, 2022 |
1, 2, 13, 18, 19, 20, 21, 22, 23, 24, and 25 |
Back Forty Project |
1-3 |
Gold Resource Corporation |
|
Development. He is a Professional Engineer and a member in good standing of Ordre des Ingénieurs du Québec (OIQ), Professional Engineers of Ontario (PEO) and Engineers & Geoscientists of British Columbia (EGBC). |
|
|
Christian Laroche, P. Eng. (GRC employee) | ||
Mr. Christian Laroche graduated from Université Laval in 2000 with a Bachelor’s degree in Metallurgical Engineering. He is registered at Ordre Ingénieur du Québec (OIQ) and at Engineer and Geoscientists of British-Columbia (EGBC). Mr. Laroche worked as a Process Engineer for BBA and as Corporate Director of Metallurgy for Compagnie Minière Osisko. He spent eight years as Director of Metallurgy for Osisko Gold Royalty and three years as Vice-President Metallurgy for Falco Resources. He is now GRC Technical Service Director of Metallurgy since 2022. |
April 5 to 7, 2022 |
10, 14, 16, 22, and 23 |
Michael J. Foley, P.E. (Former GRC employee) | ||
Mr. Foley graduated from Michigan Technological University in 1991. He is a Registered Professional Engineer in the States of Michigan and Wisconsin, USA. Mr. Foley has worked for consulting engineering firms, municipalities and contractors throughout his career. He was Director of Environment and Infrastructures for Aquila Resources and GRC from August of 2020 to September 2023. |
August 2020 to September 2023 |
15 and 22 |
Andrea K. Martin, P.E. (Foth) | ||
Ms. Andrea Martin graduated from Michigan Technological University with a Chemical Engineering degree and received a Master’s degree from University of Wisconsin Green Bay in Environmental Science & Policy. She has worked in the U.S. environmental regulatory arena for over 25 years, currently working for a consulting company, Foth Infrastructure & Environment, LLC. She specializes in mining permits applications and compliance practices, environmental impact analyses, as well as permits such as water discharge, air, and wetland permits. She is a professional engineer registered in Michigan, Wisconsin, Illinois, and Minnesota. |
|
17 and 22 |
Rodrigo Simidu, P. Eng. (GRC employee) | ||
Mr. Rodrigo Simidu graduated with a degree in Mining Engineering from University of Sao Paulo, Brazil, in 2008. He is a Professional Engineer (P. Eng.) registered with Engineers & Geoscientists British Columbia (EGBC). Mr. Simidu has over 14 years of practical experience as a mining engineer in several mining methods for |
April 5 to 7, 2022 |
13 and 22 |
Back Forty Project |
1-4 |
Gold Resource Corporation |
|
hard rock mines, with a strong background in mine planning. He is currently the principal mining Engineer for GRC, and his relevant experience includes operational, planning, corporate technical support, and consulting in Canada, USA, Mexico, Australia, South Africa, and Ghana. Prior to joining GRC, Mr. Simidu was Manager, Mine Planning at Worley, a global engineering company. |
|
|
Technical data and information used in the preparation of this report also included documents from third-party contractors. The authors sourced information from referenced documents as cited in the text and listed in the References section of this report.
1.3 |
Property Description and Ownership |
GRC controls approximately 1,304 hectares (3,222 acres) of private and public (State of Michigan) mineral lands located in Lake and Holmes Townships in Menominee County, Michigan. Approximately 1,019 hectares (2,517 acres) of these lands form a contiguous block of GRC-controlled mineral rights. The Active Project Boundary encompasses approximately 479 hectares (1,183 acres). The Project is centered at latitude 45° 27’ N and longitude 87° 51’ W.
In addition to the key properties, GRC has also purchased, leased, or optioned additional properties. These properties are either contiguous with the key parcels, may contain facilities utilized by the Company, are perceived to have exploration potential, or were purchased for other strategic purposes.
1.4 |
Accessibility, Climate, Local Resources |
The Back Forty Project area lies along the east bank of the Menominee River and consists of low, rolling hills with maximum topographic relief of 30 m and intervening wetland (in part prairie-savannah); mean elevation is approximately 200 to 300 masl. Vegetation is mostly immature hardwood-pine forest and swamp/prairie-savannah grasses; wetland areas also occur along creeks and secondary tributaries. The climate is temperate, allowing exploration, potential development, and potential mining activities to take place year-round. Regionally, July is the warmest month with a mean temperature of 19.7°C and January is the coldest month with a mean temperature of -15.4°C. On average, the region receives approximately 796 mm of precipitation annually.
The Property is located approximately 55 km south-southeast from Iron Mountain, and approximately 19 km west of Stephenson, Michigan, within the Escanaba River State Forest. Access from Stephenson is via County G12 Road, north on River Road, travelling approximately 5 km to the Project field office. A number of drill roads connect with River Road and cross the Property. Infrastructure on the Property includes a nearby power line and paved road access.
Back Forty Project |
1-5 |
Gold Resource Corporation |
|
1.5 |
History |
The Back Forty Deposit area remained unexplored until 2001 when construction of a new domestic water well on the MRT property unintentionally intersected massive sphalerite mineralization. Richard Lassin, a Michigan-based geologist, first recognized the potential of the Property.
In February 2002, two diamond drill holes were completed along the eastern edge of the Property on State mineral leases. Although the first hole (108401) had no significant results, the second hole (108402) penetrated 37 m of massive sulfides grading 9.1% Zn and 5.7 g/t Au after penetrating the capping gossan that graded 21.9 g/t Au. The East Zone had been discovered.
In 2014, a Preliminary Economic Assessment was completed for Aquila by Tetra Tech which contemplated an open pit mining/processing operation followed by an underground mining operation including an on-site processing facility and associated infrastructure at the Project.
On March 31, 2015, the Company closed a multi-level financing transaction with Orion Mine Finance (“Orion”) that included an equity private placement and a silver stream (“Stream”) for total funding of $20.75 million. Orion acquired 75% of Aquila’s life-of-mine (“LOM”) silver production from the Project for gross proceeds of $17.25 million.
On November 10, 2017, Aquila completed a financing transaction with Osisko Bermuda Limited (“OBL”), a wholly owned subsidiary of Osisko Gold Royalties Ltd. (“Osisko”) pursuant to which OBL has agreed to commit $65 million to Aquila through a $10 million private placement and $55 million gold stream purchase agreement. Under the terms of the Stream Agreement, OBL will purchase 18.5% of the refined gold from the Project (the “Threshold Stream Percentage”) until Aquila has delivered 105,000 ounces of gold (the “Production Threshold”). Upon satisfaction of the Production Threshold, the Threshold Stream Percentage will be reduced to 9.25% of the refined gold (the “Tail Stream”). In exchange for the refined gold delivered under the Stream, OBL will pay Aquila ongoing payments equal to 30% of the spot price of gold on the day of delivery, subject to a maximum payment of $600 per ounce.
On September 7, 2018, Aquila filed an open pit Feasibility Study Technical Report performed by P&E on SEDAR, with an effective date of August 1, 2018.
In 2020, a Preliminary Economic Assessment was completed for Aquila by P&E. In June 2020, Aquila amended its agreement with Osisko, reducing the total committed amount to $50 million, as well as adjusting certain milestone dates under the gold stream to align with the current project development timeline.
GRC acquired, through its wholly-owned indirect subsidiary Gold Resources Acquisition Sub, Inc., all the issued and outstanding common shares of Aquila. The Transaction was approved at a special meeting of holders of Aquila Shares held on November 17, 2021, and by the Ontario Superior Court of Justice on November 19, 2021. At the time of the GRC acquisition, Aquila had received a total of $20 million of the committed funds relating to the gold stream agreement and a total of $17.2 million had been advanced under the silver stream agreement.
1.6 |
Geological Setting |
The Back Forty VMS Deposit is one of a number of deposits located throughout the Ladysmith-Rhinelander volcanic complex in northern Wisconsin and the Upper Peninsula of Michigan. The complex lies within the lower Proterozoic
Back Forty Project |
1-6 |
Gold Resource Corporation |
|
PVB, also known as the Wisconsin Magmatic Terranes. The PVB is part of the Southern Structural Sub-province of the Canadian Shield.
Mineralization at the Back Forty Deposit consists of discrete zones of: 1) zinc or copper-rich massive sulfide (±lead), which may contain significant amounts of gold and silver, 2) stockwork stringer and peripheral sulfide, which can be gold, zinc, and copper-bearing (±lead/silver), 3) precious metal-only, low-sulfide mineralization, and 4) oxide-rich, precious metal-bearing gossan.
The zinc-copper-lead-gold-silver bearing sulfide mineralization identified on the Property exhibits typical characteristics of VMS mineralization. VMS deposits form in a marine volcanic environment by the circulation of hot hydrothermal fluids near spreading centers. Cold seawater infiltrating ocean crust off-axis is progressively heated by hot magma underlying the rift zone. Heated and buoyant fluids leach metals from the surrounding rocks. Metallic sulfides precipitate at or near the rock-water interface as a result of rapid changes in Eh and pH triggered by rapid mixing with cold ambient seawater. Precipitated sulfides form massive mounds, fracture and cavity fills, as well as replacement textures. Metal zoning is common with copper-rich zones at or near the center and zinc-rich zones at the fringes of a sulfide mound. Multiple events and zone refinement are common, often due to changes in the internal plumbing system.
1.7 |
Status of Exploration |
Drilling on the Property was conducted over several campaigns. Between 2002 and 2019, 642 boreholes totaling 124,580m were drilled. In addition to resource delineation drilling associated with the expansion of the Back Forty Mineral Resource, focused drill efforts were also undertaken which included: The drilling of exploration (geophysical) targets in the immediate vicinity of the Back Forty Deposit area, drilling to support metallurgical testing programs, and geotechnical drilling to characterize the rock quality of the Back Forty Deposit area.
1.8 |
Sample Preparation |
The drill core was boxed and sealed from a secure area at the drill sites and transported daily to the Aquila field office, located on the Property. Prior to 2009, all drill core was housed either in the outdoor fenced storage area at the field office or at the indoor Daggett core warehouse. From 2009 to 2011, the drill core was logged geotechnically and geologically, then marked for samples at the field office facility and transferred to a new core facility in Carney, Michigan (27 km away) for photographing, cutting, sampling and archiving. The Carney core warehouse was secured by locks and alarm system. As of 2011, all drill core from previous programs was transferred to the Project’s core warehouse in Carney and photographed prior to archiving. All digital computer files, including core photographs, logs, and data, are saved on a central server at the Back Forty main office in Stephenson, Michigan. The entire contents of the server are backed-up onto a tape drive and removed from the premises on a daily basis.
Assay intervals are generally 1.5 m in length and, to be as representative as possible, the sample intervals respected lithological contacts. Virtually all the core of both mineralized and unmineralized material from all drill holes was sampled by sawing the core lengthwise and retrieving half the split core for assaying. Typically, the drill core of mafic dykes was not sampled unless they exhibited visual mineralization.
Assay samples were shipped from the Aquila field office in Michigan directly to the ALS preparation facility in Elko, Nevada, the Accurassay Lab in Thunder Bay, Ontario, or the Inspectorate America Lab in Sparks, Nevada.
Back Forty Project |
1-7 |
Gold Resource Corporation |
|
The QA/QC program includes insertion of blanks and standards in the flow stream of daily core samples. From 2002 to 2017, 2,805 standards and 562 blanks were analyzed. The QA/QC procedure does not include systematic check assays, nevertheless, from 2006 to 2011, the issuer selected 1,017 samples for verification at a second laboratory using rejects.
1.9 |
Data Verification |
Data verification included site visits and a review of drill core geological descriptions. It was accomplished during a visit from July 5 to 7, 2021 by Eric Kinnan (P. Geo) from InnovExplo.
1.10 |
Mineral Processing and Metallurgical Testing |
Several historical metallurgical testwork campaigns have been completed on various samples related to the Project. The main objective of the metallurgical testwork campaigns was to quantify the metallurgical response of the VMS mineralization and included several flotation and leaching studies, comminution and gravity tests. This work was used to established metallurgical domains, give directions for test conditions and to demonstrate variability throughout the Back Forty Deposit. Metallurgical testing has generally focused on the three main sulfide mineralized zones (Main, Pinwheel and Tuff Zones) and the oxide portion of the Deposit.
The latest extensive metallurgical testwork program was undertaken on 13 samples from Back Forty Deposit representing different proportion of material type and grade range based on mining sequence. The testwork consisted of chemical and mineralogical characterization, a series of flotation and leaching tests, SART test, as well as cyanide destruction and rheology tests. A metallurgical process flowsheet was proposed and recovery values for gold, silver, copper and zinc were determined for financial model.
The previous testing campaigns were completed from 2015 to 2019 were primarily conducted at SGS (Lakefield, Ontario). A series of tests were also conducted in 2021 and 2022 at SGS (Quebec City, Quebec). The latest batch was conducted at Base Metallurgical Lab in Kamloops, British-Columbia and BQE in Burnaby, British-Columbia.
Comminution testwork included Bond ball work index (“BWI”), modified Bond ball work index (“ModBond”), abrasion index (“AI”), crusher work index (“CWI”) and SAG mill comminution (“SMC”) tests. Overall, the samples depicted a high degree of variability across the grindability characterization tests. Samples for SMC tests were considered soft to very hard with A x b ranging from 83.9 to 22.5. There was a broad range in the relative density, from 2.71 to 4.86 t/m3. Within their own mineralized zones, there was relative consistency in both hardness and density of the samples. CWI samples covered the soft to moderately hard range of hardness within the SGS database, with CWI varying from 4.4 to 12.5 kWh/t. The average CWI was 7.9 kWh/t (classified as moderately soft). BWI results ranged from very soft to hard (9.1–18.9 kWh/t). While a relatively wide range of results are observed over the data as a full set, ranges are narrower by metallurgical type, with oxides being the most competent and Pinwheel being the least competent. ModBond samples covered very soft to very hard range of hardness in the SGS database, ranging from 9.2 to 20.8 kWh/t. Following the trend from other hardness characterization tests, the global set of data shows a significant relative standard deviation, while within each metallurgical type the data range was narrower. The AI values ranged from 0.285 g to 0.564 g, with an average value of 0.398 g, which is considered medium.
Back Forty Project |
1-8 |
Gold Resource Corporation |
|
1.11 |
Mineral Resource Estimate |
The Back Forty Project Mineral Resource Estimate (the “2023 MRE”) was prepared by Marina Iund, P.Geo., Carl Pelletier, P.Geo., and Simon Boudreau, P.Eng., all from InnovExplo, using all available information.
The 2023 MRE comprises a review and update of the 2020 MRE (Bradfield et al., 2020). Since the publication on the 2020 MRE no additional drilling was completed in the modelled resource volume; therefore, the database for the 2023 MRE is the same as the 2020 MRE.
The resource area has an E-W strike length of 1,400 m, a width of 875 m, and a vertical extent of 750 m below the surface. The 2023 MRE was based on a compilation of historical and recent diamond drill holes (“DDH”). The wireframed mineralized structures were provided by the issuer and were reviewed and approved by the authors.
The effective date of the 2023 MRE is September 30th, 2023.
The 2023 MRE was prepared using GEOVIA Surpac 2022 (“Surpac”) software. Surpac was used for the grade estimation and block modelling. Basic statistics, capping, variography and validations were established using a combination of Surpac, Snowden Supervisor v.8.12 (“Supervisor”) and Microsoft Excel software.
Table 1-2: Back Forty Project 2023 Mineral Resource Estimate by Mining Method
Area (Mining Method) |
Classification |
NSR cut-off ($/t) |
Tonnes (000s) |
Au (g/t) |
Au (Moz) |
Ag (g/t) |
Ag (Moz) |
Zn (%) |
Zn (Mbs) |
Cu (%) |
Cu (lbs) |
Open pit |
Indicated |
33 |
9,360 |
2.41 |
725 |
28.06 |
8,444 |
3.74 |
772 |
0.36 |
74 |
Inferred |
33 |
566 |
2.70 |
49 |
48.84 |
889 |
1.31 |
16 |
0.35 |
4 |
|
UG long hole |
Indicated |
73 |
5,137 |
1.86 |
306 |
24.05 |
3,972 |
2.65 |
300 |
0.41 |
47 |
Inferred |
73 |
627 |
2.00 |
40 |
26.10 |
526 |
2.89 |
40 |
0.37 |
5 |
|
Total Indicated |
14,497 |
2.21 |
1,032 |
26.64 |
12,416 |
3.35 |
1,072 |
0.38 |
121 |
||
Total Inferred |
1,193 |
2.33 |
89 |
36.89 |
1,415 |
2.14 |
56 |
0.36 |
9 |
||
Notes to accompany the Mineral Resource Estimate:
1. |
The independent and qualified persons for the mineral resource estimate, as defined by S-K 1300, are Marina Iund, P.Geo., Carl Pelletier, P.Geo. and Simon Boudreau, P.Eng. all from InnovExplo Inc. The effective date is September 30th, 2023. |
2. |
These mineral resources are not mineral reserves, as they do not have demonstrated economic viability. The mineral resource estimate is reported in accordance with the S-K 1300 Regulations and Definition Standards. |
3. |
The results are presented undiluted and are considered to have reasonable prospects of economic viability. |
4. |
The estimate encompasses a gold, silver, zinc and copper deposit subdivided into 53 individual zones using the grade of the adjacent material when assayed or a value of zero when not assayed. Fifty-three 10 m buffers around each zone were also created. |
5. |
High-grade capping supported by statistical analysis was done on raw assay data before compositing and is established on a per-zone basis varying from 40 to 75 g/t Au; 350 to 1100 g/t Ag; 0.6 to 12% Cu and none to 14% Zn. |
6. |
The estimate was completed using sub-block models in GEOVIA Surpac 2022. |
7. |
Grade interpolation was performed on 1.5 m composites with the ID3 method for Au and Ag and the ID2 for Zn and Cu. |
8. |
The density was interpolated with the ID2 method for Type 1 (rich massive sulfide mineralized zones), Type 2 (stockwork stringer and peripheral sulfide mineralized zones) and Type 3 (precious metal-rich, low sulfide mineralized zones). A value of 3.05 g/cm3 was assigned to Type 4 (gossan mineralized zones). A value of 2.7 g/cm3 was assigned to the surrounding waste and to the cross-cutting mafic dykes. A value of 2.00 g/cm3 was assigned to the overburden and the cross-cutting sandstone unit. |
9. |
The mineral resource estimate is classified as Indicated and Inferred. For Type 3 zones, the Indicated mineral resource category is defined for blocks estimated in the first pass, with a closest distance of 45 m and where there is reasonable geological and grade continuity. The Inferred category is defined for blocks estimated in the first and/or second pass, with a closest distance of 90 m and where there is reasonable geological and grade continuity. For Types 1,2 and 4 zones, the Indicated mineral resource category is defined for blocks estimated in the first pass, with a closest distance of 55 m and where there is reasonable geological and grade continuity. The Inferred category is defined for blocks estimated in the first and/or second pass, with a closest distance of 110 m and where there is reasonable geological and grade continuity. |
10. |
The mineral resource estimate is locally pit-constrained with a bedrock slope angle from 31 to 49° and an overburden slope angle of 30°. It is reported at a rounded NSR cut-off of $33/t (in pit) and $73/t (underground). The NSR cut-off was calculated using the following parameters: Total processing cost = $28.00/t; Ore premium mining cost = none to $40.00/t; Administration & General = $5.00/t; gold |
Back Forty Project |
1-9 |
Gold Resource Corporation |
|
price = $1,800.00/oz; silver price = $23.30/oz; copper price = $3.90/lb and zinc price = $1.25/lb. The cut-off grades should be re-evaluated in light of future prevailing market conditions (metal prices, exchange rates, mining costs etc.).
11. |
The number of metric tonnes was rounded to the nearest thousand, and any discrepancies in the totals are due to rounding effects. The metal contents are presented in troy ounces (tonnes x grade / 31.10348). |
12. |
The authors are not aware of any known environmental, permitting, legal, title-related, taxation, socio-political, or marketing issues, or any other relevant issue not reported in the Technical Report, that could materially affect the MRE. |
1.12 |
Mineral Reserve Estimate |
Since this Technical Report Summary is an Initial Assessment and includes inferred resources, no Mineral Reserves are declared for the Back Forty Project.
1.13 |
Mining Methods |
The Back Forty mine plan presented in this Initial Assessment is based on mining the highest value material as soon as possible and treating this material through the process plants to maximize cash flow. This strategy is achieved by mining the mineralized material and either feeding the material directly to the process plant or stockpiling the material on-site for processing later per a feed schedule based on optimal economics for the operation. The mine plan consists of a combined open pit and underground mining operation at an average 2,600 tpd. Open pit mining will take place from Year 1 to Year 4. Underground development will be initiated in Year 2 and underground production mining will continue to Year 10.
Open pit mining will occur in two distinct areas, the Pinwheel pit and the Main pit as seen in Figure 1-1. The Pinwheel pit will be mined first and contains material with a higher grade in gold and copper than the average resource. This pit will be mined for 18 months. The Main pit will be started at the end of year 1 to complement the production of the Pinwheel pit. Waste material from the Main pit will be used to backfill the Pinwheel pit once its resources are exhausted.
The development of the underground mine will start at the end of Year 2 with a portal located inside the Main pit as seen in Figure 1-2. Production from the underground mine will start replacing the open pit one in Year 4. Mining underground is accomplished mostly from long hole open stoping with stopes averaging 24,000 t.
Back Forty Project |
1-10 |
Gold Resource Corporation |
|
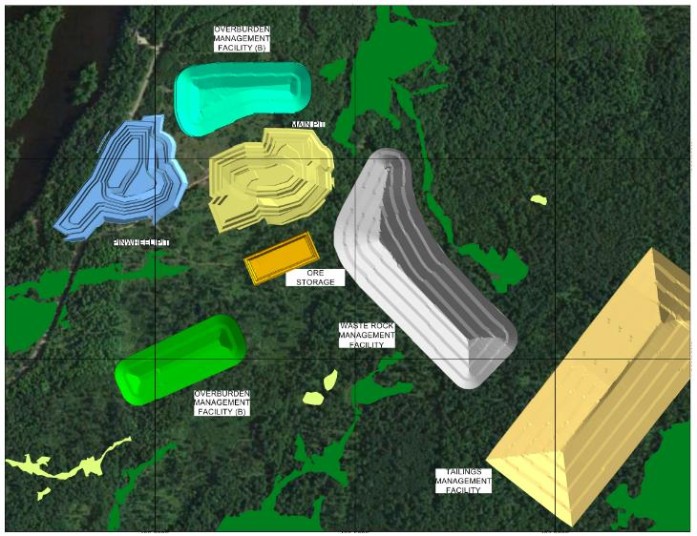
Figure 1-1: Back Forty Project Layout
Back Forty Project |
1-11 |
Gold Resource Corporation |
|
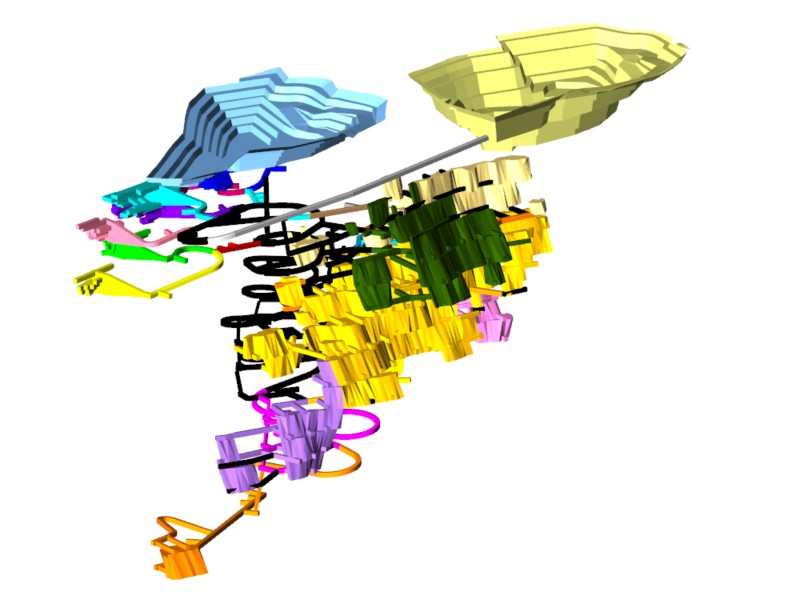
Figure 1-2: Isometric View of the Back Forty Open Pit and Underground Mine Layout
The mine schedule is presented graphically in Figure 1-3 and in details in Table 1-3.
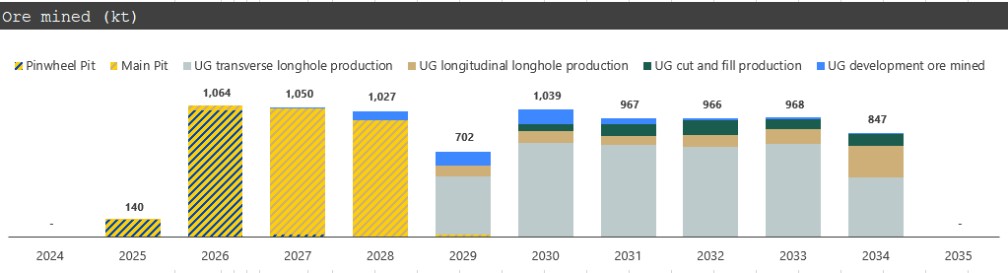
Figure 1-3: Back Forty Project Mining Schedule
Back Forty Project |
1-12 |
Gold Resource Corporation |
|
Table 1-3: Back Forty Project Mining Schedule
|
|
Period |
-1 |
1 |
2 |
3 |
4 |
5 |
6 |
7 |
8 |
9 |
Total |
|
|
Year |
2026 |
2027 |
2028 |
2029 |
2030 |
2031 |
2032 |
2033 |
2034 |
2035 |
|
Open pit |
Overburden |
kt |
820 |
517 |
6 |
|
|
|
|
|
|
|
1,344 |
Waste |
kt |
371 |
1,814 |
2,156 |
780 |
6 |
|
|
|
|
|
5,127 |
|
Mineralized material |
kt |
140 |
1,064 |
1,039 |
948 |
26 |
|
|
|
|
|
3,218 |
|
Cu grade |
% |
1.23 |
1.23 |
0.38 |
0.26 |
0.18 |
|
|
|
|
|
0.66 |
|
Zn grade |
% |
0.03 |
0.50 |
3.65 |
4.33 |
2.11 |
|
|
|
|
|
2.64 |
|
Au grade |
g/t |
5.16 |
2.23 |
3.92 |
2.18 |
2.23 |
|
|
|
|
|
2.89 |
|
Ag grade |
g/t |
58.7 |
48.9 |
18.1 |
12.8 |
8.9 |
|
|
|
|
|
28.4 |
|
Underground |
Development waste |
kt |
|
|
102 |
319 |
288 |
272 |
173 |
13 |
11 |
8 |
1,186 |
Development mineralized |
kt |
|
|
11 |
79 |
119 |
124 |
53 |
21 |
14 |
14 |
436 |
|
LH Transverse |
kt |
|
|
|
|
465 |
765 |
750 |
729 |
756 |
483 |
3,949 |
|
LH Longitudinal |
kt |
|
|
|
|
92 |
92 |
65 |
94 |
117 |
255 |
716 |
|
CF |
kt |
|
|
|
|
|
57 |
98 |
121 |
81 |
94 |
452 |
|
Cu grade |
% |
|
|
0.02 |
0.20 |
0.18 |
0.23 |
0.23 |
0.21 |
0.28 |
0.20 |
0.22 |
|
Zn grade |
% |
|
|
0.46 |
5.05 |
5.08 |
5.73 |
4.61 |
5.64 |
4.94 |
5.53 |
5.25 |
|
Au grade |
g/t |
|
|
2.59 |
2.61 |
1.87 |
2.14 |
2.09 |
2.35 |
1.86 |
2.01 |
2.07 |
|
Ag grade |
g/t |
|
|
54.4 |
41.6 |
30.0 |
22.8 |
26.4 |
22.1 |
23.1 |
25.4 |
25.0 |
|
Total |
Overburden |
kt |
820 |
517 |
6 |
|
|
|
|
|
|
|
1,344 |
Waste |
kt |
371 |
1,814 |
2,258 |
1,099 |
294 |
272 |
173 |
13 |
11 |
8 |
6,313 |
|
Mineralized material |
kt |
140 |
1,064 |
1,050 |
1,027 |
702 |
1,039 |
967 |
966 |
968 |
847 |
8,771 |
|
Cu grade |
% |
1.23 |
1.23 |
0.38 |
0.26 |
0.18 |
0.23 |
0.23 |
0.21 |
0.28 |
0.20 |
0.39 |
|
Zn grade |
% |
0.03 |
0.50 |
3.62 |
4.38 |
4.97 |
5.73 |
4.61 |
5.64 |
4.94 |
5.53 |
4.29 |
|
Au grade |
g/t |
5.16 |
2.23 |
3.91 |
2.21 |
1.88 |
2.14 |
2.09 |
2.35 |
1.86 |
2.01 |
2.37 |
|
Ag grade |
g/t |
58.7 |
48.9 |
18.5 |
15.1 |
29.2 |
22.8 |
26.4 |
22.1 |
23.1 |
25.4 |
26.2 |
Back Forty Project |
1-13 |
Gold Resource Corporation |
|
1.14 |
Processing and Recovery Methods |
The processing facility will be used to process at a nominal rate of 2,500 tpd of mineralized material and up to 2,800 based on feed material characteristics over the LOM. The flowsheet consists of a three-stage crushing followed by ball mill to a target P80 size of 50 microns. The facility will have two flotation circuits to recover copper and zinc (Figure 1-4). The copper and zinc circuits will see their respective concentrate filtered to reduce residual moisture content to approximately 10%. Both concentrates will be loaded for shipment to smelters.
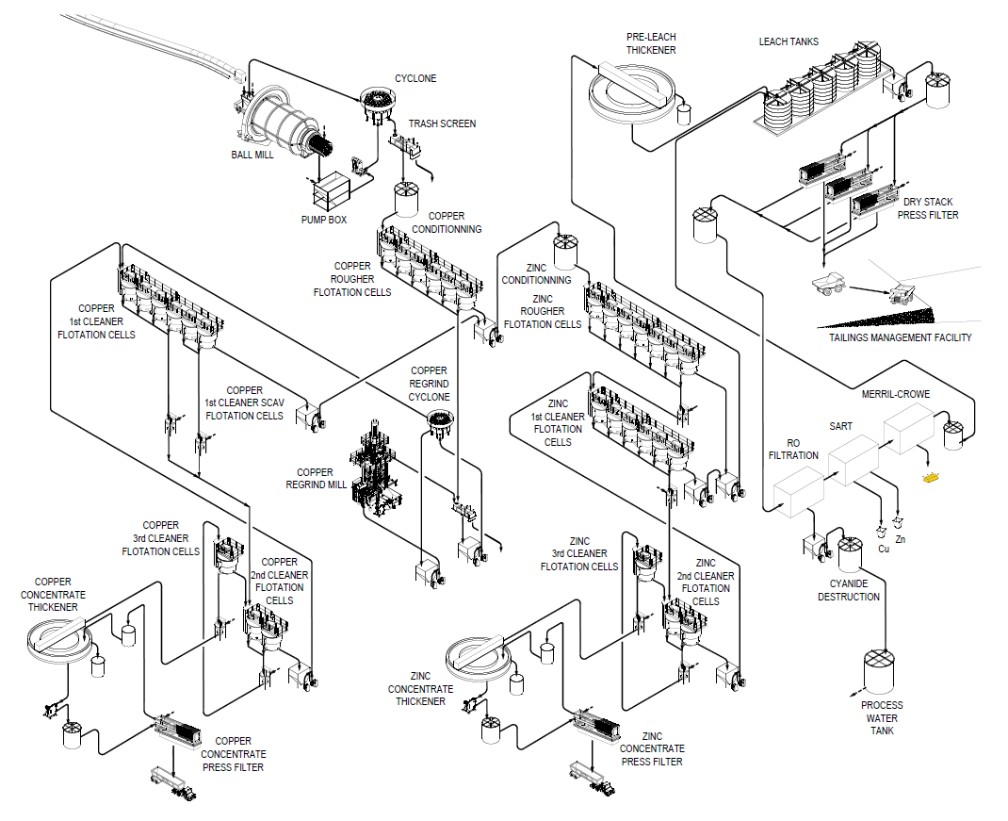
Figure 1-4: Process Flow Diagram (Processing section)
Zinc flotation tailings will be leached and dewatered using a press filter. Solids will be washed and dewatered to 15% humidity in the press filter before being sent to dry stack. Filtrate from the press filter will be processed through reverse osmosis membrane for salt rejection and through the SART circuit. Cyanide species from the solution will be converted to NaCN. Precious metals are recovered from solution in zinc precipitation circuit. Precious metal barren solution will be recirculated to leaching and recycled cyanide will be re-introduced. Cyanide destruction will
Back Forty Project |
1-14 |
Gold Resource Corporation |
|
be performed on excess dilute solution from the press filter not processed by SART and released to the collecting pond.
Paste backfill will be installed later during the life of mine when the underground mine will be in operation.
The proposed process will recover zinc and copper concentrates, as well as gold and silver in the form of doré bars. SART process will also generate copper and zinc concentrate. The copper concentrate flotation will have an estimated average of 14% copper content as well as payable gold and silver; the zinc concentrate flotation will have an estimated average of 51% zinc content.
A total of 52 personnel is required in the process plant, including 10 salaried staff and 42 hourly workers.
1.15 |
Infrastructures |
The Back Forty Project is situated in a location with close proximity to existing infrastructure. There are road networks on either side of the property and a high voltage electrical transmission corridor near the main access county road, providing grid power. Water is collected from different areas within the property at the Contact Water Basin and either re-distributed for use within the facility or treated for discharge.
The project site plan is illustrated in Figure 1-5. The project site can be largely divided into five main areas:
1. |
Access from County Road 356 leading to security gates for site entry. |
2. |
Facility Storage Areas: Waste Rock Management Facility (WRMF), Two Overburden Management Facilities (OMF), Ore Storage Facility (OSF) and Tailings Management Facility (TMF), as well as the associated water collection ponds. |
3. |
Central area where the crushing, mill, administration, electrical substation, shop and ancillary facilities are located. |
4. |
Contact Water Basin (CWB) and Waste Water Treatment Plant (WWTP). |
5. |
The open pit area is comprised of the two open pits, the underground portal located inside the Main pit and the underground ventilation infrastructures to the southwest of the open pit. To the east of the open pit exists an area designated for ore stockpiling, and adjacent to this is the overburden stockpile |
Back Forty Project |
1-15 |
Gold Resource Corporation |
|

Figure 1-5: Infrastructure and Site Access Layout
The administration building is located adjacent to the mill building. It houses offices for the site management staff as well as the engineering and technical staff. Within the administration building there is a men’s dry and a women’s dry, designed to service a total of 115 people per shift. A small infirmary is also included.
Due to the relatively short open pit mine life and the relatively small accompanying fleet of equipment, the shop is a concrete floor pole building with heat to allow the equipment dealer or the owners service truck to be placed along side the unit in need of work. Parking for heavy mobile equipment and the fuel depot is available directly adjacent from the shop and cold storage area. Personnel parking can be found on the north side of the administration building. Any vehicle that leaves the site which has been in the contact area must go through a truck wash first. A truck scale is also available for trucks entering or leaving the site.
1.16 |
Market Studies |
The metal prices used for the base case based on the average median consensus prices for each of the five years starting 2024 through 2028 as provided by the Bank of Montreal in June 2023. The median price was based on the price estimates contributed by 38 participating financial institutions. These prices are also very similar to the three-year average. As reference, two other cases are presented, the spot prices from September 29, 2023 and the median of the long term consensus from the same Bank of Montreal document.
Back Forty Project |
1-16 |
Gold Resource Corporation |
|
Table 1-4: Metal prices assumptions
Metal |
Base Case |
36-month average (as of August 28, 2023) |
Spot Price (As of September 29, 2023) |
Long term consensus (median) |
|
Au |
$/oz |
1,800 |
1,841 |
1,850 |
1,700 |
Ag |
$/oz |
23.30 |
23.70 |
22.20 |
23.00 |
Cu |
$/lb |
3.90 |
3.95 |
3.70 |
3.69 |
Zn |
$/lb |
1.25 |
1.39 |
1.19 |
1.20 |
The copper concentrates are projected to average around 14% copper over the life of mine but will range from highs above 20% in Year 4 to lows under 10% in Year 5 when the low copper Tuff zone is mined. Gold and silver grades will see similar variability, averaging around 80 g and 700 g per DMT over the life of mine, respectively, but within a range of 25-170 g gold and 300-1250 g silver.
Various alternatives for delivery of the Back Forty copper concentrates to the market were considered. As a result of this review, transportation, and other costs (including insurance, representation, losses, freight credits where applicable, etc.) for delivery to the receiving smelter/buyer are estimated at an ‘all-in’ cost of US $178 per dry metric tonne of concentrate. Treatment charges are expected to average $82.50 per dry metric tonne of concentrate.
Back Forty zinc concentrate is a mid-grade material with no payable silver or gold. Penalty items include iron, mercury and possibly cadmium, depending on the grade, over the life of the mine. The low silica level will be attractive to smelters that are concerned about residue generation.
Transportation and other costs (including insurance, representation, losses, freight credits where applicable, etc.) for delivery to the receiving smelter/buyer are estimated at an ‘all-in’ cost of US $130/ dry metric tonne of zinc concentrate. Treatment charges are expected to average $225 per dry metric tonne of concentrate.
1.17 |
Environmental Studies and Permitting |
The Back Forty Project has gone through several rounds of permitting on previous mine configurations.
Previous mine configurations that received one or more permits are presented in Table 1-5.
Back Forty Project |
1-17 |
Gold Resource Corporation |
|
Table 1-5: Previously Permitted Mine Configurations
Year of Permit Application |
Proposed Mine Configuration |
Proposed Mill |
Proposed Tailings Facility |
2015 |
Large open pit |
Dual mills with separate metallurgical processes |
Separate tailings repositories for two thickened tailings streams |
2017 |
Large open pit |
Dual mills with separate metallurgical processes |
One tailings repository for mixed thickened tailings |
2018 |
Open pit (slightly smaller than previous pit design) |
One mill with a combined metallurgical process |
One tailings repository for thickened tailings in a co-mingled configuration |
Proposed Project, applications to be prepared in 2023/2024 |
Two small open pits; underground |
One mill with a combined metallurgical process |
One dry-stack tailings facility |
All project permits have been and are anticipated to be issued by state agencies. Direct federal approvals are not required. A broad set of studies, analyses, permit documents, plans, and stakeholder outreach efforts have been prepared or are underway with selected updates in support of permit applications for the proposed Project.
Environmental studies commenced in 2008 with initiation of surface water and groundwater data collection in waterways and aquifers within and around the site. In the ensuing years, a large data set was developed and analysis of the baseline conditions and various environmental impacts from previously proposed projects have been documented in their permit applications. Those environmental studies remain valid and will be used for the proposed
Note that permits and amended permits for various project configurations were issued except for a Dam Safety Permit needed for the 2018 reconfigured project. With the exception of the NPDES permit, which will need renewal by 2025, other permits were withdrawn by mutual agreement at the end of 2020.
The Project as presented in this report has been reconfigured under GRC ownership. New permit applications will be submitted seeking approval for construction of this redesigned project. Applicable environmental studies previously submitted, supplemented by updates as appropriate, will be included in the applications. The topics and depth of environmental studies are guided by Part 632 of the Michigan Natural Resources and Environmental Protection Act, 1994 PA 451, as Amended (NREPA), Nonferrous Metallic Mining. Additional studies have been conducted in response to stakeholder concerns from prior permitting activities for the Project.
Back Forty Project |
1-18 |
Gold Resource Corporation |
|
1.18 |
Capital and Operating Costs |
The total initial capital cost for the construction of the Back Forty Project is estimated at $325.1M. The sustaining capital, which includes the capital required to put the underground mine starting in 2028, is estimated at $102.8M. In both cases, contingencies and indirect costs are included in the estimations. The total capital required over the life of mine is $427.9M.
The main initial capital costs items are:
| ● | A processing plant, including a crushing circuit |
| ● | A dry stacked tailings management facility |
| ● | A waste rock management facility |
| ● | An office building with infrastructures to support mining |
| ● | A water treatment plant |
| ● | Surface mobile equipment |
| ● | Pre-production |
| ● | Construction indirects |
| ● | Owner’s costs |
| ● | Contingency |
The main sustaining capital costs items are:
| ● | Underground capital development |
| ● | Underground mobile equipment |
| ● | Paste plant |
| ● | Underground ventilation setup |
| ● | Site reclamation and closure |
Back Forty Project |
1-19 |
Gold Resource Corporation |
|
Table 1-6: Back Forty Project Capital Costs
Cost Area |
Initial capital cost ($M) |
Sustaining capital cost ($M) |
Total cost ($M) |
Mobile equipment |
5.8 |
24.3 |
30.1 |
Open pit mine |
1.4 |
1.7 |
3.1 |
Underground mine |
- |
50.6 |
50.6 |
Capitalized OPEX |
17.9 |
7.3 |
25.1 |
Electrical and communications |
8.1 |
- |
8.1 |
Surface infrastructures |
26.8 |
4.9 |
31.7 |
Process plant |
131.1 |
5.4 |
136.5 |
Rock and tailings management |
27.9 |
- |
27.9 |
Water treatment plant |
21.8 |
- |
21.8 |
Construction indirects |
22.0 |
- |
22.0 |
Owner’s costs |
33.5 |
- |
33.5 |
Contingency |
28.9 |
8.7 |
37.6 |
Total |
325.1 |
102.8 |
427.9 |
Site reclamation and closure |
- |
22.6 |
22.6 |
Salvage value |
- |
(7.1) |
(7.1) |
Project total |
325.1 |
118.4 |
443.5 |
* Total may not add up due to rounding.
The average operating costs over the 9-year mine life is estimated to be $84.81 per tonne (“$/t”). Table 1-7 details the operating costs.
Table 1-7: Operating Costs Summary
Cost area |
Total cost ($M) |
Cost per tonne milled |
Overburden Removal and Storage |
5.4 |
0.61 |
Open Pit Mining |
50.4 |
5.75 |
Underground Mining |
194.6 |
22.19 |
Rehandling |
1.0 |
0.12 |
Processing |
256.9 |
29.30 |
Tailings Deposition |
23.7 |
2.70 |
WRMF Reclamation |
4.4 |
0.51 |
General and Administration |
79.6 |
9.07 |
Concentrate Shipping |
153.0 |
17.44 |
Capitalized OPEX |
(25.1) |
(2.87) |
Total |
743.8 |
84.81 |
* Total may not add up due to rounding.
Back Forty Project |
1-20 |
Gold Resource Corporation |
|
1.19 |
Economic Analysis |
The financial analysis for the Back Forty Project with the different scenarios all show positive outcomes with an after-tax NPV at a discount rate of 6% of $214.5M, a 25.7% IRR and 2.4 years payback for the base case. Table 1-8 shows the economic analysis for the different scenarios. The Project is most sensitive to metal prices, especially gold and zinc prices.
Table 1-8: Economic Results for the Back Forty Project
Area |
Base Case |
Spot Price (Sept 30, 2023) |
LT consensus |
Base Case Indicated only |
||
Total Process Plant Feed |
Mt |
8.77 |
8.77 |
8.77 |
8.55 |
|
Grade |
Au |
g/t |
2.37 |
2.37 |
2.37 |
2.35 |
Ag |
g/t |
26.2 |
26.2 |
26.2 |
25.8 |
|
Cu |
% |
0.39 |
0.39 |
0.39 |
0.38 |
|
Zn |
% |
4.29 |
4.29 |
4.29 |
4.34 |
|
NSR |
$/t |
210.38 |
206.71 |
196.71 |
209.57 |
|
Payable metal |
Au |
koz |
487.6 |
487.6 |
487.6 |
472.8 |
Ag |
koz |
4,800.9 |
4,800.9 |
4,800.9 |
4,605.9 |
|
Cu |
Mlb |
59.1 |
59.1 |
59.1 |
56.5 |
|
Zn |
Mlb |
658.0 |
658.0 |
658.0 |
645.7 |
|
Life of Mine |
Years |
9.0 |
9.0 |
9.0 |
9.0 |
|
Metal Prices |
Au |
$/oz |
1,800 |
1,850 |
1,700 |
1,800 |
Ag |
$/oz |
23.30 |
22.20 |
23.00 |
23.30 |
|
Cu |
$/lb |
3.90 |
3.70 |
3.69 |
3.90 |
|
Zn |
$/lb |
1.25 |
1.19 |
1.20 |
1.25 |
|
Gross Revenue |
$M |
2,042.5 |
2,010.3 |
1,946.0 |
1,985.9 |
|
Charges |
$M |
180.0 |
180.0 |
180.0 |
176.1 |
|
Penalties |
$M |
17.4 |
17.4 |
17.4 |
18.0 |
|
Net Revenue |
$M |
1,845.1 |
1,812.9 |
1,749.6 |
1,791.8 |
|
Stream |
Au |
$M |
113.7 |
116.8 |
107.3 |
110.2 |
Ag |
$M |
78.8 |
74.3 |
77.5 |
75.6 |
|
Royalties |
$M |
24.2 |
23.5 |
22.2 |
24.1 |
|
Taxes |
$M |
106.7 |
104.6 |
93.6 |
103.6 |
|
OPEX |
Total |
$M |
743.8 |
743.8 |
743.8 |
732.6 |
per tonne |
$/t |
84.81 |
84.81 |
84.81 |
85.69 |
|
CAPEX |
Initial |
$M |
325.1 |
325.1 |
325.1 |
325.4 |
Sustaining |
$M |
102.8 |
102.8 |
102.8 |
103.8 |
|
Cashflow Pre-Tax |
$M |
471.2 |
441.0 |
385.2 |
434.6 |
|
Cashflow Post-Tax |
$M |
361.2 |
336.4 |
291.7 |
331.0 |
|
Discounted Cashflow Post-Tax @ 6% |
$M |
214.4 |
197.3 |
162.6 |
194.2 |
|
Post-Tax internal rate of return |
% |
25.7 |
24.5 |
21.2 |
24.5 |
|
Post-Tax Payback |
Years |
2.4 |
2.5 |
2.9 |
2.5 |
|
Back Forty Project |
1-21 |
Gold Resource Corporation |
|
1.20 |
Qualified Person’s Conclusions and Recommendations |
The work that has been undertaken since 2021 has allowed to greatly improve the Back Forty Project over the 2020 PEA, both on the environmental, operating, and economical sides. On the environmental aspect, the following elements were improved:
| ● | Reduction in the overall Back Forty Project footprint. |
| ● | No direct wetland impacts. |
| ● | Use of filtered instead of thickened tailings, negating the requirement for dams. |
| ● | Reduction on TMF sizing with more tailings going underground as paste backfill. |
| ● | Significant reduction in WRMF sizing with smaller open pit mine and concurrent backfilling and reclamation of the Pinwheel pit. |
| ● | Open pit limit located farther from the Menominee River |
| ● | Temporary closing of River Road instead of permanent. |
On the operating side, the improvements are:
| ● | Single stream processing for all material types, reducing the stockpiling and blending requirements. |
| ● | Larger proportion of long hole mining versus cut and fill. |
| ● | High tonnage long hole stopes. |
| ● | Crusher, ore stockpile and WRMF located closer to open pit exit. |
| ● | No crown pillar with open pit to be mined. |
On the economical side, the improvements are:
| ● | Reduced sizing on open pit equipment. |
| ● | Single stream processing for all material types. |
| ● | Improved metal recoveries. |
| ● | Updated metal prices. |
| ● | Mining scheduled to process higher copper grade material separately. |
| ● | Use of SART to reduce cyanide consumption and increase base metal recoveries. |
| ● | Reclamation costs reduced from smaller WRMF and concurrent backfilling. |
Based on the work undertaken to date, as summarized in this Technical Report Summary, and the individual Qualified Persons conclusions listed in Section 22.0, the Initial Assessment has identified a viable future open pit and underground mining operation for the Back Forty Project.
Subject to ongoing Project funding and board approval, it is recommended that GRC advance the Initial Assessment concepts and commence a Feasibility Study update phase including additional studies set out in Section 22 at an estimated work program budget of $0.7M.
Back Forty Project |
1-22 |
Gold Resource Corporation |
|
2.0 |
INTRODUCTION |
2.1 |
Registrant Information |
GOLD RESOURCE CORPORATION (NYSE American: GORO) is a registrant with the United States Securities and Exchange Commission (“SEC”). GORO must report its exploration results, Mineral Resources, and Mineral Reserves using the mining disclosure standards of Subpart 229.1300 of Regulation S-K Disclosure by Registrants Engaged in Mining Operations (“SK1300”).
2.2 |
Terms Of Reference and Purpose |
The terms of reference for this TRS include:
This Technical Report Summary is an Initial Assessment (“IA”) in accordance with the SEC SK1300 for the Back Forty Project (“Back Forty” or “Back Forty Project” or the “Project”), a wholly-owned project of Gold Resource Corporation (“GRC”). Back Forty is a gold, silver, and base-metal advanced exploration stage in the Upper Peninsula of Michigan, USA. This report supports the historical, scientific, and technical information concerning the Project effective as of September 30th, 2023. This report does not purport to reflect new information regarding the Project arising after such date.
The 2023 MRE has been prepared in accordance with United States Securities and Exchange Commission’s regulation S-K Subpart 1300 respecting standards of disclosure for Mineral Projects.
The 2023 MRE has an effective date of September 30th, 2023. It represents an update of the previous mineral resource estimate (the “2020 MRE”) published in an NI 43-101 technical report and preliminary economic assessment by Bradfield et al. (2020) (the “2020 PEA”).
The abbreviations, acronyms and units used in this report are provided in Table 2-1 and Table 2-2. All currency amounts are stated in US dollars ($, US$) unless otherwise indicated. Wherever applicable, imperial units have been converted to the International System of Units (SI units) for consistency (Table 2-3).
Table 2-1: List of Abbreviations
Acronyms |
Term |
43-101 |
National Instrument 43-101 (Regulation 43-101 in Quebec) |
AA or AAS |
Atomic absorption spectroscopy |
ACNC |
American Copper and Nickel Company Inc |
AEM |
Airborne electromagnetic |
ARC |
Aquila Resources Corporation |
BFJV |
Back Forty Joint Venture |
CHTF |
Chloritic crystal tuff |
CIP |
Carbon in pulp |
CoG |
cut-off grade |
COV |
Coefficient of variation |
Back Forty Project |
2-1 |
Gold Resource Corporation |
|
CRM |
Certified reference material |
DDH |
Diamond drill hole(s) |
DDHD |
Diamond drill hole database |
DNR |
Department of Natural Resources |
DSO |
Deswik stope optimizer |
EM |
Electromagnetic |
FS |
Feasibility study |
G&A |
General and administration |
GOSS |
Gossan |
GPS |
Global Positioning System |
IAC |
Inspectorate America Corporation Analytical Laboratories |
ICP-OES |
Inductively coupled plasma optical emission spectroscopy |
ICP-MS |
Inductively coupled plasma mass spectrometry |
ID2 |
Inverse distance squared |
ID3 |
Inverse distance cubed |
JV |
Joint venture |
MASU |
Massive sulfide |
MRHY |
Massive, aphyric rhyolite |
MREC |
Menominee River Exploration Company |
MPC |
Minerals processing corporation |
MRE |
Mineral resource estimate |
NAPEG |
Northwest Territories and Nunavut Association of Professional Engineers and Geoscientists |
NPI |
Net profits interest |
NPT |
Northern Penokean Terrane |
N/E/S/W |
North/East/South/West |
NI 43-101 |
National Instrument 43-101 (Regulation 43-101 in Québec) |
NN |
Nearest neighbour |
NSR |
Net smelter return |
OGQ |
Ordre des Géologues du Québec |
OIQ |
Ordre des Ingénieurs du Québec |
OK |
Ordinary kriging |
OBL |
Osisko Bermuda Limited |
PEA |
Preliminary economic assessment |
PEM |
Pulse electromagnetic survey |
P.Eng |
Professional engineer |
P.Geo |
Professional geologist |
PGO |
Professional Geoscientists Ontario |
Back Forty Project |
2-2 |
Gold Resource Corporation |
|
PVB |
Penokean volcanic belt |
QA |
Quality assurance |
QA/QC |
Quality assurance/quality control |
QC |
Quality control |
QFP |
Quartz feldspar porphyry |
QP |
Qualified person (as defined in National Instrument 43-101) |
RATF |
Rhyolite ash tuff |
RCTF |
Rhyolite crystal tuff |
Regulation 43-101 |
National Instrument 43-101 (name in Québec) |
SEDAR |
System for electronic document analysis and retrieval |
SG |
Specific gravity |
SFST |
Sulfide stringer |
SMAS |
Semi-massive sulfide |
TFSD |
Tuffaceous sediment |
UG |
Underground |
VMS |
Volcanogenic massive sulfide |
Table 2-2 : List of Units
Symbol |
Unit |
% |
Percent |
$, US$ |
American dollar |
CA$ |
Canadian dollar |
° |
Angular degree |
°C |
Degree Celsius |
cm |
Centimeter |
cm3 |
Cubic centimeter |
g |
Gram |
Ga |
Billion years |
g/t |
Gram per metric ton (tonne) |
ha |
Hectare |
lb |
Pound |
km |
Kilometer |
km2 |
Square kilometer |
kV |
Kilo volt |
M |
Million |
m |
Meter |
m2 |
Square meter |
Back Forty Project |
2-3 |
Gold Resource Corporation |
|
Ma |
Million years |
masl |
Meters above mean sea level |
mGal |
Milligal |
mm |
Millimeter |
oz |
Troy ounce |
ppm |
Parts per million |
t |
Metric tonne (1,000 kg) |
tpd |
Metric tonnes per day |
μm |
Micrometer (micron) |
Table 2-3: Conversion Factors for Measurements
Imperial Unit |
Multiplied by |
Metric Unit |
1 inch |
25.4 |
mm |
1 foot |
0.3048 |
m |
1 acre |
0.405 |
ha |
1 ounce (troy) |
31.1035 |
g |
1 pound (avdp) |
0.4535 |
kg |
1 ton (short) |
0.9072 |
t |
1 ounce (troy) / ton (short) |
34.2857 |
g/t |
Back Forty Project |
2-4 |
Gold Resource Corporation |
|
2.3Sources of Information
The compilation and estimation of Mineral Resources and Mineral Reserves used public and private data sources. The supply of the private data sources from Gold Resource included a drill hole database, geological model, internal documentation and laboratory certificates.
As part of the mandate, the authors verified the status of all mineral titles using DNR (“Department of Natural Resources”) Mineral Management, the State of Michigan’s online claim management system (midnr.maps.arcgis.com) and official documents; agreements and technical data supplied by the issuer.
The authors had no known reason to believe that any information used to prepare this technical report is invalid or contains misrepresentations. A detailed list of cited reports is noted in Section 24.0.
The authors reviewed and appraised the information used to prepare the technical report, including the conclusions and recommendations. The authors believe this information is valid and appropriate, considering the status of the project and the purpose for which the technical report is prepared.
2.4 |
Personal Inspection Summary |
The site has been visited on numerous occasions by the different QPs as listed in Table 1-1.
2.5 |
Previously Filed Technical Report Summary Reports |
The previous Technical Report was published in an NI 43-101 technical report and preliminary economic assessment by Bradfield et al. (2020).
Back Forty Project |
2-5 |
Gold Resource Corporation |
|
3.0 |
PROPERTY DESCRIPTION |
3.1 |
Project Location |
The Project is located in the administrative township of Lake Township, Menominee County in the State of Michigan, USA (Figure 3-1). It is about 55 km south-southeast of the city of Iron Mountain and approximately 19 km west of the municipality of Stephenson. The Project is centered at latitude 45° 27’ N and longitude 87° 51’ W.
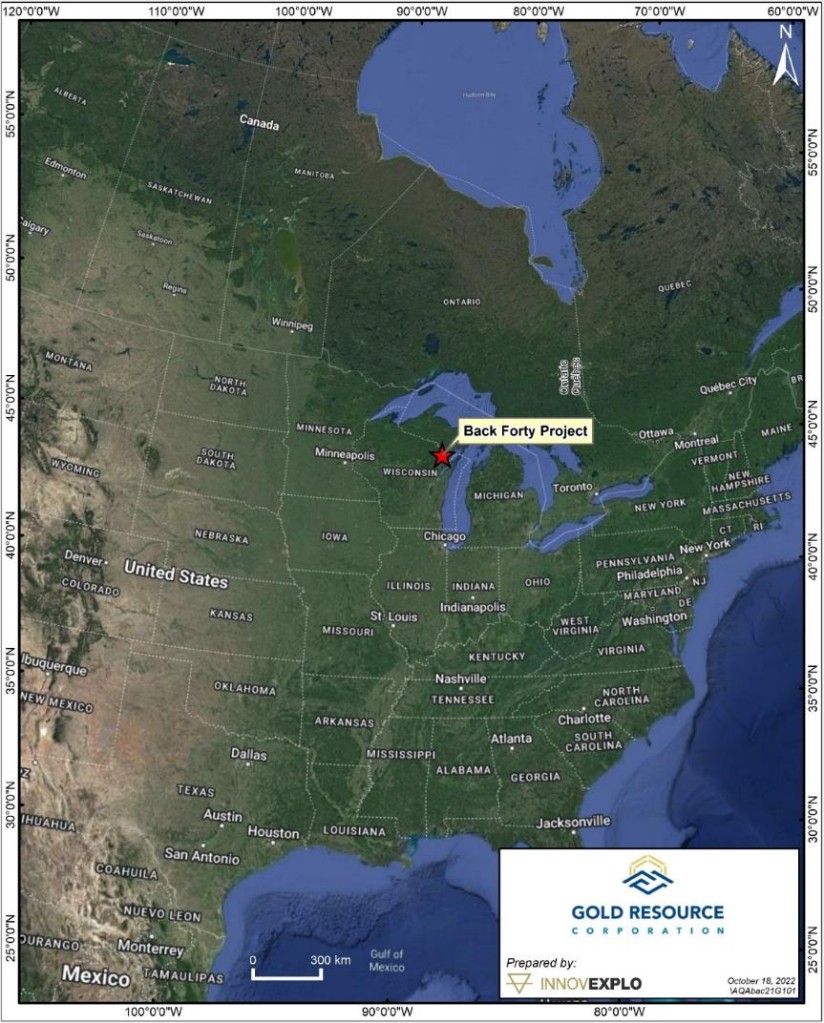
Figure 3-1: Location of the Back Forty Project
Back Forty Project |
3-1 |
Gold Resource Corporation |
|
The issuer owned or leased approximately 1,501 ha of private and public (State of Michigan) mineral lands located in Lake and Holmes Townships in Menominee County, Michigan. The active project area, thereafter, referred as the Property (Figure 3-2) encompasses approximately 389 ha and is situated in portions of Sections 1, 11 and 12 in Township 35N, Range 29W, and portions of Sections 6 and 7, in T35N, R28W. The issuer also controlled mineral rights on an additional 688 ha contiguous blocks thereafter, referred as the adjacent properties.
3.2 |
Mineral Rights |
The author verified the status of all mineral titles using DNR Mineral Management, the State of Michigan’s online claim management system (midnr.maps.arcgis.com) and official documents.
The issuer holds leases with private mineral owners, State of Michigan metallic mineral leases, purchases, and options to purchase. Lands comprising the Property are currently 100% owned or controlled by GRC. The lands comprising the adjacent properties are controlled by Gold Resource through metallic minerals leases with the State of Michigan. Some lands are subject to net smelter royalties varying from 1% to 3.5%, with certain lands subject to a 2% - 7% state royalty, which under state law can be renegotiated, at the option of GRC.
The known Mineral Resource at the Project is covered by four parcels (Parcel numbers 1, 2, 1270 and 5 on Figure 3-2). Additional parcels that make up the balance of the Property are considered important for development purposes.
Figure 3-1 presents the mineral title map, and Table 3-1 lists the mineral titles with ownership and royalties.
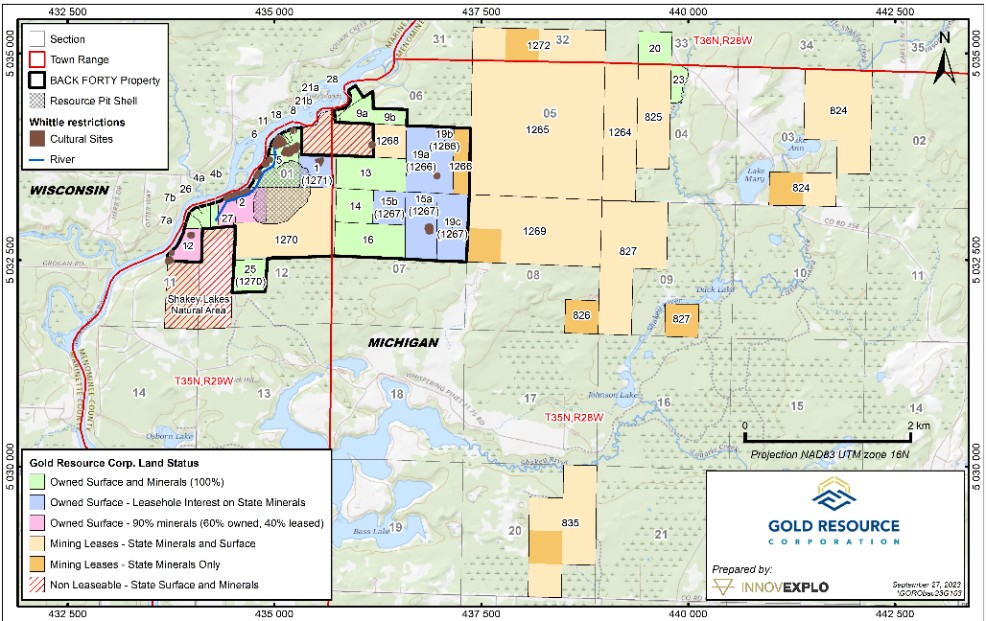
Figure 3-2: Map of Back Forty Project Land Tenure
Back Forty Project |
3-2 |
Gold Resource Corporation |
|
Table 3-1: List of Back Forty Project Land Tenure
Location |
Parcel # |
Surface Ownership and Status |
Mineral Ownership and Status |
Area (Ha) |
Lease class |
Original Agreement date (mm/dd/yyyy) |
Amendment/ Extension End date (mm/dd/yyyy) |
Royalties |
|
State of Michigan Metallic Minerals Lease | |||||||||
Adjacent Properties |
1264 |
|
|
57.9 |
Development with Restrictions |
1/22/2002 |
1/22/2032 |
2% to 7% NSR Surface and Underground |
|
Adjacent Properties |
1265 |
|
|
230.4 |
Development with Restrictions |
1/22/2002 |
1/22/2032 |
||
Property |
1266 |
|
|
55.7 |
Development with Restrictions |
1/22/2002 |
1/22/2032 |
||
Property |
1267 |
|
|
69.6 |
Development with Restrictions |
1/22/2002 |
1/22/2032 |
||
Property |
1268 |
|
|
13.9 |
Non-Development |
1/22/2002 |
1/22/2032 |
||
Adjacent Properties |
1269 |
|
|
111.4 |
Development with Restrictions |
1/22/2002 |
1/22/2032 |
||
Property |
1270 |
|
|
83.5 |
Development with Restrictions |
1/22/2002 |
1/22/2032 |
||
Property |
1271 |
|
|
13.9 |
Non-Development |
1/22/2002 |
1/22/2032 |
||
Adjacent Properties |
1272 |
|
|
55.7 |
Development with Restrictions |
|
|
||
Other |
824 |
|
|
41.8 |
Development with Restrictions |
4/2/2004 |
4/2/2024 |
||
Adjacent Properties |
825 |
|
|
44.1 |
Development with Restrictions |
4/2/2004 |
4/2/2024 |
||
Adjacent Properties |
826 |
|
|
13.9 |
Development with Restrictions |
4/2/2004 |
4/2/2024 |
||
Adjacent Properties |
827 |
|
|
97.5 |
Development with Restrictions |
4/2/2004 |
4/2/2024 |
||
Outside Adjacent properties |
835 |
|
|
83.5 |
Development with Restrictions |
4/2/2004 |
4/2/2024 |
||
Surface Owned by Gold Resource, State of Michigan Metallic Minerals Lease | |||||||||
Property |
1 (1271) |
Gold Resource (Owned) |
State (Leased) |
13.9 |
|
1/18/2002 |
|
see 1271 above |
|
Property |
15b (1267) |
Gold Resource (Owned) |
State (Leased) |
13.9 |
|
4/24/2003 |
|
see 1267 above |
|
Property |
15a (1267) |
Gold Resource (Owned) |
State (Leased) |
27.8 |
|
4/24/2003 |
|
see 1267 above |
|
Back Forty Project |
3-3 |
Gold Resource Corporation |
|
Location |
Parcel # |
Surface Ownership and Status |
Mineral Ownership and Status |
Area (Ha) |
Lease class |
Original Agreement date (mm/dd/yyyy) |
Amendment/ Extension End date (mm/dd/yyyy) |
Royalties |
Property |
19a (1266) |
Gold Resource (Owned) |
State (Leased) |
27.8 |
|
6/24/2016 |
|
see 1266 above |
Property |
19b (1266) |
Gold Resource (Owned) |
State (Leased) |
13.9 |
|
6/24/2016 |
|
see 1266 above |
Property |
19c (1267) |
Gold Resource (Owned) |
State (Leased) |
27.8 |
|
6/24/2016 |
|
see 1267 above |
Surface and 20% Minerals owned plus leasehold interest in Washburn Mineral Ownership with various NSR's | ||||||||
Property |
2 |
Gold Resource (Owned) |
Gold Resource (Owned) |
13.7 |
|
1/4/2003 |
|
2.5% NSR Underground and 3.5% Surface plus leasehold interest in Washburn Mineral Ownership with various NSR's |
Property |
12 |
Gold Resource (Owned) |
Private (Owned)/ Aquila (Leased) |
10.3 |
|
8/1/2003 |
|
1.5% NSR Surface and Underground |
Property |
27 |
Gold Resource (Owned) |
Private (Owned)/ Aquila (Leased) |
6.0 |
|
7/22/2003 |
|
2% NSR Surface and Underground |
Surface and Mineral Rights Owned | ||||||||
Property |
4a |
Gold Resource (Owned) |
Gold Resource (Owned) |
7.0 |
|
7/22/2011 |
|
|
Property |
4b |
Gold Resource (Owned) |
|
|
|
|
|
|
Property |
5 |
Gold Resource (Owned) |
Gold Resource (Owned) |
16.2 |
|
8/3/2006 |
|
|
Property |
6 |
Gold Resource (Owned) |
Gold Resource (Owned) |
4.0 |
|
5/21/2002 |
|
1.5% NSR Surface and Underground |
Property |
7 |
Gold Resource (Owned) |
Gold Resource (Owned) |
27.8 |
|
4/24/2003 |
|
2% NSR Surface and Underground |
Back Forty Project |
3-4 |
Gold Resource Corporation |
|
Location |
Parcel # |
Surface Ownership and Status |
Mineral Ownership and Status |
Area (Ha) |
Lease class |
Original Agreement date (mm/dd/yyyy) |
Amendment/ Extension End date (mm/dd/yyyy) |
Royalties |
Property |
7a |
Gold Resource (Owned) |
Gold Resource (Owned) |
2.2 |
|
8/22/2011 |
|
|
Property |
7b |
Gold Resource (Owned) |
Gold Resource (Owned) |
1.6 |
|
5/20/2004 |
|
|
Property |
8 |
Gold Resource (Owned) |
Gold Resource (Owned) |
2.7 |
|
10/3/2006 |
|
1-1/2% NSR Surface and Underground |
Property |
9a, 9b |
Gold Resource (Owned) |
Gold Resource (Owned) |
15.8 |
|
7/7/2008 |
|
1-1/2% NSR Surface and Underground |
Property |
11 |
Gold Resource (Owned) |
Gold Resource (Owned) |
0.3 |
|
1/30/2003 |
|
|
Property |
13 |
Gold Resource (Owned) |
Gold Resource (Owned) |
27.8 |
|
9/7/2001 |
|
State Royalty |
Property |
14 |
Gold Resource (Owned) |
Gold Resource (Owned) |
13.9 |
|
4/18/2005 |
|
2.5% NSR Underground and 3.5% Surface |
Property |
16 |
Gold Resource (Owned) |
Gold Resource (Owned) |
27.8 |
|
12/23/2009 |
|
2% NSR Surface and Underground |
Property |
18 |
Gold Resource (Owned) |
Gold Resource (Owned) |
0.8 |
|
1/23/2017 |
|
|
Adjacent properties |
20 |
Gold Resource (Owned) |
Gold Resource (Owned) |
13.9 |
|
4/14/2010 |
|
|
Property |
21a |
Gold Resource (Owned) |
Gold Resource (Owned) |
0.4 |
|
12/7/2010 |
|
|
Property |
21b |
Gold Resource (Owned) |
Gold Resource (Owned) |
0.4 |
|
12/7/2010 |
|
|
Adjacent properties |
23 |
Gold Resource (Owned) |
Gold Resource (Owned) |
5.5 |
|
4/26/2010 |
|
|
other |
24 |
Gold Resource (Owned) |
Gold Resource (Owned) |
257.2 |
|
1/20/2011 |
|
|
Property |
25 (1270) |
Gold Resource (Owned) |
Gold Resource (Owned) |
- |
|
10/16/2017 |
|
see 1270 above |
Back Forty Project |
3-5 |
Gold Resource Corporation |
|
Location |
Parcel # |
Surface Ownership and Status |
Mineral Ownership and Status |
Area (Ha) |
Lease class |
Original Agreement date (mm/dd/yyyy) |
Amendment/ Extension End date (mm/dd/yyyy) |
Royalties |
Property |
26 |
Gold Resource (Owned) |
Gold Resource (Owned) |
0.1 |
|
10/9/2017 |
|
|
Property |
28 |
Gold Resource (Owned) |
Gold Resource (Owned) |
1.3 |
|
3/9/2009 |
|
1.5% NSR Surface and Underground |
3.3 |
Description of the Property |
The Property parcels, which contain known Mineral Resources or are considered to be important for development, are described below.
| ■ | Parcel 1 - (13.9 ha). 100% of the surface is owned by the issuer through purchase. The severed mineral estate owned by the State of Michigan is held under lease number M-1271. |
| ■ | Parcel 2 – (13.7 ha). The surface is 100% owned by the issuer. This includes a 20% Minerals ownership plus leasehold interest in Washburn Mineral Ownership with various NSR's. The former surface owner is due a 3.5% NSR on open pit production and a 2.5% NSR on underground production. The leased mineral owners are due various NSR’s ranging from 1% to 2%. |
| ■ | Parcel 4a and 4b – (7.0 ha). Surface and Mineral Rights owned; however, the minerals are 20% owned, but the other 80% are also part of the Washburn trust. In 2020 Parcel 4a and 4b were originally named 4a. |
| ■ | Parcel 5 - (16.2 ha). Surface and Mineral Rights are 100% owned by the issuer. |
| ■ | Parcel 6 – (4.0 ha). Surface and Mineral Rights are 100% owned by the issuer. The former owner retained a 1.5% NSR from open pit production and underground production. |
| ■ | Parcel 7a and 7b – (2.2 ha and 1.6 ha respectively). Surface and Mineral Rights are 100% owned by the issuer. |
| ■ | Parcel 8 – (2.7 ha). Surface and Mineral Rights are 100% owned by the issuer. The former owner retained a 1.5% NSR from open pit production and underground production. |
| ■ | Parcel 9a and 9b – (15.8 ha). Surface and Mineral Rights are 100% owned by the issuer. The former owner retained a 1.5% NSR from open pit production and underground production. |
| ■ | Parcel 11 – (0.3 ha). Surface and Mineral Rights are 100% owned by the issuer. The former owner retained a 1.5% NSR from open pit production and underground production. |
| ■ | Parcel 12 – (10.3 ha). Surface and 20% Minerals owned plus leasehold interest in Washburn Mineral Ownership. The former owner retained a 1.5% NSR from open pit production and underground production. |
| ■ | Parcel 13 – (27.8 ha) Surface and Mineral Rights are 100% owned by the issuer. The former surface owner retained a NSR royalty equivalent to the State of Michigan royalty schedule. |
Back Forty Project |
3-6 |
Gold Resource Corporation |
|
| ■ | Parcel 14 – (13.9 ha). Surface and Mineral Rights are 100% owned by the issuer. The former owner retained a 3.5% NSR from open pit production and a 2.5% NSR from underground production. |
| ■ | Parcels 15a and 15b – (27.8 ha and 13.9 ha respectively). Surface Rights are 100% owned by the issuer. The mineral interest for these parcels is state owned and held under lease number M1267. |
| ■ | Parcel 16 – (27.8 ha). Surface and Mineral Rights are 100% owned by the issuer. The former owner retains a 2% NSR from both open pit and underground production. |
| ■ | Parcel 19a, 19b and 19c – (27.8 ha, 13.9 ha, and 27.8 ha respectively). 100% of the surface is owned by Aquila through purchase in 2016. The severed mineral estate is owned by the State of Michigan and held under state leases (M-1266 and M-1267). |
| ■ | Parcel 21a and 21b – (0.41 ha and 0.38 ha respectively). Surface and Mineral Rights are 100% owned by the issuer. |
| ■ | Parcel 25 (1270) – (16.1 ha). Surface and Mineral Rights are 100% owned by the issuer. Until recently the mineral ownership belonged to the State of Michigan Metallic Minerals Lease under Lease M-1270. The same royalties for M-1270 still apply. |
| ■ | Parcel 1270 – (State Lease M-1270, 83.5 ha). 81 ha of state surface and mineral estates in fee simple and 16 ha of state mineral estate. This lease calls for minimum royalty payments of $30/acre ($7,200) for year 2016, increasing by $5.00 per acre per year through year 2021. The rental payments increase to $55/acre after year 2021. Mineral production from the lease is subject to a sliding scale production royalty. |
| ■ | Parcel 26 – (0.1 ha). Surface and Mineral Rights are 100% owned by the issuer. |
| ■ | Parcel 27 – (6.0 ha). Surface and 20% Mineral Rights Owned plus leasehold interest in Washburn Mineral Ownership. The former owner retained a 2% NSR from open pit production and underground production. |
| ■ | Parcel 28 – (1.3 ha). Surface and Mineral Rights are 100% owned by the issuer. |
| ■ | Parcel (1268) – (State Lease M-1268; 27.9 ha of state surface and mineral estates in fee simple and 48.6 ha of state mineral estate). The severed mineral estate corresponds to the issuer owned private surface in a portion of parcel 19 (that portion residing in Section 6 of T35N, R28W). This lease calls for minimum royalty payments (deductible from future production royalties) of $30/acre ($6,000) for year 2016 increasing by $5.00 per acre per year through year 2021. The rental payments increase to $55/acre after year 2021. Mineral production from the lease is subject to a sliding scale production royalty. |
| ■ | Parcel (1267) – (State Lease M-1267; 69.6 ha of state mineral estate). The severed mineral estate corresponds to the issuer owned private surface (parcels 15a, 15b, and the portion of parcel 19 residing in Section 7 of T35N, R28W). This lease calls for minimum royalty payments (deductible from future production royalties) of $30/acre ($6,000) for year 2016, increasing by $5.00 per acre per year through year 2021. The rental payments increase to $55/acre after year 2021. Mineral production from the lease is subject to a sliding scale production royalty. |
| ■ | Parcel (1271) – (State Lease M-1271; 13.9 ha of state mineral estate) The severed mineral estate corresponds to the issuer owned private surface (parcel 1). This lease calls for minimum royalty payments (deductible from future production royalties) of $30/acre ($1,200) for year 2016, increasing by $5.00 per acre per year through |
Back Forty Project |
3-7 |
Gold Resource Corporation |
|
year 2021. The rental payments increase to $55/acre after year 2021. Mineral production from the lease is subject to a sliding scale production royalty.
3.4 |
Peripheral Properties |
In addition to the key parcels of the Property, the issuer also purchased, leased, or optioned additional properties. These properties are either contiguous with the key parcels, may contain facilities utilized by the issuer, are perceived to have exploration potential, or were purchased for other strategic purposes. Figure 3-2 shows the locations and descriptions of the properties.
| ■ | Parcel (1264) – (State Lease M-1264; 57.9 ha of state mineral estate). This lease calls for minimum royalty payments (deductible from future production royalties) of $30/acre ($6,000) for year 2016, increasing by $5.00 per acre per year through year 2021. The rental payments increase to $55/acre after year 2021. Mineral production from the lease is subject to a sliding scale production royalty. |
| ■ | Parcel (1265) – (State Lease M-1265; 230.4 ha of state mineral estate). This lease calls for minimum royalty payments (deductible from future production royalties) of $30/acre ($6,000) for year 2016, increasing by $5.00 per acre per year through year 2021. The rental payments increase to $55/acre after year 2021. Mineral production from the lease is subject to a sliding scale production royalty. |
| ■ | Parcel (1269) – (State Lease M-1269; 111.4 ha of state mineral estate). This lease calls for minimum royalty payments (deductible from future production royalties) of $30/acre ($6,000) for year 2016, increasing by $5.00 per acre per year through year 2021. The rental payments increase to $55/acre after year 2021. Mineral production from the lease is subject to a sliding scale production royalty. |
| ■ | Parcel (1272) – (State Lease M-1272; 55.7 ha of state mineral estate. This lease calls for minimum royalty payments (deductible from future production royalties) of $30/acre ($6,000) for year 2016, increasing by $5.00 per acre per year through year 2021. The rental payments increase to $55/acre after year 2021. Mineral production from the lease is subject to a sliding scale production royalty. |
| ■ | Parcel (825) – (State Lease M-00825; 44.1 ha of state mineral estate). This lease calls for minimum royalty payments (deductible from future production royalties) of $30/acre ($6,000) for year 2016, increasing by $5.00 per acre per year through year 2021. The rental payments increase to $55/acre after year 2021. Mineral production from the lease is subject to a sliding scale production royalty. |
| ■ | Parcel (826) – (State Lease M-00826; 13.9 ha of state mineral estate). This lease calls for minimum royalty payments (deductible from future production royalties) of $30/acre ($6,000) for year 2016, increasing by $5.00 per acre per year through year 2021. The rental payments increase to $55/acre after year 2021. Mineral production from the lease is subject to a sliding scale production royalty. |
| ■ | Parcel (827) – (State Lease M-00827; 97.46 ha of state mineral estate). This lease calls for minimum royalty payments (deductible from future production royalties) of $30/acre ($6,000) for year 2016, increasing by $5.00 per acre per year through year 2021. The rental payments increase to $55/acre after year 2021. Mineral production from the lease is subject to a sliding scale production royalty. |
| ■ | Parcel 20 – (13.96 ha). Surface and Mineral Rights are 100% owned by the issuer. |
| ■ | Parcel 23 – (5.5 ha). Surface and Mineral Rights are 100% owned by the issuer. |
Back Forty Project |
3-8 |
Gold Resource Corporation |
|
3.5 |
State of Michigan Metallic Mineral Leases |
Michigan state leases call for a 10-year term that can be extended to 20 years by paying advance royalties. Other terms include a one-time $1/acre minimum bonus bid, a rental rate commencing at $3/acre per year for the first five-years and $6/acre per year for years six through ten.
In the absence of mining operations, a minimum advance royalty payment (deductible from a production royalty) is due for years 11 through 20. The advance royalty payment rate begins at $10.00/acre in the eleventh year and escalates by $5.00/acre per year until the twentieth year when the rate is $55.00/acre. If production occurs, a royalty must be paid to the State. A sliding scale production royalty with no deductions of incurred costs is utilized based on an “adjusted (indexed for inflation) sales value” per short ton of dry ore. For base and precious metals, it is calculated on a quarterly basis whereby the gross sales value (revenue received by the mine from a smelter or processor, i.e. “smelter return”) is divided by ore production which is then adjusted for inflation (using the producer price index for all commodities). The resulting adjusted sales value per short ton of ore is subject to the following rates: 2% on value less than $12/t; this rate is increased by 1% for each $6.00 increase in the value above $12.00 to a maximum of $71.99/t; at or above $72/t, a 7% rate applies. The State of Michigan allows for renegotiation of production royalties (rates and method of calculation) at any time during the term of the lease.
The Michigan Department of Natural Resources (“DNR”) has revised the current mining lease agreement which clarifies and expands the royalty schedule. The new lease format calls for rental rates and advance minimum royalty payments similar to the old lease but includes an improved production royalty schedule. The new production royalty is also based on “smelter return” that includes processor deductions for (1) base smelting and refining charges (2) sampling and/or assay charges assessed by the smelter and (3) penalties for impurities that are deducted from the assay value of the ore (adjusted sales value). No deductions for operation of the mine, on-site enrichment of ore, or transportation to the smelter will be allowed in calculating smelter returns. None of these costs can be recouped by deductions against the adjusted sales value. The production royalty is calculated the same way as in the old lease for base and precious metals but uses a different royalty schedule that is shown in Table 3-2.
The new royalty rates are improved and more in line with industry standards. As with the old lease, royalty rates in the new lease agreement may be renegotiated any time during the lease term. Although the Project has no new state leases, it does have the option to renegotiate the production royalty in the older leases to the more favorable rates. A renegotiated production royalty is particularly important for leases M01270 and M01271 that control portions of the identified Mineral Resource. However, there is no guarantee that any negotiations with the state regarding modification of state lease production royalty rates will be successful.
Back Forty Project |
3-9 |
Gold Resource Corporation |
|
Table 3-2: State of Michigan Mineral Royalty Schedule
Adjusted Sales |
Value US$ per ton |
UG Royalty Rate |
Surface Royalty Rate |
|---|---|---|---|
$0.01 |
$25 |
2% |
2.50% |
$25.01 |
$50 |
2.40% |
2.90% |
$50.01 |
$75 |
2.80% |
3.30% |
$75.01 |
$100 |
3.20% |
3.70% |
$100.01 |
$125 |
3.60% |
4.10% |
$125.01 |
$150 |
4% |
4.50% |
$150.01 |
$175 |
4.40% |
4.90% |
$175.01 |
$200 |
4.80% |
5.30% |
$200.01 |
$225 |
5.20% |
5.70% |
$225.01 |
$250 |
5.60% |
6.10% |
$250.01 |
$275 |
6% |
6.50% |
$275.01 |
$300 |
6.40% |
6.90% |
$300.01 |
$325 |
6.80% |
7.30% |
$325.01 |
$350 |
7.20% |
7.70% |
$350.01 |
$375 |
7.60% |
8.10% |
$375.01 |
$400 |
8% |
8.50% |
$400.01 |
$425 |
8.40% |
8.90% |
$425.01 |
$450 |
8.80% |
9.30% |
$450.01 |
$475 |
9.20% |
9.70% |
$475.01 |
$500 |
9.60% |
10.10% |
Above |
$50.01 |
10% |
10.50% |
3.6 |
Summary of Royalties |
The royalties that apply to material planned to be mined include:
| ■ | The Michigan State royalty, which applies to approximately 28% of the total mineralized material (25% on a value basis). The royalty is calculated on a sliding scale that ranges from 2.5% to 10.5% of NSR for the open pit and 2.0% to 10.0% for the underground. |
| ■ | The Ganzer Royalty, which applies to 6% of the total mineralized material (5% on a value basis) is a flat 3.5% of NSR. |
Royalty aggregates are included in the NSR calculation. Royalties are assumed to be paid following the year in which the material is mined.
Back Forty Project |
3-10 |
Gold Resource Corporation |
|
3.7 |
Permits |
The issuer’s current and anticipated future operations, including further exploration, development activities and commencement of production on the Property, require permits from various state and local governmental authorities. Please refer to Section 17.0 for a list of permit applications for the Back Forty Project since 2015.
A title opinion was prepared for Aquila on October 14, 2019 by the law office of Steven J. Tinti. Based on records filed with the Menominee County Register of Deeds Office and the agreements examined, Mr. Tinti concluded that under Michigan law: Aquila has full rights to pursue its exploration plans on the parcels controlled by the Company that are within the Active Project Area; there are no legal impediments to pursuing the mineral exploration plans on these parcels.
Permits and amended permits for various project configurations were issued except for a Dam Safety Permit needed for the 2018 reconfigured project.
On January 4, 2021, an Administrative Law Judge issued a decision denying the prior issuance of the Wetlands Permit. The Company has determined not to proceed with its appeal of the January 2021 decision by the Administrative Law Judge to deny the prior issuance of the Wetlands Permit. The Study team is focused on a design seeking to avoid direct impacts to wetlands. Even if a Wetlands Permit is required, the issuer expects that it will be able to secure a re-issued permit from the Department of Environment, Great Lakes, and Energy (EGLE) based on the fieldwork already completed under the existing Wetlands Permit and progress on the groundwater modeling that would be used to support any estimates of indirect wetland impacts.
EGLE issued permits necessary to construct and operate the mine. These approvals include the Nonferrous Metallic Mineral Mining Permit, Michigan Air Use Permit to Install, the National Pollutant Discharge Elimination Permit (NPDES), and the Wetlands Permit. The issuer is maintaining its National Pollutant Discharge Elimination System (NPDES) Permit in good standing and will proceed with timely renewal of this permit, as required.
3.8 |
Other Significant Factors and Risks Affecting Access |
No other significant factors and risks are known to affect access to the site.
Back Forty Project |
3-11 |
Gold Resource Corporation |
|
4.0 |
ACCESSIBILITY, CLIMATE, LOCAL RESOURCES, INFRASTRUCTURE AND PHYSIOGRAPHY |
4.1 |
Access to the Property |
The Property is located in the State of Michigan, approximately 55 km south-southeast of Iron Mountain, and approximately 19 km west of Stephenson, within the Escanaba River State Forest (Figure 4-1). Access to the Property from Stephenson is via County Road G12, north on River Road, travelling approximately 5 km to the Project field office. A number of drill roads connect with River Road and cross the Property. Infrastructure on the Property includes a power line and paved road access, making it accessible throughout the year.
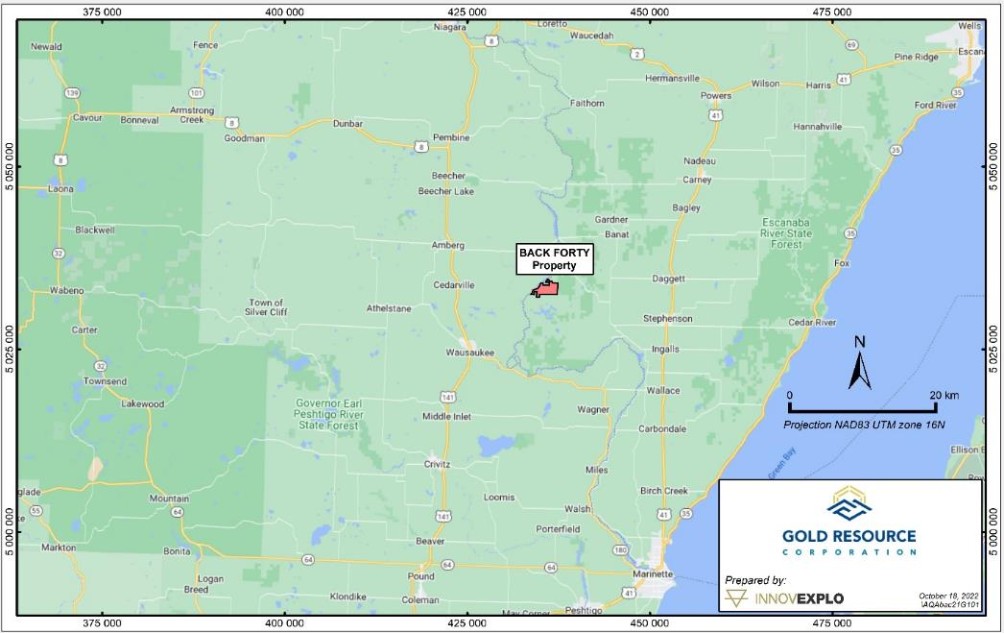
Figure 4-1: Access Map to Back Forty Property
4.2 |
Climate Description |
The Back Forty Project is under the influence of a humid continental-style climate marked by cold, humid winters and warm, humid summers. According to U.S. Climate Data at the nearest weather station (Stephenson, Michigan) (usclimatedata.com) the mean average temperatures for the warmest month is +26.9°C in July and the coldest month is January with an average temperature of -17.2°C. Average annual precipitation indicates a mean rainfall
Back Forty Project |
4-12 |
Gold Resource Corporation |
|
of 791 mm. Snow accumulates from late-October or early November to April. The area receives an average of 140 cm of snowfall per year, with most snowfall occurring in December and January.
The temperate climate allows exploration, potential development, and potential mining activities to take place year-round.
4.3 |
Availability of Required Infrastructure |
Iron Mountain and Menominee (populations of 7,000- 9,000) are the largest towns within a 55-km radius. The area has a network of paved state roads, including highways, and Iron Mountain has a commercial airline operated by Delta Connection out of the local airport.
The Project is located within ready access to water and power needs, including a 138-kV transmission line that is currently proposed to service the operation from the northeast corner of the Project site.
The issuer’s office and a fully equipped core shack are located on the Property.
4.4 |
Physiography |
The Property lies along the east bank of the Menominee River and consists of low, rolling hills with maximum topographic relief of 30 m and intervening swamps (in part prairie-savannah); mean elevation is approximately 200 to 300 meters above sea-level. Vegetation is mostly immature hardwood-pine forest (Figure 4-2) and swamp/prairie-savannah grasses; swampy areas also occur along creeks and secondary tributaries.
Outcrops are rare on the Property. Glacial overburden is variable from 40 m thick to more often < 15 m thick.
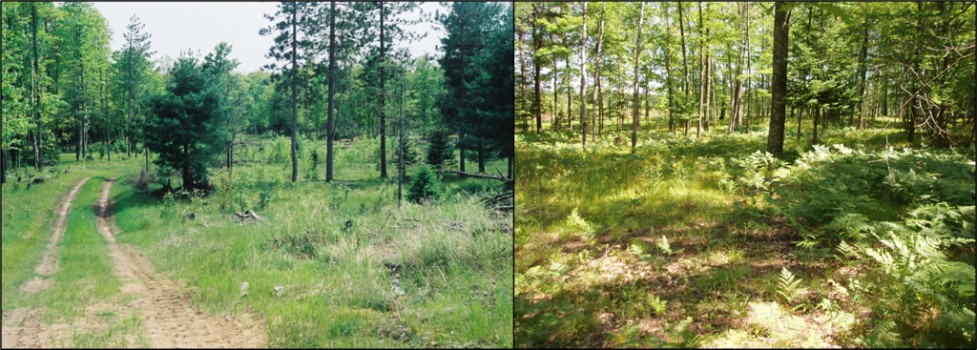
Figure 4-2: Typical Landscape of Back Forty Property
Back Forty Project |
4-13 |
Gold Resource Corporation |
|
5.0 |
HISTORY |
5.1 |
Regional/District History |
5.1.1 |
1950s to 1970s |
Exploration for volcanogenic massive sulfide (“VMS”) deposits in the Penokean Volcanic Belt (“PVB”) of Wisconsin began in the 1950’s by Kennecott Exploration. They pursued their exploration program for two decades before announcing the discovery of the Flambeau deposit in 1970.
This announcement immediately brought in competitors, several of whom (e.g., Exxon and Noranda) were, at the time, actively exploring extensions of two productive Canadian Archean greenstone belts (Wawa and Wabigoon belts, north of Lake Superior) into northern Minnesota.
Using the newly developed volcanogenic massive sulfide model and airborne electromagnetic systems including INPUT and later GEOTEM, large blocks of ground were accessed. Targets generated from the airborne surveys would be followed up on the ground by land acquisition, geophysical surveys and drilling.
5.1.2 |
1970s to 1990s |
By the late 1970’s over 60 companies were or had been actively exploring the PVB of Wisconsin. In 1976, Exxon discovered the huge Crandon deposit; other smaller but potentially economic deposits continued to be discovered through the 1980’s such as Bend (1985, Jump River Joint Venture) and Lynne (1989-90, Noranda). By the early 1990’s, at least 13 deposits and occurrences were identified, four of which were deemed commercially viable with potential ore reserves delineated.
5.1.3 |
1990s to 2001 |
Following the upswing in exploration activities in the area, low base metal prices, difficult regulation, permitting and taxation coupled with a deteriorating political environment, resulted in most companies abandoning their exploration projects.
Only Kennecott Exploration, the first company to enter the belt, endured and in 1993 brought the Flambeau deposit (the first discovered) into full-scale production. From 1993 to 1997, 1.71 million short tons grading 10.3% Cu, 0.116 oz/t Au and 1.83 oz/t Ag was produced from the open pit mine (May and Dinkowitz, 1996).
The last exploration drillhole documented in the state was in 1996 on the Bend property during the time Flambeau was in operation. All property positions have been either dropped or abandoned. The Back Forty deposit is the first new VMS discovery since Lynne was identified some 15 years ago.
5.2 |
Property History |
The Back Forty VMS appears to have been missed by all airborne electromagnetic (“AEM”) surveys flown during the height of exploration activity in the PVB. Exxon had the closest airborne survey (flown in the1970’s) that came within approximately one mile south of the property. Their survey identified a formational EM conductor south of the deposit but was never followed-up on the ground.
5.2.1 |
2001 to 2003 – Back Forty Joint Venture |
The Back Forty Deposit area remained unexplored until 2001 when construction of a new domestic water well on the MRT property unintentionally intersected massive sphalerite mineralization. Richard Lassin, a Michigan-based geologist, first recognized the potential of the Property. A business associate, Harry Kleiman, who owns a water
Back Forty Project |
5-14 |
Gold Resource Corporation |
|
well drilling company, was hired to deepen the MRT property well. Kleiman brought Lassin massive sulfide cuttings derived from the completed well. Subsequent assays of the cuttings confirmed the well had indeed penetrated 12 meters of zinc-rich massive sulfide. Upon further surface investigation of the property, bedrock exposures of favorable pyritic quartz-sericite schist were identified and an auriferous gossan which they interpreted to be capping massive sulfide mineralization at depth. This ultimately led to the acquisition of additional private and state mineral interests in the surrounding area.
In 2002, a GEOTEM, a fixed wing electromagnetic and magnetic survey, with north-south 200 m spaced lines, was flown over the area of the Back Forty discovery. Ground and down-hole pulse electromagnetic surveys (“PEM”) were also conducted during the 2002 to 2003 drilling program.
In February 2002, two diamond drill holes were completed along the eastern edge of the Property on state mineral leases. These holes targeted a 1.5 mGal gravity anomaly coincident with a strong max-min electromagnetic conductor. Although the first hole (108401) had no significant results, the second hole (108402) penetrated 37 m of massive sulfides grading 9.1% Zn and 5.7 g/t Au after penetrating the capping gossan that graded 21.9 g/t Au. The East Zone had been discovered.
Shortly thereafter, the Back Forty Joint Venture (“BFJV”) was formed between the Menominee River Exploration Company (“MREC”) and the American Copper and Nickel Company Inc. (“ACNC”), INCO’s American subsidiary. ACNC could earn a 60% interest in the Project by spending $10 million over six years. After protracted negotiations, a purchase option was finally arranged for the Thoney Property.
In October 2002 to May 2003, 71 diamond drill core holes (DDHs) collected 20,450 m of core, from which 7600 assay samples and 340 whole-rock samples were collected. This drilling campaign partially delineated a Zn-Cu-Au-Ag rich VMS deposit. However, ACNC deemed the deposit size too small to meet their minimum mineral resource requirements of 20 Mt.
By mid-2003, ACNC had negotiated with MREC an immediate withdrawal from the Project in exchange for a retained 7% net profits interest (“NPI”) in any future deposits developed within the Project area. With ACNC out of the joint venture, MREC began seeking a new partner to help advance the Project.
5.2.2 |
2004 to 2006 – Aquila Resources Corporation |
A new company, Aquila Resources Corporation (“ARC”), was formed in early 2004 for the purpose of going public with the project. However, it was not until mid-2006 that ARC merged with JML Resources through a reverse take-over and was listed on the TSX Venture Exchange. Once listed, the new company, renamed Aquila Resources Inc. (“Aquila”), raised exploration capital to restart drilling operations.
The Thoney Property was re-acquired and combined with adjacent parcels to become the Back Forty Property.
A second major drill program with a total of 80 DDHs (13,190 m) was completed to in-fill gaps from prior drilling. The majority of the drilling targeted the East and Pinwheel Zones.
5.2.3 |
2007 to 2008 – Aquila Resources Inc. |
In early 2007, Datamine International was commissioned to conduct a geostatistical Mineral Resource Estimation that included 2006 drilling results.
In April of 2007, Aquila announced the approval to list on the TSX Venture Exchange.
Back Forty Project |
5-15 |
Gold Resource Corporation |
|
A 500 km2 airborne geophysical survey was flown over the Project area in 2007. A number of strong, moderate, and weak conductive anomalies have been identified from the survey, both in the vicinity of the main deposit, to the east of the deposit under thickening Paleozoic cover, and to the west of the deposit in Wisconsin. Additional PEM surveys that were conducted in the immediate Back Forty Mineral Resource area were run during mid-to-late 2006 and 2007. A number of geophysical targets were tested successfully; other targets could not be explained through drilling.
A third drilling program was completed in 2007 which included 118 DDHs (27,800 m) to test numerous targets throughout the Mineral Resource area.
Exploration drilling continued with a fourth drill program in 2008 with an additional 66 DDHs (13,950 m).
In 2008, SRK Consulting (“SRK”), Toronto, was contracted to provide a new Mineral Resource Estimation which was released in January 2009.
5.2.4 |
2009 to 2010 – Aquila and Hudbay |
In August of 2009, Hudbay Minerals Inc. (“Hudbay”) entered into a Subscription, Option, and JV Agreement with Aquila allowing Hudbay to earn a majority share of the Back Forty Project and become the operator. Under the agreement, another phase of drilling started in the fall of 2009 and continued until June of 2010. The total number of drill holes increased to 478, with this program of 157 oriented drill holes targeting the main deposit. Another 11 holes outside the immediate deposit area were also drilled approximately 600 m to the east, targeting ground magnetic and gravity anomalies. Anomalous zinc and gold mineralization in altered rhyolites and sediments was encountered in two drill holes. Drill hole PTL-1 intersected 10.0 m of 0.61% zinc, including one 1.5 m sample of 1.08% zinc. Drill hole PTL-2 encountered an interbedded sequence of flows and tuffaceous sediments including a chlorite-altered fragmental zone containing 26.5 m of 0.54% zinc, with smaller zones exceeding 1% zinc, a lower interval of tuffaceous sediments containing 12.5 m of 0.51% zinc, and an underlying siliceous breccia with 6 m of 1.1 g/t gold, including 1.5 m of 2.67 g/t gold. The drilling results suggested that prospective host rocks continue to the east of the main deposit for at least 600 m.
In addition, five NQ3 “geotechnical” holes that targeted the conceptual open pit walls were completed. The core from these drill holes was archived in their entirety, i.e., not cut and assayed, so they are not included in the updated Mineral Resource calculation.
Golder Associates Ltd. from Mississauga, Ontario was retained to calculate an updated Mineral Resource Estimate which was released in October 2010.
In September 2010, Hudbay announced that, pursuant to the terms of a Subscription, Option, and JV Agreement with Aquila, Hudbay had exercised its option to earn a 51% joint venture interest in Aquila’s Back Forty Project after expenditures of $10 million on the Project.
5.2.5 |
2011 – Aquila Drill Program |
A total of 78 DDHs were drilled. The programs included drilling 22 high-grade gold targets at depth, four geophysical targets, and 22 relatively shallow holes to delineate the Pinwheel Gossan Zone. Eleven holes were drilled to collect metallurgical samples, 12 for condemnation purposes east of the Mineral Resource area and five holes to install monitoring wells for groundwater purposes. These additional 28 drill holes were not part of the 2018 Mineral Resource Estimate.
Back Forty Project |
5-16 |
Gold Resource Corporation |
|
Downhole PEM surveys were completed during the 2009-2011 drill programs. The surveys were completed by Crone Geophysics and reviewed and interpreted by Hudbay geophysicists who aided in the initial delineation of the main deposit at depths exceeding 650 m in the vertical direction.
5.2.6 |
2014 – Aquila and REBgold Corporation |
On January 16, 2014, REBgold Corporation (“REBgold”) and Aquila closed a statutory plan of arrangement (the “Arrangement”). The Arrangement required that:
| ■ | Aquila acquires 100% of the outstanding shares of REBgold in exchange for Aquila shares on a one-for-one basis. |
| ■ | The acquisition of 100% of the shares owned by Hudbay, effectively giving Aquila 100% ownership of the Project. |
| ■ | The non-brokered private placement of REBgold shares for gross proceeds of approximately $4.85 million (the “REBgold Financing”). Pursuant to the REBgold Financing, Baker Steel Capital Managers LLP (“Baker Steel”), on behalf of investment funds managed or controlled by it, invested $4.5 million of such gross proceeds. Proceeds from the REBgold Financing would be used for general working capital and to fund the next phase of development activity on the Project. |
Immediately following completion of the Arrangement and related transactions, there were approximately 183 million common shares of Aquila outstanding and 27.6 million common shares exercisable through stock options, convertible debentures and warrants. Immediately prior to completion of the Arrangement and related transactions, there were 64,825,568 REBgold shares outstanding (including shares issued pursuant to the REBgold Financing). All of these shares were exchanged for Aquila shares pursuant to the Arrangement on a one-for-one basis.
Pursuant to the HMI Acquisition, Hudbay’s 51% interest in the Project was acquired in consideration for the issuance of 18,650,193 common shares of Aquila, future milestone payments tied to the development of the Project and a 1% net smelter return royalty on production from certain land parcels in the Project. At the time, Baker Steel was Aquila’s largest shareholder and owned or controlled 45,483,886 Aquila common shares or approximately 25% of the outstanding Aquila common shares. Hudbay owned or controlled 33,017,758 Aquila common shares or approximately 18% of the outstanding Aquila common shares. In connection with the completion of the Arrangement, REBgold, as a wholly-owned subsidiary of Aquila, had its shares delisted from the TSX Venture Exchange and ceased to be a reporting issuer.
5.2.7 |
2014 – PEA NI 43-101 Compliant Technical Report |
In 2014, a Preliminary Economic Assessment was completed for Aquila by Tetra Tech which contemplated an open pit mining/processing operation followed by an underground mining operation including an on-site processing facility and associated infrastructure at the Project.
5.2.8 |
2015 – Aquila and Orion Mine Finance Transaction |
On March 31, 2015, the Aquila closed a multi-level financing transaction with Orion Mine Finance (“Orion”) that included an equity private placement and a silver stream for total funding of $20.75 million (collectively, the “Orion Transaction”). Concurrent with the Orion Transaction, the Company completed the repurchase of two existing royalties on the Project. As part of the Orion Transaction, Aquila issued 26,923,077 units at a price of $0.13 per unit for gross proceeds of $3.5 million, with each unit consisting of one common share and one-half common share purchase warrant. Each whole warrant allowed the holder to purchase one common share at a price of $0.19 per
Back Forty Project |
5-17 |
Gold Resource Corporation |
|
common share for a term of three years. Also, as part of the Orion Transaction, pursuant to a silver purchase agreement (the “Silver Purchase Agreement”) dated March 31, 2015, between Orion Titheco Limited, the Company and Back Forty Joint Venture LLC, Orion acquired 75% of Aquila’s life-of-mine (“LOM”) silver production from the Project for gross proceeds of $17.25 million. Orion has advanced the first installment of $6.5 million, the second installment of $3.0 million, the third installment of $3.375 million plus the $1.35 million land payment and the final installment of $2.376 million. In June 2016, the silver purchase agreement was amended to reduce the deposit owing by $625,000. In November 2016, the silver purchase agreement was amended to reduce the deposit owing by $14,000.
5.2.9 |
2015 – Aquila Drilling Programs |
Drilling in 2015 consisted of a total of 13 NQ-sized drill holes totaling 1,775 m.
The primary focus of the 2015 program consisted of 833 m of drilling in nine metallurgical drill holes (MET-15-01 to MET-15-09) targeting sulfide mineralization within the open-pit portion of the Mineral Resource area. Drill holes were designed to intercept all sulfide metallurgical domains and to provide sufficient sample material and spatial and mineralogical (grade) variability within each domain to support the necessary metallurgical testing requirements. Select intervals from the drill holes were sampled and submitted directly to SGS for assay and metallurgical testing. All holes represented ‘twin drill holes’ from previous drilling campaigns and the assays from these drill holes were not incorporated into the updated Mineral Resource Estimate.
Two drill holes (LK-15-508 and LK-15-509) targeted Mineral Resource expansion of the Pinwheel Zone on the Property that had previously been unavailable for drilling. The two drill holes intercepted zinc-rich massive sulfide and associated gold mineralization within the host rocks.
5.2.10 |
2016 – Aquila Geotechnical, Resource and Exploration Drill Programs |
In 2016, consolidation of land ownership allowed expansion of the detailed gravity grid to the northeast and southwest of the main deposit. Figure 5-1 shows a colored image of this expanded gravity data.
A total of 13 DDHs (2,333 m) were drilled in 2016. Three DDHs (627 m) were drilled for geotechnical investigation to evaluate rock quality in the south-western and south-eastern portion of the open pit Mineral Resource area as well as to test the rock mass quality along the proposed cut-off wall between the planned open pit and the Menominee River. An additional four DDHs (627 m) were completed to delineate and extend the known Mineral Resource outside of the planned open pit. And finally, six DDHs (1,195 m) were completed as part of the 2016 exploration program testing both airborne and a recently identified gravity anomaly extending southwest of the known deposit. That program resulted in the discovery of a new zone of massive sulfide mineralization – the 2016 Zone.
Back Forty Project |
5-18 |
Gold Resource Corporation |
|
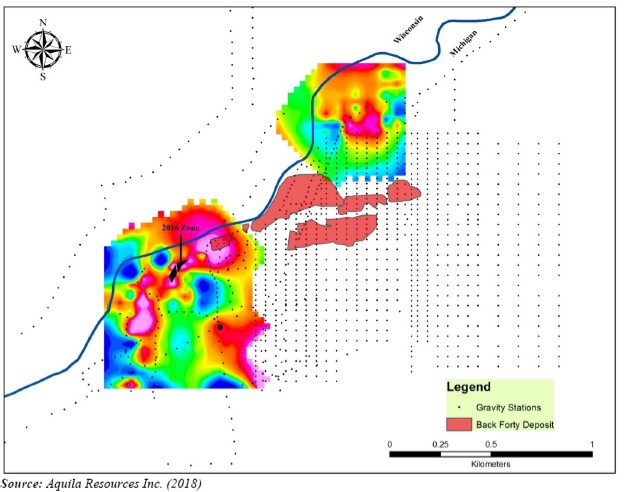
Figure 5-1: Expanded Detailed Gravity Survey Showing Newly Discovered 2016 Zone
5.2.11 |
2017 – Aquila and Osisko Bermuda Limited Transaction |
On November 10, 2017, Aquila completed a financing transaction with Osisko Bermuda Limited (“OBL”), a wholly owned subsidiary of Osisko Gold Royalties Ltd. (“Osisko”) pursuant to which OBL has agreed to commit $65 million to Aquila through a $10 million private placement and $55 million gold stream purchase agreement.
OBL purchased 49,173,076 units of Aquila at a price of CA$0.26 per unit for aggregate gross proceeds of $10 million (the “Strategic Investment”). Each unit consisted of one common share and one-quarter of one common share purchase warrant. Each whole warrant entitled the holder to purchase one common Aquila share for CA$0.34 until May 10, 2021. Osisko also had the right to participate in any future equity or equity-linked financings to maintain its ownership level in Aquila. In connection with the private placement, Osisko received the right to nominate one individual to the board of directors of Aquila and thereafter for such time as Osisko owns at least 10% of the outstanding common shares. Osisko’s nominee was appointed to the board of directors in November 2017.
Back Forty Project |
5-19 |
Gold Resource Corporation |
|
Concurrent with the Strategic Investment, the parties have entered into a Gold Purchase Agreement (the “Stream”), whereby OBL will provide Aquila with staged payments totaling $55 million, payable as follows:
| ■ | $7.5 million on close of the Stream; |
| ■ | $7.5 million upon receipt by Aquila of all material permits required for the development and operation of the Project, and receipt of a positive Feasibility Study; |
| ■ | $10 million following a positive construction decision for the Project; and |
| ■ | $30 million upon the first drawdown of an appropriate Project debt finance facility, subject to the COC Provision (as defined below). |
Under the terms of the Stream Agreement, OBL will purchase 18.5% of the refined gold from the Project (the “Threshold Stream Percentage”) until Aquila has delivered 105,000 ounces of gold (the “Production Threshold”). Upon satisfaction of the Production Threshold, the Threshold Stream Percentage will be reduced to 9.25% of the refined gold (the “Tail Stream”). In exchange for the refined gold delivered under the Stream, OBL will pay Aquila ongoing payments equal to 30% of the spot price of gold on the day of delivery, subject to a maximum payment of $600 per ounce.
In the event of a change of control of Aquila prior to the advancement of the final $30 million under the Stream, the person or entity acquiring control over the Project may elect to forgo the final payment, in which case the Threshold Stream Percentage and Tail Stream will be reduced to 9.5% and 4.75%, respectively (the “COC Provision”). All other terms and conditions of the Stream will remain unchanged.
Pursuant to the Stream, Aquila has agreed to pay a $200,000 capital commitment fee. The fee is payable 50% upon closing of the Stream transaction and 50% upon OBL funding the second deposit under the Stream. Aquila satisfied the initial $100,000 fee by way of the issuance of 478,781 common shares.
5.2.12 |
2017 – Aquila Geotechnical, Resource and Exploration Drill Programs |
A geotechnical drilling program consisting of a total of five drill holes (GT-09 to GT-13) for a total of 1,281.2 m, was undertaken to evaluate the rock mass quality within the potential underground mining area, including three drill holes (GT-09 to GT-11) in the Pinwheel area southwest of the planned open pit and two holes (GT-12 and GT-13) in the Main Zone and Deep Zone area below and southwest of the planned open pit.
In addition to collecting geotechnical data, several of the geotechnical drill holes were also designed to intercept areas of Inferred Mineral Resource in the vicinity of the Pinwheel Zone, Tuff Zone and Deep Zone.
Resource delineation drilling consisted of a total of 10 drill holes (LK-17-521 to LK-17-528, LK-17-531 and LK-17-533) as well as extensions of GT-12 and GT-13 for a total of 2,610 m. LK-17-521 through LK-17-527 were designed to intercept Inferred Mineral Resource material as well as to test the western, down-dip extension of the Pinwheel massive sulfide. All drill holes encountered massive sulfide mineralization associated with the Pinwheel massive sulfide.
LK-17-528 and LK-17-533 were designed to intercept inferred mineralization located in the Deep Zone massive sulfide and adjacent Porphyry Margin Gold Zone. Both drill holes also encountered mineralization associated with the Tuff Zone massive sulfide and stringers as well as the 90 Zone along the south margin of the proposed open pit.
Back Forty Project |
5-20 |
Gold Resource Corporation |
|
A total of nine drill holes (2,110 m) were drilled as part of an exploration program targeting a geophysical anomaly identified during 2016 and as follow-up on the newly discovered massive sulfide zone from the 2016 drill program. A downhole EM geophysical anomaly located to the south of the main deposit area was tested by drill hole LK-17-520 and encountered thin lenses of massive sulfide coincident with the location of the geophysical target. Assays returned no significant results. An additional eight drill holes were completed to further define and extend the massive sulfide zone identified in 2016. Mineralization associated with this zone was extended approximately 35 m to the east-northeast and up-dip from the 2016 intercept. The zone was also extended approximately 70 m to the west-southwest and down-dip of the previous drilling completed in 2016. Given the limited drilling in this area, mineralization has not been modelled and is not currently incorporated into the updated Mineral Resource Estimate.
5.2.13 |
2018 – P&E Mineral Resource Estimates |
P&E Mining Consultants Inc. (“P&E”) produced a Technical Report and Updated Mineral Resource Estimate, with an effective date of February 6, 2018. The Updated Mineral Resource Estimate formed the basis for the 2018 Feasibility Study that Aquila filed on SEDAR with an effective date of August 1, 2018.
5.2.14 |
2018 – P&E Open Pit Feasibility Study Technical Report |
On September 7, 2018, Aquila filed an open pit Feasibility Study Technical Report performed by P&E on SEDAR, with an effective date of August 1, 2018.
On October 5, 2018, Aquila received a payment of $7.4 million from an affiliate of Osisko under the Gold Purchase Agreement. This payment represented the second deposit of the total advance payment of US$55 million to be made by Osisko under the Gold Purchase Agreement. The payment, which was made net of a $100,000 capital commitment fee, follows receipt by Aquila of all material permits required for the development and operation of the Project in Michigan and the completion of the Back Forty Project Feasibility Study.
5.2.15 |
2018 – Aquila Exploration Drill Program |
Three drill holes totaling 633 m were completed as part of an abbreviated exploration program in 2018. The drill program was designed to test the extents of the recently discovered 2016 Zone and another geophysical target peripheral to the known deposit. The geophysical target intersected altered volcanics with anomalous zinc. One hole testing the southwest extension of the 2016 Zone intersected mineralization similar to the lower tuffaceous sediments.
5.2.16 |
2019 – Aquila, Orion Mine, and Osisko Gold Royalties Transaction |
On June 28, 2019, Aquila announced that its two largest shareholders, Orion and Osisko completed a transaction whereby Orion purchased from Osisko all 49,651,857 common shares of Aquila owned by Osisko (the “Transaction”). The Transaction was a small component of the share repurchase and secondary offering transaction first announced by Osisko on June 25, 2019. Orion now owns 97,030,609 common shares of Aquila representing approximately 28.7% of the outstanding common shares. Osisko remains a significant financial partner to Aquila as the holder of gold and silver streams on the Company’s Back Forty Project. Under its gold streaming agreement with Aquila, Osisko remains committed to funding an additional US$40 million in staged payments to continue the development of the Project.
5.2.17 |
2019 – Aquila Geo-mechanical and Metallurgy Drill Program |
The 2019 geo-mechanical drilling program consisted of a total of seven drill holes (1,274.03 m) and was designed to evaluate the rock mass quality within the west pit wall and to evaluate the rock quality on a potential crown pillar.
Back Forty Project |
5-21 |
Gold Resource Corporation |
|
In addition to collecting geotechnical data, three of the geotechnical drill holes may have intersected areas of Inferred Mineral Resource mineralization within the Mineral Resource block model in the vicinity of the Pinwheel Zone and NS Zone. None of the 2019 drill holes are included in the Updated Mineral Resource Estimate.
The primary focus of the 2019 metallurgy drilling program was to target early mining within the open-pit portion of the Mineral Resource. This was completed in eight metallurgical drill holes (MET-19-01 to MET-19-08) totaling 558.33 m.
Drill holes were designed to provide sufficient sample material and spatial and mineralogical (grade) variability within each domain to support the necessary metallurgical testing requirements. Continuous samples (quarter core) from these drill holes were submitted to Minerals Processing Lab for assaying. Composite samples (half core) were created from select intervals and sent to SGS for metallurgical testing. The remaining un-sampled material (quarter core) was reserved for potential future metallurgical testing. All holes represented are ‘twin drill holes’ from previous drilling campaigns. Assays from these drill holes were not incorporated into the Updated Mineral Resource Estimate.
5.2.18 |
2019 – P&E Mineral Resource Estimates |
P&E produced a Technical Report and Updated Mineral Resource Estimate, with an effective date of October 14, 2019.
5.2.19 |
2020 – PEA NI 43-101 & 43-101F Technical Report |
In 2020, a Preliminary Economic Assessment was completed for Aquila by P&E.
5.2.20 |
2020 – Stream Agreement Amendments |
On June 18, 2020, Aquila announced that it entered into the 2020 Stream Agreement Amendments in order to accelerate Aquila’s access to a portion of the outstanding funding under the Gold Stream Agreement and to provide additional financial flexibility. The Silver Purchase Agreement was amended to increase the designated silver stream percentage from 75% to 85% of the number of payable silver ounces produced from the Back Forty Project with no change to the ongoing price of $4.00/oz silver.
5.2.21 |
2021 - Stream Agreement Amendments |
On March 11, 2021, Aquila announced that it entered into the 2021 Stream Agreement Amendments with Osisko to amend certain terms of the Gold Stream Agreement and Silver Purchase Agreement in order to provide additional financial flexibility.
5.2.22 |
2021 – Gold Resource Corporation |
GRC acquired, through its wholly-owned indirect subsidiary Gold Resources Acquisition Sub, Inc., all the issued and outstanding common shares of Aquila. The Transaction was approved at a special meeting of holders of Aquila Shares held on November 17, 2021, and by the Ontario Superior Court of Justice on November 19, 2021.
Pursuant to the Transaction, each former holder of Aquila shares was entitled to receive 0.0399 of a GRC share per Aquila share. In addition, all the outstanding deferred share units and restricted share units of Aquila were acquired for aggregate consideration of approximately CA$0.95 million.
Back Forty Project |
5-22 |
Gold Resource Corporation |
|
6.0 |
GEOLOGICAL SETTING, MINERALIZATION, AND DEPOSIT |
The information in this section is mainly based on the 2014 PEA report by Tetra Tech (Bryan et al., 2014), as well as the 2020 PEA by P&E (Bradfield et al., 2020).
6.1 |
Regional Geology |
The Back Forty volcanogenic massive sulfide deposit is one of a number of deposits located throughout the Ladysmith-Rhinelander volcanic complex in northern Wisconsin and western Michigan. The complex lies within the lower Proterozoic Penokean Volcanic Belt (PVB), also knowns as the Wisconsin Magmatic Terrane, which is part of the Southern Structural Subprovince of the Canadian Shield (Figure 6-1).
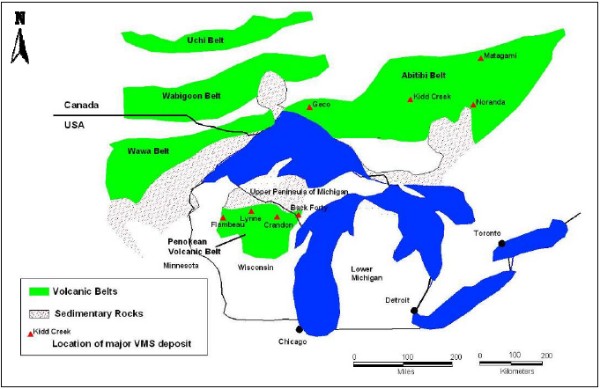
Source: (Modified from Franklin and Thorpe, 1982)
Figure 6-1: Location Map of The Back Forty VMS Deposit Within PVB In Relation to the Geological Provinces of the Canadian Shield
Sims et al. (1989) divided the PVB into the Pembine-Wausau and Marshfield subterranes, separated by the Eau Pleine shear zone. Each subterrane is characterized by volcanic island-arc-basin assemblages containing abundant calc-alkaline metavolcanic units and lesser amounts of sedimentary rocks; they generally lack major regional oxide-facies iron formations. Isotope age-dating (U-Pb and Pb-Sr) established an Early Proterozoic age ranging from 1,889 to 1,835 Ma (Figure 6-2). The northern contact of the PVB is marked by the Niagara fault zone, separating the PVB and another major terrane to the north named the “Northern Penokean Terrane” (NPT) (Sims et al., 1989).
Back Forty Project |
6-1 |
Gold Resource Corporation |
|
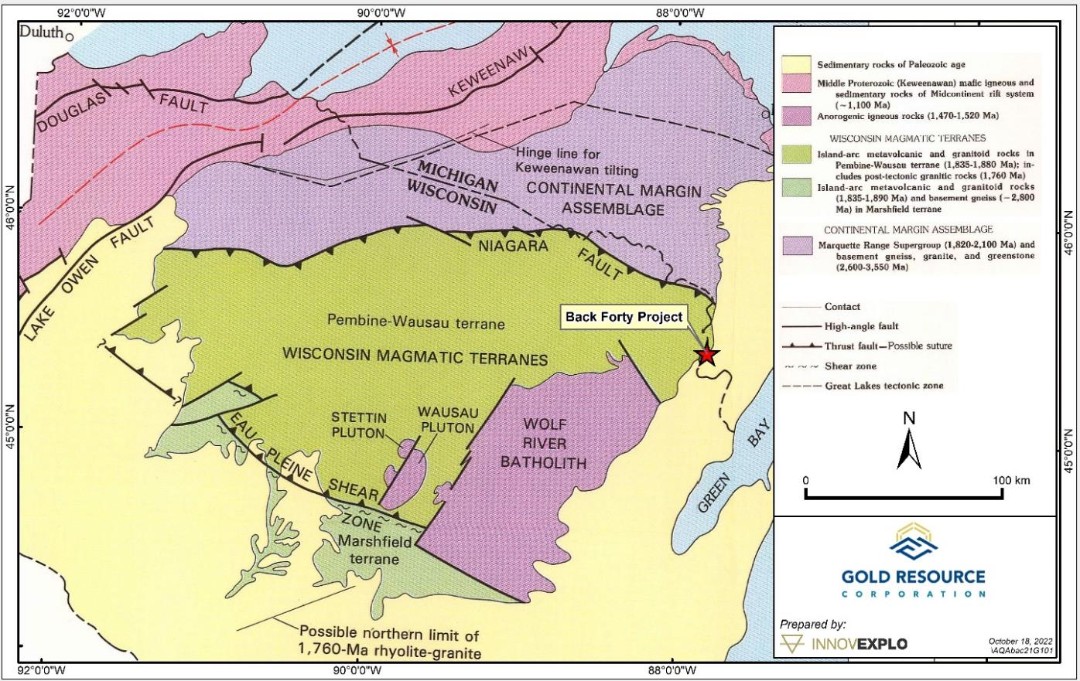
Figure 6-2: Geological Map of Northern Wisconsin and Western Michigan
Back Forty Project |
6-2 |
Gold Resource Corporation |
|
The NPT is characterized in part by a thick turbidite platform sequence, deposited at a continental margin on an Archean basement, with subordinate interbedded tholeiitic metavolcanics and major Superior-type oxide-facies iron formations. This supracrustal sequence has been interpreted to correlate with the Marquette Range Supergroup in Michigan. Both terranes (NPT and PVB) have been affected by the Penokean Orogeny, which occurred from 1,900 to 1,840 Ma, and resulted in major folding and faulting, regional metamorphism, and emplacement of major granitic intrusions.
Based on regional gravity and magnetic data, three volcanic complexes have been defined in the PVB: 1) the Ladysmith-Rhinelander volcanic complex, which dominates the northern portion of the Pembine-Wausau subterrane; 2) the Wausau complex, to the south, which has been intruded over much of its extent by the Wolf River batholith; and 3) the Eau Claire complex, in the Marshfield subterrane.
Geological, geophysical and geochemical data compiled since the 1960s define three depositional environments, each containing VMS mineralization in the 1,880 to 1,860 Ma old Ladysmith-Rhinelander complex: 1) a main volcanic-arc sequence, forming the structural core of the complex, 2) a laterally equivalent and/or possibly younger back-arc basin, volcanic-volcaniclastic succession that includes a series of mafic volcanic piles, and 3) major felsic volcanic centers in the back-arc basin and along the flanks of the main volcanic arc.
Three mineral districts in the Ladysmith-Rhinelander complex are defined by clustering of VMS deposits and occurrences as shown in Figure 6-3 (DeMatties, 1994).
Back Forty Project |
6-3 |
Gold Resource Corporation |
|
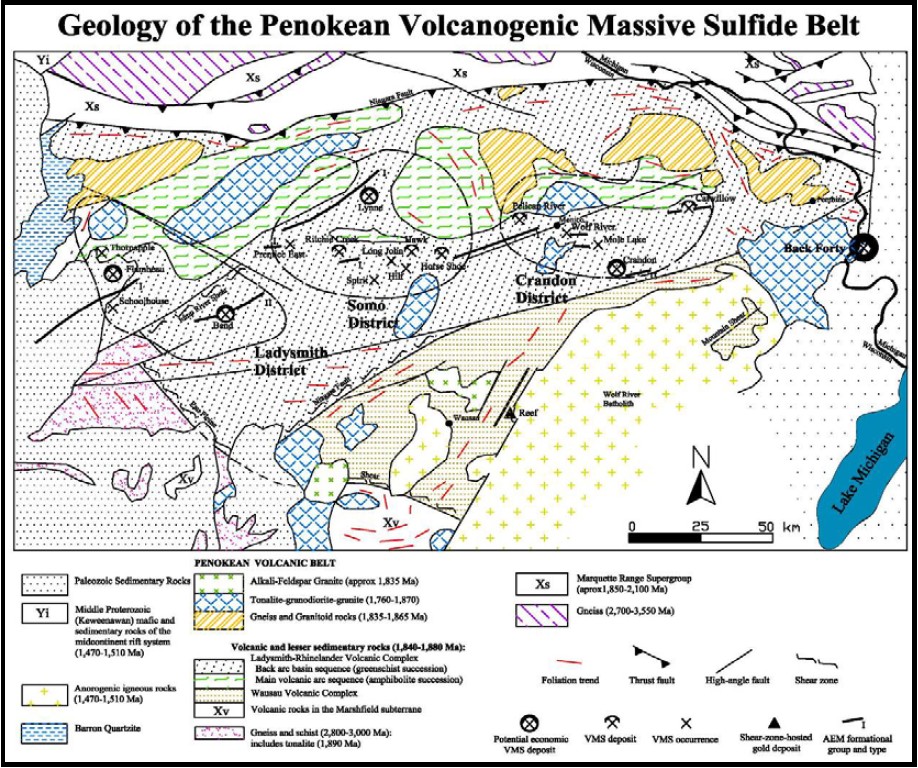
Source: DeMatties, 1994
Figure 6-3: Geological Map of The Penokean Volcanic Belt with Location and Distribution of the VMS Districts
The spatial distribution of the three districts appears to be linear, trending in an east-west direction (the so called “Highway 8” trend) and are separated from each other by 30 km to 50 km. However, a more complicated arrangement of individual deposits and occurrences is evident within each district. It is interesting to note the Back Forty Deposit is isolated from the other known districts, located at the east end of the belt and east of the Menominee River in Michigan. The nearest significant deposit is the Catwillow occurrence located at the east end of the Crandon District, approximately 50 km northwest of the Project. The distance from the Crandon District is significant given the average distance between districts of 30 km to 50 km. This known distribution strongly suggests that the Back Forty Deposit lies within a new, but as yet unrecognized, district at the extreme east end of the belt.
Together, the approximately 14 known VMS deposits account for over 150 Mt of base and precious metal mineralization. The average deposit size in this district is approximately 2.5 Mt; this average is high compared to other VMS districts worldwide (DeMatties 1994). The Back Forty Deposit exceeds in size most deposits discovered in the belt to date.
Back Forty Project |
6-4 |
Gold Resource Corporation |
|
The identified VMS deposits are classified by metal content into three groups based on zinc and copper ratios in Figure 6-4. (DeMatties 1994 and 1996). Each group exhibits various styles of mineralization that include sheets, mounds, stacked lenses, and replacements. Calculated zinc and copper ratios for the Back Forty Deposit place it in the Zn-Cu group that is dominant in the belt.
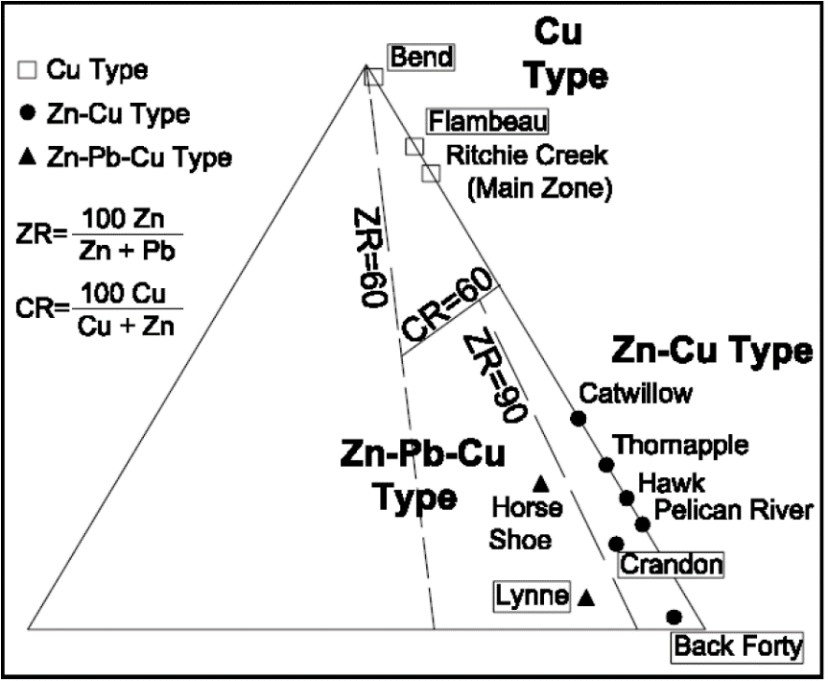
Source: DeMatties, 1994
Figure 6-4: Classification of VMS Deposits in the PVB Based on Cu and Zn Ratios
6.2 |
Local and Property Geology |
6.2.1 |
Local Geology |
The area to the west of the Project area is underlain by the 1,760 to 1,870 Ma old Athelstane Quartz Monzonite, an intrusive complex composed of tonalite, granodiorite and granite. The plutonic complex is bounded on the north, east, and south by metavolcanic rocks of the Beecher Formation and contains numerous metavolcanic rock inclusions (Figure 6-5). The volcanics generally face outward from the margin of the intrusive complex. Dykes of Athelstane Quartz Monzonite extend a short distance into the Beecher Formation (Jenkins 1973).
Back Forty Project |
6-5 |
Gold Resource Corporation |
|
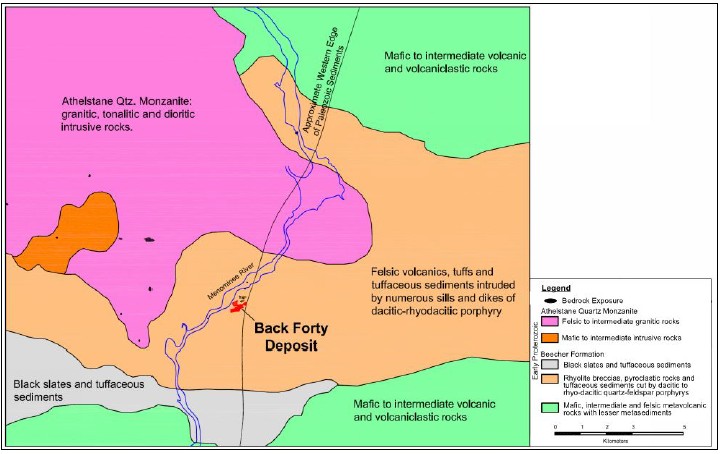
Source: Aquila Resources Inc., 2018
Figure 6-5: Geologic Map of the Back Forty Area
The Beecher Formation consists of a stratigraphically lower, 3,000 m thick sequence of calc-alkaline andesite to dacite flows and an upper 300 m thick section of interbedded felsic ash, crystal tuff, lapilli tuff, coarser fragmental rocks, and locally black slates near the stratigraphic top of the formation. The Back Forty Deposit is hosted by a volcanic complex quite similar to the upper volcaniclastic section of the Beecher Formation. Zircons extracted from rhyolite crystal tuff and intrusive rhyodacite porphyry from Back Forty have yielded a uranium/lead age of 1,874 ±4 Ma (Schulz et al. 2008). This age is consistent with the published age of the Athelstane Quartz Monzonite. It is very likely that the felsic sequence at Back Forty is a member of the Beecher Formation. The lateral extent of this volcanic center is unknown at this time. However, drilling and gravity surveys indicate it is truncated to the west and north by Athelstane Quartz Monzonite, but likely extends further to the east and south, beneath Cambrian sandstone sediments.
In the Menominee River valley, the PVB is unconformably overlain by erosional remnants of generally flat lying, Cambrian sandstone of the Munising Formation that coalesce into a coherent sandstone sheet approximately 600 m east of the Menominee River. The sandstone thickens and dips gently to the east and is overlain by progressively younger sediments of the Michigan Basin further to the east.
The majority of western Menominee County is blanketed by an irregular thickness of unconsolidated sand, gravel, peat, and clay, deposited as the glaciers receded. Locally, water bearing sand and gravel formations are included in the glacial deposits. The thickest, most extensive deposits of sand and gravel occur along the Menominee River
Back Forty Project |
6-6 |
Gold Resource Corporation |
|
in the west-central part of Menominee County (Vanlier, 1963). In Lake Township, these deposits consist of predominantly glacial outwash sand and gravel and postglacial alluvium (Farrand, 1982).
Regional deformation has produced a penetrative foliation and local shearing have been observed. The foliation is best developed in rhyolite crystal tuff units that have the strongest sericite alteration. In the fragmental units, clasts are commonly stretched parallel to foliation. In the bedded tuffaceous unit, schistosity is parallel to relict bedding.
6.2.2 |
Property Geology |
Mineralization of the Back Forty Deposit is hosted within a succession of strongly altered felsic volcanic rocks interlayered with fine grained tuffaceous sediments which locally host strata-bound massive to semi-massive sulfide units. The volcanic stratigraphy has been intruded by numerous felsic to intermediate, syn-volcanic porphyry dykes and subsequently intruded by later mafic dykes. The stratigraphy in the immediate deposit area is situated along an asymmetrical antiformal structure defined by a steeply dipping (65°) southern limb and a shallowly dipping (35°) northern limb which steepens to the southwest. The antiformal structure plunges to the west-southwest at approximately 30°. Figure 6-6 shows the bedrock geology of the Back Forty Deposit.
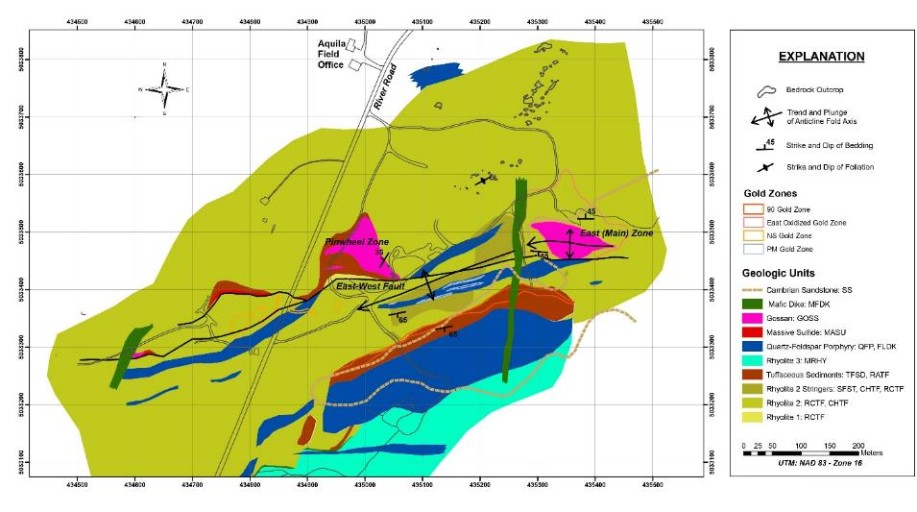
Source: Aquila Resources, 2021
Figure 6-6: Geological Map of the Back Forty Deposit
Back Forty Project |
6-7 |
Gold Resource Corporation |
|
6.2.2.1 |
Lithology |
Rhyolite crystal tuff (“RCTF”) is the dominant lithology at the Project. Certain domains of the RCTF display a distinctive, often pervasive chlorite alteration where it is then referred to as the chloritic crystal tuff (“CHTF”). Both facies include quartz +/- feldspar phyritic rhyolite tuff, vitric tuff, pyroclastic or epiclastic breccias (or pseudobreccias) and other fragmental rocks. The upper part of the CHTF commonly shows apparent clastic textures, suggesting it may have been transported and possibly reworked by epiclastic processes.
In other areas, particularly to the south of the deposit, distinctive massive, aphyric rhyolite flows (“MRHY”) may represent a late felsic domal complex. Whole rock geochemistry and the observed geologic relationships indicate these rocks were formed in a volcanic environment. All of the lithologies have been pseudomorphically replaced by predominantly quartz with varying percentages of sericite, chlorite and pyrite; the result of being intensely altered, at least once, and recrystallized. In many cases, primary textures have been completely obscured. Elsewhere, pyroclastic textures are observed, but may in fact represent irregular alteration fronts producing pseudo-fragments. While these rocks are presumably volcanic in origin, it is likely that some of this material may have been transported or reworked by gravity or water.
Volcanic-derived sedimentary units are interbedded within and often occupy the contacts between the felsic volcanic sequences. Tuffaceous sediments (“TFSD”) consist of thin-bedded volcaniclastic sediments and tuffs interbedded with chert. Some rocks are very fine grained, foliated, and finely layered to massive sericite schist. This unit is composed almost entirely of sericite with minor amounts of quartz and may contain variable amounts of pyrite and base- and precious metal sulfides when associated with massive sulfide (“MASU”). Geochemically, this unit is very similar to RCTF and has been interpreted to be bedded rhyolite ash tuffs (“RATF”). Further analysis of this unit indicates it is found associated with deformed MASU and as thin units bounded by less deformed RCTF, so it may represent a sheared phase of RCTF.
Tuffaceous sediments (“TFSD”) are similar to RATF but often show cherty or siliceous horizons interlayered with grey to white ash layers to produce a distinctive alternating pattern. This unit also includes lapilli tuff and volcaniclastic sediments. This unit is sometimes mineralized, hosting a relatively thin, undulating MASU layer with a very thin, gossan at the bedrock surface and low-sulfide, precious metal-bearing zones that are poorly defined.
At the Back Forty, the MASU and semi-massive sulfide (“SMAS”) zones are typically associated with RATF and TFSD lithologies.
Dacitic quartz feldspar porphyry (“QFP”) dykes and sills are the predominant intrusive rock; however, the entire volcanic pile is intruded by several different types of dykes and sills. Intermediate to felsic dykes are locally abundant occurring as thin isolated intrusive units to multiple sheeted dykes that may represent reactivated chilled margins of QFP, or zones where QFP has partially to completely assimilated its host. These intrusive rocks have also been intensely altered, with sericite and biotite pseudomorphically replacing feldspar and hornblende, respectively. Thin, fault-bounded biotite lamprophyre dykes have been found in the southwest part of the Project Area. Several mafic dykes (MFDK), only moderately altered by chlorite, appear to crosscut all units and may represent the youngest intrusive in the Project Area.
Cambrian-age quartz sandstone overlies the east side of the known deposit and host rocks. This sandstone is a clast-supported quartz arenite, generally poorly cemented by calcite that grades downward into moderately silicified sandstone near the unconformity. Quaternary to recent alluvium blankets nearly the entire bedrock surface except for a relatively small area of Precambrian rock exposures above 220 m in elevation. The alluvium consists of glacial till, muck, and sand, with post-glacial to recent alluvium within the Menominee River floodplain.
Back Forty Project |
6-8 |
Gold Resource Corporation |
|
Three geologic cross-sections through the Back Forty Deposit are shown in Figure 6-7, Figure 6-8, and Figure 6-9.
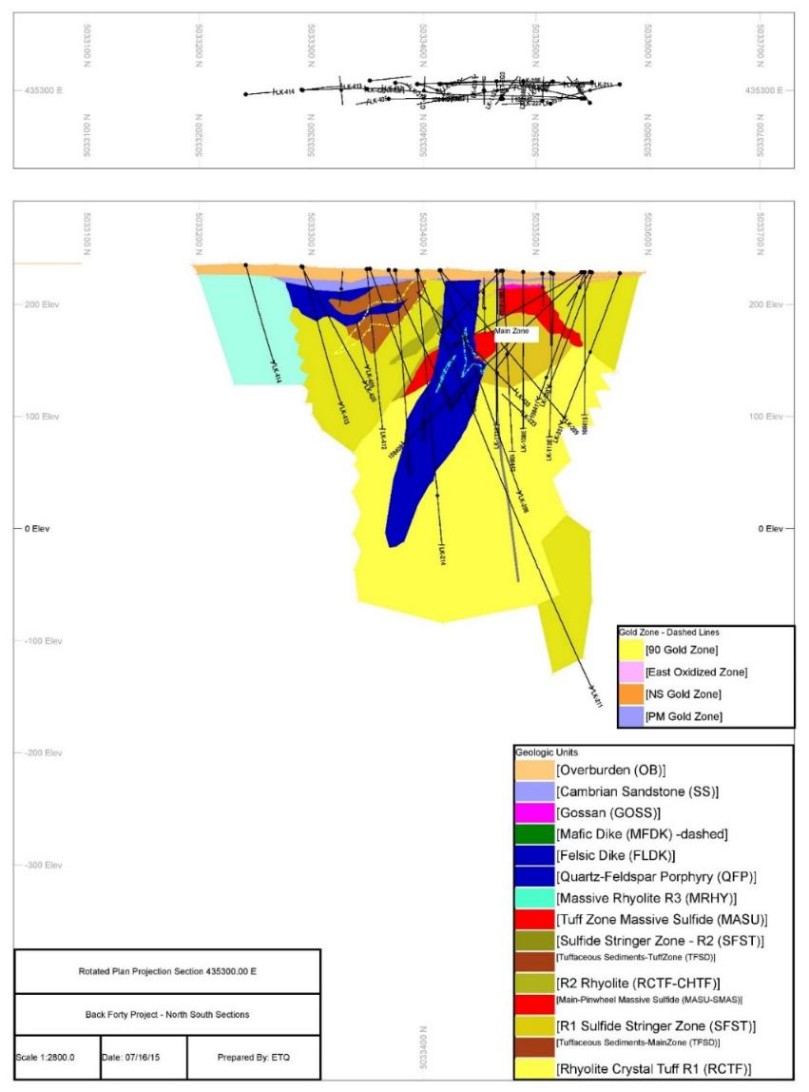
Source: Tetra Tech PEA, 2014 / Aquila 2021
Figure 6-7: Typical Cross-Section through the Eastern Portion of The Back Forty Deposit
Back Forty Project |
6-9 |
Gold Resource Corporation |
|
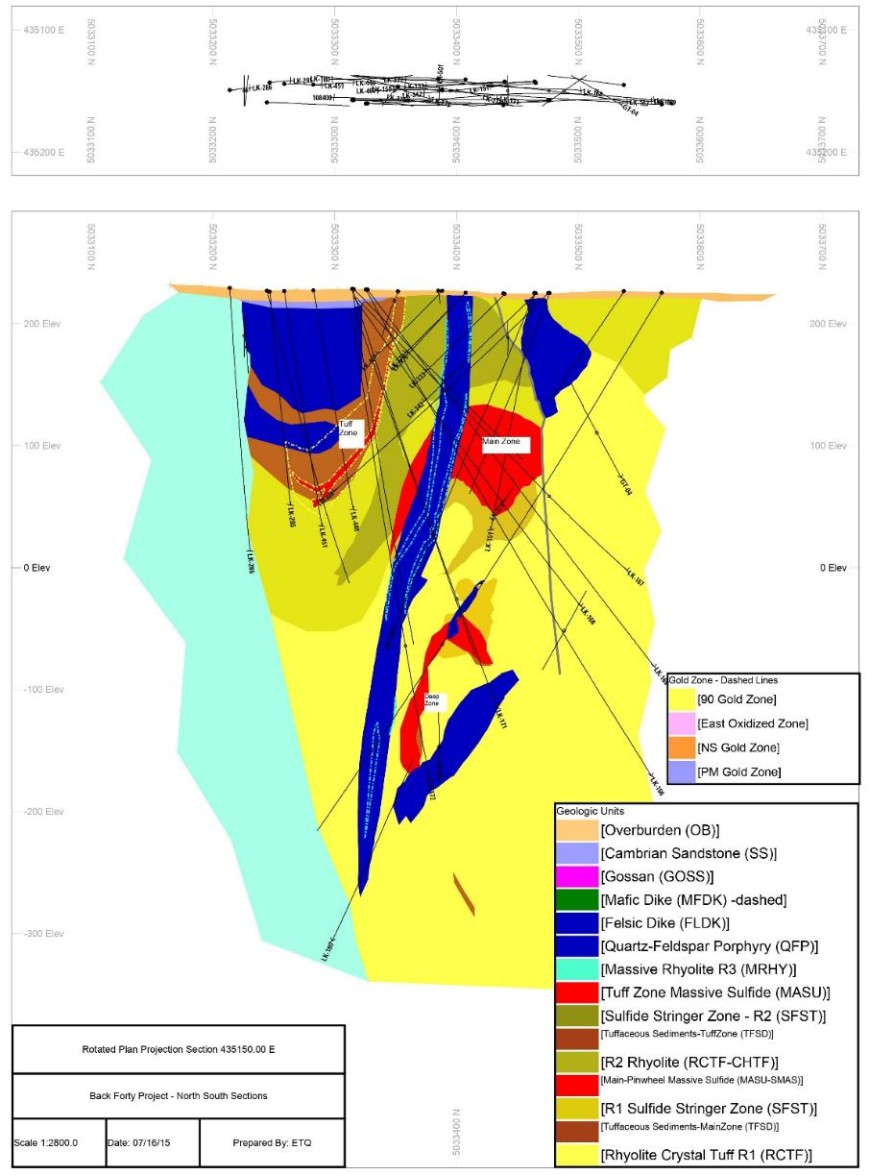
Source: Tetra Tech PEA, 2014 / Aquila 2021
Figure 6-8: N-S Cross-Section through the Central Portion of the Back Forty Deposit
Back Forty Project |
6-10 |
Gold Resource Corporation |
|
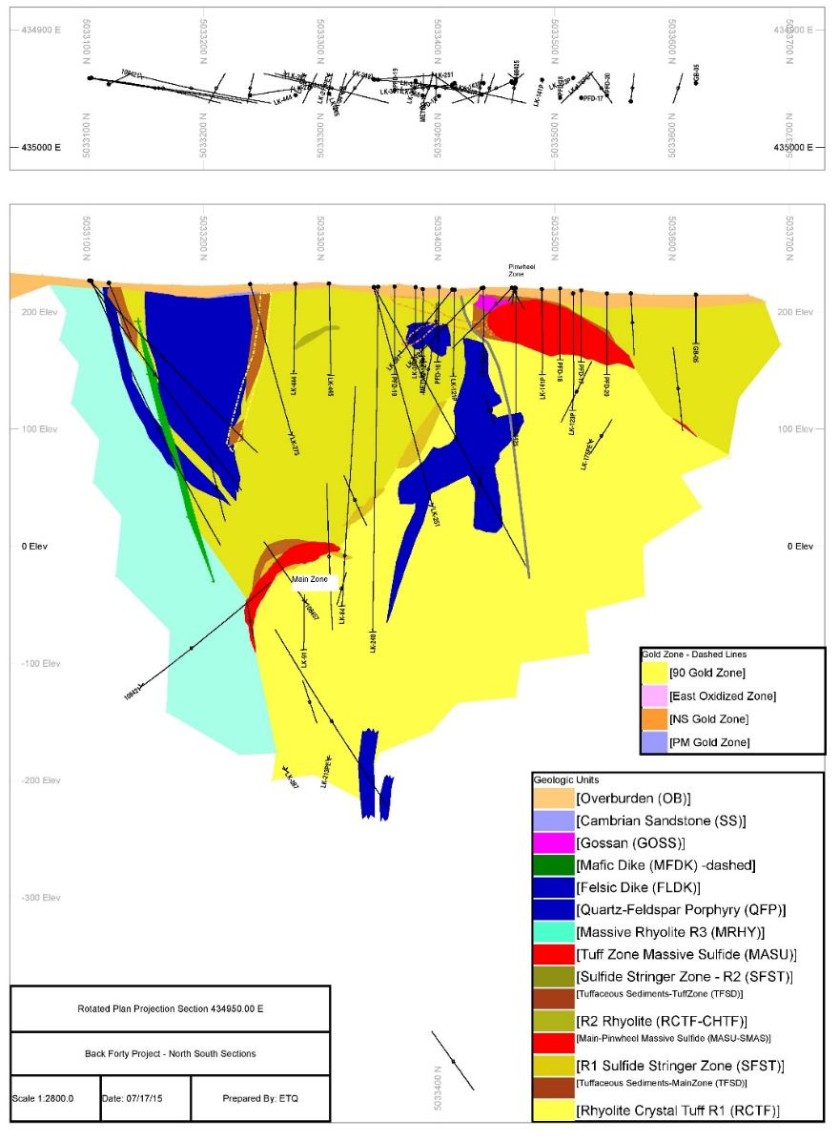
Source: Tetra Tech PEA, 2014 / Aquila 2021)
Figure 6-9: Typical Cross-Section through the Western Portion of the Back Forty Deposit
Back Forty Project |
6-11 |
Gold Resource Corporation |
|
6.3 |
Mineralization |
Mineralization at the Back Forty Deposit consists of four discrete zones:
1. |
Zn or Cu-rich massive sulfide (±Pb), which may contain significant amounts of Au and Ag; |
2. |
Stockwork stringer and peripheral sulfide, which can be Au, Zn, and Cu-bearing (±Pb/Ag); |
3. |
Precious metal-only, low-sulfide mineralization; and |
4. |
Oxide-rich, precious metal-bearing gossan. |
The 3D model of the mineralized zones is presented in Figure 6-10.

Notes: A: Plan view; B: Longitudinal view looking North; C: 3D view looking NE.
Figure 6-10: 3D Model of the Mineralized Zones of the Back Forty Deposit
At the Back Forty Deposit, MASU refers to rocks composed of at least 80% sulfide and semi-massive sulfide is composed of 40% to 80% sulfide. Both also contain variable amounts of Zn, Cu, and Ag that occur most commonly as sulfides and Au is mostly found as finely divided native metal or as a natural amalgam. Sulfide stringer (“SFST”) mineralization consists of 10% to 40% pyrite in veins with variable amounts of Cu, Ag, and Au that predominantly penetrates RCTF. Oxides and hydroxides of iron form a crudely bedded gossan (“GOSS”) above MASU, where it is exposed at the bedrock surface. GOSS contains variable amounts of Au, Ag, and Cu and accessory minerals including chlorite and calcite. Certain intervals are characterized by significant amounts of finely laminated hematite and magnetite and may represent an exhalative iron formation deposit.
Back Forty Project |
6-12 |
Gold Resource Corporation |
|
6.3.1 |
Massive Sulfide Mineralization |
VMS-style mineralization has been identified within at least two stratigraphic levels within the felsic sequence at the Back Forty Deposit (Figure 6-11). The rhyolitic rocks hosting the Back Forty sulfide mineralization are indistinguishable with respect to appearance; however, the two main rhyolites (rhyolites 1 and 2) have distinctive geochemical signatures that can be observed through aluminum-titanium and zirconium-titanium ratios (Figure 6-12). The Main Zone massive sulfide, which accounts for most of the massive sulfide mineralization, lies at the stratigraphic boundary of these two rhyolite units. Rhyolite 1 lies stratigraphically below this sulfide horizon (footwall) while Rhyolite 2 lies above the horizon (hanging wall). Another massive sulfide horizon, the Tuff Zone, is located at or near the upper contact of Rhyolite 2 and the lower contact of an overlying package of tuffaceous and siliceous sediments. A possible third massive sulfide horizon, the Deep Zone, may represent a lower mineralized zone.
In this section, massive sulfide refers to rocks composed of at least 80% sulfide, rather than the more common cut-off of 60% for massive sulfides. Semi-massive sulfide mineralization is considered to contain 10% to 80% sulfides. Sulfide stringer mineralization consists of 10 to 40% sulfides.
Back Forty Project |
6-13 |
Gold Resource Corporation |
|
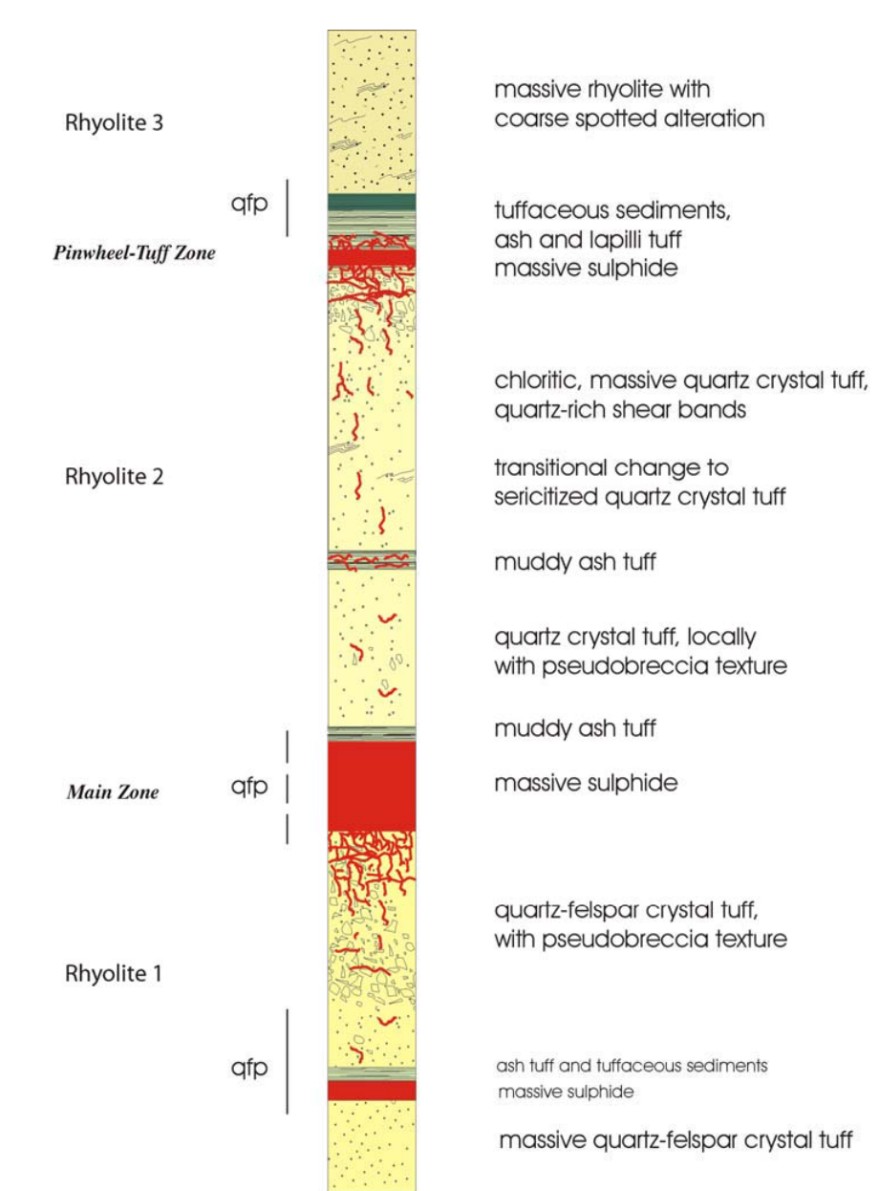
Source: DeMatties, 2007
Figure 6-11: Back Forty Massive Sulfide Stratigraphic Column
Back Forty Project |
6-14 |
Gold Resource Corporation |
|
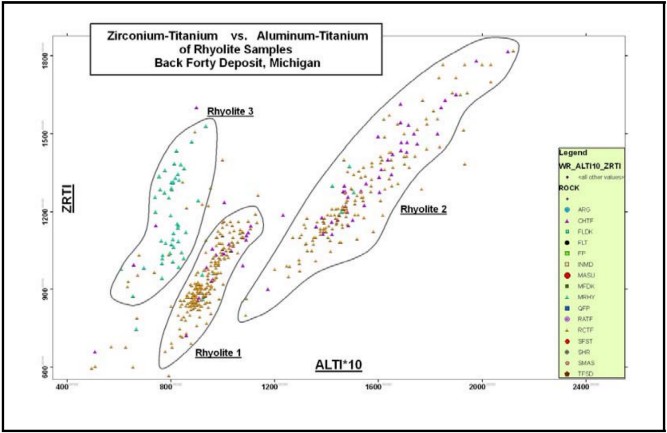
Source: Tetra Tech PEA, 2014
Figure 6-12: Zr‐Ti Versus Al‐Ti Ratios of Rhyolites at the Back Forty Project
6.3.1.1 |
Main Zone Massive Sulfide |
The Main Zone is composed of three separate massive sulfide bodies: East, Hinge, and South Limb Zones, that form a plunging antiform and are considered the same horizon. Rhyolite 1 (footwall) hosts the Main Zone along and stratigraphically below its contact with Rhyolite 2 (hanging wall). This massive sulfide hosted strata-bound Main Zone is locally enveloped by stockwork and semi-massive sulfide-types mineralization. Pervasive sericite and disseminated pyrite alteration as well as variable silicification are abundant and extend outward for an undetermined distance. This zone extends along strike for over 450 m in a west-southwest direction, is up to 100 m wide, and subcrops at its eastern end under a thin (less than 10 m) glacial overburden and local Paleozoic sandstone. The stockwork-stringer and peripheral sulfide envelope grades outward into a semi-conformable disseminated (less than 10%) pyritic halo that extends throughout the entire altered Rhyolite 1 host unit for an undetermined distance. The zone has been extensively disrupted by variably altered QFP intrusions.
The East Zone sub-crops east of the Keweenawan dyke that appears to occupy a fault. West of the dyke, the massive sulfide has been displaced downward approximately 20 m. This massive sulfide body is capped by a thin gossan (generally 3-5 m thick) and erosional outliers of Paleozoic sandstone, that are less than 0.5 m thick. At the top of the massive sulfide, directly underlying the gossan, is a thin zone of copper-rich massive sulfide (often less than 1-2 m) which was likely enriched by means of late supergene processes.
Back Forty Project |
6-15 |
Gold Resource Corporation |
|
The Hinge Zone, in part offset by faulting, has been folded tightly into a cigar-shaped body that plunges moderately at approximately 40° to the southwest along the axial plane of the antiform; the South Limb is separated from the Hinge by a laterally persistent QFP dyke and remains open to the southwest. Further west, the horizon is apparently offset downwards again between Sections 435,225E and 435,200E. Between sections 435,200E and 435,100E, deformation of the Hinge Zone has apparently resulted in tectonic thickening of this unit up to approximately 70 m. Beyond Section 435,100 E to the west, the Hinge horizon appears to pinch out against a QFP dyke.
The South Limb Zone is interpreted to represent the steeply dipping fold limb of the antiform; dipping steeply to the south and plunging to the west-southwest. This interpretation is supported by lithogeochemical data. Locally, shearing is common, resulting in an overall uniform thickness and lens-shaped geometry.
The Hinge and South Limb Zones are separated by large, variably altered QFP dykes that appear to have intruded the axial plane of the antiform. These syn- or post-mineralization QFP intrusions have intruded, cut-off, and obliterated portions of both horizons. To the west, the model suggests that the South Limb may be pinching and swelling down plunge into a series of thin to thick lenses. Drilling continues to support the above interpretation.
6.3.1.2 |
Pinwheel Zone Massive Sulfide |
The Pinwheel Zone is located in the northwest portion of the Back Forty Deposit. It is found structurally along the gently north-dipping northern limb of the antiform and is truncated to the south by the E-W fault. Limited geochemical data suggests that this unit is in fact located along the contact between Rhyolite 1 and Rhyolite 2 and is therefore likely the equivalent to the Main Zone massive sulfide and represents a ‘faulted-up’ portion of the north limb of this important massive sulfide horizon. Massive sulfide mineralization along strike of the Pinwheel Zone has been traced for roughly 700 m to the west-southwest where the gentle north-dip of the unit steepens. It should be noted, however, that the massive sulfide mineralization is to some degree discontinuous and often has a ‘stacked’ geometry, and that numerous faults and shear zones have been encountered in the adjacent host rock. The geometry of this zone is likely complicated due to these structures.
The Pinwheel Zone is broken in to two separate units based on spatial relationships and dominant mineralization types. The near-surface, gently north-dipping eastern-most portion of the Pinwheel Zone is referred to as the ‘Pinwheel Cu-Rich Zone’ due to the relative abundance of copper mineralization (predominantly pyrite + chalcopyrite) and subsequent lack of other base metals (zinc and lead) within the massive sulfide. The majority of the Cu-Rich Zone is capped by an overlying gossan that crops out on the Property along the southeast terminus of the zone. The Cu-Rich portion of the Pinwheel Zone represents the most copper-enriched massive sulfide mineralization located at the Back Forty Deposit and it is interpreted that the copper enrichment has a secondary, supergene association. It is possible, however, that this zone represents an original, high-temperature, copper rich portion of the VMS system. Along strike to the west-southwest, copper-dominant mineralization diminishes with a subsequent increase in the presence of zinc (sphalerite) and to a lesser extent lead (galena). This zone has been referred to as the ‘Pinwheel Extension’ or ‘Pinwheel Zn-Rich Zone’ and the variation in metal content with respect to the Cu-Rich portion is interpreted to be due, in part, to a lack of influence from secondary, super-gene processes.
6.3.1.3 |
Deep Zone Massive Sulfide |
The Deep Zone is located north of one of the QFP dykes, juxtaposed against the South Limb Horizon. Recent geological and geochemical data interpretation suggests that the Deep Zone may be the down-dip continuation of the South Limb (Main Zone), where it has been folded and rotated.
Back Forty Project |
6-16 |
Gold Resource Corporation |
|
The Deep Zone is relatively enriched in copper compared to the three zones of the Main Zone (East, Hinge, and South Limb) and suggests that a more copper-rich portion of this VMS system may occur at depth.
6.3.1.4 |
Tuff Zone Massive Sulfide |
The Tuff Zone massive sulfide occurs at the south edge of the Project. Stratigraphic and structural data suggest this zone is located at a higher level in the volcanic sequence. In cross sections and three-dimensional models, the zone appears to have a bowl-shaped geometry possibly reminiscent of a small relict depositional basin or local graben structure.
The Tuff Zone is hosted at or near the stratigraphically upper portions of the intensely sericitized and locally chlorite-altered Rhyolite 2 unit, as well as within the lower portion of the overlying siliceous, tuffaceous sediment unit. The Tuff Zone has been traced along strike to the southwest by drilling (parallel to the Main Zone) for roughly 250 m. The zone is predominantly steeply dipping to the south and occupies the southern limb of the antiform. Drilling intercepts down dip and at depth of the zone indicate shallowing and flattening of the unit that suggests proximity to a synclinal structure to the south. Massive sulfide mineralization of the Tuff Zones appears preferentially developed within coarser grained tuffaceous units at or near the contact of Rhyolite 2 and of the overlying tuffaceous and siliceous sediments. Overall sulfide content is less massive than that of the Main Zone (~60%-80%) and is dominated by sphalerite, pyrite, and galena. The zone’s thickness is typically on the order of a couple of meters. The horizon possibly sub-outcrops in the northeast along Sections 435,175 E and 435,150 E but plunges southwest (to at least Section 435,000 E) similar to the orientation of the massive sulfide horizons of the Main Zone.
6.3.2 |
Stockwork and Peripheral Sulfide Mineralization |
Widespread and pervasive sulfide mineralization occurs throughout the host rocks and peripheral to the massive sulfide bodies at the Deposit in the form of stockwork-stringer sulfides, massive to semi-massive discontinuous sulfide lenses, and disseminated sulfides. Geochemical data suggests that there are at least two distinct zones of peripheral sulfide mineralization that formed stratigraphically below each of the massive sulfide horizons and can be differentiated from each other by their relative location in the stratigraphy and relative metal content. Sulfide mineralization that occurs within Rhyolite 1 appears to have a mineralogical affinity with the Main Zone and Deep Zone massive sulfides and consist of predominantly pyrite (commonly gold-bearing), minor to moderate sphalerite with variable amounts of chalcopyrite. Peripheral sulfide mineralization found within Rhyolite 2 is similar mineralogically to the Tuff Zone massive sulfide unit that lies at or near the stratigraphic top of Rhyolite 2. As with the associated Tuff Zone Massive sulfide, this zone is notably copper-poor and is instead relatively enriched in zinc and lead. As with the Rhyolite 1 sulfide mineralization, it is locally gold-bearing, but is also relatively enriched in silver. It is assumed that both peripheral sulfide zones were formed contemporaneous with the hydrothermal system associated with the formation of associated massive sulfide mineralization.
6.3.3 |
Copper Mineralization Associated with Sulfide Mineralization |
Drilling has shown that the VMS mineralization of the Main and Tuff Zones is generally Copper-poor. Copper mineralization; however, appears to be more prevalent in the lower stratigraphic horizons of the Back Forty Deposit. Copper/Zinc ratios show a marked decrease that occurs at the Rhyolite 1-Rhyolite 2 contact indicating that fluids responsible for the Main Zone massive sulfide formation and underlying peripheral sulfide mineralization (stringers, disseminations, etc. of Rhyolite 1) were of higher temperature and carried more copper compared to those fluids associated with sulfide mineralization in the stratigraphically higher sulfide zones (Tuff Zone and Rhyolite 2 peripheral sulfides). Metal zonation of copper and zinc is also apparent within the massive sulfide units of the Main Zone and is often contiguous with similar metal zonation within the underlying peripheral sulfide mineralization. A
Back Forty Project |
6-17 |
Gold Resource Corporation |
|
preliminary look at the data suggests that high temperature copper-bearing hydrothermal fluids may have been focused at a number of different locations along the strike of the Main Zone horizon. Examples of this occur along the south-western portion of the East Zone near section 435,300 E, in proximity to the thickened portion of the Hinge Zone near section 435,150 E, and at the near surface, copper rich portion of the Pinwheel Zone near section 435,000E.
The highest-grade and most consistent copper mineralization has been intersected in the Pinwheel Zone. As discussed in previous sections, the Pinwheel Zone was likely enriched in copper due to late genetic zone refining (supergene) processes and it is unknown whether the Pinwheel Zone originally represented a more copper-rich part of the VMS system.
Elevated copper values (above 0.5%) have been intersected in the Deep Zone at a depth of approximately 400 m. Mineralization consists of a deformed massive to semi-massive sulfide zone within the core of the antiform.
Elevated copper values are also related to a late remobilization event that resulted in the formation of Cpy-Py stockwork mineralization under the Deep Zone. This mineralization was intersected by drill hole 108470 between 376.5 m and 405.5 m. The 29 m interval graded 0.90% copper and 0.44 g/t gold. The sulfide mineralization is clearly late and overprints thin massive sulfide bodies and altered/mineralized quartz crystal tuff of the Rhyolite 1 unit; chalcopyrite veins, replacement blebs and wisps are common.
Late chalcopyrite-pyrite overprinting also occurs locally as found in the extension of borehole 108422, where a tuffaceous sedimentary rock unit was intersected. The hole intersected Cpy-Py-Po-quartz veins and stringers from 500 m to 508 m. The veins and stringers disrupt and locally brecciate a section of delicately laminated exhalite consisting of alternating layers chert and pyrite.
6.3.4 |
Precious Metal-rich Low Sulfide Mineralization |
In addition to gold values in both the massive and stockwork-stringer sulfide zones, significant gold and silver mineralization is present in surrounding low sulphur hosted-rocks. This mineralization typically contains less than 10% sulfide, although it may contain more locally. There are three main zones in this style of mineralization which include different host rock depending on the location. The typical host rocks include tuffaceous sediments and underlying rhyolite tuff (90 Zone), sheared rhyolite (NS Zone), and QFP (PM Zone and NS Zone).
6.3.4.1 |
90 Gold Zone |
Gold mineralization of the 90 Zone occurs within the tuffaceous and siliceous sediments and underlying Rhyolite 2 adjacent to and up dip of the Tuff Zone massive sulfide horizon. While gold grades vary somewhat throughout the zone, it appears that the higher-grade portions of the zone occur along the same horizon as the Tuff Zone, but up dip from massive sulfide mineralization where the host rock is typically increasingly silicified, altered, and fractured. The zone consists of 5-10% disseminated pyrite with lesser arsenopyrite, chalcopyrite and galena. Gold mineralization is pervasive throughout the sediment package but in higher-grade portions of the zone, gold mineralization appears to be structurally controlled and likely cross cutting the section. Some near-surface gold may have been concentrated by supergene oxidation, although some high-grade gold occurs in unoxidized rocks as well. The 90 Zone extends from a depth of approximately 170 m to sub-crop just below the overburden and for 400 m along strike.
6.3.4.2 |
NS Gold Zone |
Stratigraphically and structurally, the NS Gold Zone is likely a southward continuation of the Pinwheel Zone/Pinwheel Gossan across the east-west fault. Locally, high-grade gold and silver of the NS Zone occurs in
Back Forty Project |
6-18 |
Gold Resource Corporation |
|
sheared rhyolites and rhyolite ash tuffs. Sulfide contents vary from trace to 5% and consist mainly of disseminated pyrite and galena with rare arsenopyrite. The mineralization is generally flat lying and shallow.
6.3.4.3 |
PM Gold Zone |
Gold mineralization is also hosted by the large QFP intrusion that occupies the hinge of the antiform (Porphyry Margin or PM Zone). Gold mineralization in the PM Zone typically occurs near, at, and/or across the footwall contact of the intrusion in the east and central portions of the deposit area proximal to massive and heavily mineralized sulfide zones. Gold mineralization is associated closely with pervasive, moderate to intense silicification, locally producing a mottled texture in the QFP. Sulfide mineralization consists of fine to medium-grained pyrite, arsenopyrite, galena, sphalerite, chalcopyrite, pyrrhotite and locally visible free gold. Sulfides occur as disseminated grains, blebs, veinlets and wisps; thicker sulfide veinlets have a chlorite halo.
6.3.5 |
Gossan (Supergene) Mineralization |
Near surface iron-oxide and precious metal-rich gossans cap the East Zone and the Pinwheel Zone. Both are consistently enriched in gold and in the case of the Pinwheel Gossan, silver and copper.
The East Gossan caps the East Zone Massive Sulfide. It subcrops under glacial overburden and at its eastern extent is capped by Paleozoic sandstone. The East Gossan is generally 3 m to 5 m thick, hematitic, and gold-rich.
The Pinwheel Gossan caps the Pinwheel Zone massive sulfide in the west-central portion of the Back Forty Deposit. The gossan locally exhibits a brecciated texture, probably formed by collapse of stratigraphic hanging wall rocks during volume reduction from supergene oxidation of the massive sulfide horizon. Botryoidal textures exhibited by iron minerals and poorly developed cellular boxwork have also been noted locally in the outcrop. In addition, columnar hematite/limonite observed in outcrop suggests supergene deposition above the water table, with the iron derived from adjacent massive pyrite (Blanchard, 1968). Remnant disseminated magnetite in the gossan suggests a cherty iron formation (exhalite) protolith in this portion of the zone.
6.3.6 |
Mineralization Encountered at Depth |
Drilling, primarily completed during 2010 and 2011, encountered several mineralized zones at depth and along strike of known mineralization. Limited follow-up drilling, and a large gap in the drilling between these zones and known mineralization, has made it difficult to correlate these zones of mineralization to the current geologic model.
Mineralization has been encountered in two separate stratigraphic horizons which have tentatively been called the ‘Upper Deep’ and ‘Lower Deep’ zones. Drill holeLK-479, drilled to the southwest of known mineralization and to a total depth of 911.0 m, encountered each of the two zones and represents the ‘discovery’ hole for each.
The upper mineralized section in drill hole LK-479 intercepted ~60 m of strongly altered rhyolite and tuffaceous and siliceous sediments with variable sulfide mineralization in the form of disseminated and stringer sulfides as well as two small intervals of high-grade massive sulfide. The mineralization was also cut by a quartz-feldspar porphyry dyke that contained PM-style gold mineralization. Assayed intervals (drilled thickness) within the section include: 12 m of 1.25 g/t Au, 57.9 g/t Ag, 0.41% Pb, and 1.0% Zn and 12.8 m of 4.27 g/t Au, 189.1 g/t Ag, 1.4% Pb, and 4.2% Zn. The metal content of this zone, as well as the spatial relationship to the tuffaceous and siliceous sediment unit would suggest that this zone may be related to the Tuff Zone type sulfide mineralization, however, limited and preliminary geochemical data indicates that the mineralization may reside at the contact of Rhyolite 1 and 2 which would imply that this zone is related to Main Zone mineralization. It is also interesting that the high-grade massive sulfide encountered in this section appears to cross-cut bedding which would indicate that higher-grade mineralization may be related to a cross-cutting structure. A number of drill holes attempted to follow-up on this
Back Forty Project |
6-19 |
Gold Resource Corporation |
|
intercept and encountered similar mineralization in altered rhyolite and tuffaceous and siliceous sediments, but grades were typically less substantial than that of drill hole LK-479. The zone lies roughly 80 m along strike, to the southwest of the south limb of the Main Zone massive sulfide.
The lower mineralized section in drill hole LK-479 intercepted roughly 68 m of massive sulfide overlain by stockwork stringer type mineralization. Metal content of the massive sulfide was generally zinc-poor with a relative enrichment in copper which bears some similarities to the Deep Zone massive sulfide unit. The massive sulfide was also cut by a quartz-feldspar porphyry dyke containing PM Zone style gold mineralization. The upper portion of the massive sulfide intercept consisted of 45 m of 0.72 g/t Au, 21.9 g/t Ag, 0.47% Cu, and 0.7% Zn. The lower portion of the massive sulfide contains local high-grade zinc including 13.46 m containing 0.31 g/t Au, 17.7 g/t Ag, 0.36% Cu, and 3.7% Zn. The mineralized dyke (PM Zone) cutting through the massive sulfide consisted of 6.18 m that assayed 6.4 g/t Au, 94.1 g/t Ag, and 1.82% Pb. Additional PM Zone intercepts were also reported further down the hole within a larger intercept of quartz-feldspar porphyry dyke. The two intercepts varied between 1 m and 3 m and assayed between 3 and 5 g/t Au. Massive sulfide and associated peripheral sulfide mineralization, along with local high-grade gold has been encountered in limited follow-up drilling including a section of strongly altered, quartz vein bearing rhyolite containing visible gold that was encountered in drill hole LK-484 containing 12 m (708-720 m) of 15.29 g/t Au, 66.5 g/t Ag and 0.77% Pb. Mineralization associated with this zone is located roughly 150 m to the southwest, along strike of the known mineralization of the Deep Zone massive sulfide.
6.4 |
Deposit Type |
The following description is taken from Connolly et al. (2012) and Bradfield et al. (2020) unless indicated otherwise.
The zinc-copper-gold-silver bearing sulfide mineralization identified on the Back Forty Property exhibits typical characteristics of VMS mineralization (Figure 6-13). This deposit type has been well documented in the literature since the early 1970s (Sangster, 1972, Hutchinson,1973, Franklin et al., 1981) and the exploration model for the PVB was refined after the discovery of Flambeau (DeMatties et al., 1996).
Back Forty Project |
6-20 |
Gold Resource Corporation |
|
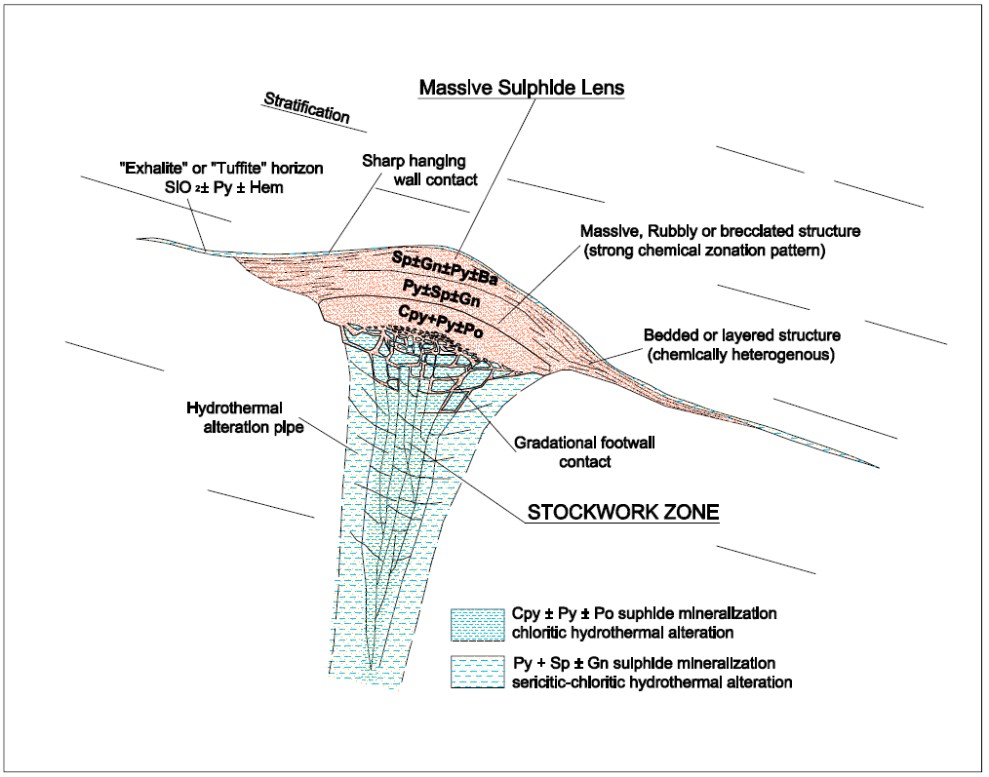
Source: DeMatties, T. A. 2007 after Lydon, 1984; Franklin et al. 1982
Figure 6-13: Principal Characteristics of an Idealized VMS Deposit
VMS deposits form in a marine volcanic environment by the circulation of hot hydrothermal fluids near spreading centers. Cold seawater infiltrating ocean crust off-axis is progressively heated by hot magma underlying the rift zone. Heated and buoyant fluids leach metals from the surrounding rocks. Metallic sulfides precipitate at or near the rock-water interface as a result of rapid changes in Eh and pH triggered by rapid mixing with cold ambient seawater. Precipitated sulfides form massive mounds, fracture and cavity fills, as well as replacement textures. Deposits are characterized by abundant iron sulfides (pyrite or pyrrhotite) and variable but subordinate amounts of chalcopyrite and sphalerite; bornite, tetrahedrite, galena, barite, and other mineral phases are concentrated in some deposits. Metal zoning is common with copper-rich zones at or near the center and zinc-rich zones at the fringes of a sulfide mound. Multiple emplacement and zone refinement are common, often due to changes in the internal plumbing system. VMS deposits are known in the Precambrian (e.g., Kidd Creek, deposits in the Noranda Camp), the Paleozoic (e.g., Rammelsberg), Mesozoic (e.g., Windy Craggy, Cyprus), and Cenozoic (e.g., Tag).
Back Forty Project |
6-21 |
Gold Resource Corporation |
|
Although only one deposit has been mined in the lower Proterozoic rocks of the PVB, the belt hosts many small occurrences to large deposits. In total, approximately 14 known VMS deposits account for over 150 Mt of base and precious metal mineralization. The average deposit size in this district is approximately 2.5 Mt; this average is high compared to other VMS districts worldwide (DeMatties 1994). The PVB VMS deposits are classified by metal content into three groups based on zinc and copper ratios (DeMatties 1994 and 1996). These include copper, zinc-copper, and zinc-lead-copper (Figure 6-4). Each group exhibits various styles of mineralization that include sheets, mounds, stacked lenses, and replacements. Calculated zinc and copper ratios for the Back Forty Deposit place it in the zinc-copper group, which is the dominant group in the belt.
Back Forty Project |
6-22 |
Gold Resource Corporation |
|
7.0 |
EXPLORATION |
7.1 |
Drilling |
Portions of Section 7.0 are modified from Connolly et al. (2012).
7.2 |
Introduction |
Drilling on the Property was conducted over several campaigns. Between 2002 and 2019, 642 boreholes totaling 124,580m were drilled. In addition to resource delineation drilling associated with the expansion of the Back Forty Mineral Resource, focused drill efforts were also undertaken which included: The drilling of exploration (geophysical) targets in the immediate vicinity of the Back Forty Deposit area, drilling to support metallurgical testing programs, and geotechnical drilling to characterize the rock quality of the Back Forty Deposit area. Geotechnical soil borings are not described in this section. Additional drilling and sampling are described in more detail in the following sections of this TRS.
Figure 7-1 shows the traces of drill holes projected to the surface. A year-by-year summary of drilling is summarized in Table 7-1.
Back Forty Project |
7-1 |
Gold Resource Corporation |
|
Table 7-1: Yearly Summary of Drilling
Year |
Drilling Company |
Core Size |
Number of Holes |
Meters Drilled |
Footage Drilled |
|---|---|---|---|---|---|
2002 |
Kleiman |
NQ |
5 |
448 |
1,469 |
2002 |
Kleiman |
BTW |
2 |
325 |
1,067 |
2002 |
Major Midwest |
NQ |
41 |
11,201 |
36,741 |
2002 |
Salisbury and Associates |
BDBGM |
1 |
59 |
195 |
2003 |
Major Midwest |
NQ |
22 |
8,518 |
27,938 |
2006 |
IDEA Drilling |
BTW |
82 |
13,214 |
43,342 |
2007 |
Boart Longyear |
BQ |
22 |
5,063 |
16,608 |
2007 |
IDEA Drilling |
BTW |
64 |
12,434 |
40,782 |
2007 |
IDEA Drilling |
BQ2 |
33 |
10,302 |
33,791 |
2008 |
Boart Longyear |
NQ |
20 |
3,126 |
10,253 |
2008 |
IDEA Drilling |
BTW |
49 |
8,871 |
29,098 |
2008 |
IDEA Drilling |
NQ2 |
15 |
6,725 |
22,058 |
2009 |
IDEA Drilling |
NQ2 |
18 |
1,260 |
4,132 |
2009 |
IDEA Drilling |
NQ3 |
23 |
2,086 |
6,841 |
2010 |
Boart Longyear |
NQ |
5 |
633 |
2,075 |
2010 |
Boart Longyear |
NQ3 |
11 |
1,830 |
6,002 |
2010 |
IDEA Drilling |
BTW |
0 |
48 |
158 |
2010 |
IDEA Drilling |
NQ |
1 |
76 |
250 |
2010 |
IDEA Drilling |
NQ2 |
12 |
1,090 |
3,577 |
2010 |
IDEA Drilling |
NQ3 |
70 |
6,836 |
22,421 |
2011 |
IDEA Drilling |
NQ3 |
15 |
7,777 |
25,510 |
2011 |
IDEA Drilling |
NQ2 |
35 |
6,202 |
20,344 |
2011 |
Boart Longyear |
NQ3 |
5 |
2,754 |
9,032 |
2011 |
Coleman Engineering |
NQ2 |
23 |
1,127 |
3,697 |
2015 |
IDEA Drilling |
NQ |
13 |
1,775 |
5,820 |
2016 |
Downing Drilling |
NQ3 |
13 |
2,333 |
7,651 |
2017 |
IDEA Drilling |
NQ3 |
13 |
2,399 |
7,868 |
2017 |
Downing Drilling |
NQ3 |
11 |
3,603 |
11,816 |
2018 |
Downing Drilling |
NQ3 |
3 |
633 |
2,078 |
2019 |
IDEA Drilling |
HQ |
12 |
1,832 |
6,011 |
Total |
639 |
124,580 |
408,625 |
||
Note: Extensions are not treated as separate drill holes
Back Forty Project |
7-2 |
Gold Resource Corporation |
|
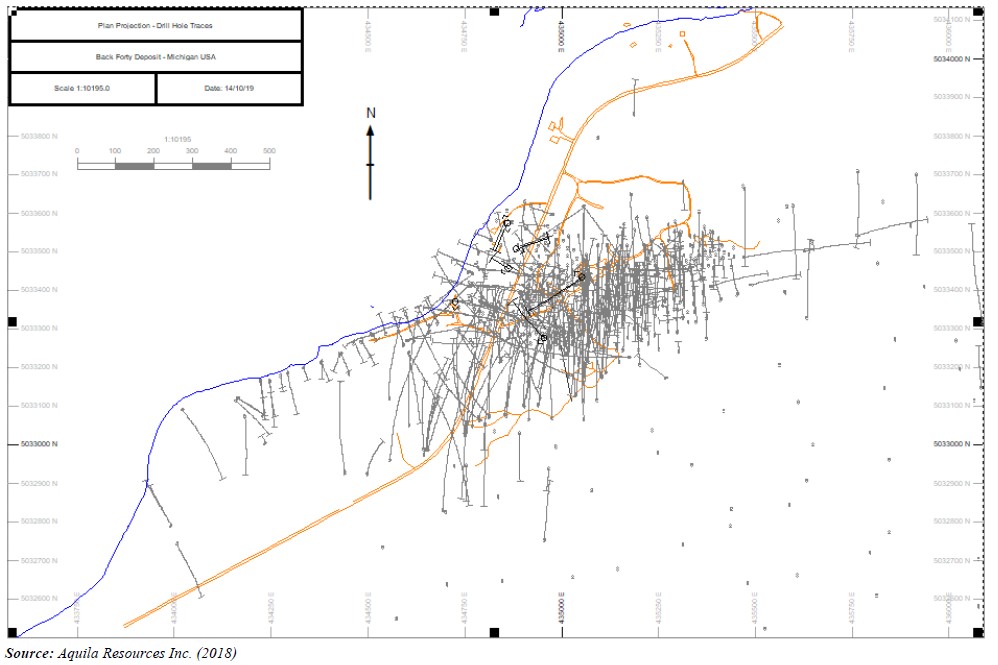
Figure 7-1: Drill Hole Plan Map Showing Drill Hole Traces Projected to Surface
7.2.1 |
2002-2003 Drilling Program |
The first program, conducted by ACNC, started in February 2002 and continued to late May 2003. Drilling was contracted to Midwest Drilling Co., a Canadian company, using up to five Longyear 44 skid-mounted drill rigs. In addition, a small number of holes were drilled by Kleiman Pump and Well Drilling of Iron Mountain, Michigan. The program consisted of 71 drill holes (20,600m), from which approximately 7,600 assay samples and 340 whole-rock samples were collected.
7.2.2 |
2006 Drilling Program |
The second drill program occurred in Q4 2006. Drilling was completed by Idea Drilling Company (“IDEA Drilling”) of Virginia, Minnesota, using two CS-1000 skid/trailer-mounted rigs. This program delivered 13,190m of core in 80 BTW sized drill holes. The majority of the drilling targeted the East and Pinwheel Zones.
7.2.3 |
2007 Drilling Program |
The third drilling program was completed in 2007. One hundred and eighteen (118) drill holes (27,800m) were completed by Boart Longyear of Wyeth, Virginia and IDEA Drilling. Boart Longyear drilled 22 NQ sized drill holes (5,060 m). IDEA Drilling utilized two drilling rigs, one of which drilled 33 NQ2 sized drill holes (10,300 m) while the
Back Forty Project |
7-3 |
Gold Resource Corporation |
|
other rig drilled 64 BTW sized drill holes (12,400m). This drilling program tested a number of targets throughout the Mineral Resource area.
7.2.4 |
2008 Drilling Program |
A fourth drill program was completed in 2008 using three drill rigs; one from Boart Longyear and two from IDEA Drilling. The former company completed 15 NQ sized drill holes (2,600 m). IDEA Drilling completed 13 NQ2 sized drill holes (4,850m) and 38 BTW sized drill holes (6,500 m). Similar to the previous year, drill targets were distributed throughout the Mineral Resource area.
7.2.5 |
2009-2010 Drilling Program |
From October 2009 to May 2010, another phase of drilling was completed. Two rigs were used: one from IDEA Drilling (trailer mounted Hagby) and one from Boart Longyear (skid-mounted 44). For this program, IDEA Drilling drilled the first 20 drill holes on the Project using NQ2 and the holes were oriented (totaling 1,327m). IDEA Drilling subsequently completed 93 NQ3 split-tube oriented drill holes and one extension using BTW for a total of 8,681 m. IDEA Drilling also drilled eleven holes outside the immediate Back Forty Deposit area that were not used for the updated Mineral Resource calculation (1,388m). Boart Longyear completed eleven NQ3 split-tube oriented drill holes that were included in the updated Mineral Resource totaling 1,492m. In addition, Boart Longyear completed five NQ3 “geotechnical” holes that targeted the conceptual open pit walls (971m). The core from these drill holes was archived in its entirety, i.e., not cut and assayed, so they are not included in the updated Mineral Resource calculation.
Drilling from 2009 to 2010 outside the immediate Back Forty Deposit approximately 600 m to the east, was targeted on ground magnetic and gravity anomalies. Anomalous zinc and gold mineralization, in altered rhyolites and sediments, was encountered in two drill holes. Drill hole PTL-1 intersected 10.0 m of 0.61% zinc, including one 1.5m sample of 1.08% zinc. Drill hole PTL-2 encountered an interbedded sequence of flows and tuffaceous sediments including a chlorite-altered fragmental zone containing 26.5m of 0.54% zinc, with smaller zones exceeding 1% zinc, a lower interval of tuffaceous sediments containing 12.5m of 0.51% zinc; and an underlying siliceous breccia with 6.0 m of 1.1 g/t gold, including 1.5m of 2.67 g/t gold. This suggests that prospective host rocks continue to the east of the Back Forty Deposit for at least 600m. These two drill holes are not part of the Back Forty Mineral Resource Estimate.
7.2.6 |
2011 Drilling Program |
A total of seventy-eight (78) holes were drilled in a series of drilling programs during the 2011 drilling program. The programs included drilling 22 high-grade gold targets at depth, four geophysical targets, and 22 relatively shallow drill holes to delineate the Pinwheel Gossan Zone.
A total of eleven holes were drilled to collect metallurgical samples, twelve for condemnation purposes east of the Mineral Resource and five drill holes to install monitoring wells for groundwater purposes. These additional 27 drill holes are not part of the updated Mineral Resource Estimate.
Ground conditions are generally good resulting in excellent core recovery between 90% and 100%. NQ and BTW sized core from each hole were logged by Aquila personnel. Information collected includes lithology, structure, alteration, and mineralization. Rock quality designations (“RQD”) were also calculated over drilled intervals and
Back Forty Project |
7-4 |
Gold Resource Corporation |
|
specific gravity was measured on select samples. Oriented core from the 2009 to 2011 program were both geotechnically and geologically logged.
7.2.7 |
2015 Drilling Program |
Drilling in 2015 consisted of a total of thirteen NQ sized drill holes totaling 1,775 m. Drilling was completed with a track-mounted LF-90 drill rig by IDEA Drilling based out of Virginia, Minnesota. Drilling operations were managed by Aquila staff with geological support including core logging, drill supervision, and core-cutting/sampling by Great Lakes Exploration Inc., based out of Menominee, Michigan.
7.2.8 |
2015 Metallurgical Drilling Program |
The primary focus of the 2015 program consisted of 833 m of drilling in nine metallurgical drill holes (MET-15-01 to MET-15-09) targeting sulfide mineralization within the open-pit portion of the Mineral Resource. Drill hole planning for the metallurgical drill program was completed by SGS Canada Inc. (Quebec, Quebec) with input from Aquila staff. In order to support the necessary metallurgical testing requirements, drill holes were designed to intercept all sulfide metallurgical domains and to provide sufficient sample material and spatial and mineralogical (grade) variability within each domain. Select intervals from the drill holes were sampled and submitted directly to SGS for assay and metallurgical testing. The remaining un-sampled material was reserved for potential future metallurgical use. All holes represented ‘twin drill holes’ from previous drilling campaigns and the assays from these drill holes were not incorporated into the updated Mineral Resource Estimate.
7.2.9 |
2015 Mineral Resource Drilling Program |
Two drill holes (LK-15-508 and LK-15-509) from the 2015 drill program targeted Mineral Resource expansion of the Pinwheel Zone on property that had previously been unavailable for drilling. The two drill holes intercepted zinc-rich massive sulfide and associated gold mineralization within the host rocks. Significant assay results are tabulated in Table 7-2.
Table 7-2: 2015 Mineral Resource Drilling - Significant Results
DDH |
From |
To |
Interval* |
Au |
Ag |
Cu |
Pb |
Zn |
(m) |
(m) |
(m) |
(g/t) |
(g/t) |
(%) |
(%) |
(%) |
|
LK-15-508 |
107.2 |
121.3 |
14.1 |
9.18 |
61.6 |
0.12 |
0.2 |
1.51 |
including |
107.2 |
110.1 |
2.8 |
38.55 |
231.8 |
0.06 |
0.52 |
0.23 |
110.1 |
118.3 |
8.2 |
0.71 |
14.5 |
0.16 |
0.13 |
2.48 |
|
including |
110.1 |
112.4 |
2.3 |
1 |
31 |
0.08 |
0.37 |
4.96 |
118.3 |
121.3 |
3 |
4.53 |
29.2 |
0.06 |
0.06 |
0.07 |
|
LK-15-509 |
136.5 |
138.1 |
1.6 |
0.62 |
25.9 |
0.08 |
0.11 |
4.25 |
144 |
154 |
10 |
0.71 |
35.7 |
0.28 |
0.31 |
2.24 |
|
including |
146.8 |
151 |
4.2 |
0.93 |
11.6 |
0.56 |
0.03 |
4.3 |
*Both holes drilled vertically. Interval is drilled thickness. True thickness is estimated to be approximately 80% of drilled thickness.
Back Forty Project |
7-5 |
Gold Resource Corporation |
|
7.2.10 |
2015 Exploration Drilling Program |
An additional two drill holes (PHC-01 and PHC-02) from the 2015 drill program targeted a geophysical anomaly peripheral to the Back Forty Deposit area. No significant grades were reported in the two drill holes, however, both holes encountered a 25 m to-50 m thick section of finely bedded, exhalative sediments with disseminated pyrrhotite, pyrite and minor chalcopyrite and sphalerite hosted by altered fragmental felsic pyroclastic rocks similar to the Back Forty host rock sequence.
7.2.11 |
2016 Drilling Program |
A total of 2,333m was drilled in thirteen holes in 2016. Drilling was completed by George Downing Estate Drilling Ltd based out of Grenville-sur-la-Rouge, Quebec with a skid-mounted LF-90 drill rig. All drill core was NQ3 diameter and was oriented and utilized split tubes to ensure maximum core recovery and to minimize the occurrence of mechanical fracturing in the core. Drilling consisted of geotechnical drilling to support open pit mine design, follow-up step-out drilling on the Pinwheel Zone, and exploration drilling focusing on evaluating recently identified geophysical anomalies to the southwest and along trend of the updated Mineral Resource Estimate.
As a note, technical difficulties were encountered with respect to obtaining downhole surveys for a number of the drill holes completed during 2016. Drilling difficulties encountered during the drilling of LK-16-511 caused the casing to dislodge from bedrock and it was necessary for the hole to be abandoned and plugged without collecting downhole survey data. The available survey data for this hole consists of a single dip measurement near the top of the hole which was collected using the orientation tool and a compass reading (azimuth) of the position of the drill rig collected prior to the drill hole being abandoned. In addition, the survey tool malfunctioned for a number of the 2016 Mineral Resource and exploration drill holes. The drill holes were left open upon completion and survey data was collected at a later date during downhole geophysical surveys.
7.2.11.1 |
2016 Geotechnical Drilling Program |
Geotechnical drilling consisted of 671m of drilling in three drill holes (GT-06 to GT-08) evaluating rock quality in the south-western and south-eastern portion of the open pit Mineral Resource area. It also included testing the rock mass quality along the proposed cut-off wall between the planned open pit and the Menominee River. The geotechnical drill program was planned by Golder. (Geotechnical logging and sampling were completed by Knight Piésold Ltd. (KP) and geological logging was completed by Aquila geologists).
Hole number GT-08 intercepted mineralization outside of the planned open pit extents. The drill hole was sampled and assayed as part of the 2017 drill program.
7.2.11.2 |
2016 Resource Drilling Program |
An additional four drill holes (627m) were completed to delineate and extend the known Mineral Resource outside of the planned open pit. Drilling was planned and managed by Aquila personnel with geologic support, including core logging, geotechnical logging, drill collar surveying, and drill supervision, by Great Lakes Exploration Inc.
Three drill holes (LK-16-511 to LK-16-513) targeted the north extension of the massive sulfide of the Pinwheel Zone. Drilling did not encounter massive sulfide but intercepted fine-grained rhyolite ash tuff with modest gold content; this was interpreted to represent the equivalent to the Pinwheel sulfide horizon. Hole number LK-16-514 was drilled as a step-out hole on the southwestern extent of the Pinwheel massive sulfide. The drill hole encountered two intervals of high-grade gold mineralization within a discrete chlorite altered rhyolite, as well as in fine grained rhyolite ash tuff, interpreted to be the equivalent horizon of the Pinwheel massive sulfide. Due to the lack of drilling in the
Back Forty Project |
7-6 |
Gold Resource Corporation |
|
vicinity of the hole, true thickness of the gold mineralization is unknown. Significant assays results are tabulated in Table 7-3.
Table 7-3: 2016 Mineral Resource Drilling - Significant Results
DDH |
From |
To |
Interval* |
Au |
Ag |
Cu |
Pb |
Zn |
(m) |
(m) |
(m) |
(g/t) |
(g/t) |
(%) |
(%) |
(%) |
|
LK-16-511 |
107.1 |
110.3 |
3.2 |
1.78 |
20.48 |
0.06 |
0.04 |
0.13 |
|
|
|
|
|
|
|
|
|
LK-16-512 |
56 |
57.2 |
1.2 |
2.29 |
2.93 |
0.01 |
0.01 |
0.004 |
|
141.57 |
142.67 |
1.1 |
1.76 |
13.02 |
0.02 |
0.03 |
0.06 |
|
|
|
|
|
|
|
|
|
LK-16-514 |
56 |
62 |
6 |
5.01 |
27.34 |
0.02 |
0 |
0.01 |
including |
60.7 |
62 |
1.3 |
14.62 |
87.7 |
0.09 |
0.01 |
0.01 |
|
125.2 |
127.1 |
1.9 |
10.01 |
155.75 |
0.17 |
1.07 |
0.11 |
*Both holes drilled vertically. Interval is drilled thickness. True thickness is estimated to be approximately 80% of drilled thickness.
7.2.11.3 |
2016 Exploration Drilling Program |
An additional six drill holes totaling 1,195m were drilled testing both airborne and recently identified ground geophysical anomalies proximal to the Back Forty Deposit. The drill program was planned and managed by Aquila personnel with technical support from consulting geologists and technicians provided by Great Lakes Exploration Inc., which included drill-rig supervision, geologic logging and sampling, drill collar surveying and core processing.
Drill hole LK-16-515 targeted a discrete gravity anomaly southwest of the Pinwheel Zone and encountered a new zinc-rich massive sulfide zone as well as deeper tuffaceous sediments containing moderate Ag, Zn, and Pb mineralization. Hole numbers LK-16-516 and LK-16-517 were drilled as an overcut and undercut of the discovery intercept, respectively. Hole number LK-16-518 targeted an airborne anomaly and intercepted a lower Tuffaceous Sediment Package at depth. Given the limited drilling in this area the mineralization has not been modeled and is not currently incorporated into the Updated Mineral Resource Estimate. Significant drill results are tabulated in Table 7-4.
Back Forty Project |
7-7 |
Gold Resource Corporation |
|
Table 7-4: 2016 Exploration Drilling - Significant Results
DDH |
From |
To |
Interval* |
Au |
Ag |
Cu |
Pb |
Zn |
|---|---|---|---|---|---|---|---|---|
(m) |
(m) |
(m) |
(g/t) |
(g/t) |
(%) |
(%) |
(%) |
|
LK-16-515* |
25 |
27.5 |
2.5 |
2.94 |
6.87 |
0.03 |
0.03 |
0.01 |
|
63 |
74.21 |
11.21 |
1.88 |
19.52 |
0.18 |
0.15 |
3.97 |
Including |
63 |
65.78 |
2.78 |
4.63 |
39.28 |
0.17 |
0.37 |
1.14 |
Including |
65.78 |
74.21 |
8.43 |
0.97 |
13 |
0.18 |
0.08 |
4.9 |
Including |
72.34 |
74.21 |
1.87 |
0.45 |
8.32 |
0.11 |
0.06 |
9.73 |
|
156.5 |
161 |
4.5 |
0.29 |
37.28 |
0.01 |
0.61 |
2.07 |
|
|
|
|
|
|
|
|
|
LK-16-516* |
76.18 |
89.2 |
13.02 |
0.81 |
23.64 |
0.08 |
0.42 |
4.92 |
Including |
77.5 |
86.85 |
9.35 |
0.84 |
10.7 |
0.09 |
0.1 |
6.7 |
Including |
80 |
86.85 |
6.85 |
0.8 |
11.92 |
0.08 |
0.11 |
7.72 |
including |
83.15 |
86.85 |
3.7 |
0.6 |
10.71 |
0.06 |
0.11 |
9.79 |
|
|
|
|
|
|
|
|
|
LK-16-517 |
90.5 |
97.28 |
6.78 |
0.31 |
5.02 |
0.04 |
0.06 |
2.99 |
|
127.9 |
128.4 |
0.5 |
0.59 |
304 |
0.06 |
4.71 |
0.01 |
|
|
|
|
|
|
|
|
|
LK-16-518 |
87.5 |
88.1 |
0.6 |
0.32 |
44.21 |
0.01 |
0.3 |
2.1 |
|
172 |
187.68 |
15.68 |
0.1 |
18.61 |
0.01 |
0.26 |
0.76 |
Including |
173.5 |
174.2 |
0.7 |
0.21 |
52.66 |
0.03 |
0.57 |
3.72 |
Including |
183.1 |
184 |
0.9 |
0.11 |
72.58 |
<0.01 |
1.26 |
3.17 |
including |
187 |
187.68 |
0.68 |
0.08 |
91.74 |
0.05 |
1.45 |
3.27 |
* Interval is drilled thickness. True thickness is estimated to be approximately 80% of drilled thickness. For LK-16-515, LK-16-516 and LK-16-517. True thickness for LK-16-518 is unknown.
7.2.12 |
2017 Drilling Program |
A total of 24 drill holes totaling 6,001m were drilled between January and June of 2017. The drilling consisted of three independent programs including a geotechnical drilling program which characterized rock mass qualities for ‘out of pit’ Mineral Resource; a Mineral Resource delineation drilling program, which included both infill drilling to convert Inferred Mineral Resources to Indicated Mineral Resources; and step out drilling on known mineralization, and an exploration program evaluating geophysical anomalies. Both a skid mounted LF-90 (Downing Drilling) and a trailer mounted Hagby (IDEA Drilling) were utilized to complete all drilling. All drill core was NQ3 and oriented utilizing split tubes.
7.2.12.1 |
2017 Geotechnical Drilling Program |
The geotechnical drilling program consisted of a total of five drill holes (GT-09 to GT-13) and 1,281.2m total of drilling designed to evaluate the rock mass quality within the potential underground mining area. This included three drill holes (GT-09 to GT-11) in the Pinwheel area southwest of the planned open pit and two holes (GT-12 and GT-
Back Forty Project |
7-8 |
Gold Resource Corporation |
|
13) in the Main Zone and Deep Zone area below and southwest of the planned open pit. The geotechnical drill program was planned, and geotechnical logging and sampling was carried out by KP. Geological logging and sampling as well as collar surveying and core processing were completed by Aquila personnel and contract geologists/technicians supplied by Great Lakes Exploration Inc. Drilling was carried out by Downing Drilling.
In addition to collecting geotechnical data, a number of the geotechnical drill holes were also designed to intercept areas of Inferred mineralization within the Mineral Resource model in the vicinity of the Pinwheel Zone, Tuff Zone and the Deep Zone. Significant assay results are provided in Table 7-5.
Table 7-5: 2017 Geotechnical Drilling - Significant Results
DDH |
From |
To |
Interval* |
Au |
Ag |
Cu |
Pb |
Zn |
(m) |
(m) |
(m) |
(g/t) |
(g/t) |
(%) |
(%) |
(%) |
|
GT-08 |
19.64 |
24.5 |
4.86 |
1.88 |
214 |
1.12 |
0.2 |
0.03 |
63 |
78.7 |
15.7 |
0.88 |
21 |
0.54 |
0.02 |
0.36 |
|
GT-09 |
55.5 |
57 |
1.5 |
9.379 |
126 |
0.16 |
0.65 |
0.04 |
59.51 |
64.5 |
4.99 |
1.319 |
13 |
0.66 |
0.17 |
9.99 |
|
76.5 |
89.3 |
12.8 |
2.241 |
9 |
0.3 |
0.04 |
0.16 |
|
GT-10 |
50.2 |
59.24 |
9.04 |
0.74 |
8 |
0.2 |
0.33 |
9.31 |
including |
76.68 |
78.75 |
2.07 |
2.905 |
38 |
0.14 |
0.3 |
0.03 |
114.23 |
128 |
13.77 |
1.381 |
14 |
0.04 |
0.08 |
3.82 |
|
including |
114.23 |
117.7 |
3.47 |
1.651 |
13 |
0.07 |
0.05 |
6.93 |
159.6 |
190 |
30.4 |
1.497 |
29 |
1.23 |
0.01 |
0.32 |
|
including |
159.6 |
180.5 |
20.9 |
1.605 |
32 |
1.58 |
0.01 |
0.37 |
GT-11 |
42.31 |
50 |
7.69 |
3.627 |
35 |
0.12 |
0.12 |
10.07 |
57.8 |
69.2 |
11.4 |
0.962 |
29 |
0.33 |
0.01 |
20.01 |
|
80.5 |
82.57 |
2.07 |
6.643 |
15 |
0.1 |
0.22 |
0.08 |
|
GT-12 |
337 |
379.07 |
42.07 |
1.176 |
15 |
0.17 |
0.05 |
5.19 |
including |
342 |
365.5 |
23.5 |
0.725 |
11 |
0.08 |
0.02 |
7.5 |
378 |
399.4 |
21.4 |
11.655 |
50 |
0.44 |
0.41 |
1.29 |
|
including |
379.07 |
385.34 |
6.27 |
28.333 |
60 |
0.51 |
0.64 |
3.24 |
GT-13 |
149.2 |
150.7 |
1.5 |
2.72 |
187 |
0.01 |
0.23 |
0.03 |
163 |
167.52 |
4.52 |
0.83 |
255.01 |
0.01 |
0.14 |
0.04 |
|
including |
164.3 |
166.15 |
1.85 |
1.64 |
531.65 |
0.02 |
0.26 |
0.05 |
171 |
186.4 |
15.4 |
1.09 |
30.52 |
0.01 |
0.28 |
0.2 |
|
including |
171.3 |
177 |
5.7 |
1.7 |
73.99 |
0.03 |
0.59 |
0.24 |
and |
180.1 |
180.38 |
0.28 |
8.74 |
4.59 |
0 |
0.01 |
0.06 |
187.4 |
189.9 |
2.5 |
1.43 |
257.36 |
0.14 |
9.06 |
23.5 |
|
189.9 |
197 |
7.1 |
1.64 |
23.36 |
0.02 |
0.7 |
1.18 |
|
343.4 |
359.07 |
15.67 |
1.72 |
2.2 |
0.11 |
0 |
0.14 |
|
including |
356.5 |
359.07 |
2.57 |
4.22 |
1.68 |
0.08 |
0 |
0.09 |
* Interval is drilled thickness and does not represent true thickness. Estimated true thickness for individual holes are: GT-08 90%, GT-09 95%, GT-10 48%, GT-11 67%, GT-12 73%, GT-13 85%
Back Forty Project |
7-9 |
Gold Resource Corporation |
|
7.2.13 |
2017 Mineral Resource Drilling Program |
Resource delineation drilling consisted of a total of ten drill holes (LK-17-521 to LK-17-528, LK-17-531 and LK-17-533) as well as extensions of GT-12 and GT-13 for a total of 2,610 m total drilled by both IDEA Drilling and Downing Drilling. The program was planned jointly by P&E and Objectivity (Sudbury, Ontario), with input from Aquila personnel. Geological logging and sampling as well as collar surveying and core processing were completed by Aquila personnel and contract geologists/technicians from Great Lakes Exploration Inc. Due to a lack of geotechnical information within the Pinwheel portion of the potential underground mine area, additional geotechnical logging was completed by Great Lakes Exploration geologists on select drill holes (LK-17-521 to LK-17-527).
Hole numbers LK-17-521 through LK-17-527 were designed to intercept Inferred Mineral Resource material and to test the western, down-dip extension of the Pinwheel massive sulfide. All drill holes encountered massive sulfide mineralization associated with the Pinwheel massive sulfide.
Hole numbers LK-17-528 and LK-17-533 were designed to intercept Inferred mineralization located in the Deep Zone massive sulfide and adjacent Porphyry Margin Gold Zone. Both drill holes also encountered mineralization associated with the Tuff Zone massive sulfide and stringers as well as the 90 Zone along the south margin of the proposed open pit.
Given the depth of the drill holes, drill hole deviation was monitored throughout drilling operations. Due to unexpected deviation, hole number LK-17-528 was terminated prior to reaching the planned final depth.
Significant assay results for all drill holes are provided in Table 7-6.
Table 7-6: 2017 Resource Drilling - Significant Results
DDH |
From |
To |
Interval* |
Au |
Ag |
Cu |
Pb |
Zn |
|---|---|---|---|---|---|---|---|---|
(m) |
(m) |
(m) |
(g/t) |
(g/t) |
(%) |
(%) |
(%) |
|
LK-17-521 |
61.1 |
62.75 |
1.65 |
0.381 |
77 |
0.06 |
1.18 |
3.02 |
68.52 |
74.49 |
5.97 |
0.719 |
53 |
0.18 |
0.37 |
2.21 |
|
133 |
145.75 |
12.75 |
0.949 |
10 |
0.29 |
0.04 |
0.07 |
|
LK-17-522 |
134.65 |
150.05 |
15.4 |
0.943 |
10 |
0.26 |
0.05 |
0.8 |
including |
134.65 |
137 |
2.35 |
0.975 |
35 |
0.29 |
0.17 |
4.1 |
LK-17-523 |
51 |
165 |
114 |
1.006 |
14 |
0.61 |
0.01 |
1.8 |
including |
67.5 |
99 |
31.5 |
0.681 |
9 |
0.28 |
0.01 |
4.55 |
120 |
165 |
45 |
1.333 |
15 |
0.99 |
0.01 |
0.39 |
|
including |
133 |
137.5 |
4.5 |
2.126 |
22 |
2.07 |
0 |
0.24 |
LK-17-524 |
45.5 |
100.58 |
55.08 |
1.304 |
13 |
0.49 |
0.04 |
0.29 |
LK-17-525 |
142.88 |
143.55 |
0.67 |
0.838 |
32 |
0.04 |
0.46 |
22.42 |
147.3 |
163.36 |
16.06 |
0.921 |
12 |
0.46 |
0.2 |
1.81 |
|
including |
147.3 |
154.5 |
7.2 |
0.766 |
19 |
0.59 |
0.43 |
3.62 |
Back Forty Project |
7-10 |
Gold Resource Corporation |
|
DDH |
From |
To |
Interval* |
Au |
Ag |
Cu |
Pb |
Zn |
|
(m) |
(m) |
(m) |
(g/t) |
(g/t) |
(%) |
(%) |
(%) |
166 |
170.63 |
4.63 |
1.83 |
8 |
0.21 |
0.06 |
0.13 |
|
LK-17-526 |
155.7 |
172.5 |
16.8 |
0.76 |
8.73 |
0.11 |
0.16 |
4.27 |
including |
156.36 |
160.25 |
3.89 |
0.85 |
17.41 |
0.18 |
0.41 |
14.17 |
including |
170.37 |
172.5 |
2.13 |
0.59 |
14.86 |
0.16 |
0.26 |
6.83 |
LK-17-527 |
54.09 |
174.3 |
120.21 |
1.14 |
13.18 |
0.72 |
0.01 |
0.6 |
including |
57 |
60 |
3 |
1.11 |
35 |
0.56 |
0.02 |
3.28 |
including |
75 |
79.5 |
4.5 |
0.88 |
7 |
0.25 |
0.01 |
3.44 |
including |
112.5 |
127 |
14.5 |
1.3 |
12.19 |
0.9 |
0.01 |
0.48 |
including |
147 |
174.3 |
27.3 |
1.52 |
21.47 |
1.54 |
0.01 |
0.32 |
LK-17-528 |
163.94 |
166.33 |
2.39 |
1.23 |
112.96 |
0.05 |
1.12 |
13.61 |
180.83 |
186.73 |
5.9 |
0.82 |
75.37 |
0.1 |
2.69 |
9.6 |
|
192.5 |
198.5 |
6 |
0.98 |
65.75 |
0.06 |
2.53 |
8.95 |
|
including |
193.74 |
196.19 |
2.45 |
1.09 |
130.41 |
0.09 |
5.31 |
19.79 |
204.4 |
211.5 |
7.1 |
1.31 |
44.26 |
0.02 |
0.52 |
0.6 |
|
including |
207 |
210 |
3 |
2.71 |
67 |
0.03 |
0.75 |
0.35 |
291.37 |
295.16 |
3.79 |
2 |
15.27 |
0.57 |
0.05 |
2.02 |
|
including |
292.87 |
294.14 |
1.27 |
4.59 |
28 |
1.14 |
0.04 |
1.37 |
LK-17-533 |
158 |
159.5 |
1.5 |
2.5 |
237 |
0.05 |
0.88 |
0.71 |
227.65 |
268.17 |
40.52 |
0.38 |
3.56 |
0.02 |
0.1 |
2.31 |
|
including |
227.65 |
228.46 |
0.81 |
4.29 |
73 |
0.03 |
2.6 |
14.14 |
including |
239.3 |
244.33 |
5.03 |
0.76 |
3.5 |
0.04 |
0.08 |
10.01 |
including |
256.5 |
261 |
4.5 |
0.59 |
1.33 |
0.04 |
0.02 |
2.88 |
436.5 |
441 |
4.5 |
0.88 |
31.67 |
0.02 |
0.61 |
0.2 |
|
442.6 |
455.84 |
13.24 |
1.18 |
16.55 |
0.59 |
0.09 |
0.84 |
|
including |
442.6 |
444.51 |
1.91 |
1.25 |
19.1 |
0.02 |
0.48 |
4.89 |
including |
444.51 |
455.84 |
11.33 |
1.17 |
16.12 |
0.68 |
0.02 |
0.16 |
* Interval is drilled thickness and does not represent true thickness. Estimated true thickness for individual holes are: LK-17-521 63%, LK-17-522 60%, LK-17-523 35%, LK-17-534 74%, LK-17-525 65%, LK-17-526 75%, LK-17-527 30%, LK-17-528 85%, LK-17-533 85%
7.2.14 |
2017 Exploration Drilling Program |
A total of nine drill holes, totaling 2,110 m were drilled as part of an exploration program targeting a geophysical anomaly identified during 2016 and as follow-up on the newly discovered massive sulfide zone from the 2016 drill program. The drill program was planned and managed by Aquila personnel while geological logging, sampling, and collar surveying was completed by contract geologists from Great Lakes Exploration Inc. Core processing, including core cutting and sampling was completed by Aquila personnel and contract technicians provided by Great Lakes Exploration Inc.
Back Forty Project |
7-11 |
Gold Resource Corporation |
|
A downhole EM geophysical anomaly located to the south of the main Deposit area, was tested by drill hole LK-17-520 and encountered thin lenses of massive sulfide coincident with the location of the geophysical target. Base and precious metal assays returned no significant results however, additional geophysical work will be completed to further evaluate the mineral potential in this area. An additional eight drill holes were completed to further define and extend the massive sulfide zone identified in 2016. Mineralization associated with this zone was extended approximately 35 m to the east-northeast and up-dip from the 2016 intercept. The zone was also extended approximately 70 m to the west-southwest and down-dip of the previous drilling completed in 2016. Given the limited drilling in this area mineralization has not been modelled and is not currently incorporated into the updated Mineral Resource Estimate. Significant results encountered during the 2017 exploration drilling program are tabulated below in Table 7-7.
Table 7-7: 2017 Exploration Drilling - Significant Results
DDH |
From |
To |
Interval* |
Au |
Ag |
Cu |
Pb |
Zn |
(m) |
(m) |
(m) |
(g/t) |
(g/t) |
(%) |
(%) |
(%) |
|
K-17-529 |
55.11 |
57.57 |
2.46 |
0.5 |
12.94 |
0.09 |
0.05 |
6.49 |
LK-17-534 |
27.5 |
28.66 |
1.16 |
1.49 |
8 |
1.39 |
0.02 |
0.01 |
112 |
114.5 |
2.5 |
0.15 |
38.2 |
0.02 |
0.67 |
0.02 |
|
including |
113.5 |
114.5 |
1 |
0.24 |
70 |
0.02 |
1.31 |
0.01 |
116.44 |
127.5 |
11.06 |
1.61 |
40.72 |
0.08 |
0.22 |
6.32 |
|
including |
117.44 |
119.73 |
2.29 |
6.2 |
174.83 |
0.13 |
0.92 |
2.06 |
and |
119.73 |
124.82 |
5.09 |
0.52 |
5.68 |
0.08 |
0.03 |
11.56 |
233.5 |
235.5 |
2 |
0.55 |
28 |
0.75 |
0.01 |
0.12 |
|
234.5 |
235.5 |
1 |
0.53 |
35 |
1.03 |
0.01 |
0.06 |
|
LK-17-535 |
64 |
78.85 |
14.85 |
0.84 |
13.23 |
0.29 |
0.04 |
0.2 |
including |
71.5 |
78.85 |
7.35 |
1.05 |
16.94 |
0.46 |
0.02 |
0.13 |
106.15 |
108 |
1.85 |
2.03 |
233.82 |
0.09 |
4.13 |
0.09 |
|
108 |
116.38 |
8.38 |
1.49 |
29.55 |
0.08 |
0.2 |
7.61 |
|
including |
108 |
113.38 |
5.38 |
1.85 |
25.58 |
0.13 |
0.17 |
11.46 |
LK-17-536 |
46.86 |
52.48 |
5.62 |
0.71 |
4.93 |
0.33 |
0.01 |
0.03 |
including |
46.86 |
47.94 |
1.08 |
1.09 |
13 |
1 |
0.01 |
0.01 |
77.5 |
79 |
1.5 |
2.73 |
8 |
0.01 |
0.06 |
0.07 |
|
99.72 |
101 |
1.28 |
0.61 |
3 |
0 |
0.01 |
4.82 |
|
127.5 |
132.03 |
4.53 |
0.57 |
5.47 |
0.01 |
0.05 |
3.19 |
|
including |
129.2 |
132.03 |
2.83 |
0.79 |
7.02 |
0 |
0.07 |
4.27 |
LK-17-537 |
84.53 |
100.5 |
15.97 |
0.86 |
13.27 |
0.11 |
0.11 |
5.48 |
87.57 |
97.69 |
10.12 |
0.95 |
7.26 |
0.07 |
0.07 |
7.04 |
|
113 |
131.09 |
18.09 |
1.26 |
11.87 |
0.03 |
0.1 |
6.37 |
|
including |
120 |
122.34 |
2.34 |
3.72 |
22.64 |
0.05 |
0.25 |
4.48 |
and |
124 |
131.09 |
7.09 |
1.27 |
15.78 |
0.04 |
0.12 |
12.17 |
Back Forty Project |
7-12 |
Gold Resource Corporation |
|
* Interval is drilled thickness
7.2.15 |
2018 Exploration Drilling Program |
Three drill holes totaling 633.27 m were completed as part of an abbreviated exploration program in 2018. The drill program was planned and managed by Aquila. Geological logging was completed by Aquila personnel with support from a contract geologist from Great Lakes Exploration Inc. Collar surveying, core processing, including core cutting and sampling was completed by Aquila personnel. Drilling was carried out by Downing Drilling. The program was designed to test the extents of the recently discovered 2016 Zone and another geophysical target peripheral to the known Deposit. Drilling at the geophysical target intersected altered volcanics with anomalous zinc. The balance of the abbreviated program focused on testing the extents of the 2016 Zone. One hole testing the southwest extension of the 2016 Zone intersected mineralization similar to the lower tuffaceous sediments. The drill holes were drilled after the current Mineral Resource Estimate was completed, and not are included in the Updated Mineral Resource Estimate.
7.2.16 |
2019 Drilling |
7.2.16.1 |
2019 Geomechanical Drilling Program |
The geomechanical drilling program consisted of a total of seven drill holes totaling 1,274m. Drilling was designed to evaluate the rock mass quality within the west pit wall and to evaluate the rock quality on a potential crown pillar. The geomechanical drill program was planned,geotechnically logged and sampled out by Knight Piésold (KP). Geological logging and sampling as well as collar surveying and core processing were completed by Aquila personnel and a contract geologist supplied by Great Lakes Exploration Inc. Drilling was carried out by IDEA Drilling.
In addition to collecting geotechnical data, three of the geotechnical drill holes may have intersected areas of Inferred Mineral Resource mineralization within the Mineral Resource block model in the vicinity of the Pinwheel Zone, and NS Zone. None of the 2019 drill holes are included in the Updated Mineral Resource Estimate.
7.2.16.2 |
2019 Metallurgy Drilling Program |
The primary focus of the 2019 program consisted of 558.33 m of drilling in eight metallurgical drill holes (MET-19-01 to MET-19-08) targeting early mining within the open-pit portion of the Mineral Resource. Drill hole planning for the metallurgical drill program was completed by Ben Chisolm of Aquila and Eric Quigley of Great Lakes Exploration, with input from Aquila staff. Drill holes were designed to intersect the target intervals to provide sufficient sample material and spatial and mineralogical (grade) variability within each domain to support the necessary metallurgical testing requirements. Continuous samples (quarter core) from these drill holes were submitted to Minerals Processing for assaying. Composite samples (half core) were created from select intervals and sent to SGS for metallurgical testing. The remaining un-sampled material (quarter core) was reserved for potential future metallurgical testing. All holes represented are ‘twin drill holes’ from previous drilling campaigns. Assays from these drill holes were not incorporated into the Updated Mineral Resource Estimate.
Back Forty Project |
7-13 |
Gold Resource Corporation |
|
7.3 |
Ground Conditions and Survey Data |
Ground conditions are generally good resulting in excellent core recovery: between 90% and 100%. NQ and BTW sized core from each hole were logged by Aquila. Information collected includes lithology, structure, alteration, and mineralization. Rock quality designations (“RQD”) were also calculated over drilled intervals and density was measured on select samples. Oriented core from the 2009 to 2011 program were geotechnically logged in addition to being geologically logged. Select oriented drill holes from 2016 and 2017 were also geotechnically logged.
All Project data are located with local UTM survey grid using North American Datum 1983 (NAD-83), including the period prior to 2009, when coordinates were originally collected in NAD-27. Borehole collar location was determined with a high-resolution differential global positioning system (“GPS”) unit (Locus System). Geologic, assay and directional survey data were compiled manually, entered into Microsoft Excel® spreadsheets, and then entered into Datamine Studio 3 for analysis and interpretation on plans, cross-sections, and 3-D wireframes.
Downhole borehole deviation was monitored during drilling, initially using a multi-shot Sperry Sun camera tool, and later using a Reflex™ FlexIt Smart tool. Both instruments determine azimuth deviation by magnetic methods. Downhole surveys were conducted approximately every 6m for the length of the drill hole.
Back Forty Project |
7-14 |
Gold Resource Corporation |
|
8.0 |
SAMPLE PREPARATION, ANALYSES, AND SECURITY |
8.1 |
Site Sample Preparation Methods and Security |
8.1.1 |
Core Handling, Sampling, and Security |
The drill core was boxed and sealed in a secure area at each drill site and transported daily to the Aquila field office, located on the Property. Prior to 2009, all drill core was housed either in the outdoor fenced storage area at the field office or at the indoor Daggett core warehouse. From 2009 to 2011, the drill core was logged geotechnically and geologically, then marked for samples at the field office facility and transferred to a new core facility in Carney, Michigan (27 km away) for photographing, cutting, sampling and archiving. The Carney core warehouse was secured by locks and alarm system. As of 2011, all drill core from previous programs was transferred to the Project’s core warehouse in Carney and photographed prior to archiving. All digital computer files, including core photographs, logs, and data, are saved on a central server at the Back Forty main office in Stephenson, Michigan. The entire contents of the server are backed up onto a tape drive and removed from the premises on a daily basis.
Assay intervals are generally 1.5 m in length and, to be as representative as possible, the sample intervals respected lithological contacts. Virtually all the core of both mineralized and unmineralized material from all drill holes was sampled by sawing the core lengthwise and retrieving half the split core for assaying. Typically, the drill core of mafic dykes was not sampled unless they exhibited visual mineralization.
Assay samples were shipped from the Aquila field office in Michigan directly to the ALS preparation facility in Elko, Nevada, the Accurassay Lab in Thunder Bay, Ontario, or the Inspectorate America lab in Sparks, Nevada. Samples prepared by ALS were sent to Vancouver for analysis. Samples prepared by Accurassay were analyzed in Thunder Bay. Inspectorate America prepared and analyzed samples in the same facility in Sparks, Nevada. All pulps and coarse rejects were returned to the Project warehouse facilities in Michigan.
The exploration work conducted by Aquila was carried out in general compliance with industry best practices with the aid of a quality assurance/quality control (QA/QC) or QC program. All aspects of the exploration data acquisition and management, including mapping, surveying, drilling, sampling, sample security, and assaying and database management, were conducted under the supervision of appropriately qualified geologists.
8.1.2 |
Laboratory Accreditation and Certification |
Aquila used seven laboratories for assaying core samples collected on the Project (as shown in Table 8-1). ALS Chemex (“ALS”) Laboratories of Reno, Nevada, Vancouver, British-Columbia and Thunder Bay, Ontario, Accurassay Laboratory (“Accurassay”) of Thunder Bay, Ontario, Bureau Veritas Mineral Laboratories (“Bureau Veritas”) previously named Inspectorate America Corporation Analytical Laboratories (“IAC”) of Sparks, Nevada and Minerals Processing Corporation (“MPC”) Laboratory of Carney, Michigan were used for primary drill core precious metal, base metal, and trace element analysis. Activation Laboratories Ltd. (“Actlabs”) of Thunder Bay, Ontario and SGS Mineral Services (“SGS”) of Toronto, Ontario, were used as umpire laboratories.
Actlabs, Accurassay, ALS, IAC, Bureau Veritas, MPC and SGS Laboratories were ISO 9001 certified and accredited (ISO/IEC 17025) for the analytical methods used routinely on the samples from the Project. Actlabs, Accurassay, ALS, IAC, Bureau Veritas, MPC and SGS Laboratories were commercial laboratories independent of the issuer and had no interest in the Project.
Back Forty Project |
8-1 |
Gold Resource Corporation |
|
Table 8-1: Summary of Assay Samples by Year
DDH |
Samples |
Laboratory Location |
Year |
108401-108471 |
7,545 |
ALS, Reno, NV and Vancouver, BC |
2002-2003 |
LK-72-LK-93 |
2,380 |
ALS, Thunder Bay, ON and Vancouver, BC |
2006 |
LK-78-LK-99 exts |
235 |
Accurassay, Thunder Bay, ON |
2006 |
LK-94-LK-151 |
3,350 |
Accurassay, Thunder Bay, ON |
2006 |
LK-152-LK186 |
5,320 |
Accurassay, Thunder Bay, ON |
2007 |
LK-187PE to LK-197 |
1,575 |
SGS, Toronto, ON |
2007 |
LK-198PE-LK-259 |
6,890 |
Accurassay, Thunder Bay, ON |
2007 |
LK-260 to LK-323 |
6,818 |
Accurassay, Thunder Bay, ON |
2008 |
LK-324,355,326,329,331,332,334,339,341,344,346 |
1,010 |
Actlabs, Thunder Bay, ON |
2008 |
108 Series Infills |
65 |
Actlabs, Thunder Bay, ON |
2008 |
LK-355 to LK-354, later extensions and infills |
3,615 |
Accurassay, Thurder Bay, ON |
2008 |
LK-355 to LK-378 |
2,190 |
Inspectorate America, Sparks, NV |
2009 |
LK-379 to LK-478 and extensions (LK-85) |
5,552 |
Inspectorate America, Sparks, NV |
2010 |
LK-479 to LK-506 and extensions |
15,831 |
Inspectorate America, Sparks, NV |
2010-2011 |
LK-15-508 to LK-15-509 |
120 |
Bureau Veritas, Sparks, NV |
2015 |
LK-16-510 to LK-16-519 |
2,724 |
MPC, Carney, MI |
2016 |
GT-08 to GT-13, LK-17-520 to LK-17-538 and extensions of GT-12,13 |
2016-2017 |
8.2 |
Laboratory Sample Preparation Methods and Analytical Procedures |
The following sample preparation methods and analytical procedures, by laboratory, took place:
| ■ | Accurassay: |
| ■ | Samples were sorted, bar-coded and logged into Accurassay’s LIMS program. They were then placed in the sample drying room. |
| ■ | Samples were crushed to 90% passing 8 mesh, and split using a Jones riffle splitter. A 250 g split was pulverized to 90% passing 150 mesh. |
| ■ | Samples were analyzed for gold by 30 g fire assay with AA finish (code ALFA1). The lower detection limit of this assay type was 5 ppb. All results greater than 5 ppm gold were re-analyzed by fire assay with gravimetric finish with a lower detection limit of 5 ppm (code ALFA3). |
| ■ | Low and intermediate grade samples were analyzed for a 32-element suite using a three-acid digestion followed by inductively coupled plasma-mass spectrometry (ICP-MS, code ICPMA). |
| ■ | High-grade samples were analyzed using “mineralized grade” three-acid digestion with an AA finish. |
Back Forty Project |
8-2 |
Gold Resource Corporation |
|
| ■ | Actlabs: |
| ■ | Samples were sorted, bar-coded and logged into the Actlabs LIMS program. They were then dried and weighed. |
| ■ | Samples were crushed to 80% passing 10 mesh or less and split using a Jones riffle splitter. A 250 g split was pulverized to 95% passing 150 mesh. |
| ■ | Three types of analyses were performed: a gold and silver fire assay with a gravimetric finish (code 1A3); a multi-element, four-acid digestion followed by inductively coupled plasma-optical emission spectrometry (ICP-OES) (code 1F2); and an “mineralized grade” ICP scan for copper, lead, zinc, and silver (code 8). |
| ■ | ALS: |
| ■ | Samples were sorted and logged into the ALS LIMS program. They were then dried and weighed. |
| ■ | Samples were crushed to +70% passing 2 mm (CRU-31). The crushed rejects were mixed by splitting once on a Jones riffle and then by re-combining the two fractions (not a normal part of ALS’s standard procedure). A minimum of 250 g of the crushed reject was split for pulverization (PUL-31) using a Jones riffle. The split was then pulverized to greater than 85% passing 75 μm mesh. |
| ■ | Samples were analyzed for gold by fire assay with AA finish (Au- AA25) on 30 g charges. Detection limits for this method are 0.01 to 100 ppm. All assay results greater than 3 ppm gold were automatically re-run using 30 g fire assay with gravimetric finish (code Au-GRA32). The detection limit for these re-runs was 0.05 to 1,000 ppm gold. |
| ■ | Samples were also analyzed using a multi-element package (ME-ICP61) which consisted of a four-acid digestion followed by inductively coupled plasma (“ICP”) with over-limit samples re-assayed for copper, lead, zinc and silver by four-acid digestion followed by AA (code AA62). |
| ■ | A limited number of samples were analyzed for mercury by aqua regia digestion and flameless AA spectrometry (Hg-CV41 with detection limits of 0.01 to 100 ppm), and for total sulfur by Leco furnace and infrared spectroscopy (code S-IR08 with detection limits of 0.01 to 50%). |
| ■ | IAC, 2009-2011: |
| ■ | Samples were sorted and logged into the IAC program. They were then dried and weighed. |
| ■ | Samples were crushed and riffle split to 250 g, and then pulverized to more than 90% passing 150 mesh. |
| ■ | Samples were analyzed using a multi-element package (GENX 10), which consists of a fire assay for gold (Au-1AT-AA), an ICP run (GNX10-AR-ICP) for metals silver, arsenic, bismuth, copper, molybdenum, lead, antimony, zinc (by aqua regia digestion, ICP analysis), and analysis for mercury (Hg-AR-TR). |
| ■ | A fire assay-gravimetric finish (Au-1AT-GV) was performed on all gold results greater than 3 ppm. |
| ■ | Higher-grade analyses by AA for zinc (Zn-AR-OR), copper (Cu-AR-OR), and lead (Pb-AR-OR) were run on results exceeding 10,000 ppm. |
| ■ | MPC Laboratory, 2015: |
| ■ | Sample preparation was performed by the MPC Laboratory |
Back Forty Project |
8-3 |
Gold Resource Corporation |
|
| ■ | Samples were sorted and logged into the MPC program. They were then dried and weighed. |
| ■ | Samples were crushed and riffle split to approximately 250 g, and then pulverized to more than 90% passing 150 mesh. |
| ■ | Pulps were sent directly from the MPC Laboratory to Inspectorate America for analysis. |
| ■ | Samples were analyzed by fire assay for gold (FA430) with an AAS finish and a 34-element Aqua Regia digestion ICP analysis (AQ270). |
| ■ | Gold assays exceeding 10 ppm and silver assays greater than 300 ppm were re-analyzed with fire assay and gravimetric finish (FA530-Au/Ag). |
| ■ | SGS: |
| ■ | Pulp samples were sorted and logged into the SGS program. |
| ■ | Pulp samples were analyzed for gold by fire assay with gravimetric finish (FAG303) and 40 trace elements by ICP (ICP40B, multi-acid digestion). |
| ■ | ICP over limits for silver were rerun using higher-grade analysis by AA (AAS21E) and for copper, lead, or zinc by ICP (ICP90Q). |
| ■ | MPC: |
| ■ | Samples were sorted and logged into the MPC program. They were then dried and weighed. |
| ■ | Samples were crushed and riffle split to 250 g, and then pulverized to more than 90% passing 150 mesh. |
| ■ | Samples were analyzed using the fire assay method (FA430) with an AAS finish for gold. |
| ■ | Samples were analyzed using either a three acid (aqua regia) or four-acid digest with ICP-ES or ICP-MS finish for silver, copper, lead and zinc. |
| ■ | Gold assays exceeding 10 ppm and silver assays greater than 100 ppm were re-analyzed by fire assay method with a gravimetric finish. |
8.3 |
Quality Control and Quality Assurance Programs |
As part of the issuer’s QA/QC program, Aquila monitors the test results sent from the laboratory for evidence of contamination or error in the analytical process.
The QA/QC program includes insertion of blanks and standards (CRMs) in the flow stream of daily core samples. From 2002 to 2017, 2805 CRM standards and 562 blanks were analyzed. The issuer’s QA/QC procedure does not include systematic check assays; nevertheless, from 2006 to 2011, the issuer selected 1017 samples for verification at a second laboratory using rejects.
Back Forty Project |
8-4 |
Gold Resource Corporation |
|
8.3.1 |
Certified Reference Materials (Standards) |
Accuracy is monitored by inserting CRMs at a ratio of one for every 10 to 25 samples (1:10 to 1:25). The definition of a QC failure is when an assay result for a standard falls outside three standard deviations (3SD). Gross outliers are excluded from the standard deviation calculation.
| ■ | 2002-2003 Drilling Program: 202 standards were used. Those standards were in-house control samples produced at MPC’s Ropes Gold Mill. Performance of uncertified material used by Aquila during the 2002-2003 Drilling Program is hard to assess due to the lack of performance gates. |
| ■ | 2006 to 2008 Drilling Programs: 833 standards were used. The author noticed that a fairly large number of assays did not fall within a three standard deviation envelope; this issue could not be resolved fully despite consulting with Aquila. However, check assays performed by Actlabs on 94 samples from the 2006 to 2008 Drilling Programs did not mirror this problem. Hence, the author concludes that assay quality at Accurassay, the primary laboratory used by Aquila, was below expectation. Nevertheless, the author regards assay data as robust enough for resource estimation. |
| ■ | 2009-2010 Drilling Program: 490 standards were used. Standards in some batches consistently returned lead and zinc values greater than three standard deviations where drill core results were lead and zinc near 1%. Discussions with Inspectorate determined that 1% lead and zinc values approach the upper limit of analysis for the ICP package and are at the 1% lower limit for the AA range. Although original ICP analyses were largely within acceptable limits of error, many were slightly over 1%. These samples were subsequently sent for AA analysis. The AA analysis was found to be slightly out of calibration, which gave the results a high bias. Inspectorate addressed the over limit reporting protocol, as well as the AA calibration issue, and adequately re-assayed all affected samples. |
| ■ | 2010-2011 Drilling Program: 978 standards were used. A total of 16 analyses for gold failed. Batches pertaining to certified standards that failed were not rerun due to other standards within the same batch passing. A total of eight standards failed for copper and four for lead. These were also considered to be either of no impact to the Mineral Resource Estimate, with other standards passing in the same batch or to be mismatched samples. |
| ■ | 2015 Drilling Program: Nine standards were used. All standards fell within acceptable limits for silver, copper and zinc and one out of three CDN-HZ-3 results for gold and one out of five CDN-ME-16 results for zinc failed high. Batches corresponding to standard failures were not rerun due to other standards within the same batch passing. |
| ■ | 2016 Drilling Program: 80 standards were used. Standard data were within accepted limits of error for silver, copper and zinc. The CDN-GS-P7E, CDN-HZ-3 and CDN-ME-16 CRMs returned one result each greater than three standard deviations for gold (a 4% failure rate). The CDN-MS-1301, CDN-ME-14 and the CDN-ME-16 standards respectively returned three, two and one result(s) greater than three standard deviations for lead (a 9% failure rate). |
| ■ | 2017 Drilling Program: 213 standards were used. The CRM failure rate rose during the 2017 program; however, the majority of failures were not of concern since failures were isolated, with multiple other standards passing in the same batch. In the majority of cases, no further action was warranted. Results for holes GT-10 and GT-11 returned with many failures for all elements, except silver, and pulps for these batches were re-analyzed at MPC for check. Comparison of the original results versus the check assays carried out by MPC |
Back Forty Project |
8-5 |
Gold Resource Corporation |
|
was made and confirmation of the original results was given. MPC results for these drill holes have been applied in the database.
The QP is of the opinion that the QA/QC results for the standards used during the issuer’s 2002-2017 Drill Programs are reliable and valid.
Back Forty Project |
8-6 |
Gold Resource Corporation |
|
Table 8-2: Gold Results of Standards Used in the 2002 to 2017 Drill Programs (CRM Quantity>25)
Year |
Lab |
CRM |
Quantity Inserted |
CRM Value (g/t Au) |
Average (g/t Au) |
Accuracy % |
Precision % |
Outliers |
Gross Outliers |
% Passing Outlier |
2002-2003 |
ALS |
GEN 2 |
75 |
0.192 |
0.18 |
-4.1 |
7.6 |
2 |
2 |
97.3 |
2002-2003 |
ALS |
MIN 2 |
81 |
2.788 |
2.71 |
-2.3 |
5.4 |
1 |
0 |
98.8 |
2002-2003 |
ALS |
VMS 2 |
30 |
0.12 |
0.13 |
10 |
8.9 |
1 |
3 |
96.7 |
2006 |
ACC |
MPC-2 |
28 |
0.79 |
0.62 |
-22 |
18.4 |
0 |
8 |
100.0 |
2006 |
ACC |
MPC-3 |
28 |
1.41 |
1.4 |
-0.4 |
18.3 |
0 |
2 |
100.0 |
2007 |
ACC |
CDN-GS-2B |
403 |
2.03 |
1.95 |
-3.8 |
10.7 |
9 |
21 |
97.8 |
2008 |
ACC |
CDN-GS-3C |
75 |
3.58 |
3.32 |
-7.3 |
11.7 |
0 |
8 |
100.0 |
2008 |
ACC |
CDN-FCM-4 |
47 |
0.97 |
0.63 |
-34.9 |
5.2 |
6 |
37 |
87.2 |
2006-2007 |
ACC |
CDN-HLHZ |
45 |
1.31 |
1.26 |
-3.4 |
15 |
0 |
10 |
100.0 |
2009-2010 |
IAC |
CDN-HLHZ |
37 |
1.31 |
1.36 |
3.8 |
4.1 |
1 |
0 |
97.3 |
2006-2007 |
ACC |
CDN-HLLC |
89 |
0.83 |
0.81 |
-1.7 |
14.9 |
0 |
16 |
100.0 |
2009-2010 |
IAC |
CDN-GS-2C |
45 |
2.06 |
2.24 |
8.8 |
3.6 |
0 |
0 |
100.0 |
2009-2010 |
IAC |
CDN-GS-2F |
50 |
2.16 |
2.26 |
4.5 |
3.4 |
0 |
0 |
100.0 |
2009-2010 |
IAC |
CDN-HZ-3 |
88 |
- |
- |
- |
- |
- |
- |
- |
2009-2011 |
IAC |
CDN-ME-2 |
250 |
2.1 |
2.15 |
2.5 |
3.3 |
3 |
0 |
98.8 |
2009-2011 |
IAC |
CDN-SE-2 |
84 |
0.242 |
0.25 |
2.5 |
4.2 |
3 |
0 |
96.4 |
2010-2011 |
IAC |
CDN-ME-16 |
61 |
1.48 |
1.48 |
-0.2 |
7.3 |
1 |
0 |
98.4 |
2010-2011 |
IAC |
CDN-ME-14 |
89 |
0.1 |
0.1 |
0.9 |
10.6 |
3 |
6 |
96.6 |
2017 |
MPC |
CDN-GS-P7E |
34 |
0.766 |
0.8 |
4.3 |
9.3 |
0 |
0 |
100.0 |
2017 |
MPC |
CDN-ME-1308 |
34 |
1.4 |
1.37 |
-2 |
6.5 |
0 |
0 |
100.0 |
2017 |
MPC |
CDN-GS-2J |
45 |
2.36 |
2.49 |
5.6 |
4 |
0 |
0 |
100.0 |
Back Forty Project |
8-7 |
Gold Resource Corporation |
|
Table 8-3: Silver Results of Standards Used in the 2002 to 2017 Drill Programs (CRM Quantity>25)
Year |
Lab |
CRM |
Quantity Inserted |
CRM Value (g/t Ag) |
Average (g/t Ag) |
Accuracy % |
Precision % |
Outliers |
Gross Outliers |
% Passing Outlier |
2002-2003 |
ALS |
GEN 2 |
75 |
1.6 |
- |
- |
- |
- |
- |
- |
2002-2003 |
ALS |
MIN 2 |
81 |
78.4 |
76.62 |
-2.3 |
3.2 |
4 |
0 |
95.1 |
2002-2003 |
ALS |
VMS 2 |
30 |
85 |
79.56 |
-6.4 |
4.2 |
0 |
0 |
100.0 |
2006 |
ACC |
MPC-2 |
28 |
34.57142857 |
18.56 |
-46.3 |
11.5 |
0 |
2 |
100.0 |
2006 |
ACC |
MPC-3 |
28 |
178.5 |
163.93 |
-8.2 |
7.6 |
0 |
0 |
100.0 |
2007 |
ACC |
CDN-GS-2B |
403 |
|
- |
- |
- |
- |
- |
|
2008 |
ACC |
CDN-GS-3C |
75 |
|
- |
- |
- |
- |
- |
|
2008 |
ACC |
CDN-FCM-4 |
47 |
54.9 |
57.38 |
4.5 |
7.3 |
2 |
2 |
95.7 |
2006-2007 |
ACC |
CDN-HLHZ |
45 |
101.2 |
95.24 |
-5.9 |
8.4 |
2 |
5 |
95.6 |
2009-2010 |
IAC |
CDN-HLHZ |
37 |
101.2 |
93.76 |
-7.4 |
5.3 |
1 |
0 |
97.3 |
2006-2007 |
ACC |
CDN-HLLC |
89 |
65.1 |
62.36 |
-4.2 |
9.2 |
3 |
9 |
96.6 |
2009-2010 |
IAC |
CDN-GS-2C |
45 |
|
- |
- |
- |
- |
- |
|
2009-2010 |
IAC |
CDN-GS-2F |
50 |
|
- |
- |
- |
- |
- |
|
2009-2010 |
IAC |
CDN-HZ-3 |
88 |
27.3 |
26.77 |
-1.9 |
5 |
4 |
0 |
95.5 |
2009-2011 |
IAC |
CDN-ME-2 |
250 |
14 |
13.9 |
-0.7 |
3.7 |
6 |
0 |
97.6 |
2009-2011 |
IAC |
CDN-SE-2 |
84 |
354 |
344.6 |
-2.6 |
1.9 |
9 |
0 |
89.3 |
2010-2011 |
IAC |
CDN-ME-16 |
61 |
30.8 |
28.55 |
-7.3 |
2.9 |
0 |
0 |
100.0 |
2010-2011 |
IAC |
CDN-ME-14 |
89 |
42.3 |
40.03 |
-5.4 |
1.9 |
1 |
1 |
98.9 |
2017 |
MPC |
CDN-GS-P7E |
34 |
|
- |
- |
- |
- |
- |
|
2017 |
MPC |
CDN-ME-1308 |
34 |
45.7 |
44.2 |
-1.1 |
4.3 |
0 |
0 |
100.0 |
2017 |
MPC |
CDN-GS-2J |
45 |
|
- |
- |
- |
- |
- |
|
Back Forty Project |
8-8 |
Gold Resource Corporation |
|
Table 8-4: Copper Results of Standards used in the 2002 to 2017 Drill Programs (CRM Quantity>25)
Year |
Lab |
CRM |
Quantity Inserted |
CRM Value (% Cu) |
Average ((% Cu) |
Accuracy % |
Precision % |
Outliers |
Gross Outliers |
% Passing Outlier |
2002-2003 |
ALS |
GEN 2 |
75 |
0.05 |
0.05 |
3.4 |
2.6 |
1 |
0 |
98.7 |
2002-2003 |
ALS |
MIN 2 |
81 |
2.05 |
2.07 |
1.4 |
2.6 |
2 |
0 |
97.5 |
2002-2003 |
ALS |
VMS 2 |
30 |
0.71 |
0.7 |
-1.4 |
2 |
1 |
0 |
96.7 |
2006 |
ACC |
MPC-2 |
28 |
0.17 |
0.12 |
-29.5 |
12.4 |
1 |
2 |
96.4 |
2006 |
ACC |
MPC-3 |
28 |
0.17 |
0.1 |
-38.3 |
8.9 |
1 |
0 |
96.4 |
2007 |
ACC |
CDN-GS-2B |
403 |
|
- |
- |
- |
- |
- |
- |
2008 |
ACC |
CDN-GS-3C |
75 |
|
- |
- |
- |
- |
- |
- |
2008 |
ACC |
CDN-FCM-4 |
47 |
0.70 |
0.67 |
-3.9 |
6.8 |
3 |
3 |
93.6 |
2006-2007 |
ACC |
CDN-HLHZ |
45 |
0.76 |
0.73 |
-4.2 |
10.8 |
1 |
4 |
97.8 |
2009-2010 |
IAC |
CDN-HLHZ |
37 |
0.76 |
0.8 |
5.9 |
4.5 |
0 |
0 |
100.0 |
2006-2007 |
ACC |
CDN-HLLC |
89 |
1.49 |
1.41 |
-5 |
7.2 |
3 |
10 |
96.6 |
2009-2010 |
IAC |
CDN-GS-2C |
45 |
|
- |
- |
- |
- |
- |
- |
2009-2010 |
IAC |
CDN-GS-2F |
50 |
|
- |
- |
- |
- |
- |
- |
2009-2010 |
IAC |
CDN-HZ-3 |
88 |
0.61 |
0.61 |
-0.8 |
4.2 |
4 |
0 |
95.5 |
2009-2011 |
IAC |
CDN-ME-2 |
250 |
0.48 |
0.47 |
-0.9 |
3.1 |
9 |
0 |
96.4 |
2009-2011 |
IAC |
CDN-SE-2 |
84 |
0.05 |
0.05 |
3.4 |
5.2 |
5 |
1 |
94.0 |
2010-2011 |
IAC |
CDN-ME-16 |
61 |
0.67 |
0.66 |
-1.8 |
3 |
2 |
0 |
96.7 |
2010-2011 |
IAC |
CDN-ME-14 |
89 |
1.22 |
1.19 |
-2.4 |
3 |
2 |
1 |
97.8 |
2017 |
MPC |
CDN-GS-P7E |
34 |
|
- |
- |
- |
- |
- |
- |
2017 |
MPC |
CDN-ME-1308 |
34 |
0.40 |
0.39 |
-2.7 |
3.8 |
0 |
0 |
100.0 |
2017 |
MPC |
CDN-GS-2J |
45 |
|
- |
- |
- |
- |
- |
- |
Back Forty Project |
8-9 |
Gold Resource Corporation |
|
Table 8-5: Lead Results of Standards used in the 2002 to 2017 Drill Programs (CRM Quantity>25)
Year |
Lab |
CRM |
Quantity Inserted |
CRM Value (% Pb) |
Average (% Pb) |
Accuracy % |
Precision % |
Outliers |
Gross Outliers |
% Passing Outlier |
2002-2003 |
ALS |
GEN 2 |
75 |
0.0579 |
0.05 |
0.3 |
3.1 |
1 |
3 |
98.7 |
2002-2003 |
ALS |
MIN 2 |
81 |
2.42 |
2.33 |
-3.9 |
2.3 |
1 |
2 |
98.8 |
2002-2003 |
ALS |
VMS 2 |
30 |
1.3 |
1.28 |
-1.8 |
2.5 |
1 |
0 |
96.7 |
2006 |
ACC |
MPC-2 |
28 |
0.48 |
0.33 |
-30.7 |
15.7 |
0 |
3 |
100.0 |
2006 |
ACC |
MPC-3 |
28 |
2.86 |
2.53 |
-11.7 |
10.8 |
1 |
1 |
96.4 |
2007 |
ACC |
CDN-GS-2B |
403 |
|
- |
- |
- |
- |
- |
- |
2008 |
ACC |
CDN-GS-3C |
75 |
|
- |
- |
- |
- |
- |
- |
2008 |
ACC |
CDN-FCM-4 |
47 |
0.34 |
0.37 |
8.1 |
10.5 |
2 |
2 |
95.7 |
2006-2007 |
ACC |
CDN-HLHZ |
45 |
0.815 |
0.84 |
2.5 |
10.2 |
1 |
5 |
97.8 |
2009-2010 |
IAC |
CDN-HLHZ |
37 |
0.815 |
0.85 |
3.6 |
5.8 |
6 |
0 |
83.8 |
2006-2007 |
ACC |
CDN-HLLC |
89 |
0.29 |
0.36 |
24.4 |
12.9 |
0 |
9 |
100.0 |
2009-2010 |
IAC |
CDN-GS-2C |
45 |
|
- |
- |
- |
- |
- |
- |
2009-2010 |
IAC |
CDN-GS-2F |
50 |
|
- |
- |
- |
- |
- |
- |
2009-2010 |
IAC |
CDN-HZ-3 |
88 |
0.707 |
0.7 |
-1.4 |
4 |
6 |
1 |
93.2 |
2009-2011 |
IAC |
CDN-ME-2 |
250 |
|
- |
- |
- |
- |
- |
- |
2009-2011 |
IAC |
CDN-SE-2 |
84 |
0.957 |
1.08 |
13.1 |
5.4 |
8 |
2 |
90.5 |
2010-2011 |
IAC |
CDN-ME-16 |
61 |
0.879 |
0.85 |
-3.8 |
2.5 |
2 |
0 |
96.7 |
2010-2011 |
IAC |
CDN-ME-14 |
89 |
0.495 |
0.48 |
-3.4 |
2.5 |
3 |
1 |
96.6 |
2017 |
MPC |
CDN-GS-P7E |
34 |
|
- |
- |
- |
- |
- |
- |
2017 |
MPC |
CDN-ME-1308 |
34 |
0.541 |
0.53 |
-1.5 |
3.4 |
1 |
0 |
97.1 |
2017 |
MPC |
CDN-GS-2J |
45 |
|
- |
- |
- |
- |
- |
- |
Back Forty Project |
8-10 |
Gold Resource Corporation |
|
Table 8-6: Zinc Results of Standards Used in the 2002 to 2017 Drill Programs (CRM Quantity>25)
Year |
Lab |
CRM |
Quantity Inserted |
CRM Value (% Zn) |
Average (% Zn) |
Accuracy % |
Precision % |
Outliers |
Gross Outliers |
% Passing Outlier |
2002-2003 |
ALS |
GEN 2 |
75 |
0.0713 |
0.06 |
-3.1 |
3.6 |
1 |
0 |
98.7 |
2002-2003 |
ALS |
MIN 2 |
81 |
2.18 |
2.23 |
2.4 |
3.4 |
3 |
0 |
96.3 |
2002-2003 |
ALS |
VMS 2 |
30 |
28.3 |
27.7 |
-2.1 |
2.9 |
0 |
0 |
100.0 |
2006 |
ACC |
MPC-2 |
28 |
2.37 |
2.35 |
-0.6 |
8.3 |
0 |
1 |
100.0 |
2006 |
ACC |
MPC-3 |
28 |
15.16 |
14.97 |
-1.3 |
6.9 |
1 |
3 |
96.4 |
2007 |
ACC |
CDN-GS-2B |
403 |
|
- |
- |
- |
- |
- |
- |
2008 |
ACC |
CDN-GS-3C |
75 |
|
- |
- |
- |
- |
- |
- |
2008 |
ACC |
CDN-FCM-4 |
47 |
1.28 |
1.18 |
-7.4 |
7.4 |
3 |
2 |
93.6 |
2006-2007 |
ACC |
CDN-HLHZ |
45 |
7.66 |
7.6 |
-0.8 |
8.6 |
0 |
6 |
100.0 |
2009-2010 |
IAC |
CDN-HLHZ |
37 |
7.66 |
7.71 |
0.7 |
3.3 |
1 |
0 |
97.3 |
2006-2007 |
ACC |
CDN-HLLC |
89 |
3.01 |
2.94 |
-2.2 |
7.3 |
0 |
15 |
100.0 |
2009-2010 |
IAC |
CDN-GS-2C |
45 |
|
- |
- |
- |
- |
- |
- |
2009-2010 |
IAC |
CDN-GS-2F |
50 |
|
- |
- |
- |
- |
- |
- |
2009-2010 |
IAC |
CDN-HZ-3 |
88 |
3.16 |
3.17 |
0.4 |
3.5 |
0 |
0 |
100.0 |
2009-2011 |
IAC |
CDN-ME-2 |
250 |
1.35 |
1.32 |
-2.4 |
2.9 |
6 |
0 |
97.6 |
2009-2011 |
IAC |
CDN-SE-2 |
84 |
1.34 |
1.48 |
10.2 |
3.5 |
12 |
4 |
85.7 |
2010-2011 |
IAC |
CDN-ME-16 |
61 |
0.807 |
0.79 |
-2 |
2.4 |
0 |
0 |
100.0 |
2010-2011 |
IAC |
CDN-ME-14 |
89 |
3.1 |
2.97 |
-4.1 |
1.9 |
23 |
0 |
74.2 |
2017 |
MPC |
CDN-GS-P7E |
34 |
|
- |
- |
- |
- |
- |
- |
2017 |
MPC |
CDN-ME-1308 |
34 |
0.429 |
0.43 |
0.2 |
4.6 |
0 |
0 |
100.0 |
2017 |
MPC |
CDN-GS-2J |
45 |
- |
- |
- |
- |
- |
- |
- |
Back Forty Project |
8-11 |
Gold Resource Corporation |
|
8.3.2 |
Blanks |
Contamination is monitored by the routine insertion of a barren sample (blank) that goes through the same sample preparation and analytical procedures as the core samples.
A total of 562 blanks were analyzed between 2002 and 2017. A general guideline for success during a contamination QC program is a rate of 90% of blank assay results not exceeding the acceptance limits of three times (3x) the detection limit. For gold assay results, the detection limit varied from 0.01 g/t Au to 0.05 g/t Au depending on the analytic method. For the sake of the study, a detection limit of 0.05 g/t was applied to all analyses. For the drilling programs performed on the Back Forty Project between 2001 and 2017, a total of 16 samples (3%) returned grades higher than 3x the detection limit (Figure 8-1 and Table 8-7) with 12 of those failures occurring in 2007.
Based on the overall performance of the blanks, the author does not consider the anomalous samples to be of significant impact to the assay data.
Table 8-7: Results of Blanks Used in the Back Forty Project Between 2002 and 2017
Year |
Laboratory |
Quantity Inserted |
Quantity Failed |
Percent Passing QC |
|---|---|---|---|---|
2002-2003 |
ALS |
95 |
1 |
99% |
2006 |
Accurassay and ALS |
11 |
1 |
91% |
2007 |
Accurassay |
147 |
12 |
92% |
2008 |
Accurassay |
39 |
0 |
100% |
2009-2010 |
IAC |
140 |
2 |
99% |
2010-2011 |
IAC |
103 |
0 |
100% |
2015 |
Bureau Veritas |
2 |
0 |
100% |
2016 |
MPC |
13 |
0 |
100% |
2017 |
MPC |
12 |
0 |
100% |
Back Forty Project |
8-12 |
Gold Resource Corporation |
|
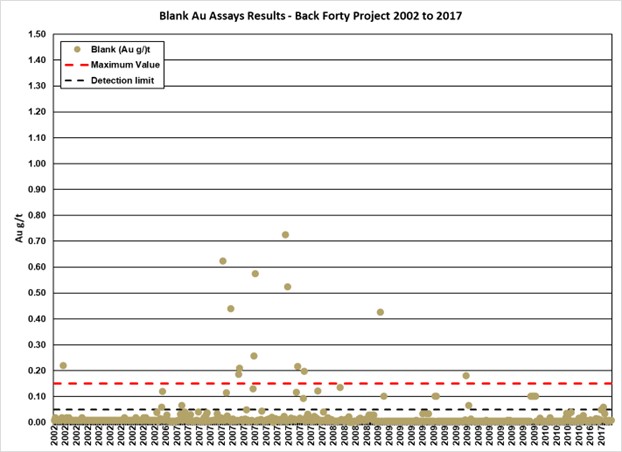
Figure 8-1: 2002-2017 Gold Results for Blanks (n=562) Assayed for the Project
8.3.3 |
Duplicate Samples |
The issuer’s QA/QC procedure does not include systematic duplicate assays.
During the 2009-2010 Drilling Program, a total of 227 field splits of core samples were collected. The preparation of these samples involved breaking drill core from a selected sample into less than three centimeter-sized fragments, randomly mixing them, and splitting the fragments into two separate samples. While these core splits are not considered true field duplicates, those pseudo-duplicates served as a general check on the reproducibility of the analyses and provided an additional check on analytical consistency.
8.3.4 |
Check Samples |
In 2006, 94 check samples from a variety of mineralized zones with a range in metal values originally analyzed by Accurassay were re-assayed at Actlabs for gold, silver, zinc and copper. An acceptable correlation was obtained between the replicate samples.
During the 2009-2010 and the 2010-2011 Drilling Programs, a total of 213 and 710 check assays, respectively, were performed by SGS in Toronto, Ontario on pulps initially analyzed by AIC. Linear regression plots of gold, silver,
Back Forty Project |
8-13 |
Gold Resource Corporation |
|
copper, lead, and zinc for replicate samples were created. Comparative analyses are robust, with regressions for all five elements falling within acceptable limits of deviation (Figure 8-2).
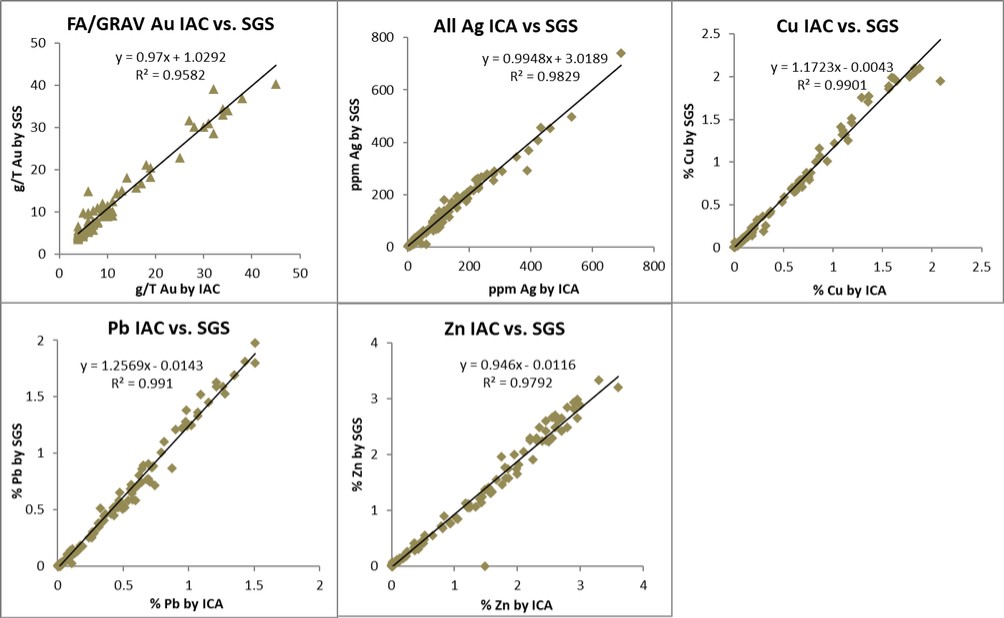
Figure 8-2: Linear Regression Graphs Comparing IAC versus SGS Assay Results
8.4 |
Qualified Person’s Opinion |
In 2019, P&E noted the direct interest in MPC Laboratory that was held by the Company’s VP Exploration during the 2016 to 2017 drill program (Bradfield et al, 2019). The VP Exploration is no longer affiliated with the issuer, therefore, there is now no relationship between the laboratory and Company. Analyses carried out at MPC during the 2016 to 2017 program totalled less than 10% of all drill core samples analyzed and, of these samples, only around 3% were exclusively analyzed at MPC. All other samples were also analyzed at Bureau Veritas and comparison of these duplicate analyses is acceptable.
The author is of the opinion that the sample preparation, security, analysis and QA/QC protocols for Drill Programs performed between 2002 and 2017 followed generally accepted industry standards, and that the data is valid and of sufficient quality for a mineral resource estimation.
Back Forty Project |
8-14 |
Gold Resource Corporation |
|
9.0 |
DATA VERIFICATION |
9.1 |
Mineral Resources |
This item covers the authors’ data verification for the 2023 MRE. Data verification included site visits and a review of drill core geological descriptions.
9.1.1 |
Site Visit |
Eric Kinnan (P.Geo.), from InnovExplo, visited the Project and the issuer’s core shack from July 5 to 7, 2021. He was accompanied by Bob Mahin, the issuer’s Director of Exploration and Geology at the time, during the site visit. The core shack is located at the issuer’s office in Carney. The site data verification included a general visual inspection of the Property, a review of drill collar location coordinates and a visual assessment of access roads. At the core shack, the author examined selected mineralized core intervals and reviewed the QA/QC program, the downhole survey data and the descriptions of lithologies, alteration and mineralization. He also performed independent check assays on selected intercepts, which were ¼ split by the issuer’s contractor.
9.2 |
Core Review |
Prior to 2009, all drill core was housed either in the outdoor fenced storage area at the field office or at the indoor Daggett core warehouse. From 2009 to 2011, the drill core was transferred to a new core facility in Carney, Michigan (27 km away) for photographing, cutting, sampling and archiving. As of 2011, all drill core from previous and subsequent programs was transferred to the Project’s core warehouse in Bagley, Michigan to be stored on indoor racks. The issuer has retained and archived all core drilled to date.
Mr. Kinnan reviewed selected core intervals on-site. The core boxes were found to be in reasonably good order and clearly identified by permanent marker. Sample tags were still present in the boxes, as were the wooden blocks placed at the beginning and end of each drill run (Figure 9-1). The numbering on the wooden blocks matched the indicated footage on each box. The sample numbers were validated, and the presence of mineralization was confirmed in the referenced half-core samples.
Back Forty Project |
10-1 |
Gold Resource Corporation |
|
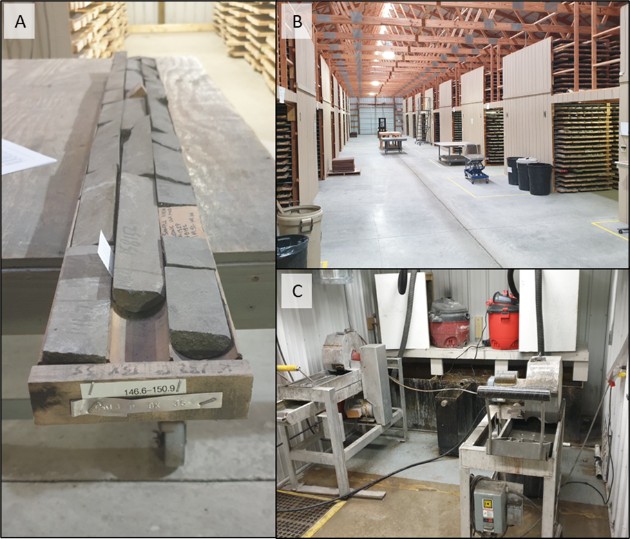
Notes: A) Box identified by marker, laboratory sample tags and wooden blocks; B) Core storage; C) Core sawing area
Figure 9-1: Photographs Taken During the Drill Core Review
9.3 |
Drill Hole Database |
Ms. Marina Iund (P.Geo.), from InnovExplo, reviewed and validated all drilling information used for the 2023 MRE. The validation included all aspects of the drill hole database (i.e., collar locations, drilling protocols, down-hole surveys, logging protocols, sampling protocols, QA/QC protocols, validation sampling, density measurements and checks against assay certificates).
9.4 |
Drill Hole Locations |
Since 2002, collar locations were surveyed by Aquila’s surveyors, consequently, no official survey reports were available for inspection. To validate the accuracy of the drill hole locations available in the database, Mr. Kinnan ran a check on 35 of the collar location coordinates.
The State of Michigan requires all exploration test holes to be completely cemented from bottom to surface and the casing removed, if possible. Holes may be left open for an extended period of time if the company plans further
Back Forty Project |
10-2 |
Gold Resource Corporation |
|
work for the holes, such as borehole geophysical surveying, and the Michigan office of Environment, Great Lakes, and Energy is notified. At the time of the visit by Mr. Kinnan, 55 exploration drill holes remained open with locatable collars. Of those, 50 holes were drilled from 2006-2010 and the remainder from 2016-onwards. Mr. Kinnan was able to validate the locations of 29 holes in total: nine from the 2006-2010 period and 20 from post-2016. The locations of selected collars were recorded using a portable GPS (Figure 9-2) and compared to the original logs. All results had acceptable precision.
The collar surveys are considered adequate for the purpose of a resource estimate.
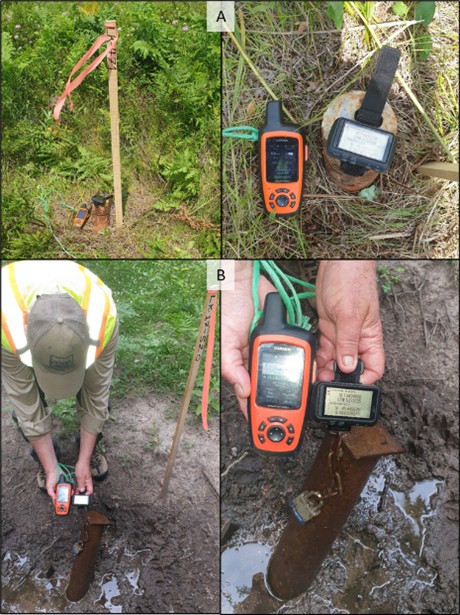
Notes: A) Hole LK-471; B) Hole LK17-520.
Figure 9-2: Examples of Onsite Collar Location Verifications
Back Forty Project |
10-3 |
Gold Resource Corporation |
|
9.5 |
Downhole Survey |
Downhole surveys were conducted on the majority of holes. The deviation measurement was taken with a multi-shot Sperry Sun camera tool, and later using a Reflex™ FlexIt Smart tool, every 3, 6 to 9 m for the length of the drill hole. Both instruments determine azimuth deviation by magnetic methods.
The downhole survey information was verified for 5% of the holes included in the 2022 MRE. Minor errors of the type normally encountered in a project database were identified and corrected.
9.6 |
Assays |
The author verified holes represent 5% of the database. The author had access to assay certificates from the issuer server for the 2002-2003 Drilling Program historical holes (those data were purged from the ALS system) and for holes analyzed by Accurassay (the laboratory went bankrupt, and no one acquired their historical database). All other certificates were obtained directly from the laboratories (20 from the 35 selected holes).
The Project database is considered to be valid, reliable and of good overall quality.
9.7 |
Independent Resampling |
During the site visit, Mr. Kinnan selected 14 quarter-splits of selected core intervals to be sawed by the issuer personnel. The QP bagged the samples and transported them to ALS for analysis.
The resampling results confirmed the ranges of grades of the mineralization for the different metals. The resampling results indicate a good reproducibility of the original assays despite some differences that may be explained by the gold and silver nugget effects visually observed in the drill core as well as the representativeness limited by the size of the quarter-splits samples. The author believes the field-duplicate results from the independent resampling program are reliable and valid for this type of project.
Table 9-1 shows the resampling results.
Back Forty Project |
10-4 |
Gold Resource Corporation |
|
Table 9-1: Summary of Independent Resampling
|
Hole ID |
Original (Aquila) |
Field Duplicate (InnovExplo) |
Difference |
|||||||||||
|
Sample ID |
Au |
Ag (g/t) |
Cu (%) |
Zn (%) |
Sample ID |
Au |
Ag (g/t) |
Cu (%) |
Zn (%) |
Au |
Ag (g/t) |
Cu (%) |
Zn (%) |
|
|
108 408 |
FX808223 |
1.37 |
12 |
0.14 |
7.74 |
25801 |
1.30 |
13 |
0.16 |
5.37 |
0.07 |
-1 |
-0.02 |
2.37 |
|
LK-497 |
842000 |
1.52 |
10 |
0.14 |
13.60 |
25803 |
1.12 |
13 |
0.12 |
11.95 |
0.40 |
-3 |
0.02 |
1.65 |
|
LK-497 |
842011 |
2.96 |
83 |
0.11 |
4.28 |
25804 |
1.78 |
60 |
0.08 |
5.85 |
1.18 |
22 |
0.04 |
-1.57 |
|
PFD-11 |
BFJ_11358 |
2.07 |
312 |
3.82 |
0.01 |
25805 |
1.81 |
121 |
3.13 |
0.05 |
0.26 |
191 |
0.69 |
-0.04 |
|
LK-81 |
133182 |
5.79 |
135 |
0.03 |
0.36 |
25806 |
6.05 |
269 |
0.06 |
0.52 |
-0.26 |
-134 |
-0.03 |
-0.16 |
|
LK-81 |
133184 |
6.99 |
102 |
0.05 |
0.03 |
25807 |
5.05 |
107 |
0.06 |
0.04 |
1.94 |
-5 |
-0.01 |
-0.01 |
|
LK-88 |
253329 |
1.50 |
22 |
0.09 |
13.70 |
25808 |
1.44 |
17 |
0.07 |
7.83 |
0.06 |
5 |
0.02 |
5.87 |
|
LK-88 |
133120 |
2.64 |
15 |
0.24 |
11.58 |
25809 |
1.68 |
14 |
0.31 |
11.35 |
0.96 |
1 |
-0.07 |
0.23 |
|
LK-132P |
158152 |
0.79 |
142 |
0.01 |
18.54 |
25810 |
0.88 |
169 |
0.02 |
24.60 |
-0.09 |
-27 |
0.00 |
-6.06 |
|
LK-281 |
359099 |
1.78 |
69 |
0.02 |
4.98 |
25811 |
1.49 |
25 |
0.01 |
4.02 |
0.29 |
44 |
0.01 |
0.96 |
|
LK181PE |
172727 |
0.69 |
48 |
1.30 |
30.94 |
25812 |
0.69 |
48 |
0.99 |
28.80 |
0.00 |
0 |
0.31 |
2.14 |
|
LK-442 |
664020-664021 |
1.25 |
14 |
0.13 |
9.51 |
25814 |
0.93 |
15 |
0.10 |
13.50 |
0.33 |
0 |
0.03 |
-3.99 |
|
LK-400 |
518968 |
7.68 |
27 |
1.76 |
3.95 |
25816 |
7.69 |
28 |
1.51 |
3.06 |
-0.01 |
-1 |
0.26 |
0.89 |
|
108 423 |
FX809811 |
3.16 |
92 |
0.04 |
13.05 |
25817 |
1.89 |
54 |
0.06 |
14.90 |
1.28 |
38 |
-0.02 |
-1.85 |
Back Forty Project |
10-5 |
Gold Resource Corporation |
|
9.8 |
Conclusion |
Overall, the authors are of the opinion that the data verification process demonstrates the validity of the data and protocols for the Project. The authors consider the database for the Project to be valid and of sufficient quality to be used for the mineral resource estimate herein. The QPs confirm that all elements for which they were directly involved with, and responsible for, are in good order and in accordance with the observations during the site visit.
Back Forty Project |
10-6 |
Gold Resource Corporation |
|
10.0 |
MINERAL PROCESSING AND METALLURGICAL TESTING |
10.1 |
Previous Testwork |
Over the life of the project, numerous testwork programs were undertaken to perform a variety of testing on several samples. Table 10-1 outlines those programs from 2007 to 2023. The majority of the testwork no longer applies to the current project design since mine development has shifted and process design evolved. The testwork that remains relevant is summarized in sections 10.1.1 (Comminution) & 10.1.2 (Concentrate Solid-Liquid Separation & Rheology).
Table 10-1: Previous Testwork Programs
Laboratory |
Year |
Program # |
Testwork program |
G&T Metallurgical Ltd. |
2007 |
KM 1983 |
-
Mineralogy
-
Rougher Flotation
|
G&T Metallurgical Ltd. |
2008 |
KM 2047 |
-
Hardness
-
Mineralogy
-
Rougher, Cleaner & LCT Flotation
-
Cyanide Leaching
-
Gravity Concentration
|
SGS Canada Inc |
2009 |
|
-
Gravity Separation
-
Cyanide Leaching
|
G&T Metallurgical Ltd. |
2010 |
KM 2575 |
-
Flotation
-
Cyanide Leaching
|
SGS Canada Inc |
2010 |
12338-001 |
-
Grindability
-
Cyanide Leaching
-
Carbon-In-Leach
-
Carbon-In-Pulp
-
Cyanide Destruction
|
G&T Metallurgical Ltd. |
2011 |
KM 2775 |
-
Flotation
-
Cyanide Leaching
|
Resource Development Inc. |
2011 |
|
-
Comminution
-
Cyanide Leaching
|
Resource Development Inc. |
2012 |
|
-
Cyanide Leaching
-
Flotation
|
SGS Canada Inc |
2015-2022 |
|
-
Comminution
-
Flotation
-
Cyanide Leaching
-
Leach Product Filtration
-
SART
-
Cyanide Destruction
-
Tailing Dewatering & Rheology
-
Concentrate Dewatering & Rheology
|
|
Base Metallurgical Laboratories Ltd. |
2023 |
BL1173 |
-
Gravity
-
Flotation
-
Bottle Roll Tests
|
BQE Water |
2023 |
|
-
Reverse Osmosis
-
SART
-
Cyanide Destruction
|
Back Forty Project |
10-7 |
Gold Resource Corporation |
|
10.1.1 |
Comminution Testwork (SGS) |
The comminution testwork consisted of grindability testing to characterize the competency, hardness and abrasion of the Back Forty Deposit material. Samples were selected and composited to represent the variability of the Back Forty Deposit from several perspectives including pyrite (and other mineral content), lithology, metallurgical type, and metal grades.
10.1.1.1 |
Comminution Circuit Characterization Testwork |
Two shipments of drill cores were sent to SGS Lakefield from July 2015 to December 2015. The shipments included 69 samples which were subjected to a series of tests: Bond ball work index (BWI, 16), modified Bond ball work index (ModBond, 61) and abrasion index (AI, 9). Further composites were created by compiling unused material and were submitted for SMC tests (9). Most of the material used for this phase was from past drilling programs and was sent as quartered NQ core. As new drill core became available, more material was sent to SGS to conduct crusher work index tests (CWI, 6); full NQ was used for that purpose only.
Samples were prepared considering the mass of material available and the tests to which the material was to be subjected. The samples submitted for Bond ball mill work index testing were also submitted for the ModBond test to establish the ModBond - BWI correlation parameters.
The summary of the results of the first phase of grindability tests for the comminution variability samples is shown in Table 10-2 and Table 10-3 and presents, for each type of tests performed, the purpose of the test, summarized comments, and results from the SGS grindability report.
Overall, the sample depicted a large amount of variability across the grindability characterization tests. The relative standard deviation of test results within each series ranged from 16 to 54, which is considered broad. Further variability grindability tests are therefore recommended to better understand the nature of this variability.
Table 10-2: Summary of Grindability Test Statistics (2016 Results)
Statistics |
Density |
CWI (kWh/t) |
JK Parameters (from SMC tests) |
BWI (kWh/t) |
ModBond (kWh/t) |
AI (g) |
|||||
CWI |
SMC |
|
A x b |
ta |
DWi |
@106 µm |
@75 µm |
@106µm |
@75 µm |
|
|
Results Available |
6 |
9 |
6 |
9 |
9 |
9 |
11 |
5 |
61 |
61 |
9 |
Average |
3.85 |
3.46 |
7.9 |
45.3 |
0.3 |
8.8 |
12.9 |
13.8 |
13.0 |
13.3 |
0.398 |
Std. Dev. |
0.64 |
0.84 |
2.9 |
24.5 |
0.1 |
2.5 |
3.2 |
2.3 |
3.1 |
2.7 |
0.107 |
Rel. Std. Dev. (%) |
16 |
24 |
37 |
54 |
32 |
28 |
25 |
17 |
24 |
20 |
27 |
Min |
2.99 |
2.71 |
4.4 |
83.9 |
0.5 |
5.3 |
9.1 |
10.6 |
8.3 |
9.2 |
0.285 |
10th Percentile |
- |
- |
- |
- |
- |
- |
- |
- |
9.6 |
10.4 |
- |
25th Percentile |
- |
- |
- |
- |
- |
- |
- |
- |
10.4 |
11.2 |
- |
Median |
4.54 |
2.96 |
7.6 |
29.4 |
0.3 |
9.8 |
12.8 |
14.4 |
12.4 |
12.7 |
0.365 |
75th Percentile |
- |
- |
- |
- |
- |
- |
- |
- |
14.8 |
14.7 |
- |
90th Percentile |
- |
- |
- |
- |
- |
- |
- |
- |
17.5 |
17.1 |
- |
Max |
4.68 |
4.86 |
12.5 |
22.5 |
0.2 |
12.3 |
18.9 |
16.7 |
21.7 |
20.8 |
0.564 |
Back Forty Project |
10-8 |
Gold Resource Corporation |
|
Table 10-3: Grindability Test Overview (2016 Results)
Grindability Test |
Comments |
Summarized Results |
|---|---|---|
|
SMC Abbreviated version of the standard JKTech Drop Weight Test (DWT) performed on rocks from a single size fraction (-16.0/+13.2 mm) |
●
Preferably calibrated against reference samples submitted to the standard DWT to consider the natural ‘gradient of hardness’ by size;
●
No suitably sized core was available and subsequently no DWT result;
●
SMC results were calibrated against the JKTech database.
|
●
Considered soft to very hard range of hardness, with A x b ranging from 83.9 to 22.5;
●
Broad range in relative density, from 2.71 to 4.86;
●
Relative consistency in hardness and density of the samples within mineralized zones.
|
|
CWI Crusher Work Index or Bond low-energy impact test (-3/+2 inches) |
●
Test requires 20 rocks to account for the variability of the samples;
●
Due to limited material availability, samples with between three and twenty rocks shipped to SGS Vancouver for the completion of the test;
●
Validation on samples of 20 specimens or more is recommended.
|
●
Results from sub-zones were used to calculate the overall zone CWI data
●
Considered soft to moderately hard range of hardness within the SGS database, with CWI varying from 4.4 kWh/t to 12.5 kWh/t.
●
Average CWI of 7.9 kWh/t, which was classified as moderately soft.
|
|
BWI Bond ball mill grindability test performed at closing sizes of 106 and 75 µm on different samples |
●
Samples selected based on the ModBond test results to cover the whole range of hardness of the variability samples;
●
Closing screen size should be selected to reflect the plant product; closing size was therefore decreased to 75 µm to consider finer primary grind as first expected;
●
Five samples were tested at both closing screen sizes.
|
●
Samples evaluated at both closing screen sizes demonstrated that the closing screen size had very limited effect on the BWI for the samples tested.
o
Difference was within the experimental error for four of the samples, [-0.2 to 0.3 kWh/t]
o
Softest sample tested showed an increase in BWI from 9.2 kWh/t at 106 µm to 10.6 kWh/t at 75 µm closing size.
●
BWI ranged from very soft (9.1 kWh/t) to hard (18.9 kWh/t).
●
Ranges were narrower by metallurgical type (oxides being the most competent and Pinwheel being the least competent).
|
|
ModBond test Single batch test, calibrated against standard BWI results |
●
First 25 samples (i.e., from the July 2015 shipment) were calibrated at 106 µm with 6 full BWI test results;
●
Second set (i.e., from the December 2015 shipment, 32 samples) were calibrated at both 106 and 75 µm against 5 full BWI test results from the same set of samples.
●
Calibration between the ModBonds at the two closing sizes was developed and used to estimate the ModBond results for the initial twenty-nine samples at 75 µm.
|
●
Samples covered the very soft (9.2 kWh/t) to very hard (20.8 kWh/t) range of hardness in the SGS database
●
Data range was narrower within each metallurgical type (oxides on average were the most competent while Pinwheel Zone samples were the least competent).
●
Average ModBond results were similar at the two closing screen sizes, 13.0 kWh/t at 106 µm and 13.3 kWh/t at 75 µm. This was classified as moderately soft in the SGS database.
●
Coarser closing size was shown to have a slightly wider range of ModBond results.
|
|
AI Bond abrasion test |
|
●
AI ranged from 0.285 g to 0.564 g, corresponding to the medium to abrasive range of the SGS database;
●
Average AI was 0.398 g.
|
Back Forty Project |
10-9 |
Gold Resource Corporation |
|
10.1.1.2 |
Additional Comminution Testing |
In 2017, 24 samples were shipped to SGS Lakefield. All 24 samples were subjected to SMC testing and five samples were subjected to Bond ball mill tests. The results are summarized in Table 10-4.
Table 10-4: Summary of Grindability Test Statistics, 2017 Results
Statistics |
Density SMC |
JK Parameters |
BWI (kWh/t) |
||
A x b |
ta |
DWi |
@ 106 µm |
||
Results Available |
24 |
24 |
24 |
24 |
5 |
Average |
3.42 |
42.9 |
0.32 |
10.5 |
11.7 |
Std. Dev. |
0.69 |
16.4 |
0.06 |
1.8 |
1.7 |
Rel. Std. Dev. (%) |
20 |
38 |
18 |
17 |
15 |
Min |
2.77 |
85.6 |
0.49 |
6.8 |
8.8 |
Median |
3.13 |
35.7 |
0.30 |
12.0 |
12.4 |
Max |
4.83 |
27.0 |
0.25 |
12.3 |
13.0 |
10.1.1.3 |
Regrinding Testing |
In 2018-2019, two rougher concentrate samples were used to determine signature plot using an IsaMill™. This test provides data on the specific energy required to reach product size and is used in the design of IsaMill™ grinding circuits. The targeted 80% passing size (P80) for both rougher concentrates tested was 17 µm. The bulk rougher concentrate, which had a feed P80 of 54.7 µm, required 38.6 kWh/t of regrinding energy to reach the targeted P80. The zinc rougher concentrate, which had a feed P80 of 61.4 µm, required 35.9 kWh/t to reach the same P80 as the bulk concentrate.
10.1.2 |
Concentrate Solid-Liquid Separation and Rheology Testwork (SGS) |
Three concentrate samples were subjected to solid-liquid separation and rheology testing. Two additional concentrate samples were subjected to flocculant response confirmation. The names of the samples and the completed tests are summarized in Table 10-5. This section reports the main results.
Table 10-5: Test Summary
Sample I.D. |
Test Program |
PP-07 Zn Clnr Conc |
Flocculant Selection, Two Stage Static Setting, U/F Rheology, Pressure Filtration |
PP-13 Bulk Clnr Conc |
|
PP-09 Zn Ro Conc |
|
PP-05 Bulk Clnr Conc |
Flocculant Response Confirmation |
PP-11 Zn Ro Conc |
Back Forty Project |
10-10 |
Gold Resource Corporation |
|
10.1.2.1 |
Sample Preparation and Characterization |
All samples were received as representative pulps with their respective process water and had a near-neutral pH. As requested, pH was adjusted with lime to 11 for the two bulk concentrate pulp samples and 12 for the zinc concentrate pulp samples.
Representative aliquots were characterized for particle size distributions using laser diffraction and for specific gravity using a gas pycnometer. Particle size distributions and specific gravity of dried solids are summarized in Table 10-6.
Table 10-6: Sample Characterization
Sample I.D. |
Particule Sizing |
SG, Dried Solids |
||
1d80, µm |
1 <1 µm, % vol |
1 <20 µm, % vol |
||
PP-07 Zn Clnr Conc |
27 |
7.8 |
68.9 |
4.10 |
PP-13 Bulk Clnr Conc |
17 |
11.4 |
85.5 |
4.40 |
PP-09 Zn Ro Conc |
48 |
3.4 |
54.7 |
4.04 |
PP-05 Bulk Clnr Conc |
14 |
18.1 |
88.9 |
4.27 |
PP-11 Zn Ro Conc |
44 |
2.2 |
61.7 |
3.63 |
1Determined using laser diffraction (Malvern) and volumetric distribution.
10.1.2.2 |
Flocculant Selection and Flocculant Response Confirmation |
Flocculant selection tests were conducted using a range of anionic, nonionic and cationic flocculants on three samples and response confirmation tests were conducted on two samples. The results indicated all responded well to BASF Magnafloc 10, which is a very high molecular weight anionic polyacrylamide flocculant, except PP-05 Bulk Clnr Conc. The samples that responded well to the selected flocculant achieved good settling characteristics as well as clear supernatant using relatively low dosage. Even at increased flocculant dosage, PP-05 Bulk Clnr Conc did not respond as well to the selected flocculant and had a hazy supernatant.
10.1.2.3 |
Static Settling |
Two stages of static settling tests evaluating the effect of feed solids density and flocculant dosage were performed in graduated cylinders which were fitted with a rotating “picket-style” rake. Static settling test results, which were considered to provide the best response, are summarized in Table 10-7.
Back Forty Project |
10-11 |
Gold Resource Corporation |
|
Table 10-7: Static Settling Results Summary
Sample I.D. |
Flocculant Dose, g/t |
Feed1 %w/w |
U/F2 %w/w |
Unit Area m2/(t/day) |
ISR3 m3/m2/day |
Supernatant4 Clarity |
TSS5 mg/L |
Testing pH |
PP-07 Zn Clnr |
10 |
5 |
58 6 |
0.22 6 |
663 |
Clear |
<10 |
12 |
PP-09 Zn Ro |
7 |
10 |
66 |
0.12 |
513 |
Clear |
22 |
12 |
PP-13 Bulk Clnr |
12 |
10 |
67 |
0.13 |
719 |
Clear |
12 |
11 |
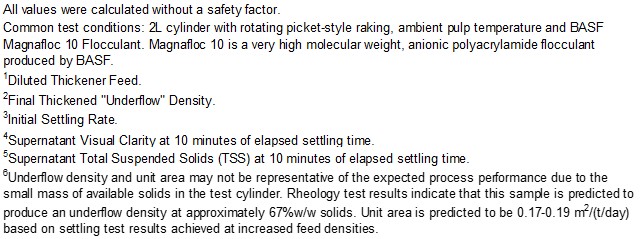
10.1.2.4 |
Rheology |
A very important aspect relating to sample characterization within the context of a rheology study is the relationship between the solids specific gravity and slurry solids content. The basis for this is the concept of particulate fluids, which is applicable in the case of the tested slurry samples. The deviation of the actual specific gravity (ASG) versus the specific gravity (SG) of the dry material defines the slurry inter-particle interaction coefficient “α”. The smaller the coefficient is, the greater the interactions are. Table 10-8 summarizes the rheology sample characterization for each of the sample densities that were tested.
The rheology test measurement data allowed for Bingham modelling and subsequent interpretation, particularly with respect to the solids content rheology profile.
Back Forty Project |
10-12 |
Gold Resource Corporation |
|
Table 10-8: Rheology Sample Characterization
Test Code |
d80 microns |
ASG |
SG |
α ASG/SG |
pH |
Temp oC |
Solids %w/w |
Density g/L |
Sample I.D. : PP-07 Zn Clnr Conc Underflow | ||||||||
T1 |
27 |
3.67 |
4.1 |
0.89 |
11.6 |
22 |
71.8 |
2094 |
T2 |
3.66 |
0.89 |
69.4 |
2019 |
||||
T3 |
3.67 |
0.89 |
65.8 |
1918 |
||||
T4 |
3.63 |
0.88 |
61.3 |
1799 |
||||
T5 |
3.60 |
0.88 |
55.6 |
1671 |
||||
Sample I.D. : PP-09 Zn Ro Conc Underflow | ||||||||
T6 |
48 |
3.78 |
4.04 |
0.93 |
11.6 |
22 |
75.8 |
2259 |
T7 |
3.79 |
0.94 |
73.3 |
2173 |
||||
T8 |
3.80 |
0.94 |
69.9 |
2063 |
||||
T9 |
3.76 |
0.93 |
65.5 |
1926 |
||||
T10 |
3.68 |
0.91 |
60.0 |
1777 |
||||
Sample I.D. : PP-13 Bulk Clnr Conc Underflow | ||||||||
T11 |
17 |
4.23 |
4.4 |
0.96 |
11.2 |
22 |
75.0 |
2340 |
T12 |
4.21 |
0.96 |
72.2 |
2225 |
||||
T13 |
4.18 |
0.95 |
68.2 |
2079 |
||||
T14 |
4.09 |
0.93 |
63.3 |
1917 |
||||
T15 |
4.02 |
0.91 |
57.1 |
1752 |
||||

Critical Solids Density (CSD) is the solids content at which a small increase of the solids content causes a significant decrease of the flowability of the slurry. The CSD value is also predictive of the maximum underflow solids content achievable in a commercial thickener and of the underflow solids content and pumpability ranges achievable in practice and with reasonable friction pressure losses for an economically feasible operation.
The CSD of the PP-07 Zn Clnr Conc Underflow sample was ~67% w/w solids, which exhibited a yield stress of 44 Pa under unsheared flow condition and 29 Pa under sheared conditions which were measured after a three-minute period of constant shearing. A degree of thixotropic response was exhibited by the sample at or above 65.8% w/w solids. Thixotropic response is a “flow-friendly” behavior whereby the resistance to flow decreases during constant shearing. Plug flow response was observed during the unsheared sample measurement at 71.8% w/w solids.
The CSD of PP-13 Bulk Clnr Conc Underflow sample was ~71% w/w solids, which exhibited a yield stress of 48 Pa under unsheared flow condition and 42 Pa under sheared conditions. A degree of thixotropic response was exhibited by the sample at or above 72.2% w/w solids.
Back Forty Project |
10-13 |
Gold Resource Corporation |
|
The solids content versus yield stress results for both samples are presented in Figure 10-1 and Figure 10-2.
|
|
Figure 10-1: Solids Content Versus Yield Stress for PP-07 Zn Clnr Conc Underflow |
|
Figure 10-2: Solids Content Versus Yield Stress for PP-13 Bulk Clnr Conc Underflow |
Back Forty Project |
10-14 |
Gold Resource Corporation |
|
10.1.2.5 |
Pressure Filtration |
Underflow pressure filtration tests were conducted at 6.9 bar and 9.9 bar pressure levels. PP-07 Zn Clnr Conc Underflow pressure filtration was conducted using filter feed at 67% w/w solids based on the results of the rheology test. Tested cake thicknesses ranged from 13 to 28 mm for both pressures tested. The resulting dry solids capacity ranged from 1,436 to 2,343 kg/m2 h. The throughput is calculated using filtration time that includes form and dry times only. Throughput will decrease after incorporating additional cycle time which includes filling, cake pressing, discharging and cloth cleaning, as required. The discharge cake residual moisture content ranged from 11.1% to 13.4% w/w. Cracks were observed on the filtered cake surface at all tested cake thicknesses. Test results for PP-07 Zn Clnr Conc are summarized in Table 10-9.
Table 10-9: Pressure Filtration Results Summary – PP-07 Zn Clnr Conc Underflow
Sample I.D. |
Filter Cloth |
Operating Conditions |
Filter Outputs |
||||||||
Feed Solids %w/w |
Pressure Level, bar |
Form time, s |
Dry time, s |
Form/Dry ratio |
1Cake Thickness, mm |
2Throughput dry kg/m2*h |
Cake Moisture, % w/w |
Filtrate TSS, mg/L |
Cake Texture |
||
PP-07 Zn Clnr Conc |
Testori P6620 TC |
67.0 |
6.9 |
7 |
43 |
0.17 |
13 |
2025 |
12.4 |
247 |
3DTT |
12 |
46 |
0.25 |
18 |
2343 |
12.9 |
164 |
DTT |
||||
20 |
84 |
0.24 |
23 |
1675 |
13.3 |
149 |
DTT |
||||
28 |
117 |
0.24 |
28 |
1436 |
13.4 |
145 |
DTT |
||||
9.9 |
7 |
48 |
0.14 |
13 |
1809 |
11.1 |
201 |
DTT |
|||
10 |
53 |
0.19 |
18 |
2174 |
12.2 |
174 |
DTT |
||||
16 |
101 |
0.16 |
23 |
1471 |
11.7 |
163 |
DTT |
||||
22 |
110 |
0.2 |
28 |
1588 |
11.5 |
129 |
DTT |
||||
1Represents half of the chamber thickness.
2Throughput is calculated using cycle time which includes form and dry times only.
3Dry to touch.
PP-13 Bulk Clnr Conc underflow pressure filtration was conducted using filter feed at 71% w/w solids based on the results of the rheology test. Tested cake thicknesses ranged from 14 to 29 mm. The resulting dry solids capacity ranged from 1,090 to 1,448 kg/m2·h. Discharge cake residual moisture content ranged from 9.8% to 12.0% w/w. Cracks were observed on the cake surface at all tested cake thicknesses. Test results for PP-13 Bulk Clnr Conc Underflow are summarized in Table 10-10.
Back Forty Project |
10-15 |
Gold Resource Corporation |
|
Table 10-10: Pressure Filtration Results Summary – PP-13 Bulk Clnr Conc Underflow
Sample I.D. |
Filter Cloth |
Operating Conditions |
Filter Outputs |
||||||||
Feed Solids %w/w |
Pressure Level, bar |
Form time, s |
Dry time, s |
Form/Dry ratio |
1Cake Thickness, mm |
2Throughput, dry kg/m2*h |
Cake Moisture, % w/w |
Filtrate TSS, mg/L |
Cake Texture |
||
PP-13 Bulk Clnr Conc |
Testori P6620 TC |
71.0 |
6.9 |
13 |
98 |
0.13 |
14 |
1090 |
9.9 |
218 |
3DTT |
21 |
102 |
0.21 |
19 |
1283 |
10.4 |
143 |
DTT |
||||
36 |
137 |
0.26 |
24 |
1201 |
11.2 |
76 |
DTT |
||||
50 |
140 |
0.35 |
29 |
1323 |
12 |
119 |
DTT |
||||
9.9 |
10 |
69 |
0.14 |
14 |
1448 |
9.8 |
293 |
DTT |
|||
19 |
101 |
0.19 |
19 |
1353 |
10.1 |
145 |
DTT |
||||
27 |
140 |
0.19 |
24 |
1249 |
10.4 |
96 |
DTT |
||||
38 |
151 |
0.25 |
29 |
1325 |
11.1 |
106 |
DTT |
||||
1Represents half of the chamber thickness.
2Throughput is calculated using cycle time which includes form and dry times only.
3Dry to touch.
Rheology tests indicated that all three underflow samples (two results summarized in this section) exhibited a Bingham plastic and thixotropic response. In general, all underflow samples responded well to pressure filtration which resulted in relatively high throughput and low residual cake moisture. Cracks were observed on the cake surfaces which formed during drying. This occurrence may prevent further dewatering. A cake pressing cycle may be required if decreased cake moisture is required.
10.2 |
Metallurgical Testing and Analytical Procedures (2022) |
10.2.1 |
SGS |
The objective of the testwork program was to test and improve the overall metallurgical performance for copper, lead, zinc, gold and silver recoveries. To do so, five bulk composites were characterized and thoroughly tested. Two composites representing oxide and sulfide ore types, namely Comp OX, Comp SU, and the three phase composites: Comp Yr 1-6, Comp Yr 7-9 and Comp Yr 10-12 were tested.
10.2.1.1 |
Sample Characterization and Mineralogical Analysis |
The five composites were received from GRC as split drill cores or crushed samples. Samples were further crushed to 100% passing 1.7mm, homogenized and split into test charges for the metallurgical testwork.
Head characterization of each composite was done through XRF, fire assay, screened metallics, and strong acid ICP. The major head analyses are summarized in Table 10-11.
Back Forty Project |
10-16 |
Gold Resource Corporation |
|
Table 10-11: Head Assay Major Element Summary
|
Sample ID |
Assay (%) |
Screened Metallics (g/t) |
|||
Cu |
Pb |
Zn |
Au |
Ag |
|
Comp OX |
0.41 |
0.084 |
2.39 |
1.43 |
17.2 |
Comp SU |
0.31 |
0.11 |
4.04 |
2.02 |
20.5 |
Comp Yr 1-6 |
0.25 |
0.11 |
3.34 |
2.39 |
15.9 |
Comp Yr 7-9 |
0.35 |
0.17 |
4.24 |
2.18 |
19.0 |
Comp Yr 10-12 |
0.37 |
0.10 |
1.44 |
1.25 |
17.7 |
For each composite, identification of minerals present and their liberation were done using QEMSCAN (Quantitative Evaluation of Minerals Analysis by Scanning Electron Microscopy) and TIMA (an acronym for TESCAN Integrated Mineral Analyzer) analysis. Composites OX and SU were ground to a P80 of ~150 µm and ~75 µm for composites Yr 1-6, Yr 7-9, and Yr 10-12 prior to being submitted for mineralogical analysis.
The modal mineral distributions, presented in Figure 10-3, show that all samples had similar mineral content, all contained major amounts of pyrite (45.2-61.1%), minor to moderate amounts of quartz (15.1-24.8%), sphalerite (2.8- 8.1%), sericite/muscovite (6.1-11.3%), chlorite/clays (2.5- 12.2%), and K-feldspar (0.7- 2.2%). Iron oxides were more prevalent in the Yr 1-6 and Yr 7-9 composites at 6.3% and 1.7%, respectively. All samples also had similar amounts of chalcopyrite (0.62-1.06%), galena (0.07-0.20%), arsenopyrite (0.10-0.23%), and other sulfides (0.08-0.17%).
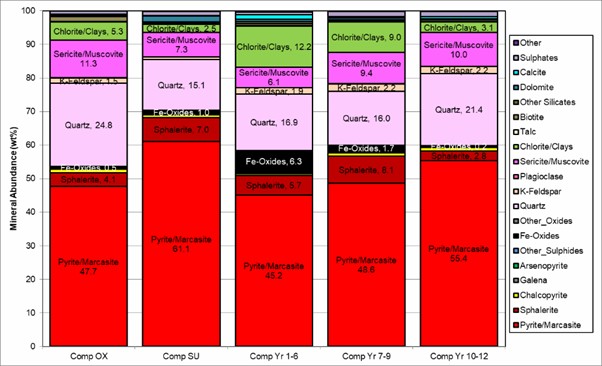
Figure 10-3: Modal Mineral Distribution
Back Forty Project |
10-17 |
Gold Resource Corporation |
|
When evaluating the liberation, a particle was considered free when 95% or more of its surface was composed of the mineral evaluated and liberated if it had ≥80%, but ≤95% area of the mineral.
At the sizes studied, liberation was found to be low to moderate (45.8 to 78.1% free + liberated) for chalcopyrite (Cu-Sulph). The liberation was the lowest for composite OX with 45.8% of the particles found to be free or liberated, and liberation improved to 62.5 and 64.2% for composites SU and Yr 10-12, respectively, and to 74.3% and 78.1% for composites Yr 1-6 and Yr 7-9, respectively. The majority of locked particles were associated with pyrite (54-74%), sphalerite (6-13%), silicates (4-13%), or complex associations of three or more of the previously listed elements.
Sphalerite liberation was good for sphalerite (78.1 to 90.4% free and liberated). Once again, the liberation was the lowest for composite OX. The majority of locked particles were associated with pyrite (48-70%), silicates (7-27%), sulphates (4-13%), copper sulfides (0.6-6%) or complex associations of three or more of the previously listed elements (7-16%).
Gold mineral deportment characterization showed that gold was mostly present as native gold or electrum (80.2-99.6%) and native gold (0.4-19.8%) with minor amounts of petzite found in Comp OX. At the studied sizes, gold liberation was poor (12.0-39.8%) in all composites except for Comp Yr 7-9, where 91.1% of the gold minerals were pure, free, or liberated. The main associations were with quartz/feldspars (up to 75% of locked particles), pyrite (5-69%), oxides (up to 16%), oxides/carbonates (up to 15%), and complex associations (17-92%).
Silver mineral deportment characterization showed that silver was present mostly as eugenite, electrum and acanthite in composites OX and SU with some luanheite present in Comp OX, while composites Yr 7-9 and Yr 10-12 were mainly composed of electrum, hessite, and acanthite. Composite Yr 1-6 contained equal proportions of freibergite, eugenite, and luanheite with lesser amounts of electrum and acanthite. Silver liberation was excellent for Comp SU at ~97% and poor in Comp Yr 7-9 at ~9% and ranged from 47.4% to 63.2% in composites OX, Yr 1-6, and Yr 10-12. The main associations were with galena (up to 52% of locked particles), pyrite (1-42%), copper sulfides (up to 24.5%), and complex associations (15-97%).
10.2.1.2 |
Gravity Separation |
In order to have an indication of the ore amenability to gravity concentration, two types of gravity concentration were performed: Extended Gravity Recoverable Gold (E-GRG) and a batch test on both Comp SU and OX. The E-GRG test was developed to simplify the standard GRG procedure and required a smaller sample size. As for the batch test, it consisted of a single batch of enhanced gravity separation using a Knelson concentrator followed by a Mozley table separation on the Knelson concentrate.
Results of the E-GRG test are summarized in Table 10-12 and Figure 10-4. The gold GRG numbers at >20 indicate the possible benefit of adding a gravity concentrator in the grinding circuit, but this is attenuated by the low grades observed in the combined gravity concentrate (8-10 g/t Au and 58-68 g/t Ag). The low concentrate grades are due to poor gold and silver mineral liberation.
For the batch test, the concentrate from the Mozley table and the combined gravity tailings were assayed for gold and silver. Table 10-13 summarizes the results and shows poor gold and silver recoveries (<5%) were achieved.
Back Forty Project |
10-18 |
Gold Resource Corporation |
|
Table 10-12: Summary of E-GRG Results
Composite |
Element |
Distribution (%) |
GRG Number |
Grade (g/t) |
||||
Stage 1 |
Stage 2 |
Stage 3 |
Total |
Conc. |
Head |
|||
|
Comp OX E-GRG1 |
Au Ag |
8.00 4.20 |
10.3 4.60 |
4.90 1.20 |
23.2 10.0 |
23.3 10.0 |
10.1 58.3 |
1.79 24.0 |
|
Comp SU E-GRG2 |
Au Ag |
6.80 3.70 |
9.10 7.10 |
6.00 2.60 |
21.9 13.4 |
21.9 13.4 |
8.86 68.4 |
2.24 28.4 |
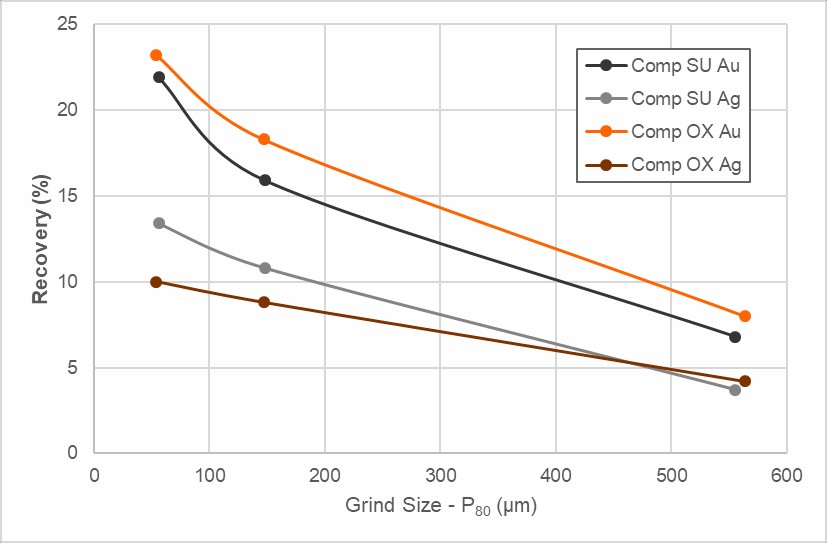
Figure 10-4: Au and Ag Recoveries Versus Grind Size
Table 10-13: Gravity Separation Test Results – Comp SU and Comp OX
|
Composite Test # |
Product |
Weight % |
Assays, g/t |
Distribution % |
||
Au |
Ag |
Au |
Ag |
|||
Comp OX G1 |
Gravity Concentrate Gravity Tail |
0.04 99.96 |
227 2.08 |
595 21.1 |
4.7 95.3 |
1.3 98.7 |
Calculated Head |
100.0 |
2.18 |
21.4 |
100.0 |
100.0 |
|
Comp SU G2 |
Gravity Concentrate Gravity Tail |
0.09 99.91 |
93.6 3.17 |
1448 32.4 |
2.5 97.5 |
3.7 96.3 |
Calculated Head |
100.0 |
3.25 |
33.6 |
100.0 |
100.0 |
|
Back Forty Project |
10-19 |
Gold Resource Corporation |
|
10.2.1.3 |
Flotation Testwork |
The majority of the testwork on Comp OX and Comp SU was completed on E-GRG or batch gravity tails while testing on the year composites (Yr 1-6, Yr, 7-9, and Yr 10-12) was performed on the ore sample directly. Twenty-two open circuit flotation tests were performed on Comp OX, 25 on Comp SU, 12 on Comp Yr 1-6, six on Comp Yr 7-9 and nine on Comp Yr 10-12. Flotation tests for Comp OX and Comp SU included rougher flotation kinetics, effect of primary and regrind sizes, reagent schemes and dosages, and pH. There was no rougher kinetics test performed on the Year composites and rougher conditions similar to those used for Composites SU and OX were used. Table 10-14 summarizes the ranges of the conditions tested for each composite. Several of the tests were able to achieve acceptable copper and zinc concentrate grades.
Figure 10-4 to Figure 10-9 present the copper and zinc rougher performance for all the composites. The full circles represent tests with the baseline copper collector, 3418A, and other tests, with additional tested collectors, are also shown. The results showed a wide range of weight recoveries for Comp OX and Comp SU while mass recoveries were maintained below 18% for the Yr 1-6, Yr 7-9, and Yr 10-12 composites. Copper recoveries ranged from 70.4% to 94.3%, with gold and silver recoveries ranging from ~32 to ~85%. Selectivity between copper and zinc stage recoveries (zinc recovery from the Cu Rougher Tail) were quite good, ranging from 65.1 to 99.1%.
Back Forty Project |
10-20 |
Gold Resource Corporation |
|
Table 10-14: Flotation Conditions Summary
Composite |
P80 (µm) |
pH |
Copper Circuit Reagent Addition (g/t) |
Zinc Circuit Reagent Addition (g/t) |
||||||||||||||||||||||||
Grind |
Cu Regrind |
Zn Regrind |
Cu Rougher |
Cu Cleaner |
Zn Rougher |
Zn Cleaner |
Ca(OH)2 |
ZnSO4 |
NaCN |
NaMBS |
Metso |
H2SO3 |
Na2SO3 |
NaCO3 |
3418A |
A241 |
DF 262 |
TNC-312 |
A208 |
Aero 5100 |
SIPX |
MIBC |
Ca(OH)2 |
CuSO4 |
SIPX |
Aero 5100 |
MIBC |
|
Comp OX |
40-84 |
9-29 |
15-22 |
5.3-10.4 |
6.0-11.8 |
~11.5 |
~12.0 |
1000-8690 |
0-600 |
0-100 |
- |
- |
50-1540 |
0-850 |
- |
0-140 |
0-35 |
- |
0-50 |
0-40 |
0-20 |
0-35 |
15-60 |
2470-15670 |
350-700 |
0-85 |
0-45 |
15-50 |
Comp SU |
33-77 |
8-31 |
10-27 |
4.5-11.1 |
~11.6 |
~11.5 |
~12.0 |
1720-11220 |
0-600 |
0-75 |
0-250 |
0-250 |
0-825 |
0-750 |
0-8510 |
0-140 |
0-30 |
- |
0-45 |
0-55 |
0-20 |
0-35 |
15-60 |
0-15045 |
0-700 |
0-150 |
0-40 |
20-50 |
|
Comp Yr 1-6 |
50-87 |
9-22 |
15-50 |
5.4-11.0 |
4.5-11.8 |
~11.5 |
~11.9 |
0-10755 |
0-550 |
0-50 |
- |
- |
- |
- |
0-1000 |
0-130 |
0-33 |
0-30 |
0-60 |
0-60 |
- |
0-150 |
18-65 |
2495-20000 |
400-900 |
0-35 |
- |
20-25 |
|
Comp Yr 7-9 |
47-77 |
10-22 |
22-65 |
~10.3 |
~11.8 |
~11.6 |
~12.0 |
3035-4760 |
160-200 |
0-50 |
- |
- |
- |
0-750 |
- |
0-130 |
- |
- |
0-30 |
0-30 |
- |
- |
20 |
2251-16725 |
700 |
25-40 |
- |
20 |
|
Comp Yr 10-12 |
32-86 |
11-30 |
21-55 |
9.5-10.5 |
11.5-12.4 |
11.0-11.6 |
~11.9 |
3035-4895 |
160-460 |
20-150 |
- |
- |
- |
0-750 |
- |
0-130 |
- |
- |
0-30 |
0-30 |
- |
- |
20-25 |
2100-13290 |
700 |
25-40 |
- |
20-25 |
Back Forty Project |
10-21 |
Gold Resource Corporation |
|
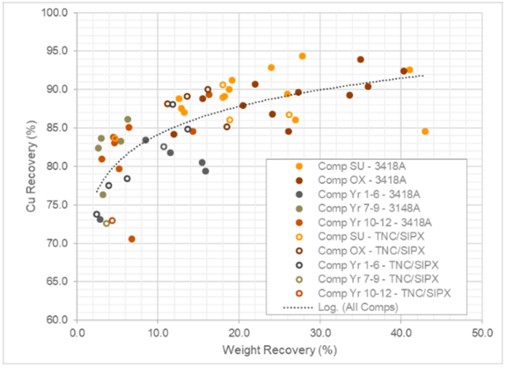
Figure 10-5: Copper Rougher Recovery Versus Weight Recovery – All Composites
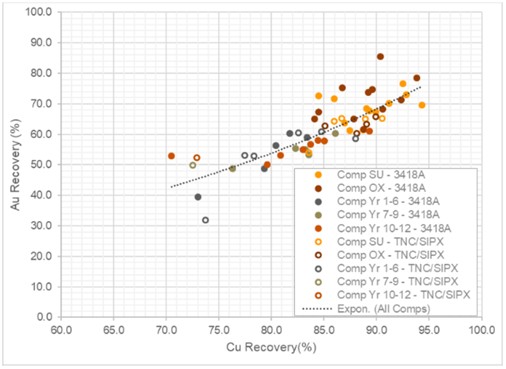
Figure 10-6: Copper Rougher Stage – Au Recovery Versus Cu Recovery
Back Forty Project |
10-22 |
Gold Resource Corporation |
|
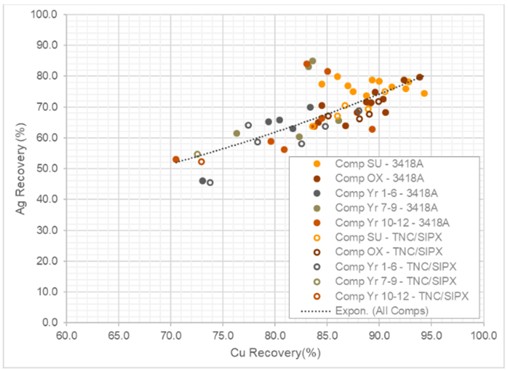
Figure 10-7: Copper Rougher Stage – Au Recovery Versus Cu Recovery
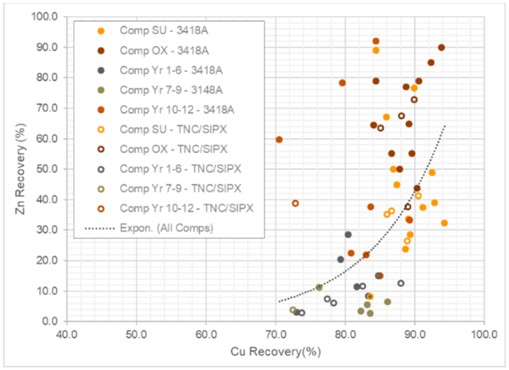
Figure 10-8: Copper Rougher Stage - Cu Versus Zn Selectivity
Back Forty Project |
10-23 |
Gold Resource Corporation |
|
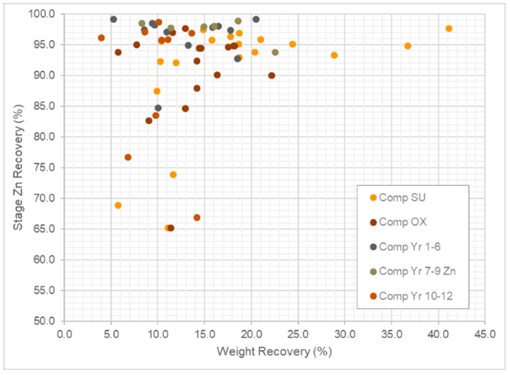
Figure 10-9: Zinc Rougher Stage Performance
Previous testwork on the Back Forty Project used very high collector additions to achieve high copper recoveries. It was suspected that the high addition rates were required due to insufficient pre-aeration. Regardless of the collector type, a series of tests were performed aiming at optimizing copper, gold, and silver recovery, while maximizing copper-zinc selectivity in the copper rougher flotation stage. For this testwork, copper recovery was not impacted by collector dosage while gold and silver recovery increased with collector dosage, reaching a plateau at ~50 g/t. However, zinc recovery increased with increasing collector dosage. Also, it was noted that zinc selectivity was much better for Comp SU than for Comp OX.
The impact on primary grind size, from 32 to 85 µm, on the recoveries was also evaluated. Decreasing grind size only produced a slight increase in copper and silver recoveries, whereas gold and zinc recoveries are significantly increasing at finer grind sizes. A primary grind P80 of 45-50 µm was ultimately selected.
A less extensive test program was undertaken to evaluate the effect of regrind size as well as pH, reagent regime, and reagent addition points in the cleaner circuits. To achieve a concentrate grading >17% Cu, a regrind P80 of 10-15 µm was necessary and addition of collector to the regrind stage was recommended to help achieve higher recoveries. A mineralogical analysis of the Cu first cleaner scavenger tails from a test on Comp SU (F16) showed that most of the remaining copper was liberated (71.5% free and liberated), and that the particles were very fine, with 80% of the copper sulfides finer than ~13 µm. The best copper circuit results were achieved in tests OX F18, SU F19, Yr 1-6 F1, Yr 7-9 F4, and Yr 10-12 F4. All tests included high collector dosage and a regrind P80 ranging from 12 to 22 µm. Tests on the year composites also included addition of collector to the regrind stage, which seemed to help maintain recovery throughout the cleaning stages. These conditions, which are presented in Table 10-15, were used for the locked cycle tests and the flowsheet used is presented in Figure 10-10.
Back Forty Project |
10-24 |
Gold Resource Corporation |
|
Table 10-15: Locked Cycle Tests Summarized Conditions
P80 (µm) |
pH |
Cu Reagent Addition (g/t) |
Zn Reagent Addition (g/t) |
||||||||||||||||
Grinding |
Cu Regrind |
Zn Regrind |
Cu Rougher |
Cu Cleaner |
Zn Rougher |
Zn Cleaner |
Ca(OH)2 |
ZnSO4 |
NaCN |
Na2SO3 |
3418A |
CMC Dep 347 |
MIBC |
Ca(OH)2 |
CuSO4 |
SIPX |
CMC Dep 347 |
MIBC |
|
Comp OX LCT1 |
51 |
10 |
7 |
10 |
11.5 |
11.5 |
12.3 |
5548 |
460 |
75 |
750 |
110 |
0 |
55 |
2835 |
500 |
40 |
0 |
20 |
Comp OX LCT2 |
47 |
14 |
20 |
10 |
11.5 |
11.5 |
12.0 |
7973 |
460 |
75 |
750 |
110 |
50 |
55 |
5331 |
500 |
0 |
40 |
20 |
Comp SU LCT1 |
55 |
9 |
18 |
10 |
11.5 |
11.5 |
12.0 |
8706 |
310 |
100 |
1500 |
110 |
0 |
55 |
6320 |
700 |
40 |
0 |
20 |
Comp Yr1-6 LCT1 |
44 |
12 |
18 |
10 |
11.5 |
11.5 |
11.9 |
5243 |
160 |
50 |
0 |
115 |
0 |
50 |
5915 |
700 |
30 |
0 |
25 |
Comp Yr7-9 LCT1 |
48 |
16 |
18 |
10 |
11.5 |
11.5 |
11.9 |
4505 |
160 |
50 |
0 |
115 |
0 |
50 |
4546 |
700 |
25 |
0 |
20 |
Comp Yr10-12 LCT1 |
47 |
14 |
15 |
10 |
11.5 |
11.5 |
11.9 |
4745 |
310 |
100 |
0 |
115 |
0 |
50 |
4072 |
700 |
30 |
0 |
25 |
Back Forty Project |
10-25 |
Gold Resource Corporation |
|
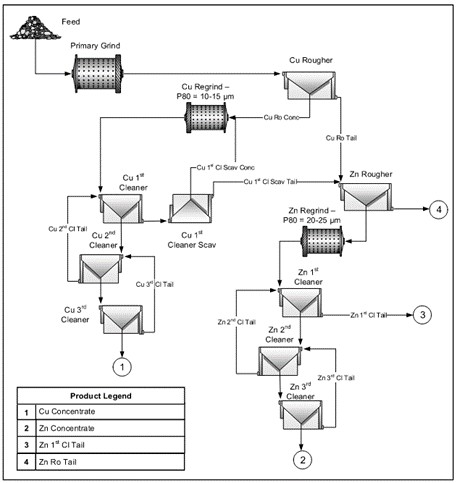
Figure 10-10: Locked Cycle Test Flowsheet
A total of six locked cycle tests were completed, one on each composite and a second on Comp OX, using zinc sulphate and sodium cyanide as depressant, 3418A as copper collector, lime for pH control to a copper rougher pH of 10.0 and cleaner pH of 11.5 to 11.8, and zinc rougher pH of 11.5 and cleaner pH of 12.0 respectively, copper sulphate as activator and SIPX as zinc collector.
The initial locked cycle tests, Comp OX LCT1 and Comp SU LCT1 did not achieve the grades and recoveries expected, likely due to the combination of very fine regrind size (P80 ~10 µm) and lack of collector in the regrind stages. By adding collector to the regrind mill, Comp OX LCT2 improved the overall copper recovery from 53.1% to 70.5% but the zinc recovery remained lower than achieved in the open circuit tests at 72.3%. Also, in the Comp OX LCT2, the stability was poor, especially for Cu and Zn, which had a number of units still held up in the Cu 3rd and 2nd cleaner tails. This is likely due to the addition of carboxymethylcellulose (CMC) as depressant in the final copper cleaning stage of cycles D to F, to improve copper grade from ~15% to ~20%, but there were not enough cycles for the excess mass rejected to stabilize. The locked cycles tests on the Year composites achieved better results, which are summarized in Table 10-16.
Back Forty Project |
10-26 |
Gold Resource Corporation |
|
Table 10-16: Locked Cycle Final Concentrates Summary
|
Composite Test # |
Product |
P80 (µm) |
Weight (%) |
Assays (%, g/t) |
Distribution (%) |
||||||||
Cu |
Pb |
Zn |
Au |
Ag |
Cu |
Pb |
Zn |
Au |
Ag |
||||
|
Comp OX LCT1 |
Cu 3rd Cl Conc Zn 3rd Cl Conc |
10.3 7.0 |
2.0 3.4 |
11.2 3.51 |
0.74 0.21 |
16.7 48.5 |
22.2 3.72 |
336 120 |
53.1 27.9 |
17.4 8.2 |
14.4 70.1 |
34.8 9.8 |
36.3 21.8 |
|
Comp OX LCT2 |
Cu 3rd Cl Conc Zn 3rd Cl Conc |
14.0 12.7 |
1.2 3.1 |
20.2 0.80 |
1.00 0.21 |
7.13 46.9 |
36.9 7.81 |
334 89.9 |
70.5 7.3 |
14.4 7.7 |
4.2 72.3 |
33.1 18.2 |
25.9 18.1 |
|
Comp SU LCT1 |
Cu 3rd Cl Conc Zn 3rd Cl Conc |
8.9 |
1.2 5.1 |
8.23 3.20 |
1.30 0.17 |
11.8 50.4 |
58.6 4.32 |
729 104 |
30.2 48.7 |
19.5 10.5 |
3.4 59.2 |
40.2 12.3 |
34.7 20.4 |
|
Comp Yr1-6 LCT1 |
Cu 3rd Cl Conc Zn 3rd Cl Conc |
11.9 |
1.2 5.5 |
17.3 0.45 |
7.07 0.13 |
12.0 54.0 |
126 3.22 |
810 40.4 |
76.5 9.1 |
71.4 5.8 |
4.4 90.9 |
57.4 6.7 |
60.3 13.7 |
|
Comp Yr7-9 LCT1 |
Cu 3rd Cl Conc Zn 3rd Cl Conc |
16.4 |
1.7 6.5 |
17.4 0.40 |
7.44 0.12 |
14.0 55.6 |
81.8 1.66 |
685 33.7 |
81.3 7.1 |
75.0 4.5 |
6.0 90.6 |
61.2 4.8 |
63.6 12.0 |
|
Comp Yr10-12 LCT1 |
Cu 3rd Cl Conc Zn 3rd Cl Conc |
13.8 |
2.0 2.3 |
18.1 1.07 |
3.98 0.17 |
9.11 51.1 |
36.6 2.64 |
455 80.2 |
83.8 5.6 |
71.6 3.4 |
12.7 80.6 |
57.1 4.7 |
54.9 10.9 |
Several flotation test products were prepared for downstream testing including flotation tails cyanidation, GlyCat™ leaching evaluation, cyanide alternative leaching, solid/liquid separation tests, and bulk cyanidation and cyanide destruction testing, and geochemical testing.
10.2.1.4 |
Cyanidation Testwork |
Cyanidation of the flotation tailings (CN, CIL, or CIP) for Comp SU, Comp OX and Yr 1-6 and intensive leaching of a pyrite concentrate for Comp OX and Comp SU were evaluated.
10.2.1.4.1 |
Cyanide Leach (CN) |
A total of 29 cyanidation tests were conducted on Comp SU (11), Comp OX (10), and Yr 1-6 (8) samples. Flotation tailings and pyrite concentrate were used for the tests looking at different test variables such as cyanide dosage, pre-treatment, DO, lead nitrate addition, pulp density and leaching time. For Comp SU, the cyanidation tests on flotation tailings were able to achieve extractions in the range of 35.4 to 55.1% Au and 3.1 to 58.8% Ag. For Comp OX, cyanide tests on flotation tailings were able to achieve extractions in the range of 21.7 to 38.9% Au and 21.4 to 62.3% Ag and for Comp Yr 1-6, extractions in the range of 47.2 to 57.3% Au and 11.6 to 47.2% Ag were achieved. Tests conditions and results are summarized in Table 10-17, Table 10-18, Figure 10-11, and Figure 10-12.
Back Forty Project |
10-27 |
Gold Resource Corporation |
|
Table 10-17: Cyanidation Leaching Conditions
|
Test # |
Feed |
Purpose |
Density % |
Pre-leaching parameters |
Leaching Parameters |
|||||||
|
Time h |
DO ppm |
pH |
Pb(NO3)2 g/t |
Time h |
Temp C |
NaCN g/l |
DO ppm |
pH |
||||
CN-1 |
SU-F4 Ro tail |
Baseline kinetics tests 1000 ppm NaCN |
45 |
0 |
- |
- |
300 |
48 |
RT |
1.0 |
8-10 |
10.5-11.0 |
CN-2 |
SU-F10 Ro tail |
Baseline kinetics tests 1000 ppm NaCN |
45 |
0 |
- |
- |
300 |
48 |
RT |
1.0 |
8-10 |
10.5-11.0 |
CN-3 |
SU-F11 Ro tail |
Baseline kinetics tests 1000 ppm NaCN |
45 |
0 |
- |
- |
300 |
48 |
RT |
1.0 |
8-10 |
10.5-11.0 |
Avg CN-1 to CN-3 |
|
|
|
|
|
|
|
|
|
|
|
|
CN-4 |
OX-F5 Ro tail |
Baseline kinetics tests 1000 ppm NaCN |
45 |
0 |
- |
- |
300 |
48 |
RT |
1.0 |
8-10 |
10.5-11.0 |
CN-5 |
OX-F9 Ro tail |
Baseline kinetics tests 1000 ppm NaCN |
45 |
0 |
- |
- |
300 |
48 |
RT |
1.0 |
8-10 |
10.5-11.0 |
CN-6 |
OX-F10 Ro tail |
Baseline kinetics tests 1000 ppm NaCN |
45 |
0 |
- |
- |
300 |
48 |
RT |
1.0 |
8-10 |
10.5-11.0 |
Avg CN-4 to CN-6 |
|
|
|
|
|
|
|
|
|
|
|
|
CN-7 |
CN Feed Comp SU |
Intensive Conditions on Flotation Tails |
40 |
4 |
12-13 |
10.5-11.0 |
300 |
72 |
RT |
1.0 |
12-13 |
10.5-11.0 |
CN-8 |
CN Feed Comp OX |
Intensive Conditions on Flotation Tails |
40 |
4 |
12-13 |
10.5-11.0 |
300 |
72 |
RT |
1.0 |
12-13 |
10.5-11.0 |
CN-9 |
SU F21B Py Con |
Pyrite conc leaching |
40 |
4 |
12-13 |
10.5-11.0 |
300 |
48 |
RT |
1.0 |
12-13 |
10.5-11.0 |
CN-10 |
OXF20B Py Con |
Pyrite conc leaching |
40 |
4 |
12-13 |
10.5-11.0 |
300 |
48 |
RT |
1.0 |
12-13 |
10.5-11.0 |
CN-11 |
CN Feed Comp SU |
No pH adjustment in pre-conditioning |
45 |
4 |
12-13 |
- |
300 |
48 |
RT |
1.0 |
12-13 |
11.0-11.5 |
CN-12 |
CN Feed Comp SU |
DO12-13 |
45 |
4 |
12-13 |
- |
300 |
48 |
RT |
0.50 |
12-13 |
11.0-11.5 |
CN-13 |
CN Feed Comp SU |
DO8-10 |
45 |
4 |
8-10 |
- |
300 |
48 |
RT |
0.50 |
8-10 |
11.0-11.5 |
Avg CN-12 to CN-13 |
|
|
|
|
|
|
|
|
|
|
|
|
CN-14 |
CN Feed Comp OX |
DO12-13 |
45 |
4 |
12-13 |
- |
300 |
48 |
RT |
0.50 |
12-13 |
11.0-11.5 |
CN-15 |
CN Feed Comp OX |
DO8-10 |
45 |
4 |
8-10 |
- |
300 |
48 |
RT |
0.50 |
8-10 |
11.0-11.5 |
Avg CN-14 to CN-15 |
|
|
|
|
|
|
|
|
|
|
|
|
CN-16 |
Rejet Flotte Zn du Yr 1-6 F4 |
45 |
4 |
8-10 |
- |
300 |
48 |
RT |
0.50 |
8-10 |
11.0-11.5 |
|
CN-17 |
CN Feed Comp SU |
As CN13, 50% solids |
50 |
4 |
8-10 |
- |
300 |
48 |
RT |
0.50 |
8-10 |
11.0-11.5 |
CN-18 |
CN Feed Comp SU |
As CN17, no lead nitrate |
50 |
4 |
8-10 |
- |
|
48 |
RT |
0.50 |
8-10 |
11.0-11.5 |
CN-19 |
CN Feed Comp OX |
As CN15, 50% solids |
50 |
4 |
8-10 |
- |
300 |
48 |
RT |
0.50 |
8-10 |
11.0-11.5 |
CN-20 |
CN Feed Comp OX |
As CN19, no lead nitrate |
50 |
4 |
8-10 |
- |
|
48 |
RT |
0.50 |
8-10 |
11.0-11.5 |
CN-21 |
CN Feed Comp SU |
As CN18, no lead nitrate, pH 10.0 -10.5, 0.25 g/L NaCN and 72h |
50 |
4 |
8-10 |
- |
|
72 |
RT |
0.25 |
8-10 |
10.0-10.5 |
CN-22 |
CN Feed Comp OX |
As CN18, no lead nitrate, pH 10.0 -10.5, 0.25 g/L NaCN and 72h |
50 |
4 |
8-10 |
- |
|
72 |
RT |
0.25 |
8-10 |
10.0-10.5 |
CN-23 |
Yr 1-6 F5 Ro Tail |
As CN18, no lead nitrate, pH 10.0 -10.5, 0.50 g/L NaCN and 72h |
50 |
4 |
8-10 |
- |
|
72 |
RT |
0.50 |
8-10 |
10.0-10.5 |
CN-24 |
Yr 1-6 F9-10 CN Feed |
Effect of CN dosage, 0.5 g/L maintained at 0.5 g/L 0-12 hrs, 0.25 g/t >12 hours |
50 |
4 |
8-10 |
- |
|
72 |
RT |
0.50 |
8-10 |
10.0-10.5 |
CN-25 |
Yr 1-6 F9-10 CN Feed |
Effect of CN dosage, 0.5 g/L maintained at 0.5 g/L 0-12 hrs, 0.25 g/t >12 hours |
50 |
4 |
8-10 |
- |
|
72 |
RT |
0.50 |
8-10 |
10.0-10.5 |
CN-26 |
Yr 1-6 F9-10 CN Feed |
Effect of CN dosage, 0.25 g/L maintained at 0.25 g/L 0-12 hrs, 0.125 g/t >12 hours |
50 |
4 |
8-10 |
- |
|
72 |
RT |
0.25 |
8-10 |
10.0-10.5 |
CN-27 |
Yr 1-6 F9-10 CN Feed |
Effect of CN dosage, 0.25 g/L maintained at 0.25 g/L 0-12 hrs, 0.125 g/t >12 hours |
50 |
4 |
8-10 |
- |
|
72 |
RT |
0.25 |
8-10 |
10.0-10.5 |
CN-28 |
Yr 1-6 F9-10 CN Feed |
Effect of CN dosage, 0.5 g/L maintained at 0.5 g/L for 72 hrs |
50 |
4 |
8-10 |
- |
|
72 |
RT |
0.50 |
8-10 |
10.0-10.5 |
CN-29 |
Yr 1-6 F9-10 CN Feed |
Effect of CN dosage, 0.5 g/L maintained at 0.5 g/L for 72 hrs |
50 |
4 |
8-10 |
- |
|
72 |
RT |
0.50 |
8-10 |
10.0-10.5 |
Back Forty Project |
10-28 |
Gold Resource Corporation |
|
Table 10-18: Direct Cyanidation Leaching Results Summary
Test |
Residue P80 (µm) |
Consumption |
Au |
Ag |
||||||||||||||||||||||||||||
Calc. |
Residue |
Calc. |
Residue |
|||||||||||||||||||||||||||||
# |
CN |
Lime |
Head |
Head |
Diff |
Extraction (%) |
Head |
Head |
Diff |
Extraction (%) |
||||||||||||||||||||||
kg/t |
2 |
6 |
12 |
24 |
36 |
48 |
72 hr |
kg/t |
g/t |
g/t |
g/t |
g/t |
2 |
6 |
12 |
24 |
36 |
48 |
72 hr |
g/t |
g/t |
g/t |
g/t |
2 |
6 |
12 |
24 |
36 |
48 |
72 hr |
||
CN-1 |
72 |
2.83 |
0.46 |
0.74 |
0.58 |
0.19 |
0.87 |
4.04 |
0.84 |
0.9 |
0.06 |
0.45 |
39.3 |
47.9 |
48.9 |
50.3 |
6.6 |
7.04 |
0.44 |
3.1 |
44.8 |
53 |
54.9 |
56 |
||||||||
CN-2 |
63 |
3.02 |
0.57 |
0.65 |
0.48 |
0.42 |
0.9 |
3.63 |
0.76 |
0.87 |
0.12 |
0.44 |
36.3 |
44.9 |
48.1 |
49.6 |
5.51 |
6.43 |
0.91 |
2.7 |
42.6 |
57.1 |
59.5 |
58 |
||||||||
CN-3 |
58 |
3.22 |
0.82 |
0.62 |
0.44 |
0.44 |
0.92 |
4.12 |
0.76 |
0.82 |
0.07 |
0.46 |
33.6 |
42 |
45.2 |
44.8 |
5.51 |
6.32 |
0.8 |
2.6 |
41.1 |
55.4 |
58.5 |
58.8 |
||||||||
Avg CN-1 to CN-3 |
3.02 |
0.62 |
0.67 |
0.5 |
0.35 |
0.89 |
3.93 |
0.78 |
0.86 |
0.08 |
0.45 |
36.4 |
44.9 |
47.4 |
48.3 |
5.88 |
6.6 |
0.72 |
2.8 |
42.8 |
55.2 |
57.7 |
57.6 |
|||||||||
CN-4 |
58 |
3.67 |
0.9 |
0.58 |
0.54 |
0.52 |
1.14 |
3.51 |
0.62 |
0.64 |
0.02 |
0.41 |
31.3 |
35.9 |
36 |
35.5 |
6.33 |
5.11 |
-1.22 |
2.05 |
56.1 |
61.4 |
68.7 |
59.9 |
||||||||
CN-5 |
60 |
2.88 |
0.66 |
0.42 |
0.39 |
0.53 |
0.85 |
2.25 |
0.62 |
0.5 |
-0.12 |
0.39 |
22.2 |
24.2 |
23.6 |
21.7 |
6.33 |
4.01 |
-2.31 |
2.45 |
39.8 |
43.6 |
41.1 |
39 |
||||||||
CN-6 |
55 |
3.31 |
0.82 |
0.62 |
0.5 |
0.58 |
0.81 |
3.5 |
0.62 |
0.57 |
-0.05 |
0.4 |
27.5 |
34.8 |
36.9 |
30.8 |
6.33 |
5.13 |
-1.2 |
2 |
44.9 |
60.9 |
59.6 |
61 |
||||||||
Avg CN-4 to CN-6 |
3.29 |
0.79 |
0.54 |
0.48 |
0.55 |
0.93 |
3.09 |
0.62 |
0.57 |
-0.05 |
0.4 |
27 |
31.6 |
32.2 |
29.3 |
6.33 |
4.75 |
-1.58 |
2.17 |
46.9 |
55.3 |
56.5 |
53.3 |
|||||||||
CN-7 |
39 |
2.74 |
0.13 |
0.73 |
0.39 |
0.07 |
0.76 |
0 |
0.67 |
6.42 |
0.76 |
0.82 |
0.07 |
0.37 |
49.9 |
54.7 |
55.1 |
55.2 |
59.5 |
59.6 |
55.1 |
5.51 |
6.58 |
1.07 |
2.75 |
42.9 |
54.3 |
60.3 |
56.4 |
55.9 |
65.7 |
58.2 |
CN-8 |
36 |
2.55 |
0.13 |
1.04 |
0.11 |
-0.01 |
0.73 |
0 |
0.6 |
6.32 |
0.62 |
0.57 |
-0.04 |
0.35 |
48.3 |
45.9 |
43.4 |
49.3 |
43.9 |
44.4 |
38.9 |
6.33 |
5.3 |
-1.03 |
2 |
61.2 |
60.7 |
62.3 |
61.1 |
59 |
57.1 |
62.3 |
CN-9 |
0 |
4.82 |
0.77 |
0.92 |
0.65 |
0.83 |
0.62 |
1.03 |
11.6 |
- |
1.66 |
- |
0.47 |
66.1 |
68.8 |
70.1 |
73.9 |
75 |
71.6 |
- |
7.3 |
- |
2.4 |
43.9 |
55 |
58 |
60.3 |
58.2 |
67.1 |
|||
CN-10 |
0 |
5.11 |
0.87 |
0.89 |
0.79 |
0.72 |
0.82 |
1.02 |
5.48 |
- |
4.29 |
- |
0.56 |
23.9 |
44.5 |
70.4 |
86 |
76.2 |
87.1 |
- |
6.95 |
- |
1.95 |
37 |
49.2 |
50.4 |
58.3 |
58.6 |
71.9 |
|||
CN-11 |
68 |
1.52 |
0.37 |
0.22 |
0.08 |
0.22 |
0.06 |
0.58 |
3.99 |
0.76 |
0.83 |
0.07 |
0.43 |
39.4 |
43.1 |
44.3 |
46.7 |
47.5 |
48.8 |
5.51 |
7.04 |
1.53 |
4 |
39.1 |
41.4 |
41 |
41.8 |
40.8 |
43.2 |
|||
CN-12 |
68 |
0.78 |
0.27 |
0.14 |
0.08 |
0.02 |
0.06 |
0.2 |
4.48 |
0.76 |
0.8 |
0.04 |
0.43 |
37.4 |
41.5 |
38.3 |
46.1 |
45.7 |
46.3 |
5.51 |
6.13 |
0.61 |
3.2 |
42.1 |
47.1 |
45.9 |
47.2 |
47.5 |
47.8 |
|||
CN-13 |
68 |
0.82 |
0.35 |
-0.01 |
0.14 |
0.1 |
0.02 |
0.22 |
4.93 |
0.76 |
0.81 |
0.05 |
0.44 |
38.3 |
39 |
41.6 |
43.7 |
45 |
46.1 |
5.51 |
5.9 |
0.38 |
3.05 |
42.7 |
47.3 |
46.2 |
47.5 |
48.3 |
48.3 |
|||
Avg CN-12 to CN-1 |
3 0.80 |
0.31 |
0.06 |
0.11 |
0.06 |
0.04 |
0.21 |
4.71 |
0.43 |
37.8 |
40.2 |
40 |
44.9 |
45.4 |
46.2 |
3.13 |
42.4 |
47.2 |
46.1 |
47.4 |
47.9 |
48 |
||||||||||
CN-14 |
65 |
0.72 |
0.31 |
0.01 |
0.08 |
0.18 |
0.02 |
0.12 |
4.96 |
0.62 |
0.58 |
-0.04 |
0.38 |
29.6 |
31.4 |
32 |
32.9 |
32.5 |
33.9 |
6.33 |
4.9 |
-1.43 |
2.4 |
49 |
50.6 |
53.2 |
51.5 |
54.2 |
51 |
|||
CN-15 |
63 |
0.68 |
0.29 |
-0.01 |
0.08 |
0.1 |
0 |
0.22 |
4.28 |
0.62 |
0.59 |
-0.03 |
0.4 |
26.4 |
30.6 |
31.1 |
29.2 |
29.5 |
33 |
6.33 |
4.73 |
-1.6 |
2.35 |
47.7 |
51.8 |
51.7 |
53.7 |
52.2 |
50.3 |
|||
Avg CN-14 to CN-1 |
5 0.70 |
0.3 |
0 |
0.08 |
0.14 |
0.01 |
0.17 |
4.62 |
0.39 |
28 |
31 |
31.5 |
31 |
31 |
33.4 |
2.38 |
48.3 |
51.2 |
52.5 |
52.6 |
53.2 |
50.7 |
||||||||||
CN-16 |
0 |
0.65 |
0.11 |
0.14 |
0.04 |
0.16 |
0.04 |
0.17 |
4.04 |
1.05 |
1.06 |
0.01 |
0.51 |
37.6 |
48.2 |
50.4 |
54.1 |
47.8 |
51.8 |
5 |
3.2 |
-1.8 |
1.7 |
43.5 |
47.7 |
47.8 |
46.9 |
48.7 |
46.9 |
|||
CN-17 |
66 |
0.82 |
0.31 |
0.02 |
0.04 |
0.08 |
0.12 |
0.18 |
10.1 |
0.76 |
0.78 |
0.02 |
0.43 |
34.3 |
35.6 |
37.4 |
46.3 |
38.9 |
44.8 |
5.51 |
6.02 |
0.51 |
3.5 |
37.7 |
40.8 |
43.8 |
45.4 |
40.9 |
41.9 |
|||
CN-18 |
66 |
0.78 |
0.35 |
-0.06 |
0.06 |
0.06 |
0.12 |
0.18 |
10.4 |
0.76 |
0.77 |
0.02 |
0.43 |
30.7 |
39.6 |
41.9 |
43.9 |
42.5 |
45.1 |
5.51 |
6 |
0.49 |
3.55 |
36.8 |
40.1 |
41.1 |
40.6 |
38.9 |
40.8 |
|||
CN-19 |
62 |
0.81 |
0.51 |
0.09 |
0.02 |
0.04 |
0.04 |
0.12 |
9.72 |
0.62 |
0.58 |
-0.04 |
0.38 |
28.4 |
31.1 |
35.2 |
36 |
34.8 |
34.9 |
6.33 |
5.09 |
-1.24 |
2.75 |
77.4 |
45.7 |
45.1 |
45.5 |
43.3 |
46 |
|||
CN-20 |
62 |
0.79 |
0.31 |
0 |
0.06 |
0.06 |
0.1 |
0.18 |
9.53 |
0.62 |
0.58 |
-0.04 |
0.37 |
31.2 |
32.5 |
34.5 |
34.6 |
35.2 |
37.1 |
6.33 |
5.1 |
-1.23 |
2.75 |
44.2 |
43.6 |
44.4 |
44.7 |
45.4 |
46 |
|||
CN-21 |
65 |
0.42 |
0 |
0 |
0.08 |
0.04 |
0.17 |
0 |
0.11 |
1.77 |
0.53 |
0.24 |
-0.29 |
0.17 |
15.8 |
28.3 |
22.9 |
25.5 |
25.4 |
25.5 |
35.4 |
5.51 |
5.73 |
0.21 |
5.55 |
11.5 |
8.5 |
5 |
5.8 |
14.9 |
6 |
3.1 |
CN-22 |
60 |
0.54 |
0.03 |
0.12 |
0.06 |
0.08 |
0.06 |
0.06 |
0.12 |
1.59 |
0.62 |
0.6 |
-0.02 |
0.41 |
19.7 |
24.4 |
22.9 |
30.9 |
32 |
32.3 |
31.6 |
6.33 |
4.39 |
-1.94 |
3.45 |
21.9 |
23.1 |
42.6 |
40.7 |
24 |
16.4 |
21.4 |
CN-23 |
93 |
0.99 |
0 |
0.06 |
0.14 |
0.24 |
0.14 |
0.16 |
0.22 |
1.51 |
1.2 |
1.21 |
0.01 |
0.55 |
38.9 |
45 |
51.8 |
50.2 |
49.4 |
44.4 |
54.6 |
4.6 |
3.48 |
-1.12 |
2.15 |
30.2 |
34.1 |
37.2 |
41.8 |
36.3 |
37.1 |
38.3 |
CN-24 |
50 |
1.34 |
0.15 |
0.14 |
0.22 |
0.36 |
0.14 |
0.06 |
0.16 |
3.19 |
0 |
1.07 |
1.07 |
0.51 |
34.6 |
45.4 |
48 |
46.9 |
53 |
40.5 |
52.6 |
0 |
4.83 |
4.83 |
2.55 |
30.5 |
33.4 |
34.3 |
84.3 |
44.3 |
54.2 |
47.2 |
CN-25 |
50 |
1.48 |
0.29 |
0.2 |
0.18 |
0.38 |
0.12 |
0.06 |
0.18 |
2.63 |
0 |
1.07 |
1.07 |
0.5 |
42.3 |
44.6 |
49.6 |
54.7 |
54 |
44.8 |
53.6 |
0 |
4.43 |
4.43 |
2.45 |
32.1 |
35.3 |
45.8 |
41.7 |
42.1 |
38.1 |
44.7 |
CN-26 |
51 |
0.73 |
0.13 |
0.08 |
0.12 |
0.15 |
0.07 |
0.06 |
0.1 |
2.8 |
0 |
1.08 |
1.08 |
0.57 |
19 |
34.6 |
36.6 |
45.4 |
46.8 |
45.9 |
47.6 |
0 |
4.31 |
4.31 |
3.6 |
19.1 |
31.5 |
31 |
27.7 |
20.9 |
20.8 |
16.5 |
CN-27 |
51 |
0.79 |
0.12 |
0.06 |
0.1 |
0.15 |
0.2 |
0.04 |
0.1 |
3.45 |
0 |
1.05 |
1.05 |
0.56 |
20.9 |
30.5 |
41.8 |
48.6 |
47.6 |
46.6 |
47.2 |
0 |
4.17 |
4.17 |
3.6 |
21.1 |
28 |
33 |
22.9 |
17 |
14.3 |
13.7 |
CN-28 |
50 |
1.33 |
0.16 |
0 |
0.11 |
0.19 |
0.08 |
0.26 |
0.37 |
4.69 |
0 |
1.05 |
1.05 |
0.46 |
38 |
52.1 |
46.4 |
53.3 |
51.2 |
45.1 |
56.2 |
0 |
4.37 |
4.37 |
2.4 |
31.5 |
36.5 |
38.7 |
39.3 |
39.4 |
39.8 |
45 |
CN-29 |
50 |
1.39 |
0.12 |
0.13 |
0.15 |
0.22 |
0.08 |
0.17 |
0.35 |
3.26 |
0 |
1.09 |
1.09 |
0.47 |
44.6 |
50.9 |
48 |
49.5 |
53.1 |
51.7 |
57.3 |
0 |
4.41 |
4.41 |
2.55 |
37.5 |
36.2 |
35.7 |
39.5 |
38.4 |
40.3 |
42.2 |
Back Forty Project |
10-29 |
Gold Resource Corporation |
|
|
|
Figure 10-11: Comp SU Direct Cyanidation Extraction |
|
|
Figure 10-12: Comp OX Direct Cyanidation Extraction |
10.2.1.4.2 |
GlyCatTM Tests |
A series of twenty GlyCat™ evaluation tests were completed on Comp SU CN Feed and Comp OX CN Feed at the SGS Lakefield Laboratory. The test conditions were provided by Mining and Process Solutions (MPS) and the results were forwarded to them for evaluation. Section 10.2.3 describes GlyCat™ tests. A sample of combined flotation tails from Comp Yr 1-6 was also provided to MPS for further evaluation.
10.2.1.4.3 |
Carbon-in-Leach (CIL) Cyanidation Tests |
Three CIL tests were conducted on the Comp SU and Comp OX, Yr1-6 combined flotation tailings. Test conditions that were used for the leach included four hours pre-aeration, 8-10 ppm DO, pH maintained at about 10.5-11, 50% solids, 0.25 g/L NaCN maintained at 0.5 g/L, 10 g/L carbon addition and 48 hour leaching time. Extractions for the three tests were in the range of 35.8 to 50.0% Au and 39.4 to 62.1% Ag. Table 10-19 summarizes the results obtained.
Back Forty Project |
10-30 |
Gold Resource Corporation |
|
Table 10-19: CIL Summary
|
|
Feed |
Density |
Time |
Pre-leaching DO |
pH |
Leaching Parameters |
Consumption |
Grade |
Extraction (%) |
||||||||||
Au |
Ag |
||||||||||||||||||
Start |
Final |
Time |
Temp |
NaCN |
DO |
CN |
Lime |
g/t |
g/t |
48hr + Carbon |
|||||||||
# |
% |
h |
ppm |
h |
C |
g/L |
ppm |
pH |
kg/t |
kg/t |
Head |
Residue |
Head |
Residue |
Au |
Ag |
|||
CIL1 |
Comp OX CN Feed |
50 |
4 |
8-10ppm |
10.5 |
8.3 |
48 |
RT |
0.25 |
8-10ppm |
10.5 |
0.54 |
2.59 |
0.58 |
0.38 |
4.33 |
1.85 |
35.8 |
62.1 |
CIL2 |
Comp SU CN Feed |
50 |
4 |
8-10ppm |
10.5 |
8.9 |
48 |
RT |
0.25 |
8-10ppm |
10.5 |
0.43 |
2.46 |
0.77 |
0.45 |
5.4 |
2.9 |
43.4 |
53 |
CIL3 |
Zn Ro Tail Yr 1-6 |
50 |
4 |
8-10ppm |
10.5 |
8.8 |
48 |
RT |
0.25 |
8-10ppm |
10.5 |
0.55 |
1.96 |
1.25 |
0.66 |
3.51 |
2.45 |
50 |
39.4 |
Table 10-20: Bulk CIP Test Summary
Pre-leaching parameters |
Leaching parameters |
Consumption |
Grade (g/t) |
Extraction (%) |
|||||||||||||||||
48h+Carbon |
|||||||||||||||||||||
Au |
Ag |
Au Ag |
|||||||||||||||||||
Test |
Feed |
Density |
Time |
DO |
pH |
pH |
PbNO3 |
Time h |
Temp |
NaCN |
DO |
pH |
Carbon |
CN |
Lime |
Head |
Residue |
Head |
Residue |
Au |
Ag |
ID |
% |
h |
ppm |
Start |
Final |
g/t |
C |
g/L |
ppm |
g/L |
kg/t |
kg/t |
|||||||||
Comp OX LCT2 CIP |
Comp OX LCT2 |
45 |
4 |
8-10 |
10.5 |
8.5 |
300 |
48 |
RT |
0.5 |
8-10 |
10.5-11 |
15 |
2.4 |
2.04 |
0.87 |
0.36 |
9.1 |
8.5 |
59.2 |
6.6 |
Yr 7-9 LCT1 CIP |
Yr 7-9 LCT1 |
45 |
5 |
8-11 |
10.5 |
8.7 |
300 |
48 |
RT |
0.5 |
8-11 |
10.5-11 |
15 |
2.24 |
1.27 |
0.86 |
0.52 |
5.1 |
4.8 |
40.1 |
6.7 |
Yr 1-6Ox CIP |
Yr 1-6/Ox |
45 |
6 |
8-12 |
10.1 |
8.4 |
300 |
48 |
RT |
0.5 |
8-12 |
10.5-11 |
10 |
1.2 |
1 |
0.89 |
0.43 |
5.7 |
2.9 |
52.5 |
49.5 |
Yr 7-12 CIP |
Yr 7-12 Flotation Tail |
45 |
7 |
8-13 |
10.5 |
8.4 |
300 |
48 |
RT |
0.5 |
8-13 |
10.5-11 |
10 |
1.23 |
1.7 |
0.81 |
0.46 |
5.5 |
2.7 |
44 |
51.1 |
Yr 10-12 CIP |
Yr 10-12 Flotation Tail |
45 |
8 |
8-14 |
10.7 |
8.5 |
300 |
48 |
RT |
0.5 |
8-14 |
10.5-11 |
10 |
2.31 |
0.97 |
0.7 |
0.32 |
8.8 |
4.4 |
54.3 |
49.8 |
Back Forty Project |
10-31 |
Gold Resource Corporation |
|
10.2.1.4.4 |
Diagnostic Leach Test (DLT) |
Two DLTs were conducted on cyanide leach test residues (Comp SU and OX) to further understand the gold deportment of the remaining gold. The test was conducted in three stages:
| ■ | Intensive cyanide leach to fully extract any readily available gold; |
| ■ | Hot caustic leach + intensive CIP leach to extract gold that is possibly associated with iron arsenate, arsenic oxides or bismuth minerals; |
| ■ | Hot nitric acid leach + intensive CIP leach to extract gold that is possibly associated with pyrite, arsenopyrite and/or other sulfides. |
The remaining gold was considered to be locked in silicates or associated with fine sulfides locked in silicates.
For the diagnostic leach test on CN residue of Comp SU, a total of 80.5% of the gold was extracted within the various stages, having relatively close distributions in the stages in the range of 24.1 to 31.1%. For the diagnostic leach test on CN residue of Comp OX, a total of only 60.3% of the gold was extracted within the various stages, resulting from a majority of the gold associated with pyrite/arsenopyrite/other sulfides (3rd stage) (40.8%) and the remaining gold associated with silicates/fine sulfides locked in silicates (39.7%).
10.2.1.4.5 |
Carbon-in-Pulp (CIP) Tests |
A series of bulk CIP tests were performed on flotation tails using conditions based on the bench scale tests that had been completed to date with the following objectives:
| ■ | Produce sufficient barren leach solution for SART testwork to be performed by BQE |
| ■ | Obtain process water analyses of the barren leach solution without detoxification |
| ■ | Simulate filter cake washing to reduce cyanide concentration to be treated |
| ■ | Obtain process water analyses of partially detoxed (diluted) barren solutions |
After testwork completion, the carbon was screened, filtered, dried, and sub-sampled for assay. The residue was filtered and the filtrate sub-sampled for analysis with the remainder forwarded to BQE for SART testing (see section 10.2.6). The filtered residue was split into four equivalent charges and three of the charges were re-pulped with varying volumes of water, selected to target resulting solution cyanide concentrations as summarized in Table 10-21 and filtered to simulate washing during vacuum filtration. Sub-samples of the barren and wash water solutions were submitted for process water analyses (see reference for analyses) and for cyanide destruction tests.
The bulk CIP test results are summarized in Table 10-20. Low adsorption onto carbon was observed for test CIP1 on Yr 1-6 + Ox combined tails. This is likely due to poor carbon contact as good adsorption onto carbon was observed in previous CIL test.
Back Forty Project |
10-32 |
Gold Resource Corporation |
|
Table 10-21: Wash Water Volumes
|
Target NaCN Concentration (ppm) |
|||
C1 |
C2 |
C3 |
C4 |
|
20 |
75 |
200 |
500 |
|
Comp OX LCT 2 CIP |
V1 |
V2 |
V3 |
V4 |
Wash Water (mL) |
11647 |
2750 |
728 |
0 |
Wash wt. |
2592 |
895 |
749 |
- |
Wet Cake wt. |
3247 |
3420 |
3382 |
3604 |
Yr 7-9 LCT1 CIP |
V1 |
V2 |
V3 |
V4 |
Wash Water (mL) |
12147 |
2750 |
1001 |
0 |
Wash wt. |
11610 |
2612 |
988 |
- |
Wet Cake wt. |
3037 |
3155 |
3107 |
3149 |
10.2.1.5 |
Cyanide Destruction Tests |
The principle of cyanide destruction consists of converting cyanide into a less toxic compound through an oxidation reaction. The SO2/Air method is usually used to establish basic flowsheet requirements. The testing aims to quantify the efficiency of detoxification of cyanide containing barren solution using SO2/Air. The standard procedure starts with a batch test where the reactor is filled with the feed pulp. A required amount of copper sulphate, used as catalyzer, is added, and the pulp is then treated in batch mode with sodium metabisulfite and air to reduce the concentration of weak acid dissociable cyanide (CNWAD) in solution to approximately 1 mg/L to establish the conditions (catalyst, oxygen, and redox potential) for starting the continuous test. The oxidation reduction potential (ORP) of the pulp is monitored with a Pt/Ag/AgCl combination electrode, whilst the residual CNWAD concentration in the solution phase is monitored during the test by Tetraethylenepentamine (TEPA) titration.
Eight cyanide destruction tests were conducted on the various Comp SU and Comp OX and Yr 1-6 Composite cyanide leach pulp and wash. Test conditions that were used for the leach included various retention time, Na2S2O5 dosages and copper (added as CuSO4*5H2O) addition. Since each of the feed materials had varying CNWAD (41 to 424 mg/L), a direct comparison to each test cannot be made for all and performance is evaluated based on effective destruction, which all tests were able to achieve (< 1 mg/L CNWAD). A summary of the cyanidation tests is presented in Table 10-22.
Two tests were conducted with 20 mg/L Cu addition (batch test 2 and 3) and resulted in good detoxification (~0.5 mg/L CNWAD) within 30 and 60 minutes, but the majority of the tests were conducted without Cu addition and still were effective with at least 60 minutes of retention time.
Back Forty Project |
10-33 |
Gold Resource Corporation |
|
Table 10-22: Cyanide Destruction Test Summary
Test |
Test Dur. |
Reten. Time |
Product (Solution Phase) |
Reagent Addition |
|||||||||||||
pH |
CNT |
CNWAD by |
Cu |
Fe |
g/g CNWAD |
g/L Feed Pulp |
kg/t Solids |
||||||||||
min |
min |
mg/L |
Ana. |
TEPA |
mg/L |
mg/L |
SO2 |
CaO |
Cu(1) |
SO2 |
CaO |
Cu(1) |
SO2 |
CaO |
Cu(1) |
||
Lab mg/L |
Titr. mg/L |
Equiv. |
Equiv. |
Equiv. |
|||||||||||||
Feed CN 1 Pulp |
125 |
125 |
77.6 |
0.07 |
|||||||||||||
Comp OX LCT2 CIP V1+2 Wash |
|||||||||||||||||
Batch Test 1 |
60 |
60 |
8.1 |
< 0.1 |
0.02 |
0.05 |
8.45 |
0.06 |
4.59 |
2.18 |
0 |
0.46 |
0.22 |
0 |
|||
Feed CN 2 Pulp |
40 |
41 |
18.4 |
0.07 |
|||||||||||||
Yr 7-9 LCT1 CIP V1 Wash |
|||||||||||||||||
Batch Test 2 |
30 |
30 |
8.5 |
< 0.1 |
< 0.01 |
0.05 |
0.22 |
0.03 |
2.77 |
2.34 |
0.49 |
0.09 |
0.08 |
0.02 |
|
|
|
Feed CN 3 Pulp |
125 |
108 |
65.5 |
0.07 |
|||||||||||||
Comp OX LCT2 CIP V1 Wash |
|||||||||||||||||
Batch Test 3 |
60 |
60 |
8.7 |
< 0.1 |
< 0.01 |
0.6 |
0.72 |
0.02 |
3.82 |
2.86 |
0.19 |
0.33 |
0.25 |
0.02 |
|||
Feed CN 4 Pulp |
125 |
112 |
61.5 |
0.16 |
|||||||||||||
Yr 7-9 LCT1 CIP V2 Wash |
|||||||||||||||||
Batch Test 4 |
60 |
60 |
8.5 |
< 0.1 |
0.01 |
0.6 |
0.61 |
0.05 |
5.3 |
3.6 |
0 |
0.48 |
0.32 |
0 |
|||
Feed CN 5 Pulp |
137 |
137 |
89.4 |
0.07 |
|||||||||||||
Comp OX LCT2 CIP V2 Wash |
|||||||||||||||||
Batch Test 5 |
60 |
60 |
8.5 |
0.1 |
3.18 |
4.8 |
0 |
0.09 |
0.13 |
0 |
|||||||
Feed CN 6 Pulp |
225 |
4 |
125 |
0.36 |
|||||||||||||
Yr 7-9 LCT1 CIP V3 Wash |
|||||||||||||||||
Batch Test 6 |
90 |
90 |
8.9 |
0.4 |
117 |
0.15 |
0.95 |
2.31 |
0 |
0.05 |
0.12 |
0 |
|||||
Feed CN 7 Pulp |
424 |
424 |
174 |
0.13 |
|||||||||||||
CIP Residue - Yr 1-6+Ox Zn Tail |
|||||||||||||||||
Batch Test 7 |
120 |
120 |
8.5 |
0.8 |
5.7 |
0 |
0 |
1.86 |
0 |
4.05 |
0 |
||||||
7-2 |
|||||||||||||||||
Continuous tests |
|||||||||||||||||
7-1 |
330 |
85 |
8.5 |
78.4 |
48.4 |
0.7 |
2.21 |
0.03 |
4.06 |
3.48 |
0 |
1.32 |
1.16 |
0 |
2.89 |
2.54 |
0 |
7-2 |
360 |
84 |
8.7 |
0.77 |
2.1 |
1 |
1 |
0.36 |
5.57 |
4.21 |
0 |
2.24 |
1.73 |
0 |
4.89 |
3.79 |
0 |
Feed CN 8 Pulp |
137 |
1.97 |
|||||||||||||||
CIP Residue - Comp Yr 7-12 Zn Tail |
|||||||||||||||||
Batch Test 8-1 |
90 |
90 |
8.7 |
0.7 |
9.35 |
6.41 |
0 |
1.39 |
0.96 |
0 |
0.63 |
0.43 |
0 |
||||
Batch Test 8-2 |
137 |
137 |
8.7 |
57.4 |
54.1 |
0 |
96.6 |
0.08 |
5.51 |
5.61 |
0 |
0.82 |
0.83 |
0 |
0.37 |
0.37 |
0 |
Continuous tests |
|||||||||||||||||
8-1 |
120 |
84 |
8.6 |
0 |
12.1 |
8.18 |
0 |
1.68 |
1.17 |
0 |
0.76 |
0.52 |
0 |
||||
8-1 |
180 |
86 |
8.7 |
57 |
56.5 |
0.7 |
101 |
0.02 |
4.64 |
3.5 |
0 |
0.66 |
0.51 |
0 |
0.3 |
0.23 |
0 |
Note:
No sample submitted for assays.
--- Test done on liquid.
Back Forty Project |
10-34 |
Gold Resource Corporation |
|
(1)Cu added using CuSO4 5H2O, SO2 added using sodium metabisulphite.
Sample collected not from reactor overflow.
Back Forty Project |
10-35 |
Gold Resource Corporation |
|
Cyanide destruction testwork was able to achieve <5 ppm CNWAD in solution under the conditions of continuous test (CND 7-2).
10.2.2 |
Alternate Gold Recovery Agent Testing at Clean Mining |
Flotation tailings samples were sent to Clean Mining in Australia to test their novel chemical. The objective of the testing was to evaluate an alternative to sodium cyanide in gold leaching. Clean Mining uses a non-toxic, non-flammable and water-soluble solution that replaces sodium cyanide as the primary gold leaching agent. Three flotation tailings samples with gold grades ranging from 0.49 to 1.06 g/t were tested. Unfortunately, the testwork resulted in a very high reagent consumption and a low gold recovery. It was decided not to pursue the testing further based on economics.
10.2.3 |
GlyCatTM Test at Mining & Process Solutions (MPS) Pty Limited |
The objective of the testwork program undertaken by MPS was to use the GlyCatTM process on one sample. This reagent has demonstrated, in other applications, the ability to reduce cyanide consumption by replacing a proportion of cyanide with a glycine-dominant lixiviant, without jeopardizing the metal recoveries.
The sample tested was prepared by SGS and represented combined flotation tails from Comp Yr1-6. The sample was thoroughly characterized for assays and mineralogical data.
Testwork consisted of a series of Diagnostic Leach Tests (DLTs) and Reactor Leach Tests (RLTs) with different reagent proportions of cyanide and glycine. The extraction was then compared with the one obtained when using only cyanide. As shown in Figure 10-13, similar metal extraction results were obtained after 48 hours when using 4.0 kg/t of glycine combined with 2 kg/t of cyanide versus 5.0 kg/t of cyanide (cyanide control test 19).
Further testing could be done to evaluate if the overall reagent consumption can be lowered.
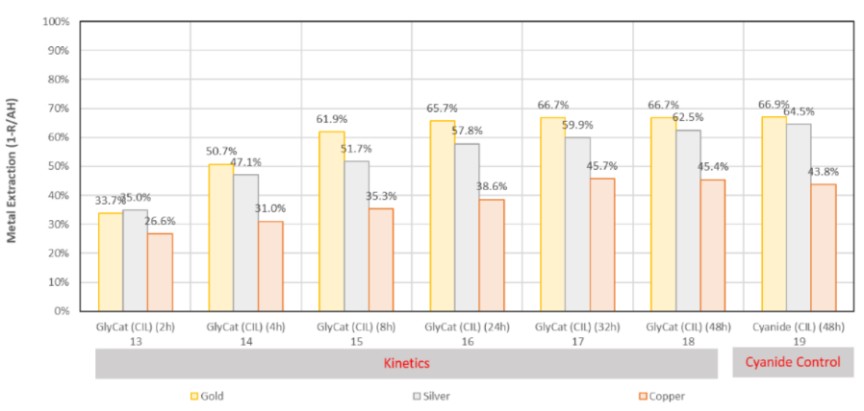
Figure 10-13: Metal Extraction Results – RLTs Round 3
Back Forty Project |
10-36 |
Gold Resource Corporation |
|
10.2.4 |
Filtration and Cyanide Wash on CIP Tailings at Diemme Filtration Lab |
The objective of the testing was to measure filtration rate and cyanide washability for two CIP tailings samples. These conditions and specifications were shared with Diemme:
| ■ | Solids feed concentration: 50% (no thickener scenario) or 62% (thickener scenario); |
| ■ | Feed liquor cyanide level: 400 ppm. Material sent to the lab was de-cyanided, and it was agreed to use a tracer (chloride) to simulate the cyanide anion; |
| ■ | Slurry temperature: room (<40°C); |
| ■ | Final cyanide level into the cake moisture: <10 ppm; |
| ■ | Final cake dryness: >85% (92% desired). |
10.2.4.1 |
Sample Preparation and Characterization |
Two CIP tailings (from cyanide leach) samples were received for this testwork. The samples were in dry solid form and identified as Ox (oxides) and Su (sulfides).
Different characterizations were done on the samples and the results are summarized in the following Table 10-23. X-ray fluorescence (XRF) and X-ray dispersion (XRD) were also performed on both samples.
Table 10-23: Sample Characterization
|
Ox |
Su |
Unit of Measurement |
Temperature |
RT |
RT |
°C |
pH |
6,65 |
7,82 |
|
Conductivity |
3,51 |
3,40 |
mS cm-1 |
Sludge density |
1,561 |
1,520 |
Kg dm-3 |
Liquid phase density |
1,0 |
1,0 |
Kg dm-3 |
Total solids |
51,75 |
47,80 |
% w/w |
807 |
727 |
g dm-3 |
|
Suspended solids |
50,70 |
46,80 |
% w/w |
791 |
711 |
g dm-3 |
|
Dissolved solids |
0,5 |
0,6 |
% w/w liquid phase |
5,0 |
6,0 |
g dm-3 liquid phase |
|
[Cl-] (i.e. [CN-]) |
477 |
448 |
Ppm |
L.O.I. |
17,7 |
23,1 |
% w/wSS |
Solid density |
- |
- |
Kg dm-3 |
CST18 |
24,8 |
14,5 |
Sec |
Back Forty Project |
10-37 |
Gold Resource Corporation |
|
Table 10-24: Sample Particle Size Distribution Measured by Laser Diffraction
|
Ox |
Su |
Unit of Measurement |
D10 |
2.75 |
2.84 |
µm |
D50 |
15.0 |
15.3 |
µm |
D80 |
46.4 |
47.9 |
µm |
D90 |
66.7 |
71.6 |
µm |
10.2.4.2 |
Filtration Testing |
Filtration tests were performed with a benchtop pilot rig that simulates the formation of a single cake with a filtration surface area of 0.0077 m2 per side. Working pressures (feeding, squeezing, blowing, etc.) were set using compressed air regulated by a pneumatic panel.
Different conditions were tested. Parameters such as chamber thickness, addition of pre-squeeze step, washing time and pressure, blowing conditions and others were studied. Both samples showed a very high filterability, resulting in very low feeding time. For this reason, the thickening might not be necessary since a solids concentration higher than 50% might not yield to appreciable improvement of the overall filter productivity. The thickened slurries were not tested.
After blowing, the cakes had final dryness around 85-90% w/w and were friable, without any thixotropic or liquid behavior.
Due to high cake permeability, washing was effectively lowering the chlorine (cyanide proxy) level down to the required target, even by using relatively high washing fluxes and high chamber thickness. The evaluation of the final chloride content into the moist filter cake was done by assuming that it is equal to the content into the filtrate collected during the final desaturation step (blowing).
The results obtained are shown in Figure 10-14. Diemme used tests 2 and 6 as reference for the Ox and Su samples respectively. It was noticed that very high washing fluxes resulted in formation of by-passes. Results showed that the required washing efficiency can be reached within 10 to 15 minutes of washing time and a 1 to 1.5 m3/dry solids tonne wash liquid consumption. At higher washing speed rate (tests 4 and 5), the wash curves showed that the chloride content decreased quickly but rose back in the final blowing filtrate; this indicates that the cake was unevenly washed. Both samples had a similar behavior as expected considering the very similar chemical and physical characteristics of the solids.
Back Forty Project |
10-38 |
Gold Resource Corporation |
|
|
|
Figure 10-14: Wash Ratio Comparison and Wash Curves
The recommended filter cloth is a standard tailings filtration media with high permeability (350-400 L dm-2 min-1). The filtrate obtained using this type of filtration cloth was completely clean after a 5-minute feeding time. The residual solids in the filtrate were on average 1460 mg/L and the clean part (after 5-minute feeding) was lower than 5 mg/L.
Release from the cloth was very good allowing a full automation of the filter press. However, some powdery material remained attached to the cloth, a low-pressure washing is therefore recommended after each cycle.
10.2.5 |
Pre-Leach and Leach Residue Dewatering at FLSmidth |
The objective of the testing was to measure solid-liquid separation rates on pre-leach and leach residue samples to predict sizing and operating parameters for full-scale thickeners, filter presses, and Pneumapress® filters.
10.2.5.1 |
Sample Preparation and Characterization |
A 12-kg dry pre-leach sample was received for this testwork. A sub-sample of the solids, as received, was taken for the pre-leach thickening testing and the remaining sample was leached for the subsequent pressure filtration testing using leaching conditions provided by Osisko.
The particle size analysis and specific gravity of the pre-leach and leach residue were measured by laser diffraction and with a gas pycnometer, respectively. The samples were diluted with tap water and the pH was adjusted to 11.5 with lime. The suspended and dissolved solids were than measured. Table 10-25 and Table 10-26 summarize the particle size distribution and the slurry characterization.
Table 10-25: Particle Size Distribution
Percent Passing |
Pre-Leach |
Leach Residue |
D80 (µm) |
51.5 |
49.9 |
D50 (µm) |
17.9 |
17.6 |
D20 (µm) |
5.4 |
5.3 |
D10 (µm) |
3.0 |
2.9 |
Back Forty Project |
10-39 |
Gold Resource Corporation |
|
Table 10-26: As-Received Sample Characteristic Summary
Measurement |
Pre-Leach |
Leach Residue |
Suspended Solids, wt% |
60.76 |
50.0 |
Dissolved Solids, wt% |
0.57 |
0.57 |
Solids Specific Gravity |
3.66 |
3.66 |
Liquor Specific Gravity |
1.0 |
1.0 |
10.2.5.2 |
Flocculant Screening |
Flocculant screening uses a qualitative and quantitative comparison for a range of flocculants typically effective in similar processes. The evaluated flocculants and their chemical characteristics are presented in Table 10-27. An anionic flocculant worked properly by producing high settling rates while having the best supernatant clarity.
Table 10-27: Evaluated Flocculants
Flocculant |
Charge |
Molecular Weight |
Charge Density |
BASF MF-10 |
Anionic |
High |
Very Low |
BASF MF-1011 |
Anionic |
High |
Medium |
SNF AN-910SH |
Anionic |
Med-High |
Low |
SNF AN-923 VHM |
Anionic |
Very High |
Medium |
Drops of flocculant solution are added to 250-mL graduated cylinders that contain slurry at a solids concentration that facilitates flocculant dispersion while providing a qualitative comparison of floc structure and O/F clarity.
10.2.5.3 |
Flux Testing |
Settling flux tests are conducted to determine the optimum slurry solids concentration for flocculation. The optimum condition is determined by measuring the initial settling velocity at various slurry solids concentrations.
A fixed flocculant dosage was added based upon flocculant screening results. Usually, the solids concentration giving the highest initial settling flux is chosen as the criteria for further testing. It should be noted that flux rates achieved during flux testing are a relative comparison and cannot be used for final thickener sizing. The results indicated that 6 to 10 wt% solids is optimum for the pre-leach sample.
10.2.5.4Continuous Fill Deep Tube Thickener Tests
The continuous fill deep tube test serves two purposes:
1. |
Flocculant dose optimization and confirmation of solids settling flux (unit area selection); and |
2. |
Accumulation of a solids bed as prescribed by the procedure to give a better prediction of the compaction rate and required bed residence time in a full-scale thickener. |
The continuous fill tests were conducted at the determined solids concentration from the flux tests. Table 10-28 summarizes results for the pre-leach samples. The underflow from the continuous fill tests was used for subsequent rheology testing. The flocculant was added in two addition points to the thickener feed slurry prior to the feedwell.
Back Forty Project |
10-40 |
Gold Resource Corporation |
|
Table 10-28: Continuous Fill Test Results – Pre-Leach
Sample |
Pre-Leach |
Feed Suspended Solids Concentration, wt% |
8.5 |
Flocculant Dose Tested, g/t |
10 – 30 |
Unit Area Range Tested, m2/tpd |
0.03 – 0.1 |
Est. Bed Sus. Solids (wt%) – 0.5 hr Retention |
64.7 |
Est. Bed Sus. Solids, wt% – 1 hr Retention |
68.5 |
Est. Bed Sus. Solids, wt% – 2 hr Retention |
70.7 |
Est. Bed Sus. Solids, wt% – 3 hr Retention |
71.5 |
Est. Bed Sus. Solids, wt% – 6hr Retention |
71.9 |
Recommended Total Flocculant Dose, g/t |
20 |
Design Unit Area, m2/tpd |
0.06 |
Overflow Clarity, ppm |
<100 |
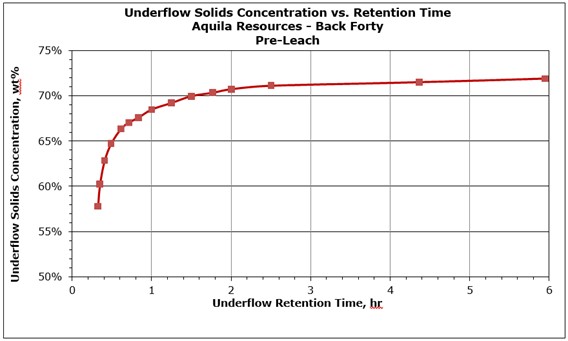
Figure 10-15: Underflow Solids Concentration Versus Retention Time – Aquila Resources – Back Forty
Back Forty Project |
10-41 |
Gold Resource Corporation |
|
10.2.5.5Thickening Sizing Parameters
The pre-leach thickening test results showed that an anionic polyacrylamide flocculant with a high molecular weight and medium charge density produces the best overflow clarity and settling velocities. BASF MF-1011 was used for the testing campaign; however, any flocculant meeting those criteria could work.
Flux testing showed the optimum feed well suspended solids concentration for flocculation was 6 to 10 wt% for the pre-leach sample.
The results showed that the pre-leach sample rapidly thickens to approximately 68 wt% solids. The targeted underflow suspended solids concentration was 45 to 50 wt%. Since the underflow solids consolidate past the target of 50 wt%, the thickener must have additional sidewall depth to better control the underflow residence time to avoid exceeding 50 wt% solids.
Table 10-29 summarizes the thickening testing results and sizing parameters for the pre-leach sample.
Table 10-29: Thickener Sizing Parameters – Pre-leach Thickener
Thickener Stream |
Pre-Leach |
Thickener Type |
High Rate |
Flocculant |
BASF MF-1011 |
Feed Suspended Solids Conc., wt% |
8.5 |
Flocculant Dosage, g/t |
20 |
Design Unit Area, m2/tpd |
0.06 |
Mud residence time required, hrs |
0.3 |
Design Underflow Solids, wt% |
50 |
|
Un-sheared Yield Stress, Pa |
20 |
Design Overflow Clarity, ppm |
<200 |
10.2.5.6Underflow Rheology Testing
Thickened underflow from the continuous fill test allows for the determination of underflow rheology necessary for proper underflow management. Process liquor diluted the thickened underflow sample through a series of solids concentrations to measure yield stress as a function of solids concentration. The yield stress was measured using a Haake VT550 Viscometer fitted with a custom designed FLSmidth vane. A yield stress of 20 Pa at 50 wt% solids was measured, which is consistent with a high-rate thickener design.
Back Forty Project |
10-42 |
Gold Resource Corporation |
|
10.2.5.7 |
Filter Press Testing |
A bench-scale testing unit was used to conduct pressure filtration tests. The test apparatus allows for variations in fill pressures, cake thicknesses, fill times, air blow times, as well as air blow pressures. These tests were performed on the post-leach sample. A post-leach slurry was prepared to 50 wt% solids as prescribed by the thickening testwork. A polypropylene media designated POPR 955 with a permeability of 1.5 m3/m2/min at 125 kPa was used for the testing. This specific filter media is typically effective in similar processes and exhibited good performance based on filtration rate, filtrate clarity, cake release, and resistance to blinding.
The test conditions and results are presented in Table 10-30.
Table 10-30: Filter Press Test Conditions and Results
Process Parameter |
Leach Residue |
Test ID |
1 |
Chamber Type |
Membrane |
Filter Media |
POPR 966 |
Filter Feed Suspended Solids, wt% |
50.0 |
Chamber Thickness, mm |
32 |
Feed Pressure, Bar |
6.9 |
Membrane Squeeze Pressure, bar |
6.9 |
Wash Pressure, Bar |
6.9 |
Drying Pressure, Bar |
6.9 |
Fill Time, min |
1.0 |
Membrane Squeeze time, min |
0.25 |
Cake Wash Time, min |
6.0 |
Air Blow Time, min |
10.0 |
Cake Wash Ratio, kg wash/kg dry solids |
0.56 |
Ultimate Cake Moisture, wt% |
9.3 |
Dry Cake Density, kg/m3 |
2,011 |
Filtrate TSS, ppm |
300 |
The filter cake consolidated rapidly which resulted in the filter feed pressure not increasing over 6.9 bar. The pressure filtration test was performed with a 32-mm chamber thickness to maximize filtration rate and cake washing efficiency. A membrane squeeze was applied to enhance the cake washing efficiency.
Filtrate volume production and the resulting pressure profile with respect to time while the chamber fills were monitored. It took approximately 0.8 minutes for a 32 mm cake to reach to the cake consolidation portion of the test. The cake moisture over air blow time during the air blow portion of the test was monitored.
After the pumping and membrane squeeze steps of the cycle, cake washing was performed up to a wash ratio of 0.56 kg of wash per kilogram of dry solids.
Back Forty Project |
10-43 |
Gold Resource Corporation |
|
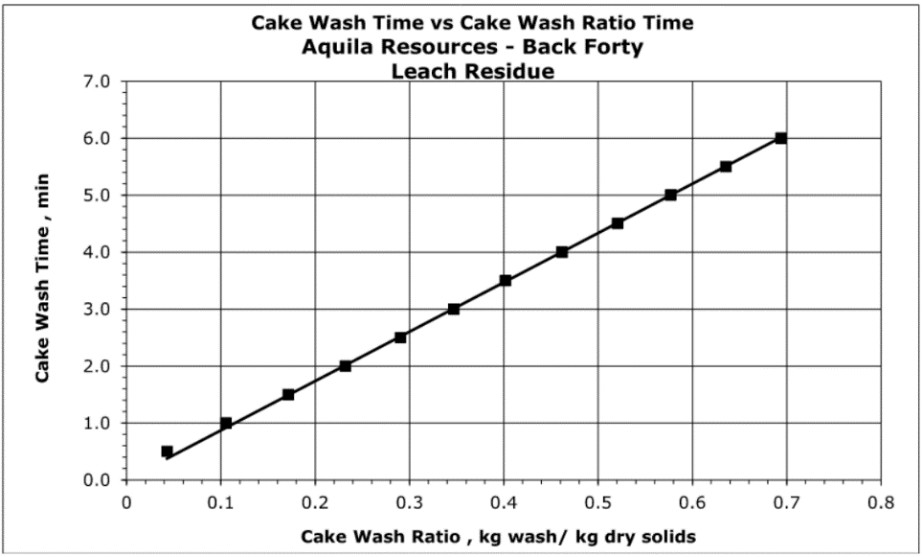
Figure 10-16: Cake Wash Time Versus Cake Wash Ratio Time – Aquila Resources – Back Forty – Leach Residue
A relationship between cake liquor cyanide concentration and required quantity of wash water was defined. Based on the results, the minimum cyanide concentration in the filter cake liquor is approximately 150 ppm which is achieved with a cake wash ratio of 0.7 kg of wash water per kg of dry solids. Those results indicated that a filter press is suitable to dewater and wash the leach residue sample. A final cake moisture content of 9.3 wt% was achieved. The filter cake was considered uniform and friable, and it released well from the filter media. The filtration rate decreases with decreasing cake moisture content due to increased cycle time.
Filtration objectives were reached by assessing bench-scale pressure filtration technology with 50 wt% feed slurry solids of the post-leach slurry. The pressure filter sizing conditions and results are presented in Table 10-31. This technology is suitable for the application.
Back Forty Project |
10-44 |
Gold Resource Corporation |
|
Table 10-31: Pressure Filtration Sizing Summary
Sample Name |
Leach Residue |
Chamber Type |
Membrane |
Filter Media |
POPR 966 |
Feed Sus. Solids, wt% |
50 |
Form Pressure, bar |
6.9 |
Cake Wash Pressure, bar |
6.9 |
Cake Blow Pressure, bar |
6.9 |
Cake Thickness, mm |
32 |
Formation Time, min |
0.8 |
Squeeze Time, min |
0.5 |
Cake Wash Time, min |
6 |
Air Blow Time, min |
3 |
Dry Cake Weight, kg/m3 |
2,010 |
Wash Ratio (kg H2O/kg solids) |
0.7 |
Final Cake Moisture, wt% |
12.0 |
Filtration Rate, kg/m2/hr |
234 |
Cyanide Remaining, ppm |
150 |
10.2.5.8 |
Pneumapress® Testing |
The operation of a commercial scale filter was simulated using the Pneumapress® bench-scale pressure filter. All the process steps performed on the commercial filter are performed on the lab filter. The testing unit allows for various feed solids concentrations, air pressures, and cake thicknesses.
A known volume of slurry is added to the test chamber, then compressed nitrogen gas at 10-bar is applied forcing the cake formation by pushing filtrate through the filter media before and after ‘breakthrough’. Breakthrough refers to the moment the cake forms and the cake drying step begins. For the tests including a washing step, the wash water is applied directly before the breakthrough point.
Filter media selection is typically effective in similar processes and exhibited great performance based on filtration rate, observed filtrate clarity, cake release, and resistance to blinding. The filtration tests were conducted using polyethylene terephthalate (#6) with an air permeability of 2.4 m3/m2/min of air volume per square meter of filter area per minute at 1.25-bar.
Samples of cake liquor were submitted for cyanide analysis.
Table 10-32 presents a summary of the tested conditions.
Back Forty Project |
10-45 |
Gold Resource Corporation |
|
Table 10-32 Summary of Pneumapress® Filtration Testing Parameters
Process Parameter |
Leach Residue |
Feed Suspended Solids, wt% |
50 |
Filter Media |
PFC #6 |
Feed Pressure, bar |
10 |
Cake Wash Pressure, bar |
10 |
Cake Blow Pressure, bar |
10 |
Cake Wash Ratio, kg wash/kg dry solids |
0 – 0.85 |
Cake Thickness Range, mm |
13 - 30 |
Slurry Volume Range, mL |
100-300 |
A relationship between the dry cake weight and cake thickness for the leach residue was determined and was used to predict throughput on the Pneumapress® unit. Other relationships were obtained to define the optimal filtration for the leach residue, dry cake weight vs. cake formation time, cake moisture vs drying time at various cake thicknesses. As expected, the final cake moisture increases with increasing cake thickness. Although the cake moisture is lowest with thinner filter cakes, the air flow requirement is also high and the capacity per cycle is lower. Therefore, FLS recommended a minimum cake thickness of 25-mm.
Based on the relationship between cake liquor cyanide concentration and required quantity of wash water, the minimum cyanide concentration obtained in the filter cake liquor was approximately 100-ppm. The cyanide removal did not reduce beyond a cake wash ratio of 0.5-kg of wash water per kg of dry solids (up to 0.85 kg/kgdry solids tested).
Back Forty Project |
10-46 |
Gold Resource Corporation |
|
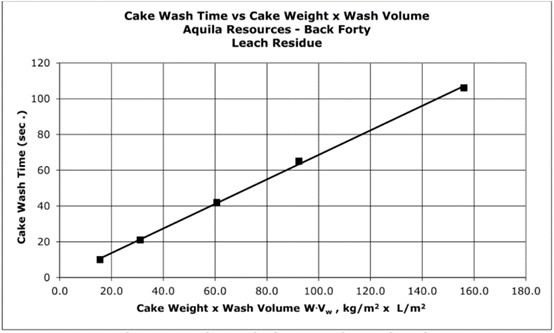
Figure 10-17: Cake Wash Time Versus Cake Weight x Wash Volume – Aquila Resources – Back Forty Leach Residue
In all cases, the Pneumapress® filter cakes were well consolidated and friable. The cake release from the filter media was complete.
Filtration objectives were reached by assessing bench-scale pressure filtration technology with 50-wt% feed slurry solids of the post-leach slurry. The Pneumapress® filter sizing conditions and results are presented in Table 10-33. This technology is suitable for the application.
Table 10-33: Summary of Sizing and Operating Pneumapress® Filter
Sample Name |
Leach Residue |
Filter Media |
#6 |
Feed Sus. Solids, wt% |
50 |
Feed/Wash Pressure, bar |
10 |
Cake Thickness, mm |
25 |
Cake Form Time, s |
45 |
Cake Wash Time, s |
65 |
Cake Dry Time, s |
30 |
Final Cake Moisture, wt% |
12.5 |
Wash Ratio, kg H2O/kg solids |
0.5 |
Filtration Rate, kg/m2/hr |
760 |
Cyanide Remaining, ppm |
100 |
Back Forty Project |
10-47 |
Gold Resource Corporation |
|
10.2.6 |
Bench Scale SART Testing at BQE Water |
The purpose of the testwork was to investigate the use of Sulphidization, Acidification, Re-neutralization and Thickening (SART) for copper, zinc and free cyanide recovery on barren leach solutions and assess the key process design criteria for integration of SART into the Back Forty metallurgical flowsheet. The specific objectives of the testwork included:
■ |
Evaluating extent of cyanide soluble copper and zinc from two ore samples from the Back Forty Deposit; |
■ |
Assessing zinc and copper recovery as ZnS and Cu2S, and corresponding recovery of free cyanide in two-stage SART treatment on two samples; |
■ |
Confirming additional value generation through the production of high-grade copper sulfide concentrate and recovery of cyanide. |
■ |
Giving initial indication to SART reagent dosage and consumption ranges related to the specific ore type. |
Figure 10-18 schematized the BQE experimental plan.
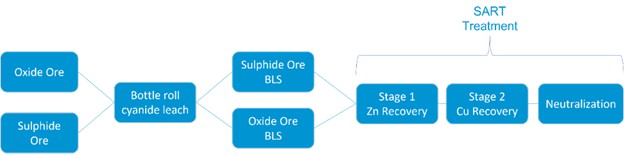
Figure 10-18: Block Diagram of the Overall Experimental Plan
10.2.6.1 |
Sample Characterization |
Two barren leachate solutions (BLS) were produced by SGS-Burnaby through bottle roll cyanide leach tests for use in SART treatment. The samples were identified as “Oxide” and “Sulfide with Pinwheel.” Assays were performed on the leach solution samples and are presented in Table 10-34. Significant copper and zinc in both the oxide and sulfide ores were leached via cyanidation. Therefore, the leach circuit in the Back Forty metallurgical flowsheet would be a good candidate for the addition of a SART circuit to recover valuable copper and zinc and associated CN.
The BLS samples contained less than 0.3 mg/L silver and no gold was detected since the cyanidation tests performed before were done as carbon in pulp. Concentrations of calcium and sulphate in the solutions were close to saturation with respect to gypsum. Both solutions contained fair content of selenium which is interesting from an environmental perspective. Thiocyanate (SCN-) was higher in the sulfide BLS, and other thiosalt species are expected to be higher in the sulfide ore BLS due to the nature of the sulfide ore. It is important to note that the full-scale plant is expected to operate with leach solution saturated with gypsum,
Back Forty Project |
10-48 |
Gold Resource Corporation |
|
and elevated SCN- and Se concentrations. Build-up of SCN- can cause interference with cyanide destruction and selenium is a constituent of concern; the effect of high concentrations of SCN- and Se in the upstream process should be considered in follow up studies.
Table 10-34: Chemical Composition of BLS Samples
Analyte (mg/L) |
Oxide BLS |
Sulfide BLS |
|---|---|---|
pH |
7.4 |
7.8 |
Copper |
388 |
241 |
Zinc |
166 |
215 |
Gold |
<0.05 |
<0.05 |
Silver |
0.29 |
0.13 |
Cobalt |
0.32 |
0.04 |
Nickel |
0.39 |
0.10 |
Iron |
0.11 |
1.10 |
Selenium |
0.06 |
0.16 |
Strontium |
0.80 |
0.77 |
Calcium |
590 |
670 |
Potassium |
47 |
58 |
Sodium |
1550 |
1760 |
Chloride |
14.5 |
30.4 |
Sulphate |
2245 |
2095 |
Thiocyanate (SCN-) |
410 |
665 |
Cyanide, WAD |
745 |
625 |
Cyanide, total |
761 |
685 |
Cyanate |
220 |
150 |
10.2.6.2 |
SART |
The SART process uses acidification to break metal-cyanide bonds, liberating free cyanide and metal ions. Added aqueous sulfide then reacts with the free metal ions to form insoluble metal sulfide precipitates, which are recovered. Lastly, the cyanide solution is neutralized and recycled for reuse in the leaching process.
Figure 10-19 presents a schematic of a bench scale SART test apparatus. The setup includes a sealed reactor for sulphidization and acidification, an open reactor for neutralization, and a sealed solid/liquid separator. The sulphidization/acidification reactor has several ports for characterization, reagent addition or sampling.
Back Forty Project |
10-49 |
Gold Resource Corporation |
|
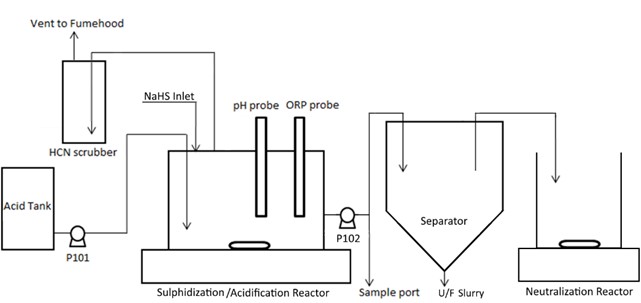
Figure 10-19: Schematic of Bench Scale SART Apparatus
The SART tests were conducted in batches of 750 mL in two stages, zinc followed by copper recovery.
The Oxide sample results of the SART tests are summarized in Table 10-35 and Table 10-36 showing the corresponding reagent consumptions. The concentrations shown in the tables represent the SART results completed with two stoichiometric NaHS dosages based on the metals (copper or zinc) and dissolved oxygen concentrations for the zinc and copper circuits. Results were adjusted for dilution due to reagent addition.
Back Forty Project |
10-50 |
Gold Resource Corporation |
|
Table 10-35: Summary of SART Tests Results on Oxide BLS
Analyte/Parameter |
Unit |
Zinc Circuit |
||||
Feed |
90% Stoichiometric |
100% Stoichiometric |
||||
Effluent |
%-Removal |
Effluent |
%-Removal |
|||
pH |
- |
7.4 |
7 |
- |
7 |
- |
Cu |
mg/L |
388 |
374 |
- |
378 |
- |
Zn |
mg/L |
166 |
25 |
85% |
0.9 |
99% |
Ag |
mg/L |
0.29 |
0.03 |
90% |
0.02 |
93% |
ZnS Generated dwb1 |
g/L |
- |
- |
- |
0.28 |
- |
Analyte/Parameter |
Unit |
Copper Circuit |
||||
Feed2 |
90% Stoichiometric |
100% Stoichiometric |
||||
Effluent |
%-Removal |
Effluent |
%-Removal |
|||
pH |
- |
7 |
4.3 |
- |
4.3 |
- |
Cu |
mg/L |
378 |
38 |
90% |
6.2 |
98% |
Zn |
mg/L |
0.9 |
6.6 |
- |
5.5 |
- |
Ag |
mg/L |
0.02 |
0.01 |
97% |
0.001 |
>99% |
Cu2S Generated dwb1 |
g/L |
- |
- |
- |
0.43 |
- |
Notes:
3. |
Dry weight basis |
4. |
Effluent of zinc circuit |
Table 10-36: Summary of SART Reagent Consumptions on Oxide BLS
Reagent |
Unit |
Zinc Circuit |
Copper Circuit |
Neutralization Circuit |
||
90% Stoichiometric |
100% Stoichiometric |
90% Stoichiometric |
100% Stoichiometric |
|||
NaHS (100%) |
g/L |
0.14 |
0.15 |
0.18 |
0.20 |
- |
Sulfuric Acid (98%) |
g/L |
0.10 |
0.15 |
0.36 |
0.47 |
- |
Hydrated Lime (99%) |
g/L |
- |
- |
- |
- |
0.92 |
Back Forty Project |
10-51 |
Gold Resource Corporation |
|
The Sulfide sample results of the SART tests are summarized in Table 10-37 and Table 10-38 showing the corresponding reagent consumptions. The concentrations shown in the tables represent the SART results completed with 100% stoichiometric NaHS dosages based on dissolved oxygen and zinc concentration for the zinc circuit and two different stoichiometric NaHS dosages based on copper and dissolved oxygen concentration for the copper circuit. Results were adjusted for dilution due to reagent addition.
Table 10-37: Summary of SART Tests Results on Sulfide BLS
Analyte/Parameter |
Unit |
Zinc Circuit |
||||
Feed |
90% Stoichiometric |
100% Stoichiometric |
||||
Effluent |
%-Removal |
Effluent |
%-Removal |
|||
pH |
- |
7.8 |
- |
- |
7 |
- |
Cu |
mg/L |
241 |
- |
- |
239 |
- |
Zn |
mg/L |
215 |
- |
- |
0.06 |
99% |
Ag |
mg/L |
0.13 |
- |
- |
<0.01 |
>92% |
ZnS Generated dwb1 |
g/L |
- |
- |
- |
0.31 |
- |
Analyte/Parameter |
Unit |
Copper Circuit |
||||
Feed2 |
90% Stoichiometric |
100% Stoichiometric |
||||
Effluent |
%-Removal |
Effluent |
%-Removal |
|||
pH |
- |
7 |
4.3 |
- |
4.3 |
- |
Cu |
mg/L |
239 |
27 |
89% |
3.9 |
98% |
Zn |
mg/L |
0.06 |
1.52 |
- |
2.6 |
- |
Ag |
mg/L |
0.01 |
<0.01 |
>92% |
<0.01 |
>92% |
Cu2S Generated dwb1 |
g/L |
- |
- |
- |
0.27 |
- |
Notes:
5. |
Dry weight basis |
6. |
Effluent of zinc circuit |
Back Forty Project |
10-52 |
Gold Resource Corporation |
|
Table 10-38: Summary of SART Reagent Consumptions on Sulfide BLS
Reagent |
Unit |
Zinc Circuit |
Copper Circuit |
Neutralization Circuit |
|||
90% Stoichiometric |
100% Stoichiometric |
90% Stoichiometric |
100% Stoichiometric |
||||
NaHS (100%) |
g/L |
- |
0.21 |
0.13 |
0.14 |
- |
|
Sulfuric Acid (98%) |
g/L |
- |
0.22 |
0.37 |
0.43 |
- |
|
Hydrated Lime (99%) |
g/L |
- |
- |
- |
- |
0.95 |
|
Results obtained showed near complete removal of zinc and copper using a 100% stoichiometric sulfide addition for SART tests performed on both the Oxide BLS and the Sulfide BLS. Silver removal of more than 90% occurred in the zinc circuit for each sample. As the expected pH of SART feed in the large-scale plant is around 10.5–11.0, the consumption of sulfuric acid and consequently the lime consumption in actual large-scale SART plant are expected to be higher.
Table 10-39 summarizes the change in constituents across SART treatment after neutralization.
Table 10-39: Effect of SART on Matrix of Leach Solutions
Analyte/Parameter |
Unit |
Oxide BLS |
Sulfide BLS |
||
Feed |
Neutralized SART Effluent |
Feed |
Neutralized SART Effluent |
||
pH |
- |
7.4 |
10.5 |
7.8 |
10.5 |
Free CN- |
mg/L |
- |
673 |
- |
636 |
WAD CN- |
mg/L |
745 |
- |
625 |
- |
Cu |
mg/L |
388 |
22 |
241 |
17 |
Zn |
mg/L |
166 |
7.6 |
215 |
3.7 |
SCN- |
mg/L |
410 |
470 |
665 |
645 |
SO42- |
mg/L |
2245 |
2270 |
2095 |
2310 |
Cl- |
mg/L |
14.5 |
19.1 |
30.4 |
31.2 |
Ca |
mg/L |
590 |
680 |
670 |
768 |
More than 98% of the cyanide complexed by metals was recovered as free cyanide in the SART effluents. The decrease in CN- between the Oxide BLS feed and neutralized SART effluent was likely due to HCN volatilization during the neutralization step, and the increase of Zn and Cu was due to imperfect solid/liquid separation prior to neutralization and re-dissolution of the Cu2S and ZnS at higher pH during neutralization. This should not be the case in a large-scale plant.
Back Forty Project |
10-53 |
Gold Resource Corporation |
|
The sulphate and calcium concentration in both SART effluents increased from their respective feeds due to the addition of lime and sulphuric acid. The results indicate that the SART effluents in the large-scale metallurgical plant will be saturated with respect to gypsum. Thiocyanate concentrations stayed consistent in both SART tests.
The following conclusions were drawn from the SART testwork:
| ■ | Near complete (>98%) removal of copper and zinc, and corresponding recovery of free cyanide, was achieved by SART treatment of both the Oxide and Sulfide BLS. The reagent consumption was close to stoichiometric values to metals; |
| ■ | The recovered cyanide from the SART process can be recycled back to the leaching circuit; |
| ■ | Silver present in the SART feeds was removed from solution and reported to the ZnS solids. |
Since the solution assays revealed that SCN- and Se will build up in leach solution in the full-scale metallurgical plant, the impacts of this build-up on the cyanide destruction process and environmental deportment of Se should be considered in follow-up studies and test programs.
10.2.7 |
Paste Backfill Testwork |
Paste backfill testwork was completed in the WSP Golder Laboratory in Sudbury, Ontario, Canada. Five samples, amounting to about 85 kg, were provided to the laboratory. A blend of three samples, derived from the latter years of production, were used to create a tailings composite (21460140 Combined Tailings (Paste)) that best represents what would be processed by the paste backfill plant. A separate sample (21460140 Comp YR 1-6, 7-9, 10-12) was used primarily for geotechnical testing related to the filtered tailings stack.
The following test program was completed on the tailings for paste backfill assessment:
| ■ | Material characterization: pH analysis, particle size distribution (PSD), specific gravity (SG), compaction characteristics, Atterberg limits as well as chemistry and mineralogy. |
| ■ | Rheological characterization: slump versus solids content, static yield stress, water bleed, plug yield stress as well as viscosity and dynamic yield stress determination. |
| ■ | Unconfined compressive strength (UCS) testing. |
10.2.7.1 |
Material Characterization |
10.2.7.1.1 |
Particle Size Distribution and Specific Gravity |
PSD was determined using a Malvern Mastersizer 3000 laser particle size analyzer according to ASTM D4464. The specific gravity (SG) of the sample was determined using vacuum de-aired water. Each slurry sample was also vacuum de-aired prior to SG measurement. Figure 10-20 illustrates the PSD of 21460140 Combined Tailings (Paste) and 21460140 Comp YR 1-6, 7-9, 10-12. Their respective SGs are shown in Table 10-40.
Back Forty Project |
10-54 |
Gold Resource Corporation |
|
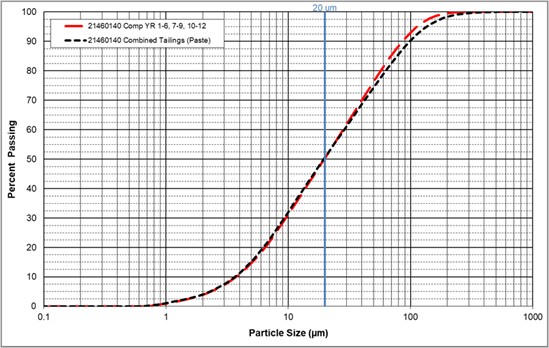
Figure 10-20: Particle Size Distribution
Table 10-40: Specific Gravity Results
Sample |
Trial 1 |
Trial 2 |
Average |
|---|---|---|---|
21460140 Comp YR 1-6, 7-9, 10-12 |
3.71 |
3.72 |
3.72 |
21460140 Combined Tailings (Paste) |
3.64 |
3.66 |
3.65 |
10.2.7.1.2 |
Compaction Characteristics |
Soil of a known moisture content is compacted into a cylindrical mold in equal layers using a weighted hammer from a specified height. This process is repeated for various moisture contents and the dry densities are determined for each. The compaction characteristics of the samples were determined in accordance with ASTM D698. The optimum moisture content and maximum dry density for the tailings are presented in Table 10-41. It is important to note that the optimum moisture content value is represented as a geotechnical moisture content.
Table 10-41: Tailings Optimum Moisture Content and Maximum Dry Density Results
Sample |
Optimum Moisture Content (Geotechnical) (%) |
Max Dry Density (kg/m3) |
|---|---|---|
21460140 Comp YR 1-6, 7-9, 10-12 |
11.4 |
2237 |
Back Forty Project |
10-55 |
Gold Resource Corporation |
|
10.2.7.1.3 |
Chemistry and Mineralogy |
Chemical and mineralogical analyses were performed using whole rock analysis (WRA) by inductively coupled plasma (ICP) and X-ray diffraction (XRD) via semi-quantitative analysis by Rietveld Method, respectively, whereas sulphur analysis was performed by the LECO method. The results for mineralogy are shown in Table 10-42.
Table 10-42: Semi-Quantitative Mineralogical Composition – 21460140 Combined Tailings (Paste)
Mineral SQ-XRD |
Chemical Formula |
Wt% |
|---|---|---|
Pyrite |
FeS2 |
44.13 |
Quartz |
SiO2 |
32.02 |
Muscovite |
KAl2(Si,Al)4O10(OH)2 |
12.98 |
Clinochlore |
(Mg,Fe)6(Si,Al)4O10(OH)8 |
8.90 |
Gypsum |
Ca(SO4)(H2O)2 |
1.97 |
Total |
100.00 |
|
10.2.7.2 |
Viscosity and Dynamic Yield Stress Determination |
Viscosity testing provides bench scale flow properties and fluid characterization. Dynamic viscosity and yield stress data is essential for mixer, pump and pipeline design. In order to compare or duplicate viscosity results of non-Newtonian fluids, it is important to test according to the same conditions. Test conditions and parameters such as cycle time and instrument sensor configuration, are critical to producing usable data from bench scale viscometers.
The yield stress determined through this testing is referred to as dynamic yield stress, since it is extrapolated from dynamic shear stress data to zero shear. The instrument sensor or bob rotated inside the cup which contained the sample, and torque measurements were recorded at several incremental speeds or shear rates.
Table 10-43 presents the results of the viscosity and dynamic yield stress test work for 21460140 Combined Tailings (Paste). The results of this test work are used to estimate the pipeline friction losses for paste backfill distribution.
Table 10-43: Bingham Viscosity and Yield Stress Summary – 21460140 Combined Tailings (Paste)
Wt% Solids |
Bingham Yield Stress (Pa) |
Bingham Viscosity (PaS) |
||
|---|---|---|---|---|
Ramp Up |
Ramp Down |
Ramp Up |
Ramp Down |
|
81.8 |
651 |
704 |
2.260 |
2.042 |
81.2 |
521 |
732 |
1.473 |
1.463 |
80.4 |
403 |
402 |
0.972 |
1.003 |
79.4 |
223 |
227 |
0.489 |
0.483 |
77.8 |
127 |
126 |
0.215 |
0.216 |
73.6 |
31 |
30 |
0.050 |
0.051 |
Back Forty Project |
10-56 |
Gold Resource Corporation |
|
10.2.7.3 |
Unconfined Compressive Strength Testing |
The UCS program was carried out to assess the backfill strength using 2” x 4” cylinders. The cylinders were cured in a high humidity environment maintained at 68 to 77°F. Three cylinders per curing period were cast and the results were averaged.
Unconfined compressive strength (UCS) testing was carried out using a Humboldt HM2800 digital load frame. The load was measured using s-type load cells. Depending on strength, either a 2,000 lb or 10,000 lb load cell was utilized.
Cured cylinders were placed between two platens and during testing the bottom platen advanced at a rate of 0.08 inch per minute. The load was continuously monitored, and the peak load was automatically recorded by the instrument.
The UCS test results are summarized in Table 10-44.
Table 10-44: UCS Test Results
Mix |
Wt% Binder |
Binder |
Material |
Slump (mm) |
Average UCS (kPa) |
||
Curing |
Curing 14 days |
Curing |
|||||
1 |
2 |
Lafarge 90/10 Slag Cement |
21460140 Combined Tailings (Paste) |
7” |
11 [1] |
149 |
441 |
2 |
6 |
7” |
1810 |
-- |
4515 |
||
3 |
6 |
10” |
1516 |
-- |
3653 |
||
4 |
2.5 |
7” |
10 [1] |
65 |
748 |
||
5 |
2.5 |
10” |
4 [1] |
9 [1] |
486 |
||
Note 1: Cylinders were too soft to break, tested with penetrometer to be tested at subsequent break period
10.3Testwork Campaign 2023
The metallurgical testwork program performed in 2023 was tailored to represent the new mining sequence developed and a new process flowsheet using reverse osmosis and cyanide recycling (SART). The testwork was conducted in 2023 at Base Metal Laboratories and BQE Water, both located in British-Colombia, Canada.
10.3.1 |
Sample Selection and Compositing |
A total of eight samples have been generated for the testwork program. Samples were composited to represent variation of material type and variation of metal grade considering a preliminary mining schedule.
Back Forty Project |
10-57 |
Gold Resource Corporation |
|
There were originally eight material types. Table 10-45 shows material type proportion for the life of the mine:
Table 10-45: Material Type Proportion
Material type |
Proportion |
Mat 1 |
68.2% |
Mat 2 |
2.7% |
Mat 3 |
7.3% |
Mat 4 |
1.9% |
Mat 5 |
5.5% |
Mat 6 |
10.3% |
Mat 7 |
0.7% |
Mat 8 |
3.4% |
The samples were composited to represent different material type proportion and range of metal grade. Table 10-46 describes sample composition.
Table 10-46: Sample Composite Description
Sample ID |
Material type |
Grade |
PFC-1 |
100% Mat 6 |
Low sulfur, high gold |
PFC-2 |
60% Mat 3, 30% Mat 6 |
High copper, low zinc, high gold |
PFC-3 |
>90% Mat 1, Mat 6 |
Medium copper, low sulfur |
PFC-4 |
75% Mat 1, 14% Mat4-8 |
High zinc, medium copper |
PFC-5 |
30% Mat 1, 30% Mat 5, 30% Mat 6 |
Low copper, low zinc, low sulfur |
PFC-6 |
50% Mat 1, 30% Mat 4, 12% Mat 6 |
High lead, low copper, high zinc |
PFC-7 |
>90% Mat 1, Mat 6 |
High copper, high sulfur |
PFC-8 |
85% Mat 1, Mat 5, Mat 6 |
High copper, high zinc |
Each sample was composed of 35kg of material. Sample have been submitted to the testwork schematic represented in Figure 10-21.
Back Forty Project |
10-58 |
Gold Resource Corporation |
|
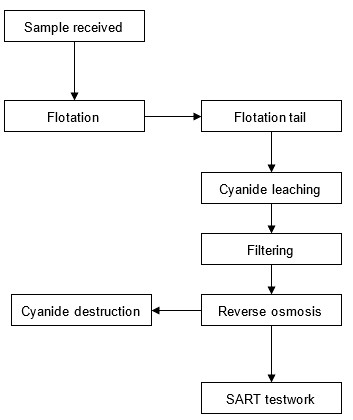
Figure 10-21: Testwork Flow Diagram
10.3.2 |
Composite Characterization |
The composites were submitted to a semi-quantitative inductively coupled plasma (“ICP”) scan for multi-element analysis. Table 10-47 summarizes head assay of the eight samples for major elements.
Table 10-47: Sample Composite Head Assays
Samples |
Assays |
||||||
Cu (%) |
Pb (%) |
Zn (%) |
Fe (%) |
Au (g/t) |
Ag (g/t) |
S (%) |
|
PFC-1 |
0.06 |
0.09 |
0.01 |
32.7 |
4.52 |
16.4 |
0.39 |
PFC-2 |
1.53 |
0.02 |
0.04 |
37.7 |
2.2 |
41 |
33.9 |
PFC-3 |
0.26 |
0.04 |
4.78 |
39.2 |
4.24 |
9.5 |
49.1 |
PFC-4 |
0.26 |
0.17 |
7.38 |
35 |
2.39 |
25.5 |
46.4 |
PFC-5 |
0.15 |
0.09 |
1.66 |
27 |
4.38 |
10.1 |
18.1 |
PFC-6 |
0.21 |
0.46 |
6.58 |
26.5 |
1.82 |
50.5 |
32.4 |
PFC-7 |
0.32 |
0.08 |
5.44 |
38.2 |
2.17 |
16 |
48.7 |
PFC-8 |
0.27 |
0.38 |
7.24 |
33.6 |
1.82 |
28 |
42.1 |
Back Forty Project |
10-59 |
Gold Resource Corporation |
|
10.3.3 |
Base Metallurgical Laboratories Ltd. |
Gravity testing, batch flotation testwork, lock-cycle flotation testwork and cyanide leach was performed on each composite at Base Metallurgical Laboratory in Kamloops, BC.
10.3.3.1 |
Gravity Testwork |
Gravity testing was completed on each composite. In each case, a 2 kg charge was ground to a target k80 of 50 µm prior to gravity separation by the Knelson concentrator; the Knelson concentrate advanced to the Mozley table for cleaning. Each test produced a Mozley Concentrate (Grav Concentrate), Mozley Tailings and Knelson Tailings; the Mozley concentrate was assayed for Au to extinction. The summary of result is shown in Table 10-48.
Table 10-48: Gravity Result Summary
Sample ID |
Gravity Concentrate |
||
Mass, % |
Assay, g/t |
Distribution, % |
|
PFC-1 |
0.26 |
38.4 |
2.17 |
PFC-2 |
0.2 |
368 |
23.8 |
PFC-3 |
0.21 |
320 |
17.8 |
PFC-4 |
0.19 |
265 |
19.1 |
PFC-5 |
0.19 |
474 |
18.2 |
PFC-6 |
0.27 |
219 |
27.1 |
PFC-7 |
0.27 |
119 |
14.5 |
PFC-8 |
0.24 |
277 |
28.5 |
Gravity recoverable gold content measured between 2.2 to 27% with mass recovery ranging between 0.19 and 0.27 %.
10.3.3.2 |
Flotation Testwork |
For this testwork campaign, flotation testwork undertaken included a number of separation processes including differential flotation of copper, copper/zinc, copper/zinc/pyrite.
In total, 48 flotation tests were conducted, including:
| ● | Eight rougher kinetics tests for copper, zinc and pyrite flotation. |
| ● | Thirty-three cleaning tests for differential copper and zinc. |
| ● | Seven locked-cycle tests for differential copper and zinc flotation. |
Optimization testwork lead to a flowsheet arrangement of Cu sequential Zn by which zinc was depressed using the ZnCN system, allowing a selective Copper concentrate to be floated followed by zinc. The flowsheet used for locked cycle testing (LCT) is conventional in design with counter current circulation of intermediate tailings within the cleaner circuit. The overall flowsheet derived from the test program showing recirculation is outlined by the block diagram in Figure 10-22.
Back Forty Project |
10-60 |
Gold Resource Corporation |
|
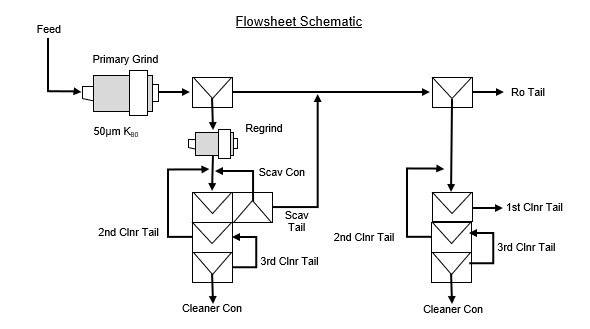
Figure 10-22: LCT Flowsheet
In total, seven LCTs were completed, one for each composite from PFC-2 to PFC-8. A summary of each LCT result is provided in Table 10-50; conditions were based on their respective batch tests.
Back Forty Project |
10-61 |
Table 10-49: LCT Conditions
Sample ID |
Test # |
Grind size, mm |
Cu rougher pH |
Cu cleaner pH |
Zn rougher pH |
Zn cleaner pH |
Reagents (overall) |
||||
ZnCN |
3894 |
3501 |
CuSO4 |
5100 |
|||||||
PFC-2 |
LCT-42 |
50 |
9 |
9.5 |
10.5 |
- |
350 |
27.5 |
35 |
- |
- |
PFC-3 |
LCT-58 |
50 |
14 |
9.5 |
10.5 |
11 |
380 |
30 |
30 |
550 |
17.5 |
PFC-4 |
LCT-49 |
50 |
11 |
9.5 |
10.5 |
11 |
385 |
22.5 |
25 |
600 |
22.5 |
PFC-5 |
LCT-69 |
50 |
12 |
9.5 |
10.5 |
11 |
715 |
- |
17 |
160 |
4 |
PFC-6 |
LCT-74 |
50 |
11 |
10.5 |
11 |
11 |
730 |
32.5 |
35 |
650 |
22.5 |
PFC-7 |
LCT-62 |
50 |
13 |
9.5 |
10.5 |
11 |
385 |
37.5 |
25 |
550 |
22.5 |
PFC-8 |
LCT-68 |
50 |
13 |
10 |
11 |
11 |
380 |
32.5 |
35 |
650 |
22.5 |
Back Forty Project |
10-62 |
Gold Resource Corporation |
|
Table 10-50: LCT Results Summary
Sample ID |
Test ID |
Products |
Weight, % |
Assay – percent or g/t |
Distribution - percent |
||||||
Cu |
Zn |
Au |
Ag |
Cu |
Zn |
Au |
Ag |
||||
PFC-2 |
LCT-42 |
Cu Con Cu Clnr Tail Cu Rougher Tl |
10.3 27 62.7 |
13.4 0.41 0.12 |
0.18 0.02 0.02 |
12.7 0.97 0.94 |
314 39 15 |
88.2 7.06 4.79 |
50.8 14.8 34.4 |
60.6 12.2 27.2 |
61.9 20.1 18 |
PFC-3 |
LCT-58 |
Cu Con Zn Con Zn Cleaner Tl Ro Tail |
0.87 7.22 3.87 88 |
24.4 0.21 0.25 0.04 |
6.25 53.8 3.75 0.75 |
287 1.3 3.14 1.4 |
364 21 13 5 |
77.7 5.63 3.6 13 |
1.15 82 3.06 13.8 |
63.3 2.37 3.07 31.2 |
33 15.8 5.42 45.8 |
PFC-4 |
LCT-49 |
Cu Con Zn Con Zn Cleaner Tl Ro Tail |
0.96 13 3.93 82.1 |
18.2 0.16 0.31 0.05 |
7.56 54.4 2.96 0.32 |
170 0.54 1.53 0.8 |
114 26 29 7.2 |
70.6 8.35 4.83 16.2 |
0.97 93.9 1.55 3.56 |
67.6 2.86 2.48 27.1 |
50.7 15.9 5.42 27.9 |
PFC-5 |
LCT-69 |
Cu Con Zn Con Zn Cleaner Tl Ro Tail |
0.49 3.82 6.34 89.3 |
20.4 1.22 0.09 0.03 |
11.6 39 0.26 0.07 |
758 6.55 3.67 1.6 |
800 61 12 2.5 |
56.3 26.5 3.07 14.2 |
3.46 91.7 1.01 3.85 |
65.8 4.48 4.16 25.6 |
42.2 25.3 8.35 24.2 |
PFC-6 |
LCT-74 |
Cu Con Zn Con Zn Cleaner Tl Ro Tail |
1.21 12.7 5.32 80.8 |
9.76 0.16 0.24 0.04 |
9.44 50.3 1.54 0.16 |
77 0.54 1.04 0.73 |
1721 59 39 9.6 |
65.4 11.5 7.08 15.9 |
1.7 95.2 1.22 1.87 |
56.5 4.13 3.34 36 |
54.5 19.7 5.51 20.4 |
PFC-7 |
LCT-62 |
Cu Con Zn Con Zn Cleaner Tl Ro Tail |
0.96 9.21 1.79 88 |
25.1 0.2 0.61 0.04 |
7.22 52.1 5.95 0.27 |
140 0.69 1.99 1.15 |
679 31 51 7 |
78 5.82 3.53 12.7 |
1.33 92 2.04 4.59 |
54.5 2.58 1.45 41.4 |
39.6 17.4 5.59 37.5 |
PFC-8 |
LCT-68 |
Cu Con Zn Con Zn Cleaner Tl Ro Tail |
1.33 13 3.26 82.4 |
15.4 0.14 0.41 0.05 |
10.8 50 2.99 0.6 |
122 0.21 0.97 0.82 |
1162 39 30 8.1 |
73.3 6.28 4.79 15.7 |
1.98 89.8 1.35 6.85 |
68.8 1.16 1.34 28.7 |
54.7 18.2 3.45 23.7 |
The LCTs performed slightly better than the respective batch test result, as expected. A mechanism to reject liberated pyrite would be necessary to increase the copper grade in the copper concentrate. Gold might be associated with pyrite for this composite. Trade off study would be necessary. However, due to sample mass limitation, this study cannot be commenced. Future testing should consider this scenario.
PFC-3 and PFC-7 showed no significant challenges during testing. Copper and gold measured high for both grade and recovery. Zinc recovery also measured high at salable grade.
PFC-4 performed well, achieving reasonable copper grade and recovery. Gold in copper concentrate also measured high with 67% recovery. The zinc circuit performance produced a recovery of 94%.
PFC-5 faced certain challenges during testing. Collector dosage needed to be dropped and ZnCN depressant to be increased as zinc started to recover into the copper rougher concentrate. As previously
Back Forty Project |
10-63 |
Gold Resource Corporation |
|
mentioned, the composite copper circuit would be considered very sensitive, hence, proper dosage and reagent scheme would be required.
PFC-6 and PFC-8 composite consisted of a significant amount of lead and no copper-lead separation circuit was implemented for the cycle test. However, the separation circuit was conducted in their respective composite batch cleaner, given the result producing salable lead concentrate and increasing the copper grade in the copper concentrate. The copper-lead concentrate for these two composites after being produced can be stock-piled and processed later, if possible.
10.3.3.3 |
Leaching Testwork |
Standard cyanide bottle roll tests were performed on flotation tail from eight sample under the test conditions provided in Table 10-51.
Table 10-51: Leaching Testwork Conditions
Grind size, K80 mm |
Slurry density, % |
Aeration |
Leaching time, hr |
Cyanide concentration, g/L |
10, 25, 50 |
35, 40, 45 |
Air, O2 |
24, 48, 72 |
1, 2 |
The bulk leaching testwork, to prepare filtrate solution for RO testing and SART testing, was performed with synthetic process water quality. The synthetic process water chemistry was achieved by modelling the process flowsheet on Metsim. All the other testwork was done with BaseMet Lab tap water.
The overall leaching test results for various testing conditions are shown in Table 10-52. The gold recovery varies significantly between each sample. However, the different leaching conditions tested for each sample gave similar recovery. The effects of grind size, dissolved oxygen content, NaCN concentration and leaching time are compared in more detail in the following sections.
Back Forty Project |
10-64 |
Gold Resource Corporation |
|
Table 10-52: Cyanide Leaching Test Results
Test ID |
Test Objective |
K80, mm |
Density, % |
NaCN [], ppm |
Preconditioning |
Consumption, kg/t |
Au extraction, % |
|||||
NaCN, 24hr |
NaCN, 48hr |
NaCN, 72hr |
CaO |
24hr |
48hr |
72hr |
||||||
CN-29B |
Leach rougher tail comparing air vs O2 |
50 |
40 |
2000 |
O2 |
2.82 |
3.48 |
3.5 |
2.84 |
27.1 |
26.3 |
28.4 |
CN-29C |
Leach rougher tail comparing air vs O2 |
50 |
40 |
2000 |
Air |
2.54 |
2.96 |
3.1 |
2.9 |
26.9 |
27.6 |
26.3 |
CN-29D |
Leach CnTL at Fine Regrind |
25 |
33.3 |
2000 |
O2 |
2.65 |
3.75 |
7.55 |
8.9 |
23.8 |
27.9 |
26.1 |
CN-29E |
Leach CnTL at Fine Regrind |
10 |
33.3 |
2000 |
O2 |
5.00 |
6.1 |
7.55 |
17.35 |
55 |
55.6 |
56.2 |
CN-30B |
Leach rougher tail comparing air vs O2 |
50 |
40 |
2000 |
O2 |
7.48 |
10.2 |
12.38 |
4.16 |
57.6 |
68.2 |
62.5 |
CN-30C |
Leach rougher tail comparing air vs O2 |
50 |
40 |
2000 |
Air |
6.62 |
9.08 |
11.12 |
4.18 |
57.3 |
59.7 |
69.5 |
CN-35B |
Leach rougher tail |
50 |
35 |
2000 |
O2 |
2.32 |
2.84 |
3.12 |
3.68 |
52.2 |
53.3 |
55.7 |
CN-35C |
Leach rougher tail |
25 |
35 |
2000 |
O2 |
2.28 |
2.92 |
3.64 |
4.64 |
50 |
52.4 |
52 |
CN-37B |
Leach rougher tail |
50 |
35 |
2000 |
O2 |
1.8 |
2.18 |
2.3 |
3.4 |
30.8 |
31.4 |
32 |
CN-37C |
Leach rougher tail |
25 |
35 |
2000 |
O2 |
2.33 |
2.87 |
3.37 |
7.8 |
43.6 |
42.2 |
43.5 |
CN-38B |
Leach rougher tail |
50 |
35 |
2000 |
O2 |
2.2 |
2.58 |
2.88 |
4.02 |
17.6 |
18 |
18.3 |
CN-38C |
Leach rougher tail |
25 |
35 |
2000 |
O2 |
2.28 |
2.92 |
3.48 |
5.22 |
51.7 |
51.7 |
51.6 |
CN-39B |
Leach rougher tail |
50 |
35 |
2000 |
O2 |
2.58 |
2.88 |
3.18 |
4.00 |
17.5 |
20.2 |
18.2 |
CN-39C |
Leach rougher tail |
25 |
35 |
2000 |
O2 |
2.7 |
3.18 |
3.7 |
6.06 |
35.2 |
28.8 |
31.7 |
CN-42B |
Leach combined rougher tail & scav. tail |
50 |
35 |
2000 |
O2 |
6.6 |
7.9 |
8.58 |
7.32 |
56.6 |
55.4 |
56.5 |
CN-42C |
Leach rougher tail |
50 |
35 |
1000 |
O2 |
2.42 |
3.06 |
n/a |
6.02 |
54.6 |
49.6 |
n/a |
Back Forty Project |
10-65 |
Gold Resource Corporation |
|
Test ID |
Test Objective |
K80, mm |
Density, % |
NaCN [], ppm |
Preconditioning |
Consumption, kg/t |
Au extraction, % |
|||||
NaCN, 24hr |
NaCN, 48hr |
NaCN, 72hr |
CaO |
24hr |
48hr |
72hr |
||||||
CN-42D |
Leach rougher tail with air |
50 |
35 |
1000 |
Air |
2.36 |
2.9 |
n/a |
5.02 |
56.1 |
59.3 |
n/a |
CN-46R-B |
Leach rougher tail |
50 |
35 |
2000 |
O2 |
1.22 |
1.38 |
1.64 |
4.08 |
63.9 |
64.1 |
65.3 |
CN-46R-C |
Leach rougher tail |
25 |
35 |
2000 |
O2 |
1.65 |
2.00 |
2.45 |
5.9 |
69.9 |
74.2 |
73.3 |
CN-49B |
Leach rougher tail |
50 |
35 |
1000 |
O2 |
2.68 |
3.16 |
n/a |
5.72 |
28.7 |
29.3 |
n/a |
CN-49C |
Leach rougher tail with air |
50 |
35 |
1000 |
Air |
2.42 |
2.96 |
n/a |
4.4 |
37.7 |
47.4 |
n/a |
CN-57B |
Leach rougher tail |
50 |
35 |
1000 |
O2 |
1.4 |
1.54 |
n/a |
4.5 |
22.8 |
23.3 |
n/a |
CN-57C |
Leach rougher tail with air |
50 |
35 |
1000 |
Air |
0.96 |
1.2 |
n/a |
2.18 |
27.8 |
35.5 |
n/a |
CN-58B |
Leach rougher tail |
50 |
35 |
1000 |
O2 |
2.24 |
2.56 |
n/a |
5.3 |
40.6 |
45.3 |
n/a |
CN-58C |
Leach rougher tail with air |
50 |
35 |
1000 |
Air |
2.16 |
2.6 |
n/a |
4.28 |
44.6 |
48.1 |
n/a |
CN-62B |
Leach rougher tail |
50 |
35 |
1000 |
O2 |
2.2 |
2.42 |
n/a |
5.88 |
24.3 |
19 |
n/a |
CN-62C |
Leach rougher tail with air |
50 |
35 |
1000 |
Air |
1.94 |
2.26 |
n/a |
4.52 |
18.9 |
24.6 |
n/a |
CN-64B |
Leach rougher tail |
50 |
35 |
1000 |
O2 |
0.7 |
0.86 |
n/a |
5.14 |
51.1 |
51 |
n/a |
CN-68B |
Leach rougher tail |
50 |
35 |
1000 |
O2 |
2.32 |
2.84 |
n/a |
6.14 |
19.7 |
20.1 |
n/a |
CN-68C |
Leach rougher tail with air |
50 |
35 |
1000 |
Air |
2.00 |
2.44 |
n/a |
5.72 |
24.7 |
25.2 |
n/a |
CN-69B |
Leach rougher tail with air |
50 |
35 |
1000 |
Air |
0.72 |
0.88 |
n/a |
4.26 |
49 |
54.6 |
n/a |
CN-85 |
Bulk leach to create filtrate solution to SART |
50 |
45 |
1000 |
Air |
1.63 |
n/a |
n/a |
2.42 |
22.7 |
n/a |
n/a |
Back Forty Project |
10-66 |
Gold Resource Corporation |
|
Test ID |
Test Objective |
K80, mm |
Density, % |
NaCN [], ppm |
Preconditioning |
Consumption, kg/t |
Au extraction, % |
|||||
NaCN, 24hr |
NaCN, 48hr |
NaCN, 72hr |
CaO |
24hr |
48hr |
72hr |
||||||
CN-86 |
Bulk leach to create filtrate solution to SART |
50 |
45 |
1000 |
Air |
0.57 |
n/a |
n/a |
1.13 |
59.3 |
n/a |
n/a |
CN-87 |
Bulk leach to create filtrate solution to SART |
50 |
45 |
1000 |
Air |
1.14 |
n/a |
n/a |
1.77 |
25.7 |
n/a |
n/a |
CN-88 |
Bulk leach to create filtrate solution to SART |
50 |
45 |
1000 |
Air |
1.35 |
n/a |
n/a |
2.48 |
47.2 |
n/a |
n/a |
CN-89 |
Bulk leach to create filtrate solution to SART |
50 |
45 |
1000 |
Air |
1.47 |
n/a |
n/a |
2.31 |
21.5 |
n/a |
n/a |
CN-90 |
Bulk leach to create filtrate solution to SART |
50 |
45 |
1000 |
Air |
2.47 |
n/a |
n/a |
2.77 |
63.4 |
n/a |
n/a |
CN-91 |
Bulk leach to create filtrate solution to SART |
50 |
45 |
1000 |
Air |
1.39 |
n/a |
n/a |
2.76 |
28.5 |
n/a |
n/a |
Back Forty Project |
10-67 |
Gold Resource Corporation |
|
The effect of the cyanide concentration on the recovery is shown in Figure 10-23. No noticeable trend was observed of NaCN concentration at 2g/L vs 1g/L on gold recovery.
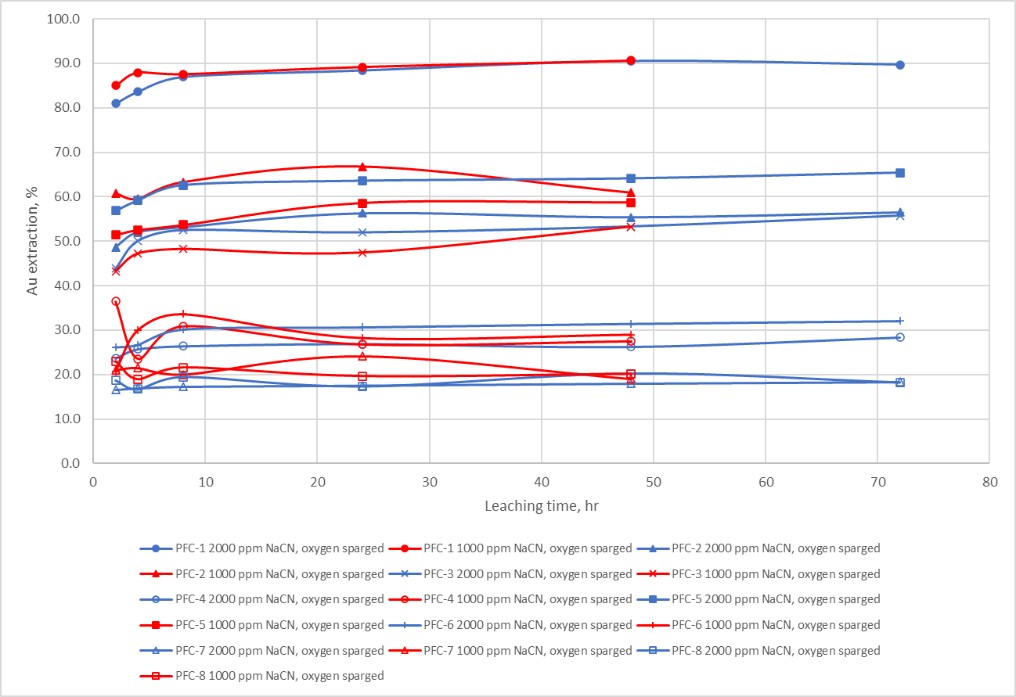
Figure 10-23: Leaching Performance Under Different Cyanide Concentrations
The impact of air sparge versus oxygen sparge was tested. Results are shown on Figure 10-24. Gold recovery is not impacted by using air versus oxygen.
Back Forty Project |
10-68 |
Gold Resource Corporation |
|
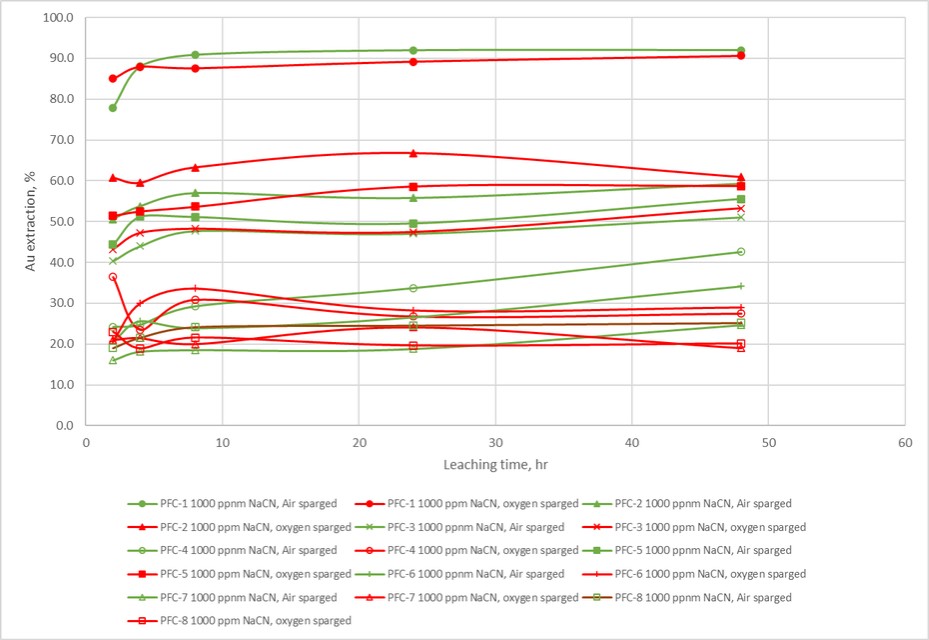
Figure 10-24: Leaching Performance Under Air and Oxygen Sparge
Back Forty Project |
10-69 |
Gold Resource Corporation |
|
10.3.3.4 |
Diagnostic Leach |
Diagnostic leach test was done on zinc rougher tailing to identify gold leaching recovery limitation and explained some low gold recovery. Diagnostic Leach Test is used to evaluate the distribution or deportment of gold in various minerals as determined by a series of selective leaches, usually by increasingly stronger oxidative acid leaches. Between each stage, cyanide leaching is used to extract the released gold. Table 10-53 shows the distribution of the gold with different minerals.
Table 10-53: Diagnostic Leach Test Gold Proportion
Sample ID |
Testwork leaching average Au recovery |
Direct cyanidable |
Carbonate locked |
Arsenopyrite locked |
Sulfide locked |
Silica encapsulated |
PFC-2 |
60.6 |
61.5 |
2.84 |
22.49 |
7.53 |
5.64 |
PFC-3 |
48.4 |
51.44 |
0.04 |
18.71 |
26.69 |
3.13 |
PFC-4 |
27.5 |
17.5 |
3.62 |
36.85 |
41.46 |
0.58 |
PFC-5 |
57.7 |
59.38 |
7.49 |
17.82 |
9.69 |
5.62 |
PFC-6 |
27.8 |
21.83 |
0.04 |
35.7 |
35.14 |
7.28 |
PFC-7 |
20.5 |
28.14 |
3.27 |
20.79 |
44.9 |
2.91 |
PFC-8 |
22.5 |
12.19 |
5.89 |
36.4 |
40.71 |
4.81 |
The testwork leaching average Au recoveries are similar to those of the direct cyanidable gold. This means the testwork is properly recovering the cyanide leachable gold. The remaining gold is more challenging to recover since it is locked in another mineral that is not affected by the cyanide. Additional grinding will be required to improve the liberation, but finer grind size has impact on cyanide consumption.
10.3.3.5 |
Reverse Osmosis, SART and Cyanide Destruction Testwork. |
BQE has been contracted to execute lab-scale Reverse Osmosis (RO), SART, and detox experiments to assess the effects of these processes in light of the updated flowsheet. This section offers an overview of the project's background and BQE’s plan for completing the specified scope of work. Additionally, it will present the preliminary findings from the initial testwork.
10.3.3.5.1 |
Project Background and Planning |
BQE provided technical support for various phases of cyanide leaching and washing test procedures conducted at the BML facility in Kamloops, British Columbia. The project encompassed the development of METSIM models for the entire metallurgical circuit of the Back Forty Project, including modeling of multiple options to enhance confidence in selecting the final flowsheet. The preliminary METSIM models were developed and the impact of different mineral composition and throughput on the process water chemistry and potential salt build up through recirculation of different streams was assessed. The final process water chemistry for the best-case scenario was generated and sent to BML Lab to perform further CN leaching test work using the process water chemistry at steady sate.
Back Forty Project |
10-70 |
Gold Resource Corporation |
|
10.3.3.5.2 |
Test Planning |
A total of eight distinct ore samples were subjected to the testing program. These various ore samples underwent flotation testing. Using the outputs from the developed METSIM models, BQE supplied Base Metallurgical Laboratory with specific water chemistry to employ for conducting bulk Bottle Roll (BR) cyanide leaching tests in order to approximate the steady state solution chemistry. These cyanidation leach tests were maintained at 1000 mg/L NaCN throughout the leach, using the BQE supplied process water chemistry. The leach residue were filtered in accordance with the existing Back Forty process flowsheet, which incorporated wash solution and filter cake ratio recommendations provided by GRC.
According to the planned testwork, the PLS samples, containing high CN, Cu, Zn, and Au, and initial wash solutions (high in CN) will be treated through the RO process, resulting in the production of permeate and retentate streams. The concentrated retentate stream is designated for utilization in the SART process and recovery of valuable Cu, Zn and CN from the solution. Meanwhile, the permeate stream, characterized by low concentrations of all species, is suitable to be mixed with the second wash cycle (low in CN) and to be integrated into the detox process.
A decision was made to combine the received filtrates and their corresponding first wash cycle samples based on their similarity in solution chemistry, resulting in the generation of four unique composites. RO and SART testing were performed on these composite solutions. At the time of issuing this memorandum, BQE conducted one RO, Desaturation, and SART testing on the first composite (Mix 1, T85 and T88); the subsequent findings are detailed in the following section.
10.3.3.5.3 |
Initial Results |
The received filtrate samples were sent for chemical analysis upon receipt, and the cyanide concentration in the first and second cycle wash solutions were measured in-house; the results of the important species are provided in Table 10-54.
Table 10-54: Concentration of the Key Species in the Received Filtrate Sample
Parameter |
Unit |
T85 PFC-4 |
T86 PFC-5 |
T87 PFC-6 |
T88 PFC-3 |
T89 PFC-7 |
T90 PFC-2 |
T91 PFC-8 |
Filtrate Solutions | ||||||||
Sulfate |
mg/L |
14400 |
12600 |
13500 |
13500 |
14400 |
13700 |
13500 |
Copper |
mg/L |
209 |
74.8 |
137 |
189 |
162 |
278 |
164 |
Zinc |
mg/L |
257 |
38 |
146 |
204 |
191 |
8.17 |
162 |
CN (Wad) |
mg/L |
871 |
517 |
633 |
730 |
717 |
546 |
708 |
Thiocyanate |
mg/L |
4870 |
4620 |
4140 |
3980 |
5000 |
4950 |
4360 |
Gold |
mg/L |
0.16 |
0.83 |
0.16 |
0.49 |
0.19 |
0.32 |
0.2 |
Chloride |
mg/L |
813 |
797 |
814 |
806 |
888 |
818 |
796 |
Calcium |
mg/L |
489 |
474 |
486 |
485 |
486 |
503 |
522 |
Sodium |
mg/L |
8700 |
8090 |
8630 |
8880 |
8920 |
8990 |
8910 |
Wash Solutions | ||||||||
1st Wash CN (Wad) |
mg/L |
534 |
101 |
307 |
315 |
460 |
91 |
214 |
2nd Wash CN (Wad) |
mg/L |
146 |
103 |
123 |
135 |
140 |
77 |
124 |
Back Forty Project |
10-71 |
Gold Resource Corporation |
|
As mentioned earlier, the received filtrate samples were selected to be mixed with the first wash cycle solutions based on the water chemistry, resulting in four composite samples. The description of each composite sample and their characteristics are as follows:
Mix 1: T-85 and T-88 with their 1st cycle wash - High Cu, Zn, and CN
Mix 2: T87, T89, and T91 with their 1st cycle wash - Medium range Cu, Zn and CN
Mix 3: T86 and its 1st cycle wash - Low range species with minimal CN in 1st wash
Mix 4: T90 and its 1st wash - Low Zn and high Cu
10.3.3.5.3.1RO Performance on Mix 1
The composition of the Mix 1 water feed, permeate, and retentate at 50% water recovery are shown in Table 10-55. As shown in Table 10-55, the RO treatment effectively produced a permeate stream with a notably low concentration of cyanide, which facilitates its subsequent processing by reducing the costs associated with CN removal via the detox process. The retentate stream, on the other hand, is a concentrated brine containing substantially higher concentrations of key species, copper and zinc, which are profitable elements when processed via SART. Salt rejection was calculated based on the concentrations of the initial feed and the permeate solutions. A salt rejection of 99.9% was achieved for sulfate, copper, and zinc, confirming the efficiency of the RO process.
Table 10-55: RO Treatments Results with Mix 1 Water @ 50% Water Recovery
Parameter |
Unit |
MIX 1 (RO feed) |
Permeate |
Retentate |
Salt Rejection, % |
Sulfate |
mg/L |
13000 |
17.6 |
2530 |
99.9% |
Copper |
mg/L |
181 |
0.126 |
362 |
99.9% |
Zinc |
mg/L |
206 |
0.24 |
409 |
99.9% |
Cyanide (WAD) |
mg/L |
788 |
28.3 |
1553 |
96.4% |
Gold |
mg/L |
Pending |
Pending |
Pending |
- |
General Parameters | |||||
pH |
- |
11.4 |
11.3 |
11.01 |
- |
Conductivity |
uS/cm |
30600 |
435 |
44600 |
- |
After RO treatment, the supersaturated retentate was subjected to a desaturation stage to remove calcium and sulphate as gypsum.
10.3.3.5.3.2SART Performance on Mix 1
Table 10-56 summarizes the results of the SART test on the Mix 1 retentate stream produced through the RO testwork. The concentrations presented in the tables represent the 100% stoichiometric NaHS requirement based on the concentrations of metals (copper or zinc) and dissolved oxygen. Results demonstrated that NaHS dosages
Back Forty Project |
10-72 |
Gold Resource Corporation |
|
based on a 100% stoichiometric requirement were sufficient to precipitate copper and zinc as metal sulfides in the SART effluent, reducing their concentrations in the feed to an acceptable level.
Table 10-56: Summary of SART Tests Results on Mix 1 Retentate
Parameters |
Unit |
RO Retentate |
Final SART Effluent |
% Removal |
Cu |
mg/L |
362 |
2.58 |
99.3 |
Zn |
mg/L |
409 |
0.73 |
99.8 |
CN (Wad) |
mg/L |
1553 |
Pending |
- |
General Parameters | ||||
pH |
- |
11.01 |
11.0 |
- |
10.3.3.5.4 |
Ongoing Work |
Each of these PLS leachate composite samples (Mix 2, Mix 3, and Mix 4) will be treated through the RO process, where the concentrated retentate stream will be subjected to the desaturation and SART testwork. The permeate stream of all the composites will be mixed with the second wash cycle waters and will be tested for cyanide destruction using SO2.
10.4 |
Qualified Person’s Opinion on the Adequacy of Metallurgical Testing |
The QP is of the opinion that sufficient testing has been done on the Back Forty Project mineralized material in order to understand the kinematics of metal recoveries. This knowledge is sufficient to be able to design a processing plant that uses the results of the testing campaigns.
Back Forty Project |
10-73 |
Gold Resource Corporation |
|
11.0MINERAL RESOURCE ESTIMATES
The Back Forty Project Mineral Resource Estimate (the “2023 MRE”) was prepared by Marina Iund, P.Geo., Carl Pelletier, P.Geo., and Simon Boudreau, P.Eng., all from InnovExplo, using all available information.
The 2023 MRE comprises a review and update of the 2020 MRE (Bradfield et al., 2020). Since the publication on the 2020 MRE, no additional drilling was completed in the modelled resource volume; therefore, the database for the 2023 MRE is the same as the 2020 MRE.
The resource area has an E-W strike length of 1,400 m, a width of 875 m, and a vertical extent of 750 m below the surface. The 2023 MRE was based on a compilation of historical and recent diamond drill holes (“DDH”). The wireframed mineralized structures were provided by the issuer and were reviewed and approved by the authors.
The effective date of the 2023 MRE is September 30th, 2023.
11.1 |
Methodology |
The 2023 MRE was prepared using GEOVIA Surpac 2022 (“Surpac”) software. Surpac was used for the grade estimation and block modelling. Basic statistics, capping, variography and validations were established using a combination of Surpac, Snowden Supervisor v.8.12 (“Supervisor”) and Microsoft Excel (“Excel”) software. The main steps in the methodology were as follows:
■ |
Database validation of the DDH used for the resource estimate; |
■ |
Review and validation of the geological model and interpretation; |
■ |
Generation of drill hole intercepts for each mineralized structure; |
■ |
Basic statistics and capping study on assay data; |
■ |
Grade compositing; |
■ |
Variography; |
■ |
Block model creation; |
■ |
Grade interpolations; |
■ |
Validation of selected grade model; |
■ |
Resource categorization; |
■ |
Assessment of reasonable prospects for an eventual economic extraction; and |
■ |
Mineral resource statement. |
Back Forty Project |
11-1 |
Gold Resource Corporation |
|
11.2 |
Drill Hole Database |
All drilling and assay data were provided in the form of Excel data files by the issuer. The diamond drill hole database (DDHD) contains 741 surface DDH, including 65,111 assays, which corresponds to all the DDH completed on the Project. Five geotechnical drill holes were excluded from the DDHD because they were not sampled for metals content analysis.
The Surpac database contains 512 DDH corresponding to a subset of the DDHD covering the resource area (Figure 11-1).
The resource database includes gold, silver, copper, lead, zinc and sulfur assay results, as well as lithological descriptions taken from drill core logs.
In addition to the basic tables of raw data, the resource database includes several tables of calculated drill hole composites and wireframe solid intersections, which are required for the statistical evaluation and resource block modelling.
Back Forty Project |
11-2 |
Gold Resource Corporation |
|
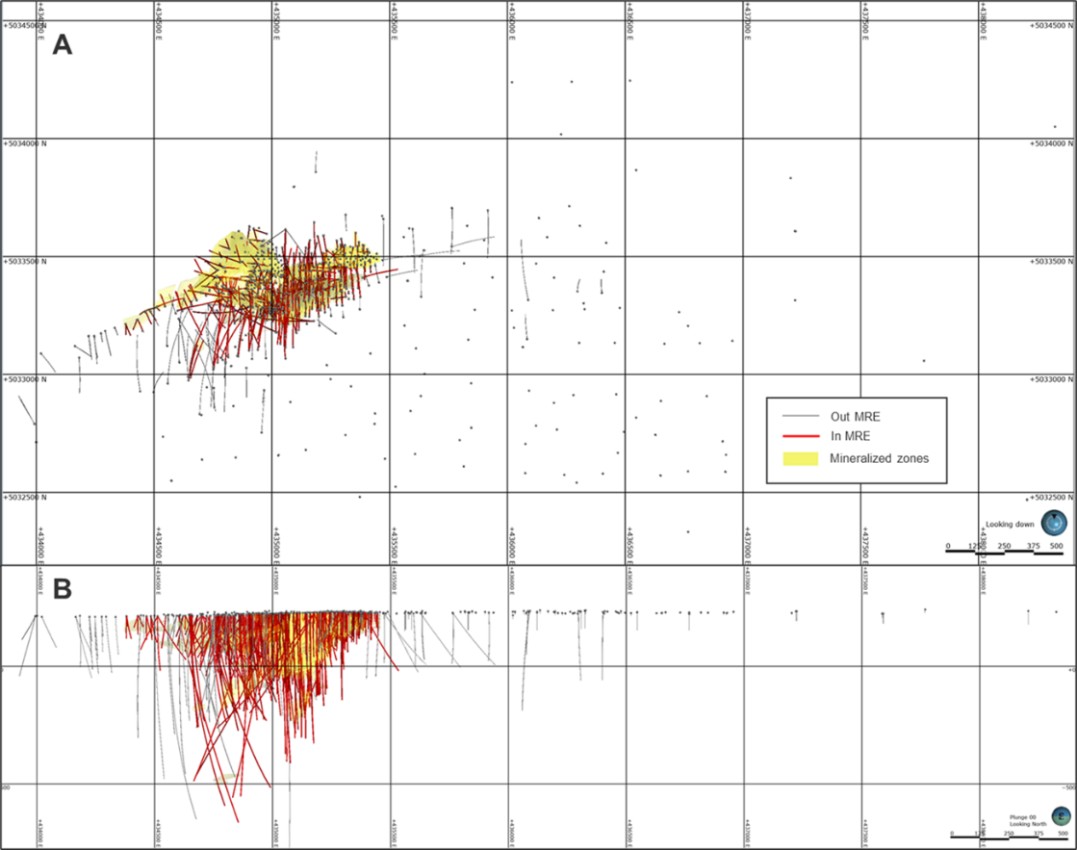
Figure 11-1: Surface Plan View (A) and Vertical Cross-Section Looking North (B) of the Validated DDH Used in the 2023 MRE
Back Forty Project |
11-3 |
Gold Resource Corporation |
|
11.3 |
Geological Model |
The geological model developed by Bradfield et al. in 2020 (Bradfield et al., 2020) was reviewed and validated. The main lithologies of the deposit include a succession of strongly altered rhyolites interlayered with tuffaceous sediments which locally host stratabound massive to semi-massive sulfide units. The volcanic stratigraphy is folded into an asymmetrical antiformal structure dipping 30° to the W-SW and has been intruded by several felsic to intermediate, syn-volcanic porphyry dykes and subsequently intruded by later mafic dykes.
The mineralization domains were defined by continuous mineralized structures, lithology along strike and down dip, and NSR values. Fifty-three mineralization wireframes were created (Figure 11-2) from successive cross-sectional polylines on east-facing vertical sections with a variable 10 m to 25 m spacing. On each section, polyline interpretations were digitized from drill hole to drill hole, but not typically extended more than 25 m into untested territory. The minimum constrained sample length for interpretation was 2.0 m. The mineralized wireframes can be divided into four types of mineralized zones:
■ |
Type 1 - Rich massive sulfide mineralized zones (17 wireframes) |
■ |
Type 2 - Stockwork stringer and peripheral sulfide mineralized zones (24 wireframes) |
■ |
Type 3 - Precious metal-rich, low sulfide mineralized zones (7 wireframes) |
■ |
Type 4 - Gossan (supergene) mineralized zones (5 wireframes) |
Back Forty Project |
11-4 |
Gold Resource Corporation |
|
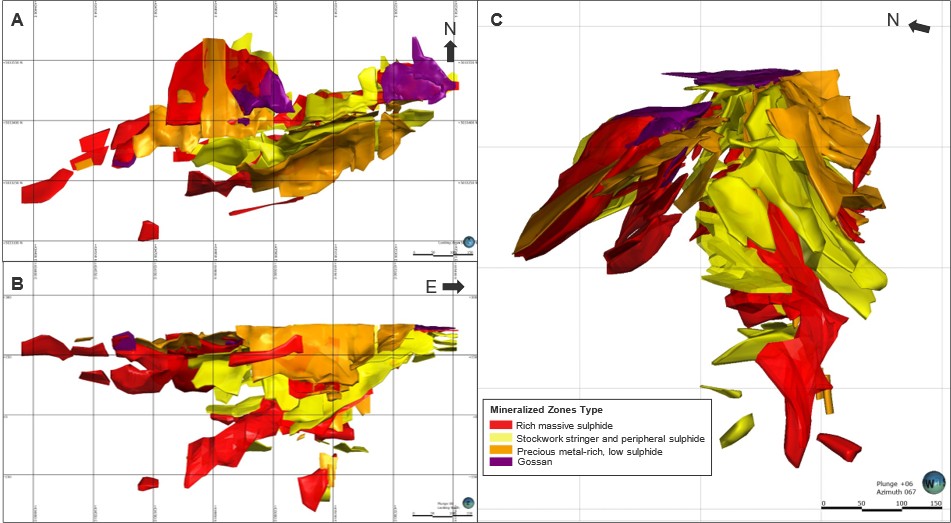
Figure 11-2: Mineralized Solids of the Back Forty Project
Back Forty Project |
11-5 |
Gold Resource Corporation |
|
The authors added dilution envelopes to the model, which correspond to 10 m buffers around each mineralized zone.
The geological model also contains two surfaces to define the topography and the overburden/bedrock contact, two solids corresponding to late, crosscutting mafic dykes and one solid corresponding to a late, crosscutting sandstone unit.
11.4 |
High-grade Capping |
Codes were automatically attributed to any drill hole assay intervals intersecting the interpreted mineralized structure wireframes. The codes are based on the name of the 3D wireframe. The coded intercepts were used to analyze sample lengths and generate statistics for high-grade capping.
Basic univariate statistics for gold, silver, copper, lead and zinc were completed on zones with the most important set of data, and observations were generalized to other similar type of zones with less data.
Capping was applied to raw assays. The following criteria were used to decide if capping was warranted:
■ |
The coefficient of variation of the assay population is above 3.0. |
■ |
The quantity of metal contained in the top 10% highest grade samples is above 40%, and/or the quantity of metal in the top 1% highest grade samples is higher than 10%. |
■ |
The probability plot of grade distribution shows abnormal breaks or scattered points outside the main distribution curve. |
■The log normal distribution of grades shows erratic grade bins or distanced values from the main population.
The capping threshold decided for all zones is consistent with the combination of three criteria:
■ |
Break in the probability plot. |
■ |
Coefficient of variation below 3.0 after capping. |
■ |
Total metal of the top 1% highest grade samples is below 10% after capping. |
Table 11-1 present a summary of the statistical analysis by metal. Figure 11-3 and Figure 11-4 show examples of graphs supporting the zinc and gold capping values for the 1010 zone.
Back Forty Project |
11-6 |
Gold Resource Corporation |
|
Table 11-1: Summary of Univariate Statistics on Raw Assays for Gold and Silver
Metal |
Zone type * |
No. of Samples |
Max (g/t) |
Uncut Mean (g/t) |
Uncut COV |
Capping (g/t) |
No. Capped |
Cut Mean (g/t) |
Cut COV |
Cut Metal Factor (%) |
Au |
Type 1 |
4732 |
375.06 |
3.01 |
2.12 |
65 |
1 |
2.05 |
1.7 |
0.47 |
Type 2 |
4,510 |
114.58 |
1.23 |
2.47 |
50 |
3 |
1.21 |
2.03 |
1.88 |
|
Type 3 |
2,243 |
185.72 |
3.3 |
2.61 |
40 |
16 |
3 |
1.88 |
7.29 |
|
Type 4 |
515 |
150 |
7.09 |
2.17 |
75 |
4 |
6.67 |
1.86 |
6.23 |
|
Ag |
Type 1 |
5,130 |
4035 |
29.15 |
3.4 |
1000 |
6 |
27.73 |
2.34 |
2.33 |
Type 2 |
4489 |
2160 |
15.74 |
3.58 |
350 |
15 |
14.58 |
2.32 |
7.2 |
|
Type 3 |
2184 |
8218.6 |
53.62 |
4.47 |
1100 |
7 |
46.76 |
2.4 |
10.69 |
|
Type 4 |
494 |
1557 |
50.55 |
3.08 |
1000 |
4 |
47.46 |
2.74 |
4.81 |
Note: * Type 1: Rich massive sulfide mineralized zones; Type 2: Stockwork stringer and peripheral sulfide mineralized zones; Type 3: Precious metal-rich, low sulfide mineralized zones; Type 4: Gossan (supergene) mineralized zones
Table 11-2: Summary of Univariate Statistics on Raw Assays for Copper, Lead, and Zinc
Metal |
Zone type * |
No. of Samples |
Max (%) |
Uncut Mean (%) |
Uncut COV |
Capping (%) |
No. Capped |
Cut Mean (%) |
Cut COV |
Cut Metal Factor (%) |
|
Cu |
Type 1 |
5,121 |
15.3 |
0.49 |
1.96 |
12 |
3 |
0.49 |
1.93 |
0.19 |
Type 2 |
4437 |
7.18 |
0.13 |
0.13 |
3 |
5 |
0.13 |
2.2 |
0.67 |
|
Type 3 |
1963 |
20.27 |
0.07 |
8.44 |
2 |
6 |
0.05 |
3.01 |
19.26 |
|
Type 4 Cu Rich (2080,2200) |
137 |
16.86 |
1.04 |
2.54 |
9 |
4 |
0.89 |
2.14 |
12.86 |
|
Type 4 Cu Poor (2086,2090,2100) |
343 |
1.23 |
0.05 |
2.33 |
0.6 |
5 |
0.05 |
2.02 |
6.49 |
|
Pb |
Type 1 Pb Rich (Tuff area: 1070,3220,3160) |
142 |
12.88 |
2.35 |
1.14 |
none |
0 |
2.35 |
1.14 |
0 |
|
Type 1 others (MS main and PW areas) |
4,973 |
16.45 |
0.15 |
3.58 |
4 |
16 |
0.14 |
2.83 |
4.97 |
Type 2 |
4436 |
25.4 |
0.2 |
3.11 |
5 |
8 |
0.2 |
2.27 |
3.5 |
|
Type 3 |
1973 |
12.68 |
0.37 |
2.86 |
10 |
5 |
0.36 |
2.79 |
0.72 |
|
Type 4 |
454 |
2.61 |
0.04 |
3.34 |
none |
0 |
0.04 |
3.34 |
0 |
|
Zn |
Type 1 Zn Rich (Main area: 1010, 1020,1030) |
3,163 |
45.86 |
5.66 |
1.19 |
none |
0 |
5.66 |
1.19 |
0 |
Type 1 others |
1,960 |
33.73 |
5.26 |
2.29 |
none |
0 |
5.26 |
2.29 |
0 |
|
Type 2 |
4443 |
29.1 |
0.98 |
2.03 |
none |
0 |
0.98 |
2.03 |
0 |
|
Type 3 |
1971 |
42.14 |
0.51 |
4.01 |
12 |
14 |
0.45 |
2.98 |
10.11 |
|
Type 4 |
455 |
0.75 |
0.02 |
3.56 |
none |
0 |
0.02 |
3.56 |
0 |
Note: * Type 1: Rich massive sulfide mineralized zones; Type 2: Stockwork stringer and peripheral sulfide mineralized zones; Type 3: Precious metal-rich, low sulfide mineralized zones; Type 4: Gossan (supergene) mineralized zones
Back Forty Project |
11-7 |
Gold Resource Corporation |
|
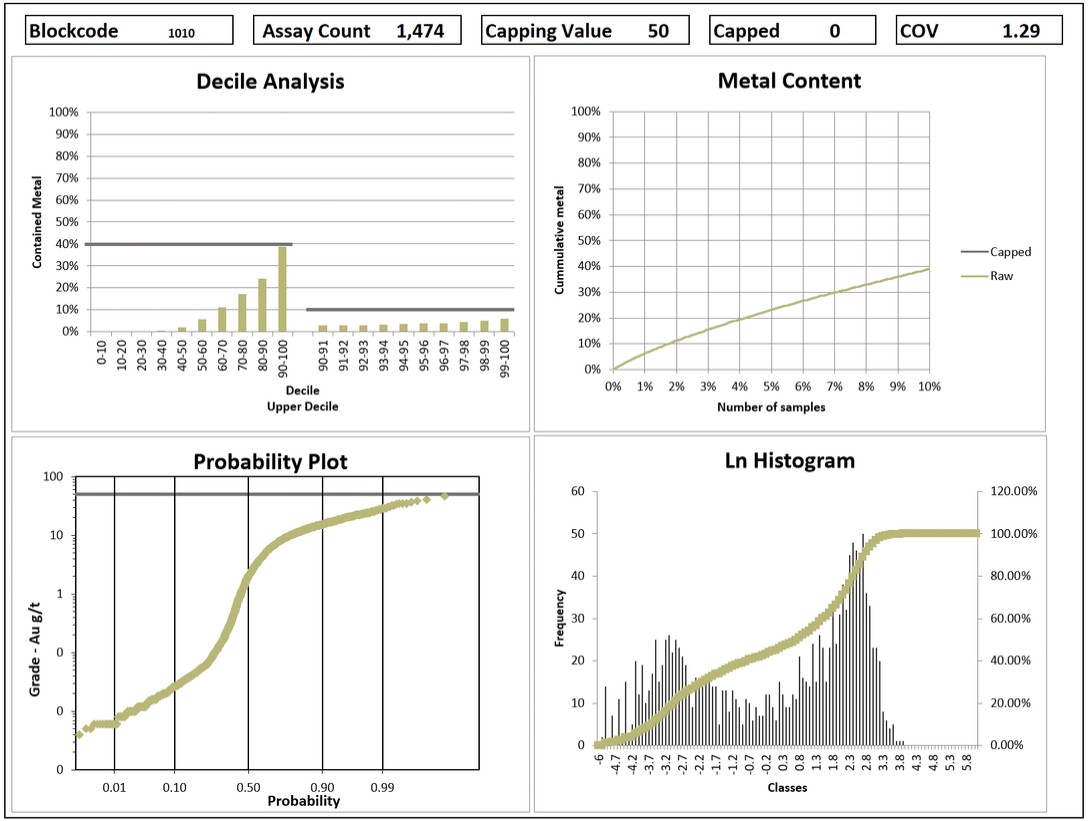
Figure 11-3: Example of Graphs Supporting the None Capping of Zinc for the 1010 Zone
Back Forty Project |
11-8 |
Gold Resource Corporation |
|
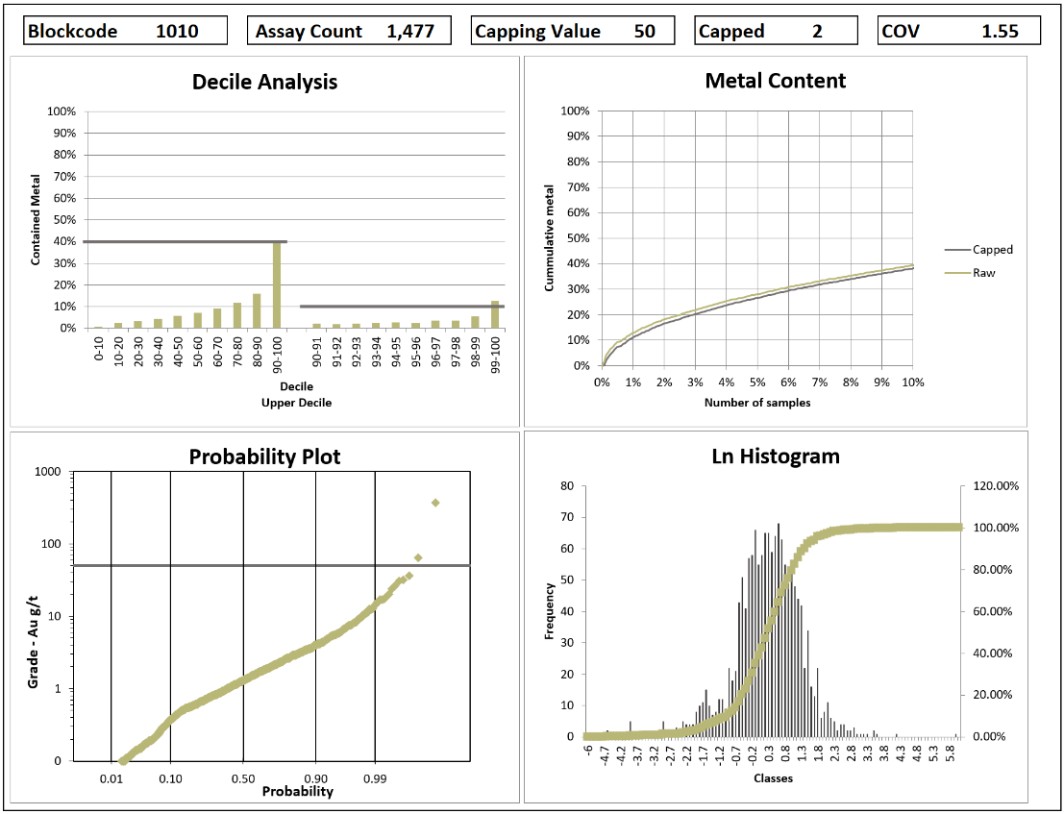
Figure 11-4: Example of Graphs Supporting a Capping Value of 50 G/T Au for the 1010 Zone
Back Forty Project |
11-9 |
Gold Resource Corporation |
|
11.5 |
Compositing |
In order to minimize any bias introduced by the variable sample lengths, the assays were composited within each of the mineralized zones and dilution envelopes. The thickness of the mineralized zones, the proposed block size, and the original sample lengths were taken into consideration to determine the selected composite length, which was set at 1.5 m. All intervals defining each of the mineralized zones and dilution envelopes were composited to 1.5 m equal lengths, with any tail longer than 0.75 m equally distributed. A grade of 0.00 g/t Au was assigned to missing sample intervals. A total of 29,566 composites were generated.
Table 11-3 summarizes the basic statistics for the DDH composites and Table 11-4 illustrates the effect of capping and compositing on the original COV of the raw data.
Table 11-3: Summary Statistics for the Composites
Zone type * |
No. of Samples |
Max Au (g/t) |
Mean Au (g/t) |
SD (Au) |
COV (Au) |
Type 1 |
4739 |
64.1 |
2.02 |
2.95 |
1.46 |
Type 2 |
4388 |
50 |
1.19 |
2.29 |
1.92 |
Type 3 |
2098 |
40 |
2.87 |
5.02 |
1.75 |
Type 4 |
430 |
75 |
6.34 |
11.73 |
1.85 |
Zone type * |
No. of Samples |
Max Ag (g/t) |
Mean Ag (g/t) |
SD (Ag) |
COV (Ag) |
Type 1 |
4739 |
987.41 |
25.72 |
50.51 |
1.96 |
Type 2 |
4388 |
350 |
14.12 |
31.59 |
2.24 |
Type 3 |
2098 |
1100 |
41.6 |
92.87 |
2.23 |
Type 4 |
430 |
754.36 |
40.07 |
93.5 |
2.33 |
Zone type * |
No. of Samples |
Max Cu (%) |
Mean Cu (%) |
SD (Cu) |
COV (Cu) |
Type 1 |
4739 |
12 |
0.49 |
0.92 |
1.89 |
Type 2 |
4388 |
3 |
0.12 |
0.25 |
2.12 |
Type 3 |
2098 |
1.76 |
0.04 |
0.11 |
2.76 |
Type 4 |
430 |
8.73 |
0.21 |
0.7 |
3.38 |
Zone type * |
No. of Samples |
Max Pb (%) |
Mean Pb (%) |
SD (Pb) |
COV (Pb) |
Type 1 |
4739 |
9.74 |
0.19 |
0.65 |
3.33 |
Type 2 |
4388 |
5 |
0.19 |
0.4 |
2.13 |
Type 3 |
2098 |
7.8 |
0.27 |
0.66 |
2.47 |
Type 4 |
430 |
0.61 |
0.03 |
0.06 |
1.98 |
Zone type * |
No. of Samples |
Max Zn (%) |
Mean Zn (%) |
SD (Zn) |
COV (Zn) |
Type 1 |
4739 |
44.82 |
4.34 |
6.13 |
1.41 |
Type 2 |
4388 |
27.95 |
0.9 |
1.69 |
1.87 |
Type 3 |
2098 |
12 |
0.36 |
1.04 |
2.88 |
Type 4 |
430 |
0.75 |
0.01 |
0.05 |
3.6 |
* Type 1: Rich massive sulfide mineralized zones; Type 2: Stockwork stringer and peripheral sulfide mineralized zones; Type 3: Precious metal-rich, low sulfide mineralized zones; Type 4: Gossan (supergene) mineralized zones
Back Forty Project |
11-10 |
Gold Resource Corporation |
|
Table 11-4: Coefficient of Variation for Assays and Composites
Zone type * |
Type 1 |
Type 2 |
Type 3 |
Type 4 |
|
Raw assays COV (Au) |
UnCut |
2.91 |
2.596 |
2.696 |
2.182 |
Cut |
1.702 |
2.14 |
1.937 |
1.877 |
|
Composite COV (Au) |
1.46 |
1.92 |
1.75 |
1.85 |
|
Raw assays COV (Ag) |
UnCut |
3.407 |
3.622 |
4.618 |
12.234 |
Cut |
2.346 |
2.352 |
2.49 |
2.751 |
|
Composite COV (Ag) |
1.96 |
2.24 |
2.23 |
2.33 |
|
Raw assays COV (Cu) |
UnCut |
1.981 |
2.409 |
9.155 |
4.434 |
Cut |
1.954 |
2.256 |
3.275 |
3.835 |
|
Composite COV (Cu) |
1.89 |
2.12 |
2.76 |
3.38 |
|
Raw assays COV (Pb) |
UnCut |
3.702 |
3.182 |
3.123 |
3.571 |
Cut |
3.438 |
2.326 |
3.053 |
3.571 |
|
Composite COV (Pb) |
3.33 |
2.13 |
2.47 |
1.98 |
|
Raw assays COV (Zn) |
UnCut |
1.492 |
2.126 |
4.3 |
3.905 |
Cut |
1.492 |
2.126 |
3.246 |
3.905 |
|
Composite COV (Zn) |
1.41 |
1.87 |
2.88 |
3.6 |
|
* Type 1: Rich massive sulfide mineralized zones; Type 2: Stockwork stringer and peripheral sulfide mineralized zones; Type 3: Precious metal-rich, low sulfide mineralized zones; Type 4: Gossan (supergene) mineralized zones
11.6 |
Density |
Densities are used to calculate tonnage from the estimated volumes in the resource-grade block model.
The drill hole database contains a total of 1,457 density measurements of which 879 measurements were analyzed for sulphur. As observed in the last MRE (Bradfield et al., 2020), the density correlated well with the sulphur content. Figure 11-5 shows the correlation between bulk density and sulphur for massive sulfide (including semi-massive sulfide) and non-massive sulfide mineralization (stringers and gold zones).
Back Forty Project |
11-11 |
Gold Resource Corporation |
|
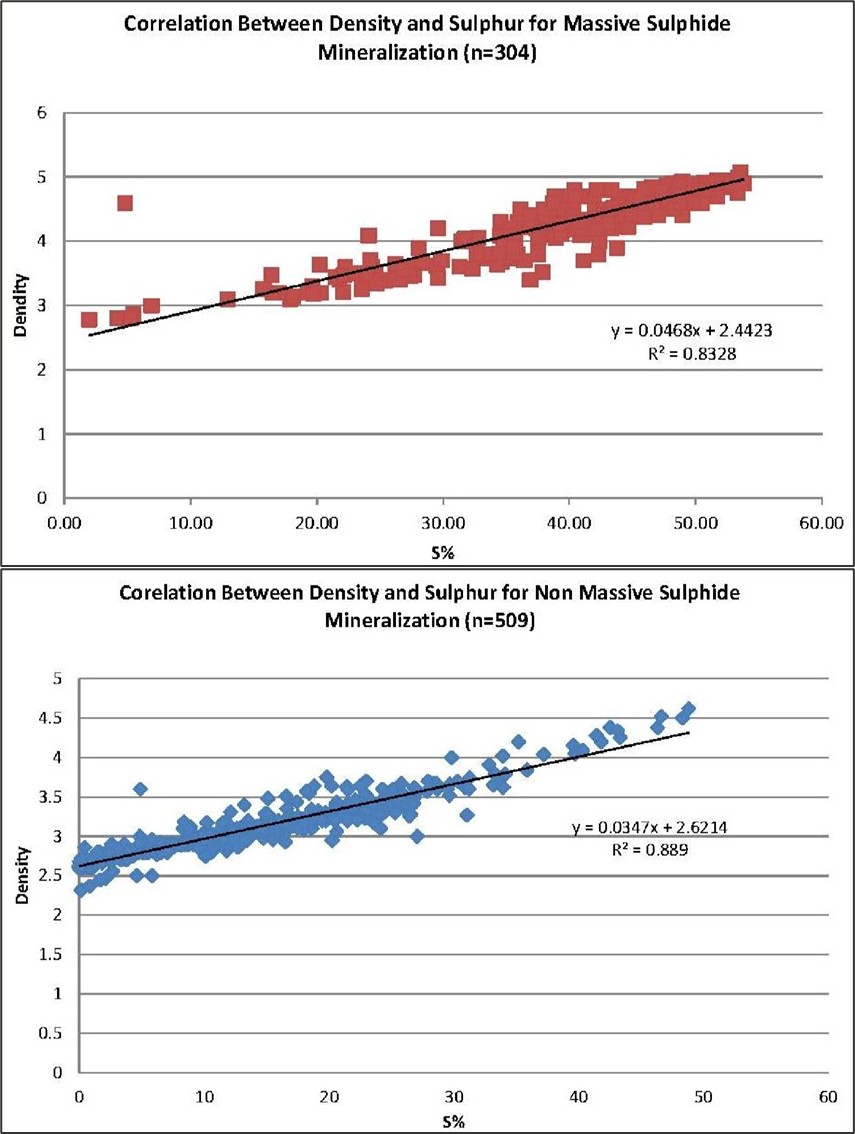
From Bradfield et al., 2020
Figure 11-5: Correlation Between Bulk Density and Sulfur
Back Forty Project |
11-12 |
Gold Resource Corporation |
|
To estimate the block model density inside all the mineralized zones and dilution envelopes, except for the gossan type zones, the author proceeded as following:
■ |
Populated the density assay database using linear regression of density and sulfur when density measurements were not available, but sulfur measurements were available. |
■ |
Interpolated with composite based on the variography study. |
Since the measured density values correlated poorly with sulphur in the gossan, a density of 3.05 g/cm3, based on an average of 41 samples of gossan, was applied to all gossan zones.
A value of 2.7 g/cm3 was assigned to the surrounding waste and to the cross-cutting mafic dykes. A value of 2.00 g/cm3 was assigned to the overburden and the cross-cutting sandstone unit.
11.7 |
Block Model |
A block model was established to enclose a sufficiently large volume to host an open pit. The model corresponds to a sub-block model in Surpac and without rotation. The sub-blocks were created within each individual mineralized zone, dilution envelope, overburden and crosscutting waste unit. The block model origins correspond to the lower left corner.
Block dimensions reflect the sizes of mineralized zones and plausible mining methods.
Table 11-5 presents the properties of the block model.
Table 11-5: Block Model Properties
Properties |
X (columns) |
Y (columns) |
Z (columns) |
Minimum coordinates (m) |
434335.5 |
5032905.5 |
-510 |
Maximum coordinates (m) |
435735.5 |
5033780.5 |
240 |
User block size (m) |
5 |
5 |
5 |
Minimum block size (m) |
1.25 |
1.25 |
1.25 |
Rotation |
0° |
||
11.8 |
Variography and Search Ellipsoids |
The 3D variography was carried out in Supervisor on composites of capped assay data for each element. The variography analysis was performed on zones with the most important set of data, and observations were generalized to other similar type of zones with less data (similar mineralization type, areas, orientation) and dilution envelopes. When necessary, ellipse orientation was adjusted to best fit zones behavior. The 3D directional-specific investigations yielded the best-fit model along an orientation that corresponds to the strike and dip of the mineralized zones.
The downhole variograms suggest a low nugget effect between 0 and 4%.
The search ellipsoid was based on the variography study. The interpolation strategy counts three cumulative passes. First pass corresponds to half the variography ranges, second pass 1x and third pass 1.5x the variography ranges.
Back Forty Project |
11-13 |
Gold Resource Corporation |
|
Figure 11-6 illustrates example of shapes and ranges of the search ellipsoids for the first pass. Table 11-6 summarizes the parameters of the ellipsoid used for interpolation.
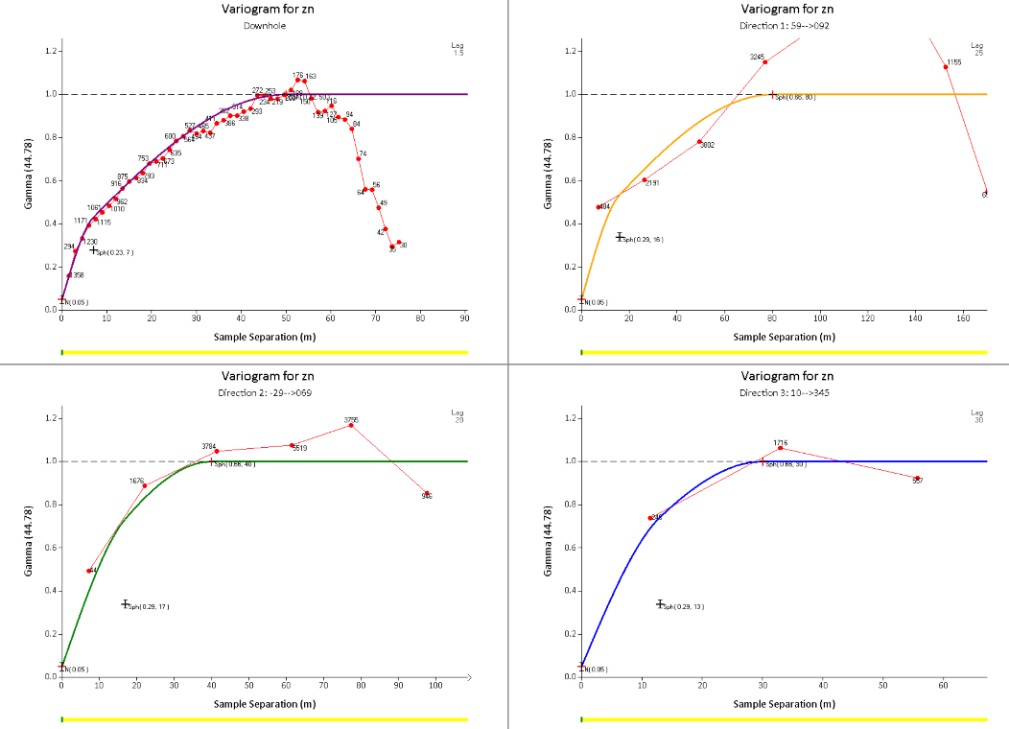
Figure 11-6: Variography Study for Zinc in the Main MS1 Zone
Table 11-6: Parameters of the Ellipsoid Use for Interpolation
Rockcode |
Zone name |
Zone type |
Surpac orientation |
X (m) |
Y (m) |
Z (m) |
||
|---|---|---|---|---|---|---|---|---|
Z |
X |
Y |
||||||
Au | ||||||||
1010 |
MainMS1 |
1 |
100 |
68 |
63 |
85 |
50 |
25 |
1020 |
MainMS2 |
|||||||
1080 |
DeepMS1 |
|||||||
1090 |
DeepMS2 |
|||||||
1100 |
DDeepMS1 |
|||||||
1110 |
DDeepMS2 |
|||||||
1030 |
MainMS3 |
17 |
68 |
-25 |
100 |
80 |
10 |
|
1070 |
TFMS |
|||||||
3220 |
TFSD |
|||||||
3160 |
UpDeep |
|||||||
1040 |
PWMS1 |
38 |
-14 |
26 |
100 |
80 |
10 |
|
Back Forty Project |
11-14 |
Gold Resource Corporation |
|
Rockcode |
Zone name |
Zone type |
Surpac orientation |
X (m) |
Y (m) |
Z (m) |
||
|---|---|---|---|---|---|---|---|---|
Z |
X |
Y |
||||||
1041 |
PWMSZnCu |
|
|
|
|
|
|
|
1042 |
PWMSCR |
|||||||
1050 |
PWMS2 |
|||||||
1060 |
PWMS3 |
|||||||
1120 |
PWMS4 |
|||||||
1130 |
PWMS5 |
|||||||
2010 |
90AU |
3 |
27 |
62 |
-43 |
55 |
20 |
10 |
2030 |
PMAU1 |
|||||||
2040 |
PMAU2 |
|||||||
2050 |
PMAU3 |
|||||||
2020 |
NSAU |
143 |
23 |
9 |
75 |
30 |
5 |
|
2060 |
PMAU4 |
|||||||
2070 |
PMAU5 |
|||||||
3000 |
MainSTR |
2 |
97 |
58 |
71 |
75 |
25 |
30 |
3010 |
MainSTR1 |
|||||||
3020 |
MainSTR2 |
|||||||
3030 |
MainSTR3 |
|||||||
3040 |
MainSTR4 |
|||||||
3050 |
MainSTR5 |
|||||||
3090 |
MainSTR9 |
|||||||
3100 |
MainSTR10 |
|||||||
3110 |
MainSTR11 |
|||||||
3120 |
MainSTR12 |
|||||||
3150 |
DeepSTR1 |
|||||||
3155 |
DeepSTR2 |
|||||||
3156 |
DeepSTR3 |
|||||||
3060 |
MainSTR6 |
31 |
58 |
-36 |
135 |
70 |
20 |
|
3070 |
MainSTR7 |
|||||||
3170 |
TFSTR1 |
|||||||
3180 |
TFSTR2 |
|||||||
3190 |
TFSTR3 |
|||||||
3210 |
TFSTR5 |
|||||||
3230 |
TFSTR6 |
|||||||
3200 |
TFSTR4 |
31 |
-58 |
36 |
135 |
70 |
20 |
|
3080 |
MainSTR8 |
|||||||
3130 |
PWSTR |
38 |
-14 |
26 |
135 |
70 |
20 |
|
3140 |
PWSTR2 |
|||||||
2080 |
PWGossan |
4 |
0 |
0 |
0 |
60 |
45 |
10 |
2086 |
PWGossanLeach |
|||||||
2090 |
EastGossan |
|||||||
2100 |
EAST_OX |
|||||||
2200 |
PWGSN2 |
|||||||
Ag | ||||||||
1010 |
MainMS1 |
1 |
83 |
39 |
77 |
90 |
45 |
30 |
1020 |
MainMS2 |
|||||||
1080 |
DeepMS1 |
|||||||
1090 |
DeepMS2 |
|||||||
1100 |
DDeepMS1 |
|||||||
1110 |
DDeepMS2 |
|||||||
1030 |
MainMS3 |
80 |
0 |
-70 |
90 |
70 |
12 |
|
1070 |
TFMS |
|||||||
3220 |
TFSD |
|||||||
3160 |
UpDeep |
|||||||
1040 |
PWMS1 |
29 |
-18 |
-24 |
90 |
70 |
12 |
|
Back Forty Project |
11-15 |
Gold Resource Corporation |
|
Rockcode |
Zone name |
Zone type |
Surpac orientation |
X (m) |
Y (m) |
Z (m) |
||
|---|---|---|---|---|---|---|---|---|
Z |
X |
Y |
||||||
1041 |
PWMSZnCu |
|
|
|
|
|
|
|
1042 |
PWMSCR |
|||||||
1050 |
PWMS2 |
|||||||
1060 |
PWMS3 |
|||||||
1120 |
PWMS4 |
|||||||
1130 |
PWMS5 |
|||||||
2010 |
90AU |
3 |
39 |
54 |
-54 |
70 |
25 |
10 |
2030 |
PMAU1 |
|||||||
2040 |
PMAU2 |
|||||||
2050 |
PMAU3 |
|||||||
2020 |
NSAU |
112 |
16 |
20 |
100 |
50 |
5 |
|
2060 |
PMAU4 |
|||||||
2070 |
PMAU5 |
|||||||
3000 |
MainSTR |
2 |
106 |
68 |
63 |
120 |
30 |
10 |
3010 |
MainSTR1 |
|||||||
3020 |
MainSTR2 |
|||||||
3030 |
MainSTR3 |
|||||||
3040 |
MainSTR4 |
|||||||
3050 |
MainSTR5 |
|||||||
3090 |
MainSTR9 |
|||||||
3100 |
MainSTR10 |
|||||||
3110 |
MainSTR11 |
|||||||
3120 |
MainSTR12 |
|||||||
3150 |
DeepSTR1 |
|||||||
3155 |
DeepSTR2 |
|||||||
3156 |
DeepSTR3 |
|||||||
3060 |
MainSTR6 |
31 |
58 |
-36 |
85 |
85 |
10 |
|
3070 |
MainSTR7 |
|||||||
3170 |
TFSTR1 |
|||||||
3180 |
TFSTR2 |
|||||||
3190 |
TFSTR3 |
|||||||
3210 |
TFSTR5 |
|||||||
3230 |
TFSTR6 |
|||||||
3200 |
TFSTR4 |
31 |
-58 |
36 |
85 |
85 |
10 |
|
3080 |
MainSTR8 |
|||||||
3130 |
PWSTR |
29 |
-18 |
-24 |
85 |
85 |
10 |
|
3140 |
PWSTR2 |
|||||||
2080 |
PWGossan |
4 |
350 |
0 |
0 |
40 |
30 |
10 |
2086 |
PWGossanLeach |
|||||||
2090 |
EastGossan |
|||||||
2100 |
EAST_OX |
|||||||
2200 |
PWGSN2 |
|||||||
Cu | ||||||||
1010 |
MainMS1 |
1 |
108 |
72 |
56 |
35 |
25 |
25 |
1020 |
MainMS2 |
|||||||
1080 |
DeepMS1 |
|||||||
1090 |
DeepMS2 |
|||||||
1100 |
DDeepMS1 |
|||||||
1110 |
DDeepMS2 |
|||||||
1030 |
MainMS3 |
76 |
9 |
-70 |
70 |
45 |
15 |
|
1070 |
TFMS |
|||||||
3220 |
TFSD |
|||||||
3160 |
UpDeep |
|||||||
1040 |
PWMS1 |
65 |
0 |
30 |
70 |
45 |
15 |
|
Back Forty Project |
11-16 |
Gold Resource Corporation |
|
Rockcode |
Zone name |
Zone type |
Surpac orientation |
X (m) |
Y (m) |
Z (m) |
||
|---|---|---|---|---|---|---|---|---|
Z |
X |
Y |
||||||
1041 |
PWMSZnCu |
|
|
|
|
|
|
|
1042 |
PWMSCR |
|||||||
1050 |
PWMS2 |
|||||||
1060 |
PWMS3 |
|||||||
1120 |
PWMS4 |
|||||||
1130 |
PWMS5 |
|||||||
2010 |
90AU |
3 |
54 |
37 |
-65 |
55 |
40 |
10 |
2030 |
PMAU1 |
|||||||
2040 |
PMAU2 |
|||||||
2050 |
PMAU3 |
|||||||
2020 |
NSAU |
84 |
4 |
25 |
65 |
27 |
7 |
|
2060 |
PMAU4 |
|||||||
2070 |
PMAU5 |
|||||||
3000 |
MainSTR |
2 |
97 |
58 |
71 |
75 |
25 |
30 |
3010 |
MainSTR1 |
|||||||
3020 |
MainSTR2 |
|||||||
3030 |
MainSTR3 |
|||||||
3040 |
MainSTR4 |
|||||||
3050 |
MainSTR5 |
|||||||
3090 |
MainSTR9 |
|||||||
3100 |
MainSTR10 |
|||||||
3110 |
MainSTR11 |
|||||||
3120 |
MainSTR12 |
|||||||
3150 |
DeepSTR1 |
|||||||
3155 |
DeepSTR2 |
|||||||
3156 |
DeepSTR3 |
|||||||
3060 |
MainSTR6 |
31 |
58 |
-36 |
135 |
70 |
20 |
|
3070 |
MainSTR7 |
|||||||
3170 |
TFSTR1 |
|||||||
3180 |
TFSTR2 |
|||||||
3190 |
TFSTR3 |
|||||||
3210 |
TFSTR5 |
|||||||
3230 |
TFSTR6 |
|||||||
3200 |
TFSTR4 |
31 |
-58 |
36 |
135 |
70 |
20 |
|
3080 |
MainSTR8 |
|||||||
3130 |
PWSTR |
38 |
-14 |
26 |
135 |
70 |
20 |
|
3140 |
PWSTR2 |
|||||||
2080 |
PWGossan |
4 |
0 |
0 |
0 |
60 |
45 |
10 |
2086 |
PWGossanLeach |
|||||||
2090 |
EastGossan |
|||||||
2100 |
EAST_OX |
|||||||
2200 |
PWGSN2 |
|||||||
Ag | ||||||||
1010 |
MainMS1 |
1 |
83 |
39 |
77 |
90 |
45 |
30 |
1020 |
MainMS2 |
|||||||
1080 |
DeepMS1 |
|||||||
1090 |
DeepMS2 |
|||||||
1100 |
DDeepMS1 |
|||||||
1110 |
DDeepMS2 |
|||||||
1030 |
MainMS3 |
80 |
0 |
-70 |
90 |
70 |
12 |
|
1070 |
TFMS |
|||||||
3220 |
TFSD |
|||||||
3160 |
UpDeep |
|||||||
1040 |
PWMS1 |
29 |
-18 |
-24 |
90 |
70 |
12 |
|
Back Forty Project |
11-17 |
Gold Resource Corporation |
|
Rockcode |
Zone name |
Zone type |
Surpac orientation |
X (m) |
Y (m) |
Z (m) |
||
|---|---|---|---|---|---|---|---|---|
Z |
X |
Y |
||||||
1041 |
PWMSZnCu |
|
|
|
|
|
|
|
1042 |
PWMSCR |
|||||||
1050 |
PWMS2 |
|||||||
1060 |
PWMS3 |
|||||||
1120 |
PWMS4 |
|||||||
1130 |
PWMS5 |
|||||||
2010 |
90AU |
3 |
39 |
54 |
-54 |
70 |
25 |
10 |
2030 |
PMAU1 |
|||||||
2040 |
PMAU2 |
|||||||
2050 |
PMAU3 |
|||||||
2020 |
NSAU |
112 |
16 |
20 |
100 |
50 |
5 |
|
2060 |
PMAU4 |
|||||||
2070 |
PMAU5 |
|||||||
3000 |
MainSTR |
2 |
106 |
68 |
63 |
120 |
30 |
10 |
3010 |
MainSTR1 |
|||||||
3020 |
MainSTR2 |
|||||||
3030 |
MainSTR3 |
|||||||
3040 |
MainSTR4 |
|||||||
3050 |
MainSTR5 |
|||||||
3090 |
MainSTR9 |
|||||||
3100 |
MainSTR10 |
|||||||
3110 |
MainSTR11 |
|||||||
3120 |
MainSTR12 |
|||||||
3150 |
DeepSTR1 |
|||||||
3155 |
DeepSTR2 |
|||||||
3156 |
DeepSTR3 |
|||||||
3060 |
MainSTR6 |
31 |
58 |
-36 |
85 |
85 |
10 |
|
3070 |
MainSTR7 |
|||||||
3170 |
TFSTR1 |
|||||||
3180 |
TFSTR2 |
|||||||
3190 |
TFSTR3 |
|||||||
3210 |
TFSTR5 |
|||||||
3230 |
TFSTR6 |
|||||||
3200 |
TFSTR4 |
31 |
-58 |
36 |
85 |
85 |
10 |
|
3080 |
MainSTR8 |
|||||||
3130 |
PWSTR |
29 |
-18 |
-24 |
85 |
85 |
10 |
|
3140 |
PWSTR2 |
|||||||
2080 |
PWGossan |
4 |
350 |
0 |
0 |
40 |
30 |
10 |
2086 |
PWGossanLeach |
|||||||
2090 |
EastGossan |
|||||||
2100 |
EAST_OX |
|||||||
2200 |
PWGSN2 |
|||||||
| ||||||||
1010 |
MainMS1 |
1 |
100 |
68 |
63 |
85 |
50 |
25 |
1020 |
MainMS2 |
|||||||
1080 |
DeepMS1 |
|||||||
1090 |
DeepMS2 |
|||||||
1100 |
DDeepMS1 |
|||||||
1110 |
DDeepMS2 |
|||||||
1030 |
MainMS3 |
17 |
68 |
-25 |
100 |
80 |
10 |
|
1070 |
TFMS |
|||||||
3220 |
TFSD |
|||||||
3160 |
UpDeep |
|||||||
1040 |
PWMS1 |
38 |
-14 |
26 |
100 |
80 |
10 |
|
Back Forty Project |
11-18 |
Gold Resource Corporation |
|
Rockcode |
Zone name |
Zone type |
Surpac orientation |
X (m) |
Y (m) |
Z (m) |
||
|---|---|---|---|---|---|---|---|---|
Z |
X |
Y |
||||||
1041 |
PWMSZnCu |
|
|
|
|
|
|
|
1042 |
PWMSCR |
|||||||
1050 |
PWMS2 |
|||||||
1060 |
PWMS3 |
|||||||
1120 |
PWMS4 |
|||||||
1130 |
PWMS5 |
|||||||
2010 |
90AU |
3 |
27 |
62 |
-43 |
55 |
20 |
10 |
2030 |
PMAU1 |
|||||||
2040 |
PMAU2 |
|||||||
2050 |
PMAU3 |
|||||||
2020 |
NSAU |
143 |
23 |
9 |
75 |
30 |
5 |
|
2060 |
PMAU4 |
|||||||
2070 |
PMAU5 |
|||||||
3000 |
MainSTR |
2 |
97 |
58 |
71 |
75 |
25 |
30 |
3010 |
MainSTR1 |
|||||||
3020 |
MainSTR2 |
|||||||
3030 |
MainSTR3 |
|||||||
3040 |
MainSTR4 |
|||||||
3050 |
MainSTR5 |
|||||||
3090 |
MainSTR9 |
|||||||
3100 |
MainSTR10 |
|||||||
3110 |
MainSTR11 |
|||||||
3120 |
MainSTR12 |
|||||||
3150 |
DeepSTR1 |
|||||||
3155 |
DeepSTR2 |
|||||||
3156 |
DeepSTR3 |
|||||||
3060 |
MainSTR6 |
31 |
58 |
-36 |
135 |
70 |
20 |
|
3070 |
MainSTR7 |
|||||||
3170 |
TFSTR1 |
|||||||
3180 |
TFSTR2 |
|||||||
3190 |
TFSTR3 |
|||||||
3210 |
TFSTR5 |
|||||||
3230 |
TFSTR6 |
|||||||
3200 |
TFSTR4 |
31 |
-58 |
36 |
135 |
70 |
20 |
|
3080 |
MainSTR8 |
|||||||
3130 |
PWSTR |
38 |
-14 |
26 |
135 |
70 |
20 |
|
3140 |
PWSTR2 |
|||||||
2080 |
PWGossan |
4 |
0 |
0 |
0 |
60 |
45 |
10 |
2086 |
PWGossanLeach |
|||||||
2090 |
EastGossan |
|||||||
2100 |
EAST_OX |
|||||||
2200 |
PWGSN2 |
|||||||
Ag | ||||||||
1010 |
MainMS1 |
1 |
83 |
39 |
77 |
90 |
45 |
30 |
1020 |
MainMS2 |
|||||||
1080 |
DeepMS1 |
|||||||
1090 |
DeepMS2 |
|||||||
1100 |
DDeepMS1 |
|||||||
1110 |
DDeepMS2 |
|||||||
1030 |
MainMS3 |
80 |
0 |
-70 |
90 |
70 |
12 |
|
1070 |
TFMS |
|||||||
3220 |
TFSD |
|||||||
3160 |
UpDeep |
|||||||
1040 |
PWMS1 |
29 |
-18 |
-24 |
90 |
70 |
12 |
|
Back Forty Project |
11-19 |
Gold Resource Corporation |
|
Rockcode |
Zone name |
Zone type |
Surpac orientation |
X (m) |
Y (m) |
Z (m) |
||
|---|---|---|---|---|---|---|---|---|
Z |
X |
Y |
||||||
1041 |
PWMSZnCu |
|
|
|
|
|
|
|
1042 |
PWMSCR |
|||||||
1050 |
PWMS2 |
|||||||
1060 |
PWMS3 |
|||||||
1120 |
PWMS4 |
|||||||
1130 |
PWMS5 |
|||||||
2010 |
90AU |
3 |
39 |
54 |
-54 |
70 |
25 |
10 |
2030 |
PMAU1 |
|||||||
2040 |
PMAU2 |
|||||||
2050 |
PMAU3 |
|||||||
2020 |
NSAU |
112 |
16 |
20 |
100 |
50 |
5 |
|
2060 |
PMAU4 |
|||||||
2070 |
PMAU5 |
|||||||
3000 |
MainSTR |
2 |
106 |
68 |
63 |
120 |
30 |
10 |
3010 |
MainSTR1 |
|||||||
3020 |
MainSTR2 |
|||||||
3030 |
MainSTR3 |
|||||||
3040 |
MainSTR4 |
|||||||
3050 |
MainSTR5 |
|||||||
3090 |
MainSTR9 |
|||||||
3100 |
MainSTR10 |
|||||||
3110 |
MainSTR11 |
|||||||
3120 |
MainSTR12 |
|||||||
3150 |
DeepSTR1 |
|||||||
3155 |
DeepSTR2 |
|||||||
3156 |
DeepSTR3 |
|||||||
3060 |
MainSTR6 |
31 |
58 |
-36 |
85 |
85 |
10 |
|
3070 |
MainSTR7 |
|||||||
3170 |
TFSTR1 |
|||||||
3180 |
TFSTR2 |
|||||||
3190 |
TFSTR3 |
|||||||
3210 |
TFSTR5 |
|||||||
3230 |
TFSTR6 |
|||||||
3200 |
TFSTR4 |
31 |
-58 |
36 |
85 |
85 |
10 |
|
3080 |
MainSTR8 |
|||||||
3130 |
PWSTR |
29 |
-18 |
-24 |
85 |
85 |
10 |
|
3140 |
PWSTR2 |
|||||||
2080 |
PWGossan |
4 |
350 |
0 |
0 |
40 |
30 |
10 |
2086 |
PWGossanLeach |
|||||||
2090 |
EastGossan |
|||||||
2100 |
EAST_OX |
|||||||
2200 |
PWGSN2 |
|||||||
11.9 |
Grade Interpolation |
The interpolation profiles were customized for each mineralized zones and dilution envelopes using hard boundaries.
The variography study provided the parameters used to interpolate the grade model using capped assay composites. The interpolation was run on a point area workspace extracted from the composite dataset in Surpac. A cumulative 3-pass search strategy was used for the resource estimate. Pass 1 corresponds to half the variography
Back Forty Project |
11-20 |
Gold Resource Corporation |
|
ranges (0.5x); pass 2 to the variography ranges (1x) for blocks not estimated during the first pass and pass 3 to one and a half time (1.5x) the variography ranges for blocks not estimated during the second pass.
For the final resource estimate, the ID3 method was selected for Au and Ag and the ID2 method was selected for Zn, Cu and Sg, as they better honor the raw assays and composites grade distribution for the deposit.
The strategy and parameters used for the grade estimation are summarized in Table 11-7
Figure 11-7 illustrate an example of grade distribution.
Table 11-7: Composite Search Specifications
Pass |
No. of composites |
||
Min |
Max |
Max/hole |
|
Pass 1 |
9 |
18 |
4 |
Pass 2 |
5 |
18 |
4 |
Pass 3 |
2 |
18 |
4 |
Back Forty Project |
11-21 |
Gold Resource Corporation |
|
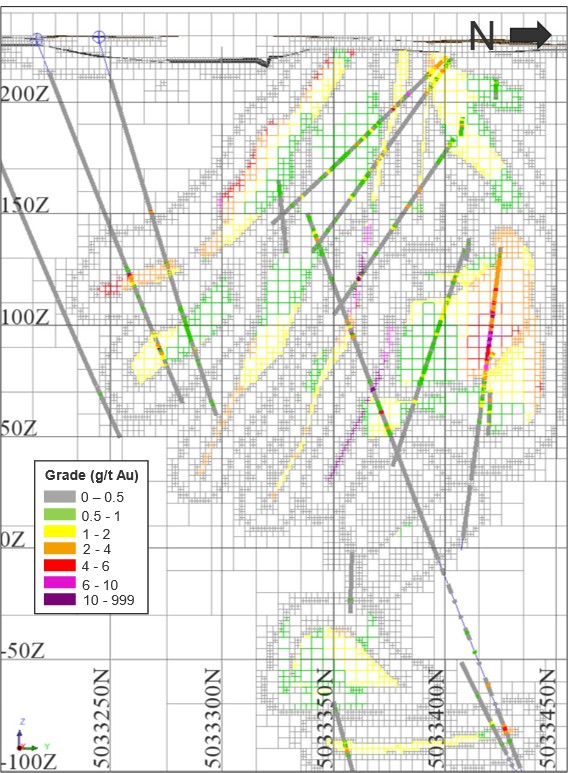
Figure 11-7: Gold Grade Distribution for Section 435140E
Back Forty Project |
11-22 |
Gold Resource Corporation |
|
11.10 |
Block Model Validation |
The block model was validated visually and statistically. The visual validation conducted on sections, plans and longitudinal views for both densely and sparsely drilled areas confirmed that the block model honors the drill hole composite data.
OK, and NN models were produced to check for local bias in the models. The ID2 and ID3 models matched well with the OK models, and the differences in the high-grade composite areas are within acceptable limits. The trend and local variation of the estimated ID2, ID3 and OK models were compared with the NN models and composite data using swath plots in three directions (North, East and Elevation) for the first pass. The ID2, ID3, NN and OK models show similar trends in grades with the expected smoothing for each method when compared to the composite data.
Figure 11-8 and Figure 11-9 show an example of the swath plot of zone 2010 for the gold and zinc respectively.
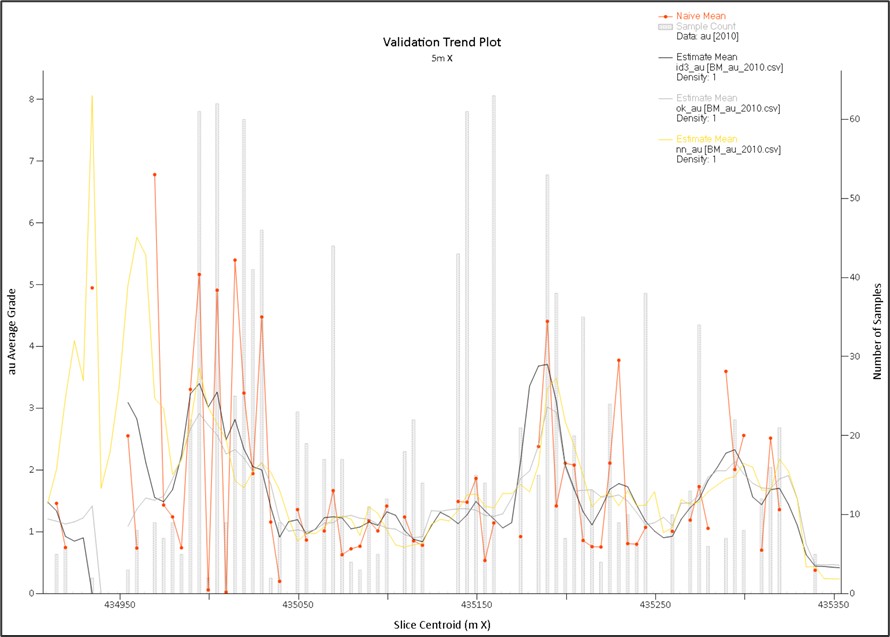
Figure 11-8: Validation Swath Plot of Zone 2010 for Gold (East Direction)
Back Forty Project |
11-23 |
Gold Resource Corporation |
|
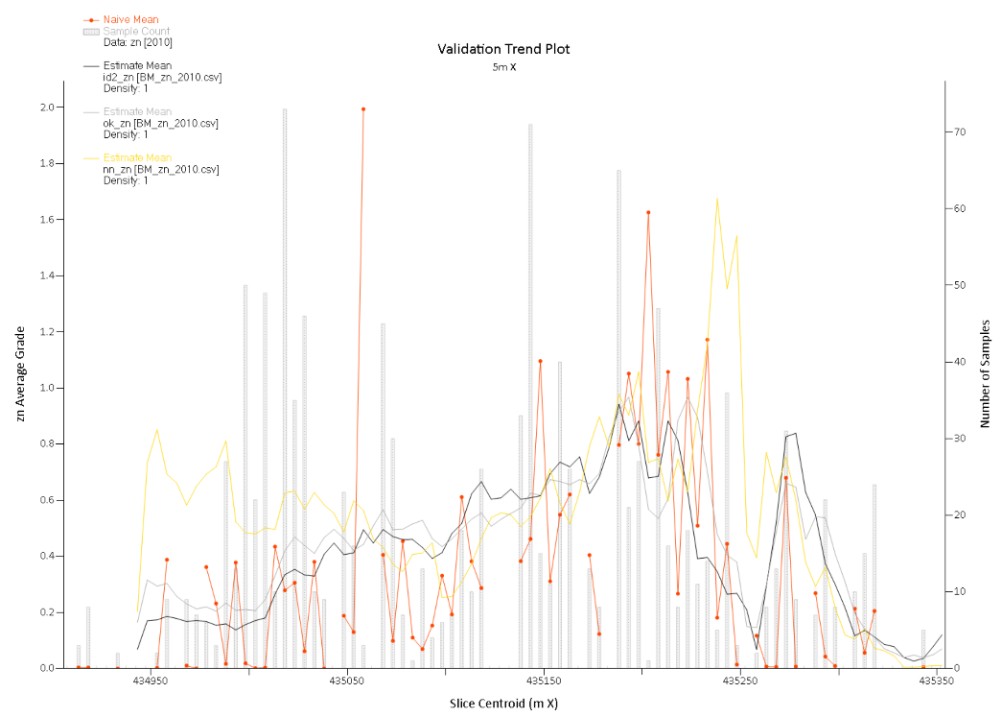
Figure 11-9: Validation Swath Plot of Zone 2010 for Zinc (East Direction)
Table 11-8 compares the global block model mean for four interpolation scenarios (OK, ID2, ID3 and NN) and the composite grades for some mineralized zones for the first pass. Generally, the comparison between composite and block grade distribution did not identify significant issues between the OK, ID3 and ID2 results.
Back Forty Project |
11-24 |
Gold Resource Corporation |
|
Table 11-8: Comparison of The Block and Composite Mean Grades
Properties |
1010 (Main MS1) |
2010 (90AU) |
3000 (Main STR) |
Number of composites |
1423 |
1245 |
1211 |
Number of blocks Au |
40258 |
11742 |
38195 |
Comp Au (g/t) |
2.05 |
2.23 |
1.66 |
Comp Au (g/t) declustered 20x20x20m |
2.27 |
1.80 |
1.65 |
ID3 Au (g/t) |
2.3 |
2.13 |
1.74 |
OK Au (g/t) |
2.36 |
2.09 |
1.74 |
NN Au (g/t) |
2.58 |
2.16 |
1.86 |
Number of blocks Ag |
33623 |
22023 |
22778 |
Comp Ag (g/t) |
15.33 |
40.94 |
6.95 |
Comp Ag (g/t) declustered 20x20x20m |
16.88 |
38.81 |
8.07 |
ID3 Ag (g/t) |
16.02 |
44.13 |
7.02 |
OK Ag (g/t) |
16.47 |
43.40 |
7.36 |
NN Ag (g/t) |
15.89 |
39.30 |
7.76 |
Number of blocks Cu |
17618 |
25685 |
25398 |
Comp Cu (%) |
0.33 |
0.02 |
0.19 |
Comp Cu (%) declustered 20x20x20m |
0.32 |
0.02 |
0.19 |
ID2 Cu (%) |
0.28 |
0.02 |
0.19 |
OK Cu (%) |
0.28 |
0.02 |
0.19 |
NN Cu (%) |
0.27 |
0.02 |
0.19 |
Number of blocks Zn |
31218 |
63599 |
31594 |
Comp Zn (%) |
5.46 |
0.38 |
0.77 |
Comp Zn (%) declustered 20x20x20m |
5.19 |
0.48 |
0.83 |
ID2 Zn (%) |
6.15 |
0.43 |
0.82 |
OK Zn (%) |
5.66 |
0.46 |
0.85 |
NN Zn (%) |
5.24 |
0.49 |
0.83 |
11.11 |
Mineral Resource Classification |
The 2023 MRE comprises Indicated and Inferred Resources.
For Type 3 zones (precious metal rich zones, low sulfide), the Indicated mineral resource category is defined for blocks estimated in the first pass, with a closest distance of 45 m and where there is reasonable geological and grade continuity. The Inferred category is defined for blocks estimated in the first and/or second pass, with a closest distance of 90 m and where there is reasonable geological and grade continuity.
For Types 1, 2 and 4 zones, the Indicated mineral resource category is defined for blocks estimated in the first pass, with a closest distance of 55 m and where there is reasonable geological and grade continuity. The Inferred
Back Forty Project |
11-25 |
Gold Resource Corporation |
|
category is defined for blocks estimated in the first and/or second pass, with a closest distance of 110 m and where there is reasonable geological and grade continuity.
11.12 |
NSR Calculation |
The 2023 MRE was obtained from applying NSR cut-off values to the block models and reporting the resulting tonnes and grades for potentially mineable areas. The NSR calculation was provided by Christian Laroche, P. Eng from GRC. Table 11-9 presents the parameters used to calculate the NSR values that determine the net block revenue for the potentially economic portions of the constrained mineralization.
Table 11-9: Input Parameters Used for The NSR Estimation
Parameter |
Unit |
Value |
Reference number |
Metal prices | |||
Copper |
$/lb |
3.90 |
1 |
Zinc |
$/lb |
1.25 |
2 |
Gold |
$/oz |
1,800 |
3 |
Silver |
$/oz |
23.30 |
4 |
Conversion factor |
|
||
lb-t |
lb/t |
2,204.62262 |
5 |
g-oz |
g/oz |
31.10348 |
6 |
Foundry contract clause | |||
Copper concentrate (“Cucon”) |
|
||
Foundry fees |
$/t |
85.00 |
7 |
Average penalty |
$ |
6.86 |
8 |
Payable |
% |
96.5 |
9 |
Minimum decrease |
% |
1.0 |
10 |
Refining costs |
$/lb |
0.085 |
11 |
Mass pull |
% |
2.07 |
12 |
Gold recovery |
% |
61.41 |
13 |
Silver recovery |
% |
50.30 |
14 |
Copper recovery |
% |
74.49 |
15 |
Zinc recovery |
% |
1.90 |
16 |
Lead recovery |
% |
45.18 |
17 |
Zinc concentrate (“Zncon”) | |||
Average penalty |
$ |
6.05 |
18 |
Foundry fees |
$/t |
225 |
19 |
Refining costs |
$/lb |
0.00 |
|
Payable |
% |
85 |
20 |
Minimum decrease |
% |
8 |
21 |
Mass pull |
% |
9.25 |
22 |
Gold recovery |
% |
2.47 |
23 |
Back Forty Project |
11-26 |
Gold Resource Corporation |
|
Parameter |
Unit |
Value |
Reference number |
||
Silver recovery |
% |
15.87 |
24 |
||
Copper recovery |
% |
0.00 |
25 |
||
Zinc recovery |
% |
94.52 |
26 |
||
Lead recovery |
% |
1.38 |
27 |
||
Silver | |||||
Minimum grade in Zncon |
g/t |
93.3 |
28 |
||
Grade 2 |
g/t |
350 |
29 |
||
Grade 3 |
g/t |
500 |
30 |
||
Payable < 30 |
% |
- |
31 |
||
Payable < 350 et >30 |
% |
90 |
32 |
||
Payable < 500 et >350 |
% |
91 |
33 |
||
Payable >500 |
% |
92 |
34 |
||
Refining costs |
$/oz |
0.35 |
35 |
||
Gold | |||||
Minimum grade |
g/t |
1.0 |
36 |
||
Payable >1 |
% |
96.5 |
37 |
||
Refining costs |
$/oz |
6.00 |
38 |
||
Transportation fees | |||||
Copper concentrate | |||||
Transport |
$/t |
108.00 |
39 |
||
Humidity |
% |
8.00 |
40 |
||
Zinc concentrate | |||||
Transport |
$/t |
90.00 |
41 |
||
Humidity |
% |
8.00 |
42 |
||
The NSR was calculated using the following planned processing steps:
■ |
Copper concentrate |
■ |
Zinc concentrate |
■ |
Gold and silver leach |
The NSR calculation also take into account the royalties as well as the Stream agreement with Osisko (5.2.11; 5.2.20; 5.2.21).
Table 11-10 presents the formulas created to calculate the NSR. Note that when parameters presented in Table 11-9 are used, the reference number of that parameter is noted in brackets.
The formulas were written as macros in Surpac and calculated for each block of the model.
Back Forty Project |
11-27 |
Gold Resource Corporation |
|
Table 11-10: NSR Calculations
Attribute Name |
Description |
Equation |
1AuCuCon |
Au in Cu concentrate |
id3_au*0.6141(13)/0.0207(12) |
2AgCuCon |
Ag in Cu concentrate |
id3_ag*0.503(14)/0.0207(12) |
3CuCuCon |
Cu in Cu concentrate |
id2_cu*0.7449(15)/0.0207(12) |
4ZnCuCon |
Zn in Cu concentrate |
id2_zn*0.019(16)/0.0207(12) |
5PbCuCon |
Pb in Cu concentrate |
id2_pb*0.4518(17)/0.0207(12) |
6AuFZnC |
Au feed in Zn concentrate |
(id3_au-(id3_au*0.6141(13)))/(1-0.0207(12)) |
7AgFZnC |
Ag feed in Zn concentrate |
(id3_ag-(id3_ag*0.503(14)))/(1-0.0207(12)) |
8CuFZnC |
Cu feed in Zn concentrate |
(id2_cu-(id2_cu*0.7449(15)))/(1-0.0207(12)) |
9ZnFZnC |
Zn feed in Zn concentrate |
(id2_zn-(id2_zn*0.019(16)))/(1-0.0207(12)) |
10PbFZnC |
Pb feed in Zn concentrate |
(id2_pb-(id2_pb*0.4518(17)))/(1-0.0207(12)) |
11AuZnCon |
Au in Zn concentrate |
[6AuFZnC]*0.0247(23)/ 0.0925(22) |
12AgZnCon |
Ag in Zn concentrate |
[7AgFZnC]*0.1587(24)/ 0.0925(22) |
13CuZnCon |
Cu in Zn concentrate |
[8CuFZnC]*0.00(25)/ 0.0925(22) |
14ZnZnCon |
Zn in Zn concentrate |
[9ZnFZnC]*0.9452(26)/ 0.0925(22) |
15PbZnCon |
Pb in Zn concentrate |
[10PbFZnC]*0.0138(27)/ 0.0925(22) |
16AuLF |
Au feed grade Leach |
([6AuFZnC]-([6AuFZnC]*0.0247(23)))/(1-0.0925(22)) |
17AgLF |
Ag feed grade Leach |
([7AgFZnC]-([7AgFZnC]* 0.1587(24)))/(1-0.0925(22)) |
18AuLRec |
Au recuperation Leach |
(14.938*[16AuLF]+20.472)/100 |
19AgLRec |
Ag recuperation Leach |
(0.4364*[17AgLF]+50.615)/100 |
20NSRAuC |
NSR Au in Cu concentrate |
if([1AuCuCon]<0,0,(([1AuCuCon]-1(10))*0.965)/31.10348(6)*(1800(3)-6(38))) |
21NSRAgC |
NSR Ag in Cu concentrate |
max(0,min(min([2AgCuCon],350(29))*0.9(32),min([2AgCuCon]*100,350(29))-30(28))+(max([2AgCuCon],350(29))-350(29))*0.91(33)+(max([2AgCuCon]*100,500(30))-500(30))*(0.92(34)-0.91(33)))/31.10348(6)*(23.3(4)-0.35(35)) |
22NSRCuC |
NSR Cu concentrate |
min([3CuCuCon]*0.965(9),[3CuCuCon]-1(10))/100*2204.62262(5)*(3.9(1)-0.085(11))) |
23NSRAuZ |
NSR Au in Zn concentrate |
if([11AuZnCon]<1(36),0,(([11AuZnCon]-1(36))*0.7)/31.10348(6)*(1800(3)-6(38))) |
24NSRAgZ |
NSR Ag in Zn concentrate |
if([12AgZnCon]<93.3(28),0,(([12AgZnCon]-93.3(28))*0.7)/31.10348(6)*(23.3(4)-0.35(35))) |
25NSRZnZ |
NSR Zn in Zn concentrate |
min([14ZnZnCon]*0.85(20),[14ZnZnCo]-8(21))/100*2204.62262(5)*1.25(2) |
26NSRAuL |
NSR Au Leach |
([16AuLF]*[18AuLRec])/31.10348(6)*(1800(3)-6(22)) |
27NSRAgL |
NSR Ag Leach |
([17AgLF]*[19AgLRec])/31.10348(6)*(23.3(4)-0.35(19)) |
28Pb_Penalties |
Penalties Pb in CuCon |
if(([4ZnCuCon]+[5PbCuCon])>6,(([4ZnCuCon]+[5PbCuCon])*2.5),0) |
29NSRCuC |
NSR Cu concentrate |
(([22NSRCuC]+[20NSRAuC]+[21NSRAgC])-(108(39)*(1/(1+0.08(40)))+85(7)+6.86(8)+ [28Pb_Penalties]))*0.0207(12) |
30NSRZnC |
NSR Zn concentrate |
(([25NSRZnZ]+ [23NSRAuZ]+[24NSRAgZ])-(90(41)*(1/(1- |
Back Forty Project |
11-28 |
Gold Resource Corporation |
|
Attribute Name |
Description |
Equation |
|
|
0.08(42)))+225(19)+6.05(18)))*0.0207(12) |
31NSRLeach |
NSR Leach |
[26NSRAuL]+[27NSRAgL] |
32NSRTot |
NSR Total |
[29NSRCuC]+[30NSRZnC]+[ 31NSRLeach] |
33a_NSR_royalty_pit |
Royalty Country parcel Pit mining |
[32NSRTot]*0.01 |
33b_NSR_royalty_pit |
Royalty Private parcel Pit mining |
([32NSRTot]*0.01)+([32NSRTot]*0.035) |
33c_NSR_royalty_pit |
Royalty Michigan parcel UG mining |
if([32NSRTot]<25,[32NSRTot]*0.025, if([32NSRTot] > 25.01 & [32NSRTot] < 50 ,[32NSRTot]*0.029,if([32NSRTot] > 50.01 & [32NSRTot] < 75 ,[32NSRTot]*0.033,if([32NSRTot] > 75.01 & [32NSRTot] < 100 ,[32NSRTot]*0.037,if([32NSRTot] > 100.01 & [32NSRTot] < 125 ,[32NSRTot]*0.041,if([32NSRTot] > 125.01 & [32NSRTot] < 150 ,[32NSRTot]*0.045,if([32NSRTot] > 150.01 & [32NSRTot] < 175 ,[32NSRTot]*0.049,if([32NSRTot] > 175.01 & [32NSRTot] < 200 ,[32NSRTot]*0.053,if([32NSRTot] > 200.01 & [32NSRTot] < 225 ,[32NSRTot]*0.057,if([32NSRTot] > 225.01 & [32NSRTot] < 250 ,[32NSRTot]*0.061,if([32NSRTot] > 250.01 & [32NSRTot] < 275 ,[32NSRTot]*0.065,if([32NSRTot] > 275.01 & [32NSRTot] < 300 ,[32NSRTot]*0.069,if([32NSRTot] > 300.01 & [32NSRTot] < 325 ,[32NSRTot]*0.073,if([32NSRTot] > 325.01 & [32NSRTot] < 350 ,[32NSRTot]*0.077,if([32NSRTot] > 350.01 & [32NSRTot] < 375 ,[32NSRTot]*0.081,if([32NSRTot] > 375.01 & [32NSRTot] < 400 ,[32NSRTot]*0.085,if([32NSRTot] > 400.01 & [32NSRTot] < 425 ,[32NSRTot]*0.089,if([32NSRTot] > 425.01 & [32NSRTot] < 450 ,[32NSRTot]*0.093,if([32NSRTot] > 450.01 & [32NSRTot] < 475 ,[32NSRTot]*0.097,if([32NSRTot] > 475.01 & [32NSRTot] < 500 ,[32NSRTot]*0.101,if([32NSRTot] > 500.01, [32NSRTot]*0.105,0)))))))))))))))))))))+[32NSRTot]*0.01 |
34a_NSR_royalty_ug |
Royalty Country parcel UG mining |
[32NSRTot]*0.01 |
34b_NSR_royalty_ug |
Royalty Private parcel UG mining |
([32NSRTot]*0.01)+([32NSRTot]*0.025) |
34c_NSR_royalty_ug |
Royalty Michigan parcel UG mining |
if([32NSRTot]<25,[32NSRTot]*0.02, if([32NSRTot] > 25.01 & [32NSRTot] < 50 ,[32NSRTot]*0.024,if([32NSRTot] > 50.01 & [32NSRTot] < 75 ,[32NSRTot]*0.029,if([32NSRTot] > 75.01 & [32NSRTot] < 100 ,[32NSRTot]*0.032,if([32NSRTot] > 100.01 & [32NSRTot] < 125 ,[32NSRTot]*0.036,if([32NSRTot] > 125.01 & [32NSRTot] < 150 ,[32NSRTot]*0.040,if([32NSRTot] > 150.01 & [32NSRTot] < 175 ,[32NSRTot]*0.044,if([32NSRTot] > 175.01 & [32NSRTot] < 200 ,[32NSRTot]*0.048,if([32NSRTot] > 200.01 & [32NSRTot] < 225 ,[32NSRTot]*0.052,if([32NSRTot] > 225.01 & [32NSRTot] < 250 ,[32NSRTot]*0.056,if([32NSRTot] > 250.01 & [32NSRTot] < 275 ,[32NSRTot]*0.060,if([32NSRTot] > 275.01 & [32NSRTot] < 300 ,[32NSRTot]*0.064,if([32NSRTot] > 300.01 & [32NSRTot] < 325 ,[32NSRTot]*0.068,if([32NSRTot] > 325.01 & [32NSRTot] < 350 ,[32NSRTot]*0.072,if([32NSRTot] > 350.01 & [32NSRTot] < 375 ,[32NSRTot]*0.076,if([32NSRTot] > 375.01 & [32NSRTot] < 400 ,[32NSRTot]*0.080,if([32NSRTot] > 400.01 & [32NSRTot] < 425 ,[32NSRTot]*0.084,if([32NSRTot] > 425.01 & [32NSRTot] < 450 ,[32NSRTot]*0.088,if([32NSRTot] > 450.01 & [32NSRTot] < 475 ,[32NSRTot]*0.092,if([32NSRTot] > 475.01 & [32NSRTot] < 500 ,[32NSRTot]*0.096,if([32NSRTot] > 500.01, [32NSRTot]*0.100,0)))))))))))))))))))))+[32NSRTot]*0.01 |
Back Forty Project |
11-29 |
Gold Resource Corporation |
|
Attribute Name |
Description |
Equation |
35NSR_Au |
|
[20NSRAuC]*0.0207(12)+[23NSRAuZ]*0.0925(22)+[ 26NSRAuL] |
35NSR_Ag |
|
[21NSRAgC]*0.0207(12)+[24NSRAgZ]*0.0925(22)+[ 27NSRAgL] |
36StreamAu |
Stream Au |
0.185*(1-0.3)*[NSR_AU] |
37StreamAg |
Stream Ag |
0.85*[NSR_AG]*(23.3(4)-4)/(23.3(4)-0.35) |
38_NSR_final_pit |
NSR Final pit mining |
max(0,[32NSRTot]-[33Royalty_pit]-[37StreamAg]-[36StreamAu]) |
39_NSR_final_ug |
NSR Final UG mining |
max(0,[32NSRTot]-[34Royalty_UG]-[37StreamAg]-[36StreamAu]) |
11.13 |
Economical Parameters and Cut-Off Grade |
The 2023 MRE was compiled using a minimum NSR cut-off value for two combined potential extraction scenarios: open pit and underground. The Whittle input parameters and the NSR cut-off parameters used for the in-pit cut-off value and underground cut-off value are presented in Table 11-11.
Table 11-11: Input Parameters Used for the Cut-Off Grade Estimation
Parameter |
Unit |
Value for open pits |
Value for underground – long hole |
Total processing cost |
$/t treated |
28.00 |
28.00 |
Ore premium mining cost |
$/t treated |
- |
40.00 |
Administration & General |
$/t treated |
5.00 |
5.00 |
Proposed NSR COG |
$/t |
33.00 |
73.00 |
Using the parameters shown above, NSR cut-off values of $33/t and $73/t were selected for the open-pit potential and the long hole underground potential, respectively. A Whittle pit shell was used to constrain the 2023 MRE for its near surface potential. Resource-level optimized pit shell and corresponding open-pit cut-off value are then used for the open pit resources statement. The remaining (out-pit) mineralized material was then flagged for its underground potential. Deswik Stope Optimizer (“DSO”) was used to apply constraining volumes to any blocks in the potential underground extraction scenario to address the reasonable prospect for eventual economic extraction of underground resources. Figure 11-10 showing the optimized pit-shell and DSO stope designs of the classified mineral resources, is provided to visualize relationships between the two.
11.14 |
Mineral Resource Estimate |
The authors are of the opinion that the current mineral resource estimate can be classified as Indicated and Inferred mineral resources based on geological and grade continuity, data density, search ellipse criteria, drill hole spacing and interpolation parameters. The authors also believe that the requirement of “reasonable prospects for eventual economic extraction” has been met by having:
■ |
Resources constrained by a pit shell, with a 31 to 49° pit wall angle in rock and a 30° angle in overburden. A minimum distance of 50 m from the river, 30 m from cultural sites and 30 m from wetlands located on the north-east of the pit shell was applied (Figure 3-2). |
Back Forty Project |
11-30 |
Gold Resource Corporation |
|
■ |
Constraining volumes applied to any blocks (potential underground extraction scenario) using the DSO for the out-pit resources; and |
■ |
Cut-off grades based on reasonable inputs amenable to potential open-pit and underground extraction scenarios. |
Figure 11-10 presents the Mineral Resources constrained in-pit and in DSO stope designs above their respective CoG.
Back Forty Project |
11-31 |
Gold Resource Corporation |
|
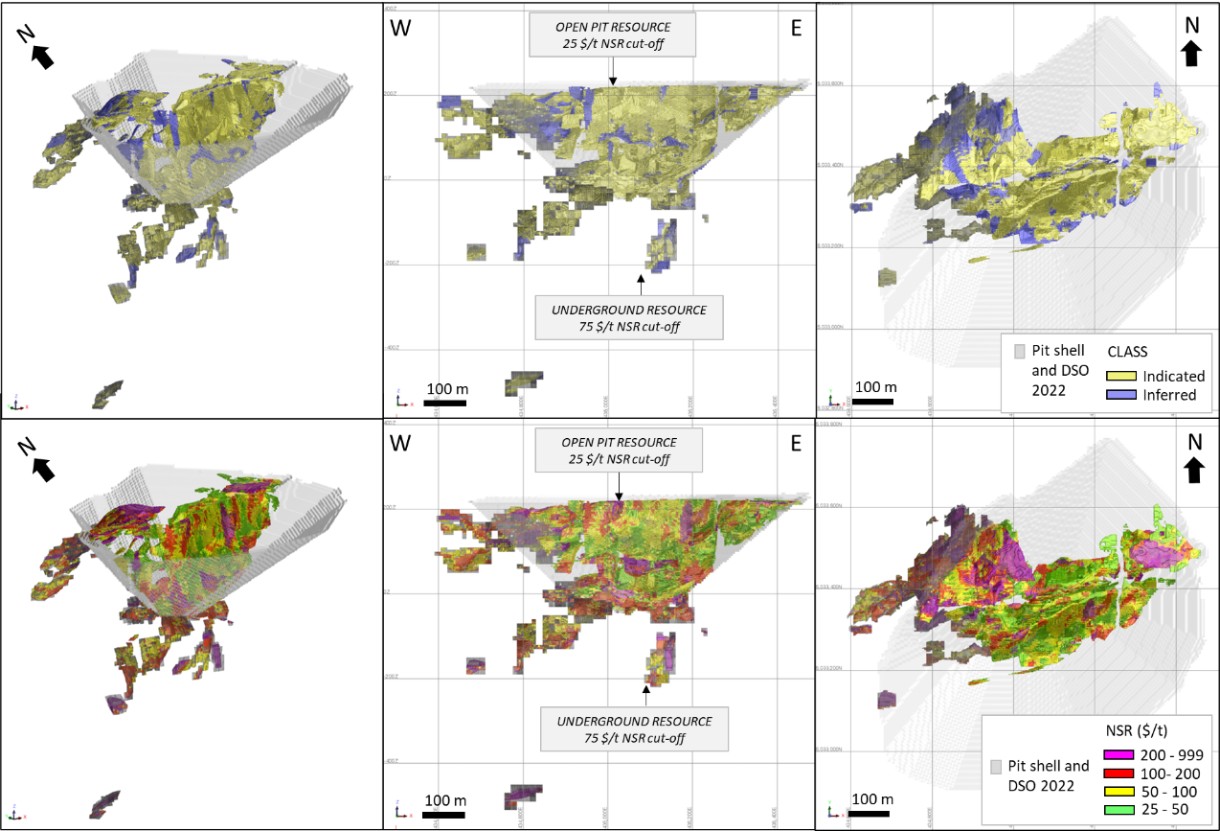
Figure 11-10: Isometric, Longitudinal and Plan Views Showing the Classified Mineral Resources and the Interpolated NSR Constrained in Optimized Pit-shells and DSO Stope Designs
Back Forty Project |
11-32 |
Gold Resource Corporation |
|
The 2023 MRE is considered reliable and based on quality data and geological knowledge. The 2023 MRE is reported here in accordance with the S-K 1300 Regulations and Definition Standards.
Table 11-12 displays the results of the 2023 MRE combining potential open pit and underground selective mining scenarios at a NSR cut-off of $33/t (in pit) and $73/t (long hole underground), respectively.
Table 11-12: Back Forty Project 2023 Mineral Resource Estimate by Mining Method
Area (Mining Method) |
Classification |
NSR cut-off ($/t) |
Tonnes (000s) |
Au (g/t) |
Au (Moz) |
Ag (g/t) |
Ag (Moz) |
Zn (%) |
Zn (Mbs) |
Cu (%) |
Cu (lbs) |
Open pit |
Indicated |
33 |
9,360 |
2.41 |
725 |
28.06 |
8,444 |
3.74 |
772 |
0.36 |
74 |
Inferred |
33 |
566 |
2.70 |
49 |
48.84 |
889 |
1.31 |
16 |
0.35 |
4 |
|
UG long hole |
Indicated |
73 |
5,137 |
1.86 |
306 |
24.05 |
3,972 |
2.65 |
300 |
0.41 |
47 |
Inferred |
73 |
627 |
2.00 |
40 |
26.10 |
526 |
2.89 |
40 |
0.37 |
5 |
|
Total Indicated |
14,497 |
2.21 |
1,032 |
26.64 |
12,416 |
3.35 |
1,072 |
0.38 |
121 |
||
Total Inferred |
1,193 |
2.33 |
89 |
36.89 |
1,415 |
2.14 |
56 |
0.36 |
9 |
||
Notes to accompany the Mineral Resource Estimate:
13. |
The independent and qualified persons for the mineral resource estimate, as defined by S-K 1300, are Marina Iund, P.Geo., Carl Pelletier, P.Geo. and Simon Boudreau, P.Eng. all from InnovExplo Inc. The effective date is September 30th, 2023. |
14. |
These mineral resources are not mineral reserves, as they do not have demonstrated economic viability. The mineral resource estimate is reported in accordance with the S-K 1300 Regulations and Definition Standards. |
15. |
The results are presented undiluted and are considered to have reasonable prospects of economic viability. |
16. |
The estimate encompasses a gold, silver, zinc and copper deposit subdivided into 53 individual zones using the grade of the adjacent material when assayed or a value of zero when not assayed. Fifty-three 10 m buffers around each zone were also created. |
17. |
High-grade capping supported by statistical analysis was done on raw assay data before compositing and is established on a per-zone basis varying from 40 to 75 g/t Au; 350 to 1100 g/t Ag; 0.6 to 12% Cu and none to 14% Zn. |
18. |
The estimate was completed using sub-block models in GEOVIA Surpac 2022. |
19. |
Grade interpolation was performed on 1.5 m composites with the ID3 method for Au and Ag and the ID2 for Zn and Cu. |
20. |
The density was interpolated with the ID2 method for Type 1 (rich massive sulfide mineralized zones), Type 2 (stockwork stringer and peripheral sulfide mineralized zones) and Type 3 (precious metal-rich, low sulfide mineralized zones). A value of 3.05 g/cm3 was assigned to Type 4 (gossan mineralized zones). A value of 2.7 g/cm3 was assigned to the surrounding waste and to the cross-cutting mafic dykes. A value of 2.00 g/cm3 was assigned to the overburden and the cross-cutting sandstone unit. |
21. |
The mineral resource estimate is classified as Indicated and Inferred. For Type 3 zones, the Indicated mineral resource category is defined for blocks estimated in the first pass, with a closest distance of 45 m and where there is reasonable geological and grade continuity. The Inferred category is defined for blocks estimated in the first and/or second pass, with a closest distance of 90 m and where there is reasonable geological and grade continuity. For Types 1,2 and 4 zones, the Indicated mineral resource category is defined for blocks estimated in the first pass, with a closest distance of 55 m and where there is reasonable geological and grade continuity. The Inferred category is defined for blocks estimated in the first and/or second pass, with a closest distance of 110 m and where there is reasonable geological and grade continuity. |
22. |
The mineral resource estimate is locally pit-constrained with a bedrock slope angle from 31 to 49° and an overburden slope angle of 30°. It is reported at a rounded NSR cut-off of $33/t (in pit) and $73/t (underground). The NSR cut-off was calculated using the following parameters: Total processing cost = $28.00/t; Ore premium mining cost = none to $40.00/t; Administration & General = $5.00/t; gold price = $1,800.00/oz; silver price = $23.30/oz; copper price = $3.90/lb and zinc price = $1.25/lb. The cut-off grades should be re-evaluated in light of future prevailing market conditions (metal prices, exchange rates, mining costs etc.). |
23. |
The number of metric tonnes was rounded to the nearest thousand, and any discrepancies in the totals are due to rounding effects. The metal contents are presented in troy ounces (tonnes x grade / 31.10348). |
24. |
The authors are not aware of any known environmental, permitting, legal, title-related, taxation, socio-political, or marketing issues, or any other relevant issue not reported in the Technical Report, that could materially affect the MRE. |
The cut-off grade sensitivity analysis (Table 11-13) demonstrates the homogeneity of the grade distribution inside the deposit. It is notable that, despite variation of the cut-off NSR, the variation in tonnage and grade associated to it is low.
The reader should be cautioned that the numbers provided herein should not be interpreted as a mineral resource statement. The reported quantities and grade estimates at different NSR cut-off values are presented in-situ and
Back Forty Project |
11-33 |
Gold Resource Corporation |
|
for the sole purpose of demonstrating the sensitivity of the resource model to the selection of a reporting NSR cut-off.
Table 11-13: Back Forty Project 2022 Mineral Resource Estimate, Cut-Off Sensitivity
Area (Mining Method) |
Classification |
NSR cut-off ($/t) |
Tonnes (000s) |
Au (g/t) |
Au (Moz) |
Ag (g/t) |
Ag (Moz) |
Zn (%) |
Zn (Mbs) |
Cu (%) |
Cu (lbs) |
Open pit |
Indicated |
39.6 |
8,586 |
2.51 |
693 |
28.58 |
7,890 |
3.91 |
740 |
0.38 |
72 |
36.3 |
8,845 |
2.48 |
705 |
28.41 |
8,079 |
3.84 |
749 |
0.37 |
72 |
||
33 |
9,360 |
2.41 |
725 |
28.06 |
8,444 |
3.74 |
772 |
0.36 |
74 |
||
29.7 |
9,985 |
2.32 |
745 |
27.38 |
8,790 |
3.56 |
784 |
0.34 |
75 |
||
26.4 |
10,546 |
2.25 |
763 |
26.81 |
9,090 |
3.42 |
795 |
0.33 |
77 |
||
Inferred |
39.6 |
509 |
2.85 |
47 |
50.23 |
822 |
1.4 |
16 |
0.38 |
4 |
|
36.3 |
524 |
2.8 |
47 |
49.86 |
840 |
1.37 |
16 |
0.37 |
4 |
||
33 |
566 |
2.7 |
49 |
48.84 |
889 |
1.31 |
16 |
0.35 |
4 |
||
29.7 |
618 |
2.56 |
51 |
46.99 |
934 |
1.24 |
17 |
0.33 |
4 |
||
26.4 |
663 |
2.45 |
52 |
45.25 |
964 |
1.17 |
17 |
0.31 |
5 |
||
UG long hole |
Indicated |
87.6 |
4,456 |
1.98 |
283 |
24.98 |
3,579 |
3.05 |
300 |
0.42 |
41 |
80.3 |
4,707 |
1.91 |
289 |
24.91 |
3,770 |
2.92 |
303 |
0.41 |
42 |
||
73 |
5,137 |
1.86 |
306 |
24.05 |
3,972 |
2.65 |
300 |
0.41 |
47 |
||
65.7 |
5,718 |
1.79 |
330 |
23.65 |
4,347 |
2.54 |
320 |
0.40 |
51 |
||
58.4 |
6,131 |
1.73 |
341 |
23.07 |
4,547 |
2.44 |
330 |
0.39 |
53 |
||
Inferred |
87.6 |
519 |
2.12 |
35 |
28.78 |
480 |
3.40 |
39 |
0.37 |
4 |
|
80.3 |
575 |
2.10 |
39 |
26.79 |
495 |
2.68 |
34 |
0.39 |
5 |
||
73 |
627 |
2.00 |
40 |
26.10 |
526 |
2.89 |
40 |
0.37 |
5 |
||
65.7 |
673 |
1.93 |
42 |
25.22 |
546 |
2.43 |
36 |
0.35 |
5 |
||
58.4 |
769 |
1.78 |
44 |
23.50 |
581 |
2.33 |
40 |
0.35 |
6 |
11.15 |
Mineral Resource Uncertainty Discussion |
Mineral Resources are not Mineral Reserves and do not necessarily demonstrate economic viability. There is no certainty that all or any part of this Mineral Resource will be converted into Mineral Reserve. Inferred Mineral Resources are too speculative geologically to have economic considerations applied to them to enable them to be categorized as Mineral Reserves.
Mineral Resource estimates may be materially affected by the quality of data, natural geological variability of mineralization and / or metallurgical recovery and the accuracy of the economic assumptions supporting reasonable prospects for economic extraction including metal prices, and mining and processing costs.
Back Forty Project |
11-34 |
Gold Resource Corporation |
|
The following risks were identified:
■ |
The QAQC shows that the assay quality at the laboratory used for the 2006 to 2008 drilling programs (35% of the assays in the database), was below expectation. Nevertheless, the authors regard assay data as robust enough for resource estimation. |
■ |
In 2019, P&E noted the direct interest in MPC Laboratory that was held by the Company’s VP Exploration during the 2016 to 2017 drill program (Bradfield et al, 2019). The VP Exploration is no longer affiliated with the issuer, therefore there is now no relationship between the laboratory and Company. Analyses carried out at MPC during the 2016 to 2017 program totalled less than 10% of all drill core samples analyzed; of these samples, only around 3% were exclusively analyzed at MPC. All other samples were also analyzed at Bureau Veritas and comparison of these duplicate analyses is acceptable. |
■ |
Validation of some assay data could not be independently verified. The author had access to assay certificates from the issuer server for the 2002-2003 Drilling Program historical holes (this data was purged from ALS system) and for holes analyzed by Accurassay (the laboratory went bankrupt, and no one acquired their historical database). All other certificates were obtained directly from the laboratories (20 from the 35 selected holes). This does not necessarily mean that the data is inaccurate; however, it does increase the level of uncertainty regarding the quality of the data. |
■ |
Validation of collar location data could not be independently verified. Since 2002, collar locations were surveyed by Aquila’s surveyors; consequently, no official survey reports were available. This does not necessarily mean that the data is inaccurate; however, it does increase the level of uncertainty regarding the quality of the data. |
■ |
The author considered that the geological model was based on strong geological knowledges. Nevertheless, the deposit is geologically complex and it’s possible that new exploration data may result in changes in the geological knowledge, mainly at depth. |
■ |
The NSR calculation includes metallurgical recovery assumptions that could perform below expectations. |
Mineral Resources may also be affected by the estimation methodology and parameters and assumptions used in the grade estimation process including top-cutting (capping) of data or search and estimation strategies, although it is the opinion of the QP that there is a low likelihood of this having a material impact on the Mineral Resource estimate.
11.16 |
Qualified Person’s Opinion on Factors that are Likely to Influence the Prospect of Economic Extraction |
The authors are of the opinion that the Mineral Resource block model is representative of the informing data and that the data is of sufficient quality to support the 2023 Mineral Resource Estimate to an Indicated and Inferred confidence level. Furthermore, all issues relating to all relevant technical and economic factors likely to influence the prospect of economic extraction can be resolved with further work.
The 2023 Mineral Resource Estimate may be materially impacted by any future changes in the break-even cut-off grade, potentially resulting from changes in processing recoveries, mining costs, metal prices or from changes in geological knowledge as a result of new exploration data.
Back Forty Project |
11-35 |
Gold Resource Corporation |
|
12.0 |
MINERAL RESERVE ESTIMATES |
There are no stated Mineral Reserves for the Back Forty Project.
Back Forty Project |
12-1 |
Gold Resource Corporation |
|
13.0 |
MINING METHODS |
13.1 |
Introduction |
The Back Forty Deposit is suitable for both open pit and underground methods. The Back Forty Project will start with open pit production. The development of the underground infrastructures will start in the second year and production will start at the end of the third year to complement the diminishing open pit production to the mill. Only material from the Measured and Indicated categories have been used to create the open pit and underground designs.
13.1.1 |
Open Pit |
All work related to pit optimization for the report was performed using the Pseudoflow tool in Whittle Software and verified by the Pseudoflow tool in Deswik. Whittle and Deswik are commercially available mine design software applications. The pit design was performed by Deswik open pit tool. The mine planning was performed using Deswik Sched for Open Pit Metals.
From the pit shells selected, a final pit design was created adhering to geotechnical parameters and mine design criteria for the Back Forty Project. For mine planning purposes the Pinwheel pit is mined first and then backfilled using waste from the Main pit.
13.1.2 |
Underground |
The underground portion of the Back Forty Deposit consists of an area roughly 520 m long, 350 m wide and extending to a depth of roughly 440 m below surface topography. Access to the deposit will be via a ramp from surface, with the underground portal located on the 207.5 m pit bench.
Extraction will be achieved from four mineralized zones: Pinwheel, Tuff, Main and Deep. Each of these mining areas will be serviced by supporting infrastructure including a Paste backfill system, power distribution, water supply, ventilation, dewatering and communications.
The proposed mining approach will use a combination of mechanized Cut and Fill (“CF”) and Longhole (“LH”) methods. LH mining is the dominant method, producing approximately 91% of mined tonnes, with CF producing the remaining 9% of tonnes.
Figure 13-1 shows the overall underground mine layout in cross-section.
Back Forty Project |
13-1 |
Gold Resource Corporation |
|
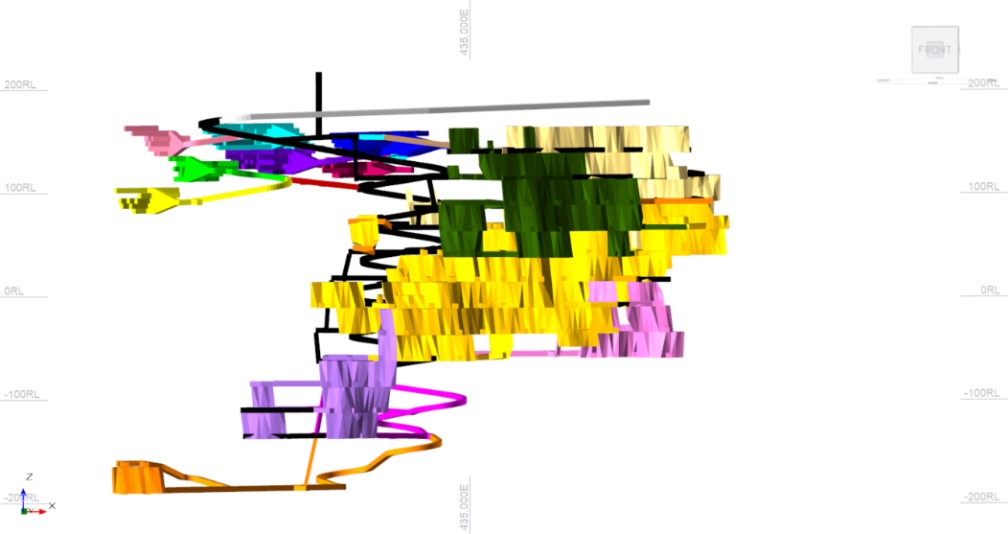
Figure 13-1: Back Forty Underground Mine Looking West
13.2 |
Data Acquisition |
To ensure that correct inputs and reasonable assumptions have been used for mine planning, costs and productivity were derived from first principles and were validated by reviewing historical and current costs at similar mines.
13.2.1 |
Density |
The density was originally coded in the block model for each block based on the rock type category and the metallurgical type as shown in Table 13-1.
Table 13-1: Material Density
Rock type |
Density (tonnes/m³) |
Overburden |
2.0 |
Waste |
2.7 |
Ore |
variable |
13.2.2 |
Swell Factor |
Based on the experience on similar projects, it was assumed that a swell factor of 1.3 (30%) will be applied to blasted rock materials.
13.2.3 |
Moisture Content |
Moisture content is necessary for the estimation of haul truck requirements since all materials are hauled in wet condition. A moisture content of 2% in the rock was applied.
Back Forty Project |
13-2 |
Gold Resource Corporation |
|
13.3Geotechnical
Knight Piésold Ltd. (KP) has been providing geotechnical, geomechanical, and hydrogeological services for the Project since 2016.
13.3.1 |
Geomechanical Domain Definition |
The encountered rock masses were grouped into geomechanical domains. Each domain contains rock masses with similar engineering characteristics that are expected to perform similarly within the final open pit slopes and underground mine. Several possible domain definitions were considered based on lithology, structural geology, and spatial position. The rock mass structure at the project is characterized by an anticline and the following dominant discontinuity orientations have been observed.
· |
The foliation (Joint Set A) is locally parallel to the anticline and thus its orientation varies across the deposit. The foliation strikes NE-SW to E-W, dipping moderately to the NW to N in the Pinwheel Zone and the North Limb of the Main Zone. In the Hinge area between the North and South Limbs of the Main Zone, the foliation is sub-horizontal. In the South Limb of the Main Zone and in the Tuff Zone, the foliation strikes SW-NE, dipping moderately to the SE. |
· |
A cross-cutting joint set (Joint Set B) striking SE-NW and dipping moderately to the NE is observed in the Main Zone. |
· |
A sub-horizontal joint set (Joint Set C) is observed throughout the deposit. |
· |
Several minor joint sets (Joint Sets D, E, G) and preferred orientations are also observed, most of which are either steeply dipping or represent local variations in the orientation of the other sets. |
Based on the observed rock mass structure, the following structural domains were defined based on spatial position:
· |
Pinwheel Zone |
· |
Main Zone North Limb |
· |
Main Zone Hinge |
· |
Main Zone South Limb (includes the Tuff Zone) |
The rock mass quality at the deposit varies both spatially and by lithology. A near-surface weathered zone, approximately 5 to 50 m thick overlays the deposit and is characterized by a Rock Mass Rating (RMR76) design value of 40. The Pinwheel Zone is associated with reduced rock mass quality, believed to be due to the presence of multiple faults/shears and its proximity to surface. The design RMR76 values for the ore and host rock range from 50 to 55. The Main and Tuff Zone are characterized by more competent rock masses, with design RMR76 values of 70 to 75 for the ore and 65 to 75 for the host rock. The average Unconfined Compressive Strength (UCS) ranges from approximately 130 to 165 MPa for the ore and from 100 to 150 MPa for the host rock.
Rock mass quality domains were ultimately defined for both the Pinwheel Zone and the Main and Tuff Zone by major lithology groupings. The rock mass quality domains are as follows.
· |
Near-Surface Weathered Zone |
· |
Rhyolite Crystal Tuff (RCTF) |
· |
Chloritic Tuff (CHTF) |
· |
Massive Rhyolite (MRHY) |
· |
Tuff, Tuffaceous Sediments and Rhyolite Ash Tuff (TUFF, TFSD & RATF) |
· |
Massive and Semi-Massive Sulfides (MASU & SMAS) |
· |
Sulfide Stringers (SFST) |
Back Forty Project |
13-3 |
Gold Resource Corporation |
|
The TUFF, TFSD & RATF were sub-divided above and below an elevation of 120 m to reflect a slight increase in rock mass quality with depth. Minor rock mass quality domains were also defined for the Quartz Feldspar Porphyry (QFP), Felsic Dykes (FLDK), and Mafic Dykes (MFDK).
13.3.2 |
Open Pit |
The open pit geotechnical parameters were provided by Knight Piésold. These recommendations were made for an earlier version of the pit design with a much larger volume but are still considered adequate since the slopes are still located in the same host rocks. The pit slope geotechnical parameters are summarized in Table 13-2.
Table 13-2: Open Pit Geotechnical Parameters
Geotechnical Parameters |
Unit |
Value |
Source |
Overburden |
|||
Face Angle |
° |
22 |
2020 PEA geotechnical recommendations |
Bench Height |
m |
7.5 |
2020 PEA geotechnical recommendations |
Berm Width |
m |
3 |
Automatically calculated |
Inter-rampe angle |
° |
19 |
2020 PEA report, page 285 |
Weathered / all sectors |
|||
Face Angle |
° |
75 |
Knight Piésold, NB22-00017 - Open Pit Slope Recommendations, January 14, 2022 |
Bench Height |
m |
7.5 |
2020 PEA geotechnical recommendations |
Berm Width |
m |
4.3 |
Automatically calculated |
Inter-rampe angle |
° |
43 |
Knight Piésold, NB22-00017 - Open Pit Slope Recommendations, January 14, 2022 |
Fresh Rock |
|||
Face Angle |
° |
75 |
Knight Piésold, NB22-00017 - Open Pit Slope Recommendations, January 14, 2022 |
Bench Height (blasts are performed on 7.5 m) |
m |
22.5 |
2020 PEA geotechnical recommendations |
Berm Width |
m |
10.3 |
Automatically calculated |
Inter-rampe angle |
° |
54 |
Knight Piésold, NB22-00017 - Open Pit Slope Recommendations, January 14, 2022 |
Back Forty Project |
13-4 |
Gold Resource Corporation |
|
13.3.3 |
Underground |
The proposed mine plan incorporates drift and fill stoping in the Pinwheel Zone and both transverse and longitudinal open stoping in the Main and Tuff Zones. The drift and fill stopes are 5 m high and the open stopes have a sub-level spacing of 25 m. Access is via a decline from surface. Stability analyses were undertaken to provide input to the underground rock mine design. Guidance was provided on:
· |
Drift and Fill Stope Dimensions - Achievable dimensions for the drift and fill stopes were evaluated using the empirical Critical Span Curve. A span of 5 m is recommended for the stopes planned for the Pinwheel Zone. |
· |
Open Stope Dimensions - Achievable dimensions for both transverse and longitudinal open stoping were evaluated using the empirical Stability Graph Method. Transverse stopes with a dip of 55° and a Hangingwall (HW) - Footwall (FW) span of 16 m are expected to be able to achieve a strike length of 22 m. Longitudinal stopes were limited to a HW-FW span of 8 m and are expected to be able to achieve a strike length between 22 and 28 m, depending on the HW lithology. |
· |
Open Stope Dilution Estimates - The expected dilution for the recommended stope geometries was estimated using the Equivalent Linear Overbreak/Slough (ELOS) Method. The HW dilution is expected to average between 0.5 to 1 m, and the FW dilution is predicted to average 0.5 m. |
· |
Ground Support - Ground support recommendations have been developed for the lateral development and stopes. The recommended support systems were based on Canadian mining practice, experience at other operations, and the ability of the ground support to manage potential wedges. The primary support consists of 2.4 m long No.6 rebar or PM12 Swellex bolts in the back and 1.8 m long No. 6 rebar or 35 mm Friction Sets in the walls on a 1.2 m x 1.2 m square pattern with 6-gauge 10 cm aperture galvanized welded wire mesh to within 1.5 m of the floor. This will be supplemented with cable bolts, 0-gauge welded wire straps and/or fibrecrete. |
· |
Paste Backfill Strength - The backfill strength required to allow single exposures of the side or end wall of the open stopes or drift and fill stopes was evaluated using the analytical method developed by Mitchell (1982). A strength of 250 kPa is recommended for the drift and fill stopes and longitudinal open stopes, while a strength of 450 kPa is recommended for the transverse open stopes. |
13.4 |
Hydrological |
The open pit groundwater inflow parameters were provided by Foth to GRC.
The calibrated model used by Foth considered 16 layers of material from the Quaternary till to the fresh Precambrian bedrock. The model was initially run in steady state mode then the mine dewatering was simulated via periods based on a proposed mining schedule which includes open pit and underground production. Foth did simulations for a base case and a worst case, which applied a hydraulic conductivity K factor multiplied by two, for all the hydrostratigraphic units.
The worst-case scenario numbers for the groundwater inflow inputs were used. The simulation was based on an earlier version of the pit design with a much larger footprint than the one in this study, but the results are considered conservative as the same layers of material will be encountered, just on a smaller scale. An updated study will be required for the next phase of engineering.
Golder/WSP provided the water inflows from direct precipitations and from storm events (Golder, 2022). The data is summarized in the following table.
Back Forty Project |
13-5 |
Gold Resource Corporation |
|
Table 13-3: Hydrological parameters
Locations and Inflows |
Flow |
||
m3/month |
m3/day |
US gpm |
|
Open Pit Sump |
|
|
|
Groundwater Inflow - Open Pit (Maximum Inflow) |
93,277 |
3,009 |
552 |
Runoff - Open Pit Catchment (Average Climate Year: Wettest Month) |
20,695 |
668 |
122 |
Runoff - Storm Event (200yr-24hr pumped over 14 days) |
- |
2,557 |
469 |
Total Pump Rate from Open Pit Sump to WRCP |
113,972 |
6,234 |
1,144 |
Underground Mine Sumps |
|
|
|
Total Pump Rate from Lower Sump to Upper Sump |
- |
959 |
176 |
Total Pump Rate from Upper Sump to WRCP |
- |
1,450 |
266 |
West Runoff Collection Pond |
|
|
|
Inflow from Open Pit Sump |
- |
6,234 |
1,144 |
Inflow from Upper Sump |
- |
1,450 |
266 |
Runoff - WRCP Catchment (Average Climate Year: Wettest Month) |
19,022 |
614 |
113 |
Runoff - Storm Event (200yr-24hr pumped over 30 days) |
- |
1,010 |
185 |
Total Pump Rate from WRCP to CWB |
19,022 |
9,307 |
1,707 |
13.5 |
Open Pit Optimization |
The pit optimization process consists of utilizing economic criteria including costs and revenues as well as geotechnical considerations to determine to what extent the Back Forty Deposit can be mined profitably.
The pit optimization was determined using Whittle software with the Pseudoflow algorithm and verified by running Deswik with the Pseudoflow algorithm, using the same economic criteria (mining costs, processing costs, revenue per block). As an underground mine is also contemplated at Back Forty, the trade-off option to identify the optimal switch depth between open pit and underground mining was used in Whittle.
Table 13-4 below summarizes the criteria used for pit optimization.
Back Forty Project |
13-6 |
Gold Resource Corporation |
|
Table 13-4: Input Criteria for Pit Optimizations
ITEM |
UNIT |
VALUE |
Inter-Ramp Angle (IRA) |
|
|
Overburden |
° |
19 |
Weathered |
° |
43 |
Fresh Rock |
° |
54 |
Overal Slope Angle (including ramps) |
|
|
Overburden |
° |
19 |
Weathered |
° |
46 |
Fresh Rock |
° |
46 |
Mine design criteria |
|
|
Mining Recovery |
% |
95 |
Mining Dilution |
% |
10 |
Operating costs/parameters |
|
|
Mining Cost (rock) |
US$/t rock |
4.00 |
Mining Cost (Overburden) |
US$/t overburden |
3.00 |
Mining Rehabilitation Cost |
US$/t mined |
3.00 |
Underground mining Cost |
US$/t ore |
50.00 |
Processing costs, G&A |
|
|
Processing cost |
US$/t milled |
35.00 |
General and Administration costs |
US$/t milled |
8.00 |
Recovery |
|
|
Recovery Grade for Au |
no unit |
80% |
Recovery Grade for Ag |
no unit |
80% |
Recovery Grade for Cu |
no unit |
80% |
Recovery Grade for Zn |
no unit |
88% |
Selling Prices and costs |
|
|
Selling Prices Grade for Au |
US$/t.oz |
1700 |
Selling Prices Grade for Ag |
US$/t.oz |
21 |
Selling Prices Grade for Cu |
US$/lb |
3.20 |
Selling Prices Grade for Zn |
US$/lb |
1.15 |
All financial figures are in US dollars. The geotechnical parameters are based on the one proposed by Knight PIésold.
All parameter costs listed on Table 13-4 were used solely to generate economic pit shells and should not be confused with operating costs that will be used later to develop mining cost estimates for the financial model and economic analysis.
Pit optimization based on the parameters in Table 13-4 was ran in Whittle for different revenue factors. By applying cost parameters and the above-mentioned reference selling prices of Au, Ag, Cu, Zn and Pb, the pit optimization exercise generated a series of 6 shells with revenue factors ranging from 0.5 to 1.0 (Table 13-5 and Figure 13-2).
Back Forty Project |
13-7 |
Gold Resource Corporation |
|
Table 13-5: Whittle Pit Optimization Results
Pit |
Rev Factor |
Rock |
Ore |
Strip |
AG |
AU |
CU |
ZN |
Tonnes |
Tonnes |
Ratio |
g/t |
g/t |
% |
% |
||
1 |
0.5 |
3,277,110 |
1,460,005 |
1.24 |
36.60 |
3.81 |
0.94 |
2.66 |
2 |
0.6 |
3,887,909 |
1,789,775 |
1.17 |
33.18 |
3.49 |
0.85 |
2.38 |
3 |
0.7 |
4,539,271 |
2,082,632 |
1.18 |
30.76 |
3.26 |
0.79 |
2.17 |
4 |
0.8 |
7,660,439 |
2,803,150 |
1.73 |
26.30 |
2.86 |
0.65 |
2.23 |
5 |
0.9 |
8,246,227 |
3,027,224 |
1.72 |
25.28 |
2.75 |
0.62 |
2.19 |
6 |
1 |
8,963,657 |
3,296,424 |
1.72 |
24.52 |
2.63 |
0.57 |
2.14 |
As evidenced in Figure 13-3, the revenue factor 1 results show 2 distinct pits which are highly constrained by the proximity of wetlands, the Menominee River and by the possibility of underground mining.
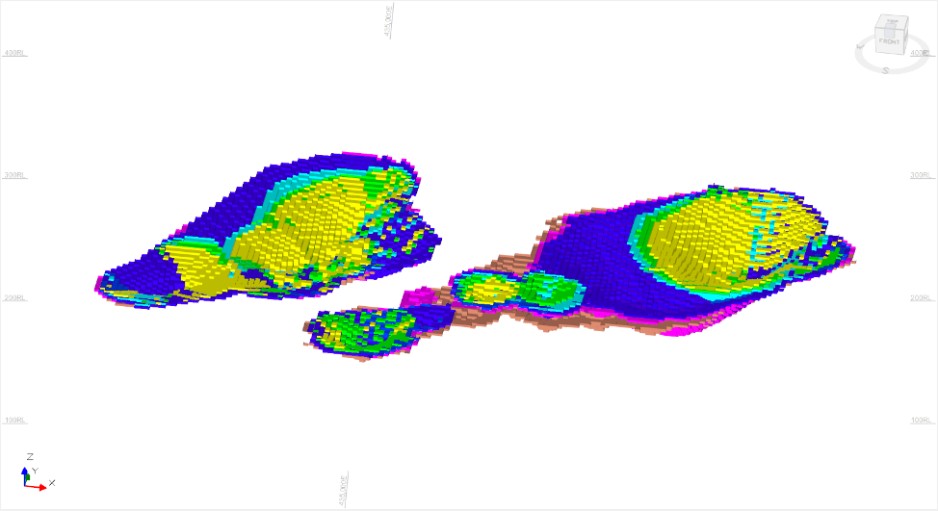
Figure 13-2 : Whittle Pit Optimization Shells
Back Forty Project |
13-8 |
Gold Resource Corporation |
|
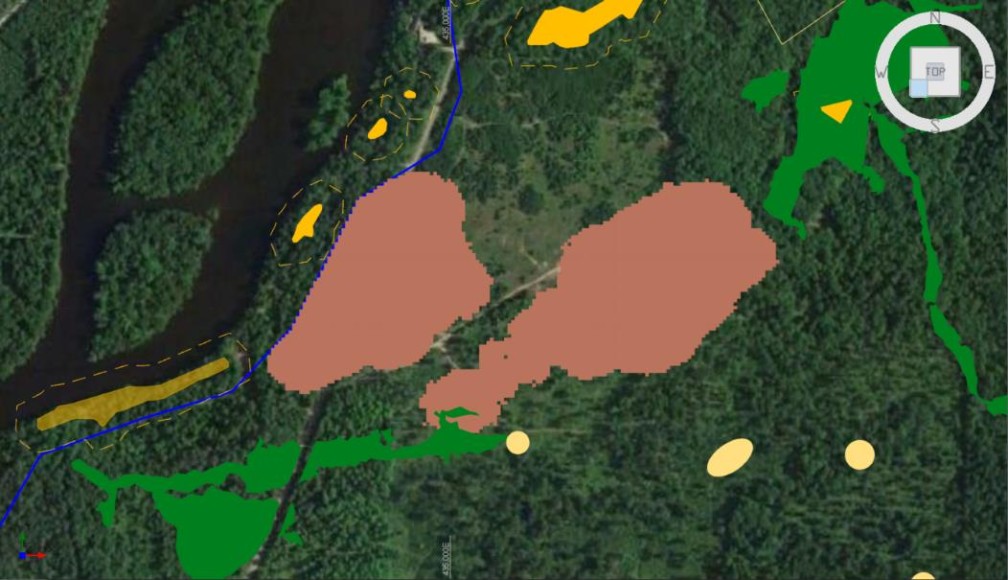
Figure 13-3: Revenue Factor 1 Pit Shell
13.6 |
Pit Design Selection |
Once the final pit shells have been determined, the next step is to design the operational pit. The operational pit must be designed to meet industry and regulated safety standards to provide practical and safe access for mine personnel and equipment from surface to pit bottom. The pit design uses the pit shell as a guideline and includes ramps, smoothed pit walls and ensures that the pit can be safely mined using selected equipment. The following sections discuss the parameters and methodology used to build the pit design and presents the results, including pit design geometry and in-pit resources.
13.6.1 |
Mining Methods |
The mining method selected for the Back Forty Project is a combination of:
■ |
A conventional open pit drill and blast operation with truck and shovel excavation and transport of blasted material. |
■ |
An underground mine operation with mostly long-hole stopes and cut and fill stopes. |
The overburden material is mainly constituted of till at variable thicknesses, ranging from 0 m to approximately 0.5 m over the pit area. No drill and blast activities are planned for the removal of overburden.
Back Forty Project |
13-9 |
Gold Resource Corporation |
|
The ore and waste rock material will be drilled and blasted in 7.5 m benches, then loaded into articulated haul trucks with hydraulic shovels and wheel loaders.
13.6.2 |
Haul Road and Ramp Design |
A dual-lane traffic ramp of 18 m width was designed from surface to elevation of the third to last bench, then a single-lane traffic ramp of 12 m width was designed to reach the pit bottom, thus increasing ore recovery from the deepest benches. Haul traffic must be closely monitored for safe operations when mining the bottommost two benches. The ramps of both pits exit to the southeast for an easy access to ore crusher and the waste rock stockpile. A maximum grade of 10% was considered for ramps in the pit design to optimize haul truck performance. The average slope of the ramp is 8.8%.
13.6.2.1 |
In-Pit Dual-Lane Traffic on Rock |
For in-pit dual-lane traffic on rock, a minimum width of 3.5 times the width of the largest truck was designed. The overall width of a 45 t articulated truck is 3.8 m (CAT 745) which results in a running surface of 13.3 m; the ditch is included in the running surface. The allowance for a berm (2 m) increases the total road width to 15.3 m. The overall ramp width was design at 18 m to allow for larger equipment if required.
13.6.2.2 |
In-Pit Single-Lane Traffic on Rock |
For in-pit single-lane traffic on rock, a minimum width of two times the width of the largest truck was used. The overall width of a 45 t articulated truck is 3.8 m (CAT 745) requiring a running surface of 7.6 m, with the ditch included in the running surface. The allowance for a berm (2 m) increases the total road width to 9.6 m. The overall ramp width was designed at 12 m to allow for larger equipment if required.
13.7 |
Mine Dilution and Mining Recovery |
Due to the specification of large scale mine equipment, orebody shape, and ore contact with waste material, it is always challenging to perfectly separate mineralized material from waste material during mining operations. As a result, diluting waste rock is sometimes mined as ore material, particularly at the fringes of a deposit. The regularization of the block model to 5 m x 5 m x 2.5 m selective mining unit (SME) includes waste material in the mineralized blocks and results in a 6.2% increase in tonnes and a reduction of 4.8% of the grades compared to an unregularized block model. In addition, during mining operations some ore material is not mined. The “lost” ore will be removed from ore material and added to waste material for volumetric balance. To account for ore losses, a 95% mining recovery factor is estimated and applied.
13.8 |
Final Pit Design |
Based on the selected final pit shell and pit design criteria, a final pit design was created. The final design includes two distinct excavations, the Pinwheel and Main pits.
Back Forty Project |
13-10 |
Gold Resource Corporation |
|

Figure 13-4: Ultimate Pit, Overburden Stockpile and Waste Rock Dump
13.8.1 |
Pinwheel Pit |
The Pinwheel pit is located in the western section of the property and, at its closest, is 75 m from the Menominee River. It also overlaps the River Road. The pit measures 375 m in strike along the NNE axis, 215 m across and 60 meters in depth. This pit is mostly located in the Pinwheel zone which is rich in copper but poor in zinc. Mining this zone first and not blending it with the Main and Tuff zone helps improve the milling recoveries. The pit starts in the Pinwheel Gossan which is rich in gold and silver. Mining starts during preproduction in order to supply material to the mill for commissioning and ends in Q3 of 2027. Once finished, the Pinwheel pit is backfilled using waste material from the Main Pit as discussed in section 17.2.1. Once the pit is backfilled and the area reclaimed, the River Road will be reopened.
Back Forty Project |
13-11 |
Gold Resource Corporation |
|
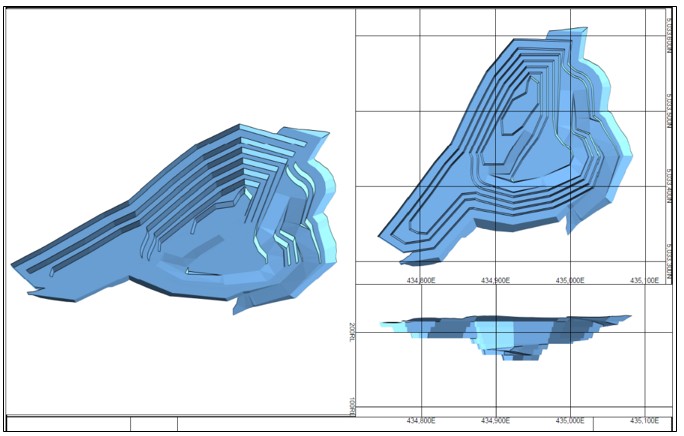
Figure 13-5: Pinwheel Pit Views
Table 13-6: Pinwheel Pit Production
Pinwheel Pit |
Tonnes (kT) |
Diluted Cu grade (%) |
Diluted Zn grade (%) |
Diluted Au grade (g/t) |
Diluted Au grade (g/t) |
Overburden |
776 |
- |
- |
- |
- |
Waste material |
1,186 |
- |
- |
- |
- |
Mineralized material (Measured and Indicated) |
1,006 |
1.30 |
0.11 |
2.61 |
51.69 |
Mineralized material (Inferred) |
177 |
0.86 |
2.02 |
2.19 |
40.79 |
13.8.2 |
Main Pit |
The Main pit is located approximately 50 m east of the Pinwheel pit. It spans 310 m in the E-W orientation, 235 m N-S and 90m in depth. Materialized material principally comes from the Main zone with some also coming from the eastern Gossan and the Tuff zone. This pit starts being mined in Q3 of 2027 and ends in Q4 2028. The south-west
Back Forty Project |
13-12 |
Gold Resource Corporation |
|
extremity of the pit on bench elevation 185 will host the underground portal which will be excavated in Q2 of 2028 to support the underground production.
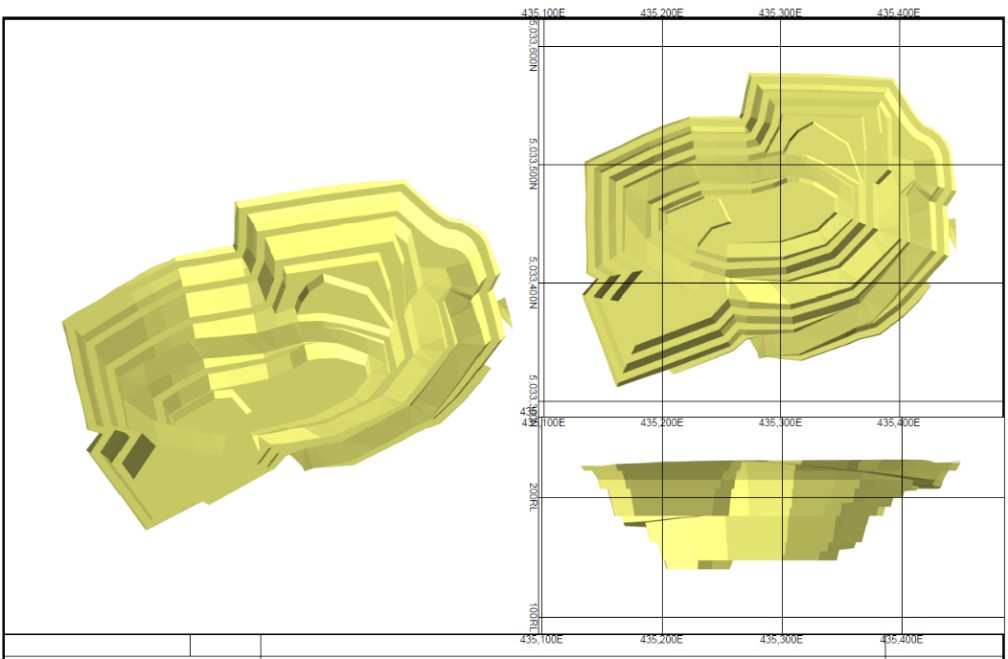
Figure 13-6: Main Pit Views
Table 13-7: Main Pit Production
Main Pit |
Tonnes (kT) |
Diluted Cu grade (%) |
Diluted Zn grade (%) |
Diluted Au grade (g/t) |
Diluted Au grade (g/t) |
Overburden |
568 |
- |
- |
- |
- |
Waste material |
3,941 |
- |
- |
- |
- |
Mineralized material (Measured and Indicated) |
2,006 |
0.32 |
3.94 |
3.07 |
15.43 |
Mineralized material (Inferred) |
29 |
0.13 |
2.43 |
2.77 |
11.13 |
Back Forty Project |
13-13 |
Gold Resource Corporation |
|
13.9 |
Equipment Fleet |
This section presents the equipment fleet required to achieve the open pit production schedule. The operating costs are calculated from an owner-operated scenario but with rented equipment due to the relatively short open pit mine life. A contractor-operated scenario has also been contemplated but found to have similar costs. Table 13-8 summarizes the mining equipment selected for the project.
Table 13-8: Open Pit Mining Fleet
Major Mining Equipment Fleet |
Year 0 |
Year 1 |
Year 2 |
Year 3 |
Articulated truck (CAT 745) |
2 |
4 |
3 |
2 |
Hydraulic Shovel |
1 |
1 |
1 |
1 |
Wheel Loader |
1 |
1 |
1 |
1 |
Drills |
1 |
1 |
1 |
1 |
Auxiliary Equipment |
Year 1 |
Year 2 |
Year 3 |
Year 4 |
Dozer D8 |
1 |
1 |
1 |
1 |
Motor Grader CAT14M |
1 |
1 |
1 |
1 |
Small Loader CAT972 |
1 |
1 |
1 |
1 |
Small Excavator CAT352 |
1 |
1 |
1 |
1 |
Water Truck (CAT 745) |
1 |
1 |
1 |
1 |
Utility Mechanical Truck |
1 |
1 |
1 |
1 |
Personnel Carrier |
1 |
1 |
1 |
1 |
Fuel Lube Truck |
1 |
1 |
1 |
1 |
Lighting Tower |
3 |
4 |
4 |
3 |
Pickup Truck |
4 |
8 |
8 |
6 |
Boom Truck |
1 |
1 |
1 |
1 |
13.9.1 |
Loading |
Loading of the CAT 745 trucks will be accomplished by either the 395 shovel (at a 60% ratio) or the CAT 988 loader (at a 40% ratio). The primary mining equipment will be supported by a CAT 972 loader that will rehandle material
Back Forty Project |
13-14 |
Gold Resource Corporation |
|
from time to time and will do snow plowing, as well as a CAT 352 Excavator that will be used to reshape the final overburden walls, scale final rock walls, and excavate ditches.
13.9.2 |
Hauling |
CAT 745 trucks have been selected to haul overburden and blasted rock material to either the overburden dump, the waste dump, or the crusher pad.
13.9.3 |
Drilling and Blasting |
Blasthole drilling will be accomplished by Flexiroc D60 drills. Because of the short mine life and relative shallowness of each pit, it is not considered necessary to pre-split the final walls. Charging of blast holes will be provided by an explosive subcontractor.
13.10 |
Auxiliary Fleet |
An auxiliary equipment fleet is required to support the mine operations. The auxiliary equipment won’t be used as many hours as the production equipment. For example, two pieces of equipment may require only one operator as he will use one or the other depending on the situation.
13.11 |
Manpower Requirement |
Table 13-9 summarizes the personnel requirements for the mine operations, mine management, maintenance, and the technical services of the open pit. The work schedule is specified for each assignment. It is assumed that the mine will operate 24 hours per day, 7 days a week all year round, with two shifts of 12 hours duration. Starting in 2029, some of the technical and supervision staff will be shared with the underground.
Table 13-9: Projected Mining Roster
Labour |
Schedule |
2026 (6 months) |
2027 |
2028 |
2029 |
|---|---|---|---|---|---|
Shovel/loader operators |
7D/7N |
4 |
8 |
8 |
8 |
Truck operators |
7D/7N |
8 |
16 |
12 |
8 |
Blaster/Blasting assistant |
7D/7N |
3 |
6 |
6 |
4 |
Drill operators |
7D/7N |
2 |
4 |
4 |
4 |
Laborer |
7D/7N |
2 |
4 |
4 |
2 |
Dozer Operator |
7D/7N |
2 |
4 |
4 |
4 |
Grader/loader operator |
7D/7N |
2 |
4 |
4 |
4 |
Secondary Equipment operator |
7D/7N |
4 |
8 |
8 |
4 |
Superintendent |
5D |
1 |
1 |
1 |
0.5 |
Pit Foreman |
7D/7N |
4 |
4 |
4 |
4 |
Drilling Foreman |
7D |
2 |
2 |
2 |
2 |
Back Forty Project |
13-15 |
Gold Resource Corporation |
|
Labour |
Schedule |
2026 (6 months) |
2027 |
2028 |
2029 |
|---|---|---|---|---|---|
Clerk |
7D |
2 |
2 |
2 |
2 |
Planner |
7D |
2 |
2 |
2 |
2 |
Foreman |
7D |
2 |
2 |
2 |
2 |
Lead Mechanic |
7D/7N |
2 |
4 |
4 |
4 |
Intermediate Mechanic |
7D/7N |
2 |
4 |
4 |
4 |
Welder |
5D |
1 |
1 |
1 |
1 |
Superintendent Technical Services |
5D |
1 |
1 |
1 |
1 |
Mining Engineer |
7D |
2 |
2 |
2 |
1 |
Mine Technician |
5D |
1 |
1 |
1 |
1 |
Surveyor/Rodman |
7D |
2 |
2 |
2 |
2 |
Senior Geologist |
5D |
1 |
1 |
1 |
1 |
Geologist |
7D |
2 |
2 |
2 |
1 |
Grade Control Technician |
7D/7N |
2 |
4 |
4 |
4 |
Total |
|
56 |
89 |
85 |
70.5 |
13.12 |
Mine Design Underground |
The underground mineral resources at Back Forty are comprised of four zones which vary in thickness and dip, ranging from 3 m to 30 m in thickness and dipping from 30 to 70 degrees. Therefore, a combination of mechanized cut-and fill and longhole longitudinal and transverse mining methods is proposed, depending on mineral zone geometry.
The mechanized cut-andfill (C&F) method is applied in mining areas with adverse ground conditions and where the vein dip is less than 55 degrees.
The longitudinal long-hole method will be used in mining areas where the vein thickness is less than 8 m, with a maximum stope strike of 22 m and a minimum stope dip of 55 degrees.
Transverse longhole stoping will be used where the vein width is greater than 8 m and up to 16 m, with a maximum stope strike of 22 m and a minimum stope dip of 55 degrees. A 50 m surface crown pillar and 30 m pillars with open pits are left in place for stability.
Back Forty Project |
13-16 |
Gold Resource Corporation |
|
13.12.1 |
Stope Design |
The stopes were created in the Stope Optimizer module in Deswik (DSO) based on geotechnical parameters provided by Knight Piésold to include dilution. The optimizer was ran only on Measured and Indicated material.
Table 13-10: Stope parameters
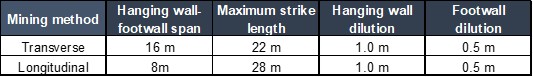
Stopes were created in 5 m sections and manually reworked to create minable shapes fitting with the mining grid and developments.
A total of 235 stopes were created, 164 transverse and 71 longitudinal. The average transverse stope is 24,000 t while the average longitudinal stope is 10,750 t.
Cut and fill stopes were designed by creating development drift in 5 m x 5 m blocks identified in DSO for the Pinwheel zone.
As shown in Table 13-11, there is almost no Inferred material in the underground stopes as they were optimized for Measured and Indicated material. Most of the Inferred material comes from development.
Table 13-11: Underground Production (Includes Long Hole Stopes, Cut and Fill Stopes, and Development)
Main Pit |
Tonnes (kT) |
Diluted Cu grade (%) |
Diluted Zn grade (%) |
Diluted Au grade (g/t) |
Diluted Au grade (g/t) |
Mineralized material (Measured and Indicated) |
5,538 |
0.22 |
5.24 |
2.03 |
24.53 |
Mineralized material (Inferred) |
14 |
1.01 |
8.03 |
20.92 |
191.92 |
Back Forty Project |
13-17 |
Gold Resource Corporation |
|
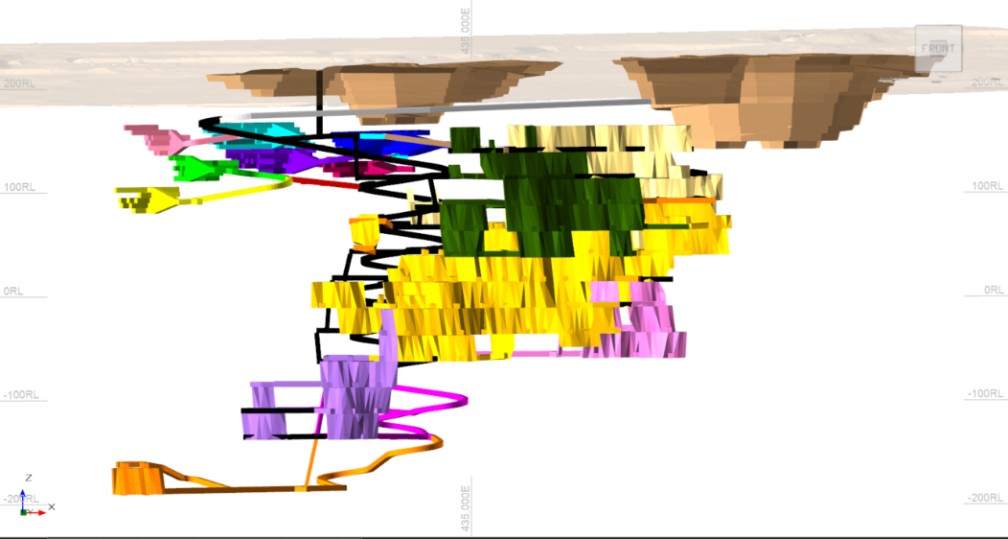
Figure 13-7: Open Pit and Underground Workings Looking North
Figure 13-8: Underground Infrastructures Looking North
Back Forty Project |
13-18 |
Gold Resource Corporation |
|
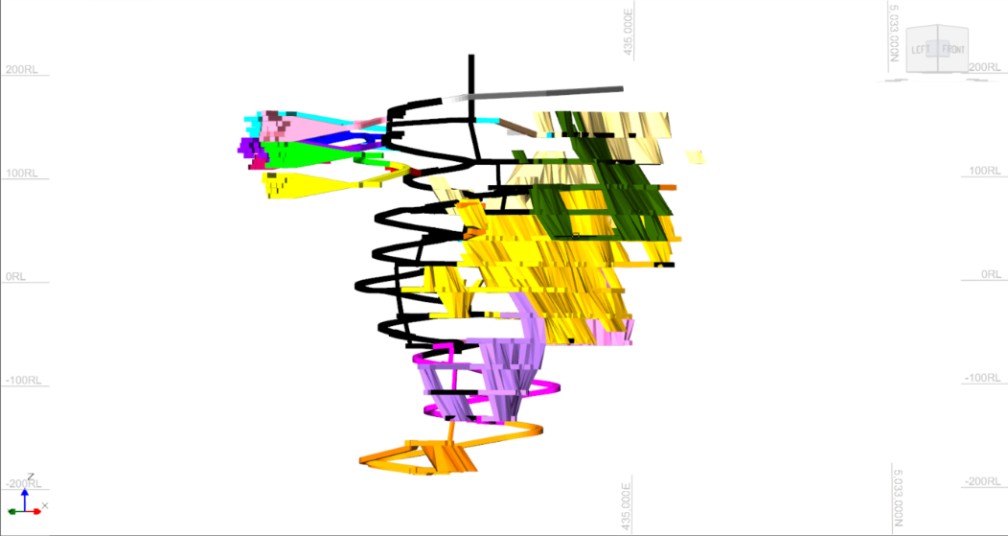
Figure 13-9: Underground Infrastructures Looking NW
13.12.2 |
Mechanized Cut and Fill |
The mechanized C&F mining technique is proposed for the PinwheelL zone. From the ramp a pivot drift will be developed on a -15% grade to access the stope and, starting from the bottom and moving upwards, ore will be extracted in horizontal slices. Mineralized material will be drilled by face jumbos and blasted, and the muck removed from the stope by LHD. Once the cut has been mined out, it will be backfilled, with the fill becoming the working platform from which the next level is mined. Back slashing of the access ramp will provide access to the upper cuts within the stope, and production will continue until the topmost cut of the stope has been mined and backfilled. Figure 13-10 is a schematic showing the Cut and Fill mining method.
Back Forty Project |
13-19 |
Gold Resource Corporation |
|
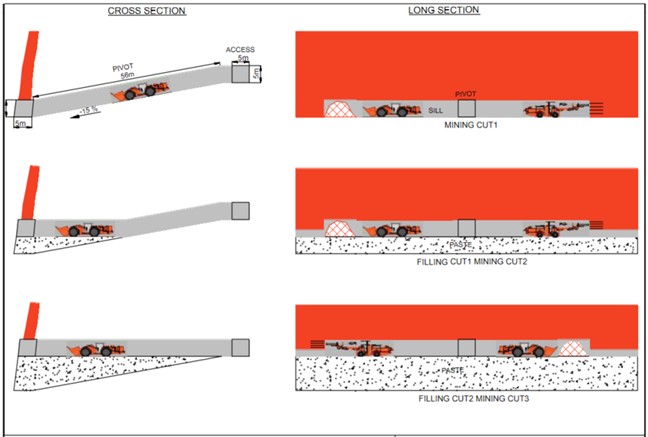
Figure 13-10: Cross-section of Typical Cut-and-Fill Stope
Longhole stoping will be used in the Tuff, Main and Deep zones. This method is a commonly employed method in large scale mining. It is a productive method that is primarily used for steep dip ore bodies with regular shape, primarily used when the ore body is relatively narrow in width (6-30 m). The ore body is divided into parallel sublevels with a defined height between one another. Once this is completed, drifts are created through the ore body to enable mining of stopes between sublevels. The stope production cycle includes blasthole drilling, slot raise opening, production blasting, mucking and backfilling. There are several variations of the long-hole mining method with longitudinal stoping and transverse stoping applied at Back Forty.
Longitudinal stoping is a preferred method when the orebody is narrow and steeply dipping. The top sills are excavated to the full vein width to permit drilling of parallel blastholes, typically at a staggered pattern, as illustrated in Figure 13-11.
Back Forty Project |
13-20 |
Gold Resource Corporation |
|
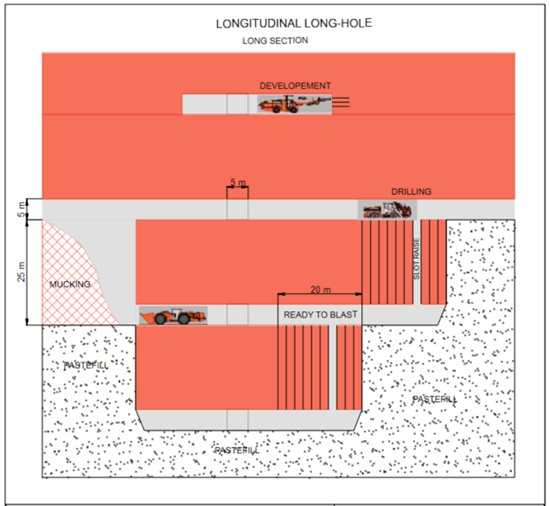
Figure 13-11: Sectional View of Longitudinal Longhole Stope
Transverse longhole stoping, commonly referred to as primary-secondary sequence mining, is useful for a wide orebody. Overcut and undercut draw points, derived from a haulage drift, provide access to the top and bottom of the stope. Stopes are oriented in a transverse manner to the strike of the ore and are mined using an alternating primary and secondary sequence. In very wide areas, stopes are subdivided into smaller panels and mined in sequence from the hanging wall to the footwall. The long hole drill pattern is designed to contour the stope geometry. Cable bolts are often installed above the stope to provide additional support to the rock mass, preventing larger blocks from falling into the excavated stope. Figure 13-12 provides a sectional view of a typical transverse longhole stope.
Back Forty Project |
13-21 |
Gold Resource Corporation |
|
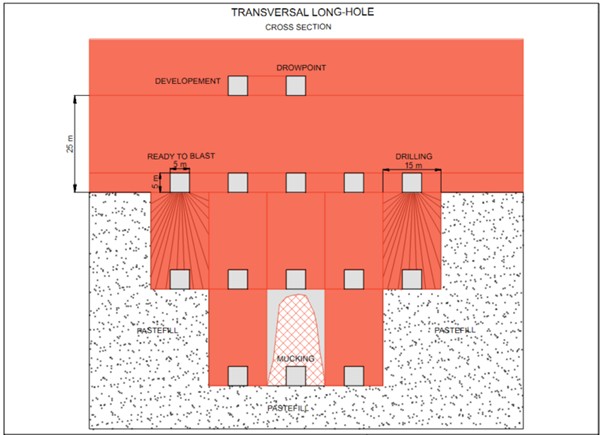
Figure 13-12: Sectional View of a Typical Transverse Longhole Stope
13.12.3 |
Lateral and Vertical Development |
Lateral development will consist of an access ramp, level access, haulage drift, production drift, drawpoints, and excavations for infrastructure. Lateral development will be accomplished with standard face jumbos, rockbolting jumbos, LHDs and underground haul trucks.
Vertical development will consist of ventilation fresh air raises, which will be excavated using an Alimak raise climber, to allow for installation of ground support and the equipping of secondary egress.
The main development heading profiles and meters for the underground workings are presented in Table 13-12.
Back Forty Project |
13-22 |
Gold Resource Corporation |
|
Table 13-12: Lateral and Vertical Underground Mine Development
Heading Type |
Width (m) |
Height (m) |
Total Meters (m) |
Main Ramp |
5.5 |
5.5 |
2,708 |
Level Access |
5.5 |
5.5 |
2,379 |
Haulage drift |
5.5 |
5.5 |
3,261 |
Production drift |
5.0 |
5.0 |
7,219 |
Drawpoints |
5.0 |
5.0 |
2,123 |
Infrastructure |
varies |
varies |
1.979 |
Total |
|
|
19,669 |
|
Vertical Development |
|
Name |
Length (m) |
Diameter (m) |
Fresh air raise (Type 1) |
61 |
5 |
Fresh air raise (Type 2) |
381 |
3 |
Total |
442 |
|
Level spacing for longhole stoping has been based on the efficiency of long hole drilling. The level distance is generally 25 m floor to floor.
The level distance for the cut-and-fill mining technique is set at 25 m to allow for five, 5 m high cuts (5m H by 5m W) and to minimize the total development required.
The decline will provide access to mining levels for all zones. Depending on the mining methods selected, access drifts may be required to access the mineralized zones. Excavation dimensions are set at 5.5 m x 5.5 m. Rigid ventilation ducts, piping for freshwater and dewatering, and power cables will be installed in the decline and main access drifts. The decline ramp grade is set at -15%. Dimensions will allow the use of 17 t LHDs and 50 t trucks.
Back Forty Project |
13-23 |
Gold Resource Corporation |
|
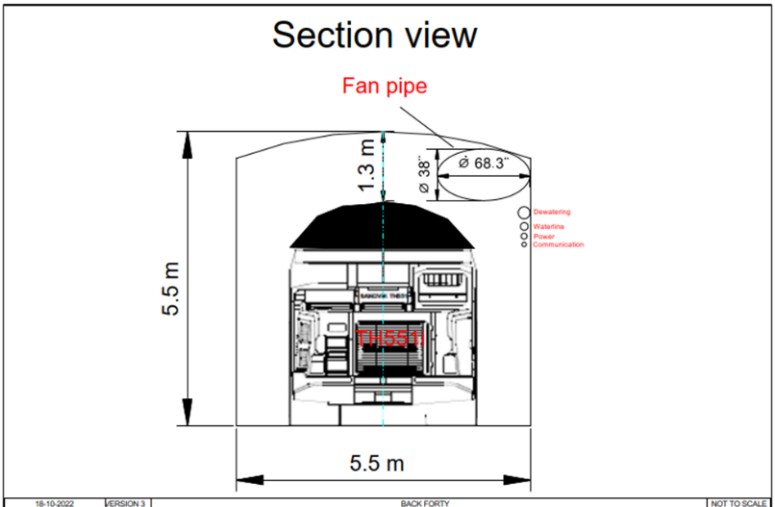
Figure 13-13: Typical Lateral Development Heading
Pivot drives will be excavated for zones mined by cut-and-fill. The pivot drive dimensions are set at 5 m x 5 m. The pivot drive incline will range from -18% to +18% grade. The first pass advance will be conventional development and will be followed by five backslash passes.
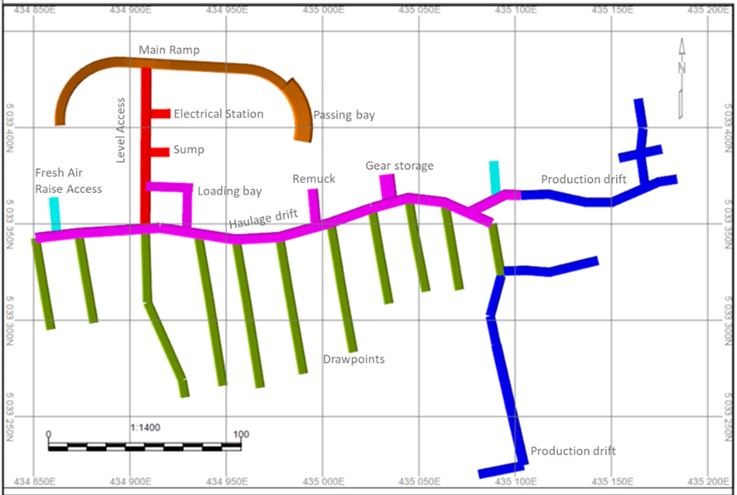
Figure 13-14: Typical Level Development
Back Forty Project |
13-24 |
Gold Resource Corporation |
|
13.12.4 |
Underground Mining Equipment |
Mobile equipment was selected to accommodate the mining methods and to support the planned production rate. The amount of material moved and the distance to the final destination determines the total number of LHD and truck operational hours and the number of units needed for each category of mining equipment. The equipment fleet includes the main development and production vehicles as well as auxiliary vehicles, to support operations.
Vertical development will be Alimak raising and will be completed by contractors providing the equipment as required. The raising equipment is excluded from the equipment list.
The LOM mobile equipment fleet is summarized in Table 13-13.
Table 13-13: Projected Underground Mine Equipment Fleet
Production Equipment |
LOM Quantity |
Two-boom Face Jumbos |
3 |
LHD 17 t |
5 |
Truck 50 t - Ramp haulage |
4 |
Production Drill (102mm) |
2 |
Omnia 975 Bolter |
2 |
Backhoe |
1 |
Boom truck |
1 |
Fuel-Lube truck |
1 |
Emulsion Charger |
1 |
Scissor lift |
2 |
Underground Grader |
1 |
Service Equipment |
LOM Quantity |
Electrical support vehicle |
1 |
Mechanical support vehicle |
1 |
Operations pickup truck |
2 |
Surveyor pickup truck |
1 |
Supervision pickup truck |
2 |
Personnel carrier |
2 |
Total |
32 |
Back Forty Project |
13-25 |
Gold Resource Corporation |
|
13.12.5 |
Underground Mine Personnel Requirements |
The personnel list over the life of the underground mining operations is presented in Table 13-14.
Operators and some of the technical staff will work a schedule consisting of seven days of dayshift, seven days of nightshift, and seven days off. General staff will work on a five-days-on, two-days-off shift cycle.
Underground production and lateral development excavations will be conducted by Back Forty personnel, while contractors will conduct vertical raise development.
Table 13-14: Proposed Underground Mine Roster
UG Operation Employment |
Schedule |
2028 |
2029 |
2030 |
2031 |
2032 |
2033 |
2034 |
2035 |
Mine Superintendent |
5D |
0 |
0.5 |
1 |
1 |
1 |
1 |
1 |
1 |
Mine Foreman |
7D/7N |
2 |
4 |
4 |
4 |
4 |
4 |
4 |
4 |
Technical Services Superintendent |
5D |
- |
- |
1 |
1 |
1 |
1 |
1 |
1 |
Mine Engineer |
7D |
- |
1 |
4 |
4 |
4 |
4 |
4 |
3 |
Geologist |
7D |
- |
1 |
2 |
4 |
4 |
4 |
4 |
2 |
Surveyor |
7D |
- |
2 |
2 |
4 |
4 |
4 |
4 |
2 |
Geologist Technician |
7D/7N |
- |
2 |
2 |
4 |
4 |
4 |
4 |
2 |
Jumbo Operator |
7D/7N |
4 |
12 |
12 |
12 |
12 |
12 |
8 |
8 |
LHD Operator Ore Mucking |
7D/7N |
- |
4 |
8 |
8 |
8 |
8 |
8 |
8 |
Blaster |
7D/7N |
- |
4 |
4 |
4 |
4 |
4 |
4 |
4 |
LDH Operator Development |
7D/7N |
4 |
12 |
12 |
12 |
12 |
12 |
8 |
8 |
Roof Bolter |
7D/7N |
4 |
8 |
8 |
8 |
8 |
8 |
4 |
4 |
Truck Driver |
7D/7N |
4 |
4 |
8 |
12 |
16 |
16 |
16 |
12 |
Long Hole Driller |
7D/7N |
0 |
4 |
8 |
8 |
8 |
8 |
8 |
8 |
Paste fill |
7D |
- |
2 |
4 |
4 |
4 |
4 |
4 |
4 |
Electrician / Instrumentation |
7D |
2 |
2 |
4 |
4 |
4 |
4 |
4 |
4 |
Laborer |
7D/7N |
4 |
8 |
8 |
8 |
8 |
8 |
8 |
6 |
Blasting Assistant |
7D/7N |
- |
4 |
4 |
4 |
4 |
4 |
4 |
2 |
Total |
|
28 |
78.5 |
96 |
106 |
110 |
110 |
98 |
83 |
Back Forty Project |
13-26 |
Gold Resource Corporation |
|
13.12.6 |
Mine Services |
13.12.6.1 |
Ventilation |
The Project is ventilated through an intake connection to surface, which air route includes travel through mining areas via horizontal and vertical openings, with all air exhausted from the mine through the main ramp.
The two main ventilation fans are sized to supply 425 kCFM airflow as dictated by the mining fleet and requirements for personnel. The main fans will be located on surface in a horizontal arrangement, and each will be equipped with 1,000 HP (746 kW) motors and a heater of 14.3 MBtu/hr (4.19 MW). The fan elbow is equipped with a double door for personnel to have the ability to use the escapeway. Soundproofing has been installed at the inlet of the heater to meet the requirements of 85 decibels sound emission (US Dept. of Labor, 2008).
The underground ventilation layout will consist of a 5 m diameter Alimak-driven raise from surface down to the third level (135L) and 3 m diameter Alimak raises for connections to all levels to the bottom of the mine. The intake raise is connected to the level access, and a bulkhead is installed at each production level access and is equipped with both a regulator and a double man door.
The ventilation raises will also serve as an escapeway. The escapeway is installed inside the raise and is of a ladder tube type. The ladder tube will be sealed off at the bottom to prevent high airspeed on workers when climbing.
The proposed ventilation network is illustrated in Figure 13-15.
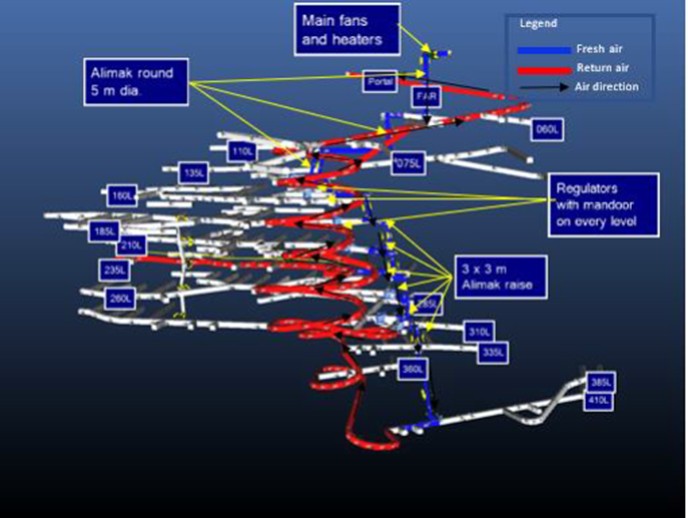
Figure 13-15: Ventilation Network Isometric View
Back Forty Project |
13-27 |
Gold Resource Corporation |
|
13.12.6.2 |
Airflow Requirements |
The fresh air requirement for the mine was based on requirements per unit that have been established using a list of approved diesel engines and capacity to maintain adequate underground air quality and working temperatures. The airflow calculations are based on the main operating equipment requirements. Conservative utilization rates were applied to account for the time when machines may be mechanically unavailable, or simply not in use.
Table 13-15 shows the ventilation rate for each piece of diesel equipment and the fresh air volumes needed to respect regulation and protect workers.
Table 13-15: Airflow requirements calculations
Equipment |
Model |
Engine |
Units |
Engine Power |
Airflow requirement per unit |
Utilization rate |
Total airflow required |
|
kW |
kCFM |
kCFM |
||||
Production drill |
DL421 |
M-B OM904LA (110kW, Stage IIIA) |
2 |
110 |
9.2 |
25% |
4.6 |
Jumbo |
DD421 |
M-B OM904LA (110kW, Stage IIIA) |
3 |
110 |
9.2 |
25% |
6.9 |
Bolter |
ME-975 |
Volvo TAD570VE |
2 |
110 |
1.6 |
25% |
0.8 |
Backhoe |
CAT420 |
C6.3 |
1 |
75 |
9.5 |
50% |
4.8 |
Boom Truck |
BT3 |
Volvo TAD572VE |
1 |
160 |
2.8 |
50% |
1.4 |
Emulsion Charger |
EC3 |
Volvo TAD570VE |
1 |
110 |
5 |
50% |
2.5 |
Scissor |
SL3 |
Volvo TAD570VE |
2 |
110 |
5 |
50% |
5.0 |
Service vehicle |
Maclean Cassette |
Volvo TAD570VE |
1 |
110 |
5 |
50% |
2.5 |
Jeep |
Land Cruiser |
4.2 TD 24V (170HP) |
7 |
96 |
7.3 |
50% |
25.6 |
Grader |
UG20M |
CAT C7.1 ACERT TIER 4 |
1 |
168 |
16.5 |
75% |
12.4 |
Haul truck |
TH551i |
Volvo TAD1642VE-B (Tier 2) |
4 |
515 |
48.4 |
100% |
193.6 |
Scoop |
LH517i |
Volvo TAD1342VE |
5 |
310 |
24.5 |
100% |
122.5 |
Total |
382.5 |
||||||
Contingency |
76.5 |
||||||
Total |
459.0 |
Back Forty Project |
13-28 |
Gold Resource Corporation |
|
13.12.6.3 |
Overall Ventilation Stages |
The initial ventilation stage will focus on the development of the ramp to access the bottom of the main 5 m diameter intake ventilation raise. This development will be supported by the 186 kW (250 hp) portal intake fan installed on a skid, with 50-inch equivalent diameter oval rigid PVC ducting. A 50 Hp auxiliary fan will direct ventilation air from the ramp and duct it to the development headings.
Once the first raise is constructed, then the main fans can be installed so that it creates a main ventilation circuit. The development fan and its ducting will then be moved underground to take fresh air from the raise bottom to continue developing the ramp to depth.
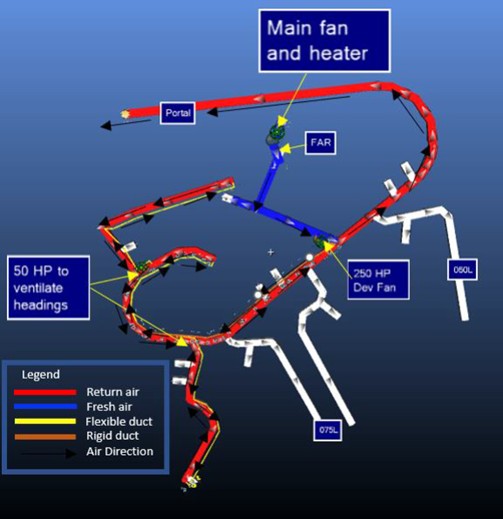
Figure 13-16: Plan View of Second Stage of Ventilation System
Back Forty Project |
13-29 |
Gold Resource Corporation |
|
After the decline ramp reaches the third level, the main ventilation raise will be constructed by Alimak and equipped with a bulkhead and regulator upon completion of the excavation. Fresh air provided from the regulator will be pushed by a 50 Hp (37 kW) fan to the level and another 15 Hp fan will be used to ventilate active development headings. The schematic of the production level auxiliary ventilation is shown in Figure 13-17.
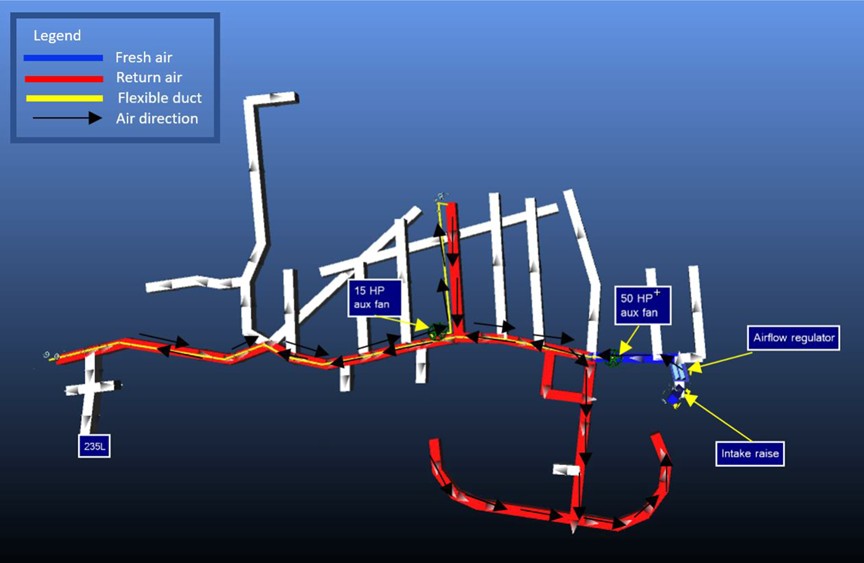
Figure 13-17: Plan View of Typical Production Level Ventilation System
13.12.6.4 |
Ventilation Controls |
The main fans are equipped with variable frequency drives (VFDs), which can be modulated during shift change to function at a reduced speed of 80%. In a 24-hour period, the reduced function will amount to five hours, which would result in 12% energy savings on power consumption for the main fans.
The VFD would also be used in case of an emergency as the escapeway is installed in the intake raises and a procedure would be in place to reduce the fan speed so that it is easier for the workers to access and climb ladders within the main intake air system.
The 50 Hp (37 kW) and 15 Hp (11 kW) fans for the production levels equipped with on/off starters, would be controlled remotely in order to generate energy savings and more importantly, ensure optimal blast clearing times by shutting fans down prior to a blast and starting them immediately after the blast.
Back Forty Project |
13-30 |
Gold Resource Corporation |
|
An airflow and carbon monoxide (CO) monitor unit will be installed between every ramp to have the ability to detect if a man door is left open or detect any heavy leakage at the regulator or the stope. All these units would be connected to the underground communication system and relayed back to the surface. A mine ventilation control software specific for this application will be used to modify speed or fan status and visualize airflows measured by the monitors and gas levels.
13.12.6.5 |
Backfill |
Two types of backfill will be employed at the mine – cemented paste fill and unconsolidated waste (rock fill). Paste fill is used primarily in cut-and-fill, longitudinal and primary transverse stopes. Rock fill will be used in secondary longhole stopes and wherever the mining design and sequence will allow it.
Waste rock from lateral development will be used for rock fill, and LHDs will be used to transport waste from the development heading or remuck bay to the stope.
Laboratory test work was done by WSP/Golder (see Section 10.2.7) to assess the binder content and the cure time required to reach target UCS strengths recommended by the geotechnical team. The proposed recipe consists of a 2.5% (90/10) slag cement binder with 28 days curing time, which gives an UCS of 748 Kpa and 486 kPa for 7” slump and 10” slump paste, respectively. The test results are being used in the design of the paste backfill pumping and piping system.
A surface paste plant will produce the paste fill, which will be transferred to the different underground mining zones via a system of boreholes and lateral piping. The system is presented in Figure 13-18.
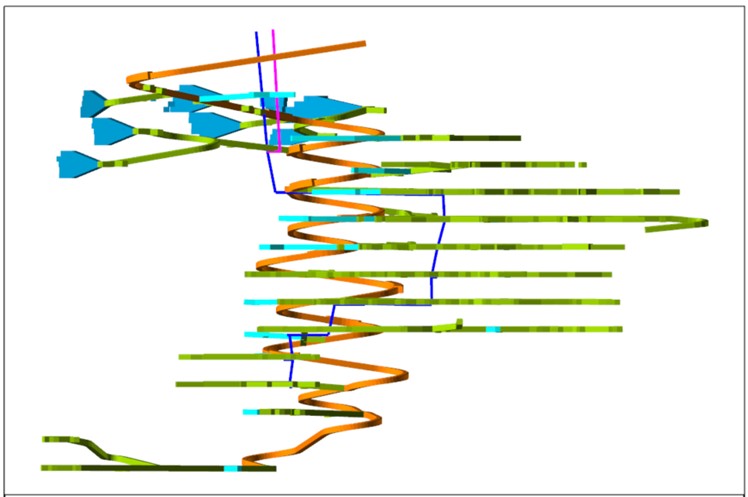
Figure 13-18: Paste Backfill Network
Back Forty Project |
13-31 |
Gold Resource Corporation |
|
13.13 |
Mining schedule |
The mining schedule has been built in Deswik. Open pit mining in the Pinwheel pit starts during pre-production followed by the Main pit. Underground production starts in year 3 to complement the exhaustion of the open pit resources. Underground mining continues. Mining of higher-grade material has been prioritized in the early quarters to improve the economics of the project. Material from the Measured, Indicated and Inferred categories are considered materialized material in this schedule.
Back Forty Project |
13-32 |
Gold Resource Corporation |
|
Table 13-16: Back Forty Mining Schedule
|
|
Period |
-1 |
1 |
2 |
3 |
4 |
5 |
6 |
7 |
8 |
9 |
Total |
|
|
Year |
2026 |
2027 |
2028 |
2029 |
2030 |
2031 |
2032 |
2033 |
2034 |
2035 |
|
Open pit |
Overburden |
kt |
820 |
517 |
6 |
|
|
|
|
|
|
|
1,344 |
Waste |
kt |
371 |
1,814 |
2,156 |
780 |
6 |
|
|
|
|
|
5,127 |
|
Mineralized material |
kt |
140 |
1,064 |
1,039 |
948 |
26 |
|
|
|
|
|
3,218 |
|
Cu grade |
% |
1.23 |
1.23 |
0.38 |
0.26 |
0.18 |
|
|
|
|
|
0.66 |
|
Zn grade |
% |
0.03 |
0.50 |
3.65 |
4.33 |
2.11 |
|
|
|
|
|
2.64 |
|
Au grade |
g/t |
5.16 |
2.23 |
3.92 |
2.18 |
2.23 |
|
|
|
|
|
2.89 |
|
Ag grade |
g/t |
58.7 |
48.9 |
18.1 |
12.8 |
8.9 |
|
|
|
|
|
28.4 |
|
Underground |
Development waste |
kt |
|
|
102 |
319 |
288 |
272 |
173 |
13 |
11 |
8 |
1,186 |
Development mineralized |
kt |
|
|
11 |
79 |
119 |
124 |
53 |
21 |
14 |
14 |
436 |
|
LH Transverse |
kt |
|
|
|
|
465 |
765 |
750 |
729 |
756 |
483 |
3,949 |
|
LH Longitudinal |
kt |
|
|
|
|
92 |
92 |
65 |
94 |
117 |
255 |
716 |
|
CF |
kt |
|
|
|
|
|
57 |
98 |
121 |
81 |
94 |
452 |
|
Cu grade |
% |
|
|
0.02 |
0.20 |
0.18 |
0.23 |
0.23 |
0.21 |
0.28 |
0.20 |
0.22 |
|
Zn grade |
% |
|
|
0.46 |
5.05 |
5.08 |
5.73 |
4.61 |
5.64 |
4.94 |
5.53 |
5.25 |
|
Au grade |
g/t |
|
|
2.59 |
2.61 |
1.87 |
2.14 |
2.09 |
2.35 |
1.86 |
2.01 |
2.07 |
|
Ag grade |
g/t |
|
|
54.4 |
41.6 |
30.0 |
22.8 |
26.4 |
22.1 |
23.1 |
25.4 |
25.0 |
|
Total |
Overburden |
kt |
820 |
517 |
6 |
|
|
|
|
|
|
|
1,344 |
Waste |
kt |
371 |
1,814 |
2,258 |
1,099 |
294 |
272 |
173 |
13 |
11 |
8 |
6,313 |
|
Mineralized material |
kt |
140 |
1,064 |
1,050 |
1,027 |
702 |
1,039 |
967 |
966 |
968 |
847 |
8,771 |
|
Cu grade |
% |
1.23 |
1.23 |
0.38 |
0.26 |
0.18 |
0.23 |
0.23 |
0.21 |
0.28 |
0.20 |
0.39 |
|
Zn grade |
% |
0.03 |
0.50 |
3.62 |
4.38 |
4.97 |
5.73 |
4.61 |
5.64 |
4.94 |
5.53 |
4.29 |
|
Au grade |
g/t |
5.16 |
2.23 |
3.91 |
2.21 |
1.88 |
2.14 |
2.09 |
2.35 |
1.86 |
2.01 |
2.37 |
|
Ag grade |
g/t |
58.7 |
48.9 |
18.5 |
15.1 |
29.2 |
22.8 |
26.4 |
22.1 |
23.1 |
25.4 |
26.2 |
Back Forty Project |
13-33 |
Gold Resource Corporation |
|
14.0 |
PROCESSING AND RECOVERY METHODS |
14.1 |
Summary/Introduction |
The proposed process plant will treat gold, silver, zinc, and copper ore at a nominal throughput of 2,500 tpd and up to 2,800 tpd depending on the feed material type characteristics. The ore will be sourced from the open pit in the earlier years of operation and from the underground mine in the later years. The process combines flotation stages to recover base metals and cyanidation stages to recover precious metals. The process plant will consist of three separate facilities:
■ |
A crushing facility housing a primary jaw crusher, secondary and tertiary cone crusher and related material-handling equipment capable of screening and crushing ore originating from either open pit or underground operations. |
■ |
A coarse ore silo and related feeding and reclaim systems. |
■ |
A main processing facility housing a single stage grinding circuit, copper and zinc flotation circuits, pre-leach thickening, cyanide leaching, dry stack pressure filter, reverse osmosis and SART cyanide recovery circuit, Merrill-Crowe, cyanide destruction, thickening and filtration of copper and zinc concentrates, as well as utilities and services including water tanks and reagent systems. |
Some of the process equipment (leach tanks, cyanide destruction tanks, and pre-leach thickeners) is located outdoors in the vicinity of the main process plant building. Important sets of pumps throughout the process consist of two units (one operating and one standby).
Figure 14-1 and Figure 14-2 below shows the simplified milling flowsheet for the Back Forty processing facility.
Back Forty Project |
14-1 |
Gold Resource Corporation |
|
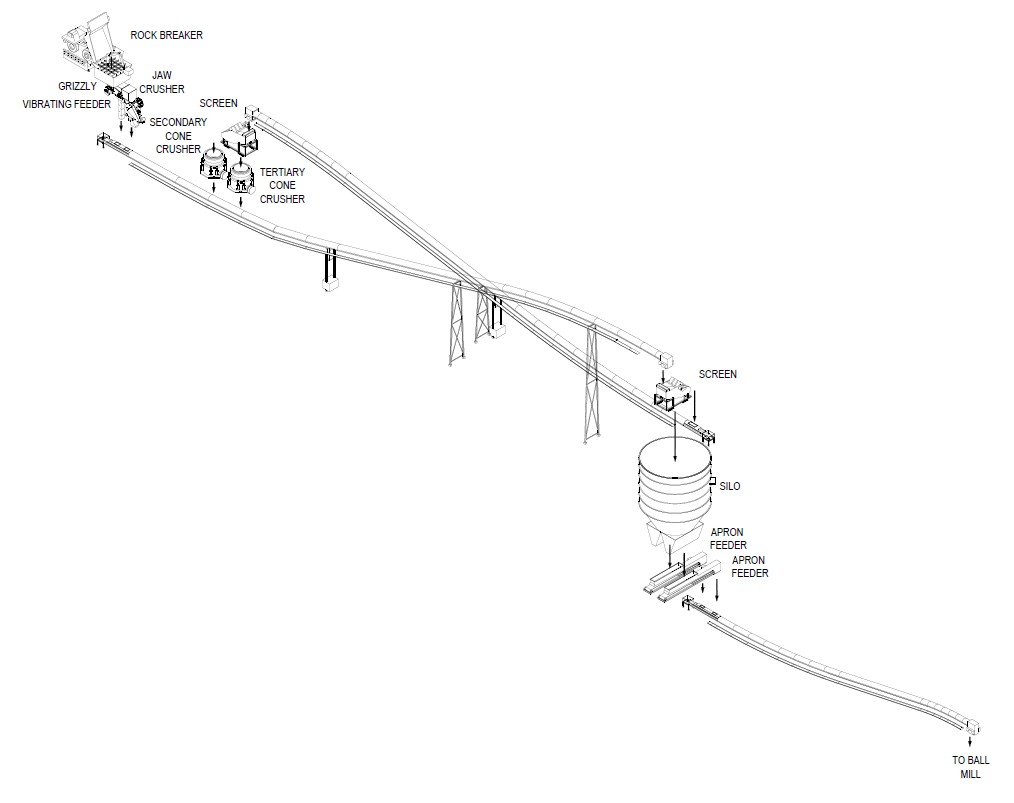
Figure 14-1: Process Flow Diagram (Crushing section)
Back Forty Project |
14-2 |
Gold Resource Corporation |
|
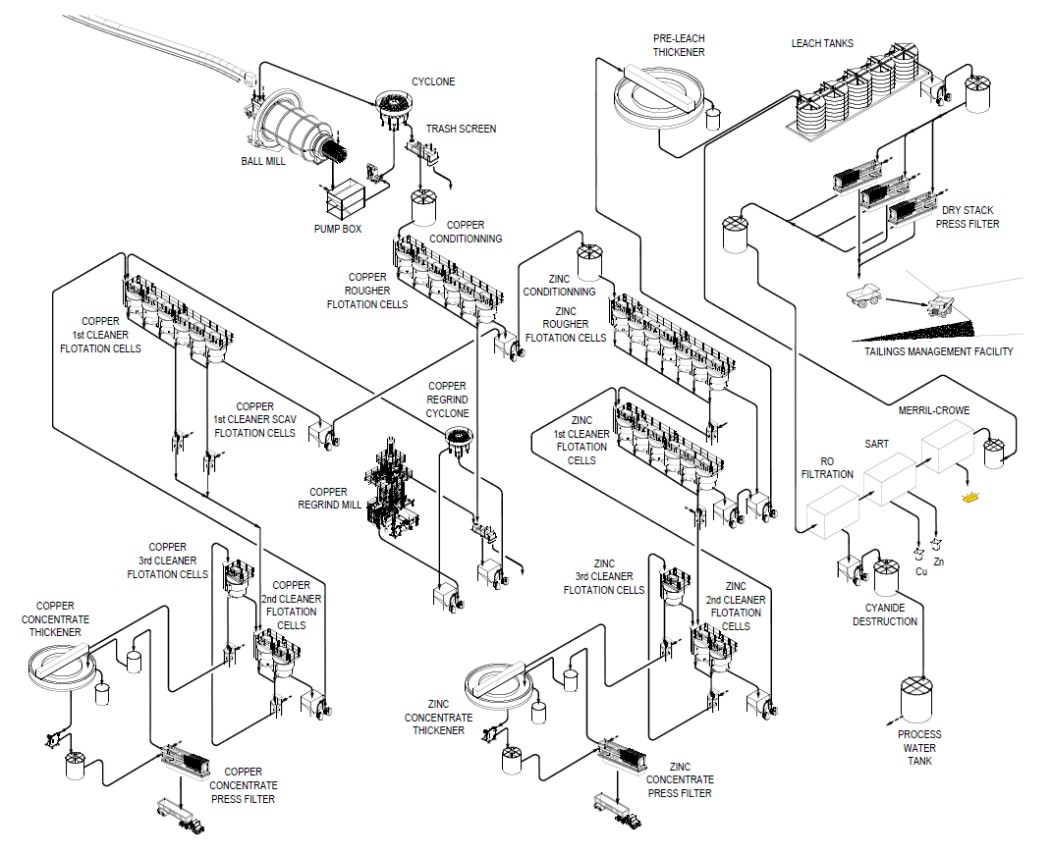
Figure 14-2: Process Flow Diagram (Processing section)
Back Forty Project |
14-3 |
Gold Resource Corporation |
|
14.2 |
Design Criteria |
The Back Forty process plant will operate 24 hours per day, seven days per week, 52 weeks per year. The crushing plant operating availability will be 75% and the concentrator will be operated on a 92% availability. The process plant will run at a throughput rate of 2,500 dry tonnes per day or a nominal rate of 113.2 dry tonnes per hour. The mill was sized with and to attain processing targets presented in Table 14-1.
Table 14-1: Process Design Criteria
Parameter |
Units |
Value |
|---|---|---|
Plant Throughput |
tpd |
2,500 |
Crushing Plant Availability |
% |
75 |
Plant Availability |
% |
92 |
Material Specific Gravity |
- |
3.66 |
|
Copper Head Grade – 95th percentile Yr 1-2 Yr 3+ |
% |
1.72 0.49 |
Zinc Head Grade – 95th percentile |
% |
6.61 |
Grind Size (P80) |
µm |
50 |
Copper Regrind Mill Product Size (P80) |
µm |
15 |
Copper Concentrate SG |
- |
4.25 |
Zinc Concentrate SG |
- |
4.05 |
Concentrate Moisture |
% |
8 |
Leach Circuit Residence Time |
hrs |
24 |
Leach Slurry Density |
% solids (w/w) |
45 |
Oxygen Source |
- |
Air |
Gold Recovery Method |
- |
Merril Crowe |
Cyanide Destruction Method |
- |
SO2 / Air |
Cyanide Destruction Residence Time – Design |
min |
85 |
Tailings Discharge Slurry Density |
% solids (w/w) |
87.7 |
Tailings Disposal |
|
Dry Stack, Paste Backfill |
Back Forty Project |
14-4 |
Gold Resource Corporation |
|
14.3 |
Process Description |
14.3.1 |
Crushing |
Ore is sourced from the open pit in the earlier years of operation and from the underground mine in the later years of operation. From the mining location, the ore is trucked to the crushing circuit in the vicinity of the process plant. The trucks dump onto a static grizzly, with an opening size of 750 mm (30 in), and is equipped with a hydraulic rock breaker that can handle and break oversized rocks. The material is then collected in the crushing plant feed hopper where rocks (95% solids) are metered at a rate of 138 t/h to the vibrating grizzly feeder. Oversized rock from the grizzly feeder is fed to a jaw crusher. The jaw crusher product and the undersize rock from the grizzly feeder are transferred by gravity to a sacrificial conveyor. A conveyor transports the ore to a primary classification screen installed on top of the mill feed silo. The primary classification screen will screen out +9.5mm rock and return it via conveyor to the secondary classification screen located in the crushing building. The secondary classification screen will separate the rock, sending +23mm rock to the secondary crusher and -23mm rock to the tertiary crusher. The primary classification screen passing -9.5mm feeds the mill feed silo. Both secondary and tertiary crusher product are recirculated to the primary classification screen. The crushing circuit availability is 75%. Table 14-2 below summarizes the crushing unit specifications.
Table 14-2: Crushing Unit Specifications
Parameter |
Value (metric) |
Value (imperial) |
Grizzly Feed Installed Power |
30 kW |
40 HP |
Jaw Crusher Installed Power |
130 kW |
175 HP |
Primary Classification Screen Installer Power |
74 kW |
100 HP |
Secondary Classification Screen Installer Power |
74 kW |
100 HP |
Secondary Cone Crusher Installed Power |
335 kW |
450 HP |
Tertiary Cone Crusher Installed Power |
335 kW |
450 HP |
The crushing building is equipped with one overhead crane and a dust collector.
14.3.2 |
Ore Handling and Grinding |
The ore from the crushing circuit is conveyed to the 24-hour residence time ore silo. The ore is then reclaimed from the silo using one of two apron feeders that discharges onto the ball mill feed conveyor at a nominal feed rate of 113 t/h.
Comminution is performed by a single stage grinding circuit to attain a product size (P80) of 50 µm. Ore is fed to a ball mill with a feed size (F80) of 9.5 mm with lime and process water being added to reach a feed density of 72%. The ball mill is in closed circuit with a cyclone cluster. The cyclone underflow recirculate back to the ball mill and the cyclone overflow is routed to the cyclone overflow trash screen prior to copper flotation. The ball mills were
Back Forty Project |
14-5 |
Gold Resource Corporation |
|
sized based on specific energy calculations by Orway Mineral Consultants. The ball mill is equipped with an automated grinding media feeder.
Table 14-3: Grinding Unit Specifications
Parameter |
Value (metric) |
Value (imperial) |
Ore Silo Capacity |
2500 t |
|
Ball Mill Installed Power |
3200 kW |
4291HP |
Ball Mill Diameter |
4.88 m |
16 ft |
Ball Mill Grinding Media Size |
100 mm |
4 in |
There is a dust collector and a hoist in the ore silo building. In the grinding area, there are two sump pumps and an overhead crane.
14.3.3 |
Copper Flotation |
The copper flotation circuit consists of one rougher stage, one regrind stage and four cleaner stages. Fresh feed originates from the grinding cyclone overflow trash screen undersize at a 31% solids content. Table 14-4 below summarizes the number of cells required per flotation stage. To size flotation cells, a scale up factor of 2.5 was used from laboratory locked cycle test residence times. Based on testwork, the target copper flotation recovery is 79%.
Table 14-4: Copper Flotation Cell Dimensions
Flotation Stage |
# Of cells |
Cell size (m³) |
Cell size (ft³) |
Pre-Aeration Cells |
2 |
10 |
350 |
Rougher Cells |
6 |
10 |
350 |
1st Cleaner Cells |
4 |
5 |
175 |
1st Cleaner Scavenger Cells |
2 |
5 |
175 |
2nd Cleaner Cells |
2 |
5 |
175 |
3rd Cleaner Cells |
1 |
5 |
175 |
The copper flotation circuit is designed to minimize metal losses. As such, the tails from each stage are recirculated back upstream. Additionally, the rougher and 1st cleaner scavenger tails are pumped to the head of the zinc flotation circuit. The final copper flotation concentrate at 18% Cu (target) is pumped to the copper concentrate thickener for dewatering. Figure 14-3 below shows a diagram of the copper flotation circuit.
Back Forty Project |
14-6 |
Gold Resource Corporation |
|
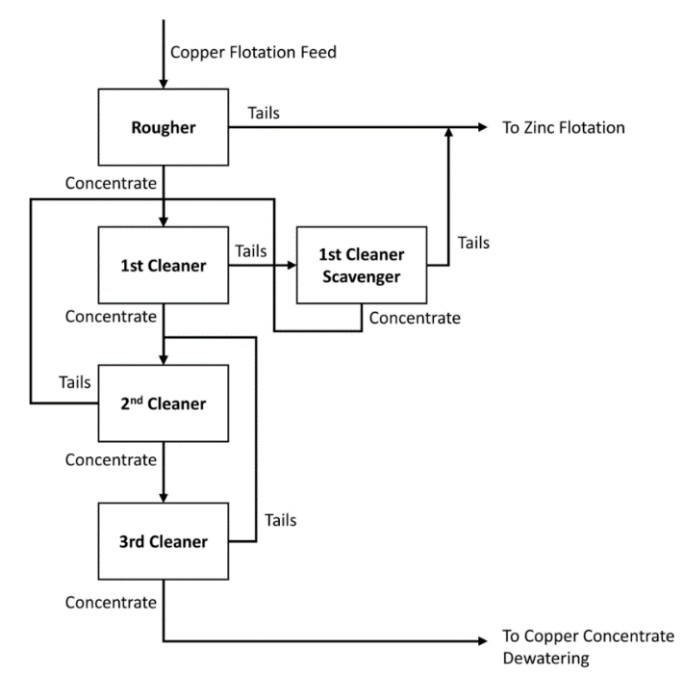
Figure 14-3: Copper Flotation Circuit
The copper flotation circuit is equipped with a regrind mill with a product target size of 15 µm (P80) for the cleaner flotation feed. The feed to the regrind circuit is pumped to a cyclone cluster consisting of ten cyclones. The cyclone overflow then flows by gravity to the copper cleaner circuit while the cyclone underflow flows by gravity to the regrind mill feed box and is pumped to the mill feed. The regrind mill auxiliaries consist of a feed box, grinding media holding tank and a recovery screen. Table 14-5 below summarizes the copper regrind equipment specifications.
Table 14-5: Copper Regrind Equipment Specifications
Parameter |
Value (metric) |
Value (imperial) |
Copper Regrind Mill Installed Power |
1475 kW |
2000 HP |
Copper Regrind Cyclone Diameter |
150 mm |
6 in |
An on-stream analyzer (OSA) is installed in the general area of the copper and zinc flotation circuit to provide live metal grade information for 16 flotation (copper and zinc) streams. The OSA system is equipped with an analyzer, a multiplexer and a demultiplexer. The multiplexer is fed from both gravity and pressure samplers installed in the
Back Forty Project |
14-7 |
Gold Resource Corporation |
|
process to capture representative samples from all streams. The process is also equipped with a particle size analyzer (PSA), which outputs a size distribution for the copper rougher feed, copper cleaner feed (copper regrind product) and zinc cleaner feed to ensure particle size requirements are met for optimal metal recovery.
The copper flotation area is equipped with three sump pumps and serviced by the grinding overhead crane.
14.3.4 |
Zinc Flotation |
The zinc flotation circuit consists of one rougher stage and three cleaner stages. Copper rougher tails and copper first cleaner scavenger tails constitute the combined fresh feed. Table 14-6 below summarizes the number of cells required per flotation stage. To size flotation cells, a scale up factor of 2.5 was used from laboratory locked cycle test residence times. The target zinc flotation recovery based on testwork is 91%.
Table 14-6: Zinc Flotation Cell Dimensions
Flotation Stage |
# of cells |
Cell size (m³) |
Cell size (ft³) |
Rougher Conditioning Cells |
2 |
20 |
700 |
Rougher Cells |
7 |
20 |
700 |
1st Cleaner Conditioning Cells |
2 |
10 |
350 |
1st Cleaner Cells |
4 |
10 |
350 |
2nd Cleaner Cells |
4 |
5 |
175 |
3rd Cleaner Cells |
2 |
5 |
175 |
The zinc flotation circuit is designed to minimize metal losses. As such, the tails from each stage are recirculated back upstream. The circuit tails (zinc rougher tails) are pumped to the pre-leach thickener. The final zinc flotation concentrate at 55% Zn (target) is pumped to the zinc concentrate thickener for dewatering. Figure 14-4 below shows a diagram of the zinc flotation circuit.
Back Forty Project |
14-8 |
Gold Resource Corporation |
|
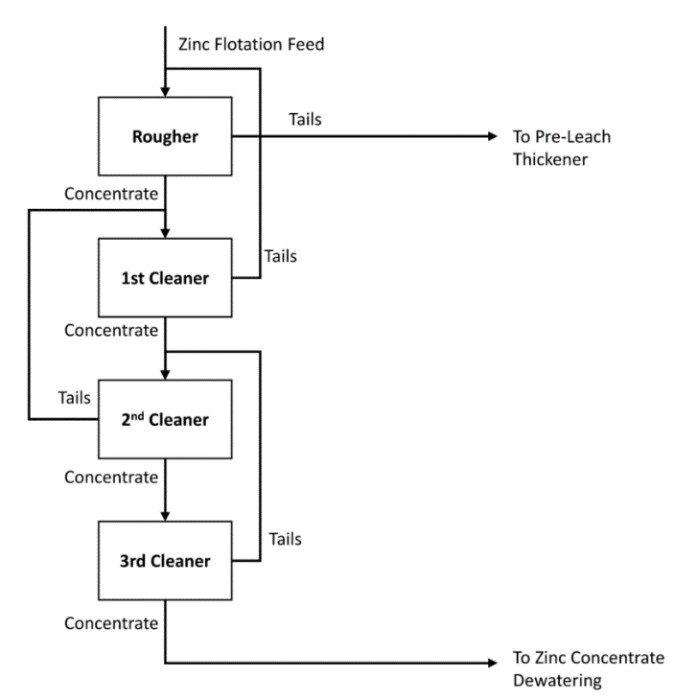
Figure 14-4: Zinc Flotation Circuit
The zinc flotation area is equipped with three sump pumps and is serviced by the grinding area overhead crane.
14.3.5 |
Concentrate Dewatering |
Copper flotation third cleaner concentrate is pumped to the copper concentrate thickener feedbox, where it is mixed with flocculant and filtrate and let to settle in the thickener. Thickener underflow at 65% solids is pumped to the copper filter feed tank, and the thickener overflow is collected into the concentrate thickener overflow tank with the zinc thickener overflow and pumped to the process water tank. Thickened copper concentrate is then pumped to a single horizontal press filter to bring the moisture content down to 8%. The filter discharge is stockpiled and trucked to a rail loadout located offsite for shipping. The filtrate is collected in a tank and pumped back to the thickener feedbox.
Zinc flotation third cleaner concentrate is pumped to the zinc concentrate thickener feedbox, where it is mixed with flocculant and filtrate and let to settle in the thickener. Thickener underflow at 65% solids is pumped to the zinc filter feed tank, and the thickener overflow is collected into the concentrate thickener overflow tank with the copper thickener overflow and pumped to the process water tank. Thickened zinc concentrate is pumped to two horizontal filter presses to bring the moisture content down to 8%. There will be one operating zinc concentrate filter for the first four years of operation and the second unit will come online for the fifth year to process the increased zinc concentrate production. The filter discharge is stockpiled and trucked to a rail loadout located offsite for shipping.
Back Forty Project |
14-9 |
Gold Resource Corporation |
|
The filtrates are collected in a tank and pumped back to the thickener feedbox. Table 14-7 below summarizes the equipment specifications for the concentrate dewatering circuits.
Table 14-7: Concentrate Dewatering Equipment Specifications
Parameter |
Value (metric) |
Value (imperial) |
Copper Concentrate Thickener Diameter |
4 m |
13 ft |
Copper Concentrate Filtration Area |
4.7 m2 |
50 ft2 |
Copper Concentrate Filter Cycle Time |
9 minutes |
|
Zinc Concentrate Thickener Diameter |
10 m |
33 ft |
Zinc Concentrate Filtration Area |
15.8 m2 |
170 ft2 |
Zinc Concentrate Filter Cycle Time |
9.5 minutes |
|
The concentrate dewatering area is equipped with four sump pumps and one overhead crane.
14.3.6Cyanide Leaching
Zinc flotation rougher tails is pumped to the pre-leach thickener feedbox where it is mixed with flocculant and let to settle in the thickener prior to leaching. Thickened slurry at 67% solids is pumped to the leaching distribution box, and the thickener overflow is collected into the pre-leach thickener overflow tank and pumped to the process water tank.
In the leaching distribution box, thickened slurry is mixed with lime, sodium cyanide bearing solution recycled from the SART process and new cyanide make-up. Then, it is fed into the first of four leaching tanks for the cyanide gold leaching 24-hr residence time. Selected sodium cyanide concentration for optimized gold and silver recovery is 1 g/L. Slurry flows by gravity from one tank to the next and from the last tank. Each leaching tank is aerated and equipped with an agitator for constant agitation.
Table 14-8: Leaching & CIP Equipment Sizing
Parameter |
Value (metric) |
Value (imperial) |
Pre-Leach Thickener Diameter |
14 m |
46 ft |
Leach tank volume |
1434 m3 |
50,641 ft3 |
Leach tank agitator power |
55 kW |
75 HP |
Back Forty Project |
14-10 |
Gold Resource Corporation |
|
14.3.7Solution Dewatering
Slurry from leach tank gravity feed filter feed tank. From the filter feed tank, slurry is pumped into three horizontal press filters. Precious metal bearing solution is separate from solid in the filter. Washing water is circulated in the press filter to wash-out residual cyanide and precious metal. Once the dewatering and washing cycles are completed, the press filter opens and discharges a dried solid cake onto the conveyor. It is then stored in a bin before being trucked to dry the stack tailing facility. Dry stack solid contain 15% of residual humidity.
Filtrate recovered from the press filter is pumped to a reverse osmosis membrane filter.
Water coming from clothes and the core from the presses is collected in a tank and pumped back to the pre-leach thickener feedbox.
Table 14-9 below summarizes the equipment specifications for the tailings dewatering circuit.
Table 14-9: Tailings Dewatering Equipment Specifications
Parameter |
Value (metric) |
Value (imperial) |
Tailings Filtration Area (per filter) |
239 m2 |
2573 ft2 |
Tailings Filter Cycle Time |
10.9 minutes |
|
The tailings dewatering area is serviced by two sumps and one overhead crane.
14.3.8Reverse-Osmosis (RO) System
The primary objective of the Reverse Osmosis (RO) circuit is to concentrate weak acid dissociable (WAD) and free cyanide as well as gold-CN complex in the retentate (RO concentrate) and generate non-gold bearing solution with low CN (RO permeate).
14.3.8.1 |
RO Unit |
The RO unit is composed of an RO feed tank, RO membrane skids, an RO permeate tank, and a clean-in-place (CIP) skid that serves the RO units. The RO unit operates under high pressure and separates the incoming water into a low salt RO permeate stream (~60% of feed flow) and a high salt RO retentate stream (~ 40% of feed flow) containing an elevated concentration of CN. Filter press filtrate is pumped from the RO feed tank to the operating RO units, where the membrane rejects over >95% of all ions, including SCN-, CNO-, and CN (WAD and free) into the retentate. To minimize scaling in the RO, antiscalants are dosed into the feed upstream of the RO.
The RO retentate will be directed to desaturation reactors to precipitate the excess sulphate and calcium as gypsum. The clean RO permeate free of gold, and with low CN concentration is directed to the detox circuit for CN destruction to the discharge targets levels.
There are two cleaning methods for maintaining the RO system: permeate flush and clean-in-place (CIP). The permeate flush is performed regularly to dissolve and remove scales, particularly gypsum, from the RO vessels. The CIP is typically used once a month to dissolve the accumulated scale that has fouled the surface of the RO
Back Forty Project |
14-11 |
Gold Resource Corporation |
|
membrane module during operation. Periodic CIP ensures flux recovery and the normal operation of the membrane system.
14.3.8.2 |
RO Retentate Desaturation Circuit |
The RO retentate desaturation system is comprised of two continuous agitated reactors (HRT of ~ 45 mins) and a clarifier. The circuit operates by receiving the RO retentate, which contains high CN and is supersaturated with calcium and sulphate ions that need to be precipitated out as gypsum. To facilitate solids precipitation, the clarifier underflow solids are recirculated to the agitated reactors, serving as the seeds for solids precipitation. Additionally, ferric (5-10 ppm) and flocculant are added to enhance solid formation and settling in the clarifier. The contents of the desaturation reactor will be transferred to the clarifier for solid-liquid separation. A portion of the clarifier underflow will be directed to desaturation reactors as re-seed and the remaining portion will be directed to a filter press or will be transferred into a leaching circuit. The clarifier overflow is sent to the SART circuit.
14.3.9 |
Cyanide Recovery (SART) |
Cyanide consumption is high and it represents one of the highest cost centers in the processing operating costs. Introduction of the SART process in the flowsheet reduces the processing operating costs by recovering the cyanide and reusing it in the process. Additional recovery of copper and zinc, from precipitation, will also improve the economics of the project. The SART process begins by separating the weak-acid dissociable base metal-cyanide from the rich solution coming out of the RO system. Solution is pumped into a primary reactor where sulfuric acid and sulphidization agent are introduced. Insoluble metal sulfide and free cyanide results from the reaction. Solution is pumped into a clarifier where metal sulfide precipitated. Clarifier under flow is pumped to a press filter where the solid is dewatered up to 8% remaining moisture. Saleable metal concentrate will be bagged and sold to a smelter. Clarifier overflow solution containing HCN is pumped into a second reactor where lime is added to neutralize the solution and convert HCN back into non-volatile sodium cyanide. Solution from the second reactor is pumped into a clarifier to precipitated gypsum, created with the addition of the lime.
Solution containing recovered NaCN is pumped to the Merrill-Crowe plant for precious metal recovery.
Table 14-10 below summarizes the equipment specifications for the SART circuit.
Table 14-10: SART Equipment Specifications
Parameter |
Value (metric) |
Value (imperial) |
Zinc sulphidization reactor volume |
10 m3 |
353 ft3 |
Zinc clarifier diameter |
4.6 m |
15 ft |
Zinc press filter capacity |
0.2 m3/cycle |
7 ft3/cycle |
Copper sulphidization reactor volume |
10 m3 |
353 ft3 |
Copper clarifier diameter |
4.6 m |
15 ft |
Copper press filter capacity |
0.22 m3/cycle |
8 ft3/cycle |
Neutralization tank volume |
33 m3 |
1165 m3 |
Back Forty Project |
14-12 |
Gold Resource Corporation |
|
14.3.10 |
Precious Metal Recovery/Gold Room |
Precious metal recovery from solution is accomplished using the Merrill-Crowe process. Pregnant liquor from the SART clarifier will be stored in the pregnant solution tank. Clarified pregnant solution will be treated by the Merrill Crowe/zinc-dust cementation to recover the contained precious metals. The barren solution will be mainly recycled to the leach tank as a recycled cyanide source. The nominal solution feed rate to the Merrill Crowe precipitation circuit will be approximately 100 m3/hr.
A further stage of clarification will be required to reduce the suspended solids content to <5 mg/L for efficient zinc precipitation. The clarifying filter feed pumps the pregnant solution from the pregnant solution tank to the clarifying disk filters to remove any residual solids. Two filters will be provided in a duty/standby arrangement. Pre-coat will be required to enhance the capture of the fine solids at the start of each cycle. At the end of the filtration cycle, the clarifying filter sludge will be pumped back to the leach circuit to minimize any loss of precious metals in the entrained solution.
Filtrate from the clarifying filters will feed the de-aeration tower. Dissolved oxygen will be removed under vacuum by splashing the pregnant solution over the tower packings to increase the exposed surface area. De-aeration of the solution will prevent excessive zinc consumption by minimizing side reactions that oxidize zinc.
De-aerated pregnant solution will be mixed with the zinc dust slurry and pumped to the precipitate filters using precipitate filter feed pumps. Zinc dust will be mixed with the solution in a zinc mixing cone.
The filters will typically be operated in a duty/standby configuration and operated until the pressure reaches a predetermined value. Filtrate will report to the barren solution tank and be recycled in the leaching circuit as a cyanide source. At the end of the filtration cycle, feed pumps will be shut down, filters drained, and compressed air may be used to further dewater the cake. The filter cake will be dropped into a precipitate pan for smelting. Precious metal recovery from the solution to zinc precipitate will be about 99.5%.
Zinc precipitates from the Merrill-Crowe circuit will be loaded into a mercury retort for removal of mercury and further treated by smelting into silver–gold doré. The smelting process will be performed in batch mode.
Once the mercury-free material has cooled, following the retort process, it will be mixed with fluxes and loaded into the electric furnace for smelting. The fluxes will react with base metal oxides to form a slag, whilst the gold and silver will remain as molten metal. The molten metal will be cast into doré ingots.
The doré bars will be stored in a secure vault for selling. The gold recovery circuit is equipped with three sump pumps and one overhead crane located in the Gold Room.
14.3.11 |
Cyanide Destruction |
Cyanide destruction takes place in two tanks in series, using the SO2/Air process. The design residence time is 85 minutes. Low cyanide content of the dry stack press filter washing cycle, and the clean RO permeate with low CN concentration, is directed into a pumpbox and pumped to the cyanide destruction feedbox where it is mixed with sodium metabisulfite and copper sulfate. The solution in the feedbox flows by gravity to the first cyanide destruction tank where it is agitated and sparged with compressed air. The tank overflows into the second cyanide destruction tank, where further agitation and sparging occurs. The cyanide destruction tailings, from the second tank, overflow to a pumpbox and are pumped to the water treatment pond.
Table 14-11 below summarizes the cyanide destruction tank sizing.
Back Forty Project |
14-13 |
Gold Resource Corporation |
|
Table 14-11: Cyanide Destruction Tank Sizing
Parameter (per tank) |
Value (metric) |
Value (imperial) |
Cyanide Destruction Tank Volume |
199 m3 |
7,028 ft3 |
Cyanide Destruction Tank Diameter |
5.7 m |
18.7 ft |
Cyanide Destruction Tank Height |
7.8 m |
25.6 ft |
14.3.12 |
Reagent Systems |
Reagents are used in the process to facilitate the treatment of the ore to concentrate minerals. Table 14-12 below summarizes the dosing rates of the main reagents.
Table 14-12: Reagents Dosing Rates
Reagent |
Dosing Rate (kg/mt) |
Aero 3501 |
0.027 |
Zinc Sulfate |
0.321 |
Aero 3498 |
0.024 |
Aero 5100 |
0.014 |
H57 |
0.076 |
NaSH |
0.886 |
Methyl Isobutyl Carbinol (MIBC) |
0.031 |
Flocculant |
0.04 |
Sodium Cyanide |
0.677 |
Copper Sulfate |
0.488 |
Sodium Metabisulfite |
0.68 |
Lime |
5.48 |
Antiscalant |
0.026 |
H2SO4 |
4.31 |
Copper sulfate |
0.038 |
NaOH |
0.05 |
Back Forty Project |
14-14 |
Gold Resource Corporation |
|
14.3.13 |
Air & Water Services |
A series of two air compressors, two receivers and a dryer are used for service and instrumentation air and for sparging in the leaching circuit. A set of one air compressor and one air receiver is used to provide sparging to the cyanide destruction process. Additionally, flotation blowers supply air to the flotation circuits. Both the crushing circuit and the ore silo have their own air services each comprised of a compressor, dryer, and receiver.
Process water is sourced from thickener overflows and collected in the process water tank which has a 1.5-hour residence time. It is then pumped through the process water loop with two pumps operating and one standby pump to ensure continuous process water flow. Excess process water collected is bled to the Waste Water Treatment Plant (WWTP). Fresh water is sourced from the Contact Water Basin (CWB) and pumped to the fresh water tank which has a 1.5-hour residence time. It is then pumped through the fresh water loop by one operating pump and one standby pump to ensure continuous fresh water flow to the process. Gland water is pumped from the fresh water tank to the gland water tank with a 3-hour residence time and pumped through the gland water loop by one operating pump and one standby pump to ensure continuous pump operation throughout the process. Table 14-13 below summarizes water tank sizing.
Table 14-13: Water Tank Sizing
Parameter |
Value (metric) |
Value (imperial) |
Process Water Tank Volume |
580 m3 |
20,500 ft3 |
Fresh Water Tank Volume |
215 m3 |
7,600 ft3 |
Gland Water Tank Volume |
80 m3 |
2,800 ft3 |
14.4 |
Process Plant Personnel |
A total of 52 workers are required in the process plant, including 10 salaried staff and 42 hourly workers divided into management, technical services, operations and maintenance departments. Details are available in Table 14-14.
Back Forty Project |
14-15 |
Gold Resource Corporation |
|
Table 14-14: Mill Operations Manpower
Description |
Category |
Employees |
|||
Operations |
|||||
Mill Manager |
staff |
1 |
|||
Head Metallurgist |
staff |
1 |
|||
Plant Metallurgist |
staff |
1 |
|||
Metallurgical Technician |
hourly |
2 |
|||
Mill Operations Supervisor/Foreman |
staff |
4 |
|||
Mill Operators |
hourly |
16 |
|||
Laborer |
hourly |
4 |
|||
Service/Loader Operator and Transload |
hourly |
2 |
|||
Sub-total Operations |
|
31 |
|||
Maintenance |
|||||
Maintenance Supervisor |
staff |
1 |
|||
Process Control/Network Technician |
staff |
1 |
|||
Maintenance Planner |
staff |
1 |
|||
Industrial Mechanic |
hourly |
12 |
|||
Electrician |
hourly |
4 |
|||
Instrument Technician |
hourly |
2 |
|||
Sub-total Maintenance |
|
21 |
|||
Total Process Manpower |
52 |
||||
14.5 |
Metal Recovery Projections |
Based on the latest laboratory testwork and the proposed mill flowsheet, the overall projected metal recoveries and concentrate grades for gold, silver, copper and zinc from the Back Forty Deposit are presented in Table 14-15, Table 14-16, and Table 14-17.
Back Forty Project |
14-16 |
Gold Resource Corporation |
|
Table 14-15: Metallurgical Cu Concentrate Grade
Description |
Cu concentrate |
High copper grade processing (yr:1-2) | |
Mass pull |
MP = 0.3536*exp(2.1618*(HGCu+HGPb)) |
Cu recovery |
Cu rec: 91*(1-exp(-6.133*HGCu)) |
Pb grade |
Con gr Pb = 10.098*(HGCu/HGPb)-0.983 |
Au grade |
(Con gr Cu/Con gr Au) = 1.4022*(HGCu/HGAu)-0.0229 |
Ag grade |
(Con gr Ag/Con gr Au) = 0.8965*(HGAg/HGAu)-1.0799 |
Normal copper grade procession (yr :3+) | |
Mass pull |
MP = 0.3536*exp(2.1618*(HGCu+HGPb)) |
Cu grade |
Con gr Cu = 23.66*(1-exp(-1.237*(HGCu/HGPb)) |
Zn grade |
Con gr Pb+Zn = 1.1469*Con gr Pb+7.5601 |
Pb grade |
Con gr Pb = 9.1735*(HGCu/HGPb)-0.707 |
Au grade |
(Con gr Cu/Con gr Au) = 1.4022*(HGCu/HGAu)-0.0229 |
Ag grade |
(Con gr Ag/Con gr Au) = 0.8965*(HGAg/HGAu)-1.0799 |
Table 14-16: Metallurgical Zn Concentrate Grade
Description |
Zn concentrate |
Mass pull |
MP = 1.6819*HGZn+0.7995 |
Cu grade |
Back calculate from Leach feed grade |
Zn grade |
Con gr Zn = 52.7277*(1-exp(-0.81316*HGZn)) |
Au grade |
Back calculate from Leach feed grade |
Ag grade |
Back calculate from Leach feed grade |
Table 14-17: Metallurgical Leaching Recovery
Description |
Leach recovery |
Leach feed gr Au |
0.9217*LN(Zn feed gr Au)+1.0405 |
Leach feed gr Ag |
5.3603*LN(Zn feed gr Ag)-5.6636 |
Leach feed gr Cu |
Leach feed grade Cu/Leach feed grade Au = 0.0048*(Zn feed grade Zn/Zn feed grade Au) + 0.0142 |
Au recovery |
Rec Au = 0.58 – 1.062*Leach feed gr Au + 3.583*Leach feed gr Cu + 0.596*(Leach feed gr Au)2 |
Ag recovery |
Rec Ag = 0.4365*Leach feed gr Ag + 50.615 |
Back Forty Project |
14-17 |
Gold Resource Corporation |
|
15.0 |
INFRASTRUCTURE |
The Back Forty Project is situated in a location with close proximity to existing infrastructure. There are road networks on either side of the property and a high voltage electrical transmission corridor near the main access county road, providing grid power. Water is collected from different areas within the property at the Contact Water Basin and either re-distributed for use within the facility or treated for discharge.
The project site plan is illustrated in Figure 15-1 and Figure 15-2. The project site can be largely divided into five (5) main areas:
1. |
Access from County Road 356 leading to security gates for site entry |
2. |
Facility Storage Areas. Waste Rock Management Facility (WRMF), Two - Overburden Management Facilities (OMF), Ore Storage Facility (OSF) and Tailings Management Facility (TMF) as well as the associated water collection ponds. |
3. |
Central area where the crushing, mill, administration, electrical substation, shop and ancillary facilities are located. |
4. |
Contact Water Basin (CWB) and Waste Water Treatment Plant (WWTP). |
5. |
The open pit area is comprised of the two open pits, the underground portal located inside the Main pit and the underground ventilation infrastructures to the south west of the open pit. To the east of the open pit there is an area designated for ore stockpiling and adjacent to this, is the overburden stockpile. |
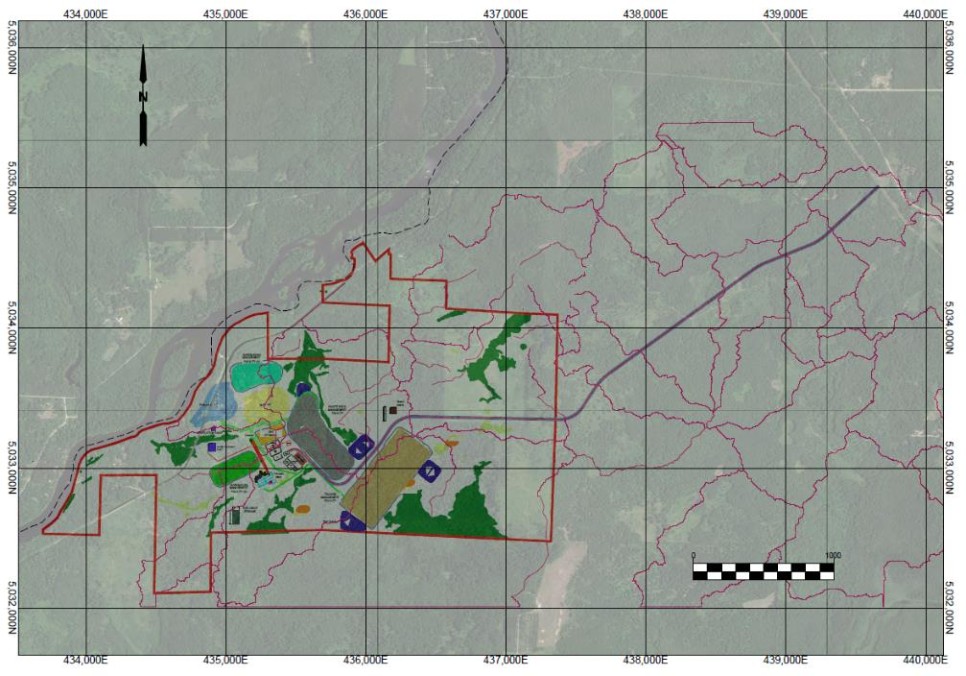
Figure 15-1: Infrastructure and Site Access Layout
Back Forty Project |
15-1 |
Gold Resource Corporation |
|
The administration building is located adjacent to the mill building. It houses offices for the site management staff as well as the engineering and technical staff. Within the administration building there is a men’s dry and a women’s dry, designed to service a total of 115 people per shift. A small infirmary is also included.
Due to the relatively short open pit mine and the accompanying fleet of equipment and another fleet of equipment for a relatively short underground campaign, the shop is a concrete floor pole building with heat to allow the equipment dealer or the owners service truck to be placed alongside the unit in need of work. Parking for heavy mobile equipment and the fuel depot is available directly adjacent from the shop and cold storage area. Personnel parking can be found on the north side of the administration building. Any vehicle that leaves the site which has been in the contact area must go through a truck wash first. A truck scale is also available for trucks entering or leaving the site.
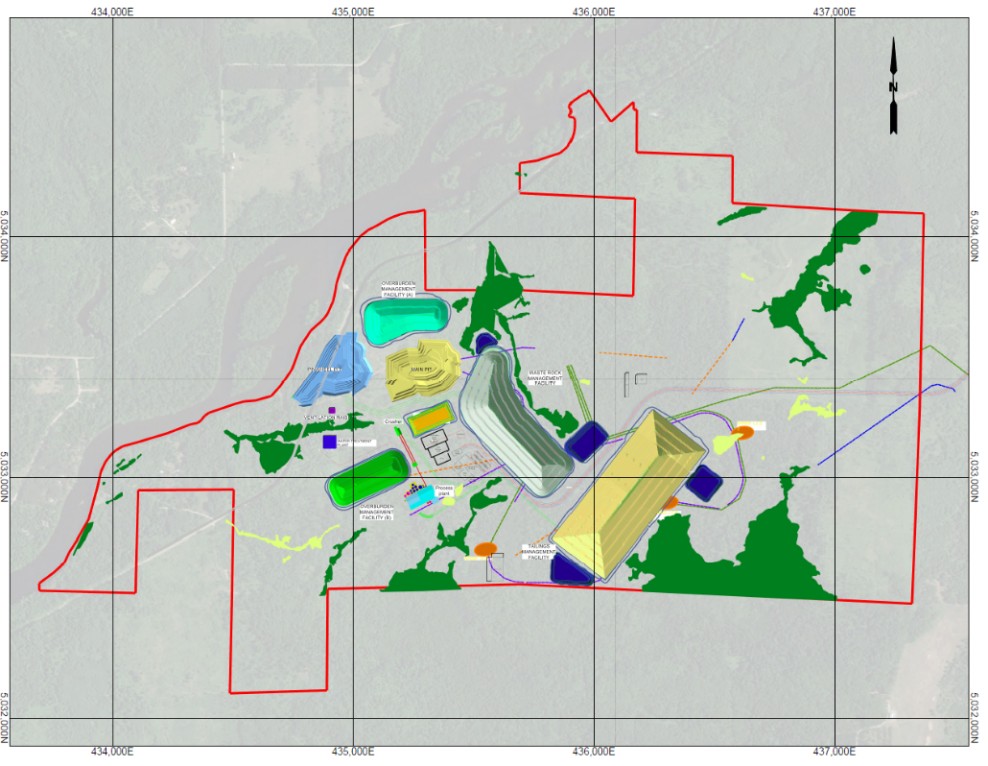
Figure 15-2: Site Infrastructure Layout
Back Forty Project |
15-2 |
Gold Resource Corporation |
|
15.1 |
Surface Infrastructure and Mine Support Facilities |
15.1.1 |
Site Access Roads |
Access to the project is from the east of the property from a purpose-built road connecting onto County Road 356. The access road is approximately 2.5 miles long and is intended to be two lanes wide, undivided. Site access from County Road 356 to locations such as Stephenson, Michigan and the concentrate load out facility is through paved roads.
15.1.2 |
Buildings and Other Facilities |
The following facilities are planned for the project:
■ |
Security guard house and gates |
■ |
Wastewater treatment plant (WWTP) |
■ |
Truck wash building |
■ |
Potable water station |
■ |
Emergency power generating station |
■ |
Administration building, comprised of men’s and women’s dry, engineering offices and infirmary |
■ |
Shop |
■ |
Primary, secondary and tertiary crushing in one building |
■ |
Mill building comprised of primary and secondary grinding, floatation, acid wash and elution, tailings filtration, warehouse, assay laboratory, refining area, reagent storage, paste backfill plant, concentrate filtration and loading, and mechanical and electrical shops and distribution. |
■ |
Cold storage building |
■ |
Electrical Substation |
■ |
Explosives storage magazine |
■ |
Fuel station (gas, diesel and propane) |
■ |
Vent shaft and underground ventilation station |
The other facilities are located in close proximity to the mill. Many of the buildings are to be modular construction, these include the security guard house, potable water station, administration building and mine dry. WWTP, truck wash and cold storage will be prefabricated metal or wood structure with steel cladding. All the heated site buildings will have insulated floor (where applicable), as well as wall and ceiling insulation. The mill will be a purpose-built building.
15.1.3 |
Communications |
The proposed high speed digital communication network for the project will be distributed using 24 stranded single mode fiber optic cable for all systems including voice and data. The 138kV pole line supplying power to the site will be equipped with an optical skywire or optical ground wire that will provide grounding protection for the power line.
Back Forty Project |
15-3 |
Gold Resource Corporation |
|
The line will also contain fiber strands to provide mine wide network communication from the local telecommunication tower. The optical skywire will be terminated to the mine main private network servers such that it would provide a stable network for the entire site.
The main network fiber-backbone will be sized to accommodate maximum site data throughput. The network in general will be a ring topology for redundancy and spurs wherever needed. The network will be designed in such a way that communication can be moved/extended based on the mine production and operation pattern. Within the mine, the network will be distributed using 24 strand single mode fiber optic cable installed on overhead power line and follow the power cables. Each area of the mine will have a dedicated fiber termination patch panel to provide hardwired and wireless access point for continuous connectivity.
15.1.4 |
Power Supply |
The area electrical transmission company will supply the local electrical utility from a 138kV radial overhead line from the county road area located approximately 2.9 miles away from the proposed mill site and the adjacent substation. The 138kV overhead pole line will be brought to the mine property along the site access road from the north side of the mill to avoid the traffic intersections to the main substation. The main substation is fenced to restrict access to authorized personnel only located on the north side of the mill facility.
The local electrical utility has indicated that they would cover the cost of the substation. The cost of the 138kV extension would likely need to be borne by the Back Forty project.
The total peak demand load for the surface and underground facilities is 16.7MW with the total connected load of 22MW. The loads are being supplied by two 15MVA load sharing transformers connected for normal operations and two 2000kW diesel generators for emergency power.
15.1.5 |
Power Distribution |
Power distribution for the site will be fed from the main substation. The main substation will house two transformers to step down the 138kV supply voltage to utilization and distribution voltage of 4,160V. The two load sharing transformers will supply power for the entire mine with a staged approach. During the initial mining operation and start-up only one transformer will be employed to facilitate the needs of the mine. As the mine expands to grow its operation, the second transformer is later brought into service reducing the initial capital expenditure. The switching circuits and protective devices will be procured and installed to safeguard the system and allow for regular maintenance.
Two 4,160V, 2000kW diesel generators will provide emergency power for unforeseen transmission system outages to allow for safe shutdowns, critical surface operations and underground mine evacuation. One of the diesel generators will be procured and energized at a later date based on the electrical loading requirements.
The transformers and the diesel generator will feed the main 4160V switchgear located inside the process plant substation. The 4160V system will feed large mechanical loads such as the ball mill along with transmitting power to all other areas of the mine. In addition to the large mechanical loads located inside the mill, the main switchgear will feed all remaining 480V loads housed inside the mill using two 3MVA step-down transformers. The rest of the mining facilities will be fed using two 4,160V trunk lines: West Pole line and East Pole line.
The west and east trunk lines will exit the main substation at 4,160V using overhead pole lines in a normal arrangement and will proceed with buried underground sections at all road crossings. Step-down transformation and distribution systems will be implemented at each specific local area across the property based on the loading
Back Forty Project |
15-4 |
Gold Resource Corporation |
|
requirements, with a robust pole line allocation for the power supply to the fans, pumping areas, water treatment plants, open pit and underground workings.
15.2 |
Water Supply, Distribution and Treatment |
15.2.1 |
Fresh Water Supply to Mill |
Freshwater is delivered through a buried 6-inch diameter HDPE pipe from a pumping system located beside the CWB to a freshwater tank and a fire water tank located at the mill. The sump consists of one 12-inch diameter HDPE pipe introducing water from the CWB to the sump by gravity. Two submersible water pumps (one operating, one standby) with associated piping and fitting reside in the sump. The sump itself is made of a precast concrete manhole (5 feet diameter x 10 feet deep) combined with a precast concrete base and lid.
15.2.2 |
Potable Water Supply |
Potable water for the mill, the administration building, wastewater treatment plant and the truck shop is pumped from a well with a submersible well pump, through a filtration system and delivered to the potable water station (PWS). The PWS consists of one 10,000-gallon storage tank, two distribution pumps, and one pressure expansion tank.
The water requirements for specific areas of the project are noted below:
■ |
Office/dry: 7,200 gallons / day |
■ |
Washroom in truck shop: 50 gallons / day |
■ |
Rest room, laboratory sink, and safety eyewash/shower stations in wastewater treatment plant: 50 gallons/day |
■ |
Washroom/rest room in mill: 50 gallons / day |
Potable water at the guard house is pumped from an independent well equipped with a submersible pump, (through filtration system if required, pending on water quality report) and delivered to the water expansion tank. The water is then pumped to the water heater, washroom, and kitchen. Each potable water system consists of one submersible well pump, one water expansion tank and one 48-gallon water heater.
15.2.3 |
Contact Water Collection System |
Contact water is managed throughout the surface infrastructure of the site through five pumping and pipeline systems. These systems function to transport contact water collected in the East and South TMF ponds, East and North WRMF ponds, and the CWB. These four systems, designed based on the water balance modeling data, are outlined as follows:
■ |
South TMF Pond to CWB |
■ |
East TMF Pond to CWB |
■ |
North WRMF Pond to CWB |
■ |
East WRMF Pond to CWB |
All ponds and basins on the site are sized to contain the design storm event without any reliance on pumping systems. The design storm event is the 200-year design storm with an additional 25% to design for climate change
Back Forty Project |
15-5 |
Gold Resource Corporation |
|
over the life of the project. This design storm is 7.2 inches of precipitation in a 24-hour duration. The pumping system from each pond to the CWB are designed to empty the pond in 30 days or less.
The TMF and WRMF ponds are designed to collect the leachate and surface runoff from the respective facilities. The mill and other surface contact water areas will be graded to drain to the CWB.
15.2.4 |
Wastewater Treatment |
The Back Forty Wastewater Treatment Plant (WWTP) treats all excess contact water collected in the Contact Water Basin (CWB) prior to reuse or discharge. Discharge will be in compliance with National Pollutant Discharge Elimination System (NPDES) permit number MI0059945 issued by the State of Michigan Department of Environment, Great Lakes, and Energy. Contact water includes runoff from the TMF, runoff from stockpiles and waste rock facilities, dewatering of the pit and underground workings, and any other sources of water that have potentially been in contact with exposed rock or areas impacted by site activities including milling and ore, overburden, waste rock and tailings management. Contact water will be collected throughout the site and will ultimately be transferred to the CWB, which will also serve as the influent source to the WWTP. Contact water and treated effluent will be reused to the greatest extent possible on the site so that the treated water discharged to surface water and the makeup water requirement are minimized. In addition to contact water, the treated sewage from the site sewage treatment facility will be transferred directly to the WWTP for treatment of low levels of mercury that may be present in the sources of wastewater discharge to the sewage treatment system.
The WWTP is hydraulically designed to treat contact water pumped from the CWB at an average flow rate of 600gpm and a peak flow rate of 800gpm. These are the design flows for equipment sizing, while the projected annual total volumes of water collected are expected to range from 170,140,000 gallons to 266,272,000 gallons at an average continuous rate of 324gpm to 506gpm. Operation of the WWTP at 600gpm to 800gpm will allow for reduced operating hours when flows are at the annual average or below. Hydraulic operational flexibility is also provided by automating the system to operate overnight unattended, by providing most pumps with variable frequency drives (VFDs) and using control valves as needed.
The WWTP consists of a multistep treatment train designed to remove cadmium, copper, mercury, and zinc to below the surface water discharge criteria and expected NPDES permit limits including the low mercury limit of 1.3 ng/L. In addition, the ability to reduce sulfate is included because sulfate is projected to be present in the contact water at a concentration that is within 10 percent of the potential regulatory limit. The major treatment steps include the following:
■ |
Clarification for gross removal of total suspended solids (TSS) in the influent from the CWB. The underflow concentrated precipitated metals and TSS are dewatered for offsite disposal in a sludge management system. |
■ |
Ultrafiltration and reverse osmosis - The clarified effluent from the TSS removal system is filtered through an ultrafilter and then treated in a reverse osmosis (RO) step. The RO concentrates the sulfate and residual metals for further treatment. High rejection of all target contaminants is expected in the RO system. |
■ |
Brine treatment – The concentrate brine stream containing elevated levels of sulfate and residual metals is treated in a lime High Density Sludge (HDS) system for sulfate removal with a sulfide polish to provide removal of residual mercury that was concentrated in the RO system. The sludge from the lime HDS system is managed and dewatered for offsite disposal. The treated brine is recombined with the RO permeate for a final mercury polishing step. |
Back Forty Project |
15-6 |
Gold Resource Corporation |
|
■ |
Mercury Polishing – The treated brine and RO permeate is recombined and then treated through columns of metal removal media shown to provide high removal efficiency for mercury (MetSorb®) and then through columns of ion exchange resin (Dupont AmberSep-43600) that has been shown to reduce low levels of mercury to less than 1.3 ng/L. |
■ |
The WWTP will be housed in a pre-engineered metal building. In addition to the process and chemical feeding and storage areas, the WWTP will have a combination break/control room, a small laboratory area for on-site testing and sample handling, and a rest room. Safety eyewash/shower units will be provided in the process and chemical areas. The washroom, lab sink and safety eyewash/shower stations will be supplied with potable water. |
The treated water will be discharged to the Menominee River through a gravity pipeline under an NPDES permit and the discharge limits for heavy metals, mercury, total suspended solids, sulfate, and pH will be met at the end-of-pipe prior to discharge to the river. Treated effluent flow rates can range from 200gpm during low water flow conditions up to 800gpm during high water flow storm events. The pipeline will be buried below grade to a minimum depth of 5 ft to prevent freezing and will be sloped to facilitate gravity flow. Manholes will be installed every 800 ft along the length of the pipeline to allow for pipeline inspection and maintenance access. A manhole flume will also be provided at the final manhole location to allow local authority to perform any required data collection and measurements.
15.2.5 |
Sewage Treatment |
A 7,200 gallon per day capacity packaged membrane bioreactor sewage treatment plant will treat sewage generated on the site from the administration building and other facilities such as the mill and shop areas. Sewage from the administration building will flow by gravity to the sewage treatment plant. Sewage from other facilities will be transferred periodically by a contracted vacuum truck to the sewage treatment plant. Treated effluent from the sewage facility will be sampled for regulatory purposes at the discharge of the sewage treatment facility. Treated sewage plant effluent may have naturally occurring mercury levels present in the source water that are above the 1.3 ng/L surface water discharge limit for mercury. Therefore, treated effluent from the sewage treatment plant will be pumped to the WWTP. If analytical data indicates that treated sewage has mercury concentrations above 1.3 ng/L the treated sewage will be combined with influent from the CWB into the WWTP for treatment of mercury and for discharge to the Menominee River. If the treated sewage does not have elevated levels of mercury greater than 1.3 ng/L the treated sewage will be combined with the effluent from the WWTP for discharge to the Menominee River.
15.2.6 |
Open Pit Dewatering |
Similar to the underground, water inflows to the open pit include a combination of groundwater and direct precipitation (regular and storm events). Groundwater inflows utilized as the basis of design were provided from the Foth high estimate scenario for Years 0 through 12 of operations (Variable 202-552gpm). The open pit catchment runoff was estimated at 122gpm. Likewise, the design flow also accounts for the 200 year, 24-hour storm event, pumped over 14 days at 460 gpm to result in a combined design flow range of 324-1,143 gpm.
To accommodate the pit development and relocation of pumps through each year of operation, the open pit dewatering will utilize trailer mounted, diesel powered suction pumps. Likewise, to accommodate the use of a single pump model and avoid multiple pumping configurations between the operational flows and storm event flows (operational flows averaging 44% of storm flow), all pumps are sized to accommodate the storm event and as such, will dewater the operational flow in a reduced time. With the maximum flow expected in year 0 of operation, the
Back Forty Project |
15-7 |
Gold Resource Corporation |
|
pumps shall be arranged with two pumps in parallel configuration for year 0 at 572 gpm. From years 1 through 12, the combined flow is relatively stable at approximately 800 gpm, and as such, the pumps will be configured in series operating at 800 gpm. As the development progresses and the system pressure head increases, additional pumps will be configured in series to provide the required head for pumping operation. At the end of year 12, the system will utilize six pumps arranged in series at the bottom of the pit.
The pipeline profile will utilize a steel truss structure for the line to traverse the side of the pit wall and accommodate the most direct route from the pit sump to the edge of the pit. From the edge of the pit, the pipeline will run parallel to the pit perimeter in a buried trench for transportation of water to the CWB. All piping underground and inside the limits of the open pit will utilize single walled piping.
15.3 |
Mine Waste Management |
15.3.1 |
Tailings Management Facility |
The TMF will be located about 0.7 km east of the process plant. At full development, the TMF will cover a total footprint area of 21.8 ha and it will have a maximum height of 50 m. As shown on Figure 15-3, the TMF is just east of the east side of the WRMF. On all the sides a granular starter dyke will provide the initial containment. The TMF will be constructed by placing and compacting filtered tailings to form a truncated pyramid. As shown on Figure 15-4, the sideslopes of the TMF will have benches at 10 m vertical intervals with inter-bench sideslopes of 3H:1V (horizontal:vertical).
The TMF has been designed to have a volumetric capacity of about 3.4 Mm3. The allocation of space is as follows:
■ |
Compacted tailings: 2.94M LCM with 8% loss to compaction = 2.70 Mm3. |
■ |
Waste rock (for roads): 2.96M LCM generated and 2.71M LCM needed to back fill pit = 0.25 Mm3. |
■ |
Contingency storage: 15% of total volume = 0.44 Mm3. |
The compacted filtered tailings will form the structure of the TMF. Excess waste rock (the volume in excess of backfill for the open pit) will also be incorporated into the structure to provide for equipment access and to act as internal drainage structures. The tailings will be pressure filtered in the process plant and trucked to the TMF using articulated haul trucks. The tailings will be spread in thin lifts and compacted.
Geotechnical testing has been carried out on a combined tailings sample representative of the tailings throughout LoM. The testing included a standard Proctor compaction test, which indicated that the standard Proctor maximum compacted dry density (SPMDD) was 2,237 kg/m3. Tailings placed in the “structural” zone of the TMF will be required to be compacted to a density of at least 95% of the SPMDD (i.e., 2,125 kg/m3). Based on the Standard Proctor curve, a moisture content of 17% should not be exceeded in order to achieve 95% of the SPMDD. A 17% geotechnical moisture content (weight of water over the weight of tailings solids) equals about 14.5% metallurgical water content (weight of water over total weight) or a solids content of 85.5%. Strict dewatering specifications will be set as design targets for the filter press design and operation. A certain amount of “off-spec” tailings (i.e., tailings with excessive moisture content) will be inevitable; however, “off-spec” tailings will be placed into a designated “non-structural” zone within the TMF.
Back Forty Project |
15-8 |
Gold Resource Corporation |
|
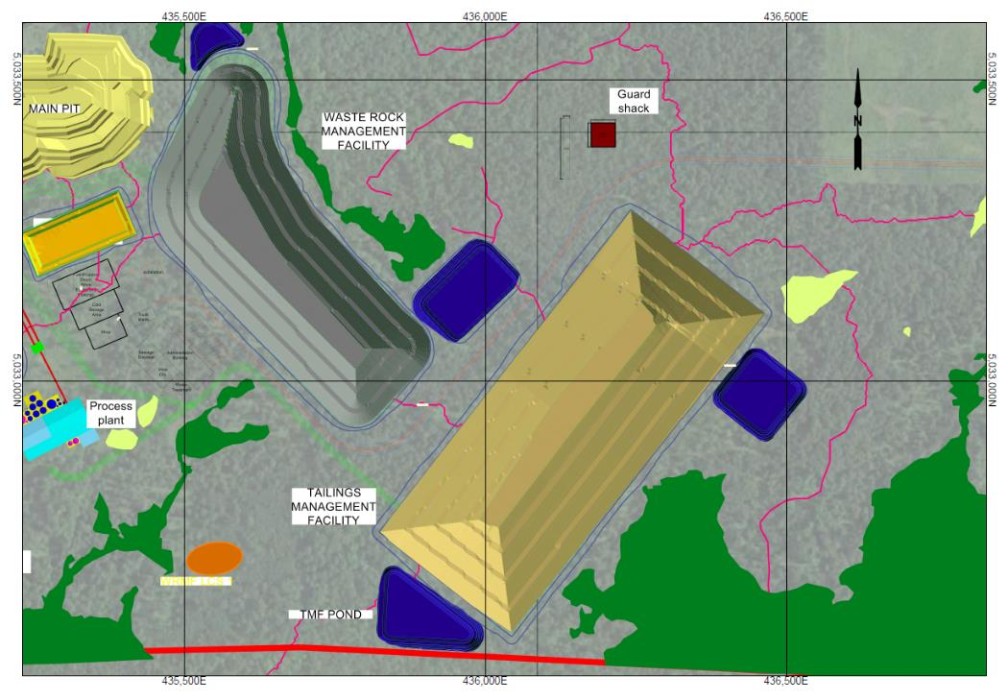
Figure 15-3: Plan View of the TMF
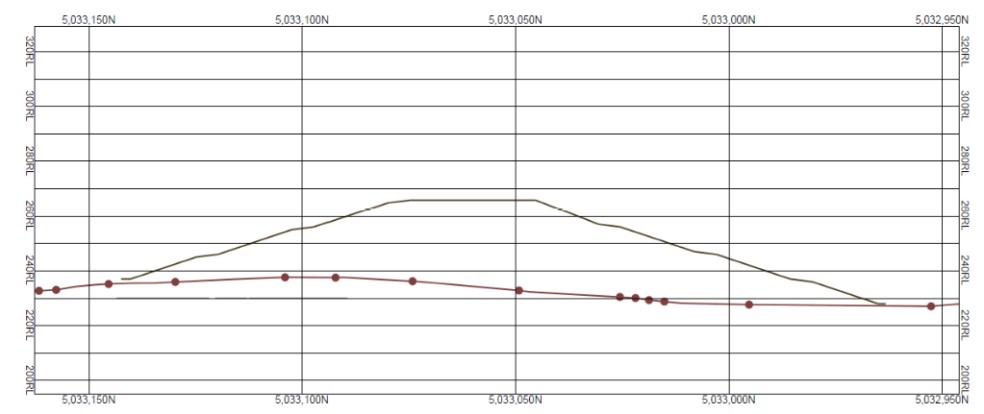
Figure 15-4: Typical Section of the TMF
Back Forty Project |
15-9 |
Gold Resource Corporation |
|
The basal limits of the TMF will be covered with a double liner system with a leak collection system as shown on Figure 15-5. The liner system will consist of a composite primary liner and a single secondary liner. A drainage aggregate layer will be provided above the primary liner to collect and remove the tailings leachate. A geocomposite drain will be provided between the primary and secondary liners to collect and remove any leakage through the primary liner. The base of the TMF will be sloped with gradient of at least 0.5% towards each TMF Pond to allow the leachate and any leakage to drain by gravity towards the TMF Ponds. A perimeter berm and ditch will be provided to collect run-off from the exterior side slopes of the TMF and to convey it to the TMF Pond.
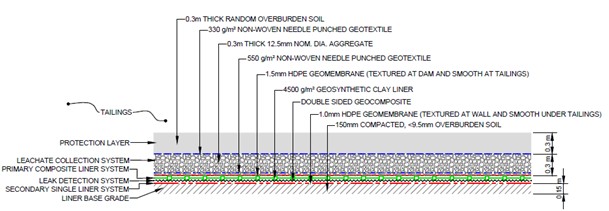
Figure 15-5: The Double Liner System of the TMF
After closure, a multi-layer cover which will support vegetation will be placed over the TMF to limit infiltration. The volume of leachate is expected to drop to low levels following cover placement. The TMF closure cover will have a system of chutes and ditches (designed to convey storm events) to direct clean runoff water from the facility into an external sedimentation pond.
15.3.2 |
Waste Rock Management Facility |
As shown in Figure 15-6, waste rock will be stored temporarily in the Waste Rock Management Facility (WRMF), which will be located about 550 m east of the open pit. As part of mine closure plan, the waste rock will be removed from the WRMF and used to backfill the open pit.
The WRMF will have a total footprint area of 37.4 ha and a maximum design capacity of 2.7 Mm3. The non-acid generating (NAG) and possible acid generating (PAG) waste rock will be stored separately but contiguously in the WRMF in a configuration that will allow the PAG to be removed prior to the NAG.
Back Forty Project |
15-10 |
Gold Resource Corporation |
|
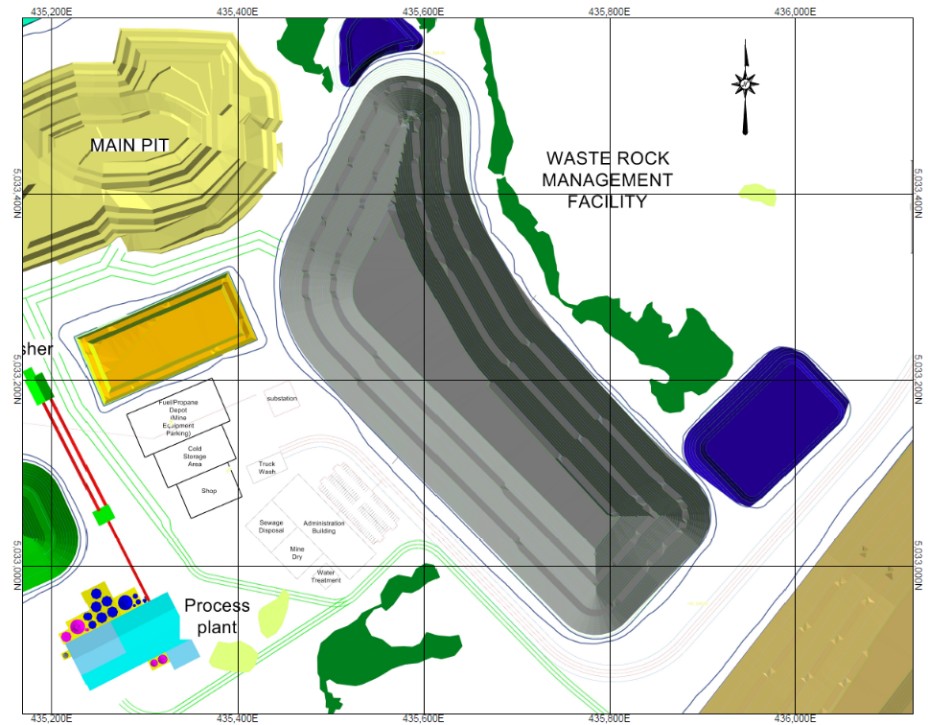
Figure 15-6: Plan View of WRMF
The waste rock will be deposited in four lifts up to 10.0 m high with a 5 m wide bench at each lift. The side slopes of each bench will be deposited at 2.5H:1V. The typical cross-section of the WMRF is presented in Figure 15-7.
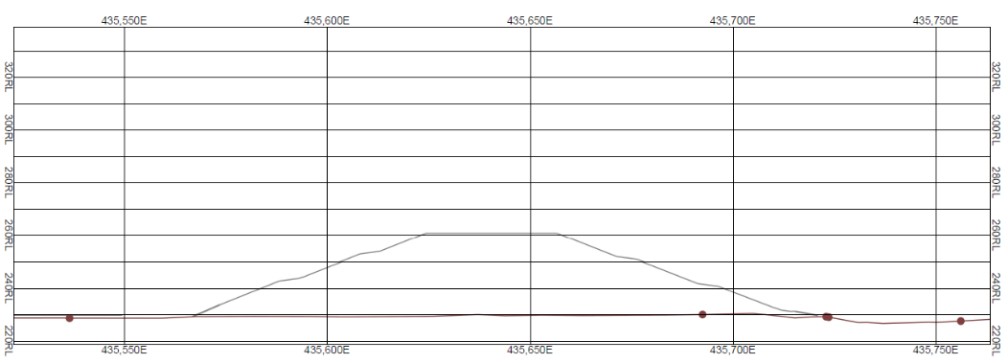
Figure 15-7: Typical Cross-Section of the WRMF
Back Forty Project |
15-11 |
Gold Resource Corporation |
|
The footprint of the WRMF will be covered with a double liner system with a leak collection system as shown on Figure 15-8. The liner system will consist of a composite primary liner and a single secondary liner similar to the liner system of the TMF. A drainage aggregate will be provided above the primary liner to collect and remove the waste rock leachate. A geocomposite drain will be provided between the primary and secondary liners to collect and remove leakage from the primary liner. The base of the WRMF will be graded to drain to the perimeter of the pile with a minimum gradient of 1%. Perimeter ditches will collect the leachate and runoff and direct it into the Runoff Collection Pond (RCP) or to one of the Leachate Collection Sumps, from where it will be pumped to the site Contact Water Basin (CWB) for reuse or treatment. The LCSs will have the same double liner system as the WRMF itself.
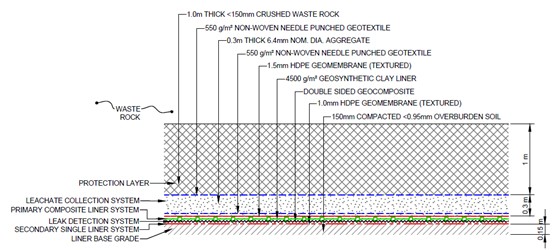
Figure 15-8: The Double Liner System of the WRMF
15.3.3 |
Ore Stockpile |
The Ore Stockpile will be a granular pad located close to the open pit where the haul road ramp reaches the surface. The Ore Stockpile will be adjacent to the ore crusher. It will have capacity to store up to 0.13 Mm3 of ore. No contingency volume is assumed.
The Ore Stockpile will be a rectangular pad which is graded with a minimum of cross-slope of 0.5% to drain towards the Open Pit and/or the CWB. The granular pad will be designed to support the wheel loads from loaded mine haul trucks. The granular pad will be inset below the ground surface, and it will be underlain by a double liner system, similar to that of the WRMF (Figure 15-8). The system will consist of a composite primary liner system and a single secondary liner. A blanket drainage layer and a network of pipelines will be used to limit the leachate (seepage) head over the primary liner to less than or equal to 0.3 m (1.0 ft). A geocomposite will be installed between the primary and secondary liners to allow for detection and recovery of any leakage. Leachate and any leakage will be pumped to the WRCP by means of a submersible pump lowered into a riser pipe.
The Ore Stockpile is designed to have maximum side slopes of 2:1 (H:V) and a maximum height of 10 m.
Back Forty Project |
15-12 |
Gold Resource Corporation |
|
No ore will remain on the Ore Stockpile after the end of operations. For closure, the operational ore stockpile footprint will be decommissioned. Any contaminated aggregate will be relocated to the Open Pit. The liner and leachate collection systems will be removed, and the pad area will be regraded and revegetated.
15.4 |
Concentrate Transport |
Concentrate transport will be provided by an outside company to pick up the concentrate from the concentrate shed in the southeast corner of the mill. The concentrate shipping company will provide a transload facility to place the concentrate on rail for transport to the smelter.
15.5 |
Underground Infrastructure |
15.5.1 |
Underground Mine Dewatering |
Water inflows to the underground mine include a combination of groundwater and water generated through operation of underground services (drill rigs, dust suppression, etc.). Groundwater inflow estimates were provided by Foth through predictive modeling. The year 11 inflow rate of the high estimate scenario (allows for uncertainty in measured hydraulic parameters) was used as the basis of design which features a 77%-23% split between the open pit and underground; resulting in an underground inflow of 63gpm. This value represents the maximum groundwater inflow expected underground over the life of mine. Water generated by underground services was estimated through historical data at 168gpm, for a combined total of 266gpm.
At completed development, the underground mine will feature two sets of sumps, namely, the Upper Sump at approximately 68 masl (level 160) and Lower Sump at -184 masl (level 140). The Upper Sump is designed to handle the full water inflow of 266gpm, while the Lower Sump is designed to handle 66% of the total flow at 176gpm. All water above level 160 will drain via gravity to the Upper Sump and water below level 160 shall drain to the Lower Sump. Once water has drained to the respective sump areas, it will be split between two individual sump structures, each equipped with a single VT pump sized to handle half of the total flow (i.e., 133gpm for the Upper Sump and 88gpm for the Lower Sump). One shelf spare shall be stocked and readily available to install in the event of pump failure. The two VT pumps, one at each sump location, will operate in parallel configuration to transport water from the respective sump structures to a common header. The pumps in each sump are envisioned to operate through level control on the sump water level. Water in the lower sump will first be pumped to the Upper Sump. Likewise, water in the Upper Sump will be pumped to the WRCP on surface, followed by transport to the CWB, and the subsequent WWTP before it is treated and ultimately discharged back into the environment. Routing of the header pipelines throughout the mine shall make use of the vertical ventilation raises to provide the most direct routing between sumps and the surface.
15.5.2 |
Electrical Power Distribution |
Underground mine power will be distributed from 5kV west overhead pole line fed from the main substation. The main 5kV overhead line feeds the entire underground mine from the portal area via messenger wire. The estimated loading for the underground mining operation with the fresh air fans is 3.2MW supplied by 600A, 4160V medium voltage switchgear. The underground development, production and auxiliary loads will be supported by multiple 750kVA mine load centers with an input of 4160V fed using mine trailing cables. Localized NEMA 3R electrical equipment fed from outdoor rated switchgears would be required at some permanent underground facilities such as the dewatering areas, PLC panels, etc. The MLC and electrical equipment cutouts will be grounded, bonded,
Back Forty Project |
15-13 |
Gold Resource Corporation |
|
and fenced with warning signs to restrict authorized personnel only. All electrical equipment placed on the ground will be on a flat levelled surface and sufficient working space for access.
15.5.3 |
Communications |
Fiber optic cable would originate from the surface and will be routed down through the 5kV west pole line. The composite fiber optic cable will be hung on the opposite side of the rib from the power cable to reduce the attenuation experienced by the fiber optic cable. The composite fiber optic cable will be terminated at each main cutout while traversing various underground levels. The fiber network will be connected to a series of ethernet switches, daisy chained with battery backed up power supply. Local ethernet switches will also be equipped with antennas for wireless communication and POE ports will be used to communicate with and power IP cameras, PLC panels, remote IO panels and multiple wireless access points. The wireless access points will be used to expand wireless communication by creating a wireless mesh network in hard-to-reach production areas over CAT6e cable and hung over the top of the ribs. This system will be modular, easy to install and can be replicated as the mining operation evolves.
15.6 |
Paste Backfill Plant |
The paste backfill plant is located in the mill building. Paste is discharged from the plant via an insulated and heat traced pipeline on the surface to a borehole collar. The paste backfill plant is designed to process 100% of the tailings solids, at an operating rate of 107 tonne/h (tailings solids). Paste backfill can be poured at an operating flow rate of 81m3/h.
Filter cake delivered from the mill will be delivered into the live bottom feeder by a bi-directional conveyor. The live bottom feeder serves to break up the filter cake lumps so that it can be readily handled by downstream equipment. Filter cake will then be discharged from the belt conveyor into the twin shaft continuous paste mixer. The paste mixer discharges through an overflow to a paste hopper that feeds a paste pump. Binder is delivered to the paste mixer by a binder screw conveyor at a flow rate controlled by a loss in weight feeder, situated below binder silos. In addition, dilution water (process water) will be also supplied into the paste mixer bringing the contents to the target slump.
In addition to the key backfill process described, the following auxiliary systems can also be found in the paste backfill plant building:
■ |
A decant sump pit to capture the solids from plant cleanup with the supernatant pumped to the open pit area. |
■ |
The process water will be obtained from underground and will be pumped to a process water storage tank. Process water distribution will be handled by low pressure water pumps for internal plant use. A high-pressure water pump is included for emergency flushing of the paste discharge piping. |
■ |
The compressed air system will provide both plant air and instrument air. The instrument air will be distributed throughout the plant. The plant air will be used primarily for the flushing of the paste pipeline. |
Paste delivery to target stopes underground will start at the positive displacement style paste pump. The paste traverses across the surface to one of two surface to underground boreholes (operating and standby). The paste will then travel to the target stopes via inclined boreholes and underground piping.
Back Forty Project |
15-14 |
Gold Resource Corporation |
|
16.0 |
MARKET STUDIES |
16.1 |
Metal Prices Assumptions |
The metal prices used for the base case based on the average median consensus prices for years 2024 through 2028 as provided by the Bank of Montreal in June 2023. The median price was based on the price estimates contributed by 38 participating financial institutions. These prices are also very similar to the three-year average. As reference, two other cases are presented, the spot prices from September 29, 2023, and the median of the long term consensus from the same Bank of Montreal document.
Table 16-1: Metal Prices Assumptions
Metal |
Base Case |
36-month average (as of August 28, 2023) |
Spot Price (As of September 29, 2023) |
Long term consensus (median) |
|
Au |
$/oz |
1,800 |
1,841 |
1,850 |
1,700 |
Ag |
$/oz |
23.30 |
23.70 |
22.20 |
23.00 |
Cu |
$/lb |
3.90 |
3.95 |
3.70 |
3.69 |
Zn |
$/lb |
1.25 |
1.39 |
1.19 |
1.20 |
16.2 |
Base Metal Markets and Costs Assumptions |
GRC requested a zinc and copper market study to Stone House Consulting and Exen Consulting Services respectively to assess the marketability of the Back Forty Project concentrates.
16.2.1 |
Zinc Concentrate Market |
As a result of gas shortages stemming from the Russia-Ukraine conflict, several European zinc smelters shut down in 2022 due to the record high electricity prices. With moderating power costs, two Nyrstar smelters resumed production earlier this year, but the two closed Glencore plants in Germany and Italy have remained closed. It is likely that the Nordenham plant in Germany will resume production in the medium term, but the Portovesme plant in Italy will likely close permanently.
It was forecast by the major market research companies, like CRU and Wood Mackenzie, that a concentrate surplus in 2023 was expected, based on some new mine production, such as at Ozernoye in Russia, and reduced smelter capacity in Europe. The year started in that direction, with spot treatment charges (“TCs”) in the range of $270 per DMT, up over $150 per DMT from one year earlier. The zinc benchmark treatment charge for 2023 was settled at $274 per DMT, an increase from the 2022 benchmark of $230 per DMT. The 2023 zinc benchmark settlement included price participation of 6% above an LME price of $3,000, with no downscale. This means that for every $100 increase in the LME price over $3,000, the benchmark treatment charge increases by $6 per DMT.
Since the beginning of the year, though, spot TCs have fallen to their current level of $150 per DMT for August. The tightening concentrate market has come from restarted smelter production in Europe, price related closures of the Tara and Jaguar mines, and a labor conflict that has closed the large Penasquito mine in Mexico.
Increased production from new mines and expansions at existing mines is expected to keep the concentrate market in a surplus position into 2026, when several mine closures are expected to bring the market back into balance by 2027.
Back Forty Project |
16-1 |
Gold Resource Corporation |
|
The ten-year average benchmark treatment charge for zinc, to August 2023, is $220.90, with annual benchmark settlements in the range of $147 to $299.75 per DMT (see Figure 16-1).
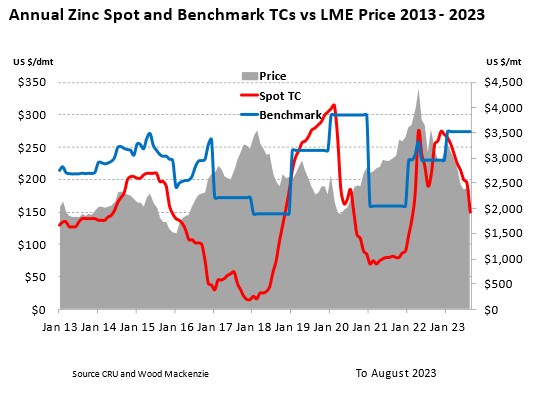
Figure 16-1: 10 Year Chart- Zinc Spot and Benchmark TCs versus LME Zinc Price
Price participation was a normal part of the benchmark settlement up until 2016 when a flat benchmark TC was introduced. Underprice participation, the benchmark TC was escalated or de-escalated by a percentage of the zinc price according to the change in the LME price from a negotiated basis price. The percent of escalation, de-escalation and the basis price were agreed annually.
There was limited price participation in some benchmark settlements in 2018, 2022, and again in 2023. Given the current price volatility, it is assumed that there will be some price participation in upcoming benchmark settlements.
For the purposes of this evaluation, a benchmark treatment charge of $225 per DMT, at a zinc basis price of $3,000 per MT, with price participation of +5/ -2, has been assumed. The +5/-2 means that for every $100 increase in the LME zinc price above the basis price of $3,000 per tonne, the TC will be increased by $5 per DMT, and for every $100 that the LME zinc price falls below $3,000 per tonne, the TC will be reduced by $2 per DMT.
16.2.1.1 |
Market for Back Forty Zinc Concentrates |
Smelters worldwide are operating under increased environmental scrutiny with respect to deleterious elements, especially mercury, arsenic, and thallium. Additionally, several residue producing or penalty elements, such as iron, silica, manganese and selenium are prevalent in many concentrates and could restrict interest in a new concentrate.
Back Forty Project |
16-2 |
Gold Resource Corporation |
|
Each zinc smelter worldwide has a different capability to recover valuable metals and to treat deleterious elements. Not all smelters recover precious metals. Some smelters are limited in the amount of a specific impurity that they can accept and process.
Back Forty zinc concentrate is a mid-grade material with no payable silver or gold. Penalty items include iron, mercury and possibly cadmium, depending on the grade, over the life of the mine. The low silica level will be attractive to smelters that are concerned about residue generation.
The expected volume and quality of production is expected to vary during the life of the project, as is illustrated in Table 16-2.
Table 16-2: Expected Tonnage and Grade of Back Forty Zinc Concentrate- 2027- 2034
Annual Range |
||||
Zinc concentrate |
Units |
Wt. ave. assay |
Low |
High |
Zn grade |
% |
51.20 |
48 |
52 |
Au grade |
g/t |
0.20 |
0.11 |
0.32 |
Ag grade |
g/t |
18.69 |
12.2 |
26.5 |
Pb grade |
% |
0.31 |
0.03 |
0.54 |
Fe grade |
% |
9.09 |
8.25 |
10.33 |
As grade |
g/t |
381.40 |
254 |
970 |
Bi grade |
g/t |
3.44 |
2.00 |
6.00 |
Cd grade |
g/t |
2625.23 |
2433 |
2776 |
Sb grade |
g/t |
34.93 |
14.00 |
69.00 |
MgO grade |
% |
0.13 |
0.03 |
0.27 |
Mn grade |
g/t |
1264.31 |
967.32 |
1694.00 |
Si grade |
% |
0.13 |
0.08 |
0.19 |
Ni grade |
g/t |
23.11 |
10.00 |
49.29 |
Hg grade |
g/t |
258 |
176 |
365 |
Cl grade |
% |
0.009 |
0.009 |
0.009 |
F grade |
% |
0.009 |
0.009 |
0.009 |
Se grade |
gpt |
22 |
17.6 |
23.6 |
Dry production |
kt (DMT) |
666.24 |
66.2 |
107.97 |
Back Forty zinc concentrates can be treated at smelters in North America, Europe or Asia. North American smelters will potentially have interest in this material and can take direct rail delivery. Glencore’s zinc smelter in Valleyfield, Quebec is well located geographically and has good capability to handle deleterious elements. Valleyfield does not have any precious metals recovery and so it will be a good home for Back Forty concentrate. Teck’s smelter in Trail, British Columbia, and Nyrstar’s Clarkesville, Tennessee smelter are other potential North American destinations, although both are known to have less flexibility with impurities. Trail focuses on precious metals content in sourcing concentrates, and so would have limited interest. Clarksville smelter is limited in residue storage, so would have difficulty treating a concentrate with 9% iron content.
European zinc smelters can be accessed through the bulk terminals in Trois Rivieres and Quebec City. All European smelters have good capacity for treating concentrates like Back Forty, such as Nyrstar’s Balen and Auby plants, or
Back Forty Project |
16-3 |
Gold Resource Corporation |
|
Glencore’s Aviles and Nordenham plants. Boliden is currently expanding the Odda plant in Norway, which has good capability to treat residues, so the high iron content should not be an issue. In general, European plants have good capacity to handle mercury content in concentrates like Back Forty.
Sales to Asian smelters can be accessed through the ports of Trois Rivieres and Quebec City or the port of Vancouver. The two zinc plants in Korea are amongst the most flexible custom smelters in the world, making them potential homes for this concentrate.
Japanese smelters are more restrictive in the quality of the concentrates that they treat. The mercury content in Back Forty will likely exceed the level that would allow treatment at Japanese smelters.
China is the only country that has specific limits on certain impurities in imported concentrates. For zinc concentrates, those limits are 0.6% for arsenic, 0.3% for cadmium, and 0.06% (600 ppm) for mercury. For Back Forty, it is important that the cadmium level be below 0.3% and the mercury remain under 600 ppm in order to be considered for sale to the Chinese spot market.
In 2018, China imposed a 25% duty on US origin zinc and copper concentrates, which has since been rescinded. It is possible that this duty could be re-established in the event of a trade dispute between the US and China. It is recommended that China not become a critical market for Back Forty concentrates, if possible. Given that North America and Europe are the likely markets for the zinc concentrate, the China duty risk on the project is insignificant.
Production of zinc concentrates at the Back Forty mine is expected to vary over the life of the project. Even at the higher production volumes, it is expected that all tonnage can be sold to smelters in North America and Europe.
The expected terms for the sale of Back Forty zinc concentrate to any of the Western smelters are summarized below:
Treatment Charge
$225 USD per dry metric tonne, basis $3000, +5/ -2, delivered buyer’s facility
Payables
Zinc: Pay for 85% of the content, subject to a minimum deduction of 8 units, at the London Metal Exchange Special High Grade zinc quotation averaged over the quotational period. Given that Back Forty zinc concentrate contains on average 51.2% zinc, the concentrate will be subject to the minimum deduction of 8 units.
Gold: Deduct 1 gram/DMT from the assay and pay for 70% of the balance at the London Bullion market daily quotation for gold averaged over the quotational period. As Back Forty zinc concentrate contains less than the 1 gram/DMT minimum deduction, there will be no gold payment for Back Forty zinc concentrate.
Silver: Deduct 3 oz./DMT from the assay and pay for 70% of the balance at the London Bullion market daily quotation for silver averaged over the quotational period. As Back Forty contains less than the 3 oz./DMT minimum deduction, there will be no silver payment for Back Forty zinc concentrate.
Penalties
Iron: $2.00 per DMT for each 1% that the iron assay exceeds 8%
Mercury: $2.50 per DMT for each 100 ppm that the mercury assay exceeds 100 ppm
Back Forty Project |
16-4 |
Gold Resource Corporation |
|
Cadmium: $2.50 per DMT for each 0.1% that the cadmium assay exceeds 0.30%
Transportation and Logistics
Transportation and other costs (including insurance, representation, losses, freight credits where applicable, etc.) for delivery to the receiving smelter/buyer are estimated at an ‘all-in’ cost of US $130/dry metric tonne of zinc concentrate. This represents an average freight for assumed deliveries to Valleyfield and to Europe.
16.2.2 |
Copper Concentrate Market |
The treatment charge and copper refining charge (“TC/RCs”) are the charges deducted from the value of the payable metals contained in the copper concentrate to cover the costs of smelting the concentrate and refining the copper anodes into LME grade copper metal. TC/RCs are responsive to basic copper concentrate supply-demand fundamentals with floors and ceilings to these charges being typically governed by mine and smelter economics, based on copper metal and by-product prices and operating costs.
Influenced by a rapidly expanding copper smelting industry in China, “benchmark” TC/RCs averaged just $64 per DMT smelting and 6.4¢/lb copper refining during the period 2004-2013 (in dollars of the day). However, during the most recent 10-year period (2014-23), benchmark TC/RCs have averaged just under US $83 per DMT and 8.3¢/lb, within a range of $59.50 and 5.95¢ to $107 and 10.7¢, respectively (Figure 16-2- combined TC/RC shown in equivalent US¢/lb Cu, basis 28% Cu grade in concentrates).
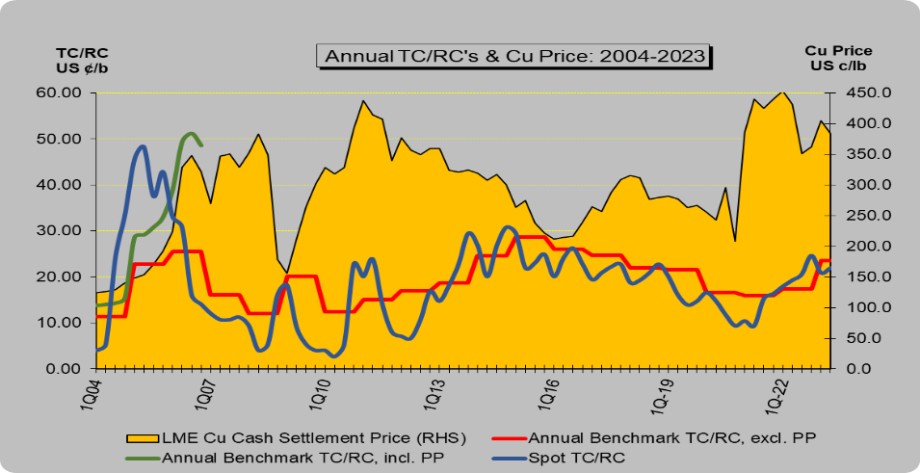
Source: Exen Consulting Services (2023)
Figure 16-2: 20 Year Treatment and Copper Refining Charge History
Spot treatment and refining charges have ranged to even greater extremes, with nominal highs seen in 2006 above $160/16¢, to headline figure lows witnessed in early 2004 and again in 2007-08 on mine to merchant business actually below $0/0¢.
With agreements reached between Freeport McMoRan and several Chinese smelters in late-November 2022, benchmark treatment and refining charges for 2023 were set at $88/DMT smelting and 8.8¢/lb copper refining, up
Back Forty Project |
16-5 |
Gold Resource Corporation |
|
35% on 2022’s level of $65 and 6.5¢, respectively. Although we have seen some further softening in 2023, the concentrate market has been relatively balanced and signs currently point to a rollover of charges in 2024. The concentrate market is expected to remain balanced in the short-term due to rising mine supply in Indonesia, Chile, Peru and the Democratic Republic of Congo (DRC). However, a dearth of significant new mine production in the second-half of the decade combined with new smelter capacity in China, India, Indonesia and the DRC, is projected to tighten the concentrate market, capping any material increase in long-term TC/RCs and pushing terms back down to and possibly below long-term historical averages.
Equally important, projected copper mine output will fail to keep pace with the expected growth in metal consumption which is trending higher in response to increased demand from copper’s role in energy transition and greenification. Even at modest growth rates in metal demand, insufficient copper supply will likely begin to manifest itself before the end of the decade unless new mine projects are brought online. However, with little in the development pipeline for the second half of the decade, most analysts are projecting a continued uptrend in copper prices in response to this metal supply-demand dynamic.
16.2.2.1 |
Market for Back Forty Copper Concentrates |
Based on the current mine plan, the high-copper bearing Pinwheel zone will be mined first, producing in the order of 110-120,000 DMT of relatively clean copper-gold concentrates in the first two to three years of production. Annual production levels will range from 10,000 to 20,000 DMT thereafter as the mine transitions through the different ore zones (see Figure 16-3).
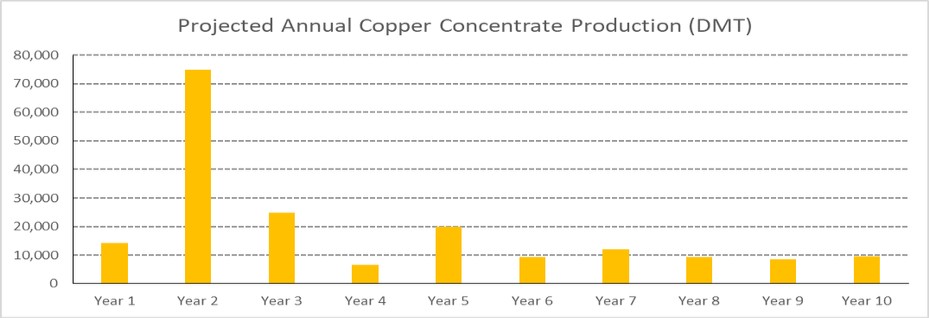
Figure 16-3: Projected Annual Copper Concentrate Production
The concentrates are projected to average around 14% copper over the life of mine but will range from highs above 20% in Year 4 to lows under 10% in Year 5 when the low copper Tuff zone is mined. Gold and silver grades will see similar variability, averaging around 80 g and 700 g per DMT over the life of the mine, respectively, but within a range of 25-170 g gold and 300-1250 g silver.
While relatively low in some deleterious elements commonly found in copper concentrates (e.g. arsenic, antimony, bismuth), the Back Forty concentrates to be produced starting in Year 3 are projected to contain elevated levels of lead, zinc and mercury which will make them unsuitable for direct processing at most copper smelters, including
Back Forty Project |
16-6 |
Gold Resource Corporation |
|
Chinese smelters where regulatory restrictions limit the level of specific deleterious elements in imports of copper concentrates.
The expected analysis of the concentrates over the mine life is set out in Table 16-3 below.
Although the Back Forty concentrates are not suited to all copper smelters, the high levels of gold and silver will make them attractive to certain buyers, including traders for blending operations. Furthermore, smelters in North America capable of treating the Back Forty concentrates are well located to receive them direct by rail. Although the relatively low annual production for Year 3 onward will likely preclude offshore shipments in bulk, competitively
priced deliveries to European or Asian destinations can be made in standard twenty-foot ocean containers which can be loaded directly at the mine site.
Table 16-3: Back Forty Copper Concentrates Expected Mine life Analysis
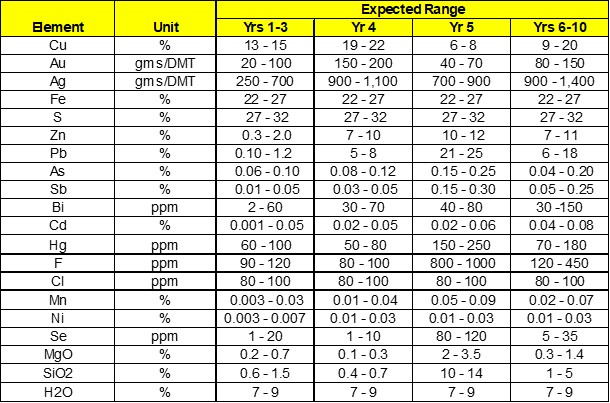
It is also worth noting that, for the purposes of this report, while all of the above production is being classified as copper concentrates and valued accordingly, the very high lead production in Year 5 (approx. 20,000 DMT at 21-25% Pb and 6-8% Cu) may not be acceptable at any copper smelter. Nonetheless, this production may be marketed as a lead concentrate and, in fact, may have more value as such, some lead smelters will offer credits for zinc and copper as opposed to having the contained lead and zinc heavily penalized by copper smelters.
Back Forty Project |
16-7 |
Gold Resource Corporation |
|
Commercial Terms – Back Forty Copper Concentrates
For the purposes of the project evaluation, the following commercial terms have been assumed based on the projected analysis of the copper concentrates:
Payables
Cu: For Cu <8%, deduct 1.5 units
For Cu ≥8%, but <11%, deduct 1.4 units
For Cu ≥11%, but <14%, deduct 1.3 units
For Cu ≥14%, but <17%, deduct 1.2 units
For Cu ≥17%, but <20%, deduct 1.1 units
For Cu ≥20%, 96.5%, subject to minimum deduction of 1.0 unit
Ag: 92%, subject to a minimum deduction of 30 g/DMT
Au: 96.5%, subject to a minimum deduction of 1.0 g/DMT
Treatment Charge
Table 16-4: Copper Concentrate Treatment Charge & Refining Charges (US $)
Payable Metal |
Treatment Charge |
Refining Charge |
Copper |
$82.50/DMT, delivered |
$0.0825/lb payable |
Gold |
- |
$5.00/oz payable |
Silver |
- |
$0.50/oz payable |
Penalties
Table 16-5: Copper Concentrate Penalties
Element |
Penalty |
Lead |
$2.00/DMT for each 1.0% > 0.5% up to 3.0% |
$4.00/DMT for each 1.0% > 3.0% up to 5.0% |
|
$6.00/DMT for each 1.0% > 5.0% up to 8.0% |
|
$10.00/DMT for each 1.0% > 8.0% |
|
Zinc |
$1.50/DMT for each 1.0% > 3.0% up to 6.0% |
$4.00/DMT for each 1.0% > 6.0% up to 10.0% |
|
$7.00/DMT for each 1.0% > 10.0% |
|
Arsenic |
$3.00/DMT for each 0.10% > 0.20% |
Antimony |
$3.00/DMT for each 0.10% > 0.10% |
Cadmium |
$3.00/DMT for each 0.01% > 0.03% |
Fluorine |
$2.00/DMT for each 100 ppm > 300 ppm |
Mercury |
$0.20/DMT for each 1 ppm > 10 ppm up to 100 ppm |
$0.40/DMT for each 1 ppm > 100 ppm |
Back Forty Project |
16-8 |
Gold Resource Corporation |
|
Over the life of the mine, penalties are expected to average approximately $70 per dry metric ton of concentrates.
Transportation and Logistics
Various alternatives for delivery of the Back Forty copper concentrates to the market were considered. As a result of this review, transportation and other costs (including insurance, representation, losses, freight credits where applicable, etc.) for delivery to the receiving smelter/buyer are estimated at an ‘all-in’ cost of US $178 per dry metric ton of concentrate.
Back Forty Project |
16-9 |
Gold Resource Corporation |
|
17.0 |
ENVIRONMENTAL STUDIES, PERMITTING, AND PLANS, NEGOTIATIONS, OR AGREEMENTS WITH LOCAL INDIVIDUALS OR GROUPS |
The Back Forty Project has gone through several rounds of permitting on previous mine configurations. This section summarizes the permitting history, the environmental studies that have supported these efforts and are useful to the proposed Project, and the approach that the proposed Project is taking for environmental protections.
The status of its environmental studies is well advanced. Briefly, previous mine configurations that received one or more permits are presented in Table 17-1.
Table 17-1: Previously Permitted Mine Configurations
Year of Permit Application |
Proposed Mine Configuration |
Proposed Mill |
Proposed Tailings Facility |
2015 |
Large open pit |
Dual mills with separate metallurgical processes |
Separate tailings repositories for two thickened tailings streams |
2017 |
Large open pit |
Dual mills with separate metallurgical processes |
One tailings repository for mixed thickened tailings |
2018 |
Open pit (slightly smaller than previous pit design) |
One mill with a combined metallurgical process |
One tailings repository for thickened tailings in a co-mingled configuration |
Proposed Project, applications to be prepared in 2023/2024 |
Two small open pits; underground |
One mill with a combined metallurgical process |
One dry-stack tailings facility |
All project permits had been and are anticipated to be issued by state agencies. Direct federal approvals are not required. A broad set of studies, analyses, permit documents, plans, and stakeholder outreach efforts have been prepared or are underway with selected updates in support of permit applications for the proposed Project.
Back Forty Project |
17-1 |
Gold Resource Corporation |
|
17.1 |
Environmental Studies Addressed in Previous Project Proposals |
Environmental studies commenced in 2008 with initiation of surface water and groundwater data collection in waterways and aquifers within and around the site. In the ensuing years, a large data set was developed and analysis of the baseline conditions and various environmental impacts from previously proposed projects have been documented in their permit applications. Those environmental studies remain valid and will be used for the proposed Project, with appropriate updates. The previous permit applications are listed formally in the reference section under Foth Infrastructure & Environment, LLC (Foth) and are listed below with permit issuance record.
· |
2015: |
o |
Mining Permit Application Volume I (Foth, 2015a)1 |
o |
Mining Permit Application Volume II, Environmental Impact Assessment (Foth, 2015b) 1,2 |
o |
Permit to Install [Air] Application (Foth, 2015c) 1 |
o |
Wetland Permit Application (Foth, 2015d) 3 |
o |
National Pollutant Discharge Elimination System Permit Application (Foth, 2015e) 1 |
· |
2017: |
o |
Wetland Permit Application (revision to the 2015 application) (Foth, 2017) 1, 6 |
· |
2018 Reconfigured Project: |
o |
Mining Permit Application Amendment Volume I (Foth, 2018a) 1 |
o |
Mining Permit Application Volume II, Environmental Impact Assessment Amendment (Foth, 2018b) 1,2 |
o |
Permit to Install Application (Foth, 2018c) 1 |
o |
Dam Safety Permit Application, Tailings Management Facility and Contact Water Basin (Foth, 2018d) 3, 4 |
· |
2020: |
o |
National Pollution Discharge Elimination System Permit Renewal Application (Foth, 2020) 1,5 |
1 Permit was granted.
2 Part of the Mining Permit.
3 Permit application was withdrawn in 2019.
4 Permit is currently valid.
5 An Administrative Law Judge remanded this permit in 2021 (Final Decision and Order Daniel L. Pulter, 2021).
Note that permits and amended permits for various project configurations were issued except for a Dam Safety Permit needed for the 2018 reconfigured project. With the exception of the NPDES permit which will need renewal by 2025, other permits were withdrawn by mutual agreement at the end of 2020.
The Project as presented in this report has been reconfigured under GRC ownership. New permit applications will be submitted seeking approval for construction of this redesigned project. Applicable environmental studies previously submitted and supplemented by updates as appropriate will be included in the applications. The topics and depth of environmental studies are guided by Part 632 of the Michigan Natural Resources and Environmental Protection Act, 1994 PA 451, as Amended (NREPA), Nonferrous Metallic Mining. Additional studies have been
Back Forty Project |
17-2 |
Gold Resource Corporation |
|
conducted in response to stakeholder concerns from prior permitting activities for the Project. The remainder of this section summarizes the environmental studies currently in hand.
17.1.1 |
Environment and Social Impact Assessments |
Environmental studies address both baseline data documentation and analysis of the environmental and social impacts resulting from the proposed mine. The impact analyses have informed the engineering studies and designs to avoid or minimize environmental risk. A socioeconomic study is underway to describe social impacts of the project. Studies and associated information will be issued in permit applications and may include multiple studies under the following topics:
· |
Soils |
· |
Geology |
· |
Geotechnical Investigation |
· |
Geochemical Investigation and Water Quality Modeling |
· |
Hydrogeology: |
o |
Precambrian Bedrock Hydrogeological Report |
o |
Groundwater and Surface Water Occurrence and Quality |
o |
Wetlands and Floodplains |
o |
Water Wells |
o |
Natural and Wild and Scenic Rivers |
o |
Groundwater Modeling to assess groundwater inflow to the mine |
o |
Wetland hydrological impacts |
o |
Watershed scale environmental water balance |
· |
Flora and Fauna: |
o |
Aquatic Biota and Habitats |
o |
Terrestrial Biota, Habitats and Ecosystems Evaluation |
o |
Threatened, Endangered Species and Species of Special Concern |
o |
Invasive Species |
· |
Cultural, Historical, and Archaeological Resources |
· |
Air Quality, Climatology, and Air Quality Impact Analysis |
· |
Aesthetic Resources (Visual, Noise, Light, Seismicity, Traffic) |
· |
Cumulative Impact Analysis (Air Deposition Analysis) |
· |
Socioeconomic Study |
· |
Public Input and Other Information |
17.1.2 |
Area of Direct Influence |
The area of direct influence emanates from the activities proposed during construction, operation, and reclamation of the project. Figure 17-1 and Figure 17-2 show the project setting from two perspectives. The project is located in a rural area containing water bodies, wetlands, and forest cover. Being close to a boundary river between two states, the project’s potential impact to the Menominee River is of interest. The facility design and operational practices are being developed to meet protective permit conditions. Areas of influence to the following resources have been the focus of environmental studies and include those items discussed below.
Back Forty Project |
17-3 |
Gold Resource Corporation |
|
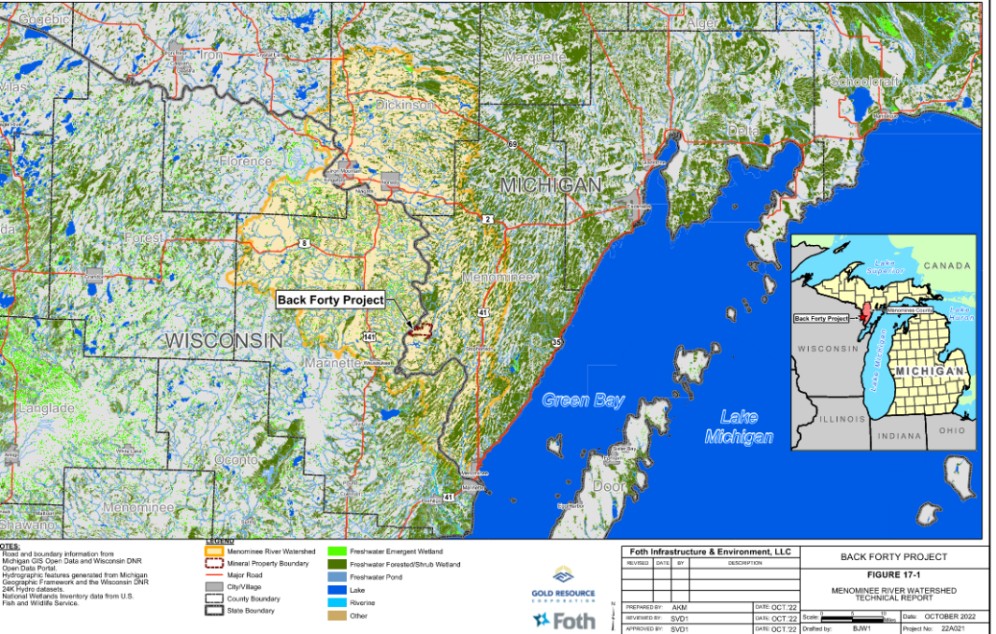
Figure 17-1: Back Forty Project Area of Influence
Back Forty Project |
17-4 |
Gold Resource Corporation |
|
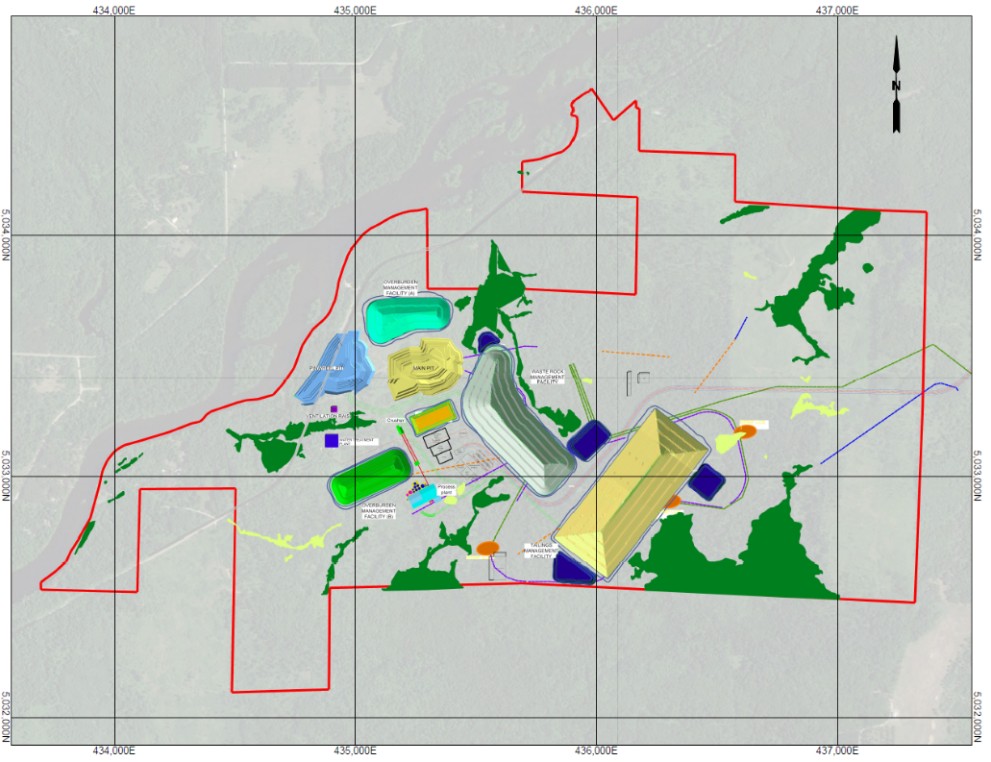
Figure 17-2: Back Forty Project Infrastructures
17.1.3 |
Groundwater |
The area of influence to groundwater from the project is confined to the vicinity of the project. Groundwater flows generally from east to west across the site towards the Menominee River. Groundwater quality is commensurate with an unimpacted greenfield site. Groundwater will be protected by design methods, operation practices, and the permit requirements including the Mining and NPDES Permits. Such requirements include liner systems, spill planning, monitoring, water treatment, and reporting.
17.1.4 |
Wetlands |
The region contains abundant wetlands; however, the site has adequate upland areas for siting facilities. In previous project configurations, direct wetland impacts necessitated obtaining a Part 301/303 wetland and streams permit. This proposed Project avoids all direct wetland and stream impacts. A Part 301/303 Permit is not anticipated.
Back Forty Project |
17-5 |
Gold Resource Corporation |
|
Potential indirect impacts to wetlands attributed to mine operations will be addressed as part of the Environmental Impact Assessment required as part of the Part 632 Mining Permit.
17.1.5 |
Surface Water |
The site is bordered by the Menominee River to the west, the Shakey River to the east, and Shakey Lakes to the south. Within the encompassed area are numerous wetlands and several inland streams, some of which are ephemeral. Water quality and flow data have been collected since 2008. The Menominee River is between Wisconsin and Michigan. It receives water discharges from several industrial facilities and municipalities and maintains good water quality and significant base flow. Dams and obstructions upstream and downstream prevent navigation; however, the river is used for recreation and has healthy ecosystems and habitats.
The Shakey River is east of the Project and flows in a southerly direction. South of the Project it turns west to empty into the Menominee River. A dam constructed decades ago has formed the Shakey Lakes south of the Project, the site of a small community and a park. Both groundwater and surface water have a boundary bisecting the planned facility area such that a portion flows west to the Menominee River with the remainder flowing south and east to the Shakey River. In past permitting efforts, hydrologic modeling has been prepared to estimate impacts from water drawdown from mine excavation. This modeling will be updated for the proposed Project.
17.1.6 |
Air Quality |
Air quality is good in the region and at the site. There are few major sources of air contaminants in the region and none in the immediate area. Air quality data was collected and documented in the Environmental Impact Assessments (Foth, 2015b, 2018b).
17.1.7 |
Flora and Fauna |
The project footprint (area of disturbance) will remove habitat from the site. This change will not directly influence the character and activities of flora and fauna in the surrounding area and region. Studies including terrestrial and aquatic biota with specifics for threatened, endangered, and special concern species will be included in the applications.
17.1.8 |
Aesthetic Resource and Recreation |
The site is located in a forested, rural area. The facility may be visible to the public from accessible areas: River Road and the Menominee River to the west and from County Road 356 to the east. Recreation nearby includes hunting, fishing, hiking, and snowmobiling where the facility may be visible to those participants. The aesthetics, as experienced from these activities depends on how close the individual is to the facilities; however, the view from the river will be limited due to the steep topography of the riverbank on the west side of the project. During operations, there may be occasional activity and facilities visible from some vantage points. Once the site has been reclaimed, however, only the Tailings Management Facility will remain. The Tailings Management Facility placement on the eastern extent of the main facility is advantageous as it increases the distance to the Menominee River and the cultural resources in that vicinity. Reclaiming the Tailings Management Facility includes a topsoil and
Back Forty Project |
17-6 |
Gold Resource Corporation |
|
vegetative cover to blend in with surroundings. The remainder of the site will be returned to approximately current topography and conditions. Recreational activities will be essentially unaffected by the presence of the Project.
17.1.9 |
Biodiversity |
The biodiversity in the region is consistent with that expected in a rural, forested area in a northern climate. Logging is common in the region and the area supports a variety of year-round recreational activities. Baseline studies at the Project show intact flora, fauna, and biodiversity consistent with the surrounding region. The facility will directly influence the footprint of disturbance and a buffer of surrounding area, however, not to the extent that the character and behavior of flora and fauna will change in the surrounding area and region. Regular monitoring including threatened and endangered, special concern species and invasive species will continue to confirm flora and fauna trends and health. Requirements to monitor and address any impacts on threatened, endangered, and special concern species will be provided under the Mining Permit.
17.1.10 |
Archaeological and Speleological Studies |
Archaeology, cultural, and historical artifacts at the site have been studied extensively. The studies in and around the site have been focused in the areas of facility siting to confirm that no resources are present within the area of disturbance. The locations of archaeological resources and a surrounding 30-meter buffer have been documented and surface design has avoided these areas. Additionally, in the event of an unanticipated discovery during mining activities, a protocol has been developed and approved in previous permits. The area starting from the mouth of the Menominee River and extending north past the project is identified by the Menominee Indian Tribe of Wisconsin as their cultural and ancestral lands. No treaties apply to the area. The studies to be included in the permit applications consider data and field observations over several decades. The tribe petitioned the Michigan State Historical Preservation Office to label the eastern bank of the Menominee River, including a portion of the open pit as a designated cultural landscape. The petition for listing was approved and the cultural landscape is currently listed on the National Register of Historic Places. As required in Part 632, the Environmental Impact Assessment will document efforts that GRC has taken to avoid, minimize and mitigate impacts to cultural resources and the designated cultural landscape. The cultural landscape designation does not disallow issuance of a Mining Permit. Currently, GRC continues to pursue engagement with interested Native American Tribes, including the Menominee Indian Tribe of Wisconsin, to discuss and, if possible, accommodate their concerns. The Mining Permit Application Volume II Environmental Impact Assessment will address stakeholder concerns. Speleological studies were not prepared because there are no caves in the area.
17.1.11 |
Socio-Economic Study |
GRC is preparing a study that will be included in permit applications to characterize the economic and social impacts of construction and operations from the project. The methodology uses data and modeling to estimate economic impacts on selected counties adjacent to the project over the years of construction and operation. Tax impacts at federal, state, and local levels will be considered. The region is sparsely populated on both the Michigan and Wisconsin sides of the project. The socioeconomic impact of the project will affect the area surrounding the project in both states. The direct labor needs for the project include drivers, mill and mine operators, maintenance, construction, professional and administrative personnel. Indirect employment impacts will be positive with the need
Back Forty Project |
17-7 |
Gold Resource Corporation |
|
for housing, food, and other basic services. Growth in housing and infrastructure for the employees will also be needed. The state will receive taxes and royalties through the leases GRC will exercise for the project.
17.2 |
Protective Measures of Facility Design |
The Project may potentially impact sensitive receptors from mine pit development, the underground mine, closure methods, water management, and dust generation. The following describes general characteristics of the proposed Project that address these topics. Section 17.3 describes waste management in more detail.
17.2.1 |
Mine Development and Mine Closure |
Two small open pits will initiate mining and will be developed in series. These pits are within the footprint of the previously proposed open pits (Table 17-1) and are independent of the underground mine. The west pit (Pinwheel pit) will generate the initial ore supply. It has closest proximity to the Menominee River and will interfere with River Road, a public road that runs parallel to the river. Reclaiming this pit will be done immediately after its excavation is complete. The west pit will be completely excavated in about 18 months with waste rock stored on the waste rock pad (Figure 17-2). The east pit (Main pit) will then begin development. Waste rock from the east pit will be directly transported to backfill the west pit. Waste rock stored on the pad will be used to backfill the east pit. Reclaiming the west pit is estimated to take a year, therefore, River Road may be out of commission for no more than three years. A detour will be established and although inconvenient, fully isolating the west pit activities from the public reduces safety risks. Reopening River Road will be done as expeditiously as possible.
Maintaining structural integrity of the riverbank during west pit excavation will be addressed. The west pit proximity to the Menominee River is about 200 feet (61 meter). A demonstration of riverbank stability and structural integrity of the pillar between the west mine and the river was part of the 2015 Mining Permit Application and subsequent contested case hearing. The analysis is valid for this mine configuration and will be updated, as needed, and presented in the Mining Permit Application for the proposed Project.
Closure of the two pits will also consider the potential for migration of weathering products. Geochemical analysis and modeling will be included in permit applications to assess how the potential of pore water in the backfilled waste rock will impact water quality in the Menominee River. Under the Mining Permit, ongoing studies and monitoring requirements will result in a detailed limestone amendment plan and closure design to neutralize pore water in reflooded backfill.
The two pits will be reclaimed soon after their excavation: Waste rock will be kept below a certain elevation, with overburden and topsoil placed atop to support final grade and vegetation establishment.
The development and backfill duration of the two pits will be approximately four years, thus waste rock stored on the surface facility will be subject to weathering for a short duration. This reduces the potential for pit backfill weathering contaminants from the east pit migrating via groundwater to the Menominee River.
Accelerated pit reflooding can further reduce the duration of geochemical liberation of weathering products on the backfilled waste rock. Additional contingency plans will also be proposed, addressing the potential that groundwater concentrations in the closed mine begin trending higher than anticipated. Groundwater from the backfilled pits can be circulated through the wastewater treatment plant to reduce concentrations in the backfilled pore water to an
Back Forty Project |
17-8 |
Gold Resource Corporation |
|
equilibrium that is protective of the Menominee River. The duration of this contingency, if indicated, will be included in the permit applications and subsequent model updates.
The underground workings will be developed from an entrance south of the two pits. It will be monitored throughout operations for the structural integrity of the crown pillar. Ongoing backfill that limits the open areas at any time, subsidence monitoring, and water inflow monitoring to mitigate unanticipated flows will be elements of overall monitoring and will be detailed in the Mining Permit Application. Ongoing reclamation of the underground mine reduces waste at the surface by permanently accommodating a portion of the waste rock and tailings. Timely backfill of excavated stopes using waste rock and cemented paste backfill reduces subsidence risk. When mining is complete, cemented rock bulkhead structures will be constructed in selected locations to minimize hydraulic mixing and prevent entry into the closed mine.
In summary, closure includes the following actions once mining operations are complete:
· |
Mine Closure: |
o |
Reclamation of the west and east pits will take place immediately after pit excavation is complete. Both pits will be backfilled with waste rock amended with limestone. |
o |
Placement of overburden, topsoil, and vegetation to return the pit areas to approximate natural conditions and topography. |
o |
Installation of groundwater monitoring wells within the two pit backfill to monitor pore water concentrations and groundwater flow recovery. Should concentration trend higher than expected, water from the backfilled pit may be extracted using a well system and circulated through a wastewater treatment system until concentrations subside and equilibrium is attained. |
o |
Reclamation of the underground mine starts during operations with ongoing stope backfill with waste rock and cemented tailings. |
o |
Upon cessation of mining, installation of cemented rock bulkhead structures in the underground mine workings. |
o |
Installation of monitoring wells placed in various mine sections. |
o |
Monitoring, including water quality characteristics to evaluate trends and concentrations. |
· |
Facility Closure: |
o |
Removal of remaining waste rock from the WRMF and placement into the TMF. |
o |
Decommissioning all systems and using, recycling, or disposing of excess materials. |
o |
Demolition and disposal of surface facilities. |
o |
Regrade the site to approximate natural topography, place topsoil and revegetate. |
o |
Installation of a cover system on the Tailings Management Facility to reduce the water infiltration into the tailings. |
o |
When no longer needed, the wastewater treatment system will be decommissioned and removed. |
· |
Post Closure: |
o |
After closure is complete, a monitoring system and reporting will take place under agency guidance. |
17.2.2 |
Water Management |
The water management strategy relies on design, construction, and operation practices with special consideration of contact water containment in highly variable conditions during the life of mine. Structures such as the contact water basins and contact water ditches will have liner systems to prevent infiltration and will be sized for a conservatively selected storm event with additional capacity to accommodate climate change. Process water will be managed within the water management system, which will need to supply significant mill water demand and manage variable facility inflows including mine water inflow and precipitation on the contact area. The system will:
· |
Maintain containment of all contact and process water |
· |
Provide consistent water supply to the mill |
Back Forty Project |
17-9 |
Gold Resource Corporation |
|
· |
Accommodate storm event inflow into the system without overflow to the environment |
· |
Treat excess water to strict water quality limits required by permit prior to discharge to the Menominee River. |
Two effluents entering the environment from the facility will be managed: treated water discharge effluent to the Menominee River and non-contact stormwater. Discharge requirements and practices will be outlined in the Mining Permit and NPDES permit. The effluent from the wastewater treatment plant will be closely monitored to maintain strict permit limits. All contact water including mine water inflow, leachate collected from waste repositories, excess mill water, and stormwater collected from the contact area, will be collected in contact water basins. The wastewater treatment plant will reduce contaminants in the influent water to stringent water quality standards on a consistent basis in compliance with the permits. The permit limits will be based on standards developed by Michigan Department of the Environment, Great Lakes, and Energy (EGLE). These standards have been confirmed as protective of the environment. Berms separating contact area and non-contact areas assure that contact water and stormwater will flow to the appropriate location.
Non-contact stormwater falls outside the contact water management area and, therefore, will not be contaminated from contact with potentially reactive materials. Non-contact stormwater will eventually reach the Menominee River to the west and Shakey River to the east in similar fashion to current conditions. Monitoring, focusing on aquatic life and water quality and flows will demonstrate continued ecological health of both rivers.
The water management system will address the protection of the Menominee River during every phase of mine life. Protections will be demonstrated in the applications and included in the Mining Permit requirements. Section 17.2 describes mine design and closure approaches that will be employed to protect the Menominee River and the environment in general. However, a regulatory issue affecting the Menominee River is in evaluation initiated in 2022 of the navigability of the Menominee River. Under Section 10 of the Rivers and Harbors Act of 1899, the US Army Corps of Engineers (USACE) is studying the Menominee River upstream from the vicinity of Menominee-Marinette, shown on Figure 17-1. The Menominee River has not historically been and is not currently used for commerce north of Menominee-Marinette, primarily due to numerous obstructions and depth and velocity challenges. Should the river be redesignated as navigable, wetland permitting along the river and its tributaries may shift to the USACE. Because the proposed design avoids the need for a wetland permit, this regulatory issue should not affect the Project.
17.2.3 |
Air Quality Management |
Air emissions from the project operations will be primarily from fugitive sources with additional emissions from equipment and ventilation stacks. The emissions will be inventoried in the air permit application and modeled to demonstrate compliance with state and federal air quality standards. To consistently maintain air quality, pollution control equipment, operating parameters, and fugitive dust practices will be dictated in the permit. The air permit will contain regular compliance monitoring and reporting requirements. Air permits are issued based upon a variety of protective standards addressing both public health and the environment. The potential cross media impacts from air emissions will be evaluated and included in the Environmental Impact Assessment. Modeling conducted on facility emissions will quantify the particulate matter potentially depositing on surrounding soils and water bodies. Several metals and sulfur will be analyzed for potential impacts to fulfill the cumulative impact analysis requirements of NREPA Part 632.
Back Forty Project |
17-10 |
Gold Resource Corporation |
|
17.3 |
Waste Management |
NREPA Part 632 Nonferrous Metallic Mining and associated rules outline requirements for waste rock and tailings storage and disposal. Based on the requirements, standard practice, and design of structures, facilities, and operations, the permit applications will describe the methods and details incorporated into facility design and operations that minimize environmental impacts. Managing facility waste is a primary strategy in avoiding and mitigating environmental impacts.
17.3.1 |
Waste Rock Management |
The Waste Rock Management Facility will accommodate mine waste from the operations. The Waste Rock Management Facility is a temporary facility used to store waste rock excavated from the west pit. Without the need to store waste rock from the east pit, the facility size can be minimized. Drainage from precipitation on the facility will report to the liner and be routed via ditches to the contact water system. As the east pit is excavated, waste rock will be placed into the west pit. At the end of east pit excavation, waste rock stored on the waste rock management facility will be used for backfill. The two pits will be reclaimed soon after their excavation: the west pit will be developed in about 18 months with waste rock stored on the waste rock pad (Figure 17-2). The duration of pit development and backfill will be approximately four years.
Waste rock from the underground mine development may be brought to the surface temporarily; however, optimally, most waste rock will remain underground and be used for ongoing backfill. At the end of mining, any leftover waste rock on the surface will be transferred to the Tailings Management Facility.
17.3.2 |
Tailings Management Facility |
The Tailings Management Facility will be a permanent facility, engineered to accommodate tailings material generated from ore processing in the mill. It will be constructed with a liner and leak detection system to prevent groundwater impacts in accordance with requirements and standard practice. Tailings exiting the mill will be dewatered in a filter press, resulting in a filter cake of moist, fine-grained material. Filtered tailings will be hauled by truck to the Tailings Management Facility and carefully placed and compacted in lifts. The tailings pile will become dense and resistant to water infiltration from precipitation thereby minimizing leachate draining to the liner system. This has the advantage of reduced water management needs during operation and a shorter duration of drainage after reclamation commences. Upon mining cessation, an engineered cover system will be installed to further limit water entering the tailings pile. Closure of the Tailings Management Facility should be efficient in that with little excess water in the stored tailings, drainage will diminish soon after the cover is installed. The need for treating or disposing the drainage water will be minimized.
A portion of the tailings will not report to the Tailings Management Facility but will be mixed with cement and used to backfill selected stopes. Not only does this safely and permanently manage these tailings, the cemented stopes helps maintain the structural integrity of the underground mine.
17.3.3 |
Other Waste |
The waste stream from the wastewater treatment plant operations will be in sludge or solids form. Additionally, other typical facility wastes such as used oil and used solvents will be managed in accordance with applicable rules.
Back Forty Project |
17-11 |
Gold Resource Corporation |
|
Waste to be disposed will be containerized and shipped to an appropriate disposal facility or landfill in accordance with state and local regulations.
17.4 |
Site Monitoring |
Site monitoring will be comprehensive and a continuation of many elements of baseline monitoring. An environmental monitoring plan will be initially proposed in the Mining Permit Application, then likely adjusted during permit processing. A more detailed plan is typically prepared for approval that addresses all environmental media. Components of the monitoring plan begin pre-construction and continue through post-closure until the site is deemed closed by EGLE and financial assurance has been returned to the mine owner. This is anticipated to take several decades.
Media to be monitored focuses on the media named in the initial environmental studies listed in Section 17.1.1. The Mining and NPDES permits will require monitoring to continue in the network of surface water stations established for baseline conditions along with additional stations. This enables project impacts to be identified and, if needed, mitigation measures to be implemented. This monitoring is part of the ongoing demonstration of satisfactory surface water quality conditions. Biota including aquatic resources, wildlife, and vegetation will continue to be monitored throughout mine life. Additionally, facility monitoring of various operations, such as wastewater discharges, groundwater monitoring wells (compliance wells) located within the facility, and leachate collection systems, are assembled into monthly and annual reports submitted to EGLE. This becomes public information providing transparency with the agency and the public.
17.5 |
Permitting Requirements |
Permits are required for the facility to be constructed. All permits listed are state issued according to the appropriate parts of NREPA.
· |
Part 632 Mining Permit (encompasses the Environmental Impact Assessment) |
· |
Part 31 National Pollutant Discharge Elimination System |
· |
Part 55 Permit to Install (Air Permit) |
Applications for these three permits for a mine with a smaller footprint than previous mine configurations are expected to be processed efficiently. The estimated schedule to obtain permits is within 12 to 18 months after application submittal.
17.6 |
Financial Assurance |
Financial assurance is a requirement in all Part 632 mining permits. This assurance to be maintained by the applicant is to address the costs of clean up and restoration of the facility in the event that the mine owner cannot fulfill its permit responsibilities. The Mining Permit Application for the proposed Project will have an estimate of financial assurance over the life of the project with final negotiations with EGLE to follow. Financial assurance will address demolition of surface facilities and closure of the mine performed by a third party and administered by
Back Forty Project |
17-12 |
Gold Resource Corporation |
|
EGLE. Financial assurance also includes costs for long-term monitoring and water treatment for the post closure mine. Mining activities cannot be initiated until financial assurance is submitted and approved by EGLE.
17.7 |
Plans, Negotiations, or Agreements with Local Individuals or Groups |
Communications with local individuals and groups are ongoing and will continue throughout the project. The topics focus on safety and stakeholder engagement. These communications will continue and address concerns from stakeholders as appropriate. An example is a Memorandum of Understanding between Stephenson Area Public Schools and Aquila Resources, Inc. – Back Forty Mine. This 2020 agreement documents the commitment of both parties to safety during student transportation days and times. Outreach to native American tribes will continue to better understand concerns and pursue mutually agreeable activities. In early fall 2022, EGLE hosted a Scoping Environmental Impact Assessment meeting for the tribes and interested agency representatives. Project information and the permitting process were topics of presentation with dialog on questions and concerns. Thereafter, GRC hosted two site tours for interested attendees where all parties were able to present important information and concerns. Written comments were submitted to EGLE and will be considered in preparation of upcoming applications.
17.8 |
Descriptions of Any Commitments to Ensure Local Procurement and Hiring |
Local procurement and hiring are important to the area. Contacts and meetings have commenced with Upper Peninsula of Michigan unions to discuss the project and the need for skilled trades to construct the project. Wisconsin will likely also provide skilled trades people. Support for the project has been generated among members of these groups. With a construction project of this size, local companies are also watching the progress of the project for work opportunities. Some organizations were involved in similar activities in 2008 to about 2014 as the construction and commissioning of the Eagle Mine near Big Bay, Michigan was underway.
17.9 |
Qualified Person’s Opinion on the Adequacy of Current Plans to Address Any Issues Related to Environmental Compliance, Permitting, and Local Individuals or Group |
As the Qualified Person vouching for the adequacy of current plans for environmental compliance, permitting, and engagement of local individuals or groups, I confirm I am in agreement with Section 17 of this technical report.
Back Forty Project |
17-13 |
Gold Resource Corporation |
|
18.0 |
CAPITAL AND OPERATING COSTS |
18.1 |
Capital Costs |
The capital and operating cost estimates in this Initial Assessment (“IA”) for the Back Forty Project are based on the construction of a mining and processing operation at a nominal 2,500 tpd throughput.
18.1.1 |
Summary |
The total initial capital cost for the construction of the Back Forty Project is estimated at $325.1M. The sustaining capital, which includes the capital required to bring the underground mine into production starting in 2028, is estimated at $102.8M. In both cases, contingencies and indirect costs are included in the estimations. The total capital required over the life of mine is $427.9M.
The main initial capital costs items are:
· |
A processing plant, including a crushing circuit. |
· |
A dry stacked tailings management facility. |
· |
A waste rock management facility. |
· |
An office building with infrastructures to support mining. |
· |
A water treatment plant. |
· |
Surface mobile equipment. |
· |
Pre-production. |
· |
Construction indirects. |
· |
Owner’s costs. |
· |
Contingency. |
The main sustaining capital costs items are:
· |
Underground capital development. |
· |
Underground mobile equipment. |
· |
Paste plant. |
· |
Underground ventilation setup. |
· |
Site reclamation and closure. |
Back Forty Project |
18-1 |
Gold Resource Corporation |
|
Table 18-1: Back Forty Project Capital Costs
Cost Area |
Initial capital cost ($M) |
Sustaining capital cost ($M) |
Total cost ($M) |
Mobile equipment |
5.8 |
24.3 |
30.1 |
Open pit mine |
1.4 |
1.7 |
3.1 |
Underground mine |
- |
50.6 |
50.6 |
Capitalized OPEX |
17.9 |
7.3 |
25.1 |
Electrical and communications |
8.1 |
- |
8.1 |
Surface infrastructures |
26.8 |
4.9 |
31.7 |
Process plant |
131.1 |
5.4 |
136.5 |
Rock and tailings management |
27.9 |
- |
27.9 |
Water treatment plant |
21.8 |
- |
21.8 |
Construction indirects |
22.0 |
- |
22.0 |
General services |
33.5 |
- |
33.5 |
Contingency |
28.9 |
8.7 |
37.6 |
Total |
325.1 |
102.8 |
428.0 |
Site reclamation and closure |
- |
22.6 |
22.6 |
Salvage value |
- |
(7.1) |
(7.1) |
Project total |
325.1 |
118.4 |
443.5 |
* Total may not add up due to rounding.
18.1.2 |
Scope and structure of Capital Cost Estimate |
The capital costs estimates for the Initial Assessment meet the AACE Class 4 requirements and have an accuracy range of ±25%. While some sections have details costs and would qualify for class 3, the overall project is considered class 4. Further work is required, especially on the waste and tailings management facilities, in order to qualify for Class 3 and be considered as a Preliminary Feasibility Study (PFS).
The capital costs estimates are based on the following criteria:
· |
It is based on a measurable degree of engineering completion. |
· |
It reflects generally accepted practices in the cost engineering profession. |
Back Forty Project |
18-2 |
Gold Resource Corporation |
|
· |
Equipment pricing is based on either proposals received specifically for the Project, recent budget quotes from suppliers, or derived from recent projects and databases. |
· |
Labor costs are based on current Michigan rates obtained from local contractors and wage surveys. |
· |
Estimations include earthworks, construction material, equipment, and labor. |
· |
Equipment costs include allowance for freight and insurance. |
· |
Costs are expressed in Q2 2023 United States dollars. |
18.1.3 |
Exclusions |
The following items are excluded from the capital cost estimate:
· |
Permitting, licensing, land acquisitions, and financial costs. |
· |
Costs incurred to date, including studies and work programs. |
· |
Sunk costs and pre-permit expenses. |
· |
Taxes which are included in the financial model. |
· |
Operating costs. |
· |
Change to design criteria. |
· |
Work stoppages. |
· |
Scope changes. |
· |
Delays in schedule over what has been covered by contingencies. |
· |
No inflation or escalation are included |
18.1.4 |
Initial Capital Cost |
18.1.4.1 |
Initial Capital Costs Summary |
The initial capital cost by area is listed in Table 18-2.
Back Forty Project |
18-3 |
Gold Resource Corporation |
|
Table 18-2: Initial Capital Costs
Cost Area |
Initial Capital cost ($M) |
Mobile equipment |
5.8 |
Open pit mine |
1.4 |
Capitalized OPEX |
17.9 |
Electrical and communications |
8.1 |
Surface infrastructures |
26.8 |
Process plant |
131.1 |
Rock and tailings management |
27.9 |
Water treatment and management |
21.8 |
Construction indirects |
22.0 |
General services |
33.5 |
Contingency |
28.9 |
Total |
325.1 |
* Total may not add up due to rounding.
18.1.4.2 |
Surface Mobile Equipment |
The surface mobile equipment includes equipment used for tailings disposal and other surface equipment. It does not include production equipment which is going to be leased and is accounted in operating costs.
Table 18-3: Initial Capital Costs for Mobile Equipment
Mobile equipment |
Initial capital cost ($M) |
Motor grader (CAT 14M) |
0.8 |
Surface loader (CAT 972) |
0.6 |
Excavator (CAT 352) |
0.7 |
Water truck (CAT 740) |
1.0 |
Articulated truck (CAT 740) |
0.8 |
Dozer (CAT D6) |
0.6 |
Service equipment |
1.1 |
Pickup trucks |
0.3 |
Total |
5.8 |
* Total may not add up due to rounding.
Back Forty Project |
18-4 |
Gold Resource Corporation |
|
18.1.4.3 |
Open Pit Mine |
Mining includes pumps and infrastructures for dewatering and the explosive storage building. Sustaining CAPEX will be required for pumping as both the open pits get developed deeper.
Table 18-4: Initial Capital Costs for the Open Pit Mine
Open pit mine |
Initial capital cost ($M) |
Explosive storage |
0.2 |
Mine dewatering |
1.2 |
Total |
1.4 |
18.1.4.4 |
Capitalized OPEX |
Capitalized OPEX includes mining and process operating costs incurred before the commercial production.
Table 18-5: Initial Capital Costs for Capitalized OPEX
Capitalized OPEX |
Initial capital cost ($M) |
Mining |
8.3 |
Processing |
4.7 |
General and Administration |
2.2 |
Shipping |
2.7 |
Total |
17.9 |
* Total may not add up due to rounding.
18.1.4.5 |
Electrical and Communications |
Electrical includes the construction of a power line from a substation located at the site entrance and distribution on site. The construction of the substation is not included in the capital cost as it is expected to be constructed by the electricity supplier.
Table 18-6: Initial Capital Costs for Electrical and Communication
Electrical and communication |
Initial capital cost ($M) |
138 kV line |
4.0 |
Emergency generators |
1.9 |
Distribution on site |
2.2 |
Total |
8.1 |
Back Forty Project |
18-5 |
Gold Resource Corporation |
|
18.1.4.6 |
Site Infrastructures |
Site infrastructure includes supporting infrastructures for the mine and processing plant.
Site preparation includes cleaning and grubbing along with the top-soil removal of the area where infrastructures will be located.
Site earthworks includes the leveling of the topography to allow construction and adequate drainage, construction of concrete pads for secondary infrastructures and fencing around the property.
Road includes the construction of the access road between County Road 356 and the main infrastructures, the haulage roads between the mine and different deposition point and between the processing plant and the tailings management facility.
Buildings includes the administrative building, guard house, cold storage, and truck shop.
Table 18-7: Initial Capital Costs for Site Infrastructures
Site Infrastructures |
Initial capital cost ($M) |
Cleaning and grubbing |
1.8 |
Site preparation |
1.2 |
Site Earthworks |
3.5 |
Access road |
1.7 |
Guard house |
0.7 |
Buildings |
16.6 |
Potable water station |
0.7 |
Fresh water station |
0.1 |
Cold storage |
0.5 |
Total |
26.8 |
* Total may not add up due to rounding.
18.1.4.7 |
Process Plant |
Processing plant includes earthworks, concrete, structural steel, mechanical, piping, electrical and instrumentation equipment for the building and the related infrastructures such as the crushing, grinding, flotation, leaching, Merrill-Crowe, SART, tailings and concentrate areas.
Back Forty Project |
18-6 |
Gold Resource Corporation |
|
Table 18-8: Initial Capital Costs for Process Plant
Process plant |
Initial capital cost ($M) |
Building |
56.0 |
Control room and instrumentation |
2.0 |
Crushing |
8.5 |
Ore silo |
1.2 |
Grinding |
4.6 |
Reagent distribution |
5.8 |
Flotation |
13.0 |
Leaching |
6.7 |
Merril-Crowe |
3.4 |
SART |
12.7 |
Detox |
1.9 |
Tailings dewatering |
8.1 |
Concentrate process water |
1.7 |
Concentrated dewatering |
5.4 |
Total |
131.1 |
* Total may not add up due to rounding.
18.1.4.8 |
Rock and Tailings Management |
The construction of the rock and tailings deposition facilities will be accomplished in the first 3 quarters of 2026 in time for the pre-production to start in Q4 2026.
Ore stockpile construction costs include earthworks, liner installation and the piping and drainage system.
Waste rock management facility (WRMF) construction costs include earthworks, liner installation and the piping and drainage system.
Tailings management facility (TMF) includes earthworks, liner installation and the piping and drainage system.
Back Forty Project |
18-7 |
Gold Resource Corporation |
|
Table 18-9: Initial Capital Costs for Rock and Tailings Management
Rock and tailings Management |
Initial capital cost ($M) |
Ore stockpile |
1.4 |
WRMF |
13.0 |
TMF |
13.6 |
Total |
27.9 |
* Total may not add up due to rounding.
18.1.4.9 |
Water Treatment and Management |
Water management includes leachate collection, ponds and contact water basin.
Waste water treatment plant includes the building and all the equipment required to treat water according to all the regulations in order to be discharge in the environment.
Table 18-10: Initial Capital Costs for Water Treatment and Management
Water management |
Initial capital cost ($M) |
Water treatment plant |
19.0 |
LCS |
0.2 |
TMF Pond |
1.1 |
Contact water basin |
1.5 |
Total |
21.8 |
18.1.4.10 |
Construction Indirect Costs |
Construction indirect costs include all the engineering activities as well as site construction management. A full suite of temporary facilities is also included as well as tools and operating and maintenance costs for construction equipment, construction equipment rentals, site power generation and fuel.
Table 18-11: Initial Capital Costs for Construction Indirect Costs
Construction indirects |
Initial capital cost ($M) |
Construction indirect |
32.3 |
Total |
32.3 |
Back Forty Project |
18-8 |
Gold Resource Corporation |
|
18.1.4.11 |
General Services |
General services include all the support departments that will be staffed and organized to assist during the development stage of the Project and will continue their functions during the operating phase; it includes the following:
· |
General Administration (General Management) |
· |
Supply Chain |
· |
HR & Training |
· |
Health and Safety |
· |
ESR |
· |
Security |
· |
IT |
· |
Accounting and Finance |
It also includes insurance, legal and other financial costs.
Table 18-12: Initial Capital Costs for General Services
General services |
Initial capital cost ($M) |
General services |
33.5 |
Total |
33.5 |
18.1.4.12 |
Contingency |
Contingency is an allowance included in the initial capital cost estimate that is expected to be spent to cover the known but undefined items within the scope of the estimate. These can arise due to currently undefined items of work or equipment, or to uncertainty in the estimated quantities and unit prices for labor, equipment, and materials. Contingency does not cover scope changes, project exclusions, or project risk reserve costs. Contingency is estimated at 10.35% of the total capital cost less the capitalized operating costs.
Table 18-13: Initial Capital Costs for Contingency
Contingency |
Initial capital cost ($M) |
Contingency |
28.9 |
Total |
28.9 |
18.1.5 |
Sustaining Capital Costs |
18.1.5.1 |
Sustaining Capital Summary |
The sustaining capital costs include all the capital costs incurred after the start of commercial production. It mostly includes capital to start the underground mine.
Back Forty Project |
18-9 |
Gold Resource Corporation |
|
Table 18-14: Sustaining Capital Costs Summary
Cost Area |
Sustaining capital cost ($M) |
Mobile equipment |
24.3 |
Open pit mine |
1.7 |
Underground mine |
50.6 |
Capitalized OPEX |
7.3 |
Site infrastructures |
4.9 |
Process plant |
5.4 |
Contingency |
8.7 |
Total |
102.9 |
Site reclamation and closure |
22.6 |
Salvage value |
(7.1) |
Project total |
118.4 |
* Total may not add up due to rounding.
18.1.5.2 |
Mobile Equipment |
The underground equipment list is based on the production schedule and productivity of each model. LHD equipment will be equipped with teleoperation capabilities to allow extraction in between shifts during blasting gas evacuation. Battery operated LHDs and trucks would be privileged but are currently difficult to source and have a long waiting list. The purchase of electrical equipment will have to be reassessed prior to starting the underground mine. The equipment will be purchased over a three-year period based from 2028 to 2030 based on productivity requirement.
Back Forty Project |
18-10 |
Gold Resource Corporation |
|
Table 18-15: Sustaining Capital Costs for Mobile Equipment
Mobile equipment |
Unit |
Sustaining capital cost ($M) |
Jumbo (Sandvik DD421) |
3 |
3.0 |
LHD (Sandvik LH517) |
5 |
6.1 |
Mining truck (Sandvik TH551) |
4 |
5.6 |
Production drill (Sandvik DL421) |
2 |
2.1 |
Bolter (Omnia 975) |
3 |
3.2 |
Boom truck |
1 |
0.5 |
Fuel-lube truck |
1 |
0.5 |
Emulsion charger |
1 |
0.6 |
Scissor lift |
2 |
1.0 |
Backhoe |
1 |
0.1 |
Grader |
1 |
0.7 |
Electrical support vehicle |
1 |
0.1 |
Mechanical support vehicle |
1 |
0.1 |
Pickup |
4 |
0.3 |
Surveyor pickup |
1 |
0.1 |
Personnel carrier |
2 |
0.2 |
Total |
33 |
24.3 |
* Total may not add up due to rounding.
18.1.5.3 |
Underground Mine |
Initial capital costs for the underground mine are treated as sustaining capital costs for the Back Forty Project since open pit mining will be well underway by the time the underground mine is developed.
Underground sustaining cost estimates are based on first principal estimates and detailed underground design.
Table 18-16: Sustaining Capital Costs for Underground Mine
Underground mine |
Sustaining capital cost ($M) |
Capital development |
34.3 |
Ventilation |
2.0 |
Infrastructures |
12.1 |
Escapeway |
2.2 |
Total |
50.6 |
* Total may not add up due to rounding.
Back Forty Project |
18-11 |
Gold Resource Corporation |
|
18.1.5.4 |
Capitalized OPEX |
A portion of the open pit mining costs are considered as capitalized operating costs as the stripping ratio in the first years is much higher the later years. This reports some of the costs to later years.
Table 18-17: Sustaining Capital Costs for Capitalized OPEX
Capitalized OPEX |
Sustaining capital cost ($M) |
Open pit stripping |
7.3 |
Total |
7.3 |
18.1.5.5 |
Site Infrastructure |
Ventilation infrastructures are required for the underground mine. A set of 2 x 1000 HP fans with heaters are to be installed at the end of 2028 and in early 2029 when the underground development and ventilation raises are ready.
Table 18-18: Sustaining Capital Costs for Site Infrastructures
Site infrastructures |
Sustaining capital cost ($M) |
UG ventilation infrastructure |
4.9 |
Total |
4.9 |
18.1.5.6 |
Processing Plant |
The paste backfill plant installation in the processing plant will be constructed in 2029 to be ready for underground production.
Table 18-19: Sustaining Capital Costs for Processing Plant
Processing plant |
Sustaining capital cost ($M) |
Paste plant |
5.4 |
Total |
5.4 |
18.1.5.7 |
Contingency |
A 10% contingency is added to all sustaining capital costs except for capitalized operating costs.
Back Forty Project |
18-12 |
Gold Resource Corporation |
|
Table 18-20: Sustaining Capital Costs for Contingency
Contingency |
Sustaining capital cost ($M) |
Contingency |
8.7 |
Total |
8.7 |
18.1.5.8 |
Site Reclamation and Closure |
Closure and rehabilitation costs are incurred after the end of the mine life. They include reclamation, dismantling and removal of surface infrastructures, and the restoration of the leftover waste rock and tailings management facilities, as well as the associated monitoring and engineering activities.
Table 18-21: Sustaining Capital Costs for Rehabilitation and Closure
Rehabilitation and closure |
Sustaining capital cost ($M) |
Site reclamation and closure |
22.6 |
Total |
22.6 |
18.1.5.9 |
Salvage Value |
It is expected that some equipment may be resold once they are not required. The VXP 1000 regrind mill is only used for the first two years while mining the high copper zone. The supplier has given a $1.1M value after this period. The open pit drill is the only mining equipment bought and could be resold after the end of the open pit mining. A salvage value was also given to underground mining equipment and main items in the process plant.
Table 18-22: Sustaining Capital Costs for Salvage Value
Salvage value |
Sustaining capital cost ($M) |
VXP1000 regrind mill |
-1.1 |
Open pit drill |
-0.3 |
Underground equipment |
-2.3 |
Milling equipment |
-3.4 |
Total |
-7.1 |
Back Forty Project |
18-13 |
Gold Resource Corporation |
|
18.2 |
Operating Costs |
18.2.1 |
Summary |
The average operating costs over the 9-year mine life is estimated to be $84.81 per tonne (“$/t”). Table 18-23 details to operating costs.
Table 18-23: Operating Costs Summary
Cost area |
Total cost ($M) |
Cost per tonne milled |
Overburden Removal and Storage |
5.4 |
0.61 |
Open Pit Mining |
50.4 |
5.75 |
Underground Mining |
194.6 |
22.19 |
Rehandling |
1.0 |
0.12 |
Processing |
256.9 |
29.30 |
Tailings Deposition |
23.7 |
2.70 |
WRMF Reclamation |
4.4 |
0.51 |
General and Administration |
79.6 |
9.07 |
Concentrate Shipping |
153.0 |
17.44 |
Capitalized OPEX |
(25.1) |
(2.87) |
Total |
743.8 |
84.81 |
* Total may not add up due to rounding.
18.2.2 |
Basis of Operating Cost Estimate |
The operating cost estimate was based on Q2 2023 assumptions. Costs were generally itemized in detail; however, some items of lesser significance are calculated estimates, or have been included as an allowance. The operating costs estimate is based on the detailed monthly mine schedule established in Deswik. No contingency or cost escalation are assumed.
18.2.3 |
Mining |
18.2.3.1 |
Overburden |
The operating costs for moving and storing overburden is based on quotations received from local contractors.
They include a portion of fixed and variable costs,but have been converted to a cost per tonne basis.
Back Forty Project |
18-14 |
Gold Resource Corporation |
|
Table 18-24: Operating Costs for Overburden
Cost area |
Total cost ($M) |
Cost per tonne mined |
Cost per tonne milled |
Overburden |
5.4 |
4.00 |
0.61 |
Total |
5.4 |
4.00 |
0.61 |
18.2.3.2 |
Open Pit |
Operating costs for the open pit have been based on detailed calculations for every cost area. The total open pit operating cost is $50.4M. The average open pit mining cost is $6.04/t mined.
Drilling and blasting costs include drilling tools, maintenance, explosives and blasting accessories.
Loading includes consumables and maintenance for loading equipment.
Hauling includes consumables and maintenance for hauling equipment.
Auxiliary equipment includes consumables and maintenance for auxiliary equipment.
Services includes all manpower (operation, supervision, technical services, electrical and mechanical).
Equipment rental includes the costs to rent new equipment from the manufacturer. Rental fee is based on a 20% downpayment on the equipment and a quarterly payment of 5% of the equipment cost at a 7.1% interest rate.
The use of contractors would lower the variable costs but increase the fixed costs and would result in minimal gains. If negations with a contractor can lead to a reduction in costs, this option should be further investigated.
Table 18-25: Operating Costs for Open Pit Mine
Cost area |
Total cost ($M) |
Cost per tonne mined |
Cost per tonne milled |
Drilling and blasting |
4.4 |
0.52 |
1.35 |
Loading |
5.2 |
0.62 |
1.61 |
Hauling |
4.7 |
0.56 |
1.46 |
Auxiliary equipment |
8.2 |
0.98 |
2.54 |
Services |
23.6 |
2.82 |
7.33 |
Equipment rental |
4.4 |
0.53 |
1.37 |
Total |
50.4 |
6.04 |
15.67 |
* Total may not add up due to rounding.
Back Forty Project |
18-15 |
Gold Resource Corporation |
|
18.2.3.3 |
Underground |
Operating costs for the underground mine have been based on detailed calculations for every cost area. The total open pit operating cost is $194.6M. The average underground mining cost is $38.04/t mined. The operating cost for long hole mining is $37.62/t while the operating cost for cut and fill is $42.37/t.
Grade control includes diamond drilling and assaying to better define the ore zones.
Horizontal development includes consumables, maintenance, ground support, manpower and explosives for development. The cost for ramp and infrastructures at 5.5m x 5.5m is $3,060/m and $2,510/m for development in ore at 5.0m x 5.0m.
Drilling and blasting includes consumables, manpower, explosives and blasting accessories. Opening raise done by contractors is also included.
Loading includes consumables and manpower to extract the material from the stopes to load the mining truck.
Hauling includes consumables and manpower to haul material to the surface.
Backfill includes consumables and binder. Maintenance of the backfill plant is included in the processing plant operating cost.
Services includes supervision and technical services.
Ventilation includes consumables, maintenance, electricity and propane.
Energy includes electricity for equipment, pumping, compressed air and other installations.
Maintenance includes consumables and maintenance for drilling, loading, hauling and auxiliary equipment.
Table 18-26: Operating Costs for Underground Mine
Cost area |
Total cost ($M) |
Cost per tonne mined |
Grade control |
8.1 |
1.58 |
Horizontal development |
23.4 |
4.58 |
Drilling and blasting |
37.9 |
7.40 |
Loading |
16.0 |
3.15 |
Hauling |
21.8 |
4.26 |
Backfill |
23.8 |
4.64 |
Services |
16.4 |
3.20 |
Ventilation |
14.8 |
2.89 |
Energy |
7.0 |
1.37 |
Maintenance |
25.4 |
4.96 |
Total |
194.6 |
38.04 |
* Total may not add up due to rounding.
Back Forty Project |
18-16 |
Gold Resource Corporation |
|
18.2.4 |
Material Rehandling |
Material rehandling is required to reclaim mineralized material stored on the ore stockpile. The surface loader will be used to transfer the material to the crusher. A total of 513kt will need to be rehandled according to the mine plan.
Table 18-27: Operating Costs for Material Rehandling
Cost area |
Total cost ($M) |
Cost per tonne rehandled |
Cost per tonne milled |
Rehandling |
1.0 |
2.00 |
0.12 |
Total |
1.0 |
2.00 |
0.12 |
18.2.5 |
Processing |
The annual process operating cost was estimated to be USD 28.5 M. A breakdown of this value and the unit costs are presented in Table 18-28. The main operating costs for the processing plant are the reagents, manpower and utilities, representing approximately 85% of the costs.
Table 18-28: Operating Costs for Process Plant
Cost area |
Total cost ($M) |
Cost per tonne mined |
Manpower |
58.4 |
6.65 |
Mill reagents |
84.9 |
9.67 |
Grinding media |
22.3 |
2.54 |
Utilities |
41.3 |
4.70 |
Consumables and wear parts |
17.6 |
2.00 |
Maintenance |
24.6 |
2.80 |
Mobile equipment |
3.2 |
0.36 |
Laboratory |
5.1 |
0.58 |
Total |
257.3 |
29.30 |
* Total may not add up due to rounding.
Staffing was estimated by benchmarking against similar projects. The manpower costs include requirements for plant operation, such as management, metallurgy, operations and maintenance. The total operational labor averaged 52 employees.
Individual personnel were divided into their respective positions and classified as either 8-hour or 12-hour shift employees. The rates were estimated as overall rates, including all benefits and were based on GRC’s knowledge of the employment market in the geographical area of the project. Salaries were also benchmarked against similar projects.
Back Forty Project |
18-17 |
Gold Resource Corporation |
|
Individual reagent consumption rates were estimated based on the metallurgical testwork results. Each of the reagent cost was obtained through vendor quotes, except for the refining fluxes. The unit costs included delivery to the mine site.
The annual cost for grinding media for the SAG mill, ball mill and regrind mills was estimated based on the expected media consumption (g/kWh) and the cost per tonne of grinding media. The comminution study completed by Orway for the study was used as a basis to determine the media consumption. The steel and ceramic media costs were obtained through vendor quotes and included site delivery.
The process plant utilities costs include electricity and propane required for processing only (heating and ventilation costs are included in General and Administration costs).
The processing power draw was based on the average power utilization of each motor on the electrical load list. The operating power was estimated to be 10.4 MW and the power cost provided by GRC was 0.0635 USD/kWh.
Propane consumption was estimated based on the requirements for each propane fueled equipment (values provided by the equipment vendor). Operating factors were applied to determine the annual requirements. The propane cost (0.526 USD/L) was provided by GRC based on a quote obtained from a local propane supplier.
Consumables and wear parts costs include the replacement of critical wear items such as crushers and mill liners, screen panels, filter cloths, etc. The wear and replacement rates were estimated based on GRC calculation methods and database, metallurgical testwork results and supplier quotations.
Capital spares are critical replacement parts maintained in inventory to allow immediate repairs (cyclones, pumps, etc.). Annual capital spares costs are calculated based on the total mechanical equipment cost. Maintenance supplies costs (lubricants, gaskets, etc.) are calculated as a percentage of the capital spares parts cost.
The process plant mobile equipment cost category consists of the annual expenses related to the operation of the pick-up trucks, loaders, forklifts and others required to ensure proper functioning of the mill. For each type of equipment, the number of units and their annual operating hours have been determined. Hourly fuel consumption and maintenance costs were estimated to calculate the annual mobile equipment expenses.
The metallurgical laboratory costs are estimated based on GRC experience and a provision for testwork performed by external laboratories.
18.2.6 |
Tailings Disposition |
Tailings disposition includes the manpower and maintenance to haul, dispose and compact the tailings in the TMF.
Table 18-29: Operating Costs for Tailings Disposition
Cost area |
Total cost ($M) |
Cost per tonne milled |
Tailings disposition |
23.7 |
2.70 |
Total |
23.7 |
2.70 |
Back Forty Project |
18-18 |
Gold Resource Corporation |
|
18.2.7 |
WRMF Reclamation |
Transportation of the waste store in the WRMF to backfill the Main pit is included in operating costs. It includes manpower and maintenance for transportation and disposition of the waste in the pit. This activity will begin in the last year of production in anticipation of the site closure.
Table 18-30: Operating Costs for WRMF reclamation
Cost area |
Total cost ($M) |
Cost per tonne milled |
WRMF reclamation |
4.5 |
0.51 |
Total |
4.5 |
0.51 |
18.2.8 |
General and Administration |
General and administrative (“G&A”) costs are expenses not directly related to the production of goods and encompass items nots included in the mining, processing, water and waste management and transportation costs of the Project.
Table 18-31: Operating Costs for General and Administration
Cost area |
Total cost ($M) |
Cost per year |
Cost per tonne |
Salaries |
37.3 |
4.03 |
4.25 |
Insurance |
23.1 |
2.50 |
2.64 |
Property taxes and leases |
1.1 |
0.12 |
0.13 |
Supplies |
1.0 |
0.11 |
0.11 |
Community relations |
4.6 |
0.50 |
0.53 |
Legal |
2.3 |
0.25 |
0.26 |
Consulting services |
2.3 |
0.25 |
0.26 |
IT |
4.6 |
0.50 |
0.53 |
Accounting |
2.3 |
0.25 |
0.26 |
Training |
0.9 |
0.10 |
0.11 |
Total |
79.6 |
8.60 |
9.07 |
* Total may not add up due to rounding.
18.2.9 |
Concentrate Transportation |
Concentrate created in the processing plant will need to be transported to copper and zinc refiners for final transformation and payment. The concentrate will be transported by truck to a local infrastructure which can load both railcars and vessels. It is expected the concentrate will mostly be transported by train to Eastern Canada, but the shipping by vessel could allow to take advantage of better terms with refiners overseas. Transportation from the
Back Forty Project |
18-19 |
Gold Resource Corporation |
|
mine to the final destination is evaluated at 130$/t of concentrate for the zinc concentrate and 178$/t for the copper concentrate.
Table 18-32: Operating Costs for Concentrate Transportation
Cost area |
Total cost ($M) |
Cost per tonne mined |
Loading infrastructure rental |
18.8 |
2.15 |
Copper concentrate |
37.7 |
4.30 |
Zinc concentrate |
96.4 |
11.00 |
Total |
108.5 |
17.44 |
* Total may not add up due to rounding.
Back Forty Project |
18-20 |
Gold Resource Corporation |
|
19.0 |
ECONOMIC ANALYSIS |
The economic assessment of the Back Forty Project (the “Project”) for Gold Resource Corporation (“GRC”) was carried out using a discounted cash flow approach on a pre-tax and after-tax basis, based on the median of 2024 to 2028 consensus prices from analysts collected by GRC dated June 2023. No provision was made for the effects of inflation.
The internal rate of return (“IRR”) on total investment was calculated based on 100% equity financing, even though GRC may decide in the future to finance part of the Project with debt financing. The net present value (“NPV”) was calculated from the cash flow generated by the Project, using a discount rate of 6%. The simple payback period and the payback period after the start of operations are based on the undiscounted annual cash flow of the Project and they are also indicated as a financial measure. Furthermore, a sensitivity analysis has been performed for the after-tax base case to assess the impact of variations in the Project capital costs, metal prices, and operating costs.
The economic analysis presented in this chapter contains forward-looking information with regards to the commodity prices, proposed mine production plan, projected metal recoveries, operating costs, construction costs, and the Project schedule. The results of the economic analysis are subject to a number of known and unknown risks, uncertainties, and other factors that may cause actual results to differ materially from those presented here.
As per the SK1300 requirement for IA, the economic analysis is presented in detail for two scenarios, one with Inferred resource included in the mine plan and one without, but two additional scenarios are presented for sensitivity. The optimization process for open pit and underground production was made without Inferred material. The case with Inferred material adds tonnes and grade from this category of material to the mine plan. Inferred material was considered without grades in the original case. The metal prices used for the base case based on the average median consensus prices for each of the five years starting 2024 through 2028 as provided by the Bank of Montreal in June 2023. The median price was based on the price estimates contributed by 38 participating financial institutions. These prices are also very similar to the three-year average. As reference, two other cases are presented, the spot prices from September 29, 2023 and the median of the long term consensus from the same Bank of Montreal document.
Table 19-1: Metal Prices for Different Economic Analysis Scenarios
Metal |
Base Case |
36-month average (as of August 28, 2023) |
Spot Price (As of September 29, 2023) |
Long term consensus (median) |
|
Au |
$/oz |
1,800 |
1,841 |
1,850 |
1,700 |
Ag |
$/oz |
23.30 |
23.70 |
22.20 |
23.00 |
Cu |
$/lb |
3.90 |
3.95 |
3.70 |
3.69 |
Zn |
$/lb |
1.25 |
1.39 |
1.18 |
1.20 |
19.1 |
Disclaimer on Mineral Resource and Financial Analysis |
Mineral Resources, unlike Mineral Reserves, do not have demonstrated economic viability. In order to declare Mineral Reserves, at least a Prefeasibility level study is required. Since this TRS is an Initial Assessment, not enough engineering details are available to bring it to a PFS level.
Back Forty Project |
19-1 |
Gold Resource Corporation |
|
19.2 |
Demonstration of Economic Viability |
The financial analysis for the Back Forty Project with the different scenarios all show positive outcomes with an after-tax NPV at a discount rate of 6% of $214.5M, a 25.7% IRR and 2.4 years payback for the base case. Table 19-2 shows the economic analysis for the different scenarios.
Table 19-2: Economic Results for Back Forty Project
Area |
Base Case |
Spot Price |
LT consensus |
Base Case Indicated only |
||
Total Process Plant Feed |
Mt |
8.77 |
8.77 |
8.77 |
8.55 |
|
Grade |
Au |
g/t |
2.37 |
2.37 |
2.37 |
2.35 |
Ag |
g/t |
26.2 |
26.2 |
26.2 |
25.8 |
|
Cu |
% |
0.39 |
0.39 |
0.39 |
0.38 |
|
Zn |
% |
4.29 |
4.29 |
4.29 |
4.34 |
|
NSR |
$/t |
210.38 |
206.71 |
196.71 |
209.57 |
|
Payable metal |
Au |
koz |
487.6 |
487.6 |
487.6 |
472.8 |
Ag |
koz |
4,800.9 |
4,800.9 |
4,800.9 |
4,605.9 |
|
Cu |
Mlb |
59.1 |
59.1 |
59.1 |
56.5 |
|
Zn |
Mlb |
658.0 |
658.0 |
658.0 |
645.7 |
|
Life of Mine |
Years |
9.0 |
9.0 |
9.0 |
9.0 |
|
Metal Prices |
Au |
$/oz |
1,800 |
1,850 |
1,700 |
1,800 |
Ag |
$/oz |
23.30 |
22.20 |
23.00 |
23.30 |
|
Cu |
$/lb |
3.90 |
3.70 |
3.69 |
3.90 |
|
Zn |
$/lb |
1.25 |
1.19 |
1.20 |
1.25 |
|
Gross Revenue |
$M |
2,042.5 |
2,010.3 |
1946.0 |
1,985.9 |
|
Charges |
$M |
180.0 |
180.0 |
180.0 |
176.1 |
|
Penalties |
$M |
17.4 |
17.4 |
17.4 |
18.0 |
|
Net Revenue |
$M |
1,845.1 |
1,812.9 |
1,749.6 |
1,791.8 |
|
Stream |
Au |
$M |
113.7 |
116.8 |
107.3 |
110.2 |
Ag |
$M |
78.8 |
74.3 |
77.5 |
75.6 |
|
Royalties |
$M |
24.2 |
23.5 |
22.2 |
24.1 |
|
Taxes |
$M |
106.7 |
104.6 |
93.6 |
103.6 |
|
OPEX |
Total |
$M |
743.8 |
743.8 |
743.8 |
732.6 |
per tonne |
$/t |
84.81 |
84.81 |
84.81 |
85.69 |
|
CAPEX |
Initial |
$M |
325.1 |
325.1 |
325.1 |
325.4 |
Sustaining |
$M |
102.8 |
102.8 |
102.8 |
103.8 |
|
Cashflow Pre-Tax |
$M |
471.2 |
441.0 |
385.2 |
434.6 |
|
Cashflow Post-Tax |
$M |
361.2 |
336.4 |
291.7 |
331.0 |
|
Discounted Cashflow Post-Tax @ 6% |
$M |
214.4 |
197.3 |
162.6 |
194.2 |
|
Post-Tax internal rate of return |
% |
25.7 |
24.5 |
21.2 |
24.5 |
|
Post-Tax Payback |
Years |
2.4 |
2.5 |
2.9 |
2.5 |
|
Back Forty Project |
19-2 |
Gold Resource Corporation |
|
19.3 |
Principal Assumptions |
The principal assumptions for the financial model are listed below.
19.3.1 |
Metal Prices |
Metal prices for the different scenarios are listed in Table 19-1. As discussed in Section 16.1, these prices are based on analyst’s median consensus prices for mid-term or long-term and on spot prices on September 29th, 2023.
19.3.2 |
Discount Rate |
NPV is reported using a discount rate of 6%, which reflects that an excess of 43% of gross revenue is generated from precious metals (which are typically afforded a discount rate of 5% for a low-risk geography such as Michigan). NPV is expressed in real, Q2 2023 terms. The start date for discounting is the commencement of Project construction. It is expected that no material expenditures will be made prior to this date.
19.3.3 |
Taxes |
Results were calculated on a post-tax basis and incorporate the current US fiscal regime as follows:
· |
The state Nonferrous Metallic Minerals Extraction Severance Tax has been applied. The severance tax rate of 2.75% is applied to taxable mineral value, which is the NSR. |
· |
The Michigan state income tax rate of 6%, which is applied to pre-tax income. Other deductions include an allowance for depletion, depreciation of capital investment and amortization of closure expenses. |
· |
The federal income tax rate of 21%, which is applied to pre-tax income that includes the state income taxes as a deduction. Other deductions include an allowance for depletion, depreciation of capital investment and amortization of closure expenses. |
19.3.4 |
Revenues |
Revenues are based on commercial terms for concentrate and doré, based on guidance from specialist metal traders and are as follow:
19.3.4.1 |
Copper Concentrate |
Transportation and other costs (including insurance, representation, losses, freight credits where applicable, etc.) for delivery to the receiving smelter/buyer are estimated at an ‘all-in’ cost of US $178/dry metric tonne of concentrate.
Concentrate grade would be adjusted to target the optimal economics per material type with an average of 14.0%. Copper payables would be calculated on a 1.2-unit deduction to a maximum of 96.5%. Treatment charges would include a base rate of $82.5/t, with average penalties of approximately $68/t for mercury, zinc and lead. The high penalties are primarily due to the lead content starting in Year 4. A lead circuit could be added to the processing plant at this time to recover the lead and to reduce the penalties, but this is not part of this study. Refining charges would be $0.085/lb payable Cu.
The grades of by-product Au and Ag would average 66.5 g/t and 653 g/t, respectively. These high grades would be expected to make Back Forty copper concentrate desirable and allow maximum payables of 96.3% Au and 90% Ag to be achieved. Refining charges would be $6/oz Au and $0.50/oz Ag.
Back Forty Project |
19-3 |
Gold Resource Corporation |
|
19.3.4.2 |
Zinc Concentrate |
Transportation and other costs (including insurance, representation, losses, freight credits where applicable, etc.) for delivery to the receiving smelter/buyer are estimated at an ‘all-in’ cost of US $130/dry metric tonne of zinc concentrate. This represents an average freight for assumed deliveries to Valleyfield and to Europe.
Concentrate grade would be adjusted to target the optimal economics per material type with an average of 51.6%. Zinc payables would be calculated on an eight-unit deduction to a maximum of 85%. Treatment charges would include a base rate of $225/t, with average penalties of $6/t for mercury, iron and silica content. There are no refining charges for zinc.
19.3.4.3 |
Doré |
Doré would command payables of 99.5% Au and 99% Ag. Refining and transportation charges of $6/oz Au and $0.35/oz are included in the financial model.
19.3.4.4 |
SART |
Sludges recovered from the RO process of SART contain high purity copper and zinc. The revenues from the metal recovered are estimated the same way as the respective concentrates with the same transportation, treatment and payable, but without penalties.
19.3.5 |
Gold and Silver Streams with Osisko |
Aquila previously sold a stream of 85% of future silver production. The commercial arrangements associated with the stream included initial payments totaling $17.25M and a further $4/oz for silver delivered into the stream. The financial model does not include the initial payments as inflows as these have already been received.
Aquila also previously sold a stream of 18.5% of gold production to a cap of 105 koz into the stream (or approximately 568 koz total production). Thereafter, the stream reduces to 9.25% of total production. Over the life of mine, gold delivered into the stream is forecast to total 90.1 koz. Gold stream payments included phased initial payments of $55M, of which $17.5M has been received to date. The model reflects the final $30M deposit as an inflow during the construction period. The stream also makes provision for payment of 30% of the spot price, to a maximum of $600/oz, for gold delivered into the stream.
The streams are omitted from the calculation of tax obligations, with pre-tax revenues calculated based on the entirety of production sold at forecast spot prices.
19.3.6 |
Metallurgical Recoveries |
The mathematical equations used to model metallurgical recovery (see Section 14.5 of this TRS) were generated from regression analysis of testwork data. For all metals, this analysis showed a strong correlation between the grade of the sample tested and recovery, with recovery increasing as a function of grade. It was also observed that material from different zones reacted differently, especially material with high copper grades in the Pinwheel zone. As such, the recovery equations in the financial model were adapted to the material type being processed for the first two years where material exclusively comes from the Pinwheel zone. As these functions are not linear, the recovery estimate for the average grade that will be processed in a given month is not necessarily equal to the sum of recovery estimates for the individual blocks of material. In practical terms, this reflects that recovery from a stream of varying material grades will be higher than if the grade were kept constant. The average recoveries by circuit is given in Table 19-3.
Back Forty Project |
19-4 |
Gold Resource Corporation |
|
Table 19-3: Metallurgical Recoveries from the Different Circuits
Copper circuit |
Zinc Circuit |
Leaching |
SART |
Overall |
Payable |
|
Cu recovery |
80.7% |
0.0% |
0.0% |
5.6% |
86.4% |
80.4% |
Zn Recovery |
2.0% |
93.1% |
0.0% |
0.6% |
95.7% |
79.3% |
Gold recovery |
62.1% |
2.7% |
13.0% |
0.0% |
77.8% |
72.9% |
Silver recovery |
55.2% |
15.6% |
16.0% |
0.0% |
86.8% |
64.5% |
19.3.7 |
Royalties |
The royalties that apply to material planned to be mined include:
■ |
The Michigan State royalty, which applies to approximately 28% of the total mineralized material (25% on a value basis), is calculated on a sliding scale that ranges from 2.5% to 10.5% of NSR for the open pit and 2.0% to 10.0% for the underground. |
■ |
The Ganzer Royalty, which applies to 6% of the total mineralized material (5% on a value basis), is a flat 3.5% of NSR. |
19.4 |
Cashflow Forecast |
19.4.1 |
Base Case with Inferred Material |
This cashflow forecast includes material from the Inferred category. There is a total of 221kt of Inferred material in the mine plan for 2.5% of the processed tonnes. Inferred material is too speculative in nature to be considered as Mineral Reserves.
19.4.1.1 |
Results of Economic Analysis |
There is an anticipated 18-month period for the construction of the processing plant and all associated infrastructures. Startup of the processing plant will be in Q4 2026 to be able to start commercial production in Q1 2027. Overburden removal over the Pinwheel pit will start in Q2 2026 in order to be able to start mining in Q4. Open pit production from the Pinwheel and Main pits are the source of materialized material sent for processing for the first three years. A 500kt stockpile will be created and will serve as a complement to underground production starting 2030. An average of 2,600 tpd will be processed at the mill during the 9-year mine life. A total of 520 koz of gold, 6,419 koz of silver, 64.4 Mlb of copper and 794.2 Mlb of zinc will be recovered during the mine life. Table 19-4 details the production and cash flows for the duration of the mine. Figure 19-1 and Figure 19-2 show graphically the production and recovered metal profiles, while Figure 19-3 shows the cash flow profile.
Back Forty Project |
19-5 |
Gold Resource Corporation |
|
Table 19-4: Cash Flow Forecast with Inferred Resource
year |
-2 |
-1 |
1 |
2 |
3 |
4 |
5 |
6 |
7 |
8 |
9 |
10 |
11 |
12 |
||
2025 |
2026 |
2027 |
2028 |
2029 |
2030 |
2031 |
2032 |
2033 |
2034 |
2035 |
2036 |
2037 |
2038 |
|||
Mining |
Total |
|||||||||||||||
Overburden mined |
kt |
1,344 |
- |
820 |
517 |
6 |
- |
- |
- |
- |
- |
- |
- |
- |
- |
- |
OP waste mined |
kt |
5,127 |
- |
371 |
1,814 |
2,156 |
780 |
6 |
- |
- |
- |
- |
- |
- |
- |
- |
OP marginal material mined |
kt |
291 |
- |
7 |
70 |
89 |
121 |
4 |
- |
- |
- |
- |
- |
- |
- |
- |
OP ore mined |
kt |
2,927 |
- |
133 |
994 |
950 |
827 |
23 |
- |
- |
- |
- |
- |
- |
- |
- |
Pinwheel Pit |
kt |
1,183 |
- |
138 |
1,026 |
19 |
- |
- |
- |
- |
- |
- |
- |
- |
- |
- |
Main Pit |
kt |
2,035 |
- |
1 |
39 |
1,020 |
948 |
26 |
- |
- |
- |
- |
- |
- |
- |
- |
UG development waste mined |
kt |
1,186 |
- |
- |
- |
102 |
319 |
288 |
272 |
173 |
13 |
11 |
8 |
- |
- |
- |
UG development marginal material mined |
kt |
39 |
- |
- |
- |
4 |
7 |
14 |
8 |
2 |
1 |
1 |
3 |
- |
- |
- |
UG development ore mined |
kt |
397 |
- |
- |
- |
7 |
72 |
104 |
116 |
52 |
21 |
13 |
12 |
- |
- |
- |
UG production ore mined |
kt |
5,116 |
- |
- |
- |
- |
- |
557 |
915 |
914 |
944 |
954 |
832 |
- |
- |
- |
UG transverse longhole production |
kt |
3,949 |
- |
- |
- |
- |
- |
465 |
765 |
750 |
729 |
756 |
483 |
- |
- |
- |
UG longitudinal longhole production |
kt |
716 |
- |
- |
- |
- |
- |
92 |
92 |
65 |
94 |
117 |
255 |
- |
- |
- |
UG cut and fill production |
kt |
452 |
- |
- |
- |
- |
- |
- |
57 |
98 |
121 |
81 |
94 |
- |
- |
- |
Total ore mined |
kt |
8,771 |
- |
140 |
1,064 |
1,050 |
1,027 |
702 |
1,039 |
967 |
966 |
968 |
847 |
- |
- |
- |
Total material mined |
kt |
19,646 |
- |
1,471 |
4,460 |
4,354 |
3,075 |
1,023 |
1,310 |
1,140 |
979 |
979 |
855 |
- |
- |
- |
OP strip ratio |
2.01 |
- |
8.53 |
2.19 |
2.08 |
0.82 |
0.23 |
- |
- |
- |
- |
- |
- |
- |
- |
|
Processing |
||||||||||||||||
Ore processed |
kt |
8,771 |
- |
140 |
962 |
964 |
945 |
974 |
1,011 |
995 |
966 |
968 |
847 |
- |
- |
- |
Gold grade |
g/t |
2.37 |
- |
5.16 |
2.34 |
4.14 |
2.32 |
1.69 |
2.16 |
2.08 |
2.35 |
1.86 |
2.01 |
- |
- |
- |
Silver grade |
g/t |
26.23 |
- |
58.66 |
51.81 |
19.59 |
15.81 |
24.41 |
22.89 |
26.20 |
22.08 |
23.12 |
25.39 |
- |
- |
- |
Copper grade |
% |
0.39% |
- |
1.23% |
1.35% |
0.41% |
0.27% |
0.17% |
0.23% |
0.23% |
0.21% |
0.28% |
0.20% |
- |
- |
- |
Zinc grade |
% |
4.29% |
- |
0.03% |
0.52% |
3.81% |
4.71% |
3.79% |
5.80% |
4.57% |
5.64% |
4.94% |
5.53% |
- |
- |
- |
Cash flow |
||||||||||||||||
Net revenue |
US$M |
1,845.1 |
- |
53.8 |
221.2 |
282.3 |
185.2 |
151.7 |
213.1 |
183.1 |
208.1 |
177.5 |
169.0 |
- |
- |
- |
Private royalties and streams |
US$M |
- 186.7 |
30.0 |
- 8.6 |
- 35.6 |
- 30.9 |
- 15.6 |
- 20.4 |
- 22.7 |
- 22.2 |
- 23.5 |
- 19.3 |
- 17.8 |
- |
- |
- |
Operating costs |
US$M |
- 743.8 |
- |
- |
- 75.4 |
- 70.4 |
- 70.8 |
- 81.6 |
- 99.2 |
- 88.4 |
- 88.4 |
- 87.5 |
- 78.2 |
- 3.8 |
- |
- |
Capital expenditures |
US$M |
- 420.9 |
- 122.4 |
- 171.7 |
- 32.4 |
- 24.9 |
- 34.3 |
- 17.4 |
- 12.5 |
- 8.3 |
- 0.9 |
- 0.9 |
4.8 |
- |
- |
- |
Closure costs |
US$M |
- 22.6 |
- |
- |
- |
- |
- |
- |
- |
- |
- |
- |
- 2.3 |
- 9.0 |
- 11.3 |
- |
Changes in working capital |
US$M |
- 0.0 |
- |
- 2.1 |
- 0.8 |
- 1.3 |
0.5 |
- 0.4 |
0.0 |
0.5 |
- 0.4 |
0.6 |
1.6 |
1.5 |
- 0.0 |
0.2 |
Mining duties and taxes |
US$M |
- 110.0 |
- 0.9 |
- 2.3 |
- 9.2 |
- 14.1 |
- 7.4 |
- 5.6 |
- 8.7 |
- 13.4 |
- 19.5 |
- 14.2 |
- 14.7 |
- |
- |
- |
Total after-tax cash flow |
US$M |
361.2 |
- 93.3 |
- 130.8 |
67.8 |
140.8 |
57.6 |
26.1 |
70.0 |
51.3 |
75.5 |
56.2 |
62.4 |
- 11.3 |
- 11.3 |
0.2 |
Cumulative total after-tax cash flow |
US$M |
- 93.3 |
- 224.1 |
- 156.3 |
- 15.5 |
42.1 |
68.2 |
138.2 |
189.5 |
265.0 |
321.2 |
383.6 |
372.3 |
361.0 |
361.2 |
|
Total discounted after-tax cash flow |
US$M |
214.5 |
- 93.3 |
- 123.4 |
60.3 |
118.2 |
45.6 |
19.5 |
49.4 |
34.1 |
47.4 |
33.3 |
34.9 |
- 5.9 |
- 5.6 |
0.1 |
Cumulative total discounted after-tax cash flow |
US$M |
|
- 93.3 |
- 216.7 |
- 156.4 |
- 38.2 |
7.5 |
27.0 |
76.4 |
110.4 |
157.8 |
191.1 |
225.9 |
220.0 |
214.3 |
214.4 |
Back Forty Project |
19-6 |
Gold Resource Corporation |
|
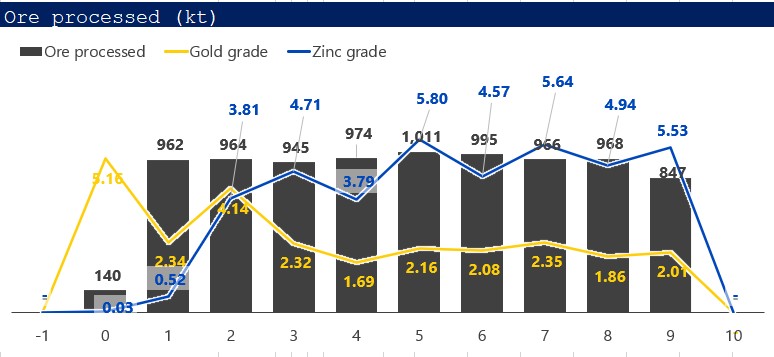
Figure 19-1: Materialized Material Processed and Grade Profiles for Gold and Zinc
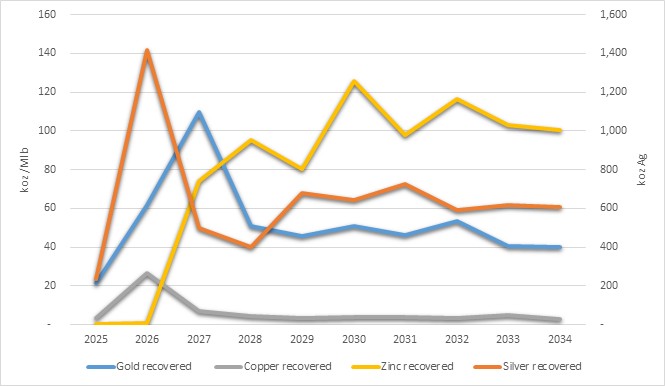
Figure 19-2: Recovered Metal Profile
Back Forty Project |
19-7 |
Gold Resource Corporation |
|
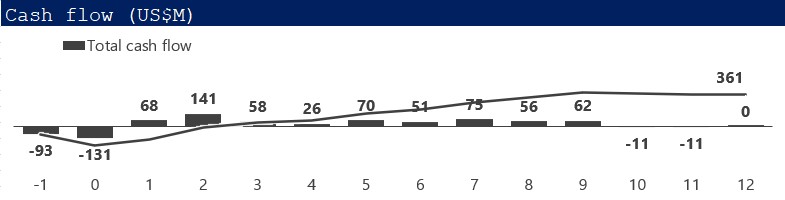
Figure 19-3: Cash Flow Profile
19.4.1.2 |
Net Present Value, Internal Rate of Return, and Payback Period |
The base case with Inferred material shows a $291.5 pre-tax and $214.5M after-tax Net Present Value at a 6% discount rate. The Internal Rate of Return is 25.7% and the payback period is 2.4 years. All these results show that the Back Forty Project could be a viable and profitable project.
19.4.1.3 |
Taxes, Royalties, Other Government Levies, or Interests |
During the Back Forty Project mine life, $297M will be paid in taxes, royalties, and streams. Table 19-5 details these payments.
Table 19-5: Taxes, Royalties, and Streams Payments
Type |
Detail |
$M |
Taxes |
Michigan Nonferrous Metallic Minerals Extraction Severance Tax |
56.1 |
U.S. Federal Corporate Income Tax |
43.9 |
|
Michigan State Corporate Income Tax |
9.9 |
|
Royalties |
Private |
2.5 |
State |
21.8 |
|
Stream |
Gold |
83.7 |
Silver |
78.8 |
|
Total |
296.6 |
|
Note: The gold stream takes into account a $30M payment to be paid by Osisko at the start of construction of the Back Forty Project.
19.4.2 |
Base Case without Inferred Material |
This cashflow forecast excludes material from the Inferred category. Even if no Inferred material is included in the mine plan, this case cannot be considered to declare Mineral Reserves. It is presented to show the effect of the presence of Inferred material on the economics of the Project.
Back Forty Project |
19-8 |
Gold Resource Corporation |
|
19.4.2.1 |
Results of Economic Analysis |
This scenario uses the same construction schedule as the original scenario, but the mining and processing schedules were modified to fit with production and storage constraints. In this scenario, a total of 504 koz of gold, 6,150 koz of silver, 61.6 Mlb of copper and 779.6 Mlb of zinc will be recovered during the mine life. Table 19-6 details the production and cash flows for the duration of the mine. Figure 19-4 and Figure 19-5 show graphically the production and recovered metal profiles, while Figure 19-6 shows the cash flow profile.
Back Forty Project |
19-9 |
Gold Resource Corporation |
|
Table 19-6: Cash Flow Forecast Without Inferred Resource
year |
-2 |
-1 |
1 |
2 |
3 |
4 |
5 |
6 |
7 |
8 |
9 |
10 |
11 |
12 |
||
2025 |
2026 |
2027 |
2028 |
2029 |
2030 |
2031 |
2032 |
2033 |
2034 |
2035 |
2036 |
2037 |
2038 |
|||
Mining |
Total |
|||||||||||||||
Overburden mined |
kt |
1,344 |
- |
784 |
556 |
3 |
0 |
- |
- |
- |
- |
- |
- |
- |
- |
- |
OP waste mined |
kt |
5,334 |
423 |
2,870 |
1,523 |
517 |
- |
- |
- |
- |
- |
- |
- |
- |
- |
|
OP marginal material mined |
kt |
267 |
7 |
90 |
55 |
116 |
- |
- |
- |
- |
- |
- |
- |
- |
- |
|
OP ore mined |
kt |
2,744 |
125 |
974 |
986 |
659 |
- |
- |
- |
- |
- |
- |
- |
- |
- |
|
Pinwheel Pit |
kt |
1,006 |
131 |
875 |
- |
- |
- |
- |
- |
- |
- |
- |
- |
- |
- |
|
Main Pit |
kt |
2,006 |
1 |
189 |
1,041 |
- |
- |
- |
- |
- |
- |
- |
- |
- |
- |
|
UG development waste mined |
kt |
1,211 |
- |
- |
66 |
370 |
304 |
305 |
132 |
16 |
9 |
9 |
- |
- |
- |
|
UG development marginal material mined |
kt |
37 |
- |
- |
3 |
4 |
15 |
8 |
1 |
2 |
0 |
3 |
- |
- |
- |
|
UG development ore mined |
kt |
375 |
- |
- |
6 |
49 |
133 |
96 |
49 |
21 |
10 |
11 |
- |
- |
- |
|
UG production ore mined |
kt |
5,127 |
- |
- |
- |
- |
674 |
935 |
921 |
946 |
955 |
697 |
- |
- |
- |
|
UG transverse longhole production |
kt |
3,949 |
- |
- |
- |
- |
537 |
828 |
664 |
746 |
814 |
359 |
- |
- |
- |
|
UG longitudinal longhole production |
kt |
726 |
- |
- |
- |
- |
137 |
48 |
145 |
87 |
58 |
251 |
- |
- |
- |
|
UG cut and fill production |
kt |
452 |
- |
- |
- |
- |
- |
58 |
111 |
112 |
82 |
88 |
- |
- |
- |
|
Total ore mined |
kt |
8,550 |
- |
132 |
1,064 |
1,051 |
828 |
822 |
1,038 |
970 |
968 |
965 |
711 |
- |
- |
- |
Total material mined |
kt |
16,438 |
- |
1,340 |
4,490 |
2,643 |
1,715 |
1,126 |
1,344 |
1,102 |
985 |
974 |
720 |
- |
- |
- |
OP strip ratio |
2.22 |
- |
9.15 |
3.22 |
1.47 |
0.67 |
- |
- |
- |
- |
- |
- |
- |
- |
- |
|
Processing |
||||||||||||||||
Ore processed |
kt |
8,550 |
- |
132 |
962 |
964 |
945 |
894 |
1,011 |
998 |
968 |
965 |
711 |
- |
- |
- |
Gold grade |
g/t |
2.35 |
- |
4.60 |
3.02 |
3.68 |
1.96 |
1.82 |
2.17 |
2.05 |
2.09 |
1.99 |
1.90 |
- |
- |
- |
Silver grade |
g/t |
25.75 |
- |
74.90 |
47.31 |
17.90 |
14.67 |
28.55 |
19.94 |
29.44 |
21.30 |
19.60 |
26.85 |
- |
- |
- |
Copper grade |
% |
0.38% |
- |
1.61% |
1.19% |
0.46% |
0.20% |
0.18% |
0.23% |
0.22% |
0.25% |
0.24% |
0.19% |
- |
- |
- |
Zinc grade |
% |
4.34% |
- |
0.04% |
0.29% |
4.40% |
4.05% |
4.56% |
5.87% |
4.41% |
5.44% |
5.51% |
5.30% |
- |
- |
- |
Cash flow |
||||||||||||||||
Net revenue |
US$M |
1,791.8 |
- |
51.6 |
244.6 |
264.1 |
157.8 |
158.4 |
213.0 |
182.2 |
193.8 |
189.8 |
136.6 |
- |
- |
- |
Private royalties and streams |
US$M |
- 179.8 |
30.0 |
- 8.7 |
- 38.8 |
- 26.5 |
- 14.4 |
- 20.7 |
- 21.2 |
- 24.2 |
- 20.5 |
- 19.6 |
- 15.3 |
- |
- |
- |
Operating costs |
US$M |
- 732.6 |
- |
- |
- 75.2 |
- 71.3 |
- 65.9 |
- 85.1 |
- 99.4 |
- 88.4 |
- 88.4 |
- 87.9 |
- 67.0 |
- 3.9 |
- |
- |
Capital expenditures |
US$M |
- 422.1 |
- 122.4 |
- 172.1 |
- 37.1 |
- 19.1 |
- 36.8 |
- 16.9 |
- 15.0 |
- 5.8 |
- 0.9 |
- 0.9 |
4.8 |
- |
- |
- |
Closure costs |
US$M |
- 22.6 |
- |
- |
- |
- |
- |
- |
- |
- |
- |
- |
- 2.3 |
- 9.0 |
- 11.3 |
- |
Changes in working capital |
US$M |
- 0.0 |
- |
- 2.0 |
- 1.8 |
- 0.3 |
2.0 |
- 1.8 |
- 0.1 |
0.5 |
- 0.0 |
- 0.1 |
2.6 |
0.8 |
- 0.0 |
0.2 |
Mining duties and taxes |
US$M |
- 103.6 |
- 0.9 |
- 2.1 |
- 10.6 |
- 13.1 |
- 5.9 |
- 5.9 |
- 8.6 |
- 12.2 |
- 16.9 |
- 16.3 |
- 10.9 |
- |
- |
- |
Total after-tax cash flow |
US$M |
331.0 |
- 93.3 |
- 133.3 |
81.1 |
133.9 |
36.8 |
27.9 |
68.6 |
52.1 |
67.0 |
65.0 |
48.5 |
- 12.2 |
- 11.3 |
0.2 |
Cumulative total after-tax cash flow |
US$M |
- 93.3 |
- 226.7 |
- 145.5 |
- 11.7 |
25.1 |
53.0 |
121.6 |
173.7 |
240.7 |
305.7 |
354.3 |
342.1 |
330.8 |
331.0 |
|
Total discounted after-tax cash flow |
US$M |
194.2 |
- 93.3 |
- 125.8 |
72.2 |
112.4 |
29.1 |
20.8 |
48.4 |
34.7 |
42.0 |
38.5 |
27.1 |
- 6.4 |
- 5.6 |
0.1 |
Cumulative total discounted after-tax cash flow |
US$M |
|
- 93.3 |
- 219.1 |
- 146.9 |
- 34.5 |
- 5.4 |
15.4 |
63.8 |
98.5 |
140.5 |
179.0 |
206.1 |
199.7 |
194.1 |
|
Back Forty Project |
19-10 |
Gold Resource Corporation |
|
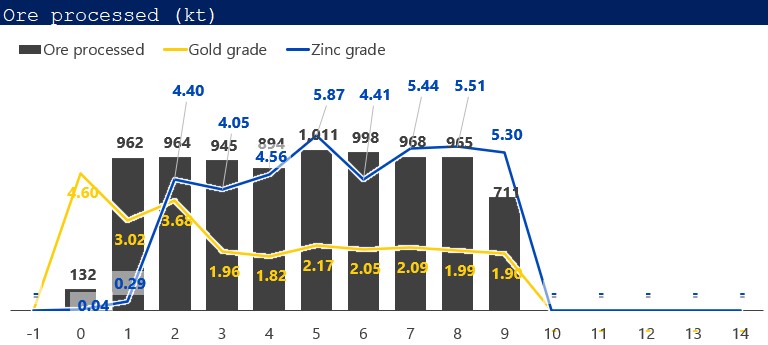
Figure 19-4: Materialized Material Processed and Grade Profiles for Gold and Zinc for Case Without Inferred Material
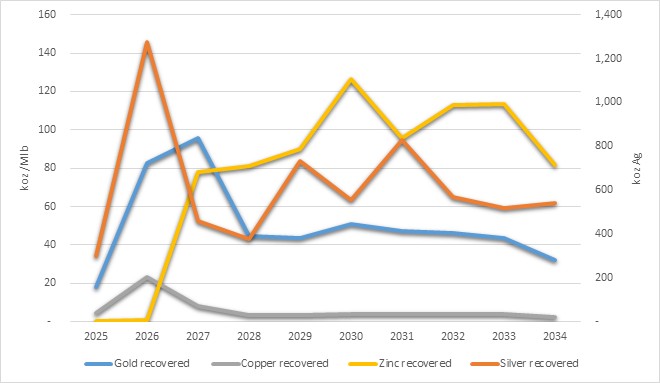
Figure 19-5: Recovered Metal Profile for Case Without Inferred Material
Back Forty Project |
19-11 |
Gold Resource Corporation |
|

Figure 19-6: Cash Flow Profile for Case Without Inferred Material
19.4.2.2 |
Net Present Value, Internal Rate of Return, and Payback Period |
The case without Inferred material shows a $267.3 pre-tax and a $194.2M after-tax Net Present Value at a 6% discount rate. The Internal Rate of Return is 24.5% and the payback period is 2.5 years. All these results are very similar to the case with Inferred material and show that the Back Forty Project could be a viable and profitable project.
19.4.2.3 |
Taxes, Royalties, Other Government Levies, or Interests |
In this case, during the Back Forty Project mine life, $283.5M will be paid in taxes, royalties, and streams. Table 19-7 details these payments.
Table 19-7: Taxes, Royalties, and Streams Payments for Case Without Inferred Material
Type |
Detail |
$M |
Taxes |
Michigan Nonferrous Metallic Minerals Extraction Severance Tax |
54.6 |
U.S. Federal Corporate Income Tax |
40.0 |
|
Michigan State Corporate Income Tax |
9.0 |
|
Royalties |
Private |
2.4 |
State |
21.6 |
|
Stream |
Gold |
80.2 |
Silver |
75.6 |
|
Total |
283.5 |
|
Note: The gold stream takes into account a $30M payment to be paid by Osisko at the start of construction of the Back Forty Project.
Back Forty Project |
19-12 |
Gold Resource Corporation |
|
19.5 |
Sensitivity Analysis |
To observe the sensitivity of the Back Forty Project to different uncertainties, financial analysis for two other metal prices scenarios is shown. Those scenarios include Inferred resource material the base case scenario. These two scenarios show plausible more conservative expectations for metal prices. Furthermore, different parameters in the base case scenario with Inferred material were varied -50% to + 50% to see their impact on NPV and IRR.
Table 19-8: Sensitivity to Different Metal Prices
Area |
|
|
Base Case |
Spot Price |
LT consensus |
Metal Prices |
Au |
$/oz |
1,800 |
1,850 |
1,700 |
Change |
3% |
-6% |
|||
Ag |
$/oz |
23.3 |
22.2 |
23 |
|
Change |
-5% |
-1% |
|||
Cu |
$/lb |
3.9 |
3.7 |
3.69 |
|
Change |
-5% |
-5% |
|||
Zn |
$/lb |
1.25 |
1.19 |
1.2 |
|
Change |
-5% |
-4% |
|||
Net Revenue |
|
$M |
1,845.1 |
1,812.9 |
1,746.0 |
Change |
-2% |
-5% |
|||
Stream |
Au |
$M |
113.7 |
116.8 |
107.3 |
Change |
3% |
-6% |
|||
Ag |
$M |
78.8 |
74.3 |
77.5 |
|
Change |
-6% |
-2% |
|||
Royalties |
|
$M |
24.2 |
23.5 |
22.2 |
Change |
-3% |
-8% |
|||
Taxes |
|
$M |
106.7 |
104.6 |
93.6 |
Change |
-2% |
-12% |
|||
Cashflow Pre-Tax |
|
$M |
471.2 |
441 |
385.2 |
Change |
-6% |
-18% |
|||
Cashflow Post-Tax |
|
$M |
361.2 |
336.4 |
291.7 |
Change |
-7% |
-19% |
|||
Discounted Cashflow Post-Tax @ 6% |
|
$M |
214.4 |
197.3 |
162.6 |
Change |
-8% |
-24% |
|||
Post-Tax Internal Rate of Return |
|
% |
25.7 |
24.5 |
21.2 |
Change |
-5% |
-18% |
|||
Post-Tax Payback |
|
Years |
2.4 |
2.5 |
2.9 |
Change |
4% |
21% |
|||
Back Forty Project |
19-13 |
Gold Resource Corporation |
|
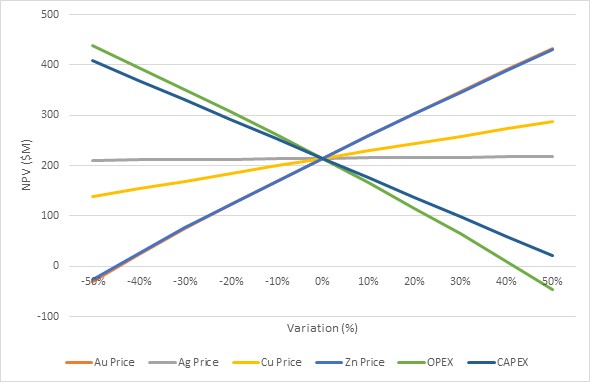
Figure 19-7: Spider Chart for Variation of Metal and Expenses on NPV
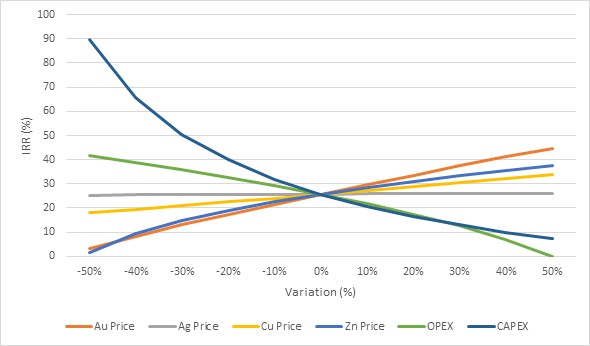
Figure 19-8: Spider Chart for Variation of Metal and Expenses on IRR
Back Forty Project |
19-14 |
Gold Resource Corporation |
|
From Table 19-8, Figure 19-7, and Figure 19-8 , it is possible to see that both gold and zinc prices have almost the same impact on the Back Forty Project. Operating costs also have a higher impact on NPV than capital costs, but a reduction in capital costs improves IRR the most. The only cases where the Back Forty Project has negative NPV are for gold or zinc price reduction over 45% or if operating costs increase more than 40%.
Back Forty Project |
19-15 |
Gold Resource Corporation |
|
20.0 |
ADJACENT PROPERTIES |
There are no exploration or mining projects in close vicinity of the Back Forty Project.
Section 20 has been modified from Connolly et al. (2012).
The Back Forty Deposit is hosted within the Penokean Volcanic Belt (“PVB”) which extends from the Upper Peninsula of Michigan to the western portion of north central Wisconsin and which hosts a number of VMS deposits and occurrences which have seen varied extents of exploration and development activity over the course of the past few decades. In addition to the deposits of the PVB, the Back Forty Deposit is situated proximal to intrusive and extrusive rocks associated with the Mid-Continent Rift (“MCR”). The MCR hosts a number of copper and copper-nickel deposits. This section summarizes the non-ferrous mining and exploration activities associated with these terranes proximal to the Back Forty Deposit. Table 20-1 summarizes the non-ferrous properties of the PVB by commodity, company and location within a 160km radius of the Back Forty Project. The table does not include the prolific native copper mining district of the Keweenaw Peninsula in the northern part of the Upper Peninsula. The Qualified Person has not been able to verify the information noted in Table 20-1 and the mineralization of the non-ferrous properties is not necessarily indicative of the mineralization at the Project.
Currently, only the Eagle Mine is in operation within the region. The Eagle Mine, approximately 105 km north of the Back Forty Deposit, is hosted by rocks of the MCR and is currently producing nickel and copper as the primary metals.
Past producing mines within the region include the Ropes Gold Mine and the White Pine Copper Mine located in the Upper Peninsula of Michigan and the Flambeau Mine, located in Wisconsin. The Flambeau Mine constitutes the only VMS deposit of the PVB that has gone into commercial production, producing copper, gold and silver. The mine concluded operations in the 1990s.
Presently, there are six advanced exploration properties in the region including Michigan’s Upper Peninsula, Wisconsin, Minnesota, and Southern Ontario. These include VMS style deposits of the PVB located in Wisconsin (Crandon and Lynne), as well as copper and copper-nickel deposits associated with the MCR.
Aquila explored two deposits within the PVB which are both located in Wisconsin but sold them to Green Light Metals in 2021. The Bend deposit, located in Taylor County, is a copper and gold-rich VMS deposit. Initial discovery and exploration work was completed in the 1980s by the Jump River Joint Venture. The Property was intermittently explored since 2010. The Reef deposit, located in Marathon County, was initially discovered and explored by INCO, then Noranda in the 1980s.
Back Forty Project |
20-1 |
Gold Resource Corporation |
|
Table 20-1: Non-Ferrous Properties of the Great Lakes Region
Property |
Commodity |
Affiliated Company |
Location |
Distance from Back Forty (km) |
Operating | ||||
Eagle Mine |
Ni/Cu |
Lundin |
Upper Peninsula of Michigan |
105 |
Former Operations | ||||
Flambeau |
Ni/Cu |
Kennecott (Rio Tinto) |
Wisconsin |
160 |
White Pine |
Cu |
Highland Copper |
Upper Peninsula of Michigan |
135 |
Ropes |
Au |
Callahan Mining Co. |
Upper Peninsula of Michigan |
105 |
Advanced Exploration | ||||
Back Forty |
Zn/Au/Cu/Ag |
GRC |
Upper Peninsula of Michigan |
- |
Copperwood |
Cu |
Highland Copper |
Upper Peninsula of Michigan |
137 |
Crandon |
Zn/Cu |
2 WI Tribes |
Wisconsin |
65 |
Lynne |
Zn/Pb/Cu/Ag |
Noranda |
Wisconsin |
115 |
Exploration Properties | ||||
Peninsula |
Au |
MPC |
Upper Peninsula of Michigan |
65 |
Reef |
Au |
Green Light Metals |
Wisconsin |
85 |
Bend |
Cu/Au |
Green Light Metals |
Wisconsin |
135 |
Back Forty Project |
20-2 |
Gold Resource Corporation |
|
21.0 |
OTHER RELEVANT DATA AND INFORMATION |
At the time of the publication of the TRS, laboratory testing is still ongoing for SART. The data used in the TRS are based on preliminary results and could change once the final results are available. Other than the aforementioned information, the Qualified Persons are not aware of any other relevant data or information that has not been included in this Technical Report Summary.
Back Forty Project |
21-1 |
Gold Resource Corporation |
|
22.0 |
INTERPRETATION AND CONCLUSIONS |
The work that has been undertaken since 2021 has allowed great improvements the Back Forty Project over the 2020 PEA, both on the environmental, operating and economical sides. On the environmental aspect, the following elements were improved:
· |
Reduction in the overall Back Forty Project footprint. |
· |
No direct wetland impacts. |
· |
Use of filtered (instead of thickened) tailings, negating the requirement for dams. |
· |
Reduction on TMF sizing with more tailings going underground as paste backfill. |
· |
Significant reduction in WRMF sizing with smaller open pit mine and concurrent backfilling and reclamation of the Pinwheel pit. |
· |
Open pit limit located farther from the Menominee River |
· |
Temporary closing of River Road, instead of permanent. |
On the operating side, the improvements are:
· |
Single stream processing for all material types, reducing the stockpiling and blending requirements. |
· |
Larger proportion of long hole mining versus cut and fill. |
· |
High tonnage long hole stopes. |
· |
Crusher, ore stockpile and WRMF located closer to the open pit exit. |
· |
No crown pillar with the open pit to be mined. |
On the economical side, the improvements are:
· |
Reduced sizing on open pit equipment. |
· |
Single stream processing for all material types. |
· |
Improved metal recoveries. |
· |
Updated metal prices. |
· |
Mining scheduled to process higher copper grade material separately. |
· |
Use of SART to reduce cyanide consumption and increase base metal recoveries. |
· |
Reclamation costs reduced from smaller WRMF and concurrent backfilling. |
The following sections will detail the comments from the different QPs in their area of expertise.
22.1 |
Property Description and Accessibility |
GRC controls approximately 1,304 hectares (3,222 acres) of private and public (State of Michigan) mineral lands located in Lake and Holmes Townships in Menominee County, Michigan. Approximately 1,019 hectares (2,517 acres) of these lands form a contiguous block of GRC-controlled mineral rights. The Active Project Boundary encompasses approximately 479 hectares (1,183 acres). The Project is centered at latitude 45° 27’ N and longitude 87° 51’ W.
In addition to the key properties, GRC has also purchased, leased, or optioned additional properties. These properties are either contiguous with the key parcels, may contain facilities utilized by the Company, are perceived to have exploration potential, or were purchased for other strategic purposes. The QP has confirmed that surface and minerals rights are in good standing and sufficient for the proposed Back Forty Project site layout and
Back Forty Project |
22-1 |
Gold Resource Corporation |
|
operations. In the opinion of the QPs, the accessibility, climate, and available infrastructures all support the Back Forty Project proposed infrastructures.
22.2 |
Geology, Mineralization, Exploration, Drilling, and Sampling |
The Back Forty volcanogenic massive sulfide deposit is one of a number of deposits located throughout the Ladysmith-Rhinelander volcanic complex in northern Wisconsin and western Michigan. The complex lies within the lower Proterozoic Penokean Volcanic Belt, also knowns as the Wisconsin Magmatic Terrane, which is part of the Southern Structural Subprovince of the Canadian Shield. In the opinion of the QPs, sufficient drilling and exploration work has been undertaken to have an adequate understanding of the settings, lithologies, and structural controls of the Back Forty Deposit. Furthermore, the QPs are of the opinion that the sample preparation, security, analysis and QA/QC protocols for Drill Programs performed between 2002 and 2017 followed generally accepted industry standards, and that the data is valid and of sufficient quality for a mineral resource estimation.
22.3 |
Mineral Processing and Metallurgical Testing |
Several historical metallurgical testwork campaigns have been completed on various samples related to the Project. The main objective of the metallurgical testwork campaigns was to quantify the metallurgical response of the VMS mineralization and included several flotation and leaching studies, comminution and gravity tests. This work was used to establish metallurgical domains and direction for test conditions and to demonstrate variability throughout the Back Forty Deposit. Metallurgical testing has generally focused on the three main sulfide mineralized zones (Main, Pinwheel and Tuff Zones) and the oxide portion of the Deposit. The latest extensive metallurgical testwork program was undertaken on 13 samples from the Back Forty Deposit representing different proportion of material type and grade range based on mining sequence. The testwork consisted of chemical and mineralogical characterization, a series of flotation and leaching tests, SART test, as well as cyanide destruction and rheology tests.
The key results from the metallurgical testwork are as follows:
· |
The metallurgical projections were established with flotation testwork completed on the latest testwork campaign performed at Base Metallurgical Laboratory. |
· |
Mill throughput is dictated by rock competency of the material process. Throughput is maximized according to mill installed power and mining sequence. |
· |
Leaching testwork showed that cyanide consumption is higher, essentially due to the level of copper. Testwork shows the addition of reverse osmosis and SART had a positive economical impact by reducing the cyanide consumption and by increasing copper and zinc recovery. |
· |
Dewatering filtration testwork performed at Diemme showed the washing cycle can lower the cyanide concentration in the remaining dried tailing humidity. Testwork also showed the press filter performance is not affected by using a feed slurry of 45% solid. |
· |
Diagnostic leach showed important proportion of the gold is locked in mineral and that is not affected by cyanide. This proportion of the gold will not be recoverable by the existing flowsheet. |
· |
Fine regrinding of the copper rougher concentrate stream is required to improve copper liberation and reduce loss to tailing. Regrinding is to be performed in vertical tower mills, which has demonstrated good energy efficiency. |
A metallurgical process flowsheet was proposed and recovery values for gold, silver, copper and zinc were determined for financial model.
In the opinion of the QPs, sufficient testing is available to understand and predict metallurgical response of the different mineralization to the proposed processing flowsheet.
Back Forty Project |
22-2 |
Gold Resource Corporation |
|
22.4 |
Mineral Resources |
The objective of InnovExplo’s mandate was to update the mineral resource estimate for the Back Forty Project (the “2023 MRE”).
The authors conclude the following:
· |
The database supporting the 2023 MRE is complete, valid and up to date. |
· |
The key parameters of the 2023 MRE (density, capping, compositing, interpolation, search ellipsoid, etc.) are supported by data and statistical and/or geostatistical analysis. |
· |
The 2023 MRE includes Indicated and Inferred mineral resources for a combination of two mining methods: open pit and underground long hole. The NSR cut-offs were $/t 33.00 and $/t 73.00 respectively. |
· |
Cut-off grades were calculated at a gold price of $1,800 per troy ounce, a silver price of $23.30 per troy ounce, a copper price of $3.90 per pound, a zinc price of $1.25 per pound and reasonable mining, processing and G&A costs. |
· |
In a combined pit and underground mining scenario, the Project contains an estimated Indicated mineral resource of 14,497 t at 2.21 g/t Au for 1,032,000 ounces of gold, 26.64 g/t Ag for 12,416,000 ounces of silver, 0.38% Cu for 121 Mlbs of copper, and 3.35% Zn for 1,072 Mlbs of zinc, and an Inferred mineral resource of 1,193,000 t at 2.33 g/t Au for 89,000 ounces of gold, 36.89 g/t Ag for 1,415,000 ounces of silver, 0.36% Cu for 9 Mlbs of copper, and 2.14% Zn for 56 Mlbs of zinc. |
· |
The results of the MRE 2023 represent a 26% increase in total Indicated mineral resource estimated ounces and a 28% increase in the total Inferred resource estimated ounces compared to the previous 2020 MRE (Bradfield et al., 2020). This increase is mainly due to the adjustment of the economic parameters to reflect current economic conditions. No additional drilling was completed on the modeled resource volume since the previous MRE. |
· |
Based on preliminary metallurgical testwork, the Project appears amenable to standard recovery processes. The NSR was calculated using the following planned processing steps: copper concentrate, zinc concentrate and gold and silver leach. |
· |
Additional diamond drilling could potentially upgrade some of the Inferred resources to the Indicated category and potentially add to the Inferred mineral resource since most of the mineralized zones have not been fully explored along strike or at depth. |
The QPs consider the 2023 MRE to be reliable, thorough, and based on quality data, reasonable hypotheses, and parameters prepared in accordance with SK1300 requirements.
22.5 |
Mining Methods |
In the opinion of the QPs, the Back Forty Deposit, by its location, geomechanical and geological characteristics, is amenable to both open pit and underground mining operations. Even if a larger open pit operation could be possible, it was determined that a reduced open pit portion and a larger underground one would benefit the overall project.
Open pit mining will occur in two distinct areas, the Pinwheel pit and the Main pit. The Pinwheel pit will be mined first and contains material with a higher grade in gold and copper than the average resource. This pit will be mined for 18 months. The Main pit will be started at the end of Year 1 to complement the production of the Pinwheel pit. Waste material from the Main pit will be used to backfill the Pinwheel pit once its resources are exhausted.
The development of the underground mine will start at the end of Year 2 with a portal located inside the Main pit. Production from the underground mine will start replacing the open pit one in Year 4. Mining underground is accomplished mostly from long hole open stoping with stopes averaging 24,000 t.
Back Forty Project |
22-3 |
Gold Resource Corporation |
|
22.6 |
Processing and Recovery Methods |
The processing facility will be used to process at a nominal rate of 2,500 tpd of mineralized material and up to 2,800, based on feed material characteristics over the LOM. The flowsheet consists of a three stage crushing followed by ball mill to a target P80 size of 50 microns. The facility will have two flotation circuits to recover copper and zinc. The copper and zinc circuits will see their respective concentrate filtered to reduce residual moisture content to approximately 10%. Both concentrates will be loaded for shipment to smelters.
Zinc flotation tailings will be leached and dewatered using a press filter. Solids will be washed and dewatered to 15% humidity in the press filter before being sent to dry stack. Filtrate from the press filter will be processed through reverse osmosis membrane for salt rejection and through the SART circuit. Cyanide species from the solution will be converted to NaCN. Precious metals are recovered from solution in the zinc precipitation circuit. Precious metal barren solution will be recirculated to leaching and recycled cyanide will be re-introduced. Cyanide destruction will be performed on the excess diluted solution from the press filters and released to the collecting pond.
Paste backfill will be installed later during the life of mine when the underground mine will be in operation.
The proposed process will recover zinc and copper concentrates, as well as gold and silver in the form of doré bars. The SART process will also generate copper and zinc concentrate. The copper concentrate flotation will have an estimated average of 14% copper content as well as payable gold and silver; the zinc concentrate flotation will have an estimated average of 51% zinc content.
The QP responsible for this section of this Technical Report considers process requirements to be well understood, and consistent with the metallurgical testing results. There is no indication that the characteristics of the material being mined will change and therefore the recovery assumptions applied for future mining are considered reasonable for this report. The plant is of a conventional design and uses conventional consumables.
22.7 |
Infrastructures |
The Back Forty Project is situated in a location with close proximity to existing infrastructure. There are road networks on either side of the property and a high voltage electrical transmission corridor near the main access county road, providing grid power. Water is collected from different areas within the property at the Contact Water Basin and either re-distributed for use within the facility or treated for discharge.
The project site can be largely divided into five main areas:
1. |
Access from County Road 356 leading to security gates for site entry. |
2. |
Facility Storage Areas: Waste Rock Management Facility (WRMF), two Overburden Management Facilities (OMF), Ore Storage Facility (OSF) and Tailings Management Facility (TMF), as well as the associated water collection ponds. |
3. |
Central area where the crushing, mill, administration, electrical substation, shop and ancillary facilities are located. |
4. |
Contact Water Basin (CWB) and Waste Water Treatment Plant (WWTP). |
5. |
The open pit area is comprised of the two open pits, the underground portal located inside the Main pit and the underground ventilation infrastructures to the southwest of the open pit. To the east of the open pit there is an area designated for ore stockpiling, and adjacent to this is the overburden stockpile. |
In the opinion of the QPs, the infrastructures are sufficient to support the Back Forty Project as presented in this IA.
Back Forty Project |
22-4 |
Gold Resource Corporation |
|
22.8 |
Market Studies |
The metal prices used for the base case are the same as used for GRC’s Don David Gold Mine reserves and are based on the median of 2024 to 2028 consensus prices from analysts collected by GRC dated June 2023. These prices are also very similar to the three-year average.
Back Forty zinc concentrate is a mid-grade material with no payable silver or gold. Penalty items include iron, mercury and possibly cadmium, depending on the grade, over the life of the mine. The low silica level will be attractive to smelters that are concerned about residue generation. Back Forty zinc concentrates can be treated at smelters in North America, Europe or Asia. North American smelters will potentially have interest in this material and can take direct rail delivery.
Based on the current mine plan, the high-copper bearing Pinwheel zone will be mined first, producing in the order of 110-120,000 DMT of relatively clean copper-gold concentrates in the first two to three years of production. Annual production levels will range from 10-20,000 DMT thereafter as the mine transitions through the different ore zones. The concentrates are projected to average around 14% copper over the life of mine but will range from highs above 20% in Year 4 to lows under 10% in Year 5 when the low copper Tuff zone is mined. Gold and silver grades will see similar variability, averaging around 80 g and 700 g per DMT over the life of the mine, respectively, but within a range of 25-170 g gold and 300-1,250 g silver.
While relatively low in some deleterious elements commonly found in copper concentrates (e.g. arsenic, antimony, bismuth), the Back Forty concentrates to be produced starting in Year 3 are projected to contain elevated levels of lead, zinc and mercury, which will make them unsuitable for direct processing at most copper smelters, including Chinese smelters where regulatory restrictions limit the level of specific deleterious elements in imports of copper concentrates.
Although the Back Forty concentrates are not suited to all copper smelters, the high levels of gold and silver will make them attractive to certain buyers, including traders for blending operations. Furthermore, smelters in North America capable of treating the Back Forty concentrates are well located to receive them direct by rail.
In the QPs opinion, the metals produced at the Back Forty Project can be sold on the different markets and generate the revenues presented in this IA.
22.9 |
Environmental Studies, Permitting, and Social Impacts |
Environmental studies commenced in 2008 with initiation of surface water and groundwater data collection in waterways and aquifers within and around the site. In the ensuing years, a large data set was developed and analysis of the baseline conditions and various environmental impacts from previously proposed projects have been documented in their permit applications. Those environmental studies remain valid and will be used for the proposed Project, with appropriate updates.
In the QPs opinion, the adequacy of current plans for environmental compliance, permitting, and engagement of local individuals or groups is sufficient to support this IA.
Back Forty Project |
22-5 |
Gold Resource Corporation |
|
22.10 |
Capital and Operating Costs |
The cost estimates are based on Q2 2023 assumptions. Costs were generally itemized in detail; however, some items of lesser significance are calculated estimates or have been included as an allowance. The operating costs estimate is based on the detailed monthly mine schedule established in Deswik.
The total initial capital cost for the construction of the Back Forty Project is estimated at $325.1M. The sustaining capital, which includes the capital required to bring the underground mine into production starting in 2028, is estimated at $102.8M. In both cases, contingencies and indirect costs are included in the estimations. The total capital required over the life of mine is $427.9M.
The main initial capital costs items are:
· |
A processing plant, including a crushing circuit. |
· |
A dry stacked tailings management facility. |
· |
A waste rock management facility. |
· |
An office building with infrastructures to support mining. |
· |
A water treatment plant. |
· |
Surface mobile equipment. |
· |
Pre-production. |
· |
Construction indirects. |
· |
General services. |
· |
Contingency. |
The main sustaining capital costs items are:
· |
Underground capital development. |
· |
Underground mobile equipment. |
· |
Paste plant. |
· |
Underground ventilation setup. |
· |
Site reclamation and closure. |
The average operating costs over the nine-year mine life is estimated to be $84.81 per tonne. No contingency or cost escalation is assumed in the operating costs.
In the QPs opinion, the capital and operating costs have been established with enough details and allowances to support this IA.
22.11 |
Economic Analysis |
The economic assessment of the Back Forty Project for Gold Resource Corporation was carried out using a discounted cash flow approach on a pre-tax and after-tax basis, based on the median of 2024 to 2028 consensus prices from analysts collected by GRC dated June 2023. No provision was made for the effects of inflation.
The internal rate of return (“IRR”) on total investment was calculated based on 100% equity financing, even though GRC may decide in the future to finance part of the Project with debt financing. The net present value (“NPV”) was calculated from the cash flow generated by the Project, using a discount rate of 6%. The simple payback period and the payback period after the start of operations are based on the undiscounted annual cash flow of the Project and they are also indicated as a financial measure. Furthermore, a sensitivity analysis has been performed for the after-tax base case to assess the impact of variations in the Project capital costs, metal prices, and operating costs.
Back Forty Project |
22-6 |
Gold Resource Corporation |
|
The financial analysis for the Back Forty Project with the different scenarios all show positive outcomes with an after-tax NPV at a discount rate of 6% of $214.5M, a 25.7% IRR and 2.4 years payback for the base case.
The sensitivity analysis demonstrates that both the gold and zinc prices have almost the same impact on the Back Forty Project. Operating costs also have a higher impact on NPV than capital costs, but a reduction in capital costs improves IRR the most. The only cases where the Back Forty Project has negative NPV are for gold or zinc price reduction over 45% or if operating costs increase more than 40%.
22.12 |
Significant Risks and Uncertainties |
Table 22-1 identifies the significant internal risks, potential impacts and possible risk mitigation measures that could affect the future economic outcome of the Project. The list does not include the external risks that apply to all mining projects (e.g., changes in metal prices, exchange rates, availability of investment capital, change in government regulations, etc.).
Significant opportunities that could improve the economics, timing and permitting are identified in Table 22-2. Further information and study are required before these opportunities can be included in the Project economics.
Table 22-1: Risks for the Project
Risk |
Potential Impact |
Possible Risk Mitigation |
Metallurgical recoveries |
Metallurgical tests are based on a limited number of samples. Recovery could be worse than what is currently assumed. |
Additional metallurgical testwork |
Lead content in the copper concentrate |
Starting Year 4, the lead content will increase in the copper concentrate, increasing the penalties and sometimes to levels that could make it difficult to sell the concentrate on the market. |
Add a lead recovery stage in the processing plant |
Social acceptability |
Located near recreational areas |
Maintain a pro-active and transparent strategy and communication plan with local communities. |
More challenging ground conditions for open pit and underground mining |
Reduced productivity. Increased operating costs. Loss of mineral resource. |
Tight monitoring and ground control management plan. |
Delays in reception of permits |
Delays in start of construction and operation |
Dedicated team to coordinate permitting. |
Back Forty Project |
22-7 |
Gold Resource Corporation |
|
Table 22-2: Opportunities for the Project
Opportunity |
Explanation |
Potential Benefit |
Resource development potential |
Potential for additional discoveries at depth and around the deposit by drilling. Potential to convert inferred mineral resources to a higher level of confidence. |
Adding indicated and inferred mineral resources increases the economic value of the mining project. |
Surface exploration drilling |
Potential for additional inferred mineral resources by drilling targets in the known extensions of the deposit. |
Adding inferred mineral resources increases the economic value of the mining project. |
Metallurgical recovery optimization |
Metallurgical tests are preliminary, and recoveries could be better than currently assumed. |
Recovery could be optimized and better than what is currently assumed. Lead could be recovered to reduce penalties and be sold on the market. |
Use of electrical or battery-operated mining equipment |
Battery-operated equipment are currently difficult to source due to high demand. It may be easier to source once the mine is in operation |
Reduction in fuel consumption, increase on equipment availability, reduction in carbon footprint, reduction in ventilation requirement. |
Increased use of mining automation |
Automation is only planed for underground in-between shift operations. Full automation is possible and being implemented in some mines. |
Reduction in manpower. Increased productivity |
Use an ore sorter |
An ore sorter could be used to remove part of the waste material from the mineralized material |
Reduce dilution and the amount of tonnes hauled and processed. |
Back Forty Project |
22-8 |
Gold Resource Corporation |
|
23.0 |
RECOMMENDATIONS |
In order to advance the Back Forty Project to the Feasibility stage, the following work is required:
· |
Higher degree of engineering for the processing plant. |
· |
Higher degree of engineering for the WRMF. |
· |
Higher degree of engineering for the TMF. |
· |
Higher degree of engineering for the water collection facilities. |
· |
Review of the hydrogeological settings at the site with the revised open pit and underground designs. |
Also, some additional work could help further improve the Project:
· |
Use of electrical or battery-operated mining equipment. |
· |
Include a higher degree of automation in underground mining. |
· |
Addition of a lead recovery stage to the processing plant. |
· |
Additional flotation testwork should be done with higher lead grade to determine if a saleable lead concentrate can be produced. |
· |
Test the Back Forty material for amenability to ore sorting. |
· |
Further investigation on the impacts of alternative grade interpolation methods (surface normal, dynamic anisotrophy and so forth; perform a kriging neighborhood analysis (KNA) to evaluate the impacts on refining various model interpolation and estimation parameters and assumptions (i.e. sample selectivity, block size analyses and so forth). |
· |
Consider further interpretive controls on the leapfrog lithological domain modeling to improve geological reasonableness of the domain modeling. |
· |
Additional filtering testwork should be done with slurry containing cyanide and gold to validate residual cyanide and gold content in the dried cake. Previous testwork was done using tracer because of the restriction to export hazardous material. |
A cost estimate has been prepared for the recommended work program to serve as a guideline. The budget for the proposed program is presented in Table 23-1. Expenditures are estimated at $690,000 (incl. 15% for contingencies).
Table 23-1: Estimated Costs for the Recommended Work Program
Work Program |
Description |
Budget Cost |
|---|---|---|
Feasibility study |
Additional metallurgical, hydrogeological, and engineering studies |
$0.6M |
Contingencies |
|
$0.1M |
TOTAL |
|
$0.7M |
Back Forty Project |
23-1 |
Gold Resource Corporation |
|
24.0 |
REFERENCES |
Base Metal Labs, 2023, Metallurgical Study of the Back Forty Project, August 2023
Blanchard, R.,1968. Interpretation of Leached Outcrops. Nevada Bureau of Mines, Bull. No. 66, 196 pg.
Bradfield et al., 2020. Preliminary Economic Assessment of the Back Forty Deposit, Menominee County, Michigan, USA. Prepared by P&E Consultants Inc. for Aquila Resources Inc. Effective date October 14, 2019.
Bryan et al., 2014. Preliminary Economic Assessment of the Back Forty Deposit, Michigan, USA. Prepared by Tetra Tech MM Inc. for Aquila Resources Inc. Effective date July 23, 2014.
Connolly, et al., 2012. Preliminary Economic Assessment Technical Report on the Back Forty Deposit, Menominee County, Michigan, USA. Prepared for Aquila Resources Inc. April 26, 2012.
DeMatties, T. A., 1994. Early Proterozoic volcanogenic massive sulfide deposits in Wisconsin: an overview: Economic Geology, v.89, p.1122-1151.
DeMatties, T. A., 1996, A geologic framework for Early Proterozoic volcanogenic massive sulfide deposits in Wisconsin: an exploration model: in Volcanogenic Massive Sulfide Deposits of Northern Wisconsin: A Commemorative Volume; G.L. LaBerge (ed), Institute on Lake Superior Geology, v. 42, part 2, p.31-65.
DeMatties, T.A., 2007. An Evaluation of the Back Forty Volcanogenic Massive Sulfide (VMS) Deposit, Menominee County, Michigan, USA, Technical Report. Cambridge Minnesota. Independent technical report prepared for Aquila Resources (USA) Inc. and filed on SEDAR.
Farrand, W.R., and Bell, D.L., 1982, Quaternary geology of Michigan: Kalamazoo, Mich., Michigan Geological Survey Division [Map], 2 sheets, scale 1:500,000.
Foth Infrastructure & Environment, LLC, 2015a. Mining Permit Application, Volume I. October 2015.
Foth Infrastructure & Environment, LLC, 2015b. Mining Permit Application Volume II Environmental Impact Assessment. October 2015.
Foth Infrastructure & Environment, LLC, 2015c. Michigan Air Use Permit – Permit to Install. October 2015.
Foth Infrastructure & Environment, LLC, 2015d. Wetland Permit Application. October 2015.
Foth Infrastructure & Environment, LLC, 2015e. National Pollutant Discharge Elimination System Permit Application for Discharges to Surface Waters, Back Forty Project Area. October 2015.
Foth Infrastructure & Environment, LLC, 2017. Permit Application – Back Forty Project, MDEQ/USACE Joint Permit Application for: Wetland Protection, Inland Lakes and Streams, Floodplain. October 2017.
Foth Infrastructure & Environment, LLC, 2018a. Mining Permit Amendment Application, Volume I. November 2018.
Foth Infrastructure & Environment, LLC, 2018b. Mining Permit Amendment Application, Volume II Environmental Impact Assessment. October 2015.
Foth Infrastructure & Environment, LLC, 2018c. Michigan Air Use Permit – Permit to Install. November 2018.
Foth Infrastructure & Environment, LLC, 2018d. Dam Safety Permit Application, Tailings Management Facility and Contact Water Basin, November 2018.
Back Forty Project |
24-1 |
Gold Resource Corporation |
|
Foth Infrastructure & Environment, LLC, 2020. National Pollutant Discharge Elimination System Permit Renewal Application Back Forty Project. March 2020.
Foth Infrastructure & Environment, LLC, 2022. Groundwater Modeling of Mine Inflows and Water Control. November 2022.
Franklin, J.M., and Thorpe, R.I., 1982. Comparative metallogeny of the Superior, Slave and Churchill provinces in Hutchinson, R.W., Spence, C.D., and Franklin, J.M., Precambrian sulfide deposits (H.S.Robinson Memorial Volume): Geological Association of Canada Special Paper 25, p3-90.
Golder Associates Ltd., 2021, Climate Data Review – Back Forty Project, December 2021.
Golder Associates Ltd., 2022, Climate Change Literature Review – Back Forty Project, February 2022.
Hutchinson, R. W. (1973) Volcanogenic Sulfide Deposits and Their Metallogenic Significance. Economic Geology, 68 (8). 1223-1246
Jenkins, R.A., 1973, The geology of Beecher and Pemene Townships, Marinette County, Wisconsin [Abstract]: Proceedings of the 19th Annual Institute on Lake Superior Geology, p. 15-16.
Knight Piésold Ltd, 2021, Preliminary Stope Sizing Recommendations, December 2021
Knight Piésold Ltd, 2022, Open Pit Slope Recommendations, January 2022
Lincoln et al., 2018. Back Forty Project, Michigan, USA – Feasibility Study, NI 43-101 Technical Report. Prepared by Lycopodium Minerals Canada Ltd. Effective date February 6, 2018.
Lydon, J.W., 1984, Volcanogenic massive sulfide deposits, Part 1--A descriptive model: Geoscience Canada, v. 11, p. 195-202.
May, E.R., and Dinkowitz, S.R., 1996, An overview of the Flambeau supergene enriched massive sulfide deposit— Geology and mineralogy, Rusk County, Wisconsin, in Laberge, G.L., ed., Volcanogenic massive sulfide deposits of northern Wisconsin—A commemorative volume, v. 2 of Institute on Lake Superior Geology, 42nd annual meeting, Cable, Wisc., 15–19 May 1996, Proceedings: St. Paul, Minn., The Institute, p. 67–93.
Mining & Process Solutions Pty Limited, 2022, “Discovery” Glycine Leaching Assessment Gold Resources Corporation Back Forty Project, MI, USA, November 2022, 43 pages
Orway Mineral Consultants, 2023, Comminution Circuit Design PEA Evaluation, June 2023
Puritch et al., 2018. Updated Mineral Resource Estimate and Technical Report on the Back Forty Project, Michigan, USA. Prepared by P&E Mining Consultants Inc. Effective date February 6, 2018.
Sangster, D.F., 1972. Precambrian volcanogenic massive sulfide deposits in Canada: a review. Dept. of Energy, Mines and Resources, 44 p.
Schulz, K.J., Nicholson, S.W., and Van Schmus, W.R., 2008, Penokean massive sulfide deposits: Age, geochemistry, and paleotectonic setting [ext. abs.]: Institute of Lake Superior Geology Annual Meeting, 54th, Marquette, Michigan, 2008, Program and Abstracts, p. 76-77.
SGS Canada Inc., 2019, Solid-liquid separation and rheology test results summary for various concentrate samples from the Back Forty project for Aquila Resources Inc., February 2019, 12 pages
SGS Canada Inc., 2022, Metallurgical Testwork on Samples from the Back Forty Project, October 2022.
Back Forty Project |
24-2 |
Gold Resource Corporation |
|
Sims, P.K., Van Schmus, W.R., Schulz, K.J., and Peterman, Z.E., 1989, Tectonostratigraphic evolution of the Early Proterozoic Wisconsin magmatic terranes of the Penokean Orogen: Canadian Journal of Earth Sciences, v. 26, p. 2145-2158.
StoneHouse Consulting Inc. and Exen Consulting Services, 2023, Metal Prices and Market Outlook – Zn and Cu, Oct 2023.
Vanlier, K.E., 1963a. Reconnaissance of the ground-water resources in Alger County, Michigan: Michigan Geological Survey Water Investigation 1, 55 p.
Vanlier, K.E.,1963b. Ground water in Menominee County: Michigan Geological Survey Water Investigation 2, 42 p.
WSP/Golder, 2022, Design Basis for Back Forty Mine Waste Management and Surface Water Management Facilities, October 2022.
WSP/Golder, 2022, Feasibility Level Design Services for Underground Plus Open Pit Back Forty Project, Michigan – Phase 2000: Tailings Testing, November 2022
Back Forty Project |
24-3 |
Gold Resource Corporation |
|
25.0 |
RELIANCE ON INFORMATION PROVIDED BY THE REGISTRANT |
The QPs have relied on input from GRC and qualified independent consulting companies in preparing this report. The QPs’ responsibility was to ensure that this SEC SK1300 Technical Report met the required guidelines and standards considering that certain information reviewed in connection with the preparation hereof was contributed by certain external consultants for GRC.
The information, conclusions, opinions and estimates contained herein are also based on data, reports, and other information supplied by GRC and other third-party sources, including those referenced in Section 24 “References”.
Back Forty Project |
25-1 |
Gold Resource Corporation |
|
26.0 |
DATE AND SIGNATURE PAGE |
This report titled “SK1300 Technical Report Summary on the Back Forty Project, Michigan, USA” is current as of September 30th, 2023. It was prepared and signed by the below QP’s for their respective sections of the responsibility for the report.
(Dated and Signed) |
|
|
Marina Iund, P. Geo (InnovExplo) |
|
Date |
Sections: |
|
|
3, 4, 5, 6, 7, 8, 9, 11, 22, and 23 |
|
|
(Dated and Signed) |
|
|
Carl Pelletier, P. Geo. (InnovExplo) |
|
Date |
Sections: |
|
|
3, 4, 5, 6, 7, 8, 9, 11, 22, and 23 |
|
|
(Dated and Signed) |
|
|
Simon Boudreau, P. Eng. (InnovExplo) |
|
Date |
Section: |
|
|
11.13 |
|
|
(Dated and Signed) |
|
|
Eric Kinnan, P. Geo. (InnovExplo) |
|
Date |
Section: |
|
|
9 and 22 |
|
|
(Dated and Signed) |
|
|
Andrea K. Martin, P. Geo. (Foth) |
|
Date |
Sections: |
|
|
17 and 22 |
|
|
(Dated and Signed) |
|
|
Michael J. Foley, P. E. (Former GRC Employee) |
|
Date |
Sections: |
|
|
15 and 22 |
|
|
(Dated and Signed) |
|
|
Rodrigo Simidu, P. Eng. (GRC Employee) |
|
Date |
Sections: |
|
|
13 and 22 |
|
|
(Dated and Signed) |
|
|
Christian Laroche, P. Eng. (GRC Employee) |
|
Date |
Sections: |
|
|
10, 14, 16, 22, and 23 |
|
|
(Dated and Signed) |
|
|
Patrick Frenette, P. Eng. (GRC Employee) |
|
Date |
Sections: |
|
|
1, 2, 13, 18, 19, 20, 21, 22, 23, 24 and 25 |
|
|
Back Forty Project |
26-1 |

Exhibit 99.1
NEWS - FOR IMMEDIATE RELEASE |
NYSE American: GORO |
October 26, 2023 |
|
GOLD RESOURCE CORPORATION
REPORTS THE FILING OF A SK1300 INITIAL ASSESSMENT FOR THE BACK FORTY PROJECT
DENVER – October 26, 2023 – Gold Resource Corporation (NYSE American: GORO) (the “Company”, “we”, “our” or “GRC”) is pleased to announce the results of a SK1300 compliant Technical Report Summary for an Initial Assessment (“IA” or the “Technical Report”) which comprises an updated Mineral Resource Estimate (“MRE”) and a financial analysis for the Company’s 100% owned Back Forty Project (“Back Forty” or the “Project”), located in the Upper Peninsula of Michigan.
Allen Palmiere, the Company’s CEO stated: “We are very happy with the results of the study. It confirms our belief that the Back Forty Project represents an opportunity to create substantial value for our shareholders. This study is the result of veery strong technical work and represents a compete revision to the mine plan, process flow, project footprint and the elimination of any wetlands impact. It has been designed to minimize the environmental impact by reducing the footprint and adopting dry-stack tailings management thus eliminating the need for a tailings dam. We are very pleased with the results and are looking forward to advancing the project.”
The IA integrates the work done by InnovExplo Inc. (“InnovExplo”), Foth Infrastructure & Environment (“Foth”), and GRC since the 2020 NI43-101 Preliminary Economic Assessment (“PEA”) to improve the Project while at the same time reducing its environmental impact. The results suggest a very robust Project with a moderate capital investment and a 9-year mine life during which 504 koz of gold, 6,150 koz of silver, 61.6 Mlbs of copper and 778 Mlbs of zinc would be produced.
The Project consists in two open pit mines, an underground mine, a nominal 2,500 metric tonnes per day (“tpd”) processing plant and the supporting infrastructures (Figure 1). A 21-month construction period would be followed by open pit mining in the Pinwheel Pit and then in the Main Pit for the first 3 years. Development for the underground mine would start in Year 2 from inside the Main Pit to support the processing plant starting in Year 4.
STUDY HIGHLIGHTS:
| ● | $214.4 million after-tax net present value at a 6% discount rate (“NPV6”) (pre-tax $291.5 million) at a base case metal prices of $1,800 per ounce (“/oz”) for gold, $23.30/oz for silver, $3.90 per pound (“/lb”) for copper, and $1.25/lb for zinc; |
| ● | 25.7% after-tax internal rate of return (“IRR”); |
| ● | $25.8million average annual after-tax free cash flow (“FCF”); |
| ● | $361.2 million cumulative after-tax life-of-mine (“LOM”) FCF; |
| ● | 56,000 ounces (“oz”) of gold, 683,300 oz of silver, 6.8 Mlbs of copper, and 86.4 Mlbs of zinc LOM average annual production |
| ● | 504 koz of gold, 6,150 koz of silver, 61.6 Mlbs of copper and 778 Mlbs of zinc LOM total cumulative metal production; |
| ● | 2.37 grams per tonne (“g/t”) gold, 26.2 g/t silver, 0.39% copper, and 4.29% zinc for $210 per tonne (“$/t”) net smelter return (“NSR”) average LOM diluted head grade; |
| ● | Average overall LOM recovery rates 77.8% for gold, 86.8% for silver, 86.4% for copper, and 95.7% for zinc; |
| ● | 84.81 $/t milled LOM total unit operating costs; |
| ● | $325.1 million initial capital expenditures (including $28.9 million in contingency costs); |
| ● | $102.8 million sustaining capital expenditures (including $8.7 million in contingency costs). |
1
Figure 1: Proposed Back Forty Project Infrastructure Layout
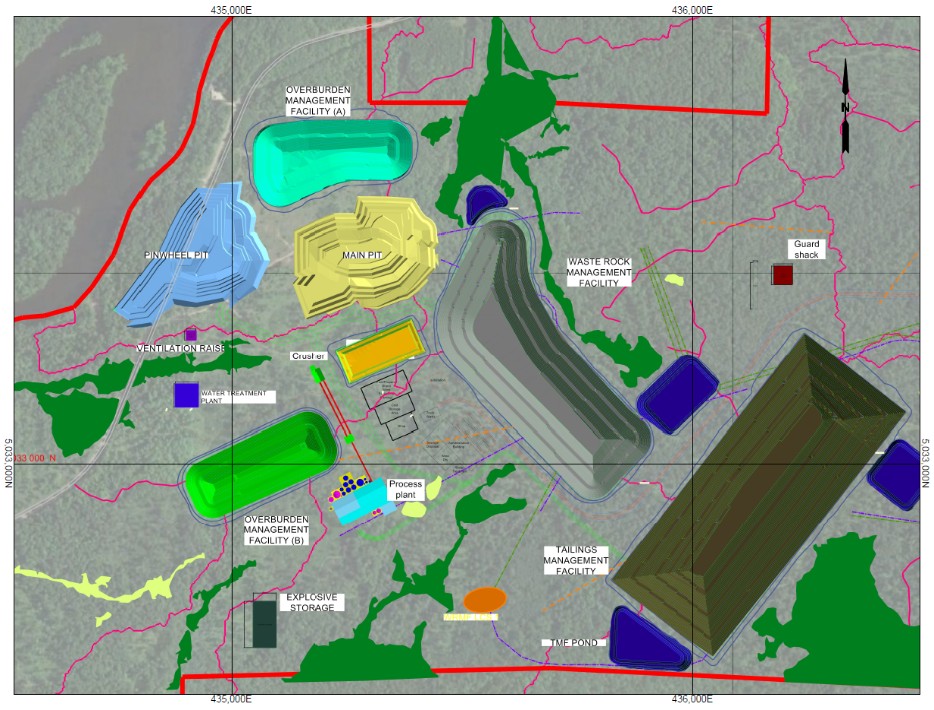
STUDY DETAILS
The Back Forty Project is an advanced stage polymetallic exploration project fully owned by GRC located in the Upper Peninsula of Michigan. The IA was prepared and compiled by GRC with support by independent consulting firms InnovExplo and Foth.
ECONOMIC ANALYSIS
The Company used a base case where material from the inferred resource category was included in the mine plan, and an alternative case without, to highlight the sensitivity of the Project to the resource categories, the high proportion of indicated material and the possible upside of the actual case. The base case has 2.5% of the mill feed from the Inferred category. The metal price assumptions are based on the median of the consensus prices from analysts collected by GRC. These prices are $1,800/oz Au, $23.30/oz Ag, $3.90/lb Cu, and $1.25/lb Zn. Based on these assumptions, the Project generates an after-tax NPV6 of $214 million and an after-tax IRR of 25.7% on an unlevered basis when Inferred resources are included in the mine plan. The case without Inferred resources shows an after-tax NPV6 of $194 million and an after-tax IRR of 24.5% under the same assumptions. The economics of the Project are most sensitive to gold and zinc prices, followed by operating costs and capital costs.
Table 1: Back Forty Project IA Summary Results
2
Metric |
Unit |
Base Case with Inferred |
Base Case Indicated only |
|
Total Process Plant Feed |
Mt |
8.77 |
8.55 |
|
Grade |
Au |
g/t |
2.37 |
2.35 |
Ag |
g/t |
26.2 |
25.8 |
|
Cu |
% |
0.39 |
0.38 |
|
Zn |
% |
4.29 |
4.34 |
|
NSR |
$/t |
210.38 |
209.57 |
|
Payable metal |
Au |
koz |
487.6 |
472.8 |
Ag |
koz |
4,800.9 |
4,605.9 |
|
Cu |
Mlbs |
59.1 |
56.5 |
|
Zn |
Mlbs |
658.0 |
645.7 |
|
Life of Mine (“LOM”) |
Years |
9.0 |
9.0 |
|
Metal Prices |
Au |
$/oz |
1,800 |
1,800 |
Ag |
$/oz |
23.30 |
23.30 |
|
Cu |
$/lb |
3.90 |
3.90 |
|
Zn |
$/lb |
1.25 |
1.25 |
|
Gross Revenue |
$M |
2,042.5 |
1,985.9 |
|
Charges |
$M |
180.0 |
176.1 |
|
Penalties |
$M |
17.4 |
18.0 |
|
Net Revenue |
$M |
1,845.1 |
1,791.8 |
|
Stream |
Au |
$M |
113.7 |
110.2 |
Ag |
$M |
78.8 |
75.6 |
|
Royalties |
$M |
24.2 |
24.1 |
|
Taxes |
$M |
106.7 |
103.6 |
|
OPEX |
Total |
$M |
743.8 |
732.6 |
per tonne |
$/t |
84.81 |
85.69 |
|
CAPEX |
Initial |
$M |
325.1 |
325.4 |
Sustaining |
$M |
102.8 |
103.8 |
|
Cashflow Pre-Tax |
$M |
471.2 |
434.6 |
|
Cashflow Post-Tax |
$M |
361.2 |
331.0 |
|
Discounted Cashflow Post-Tax @ 6% |
$M |
214.4 |
194.2 |
|
Post-Tax internal rate of return |
% |
25.7 |
24.5 |
|
Post-Tax Payback |
Years |
2.4 |
2.5 |
|
3
Figure 2: NPV6 Sensitivity
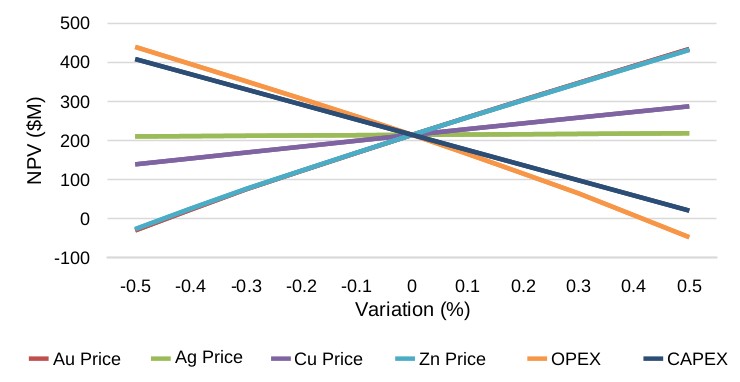
|
-50% |
-40% |
-30% |
-20% |
-10% |
0% |
10% |
20% |
30% |
40% |
50% |
Au Price |
-29.6 |
23.3 |
75.3 |
122.3 |
168.6 |
214.4 |
259.4 |
303.7 |
347.1 |
390.5 |
433.7 |
Ag Price |
210.4 |
211.2 |
212.0 |
212.8 |
213.6 |
214.4 |
215.3 |
216.0 |
216.8 |
217.7 |
218.5 |
Cu Price |
139.1 |
154.1 |
169.3 |
184.3 |
199.4 |
214.4 |
229.2 |
243.8 |
258.4 |
272.9 |
287.3 |
Zn Price |
-26.2 |
26.1 |
76.4 |
123.0 |
169.2 |
214.4 |
259.0 |
302.6 |
345.8 |
388.8 |
431.4 |
OPEX |
439.0 |
395.2 |
351.4 |
306.8 |
261.4 |
214.4 |
165.6 |
115.6 |
65.1 |
9.2 |
-47.0 |
CAPEX |
408.0 |
369.3 |
330.6 |
291.9 |
253.2 |
214.4 |
175.7 |
137.0 |
98.3 |
59.6 |
20.9 |
Figure 3: IRR sensitivity
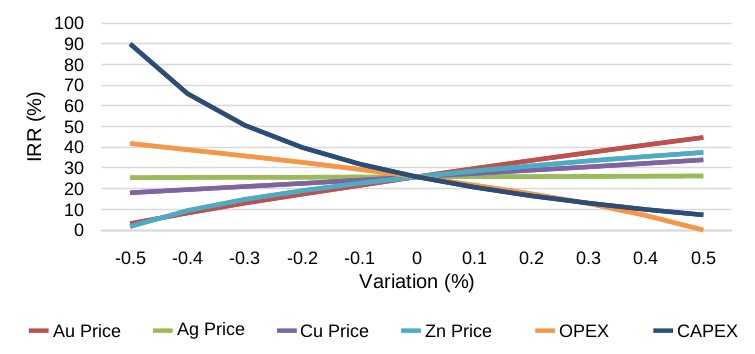
|
-50% |
-40% |
-30% |
-20% |
-10% |
0% |
10% |
20% |
30% |
40% |
50% |
Au Price |
3.1% |
8.2% |
13.0% |
17.3% |
21.5% |
25.7% |
29.7% |
33.6% |
37.4% |
41.1% |
44.7% |
Ag Price |
25.3% |
25.4% |
25.5% |
25.5% |
25.6% |
25.7% |
25.8% |
25.8% |
25.9% |
26.0% |
26.1% |
Cu Price |
18.0% |
19.5% |
21.0% |
22.5% |
24.1% |
25.7% |
27.3% |
28.9% |
30.5% |
32.2% |
33.9% |
Zn Price |
1.7% |
9.4% |
14.8% |
19.0% |
22.6% |
25.7% |
28.5% |
31.0% |
33.4% |
35.5% |
37.5% |
OPEX |
41.8% |
38.8% |
35.8% |
32.7% |
29.3% |
25.7% |
21.7% |
17.5% |
12.8% |
7.0% |
0.0% |
CAPEX |
89.9% |
65.9% |
50.6% |
39.9% |
31.9% |
25.7% |
20.7% |
16.5% |
13.0% |
9.9% |
7.3% |
4
MINERAL RESOURCE ESTIMATE
The IA includes an updated MRE done by InnovExplo. No additional drilling has occurred on site since 2019, but the geological interpretation, interpolation parameters and NSR calculations were updated. This represents an increase of 17% in the total value in the block model (NSR x tonnes) compared to the previous MRE. However, deductions for the gold and silver streams, along with the royalties, were included in the NSR calculations against the cut-off grade (“CoG”). These deductions were not part of the previous MRE. When the deductions are included, the total value in the block model is 4% less than the previous MRE. The underground part of the MRE was confined using a Stope Optimizer software, which is more restrictive than the method used in the previous MRE. The CoG for open pit and underground were updated to reflect costs closer to the proposed mining methods. In total, the Measured and Indicated resource reduced by 21% while the Inferred resource is within 1% of the previous MRE. The effective date of the MRE is September 30th, 2023.
Table 2: Back Forty Project Mineral Resource Statement - September 30th, 2023
Area (Mining Method) |
Classification |
NSR cut-off ($/t) |
Tonnes (000s) |
Au (g/t) |
Au (Moz) |
Ag (g/t) |
Ag (Moz) |
Zn (%) |
Zn (Mbs) |
Cu (%) |
Cu (lbs) |
|---|---|---|---|---|---|---|---|---|---|---|---|
Open pit |
Indicated |
33 |
9,360 |
2.41 |
725 |
28.06 |
8,444 |
3.74 |
772 |
0.36 |
74 |
Inferred |
33 |
566 |
2.70 |
49 |
48.84 |
889 |
1.31 |
16 |
0.35 |
4 |
|
UG long hole |
Indicated |
73 |
5,137 |
1.86 |
306 |
24.05 |
3,972 |
2.65 |
300 |
0.41 |
47 |
Inferred |
73 |
627 |
2.00 |
40 |
26.10 |
526 |
2.89 |
40 |
0.37 |
5 |
|
Total Indicated |
14,497 |
2.21 |
1,032 |
26.64 |
12,416 |
3.35 |
1,072 |
0.38 |
121 |
||
Total Inferred |
1,193 |
2.33 |
89 |
36.89 |
1,415 |
2.14 |
56 |
0.36 |
9 |
||
Notes to accompany the Mineral Resource Estimate:
| 1. | The independent and qualified persons for the mineral resource estimate, as defined by S-K 1300, are Marina Iund, P.Geo., Carl Pelletier, P.Geo. and Simon Boudreau, P.Eng. all from InnovExplo Inc. The effective date is September 30th, 2023. |
| 2. | These mineral resources are not mineral reserves, as they do not have demonstrated economic viability. The mineral resource estimate is reported in accordance with the S-K 1300 Regulations and Definition Standards. |
| 3. | The results are presented undiluted and are considered to have reasonable prospects of economic viability. |
| 4. | The estimate encompasses a gold, silver, zinc and copper deposit subdivided into 53 individual zones using the grade of the adjacent material when assayed or a value of zero when not assayed. Fifty-three 10 m buffers around each zone were also created. |
| 5. | High-grade capping supported by statistical analysis was done on raw assay data before compositing and is established on a per-zone basis varying from 40 to 75 g/t Au; 350 to 1100 g/t Ag; 0.6 to 12% Cu and none to 14% Zn. |
| 6. | The estimate was completed using sub-block models in GEOVIA Surpac 2022. |
| 7. | Grade interpolation was performed on 1.5 m composites with the ID3 method for Au and Ag and the ID2 for Zn and Cu. |
| 8. | The density was interpolated with the ID2 method for Type 1 (rich massive sulfide mineralized zones), Type 2 (stockwork stringer and peripheral sulfide mineralized zones) and Type 3 (precious metal-rich, low sulfide mineralized zones). A value of 3.05 g/cm3 was assigned to Type 4 (gossan mineralized zones). A value of 2.7 g/cm3 was assigned to the surrounding waste and to the cross-cutting mafic dykes. A value of 2.00 g/cm3 was assigned to the overburden and the cross-cutting sandstone unit. |
| 9. | The mineral resource estimate is classified as Indicated and Inferred. For Type 3 zones, the Indicated mineral resource category is defined for blocks estimated in the first pass, with a closest distance of 45 m and where there is reasonable geological and grade continuity. The Inferred category is defined for blocks estimated in the first and/or second pass, with a closest distance of 90 m and where there is reasonable geological and grade continuity. For Types 1,2 and 4 zones, the Indicated mineral resource category is defined for blocks estimated in the first pass, with a closest distance of 55 m and where there is reasonable geological and grade continuity. The Inferred category is defined for blocks estimated in the first and/or second pass, with a closest distance of 110 m and where there is reasonable geological and grade continuity. |
| 10. | The mineral resource estimate is locally pit-constrained with a bedrock slope angle from 31 to 49° and an overburden slope angle of 30°. It is reported at a rounded NSR cut-off of $33/t (in pit) and $73/t (underground). The NSR cut-off was calculated using the following parameters: Total processing cost = $28.00/t; Ore premium mining cost = none to $40.00/t; Administration & General = $5.00/t; gold price = $1,800.00/oz; silver price = $23.30/oz; copper price = $3.90/lb and zinc price = $1.25/lb. The cut-off grades should be re-evaluated in light of future prevailing market conditions (metal prices, exchange rates, mining costs etc.). |
| 11. | The number of metric tonnes was rounded to the nearest thousand, and any discrepancies in the totals are due to rounding effects. The metal contents are presented in troy ounces (tonnes x grade / 31.10348). |
| 12. | The authors are not aware of any known environmental, permitting, legal, title-related, taxation, socio-political, or marketing issues, or any other relevant issue not reported in the Technical Report, that could materially affect the MRE. |
5
CAPITAL COSTS
The total initial capital cost for the construction of the Back Forty Project is estimated at $325.1M. The sustaining capital, which includes the capital required to bring the underground mine into production starting in 2028, is estimated at $102.8M. In both cases, contingencies and indirect costs are included in the estimations.
Table 3: Back Forty Project Capital Costs Summary
Cost Area |
Initial capital cost ($M) |
Sustaining capital cost ($M) |
Total cost ($M) |
Mobile equipment |
5.8 |
24.3 |
30.1 |
Open pit mine |
1.4 |
1.7 |
3.1 |
Underground mine |
- |
50.6 |
50.6 |
Capitalized OPEX |
17.9 |
7.3 |
25.1 |
Electrical and communications |
8.1 |
- |
8.1 |
Surface infrastructures |
26.8 |
4.9 |
31.7 |
Process plant |
131.1 |
5.4 |
136.5 |
Rock and tailings management |
27.9 |
- |
27.9 |
Water treatment plant |
21.8 |
- |
21.8 |
Construction indirects |
22.0 |
- |
22.0 |
Owner’s costs |
33.5 |
- |
33.5 |
Contingency |
28.9 |
8.7 |
37.6 |
Total |
325.1 |
102.8 |
427.9 |
Site reclamation and closure |
- |
22.6 |
22.6 |
Salvage value |
- |
(7.1) |
(7.1) |
Project total |
325.1 |
118.4 |
443.5 |
OPERATING COSTS
The operating costs estimate includes mining, both open pit and underground, ore processing, concentrate shipping, tailings management, water treatment and general and administration expenses. The average operating costs over the 9-year mine life is estimated to be $84.81/t. The open pit mining operating costs are estimated at $6.04/t mined while the underground mining costs are estimated at $38.04/t mined.
6
Table 4: Back Forty Project Operating Costs
Cost area |
Total cost ($M) |
Cost per tonne milled |
Overburden Removal and Storage |
5.4 |
0.61 |
Open Pit Mining |
50.4 |
5.75 |
Underground Mining |
194.6 |
22.19 |
Rehandling |
1.0 |
0.12 |
Processing |
256.9 |
29.30 |
Tailings Deposition |
23.7 |
2.70 |
WRMF Reclamation |
4.4 |
0.51 |
General and Administration |
79.6 |
9.07 |
Concentrate Shipping |
153.0 |
17.44 |
Capitalized OPEX |
(25.1) |
(2.87) |
Total |
743.8 |
84.81 |
MINING
The mine plan consists of a combined open pit and underground mining operation at an average 2,600 tpd. Open pit mining will take place from Year 1 to Year 4. Underground development will be initiated in Year 2 and underground production mining will continue to Year 10.
Open pit mining will occur in two distinct areas, the Pinwheel pit and the Main pit. The Pinwheel pit will be mined first and contains material with a higher grade in gold and copper than the average resource. This pit will be mined for 18 months. The Main pit will be started at the end of year 1 to complement the production of the Pinwheel pit. Waste material from the Main pit will be used to backfill the Pinwheel pit once its resources are exhausted.
The development of the underground mine will start at the end of Year 2 with a portal located inside the Main pit. Production from the underground mine will start replacing the open pit one in Year 4. Mining underground is accomplished mostly from long hole open stoping with stopes averaging 24,000 t.
Figure 4: Back Forty Project Production Profile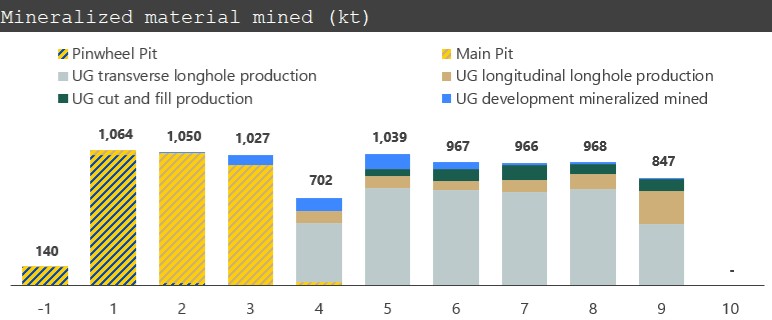
7
PROCESSING
The processing facility will be used to process at a nominal rate of 2,500 tpd of mineralized material and up to 2,800 based on feed material characteristics over the LOM. The flowsheet consists of a three-stage crushing followed by ball mill to a target P80 size of 50 microns. The facility will have two flotation circuits to recover copper and zinc. The copper and zinc circuits will see their respective concentrate filtered to reduce residual moisture content to approximately 10%. Both concentrates will be loaded for shipment to smelters.
Zinc flotation tailings will be leached and dewatered using a press filter. Solids will be washed and dewatered to 15% humidity in the press filter before being sent to dry stack. Filtrate from the press filter will be processed through reverse osmosis membrane for salt rejection and through the SART circuit. Cyanide species from the solution will be converted to NaCN. Precious metals are recovered from solution in zinc precipitation circuit. Precious metal barren solution will be recirculated to leaching and recycled cyanide will be re-introduced. Cyanide destruction will be performed on excess dilute solution from the press filter not processed by SART and released to the collecting pond.
Paste backfill will be installed later during the life of mine when the underground mine will be in operation.
The proposed process will recover zinc and copper concentrates, as well as gold and silver in the form of doré bars. SART process will also generate copper and zinc concentrate. The copper concentrate flotation will have an estimated average of 14% copper content as well as payable gold and silver; the zinc concentrate flotation will have an estimated average of 51% zinc content.
Figure 5: Back Forty Project Processing Profile
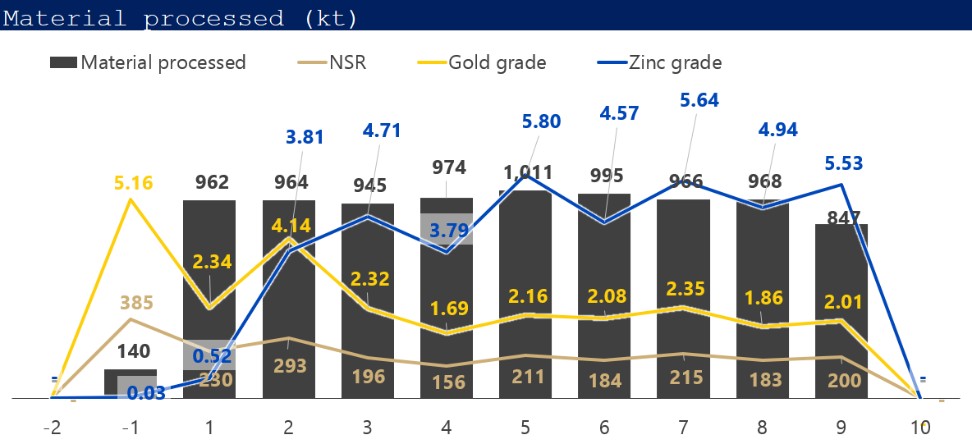
8
INFRASTRUCTURES
The Back Forty Project is situated in a location with close proximity to existing infrastructure. There are road networks on either side of the property and a high voltage electrical transmission corridor near the main access county road, providing grid power. Water is collected from different areas within the property at the Contact Water Basin and either re-distributed for use within the facility or treated for discharge.
The project site can be largely divided into five main areas:
| 1. | Access from County Road 356 leading to security gates for site entry. |
| 2. | Facility Storage Areas: Waste Rock Management Facility (“WRMF”), Two Overburden Management Facilities (“OMF”), Ore Storage Facility (“OSF”) and Tailings Management Facility (“TMF”), as well as the associated water collection ponds. |
| 3. | Central area where the crushing, mill, administration, electrical substation, shop and ancillary facilities are located. |
| 4. | Contact Water Basin (“CWB”) and Waste Water Treatment Plant (“WWTP”). |
| 5. | The open pit area is comprised of the two open pits, the underground portal located inside the Main pit and the underground ventilation infrastructures to the southwest of the open pit. To the east of the open pit there is an area designated for ore stockpiling, and adjacent to this is the overburden stockpile |
TECHNICAL INFORMATION AND QUALIFIED PERSONS
The IA is prepared by personnel of GRC and independent representatives of InnovExplo and Foth, each of whom is a "qualified person" (within the meaning of Regulation S-K Subpart 229.1300 Disclosure by Registrants Engaged in Mining Operations (“SK1300”)) (each, a "QP"). Each of the QPs have reviewed and confirmed that this news release fairly and accurately reflects, in the form and context in which it appears, the information contained in the respective sections of the Back Forty IA for which they are responsible. At the effective date of the IA, the QPs certified that to the best of their information, knowledge and belief, the parts of the IA for which they were responsible, contained all scientific and technical information that was required to be disclosed to make the Back Forty Project IA not misleading. The affiliation and areas of responsibility for each QP involved in preparing the IA are provided below.
InnovExplo QPs
| ● | Carl Pelletier, P.Geo – Mineral Resources Estimate |
| ● | Marina Iund, P.Geo – Mineral Resources Estimate |
| ● | Eric Kinnan, P. Geo – Data Verification |
| ● | Simon Boudreau, P.Eng – Mineral Resources Estimate |
Foth QPs
| ● | Andrea K. Martin, P.Eng – Environmental Studies and Permitting |
GRC QPs
| ● | Rodrigo Simidu, P.Eng – Underground Mining |
| ● | Michael J. Foley, P.Eng – Infrastructures |
| ● | Christian Laroche, P.Eng – Metallurgical testing and Process Plant Design |
| ● | Patrick Frenette, P.Eng – Open Pit Mining, Capital Costs, Operating Costs, Economic Analysis, Overall study integration. |
9
About GRC:
Gold Resource Corporation is a gold and silver producer with its operations centered on the Don David Gold Mine in Oaxaca, Mexico its Back Forty gold-copper development Project in Michigan, USA. Under the direction of an experienced board and senior leadership team, the Company’s focus is to unlock the significant exploration upside of its mine and surrounding large land package to the benefit of its existing infrastructure. For more information, please visit GRC’s website, located at www.goldresourcecorp.com and read the Company’s Annual Report on Form 10-K for the fiscal year ended December 31, 2022 for an understanding of the risk factors associated with its business.
Forward-Looking Statements:
This press release contains forward-looking statements that involve risks and uncertainties. The statements contained in this press release that are not purely historical are forward-looking statements within the meaning of Section 27A of the Securities Act of 1933, as amended, and Section 21E of the Exchange Act of 1934, as amended. When used in this press release, the words “plan”, “target”, "anticipate," "believe," "estimate," "intend" and "expect" and similar expressions are intended to identify such forward-looking statements. Such forward-looking statements include, without limitation, the statements regarding the potential for additional mineral resources in future mine plans. All forward-looking statements in this press release are based upon information available to Gold Resource Corporation as of the date of this press release, and the Company assumes no obligation to update any such forward-looking statements. Forward looking statements involve a number of risks and uncertainties, and there can be no assurance that such statements will prove to be accurate. Forward-looking statements are subject to risks and uncertainties, including the possibility of lower than anticipated revenue or higher than anticipated costs, volatility in commodity prices, and declines in general economic conditions. Additional risks related to the Company may be found in the periodic and current reports filed with the SEC by the Company, including the Company’s Annual Report on Form 10-K for the year ended December 31, 2022, which are available on the SEC’s website at www.sec.gov.
Contacts:
Allen Palmiere
Chief Executive Officer
Allen.Palmiere@GRC-USA.com
www.goldresourcecorp.com
10