UNITED STATES
SECURITIES AND EXCHANGE COMMISSION
Washington, D.C. 20549
FORM 10-Q
(Mark One)
☒ |
QUARTERLY REPORT PURSUANT TO SECTION 13 OR 15(d) OF THE SECURITIES EXCHANGE ACT OF 1934 |
For the quarterly period ended September 30, 2023
OR
☐ |
TRANSITION REPORT PURSUANT TO SECTION 13 OR 15(d) OF THE SECURITIES EXCHANGE ACT OF 1934 |
For the Transition period from ____ to ____
Commission file number 1-11314
LTC PROPERTIES, INC.
(Exact name of Registrant as specified in its charter)
|
|
|
|
|
Maryland |
|
|
|
71-0720518 |
(State or other jurisdiction of |
|
|
|
(I.R.S. Employer |
incorporation or organization) |
|
|
|
Identification No.) |
2829 Townsgate Road, Suite 350
Westlake Village, California 91361
(Address of principal executive offices, including zip code)
(805) 981-8655
(Registrant’s telephone number, including area code)
Securities registered pursuant to Section 12(b) of the Act:
Title of each class |
Trading symbol(s) |
Name of each exchange on which registered |
Common stock, $.01 par value |
LTC |
New York Stock Exchange |
Indicate by check mark whether registrant (1) has filed all reports required to be filed by Section 13 or 15(d) of the Securities Exchange Act of 1934 during the preceding 12 months (or for such shorter period that the registrant was required to file such reports), and (2) has been subject to such filing requirements for the past 90 days. Yes ☑ No ☐
Indicate by check mark whether the registrant has submitted electronically every Interactive Data File required to be submitted pursuant to Rule 405 of Regulation S-T (§ 232.405 of this chapter) during the preceding 12 months (or for such shorter period that the registrant was required to submit such files). Yes ☑ No ☐
Indicate by check mark whether the registrant is a large accelerated filer, an accelerated filer a non-accelerated filer, a smaller reporting company, or an emerging growth company. See definitions of “large accelerated filer,” “accelerated filer,” “smaller reporting company,” and “emerging growth company” in Rule 12b-2 of the Exchange Act.
|
|
|
|
|
Large accelerated filer ☑ |
Accelerated filer ☐ |
Non-accelerated filer ☐ |
Smaller reporting company ☐ |
Emerging growth company ☐ |
If an emerging growth company, indicate by check mark if the registrant has elected not to use the extended transition period for complying with any new or revised financial accounting standards provided pursuant to Section 13(a) of the Exchange Act. ¨☐
Indicate by check mark whether the registrant is a shell company (as defined in Rule 12b-2 of the Exchange Act).
Yes ☐ No ☑
The number of shares of common stock outstanding on October 19, 2023 was 41,411,693.
LTC PROPERTIES, INC.
FORM 10-Q
September 30, 2023
INDEX
|
|
|
PART I -- Financial Information |
Page |
|
|
|
|
Item 1. |
Financial Statements |
|
|
3 |
|
|
4 |
|
|
5 |
|
|
6 |
|
|
7 |
|
|
8 |
|
Management’s Discussion and Analysis of Financial Condition and Results of Operations |
29 |
|
52 |
||
52 |
||
|
||
|
|
|
53 |
||
53 |
||
53 |
||
53 |
||
54 |
||
LTC PROPERTIES, INC.
CONSOLIDATED BALANCE SHEETS
(amounts in thousands, except per share)
|
|
|
|
|
|
|
|
|
|
September 30, 2023 |
|
December 31, 2022 |
|
||
|
|
(unaudited) |
|
(audited) |
|
||
ASSETS |
|
|
|
|
|
|
|
Investments: |
|
|
|
|
|
|
|
Land |
|
$ |
123,919 |
|
$ |
124,665 |
|
Buildings and improvements |
|
|
1,260,891 |
|
|
1,273,025 |
|
Accumulated depreciation and amortization |
|
|
(386,483) |
|
|
(389,182) |
|
Operating real estate property, net |
|
|
998,327 |
|
|
1,008,508 |
|
Properties held-for-sale, net of accumulated depreciation: 2023—$11,590; 2022—$2,305 |
|
|
9,448 |
|
|
10,710 |
|
Real property investments, net |
|
|
1,007,775 |
|
|
1,019,218 |
|
Financing receivables, net of credit loss reserve: 2023—$1,981; 2022—$768 |
|
|
196,053 |
|
|
75,999 |
|
Mortgage loans receivable, net of credit loss reserve: 2023—$4,777; 2022—$3,930 |
|
|
473,567 |
|
|
389,728 |
|
Real estate investments, net |
|
|
1,677,395 |
|
|
1,484,945 |
|
Notes receivable, net of credit loss reserve: 2023—$637; 2022—$589 |
|
|
63,056 |
|
|
58,383 |
|
Investments in unconsolidated joint ventures |
|
|
19,340 |
|
|
19,340 |
|
Investments, net |
|
|
1,759,791 |
|
|
1,562,668 |
|
|
|
|
|
|
|
|
|
Other assets: |
|
|
|
|
|
|
|
Cash and cash equivalents |
|
|
11,302 |
|
|
10,379 |
|
Debt issue costs related to revolving line of credit |
|
|
1,719 |
|
|
2,321 |
|
Interest receivable |
|
|
54,605 |
|
|
46,000 |
|
Straight-line rent receivable |
|
|
20,068 |
|
|
21,847 |
|
Lease incentives |
|
|
2,193 |
|
|
1,789 |
|
Prepaid expenses and other assets |
|
|
18,185 |
|
|
11,099 |
|
Total assets |
|
$ |
1,867,863 |
|
$ |
1,656,103 |
|
LIABILITIES |
|
|
|
|
|
|
|
Revolving line of credit |
|
$ |
362,250 |
|
$ |
130,000 |
|
Term loans, net of debt issue costs: 2023—$380; 2022—$489 |
|
|
99,620 |
|
|
99,511 |
|
Senior unsecured notes, net of debt issue costs: 2023—$1,307; 2022—$1,477 |
|
|
494,353 |
|
|
538,343 |
|
Accrued interest |
|
|
3,893 |
|
|
5,234 |
|
Accrued expenses and other liabilities |
|
|
47,364 |
|
|
32,708 |
|
Total liabilities |
|
|
1,007,480 |
|
|
805,796 |
|
EQUITY |
|
|
|
|
|
|
|
Stockholders’ equity: |
|
|
|
|
|
|
|
Common stock: $0.01 par value; 60,000 shares authorized; shares issued and outstanding: 2023—41,412; 2022—41,262 |
|
|
413 |
|
|
412 |
|
Capital in excess of par value |
|
|
937,550 |
|
|
931,124 |
|
Cumulative net income |
|
|
1,606,165 |
|
|
1,544,660 |
|
Accumulated other comprehensive income |
|
|
8,596 |
|
|
8,719 |
|
Cumulative distributions |
|
|
(1,727,315) |
|
|
(1,656,548) |
|
Total LTC Properties, Inc. stockholders’ equity |
|
|
825,409 |
|
|
828,367 |
|
Non-controlling interests |
|
|
34,974 |
|
|
21,940 |
|
Total equity |
|
|
860,383 |
|
|
850,307 |
|
Total liabilities and equity |
|
$ |
1,867,863 |
|
$ |
1,656,103 |
|
See accompanying notes.
3
LTC PROPERTIES, INC.
CONSOLIDATED STATEMENTS OF INCOME
(amounts in thousands, except per share, unaudited)
|
|
Three Months Ended |
|
Nine Months Ended |
|
|
||||||||
|
|
September 30, |
|
September 30, |
|
|
||||||||
|
|
2023 |
|
2022 |
|
2023 |
|
2022 |
|
|
||||
Revenues: |
|
|
|
|
|
|
|
|
|
|
|
|
|
|
Rental income |
|
$ |
31,589 |
|
$ |
31,585 |
|
$ |
94,861 |
|
$ |
93,537 |
|
|
Interest income from financing receivables |
|
|
3,832 |
|
|
357 |
|
|
11,413 |
|
|
357 |
|
|
Interest income from mortgage loans |
|
|
12,247 |
|
|
10,379 |
|
|
35,417 |
|
|
30,112 |
|
|
Interest and other income |
|
|
1,635 |
|
|
1,182 |
|
|
5,358 |
|
|
3,308 |
|
|
Total revenues |
|
|
49,303 |
|
|
43,503 |
|
|
147,049 |
|
|
127,314 |
|
|
Expenses: |
|
|
|
|
|
|
|
|
|
|
|
|
|
|
Interest expense |
|
|
12,674 |
|
|
7,941 |
|
|
34,595 |
|
|
22,607 |
|
|
Depreciation and amortization |
|
|
9,499 |
|
|
9,385 |
|
|
28,085 |
|
|
28,202 |
|
|
Impairment loss |
|
|
— |
|
|
1,286 |
|
|
12,510 |
|
|
1,286 |
|
|
Provision for credit losses |
|
|
189 |
|
|
795 |
|
|
2,107 |
|
|
1,454 |
|
|
Transaction costs |
|
|
329 |
|
|
629 |
|
|
537 |
|
|
728 |
|
|
Property tax expense |
|
|
3,271 |
|
|
4,179 |
|
|
9,751 |
|
|
12,180 |
|
|
General and administrative expenses |
|
|
5,959 |
|
|
5,888 |
|
|
18,344 |
|
|
17,407 |
|
|
Total expenses |
|
|
31,921 |
|
|
30,103 |
|
|
105,929 |
|
|
83,864 |
|
|
Other operating income: |
|
|
|
|
|
|
|
|
|
|
|
|
|
|
Gain (loss) on sale of real estate, net |
|
|
4,870 |
|
|
(387) |
|
|
20,545 |
|
|
37,809 |
|
|
Operating income |
|
|
22,252 |
|
|
13,013 |
|
|
61,665 |
|
|
81,259 |
|
|
Income from unconsolidated joint ventures |
|
|
375 |
|
|
376 |
|
|
1,127 |
|
|
1,127 |
|
|
Net income |
|
|
22,627 |
|
|
13,389 |
|
|
62,792 |
|
|
82,386 |
|
|
Income allocated to non-controlling interests |
|
|
(430) |
|
|
(99) |
|
|
(1,287) |
|
|
(301) |
|
|
Net income attributable to LTC Properties, Inc. |
|
|
22,197 |
|
|
13,290 |
|
|
61,505 |
|
|
82,085 |
|
|
Income allocated to participating securities |
|
|
(147) |
|
|
(131) |
|
|
(440) |
|
|
(481) |
|
|
Net income available to common stockholders |
|
$ |
22,050 |
|
$ |
13,159 |
|
$ |
61,065 |
|
$ |
81,604 |
|
|
|
|
|
|
|
|
|
|
|
|
|
|
|
|
|
Earnings per common share: |
|
|
|
|
|
|
|
|
|
|
|
|
|
|
Basic |
|
$ |
0.54 |
|
$ |
0.33 |
|
$ |
1.48 |
|
$ |
2.06 |
|
|
Diluted |
|
$ |
0.54 |
|
$ |
0.32 |
|
$ |
1.48 |
|
$ |
2.04 |
|
|
|
|
|
|
|
|
|
|
|
|
|
|
|
|
|
Weighted average shares used to calculate earnings per common share: |
|
|
|
|
|
|
|
|
|
|
|
|
|
|
Basic |
|
|
41,153 |
|
|
40,270 |
|
|
41,127 |
|
|
39,658 |
|
|
Diluted |
|
|
41,211 |
|
|
40,552 |
|
|
41,185 |
|
|
39,939 |
|
|
|
|
|
|
|
|
|
|
|
|
|
|
|
|
|
Dividends declared and paid per common share |
|
$ |
0.57 |
|
$ |
0.57 |
|
$ |
1.71 |
|
$ |
1.71 |
|
|
|
|
|
|
|
|
|
|
|
|
|
|
|
|
|
See accompanying notes.
4
LTC PROPERTIES, INC.
CONSOLIDATED STATEMENTS OF COMPREHENSIVE INCOME
(amounts in thousands, unaudited)
|
|
Three Months Ended |
|
Nine Months Ended |
|
||||||||
|
|
September 30, |
|
September 30, |
|
||||||||
|
|
2023 |
|
2022 |
|
2023 |
|
2022 |
|
||||
Net income |
|
$ |
22,627 |
|
$ |
13,389 |
|
$ |
62,792 |
|
$ |
82,386 |
|
Unrealized gain on cash flow hedges before reclassification |
|
|
1,034 |
|
|
3,501 |
|
|
2,629 |
|
|
9,361 |
|
(Gains) losses reclassified from accumulated other comprehensive income to interest expense |
|
|
(1,006) |
|
|
(195) |
|
|
(2,752) |
|
|
256 |
|
Comprehensive income |
|
|
22,655 |
|
|
16,695 |
|
|
62,669 |
|
|
92,003 |
|
Less: Comprehensive income allocated to non-controlling interests |
|
|
(430) |
|
|
(99) |
|
|
(1,287) |
|
|
(301) |
|
Comprehensive income attributable to LTC Properties, Inc. |
|
$ |
22,225 |
|
$ |
16,596 |
|
$ |
61,382 |
|
$ |
91,702 |
|
5
LTC PROPERTIES, INC.
CONSOLIDATED STATEMENTS OF EQUITY
(In thousands)
|
|
|
|
|
|
|
|
Capital in |
|
|
Cumulative |
|
|
|
|
|
|
|
|
Total |
|
|
Non- |
|
|
|
|
|
|
Common Stock |
|
|
Excess of |
|
|
Net |
|
|
Accumulated |
|
|
Cumulative |
|
|
Stockholder's |
|
|
Controlling |
|
|
Total |
|
|||
|
|
Shares |
|
|
Amount |
|
|
Par Value |
|
|
Income |
|
|
OCI |
|
|
Distributions |
|
|
Equity |
|
|
Interests |
|
|
Equity |
|
Balance—December 31, 2021 |
|
39,374 |
|
$ |
394 |
|
$ |
856,895 |
|
$ |
1,444,636 |
|
$ |
(172) |
|
$ |
(1,565,039) |
|
$ |
736,714 |
|
$ |
8,413 |
|
$ |
745,127 |
|
Common Stock cash distributions ($0.57 per share) |
|
— |
|
|
— |
|
|
— |
|
|
— |
|
|
— |
|
|
(22,480) |
|
|
(22,480) |
|
|
— |
|
|
(22,480) |
|
Stock-based compensation expense |
|
— |
|
|
— |
|
|
1,925 |
|
|
— |
|
|
— |
|
|
— |
|
|
1,925 |
|
|
— |
|
|
1,925 |
|
Net income |
|
— |
|
|
— |
|
|
— |
|
|
14,412 |
|
|
— |
|
|
— |
|
|
14,412 |
|
|
95 |
|
|
14,507 |
|
Cash paid for taxes in lieu of common shares |
|
(37) |
|
|
— |
|
|
(1,255) |
|
|
— |
|
|
— |
|
|
— |
|
|
(1,255) |
|
|
— |
|
|
(1,255) |
|
Non-controlling interest distributions |
|
— |
|
|
— |
|
|
— |
|
|
— |
|
|
— |
|
|
— |
|
|
— |
|
|
(95) |
|
|
(95) |
|
Fair market valuation adjustment for interest rate swap |
|
— |
|
|
— |
|
|
— |
|
|
— |
|
|
4,876 |
|
|
— |
|
|
4,876 |
|
|
— |
|
|
4,876 |
|
Other |
|
123 |
|
|
1 |
|
|
(7) |
|
|
— |
|
|
— |
|
|
— |
|
|
(6) |
|
|
— |
|
|
(6) |
|
Balance—March 31, 2022 |
|
39,460 |
|
$ |
395 |
|
$ |
857,558 |
|
$ |
1,459,048 |
|
$ |
4,704 |
|
$ |
(1,587,519) |
|
$ |
734,186 |
|
$ |
8,413 |
|
$ |
742,599 |
|
Issuance of common stock |
|
910 |
|
|
9 |
|
|
33,684 |
|
|
— |
|
|
— |
|
|
- |
|
|
33,693 |
|
|
— |
|
|
33,693 |
|
Common Stock cash distributions ($0.57 per share) |
|
— |
|
|
— |
|
|
— |
|
|
— |
|
|
— |
|
|
(22,635) |
|
|
(22,635) |
|
|
— |
|
|
(22,635) |
|
Stock-based compensation expense |
|
— |
|
|
— |
|
|
2,012 |
|
|
— |
|
|
— |
|
|
— |
|
|
2,012 |
|
|
— |
|
|
2,012 |
|
Net income |
|
— |
|
|
— |
|
|
— |
|
|
54,383 |
|
|
— |
|
|
— |
|
|
54,383 |
|
|
107 |
|
|
54,490 |
|
Cash paid for taxes in lieu of common shares |
|
(2) |
|
|
— |
|
|
(100) |
|
|
— |
|
|
— |
|
|
— |
|
|
(100) |
|
|
— |
|
|
(100) |
|
Non-controlling interest distributions |
|
— |
|
|
— |
|
|
— |
|
|
— |
|
|
— |
|
|
— |
|
|
— |
|
|
(998) |
|
|
(998) |
|
Fair market valuation adjustment for interest rate swap |
|
— |
|
|
— |
|
|
— |
|
|
— |
|
|
1,435 |
|
|
— |
|
|
1,435 |
|
|
— |
|
|
1,435 |
|
Other |
|
12 |
|
|
— |
|
|
— |
|
|
— |
|
|
— |
|
|
— |
|
|
— |
|
|
— |
|
|
— |
|
Balance—June 30, 2022 |
|
40,380 |
|
$ |
404 |
|
$ |
893,154 |
|
$ |
1,513,431 |
|
$ |
6,139 |
|
$ |
(1,610,154) |
|
$ |
802,974 |
|
$ |
7,522 |
|
$ |
810,496 |
|
Issuance of common stock |
|
125 |
|
|
— |
|
|
4,753 |
|
|
— |
|
|
— |
|
|
- |
|
|
4,753 |
|
|
— |
|
|
4,753 |
|
Common Stock cash distributions ($0.57 per share) |
|
— |
|
|
— |
|
|
— |
|
|
— |
|
|
— |
|
|
(23,087) |
|
|
(23,087) |
|
|
— |
|
|
(23,087) |
|
Stock-based compensation expense |
|
— |
|
|
— |
|
|
2,014 |
|
|
— |
|
|
— |
|
|
— |
|
|
2,014 |
|
|
— |
|
|
2,014 |
|
Net income |
|
— |
|
|
— |
|
|
— |
|
|
13,290 |
|
|
— |
|
|
— |
|
|
13,290 |
|
|
99 |
|
|
13,389 |
|
Cash paid for taxes in lieu of common shares |
|
— |
|
|
— |
|
|
- |
|
|
— |
|
|
— |
|
|
— |
|
|
- |
|
|
— |
|
|
- |
|
Non-controlling interest contributions |
|
— |
|
|
— |
|
|
- |
|
|
— |
|
|
— |
|
|
— |
|
|
- |
|
|
14,375 |
|
|
14,375 |
|
Non-controlling interest distributions |
|
— |
|
|
— |
|
|
— |
|
|
— |
|
|
— |
|
|
— |
|
|
— |
|
|
(77) |
|
|
(77) |
|
Fair market valuation adjustment for interest rate swap |
|
— |
|
|
— |
|
|
— |
|
|
— |
|
|
3,306 |
|
|
— |
|
|
3,306 |
|
|
— |
|
|
3,306 |
|
Balance—September 30, 2022 |
|
40,505 |
|
$ |
404 |
|
$ |
899,921 |
|
$ |
1,526,721 |
|
$ |
9,445 |
|
$ |
(1,633,241) |
|
$ |
803,250 |
|
$ |
21,919 |
|
$ |
825,169 |
|
|
|
|
|
|
|
|
|
|
|
|
|
|
|
|
|
|
|
|
|
|
|
|
|
|
|
|
|
Balance—December 31, 2022 |
|
41,262 |
|
$ |
412 |
|
$ |
931,124 |
|
$ |
1,544,660 |
|
$ |
8,719 |
|
$ |
(1,656,548) |
|
$ |
828,367 |
|
$ |
21,940 |
|
$ |
850,307 |
|
Issuance of common stock |
|
48 |
|
|
— |
|
|
1,697 |
|
|
— |
|
|
— |
|
|
— |
|
|
1,697 |
|
|
— |
|
|
1,697 |
|
Issuance of restricted stock |
|
128 |
|
|
1 |
|
|
(1) |
|
|
— |
|
|
— |
|
|
— |
|
|
— |
|
|
— |
|
|
— |
|
Common Stock cash distributions ($0.57 per share) |
|
— |
|
|
— |
|
|
— |
|
|
— |
|
|
— |
|
|
(23,563) |
|
|
(23,563) |
|
|
— |
|
|
(23,563) |
|
Stock-based compensation expense |
|
— |
|
|
— |
|
|
2,088 |
|
|
— |
|
|
— |
|
|
— |
|
|
2,088 |
|
|
— |
|
|
2,088 |
|
Net income |
|
— |
|
|
— |
|
|
— |
|
|
33,134 |
|
|
— |
|
|
— |
|
|
33,134 |
|
|
427 |
|
|
33,561 |
|
Cash paid for taxes in lieu of common shares |
|
(41) |
|
|
— |
|
|
(1,538) |
|
|
— |
|
|
— |
|
|
— |
|
|
(1,538) |
|
|
— |
|
|
(1,538) |
|
Non-controlling interest contributions |
|
— |
|
|
— |
|
|
— |
|
|
— |
|
|
— |
|
|
— |
|
|
— |
|
|
3,831 |
|
|
3,831 |
|
Non-controlling interest distributions |
|
— |
|
|
— |
|
|
— |
|
|
— |
|
|
— |
|
|
— |
|
|
— |
|
|
(406) |
|
|
(406) |
|
Fair market valuation adjustment for interest rate swap |
|
— |
|
|
— |
|
|
— |
|
|
— |
|
|
(1,362) |
|
|
— |
|
|
(1,362) |
|
|
— |
|
|
(1,362) |
|
Other |
|
(1) |
|
|
— |
|
|
— |
|
|
— |
|
|
— |
|
|
— |
|
|
— |
|
|
— |
|
|
— |
|
Balance—March 31, 2023 |
|
41,396 |
|
$ |
413 |
|
$ |
933,370 |
|
$ |
1,577,794 |
|
$ |
7,357 |
|
$ |
(1,680,111) |
|
$ |
838,823 |
|
$ |
25,792 |
|
$ |
864,615 |
|
Issuance of restricted stock |
|
15 |
|
|
— |
|
|
— |
|
|
— |
|
|
— |
|
|
— |
|
|
— |
|
|
— |
|
|
— |
|
Common Stock cash distributions ($0.57 per share) |
|
— |
|
|
— |
|
|
— |
|
|
— |
|
|
— |
|
|
(23,599) |
|
|
(23,599) |
|
|
— |
|
|
(23,599) |
|
Stock-based compensation expense |
|
— |
|
|
— |
|
|
2,138 |
|
|
— |
|
|
— |
|
|
— |
|
|
2,138 |
|
|
— |
|
|
2,138 |
|
Net income |
|
— |
|
|
— |
|
|
— |
|
|
6,174 |
|
|
— |
|
|
— |
|
|
6,174 |
|
|
430 |
|
|
6,604 |
|
Cash paid for taxes in lieu of common shares |
|
(2) |
|
|
— |
|
|
(81) |
|
|
— |
|
|
— |
|
|
— |
|
|
(81) |
|
|
— |
|
|
(81) |
|
Non-controlling interest contributions |
|
— |
|
|
— |
|
|
— |
|
|
— |
|
|
— |
|
|
— |
|
|
— |
|
|
9,133 |
|
|
9,133 |
|
Non-controlling interest distributions |
|
— |
|
|
— |
|
|
— |
|
|
— |
|
|
— |
|
|
— |
|
|
— |
|
|
(406) |
|
|
(406) |
|
Fair market valuation adjustment for interest rate swap |
|
— |
|
|
— |
|
|
— |
|
|
— |
|
|
1,211 |
|
|
— |
|
|
1,211 |
|
|
— |
|
|
1,211 |
|
Balance—June 30, 2023 |
|
41,409 |
|
$ |
413 |
|
$ |
935,427 |
|
$ |
1,583,968 |
|
$ |
8,568 |
|
$ |
(1,703,710) |
|
$ |
824,666 |
|
$ |
34,949 |
|
$ |
859,615 |
|
Issuance of restricted stock |
|
3 |
|
|
— |
|
|
— |
|
|
— |
|
|
— |
|
|
— |
|
|
— |
|
|
— |
|
|
— |
|
Common Stock cash distributions ($0.57 per share) |
|
— |
|
|
— |
|
|
— |
|
|
— |
|
|
— |
|
|
(23,605) |
|
|
(23,605) |
|
|
— |
|
|
(23,605) |
|
Stock-based compensation expense |
|
— |
|
|
— |
|
|
2,123 |
|
|
— |
|
|
— |
|
|
— |
|
|
2,123 |
|
|
— |
|
|
2,123 |
|
Net income |
|
— |
|
|
— |
|
|
— |
|
|
22,197 |
|
|
— |
|
|
— |
|
|
22,197 |
|
|
430 |
|
|
22,627 |
|
Non-controlling interest distributions |
|
— |
|
|
— |
|
|
— |
|
|
— |
|
|
— |
|
|
— |
|
|
— |
|
|
(405) |
|
|
(405) |
|
Fair market valuation adjustment for interest rate swap |
|
— |
|
|
— |
|
|
— |
|
|
— |
|
|
28 |
|
|
— |
|
|
28 |
|
|
— |
|
|
28 |
|
Balance—September 30, 2023 |
|
41,412 |
|
$ |
413 |
|
$ |
937,550 |
|
$ |
1,606,165 |
|
$ |
8,596 |
|
$ |
(1,727,315) |
|
$ |
825,409 |
|
$ |
34,974 |
|
$ |
860,383 |
|
6
LTC PROPERTIES, INC.
CONSOLIDATED STATEMENTS OF CASH FLOWS
(amounts in thousands, unaudited)
|
|
Nine Months Ended September 30, |
|
|||||
|
|
2023 |
|
2022 |
|
|
||
OPERATING ACTIVITIES: |
|
|
|
|
|
|
|
|
Net income |
|
$ |
62,792 |
|
$ |
82,386 |
|
|
Adjustments to reconcile net income to net cash provided by operating activities: |
|
|
|
|
|
|
|
|
Depreciation and amortization |
|
|
28,085 |
|
|
28,202 |
|
|
Stock-based compensation expense |
|
|
6,349 |
|
|
5,951 |
|
|
Impairment loss |
|
|
12,510 |
|
|
1,286 |
|
|
Gain on sale of real estate, net |
|
|
(20,545) |
|
|
(37,809) |
|
|
Income from unconsolidated joint ventures |
|
|
(1,127) |
|
|
(1,127) |
|
|
Income distributions from unconsolidated joint ventures |
|
|
— |
|
|
351 |
|
|
Straight-line rental adjustment |
|
|
1,635 |
|
|
963 |
|
|
Exchange of prepayment fee for participating interest in mortgage loan |
|
|
(1,380) |
|
|
— |
|
|
Adjustment for collectability of lease incentives and rental income |
|
|
26 |
|
|
256 |
|
|
Amortization of lease incentives |
|
|
584 |
|
|
665 |
|
|
Provision for credit losses |
|
|
2,107 |
|
|
1,454 |
|
|
Application of interest reserve |
|
|
(1,788) |
|
|
(4,348) |
|
|
Amortization of debt issue costs |
|
|
900 |
|
|
841 |
|
|
Other non-cash items, net |
|
|
71 |
|
|
(170) |
|
|
Change in operating assets and liabilities |
|
|
|
|
|
|
|
|
Lease incentives funded |
|
|
(1,023) |
|
|
(418) |
|
|
Increase in interest receivable |
|
|
(8,605) |
|
|
(4,768) |
|
|
Decrease in accrued interest payable |
|
|
(1,341) |
|
|
(625) |
|
|
Net change in other assets and liabilities |
|
|
(318) |
|
|
(318) |
|
|
Net cash provided by operating activities |
|
|
78,932 |
|
|
72,772 |
|
|
INVESTING ACTIVITIES: |
|
|
|
|
|
|
|
|
Investment in real estate properties |
|
|
(43,759) |
|
|
(51,815) |
|
|
Investment in real estate developments |
|
|
— |
|
|
(105) |
|
|
Investment in real estate capital improvements |
|
|
(5,053) |
|
|
(4,555) |
|
|
Proceeds from sale of real estate, net |
|
|
51,410 |
|
|
72,628 |
|
|
Investment in financing receivable |
|
|
(112,712) |
|
|
(61,661) |
|
|
Investment in real estate mortgage loans receivable |
|
|
(72,260) |
|
|
(35,234) |
|
|
Principal payments received on mortgage loans receivable |
|
|
301 |
|
|
625 |
|
|
Advances and originations under notes receivable |
|
|
(19,258) |
|
|
(37,008) |
|
|
Principal payments received on notes receivable |
|
|
7,077 |
|
|
6,618 |
|
|
Net cash used in investing activities |
|
|
(194,254) |
|
|
(110,507) |
|
|
FINANCING ACTIVITIES: |
|
|
|
|
|
|
|
|
Borrowings from revolving line of credit |
|
|
274,450 |
|
|
194,000 |
|
|
Repayment of revolving line of credit |
|
|
(42,200) |
|
|
(153,900) |
|
|
Proceeds from issuance of senior unsecured notes |
|
|
— |
|
|
75,000 |
|
|
Principal payments on senior unsecured notes |
|
|
(44,160) |
|
|
(43,160) |
|
|
Proceeds from common stock issued |
|
|
1,777 |
|
|
38,957 |
|
|
Distributions paid to stockholders |
|
|
(70,767) |
|
|
(68,202) |
|
|
Contribution from non-controlling interests |
|
|
— |
|
|
50 |
|
|
Distributions paid to non-controlling interests |
|
|
(1,217) |
|
|
(1,170) |
|
|
Financing costs paid |
|
|
(19) |
|
|
(1,162) |
|
|
Cash paid for taxes in lieu of shares upon vesting of restricted stock |
|
|
(1,619) |
|
|
(1,355) |
|
|
Other |
|
|
— |
|
|
(6) |
|
|
Net cash provided by financing activities |
|
|
116,245 |
|
|
39,052 |
|
|
Increase in cash and cash equivalents |
|
|
923 |
|
|
1,317 |
|
|
Cash and cash equivalents, beginning of period |
|
|
10,379 |
|
|
5,161 |
|
|
Cash and cash equivalents, end of period |
|
$ |
11,302 |
|
$ |
6,478 |
|
|
|
|
|
|
|
|
|
|
|
Supplemental disclosure of cash flow information: |
|
|
|
|
|
|
|
|
Interest paid |
|
$ |
35,036 |
|
$ |
22,391 |
|
|
Non-cash investing and financing transactions: |
|
|
|
|
|
|
|
|
Contribution from non-controlling interest |
|
$ |
12,965 |
|
$ |
14,325 |
|
|
Exchange of mezzanine loan and related prepayment fee for participating interest in mortgage loan |
|
$ |
(8,841) |
|
$ |
— |
|
|
Reserves withheld at financing and mortgage loan receivable origination |
|
$ |
(5,147) |
|
$ |
— |
|
|
Accretion of interest reserve recorded as mortgage loan receivable |
|
$ |
1,788 |
|
$ |
4,348 |
|
|
(Decrease) increase in fair value of interest rate swap agreements |
|
$ |
(123) |
|
$ |
9,617 |
|
|
Mortgage loan receivable reserve withheld at origination |
|
$ |
1,506 |
|
$ |
102 |
|
|
See accompanying notes.
7
1. |
General |
LTC Properties, Inc., a health care real estate investment trust (“REIT”), was incorporated on May 12, 1992 in the State of Maryland and commenced operations on August 25, 1992. We invest primarily in seniors housing and health care properties primarily through sale-leasebacks, mortgage financing, joint ventures and structured finance solutions including preferred equity and mezzanine lending. We conduct and manage our business as one operating segment, rather than multiple operating segments, for internal reporting and internal decision-making purposes. Our primary objectives are to create, sustain and enhance stockholder equity value and provide current income for distribution to stockholders through real estate investments in seniors housing and health care properties managed by experienced operators. Our primary seniors housing and health care property classifications include skilled nursing centers (“SNF”), assisted living communities (“ALF”), independent living communities (“ILF”), memory care communities (“MC”) and combinations thereof. We also invest in other (“OTH”) types of properties, such as land parcels, projects under development (“UDP”) and behavioral health care hospitals. To meet these objectives, we attempt to invest in properties that provide opportunity for additional value and current returns to our stockholders and diversify our investment portfolio by geographic location, operator, property classification and form of investment.
We have prepared consolidated financial statements included herein without audit and in the opinion of management have included all adjustments necessary for a fair presentation of the consolidated financial statements pursuant to the rules and regulations of the Securities and Exchange Commission (“SEC”). Certain information and note disclosures normally included in financial statements prepared in accordance with U.S. generally accepted accounting principles (“GAAP”) have been condensed or omitted pursuant to rules and regulations governing the presentation of interim financial statements. The accompanying consolidated financial statements include the accounts of our company and its wholly-owned subsidiaries. All significant intercompany accounts and transactions have been eliminated in consolidation. The results of operations for the three and nine months ended September 30, 2023 and 2022 are not necessarily indicative of the results for a full year.
No provision has been made for federal or state income taxes. Our company qualifies as a REIT under Sections 856 through 860 of the Internal Revenue Code of 1986, as amended. As such, we generally are not taxed on income that is distributed to our stockholders.
2. |
Real Estate Investments |
Assisted living communities, independent living communities, memory care communities and combinations thereof are included in the assisted living property classification (collectively “ALF”).
Any reference to the number of properties or facilities, number of units, number of beds, number of operators and yield on investments in real estate are unaudited and outside the scope of our independent registered public accounting firm’s review of our consolidated financial statements in accordance with the standards of the Public Company Accounting Oversight Board.
Owned Properties. Our owned properties are leased pursuant to non-cancelable operating leases. Each lease is a triple net lease which requires the lessee to pay all taxes, insurance, maintenance and repairs, capital and non-capital expenditures and other costs necessary in the operations of the facilities. Many of the leases contain renewal options. The majority of our leases contain provisions for specified annual increases over the rents of the prior year.
8
LTC PROPERTIES, INC.
NOTES TO CONSOLIDATED FINANCIAL STATEMENTS CONTINUED
(Unaudited)
The following table summarizes our investments in owned properties at September 30, 2023 (dollar amounts in thousands):
|
|
|
|
|
|
|
|
|
|
|
|
|
Average |
|
|
|
|
|
|
|
Percentage |
|
Number |
|
Number of |
|
Investment |
|
|||
|
|
Gross |
|
of |
|
of |
|
SNF |
|
ALF |
|
per |
|
||
Type of Property |
|
Investment |
|
Investment |
|
Properties (1) |
|
Beds |
|
Units |
|
Bed/Unit |
|
||
Assisted Living |
|
$ |
800,963 |
|
57.0 |
% |
92 |
|
— |
|
5,323 |
|
$ |
150.47 |
|
Skilled Nursing |
|
|
592,880 |
|
42.1 |
% |
50 |
|
6,113 |
|
236 |
|
$ |
93.38 |
|
Other (2) |
|
|
12,005 |
|
0.9 |
% |
1 |
|
118 |
|
— |
|
|
— |
|
Total |
|
$ |
1,405,848 |
|
100.0 |
% |
143 |
|
6,231 |
|
5,559 |
|
|
|
|
| (1) | We own properties in 24 states that are leased to 22 different operators. |
| (2) | Includes three parcels of land held-for-use, and one behavioral health care hospital. |
Many of our existing leases contain renewal options that, if exercised, could result in the amount of rent payable upon renewal being greater or less than that currently being paid.
During 2023, Brookdale Senior Living Communities, Inc. (“Brookdale”) elected not to exercise its renewal option under a master lease that matures on December 31, 2023. We re-leased 10 of the 35 properties in the existing Brookdale portfolio to Brookdale under a new master lease. This new master lease includes six properties in Colorado and four in Kansas. The six-year master lease will commence on January 1, 2024. Rent in the first lease year is set at $8,000,000 escalating by approximately 2.0% annually. The lease includes a purchase option that can be exercised in 2029. We also agreed to fund $4,500,000 for capital expenditures for the first two years of the lease at an initial rate of 8.0%, escalating by approximately 2.0% annually thereafter. Subsequent to September 30, 2023, we added seven additional properties to the new Brookdale master lease commencing on January 1, 2024. One property is located in Ohio with 42 assisted living units and six are located in Texas with 235 assisted living units. These properties are currently included in the original Brookdale master lease. As a result of this amendment, Brookdale will operate 17 properties under the new master lease with the initial annual rent of $9,325,000 and the capital expenditure commitment will be $7,150,000. Additionally, the new master lease provides Brookdale with a purchase option on these seven properties. Also, subsequent to September 30, 2023, we leased six assisted living communities located in Oklahoma, with a total of 219 units, to a current LTC operator under a new master lease, expected to commence on November 1, subject to the issuance of licensure to the new operator. These properties are currently included in the original Brookdale master lease. The lease term is for three years, with one four-year extension period. Rent in the first year is set at $960,000, increasing to $984,000 in the second year and $1,150,000 in the third year. This master lease includes a purchase option that can be exercised starting in November 2027 through October 2029 if the lessee exercises its four-year extension option. Also, we entered into agreements to sell seven assisted living communities in the existing Brookdale portfolio. These properties were classified as held-for-sale as of September 30, 2023.
Additionally, during 2023, a master lease covering two skilled nursing centers that was scheduled to mature in 2023 was renewed at the contractual rate for another five years extending the maturity to November 2028. The centers have a total of 216 beds and are located in Florida. Also, during 2023, a master lease covering two skilled nursing centers that was scheduled to mature in 2023 was renewed for another two years extending the maturity to December 2025. The master lease was renewed at the contractual annual cash rent of $1,005,000 increasing 2.5% per year. As amended, this master lease provides the lessee with a purchase option available through December 31, 2024.
9
LTC PROPERTIES, INC.
NOTES TO CONSOLIDATED FINANCIAL STATEMENTS CONTINUED
(Unaudited)
The centers have a total of 141 beds and are located in Tennessee.
During 2023, we transitioned a portfolio of eight assisted living communities with 500 units in Illinois, Ohio and Michigan to Encore Senior Living (“Encore”). We agreed to provide assistance in the second quarter of 2023 to the former operator of this portfolio and as part of the transition, we received repayment of $1,250,000 of deferred rent which represents $934,000 of April and May 2023 deferred rent and $316,000 of unrecorded deferred rent provided in 2022. Cash rent under the new two-year lease with Encore is based on mutually agreed upon fair market rent beginning in September 2023.
We monitor the collectability of our receivable balances, including deferred rent receivable balances, on an ongoing basis. We write-off uncollectible operator receivable balances, including straight- line rent receivable and lease incentives balances, as a reduction to rental income in the period such balances are no longer probable of being collected. Therefore, recognition of rental income is limited to the lesser of the amount of cash collected or rental income reflected on a “straight-line” basis for those customer receivable balances deemed uncollectible. We wrote-off straight-line rent receivable and lease incentives balances of $26,000 and $256,000 for the nine months ended September 30, 2023 and 2022, respectively, as a result of property sales and lease terminations.
We continue to take into account the current financial condition of our operators, including consideration of the pace of recovery from the impact of COVID-19, and inflation on the financial performance of our operators in our estimation of uncollectible accounts and deferred rents receivable at September 30, 2023. We are closely monitoring the collectability of such rents and will adjust future estimations as appropriate as further information becomes known.
The following table summarizes components of our rental income for the nine months ended September 30, 2023 and 2022 (in thousands):
|
|
Three Months Ended |
|
Nine Months Ended |
|||||||||
|
|
September 30, |
|
September 30, |
|||||||||
Rental Income |
|
|
2023 |
|
|
2022 |
|
|
2023 |
|
|
2022 |
|
Contractual cash rental income |
|
$ |
29,121 |
(1) |
$ |
28,180 |
|
$ |
87,260 |
(1) |
$ |
83,203 |
|
Variable cash rental income |
|
|
3,386 |
(2) |
|
4,160 |
(2) |
|
9,846 |
(2) |
|
12,218 |
(2) |
Straight-line rent |
|
|
(747) |
(3) |
|
(436) |
|
|
(1,635) |
(3) |
|
(963) |
|
Adjustment for collectability of lease incentives and rental income |
|
|
— |
|
|
(83) |
(4) |
|
(26) |
|
|
(256) |
(5) |
Amortization of lease incentives |
|
|
(171) |
|
|
(236) |
|
|
(584) |
|
|
(665) |
|
Total |
|
$ |
31,589 |
|
$ |
31,585 |
|
$ |
94,861 |
|
$ |
93,537 |
|
| (1) | Increased primarily due to rental income from acquisitions and transitioned portfolios, repayment of deferred rent and annual rent escalations, partially offset by sold properties. |
| (2) | The variable rental income for the three and nine months ended September 30, 2023 and the three and nine months ended September 30, 2022, primarily includes reimbursement of real estate taxes of our lessees. Decreased primarily due to property tax reassessment and sold properties partially offset by acquisitions. |
| (3) | Decreased primarily due to deferred rent repayment and normal amortization. |
| (4) | Represents lease incentive balances write-off related to two properties that were transitioned to another operator in our portfolio. |
| (5) | Represents a lease incentive balance write-off related to a closed property and subsequent lease termination and (4) above. |
10
LTC PROPERTIES, INC.
NOTES TO CONSOLIDATED FINANCIAL STATEMENTS CONTINUED
(Unaudited)
Some of our lease agreements provide purchase options allowing the lessees to purchase the properties they currently lease from us. The following table summarizes information about purchase options included in our lease agreements (dollar amounts in thousands):
|
|
Type |
|
Number |
|
|
|
|
|
|
|
|
|
|
|
of |
|
of |
|
|
Gross |
|
|
Net Book |
|
Option |
|
State |
|
Property |
|
Properties |
|
|
Investments |
|
|
Value |
|
Window |
|
California |
|
ALF/MC |
|
2 |
|
$ |
38,895 |
|
$ |
33,013 |
|
2023-2029 |
|
Florida |
|
MC |
|
1 |
|
|
7,680 |
|
|
4,681 |
|
2029 |
(1) |
Florida |
|
SNF |
|
3 |
|
|
76,712 |
|
|
76,712 |
|
2025-2027 |
(2) |
North Carolina |
|
ALF/MC |
|
11 |
|
|
121,321 |
|
|
121,321 |
|
2025-2028 |
(3) |
Ohio |
|
MC |
|
1 |
|
|
16,161 |
|
|
13,598 |
|
2024-2025 |
|
Ohio |
|
ILF/ALF/MC |
|
1 |
|
|
54,714 |
|
|
53,990 |
|
2025-2027 |
|
South Carolina |
|
ALF/MC |
|
1 |
|
|
11,680 |
|
|
8,619 |
|
2029 |
|
Tennessee |
|
SNF |
|
2 |
|
|
5,275 |
|
|
2,298 |
|
2023-2024 |
|
Texas |
|
SNF |
|
4 |
|
|
52,426 |
|
|
50,438 |
|
2027-2029 |
(4) |
Total |
|
|
|
|
|
$ |
384,864 |
|
$ |
364,670 |
|
|
|
| (1) | During 2023, we recorded an impairment loss of $7,522. See Impairment Loss below for more information. |
| (2) | During 2022, we entered into a joint venture (“JV”) to purchase three skilled nursing centers with a total of 299 beds. The JV leased the properties under a 10-year master lease. For more information regarding this transaction see Financing Receivables below. |
| (3) | During 2023, we entered into a JV that purchased 11 ALFs and MCs with a total of 523 units and leased the communities under a 10-year master lease. The master lease provides the operator with the option to buy up to 50% of the properties at the beginning of the third lease year, and the remaining properties at the beginning of the fourth lease year through the end of the sixth lease year, with an exit IRR of 9.0% on any portion of the properties being purchased. For more information regarding this transaction see Financing Receivables below. |
| (4) | During 2022, we purchased four skilled nursing centers and leased these properties under a 10-year lease with an existing operator. The lease allows the operator to elect either an earn-out payment or purchase option. If neither option is elected within the timeframe defined in the lease, both elections are terminated. For more information regarding the earn-out see Note 8. Commitments and Contingencies. |
Impairment Loss. In conjunction with the planned sale of a 70-unit assisted living community located in Florida, we recorded a $434,000 impairment loss during the three months ended March 31, 2023 and a $1,222,000 impairment loss during the fourth quarter of 2022. During the second quarter of 2023, the community was sold for $4,850,000. Additionally, during 2023, we performed a recoverability analysis on the carrying value of two assisted living communities that we are negotiating to sell and concluded that their carrying value may not be recoverable through future undiscounted cash flows. Accordingly, we recorded an aggregate impairment loss of $12,076,000 during the second quarter of 2023. As of September 30, 2023, we do not believe these communities meet the criteria to be classified as held-for-sale.
11
LTC PROPERTIES, INC.
NOTES TO CONSOLIDATED FINANCIAL STATEMENTS CONTINUED
(Unaudited)
Properties Held -for-Sale. The following summarizes our held-for-sale properties as of September 30, 2023 (dollar amounts in thousands):
|
|
Type |
|
Number |
|
Number |
|
|
|
|
|
|
|
|
|
of |
|
of |
|
of |
|
|
Gross |
|
|
Accumulated |
|
State |
|
Property |
|
Properties |
|
Beds/units |
|
|
Investment |
|
|
Depreciation |
|
FL |
|
ALF |
|
4 |
|
176 |
|
$ |
12,215 |
|
$ |
7,213 |
|
SC |
|
ALF |
|
3 |
|
128 |
|
|
8,823 |
|
|
4,377 |
|
|
|
|
|
7 |
|
304 |
|
$ |
21,038 |
|
$ |
11,590 |
|
Acquisitions. The following table summarizes our acquisitions for the nine months ended September 30, 2023 and 2022 (dollar amounts in thousands):
|
|
|
|
Cash |
|
|
|
|
Non- |
|
|
|
|
|
|
Number |
|
Number |
|||
|
|
|
|
Paid at |
|
Assumed |
|
|
Controlling |
|
Transaction |
|
|
Assets |
|
of |
|
of |
|||
Year |
|
Type of Property |
|
Acquisition |
|
Liabilities |
|
|
Interest |
|
Costs |
|
|
Acquired |
|
Properties |
|
Beds/Units |
|||
2023 |
|
ALF (1) |
|
$ |
43,759 |
|
$ |
9,767 |
|
$ |
9,133 |
|
$ |
363 |
|
$ |
63,022 |
(2) |
1 |
|
242 |
|
|
|
|
|
|
|
|
|
|
|
|
|
|
|
|
|
|
|
|
|
|
2022 |
|
SNF (3) |
|
$ |
51,815 |
|
$ |
— |
|
$ |
— |
|
$ |
— |
|
$ |
51,815 |
|
4 |
|
339 |
| (1) | We entered into a $54,134 Joint Venture (“JV”) and contributed $45,000 into the JV that purchased an ILF/ALF/MC in Ohio. Under the JV agreement, the seller, our JV partner, has the option to purchase the campus between the third and fourth lease years for LTC’s allocation of the JV investment plus an IRR of 9.75%. The campus was leased to Encore Senior Living (“Encore”) under a 10-year term with an initial yield of 8.25% on LTC’s allocation of the JV investment. LTC committed to fund $2,100 of lease incentives under the Encore lease of which $1,004 has been funded. |
| (2) | Includes $8,309 tax abatement intangible included in the Prepaid expenses and other assets line item in our Consolidated Balance Sheets. |
| (3) | The properties are located in Texas and are leased to an affiliate of an existing operator under a 10-year lease with two 5-year renewal options. Additionally, the lease provides either an earn-out payment or purchase option but not both. If neither option is elected within the timeframe defined in the lease, both elections are terminated. The earn-out payment is available, contingent on achieving certain thresholds per the lease, beginning at the end of the second lease year through the end of the fifth lease year. The purchase option is available beginning in the sixth lease year through the end of the seventh lease year. The initial cash yield is 8% for the first year, increasing to 8.25% for the second year, then increases annually by 2.0% to 4.0% based on the change in the Medicare Market Basket Rate. In connection with the transaction, we provided the lessee a 10-year working capital loan for up to $2,000 at 8% for first year, increasing to 8.25% for the second year, then increasing annually with the lease rate. During 2023, the working capital loan was fully repaid. Accordingly, the working capital commitment has been terminated. |
12
LTC PROPERTIES, INC.
NOTES TO CONSOLIDATED FINANCIAL STATEMENTS CONTINUED
(Unaudited)
Intangible Assets. We make estimates as part of our allocation of the purchase price of acquisitions to various components of acquisition based upon the fair value of each component. In determining fair value, we use current appraisals or other third-party opinions of value. The most significant components of our allocations are typically the allocation of fair value to land and buildings, and for certain of our acquisitions, in-place leases and other intangible assets. In the case of the value of in-place leases, we make the best estimates based on the evaluation of the specific characteristics of each tenant’s lease. Factors considered include estimates of carrying costs during the hypothetical expected lease-up periods, market conditions and costs to execute similar leases. The following is a summary of the carrying amount of intangible assets as of September 30, 2023 (in thousands):
|
|
|
|
|
|
|
|
|
|
|
|
|
|
|
|
|
|
|
|
|
|
|
|
|
September 30, 2023 |
|
December 31,2022 |
||||||||||||||||||
|
|
|
|
|
|
|
Accumulated |
|
|
|
|
|
|
|
|
|
|
Accumulated |
|
|
|
|
Assets |
|
|
Cost |
|
|
|
Amortization |
|
|
|
Net |
|
|
Cost |
|
|
|
Amortization |
|
|
|
Net |
In-place leases |
|
$ |
11,348 |
(1) |
|
$ |
(5,886) |
(2) |
|
$ |
5,462 |
|
$ |
9,474 |
(1) |
|
$ |
(5,362) |
(2) |
|
$ |
4,112 |
Tax abatement intangible |
|
|
8,309 |
(3) |
|
|
(231) |
(3) |
|
|
8,078 |
|
|
— |
(3) |
|
|
— |
(3) |
|
|
— |
| (1) | Included in the Buildings and improvements line item in our Consolidated Balance Sheets. |
| (2) | Included in the Accumulated depreciation and amortization line item in our Consolidated Balance Sheets. |
| (3) | Included in the Prepaid expenses and other assets line item in our Consolidated Balance Sheets. |
Improvements and Developments. During the nine months ended September 30, 2023 and 2022, we invested in the following (in thousands):
|
|
|
Nine Months Ended September 30, |
|
||||||||||
Type of Property |
|
|
2023 |
|
|
|
2022 |
|
||||||
|
|
Developments |
|
Improvements |
|
|
Developments |
|
Improvements |
|
||||
Assisted Living Communities |
|
$ |
— |
|
$ |
2,418 |
|
|
$ |
105 |
|
$ |
3,015 |
|
Skilled Nursing Centers |
|
|
— |
|
|
2,548 |
|
|
|
— |
|
|
981 |
|
Other |
|
|
— |
|
|
87 |
|
|
|
— |
|
|
559 |
|
Total |
|
$ |
— |
|
$ |
5,053 |
|
|
$ |
105 |
|
$ |
4,555 |
|
13
LTC PROPERTIES, INC.
NOTES TO CONSOLIDATED FINANCIAL STATEMENTS CONTINUED
(Unaudited)
Properties Sold. During the three and nine months ended September 30, 2023, we recorded a gain on sale of $4,870,000 and $20,545,000, respectively. During the three and nine months ended September 30, 2022, we recorded a loss on sale of $387,000 and a gain on sale of $37,809,000, respectively. The following table summarizes property sales during the nine months ended September 30, 2023 and 2022 (dollar amounts in thousands):
|
|
|
|
|
|
|
|
|
|
|
|
|
|
|
|
|
|
|
|
|
|
|
Type |
|
Number |
|
Number |
|
|
|
|
|
|
|
|
|
|
|
|
|
|
of |
|
of |
|
of |
|
|
Sales |
|
|
Carrying |
|
|
Net |
|
Year |
|
State |
|
Properties |
|
Properties |
|
Beds/Units |
|
|
Price |
|
|
Value |
|
|
Gain (Loss) (1) |
|
2023 |
|
Florida |
|
ALF |
|
1 |
|
70 |
|
$ |
4,850 |
|
$ |
4,082 |
|
$ |
65 |
|
|
|
Kentucky |
|
ALF |
|
1 |
|
60 |
|
|
11,000 |
|
|
10,720 |
|
|
57 |
|
|
|
New Jersey |
|
ALF |
|
1 |
|
39 |
|
|
2,000 |
|
|
1,552 |
|
|
266 |
|
|
|
New Mexico |
|
SNF |
|
2 |
|
235 |
|
|
21,250 |
|
|
5,523 |
|
|
15,287 |
|
|
|
Nebraska |
|
ALF |
|
3 |
|
117 |
|
|
2,984 |
|
|
2,934 |
|
|
— |
|
|
|
Pennsylvania |
|
ALF |
|
2 |
|
130 |
|
|
11,128 |
|
|
6,054 |
|
|
4,870 |
|
Total 2023 |
|
|
|
|
|
10 |
|
651 |
|
$ |
53,212 |
|
$ |
30,865 |
|
$ |
20,545 |
|
|
|
|
|
|
|
|
|
|
|
|
|
|
|
|
|
|
|
|
2022 |
|
California |
|
ALF |
|
2 |
|
232 |
|
$ |
43,715 |
|
$ |
17,832 |
|
$ |
25,867 |
|
|
|
California |
|
SNF |
|
1 |
|
121 |
|
|
13,250 |
|
|
1,846 |
|
|
10,846 |
|
|
|
Texas |
|
SNF |
|
1 |
|
— |
|
|
485 |
|
|
697 |
|
|
(434) |
|
|
|
Virginia |
|
ALF |
|
1 |
|
74 |
|
|
16,895 |
|
|
15,549 |
|
|
1,344 |
(2) |
|
|
n/a |
|
n/a |
|
— |
|
— |
|
|
— |
|
|
— |
|
|
186 |
(3) |
Total 2022 |
|
|
|
|
|
5 |
|
427 |
|
$ |
74,345 |
|
$ |
35,924 |
|
$ |
37,809 |
|
(
| (1) | Calculation of net gain includes cost of sales and write-off of straight-line receivable and lease incentives, when applicable. |
| (2) | In connection with this sale, the former operator paid us a lease termination fee of $1,181 which is not included in the gain on sale. |
| (3) | We recognized additional gain due to the reassessment adjustment of the holdbacks related to properties sold during 2019 and 2020, under the expected value model per ASC Topic 606, Contracts with Customers (“ASC 606”). |
Financing Receivables. As part of our acquisitions, we may from time to time, invest in sale and leaseback transactions. In accordance with ASC Topic 842, Leases (“ACS 842”), we are required to determine whether the sale and leaseback transaction qualifies as a sale. ASC 842 clarifies that an option for the seller-lessee to repurchase a real estate asset would generally preclude accounting for the transfer of the asset as a sale. Therefore, a sale and leaseback transaction of real estate that includes a seller-lessee repurchase option is accounted for as a failed sale and leaseback transaction. As a result, the purchased assets of a failed sale and leaseback transaction would be presented as Financing receivables on our Consolidated Balance Sheets and the rental revenue from these properties is recorded as Interest income from financing receivables on our Consolidated Statements of Income. Furthermore, upon expiration of the purchase option if the purchase option remains unexercised by the seller-lessee, the purchased assets will be reclassified from Financing receivables to Real property investments on our Consolidated Balance Sheets.
During 2023, we entered into a $121,321,000 JV with an affiliate of an existing operator and contributed $117,490,000 into the JV that purchased 11 assisted living and memory care communities from an affiliate of our JV partner. The JV leased the communities back to an affiliate of the seller under a 10-year master lease, with two five-year renewal options. The contractual initial cash yield of 7.25% increases to 7.5% in year three then escalates thereafter based on CPI subject to a floor of 2.0% and a ceiling of 4.0%. Additionally, the JV provided the seller-lessee with a purchase option to buy up to 50% of the properties at the beginning of the third lease year and the remaining properties at the beginning of the fourth lease year through the end of the sixth lease year, with an exit Internal Rate of Return (“IRR”) of 9.0%. During the three and nine months ended September 30, 2023, we recognized $2,427,000 and $7,198,000, respectively of Interest income from financing receivables and upon origination we recorded $1,213,000 Provision for credit losses equal to 1% of the financing receivable balance related to this investment.
14
LTC PROPERTIES, INC.
NOTES TO CONSOLIDATED FINANCIAL STATEMENTS CONTINUED
(Unaudited)
During 2022, we entered into a JV and contributed $61,661,000 into the JV that purchased three skilled nursing centers located in Florida for $75,825,000. The JV leased the centers back to an affiliate of the seller under a 10-year master lease, with two five-year renewal options and provided the seller-lessee with a purchase option, exercisable at the beginning of the fourth year through the end of the fifth year. During the three and nine months ended September 30, 2023, we recognized $1,405,000 and $4,215,000, respectively of Interest income from financing receivables related to this investment.
Mortgage Loans. The following table sets forth information regarding our investments in mortgage loans secured by first mortgages at September 30, 2023 (dollar amounts in thousands):
|
|
|
|
|
|
|
|
|
Type |
|
Percentage |
|
Number of |
|
Investment |
|||||||
|
|
|
|
|
|
Gross |
|
of |
|
of |
|
|
|
|
|
SNF |
|
ALF |
|
per |
||
Interest Rate |
|
Maturity |
|
State |
|
Investment |
|
Property |
|
Investment |
|
Loans (1) |
|
Properties (2) |
|
Beds |
|
Units |
|
Bed/Unit |
||
7.5% |
|
2024 |
|
MO |
|
$ |
1,961 |
|
OTH |
|
0.4 |
% |
1 |
|
— |
(3) |
— |
|
— |
|
$ |
n/a |
7.5% |
|
2024 |
|
LA |
|
|
29,346 |
|
SNF |
|
6.1 |
% |
1 |
|
1 |
|
189 |
|
— |
|
$ |
155.27 |
7.5% |
|
2024 |
|
GA |
|
|
51,111 |
(4) |
ALF |
|
10.7 |
% |
1 |
|
1 |
|
— |
|
203 |
|
$ |
251.78 |
7.8% |
|
2025 |
|
FL |
|
|
16,706 |
|
ALF |
|
3.5 |
% |
1 |
|
1 |
|
— |
|
68 |
|
$ |
245.68 |
7.3% |
|
2025 |
|
NC |
|
|
10,750 |
(4) |
ALF |
|
2.2 |
% |
1 |
|
1 |
|
— |
|
45 |
|
$ |
238.89 |
7.3% (5) |
|
2025 |
|
NC/SC |
|
|
58,331 |
|
ALF |
|
12.2 |
% |
1 |
|
13 |
|
— |
|
523 |
|
$ |
111.53 |
7.3% (5) |
|
2026 |
|
NC |
|
|
34,043 |
|
ALF |
|
7.1 |
% |
1 |
|
4 |
|
— |
|
217 |
|
$ |
156.88 |
7.3% (5) |
|
2026 |
|
NC |
|
|
826 |
|
OTH |
|
0.2 |
% |
1 |
|
— |
(6) |
— |
|
— |
|
$ |
— |
8.8% |
|
2028 |
|
IL |
|
|
16,500 |
(7) |
SNF |
|
3.5 |
% |
1 |
|
1 |
|
150 |
|
— |
|
$ |
110.00 |
10.6% (8) |
|
2043 |
|
MI |
|
|
184,220 |
|
SNF |
|
38.5 |
% |
1 |
|
15 |
|
1,875 |
|
— |
|
$ |
98.25 |
9.7% (8) |
|
2045 |
|
MI |
|
|
40,000 |
|
SNF |
|
8.4 |
% |
1 |
|
4 |
|
480 |
|
— |
|
$ |
83.33 |
10.1% |
|
2045 |
|
MI |
|
|
19,700 |
|
SNF |
|
4.1 |
% |
1 |
|
2 |
|
201 |
|
— |
|
$ |
98.01 |
10.3% (8) |
|
2045 |
|
MI |
|
|
14,850 |
|
SNF |
|
3.1 |
% |
1 |
|
1 |
|
146 |
|
— |
|
$ |
101.71 |
Total |
|
|
|
|
|
$ |
478,344 |
(9) |
|
|
100.0 |
% |
13 |
|
44 |
|
3,041 |
|
1,056 |
|
$ |
116.75 |
| (1) | Some loans contain certain guarantees and provide for certain facility fees. |
| (2) | Our mortgage loans are secured by properties located in eight states with seven borrowers. |
| (3) | Represents a mortgage loan secured by a parcel of land for the future development of a 91-bed post-acute SNF. |
| (4) | During the first quarter of 2023, we originated a $10,750 mortgage loan secured by a 45-unit MC located in North Carolina. The loan carries a two-year term with an interest-only rate of 7.25% and an IRR of 9.0%. Additionally, we invested $51,111 in an existing mortgage loan secured by a 203-unit ILF, ALF and MC located in Georgia by acquiring a participating interest owned by existing lenders for $42,251 in addition to converting our $7,461 mezzanine loan in the property into a participating interest in the mortgage loan. The mortgage loan matures in October 2024 and our investment is at an initial rate of 7.5% with an IRR of 7.75%. We recorded $1,380 of additional interest income in connection with the effective prepayment of the mezzanine loan in the first quarter of 2023. |
| (5) | Represents the initial rate with an IRR of 8%. |
| (6) | Represents a mortgage loan secured by a parcel of land in North Carolina held for future development of a seniors housing community. |
| (7) | During the second quarter of 2023, we originated a $16,500 senior loan for the purchase of a 150-bed SNF in Illinois. The mortgage loan matures in June 2028 and our investment is at an interest rate of 8.75%. |
| (8) | Mortgage loans provide for 2.25% annual increases in the interest rate. |
| (9) | During the third quarter of 2023, we committed to fund a $19,500 mortgage loan for the construction of an 85-unit ALF and MC in Michigan. The borrower contributed $12,100 of equity which will initially fund the construction. Once all of the borrower’s equity has been drawn, we will begin funding the commitment. The loan term is approximately three years at a rate of 8.75%, and includes two, one-year extensions, each of which is contingent on certain coverage thresholds. |
15
LTC PROPERTIES, INC.
NOTES TO CONSOLIDATED FINANCIAL STATEMENTS CONTINUED
(Unaudited)
The following table summarizes our mortgage loan activity for the nine months ended September 30, 2023 and 2022 (in thousands):
|
|
Nine Months Ended September 30, |
||||||
|
|
2023 |
|
|
2022 |
|
||
Originations and funding under mortgage loans receivable |
|
$ |
83,383 |
(1) |
|
$ |
35,234 |
(2) |
Application of interest reserve |
|
|
1,609 |
|
|
|
4,348 |
|
Scheduled principal payments received |
|
|
(301) |
|
|
|
(625) |
|
Mortgage loan premium amortization |
|
|
(5) |
|
|
|
(4) |
|
Provision for loan loss reserve |
|
|
(847) |
|
|
|
(389) |
|
Net increase in mortgage loans receivable |
|
$ |
83,839 |
|
|
$ |
38,564 |
|
| (1) | We originated the following: |
| (a) | $10,750 mortgage loan secured by a 45-unit MC located in North Carolina. The loan carries a two-year term with an interest-only rate of 7.25% and an IRR of 9.0%; |
| (b) | $51,111 mortgage loan investment secured by a 203-unit ILF, ALF and MC located in Georgia. We acquired a participating interest owned by existing lenders for $42,251 in addition to converting our $7,461 mezzanine loan in the property into a participating interest in the mortgage loan. The mortgage loan matures in October 2024 and our investment is at an initial rate of 7.5% with an IRR of 7.75%. We recorded $1,380 of additional interest income in connection with the effective prepayment of the mezzanine loan in the first quarter of 2023; |
| (c) | $16,500 senior loan for the purchase of a 150-bed SNF in Illinois. The mortgage loan matures in June 2028 and our investment is at an interest rate of 8.75%; |
| (d) | 5,022 of additional funding under other mortgage loans receivable; and |
| (e) | $19,500 mortgage loan commitment for the construction of an 85-unit ALF and MC in Michigan. The borrower contributed $12,100 of equity which will initially fund the construction. Once all of the borrower’s equity has been drawn, we will begin funding the commitment. The loan term is approximately three years at a rate of 8.75%, and includes two, one-year extensions, each of which is contingent on certain coverage thresholds. |
| (2) | We originated two senior mortgage loans, secured by four ALFs operated by an existing operator, as well as a land parcel in North Carolina. The communities have a combined total of 217 units, with an average age of less than four years. The land parcel is approximately 7.6 acres adjacent to one of the ALFs and is being held for the future development of a seniors housing community. The mortgage loans have a four-year term, an interest rate of 7.25% and an IRR of 8%. |
We apply ASU No. 2016-13, Measurement of Credit Losses on Financial Instruments (“ASU 2016-13”) and the “expected loss” model to estimate our loan losses on our mortgage loans and notes receivable. In determining the expected losses on these receivables, we utilize the probability of default and discounted cash flow methods. Further, we stress-test the results to reflect the impact of unknown adverse future events including recessions.
As of September 30, 2023, the accrued interest receivable of $54,605,000 was not included in the measurement of expected credit losses on the financing receivables, mortgage loans receivable and notes receivable (see Note 4. Notes Receivable). We elected not to measure an allowance for expected credit losses on the related accrued interest receivable using the expected credit loss standard. Rather, we have elected to write-off accrued interest receivable by reversing interest income and/or recognizing credit loss expense as incurred. We review the collectability of the accrued interest receivable quarterly as part of our review of the financing receivables, mortgage loans receivable or notes receivables including the performance of the underlying collateral and net worth of the borrower. For the nine months ended September 30, 2023 and 2022, we did not write-off any accrued interest receivable.
16
LTC PROPERTIES, INC.
NOTES TO CONSOLIDATED FINANCIAL STATEMENTS CONTINUED
(Unaudited)
3. |
Investment in Unconsolidated Joint Ventures |
We have preferred equity investments in two joint ventures. We determined that each of these JVs meets the accounting criteria to be considered a variable interest entity (“VIE”). We are not the primary beneficiary of the JVs as we do not have both: 1) the power to direct the activities that most significantly affect the JVs’ economic performance, and 2) the right to receive benefits from the VIE or the obligation to absorb losses of the VIE that could be significant to the VIE. However, we do have significant influence over the JVs. Therefore, we have accounted for the JVs using the equity method of accounting. The following table provides information regarding these preferred equity investments (dollar amounts in thousands):
|
|
Type |
|
Type |
|
Total |
|
|
Contractual |
|
|
Number |
|
|
|
|
|
|
of |
|
of |
|
Preferred |
|
|
Cash |
|
|
of |
|
|
Carrying |
|
State |
|
Properties |
|
Investment |
|
Return |
|
|
Portion |
|
|
Beds/ Units |
|
|
Value |
|
Washington |
|
ALF/MC |
|
Preferred Equity |
(1) |
12 |
% |
|
7 |
% |
|
95 |
|
$ |
6,340 |
(1) |
Washington |
|
UDP |
|
Preferred Equity |
(2) |
14 |
% |
|
8 |
% |
|
— |
|
|
13,000 |
(2) |
Total |
|
|
|
|
|
|
|
|
|
|
|
95 |
|
$ |
19,340 |
|
| (1) | Represents a preferred equity interest in an entity that developed and owns a 95-unit ALF and MC in Washington. Our investment represents 15.5% of the total investment. The preferred equity investment earns an initial cash rate of 7% increasing to 9% in year four until the internal rate of return (“IRR”) is 8%. After achieving an 8% IRR, the cash rate drops to 8% with an IRR ranging between 12% to 14%, depending upon timing of redemption. During the fourth quarter of 2021, the entity completed the development project and received its certificate of occupancy. We have the option to require the JV partner to purchase our preferred equity interest at any time between August 17, 2031 and December 31, 2036. |
| (2) | Represents a preferred equity interest in an entity that will develop and own a 267-unit ILF and ALF in Washington. Our investment represents 11.0% of the estimated total investment. The preferred equity investment earns an initial cash rate of 8% with an IRR of 14%. The JV partner has the option to buy out our investment at any time after August 31, 2023 at the IRR rate. Also, we have the option to require the JV partner to purchase our preferred equity interest at any time between August 31, 2027 and, upon project completion and leasing the property, prior to the end of the first renewal term of the lease. |
During the three and nine months ended September 30, 2023, we recognized $375,000 and $1,127,000, respectively, in income from unconsolidated joint ventures. During the three and nine months ended September 30, 2022, we recognized $376,000 and $1,127,000, respectively, in income from unconsolidated joint ventures. The following table summarizes our income recognized, and application of interest reserves related to our investments in unconsolidated joint ventures for the nine months ended September 30, 2023 and 2022 (in thousands):
|
|
Type |
|
|
|
|
|
|
|
|
|
|
|
|
of |
|
|
Income |
|
|
Cash Interest |
|
|
Application of |
|
Year |
|
Properties |
|
|
Recognized |
|
|
Earned |
|
|
Interest Reserve |
|
2023 |
|
ALF/MC |
|
$ |
337 |
|
$ |
— |
|
$ |
337 |
|
|
|
UDP |
|
|
790 |
|
|
— |
|
|
790 |
|
Total |
|
|
|
$ |
1,127 |
|
$ |
— |
|
$ |
1,127 |
|
|
|
|
|
|
|
|
|
|
|
|
|
|
2022 |
|
ALF/MC |
|
$ |
337 |
|
$ |
— |
|
$ |
337 |
|
|
|
UDP |
|
|
790 |
|
|
351 |
|
|
439 |
|
Total |
|
|
|
$ |
1,127 |
|
$ |
351 |
|
$ |
776 |
|
17
LTC PROPERTIES, INC.
NOTES TO CONSOLIDATED FINANCIAL STATEMENTS CONTINUED
(Unaudited)
4. |
Notes Receivable |
Notes receivable consist of a mezzanine loan and working capital loans. The following table sets forth information regarding our investment in notes receivable at September 30, 2023 (dollar amounts in thousands):
Interest |
|
|
|
|
|
|
Type of |
|
Gross |
|
|
|
|
Type of |
|
|
Rate |
|
IRR |
|
|
Maturity |
|
Loan |
|
Investment |
|
|
# of loans |
|
Property |
|
|
5.0% |
|
— |
|
|
2024 |
|
Working capital |
|
$ |
2,442 |
|
|
1 |
|
ALF |
|
4.0% |
|
— |
|
|
2024 |
|
Working capital |
|
|
13,531 |
|
|
1 |
|
SNF |
|
5.0% |
|
— |
|
|
2025 |
|
Working capital |
|
|
732 |
|
|
1 |
|
ALF |
|
7.5% |
|
— |
|
|
2027 |
|
Working capital |
|
|
550 |
|
|
1 |
|
ALF |
|
8.0% |
|
11.0 |
% |
|
2027 |
|
Mezzanine |
|
|
25,000 |
|
|
1 |
|
ALF |
|
8.8% |
|
12.0 |
% |
|
2028 |
|
Mezzanine |
|
|
17,000 |
(1) |
|
1 |
|
ALF |
|
6.5% |
|
— |
|
|
2030 |
|
Working capital |
|
|
138 |
|
|
1 |
|
SNF |
|
7.3% |
|
— |
|
|
2030 |
|
Working capital |
|
|
500 |
|
|
1 |
|
ALF |
|
7.3% |
|
— |
|
|
2030 |
|
Working capital |
|
|
1,107 |
|
|
1 |
|
ALF |
|
7.0% |
|
— |
|
|
2031 |
|
Working capital |
|
|
2,693 |
|
|
1 |
|
ALF |
|
|
|
|
|
|
|
|
|
|
$ |
63,693 |
(2) |
|
10 |
|
|
|
| (1) | During the third quarter of 2023, we originated a mezzanine loan to recapitalize an existing 130-unit ILF/ALF/MC in Georgia and construction of 89 additional units. The loan term is five years at an initial yield of 8.75% and an IRR of 12.0%. |
| (2) | Excludes the impact of credit loss reserve. |
The following table is a summary of our notes receivable components as of September 30, 2023 and December 31, 2022 (in thousands):
|
September 30, 2023 |
|
December 31, 2022 |
|
||
Mezzanine loans |
$ |
42,000 |
|
$ |
36,815 |
|
Working capital loans |
|
21,693 |
|
|
22,157 |
|
Notes receivable credit loss reserve |
|
(637) |
|
|
(589) |
|
Total |
$ |
63,056 |
|
$ |
58,383 |
|
The following table summarizes our notes receivable activity for the nine months ended September 30, 2023 and 2022 (in thousands):
|
Nine Months Ended September 30, |
|||||
|
|
2023 |
|
|
2022 |
|
Advances under notes receivable |
$ |
19,258 |
(1) |
$ |
37,008 |
(3) |
Principal payments received under notes receivable |
|
(14,537) |
(2) |
|
(6,618) |
|
Provision for credit losses |
|
(48) |
|
|
(303) |
|
Net increase in notes receivable |
$ |
4,673 |
|
$ |
30,087 |
|
| (1) | During the third quarter of 2023, we originated a mezzanine loan to recapitalize an existing 130-unit ILF/ALF/MC in Georgia and construction of 89 additional units. The loan term is five years at an initial yield of 8.75% and an IRR of 12.0%. |
| (2) | During 2023, we received $4,545, which includes a prepayment fee and the exit IRR totaling $190 from a mezzanine loan prepayment. The mezzanine loan was on a 136-unit ILF in Oregon. Additionally, another $7,461 mezzanine loan was effectively prepaid through converting it as part of our $51,111 investment in a participating interest in an existing mortgage loan that is secured by a 203-unit ALF, ILF and MC located in Georgia. We recorded $1,380 of interest income in connection with the effective prepayment of the mezzanine loan. |
| (3) | During 2022, we originated a $25,000 mezzanine loan for the recapitalization of a five-property seniors housing portfolio. The mezzanine loan has a term of approximately five years, with two one-year extension options and bears interest at 8% with an IRR of 11%. The five communities are located in Oregon and Montana, have a total of 621 units, and include independent living, assisted living and memory care. |
18
LTC PROPERTIES, INC.
NOTES TO CONSOLIDATED FINANCIAL STATEMENTS CONTINUED
(Unaudited)
5. |
Lease Incentives |
Our non-contingent lease incentive balances at September 30, 2023 and December 31, 2022 were $2,193,000 and $1,789,000, respectively. The following table summarizes our lease incentives activity for the nine months ended September 30, 2023 and 2022 (in thousands):
|
|
Nine Months Ended September 30, |
|||||
|
|
|
2023 |
|
|
2022 |
|
Lease incentives funded |
|
$ |
1,023 |
(1) |
$ |
418 |
|
Amortization of lease incentives |
|
|
(584) |
|
|
(665) |
|
Adjustment for collectability of lease incentives |
|
|
— |
|
|
(256) |
(3) |
Other adjustments (2) |
|
|
(35) |
|
|
(174) |
|
Net increase (decrease) in non-contingent lease incentives |
|
$ |
404 |
|
$ |
(677) |
|
| (1) | As part of our investment in a $54,134 JV, we committed to fund $2,100 of lease incentive, of which $1,004 was funded during the nine months ended September 30, 2023. |
| (2) | Primarily relates to lease incentive balance write-off related to property sales. |
| (3) | Represents the lease incentive balance write-off related to a closed property and subsequent lease termination and lease incentive balance write-off related to 12 assisted living communities transitioned to an existing operator. |
Non-contingent lease incentives represent payments made to our lessees for various reasons including entering into a new lease or lease amendments and extensions. Contingent lease incentives represent potential contingent earn-out payments that may be made to our lessees in the future, as part of our lease agreements. From time to time, we may commit to provide contingent payments to our lessees, upon our properties achieving certain rent coverage ratios. Once the contingent payment becomes probable and estimable, the contingent payment is recorded as a lease incentive. Lease incentives are amortized as a yield adjustment to rental income over the remaining life of the lease.
6. |
Debt Obligations |
Unsecured Credit Facility. We have an unsecured credit agreement (the “Credit Agreement”) that provides for an aggregate commitment of the lenders of up to $500,000,000 comprising of a $400,000,000 revolving credit facility (the “Revolving Line of Credit”) and two $50,000,000 term loans (the “Term Loans”). The Credit Agreement permits us to request increases to the Revolving Line of Credit and Term Loans commitments up to a total of $1,000,000,000. The Revolving Line of Credit matures November 19, 2025 and provides for a one-year extension option at our discretion, subject to customary conditions. The Term Loans mature on November 19, 2025 and November 19, 2026. During the fourth quarter of 2022, we entered into the First Amendment (the “Amended Credit Agreement”) to replace LIBOR with SOFR, plus a credit spread adjustment of 10 basis points (“Adjusted SOFR”), as the reference rate for purpose of calculating interest under the Amended Credit Agreement. Other material terms of the Credit Agreement remain unchanged. Based on our leverage at September 30, 2023, the facility provides for interest annually at Adjusted SOFR plus 120 basis points and a facility fee of 20 basis points and the Term Loans provide for interest annually at Adjusted SOFR plus 140 basis points.
Interest Rate Swap Agreements. In connection with entering into the Term Loans described above, we entered into two receive variable/pay fixed interest rate swap agreements (the “Interest Rate Swaps”) with maturities of November 19, 2025 and November 19, 2026, respectively, that will effectively lock-in the forecasted interest payments on the Term Loans’ borrowings over their four and five year terms of the loans. The Interest Rate Swaps are considered cash flow hedges and are recorded on our Consolidated Balance Sheets at fair value in Prepaid expenses and other assets, with cumulative changes in the fair value of these instruments recognized in Accumulated other comprehensive income (loss) on our Consolidated Balance Sheets.
19
LTC PROPERTIES, INC.
NOTES TO CONSOLIDATED FINANCIAL STATEMENTS CONTINUED
(Unaudited)
In connection with entering into the Amended Credit Agreement discussed above, we entered into amendments to our Interest Rate Swaps to account for SOFR as the updated reference rate in the Amended Credit Agreement. During the three and nine months ended September 30, 2023, we recorded a $28,000 increase and $123,000 decrease in fair value of Interest Rate Swaps, respectively. During the three and nine months ended September 30, 2022, we recorded increase of $3,306,000 and $9,617,000 in fair value of Interest Rate Swaps, respectively.
As of September 30, 2023 and December 31, 2022, the terms of the Interest Rate Swaps are as follows (dollar amounts in thousands):
|
|
|
|
|
|
|
|
|
|
Notional |
|
Fair Value at |
|
|||||
Date Entered |
|
Maturity Date |
|
Swap Rate |
|
Rate Index |
|
|
Amount |
|
|
September 30, 2023 |
|
|
|
December 31, 2022 |
|
|
November 2021 |
|
November 19, 2025 |
|
2.62 |
% |
|
1-month SOFR |
|
$ |
50,000 |
|
$ |
3,776 |
|
|
$ |
4,003 |
|
November 2021 |
|
November 19, 2026 |
|
2.76 |
% |
|
1-month SOFR |
|
|
50,000 |
|
|
4,820 |
|
|
|
4,716 |
|
|
|
|
|
|
|
|
|
|
$ |
100,000 |
|
$ |
8,596 |
|
|
$ |
8,719 |
|
Senior Unsecured Notes. We have senior unsecured notes held by institutional investors with interest rates ranging from 3.66% to 5.03%. The senior unsecured notes mature between 2024 and 2033.
The senior unsecured notes and the Credit Agreement, including the Revolving Line of Credit and the Term Loans, contain financial covenants, which are measured quarterly, that require us to maintain, among other things:
| ● | a ratio of total indebtedness to total asset value not greater than 0.6 to 1.0; |
| ● | a ratio of secured debt to total asset value not greater than 0.35 to 1.0; |
| ● | a ratio of unsecured debt to the value of the unencumbered asset value not greater than 0.6 to 1.0; and |
| ● | a ratio of EBITDA, as calculated in the debt obligation, to fixed charges not less than 1.50 to 1.0. |
At September 30, 2023, we were in compliance with all applicable financial covenants. These debt obligations also contain additional customary covenants and events of default that are subject to a number of important and significant limitations, qualifications and exceptions.
The following table sets forth information regarding debt obligations by component as of September 30, 2023 and December 31, 2022 (dollar amounts in thousands):
|
|
|
|
|
|
|
|
|
|
|
|
|
|
|
|
|
|
|
|
At September 30, 2023 |
|
At December 31, 2022 |
|
||||||||
|
|
Applicable |
|
|
|
Available |
|
|
|
Available |
|
||||
|
|
Interest |
|
Outstanding |
|
for |
|
Outstanding |
|
for |
|
||||
Debt Obligations |
|
Rate (1) |
|
Balance |
|
Borrowing |
|
Balance |
|
Borrowing |
|
||||
Revolving line of credit |
|
6.63% |
|
$ |
362,250 |
|
$ |
37,750 |
|
$ |
130,000 |
|
$ |
270,000 |
|
Term loans, net of debt issue costs |
|
2.74% |
|
|
99,620 |
|
|
— |
|
|
99,511 |
|
|
— |
|
Senior unsecured notes, net of debt issue costs |
|
4.20% |
|
|
494,353 |
|
|
— |
|
|
538,343 |
|
|
— |
|
Total |
|
4.97% |
|
$ |
956,223 |
|
$ |
37,750 |
|
$ |
767,854 |
|
$ |
270,000 |
|
| (1) | Represents weighted average of interest rate as of September 30, 2023. |
20
LTC PROPERTIES, INC.
NOTES TO CONSOLIDATED FINANCIAL STATEMENTS CONTINUED
(Unaudited)
During the nine months ended September 30, 2023 and 2022, our debt borrowings and repayments were as follows (in thousands):
|
|
|
|
|
|
|
|
|
|
|
|
|
|
|
|
Nine Months Ended September 30, |
|
||||||||||
|
|
2023 |
|
2022 |
|
||||||||
Debt Obligations |
|
|
Borrowings |
|
|
Repayments |
|
Borrowings |
|
Repayments |
|
||
Revolving line of credit |
|
$ |
274,450 |
|
$ |
(42,200) |
|
$ |
194,000 |
|
$ |
(153,900) |
|
Senior unsecured notes |
|
|
— |
|
|
(44,160) |
|
|
75,000 |
|
|
(43,160) |
|
Total |
|
$ |
274,450 |
|
$ |
(86,360) |
|
$ |
269,000 |
|
$ |
(197,060) |
|
7. |
Equity |
Non-controlling Interests. We have entered into partnerships to develop and/or own real estate. Given that our limited members do not have the substantive kick-out rights, liquidation rights, or participation rights, we have concluded that the partnerships are VIEs. As we exercise power over and receive benefits from the VIEs, we are considered the primary beneficiary. Accordingly, we consolidate the VIEs and record the non-controlling interests on the consolidated financial statements.
As of September 30, 2023, we have the following consolidated VIEs (in thousands):
|
|
|
|
|
|
|
|
|
Gross |
|
|
|
|
Investment |
|
|
|
Property |
|
|
|
|
Consolidated |
|
|
Non-Controlling |
|
Year |
|
Purpose |
|
Type |
|
State |
|
|
Assets (1) |
|
|
Interests |
|
2023 |
|
Owned real estate |
(2) |
ILF/ALF/MC |
|
OH |
|
$ |
54,714 |
|
$ |
9,134 |
|
2023 |
|
Owned real estate |
(3) |
ALF/MC |
|
NC |
|
|
121,321 |
|
|
3,831 |
|
2022 |
|
Owned real estate |
(4) |
SNF |
|
FL |
|
|
76,712 |
|
|
14,325 |
|
2018 |
|
Owned real estate |
|
ILF |
|
OR |
|
|
14,650 |
|
|
2,907 |
|
2018 |
|
Owned real estate and development |
|
ALF/MC |
|
OR |
|
|
18,452 |
|
|
1,231 |
|
2017 |
|
Owned real estate and development |
|
ILF/ALF/MC |
|
WI |
|
|
22,007 |
|
|
2,305 |
|
2017 |
|
Owned real estate |
|
ALF/MC |
|
SC |
|
|
11,680 |
|
|
1,240 |
|
Total |
|
|
|
|
|
|
|
$ |
319,536 |
|
$ |
34,973 |
|
| (1) | Includes the total real estate investments and excludes intangible assets. |
| (2) | During the second quarter of 2023, we entered into a JV that purchased an ILF/ALF/MC in Ohio with a total of 242 units. For more information see Acquisitions above in Note 2. |
| (3) | During the first quarter of 2023, we entered into a JV that purchased 11 ALF and MC with a total of 523 units. For more information regarding this transaction see Financing Receivable above in Note 2. |
| (4) | During 2022, we entered into a JV that purchased three SNFs with a total of 299 beds. For more information regarding this transaction see Financing Receivable above in Note 2. |
Common Stock. We have separate equity distribution agreements (collectively, “Equity Distribution Agreements”) to offer and sell, from time to time, up to $200,000,000 in aggregate offering price of shares of our common stock. During the nine months ended September 30, 2023, we sold 48,500 shares of common stock for $1,777,000 in net proceeds under our Equity Distribution Agreements. In conjunction with the sale of common stock, we incurred $80,000 of costs associated with this agreement which have been recorded in additional paid in capital as a reduction of proceeds received. At September 30, 2023, we had $128,822,000 available under the Equity Distribution Agreements.
During the nine months ended September 30, 2023 and 2022, we acquired 43,933 shares and 39,463 shares, respectively, of common stock held by employees who tendered owned shares to satisfy tax withholding obligations.
21
LTC PROPERTIES, INC.
NOTES TO CONSOLIDATED FINANCIAL STATEMENTS CONTINUED
(Unaudited)
Available Shelf Registration. We have an automatic shelf registration statement on file with the SEC, and currently have the ability to file additional automatic shelf registration statements, to provide us with capacity to publicly offer an indeterminate amount of common stock, preferred stock, warrants, debt, depositary shares, or units. We may from time to time raise capital under our automatic shelf registration statement in amounts, at prices, and on terms to be announced when and if the securities are offered. The specifics of any future offerings, along with the use of proceeds of any securities offered, will be described in detail in a prospectus supplement, or other offering materials, at the time of the offering. Our shelf registration statement expires on February 17, 2025.
Distributions. We declared and paid the following cash dividends (in thousands):
|
|
Nine Months Ended September 30, |
|
|||||||||||
|
|
2023 |
|
2022 |
|
|
||||||||
|
|
Declared |
|
Paid |
|
Declared |
|
Paid |
|
|
||||
Common Stock (1) |
|
$ |
70,767 |
|
$ |
70,767 |
|
$ |
68,202 |
|
$ |
68,202 |
|
|
| (1) | Represents $0.19 per share per month for the nine months ended September 30, 2023 and 2022. |
In October 2023, we declared a monthly cash dividend of $0.19 per share on our common stock for the months of October, November and December 2023, payable on October 31, November 30, and December 29, 2023, respectively, to stockholders of record on October 23, November 22, and December 21, 2023, respectively.
Stock-Based Compensation. During the second quarter of 2021, we adopted and our shareholders approved the 2021 Equity Participation Plan (“the 2021 Plan”) which replaces the 2015 Equity Participation Plan (“the 2015 Plan”). Under the 2021 Plan, 1,900,000 shares of common stock have been authorized and reserved for awards, less one share for every one share that was subject to an award granted under the 2015 Plan after December 31, 2020 and prior to adoption. In addition, any shares that are not issued under outstanding awards under the 2015 Plan because the shares were forfeited or cancelled after December 31, 2020 will be added to and again be available for awards under the 2021 Plan. Under the 2021 Plan, the shares were authorized and reserved for awards to officers, employees, non-employee directors and consultants. The terms of the awards granted under the 2021 Plan and the 2015 Plan are set by our compensation committee at its discretion.
At September 30, 2023, we had 5,000 stock options outstanding and exercisable. During each of the nine months ended September 30, 2023 and 2022, 5,000 stock options expired and were cancelled. During the nine months ended September 30, 2023 and 2022, no stock options were granted or exercised.
The following table summarizes our restricted stock activity for the nine months ended September 30, 2023 and 2022:
|
|
Nine Months Ended September 30, |
|||||
|
|
2023 |
|
2022 |
|
||
Outstanding, January 1 |
|
|
229,236 |
|
|
197,422 |
|
Granted |
|
|
146,020 |
|
|
135,210 |
|
Vested |
|
|
(115,551) |
|
|
(103,396) |
|
Cancelled |
|
|
(1,085) |
|
|
— |
|
Outstanding, September 30 |
|
|
258,620 |
|
|
229,236 |
|
No performance-based stock units vested during the nine months ended September 30, 2023, and 2022.
22
LTC PROPERTIES, INC.
NOTES TO CONSOLIDATED FINANCIAL STATEMENTS CONTINUED
(Unaudited)
During the nine months ended September 30, 2023 and 2022, we granted restricted stock and performance-based stock units under the 2021 Plan as follows:
|
|
No. of |
|
Price per |
|
|
|
|
|
|
Year |
|
Shares/Units |
|
Share |
|
Reward Type |
|
Vesting Period |
|
|
2023 |
|
127,960 |
|
$ |
37.16 |
|
Restricted stock |
|
ratably over 3 years |
|
|
|
86,867 |
|
$ |
37.16 |
|
Performance-based stock units |
|
TSR targets (1) |
|
|
|
15,060 |
|
$ |
31.54 |
|
Restricted stock |
|
May 24,2024 |
|
|
|
3,000 |
|
$ |
35.45 |
|
Restricted stock |
|
July 25, 2024 |
|
|
|
232,887 |
|
|
|
|
|
|
|
|
|
|
|
|
|
|
|
|
|
|
|
2022 |
|
122,865 |
|
$ |
33.94 |
|
Restricted stock |
|
ratably over 3 years |
|
|
|
86,332 |
|
$ |
33.94 |
|
Performance-based stock units |
|
TSR targets (1) |
|
|
|
12,345 |
|
$ |
38.48 |
|
Restricted stock |
|
May 25, 2023 |
|
|
|
221,542 |
|
|
|
|
|
|
|
|
|
|
|
|
|
|
|
|
|
|
|
| (1) | Vesting is based on achieving certain total shareholder return (“TSR”) targets in 4 years with acceleration opportunity in 3 years. |
Compensation expense recognized related to the vesting of restricted common stock and performance-based stock units for the nine months ended September 30, 2023 and 2022 were $6,349,000 and $5,951,000, respectively. At September 30, 2023, the remaining compensation expense to be recognized related to the future service period of unvested outstanding restricted common stock and performance-based stock units are as follows (in thousands):
|
|
Remaining |
|
|
|
Compensation |
|
Vesting Date |
|
Expense |
|
October - December 2023 |
|
$ |
2,132 |
2024 |
|
|
6,026 |
2025 |
|
|
3,238 |
2026 |
|
|
356 |
Total |
|
$ |
11,752 |
23
LTC PROPERTIES, INC.
NOTES TO CONSOLIDATED FINANCIAL STATEMENTS CONTINUED
(Unaudited)
8. |
Commitments and Contingencies |
At September 30, 2023, we had commitments as follows (in thousands):
|
|
|
|
|
|
|
|
Total |
|
|
|
|
|
|
Investment |
|
2023 |
|
Commitment |
|
Remaining |
||||
|
|
Commitment |
|
Funding |
|
Funded |
|
Commitment |
||||
Real estate properties (Note 2. Real Estate Investments) |
|
$ |
10,242 |
(1) |
$ |
1,932 |
|
$ |
2,650 |
|
$ |
7,592 |
Accrued incentives and earn-out liabilities (Note 5. Lease Incentives) |
|
|
21,100 |
(2) |
|
1,004 |
|
|
1,004 |
|
|
20,096 |
Mortgage loans (Note 2. Real Estate Investments) |
|
|
43,598 |
(3) |
|
1,476 |
|
|
7,178 |
|
|
36,420 |
Notes receivable (Note 4. Notes Receivable) |
|
|
28,950 |
(4) |
|
2,258 |
|
|
15,973 |
|
|
12,977 |
Total |
|
$ |
103,890 |
|
$ |
6,670 |
|
$ |
26,805 |
|
$ |
77,085 |
| (1) | Represents commitments to purchase land and improvements, if applicable, and to develop, re-develop, renovate or expand seniors housing and skilled nursing properties. |
| (2) | Includes an earn-out payment of up to $3,000 to an operator under a master lease on four SNFs in Texas which were acquired during 2022. The master lease allows either an earn-out payment up to $3,000 or a purchase option. The earn-out payment is available, contingent on achieving certain thresholds per the lease, beginning at the end of the second lease year through the end of the fifth lease year. If neither option is elected within the timeframe defined in the lease, both elections are terminated. For more information regarding the purchase option see Note 2. Real Estate Investments. |
| (3) | Represents $19,500 related to a construction loan, $6,098 of commitments for the expansion, renovation and working capital related to seniors housing and skilled nursing properties securing the mortgage loans and $18,000 of commitments which are contingent upon the borrower achieving certain coverage ratios. |
| (4) | Represents working capital loan commitments. |
Additionally, some of our lease agreements provide purchase options allowing the lessee to purchase the properties they currently lease from us. See Note 2. Real Estate Investments for a table summarizing information about our purchase options.
We are a party from time to time to various general and professional liability claims and lawsuits asserted against the lessees or borrowers of our properties, which in our opinion are not singularly or in the aggregate material to our results of operations or financial condition. These types of claims and lawsuits may include matters involving general or professional liability, which we believe under applicable legal principles are not our responsibility as a non-possessory landlord or mortgage holder. We believe that these matters are the responsibility of our lessees and borrowers pursuant to general legal principles and pursuant to insurance and indemnification provisions in the applicable leases or mortgages. We intend to continue to vigorously defend such claims.
24
LTC PROPERTIES, INC.
NOTES TO CONSOLIDATED FINANCIAL STATEMENTS CONTINUED
(Unaudited)
9. |
Major Operators |
We have one operator that represents 10% or more of our combined rental revenue and interest income from mortgage loans. The following table sets forth information regarding our major operator as of September 30, 2023:
|
|
Number of |
|
Number of |
|
Percentage of |
|
||||||||
|
|
|
|
|
|
SNF |
|
ALF |
|
Total |
|
|
Total |
|
|
Operator |
|
SNF |
|
ALF |
|
Beds |
|
Units |
|
Revenues (1) |
|
|
Assets (2) |
|
|
Prestige Healthcare (3) |
|
24 |
|
— |
|
2,820 |
|
93 |
|
16.6 |
% |
|
14.2 |
% |
|
| (1) | During 2023, we agreed to defer up to $1,500, or up to $300 per month for May through September 2023, in interest payments due on one of Prestige Healthcare’s mortgage loans secured by 15 skilled nursing centers in Michigan. We deferred $600 in interest payments during the second quarter of 2023 and $900 in interest payments during the third quarter of 2023. |
| (2) | Represents the net carrying value of the mortgage loans and properties we own divided by the Total assets on the Consolidated Balance Sheets. |
| (3) | The majority of the revenue derived from this operator relates to interest income from mortgage loans. |
Subsequent to September 30, 2023, we amended the loan with Prestige which was subject to a previously agreed interest deferral and is secured by 15 skilled nursing centers in Michigan. As part of the amendment, LTC has drawn down $2,767,000 of the approximate $4,945,000 letter of credit from Prestige to repay all deferred interest outstanding through October 2023. We will further draw down approximately $334,000 in each of November and December 2023 to be applied toward interest due on the loan at that point. As a result, we expect to receive all contractual interest of $19,539,000 due from Prestige in 2023. Beginning on January 1, 2024, the monthly minimum interest payment due to LTC will be set based on an annual current pay rate of 8.5% on the outstanding loan balance. The contractual interest rate of the loan remains unchanged.
Our financial position and ability to make distributions may be adversely affected if Prestige Healthcare or any of our lessees and borrowers face financial difficulties, including any bankruptcies, inability to emerge from bankruptcy, insolvency or general downturn in business of any such operator, continuing impact upon services or occupancy levels due to COVID-19, or in the event any such operator does not renew and/or extend its relationship with us.
25
LTC PROPERTIES, INC.
NOTES TO CONSOLIDATED FINANCIAL STATEMENTS CONTINUED
(Unaudited)
10. |
Earnings per Share |
The following table sets forth the computation of basic and diluted net income per share (in thousands, except per share amounts):
|
|
Three Months Ended |
|
Nine Months Ended |
|
||||||||
|
|
September 30, |
|
September 30, |
|
||||||||
|
|
2023 |
|
2022 |
|
2023 |
|
2022 |
|
||||
Net income |
|
$ |
22,627 |
|
$ |
13,389 |
|
$ |
62,792 |
|
$ |
82,386 |
|
Less income allocated to non-controlling interests |
|
|
(430) |
|
|
(99) |
|
|
(1,287) |
|
|
(301) |
|
Less income allocated to participating securities: |
|
|
|
|
|
|
|
|
|
|
|
|
|
Non-forfeitable dividends on participating securities |
|
|
(147) |
|
|
(131) |
|
|
(440) |
|
|
(401) |
|
Income allocated to participating securities |
|
|
— |
|
|
— |
|
|
— |
|
|
(80) |
|
Total net income allocated to participating securities |
|
|
(147) |
|
|
(131) |
|
|
(440) |
|
|
(481) |
|
Net income available to common stockholders |
|
|
22,050 |
|
|
13,159 |
|
|
61,065 |
|
|
81,604 |
|
Effect of dilutive securities: |
|
|
|
|
|
|
|
|
|
|
|
|
|
Participating securities (1) |
|
|
— |
|
|
— |
|
|
— |
|
|
— |
|
Net income for diluted net income per share |
|
$ |
22,050 |
|
$ |
13,159 |
|
$ |
61,065 |
|
$ |
81,604 |
|
|
|
|
|
|
|
|
|
|
|
|
|
|
|
Shares for basic net income per share |
|
|
41,153 |
|
|
40,270 |
|
|
41,127 |
|
|
39,658 |
|
Effect of dilutive securities: |
|
|
|
|
|
|
|
|
|
|
|
|
|
Stock options (2) |
|
|
— |
|
|
1 |
|
|
— |
|
|
— |
|
Performance-based stock units |
|
|
58 |
|
|
281 |
|
|
58 |
|
|
281 |
|
Participating securities (1) |
|
|
— |
|
|
— |
|
|
— |
|
|
— |
|
Total effect of dilutive securities |
|
|
58 |
|
|
282 |
|
|
58 |
|
|
281 |
|
Shares for diluted net income per share |
|
|
41,211 |
|
|
40,552 |
|
|
41,185 |
|
|
39,939 |
|
|
|
|
|
|
|
|
|
|
|
|
|
|
|
Basic net income per share |
|
$ |
0.54 |
|
$ |
0.33 |
|
$ |
1.48 |
|
$ |
2.06 |
|
Diluted net income per share |
|
$ |
0.54 |
|
$ |
0.32 |
|
$ |
1.48 |
|
$ |
2.04 |
|
| (1) | For the three and nine months ended September 30, 2023 and 2022, the participating securities have been excluded from the computation of diluted net income per share as such inclusion would be anti-dilutive. |
| (2) | For the three and nine months ended September 30, 2023 and the nine months ended September 30, 2022, the stock options have been excluded from the computation of diluted net income per share as such inclusion would be anti-dilutive. |
11. |
Fair Value Measurements |
In accordance with the accounting guidance regarding the fair value option for financial assets and financial liabilities, entities are permitted to choose to measure certain financial assets and liabilities at fair value, with the change in unrealized gains and losses reported in earnings. We did not elect the fair value option for any of our financial assets and financial liabilities.
26
LTC PROPERTIES, INC.
NOTES TO CONSOLIDATED FINANCIAL STATEMENTS CONTINUED
(Unaudited)
The carrying amount of cash and cash equivalents approximates their fair value because of the short-term maturity of these instruments. We do not invest our cash in auction rate securities. The carrying value and estimated fair value of our financial instruments as of September 30, 2023 and December 31, 2022 were as follows (in thousands):
|
|
At September 30, 2023 |
|
At December 31, 2022 |
|
||||||||
|
|
Carrying |
|
Fair |
|
Carrying |
|
Fair |
|
||||
|
|
Value |
|
Value |
|
Value |
|
Value |
|
||||
Financing receivable, net of credit loss reserve |
|
$ |
196,053 |
|
$ |
199,050 |
(1) |
$ |
75,999 |
|
$ |
76,033 |
(1) |
Mortgage loans receivable, net of credit loss reserve |
|
|
473,567 |
|
|
560,808 |
(2) |
|
389,728 |
|
|
461,276 |
(2) |
Notes receivable, net of credit loss reserve |
|
|
63,056 |
|
|
70,482 |
(3) |
|
58,383 |
|
|
61,858 |
(3) |
Revolving line of credit |
|
|
362,250 |
|
|
362,250 |
(4) |
|
130,000 |
|
|
130,000 |
(4) |
Term loans, net of debt issue costs |
|
|
99,620 |
|
|
100,000 |
(4) |
|
99,511 |
|
|
100,000 |
(4) |
Senior unsecured notes, net of debt issue costs |
|
|
494,353 |
|
|
429,534 |
(5) |
|
538,343 |
|
|
477,653 |
(5) |
| (1) | Our investment in financing receivables is classified as Level 3. The fair value is determined using a widely accepted valuation technique, discounted cash flow analysis on the expected cash flows. The discount rate used to value our future cash inflows of the financing receivables at September 30, 2023 and December 31, 2022 was 7.6%. |
| (2) | Our investment in mortgage loans receivable is classified as Level 3. The fair value is determined using a widely accepted valuation technique, discounted cash flow analysis on the expected cash flows. The discount rate is determined using our assumption on market conditions adjusted for market and credit risk and current returns on our investments. The discount rate used to value our future cash inflows of the mortgage loans receivable at September 30, 2023 and December 31, 2022 was 9.1% and 9.3%, respectively. |
| (3) | Our investments in notes receivable are classified as Level 3. The discount rate is determined using our assumption on market conditions adjusted for market and credit risk and current returns on our investments. The discount rate used to value our future cash flows of the notes receivable at September 30, 2023 and December 31, 2022, were 6.8% and 7.1%, respectively. |
| (4) | Our revolving line of credit and term loans bear interest at a variable interest rate. The estimated fair value of our revolving line of credit and term loans approximated their carrying values at September 30, 2023 and December 31, 2022 based upon prevailing market interest rates for similar debt arrangements. |
| (5) | Our obligation under our senior unsecured notes is classified as Level 3 and thus the fair value is determined using a widely accepted valuation technique, discounted cash flow analysis on the expected cash flows. The discount rate is measured based upon management’s estimates of rates currently prevailing for comparable loans available to us, and instruments of comparable maturities. At September 30, 2023, the discount rate used to value our future cash outflow of our senior unsecured notes was 7.25% for those maturing before year 2030 and 7.50% for those maturing at or beyond year 2030. At December 31, 2022, the discount rate used to value our future cash outflow of our senior unsecured notes was 6.50% for those maturing before year 2030 and 7.00% for those maturing at or beyond year 2030. |
12. |
Subsequent Events |
Subsequent to September 30, 2023, the following events occurred:
Real Estate: We added seven additional properties to the new Brookdale master lease commencing on January 1, 2024. One property is located in Ohio with 42 assisted living units and six are located in Texas with 235 assisted living units. These properties are currently included in the original Brookdale master lease. As a result of this amendment, Brookdale will operate 17 properties under the new master lease with the initial annual rent of $9,325,000 and the capital expenditure commitment will be $7,150,000. Additionally, the new master lease provides Brookdale with a purchase option on these seven properties. Also, we leased six assisted living communities located in Oklahoma, with a total of 219 units, to a current LTC operator under a new master lease, expected to commence on November 1, subject to the issuance of licensure to the new operator. These properties are currently included in the original Brookdale master lease. The lease term is for three years, with one four-year extension period. Rent in the first year is set at $960,000, increasing to $984,000 in the second year, and $1,150,000 in the third year. Additionally, the master lease includes a purchase option that can be exercised starting in November 2027 through October 2029 if the lessee exercises its four-year extension option.
27
LTC PROPERTIES, INC.
NOTES TO CONSOLIDATED FINANCIAL STATEMENTS CONTINUED
(Unaudited)
Furthermore, we amended the loan with Prestige which was subject to a previously agreed interest deferral and is secured by 15 skilled nursing centers in Michigan. As part of the amendment, LTC has drawn down $2,767,000 of the approximate $4,945,000 letter of credit from Prestige to repay all deferred interest outstanding through October 2023. We will further draw down approximately $334,000 in each of November and December 2023 to be applied toward interest due on the loan at that point. As a result, we expect to receive all contractual interest of $19,539,000 due from Prestige in 2023. Beginning on January 1, 2024, the monthly minimum interest payment due to LTC will be set based on an annual current pay rate of 8.5% on the outstanding loan balance. The contractual interest rate of the loan remains unchanged.
Equity: We declared a monthly cash dividend of $0.19 per share on our common stock for the months of October, November and December 2023, payable on October 31, November 30, and December 29, 2023, respectively to stockholders of record on October 23, November 22, and December 21, 2023, respectively.
28
Item 2.MANAGEMENT’S DISCUSSION AND ANALYSIS OF FINANCIAL CONDITION AND RESULTS OF OPERATIONS
Cautionary Statement Regarding Forward-Looking Statements
This quarterly report contains forward-looking statements within the meaning of Section 27A of the Securities Act of 1933, as amended, and Section 21E of the Securities Exchange Act of 1934, as amended, adopted pursuant to the Private Securities Litigation Reform Act of 1995. Statements that are not purely historical may be forward-looking. You can identify some of the forward-looking statements by their use of forward-looking words, such as “believes,” “expects,” “may,” “will,” “could,” “would,” “should,” “seeks,” “approximately,” “intends,” “plans,” “estimates” or “anticipates,” or the negative of those words or similar words. Forward-looking statements involve inherent risks and uncertainties regarding events, conditions and financial trends that may affect our future plans of operation, business strategy, results of operations and financial position. A number of important factors could cause actual results to differ materially from those included within or contemplated by such forward-looking statements, including, but not limited to, our dependence on our operators for revenue and cash flow; the duration and extent of the effects of the COVID-19 pandemic; government regulation of the health care industry; federal and state health care cost containment measures including reductions in reimbursement from third-party payors such as Medicare and Medicaid; required regulatory approvals for operation of health care facilities; a failure to comply with federal, state, or local regulations for the operation of health care facilities; the adequacy of insurance coverage maintained by our operators; our reliance on a few major operators; our ability to renew leases or enter into favorable terms of renewals or new leases; the impact of inflation, operator financial or legal difficulties; the sufficiency of collateral securing mortgage loans; an impairment of our real estate investments; the relative illiquidity of our real estate investments; our ability to develop and complete construction projects; our ability to invest cash proceeds for health care properties; a failure to qualify as a REIT; our ability to grow if access to capital is limited; and a failure to maintain or increase our dividend. For a discussion of these and other factors that could cause actual results to differ from those contemplated in the forward-looking statements, please see the discussion under “Risk Factors” contained in our Annual Report on Form 10-K for the fiscal year ended December 31, 2022 and in our publicly available filings with the Securities and Exchange Commission. We do not undertake any responsibility to update or revise any of these factors or to announce publicly any revisions to forward-looking statements, whether as a result of new information, future events or otherwise.
Executive Overview
Business and Investment Strategy
We are a real estate investment trust (“REIT”) that invests in seniors housing and health care properties through sale-leaseback, financing receivables, mortgage financing, joint ventures and structured finance solutions including preferred equity and mezzanine lending. Our primary objectives are to create, sustain and enhance stockholder equity value and provide current income for distribution to stockholders through real estate investments in seniors housing and health care properties managed by experienced operators.
29
The following graph summarizes our gross investments as of September 30, 2023:
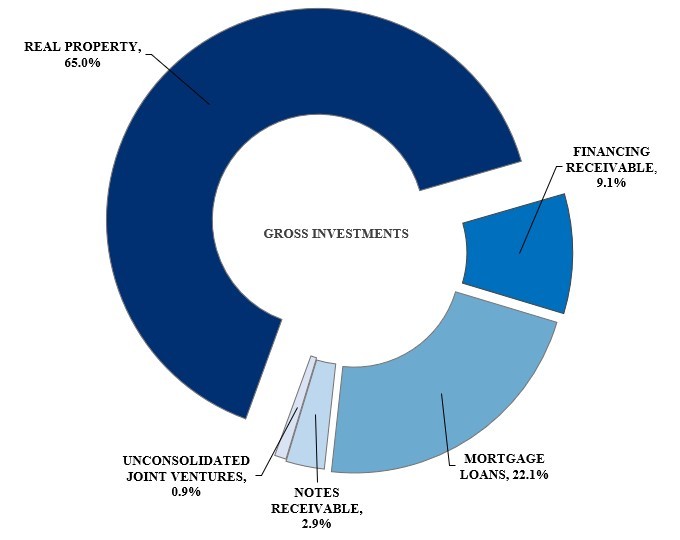
Our primary seniors housing and health care property classifications include skilled nursing centers (“SNF”), assisted living communities (“ALF”), independent living communities (“ILF”), memory care communities (“MC”) and combinations thereof. We also invest in other (“OTH”) types of properties, such as land parcels, projects under development (“UDP”) and behavioral health care hospitals. To meet these objectives, we attempt to invest in properties that provide opportunity for additional value and current returns to our stockholders and diversify our investment portfolio by geographic location, operator, property classification and form of investment.
We conduct and manage our business as one operating segment for internal reporting and internal decision-making purposes. For purposes of this quarterly report and other presentations, we generally include ALF, ILF, MC, and combinations thereof in the ALF classification. As of September 30, 2023, seniors housing and health care properties comprised approximately 99.3% of our gross investment portfolio. We have been operating since August 1992.
Substantially all of our revenues and sources of cash flows from operations are derived from operating lease rentals, interest earned on financing receivable, interest earned on outstanding loans receivable and income from investments in unconsolidated joint ventures. Income from our investments represent our primary source of liquidity to fund distributions and are dependent upon the performance of the operators on their lease and loan obligations and the rates earned thereon. To the extent that the operators experience operating difficulties and are unable to generate sufficient cash to make payments to us, there could be a material adverse impact on our consolidated results of operations, liquidity and/or financial condition. To mitigate this risk, we monitor our investments through a variety of methods determined by property type and operator. Our monitoring process includes periodic review of financial statements for each facility, periodic review of operator credit, scheduled property inspections and review of covenant compliance.
30
In addition to our monitoring and research efforts, we also structure our investments to help mitigate payment risk. Some operating leases and loans are credit enhanced by guaranties and/or letters of credit. In addition, operating leases are typically structured as master leases and loans are generally cross-defaulted and cross-collateralized with other loans, operating leases or agreements between us and the operator and its affiliates.
Depending upon the availability and cost of external capital, we anticipate making additional investments in health care related properties. New investments are generally funded from cash on hand, proceeds from periodic asset sales, temporary borrowings under our unsecured revolving line of credit and internally generated cash flows. Our investments generate internal cash from rent and interest receipts and principal payments on loan receivables and income from unconsolidated joint ventures. Permanent financing for future investments, which replaces funds drawn under our unsecured revolving line of credit, is expected to be provided through a combination of public and private offerings of debt and equity securities. We could also look to secured and unsecured debt financing. The timing, source and amount of cash flows provided by financing activities and used in investing activities are sensitive to the capital markets’ environment, especially to changes in interest rates. Changes in the capital markets’ environment may impact the availability of cost-effective capital.
We believe our business model has enabled and will continue to enable us to maintain the integrity of our property investments, including in response to financial difficulties that may be experienced by operators. Traditionally, we have taken a conservative approach to managing our business, choosing to maintain liquidity and exercise patience until favorable investment opportunities arise.
31
Real Estate Portfolio Overview
The following tables summarize our real estate investment portfolio by owned properties and mortgage loans and by property type, as of September 30, 2023 (dollar amounts in thousands):
|
|
|
|
|
|
|
|
|
|
|
|
|
|
Nine Months Ended |
|
|||||
|
|
|
|
|
|
|
|
|
|
|
|
|
|
September 30, 2023 |
|
|||||
|
|
|
|
Number of |
|
|
|
|
Percentage |
|
|
|
|
|
|
Percentage |
|
|
||
|
|
Number of |
|
SNF |
|
ALF |
|
Gross |
|
of |
|
|
Rental |
|
|
of Total |
|
|
||
Owned Properties |
|
Properties (1) |
|
Beds |
|
Units |
|
Investments |
|
Investments |
|
|
Revenue |
|
|
Revenues |
|
|
||
Assisted Living |
|
92 |
|
— |
|
5,323 |
|
$ |
800,963 |
|
37.0 |
% |
|
$ |
39,958 |
|
|
29.2 |
% |
|
Skilled Nursing |
|
50 |
|
6,113 |
|
236 |
|
|
592,880 |
|
27.4 |
% |
|
|
43,344 |
|
|
31.7 |
% |
|
Other (2) |
|
1 |
|
118 |
|
— |
|
|
12,005 |
|
0.6 |
% |
|
|
750 |
|
|
0.5 |
% |
|
Total Owned Properties |
|
143 |
|
6,231 |
|
5,559 |
|
|
1,405,848 |
|
65.0 |
% |
|
|
84,052 |
(4) |
|
61.4 |
% |
|
|
|
|
|
|
|
|
|
|
|
|
|
|
|
|
|
|
|
|
|
|
|
|
|
|
Number of |
|
|
|
|
Percentage |
|
|
Interest Income |
|
|
Percentage |
|
|
|||
|
|
Number of |
|
SNF |
|
ALF |
|
|
Gross |
|
of |
|
|
from Financing |
|
|
of Total |
|
|
|
Financing Receivables |
|
Properties (1) |
|
Beds |
|
Units |
|
|
Investments |
|
Investments |
|
|
Receivable |
|
|
Revenues |
|
|
|
Assisted Living |
|
11 |
|
— |
|
523 |
|
|
121,321 |
|
5.6 |
% |
|
|
7,198 |
|
|
5.3 |
% |
|
Skilled Nursing |
|
3 |
|
299 |
|
— |
|
|
76,712 |
|
3.5 |
% |
|
|
4,215 |
|
|
3.1 |
% |
|
Total Financing Receivables |
|
14 |
|
299 |
|
523 |
|
|
198,033 |
|
9.1 |
% |
|
|
11,413 |
|
|
8.4 |
% |
|
|
|
|
|
|
|
|
|
|
|
|
|
|
|
|
|
|
|
|
|
|
|
|
|
|
Number of |
|
|
|
|
Percentage |
|
|
Interest Income |
|
|
Percentage |
|
|
|||
|
|
Number of |
|
SNF |
|
ALF |
|
|
Gross |
|
of |
|
|
from Mortgage |
|
|
of Total |
|
|
|
Mortgage Loans |
|
Properties (1) |
|
Beds |
|
Units |
|
|
Investments |
|
Investments |
|
|
Loans |
|
|
Revenues |
|
|
|
Assisted Living |
|
20 |
|
— |
|
1,056 |
|
|
170,941 |
|
7.9 |
% |
|
|
9,436 |
|
|
6.9 |
% |
|
Skilled Nursing |
|
24 |
|
3,041 |
|
— |
|
|
304,616 |
|
14.1 |
% |
|
|
25,824 |
|
|
18.9 |
% |
|
Other (3) |
|
— |
|
— |
|
— |
|
|
2,787 |
|
0.1 |
% |
|
|
157 |
|
|
0.1 |
% |
|
Total Mortgage Loans |
|
44 |
|
3,041 |
|
1,056 |
|
|
478,344 |
|
22.1 |
% |
|
|
35,417 |
|
|
25.9 |
% |
|
|
|
|
|
|
|
|
|
|
|
|
|
|
|
|
|
|
|
|
|
|
|
|
|
|
Number of |
|
|
|
|
Percentage |
|
|
Interest |
|
|
Percentage |
|
|
|||
|
|
Number of |
|
SNF |
|
ALF |
|
|
Gross |
|
of |
|
|
and other |
|
|
of Total |
|
|
|
Notes Receivable |
|
Properties (1) |
|
Beds |
|
Units |
|
|
Investments |
|
Investments |
|
|
Income |
|
|
Revenues |
|
|
|
Assisted Living |
|
6 |
|
— |
|
751 |
|
|
50,024 |
|
2.3 |
% |
|
|
4,323 |
|
|
3.2 |
% |
|
Skilled Nursing |
|
— |
|
— |
|
— |
|
|
13,669 |
|
0.6 |
% |
|
|
475 |
|
|
0.3 |
% |
|
Total Notes Receivable |
|
6 |
|
— |
|
751 |
|
|
63,693 |
|
2.9 |
% |
|
|
4,798 |
|
|
3.5 |
% |
|
|
|
|
|
|
|
|
|
|
|
|
|
|
|
|
|
|
|
|
|
|
|
|
|
|
Number of |
|
|
|
|
Percentage |
|
|
Income from |
|
|
Percentage |
|
|
|||
|
|
Number of |
|
SNF |
|
ALF |
|
|
Gross |
of |
|
|
Unconsolidated |
|
|
of Total |
|
|
||
Unconsolidated Joint Ventures |
|
Properties (1) |
|
Beds |
|
Units |
|
|
Investments |
Investments |
|
|
Joint Ventures |
|
|
Revenues |
|
|
||
Assisted Living |
|
1 |
|
— |
|
95 |
|
|
6,340 |
|
0.3 |
% |
|
|
337 |
|
|
0.2 |
% |
|
Under Development |
|
— |
|
— |
|
— |
|
|
13,000 |
|
0.6 |
% |
|
|
790 |
|
|
0.6 |
% |
|
Total Unconsolidated Joint Ventures |
|
1 |
|
— |
|
95 |
|
|
19,340 |
|
0.9 |
% |
|
|
1,127 |
|
|
0.8 |
% |
|
|
|
|
|
|
|
|
|
|
|
|
|
|
|
|
|
|
|
|
|
|
Total Portfolio |
|
208 |
|
9,571 |
|
7,984 |
|
$ |
2,165,258 |
|
100.0 |
% |
|
$ |
136,807 |
|
|
100.0 |
% |
|
|
|
Number |
|
Number of |
|
|
|
|
Percentage |
|
|
||
|
|
of |
|
SNF |
|
ALF |
|
Gross |
|
of |
|
|
|
Summary of Properties by Type |
|
Properties (1) |
|
Beds |
|
Units |
|
Investments |
|
Investments |
|
|
|
Assisted Living |
|
130 |
|
— |
|
7,748 |
|
$ |
1,149,589 |
|
53.1 |
% |
|
Skilled Nursing |
|
77 |
|
9,453 |
|
236 |
|
|
987,877 |
|
45.6 |
% |
|
Other (2) (3) |
|
1 |
|
118 |
|
— |
|
|
14,792 |
|
0.7 |
% |
|
Under Development |
|
— |
|
— |
|
— |
|
|
13,000 |
|
0.6 |
% |
|
Total Portfolio |
|
208 |
|
9,571 |
|
7,984 |
|
$ |
2,165,258 |
|
100.0 |
% |
|
| (1) | We have investments in owned properties, financing receivables, mortgage loans, notes receivable and unconsolidated joint ventures in 27 states to 29 operators. |
| (2) | Includes three parcels of land held-for-use and one behavioral health care hospital. |
| (3) | Includes one parcel of land in Missouri securing a first mortgage held for future development of a post-acute SNF and one parcel of land in North Carolina securing a first mortgage held for future development of a seniors housing community. |
| (4) | Excludes variable rental income from lessee reimbursement of $9,846 and sold properties of $963. |
32
As of September 30, 2023, we had $1.7 billion in net carrying value of investments, consisting of $1.0 billion or 57.3% invested in owned and leased properties, $0.2 billion or 11.1% invested in financing receivables, $0.5 billion or 26.9% invested in mortgage loans secured by first mortgages, $63.1 million or 3.6% in notes receivable and $19.3 million or 1.1% in unconsolidated joint ventures.
Rental income, income from financing receivables and interest income from mortgage loans represented 64.5%, 7.8% and 24.1%, respectively, of Total revenues on the Consolidated Statements of Income for the nine months ended September 30, 2023. In most instances, our lease structure contains fixed annual rental escalations and/or annual rental escalations that are contingent upon changes in the Consumer Price Index. Certain leases have annual rental escalations that are contingent upon changes in the gross operating revenues of the property. This revenue is not recognized until the appropriate contingencies have been resolved.
Many of our existing leases contain renewal options that, if exercised, could result in the amount of rent payable upon renewal being greater or less than that currently being paid. During 2023, Brookdale Senior Living Communities, Inc. (“Brookdale”) elected not to exercise its renewal option under a master lease that matures on December 31, 2023. See below under Update on Certain Operators for further discussion.
Additionally, during 2023, a master lease covering two skilled nursing centers that was scheduled to mature in 2023 was renewed at the contractual rate for another five years extending the maturity to November 2028. The centers have a total of 216 beds and are located in Florida. Also, another master lease covering two skilled nursing centers that was scheduled to mature in 2023 was renewed for another two years extending the maturity to December 2025. The master lease was renewed at the contractual annual cash rent of $1.0 million increasing 2.5% per year. As amended, this master lease provides the lessee with a purchase option available through December 31, 2024. The centers have a total of 141 beds and are located in Tennessee.
For the nine months ended September 30, 2023, we recorded $1.6 million in straight-line rental adjustment and amortization of lease incentive cost of $0.6 million. During the nine months ended September 30, 2023, we received $97.1 million of cash rental income, which includes $9.8 million of operator reimbursements for real estate taxes. At September 30, 2023, the straight-line rent receivable balance on the consolidated balance sheet was $20.1 million.
For the nine months ended September 30, 2023, we recorded $35.4 million in Interest income from mortgage loans which includes $28.0 million of interest received in cash, $1.8 million of income from interest reserves and $5.6 million in mortgage loans effective interest. At September 30, 2023, the mortgage loans effective interest receivable which is included in the Interest receivable line item in our Consolidated Balance Sheets was $49.8 million.
Update on Certain Operators
Anthem Memory Care
Anthem Memory Care (“Anthem”) operates 11 memory care communities under a master lease and was placed in default in 2017 resulting from Anthem’s partial payment of its minimum rent. However, we did not enforce our rights and remedies pertaining to the event of default, under the stipulation that Anthem achieves sufficient performance and pays agreed upon rent. Anthem increased their rent payment every year between 2017 and 2021. During the second and third quarter of 2022, we agreed to a certain temporary rent reduction totaling $1.5 million. During the fourth quarter of 2022, we received payment of Anthem’s $1.5 million temporary rent reduction and a return to Anthem’s previously agreed upon rent of $0.9 million per month.
33
Accordingly, Anthem paid us the agreed upon annual cash rent of $10.8 million in 2022 and we anticipate receiving $10.8 million in 2023 and 2024. During the first quarter of 2023, we transitioned a 60-unit memory care community located in Ohio to Anthem under a new two-year lease. Under the new two-year lease, no rent was paid through May 2023 after which cash rent is based on mutually agreed upon fair market rent. The first quarterly mutually agreed upon rent for June through August 2023 was set at $45,000 and paid in August 2023. The second quarterly mutually agreed upon rent for the period of September through November was set at $60,000 and is payable in November 2023, at which time rent will be reset for the following three months. Anthem is current on agreed upon rent payments through October 2023. We receive regular financial performance updates from Anthem and continue to monitor their performance obligations under the master lease agreement.
Brookdale Senior Living Communities, Inc
Brookdale Senior Living Communities, Inc’s (“Brookdale”) master lease matures on December 31, 2023 and provides Brookdale a $4.0 million capital commitment, which expired on February 28, 2023, at a yield of 7% with a reduced rate for qualified ESG projects. During 2023, we funded $0.9 million under Brookdale’s capital commitment. The master lease provides three renewal options consisting of a two-year renewal option, a five-year renewal option and a 10-year renewal option. During the first quarter of 2023, Brookdale elected not to exercise its renewal option. Brookdale is obligated to pay rent on the portfolio of 35 assisted living communities through maturity and is current on rent payments through October 2023. We are working on options for the portfolio as follows:
| ● | We entered into agreements to sell seven assisted unit communities in the existing Brookdale portfolio. Four properties located in Florida will be sold for approximately $18.8 million, and three properties in South Carolina will be sold for approximately $8.4 million. We expect these sales to close during the fourth quarter of 2023 and expect to receive $20.0-$21.0 million of proceeds, net of transaction costs and seller financing, as a result of these sales. These properties were classified as held-for-sale as of September 30, 2023. |
| ● | We re-leased 10 properties in the existing Brookdale portfolio to Brookdale under a new master lease. This new master lease includes six properties in Colorado and four in Kansas. The six-year master lease will commence on January 1, 2024. Rent in the first year is set at $8.0 million escalating by approximately 2.0% annually. The lease includes a purchase option that can be exercised in 2029. We also agreed to fund $4.5 million for capital expenditures for the first two years of the lease at an initial rate of 8.0%, escalating by approximately 2.0% thereafter. |
| ● | Subsequent to September 30, 2023, we added seven additional properties to the new Brookdale master lease commencing on January 1, 2024. One property is located in Ohio with 42 assisted living units and six are located in Texas with 235 assisted living units. These properties are currently included in the original Brookdale master lease. As a result of this amendment, Brookdale will operate 17 properties under the new master lease with the initial annual rent of $9.3 million and the capital expenditure commitment will be $7.2 million. Additionally, the new master lease provides Brookdale with a purchase option on these seven properties. |
| ● | Subsequent to September 30, 2023, we leased six assisted living communities located in Oklahoma, with a total of 219 units, to a current LTC operator under a new master lease, expected to commence on November 1, subject to the issuance of licensure to the new operator. These properties are currently included in the original Brookdale master lease. The lease term is for three years, with one four-year extension period. Rent in the first year is set at $960,000, increasing to $984,000 in the second year and $1.2 million in the third year. Additionally, the |
34
| master lease includes a purchase option that can be exercised starting in November 2027 through October 2029 if the lessee exercises its four-year extension option. |
| ● | For the remaining five properties located in North Carolina with a total of 210 assisted living units, we are currently working on finalizing a new lease for these properties. |
Prestige Healthcare
Prestige Healthcare (“Prestige”) operates 22 skilled nursing centers located in Michigan secured under four mortgage loans and two skilled nursing centers located in South Carolina under a master lease. Prestige is our largest operator based upon revenues and assets representing 16.6% of our total revenues and 14.2% of our total assets as of September 30, 2023. During the second quarter of 2023, we agreed to defer up to $1.5 million, or up to $0.3 million per month for May through September 2023, in interest payments due on one of Prestige’s mortgage loans secured by 15 skilled nursing centers. We deferred $0.6 million and $0.9 million in interest payments during the second and third quarter of 2023, respectively. Subsequent to September 30, 2023, we amended the loan. As part of the amendment, LTC has drawn down $2.8 million of the approximate $5.0 million letter of credit from Prestige to repay all deferred interest outstanding through October 2023. We will further draw down approximately $334,000 in each of November and December 2023 to be applied toward interest due on the loan at that point. As a result, we expect to receive all contractual interest of $19.5 million due from Prestige in 2023. Beginning on January 1, 2024, the minimum mortgage interest payment due to LTC will be set based on an annual current pay rate of 8.5% on the outstanding loan balance. The contractual interest rate of the loan remains unchanged. From retro-active Medicaid funds due to Prestige, we expect our letter of credit will be replenished in 2024 and Prestige will be able to pay all contractual interest during 2024 and 2025.
Other Operators
During the nine months ended September 30, 2023, we provided $1.9 million of abated rent to the same operator for which we have been providing assistance. Also, we provided the same operator $0.2 million of abated rent in October 2023 and we agreed to provide up to $0.2 million per month from November through December 2023 pursuant to a master lease covering two assisted living communities. We anticipate receiving $0.3 million in rent during 2023 from this operator.
Additionally, during 2023, we transitioned a portfolio of eight assisted living communities with a total of 500 units in Illinois, Ohio and Michigan to Encore Senior Living (“Encore”). We agreed to provide assistance in the second quarter of 2023 to the former operator of this portfolio and as part of the transition, we received repayment of $1.25 million of deferred rent which represents $0.93 million of April and May 2023 deferred rent and $0.32 million of unrecorded deferred rent provided in 2022. Cash rent under the new two-year lease with Encore is based on mutually agreed upon fair market rent beginning in month four of the lease.
2023 Activities Overview
The following tables summarize our transactions during the nine months ended September 30, 2023 (dollar amounts in thousands):
Acquisitions
During 2023, we entered into a $54.1 million Joint Venture (“JV”) and contributed $45.0 million into the JV that purchased an independent living, assisted living and memory care campus in Ohio. Under the JV agreement, the seller, our JV partner, has the option to purchase the campus between the third and fourth lease years for LTC’s allocation of the JV investment plus an IRR of 9.75%. The campus was leased to Encore Senior Living (“Encore”) under a 10-year term with an initial yield of 8.25% on LTC’s allocation of the JV investment.
35
LTC committed to fund $2.1 million of lease incentives under the Encore lease of which $1.0 million was funded during 2023. Rent is expected to be approximately $3.9 million per year.
Investment in Improvement projects
|
|
Amount |
|
Assisted Living Communities |
|
$ |
2,418 |
Skilled Nursing Centers |
|
|
2,548 |
Other |
|
|
87 |
Total |
|
$ |
5,053 |
Impairment Loss
In conjunction with the planned sale of a 70-unit assisted living community located in Florida, we recorded a $0.4 million impairment loss during the three months ended March 31, 2023 and a $1.2 million impairment loss during the fourth quarter of 2022. During the second quarter of 2023, the community was sold for $4.9 million. Additionally, during 2023, we performed a recoverability analysis on the carrying value of two assisted living communities that we are negotiating to sell and concluded that their carrying value may not be recoverable through future undiscounted cash flows. Accordingly, we recorded an aggregate impairment loss of $12.1 million. As of September 30, 2023, we do not believe these communities meet the criteria to be classified as held-for-sale.
Properties Held -for-Sale
|
|
Type |
|
Number |
|
Number |
|
|
|
|
|
|
|
|
|
of |
|
of |
|
of |
|
|
Gross |
|
|
Accumulated |
|
State |
|
Property |
|
Properties |
|
Beds/units |
|
|
Investment |
|
|
Depreciation |
|
FL |
|
ALF |
|
4 |
|
176 |
|
$ |
12,215 |
|
$ |
7,213 |
|
SC |
|
ALF |
|
3 |
|
128 |
|
|
8,823 |
|
|
4,377 |
|
|
|
|
|
7 |
|
304 |
|
$ |
21,038 |
|
$ |
11,590 |
|
Properties Sold
|
|
Type |
|
Number |
|
Number |
|
|
|
|
|
|
|
|
|
|
|
|
of |
|
of |
|
of |
|
|
Sales |
|
|
Carrying |
|
|
Net |
|
State |
|
Properties |
|
Properties |
|
Beds/Units |
|
|
Price |
|
|
Value |
|
|
Gain (1) |
|
Florida |
|
ALF |
|
1 |
|
70 |
|
$ |
4,850 |
|
$ |
4,082 |
|
$ |
65 |
|
Kentucky |
|
ALF |
|
1 |
|
60 |
|
|
11,000 |
|
|
10,720 |
|
|
57 |
|
New Jersey |
|
ALF |
|
1 |
|
39 |
|
|
2,000 |
|
|
1,552 |
|
|
266 |
|
New Mexico |
|
SNF |
|
2 |
|
235 |
|
|
21,250 |
|
|
5,523 |
|
|
15,287 |
|
Nebraska |
|
ALF |
|
3 |
|
117 |
|
|
2,984 |
|
|
2,934 |
|
|
— |
|
Pennsylvania |
|
ALF |
|
2 |
|
130 |
|
|
11,128 |
|
|
6,054 |
|
|
4,870 |
|
|
|
|
|
10 |
|
651 |
|
$ |
53,212 |
|
$ |
30,865 |
|
$ |
20,545 |
|
| (1) | Calculation of net gain includes cost of sales and write-off of straight-line receivable and lease incentives, when applicable. |
Financing Receivables
During 2023, we entered into a $121.3 million JV with an affiliate of an existing operator and contributed $117.5 million into the JV that purchased 11 assisted living and memory care communities from an affiliate of our JV partner. The JV leased the communities back to an affiliate of the seller under a 10-year master lease, with two five-year renewal options. The contractual initial cash yield of 7.25% increases to 7.5% in year three then escalates thereafter based on CPI subject to a floor of 2.0% and a ceiling of 4.0%. Additionally, the JV provided the seller-lessee with a purchase option to buy up to 50% of the properties at the beginning of the third lease year and the remaining properties at the beginning of the fourth lease year through the end of the sixth lease year, with an exit Internal Rate of Return (“IRR”)
36
of 9.0%. In accordance with GAAP, the communities acquired by the JV are required to be presented as Financing receivables on our Consolidated Balance Sheets and the rental revenue from these properties is recorded as Interest income from financing receivables on our Consolidated Statements of Income. Furthermore, upon expiration of the purchase option if the purchase option remains unexercised by the seller-lessee, the purchased assets will be reclassified from Financing receivables to Real property investments on our Consolidated Balance Sheets. Upon origination, we recorded $1.2 million Provision for credit losses equal to 1% of the loan balance related to this investment. During the three and nine months ended September 30, 2023, we recognized $3.8 million and $11.4 million, respectively, of Interest income from financing receivables from our investments in financing receivables.
Investment in Mortgage Loans
|
|
Amount |
|
|
Originations and funding under mortgage loans receivable |
|
$ |
83,383 |
(1) |
Application of interest reserve |
|
|
1,609 |
|
Scheduled principal payments received |
|
|
(301) |
|
Mortgage loan premium amortization |
|
|
(5) |
|
Provision for loan loss reserve |
|
|
(847) |
|
Net increase in mortgage loans receivable |
|
$ |
83,839 |
|
| (1) | We originated the following: |
| a. | $10,750 mortgage loan secured by a 45-unit MC located in North Carolina. The loan carries a two-year term with an interest-only rate of 7.25% and an IRR of 9.0%; |
| b. | $51,111 mortgage loan investment secured by a 203-unit ILF, ALF and MC located in Georgia. We acquired a participating interest owned by existing lenders for $42,251 in addition to converting our $7,461 mezzanine loan in the property into a participating interest in the mortgage loan. The initial rate is 7.5% with an IRR of 7.75%. The mortgage loan matures in October 2024. We recorded $1,380 of additional interest income in connection with the effective prepayment of the mezzanine loan in the first quarter of 2023; |
| c. | $16,500 senior loan for the purchase of a 150-bed SNF in Illinois. The mortgage loan matures in June 2028 and our investment is at an interest rate of 8.75%; |
| d. | $5,022 of additional funding under other mortgage loans receivable; and |
| e. | $19,500 mortgage loan commitment for the construction of an 85-unit assisted living and memory care community in Michigan. The borrower contributed $12,100 of equity which will initially fund the construction. Once all of the borrower’s equity has been drawn, we will begin funding the commitment. The loan term is approximately three years at a rate of 8.75%, and includes two, one-year extensions, each of which is contingent on certain coverage thresholds. |
Preferred Equity Investment in Unconsolidated Joint Ventures
|
|
|
|
|
|
|
|
|
|
|
|
|
|
|
|
|
|
|
|
|
|
|
|
|
|
Type |
|
Total |
|
|
Contractual |
|
|
Number |
|
|
|
|
|
|
|
|
Cash |
|
|
Application |
|
|
|
of |
|
Preferred |
|
|
Cash |
|
|
of |
|
|
Carrying |
|
|
Income |
|
|
Interest |
|
|
of Interest |
|
State |
|
Properties |
|
Return |
|
|
Portion |
|
|
Beds/ Units |
|
|
Value |
|
|
Recognized |
|
|
Received |
|
|
Reserve |
|
Washington (1) |
|
ALF/MC |
|
12 |
% |
|
7 |
% |
|
95 |
|
$ |
6,340 |
|
$ |
337 |
|
$ |
— |
|
$ |
337 |
|
Washington (2) |
|
UDP |
|
14 |
% |
|
8 |
% |
|
— |
|
|
13,000 |
|
|
790 |
|
|
— |
|
|
790 |
|
|
|
|
|
|
|
|
|
|
|
95 |
|
$ |
19,340 |
|
$ |
1,127 |
|
$ |
— |
|
$ |
1,127 |
|
| (1) | Represents a preferred equity interest in an entity that developed and owns a 95-unit ALF and MC in Washington. Our investment represents 15.5% of the total investment. The preferred equity investment earns an initial cash rate of 7% increasing to 9% in year four until the internal rate of return (“IRR”) is 8%. After achieving an 8% IRR, the cash rate drops to 8% with an IRR ranging between 12% to 14%, depending upon timing of redemption. During the fourth quarter of 2021, the entity completed the development project and received its certificate of occupancy. We have the option to require the JV partner to purchase our preferred equity interest at any time between August 17, 2031 and December 31, 2036. |
| (2) | Represents a preferred equity interest in an entity that will develop and own a 267-unit ILF and ALF in Washington. Our investment represents 11.0 % of the estimated total investment. The preferred equity investment earns an initial cash rate of 8% with an IRR of 14%. The JV partner has the option to buy out our investment at any time after August 31, 2023 at the IRR rate. Also, we have the option to require the JV partner to purchase our preferred equity interest at any time between August 31, 2027 and, upon project completion and leasing the property, prior to the end of the first renewal term of the lease. |
37
Notes Receivable
|
|
Amount |
|
|
|
Advances under notes receivable |
|
$ |
19,258 |
(1) |
|
Principal payments received under notes receivable |
|
|
(14,537) |
(2) |
|
Provision for credit losses |
|
|
(48) |
|
|
Net decrease in notes receivable |
|
$ |
4,673 |
|
|
| (1) | During the third quarter of 2023, we originated a mezzanine loan to recapitalize an existing 130-unit ILF, ALF and MC in Georgia and construction of 89 additional units. The loan term is five years at an initial yield of 8.75% and an IRR of 12.0%. |
| (2) | During 2023, we received $4,545, which includes a prepayment fee and the exit IRR totaling $190 related to the payoff of a mezzanine loan on a 136-unit ILF in Oregon. Additionally, another $7,461 mezzanine loan was effectively prepaid through converting it as part of our $51,111 investment in a participating interest in an existing mortgage loan that is secured by a 203-unit ALF, ILF and MC located in Georgia. We recorded $1,380 of interest income in connection with the effective prepayment of the mezzanine loan. |
Health Care Regulatory
The Centers for Medicare & Medicaid Services (“CMS”) annually updates Medicare skilled nursing facility (“SNF”) prospective payment system rates and other policies. On April 8, 2021, CMS issued a proposed rule to update SNF rates and policies for fiscal year 2022, which started October 1, 2021, and issued the final rule on July 29, 2021. CMS estimated that the aggregate impact of the payment policies in the final rule would result in an increase of approximately $410 million in Medicare Part A payments to SNFs in fiscal year 2022. The final rule also includes several policies that update the SNF Quality Reporting Program and the SNF Value-Based Program for fiscal year 2022. On April 11, 2022, CMS issued a proposed rule to update SNF rates and policies for fiscal year 2023. CMS estimated that the aggregate impact of the payment policies in the proposed rule would result in a decrease of approximately $320 million in Medicare Part A payments to SNFs in fiscal year 2023 compared to fiscal year 2022. CMS also sought input on the effects of direct care staffing requirements to improve long-term care requirements for participation and promote thoughtful, informed staffing plans and decisions within facilities to meet residents’ needs, including maintaining or improving resident function and quality of life. Specifically, CMS sought input on establishing minimum staffing requirements for long-term care facilities. On June 29, 2022, CMS issued updates to guidance on minimum health and safety standards that long-term care facilities must meet to participate in Medicare and Medicaid and issued new guidance in the State Operations Manual to address issues that significantly affect residents of long-term care facilities. On July 29, 2022, CMS issued a final rule to update SNF rates and policies for fiscal year 2023. CMS estimated that the aggregate impact of the payment policies in the final rule would result in an increase of 2.7%, or approximately $904 million, in Medicare Part A payments to SNFs in fiscal year 2023 compared to fiscal year 2022. CMS also finalized a permanent 5% cap on annual wage index decreases to smooth year-to-year changes in providers’ wage index payments. In addition, CMS indicated that it would continue to review the comments it received in response to its request for information on establishing minimum staffing requirements for long-term care facilities, and that it intended to issue proposed rules on a minimum staffing level measure within one year. On April 4, 2023, CMS issued a proposed rule that would update SNF rates and policies for fiscal year 2024. CMS estimated that the aggregate impact of the payment policies in the proposed rule would result in a net increase of 3.7%, or approximately $1.2 billion, in Medicare Part A payments to SNFs in fiscal year 2024. CMS also indicated that it continued to review the feedback it received from its comment solicitation regarding minimum staffing requirements and that the feedback would be used, along with evidence from its mixed-methods study launched in August 2022 collecting quantitative and qualitative evidence on staffing levels within nursing homes, to inform proposals for minimum direct care staffing requirements in nursing homes in a future rulemaking. On July 21, 2023, CMS issued a final rule to update SNF rates and policies for fiscal year 2024. CMS estimated that the aggregate impact of the payment policies in the final rule would result in a net increase of 4.0%, or approximately $1.4 billion, in Medicare Part A payments to SNFs in fiscal year 2024.
38
In addition, the final rule includes updates to the SNF Quality Reporting Program and the SNF Value-Based Purchasing Program for fiscal year 2024 and future years, including the adoption of a measure intended to address staff turnover, as outlined in the President’s Executive Order 14070 Increasing Access to High-Quality Care and Supporting Caregivers. Finally, the rule finalizes a constructive waiver process to ease administrative burdens for CMS related to processing civil monetary penalty appeals.
On September 1, 2023, CMS issued the Minimum Staffing Standards for Long-Term Care Facilities and Medicaid Institutional Payment Transparency Reporting proposed rule, which seeks to establish comprehensive nurse staffing requirements. The proposed rule consists of three core staffing proposals: (1) minimum nurse staffing standards of 0.55 hours per resident day (“HPRD”) for Registered Nurses (“RNs”) and 2.45 HPRD for Nurse Aids (“NAs”); (2) a requirement to have an RN onsite 24 hours a day, seven days a week; and (3) enhanced facility assessment requirements. The proposed rule also includes a staggered implementation approach and possible hardship exemptions for select facilities. Comments on the proposed rule must be submitted by November 6, 2023.
There can be no assurance that these rules or future regulations modifying Medicare skilled nursing facility payment rates or other requirements for Medicare and/or Medicaid participation will not have an adverse effect on the financial condition of our borrowers and lessees which could, in turn, adversely impact the timing or level of their payments to us.
On March 26, 2020, President Trump signed into law the Coronavirus Aid, Relief, and Economic Security Act (the “CARES Act”), sweeping legislation intended to bolster the nation’s response to the COVID-19 pandemic. In addition to offering economic relief to individuals and impacted businesses, the law expanded coverage of COVID-19 testing and preventative services, addressed health care workforce needs, eased restrictions on telehealth services during the crisis, and increased Medicare regulatory flexibility, among many other provisions. Notably, the CARES Act temporarily suspended the 2% across-the-board “sequestration” from May 1, 2020 through December 31, 2020, and extended the Medicare sequester requirement through fiscal year 2030. In addition, the law provided $100 billion in grants to eligible health care providers for health care related expenses or lost revenues that are attributable to COVID-19. On April 10, 2020, CMS announced the distribution of $30 billion in funds to Medicare providers based upon their 2019 Medicare fee for service revenues. Eligible providers were required to agree to certain terms and conditions in receiving these grants. In addition, the Department of Health and Human Services (“HHS”) authorized $20 billion of additional funding for providers that have already received funds from the initial distribution of $30 billion. Unlike the first round of funds, which came automatically, providers were required to apply for these additional funds and submit the required supporting documentation, using the online portal provided by HHS. Providers were required to attest to and agree to specific terms and conditions for the use of such funds. HHS expressed a goal of allocating the whole $50 billion proportionally across all providers based on those providers’ proportional share of 2018 net Medicare fee-for-service revenue, so that some providers would not be eligible for additional funds. On May 22, 2020, HHS announced that it had begun distributing $4.9 billion in additional relief funds to SNFs to offset revenue losses and assist nursing homes with additional costs related to responding to the COVID-19 public health emergency and the shipments of personal protective equipment provided to nursing homes by the Federal Emergency Management Agency. On June 9, 2020, HHS announced that it expected to distribute approximately $15 billion to eligible providers that participate in state Medicaid and Children’s Health Insurance Program (“CHIP”) programs and have not received a payment from the Provider Relief Fund General Allocation. On July 22, 2020, HHS announced $5 billion in Provider Relief Funds to Medicare-certified long-term care facilities and state veterans’ homes to build nursing home skills and enhance nursing homes’ response to COVID-19, including enhanced infection control. Nursing homes were required to participate in the Nursing Home COVID-19 training to qualify for this funding. On August 27, 2020, HHS announced that it had distributed almost $2.5 billion to nursing homes to support increased testing, staffing, and personal protective equipment needs.
39
On September 3, 2020, HHS announced a $2 billion performance-based incentive payment distribution to nursing homes and SNFs. Finally, on October 1, 2020, HHS announced $20 billion in additional funding for several types of providers, including those who previously received, rejected, or accepted a general distribution provider relief fund payment. The application deadline for these Phase 3 funds was November 6, 2020.
The Consolidated Appropriations Act, 2021 included a $900 billion COVID-19 relief package. Of the $900 billion in COVID-19 relief, $73 billion was allocated to HHS. Notably, the legislation added an additional $3 billion to the Provider Relief Fund, includes language specific to reporting requirements, and allows providers to use any reasonable method to calculate lost revenue, including the difference between such provider’s budgeted and actual revenue budget if such budget had been established and approved prior to March 27, 2020, to demonstrate entitlement for these funds. This change reverts to HHS’ previous guidance from June 2020 on how to calculate lost revenues. The Consolidated Appropriations Act, 2021 also extended the CARES Act’s sequestration suspension to March 31, 2021. On January 15, 2021, HHS announced that it would be amending the reporting timeline for Provider Relief Funds and indicated that it was working to update the Provider Relief Fund requirements to be consistent with the passage of the Consolidated Appropriations Act, 2021.
On June 11, 2021, HHS issued revised reporting requirements for recipients of Provider Relief Fund payments. The announcement included expanding the amount of time providers would have to report information, aimed to reduce burdens on smaller providers, and extended key deadlines for expending Provider Relief Fund payments for recipients who received payments after June 30, 2020. The revised reporting requirements are applicable to providers who received one or more payments exceeding, in the aggregate, $10,000 during a single Payment Received Period from the PRF General Distributions, Targeted Distributions, and/or Skilled Nursing Facility and Nursing Home Infection Control Distributions. On July 1, 2021, HHS, through the Health Resources and Services Administration (“HRSA”), notified recipients of Provider Relief Fund payments by e-mail that the Provider Relief Fund Reporting Portal was open for recipients who were required to report on the use of funds in Reporting Period 1, as described by HHS’s June 11, 2021 update to the reporting requirements. On September 10, 2021, HHS announced a final 60-day grace period of the September 30, 2021 reporting deadline for Provider Relief Funds exceeding $10,000 in aggregate payments received from April 10, 2020 to June 30, 2020. Although the September 30, 2021 reporting deadline remained in place, HHS explained that recoupment or other enforcement actions would not be initiated during the 60-day grace period, which began on October 1, 2021 and ended on November 30, 2021.
Reporting Period 2, for providers who received one or more payments exceeding $10,000, in the aggregate, from July 1, 2020 to December 31, 2020, was from January 1, 2022 to March 31, 2022. Reporting Period 3, for providers who received one or more payments exceeding $10,000, in the aggregate, from January 1, 2021 to June 30, 2021, was from July 1, 2022 to September 30, 2022. Reporting Period 4, for providers who received one or more payments exceeding $10,000, in the aggregate, from July 1, 2021 to December 31, 2021, was from January 1, 2023 to March 31, 2023. Reporting Period 5, for providers who received one or more payments exceeding $10,000, in the aggregate, from January 1, 2022 to June 30, 2022, was from July 1, 2023 to September 30, 2023. Reporting Period 6, for providers who received one or more payments exceeding $10,000, in the aggregate, from July 1, 2022 to December 31, 2022, opens January 1, 2024.
On September 10, 2021, the Biden Administration announced $25.5 billion in new funding for health care providers affected by the COVID-19 pandemic, including $8.5 billion in American Rescue Plan (“ARP”) resources for providers who serve rural Medicaid, CHIP, or Medicare patients, and an additional $17 billion for Phase 4 Provider Relief Funds for a broad range of providers who can document revenue loss and expenses associated with the pandemic, including assisted living facilities that were state-licensed/certified on or before December 31, 2020.
40
Approximately 25% of the Phase 4 allocation was for bonus payments based on the amount and type of services provided to Medicaid, CHIP, and Medicare beneficiaries from January 1, 2019 through September 30, 2020. On December 14, 2021, HHS announced the distribution of approximately $9 billion in Provider Relief Fund Phase 4 payments to health care providers who have experienced revenue losses and expenses related to the COVID-19 pandemic. Further, on January 25, 2022, HHS announced that it would be making more than $2 billion in Provider Relief Fund Phase 4 General Distribution payments to more than 7,600 providers across the country that same week. On March 22, 2022, HHS announced an additional $413 million in Provider Relief Fund Phase 4 payments to more than 3,600 providers across the country. On April 13, 2022, HRSA announced the disbursement of more than $1.75 billion in Provider Relief Fund payments to 3,680 providers across the country. On April 10, 2023, President Biden signed into law H.J. Res. 7, which terminated the national emergency related to the COVID-19 pandemic. Separately, the declared public health emergency expired May 11, 2023.
Following prior legislation suspending sequestration, on December 10, 2021, President Biden signed the Protecting Medicare and American Farmers from Sequester Cuts Act, which extended the suspension of the Medicare 2% sequestration reduction through March 31, 2022, and then reduced the sequestration cuts to 1% from April through June 2022. As of July 1, 2022, cuts of 2% were re-imposed.
Congress periodically considers legislation revising Medicare and Medicaid policies, including legislation that could have the impact of reducing Medicare reimbursement for SNFs and other Medicare providers, limiting state Medicaid funding allotments, encouraging home and community-based long-term care services as an alternative to institutional settings, or otherwise reforming payment policy for post-acute care services. There can be no assurances that enacted or future legislation will not have an adverse impact on the financial condition of our lessees and borrowers, which subsequently could materially adversely impact our company.
Additional reforms affecting the payment for and availability of health care services have been proposed at the federal and state level and adopted by certain states. Increasingly, state Medicaid programs are providing coverage through managed care programs under contracts with private health plans, which is intended to decrease state Medicaid costs. Congress and state legislatures can be expected to continue to review and assess alternative health care delivery systems and payment methodologies. Changes in the law, new interpretations of existing laws, or changes in payment methodologies may have a dramatic effect on the definition of permissible or impermissible activities, the relative costs associated with doing business and the amount of reimbursement by the government and other third-party payors.
Key Performance Indicators, Trends and Uncertainties
We utilize several key performance indicators to evaluate the various aspects of our business. These indicators are discussed below and relate to concentration risk and credit strength. Management uses these key performance indicators to facilitate internal and external comparisons to our historical operating results in making operating decisions and for budget planning purposes.
Concentration Risk. We evaluate by gross investment our concentration risk in terms of asset mix, real estate investment mix, operator mix and geographic mix. Concentration risk is valuable to understand what portion of our real estate investments could be at risk if certain sectors were to experience downturns. Asset mix measures the portion of our investments that are real property or mortgage loans. The National Association of Real Estate Investment Trusts (“NAREIT”), an organization representing U.S. REITs and publicly traded real estate companies, classifies a company with 50% or more of assets directly or indirectly in the equity ownership of real estate as an equity REIT. Investment mix measures the portion of our investments that relate to our various property classifications.
41
Operator mix measures the portion of our investments that relate to our top five operators. Geographic mix measures the portion of our real estate investment that relate to our top five states.
The following table reflects our recent historical trends of concentration risk (gross investment, in thousands):
|
|
|
|
|
|
|
|
|
|
|
|
|
|
|
|
|
|
|
9/30/23 |
|
6/30/23 |
|
3/31/23 |
|
12/31/22 |
|
9/30/22 |
|
|||||
Asset mix: |
|
|
|
|
|
|
|
|
|
|
|
|
|
|
|
|
Real property |
|
$ |
1,405,848 |
|
$ |
1,421,260 |
|
$ |
1,389,222 |
|
$ |
1,410,705 |
|
$ |
1,408,402 |
|
Financing receivables |
|
|
198,033 |
|
|
198,056 |
|
|
198,077 |
|
|
76,767 |
|
|
76,267 |
|
Loans receivable |
|
|
478,344 |
|
|
476,739 |
|
|
457,524 |
|
|
393,658 |
|
|
386,868 |
|
Notes receivable |
|
|
63,693 |
|
|
46,412 |
|
|
46,936 |
|
|
58,973 |
|
|
59,014 |
|
Unconsolidated joint ventures |
|
|
19,340 |
|
|
19,340 |
|
|
19,340 |
|
|
19,340 |
|
|
19,340 |
|
Real estate investment mix: |
|
|
|
|
|
|
|
|
|
|
|
|
|
|
|
|
Assisted living communities |
|
$ |
1,149,589 |
|
$ |
1,146,827 |
|
$ |
1,113,096 |
|
$ |
951,441 |
|
$ |
945,552 |
|
Skilled nursing centers |
|
|
987,877 |
|
|
987,188 |
|
|
970,300 |
|
|
980,401 |
|
|
976,753 |
|
Other (1) |
|
|
14,792 |
|
|
14,792 |
|
|
14,703 |
|
|
14,601 |
|
|
14,586 |
|
Under development |
|
|
13,000 |
|
|
13,000 |
|
|
13,000 |
|
|
13,000 |
|
|
13,000 |
|
Operator mix: |
|
|
|
|
|
|
|
|
|
|
|
|
|
|
|
|
ALG Senior |
|
$ |
310,789 |
|
$ |
307,891 |
|
$ |
326,288 |
|
$ |
192,699 |
|
$ |
189,533 |
|
Prestige Healthcare (1) |
|
|
272,767 |
|
|
272,818 |
|
|
271,904 |
|
|
271,476 |
|
|
271,851 |
|
Encore Senior Living |
|
|
179,430 |
|
|
179,153 |
|
|
57,101 |
|
|
57,101 |
|
|
57,101 |
|
HMG Healthcare |
|
|
176,644 |
|
|
176,285 |
|
|
176,285 |
|
|
175,835 |
|
|
174,107 |
|
Anthem Memory Care |
|
|
156,054 |
|
|
155,867 |
|
|
155,629 |
|
|
139,176 |
|
|
139,176 |
|
Remaining operators |
|
|
1,069,574 |
|
|
1,069,793 |
|
|
1,123,892 |
|
|
1,123,156 |
|
|
1,118,123 |
|
Geographic mix: |
|
|
|
|
|
|
|
|
|
|
|
|
|
|
|
|
Texas |
|
$ |
329,545 |
|
$ |
328,517 |
|
$ |
328,442 |
|
$ |
327,490 |
|
$ |
325,380 |
|
Michigan |
|
|
281,159 |
|
|
281,210 |
|
|
280,294 |
|
|
280,389 |
|
|
280,932 |
|
North Carolina |
|
|
234,665 |
|
|
233,301 |
|
|
232,841 |
|
|
99,646 |
|
|
95,456 |
|
Florida |
|
|
146,178 |
|
|
146,019 |
|
|
159,461 |
|
|
158,892 |
|
|
158,175 |
|
Ohio |
|
|
142,483 |
|
|
142,206 |
|
|
87,693 |
|
|
87,569 |
|
|
87,543 |
|
Remaining states |
|
|
1,031,228 |
|
|
1,030,554 |
|
|
1,022,368 |
|
|
1,005,457 |
|
|
1,002,405 |
|
| (1) | Includes three parcels of land located adjacent to properties securing the Prestige Healthcare mortgage loan and are managed by Prestige. |
Credit Strength. We measure our credit strength both in terms of leverage ratios and coverage ratios. Our leverage ratios include debt to gross asset value and debt to market capitalization. The leverage ratios indicate how much of our Consolidated Balance Sheets capitalization is related to long-term obligations. Our coverage ratios include interest coverage ratio and fixed charge coverage ratio. The coverage ratios indicate our ability to service interest and fixed charges (interest). The coverage ratios are based on earnings before interest, taxes, depreciation and amortization for real estate (“EBITDAre”) as defined by NAREIT. EBITDAre is calculated as net income available to common stockholders (computed in accordance with GAAP) excluding (i) interest expense, (ii) income tax expense, (iii) real estate depreciation and amortization, (iv) impairment write-downs of depreciable real estate, (v) gains or losses on the sale of depreciable real estate, and (vi) adjustments for unconsolidated partnerships and joint ventures. Leverage ratios and coverage ratios are widely used by investors, analysts and rating agencies in the valuation, comparison, rating and investment recommendations of companies. The following table reflects the recent historical trends for our credit strength measures:
42
Balance Sheet Metrics
|
|
Year to Date |
|
Quarter Ended |
|
||||||||||||
|
|
9/30/23 |
|
9/30/23 |
|
|
6/30/23 |
|
|
3/31/23 |
|
|
12/31/22 |
|
|
9/30/22 |
|
Debt to gross asset value |
|
42.1 |
% |
42.1 |
% |
|
42.1 |
% |
(3) |
41.0 |
% |
(3) |
37.4 |
% |
(6) |
38.9 |
% |
Debt to market capitalization ratio |
|
41.8 |
% |
41.8 |
% |
(1) |
41.1 |
% |
(1) |
38.3 |
% |
(4) |
34.4 |
% |
|
34.4 |
% |
Interest coverage ratio (8) |
|
3.4 |
x |
3.2 |
x |
(2) |
3.5 |
x |
|
3.6 |
x |
(5) |
4.4 |
x |
(7) |
4.2 |
x |
Fixed charge coverage ratio (8) |
|
3.4 |
x |
3.2 |
x |
(2) |
3.5 |
x |
|
3.6 |
x |
(5) |
4.4 |
x |
(7) |
4.2 |
x |
| (1) | Increased due to decrease in market capitalization and increase in outstanding debt. |
| (2) | Decreased due to increase in interest expense partially offset by increase in interest income from mortgage loans and other notes receivable. |
| (3) | Increased due to increase in outstanding debt partially offset by increase in gross asset value. |
| (4) | Increased due to increase in outstanding debt. |
| (5) | Decreased due to increase in interest expense. |
| (6) | Decreased due to decrease in outstanding debt and increase in gross asset value. |
| (7) | Increased due to increase in rental income and interest income from financing receivables partially offset by an increase in interest expense. |
| (8) | In calculating our interest coverage and fixed charge coverage ratios above, we use EBITDAre, which is a financial measure not derived in accordance with GAAP (non-GAAP financial measure). EBITDAre is not an alternative to net income, operating income or cash flows from operating activities as calculated and presented in accordance with GAAP. You should not rely on EBITDAre as a substitute for any such GAAP financial measures or consider it in isolation, for the purpose of analyzing our financial performance, financial position or cash flows. Net income is the most directly comparable GAAP measure to EBITDAre. |
|
|
Year to Date |
|
Quarter Ended |
|
||||||||||||||
|
|
9/30/23 |
|
9/30/23 |
|
6/30/23 |
|
3/31/23 |
|
12/31/22 |
|
9/30/22 |
|
||||||
Net income |
|
$ |
62,792 |
|
$ |
22,627 |
|
$ |
6,604 |
|
$ |
33,561 |
|
$ |
18,198 |
|
$ |
13,389 |
|
Less/Add: (Gain)/loss on sale |
|
|
(20,545) |
|
|
(4,870) |
|
|
(302) |
|
|
(15,373) |
|
|
(21) |
|
|
387 |
|
Add: Impairment loss |
|
|
12,510 |
|
|
— |
|
|
12,076 |
|
|
434 |
|
|
2,136 |
|
|
1,286 |
|
Add: Interest expense |
|
|
34,595 |
|
|
12,674 |
|
|
11,312 |
|
|
10,609 |
|
|
8,830 |
|
|
7,941 |
|
Add: Depreciation and amortization |
|
|
28,085 |
|
|
9,499 |
|
|
9,376 |
|
|
9,210 |
|
|
9,294 |
|
|
9,385 |
|
EBITDAre |
|
$ |
117,437 |
|
$ |
39,930 |
|
$ |
39,066 |
|
$ |
38,441 |
|
$ |
38,437 |
|
$ |
32,388 |
|
Add: Non-recurring one-time items |
|
|
262 |
(1) |
|
— |
|
|
— |
|
|
262 |
(1) |
|
— |
|
|
1,260 |
(2) |
Adjusted EBITDAre |
|
$ |
117,699 |
|
$ |
39,930 |
|
$ |
39,066 |
|
$ |
38,703 |
|
$ |
38,437 |
|
$ |
33,648 |
|
|
|
|
|
|
|
|
|
|
|
|
|
|
|
|
|
|
|
|
|
Interest expense |
|
$ |
34,595 |
|
$ |
12,674 |
|
$ |
11,312 |
|
$ |
10,609 |
|
$ |
8,830 |
|
$ |
7,941 |
|
|
|
|
|
|
|
|
|
|
|
|
|
|
|
|
|
|
|
|
|
Interest coverage ratio |
|
|
3.4 |
x |
|
3.2 |
x |
|
3.5 |
x |
|
3.6 |
x |
|
4.4 |
x |
|
4.2 |
x |
|
|
|
|
|
|
|
|
|
|
|
|
|
|
|
|
|
|
|
|
Interest expense |
|
$ |
34,595 |
|
$ |
12,674 |
|
$ |
11,312 |
|
$ |
10,609 |
|
$ |
8,830 |
|
$ |
7,941 |
|
Total fixed charges |
|
$ |
34,595 |
|
$ |
12,674 |
|
$ |
11,312 |
|
$ |
10,609 |
|
$ |
8,830 |
|
$ |
7,941 |
|
|
|
|
|
|
|
|
|
|
|
|
|
|
|
|
|
|
|
|
|
Fixed charge coverage ratio |
|
|
3.4 |
x |
|
3.2 |
x |
|
3.5 |
x |
|
3.6 |
x |
|
4.4 |
x |
|
4.2 |
x |
| (1) | Represents $1,832 provision for credit losses related to the $121,321 acquisition accounted for as a financing receivable and $61,900 of mortgage loan originations partially offset by $1,570 exit IRR income related to the payoff of two mezzanine loans. |
| (2) | Represents $500 lease termination fee paid to a former operator in exchange for cooperation in facilitating an orderly transition and $760 provision for credit losses related to the $75,825 acquisition accounted for as a financing receivable during the third quarter of 2022. |
43
We evaluate our key performance indicators in conjunction with current expectations to determine if historical trends are indicative of future results. Our expected results may not be achieved, and actual results may differ materially from our expectations. This may be a result of various factors, including, but not limited to
| ● | The status of the economy; |
| ● | The status of capital markets, including prevailing interest rates; |
| ● | Compliance with and changes to regulations and payment policies within the health care industry; |
| ● | Changes in financing terms; |
| ● | Competition within the health care and seniors housing industries; and |
| ● | Changes in federal, state and local legislation. |
Additionally, as described in the Executive Overview above, COVID-19 and the pace of recovery for COVID-19 on our operators adversely affected and is expected to continue to adversely affect our business, results of operations, cash flows and financial condition. Depending on the future developments regarding COVID-19 and the pace of recovery for its effects, historical trends reflected in our balance sheet metrics may not be achieved in the future.
Management regularly monitors the economic and other factors listed above. We develop strategic and tactical plans designed to improve performance and maximize our competitive position. Our ability to achieve our financial objectives is dependent upon our ability to effectively execute these plans and to appropriately respond to emerging economic and company-specific trends.
44
Operating Results (unaudited, in thousands)
|
|
Three Months Ended |
|
|
|
|
||||
|
|
September 30, |
|
|
|
|||||
|
|
2023 |
|
2022 |
|
Difference |
|
|||
Revenues: |
|
|
|
|
|
|
|
|
|
|
Rental income |
|
$ |
31,589 |
|
$ |
31,585 |
|
$ |
4 |
|
Interest income from financing receivables |
|
|
3,832 |
|
|
357 |
|
|
3,475 |
(1) |
Interest income from mortgage loans |
|
|
12,247 |
|
|
10,379 |
|
|
1,868 |
(2) |
Interest and other income |
|
|
1,635 |
|
|
1,182 |
|
|
453 |
(3) |
Total revenues |
|
|
49,303 |
|
|
43,503 |
|
|
5,800 |
|
|
|
|
|
|
|
|
|
|
|
|
Expenses: |
|
|
|
|
|
|
|
|
|
|
Interest expense |
|
|
12,674 |
|
|
7,941 |
|
|
(4,733) |
(4) |
Depreciation and amortization |
|
|
9,499 |
|
|
9,385 |
|
|
(114) |
|
Impairment loss |
|
|
— |
|
|
1,286 |
(5) |
|
1,286 |
|
Provision for credit losses |
|
|
189 |
|
|
795 |
|
|
606 |
(6) |
Transaction costs |
|
|
329 |
|
|
629 |
|
|
300 |
|
Property tax expense |
|
|
3,271 |
|
|
4,179 |
|
|
908 |
(7) |
General and administrative expenses |
|
|
5,959 |
|
|
5,888 |
|
|
(71) |
|
Total expenses |
|
|
31,921 |
|
|
30,103 |
|
|
(1,818) |
|
|
|
|
|
|
|
|
|
|
|
|
Other operating income: |
|
|
|
|
|
|
|
|
|
|
Gain (loss) on sale of real estate, net |
|
|
4,870 |
(8) |
|
(387) |
(9) |
|
5,257 |
|
Operating income |
|
|
22,252 |
|
|
13,013 |
|
|
9,239 |
|
Income from unconsolidated joint ventures |
|
|
375 |
|
|
376 |
|
|
(1) |
|
Net income |
|
|
22,627 |
|
|
13,389 |
|
|
9,238 |
|
Income allocated to non-controlling interests |
|
|
(430) |
|
|
(99) |
|
|
(331) |
|
Net income attributable to LTC Properties, Inc. |
|
|
22,197 |
|
|
13,290 |
|
|
8,907 |
|
Income allocated to participating securities |
|
|
(147) |
|
|
(131) |
|
|
(16) |
|
Net income available to common stockholders |
|
$ |
22,050 |
|
$ |
13,159 |
|
$ |
8,891 |
|
| (1) | Represents the revenue from the acquisition of 11 ALFs and MCs located in North Carolina for $121,321 during the first quarter of 2023 and the acquisition of three SNFs located in Florida for $75,825 during the third quarter of 2022. In accordance with ASC 842, these transactions are accounted as financing receivables. See Note 2. Real Estate Investments within our consolidated financial statements for more information. |
| (2) | Increased primarily due to mortgage loan originations during 2023. |
| (3) | Increased primarily due to origination of a $17,000 mezzanine loan during the third quarter of 2023 and repayment of deferred interest due from a master lease partially offset by lower income from loan payoffs. |
| (4) | Increased primarily due to higher outstanding balance and higher interest rates on our revolving line of credit. |
| (5) | Represents the impairment loss related to an assisted living community in Kentucky. |
| (6) | Decreased primarily due to the financing receivable origination during the third quarter of 2022. |
| (7) | Decreased primarily due to property tax reassessment and properties sold partially offset by acquisitions. |
| (8) | Represents the gain on sale related to two ALFs located in Pennsylvania during the third quarter of 2023. |
| (9) | Represents the net loss on sale of $434 related to a closed skilled nursing center in Texas offset by additional gain due to quarterly reassessment of prior years’ sale holdbacks. |
45
|
|
Nine Months Ended |
|
|
|
|
||||
|
|
September 30, |
|
|
|
|||||
|
|
2023 |
|
2022 |
|
Difference |
|
|||
Revenues: |
|
|
|
|
|
|
|
|
|
|
Rental income |
|
$ |
94,861 |
|
$ |
93,537 |
|
$ |
1,324 |
(1) |
Interest income from financing receivable |
|
|
11,413 |
|
|
357 |
|
|
11,056 |
(2) |
Interest income from mortgage loans |
|
|
35,417 |
|
|
30,112 |
|
|
5,305 |
(3) |
Interest and other income |
|
|
5,358 |
|
|
3,308 |
|
|
2,050 |
(4) |
Total revenues |
|
|
147,049 |
|
|
127,314 |
|
|
19,735 |
|
|
|
|
|
|
|
|
|
|
|
|
Expenses: |
|
|
|
|
|
|
|
|
|
|
Interest expense |
|
|
34,595 |
|
|
22,607 |
|
|
(11,988) |
(5) |
Depreciation and amortization |
|
|
28,085 |
|
|
28,202 |
|
|
117 |
|
Impairment loss |
|
|
12,510 |
(6) |
|
1,286 |
(7) |
|
(11,224) |
|
Provision for credit losses |
|
|
2,107 |
|
|
1,454 |
|
|
(653) |
(8) |
Transaction costs |
|
|
537 |
|
|
728 |
|
|
191 |
|
Property tax expense |
|
|
9,751 |
|
|
12,180 |
|
|
2,429 |
(9) |
General and administrative expenses |
|
|
18,344 |
|
|
17,407 |
|
|
(937) |
(10) |
Total expenses |
|
|
105,929 |
|
|
83,864 |
|
|
(22,065) |
|
|
|
|
|
|
|
|
|
|
|
|
Other operating income: |
|
|
|
|
|
|
|
|
|
|
Gain on sale of real estate, net |
|
|
20,545 |
(11) |
|
37,809 |
(12) |
|
(17,264) |
|
Operating income |
|
|
61,665 |
|
|
81,259 |
|
|
(19,594) |
|
Income from unconsolidated joint ventures |
|
|
1,127 |
|
|
1,127 |
|
|
— |
|
Net income |
|
|
62,792 |
|
|
82,386 |
|
|
(19,594) |
|
Income allocated to non-controlling interests |
|
|
(1,287) |
|
|
(301) |
|
|
(986) |
|
Net income attributable to LTC Properties, Inc. |
|
|
61,505 |
|
|
82,085 |
|
|
(20,580) |
|
Income allocated to participating securities |
|
|
(440) |
|
|
(481) |
|
|
41 |
|
Net income available to common stockholders |
|
$ |
61,065 |
|
$ |
81,604 |
|
$ |
(20,539) |
|
| (1) | Increased primarily due to rental income from acquisitions, rent received from transitioned portfolios, repayment of deferred rent and annual rent escalations partially offset by sold properties and decrease in property tax revenue. |
| (2) | Represents the revenue from the acquisition of 11 ALFs and MCs located in North Carolina for $121,321 during the first quarter of 2023 and the acquisition of three SNFs located in Florida for $75,825 during the third quarter of 2022. In accordance with ASC 842, these transactions are accounted as financing receivables. See Note 2. Real Estate Investments within our consolidated financial statements for more information. |
| (3) | Increased primarily due to mortgage loan originations during the second quarter of 2022 and the first and second quarter of 2023 and additional funding under mortgage loans. |
| (4) | Increased primarily due to origination of a $17,000 mezzanine loan during the third quarter of 2023, prepayment fees received in connection with the payoff of two mezzanine loans during the first quarter of 2023 and repayment of deferred interest related to a master lease partially offset by lower income from loan payoffs. |
| (5) | Increased primarily due to higher outstanding balance and higher interest rates on our revolving line of credit. |
| (6) | Represents $434 impairment loss related to a 70-unit ALF located in Florida that was sold during 2023. Additionally, represents aggregate impairment loss of $12,076 related to two ALFs. See Note 2. Real Estate Investments within our consolidated financial statements for more information. |
| (7) | Represents the impairment loss related to an assisted living community in Kentucky. |
| (8) | Increased primarily due to more originations during the nine months ended September 30, 2023 compared to nine months ended September 30, 2022. |
| (9) | Decreased primarily due to property tax reassessment and properties sold partially offset by acquisitions. |
| (10) | Increased due to higher incentive compensation charges and increases in overall costs due to inflationary pressures and the timing of certain expenditures. |
| (11) | Represents the net gain on sale related to five ALFs located in Florida, Kentucky, New Jersey and Pennsylvania and two SNFs in New Mexico during 2023. |
| (12) | Represents the net gain on sale of $38,052 related to a SNF located in California and three ALFs located in Virginia and California during the second quarter of 2022 and quarterly reassessment of prior years’ sale holdbacks partially offset by the net loss on sale of $434 related to a closed skilled nursing center in Texas. |
46
Funds From Operations Available to Common Stockholders
Funds from Operations (“FFO”) attributable to common stockholders, basic FFO attributable to common stockholders per share and diluted FFO attributable to common stockholders per share are supplemental measures of a REIT’s financial performance that are not defined by GAAP. Real estate values historically rise and fall with market conditions, but cost accounting for real estate assets in accordance with GAAP assumes that the value of real estate assets diminishes predictably over time. We believe that by excluding the effect of historical cost depreciation, which may be of limited relevance in evaluating current performance, FFO facilitates comparisons of operating performance between periods.
We use FFO as a supplemental performance measurement of our cash flow generated by operations. FFO does not represent cash generated from operating activities in accordance with GAAP, and is not necessarily indicative of cash available to fund cash needs and should not be considered an alternative to net income available to common stockholders.
We calculate and report FFO in accordance with the definition and interpretive guidelines issued by NAREIT. FFO, as defined by NAREIT, means net income available to common stockholders (computed in accordance with GAAP) excluding gains or losses on the sale of real estate and impairment write-downs of depreciable real estate plus real estate depreciation and amortization, and after adjustments for unconsolidated partnerships and joint ventures. Our calculation of FFO may not be comparable to FFO reported by other REITs that do not define the term in accordance with the current NAREIT definition or that have a different interpretation of the current NAREIT definition from us; therefore, caution should be exercised when comparing our FFO to that of other REITs.
The following table reconciles GAAP net income available to common stockholders to NAREIT FFO available to common stockholders (unaudited, amounts in thousands, except per share amounts):
|
|
Three Months Ended |
|
Nine Months Ended |
|
||||||||
|
|
September 30, |
|
September 30, |
|
||||||||
|
|
2023 |
|
2022 |
|
2023 |
|
2022 |
|
||||
GAAP net income available to common stockholders |
|
$ |
22,050 |
|
$ |
13,159 |
|
$ |
61,065 |
|
$ |
81,604 |
|
Add: Depreciation and amortization |
|
|
9,499 |
|
|
9,385 |
|
|
28,085 |
|
|
28,202 |
|
Add: Impairment loss |
|
|
— |
|
|
1,286 |
|
|
12,510 |
|
|
1,286 |
|
Less/add: (Gain)/loss on sale of real estate, net |
|
|
(4,870) |
|
|
387 |
|
|
(20,545) |
|
|
(37,809) |
|
NAREIT FFO attributable to common stockholders |
|
$ |
26,679 |
|
$ |
24,217 |
|
$ |
81,115 |
|
$ |
73,283 |
|
NAREIT FFO attributable to common stockholders per share: |
|
|
|
|
|
|
|
|
|
|
|
|
|
Basic |
|
$ |
0.65 |
|
$ |
0.60 |
|
$ |
1.97 |
|
$ |
1.85 |
|
Diluted |
|
$ |
0.65 |
|
$ |
0.60 |
|
$ |
1.97 |
|
$ |
1.83 |
|
Weighted average shares used to calculate NAREIT FFO per share: |
|
|
|
|
|
|
|
|
|
|
|
|
|
Basic |
|
|
41,153 |
|
|
40,270 |
|
|
41,127 |
|
|
39,658 |
|
Diluted |
|
|
41,469 |
(1) |
|
40,781 |
(2) |
|
41,440 |
(1) |
|
39,939 |
(3) |
| (1) | Includes the effect of performance-based stock units and participating securities. |
| (2) | Includes the effect of stock option equivalents, performance-based stock units and participating securities. |
| (3) | Includes the effect of performance-based stock units. |
47
Liquidity and Capital Resources
Sources and Uses of Cash
As of September 30, 2023, we had a total of $11.3 million of cash and cash equivalents, $37.8 million available under our unsecured revolving line of credit and the potential ability to access the capital markets through the issuance of $128.8 million of common stock under our Equity Distribution Agreements. Furthermore, we have the ability to access the capital markets through the issuance of debt and/or equity securities under an automatic shelf registration statement.
We believe that our current cash balance, cash flow from operations available for distribution or reinvestment, our borrowing capacity and our potential ability to access the capital markets are sufficient to provide for payment of our current operating costs, meet debt obligations and pay common dividends at least sufficient to maintain our REIT status and repay borrowings at, or prior to, their maturity. The timing, source and amount of cash flows used in financing and investing activities are sensitive to the capital markets environment, especially to changes in interest rates. In addition, COVID-19 has adversely affected our operators’ business, results of operations, cash flows and financial condition which could, in turn, adversely affect our financial position.
We maintain our cash deposits primarily in financial institutions, which may at times exceed amounts covered by insurance provided by the U.S. Federal Deposit Insurance Corporation (“FDIC”). We have not experienced any losses related to amounts in excess of FDIC limits.
The operating results of the facilities will be impacted by various factors over which the operators/owners may have no control. Those factors include, without limitation, the health of the economy, inflation pressures, employee availability and cost, changes in supply of or demand for competing seniors housing and health care facilities, competition from home health providers, ability to control other rising operating costs, the potential for significant reforms in the health care industry including state and federal reimbursement programs, and the ongoing recovery for the impact of COVID-19. Prestige is our largest operator based upon revenues and assets representing 16.6% of our total revenues and 14.2% of our total assets as of September 30, 2023. During the second quarter of 2023, we agreed to defer up to $1.5 million, or up to $0.3 million per month for May through September 2023, in interest payments due on one of Prestige’s mortgage loans secured by 15 skilled nursing centers. We deferred $0.6 million and $0.9 million in interest payments during the second quarter and third quarters of 2023. Subsequent to September 30, 2023, we amended the loan. As part of the amendment, LTC has drawn down $2.8 million of the approximate $5.0 million letter of credit from Prestige to repay all deferred interest outstanding through October 2023. We will further draw down approximately $334,000 in each of November and December 2023 to be applied toward interest due on the loan at that point. As a result, we expect to receive all contractual interest of $19.5 million due from Prestige in 2023. Beginning on January 1, 2024, the minimum mortgage interest payment due to LTC will be set based on an annual current pay rate of 8.5% on the outstanding loan balance. The contractual interest rate of the loan remains unchanged. From retro-active Medicaid funds due to Prestige, we expect our letter of credit will be replenished in 2024 and Prestige will be able to pay all contractual interest during 2024 and 2025.
Our financial position and ability to make distributions may be adversely affected if Prestige faces financial difficulties, including bankruptcy, inability to emerge from bankruptcy, insolvency or a general downturn in its business.
In addition, our future growth in net income and cash flow may be adversely impacted by various proposals for changes in the governmental regulations and financing of the health care industry, and the continuing impact of our operators recovery for the effects of COVID-19. We cannot presently predict what impact these proposals may have, if any. We believe that an adequate provision has been made for the possibility of loans proving uncollectible but we will continually evaluate the financial status of the operations of the seniors housing and health care properties.
48
In addition, we will monitor our borrowers and the underlying collateral for mortgage loans and will make future revisions to the provision, if considered necessary.
Depending on our borrowing capacity, compliance with financial covenants, ability to access the capital markets, and the payment of dividends may be negatively impacted. We continuously evaluate the availability of cost-effective capital and believe we have sufficient liquidity for our current dividend, corporate expenses and additional capital investments in 2023 and 2024.
Our investments, principally our investments in owned properties and mortgage loans, are subject to the possibility of loss of their carrying values as a result of changes in market prices, interest rates and inflationary expectations. The effects on interest rates may affect our costs of financing our operations and the fair market value of our financial assets. Generally, our leases have agreed upon annual increases and our loans have predetermined increases in interest rates. Inasmuch as we may initially fund some of our investments with variable interest rate debt, we would be at risk of net interest margin deterioration if medium and long-term rates were to increase.
Our primary sources of cash include rent and interest receipts, borrowings under our unsecured credit facility, public and private issuances of debt and equity securities, proceeds from investment dispositions and principal payments on loans receivable. Our primary uses of cash include dividend distributions, debt service payments (including principal and interest), real property investments (including acquisitions, capital expenditures and construction advances), loan advances and general and administrative expenses. These sources and uses of cash are reflected in our Consolidated Statements of Cash Flows as summarized below (in thousands):
|
|
Nine Months Ended September 30, |
|
|
Change |
|
||||
Net Cash provided by (used in): |
|
2023 |
|
2022 |
|
|
$ |
|
||
Operating activities |
|
$ |
78,932 |
|
$ |
72,772 |
|
$ |
6,160 |
|
Investing activities |
|
|
(194,254) |
|
|
(110,507) |
|
|
(83,747) |
|
Financing activities |
|
|
116,245 |
|
|
39,052 |
|
|
77,193 |
|
Increase in cash and cash equivalents |
|
|
923 |
|
|
1,317 |
|
|
(394) |
|
Cash and cash equivalents, beginning of period |
|
|
10,379 |
|
|
5,161 |
|
|
5,218 |
|
Cash and cash equivalents, end of period |
|
$ |
11,302 |
|
$ |
6,478 |
|
$ |
4,824 |
|
Debt Obligations
Unsecured Credit Facility. We have an unsecured credit agreement (the “Credit Agreement”) that provides for an aggregate commitment of the lenders of up to $500.0 million comprising of a $400.0 million revolving credit facility (the “Revolving Line of Credit”) and two $50.0 million term loans (the “Term Loans”). The Credit Agreement permits us to request increases to the Revolving Line of Credit and Term Loans commitments up to a total of $1.0 billion. The Revolving Line of Credit matures November 19, 2025 and provides for a one-year extension option at our discretion, subject to customary conditions. The Term Loans mature on November 19, 2025 and November 19, 2026. During 2022, we entered into the First Amendment to the Third Amended and Restated Credit Agreement (the “Amended Credit Agreement”) to replace London Interbank Offered Rate (“LIBOR”) with the Secured Overnight Financing Rate (“SOFR”), plus a credit spread adjustment of 10 basis points, (“Adjusted SOFR”) as the reference rate for purpose of calculating interest under the Amended Credit Agreement. Other material terms of the Credit Agreement remain unchanged. Based on our leverage at September 30, 2023, the facility provides for interest annually at Adjusted SOFR plus 120 basis points and a facility fee of 20 basis points and the Term Loans provide for interest annually at Adjusted SOFR plus 140 basis points.
49
Interest Rate Swap Agreements. In connection with entering into the Term Loans as described above, we entered into two receive variable/pay fixed interest rate swap agreements (the “Interest Rate Swaps”) with maturities of November 19, 2025 and November 19, 2026, respectively, that will effectively lock-in the forecasted interest payments on the Term Loans’ borrowings over their four and five year terms of the loans. The Interest Rate Swaps are considered cash flow hedges and are recorded on our Consolidated Balance Sheets at fair value, with changes in the fair value of these instruments recognized in Accumulated other comprehensive income (loss) on our Consolidated Balance Sheets. In connection with entering into the Amended Credit Agreement discussed above, we entered into amendments to our Interest Rate Swaps to account for SOFR as the updated reference rate in the Amended Credit Agreement. During the nine months ended September 30, 2023, we recorded a $123,000 decrease in fair value of Interest Rate Swaps.
As of September 30, 2023, the terms of the Interest Rate Swaps are as follows (dollar amounts in thousands):
|
|
|
|
|
|
|
|
|
|
Notional |
|
Fair Value at |
||
Date Entered |
|
Maturity Date |
|
Swap Rate |
|
Rate Index |
|
|
Amount |
|
|
September 30, 2023 |
|
|
November 2021 |
|
November 19, 2025 |
|
2.62 |
% |
|
1-month SOFR |
|
$ |
50,000 |
|
$ |
3,776 |
|
November 2021 |
|
November 19, 2026 |
|
2.76 |
% |
|
1-month SOFR |
|
|
50,000 |
|
|
4,820 |
|
|
|
|
|
|
|
|
|
|
$ |
100,000 |
|
$ |
8,596 |
|
Senior Unsecured Notes. We have senior unsecured notes held by institutional investors with interest rates ranging from 3.66% to 5.03%. The senior unsecured notes mature between 2024 and 2033.
The senior unsecured notes and the Credit Agreement, including the Revolving Line of Credit and the Term Loans, contain financial covenants, which are measured quarterly, that require us to maintain, among other things:
| ● | a ratio of total indebtedness to total asset value not greater than 0.6 to 1.0; |
| ● | a ratio of secured debt to total asset value not greater than 0.35 to 1.0; |
| ● | a ratio of unsecured debt to the value of the unencumbered asset value not greater than 0.6 to 1.0; and |
| ● | a ratio of EBITDA, as calculated in the debt obligation, to fixed charges not less than 1.50 to 1.0. |
At September 30, 2023, we were in compliance with all applicable financial covenants. These debt obligations also contain additional customary covenants and events of default that are subject to a number of important and significant limitations, qualifications and exceptions.
The debt obligations by component as of September 30, 2023 are as follows (dollar amounts in thousands):
|
|
Applicable |
|
|
|
|
Available |
|
|
|
Interest |
|
Outstanding |
|
for |
||
Debt Obligations |
|
Rate (1) |
|
Balance |
|
Borrowing |
||
Revolving line of credit |
|
6.63% |
|
$ |
362,250 |
|
$ |
37,750 |
Term loans, net of debt issue costs |
|
2.74% |
|
|
99,620 |
|
|
— |
Senior unsecured notes, net of debt issue costs |
|
4.20% |
|
|
494,353 |
|
|
— |
Total |
|
4.97% |
|
$ |
956,223 |
|
$ |
37,750 |
| (1) | Represents weighted average of interest rate as of September 30, 2023. |
50
During the nine months ended September 30, 2023, our debt borrowings and repayments were as follows (in thousands):
Debt Obligations |
|
|
Borrowings |
|
|
Repayments |
|
Revolving line of credit |
|
$ |
274,450 |
|
$ |
(42,200) |
|
Senior unsecured notes |
|
|
— |
|
|
(44,160) |
|
Total |
|
$ |
274,450 |
|
$ |
(86,360) |
|
Equity
At September 30, 2023, we had 41,411,693 shares of common stock outstanding, equity on our balance sheet totaled $860.4 million and our equity securities had a market value of $1.3 billion. During the nine months ended September 30, 2023, we declared and paid $70.8 million of cash dividends.
During the nine months ended September 30, 2023, we acquired 43,933 shares of common stock held by employees who tendered owned shares to satisfy tax withholding obligations.
Subsequent to September 30, 2023, we declared a monthly cash dividend of $0.19 per share on our common stock for the months of October, November and December 2023, payable on October 31, November 30, and December 29, 2023, respectively, to stockholders of record on October 23, November 22, and December 21, 2023, respectively.
At-The-Market Program. We have separate equity distribution agreements (collectively, “Equity Distribution Agreements”) to offer and sell, from time to time, up to $200.0 million in aggregate offering price of shares of our common stock. During the nine months ended September 30, 2023, we sold 48,500 shares of common stock for $1.8 million in net proceeds under our Equity Distribution Agreements. In conjunction with the sale of common stock, we incurred $80,000 of costs associated with this agreement which have been recorded in additional paid in capital as a reduction of proceeds received. Accordingly, we have $128.8 million available under the Equity Distribution Agreements.
Available Shelf Registrations. We have an automatic shelf registration statement on file with the SEC and currently have the ability to file additional automatic shelf registration statements to provide us with capacity to publicly offer an indeterminate amount of common stock, preferred stock, warrants, debt, depositary shares, or units. We may from time to time raise capital under our automatic registration statement in amounts, at prices, and on terms to be announced when and if the securities are offered. The specifics of any future offerings, along with the use of proceeds of any securities offered, will be described in detail in a prospectus supplement, or other offering materials, at the time of the offering. Our shelf registration statement expires on February 17, 2025.
Stock-Based Compensation. During the second quarter of 2021, we adopted and our shareholders approved the 2021 Equity Participation Plan (“the 2021 Plan”) which replaces the 2015 Equity Participation Plan (“the 2015 Plan”). Under the 2021 Plan, 1,900,000 shares of common stock have been authorized and reserved for awards, less one share for every one share that was subject to an award granted under the 2015 Plan after December 31, 2020 and prior to adoption. In addition, any shares that are not issued under outstanding awards under the 2015 Plan because the shares were forfeited or cancelled after December 31, 2020 will be added to and again be available for awards under the 2021 Plan. Under the 2021 Plan, the shares were authorized and reserved for awards to officers, employees, non-employee directors and consultants. The terms of the awards granted under the 2021 Plan and the 2015 Plan are set by our compensation committee at its discretion.
51
During the nine months ended September 30, 2023, we awarded restricted stock and performance-based stock units as follows:
No. of |
|
Price per |
|
|
|
|
|
|
Shares |
|
Share |
|
Award Type |
|
Vesting Period |
|
|
127,960 |
|
$ |
37.16 |
|
Restricted stock |
|
ratably over 3 years |
|
86,867 |
|
$ |
37.16 |
|
Performance-based stock units |
|
TSR targets (1) |
|
15,060 |
|
$ |
31.54 |
|
Restricted stock |
|
May 24,2024 |
|
3,000 |
|
$ |
35.45 |
|
Restricted stock |
|
July 25, 2024 |
|
232,887 |
|
|
|
|
|
|
|
|
| (1) | Vesting is based on achieving certain total shareholder return (“TSR”) targets in 4 years with an acceleration opportunity in 3 years. |
Critical Accounting Policies
Our consolidated financial statements included in Part I, Item 1 of this Quarterly Report on Form 10-Q are prepared in conformity with U.S. generally accepted accounting principles for interim financial information set forth in the Accounting Standards Codification as published by the Financial Accounting Standards Board, which require us to make estimates and assumptions regarding future events that affect the amounts reported in our financial statements and accompanying footnotes. We base these estimates on our experience and assumptions regarding future events we believe to be reasonable under the circumstances. Actual results could differ from those estimates and such differences may be material to the consolidated financial statements. We have described our most critical accounting policies in the “Management’s Discussion and Analysis of Financial Condition and Results of Operations” section of our Annual Report on Form 10-K for the year ended December 31, 2022. There have been no material changes to our critical accounting policies or estimates since December 31, 2022.
Item 3. QUANTITATIVE AND QUALITATIVE DISCLOSURES ABOUT MARKET RISK
There were no material changes in our market risk during the nine months ended September 30, 2023. For additional information, refer to Item 7A as presented in our Annual Report on Form 10-K for the year ended December 31, 2022.
Item 4. CONTROLS AND PROCEDURES
Our management, with the participation of our Chief Executive Officer and Chief Financial Officer, has evaluated the effectiveness of our disclosure controls and procedures (as such term is defined in Rules 13a-15(e) and 15d-15(e) under the Securities Exchange Act of 1934, as amended). As of the end of the period covered by this report based on such evaluation our Chief Executive Officer and Chief Financial Officer have concluded that, as of the end of such period, our disclosure controls and procedures were effective.
There has been no change in our internal control over financial reporting during the period covered by this report that has materially affected, or is reasonably likely to materially affect, our internal control over financial reporting.
52
PART II
OTHER INFORMATION
Item 1. LEGAL PROCEEDINGS
We are and may become from time to time a party to various claims and lawsuits arising in the ordinary course of business, which in our opinion are not singularly or in the aggregate anticipated to be material to our results of operations or financial condition. Claims and lawsuits may include matters involving general or professional liability asserted against the lessees or borrowers related to our properties, which we believe under applicable legal principles are not our responsibility as a non-possessory landlord or mortgage holder. We believe that these matters are the responsibility of our lessees and borrowers pursuant to general legal principles and pursuant to insurance and indemnification provisions in the applicable leases or mortgages. We intend to continue to vigorously defend such claims and lawsuits.
Item 1A. RISK FACTORS
There have been no material changes from the risk factors as previously disclosed in our Annual Report on Form 10-K for the fiscal year ended December 31, 2022.
Item 2. UNREGISTERED SALES OF EQUITY SECURITIES AND USE OF PROCEEDS
None
Item 5. OTHER INFORMATION
Rule 10b5-1 Trading Arrangements
During the three months ended September 30, 2023, no director or officer of our company adopted or terminated a “Rule 10b5-1 trading arrangement” or “non-Rule 10b5-1 trading arrangement” as defined in Item 408(a) of Regulation S-K.
53
Item 6. EXHIBITS
3.1 |
|
|
|
|
3.2 |
|
31.1 |
|
|
|
31.2 |
|
|
|
32 |
|
101.INS |
Inline XBRL Instance Document - the instance document does not appear in the Interactive Data File because its XBRL tags are embedded within the Inline XBRL document. |
|
|
101.SCH |
Inline XBRL Taxonomy Extension Schema Document |
|
|
101.CAL |
Inline XBRL Taxonomy Extension Calculation Linkbase Document |
|
|
101.DEF |
Inline XBRL Taxonomy Extension Definitions Linkbase Document |
|
|
101.LAB |
Inline XBRL Taxonomy Extension Label Linkbase Document |
|
|
101.PRE |
Inline XBRL Taxonomy Extension Presentation Linkbase Document |
|
|
104 |
Cover Page Interactive Data File (formatted as Inline XBRL and contained in Exhibit 101) |
54
SIGNATURES
Pursuant to the requirements of the Securities Exchange Act of 1934, the registrant has duly caused this report to be signed on its behalf by the undersigned, thereunto duly authorized.
|
LTC PROPERTIES, INC. |
|
|
Registrant |
|
|
|
|
|
|
|
|
|
|
Dated: October 26th, 2023 |
By: |
/s/ Caroline Chikhale |
|
|
Caroline Chikhale |
|
|
Executive Vice President, Chief Accounting |
|
|
(Principal Accounting Officer) |
55
Exhibit 31.1
CERTIFICATION OF THE CHIEF EXECUTIVE OFFICER
PURSUANT TO SECTION 302 OF THE SARBANES-OXLEY ACT OF 2002
I, Wendy L. Simpson, certify that:
/s/ Wendy L. Simpson |
|
|
Wendy L. Simpson |
|
|
Chairman and Chief Executive Officer |
|
|
(Principal Executive Officer) |
|
|
October 26, 2023 |
|
|
Exhibit 31.2
CERTIFICATION OF THE CHIEF FINANCIAL OFFICER
PURSUANT TO SECTION 302 OF THE SARBANES-OXLEY ACT OF 2002
I, Pam Kessler, certify that:
|
|
/s/ Pam Kessler |
|
Pam Kessler |
|
Co-President, Chief Financial Officer |
|
and Corporate Secretary |
|
(Principal Financial Officer) |
|
October 26, 2023 |
|
Exhibit 32
CERTIFICATIONS PURSUANT TO
18 U.S.C. SECTION 1350,
AS ADOPTED PURSUANT TO
SECTION 906 OF THE SARBANES-OXLEY ACT OF 2002
Pursuant to 18 U.S.C. 1350, as adopted pursuant to Section 906 of the Sarbanes-Oxley Act of 2002, each of the undersigned officers of LTC Properties, Inc. (the “Company”) hereby certifies with respect to the Quarterly Report on Form 10-Q of the Company for the quarter ended September 30, 2023 as filed with the Securities and Exchange Commission (the “Report”) that to her knowledge:
| (1) | The Report fully complies with the requirements of section 13(a) or 15(d) of the Securities Exchange Act of 1934; and |
| (2) | The information contained in the Report fairly presents, in all material respects, the financial condition and results of operations of the Company. |
Date: October 26, 2023 |
|
/s/ Wendy L. Simpson |
|
|
|
Wendy L. Simpson |
|
|
|
|
|
Date: October 26, 2023 |
|
/s/ Pam Kessler |
|
|
|
Pam Kessler |
|
This certification is not deemed filed with the Securities and Exchange Commission and is not to be incorporated by reference into any filing of the Company under the Securities Act of 1933 or the Securities Act of 1934 (whether made before or after the date of the Report), irrespective of any general incorporation language contained in such filing.