UNITED STATES
SECURITIES AND EXCHANGE COMMISSION
Washington, D. C. 20549
FORM 8-K
CURRENT REPORT
Pursuant to Section 13 or 15(d) of The Securities Exchange Act of 1934
Date of Report (Date of earliest event reported): September 26, 2023 (September 26, 2023)
MATSON, INC.
(Exact Name of Registrant as Specified in its Charter)
_____________________
Hawaii |
|
001-34187 |
|
99-0032630 |
(State or Other Jurisdiction of |
|
(Commission File Number) |
|
(I.R.S. Employer Identification |
1411 Sand Island Parkway |
|
|
Honolulu, Hawaii |
|
96819 |
(Address of principal executive offices) |
|
(zip code) |
Registrant’s telephone number, including area code: (808) 848-1211
(Former Name or former address, if changed since last report)
_____________________
Check the appropriate box below if the Form 8-K filing is intended to simultaneously satisfy the filing obligation of the registrant under any of the following provisions:
☐ |
Written communications pursuant to Rule 425 under the Securities Act (17 CFR 230.425) |
☐ |
Soliciting material pursuant to Rule 14a-12 under the Exchange Act (17 CFR 240.14a-12) |
☐ |
Pre-commencement communications pursuant to Rule 14d-2(b) under the Exchange Act (17 CFR 240.14d-2(b)) |
☐ |
Pre-commencement communications pursuant to Rule 13e-4(c) under the Exchange Act (17 CFR 240.13e-4(c)) |
Securities registered pursuant to Section 12(b) of the Act:
Title of each class |
Trading Symbol(s) |
Name of each exchange on which registered |
Common Stock, without par value |
MATX |
New York Stock Exchange |
Indicate by check mark whether the registrant is an emerging growth company as defined in Rule 405 of the Securities Act of 1933 (§230.405 of this chapter) or Rule 12b-2 of the Securities Exchange Act of 1934 (§240.12b-2 of this chapter).
Emerging growth company ☐
If an emerging growth company, indicate by check mark if the registrant has elected not to use the extended transition period for complying with any new or revised financial accounting standards provided pursuant to Section 13(a) of the Exchange Act. ☐
Item 7.01.Regulation FD Disclosure.
Matson, Inc. (“Matson” or the “Company”) will present an overview of the Company to certain investors beginning on or about September 26, 2023. Matson will use the presentation materials attached as Exhibit 99.1 to this Form 8-K. The information set forth in these materials speaks only as of the date of the materials.
Statements in this Form 8-K and the attached exhibit that are not historical facts are “forward-looking statements,” within the meaning of the Private Securities Litigation Reform Act of 1995, that involve a number of risks and uncertainties that could cause actual results to differ materially from those contemplated by the relevant forward-looking statement. Factors that could cause actual results to differ materially from those contemplated in the statements include, without limitation, those described on pages 14-24 of the Form 10-K filed by Matson on February 24, 2023. These forward-looking statements are not guarantees of future performance. Actual results could differ materially from those anticipated in the forward-looking statements and future results could differ materially from historical performance.
Item 9.01.Financial Statements and Exhibits.
(a) - (c) Not applicable.
(d) Exhibits.
The exhibit listed below is being furnished with this Form 8-K.
99.1 |
|
|
|
104 |
Cover Page Interactive Data File (formatted in Inline XBRL and included as Exhibit 101). |
SIGNATURE
Pursuant to the requirements of the Securities Exchange Act of 1934, as amended, the registrant has duly caused this report to be signed on its behalf by the undersigned hereunto duly authorized.
|
MATSON, INC. |
|
|
|
|
|
/s/ Joel M. Wine |
|
Joel M. Wine |
|
Executive Vice President and Chief Financial Officer |
|
|
|
|
Dated: September 26, 2023 |
|
|
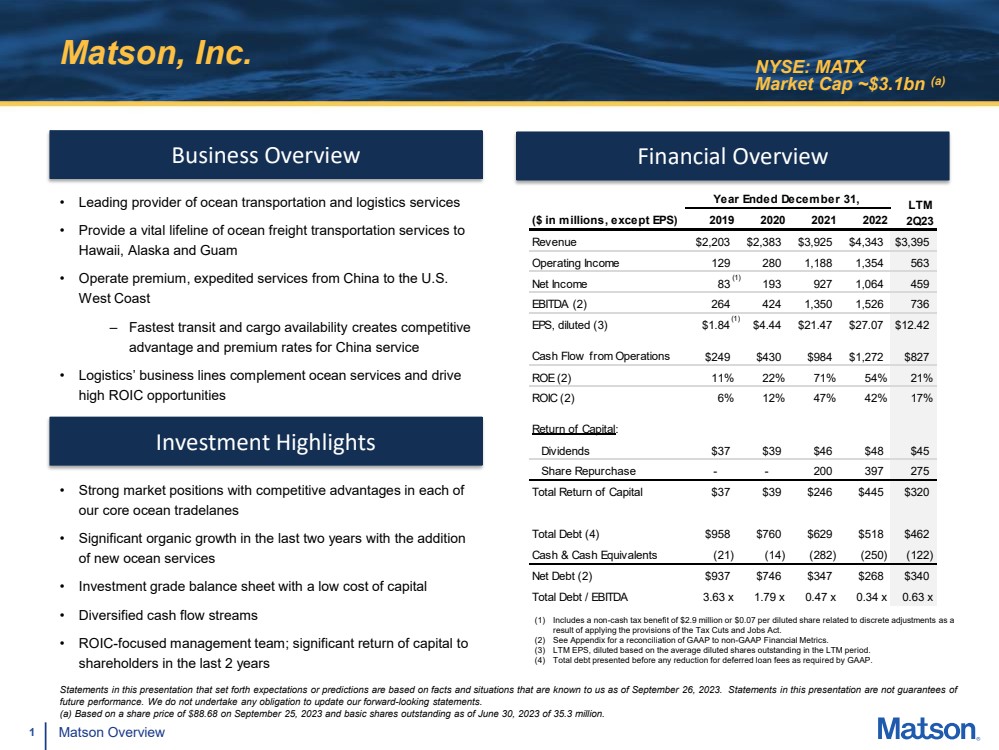
1 Matson Overview Matson, Inc. Business Overview Financial Overview • Leading provider of ocean transportation and logistics services • Provide a vital lifeline of ocean freight transportation services to Hawaii, Alaska and Guam • Operate premium, expedited services from China to the U.S. West Coast – Fastest transit and cargo availability creates competitive advantage and premium rates for China service • Logistics’ business lines complement ocean services and drive high ROIC opportunities Investment Highlights • Strong market positions with competitive advantages in each of our core ocean tradelanes • Significant organic growth in the last two years with the addition of new ocean services • Investment grade balance sheet with a low cost of capital • Diversified cash flow streams • ROIC-focused management team; significant return of capital to shareholders in the last 2 years NYSE: MATX Market Cap ~$3.1bn (a) (1) Includes a non-cash tax benefit of $2.9 million or $0.07 per diluted share related to discrete adjustments as a result of applying the provisions of the Tax Cuts and Jobs Act. (2) See Appendix for a reconciliation of GAAP to non-GAAP Financial Metrics. (3) LTM EPS, diluted based on the average diluted shares outstanding in the LTM period. (4) Total debt presented before any reduction for deferred loan fees as required by GAAP. Statements in this presentation that set forth expectations or predictions are based on facts and situations that are known to us as of September 26, 2023. Statements in this presentation are not guarantees of future performance. We do not undertake any obligation to update our forward-looking statements. (a) Based on a share price of $88.68 on September 25, 2023 and basic shares outstanding as of June 30, 2023 of 35.3 million. ($ in millions, except EPS) 2019 2020 2021 2022 Revenue $2,203 $2,383 $3,925 $4,343 $3,395 Operating Income 129 280 1,188 1,354 563 Net Income 83 193 927 1,064 459 EBITDA (2) 264 424 1,350 1,526 736 EPS, diluted (3) $1.84 $4.44 $21.47 $27.07 $12.42 Cash Flow from Operations $249 $430 $984 $1,272 $827 ROE (2) 11% 22% 71% 54% 21% ROIC (2) 6% 12% 47% 42% 17% Return of Capital: Dividends $37 $39 $46 $48 $45 Share Repurchase - - 200 397 275 Total Return of Capital $37 $39 $246 $445 $320 Total Debt (4) $958 $760 $629 $518 $462 Cash & Cash Equivalents (21) (14) (282) (250) (122) Net Debt (2) $937 $746 $347 $268 $340 Total Debt / EBITDA 3.63 x 1.79 x 0.47 x 0.34 x 0.63 x Year Ended December 31, LTM 2Q23 (1) (1) |
|
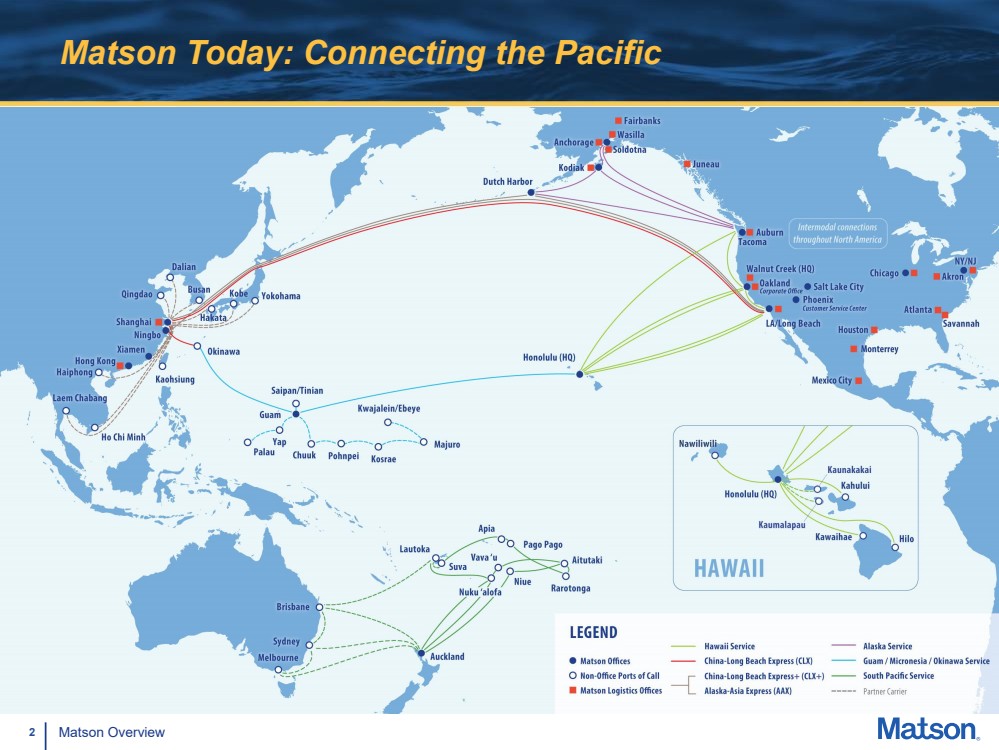
2 Matson Overview Matson Today: Connecting the Pacific |
|
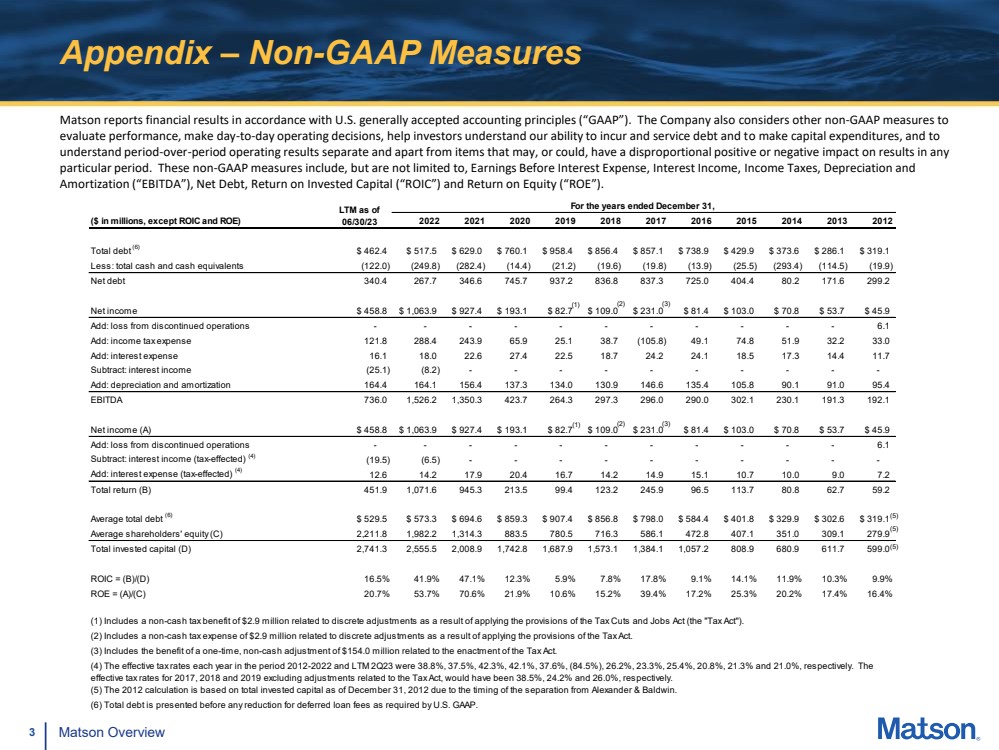
3 Matson Overview Appendix – Non-GAAP Measures Matson reports financial results in accordance with U.S. generally accepted accounting principles (“GAAP”). The Company also considers other non-GAAP measures to evaluate performance, make day-to-day operating decisions, help investors understand our ability to incur and service debt and to make capital expenditures, and to understand period-over-period operating results separate and apart from items that may, or could, have a disproportional positive or negative impact on results in any particular period. These non-GAAP measures include, but are not limited to, Earnings Before Interest Expense, Interest Income, Income Taxes, Depreciation and Amortization (“EBITDA”), Net Debt, Return on Invested Capital (“ROIC”) and Return on Equity (“ROE”). For the years ended December 31, ($ in millions, except ROIC and ROE) 2022 2021 2020 2019 2018 2017 2016 2015 2014 2013 2012 Total debt (6) $ 462.4 $ 517.5 $ 629.0 $ 760.1 $ 958.4 $ 856.4 $ 857.1 $ 738.9 $ 429.9 $ 373.6 $ 286.1 $ 319.1 Less: total cash and cash equivalents (122.0) (249.8) (282.4) (14.4) (21.2) (19.6) (19.8) (13.9) (25.5) (293.4) (114.5) (19.9) Net debt 340.4 267.7 346.6 745.7 937.2 836.8 837.3 725.0 404.4 80.2 171.6 299.2 Net income $ 458.8 $ 1,063.9 $ 927.4 $ 193.1 $ 82.7 $ 109.0 $ 231.0 $ 81.4 $ 103.0 $ 70.8 $ 53.7 $ 45.9 Add: loss from discontinued operations - - - - - - - - - - - 6.1 Add: income tax expense 121.8 288.4 243.9 65.9 25.1 38.7 (105.8) 49.1 74.8 51.9 32.2 33.0 Add: interest expense 16.1 18.0 22.6 27.4 22.5 18.7 24.2 24.1 18.5 17.3 14.4 11.7 Subtract: interest income (25.1) (8.2) - - - - - - - - - - Add: depreciation and amortization 164.4 164.1 156.4 137.3 134.0 130.9 146.6 135.4 105.8 90.1 91.0 95.4 EBITDA 736.0 1,526.2 1,350.3 423.7 264.3 297.3 296.0 290.0 302.1 230.1 191.3 192.1 Net income (A) $ 458.8 $ 1,063.9 $ 927.4 $ 193.1 $ 82.7 $ 109.0 $ 231.0 $ 81.4 $ 103.0 $ 70.8 $ 53.7 $ 45.9 Add: loss from discontinued operations - - - - - - - - - - - 6.1 Subtract: interest income (tax-effected) (4) (19.5) (6.5) - - - - - - - - - - Add: interest expense (tax-effected) (4) 12.6 14.2 17.9 20.4 16.7 14.2 14.9 15.1 10.7 10.0 9.0 7.2 Total return (B) 451.9 1,071.6 945.3 213.5 99.4 123.2 245.9 96.5 113.7 80.8 62.7 59.2 Average total debt (6) $ 529.5 $ 573.3 $ 694.6 $ 859.3 $ 907.4 $ 856.8 $ 798.0 $ 584.4 $ 401.8 $ 329.9 $ 302.6 $ 319.1 Average shareholders' equity (C) 2,211.8 1,982.2 1,314.3 883.5 780.5 716.3 586.1 472.8 407.1 351.0 309.1 279.9 Total invested capital (D) 2,741.3 2,555.5 2,008.9 1,742.8 1,687.9 1,573.1 1,384.1 1,057.2 808.9 680.9 611.7 599.0 ROIC = (B)/(D) 16.5% 41.9% 47.1% 12.3% 5.9% 7.8% 17.8% 9.1% 14.1% 11.9% 10.3% 9.9% ROE = (A)/(C) 20.7% 53.7% 70.6% 21.9% 10.6% 15.2% 39.4% 17.2% 25.3% 20.2% 17.4% 16.4% (6) Total debt is presented before any reduction for deferred loan fees as required by U.S. GAAP. (5) The 2012 calculation is based on total invested capital as of December 31, 2012 due to the timing of the separation from Alexander & Baldwin. LTM as of 06/30/23 (1) Includes a non-cash tax benefit of $2.9 million related to discrete adjustments as a result of applying the provisions of the Tax Cuts and Jobs Act (the "Tax Act"). (2) Includes a non-cash tax expense of $2.9 million related to discrete adjustments as a result of applying the provisions of the Tax Act. (3) Includes the benefit of a one-time, non-cash adjustment of $154.0 million related to the enactment of the Tax Act. (4) The effective tax rates each year in the period 2012-2022 and LTM 2Q23 were 38.8%, 37.5%, 42.3%, 42.1%, 37.6%, (84.5%), 26.2%, 23.3%, 25.4%, 20.8%, 21.3% and 21.0%, respectively. The effective tax rates for 2017, 2018 and 2019 excluding adjustments related to the Tax Act, would have been 38.5%, 24.2% and 26.0%, respectively. (2) (3) (2) (3) (5) (5) (5) (1) (1) |