UNITED STATES
SECURITIES AND EXCHANGE COMMISSION
Washington, D.C. 20549
FORM 8-K
CURRENT REPORT
Pursuant to Section 13 or 15(d)
of the Securities Exchange Act of 1934
Date of Report (Date of earliest event reported): September 6, 2023
FLUSHING FINANCIAL CORPORATION
(Exact name of registrant as specified in its charter)
001-33013
(Commission File Number)
Delaware
(State or Other Jurisdiction of Incorporation)
11-3209278
(I.R.S. Employer Identification No.)
220 RXR Plaza, Uniondale, NY 11556
(Address of principal executive offices)
(718) 961-5400
(Registrant's telephone number, including area code)
Check the appropriate box below if the Form 8-K filing is intended to simultaneously satisfy the filing obligation of the registrant under any of the following provisions:
☐ Written communications pursuant to Rule 425 under the Securities Act (17 CFR 230.425)
☐ Soliciting material pursuant to Rule 14a-12 under the Exchange Act (17 CFR 240.14a-12)
☐ Pre-commencement communications pursuant to Rule 14d-2(b) under the Exchange Act (17 CFR 240.14d-2(b))
☐ Pre-commencement communications pursuant to Rule 13e-4(c) under the Exchange Act (17 CFR 240.13e-4(c))
Securities registered pursuant to Section 12(b) of the Act:
Common Stock, $0.01 par value |
FFIC |
The Nasdaq Stock Market LLC |
Indicate by check mark whether the registrant is an emerging growth company as defined in Rule 405 of the Securities Act of 1933 (§230.405 of this chapter) or Rule 12b-2 of the Securities Exchange Act of 1934 (§240.12b-2 of this chapter).
Emerging growth company ☐
If an emerging growth company, indicate by check mark if the registrant has elected not to use the extended transition period for complying with any new or revised financial accounting standards provided pursuant to Section 13(a) of the Exchange Act. ☐
Item 7.01. Regulation FD Disclosure.
On September 6, 2023, Flushing Financial Corp. (the “Company”) made available to investors, and to post on its website, the presentation attached hereto as Exhibit 99.1.
Item 9.01. Financial Statements and Exhibits.
104 Cover Page Interactive Data File (embedded within the Inline XBRL document) |
SIGNATURE
Pursuant to the requirements of the Securities Exchange Act of 1934, the registrant has duly caused this report to be signed on its behalf by the undersigned hereunto duly authorized.
|
FLUSHING FINANCIAL CORPORATION |
|
|
|
|
|
|
|
Date: September 6, 2023 |
By: |
/s/ SUSAN K. CULLEN |
|
|
Susan K. Cullen |
|
|
Senior Executive Vice President, Chief Financial Officer |
|
|
And Treasurer. |
|
Raymond James Conference Presentation September 6, 2023 |
|
Safe Harbor Statement 2 “Safe Harbor” Statement under the Private Securities Litigation Reform Act of 1995: Statements in this Presentation relating to plans, strategies, economic performance and trends, projections of results of specific activities or investments and other statements that are not descriptions of historical facts may be forward-looking statements within the meaning of the Private Securities Litigation Reform Act of 1995, Section 27A of the Securities Act of 1933 and Section 21E of the Securities Exchange Act of 1934. Forward-looking information is inherently subject to risks and uncertainties, and actual results could differ materially from those currently anticipated due to a number of factors, which include, but are not limited to, risk factors discussed in the Company’s Annual Report on Form 10-K for the fiscal year ended December 31, 2022, and in other documents filed by the Company with the Securities and Exchange Commission from time to time. Forward-looking statements may be identified by terms such as “may”, “will”, “should”, “could”, “expects”, “plans”, “intends”, “anticipates”, “believes”, “estimates”, “predicts”, “forecasts”, “goals”, “potential” or “continue” or similar terms or the negative of these terms. Although we believe that the expectations reflected in the forward-looking statements are reasonable, we cannot guarantee future results, levels of activity, performance or achievements. The Company has no obligation to update these forward-looking statements. |
|
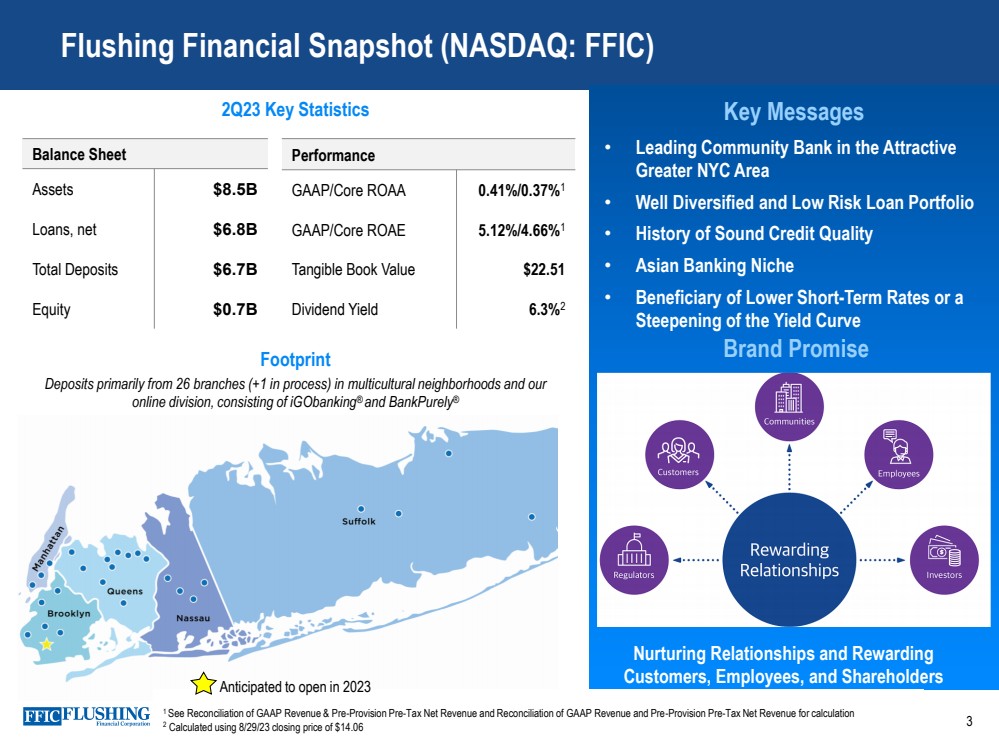
Flushing Financial Snapshot (NASDAQ: FFIC) Key Messages Balance Sheet Assets $8.5B Loans, net $6.8B Total Deposits $6.7B Equity $0.7B Performance GAAP/Core ROAA 0.41%/0.37%1 GAAP/Core ROAE 5.12%/4.66%1 Tangible Book Value $22.51 Dividend Yield 6.3%2 2Q23 Key Statistics Footprint Deposits primarily from 26 branches (+1 in process) in multicultural neighborhoods and our online division, consisting of iGObanking® and BankPurely® • Leading Community Bank in the Attractive Greater NYC Area • Well Diversified and Low Risk Loan Portfolio • History of Sound Credit Quality • Asian Banking Niche • Beneficiary of Lower Short-Term Rates or a Steepening of the Yield Curve 1 See Reconciliation of GAAP Revenue & Pre-Provision Pre-Tax Net Revenue and Reconciliation of GAAP Revenue and Pre-Provision Pre-Tax Net Revenue for calculation 2 Calculated using 8/29/23 closing price of $14.06 Brand Promise Nurturing Relationships and Rewarding Customers, Employees, and Shareholders Anticipated to open in 2023 3 |
|
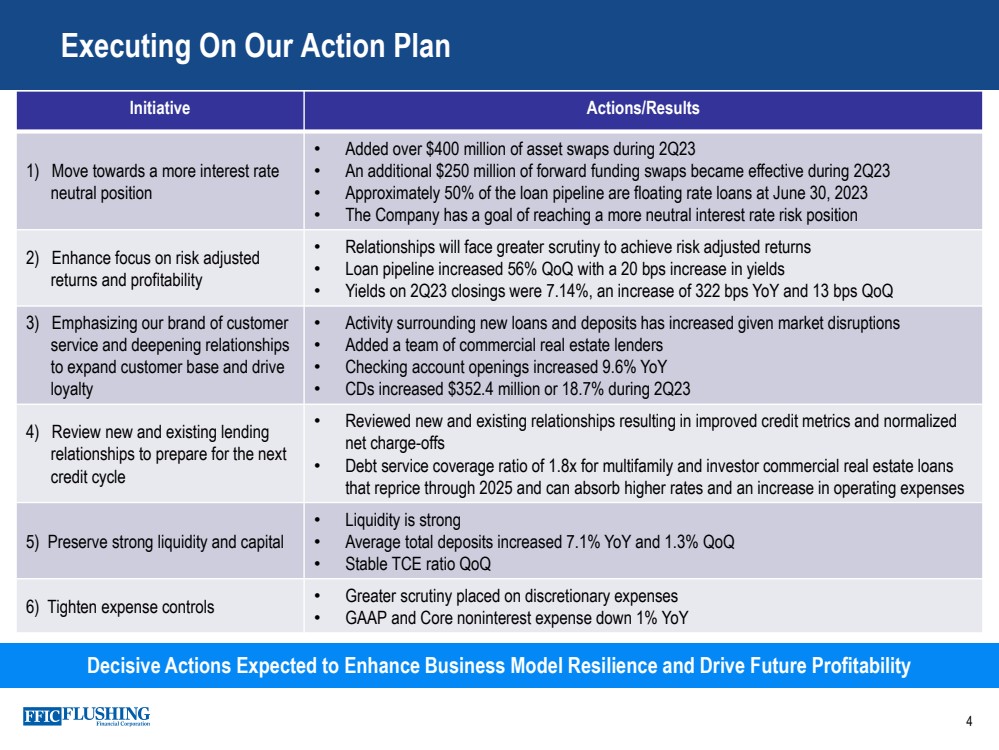
Initiative Actions/Results 1) Move towards a more interest rate neutral position • Added over $400 million of asset swaps during 2Q23 • An additional $250 million of forward funding swaps became effective during 2Q23 • Approximately 50% of the loan pipeline are floating rate loans at June 30, 2023 • The Company has a goal of reaching a more neutral interest rate risk position 2) Enhance focus on risk adjusted returns and profitability • Relationships will face greater scrutiny to achieve risk adjusted returns • Loan pipeline increased 56% QoQ with a 20 bps increase in yields • Yields on 2Q23 closings were 7.14%, an increase of 322 bps YoY and 13 bps QoQ 3) Emphasizing our brand of customer service and deepening relationships to expand customer base and drive loyalty • Activity surrounding new loans and deposits has increased given market disruptions • Added a team of commercial real estate lenders • Checking account openings increased 9.6% YoY • CDs increased $352.4 million or 18.7% during 2Q23 4) Review new and existing lending relationships to prepare for the next credit cycle • Reviewed new and existing relationships resulting in improved credit metrics and normalized net charge-offs • Debt service coverage ratio of 1.8x for multifamily and investor commercial real estate loans that reprice through 2025 and can absorb higher rates and an increase in operating expenses 5) Preserve strong liquidity and capital • Liquidity is strong • Average total deposits increased 7.1% YoY and 1.3% QoQ • Stable TCE ratio QoQ 6) Tighten expense controls • Greater scrutiny placed on discretionary expenses • GAAP and Core noninterest expense down 1% YoY 4 Executing On Our Action Plan Decisive Actions Expected to Enhance Business Model Resilience and Drive Future Profitability |
|
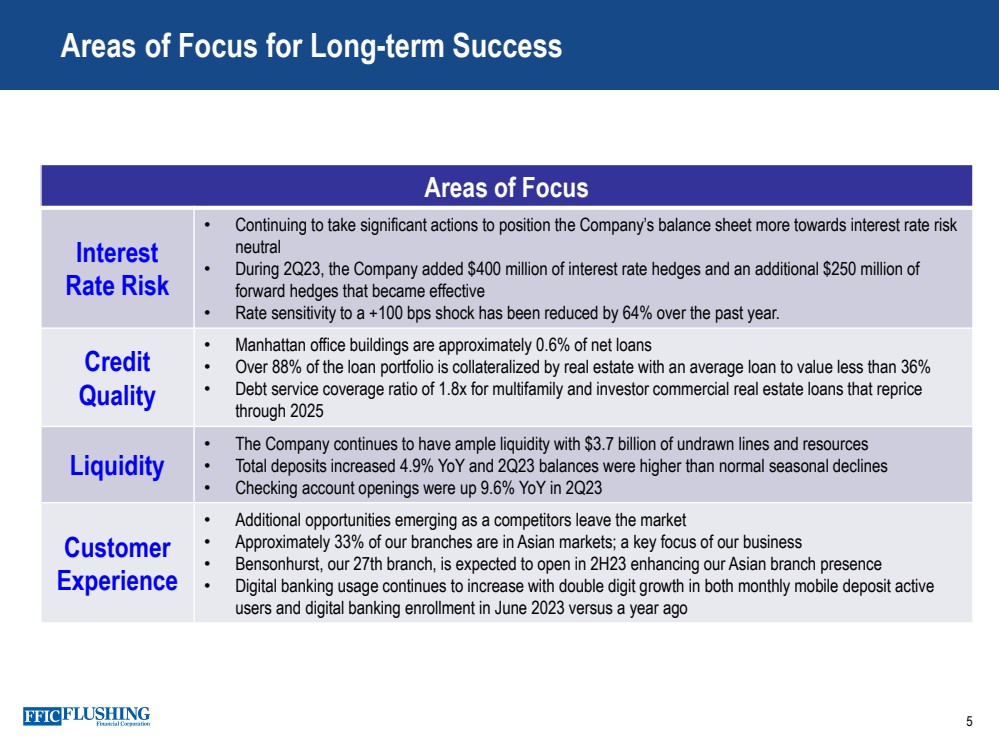
5 Areas of Focus for Long-term Success Areas of Focus Interest Rate Risk • Continuing to take significant actions to position the Company’s balance sheet more towards interest rate risk neutral • During 2Q23, the Company added $400 million of interest rate hedges and an additional $250 million of forward hedges that became effective • Rate sensitivity to a +100 bps shock has been reduced by 64% over the past year. Credit Quality • Manhattan office buildings are approximately 0.6% of net loans • Over 88% of the loan portfolio is collateralized by real estate with an average loan to value less than 36% • Debt service coverage ratio of 1.8x for multifamily and investor commercial real estate loans that reprice through 2025 Liquidity • The Company continues to have ample liquidity with $3.7 billion of undrawn lines and resources • Total deposits increased 4.9% YoY and 2Q23 balances were higher than normal seasonal declines • Checking account openings were up 9.6% YoY in 2Q23 Customer Experience • Additional opportunities emerging as a competitors leave the market • Approximately 33% of our branches are in Asian markets; a key focus of our business • Bensonhurst, our 27th branch, is expected to open in 2H23 enhancing our Asian branch presence • Digital banking usage continues to increase with double digit growth in both monthly mobile deposit active users and digital banking enrollment in June 2023 versus a year ago |
|
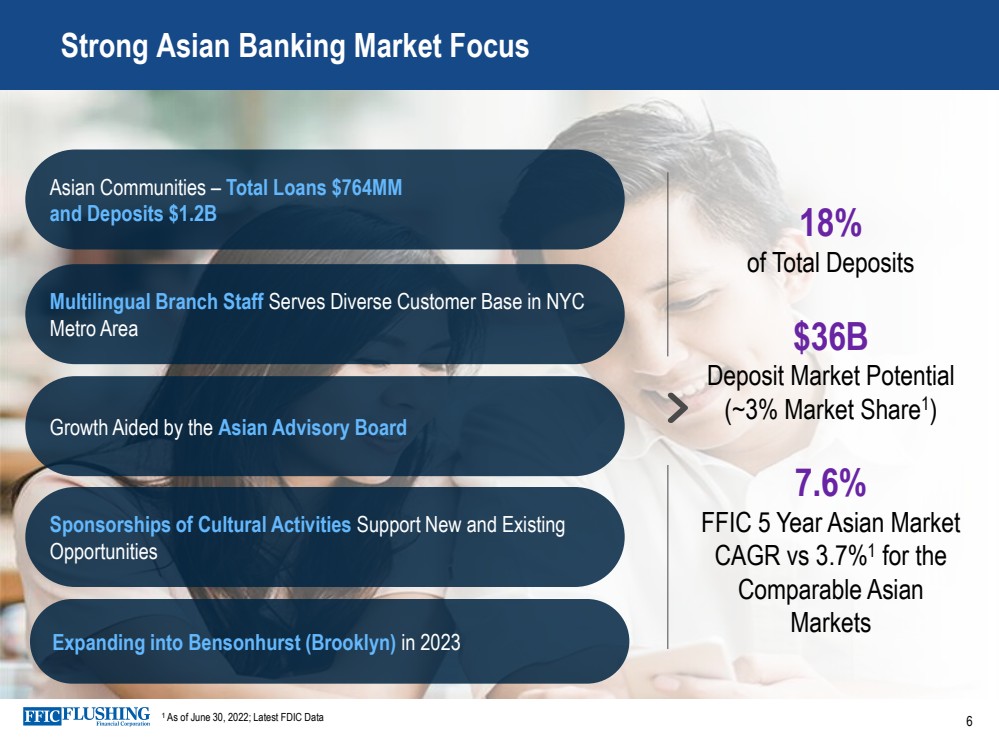
Strong Asian Banking Market Focus 18% of Total Deposits $36B Deposit Market Potential (~3% Market Share1 ) 7.6% FFIC 5 Year Asian Market CAGR vs 3.7%1 for the Comparable Asian Markets Asian Communities – Total Loans $764MM and Deposits $1.2B Multilingual Branch Staff Serves Diverse Customer Base in NYC Metro Area Growth Aided by the Asian Advisory Board Sponsorships of Cultural Activities Support New and Existing Opportunities 1 As of June 30, 2022; Latest FDIC Data Expanding into Bensonhurst (Brooklyn) in 2023 6 |
|
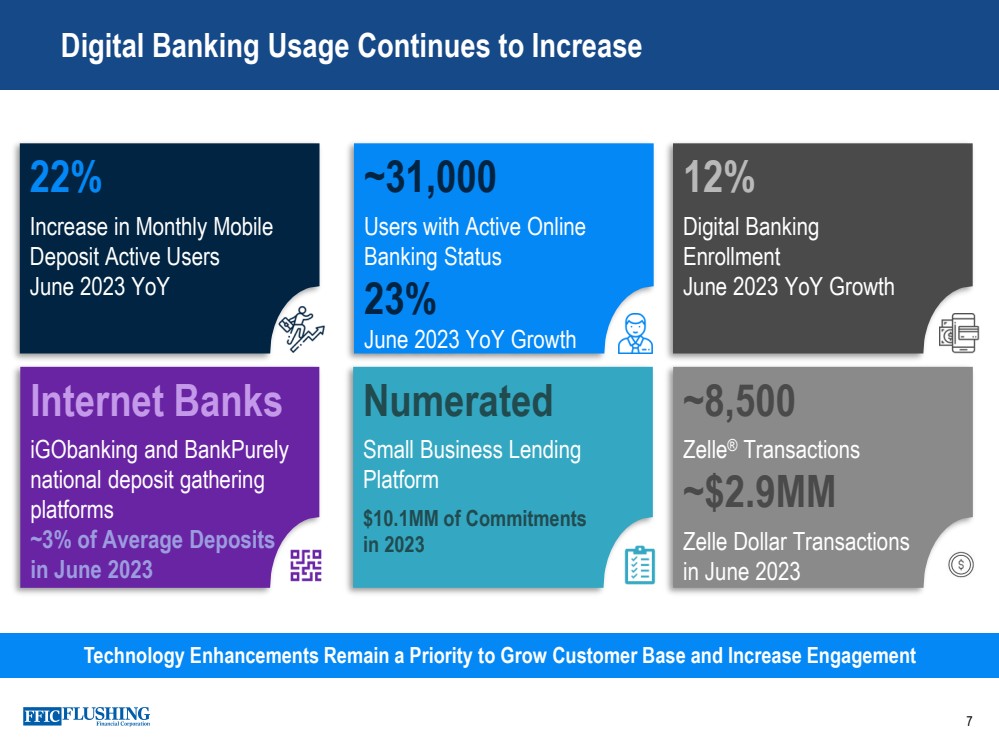
Digital Banking Usage Continues to Increase 7 Technology Enhancements Remain a Priority to Grow Customer Base and Increase Engagement 22% Increase in Monthly Mobile Deposit Active Users June 2023 YoY ~31,000 Users with Active Online Banking Status 23% June 2023 YoY Growth 12% Digital Banking Enrollment June 2023 YoY Growth Numerated Small Business Lending Platform $10.1MM of Commitments in 2023 Internet Banks iGObanking and BankPurely national deposit gathering platforms ~3% of Average Deposits in June 2023 ~8,500 Zelle® Transactions ~$2.9MM Zelle Dollar Transactions in June 2023 |
|
▪ Hosted ribbon-cutting ceremony at Hauppauge Branch ▪ Sponsored the HIA-LI 25th Trade Show & Conference , Korean American Real Estate Expo, and Vaisakhi Mela 8 Key Community Events During 2Q23 |
|
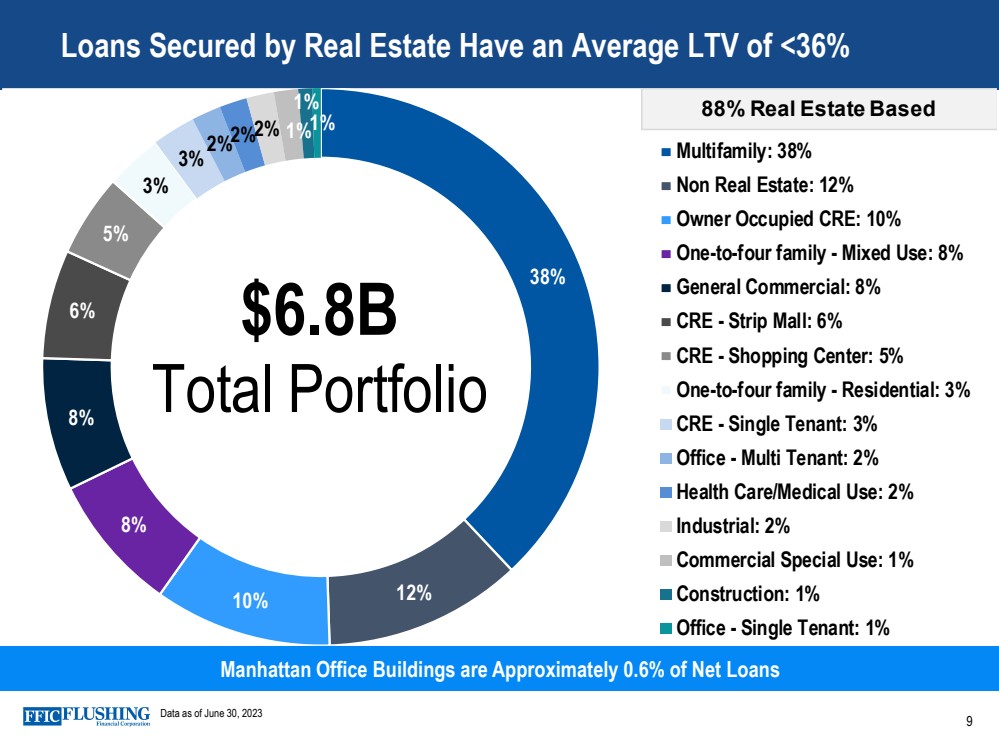
Loans Secured by Real Estate Have an Average LTV of <36% Manhattan Office Buildings are Approximately 0.6% of Net Loans Data as of June 30, 2023 38% 12% 10% 8 % 8 % 6 % 5 % 3 % 3 %2 %2 %2 % 1 % 1 % 1 % Multifamily: 38% Non Real Estate: 12% Owner Occupied CRE: 10% One-to-four family - Mixed Use: 8% General Commercial: 8% CRE - Strip Mall: 6% CRE - Shopping Center: 5% One-to-four family - Residential: 3% CRE - Single Tenant: 3% Office - Multi Tenant: 2% Health Care/Medical Use: 2% Industrial: 2% Commercial Special Use: 1% Construction: 1% Office - Single Tenant: 1% $6.8B Total Portfolio 88% Real Estate Based 9 |
|
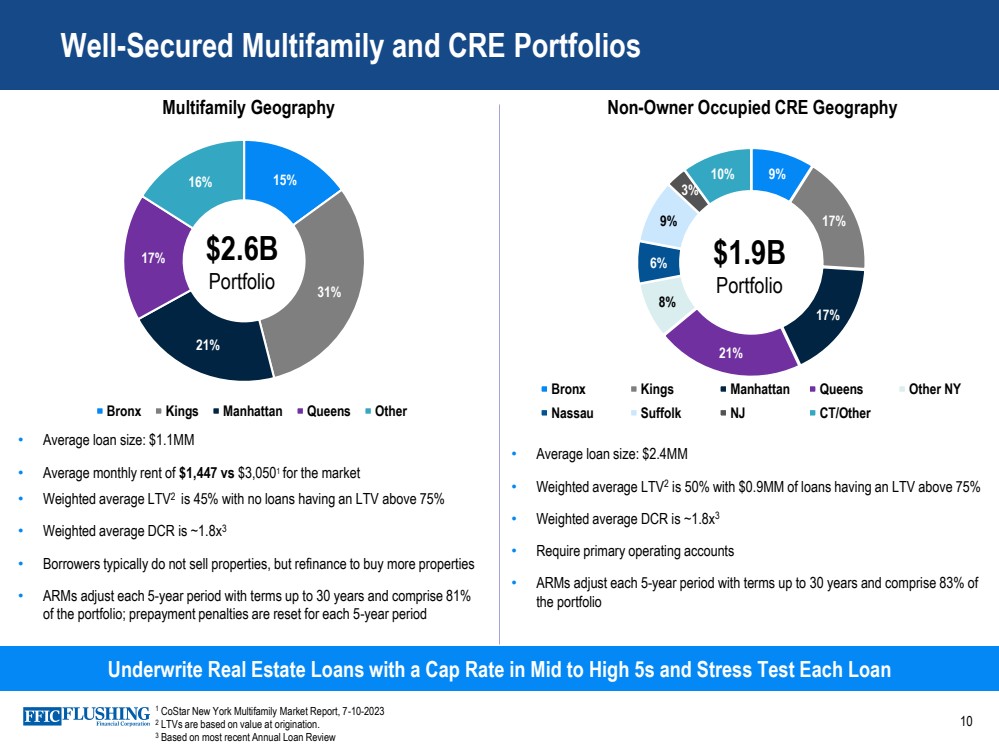
Well-Secured Multifamily and CRE Portfolios 10 Underwrite Real Estate Loans with a Cap Rate in Mid to High 5s and Stress Test Each Loan Multifamily Geography 15% 31% 21% 17% 16% Bronx Kings Manhattan Queens Other $2.6B Portfolio • Average loan size: $1.1MM • Average monthly rent of $1,447 vs $3,0501 for the market • Weighted average LTV2 is 45% with no loans having an LTV above 75% • Weighted average DCR is ~1.8x3 • Borrowers typically do not sell properties, but refinance to buy more properties • ARMs adjust each 5-year period with terms up to 30 years and comprise 81% of the portfolio; prepayment penalties are reset for each 5-year period • Average loan size: $2.4MM • Weighted average LTV2 is 50% with $0.9MM of loans having an LTV above 75% • Weighted average DCR is ~1.8x3 • Require primary operating accounts • ARMs adjust each 5-year period with terms up to 30 years and comprise 83% of the portfolio Non-Owner Occupied CRE Geography 9% 17% 17% 21% 8% 6% 9% 3% 10% Bronx Kings Manhattan Queens Other NY Nassau Suffolk NJ CT/Other $1.9B Portfolio 1 CoStar New York Multifamily Market Report, 7-10-2023 2 LTVs are based on value at origination. 3 Based on most recent Annual Loan Review |
|
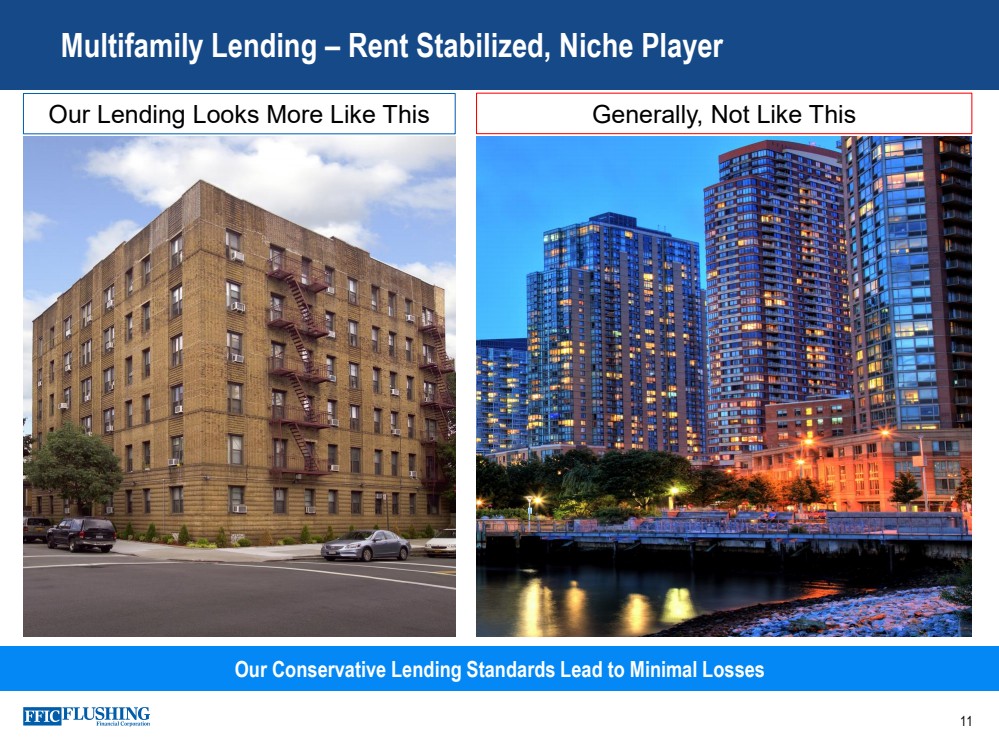
Multifamily Lending – Rent Stabilized, Niche Player Our Conservative Lending Standards Lead to Minimal Losses Our Lending Looks More Like This Generally, Not Like This 11 |
|
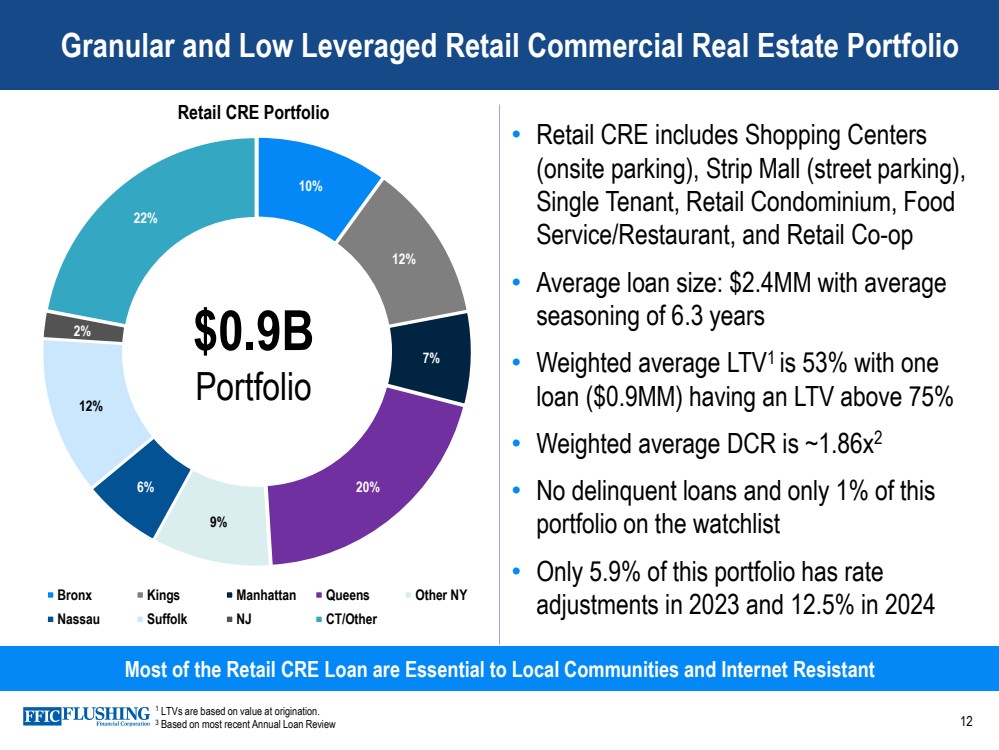
Granular and Low Leveraged Retail Commercial Real Estate Portfolio 12 Most of the Retail CRE Loan are Essential to Local Communities and Internet Resistant • Retail CRE includes Shopping Centers (onsite parking), Strip Mall (street parking), Single Tenant, Retail Condominium, Food Service/Restaurant, and Retail Co-op • Average loan size: $2.4MM with average seasoning of 6.3 years • Weighted average LTV1 is 53% with one loan ($0.9MM) having an LTV above 75% • Weighted average DCR is ~1.86x2 • No delinquent loans and only 1% of this portfolio on the watchlist • Only 5.9% of this portfolio has rate adjustments in 2023 and 12.5% in 2024 Retail CRE Portfolio 10% 12% 7% 20% 9% 6% 12% 2% 22% Bronx Kings Manhattan Queens Other NY Nassau Suffolk NJ CT/Other $0.9B Portfolio 1 LTVs are based on value at origination. 3 Based on most recent Annual Loan Review |
|
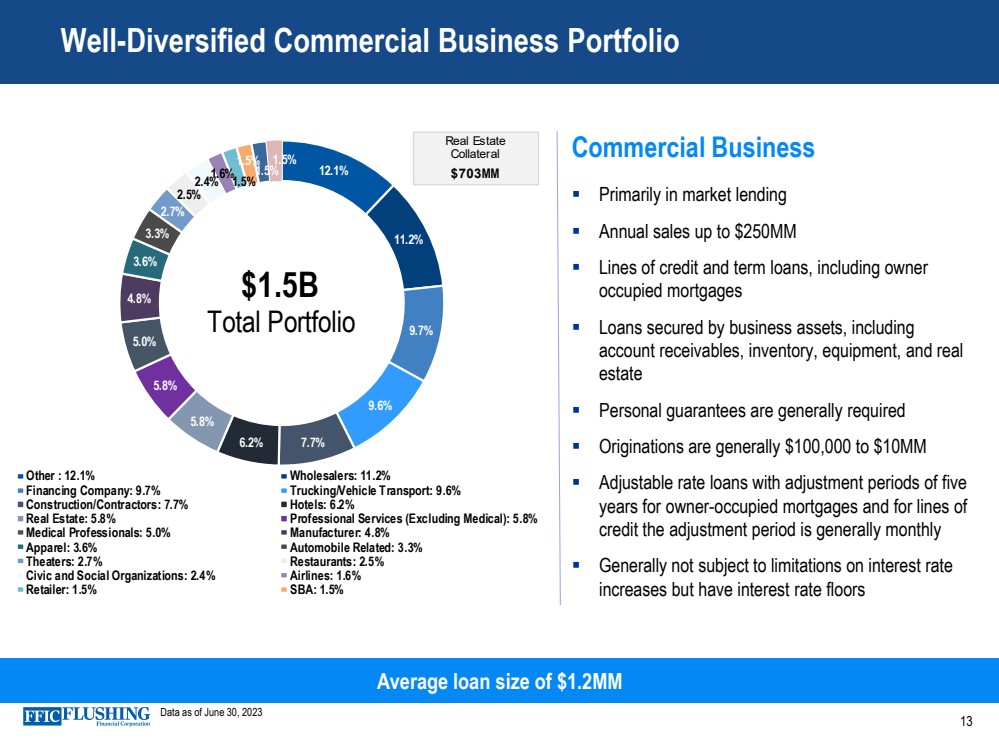
13 Well-Diversified Commercial Business Portfolio Commercial Business ▪ Primarily in market lending ▪ Annual sales up to $250MM ▪ Lines of credit and term loans, including owner occupied mortgages ▪ Loans secured by business assets, including account receivables, inventory, equipment, and real estate ▪ Personal guarantees are generally required ▪ Originations are generally $100,000 to $10MM ▪ Adjustable rate loans with adjustment periods of five years for owner-occupied mortgages and for lines of credit the adjustment period is generally monthly ▪ Generally not subject to limitations on interest rate increases but have interest rate floors Average loan size of $1.2MM Data as of June 30, 2023 12.1% 11.2% 9.7% 9.6% 6.2% 7.7% 5.8% 5.8% 5.0% 4.8% 3.6% 3.3% 2.7% 2.5% 2.4%1.6%1.5% 1.5% 1.5% 1.5% Other : 12.1% Wholesalers: 11.2% Financing Company: 9.7% Trucking/Vehicle Transport: 9.6% Construction/Contractors: 7.7% Hotels: 6.2% Real Estate: 5.8% Professional Services (Excluding Medical): 5.8% Medical Professionals: 5.0% Manufacturer: 4.8% Apparel: 3.6% Automobile Related: 3.3% Theaters: 2.7% Restaurants: 2.5% Civic and Social Organizations: 2.4% Airlines: 1.6% Retailer: 1.5% SBA: 1.5% $1.5B Total Portfolio Real Estate Collateral $703MM |
|
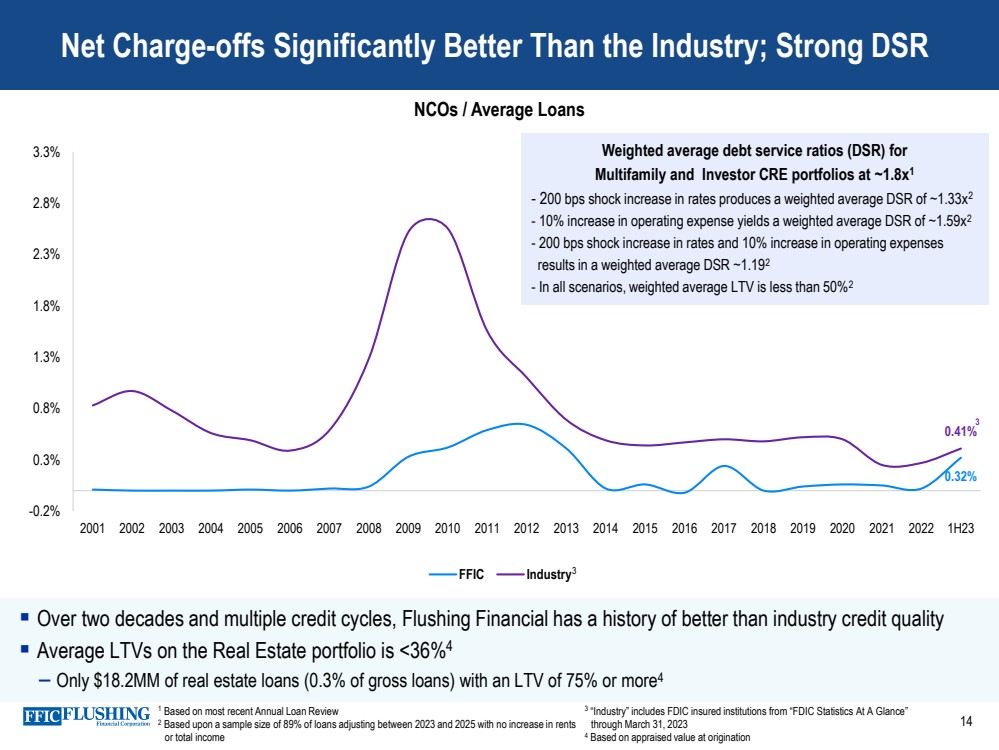
▪ Over two decades and multiple credit cycles, Flushing Financial has a history of better than industry credit quality ▪ Average LTVs on the Real Estate portfolio is <36%4 – Only $18.2MM of real estate loans (0.3% of gross loans) with an LTV of 75% or more4 Net Charge-offs Significantly Better Than the Industry; Strong DSR NCOs / Average Loans 0.32% 0.41% -0.2% 0.3% 0.8% 1.3% 1.8% 2.3% 2.8% 3.3% 2001 2002 2003 2004 2005 2006 2007 2008 2009 2010 2011 2012 2013 2014 2015 2016 2017 2018 2019 2020 2021 2022 1H23 FFIC Industry Weighted average debt service ratios (DSR) for Multifamily and Investor CRE portfolios at ~1.8x1 - 200 bps shock increase in rates produces a weighted average DSR of ~1.33x2 - 10% increase in operating expense yields a weighted average DSR of ~1.59x2 - 200 bps shock increase in rates and 10% increase in operating expenses results in a weighted average DSR ~1.192 - In all scenarios, weighted average LTV is less than 50%2 3 3 1 Based on most recent Annual Loan Review 2 Based upon a sample size of 89% of loans adjusting between 2023 and 2025 with no increase in rents or total income 3 “Industry” includes FDIC insured institutions from “FDIC Statistics At A Glance” through March 31, 2023 4 Based on appraised value at origination 14 |
|
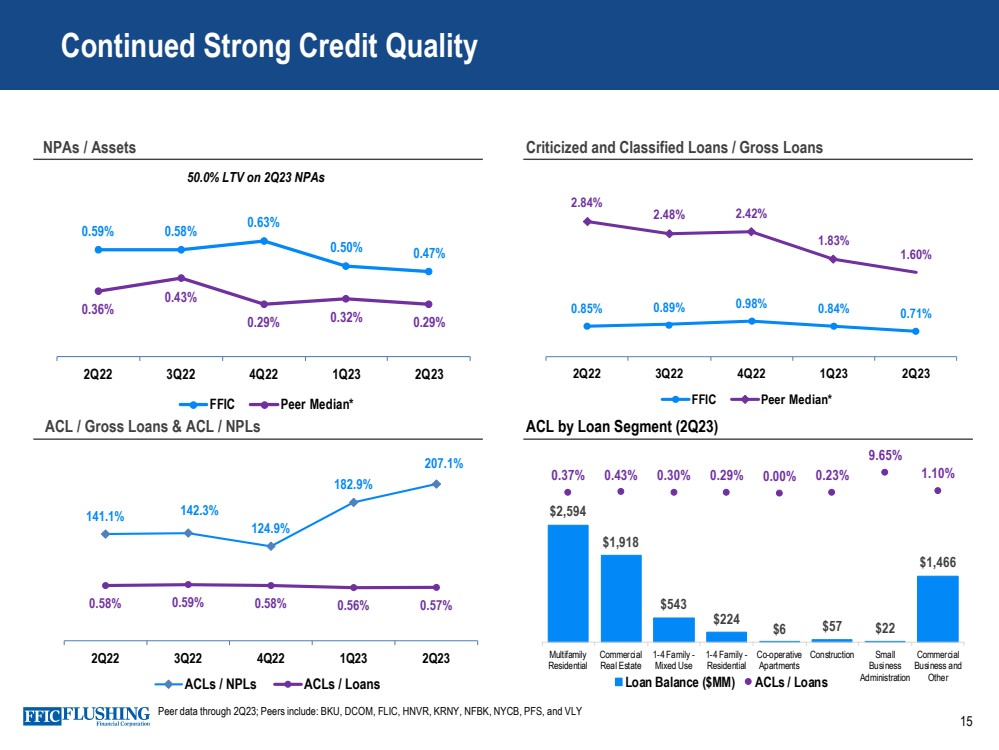
0.59% 0.58% 0.63% 0.50% 0.47% 0.36% 0.43% 0.29% 0.32% 0.29% 0.00% 0.10% 0.20% 0.30% 0.40% 0.50% 0.60% 0.70% 0.80% 0.90% 1.00% 2Q22 3Q22 4Q22 1Q23 2Q23 FFIC Peer Median* 15 Continued Strong Credit Quality NPAs / Assets Criticized and Classified Loans / Gross Loans ACL / Gross Loans & ACL / NPLs ACL by Loan Segment (2Q23) $2,594 $1,918 $543 $224 $6 $57 $22 $1,466 0.37% 0.43% 0.30% 0.29% 0.00% 0.23% 9.65% 1.10% -70.00% -60.00% -50.00% -40.00% -30.00% -20.00% -10.00% 0.00% 10.00% Multifamily Residential Commercial Real Estate 1-4 Family - Mixed Use 1-4 Family - Residential Co-operative Apartments Construction Small Business Administration Commercial Business and Other Loan Balance ($MM) ACLs / Loans 50.0% LTV on 2Q23 NPAs Peer data through 2Q23; Peers include: BKU, DCOM, FLIC, HNVR, KRNY, NFBK, NYCB, PFS, and VLY0.85% 0.89% 0.98% 0.84% 0.71% 2.84% 2.48% 2.42% 1.83% 1.60% 0.00% 0.50% 1.00% 1.50% 2.00% 2.50% 3.00% 3.50% 4.00% 4.50% 5.00% 2Q22 3Q22 4Q22 1Q23 2Q23 FFIC Peer Median* 141.1% 142.3% 124.9% 182.9% 207.1% 0.58% 0.59% 0.58% 0.56% 0.57% 0% 0% 0% 1% 1% 1% 1% 1% 2% 2% 2% 0% 50% 100% 150% 200% 250% 2Q22 3Q22 4Q22 1Q23 2Q23 ACLs / NPLs ACLs / Loans |
|
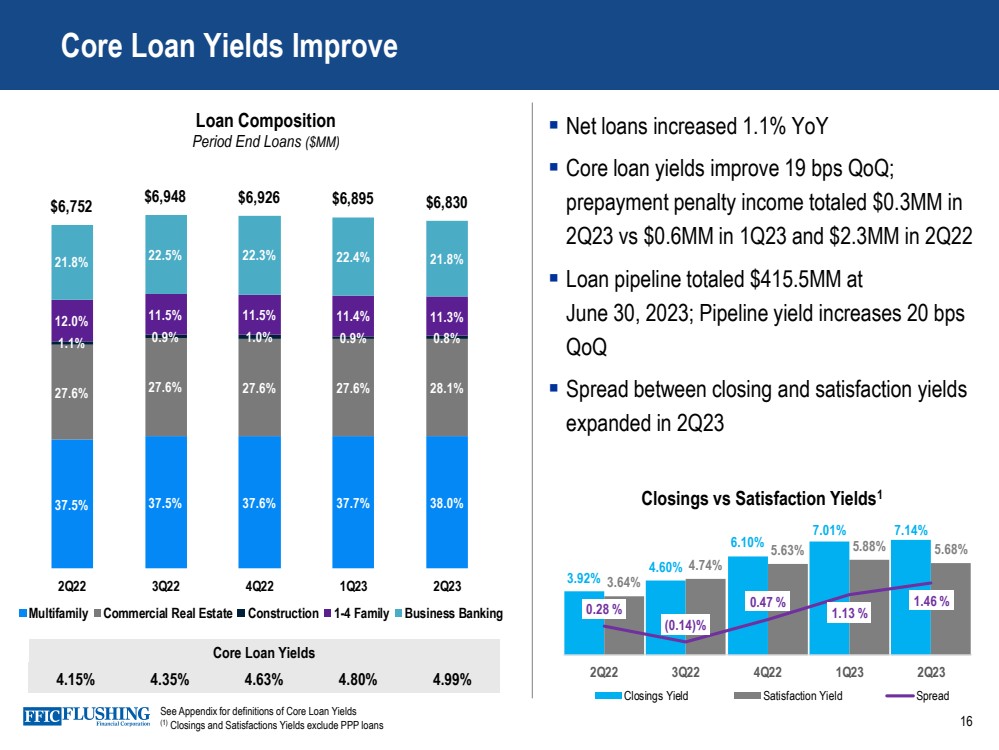
37.5% 37.5% 37.6% 37.7% 38.0% 27.6% 27.6% 27.6% 27.6% 28.1% 1.1% 0.9% 1.0% 0.9% 0.8% 12.0% 11.5% 11.5% 11.4% 11.3% 21.8% 22.5% 22.3% 22.4% 21.8% $6,752 $6,948 $6,926 $6,895 $6,830 - 1,0 00 2,0 00 3,0 00 4,0 00 5,0 00 6,0 00 7,0 00 8,0 00 2Q22 3Q22 4Q22 1Q23 2Q23 Multifamily Commercial Real Estate Construction 1-4 Family Business Banking Core Loan Yields Improve 16 Core Loan Yields 4.15% 4.35% 4.63% 4.80% 4.99% Loan Composition Period End Loans ($MM) ▪ Net loans increased 1.1% YoY ▪ Core loan yields improve 19 bps QoQ; prepayment penalty income totaled $0.3MM in 2Q23 vs $0.6MM in 1Q23 and $2.3MM in 2Q22 ▪ Loan pipeline totaled $415.5MM at June 30, 2023; Pipeline yield increases 20 bps QoQ ▪ Spread between closing and satisfaction yields expanded in 2Q23 See Appendix for definitions of Core Loan Yields (1) Closings and Satisfactions Yields exclude PPP loans Closings vs Satisfaction Yields1 3.92% 4.60% 6.10% 7.01% 7.14% 3.64% 4.74% 5.63% 5.88% 5.68% 0.28 % (0.14)% 0.47 % 1.13 % 1.46 % (0.50)% 0.00 % 0.50 % 1.00 % 1.50 % 2.00 % 2.50 % 3.00 % 0.00% 1.00% 2.00% 3.00% 4.00% 5.00% 6.00% 7.00% 8.00% 2Q22 3Q22 4Q22 1Q23 2Q23 Closings Yield Satisfaction Yield Spread |
|
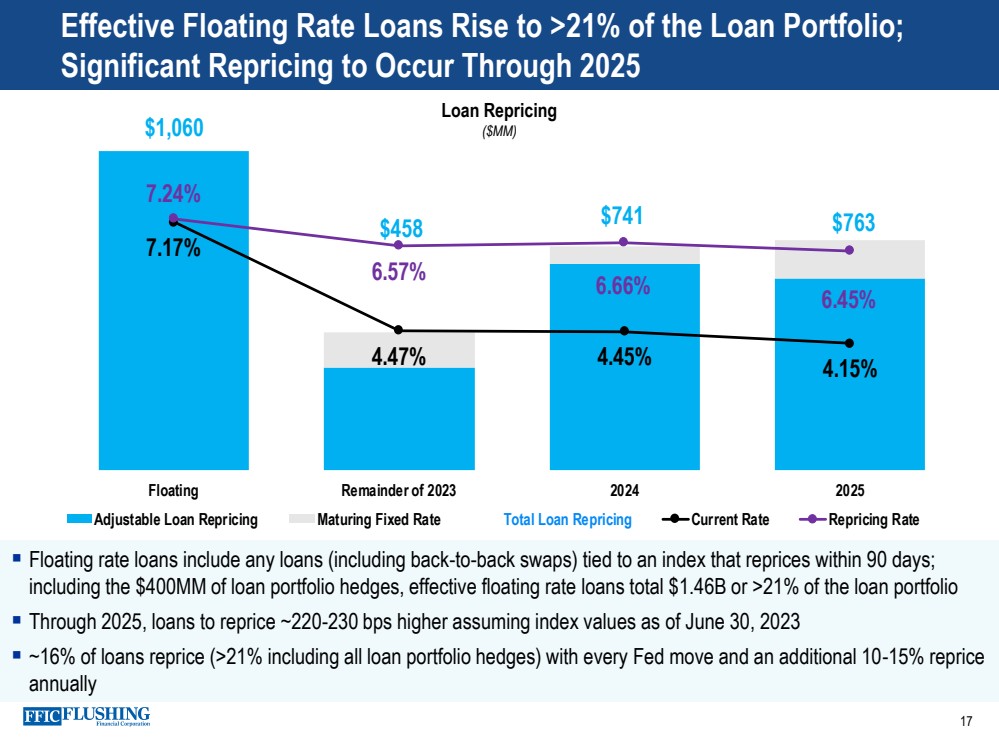
▪ Floating rate loans include any loans (including back-to-back swaps) tied to an index that reprices within 90 days; including the $400MM of loan portfolio hedges, effective floating rate loans total $1.46B or >21% of the loan portfolio ▪ Through 2025, loans to reprice ~220-230 bps higher assuming index values as of June 30, 2023 ▪ ~16% of loans reprice (>21% including all loan portfolio hedges) with every Fed move and an additional 10-15% reprice annually $1,060 $458 $741 $763 7.17% 4.47% 4.45% 4.15% 7.24% 6.57% 6.66% 6.45% - 200 400 600 800 1,0 00 1,2 00 Floating Remainder of 2023 2024 2025 Adjustable Loan Repricing Maturing Fixed Rate Total Loan Repricing Current Rate Repricing Rate Effective Floating Rate Loans Rise to >21% of the Loan Portfolio; Significant Repricing to Occur Through 2025 17 Loan Repricing ($MM) |
|
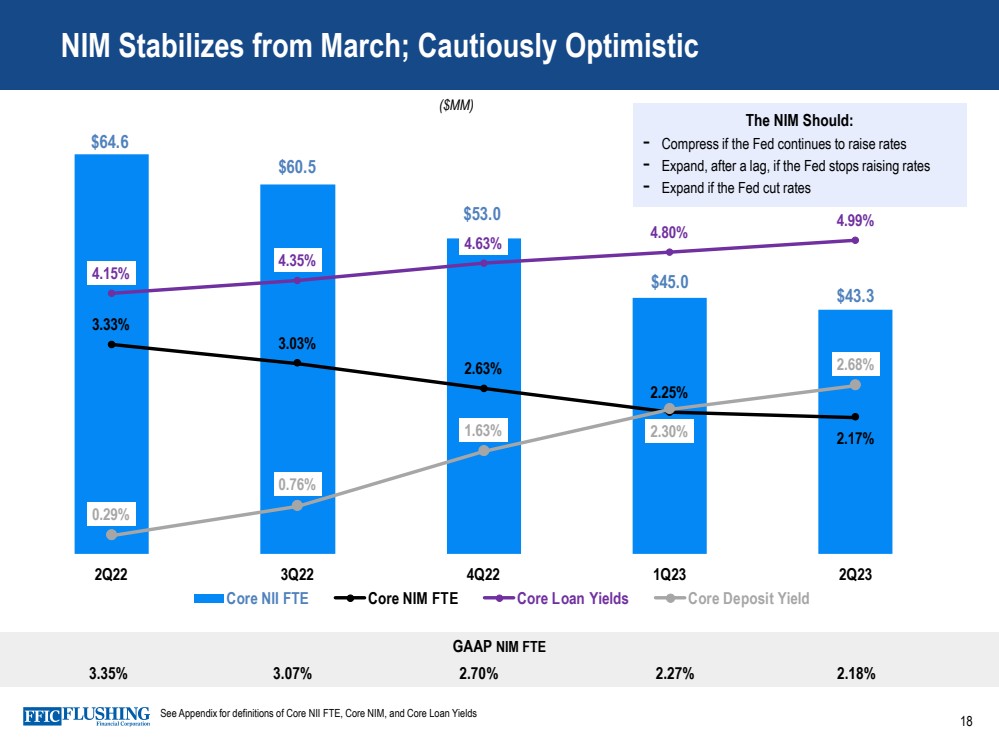
$64.6 $60.5 $53.0 $45.0 $43.3 3.33% 3.03% 2.63% 2.25% 2.17% 4.15% 4.35% 4.63% 4.80% 4.99% 0.29% 0.76% 1.63% 2.30% 2.68% 0.00% 1.00% 2.00% 3.00% 4.00% 5.00% 6.00% 7.00% $10.0 $20.0 $30.0 $40.0 $50.0 $60.0 $70.0 2Q22 3Q22 4Q22 1Q23 2Q23 Core NII FTE Core NIM FTE Core Loan Yields Core Deposit Yield GAAP NIM FTE 3.35% 3.07% 2.70% 2.27% 2.18% NIM Stabilizes from March; Cautiously Optimistic 18 ($MM) See Appendix for definitions of Core NII FTE, Core NIM, and Core Loan Yields The NIM Should: - Compress if the Fed continues to raise rates - Expand, after a lag, if the Fed stops raising rates - Expand if the Fed cut rates |
|
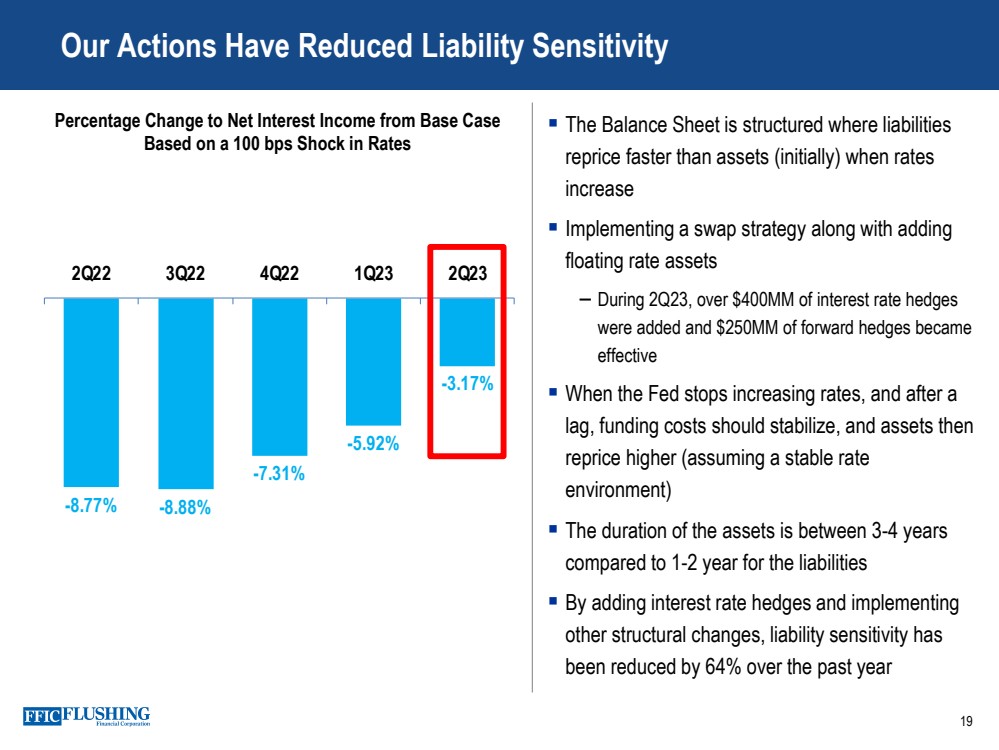
19 Our Actions Have Reduced Liability Sensitivity ▪ The Balance Sheet is structured where liabilities reprice faster than assets (initially) when rates increase ▪ Implementing a swap strategy along with adding floating rate assets – During 2Q23, over $400MM of interest rate hedges were added and $250MM of forward hedges became effective ▪ When the Fed stops increasing rates, and after a lag, funding costs should stabilize, and assets then reprice higher (assuming a stable rate environment) ▪ The duration of the assets is between 3-4 years compared to 1-2 year for the liabilities ▪ By adding interest rate hedges and implementing other structural changes, liability sensitivity has been reduced by 64% over the past year Percentage Change to Net Interest Income from Base Case Based on a 100 bps Shock in Rates -8.77% -8.88% -7.31% -5.92% -3.17% 2Q22 3Q22 4Q22 1Q23 2Q23 |
|
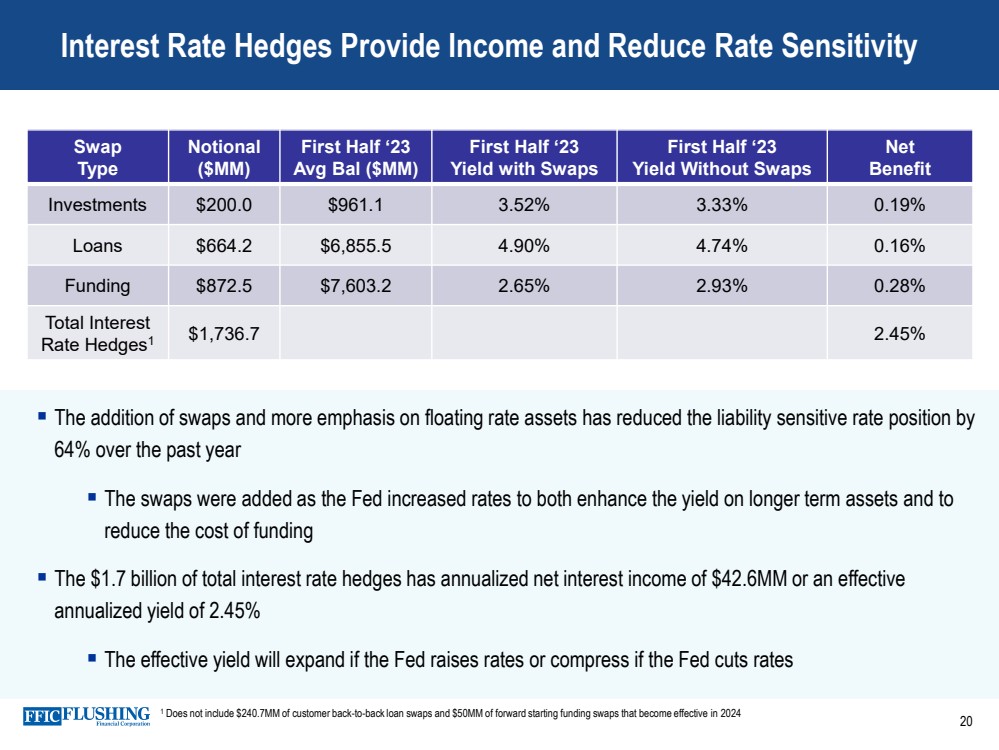
20 Interest Rate Hedges Provide Income and Reduce Rate Sensitivity Swap Type Notional ($MM) First Half ‘23 Avg Bal ($MM) First Half ‘23 Yield with Swaps First Half ‘23 Yield Without Swaps Net Benefit Investments $200.0 $961.1 3.52% 3.33% 0.19% Loans $664.2 $6,855.5 4.90% 4.74% 0.16% Funding $872.5 $7,603.2 2.65% 2.93% 0.28% Total Interest Rate Hedges1 $1,736.7 2.45% ▪ The addition of swaps and more emphasis on floating rate assets has reduced the liability sensitive rate position by 64% over the past year ▪ The swaps were added as the Fed increased rates to both enhance the yield on longer term assets and to reduce the cost of funding ▪ The $1.7 billion of total interest rate hedges has annualized net interest income of $42.6MM or an effective annualized yield of 2.45% ▪ The effective yield will expand if the Fed raises rates or compress if the Fed cuts rates 1 Does not include $240.7MM of customer back-to-back loan swaps and $50MM of forward starting funding swaps that become effective in 2024 |
|
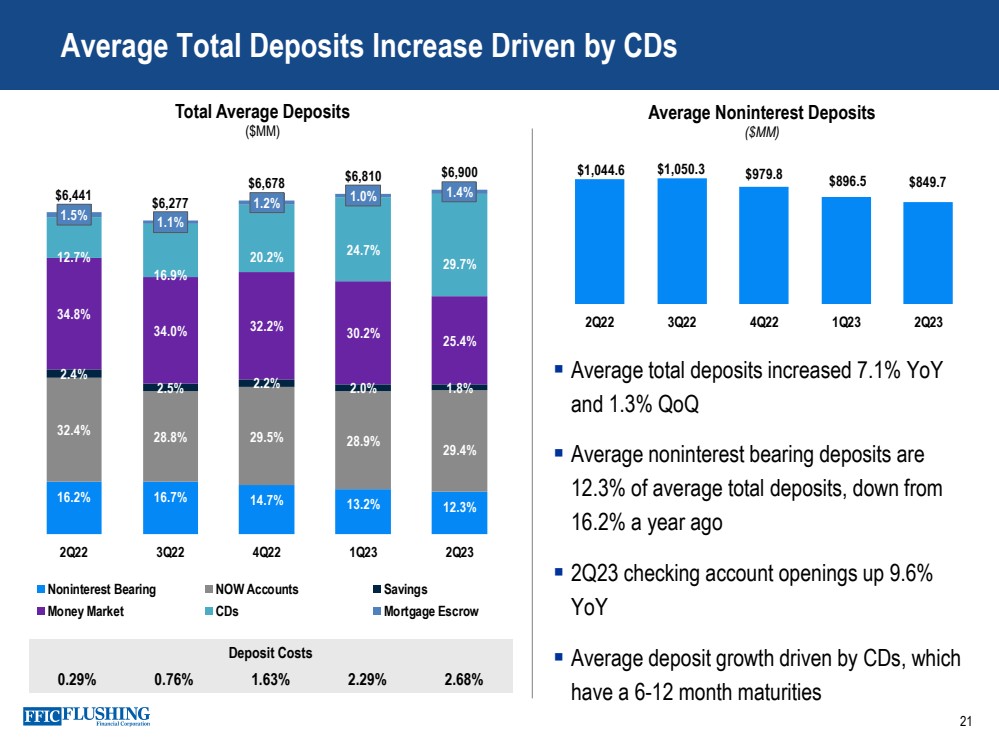
16.2% 16.7% 14.7% 13.2% 12.3% 32.4% 28.8% 29.5% 28.9% 29.4% 2.4% 2.5% 2.2% 2.0% 1.8% 34.8% 34.0% 32.2% 30.2% 25.4% 12.7% 16.9% 20.2% 24.7% 29.7% 1.5% 1.1% 1.2% $6,441 1.0% 1.4% $6,277 $6,678 $6,810 $6,900 0 1 00 0 2 00 0 3 00 0 4 00 0 5 00 0 6 00 0 7 00 0 8 00 0 2Q22 3Q22 4Q22 1Q23 2Q23 Noninterest Bearing NOW Accounts Savings Money Market CDs Mortgage Escrow Average Total Deposits Increase Driven by CDs 21 Total Average Deposits ($MM) ▪ Average total deposits increased 7.1% YoY and 1.3% QoQ ▪ Average noninterest bearing deposits are 12.3% of average total deposits, down from 16.2% a year ago ▪ 2Q23 checking account openings up 9.6% YoY ▪ Average deposit growth driven by CDs, which have a 6-12 month maturities Average Noninterest Deposits ($MM) Deposit Costs 0.29% 0.76% 1.63% 2.29% 2.68% $1,044.6 $1,050.3 $979.8 $896.5 $849.7 - 100 100 300 500 700 900 1100 1300 2Q22 3Q22 4Q22 1Q23 2Q23 |
|
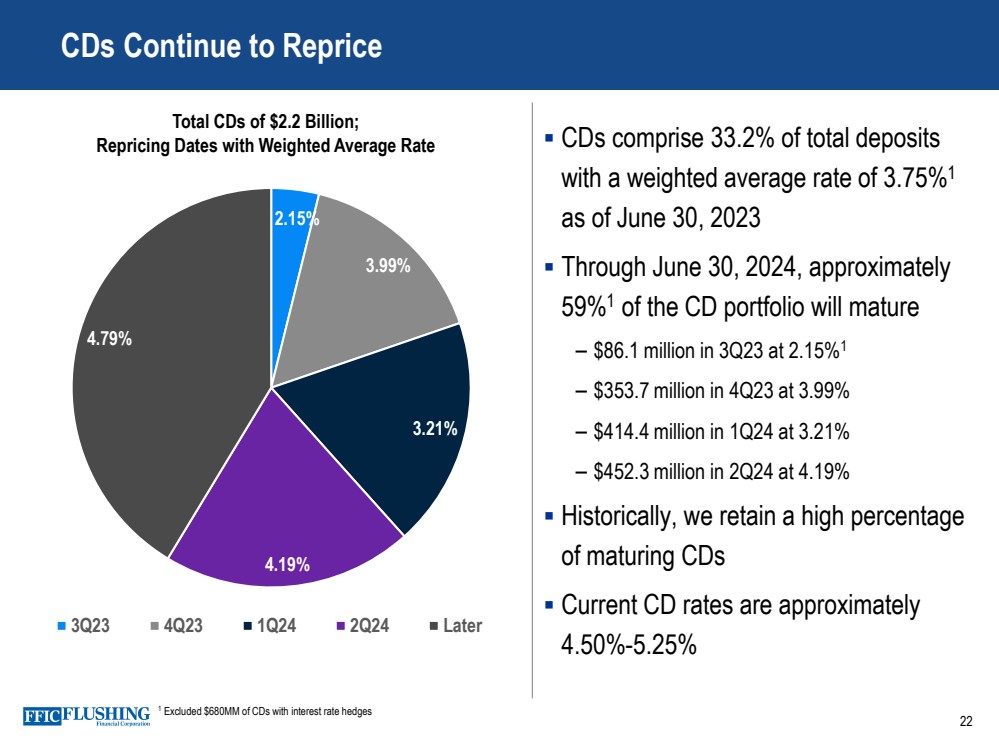
22 CDs Continue to Reprice ▪ CDs comprise 33.2% of total deposits with a weighted average rate of 3.75%1 as of June 30, 2023 ▪ Through June 30, 2024, approximately 59%1 of the CD portfolio will mature – $86.1 million in 3Q23 at 2.15%1 – $353.7 million in 4Q23 at 3.99% – $414.4 million in 1Q24 at 3.21% – $452.3 million in 2Q24 at 4.19% ▪ Historically, we retain a high percentage of maturing CDs ▪ Current CD rates are approximately 4.50%-5.25% Total CDs of $2.2 Billion; Repricing Dates with Weighted Average Rate 1 Excluded $680MM of CDs with interest rate hedges 2.15% 3.99% 3.21% 4.19% 4.79% 3Q23 4Q23 1Q24 2Q24 Later |
|
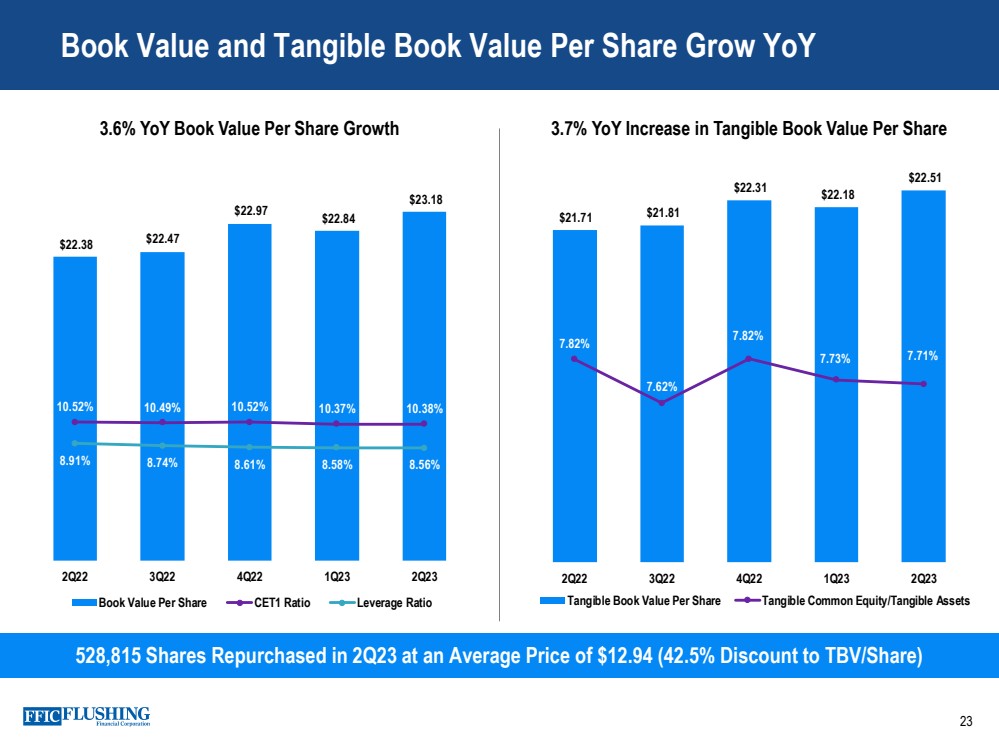
Book Value and Tangible Book Value Per Share Grow YoY 23 528,815 Shares Repurchased in 2Q23 at an Average Price of $12.94 (42.5% Discount to TBV/Share) 3.6% YoY Book Value Per Share Growth 3.7% YoY Increase in Tangible Book Value Per Share $21.71 $21.81 $22.31 $22.18 $22.51 7.82% 7.62% 7.82% 7.73% 7.71% 6.90% 7.10% 7.30% 7.50% 7.70% 7.90% 8.10% 8.30% 8.50% 8.70% $15. 00 $16. 00 $17. 00 $18. 00 $19. 00 $20. 00 $21. 00 $22. 00 $23. 00 2Q22 3Q22 4Q22 1Q23 2Q23 Tangible Book Value Per Share Tangible Common Equity/Tangible Assets $22.38 $22.47 $22.97 $22.84 $23.18 10.52% 10.49% 10.52% 10.37% 10.38% 8.91% 8.74% 8.61% 8.58% 8.56% 0.00% 5.00% 10.00% 15.00% 20.00% 25.00% 30.00% $17. 00 $18. 00 $19. 00 $20. 00 $21. 00 $22. 00 $23. 00 $24. 00 2Q22 3Q22 4Q22 1Q23 2Q23 Book Value Per Share CET1 Ratio Leverage Ratio |
|
24 ▪ Executing on our Action Plan – These actions will result in improved profitability in the future and set the stage for consistent and significantly higher returns ▪ Areas of Focus improved during the quarter – Significantly reduced liability sensitivity – Credit quality improved and underwriting remains solid – Expanded liquidity capacity – Continue to service our customers and deepen relationships ▪ Improving metrics but cautious on the environment – 2Q23 NIM was in line with the month of March – Asset quality improved during the quarter – Deposit balances were better than past seasonal patterns – Loans declined slightly – Capital ratios were stable – Expecting additional Fed rate increases Key Takeaways – Cautiously Optimistic |
|
Appendix 25 |
|
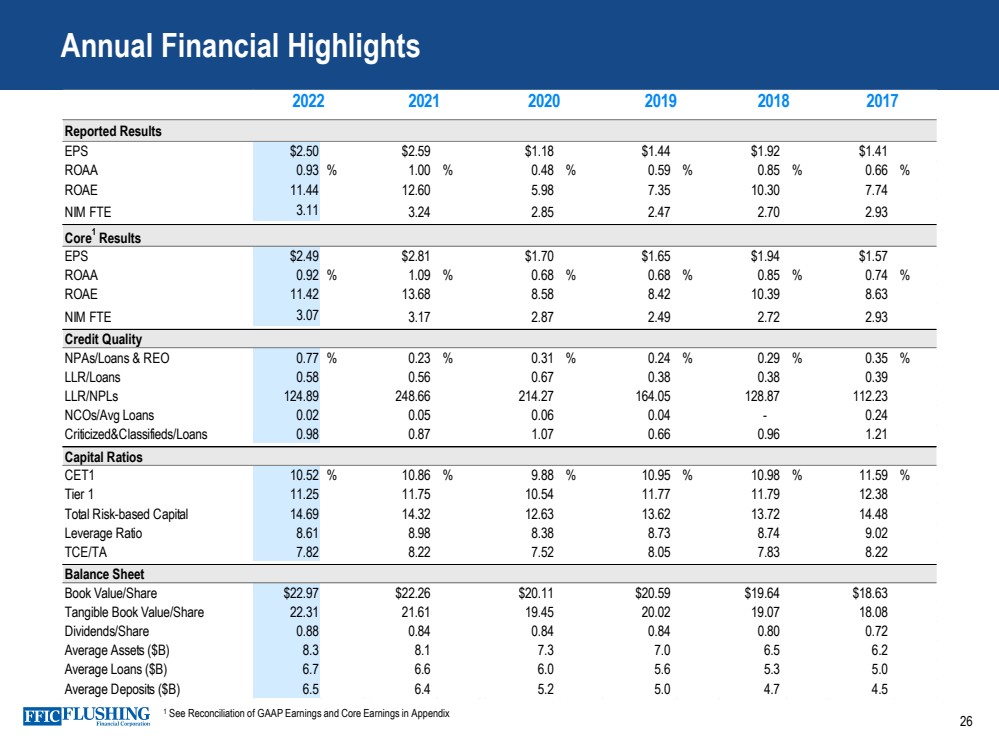
26 Annual Financial Highlights Reported Results EPS $2.50 $2.59 $1.18 $1.44 $1.92 $1.41 ROAA 0.93 % 1.00 % 0.48 % 0.59 % 0.85 % 0.66 % ROAE 11.44 12.60 5.98 7.35 10.30 7.74 NIM FTE 3.11 3.24 2.85 2.47 2.70 2.93 Core1 Results EPS $2.49 $2.81 $1.70 $1.65 $1.94 $1.57 ROAA 0.92 % 1.09 % 0.68 % 0.68 % 0.85 % 0.74 % ROAE 11.42 13.68 8.58 8.42 10.39 8.63 NIM FTE 3.07 3.17 2.87 2.49 2.72 2.93 Credit Quality NPAs/Loans & REO 0.77 % 0.23 % 0.31 % 0.24 % 0.29 % 0.35 % LLR/Loans 0.58 0.56 0.67 0.38 0.38 0.39 LLR/NPLs 124.89 248.66 214.27 164.05 128.87 112.23 NCOs/Avg Loans 0.02 0.05 0.06 0.04 - 0.24 Criticized&Classifieds/Loans 0.98 0.87 1.07 0.66 0.96 1.21 Capital Ratios CET1 10.52 % 10.86 % 9.88 % 10.95 % 10.98 % 11.59 % Tier 1 11.25 11.75 10.54 11.77 11.79 12.38 Total Risk-based Capital 14.69 14.32 12.63 13.62 13.72 14.48 Leverage Ratio 8.61 8.98 8.38 8.73 8.74 9.02 TCE/TA 7.82 8.22 7.52 8.05 7.83 8.22 Balance Sheet Book Value/Share $22.97 $22.26 $20.11 $20.59 $19.64 $18.63 Tangible Book Value/Share 22.31 21.61 19.45 20.02 19.07 18.08 Dividends/Share 0.88 0.84 0.84 0.84 0.80 0.72 Average Assets ($B) 8.3 8.1 7.3 7.0 6.5 6.2 Average Loans ($B) 6.7 6.6 6.0 5.6 5.3 5.0 Average Deposits ($B) 6.5 6.4 5.2 5.0 4.7 4.5 2022 2021 2020 2019 2018 2017 1 See Reconciliation of GAAP Earnings and Core Earnings in Appendix |
|
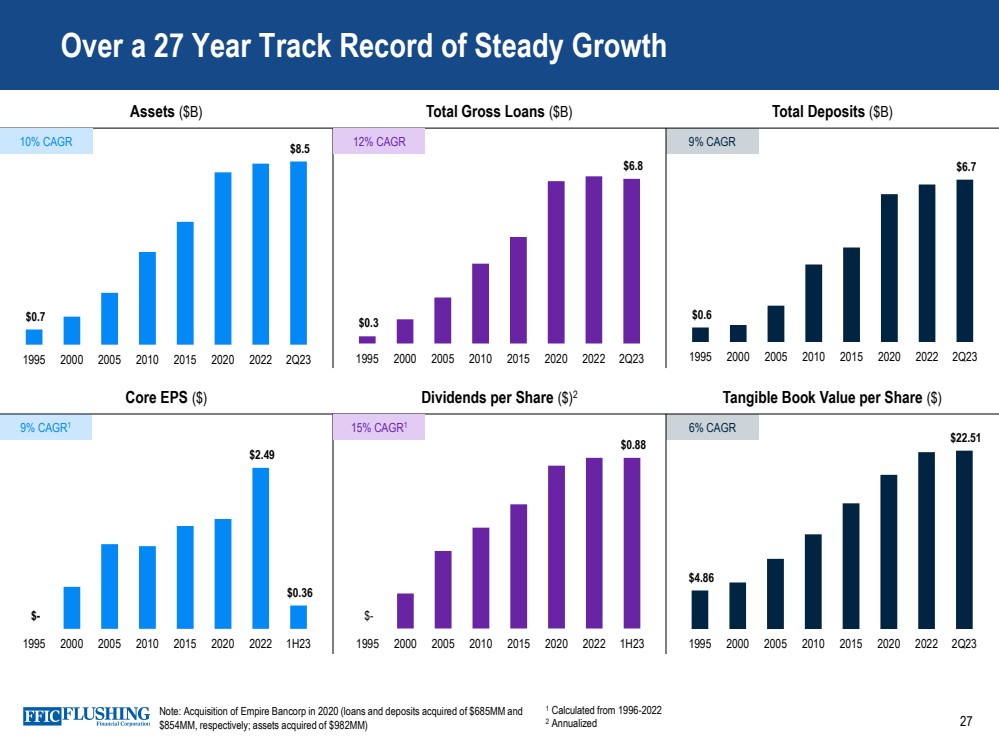
Over a 27 Year Track Record of Steady Growth Core EPS ($) Dividends per Share ($)2 Tangible Book Value per Share ($) Assets ($B) Total Gross Loans ($B) Total Deposits ($B) $- $0.88 1995 2000 2005 2010 2015 2020 2022 1H23 $- $2.49 $0.36 1995 2000 2005 2010 2015 2020 2022 1H23 $0.6 $6.7 1995 2000 2005 2010 2015 2020 2022 2Q23 $0.3 $6.8 1995 2000 2005 2010 2015 2020 2022 2Q23 $0.7 $8.5 1995 2000 2005 2010 2015 2020 2022 2Q23 10% CAGR 12% CAGR 9% CAGR 9% CAGR1 15% CAGR1 $4.86 $22.51 1995 2000 2005 2010 2015 2020 2022 2Q23 6% CAGR Note: Acquisition of Empire Bancorp in 2020 (loans and deposits acquired of $685MM and $854MM, respectively; assets acquired of $982MM) 27 1 Calculated from 1996-2022 2 Annualized |
|
Reconciliation of GAAP Earnings and Core Earnings 28 Non-cash Fair Value Adjustments to GAAP Earnings The variance in GAAP and core earnings is partly driven by the impact of non-cash net gains and losses from fair value adjustments. These fair value adjustments relate primarily to borrowings carried at fair value under the fair value option. Core Net Income, Core Diluted EPS, Core ROAE, Core ROAA, Pre-provision, Pre-tax Net Revenue, Core Net Interest Income FTE, Core Net Interest Margin FTE, Core Interest Income and Yield on Total Loans, Core Noninterest Income, Core Noninterest Expense and Tangible Book Value per common share are each non-GAAP measures used in this presentation. A reconciliation to the most directly comparable GAAP financial measures appears below in tabular form. The Company believes that these measures are useful for both investors and management to understand the effects of certain interest and noninterest items and provide an alternative view of the Company's performance over time and in comparison, to the Company's competitors. These measures should not be viewed as a substitute for net income. The Company believes that tangible book value per common share is useful for both investors and management as this measure is commonly used by financial institutions, regulators and investors to measure the capital adequacy of financial institutions. The Company believes this measure facilitates comparison of the quality and composition of the Company's capital over time and in comparison, to its competitors. This measure should not be viewed as a substitute for total shareholders' equity. These non-GAAP measures have inherent limitations, are not required to be uniformly applied and are not audited. They should not be considered in isolation or as a substitute for analysis of results reported under GAAP. These non-GAAP measures may not be comparable to similarly titled measures reported by other companies. |
|
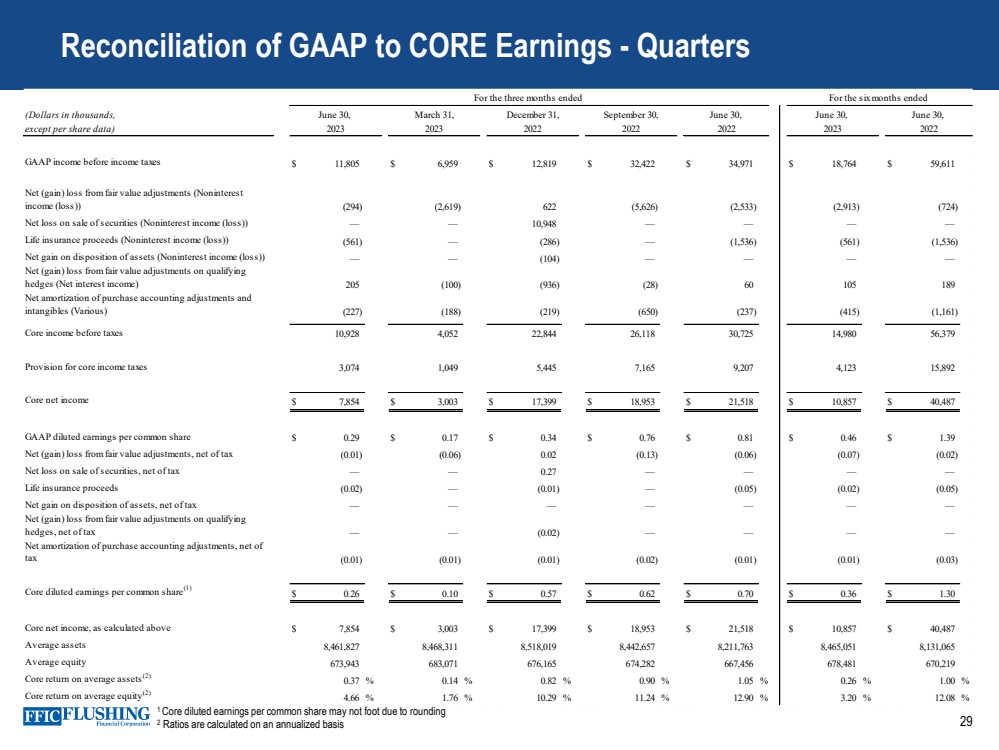
29 1 Core diluted earnings per common share may not foot due to rounding 2 Ratios are calculated on an annualized basis Reconciliation of GAAP to CORE Earnings - Quarters (Dollars in thousands, except per share data) GAAP income before income taxes $ 11,805 $ 6,959 $ 12,819 $ 32,422 $ 34,971 $ 18,764 $ 59,611 Net (gain) loss from fair value adjustments (Noninterest income (loss)) (294) (2,619) 622 (5,626) (2,533) (2,913) (724) Net loss on sale of securities (Noninterest income (loss)) — — 10,948 — — — — Life insurance proceeds (Noninterest income (loss)) (561) — (286) — (1,536) (561) (1,536) Net gain on disposition of assets (Noninterest income (loss)) — — (104) — — — — Net (gain) loss from fair value adjustments on qualifying hedges (Net interest income) 205 (100) (936) (28) 60 105 189 Net amortization of purchase accounting adjustments and intangibles (Various) (227) (188) (219) (650) (237) (415) (1,161) Core income before taxes 10,928 4,052 22,844 26,118 30,725 14,980 56,379 Provision for core income taxes 3,074 1,049 5,445 7,165 9,207 4,123 15,892 Core net income $ 7,854 $ 3,003 $ 17,399 $ 18,953 $ 21,518 $ 10,857 $ 40,487 GAAP diluted earnings per common share $ 0.29 $ 0.17 $ 0.34 $ 0.76 $ 0.81 $ 0.46 $ 1.39 Net (gain) loss from fair value adjustments, net of tax (0.01) (0.06) 0.02 (0.13) (0.06) (0.07) (0.02) Net loss on sale of securities, net of tax — — 0.27 — — — — Life insurance proceeds (0.02) — (0.01) — (0.05) (0.02) (0.05) Net gain on disposition of assets, net of tax — — — — — — — Net (gain) loss from fair value adjustments on qualifying hedges, net of tax — — (0.02) — — — — Net amortization of purchase accounting adjustments, net of tax (0.01) (0.01) (0.01) (0.02) (0.01) (0.01) (0.03) Core diluted earnings per common share(1) $ 0.26 $ 0.10 $ 0.57 $ 0.62 $ 0.70 $ 0.36 $ 1.30 Core net income, as calculated above $ 7,854 $ 3,003 $ 17,399 $ 18,953 $ 21,518 $ 10,857 $ 40,487 Average assets 8,461,827 8,468,311 8,518,019 8,442,657 8,211,763 8,465,051 8,131,065 Average equity 673,943 683,071 676,165 674,282 667,456 678,481 670,219 Core return on average assets(2) 0.37 % 0.14 % 0.82 % 0.90 % 1.05 % 0.26 % 1.00 % Core return on average equity(2) 4.66 % 1.76 % 10.29 % 11.24 % 12.90 % 3.20 % 12.08 % 2023 June 30, March 31, 2023 2022 June 30, 2023 2022 December 31, September 30, June 30, 2022 2022 June 30, For the three months ended For the six months ended |
|
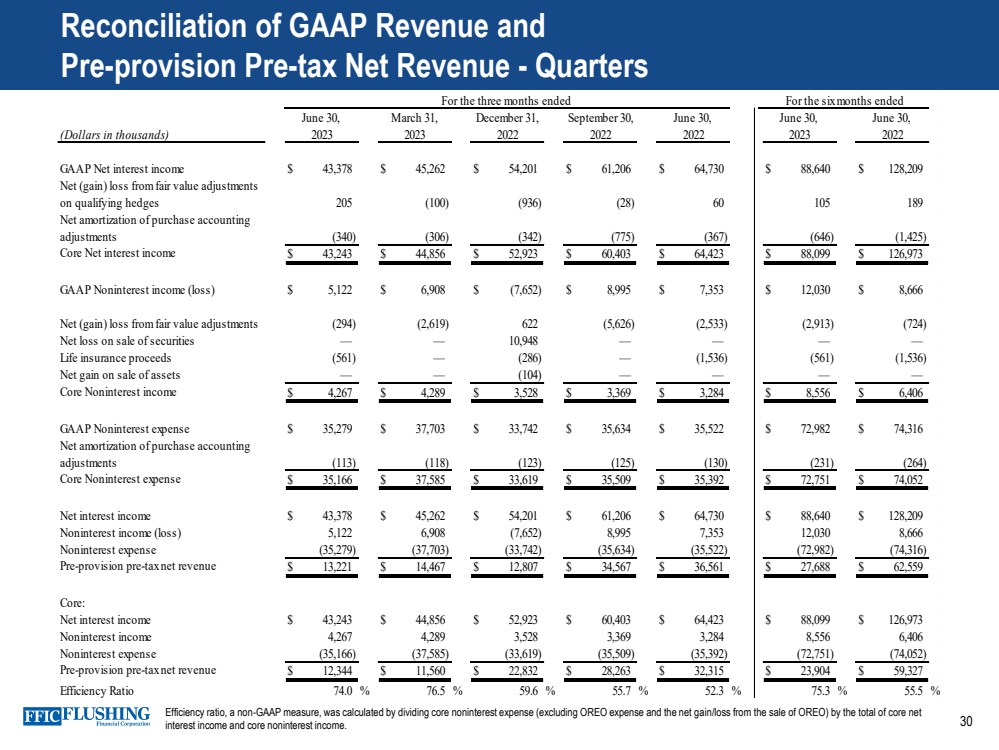
30 Reconciliation of GAAP Revenue and Pre-provision Pre-tax Net Revenue - Quarters (Dollars in thousands) GAAP Net interest income $ 43,378 $ 45,262 $ 54,201 $ 61,206 $ 64,730 $ 88,640 $ 128,209 Net (gain) loss from fair value adjustments on qualifying hedges 205 (100) (936) (28) 60 105 189 Net amortization of purchase accounting adjustments (340) (306) (342) (775) (367) (646) (1,425) Core Net interest income $ 43,243 $ 44,856 $ 52,923 $ 60,403 $ 64,423 $ 88,099 $ 126,973 GAAP Noninterest income (loss) $ 5,122 $ 6,908 $ (7,652) $ 8,995 $ 7,353 $ 12,030 $ 8,666 Net (gain) loss from fair value adjustments (294) (2,619) 622 (5,626) (2,533) (2,913) (724) Net loss on sale of securities — — 10,948 — — — — Life insurance proceeds (561) — (286) — (1,536) (561) (1,536) Net gain on sale of assets — — (104) — — — — Core Noninterest income $ 4,267 $ 4,289 $ 3,528 $ 3,369 $ 3,284 $ 8,556 $ 6,406 GAAP Noninterest expense $ 35,279 $ 37,703 $ 33,742 $ 35,634 $ 35,522 $ 72,982 $ 74,316 Net amortization of purchase accounting adjustments (113) (118) (123) (125) (130) (231) (264) Core Noninterest expense $ 35,166 $ 37,585 $ 33,619 $ 35,509 $ 35,392 $ 72,751 $ 74,052 Net interest income $ 43,378 $ 45,262 $ 54,201 $ 61,206 $ 64,730 $ 88,640 $ 128,209 Noninterest income (loss) 5,122 6,908 (7,652) 8,995 7,353 12,030 8,666 Noninterest expense (35,279) (37,703) (33,742) (35,634) (35,522) (72,982) (74,316) Pre-provision pre-tax net revenue $ 13,221 $ 14,467 $ 12,807 $ 34,567 $ 36,561 $ 27,688 $ 62,559 Core: Net interest income $ 43,243 $ 44,856 $ 52,923 $ 60,403 $ 64,423 $ 88,099 $ 126,973 Noninterest income 4,267 4,289 3,528 3,369 3,284 8,556 6,406 Noninterest expense (35,166) (37,585) (33,619) (35,509) (35,392) (72,751) (74,052) Pre-provision pre-tax net revenue $ 12,344 $ 11,560 $ 22,832 $ 28,263 $ 32,315 $ 23,904 $ 59,327 Efficiency Ratio 74.0 % 76.5 % 59.6 % 55.7 % 52.3 % 75.3 % 55.5 % For the three months ended For the six months ended June 30, March 31, December 31, September 30, June 30, June 30, June 30, 2023 2023 2022 2022 2022 2023 2022 Efficiency ratio, a non-GAAP measure, was calculated by dividing core noninterest expense (excluding OREO expense and the net gain/loss from the sale of OREO) by the total of core net interest income and core noninterest income. |
|
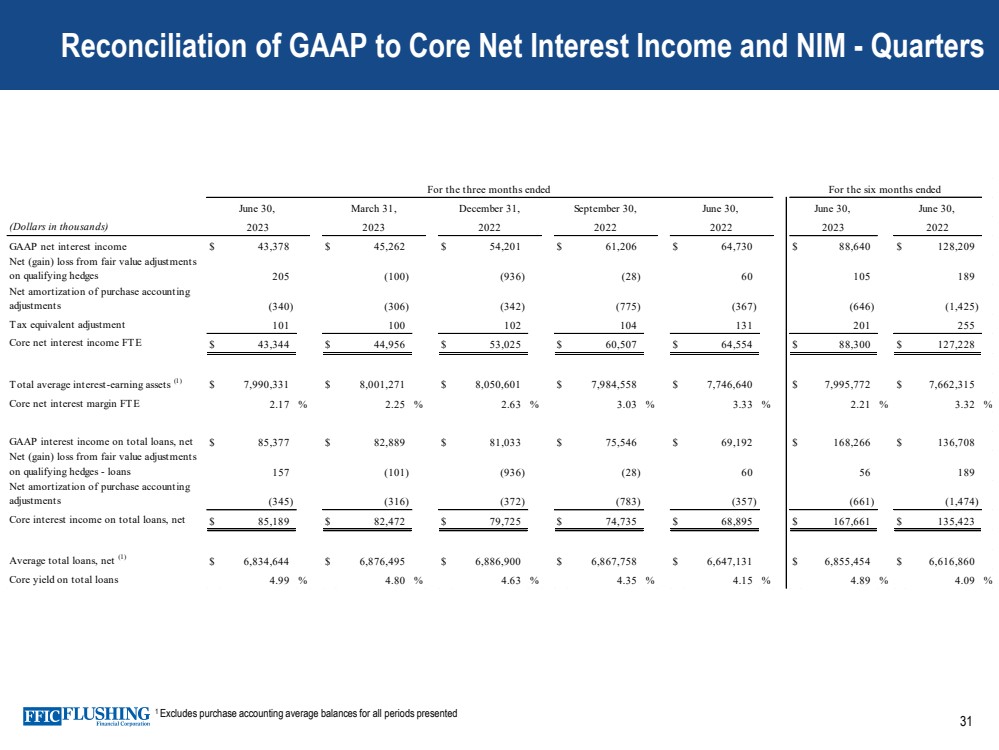
31 1 Excludes purchase accounting average balances for all periods presented Reconciliation of GAAP to Core Net Interest Income and NIM - Quarters (Dollars in thousands) GAAP net interest income $ 43,378 $ 45,262 $ 54,201 $ 61,206 $ 64,730 $ 88,640 $ 128,209 Net (gain) loss from fair value adjustments on qualifying hedges 205 (100) (936) (28) 6 0 105 189 Net amortization of purchase accounting adjustments (340) (306) (342) (775) (367) (646) (1,425) Tax equivalent adjustment 101 100 102 104 131 201 255 Core net interest income FTE $ 43,344 $ 44,956 $ 53,025 $ 60,507 $ 64,554 $ 88,300 $ 127,228 Total average interest-earning assets (1) $ 7,990,331 $ 8,001,271 $ 8,050,601 $ 7,984,558 $ 7,746,640 $ 7,995,772 $ 7,662,315 Core net interest margin FTE 2.17 % 2.25 % 2.63 % 3.03 % 3.33 % 2.21 % 3.32 % GAAP interest income on total loans, net $ 85,377 $ 82,889 $ 81,033 $ 75,546 $ 69,192 $ 168,266 $ 136,708 Net (gain) loss from fair value adjustments on qualifying hedges - loans 157 (101) (936) (28) 6 0 5 6 189 Net amortization of purchase accounting adjustments (345) (316) (372) (783) (357) (661) (1,474) Core interest income on total loans, net $ 85,189 $ 82,472 $ 79,725 $ 74,735 $ 68,895 $ 167,661 $ 135,423 Average total loans, net (1) $ 6,834,644 $ 6,876,495 $ 6,886,900 $ 6,867,758 $ 6,647,131 $ 6,855,454 $ 6,616,860 Core yield on total loans 4.99 % 4.80 % 4.63 % 4.35 % 4.15 % 4.89 % 4.09 % For the six months ended June 30, June 30, 2023 2023 2022 2022 2022 2023 2022 For the three months ended June 30, March 31, December 31, September 30, June 30, |
|
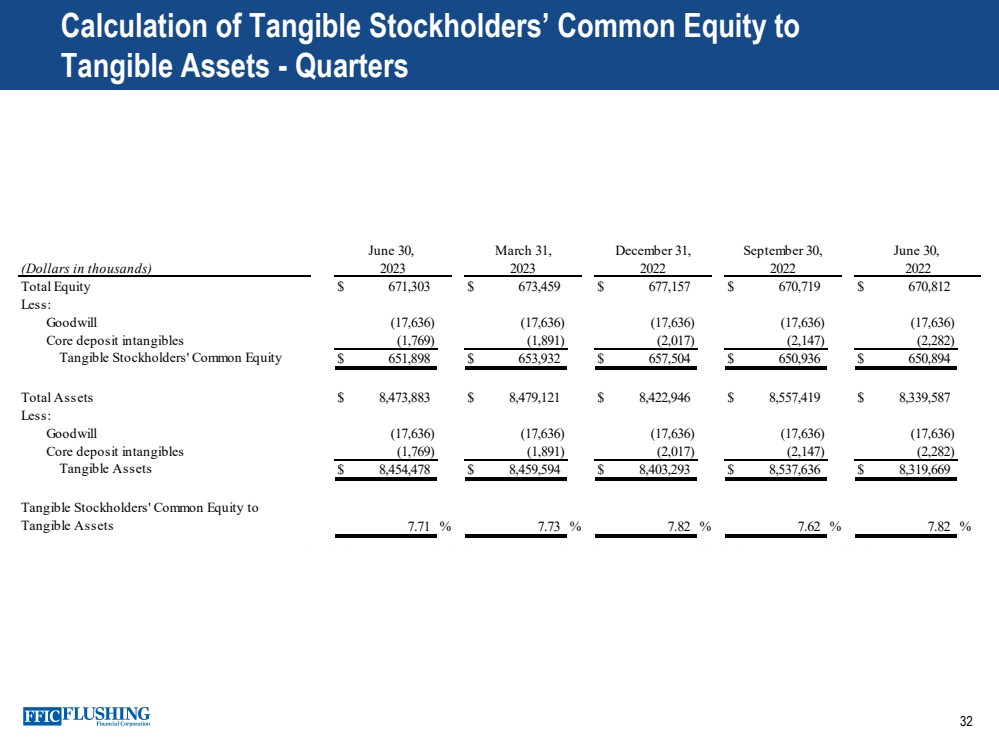
32 Calculation of Tangible Stockholders’ Common Equity to Tangible Assets - Quarters (Dollars in thousands) Total Equity $ 671,303 $ 673,459 $ 677,157 $ 670,719 $ 670,812 Less: Goodwill (17,636) (17,636) (17,636) (17,636) (17,636) Core deposit intangibles (1,769) (1,891) (2,017) (2,147) (2,282) Tangible Stockholders' Common Equity $ 651,898 $ 653,932 $ 657,504 $ 650,936 $ 650,894 Total Assets $ 8,473,883 $ 8,479,121 $ 8,422,946 $ 8,557,419 $ 8,339,587 Less: Goodwill (17,636) (17,636) (17,636) (17,636) (17,636) Core deposit intangibles (1,769) (1,891) (2,017) (2,147) (2,282) Tangible Assets $ 8,454,478 $ 8,459,594 $ 8,403,293 $ 8,537,636 $ 8,319,669 Tangible Stockholders' Common Equity to Tangible Assets 7.71 % 7.73 % 7.82 % 7.62 % 7.82 % 2023 March 31, 2023 June 30, 2022 September 30, June 30, 2022 December 31, 2022 |
|
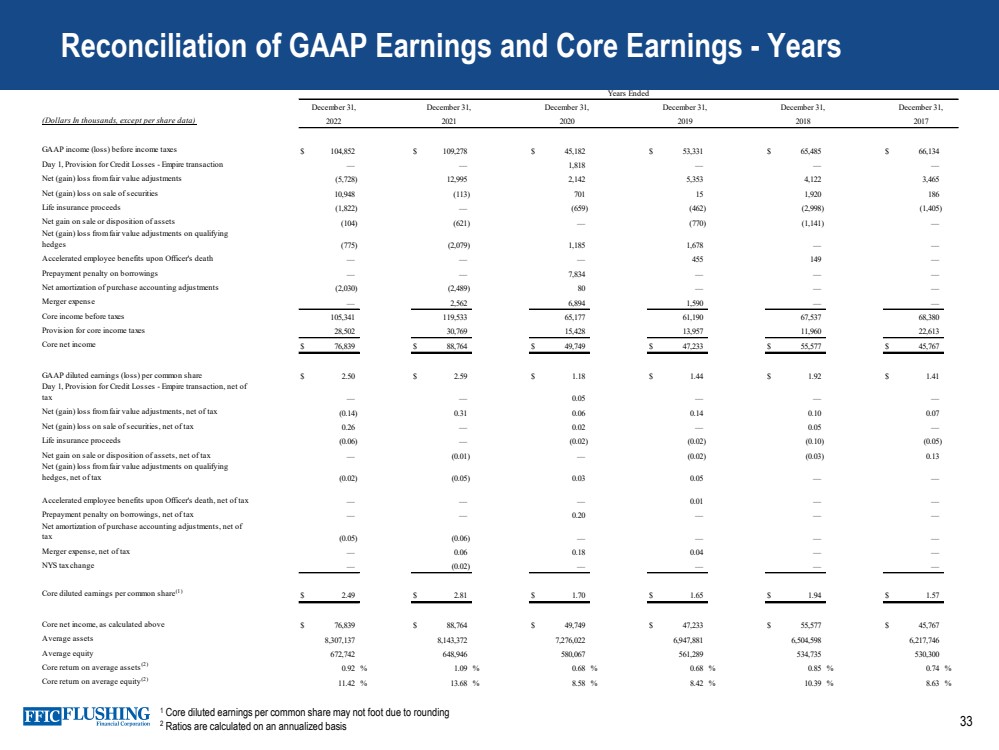
33 Reconciliation of GAAP Earnings and Core Earnings - Years 1 Core diluted earnings per common share may not foot due to rounding 2 Ratios are calculated on an annualized basis (Dollars In thousands, except per share data) GAAP income (loss) before income taxes $ 104,852 $ 109,278 $ 45,182 $ 53,331 $ 65,485 $ 66,134 Day 1, Provision for Credit Losses - Empire transaction — — 1,818 — — — Net (gain) loss from fair value adjustments (5,728) 12,995 2,142 5,353 4,122 3,465 Net (gain) loss on sale of securities 10,948 (113) 701 15 1,920 186 Life insurance proceeds (1,822) — (659) (462) (2,998) (1,405) Net gain on sale or disposition of assets (104) (621) — (770) (1,141) — Net (gain) loss from fair value adjustments on qualifying hedges (775) (2,079) 1,185 1,678 — — Accelerated employee benefits upon Officer's death — — — 455 149 — Prepayment penalty on borrowings — — 7,834 — — — Net amortization of purchase accounting adjustments (2,030) (2,489) 80 — — — Merger expense — 2,562 6,894 1,590 — — Core income before taxes 105,341 119,533 65,177 61,190 67,537 68,380 Provision for core income taxes 28,502 30,769 15,428 13,957 11,960 22,613 Core net income $ 76,839 $ 88,764 $ 49,749 $ 47,233 $ 55,577 $ 45,767 GAAP diluted earnings (loss) per common share $ 2.50 $ 2.59 $ 1.18 $ 1.44 $ 1.92 $ 1.41 Day 1, Provision for Credit Losses - Empire transaction, net of tax — — 0.05 — — — Net (gain) loss from fair value adjustments, net of tax (0.14) 0.31 0.06 0.14 0.10 0.07 Net (gain) loss on sale of securities, net of tax 0.26 — 0.02 — 0.05 — Life insurance proceeds (0.06) — (0.02) (0.02) (0.10) (0.05) Net gain on sale or disposition of assets, net of tax — (0.01) — (0.02) (0.03) 0.13 Net (gain) loss from fair value adjustments on qualifying hedges, net of tax (0.02) (0.05) 0.03 0.05 — — Accelerated employee benefits upon Officer's death, net of tax — — — 0.01 — — Prepayment penalty on borrowings, net of tax — — 0.20 — — — Net amortization of purchase accounting adjustments, net of tax (0.05) (0.06) — — — — Merger expense, net of tax — 0.06 0.18 0.04 — — NYS tax change — (0.02) — — — — Core diluted earnings per common share(1) $ 2.49 $ 2.81 $ 1.70 $ 1.65 $ 1.94 $ 1.57 Core net income, as calculated above $ 76,839 $ 88,764 $ 49,749 $ 47,233 $ 55,577 $ 45,767 Average assets 8,307,137 8,143,372 7,276,022 6,947,881 6,504,598 6,217,746 Average equity 672,742 648,946 580,067 561,289 534,735 530,300 Core return on average assets(2) 0.92 % 1.09 % 0.68 % 0.68 % 0.85 % 0.74 % Core return on average equity(2) 11.42 % 13.68 % 8.58 % 8.42 % 10.39 % 8.63 % Years Ended December 31, 2022 December 31, 2021 December 31, 2020 2018 December 31, December 31, 2017 December 31, 2019 |
|
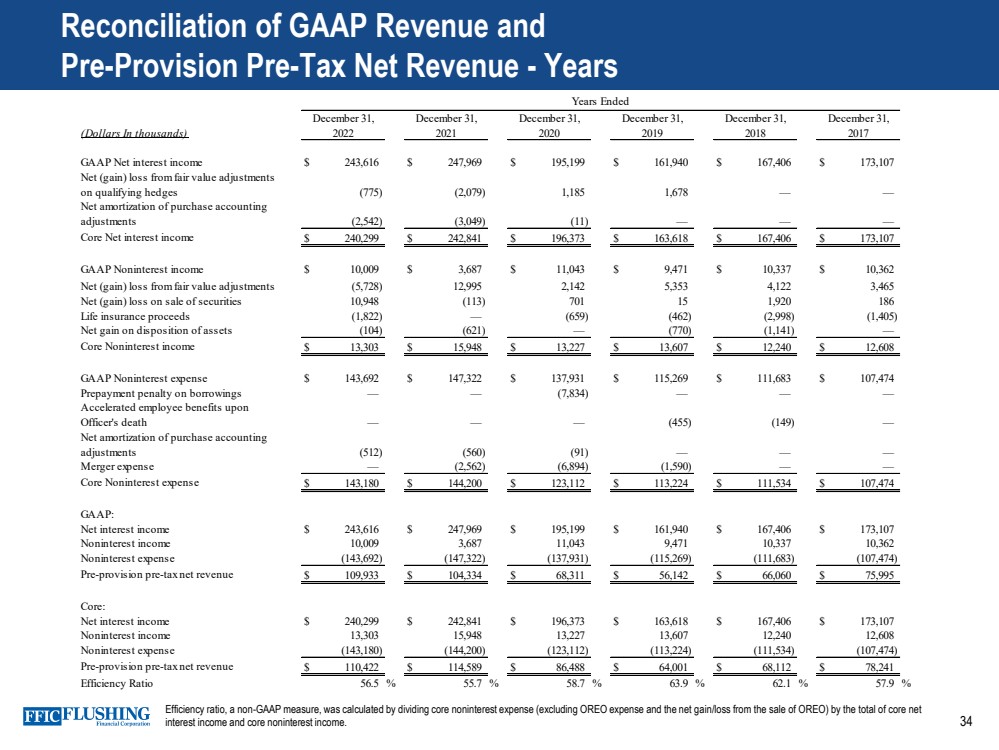
34 Reconciliation of GAAP Revenue and Pre-Provision Pre-Tax Net Revenue - Years Efficiency ratio, a non-GAAP measure, was calculated by dividing core noninterest expense (excluding OREO expense and the net gain/loss from the sale of OREO) by the total of core net interest income and core noninterest income. (Dollars In thousands) GAAP Net interest income $ 243,616 $ 247,969 $ 195,199 $ 161,940 $ 167,406 $ 173,107 Net (gain) loss from fair value adjustments on qualifying hedges (775) (2,079) 1,185 1,678 — — Net amortization of purchase accounting adjustments (2,542) (3,049) (11) — — — Core Net interest income $ 240,299 $ 242,841 $ 196,373 $ 163,618 $ 167,406 $ 173,107 GAAP Noninterest income $ 10,009 $ 3,687 $ 11,043 $ 9,471 $ 10,337 $ 10,362 Net (gain) loss from fair value adjustments (5,728) 12,995 2,142 5,353 4,122 3,465 Net (gain) loss on sale of securities 10,948 (113) 701 15 1,920 186 Life insurance proceeds (1,822) — (659) (462) (2,998) (1,405) Net gain on disposition of assets (104) (621) — (770) (1,141) — Core Noninterest income $ 13,303 $ 15,948 $ 13,227 $ 13,607 $ 12,240 $ 12,608 GAAP Noninterest expense $ 143,692 $ 147,322 $ 137,931 $ 115,269 $ 111,683 $ 107,474 Prepayment penalty on borrowings — — (7,834) — — — Accelerated employee benefits upon Officer's death — — — (455) (149) — Net amortization of purchase accounting adjustments (512) (560) (91) — — — Merger expense — (2,562) (6,894) (1,590) — — Core Noninterest expense $ 143,180 $ 144,200 $ 123,112 $ 113,224 $ 111,534 $ 107,474 GAAP: Net interest income $ 243,616 $ 247,969 $ 195,199 $ 161,940 $ 167,406 $ 173,107 Noninterest income 10,009 3,687 11,043 9,471 10,337 10,362 Noninterest expense (143,692) (147,322) (137,931) (115,269) (111,683) (107,474) Pre-provision pre-tax net revenue $ 109,933 $ 104,334 $ 68,311 $ 56,142 $ 66,060 $ 75,995 Core: Net interest income $ 240,299 $ 242,841 $ 196,373 $ 163,618 $ 167,406 $ 173,107 Noninterest income 13,303 15,948 13,227 13,607 12,240 12,608 Noninterest expense (143,180) (144,200) (123,112) (113,224) (111,534) (107,474) Pre-provision pre-tax net revenue $ 110,422 $ 114,589 $ 86,488 $ 64,001 $ 68,112 $ 78,241 Efficiency Ratio 56.5 % 55.7 % 58.7 % 63.9 % 62.1 % 57.9 % December 31, 2018 December 31, 2017 Years Ended December 31, 2019 December 31, 2022 December 31, 2021 December 31, 2020 |
|
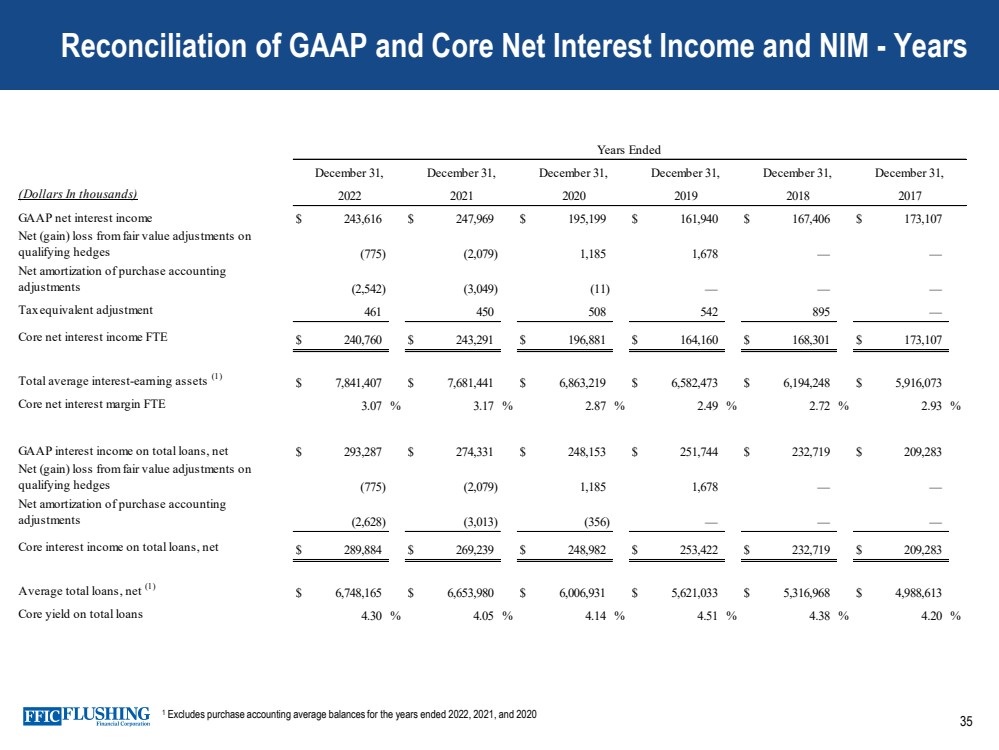
35 Reconciliation of GAAP and Core Net Interest Income and NIM - Years 1 Excludes purchase accounting average balances for the years ended 2022, 2021, and 2020 (Dollars In thousands) GAAP net interest income $ 243,616 $ 247,969 $ 195,199 $ 161,940 $ 167,406 $ 173,107 Net (gain) loss from fair value adjustments on qualifying hedges (775) (2,079) 1,185 1,678 — — Net amortization of purchase accounting adjustments (2,542) (3,049) (11) — — — Tax equivalent adjustment 461 450 508 542 895 — Core net interest income FTE $ 240,760 $ 243,291 $ 196,881 $ 164,160 $ 168,301 $ 173,107 Total average interest-earning assets (1) $ 7,841,407 $ 7,681,441 $ 6,863,219 $ 6,582,473 $ 6,194,248 $ 5,916,073 Core net interest margin FTE 3.07 % 3.17 % 2.87 % 2.49 % 2.72 % 2.93 % GAAP interest income on total loans, net $ 293,287 $ 274,331 $ 248,153 $ 251,744 $ 232,719 $ 209,283 Net (gain) loss from fair value adjustments on qualifying hedges (775) (2,079) 1,185 1,678 — — Net amortization of purchase accounting adjustments (2,628) (3,013) (356) — — — Core interest income on total loans, net $ 289,884 $ 269,239 $ 248,982 $ 253,422 $ 232,719 $ 209,283 Average total loans, net (1) $ 6,748,165 $ 6,653,980 $ 6,006,931 $ 5,621,033 $ 5,316,968 $ 4,988,613 Core yield on total loans 4.30 % 4.05 % 4.14 % 4.51 % 4.38 % 4.20 % Years Ended December 31, 2019 December 31, 2022 December 31, 2021 December 31, 2020 December 31, 2018 2017 December 31, |
|
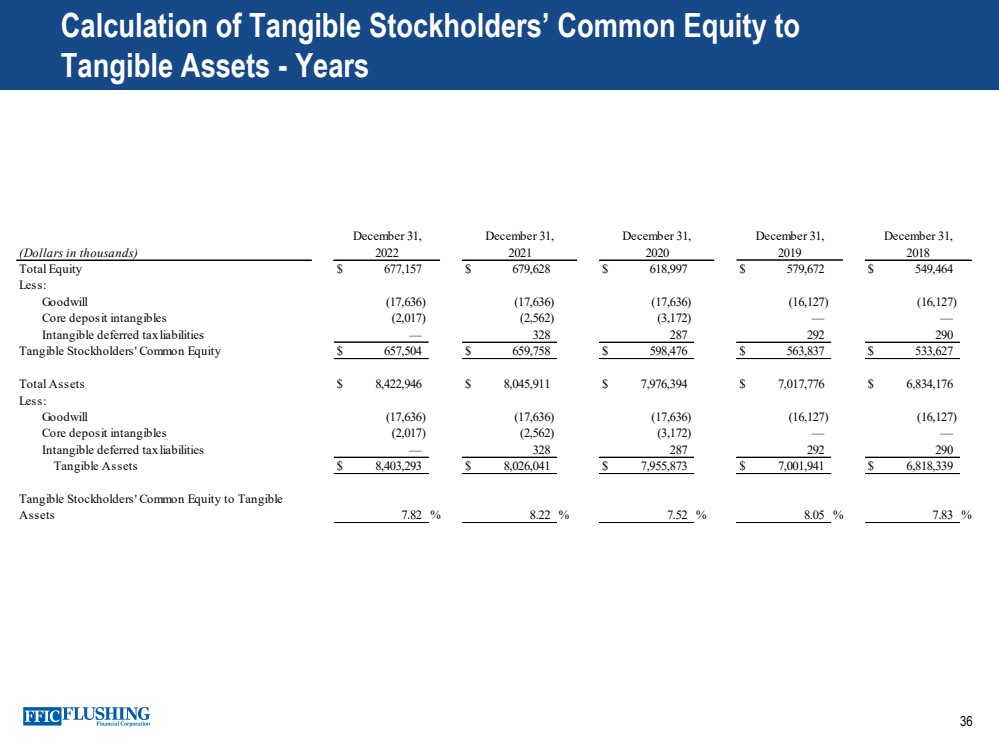
36 Calculation of Tangible Stockholders’ Common Equity to Tangible Assets - Years (Dollars in thousands) Total Equity $ 677,157 $ 679,628 $ 618,997 $ 579,672 $ 549,464 Less: Goodwill (17,636) (17,636) (17,636) (16,127) (16,127) Core deposit intangibles (2,017) (2,562) (3,172) — — Intangible deferred tax liabilities — 328 287 292 290 Tangible Stockholders' Common Equity $ 657,504 $ 659,758 $ 598,476 $ 563,837 $ 533,627 Total Assets $ 8,422,946 $ 8,045,911 $ 7,976,394 $ 7,017,776 $ 6,834,176 Less: Goodwill (17,636) (17,636) (17,636) (16,127) (16,127) Core deposit intangibles (2,017) (2,562) (3,172) — — Intangible deferred tax liabilities — 328 287 292 290 Tangible Assets $ 8,403,293 $ 8,026,041 $ 7,955,873 $ 7,001,941 $ 6,818,339 Tangible Stockholders' Common Equity to Tangible Assets 7.82 % 8.22 % 7.52 % 8.05 % 7.83 % December 31, 2022 December 31, 2021 December 31, December 31, December 31, 2020 2019 2018 |
|
37 Contact Details Susan K. Cullen SEVP, CFO & Treasurer Phone: (718) 961-5400 Email: scullen@flushingbank.com Al Savastano, CFA Director of Investor Relations Phone: (516) 820-1146 Email: asavastano@flushingbank.com |
|