st
UNITED STATES
SECURITIES AND EXCHANGE COMMISSION
WASHINGTON, D.C. 20549
FORM 10-Q
☒ Quarterly Report Pursuant to Section 13 or 15(d) of the Securities Exchange Act of 1934 for the quarterly period
ended June 30, 2023
OR
☐ Transition Report Pursuant to Section 13 or 15(d) of the Securities Exchange Act of 1934 for the transition period from _______ to _______
Commission File Number 0-21719
Steel Dynamics, Inc.
(Exact name of registrant as specified in its charter)
Indiana |
|
35-1929476 |
(State or other jurisdiction of incorporation or organization) |
|
(I.R.S. Employer Identification No.) |
|
|
|
7575 West Jefferson Blvd, Fort Wayne, IN |
|
46804 |
(Address of principal executive offices) |
|
(Zip Code) |
Registrant’s telephone number, including area code: (260) 969-3500
Not Applicable
(Former name, former address and former fiscal year, if changed since last report.)
Securities registered pursuant to Section 12(b) of the Act.
Title of each class |
Trading Symbol |
Name of each exchange on which registered |
Common Stock voting, $0.0025 par value |
STLD |
NASDAQ Global Select Market |
Indicate by check mark whether the registrant (1) has filed all reports required to be filed by Section 13 or 15(d) of the Securities Exchange Act of 1934 during the preceding 12 months (or for such shorter period that the registrant was required to file such reports), and (2) has been subject to such filing requirements for the past 90 days. Yes ⌧ No ◻
Indicate by check mark whether the registrant has submitted electronically every Interactive Data File required to be submitted pursuant to Rule 405 of Regulation S-T (§232.405 of this chapter) during the preceding 12 months (or for such shorter period that the registrant was required to submit such files). Yes ⌧ No ◻
Indicate by check mark whether the registrant is a large accelerated filer, an accelerated filer, a non-accelerated filer, a smaller reporting company, or an emerging growth company. See the definitions of “large accelerated filer,” “accelerated filer,” “smaller reporting company,” and “emerging growth company” in Rule 12b-2 of the Exchange Act.
|
|
Large accelerated filer ⌧ |
|
Accelerated filer ◻ |
|
Non-accelerated filer ◻ |
|
|
|
|
|
|
|
|
|
|
|
Smaller reporting company ☐ |
|
Emerging growth company ☐ |
|
|
|
If an emerging growth company, indicate by check mark if the registrant has elected not to use the extended transition period for complying with any new or revised financial accounting standards provided pursuant to Section 13(a) of the Exchange Act. ◻
Indicate by check mark whether the registrant is a shell company (as defined in Rule 12b-2 of the Exchange Act). Yes ☐ No⌧
As of July 31, 2023, Registrant had 165,644,387 outstanding shares of common stock.
STEEL DYNAMICS, INC.
Table of Contents
PART I. Financial Information | ||
| ||
Item 1. |
Financial Statements: |
Page |
|
|
|
|
Consolidated Balance Sheets as of June 30, 2023 (unaudited) and December 31, 2022 |
1 |
|
|
|
|
2 |
|
|
|
|
|
3 |
|
|
|
|
|
4 |
|
|
|
|
|
5 |
|
|
|
|
Management’s Discussion and Analysis of Financial Condition and Results of Operations |
16 |
|
|
|
|
25 |
||
|
|
|
25 |
||
|
|
|
|
|
|
|
|
|
|
|
|
|
|
|
26 |
||
|
|
|
26 |
||
|
|
|
26 |
||
|
|
|
26 |
||
|
|
|
26 |
||
|
|
|
27 |
||
|
|
|
28 |
||
|
|
|
29 |
||
|
|
|
30 |
||
STEEL DYNAMICS, INC.
CONSOLIDATED BALANCE SHEETS
(in thousands, except share data)
|
June 30, |
|
|
December 31, |
||
|
2023 |
|
|
2022 |
||
Assets |
(unaudited) |
|
|
|
|
|
Current assets |
|
|
|
|
|
|
Cash and equivalents |
$ |
1,475,356 |
|
|
$ |
1,628,417 |
Short-term investments |
|
611,701 |
|
|
|
628,215 |
Accounts receivable, net |
|
2,079,949 |
|
|
|
1,976,282 |
Accounts receivable-related parties |
|
63,015 |
|
|
|
79,769 |
Inventories |
|
3,044,009 |
|
|
|
3,129,964 |
Other current assets |
|
122,025 |
|
|
|
195,371 |
Total current assets |
|
7,396,055 |
|
|
|
7,638,018 |
|
|
|
|
|
|
|
Property, plant and equipment, net |
|
5,783,622 |
|
|
|
5,373,665 |
|
|
|
|
|
|
|
Intangible assets, net |
|
274,005 |
|
|
|
267,507 |
Goodwill |
|
477,471 |
|
|
|
502,067 |
Other assets |
|
620,244 |
|
|
|
378,727 |
Total assets |
$ |
14,551,397 |
|
|
$ |
14,159,984 |
Liabilities and Equity |
|
|
|
|
|
|
Current liabilities |
|
|
|
|
|
|
Accounts payable |
$ |
1,039,149 |
|
|
$ |
1,007,304 |
Accounts payable-related parties |
|
9,435 |
|
|
|
9,934 |
Income taxes payable |
|
39,177 |
|
|
|
6,520 |
Accrued payroll and benefits |
|
321,303 |
|
|
|
610,558 |
Accrued expenses |
|
293,102 |
|
|
|
340,646 |
Current maturities of long-term debt |
|
56,869 |
|
|
|
57,334 |
Total current liabilities |
|
1,759,035 |
|
|
|
2,032,296 |
|
|
|
|
|
|
|
Long-term debt |
|
3,010,829 |
|
|
|
3,013,241 |
Deferred income taxes |
|
941,491 |
|
|
|
889,103 |
Other liabilities |
|
175,073 |
|
|
|
129,539 |
Total liabilities |
|
5,886,428 |
|
|
|
6,064,179 |
|
|
|
|
|
|
|
Commitments and contingencies |
|
|
|
|
|
|
|
|
|
|
|
|
|
Redeemable noncontrolling interests |
|
171,212 |
|
|
|
181,503 |
|
|
|
|
|
|
|
Equity |
|
|
|
|
|
|
Common stock voting, $0.0025 par value; 900,000,000 shares authorized; |
|
|
|
|
|
|
267,772,737 and 267,762,488 shares issued; and 166,383,336 and 172,936,163 |
|
|
|
|
|
|
shares outstanding, as of June 30, 2023 and December 31, 2022, respectively |
|
650 |
|
|
|
650 |
Treasury stock, at cost; 101,389,401 and 94,826,325 shares, |
|
|
|
|
|
|
as of June 30, 2023 and December 31, 2022, respectively |
|
(5,179,722) |
|
|
|
(4,459,513) |
Additional paid-in capital |
|
1,204,134 |
|
|
|
1,212,566 |
Retained earnings |
|
12,681,894 |
|
|
|
11,375,765 |
Accumulated other comprehensive income |
|
1,027 |
|
|
|
889 |
Total Steel Dynamics, Inc. equity |
|
8,707,983 |
|
|
|
8,130,357 |
Noncontrolling interests |
|
(214,226) |
|
|
|
(216,055) |
Total equity |
|
8,493,757 |
|
|
|
7,914,302 |
Total liabilities and equity |
$ |
14,551,397 |
|
|
$ |
14,159,984 |
See notes to consolidated financial statements.
1
STEEL DYNAMICS, INC.
CONSOLIDATED STATEMENTS OF INCOME (UNAUDITED)
(in thousands, except per share data)
|
|
|
|
|
|
|
|
|
|
|
|
|
Three-Month Periods Ended |
|
Six-Month Periods Ended |
||||||||
|
June 30, |
|
June 30, |
||||||||
|
2023 |
|
2022 |
|
2023 |
|
2022 |
||||
|
|
|
|
|
|
|
|
|
|
|
|
Net sales |
|
|
|
|
|
|
|
|
|
|
|
Unrelated parties |
$ |
4,930,422 |
|
$ |
5,964,503 |
|
$ |
9,675,775 |
|
$ |
11,375,304 |
Related parties |
|
151,208 |
|
|
248,375 |
|
|
299,061 |
|
|
407,476 |
Total net sales |
|
5,081,630 |
|
|
6,212,878 |
|
|
9,974,836 |
|
|
11,782,780 |
|
|
|
|
|
|
|
|
|
|
|
|
Costs of goods sold |
|
3,774,772 |
|
|
4,329,536 |
|
|
7,611,856 |
|
|
8,116,925 |
Gross profit |
|
1,306,858 |
|
|
1,883,342 |
|
|
2,362,980 |
|
|
3,665,855 |
|
|
|
|
|
|
|
|
|
|
|
|
Selling, general and administrative expenses |
|
141,209 |
|
|
118,377 |
|
|
285,518 |
|
|
270,392 |
Profit sharing |
|
90,990 |
|
|
139,742 |
|
|
160,565 |
|
|
268,211 |
Amortization of intangible assets |
|
10,924 |
|
|
7,160 |
|
|
17,802 |
|
|
14,322 |
Operating income |
|
1,063,735 |
|
|
1,618,063 |
|
|
1,899,095 |
|
|
3,112,930 |
|
|
|
|
|
|
|
|
|
|
|
|
Interest expense, net of capitalized interest |
|
20,767 |
|
|
25,667 |
|
|
43,274 |
|
|
42,336 |
Other (income) expense, net |
|
(31,348) |
|
|
(4,021) |
|
|
(66,284) |
|
|
16,447 |
Income before income taxes |
|
1,074,316 |
|
|
1,596,417 |
|
|
1,922,105 |
|
|
3,054,147 |
|
|
|
|
|
|
|
|
|
|
|
|
Income tax expense |
|
258,139 |
|
|
381,765 |
|
|
461,595 |
|
|
732,141 |
Net income |
|
816,177 |
|
|
1,214,652 |
|
|
1,460,510 |
|
|
2,322,006 |
|
|
|
|
|
|
|
|
|
|
|
|
Net income attributable to noncontrolling interests |
|
(4,070) |
|
|
(5,098) |
|
|
(11,093) |
|
|
(8,521) |
Net income attributable to Steel Dynamics, Inc. |
$ |
812,107 |
|
$ |
1,209,554 |
|
$ |
1,449,417 |
|
$ |
2,313,485 |
|
|
|
|
|
|
|
|
|
|
|
|
|
|
|
|
|
|
|
|
|
|
|
|
|
|
|
|
|
|
|
|
|
|
|
|
Basic earnings per share attributable to Steel |
|
|
|
|
|
|
|
|
|
|
|
Dynamics, Inc. stockholders |
$ |
4.83 |
|
$ |
6.49 |
|
$ |
8.54 |
|
$ |
12.22 |
|
|
|
|
|
|
|
|
|
|
|
|
Weighted average common shares outstanding |
|
168,009 |
|
|
186,442 |
|
|
169,803 |
|
|
189,300 |
|
|
|
|
|
|
|
|
|
|
|
|
Diluted earnings per share attributable to Steel |
|
|
|
|
|
|
|
|
|
|
|
Dynamics, Inc. stockholders, including the effect |
|
|
|
|
|
|
|
|
|
|
|
of assumed conversions when dilutive |
$ |
4.81 |
|
$ |
6.44 |
|
$ |
8.49 |
|
$ |
12.14 |
|
|
|
|
|
|
|
|
|
|
|
|
Weighted average common shares and share equivalents outstanding |
|
168,865 |
|
|
187,740 |
|
|
170,672 |
|
|
190,491 |
|
|
|
|
|
|
|
|
|
|
|
|
Dividends declared per share |
$ |
0.425 |
|
$ |
0.34 |
|
$ |
0.85 |
|
$ |
0.68 |
See notes to consolidated financial statements.
2
STEEL DYNAMICS, INC.
CONSOLIDATED STATEMENTS OF COMPREHENSIVE INCOME (UNAUDITED)
(in thousands)
|
|
|
|
|
|
|
|
|
|
|
|
|
Three-Month Periods Ended |
|
Six-Month Periods Ended |
||||||||
|
June 30, |
|
June 30, |
||||||||
|
2023 |
|
2022 |
|
2023 |
|
2022 |
||||
|
|
|
|
|
|
|
|
|
|
|
|
Net income |
$ |
816,177 |
|
$ |
1,214,652 |
|
$ |
1,460,510 |
|
$ |
2,322,006 |
Other comprehensive income - net unrealized gain (loss) on cash |
|
|
|
|
|
|
|
|
|
|
|
flow hedging derivatives, net of income tax expense (benefit) of |
|
|
|
|
|
|
|
|
|
|
|
($247) and ($4,465) for the three months ended, and $44 and ($908) |
|
|
|
|
|
|
|
|
|
|
|
for the six months ended June 30, 2023 and 2022, respectively |
|
(773) |
|
|
(14,295) |
|
|
138 |
|
|
(2,908) |
Comprehensive income |
|
815,404 |
|
|
1,200,357 |
|
|
1,460,648 |
|
|
2,319,098 |
|
|
|
|
|
|
|
|
|
|
|
|
Comprehensive income attributable to noncontrolling interests |
|
(4,070) |
|
|
(5,098) |
|
|
(11,093) |
|
|
(8,521) |
Comprehensive income attributable to Steel Dynamics, Inc. |
$ |
811,334 |
|
$ |
1,195,259 |
|
$ |
1,449,555 |
|
$ |
2,310,577 |
See notes to consolidated financial statements.
3
STEEL DYNAMICS, INC.
CONSOLIDATED STATEMENTS OF CASH FLOWS (UNAUDITED)
(in thousands)
|
|
|
|
|
|
|
|
|
|
|
|
|
Three-Month Periods Ended |
|
Six-Month Periods Ended |
||||||||
|
June 30, |
|
June 30, |
||||||||
|
2023 |
|
2022 |
|
2023 |
|
2022 |
||||
|
|
|
|
|
|
|
|
|
|
|
|
Operating activities: |
|
|
|
|
|
|
|
|
|
|
|
Net income |
$ |
816,177 |
|
$ |
1,214,652 |
|
$ |
1,460,510 |
|
$ |
2,322,006 |
|
|
|
|
|
|
|
|
|
|
|
|
Adjustments to reconcile net income to net cash provided by |
|
|
|
|
|
|
|
|
|
|
|
operating activities: |
|
|
|
|
|
|
|
|
|
|
|
Depreciation and amortization |
|
110,970 |
|
|
95,701 |
|
|
218,664 |
|
|
183,247 |
Equity-based compensation |
|
11,678 |
|
|
11,069 |
|
|
27,756 |
|
|
27,588 |
Deferred income taxes |
|
43,380 |
|
|
(2,636) |
|
|
52,388 |
|
|
(4) |
Other adjustments |
|
1,541 |
|
|
(640) |
|
|
(8,465) |
|
|
10,517 |
Changes in certain assets and liabilities: |
|
|
|
|
|
|
|
|
|
|
|
Accounts receivable |
|
(16,971) |
|
|
(297,047) |
|
|
(87,893) |
|
|
(744,281) |
Inventories |
|
(55,158) |
|
|
(130,552) |
|
|
85,954 |
|
|
(116,237) |
Other assets |
|
(4,923) |
|
|
(12,887) |
|
|
2,919 |
|
|
6,515 |
Accounts payable |
|
(114,013) |
|
|
187,521 |
|
|
3,299 |
|
|
111,550 |
Income taxes receivable/payable |
|
(85,486) |
|
|
(203,352) |
|
|
103,761 |
|
|
138,553 |
Accrued expenses |
|
100,611 |
|
|
140,023 |
|
|
(317,304) |
|
|
(118,634) |
Net cash provided by operating activities |
|
807,806 |
|
|
1,001,852 |
|
|
1,541,589 |
|
|
1,820,820 |
|
|
|
|
|
|
|
|
|
|
|
|
Investing activities: |
|
|
|
|
|
|
|
|
|
|
|
Purchases of property, plant and equipment |
|
(358,280) |
|
|
(164,142) |
|
|
(584,599) |
|
|
(323,472) |
Purchases of short-term investments |
|
(165,052) |
|
|
(351,510) |
|
|
(521,829) |
|
|
(351,510) |
Proceeds from maturities of short-term investments |
|
267,969 |
|
|
- |
|
|
539,076 |
|
|
- |
Investments in unconsolidated affiliates |
|
- |
|
|
- |
|
|
- |
|
|
(222,480) |
Other investing activities |
|
(217,905) |
|
|
4,817 |
|
|
(215,562) |
|
|
5,227 |
Net cash used in investing activities |
|
(473,268) |
|
|
(510,835) |
|
|
(782,914) |
|
|
(892,235) |
|
|
|
|
|
|
|
|
|
|
|
|
Financing activities: |
|
|
|
|
|
|
|
|
|
|
|
Issuance of current and long-term debt |
|
327,132 |
|
|
382,868 |
|
|
721,042 |
|
|
702,647 |
Repayment of current and long-term debt |
|
(321,143) |
|
|
(414,719) |
|
|
(726,422) |
|
|
(763,991) |
Dividends paid |
|
(72,323) |
|
|
(64,344) |
|
|
(131,121) |
|
|
(115,043) |
Purchases of treasury stock |
|
(380,206) |
|
|
(517,024) |
|
|
(734,203) |
|
|
(906,214) |
Other financing activities |
|
(17,579) |
|
|
(60,241) |
|
|
(41,028) |
|
|
(82,768) |
Net cash used in financing activities |
|
(464,119) |
|
|
(673,460) |
|
|
(911,732) |
|
|
(1,165,369) |
|
|
|
|
|
|
|
|
|
|
|
|
Decrease in cash, cash equivalents, and restricted cash |
|
(129,581) |
|
|
(182,443) |
|
|
(153,057) |
|
|
(236,784) |
Cash, cash equivalents, and restricted cash at beginning of period |
|
1,610,443 |
|
|
1,195,028 |
|
|
1,633,919 |
|
|
1,249,369 |
|
|
|
|
|
|
|
|
|
|
|
|
Cash, cash equivalents, and restricted cash at end of period |
$ |
1,480,862 |
|
$ |
1,012,585 |
|
$ |
1,480,862 |
|
$ |
1,012,585 |
|
|
|
|
|
|
|
|
|
|
|
|
|
|
|
|
|
|
|
|
|
|
|
|
Supplemental disclosure information: |
|
|
|
|
|
|
|
|
|
|
|
Cash paid for interest |
$ |
41,781 |
|
$ |
41,114 |
|
$ |
51,377 |
|
$ |
50,282 |
Cash paid for income taxes, net |
$ |
308,055 |
|
$ |
580,454 |
|
$ |
312,758 |
|
$ |
590,402 |
See notes to consolidated financial statements.
4
Note 1. Description of the Business and Significant Accounting Policies
Description of the Business
Steel Dynamics, Inc. (SDI), together with its subsidiaries (the company), is one of the largest and most diversified domestic steel producers and metals recycler, combined with a meaningful steel fabrication manufacturing platform. The company has three reporting segments: steel operations, metals recycling operations, and steel fabrication operations.
Steel Operations Segment. Steel operations include the company’s electric arc furnace (EAF) steel mills, including Butler Flat Roll Division, Columbus Flat Roll Division, Southwest-Sinton Flat Roll Division, Structural and Rail Division, Engineered Bar Products Division, Roanoke Bar Division, Steel of West Virginia, steel coating and processing operations at The Techs, Heartland Flat Roll Division, United Steel Supply (USS) – 90% equity interest as of April 1, 2023, Vulcan Threaded Products, Inc., and SDI Biocarbon Solutions, LLC, a joint venture to construct and operate a biocarbon production facility. Steel operations accounted for 67% of the company’s consolidated net sales during the three-month periods ended June 30, 2023 and 2022 and the six-month period ended June 30, 2022 and 65% during the six-month period ended June 30, 2023.
Metals Recycling Operations Segment. Metals recycling operations include the company’s OmniSource ferrous and nonferrous processing, transportation, marketing, brokerage, and scrap management services primarily throughout the United States and in Central and Northern Mexico. Metals recycling operations accounted for 12% of the company’s consolidated net sales during the three and six-month periods ended June 30, 2023 and 10% during the three and six-month periods ended June 30, 2022.
Steel Fabrication Operations Segment. Steel fabrication operations include the company’s New Millennium Building Systems’ joist and deck plants located throughout the United States, and in Northern Mexico. Revenues from these plants are generated from the fabrication of trusses, girders, steel joists and steel deck used within the non-residential construction industry. Steel fabrication operations accounted for 15% and 16% of the company’s consolidated net sales during the three and six-month periods ended June 30, 2023, respectively, and 17% during the three and six-month periods ended June 30, 2022.
Other. Other operations consist of subsidiary operations that are below the company’s quantitative thresholds required for reportable segments and primarily consist of joint ventures, including the company’s newly announced aluminum flat roll mill and the company’s idled Minnesota ironmaking operations. Also included in “Other” are certain unallocated corporate accounts, such as the company’s senior unsecured credit facility, senior notes, certain other investments and certain profit sharing expenses.
Significant Accounting Policies
Principles of Consolidation
The consolidated financial statements include the accounts of SDI, together with its wholly- and majority-owned or controlled subsidiaries, after elimination of intercompany accounts and transactions. Noncontrolling and redeemable noncontrolling interests represent the noncontrolling owners’ proportionate share in the equity, income, or losses of the company’s majority-owned or controlled consolidated subsidiaries. Redeemable noncontrolling interests related to USS (owned 90% by SDI at April 1, 2023 and 87.5% at December 31, 2022) are $60.0 million at June 30, 2023, and $70.3 million at December 31, 2022. On April 1, 2023, a noncontrolling member of USS exercised its option to require SDI to purchase its 2.5% equity interest, increasing SDI’s ownership to 90%. The remaining noncontrolling members’ option to require SDI to purchase the remaining 10% equity interest of USS has been extended to on or after February 28, 2025. Redeemable noncontrolling interests related to Mesabi Nugget (owned 85.5% by SDI) are $111.2 million at June 30, 2023, and December 31, 2022.
5
Note 1. Description of the Business and Significant Accounting Policies (Continued)
Use of Estimates
These consolidated financial statements are prepared in conformity with accounting principles generally accepted in the United States, and accordingly, include amounts that require management to make estimates and assumptions that affect the amounts reported in the consolidated financial statements and in the notes thereto. Significant items subject to such estimates and assumptions include the carrying value of property, plant and equipment, intangible assets, and goodwill; valuation allowances for trade receivables, inventories and deferred income tax assets; unrecognized tax benefits; potential environmental liabilities; and litigation claims and settlements. Actual results may differ from these estimates and assumptions.
In the opinion of management, these financial statements reflect all normal recurring adjustments necessary for a fair presentation of the interim period results. These consolidated financial statements and notes should be read in conjunction with the audited financial statements and notes thereto included in the company’s Annual Report on Form 10-K for the year ended December 31, 2022.
Cash and Equivalents, and Restricted Cash
Cash and equivalents include all highly liquid investments with a maturity of three months or less at the date of acquisition. Restricted cash is primarily funds held in escrow as required by various insurance and government organizations. The balance of cash, cash equivalents and restricted cash in the consolidated statements of cash flows includes restricted cash of $5.5 million for all periods presented, which are recorded in Other Assets (noncurrent) in the company’s consolidated balance sheets.
Senior Credit Facility
On July 19, 2023, the company entered into a new unsecured credit agreement comprised of a senior unsecured credit facility (Facility), which provides a $1.2 billion Revolver, maturing July 19, 2028. The new Credit Agreement replaces the December 3, 2019 Credit Agreement. Subject to certain conditions, the company has the ability to increase the Revolver size by $500.0 million. The Facility is available to fund working capital, capital expenditures, and other general corporate purposes. The Facility contains financial covenants and other covenants pertaining to the company’s ability to incur indebtedness and permit liens on certain assets. The company’s ability to borrow funds within the terms of the unsecured Revolver is dependent upon its continued compliance with financial and other covenants.
The Facility pricing grid is adjusted quarterly and is based on either the company’s leverage of net debt (as defined in the Facility) to last-twelve-months (LTM) consolidated Adjusted EBITDA as defined in the Facility (earnings before interest, taxes, depreciation, amortization, and certain other non-cash items, as defined in the Facility), or the company’s credit ratings. The minimum pricing is adjusted Secured Overnight Financing Rate (SOFR) plus 1.000% and the maximum pricing is adjusted SOFR plus 1.75%. In addition, the company is subject to an unused commitment fee of between 0.11% and 0.275% (based on either the company’s leverage of net debt to LTM consolidated adjusted EBITDA, or the company’s credit ratings) which is applied to the unused portion of the Revolver.
6
Note 1. Description of the Business and Significant Accounting Policies (Continued)
Other Obligations
One of the company’s consolidated joint venture subsidiaries amended and restated its secured credit agreement and extended the maturity to June 2028, comprised of a $125.0 million revolving credit facility, which is subject to a borrowing base determined from eligible accounts receivable and inventory.
Goodwill
The company’s goodwill consisted of the following at June 30, 2023, and December 31, 2022 (in thousands):
|
|
|
|
|
|
|
|
|
|
|
|
June 30, |
|
December 31, |
|
||
|
|
|
2023 |
|
2022 |
|
||
|
|
|
|
|
|
|
|
|
|
Steel Operations Segment |
|
$ |
272,133 |
|
$ |
272,133 |
|
|
Metals Recycling Operations Segment |
|
|
203,413 |
|
|
228,009 |
|
|
Steel Fabrication Operations Segment |
|
|
1,925 |
|
|
1,925 |
|
|
|
|
$ |
477,471 |
|
$ |
502,067 |
|
Credit Losses
The company is exposed to credit risk in the event of nonpayment of accounts receivable by customers. The company mitigates its exposure to credit risk, which it generally extends on an unsecured basis, by performing ongoing credit evaluations and taking further action if necessary, such as requiring letters of credit or other security interests to support the customer receivable. The allowance for credit losses for accounts receivable is based on the company’s reasonable estimate of known credit risks and historical experience, adjusted for current and anticipated economic and other pertinent factors affecting the company’s customers, that may differ from historical experience. Customer accounts receivable are written off when all collection efforts have been exhausted and the amounts are deemed uncollectible.
At June 30, 2023, the company reported $2,143 million of accounts receivable, net of allowances for credit losses of $7.9 million. Changes in the allowance were not material for each of the three and six-month periods ended June 30, 2023 and 2022.
Note 2. Earnings Per Share
Basic earnings per share is based on the weighted average shares of common stock outstanding during the period. Diluted earnings per share assumes the weighted average dilutive effect of common share equivalents outstanding during the period applied to the company’s basic earnings per share. Common share equivalents represent potentially dilutive restricted stock units, deferred stock units, restricted stock, and performance awards, and are excluded from the computation in periods in which they have an anti-dilutive effect. There were no anti-dilutive common share equivalents as of or for the three and six-month periods ended June 30, 2023 and 2022.
7
Note 2. Earnings Per Share (Continued)
|
|
|
|
|
|
|
|
|
|
|
|
|
|
|
|
|
|
|
Three-Month Periods Ended June 30, |
||||||||||||||||
|
2023 |
|
2022 |
||||||||||||||
|
|
|
|
Weighted |
|
|
|
|
|
|
|
Weighted |
|
|
|
||
|
|
|
|
Average |
|
|
|
|
|
|
|
Average |
|
|
|
||
|
Net Income |
|
Shares |
|
Per Share |
|
Net Income |
|
Shares |
|
Per Share |
||||||
|
(Numerator) |
|
(Denominator) |
|
Amount |
|
(Numerator) |
|
(Denominator) |
|
Amount |
||||||
Basic earnings per share |
$ |
812,107 |
|
|
168,009 |
|
$ |
4.83 |
|
$ |
1,209,554 |
|
|
186,442 |
|
$ |
6.49 |
Dilutive common share equivalents |
|
- |
|
|
856 |
|
|
|
|
|
- |
|
|
1,298 |
|
|
|
Diluted earnings per share |
$ |
812,107 |
|
|
168,865 |
|
$ |
4.81 |
|
$ |
1,209,554 |
|
|
187,740 |
|
$ |
6.44 |
|
|
|
|
|
|
|
|
|
|
|
|
|
|
|
|
|
|
|
Six-Month Periods Ended June 30, |
||||||||||||||||
|
2023 |
|
2022 |
||||||||||||||
|
|
|
|
Weighted |
|
|
|
|
|
|
|
Weighted |
|
|
|
||
|
|
|
|
Average |
|
|
|
|
|
|
|
Average |
|
|
|
||
|
Net Income |
|
Shares |
|
Per Share |
|
Net Income |
|
Shares |
|
Per Share |
||||||
|
(Numerator) |
|
(Denominator) |
|
Amount |
|
(Numerator) |
|
(Denominator) |
|
Amount |
||||||
Basic earnings per share |
$ |
1,449,417 |
|
|
169,803 |
|
$ |
8.54 |
|
$ |
2,313,485 |
|
|
189,300 |
|
$ |
12.22 |
Dilutive common share equivalents |
|
- |
|
|
869 |
|
|
|
|
|
- |
|
|
1,191 |
|
|
|
Diluted earnings per share |
$ |
1,449,417 |
|
|
170,672 |
|
$ |
8.49 |
|
$ |
2,313,485 |
|
|
190,491 |
|
$ |
12.14 |
Note 3. Inventories
Inventories are stated at lower of cost or net realizable value. Cost is determined using a weighted average cost method for raw materials (including scrap and purchased steel substrate) and supplies, and on a first-in, first-out basis for other inventory. Inventory consisted of the following (in thousands):
|
June 30, |
|
December 31, |
||
|
2023 |
|
2022 |
||
Raw materials |
$ |
1,416,669 |
|
$ |
1,608,344 |
Supplies |
|
678,823 |
|
|
629,074 |
Work in progress |
|
305,691 |
|
|
256,071 |
Finished goods |
|
642,826 |
|
|
636,475 |
Total inventories |
$ |
3,044,009 |
|
$ |
3,129,964 |
Note 4. Changes in Equity
The following tables provide a reconciliation of the beginning and ending carrying amounts of total equity, equity attributable to stockholders of Steel Dynamics, Inc., and equity and redeemable amounts attributable to noncontrolling interests (in thousands) for each of the three and six-month periods ended June 30, 2023 and 2022:
8
Note 4. Changes in Equity (Continued)
|
|
|
|
|
|
|
|
|
|
|
|
|
|
|
|
|
|
|
|
|
|
|
|
|
|
|
|
|
|
|
|
|
|
|
|
|
|
|
|
|
|
|
|
|
|
|
|
|
|
|
|
Stockholders of Steel Dynamics, Inc. |
|
|
|
|
|
|
|
|
|
|||||||||||||
|
|
|
|
|
|
|
|
|
|
|
Accumulated |
|
|
|
|
|
|
|||||||
|
|
|
|
|
|
Additional |
|
|
|
Other |
|
|
|
|
|
Redeemable |
||||||||
|
|
Common |
|
Treasury |
|
Paid-In |
|
Retained |
|
Comprehensive |
|
Noncontrolling |
|
Total |
|
Noncontrolling |
||||||||
|
|
Stock |
|
Stock |
|
Capital |
|
Earnings |
|
Income |
|
Interests |
|
Equity |
|
Interests |
||||||||
Balances at December 31, 2022 |
|
$ |
650 |
|
$ |
(4,459,513) |
|
$ |
1,212,566 |
|
$ |
11,375,765 |
|
$ |
889 |
|
$ |
(216,055) |
|
$ |
7,914,302 |
|
$ |
181,503 |
Dividends declared |
|
|
- |
|
|
- |
|
|
- |
|
|
(72,316) |
|
|
- |
|
|
- |
|
|
(72,316) |
|
|
- |
Noncontrolling investors, net |
|
|
- |
|
|
- |
|
|
- |
|
|
- |
|
|
- |
|
|
(7,387) |
|
|
(7,387) |
|
|
4,702 |
Share repurchases |
|
|
- |
|
|
(353,997) |
|
|
- |
|
|
- |
|
|
- |
|
|
- |
|
|
(353,997) |
|
|
- |
Equity-based compensation |
|
|
- |
|
|
12,997 |
|
|
(18,487) |
|
|
(138) |
|
|
- |
|
|
- |
|
|
(5,628) |
|
|
- |
Net income |
|
|
- |
|
|
- |
|
|
- |
|
|
637,310 |
|
|
- |
|
|
7,023 |
|
|
644,333 |
|
|
- |
Other comprehensive income, net of tax |
|
|
- |
|
|
- |
|
|
- |
|
|
- |
|
|
911 |
|
|
- |
|
|
911 |
|
|
- |
Balances at March 31, 2023 |
|
|
650 |
|
|
(4,800,513) |
|
|
1,194,079 |
|
|
11,940,621 |
|
|
1,800 |
|
|
(216,419) |
|
|
8,120,218 |
|
|
186,205 |
Dividends declared |
|
|
- |
|
|
- |
|
|
- |
|
|
(70,694) |
|
|
- |
|
|
- |
|
|
(70,694) |
|
|
- |
Noncontrolling investors, net |
|
|
- |
|
|
- |
|
|
- |
|
|
- |
|
|
- |
|
|
(1,877) |
|
|
(1,877) |
|
|
(14,993) |
Share repurchases |
|
|
- |
|
|
(380,206) |
|
|
- |
|
|
- |
|
|
- |
|
|
- |
|
|
(380,206) |
|
|
- |
Equity-based compensation |
|
|
- |
|
|
997 |
|
|
10,055 |
|
|
(140) |
|
|
- |
|
|
- |
|
|
10,912 |
|
|
- |
Net income |
|
|
- |
|
|
- |
|
|
- |
|
|
812,107 |
|
|
- |
|
|
4,070 |
|
|
816,177 |
|
|
- |
Other comprehensive loss, net of tax |
|
|
- |
|
|
- |
|
|
- |
|
|
- |
|
|
(773) |
|
|
- |
|
|
(773) |
|
|
- |
Balances at June 30, 2023 |
|
$ |
650 |
|
$ |
(5,179,722) |
|
$ |
1,204,134 |
|
$ |
12,681,894 |
|
$ |
1,027 |
|
$ |
(214,226) |
|
$ |
8,493,757 |
|
$ |
171,212 |
|
|
|
|
|
|
|
|
|
|
|
|
|
|
|
|
|
|
|
|
|
|
|
|
|
|
|
|
|
|
|
|
|
|
|
|
|
|
|
|
|
|
|
|
|
|
|
|
|
|
|
|
Stockholders of Steel Dynamics, Inc. |
|
|
|
|
|
|
|
|
|
|||||||||||||
|
|
|
|
|
|
|
|
|
|
|
|
|
|
Accumulated |
|
|
|
|
|
|
|
|
|
|
|
|
|
|
|
|
|
Additional |
|
|
|
Other |
|
|
|
|
|
Redeemable |
|||||||
|
|
Common |
|
Treasury |
|
Paid-In |
|
Retained |
|
Comprehensive |
|
Noncontrolling |
|
Total |
|
Noncontrolling |
||||||||
|
|
Stock |
|
Stock |
|
Capital |
|
Earnings |
|
Income (Loss) |
|
Interests |
|
Equity |
|
Interests |
||||||||
Balances at December 31, 2021 |
|
$ |
649 |
|
$ |
(2,674,267) |
|
$ |
1,218,933 |
|
$ |
7,761,417 |
|
$ |
(2,091) |
|
$ |
(195,884) |
|
$ |
6,108,757 |
|
$ |
211,414 |
Dividends declared |
|
|
- |
|
|
- |
|
|
- |
|
|
(64,344) |
|
|
- |
|
|
- |
|
|
(64,344) |
|
|
- |
Noncontrolling investors, net |
|
|
- |
|
|
- |
|
|
- |
|
|
- |
|
|
- |
|
|
(21,633) |
|
|
(21,633) |
|
|
16,500 |
Share repurchases |
|
|
- |
|
|
(389,190) |
|
|
- |
|
|
- |
|
|
- |
|
|
- |
|
|
(389,190) |
|
|
- |
Equity-based compensation |
|
|
- |
|
|
12,960 |
|
|
(14,910) |
|
|
(121) |
|
|
- |
|
|
- |
|
|
(2,071) |
|
|
- |
Net income |
|
|
- |
|
|
- |
|
|
- |
|
|
1,103,931 |
|
|
- |
|
|
3,423 |
|
|
1,107,354 |
|
|
- |
Other comprehensive income, net of tax |
|
|
- |
|
|
- |
|
|
- |
|
|
- |
|
|
11,387 |
|
|
- |
|
|
11,387 |
|
|
- |
Balances at March 31, 2022 |
|
$ |
649 |
|
$ |
(3,050,497) |
|
$ |
1,204,023 |
|
$ |
8,800,883 |
|
$ |
9,296 |
|
$ |
(214,094) |
|
$ |
6,750,260 |
|
$ |
227,914 |
Dividends declared |
|
|
- |
|
|
- |
|
|
- |
|
|
(62,088) |
|
|
- |
|
|
- |
|
|
(62,088) |
|
|
- |
Noncontrolling investors, net |
|
|
- |
|
|
- |
|
|
630 |
|
|
(2,495) |
|
|
- |
|
|
1,235 |
|
|
(630) |
|
|
(59,611) |
Share repurchases |
|
|
- |
|
|
(517,024) |
|
|
- |
|
|
- |
|
|
- |
|
|
- |
|
|
(517,024) |
|
|
- |
Equity-based compensation |
|
|
- |
|
|
1,028 |
|
|
8,828 |
|
|
(144) |
|
|
- |
|
|
- |
|
|
9,712 |
|
|
- |
Net income |
|
|
- |
|
|
- |
|
|
- |
|
|
1,209,554 |
|
|
- |
|
|
5,098 |
|
|
1,214,652 |
|
|
- |
Other comprehensive loss, net of tax |
|
|
- |
|
|
- |
|
|
- |
|
|
- |
|
|
(14,295) |
|
|
- |
|
|
(14,295) |
|
|
- |
Balances at June 30, 2022 |
|
$ |
649 |
|
$ |
(3,566,493) |
|
$ |
1,213,481 |
|
$ |
9,945,710 |
|
$ |
(4,999) |
|
$ |
(207,761) |
|
$ |
7,380,587 |
|
$ |
168,303 |
Note 5. Derivative Financial Instruments
The company is exposed to certain risks relating to its ongoing business operations. The company utilizes derivative instruments to mitigate commodity margin risk, and occasionally to mitigate foreign currency exchange rate risk, and have in the past to mitigate interest rate fluctuation risk. The company routinely enters into forward exchange traded futures and option contracts to manage the price risk associated with nonferrous metals inventory as well as purchases and sales of nonferrous metals (primarily aluminum and copper) and ferrous metals. The company offsets fair value amounts recognized for derivative instruments executed with the same counterparty under master netting agreements.
9
Note 5. Derivative Financial Instruments (Continued)
Commodity Futures Contracts. If the company is “long” on futures contracts, it means the company has more futures contracts purchased than futures contracts sold for the underlying commodity. If the company is “short” on a futures contract, it means the company has more futures contracts sold than futures contracts purchased for the underlying commodity. The following summarizes the company’s significant futures contract commitments as of June 30, 2023:
|
|
|
|
|
|
|
|
Commodity Futures |
|
Long/Short |
|
Metric Tons |
|
|
Aluminum |
|
Long |
|
8,150 |
|
|
Aluminum |
|
Short |
|
12,500 |
|
|
Copper |
|
Long |
|
55,905 |
|
|
Copper |
|
Short |
|
74,877 |
|
The following summarizes the location and amounts of the fair values reported on the company’s consolidated balance sheets as of June 30, 2023, and December 31, 2022, and gains and losses related to derivatives included in the company’s statement of income for the three and six-month periods ended June 30, 2023, and 2022 (in thousands):
|
|
|
|
|
|
|
|
|
|
|
|
|
|
|
|
|
Asset Derivatives |
|
Liability Derivatives |
||||||||
|
Balance sheet |
|
Fair Value |
|
Fair Value |
||||||||
|
location |
|
June 30, 2023 |
|
December 31, 2022 |
|
June 30, 2023 |
|
December 31, 2022 |
||||
Derivative instruments designated as hedges |
|
|
|
|
|
|
|
|
|
|
|
|
|
Commodity futures |
Other current assets |
|
$ |
4,485 |
|
$ |
2,169 |
|
$ |
1,979 |
|
$ |
2,119 |
|
|
|
|
|
|
|
|
|
|
|
|
|
|
Derivative instruments not designated as hedges |
|
|
|
|
|
|
|
|
|
|
|
|
|
Commodity futures |
Other current assets |
|
|
26,915 |
|
|
2,102 |
|
|
14,398 |
|
|
5,269 |
Total derivative instruments |
|
|
$ |
31,400 |
|
$ |
4,271 |
|
$ |
16,377 |
|
$ |
7,388 |
The fair value of the above derivative instruments along with required margin deposit amounts with the same counterparty under master netting arrangements totaled $18.2 million at June 30, 2023, and $23.5 million at December 31, 2022, and are reflected in other current assets in the consolidated balance sheets.
|
|
|
Amount of gain |
|
|
|
|
Amount of loss |
||||||||
|
|
|
recognized in income |
|
|
|
Location of loss |
recognized in income |
||||||||
|
|
Location of gain |
on derivatives for the |
|
|
|
recognized |
on derivatives for the |
||||||||
|
|
recognized |
three-month periods |
|
Hedged items in |
|
in income on |
three-month periods |
||||||||
|
|
in income on |
ended June 30, |
|
fair value hedge |
|
related hedged |
ended June 30, |
||||||||
|
|
derivatives |
2023 |
|
2022 |
|
relationships |
|
items |
2023 |
|
2022 |
||||
Derivatives in fair value hedging relationships |
|
|
|
|
|
|
|
|
|
|
|
|
|
|
|
|
Commodity futures |
|
Costs of goods sold |
$ |
2,430 |
|
$ |
11,956 |
|
Firm commitments |
|
Costs of goods sold |
$ |
(264) |
|
$ |
(4,343) |
|
|
|
|
|
|
|
|
|
Inventory |
|
Costs of goods sold |
|
(368) |
|
|
(5,996) |
|
|
|
|
|
|
|
|
|
|
|
|
$ |
(632) |
|
$ |
(10,339) |
Derivatives not designated as hedging instruments |
|
|
|
|
|
|
|
|
|
|
|
|
|
|
|
|
Commodity futures |
|
Costs of goods sold |
$ |
18,639 |
|
$ |
27,391 |
|
|
|
|
|
|
|
|
|
10
Note 5. Derivative Financial Instruments (Continued)
|
|
|
Amount of gain |
|
|
|
|
Amount of gain (loss) |
||||||||
|
|
|
recognized in income |
|
|
|
Location of gain |
recognized in income |
||||||||
|
|
Location of gain |
on derivatives for the |
|
|
|
(loss) recognized |
on derivatives for the |
||||||||
|
|
recognized |
six-month periods |
|
Hedged items in |
|
in income on |
six-month periods |
||||||||
|
|
in income on |
ended June 30, |
|
fair value hedge |
|
related hedged |
ended June 30, |
||||||||
|
|
derivatives |
2023 |
|
2022 |
|
relationships |
|
items |
2023 |
|
2022 |
||||
Derivatives in fair value hedging relationships |
|
|
|
|
|
|
|
|
|
|
|
|
|
|
|
|
Commodity futures |
|
Costs of goods sold |
$ |
2,275 |
|
$ |
13,281 |
|
Firm commitments |
|
Costs of goods sold |
$ |
113 |
|
$ |
(5,535) |
|
|
|
|
|
|
|
|
|
Inventory |
|
Costs of goods sold |
|
(129) |
|
|
(6,380) |
|
|
|
|
|
|
|
|
|
|
|
|
$ |
(16) |
|
$ |
(11,915) |
Derivatives not designated as hedging instruments |
|
|
|
|
|
|
|
|
|
|
|
|
|
|
|
|
Commodity futures |
|
Costs of goods sold |
$ |
7,249 |
|
$ |
16,170 |
|
|
|
|
|
|
|
|
|
Derivatives accounted for as fair value hedges had ineffectiveness resulting in gains of $348,000 and $10,000 during the three-month periods ended June 30, 2023, and 2022, respectively, and gains of $47,000 and $295,000 during the six-month periods ended June 30, 2023, and 2022, respectively. Gains excluded from hedge effectiveness testing of $1.4 million and $1.6 million decreased cost of goods sold during the three-month periods ended June 30, 2023, and 2022, respectively. Gains excluded from hedge effectiveness testing of $2.2 million and $1.1 million decreased cost of goods sold during the six months ended June 30, 2023, and 2022, respectively.
Derivatives accounted for as cash flow hedges resulted in net gains of $321,000 and net losses of $21.4 million recognized in other comprehensive income for the three-month periods ended June 30, 2023, and 2022, respectively, and net gains of $2.3 million and net losses of $3.2 million for the six-month periods ended June 30, 2023, and 2022, respectively. Net gains of $1.3 million and $2.6 million were reclassified from accumulated other comprehensive income for the three-month periods ended June 30, 2023, and 2022, respectively, and net gains of $2.1 million and net losses of $599,000 for the six-month periods ended June 30, 2023, and 2022, respectively. At June 30, 2023, the company expects to reclassify all $1.4 million of net gains on derivative instruments from accumulated other comprehensive income to earnings during the next 12 months due to the settlement of futures contracts. The maximum term over which the company is hedging its exposure to the variability of future cash flows for forecasted transactions is less than 12 months.
Note 6. Fair Value Measurements
Accounting standards provide a comprehensive framework for measuring fair value and sets forth a definition of fair value and establishes a hierarchy prioritizing the inputs to valuation techniques, giving the highest priority to quoted prices in active markets for identical assets and liabilities and the lowest priority to unobservable value inputs. Levels within the hierarchy are defined as follows:
| ● | Level 1—Unadjusted quoted prices for identical assets and liabilities in active markets; |
| ● | Level 2—Quoted prices for similar assets and liabilities in active markets (other than those included in Level 1) which are observable for the asset or liability, either directly or indirectly; and |
| ● | Level 3—Valuations derived from valuation techniques in which one or more significant inputs or significant value drivers are unobservable. |
11
Note 6. Fair Value Measurements (Continued)
The following table sets forth financial assets and liabilities measured at fair value on a recurring basis in the consolidated balance sheet and the respective levels to which the fair value measurements are classified within the fair value hierarchy as of June 30, 2023 and December 31, 2022 (in thousands):
|
|
|
|
|
|
|
|
|
|
|
|
|
|
|
|
Quoted Prices |
|
Significant |
|
|
|
||
|
|
|
|
in Active |
|
Other |
|
Significant |
|||
|
|
|
|
Markets for |
|
Observable |
|
Unobservable |
|||
|
|
|
|
Identical Assets |
|
Inputs |
|
Inputs |
|||
|
Total |
|
(Level 1) |
|
(Level 2) |
|
(Level 3) |
||||
June 30, 2023 |
|
|
|
|
|
|
|
|
|
|
|
Short-term investments |
$ |
611,701 |
|
$ |
- |
|
$ |
611,701 |
|
$ |
- |
Commodity futures – financial assets |
|
31,400 |
|
|
- |
|
|
31,400 |
|
|
- |
Commodity futures – financial liabilities |
|
16,377 |
|
|
- |
|
|
16,377 |
|
|
- |
|
|
|
|
|
|
|
|
|
|
|
|
December 31, 2022 |
|
|
|
|
|
|
|
|
|
|
|
Short-term investments |
$ |
628,215 |
|
$ |
- |
|
$ |
628,215 |
|
$ |
- |
Commodity futures – financial assets |
|
4,271 |
|
|
- |
|
|
4,271 |
|
|
- |
Commodity futures – financial liabilities |
|
7,388 |
|
|
- |
|
|
7,388 |
|
|
- |
The carrying amounts of financial instruments including cash and equivalents, and restricted cash approximate fair value (Level 1). The fair values of short-term investments and commodity futures contracts are estimated by the use of quoted market prices, estimates obtained from brokers, and other appropriate valuation techniques based on references available (Level 2). The fair value of long-term debt, including current maturities, as determined by quoted market prices (Level 2), was approximately $2.7 billion at June 30, 2023, and December 31, 2022, (with a corresponding carrying amount in the consolidated balance sheet of $3.1 billion at June 30, 2023 and December 31, 2022).
Note 7. Commitments and Contingencies
The company is involved in various routine litigation matters, including administrative proceedings, regulatory proceedings, governmental investigations, environmental matters, and commercial and construction contract disputes, none of which are expected to have a material impact on the company’s financial condition, results of operations, or liquidity.
Note 8. Segment Information
The company’s operations are primarily organized and managed by reportable operating segments, which are steel operations, metals recycling operations, and steel fabrication operations. The segment operations are more fully described in Note 1 to the consolidated financial statements. Operating segment performance and resource allocations are primarily based on operating results before income taxes. The accounting policies of the reportable segments are consistent with those described in Note 1 to the consolidated financial statements. Intra-segment sales and any related profits are eliminated in consolidation. Amounts included in the category “Other” are from subsidiary operations that are below the quantitative thresholds required for reportable segments and primarily consist of joint ventures, including the company’s newly announced aluminum flat roll mill and the company’s idled Minnesota ironmaking operations. Also included in “Other” are certain unallocated corporate accounts, such as the company’s senior unsecured credit facility, senior notes, certain other investments and certain profit sharing expenses.
The company’s segment results, including disaggregated revenue by segment to external, external non-United States, and other segment customers, are as follows (in thousands):
12
Note 8. Segment Information (Continued)
|
|
|
|
|
|
|
|
|
|
|
|
|
|
|
|
|
|
|
|
|
|
|
|
Metals |
|
Steel |
|
|
|
|
|
|
|
|
|
||
For the three-month period ended |
|
Steel |
|
Recycling |
|
Fabrication |
|
|
|
|
|
|
|
|
|
|||
June 30, 2023 |
|
Operations |
|
Operations |
|
Operations |
|
Other |
|
Eliminations |
|
Consolidated |
||||||
|
|
|
|
|
|
|
|
|
|
|
|
|
|
|
|
|
|
|
Net sales - disaggregated revenue |
|
|
|
|
|
|
|
|
|
|
|
|
|
|
|
|
|
|
External |
|
$ |
3,123,476 |
|
$ |
368,561 |
|
$ |
779,374 |
|
$ |
259,963 |
|
$ |
- |
|
$ |
4,531,374 |
External Non-U.S. |
|
|
274,033 |
|
|
223,812 |
|
|
35 |
|
|
52,376 |
|
|
- |
|
|
550,256 |
Other segments |
|
|
210,724 |
|
|
575,752 |
|
|
189 |
|
|
269 |
|
|
(786,934) |
|
|
- |
|
|
|
3,608,233 |
|
|
1,168,125 |
|
|
779,598 |
|
|
312,608 |
|
|
(786,934) |
|
|
5,081,630 |
Operating income (loss) |
|
|
702,646 |
|
|
33,005 |
|
|
462,080 |
|
|
(120,811) |
(1) |
|
(13,185) |
|
|
1,063,735 |
Income (loss) before income taxes |
|
|
703,887 |
|
|
38,225 |
|
|
462,207 |
|
|
(116,407) |
|
|
(13,596) |
|
|
1,074,316 |
Depreciation and amortization |
|
|
81,590 |
|
|
20,761 |
|
|
2,422 |
|
|
6,197 |
|
|
- |
|
|
110,970 |
Capital expenditures |
|
|
101,806 |
|
|
25,259 |
|
|
7,138 |
|
|
224,077 |
|
|
- |
|
|
358,280 |
|
|
|
|
|
|
|
|
|
|
|
|
|
|
|
|
|
|
|
As of June 30, 2023 |
|
|
|
|
|
|
|
|
|
|
|
|
|
|
|
|
|
|
Assets |
|
$ |
8,802,562 |
|
$ |
1,418,244 |
|
$ |
1,148,279 |
|
$ |
3,357,423 |
(2) |
$ |
(175,111) |
(3) |
$ |
14,551,397 |
|
|
|
|
|
|
|
|
|
|
|
|
|
|
|
|
|
|
|
Footnotes related to the three-month period ended June 30, 2023, segment results (in millions): | ||||||||
|
|
|
|
|
|
|
|
|
(1) |
Corporate SG&A |
$ |
(22.6) |
|
(2) |
Cash and equivalents |
$ |
1,325.9 |
|
Companywide equity-based compensation |
|
(11.2) |
|
|
Short-term and other investments |
|
837.3 |
|
Company profit sharing component |
|
(88.0) |
|
|
Accounts receivable |
|
50.8 |
|
Other, net |
|
1.0 |
|
|
Inventories |
|
117.4 |
|
|
$ |
(120.8) |
|
|
Property, plant and equipment, net |
|
689.4 |
|
|
|
|
|
|
Intra-company debt |
|
35.7 |
|
|
|
|
|
|
Investments in unconsolidated affiliates |
|
231.5 |
|
|
|
|
|
|
Other |
|
69.4 |
|
|
|
|
|
|
|
$ |
3,357.4 |
|
|
|
|
|
|
|
|
|
(3) |
Elimination of intra-company receivables |
$ |
(104.8) |
|
|
|
|
|
|
Elimination of intra-company debt |
|
(35.7) |
|
|
|
|
|
|
Other |
|
(34.6) |
|
|
|
|
|
|
|
$ |
(175.1) |
|
|
|
|
|
13
Note 8. Segment Information (Continued)
|
|
|
|
|
|
|
|
|
|
|
|
|
|
|
|
|
|
|
|
|
|
|
|
Metals |
|
Steel |
|
|
|
|
|
|
|
|
|
||
For the three-month period ended |
|
Steel |
|
Recycling |
|
Fabrication |
|
|
|
|
|
|
|
|
|
|||
June 30, 2022 |
|
Operations |
|
Operations |
|
Operations |
|
Other |
|
Eliminations |
|
Consolidated |
||||||
|
|
|
|
|
|
|
|
|
|
|
|
|
|
|
|
|
|
|
Net sales - disaggregated revenue |
|
|
|
|
|
|
|
|
|
|
|
|
|
|
|
|
|
|
External |
|
$ |
3,929,646 |
|
$ |
476,093 |
|
$ |
1,085,710 |
|
$ |
330,574 |
|
$ |
- |
|
$ |
5,822,023 |
External Non-U.S. |
|
|
212,376 |
|
|
173,642 |
|
|
44 |
|
|
4,793 |
|
|
- |
|
|
390,855 |
Other segments |
|
|
104,594 |
|
|
706,247 |
|
|
4,444 |
|
|
372 |
|
|
(815,657) |
|
|
- |
|
|
|
4,246,616 |
|
|
1,355,982 |
|
|
1,090,198 |
|
|
335,739 |
|
|
(815,657) |
|
|
6,212,878 |
Operating income (loss) |
|
|
1,102,725 |
|
|
54,443 |
|
|
599,191 |
|
|
(162,194) |
(1) |
|
23,898 |
|
|
1,618,063 |
Income (loss) before income taxes |
|
|
1,086,795 |
|
|
53,446 |
|
|
596,763 |
|
|
(164,143) |
|
|
23,556 |
|
|
1,596,417 |
Depreciation and amortization |
|
|
73,962 |
|
|
13,021 |
|
|
2,433 |
|
|
6,285 |
|
|
- |
|
|
95,701 |
Capital expenditures |
|
|
135,864 |
|
|
15,199 |
|
|
4,569 |
|
|
8,510 |
|
|
- |
|
|
164,142 |
|
|
|
|
|
|
|
|
|
|
|
|
|
|
|
|
|
|
|
Footnotes related to the three-month period ended June 30, 2022, segment results (in millions): | ||||||||
|
|
|
|
|
|
|
|
|
(1) |
Corporate SG&A |
$ |
(12.7) |
|
|
|
|
|
|
Companywide equity-based compensation |
|
(8.8) |
|
|
|
|
|
|
Company profit sharing component |
|
(136.7) |
|
|
|
|
|
|
Other, net |
|
(4.0) |
|
|
|
|
|
|
|
$ |
(162.2) |
|
|
|
|
|
|
|
|
|
|
|
|
|
|
|
|
|
|
|
|
|
|
|
|
|
|
|
|
|
|
|
|
|
|
|
|
|
|
|
|
|
|
|
|
|
|
|
|
Metals |
|
Steel |
|
|
|
|
|
|
|
|
|
||
For the six-month period ended |
|
Steel |
|
Recycling |
|
Fabrication |
|
|
|
|
|
|
|
|
|
|||
June 30, 2023 |
|
Operations |
|
Operations |
|
Operations |
|
Other |
|
Eliminations |
|
Consolidated |
||||||
|
|
|
|
|
|
|
|
|
|
|
|
|
|
|
|
|
|
|
Net sales - disaggregated revenue |
|
|
|
|
|
|
|
|
|
|
|
|
|
|
|
|
|
|
External |
|
$ |
5,970,662 |
|
$ |
751,364 |
|
$ |
1,648,076 |
|
$ |
612,292 |
|
$ |
- |
|
$ |
8,982,394 |
External Non-U.S. |
|
|
487,668 |
|
|
424,477 |
|
|
101 |
|
|
80,196 |
|
|
- |
|
|
992,442 |
Other segments |
|
|
335,534 |
|
|
1,154,211 |
|
|
225 |
|
|
269 |
|
|
(1,490,239) |
|
|
- |
|
|
|
6,793,864 |
|
|
2,330,052 |
|
|
1,648,402 |
|
|
692,757 |
|
|
(1,490,239) |
|
|
9,974,836 |
Operating income (loss) |
|
|
1,044,406 |
|
|
72,693 |
|
|
1,013,352 |
|
|
(219,751) |
(1) |
|
(11,605) |
|
|
1,899,095 |
Income (loss) before income taxes |
|
|
1,046,387 |
|
|
83,774 |
|
|
1,013,619 |
|
|
(209,303) |
|
|
(12,372) |
|
|
1,922,105 |
Depreciation and amortization |
|
|
165,066 |
|
|
35,126 |
|
|
4,753 |
|
|
13,719 |
|
|
- |
|
|
218,664 |
Capital expenditures |
|
|
222,345 |
|
|
44,956 |
|
|
11,634 |
|
|
305,664 |
|
|
- |
|
|
584,599 |
|
|
|
|
|
|
|
|
|
|
|
|
|
|
|
|
|
|
|
|
|
|
|
|
|
|
|
|
Footnotes related to the six-month period ended June 30, 2023, segment results (in millions): | ||||||||
|
|
|
|
|
|
|
|
|
(1) |
Corporate SG&A |
$ |
(46.2) |
|
|
|
|
|
|
Companywide equity-based compensation |
|
(24.8) |
|
|
|
|
|
|
Company profit sharing component |
|
(156.9) |
|
|
|
|
|
|
Other, net |
|
8.1 |
|
|
|
|
|
|
|
$ |
(219.8) |
|
|
|
|
|
14
Note 8. Segment Information (Continued)
|
|
|
|
|
|
|
|
|
|
|
|
|
|
|
|
|
|
|
|
|
|
|
|
Metals |
|
Steel |
|
|
|
|
|
|
|
|
|
||
For the six-month period ended |
|
Steel |
|
Recycling |
|
Fabrication |
|
|
|
|
|
|
|
|
|
|||
June 30, 2022 |
|
Operations |
|
Operations |
|
Operations |
|
Other |
|
Eliminations |
|
Consolidated |
||||||
|
|
|
|
|
|
|
|
|
|
|
|
|
|
|
|
|
|
|
Net sales - disaggregated revenue |
|
|
|
|
|
|
|
|
|
|
|
|
|
|
|
|
|
|
External |
|
$ |
7,502,848 |
|
$ |
924,136 |
|
$ |
2,015,552 |
|
$ |
627,695 |
|
$ |
- |
|
$ |
11,070,231 |
External Non-U.S. |
|
|
401,670 |
|
|
305,224 |
|
|
183 |
|
|
5,472 |
|
|
- |
|
|
712,549 |
Other segments |
|
|
273,751 |
|
|
1,269,839 |
|
|
4,563 |
|
|
1,030 |
|
|
(1,549,183) |
|
|
- |
|
|
|
8,178,269 |
|
|
2,499,199 |
|
|
2,020,298 |
|
|
634,197 |
|
|
(1,549,183) |
|
|
11,782,780 |
Operating income (loss) |
|
|
2,265,735 |
|
|
99,403 |
|
|
1,066,066 |
|
|
(336,729) |
(1) |
|
18,455 |
|
|
3,112,930 |
Income (loss) before income taxes |
|
|
2,239,011 |
|
|
99,176 |
|
|
1,061,962 |
|
|
(363,772) |
|
|
17,770 |
|
|
3,054,147 |
Depreciation and amortization |
|
|
140,644 |
|
|
26,275 |
|
|
4,863 |
|
|
11,465 |
|
|
- |
|
|
183,247 |
Capital expenditures |
|
|
272,054 |
|
|
26,756 |
|
|
8,259 |
|
|
16,403 |
|
|
- |
|
|
323,472 |
|
|
|
|
|
|
|
|
|
|
|
|
|
|
|
|
|
|
|
|
|
|
|
|
|
|
|
|
Footnotes related to the six-month period ended June 30, 2022, segment results (in millions): | ||||||||
|
|
|
|
|
|
|
|
|
(1) |
Corporate SG&A |
$ |
(32.3) |
|
|
|
|
|
|
Companywide equity-based compensation |
|
(24.7) |
|
|
|
|
|
|
Company profit sharing component |
|
(262.3) |
|
|
|
|
|
|
Other, net |
|
(17.4) |
|
|
|
|
|
|
|
$ |
(336.7) |
|
|
|
|
|
15
ITEM 2. MANAGEMENT’S DISCUSSION AND ANALYSIS OF FINANCIAL CONDITION AND RESULTS OF OPERATIONS
Forward-Looking Statements
This report contains some predictive statements about future events, including statements related to conditions in domestic or global economies, conditions in steel, aluminum, and recycled metals market places, Steel Dynamics' revenues, costs of purchased materials, future profitability and earnings, and the operation of new, existing or planned facilities. These statements, which we generally precede or accompany by such typical conditional words as "anticipate", "intend", "believe", "estimate", "plan", "seek", "project", or "expect", or by the words "may", "will", or "should", are intended to be made as "forward-looking", subject to many risks and uncertainties, within the safe harbor protections of the Private Securities Litigation Reform Act of 1995. These statements speak only as of this date and are based upon information and assumptions, which we consider reasonable as of this date, concerning our businesses and the environments in which they operate. Such predictive statements are not guarantees of future performance, and we undertake no duty to update or revise any such statements. Some factors that could cause such forward-looking statements to turn out differently than anticipated include: (1) domestic and global economic factors; (2) global steelmaking overcapacity and imports of steel, together with increased scrap prices; (3) pandemics, epidemics, widespread illness or other health issues, such as COVID-19 or its variants; (4) the cyclical nature of the steel industry and the industries we serve; (5) volatility and major fluctuations in prices and availability of scrap metal, scrap substitutes and supplies, and our potential inability to pass higher costs on to our customers; (6) cost and availability of electricity, natural gas, oil, or other energy resources are subject to volatile market conditions; (7) increased environmental, greenhouse gas emissions and sustainability considerations or regulations; (8) compliance with and changes in environmental and remediation requirements; (9) significant price and other forms of competition from other steel and aluminum producers, scrap processors and alternative materials; (10) availability of an adequate source of supply of scrap for our metals recycling operations; (11) cybersecurity threats and risks to the security of our sensitive data and information technology; (12) the implementation of our growth strategy; (13) litigation and legal compliance; (14) unexpected equipment downtime or shutdowns; (15) governmental agencies may refuse to grant or renew some of our licenses and permits; (16) our senior unsecured credit facility contains, and any future financing agreements may contain, restrictive covenants that may limit our flexibility; and (17) the impacts of impairment charges.
More specifically, we refer you to our more detailed explanation of these and other factors and risks that may cause such predictive statements to turn out differently, as set forth in our most recent Annual Report on Form 10-K under the headings Special Note Regarding Forward-Looking Statements and Risk Factors for the year ended December 31, 2022, in our quarterly reports on Form 10-Q, or in other reports which we from time to time file with the Securities and Exchange Commission. These reports are available publicly on the Securities and Exchange Commission website, www.sec.gov, and on our website, www.steeldynamics.com under “Investors – SEC Filings.”
Description of the Business
We are one of the largest domestic steel producers and metal recyclers in the United States, based on estimated steelmaking and steel coating capacity of approximately 16 million tons and actual metals recycling volumes, with one of the most diversified product and end market portfolios in the domestic steel industry, combined with meaningful downstream steel fabrication operations. Our primary sources of revenue are from the manufacture and sale of steel products, the processing and sale of recycled ferrous and nonferrous metals, and the fabrication and sale of steel joists and deck products.
Operating Statement Classifications
Net Sales. Net sales from our operations are a factor of volumes shipped, product mix and related pricing. We charge premium prices for certain grades of steel, product dimensions, certain smaller volumes, and for value-added processing or coating of our steel products. Except for the steel fabrication operations, we recognize revenues from sales and the allowance for estimated returns and claims from these sales at the point in time control of the product transfers to the customer, upon shipment or delivery. Our steel fabrication operations recognize revenues over time based on completed fabricated tons to date as a percentage of total tons required for each contract.
16
Costs of Goods Sold. Our costs of goods sold represent all direct and indirect costs associated with the manufacture of our products. The principal elements of these costs are scrap and scrap substitutes (which represent the most significant single component of our consolidated costs of goods sold), steel substrate, direct and indirect labor and related benefits, alloys, zinc, transportation and freight, repairs and maintenance, utilities such as electricity and natural gas, and depreciation.
Selling, General and Administrative Expenses. Selling, general and administrative expenses consist of all costs associated with our sales, finance and accounting, and administrative departments, including, among other items, labor and related benefits, and professional services.
Companywide profit sharing and amortization of intangible assets are each separately presented in the statement of income.
Interest Expense, net of Capitalized Interest. Interest expense consists of interest associated with our senior credit facilities and other debt, net of interest costs that are required to be capitalized during the construction period of certain capital investment projects.
Other (Income) Expense, net. Other income consists of interest income earned on our temporary cash deposits, short-term and other investments, and any other non-operating income activity, including income from investments in unconsolidated affiliates accounted for under the equity method. Other expense consists of any non-operating costs, such as certain acquisition and financing expenses.
Results Overview
In the second quarter of 2023 we achieved quarterly steel shipments of 3.2 million tons, as steel demand remained strong, most notably in the automotive, construction, energy, and industrial sectors. Our metals recycling operations benefitted from continued steady domestic steel industry demand, while our steel fabrication segment again achieved historically strong results on continued solid non-residential construction demand.
Consolidated operating income decreased $554.3 million, or 34%, to $1.1 billion for the second quarter of 2023, compared to the second quarter of 2022. Second quarter 2023 net income attributable to Steel Dynamics, Inc. decreased $397.4 million, or 33%, to $812.1 million, compared to the second quarter of 2022, consistent with the decreased operating income.
Consolidated operating income decreased $1.2 billion, or 39%, to $1.9 billion for the first half of 2023, compared to the first half of 2022. First half 2023 net income attributable to Steel Dynamics, Inc. decreased $864.1 million to $1.4 billion, compared to the first half of 2022, consistent with the decreased operating income.
17
Segment Operating Results 2023 vs. 2022 (dollars in thousands)
|
|
|
|
|
|
|
|
|
|
|
|
|
|
|
|
|
Three Months Ended June 30, |
|
Six Months Ended June 30, |
||||||||||||
|
2023 |
|
% Change |
|
|
2022 |
|
2023 |
|
% Change |
|
2022 |
|||
Net sales: |
|
|
|
|
|
|
|
|
|
|
|
|
|
|
|
Steel Operations Segment |
$ |
3,608,233 |
|
(15)% |
|
$ |
4,246,616 |
|
$ |
6,793,864 |
|
(17)% |
|
$ |
8,178,269 |
Metals Recycling Operations Segment |
|
1,168,125 |
|
(14)% |
|
|
1,355,982 |
|
|
2,330,052 |
|
(7)% |
|
|
2,499,199 |
Steel Fabrication Operations Segment |
|
779,598 |
|
(28)% |
|
|
1,090,198 |
|
|
1,648,402 |
|
(18)% |
|
|
2,020,298 |
Other |
|
312,608 |
|
(7)% |
|
|
335,739 |
|
|
692,757 |
|
9% |
|
|
634,197 |
|
|
5,868,564 |
|
|
|
|
7,028,535 |
|
|
11,465,075 |
|
|
|
|
13,331,963 |
Intra-company |
|
(786,934) |
|
|
|
|
(815,657) |
|
|
(1,490,239) |
|
|
|
|
(1,549,183) |
|
$ |
5,081,630 |
|
(18)% |
|
$ |
6,212,878 |
|
$ |
9,974,836 |
|
(15)% |
|
$ |
11,782,780 |
|
|
|
|
|
|
|
|
|
|
|
|
|
|
|
|
Operating income (loss): |
|
|
|
|
|
|
|
|
|
|
|
|
|
|
|
Steel Operations Segment |
$ |
702,646 |
|
(36)% |
|
$ |
1,102,725 |
|
$ |
1,044,406 |
|
(54)% |
|
$ |
2,265,735 |
Metals Recycling Operations Segment |
|
33,005 |
|
(39)% |
|
|
54,443 |
|
|
72,693 |
|
(27)% |
|
|
99,403 |
Steel Fabrication Operations Segment |
|
462,080 |
|
(23)% |
|
|
599,191 |
|
|
1,013,352 |
|
(5)% |
|
|
1,066,066 |
Other |
|
(120,811) |
|
26% |
|
|
(162,194) |
|
|
(219,751) |
|
35% |
|
|
(336,729) |
|
|
1,076,920 |
|
|
|
|
1,594,165 |
|
|
1,910,700 |
|
|
|
|
3,094,475 |
Intra-company |
|
(13,185) |
|
|
|
|
23,898 |
|
|
(11,605) |
|
|
|
|
18,455 |
|
$ |
1,063,735 |
|
(34)% |
|
$ |
1,618,063 |
|
$ |
1,899,095 |
|
(39)% |
|
$ |
3,112,930 |
Steel Operations Segment |
Steel operations consist of our electric arc furnace steel mills, producing steel from ferrous scrap and scrap substitutes, utilizing continuous casting, automated rolling mills, numerous value-added downstream steel coating and processing operations, and distribution operations. Our steel operations sell directly to end-users, steel fabricators, and service centers. These products are used in numerous industry sectors, including the construction, automotive, manufacturing, transportation, heavy and agriculture equipment, and pipe and tube (including OCTG) markets. Steel operations accounted for 67% of our consolidated net sales during the three-month periods ended June 30, 2023 and 2022 and the six-month period ended June 30, 2022, and 65% during the six-month period ended June 30, 2023.
Steel Operations Segment Shipments (tons):
|
|
|
|
|
|
|
|
|
|
|
|
|
Three Months Ended June 30, |
|
Six Months Ended June 30, |
||||||||
|
2023 |
|
% Change |
|
2022 |
|
2023 |
|
% Change |
|
2022 |
|
|
|
|
|
|
|
|
|
|
|
|
Total shipments |
3,211,275 |
|
3% |
|
3,114,245 |
|
6,520,571 |
|
9% |
|
6,009,073 |
Intra-segment shipments |
(324,660) |
|
|
|
(355,720) |
|
(659,896) |
|
|
|
(741,009) |
Steel Operations Segment shipments |
2,886,615 |
|
5% |
|
2,758,525 |
|
5,860,675 |
|
11% |
|
5,268,064 |
|
|
|
|
|
|
|
|
|
|
|
|
External shipments |
2,703,031 |
|
0% |
|
2,691,918 |
|
5,536,500 |
|
9% |
|
5,101,681 |
18
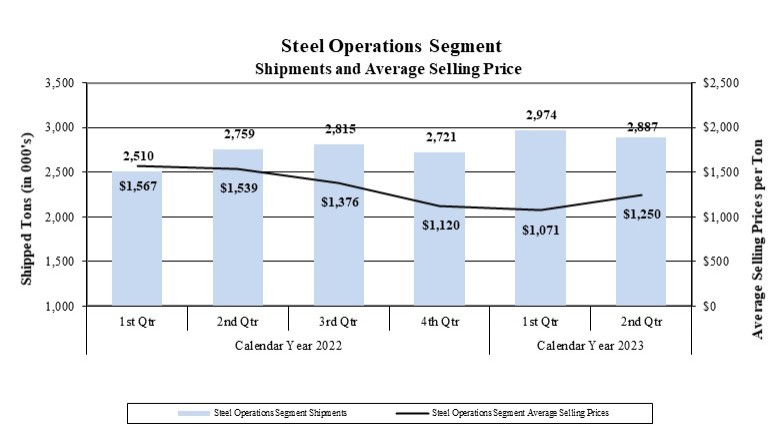
Steel Operations Segment Results 2023 vs. 2022
During the second quarter of 2023, our steel operations achieved consistent shipments of 3.2 million tons (2.9 million excluding intra-segment) with the sequential quarter, including 356,000 tons from Sinton. Steel order activity remained steady, with the automotive, construction, industrial and energy sectors continuing to lead demand. Sheet steel pricing was substantially lower than the second quarter of 2022, as prices steadily declined throughout 2022, but continued their upward trend during the first half of 2023. Second quarter 2023 total steel segment average selling prices decreased 19%, or $289 per ton, compared to second quarter of 2022. Steel operations segment shipments increased 5% in the second quarter 2023, as compared to the same period in 2022. Net sales for the steel operations in the second quarter 2023 decreased 15% compared to the same period in 2022, due to the decrease in average steel selling prices offsetting slightly increased shipments. Net sales for the steel operations decreased 17%, in the first half of 2023 when compared to the same period in 2022, again due to the decrease in average steel selling prices offsetting increased shipments.
Metallic raw materials used in our electric arc furnaces represent our single most significant steel manufacturing cost, generally comprising approximately 55% to 65% of our steel mill operations’ manufacturing costs. Our metallic raw material cost per net ton consumed in our steel operations decreased $94, or 18%, in the second quarter of 2023, compared to the same period in 2022, consistent with overall decreased domestic scrap pricing noted below in the metals recycling operations segment discussion. In the first half of 2023, our metallic raw material cost per ton decreased $79, or 16%, compared to the same period in 2022.
As a result of average selling prices decreasing more than scrap costs, specifically for sheet steel products, metal spread (which we define as the difference between average steel mill selling prices and the cost of ferrous scrap consumed in our steel mills) decreased 19% in the second quarter of 2023 compared to the second quarter of 2022. As a result of this metal spread compression, operating income for the steel operations decreased 36%, to $702.6 million, in the second quarter of 2023, compared to the same period in 2022. First half 2023 operating income decreased 54%, to $1.0 billion, compared to the first half of 2022 due primarily to a 29% decrease in metal spread.
19
Metals Recycling Operations Segment |
Metals recycling operations includes both ferrous and nonferrous scrap metal processing, transportation, marketing, brokerage, and scrap management services. Our steel mills utilize a large portion of the ferrous scrap sold by our metals recycling operations as raw material in our steelmaking operations, and the remainder is sold to other consumers, such as other steel manufacturers and foundries. In the second quarters of 2023 and 2022, 62% and 68%, respectively, of metals recycling operations ferrous scrap was sold to our own steel mills, while our steel mill utilization (excluding Sinton) was 93% and 95% in the second quarters of 2023 and 2022, respectively. Metals recycling operations accounted for 12% of our consolidated net sales during the three and six-month periods ended June 30, 2023, and 10% during the three and six-month periods ended June 30, 2022.
Metals Recycling Operations Segment Shipments:
|
|
|
|
|
|
|
|
|
|
|
|
|
Three Months Ended June 30, |
|
Six Months Ended June 30, |
||||||||
|
2023 |
|
% Change |
|
2022 |
|
2023 |
|
% Change |
|
2022 |
Ferrous metal (gross tons) |
|
|
|
|
|
|
|
|
|
|
|
Total |
1,520,164 |
|
12% |
|
1,358,729 |
|
2,972,985 |
|
13% |
|
2,623,951 |
Inter-company |
(942,185) |
|
2% |
|
(920,728) |
|
(1,827,603) |
|
5% |
|
(1,748,722) |
External shipments |
577,979 |
|
32% |
|
438,001 |
|
1,145,382 |
|
31% |
|
875,229 |
|
|
|
|
|
|
|
|
|
|
|
|
Nonferrous metals (thousands of pounds) |
|
|
|
|
|
|
|
|
|
|
|
Total |
279,763 |
|
5% |
|
266,781 |
|
565,600 |
|
7% |
|
527,671 |
Inter-company |
(35,403) |
|
|
|
(35,899) |
|
(80,509) |
|
|
|
(60,660) |
External shipments |
244,360 |
|
6% |
|
230,882 |
|
485,091 |
|
4% |
|
467,011 |
Metals Recycling Operations Segment Results 2023 vs. 2022
During the second quarter of 2023, our metals recycling operations continued its positive momentum from the first quarter, benefitting from modestly higher domestic steel industry demand, resulting in higher scrap shipments. Net sales decreased 14% during the second quarter of 2023 compared to the same period in 2022, driven by decreased average selling prices for both ferrous and nonferrous metals, which more than offset increased shipping volumes. Domestic steel mill utilization rates were approximately 76% in the second quarter of 2023, as compared to approximately 82% in the second quarter of 2022. Ferrous scrap average selling prices decreased 21% during the second quarter of 2023 compared to the same period in 2022, while average nonferrous scrap prices decreased 22%. Ferrous metal spreads (which we define as the difference between average selling prices and the cost of purchased scrap) decreased 28% during the second quarter of 2023 compared to the same period in 2022, while nonferrous metals spreads increased 43%. As a result of the compressed ferrous metals spreads, metals recycling operations operating income decreased 39% to $33.0 million in the second quarter of 2023 compared to the second quarter of 2022.
Net sales for our metals recycling operations in the first half of 2023 decreased 7% compared to the same period in 2022, driven by decreased pricing while shipments increased. Ferrous scrap average selling prices decreased 17% during the first half of 2023 compared to the same period in 2022, while nonferrous average selling prices decreased 14%. Ferrous and nonferrous shipments increased 13% and 7%, respectively, in the first half of 2023 compared to the first half of 2022. Ferrous metal spreads decreased 18%, while nonferrous metal spreads increased 16% in the first half of 2023 compared to the first half of 2022. Metals recycling operations operating income in the first half of 2023 of $72.7 million decreased 27% from the first half of 2022, as decreased ferrous metal spread more than offset increased shipments.
20
Steel Fabrication Operations Segment |
Steel fabrication operations include seven New Millennium Building Systems joist and deck plants located throughout the United States, and in Northern Mexico. Revenues from these plants are generated from the fabrication of steel joists, girders, trusses, and steel deck used within the non-residential construction industry. Steel fabrication operations accounted for 15% and 16% of our consolidated net sales during the three and six-month periods ended June 30, 2023, respectively, and 17% during the three and six-month periods ended June 30, 2022.
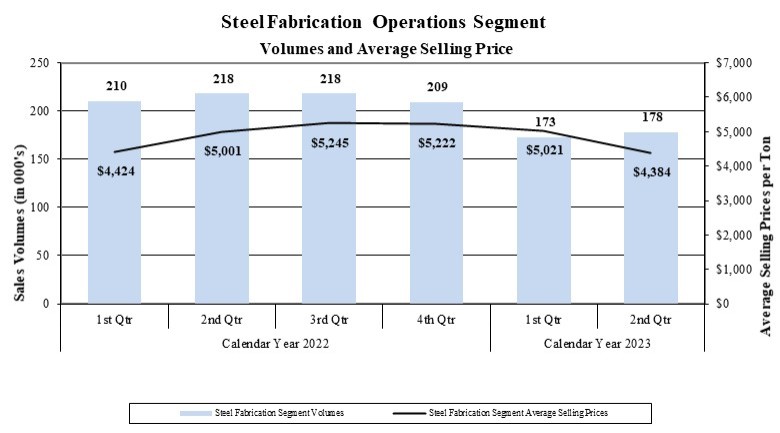
Steel Fabrication Operations Segment Results 2023 vs. 2022
Our steel fabrication operations continue to benefit from the solid non-residential construction market, as evidenced by a strong order backlog that extends into 2024. The continued onshoring of manufacturing, coupled with the robust U.S. infrastructure and Inflation Reduction Act programs and industrial build-outs, supports consistent strong demand. Net sales for the steel fabrication operations decreased 28% during the second quarter of 2023 compared to the same period in 2022, as average selling prices decreased $617 per ton, or 12%, while volume decreased 18%. Net sales for the segment decreased 18% during the first half of 2023, compared to the same period in 2022, as volume decreased 18%, and average selling prices were comparable year over year.
The purchase of various steel products is the largest single cost of production for our steel fabrication operations, historically representing approximately two-thirds of the total cost of manufacturing. The average cost per ton of steel consumed decreased 30% in the second quarter 2023, as compared to the same period in 2022. As a result of decreased selling prices per ton more than offsetting decreased steel input costs per ton, metal spread (which we define as the difference between average selling prices and the cost of purchased steel) decreased 3% in the second quarter of 2023 compared to the same period in 2022. This metal spread compression coupled with decreased volume, resulted in operating income decreasing 23% to $462.1 million in the second quarter 2023, compared to $599.2 million in the same period in 2022. For the first half of 2023, operating income decreased 50% to $1.0 billion compared to the first half of 2022, as a 16% increase in metal spread was more than offset by the 18% decrease in volume.
21
Other Operations |
Second Quarter Consolidated Results 2023 vs. 2022
Selling, General and Administrative Expenses. Selling, general and administrative expenses of $141.2 million during the second quarter of 2023 increased 19% from $118.4 million during the second quarter of 2022. Selling, general and administrative expenses represented 2.8% and 1.9% of net sales during second quarter 2023 and 2022, respectively.
Profit sharing expense during the second quarter of 2023 of $91.0 million decreased 35% from the $139.7 million during the same period in 2022, consistent with decreased pretax earnings. Profit sharing expense for eligible employees is 8% of consolidated pretax income excluding noncontrolling interests and other items.
Interest Expense, net of Capitalized Interest. During the second quarter of 2023, interest expense was $20.8 million, a decrease of $4.9 million compared to the second quarter of 2022. The lower interest expense in the second quarter 2023 compared to the same period in 2022 was due to higher capitalized interest in 2023 related to construction at our Sinton and Heartland divisions and the aluminum flat rolled products mill.
Other (Income) Expense, net. Net other income was $31.3 million in the second quarter of 2023, compared to $4.0 million in the second quarter of 2022, due primarily to an increase in interest income of $24.0 million associated with an increase in invested cash and short-term investments.
Income Tax Expense. Second quarter 2023 income tax expense of $258.1 million, at an effective income tax rate of 24.0%, decreased 32% compared to the $381.8 million, at an effective income tax rate of 23.9%, during the second quarter of 2022, consistent with decreased pretax earnings.
First Half Consolidated Results 2023 vs. 2022
Selling, General and Administrative Expenses. Selling, general and administrative expenses of $285.5 million during the first half of 2023 increased 6% from $270.4 million during the first half of 2022. Selling, general and administrative expenses represented 2.9% and 2.3% of net sales during first half of 2023 and 2022, respectively.
Profit sharing expense during the first half of 2023 of $160.6 million decreased 40% from the $268.2 million during the same period in 2022, consistent with decreased pretax earnings.
Other (Income) Expense, net. Net other income was $66.3 million in the first half of 2023, compared to expense of $16.4 million in the first half of 2022, due primarily to an increase in interest income of $49.4 million associated with an increase in our invested cash and short-term investments in the first half of 2023, as well as an increase in net earnings from investments in unconsolidated affiliates of $13.2 million.
Interest Expense, net of Capitalized Interest. During the first half of 2023, interest expense of $43.3 million increased 2% from $42.3 million during the first half of 2022.
Income Tax Expense. First half 2023 income tax expense of $461.6 million decreased 37% compared to the $732.1 million during the first half of 2022, at an effective income tax rate of 24.0% during both periods, consistent with decreased pretax earnings.
Liquidity and Capital Resources
Capital Resources and Long-term Debt. Our business is capital intensive and requires substantial expenditures for, among other things, the purchase and maintenance of equipment used in our operations, and to remain in compliance with environmental laws. Our short-term and long-term liquidity needs arise primarily from working capital requirements, capital expenditures, including expansion projects, principal and interest payments related to our outstanding indebtedness (no significant principal payments until 2024), dividends to our shareholders, and potential stock repurchases and acquisitions or investments.
22
We have met and intend to continue to meet these liquidity requirements primarily with available cash and cash provided by operations, long-term borrowings, and we also have availability under our unsecured Revolver. Our liquidity at June 30, 2023, is as follows (in thousands):
|
|
|
|
|
|
|
|
|
|
|
|
|
Cash and equivalents |
|
$ |
1,475,356 |
|
|
|
|
|
|
Short-term and other investments |
|
|
837,340 |
|
|
|
|
|
|
Revolver availability |
|
|
1,190,829 |
|
|
|
|
|
|
Total liquidity |
|
$ |
3,503,525 |
|
|
|
Our total outstanding debt of $3.1 billion is consistent with our total outstanding debt at December 31, 2022. Our total long-term debt to capitalization ratio (representing our long-term debt, including current maturities, divided by the sum of our long-term debt, redeemable noncontrolling interests, and our total stockholders’ equity) was 26.1% and 27.7% at June 30, 2023, and December 31, 2022, respectively.
Our unsecured credit agreement has a senior unsecured revolving credit facility (Facility), which provides a $1.2 billion unsecured Revolver. The unsecured Revolver is available to fund working capital, capital expenditures, and other general corporate purposes. The Facility contains financial covenants and other covenants pertaining to our ability to incur indebtedness and permit liens on certain assets. Our ability to borrow funds within the terms of the unsecured Revolver is dependent upon our continued compliance with the financial and other covenants. At June 30, 2023, we had $1.2 billion of availability on the Revolver, $9.2 million of outstanding letters of credit and other obligations which reduce availability, and there were no borrowings outstanding. Subsequent to June 30, the company entered into a new unsecured credit agreement, replacing the previous one, which has a senior unsecured credit facility (New Facility), which provides a $1.2 billion Revolver and matures in July 2028. Subject to certain conditions, we have the ability to increase the New Facility size by $500.0 million.
The financial covenants under our Facility state that we must maintain an interest coverage ratio of not less than 2.50:1.00. Our interest coverage ratio is calculated by dividing our last-twelve-months (LTM) consolidated Adjusted EBITDA as defined in the Facility (earnings before interest, taxes, depreciation, amortization, and certain other non-cash transactions as defined in the Facility) by our LTM gross interest expense, less amortization of financing fees. In addition, a debt to capitalization ratio of not more than 0.60:1.00 must be maintained. At June 30, 2023, our interest coverage ratio and debt to capitalization ratio were 43.08:1.00 and 0.26:1.00, respectively. We were, therefore, in compliance with these covenants at June 30, 2023, and we anticipate we will continue to be in compliance during the next twelve months.
Working Capital (representing excess of current assets over current liabilities). We generated cash flow from operations of $1.5 billion in the first half of 2023 compared to $1.8 billion in the same 2022 period. Working capital increased $31.3 million, or 11%, during the first half of 2023 to $5.6 billion at June 30, 2023, due primarily to a $289.2 million decrease in accrued payroll and benefits related to the payment of the 2022 company-wide profit sharing, partially offset by the current year’s accrual. Current assets decreased $242.0 million due to a decrease in cash and equivalents and inventories, partially offset by an increase in accounts receivable.
Capital Investments. During the first half of 2023, we invested $584.6 million in property, plant and equipment, primarily within our steel operations segment and previously announced aluminum flat roll mill, compared with $323.5 million invested during the same period in 2022. As announced in 2022, we plan to invest $2.5 billion in a new state-of-the-art low-carbon aluminum flat roll mill with two supporting satellite recycled aluminum slab centers, which is planned to be funded by available cash and cash flow from operations. Related expenditures began in the third quarter of 2022 and are expected to continue through 2025. We entered 2023 with ample liquidity of $3.4 billion and anticipate operating cash flow generation to provide for our planned 2023 capital requirements.
Cash Dividends. As a reflection of continued confidence in our current and future cash flow generation capability and financial position, we increased our quarterly cash dividend by 25% to $0.425 per share in the first quarter and continuing into the second quarter of 2023 (from $0.34 per share in 2022), resulting in declared cash dividends of $143.0 million during the first half of 2023, compared to $126.4 million during the same period in 2022. We paid cash dividends of $131.1 million and $115.0 million during the first half of 2023 and 2022, respectively.
23
Our board of directors, along with executive management, approves the payment of dividends on a quarterly basis. The determination to pay cash dividends in the future is at the discretion of our board of directors, after taking into account various factors, including our financial condition, results of operations, outstanding indebtedness, current and anticipated cash needs and growth plans.
Other. Our board of directors has authorized share repurchase programs during prior years, the most recent of which occurred in November 2022 for a program of up to $1.5 billion of the company’s common stock. Under the share repurchase programs, purchases take place as and when we determine in open market or private transactions made based upon the market price of our common stock, the nature of other investment opportunities or growth projects, our cash flows from operations, and general economic conditions. The share repurchase programs do not require us to acquire any specific number of shares, and may be modified, suspended, extended, or terminated by us at any time. The share repurchase programs do not have an expiration date. There were $734.2 million and $906.2 million of share repurchases during the first half of 2023 and 2022, respectively. As of June 30, 2023, we had $605.7 million remaining available to purchase under the November 2022 share repurchase program.
Our ability to meet our debt service obligations and reduce our total debt will depend upon our future performance which, in turn, will depend upon general economic, financial, and business conditions, along with competition, legislation and regulatory factors that are largely beyond our control. In addition, we cannot assure that our operating results, cash flows, access to credit markets and capital resources will be sufficient for repayment of our indebtedness in the future. We believe that based upon current levels of operations and anticipated growth, cash flows from operations, together with other available sources of funds, including borrowings under our Revolver, if necessary, will be adequate for the next twelve months for making required payments of principal and interest on our indebtedness, funding working capital requirements, and funding anticipated capital expenditures.
24
ITEM 3. QUANTITATIVE AND QUALITATIVE DISCLOSURES ABOUT MARKET RISK
Commodity Risk
In the normal course of business, we are exposed to the market risk and price fluctuations related to the sale of our products and to the purchase of raw materials used in our operations, such as metallic raw materials, electricity, natural gas and its transportation services, fuel, air products, zinc, and electrodes. Our risk strategy associated with product sales has generally been to obtain competitive prices for our products and to allow operating results to reflect market price movements dictated by supply and demand.
Our risk strategy associated with the purchase of raw materials utilized within our operations has generally been to make some commitments with suppliers relating to future expected requirements for some commodities such as electricity, water, natural gas and its transportation services, fuel, air products, zinc, and electrodes. Certain of these commitments contain provisions which require us to “take or pay” for specified quantities without regard to actual usage for periods of generally up to 5 years for physical commodity requirements and commodity transportation requirements, with some extending beyond, and for up to 15 years for air products and 29 years for water products. We utilized such “take or pay” requirements during the past three years under these contracts. We believe that production requirements will be such that consumption of the products or services purchased under these commitments will occur in the normal production process.
In our metals recycling and steel operations, we have certain fixed price contracts with various customers and suppliers for future delivery of nonferrous and ferrous metals. Our risk strategy has been to enter into base metal financial contracts with the goal to protect the profit margin, within certain parameters, that was contemplated when we entered into the transaction with the customer or vendor. At June 30, 2023, we had a cumulative unrealized gain associated with these financial contracts of $15 million, substantially all of which have a settlement date within the next twelve months. We believe the customer contracts associated with the financial contracts will be fully consummated.
ITEM 4. CONTROLS AND PROCEDURES
| (a) | Evaluation of Disclosure Controls and Procedures |
As required, we carried out an evaluation, under the supervision and with the participation of our principal executive officer and principal financial officer, of the effectiveness of our disclosure controls and procedures, as defined in rules 13a-15(e) and 15d-15(e) under the Securities Exchange Act of 1934, as amended (the Exchange Act). Based on this evaluation, our principal executive officer and principal financial officer concluded that, as of June 30, 2023, the end of the period covered by this quarterly report, our disclosure controls and procedures were designed to provide and were effective to provide reasonable assurance that the information required to be disclosed by us in the reports we file or submit under the Exchange Act is recorded, processed, summarized and reported within the time periods specified in the applicable rules and forms, and that it is accumulated and communicated to our management, including our principal executive and principal financial officers, as appropriate to allow timely decisions regarding required disclosure.
| (b) | Changes in Internal Controls Over Financial Reporting |
No changes in our internal control over financial reporting (as defined in Rules 13a-15(f) and 15d-15(f) under the Exchange Act) occurred during the fiscal quarter ended June 30, 2023, that has materially affected, or is reasonably likely to materially affect, our internal control over financial reporting.
25
PART II OTHER INFORMATION
ITEM 1. LEGAL PROCEEDINGS
We are involved in various litigation matters, including administrative proceedings, regulatory proceedings, governmental investigations, environmental matters, and commercial and construction contract disputes, none of which are currently expected to have a material impact on our financial condition, results of operations, or liquidity.
We may also be involved from time to time in various governmental investigations, regulatory proceedings or judicial actions seeking penalties, injunctive relief, and/or remediation under federal, state and local environmental laws and regulations. The United States EPA has conducted such investigations and proceedings involving us, in some instances along with state environmental regulators, under various environmental laws, including RCRA, CERCLA, the Clean Water Act and the Clean Air Act. Some of these matters have resulted in fines or penalties, exclusive of interest and costs, which did not exceed $1 million in aggregate, as of June 30, 2023.
ITEM 1A. RISK FACTORS
No material changes have occurred to the indicated risk factors as disclosed in our Annual Report on Form 10-K for the year ended December 31, 2022.
ITEM 2. UNREGISTERED SALES OF EQUITY SECURITIES AND USE OF PROCEEDS
(c) Issuer Purchases of Equity Securities
We purchased the following equity securities registered by us pursuant to Section 12 of the Exchange Act during the three-month period ended June 30, 2023.
Period |
|
Total Number of Shares Purchased |
|
Average Price Paid per Share |
|
Total Number of Shares Purchased as Part of Publicly Announced Programs (1) |
|
Maximum Dollar Value of Shares That May Yet be Purchased Under the Programs |
|||||
Quarter ended June 30, 2023 |
|
|
|
|
|
|
|
|
|
|
|
||
|
|
|
|
|
|
|
|
|
|
|
|
|
|
April 1 - 30 |
|
1,242,409 |
|
|
$ |
106.58 |
|
|
1,242,409 |
|
|
$ |
850,995 |
May 1 - 31 |
|
2,091,969 |
|
|
|
98.18 |
|
|
2,091,969 |
|
|
|
647,688 |
June 1 - 30 |
|
419,067 |
|
|
|
101.20 |
|
|
419,067 |
|
|
|
605,705 |
|
|
3,753,445 |
|
|
|
|
|
|
3,753,445 |
|
|
|
|
| (1) | In November 2022, our board of directors authorized a share repurchase program of up to $1.5 billion of our common stock. |
ITEM 3. DEFAULTS UPON SENIOR SECURITIES
None.
ITEM 4. MINE SAFETY DISCLOSURES
None.
26
ITEM 5. OTHER INFORMATION
During the three month period ended June 30, 2023, none of the Company’s directors or executive officers adopted, modified or terminated a “Rule 10b5-1 trading arrangement” or a “non-Rule 10b5-1 trading arrangement” as such terms are defined under Item 408 of Regulation S-K.
27
ITEM 6. EXHIBITS
Reference is made to the Exhibit Index preceding the signature page hereto, which Exhibit Index is hereby incorporated into this item.
28
EXHIBIT INDEX
Articles of Incorporation | |
|
|
3.1* |
|
|
|
3.2 |
|
|
|
Material Contracts | |
|
|
10.62† |
|
|
|
10.63 |
|
| |
Executive Officer Certifications | |
|
|
31.1* |
|
|
|
31.2* |
|
|
|
32.1* |
|
|
|
32.2* |
|
| |
XBRL Documents | |
|
|
101.INS* |
XBRL Instance Document - the instance document does not appear in the Interactive Data File because its XBRL tags are embedded within the Inline XBRL document. |
|
|
101.SCH* |
Inline XBRL Taxonomy Extension Schema Document |
|
|
101.CAL* |
Inline XBRL Taxonomy Extension Calculation Document |
|
|
101.DEF* |
Inline XBRL Taxonomy Definition Document |
|
|
101.LAB* |
Inline XBRL Taxonomy Extension Label Document |
|
|
101.PRE* |
Inline XBRL Taxonomy Presentation Document |
|
|
104* |
Cover Page Interactive Data File (formatted as Inline XBRL and contained in Exhibit 101) |
* |
Filed concurrently herewith |
† Indicates a management contract or compensatory plan or arrangement Pursuant to the requirements of the Securities Exchange Act of 1934, the registrant has duly caused this report to be signed on its behalf by the undersigned, thereunto duly authorized.
29
SIGNATURE
August 8, 2023 |
|
|
|
|
|
|
|
STEEL DYNAMICS, INC. |
|
|
|
|
By: |
/s/ Theresa E. Wagler |
|
|
Theresa E. Wagler |
|
|
Executive Vice President and Chief Financial Officer |
|
|
(Principal Financial Officer and Principal Accounting Officer) |
30
Exhibit 3.1
AMENDED AND RESTATED ARTICLES OF INCORPORATION
OF
STEEL DYNAMICS, INC.
The Articles of Incorporation of Steel Dynamics, Inc., pursuant to the provisions of the Indiana Business Corporation Law (“Act”), are hereby amended and restated in their entirety as follows:
ARTICLE I
NAME
The name of the Corporation is Steel Dynamics, Inc.
ARTICLE II
REGISTERED OFFICE AND REGISTERED AGENT
The address of the Corporation’s Registered Office in the State of Indiana is 7575 W. Jefferson Blvd., Fort Wayne, IN, 46804, USA. The name of its Registered Agent at such address is Anne Simerman.
ARTICLE III
PURPOSE
The purpose of the Corporation is to engage in any lawful act or activity for which corporations may be organized under the Act.
ARTICLE IV
AUTHORIZED SHARES
The total number of shares of capital stock which the Corporation has authority to issue is 900,000,000 shares of common stock, par value $0.0025 per share (“Common Stock”). The holders of the Common Stock shall be entitled to one (1) vote per share on all matters to be voted on by the Corporation’s shareholders. As and when dividends are declared or paid, the holders of Common Stock shall be entitled to participate in such dividends ratably on a per share basis. The holders of the Common Stock shall be entitled to participate ratably on a per share basis in all distributions to the holders to the Common Stock in any liquidation, dissolution or winding up of the Corporation.
ARTICLE V
DIRECTORS
The number of Directors may from time to time be fixed by the Bylaws. If the Bylaws do not fix the number of Directors, then the number of Directors shall be ten (10). Vacancies occurring in the Board of Directors shall be filled in the manner provided in the Bylaws, or if the Bylaws do not provide for the filling of vacancies, then in the manner provided by Indiana law.
ARTICLE VI
STOCKHOLDER MEETINGS
Meetings of stockholders shall be held at such place, within or without the State of Indiana, as may be designated by the Board of Directors.
ARTICLE VII
AMENDMENT OF ARTICLES OR BYLAWS
Section 1. Amendment of Articles. The Corporation reserves the right to amend, alter, change or repeal any provisions contained in these Amended and Restated Articles of Incorporation, in the manner now or hereafter prescribed by statute or by these Amended and Restated Articles of Incorporation, and all rights conferred upon stockholders herein are granted subject to that reservation.
Section 2. Amendment of Bylaws. The Corporation’s Bylaws may be made, altered, changed or repealed by action of either: (a) the Board of Directors, acting by the affirmative vote of a majority of the entire number of directors, or (b) the stockholders, acting by the affirmative vote of not less than a majority of the votes entitled to be cast by the holders of the outstanding shares entitled to vote thereon, at a meeting of the stockholders called, in whole or in part, for that purpose.
ARTICLE VIII
VALIDITY
In the event any provision (or portion thereof) of these Articles of Incorporation shall be found to be invalid, prohibited, or unenforceable for any reason, the remaining provisions (or portions thereof) of these Articles of Incorporation shall be deemed to remain in full force and effect, and shall be construed as if such invalid, prohibited, or unenforceable provision had been stricken here from or otherwise rendered inapplicable, it being the intent of the Corporation and its stockholders that each such remaining provision (or potion thereof) of these Articles of Incorporation remain, to the fullest extent permitted by applicable law, applicable and enforceable as to all stockholders, notwithstanding any such finding.
ARTICLE IX
INDEMNIFICATION
Section 1. Definitions. For purposes of this Article IX, the following definitions shall apply:
(a)Corporation. The “Corporation” shall include the Corporation and any domestic or foreign predecessor entity of the Corporation in a merger or other transaction in which the predecessor’s existence ceased upon consummation of the transaction.
(b)Director. “Director” means an individual who is or was a director of the Corporation or an individual who, while a director of the Corporation, is or was serving at the Corporation’s request as a director, officer, partner, trustee, employee, or agent of another foreign or domestic corporation, partnership, joint venture, trust, employee benefit plan, or other enterprise, whether for profit or not. A director is considered to be serving an employee benefit plan at the Corporation’s request if the director’s duties to the Corporation also impose duties on, or otherwise involve services by, the director to the plan or to participants in or beneficiaries of the plan. “Director” includes, unless the context requires otherwise, the estate or personal representative of a director.
(c)Officer. “Officer” means an individual who is or was an officer of the Corporation or an individual who, while an officer of the Corporation, is or was serving at the Corporation’s request as a director, officer, partner, trustee, employee, or agent of another foreign or domestic corporation, partnership, joint venture, trust, employee benefit plan, or other enterprise, whether for profit or not. An officer is considered to be serving an employee benefit plan at the Corporation’s request if the officer’s duties to the Corporation also impose duties on, or otherwise involve services by, the officer to the plan or to participants in or beneficiaries of the plan. “Officer” includes, unless the context requires otherwise, the estate or personal representative of an officer.
(d)Expenses. “Expenses” include counsel fees.
(e)Liability. “Liability” means the obligation to pay a judgment, settlement, penalty, fine (including an excise tax assessed with respect to an employee benefit plan), or reasonable expenses incurred with respect to a proceeding.
(f)Official Capacity. “Official capacity” means:
(1)when used with respect to a director, the office of director in the Corporation; and
(2)when used with respect to an officer, the office in the Corporation held by the officer. “Official capacity” does not include service for any other foreign or domestic corporation or any partnership, joint venture, trust, employee benefit plan, or other enterprise, whether for profit or not.
(g)Party. “Party” includes an individual who was, is, or is threatened to be made a named defendant or respondent in a proceeding.
(h)Proceeding. “Proceeding” means any threatened, pending, or completed action, suit, or proceeding, whether civil, criminal, administrative, or investigative and whether formal or informal.
Section 2. Mandatory Indemnification. The Corporation shall indemnify a director who was wholly successful, on the merits or otherwise, in the defense of any proceeding to which the director was a party because the director is or was a director of the Corporation against reasonable expenses incurred by the director in connection with the proceeding.
Section 3. Other Indemnification.
(a)Without limiting the provisions of Section 2, the Corporation shall indemnify an individual made a party to a proceeding because the individual is or was a director against liability incurred in the proceeding if:
(1)the individual’s conduct was in good faith; and
(2)the individual reasonably believed:
(A)in the case of conduct in the individual’s official capacity with the Corporation, that the individual’s conduct was in its best interests; and
(B)in all other cases, that the individual’s conduct was at least not opposed to its best interests; and
(3)in the case of any criminal proceeding, the individual either:
(A)had reasonable cause to believe the individual’s conduct was lawful; or
(B)had no reasonable cause to believe the individual’s conduct was unlawful.
(b)A director’s conduct with respect to an employee benefit plan for a purpose the director reasonably believed to be in the interests of the participants in and beneficiaries of the plan is conduct that satisfies the requirement of subsection (a)(2)(B).
(c)The termination of a proceeding by judgment, order, settlement, conviction, or upon a plea of nolo contendere or its equivalent is not, of itself, determinative that the director did not meet the standard of conduct described in this section.
Section 4. Advancement of Expenses.
(a)The Corporation may pay for or reimburse the reasonable expenses incurred by a director who is a party to a proceeding in advance of final disposition of the proceeding if:
(1)the director furnishes the Corporation a written affirmation of the director’s good faith belief that the director has met the standard of conduct described in Section 3 of this Article;
(2)the director furnishes the Corporation a written undertaking, executed personally or on the director’s behalf, to repay the advance if it is ultimately determined that the director did not meet the standard of conduct; and
(3)a determination is made that the facts then known to those making the determination would not preclude indemnification under this Article.
(b)The undertaking required by Subsection (a)(2) must be an unlimited general obligation of the director but need not be secured and may be accepted without reference to financial ability to make repayment.
(c)Determinations and authorizations of payments under this Section shall be made in the manner specified in Section 6 of this Article.
Section 5. Application to Court. A director of the Corporation who is a party to a proceeding may apply for indemnification to the court conducting the proceeding or to another court of competent jurisdiction. On receipt of an application, the court after giving any notice the court considers necessary may order indemnification if it determines:
(1)the director is entitled to mandatory indemnification under Section 2 of this Article, in which case the court shall also order the Corporation to pay the director’s reasonable expenses incurred to obtain court-ordered indemnification; or
(2)the director is fairly and reasonably entitled to indemnification in view of all the relevant circumstances, whether or not the director met the standard of conduct set forth in Section 3 of this Article.
Section 6. Determination and Authorization.
(a)The Corporation may not indemnify a director under Section 3 of this Article unless authorized in the specific case after a determination has been made that indemnification of the director is permissible in the circumstances because the director has met the standard of conduct set forth in Section 3 of this Article.
(b)The determination shall be made by any one (1) of the following procedures:
(1)By the Board of Directors by majority vote of a quorum consisting of directors not at the time parties to the proceeding.
(2)If a quorum cannot be obtained under subdivision (1), by majority vote of a committee duly designated by the Board of Directors (in which designation directors who are parties may participate), consisting solely of two (2) or more directors not at the time parties to the proceeding.
(3)By special legal counsel:
(A)selected by the board of directors or its committee in the manner prescribed in subdivision (1) or (2); or
(B)if a quorum of the Board of Directors cannot be obtained under subdivision (1) and a committee cannot be designated under subdivision (2), selected by majority vote of the full Board of Directors (in which selection directors who are parties may participate).
(4)By the shareholders, but shares owned by or voted under the control of directors who are at the time parties to the proceeding may not be voted on the determination.
(c)Authorization of indemnification and evaluation as to reasonableness of expenses shall be made in the same manner as the determination that indemnification is permissible, except that if the determination is made by special legal counsel, authorization of indemnification and evaluation as to reasonableness of expenses shall be made by those entitled under Subsection (b)(3) to select counsel.
Section 7. Indemnification of Officers.
(1)An officer of the Corporation, whether or not a director, is entitled to mandatory indemnification under Section 2 of this Article, and to the indemnification under Section 3, and is entitled to apply for court-ordered indemnification under Section 5 of this Article, in each case to the same extent as a director; and
(2)the Corporation may indemnify and advance expenses under this Article to an officer, whether or not a director, to the same extent as to a director.
Section 8. Insurance. The Corporation may purchase and maintain insurance on behalf of an individual who is or was a director, officer, employee, or agent of the Corporation, or who, while a director, officer, employee, or agent of the Corporation, is or was serving at the request of the Corporation as a director, officer, partner, trustee, employee, or agent of another foreign or domestic corporation, partnership, joint venture, trust, employee benefit plan, or other enterprise, against liability asserted against or incurred by the individual in that capacity or arising from the individual’s status as a director, officer, employee, or agent, whether or not the Corporation would have power to indemnify the individual against the same liability under Sections 2 or 3 of this Article.
Section 9. Miscellaneous.
(a)The indemnification and advance for expenses provided for or authorized by this Article does not exclude any other rights to indemnification and advance for expenses that a person may have under:
(1)the Corporation’s Bylaws;
(2)a resolution of the Board of Directors or of the shareholders; or
(3)any other authorization, whenever adopted, after notice, by a majority vote of all the voting shares then issued and outstanding.
(b)This Article does not limit the Corporation’s power to pay or reimburse expenses incurred by a director, officer, employee, or agent in connection with the person’s appearance as a witness in a proceeding at a time when the person has not been made a named defendant or respondent to the proceeding.
(c)The rights of indemnification herein provided shall be severable, shall continue as to a person who has ceased to serve as a director or officer and shall inure to the benefit of the heirs, executors, administrators and other legal representatives of such person.
(d)Subject to the limitations above imposed in this Article, it is intended by this Article to grant indemnification to the full extent permissible under the law. It is not intended, however, that the provisions of this indemnification shall be applicable to, and this Article is not to be construed as granting indemnity with respect to, matters as to which indemnification would be in contravention of the laws of the State of Indiana or the United States of America whether as a matter of public policy or pursuant to any statutory provision.
ARTICLE X
ELECTION OF DIRECTORS
At each annual meeting of stockholders, the Directors to be elected at the meeting shall be chosen by the majority of the votes cast by the holders of outstanding shares entitled to vote in the election at the meeting, provided a quorum is present; provided, however, that if the number of nominees exceeds the number of Directors to be elected, then Directors shall be elected by the vote of a plurality of the votes cast by the holders of outstanding shares entitled to vote in the election at the meeting, provided a quorum is present. For purposes of this Article X, a “majority of votes cast” shall mean that the number of votes cast “for” a Director’s election exceeds the number of votes cast “against” that Director’s election.
The undersigned, being the President of the Corporation, executes these Amended and Restated Articles of Incorporation and verifies that the facts contained herein are true this 9th day of September, 1996.
/s/ Keith E. Busse |
|
Keith E. Busse, President |
|
EXHIBIT 31.1
CERTIFICATION PURSUANT TO SECTION 302 OF THE
SARBANES-OXLEY ACT OF 2002
I, Mark D. Millett, certify that:
1. I have reviewed this quarterly report for the period ended June 30, 2023, on Form 10-Q of Steel Dynamics, Inc.;
2. Based on my knowledge, this report does not contain any untrue statement of a material fact or omit to state a material fact necessary to make the statements made, in light of the circumstances under which such statements were made, not misleading with respect to the period covered by this report;
3. Based on my knowledge, the financial statements, and other financial information included in this report, fairly present in all material respects the financial condition, results of operations and cash flows of the registrant as of, and for, the periods presented in this report;
4. The registrant’s other certifying officer and I are responsible for establishing and maintaining disclosure controls and procedures (as defined in Exchange Act Rules 13a-15(e) and 15d-15(e)) and internal control over financial reporting (as defined in Exchange Act Rules 13a-15(f) and 15d-15(f)) for the registrant and have:
(a) Designed such disclosure controls and procedures, or caused such disclosure controls and procedures to be designed under our supervision, to ensure that material information relating to the registrant, including its consolidated subsidiaries, is made known to us by others within those entities, particularly during the period in which this report is being prepared;
(b) Designed such internal control over financial reporting, or caused such internal control over financial reporting to be designed under our supervision, to provide reasonable assurance regarding the reliability of financial reporting and the preparation of financial statements for external purposes in accordance with generally accepted accounting principles;
(c) Evaluated the effectiveness of the registrant’s disclosure controls and procedures and presented in this report our conclusions about the effectiveness of the disclosure controls and procedures, as of the end of the period covered by this report based on such evaluation; and
(d) Disclosed in this report any change in the registrant’s internal control over financial reporting that occurred during the registrant’s most recent fiscal quarter (the registrant’s fourth fiscal quarter in the case of an annual report) that has materially affected, or is reasonably likely to materially affect, the registrant’s internal control over financial reporting; and
5. The registrant’s other certifying officer and I have disclosed, based on our most recent evaluation of internal control over financial reporting, to the registrant’s auditors and the audit committee of the registrant’s board of directors (or persons performing the equivalent functions):
(a) All significant deficiencies and material weaknesses in the design or operation of internal control over financial reporting which are reasonably likely to adversely affect the registrant’s ability to record, process, summarize and report financial information; and
(b) Any fraud, whether or not material, that involves management or other employees who have a significant role in the registrant’s internal control over financial reporting.
/s/ Mark D. Millett |
|
Mark D. Millett |
|
Chairman and Chief Executive Officer |
|
(Principal Executive Officer) |
|
|
August 8, 2023 |
|
EXHIBIT 31.2
CERTIFICATION PURSUANT TO SECTION 302 OF THE
SARBANES-OXLEY ACT OF 2002
I, Theresa E. Wagler, certify that:
1. I have reviewed this quarterly report for the period ended June 30, 2023, on Form 10-Q of Steel Dynamics, Inc.;
2. Based on my knowledge, this report does not contain any untrue statement of a material fact or omit to state a material fact necessary to make the statements made, in light of the circumstances under which such statements were made, not misleading with respect to the period covered by this report;
3. Based on my knowledge, the financial statements, and other financial information included in this report, fairly present in all material respects the financial condition, results of operations and cash flows of the registrant as of, and for, the periods presented in this report;
4. The registrant’s other certifying officer and I are responsible for establishing and maintaining disclosure controls and procedures (as defined in Exchange Act Rules 13a-15(e) and 15d-15(e)) and internal control over financial reporting (as defined in Exchange Act Rules 13a-15(f) and 15d-15(f)) for the registrant and have:
(a) Designed such disclosure controls and procedures, or caused such disclosure controls and procedures to be designed under our supervision, to ensure that material information relating to the registrant, including its consolidated subsidiaries, is made known to us by others within those entities, particularly during the period in which this report is being prepared;
(b) Designed such internal control over financial reporting, or caused such internal control over financial reporting to be designed under our supervision, to provide reasonable assurance regarding the reliability of financial reporting and the preparation of financial statements for external purposes in accordance with generally accepted accounting principles;
(c) Evaluated the effectiveness of the registrant’s disclosure controls and procedures and presented in this report our conclusions about the effectiveness of the disclosure controls and procedures, as of the end of the period covered by this report based on such evaluation; and
(d) Disclosed in this report any change in the registrant’s internal control over financial reporting that occurred during the registrant’s most recent fiscal quarter (the registrant’s fourth fiscal quarter in the case of an annual report) that has materially affected, or is reasonably likely to materially affect, the registrant’s internal control over financial reporting; and
5. The registrant’s other certifying officer and I have disclosed, based on our most recent evaluation of internal control over financial reporting, to the registrant’s auditors and the audit committee of the registrant’s board of directors (or persons performing the equivalent functions):
(a) All significant deficiencies and material weaknesses in the design or operation of internal control over financial reporting which are reasonably likely to adversely affect the registrant’s ability to record, process, summarize and report financial information; and
(b) Any fraud, whether or not material, that involves management or other employees who have a significant role in the registrant’s internal control over financial reporting.
/s/ Theresa E. Wagler |
|
Theresa E. Wagler |
|
Executive Vice President and Chief Financial Officer |
|
(Principal Financial Officer and Principal Accounting Officer) |
|
August 8, 2023 |
|
EXHIBIT 32.1
Chief Executive Officer Certification
Pursuant to 18 U.S.C. Section 1350, as Adopted Pursuant to
Section 906 of the Sarbanes-Oxley Act of 2002
In connection with the Quarterly Report of Steel Dynamics, Inc. (the “Company”) on Form 10-Q for the period ended June 30, 2023 (the “Report”), as filed with the Securities and Exchange Commission on the date hereof, I, Mark D. Millett, Chairman and Chief Executive Officer of Steel Dynamics, Inc., certify, pursuant to 18 U.S.C. § 1350, as adopted pursuant to Section 906 of the Sarbanes-Oxley Act of 2002, that:
1. The Report fully complies with the requirements of Section 13(a) or 15(d) of the Securities Exchange Act of 1934; and
2. The information contained in the Report fairly presents, in all material respects, the financial condition and results of operations of the Company.
/s/ Mark D. Millett |
|
Mark D. Millett |
|
Chairman and Chief Executive Officer |
|
(Principal Executive Officer) |
|
August 8, 2023 |
|
A signed original of this written statement required by Section 906 has been provided to Steel Dynamics, Inc. and will be retained by Steel Dynamics, Inc. and furnished to the Securities and Exchange Commission or its staff upon request.
EXHIBIT 32.2
Chief Financial Officer Certification
Pursuant to 18 U.S.C. Section 1350, as Adopted Pursuant to
Section 906 of the Sarbanes-Oxley Act of 2002
In connection with the Quarterly Report of Steel Dynamics, Inc. (the “Company”) on Form 10-Q for the period ended June 30, 2023 (the “Report”), as filed with the Securities and Exchange Commission on the date hereof, I, Theresa E. Wagler, Executive Vice President and Chief Financial Officer of Steel Dynamics, Inc., certify, pursuant to 18 U.S.C. § 1350, as adopted pursuant to Section 906 of the Sarbanes-Oxley Act of 2002, that:
1. The Report fully complies with the requirements of Section 13(a) or 15(d) of the Securities Exchange Act of 1934; and
2. The information contained in the Report fairly presents, in all material respects, the financial condition and results of operations of the Company.
/s/ Theresa E. Wagler |
|
Theresa E. Wagler |
|
Executive Vice President and Chief Financial Officer |
|
(Principal Financial Officer and Principal Accounting Officer) |
|
August 8, 2023 |
|
A signed original of this written statement required by Section 906 has been provided to Steel Dynamics, Inc. and will be retained by Steel Dynamics, Inc. and furnished to the Securities and Exchange Commission or its staff upon request.