UNITED STATES
SECURITIES AND EXCHANGE COMMISSION
Washington, DC 20549
FORM 6-K
REPORT OF FOREIGN PRIVATE ISSUER
PURSUANT TO RULE 13a-16 OR 15d-16
UNDER THE SECURITIES EXCHANGE ACT OF 1934
For the month of August, 2023.
Commission File Number 001-38755
Suzano S.A.
(Exact name of registrant as specified in its charter)
SUZANO INC.
(Translation of Registrant’s Name into English)
Av. Professor Magalhaes Neto, 1,752
10th Floor, Rooms 1010 and 1011
Salvador, Brazil 41 810-012
(Address of principal executive office)
Indicate by check mark whether the registrant files or will file annual reports under cover of Form 20-F or Form 40-F.
Form 20-F ⌧ Form 40-F ◻
Indicate by check mark if the registrant is submitting the Form 6-K in paper as permitted by Regulation S-T Rule 101(b)(1): ◻
Indicate by check mark if the registrant is submitting the Form 6-K in paper as permitted by Regulation S-T Rule 101(b)(7): ◻ Pursuant to the requirements of the Securities Exchange Act of 1934, the registrant has duly caused this report to be signed on its behalf by the undersigned, thereunto duly authorized.
SIGNATURE
Date: August 3, 2023
|
|
SUZANO S.A. |
|
|
|
|
By: |
/s/ Marcelo Feriozzi Bacci |
|
Name: |
Marcelo Feriozzi Bacci |
|
Title: |
Chief Financial and Investor Relations Officer |
3
|
Earnings Conference Call 2Q23 |
|
Disclaimer 2 This presentation contains what are considered “forward-looking statements,” as defined in Section 27A of the 1933 Securities Act and Section 21E of the 1934 Securities Exchange Act, as amended. Some of these forward-looking statements are identified with words such as “believe,” “may,” “could,” “would,” “possible,” “will,” “should,” “expect,” “intend,” “plan,” “anticipate,” “estimate,” “potential,” “outlook” or “continue,” as well as the negative forms of these words, other terms of similar meaning or the use of future dates. The forward-looking statements include, without limitation, statements related to the declaration or payment of dividends, implementation of the key operational and financial strategies and investment plans, guidance about future operations and factors or trends that influence the financial situation, liquidity or operational results. Such statements reflect the current view of the management and are subject to diverse risks and uncertainties. These are qualified in accordance with the inherent risks and uncertainties involving future expectations in general, and actual results could differ materially from those currently anticipated due to various risks and uncertainties. There is no guarantee that the expected events, trends or results will actually occur. The statements are based on diverse assumptions and factors, including general economic and market conditions, industry conditions and operating factors. Any changes in such assumptions or factors could cause actual results to differ materially from current expectations. Suzano does not undertake any obligation to update any such forward-looking statements as a result of new information, future events or otherwise, except as expressly required by law. All forward-looking statements in this presentation are covered in their entirety by this disclaimer. In addition, this presentation contains some financial indicators that are not recognized by the BR GAAP or IFRS. These indicators do not have a standard meaning and may not be comparable to indicators with a similar description used by other companies. We provide these indicators because we use them as measurements of Suzano's performance; they should not be considered separately or as a replacement for other financial metrics that have been disclosed in accordance with BR GAAP or IFRS. |
|
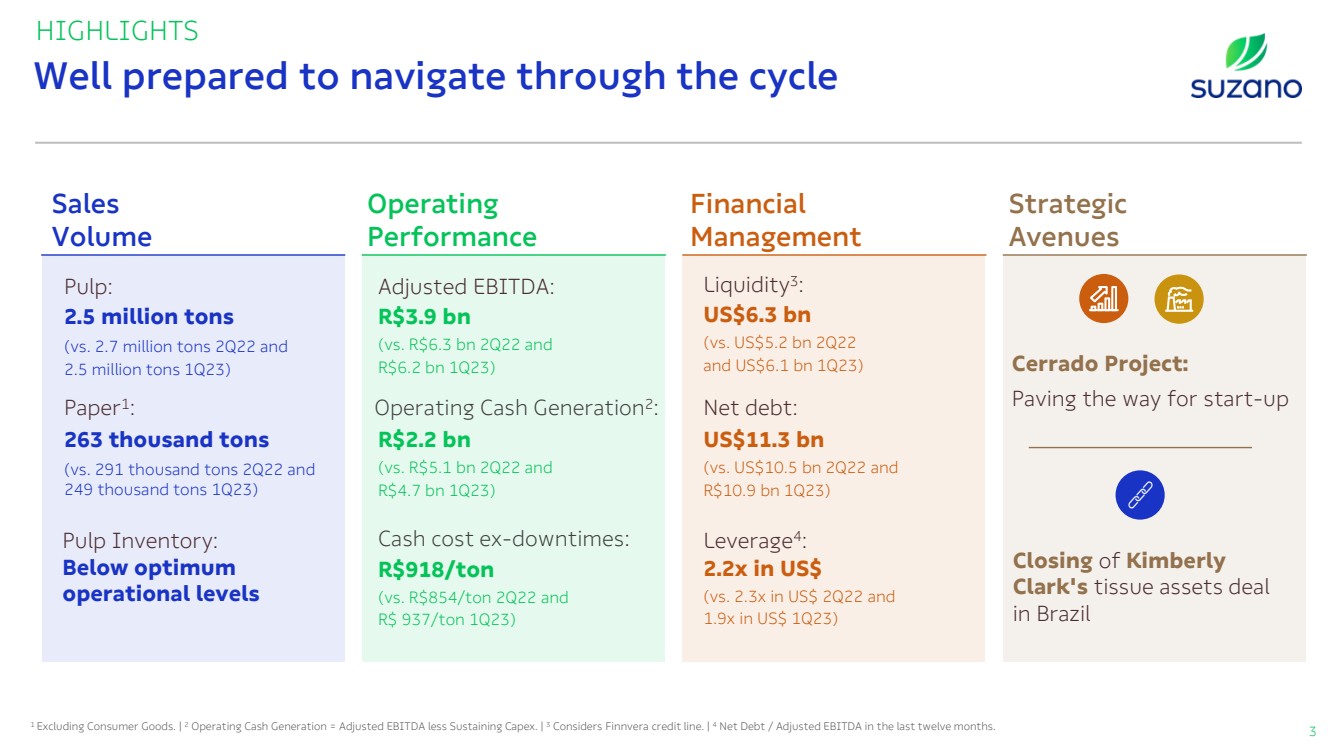
Well prepared to navigate through the cycle 3 HIGHLIGHTS Adjusted EBITDA: Liquidity3 : 1 Excluding Consumer Goods. | 2 Operating Cash Generation = Adjusted EBITDA less Sustaining Capex. | 3 Considers Finnvera credit line. | 4 Net Debt / Adjusted EBITDA in the last twelve months. Sales Volume Financial Management Operating Performance 2.5 million tons (vs. 2.7 million tons 2Q22 and 2.5 million tons 1Q23) Pulp: 263 thousand tons (vs. 291 thousand tons 2Q22 and 249 thousand tons 1Q23) Paper1 : Pulp Inventory: Below optimum operational levels Operating Cash Generation2 : Cash cost ex-downtimes: R$3.9 bn (vs. R$6.3 bn 2Q22 and R$6.2 bn 1Q23) R$2.2 bn (vs. R$5.1 bn 2Q22 and R$4.7 bn 1Q23) R$918/ton (vs. R$854/ton 2Q22 and R$ 937/ton 1Q23) US$11.3 bn (vs. US$10.5 bn 2Q22 and R$10.9 bn 1Q23) Leverage4 : US$6.3 bn (vs. US$5.2 bn 2Q22 and US$6.1 bn 1Q23) Net debt: 2.2x in US$ (vs. 2.3x in US$ 2Q22 and 1.9x in US$ 1Q23) Strategic Avenues Closing of Kimberly Clark's tissue assets deal in Brazil Cerrado Project: Paving the way for start-up |
|
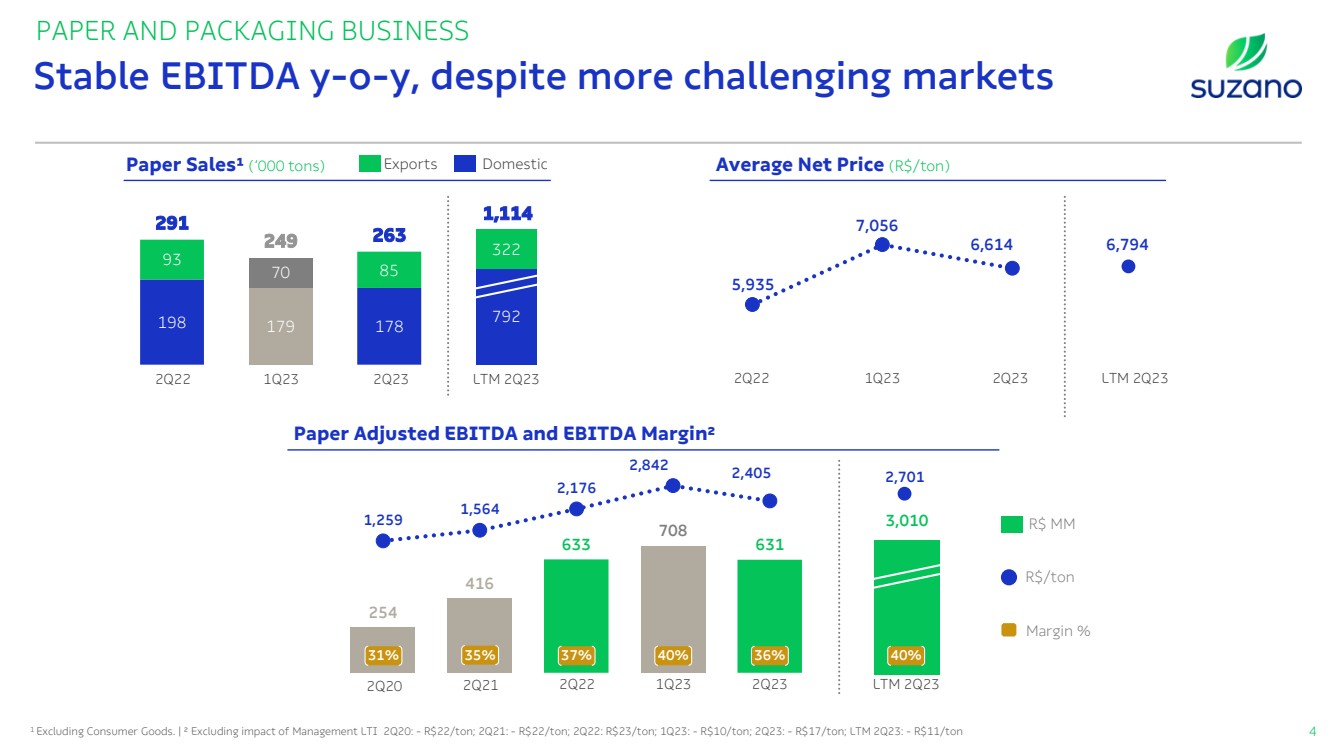
3,010 6,794 5,935 7,056 6,614 1,259 1,564 2,176 2,842 2,405 PAPER AND PACKAGING BUSINESS Paper Sales¹ (‘000 tons) Average Net Price (R$/ton) Stable EBITDA y-o-y, despite more challenging markets 4 2Q22 1Q23 2Q23 LTM 2Q23 792 322 1,114 198 179 178 93 70 85 291 249 263 254 416 633 708 631 37% 40% 36% 2Q22 1Q23 2Q23 LTM 2Q23 2,701 2Q22 1Q23 2Q23 LTM 2Q23 31% 35% 2Q20 2Q21 Paper Adjusted EBITDA and EBITDA Margin² R$ MM R$/ton Margin % 40% Exports Domestic 1 Excluding Consumer Goods. | ² Excluding impact of Management LTI 2Q20: - R$22/ton; 2Q21: - R$22/ton; 2Q22: R$23/ton; 1Q23: - R$10/ton; 2Q23: - R$17/ton; LTM 2Q23: - R$11/ton |
|
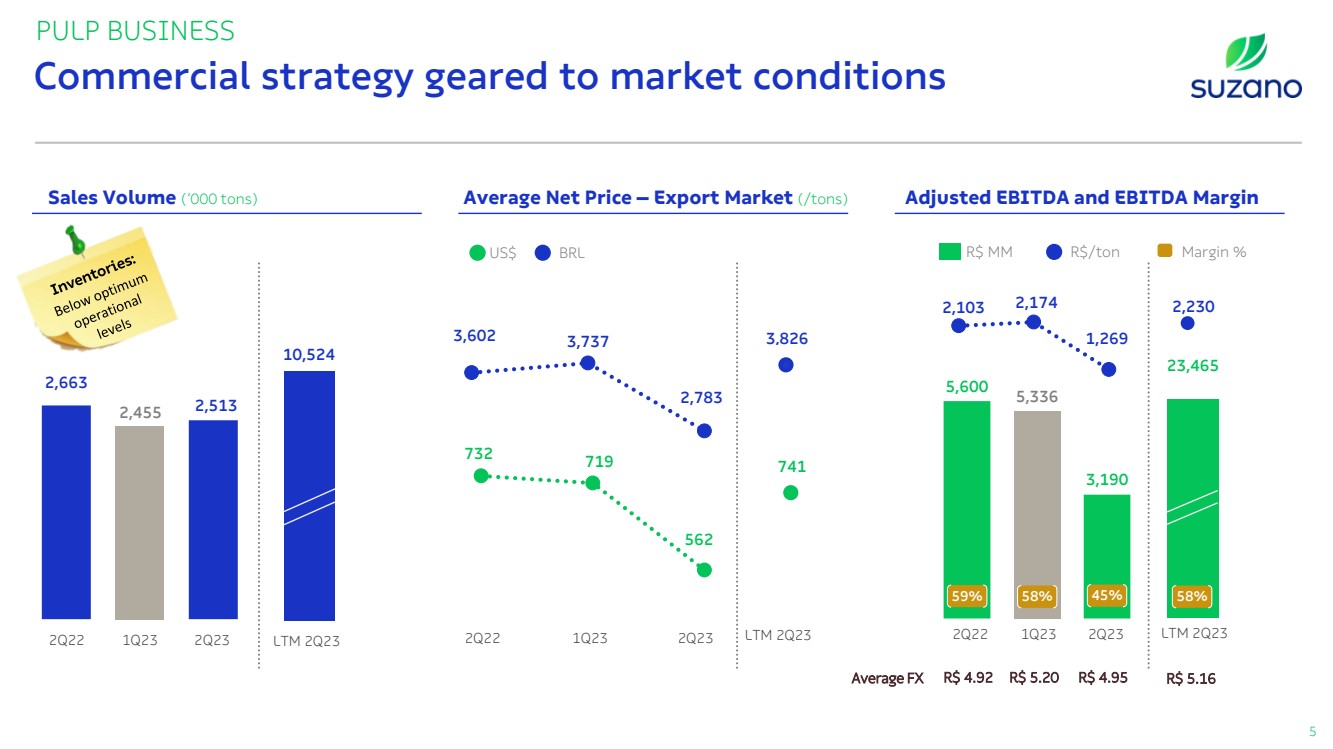
732 719 562 2,663 2,455 2,513 PULP BUSINESS 2Q22 1Q23 2Q23 10,524 LTM 2Q23 23,465 5,600 5,336 3,190 2Q22 1Q23 2Q23 LTM 2Q23 Average FX R$ 4.92 R$ 5.20 R$ 4.95 R$ 5.16 Commercial strategy geared to market conditions 5 2,103 2,174 1,269 2Q22 1Q23 2Q23 3,602 3,737 2,783 US$ BRL 59% 58% 45% 58% LTM 2Q23 2,230 Sales Volume (‘000 tons) Average Net Price – Export Market (/tons) Adjusted EBITDA and EBITDA Margin R$ MM R$/ton Margin % 3,826 741 |
|
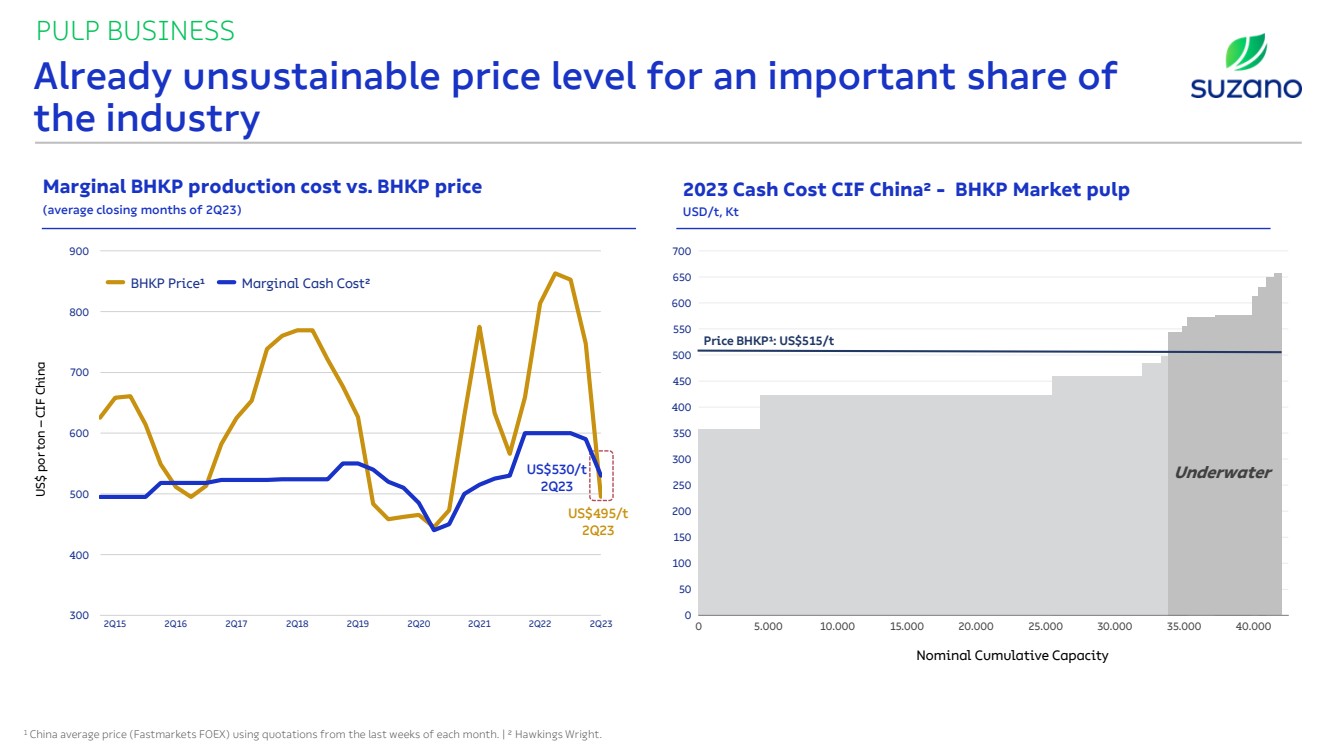
PULP BUSINESS Already unsustainable price level for an important share of the industry Marginal BHKP production cost vs. BHKP price (average closing months of 2Q23) 2023 Cash Cost CIF China² - BHKP Market pulp USD/t, Kt 1 China average price (Fastmarkets FOEX) using quotations from the last weeks of each month. | ² Hawkings Wright. US$ por ton – CIF China 0 5.000 10.000 15.000 20.000 30.000 450 400 500 350 550 300 600 250 650 200 700 150 100 25.000 50 0 35.000 40.000 US$530/t 2Q23 US$495/t 2Q23 Nominal Cumulative Capacity Underwater Price BHKP¹: US$515/t 300 400 500 600 700 800 900 2Q15 2Q16 2Q17 2Q18 2Q19 2Q20 2Q21 2Q22 2Q23 BHKP Price¹ Marginal Cash Cost² |
|
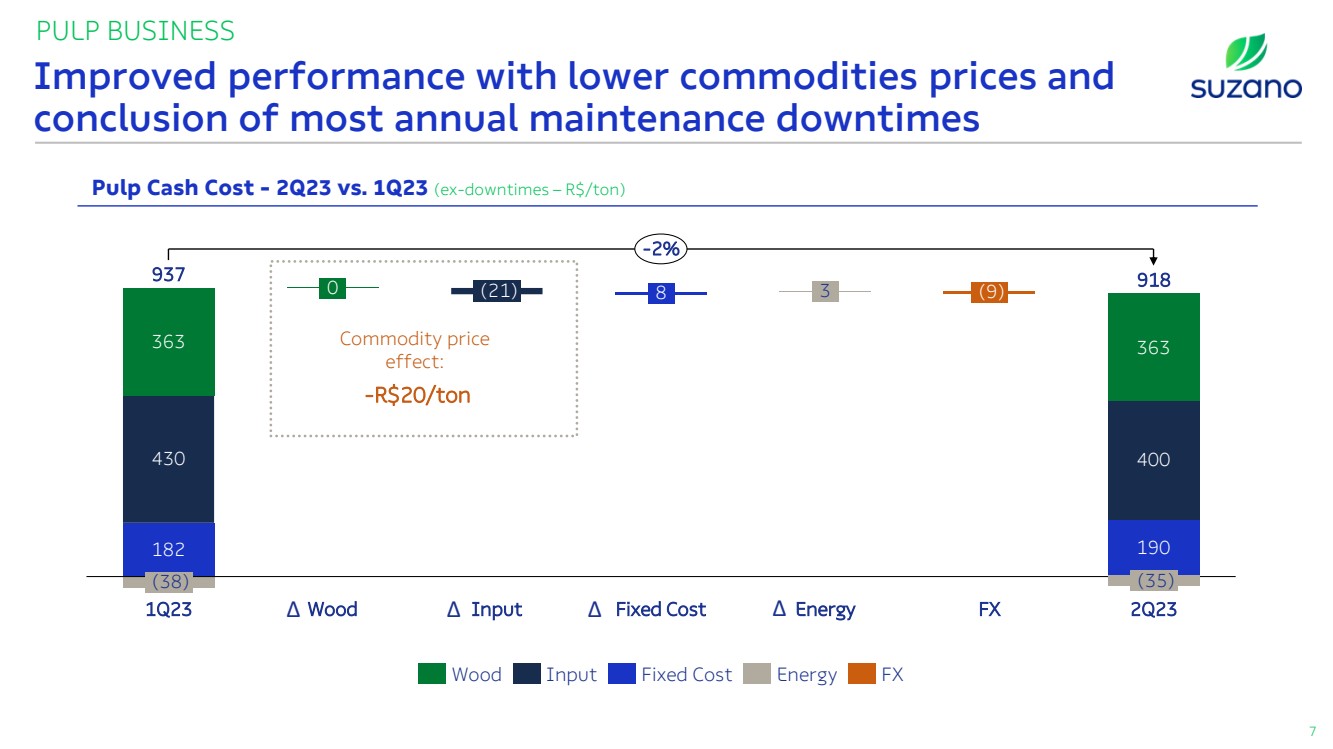
182 430 190 363 400 363 (38) 1Q23 0 Wood (21) Input 8 Fixed Cost 3 Energy (9) FX (35) 2Q23 937 918 -2% PULP BUSINESS Pulp Cash Cost - 2Q23 vs. 1Q23 (ex-downtimes – R$/ton) Improved performance with lower commodities prices and conclusion of most annual maintenance downtimes 7 Commodity price effect: -R$20/ton Δ Δ Δ Δ Wood Input Fixed Cost Energy FX |
|
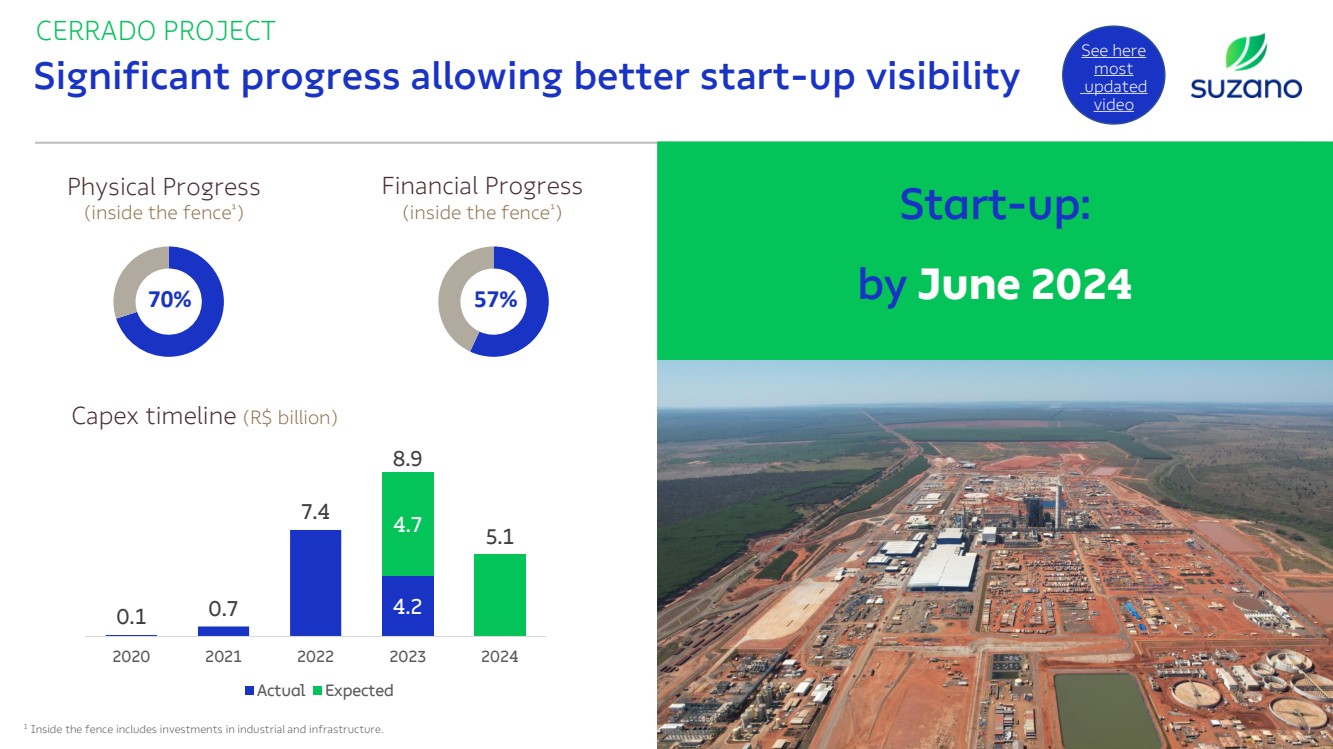
CERRADO PROJECT Significant progress allowing better start-up visibility 8 See here most updated video 1 Inside the fence includes investments in industrial and infrastructure. Physical Progress (inside the fence¹ ) 57% Financial Progress (inside the fence¹ ) 70% Start-up: by June 2024 Capex timeline (R$ billion) 4.2 4.7 0.1 0.7 7.4 8.9 5.1 2020 2021 2022 2023 2024 Actual Expected |
|
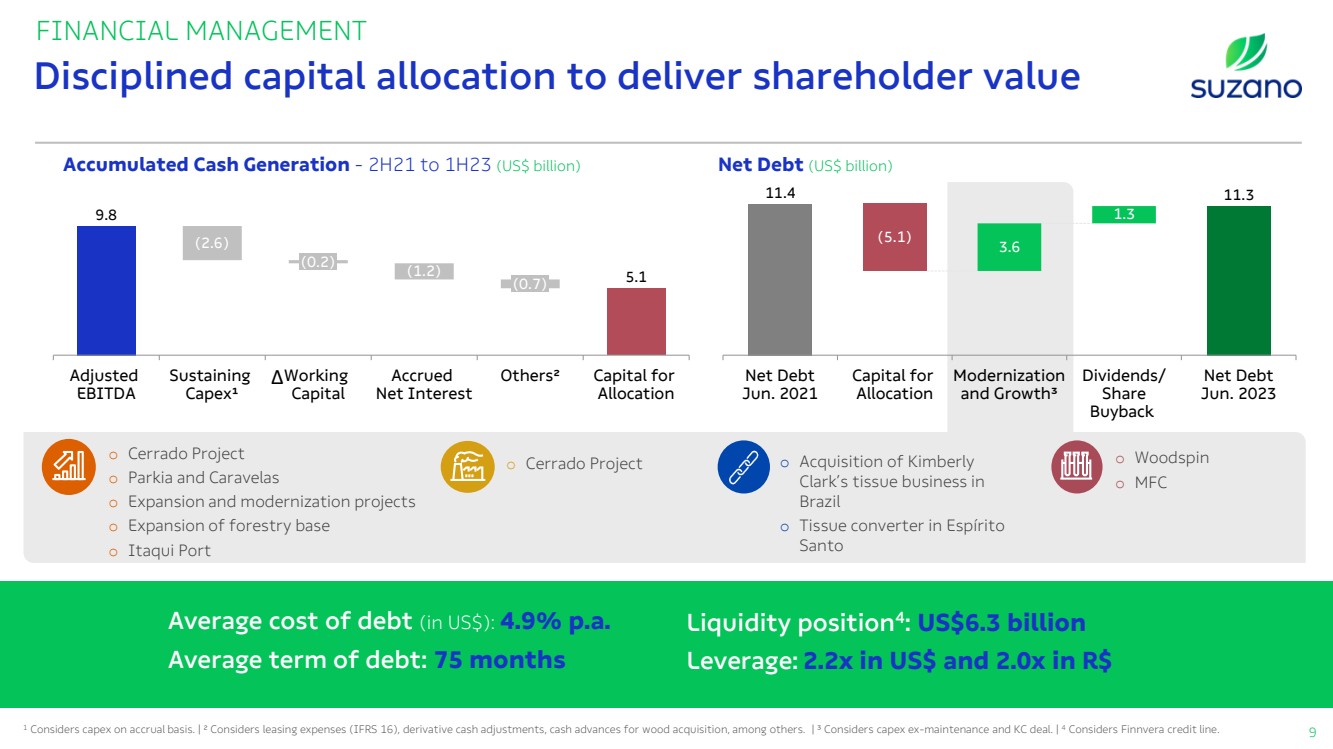
FINANCIAL MANAGEMENT Accumulated Cash Generation - 2H21 to 1H23 (US$ billion) Net Debt (US$ billion) Disciplined capital allocation to deliver shareholder value 9 Average cost of debt (in US$): 4.9% p.a. Average term of debt: 75 months 1 Considers capex on accrual basis. | ² Considers leasing expenses (IFRS 16), derivative cash adjustments, cash advances for wood acquisition, among others. | ³ Considers capex ex-maintenance and KC deal. | 4 Considers Finnvera credit line. Liquidity position4 : US$6.3 billion Leverage: 2.2x in US$ and 2.0x in R$ o Cerrado Project o Parkia and Caravelas o Expansion and modernization projects o Expansion of forestry base o Itaqui Port o Cerrado Project o Acquisition of Kimberly Clark’s tissue business in Brazil o Tissue converter in Espírito Santo o Woodspin o MFC 9.8 5.1 Adjusted EBITDA (2.6) Sustaining Capex¹ (0.2) Working Capital (1.2) Accrued Net Interest (0.7) Others² Capital for Allocation 11.4 11.3 3.6 1.3 Net Debt Jun. 2021 (5.1) Capital for Allocation Modernization and Growth³ Dividends/ Share Buyback Net Debt Jun. 2023 Δ |
|
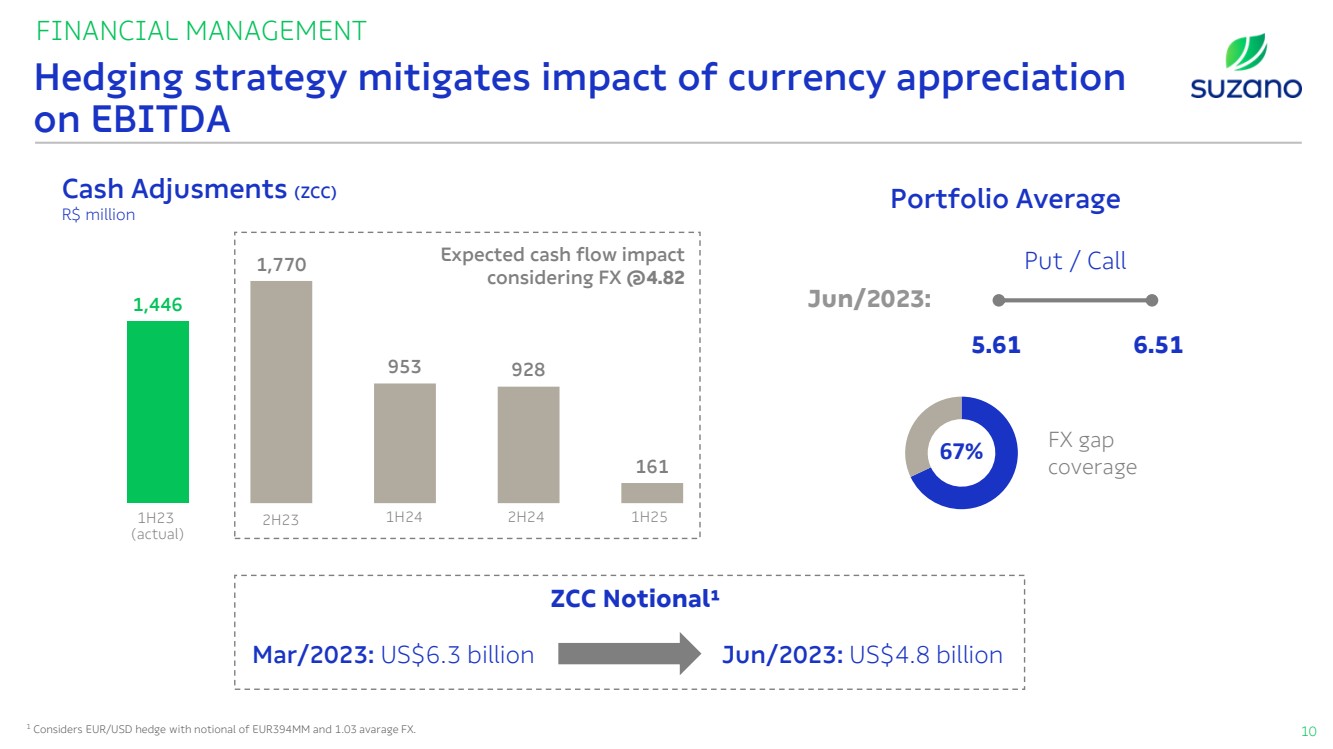
FINANCIAL MANAGEMENT Hedging strategy mitigates impact of currency appreciation on EBITDA 10 Cash Adjusments (ZCC) R$ million Portfolio Average Jun/2023: Put / Call 5.61 6.51 67% FX gap coverage Mar/2023: US$6.3 billion Jun/2023: US$4.8 billion ZCC Notional¹ 1 Considers EUR/USD hedge with notional of EUR394MM and 1.03 avarage FX. 1,446 1,770 953 928 161 1H23 (actual) Expected cash flow impact considering FX @4.82 2H23 1H24 2H24 1H25 |
|
Takeaways o Cycle proof asset portfolio and business model; o Cash production cost on a downward trend; o Opportunities for liability management on the radar; o Financial discipline and long-term value creation through capital allocation; o Significant progress in strategic avenues. |
|
Q&A 2Q23 Investor Relations www.suzano.com.br/ir ri@suzano.com.br |