June 30
UNITED STATES
SECURITIES AND EXCHANGE COMMISSION
Washington, D.C. 20549
FORM 8-K
CURRENT REPORT
Pursuant to Section 13 or 15(d) of The Securities Exchange Act of 1934
Date of Report (Date of earliest event reported): July 28, 2023 (July 28, 2023)
ARCBEST CORPORATION
(Exact name of registrant as specified in its charter)
Delaware |
0-19969 |
71-0673405 |
(State or other jurisdiction of incorporation) |
(Commission File Number) |
(IRS Employer Identification No.) |
|
8401 McClure Drive Fort Smith, Arkansas (Address of principal executive offices) |
|
72916 (Zip Code) |
| ||
Registrant’s telephone number, including area code: (479) 785-6000
Not Applicable
(Former name or former address, if changed since last report)
Check the appropriate box below if the Form 8-K filing is intended to simultaneously satisfy the filing obligation of the registrant under any of the following provisions.
☐ |
Written communication pursuant to Rule 425 under the Securities Act (17 CFR 230.425) |
☐ |
Soliciting material pursuant to Rule 14a-12 under the Exchange Act (17 CFR 240.14a-12) |
☐ |
Pre-commencement communications pursuant to Rule 14d-2(b) under the Exchange Act (17 CFR 240.14d-2(b)) |
☐ |
Pre-commencement communications pursuant to Rule 13e-4(c) under the Exchange Act (17 CFR 240.13e-4(c)) |
Securities registered pursuant to Section 12(b) of the Securities Exchange Act of 1934:
Title of each class |
Trading Symbol(s) |
Name of each exchange on which registered |
Common Stock $0.01 Par Value |
ARCB |
Nasdaq |
Indicate by check mark whether the registrant is an emerging growth company as defined in Rule 405 of the Securities Act of 1933 (§230.405 of this chapter) or Rule 12b-2 of the Securities Exchange Act of 1934 (§240.12b-2 of this chapter).
Emerging growth company☐
If an emerging growth company, indicate by check mark if the registrant has elected not to use the extended transition period for complying with any new or revised financial accounting standards provided pursuant to Section 13(a) of the Exchange Act.☐
ITEM 2.02 – RESULTS OF OPERATIONS AND FINANCIAL CONDITION
On July 28, 2023, ArcBest® (Nasdaq: ARCB) (the “Company”) issued a press release announcing its unaudited second quarter 2023 results. A copy of the press release is furnished as Exhibit 99.1 to this Current Report on Form 8-K and incorporated herein by reference. Additional supplemental information and presentation slides to be used in connection with the scheduled conference call to discuss the second quarter results are furnished as Exhibit 99.2 and Exhibit 99.3 to this Current Report on Form 8-K and incorporated herein by reference.
The Company reports its financial results in accordance with generally accepted accounting principles (“GAAP”). However, management believes that certain non-GAAP financial measures and ratios and other information utilized for internal analysis provide analysts, investors, and others the same information that we use internally for purposes of assessing the Company’s core operating performance and provide meaningful comparisons between current and prior period results, as well as important information regarding performance trends. The use of certain non-GAAP measures improves comparability in analyzing ArcBest’s performance because it removes the impact of items from operating results that, in management’s opinion, do not reflect ArcBest’s core operating performance.
The press release in Exhibit 99.1, the supplemental information in Exhibit 99.2, and the presentation slides in Exhibit 99.3 include certain non-GAAP information. Certain information discussed in the scheduled conference call could also be considered non-GAAP measures. Reconciliations of the non-GAAP measures to the most directly comparable financial measures calculated and presented in accordance with GAAP are included in Exhibit 99.1 herein, including reconciliations of GAAP earnings and earnings per share to non-GAAP financial measures, reconciliations of GAAP to non-GAAP effective tax rates, and calculations of adjusted earnings before interest, taxes, depreciation and amortization (“Adjusted EBITDA”). Reconciliations of non-GAAP measures included in the presentation slides to the most directly comparable GAAP financial measures are also included within Exhibit 99.3 herein.
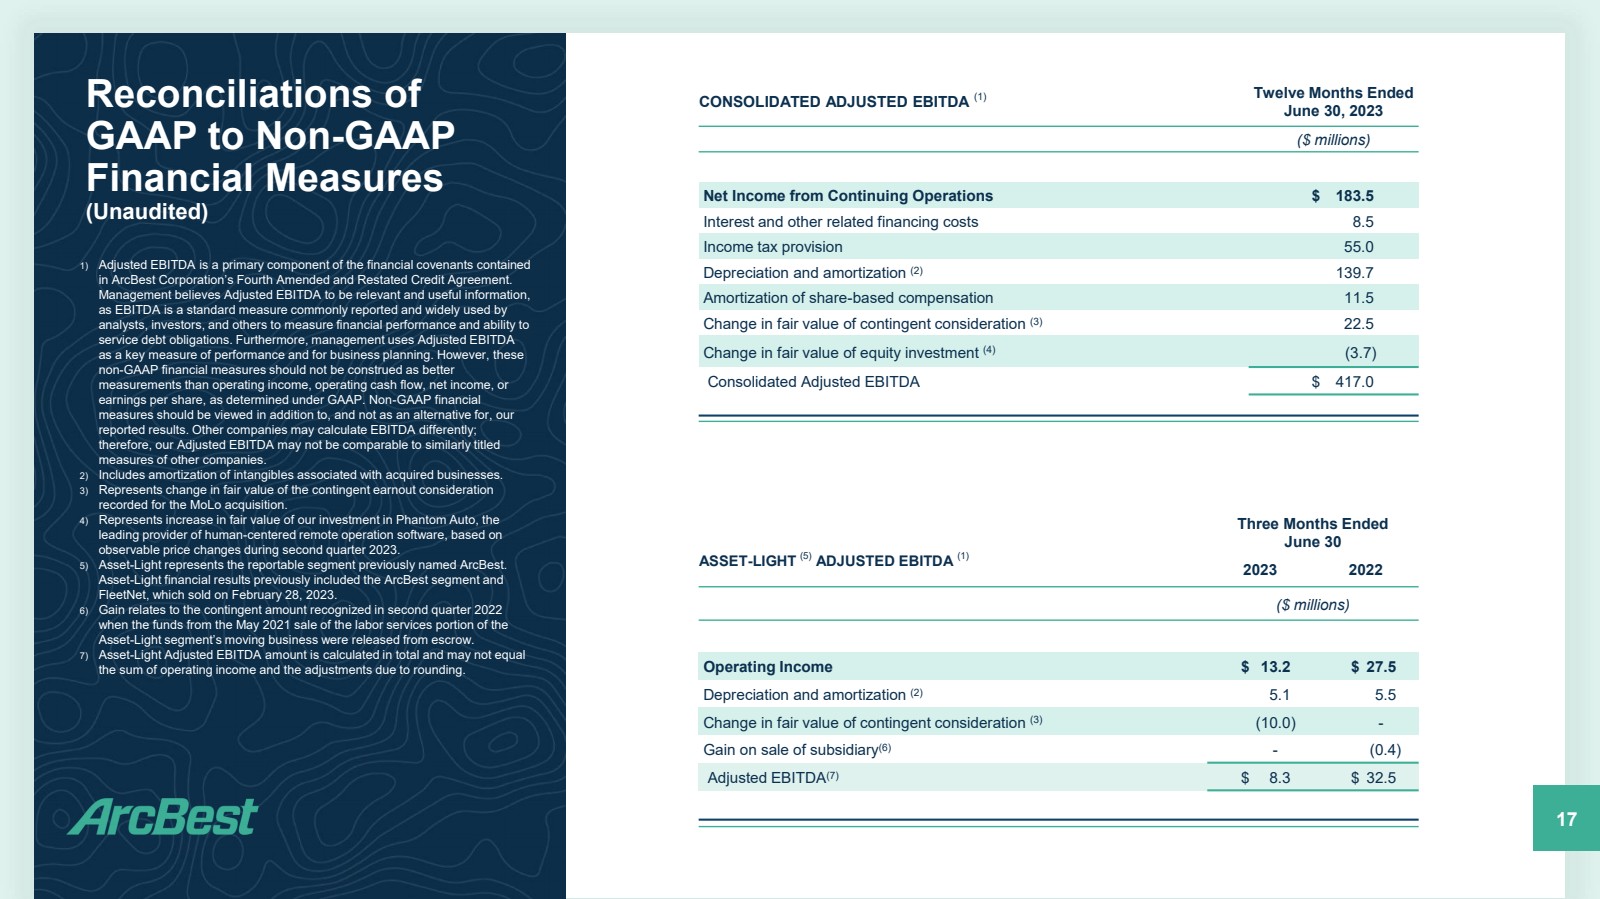
Management believes EBITDA and Adjusted EBITDA to be relevant and useful information as EBITDA is a standard measure commonly reported and widely used by analysts, investors and others to measure financial performance and ability to service debt obligations. Additionally, Adjusted EBITDA is a primary component of the financial covenants contained in ArcBest’s credit agreement. Other companies may calculate EBITDA and Adjusted EBITDA differently; therefore, ArcBest’s calculation of EBITDA and Adjusted EBITDA may not be comparable to similarly titled measures of other companies. Non-GAAP financial measures should be viewed in addition to, and not as an alternative for, ArcBest’s reported results. These financial measures should not be construed as better measurements than operating income, operating cash flow, net income or earnings per share, as determined under GAAP.
ITEM 9.01 – FINANCIAL STATEMENTS AND EXHIBITS
Exhibit No. |
|
Description of Exhibit |
|
|
|
99.1 |
|
|
99.2 |
|
|
99.3 |
|
|
104 |
|
Cover Page Interactive Data File – The cover page interactive data file does not appear in the Interactive Data File because its XBRL tags are embedded within the Inline XBRL document |
SIGNATURES
Pursuant to the requirements of the Securities Exchange Act of 1934, the registrant has duly caused this report to be signed on its behalf by the undersigned hereunto duly authorized.
|
|
|
ARCBEST CORPORATION |
|
|
|
|
|
|
|
(Registrant) |
|
|
|
|
Date: |
July 28, 2023 |
|
/s/ Michael R. Johns |
|
Michael R. Johns |
||
|
Chief Legal Officer |
||
|
and Corporate Secretary |
||
Exhibit 99.1
Investor Relations Contact: David Humphrey |
Media Contact: Autumnn Mahar |
Title: Vice President – Investor Relations |
Title: Senior Manager, PR and Social |
Phone: 479-785-6200 |
Phone: 479-494-8221 |
Email: dhumphrey@arcb.com |
Email: amahar@arcb.com |
ArcBest Announces Second Quarter 2023 Results
Well-positioned to serve customers in a rapidly changing market
Increased focus on efficient and effective operations
| ● | Second quarter 2023 net income of $40.4 million, or $1.64 per diluted share. |
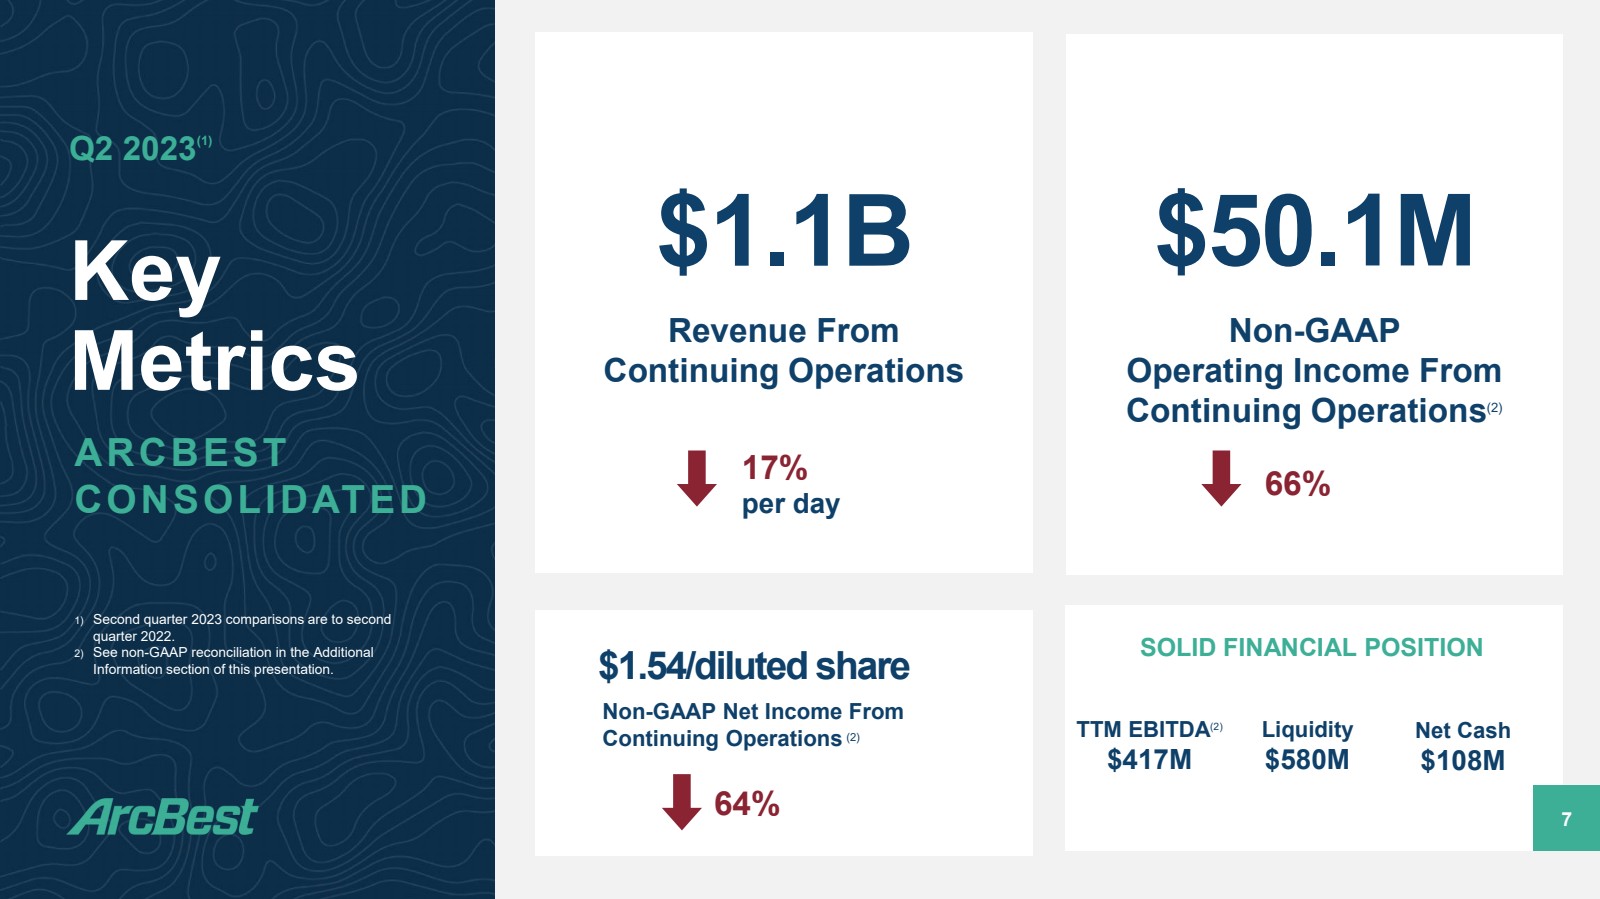
| ● | Second quarter 2023 net income from continuing operations of $39.6 million, or $1.60 per diluted share. On a non-GAAP basis, second quarter 2023 net income from continuing operations of $38.0 million, or $1.54 per diluted common share. |
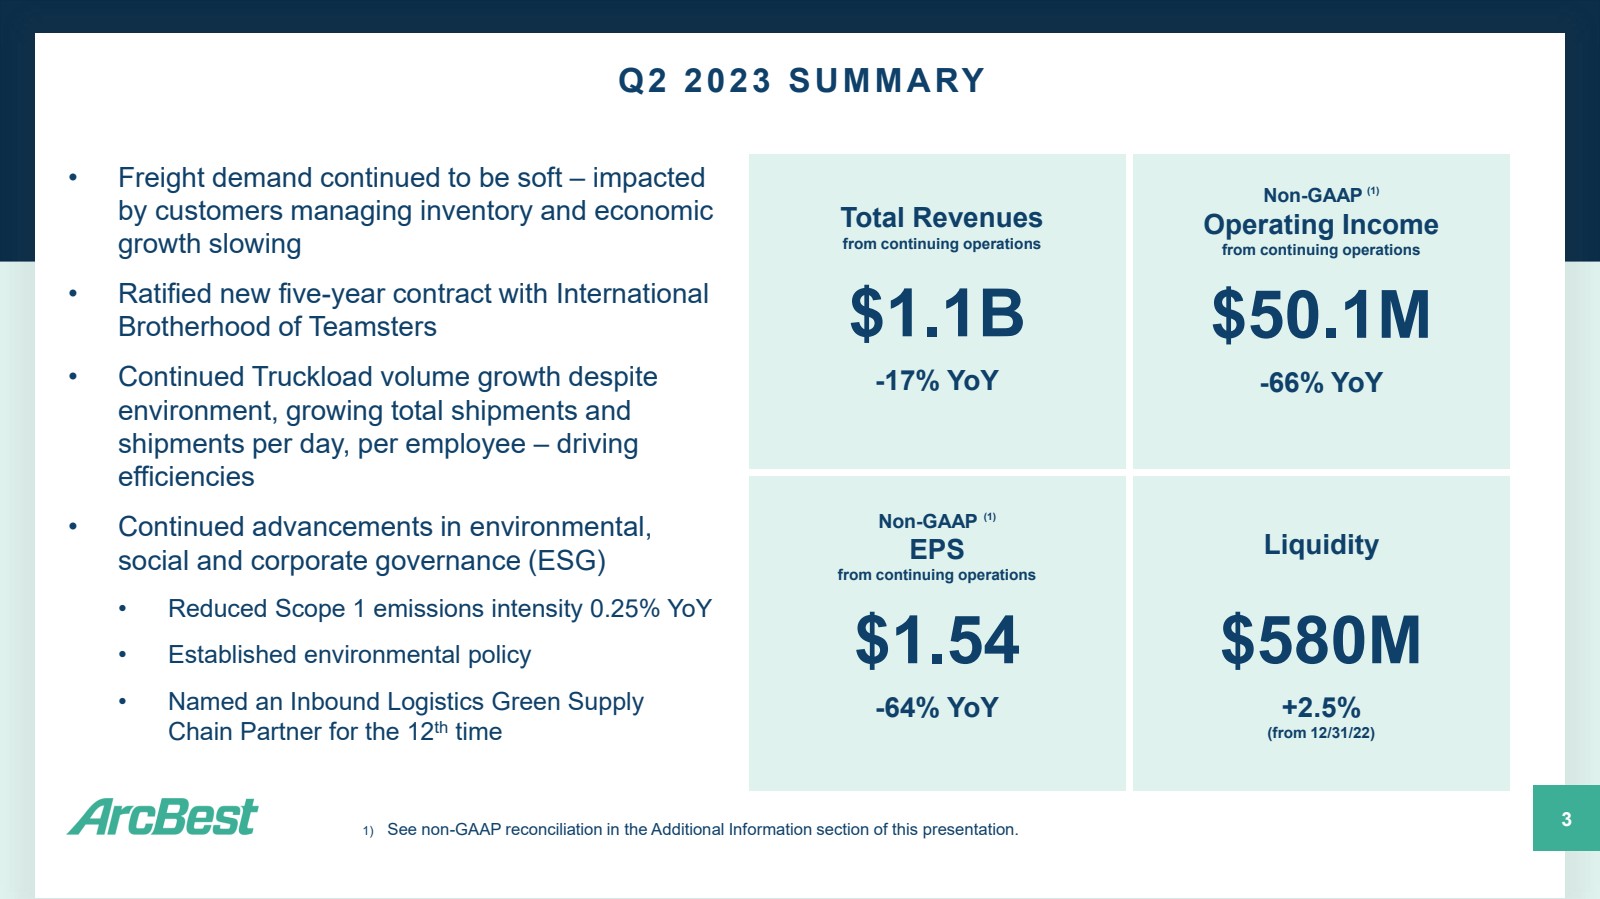
FORT SMITH, Ark., July 28, 2023 — ArcBest® (Nasdaq: ARCB), a leader in supply chain logistics, today reported second quarter 2023 revenue from continuing operations of $1.1 billion, compared to $1.3 billion in the second quarter of 2022. Second quarter 2023 net income was $40.4 million, or $1.64 per diluted share, compared to $102.5 million, or $4.00 per diluted share, in the second quarter of 2022.
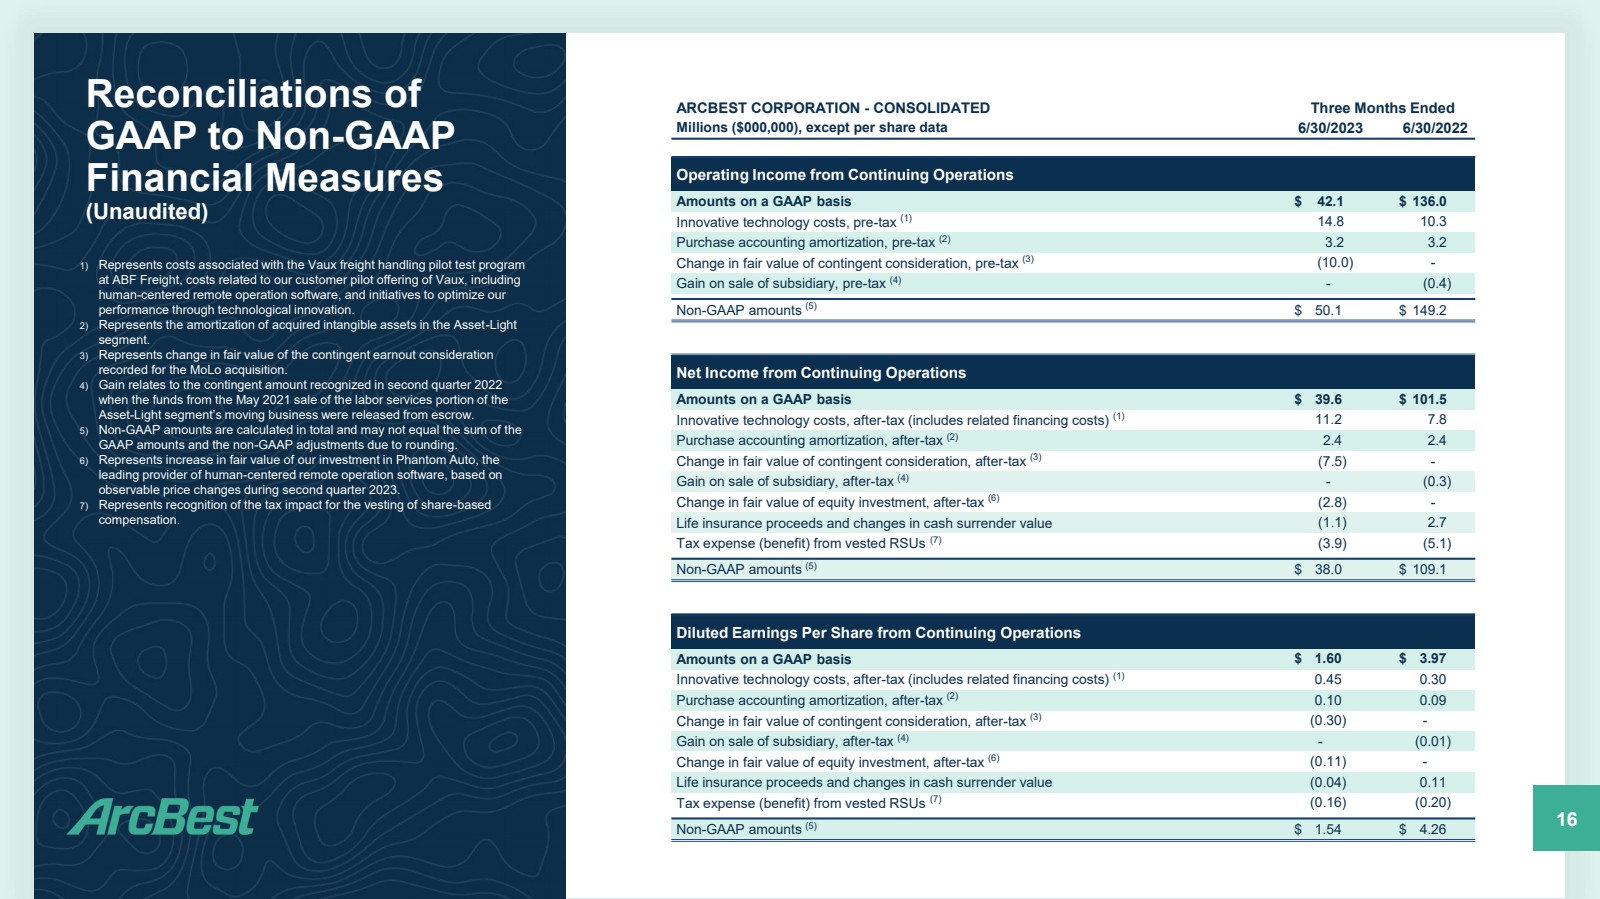
ArcBest’s second quarter 2023 operating income from continuing operations was $42.1 million, compared to $136.0 million in the second quarter of 2022, and net income from continuing operations was $39.6 million, or $1.60 per diluted share, compared to $101.5 million, or $3.97 per diluted share, in the prior-year period.
Excluding certain items in both periods as identified in the attached reconciliation tables, second quarter 2023 non-GAAP operating income from continuing operations was $50.1 million, compared to $149.2 million in the prior-year period. On a non-GAAP basis, net income from continuing operations was $38.0 million, or $1.54 per diluted share, compared to $109.1 million, or $4.26 per diluted share, in second quarter 2022.
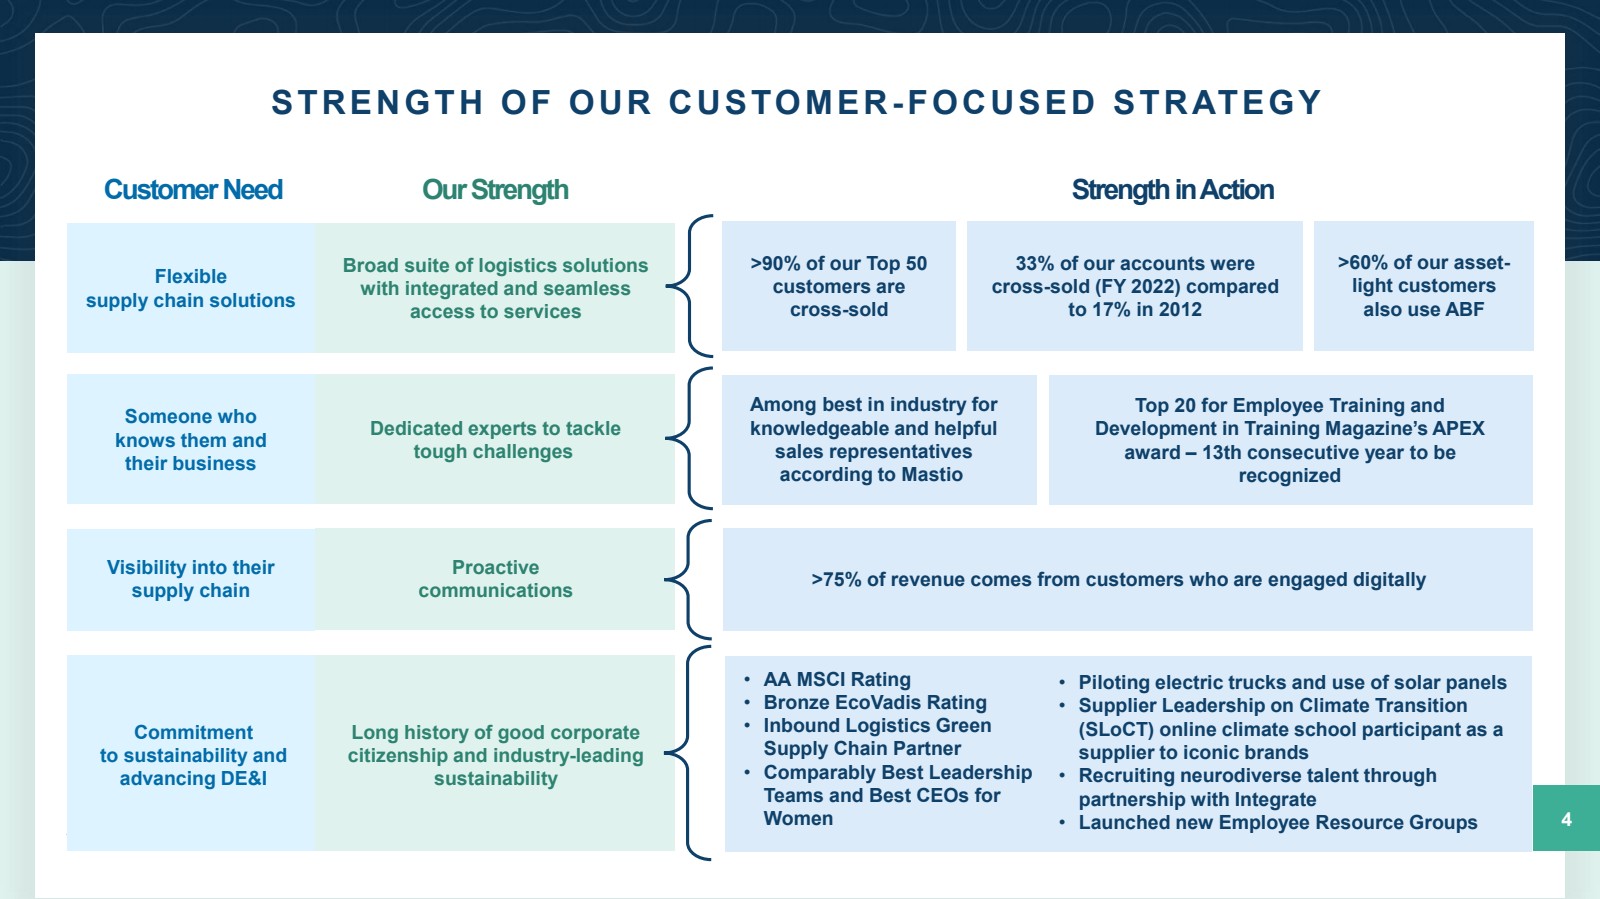
“ArcBest is uniquely positioned to meet customers’ needs, especially in a market that is rapidly changing,” said Judy R. McReynolds, ArcBest chairman, president and CEO. “We serve as trusted advisors – ready to keep customer supply chains moving with a full suite of logistics solutions, including a nationwide network of asset-based LTL capacity.”
ArcBest recognizes the importance of operating in the most efficient and effective way possible, which enables growth and creates value. In its Asset-Based segment, ArcBest has seen productivity and service improvements from deploying highly-experienced teams to train managers and employees on operational best practices in certain locations. Based on this success, ArcBest is redeploying resources to expand these training efforts. ArcBest also sees the opportunity to improve Asset-Based profitability by prioritizing network capacity to serve core customers that value long-term partnerships. In its Asset-Light segment, ArcBest is focused on aligning costs with business levels and achieved the $3 million of previously announced cost reductions for second quarter 2023.
1
Second Quarter Results of Operations Comparisons
Asset-Based
Second Quarter 2023 Versus Second Quarter 2022
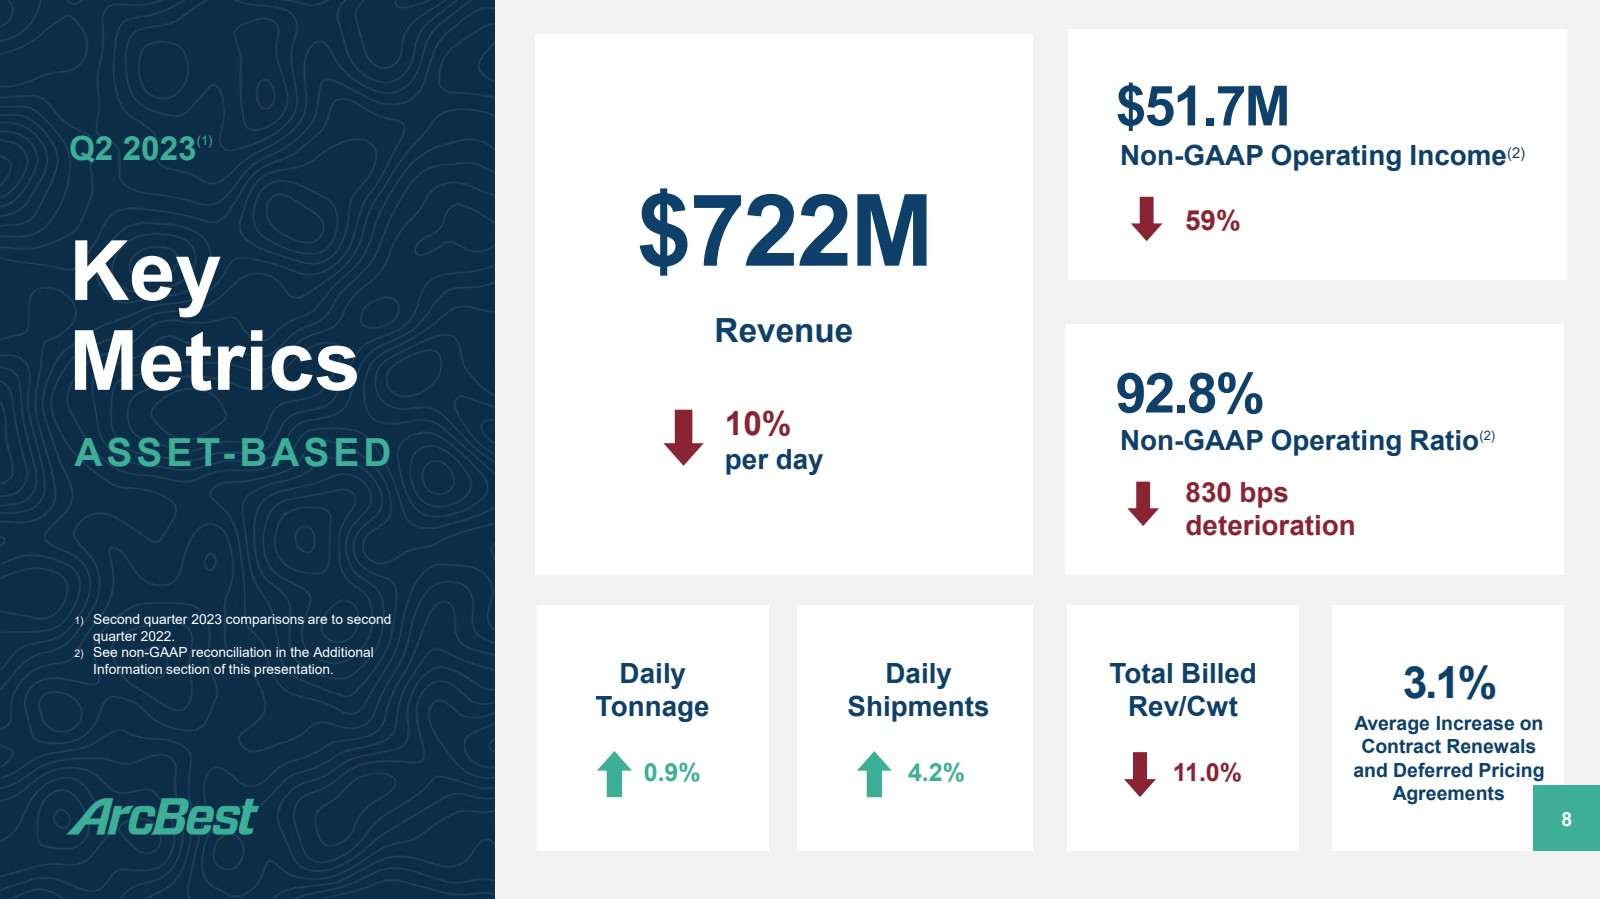
| ● | Revenue of $722.0 million compared to $802.6 million, a per-day decrease of 10.0 percent. |
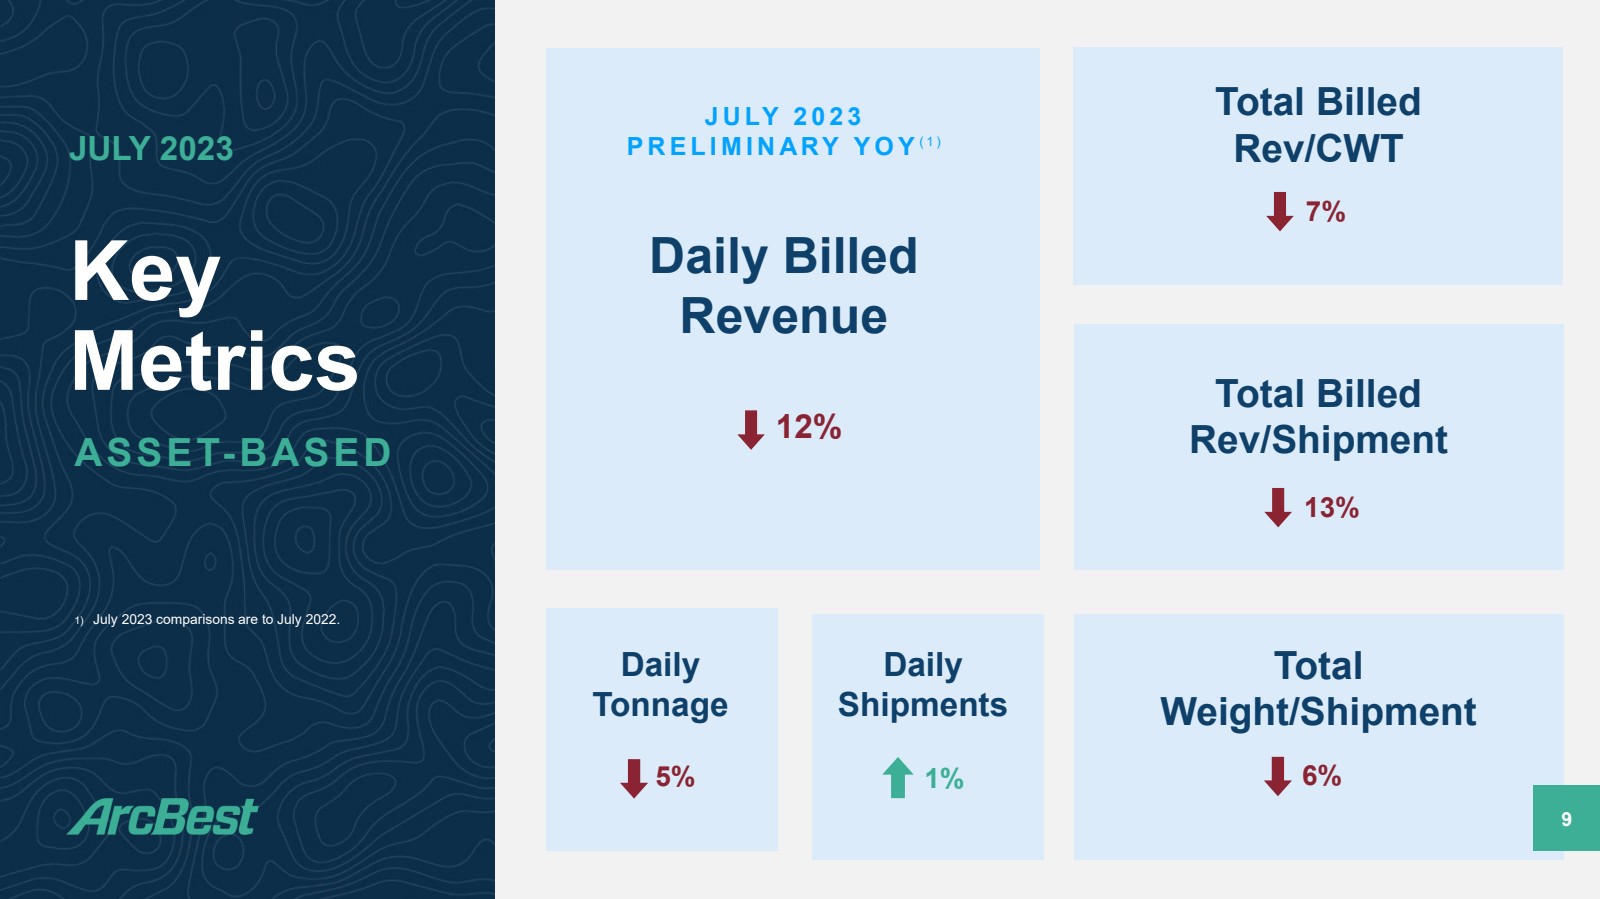
| ● | Total tonnage per day increased 0.9 percent; LTL-rated weight per shipment decreased 1.5 percent. |
| ● | Total shipments per day increased 4.2 percent. |
| ● | Total billed revenue per hundredweight decreased 11.0 percent. Revenue per hundredweight on LTL-rated business, excluding fuel surcharge, decreased by a percentage in the mid-single digits. |
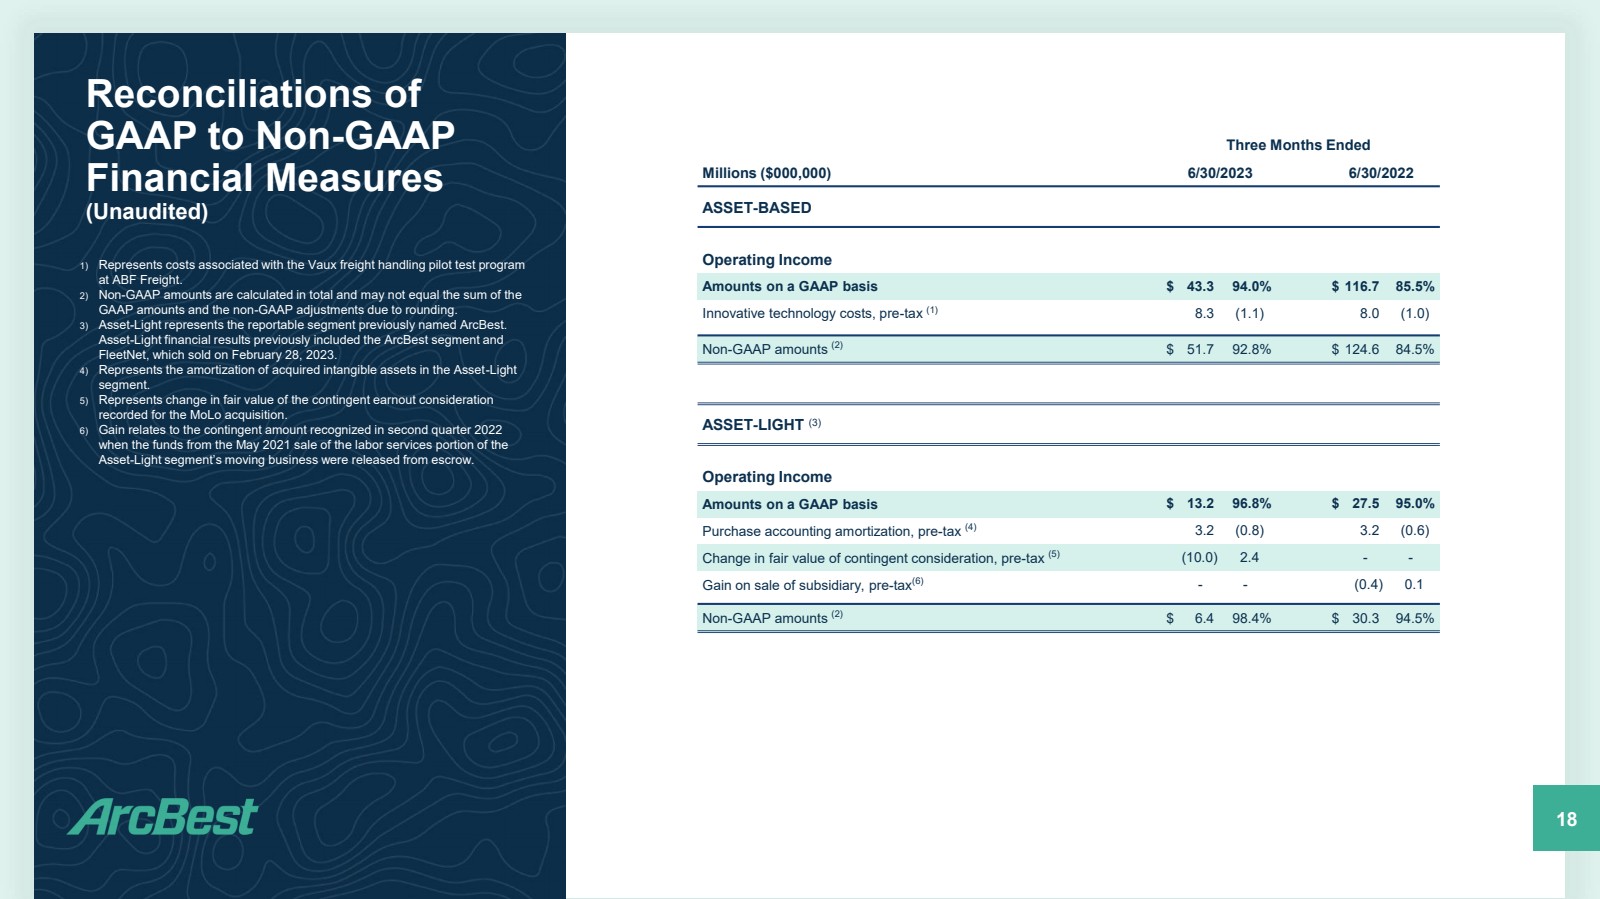
| ● | Operating income of $43.3 million and an operating ratio of 94.0 percent compared to operating income of $116.7 million and an operating ratio of 85.5 percent. On a non-GAAP basis, operating income of $51.7 million and an operating ratio of 92.8 percent compared to operating income of $124.6 million and an operating ratio of 84.5 percent. |
The decrease in second quarter total revenue for ArcBest’s Asset-Based business compared to the prior-year period was primarily due to a general slowing of core customer order frequency, smaller average shipment quantities related to a weaker economy and less fuel surcharge revenue based on lower diesel fuel prices. ArcBest maintained more consistent business and labor levels during the second quarter by using its tech-enabled, dynamic LTL-rated pricing program to secure incrementally profitable shipments to more effectively utilize available ABF Freight network capacity. As a result, LTL-rated shipments and tonnage in ArcBest’s Asset-Based business increased compared to the prior-year period. On a sequential basis compared to the first quarter, LTL-rated tonnage increased while shipments were flat, which is weaker than normal, seasonal expectations.
The pricing environment continues to be rational as pricing on core LTL-rated business, excluding fuel surcharges, increased by a percentage in the high-single digits in second quarter 2023. On a sequential basis, compared to the first quarter, revenue per hundredweight, excluding fuel surcharge, on core LTL-rated business increased by a percentage in the low-single digits. The decrease in the second quarter 2023 revenue per hundredweight pricing measure was driven by the change in mix associated with a decrease in core LTL-rated shipments and an increase in dynamic, market-priced LTL-rated shipments as well as an increase in heavier-weighted truckload-rated shipments compared to the prior-year period. The year-over-year total revenue per hundredweight decrease in second quarter 2023 followed a 17.7 percent increase in second quarter 2022 versus second quarter 2021. In addition, lower diesel fuel prices, and the resulting decrease in fuel surcharge revenue, meaningfully impacted year-over-year and sequential comparisons of revenue per hundredweight statistics.
Asset-Light‡
Second Quarter 2023 Versus Second Quarter 2022
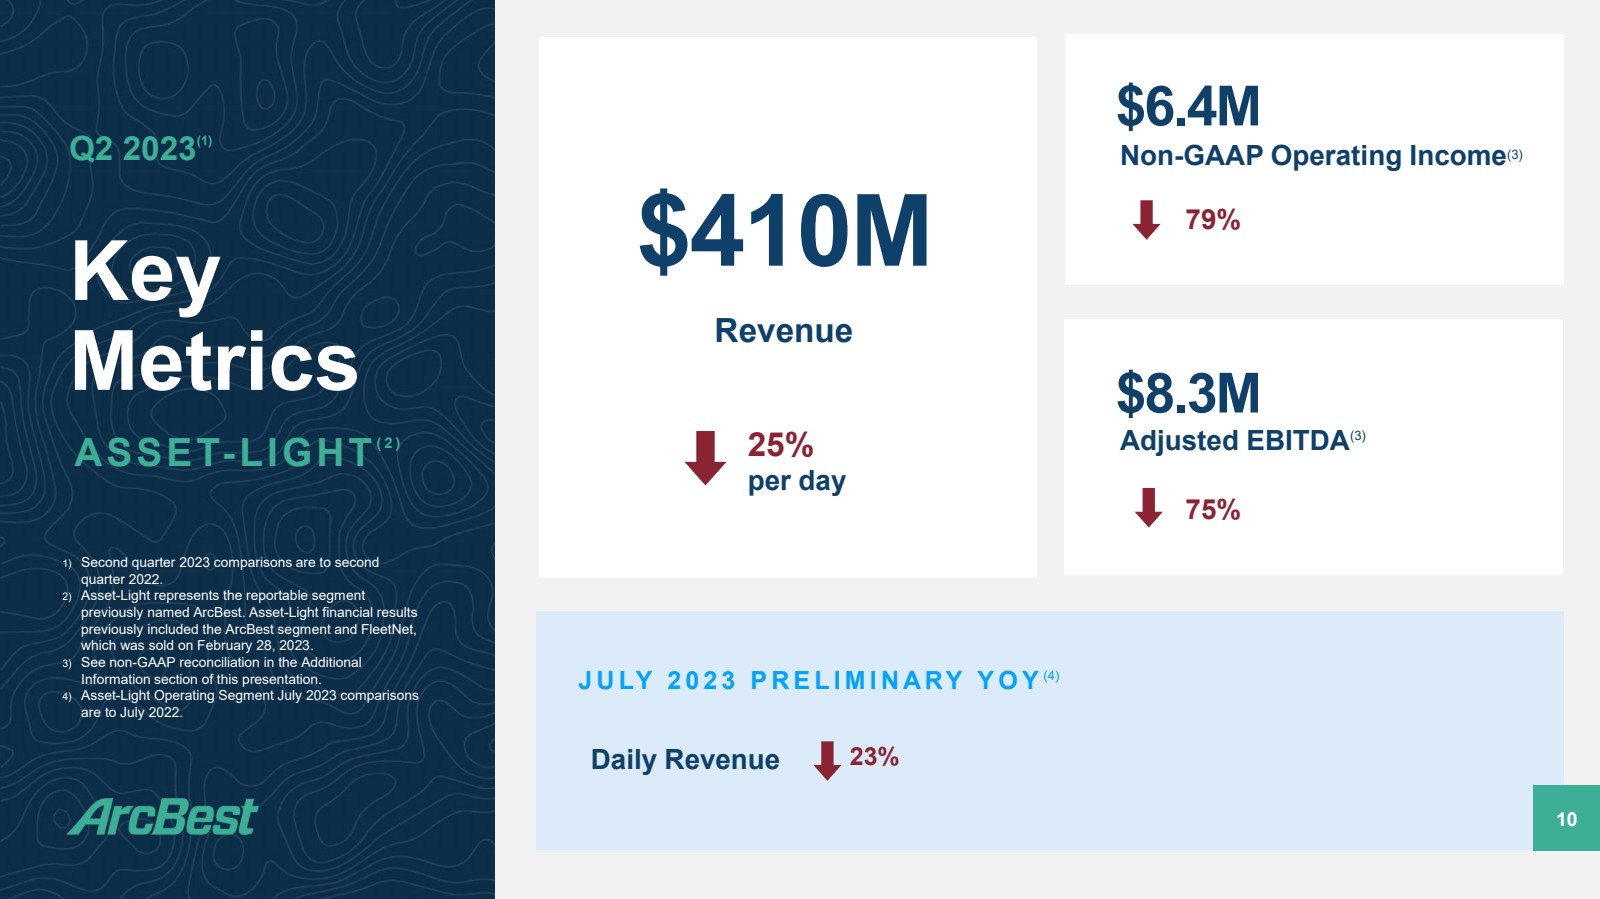
| ● | Revenue of $409.8 million compared to $549.7 million, a per-day decrease of 25.4 percent. |
| ● | Operating income of $13.2 million compared to operating income of $27.5 million. On a non-GAAP basis, operating income of $6.4 million compared to $30.3 million. |
| ● | Adjusted earnings before interest, taxes, depreciation and amortization (“Adjusted EBITDA”) of $8.3 million compared to $32.5 million, as detailed in the attached non-GAAP reconciliation tables. |
Current year second quarter revenue results were impacted by lower average revenue per shipment as a result of a softer market environment. Despite the increase in daily shipments resulting from growth in the truckload business, lower shipment rates and related shipment margins drove reduced second quarter profitability. During last year’s second quarter, as purchased transportation buy rates steadily decreased, Asset-Light benefited from higher market rates on committed business, which resulted in record profitability.
During the second quarter, employee-related and outside services cost reductions were implemented to better align resources with business levels. As a result, excluding purchased transportation and the impact of the change in fair value of contingent consideration, operating expenses were managed lower by $3 million, or 5 percent, compared to first quarter 2023.
2
NOTE ‡ - Asset-Light represents the reportable segment previously named ArcBest. Asset-Light financial results previously included the ArcBest segment and FleetNet, which was sold on February 28, 2023.
Share Repurchase Program
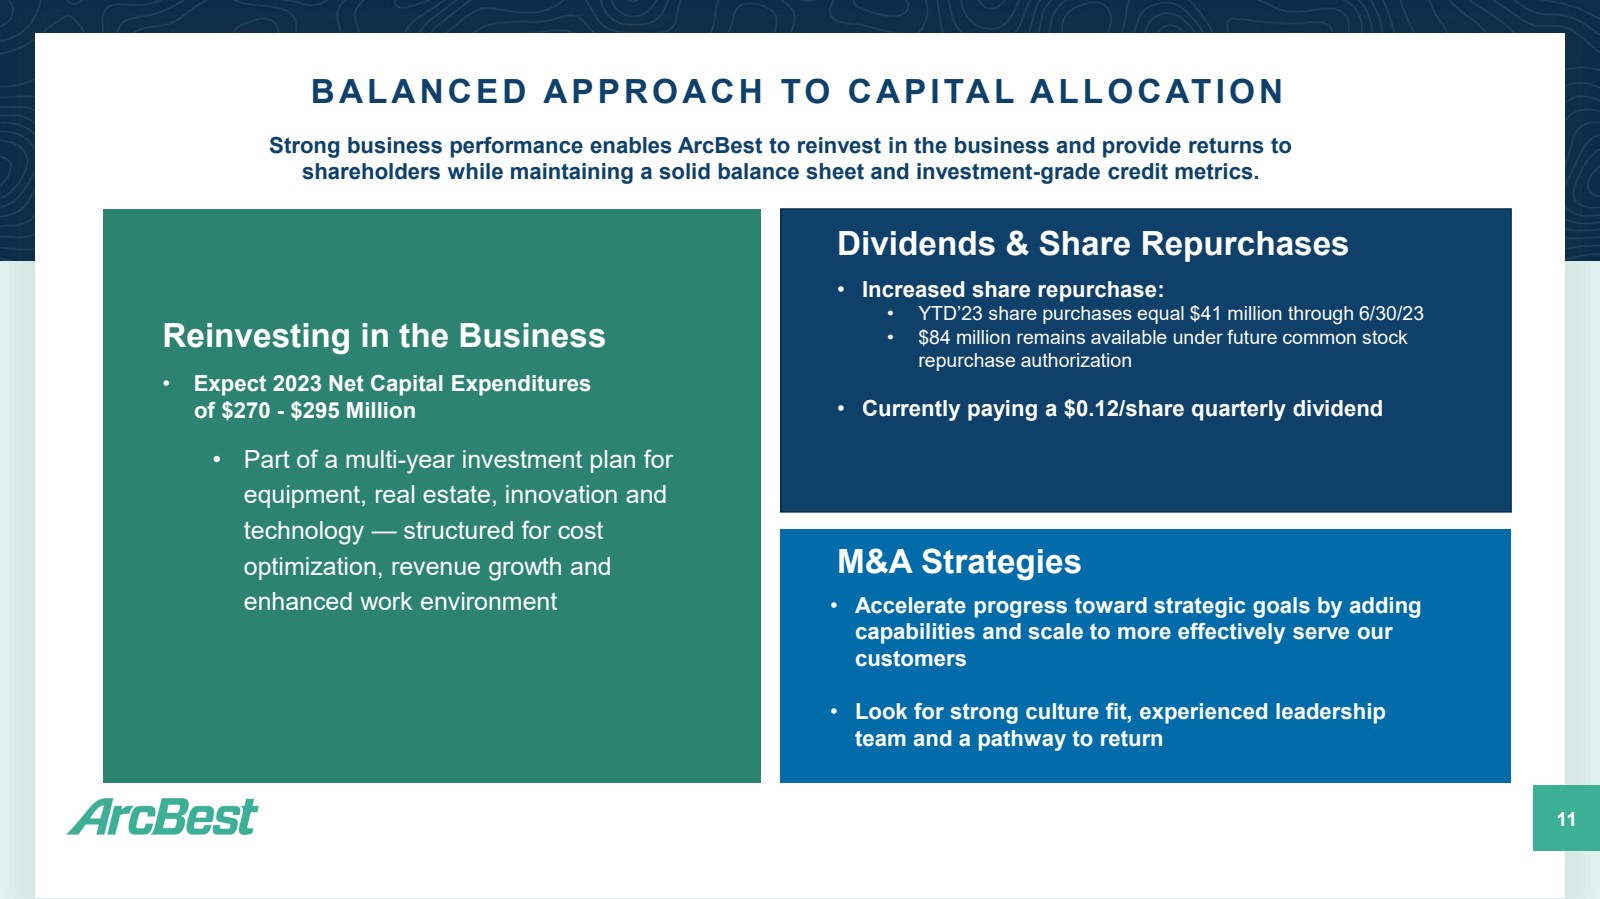
Year-to-date through the end of the second quarter, ArcBest has returned $41.2 million of capital to shareholders through common stock share repurchases and $83.8 million remains available under the current repurchase authorization for future common stock purchases.
Conference Call
ArcBest will host a conference call with company executives to discuss the second quarter 2023 results. The call will be today, Friday, July 28 at 9:30 a.m. EDT (8:30 a.m. CDT). Interested parties are invited to listen by calling (800) 757-9216 or by joining the webcast which can be found on ArcBest’s website at arcb.com. Slides to accompany this call are included in Exhibit 99.3 of the Form 8-K filed on July 28, 2023, will be posted and available to download on the company’s website prior to the scheduled conference time, and will be included in the webcast. Following the call, a recorded playback will be available through the end of the day on September 15, 2023. To listen to the playback, dial (800) 633-8284 or (402) 977-9140 (for international callers). The conference call ID for the playback is 22027510. The conference call and playback can also be accessed, through September 15, 2023, on ArcBest’s website at arcb.com.
About ArcBest
ArcBest® (Nasdaq: ARCB) is a multibillion-dollar integrated logistics company that helps keep the global supply chain moving. Founded in 1923 and now with over 15,000 employees across nearly 250 campuses and service centers, the company is a logistics powerhouse, fueled by the simple notion of finding a way to get the job done. Through innovative thinking, agility and trust, ArcBest leverages its full suite of shipping and logistics solutions to meet customers’ critical needs, each and every day. For more information, visit arcb.com.
3
The following is a “safe harbor” statement under the Private Securities Litigation Reform Act of 1995: Certain statements and information in this press release concerning results for the three months ended June 30, 2023, may constitute “forward-looking statements” within the meaning of the Private Securities Litigation Reform Act of 1995, including, among others, statements regarding (i) our expectations about our intrinsic value or our prospects for growth and value creation and (ii) our financial outlook, position, strategies, goals, and expectations. Terms such as “anticipate,” “believe,” “could,” “estimate,” “expect,” “forecast,” “foresee,” “intend,” “may,” “plan,” “predict,” “project,” “scheduled,” “should,” “would,” and similar expressions and the negatives of such terms are intended to identify forward-looking statements. These statements are based on management’s beliefs, assumptions, and expectations based on currently available information, are not guarantees of future performance, and involve certain risks and uncertainties (some of which are beyond our control). Although we believe that the expectations reflected in these forward-looking statements are reasonable as and when made, we cannot provide assurance that our expectations will prove to be correct. Actual outcomes and results could materially differ from what is expressed, implied, or forecasted in these statements due to a number of factors, including, but not limited to: the effects of a widespread outbreak of an illness or disease, including the COVID-19 pandemic, or any other public health crisis, as well as regulatory measures implemented in response to such events; external events which may adversely affect us or the third parties who provide services for us, for which our business continuity plans may not adequately prepare us, including, but not limited to, acts of war or terrorism, or military conflicts; data privacy breaches, cybersecurity incidents, and/or failures of our information systems, including disruptions or failures of services essential to our operations or upon which our information technology platforms rely; interruption or failure of third-party software or information technology systems or licenses; untimely or ineffective development and implementation of, or failure to realize the potential benefits associated with, new or enhanced technology or processes, including the Vaux freight handling pilot test program at ABF Freight and our customer pilot offering of Vaux, including human-centered remote operation software; the loss or reduction of business from large customers; the timing and performance of growth initiatives and the ability to manage our cost structure; the cost, integration, and performance of any recent or future acquisitions, including the acquisition of MoLo Solutions, LLC, and the inability to realize the anticipated benefits of the acquisition within the expected time period or at all; maintaining our corporate reputation and intellectual property rights; nationwide or global disruption in the supply chain resulting in increased volatility in freight volumes; competitive initiatives and pricing pressures; increased prices for and decreased availability of new revenue equipment, decreases in value of used revenue equipment, and higher costs of equipment-related operating expenses such as maintenance, fuel, and related taxes; availability of fuel, the effect of volatility in fuel prices and the associated changes in fuel surcharges on securing increases in base freight rates, and the inability to collect fuel surcharges; relationships with employees, including unions, and our ability to attract, retain, and upskill employees; unfavorable terms of, or the inability to reach agreement on, future collective bargaining agreements or a workforce stoppage by our employees covered under ABF Freight’s collective bargaining agreement; union employee wages and benefits, including changes in required contributions to multiemployer plans; availability and cost of reliable third-party services; our ability to secure independent owner operators and/or operational or regulatory issues related to our use of their services; litigation or claims asserted against us; governmental regulations; environmental laws and regulations, including emissions-control regulations; default on covenants of financing arrangements and the availability and terms of future financing arrangements; our ability to generate sufficient cash from operations to support significant ongoing capital expenditure requirements and other business initiatives; self-insurance claims and insurance premium costs; potential impairment of goodwill and intangible assets; general economic conditions and related shifts in market demand that impact the performance and needs of industries we serve and/or limit our customers’ access to adequate financial resources; increasing costs due to inflation and rising interest rates; seasonal fluctuations, adverse weather conditions, natural disasters, and climate change; and other financial, operational, and legal risks and uncertainties detailed from time to time in ArcBest Corporation’s public filings with the Securities and Exchange Commission (“SEC”).
For additional information regarding known material factors that could cause our actual results to differ from those expressed in these forward-looking statements, please see our filings with the SEC, including our Annual Report on Form 10-K, Quarterly Reports on Form 10-Q, and Current Reports on Form 8-K.
Readers are cautioned not to place undue reliance on forward-looking statements, which speak only as of the date hereof. We undertake no obligation to publicly update or revise any forward-looking statements after the date they are made, whether as a result of new information, future events, or otherwise.
Financial Data and Operating Statistics
The following tables show financial data and operating statistics on ArcBest® and its reportable segments.
4
ARCBEST CORPORATION
CONSOLIDATED STATEMENTS OF OPERATIONS
|
|
Three Months Ended |
|
Six Months Ended |
|
||||||||
|
|
June 30 |
|
June 30 |
|
||||||||
|
|
2023 |
|
2022 |
|
2023 |
|
2022 |
|
||||
|
|
(Unaudited) |
|
||||||||||
|
|
($ thousands, except share and per share data) |
|
||||||||||
REVENUES |
|
$ |
1,103,464 |
|
$ |
1,321,692 |
|
$ |
2,209,558 |
|
$ |
2,589,783 |
|
|
|
|
|
|
|
|
|
|
|
|
|
|
|
OPERATING EXPENSES |
|
|
1,061,348 |
|
|
1,185,654 |
|
|
2,146,283 |
|
|
2,360,802 |
|
|
|
|
|
|
|
|
|
|
|
|
|
|
|
OPERATING INCOME |
|
|
42,116 |
|
|
136,038 |
|
|
63,275 |
|
|
228,981 |
|
|
|
|
|
|
|
|
|
|
|
|
|
|
|
OTHER INCOME (COSTS) |
|
|
|
|
|
|
|
|
|
|
|
|
|
Interest and dividend income |
|
|
3,725 |
|
|
353 |
|
|
6,658 |
|
|
452 |
|
Interest and other related financing costs |
|
|
(2,205) |
|
|
(1,863) |
|
|
(4,532) |
|
|
(3,803) |
|
Other, net |
|
|
5,038 |
|
|
(2,807) |
|
|
6,818 |
|
|
(3,633) |
|
|
|
|
6,558 |
|
|
(4,317) |
|
|
8,944 |
|
|
(6,984) |
|
|
|
|
|
|
|
|
|
|
|
|
|
|
|
INCOME FROM CONTINUING OPERATIONS BEFORE INCOME TAXES |
|
|
48,674 |
|
|
131,721 |
|
|
72,219 |
|
|
221,997 |
|
|
|
|
|
|
|
|
|
|
|
|
|
|
|
INCOME TAX PROVISION |
|
|
9,074 |
|
|
30,179 |
|
|
13,772 |
|
|
52,447 |
|
|
|
|
|
|
|
|
|
|
|
|
|
|
|
NET INCOME FROM CONTINUING OPERATIONS |
|
|
39,600 |
|
|
101,542 |
|
|
58,447 |
|
|
169,550 |
|
|
|
|
|
|
|
|
|
|
|
|
|
|
|
INCOME FROM DISCONTINUED OPERATIONS, NET OF TAX(1) |
|
|
843 |
|
|
919 |
|
|
53,279 |
|
|
2,480 |
|
|
|
|
|
|
|
|
|
|
|
|
|
|
|
NET INCOME |
|
$ |
40,443 |
|
$ |
102,461 |
|
$ |
111,726 |
|
$ |
172,030 |
|
|
|
|
|
|
|
|
|
|
|
|
|
|
|
BASIC EARNINGS PER COMMON SHARE(2) |
|
|
|
|
|
|
|
|
|
|
|
|
|
Continuing operations |
|
$ |
1.65 |
|
$ |
4.13 |
|
$ |
2.42 |
|
$ |
6.88 |
|
Discontinued operations(1) |
|
|
0.04 |
|
|
0.04 |
|
|
2.20 |
|
|
0.10 |
|
|
|
$ |
1.68 |
|
$ |
4.16 |
|
$ |
4.62 |
|
$ |
6.98 |
|
|
|
|
|
|
|
|
|
|
|
|
|
|
|
DILUTED EARNINGS PER COMMON SHARE(2) |
|
|
|
|
|
|
|
|
|
|
|
|
|
Continuing operations |
|
$ |
1.60 |
|
$ |
3.97 |
|
$ |
2.35 |
|
$ |
6.58 |
|
Discontinued operations(1) |
|
|
0.03 |
|
|
0.04 |
|
|
2.14 |
|
|
0.10 |
|
|
|
$ |
1.64 |
|
$ |
4.00 |
|
$ |
4.49 |
|
$ |
6.68 |
|
|
|
|
|
|
|
|
|
|
|
|
|
|
|
AVERAGE COMMON SHARES OUTSTANDING |
|
|
|
|
|
|
|
|
|
|
|
|
|
Basic |
|
|
24,064,882 |
|
|
24,607,362 |
|
|
24,175,893 |
|
|
24,658,739 |
|
Diluted |
|
|
24,672,948 |
|
|
25,596,031 |
|
|
24,864,691 |
|
|
25,756,314 |
|
| 1) | Discontinued operations represents the FleetNet segment, which sold on February 28, 2023. The six months ended June 30, 2023 includes net gain on sale of FleetNet of $52.3 million after-tax, or $2.16 basic earnings per share and $2.10 diluted earnings per share. |
| 2) | Earnings per common share is calculated in total and may not equal the sum of earnings per common share from continuing operations and discontinued operations due to rounding. |
5
ARCBEST CORPORATION
CONSOLIDATED BALANCE SHEETS
|
|
June 30 |
|
December 31 |
|
||
|
|
2023 |
|
2022 |
|
||
|
|
(Unaudited) |
|
||||
|
|
($ thousands, except share data) |
|
||||
ASSETS |
|
|
|
|
|
|
|
CURRENT ASSETS |
|
|
|
|
|
|
|
Cash and cash equivalents |
|
$ |
187,286 |
|
$ |
158,264 |
|
Short-term investments |
|
|
153,116 |
|
|
167,662 |
|
Accounts receivable, less allowances (2023 - $11,318; 2022 - $13,892) |
|
|
429,570 |
|
|
517,494 |
|
Other accounts receivable, less allowances (2023 - $721; 2022 - $713) |
|
|
11,160 |
|
|
11,016 |
|
Prepaid expenses |
|
|
33,244 |
|
|
39,484 |
|
Prepaid and refundable income taxes |
|
|
39,230 |
|
|
19,239 |
|
Current assets of discontinued operations |
|
|
— |
|
|
64,736 |
|
Other |
|
|
11,584 |
|
|
11,888 |
|
TOTAL CURRENT ASSETS |
|
|
865,190 |
|
|
989,783 |
|
|
|
|
|
|
|
|
|
PROPERTY, PLANT AND EQUIPMENT |
|
|
|
|
|
|
|
Land and structures |
|
|
421,821 |
|
|
401,840 |
|
Revenue equipment |
|
|
1,062,854 |
|
|
1,038,832 |
|
Service, office, and other equipment |
|
|
309,952 |
|
|
298,234 |
|
Software |
|
|
167,292 |
|
|
167,164 |
|
Leasehold improvements |
|
|
26,240 |
|
|
23,466 |
|
|
|
|
1,988,159 |
|
|
1,929,536 |
|
Less allowances for depreciation and amortization |
|
|
1,159,626 |
|
|
1,129,366 |
|
|
|
|
828,533 |
|
|
800,170 |
|
|
|
|
|
|
|
|
|
GOODWILL |
|
|
304,753 |
|
|
304,753 |
|
INTANGIBLE ASSETS, NET |
|
|
107,467 |
|
|
113,733 |
|
OPERATING RIGHT-OF-USE ASSETS |
|
|
194,597 |
|
|
166,515 |
|
DEFERRED INCOME TAXES |
|
|
6,918 |
|
|
6,342 |
|
LONG-TERM ASSETS OF DISCONTINUED OPERATIONS |
|
|
— |
|
|
11,097 |
|
OTHER LONG-TERM ASSETS |
|
|
106,644 |
|
|
101,893 |
|
TOTAL ASSETS |
|
$ |
2,414,102 |
|
$ |
2,494,286 |
|
|
|
|
|
|
|
|
|
LIABILITIES AND STOCKHOLDERS’ EQUITY |
|
|
|
|
|
|
|
CURRENT LIABILITIES |
|
|
|
|
|
|
|
Accounts payable |
|
$ |
245,998 |
|
$ |
269,854 |
|
Income taxes payable |
|
|
— |
|
|
16,017 |
|
Accrued expenses |
|
|
299,339 |
|
|
338,457 |
|
Current portion of long-term debt |
|
|
64,882 |
|
|
66,252 |
|
Current portion of operating lease liabilities |
|
|
31,047 |
|
|
26,225 |
|
Current liabilities of discontinued operations |
|
|
— |
|
|
51,665 |
|
TOTAL CURRENT LIABILITIES |
|
|
641,266 |
|
|
768,470 |
|
|
|
|
|
|
|
|
|
LONG-TERM DEBT, less current portion |
|
|
168,105 |
|
|
198,371 |
|
OPERATING LEASE LIABILITIES, less current portion |
|
|
174,145 |
|
|
147,828 |
|
POSTRETIREMENT LIABILITIES, less current portion |
|
|
12,169 |
|
|
12,196 |
|
LONG-TERM LIABILITIES OF DISCONTINUED OPERATIONS |
|
|
— |
|
|
781 |
|
CONTINGENT CONSIDERATION |
|
|
117,040 |
|
|
112,000 |
|
OTHER LONG-TERM LIABILITIES |
|
|
37,314 |
|
|
42,745 |
|
DEFERRED INCOME TAXES |
|
|
52,702 |
|
|
60,494 |
|
|
|
|
|
|
|
|
|
STOCKHOLDERS’ EQUITY |
|
|
|
|
|
|
|
Common stock, $0.01 par value, authorized 70,000,000 shares; |
|
|
300 |
|
|
298 |
|
Additional paid-in capital |
|
|
335,397 |
|
|
339,582 |
|
Retained earnings |
|
|
1,194,610 |
|
|
1,088,693 |
|
Treasury stock, at cost, 2023: 5,982,679 shares; 2022: 5,529,383 shares |
|
|
(325,515) |
|
|
(284,275) |
|
Accumulated other comprehensive income |
|
|
6,569 |
|
|
7,103 |
|
TOTAL STOCKHOLDERS’ EQUITY |
|
|
1,211,361 |
|
|
1,151,401 |
|
TOTAL LIABILITIES AND STOCKHOLDERS' EQUITY |
|
$ |
2,414,102 |
|
$ |
2,494,286 |
|
6
ARCBEST CORPORATION
CONSOLIDATED STATEMENTS OF CASH FLOWS
|
|
Six Months Ended |
|
||||
|
|
June 30 |
|
||||
|
|
2023 |
|
2022 |
|
||
|
|
(Unaudited) |
|
||||
|
|
($ thousands) |
|
||||
OPERATING ACTIVITIES |
|
|
|
|
|
|
|
Net income |
|
$ |
111,726 |
|
$ |
172,030 |
|
Adjustments to reconcile net income to net cash provided by operating activities: |
|
|
|
|
|
|
|
Depreciation and amortization |
|
|
64,804 |
|
|
63,690 |
|
Amortization of intangibles |
|
|
6,398 |
|
|
6,463 |
|
Share-based compensation expense |
|
|
5,585 |
|
|
6,641 |
|
Provision for losses on accounts receivable |
|
|
2,257 |
|
|
3,583 |
|
Change in deferred income taxes |
|
|
(8,228) |
|
|
(6,371) |
|
(Gain) loss on sale of property and equipment |
|
|
1,188 |
|
|
(4,073) |
|
Gain on sale of subsidiary |
|
|
— |
|
|
(402) |
|
Pre-tax gain on sale of discontinued operations |
|
|
(70,215) |
|
|
— |
|
Change in fair value of contingent consideration |
|
|
5,040 |
|
|
810 |
|
Change in fair value of equity investment |
|
|
(3,739) |
|
|
— |
|
Changes in operating assets and liabilities: |
|
|
|
|
|
|
|
Receivables |
|
|
83,542 |
|
|
(87,092) |
|
Prepaid expenses |
|
|
6,353 |
|
|
7,477 |
|
Other assets |
|
|
759 |
|
|
72 |
|
Income taxes |
|
|
(35,968) |
|
|
4,211 |
|
Operating right-of-use assets and lease liabilities, net |
|
|
3,059 |
|
|
114 |
|
Accounts payable, accrued expenses, and other liabilities |
|
|
(68,804) |
|
|
17,470 |
|
NET CASH PROVIDED BY OPERATING ACTIVITIES |
|
|
103,757 |
|
|
184,623 |
|
|
|
|
|
|
|
|
|
INVESTING ACTIVITIES |
|
|
|
|
|
|
|
Purchases of property, plant and equipment, net of financings |
|
|
(83,171) |
|
|
(49,682) |
|
Proceeds from sale of property and equipment |
|
|
2,853 |
|
|
9,115 |
|
Proceeds from sale of discontinued operations |
|
|
100,949 |
|
|
— |
|
Business acquisition, net of cash acquired(1) |
|
|
— |
|
|
2,279 |
|
Proceeds from sale of subsidiary |
|
|
— |
|
|
475 |
|
Purchases of short-term investments |
|
|
(46,858) |
|
|
(64,330) |
|
Proceeds from sale of short-term investments |
|
|
63,693 |
|
|
35,840 |
|
Capitalization of internally developed software |
|
|
(7,010) |
|
|
(8,541) |
|
NET CASH PROVIDED BY (USED IN) INVESTING ACTIVITIES |
|
|
30,456 |
|
|
(74,844) |
|
|
|
|
|
|
|
|
|
FINANCING ACTIVITIES |
|
|
|
|
|
|
|
Borrowings under credit facilities |
|
|
— |
|
|
58,000 |
|
Proceeds from notes payable |
|
|
— |
|
|
7,280 |
|
Payments on long-term debt |
|
|
(35,114) |
|
|
(84,905) |
|
Net change in book overdrafts |
|
|
(13,171) |
|
|
6,085 |
|
Deferred financing costs |
|
|
57 |
|
|
— |
|
Payment of common stock dividends |
|
|
(5,809) |
|
|
(4,927) |
|
Purchases of treasury stock |
|
|
(41,240) |
|
|
(31,237) |
|
Payments for tax withheld on share-based compensation |
|
|
(10,022) |
|
|
(9,637) |
|
NET CASH USED IN FINANCING ACTIVITIES |
|
|
(105,299) |
|
|
(59,341) |
|
|
|
|
|
|
|
|
|
NET INCREASE IN CASH AND CASH EQUIVALENTS |
|
|
28,914 |
|
|
50,438 |
|
Cash and cash equivalents of continuing operations at beginning of period |
|
|
158,264 |
|
|
76,568 |
|
Cash and cash equivalents of discontinued operations at beginning of period |
|
|
108 |
|
|
52 |
|
CASH AND CASH EQUIVALENTS AT END OF PERIOD |
|
$ |
187,286 |
|
$ |
127,058 |
|
|
|
|
|
|
|
|
|
NONCASH INVESTING ACTIVITIES |
|
|
|
|
|
|
|
Equipment financed |
|
$ |
3,478 |
|
$ |
19,498 |
|
Accruals for equipment received |
|
$ |
10,106 |
|
$ |
7,574 |
|
Lease liabilities arising from obtaining right-of-use assets |
|
$ |
43,366 |
|
$ |
30,210 |
|
| 1) | Represents cash received from escrow for post-closing adjustments related to the acquisition of MoLo. |
Note: The statements of cash flows for the six months ended June 30, 2023 and 2022, includes cash flows from continuing operations and cash flows from the discontinued operations of FleetNet America®, which was sold on February 28, 2023.
7
ARCBEST CORPORATION
FINANCIAL STATEMENT OPERATING SEGMENT DATA AND OPERATING RATIOS
|
Three Months Ended |
|
|
Six Months Ended |
|
||||||||||||||||||
|
June 30 |
|
|
June 30 |
|
||||||||||||||||||
|
2023 |
|
|
2022 |
|
|
2023 |
|
|
2022 |
|
||||||||||||
|
(Unaudited) |
|
|||||||||||||||||||||
|
($ thousands, except percentages) |
|
|||||||||||||||||||||
REVENUES FROM CONTINUING OPERATIONS |
|
|
|
|
|
|
|
|
|
|
|
|
|
|
|
|
|
|
|
|
|
|
|
Asset-Based |
$ |
722,015 |
|
|
|
|
$ |
802,622 |
|
|
|
|
$ |
1,419,832 |
|
|
|
|
$ |
1,507,933 |
|
|
|
Asset-Light(1) |
|
409,816 |
|
|
|
|
|
549,655 |
|
|
|
|
|
847,908 |
|
|
|
|
|
1,144,939 |
|
|
|
Other and eliminations |
|
(28,367) |
|
|
|
|
|
(30,585) |
|
|
|
|
|
(58,182) |
|
|
|
|
|
(63,089) |
|
|
|
Total consolidated revenues from continuing operations |
$ |
1,103,464 |
|
|
|
|
$ |
1,321,692 |
|
|
|
|
$ |
2,209,558 |
|
|
|
|
$ |
2,589,783 |
|
|
|
|
|
|
|
|
|
|
|
|
|
|
|
|
|
|
|
|
|
|
|
|
|
|
|
OPERATING EXPENSES FROM CONTINUING OPERATIONS |
|
|
|
|
|
|
|
|
|
|
|
|
|
|
|
|
|
|
|
|
|
|
|
Asset-Based |
|
|
|
|
|
|
|
|
|
|
|
|
|
|
|
|
|
|
|
|
|
|
|
Salaries, wages, and benefits |
$ |
344,538 |
|
47.7 |
% |
|
$ |
328,068 |
|
40.9 |
% |
|
$ |
680,143 |
|
47.9 |
% |
|
$ |
641,565 |
|
42.5 |
% |
Fuel, supplies, and expenses |
|
90,897 |
|
12.6 |
|
|
|
99,296 |
|
12.4 |
|
|
|
185,185 |
|
13.1 |
|
|
|
184,127 |
|
12.2 |
|
Operating taxes and licenses |
|
14,094 |
|
2.0 |
|
|
|
12,823 |
|
1.6 |
|
|
|
28,073 |
|
2.0 |
|
|
|
25,316 |
|
1.7 |
|
Insurance |
|
12,889 |
|
1.8 |
|
|
|
12,197 |
|
1.5 |
|
|
|
26,162 |
|
1.8 |
|
|
|
22,628 |
|
1.5 |
|
Communications and utilities |
|
4,553 |
|
0.6 |
|
|
|
4,648 |
|
0.6 |
|
|
|
9,857 |
|
0.7 |
|
|
|
9,335 |
|
0.6 |
|
Depreciation and amortization |
|
25,273 |
|
3.5 |
|
|
|
24,463 |
|
3.1 |
|
|
|
50,184 |
|
3.5 |
|
|
|
48,768 |
|
3.2 |
|
Rents and purchased transportation |
|
101,922 |
|
14.1 |
|
|
|
121,550 |
|
15.1 |
|
|
|
192,666 |
|
13.6 |
|
|
|
224,535 |
|
14.9 |
|
Shared services |
|
74,468 |
|
10.3 |
|
|
|
75,584 |
|
9.4 |
|
|
|
139,081 |
|
9.8 |
|
|
|
142,734 |
|
9.6 |
|
(Gain) loss on sale of property and equipment |
|
416 |
|
0.1 |
|
|
|
(1,370) |
|
(0.2) |
|
|
|
365 |
|
— |
|
|
|
(4,065) |
|
(0.3) |
|
Innovative technology costs(2) |
|
8,343 |
|
1.1 |
|
|
|
7,954 |
|
1.0 |
|
|
|
14,411 |
|
1.0 |
|
|
|
14,914 |
|
1.0 |
|
Other |
|
1,297 |
|
0.2 |
|
|
|
753 |
|
0.1 |
|
|
|
2,909 |
|
0.2 |
|
|
|
1,386 |
|
0.1 |
|
Total Asset-Based |
|
678,690 |
|
94.0 |
% |
|
|
685,966 |
|
85.5 |
% |
|
|
1,329,036 |
|
93.6 |
% |
|
|
1,311,243 |
|
87.0 |
% |
|
|
|
|
|
|
|
|
|
|
|
|
|
|
|
|
|
|
|
|
|
|
|
|
Asset-Light(1) |
|
|
|
|
|
|
|
|
|
|
|
|
|
|
|
|
|
|
|
|
|
|
|
Purchased transportation |
$ |
343,102 |
|
83.7 |
% |
|
$ |
448,160 |
|
81.5 |
% |
|
$ |
713,265 |
|
84.1 |
% |
|
$ |
956,540 |
|
83.5 |
% |
Supplies and expenses |
|
3,348 |
|
0.8 |
|
|
|
4,263 |
|
0.8 |
|
|
|
7,420 |
|
0.9 |
|
|
|
7,529 |
|
0.7 |
|
Depreciation and amortization(3) |
|
5,085 |
|
1.2 |
|
|
|
5,468 |
|
1.0 |
|
|
|
10,153 |
|
1.2 |
|
|
|
10,648 |
|
0.9 |
|
Shared services |
|
48,985 |
|
12.0 |
|
|
|
57,986 |
|
10.6 |
|
|
|
100,414 |
|
11.8 |
|
|
|
108,183 |
|
9.5 |
|
Contingent consideration(4) |
|
(10,000) |
|
(2.4) |
|
|
|
— |
|
— |
|
|
|
5,040 |
|
0.6 |
|
|
|
810 |
|
0.1 |
|
Gain on sale of subsidiary(5) |
|
— |
|
— |
|
|
|
(402) |
|
(0.1) |
|
|
|
— |
|
— |
|
|
|
(402) |
|
— |
|
Other |
|
6,116 |
|
1.5 |
|
|
|
6,701 |
|
1.2 |
|
|
|
12,527 |
|
1.5 |
|
|
|
13,036 |
|
1.1 |
|
Total Asset-Light |
|
396,636 |
|
96.8 |
% |
|
|
522,176 |
|
95.0 |
% |
|
|
848,819 |
|
100.1 |
% |
|
|
1,096,344 |
|
95.8 |
% |
|
|
|
|
|
|
|
|
|
|
|
|
|
|
|
|
|
|
|
|
|
|
|
|
Other and eliminations(6) |
|
(13,978) |
|
|
|
|
|
(22,488) |
|
|
|
|
|
(31,572) |
|
|
|
|
|
(46,785) |
|
|
|
Total consolidated operating expenses from continuing operations |
$ |
1,061,348 |
|
96.2 |
% |
|
$ |
1,185,654 |
|
89.7 |
% |
|
$ |
2,146,283 |
|
97.1 |
% |
|
$ |
2,360,802 |
|
91.2 |
% |
|
|
|
|
|
|
|
|
|
|
|
|
|
|
|
|
|
|
|
|
|
|
|
|
OPERATING INCOME FROM CONTINUING OPERATIONS |
|
|
|
|
|
|
|
|
|
|
|
|
|
|
|
|
|
|
|
|
|
|
|
Asset-Based |
$ |
43,325 |
|
|
|
|
$ |
116,656 |
|
|
|
|
$ |
90,796 |
|
|
|
|
$ |
196,690 |
|
|
|
Asset-Light(1) |
|
13,180 |
|
|
|
|
|
27,479 |
|
|
|
|
|
(911) |
|
|
|
|
|
48,595 |
|
|
|
Other and eliminations(6) |
|
(14,389) |
|
|
|
|
|
(8,097) |
|
|
|
|
|
(26,610) |
|
|
|
|
|
(16,304) |
|
|
|
Total consolidated operating income from continuing operations |
$ |
42,116 |
|
|
|
|
$ |
136,038 |
|
|
|
|
$ |
63,275 |
|
|
|
|
$ |
228,981 |
|
|
|
| 1) | Asset-Light represents the reportable segment previously named ArcBest. Asset-Light financial results previously included the ArcBest segment and FleetNet, which was sold on February 28, 2023. |
| 2) | Represents costs associated with the Vaux freight handling pilot test program at ABF Freight. |
| 3) | Depreciation and amortization includes amortization of intangibles associated with acquired businesses. |
| 4) | Represents the fair value of the contingent earnout consideration recorded for the MoLo acquisition. The liability for contingent consideration is remeasured at each quarterly reporting date, and any change in fair value as a result of the recurring assessments is recognized in operating income. The contingent consideration for the MoLo acquisition will be paid based on achievement of certain targets of adjusted earnings before interest, taxes, depreciation, and amortization, as adjusted for certain items pursuant to the merger agreement, for years 2023 through 2025. |
| 5) | Gain relates to the contingent amount recognized in second quarter 2022 when the funds from the May 2021 sale of the labor services portion of the Asset-Light segment’s moving business were released from escrow. |
| 6) | “Other and eliminations” includes corporate costs for certain unallocated shared service costs which are not attributable to any segment, additional investments to offer comprehensive transportation and logistics services across multiple operating segments, and other investments in ArcBest technology and innovations. |
8
ARCBEST CORPORATION
RECONCILIATIONS OF GAAP TO NON-GAAP FINANCIAL MEASURES
Non-GAAP Financial Measures
We report our financial results in accordance with U.S. generally accepted accounting principles (“GAAP”). However, management believes that certain non-GAAP performance measures and ratios utilized for internal analysis provide analysts, investors, and others the same information that we use internally for purposes of assessing our core operating performance and provides meaningful comparisons between current and prior period results, as well as important information regarding performance trends. Accordingly, non-GAAP results are presented on a continuing operations basis, excluding the discontinued operations of FleetNet, which was sold on February 28, 2023. The use of certain non-GAAP measures improves comparability in analyzing our performance because it removes the impact of items from operating results that, in management's opinion, do not reflect our core operating performance. Other companies may calculate non-GAAP measures differently; therefore, our calculation may not be comparable to similarly titled measures of other companies. Certain information discussed in the scheduled conference call could be considered non-GAAP measures. Non-GAAP financial measures should be viewed in addition to, and not as an alternative for, our reported results. These financial measures should not be construed as better measurements than operating income, operating cash flow, net income or earnings per share, as determined under GAAP.
|
|
Three Months Ended |
|
Six Months Ended |
|||||||||
|
|
June 30 |
|
June 30 |
|
||||||||
|
|
2023 |
|
2022 |
|
2023 |
|
2022 |
|
||||
ArcBest Corporation - Consolidated |
|
(Unaudited) |
|
||||||||||
|
|
($ thousands, except per share data) |
|
||||||||||
Operating Income from Continuing Operations |
|
|
|
|
|
|
|
|
|
|
|
|
|
Amounts on GAAP basis |
|
$ |
42,116 |
|
$ |
136,038 |
|
$ |
63,275 |
|
$ |
228,981 |
|
Innovative technology costs, pre-tax(1) |
|
|
14,821 |
|
|
10,341 |
|
|
27,299 |
|
|
20,027 |
|
Purchase accounting amortization, pre-tax(2) |
|
|
3,192 |
|
|
3,214 |
|
|
6,384 |
|
|
6,427 |
|
Change in fair value of contingent consideration, pre-tax(3) |
|
|
(10,000) |
|
|
— |
|
|
5,040 |
|
|
810 |
|
Gain on sale of subsidiary, pre-tax(4) |
|
|
— |
|
|
(402) |
|
|
— |
|
|
(402) |
|
Non-GAAP amounts |
|
$ |
50,129 |
|
$ |
149,191 |
|
$ |
101,998 |
|
$ |
255,843 |
|
|
|
|
|
|
|
|
|
|
|
|
|
|
|
Net Income from Continuing Operations |
|
|
|
|
|
|
|
|
|
|
|
|
|
Amounts on GAAP basis |
|
$ |
39,600 |
|
$ |
101,542 |
|
$ |
58,447 |
|
$ |
169,550 |
|
Innovative technology costs, after-tax (includes related financing costs)(1) |
|
|
11,206 |
|
|
7,789 |
|
|
20,686 |
|
|
15,078 |
|
Purchase accounting amortization, after-tax(2) |
|
|
2,398 |
|
|
2,397 |
|
|
4,796 |
|
|
4,793 |
|
Change in fair value of contingent consideration, after-tax(3) |
|
|
(7,512) |
|
|
— |
|
|
3,787 |
|
|
604 |
|
Gain on sale of subsidiary, after-tax(4) |
|
|
— |
|
|
(317) |
|
|
— |
|
|
(317) |
|
Change in fair value of equity investment, after-tax(5) |
|
|
(2,786) |
|
|
— |
|
|
(2,786) |
|
|
— |
|
Life insurance proceeds and changes in cash surrender value |
|
|
(1,086) |
|
|
2,710 |
|
|
(2,582) |
|
|
3,503 |
|
Tax benefit from vested RSUs(6) |
|
|
(3,864) |
|
|
(5,059) |
|
|
(4,915) |
|
|
(5,929) |
|
Non-GAAP amounts |
|
$ |
37,956 |
|
$ |
109,062 |
|
$ |
77,433 |
|
$ |
187,282 |
|
|
|
|
|
|
|
|
|
|
|
|
|
|
|
Diluted Earnings Per Share from Continuing Operations |
|
|
|
|
|
|
|
|
|
|
|
|
|
Amounts on GAAP basis |
|
$ |
1.60 |
|
$ |
3.97 |
|
$ |
2.35 |
|
$ |
6.58 |
|
Innovative technology costs, after-tax (includes related financing costs)(1) |
|
|
0.45 |
|
|
0.30 |
|
|
0.83 |
|
|
0.59 |
|
Purchase accounting amortization, after-tax(2) |
|
|
0.10 |
|
|
0.09 |
|
|
0.19 |
|
|
0.19 |
|
Change in fair value of contingent consideration, after-tax(3) |
|
|
(0.30) |
|
|
— |
|
|
0.15 |
|
|
0.02 |
|
Gain on sale of subsidiary, after-tax(4) |
|
|
— |
|
|
(0.01) |
|
|
— |
|
|
(0.01) |
|
Change in fair value of equity investment, after-tax(5) |
|
|
(0.11) |
|
|
— |
|
|
(0.11) |
|
|
— |
|
Life insurance proceeds and changes in cash surrender value |
|
|
(0.04) |
|
|
0.11 |
|
|
(0.10) |
|
|
0.14 |
|
Tax benefit from vested RSUs(6) |
|
|
(0.16) |
|
|
(0.20) |
|
|
(0.20) |
|
|
(0.23) |
|
Non-GAAP amounts(7) |
|
$ |
1.54 |
|
$ |
4.26 |
|
$ |
3.11 |
|
$ |
7.27 |
|
| 1) | Represents costs associated with the Vaux freight handling pilot test program at ABF Freight, costs related to our customer pilot offering of Vaux, including human-centered remote operation software, and initiatives to optimize our performance through technological innovation. |
| 2) | Represents the amortization of acquired intangible assets in the Asset-Light segment. |
| 3) | Represents change in fair value of the contingent earnout consideration recorded for the MoLo acquisition, as previously described in the footnotes to the Financial Statement Operating Segment Data and Operating Ratios table. |
| 4) | Gain relates to the contingent amount recognized in second quarter 2022 when the funds from the May 2021 sale of the labor services portion of the Asset-Light segment’s moving business were released from escrow. |
| 5) | Represents increase in fair value of our investment in Phantom Auto, the leading provider of human-centered remote operation software, based on observable price changes during second quarter 2023. |
| 6) | Represents recognition of the tax impact for the vesting of share-based compensation. |
| 7) | Non-GAAP earnings per share is calculated in total and may not equal the sum of the GAAP amounts and the non-GAAP adjustments due to rounding. |
9
ARCBEST CORPORATION
RECONCILIATIONS OF GAAP TO NON-GAAP FINANCIAL MEASURES – Continued
|
|
Three Months Ended |
|
Six Months Ended |
|
||||||||||||||||||||
|
|
June 30 |
|
June 30 |
|
||||||||||||||||||||
|
|
2023 |
|
2022 |
|
2023 |
|
2022 |
|
||||||||||||||||
Segment Operating Income Reconciliations |
|
(Unaudited) |
|
||||||||||||||||||||||
|
|
($ thousands, except percentages) |
|
||||||||||||||||||||||
Asset-Based Segment |
|
|
|
|
|
||||||||||||||||||||
Operating Income ($) and Operating Ratio (% of revenues) |
|
|
|
|
|
|
|
|
|
|
|
|
|
|
|
||||||||||
Amounts on GAAP basis |
|
$ |
43,325 |
|
94.0 |
% |
|
$ |
116,656 |
|
85.5 |
% |
|
$ |
90,796 |
|
93.6 |
% |
|
$ |
196,690 |
|
87.0 |
% |
|
Innovative technology costs, pre-tax(1) |
|
|
8,343 |
|
(1.1) |
|
|
|
7,954 |
|
(1.0) |
|
|
|
14,411 |
|
(1.0) |
|
|
|
14,914 |
|
(1.0) |
|
|
Non-GAAP amounts(2) |
|
$ |
51,668 |
|
92.8 |
% |
|
$ |
124,610 |
|
84.5 |
% |
|
$ |
105,207 |
|
92.6 |
% |
|
$ |
211,604 |
|
86.0 |
% |
|
|
|
|
|
|
|
||||||||||||||||||||
Asset-Light Segment(3) |
|
|
|
|
|
||||||||||||||||||||
Operating Income (Loss) ($) and Operating Ratio (% of revenues) |
|
|
|
|
|
|
|
|
|
|
|
|
|
|
|
||||||||||
Amounts on GAAP basis |
|
$ |
13,180 |
|
96.8 |
% |
|
$ |
27,479 |
|
95.0 |
% |
|
$ |
(911) |
|
100.1 |
% |
|
$ |
48,595 |
|
95.8 |
% |
|
Purchase accounting amortization, pre-tax(4) |
|
|
3,192 |
|
(0.8) |
|
|
|
3,214 |
|
(0.6) |
|
|
|
6,384 |
|
(0.8) |
|
|
|
6,427 |
|
(0.6) |
|
|
Change in fair value of contingent consideration, pre-tax(5) |
|
|
(10,000) |
|
2.4 |
|
|
|
— |
|
— |
|
|
|
5,040 |
|
(0.6) |
|
|
|
810 |
|
(0.1) |
|
|
Gain on sale of subsidiary, pre-tax(6) |
|
|
— |
|
— |
|
|
|
(402) |
|
0.1 |
|
|
|
— |
|
— |
|
|
|
(402) |
|
— |
|
|
Non-GAAP amounts(2) |
|
$ |
6,372 |
|
98.4 |
% |
|
$ |
30,291 |
|
94.5 |
% |
|
$ |
10,513 |
|
98.8 |
% |
|
$ |
55,430 |
|
95.2 |
% |
|
|
|
|
|
|
|
||||||||||||||||||||
Other and Eliminations |
|
|
|
|
|
||||||||||||||||||||
Operating Income (Loss) ($) |
|
|
|
|
|
|
|
|
|
|
|
|
|
|
|
||||||||||
Amounts on GAAP basis |
|
$ |
(14,389) |
|
|
|
|
$ |
(8,097) |
|
|
|
|
$ |
(26,610) |
|
|
|
|
$ |
(16,304) |
|
|
|
|
Innovative technology costs, pre-tax(7) |
|
|
6,478 |
|
|
|
|
|
2,387 |
|
|
|
|
|
12,888 |
|
|
|
|
|
5,113 |
|
|
|
|
Non-GAAP amounts(2) |
|
$ |
(7,911) |
|
|
|
|
$ |
(5,710) |
|
|
|
|
$ |
(13,722) |
|
|
|
|
$ |
(11,191) |
|
|
|
|
| 1) | Represents costs associated with the Vaux freight handling pilot test program at ABF Freight. |
| 2) | Non-GAAP amounts are calculated in total and may not equal the sum of the GAAP amounts and the non-GAAP adjustments due to rounding. |
| 3) | Asset-Light represents the reportable segment previously named ArcBest. Asset-Light financial results previously included the ArcBest segment and FleetNet, which was sold on February 28, 2023. |
| 4) | Represents the amortization of acquired intangible assets in the Asset-Light segment. |
| 5) | Represents change in fair value of the contingent earnout consideration recorded for the MoLo acquisition, as previously described in the footnotes to the Financial Statement Operating Segment Data and Operating Ratios table. |
| 6) | Gain relates to the contingent amount recognized in second quarter 2022 when the funds from the May 2021 sale of the labor services portion of the Asset-Light segment’s moving business were released from escrow. |
| 7) | Represents certain costs related to our customer pilot offering of Vaux, including human-centered remote operation software, and initiatives to optimize our performance through technological innovation. |
10
ARCBEST CORPORATION
RECONCILIATIONS OF GAAP TO NON-GAAP FINANCIAL MEASURES – Continued
Effective Tax Rate Reconciliation |
|
|
|
|
|
|
|
|
|
|
|
|
|
|
||||
ArcBest Corporation - Consolidated |
|
|
|
|
|
|
|
|
|
|
|
|
|
|
|
|
|
|
|
|
|
|
|
|
|
|
|
|
|
|
|
|
|
|
|
|
|
(Unaudited) |
|
|
|
|
|
|
|
|
|
|
|
|
|
|
|
|
|
|
($ thousands, except percentages) |
|
Three Months Ended June 30, 2023 |
||||||||||||||||
|
|
|
|
|
Other |
|
Income |
|
Income |
|
|
|
|
|
|
|||
CONTINUING OPERATIONS |
|
Operating |
|
Income |
|
Before Income |
|
Tax |
|
Net |
|
|
||||||
|
|
Income |
|
(Costs) |
|
Taxes |
|
Provision |
|
Income |
|
Tax Rate(6) |
||||||
Amounts on GAAP basis |
|
$ |
42,116 |
|
$ |
6,558 |
|
$ |
48,674 |
|
$ |
9,074 |
|
$ |
39,600 |
|
18.6 |
% |
Innovative technology costs(1) |
|
|
14,821 |
|
|
241 |
|
|
15,062 |
|
|
3,856 |
|
|
11,206 |
|
25.6 |
|
Purchase accounting amortization(2) |
|
|
3,192 |
|
|
— |
|
|
3,192 |
|
|
794 |
|
|
2,398 |
|
24.9 |
|
Change in fair value of contingent consideration(3) |
|
|
(10,000) |
|
|
— |
|
|
(10,000) |
|
|
(2,488) |
|
|
(7,512) |
|
(24.9) |
|
Change in fair value of equity investment(4) |
|
|
— |
|
|
(3,739) |
|
|
(3,739) |
|
|
(953) |
|
|
(2,786) |
|
(25.5) |
|
Life insurance proceeds and changes in cash surrender value |
|
|
— |
|
|
(1,086) |
|
|
(1,086) |
|
|
— |
|
|
(1,086) |
|
— |
|
Tax benefit from vested RSUs(5) |
|
|
— |
|
|
— |
|
|
— |
|
|
3,864 |
|
|
(3,864) |
|
— |
|
Non-GAAP amounts |
|
$ |
50,129 |
|
$ |
1,974 |
|
$ |
52,103 |
|
$ |
14,147 |
|
$ |
37,956 |
|
27.2 |
% |
|
|
Six Months Ended June 30, 2023 |
||||||||||||||||
|
|
|
|
Other |
|
Income |
|
Income |
|
|
|
|
|
|
||||
|
|
Operating |
|
Income |
|
Before Income |
|
Tax |
|
Net |
|
|
||||||
|
|
Income |
|
(Costs) |
|
Taxes |
|
Provision |
|
Income |
|
Tax Rate(6) |
||||||
Amounts on GAAP basis |
|
$ |
63,275 |
|
$ |
8,944 |
|
$ |
72,219 |
|
$ |
13,772 |
|
$ |
58,447 |
|
19.1 |
% |
Innovative technology costs(1) |
|
|
27,299 |
|
|
500 |
|
|
27,799 |
|
|
7,113 |
|
|
20,686 |
|
25.6 |
|
Purchase accounting amortization(2) |
|
|
6,384 |
|
|
— |
|
|
6,384 |
|
|
1,588 |
|
|
4,796 |
|
24.9 |
|
Change in fair value of contingent consideration(3) |
|
|
5,040 |
|
|
— |
|
|
5,040 |
|
|
1,253 |
|
|
3,787 |
|
24.9 |
|
Change in fair value of equity investment(4) |
|
|
— |
|
|
(3,739) |
|
|
(3,739) |
|
|
(953) |
|
|
(2,786) |
|
(25.5) |
|
Life insurance proceeds and changes in cash surrender value |
|
|
— |
|
|
(2,582) |
|
|
(2,582) |
|
|
— |
|
|
(2,582) |
|
— |
|
Tax benefit from vested RSUs(5) |
|
|
— |
|
|
— |
|
|
— |
|
|
4,915 |
|
|
(4,915) |
|
— |
|
Non-GAAP amounts |
|
$ |
101,998 |
|
$ |
3,123 |
|
$ |
105,121 |
|
$ |
27,688 |
|
$ |
77,433 |
|
26.3 |
% |
|
|
Three Months Ended June 30, 2022 |
||||||||||||||||
|
|
|
|
Other |
|
Income |
|
Income |
|
|
|
|
|
|||||
CONTINUING OPERATIONS |
|
Operating |
|
Income |
|
Before Income |
|
Tax |
|
Net |
|
|
||||||
|
|
Income |
|
(Costs) |
|
Taxes |
|
Provision |
|
Income |
|
Tax Rate(6) |
||||||
Amounts on GAAP basis |
|
$ |
136,038 |
|
$ |
(4,317) |
|
$ |
131,721 |
|
$ |
30,179 |
|
$ |
101,542 |
|
22.9 |
% |
Innovative technology costs(1) |
|
|
10,341 |
|
|
148 |
|
|
10,489 |
|
|
2,700 |
|
|
7,789 |
|
25.7 |
|
Purchase accounting amortization(2) |
|
|
3,214 |
|
|
— |
|
|
3,214 |
|
|
817 |
|
|
2,397 |
|
25.4 |
|
Gain on sale of subsidiary(7) |
|
|
(402) |
|
|
— |
|
|
(402) |
|
|
(85) |
|
|
(317) |
|
(21.1) |
|
Life insurance proceeds and changes in cash surrender value |
|
|
— |
|
|
2,710 |
|
|
2,710 |
|
|
— |
|
|
2,710 |
|
— |
|
Tax benefit from vested RSUs(5) |
|
|
— |
|
|
— |
|
|
— |
|
|
5,059 |
|
|
(5,059) |
|
— |
|
Non-GAAP amounts |
|
$ |
149,191 |
|
$ |
(1,459) |
|
$ |
147,732 |
|
$ |
38,670 |
|
$ |
109,062 |
|
26.2 |
% |
|
|
Six Months Ended June 30, 2022 |
||||||||||||||||
|
|
|
|
Other |
|
Income |
|
Income |
|
|
|
|
|
|
||||
|
|
Operating |
|
Income |
|
Before Income |
|
Tax |
|
Net |
|
|
||||||
|
|
Income |
|
(Costs) |
|
Taxes |
|
Provision |
|
Income |
|
Tax Rate(6) |
||||||
Amounts on GAAP basis |
|
$ |
228,981 |
|
$ |
(6,984) |
|
$ |
221,997 |
|
$ |
52,447 |
|
$ |
169,550 |
|
23.6 |
% |
Innovative technology costs(1) |
|
|
20,027 |
|
|
277 |
|
|
20,304 |
|
|
5,226 |
|
|
15,078 |
|
25.7 |
|
Purchase accounting amortization(2) |
|
|
6,427 |
|
|
— |
|
|
6,427 |
|
|
1,634 |
|
|
4,793 |
|
25.4 |
|
Change in fair value of contingent consideration(3) |
|
|
810 |
|
|
— |
|
|
810 |
|
|
206 |
|
|
604 |
|
25.4 |
|
Gain on sale of subsidiary(7) |
|
|
(402) |
|
|
— |
|
|
(402) |
|
|
(85) |
|
|
(317) |
|
(21.1) |
|
Life insurance proceeds and changes in cash surrender value |
|
|
— |
|
|
3,503 |
|
|
3,503 |
|
|
— |
|
|
3,503 |
|
— |
|
Tax benefit from vested RSUs(5) |
|
|
— |
|
|
— |
|
|
— |
|
|
5,929 |
|
|
(5,929) |
|
— |
|
Non-GAAP amounts |
|
$ |
255,843 |
|
$ |
(3,204) |
|
$ |
252,639 |
|
$ |
65,357 |
|
$ |
187,282 |
|
25.9 |
% |
| 1) | Represents costs associated with the Vaux freight handling pilot test program at ABF Freight, costs related to our customer pilot offering of Vaux, including human-centered remote operation software, and initiatives to optimize our performance through technological innovation. |
| 2) | Represents the amortization of acquired intangible assets in the Asset-Light segment. |
| 3) | Represents change in fair value of the contingent earnout consideration recorded for the MoLo acquisition, as previously described in the footnotes to the Financial Statement Operating Segment Data and Operating Ratios table. |
| 4) | Represents increase in fair value of our investment in Phantom Auto, the leading provider of human-centered remote operation software, based on observable price changes during second quarter 2023. |
| 5) | Represents recognition of the tax impact for the vesting of share-based compensation. |
| 6) | Tax rate for total “Amounts on GAAP basis” represents the effective tax rate. The tax effects of non-GAAP adjustments are calculated based on the statutory rate applicable to each item based on tax jurisdiction, unless the nature of the item requires the tax effect to be estimated by applying a specific tax treatment. |
| 7) | Gain relates to the contingent amount recognized in second quarter 2022 when the funds from the May 2021 sale of the labor services portion of the Asset-Light segment’s moving business were released from escrow. |
11
ARCBEST CORPORATION
RECONCILIATIONS OF GAAP TO NON-GAAP FINANCIAL MEASURES – Continued
Adjusted Earnings Before Interest, Taxes, Depreciation, and Amortization (Adjusted EBITDA)
Management uses Adjusted EBITDA as a key measure of performance and for business planning. The measure is particularly meaningful for analysis of operating performance because it excludes amortization of acquired intangibles and software of the Asset-Light segment, changes in the fair value of contingent consideration and equity investment, and gain on sale of subsidiary, which are significant expenses or gains resulting from strategic decisions rather than core daily operations. Additionally, Adjusted EBITDA is a primary component of the financial covenants contained in our credit agreement. The calculation of Consolidated Adjusted EBITDA as presented below begins with net income from continuing operations, which is the most directly comparable GAAP measure. The calculation of Asset-Light Adjusted EBITDA as presented below begins with operating income, as other income (costs), income taxes, and net income from continuing operations are reported at the consolidated level and not included in the operating segment financial information evaluated by management to make operating decisions.
|
|
Three Months Ended |
|
Six Months Ended |
|||||||||
|
|
June 30 |
|
|
June 30 |
|
|||||||
|
|
2023 |
|
2022 |
|
2023 |
|
2022 |
|
||||
|
|
(Unaudited) |
|
||||||||||
|
|
($ thousands) |
|
||||||||||
ArcBest Corporation - Consolidated Adjusted EBITDA from Continuing Operations |
|
|
|||||||||||
Net Income from Continuing Operations |
|
$ |
39,600 |
|
$ |
101,542 |
|
$ |
58,447 |
|
$ |
169,550 |
|
Interest and other related financing costs |
|
|
2,205 |
|
|
1,863 |
|
|
4,532 |
|
|
3,803 |
|
Income tax provision |
|
|
9,074 |
|
|
30,179 |
|
|
13,772 |
|
|
52,447 |
|
Depreciation and amortization(1) |
|
|
35,811 |
|
|
34,884 |
|
|
70,821 |
|
|
69,280 |
|
Amortization of share-based compensation |
|
|
3,350 |
|
|
3,799 |
|
|
5,532 |
|
|
6,500 |
|
Change in fair value of contingent consideration(2) |
|
|
(10,000) |
|
|
— |
|
|
5,040 |
|
|
810 |
|
Change in fair value of equity investment(3) |
|
|
(3,739) |
|
|
— |
|
|
(3,739) |
|
|
— |
|
Gain on sale of subsidiary(4) |
|
|
— |
|
|
(402) |
|
|
— |
|
|
(402) |
|
Consolidated Adjusted EBITDA from Continuing Operations |
|
$ |
76,301 |
|
$ |
171,865 |
|
$ |
154,405 |
|
$ |
301,988 |
|
|
|
Three Months Ended |
|
Six Months Ended |
|
||||||||
|
|
June 30 |
|
June 30 |
|
||||||||
|
|
2023 |
|
2022 |
|
2023 |
|
2022 |
|
||||
|
|
(Unaudited) |
|
||||||||||
|
|
($ thousands) |
|
||||||||||
Asset-Light Adjusted EBITDA(5) |
|
|
|
|
|
|
|
|
|
|
|
|
|
Operating Income |
|
$ |
13,180 |
|
$ |
27,479 |
|
$ |
(911) |
|
$ |
48,595 |
|
Depreciation and amortization(1) |
|
|
5,085 |
|
|
5,468 |
|
|
10,153 |
|
|
10,648 |
|
Change in fair value of contingent consideration(2) |
|
|
(10,000) |
|
|
— |
|
|
5,040 |
|
|
810 |
|
Gain on sale of subsidiary(4) |
|
|
— |
|
|
(402) |
|
|
— |
|
|
(402) |
|
Asset-Light Adjusted EBITDA |
|
$ |
8,265 |
|
$ |
32,545 |
|
$ |
14,282 |
|
$ |
59,651 |
|
| 1) | Includes amortization of intangibles associated with acquired businesses. |
| 2) | Represents change in fair value of the contingent earnout consideration recorded for the MoLo acquisition, as previously described in the footnotes to the Financial Statement Operating Segment Data and Operating Ratios table. |
| 3) | Represents increase in fair value of our investment in Phantom Auto, the leading provider of human-centered remote operation software, based on observable price changes during second quarter 2023. |
| 4) | Gain relates to the contingent amount recognized in second quarter 2022 when the funds from the May 2021 sale of the labor services portion of the Asset-Light segment’s moving business were released from escrow. |
| 5) | Asset-Light represents the reportable segment previously named ArcBest. Asset-Light financial results previously included the ArcBest segment and FleetNet, which sold on February 28, 2023. |
12
ARCBEST CORPORATION
OPERATING STATISTICS
|
|
Three Months Ended |
|
|
Six Months Ended |
|
||||||||||||
|
|
June 30 |
|
|
June 30 |
|
||||||||||||
|
|
2023 |
|
2022 |
|
% Change |
|
|
2023 |
|
2022 |
|
% Change |
|
||||
|
|
(Unaudited) |
|
|||||||||||||||
Asset-Based |
|
|
|
|
|
|
|
|
|
|
|
|
|
|
|
|
|
|
|
|
|
|
|
|
|
|
|
|
|
|
|
|
|
|
|
|
|
Workdays |
|
|
63.5 |
|
|
63.5 |
|
|
|
|
|
127.5 |
|
|
127.0 |
|
|
|
|
|
|
|
|
|
|
|
|
|
|
|
|
|
|
|
|
|
|
Billed Revenue(1) / CWT |
|
$ |
40.72 |
|
$ |
45.76 |
|
(11.0%) |
|
|
$ |
41.33 |
|
$ |
44.77 |
|
(7.7%) |
|
|
|
|
|
|
|
|
|
|
|
|
|
|
|
|
|
|
|
|
Billed Revenue(1) / Shipment |
|
$ |
545.35 |
|
$ |
632.43 |
|
(13.8%) |
|
|
$ |
537.38 |
|
$ |
606.14 |
|
(11.3%) |
|
|
|
|
|
|
|
|
|
|
|
|
|
|
|
|
|
|
|
|
Shipments |
|
|
1,330,068 |
|
|
1,276,859 |
|
4.2% |
|
|
|
2,664,822 |
|
|
2,504,083 |
|
6.4% |
|
|
|
|
|
|
|
|
|
|
|
|
|
|
|
|
|
|
|
|
Shipments / Day |
|
|
20,946 |
|
|
20,108 |
|
4.2% |
|
|
|
20,901 |
|
|
19,717 |
|
6.0% |
|
|
|
|
|
|
|
|
|
|
|
|
|
|
|
|
|
|
|
|
Tonnage (Tons) |
|
|
890,686 |
|
|
882,367 |
|
0.9% |
|
|
|
1,732,204 |
|
|
1,695,097 |
|
2.2% |
|
|
|
|
|
|
|
|
|
|
|
|
|
|
|
|
|
|
|
|
Tons / Day |
|
|
14,027 |
|
|
13,896 |
|
0.9% |
|
|
|
13,586 |
|
|
13,347 |
|
1.8% |
|
|
|
|
|
|
|
|
|
|
|
|
|
|
|
|
|
|
|
|
Pounds / Shipment |
|
|
1,339 |
|
|
1,382 |
|
(3.1%) |
|
|
|
1,300 |
|
|
1,354 |
|
(4.0%) |
|
|
|
|
|
|
|
|
|
|
|
|
|
|
|
|
|
|
|
|
Average Length of Haul (Miles) |
|
|
1,122 |
|
|
1,096 |
|
2.4% |
|
|
|
1,109 |
|
|
1,088 |
|
1.9% |
|
|
|
|
|
|
|
|
|
|
|
|
|
|
|
|
|
|
|
|
| 1) | Revenue for undelivered freight is deferred for financial statement purposes in accordance with the Asset-Based segment revenue recognition policy. Billed revenue used for calculating revenue per hundredweight measurements has not been adjusted for the portion of revenue deferred for financial statement purposes. |
|
|
Year Over Year % Change |
||||
|
|
Three Months Ended |
Six Months Ended |
|||
|
|
June 30, 2023 |
June 30, 2023 |
|||
|
|
(Unaudited) |
||||
Asset-Light(2)(3) |
|
|
|
|
|
|
|
|
|
|
|
|
|
Revenue / Shipment |
|
|
(30.0%) |
|
|
(30.3%) |
|
|
|
|
|
|
|
Shipments / Day |
|
|
3.5% |
|
|
2.3% |
| 2) | Asset-Light represents the reportable segment previously named ArcBest. |
| 3) | Statistical data related to managed transportation solutions transactions is not included in the presentation of operating statistics for the Asset-Light segment for the periods presented. |
###
13
Exhibit 99.2
ArcBest® is providing this exhibit as supplemental information to its scheduled conference call and the press release announcing the Company’s unaudited second quarter 2023 results filed as Exhibit 99.1 to the Company’s Current Report on Form 8-K. Certain statements and information in this exhibit may constitute “forward-looking statements” within the meaning of the Private Securities Litigation Reform Act of 1995. Refer to the “Forward-Looking Statements” disclosure at the end of this exhibit.
Non-GAAP Financial Measures
ArcBest reports its financial results in accordance with generally accepted accounting principles (“GAAP”); however, this exhibit includes certain non-GAAP information. Refer to the discussion of non-GAAP information included in Item 2.02 of the Current Report on Form 8-K to which this exhibit is included for further information, including reference to reconciliations of GAAP to non-GAAP financial measures provided by the Company.
Summary Operating and Financial Impacts
Asset-Based Segment
2Q’23 Year-over-Year Yield Metrics
| ● | Billed Rev/Cwt on core LTL-rated business, excluding fuel surcharges, increased by a percentage in the high single digits. |
| ● | Average price increase on contract renewals and deferred pricing agreements negotiated during 2Q’23: +3.1% |
Year-over-Year Monthly Total Daily Business Trends
|
|
April 2023 |
|
May 2023 |
|
June 2023 |
|
July 2023(1)(2) |
|
||||
|
|
|
|
|
|
|
|
|
|
|
|
|
|
Billed Revenue/Day(3) |
|
|
-9.1 |
% |
|
-10.2 |
% |
|
-11.2 |
% |
|
-12 |
% |
Total Tons/Day |
|
|
+1.3 |
% |
|
+1.6 |
% |
|
-0.2 |
% |
|
-5 |
% |
Total Shipments/Day |
|
|
+4.7 |
% |
|
+2.5 |
% |
|
+5.4 |
% |
|
+1 |
% |
| 1) | Statistics for the full month of July 2023 have not been finalized and are preliminary. |
| 2) | There will be 19.5 workdays in July 2023, and there were 20 workdays in July 2022. |
| 3) | Revenue for undelivered freight is deferred for financial statement purposes in accordance with the Asset-Based segment revenue recognition policy. Billed revenue per day has not been adjusted for the portion of revenue deferred for financial statement purposes. |
1
Asset-Based Segment
July 2023 Business Update
See tables above for July 2023 revenue, tonnage and shipment metric comparisons. Statistics for July 2023 have not been finalized. Preliminary Asset-Based financial metrics and business trends for July 2023, compared to the same period last year, are as follows:
| ● | Total Billed Revenue/CWT decreased approximately 7% impacted by lower fuel surcharge. |
| ● | Total Billed Revenue/Shipment decreased approximately 13%. |
| ● | Total Weight/Shipment decreased approximately 6%. |
The ArcBest Asset-Based segment implemented cost savings actions in July 2023 to improve overall segment profitability, resulting in a reduction in total average daily shipments to approximately 19,500 shipments per day, a decline of approximately 5% compared to 2Q’23 levels. The decrease in shipments was accomplished by reducing shipments sourced from the Asset-Based dynamic LTL-rated, market-based pricing program. In addition, over the past week, the Asset-Based segment has experienced more than a 10% increase in core LTL-rated shipments per day when compared to June 2023, which was offset by further reductions in dynamic LTL-rated shipments.
The pricing environment continues to be rational as the revenue per hundredweight change in July 2023 followed an 11% increase in July 2022 versus July 2021. The decrease in the July 2023 revenue per hundredweight pricing measure was driven by the change in mix associated with a decrease in core LTL-rated shipments and an increase in dynamic, market-priced LTL-rated shipments compared to the prior-year period. Lower diesel fuel costs in 2023 compared to the same period in 2022 have also contributed to reduced fuel surcharge revenue this year, thus impacting year-over-year yield management statistical comparisons. Pricing on core LTL-rated business, excluding fuel surcharges, increased by a percentage in the low-single digits in July 2023.
Excluding periods impacted by the pandemic, the average sequential change in ArcBest’s Asset-Based operating ratio in the third quarter versus the second quarter has been relatively flat.
3Q’23 Other Items
| ● | In late July 2023, the decision was made to pause the Vaux hardware pilot at ABF Freight distribution centers in Kansas City and Salt Lake City. Innovative Technology Costs associated with these pilot locations are expected to continue through August 2023. |
| ● | Projected Innovative Technology Costs in our Asset-Based business associated with the Vaux freight handling pilot test program at ABF Freight (non-GAAP reconciling item): $6 million vs. $6 million in 3Q’22 |
| ● | There will be 62.5 workdays in 3Q’23, and there were 64.0 workdays in 3Q’22. |
2
Asset-Light Operating Segment
2Q’23 and July 2023 Monthly Total Daily Business Trends
|
|
April 2023 |
|
May 2023 |
|
June 2023 |
|
July 2023(1)(2) |
|
||||
|
|
|
|
|
|
|
|
|
|
|
|
|
|
Revenue/Day (Year-over-Year) |
|
|
-24.2 |
% |
|
-25.7 |
% |
|
-26.1 |
% |
|
-23 |
% |
Shipments/Day (Year-over-Year)(3) |
|
|
+2.4 |
% |
|
+4.2 |
% |
|
+3.8 |
% |
|
+3 |
% |
Revenue/Shipment (Year-over-Year)(3) |
|
|
-28.8 |
% |
|
-30.8 |
% |
|
-30.1 |
% |
|
-29 |
% |
| 1) | Statistics for the full month of July 2023 have not been finalized and are preliminary. |
| 2) | There will be 19.5 workdays in July 2023, and there were 20 workdays in July 2022. |
| 3) | Changes in Shipments/Day and Revenue/Shipment do not include managed transportation solutions transactions for the Asset-Light operating segment for the periods presented. |
Purchased transportation expense as a percentage of revenue averaged approximately 85% for July 2023, compared to the second quarter 2023 average of 83.7% and the third quarter 2022 average of 82.6%.
Year-over-year changes in revenue per shipment and purchased transportation expense as a percentage of revenue reflect continued market softness combined with business mix changes. During the current environment, ArcBest continues to manage operating expenses to align with business levels.
ArcBest Consolidated
On a preliminary basis, July 2023 consolidated revenues decreased approximately 18% on a per-day basis compared to July 2022.
3Q’23 – Projected Other Items
| ● | Projected Innovative Technology Costs in “Other and eliminations” related to our freight handling pilot program with third-party customers and human-centered remote and automated operations, as previously announced in connection with our investment in Phantom Auto (non-GAAP reconciling item): $7 million vs. $4 million in 3Q’22 |
| ● | Loss in “Other and eliminations” (non-GAAP basis which excludes Projected Innovative Technology Costs): $6 million vs. $5 million in 3Q’22 |
| ● | Interest Income, net of Interest Expense: $0.9 million vs. Interest Expense, net of Interest Income of $0.6 million in 3Q’22 |
FY’23 – Projected Other Items
| ● | Projected Innovative Technology Costs in “Other and eliminations” related to our freight handling pilot program with third-party customers and human-centered remote and automated operations, as previously announced in connection with our investment in Phantom Auto (non-GAAP reconciling item): $25 million vs. $14 million in 2022 |
| ● | Loss in “Other and eliminations” (non-GAAP basis which excludes Projected Innovative Technology Costs and other items): $26 million vs. $25 million in 2022. |
| ● | Interest Income, net of Interest Expense: $3 million vs. Interest Expense, net of Interest Income of $4 million in 2022 |
3
ArcBest Consolidated
“Other and eliminations” within Operating Income on the Operating Segment Data and Operating Ratios statement
| ● | The “Other and eliminations” line includes expenses related to shared services for the delivery of comprehensive transportation and logistics services to ArcBest’s customers, as well as investments in ArcBest technology and innovation. Shared services represent costs incurred to support all segments including sales, yield, customer service, marketing, capacity sourcing functions, human resources, financial services, information technology, legal and other company-wide services. Shared services are primarily allocated to the reporting segments based upon resource utilization-related metrics, such as estimated shipment levels or number of personnel supported, and therefore fluctuate with business levels. As a result, the loss in “Other and eliminations” tends to be higher in periods when business levels are lower and, consequently, allocations to operating segments are lower. |
MoLo Contingent Earnout Consideration
As previously disclosed, contingent earnout consideration for the MoLo acquisition will be paid based on achievement of certain targets of adjusted earnings before interest, taxes, depreciation, and amortization, as adjusted for certain items pursuant to the merger agreement, for years 2023 through 2025. The liability for contingent earnout consideration is remeasured at fair value each quarter, and any change in fair value as a result of the recurring quarterly assessment is recognized in operating income. Factors impacting the fair value of the contingent earnout consideration include actual and forecasted operating results of MoLo, market volatility and discount rate considerations (including interest rates and other market factors).
ArcBest Consolidated Capital Expenditures
FY’23 – Projected
| ● | Total Net Capital Expenditures, including financed equipment: $270 million to $295 million (from the previous $300 million to $325 million) |
| ● | Approximately $60 million of previously planned 2022 net capital expenditures, associated with supply chain-related manufacturing delays and cancellations, are included in the 2023 net capital expenditures total. |
| ● | Includes revenue equipment purchases (majority for Asset-Based) of $165 million. |
| ● | Includes real estate expenditures (majority for Asset-Based) of $50 million to $60 million. |
| ● | The remaining amount of capital expenditures includes items related to technology and miscellaneous dock equipment upgrades and enhancements. |
| ● | Intangible asset amortization, primarily reflecting purchase accounting amortization related to the MoLo acquisition: $13 million |
4
Share Repurchase Program
Based on repurchases settled through June 30, 2023, $83.8 million remains available under the current repurchase authorization for future common stock purchases.
Tax Rate
ArcBest’s second quarter 2023 effective GAAP tax rate for continuing operations was 18.6%. The “Effective Tax Rate Reconciliation” table of ArcBest’s second quarter 2023 earnings press release in Exhibit 99.1 shows the reconciliation of GAAP to non-GAAP effective tax rates. The effective non-GAAP tax rate for second quarter 2023 was 27.2%. Under the current tax laws, we expect our full year 2023 non-GAAP tax rate for continuing operations to be in a range of 26% to 26.5%. The effective tax rate may be impacted by discrete items that could occur throughout the year.
“Other, net” line within Other Income (Costs) on the Consolidated Statements of Operations
The “Other, net” line of ArcBest’s income statement primarily includes the costs associated with postretirement plans, changes in cash surrender value of life insurance and changes in fair value of equity investment. After excluding non-GAAP reconciling items detailed in the table below, ArcBest expects the 2023 non-GAAP “Other, net” expense to approximate the 2022 expense.
Changes in cash surrender value of life insurance included an increase of $1.1 million in second quarter 2023 compared to a decrease of $2.7 million in second quarter 2022, reflecting market gains experienced in second quarter 2023 on these assets that are invested much like pension plan assets. Changes in fair value of equity investment represents a $3.7 million increase in the fair value of our investment in Phantom Auto, the leading provider of human-centered remote operation software, based on observable price changes during second quarter 2023. ArcBest excludes changes in cash surrender value and changes in fair value of equity investments when presenting non-GAAP net income and EPS.
|
|
Three Months Ended |
|
||||
|
|
June 30 |
|
||||
|
|
2023 |
|
2022 |
|
||
|
|
(in millions) |
|||||
Other, net |
|
|
|
|
|
|
|
Amounts on GAAP basis - income (costs) |
|
$ |
5.0 |
|
$ |
(2.8) |
|
Non-GAAP Adjustments: |
|
|
|
|
|
|
|
Life insurance proceeds and changes in cash surrender value(1) |
|
|
(1.1) |
|
|
2.7 |
|
Change in fair value of equity investment |
|
|
(3.7) |
|
|
— |
|
Non-GAAP amounts - income (costs) |
|
$ |
0.2 |
|
$ |
(0.1) |
|
| 1) | Amounts in parentheses indicate gains. |
5
Forward-Looking Statements
The following is a “safe harbor” statement under the Private Securities Litigation Reform Act of 1995: Certain statements and information in this exhibit may constitute “forward-looking statements” within the meaning of the Private Securities Litigation Reform Act of 1995, including, among others, statements regarding (i) our expectations about our intrinsic value or our prospects for growth and value creation and (ii) our financial outlook, position, strategies, goals, and expectations. Terms such as “anticipate,” “believe,” “could,” “estimate,” “expect,” “forecast,” “foresee,” “intend,” “may,” “plan,” “predict,” “project,” “scheduled,” “should,” “would,” and similar expressions and the negatives of such terms are intended to identify forward-looking statements. These statements are based on management’s beliefs, assumptions, and expectations based on currently available information, are not guarantees of future performance, and involve certain risks and uncertainties (some of which are beyond our control). Although we believe that the expectations reflected in these forward-looking statements are reasonable as and when made, we cannot provide assurance that our expectations will prove to be correct. Actual outcomes and results could materially differ from what is expressed, implied, or forecasted in these statements due to a number of factors, including, but not limited to: the effects of a widespread outbreak of an illness or disease, including the COVID-19 pandemic, or any other public health crisis, as well as regulatory measures implemented in response to such events; external events which may adversely affect us or the third parties who provide services for us, for which our business continuity plans may not adequately prepare us, including, but not limited to, acts of war or terrorism, or military conflicts; data privacy breaches, cybersecurity incidents, and/or failures of our information systems, including disruptions or failures of services essential to our operations or upon which our information technology platforms rely; interruption or failure of third-party software or information technology systems or licenses; untimely or ineffective development and implementation of, or failure to realize the potential benefits associated with, new or enhanced technology or processes, including the Vaux freight handling pilot test program at ABF Freight and our customer pilot offering of Vaux, including human-centered remote operation software; the loss or reduction of business from large customers; the timing and performance of growth initiatives and the ability to manage our cost structure; the cost, integration, and performance of any recent or future acquisitions, including the acquisition of MoLo Solutions, LLC, and the inability to realize the anticipated benefits of the acquisition within the expected time period or at all; maintaining our corporate reputation and intellectual property rights; nationwide or global disruption in the supply chain resulting in increased volatility in freight volumes; competitive initiatives and pricing pressures; increased prices for and decreased availability of new revenue equipment, decreases in value of used revenue equipment, and higher costs of equipment-related operating expenses such as maintenance, fuel, and related taxes; availability of fuel, the effect of volatility in fuel prices and the associated changes in fuel surcharges on securing increases in base freight rates, and the inability to collect fuel surcharges; relationships with employees, including unions, and our ability to attract, retain, and upskill employees; unfavorable terms of, or the inability to reach agreement on, future collective bargaining agreements or a workforce stoppage by our employees covered under ABF Freight’s collective bargaining agreement; union employee wages and benefits, including changes in required contributions to multiemployer plans; availability and cost of reliable third-party services; our ability to secure independent owner operators and/or operational or regulatory issues related to our use of their services; litigation or claims asserted against us; governmental regulations; environmental laws and regulations, including emissions-control regulations; default on covenants of financing arrangements and the availability and terms of future financing arrangements; our ability to generate sufficient cash from operations to support significant ongoing capital expenditure requirements and other business initiatives; self-insurance claims and insurance premium costs; potential impairment of goodwill and intangible assets; general economic conditions and related shifts in market demand that impact the performance and needs of industries we serve and/or limit our customers’ access to adequate financial resources; increasing costs due to inflation and rising interest rates; seasonal fluctuations, adverse weather conditions, natural disasters, and climate change; and other financial, operational, and legal risks and uncertainties detailed from time to time in ArcBest Corporation’s public filings with the Securities and Exchange Commission (“SEC”).
For additional information regarding known material factors that could cause our actual results to differ from those expressed in these forward-looking statements, please see our filings with the SEC, including our Annual Report on Form 10-K, Quarterly Reports on Form 10-Q, and Current Reports on Form 8-K.
Readers are cautioned not to place undue reliance on forward-looking statements, which speak only as of the date hereof. We undertake no obligation to publicly update or revise any forward-looking statements after the date they are made, whether as a result of new information, future events, or otherwise.
6
|
2Q’23 Earnings Presentation |
|
Forward Looking Statements 2 Certain statements and information in this presentation concerning results for the three months ended June 30, 2023, may constitute “forward-looking statements” within the meaning of the Private Securities Litigation Reform Act of 1995, including, among others, statements regarding (i) our expectations about our intrinsic value or our prospects for growth and value creation and (ii) our financial outlook, position, strategies, goals, and expectations. Terms such as “anticipate,” “believe,” “could,” “estimate,” “expect,” “forecast,” “foresee,” “intend,” “may,” “plan,” “predict,” “project,” “scheduled,” “should,” “would,” and similar expressions and the negatives of such terms are intended to identify forward-looking statements. These statements are based on management’s beliefs, assumptions, and expectations based on currently available information, are not guarantees of future performance, and involve certain risks and uncertainties (some of which are beyond our control). Although we believe that the expectations reflected in these forward-looking statements are reasonable as and when made, we cannot provide assurance that our expectations will prove to be correct. Actual outcomes and results could materially differ from what is expressed, implied, or forecasted in these statements due to a number of factors, including, but not limited to: the effects of a widespread outbreak of an illness or disease, including the COVID-19 pandemic, or any other public health crisis, as well as regulatory measures implemented in response to such events; external events which may adversely affect us or the third parties who provide services for us, for which our business continuity plans may not adequately prepare us, including, but not limited to, acts of war or terrorism, or military conflicts; data privacy breaches, cybersecurity incidents, and/or failures of our information systems, including disruptions or failures of services essential to our operations or upon which our information technology platforms rely; interruption or failure of third-party software or information technology systems or licenses; untimely or ineffective development and implementation of, or failure to realize the potential benefits associated with, new or enhanced technology or processes, including the Vaux freight handling pilot test program at ABF Freight and our customer pilot offering of Vaux, including human-centered remote operation software; the loss or reduction of business from large customers; the timing and performance of growth initiatives and the ability to manage our cost structure; the cost, integration, and performance of any recent or future acquisitions, including the acquisition of MoLo Solutions, LLC, and the inability to realize the anticipated benefits of the acquisition within the expected time period or at all; maintaining our corporate reputation and intellectual property rights; nationwide or global disruption in the supply chain resulting in increased volatility in freight volumes; competitive initiatives and pricing pressures; increased prices for and decreased availability of new revenue equipment, decreases in value of used revenue equipment, and higher costs of equipment-related operating expenses such as maintenance, fuel, and related taxes; availability of fuel, the effect of volatility in fuel prices and the associated changes in fuel surcharges on securing increases in base freight rates, and the inability to collect fuel surcharges; relationships with employees, including unions, and our ability to attract, retain, and upskill employees; unfavorable terms of, or the inability to reach agreement on, future collective bargaining agreements or a workforce stoppage by our employees covered under ABF Freight’s collective bargaining agreement; union employee wages and benefits, including changes in required contributions to multiemployer plans; availability and cost of reliable third-party services; our ability to secure independent owner operators and/or operational or regulatory issues related to our use of their services; litigation or claims asserted against us; governmental regulations; environmental laws and regulations, including emissions-control regulations; default on covenants of financing arrangements and the availability and terms of future financing arrangements; our ability to generate sufficient cash from operations to support significant ongoing capital expenditure requirements and other business initiatives; self-insurance claims and insurance premium costs; potential impairment of goodwill and intangible assets; general economic conditions and related shifts in market demand that impact the performance and needs of industries we serve and/or limit our customers’ access to adequate financial resources; increasing costs due to inflation and rising interest rates; seasonal fluctuations, adverse weather conditions, natural disasters, and climate change; and other financial, operational, and legal risks and uncertainties detailed from time to time in ArcBest Corporation’s public filings with the Securities and Exchange Commission (“SEC”). For additional information regarding known material factors that could cause our actual results to differ from those expressed in these forward-looking statements, please see our filings with the SEC, including our Annual Report on Form 10-K, Quarterly Reports on Form 10-Q, and Current Reports on Form 8-K. Readers are cautioned not to place undue reliance on forward-looking statements, which speak only as of the date hereof. We undertake no obligation to publicly update or revise any forward-looking statements after the date they are made, whether as a result of new information, future events, or otherwise. |
|
3 Q2 2023 SUMMARY • Freight demand continued to be soft – impacted by customers managing inventory and economic growth slowing • Ratified new five-year contract with International Brotherhood of Teamsters • Continued Truckload volume growth despite environment, growing total shipments and shipments per day, per employee – driving efficiencies • Continued advancements in environmental, social and corporate governance (ESG) • Reduced Scope 1 emissions intensity 0.25% YoY • Established environmental policy • Named an Inbound Logistics Green Supply Chain Partner for the 12th time $1.1B Total Revenues from continuing operations -17% YoY $50.1M Non-GAAP (1) Operating Income from continuing operations -66% YoY $1.54 Non-GAAP (1) EPS from continuing operations -64% YoY $580M Liquidity +2.5% (from 12/31/22) 1) See non-GAAP reconciliation in the Additional Information section of this presentation. |
|
STRENGTH OF OUR CUSTOMER -FOCUSED STRATEGY 4 Customer Need Our Strength Flexible supply chain solutions Broad suite of logistics solutions with integrated and seamless access to services Strength in Action Someone who knows them and their business Dedicated experts to tackle tough challenges Visibility into their supply chain Proactive communications >75% of revenue comes from customers who are engaged digitally Commitment to sustainability and advancing DE&I Long history of good corporate citizenship and industry-leading sustainability • AA MSCI Rating • Bronze EcoVadis Rating • Inbound Logistics Green Supply Chain Partner • Comparably Best Leadership Teams and Best CEOs for Women >90% of our Top 50 customers are cross-sold 33% of our accounts were cross-sold (FY 2022) compared to 17% in 2012 >60% of our asset-light customers also use ABF Among best in industry for knowledgeable and helpful sales representatives according to Mastio Top 20 for Employee Training and Development in Training Magazine’s APEX award – 13th consecutive year to be recognized • Piloting electric trucks and use of solar panels • Supplier Leadership on Climate Transition (SLoCT) online climate school participant as a supplier to iconic brands • Recruiting neurodiverse talent through partnership with Integrate • Launched new Employee Resource Groups |
|
2009 2010 2011 2012 2013 2014 2015 2016 2017 2018 2019 2020 2021 2022 2009 2010 2011 2012 2013 2014 2015 2016 2017 2018 2019 2020 2021 2022 ACCELERATING PERFORMANCE OVER SUSTAINED PERIOD 5 $1.5B $1.7B $1.9B $2.1B $2.3B $2.6B $2.7B $2.7B $2.8B $3.1B $3.0B $2.9B $4.0B $5.3B -$84M -$46M $17M -$04M $24M $75M $82M $54M $76M $159M $118M $128M $318M $473M -5.7% -2.8% 0.9% -0.2% 1.1% 2.9% 3.1% 2.0% 2.7% 5.2% 4.0% 4.3% 8.0% 8.9% Revenue up 190% Operating Income (non-GAAP) up $557M Profit Margin (non-GAAP) up 1,460 bps Non-GAAP operating income and profit margin have been restated to be consistent with current financial statement presentation and non-GAAP measures (not adjusted for discontinued operations). |
|
INVESTMENT IS REQUIRED FOR GROWTH 6 INVESTMENT IN: People Solutions Technology Future Growth Pricing Intelligence Tools Daily visibility to industry data and intelligence across our digital platforms informs yield strategy and enables proprietary pricing tools Facility Upgrades & Expansions Facility and equipment investments to enable growth and improve employee experience Strengthened Truckload offering advances capture of large growth opportunity Truckload Solutions Technology & Innovation Completed phase one rollout of City Route Optimization – expanding functionality to Optimize Pickups |
|
$1.1B Revenue From Continuing Operations 17% per day $50.1M Non-GAAP Operating Income From Continuing Operations (2) 66% $1.54/diluted share Non-GAAP Net Income From Continuing Operations (2) 64% Key Metrics Q2 2023(1) 7 ARCBEST CONSOLIDATED 1) Second quarter 2023 comparisons are to second quarter 2022. 2) See non-GAAP reconciliation in the Additional Information section of this presentation. SOLID FINANCIAL POSITION TTM EBITDA(2) $417M Liquidity $580M Net Cash $108M |
|
$722M Revenue 10% per day $51.7M Non -GAAP Operating Income(2) 59% 92.8% Non -GAAP Operating Ratio (2) 830 bps deterioration Daily Tonnage 0.9% Daily Shipments 4.2% Total Billed Rev/Cwt 11.0% 3.1% Average Increase on Contract Renewals and Deferred Pricing Agreements Q2 2023(1) 8 Key Metrics ASSET -BASED 1) Second quarter 2023 comparisons are to second quarter 2022. 2) See non -GAAP reconciliation in the Additional Information section of this presentation. |
|
Key Metrics JULY 2023 9 Daily Billed Revenue Total Billed Rev/CWT ASSET-BASED Daily Tonnage Daily Shipments Total Billed Rev/Shipment Total Weight/Shipment 12% 13% J U LY 2 0 2 3 P R E L I M I N ARY Y O Y ( 1 ) 1) July 2023 comparisons are to July 2022. 5% 1% 6% 7% |
|
Key Metrics Q2 2023(1) 10 ASSET-LIGHT( 2 ) J U LY 2 0 2 3 P R E L I M I N ARY Y O Y (4) Daily Revenue 1) Second quarter 2023 comparisons are to second quarter 2022. 2) Asset-Light represents the reportable segment previously named ArcBest. Asset-Light financial results previously included the ArcBest segment and FleetNet, which was sold on February 28, 2023. 3) See non-GAAP reconciliation in the Additional Information section of this presentation. 4) Asset-Light Operating Segment July 2023 comparisons are to July 2022. 23% $410M Revenue 25% per day $6.4M Non-GAAP Operating Income(3) 79% $8.3M Adjusted EBITDA(3) 75% |
|
11 BALANCED APPROACH TO CAPITAL ALLOCATION Strong business performance enables ArcBest to reinvest in the business and provide returns to shareholders while maintaining a solid balance sheet and investment-grade credit metrics. Reinvesting in the Business Dividends & Share Repurchases M&A Strategies • Expect 2023 Net Capital Expenditures of $270 - $295 Million • Part of a multi-year investment plan for equipment, real estate, innovation and technology — structured for cost optimization, revenue growth and enhanced work environment • Increased share repurchase: • YTD’23 share purchases equal $41 million through 6/30/23 • $84 million remains available under future common stock repurchase authorization • Currently paying a $0.12/share quarterly dividend • Accelerate progress toward strategic goals by adding capabilities and scale to more effectively serve our customers • Look for strong culture fit, experienced leadership team and a pathway to return |
|
ARCBEST’S CUSTOMER-LED STRATEGY YIELDS RESULTS 12 >5x Revenue per account is over 5X higher on cross-sold accounts >4x Profit per account is over 4X higher on cross-sold accounts 9% Retention rates are 9 percentage points higher on cross-sold accounts >60% Over 60% of our customers who use asset-light services also utilize our asset-based services >75% Over 75% of revenue came from digitally connected customers |
|
Three-Point Strategy Continues to Deliver Shareholder Value & Drive Business Growth 13 1 2 3 ENHANCED SHAREHOLDER VALUE Increase Efficiency Optimize ABF network Drive scale and productivity to improve Asset-Light operating margin Leverage technology Drive Innovation Develop and implement disruptive and game changing innovations Launch new revenue streams Co-create and scale with customers Accelerate Growth Secure new customers Expand with existing customers through market penetration Retain existing customers |
|
14 Note: ArcBest Corporation reports its financial results in accordance with generally accepted accounting principles (“GAAP”). However, management believes that certain non-GAAP performance measures utilized for internal analysis provides analysts, investors, and others the same information that we use internally for purposes of assessing our core operating performance and provides meaningful comparisons between current and prior period results, as well as important information regarding performance trends. Accordingly, using these measures improves comparability in analyzing our performance because it removes the impact of items from operating results that, in management's opinion, do not reflect our core operating performance. Non-GAAP financial measures should be viewed in addition to, and not as an alternative for, our reported results. These financial measures should not be construed as better measurements than operating income, operating cash flow, net income or earnings per share, as determined under GAAP. Reconciliations of GAAP to Non-GAAP Financial Measures (Unaudited) ADDITIONAL INFORMATION |
|
ArcBest Consolidated (including discontinued operations) 15 RECONCILIATIONS OF GAAP TO NON-GAAP FINANCIAL MEASURES (Unaudited) 2009 2010 2011 2012 2013 2014 2015 2016 2017 2018 2019 2020 2021 2022 ArcBest Corporation - Consolidated Operating Income Amounts on a GAAP basis (1) $ (147.9) $ (46.3) $ 16.6 $ (5.8) $ 24.3 $ 74.9 $ 79.8 $ 34.1 $ 61.3 $ 109.1 $ 63.8 $ 98.3 $ 281.0 $ 399.3 Restructuring charges, pre-tax (2) - - - - - - - 10.3 3.0 1.7 - - - - Transaction costs, pre-tax (3) - - - 2.1 - - 1.4 0.6 - - - - 6.0 - Multiemployer pension withdrawal liability charge, pre-tax (4) - - - - - - - - - 37.9 - - - - Gain on sale of subsidiaries, pre-tax (5) - - - - - - - - (0.2) (1.9) - - (6.9) (0.4) Innovative technology costs, pre-tax (6) - - - - - - - 4.9 7.3 8.5 20.7 25.6 32.8 40.8 ELD conversion costs, pre-tax (7) - - - - - - - - - - 2.7 - - - Asset impairment, pre-tax (8) 64.0 - - - - - - - - - 26.5 - - - Nonunion pension termination costs, pre-tax (9) - - - - - - - - - - 0.4 - - - Purchase accounting amortization, pre-tax (10) - - - - - - - 3.9 4.2 4.2 4.2 3.7 5.3 12.9 Change in fair value of contingent consideration, pre-tax (11) - - - - - - - - - - - - - 18.3 Third-party casualty expense at FleetNet, pre-tax (12) - - - - - - 0.9 - - - - - - - Nonunion vacation policy enhancement, pre-tax (13) - - - - - - - - - - - - - 2.1 Non-GAAP amounts (14) $ (83.9) $ (46.3) $ 16.6 $ (3.7) $ 24.3 $ 74.9 $ 82.1 $ 53.8 $ 75.7 $ 159.5 $ 118.2 $ 127.6 $ 318.1 $ 472.9 1) Operating Income for 2009-2017 has been adjusted for the January 1, 2018, adoption of an amendment to ASC Topic 715 which requires the components of net periodic benefit cost other than service cost for our pension, SBP and postretirement plans to be presented within Other Income (Costs) in the consolidated financial statements and, therefore, excluded from Operating Income presented in this table. (The 2009-2017 amounts presented were adjusted for the change in presentation of net periodic benefit costs in the 2018 financial statements to conform with the current year presentation.) 2) Restructuring charges relate to the realignment of the Company’s organizational structure announced on November 3, 2016. 3) Represents costs associated with the November 1, 2021 acquisition of MoLo Solutions, LLC. 4) Represents a one-time charge recognized in June 2018 for the multiemployer pension fund withdrawal liability resulting from the transition agreement ABF Freight, Inc. entered into with the New England Teamsters and Trucking Industry Pension Fund. 5) Gains associated with the December 2017 and April 2021 divestures of moving services subsidiaries for which the gains were recognized in third quarter 2017 and 2018 and second quarter 2021, respectively, when the contingent consideration was received on the transactions, as well as including the contingent amount recognized in second quarter 2022 when the funds were released to escrow. 6) Costs associated with the freight handling pilot test program at ABF Freight announced in third quarter 2019 and initiatives to optimize performance through technological innovation, including costs related to our investment in human-centered remote operation software announced in first quarter 2022. Costs for 2017-2020 have been adjusted to conform to the presentation of innovative technology costs for 2021. 7) Impairment charges related to equipment replacement and other one-time costs incurred to comply with the electronic logging device (“ELD”) mandate which became effective in December 2019. 8) Noncash goodwill impairment charge recognized in fourth quarter 2009. Noncash impairment charge recognized in fourth quarter 2019 relates to a portion of the goodwill, customer relationship intangible assets, and revenue equipment associated with the acquisition of truckload brokerage and truckload dedicated businesses within the ArcBest segment. 9) Consulting fee incurred in third quarter 2019 associated with the termination of the nonunion defined benefit pension plan. 10) Represents the amortization of acquired intangible assets related to the November 1, 2021 acquisition of MoLo and previously acquired businesses in the ArcBest segment. 11) Represents increase in fair value of the contingent earnout consideration recorded for the MoLo acquisition. The liability for contingent consideration is remeasured at each quarterly reporting date, and any change in fair value as a result of the recurring assessments is recognized in operating income. The contingent consideration for the MoLo acquisition will be paid based on achievement of certain targets of adjusted earnings before interest, taxes, depreciation, and amortization, as adjusted for certain items pursuant to the merger agreement, for years 2023 through 2025. 12) Unfavorable third-party casualty claim associated with a bankrupt FleetNet customer. 13) Represents a one-time, noncash charge for enhancements to our nonunion vacation policy which were effective third quarter 2022. 14) Non-GAAP amounts are calculated in total and may not foot due to rounding. $ millions |
|
ARCBEST CORPORATION - CONSOLIDATED Three Months Ended Millions ($000,000), except per share data 6/30/2023 6/30/2022 Operating Income from Continuing Operations Amounts on a GAAP basis $ 42.1 $ 136.0 Innovative technology costs, pre -tax (1) 14.8 10.3 Purchase accounting amortization, pre -tax (2) 3.2 3.2 Change in fair value of contingent consideration, pre -tax (3) (10.0) - Gain on sale of subsidiary, pre -tax (4) - (0.4) Non -GAAP amounts (5) $ 50.1 $ 149.2 Net Income from Continuing Operations Amounts on a GAAP basis $ 39.6 $ 101.5 Innovative technology costs, after -tax (includes related financing costs) (1) 11.2 7.8 Purchase accounting amortization, after -tax (2) 2.4 2.4 Change in fair value of contingent consideration, after -tax (3) (7.5) - Gain on sale of subsidiary, after -tax (4) - (0.3) Change in fair value of equity investment, after -tax (6) (2.8) - Life insurance proceeds and changes in cash surrender value (1.1) 2.7 Tax expense (benefit) from vested RSUs (7) (3.9) (5.1) Non -GAAP amounts (5) $ 38.0 $ 109.1 Diluted Earnings Per Share from Continuing Operations Amounts on a GAAP basis $ 1.60 $ 3.97 Innovative technology costs, after -tax (includes related financing costs) (1) 0.45 0.30 Purchase accounting amortization, after -tax (2) 0.10 0.09 Change in fair value of contingent consideration, after -tax (3) (0.30) - Gain on sale of subsidiary, after -tax (4) - (0.01) Change in fair value of equity investment, after -tax (6) (0.11) - Life insurance proceeds and changes in cash surrender value (0.04) 0.11 Tax expense (benefit) from vested RSUs (7) (0.16) (0.20) Non -GAAP amounts (5) $ 1.54 $ 4.26 Reconciliations of GAAP to Non -GAAP Financial Measures (Unaudited) 16 1) Represents costs associated with the Vaux freight handling pilot test program at ABF Freight, costs related to our customer pilot offering of Vaux, including human -centered remote operation software, and initiatives to optimize our performance through technological innovation. 2) Represents the amortization of acquired intangible assets in the Asset -Light segment. 3) Represents change in fair value of the contingent earnout consideration recorded for the MoLo acquisition. 4) Gain relates to the contingent amount recognized in second quarter 2022 when the funds from the May 2021 sale of the labor services portion of the Asset -Light segment’s moving business were released from escrow. 5) Non -GAAP amounts are calculated in total and may not equal the sum of the GAAP amounts and the non -GAAP adjustments due to rounding. 6) Represents increase in fair value of our investment in Phantom Auto, the leading provider of human -centered remote operation software, based on observable price changes during second quarter 2023. 7) Represents recognition of the tax impact for the vesting of share -based compensation. |
|
Reconciliations of GAAP to Non -GAAP Financial Measures (Unaudited) 17 1) Adjusted EBITDA is a primary component of the financial covenants contained in ArcBest Corporation’s Fourth Amended and Restated Credit Agreement. Management believes Adjusted EBITDA to be relevant and useful information, as EBITDA is a standard measure commonly reported and widely used by analysts, investors, and others to measure financial performance and ability to service debt obligations. Furthermore, management uses Adjusted EBITDA as a key measure of performance and for business planning. However, these non -GAAP financial measures should not be construed as better measurements than operating income, operating cash flow, net income, or earnings per share, as determined under GAAP. Non -GAAP financial measures should be viewed in addition to, and not as an alternative for, our reported results. Other companies may calculate EBITDA differently; therefore, our Adjusted EBITDA may not be comparable to similarly titled measures of other companies. 2) Includes amortization of intangibles associated with acquired businesses. 3) Represents change in fair value of the contingent earnout consideration recorded for the MoLo acquisition. 4) Represents increase in fair value of our investment in Phantom Auto, the leading provider of human -centered remote operation software, based on observable price changes during second quarter 2023. 5) Asset -Light represents the reportable segment previously named ArcBest. Asset -Light financial results previously included the ArcBest segment and FleetNet, which sold on February 28, 2023. 6) Gain relates to the contingent amount recognized in second quarter 2022 when the funds from the May 2021 sale of the labor services portion of the Asset -Light segment’s moving business were released from escrow. 7) Asset -Light Adjusted EBITDA amount is calculated in total and may not equal the sum of operating income and the adjustments due to rounding. Three Months Ended June 30 ASSET -LIGHT (5) ADJUSTED EBITDA (1) 2023 2022 ($ millions) Operating Income $ 13.2 $ 27.5 Depreciation and amortization (2) 5.1 5.5 Change in fair value of contingent consideration (3) (10.0) - Gain on sale of subsidiary(6) - (0.4) Adjusted EBITDA(7) $ 8.3 $ 32.5 CONSOLIDATED ADJUSTED EBITDA (1) Twelve Months Ended June 30, 2023 ($ millions) Net Income from Continuing Operations $ 183.5 Interest and other related financing costs 8.5 Income tax provision 55.0 Depreciation and amortization (2) 139.7 Amortization of share -based compensation 11.5 Change in fair value of contingent consideration (3) 22.5 Change in fair value of equity investment (4) (3.7) Consolidated Adjusted EBITDA $ 417.0 |
|
Reconciliations of GAAP to Non-GAAP Financial Measures (Unaudited) 18 1) Represents costs associated with the Vaux freight handling pilot test program at ABF Freight. 2) Non-GAAP amounts are calculated in total and may not equal the sum of the GAAP amounts and the non-GAAP adjustments due to rounding. 3) Asset-Light represents the reportable segment previously named ArcBest. Asset-Light financial results previously included the ArcBest segment and FleetNet, which sold on February 28, 2023. 4) Represents the amortization of acquired intangible assets in the Asset-Light segment. 5) Represents change in fair value of the contingent earnout consideration recorded for the MoLo acquisition. 6) Gain relates to the contingent amount recognized in second quarter 2022 when the funds from the May 2021 sale of the labor services portion of the Asset-Light segment’s moving business were released from escrow. Three Months Ended Millions ($000,000) 6/30/2023 6/30/2022 ASSET-BASED Operating Income Amounts on a GAAP basis $ 43.3 94.0% $ 116.7 85.5% Innovative technology costs, pre-tax (1) 8.3 (1.1) 8.0 (1.0) Non-GAAP amounts (2) $ 51.7 92.8% $ 124.6 84.5% ASSET-LIGHT (3) Operating Income Amounts on a GAAP basis $ 13.2 96.8% $ 27.5 95.0% Purchase accounting amortization, pre-tax (4) 3.2 (0.8) 3.2 (0.6) Change in fair value of contingent consideration, pre-tax (5) (10.0) 2.4 - - Gain on sale of subsidiary, pre-tax(6) - - (0.4) 0.1 Non-GAAP amounts (2) $ 6.4 98.4% $ 30.3 94.5% |