UNITED STATES
SECURITIES AND EXCHANGE COMMISSION
Washington, D.C. 20549
FORM 10-Q
(Mark One)
☒ |
QUARTERLY REPORT PURSUANT TO SECTION 13 OR 15(d) OF THE SECURITIES EXCHANGE ACT OF 1934 |
For the quarterly period ended June 30, 2023
☐ |
TRANSITION REPORT PURSUANT TO SECTION 13 OR 15(d) OF THE SECURITIES EXCHANGE ACT OF 1934 |
For the transition period from ______ to ______
Commission File Number: 001-34857

Gold Resource Corporation
(Exact Name of Registrant as Specified in its charter)
Colorado |
84-1473173 |
|
(State or other jurisdiction of incorporation or organization) |
(I.R.S. Employer Identification No.) |
7900 E. Union Ave, Suite 320, Denver, Colorado 80237
(Address of Principal Executive Offices) (Zip Code)
(303) 320-7708
(Registrant’s telephone number including area code)
Securities registered pursuant to Section 12(b) of the Act:
a |
||
Title of each class |
Trading Symbol |
Name of each exchange where registered |
Common Stock |
GORO |
NYSE American |
Indicate by check mark whether the registrant (1) has filed all reports required to be filed by Section 13 or 15(d) of the Securities Exchange Act of 1934 during the preceding 12 months (or for such shorter period that the registrant was required to file such reports), and (2) has been subject to such filing requirements for the past 90 days.Yes⌧No◻
Indicate by check mark whether the registrant has submitted electronically every Interactive Data File required to be submitted pursuant to Rule 405 of Regulation S-T (§232.405 of this chapter) during the preceding 12 months (or for such shorter period that the registrant was required to submit such files). Yes⌧No◻
Indicate by check mark whether the registrant is a large accelerated filer, an accelerated filer, a non-accelerated filer, a smaller reporting company, or an emerging growth company. See definitions of “large accelerated filer”, “accelerated filer”, “smaller reporting company”, and “emerging growth company” in Rule 12b-2 of the Exchange Act.
Large accelerated filer |
◻ |
Accelerated filer |
☒ |
|
|
|
|
Non-accelerated filer |
◻ |
Smaller reporting company |
☒ |
|
|
|
|
|
|
Emerging growth company |
☐ |
If an emerging growth company, indicate by check mark if the registrant has elected not to use the extended transition period for complying with any new or revised financial accounting standards provided pursuant to Section 13(a) of the Exchange Act◻
Indicate by check mark whether registrant is a shell company (as defined in Rule 12b-2 of the Exchange Act). Yes☐No⌧
Indicate the number of shares outstanding of each of the issuer’s classes of common stock, as of the latest practicable date: 88,468,542 shares of common stock outstanding as of July 24, 2023.
GOLD RESOURCE CORPORATION
FORM 10-Q
Table of Contents
|
|
|
Page |
|
|
2 |
|
|
|
|
|
|
|
3 |
|
Condensed Consolidated Interim Financial Statements and Notes |
3 |
||
|
|
3 |
|
|
|
4 |
|
|
|
5 |
|
|
|
7 |
|
|
|
8 |
|
|
Management’s Discussion and Analysis of Financial Condition and Results of Operations |
24 |
|
|
47 |
||
|
48 |
||
|
|
|
|
|
|
48 |
|
|
48 |
||
|
49 |
||
|
49 |
||
|
49 |
||
|
49 |
||
|
49 |
||
|
49 |
||
50 |
|||
|
San Jose de Gracia, Oaxaca |
Gold Resource Corporation
1
SECOND QUARTER 2023 HIGHLIGHTS
Highlights for the three months ended June 30, 2023 are summarized below and discussed further under Item 2—Management’s Discussion and Analysis of Financial Condition and Results of Operations:
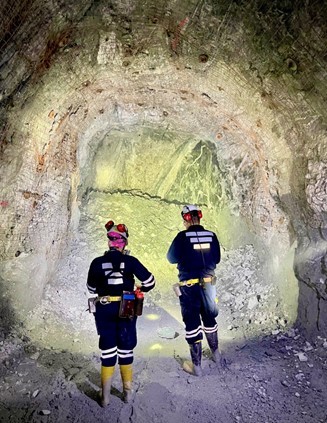
Don David Gold Mine
| ● | No lost time incidents during the quarter. Our year-to-date LTIFR safety record is 0.22 as compared to the Mexican average of 0.88 (in US equivalent). Safety at Gold Resource Corporation is paramount. Even with a good track record at the Don David Gold Mine (“DDGM”), the Company continues to strive each quarter for improved measures, awareness, and training. |
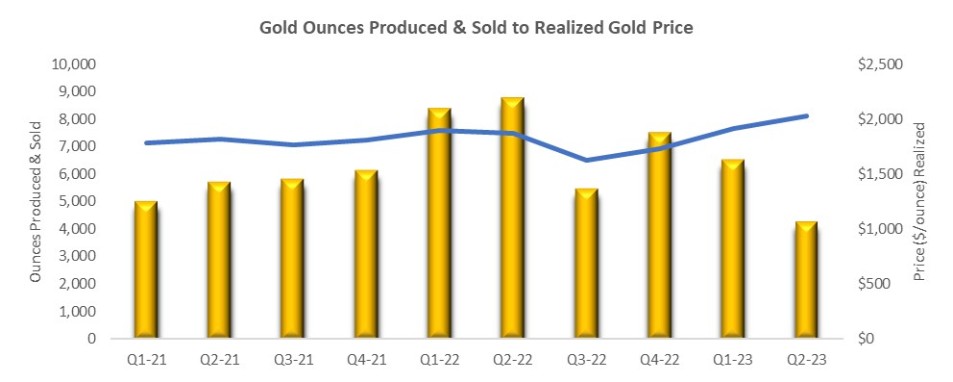
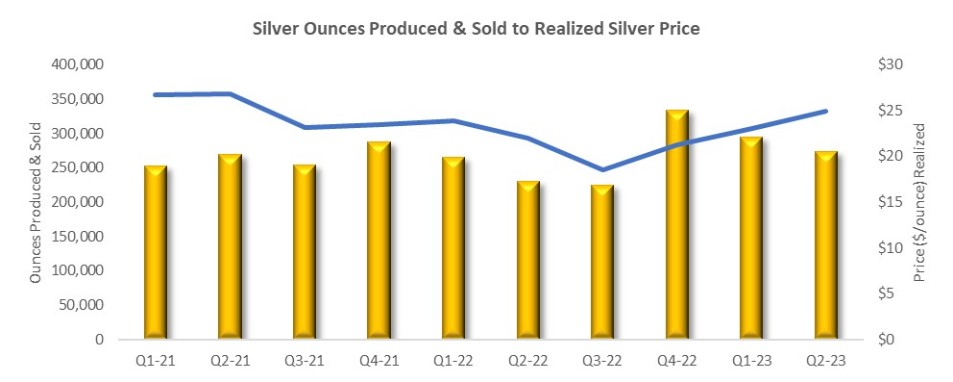
| ● | In the second quarter of 2023, the Don David Gold Mine produced and sold a total of 7,689 gold equivalent (“AuEq”) ounces, comprised of 4,287 gold ounces and 274,257 silver ounces at an average sales price per ounce of $2,010 and $25, respectively. |
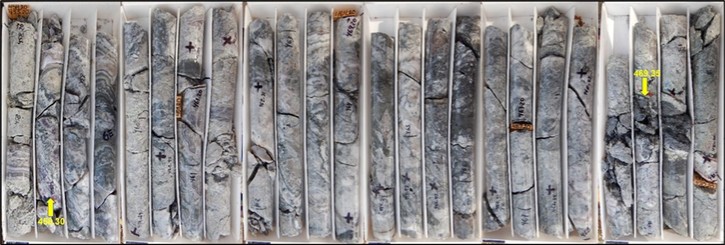
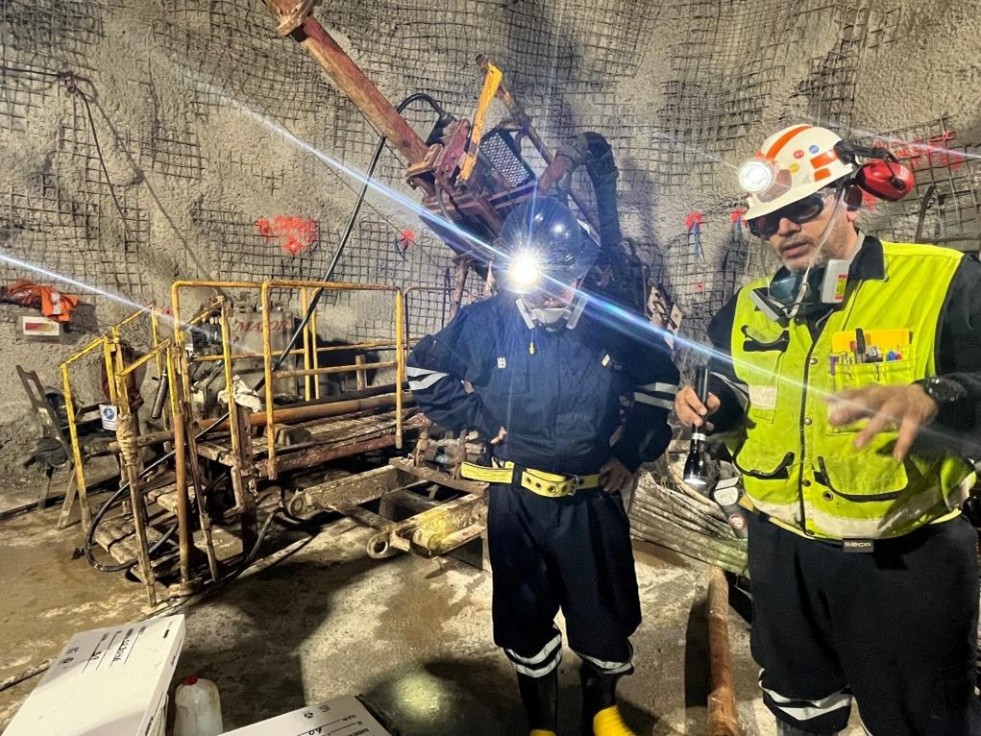
| ● | The DDGM diamond drilling program has progressed as planned during the second quarter with encouraging results. Drilling continues to advance at DDGM on two fronts: (1) Infill drilling with the objective of upgrading defined Inferred resources to the Indicated category; and (2) Exploration drilling with the objective of identifying additional Inferred resources via step-out drilling along the South Soledad, Sagrario, Marena and Three Sisters vein systems, as well as on the recently identified Gloria vein system. |
Back Forty Project
| ● | Optimization work related to the metallurgy and the economic model for the Back Forty Project in Michigan, USA is near completion. The Company plans to release these updated results in a report during the third quarter. |
| ● | Updated site layout designs have focused on little to no impact on wetlands and being fully protective of the environment. The U.S. Supreme Court ruling in Sackett v. Environmental Protection Agency limits the federal government’s authority with regards to wetlands and will likely result in not needing a “dredge and fill” wetland permit. The “drawdown” of wetlands will be regulated by Michigan State authorities. |
Financial
| ● | The Company has $18.0 million in cash as of June 30, 2023, and no debt. |
| ● | Net loss was $4.6 million or $0.05 per share for the quarter. |
| ● | Working capital was $20.8 million as of June 30, 2023. |
| ● | Total cash cost after co-product credits for the quarter was $1,333 per gold equivalent (“AuEq”) ounce and total all-in sustaining cost (“AISC”) after co-product credits for the quarter was $1,990 per AuEq ounce. Although the year-to-date total cash cost after co-product credits of $979 and total AISC after co-product credits of $1,551 are within guidance, the strengthening of the peso and lower zinc prices may result in needing to revise the full year guidance later in the year. (See Item 2—Management’s Discussion and Analysis of Financial Condition and Results of Operations – Non-GAAP Measures below for a reconciliation of non-GAAP measures to applicable GAAP measures). |
| ● | The Company’s At The Market Offering Agreement with H.C. Wainwright & Co., LLC (the “Agent”), which was entered into in November 2019 (the “ATM Agreement”), pursuant to which the Agent agreed to act as the Company’s sales agent with respect to the offer and sale from time to time of the Company’s common stock having an aggregate gross sales price of up to $75.0 million, was renewed in June 2023. |
Gold Resource Corporation
2
PART I - FINANCIAL INFORMATION
ITEM 1. Financial Statements
GOLD RESOURCE CORPORATION
CONDENSED CONSOLIDATED INTERIM BALANCE SHEETS
(U.S. dollars in thousands, except share and per share amounts)
(Unaudited)
|
|
As of |
|
As of |
||
|
|
June 30, |
|
December 31, |
||
|
Note |
2023 |
|
2022 |
||
ASSETS |
|
|
|
|
|
|
Current assets: |
|
|
|
|
|
|
Cash and cash equivalents |
|
$ |
17,957 |
|
$ |
23,675 |
Accounts receivable, net |
|
|
4,355 |
|
|
5,085 |
Inventories, net |
4 |
|
10,874 |
|
|
13,500 |
Prepaid expenses and other current assets |
6 |
|
6,776 |
|
|
3,839 |
Total current assets |
|
|
39,962 |
|
|
46,099 |
Property, plant and mine development, net |
7 |
|
145,645 |
|
|
152,563 |
Other non-current assets |
8 |
|
5,465 |
|
|
5,509 |
Total assets |
|
$ |
191,072 |
|
$ |
204,171 |
LIABILITIES AND SHAREHOLDERS' EQUITY |
|
|
|
|
|
|
Current liabilities: |
|
|
|
|
|
|
Accounts payable |
|
$ |
13,114 |
|
$ |
13,329 |
Mining royalty taxes payable, net |
|
|
1,130 |
|
|
3,945 |
Contingent consideration |
12 |
|
2,263 |
|
|
2,211 |
Accrued expenses and other current liabilities |
9 |
|
2,608 |
|
|
5,197 |
Total current liabilities |
|
|
19,115 |
|
|
24,682 |
Reclamation and remediation liabilities |
11 |
|
12,541 |
|
|
10,366 |
Gold and silver stream agreements liability |
10 |
|
44,015 |
|
|
43,466 |
Deferred tax liabilities, net |
5 |
|
4,674 |
|
|
9,224 |
Contingent consideration |
12 |
|
2,191 |
|
|
2,179 |
Other non-current liabilities |
9 |
|
1,835 |
|
|
2,490 |
Total liabilities |
|
|
84,371 |
|
|
92,407 |
Shareholders' equity: |
|
|
|
|
|
|
Common stock - $0.001 par value, 200,000,000 shares authorized: |
|
|
|
|
|
|
88,468,542 and 88,398,109 shares outstanding at June 30, 2023 and December 31, 2022, respectively |
|
|
89 |
|
|
89 |
Additional paid-in capital |
|
|
111,580 |
|
|
111,024 |
Retained earnings |
|
|
2,087 |
|
|
7,706 |
Treasury stock at cost, 336,398 shares |
|
|
(5,884) |
|
|
(5,884) |
Accumulated other comprehensive loss |
|
|
(1,171) |
|
|
(1,171) |
Total shareholders' equity |
|
|
106,701 |
|
|
111,764 |
Total liabilities and shareholders' equity |
|
$ |
191,072 |
|
$ |
204,171 |
The accompanying notes are an integral part of these Condensed Consolidated Interim Financial Statements.
Gold Resource Corporation—Condensed Consolidated Interim Financial Statements and Notes (Unaudited)
3
GOLD RESOURCE CORPORATION
CONDENSED CONSOLIDATED INTERIM STATEMENTS OF OPERATIONS
(U.S. dollars in thousands, except share and per share amounts)
(Unaudited)
|
|
For the three months ended |
|
For the six months ended |
||||||||
|
|
June 30, |
|
June 30, |
||||||||
|
Note |
2023 |
|
2022 |
|
2023 |
|
2022 |
||||
|
|
|
|
|
|
|
|
|
|
|
|
|
Sales, net |
3 |
$ |
24,807 |
|
$ |
37,064 |
|
$ |
56,035 |
|
$ |
82,481 |
Cost of sales: |
|
|
|
|
|
|
|
|
|
|
|
|
Production costs |
|
|
20,302 |
|
|
21,722 |
|
|
40,152 |
|
|
41,796 |
Depreciation and amortization |
|
|
6,474 |
|
|
7,262 |
|
|
13,728 |
|
|
13,220 |
Reclamation and remediation |
|
|
200 |
|
|
61 |
|
|
395 |
|
|
123 |
Total cost of sales |
|
|
26,976 |
|
|
29,045 |
|
|
54,275 |
|
|
55,139 |
Mine gross (loss) profit |
|
|
(2,169) |
|
|
8,019 |
|
|
1,760 |
|
|
27,342 |
Costs and expenses: |
|
|
|
|
|
|
|
|
|
|
|
|
General and administrative expenses |
|
|
2,130 |
|
|
1,920 |
|
|
3,323 |
|
|
3,819 |
Mexico exploration expenses |
|
|
1,045 |
|
|
810 |
|
|
2,434 |
|
|
2,047 |
Michigan Back Forty Project expenses |
|
|
395 |
|
|
2,027 |
|
|
845 |
|
|
3,095 |
Stock-based compensation |
16 |
|
7 |
|
|
393 |
|
|
604 |
|
|
1,167 |
Realized and unrealized (gain) loss on zinc zero cost collar |
17 |
|
- |
|
|
(3,799) |
|
|
- |
|
|
338 |
Other expense, net |
18 |
|
711 |
|
|
214 |
|
|
2,180 |
|
|
1,052 |
Total costs and expenses |
|
|
4,288 |
|
|
1,565 |
|
|
9,386 |
|
|
11,518 |
(Loss) income before income taxes |
|
|
(6,457) |
|
|
6,454 |
|
|
(7,626) |
|
|
15,824 |
(Benefit) provision for income taxes |
5 |
|
(1,873) |
|
|
3,781 |
|
|
(2,007) |
|
|
9,132 |
Net (loss) income |
|
$ |
(4,584) |
|
$ |
2,673 |
|
$ |
(5,619) |
|
$ |
6,692 |
Net (loss) income per common share: |
|
|
|
|
|
|
|
|
|
|
|
|
Basic and diluted net (loss) income per common share |
19 |
$ |
(0.05) |
|
$ |
0.03 |
|
$ |
(0.06) |
|
$ |
0.08 |
|
|
|
|
|
|
|
|
|
|
|
|
|
Weighted average shares outstanding: |
|
|
|
|
|
|
|
|
|
|
|
|
Basic |
19 |
|
88,468,542 |
|
|
88,343,992 |
|
|
88,437,413 |
|
|
88,341,398 |
Diluted |
19 |
|
88,468,542 |
|
|
88,791,552 |
|
|
88,437,413 |
|
|
88,646,849 |
The accompanying notes are an integral part of these Condensed Consolidated Interim Financial Statements.
Gold Resource Corporation—Condensed Consolidated Interim Financial Statements and Notes (Unaudited)
4
GOLD RESOURCE CORPORATION
CONDENSED CONSOLIDATED INTERIM STATEMENTS OF CHANGES IN SHAREHOLDERS’ EQUITY
(U.S. dollars in thousands, except share amounts)
(Unaudited)
|
|
For the three months ended June 30, 2023 and 2022 |
||||||||||||||||||
|
|
Number of |
|
Par Value of |
|
Additional Paid- |
|
Retained |
|
Treasury |
|
Accumulated |
|
Total |
||||||
Balance, March 31, 2022 |
|
88,675,172 |
|
$ |
89 |
|
$ |
109,982 |
|
$ |
20,699 |
|
$ |
(5,884) |
|
$ |
(1,171) |
|
$ |
123,715 |
Stock-based compensation |
|
- |
|
|
- |
|
|
507 |
|
|
- |
|
|
- |
|
|
- |
|
|
507 |
Common stock issued for vested restricted stock units |
|
38,503 |
|
|
- |
|
|
- |
|
|
- |
|
|
- |
|
|
- |
|
|
- |
Dividends declared (1) |
|
- |
|
|
- |
|
|
- |
|
|
(884) |
|
|
- |
|
|
- |
|
|
(884) |
Surrender of stock for taxes due on vesting |
|
(4,585) |
|
|
- |
|
|
(9) |
|
|
- |
|
|
- |
|
|
- |
|
|
(9) |
Net income |
|
- |
|
|
- |
|
|
- |
|
|
2,673 |
|
|
- |
|
|
- |
|
|
2,673 |
Balance, June 30, 2022 |
|
88,709,090 |
|
$ |
89 |
|
$ |
110,480 |
|
$ |
22,488 |
|
$ |
(5,884) |
|
$ |
(1,171) |
|
$ |
126,002 |
|
|
|
|
|
|
|
|
|
|
|
|
|
|
|
|
|
|
|
|
|
Balance, March 31, 2023 |
|
88,804,940 |
|
$ |
89 |
|
$ |
111,286 |
|
$ |
6,671 |
|
$ |
(5,884) |
|
$ |
(1,171) |
|
$ |
110,991 |
Stock-based compensation |
|
- |
|
|
- |
|
|
294 |
|
|
- |
|
|
- |
|
|
- |
|
|
294 |
Net loss |
|
- |
|
|
- |
|
|
- |
|
|
(4,584) |
|
|
- |
|
|
- |
|
|
(4,584) |
Balance, June 30, 2023 |
|
88,804,940 |
|
$ |
89 |
|
$ |
111,580 |
|
$ |
2,087 |
|
$ |
(5,884) |
|
$ |
(1,171) |
|
$ |
106,701 |
| (1) | Cash dividends declared and paid per share was $0.01 for the three months ended June 30, 2022. On February 13, 2023, the Company announced the suspension of future quarterly dividends to protect our balance sheet and to focus capital resources on exploration and growth opportunities. |
The accompanying notes are an integral part of these Condensed Consolidated Interim Financial Statements
Gold Resource Corporation—Condensed Consolidated Interim Financial Statements and Notes (Unaudited)
5
GOLD RESOURCE CORPORATION
CONDENSED CONSOLIDATED INTERIM STATEMENTS OF CHANGES IN SHAREHOLDERS’ EQUITY
(U.S. dollars in thousands, except share amounts)
(Unaudited)
|
|
For the six months ended June 30, 2023 and 2022 |
||||||||||||||||||
|
|
Number of |
|
Par Value of |
|
Additional Paid- |
|
Retained |
|
Treasury |
|
Accumulated |
|
Total |
||||||
Balance, December 31, 2021 |
|
88,675,172 |
|
$ |
89 |
|
$ |
110,153 |
|
$ |
17,563 |
|
$ |
(5,884) |
|
$ |
(1,171) |
|
$ |
120,750 |
Stock-based compensation |
|
- |
|
|
- |
|
|
667 |
|
|
- |
|
|
- |
|
|
- |
|
|
667 |
Net stock options exercised |
|
- |
|
|
- |
|
|
(331) |
|
|
- |
|
|
- |
|
|
- |
|
|
(331) |
Common stock issued for vested restricted stock units |
|
38,503 |
|
|
- |
|
|
- |
|
|
- |
|
|
- |
|
|
- |
|
|
- |
Dividends declared (1) |
|
- |
|
|
- |
|
|
- |
|
|
(1,767) |
|
|
- |
|
|
- |
|
|
(1,767) |
Surrender of stock for taxes due on vesting |
|
(4,585) |
|
|
- |
|
|
(9) |
|
|
- |
|
|
- |
|
|
- |
|
|
(9) |
Net income |
|
- |
|
|
- |
|
|
- |
|
|
6,692 |
|
|
- |
|
|
- |
|
|
6,692 |
Balance, June 30, 2022 |
|
88,709,090 |
|
$ |
89 |
|
$ |
110,480 |
|
$ |
22,488 |
|
$ |
(5,884) |
|
$ |
(1,171) |
|
$ |
126,002 |
|
|
|
|
|
|
|
|
|
|
|
|
|
|
|
|
|
|
|
|
|
Balance, December 31, 2022 |
|
88,734,507 |
|
$ |
89 |
|
$ |
111,024 |
|
$ |
7,706 |
|
$ |
(5,884) |
|
$ |
(1,171) |
|
$ |
111,764 |
Stock-based compensation |
|
- |
|
|
- |
|
|
567 |
|
|
- |
|
|
- |
|
|
- |
|
|
567 |
Common stock issued for vested restricted stock units |
|
88,570 |
|
|
- |
|
|
- |
|
|
- |
|
|
- |
|
|
- |
|
|
- |
Surrender of stock for taxes due on vesting |
|
(18,137) |
|
|
- |
|
|
(11) |
|
|
- |
|
|
- |
|
|
- |
|
|
(11) |
Net loss |
|
|
|
|
- |
|
|
- |
|
|
(5,619) |
|
|
- |
|
|
- |
|
|
(5,619) |
Balance, June 30, 2023 |
|
88,804,940 |
|
$ |
89 |
|
$ |
111,580 |
|
$ |
2,087 |
|
$ |
(5,884) |
|
$ |
(1,171) |
|
$ |
106,701 |
| (1) | Cash dividends declared and paid per share were $0.02 for the six months ended June 30, 2022. On February 13, 2023, the Company announced the suspension of future quarterly dividends to protect our balance sheet and to focus capital resources on exploration and growth opportunities. |
The accompanying notes are an integral part of these Condensed Consolidated Interim Financial Statements.
Gold Resource Corporation—Condensed Consolidated Interim Financial Statements and Notes (Unaudited) 6 CONDENSED CONSOLIDATED INTERIM STATEMENTS OF CASH FLOWS
GOLD RESOURCE CORPORATION
(U.S. dollars in thousands)
(Unaudited)
|
|
For the six months ended June 30, |
||||
|
Note |
2023 |
|
2022 |
||
Cash flows from operating activities: |
|
|
|
|
|
|
Net (loss) income |
|
$ |
(5,619) |
|
$ |
6,692 |
Adjustments to reconcile net (loss) income to net cash provided by operating activities: |
|
|
|
|
|
|
Deferred income tax benefit |
|
|
(2,965) |
|
|
(1,198) |
Depreciation and amortization, including accretion in reclamation |
|
|
13,772 |
|
|
13,294 |
Stock-based compensation |
|
|
604 |
|
|
1,167 |
Other operating adjustments |
21 |
|
616 |
|
|
(1,827) |
Changes in operating assets and liabilities: |
|
|
|
|
|
|
Accounts receivable |
|
|
730 |
|
|
2,395 |
Inventories |
|
|
1,762 |
|
|
(1,688) |
Prepaid expenses and other current assets |
|
|
(594) |
|
|
(1,829) |
Other noncurrent assets |
|
|
(72) |
|
|
- |
Accounts payable and other accrued liabilities |
|
|
(2,394) |
|
|
(943) |
Mining royalty and income taxes payable, net |
|
|
(5,367) |
|
|
(3,857) |
Net cash provided by operating activities |
|
|
473 |
|
|
12,206 |
|
|
|
|
|
|
|
Cash flows from investing activities: |
|
|
|
|
|
|
Capital expenditures |
|
|
(6,001) |
|
|
(10,518) |
Proceeds from the sale of gold and silver rounds |
|
|
- |
|
|
533 |
Net cash used in investing activities |
|
|
(6,001) |
|
|
(9,985) |
|
|
|
|
|
|
|
Cash flows from financing activities: |
|
|
|
|
|
|
Cash settlement of options exercise |
|
|
- |
|
|
(376) |
Dividends paid |
|
|
- |
|
|
(1,767) |
Other financing activities |
|
|
(16) |
|
|
- |
Net cash used in financing activities |
|
|
(16) |
|
|
(2,143) |
Effect of exchange rate changes on cash and cash equivalents |
|
|
(174) |
|
|
(455) |
|
|
|
|
|
|
|
Net decrease in cash and cash equivalents |
|
|
(5,718) |
|
|
(377) |
Cash and cash equivalents at beginning of period |
|
|
23,675 |
|
|
33,712 |
Cash and cash equivalents at end of period |
|
$ |
17,957 |
|
$ |
33,335 |
|
|
|
|
|
|
|
Supplemental Cash Flow Information |
|
|
|
|
|
|
Income and mining taxes paid |
|
$ |
6,068 |
|
$ |
15,972 |
Non-cash investing or financing activities |
|
|
|
|
|
|
Change in capital expenditures in accounts payable |
|
$ |
(795) |
|
$ |
(1,094) |
The accompanying notes are an integral part of these Condensed Consolidated Interim Financial Statements.
GOLD RESOURCE CORPORATION
NOTES TO THE CONDENSED CONSOLIDATED INTERIM FINANCIAL STATEMENTS
June 30, 2023
(Unaudited)
1. Basis of Preparation of Financial Statements
Gold Resource Corporation—Condensed Consolidated Interim Financial Statements and Notes (Unaudited) 7 The Condensed Consolidated Interim Financial Statements (“interim financial statements”) of Gold Resource Corporation and its subsidiaries (collectively, the “Company”) are unaudited and have been prepared in accordance with the rules of the Securities and Exchange Commission (“SEC”) for interim statements. Certain information and footnote disclosures required by United States Generally Accepted Accounting Principles (“U.S. GAAP”) have been condensed or omitted as permitted by such rules, although the Company believes that the disclosures included are adequate to make the information presented not misleading. In the opinion of management, all adjustments (including normal recurring adjustments) and disclosures necessary for a fair presentation of these interim financial statements have been included. The results reported in these interim financial statements are not necessarily indicative of the results that may be reported for the entire year. These interim financial statements should be read in conjunction with the audited consolidated financial statements for the year ended December 31, 2022 included in the Company’s annual report on Form 10-K (the “2022 Annual Report”). The year-end balance sheet data was derived from the audited financial statements. Unless otherwise noted, there have been no material changes to the footnotes from those accompanying the audited consolidated financial statements contained in the 2022 Annual Report.
Certain items in the prior period’s consolidated financial statements and notes have been reclassified to conform to the current presentation. In the three and six months ended June 30, 2022, exploration expenses included both the Don David Gold Mine (“DDGM”) exploration expenses and the Back Forty Project expenses. In 2023, these are presented on separate lines in the Consolidated Statements of Operations to align with the current presentation. These reclassifications had no effect on the reported results of operations.
2. Recently Adopted Accounting Standards
Recent accounting pronouncements issued have been evaluated and do not presently impact our financial statements and supplemental data.
Gold Resource Corporation—Condensed Consolidated Interim Financial Statements and Notes (Unaudited) 8 The Company derives its revenue from the sale of doré and concentrates.
3. Revenue
The following table presents the Company’s net sales for each period presented, disaggregated by source:
|
|
|
|
|
|
|
|
|
|
|
|
|
|
|
For the three months ended June 30, |
|
For the six months ended June 30, |
||||||||
|
|
2023 |
|
2022 |
|
2023 |
|
2022 |
||||
|
|
(in thousands) |
|
(in thousands) |
||||||||
Doré sales, net |
|
|
|
|
|
|
|
|
|
|
|
|
Gold |
|
$ |
543 |
|
$ |
2,484 |
|
$ |
2,268 |
|
$ |
3,728 |
Silver |
|
|
32 |
|
|
57 |
|
|
101 |
|
|
77 |
Less: Refining charges |
|
|
(17) |
|
|
(10) |
|
|
(42) |
|
|
(17) |
Total doré sales, net |
|
|
558 |
|
|
2,531 |
|
|
2,327 |
|
|
3,788 |
Concentrate sales |
|
|
|
|
|
|
|
|
|
|
|
|
Gold |
|
|
7,949 |
|
|
13,850 |
|
|
18,571 |
|
|
28,391 |
Silver |
|
|
6,609 |
|
|
5,146 |
|
|
13,182 |
|
|
11,231 |
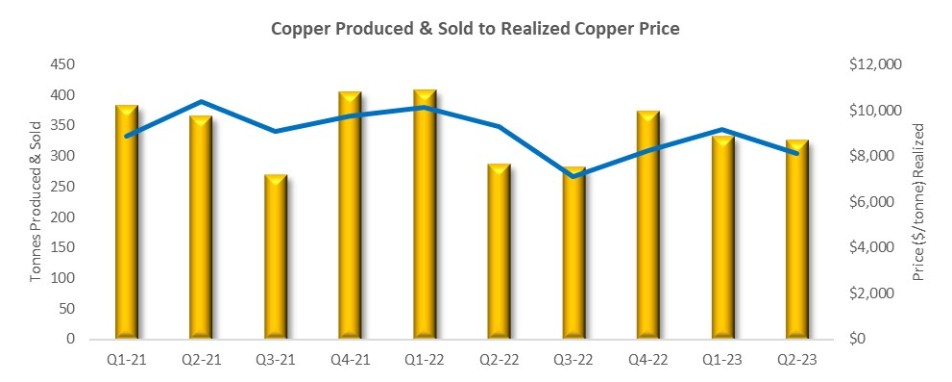
Copper |
|
|
2,749 |
|
|
2,708 |
|
|
5,743 |
|
|
6,805 |
Lead |
|
|
2,782 |
|
|
3,768 |
|
|
5,747 |
|
|
7,595 |
Zinc |
|
|
7,928 |
|
|
14,352 |
|
|
17,479 |
|
|
30,669 |
Less: Treatment and refining charges |
|
|
(3,311) |
|
|
(3,127) |
|
|
(6,470) |
|
|
(5,868) |
Total concentrate sales, net |
|
|
24,706 |
|
|
36,697 |
|
|
54,252 |
|
|
78,823 |
Realized gain - embedded derivative, net (1) |
|
|
248 |
|
|
1,160 |
|
|
882 |
|
|
2,026 |
Unrealized (loss) - embedded derivative, net |
|
|
(705) |
|
|
(3,324) |
|
|
(1,426) |
|
|
(2,156) |
Total sales, net |
|
$ |
24,807 |
|
$ |
37,064 |
|
$ |
56,035 |
|
$ |
82,481 |
| (1) | Copper, lead, and zinc are co-products. In the Realized gain - embedded derivative, net, there is $0.1 million loss and $0.3 million gain, respectively, related to these co-products for the three and six months ended June 30, 2023. There is $1.2 million and $1.7 million gain, respectively, in the Realized gain - embedded derivative, net, related to the co-products for the three and six months ended June 30, 2022. |
4. Inventories, net
At June 30, 2023 and December 31, 2022, inventories, net, consisted of the following:
|
|
|
|
|
|
|
|
|
As of |
|
As of |
||
|
|
June 30, |
|
December 31, |
||
|
|
2023 |
|
2022 |
||
|
|
(in thousands) |
||||
Stockpiles - underground mine |
|
$ |
244 |
|
$ |
597 |
Concentrates |
|
|
1,384 |
|
|
3,271 |
Doré, net |
|
|
359 |
|
|
653 |
Subtotal - product inventories |
|
|
1,987 |
|
|
4,521 |
Materials and supplies (1) |
|
|
8,887 |
|
|
8,979 |
Total |
|
$ |
10,874 |
|
$ |
13,500 |
| (1) | Net of reserve for obsolescence of $0.1 million as of June 30, 2023 and December 31, 2022. |
5. Income Taxes
The Company recorded an income tax benefit of $1.9 million and $2.0 million, respectively, for the three and six months ended June 30, 2023. For the three and six months ended June 30, 2022, the Company recorded an income tax expense of $3.8 million and $9.1 million, respectively. In accordance with applicable accounting rules, the interim provision for taxes is calculated using the estimated consolidated annual effective tax rate. The consolidated effective tax rate is a function of the combined effective tax rates for the jurisdictions in which the Company operates. Variations in the relative
Gold Resource Corporation—Condensed Consolidated Interim Financial Statements and Notes (Unaudited) 9 proportions of jurisdictional income could result in fluctuations to the Company’s consolidated effective tax rate.
At the federal level, the Company’s income in the U.S. is taxed at 21%, and a 5% withholding tax applies to dividends received from Mexico. The Mexico income is taxed at 37.5% (30% income tax and 7.5% mining tax), and Canada income is taxed at 26.5%, which results in a consolidated effective tax rate above statutory U.S. Federal rates. The U.S. and Canadian jurisdictions do not currently generate taxable income.
Mexico Mining Taxation
Mining entities in Mexico are subject to two mining duties, in addition to the 30% Mexico corporate income tax: (i) a “special” mining duty of 7.5% of taxable income as defined under Mexican tax law (also referred to as “mining royalty tax”) on extraction activities performed by concession holders, and (ii) the “extraordinary” mining duty of 0.5% on gross revenue from the sale of gold, silver, and platinum. The mining royalty tax is generally applicable to earnings before income tax, depreciation, depletion, amortization, and interest. In calculating the mining royalty tax, there are no Gold Resource Corporation deductions related to depreciable costs from operational fixed assets, but prospecting and exploration expenses are amortized using a 10% rate in a 10-year straight line. Both duties are tax deductible for income tax purposes. As a result, our effective tax rate applicable to the Company’s Mexican operations is higher than Mexico’s statutory rate.
The Company periodically transfers funds from its Mexican wholly owned subsidiary to the U.S. in the form of dividends, which are subject to a 10% Mexico withholding tax, unless otherwise provided per a tax treaty. The current U.S.-Mexico tax treaty limits the dividend withholding tax between these countries to 5%, as long as certain requirements are met. Based on the Company’s understanding that it meets these requirements, the Company pays a 5% withholding tax on dividends paid from Mexico. The impact of the planned annual dividends for 2023 is reflected in the estimated annual effective tax rate. As of June 30, 2023, the Company recorded $0.6 million deferred tax liability related to the 5% withholding tax on funds available for transfer to the U.S. as dividends in the future are no longer deemed to be permanently reinvested in Mexico. If these funds are distributed to the U.S. from Mexico in the future, at that time, they will be subject to the 5% dividend withholding tax payment upon distribution.
As of June 30, 2023, the Company believes that it has no liability for uncertain tax positions.
6. Prepaid Expenses and Other Current Assets
At June 30, 2023 and December 31, 2022, prepaid expenses and other current assets consisted of the following:
|
|
As of |
|
As of |
||
|
|
June 30, |
|
December 31, |
||
|
|
2023 |
|
2022 |
||
|
|
(Unaudited) |
|
|
|
|
|
|
(in thousands) |
||||
Advances to suppliers |
|
$ |
706 |
|
$ |
867 |
Prepaid insurance |
|
|
2,436 |
|
|
1,298 |
Prepaid income tax |
|
|
2,813 |
|
|
432 |
Other current assets |
|
|
821 |
|
|
1,242 |
Total |
|
$ |
6,776 |
|
$ |
3,839 |
A value added (“IVA”) tax in Mexico is assessed on the sales of products and purchases of materials and services. Businesses owe IVA taxes as the business sells a product and collects IVA taxes from its customers. Likewise, businesses are generally entitled to recover the taxes they have paid related to purchases of materials and services, either as a refund or credit to IVA tax payable. Amounts recorded as IVA taxes in the consolidated financial statements represent the net estimated IVA tax payable or receivable, since there is a legal right of offset of IVA taxes. As of June 30, 2023, this resulted in an asset balance, included in Other current assets.
Gold Resource Corporation—Condensed Consolidated Interim Financial Statements and Notes (Unaudited)
10
7. Property, Plant and Mine Development, net
At June 30, 2023 and December 31, 2022, property, plant and mine development, net consisted of the following:
|
|
|
|
|
|
|
|
|
As of |
|
As of |
||
|
|
June 30, |
|
December 31, |
||
|
|
2023 |
|
2022 |
||
|
|
(in thousands) |
||||
Asset retirement costs |
|
$ |
7,449 |
|
$ |
7,449 |
Construction-in-progress |
|
|
208 |
|
|
351 |
Furniture and office equipment |
|
|
1,827 |
|
|
1,732 |
Land |
|
|
9,033 |
|
|
9,033 |
Mineral interest |
|
|
79,543 |
|
|
79,543 |
Light vehicles and other mobile equipment |
|
|
2,151 |
|
|
2,327 |
Machinery and equipment |
|
|
41,774 |
|
|
41,343 |
Mill facilities and infrastructure |
|
|
35,915 |
|
|
35,917 |
Mine Development |
|
|
110,625 |
|
|
105,263 |
Software and licenses |
|
|
1,554 |
|
|
1,552 |
Subtotal (1) |
|
|
290,079 |
|
|
284,510 |
Accumulated depreciation and amortization |
|
|
(144,434) |
|
|
(131,947) |
Total |
|
$ |
145,645 |
|
$ |
152,563 |
| (1) | Includes accrued capital expenditures of $0.4 million and $1.3 million at June 30, 2023 and December 31, 2022, respectively. |
The Company recorded depreciation and amortization expense of $6.5 million and $13.7 million, respectively, for the three and six months ended June 30, 2023 as compared to $7.3 million and $13.2 million, respectively, for the same periods ended June 30, 2022.
8. Other Non-current Assets
At June 30, 2023 and December 31, 2022, other non-current assets consisted of the following:
|
|
|
|
|
|
|
|
|
As of |
|
As of |
||
|
|
June 30, |
|
December 31, |
||
|
|
2023 |
|
2022 |
||
|
|
(in thousands) |
||||
Investment in Maritime |
|
$ |
1,418 |
|
$ |
1,559 |
Investment in Green Light Metals |
|
|
3,697 |
|
|
3,611 |
Other non-current assets |
|
|
350 |
|
|
339 |
Total |
|
$ |
5,465 |
|
$ |
5,509 |
Investment in Maritime
On September 22, 2022, the Company invested Canadian Dollar (“C$”) 2.4 million (or $1.7 million) in the common shares of Maritime Resources Corp. The 47 million shares purchased represented 9.9% of the issued and outstanding shares of Maritime. As of June 30, 2023 and December 31, 2022, the value of the investment was $1.4 and $1.6 million, respectively.
Investment in Green Light Metals
A promissory note was acquired in the Aquila Resources Inc. (“Aquila”) acquisition. In October 2021, Aquila sold its Wisconsin assets to Green Light Metals in return for a C$4.9 million ($3.9 million) promissory note. In December 2022, an amended agreement was executed (1) amending the maturity date to December 28, 2022, (2) clarifying the definition of “qualified financing” which set the value to C$0.40 per share for the common shares that were to be issued at maturity; and (3) adding a top-up provision that would result in additional common shares being issued to the Company if any Green
Gold Resource Corporation—Condensed Consolidated Interim Financial Statements and Notes (Unaudited) 11 Light Metals financing was raised at less than C$0.40 per share before March 31, 2023, essentially preventing dilution and ensuring that the total value of the Green Light Metals shares held by the Company at March 31, 2023 remains at C$4.9 million.
Upon maturity on December 28, 2022, the Company received 12,250,000 private shares of Green Light Metals, which settled the promissory note. The shares received represented 28.5% ownership in Green Light Metals at the time. After this settlement and before March 31, 2023, additional financing was raised by Green Light Metals at C$0.40 per share. Therefore, the top-up provision was not triggered and no additional shares were received. The Company’s ownership in Green Light Metals as of June 30, 2023 is approximately 28%. As of June 30, 2023 and as of December 31, 2022, the value of this equity investment was $3.7 and $3.6 million, respectively.
9. Accrued Expenses and Other Liabilities
At June 30, 2023 and December 31, 2022, accrued expenses and other liabilities consisted of the following:
|
|
As of |
|
As of |
||
|
|
June 30, |
|
December 31, |
||
|
|
2023 |
|
2022 |
||
|
|
(in thousands) |
||||
Accrued royalty payments |
|
$ |
1,054 |
|
$ |
1,787 |
Share-based compensation liability |
|
|
147 |
|
|
- |
Liability for Aquila drillhole capping (1) |
|
|
110 |
|
|
- |
Employee profit sharing obligation |
|
|
98 |
|
|
2,206 |
Other payables |
|
|
1,199 |
|
|
1,204 |
Total accrued expenses and other current liabilities |
|
$ |
2,608 |
|
$ |
5,197 |
|
|
|
|
|
|
|
Accrued non-current labor obligation |
|
$ |
1,237 |
|
$ |
1,050 |
Share-based compensation liability |
|
|
506 |
|
|
884 |
Other long-term liabilities |
|
|
92 |
|
|
556 |
Total other non-current liabilities |
|
$ |
1,835 |
|
$ |
2,490 |
| (1) | This is the current portion of the Company’s reclamation and remediation liabilities. Please see Note 11— Reclamation and Remediation in Item 1—Condensed Consolidated Interim Financial Statements and Notes (unaudited) for additional information. |
10. Gold and Silver Stream Agreements
The following table presents the Company’s liabilities related to the Gold and Silver Stream Agreements as of June 30, 2023 and December 31, 2022:
|
|
|
|
|
|
|
|
|
As of |
|
As of |
||
|
|
June 30, |
|
December 31, |
||
|
|
2023 |
|
2022 |
||
|
|
(in thousands) |
||||
Liability related to the Gold Stream Agreement |
|
$ |
20,995 |
|
$ |
20,881 |
Liability related to the Silver Stream Agreement |
|
|
23,020 |
|
|
22,585 |
Total liability |
|
$ |
44,015 |
|
$ |
43,466 |
Periodic interest expense will be incurred based on an implied interest rate. The implied interest rate is determined based on the timing and probability of future production and an 8% discount rate. Interest expense is recorded to the Consolidated Statements of Operations, and the gold and silver stream agreement liability recorded on the Consolidated Balance Sheet. These liabilities approximate fair value.
Gold Resource Corporation—Condensed Consolidated Interim Financial Statements and Notes (Unaudited) 12 In November 2017, Aquila entered into a stream agreement with Osisko Bermuda Limited (“OBL”), a wholly owned subsidiary of Osisko Gold Royalties Ltd (TSX & NYSE: OR), pursuant to which OBL agreed to commit approximately $55 million to Aquila through a gold stream purchase agreement.
Gold Streaming Agreement
In June 2020, Aquila amended its agreement with Osisko, reducing the total committed amount to $50 million, as well as adjusting certain milestone dates under the gold stream to align with the current project development timeline. Aquila had received a total of $20 million of the committed funds at the time of the Gold Resource Corporation acquisition. Remaining deposits from OBL are $5 million upon receipt of permits required for the development and operation of the Back Forty Project and $25 million upon the first drawdown of an appropriate project debt finance facility. OBL has been provided a general security agreement over the Back Forty Project, which consists of the subsidiaries of Gold Resource Acquisition Sub. Inc., a 100% owned subsidiary of Gold Resource Corporation. The initial term of the agreement is for 40 years, automatically renewable for successive ten-year periods. The agreement is subject to certain operating and financial covenants, which are in good standing as of June 30, 2023.
The $20 million received from OBL through June 30, 2023 is shown as a long-term liability on the Consolidated Balance Sheet, along with an implied interest. The implied interest rate is applied on OBL advance payments and calculated on the total expected life-of-mine production to be deliverable (as supported in the Back Forty Project Preliminary Economic Assessment) at December 31, 2022 closing gold and silver metal price and is discounted at 8.0%. As the remaining $30 million deposit is subject to the completion of certain milestones and the satisfaction of certain other conditions, this amount is not reflected on the Consolidated Balance Sheet.
Per the terms of the gold stream agreement, OBL will purchase 18.5% of the refined gold from Back Forty (the “Threshold Stream Percentage”) until the Company has delivered 105,000 ounces of gold (the “Production Threshold”). Upon satisfaction of the Production Threshold, the Threshold Stream Percentage will be reduced to 9.25% of the refined gold (the “Tail Stream”). In exchange for the refined gold delivered under the Stream Agreement, OBL will pay the Company ongoing payments equal to 30% of the spot price of gold on the day of delivery, subject to a maximum payment of $600 per ounce. Where the market price of gold is greater than the price paid, the difference realized from the sale of the gold will be applied against the deposit received from Osisko. (See Note 12—Commitments and Contingencies in Item 1—Condensed Consolidated Interim Financial Statements and Notes (unaudited) for additional information.)
Silver Stream Agreement
Through a series of contracts, Aquila executed a silver stream agreement with OBL to purchase 85% of the silver produced and sold at the Back Forty Project. A total of $17.2 million has been advanced under the agreement of June 30, 2023. There are no future deposits remaining under the agreement. The initial term of the agreement is for 40 years, automatically renewable for successive ten-year periods. The agreement is subject to certain operating and financial covenants, which are in good standing as of June 30, 2023.
Per the terms of the silver stream agreement, OBL will purchase 85% of the silver produced from the Back Forty Project at a fixed price of $4 per ounce of silver. Where the market price of silver is greater than $4 per ounce, the difference realized from the sale of the silver will be applied against the deposit received from Osisko.
The $17.2 million received from OBL through June 30, 2023 is shown as a long-term liability on the Consolidated Balance Sheet along with an implied interest. (See Note 12—Commitments and Contingencies in Item 1—Condensed Consolidated Interim Financial Statements and Notes (unaudited) for additional information.)
Gold Resource Corporation—Condensed Consolidated Interim Financial Statements and Notes (Unaudited) 13 The following table presents the reclamation and remediation obligations as of June 30, 2023 and December 31, 2022:
11. Reclamation and Remediation
|
|
|
|
|
|
|
|
|
As of |
|
As of |
||
|
|
June 30, |
|
December 31, |
||
|
|
2023 |
|
2022 |
||
|
|
(in thousands) |
||||
Current reclamation and remediation liabilities (1) |
|
$ |
110 |
|
$ |
- |
Non-current reclamation and remediation liabilities |
|
|
12,541 |
|
|
10,366 |
Total |
|
$ |
12,651 |
|
$ |
10,366 |
| (1) | The current portion of reclamation and remediation liabilities are included in Accrued expenses and other current liabilities. Please see Note 9— Accrued Expenses and Other Liabilities in Item 1— Item 1—Condensed Consolidated Interim Financial Statements and Notes (unaudited) for additional information. |
The following table presents the changes in reclamation and remediation obligations for the six months ended June 30, 2023 and the year ended December 31, 2022:
|
|
2023 |
|
2022 |
||
|
|
(in thousands) |
||||
Reclamation liabilities – balance at beginning of period |
|
$ |
1,949 |
|
$ |
1,833 |
Foreign currency exchange loss |
|
|
260 |
|
|
116 |
Reclamation liabilities – balance at end of period |
|
|
2,209 |
|
|
1,949 |
|
|
|
|
|
|
|
Asset retirement obligation – balance at beginning of period (1) |
|
|
8,417 |
|
|
1,279 |
Changes in estimate (1) |
|
|
- |
|
|
6,384 |
Liability for Aquila drillhole capping (2) |
|
|
514 |
|
|
- |
Accretion |
|
|
354 |
|
|
668 |
Foreign currency exchange loss |
|
|
1,157 |
|
|
86 |
Asset retirement obligation – balance at end of period |
|
|
10,442 |
|
|
8,417 |
Total period end balance |
|
$ |
12,651 |
|
$ |
10,366 |
| (1) | In 2022, the Company updated its closure plan study, which resulted in a $6.4 million increase in the estimated liability and asset retirement costs. This increase is a result of formalizing a tailings storage facility closure plan, the addition of the dry stack facility and the filtration plant, and the increase of inflation in Mexico. |
| (2) | As of December 31, 2022, the Company reported the liability to remediate exploration drill holes at the Back Forty Project in Michigan, USA in other non-current liabilities. As of March 31, 2023, this liability was reclassified to non-current reclamation and remediation liabilities. Upon completion of the optimization work and the related mine closure plan, an asset for asset retirement obligation and corresponding liability for reclamation and remediation will be recorded. |
The Company’s undiscounted reclamation liabilities of $2.2 million and $1.9 million as of June 30, 2023 and December 31, 2022, respectively, are related to the Don David Gold Mine in Mexico. These represent reclamation liabilities that were expensed through 2013 before proven and probable reserves were established and the Company was considered to be a development stage entity; therefore, most of the costs, including asset retirement costs, were not allowed to be capitalized as part of our Property, Plant & Mine Development.
The Company’s asset retirement obligations reflect the additions to the asset for reclamation and remediation costs in Property, Plant & Mine Development, post 2013 development stage status, which are discounted using a credit adjusted risk-free rate of 8%. As of June 30, 2023 and December 31, 2022, the Company’s asset retirement obligation related to was $10.4 million and $8.4 million, respectively, and was mostly related to the Don David Gold Mine in Mexico.
Gold Resource Corporation—Condensed Consolidated Interim Financial Statements and Notes (Unaudited) 14 As of June 30, 2023 and December 31, 2022, the Company has equipment purchase commitments of approximately $0.7 million and $1.2 million, respectively.
12. Commitments and Contingencies
Commitments
Contingent Consideration
With the Aquila acquisition, the Company assumed a contingent consideration related to the December 30, 2013, Aquila acquisition of 100% of the shares of HudBay Michigan Inc. (“HMI”), a subsidiary of HudBay Minerals Inc. (“HudBay”), effectively giving Aquila 100% ownership in the Back Forty Project (the “HMI Acquisition”). Pursuant to the HMI Acquisition, HudBay’s 51% interest in the Back Forty Project was acquired in consideration for the issuance of common shares of Aquila, future milestone payments tied to the development of the Back Forty Project, and a 1% net smelter return royalty on production from certain land parcels in the project. The issuance of shares and 1% net smelter obligations were settled before the Company acquired Aquila.
The contingent consideration is composed of the following in Canadian dollars:
The value of future installments is based on C$9 million tied to development of the Back Forty project as follows:
| a. | C$3 million payable on completion of any form of financing for purposes including the commencement of construction of Back Forty. Up to 50% of the C$3 million can be paid, at the Company’s option, in Gold Resource Corporation shares with the balance payable in cash. (If, as of the tenth anniversary of the HMI acquisition by Aquila, this milestone has not been achieved or payment made, HudBay has the right to repurchase a 51% ownership in the Back Forty Project); |
| b. | C$2 million payable in cash 90 days after the commencement of commercial production; |
| c. | C$2 million payable in cash 270 days after the commencement of commercial production; and |
| d. | C$2 million payable in cash 450 days after the commencement of commercial production. |
The value of the contingent consideration as of June 30, 2023 was $4.5 million, including $2.3 million in current liabilities and $2.2 million in non-current liabilities. As the Company has the option to pay the first milestone payment of C$3 million ($2.3 million) in 2023 in order to prevent the repurchase of 51% ownership by HMI, this portion is presented as a current liability, with $2.2 million remaining in long-term liability. The contingent consideration is adjusted for the time value of money and the likelihood of the milestone payments. Any future changes in the value of the contingent consideration will be recognized in the Consolidated Statements of Operations.
Other Contingencies
The Company has certain other contingencies resulting from litigation, claims, and other commitments and is subject to a variety of environmental and safety laws and regulations incident to the ordinary course of business. The Company currently has no basis to conclude that any or all of such contingencies will materially affect its financial position, results of operations, or cash flows. However, in the future, there may be changes to these contingencies, or additional contingencies may occur, any of which might result in an accrual or a change in current accruals recorded by the Company, and there can be no assurance that their ultimate disposition will not have a material adverse effect on the Company’s financial position, results of operations or cash flows.
With the acquisition of Aquila Resources Inc. on December 10, 2021, the Company assumed substantial liabilities that relate to the gold and silver stream agreements with Osisko Bermuda Limited. Under the agreements, Osisko deposited a total of $37.2 million upfront in exchange for a portion of the future gold and silver production from the Back Forty Project. The stream agreements contain customary provisions regarding default and security. In the event that our subsidiary defaults under the stream agreements, including failing to achieve commercial production at a future date, it may be required
Gold Resource Corporation—Condensed Consolidated Interim Financial Statements and Notes (Unaudited) 15 to repay the deposit plus accumulated interest at a rate agreed with Osisko.
If it fails to do so, Osisko may be entitled to enforce its remedies as a secured party and take possession of the assets that comprise the Back Forty Project.
13. Shareholders’ Equity
No dividends were declared and paid in 2023. During the three and six months ended June 30, 2022, the Company declared and paid dividends of $0.01 per common share and $0.02 per common share for an aggregate total of $0.9 million and $1.8 million, respectively.
14. Derivatives
Embedded Derivatives
Concentrate Sales
Concentrate sales contracts contain embedded derivatives due to the provisional pricing terms for unsettled shipments. At the end of each reporting period, the Company records an adjustment to accounts receivable and revenue to reflect the mark-to-market adjustments for outstanding provisional invoices based on forward metal prices. Please see Note—20 Fair Value Measurement in Item 1—Condensed Consolidated Interim Financial Statements and Notes (unaudited) for additional information on the realized and unrealized gain (loss) recorded to adjust accounts receivable and revenue.
The following table summarizes the Company’s unsettled sales contracts at June 30, 2023 with the quantities of metals under contract subject to final pricing expected to occur through August 2023:
|
|
Gold |
|
Silver |
|
Copper |
|
Lead |
|
Zinc |
|
|
Total |
|||||
|
|
(ounces) |
|
(ounces) |
|
(tonnes) |
|
(tonnes) |
|
(tonnes) |
|
|
|
|||||
Under contract |
|
|
4,681 |
|
|
334,989 |
|
|
326 |
|
|
2,371 |
|
|
4,681 |
|
|
|
Average forward price (per ounce or tonne) |
|
$ |
1,954 |
|
$ |
23.65 |
|
$ |
8,434 |
|
$ |
2,110 |
|
|
2,719 |
|
|
|
Unsettled sales contracts value (in thousands) |
|
$ |
9,147 |
|
$ |
7,922 |
|
$ |
2,749 |
|
$ |
5,003 |
|
$ |
12,728 |
|
$ |
37,549 |
Other Derivatives
Zinc zero cost collar
Derivative instruments that are not designated as hedging instruments are required to be recorded on the balance sheet at fair value. Changes in fair value will impact the Company’s earnings through mark-to-market adjustments until the physical commodity is delivered or the financial instrument is settled. The fair value does not reflect the realized or cash value of the instrument. As of December 31, 2022, the Company’s hedge program concluded, but the Company may utilize similar programs in the future to manage near-term exposure to cash flow variability from metal prices.
The Company manages credit risk by selecting counterparties believed to be financially strong, by entering into netting arrangements with counterparties and by requiring other credit risk mitigants, as appropriate. The Company actively evaluates the creditworthiness of its counterparties, assigns appropriate credit limits, and monitors credit exposures against those assigned limits.
15. Employee Benefits
Effective October 2012, the Company adopted a profit sharing plan (the “Plan”) which covers all U.S. employees. The Plan meets the requirements of a qualified retirement plan pursuant to the provisions of Section 401(k) of the Internal Revenue Code. The Plan also provides eligible employees the opportunity to make tax deferred contributions to a retirement trust account up to 90% of their qualified wages, subject to the IRS annual maximums.
Gold Resource Corporation—Condensed Consolidated Interim Financial Statements and Notes (Unaudited) 16 Under Mexican law, employees are entitled to receive statutory profit sharing (Participación a los Trabajadores de las Utilidades or “PTU”) payments.
The required cash payment to employees in the aggregate is equal to 10% of their employer’s profit subject to PTU, which differs from profit determined under U.S. GAAP. Please see Note 9—Accrued Expenses and Other Liabilities in Item 1—Condensed Consolidated Interim Financial Statements and Notes (unaudited) for additional information.
16. Stock-Based Compensation
The Company’s compensation program comprises three main elements: base salary, an annual short-term incentive plan (“STIP”) cash award, and long-term equity-based incentive compensation (“LTIP”) in the form of deferred stock units (“DSUs”), restricted stock units (“RSUs”), stock options, and performance share units (“PSUs”).
The Gold Resource Corporation 2016 Equity Incentive Plan (the “Incentive Plan”) allows for the issuance of up to 5 million shares of common stock in the form of incentive and non-qualified stock options, stock appreciation rights, RSUs, stock grants, stock units, performance shares, PSUs, and performance cash. Additionally, pursuant to the terms of the Incentive Plan, any award outstanding under the prior plan that is terminated, expired, forfeited, or canceled for any reason, will be available for grant under the Incentive Plan.
DSUs of nil and 278,663, respectively, were granted to the Board of Directors during the three and six months ended June 30, 2023. DSUs of nil and 214,357 were granted to the Board of Directors during the three and six months ended June 30, 2022, respectively. DSUs are vested immediately and redeemable in cash or shares at the earlier of 10 years or upon the eligible directors’ termination. Termination is deemed to occur on the earliest of: (1) the date of voluntary resignation or retirement of the director from the Board; (2) the date of death of the director; or (3) the date of removal of the director from the Board whether by shareholder resolution, failure to achieve re-election, or otherwise; and on which date the director is not a director or employee of the Company or any of its affiliates. These awards contain a cash settlement feature and are therefore classified as a liability and are marked to market each reporting period.
The Company may also issue DSUs for directors in lieu of board fees at their request. During the three and six months ended June 30, 2023, respectively, there were 17,652 and 31,301 DSUs granted in lieu of board fees that are also subject to mark-to-market adjustment. During the three and six months ended June 30, 2022, respectively, there were 3,352 and 6,708 DSUs granted in lieu of board fees that are also subject to mark-to-market adjustment. Additionally, during the first quarter of 2023, executives were granted 212,407 DSUs in lieu of half of their STIP cash bonus for 2022.
During both the three and six months ended June 30, 2023, there were 323,900 DSUs redeemed for the cash value of $0.3 million. There were no DSU redemptions during the same periods in 2022.
As of June 30, 2023 and 2022, the non-current liability balances related to DSUs were $0.4 million and $0.6 million, respectively. For the three months ended June 30, 2023 and 2022, respectively, the changes in liabilities related to DSUs resulted in $0.3M million and $0.2 million credit to stock-based compensation expense. For the six months ended June 30, 2023 and 2022, respectively, the changes in liabilities related to DSUs resulted in $0.1 million and $0.4 million stock-based compensation expense, respectively.
RSUs of 167,133 and 779,192 were granted during the three and six months ended June 30, 2023, respectively. RSUs of 377,076 and 611,681 were granted during the three and six months ended June 30, 2022, respectively. During the three and six months ended June 30, 2023, respectively, a total of nil and 195,525 RSUs vested. Both during the three and six months ended June 30, 2022, a total of 77,801 RSUs vested. For the RSUs vesting in 2023, 70,433 common shares were issued with an intrinsic value and a fair value of $61,981, RSUs of 18,137 were withheld for taxes due to net settlement, and 106,955 RSUs were deferred.
No stock options were granted nor exercised during the three and six months ended June 30, 2023. Stock options of nil and 320,816 were granted during the three and six months ended June 30, 2022, respectively. Stock options of nil and 355,000, respectively, were exercised during the three and six months ended June 30, 2022. The exercises in 2022 were settled in cash.
Gold Resource Corporation—Condensed Consolidated Interim Financial Statements and Notes (Unaudited) 17 PSUs of nil and 534,890 were granted during the three and six months ended June 30, 2023 respectively.
PSUs of 400,894 and 695,041 were granted during the three and six months ended June 30, 2022, respectively. PSUs cliff vest usually in three years based on the relative and absolute total shareholder return of a predetermined peer group and are expected to be settled in cash.
During the three and six months ended June 30, 2023, there were 60,214 and 98,483 PSUs, respectively, forfeited due to employee terminations. There were no forfeitures during the same periods in 2022.
As of June 30, 2023 and 2022, the current liability balances related to PSUs were $0.1 million and nil, respectively, and the non-current liability balances related to PSUs were $0.2 million and $0.1 million, respectively.
Stock-based compensation expense for the periods presented is as follows:
|
|
|
|
|
|
|
|
|
|
|
|
|
|
|
For the three months ended June 30, |
|
For the six months ended June 30, |
||||||||
|
|
2023 |
|
2022 |
|
2023 |
|
2022 |
||||
|
|
(in thousands) |
|
(in thousands) |
||||||||
Deferred stock units |
|
|
(288) |
|
|
(207) |
|
|
69 |
|
|
370 |
Restricted stock units |
|
|
174 |
|
|
256 |
|
|
327 |
|
|
304 |
Stock options |
|
$ |
120 |
|
$ |
250 |
|
$ |
240 |
|
$ |
399 |
Performance stock units |
|
|
1 |
|
|
94 |
|
|
(32) |
|
|
94 |
Total |
|
$ |
7 |
|
$ |
393 |
|
$ |
604 |
|
$ |
1,167 |
The Company’s STIP for its management team provides annual cash payable upon achievement of specified performance metrics. As of June 30, 2023, the Company accrued $0.8 million payable in cash related to the 2023 STIP program.
17. Zinc Zero Cost Collar
During the three and six months ended June 30, 2023 and 2022, the realized and unrealized (gains) losses related to the Company’s zinc zero cost collar are the following:
|
|
For the three months ended June 30, |
|
For the six months ended June 30, |
||||||||
|
|
2023 |
|
2022 |
|
2023 |
|
2022 |
||||
|
|
(in thousands) |
|
(in thousands) |
||||||||
Realized loss on zinc zero cost collar |
|
$ |
- |
|
$ |
829 |
|
$ |
- |
|
$ |
2,457 |
Unrealized gain on zinc zero cost collar (1) |
|
|
- |
|
|
(4,628) |
|
|
- |
|
|
(2,119) |
Total |
|
$ |
- |
|
$ |
(3,799) |
|
$ |
- |
|
$ |
338 |
| (1) | Gains and losses due to changes in fair value are non-cash in nature until such time that they are realized through cash transactions. |
On May 18, 2021, the Company entered into a Trading Agreement with Auramet International LLC that governs nonexchange traded, over-the-counter, spot, forward and option transactions on both a deliverable and non-deliverable basis involving various metals and currencies. Gains and losses due to changes in fair value are non-cash in nature until such time that they are realized through cash transactions. Please see Note 14—Derivatives in Item 1—Condensed Consolidated Interim Financial Statements and Notes (unaudited) for additional information. As of December 31, 2022, the Company’s hedge program concluded, but the Company may utilize similar programs in the future to manage near-term exposure to cash flow variability from metal prices.
Gold Resource Corporation—Condensed Consolidated Interim Financial Statements and Notes (Unaudited) 18 Other expense, net, for the periods presented consisted of the following:
18. Other Expense, net
|
|
For the three months ended June 30, |
|
For the six months ended June 30, |
||||||||
|
|
2023 |
|
2022 |
|
2023 |
|
2022 |
||||
|
|
(in thousands) |
|
(in thousands) |
||||||||
Unrealized currency exchange (gain) loss (1) |
|
$ |
(114) |
|
$ |
77 |
|
$ |
339 |
|
$ |
522 |
Realized currency exchange loss |
|
|
133 |
|
|
30 |
|
|
309 |
|
|
159 |
Realized and unrealized loss (gain) from gold and silver rounds, net |
|
|
6 |
|
|
8 |
|
|
(3) |
|
|
(28) |
Loss on disposal of fixed assets |
|
|
12 |
|
|
- |
|
|
12 |
|
|
- |
Interest on streaming liabilities |
|
|
275 |
|
|
134 |
|
|
549 |
|
|
310 |
Severance (2) |
|
|
267 |
|
|
- |
|
|
877 |
|
|
- |
Other expense (income) |
|
|
132 |
|
|
(35) |
|
|
97 |
|
|
89 |
Total |
|
$ |
711 |
|
$ |
214 |
|
$ |
2,180 |
|
$ |
1,052 |
| (1) | Gains and losses due to changes in fair value are non-cash in nature until such time that they are realized through cash transactions. For additional information regarding the Company’s fair value measurements and investments, please see Note 20—Fair Value Measurement in Item 1—Condensed Consolidated Interim Financial Statements and Notes (unaudited) for additional information. |
| (2) | This is due to an organized reduction of workforce and leadership change at DDGM in Mexico. |
19. Net Income per Common Share
Basic net income per common share is calculated based on the weighted average number of common shares outstanding for the period. Diluted earnings per common share are calculated based on the assumption that stock options and other dilutive securities outstanding, which have an exercise price less than the average market price of the Company’s common shares during the period, would have been exercised on the later of the beginning of the period or the date granted and that the funds obtained from the exercise were used to purchase common shares at the average market price during the period. All the Company’s RSUs are considered to be dilutive in periods with net income.
The effect of the Company’s dilutive securities is calculated using the treasury stock method and only those instruments that result in a reduction in net income per common share are included in the calculation. Options to purchase 1.5 million shares of common stock at weighted average exercise prices of $2.88 were outstanding as of June 30, 2023 but had no dilutive effect due to the net loss. Options to purchase 2.3 million shares of common stock at a weighted average exercise prices of $4.49 were outstanding as of June 30, 2022 but were not included in the computation of diluted weighted average common shares outstanding, as the exercise price of the options exceeded the average price of the Company’s common stock during the reporting period, and therefore are anti-dilutive.
Basic and diluted net income per common share is calculated as follows:
|
|
|
|
|
|
|
|
|
|
|
|
|
|
|
For the three months ended |
|
For the six months ended |
||||||||
|
|
June 30, |
|
June 30, |
||||||||
|
|
2023 |
|
2022 |
|
2023 |
|
2022 |
||||
Numerator: |
|
|
|
|
|
|
|
|
|
|
|
|
Net (loss) income (in thousands) |
|
$ |
(4,584) |
|
$ |
2,673 |
|
$ |
(5,619) |
|
$ |
6,692 |
|
|
|
|
|
|
|
|
|
|
|
|
|
Denominator: |
|
|
|
|
|
|
|
|
|
|
|
|
Basic weighted average shares of common stock outstanding |
|
|
88,468,542 |
|
|
88,343,992 |
|
|
88,437,413 |
|
|
88,341,398 |
Dilutive effect of share-based awards |
|
|
- |
|
|
447,560 |
|
|
- |
|
|
305,451 |
Diluted weighted average common shares outstanding |
|
|
88,468,542 |
|
|
88,791,552 |
|
|
88,437,413 |
|
|
88,646,849 |
|
|
|
|
|
|
|
|
|
|
|
|
|
Basic and diluted net (loss) income per common share |
|
$ |
(0.05) |
|
$ |
0.03 |
|
$ |
(0.06) |
|
$ |
0.08 |
Gold Resource Corporation—Condensed Consolidated Interim Financial Statements and Notes (Unaudited) 19 Fair value accounting establishes a fair value hierarchy that prioritizes the inputs to valuation techniques used to measure fair value.
20. Fair Value Measurement
The hierarchy gives the highest priority to unadjusted quoted prices in active markets for identical assets or liabilities (Level 1 measurements) and the lowest priority to unobservable inputs (Level 3 measurements). The three levels of the fair value hierarchy are described below:
Level 1 |
Unadjusted quoted prices in active markets that are accessible at the measurement date for identical, unrestricted assets or liabilities; |
Level 2 |
Quoted prices in markets that are not active, or inputs that are observable, either directly or indirectly, for substantially the full term of the asset or liability; and |
Level 3 |
Prices or valuation techniques that require inputs that are both significant to the fair value measurement and unobservable (supported by little or no market activity). |
As required by accounting guidance, assets and liabilities are classified in their entirety based on the lowest level of input that is significant to the fair value measurement. These assets and liabilities are remeasured for each reporting period. The following tables set forth certain of the Company’s assets and liabilities measured at fair value by level within the fair value hierarchy as of June 30, 2023 and December 31, 2022:
|
|
As of |
|
As of |
|
|
||
|
|
June 30, |
|
December 31, |
|
Input Hierarchy Level |
||
|
|
2023 |
|
2022 |
|
|
||
|
|
(in thousands) |
|
|
||||
Cash and cash equivalents |
|
$ |
17,957 |
|
$ |
23,675 |
|
Level 1 |
Accounts receivable, net |
|
$ |
4,355 |
|
$ |
5,085 |
|
Level 2 |
Investment in equity securities-Maritime |
|
$ |
1,418 |
|
$ |
1,559 |
|
Level 1 |
Investment in equity securities-Green Light Metals |
|
$ |
3,697 |
|
$ |
3,611 |
|
Level 3 |
The following methods and assumptions were used to estimate the fair value of each class of financial instrument:
Cash and cash equivalents: Cash and cash equivalents consist primarily of cash deposits and are valued at cost, which approximates fair value.
Accounts receivable, net: Accounts receivable, net include amounts due to the Company for deliveries of concentrates and doré sold to customers. Concentrate sales contracts provide for provisional pricing as specified in such contracts. These sales contain an embedded derivative related to the provisional pricing mechanism which is bifurcated and accounted for as a derivative. At the end of each reporting period, the Company records an adjustment to sales to reflect the mark-to-market of outstanding provisional invoices based on the forward price curve. Because these provisionally priced sales have not yet settled as of the reporting date, the mark-to-market adjustment related to these invoices is included in accounts receivable as of each reporting date.
At June 30, 2023 and December 31, 2022, the Company had an unrealized loss of $0.8 million and an unrealized gain of $0.6 million, respectively, included in its accounts receivable on the accompanying Consolidated Balance Sheets related to mark-to-market adjustments on the embedded derivatives. Please see Note 14—Derivatives in Item 1—Condensed Consolidated Interim Financial Statements and Notes (unaudited) for additional information.
Investment in equity securities—Maritime: On September 22, 2022, Gold Resource Corporation invested C$2.4 million (or $1.7 million) in the common shares of Maritime Resources Corp. (“Maritime”), ticker symbol MAE.V on TSX-V, in a private placement. The 47 million shares purchased represent less than 10% of the issued and outstanding shares of Maritime. As of June 30, 2023, the share price of Maritime was C$0.040, compared to C$0.045 as at December 31, 2022; and therefore, an unrealized loss of $0.2 million was recorded, offset by a small foreign exchange gain.
Gold Resource Corporation—Condensed Consolidated Interim Financial Statements and Notes (Unaudited) 20 Investment in equity securities—Green Light Metals: Upon maturity on December 28, 2022, the Company received 12,250,000 private shares of Green Light Metals, which settled the promissory note receivable from Green Light Metals.
The shares received represented approximately 28.5% ownership at the time. Management chose to account for this investment using the fair value option; therefore, these securities are carried at fair value. As of June 30, 2023, the value of this equity investment was C$4.9 million ($3.7 million). The value of the issued shares was determined to be C$0.40 per share, which was based on the significant unobservable input of Green Light Metals recent equity transactions. For the six months ended June 30, 2023, there have been no gains or losses on the value of the shares the Company received, other than some foreign exchange gains.
Gains and losses related to changes in the fair value of these financial instruments were included in the Company’s Condensed Consolidated Interim Statements of Operations as shown in the following table:
|
|
|
|
|
|
|
|
|
|
|
|
|
|
|
|
|
|
For the three months ended June 30, |
|
For the six months ended June 30, |
|
Statements of Operations Classification |
|||||||||
|
|
2023 |
|
2022 |
|
|
2023 |
|
2022 |
|
|
||||
|
Note |
(in thousands) |
|
|
|||||||||||
Realized and unrealized derivative loss, net |
14 |
$ |
(457) |
|
$ |
(2,164) |
|
|
$ |
(544) |
|
$ |
(130) |
|
Sales, net |
Realized loss on zinc zero cost collar |
17 |
$ |
- |
|
$ |
(829) |
|
|
$ |
- |
|
$ |
(2,457) |
|
Realized and unrealized loss on zinc zero cost collar |
Unrealized gain on zinc zero cost collar |
17 |
$ |
- |
|
$ |
4,628 |
|
|
$ |
- |
|
$ |
2,119 |
|
Realized and unrealized loss on zinc zero cost collar |
Realized/Unrealized Derivatives
The following tables summarize the Company’s realized/unrealized derivatives for the periods presented (in thousands):
|
|
Gold |
|
Silver |
|
Copper |
|
Lead |
|
Zinc |
|
Total |
||||||
For the three months ended June 30, 2023 |
|
|
|
|
|
|
|
|
|
|
|
|
|
|
|
|
|
|
Realized gain (loss) |
|
$ |
127 |
|
$ |
196 |
|
$ |
(8) |
|
$ |
54 |
|
$ |
(121) |
|
$ |
248 |
Unrealized (loss) gain |
|
|
(44) |
|
|
(34) |
|
|
(46) |
|
|
93 |
|
|
(674) |
|
|
(705) |
Total realized/unrealized derivatives, net |
|
$ |
83 |
|
$ |
162 |
|
$ |
(54) |
|
$ |
147 |
|
$ |
(795) |
|
$ |
(457) |
|
|
Gold |
|
Silver |
|
Copper |
|
Lead |
|
Zinc |
|
Total |
||||||
For the three months ended June 30, 2022 |
|
|
|
|
|
|
|
|
|
|
|
|
|
|
|
|
|
|
Realized gain (loss) |
|
$ |
56 |
|
$ |
(95) |
|
$ |
(58) |
|
$ |
37 |
|
$ |
1,220 |
|
$ |
1,160 |
Unrealized loss |
|
|
(243) |
|
|
(164) |
|
|
(121) |
|
|
(246) |
|
|
(2,550) |
|
|
(3,324) |
Total realized/unrealized derivatives, net |
|
$ |
(187) |
|
$ |
(259) |
|
$ |
(179) |
|
$ |
(209) |
|
$ |
(1,330) |
|
$ |
(2,164) |
|
|
|
|
|
|
|
|
|
|
|
|
|
|
|
|
|
|
|
|
|
Gold |
|
Silver |
|
Copper |
|
Lead |
|
Zinc |
|
Total |
||||||
For the six months ended June 30, 2023 |
|
|
|
|
|
|
|
|
|
|
|
|
|
|
|
|
|
|
Realized gain |
|
$ |
241 |
|
$ |
345 |
|
$ |
46 |
|
$ |
148 |
|
$ |
102 |
|
$ |
882 |
Unrealized loss |
|
|
(81) |
|
$ |
(305) |
|
$ |
(56) |
|
$ |
(10) |
|
$ |
(974) |
|
|
(1,426) |
Total realized/unrealized derivatives, net |
|
$ |
160 |
|
$ |
40 |
|
$ |
(10) |
|
$ |
138 |
|
$ |
(872) |
|
$ |
(544) |
|
|
|
|
|
|
|
|
|
|
|
|
|
|
|
|
|
|
|
|
|
Gold |
|
Silver |
|
Copper |
|
Lead |
|
Zinc |
|
Total |
||||||
For the six months ended June 30, 2022 |
|
|
|
|
|
|
|
|
|
|
|
|
|
|
|
|
|
|
Realized gain (loss) |
|
$ |
182 |
|
$ |
154 |
|
$ |
(15) |
|
$ |
56 |
|
$ |
1,649 |
|
$ |
2,026 |
Unrealized (loss) gain |
|
|
(1) |
|
|
111 |
|
|
(105) |
|
|
(199) |
|
|
(1,962) |
|
|
(2,156) |
Total realized/unrealized derivatives, net |
|
$ |
181 |
|
$ |
265 |
|
$ |
(120) |
|
$ |
(143) |
|
$ |
(313) |
|
$ |
(130) |
Gold Resource Corporation—Condensed Consolidated Interim Financial Statements and Notes (Unaudited) 21 Other operating adjustments and write-downs within the net cash provided by operations on the Condensed Consolidated Statements of Cash Flows for the three and six months ended June 30, 2023 and 2022 consisted of the following:
21. Supplementary Cash Flow Information
|
|
|
|
|
|
|
|
|
|
|
|
|
|
|
For the three months ended June 30, |
|
For the six months ended June 30, |
||||||||
|
|
2023 |
|
2022 |
|
2023 |
|
2022 |
||||
|
|
(in thousands) |
|
(in thousands) |
||||||||
Unrealized loss (gain) on gold and silver rounds |
|
$ |
5 |
|
$ |
8 |
|
$ |
(4) |
|
$ |
(62) |
Unrealized foreign currency exchange (gain) loss |
|
|
(114) |
|
|
77 |
|
|
339 |
|
|
522 |
Unrealized loss on zinc zero cost collar |
|
|
- |
|
|
(4,628) |
|
|
- |
|
|
(2,119) |
Other |
|
|
94 |
|
|
165 |
|
|
281 |
|
|
(168) |
Total other operating adjustments |
|
$ |
(15) |
|
$ |
(4,378) |
|
$ |
616 |
|
$ |
(1,827) |
22. Segment Reporting
As of June 30, 2023, the Company has organized its operations into three geographic regions: Oaxaca, Mexico, Michigan, U.S.A., and Corporate and Other. Oaxaca, Mexico represents the Company’s only production stage property. Michigan, U.S.A. is an advanced exploration stage property. Intercompany revenue and expense amounts have been eliminated within each segment in order to report the net income (loss) on the basis that management uses internally for evaluating segment performance. The Company’s business activities that are not considered production stage or advanced exploration stage properties are included in Corporate and Other.
The following table shows selected information from the Consolidated Balance Sheets relating to the Company’s segments (in thousands):
|
|
Oaxaca, |
|
Michigan, |
|
Corporate |
|
Consolidated |
||||
As of June 30, 2023 |
|
|
|
|
|
|
|
|
|
|
|
|
Total current assets |
|
$ |
34,487 |
|
$ |
150 |
|
$ |
5,325 |
|
$ |
39,962 |
Total non-current assets |
|
|
56,445 |
|
|
92,948 |
|
|
1,717 |
|
|
151,110 |
Total assets |
|
$ |
90,932 |
|
$ |
93,098 |
|
$ |
7,042 |
|
$ |
191,072 |
Total current liabilities |
|
$ |
14,601 |
|
|
2,502 |
|
|
2,012 |
|
$ |
19,115 |
Total non-current liabilities |
|
|
3,446 |
|
|
60,823 |
|
|
987 |
|
|
65,256 |
Total shareholders' equity |
|
|
72,885 |
|
|
29,773 |
|
|
4,043 |
|
|
106,701 |
Total liabilities and shareholders' equity |
|
$ |
90,932 |
|
$ |
93,098 |
|
$ |
7,042 |
|
$ |
191,072 |
|
|
|
|
|
|
|
|
|
|
|
|
|
As of December 31, 2022 |
|
|
|
|
|
|
|
|
|
|
|
|
Total current assets |
|
$ |
38,032 |
|
$ |
272 |
|
$ |
7,795 |
|
$ |
46,099 |
Total non-current assets |
|
|
63,342 |
|
|
92,927 |
|
|
1,803 |
|
|
158,072 |
Total assets |
|
$ |
101,374 |
|
$ |
93,199 |
|
$ |
9,598 |
|
$ |
204,171 |
Total current liabilities |
|
$ |
20,035 |
|
$ |
3,352 |
|
$ |
1,295 |
|
$ |
24,682 |
Total non-current liabilities |
|
|
5,533 |
|
|
60,648 |
|
|
1,544 |
|
|
67,725 |
Total shareholders' equity |
|
|
75,806 |
|
|
29,199 |
|
|
6,759 |
|
|
111,764 |
Total liabilities and shareholders' equity |
|
$ |
101,374 |
|
$ |
93,199 |
|
$ |
9,598 |
|
$ |
204,171 |
Gold Resource Corporation—Condensed Consolidated Interim Financial Statements and Notes (Unaudited) 22 The following table shows selected information from the Consolidated Statements of Operations relating to the Company’s segments (in thousands):
|
|
Oaxaca, |
|
Michigan, |
|
Corporate |
|
Consolidated |
||||
For the three months ended June 30, 2023 |
|
|
|
|
|
|
|
|
|
|
|
|
Sales, net |
|
$ |
24,807 |
|
$ |
- |
|
$ |
- |
|
$ |
24,807 |
Total mine cost of sales, including depreciation |
|
|
26,376 |
|
|
28 |
|
|
572 |
|
|
26,976 |
Exploration expense |
|
|
1,045 |
|
|
395 |
|
|
- |
|
|
1,440 |
Total other costs and expenses, including G&A |
|
|
72 |
|
|
(30) |
|
|
2,806 |
|
|
2,848 |
Provision for income taxes |
|
|
(1,612) |
|
|
(215) |
|
|
(46) |
|
|
(1,873) |
Net loss |
|
$ |
(1,074) |
|
$ |
(178) |
|
$ |
(3,332) |
|
$ |
(4,584) |
|
|
|
|
|
|
|
|
|
|
|
|
|
For the three months ended June 30, 2022 |
|
|
|
|
|
|
|
|
|
|
|
|
Sales, net |
|
$ |
37,064 |
|
$ |
- |
|
$ |
- |
|
$ |
37,064 |
Total mine cost of sales, including depreciation |
|
|
28,995 |
|
|
33 |
|
|
17 |
|
|
29,045 |
Exploration expense |
|
|
810 |
|
|
2,027 |
|
|
- |
|
|
2,837 |
Total other costs and expenses, including G&A |
|
|
(3,568) |
|
|
121 |
|
|
2,175 |
|
|
(1,272) |
Provision for income taxes |
|
|
3,518 |
|
|
- |
|
|
263 |
|
|
3,781 |
Net income (loss) |
|
$ |
7,309 |
|
$ |
(2,181) |
|
$ |
(2,455) |
|
$ |
2,673 |
|
|
|
|
|
|
|
|
|
|
|
|
|
|
|
|
Oaxaca, |
|
Michigan, |
|
Corporate |
|
Consolidated |
||||
For the six months ended June 30, 2023 |
|
|
|
|
|
|
|
|
|
|
|
|
Sales, net |
|
$ |
56,035 |
|
$ |
- |
|
$ |
- |
|
$ |
56,035 |
Total mine cost of sales, including depreciation |
|
|
53,036 |
|
|
42 |
|
|
1,197 |
|
|
54,275 |
Exploration expense |
|
|
2,434 |
|
|
845 |
|
|
- |
|
|
3,279 |
Total other costs and expenses, including G&A |
|
|
703 |
|
|
214 |
|
|
5,190 |
|
|
6,107 |
Provision for income taxes |
|
|
(1,562) |
|
|
(437) |
|
|
(8) |
|
|
(2,007) |
Net income (loss) |
|
$ |
1,424 |
|
$ |
(664) |
|
$ |
(6,379) |
|
$ |
(5,619) |
|
|
|
|
|
|
|
|
|
|
|
|
|
For the six months ended June 30, 2022 |
|
|
|
|
|
|
|
|
|
|
|
|
Sales, net |
|
$ |
82,481 |
|
$ |
- |
|
$ |
- |
|
$ |
82,481 |
Total mine cost of sales, including depreciation |
|
|
55,089 |
|
|
33 |
|
|
17 |
|
|
55,139 |
Exploration expense |
|
|
2,047 |
|
|
3,095 |
|
|
- |
|
|
5,142 |
Total other costs and expenses, including G&A |
|
|
1,124 |
|
|
438 |
|
|
4,814 |
|
|
6,376 |
Provision for income taxes |
|
|
8,869 |
|
|
- |
|
|
263 |
|
|
9,132 |
Net income (loss) |
|
$ |
15,352 |
|
$ |
(3,566) |
|
$ |
(5,094) |
|
$ |
6,692 |
|
|
|
|
|
|
|
|
|
|
|
|
|
Gold Resource Corporation—Condensed Consolidated Interim Financial Statements and Notes (Unaudited) 23 ITEM 2.
Management’s Discussion and Analysis of Financial Condition and Results of Operations
The following discussion summarizes the results of operations of Gold Resource Corporation and its subsidiaries (“we”, “our,” “us,” or the “Company”) for the three and six months ended June 30, 2023 and compares those results with the three and six months ended June 30, 2022. It also analyzes the Company’s financial condition as of June 30, 2023 and compares it to the financial condition as of December 31, 2022. This discussion should be read in conjunction with management’s discussion and analysis and the audited consolidated financial statements and footnotes contained in the 2022 Annual Report.
The discussion also presents certain non-GAAP financial measures that are important to management in its evaluation of our operating results, and which are used by management to compare our performance with what we perceive to be peer group mining companies and are relied on as part of management’s decision-making process. Management believes these measures may also be important to investors in evaluating our performance. For a detailed description of each of the non-GAAP financial measures and a reconciliation to GAAP financial measures, please see the discussion below under “Non-GAAP Measures.” Also see Forward-Looking Statements at the end of this Item 2 for important information regarding statements contained herein.
Overview
Gold Resource Corporation is a mining company that pursues gold, silver, and other metal projects that are expected to achieve both low operating costs and high returns on capital. The Don David Gold Mine is our cornerstone asset comprised of six properties. The Company’s focus is to unlock the significant upside potential of this asset through optimization of the current operations, growing the existing resource, and identifying new opportunities near existing infrastructure. The primary mineral production is coming from the Arista underground mine. This mine supplies ore to our processing facilities to produce gold and silver doré and copper, lead, and zinc concentrates which also contain gold and silver.
The Back Forty Project, when developed, is expected to produce gold and silver doré and copper and zinc concentrates bearing gold and silver. Optimization work related to metallurgy and the economic models progressed during the second quarter of 2023. Once the optimization work is completed, the Board will evaluate the current economic climate and make a decision on how to proceed with the Back Forty Mine.
|
Field safety inspection underground |
DDGM’s continued pursuit for excellence in safety is paying great rewards. Our most valuable assets, our people, have increased their participation with leading indicators. This leadership role undertaken by everyone, is translating into no Lost Time Incidents, many closed action plans, and a sense of empowerment that reaches out beyond the mine into our neighboring communities. The same discipline applied to safety, is also becoming part of the operation’s daily planning and execution. DDGM has implemented several initiatives during the first half of the year, resulting in cost savings and improved efficiencies, such as improved blasting techniques, drilling patterns, ramp maintenance, and overall housekeeping. These initiatives have partially offset the increased costs due to the strengthening Mexican peso. Ground support challenges continue; however, these challenges are being embraced as opportunities. For example, a fault in one of the stopes being mined during the second quarter forced the team to act on the side of safety, rehabilitate the area and redirect mine production to the lower levels of the mine. The result was far more favorable base |
Gold Resource Corporation—Management’s Discussion and Analysis of Financial Condition and Results of Operations 24 The processing plant had to respond to higher power costs due to both the power rate increase and the strengthening Mexican peso.
metal grades, especially for zinc; however precious metal prices were lower than planned. |
One opportunity was identified, and we implemented the testing of a new reagent mixture in the copper concentrate. It improved the liberation of lead, thus improving the quality of the copper.
Lastly, the operations team has now moved mainly into long hole stoping for the remaining part of the year. This mining methodology not only accelerates productivity, but it also maintains lower costs compared to the cut and fill mining methodology utilized year to date. We are confident the operations are making the necessary improvements needed to deliver on our annual production guidance.
2023 DDGM Exploration Updates
Our portfolio of properties that make up the Don David Gold Mine are located along a 55-kilometer trend of the San Jose structural corridor in the Sierra Madre Sur mountain range. This structural corridor trends north 70 degrees west and spans three historic mining districts within the state of Oaxaca. Surface exploration activity continues on several properties with a goal of defining additional priority drill targets, demonstrating our commitment to long-term investment in Oaxaca, Mexico.
Underground exploration drilling continued during the second quarter of 2023, where access is available, from various locations within the Arista mine: (1) to continue testing of the Three Sisters vein system, as well as other new vein targets, such as the recently identified Gloria vain system and (2) to further define and expand the Mineral Reserves and Mineral Resources of the current vein systems in production.
During the second quarter of 2023, we completed 8 exploration drill holes (4,425 meters) and 37 infill drill holes (5,700 meters).
| ● | Exploration drilling in the second quarter of 2023 continued testing the northwest extension of the Switchback system at depth and along strike where we have confirmed the continuation of the system. Drilling also continued exploration of the Three Sisters vein system in conjunction with the newly discovered Gloria vein system, located immediately west of Three Sisters. The Switchback system extends for over a kilometer along a NW-SE strike and continues to remain open in both directions along strike as well as up- and down-dip. The Three Sisters and Gloria vein systems also remain open at depth and along strike. Exploration drilling in 2023 will continue to focus on these structures as well as the down-dip extensions of the Soledad South vein (Switchback) and Marena zone (Arista). |
| ● | Infill drilling in the second quarter of 2023 continued to focus on both the Arista and Switchback vein systems, defining mineralization along strike and down-dip of existing workings. Infill drilling continues to confirm zones of high-grade mineralization within the resource model as well as additional mineralized structures outside existing models, including, the Marena zone (Arista), and the Soledad South and Susana North veins (Switchback). |
|
Gold Resource Corporation—Management’s Discussion and Analysis of Financial Condition and Results of Operations 25 Regional exploration activities continued during the second quarter of 2023 with the evaluation and prioritization of advanced stage projects located along the 55-kilometer trend of the San Jose structural corridor (i.e.
Hole No. 523058: Gloria vein zone (458.30 – 469.35 m; 11.05 m) |
Alta Gracia, Margaritas, Chamizo, El Rey, and Jabali projects) where the Don David Gold Mine controls a total of 55.1 square kilometers of concession holdings. Other prospects near the Arista mine are also being re-evaluated for additional near-term potential with a goal of defining additional priority drill targets. Below is the regional geologic map and outline of the DDGM concession holdings showing the advanced stage project locations.
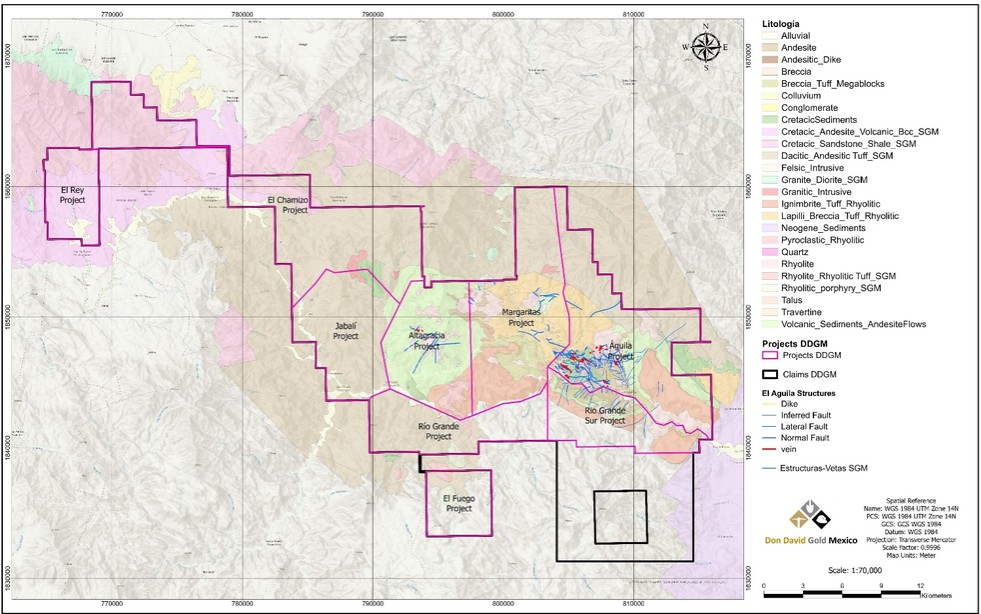
Regional Geologic Map Showing Advanced Stage Exploration Project Locations
Gold Resource Corporation—Management’s Discussion and Analysis of Financial Condition and Results of Operations 26 Mine activities during the second quarter of 2023 included development and ore extraction from the Arista mine.
Results of Operations
Don David Gold Mine
The following table summarizes certain production statistics about our Don David Gold Mine for the periods indicated:
|
|
For the three months ended June 30, |
|
For the six months ended June 30, |
||||||||
|
|
2023 |
|
2022 |
|
2023 |
|
2022 |
||||
Arista Mine |
|
|
|
|
|
|
|
|
|
|
|
|
Milled |
|
|
|
|
|
|
|
|
|
|
|
|
Tonnes Milled |
|
|
113,510 |
|
|
128,884 |
|
|
230,231 |
|
|
264,685 |
Grade |
|
|
|
|
|
|
|
|
|
|
|
|
Average Gold Grade (g/t) |
|
|
1.59 |
|
|
2.63 |
|
|
1.97 |
|
|
2.82 |
Average Silver Grade (g/t) |
|
|
86 |
|
|
64 |
|
|
90 |
|
|
73 |
Average Copper Grade (%) |
|
|
0.37 |
|
|
0.32 |
|
|
0.37 |
|
|
0.37 |
Average Lead Grade (%) |
|
|
1.64 |
|
|
1.99 |
|
|
1.69 |
|
|
1.98 |
Average Zinc Grade (%) |
|
|
3.72 |
|
|
4.00 |
|
|
3.80 |
|
|
4.46 |
Recoveries |
|
|
|
|
|
|
|
|
|
|
|
|
Average Gold Recovery (%) |
|
|
79.7 |
|
|
85.1 |
|
|
80.4 |
|
|
84.7 |
Average Silver Recovery (%) |
|
|
91.9 |
|
|
93.2 |
|
|
91.5 |
|
|
93.3 |
Average Copper Recovery (%) |
|
|
79.1 |
|
|
72.7 |
|
|
78.1 |
|
|
75.9 |
Average Lead Recovery (%) |
|
|
74.6 |
|
|
78.6 |
|
|
75.9 |
|
|
78.1 |
Average Zinc Recovery (%) |
|
|
84.6 |
|
|
83.1 |
|
|
84.6 |
|
|
83.5 |
Combined |
|
|
|
|
|
|
|
|
|
|
|
|
Tonnes Milled (1) |
|
|
113,510 |
|
|
129,099 |
|
|
231,291 |
|
|
265,943 |
Tonnes Milled per Day (2) |
|
|
1,395 |
|
|
1,516 |
|
|
1,408 |
|
|
1,553 |
Metal production (3) |
|
|
|
|
|
|
|
|
|
|
|
|
Gold (ozs.) |
|
|
4,637 |
|
|
9,317 |
|
|
11,808 |
|
|
20,504 |
Silver (ozs.) |
|
|
289,816 |
|
|
249,088 |
|
|
612,492 |
|
|
581,380 |
Copper (tonnes) |
|
|
334 |
|
|
303 |
|
|
670 |
|
|
734 |
Lead (tonnes) |
|
|
1,389 |
|
|
2,020 |
|
|
2,948 |
|
|
4,093 |
Zinc (tonnes) |
|
|
3,569 |
|
|
4,282 |
|
|
7,406 |
|
|
9,844 |
Metal produced and sold (3) |
|
|
|
|
|
|
|
|
|
|
|
|
Gold (ozs.) |
|
|
4,287 |
|
|
8,746 |
|
|
10,795 |
|
|
17,127 |
Silver (ozs.) |
|
|
274,257 |
|
|
231,622 |
|
|
569,072 |
|
|
497,029 |
Copper (tonnes) |
|
|
327 |
|
|
286 |
|
|
659 |
|
|
694 |
Lead (tonnes) |
|
|
1,317 |
|
|
1,755 |
|
|
2,734 |
|
|
3,394 |
Zinc (tonnes) |
|
|
3,141 |
|
|
3,590 |
|
|
6,201 |
|
|
7,949 |
Percentage payable metal (3) |
|
|
|
|
|
|
|
|
|
|
|
|
Gold (%) |
|
|
92 |
|
|
94 |
|
|
91 |
|
|
84 |
Silver (%) |
|
|
95 |
|
|
93 |
|
|
93 |
|
|
85 |
Copper (%) |
|
|
98 |
|
|
94 |
|
|
98 |
|
|
95 |
Lead (%) |
|
|
95 |
|
|
87 |
|
|
93 |
|
|
83 |
Zinc (%) |
|
|
88 |
|
|
84 |
|
|
84 |
|
|
81 |
| (1) | During the six months ended June 30, 2023 and 2022, tonnes milled includes 1,060 and 1,258 purchased tonnes, respectively, related to a collaborative initiative with a local community to ensure the proper environmental treatment and storage of the material. |
| (2) | Based on actual days the mill operated during the period. |
| (3) | The difference between what we report as "ounces/tonnes produced" and "payable ounces/tonnes sold" is attributable to the difference between the quantities of metals contained in the concentrates we produce versus the portion of those metals actually paid for according to the terms of our sales contracts. Differences can also arise from inventory changes incidental to shipping schedules, or variances in ore grades and recoveries, which impact the amounts of metals contained in concentrates produced and sold. |
Gold Resource Corporation—Management’s Discussion and Analysis of Financial Condition and Results of Operations 27 During the three months ended June 30, 2023, total tonnes milled of 113,510 were 12% lower than for the same period in 2022.
Second quarter 2023 compared to second quarter 2022
Production
Metal production for gold, lead, and zinc decreased by 50%, 31%, and 17%, respectively, during the three months ended June 30, 2023 as compared to the same period last year as a result of the lower tonnes processed and lower metal grades as expected and in line with the 2023 mine plan. Metal production for silver and copper increased by 16% and 10%, respectively, during the three months ended June 30, 2023 as compared to the same period last year due to higher metal grades for silver and copper.
Grades & Recoveries
During the three months ended June 30, 2023, all of the ore processed came from the Arista underground mine with an average gold grade of 1.59 g/t and silver grade of 86 g/t, compared to 2.63 g/t and 64 g/t, respectively, for the same period in 2022. The average gold grade was 40% lower and silver grade 34% higher. As shown in the Technical Report Summary for DDGM incorporated by reference in the 2022 Annual Report (the “Technical Report Summary”), grades are expected to decline in 2023 in line with the life of mine average shown in the estimates of mineral reserves (as defined subpart 1300 of Regulation S-K, “Mineral Reserve”) and mineral resources (as defined subpart 1300 of Regulation S-K, “Mineral Resource”) tables contained therein (the “Mineral Reserve and Mineral Resource Tables”). As grades decline, recoveries are expected to decline as well. Our base metals average grades during the three months ended June 30, 2023 were 0.37% for copper, 1.64% for lead, and 3.72% for zinc. While copper grades were 16% higher, lead and zinc grades were 18% and 7% lower, respectively, than in the same period in 2022.
Gold and silver recoveries for the three months ended June 30, 2023 were 79.7% and 91.9%, respectively, reflecting a 6% decrease for gold and a 1% decrease for silver over the same period in 2022. We have encountered different mineralization containing not only high-grade metals, but a portion of the production areas are in zones of high quartz mineralization. Some of the gold is encapsulated in the quartz and is lost due to the fact it cannot be recovered in the flotation circuit. Copper, lead, and zinc recoveries for the three months ended June 30, 2023 were 79.1%, 74.6%, and 84.6%, respectively. While recoveries for copper and zinc for the three months ended June 30, 2023 increased by 9% and 2%, respectively, recoveries for lead decreased by 5%, compared to the same period in 2022. As shown in the Technical Report Summary incorporated by reference in the 2022 Annual Report, future recoveries and grades are expected to be in line with the life of mine average shown in the Mineral Reserve and Mineral Resource Tables.
Year-to-date 2023 compared to year-to-date 2022
Production
During the six months ended June 30, 2023, total tonnes milled of 230,231 were 13% lower than for the same period in 2022. Metal production for gold, copper, lead, and zinc decreased by 42%, 9%, 28%, and 25%, respectively, during the six months ended June 30, 2023 as compared to the same period last year as a result of the lower tonnes processed and lower metal grades as expected and in line with the 2023 mine plan. Metal production for silver increased by 5% during the six months ended June 30, 2023 as compared to the same period last year due to higher silver grades.
Grades & Recoveries
During the six months ended June 30, 2023, the majority of ore processed came from the Arista underground mine with an average gold grade of 1.97 g/t and silver grade of 90 g/t, compared to 2.82 g/t and 73 g/t, respectively, for the same period in 2022. The average gold grade was 30% lower, and silver grade was 23% higher. As shown in the Technical Report Summary incorporated by reference in the 2022 Annual Report, grades are expected to decline in 2023 in line with the life of mine average shown in the Mineral Reserve and Mineral Resource Tables. As grades decline, recoveries are expected to decline as well. Our base metals average grades during the six months ended June 30, 2023 were 0.37% copper, 1.69% lead,
Gold Resource Corporation—Management’s Discussion and Analysis of Financial Condition and Results of Operations 28 and 3.80% zinc.
While copper grade was the same, lead and zinc grades were both 15% lower than in the same period in 2022.
Gold and silver recoveries for the six months ended June 30, 2023 were 80.4% and 91.5%, respectively, reflecting a 5% decrease for gold and a 2% decrease for silver over the same period in 2022. We have encountered different mineralization containing not only high-grade metals, but a portion of the production areas are in zones of high quartz mineralization. Quartz has an adverse effect on the floatation while encapsulating some of the gold. Copper, lead, and zinc recoveries for the six months ended June 30, 2023 were 78.1%, 75.9%, and 84.6%, respectively. While recoveries for copper and zinc for the six months ended June 30, 2023 increased by 3% and 1%, respectively, recoveries for lead decreased by 3% compared to the same period in 2022. As shown in the Technical Report Summary incorporated by reference in the 2022 Annual Report, future recoveries and grades are expected to be in line with the life of mine average shown in the Mineral Reserve and Mineral Resource Tables.
Sales Statistics
The following table summarizes certain sales statistics about the Don David Gold Mine operations for the periods indicated:
|
|
For the three months ended June 30, |
|
For the six months ended June 30, |
||||||||
|
|
2023 |
|
2022 |
|
2023 |
|
2022 |
||||
Net sales |
|
|
|
|
|
|
|
|
|
|
|
|
Gold |
|
$ |
8,492 |
|
$ |
16,334 |
|
$ |
20,839 |
|
$ |
32,119 |
Silver |
|
|
6,641 |
|
|
5,203 |
|
|
13,283 |
|
|
11,308 |
Copper |
|
|
2,749 |
|
|
2,708 |
|
|
5,743 |
|
|
6,805 |
Lead |
|
|
2,782 |
|
|
3,768 |
|
|
5,747 |
|
|
7,595 |
Zinc |
|
|
7,928 |
|
|
14,352 |
|
|
17,479 |
|
|
30,669 |
Less: Treatment and refining charges |
|
|
(3,328) |
|
|
(3,137) |
|
|
(6,512) |
|
|
(5,885) |
Realized and unrealized (loss) gain - embedded derivative, net |
|
|
(457) |
|
|
(2,164) |
|
|
(544) |
|
|
(130) |
Total sales, net |
|
$ |
24,807 |
|
$ |
37,064 |
|
$ |
56,035 |
|
$ |
82,481 |
Metal produced and sold |
|
|
|
|
|
|
|
|
|
|
|
|
Gold (ozs.) |
|
|
4,287 |
|
|
8,746 |
|
|
10,795 |
|
|
17,127 |
Silver (ozs.) |
|
|
274,257 |
|
|
231,622 |
|
|
569,072 |
|
|
497,029 |
Copper (tonnes) |
|
|
327 |
|
|
286 |
|
|
659 |
|
|
694 |
Lead (tonnes) |
|
|
1,317 |
|
|
1,755 |
|
|
2,734 |
|
|
3,394 |
Zinc (tonnes) |
|
|
3,141 |
|
|
3,590 |
|
|
6,201 |
|
|
7,949 |
Average metal prices realized (1) |
|
|
|
|
|
|
|
|
|
|
|
|
Gold ($ per oz.) |
|
$ |
2,010 |
|
$ |
1,874 |
|
$ |
1,953 |
|
$ |
1,886 |
Silver ($ per oz.) |
|
$ |
24.93 |
|
$ |
22.05 |
|
$ |
23.95 |
|
$ |
23.06 |
Copper ($ per tonne) |
|
$ |
8,397 |
|
$ |
9,275 |
|
$ |
8,788 |
|
$ |
9,786 |
Lead ($ per tonne) |
|
$ |
2,153 |
|
$ |
2,168 |
|
$ |
2,156 |
|
$ |
2,254 |
Zinc ($ per tonne) |
|
$ |
2,485 |
|
$ |
4,338 |
|
$ |
2,835 |
|
$ |
4,066 |
Gold equivalent ounces sold |
|
|
|
|
|
|
|
|
|
|
|
|
Gold Ounces |
|
|
4,287 |
|
|
8,746 |
|
|
10,795 |
|
|
17,127 |
Gold Equivalent Ounces from Silver |
|
|
3,402 |
|
|
2,729 |
|
|
6,979 |
|
|
6,077 |
Total AuEq oz |
|
|
7,689 |
|
|
11,475 |
|
|
17,774 |
|
|
23,204 |
| (1) | Average metal prices realized vary from the market metal prices due to final settlement adjustments from our provisional invoices when they are settled. Our average metal prices realized will therefore differ from the average market metal prices in most cases. |
Gold Resource Corporation—Management’s Discussion and Analysis of Financial Condition and Results of Operations 29 Key drivers in the production and financial results for the second quarter of 2023, as compared to the second quarter of 2022, relate to the lower tonnes mined and changes in metal grades.
Second quarter 2023 compared to second quarter 2022
These results align with the 2023 mine plan and were considered in the 2023 guidance disclosed in the 2022 Annual Report. Financial results have also been impacted unfavorably by the strengthening Mexican peso and the lower zinc price realized in 2023.
Metal Sold
During the three months ended June 30, 2023, gold sales of 4,287 ounces, lead sales of 1,317 tonnes, and zinc sales of 3,141 tonnes decreased by 51%, 25%, and 13%, respectively, as compared to the same period in 2022. Silver and copper sales of 274,257 ounces and 327 tonnes, respectively, increased by 18% and 14% during the three months ended June 30, 2023 compared to the same period in 2022.
Average metal prices realized
During the three months ended June 30, 2023, the average metal prices were $2,010 per ounce for gold, $24.93 per ounce for silver, $8,397 per tonne for copper, $2,153 per tonne for lead, and $2,485 per tonne for zinc. Compared to the same period in 2022, the average metal price for gold and silver increased by 7% and 13%, respectively, while the average metal price for copper, lead, and zinc decreased by 9%, 1%, and 43%, respectively.
Year-to-date 2023 compared to year-to-date 2022
Key drivers in the production and financial results for the six months ended June 30, 2023, as compared to the same period in 2022, relate to the lower tonnes mined and changes in metal grades. These results align with the 2023 mine plan and were considered in the 2023 guidance disclosed in the 2022 Annual Report. Financial results have also been impacted unfavorably by the strengthening Mexican peso and the lower zinc price realized in 2023.
Metal Sold
During the six months ended June 30, 2023, gold sales of 10,795 ounces, copper sales of 659 tonnes, lead sales of 2,734 tonnes, and zinc sales of 6,201 tonnes decreased by 37%, 5%, 19%, and 22%, respectively, as compared to the same period in 2022. Silver sales of 569,072 ounces increased by 14% during the six months ended June 30, 2023 compared to the same period in 2022.
Average metal prices realized
During the six months ended June 30, 2023, the average metal prices were $1,953 per ounce for gold, $23.95 per ounce for silver, $8,788 per tonne for copper, $2,156 per tonne for lead, and $2,835 per tonne for zinc. Compared to the same period in 2022, the average metal price for both gold and silver increased by 4%, while the average metal price for copper, lead, and zinc decreased by 10%, 4%, and 30%, respectively.
Gold Resource Corporation—Management’s Discussion and Analysis of Financial Condition and Results of Operations 30 Gold Resource Corporation—Management’s Discussion and Analysis of Financial Condition and Results of Operations 31
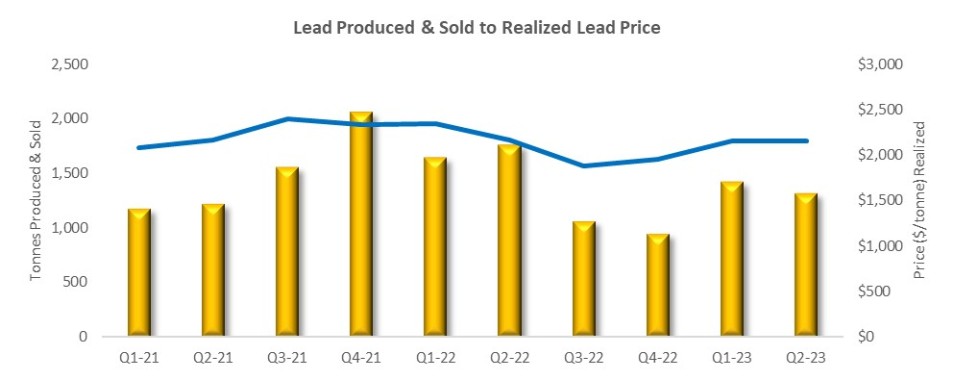
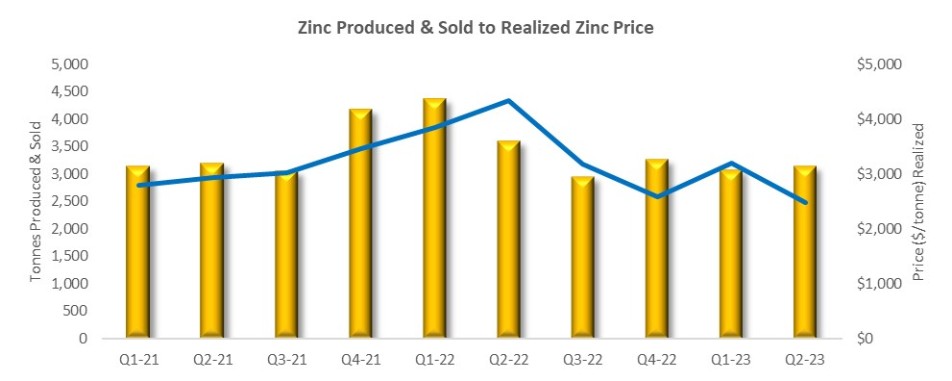
Gold Resource Corporation—Management’s Discussion and Analysis of Financial Condition and Results of Operations 32 The following table summarizes certain financial data of the Company for the periods indicated:
Financial Measures
|
|
For the three months ended June 30, |
|
For the six months ended June 30, |
|||||||||||
|
|
2023 |
|
2022 |
|
2023 |
|
2022 |
|||||||
|
|
(in thousands) |
|
(in thousands) |
|||||||||||
Doré and concentrate sales |
|
$ |
28,592 |
|
$ |
42,365 |
|
$ |
63,091 |
|
$ |
88,496 |
|||
Less: Treatment and refining charges |
|
|
(3,328) |
|
|
(3,137) |
|
|
(6,512) |
|
|
(5,885) |
|||
Realized/unrealized derivatives, net |
|
|
(457) |
|
|
(2,164) |
|
|
(544) |
|
|
(130) |
|||
Sales, net |
|
|
24,807 |
|
|
37,064 |
|
|
56,035 |
|
|
82,481 |
|||
Total cost of sales |
|
|
26,976 |
|
|
29,045 |
|
|
54,275 |
|
|
55,139 |
|||
Mine gross (loss) profit |
|
|
(2,169) |
|
|
8,019 |
|
|
1,760 |
|
|
27,342 |
|||
Other costs and expenses, including tax: |
|
|
2,415 |
|
|
5,346 |
|
|
7,379 |
|
|
20,650 |
|||
Net (loss) income |
|
$ |
(4,584) |
|
$ |
2,673 |
|
$ |
(5,619) |
|
$ |
6,692 |
|||
|
|
|
|
|
|
|
|
|
|
|
|
|
|||
Other Non-GAAP Financial Measures: |
|
|
|
|
|
|
|
|
|
|
|
|
|||
Total cash cost after co-product credits per AuEq oz sold (1) |
|
$ |
1,333 |
|
$ |
247 |
|
$ |
979 |
|
$ |
61 |
|||
Total consolidated all-in sustaining cost after co-product credits per AuEq oz sold (1) |
|
$ |
1,990 |
|
$ |
805 |
|
$ |
1,551 |
|
$ |
653 |
|||
Total all-in cost after co-product credits per AuEq oz sold (1) |
|
$ |
2,196 |
|
$ |
1,099 |
|
$ |
1,744 |
|
$ |
956 |
|||
| (1) | For a detailed description of each of the non-GAAP financial measures and a reconciliation to GAAP financial measures, please see the discussion below under “Non-GAAP Measures”. |
Second quarter 2023 compared to second quarter 2022
Sales, net
Net sales of $24.8 million for DDGM for the three months ended June 30, 2023 decreased by $12.3 million, or 33%, compared to the same period in 2022. The decrease in 2023 net sales is the result of decreased sales volumes and lower realized metal prices for copper, lead, and zinc outlined in the sales statistics table above. Additionally, treatment and refining charges during the three months ended June 30, 2023 increased by 6% as a result of an increase in the zinc treatment charge benchmark and spot price.
Total cost of sales
Total cost of sales of $27.0 million for the three months ended June 30, 2023 decreased by 7% from $29.0 million for the same period in 2022. The $2.0 million decrease was primarily related to a $1.4 million decrease in production cost and $0.8 million decrease in depreciation expense. Production costs of $20.3 million for the three months ended June 30, 2023 are 6% lower than the production costs of $21.7 million for the same period in 2022. The decrease is directly related to a 12% decrease in ore tonnes processed. Although cost of sales and production costs were lower during the second quarter of 2023 compared to the same period in 2023, cost of sales as a percentage of revenue was 30% higher because the increased power rates and the strengthening of the peso negatively impacted production costs.
Mine gross (loss) profit
For the three months ended June 30, 2023, the Company had a mine gross loss of $2.2 million. Mine gross profit decreased $10.2 million, or 127%, compared to the same period in 2022. The decrease was primarily due to a $12.3 million, or 33%, decrease in net sales, offset by a $1.4 million, or 7%, decrease in production costs and a $0.8 million, or 11%, decrease in depreciation and amortization expenses.
The relationship between sales and the cost of sales, and therefore mine gross profit, is not perfectly correlated to the tonnes of ore processed. While both sales and the cost of sales are impacted by the tonnes of ore processed, other factors,
Gold Resource Corporation—Management’s Discussion and Analysis of Financial Condition and Results of Operations 33 such as the grade of ore processed, metal commodity prices, and operating costs have a significant impact on mine gross profit.
For example, in the second quarter of 2023, the tonnes of ore processed decreased 12% and total cost of sales only decreased by 7% compared to the second quarter of 2022 due to a 6% higher cost per tonne processed; however, sales decreased by 33% due to a decrease in ore tonnes processed and a decrease in grade of ore tonnes processed. The decrease in sales is explained by the decrease in tonnes and grades during the second quarter of 2023, and the increase in operating costs is primarily explained by the increase in unit operating costs discussed above.
We expect grades to vary from period to period based on the annual mine plan. The gold grades are expected to trend downwards over time toward the average grade of 1.14 g/t (and exclusive of silver, copper, lead, and zinc contained grades), reflected in our mineral reserve estimate. However, as mine development progresses and infill drilling occurs, opportunities to refine mining methods and reduce dilution may have a favorable impact on future mined grades.
Net (loss) income
For the three months ended June 30, 2023, we recorded a net loss of $4.6 million, as compared to net income of $2.7 million during the same period in 2022. The $7.3 million decrease in net income is mainly attributable to the lower mine gross profit discussed above.
Year-to-date 2023 compared to year-to-date 2022
Sales, net
Net sales of $56.0 million for DDGM for the six months ended June 30, 2023 decreased by $16.4 million, or 32%, compared to the same period in 2022. The decrease in 2023 sales is the result of decreased sales volumes outlined in the sales statistics table above. Additionally, treatment and refining charges during the six months ended June 30, 2023 increased by 11% as a result of an increase in the zinc treatment charge benchmark and spot price.
Total cost of sales
Total cost of sales decreased by 2% to $54.3 million for the six months ended June 30, 2023 from $55.1 million for the same period in 2022. The $0.9 million decrease was primarily related to a $1.6 million decrease in production cost offset by a $0.5 million increase in depreciation expense. Production costs of $40.2 million for the six months ended June 30, 2023 are 4% lower than the production costs of $41.8 million for the same period in 2022. The decrease is directly related to a 13% decrease in ore tonnes processed. Although cost of sales and production costs were lower during the six months ended June 30, 2023 compared to the same period in 2022, cost of sales as a percentage of revenue was 30% higher because the increased power rates and the strengthening of the peso negatively impacted production costs.
Mine gross (loss) profit
For the six months ended June 30, 2023, mine gross profit decreased $25.6 million, or 94%, compared to the same period in 2022. The decrease was primarily due to a $26.4 million, or 32%, decrease in net sales and a $0.5 million, or 4%, increase in depreciation and amortization expenses.
The relationship between sales and the cost of sales, and therefore mine gross profit, is not perfectly correlated to the tonnes of ore processed. While both sales and the cost of sales are impacted by the tonnes of ore processed, other factors, such as the grade of ore processed, metal commodity prices, and operating costs have a significant impact on mine gross profit. For example, for the six months ended June 30, 2023, the volume of ore processed decreased 13% and total cost of sales decreased by 2% compared to the same period in 2022 due to a 13% higher cost per tonne processed; however, sales decreased by 32% due to a decrease in ore tonnes processed and a decrease in grade of ore tonnes processed. The decrease in sales is explained by the decrease in volumes and grades during the second quarter of 2023, and the increase in operating costs is primarily explained by the increase in depreciation and increase in unit operating costs discussed above.
Gold Resource Corporation—Management’s Discussion and Analysis of Financial Condition and Results of Operations 34 We expect grades to vary from period to period based on the annual mine plan.
The gold grades are expected to trend downwards over time toward the average grade of 1.14 g/t (and exclusive of silver, copper, lead, and zinc contained grades), reflected in our mineral reserve estimate. However, as capital intensive mine development progresses and infill drilling occurs, opportunities to refine mining methods and eliminate dilution may have a favorable impact on future mined grades.
Net (loss) income
For the six months ended June 30, 2023, we recorded a net loss of $5.6 million, as compared to net income of $6.7 million during the same period in 2022. The $12.3 million decrease in net income is mainly attributable to the mine gross loss discussed above.
Other Costs and Expenses, Including Taxes
|
|
For the three months ended June 30, |
|
For the six months ended June 30, |
|
|||||||||||
|
|
2023 |
|
2022 |
|
2023 |
|
2022 |
|
|||||||
|
|
(in thousands) |
|
(in thousands) |
|
|||||||||||
Other costs and expenses: |
|
|
|
|
|
|
|
|
|
|
|
|
|
|||
General and administrative expenses |
|
$ |
2,130 |
|
$ |
1,920 |
|
$ |
3,323 |
|
$ |
3,819 |
|
|||
Mexico exploration expenses |
|
|
1,045 |
|
|
810 |
|
|
2,434 |
|
|
2,047 |
|
|||
Michigan Back Forty Project expenses |
|
|
395 |
|
|
2,027 |
|
|
845 |
|
|
3,095 |
|
|||
Stock-based compensation |
|
|
7 |
|
|
393 |
|
|
604 |
|
|
1,167 |
|
|||
Realized and unrealized (gain) loss on zinc zero cost collar |
|
|
- |
|
|
(3,799) |
|
|
- |
|
|
338 |
|
|||
Other expense, net |
|
|
711 |
|
|
214 |
|
|
2,180 |
|
|
1,052 |
|
|||
Total other costs and expenses |
|
|
4,288 |
|
|
1,565 |
|
|
9,386 |
|
|
11,518 |
|
|||
(Benefit) provision for income taxes |
|
|
(1,873) |
|
|
3,781 |
|
|
(2,007) |
|
|
9,132 |
|
|||
Total other costs, including taxes |
|
$ |
2,415 |
|
$ |
5,346 |
|
$ |
7,379 |
|
$ |
20,650 |
|
|||
Second quarter 2023 compared to second quarter 2022
General and administrative expenses: For the three months ended June 30, 2023 and 2022, general and administrative expenses were $2.1 million and $1.9 million, respectively, representing a 11% increase primarily due to the allocation of $0.6 million corporate personnel costs for management and technical services specifically related to DDGM from general and administrative expenses to production costs for the Mexican operations.
DDGM Exploration expenses: For the three months ended June 30, 2023, exploration expenses in DDGM totaled $1.0 million, compared to $0.8 million for the same period in 2022. Exploration activities in Oaxaca, Mexico increased compared to the same period in 2022 primarily due to increased exploration drilling activity and increased contract drilling rates in 2023.
Back Forty Project expenses: For the three months ended June 30, 2023, costs for the optimization work totaled $0.4 million, compared to $2.0 million for the same period in 2022. The 80% decrease is due to nearing completion of the optimization work and utilizing third parties only on a limited basis until after the completion of the capital cost analysis for the project.
Stock-based compensation: Stock-based compensation decreased by $0.4 million for the three months ended June 30, 2023 compared to the same period in 2022. This decrease is mainly due to the downward mark-to-market adjustment in the liability classified equity awarded, due to a decrease in share price.
Realized and unrealized loss on zinc zero cost collar: As of December 31, 2022, the Company’s hedge program concluded, therefore no gains or losses were recorded in 2023. For the three months ended June 30, 2022, $3.8 million gain was recorded related to the zinc zero cost collar, consisting of a realized loss of $0.8 million and an unrealized gain of $4.6 million.
Gold Resource Corporation—Management’s Discussion and Analysis of Financial Condition and Results of Operations 35 Other expense, net: For the three months ended June 30, 2023, $0.7 million of other expense was recorded compared to $0.2 million other expense during the same period of 2022.
The $0.5 million increase primarily is the result of the $0.3 million severance expense due to the reduction of workforce and changes in the leadership team at DDGM in Mexico. Please see Note 18 - Other expense, net in Item 1—Condensed Consolidated Interim Financial Statements and Notes (unaudited) for a detailed breakdown.
Provision for income taxes: For the three months ended June 30, 2023, income tax benefit was $1.9 million, compared to $3.8 million income tax expense for the same period in 2022. The decrease in income tax expense for the three months ended June 30, 2023 is driven by the decrease in the three-month net income before income taxes.
Year-to-date 2023 compared to year-to-date 2022
General and administrative expenses: For the six months ended June 30, 2023 and 2022, general and administrative expenses were $3.3 million and $3.8 million, respectively, representing a 13% decrease from the same period of 2022 primarily due to the impact of increased audit fees and consulting services in the second quarter of 2022, related to finalizing the Aquila acquisition and the allocation of $1.2 million corporate personnel costs for management and technical services specifically related to DDGM from general and administrative expenses to production costs for the Mexican operations.
DDGM Exploration expenses: For the six months ended June 30, 2023, exploration expenses in DDGM totaled $2.4 million, compared to $2.0 million for the same period in 2022. Exploration activities in Oaxaca, Mexico increased compared to the same period in 2022 primarily due to increased drilling activity and increased contract drilling rates in 2023.
Back Forty Project expenses: For the six months ended June 30, 2023, costs for the optimization work totaled $0.8 million, compared to $3.1 million for the same period in 2022. The 74% decrease is due to nearing completion of the optimization work and utilizing third parties only on a limited basis until after the completion of the capital cost analysis for the project.
Stock-based compensation: Stock-based compensation decreased by $0.6 million for the six months ended June 30, 2023 compared to the same period in 2022. This decrease is mainly due to the downward mark-to-market adjustment in the liability classified equity awarded, due to a decrease in share price.
Realized and unrealized loss on zinc zero cost collar: As of December 31, 2022, the Company’s hedge program concluded, therefore no gains or losses were recorded in 2023. For the six months ended June 30, 2022, $0.3 million loss was recorded related to the zinc zero cost collar. The year-to-date loss of $0.3 million is the result of the year-to-date realized loss of $2.4 million offset by the $2.1 million unrealized gain related to the zero cost collars that will mature July through December 2022.
Other expense, net: For the six months ended June 30, 2023, $2.2 million of other expense was recorded compared to $1.1 million other expense during the same period of 2022. The $1.1 million increase primarily is the result of the $0.9 million severance expense due to the reduction of workforce and change in the leadership team at DDGM in Mexico. Please see Note 18 - Other expense, net in Item 1—Condensed Consolidated Interim Financial Statements and Notes (unaudited) above for a detailed breakdown.
Provision for income taxes: For the six months ended June 30, 2023, income tax benefit was $2.0 million, compared to $9.1 million income tax expense for the same period in 2022. The decrease in income tax expense for the six months ended June 30, 2023 is driven by the decrease in the six-month net income before income taxes.
Gold Resource Corporation—Management’s Discussion and Analysis of Financial Condition and Results of Operations 36 Total cash cost after co-product credits per AuEq oz sold: For the three months ended June 30, 2023, the total cash cost after co-product credits per AuEq oz sold is $1,333 compared to $247 for the same period in 2022.
Other Non-GAAP Financial Measures
Second quarter 2023 compared to second quarter 2022
The increase is due to the lower amount of co-product credits we received during the second quarter of 2023, the 33% decrease in total number of AuEq ounces sold, and the 6% increase in treatment and refining charges as a result of an increase in the zinc treatment charge benchmark and spot price. Although production costs were lower in the second quarter of 2023 compared the same period last year, the strengthening peso and increased energy costs negatively impacted production costs and therefore, the cost per tonne processed and the total cash cost after co-product credits per AuEq oz sold.
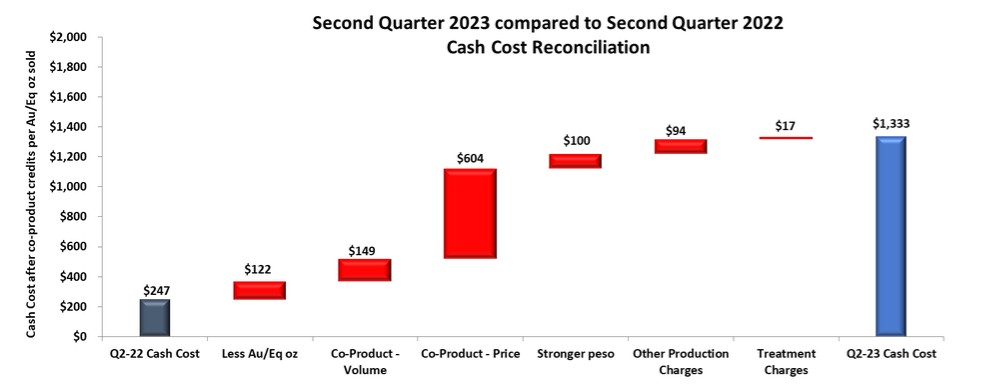
Total consolidated all-in sustaining cost after co-product credits per AuEq oz sold: For the three months ended June 30, 2023, the total consolidated all-in sustaining cost after co-product credits per AuEq oz sold was $1,990 compared to $805 for the same period in 2022. The increase is directly related to the higher cash costs per ounce discussed above partially offset by lower sustaining capital expenditures.
Total all-in cost after co-product credits per AuEq oz sold: For the three months ended June 30, 2023, the total all-in cost after co-product credits per AuEq oz sold was $2,196 compared to $1,099 for the same period in 2022. The increase is due to the higher all-in sustaining costs discussed above and lower exploration expense related to advancing the Back Forty optimization work and permitting activities.
Year-to-date 2023 compared to year-to-date 2022
Total cash cost after co-product credits per AuEq oz sold: For the six months ended June 30, 2023, the total cash cost after co-product credits per AuEq oz sold was $979 compared to $61 for the same period in 2022. The increase is due to the lower amount of co-product credits we received during the six months ended June 30, 2023, the 23% decrease in total number of AuEq ounces sold, and the 11% increase in treatment and refining charges as a result of an increase in the zinc treatment charge benchmark and spot price. Although production costs were lower for the six months ended June 30, 2023 2023 compared the same period last year, the strengthening peso and increased energy costs negatively impacted production costs and therefore, the cost per tonne processed and the total cash cost after co-product credits per AuEq oz sold.
Gold Resource Corporation—Management’s Discussion and Analysis of Financial Condition and Results of Operations 37 Total consolidated all-in sustaining cost after co-product credits per AuEq oz sold: For the six months ended June 30, 2023, the total consolidated all-in sustaining cost after co-product credits per AuEq oz sold was $1,551 compared to $653 for the same period in 2022.
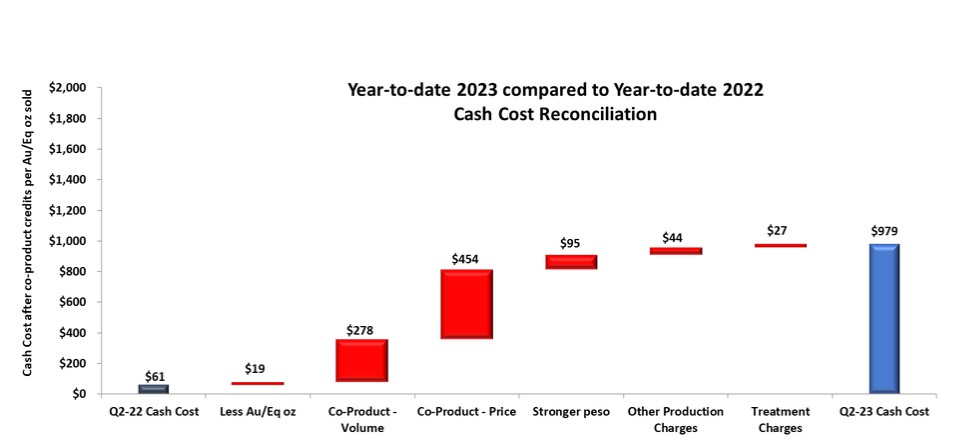
The increase is directly related to the higher cash costs per ounce discussed above partially offset by lower sustaining capital expenditures.
Total all-in cost after co-product credits per AuEq oz sold: For the three months ended June 30, 2023, the total all-in cost after co-product credits per AuEq oz sold was $1,744 compared to $956 for the same period in 2022. The increase is due to the higher all-in sustaining costs discussed above, partially offset by lower Back Forty costs due to nearing completion of the optimization work and utilizing third parties only on a limited basis until after completion of capital cost analysis for the project.
For a detailed description of each of the non-GAAP financial measures and a reconciliation to GAAP financial measures, please see the discussion below under “Non-GAAP Measures.”
Gold Resource Corporation—Management’s Discussion and Analysis of Financial Condition and Results of Operations
38
2023 Capital and Exploration Investment Summary
|
|
For the six months ended June 30, 2023 |
|
2023 full year guidance |
|||
|
|
(in thousands) |
|||||
Sustaining Investments: |
|
|
|
|
|
|
|
Underground Development |
Capital |
$ |
2,362 |
|
|
|
|
Infill Drilling |
Capitalized Exploration |
|
1,785 |
|
|
|
|
Other Sustaining Capital |
Capital |
|
628 |
|
|
|
|
Surface and Underground Exploration Development & Other |
Capitalized Exploration |
|
1,079 |
|
|
|
|
Subtotal of Sustaining Investments: |
|
|
5,854 |
|
$ |
9 - 11 million |
|
Growth Investments: |
|
|
|
|
|
|
|
DDGM growth: |
|
|
|
|
|
|
|
Surface Exploration / Other |
Exploration |
|
1,139 |
|
|
|
|
Underground Exploration Drilling |
Exploration |
|
1,295 |
|
|
|
|
Underground Exploration Development |
Capitalized Exploration |
|
147 |
|
|
|
|
Back Forty growth: |
|
|
|
|
|
|
|
Back Forty Project Optimization & Permitting |
Exploration |
|
845 |
|
|
|
|
Subtotal of Growth Investments: |
|
|
3,426 |
|
$ |
6 - 7 million |
|
Total Capital and Exploration: |
|
$ |
9,280 |
|
$ |
15 - 18 million |
|
The Company’s investment in Mexico through the second quarter of 2023 totaled $8.4 million. Our investment in Mexico is focused on favorably impacting our environment, social, and governance programs while creating operational efficiencies and sustainability. At the Back Forty Project, $0.8 million has been invested in optimization work and permitting initiatives year-to-date.
Gold Resource Corporation—Management’s Discussion and Analysis of Financial Condition and Results of Operations 39 Mine development during the quarter included ramps and access to different areas of the deposit, ventilation shafts, and exploration development drifts.
Underground and Exploration Development:
A total of 203 meters of development (included in Infill Drilling and Exploration Development in the table above), at a cost of $0.5 million was completed during the second quarter of 2023. As part of ongoing safety initiatives, the Company also invested in additional ground support and improved ventilation for the mine. We plan to invest a total of $1.5 million in over 700 meters of exploration development in full year 2023.
|
Examining exploration drill core at an underground drill station (Switchback) |
Back Forty Feasibility and Permitting:
Work on optimizing feasibility for the Back Forty Project progressed during the second quarter of 2023. Mine planning, process plant design, site layout, and infrastructure were largely completed during 2022. Current initiatives are focused on finalizing the financial models with operating and capital costs, which may be subject to some volatility due to the inflationary market conditions. Environmental and cultural resource considerations have been a key factor in the overall project design. Work related to metallurgy and the economic model will continue and once completed, the Board will evaluate the current economic climate and make a decision on how to proceed with the Back Forty Mine.
Non-GAAP Measures
Gold Resource Corporation—Management’s Discussion and Analysis of Financial Condition and Results of Operations 40 Throughout this report, we have provided information prepared or calculated according to U.S. GAAP and have referenced certain non-GAAP performance measures which we believe will assist with understanding the performance of our business. These measures are based on precious metal gold equivalent ounces sold and include (i) total cash cost after co-product credits per ounce, and (ii) total all-in sustaining cost after co-product credits (“AISC”) per ounce. Because the non-GAAP performance measures do not have any standardized meaning prescribed by U.S. GAAP, they may not be comparable to similar measures presented by other companies. Accordingly, these measures should not be considered in isolation, or as a substitute for, measures of performance prepared in accordance with U.S. GAAP. These non-GAAP measures are not necessarily indicative of operating profit or cash flow from operations as determined under GAAP.
For financial reporting purposes, we report the sale of base metals as part of our revenue. Revenue generated from the sale of base metals in our concentrates is considered a co-product of our gold and silver production for the purpose of calculating our total cash cost after co-product credits for our Don David Gold Mine. We periodically review our revenues to ensure that our reporting of primary products and co-products is appropriate. Because we consider copper, lead, and zinc to be co-products of our precious metal production, the value of these metals continues to be applied as a reduction to total cash costs in our calculation of total cash cost after co-product credits per precious metal gold equivalent ounce sold. Likewise, we believe the identification of copper, lead, and zinc as co-product credits is appropriate due to their lower per unit economic value contribution compared to the precious metals and since gold and silver are the primary products we intend to produce.
Total cash cost after co-product credits is a measure developed by the Gold Institute to provide a uniform standard for industry comparison purposes, and it includes total cash cost before co-product credits less co-product credits, or revenues earned from base metals.
AISC includes total cash cost after co-product credits plus other costs related to sustaining production, including allocated sustaining general and administrative expenses, and sustaining capital expenditures. We determined sustaining capital expenditures as those capital expenditures that are necessary to maintain current production and execute the current mine plan. AISC is calculated based on the current guidance from the World Gold Council.
Gold Resource Corporation—Management’s Discussion and Analysis of Financial Condition and Results of Operations 41 The following table summarizes the Company’s total all-in cost after co-product credits per precious metal gold equivalent ounce sold:
Reconciliations to U.S. GAAP
|
For the three months ended June 30, |
|
For the six months ended June 30, |
||||||||
|
2023 |
|
2022 |
|
2023 |
|
2022 |
||||
|
(in thousands, except per oz) |
||||||||||
Gold equivalent ounces sold (oz) |
|
7,689 |
|
|
11,475 |
|
|
17,774 |
|
|
23,204 |
Total production costs (1) |
$ |
20,302 |
|
$ |
21,722 |
|
$ |
40,152 |
|
$ |
41,796 |
Treatment and refining charges (2) |
|
3,328 |
|
|
3,137 |
|
|
6,512 |
|
|
5,885 |
Co-product credits (3) |
|
(13,384) |
|
|
(22,027) |
|
|
(29,265) |
|
|
(46,268) |
Total cash cost after co-product credits |
|
10,246 |
|
|
2,832 |
|
|
17,399 |
|
|
1,413 |
Total cash cost after co-product credits per AuEq oz sold |
$ |
1,333 |
|
$ |
247 |
|
$ |
979 |
|
$ |
61 |
Sustaining - capitalized expenditure (4) |
|
2,187 |
|
|
4,028 |
|
|
4,775 |
|
|
8,624 |
Sustaining - Exploration Expenditure (4) |
|
531 |
|
|
- |
|
|
1,079 |
|
|
- |
Reclamation and remediation (5) |
|
200 |
|
|
61 |
|
|
395 |
|
|
123 |
Subtotal of DDGM sustaining costs |
|
2,918 |
|
|
4,089 |
|
|
6,249 |
|
|
8,747 |
DDGM all-in sustaining cost after co-product credits per AuEq oz sold |
|
1,712 |
|
|
603 |
|
$ |
1,330 |
|
$ |
438 |
Sustaining - general and administrative, including stock-based compensation expenses (6) |
|
2,137 |
|
|
2,313 |
|
|
3,927 |
|
|
4,986 |
Consolidated all-in sustaining cost after co-product credits |
|
15,301 |
|
|
9,234 |
|
|
27,575 |
|
|
15,146 |
Total consolidated all-in sustaining cost after co-product credits per AuEq oz sold |
$ |
1,990 |
|
$ |
805 |
|
$ |
1,551 |
|
$ |
653 |
Non-sustaining cost- capital expenditure (4) |
|
147 |
|
|
541 |
|
|
147 |
|
|
1,894 |
Non-sustaining cost- exploration expenditure (1) |
|
1,440 |
|
|
2,837 |
|
|
3,279 |
|
|
5,142 |
Subtotal of non-sustaining costs |
|
1,587 |
|
|
3,378 |
|
|
3,426 |
|
|
7,036 |
Total all-in cost after co-product credits |
|
16,888 |
|
|
12,612 |
|
|
31,001 |
|
|
22,182 |
Total all-in cost after co-product credits per AuEq oz sold |
$ |
2,196 |
|
$ |
1,099 |
|
$ |
1,744 |
|
$ |
956 |
| (1) | Refer to Production costs in Item 1—Condensed Consolidated Interim Financial Statements and Notes (unaudited): Condensed Consolidated Interim Statements of Operations. |
| (2) | Refer to Treatment and refining charges in Item 1—Condensed Consolidated Interim Financial Statements and Notes (unaudited): Note 3 – Revenue. |
| (3) | Refer to Realized/Unrealized Derivatives for copper, zinc, and lead in Item 1—Condensed Consolidated Interim Financial Statements and Notes (unaudited): Note 20 – Fair Value Measurement. Note that Co-product credits for the prior year (2022) comparable numbers were adjusted to include realized embedded derivatives only for co-products and align with the current year presentation. |
| (4) | Refer to Capital expenditures in Item 1—Condensed Consolidated Interim Financial Statements and Notes (unaudited): Condensed Consolidated Interim Statements of Cash Flows |
| (5) | Refer to Reclamation and remediation in Item 1—Condensed Consolidated Interim Financial Statements and Notes (unaudited): Condensed Consolidated Interim Statements of Operations. Note that the prior year (2022) comparable numbers were adjusted to include Reclamation and remediation and align with the current year presentation. |
| (6) | Refer to General and administrative expenses and Stock-based compensation in Item 1—Condensed Consolidated Interim Financial Statements and Notes (unaudited): Condensed Consolidated Interim Statements of Operations |
Gold Resource Corporation—Management’s Discussion and Analysis of Financial Condition and Results of Operations
42
Trending Highlights
|
|
|
|
|
|
|
|
|
2022 |
|
2023 |
||||
|
Q1 |
Q2 |
Q3 |
Q4 |
|
Q1 |
Q2 |
Operating Data |
|
|
|
|
|
|
|
Total tonnes milled |
136,844 |
129,099 |
110,682 |
116,616 |
|
117,781 |
113,510 |
Average Grade |
|
|
|
|
|
- |
|
Gold (g/t) |
3.00 |
2.63 |
1.98 |
2.51 |
|
2.33 |
1.59 |
Silver (g/t) |
81 |
64 |
80 |
109 |
|
94 |
86 |
Copper (%) |
0.41 |
0.32 |
0.37 |
0.45 |
|
0.37 |
0.37 |
Lead (%) |
1.97 |
1.99 |
1.59 |
1.58 |
|
1.73 |
1.64 |
Zinc (%) |
4.89 |
4.00 |
4.21 |
4.27 |
|
3.88 |
3.72 |
Metal production (before payable metal deductions) |
|
|
|
|
|
|
|
Gold (ozs.) |
11,187 |
9,317 |
5,851 |
7,767 |
|
7,171 |
4,637 |
Silver (ozs.) |
332,292 |
249,088 |
261,256 |
370,768 |
|
322,676 |
289,816 |
Copper (tonnes) |
431 |
303 |
296 |
406 |
|
336 |
334 |
Lead (tonnes) |
2,073 |
2,020 |
1,249 |
1,323 |
|
1,559 |
1,389 |
Zinc (tonnes) |
5,562 |
4,282 |
3,901 |
4,198 |
|
3,837 |
3,569 |
Metal produced and sold |
|
|
|
|
|
|
|
Gold (ozs.) |
8,381 |
8,746 |
5,478 |
7,514 |
|
6,508 |
4,287 |
Silver (ozs.) |
265,407 |
231,622 |
225,012 |
335,168 |
|
294,815 |
274,257 |
Copper (tonnes) |
408 |
286 |
282 |
372 |
|
332 |
327 |
Lead (tonnes) |
1,639 |
1,755 |
1,056 |
941 |
|
1,417 |
1,317 |
Zinc (tonnes) |
4,359 |
3,590 |
2,943 |
3,265 |
|
3,060 |
3,141 |
Average metal prices realized |
|
|
|
|
|
|
|
Gold ($ per oz.) |
$ 1,898 |
$ 1,874 |
$ 1,627 |
$ 1,734 |
|
$ 1,915 |
$ 2,010 |
Silver ($ per oz.) |
$ 23.94 |
$ 22.05 |
$ 18.54 |
$ 21.25 |
|
$ 23.04 |
$ 24.93 |
Copper ($ per tonne) |
$ 10,144 |
$ 9,275 |
$ 7,115 |
$ 8,221 |
|
$ 9,172 |
$ 8,397 |
Lead ($ per tonne) |
$ 2,347 |
$ 2,168 |
$ 1,882 |
$ 1,954 |
|
$ 2,158 |
$ 2,153 |
Zinc ($ per tonne) |
$ 3,842 |
$ 4,338 |
$ 3,186 |
$ 2,577 |
|
$ 3,195 |
$ 2,485 |
Gold equivalent ounces sold |
|
|
|
|
|
|
|
Gold Ounces |
8,381 |
8,746 |
5,478 |
7,514 |
|
6,508 |
4,287 |
Gold Equivalent Ounces from Silver |
3,348 |
2,729 |
2,564 |
4,107 |
|
3,547 |
3,402 |
Total AuEq oz |
11,729 |
11,475 |
8,042 |
11,621 |
|
10,055 |
7,689 |
Financial Data ($'s in thousands except for per ounce) |
|
|
|
|
|
|
|
Total sales, net |
$ 45,417 |
$ 37,064 |
$ 23,869 |
$ 32,374 |
|
$ 31,228 |
$ 24,807 |
Total cash cost after co-product credits per AuEq oz sold(1) |
($ 163) |
$ 247 |
$ 1,103 |
$ 842 |
|
$ 711 |
$ 1,333 |
Total consolidated all-in sustaining cost after co-product credits per AuEq oz sold(1) |
$ 462 |
$ 799 |
$ 1,831 |
$ 1,226 |
|
$ 1,221 |
$ 1,990 |
Production Costs |
$ 20,074 |
$ 21,722 |
$ 19,380 |
$ 19,773 |
|
$ 19,850 |
$ 20,302 |
Production Costs/Tonnes Milled |
$ 147 |
$ 168 |
$ 175 |
$ 170 |
|
$ 169 |
$ 179 |
Operating Cash Flows |
$ 4,230 |
$ 7,976 |
($ 4,292) |
$ 6,243 |
|
$ 1,024 |
($ 551) |
Net income (loss) |
$ 4,019 |
$ 2,673 |
($ 9,730) |
($ 3,283) |
|
($ 1,035) |
($ 4,584) |
Earnings (loss) per share - basic |
$ 0.05 |
$ 0.03 |
($ 0.11) |
($ 0.04) |
|
($ 0.01) |
($ 0.05) |
| (1) | See Item 2—Management’s Discussion and Analysis of Financial Condition and Results of Operations – Non-GAAP Measures for a reconciliation of non-GAAP measures to applicable GAAP measures in the respective Annual Report on Form 10-K and Quarterly Reports on Forms 10-Q as filed with the SEC for the respective period. |
Gold Resource Corporation—Management’s Discussion and Analysis of Financial Condition and Results of Operations 43 As of June 30, 2023, working capital was $20.8 million, and it consists of current assets of $40.0 million and current liabilities of $19.1 million.
Liquidity and Capital Resources
This represents a $0.6 million, or 3%, decrease from the working capital balance of $21.4 million as of December 31, 2022. The primary factors influencing the decrease in our working capital was a payment of the liability related to the mining royalty tax, as well as the cash provided by operating activities of $0.5 million, offset by $6.0 million of cash used in investing activities as reported in the Condensed Consolidated Interim Statements of Cash Flows. Our working capital balance fluctuates as we use cash to fund our operations, financing and investing activities, including exploration, mine development, and income taxes. We believe that as a result of our cash balances, the performance of our current and expected operations, and the current metals prices, we will be able to meet our known obligations and other potential cash requirements for the next 12 months and beyond.
Long-term liabilities assumed with the Aquila acquisition, capital requirements to develop the Back Forty Project, and potential project financing may have an impact on liquidity in the long term. These long-term liabilities are contingent upon the approval of the Back Forty Project by the Company’s Board of Directors and securing project financing. Project financing is not expected to be required any earlier than 2024.
Cash and cash equivalents as of June 30, 2023 decreased to $18.0 million from $23.7 million as of December 31, 2022, a net decrease in cash of $5.7 million. The decrease is primarily due to cash spent on capital and exploration expenditures at DDGM and at the Back Forty Project, and mining royalty tax payments for the 2022 tax years, offset by cash inflow from operations.
Of the $18.0 million cash balance as of June 30, 2023, $13.3 million was held in foreign subsidiaries, primarily held in U.S. dollar denominated accounts with the remainder in foreign currencies readily convertible to U.S. dollars. The Don David Gold Mine’s primary source of liquidity is the sale of doré and concentrates. The Don David Gold Mine has been self-sustaining since production commencement in 2010 and has been a source of cash for U.S. operations and projects.
Net cash provided by operating activities for the six months ended June 30, 2023 was $0.5 million compared to $12.2 million for the same period in 2022. Investing activities are mainly attributable to continued reinvestment in DDGM.
Net cash used in investing activities of $6.0 million for the six months ended June 30, 2023 decreased from $10.0 million from the same period in 2022. The decrease is mainly attributed to the 2022 investment in work to complete the commissioning of the filtration plant, the dry stack facility, and the gold regrind circuit.
Net cash used in financing activities for six months ended June 30, 2023 was a net outflow of $16,000 compared to a net outflow of $2.1 million for same period in 2022. The change is primarily related to the discontinuation of shareholder dividends.
While current macro risk factors, such as economic uncertainties and supply chain interruptions have not had a significant adverse impact on exploration plans, results of operations, financial position, and cash flows during the current fiscal year, future impacts are unknown at this time. However, we believe there is sufficient liquidity and capital resources to fund operations and corporate activities for the foreseeable future.
In November 2019, we filed a universal shelf registration statement on Form S-3 with the SEC for the proposed offering from time to time of up to $200,000,000 of our securities, including common stock, preferred stock, and/or warrants (the “Shelf Registration Statement”). At that time, we also entered into the ATM Agreement pursuant to which we may sell shares of our common stock under an effective shelf registration statement at market prices from time to time. In May 2023, a new Shelf Registration Statement was filed and in June 2023, the ATM Agreement was renewed. As such, the Company can utilize the ATM Agreement again if needed.
Gold Resource Corporation—Management’s Discussion and Analysis of Financial Condition and Results of Operations 44 For a discussion of recently adopted and recently issued accounting pronouncements, please see Note 2—Recently Adopted Accounting Standards in Item 1—Condensed Consolidated Interim Financial Statements and Notes (unaudited) above.
Accounting Developments
Forward-Looking Statements
This report contains “forward-looking statements” within the meaning of Section 27A of the Securities Act of 1933 and Section 21E of the Securities Exchange Act of 1934. We use the words “anticipate,” “continue,” “likely,” “estimate,” “expect,” “may,” “could,” “will,” “project,” “should,” “believe,” and similar expressions (including negative and grammatical variations) to identify forward looking statements. Such forward-looking statements include, without limitation, statements regarding:
| ● | Our strategy for significant future investment in Oaxaca, Mexico and in Michigan, USA for development and exploration activities; |
| ● | The expected timing for the Back Forty optimized feasibility study, permitting, detailed engineering, and project financing; |
| ● | Our expectations regarding future grades and recoveries from mining at DDGM; |
| ● | Expectations regarding 2023 capital investment, exploration spending, and general and administrative costs; |
| ● | Future exploration plans at DDGM, including vein systems targeted for future exploration activity; |
| ● | Compliance with existing legal and regulatory requirements, including future asset reclamation costs; |
| ● | Estimates of Mineral Resources and Mineral Reserves; |
| ● | Our expectations regarding whether dividends will be paid in the future; and |
| ● | Our ability to satisfy our obligations and other potential cash requirements over the next twelve months. |
Forward-looking statements are neither historical facts nor assurances of future performance. Rather, they are based only on our current beliefs, expectations, and assumptions regarding the future of our business, future plans and strategies, projections, anticipated events and trends, the economy, and other future conditions. Because forward-looking statements relate to the future, they are subject to inherent uncertainties, risks, and changes in circumstances that are difficult to predict, and many of which are outside of our control. Our actual results and financial condition may differ materially from those indicated in the forward-looking statements. Therefore, you should not rely on any of these forward-looking statements. Important factors that could cause our actual results and financial condition to differ materially from those indicated in the forward-looking statements include, among others, the following:
| ● | Commodity price fluctuations; |
| ● | Mine protests and work stoppages; |
| ● | Rock formations, faults and fractures, water flow and possible CO2 gas exhalation, or other unanticipated geological challenges; |
| ● | Unexpected changes in business and economic conditions, including supply chain challenges, the rate of inflation, and their impact on operating and capital costs; |
Gold Resource Corporation—Management’s Discussion and Analysis of Financial Condition and Results of Operations
45
| ● | Changes in interest rates and currency exchange rates; |
| ● | Adverse technological changes and cybersecurity threats; |
| ● | Unanticipated increases in our operating costs and other costs of doing business; |
| ● | Access to land and availability of materials, equipment, supplies, labor and supervision, power, and water; |
| ● | Results of current and future feasibility studies; |
| ● | Interpretation of drill hole results and the geology, grade, and continuity of mineralization; |
| ● | Litigation by private parties or regulatory action by governmental entities; |
| ● | Acts of God, such as floods, earthquakes, and any other natural disasters; |
| ● | The inherent uncertainty of Mineral Resource and Mineral Reserve estimates; and |
| ● | Such other factors are discussed below under Item 1A—Risk Factors in Part II—Other Information. |
Many of these factors are beyond our ability to control or predict. Although we believe that the expectations reflected in our forward-looking statements are based on reasonable assumptions, such expectations may prove to be materially incorrect due to known and unknown risks and uncertainties. You should not unduly rely on any of our forward-looking statements. These statements speak only as of the date of this Quarterly Report on Form 10-Q. Except as required by law, we are not obligated to publicly release any revisions to these forward-looking statements to reflect future events or developments. All subsequent written and oral forward-looking statements attributable to us and persons acting on our behalf are qualified in their entirety by the cautionary statements contained in this section and elsewhere in this Quarterly Report on Form 10-Q.
Gold Resource Corporation—Management’s Discussion and Analysis of Financial Condition and Results of Operations 46 Our exposure to market risks includes, but is not limited to, the following risks: changes in commodity prices, foreign currency exchange rates, provisional sales contract risks, changes in interest rates, and equity price risks.
ITEM 3: Quantitative and Qualitative Disclosures about Market Risk
We do not use derivative financial instruments as part of an overall strategy to manage market risk; however, we may consider such arrangements in the future as we evaluate our business and financial strategy.
Commodity Price Risk
The results of our operations, cash flows, and financial condition depend in large part upon the market prices of gold, silver, copper, lead, and zinc. Metal prices fluctuate widely and are affected by numerous factors beyond our control. The level of interest rates, the rate of inflation, government fiscal and monetary policy, the stability of exchange rates, the world supply of and demand for gold, silver, and other metals, among other factors, can all cause significant fluctuations in commodity prices. Such external economic factors are in turn influenced by changes in international investment patterns, monetary systems, and political developments. The metal price markets have fluctuated widely in recent years, and future price declines could cause a mineral project to become uneconomic, thereby having a material adverse effect on our business and financial condition. We previously entered into a zinc zero cost collar to protect the selling price for zinc, but that hedge program has concluded. We have not entered into derivative contracts to protect the selling price for gold, silver, copper or lead. We may in the future more actively manage our exposure through additional derivative contracts, although we have no intention of doing so in the near-term.
In addition to materially adversely affecting our reserve estimates, results of operations and/or our financial condition, declining gold and silver prices could require a reassessment of the feasibility of a project. Even if a project is ultimately determined to be economically viable, the need to conduct such a reassessment may cause delays in the implementation of a project.
Foreign Currency Risk
Our foreign operation sells its gold, silver, copper, lead, and zinc production based on U.S. dollar metal prices. Fluctuations in foreign currency exchange rates do not have a material impact on our revenue since gold, silver, copper, lead, and zinc are sold throughout the world in U.S. dollars.
Foreign currency exchange rate fluctuations can increase or decrease our costs to the extent we pay costs in currencies other than the U.S. Dollar. We are primarily impacted by Mexican peso rate changes relative to the U.S. Dollar, as we incur some costs in the Mexican peso. When the value of the peso rises in relation to the U.S. Dollar, some of our costs in Mexico may increase, thus materially adversely affecting our operating results. Alternatively, when the value of the peso drops in relation to the U.S. Dollar, peso-denominated costs in Mexico will decrease in U.S. Dollar terms. Future fluctuations may give rise to foreign currency exposure, which may affect our financial results. Approximately 50% to 60% of expenses are paid in currencies other than the U.S. dollar.
We have not utilized market-risk sensitive instruments to manage our exposure to foreign currency exchange rates but may in the future actively manage our exposure to foreign currency exchange rate risk.
Gold Resource Corporation
47
Provisional Sales Contract Risk
We enter into concentrate sales contracts which, in general, provide for a provisional payment to us based upon provisional assays and prices. The provisionally priced sales contracts contain an embedded derivative that is required to be separated from the host contract for accounting purposes. The host contract is the receivable from the sale of concentrates determined at the quoted metal prices at the time of shipment delivery to the customer. The embedded derivative, which does not qualify for hedge accounting, is adjusted to market through revenue each period prior to settlement. Changes in the prices of metals between the shipment delivery and final settlement date will result in adjustments to revenues related to the sales of concentrate previously recorded upon shipment delivery. Please see Note 14—Derivatives in Item 1—Condensed Consolidated Interim Financial Statements and Notes (unaudited) above for additional information.
Interest Rate Risk
We consider our interest rate risk exposure to be insignificant at this time, as our interest rate is related and embedded in immaterial payments for office leases.
Equity Price Risk
We have in the past, and may in the future, seek to acquire additional funding through sale of common stock and other equity. The price of our common stock has been volatile in the past and may also be volatile in the future. As a result, there is a risk that we may not be able to sell our common stock at an acceptable price should the need for new equity funding arise.
ITEM 4: Controls and Procedures
Evaluation of Disclosure Controls and Procedures
During the fiscal period covered by this report, our management, with the participation of our Chief Executive Officer and Chief Financial Officer, carried out an evaluation of the effectiveness of the design and operation of our disclosure controls and procedures (as defined in Rules 13a-15(e) and 15d-15(e) of the Securities Exchange Act of 1934, as amended). Based on such evaluation, our Chief Executive Officer and Chief Financial Officer have concluded that, as of the end of the period covered by this report, our disclosure controls and procedures were effective to ensure that information required to be disclosed by us in reports that we file or submit under the Exchange Act are recorded, processed, summarized and reported within the required time periods and are designed to ensure that information required to be disclosed in our reports is accumulated and communicated to our management, including our Chief Executive Officer and Chief Financial Officer as appropriate, to allow timely decisions regarding required disclosure.
Changes in Internal Control Over Financial Reporting
There were no changes that occurred during the three months ended June 30, 2023, that have materially affected, or are reasonably likely to materially affect, our internal control over financial reporting.
PART II – OTHER INFORMATION
ITEM 1: Legal Proceedings
In February 2020, a local Ejido community (who claim to be an indigenous community) filed an injunction against the Mexican federal government through which they demanded the cancellation of several concession titles. The federal government ordered a suspension to prevent work related to excavating, drilling, opening tunnels and exploiting the mineral resources on the surface and subsoil of the concessions named in the injunction. Presently, the Don David Gold Mine does not perform such works in the named concessions in lands of the indigenous community. The lawsuit filed in February 2020 has not progressed to a final ruling.
Gold Resource Corporation
48
We know of no other material, existing or pending legal proceedings against us, nor are we involved as a plaintiff in any material proceeding or pending litigation.
ITEM 1A: Risk Factors
Item 1A. Risk Factors of the 2022 Annual Report includes a discussion of our known material risk factors, other than risks that could apply to any issuer or offering. There have been no material changes from the risk factors described in the 2022 Annual Report.
ITEM 2: Unregistered Sales of Equity Securities and Use of Proceeds
None.
ITEM 3: Defaults upon Senior Securities
None.
ITEM 4: Mine Safety Disclosures
While the Company owns an advanced exploration project in Michigan, USA, the project is not yet subject to the Mine Safety and Health Administration jurisdiction and therefore, the mine safety disclosure requirements are not applicable.
ITEM 5: Other Information
None.
ITEM 6: Exhibits
The following exhibits are filed or furnished herewith or incorporated herein by reference:
|
||
Exhibit |
|
Descriptions |
31.1 |
|
Certification pursuant to Section 302 of the Sarbanes-Oxley Act of 2002 for Allen Palmiere. |
31.2 |
|
Certification pursuant to Section 302 of the Sarbanes-Oxley Act of 2002 for Kimberly C. Perry. |
32* |
|
|
101 |
|
Financial statements from the Quarterly Report on Form 10-Q of Gold Resource Corporation as of or for the three and six months ended June 30, 2023, formatted in inline XBRL: (i) the Condensed Consolidated Interim Balance Sheets, (ii) the Condensed Consolidated Interim Statements of Operations, (iii) the Condensed Consolidated Interim Statements of Changes in Shareholders’ Equity, (iv) the Condensed Consolidated Interim Statements of Cash Flows, and (v) the Notes to the Condensed Consolidated Interim Financial Statements. |
104 |
|
Cover Page Interactive Data File (embedded within the XBRL document) |
* |
This document is not being “filed” for purposes of Section 18 of the Securities Exchange Act of 1934, as amended, or otherwise subject to the liabilities of that Section. Registration Statements or other documents filed with the SEC shall not incorporate this exhibit by reference, except as otherwise expressly stated in such filing. |
Gold Resource Corporation
49
SIGNATURES
In accordance with Section 13 or 15(d) of the Exchange Act of 1934, the Company has caused this Report to be signed on its behalf by the undersigned, thereunto duly authorized.
|
|
|
|
|
|
GOLD RESOURCE CORPORATION |
|
|
|
|
|
Dated: July 26, 2023 |
|
|
/s/ Allen Palmiere |
|
|
By: |
Allen Palmiere, |
|
|
|
Chief Executive Officer, |
|
|
|
|
|
|
|
|
|
|
||
|
|
|
|
Dated: July 26, 2023 |
|
|
/s/ Kimberly C. Perry |
|
|
By: |
Kimberly C. Perry, |
|
|
|
Chief Financial Officer |
Gold Resource Corporation
50
Exhibit 31.1
CERTIFICATION
PURSUANT TO SECTION 302 OF THE SARBANES-OXLEY ACT OF 2002
I, Allen Palmiere, certify that:
1. I have reviewed this Form 10-Q of Gold Resource Corporation;
2. Based on my knowledge, this report does not contain any untrue statement of a material fact or omit to state a material fact necessary to make the statements made, in light of the circumstances under which such statements were made, not misleading with respect to the period covered by this report;
3. Based on my knowledge, the financial statements, and other financial information included in this report, fairly present in all material respects the financial condition, results of operations and cash flows of the registrant as of, and for, the periods presented in this report;
4. The registrant’s other certifying officer(s) and I are responsible for establishing and maintaining disclosure controls and procedures (as defined in Exchange Act Rules 13a-15(e) and 15d-15(e)) and internal control over financial reporting (as defined in Exchange Act Rules 13a-15(f) and 15d-15(f)) for the registrant and have:
a. Designed such disclosure controls and procedures, or caused such disclosure controls and procedures to be designed under our supervision, to ensure that material information relating to the registrant, including its consolidated subsidiaries, is made known to us by others within those entities, particularly during the period in which this report is being prepared;
b. Designed such internal control over financial reporting, or caused such internal control over financial reporting to be designed under our supervision, to provide reasonable assurance regarding the reliability of financial reporting and the preparation of financial statements for external purposes in accordance with generally accepted accounting principles;
c. Evaluated the effectiveness of the registrant’s disclosure controls and procedures and presented in this report our conclusions about the effectiveness of the disclosure controls and procedures, as of the end of the period covered by this report based on such evaluation; and
d. Disclosed in this report any change in the registrant’s internal control over financial reporting that occurred during the registrant’s most recent fiscal quarter (the registrant’s fourth fiscal quarter in the case of an annual report) that has materially affected, or is reasonably likely to materially affect, the registrant’s internal control over financial reporting; and
5. The registrant’s other certifying officer(s) and I have disclosed, based on our most recent evaluation of internal control over financial reporting, to the registrant’s auditors and the audit committee of the registrant’s board of directors (or persons performing the equivalent functions):
a. All significant deficiencies and material weaknesses in the design or operation of internal control over financial reporting which are reasonably likely to adversely affect the registrant’s ability to record, process, summarize and report financial information; and
b. Any fraud, whether or not material, that involves management or other employees who have a significant role in the registrant’s internal control over financial reporting.
Date: July 26, 2023 |
|
|
|
/s/ Allen Palmiere |
|
Allen Palmiere |
|
Chief Executive Officer, President and Director |
|
Exhibit 31.2
CERTIFICATION
PURSUANT TO SECTION 302 OF THE SARBANES-OXLEY ACT OF 2002
I, Kimberly C. Perry, certify that:
1. I have reviewed this Form 10-Q of Gold Resource Corporation;
2. Based on my knowledge, this report does not contain any untrue statement of a material fact or omit to state a material fact necessary to make the statements made, in light of the circumstances under which such statements were made, not misleading with respect to the period covered by this report;
3. Based on my knowledge, the financial statements, and other financial information included in this report, fairly present in all material respects the financial condition, results of operations and cash flows of the registrant as of, and for, the periods presented in this report;
4. The registrant’s other certifying officer(s) and I are responsible for establishing and maintaining disclosure controls and procedures (as defined in Exchange Act Rules 13a-15(e) and 15d-15(e)) and internal control over financial reporting (as defined in Exchange Act Rules 13a-15(f) and 15d-15(f)) for the registrant and have:
a. Designed such disclosure controls and procedures, or caused such disclosure controls and procedures to be designed under our supervision, to ensure that material information relating to the registrant, including its consolidated subsidiaries, is made known to us by others within those entities, particularly during the period in which this report is being prepared;
b. Designed such internal control over financial reporting, or caused such internal control over financial reporting to be designed under our supervision, to provide reasonable assurance regarding the reliability of financial reporting and the preparation of financial statements for external purposes in accordance with generally accepted accounting principles;
c. Evaluated the effectiveness of the registrant’s disclosure controls and procedures and presented in this report our conclusions about the effectiveness of the disclosure controls and procedures, as of the end of the period covered by this report based on such evaluation; and
d. Disclosed in this report any change in the registrant’s internal control over financial reporting that occurred during the registrant’s most recent fiscal quarter (the registrant’s fourth fiscal quarter in the case of an annual report) that has materially affected, or is reasonably likely to materially affect, the registrant’s internal control over financial reporting; and
5. The registrant’s other certifying officer(s) and I have disclosed, based on our most recent evaluation of internal control over financial reporting, to the registrant’s auditors and the audit committee of the registrant’s board of directors (or persons performing the equivalent functions):
a. All significant deficiencies and material weaknesses in the design or operation of internal control over financial reporting which are reasonably likely to adversely affect the registrant’s ability to record, process, summarize and report financial information; and
b. Any fraud, whether or not material, that involves management or other employees who have a significant role in the registrant’s internal control over financial reporting.
Date: July 26, 2023 |
|
|
|
/s/ Kimberly C. Perry |
|
Kimberly C. Perry |
|
Chief Financial Officer |
|
Exhibit 32
CERTIFICATION
PURSUANT TO SECTION 906 OF THE SARBANES-OXLEY ACT OF 2002
I, Allen Palmiere, Chief Executive Officer, President and Director, and I, Kimberly C. Perry, Chief Financial Officer of Gold Resource Corporation (the “Company”) certify that:
1. I have reviewed the quarterly report on Form 10-Q of the Company;
2. Based on my knowledge, this quarterly report does not contain any untrue statement of a material fact or omit to state a material fact necessary to make the statements made, in light of the circumstances under which such statements were made, not misleading with respect to the period covered by this quarterly report; and
3. Based on my knowledge, the financial statements, and other financial information included in this quarterly report, fairly present in all material respects the financial condition, results of operations and cash flows of the Company as of, and for, the period presented in this quarterly report.
Date: July 26, 2023 |
|
|
|
/s/ Allen Palmiere |
|
Allen Palmiere |
|
Chief Executive Officer, President and Director |
|
|
|
|
|
Date: July 26, 2023 |
|
|
|
/s/ Kimberly C. Perry |
|
Kimberly C. Perry |
|
Chief Financial Officer |
|