UNITED STATES
SECURITIES AND EXCHANGE COMMISSION
Washington, D.C. 20549
FORM 8-K
CURRENT REPORT
PURSUANT TO SECTION 13 OR 15(d) OF
THE SECURITIES EXCHANGE ACT OF 1934
July 26, 2023
Date of Report
(Date of earliest event reported)
BRIDGEWATER BANCSHARES, INC.
(Exact name of registrant as specified in its charter)
|
Minnesota (State or other jurisdiction of incorporation) |
001-38412 (Commission File Number) |
26-0113412 (I.R.S. Employer Identification No.) |
|
4450 Excelsior Boulevard, Suite 100 St. Louis Park, Minnesota (Address of principal executive offices) |
55416 (Zip Code) |
Registrant’s telephone number, including area code: (952) 893-6868
Not Applicable
(Former name or former address, if changed since last report.)
Check the appropriate box below if the Form 8-K filing is intended to simultaneously satisfy the filing obligation of the registrant under any of the following provisions:
☐ Written communications pursuant to Rule 425 under the Securities Act (17 CFR 230.425)
☐ Soliciting material pursuant to Rule 14a-12 under the Exchange Act (17 CFR 240.14a-12)
☐ Pre-commencement communications pursuant to Rule 14d-2(b) under the Exchange Act (17 CFR 240.14d-2(b))
☐ Pre-commencement communications pursuant to Rule 13e-4(c) under the Exchange Act (17 CFR 240.13e-4(c))
Securities registered pursuant to Section 12(b) of the Act:
Title of each class: |
|
Trading Symbol |
|
Name of each exchange on which registered: |
|
Common Stock, $0.01 Par Value Depositary Shares, each representing a 1/100th interest in a share of 5.875% Non-Cumulative Perpetual Preferred Stock, Series A |
|
BWB BWBBP |
|
The NASDAQ Stock Market LLC The NASDAQ Stock Market LLC |
Indicate by check mark whether the registrant is an emerging growth company as defined in Rule 405 of the Securities Act of 1933 (§230.405 of this chapter) or Rule 12b-2 of the Securities Exchange Act of 1934 (§240.12b-2 of this chapter).
Emerging growth company ☒
If an emerging growth company, indicate by check mark if the registrant has elected not to use the extended transition period for complying with any new or revised financial accounting standards provided pursuant to Section 13(a) of the Exchange Act. ☐
Item 2.02 Results of Operations and Financial Condition.
On July 26, 2023, Bridgewater Bancshares, Inc. (the “Company”) issued a press release announcing its financial results for the three and six months ended June 30, 2023. A copy of the press release is attached as Exhibit 99.1 to this Current Report on Form 8-K and is incorporated herein by reference.
The information furnished in this item of this Form 8-K, and the related exhibits, shall not be deemed “filed” for purposes of Section 18 of the Securities Exchange Act of 1934, as amended (the “Exchange Act”), or incorporated by reference in any filing under the Securities Act of 1933, as amended, or the Exchange Act, except as may be expressly set forth by specific reference in such filing.
Item 7.01 Regulation FD Disclosure.
The Company hereby furnishes the Investor Presentation attached hereto as Exhibit 99.2.
The information furnished in this item of this Form 8-K, and the related exhibits, shall not be deemed “filed” for purposes of Section 18 of the Exchange Act, or incorporated by reference in any filing under the Securities Act of 1933, as amended, or the Exchange Act, except as may be expressly set forth by specific reference in such filing.
Item 8.01 Other Events.
On July 26, 2023, in its 2023 second quarter earnings release, the Company announced that its Board of Directors had declared a quarterly cash dividend on its 5.875% Non-Cumulative Perpetual Preferred Stock, Series A (“Series A Preferred Stock”). The quarterly cash dividend of $36.72 per share, equivalent to $0.3672 per depository share, each representing a 1/100th interest in a share of the Series A Preferred Stock (Nasdaq: BWBBP), is payable on September 1, 2023, to shareholders of record of the Series A Preferred Stock at the close of business on August 15, 2023.
Item 9.01 Financial Statements and Exhibits.
(d) Exhibits
Exhibit 99.1 |
Exhibit 99.2 |
Exhibit 104 |
Cover Page Interactive Data File (embedded within the Inline XBRL document) |
2
SIGNATURES
Pursuant to the requirements of the Securities Exchange Act of 1934, the registrant has duly caused this report to be signed on its behalf by the undersigned thereunto duly authorized.
|
Bridgewater Bancshares, Inc. |
|
|
|
|
Date: July 26, 2023 |
|
|
By: /s/ Jerry Baack |
|
Name: Jerry Baack |
|
Title: Chairman, Chief Executive Officer and President |
3
Exhibit 99.1


Media Contact: |
Investor Contact: |
July 26, 2023
Bridgewater Bancshares, Inc. Announces Second Quarter 2023 Net Income
of $9.8 Million, $0.31 Diluted Earnings Per Common Share
Second Quarter 2023 Highlights
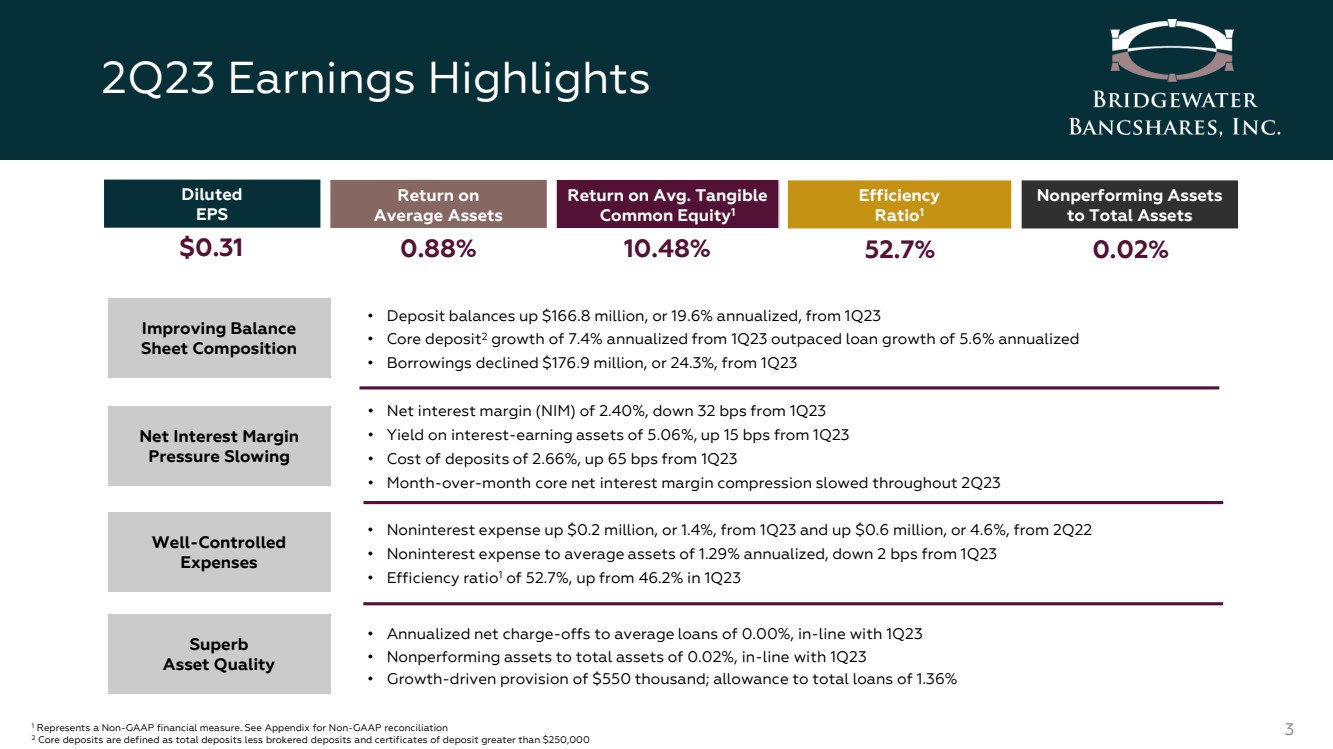
| ● | Annualized return on average assets (ROA) of 0.88%, compared to 1.07% for the first quarter of 2023. |
| ● | Annualized return on average shareholders’ equity (ROE) of 9.69%, compared to 11.70% for the first quarter of 2023, and annualized return on average tangible common equity (ROATCE)(1) of 10.48%, compared to 12.90% for the first quarter of 2023. |
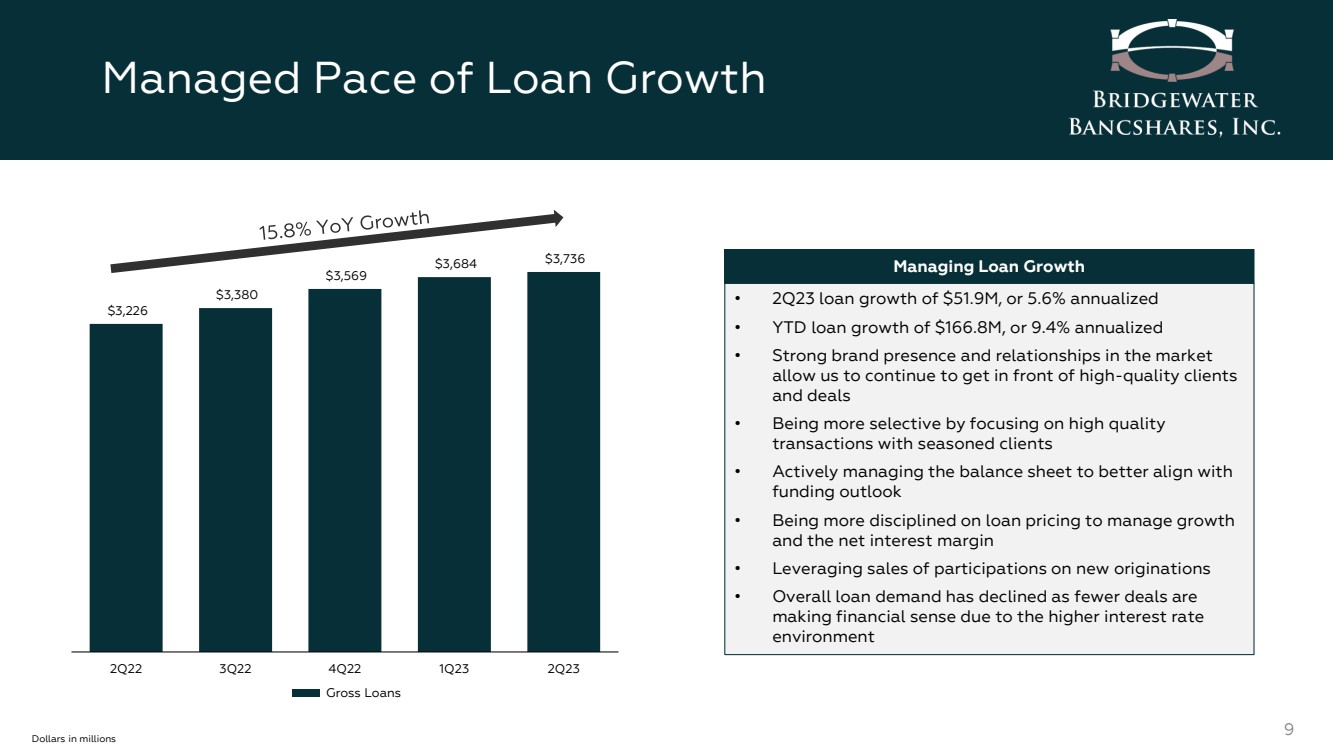
| ● | Gross loans increased $51.9 million, or 5.6% annualized, from the first quarter of 2023. |
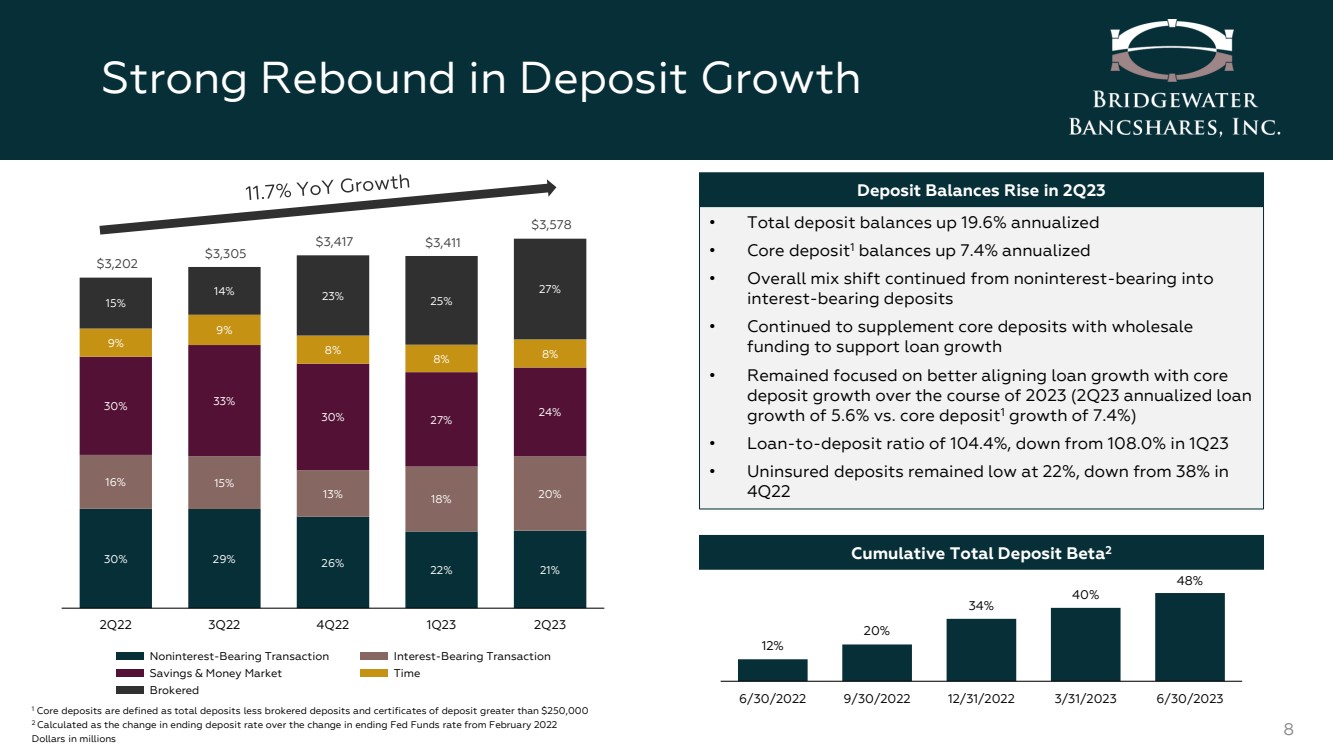
| ● | Deposits increased by $166.8 million, or 19.6% annualized, from the first quarter of 2023, including an increase of core deposits(2) of $45.3 million, or 7.4% annualized. |
| ● | Total borrowing capacity of $1.5 billion at June 30, 2023, compared to $783.0 million at December 31, 2022. |
| ● | Net interest margin (on a fully tax-equivalent basis) of 2.40%, compared to 2.72% in the first quarter of 2023. |
| ● | Efficiency ratio(1) of 52.7%, compared to 46.2% for the first quarter of 2023. |
| ● | Noninterest expense increased slightly by $205,000, or 1.4%, from the first quarter of 2023, with annualized noninterest expense to average assets of 1.29%, compared to 1.31% for the first quarter of 2023. |
| ● | A credit loss provision of $550,000 was recorded to support continued loan growth, with allowance for credit losses to total loans of 1.36% at both June 30, 2023 and March 31, 2023. |
| ● | Annualized net loan charge-offs (recoveries) as a percentage of average loans of 0.00% for the second quarter of 2023, in-line with the first quarter of 2023. |
| ● | Nonperforming assets to total assets of 0.02% at June 30, 2023 and March 31, 2023. |
| ● | Tangible book value per share(1) of $12.15 at June 30, 2023, an increase of $0.20, or 6.7% annualized, compared to $11.95 at March 31, 2023. |
| (1) | Represents a non-GAAP financial measure. See "Non-GAAP Financial Measures" for further details. |
| (2) | Core deposits are defined as total deposits less brokered deposits and certificates of deposit greater than $250,000. |
Page 1 of 17
St. Louis Park, MN – Bridgewater Bancshares, Inc. (Nasdaq: BWB) (the Company), the parent company of Bridgewater Bank (the Bank), today announced net income of $9.8 million for the second quarter of 2023, compared to $11.6 million for the first quarter of 2023, and $12.9 million for the second quarter of 2022. Earnings per diluted common share for the second quarter of 2023 were $0.31, compared to $0.37 per diluted common share for the first quarter of 2023, and $0.41 per diluted common share for the same period in 2022.
“Bridgewater’s second quarter results were highlighted by several improving financial trends as we continue to manage the business through a challenging banking environment,” said Chairman, Chief Executive Officer, and President, Jerry Baack. “The overall composition of our balance sheet improved with a strong inflow of deposits, including growth in core deposits, and a reduction in overall borrowings. While our net interest margin remained under pressure, we saw the pace of compression slow noticeably on a month-to-month basis during the quarter. In addition, noninterest expense was again well controlled and asset quality remained superb.”
“During the quarter, our teams maintained their focus on supporting and growing our client base, both by proactively engaging with our existing clients and cultivating new relationships across the Twin Cities market. In July, we also relocated our downtown Minneapolis branch to an enhanced location with more space to better serve our clients. We believe our proven ability to develop strong client relationships, combined with encouraging financial trends, will continue to drive success moving forward.”
Page 2 of 17
Key Financial Measures
|
|
As of and for the Three Months Ended |
|
|
As of and for the Six Months Ended |
|
|||||||||||
|
|
June 30, |
|
March 31, |
|
June 30, |
|
|
June 30, |
|
June 30, |
|
|||||
|
|
2023 |
|
2023 |
|
2022 |
|
|
2023 |
|
2022 |
|
|||||
Per Common Share Data |
|
|
|
|
|
|
|
|
|
|
|
|
|
|
|
|
|
Basic Earnings Per Share |
|
$ |
0.32 |
|
$ |
0.38 |
|
$ |
0.43 |
|
|
$ |
0.70 |
|
$ |
0.83 |
|
Diluted Earnings Per Share |
|
|
0.31 |
|
|
0.37 |
|
|
0.41 |
|
|
|
0.69 |
|
|
0.80 |
|
Book Value Per Share |
|
|
12.25 |
|
|
12.05 |
|
|
11.14 |
|
|
|
12.25 |
|
|
11.14 |
|
Tangible Book Value Per Share (1) |
|
|
12.15 |
|
|
11.95 |
|
|
11.03 |
|
|
|
12.15 |
|
|
11.03 |
|
Basic Weighted Average Shares Outstanding |
|
|
27,886,425 |
|
|
27,726,894 |
|
|
27,839,260 |
|
|
|
27,807,100 |
|
|
27,980,749 |
|
Diluted Weighted Average Shares Outstanding |
|
|
28,198,739 |
|
|
28,490,046 |
|
|
28,803,842 |
|
|
|
28,350,705 |
|
|
28,991,780 |
|
Shares Outstanding at Period End |
|
|
27,973,995 |
|
|
27,845,244 |
|
|
27,677,372 |
|
|
|
27,973,995 |
|
|
27,677,372 |
|
|
|
|
|
|
|
|
|
|
|
|
|
|
|
|
|
|
|
Selected Performance Ratios |
|
|
|
|
|
|
|
|
|
|
|
|
|
|
|
|
|
Return on Average Assets (Annualized) |
|
|
0.88 |
% |
|
1.07 |
% |
|
1.38 |
% |
|
|
0.97 |
% |
|
1.40 |
% |
Pre-Provision Net Revenue Return on Average Assets (Annualized) (1) |
|
|
1.16 |
|
|
1.49 |
|
|
2.19 |
|
|
|
1.32 |
|
|
2.16 |
|
Return on Average Shareholders' Equity (Annualized) |
|
|
9.69 |
|
|
11.70 |
|
|
13.55 |
|
|
|
10.69 |
|
|
13.27 |
|
Return on Average Tangible Common Equity (Annualized) (1) |
|
|
10.48 |
|
|
12.90 |
|
|
15.26 |
|
|
|
11.68 |
|
|
14.91 |
|
Yield on Interest Earning Assets (2) |
|
|
5.06 |
|
|
4.91 |
|
|
4.16 |
|
|
|
4.99 |
|
|
4.15 |
|
Yield on Total Loans, Gross (2) |
|
|
5.19 |
|
|
5.06 |
|
|
4.45 |
|
|
|
5.12 |
|
|
4.45 |
|
Cost of Total Deposits |
|
|
2.66 |
|
|
2.01 |
|
|
0.46 |
|
|
|
2.34 |
|
|
0.44 |
|
Cost of Funds |
|
|
2.91 |
|
|
2.41 |
|
|
0.63 |
|
|
|
2.66 |
|
|
0.61 |
|
Net Interest Margin (2) |
|
|
2.40 |
|
|
2.72 |
|
|
3.58 |
|
|
|
2.55 |
|
|
3.59 |
|
Core Net Interest Margin (1)(2) |
|
|
2.31 |
|
|
2.62 |
|
|
3.34 |
|
|
|
2.47 |
|
|
3.34 |
|
Efficiency Ratio (1) |
|
|
52.7 |
|
|
46.2 |
|
|
40.2 |
|
|
|
49.3 |
|
|
41.2 |
|
Noninterest Expense to Average Assets (Annualized) |
|
|
1.29 |
|
|
1.31 |
|
|
1.47 |
|
|
|
1.30 |
|
|
1.51 |
|
Loan to Deposit Ratio |
|
|
104.4 |
|
|
108.0 |
|
|
100.7 |
|
|
|
|
|
|
|
|
Core Deposits to Total Deposits (3) |
|
|
70.3 |
|
|
72.4 |
|
|
82.9 |
|
|
|
|
|
|
|
|
Tangible Common Equity to Tangible Assets (1) |
|
|
7.39 |
|
|
7.23 |
|
|
7.87 |
|
|
|
|
|
|
|
|
|
|
|
|
|
|
|
|
|
|
|
|
|
|
|
|
|
|
Capital Ratios (Bank Only) (4) |
|
|
|
|
|
|
|
|
|
|
|
|
|
|
|
|
|
Tier 1 Leverage Ratio |
|
|
10.69 |
% |
|
10.61 |
% |
|
11.43 |
% |
|
|
|
|
|
|
|
Common Equity Tier 1 Risk-based Capital Ratio |
|
|
11.66 |
|
|
11.37 |
|
|
11.53 |
|
|
|
|
|
|
|
|
Tier 1 Risk-based Capital Ratio |
|
|
11.66 |
|
|
11.37 |
|
|
11.53 |
|
|
|
|
|
|
|
|
Total Risk-based Capital Ratio |
|
|
12.91 |
|
|
12.62 |
|
|
12.74 |
|
|
|
|
|
|
|
|
|
|
|
|
|
|
|
|
|
|
|
|
|
|
|
|
|
|
Capital Ratios (Consolidated) (4) |
|
|
|
|
|
|
|
|
|
|
|
|
|
|
|
|
|
Tier 1 Leverage Ratio |
|
|
9.47 |
% |
|
9.41 |
% |
|
10.33 |
% |
|
|
|
|
|
|
|
Common Equity Tier 1 Risk-based Capital Ratio |
|
|
8.72 |
|
|
8.48 |
|
|
8.50 |
|
|
|
|
|
|
|
|
Tier 1 Risk-based Capital Ratio |
|
|
10.33 |
|
|
10.08 |
|
|
10.29 |
|
|
|
|
|
|
|
|
Total Risk-based Capital Ratio |
|
|
13.50 |
|
|
13.25 |
|
|
13.98 |
|
|
|
|
|
|
|
|
| (1) | Represents a non-GAAP financial measure. See "Non-GAAP Financial Measures" for further details. |
| (2) | Amounts calculated on a tax-equivalent basis using the statutory federal tax rate of 21%. |
| (3) | Core deposits are defined as total deposits less brokered deposits and certificates of deposit greater than $250,000. |
| (4) | Preliminary data. Current period subject to change prior to filings with applicable regulatory agencies. |
Page 3 of 17
Selected Financial Data
|
|
June 30, |
|
March 31, |
|
December 31, |
|
September 30, |
|
June 30, |
|||||
(dollars in thousands) |
|
2023 |
|
2023 |
|
2022 |
|
2022 |
|
2022 |
|||||
Selected Balance Sheet Data |
|
|
|
|
|
|
|
|
|
|
|
|
|
|
|
Total Assets |
|
$ |
4,603,185 |
|
$ |
4,602,899 |
|
$ |
4,345,662 |
|
$ |
4,128,987 |
|
$ |
3,883,264 |
Total Loans, Gross |
|
|
3,736,211 |
|
|
3,684,360 |
|
|
3,569,446 |
|
|
3,380,082 |
|
|
3,225,885 |
Allowance for Credit Losses |
|
|
50,701 |
|
|
50,148 |
|
|
47,996 |
|
|
46,491 |
|
|
44,711 |
Goodwill and Other Intangibles |
|
|
2,832 |
|
|
2,866 |
|
|
2,914 |
|
|
2,962 |
|
|
3,009 |
|
|
|
|
|
|
|
|
|
|
|
|
|
|
|
|
Deposits |
|
|
3,577,932 |
|
|
3,411,123 |
|
|
3,416,543 |
|
|
3,305,074 |
|
|
3,201,953 |
Tangible Common Equity (1) |
|
|
339,780 |
|
|
332,626 |
|
|
324,636 |
|
|
312,531 |
|
|
305,360 |
Total Shareholders' Equity |
|
|
409,126 |
|
|
402,006 |
|
|
394,064 |
|
|
382,007 |
|
|
374,883 |
Average Total Assets - Quarter-to-Date |
|
|
4,483,662 |
|
|
4,405,234 |
|
|
4,251,345 |
|
|
3,948,201 |
|
|
3,743,575 |
Average Shareholders' Equity - Quarter-to-Date |
|
|
406,347 |
|
|
403,533 |
|
|
387,589 |
|
|
384,020 |
|
|
381,448 |
|
|
For the Three Months Ended |
|
For the Six Months Ended |
|
|||||||||||
|
|
June 30, |
|
March 31, |
|
June 30, |
|
June 30, |
|
June 30, |
|
|||||
(dollars in thousands) |
|
2023 |
|
2023 |
|
2022 |
|
2023 |
|
2022 |
|
|||||
Selected Income Statement Data |
|
|
|
|
|
|
|
|
|
|
|
|
|
|
|
|
Interest Income |
|
$ |
55,001 |
|
$ |
51,992 |
|
$ |
37,782 |
|
$ |
106,993 |
|
$ |
72,476 |
|
Interest Expense |
|
|
29,129 |
|
|
23,425 |
|
|
5,252 |
|
|
52,554 |
|
|
9,766 |
|
Net Interest Income |
|
|
25,872 |
|
|
28,567 |
|
|
32,530 |
|
|
54,439 |
|
|
62,710 |
|
Provision for Credit Losses |
|
|
50 |
|
|
625 |
|
|
3,025 |
|
|
675 |
|
|
4,700 |
|
Net Interest Income after Provision for Credit Losses |
|
|
25,822 |
|
|
27,942 |
|
|
29,505 |
|
|
53,764 |
|
|
58,010 |
|
Noninterest Income |
|
|
1,415 |
|
|
1,943 |
|
|
1,650 |
|
|
3,358 |
|
|
3,207 |
|
Noninterest Expense |
|
|
14,388 |
|
|
14,183 |
|
|
13,752 |
|
|
28,571 |
|
|
27,260 |
|
Income Before Income Taxes |
|
|
12,849 |
|
|
15,702 |
|
|
17,403 |
|
|
28,551 |
|
|
33,957 |
|
Provision for Income Taxes |
|
|
3,033 |
|
|
4,060 |
|
|
4,521 |
|
|
7,093 |
|
|
8,813 |
|
Net Income |
|
|
9,816 |
|
|
11,642 |
|
|
12,882 |
|
|
21,458 |
|
|
25,144 |
|
Preferred Stock Dividends |
|
|
(1,014) |
|
|
(1,013) |
|
|
(1,014) |
|
|
(2,027) |
|
|
(2,027) |
|
Net Income Available to Common Shareholders |
|
$ |
8,802 |
|
$ |
10,629 |
|
$ |
11,868 |
|
$ |
19,431 |
|
$ |
23,117 |
|
Income Statement
Net Interest Income
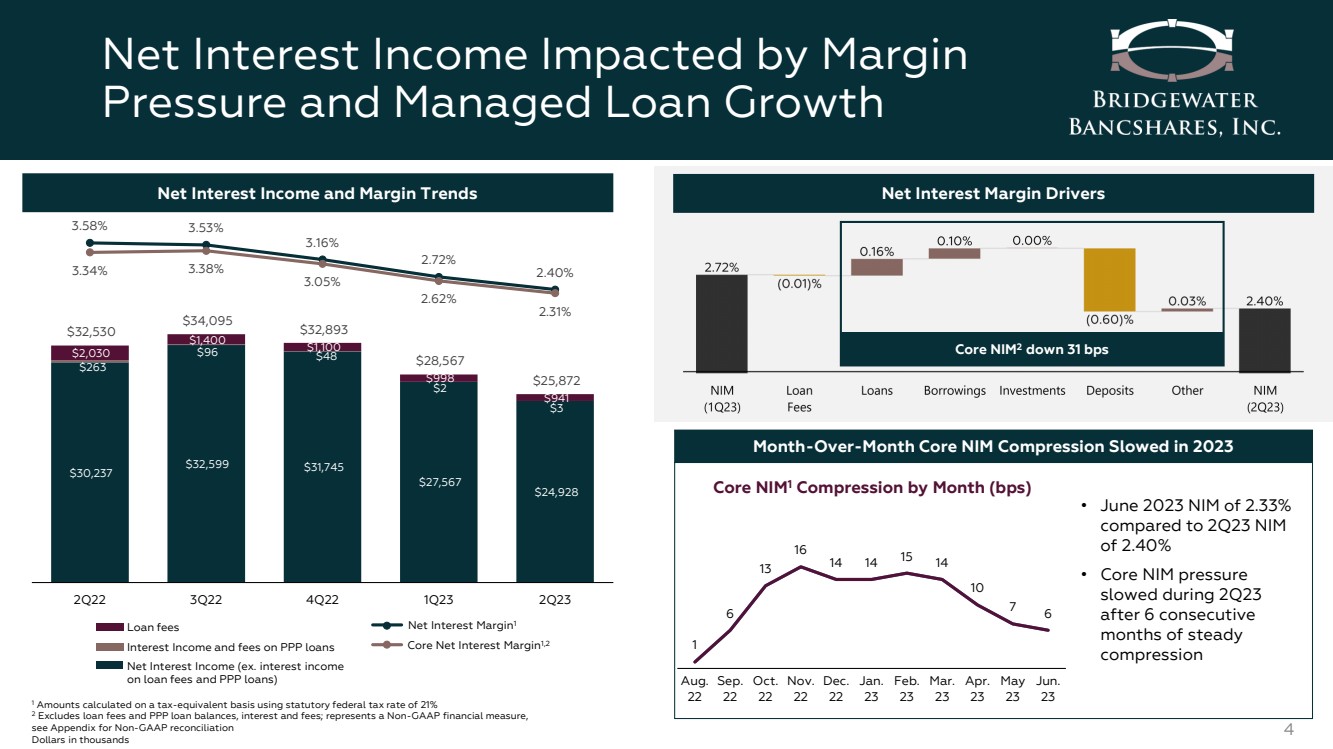
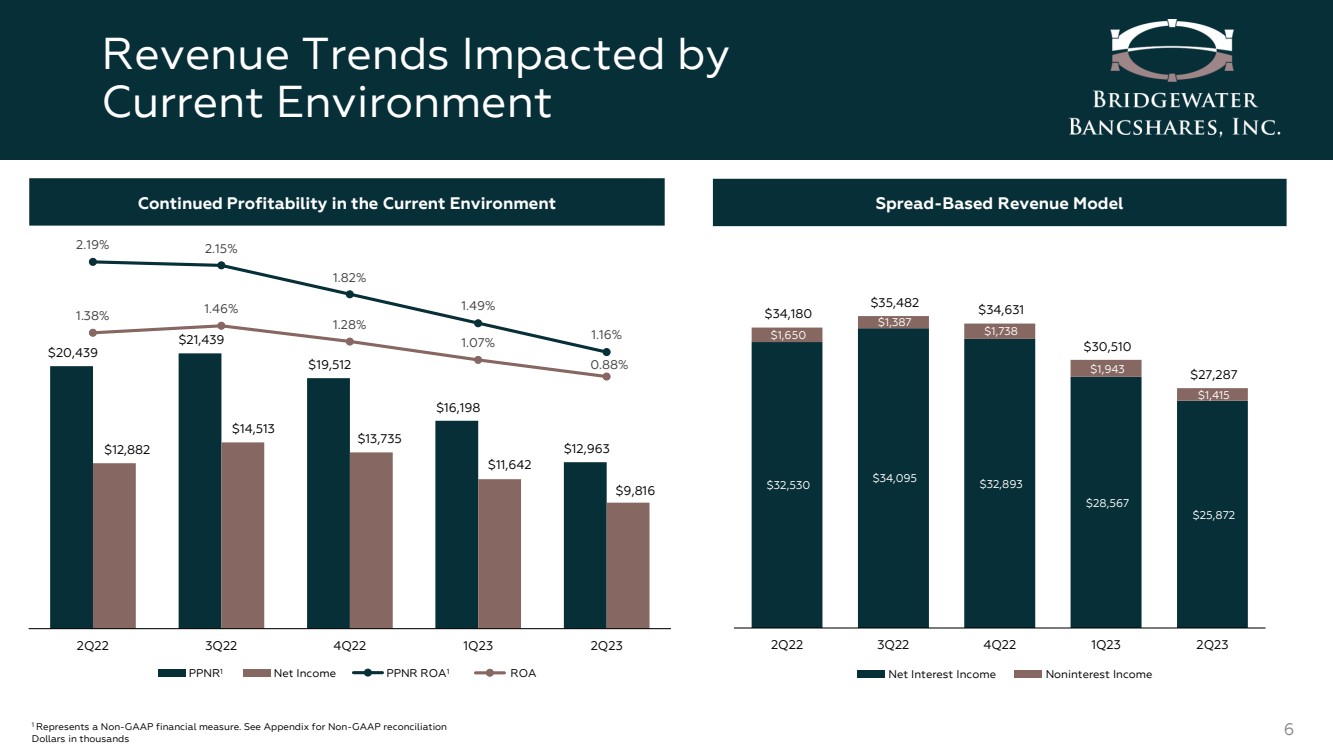
Net interest income was $25.9 million for the second quarter of 2023, a decrease of $2.7 million, from $28.6 million in the first quarter of 2023, and a decrease of $6.7 million, from $32.5 million in the second quarter of 2022. The linked-quarter decrease in net interest income was primarily due to higher rates paid on deposits in the rising interest rate environment. The year-over-year decrease in net interest income was primarily due to higher rates paid on deposits and increased borrowings in the rising interest rate environment. Average interest earning assets were $4.40 billion for the second quarter of 2023, an increase of $71.3 million, or 1.7%, from $4.32 billion for the first quarter of 2023, and an increase of $723.3 million, or 19.7%, from $3.67 billion for the second quarter of 2022. The linked-quarter increase in average interest earning assets was primarily due to continued growth in the loan portfolio. The year-over-year increase in average interest earning assets was primarily due to strong growth in the loan portfolio and purchases of investment securities.
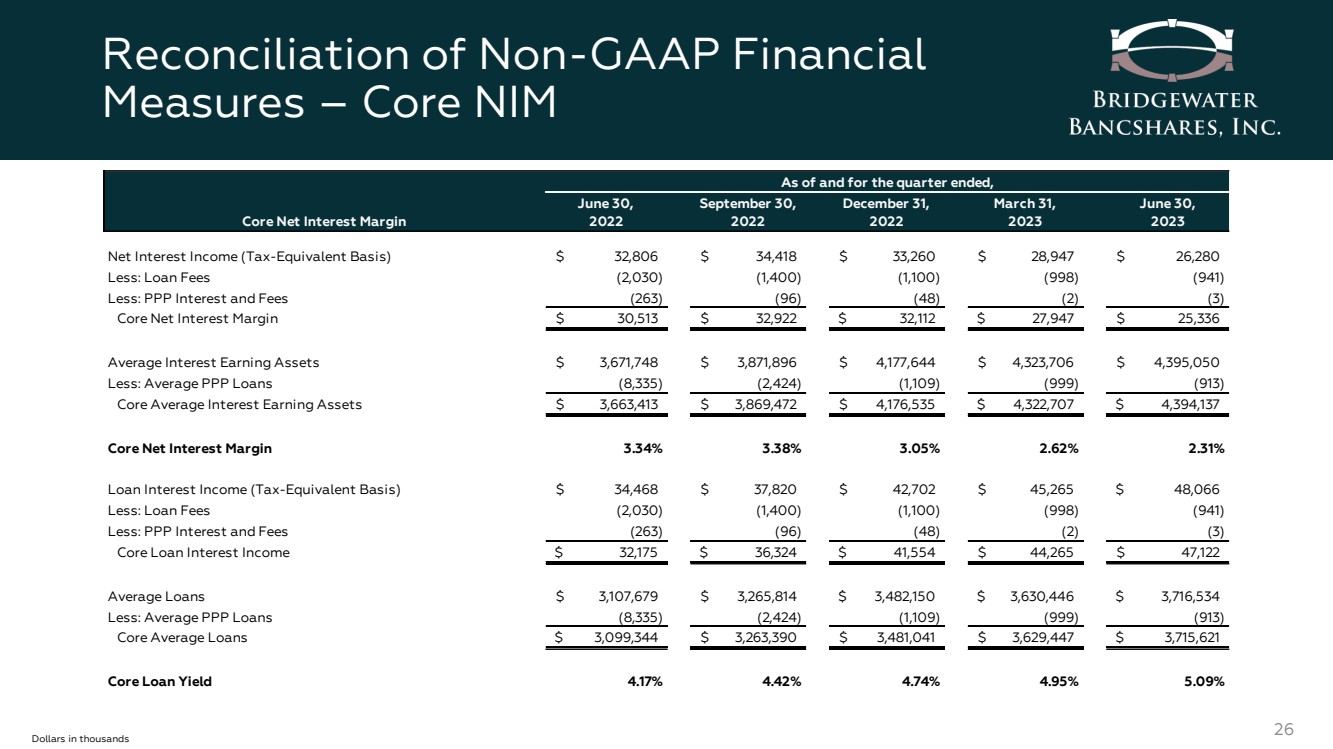
Net interest margin (on a fully tax-equivalent basis) for the second quarter of 2023 was 2.40%, a 32 basis point decrease from 2.72% in the first quarter of 2023, and a 118 basis point decrease from 3.58% in the second quarter of 2022. Core net interest margin (on a fully tax-equivalent basis), a non-GAAP financial measure which excludes the impact of loan fees and PPP balances, interest, and fees, for the second quarter of 2023 was 2.31%, a 31 basis point decrease from 2.62% in the first quarter of 2023, and a 103 basis point decrease from 3.34% in the second quarter of 2022. The linked-quarter decline in the margin was primarily due to higher funding costs, offset partially by higher earning asset yields. The year-over-year decline in the margin was primarily due to higher funding costs and increased borrowings in the rising interest rate environment, offset partially by higher earning asset yields.
Page 4 of 17
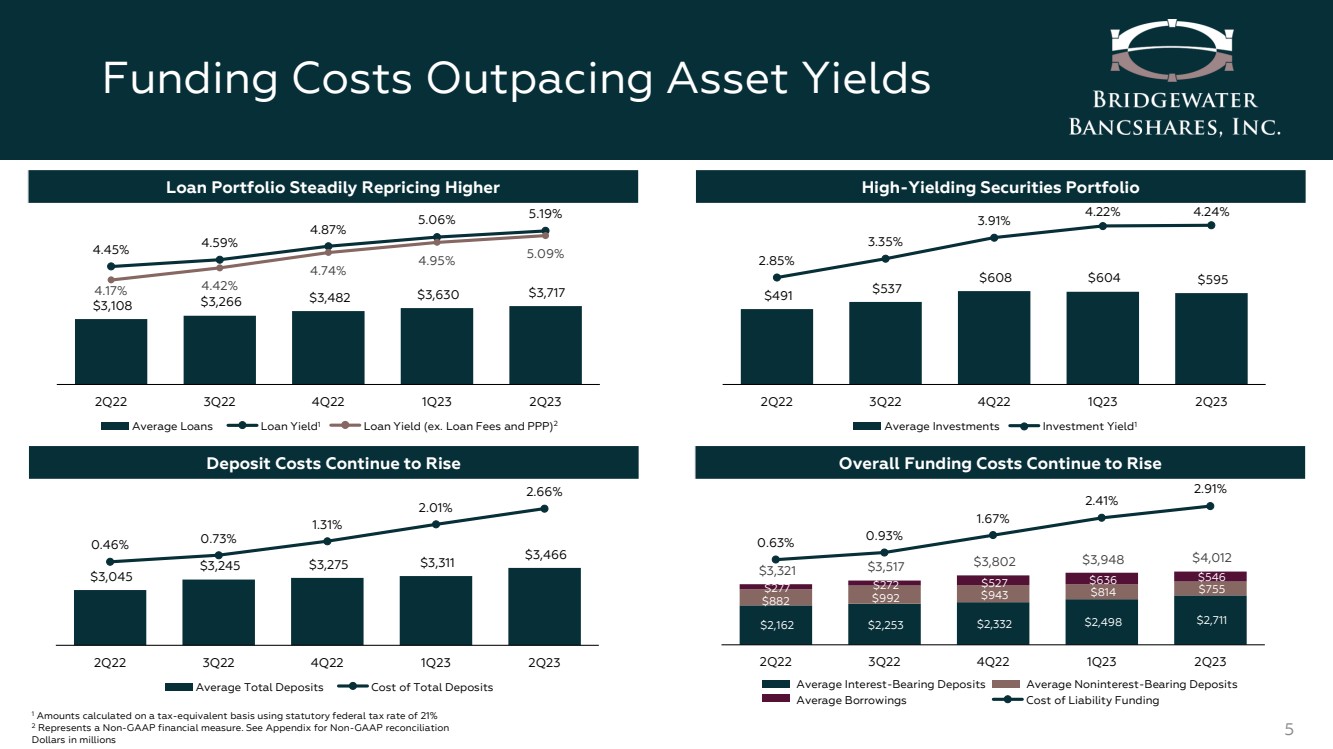
Interest income was $55.0 million for the second quarter of 2023, an increase of $3.0 million, from $52.0 million in the first quarter of 2023, and an increase of $17.2 million, from $37.8 million in the second quarter of 2022. The yield on interest earning assets (on a fully tax-equivalent basis) was 5.06% in the second quarter of 2023, compared to 4.91% in the first quarter of 2023, and 4.16% in the second quarter of 2022. The linked-quarter increase in the yield on interest earning assets was primarily due to the increase in market interest rates resulting in new loan originations and loans repricing at yields accretive to the existing portfolio. The year-over-year increase in the yield on interest earning assets was primarily due to growth and repricing of the loan and securities portfolios in the rising interest rate environment.
Loan interest income and loan fees remain the primary contributing factors to the changes in the yield on interest earning assets. The aggregate loan yield, excluding PPP loans, increased to 5.19% in the second quarter of 2023, which was 13 basis points higher than 5.06% in the first quarter of 2023, and 76 basis points higher than 4.43% in the second quarter of 2022. While loan fees have historically maintained a relatively stable contribution to the aggregate loan yield, the recent periods saw fewer loan prepayments, which historically has accelerated the recognition of loan fees. Despite the decrease in fee recognition, the Company is encouraged that the core loan yield continues to rise as new loan originations and the existing portfolio reprice in the higher rate environment.
A summary of interest and fees recognized on loans, excluding PPP loans, for the periods indicated is as follows:
|
|
Three Months Ended |
||||||||||||||
|
|
June 30, 2023 |
|
|
March 31, 2023 |
|
|
December 31, 2022 |
|
|
September 30, 2022 |
|
|
June 30, 2022 |
|
|
Interest |
|
5.09 |
% |
|
4.95 |
% |
|
4.74 |
% |
|
4.42 |
% |
|
4.17 |
% |
|
Fees |
|
0.10 |
|
|
0.11 |
|
|
0.12 |
|
|
0.17 |
|
|
0.26 |
|
|
Yield on Loans, Excluding PPP Loans |
|
5.19 |
% |
|
5.06 |
% |
|
4.86 |
% |
|
4.59 |
% |
|
4.43 |
% |
|
Interest expense was $29.1 million for the second quarter of 2023, an increase of $5.7 million, from $23.4 million in the first quarter of 2023, and an increase of $23.9 million, from $5.3 million in the second quarter of 2022. The cost of interest bearing liabilities increased 56 basis points on a linked-quarter basis from 3.03% in the first quarter of 2023 to 3.59% in the second quarter of 2023, primarily due to higher rates paid on deposits and increased utilization of FHLB advances in the rising interest rate environment. On a year-over-year basis, the cost of interest bearing liabilities increased 273 basis points from 0.86% in the second quarter of 2022 to 3.59% in the second quarter of 2023, primarily due to the rapid increase in market interest rates that occurred between the periods, which impacted all funding sources.
Interest expense on deposits was $23.0 million for the second quarter of 2023, an increase of $6.6 million, from $16.4 million in the first quarter of 2023, and an increase of $19.5 million, from $3.5 million in the second quarter of 2022. The cost of total deposits increased 65 basis points on a linked-quarter basis from 2.01% in the first quarter of 2023, to 2.66% in the second quarter of 2023, primarily due to the rising interest rate environment and increased competition from other market alternatives. On a year-over-year basis, the cost of total deposits increased 220 basis points from 0.46% in the second quarter of 2022, to 2.66% in the second quarter of 2023, primarily due to upward repricing of the deposit portfolio in the higher interest rate environment.
Page 5 of 17
A summary of the Company’s average balances, interest yields and rates, and net interest margin for the three months ended June 30, 2023, March 31, 2023, and June 30, 2022 is as follows:
|
|
For the Three Months Ended |
|
||||||||||||||||||||||
|
|
June 30, 2023 |
|
March 31, 2023 |
|
June 30, 2022 |
|
||||||||||||||||||
|
|
Average |
|
Interest |
|
Yield/ |
|
Average |
|
Interest |
|
Yield/ |
|
Average |
|
Interest |
|
Yield/ |
|
||||||
|
|
Balance |
|
& Fees |
|
Rate |
|
Balance |
|
& Fees |
|
Rate |
|
Balance |
|
& Fees |
|
Rate |
|
||||||
(dollars in thousands) |
|
|
|
|
|
|
|
|
|
|
|
|
|
|
|
|
|
|
|
|
|
|
|
|
|
Interest Earning Assets: |
|
|
|
|
|
|
|
|
|
|
|
|
|
|
|
|
|
|
|
|
|
|
|
|
|
Cash Investments |
|
$ |
59,963 |
|
$ |
587 |
|
3.93 |
% |
$ |
63,253 |
|
$ |
447 |
|
2.86 |
% |
$ |
61,046 |
|
$ |
40 |
|
0.26 |
% |
Investment Securities: |
|
|
|
|
|
|
|
|
|
|
|
|
|
|
|
|
|
|
|
|
|
|
|
|
|
Taxable Investment Securities |
|
|
568,143 |
|
|
6,000 |
|
4.24 |
|
|
574,242 |
|
|
5,958 |
|
4.21 |
|
|
417,142 |
|
|
2,696 |
|
2.59 |
|
Tax-Exempt Investment Securities (1) |
|
|
27,081 |
|
|
300 |
|
4.44 |
|
|
29,803 |
|
|
330 |
|
4.49 |
|
|
74,261 |
|
|
795 |
|
4.30 |
|
Total Investment Securities |
|
|
595,224 |
|
|
6,300 |
|
4.24 |
|
|
604,045 |
|
|
6,288 |
|
4.22 |
|
|
491,403 |
|
|
3,491 |
|
2.85 |
|
Paycheck Protection Program Loans (2) |
|
|
913 |
|
|
2 |
|
1.00 |
|
|
999 |
|
|
2 |
|
1.00 |
|
|
8,335 |
|
|
263 |
|
12.67 |
|
Loans (1)(2) |
|
|
3,715,621 |
|
|
48,064 |
|
5.19 |
|
|
3,629,447 |
|
|
45,263 |
|
5.06 |
|
|
3,099,344 |
|
|
34,205 |
|
4.43 |
|
Total Loans |
|
|
3,716,534 |
|
|
48,066 |
|
5.19 |
|
|
3,630,446 |
|
|
45,265 |
|
5.06 |
|
|
3,107,679 |
|
|
34,468 |
|
4.45 |
|
Federal Home Loan Bank Stock |
|
|
23,330 |
|
|
456 |
|
7.84 |
|
|
25,962 |
|
|
372 |
|
5.81 |
|
|
11,620 |
|
|
59 |
|
2.04 |
|
Total Interest Earning Assets |
|
|
4,395,051 |
|
|
55,409 |
|
5.06 |
% |
|
4,323,706 |
|
|
52,372 |
|
4.91 |
% |
|
3,671,748 |
|
|
38,058 |
|
4.16 |
% |
Noninterest Earning Assets |
|
|
88,611 |
|
|
|
|
|
|
|
81,528 |
|
|
|
|
|
|
|
71,827 |
|
|
|
|
|
|
Total Assets |
|
$ |
4,483,662 |
|
|
|
|
|
|
$ |
4,405,234 |
|
|
|
|
|
|
$ |
3,743,575 |
|
|
|
|
|
|
Interest Bearing Liabilities: |
|
|
|
|
|
|
|
|
|
|
|
|
|
|
|
|
|
|
|
|
|
|
|
|
|
Deposits: |
|
|
|
|
|
|
|
|
|
|
|
|
|
|
|
|
|
|
|
|
|
|
|
|
|
Interest Bearing Transaction Deposits |
|
$ |
683,034 |
|
$ |
5,918 |
|
3.48 |
% |
$ |
461,372 |
|
$ |
2,780 |
|
2.44 |
% |
$ |
552,502 |
|
$ |
694 |
|
0.50 |
% |
Savings and Money Market Deposits |
|
|
861,947 |
|
|
7,048 |
|
3.28 |
|
|
1,044,794 |
|
|
6,499 |
|
2.52 |
|
|
925,354 |
|
|
1,185 |
|
0.51 |
|
Time Deposits |
|
|
269,439 |
|
|
1,702 |
|
2.53 |
|
|
248,174 |
|
|
1,069 |
|
1.75 |
|
|
280,645 |
|
|
665 |
|
0.95 |
|
Brokered Deposits |
|
|
896,989 |
|
|
8,330 |
|
3.72 |
|
|
743,465 |
|
|
6,026 |
|
3.29 |
|
|
403,931 |
|
|
912 |
|
0.91 |
|
Total Interest Bearing Deposits |
|
|
2,711,409 |
|
|
22,998 |
|
3.40 |
|
|
2,497,805 |
|
|
16,374 |
|
2.66 |
|
|
2,162,432 |
|
|
3,456 |
|
0.64 |
|
Federal Funds Purchased |
|
|
210,677 |
|
|
2,761 |
|
5.26 |
|
|
415,111 |
|
|
4,944 |
|
4.83 |
|
|
137,379 |
|
|
410 |
|
1.20 |
|
Notes Payable |
|
|
13,750 |
|
|
285 |
|
8.33 |
|
|
13,750 |
|
|
263 |
|
7.77 |
|
|
— |
|
|
— |
|
— |
|
FHLB Advances |
|
|
242,714 |
|
|
2,092 |
|
3.46 |
|
|
128,222 |
|
|
861 |
|
2.72 |
|
|
47,511 |
|
|
167 |
|
1.41 |
|
Subordinated Debentures |
|
|
79,041 |
|
|
993 |
|
5.04 |
|
|
78,945 |
|
|
983 |
|
5.05 |
|
|
92,396 |
|
|
1,219 |
|
5.29 |
|
Total Interest Bearing Liabilities |
|
|
3,257,591 |
|
|
29,129 |
|
3.59 |
% |
|
3,133,833 |
|
|
23,425 |
|
3.03 |
% |
|
2,439,718 |
|
|
5,252 |
|
0.86 |
% |
Noninterest Bearing Liabilities: |
|
|
|
|
|
|
|
|
|
|
|
|
|
|
|
|
|
|
|
|
|
|
|
|
|
Noninterest Bearing Transaction Deposits |
|
|
755,040 |
|
|
|
|
|
|
|
813,598 |
|
|
|
|
|
|
|
882,477 |
|
|
|
|
|
|
Other Noninterest Bearing Liabilities |
|
|
64,684 |
|
|
|
|
|
|
|
54,270 |
|
|
|
|
|
|
|
39,932 |
|
|
|
|
|
|
Total Noninterest Bearing Liabilities |
|
|
819,724 |
|
|
|
|
|
|
|
867,868 |
|
|
|
|
|
|
|
922,409 |
|
|
|
|
|
|
Shareholders' Equity |
|
|
406,347 |
|
|
|
|
|
|
|
403,533 |
|
|
|
|
|
|
|
381,448 |
|
|
|
|
|
|
Total Liabilities and Shareholders' Equity |
|
$ |
4,483,662 |
|
|
|
|
|
|
$ |
4,405,234 |
|
|
|
|
|
|
$ |
3,743,575 |
|
|
|
|
|
|
Net Interest Income / Interest Rate Spread |
|
|
|
|
|
26,280 |
|
1.47 |
% |
|
|
|
|
28,947 |
|
1.88 |
% |
|
|
|
|
32,806 |
|
3.30 |
% |
Net Interest Margin (3) |
|
|
|
|
|
|
|
2.40 |
% |
|
|
|
|
|
|
2.72 |
% |
|
|
|
|
|
|
3.58 |
% |
Taxable Equivalent Adjustment: |
|
|
|
|
|
|
|
|
|
|
|
|
|
|
|
|
|
|
|
|
|
|
|
|
|
Tax-Exempt Investment Securities and Loans |
|
|
|
|
|
(408) |
|
|
|
|
|
|
|
(380) |
|
|
|
|
|
|
|
(276) |
|
|
|
Net Interest Income |
|
|
|
|
$ |
25,872 |
|
|
|
|
|
|
$ |
28,567 |
|
|
|
|
|
|
$ |
32,530 |
|
|
|
| (1) | Interest income and average rates for tax-exempt investment securities and loans are presented on a tax-equivalent basis, assuming a statutory federal income tax rate of 21%. |
| (2) | Average loan balances include nonaccrual loans. Interest income on loans includes amortization of deferred loan fees, net of deferred loan costs. |
| (3) | Net interest margin includes the tax equivalent adjustment and represents the annualized results of: (i) the difference between interest income on interest earning assets and the interest expense on interest bearing liabilities, divided by (ii) average interest earning assets for the period. |
Page 6 of 17
Provision for Credit Losses
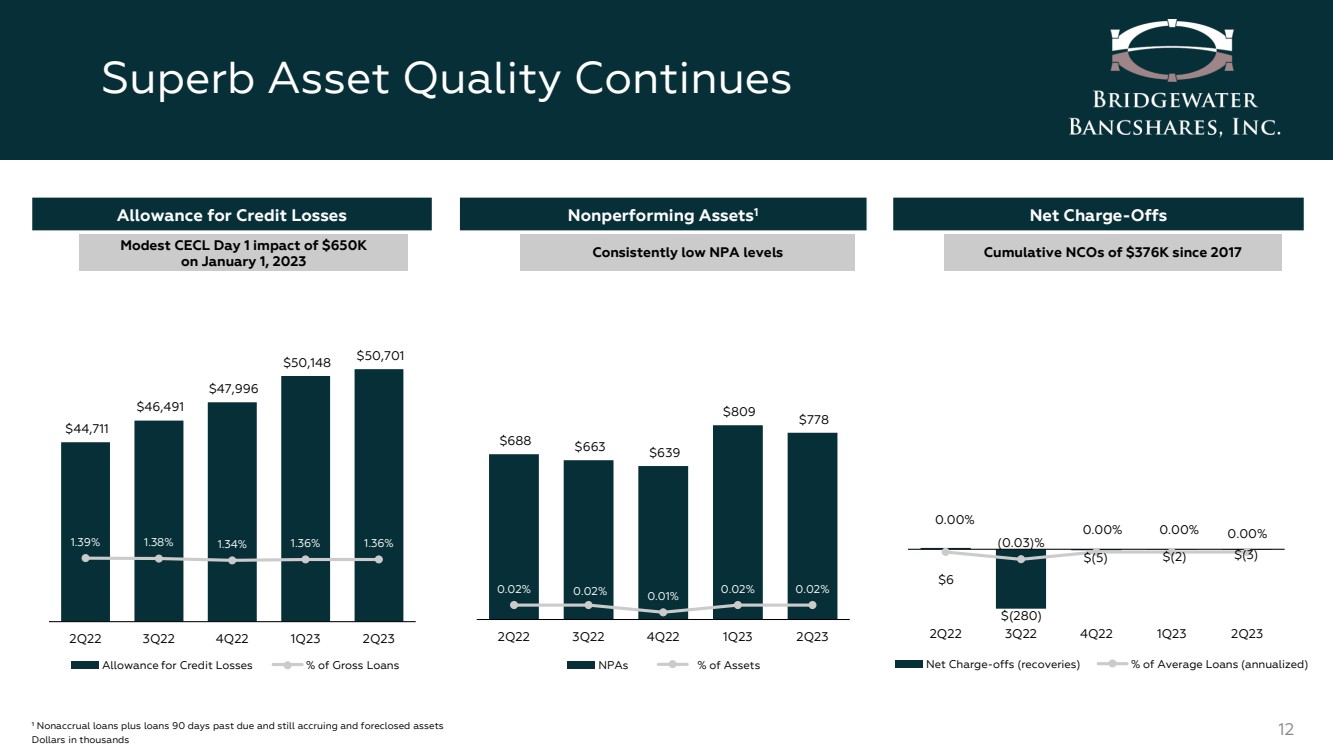
The provision for credit losses on loans was $550,000 for the second quarter of 2023, compared to $1.5 million for the first quarter of 2023 and $3.0 million for the second quarter of 2022. The provision recorded in the second quarter of 2023 was primarily attributable to the growth of the loan portfolio. The allowance for credit losses on loans to total loans was 1.36% at June 30, 2023 and March 31, 2023, compared to 1.39% at June 30, 2022.
The following table presents the activity in the Company’s allowance for credit losses on loans for the periods indicated:
|
|
Three Months Ended |
|
Six Months Ended |
|||||||||||
|
|
June 30, |
|
March 31, |
|
June 30, |
|
June 30, |
|
June 30, |
|||||
(dollars in thousands) |
|
2023 |
|
2023 |
|
2022 |
|
2023 |
|
2022 |
|||||
Balance at Beginning of Period |
|
$ |
50,148 |
|
$ |
47,996 |
|
$ |
41,692 |
|
$ |
47,996 |
|
$ |
40,020 |
Impact of Adopting CECL |
|
|
— |
|
|
650 |
|
|
— |
|
|
650 |
|
|
— |
Provision for Credit Losses |
|
|
550 |
|
|
1,500 |
|
|
3,025 |
|
|
2,050 |
|
|
4,700 |
Charge-offs |
|
|
(3) |
|
|
(4) |
|
|
(14) |
|
|
(7) |
|
|
(29) |
Recoveries |
|
|
6 |
|
|
6 |
|
|
8 |
|
|
12 |
|
|
20 |
Balance at End of Period |
|
$ |
50,701 |
|
$ |
50,148 |
|
$ |
44,711 |
|
$ |
50,701 |
|
$ |
44,711 |
The provision for credit losses for off-balance sheet credit exposures was a negative provision of $500,000 for the second quarter of 2023, compared to a negative $875,000 for the first quarter of 2023 and zero for the second quarter of 2022. The negative provision during the quarter was due to a reduction in outstanding unfunded commitments primarily attributable to the migration to funded loans.
The following table presents a summary of the activity in the provision for credit losses for the periods indicated:
|
|
|
|
|
|
|
|
|
|
|
|
|
|
|
|
|
|
Three Months Ended |
|
Six Months Ended |
|||||||||||
|
|
June 30, |
|
March 31, |
|
June 30, |
|
June 30, |
|
June 30, |
|||||
(dollars in thousands) |
|
2023 |
|
2023 |
|
2022 |
|
2023 |
|
2022 |
|||||
Provision for Credit Losses on Loans |
|
$ |
550 |
|
$ |
1,500 |
|
$ |
3,025 |
|
$ |
2,050 |
|
$ |
4,700 |
Provision for Credit Losses for Off-Balance Sheet Credit Exposures |
|
|
(500) |
|
|
(875) |
|
|
— |
|
|
(1,375) |
|
|
— |
Provision for Credit Losses |
|
$ |
50 |
|
$ |
625 |
|
$ |
3,025 |
|
$ |
675 |
|
$ |
4,700 |
Noninterest Income
Noninterest income was $1.4 million for the second quarter of 2023, a decrease of $528,000 from $1.9 million for the first quarter of 2023, and a decrease of $235,000 from $1.7 million for the second quarter of 2022. The linked-quarter decrease was primarily due to a decrease in letter of credit fees and FHLB prepayment income. The year-over-year decrease was primarily due to decreased letter of credit fees and other income, offset partially by an increase in customer service fees and bank-owned life insurance income.
The following table presents the major components of noninterest income for the periods indicated:
|
|
Three Months Ended |
|
Six Months Ended |
|||||||||||
|
|
June 30, |
|
March 31, |
|
June 30, |
|
June 30, |
|
June 30, |
|||||
(dollars in thousands) |
|
2023 |
|
2023 |
|
2022 |
|
2023 |
|
2022 |
|||||
Noninterest Income: |
|
|
|
|
|
|
|
|
|
|
|
|
|
|
|
Customer Service Fees |
|
$ |
368 |
|
$ |
349 |
|
$ |
298 |
|
$ |
717 |
|
$ |
579 |
Net Gain (Loss) on Sales of Securities |
|
|
50 |
|
|
(56) |
|
|
52 |
|
|
(6) |
|
|
52 |
Letter of Credit Fees |
|
|
379 |
|
|
634 |
|
|
564 |
|
|
1,013 |
|
|
806 |
Debit Card Interchange Fees |
|
|
155 |
|
|
138 |
|
|
152 |
|
|
293 |
|
|
285 |
Swap Fees |
|
|
— |
|
|
— |
|
|
— |
|
|
— |
|
|
557 |
Bank-Owned Life Insurance |
|
|
238 |
|
|
234 |
|
|
149 |
|
|
472 |
|
|
297 |
FHLB Prepayment Income |
|
|
— |
|
|
299 |
|
|
— |
|
|
299 |
|
|
— |
Other Income |
|
|
225 |
|
|
345 |
|
|
435 |
|
|
570 |
|
|
631 |
Totals |
|
$ |
1,415 |
|
$ |
1,943 |
|
$ |
1,650 |
|
$ |
3,358 |
|
$ |
3,207 |
Page 7 of 17
Noninterest Expense
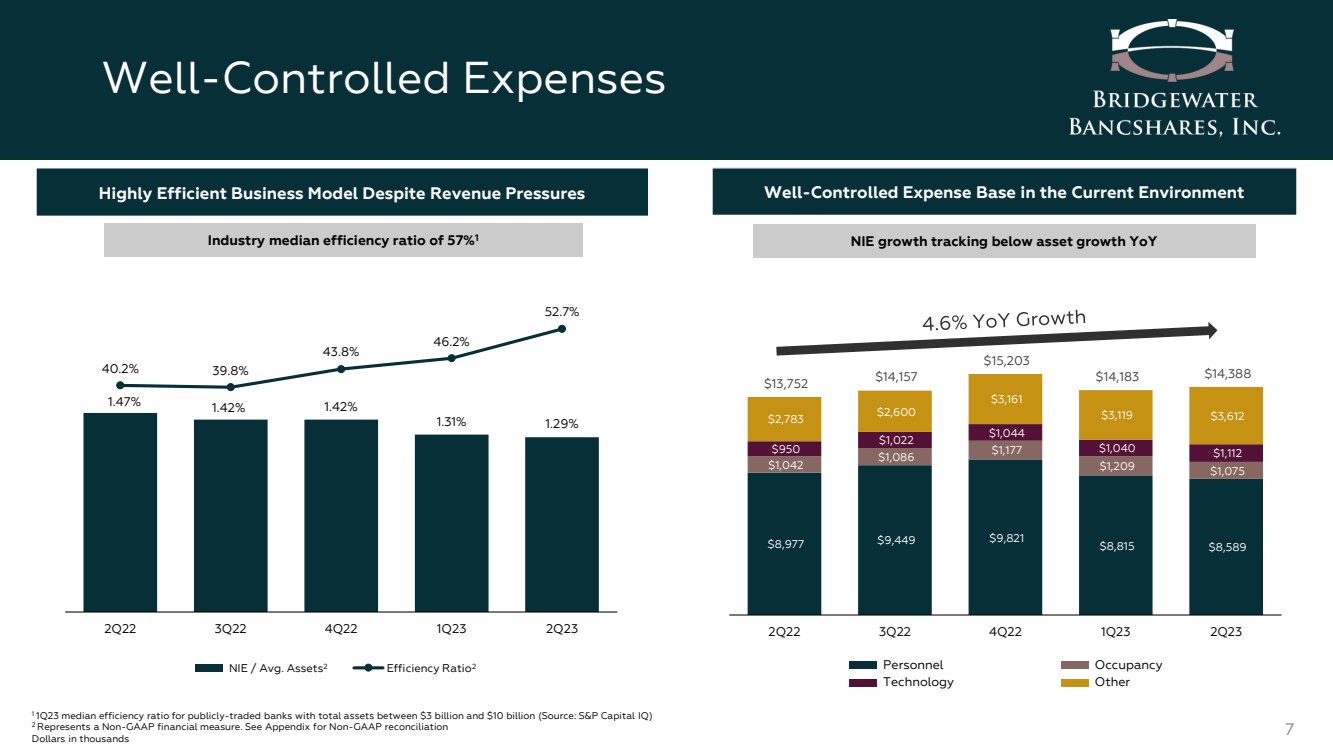
Noninterest expense was $14.4 million for the second quarter of 2023, an increase of $205,000 from $14.2 million for the first quarter of 2023, and an increase of $636,000 from $13.8 million for the second quarter of 2022. The linked-quarter increase was primarily due to industry-wide increases in the FDIC insurance assessment, offset partially by a decrease in salaries and employee benefits resulting from lower discretionary incentive accruals and a decrease in occupancy and equipment. The year-over-year increase was primarily attributable to increases in the FDIC insurance assessment and derivative collateral fees, offset partially by decreases in salaries and employee benefits and marketing and advertising.
The following table presents the major components of noninterest expense for the periods indicated:
|
|
Three Months Ended |
|
Six Months Ended |
|||||||||||
|
|
June 30, |
|
March 31, |
|
June 30, |
|
June 30, |
|
June 30, |
|||||
(dollars in thousands) |
|
2023 |
|
2023 |
|
2022 |
|
2023 |
|
2022 |
|||||
Noninterest Expense: |
|
|
|
|
|
|
|
|
|
|
|
|
|
|
|
Salaries and Employee Benefits |
|
$ |
8,589 |
|
$ |
8,815 |
|
$ |
8,977 |
|
$ |
17,404 |
|
$ |
17,671 |
Occupancy and Equipment |
|
|
1,075 |
|
|
1,209 |
|
|
1,042 |
|
|
2,284 |
|
|
2,127 |
FDIC Insurance Assessment |
|
|
900 |
|
|
665 |
|
|
330 |
|
|
1,565 |
|
|
690 |
Data Processing |
|
|
401 |
|
|
357 |
|
|
356 |
|
|
758 |
|
|
653 |
Professional and Consulting Fees |
|
|
829 |
|
|
755 |
|
|
742 |
|
|
1,584 |
|
|
1,436 |
Derivative Collateral Fees |
|
|
404 |
|
|
380 |
|
|
27 |
|
|
784 |
|
|
29 |
Information Technology and Telecommunications |
|
|
711 |
|
|
683 |
|
|
594 |
|
|
1,394 |
|
|
1,172 |
Marketing and Advertising |
|
|
321 |
|
|
262 |
|
|
524 |
|
|
583 |
|
|
1,150 |
Intangible Asset Amortization |
|
|
34 |
|
|
48 |
|
|
47 |
|
|
82 |
|
|
95 |
Amortization of Tax Credit Investments |
|
|
114 |
|
|
114 |
|
|
63 |
|
|
228 |
|
|
180 |
Other Expense |
|
|
1,010 |
|
|
895 |
|
|
1,050 |
|
|
1,905 |
|
|
2,057 |
Totals |
|
$ |
14,388 |
|
$ |
14,183 |
|
$ |
13,752 |
|
$ |
28,571 |
|
$ |
27,260 |
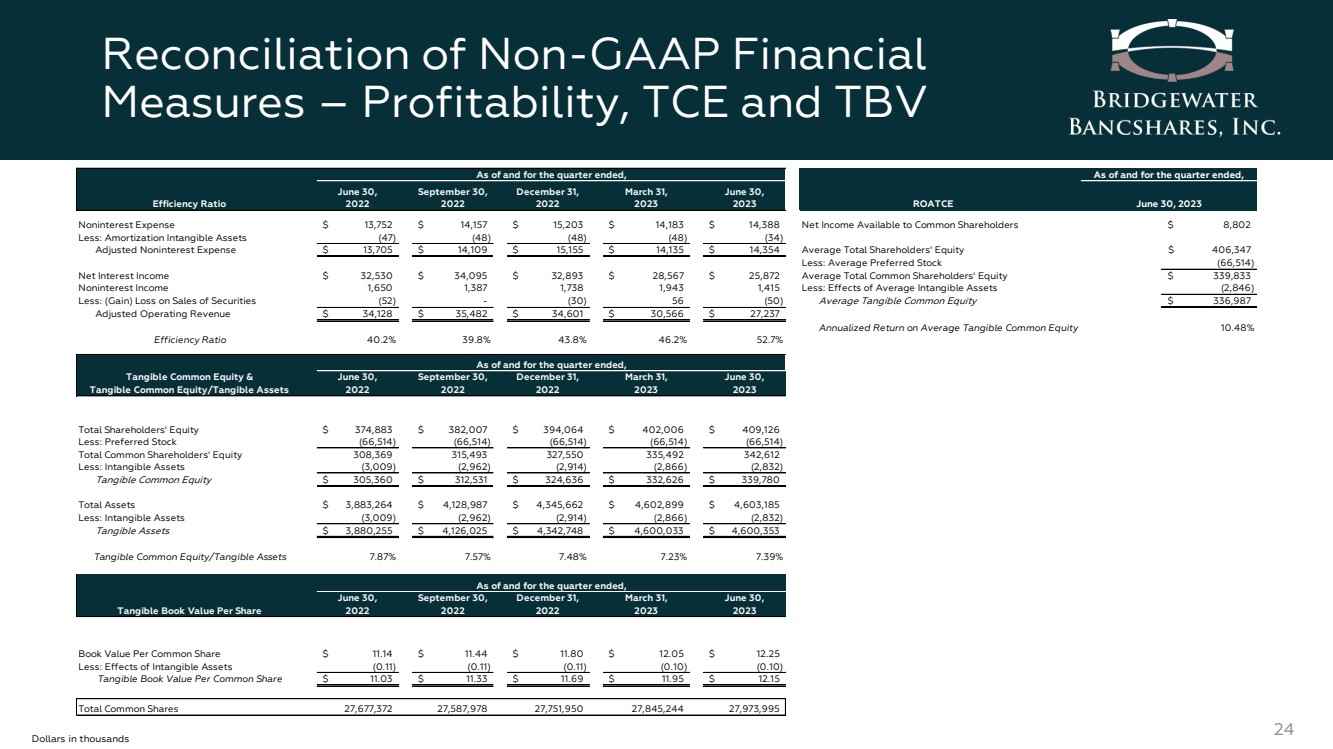
The Company had 253 full-time equivalent employees at June 30, 2023, compared to 246 employees at March 31, 2023, and 236 employees at June 30, 2022. The efficiency ratio, a non-GAAP financial measure, was 52.7% for the second quarter of 2023, compared to 46.2% for the first quarter of 2023, and 40.2% for the second quarter of 2022.
Income Taxes
The effective combined federal and state income tax rate for the second quarter of 2023 was 23.6%, a decrease from 25.9% for the first quarter of 2023, and 26.0% for the second quarter of 2022.
Balance Sheet
Total assets at June 30, 2023 and March 31, 2023 were $4.60 billion, an 18.5% increase from $3.88 billion at June 30, 2022. The year-over-year increase in total assets was primarily due to strong loan growth, purchases of investment securities, and an increase in cash and cash equivalent balances.
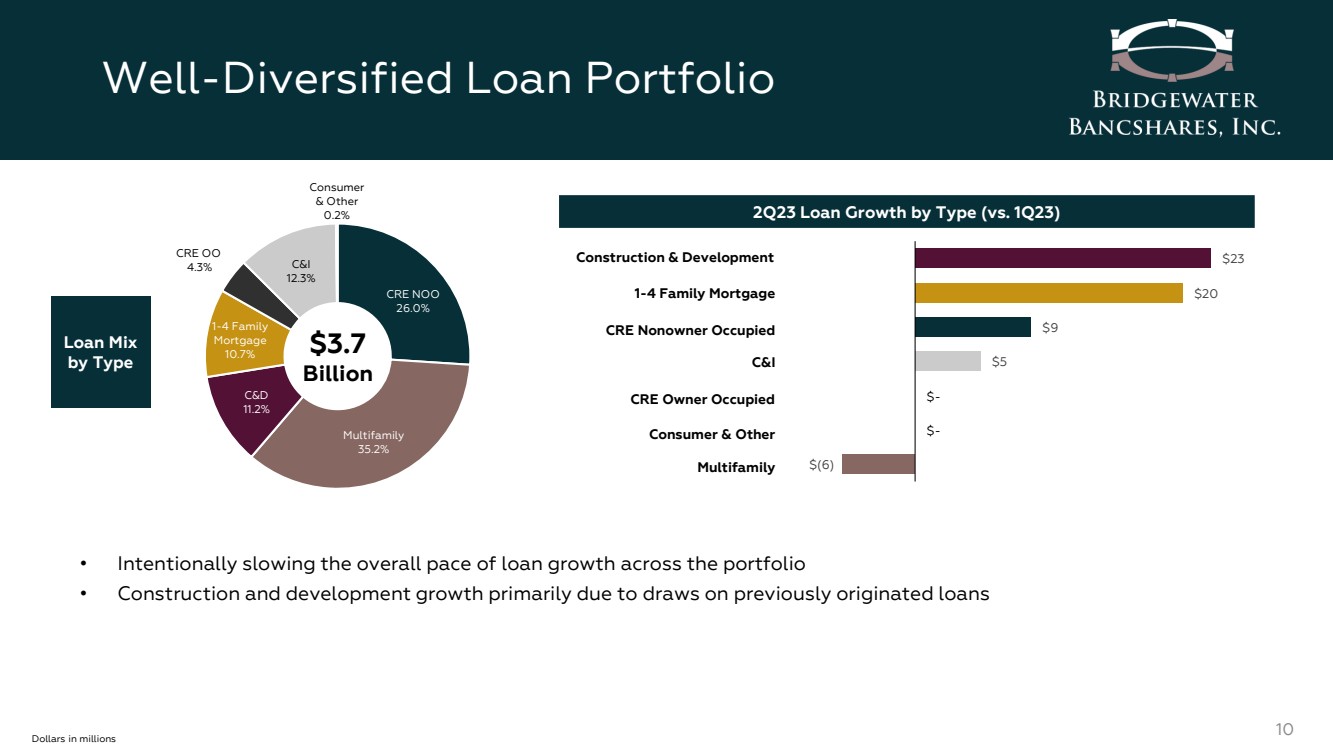
Total gross loans at June 30, 2023 were $3.74 billion, an increase of $51.9 million, or 5.6% annualized, over total gross loans of $3.68 billion at March 31, 2023, and an increase of $510.3 million, or 15.8%, over total gross loans of $3.23 billion at June 30, 2022. The increase in the loan portfolio during the second quarter of 2023 was primarily due to the funding of existing construction and land development loans and growth in the 1-4 family mortgage segment, offset partially by a decrease in the 1-4 family construction segment.
Page 8 of 17
The following table presents the dollar composition of the Company’s loan portfolio, by category, at the dates indicated:
|
|
June 30, 2023 |
|
March 31, 2023 |
|
December 31, 2022 |
|
September 30, 2022 |
|
June 30, 2022 |
|
|||||
(dollars in thousands) |
|
|
|
|
|
|
|
|
|
|
|
|
|
|
|
|
Commercial |
|
$ |
459,184 |
|
$ |
454,193 |
|
$ |
435,344 |
|
$ |
412,448 |
|
$ |
403,569 |
|
Paycheck Protection Program |
|
|
877 |
|
|
963 |
|
|
1,049 |
|
|
1,192 |
|
|
4,860 |
|
Construction and Land Development |
|
|
351,069 |
|
|
312,277 |
|
|
295,554 |
|
|
280,380 |
|
|
305,552 |
|
1 - 4 Family Construction |
|
|
69,648 |
|
|
85,797 |
|
|
70,242 |
|
|
55,177 |
|
|
53,639 |
|
Real Estate Mortgage: |
|
|
|
|
|
|
|
|
|
|
|
|
|
|
|
|
1 - 4 Family Mortgage |
|
|
400,708 |
|
|
380,210 |
|
|
355,474 |
|
|
341,102 |
|
|
334,815 |
|
Multifamily |
|
|
1,314,524 |
|
|
1,320,081 |
|
|
1,306,738 |
|
|
1,230,509 |
|
|
1,087,865 |
|
CRE Owner Occupied |
|
|
159,088 |
|
|
158,650 |
|
|
149,905 |
|
|
151,088 |
|
|
142,214 |
|
CRE Nonowner Occupied |
|
|
971,532 |
|
|
962,671 |
|
|
947,008 |
|
|
900,691 |
|
|
886,432 |
|
Total Real Estate Mortgage Loans |
|
|
2,845,852 |
|
|
2,821,612 |
|
|
2,759,125 |
|
|
2,623,390 |
|
|
2,451,326 |
|
Consumer and Other |
|
|
9,581 |
|
|
9,518 |
|
|
8,132 |
|
|
7,495 |
|
|
6,939 |
|
Total Loans, Gross |
|
|
3,736,211 |
|
|
3,684,360 |
|
|
3,569,446 |
|
|
3,380,082 |
|
|
3,225,885 |
|
Allowance for Loan Losses |
|
|
(50,701) |
|
|
(50,148) |
|
|
(47,996) |
|
|
(46,491) |
|
|
(44,711) |
|
Net Deferred Loan Fees |
|
|
(7,718) |
|
|
(8,735) |
|
|
(9,293) |
|
|
(9,088) |
|
|
(9,536) |
|
Total Loans, Net |
|
$ |
3,677,792 |
|
$ |
3,625,477 |
|
$ |
3,512,157 |
|
$ |
3,324,503 |
|
$ |
3,171,638 |
|
Total deposits at June 30, 2023 were $3.58 billion, an increase of $166.8 million, or 19.6% annualized, over total deposits of $3.41 billion at March 31, 2023, and an increase of $376.0 million, or 11.7%, over total deposits of $3.20 billion at June 30, 2022. Deposits increased in the second quarter of 2023 primarily due to inflows of core deposits, defined as deposits excluding brokered deposits and time deposits greater than $250,000, and brokered deposits. Brokered deposits continue to be used as a supplemental funding source, as needed, to support continued loan portfolio growth. Uninsured deposits as of June 30, 2023 were 22% of total deposits, down from 24% as of March 31, 2023.
The following table presents the dollar composition of the Company’s deposit portfolio, by category, at the dates indicated:
|
|
June 30, 2023 |
|
March 31, 2023 |
|
December 31, 2022 |
|
September 30, 2022 |
|
June 30, 2022 |
|
|||||
(dollars in thousands) |
|
|
|
|
|
|
|
|
|
|
|
|
|
|
|
|
Noninterest Bearing Transaction Deposits |
|
$ |
751,217 |
|
$ |
742,198 |
|
$ |
884,272 |
|
$ |
961,084 |
|
$ |
961,998 |
|
Interest Bearing Transaction Deposits |
|
|
719,488 |
|
|
630,037 |
|
|
451,992 |
|
|
510,396 |
|
|
522,151 |
|
Savings and Money Market Deposits |
|
|
860,613 |
|
|
913,013 |
|
|
1,031,873 |
|
|
1,077,333 |
|
|
952,138 |
|
Time Deposits |
|
|
271,783 |
|
|
266,213 |
|
|
272,253 |
|
|
293,052 |
|
|
272,424 |
|
Brokered Deposits |
|
|
974,831 |
|
|
859,662 |
|
|
776,153 |
|
|
463,209 |
|
|
493,242 |
|
Total Deposits |
|
$ |
3,577,932 |
|
$ |
3,411,123 |
|
$ |
3,416,543 |
|
$ |
3,305,074 |
|
$ |
3,201,953 |
|
Capital
Total shareholders’ equity at June 30, 2023 was $409.1 million, an increase of $7.1 million, or 1.8%, compared to total shareholders’ equity of $402.0 million at March 31, 2023, and an increase of $34.2 million, or 9.1%, over total shareholders’ equity of $374.9 million at June 30, 2022. The linked-quarter increase was due to net income retained and unrealized gains in the derivatives portfolio, offset partially by an increase in unrealized losses in the securities portfolio and preferred stock dividends. The year-over-year increase was due to net income retained and unrealized gains in the derivatives portfolio, offset partially by an increase in unrealized losses in the securities portfolio, stock repurchases, the adoption of the Current Expected Credit Losses (CECL) accounting methodology and preferred stock dividends. The Company did not purchase any shares of its common stock during the second quarter of 2023.
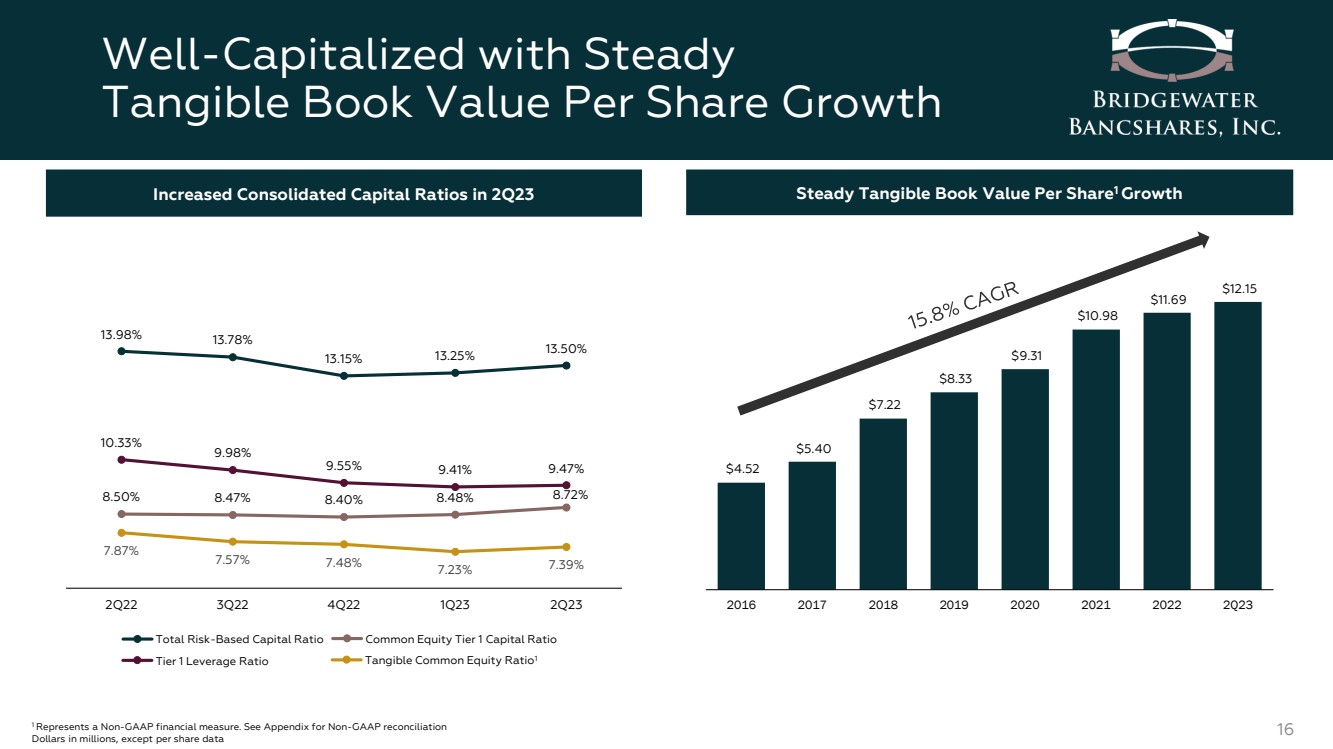
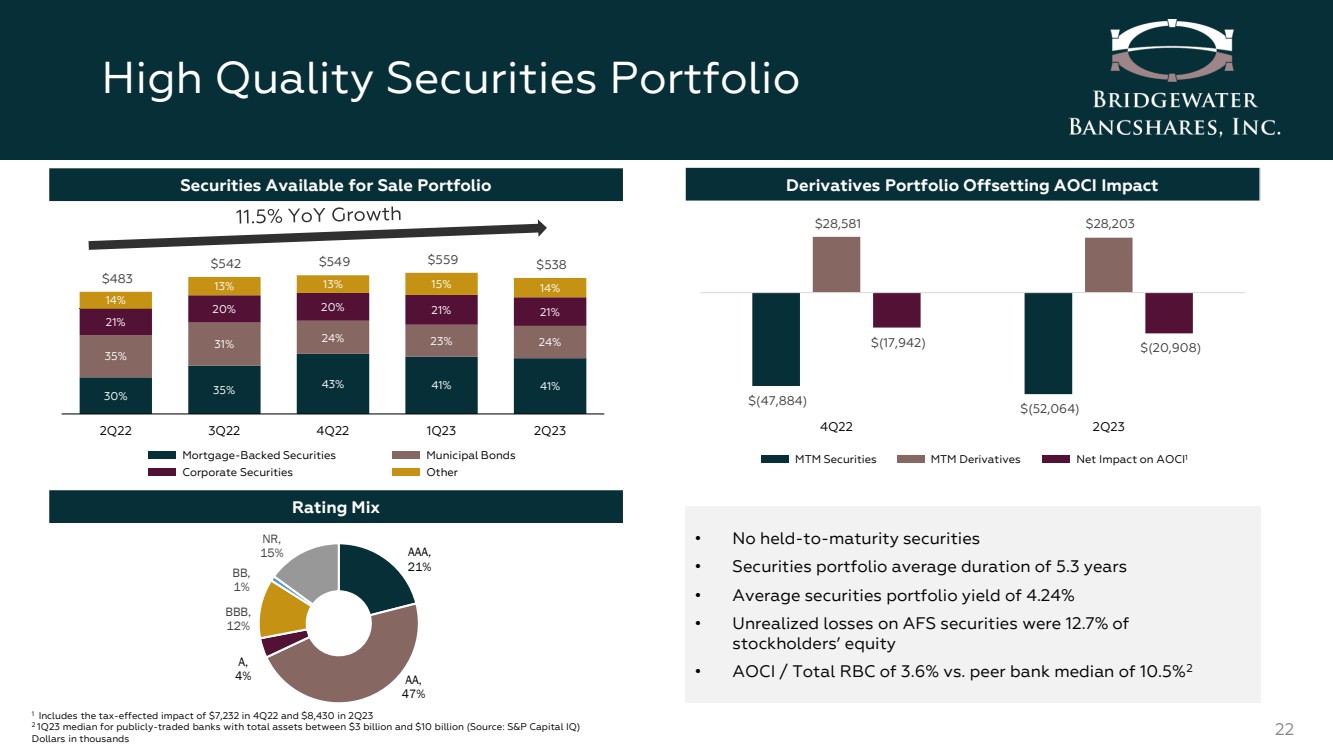
Tangible book value per share, a non-GAAP financial measure, was $12.15 as of June 30, 2023, an increase of 1.7% from $11.95 as of March 31, 2023, and an increase of 10.1% from $11.03 as of June 30, 2022. The linked-quarter and year-over-year increases occurred despite the market value depreciation of the securities portfolio driven by the rising interest rate environment. Tangible common equity as a percentage of tangible assets, a non-GAAP financial measure, was 7.39% at June 30, 2023, compared to 7.23% at March 31, 2023, and 7.87% at June 30, 2022.
Today, the Company also announced that its Board of Directors has declared a quarterly cash dividend on its 5.875% Non-Cumulative Perpetual Preferred Stock, Series A (Series A Preferred Stock). The quarterly cash dividend of $36.72 per share, equivalent to $0.3672 per depositary share, each representing a 1/100th interest in a share of the Series A Preferred Stock (Nasdaq: BWBBP), is payable on September 1, 2023 to shareholders of record of the Series A Preferred Stock at the close of business on August 15, 2023.
Page 9 of 17
Liquidity
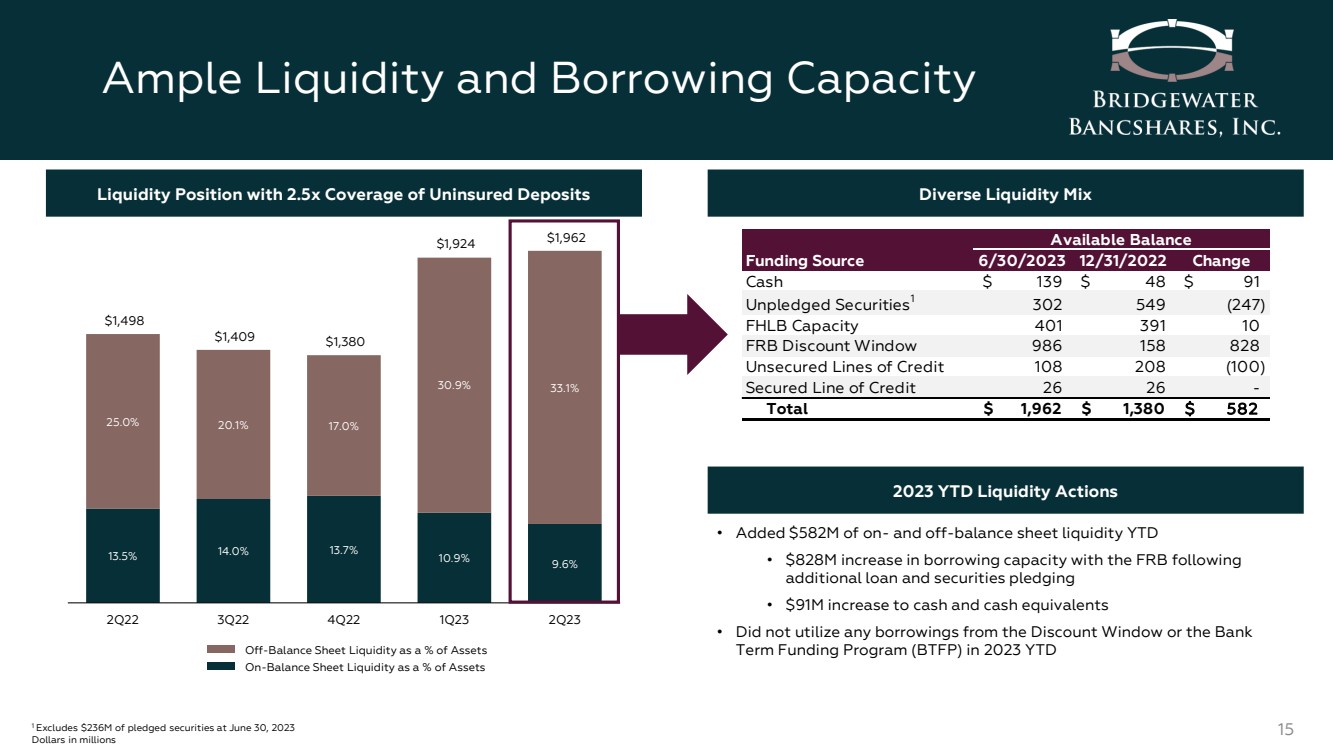
Total on- and off-balance sheet liquidity was $1.96 billion as of June 30, 2023, compared to $1.92 billion at March 31, 2023 and $1.53 billion at June 30, 2022. The Company did not utilize the Bank Term Funding Program (BTFP) or Federal Reserve Discount Window during the second quarter of 2023.
Primary Liquidity—On-Balance Sheet |
|
June 30, 2023 |
|
March 31, 2023 |
|
December 31, 2022 |
|
September 30, 2022 |
|
June 30, 2022 |
|
|||||
(dollars in thousands) |
|
|
|
|
|
|
|
|
|
|
|
|
|
|
|
|
Cash and Cash Equivalents |
|
$ |
138,618 |
|
$ |
177,116 |
|
$ |
48,090 |
|
$ |
36,332 |
|
$ |
43,168 |
|
Securities Available for Sale |
|
|
538,220 |
|
|
559,430 |
|
|
548,613 |
|
|
542,007 |
|
|
482,583 |
|
Less: Pledged Securities |
|
|
(236,206) |
|
|
(234,452) |
|
|
— |
|
|
— |
|
|
— |
|
Total Primary Liquidity |
|
$ |
440,632 |
|
$ |
502,094 |
|
$ |
596,703 |
|
$ |
578,339 |
|
$ |
525,751 |
|
Ratio of Primary Liquidity to Total Deposits |
|
|
12.3 |
% |
|
14.7 |
% |
|
17.5 |
% |
|
17.5 |
% |
|
16.4 |
% |
|
|
|
|
|
|
|
|
|
|
|
|
|
|
|
|
|
Secondary Liquidity—Off-Balance Sheet |
|
|
|
|
|
|
|
|
|
|
|
|
|
|
|
|
Borrowing Capacity |
|
|
|
|
|
|
|
|
|
|
|
|
|
|
|
|
Net Secured Borrowing Capacity with the FHLB |
|
$ |
400,792 |
|
$ |
246,795 |
|
$ |
390,898 |
|
$ |
426,604 |
|
$ |
569,076 |
|
Net Secured Borrowing Capacity with the Federal Reserve Bank |
|
|
986,644 |
|
|
990,685 |
|
|
157,827 |
|
|
156,534 |
|
|
169,766 |
|
Unsecured Borrowing Capacity with Correspondent Lenders |
|
|
108,000 |
|
|
158,000 |
|
|
208,000 |
|
|
208,000 |
|
|
208,000 |
|
Secured Borrowing Capacity with Correspondent Lender |
|
|
26,250 |
|
|
26,250 |
|
|
26,250 |
|
|
40,000 |
|
|
25,000 |
|
Total Secondary Liquidity |
|
|
1,521,686 |
|
|
1,421,730 |
|
|
782,975 |
|
|
831,138 |
|
|
971,842 |
|
Total Primary and Secondary Liquidity |
|
$ |
1,962,318 |
|
$ |
1,923,824 |
|
$ |
1,379,678 |
|
$ |
1,409,477 |
|
$ |
1,497,593 |
|
Ratio of Primary and Secondary Liquidity to Total Deposits |
|
|
54.8 |
% |
|
56.4 |
% |
|
40.4 |
% |
|
42.6 |
% |
|
46.8 |
% |
Asset Quality
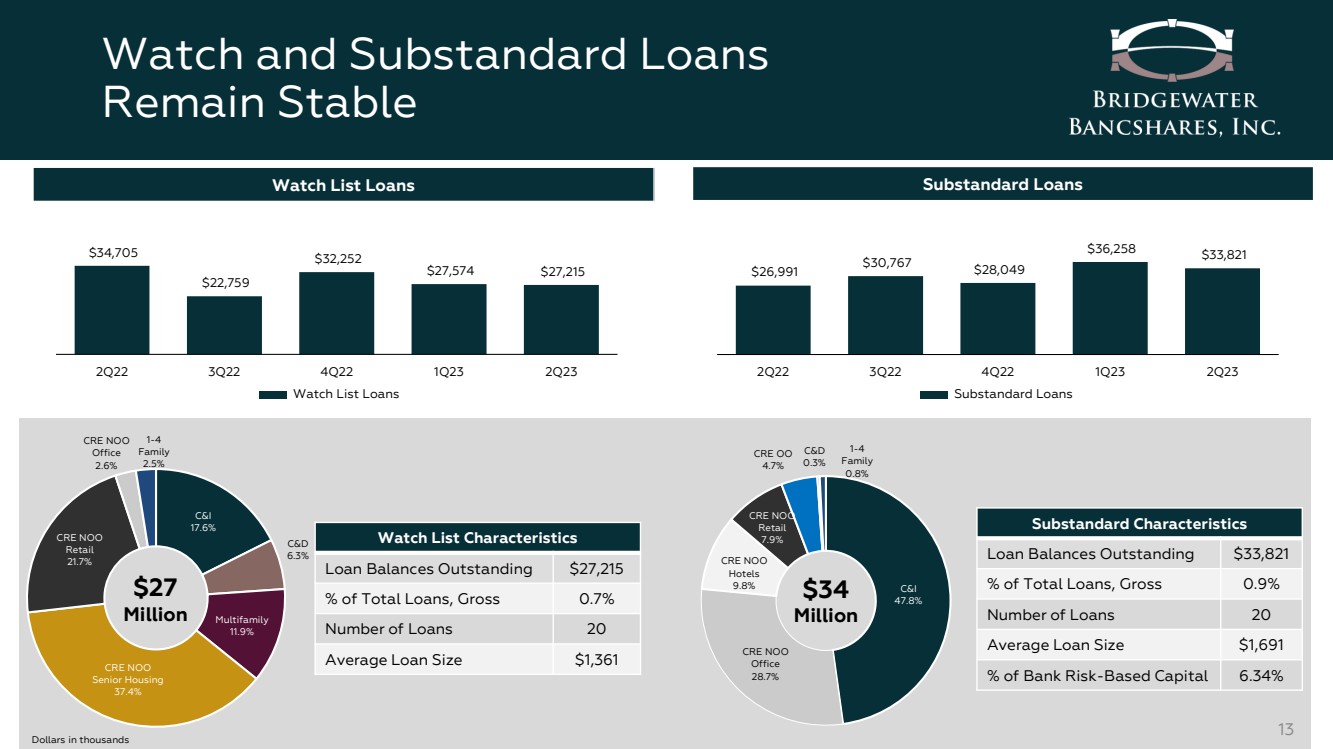
Annualized net charge-offs (recoveries) as a percentage of average loans were 0.00% for the second quarter of 2023, first quarter of 2023 and second quarter of 2022. At June 30, 2023, the Company’s nonperforming assets, which include nonaccrual loans, loans past due 90 days and still accruing, and foreclosed assets, were $778,000, or 0.02% of total assets, as compared to $809,000, or 0.02% of total assets at March 31, 2023, and $688,000, or 0.02% of total assets at June 30, 2022.
Loans that have potential weaknesses that warrant a watchlist risk rating at June 30, 2023 totaled $27.2 million, compared to $27.6 million at March 31, 2023, and $34.7 million at June 30, 2022. Loans that warranted a substandard risk rating at June 30, 2023 totaled $33.8 million, compared to $36.3 million at March 31, 2023, and $27.0 million at June 30, 2022. The linked-quarter decrease was primarily due to the upgrade of one loan relationship; however, increased uncertainty in the economic environment may result in future watchlist or adverse classifications in the loan portfolio.
The following table presents a summary of asset quality measurements at the dates indicated:
|
|
As of and for the Three Months Ended |
|
|||||||||||||
|
|
June 30, |
|
March 31, |
|
December 31 |
|
September 30, |
|
June 30, |
|
|||||
(dollars in thousands) |
|
2023 |
|
2023 |
|
2022 |
|
2022 |
|
2022 |
|
|||||
Selected Asset Quality Data |
|
|
|
|
|
|
|
|
|
|
|
|
|
|
|
|
Loans 30-89 Days Past Due |
|
$ |
— |
|
$ |
21 |
|
$ |
186 |
|
$ |
38 |
|
$ |
225 |
|
Loans 30-89 Days Past Due to Total Loans |
|
|
0.00 |
% |
|
0.00 |
% |
|
0.01 |
% |
|
0.00 |
% |
|
0.01 |
% |
Nonperforming Loans |
|
$ |
662 |
|
$ |
693 |
|
$ |
639 |
|
$ |
663 |
|
$ |
688 |
|
Nonperforming Loans to Total Loans |
|
|
0.02 |
% |
|
0.02 |
% |
|
0.02 |
% |
|
0.02 |
% |
|
0.02 |
% |
Foreclosed Assets |
|
$ |
116 |
|
$ |
116 |
|
$ |
— |
|
$ |
— |
|
$ |
— |
|
Nonaccrual Loans to Total Loans |
|
|
0.02 |
% |
|
0.02 |
% |
|
0.02 |
% |
|
0.02 |
% |
|
0.02 |
% |
Nonaccrual Loans and Loans Past Due 90 Days and Still Accruing to Total Loans |
|
|
0.02 |
|
|
0.02 |
|
|
0.02 |
|
|
0.02 |
|
|
0.02 |
|
Nonperforming Assets (1) |
|
$ |
778 |
|
$ |
809 |
|
$ |
639 |
|
$ |
663 |
|
$ |
688 |
|
Nonperforming Assets to Total Assets (1) |
|
|
0.02 |
% |
|
0.02 |
% |
|
0.01 |
% |
|
0.02 |
% |
|
0.02 |
% |
Allowance for Credit Losses to Total Loans |
|
|
1.36 |
|
|
1.36 |
|
|
1.34 |
|
|
1.38 |
|
|
1.39 |
|
Allowance for Credit Losses to Nonaccrual Loans |
|
|
7,658.76 |
|
|
7,236.36 |
|
|
7,511.11 |
|
|
7,012.22 |
|
|
6,498.69 |
|
Net Loan Charge-Offs (Recoveries) (Annualized) to Average Loans |
|
|
0.00 |
|
|
0.00 |
|
|
0.00 |
|
|
(0.03) |
|
|
0.00 |
|
| (1) | Nonperforming assets are defined as nonaccrual loans plus loans 90 days past due and still accruing plus foreclosed assets. |
Page 10 of 17
The Company will host a conference call to discuss its second quarter 2023 financial results on Thursday, July 27, 2023 at 8:00 a.m. Central Time. The conference call can be accessed by dialing 844-481-2913 and requesting to join the Bridgewater Bancshares earnings call. To listen to a replay of the conference call via phone, please dial 877-344-7529 and enter access code 5127957. The replay will be available through August 3, 2023. The conference call will also be available via a live webcast on the Investor Relations section of the Company’s website, investors.bridgewaterbankmn.com, and archived for replay.
About the Company
Bridgewater Bancshares, Inc. (Nasdaq: BWB) is a St. Louis Park, Minnesota-based financial holding company. Bridgewater's banking subsidiary, Bridgewater Bank, is a premier, full-service Twin Cities bank dedicated to serving the diverse needs of commercial real estate investors, entrepreneurs, business clients and successful individuals. By pairing a range of deposit, lending, and business services solutions with a responsive service model, Bridgewater has seen continuous growth and profitability. With total assets of $4.6 billion and seven branches as of June 30, 2023, Bridgewater is considered one of the largest locally led banks in the State of Minnesota, and has received numerous awards for its growth, banking services, and esteemed corporate culture.
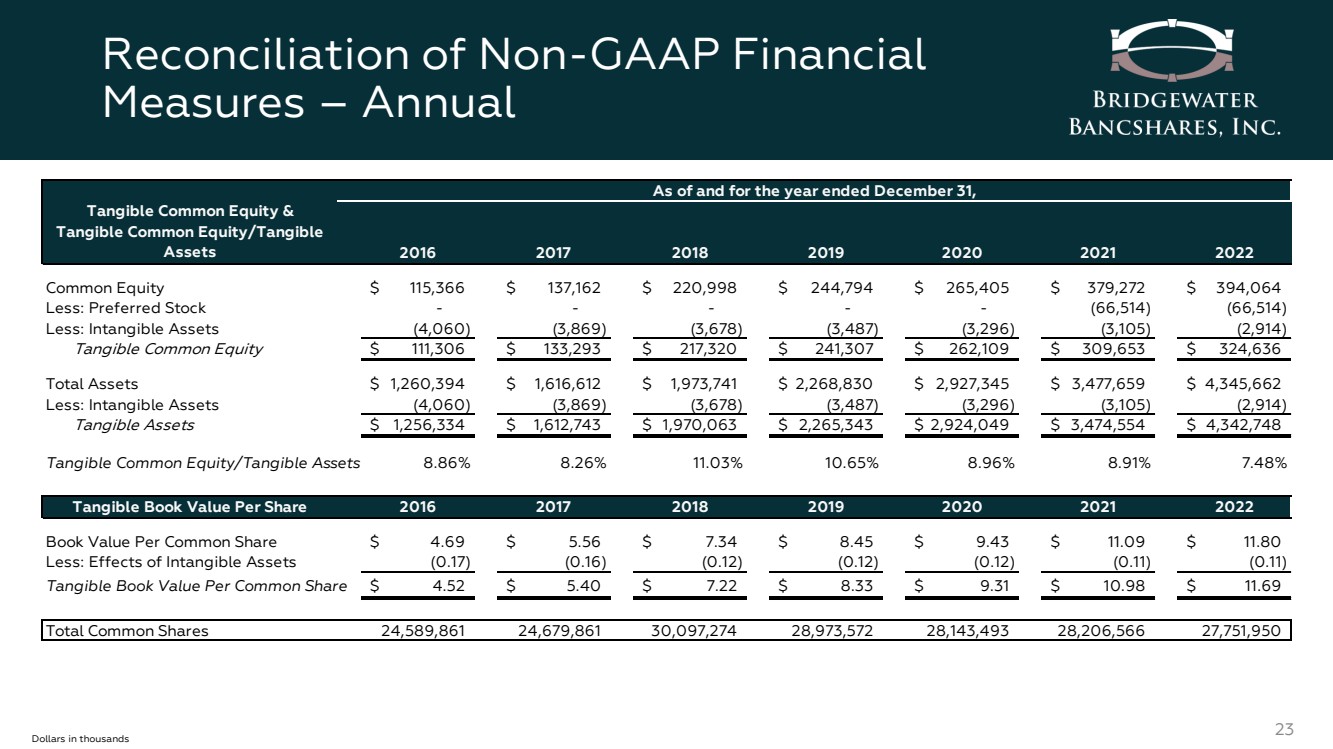
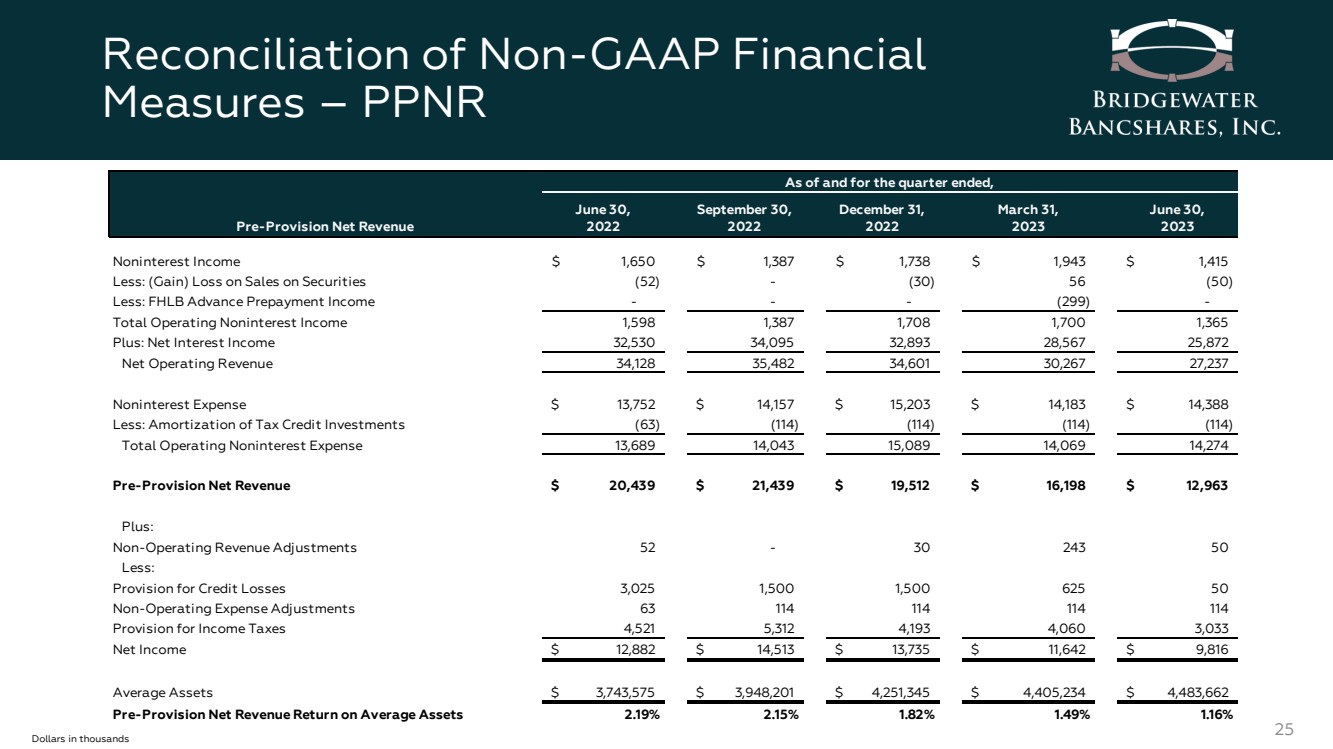
Use of Non-GAAP financial measures
In addition to the results presented in accordance with U.S. Generally Accepted Accounting Principles (GAAP), the Company routinely supplements its evaluation with an analysis of certain non-GAAP financial measures. The Company believes these non-GAAP financial measures, in addition to the related GAAP measures, provide meaningful information to investors to help them understand the Company’s operating performance and trends, and to facilitate comparisons with the performance of peers. These disclosures should not be viewed as a substitute for operating results determined in accordance with GAAP, nor are they necessarily comparable to non-GAAP performance measures that may be presented by other companies. Reconciliations of non-GAAP disclosures used in this earnings release to the comparable GAAP measures are provided in the accompanying tables.
Forward-Looking Statements
This earnings release contains “forward-looking statements” within the meaning of the safe harbor provisions of the U.S. Private Securities Litigation Reform Act of 1995. Forward-looking statements include, without limitation, statements concerning plans, estimates, calculations, forecasts and projections with respect to the anticipated future performance of the Company. These statements are often, but not always, identified by words such as “may”, “might”, “should”, “could”, “predict”, “potential”, “believe”, “expect”, “continue”, “will”, “anticipate”, “seek”, “estimate”, “intend”, “plan”, “projection”, “would”, “annualized”, “target” and “outlook”, or the negative version of those words or other comparable words of a future or forward-looking nature.
Forward-looking statements are neither historical facts nor assurances of future performance. Instead, they are based only on our current beliefs, expectations and assumptions regarding our business, future plans and strategies, projections, anticipated events and trends, the economy and other future conditions. Because forward-looking statements relate to the future, they are subject to inherent uncertainties, risks and changes in circumstances that are difficult to predict and many of which are outside of our control. Our actual results and financial condition may differ materially from those indicated in the forward-looking statements. Therefore, you should not rely on any of these forward-looking statements. Important factors that could cause our actual results and financial condition to differ materially from those indicated in the forward-looking statements include, among others, the following: interest rate risk, including the effects of recent and anticipated rate increases by the Federal Reserve; fluctuations in the values of the securities held in our securities portfolio, including as the result of rising interest rates, which has resulted in unrealized losses in our portfolio; business and economic conditions generally and in the financial services industry, nationally and within our market area, including rising rates of inflation and possible recession; the effects of recent developments and events in the financial services industry, including the large-scale deposit withdrawals over a short period of time at Silicon Valley Bank and Signature Bank that resulted in the failure of those institutions; loan concentrations in our portfolio; the overall health of the local and national real estate market; our ability to successfully manage credit risk; our ability to maintain an adequate level of allowance for loan losses; new or revised accounting standards, including as a result of the implementation of the Current Expected Credit Loss standard; the concentration of large loans to certain borrowers; the concentration of large deposits from certain clients, who have balances above current FDIC insurance limits and may withdraw deposits to diversify their exposure; our ability to successfully manage liquidity risk, which may increase our dependence on non-core funding sources such as brokered deposits, and negatively impact our cost of funds; our ability to raise additional capital to implement our business plan; our ability to implement our growth strategy and manage costs effectively; developments and uncertainty related to the future use and availability of some reference rates, such as the expected discontinuation of the London Interbank Offered Rate, as well as other alternative reference rates; the composition of our senior leadership team and our ability to attract and retain key personnel; talent and labor shortages and high rates of employee turnover; the occurrence of fraudulent activity, breaches or failures of our information security controls or cybersecurity-related incidents; interruptions involving our information technology and telecommunications systems or third-party servicers; competition in the financial services industry, including from nonbank competitors such as credit unions and “fintech” companies; the effectiveness of our risk management framework; the commencement and outcome of litigation and other legal proceedings and regulatory actions against us; the impact of recent and future legislative and regulatory changes, including in response to the recent failures of Silicon Valley Bank and Signature Bank; risks related to climate change and the negative impact it may have on our customers and their businesses; the imposition of tariffs or other governmental policies impacting the value of products produced by our commercial borrowers; severe weather, natural disasters, wide spread disease or pandemics (including the COVID-19 pandemic), acts of war or terrorism or other adverse external events including the Russian invasion of Ukraine; potential impairment to the goodwill the Company recorded in connection with our past acquisition; changes to U.S. or state tax laws, regulations and guidance, including the new 1% excise tax on stock buybacks by publicly traded companies; and any other risks described in the “Risk Factors” sections of reports filed by the Company with the Securities and Exchange Commission.
Page 11 of 17
Any forward-looking statement made by us in this press release is based only on information currently available to us and speaks only as of the date on which it is made. The Company undertakes no obligation to publicly update any forward-looking statement, whether written or oral, that may be made from time to time, whether as a result of new information, future developments or otherwise.
Page 12 of 17
Bridgewater Bancshares, Inc. and Subsidiaries
Consolidated Balance Sheets
(dollars in thousands, except share data)
|
|
June 30, |
|
December 31, |
|
June 30, |
|||
|
|
2023 |
|
2022 |
|
2022 |
|||
|
|
(Unaudited) |
|
|
|
|
(Unaudited) |
||
ASSETS |
|
|
|
|
|
|
|
|
|
Cash and Cash Equivalents |
|
$ |
177,101 |
|
$ |
87,043 |
|
$ |
73,517 |
Bank-Owned Certificates of Deposit |
|
|
1,225 |
|
|
1,181 |
|
|
1,138 |
Securities Available for Sale, at Fair Value |
|
|
538,220 |
|
|
548,613 |
|
|
482,583 |
Loans, Net of Allowance for Credit Losses of $50,701 at June 30, 2023 (unaudited), $47,996 at December 31, 2022 and $44,711 at June 30, 2022 (unaudited) |
|
|
3,677,792 |
|
|
3,512,157 |
|
|
3,171,638 |
Federal Home Loan Bank (FHLB) Stock, at Cost |
|
|
21,557 |
|
|
19,606 |
|
|
9,921 |
Premises and Equipment, Net |
|
|
49,710 |
|
|
48,445 |
|
|
49,294 |
Foreclosed Assets |
|
|
116 |
|
|
— |
|
|
— |
Accrued Interest |
|
|
13,822 |
|
|
13,479 |
|
|
10,010 |
Goodwill |
|
|
2,626 |
|
|
2,626 |
|
|
2,626 |
Other Intangible Assets, Net |
|
|
206 |
|
|
288 |
|
|
383 |
Bank-Owned Life Insurance |
|
|
33,958 |
|
|
33,485 |
|
|
25,614 |
Other Assets |
|
|
86,852 |
|
|
78,739 |
|
|
56,540 |
Total Assets |
|
$ |
4,603,185 |
|
$ |
4,345,662 |
|
$ |
3,883,264 |
|
|
|
|
|
|
|
|
|
|
LIABILITIES AND EQUITY |
|
|
|
|
|
|
|
|
|
LIABILITIES |
|
|
|
|
|
|
|
|
|
Deposits: |
|
|
|
|
|
|
|
|
|
Noninterest Bearing |
|
$ |
751,217 |
|
$ |
884,272 |
|
$ |
961,998 |
Interest Bearing |
|
|
2,826,715 |
|
|
2,532,271 |
|
|
2,239,955 |
Total Deposits |
|
|
3,577,932 |
|
|
3,416,543 |
|
|
3,201,953 |
Federal Funds Purchased |
|
|
195,000 |
|
|
287,000 |
|
|
86,000 |
Notes Payable |
|
|
13,750 |
|
|
13,750 |
|
|
— |
FHLB Advances |
|
|
262,000 |
|
|
97,000 |
|
|
56,500 |
Subordinated Debentures, Net of Issuance Costs |
|
|
79,096 |
|
|
78,905 |
|
|
92,459 |
Accrued Interest Payable |
|
|
2,974 |
|
|
2,831 |
|
|
1,393 |
Other Liabilities |
|
|
63,307 |
|
|
55,569 |
|
|
70,076 |
Total Liabilities |
|
|
4,194,059 |
|
|
3,951,598 |
|
|
3,508,381 |
|
|
|
|
|
|
|
|
|
|
SHAREHOLDERS' EQUITY |
|
|
|
|
|
|
|
|
|
Preferred Stock- $0.01 par value; Authorized 10,000,000 |
|
|
|
|
|
|
|
|
|
Preferred Stock - Issued and Outstanding 27,600 Series A shares ($2,500 liquidation preference) at June 30, 2023 (unaudited), December 31, 2022, and June 30, 2022 (unaudited) |
|
|
66,514 |
|
|
66,514 |
|
|
66,514 |
Common Stock- $0.01 par value; Authorized 75,000,000 |
|
|
|
|
|
|
|
|
|
Common Stock - Issued and Outstanding 27,973,995 at June 30, 2023 (unaudited), 27,751,950 at December 31, 2022 and 27,677,372 at June 30, 2022 (unaudited) |
|
|
280 |
|
|
278 |
|
|
277 |
Additional Paid-In Capital |
|
|
99,044 |
|
|
96,529 |
|
|
96,689 |
Retained Earnings |
|
|
264,196 |
|
|
248,685 |
|
|
222,464 |
Accumulated Other Comprehensive Loss |
|
|
(20,908) |
|
|
(17,942) |
|
|
(11,061) |
Total Shareholders' Equity |
|
|
409,126 |
|
|
394,064 |
|
|
374,883 |
Total Liabilities and Equity |
|
$ |
4,603,185 |
|
$ |
4,345,662 |
|
$ |
3,883,264 |
Page 13 of 17
Bridgewater Bancshares, Inc. and Subsidiaries
Consolidated Statements of Income
(dollars in thousands, except per share data)
(Unaudited)
|
|
Three Months Ended |
|
Six Months Ended |
|||||||||||
|
|
June 30, |
|
March 31, |
|
June 30, |
|
June 30, |
|
June 30, |
|||||
|
|
2023 |
|
2023 |
|
2022 |
|
2023 |
|
2022 |
|||||
INTEREST INCOME |
|
|
|
|
|
|
|
|
|
|
|
|
|
|
|
Loans, Including Fees |
|
$ |
47,721 |
|
$ |
44,955 |
|
$ |
34,358 |
|
$ |
92,676 |
|
$ |
66,102 |
Investment Securities |
|
|
6,237 |
|
|
6,218 |
|
|
3,325 |
|
|
12,455 |
|
|
6,195 |
Other |
|
|
1,043 |
|
|
819 |
|
|
99 |
|
|
1,862 |
|
|
179 |
Total Interest Income |
|
|
55,001 |
|
|
51,992 |
|
|
37,782 |
|
|
106,993 |
|
|
72,476 |
|
|
|
|
|
|
|
|
|
|
|
|
|
|
|
|
INTEREST EXPENSE |
|
|
|
|
|
|
|
|
|
|
|
|
|
|
|
Deposits |
|
|
22,998 |
|
|
16,374 |
|
|
3,456 |
|
|
39,372 |
|
|
6,614 |
Notes Payable |
|
|
285 |
|
|
263 |
|
|
— |
|
|
548 |
|
|
— |
FHLB Advances |
|
|
2,092 |
|
|
861 |
|
|
167 |
|
|
2,953 |
|
|
317 |
Subordinated Debentures |
|
|
993 |
|
|
983 |
|
|
1,219 |
|
|
1,976 |
|
|
2,416 |
Federal Funds Purchased |
|
|
2,761 |
|
|
4,944 |
|
|
410 |
|
|
7,705 |
|
|
419 |
Total Interest Expense |
|
|
29,129 |
|
|
23,425 |
|
|
5,252 |
|
|
52,554 |
|
|
9,766 |
|
|
|
|
|
|
|
|
|
|
|
|
|
|
|
|
NET INTEREST INCOME |
|
|
25,872 |
|
|
28,567 |
|
|
32,530 |
|
|
54,439 |
|
|
62,710 |
Provision for Credit Losses |
|
|
50 |
|
|
625 |
|
|
3,025 |
|
|
675 |
|
|
4,700 |
|
|
|
|
|
|
|
|
|
|
|
|
|
|
|
|
NET INTEREST INCOME AFTER |
|
|
|
|
|
|
|
|
|
|
|
|
|
|
|
PROVISION FOR CREDIT LOSSES |
|
|
25,822 |
|
|
27,942 |
|
|
29,505 |
|
|
53,764 |
|
|
58,010 |
|
|
|
|
|
|
|
|
|
|
|
|
|
|
|
|
NONINTEREST INCOME |
|
|
|
|
|
|
|
|
|
|
|
|
|
|
|
Customer Service Fees |
|
|
368 |
|
|
349 |
|
|
298 |
|
|
717 |
|
|
579 |
Net Gain (Loss) on Sales of Available for Sale Securities |
|
|
50 |
|
|
(56) |
|
|
52 |
|
|
(6) |
|
|
52 |
Other Income |
|
|
997 |
|
|
1,650 |
|
|
1,300 |
|
|
2,647 |
|
|
2,576 |
Total Noninterest Income |
|
|
1,415 |
|
|
1,943 |
|
|
1,650 |
|
|
3,358 |
|
|
3,207 |
|
|
|
|
|
|
|
|
|
|
|
|
|
|
|
|
NONINTEREST EXPENSE |
|
|
|
|
|
|
|
|
|
|
|
|
|
|
|
Salaries and Employee Benefits |
|
|
8,589 |
|
|
8,815 |
|
|
8,977 |
|
|
17,404 |
|
|
17,671 |
Occupancy and Equipment |
|
|
1,075 |
|
|
1,209 |
|
|
1,042 |
|
|
2,284 |
|
|
2,127 |
Other Expense |
|
|
4,724 |
|
|
4,159 |
|
|
3,733 |
|
|
8,883 |
|
|
7,462 |
Total Noninterest Expense |
|
|
14,388 |
|
|
14,183 |
|
|
13,752 |
|
|
28,571 |
|
|
27,260 |
|
|
|
|
|
|
|
|
|
|
|
|
|
|
|
|
INCOME BEFORE INCOME TAXES |
|
|
12,849 |
|
|
15,702 |
|
|
17,403 |
|
|
28,551 |
|
|
33,957 |
Provision for Income Taxes |
|
|
3,033 |
|
|
4,060 |
|
|
4,521 |
|
|
7,093 |
|
|
8,813 |
NET INCOME |
|
|
9,816 |
|
|
11,642 |
|
|
12,882 |
|
|
21,458 |
|
|
25,144 |
Preferred Stock Dividends |
|
|
(1,014) |
|
|
(1,013) |
|
|
(1,014) |
|
|
(2,027) |
|
|
(2,027) |
NET INCOME AVAILABLE TO COMMON SHAREHOLDERS |
|
$ |
8,802 |
|
$ |
10,629 |
|
$ |
11,868 |
|
$ |
19,431 |
|
$ |
23,117 |
|
|
|
|
|
|
|
|
|
|
|
|
|
|
|
|
EARNINGS PER SHARE |
|
|
|
|
|
|
|
|
|
|
|
|
|
|
|
Basic |
|
$ |
0.32 |
|
$ |
0.38 |
|
$ |
0.43 |
|
$ |
0.70 |
|
$ |
0.83 |
Diluted |
|
|
0.31 |
|
|
0.37 |
|
|
0.41 |
|
|
0.69 |
|
|
0.80 |
Page 14 of 17
Bridgewater Bancshares, Inc. and Subsidiaries
Analysis of Average Balances, Yields and Rates
(dollars in thousands, except per share data)
(Unaudited)
|
|
|
|
|
|
|
|
|
|
|
|
|
|
|
|
|
|
|
|
For the Six Months Ended |
|
||||||||||||||
|
|
June 30, 2023 |
|
June 30, 2022 |
|
||||||||||||
|
|
Average |
|
Interest |
|
Yield/ |
|
Average |
|
Interest |
|
Yield/ |
|
||||
|
|
Balance |
|
& Fees |
|
Rate |
|
Balance |
|
& Fees |
|
Rate |
|
||||
(dollars in thousands) |
|
|
|
|
|
|
|
|
|
|
|
|
|
|
|
|
|
Interest Earning Assets: |
|
|
|
|
|
|
|
|
|
|
|
|
|
|
|
|
|
Cash Investments |
|
$ |
61,599 |
|
$ |
1,034 |
|
3.38 |
% |
$ |
70,718 |
|
$ |
66 |
|
0.19 |
% |
Investment Securities: |
|
|
|
|
|
|
|
|
|
|
|
|
|
|
|
|
|
Taxable Investment Securities |
|
|
571,176 |
|
|
11,958 |
|
4.22 |
|
|
395,203 |
|
|
4,951 |
|
2.53 |
|
Tax-Exempt Investment Securities (1) |
|
|
28,435 |
|
|
629 |
|
4.46 |
|
|
72,933 |
|
|
1,574 |
|
4.35 |
|
Total Investment Securities |
|
|
599,611 |
|
|
12,587 |
|
4.23 |
|
|
468,136 |
|
|
6,525 |
|
2.81 |
|
Paycheck Protection Program Loans (2) |
|
|
956 |
|
|
5 |
|
1.00 |
|
|
13,210 |
|
|
826 |
|
12.61 |
|
Loans (1)(2) |
|
|
3,672,772 |
|
|
93,327 |
|
5.12 |
|
|
2,991,195 |
|
|
65,480 |
|
4.41 |
|
Total Loans |
|
|
3,673,728 |
|
|
93,332 |
|
5.12 |
|
|
3,004,405 |
|
|
66,306 |
|
4.45 |
|
Federal Home Loan Bank Stock |
|
|
24,639 |
|
|
828 |
|
6.77 |
|
|
8,667 |
|
|
113 |
|
2.63 |
|
Total Interest Earning Assets |
|
|
4,359,577 |
|
|
107,781 |
|
4.99 |
% |
|
3,551,926 |
|
|
73,010 |
|
4.15 |
% |
Noninterest Earning Assets |
|
|
85,087 |
|
|
|
|
|
|
|
77,395 |
|
|
|
|
|
|
Total Assets |
|
$ |
4,444,664 |
|
|
|
|
|
|
$ |
3,629,321 |
|
|
|
|
|
|
Interest Bearing Liabilities: |
|
|
|
|
|
|
|
|
|
|
|
|
|
|
|
|
|
Deposits: |
|
|
|
|
|
|
|
|
|
|
|
|
|
|
|
|
|
Interest Bearing Transaction Deposits |
|
$ |
570,964 |
|
$ |
8,698 |
|
3.07 |
% |
$ |
559,352 |
|
$ |
1,291 |
|
0.47 |
% |
Savings and Money Market Deposits |
|
|
952,865 |
|
|
13,547 |
|
2.87 |
|
|
901,102 |
|
|
2,103 |
|
0.47 |
|
Time Deposits |
|
|
258,865 |
|
|
2,771 |
|
2.16 |
|
|
284,757 |
|
|
1,410 |
|
1.00 |
|
Brokered Deposits |
|
|
820,651 |
|
|
14,356 |
|
3.53 |
|
|
405,282 |
|
|
1,810 |
|
0.90 |
|
Total Interest Bearing Deposits |
|
|
2,603,345 |
|
|
39,372 |
|
3.05 |
|
|
2,150,493 |
|
|
6,614 |
|
0.62 |
|
Federal Funds Purchased |
|
|
312,329 |
|
|
7,705 |
|
4.97 |
|
|
74,340 |
|
|
419 |
|
1.14 |
|
Notes Payable |
|
|
13,750 |
|
|
548 |
|
8.03 |
|
|
— |
|
|
— |
|
— |
|
FHLB Advances |
|
|
185,785 |
|
|
2,953 |
|
3.21 |
|
|
45,019 |
|
|
317 |
|
1.42 |
|
Subordinated Debentures |
|
|
78,994 |
|
|
1,976 |
|
5.05 |
|
|
92,341 |
|
|
2,416 |
|
5.28 |
|
Total Interest Bearing Liabilities |
|
|
3,194,203 |
|
|
52,554 |
|
3.32 |
% |
|
2,362,193 |
|
|
9,766 |
|
0.83 |
% |
Noninterest Bearing Liabilities: |
|
|
|
|
|
|
|
|
|
|
|
|
|
|
|
|
|
Noninterest Bearing Transaction Deposits |
|
|
786,009 |
|
|
|
|
|
|
|
852,648 |
|
|
|
|
|
|
Other Noninterest Bearing Liabilities |
|
|
59,504 |
|
|
|
|
|
|
|
32,248 |
|
|
|
|
|
|
Total Noninterest Bearing Liabilities |
|
|
845,513 |
|
|
|
|
|
|
|
884,896 |
|
|
|
|
|
|
Shareholders' Equity |
|
|
404,948 |
|
|
|
|
|
|
|
382,232 |
|
|
|
|
|
|
Total Liabilities and Shareholders' Equity |
|
$ |
4,444,664 |
|
|
|
|
|
|
$ |
3,629,321 |
|
|
|
|
|
|
Net Interest Income / Interest Rate Spread |
|
|
|
|
|
55,227 |
|
1.67 |
% |
|
|
|
|
63,244 |
|
3.32 |
% |
Net Interest Margin (3) |
|
|
|
|
|
|
|
2.55 |
% |
|
|
|
|
|
|
3.59 |
% |
Taxable Equivalent Adjustment: |
|
|
|
|
|
|
|
|
|
|
|
|
|
|
|
|
|
Tax-Exempt Investment Securities and Loans |
|
|
|
|
|
(788) |
|
|
|
|
|
|
|
(534) |
|
|
|
Net Interest Income |
|
|
|
|
$ |
54,439 |
|
|
|
|
|
|
$ |
62,710 |
|
|
|
| (1) | Interest income and average rates for tax-exempt investment securities and loans are presented on a tax-equivalent basis, assuming a statutory federal income tax rate of 21%. |
| (2) | Average loan balances include nonaccrual loans. Interest income on loans includes amortization of deferred loan fees, net of deferred loan costs. |
| (3) | Net interest margin includes the tax equivalent adjustment and represents the annualized results of: (i) the difference between interest income on interest earning assets and the interest expense on interest bearing liabilities, divided by (ii) average interest earning assets for the period. |
Page 15 of 17
Bridgewater Bancshares, Inc. and Subsidiaries
Non-GAAP Financial Measures
(dollars in thousands) (unaudited)
|
|
For the Three Months Ended |
|
For the Six Months Ended |
|
|||||||||||
|
|
June 30, |
|
March 31, |
|
June 30, |
|
June 30, |
|
June 30, |
|
|||||
|
|
2023 |
|
2023 |
|
2022 |
|
2023 |
|
2022 |
|
|||||
Pre-Provision Net Revenue |
|
|
|
|
|
|
|
|
|
|
|
|
|
|
|
|
Noninterest Income |
|
$ |
1,415 |
|
$ |
1,943 |
|
$ |
1,650 |
|
$ |
3,358 |
|
$ |
3,207 |
|
Less: (Gain) Loss on Sales of Securities |
|
|
(50) |
|
|
56 |
|
|
(52) |
|
|
6 |
|
|
(52) |
|
Less: FHLB Advance Prepayment Income |
|
|
— |
|
|
(299) |
|
|
— |
|
|
(299) |
|
|
— |
|
Total Operating Noninterest Income |
|
|
1,365 |
|
|
1,700 |
|
|
1,598 |
|
|
3,065 |
|
|
3,155 |
|
Plus: Net Interest Income |
|
|
25,872 |
|
|
28,567 |
|
|
32,530 |
|
|
54,439 |
|
|
62,710 |
|
Net Operating Revenue |
|
$ |
27,237 |
|
$ |
30,267 |
|
$ |
34,128 |
|
$ |
57,504 |
|
$ |
65,865 |
|
|
|
|
|
|
|
|
|
|
|
|
|
|
|
|
|
|
Noninterest Expense |
|
$ |
14,388 |
|
$ |
14,183 |
|
$ |
13,752 |
|
$ |
28,571 |
|
$ |
27,260 |
|
Less: Amortization of Tax Credit Investments |
|
|
(114) |
|
|
(114) |
|
|
(63) |
|
|
(228) |
|
|
(180) |
|
Total Operating Noninterest Expense |
|
$ |
14,274 |
|
$ |
14,069 |
|
$ |
13,689 |
|
$ |
28,343 |
|
$ |
27,080 |
|
|
|
|
|
|
|
|
|
|
|
|
|
|
|
|
|
|
Pre-Provision Net Revenue |
|
$ |
12,963 |
|
$ |
16,198 |
|
$ |
20,439 |
|
$ |
29,161 |
|
$ |
38,785 |
|
|
|
|
|
|
|
|
|
|
|
|
|
|
|
|
|
|
Plus: |
|
|
|
|
|
|
|
|
|
|
|
|
|
|
|
|
Non-Operating Revenue Adjustments |
|
|
50 |
|
|
243 |
|
|
52 |
|
|
293 |
|
|
52 |
|
Less: |
|
|
|
|
|
|
|
|
|
|
|
|
|
|
|
|
Provision for Credit Losses |
|
|
50 |
|
|
625 |
|
|
3,025 |
|
|
675 |
|
|
4,700 |
|
Non-Operating Expense Adjustments |
|
|
114 |
|
|
114 |
|
|
63 |
|
|
228 |
|
|
180 |
|
Provision for Income Taxes |
|
|
3,033 |
|
|
4,060 |
|
|
4,521 |
|
|
7,093 |
|
|
8,813 |
|
Net Income |
|
$ |
9,816 |
|
$ |
11,642 |
|
$ |
12,882 |
|
$ |
21,458 |
|
$ |
25,144 |
|
|
|
|
|
|
|
|
|
|
|
|
|
|
|
|
|
|
Average Assets |
|
$ |
4,483,662 |
|
$ |
4,405,234 |
|
$ |
3,743,575 |
|
$ |
4,444,664 |
|
$ |
3,629,321 |
|
Pre-Provision Net Revenue Return on Average Assets |
|
|
1.16 |
% |
|
1.49 |
% |
|
2.19 |
% |
|
1.32 |
% |
|
2.16 |
% |
|
|
As of and for the Three Months Ended |
|
|
As of and for the Six Months Ended |
|
|||||||||||
|
|
June 30, |
|
March 31, |
|
June 30, |
|
|
June 30, |
|
June 30, |
|
|||||
|
|
2023 |
|
2023 |
|
2022 |
|
|
2023 |
|
2022 |
|
|||||
Core Net Interest Margin |
|
|
|
|
|
|
|
|
|
|
|
|
|
|
|
|
|
Net Interest Income (Tax-Equivalent Basis) |
|
$ |
26,280 |
|
$ |
28,947 |
|
$ |
32,806 |
|
|
$ |
55,227 |
|
$ |
63,244 |
|
Less: Loan Fees |
|
|
(941) |
|
|
(998) |
|
|
(2,030) |
|
|
|
(1,939) |
|
|
(3,773) |
|
Less: PPP Interest and Fees |
|
|
(3) |
|
|
(2) |
|
|
(263) |
|
|
|
(5) |
|
|
(826) |
|
Core Net Interest Income |
|
$ |
25,336 |
|
$ |
27,947 |
|
$ |
30,513 |
|
|
$ |
53,283 |
|
$ |
58,645 |
|
|
|
|
|
|
|
|
|
|
|
|
|
|
|
|
|
|
|
Average Interest Earning Assets |
|
$ |
4,395,050 |
|
$ |
4,323,706 |
|
$ |
3,671,748 |
|
|
$ |
4,359,576 |
|
$ |
3,551,926 |
|
Less: Average PPP Loans |
|
|
(913) |
|
|
(999) |
|
|
(8,335) |
|
|
|
(956) |
|
|
(13,210) |
|
Core Average Interest Earning Assets |
|
$ |
4,394,137 |
|
$ |
4,322,707 |
|
$ |
3,663,413 |
|
|
$ |
4,358,620 |
|
$ |
3,538,716 |
|
Core Net Interest Margin |
|
|
2.31 |
% |
|
2.62 |
% |
|
3.34 |
% |
|
|
2.47 |
% |
|
3.34 |
% |
Page 16 of 17
Non-GAAP Financial Measures
(dollars in thousands) (unaudited)
|
|
For the Three Months Ended |
|
|
For the Six Months Ended |
|
|||||||||||
|
|
June 30, |
|
March 31, |
|
June 30, |
|
|
June 30, |
|
June 30, |
|
|||||
|
|
2023 |
|
2023 |
|
2022 |
|
|
2023 |
|
2022 |
|
|||||
Efficiency Ratio |
|
|
|
|
|
|
|
|
|
|
|
|
|
|
|
|
|
Noninterest Expense |
|
$ |
14,388 |
|
$ |
14,183 |
|
$ |
13,752 |
|
|
$ |
28,571 |
|
$ |
27,260 |
|
Less: Amortization of Intangible Assets |
|
|
(34) |
|
|
(48) |
|
|
(47) |
|
|
|
(82) |
|
|
(95) |
|
Adjusted Noninterest Expense |
|
$ |
14,354 |
|
$ |
14,135 |
|
$ |
13,705 |
|
|
$ |
28,489 |
|
$ |
27,165 |
|
Net Interest Income |
|
|
25,872 |
|
|
28,567 |
|
|
32,530 |
|
|
|
54,439 |
|
|
62,710 |
|
Noninterest Income |
|
|
1,415 |
|
|
1,943 |
|
|
1,650 |
|
|
|
3,358 |
|
|
3,207 |
|
Less: (Gain) Loss on Sales of Securities |
|
|
(50) |
|
|
56 |
|
|
(52) |
|
|
|
6 |
|
|
(52) |
|
Adjusted Operating Revenue |
|
$ |
27,237 |
|
$ |
30,566 |
|
$ |
34,128 |
|
|
$ |
57,803 |
|
$ |
65,865 |
|
Efficiency Ratio |
|
|
52.7 |
% |
|
46.2 |
% |
|
40.2 |
% |
|
|
49.3 |
% |
|
41.2 |
% |
|
|
As of and for the Three Months Ended |
|
|
As of and for the Six Months Ended |
|
|||||||||||
|
|
June 30, |
|
March 31, |
|
June 30, |
|
|
June 30, |
|
June 30, |
|
|||||
|
|
2023 |
|
2023 |
|
2022 |
|
|
2023 |
|
2022 |
|
|||||
Tangible Common Equity and Tangible Common Equity/Tangible Assets |
|
|
|
|
|
|
|
|
|
|
|
|
|
|
|
|
|
Total Shareholders' Equity |
|
$ |
409,126 |
|
$ |
402,006 |
|
$ |
374,883 |
|
|
|
|
|
|
|
|
Less: Preferred Stock |
|
|
(66,514) |
|
|
(66,514) |
|
|
(66,514) |
|
|
|
|
|
|
|
|
Total Common Shareholders' Equity |
|
|
342,612 |
|
|
335,492 |
|
|
308,369 |
|
|
|
|
|
|
|
|
Less: Intangible Assets |
|
|
(2,832) |
|
|
(2,866) |
|
|
(3,009) |
|
|
|
|
|
|
|
|
Tangible Common Equity |
|
$ |
339,780 |
|
$ |
332,626 |
|
$ |
305,360 |
|
|
|
|
|
|
|
|
|
|
|
|
|
|
|
|
|
|
|
|
|
|
|
|
|
|
Total Assets |
|
$ |
4,603,185 |
|
$ |
4,602,899 |
|
$ |
3,883,264 |
|
|
|
|
|
|
|
|
Less: Intangible Assets |
|
|
(2,832) |
|
|
(2,866) |
|
|
(3,009) |
|
|
|
|
|
|
|
|
Tangible Assets |
|
$ |
4,600,353 |
|
$ |
4,600,033 |
|
$ |
3,880,255 |
|
|
|
|
|
|
|
|
Tangible Common Equity/Tangible Assets |
|
|
7.39 |
% |
|
7.23 |
% |
|
7.87 |
% |
|
|
|
|
|
|
|
|
|
|
|
|
|
|
|
|
|
|
|
|
|
|
|
|
|
Tangible Book Value Per Share |
|
|
|
|
|
|
|
|
|
|
|
|
|
|
|
|
|
Book Value Per Common Share |
|
$ |
12.25 |
|
$ |
12.05 |
|
$ |
11.14 |
|
|
|
|
|
|
|
|
Less: Effects of Intangible Assets |
|
|
(0.10) |
|
|
(0.10) |
|
|
(0.11) |
|
|
|
|
|
|
|
|
Tangible Book Value Per Common Share |
|
$ |
12.15 |
|
$ |
11.95 |
|
$ |
11.03 |
|
|
|
|
|
|
|
|
|
|
|
|
|
|
|
|
|
|
|
|
|
|
|
|
|
|
Return on Average Tangible Common Equity |
|
|
|
|
|
|
|
|
|
|
|
|
|
|
|
|
|
Net Income Available to Common Shareholders |
|
$ |
8,802 |
|
$ |
10,629 |
|
$ |
11,868 |
|
|
$ |
19,431 |
|
$ |
23,117 |
|
|
|
|
|
|
|
|
|
|
|
|
|
|
|
|
|
|
|
Average Shareholders' Equity |
|
$ |
406,347 |
|
$ |
403,533 |
|
$ |
381,448 |
|
|
$ |
404,948 |
|
$ |
382,232 |
|
Less: Average Preferred Stock |
|
|
(66,514) |
|
|
(66,514) |
|
|
(66,514) |
|
|
|
(66,514) |
|
|
(66,514) |
|
Average Common Equity |
|
|
339,833 |
|
|
337,019 |
|
|
314,934 |
|
|
|
338,434 |
|
|
315,718 |
|
Less: Effects of Average Intangible Assets |
|
|
(2,846) |
|
|
(2,894) |
|
|
(3,037) |
|
|
|
(2,870) |
|
|
(3,060) |
|
Average Tangible Common Equity |
|
$ |
336,987 |
|
$ |
334,125 |
|
$ |
311,897 |
|
|
$ |
335,564 |
|
$ |
312,658 |
|
Return on Average Tangible Common Equity |
|
|
10.48 |
% |
|
12.90 |
% |
|
15.26 |
% |
|
|
11.68 |
% |
|
14.91 |
% |
|
|
Three Months Ended |
|||||||||||||
|
|
June 30, |
|
March 31, |
|
December 31, |
|
September 30, |
|
June 30, |
|||||
|
|
2023 |
|
2023 |
|
2022 |
|
2022 |
|
2022 |
|||||
Tangible Common Equity |
|
|
|
|
|
|
|
|
|
|
|
|
|
|
|
Total Shareholders' Equity |
|
$ |
409,126 |
|
$ |
402,006 |
|
$ |
394,064 |
|
$ |
382,007 |
|
$ |
374,883 |
Less: Preferred Stock |
|
|
(66,514) |
|
|
(66,514) |
|
|
(66,514) |
|
|
(66,514) |
|
|
(66,514) |
Common Shareholders' Equity |
|
|
342,612 |
|
|
335,492 |
|
|
327,550 |
|
|
315,493 |
|
|
308,369 |
Less: Intangible Assets |
|
|
(2,832) |
|
|
(2,866) |
|
|
(2,914) |
|
|
(2,962) |
|
|
(3,009) |
Tangible Common Equity |
|
$ |
339,780 |
|
$ |
332,626 |
|
$ |
324,636 |
|
$ |
312,531 |
|
$ |
305,360 |
Page 17 of 17
|
|
Disclaimer Forward-Looking Statements This presentation contains “forward-looking statements” within the meaning of the safe harbor provisions of the U.S. Private Securities Litigation Reform Act of 1995. Forward-looking statements include, without limitation, statements concerning plans, estimates, calculations, forecasts and projections with respect to the anticipated future performance of the Company. These statements are often, but not always, identified by words such as “may”, “might”, “should”, “could”, “predict”, “potential”, “believe”, “expect”, “continue”, “will”, “anticipate”, “seek”, “estimate”, “intend”, “plan”, “projection”, “would”, “annualized”, “target” and “outlook”, or the negative version of those words or other comparable words of a future or forward-looking nature. Forward-looking statements are neither historical facts nor assurances of future performance. Instead, they are based only on our current beliefs, expectations and assumptions regarding our business, future plans and strategies, projections, anticipated events and trends, the economy and other future conditions. Because forward-looking statements relate to the future, they are subject to inherent uncertainties, risks and changes in circumstances that are difficult to predict and many of which are outside of our control. Our actual results and financial condition may differ materially from those indicated in forward-looking statements. Therefore, you should not rely on any of these forward-looking statements. Important factors that could cause our actual results and financial condition to differ materially from those indicated in forward-looking statements include, among others, the following: interest rate risk, including the effects of recent and anticipated rate increases by the Federal Reserve; fluctuations in the values of the securities held in our securities portfolio or the values of derivative instruments held in our derivatives portfolio, including as a result of changes in interest rates; business and economic conditions generally and in the financial services industry, nationally and within our market area, including rising rates of inflation and possible recession; the effects of recent developments and events in the financial services industry, including the large-scale deposit withdrawals over a short period of time at Silicon Valley Bank, Signature Bank and First Republic Bank that resulted in the failure of those institutions; loan concentrations in our portfolio; the overall health of the local and national real estate market; our ability to successfully manage credit risk; our ability to maintain an adequate level of allowance for loan losses; new or revised accounting standards, including as a result of the implementation of the Current Expected Credit Loss standard; the concentration of large loans to certain borrowers; the concentration of large deposits from certain clients, who have balances above the current Federal Deposit Insurance Corporation insurance limits; our ability to successfully manage liquidity risk, which may increase our dependence on non-core funding sources such as brokered deposits, and negative impact of our cost of funds; our ability to raise additional capital to implement our business plan; our ability to implement our growth strategy and manage costs effectively; the composition of our senior leadership team and our ability to attract and retain key personnel; talent and labor shortages an high rates of employment turnover; the occurrence of fraudulent activity, breaches or failures of our information security controls or cybersecurity-related incidents, including as a result of sophisticated attacks using artificial intelligence and similar tools; interruptions involving our information technology and telecommunications systems or third-party servicers; competition in the financial services industry, including from nonbank competitors such as credit unions and “fintech” companies; the effectiveness of our risk management framework; the commencement and outcome of litigation and other legal proceedings and regulatory actions against us; the impact of recent and future legislative and regulatory changes, including in response to the recent failures of Silicon Valley Bank, Signature Bank and First Republic Bank; risks related to climate change and the negatively impact it may have on our customers and their businesses; the imposition of governmental policies impacting the value of products produced by our commercial borrowers; severe weather, natural disasters, wide spread disease or pandemics (including the COVID-19 pandemic), acts of war or terrorism, civil unrest or other adverse external events, including the Russian invasion of Ukraine; potential impairment to the goodwill we recorded in connection with our past acquisition; changes to U.S. or state tax laws, regulations and guidance, including the new 1% excise tax on stock buybacks by publicly traded companies; the success at managing the risks involved in the foregoing items; and any other risks described in the “Risk Factors” sections of reports filed by the Company with the Securities and Exchange Commission. Any forward-looking statement made by us in this press release is based only on information currently available to us and speaks only as of the date on which it is made. The Company undertake no obligation to publicly update any forward-looking statement, whether written or oral, that may be made from time to time, whether as a result of new information, future developments or otherwise. Certain of the information contained in this presentation is derived from information provided by industry sources. Although the Company believe that such information is accurate and that the sources from which it has been obtained are reliable, the Company cannot guarantee the accuracy of, and have not independently verified, such information. Use of Non-GAAP financial measures In addition to the results presented in accordance with U.S. General Accepted Accounting Principles (“GAAP”), the Company routinely supplements its evaluation with an analysis of certain non-GAAP financial measures. The Company believes these non-GAAP financial measures, in addition to the related GAAP measures, provide meaningful information to investors to help them understand the Company’s operating performance and trends, and to facilitate comparisons with the performance of peers. These disclosures should not be viewed as a substitute for operating results determined in accordance with GAAP, nor are they necessarily comparable to non-GAAP performance measures that may be presented by other companies. Reconciliations of non-GAAP disclosures to the comparable GAAP measures are provided in this presentation. 2 |
|
0.02% 2Q23 Earnings Highlights 3 • Deposit balances up $166.8 million, or 19.6% annualized, from 1Q23 • Core deposit2 growth of 7.4% annualized from 1Q23 outpaced loan growth of 5.6% annualized • Borrowings declined $176.9 million, or 24.3%, from 1Q23 • Net interest margin (NIM) of 2.40%, down 32 bps from 1Q23 • Yield on interest-earning assets of 5.06%, up 15 bps from 1Q23 • Cost of deposits of 2.66%, up 65 bps from 1Q23 • Month-over-month core net interest margin compression slowed throughout 2Q23 • Noninterest expense up $0.2 million, or 1.4%, from 1Q23 and up $0.6 million, or 4.6%, from 2Q22 • Noninterest expense to average assets of 1.29% annualized, down 2 bps from 1Q23 • Efficiency ratio1 of 52.7%, up from 46.2% in 1Q23 • Annualized net charge-offs to average loans of 0.00%, in-line with 1Q23 • Nonperforming assets to total assets of 0.02%, in-line with 1Q23 • Growth-driven provision of $550 thousand; allowance to total loans of 1.36% Improving Balance Sheet Composition Net Interest Margin Pressure Slowing Well-Controlled Expenses Superb Asset Quality $0.31 Diluted EPS Nonperforming Assets to Total Assets Efficiency Ratio1 Return on Average Assets Return on Avg. Tangible Common Equity1 0.88% 10.48% 52.7% 1 Represents a Non-GAAP financial measure. See Appendix for Non-GAAP reconciliation 2 Core deposits are defined as total deposits less brokered deposits and certificates of deposit greater than $250,000 |
|
Net Interest Income Impacted by Margin Pressure and Managed Loan Growth 4 $30,237 $32,599 $31,745 $27,567 $24,928 $263 $96 $48 $2 $3 $2,030 $1,400 $1,100 $998 $941 $32,530 $34,095 $32,893 $28,567 $25,872 3.58% 3.53% 3.16% 2.72% 3.34% 3.38% 2.40% 3.05% 2.62% 2.31% 2Q22 3Q22 4Q22 1Q23 2Q23 Core Net Interest Margin1,2 Net Interest Margin1 Net Interest Income (ex. interest income on loan fees and PPP loans) Interest Income and fees on PPP loans Loan fees Net Interest Income and Margin Trends Net Interest Margin Drivers Core NIM2 down 31 bps Month-Over-Month Core NIM Compression Slowed in 2023 1 Amounts calculated on a tax-equivalent basis using statutory federal tax rate of 21% 2 Excludes loan fees and PPP loan balances, interest and fees; represents a Non-GAAP financial measure, see Appendix for Non-GAAP reconciliation Dollars in thousands 1 6 13 16 14 14 15 14 10 7 6 Aug. 22 Sep. 22 Oct. 22 Nov. 22 Dec. 22 Jan. 23 Feb. 23 Mar. 23 Apr. 23 May 23 Jun. 23 Core NIM1 Compression by Month (bps) • June 2023 NIM of 2.33% compared to 2Q23 NIM of 2.40% • Core NIM pressure slowed during 2Q23 after 6 consecutive months of steady compression |
|
Funding Costs Outpacing Asset Yields 5 $2,162 $2,253 $2,332 $2,498 $2,711 $882 $277 $992 $943 $814 $755 $272 $527 $636 $546 $3,321 $3,517 $3,802 $3,948 $4,012 0.63% 0.93% 1.67% 2.41% 2.91% 2Q22 3Q22 4Q22 1Q23 2Q23 $3,108 $3,266 $3,482 $3,630 $3,717 4.45% 4.59% 4.87% 5.06% 5.19% 4.17% 4.42% 4.74% 4.95% 5.09% 2Q22 3Q22 4Q22 1Q23 2Q23 $3,045 $3,245 $3,275 $3,311 $3,466 0.46% 0.73% 1.31% 2.01% 2.66% 2Q22 3Q22 4Q22 1Q23 2Q23 Loan Yield (ex. Loan Fees and PPP)2 Loan Portfolio Steadily Repricing Higher High-Yielding Securities Portfolio Deposit Costs Continue to Rise Overall Funding Costs Continue to Rise $491 $537 $608 $604 $595 2.85% 3.35% 3.91% 4.22% 4.24% 2Q22 3Q22 4Q22 1Q23 2Q23 Average Interest-Bearing Deposits Average Noninterest-Bearing Deposits Average Borrowings Cost of Liability Funding Average Loans Loan Yield1 Average Investments Investment Yield1 Average Total Deposits Cost of Total Deposits 1 Amounts calculated on a tax-equivalent basis using statutory federal tax rate of 21% 2 Represents a Non-GAAP financial measure. See Appendix for Non-GAAP reconciliation Dollars in millions |
|
Revenue Trends Impacted by Current Environment 6 PPNR ROA1 Continued Profitability in the Current Environment Spread-Based Revenue Model $32,530 $34,095 $32,893 $28,567 $25,872 $1,650 $1,387 $1,738 $1,943 $1,415 $34,180 $35,482 $34,631 $30,510 $27,287 2Q22 3Q22 4Q22 1Q23 2Q23 $20,439 $21,439 $19,512 $16,198 $12,882 $12,963 $14,513 $13,735 $11,642 $9,816 2.19% 2.15% 1.82% 1.49% 1.16% 1.38% 1.46% 1.28% 1.07% 0.88% 2Q22 3Q22 4Q22 1Q23 2Q23 PPNR Net Income 1 ROA Net Interest Income Noninterest Income 1 Represents a Non-GAAP financial measure. See Appendix for Non-GAAP reconciliation Dollars in thousands |
|
$8,977 $9,449 $9,821 $8,815 $8,589 $1,042 $1,086 $1,177 $1,209 $1,075 $950 $1,022 $1,044 $1,040 $1,112 $2,783 $2,600 $3,161 $3,119 $3,612 $13,752 $14,157 $15,203 $14,183 $14,388 2Q22 3Q22 4Q22 1Q23 2Q23 Well-Controlled Expenses 7 1.47% 1.42% 1.42% 1.31% 1.29% 40.2% 39.8% 43.8% 46.2% 52.7% 2Q22 3Q22 4Q22 1Q23 2Q23 NIE / Avg. Assets2 Efficiency Ratio2 Highly Efficient Business Model Despite Revenue Pressures Well-Controlled Expense Base in the Current Environment Industry median efficiency ratio of 57%1 NIE growth tracking below asset growth YoY Personnel Occupancy Technology Other 1 1Q23 median efficiency ratio for publicly-traded banks with total assets between $3 billion and $10 billion (Source: S&P Capital IQ) 2 Represents a Non-GAAP financial measure. See Appendix for Non-GAAP reconciliation Dollars in thousands |
|
Strong Rebound in Deposit Growth 8 30% 29% 26% 22% 21% 16% 15% 13% 18% 20% 30% 33% 30% 27% 24% 9% 9% 8% 8% 8% 15% 14% 23% 25% 27% $3,202 $3,305 $3,417 $3,411 $3,578 2Q22 3Q22 4Q22 1Q23 2Q23 Noninterest-Bearing Transaction Interest-Bearing Transaction Savings & Money Market Time Brokered • Total deposit balances up 19.6% annualized • Core deposit1 balances up 7.4% annualized • Overall mix shift continued from noninterest-bearing into interest-bearing deposits • Continued to supplement core deposits with wholesale funding to support loan growth • Remained focused on better aligning loan growth with core deposit growth over the course of 2023 (2Q23 annualized loan growth of 5.6% vs. core deposit1 growth of 7.4%) • Loan-to-deposit ratio of 104.4%, down from 108.0% in 1Q23 • Uninsured deposits remained low at 22%, down from 38% in 4Q22 Deposit Balances Rise in 2Q23 1 Core deposits are defined as total deposits less brokered deposits and certificates of deposit greater than $250,000 2 Calculated as the change in ending deposit rate over the change in ending Fed Funds rate from February 2022 Dollars in millions Cumulative Total Deposit Beta2 12% 20% 34% 40% 48% 6/30/2022 9/30/2022 12/31/2022 3/31/2023 6/30/2023 |
|
Managed Pace of Loan Growth 9 $3,226 $3,380 $3,569 $3,684 $3,736 2Q22 3Q22 4Q22 1Q23 2Q23 Gross Loans Dollars in millions • 2Q23 loan growth of $51.9M, or 5.6% annualized • YTD loan growth of $166.8M, or 9.4% annualized • Strong brand presence and relationships in the market allow us to continue to get in front of high-quality clients and deals • Being more selective by focusing on high quality transactions with seasoned clients • Actively managing the balance sheet to better align with funding outlook • Being more disciplined on loan pricing to manage growth and the net interest margin • Leveraging sales of participations on new originations • Overall loan demand has declined as fewer deals are making financial sense due to the higher interest rate environment Managing Loan Growth |
|
Well-Diversified Loan Portfolio 10 Dollars in millions CRE NOO 26.0% Multifamily 35.2% C&D 11.2% 1-4 Family Mortgage 10.7% CRE OO 4.3% C&I 12.3% Consumer & Other 0.2% Loan Mix by Type $3.7 Billion 2Q23 Loan Growth by Type (vs. 1Q23) $(6) $- $- $5 $9 $20 $23 Multifamily 1-4 Family Mortgage Construction & Development C&I CRE Owner Occupied CRE Nonowner Occupied Consumer & Other • Intentionally slowing the overall pace of loan growth across the portfolio • Construction and development growth primarily due to draws on previously originated loans |
|
Loan Originations and Payoffs Are Slowing 11 New Loan Originations and Advances $268 $169 $186 $75 $47 $125 $139 $127 $145 $84 $393 $308 $313 $220 $131 2Q22 3Q22 4Q22 1Q23 2Q23 New Originations Advances Loan Payoffs and Amortization/Paydowns $163 $117 $99 $69 $54 $31 $36 $42 $42 $45 $194 $153 $141 $111 $99 2Q22 3Q22 4Q22 1Q23 2Q23 Payoffs Amortization/Paydowns $311 $373 $427 $508 $537 2Q22 3Q22 4Q22 1Q23 2Q23 Selling Participations on Larger Loans to Manage Growth Loan Participation Portfolio Balance Sold $109M of participations in 2023 YTD Dollars in millions |
|
¹ Nonaccrual loans plus loans 90 days past due and still accruing and foreclosed assets Dollars in thousands Superb Asset Quality Continues 12 $6 $(280) $(5) $(2) $(3) 0.00% (0.03)% 0.00% 0.00% 0.00% 2Q22 3Q22 4Q22 1Q23 2Q23 Net Charge-Offs Cumulative NCOs of $376K since 2017 Net Charge-offs (recoveries) % of Average Loans (annualized) $44,711 $46,491 $47,996 $50,148 $50,701 1.39% 1.38% 1.34% 1.36% 1.36% 2Q22 3Q22 4Q22 1Q23 2Q23 Allowance for Credit Losses Modest CECL Day 1 impact of $650K on January 1, 2023 Allowance for Credit Losses % of Gross Loans $688 $663 $639 $809 $778 0.02% 0.02% 0.01% 0.02% 0.02% 2Q22 3Q22 4Q22 1Q23 2Q23 Nonperforming Assets1 Consistently low NPA levels NPAs % of Assets |
|
Watch and Substandard Loans Remain Stable 13 C&I 17.6% C&D 6.3% Multifamily 11.9% CRE NOO Senior Housing 37.4% CRE NOO Retail 21.7% CRE NOO Office 2.6% 1-4 Family 2.5% $27 Million Watch List Loans Substandard Loans C&I 47.8% CRE NOO Office 28.7% CRE NOO Hotels 9.8% CRE NOO Retail 7.9% CRE OO 4.7% C&D 0.3% 1-4 Family 0.8% $34 Million Watch List Characteristics Loan Balances Outstanding $27,215 % of Total Loans, Gross 0.7% Number of Loans 20 Average Loan Size $1,361 Substandard Characteristics Loan Balances Outstanding $33,821 % of Total Loans, Gross 0.9% Number of Loans 20 Average Loan Size $1,691 % of Bank Risk-Based Capital 6.34% $34,705 $22,759 $32,252 $27,574 $27,215 2Q22 3Q22 4Q22 1Q23 2Q23 Watch List Loans $26,991 $30,767 $28,049 $36,258 $33,821 2Q22 3Q22 4Q22 1Q23 2Q23 Substandard Loans Dollars in thousands |
|
Managing CRE and Office-Related Risk 14 1 Excludes medical office of $87M at June 30, 2023 Dollars in millions Addressing CRE NOO Repricing Risk • CRE NOO loans primarily located in the Twin Cities market • Ongoing active client engagement • Clients with maturing loans or resetting rates over the next 12 months • Identify situations of possible cash flow strain • Recommend solutions early in the process Well-Managed CRE NOO Office Exposure1 Small CRE NOO Office Portfolio Low Average Loan Size LTVs In-Line with the Total Loan Portfolio 5.2% of Total Loans $2.2M Average Loan Size 62% Weighted Average LTV CRE NOO Office by Geography Twin Cities Suburban 53% Minneapolis-St. Paul CBD 13% Minneapolis-St. Paul Non-CBD 20% Out-of-State 14% $196M • Majority of CRE NOO office exposure in the Twin Cities suburbs • Only 4 loans totaling $35M located in central business districts (CBD) • Only 3 loans totaling $27M outside of Minnesota – out-of-state projects for existing local clients Lower Repricing Risk Fixed-Rate Maturity Schedule Low LTVs 79% are Fixed-Rate $114M Maturing Over the Next 12 Months 61% Weighted Average LTV |
|
Ample Liquidity and Borrowing Capacity 15 1 Excludes $236M of pledged securities at June 30, 2023 Dollars in millions 13.5% 14.0% 13.7% 10.9% 9.6% 25.0% 20.1% 17.0% 30.9% 33.1% $1,498 $1,409 $1,380 $1,924 $1,962 2Q22 3Q22 4Q22 1Q23 2Q23 Off-Balance Sheet Liquidity as a % of Assets On-Balance Sheet Liquidity as a % of Assets Liquidity Position with 2.5x Coverage of Uninsured Deposits Diverse Liquidity Mix 2023 YTD Liquidity Actions • Added $582M of on- and off-balance sheet liquidity YTD • $828M increase in borrowing capacity with the FRB following additional loan and securities pledging • $91M increase to cash and cash equivalents • Did not utilize any borrowings from the Discount Window or the Bank Term Funding Program (BTFP) in 2023 YTD Funding Source 6/30/2023 12/31/2022 Change Cash $ 139 $ 4 8 $ 9 1 Unpledged Securities1 302 549 (247) FHLB Capacity 401 391 10 FRB Discount Window 986 158 828 Unsecured Lines of Credit 108 208 (100) Secured Line of Credit 26 26 - Total $ 1,962 $ 1,380 $ 582 Available Balance |
|
Well-Capitalized with Steady Tangible Book Value Per Share Growth 16 10.33% 9.98% 9.55% 9.41% 9.47% 8.50% 8.47% 8.40% 8.48% 8.72% 13.98% 13.78% 13.15% 13.25% 13.50% 7.87% 7.57% 7.48% 7.23% 7.39% 2Q22 3Q22 4Q22 1Q23 2Q23 Total Risk-Based Capital Ratio Common Equity Tier 1 Capital Ratio Tier 1 Leverage Ratio Increased Consolidated Capital Ratios in 2Q23 Tangible Common Equity Ratio1 $4.52 $5.40 $7.22 $8.33 $9.31 $10.98 $11.69 $12.15 2016 2017 2018 2019 2020 2021 2022 2Q23 Steady Tangible Book Value Per Share1 Growth 1 Represents a Non-GAAP financial measure. See Appendix for Non-GAAP reconciliation Dollars in millions, except per share data |
|
Near-Term Expectations 17 • High single-digit loan growth in the back half of 2023 – focus on aligning loan growth more closely with core deposit growth over time • Target loan-to-deposit ratio between 95% and 105% Balance Sheet Growth • Expect the pace of net interest margin compression to continue to slow • Magnitude dependent on the path of interest rates, shape of the yield curve and pace of core deposit growth and loan payoffs Net Interest Margin • Increased pace of expense growth in the second half of 2023, including investments in people and technology, FDIC insurance expense and IntraFi deposit costs • Noninterest expense growth in-line with asset growth over time Expenses • Build tangible common equity and CET1 ratios, aided by retained earnings and managed pace of loan growth • Ongoing evaluation of potential share repurchases Capital Levels |
|
2023 Strategic Priorities – Positioning for Long-Term Success 18 Manage High Quality Balance Sheet Growth 1 2 3 4 Maintain High Efficiency While Investing in the Business Continue Scalability of ERM Function, Including Proactive Assessment of Asset Quality Risks Implement Longer Term Strategic Readiness Initiatives • Slower pace of balance sheet growth in the current environment • Manage the balance sheet to optimize net interest income • Increase emphasis on generating core deposit growth to support loan growth over the course of 2023 • Identify opportunities to better manage the discretionary spend to align expense growth with a slower pace of asset growth • Continue to invest in people and technology • Make proactive investments to scale the business and position for longer-term growth • Continued build-out of the enterprise risk management function, including enhanced stress testing capabilities • Ongoing monitoring of the loan portfolio for signs of credit weakness given the economic uncertainty heading into 2023 • Expand covenant testing and assess repricing risk on maturing loans • Complete CECL adoption in early 2023 • Expand C&I function to support further diversification of the loan portfolio and new deposit growth channels over time • Continue evaluating potential M&A opportunities and be ready to act as the right opportunity becomes available Progress-to-Date Core deposit growth outpaced loan growth in 2Q23 NIE growth of 5% YoY compared to asset growth of 19% Adopted CECL on January 1, 2023 Relocated downtown Minneapolis branch |
|
APPENDIX 19 |
|
Interest Rate Sensitivity 20 Estimated Change in NII From Immediate Interest Rate Shocks +200 bps +100 bps -100 bps (3.6)% (1.7)% +3.1% • Change in rate sensitivity position impacted by rising interest rate environment, deposit mix shift and leveraging wholesale deposits and borrowings • Better positioned for a steeper yield curve and potential future rate cuts Loan Portfolio Considerations • Loan portfolio most sensitive to changes in the 3- to 5-year portion of the yield curve • Fixed-rate nature of the loan portfolio (67%) results in slower repricing compared to deposits • Leveraging prepayment penalties on new loan originations to help maintain benefit of higher rates over time Deposit Considerations • Increased focus on funding loan growth with core deposits over time • Core deposit growth more challenging amid recent bank failures and rising interest rate environment • Continued to supplement core deposits with wholesale funding to support loan growth • Deposit base is more sensitive to changing interest rates • Cumulative deposit beta of 48%1 (0.7)% (0.4)% +0.5% 2Q22 3Q22 -200 bps (2.0)% +2.4% (2.3)% (1.2)% +1.0% 4Q22 +1.3% (9.3)% (4.6)% +6.2% 1Q23 +12.2% 1 Calculated as the change in ending deposit rate over the change in ending Fed Funds rate from February 2022 to June 2023 (3.8)% (1.9)% +4.0% 2Q23 +7.5% |
|
17% 7% 19% 21% 16% 20% $102 $41 $115 $126 $99 $119 Less Than 1 Year 1 to 2 Years 2 to 3 Years 3 to 4 Years 4 to 5 Years 5+ Years 17% 15% 11% 14% 14% 29% $422 $363 $265 $354 $351 $736 Less Than 1 Year 1 to 2 Years 2 to 3 Years 3 to 4 Years 4 to 5 Years 5+ Years Loan Portfolio Repricing 21 Fixed, 66.7% Variable, 17.2% Adjustable, 16.1% Loan Portfolio Mix Fixed-Rate Portfolio ($2.5B) Variable-Rate Portfolio ($644M) Adjustable-Rate Portfolio ($602M) Years to Maturity Stronger loan growth results in relatively quick turn of the loan portfolio and accelerated repricing: • 16% year-over-year total loan growth • $972M of total loan originations and advances over prior 12 months Variable-Rate Loan Floors 100% 100% 100% 100% 100% $550 $550 $550 $550 $550 At or Above Floor (6/30/23) Up 25 bps Up 50 bps Up 75 bps Up 100+ bps Cumulative Percent of balances at or above floor as rates rise • 85% of variable-rate portfolio have floors, all of which are at or above their floors • 95% of variable-rate loans are currently tied to SOFR or Prime Adjustable-Rate Repricing Schedule • Over 99% of the adjustable-rate loans are at or above their floors • Implies immediate repricing as rates rise, depending on the repricing schedule Dollars in millions Larger fixed-rate portfolio helps to mitigate repricing risk |
|
High Quality Securities Portfolio 22 30% 35% 43% 41% 41% 35% 31% 24% 23% 24% 21% 20% 20% 21% 21% 14% 13% 13% 15% 14% $483 $542 $549 $559 $538 2Q22 3Q22 4Q22 1Q23 2Q23 Mortgage-Backed Securities Municipal Bonds Corporate Securities Other Securities Available for Sale Portfolio AAA, 21% AA, 47% A, 4% BBB, 12% BB, 1% NR, 15% Rating Mix Derivatives Portfolio Offsetting AOCI Impact $(47,884) $(52,064) $28,581 $28,203 $(17,942) $(20,908) 4Q22 2Q23 MTM Securities MTM Derivatives Net Impact on AOCI1 • No held-to-maturity securities • Securities portfolio average duration of 5.3 years • Average securities portfolio yield of 4.24% • Unrealized losses on AFS securities were 12.7% of stockholders’ equity • AOCI / Total RBC of 3.6% vs. peer bank median of 10.5%2 1 Includes the tax-effected impact of $7,232 in 4Q22 and $8,430 in 2Q23 2 1Q23 median for publicly-traded banks with total assets between $3 billion and $10 billion (Source: S&P Capital IQ) Dollars in thousands |
|
Reconciliation of Non-GAAP Financial Measures – Annual 23 Dollars in thousands Tangible Common Equity & Tangible Common Equity/Tangible Assets 2016 2017 2018 2019 2020 2021 2022 Common Equity $ 115,366 $ 137,162 $ 220,998 $ 244,794 $ 265,405 $ 379,272 $ 394,064 Less: Preferred Stock - - - - - (66,514) (66,514) Less: Intangible Assets (4,060) (3,869) (3,678) (3,487) (3,296) (3,105) (2,914) Tangible Common Equity $ 111,306 $ 133,293 $ 217,320 $ 241,307 $ 262,109 $ 309,653 $ 324,636 Total Assets $ 1,260,394 $ 1,616,612 $ 1,973,741 $ 2,268,830 $ 2,927,345 $ 3,477,659 $ 4,345,662 Less: Intangible Assets (4,060) (3,869) (3,678) (3,487) (3,296) (3,105) (2,914) Tangible Assets $ 1,256,334 $ 1,612,743 $ 1,970,063 $ 2,265,343 $ 2,924,049 $ 3,474,554 $ 4,342,748 Tangible Common Equity/Tangible Assets 8.86% 8.26% 11.03% 10.65% 8.96% 8.91% 7.48% Tangible Book Value Per Share 2016 2017 2018 2019 2020 2021 2022 Book Value Per Common Share $ 4.69 $ 5.56 $ 7.34 $ 8.45 $ 9.43 $ 11.09 $ 11.80 Less: Effects of Intangible Assets (0.17) (0.16) (0.12) (0.12) (0.12) (0.11) (0.11) Tangible Book Value Per Common Share $ 4.52 $ 5.40 $ 7.22 $ 8.33 $ 9.31 $ 10.98 $ 11.69 Total Common Shares 24,589,861 24,679,861 30,097,274 28,973,572 28,143,493 28,206,566 27,751,950 As of and for the year ended December 31, |
|
Reconciliation of Non-GAAP Financial Measures – Profitability, TCE and TBV 24 Dollars in thousands Efficiency Ratio June 30, 2022 September 30, 2022 December 31, 2022 March 31, 2023 June 30, 2023 Noninterest Expense $ 13,752 $ 14,157 $ 15,203 $ 14,183 $ 14,388 Net Income Available to Common Shareholders Less: Amortization Intangible Assets (47) (48) (48) (48) (34) Adjusted Noninterest Expense $ 13,705 $ 14,109 $ 15,155 $ 14,135 $ 14,354 Average Total Shareholders' Equity Less: Average Preferred Stock Net Interest Income $ 32,530 $ 34,095 $ 32,893 $ 28,567 $ 25,872 Average Total Common Shareholders' Equity Noninterest Income 1,650 1,387 1,738 1,943 1,415 Less: Effects of Average Intangible Assets Less: (Gain) Loss on Sales of Securities (52) - (30) 56 (50) Average Tangible Common Equity Adjusted Operating Revenue $ 34,128 $ 35,482 $ 34,601 $ 30,566 $ 27,237 Annualized Return on Average Tangible Common Equity Efficiency Ratio 40.2% 39.8% 43.8% 46.2% 52.7% Tangible Common Equity & Tangible Common Equity/Tangible Assets June 30, 2022 September 30, 2022 December 31, 2022 March 31, 2023 June 30, 2023 Total Shareholders' Equity $ 374,883 $ 382,007 $ 394,064 $ 402,006 $ 409,126 Less: Preferred Stock (66,514) (66,514) (66,514) (66,514) (66,514) Total Common Shareholders' Equity 308,369 315,493 327,550 335,492 342,612 Less: Intangible Assets (3,009) (2,962) (2,914) (2,866) (2,832) Tangible Common Equity $ 305,360 $ 312,531 $ 324,636 $ 332,626 $ 339,780 Total Assets $ 3,883,264 $ 4,128,987 $ 4,345,662 $ 4,602,899 $ 4,603,185 Less: Intangible Assets (3,009) (2,962) (2,914) (2,866) (2,832) Tangible Assets $ 3,880,255 $ 4,126,025 $ 4,342,748 $ 4,600,033 $ 4,600,353 Tangible Common Equity/Tangible Assets 7.87% 7.57% 7.48% 7.23% 7.39% Tangible Book Value Per Share June 30, 2022 September 30, 2022 December 31, 2022 March 31, 2023 June 30, 2023 Book Value Per Common Share $ 11.14 $ 11.44 $ 11.80 $ 12.05 $ 12.25 Less: Effects of Intangible Assets (0.11) (0.11) (0.11) (0.10) (0.10) Tangible Book Value Per Common Share $ 11.03 $ 11.33 $ 11.69 $ 11.95 $ 12.15 Total Common Shares 27,677,372 27,587,978 27,751,950 27,845,244 27,973,995 As of and for the quarter ended, As of and for the quarter ended, As of and for the quarter ended, ROATCE As of and for the quarter ended, June 30, 2023 $ 8,802 $ 406,347 (66,514) $ 339,833 (2,846) $ 336,987 10.48% |
|
Reconciliation of Non-GAAP Financial Measures – PPNR 25 Dollars in thousands Pre-Provision Net Revenue June 30, 2022 September 30, 2022 December 31, 2022 March 31, 2023 June 30, 2023 Noninterest Income $ 1,650 $ 1,387 $ 1,738 $ 1,943 $ 1,415 Less: (Gain) Loss on Sales on Securities (52) - (30) 5 6 (50) Less: FHLB Advance Prepayment Income - - - (299) - Total Operating Noninterest Income 1,598 1,387 1,708 1,700 1,365 Plus: Net Interest Income 32,530 34,095 32,893 28,567 25,872 Net Operating Revenue 34,128 35,482 34,601 30,267 27,237 Noninterest Expense $ 13,752 $ 14,157 $ 15,203 $ 14,183 $ 14,388 Less: Amortization of Tax Credit Investments (63) (114) (114) (114) (114) Total Operating Noninterest Expense 13,689 14,043 15,089 14,069 14,274 Pre-Provision Net Revenue $ 20,439 $ 21,439 $ 19,512 $ 16,198 $ 12,963 Plus: Non-Operating Revenue Adjustments 5 2 - 30 243 5 0 Less: Provision for Credit Losses 3,025 1,500 1,500 625 5 0 Non-Operating Expense Adjustments 63 114 114 114 114 Provision for Income Taxes 4,521 5,312 4,193 4,060 3,033 Net Income $ 12,882 $ 14,513 $ 13,735 $ 11,642 $ 9,816 Average Assets $ 3,743,575 $ 3,948,201 $ 4,251,345 $ 4,405,234 $ 4,483,662 Pre-Provision Net Revenue Return on Average Assets 2.19% 2.15% 1.82% 1.49% 1.16% As of and for the quarter ended, |
|
Reconciliation of Non-GAAP Financial Measures – Core NIM 26 Dollars in thousands Core Net Interest Margin June 30, 2022 September 30, 2022 December 31, 2022 March 31, 2023 June 30, 2023 Net Interest Income (Tax-Equivalent Basis) $ 32,806 $ 34,418 $ 33,260 $ 28,947 $ 26,280 Less: Loan Fees (2,030) (1,400) (1,100) (998) (941) Less: PPP Interest and Fees (263) (96) (48) (2) (3) Core Net Interest Margin $ 30,513 $ 32,922 $ 32,112 $ 27,947 $ 25,336 Average Interest Earning Assets $ 3,671,748 $ 3,871,896 $ 4,177,644 $ 4,323,706 $ 4,395,050 Less: Average PPP Loans (8,335) (2,424) (1,109) (999) (913) Core Average Interest Earning Assets $ 3,663,413 $ 3,869,472 $ 4,176,535 $ 4,322,707 $ 4,394,137 Core Net Interest Margin 3.34% 3.38% 3.05% 2.62% 2.31% Loan Interest Income (Tax-Equivalent Basis) $ 34,468 $ 37,820 $ 42,702 $ 45,265 $ 48,066 Less: Loan Fees (2,030) (1,400) (1,100) (998) (941) Less: PPP Interest and Fees (263) (96) (48) (2) (3) Core Loan Interest Income $ 32,175 $ 36,324 $ 41,554 $ 44,265 $ 47,122 Average Loans $ 3,107,679 $ 3,265,814 $ 3,482,150 $ 3,630,446 $ 3,716,534 Less: Average PPP Loans (8,335) (2,424) (1,109) (999) (913) Core Average Loans $ 3,099,344 $ 3,263,390 $ 3,481,041 $ 3,629,447 $ 3,715,621 Core Loan Yield 4.17% 4.42% 4.74% 4.95% 5.09% As of and for the quarter ended, |