UNITED STATES
SECURITIES AND EXCHANGE COMMISSION
Washington, D.C. 20549
FORM 8-K
CURRENT REPORT
Pursuant to Section 13 or 15(d) of
The Securities Exchange Act of 1934
June 15, 2023
Date of Report (Date of earliest event reported)
Citizens & Northern Corporation
(Exact name of registrant as specified in its charter)
Pennsylvania |
|
0-16084 |
|
23-2451943 |
(State or other jurisdiction of incorporation) |
(Commission |
(IRS Employer |
||
|
|
|
|
|
90-92 Main Street, Wellsboro, Pennsylvania |
|
|
|
16901 |
(Address of principal executive offices) |
|
|
|
(Zip Code) |
(570) 724-3411
Registrant’s telephone number, including area code
N/A
(Former name or former address, if changed since last report.)
Check the appropriate box below if the Form 8-K filing is intended to simultaneously satisfy the filing obligation of the registrant under any of the following provisions:
☐ Written communications pursuant to Rule 425 under the Securities Act (17 CFR 230.425)
☐ Soliciting material pursuant to Rule 14a-12 under the Exchange Act (17 CFR 240.14a-12)
☐ Pre-commencement communications pursuant to Rule 14d-2(b) under the Exchange Act (17 CFR 240.14d-2(b))
☐ Pre-commencement communications pursuant to Rule 13e-4(c) under the Exchange Act (17 CFR 240.13e-4(c))
Securities registered pursuant to Section 12(b) of the Act:
Title of each class |
|
Trading Symbol |
|
Name of each exchange on which registered |
Common Stock, par value $1.00 per share |
CZNC |
Nasdaq Capital Market |
Indicate by check mark whether the registrant is an emerging growth company as defined in Rule 405 of the Securities Act of 1933 (17 CFR §230.405) or Rule 12b-2 of the Securities Exchange Act of 1934 (17 CFR §240.12b-2).
Emerging growth company ☐
If an emerging growth company, indicate by check mark if the registrant has elected not to use the extended transition period for complying with any new or revised financial accounting standards provided pursuant to Section 13(a) of the Exchange Act. ☐
Item 7.01 Regulation FD
On June 15, 2023, J. Bradley Scovill, President and CEO, and Mark A. Hughes, Treasurer and Chief Financial Officer, of Citizens & Northern Corporation (Corporation) are scheduled to present an overview of the Corporation to various institutional analysts and investors for the Piper Sandler & Co. 2023 Philly Bank Bonanza event in Philadelphia, PA.
The Investor Presentation to be used in discussions with the analysts and investors is attached as Exhibit 99.1 to this Current Report and is incorporated herein by reference. This Current Report is being furnished pursuant to Regulation FD and no part shall be deemed "filed" for any purpose.
Item 9.01 Financial Statements and Exhibits.
99.1 |
|
104 |
Cover Page Interactive Data File (embedded in the cover page formatted in Inline XBRL) |
SIGNATURES
Pursuant to the requirements of the Securities Exchange Act of 1934, the registrant has duly caused this report to be signed on its behalf by the undersigned hereunto duly authorized.
|
CITIZENS & NORTHERN CORPORATION |
|
|
|
|
Dated: June 15, 2023 |
By: |
/s/ Mark A. Hughes |
|
|
Mark A. Hughes |
|
|
Treasurer and Chief Financial Officer |
|
Piper Sandler & Co. Piper Sandler & Co. 2023 Philly Bank Bonanza June 15, 2023 |
|
CAUTION REGARDING FORWARD LOOKING STATEMENTS This presentation contains forward-looking statements within the meaning of the Private Securities Litigation Reform Act of 1995 that relate to future events or the future performance of the Company. Forward-looking statements are not guarantees of performance or results. These forward-looking statements are based on the current beliefs and expectations of the respective management of the Company and are inherently subject to significant business, economic and competitive uncertainties and contingencies, many of which are beyond their respective control. In addition, these forward-looking statements are subject to assumptions with respect to future business strategies and decisions that are subject to change. Actual results may differ materially from the anticipated results discussed or implied in these forward-looking statements because of numerous possible uncertainties. Words like "may," "plan," "contemplate," "anticipate," "believe," "intend," "continue," "expect," "project," "predict," "estimate," "could," "should," "would," "will," and similar expressions, should be considered as identifying forward-looking statements, although other phrasing may be used. Such forward-looking statements involve risks and uncertainties and may not be realized due to a variety of factors. Additional factors that could cause actual results to differ materially from those expressed in the forward-looking statements are discussed in the reports (such as Annual Reports on Form 10-K and Quarterly Reports on Form 10-Q) filed by the Company with the Securities and Exchange Commission. You should consider such factors and not place undue reliance on such forward-looking statements. No obligation is undertaken by the Company to update such forward-looking statements to reflect events or circumstances occurring after the issuance of this presentation. NON-GAAP FINANCIAL MEASURES Statements included in this presentation include non-GAAP financial measures and should be read along with the accompanying tables under the section titled “Non-GAAP Reconciliations.” The Company uses non-GAAP financial measures to analyze its performance. Management believes that non-GAAP financial measures provide additional useful information that allows readers to evaluate the ongoing performance of the Company and provide meaningful comparison to its peers. Non-GAAP financial measures should not be considered as an alternative to any measure of performance or financial condition as promulgated under GAAP, and investors should consider the Company’s performance and financial condition as reported under GAAP and all other relevant information when assessing the performance or financial condition of the Company. Non-GAAP financial measures have limitations as analytical tools, and investors should not consider them in isolation or as a substitute for analysis of the results or financial condition as reported under GAAP. Legal Disclaimer 2 |
|
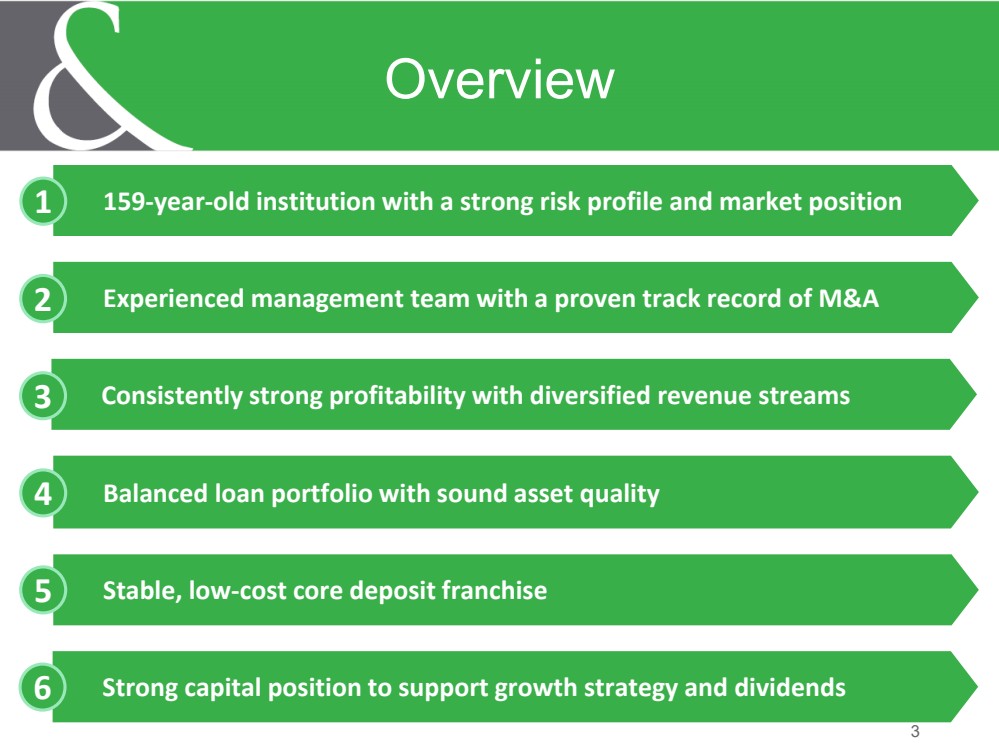
3 Overview 159-year-old institution with a strong risk profile and market position Experienced management team with a proven track record of M&A Consistently strong profitability with diversified revenue streams Balanced loan portfolio with sound asset quality Stable, low-cost core deposit franchise 1 2 3 4 5 6 Strong capital position to support growth strategy and dividends |
|
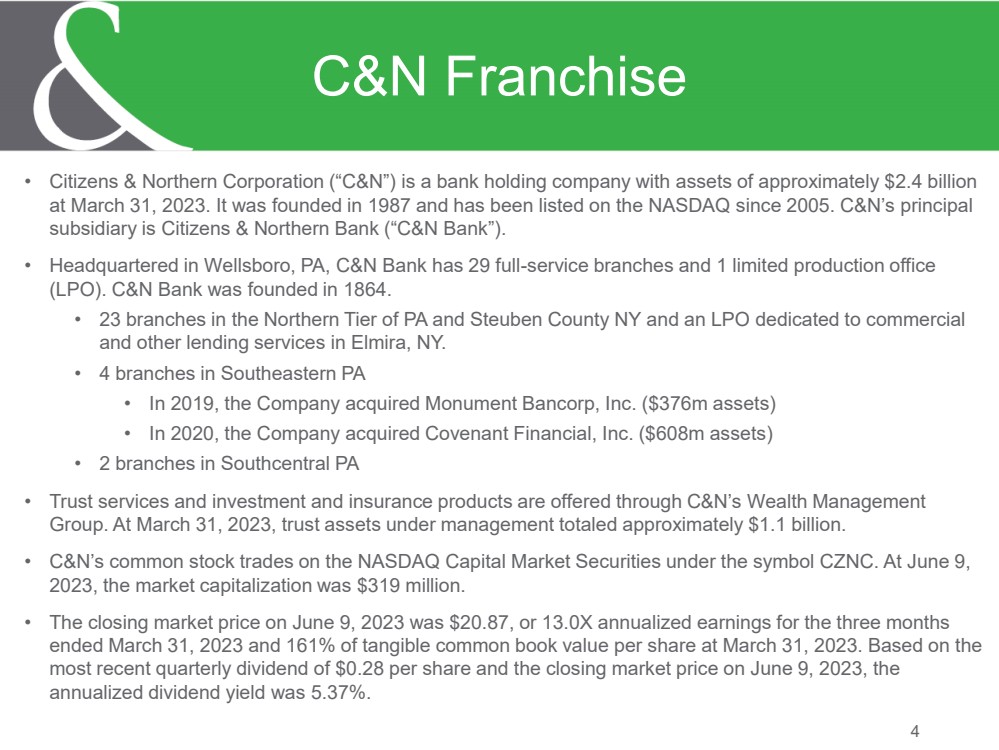
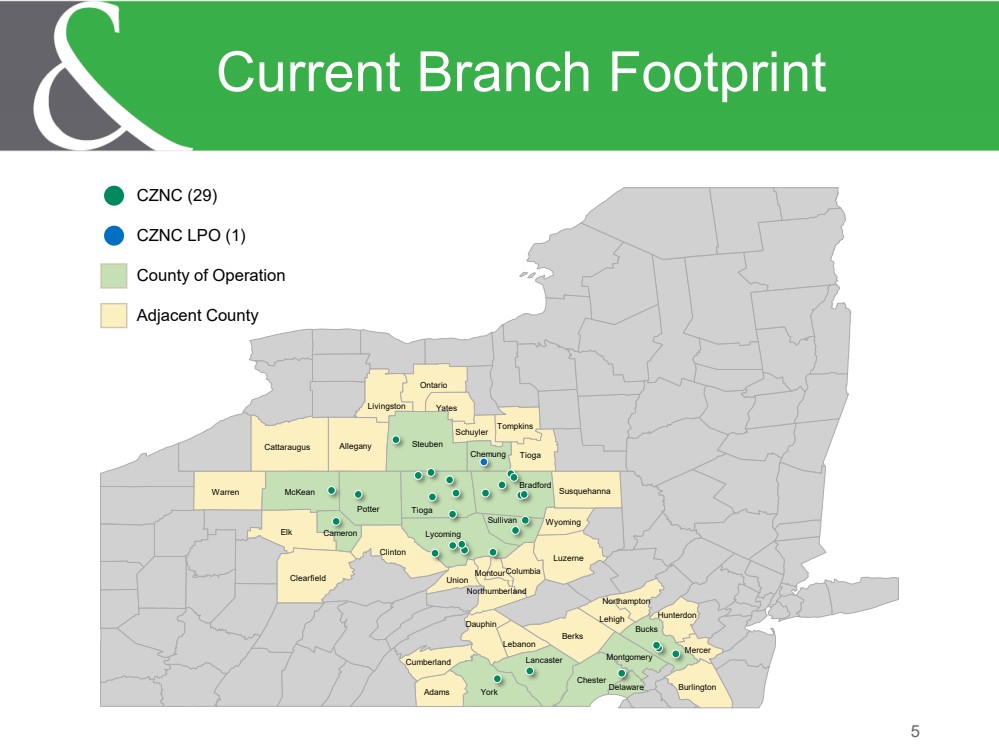
• Citizens & Northern Corporation (“C&N”) is a bank holding company with assets of approximately $2.4 billion at March 31, 2023. It was founded in 1987 and has been listed on the NASDAQ since 2005. C&N’s principal subsidiary is Citizens & Northern Bank (“C&N Bank”). • Headquartered in Wellsboro, PA, C&N Bank has 29 full-service branches and 1 limited production office (LPO). C&N Bank was founded in 1864. • 23 branches in the Northern Tier of PA and Steuben County NY and an LPO dedicated to commercial and other lending services in Elmira, NY. • 4 branches in Southeastern PA • In 2019, the Company acquired Monument Bancorp, Inc. ($376m assets) • In 2020, the Company acquired Covenant Financial, Inc. ($608m assets) • 2 branches in Southcentral PA • Trust services and investment and insurance products are offered through C&N’s Wealth Management Group. At March 31, 2023, trust assets under management totaled approximately $1.1 billion. • C&N’s common stock trades on the NASDAQ Capital Market Securities under the symbol CZNC. At June 9, 2023, the market capitalization was $319 million. • The closing market price on June 9, 2023 was $20.87, or 13.0X annualized earnings for the three months ended March 31, 2023 and 161% of tangible common book value per share at March 31, 2023. Based on the most recent quarterly dividend of $0.28 per share and the closing market price on June 9, 2023, the annualized dividend yield was 5.37%. C&N Franchise 4 |
|
CZNC (29) CZNC LPO (1) County of Operation Adjacent County Elk Tioga York Potter Steuben Berks Bradford Lycoming Clinton Warren Allegany Clearfield McKean Luzerne Cattaraugus Bucks Lancaster Tioga Chester Ontario Adams Yates Burlington Dauphin Livingston Susquehanna Sullivan Union Tompkins Lehigh Cumberland Wyoming Chemung Lebanon Schuyler Columbia Cameron Hunterdon Montgomery Mercer Northumberland Northampton Delaware Montour Current Branch Footprint 5 |
|
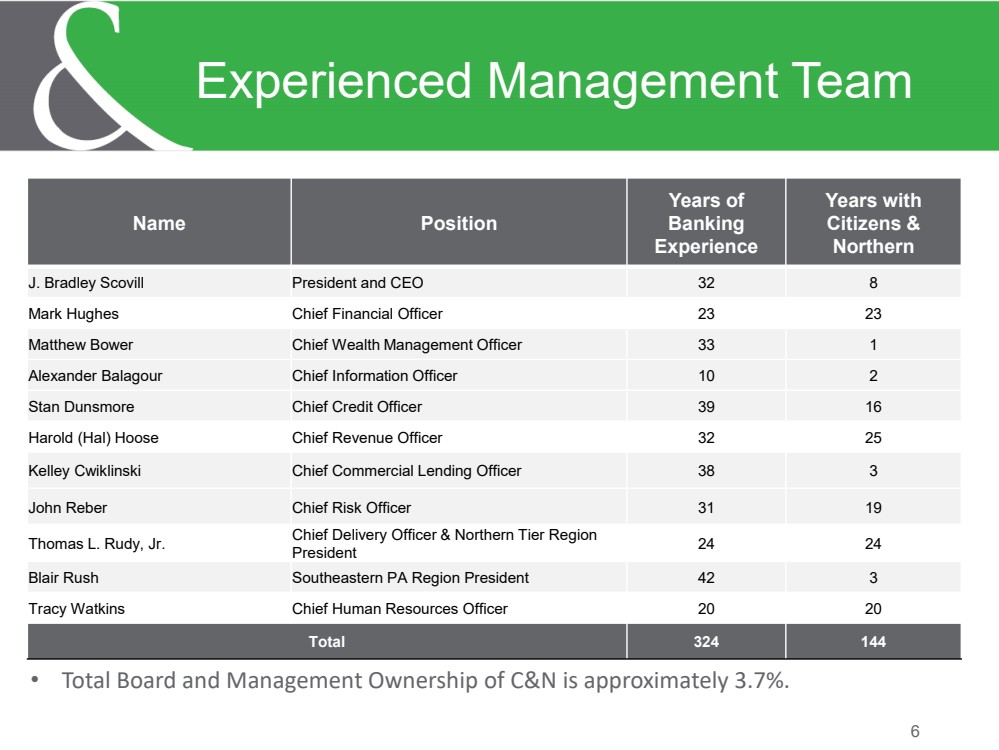
6 Experienced Management Team Name Position Years of Banking Experience Years with Citizens & Northern J. Bradley Scovill President and CEO 32 8 Mark Hughes Chief Financial Officer 23 23 Matthew Bower Chief Wealth Management Officer 33 1 Alexander Balagour Chief Information Officer 10 2 Stan Dunsmore Chief Credit Officer 39 16 Harold (Hal) Hoose Chief Revenue Officer 32 25 Kelley Cwiklinski Chief Commercial Lending Officer 38 3 John Reber Chief Risk Officer 31 19 Thomas L. Rudy, Jr. Chief Delivery Officer & Northern Tier Region President 24 24 Blair Rush Southeastern PA Region President 42 3 Tracy Watkins Chief Human Resources Officer 20 20 Total 324 144 • Total Board and Management Ownership of C&N is approximately 3.7%. |
|
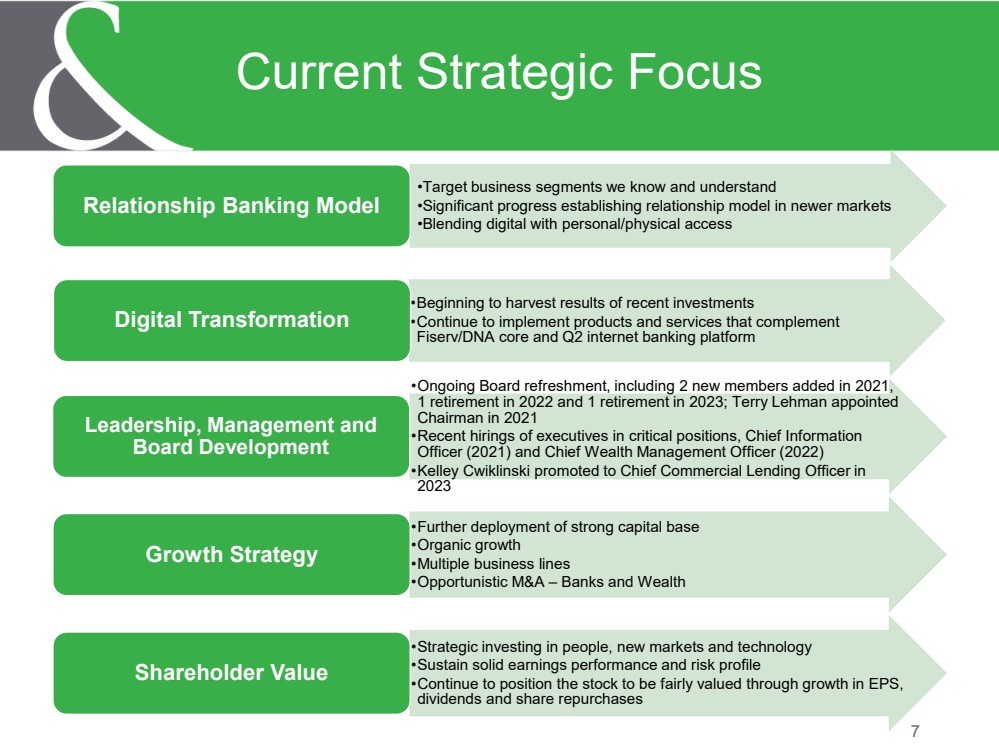
7 Current Strategic Focus •Target business segments we know and understand •Significant progress establishing relationship model in newer markets •Blending digital with personal/physical access Relationship Banking Model •Beginning to harvest results of recent investments •Continue to implement products and services that complement Fiserv/DNA core and Q2 internet banking platform Digital Transformation •Ongoing Board refreshment, including 2 new members added in 2021, 1 retirement in 2022 and 1 retirement in 2023; Terry Lehman appointed Chairman in 2021 •Recent hirings of executives in critical positions, Chief Information Officer (2021) and Chief Wealth Management Officer (2022) •Kelley Cwiklinski promoted to Chief Commercial Lending Officer in 2023 Leadership, Management and Board Development •Further deployment of strong capital base •Organic growth •Multiple business lines •Opportunistic M&A – Banks and Wealth Growth Strategy •Strategic investing in people, new markets and technology •Sustain solid earnings performance and risk profile •Continue to position the stock to be fairly valued through growth in EPS, dividends and share repurchases Shareholder Value |
|
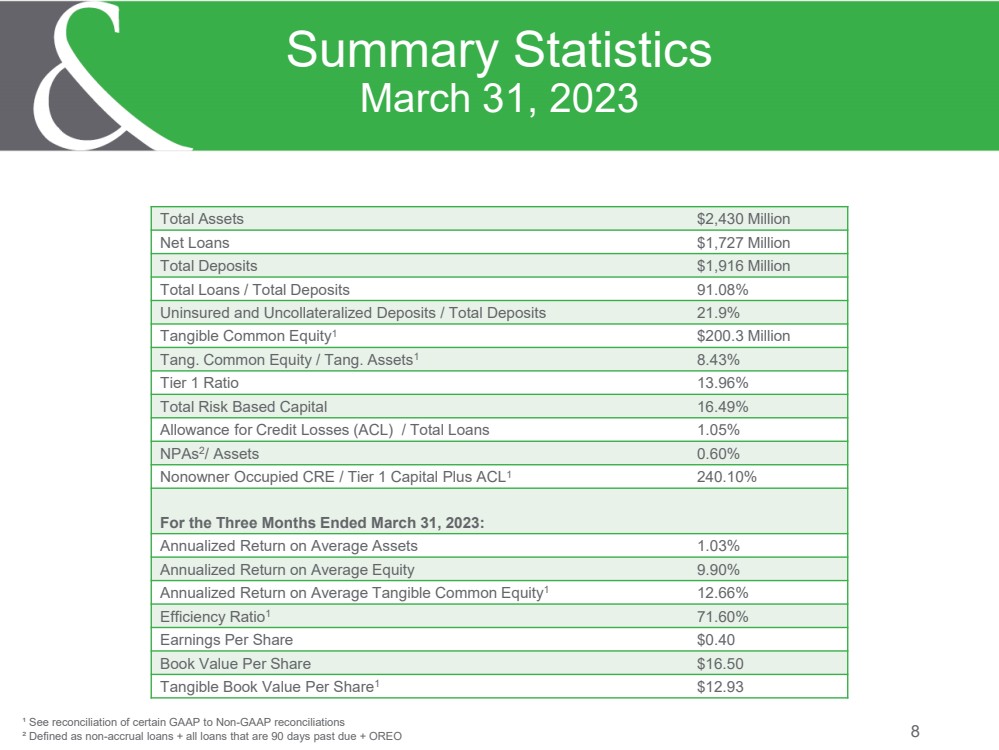
8 Summary Statistics March 31, 2023 Total Assets $2,430 Million Net Loans $1,727 Million Total Deposits $1,916 Million Total Loans / Total Deposits 91.08% Uninsured and Uncollateralized Deposits / Total Deposits 21.9% Tangible Common Equity1 $200.3 Million Tang. Common Equity / Tang. Assets1 8.43% Tier 1 Ratio 13.96% Total Risk Based Capital 16.49% Allowance for Credit Losses (ACL) / Total Loans 1.05% NPAs2 / Assets 0.60% Nonowner Occupied CRE / Tier 1 Capital Plus ACL1 240.10% For the Three Months Ended March 31, 2023: Annualized Return on Average Assets 1.03% Annualized Return on Average Equity 9.90% Annualized Return on Average Tangible Common Equity1 12.66% Efficiency Ratio1 71.60% Earnings Per Share $0.40 Book Value Per Share $16.50 Tangible Book Value Per Share1 $12.93 ¹ See reconciliation of certain GAAP to Non-GAAP reconciliations ² Defined as non-accrual loans + all loans that are 90 days past due + OREO |
|
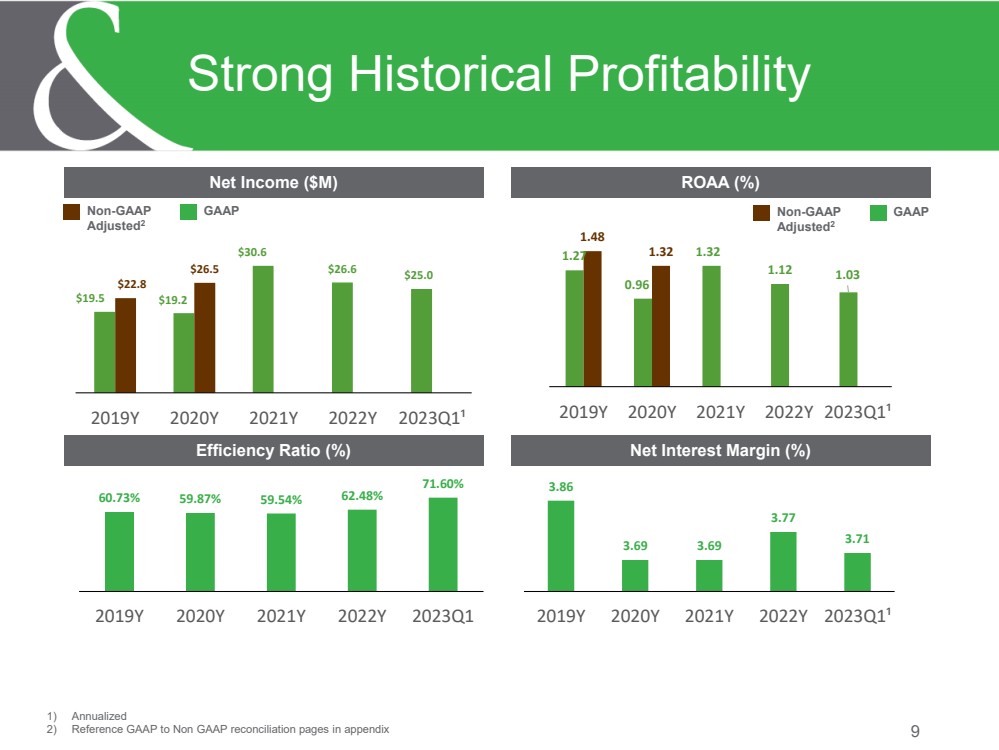
9 Strong Historical Profitability Net Income ($M) Efficiency Ratio (%) ROAA (%) Net Interest Margin (%) 1) Annualized 2) Reference GAAP to Non GAAP reconciliation pages in appendix Non-GAAP GAAP Adjusted2 Non-GAAP GAAP Adjusted2 $19.5 $19.2 $30.6 $26.6 $25.0 $22.8 $26.5 2019Y 2020Y 2021Y 2022Y 2023Q1¹ 1.27 0.96 1.32 1.12 1.03 1.48 1.32 2019Y 2020Y 2021Y 2022Y 2023Q1¹ 3.86 3.69 3.69 3.77 3.71 2019Y 2020Y 2021Y 2022Y 2023Q1¹ 60.73% 59.87% 59.54% 62.48% 71.60% 2019Y 2020Y 2021Y 2022Y 2023Q1 |
|
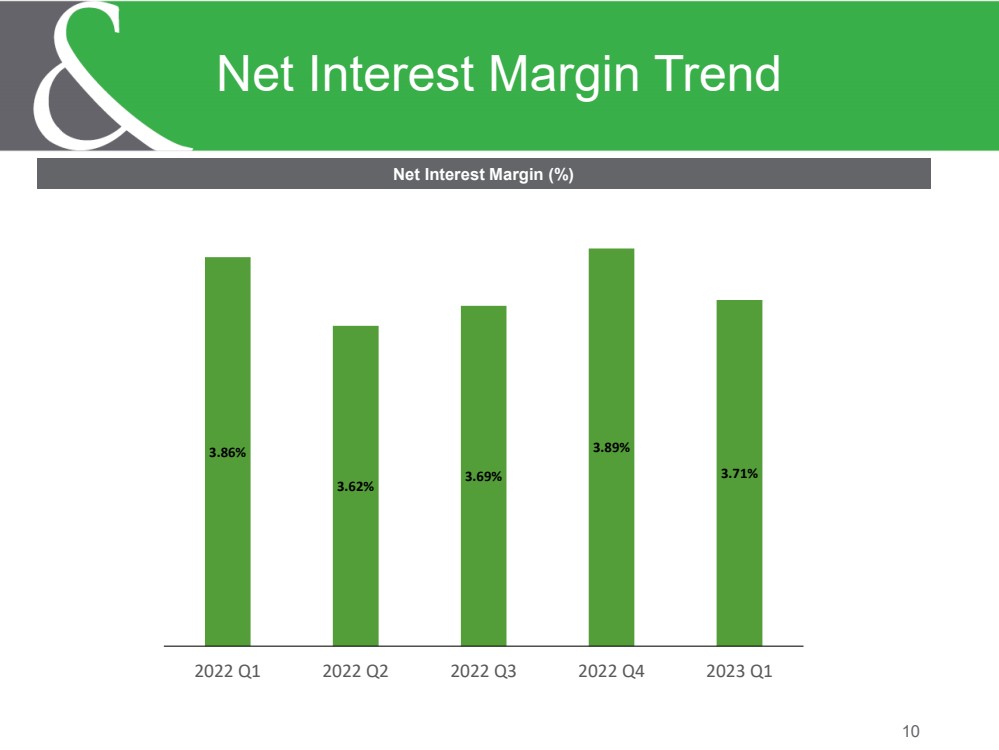
10 Net Interest Margin Trend Net Interest Margin (%) 3.86% 3.62% 3.69% 3.89% 3.71% 2022 Q1 2022 Q2 2022 Q3 2022 Q4 2023 Q1 |
|
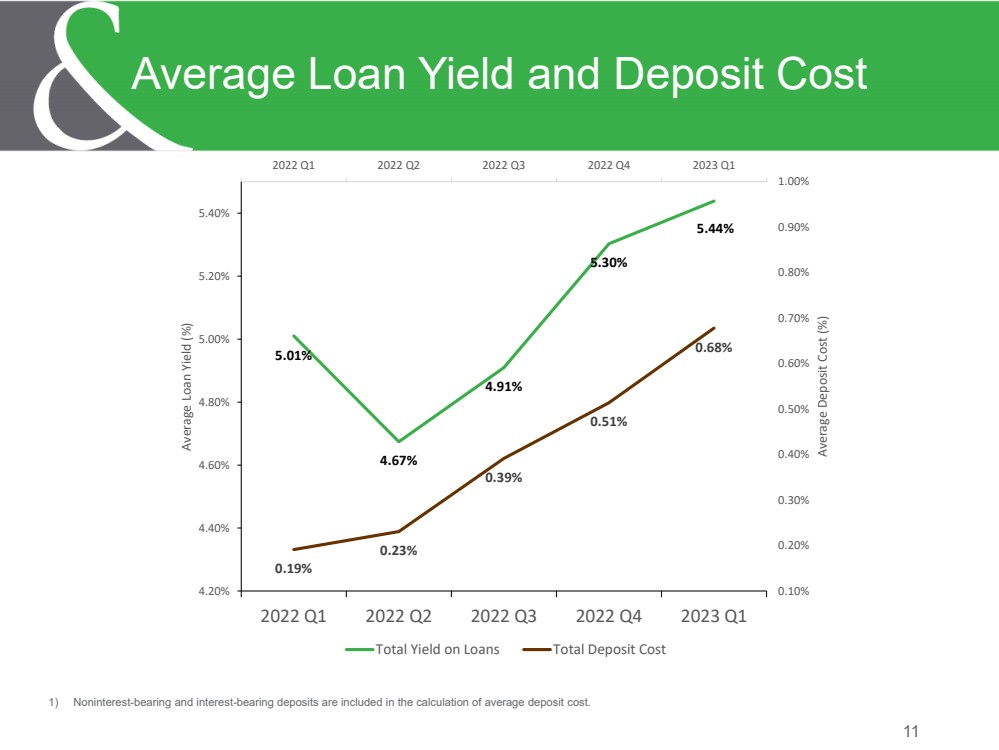
11 Average Loan Yield and Deposit Cost 1) Noninterest-bearing and interest-bearing deposits are included in the calculation of average deposit cost. 5.01% 4.67% 4.91% 5.30% 5.44% 0.19% 0.23% 0.39% 0.51% 0.68% 2022 Q1 2022 Q2 2022 Q3 2022 Q4 2023 Q1 0.10% 0.20% 0.30% 0.40% 0.50% 0.60% 0.70% 0.80% 0.90% 1.00% 4.20% 4.40% 4.60% 4.80% 5.00% 5.20% 5.40% 2022 Q1 2022 Q2 2022 Q3 2022 Q4 2023 Q1 Average Deposit Cost (%) Average Loan Yield (%) Total Yield on Loans Total Deposit Cost |
|
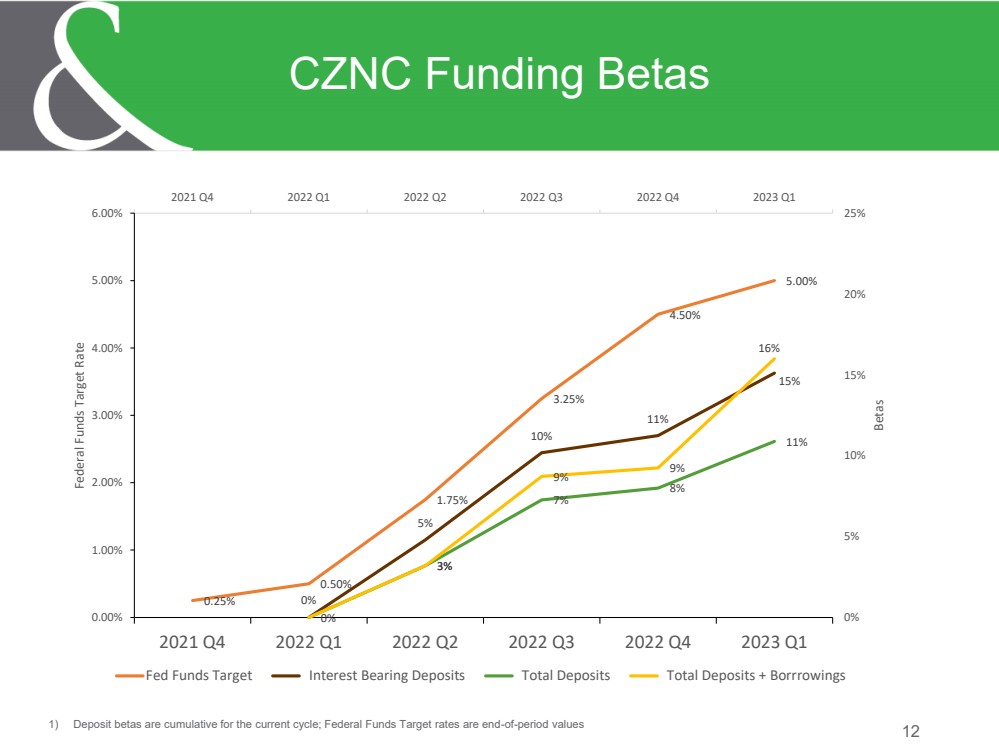
12 CZNC Funding Betas 1) Deposit betas are cumulative for the current cycle; Federal Funds Target rates are end-of-period values 0.25% 0.50% 1.75% 3.25% 4.50% 5.00% 0% 5% 10% 11% 15% 3% 7% 8% 11% 0% 9% 9% 16% 2021 Q4 2022 Q1 2022 Q2 2022 Q3 2022 Q4 2023 Q1 0% 5% 10% 15% 20% 25% 0.00% 1.00% 2.00% 3.00% 4.00% 5.00% 6.00% 2021 Q4 2022 Q1 2022 Q2 2022 Q3 2022 Q4 2023 Q1 Betas Federal Funds Target Rate Fed Funds Target Interest Bearing Deposits Total Deposits Total Deposits + Borrrowings |
|
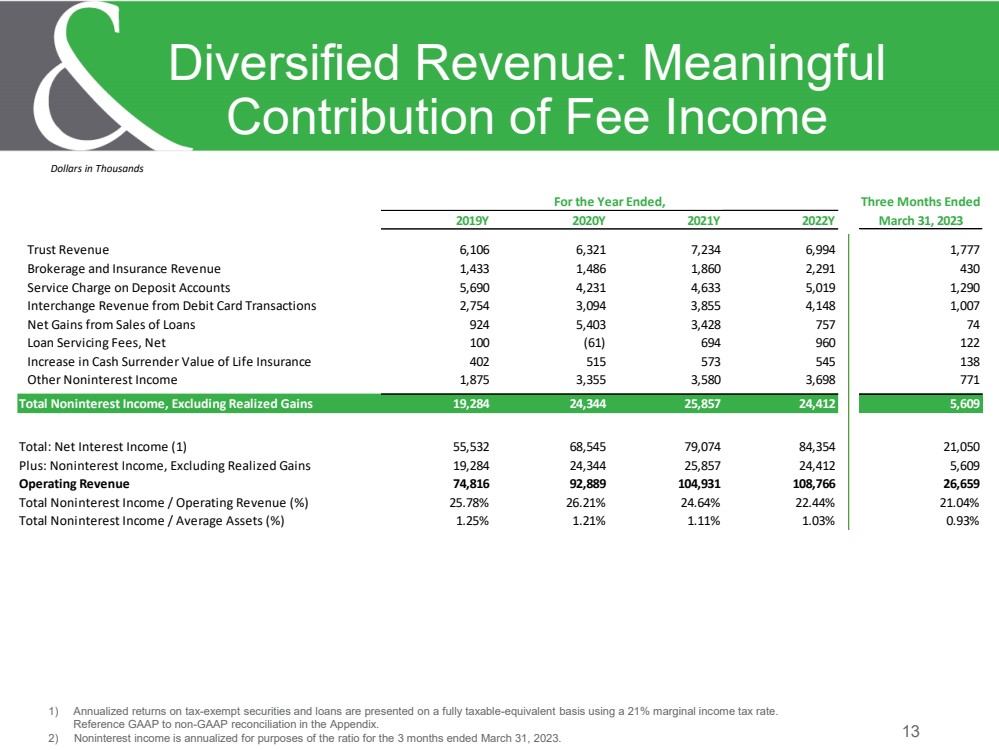
13 Diversified Revenue: Meaningful Contribution of Fee Income 1) Annualized returns on tax-exempt securities and loans are presented on a fully taxable-equivalent basis using a 21% marginal income tax rate. Reference GAAP to non-GAAP reconciliation in the Appendix. 2) Noninterest income is annualized for purposes of the ratio for the 3 months ended March 31, 2023. Dollars in Thousands For the Year Ended, Three Months Ended 2019Y 2020Y 2021Y 2022Y March 31, 2023 Trust Revenue 6,106 6,321 7,234 6,994 1,777 Brokerage and Insurance Revenue 1,433 1,486 1,860 2,291 430 Service Charge on Deposit Accounts 5,690 4,231 4,633 5,019 1,290 Interchange Revenue from Debit Card Transactions 2,754 3,094 3,855 4,148 1,007 Net Gains from Sales of Loans 924 5,403 3,428 757 74 Loan Servicing Fees, Net 100 (61) 694 960 122 Increase in Cash Surrender Value of Life Insurance 402 515 573 545 138 Other Noninterest Income 1,875 3,355 3,580 3,698 771 Total Noninterest Income, Excluding Realized Gains 19,284 24,344 25,857 24,412 5,609 Total: Net Interest Income (1) 55,532 68,545 79,074 84,354 21,050 Plus: Noninterest Income, Excluding Realized Gains 19,284 24,344 25,857 24,412 5,609 Operating Revenue 74,816 92,889 104,931 108,766 26,659 Total Noninterest Income / Operating Revenue (%) 25.78% 26.21% 24.64% 22.44% 21.04% Total Noninterest Income / Average Assets (%) 1.25% 1.21% 1.11% 1.03% 0.93% |
|
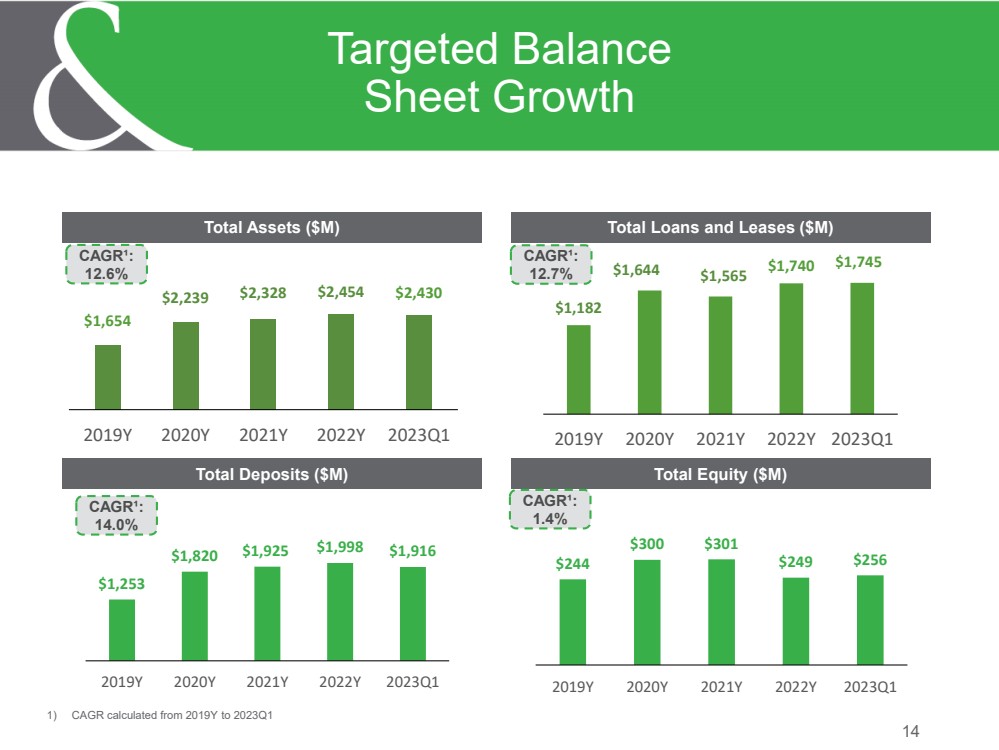
14 Targeted Balance Sheet Growth Total Assets ($M) Total Deposits ($M) Total Loans and Leases ($M) Total Equity ($M) CAGR¹: 12.6% 1) CAGR calculated from 2019Y to 2023Q1 94% 90% 80% CAGR¹: 12.7% CAGR¹: 14.0% 83% CAGR¹: 1.4% $1,654 $2,239 $2,328 $2,454 $2,430 2019Y 2020Y 2021Y 2022Y 2023Q1 $1,182 $1,644 $1,565 $1,740 $1,745 2019Y 2020Y 2021Y 2022Y 2023Q1 $1,253 $1,820 $1,925 $1,998 $1,916 2019Y 2020Y 2021Y 2022Y 2023Q1 $244 $300 $301 $249 $256 2019Y 2020Y 2021Y 2022Y 2023Q1 |
|
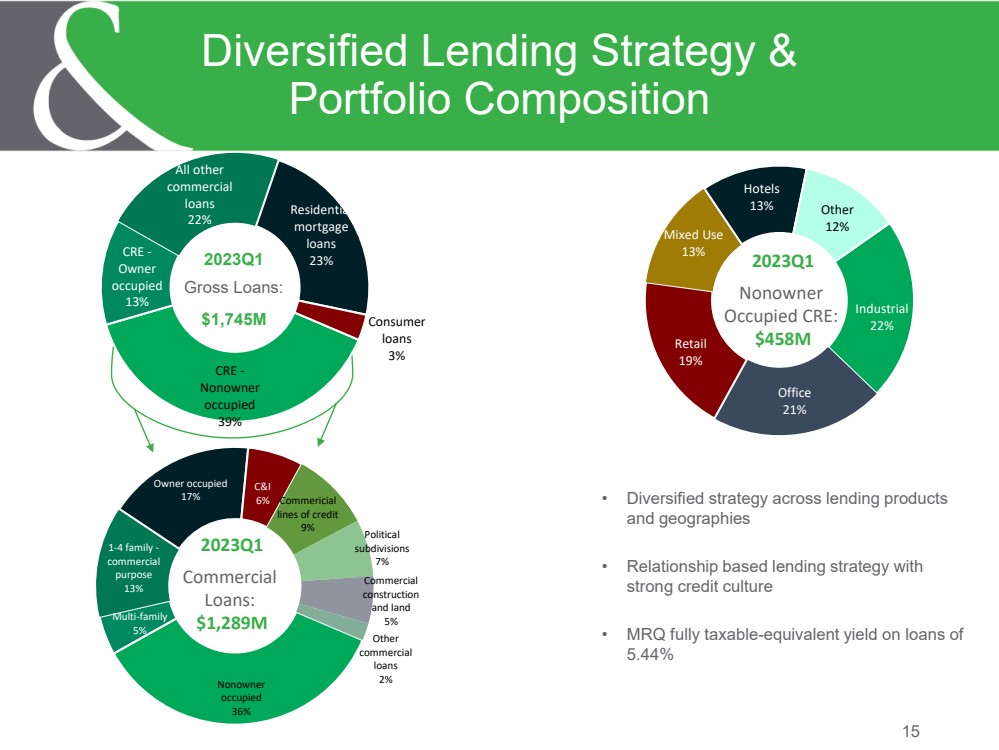
• Diversified strategy across lending products and geographies • Relationship based lending strategy with strong credit culture • MRQ fully taxable-equivalent yield on loans of 5.44% 15 Diversified Lending Strategy & Portfolio Composition 2023Q1 Gross Loans: $1,745M 2023Q1 Commercial Loans: $1,289M CRE - Nonowner occupied 39% CRE - Owner occupied 13% All other commercial loans 22% Residential mortgage loans 23% Consumer loans 3% Nonowner occupied 36% Multi-family 5% 1-4 family - commercial purpose 13% Owner occupied 17% C&I 6% Commericial lines of credit 9% Political subdivisions 7% Commercial construction and land 5% Other commercial loans 2% 2023Q1 Nonowner Occupied CRE: $458M Industrial 22% Office 21% Retail 19% Mixed Use 13% Hotels 13% Other 12% |
|
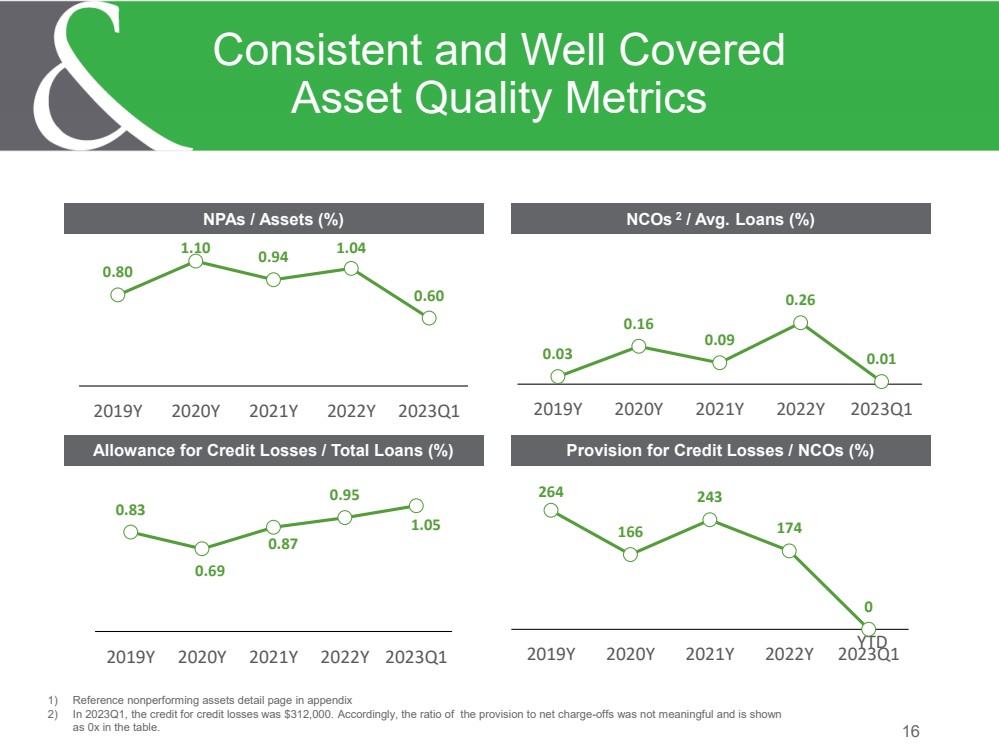
16 Consistent and Well Covered Asset Quality Metrics 1) Reference nonperforming assets detail page in appendix 2) In 2023Q1, the credit for credit losses was $312,000. Accordingly, the ratio of the provision to net charge-offs was not meaningful and is shown as 0x in the table. NPAs / Assets (%) Allowance for Credit Losses / Total Loans (%) NCOs 2 / Avg. Loans (%) Provision for Credit Losses / NCOs (%) YTD 0.80 1.10 0.94 1.04 0.60 2019Y 2020Y 2021Y 2022Y 2023Q1 0.03 0.16 0.09 0.26 0.01 2019Y 2020Y 2021Y 2022Y 2023Q1 0.83 0.69 0.87 0.95 1.05 2019Y 2020Y 2021Y 2022Y 2023Q1 264 166 243 174 0 2019Y 2020Y 2021Y 2022Y 2023Q1 |
|
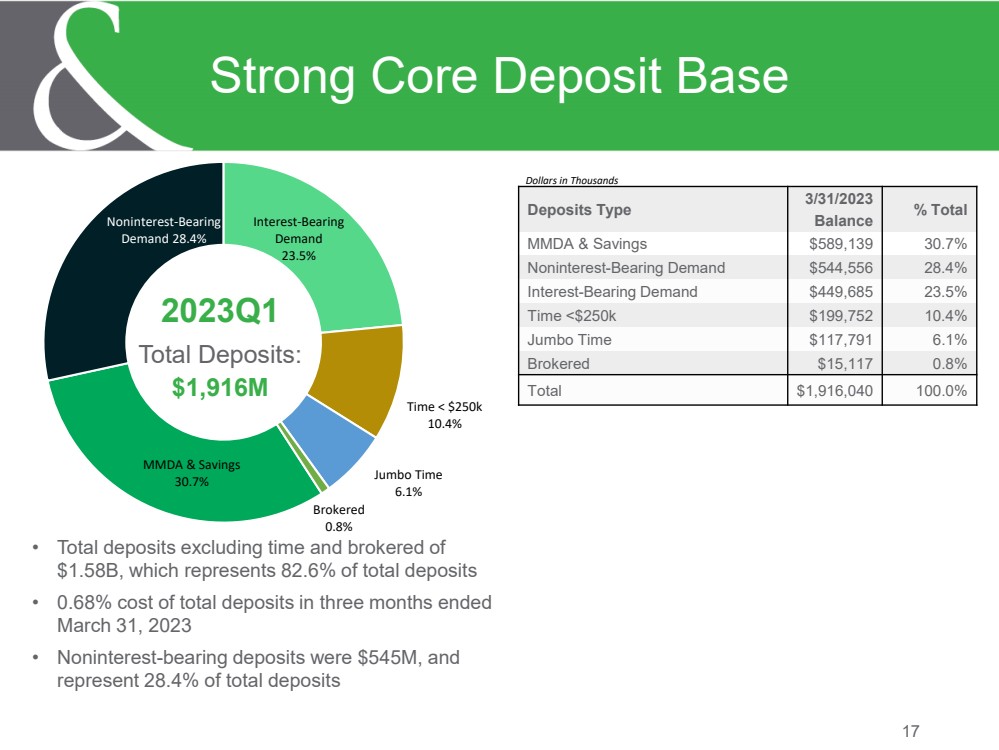
17 Strong Core Deposit Base • Total deposits excluding time and brokered of $1.58B, which represents 82.6% of total deposits • 0.68% cost of total deposits in three months ended March 31, 2023 • Noninterest-bearing deposits were $545M, and represent 28.4% of total deposits 2023Q1 Total Deposits: $1,916M Deposits Type 3/31/2023 Balance % Total MMDA & Savings $589,139 30.7% Noninterest-Bearing Demand $544,556 28.4% Interest-Bearing Demand $449,685 23.5% Time <$250k $199,752 10.4% Jumbo Time $117,791 6.1% Brokered $15,117 0.8% Total $1,916,040 100.0% Dollars in Thousands MMDA & Savings 30.7% Noninterest-Bearing Demand 28.4% Interest-Bearing Demand 23.5% Time < $250k 10.4% Jumbo Time 6.1% Brokered 0.8% |
|
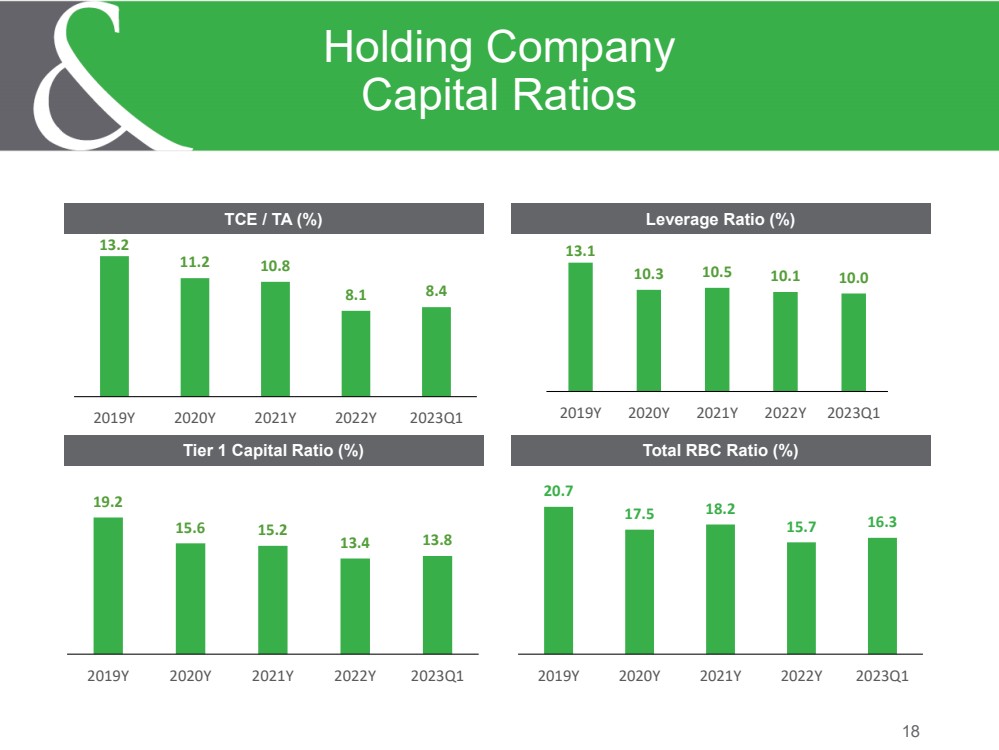
18 Holding Company Capital Ratios TCE / TA (%) Tier 1 Capital Ratio (%) Leverage Ratio (%) Total RBC Ratio (%) 13.2 11.2 10.8 8.1 8.4 2019Y 2020Y 2021Y 2022Y 2023Q1 13.1 10.3 10.5 10.1 10.0 2019Y 2020Y 2021Y 2022Y 2023Q1 19.2 15.6 15.2 13.4 13.8 2019Y 2020Y 2021Y 2022Y 2023Q1 20.7 17.5 18.2 15.7 16.3 2019Y 2020Y 2021Y 2022Y 2023Q1 |
|
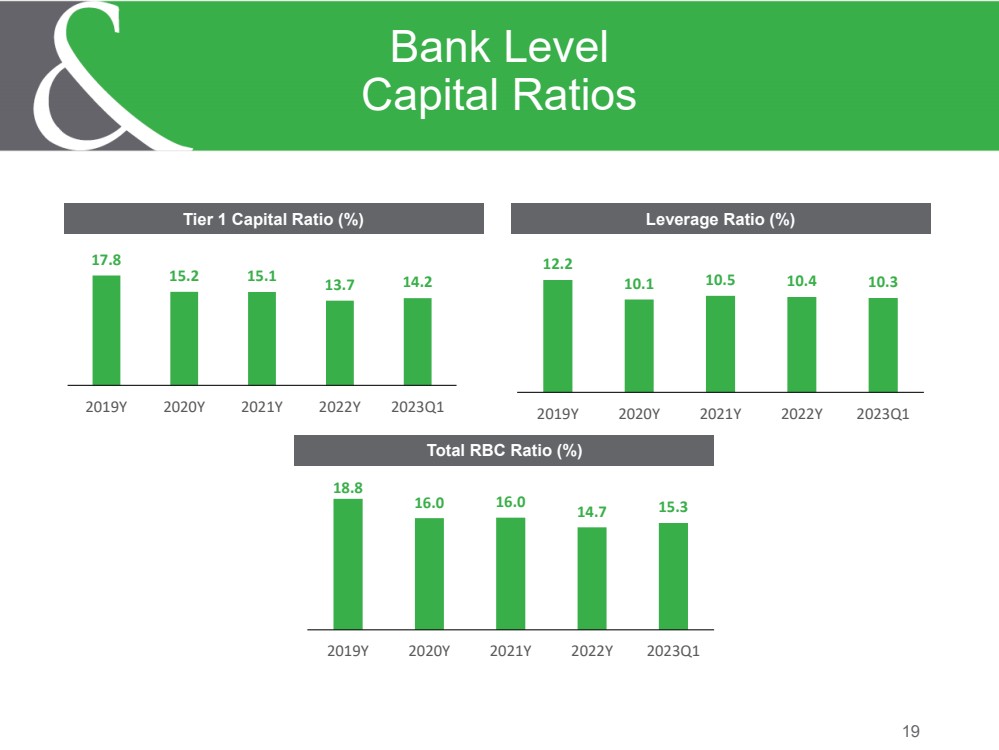
19 Bank Level Capital Ratios Tier 1 Capital Ratio (%) Leverage Ratio (%) Total RBC Ratio (%) 17.8 15.2 15.1 13.7 14.2 2019Y 2020Y 2021Y 2022Y 2023Q1 12.2 10.1 10.5 10.4 10.3 2019Y 2020Y 2021Y 2022Y 2023Q1 18.8 16.0 16.0 14.7 15.3 2019Y 2020Y 2021Y 2022Y 2023Q1 |
|
Thank You 20 |
|
Appendix 21 |
|
• J. Bradley Scovill - Mr. Scovill has served as President and Chief Executive Officer of the Corporation and Citizens & Northern Bank (the “Bank”) since March 2, 2015. Prior to joining the Corporation and Bank, Mr. Scovill most recently served as President and Chief Operating Officer of Kish Bancorp, Inc. and Kish Bank headquartered in Belleville, Pennsylvania, where he was an executive for more than five (5) years. Prior to Kish, Mr. Scovill held various executive management positions with both PNC Bank and Sterling Financial Corporation, headquartered in Lancaster, Pennsylvania. Mr. Scovill received a Bachelor of Science degree in Finance from The Pennsylvania State University. • Mark Hughes - Mr. Hughes serves as Treasurer of the Corporation and Executive Vice President and Chief Financial Officer of the Bank. Mr. Hughes served as Interim President and Chief Executive Officer of the Corporation and Bank from August 12, 2014 through March 1, 2015. Effective March 2, 2015, Mr. Hughes resigned from the positions of Interim President and Chief Executive Officer of the Corporation and Bank and was appointed to the positions he had formerly held as Treasurer of the Corporation since November 2000 and Executive Vice President and Chief Financial Officer of the Bank since August 2000. Mr. Hughes is a CPA licensed in Pennsylvania. Mr. Hughes received a Bachelor of Arts degree in Accounting from Lycoming College. • Matthew Bower - Mr. Bower has served as Executive Vice President and Chief Wealth Management Officer of the Bank since February 2022. Prior to joining the Bank, Mr. Bower served as a Managing Director at PNC’s Wealth Management Group in Atlanta, GA, where he led the team in delivering industry-leading results in client end employee satisfaction for 13 years. Mr. Bower received a Masters of Jurisprudence from Texas A&M University, School of Law in Fort Worth, TX, completed the Stanford Graduate School of Business’s Executive Leadership Program and received a Bachelor of Science degree in Political Science from Florida State University. Mr. Bower has several FINRA Licensures and has earned designations as a Certified Trust and Financial Advisor (CTFA), Certified Securities Operations Professional (CSOP) and a Chartered Wealth Manager (CWM). • Alexander Balagour - Mr. Balagour has served as Executive Vice President and Chief Information Officer of the Bank since May 2021. Prior to joining the Bank, Mr. Balagour most recently served as the Chief Information Officer at Customers Bank in Reading, PA, where he led the organization through the transformation of their sales and lending technology, data analytics and customer experience. Mr. Balagour received a Bachelor of Science degree in Computer Science from Arcadia University, where he earned the Sigma Zeta Award in Computer Science, given to the top-graduating student for academic excellence. He went on to receive his Executive Masters in Technology Management from Wharton School and School of Engineering from the University of Pennsylvania. 22 Executive Officer Biographies |
|
• Stan Dunsmore - Mr. Dunsmore has served as Executive Vice President and Chief Credit Officer of the Bank since January 2015. Previously, Mr. Dunsmore served as Vice President and Commercial Loan Sales Officer of the Bank since May 2007. Prior to the May 2007 acquisition of Citizens Trust Company by Citizens & Northern Bank, Mr. Dunsmore served as Vice President and Chief Lending Officer of Citizens Trust Company since 1995. Mr. Dunsmore received a Bachelor of Science degree in Management Science from Lock Haven University of Pennsylvania. • Harold (Hal) Hoose - Executive Vice President and Chief Revenue Officer of the Bank since February 2021; formerly Executive Vice President and Director of Lending of the Bank since March of 2005. Prior to becoming the Director of Lending, Mr. Hoose was a regional commercial relationship manager for C&N since August of 1997. Prior to that, Mr. Hoose began his banking career in 1990 as a management trainee with Commonwealth Bank (Williamsport PA) and moved to the credit/lending area of the bank in April 1993. Mr. Hoose received his Bachelor of Science degree from Mansfield University and completed the Graduate School of Banking at the University of Colorado. • Kelley Cwiklinski - Executive Vice President and Chief Commercial Lending Officer of the Bank since February 2023; formerly Senior Vice President and Director of Commercial Lending since January 2021. Prior to becoming Director of Commercial Lending, Ms. Cwiklinski was a Regional Commercial Lending Executive for the Bank since July 2020 through the acquisition of Covenant Bank. Prior to joining C&N, Ms. Cwiklinski was Executive Vice President and Chief Lending Officer of Covenant Bank from January 2015 through June 2020. Ms. Cwiklinski began her banking career in 1985 and had various commercial lending and credit-related positions prior to joining Covenant Bank. Ms. Cwiklinski is a graduate of Mercer Community College with an Associates Degree in Business Administration. • John Reber - Executive Vice President and Chief Risk Management Officer of the Bank since February 2021; formerly Executive Vice President and Director of Risk Management of the Bank since January 2011; formerly Vice President and Director of Risk Management of the Bank since June 2004. Prior to joining C&N, Mr. Reber held various staff and management positions in credit, lending and risk management with SunBank, headquartered in Lewisburg, Pennsylvania. Mr. Reber received a Bachelor of Science degree in Finance from Bloomsburg University of Pennsylvania. • Thomas L. Rudy, Jr. - Executive Vice President, Chief Delivery Officer and Region President of the Bank since February 2021; formerly Executive Vice President and Director of Branch Delivery of the Bank since February 2004; President of C&N Financial Services, LLC since January 2000; President of Bucktail Life Insurance Company since May 2018. Mr. Rudy received a Bachelor of Science degree in Finance from The Pennsylvania State University and is a graduate of the ABA Graduate School of Banking at the Wharton School, University of Pennsylvania. 23 Executive Officer Biographies |
|
• Blair Rush - Executive Vice President and Southeast Region President of the Bank since February 2021; formerly Southeast Region President of the Bank since July 2020 with the acquisition of Covenant Bank. Prior to his employment with C&N, Mr. Rush most recently served as President & Chief Operating Officer of Covenant Bank since April 2016. Prior to this time, he was the Eastern Region President with National Penn Bank. He joined National Penn through their acquisition of FirstService Bank in February 2003, where he was an Executive Vice President and was one of four original officers of the de novo FirstService Bank. Prior to FirstService Bank, Blair was a Vice President with CoreStates and Bucks County Bank where he started his forty-year banking career. Blair is a graduate of Delaware Valley College with a Bachelor of Science degree in Business Administration and the Pennsylvania Bankers Association’s Central Atlantic Advanced School of Banking. • Tracy Watkins - Ms. Watkins has served as Executive Vice President and Chief Human Resources Officer of the Bank since February 2021; formerly, Executive Vice President and Director of Human Resources of the Bank since January 2018; formerly Vice President and Director of Human Resources of the Bank since 2010, and HRIS (Human Resources Information System) & Employee Relations Manager since 2005 after joining Citizens & Northern Bank in 2003. Ms. Watkins holds a B.S. in English/Secondary Education from Juniata College, a Certificate from The Institute for Paralegal Training in Philadelphia, PA and is a Graduate of the PBA Advanced School of Banking and The Graduate School of Banking Human Resource Management School as well as being a Certified Employee Benefit Specialist (CEBS – RPA, GBA) and Senior Professional in Human Resources (SPHR). 24 Executive Officer Biographies |
|
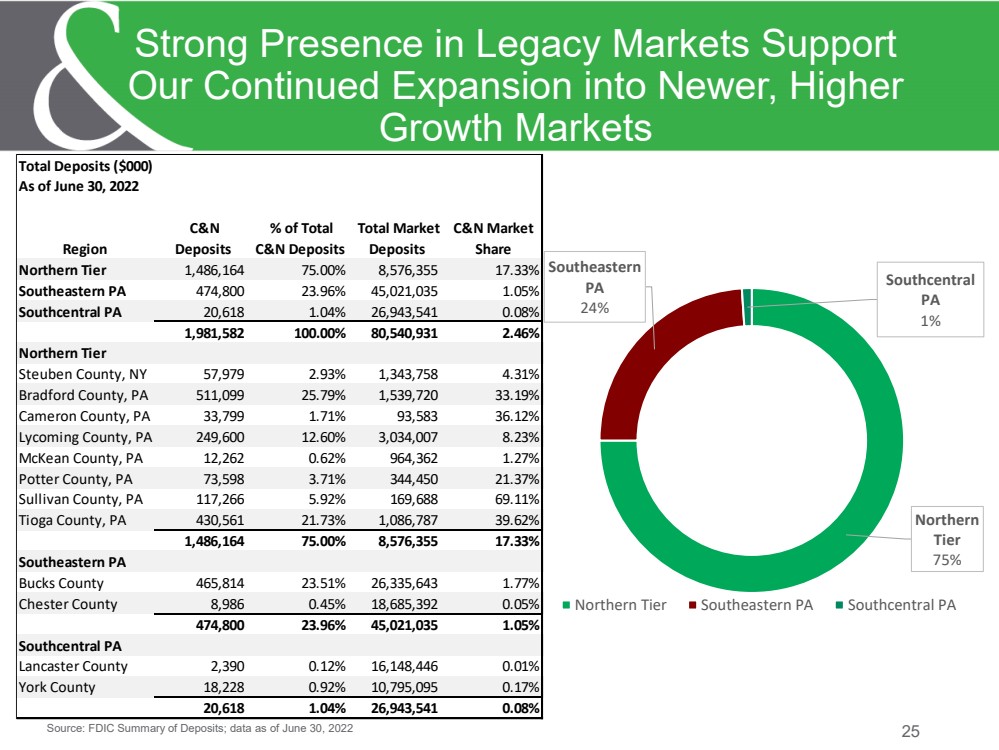
Source: FDIC Summary of Deposits; data as of June 30, 2022 25 Strong Presence in Legacy Markets Support Our Continued Expansion into Newer, Higher Growth Markets Northern Tier 75% Southeastern PA 24% Southcentral PA 1% Northern Tier Southeastern PA Southcentral PA Total Deposits ($000) As of June 30, 2022 Region C&N Deposits % of Total C&N Deposits Total Market Deposits C&N Market Share Northern Tier 1,486,164 75.00% 8,576,355 17.33% Southeastern PA 474,800 23.96% 45,021,035 1.05% Southcentral PA 20,618 1.04% 26,943,541 0.08% 1,981,582 100.00% 80,540,931 2.46% Northern Tier Steuben County, NY 57,979 2.93% 1,343,758 4.31% Bradford County, PA 511,099 25.79% 1,539,720 33.19% Cameron County, PA 33,799 1.71% 93,583 36.12% Lycoming County, PA 249,600 12.60% 3,034,007 8.23% McKean County, PA 12,262 0.62% 964,362 1.27% Potter County, PA 73,598 3.71% 344,450 21.37% Sullivan County, PA 117,266 5.92% 169,688 69.11% Tioga County, PA 430,561 21.73% 1,086,787 39.62% 1,486,164 75.00% 8,576,355 17.33% Southeastern PA Bucks County 465,814 23.51% 26,335,643 1.77% Chester County 8,986 0.45% 18,685,392 0.05% 474,800 23.96% 45,021,035 1.05% Southcentral PA Lancaster County 2,390 0.12% 16,148,446 0.01% York County 18,228 0.92% 10,795,095 0.17% 20,618 1.04% 26,943,541 0.08% |
|
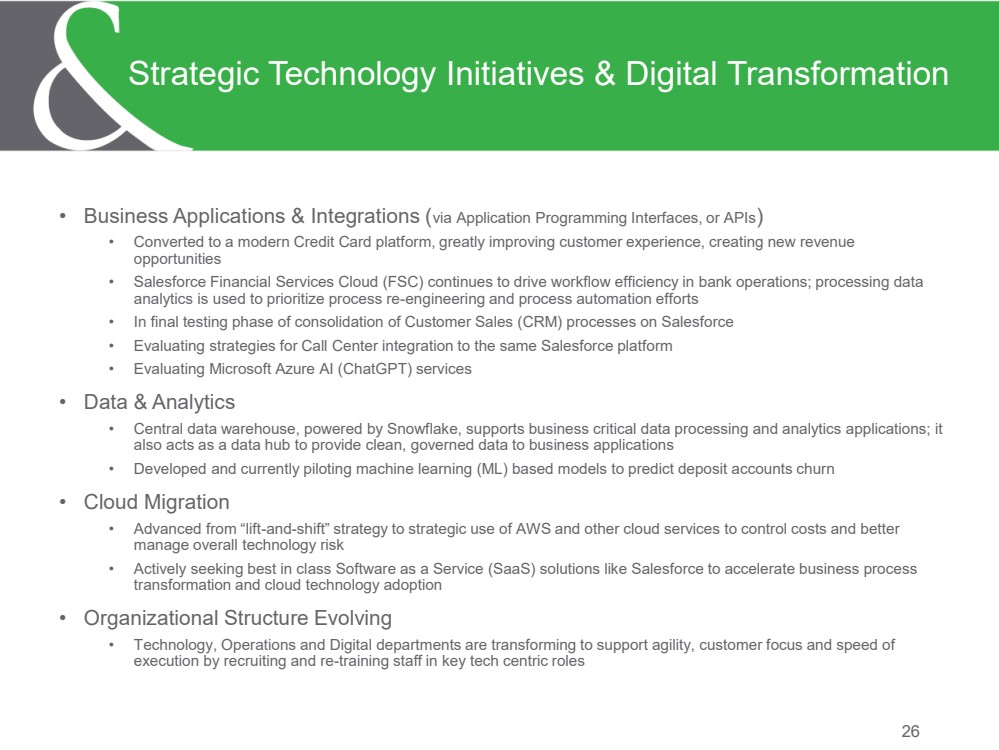
• Business Applications & Integrations (via Application Programming Interfaces, or APIs) • Converted to a modern Credit Card platform, greatly improving customer experience, creating new revenue opportunities • Salesforce Financial Services Cloud (FSC) continues to drive workflow efficiency in bank operations; processing data analytics is used to prioritize process re-engineering and process automation efforts • In final testing phase of consolidation of Customer Sales (CRM) processes on Salesforce • Evaluating strategies for Call Center integration to the same Salesforce platform • Evaluating Microsoft Azure AI (ChatGPT) services • Data & Analytics • Central data warehouse, powered by Snowflake, supports business critical data processing and analytics applications; it also acts as a data hub to provide clean, governed data to business applications • Developed and currently piloting machine learning (ML) based models to predict deposit accounts churn • Cloud Migration • Advanced from “lift-and-shift” strategy to strategic use of AWS and other cloud services to control costs and better manage overall technology risk • Actively seeking best in class Software as a Service (SaaS) solutions like Salesforce to accelerate business process transformation and cloud technology adoption • Organizational Structure Evolving • Technology, Operations and Digital departments are transforming to support agility, customer focus and speed of execution by recruiting and re-training staff in key tech centric roles 26 Strategic Technology Initiatives & Digital Transformation |
|
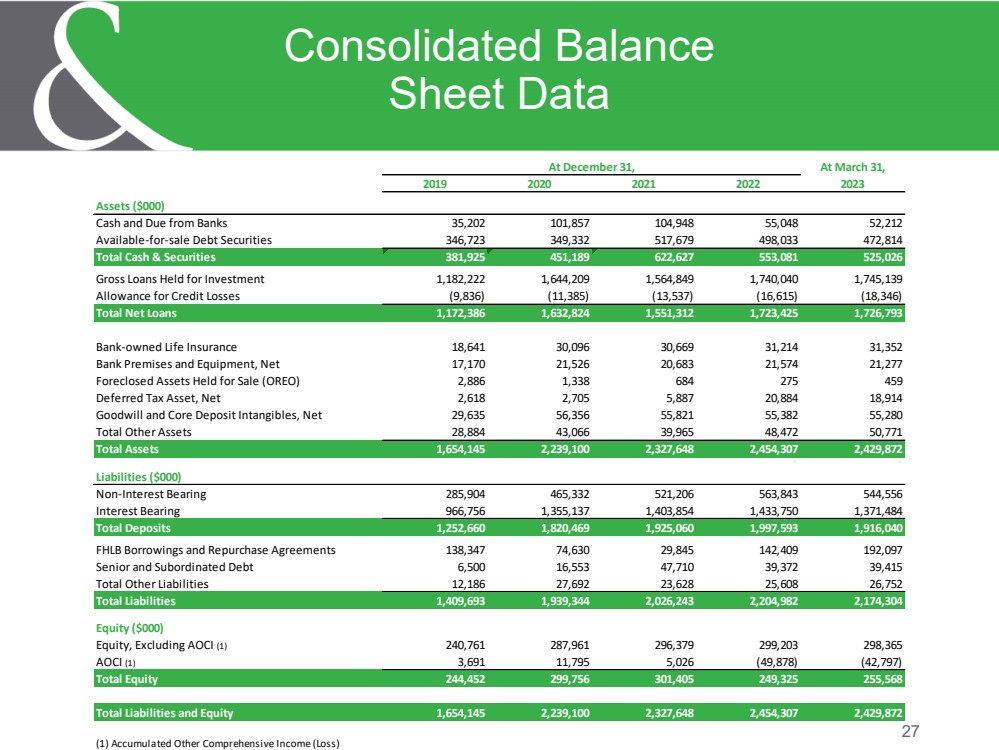
27 Consolidated Balance Sheet Data At March 31, 2019 2020 2021 2022 2023 Assets ($000) Cash and Due from Banks 35,202 101,857 104,948 55,048 52,212 Available-for-sale Debt Securities 346,723 349,332 517,679 498,033 472,814 Total Cash & Securities 381,925 451,189 622,627 553,081 525,026 Gross Loans Held for Investment 1,182,222 1,644,209 1,564,849 1,740,040 1,745,139 Allowance for Credit Losses (9,836) (11,385) (13,537) (16,615) (18,346) Total Net Loans 1,172,386 1,632,824 1,551,312 1,723,425 1,726,793 Bank-owned Life Insurance 18,641 30,096 30,669 31,214 31,352 Bank Premises and Equipment, Net 17,170 21,526 20,683 21,574 21,277 Foreclosed Assets Held for Sale (OREO) 2,886 1,338 684 275 459 Deferred Tax Asset, Net 2,618 2,705 5,887 20,884 18,914 Goodwill and Core Deposit Intangibles, Net 29,635 56,356 55,821 55,382 55,280 Total Other Assets 28,884 43,066 39,965 48,472 50,771 Total Assets 1,654,145 2,239,100 2,327,648 2,454,307 2,429,872 3 3 Liabilities ($000) Non-Interest Bearing 285,904 465,332 521,206 563,843 544,556 Interest Bearing 966,756 1,355,137 1,403,854 1,433,750 1,371,484 Total Deposits 1,252,660 1,820,469 1,925,060 1,997,593 1,916,040 FHLB Borrowings and Repurchase Agreements 138,347 74,630 29,845 142,409 192,097 Senior and Subordinated Debt 6,500 16,553 47,710 39,372 39,415 Total Other Liabilities 12,186 27,692 23,628 25,608 26,752 Total Liabilities 1,409,693 1,939,344 2,026,243 2,204,982 2,174,304 Equity ($000) Equity, Excluding AOCI (1) 240,761 287,961 296,379 299,203 298,365 AOCI (1) 3,691 11,795 5,026 (49,878) (42,797) Total Equity 244,452 299,756 301,405 249,325 255,568 Total Liabilities and Equity 1,654,145 2,239,100 2,327,648 2,454,307 2,429,872 (1) Accumulated Other Comprehensive Income (Loss) At December 31, |
|
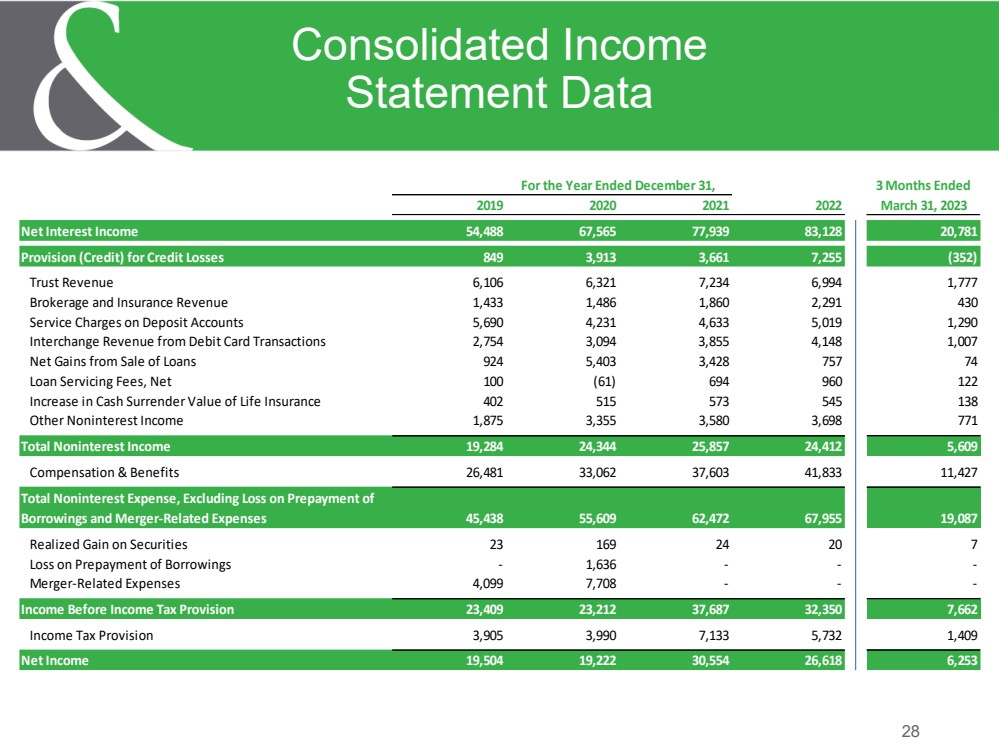
28 Consolidated Income Statement Data For the Year Ended December 31, 3 Months Ended 2019 2020 2021 2022 March 31, 2023 Net Interest Income 54,488 67,565 77,939 83,128 20,781 Provision (Credit) for Credit Losses 849 3,913 3,661 7,255 (352) Trust Revenue 6,106 6,321 7,234 6,994 1,777 Brokerage and Insurance Revenue 1,433 1,486 1,860 2,291 430 Service Charges on Deposit Accounts 5,690 4,231 4,633 5,019 1,290 Interchange Revenue from Debit Card Transactions 2,754 3,094 3,855 4,148 1,007 Net Gains from Sale of Loans 924 5,403 3,428 757 74 Loan Servicing Fees, Net 100 (61) 694 960 122 Increase in Cash Surrender Value of Life Insurance 402 515 573 545 138 Other Noninterest Income 1,875 3,355 3,580 3,698 771 Total Noninterest Income 19,284 24,344 25,857 24,412 5,609 Compensation & Benefits 26,481 33,062 37,603 41,833 11,427 Total Noninterest Expense, Excluding Loss on Prepayment of Borrowings and Merger-Related Expenses 45,438 55,609 62,472 67,955 19,087 Realized Gain on Securities 23 169 24 20 7 Loss on Prepayment of Borrowings - 1,636 - - - Merger-Related Expenses 4,099 7,708 - - - Income Before Income Tax Provision 23,409 23,212 37,687 32,350 7,662 Income Tax Provision 3,905 3,990 7,133 5,732 1,409 Net Income 19,504 19,222 30,554 26,618 6,253 |
|
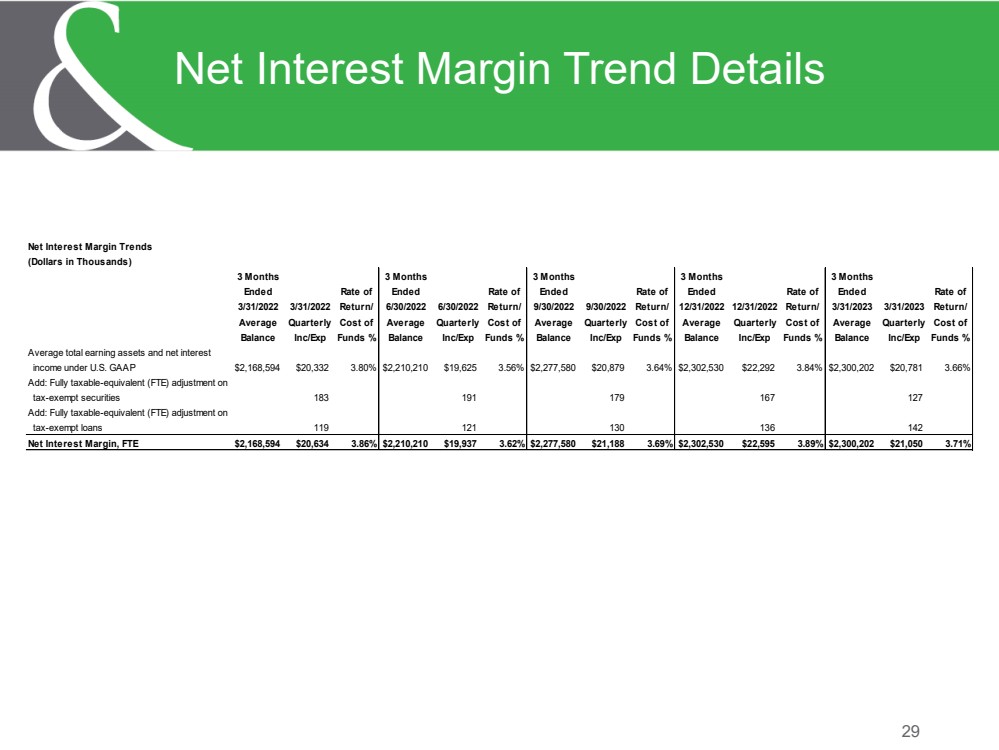
29 Net Interest Margin Trend Details Net Interest Margin Trends (Dollars in Thousands) 3 Months 3 Months 3 Months 3 Months 3 Months Ended Rate of Ended Rate of Ended Rate of Ended Rate of Ended Rate of 3/31/2022 3/31/2022 Return/ 6/30/2022 6/30/2022 Return/ 9/30/2022 9/30/2022 Return/ 12/31/2022 12/31/2022 Return/ 3/31/2023 3/31/2023 Return/ Average Quarterly Cost of Average Quarterly Cost of Average Quarterly Cost of Average Quarterly Cost of Average Quarterly Cost of Balance Inc/Exp Funds % Balance Inc/Exp Funds % Balance Inc/Exp Funds % Balance Inc/Exp Funds % Balance Inc/Exp Funds % Average total earning assets and net interest income under U.S. GAAP $2,168,594 $20,332 3.80% $2,210,210 $19,625 3.56% $2,277,580 $20,879 3.64% $2,302,530 $22,292 3.84% $2,300,202 $20,781 3.66% Add: Fully taxable-equivalent (FTE) adjustment on tax-exempt securities 183 191 179 167 127 Add: Fully taxable-equivalent (FTE) adjustment on tax-exempt loans 119 121 130 136 142 Net Interest Margin, FTE $2,168,594 $20,634 3.86% $2,210,210 $19,937 3.62% $2,277,580 $21,188 3.69% $2,302,530 $22,595 3.89% $2,300,202 $21,050 3.71% |
|
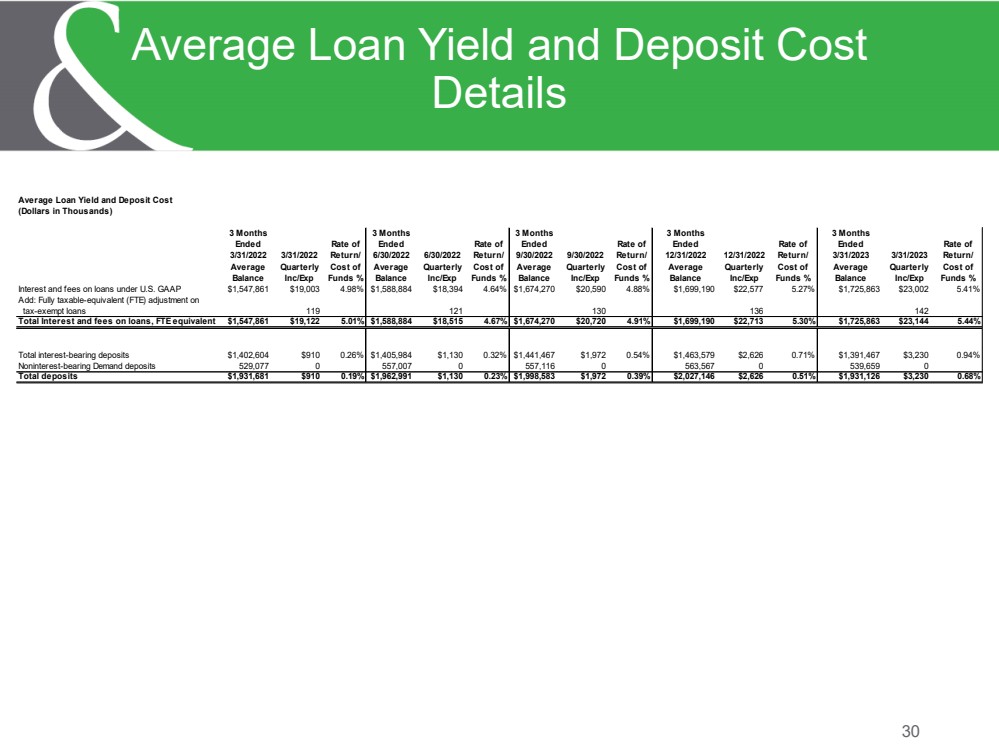
30 Average Loan Yield and Deposit Cost Details Average Loan Yield and Deposit Cost (Dollars in Thousands) 3 Months 3 Months 3 Months 3 Months 3 Months Ended Rate of Ended Rate of Ended Rate of Ended Rate of Ended Rate of 3/31/2022 3/31/2022 Return/ 6/30/2022 6/30/2022 Return/ 9/30/2022 9/30/2022 Return/ 12/31/2022 12/31/2022 Return/ 3/31/2023 3/31/2023 Return/ Average Quarterly Cost of Average Quarterly Cost of Average Quarterly Cost of Average Quarterly Cost of Average Quarterly Cost of Balance Inc/Exp Funds % Balance Inc/Exp Funds % Balance Inc/Exp Funds % Balance Inc/Exp Funds % Balance Inc/Exp Funds % Interest and fees on loans under U.S. GAAP $1,547,861 $19,003 4.98% $1,588,884 $18,394 4.64% $1,674,270 $20,590 4.88% $1,699,190 $22,577 5.27% $1,725,863 $23,002 5.41% Add: Fully taxable-equivalent (FTE) adjustment on tax-exempt loans 119 121 130 136 142 Total Interest and fees on loans, FTE equivalent $1,547,861 $19,122 5.01% $1,588,884 $18,515 4.67% $1,674,270 $20,720 4.91% $1,699,190 $22,713 5.30% $1,725,863 $23,144 5.44% Total interest-bearing deposits $1,402,604 $910 0.26% $1,405,984 $1,130 0.32% $1,441,467 $1,972 0.54% $1,463,579 $2,626 0.71% $1,391,467 $3,230 0.94% Noninterest-bearing Demand deposits 529,077 0 557,007 0 557,116 0 563,567 0 539,659 0 Total deposits $1,931,681 $910 0.19% $1,962,991 $1,130 0.23% $1,998,583 $1,972 0.39% $2,027,146 $2,626 0.51% $1,931,126 $3,230 0.68% |
|
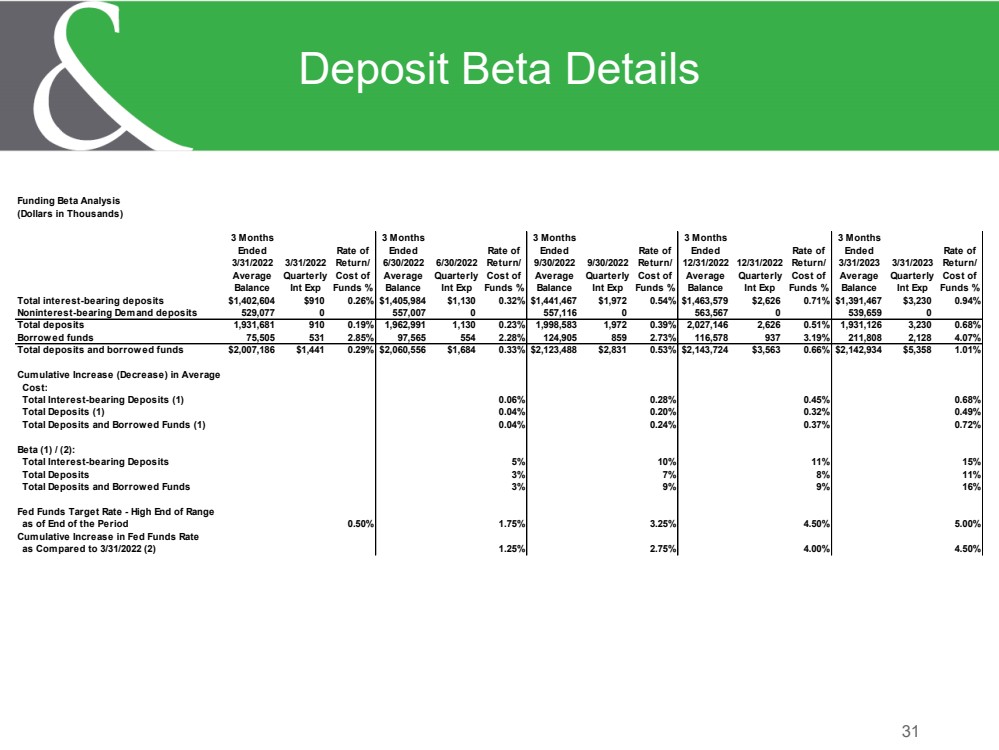
31 Deposit Beta Details Funding Beta Analysis (Dollars in Thousands) 3 Months 3 Months 3 Months 3 Months 3 Months Ended Rate of Ended Rate of Ended Rate of Ended Rate of Ended Rate of 3/31/2022 3/31/2022 Return/ 6/30/2022 6/30/2022 Return/ 9/30/2022 9/30/2022 Return/ 12/31/2022 12/31/2022 Return/ 3/31/2023 3/31/2023 Return/ Average Quarterly Cost of Average Quarterly Cost of Average Quarterly Cost of Average Quarterly Cost of Average Quarterly Cost of Balance Int Exp Funds % Balance Int Exp Funds % Balance Int Exp Funds % Balance Int Exp Funds % Balance Int Exp Funds % Total interest-bearing deposits $1,402,604 $910 0.26% $1,405,984 $1,130 0.32% $1,441,467 $1,972 0.54% $1,463,579 $2,626 0.71% $1,391,467 $3,230 0.94% Noninterest-bearing Demand deposits 529,077 0 557,007 0 557,116 0 563,567 0 539,659 0 Total deposits 1,931,681 910 0.19% 1,962,991 1,130 0.23% 1,998,583 1,972 0.39% 2,027,146 2,626 0.51% 1,931,126 3,230 0.68% Borrowed funds 75,505 531 2.85% 97,565 554 2.28% 124,905 859 2.73% 116,578 937 3.19% 211,808 2,128 4.07% Total deposits and borrowed funds $2,007,186 $1,441 0.29% $2,060,556 $1,684 0.33% $2,123,488 $2,831 0.53% $2,143,724 $3,563 0.66% $2,142,934 $5,358 1.01% Cumulative Increase (Decrease) in Average Cost: Total Interest-bearing Deposits (1) 0.06% 0.28% 0.45% 0.68% Total Deposits (1) 0.04% 0.20% 0.32% 0.49% Total Deposits and Borrowed Funds (1) 0.04% 0.24% 0.37% 0.72% Beta (1) / (2): Total Interest-bearing Deposits 5% 10% 11% 15% Total Deposits 3% 7% 8% 11% Total Deposits and Borrowed Funds 3% 9% 9% 16% Fed Funds Target Rate - High End of Range as of End of the Period 0.50% 1.75% 3.25% 4.50% 5.00% Cumulative Increase in Fed Funds Rate as Compared to 3/31/2022 (2) 1.25% 2.75% 4.00% 4.50% |
|
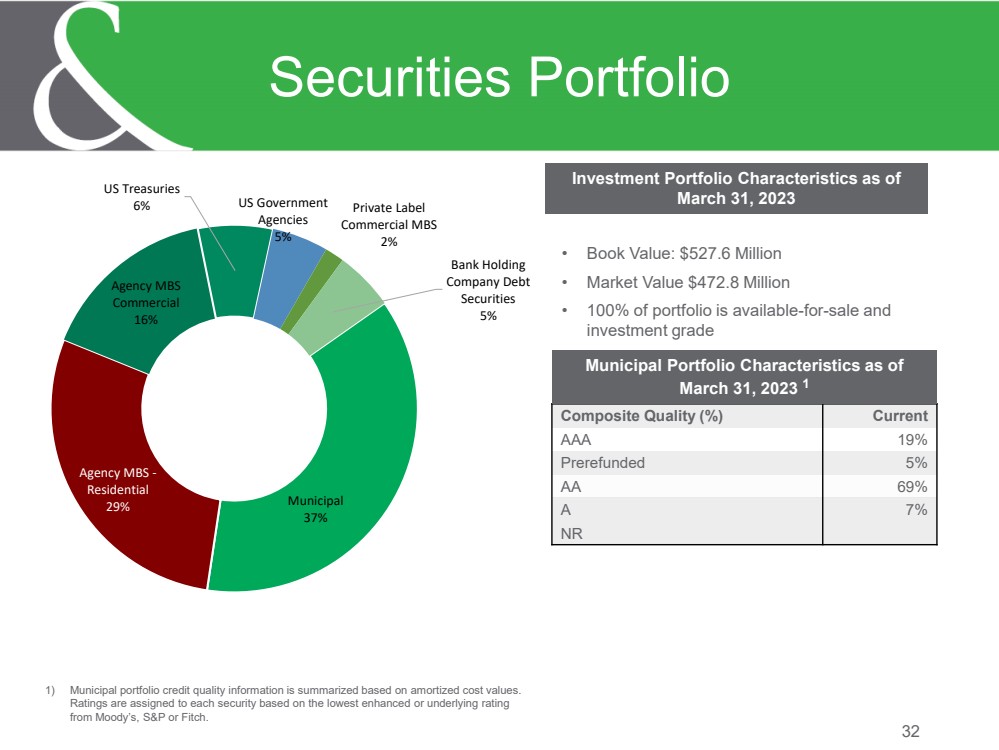
Investment Portfolio Characteristics as of March 31, 2023 32 Securities Portfolio 1) Municipal portfolio credit quality information is summarized based on amortized cost values. Ratings are assigned to each security based on the lowest enhanced or underlying rating from Moody’s, S&P or Fitch. • Book Value: $527.6 Million • Market Value $472.8 Million • 100% of portfolio is available-for-sale and investment grade Composite Quality (%) Current AAA 19% Prerefunded 5% AA 69% A 7% NR Municipal Portfolio Characteristics as of March 31, 2023 1 Municipal 37% Agency MBS - Residential 29% Agency MBS Commercial 16% US Treasuries 6% US Government Agencies 5% Private Label Commercial MBS 2% Bank Holding Company Debt Securities 5% |
|
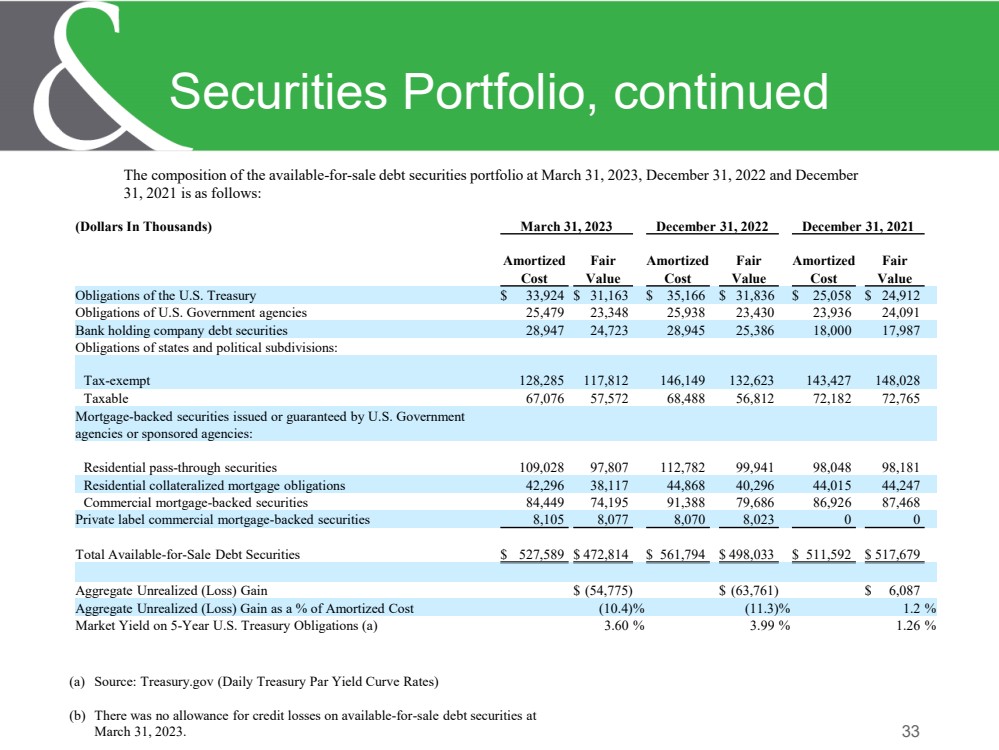
33 Securities Portfolio, continued The composition of the available-for-sale debt securities portfolio at March 31, 2023, December 31, 2022 and December 31, 2021 is as follows: (Dollars In Thousands) March 31, 2023 December 31, 2022 December 31, 2021 Amortized Fair Amortized Fair Amortized Fair Cost Value Cost Value Cost Value Obligations of the U.S. Treasury $ 33,924 $ 31,163 $ 35,166 $ 31,836 $ 25,058 $ 24,912 Obligations of U.S. Government agencies 25,479 23,348 25,938 23,430 23,936 24,091 Bank holding company debt securities 28,947 24,723 28,945 25,386 18,000 17,987 Obligations of states and political subdivisions: Tax-exempt 128,285 117,812 146,149 132,623 143,427 148,028 Taxable 67,076 57,572 68,488 56,812 72,182 72,765 Mortgage-backed securities issued or guaranteed by U.S. Government agencies or sponsored agencies: Residential pass-through securities 109,028 97,807 112,782 99,941 98,048 98,181 Residential collateralized mortgage obligations 42,296 38,117 44,868 40,296 44,015 44,247 Commercial mortgage-backed securities 84,449 74,195 91,388 79,686 86,926 87,468 Private label commercial mortgage-backed securities 8,105 8,077 8,070 8,023 0 0 Total Available-for-Sale Debt Securities $ 527,589 $ 472,814 $ 561,794 $ 498,033 $ 511,592 $ 517,679 Aggregate Unrealized (Loss) Gain $ (54,775) $ (63,761) $ 6,087 Aggregate Unrealized (Loss) Gain as a % of Amortized Cost (10.4)% (11.3)% 1.2 % Market Yield on 5-Year U.S. Treasury Obligations (a) 3.60 % 3.99 % 1.26 % (a) Source: Treasury.gov (Daily Treasury Par Yield Curve Rates) (b) There was no allowance for credit losses on available-for-sale debt securities at March 31, 2023. |
|
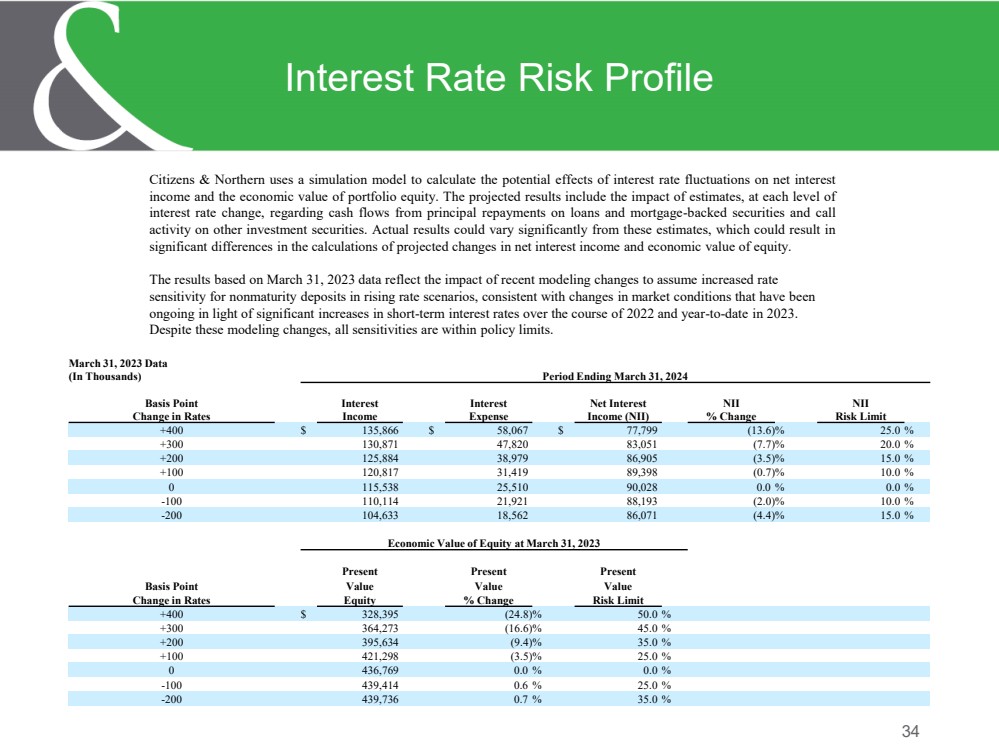
34 Interest Rate Risk Profile Citizens & Northern uses a simulation model to calculate the potential effects of interest rate fluctuations on net interest income and the economic value of portfolio equity. The projected results include the impact of estimates, at each level of interest rate change, regarding cash flows from principal repayments on loans and mortgage-backed securities and call activity on other investment securities. Actual results could vary significantly from these estimates, which could result in significant differences in the calculations of projected changes in net interest income and economic value of equity. The results based on March 31, 2023 data reflect the impact of recent modeling changes to assume increased rate sensitivity for nonmaturity deposits in rising rate scenarios, consistent with changes in market conditions that have been ongoing in light of significant increases in short-term interest rates over the course of 2022 and year-to-date in 2023. Despite these modeling changes, all sensitivities are within policy limits. March 31, 2023 Data (In Thousands) Period Ending March 31, 2024 Basis Point Interest Interest Net Interest NII NII Change in Rates Income Expense Income (NII) % Change Risk Limit +400 $ 135,866 $ 58,067 $ 77,799 (13.6)% 25.0 % +300 130,871 47,820 83,051 (7.7)% 20.0 % +200 125,884 38,979 86,905 (3.5)% 15.0 % +100 120,817 31,419 89,398 (0.7)% 10.0 % 0 115,538 25,510 90,028 0.0 % 0.0 % -100 110,114 21,921 88,193 (2.0)% 10.0 % -200 104,633 18,562 86,071 (4.4)% 15.0 % Economic Value of Equity at March 31, 2023 Present Present Present Basis Point Value Value Value Change in Rates Equity % Change Risk Limit +400 $ 328,395 (24.8)% 50.0 % +300 364,273 (16.6)% 45.0 % +200 395,634 (9.4)% 35.0 % +100 421,298 (3.5)% 25.0 % 0 436,769 0.0 % 0.0 % -100 439,414 0.6 % 25.0 % -200 439,736 0.7 % 35.0 % |
|
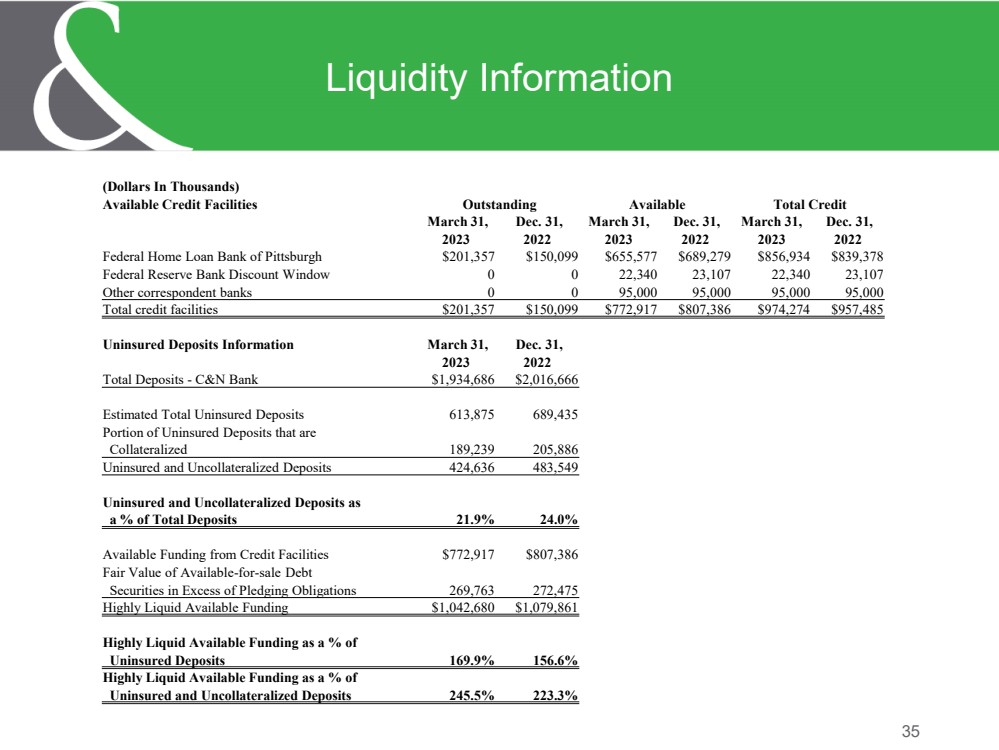
35 Liquidity Information (Dollars In Thousands) Available Credit Facilities Outstanding Available Total Credit March 31, Dec. 31, March 31, Dec. 31, March 31, Dec. 31, 2023 2022 2023 2022 2023 2022 Federal Home Loan Bank of Pittsburgh $201,357 $150,099 $655,577 $689,279 $856,934 $839,378 Federal Reserve Bank Discount Window 0 0 22,340 23,107 22,340 23,107 Other correspondent banks 0 0 95,000 95,000 95,000 95,000 Total credit facilities $201,357 $150,099 $772,917 $807,386 $974,274 $957,485 Uninsured Deposits Information March 31, Dec. 31, 2023 2022 Total Deposits - C&N Bank $1,934,686 $2,016,666 Estimated Total Uninsured Deposits 613,875 689,435 Portion of Uninsured Deposits that are Collateralized 189,239 205,886 Uninsured and Uncollateralized Deposits 424,636 483,549 Uninsured and Uncollateralized Deposits as a % of Total Deposits 21.9% 24.0% Available Funding from Credit Facilities $772,917 $807,386 Fair Value of Available-for-sale Debt Securities in Excess of Pledging Obligations 269,763 272,475 Highly Liquid Available Funding $1,042,680 $1,079,861 Highly Liquid Available Funding as a % of Uninsured Deposits 169.9% 156.6% Highly Liquid Available Funding as a % of Uninsured and Uncollateralized Deposits 245.5% 223.3% |
|
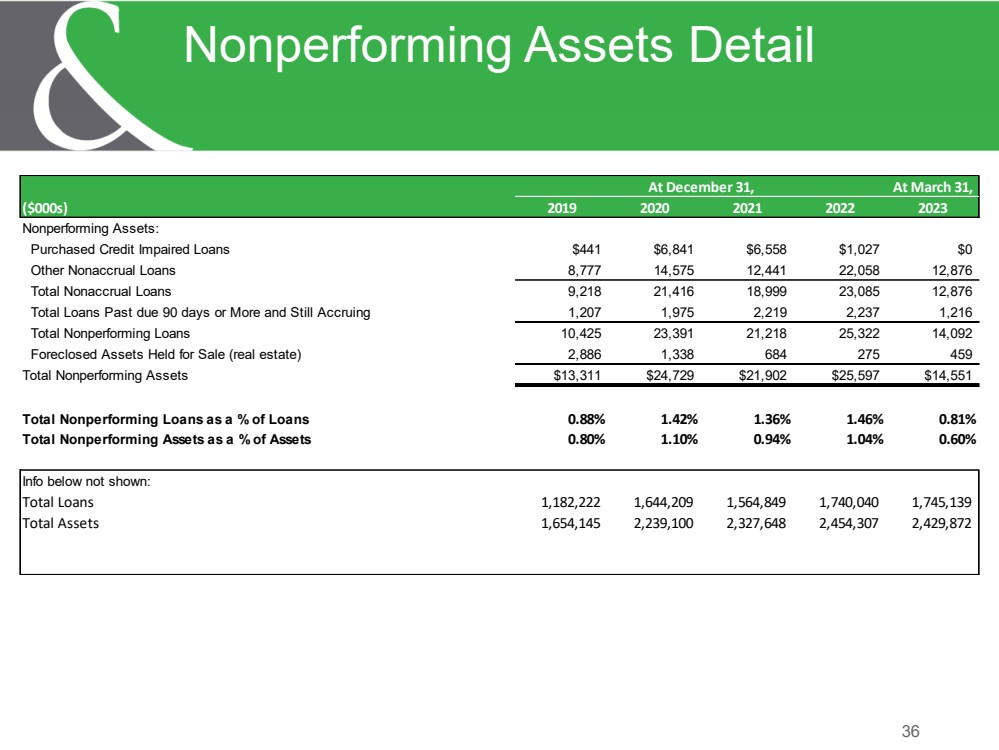
36 Nonperforming Assets Detail At March 31, ($000s) 2019 2020 2021 2022 2023 Nonperforming Assets: Purchased Credit Impaired Loans $441 $6,841 $6,558 $1,027 $0 Other Nonaccrual Loans 8,777 14,575 12,441 22,058 12,876 Total Nonaccrual Loans 9,218 21,416 18,999 23,085 12,876 Total Loans Past due 90 days or More and Still Accruing 1,207 1,975 2,219 2,237 1,216 Total Nonperforming Loans 10,425 23,391 21,218 25,322 14,092 Foreclosed Assets Held for Sale (real estate) 2,886 1,338 684 275 459 Total Nonperforming Assets $13,311 $24,729 $21,902 $25,597 $14,551 Total Nonperforming Loans as a % of Loans 0.88% 1.42% 1.36% 1.46% 0.81% Total Nonperforming Assets as a % of Assets 0.80% 1.10% 0.94% 1.04% 0.60% Info below not shown: Total Loans 1,182,222 1,644,209 1,564,849 1,740,040 1,745,139 Total Assets 1,654,145 2,239,100 2,327,648 2,454,307 2,429,872 At December 31, |
|
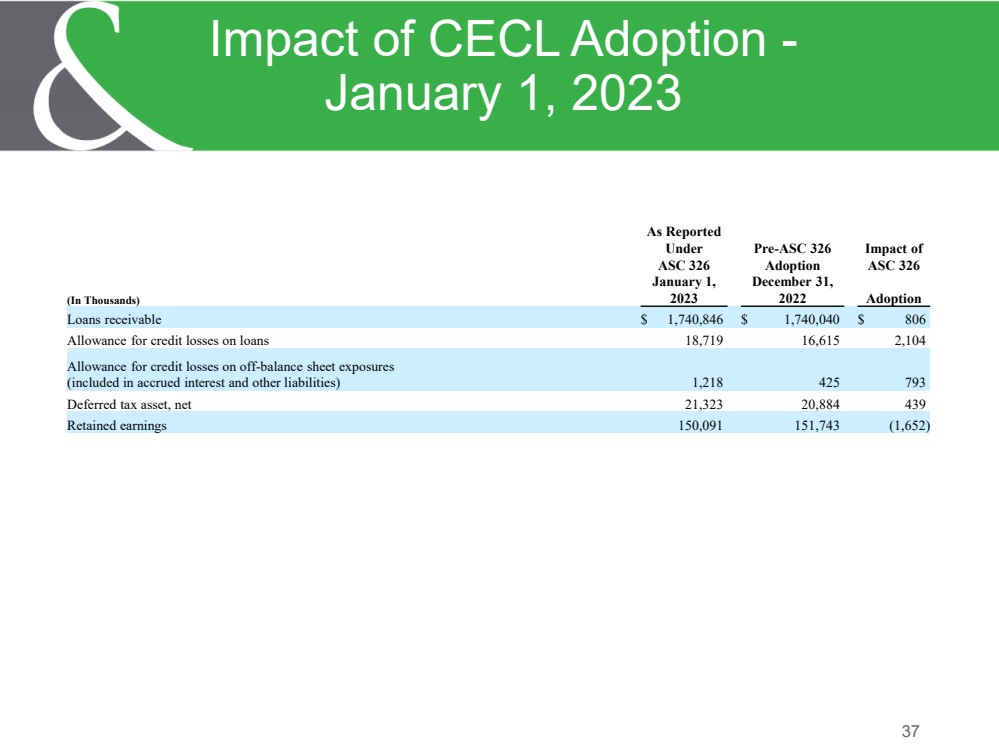
37 Impact of CECL Adoption - January 1, 2023 As Reported Under Pre-ASC 326 Impact of ASC 326 Adoption ASC 326 (In Thousands) January 1, 2023 December 31, 2022 Adoption Loans receivable $ 1,740,846 $ 1,740,040 $ 806 Allowance for credit losses on loans 18,719 16,615 2,104 Allowance for credit losses on off-balance sheet exposures (included in accrued interest and other liabilities) 1,218 425 793 Deferred tax asset, net 21,323 20,884 439 Retained earnings 150,091 151,743 (1,652) |
|
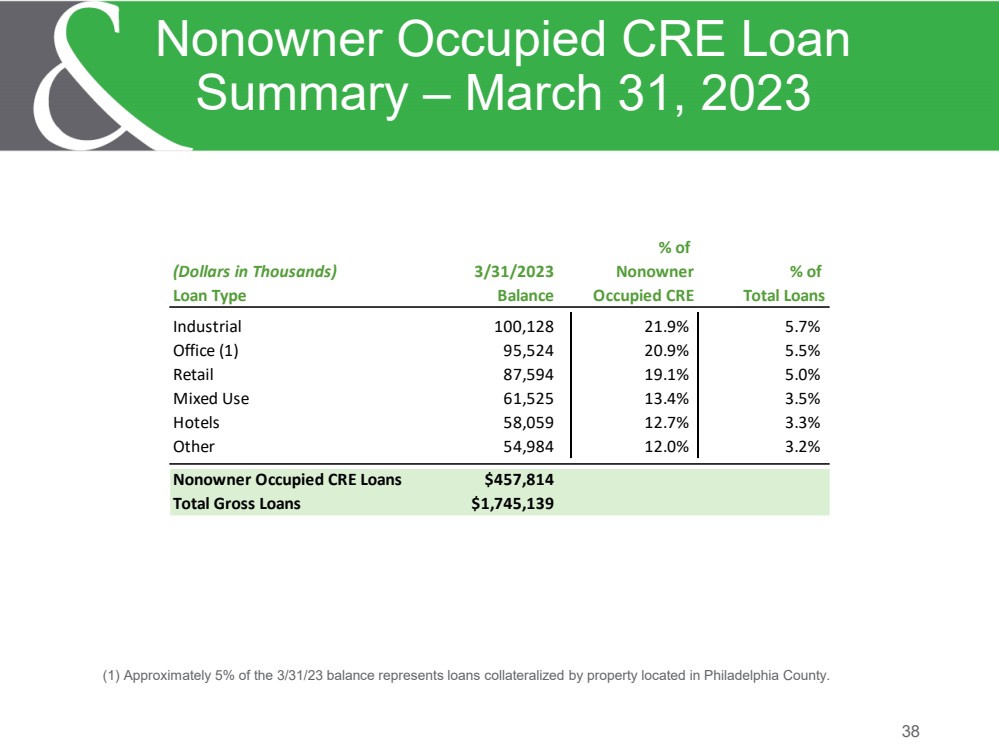
38 Nonowner Occupied CRE Loan Summary – March 31, 2023 % of (Dollars in Thousands) 3/31/2023 Nonowner % of Loan Type Balance Occupied CRE Total Loans Industrial 100,128 21.9% 5.7% Office (1) 95,524 20.9% 5.5% Retail 87,594 19.1% 5.0% Mixed Use 61,525 13.4% 3.5% Hotels 58,059 12.7% 3.3% Other 54,984 12.0% 3.2% Nonowner Occupied CRE Loans $457,814 Total Gross Loans $1,745,139 (1) Approximately 5% of the 3/31/23 balance represents loans collateralized by property located in Philadelphia County. |
|
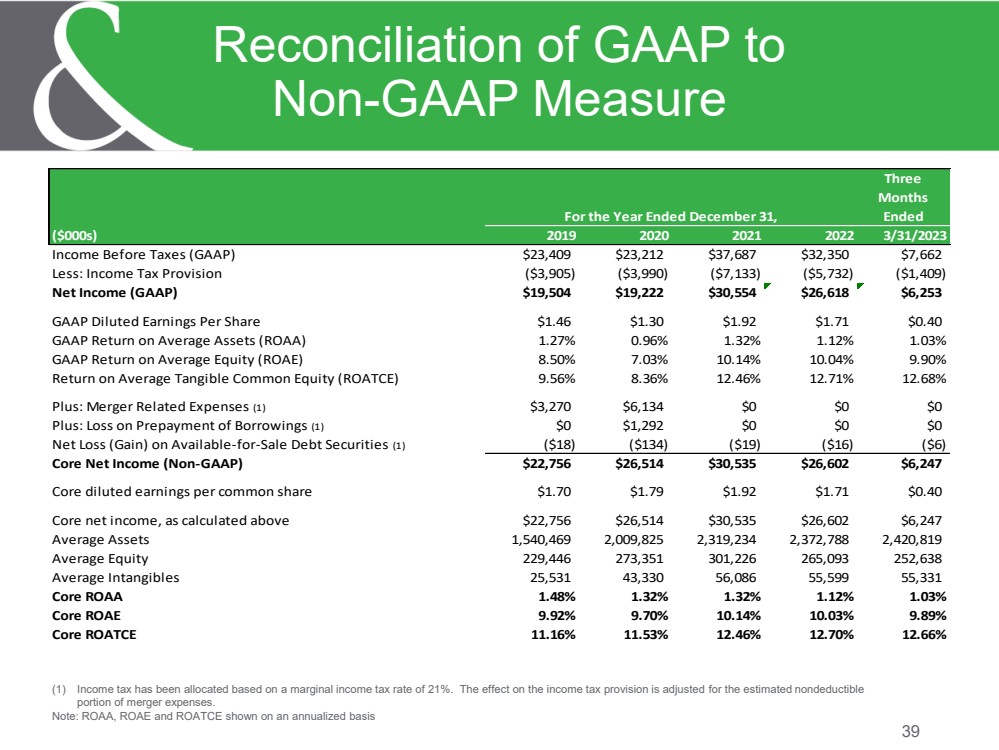
39 Reconciliation of GAAP to Non-GAAP Measure (1) Income tax has been allocated based on a marginal income tax rate of 21%. The effect on the income tax provision is adjusted for the estimated nondeductible portion of merger expenses. Note: ROAA, ROAE and ROATCE shown on an annualized basis Three Months Ended ($000s) 2019 2020 2021 2022 3/31/2023 Income Before Taxes (GAAP) $23,409 $23,212 $37,687 $32,350 $7,662 Less: Income Tax Provision ($3,905) ($3,990) ($7,133) ($5,732) ($1,409) Net Income (GAAP) $19,504 $19,222 $30,554 $26,618 $6,253 GAAP Diluted Earnings Per Share $1.46 $1.30 $1.92 $1.71 $0.40 GAAP Return on Average Assets (ROAA) 1.27% 0.96% 1.32% 1.12% 1.03% GAAP Return on Average Equity (ROAE) 8.50% 7.03% 10.14% 10.04% 9.90% Return on Average Tangible Common Equity (ROATCE) 9.56% 8.36% 12.46% 12.71% 12.68% Plus: Merger Related Expenses (1) $3,270 $6,134 $0 $0 $0 Plus: Loss on Prepayment of Borrowings (1) $0 $1,292 $0 $0 $0 Net Loss (Gain) on Available-for-Sale Debt Securities (1) ($18) ($134) ($19) ($16) ($6) Core Net Income (Non-GAAP) $22,756 $26,514 $30,535 $26,602 $6,247 Core diluted earnings per common share $1.70 $1.79 $1.92 $1.71 $0.40 Core net income, as calculated above $22,756 $26,514 $30,535 $26,602 $6,247 Average Assets 1,540,469 2,009,825 2,319,234 2,372,788 2,420,819 Average Equity 229,446 273,351 301,226 265,093 252,638 Average Intangibles 25,531 43,330 56,086 55,599 55,331 Core ROAA 1.48% 1.32% 1.32% 1.12% 1.03% Core ROAE 9.92% 9.70% 10.14% 10.03% 9.89% Core ROATCE 11.16% 11.53% 12.46% 12.70% 12.66% For the Year Ended December 31, |
|
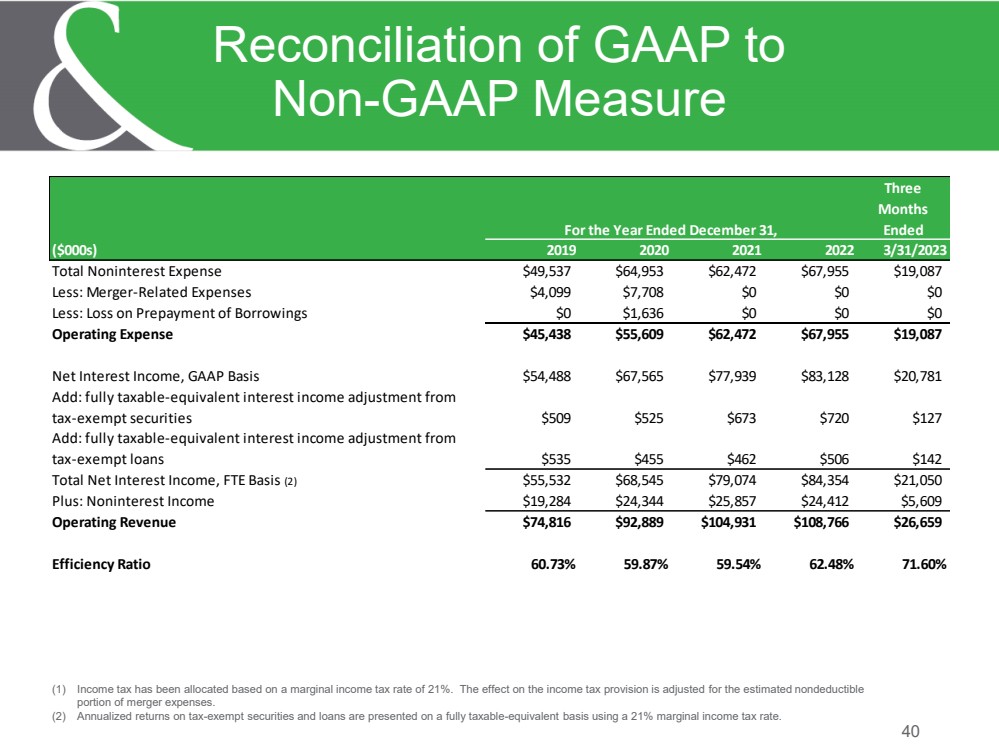
40 Reconciliation of GAAP to Non-GAAP Measure (1) Income tax has been allocated based on a marginal income tax rate of 21%. The effect on the income tax provision is adjusted for the estimated nondeductible portion of merger expenses. (2) Annualized returns on tax-exempt securities and loans are presented on a fully taxable-equivalent basis using a 21% marginal income tax rate. Three Months Ended ($000s) 2019 2020 2021 2022 3/31/2023 Total Noninterest Expense $49,537 $64,953 $62,472 $67,955 $19,087 Less: Merger-Related Expenses $4,099 $7,708 $0 $0 $0 Less: Loss on Prepayment of Borrowings $0 $1,636 $0 $0 $0 Operating Expense $45,438 $55,609 $62,472 $67,955 $19,087 Net Interest Income, GAAP Basis $54,488 $67,565 $77,939 $83,128 $20,781 Add: fully taxable-equivalent interest income adjustment from tax-exempt securities $509 $525 $673 $720 $127 Add: fully taxable-equivalent interest income adjustment from tax-exempt loans $535 $455 $462 $506 $142 Total Net Interest Income, FTE Basis (2) $55,532 $68,545 $79,074 $84,354 $21,050 Plus: Noninterest Income $19,284 $24,344 $25,857 $24,412 $5,609 Operating Revenue $74,816 $92,889 $104,931 $108,766 $26,659 Efficiency Ratio 60.73% 59.87% 59.54% 62.48% 71.60% For the Year Ended December 31, |
|
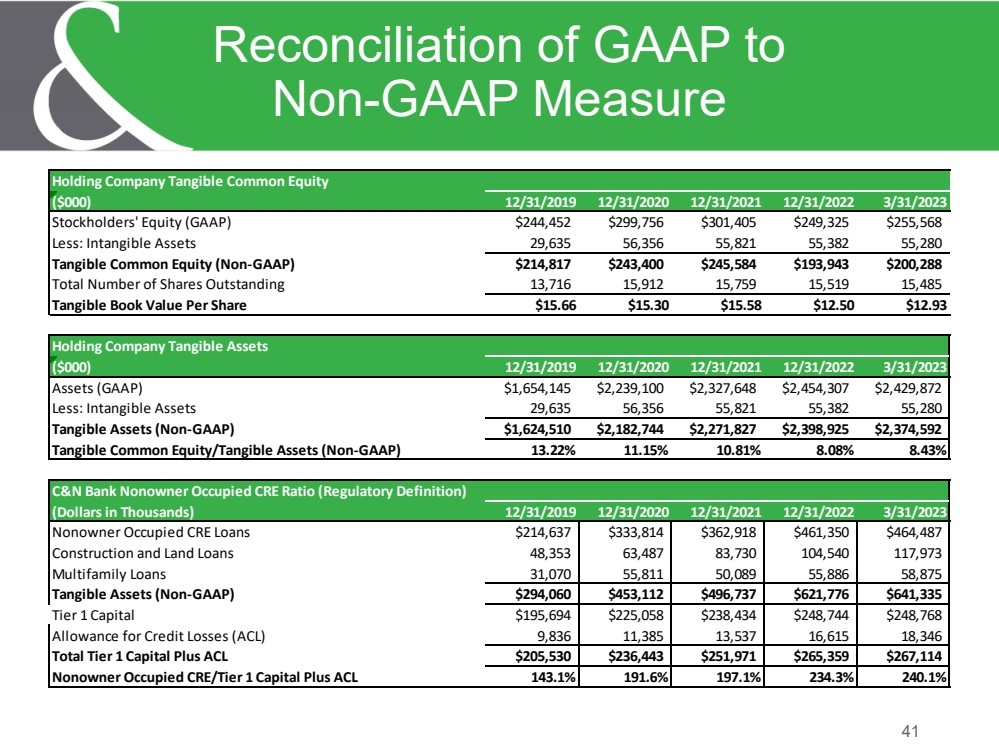
41 Reconciliation of GAAP to Non-GAAP Measure Holding Company Tangible Common Equity ($000) 12/31/2019 12/31/2020 12/31/2021 12/31/2022 3/31/2023 Stockholders' Equity (GAAP) $244,452 $299,756 $301,405 $249,325 $255,568 Less: Intangible Assets 29,635 56,356 55,821 55,382 55,280 Tangible Common Equity (Non-GAAP) $214,817 $243,400 $245,584 $193,943 $200,288 Total Number of Shares Outstanding 13,716 15,912 15,759 15,519 15,485 Tangible Book Value Per Share $15.66 $15.30 $15.58 $12.50 $12.93 Holding Company Tangible Assets ($000) 12/31/2019 12/31/2020 12/31/2021 12/31/2022 3/31/2023 Assets (GAAP) $1,654,145 $2,239,100 $2,327,648 $2,454,307 $2,429,872 Less: Intangible Assets 29,635 56,356 55,821 55,382 55,280 Tangible Assets (Non-GAAP) $1,624,510 $2,182,744 $2,271,827 $2,398,925 $2,374,592 Tangible Common Equity/Tangible Assets (Non-GAAP) 13.22% 11.15% 10.81% 8.08% 8.43% C&N Bank Nonowner Occupied CRE Ratio (Regulatory Definition) (Dollars in Thousands) 12/31/2019 12/31/2020 12/31/2021 12/31/2022 3/31/2023 Nonowner Occupied CRE Loans $214,637 $333,814 $362,918 $461,350 $464,487 Construction and Land Loans 48,353 63,487 83,730 104,540 117,973 Multifamily Loans 31,070 55,811 50,089 55,886 58,875 Tangible Assets (Non-GAAP) $294,060 $453,112 $496,737 $621,776 $641,335 Tier 1 Capital $195,694 $225,058 $238,434 $248,744 $248,768 Allowance for Credit Losses (ACL) 9,836 11,385 13,537 16,615 18,346 Total Tier 1 Capital Plus ACL $205,530 $236,443 $251,971 $265,359 $267,114 Nonowner Occupied CRE/Tier 1 Capital Plus ACL 143.1% 191.6% 197.1% 234.3% 240.1% |