UNITED STATES
SECURITIES AND EXCHANGE COMMISSION
Washington, D.C. 20549
FORM 8-K
CURRENT REPORT
Pursuant to Section 13 or 15(d) of
the Securities Exchange Act of 1934
Date of Report (Date of earliest event reported): May 9, 2023
EVgo Inc.
(Exact name of registrant as specified in its charter)
Delaware |
|
001-39572 |
|
85-2326098 |
(State or other jurisdiction of |
|
(Commission File Number) |
|
(I.R.S. Employer |
11835 West Olympic Boulevard, Suite 900E |
|
90064 |
(Address of principal executive offices) |
|
(Zip Code) |
Registrant’s telephone number, including area code: (877) 494-3833
Check the appropriate box below if the Form 8-K filing is intended to simultaneously satisfy the filing obligation of the registrant under any of the following provisions:
☐ |
Written communications pursuant to Rule 425 under the Securities Act (17 CFR 230.425) |
☐ |
Soliciting material pursuant to Rule 14a-12 under the Exchange Act (17 CFR 240.14a-12) |
☐ |
Pre-commencement communications pursuant to Rule 14d-2(b) under the Exchange Act (17 CFR 240.14d-2(b)) |
☐ |
Pre-commencement communications pursuant to Rule 13e-4(c) under the Exchange Act (17 CFR 240.13e-4(c)) |
Securities registered pursuant to Section 12(b) of the Act:
Title of each class |
Trading |
Name of each exchange |
Shares of Class A common stock, $0.0001 par value per share |
EVGO |
The Nasdaq Global Select Market |
Redeemable warrants, each whole warrant exercisable for one share of Class A common stock at an exercise price of $11.50 |
EVGOW |
The Nasdaq Global Select Market |
Indicate by check mark whether the registrant is an emerging growth company as defined in Rule 405 of the Securities Act of 1933 or Rule 12b-2 of the Securities Exchange Act of 1934.
Emerging growth company ☒
If an emerging growth company, indicate by check mark if the registrant has elected not to use the extended transition period for complying with any new or revised financial accounting standards provided pursuant to Section 13(a) of the Exchange Act. ☐
Item 2.02. Results of Operations and Financial Condition.
EVgo Inc. (the “Company”) issued a press release on May 9, 2023, announcing its financial results for the quarter ended March 31, 2023. A copy of the press release is furnished as Exhibit 99.1 to this Current Report on Form 8-K.
Item 7.01. Regulation FD Disclosure
On May 9, 2023, at 11:00 a.m. Eastern Time, the Company will host its first quarter 2023 earnings conference call and webcast. Via webcast, the Company will present portions of its first quarter 2023 earnings call presentation (the “Earnings Call Presentation”), which contains a summary of the Company’s financial results for the quarter ended March 31, 2023, financial estimates, and certain other financial and operating information regarding the Company. A copy of the Earnings Call Presentation is furnished as Exhibit 99.2 to this Current Report on Form 8-K.
The information furnished in this Current Report on Form 8-K (including exhibits 99.1 and 99.2) shall not be deemed “filed” for purposes of Section 18 of the Securities Exchange Act of 1934, as amended (the “Exchange Act”), or otherwise subject to the liabilities of such section, nor shall such information be deemed incorporated by reference in any filing under the Exchange Act or the Securities Act of 1933, as amended, except as shall be expressly set forth by specific reference in such a filing.
Item 9.01. Financial Statements and Exhibits.
(d) Exhibits.
Exhibit |
Description |
99.1 |
|
99.2 |
|
104 |
Cover Page Interactive Data File (embedded within the Inline XBRL document) |
2
SIGNATURES
Pursuant to the requirements of the Securities Exchange Act of 1934, the registrant has duly caused this report to be signed on its behalf by the undersigned hereunto duly authorized.
|
EVgo Inc. |
|
|
|
|
Date: May 9, 2023 |
By: |
/s/ Olga Shevorenkova |
|
Name: |
Olga Shevorenkova |
|
Title: |
Chief Financial Officer |
|
|
(Principal Financial Officer and Principal Accounting Officer) |
3
Exhibit 99.1

EVgo Inc. Reports First Quarter 2023 Results
| ● | Revenue grew to $25.3 million in the first quarter, representing an increase of 229% year-over-year. |
| ● | Network throughput reached 17.9 gigawatt-hours (“GWh”) in the first quarter, an increase of 124% year-over-year. |
| ● | Double-digit utilization realized in several new markets, including markets outside of California. |
| ● | Ended the first quarter with approximately 3,100 stalls in operation or under construction, with nearly 220 new stalls added to the EVgo network during the quarter. |
| ● | Added more than 67,000 new customer accounts in the first quarter, reaching approximately 614,000 overall at the end of the quarter. |
| ● | Announced expanded agreement with Chevron, with EVgo selected as an EV-charging provider of choice for Chevron and Texaco stations. |
| ● | Entered into a new agreement with Audible to bring trial memberships to EVgo customers later in 2023. |
Los Angeles – May 9, 2023 – EVgo Inc. (Nasdaq: EVGO) (“EVgo” or the “Company”) today announced results for the first quarter ended March 31, 2023. Management will host a conference call today at 11:00 a.m. ET / 8:00 a.m. PT to discuss EVgo’s results and other business highlights.
Revenue increased to $25.3 million in the first quarter of 2023, compared to $7.7 million in the first quarter of 2022, representing 229% year-over-year growth. Revenue growth was primarily driven by year-over-year increases in charging and eXtend revenues.
Network throughput increased to 17.9 GWh in the first quarter of 2023, compared to 8.0 GWh in the first quarter of 2022, representing 124% year-over-year growth. The Company added approximately 67,000 new customer accounts during the first quarter, bringing the overall number of customer accounts to approximately 614,000 at quarter-end, an increase of approximately 63% year-over-year.
“First quarter revenue growth was fueled by triple digit throughput growth as network utilization continues to increase faster than operational stall growth and EV adoption, demonstrating the strength of our business model,” said Cathy Zoi, EVgo CEO. “EVgo is investing ahead of the mass adoption of EVs in the United States and installed a record number of new stalls during the quarter. We also announced an exciting expansion of our program with Chevron, which is designed to pave the way for fast charging at conveniently located gas stations across the country. We expect revenue to increase over the remainder of the year as we benefit from increasing EV adoption, the mobilization of new, faster stations, and the deployment of EVgo eXtend sites with our partners.”
1
Business Highlights
| ● | Program with Chevron: EVgo and Chevron entered into a new agreement to offer Chevron locations across the U.S. a turnkey DC fast charging solution with a variety of ownership models, including EVgo eXtend. Through the agreement, Chevron and Texaco branded stations nationwide will have access to industry-leading fast charging equipment and integrated solutions from EVgo through both the Company’s traditional EVgo-owned offering as well as EVgo eXtend. Under the agreement, EVgo will provide hardware, design, and construction of up to 350kW charging at these sites, as well as operations and maintenance, and networking and software solutions. |
| ● | EVgo Advantage: Entered into a new agreement with Audible to bring trial memberships to EVgo customers later in 2023, making relevant audiobooks and Audible Original podcasts available to EV drivers while they charge. |
| ● | Stall Development: The Company ended the first quarter of 2023 with approximately 3,100 stalls in operation or under construction. EVgo added nearly 220 new DC fast charging stalls to its network during the quarter. |
| ● | Active Engineering and Construction (E&C) Stall Development Pipeline: The Company’s pipeline was approximately 3,500 stalls as of the end of the first quarter of 2023. |
| ● | EVgo eXtendTM: During the first quarter, the Company continued delivering charging equipment and pre-engineering work for projects under the Pilot Flying J/GM program, and began site mobilization in the second quarter of 2023. |
| ● | EVgo Autocharge+: Autocharge+ exceeded 10% of total charging sessions initiated. |
| ● | Fleet Partnerships: EVgo won contracts for a second site at MHX, a behind-the-fence, class 8 truck company, and a second site at a national food and beverage company -- both of which include EVgo Optima™, the Company’s proprietary fleet management software. |
| ● | PlugShare: Plugshare reached nearly 3.4 million registered users and achieved the milestone of 6.0 million check-ins since inception. |
| ● | Public-Private Partnership: EVgo was awarded $7.3 million from the California Energy Commission’s (“CEC”) California Electric Vehicle Infrastructure Project (“CALeVIP”) 2.0 program to deploy more than 100 350kW chargers across 19 locations in disadvantaged and/or low-income census tracts. |
| ● | Equity Issuance: In April 2023, the Company issued approximately 890,000 shares of Class A common stock with $5.7 million raised in net proceeds through an “at-the-market” equity offering. |
Financial & Operational Highlights
The below represent summary financial and operational figures for the first quarter of 2023.
| ● | Revenue of $25.3 million |
| ● | Network Throughput of 17.9 gigawatt-hours |
| ● | Customer Account Additions of approximately 67,000 accounts |
| ● | Gross Profit of $41 thousand |
| ● | Net Loss of ($49.1) million |
2
| ● | Adjusted Gross Profit of $6.4 million1 |
| ● | Adjusted EBITDA of ($20.1) million1 |
| ● | Cash Flows Used in Operating Activities of ($19.3) million |
| ● | Capital Expenditures of ($65.2) million |
1Adjusted Gross Profit / (Loss) and Adjusted EBITDA are non-GAAP measures and have not been prepared in accordance with Generally Accepted Accounting Principles in the United States of America (“GAAP”). For a definition of these non-GAAP measures and a reconciliation to the most directly comparable GAAP measure, please see “Definitions of Non-GAAP Financial Measures” and “Reconciliations of Non-GAAP Measures” included elsewhere in this release.
Unaudited, dollars in thousands |
Q1'22 |
|
Q2'22 |
|
Q3'22 |
|
Q4'22 |
|
Q1'23 |
Q1'23 vs Q1'22 |
|
|||||||
Charging revenue, retail |
|
$ |
3,502 |
|
$ |
4,389 |
|
$ |
5,176 |
|
$ |
5,828 |
|
$ |
6,615 |
89 |
% |
|
Charging revenue, commercial |
|
|
709 |
|
|
654 |
|
|
678 |
|
|
1,322 |
|
|
1,715 |
142 |
% |
|
Charging revenue, OEM |
|
|
151 |
|
|
189 |
|
|
252 |
|
|
349 |
|
|
552 |
266 |
% |
|
Regulatory credit sales |
|
|
1,378 |
|
|
2,128 |
|
|
1,178 |
|
|
968 |
|
|
1,215 |
(12) |
% |
|
Network revenue, OEM |
|
|
490 |
|
|
887 |
|
|
448 |
|
|
626 |
|
|
2,699 |
451 |
% |
|
eXtend revenue |
|
|
80 |
|
|
131 |
|
|
1,543 |
|
|
16,689 |
|
|
10,292 |
* |
% |
|
Ancillary revenue |
|
|
1,390 |
|
|
698 |
|
|
1,234 |
|
|
1,521 |
|
|
2,212 |
59 |
% |
|
Total revenue |
|
$ |
7,700 |
|
$ |
9,076 |
|
$ |
10,509 |
|
$ |
27,303 |
|
$ |
25,300 |
229 |
% |
|

*Percentage greater than 999%.
Unaudited, dollars in thousands |
Q1'23 |
|
Q1'22 |
|
Better (Worse) |
|||
Network Throughput (GWh) |
|
|
17.9 |
|
|
8.0 |
|
124% |
GAAP revenue |
|
$ |
25,300 |
|
$ |
7,700 |
|
229% |
GAAP gross profit (loss) |
|
$ |
41 |
|
$ |
(600) |
|
107% |
GAAP gross margin |
|
|
0.2% |
|
|
(7.8%) |
|
800 bps |
GAAP net loss |
|
$ |
(49,081) |
|
$ |
(55,266) |
|
11% |
Adjusted Gross Profit1 |
|
$ |
6,405 |
|
$ |
2,865 |
|
124% |
Adjusted Gross Margin1 |
|
|
25.3% |
|
|
37.2% |
|
(1,190) bps |
Adjusted EBITDA1 |
|
$ |
(20,067) |
|
$ |
(18,176) |
|
(10)% |
|
|
|
|
|
|
|
|
|
|
Q1'23 |
|
Q1'22 |
|
|
|||
Cash flows used in operating activities |
|
$ |
(19,343) |
|
$ |
(19,831) |
|
|
Capital expenditures |
|
$ |
(65,246) |
|
$ |
(28,274) |
|
|
|
|
|
|
|
|
|
|
|
1 Adjusted Gross Profit / (Loss), Adjusted Gross Margin and Adjusted EBITDA are non-GAAP measures and have not been prepared in accordance with GAAP. For a definition of these non-GAAP measures and a reconciliation to the most directly comparable GAAP measure, please see “Definitions of Non-GAAP Financial Measures” and “Reconciliations of Non-GAAP Measures” included elsewhere in this release.
2023 Financial & Operating Guidance
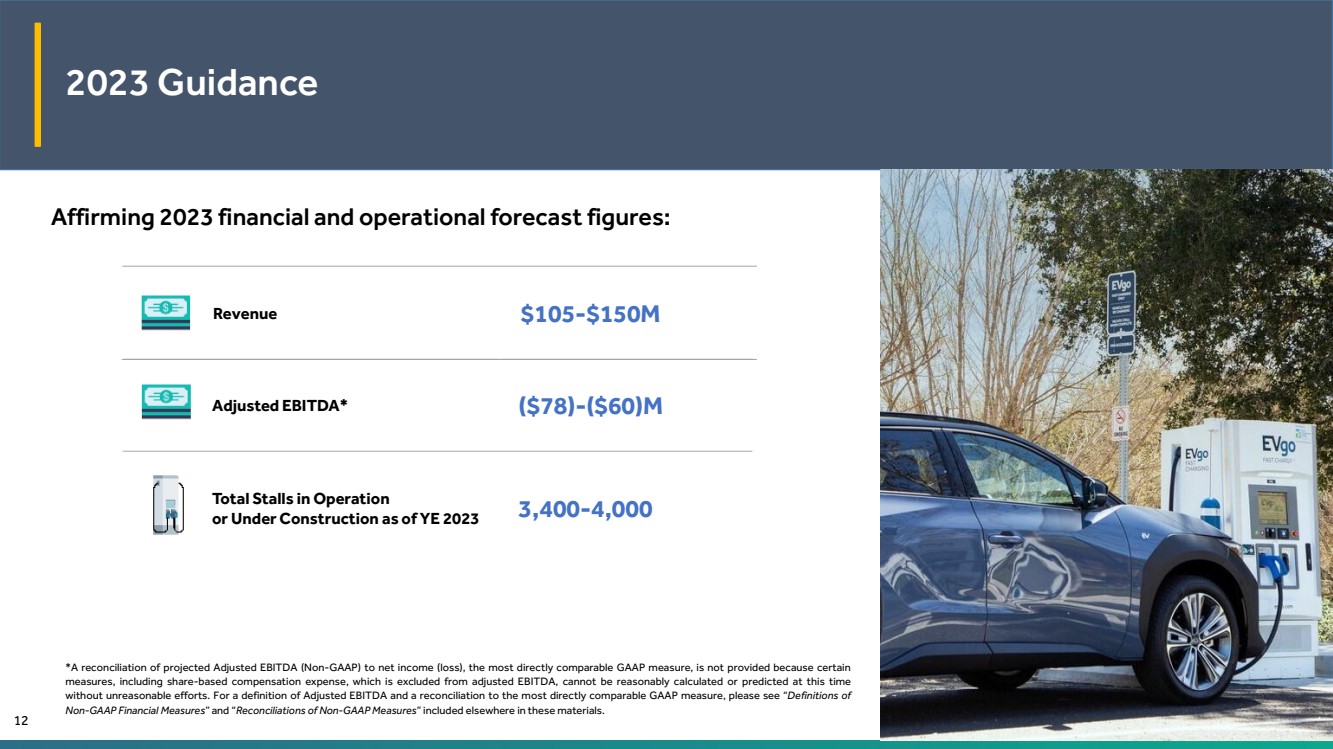
EVgo is affirming 2023 guidance as follows:
| ● | Total revenue of $105 – $150 million |
| ● | Adjusted EBITDA of ($78) – ($60) million* |
Additionally, at year-end 2023, EVgo expects to have a total of 3,400 – 4,000 DC fast charging stalls in operation or under construction.
3
*A reconciliation of projected Adjusted EBITDA (Non-GAAP) to net income (loss), the most directly comparable GAAP measure, is not provided because certain measures, including share-based compensation expense, which is excluded from adjusted EBITDA, cannot be reasonably calculated or predicted at this time without unreasonable efforts. For a definition of Adjusted EBITDA and a reconciliation to the most directly comparable GAAP measure for historical periods presented in this release, please see “Definitions of Non-GAAP Financial Measures” and “Reconciliations of Non-GAAP Measures” included elsewhere in this release.
Conference Call Information
A live audio webcast and conference call for EVgo’s first quarter 2023 earnings release will be held today at 11:00 a.m. ET / 8:00 a.m. PT. The webcast will be available at investors.evgo.com, and the dial-in information for those wishing to access via phone is:
Toll Free: (888) 340-5044 (for U.S. callers)
Toll/International: (646) 960-0363 (for callers outside the U.S.)
Conference ID: 6304708
This press release, along with other investor materials, including a slide presentation and reconciliations of certain non-GAAP measures to their nearest GAAP measures, will also be available on that site.
About EVgo
EVgo (Nasdaq: EVGO) is a leader in charging solutions, building and operating the infrastructure and tools needed to expedite the mass adoption of electric vehicles for individual drivers, rideshare and commercial fleets, and businesses. Since 2019 EVgo has purchased renewable energy certificates to match the electricity that powers its network. As one of the nation’s largest public fast charging networks, EVgo’s owned and operated charging network includes around 900 fast charging locations, 60 metropolitan areas and 30 states. EVgo continues to add more DC fast charging locations through EVgo eXtend™, its white label service offering. EVgo is accelerating transportation electrification through partnerships with automakers, fleet and rideshare operators, retail hosts such as grocery stores, shopping centers, and gas stations, policy leaders, and other organizations. With a rapidly growing network, robust software products and unique service offerings for drivers and partners including EVgo Optima™, EVgo Inside™, EVgo Rewards™, and Autocharge+, EVgo enables a world-class charging experience where drivers live, work, travel and play.
Forward-Looking Statements
This press release contains “forward-looking statements” within the meaning of the "safe harbor" provisions of the United States Private Securities Litigation Reform Act of 1995. Forward-looking statements may be identified by the use of words such as "estimate," "plan," "project," "forecast," "intend," "will," "expect," "anticipate," "believe," "seek," "target," “assume” or other similar expressions that predict or indicate future events or trends or that are not statements of historical matters. These forward-looking statements are based on management’s current expectations or beliefs and are subject to numerous assumptions, risks and uncertainties that could cause actual results to differ materially from those described in the forward-looking statements. These forward-looking statements include, but are not limited to, express or implied statements regarding EVgo’s future financial and operating performance, revenues, capital expenditures, chargers in operation or under construction and network throughput; EVgo’s expectation of market position and acceleration in its business due to factors including increased EV adoption; and the Company’s collaboration with partners enabling effective deployment of chargers, including the anticipated benefits of its partnership with Chevron. These statements are based on various assumptions, whether or not identified in this press release, and on the current expectations of EVgo’s management and are not predictions of actual performance.
4
There are a significant number of factors that could cause actual results to differ materially from the statements made in this press release, including changes or developments in the broader general market; ongoing impacts from COVID-19 on EVgo’s business, customers, and suppliers; macro political, economic, and business conditions, including inflation and geopolitical conflicts that could impact EVgo’s supply chains; increased competition, including from new and existing entrants in the EV charging market; unfavorable conditions or further disruptions in the capital and credit markets and EVgo's ability to obtain additional capital on commercially reasonable terms; EVgo’s limited operating history as a public company; EVgo’s dependence on widespread adoption of EVs and increased installation of charging stations; mechanisms surrounding energy and non-energy costs for EVgo’s charging stations; the impact of governmental support and mandates that could reduce, modify, or eliminate financial incentives, rebates, tax credits, and other support available to EVgo; supply chain disruptions; EVgo’s ability to expand into new service markets, grow its customer base, and manage its operations; impediments to EVgo’s expansion plans, including permitting delays; the need to attract additional fleet operators as customers; potential adverse effects on EVgo’s revenue and gross margins if customers increasingly claim clean energy credits and, as a result, they are no longer available to be claimed by EVgo; risks related to EVgo’s dependence on its intellectual property; and risks that EVgo’s technology could have undetected defects or errors. Additional risks and uncertainties that could affect the Company’s financial results are included under the captions “Risk Factors” and “Management’s Discussion and Analysis of Financial Condition and Results of Operations of EVgo” in EVgo’s most recent Annual Report on Form 10-K, filed with the Securities and Exchange Commission (the “SEC”), as well as its other SEC filings, copies of which are available on EVgo’s website at investors.evgo.com, and on the SEC’s website at www.sec.gov. All forward-looking statements in this press release are based on information available to EVgo as of the date hereof, and EVgo does not assume any obligation to update the forward-looking statements provided to reflect events that occur or circumstances that exist after the date on which they were made, except as required by applicable law.
5
Financial Statements
EVgo Inc. and Subsidiaries
Condensed Consolidated Balance Sheets
|
|
March 31, |
|
|
|
|
|
|
2023 |
|
December 31, |
||
(in thousands) |
|
(unaudited) |
|
2022 |
||
Assets |
|
|
|
|
|
|
Current assets |
|
|
|
|
|
|
Cash, cash equivalents and restricted cash |
|
$ |
163,512 |
|
$ |
246,193 |
Accounts receivable, net of allowance of $782 and $687 as of March 31, 2023 and December 31, 2022, respectively |
|
|
29,263 |
|
|
11,075 |
Accounts receivable, capital-build |
|
|
9,418 |
|
|
8,011 |
Prepaid expenses |
|
|
4,077 |
|
|
4,953 |
Other current assets |
|
|
10,501 |
|
|
5,252 |
Total current assets |
|
|
216,771 |
|
|
275,484 |
Property, equipment and software, net |
|
|
367,195 |
|
|
308,112 |
Operating lease right-of-use assets |
|
|
54,670 |
|
|
51,856 |
Restricted cash |
|
|
300 |
|
|
300 |
Other assets |
|
|
2,137 |
|
|
2,308 |
Intangible assets, net |
|
|
57,708 |
|
|
60,612 |
Goodwill |
|
|
31,052 |
|
|
31,052 |
Total assets |
|
$ |
729,833 |
|
$ |
729,724 |
|
|
|
|
|
|
|
Liabilities, redeemable noncontrolling interest and stockholders’ deficit |
|
|
|
|
|
|
Current liabilities |
|
|
|
|
|
|
Accounts payable |
|
$ |
18,640 |
|
$ |
9,128 |
Accrued liabilities |
|
|
40,126 |
|
|
39,233 |
Operating lease liabilities, current |
|
|
5,590 |
|
|
4,958 |
Deferred revenue, current |
|
|
24,529 |
|
|
16,023 |
Customer deposits |
|
|
12,833 |
|
|
17,867 |
Other current liabilities |
|
|
415 |
|
|
136 |
Total current liabilities |
|
|
102,133 |
|
|
87,345 |
Operating lease liabilities, noncurrent |
|
|
48,234 |
|
|
45,689 |
Earnout liability, at fair value |
|
|
3,793 |
|
|
1,730 |
Asset retirement obligations |
|
|
17,371 |
|
|
15,473 |
Capital-build liability |
|
|
28,152 |
|
|
26,157 |
Deferred revenue, noncurrent |
|
|
37,175 |
|
|
23,900 |
Warrant liabilities, at fair value |
|
|
18,684 |
|
|
12,304 |
Total liabilities |
|
|
255,542 |
|
|
212,598 |
|
|
|
|
|
|
|
Commitments and contingencies |
|
|
|
|
|
|
|
|
|
|
|
|
|
Redeemable noncontrolling interest |
|
|
1,525,282 |
|
|
875,226 |
Stockholders’ deficit |
|
|
(1,050,991) |
|
|
(358,100) |
Total liabilities, redeemable noncontrolling interest and stockholders’ deficit |
|
$ |
729,833 |
|
$ |
729,724 |
6
EVgo Inc. and Subsidiaries
Consolidated Statements of Operations
Unaudited
|
|
Three Months Ended |
||||||
|
|
March 31, |
||||||
(in thousands, except per share data) |
|
2023 |
|
2022 |
|
Change % |
||
Revenue |
|
$ |
25,300 |
|
$ |
7,700 |
|
229% |
|
|
|
|
|
|
|
|
|
Cost of revenue |
|
|
18,917 |
|
|
4,846 |
|
290% |
Depreciation, net of capital-build amortization |
|
|
6,342 |
|
|
3,454 |
|
84% |
Cost of sales |
|
|
25,259 |
|
|
8,300 |
|
204% |
Gross profit (loss) |
|
|
41 |
|
|
(600) |
|
107% |
|
|
|
|
|
|
|
|
|
General and administrative expenses |
|
|
37,889 |
|
|
25,428 |
|
49% |
Depreciation, amortization and accretion |
|
|
4,784 |
|
|
3,887 |
|
23% |
Total operating expenses |
|
|
42,673 |
|
|
29,315 |
|
46% |
Operating loss |
|
|
(42,632) |
|
|
(29,915) |
|
(43)% |
|
|
|
|
|
|
|
|
|
Interest income |
|
|
1,998 |
|
|
55 |
|
* |
Other income (expense), net |
|
|
1 |
|
|
(263) |
|
100% |
Change in fair value of earnout liability |
|
|
(2,063) |
|
|
(2,264) |
|
9% |
Change in fair value of warrant liabilities |
|
|
(6,380) |
|
|
(22,874) |
|
72% |
Total other expense, net |
|
|
(6,444) |
|
|
(25,346) |
|
75% |
Loss before income tax expense |
|
|
(49,076) |
|
|
(55,261) |
|
11% |
Income tax expense |
|
|
(5) |
|
|
(5) |
|
— % |
Net loss |
|
|
(49,081) |
|
|
(55,266) |
|
11% |
Less: net loss attributable to redeemable noncontrolling interest |
|
|
(36,005) |
|
|
(40,867) |
|
12% |
Net loss attributable to Class A common stockholders |
|
$ |
(13,076) |
|
$ |
(14,399) |
|
9% |
|
|
|
|
|
|
|
|
|
Net loss per share to Class A common stockholders, basic and diluted |
|
$ |
(0.18) |
|
$ |
(0.21) |
|
14% |

*Percentage greater than 999%.
7
EVgo Inc. and Subsidiaries
Consolidated Statements of Cash Flows
Unaudited
|
|
Three Months Ended |
||||
|
|
March 31, |
||||
(in thousands) |
|
2023 |
|
2022 |
||
Cash flows from operating activities |
|
|
|
|
|
|
Net loss |
|
$ |
(49,081) |
|
$ |
(55,266) |
Adjustments to reconcile net loss to net cash used in operating activities |
|
|
|
|
|
|
Depreciation, amortization and accretion |
|
|
11,126 |
|
|
7,341 |
Net loss on disposal of property and equipment and impairment expense |
|
|
3,460 |
|
|
1,010 |
Share-based compensation |
|
|
6,427 |
|
|
3,506 |
Change in fair value of earnout liability |
|
|
2,063 |
|
|
2,264 |
Change in fair value of warrant liabilities |
|
|
6,380 |
|
|
22,874 |
Other |
|
|
— |
|
|
288 |
Changes in operating assets and liabilities |
|
|
|
|
|
|
Accounts receivable, net |
|
|
(18,188) |
|
|
(257) |
Receivables from related parties |
|
|
— |
|
|
1,499 |
Prepaid expenses and other current and noncurrent assets |
|
|
(4,415) |
|
|
3,538 |
Operating lease assets and liabilities, net |
|
|
365 |
|
|
(2,135) |
Accounts payable |
|
|
6,493 |
|
|
154 |
Payables to related parties |
|
|
— |
|
|
25 |
Accrued liabilities |
|
|
(799) |
|
|
(2,596) |
Deferred revenue |
|
|
21,781 |
|
|
(561) |
Customer deposits |
|
|
(5,034) |
|
|
(862) |
Other current and noncurrent liabilities |
|
|
79 |
|
|
(653) |
Net cash used in operating activities |
|
|
(19,343) |
|
|
(19,831) |
Cash flows from investing activities |
|
|
|
|
|
|
Purchases of property, equipment and software |
|
|
(65,246) |
|
|
(28,274) |
Proceeds from insurance for property losses |
|
|
— |
|
|
202 |
Net cash used in investing activities |
|
|
(65,246) |
|
|
(28,072) |
Cash flows from financing activities |
|
|
|
|
|
|
Proceeds from capital-build funding |
|
|
2,216 |
|
|
4,099 |
Proceeds from exercise of warrants |
|
|
— |
|
|
2 |
Payments of issuance costs and deferred transaction costs |
|
|
(308) |
|
|
— |
Net cash provided by financing activities |
|
|
1,908 |
|
|
4,101 |
Net decrease in cash, cash equivalents and restricted cash |
|
|
(82,681) |
|
|
(43,802) |
Cash, cash equivalents and restricted cash, beginning of period |
|
|
246,493 |
|
|
485,181 |
Cash, cash equivalents and restricted cash, end of period |
|
$ |
163,812 |
|
$ |
441,379 |
8
Use of Non-GAAP Financial Measures
To supplement EVgo’s financial information, which is prepared and presented in accordance with GAAP, EVgo uses certain non-GAAP financial measures. The presentation of non-GAAP financial measures is not intended to be considered in isolation or as a substitute for, or superior to, the financial information prepared and presented in accordance with GAAP. EVgo uses these non-GAAP financial measures for financial and operational decision-making and as a means to evaluate period-to-period comparisons. EVgo believes that these non-GAAP financial measures provide meaningful supplemental information regarding the Company’s performance by excluding certain items that may not be indicative of EVgo’s recurring core business operating results.
EVgo believes that both management and investors benefit from referring to these non-GAAP financial measures in assessing EVgo’s performance. These non-GAAP financial measures also facilitate management’s internal comparisons to the Company’s historical performance. EVgo believes these non-GAAP financial measures are useful to investors both because (1) they allow for greater transparency with respect to key metrics used by management in its financial and operational decision-making and (2) they are used by EVgo’s institutional investors and the analyst community to help them analyze the health of EVgo’s business.
For more information on these non-GAAP financial measures, including reconciliations to the most comparable GAAP measures, please see the sections titled “Definitions of Non-GAAP Financial Measures” and “Reconciliations of Non-GAAP Measures” included at the end of this release.
Definitions of Non-GAAP Financial Measures
EVgo uses the following non-GAAP financial measures, in each case as defined below: “Adjusted Cost of Sales,” “Adjusted Cost of Sales as a Percentage of Revenue,” “Adjusted Gross Profit (Loss),” “Adjusted Gross Margin,” “Adjusted General and Administrative Expenses,” “Adjusted General and Administrative Expenses as a Percentage of Revenue,” “EBITDA,” “EBITDA Margin,” “Adjusted EBITDA,” and “Adjusted EBITDA Margin.” EVgo believes these measures are useful to investors in evaluating EVgo’s performance. In addition, EVgo management uses these measures internally to establish forecasts, budgets, and operational goals to manage and monitor its business. EVgo believes that these measures help to depict a more meaningful representation of the performance of the underlying business, enabling EVgo to evaluate and plan more effectively for the future.
Adjusted Cost of Sales, Adjusted Cost of Sales as a Percentage of Revenue, Adjusted Gross Profit (Loss), Adjusted Gross Margin, Adjusted General and Administrative Expenses, Adjusted General and Administrative Expenses as a Percentage of Revenue, EBITDA, EBITDA Margin, Adjusted EBITDA and Adjusted EBITDA Margin are not prepared in accordance with GAAP and may be different from non-GAAP financial measures used by other companies. These measures should not be considered as measures of financial performance under GAAP and the items excluded from or included in these metrics are significant components in understanding and assessing EVgo’s financial performance. These metrics should not be considered as alternatives to net income (loss) or any other performance measures derived in accordance with GAAP.
EVgo defines Adjusted Cost of Sales as cost of sales before: (i) depreciation, net of capital-build amortization, and (ii) share-based compensation. EVgo defines Adjusted Cost of Sales as a Percentage of Revenue as Adjusted Cost of Sales as a percentage of revenue. EVgo defines Adjusted Gross Profit (Loss) as revenue less Adjusted Cost of Sales. EVgo defines Adjusted Gross Margin as Adjusted Gross Profit (Loss) as a percentage of revenue. EVgo defines Adjusted General and Administrative Expenses as general and administrative expenses before (i) share-based compensation, (ii) loss on disposal of property and equipment and impairment expense, (iii) bad debt expense, and (iv) certain other items that management believes are not indicative of
9
EVgo’s ongoing performance. EVgo defines Adjusted General and Administrative Expenses as a Percentage of Revenue as Adjusted General and Administrative Expenses as a percentage of revenue. EVgo defines EBITDA as net income (loss) before (i) depreciation, net of capital-build amortization, (ii) amortization, (iii) accretion, (iv) interest income, and (v) income tax expense. EVgo defines EBITDA Margin as EBITDA as a percentage of revenue. EVgo defines Adjusted EBITDA as EBITDA plus (i) share-based compensation, (ii) loss on disposal of property and equipment and impairment expense, (iii) (gain) loss on investments, (iv) bad debt expense, (v) change in fair value of earnout liability, (vi) change in fair value of warrant liabilities, and (vii) certain other items that management believes are not indicative of EVgo’s ongoing performance. EVgo defines Adjusted EBITDA Margin as Adjusted EBITDA as a percentage of revenue.
Reconciliations of Non-GAAP Measures
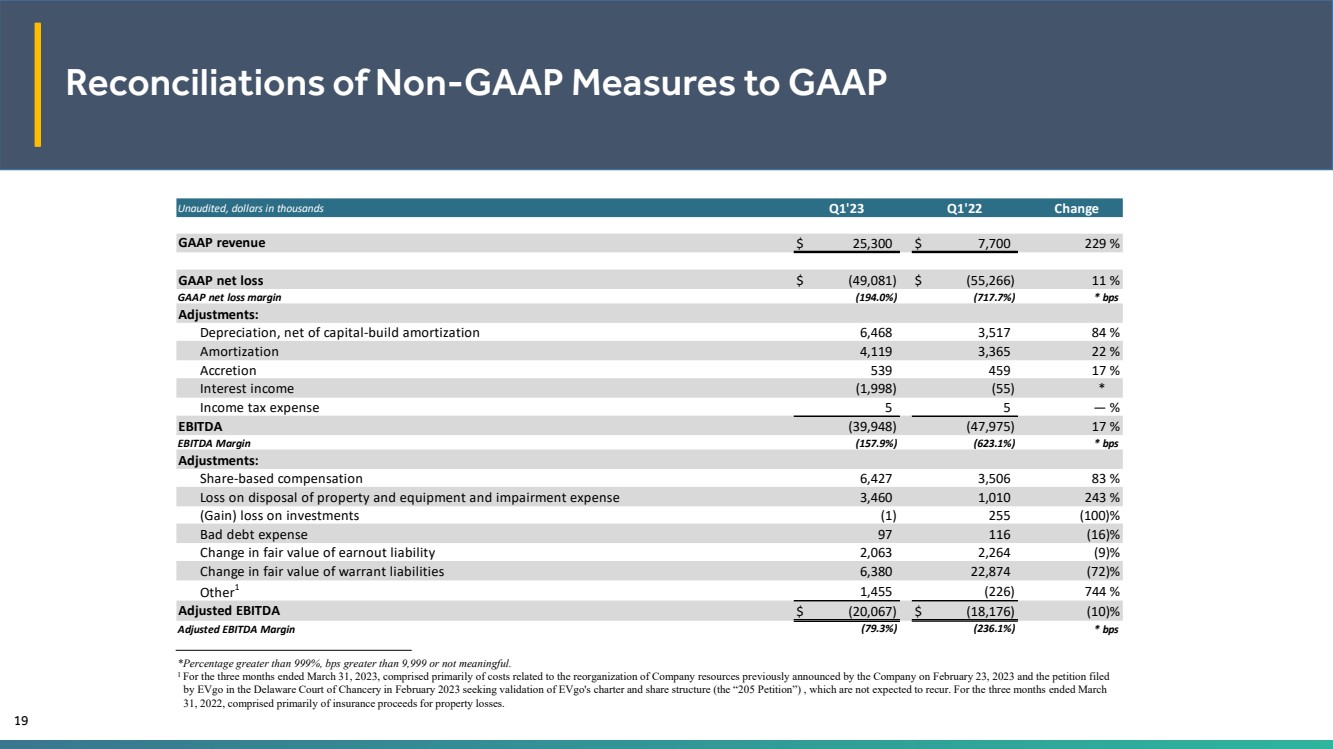
The following unaudited table presents a reconciliation of EBITDA, EBITDA Margin, Adjusted EBITDA, and Adjusted EBITDA Margin to the most directly comparable GAAP measure, in each case, for the quarters ended March 31, 2023 and 2022:
Unaudited, dollars in thousands |
Q1'23 |
|
Q1'22 |
|
Change |
||
|
|
|
|
|
|
|
|
GAAP revenue |
$ |
25,300 |
|
$ |
7,700 |
|
229% |
|
|
|
|
|
|
|
|
GAAP net loss |
$ |
(49,081) |
|
$ |
(55,266) |
|
11% |
GAAP net loss margin |
|
(194.0%) |
|
|
(717.7%) |
|
* bps |
Adjustments: |
|
|
|
|
|
|
|
Depreciation, net of capital-build amortization |
|
6,468 |
|
|
3,517 |
|
84% |
Amortization |
|
4,119 |
|
|
3,365 |
|
22% |
Accretion |
|
539 |
|
|
459 |
|
17% |
Interest income |
|
(1,998) |
|
|
(55) |
|
* |
Income tax expense |
|
5 |
|
|
5 |
|
— % |
EBITDA |
|
(39,948) |
|
|
(47,975) |
|
17% |
EBITDA Margin |
|
(157.9%) |
|
|
(623.1%) |
|
* bps |
Adjustments: |
|
|
|
|
|
|
|
Share-based compensation |
|
6,427 |
|
|
3,506 |
|
83% |
Loss on disposal of property and equipment and impairment expense |
|
3,460 |
|
|
1,010 |
|
243% |
(Gain) loss on investments |
|
(1) |
|
|
255 |
|
(100)% |
Bad debt expense |
|
97 |
|
|
116 |
|
(16)% |
Change in fair value of earnout liability |
|
2,063 |
|
|
2,264 |
|
(9)% |
Change in fair value of warrant liabilities |
|
6,380 |
|
|
22,874 |
|
(72)% |
Other1 |
|
1,455 |
|
|
(226) |
|
744% |
Adjusted EBITDA |
$ |
(20,067) |
|
$ |
(18,176) |
|
(10)% |
Adjusted EBITDA Margin |
|
(79.3%) |
|
|
(236.1%) |
|
* bps |
*Percentage greater than 999%, bps greater than 9,999 or not meaningful.
1 For the three months ended March 31, 2023, comprised primarily of costs related to the reorganization of Company resources previously announced by the Company on February 23, 2023 and the petition filed by EVgo in the Delaware Court of Chancery in February 2023 seeking validation of EVgo’s charter and share structure (the “205 Petition”), which are not expected to recur. For three months ended March 31, 2022 comprised primarily of insurance proceeds for property losses.
10
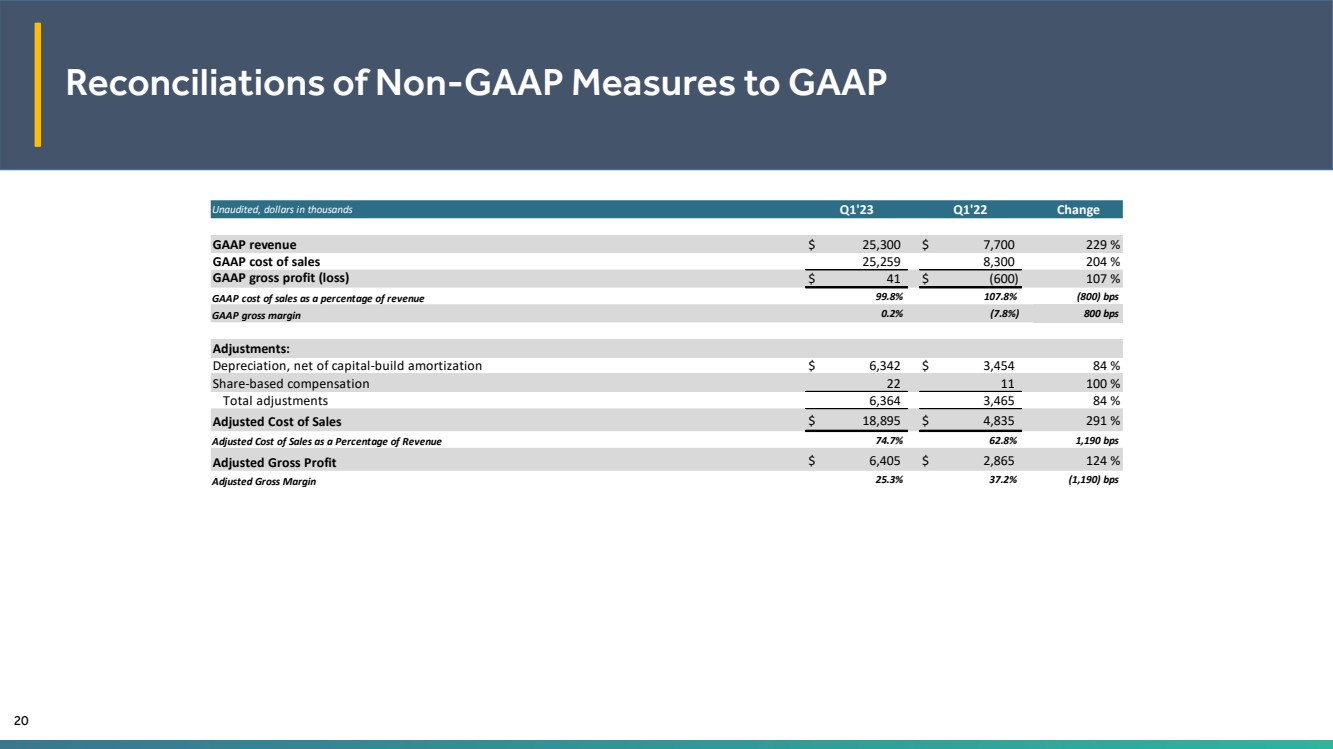
The following unaudited table presents a reconciliation of Adjusted Cost of Sales, Adjusted Cost of Sales as a Percentage of Revenue, Adjusted Gross Profit (Loss) and Adjusted Gross Margin to the most directly comparable GAAP measures, in each case, for the quarters ended March 31, 2023 and 2022:
Unaudited, dollars in thousands |
Q1'23 |
|
Q1'22 |
|
Change |
||
|
|
|
|
|
|
|
|
GAAP revenue |
$ |
25,300 |
|
$ |
7,700 |
|
229% |
GAAP cost of sales |
|
25,259 |
|
|
8,300 |
|
204% |
GAAP gross profit (loss) |
$ |
41 |
|
$ |
(600) |
|
107% |
GAAP cost of sales as a percentage of revenue |
|
99.8% |
|
|
107.8% |
|
(800) bps |
GAAP gross margin |
|
0.2% |
|
|
(7.8%) |
|
800 bps |
|
|
|
|
|
|
|
|
Adjustments: |
|
|
|
|
|
|
|
Depreciation, net of capital-build amortization |
$ |
6,342 |
|
$ |
3,454 |
|
84% |
Share-based compensation |
|
22 |
|
|
11 |
|
100% |
Total adjustments |
|
6,364 |
|
|
3,465 |
|
84% |
Adjusted Cost of Sales |
$ |
18,895 |
|
$ |
4,835 |
|
291% |
Adjusted Cost of Sales as a Percentage of Revenue |
|
74.7% |
|
|
62.8% |
|
1,190 bps |
Adjusted Gross Profit |
$ |
6,405 |
|
$ |
2,865 |
|
124% |
Adjusted Gross Margin |
|
25.3% |
|
|
37.2% |
|
(1,190) bps |
The following unaudited table presents a reconciliation of Adjusted General and Administrative Expenses and Adjusted General and Administrative Expenses as a Percentage of Revenue to the most directly comparable GAAP measures for the quarters ended March 31, 2023 and 2022:
Unaudited, dollars in thousands |
Q1'23 |
|
Q1'22 |
|
Change |
||
|
|
|
|
|
|
|
|
GAAP revenue |
$ |
25,300 |
|
$ |
7,700 |
|
229% |
GAAP general and administrative expenses |
$ |
37,889 |
|
$ |
25,428 |
|
49% |
GAAP general and administrative expenses as a percentage of revenue |
|
149.8% |
|
|
330.2% |
|
* bps |
|
|
|
|
|
|
|
|
Adjustments: |
|
|
|
|
|
|
|
Share-based compensation |
$ |
6,405 |
|
$ |
3,495 |
|
83% |
Loss on disposal of property and equipment and impairment expense |
|
3,460 |
|
|
1,010 |
|
243% |
Bad debt expense |
|
97 |
|
|
116 |
|
(16)% |
Other1 |
|
1,455 |
|
|
(226) |
|
744% |
Total adjustments |
|
11,417 |
|
|
4,395 |
|
160% |
Adjusted General and Administrative Expenses |
$ |
26,472 |
|
$ |
21,033 |
|
26% |
Adjusted General and Administrative Expenses as a Percentage of Revenue |
|
104.6% |
|
|
273.2% |
|
* bps |
*Bps greater than 9,999.
1 For the three months ended March 31, 2023, comprised primarily of costs related to the reorganization of Company resources previously announced by the Company on February 23, 2023 and the 205 Petition, which are not expected to recur. For the three months ended March 31, 2022, comprised primarily of insurance proceeds for property losses.
11
For investors:
investors@evgo.com
For Media:
press@evgo.com
Source: EVgo Inc.
12
|
EVgo Q1 2023 Earnings Call May 9, 2023 Nasdaq: EVGO – investors.evgo.com |
|
Forward-Looking Statements This presentation contains “forward-looking statements” within the meaning of the "safe harbor" provisions of the United States Private Securities Litigation Reform Act of 1995. Forward-looking statements may be identified by the use of words such as "estimate," "plan," "project," "forecast," "intend," "will," "expect," "anticipate," "believe," "seek," "target,“ “assume” or other similar expressions that predict or indicate future events or trends or that are not statements of historical matters. These forward-looking statements are based on the current expectations or beliefs of the management of EVgo Inc. (“EVgo” or the “Company”) and are subject to numerous assumptions, risks and uncertainties that could cause actual results to differ materially from those described in the forward-looking statements. These forward-looking statements include, but are not limited to, express or implied statements regarding EVgo’s future financial performance, revenues, capital expenditures, chargers in operation or under construction and network throughput; EVgo’s expectation of market position and acceleration in its business due to factors including increased EV adoption; EVgo’s collaboration with partners enabling effective deployment of chargers; and EVgo's revenue-per-stall, capex-per-stall and internal-rate-of-return targets, expectations and assumptions underlying the potential scalability of EVgo's public network, and expectations regarding the percentage of EVgo revenue to be accounted for by revenue from charging on EVgo's public network. These statements are based on various assumptions, whether or not identified in this presentation, and on the current expectations of EVgo’s management and are not predictions of actual performance. There are a significant number of factors that could cause actual results to differ materially from the statements made in this presentation, including changes or developments in the broader general market; ongoing impacts from COVID-19 on EVgo’s business, customers, and suppliers; macro political, economic, and business conditions, including inflation and geopolitical conflicts that could impact EVgo’s supply chains; increased competition, including from new and existing entrants in the EV charging market; unfavorable conditions or further disruptions in the capital and credit markets and EVgo's ability to obtain additional capital on commercially reasonable terms; EVgo’s limited operating history as a public company; EVgo’s dependence on widespread adoption of EVs and increased installation of charging stations; mechanisms surrounding energy and non-energy costs for EVgo’s charging stations; the impact of governmental support and mandates that could reduce, modify, or eliminate financial incentives, rebates, and tax credits; supply chain disruptions; EVgo’s ability to expand into new service markets, grow its customer base, and manage its operations; impediments to EVgo’s expansion plans, including permitting delays; the need to attract additional fleet operators as customers; potential adverse effects on EVgo’s revenue and gross margins if customers increasingly claim clean energy credits and, as a result, they are no longer available to be claimed by us; risks related to EVgo’s dependence on its intellectual property; risks that EVgo’s technology could have undetected defects or errors; and risks that the assumptions underlying the model inputs used in project underwriting considerations for any new charger sites prove to be inaccurate. Additional risks and uncertainties that could affect the Company’s financial results are included under the captions “Risk Factors” and “Management’s Discussion and Analysis of Financial Condition and Results of Operations of EVgo” in EVgo’s most recent Annual Report on Form 10-K, filed with the Securities and Exchange Commission (the “SEC”), as well as its other SEC filings, copies of which are available on EVgo’s website at investors.evgo.com, and on the SEC’s website at www.sec.gov. All forward-looking statements in this presentation are based on information available to us as of the date hereof, and EVgo does not assume any obligation to update the forward-looking statements provided to reflect events that occur or circumstances that exist after the date on which they were made, except as required by applicable law. Use of Non-GAAP Financial Measures To supplement EVgo’s financial information, which is prepared and presented in accordance with generally accepted accounting principles in the United States of America (“GAAP”), EVgo uses certain non-GAAP financial measures. The presentation of non-GAAP financial measures is not intended to be considered in isolation or as a substitute for, or superior to, the financial information prepared and presented in accordance with GAAP. EVgo uses these non-GAAP financial measures for financial and operational decision-making and as a means to evaluate period-to-period comparisons. EVgo believes that these non-GAAP financial measures provide meaningful supplemental information regarding EVgo’s performance by excluding certain items that may not be indicative of EVgo’s recurring core business operating results. EVgo believes that both management and investors benefit from referring to these non-GAAP financial measures in assessing EVgo’s performance. These non-GAAP financial measures also facilitate management’s internal comparisons to EVgo’s historical performance. EVgo believes these non-GAAP financial measures are useful to investors both because (1) they allow for greater transparency with respect to key metrics used by management in its financial and operational decision-making and (2) they are used by EVgo’s institutional investors and the analyst community to help them analyze the health of EVgo’s business. Reconciliations of these non-GAAP financial measures to the most comparable GAAP measures can be found in the tables included at the end of this presentation. Safe Harbor & Forward-Looking Statements 2 |
|
1 Cathy Zoi, CEO Strategic Overview 3 |
|
~3,100 stalls DCfast charging stalls in operation or under construction 900+ locations A leader in public DC fast chargingsites 9 OEM partners Engagedby multiple OEMs for partnerships ranging from charging credit and infrastructure buildout, to marketing and data integration 100% Electricity that powers EVgo’s network is matched with purchases of renewable energy certificates since 2019 ~614,000 Customer accounts ~140 million Americans within 10 miles of EVgo charger Snapshot of EVgo’s Market Position Market leader in clean mobility electrification – 100% matched with renewable power ~3,500 stalls In active engineering and construction (E&C} stall development pipeline 124% Y-o-Y network throughput growth(1) 30+ states 60+ major metropolitan areas ~3.4M users Registered PlugShare® accounts 4 Source: Company estimates, PlugShare All figures as of Q1 2023 unless otherwise noted 1) Q1 2023 vs Q1 2022 |
|
0 5,000 10,000 15,000 20,000 2020 2021 2022 2023F 2024F 2025F 2026F 2027F 2028F 2029F 2030F Rapid Acceleration in US EV Adoption and Need for DC Fast Charging Drives Scalability of EVgo Business Model 5 1.0 1.5 2.2 3.8 5.6 7.9 11.0 15.1 20.2 26.2 33.2 2020 2021 2022 2023F 2024F 2025F 2026F 2027F 2028F 2029F 2030F US EVs (in millions) Source: BloombergNEF +40% ‘22-’30 CAGR • Over $1.2 trillion in planned investment for the development and deployment of EVs through 20301 • EVgo business model leveraged to increasing EV VIO which drives utilization • Top stalls on EVgo network already in line with long-term revenue targets • Realizing increasing charge rate as EV batteries improve and EVgo deployment of ultra-fast chargers accelerates • Expect public network to account for 75%-80% of EVgo revenue over long-term (remainder eXtend, hubs, behind the fence, tech-driven services) • Target robust double-digit pre-tax unlevered IRR on portfolio basis • Attractive long-term returns underpinned by EVgo’s first-mover, analytics and platform advantages • Current gross capex per stall of approximately $130,000 to $150,000 • OEM/grant funding/tax policy available to offset capex spend Growth Forecast for DC Charging Demand Source: EVgo DC Fast Charging Demand (GWh) +55% ‘22-’30 CAGR 1 Reuters Expectations regarding the percentage of EVgo revenue to be accounted for by revenue from charging on EVgo’s public network and the internal-rate-of-return, capex-per-stall and revenue-per-stall targets reflect EVgo’s reasonable expectations and assumptions as of the date of this presentation, which could be inaccurate and cause actual results to differ materially from those described herein. See 'Safe Harbor & Forward-Looking Statements' for more information |
|
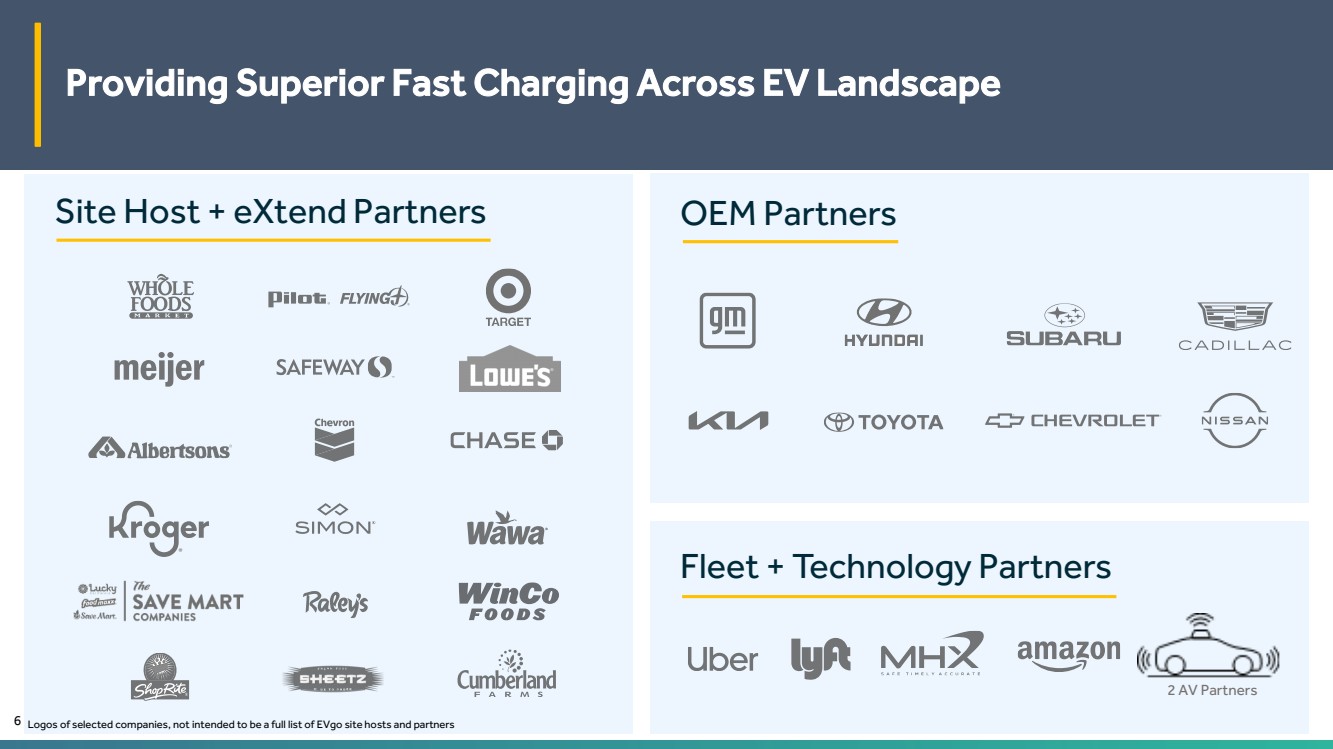
6 Providing Superior Fast Charging Across EV Landscape Site Host + eXtend Partners OEM Partners Fleet + Technology Partners 2 AV Partners Logos of selected companies, not intended to be a full list of EVgo site hosts and partners |
|
Key Business Highlights Accelerating growth and investment in network Stalls in Operation or Under Construction Network Throughput (GWh) 7 All figures for Q1 2023 or as of 03/31/2023 unless otherwise noted. ~3,100 Stalls in operation or under construction increased 48% YoY ~3,500 Active E&C Stall Development Pipeline grew 6% YoY ~220 New stalls added to our network during Q1 2023, increase of 69% YoY 17.9 GWh Network throughput up 124% from Q1 2022 229% Revenue increase versus Q1 2022 ~3.4M PlugShare registered users ~2,100 ~3,100 3/31/2022 3/31/2023 48% 8.0 17.9 Q1'22 Q1'23 124% |
|
2 Olga Shevorenkova, CFO Financial and Operational Overview |
|
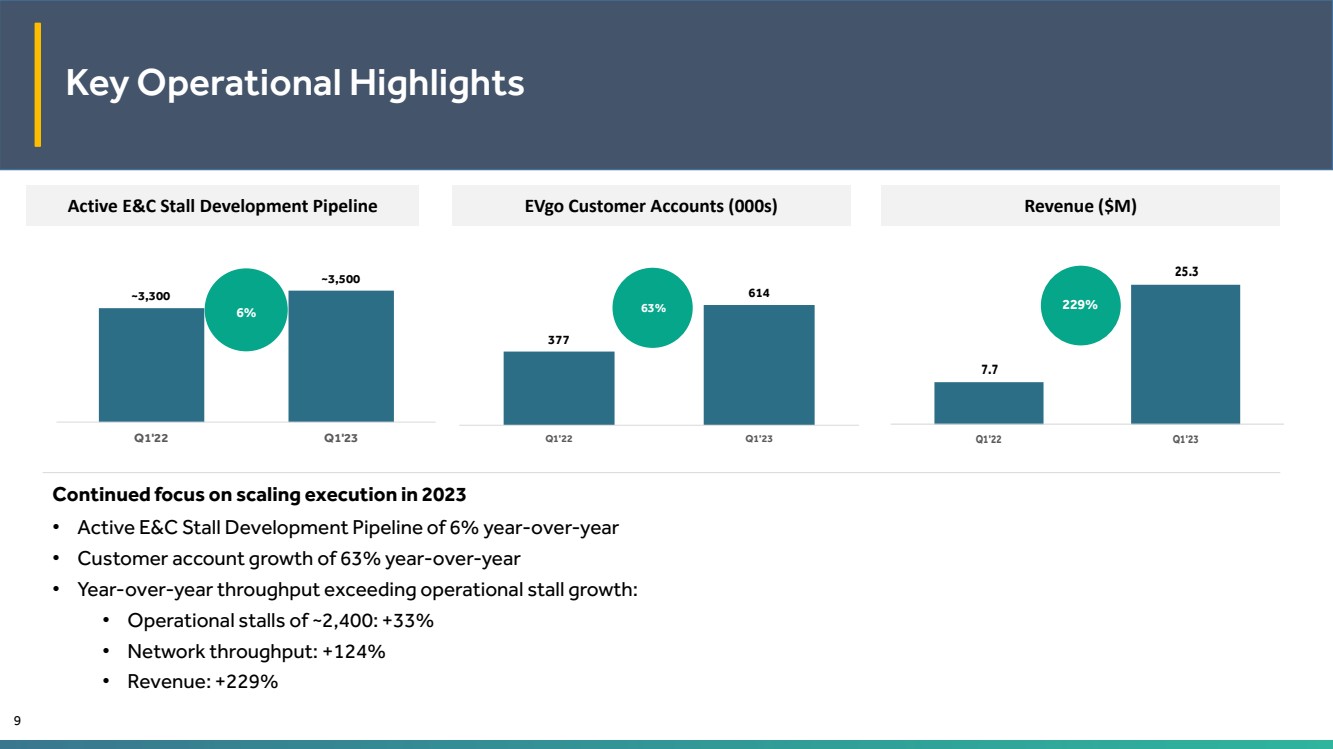
Key Operational Highlights Active E&C Stall Development Pipeline EVgo Customer Accounts (000s) Revenue ($M) Continued focus on scaling execution in 2023 • Active E&C Stall Development Pipeline of 6% year-over-year • Customer account growth of 63% year-over-year • Year-over-year throughput exceeding operational stall growth: • Operational stalls of ~2,400: +33% • Network throughput: +124% • Revenue: +229% 9 ~3,300 ~3,500 Q1'22 Q1'23 6% 7.7 25.3 Q1'22 Q1'23 63% 229% 377 614 Q1'22 Q1'23 |
|
• Revenues grew 229% year-over-year, driven by increases in eXtend and retail charging revenues • Retail charging revenue increased 89% on YoY basis • eXtend revenues increased $10.2 million as pre-engineering work and equipment delivery continued for certain Pilot Flying J sites • Adjusted gross margin declined: 25.3% compared to 37.2% in Q1 2022, primarily due to accelerated revenue recognition of regulatory credits in Q1 2022 and a reduction in LCFS prices • G&A as a percentage of revenue improved to 149.8% compared to 330.2% in Q1 2022 • Adj. G&A as a percentage of revenue improved to 104.6% compared to 273.2% in Q1 2022 • Ended Q1’23 with $163.8 million in cash, cash equivalents, and restricted cash • Q1’23 capex spend acceleration primarily driven by prepaid equipment spend Key Financial Highlights Q1 2023 Quarterly Revenue, Margin and Cash Flow Update 10 1 Adjusted Gross Profit, Adjusted Gross Margin, and Adjusted EBITDA are non-GAAP measures and have not been prepared in accordance with GAAP. For a definition of these non-GAAP measures and a reconciliation to the most directly comparable GAAP measure, please see “Definitions of Non-GAAP Financial Measures” and “Reconciliations of Non-GAAP Measures” included elsewhere in these materials. Better (Worse) Network Throughput (GWh) 17.9 8.0 124 % GAAP revenue $ 25,300 $ 7,700 229 % GAAP gross profit (loss) $ 41 $ (600) 107 % GAAP gross margin 0.2% (7.8%) 800 bps GAAP net loss $ (49,081) $ (55,266) 11 % Adjusted Gross Profit1 $ 6,405 $ 2,865 124 % Adjusted Gross Margin 1 25.3% 37.2% (1,190) bps Adjusted EBITDA1 $ (20,067) $ (18,176) (10)% Cash flows used in operating activities $ (19,343) $ (19,831) Capital expenditures $ (65,246) $ (28,274) Unaudited, dollars in thousands Q1'23 Q1'22 Q1'23 Q1'22 |
|
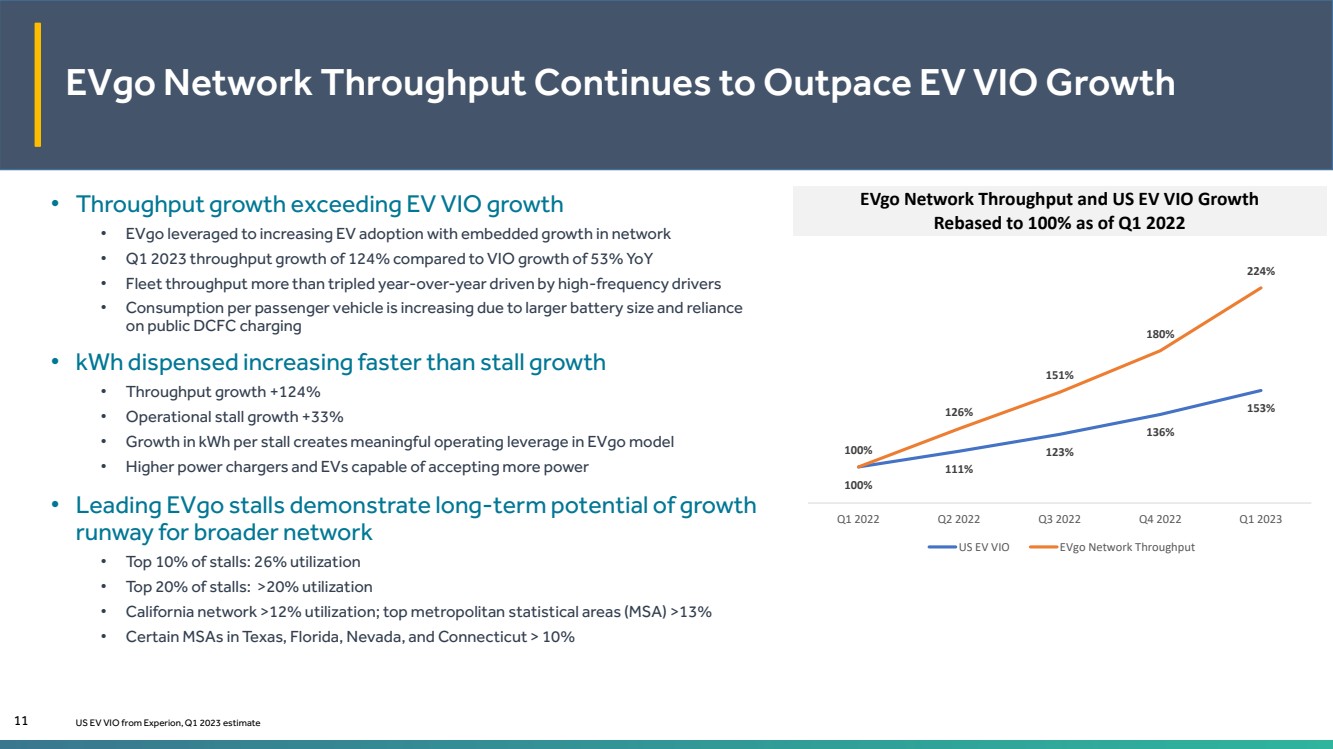
• Throughput growth exceeding EV VIO growth • EVgo leveraged to increasing EV adoption with embedded growth in network • Q1 2023 throughput growth of 124% compared to VIO growth of 53% YoY • Fleet throughput more than tripled year-over-year driven by high-frequency drivers • Consumption per passenger vehicle is increasing due to larger battery size and reliance on public DCFC charging • kWh dispensed increasing faster than stall growth • Throughput growth +124% • Operational stall growth +33% • Growth in kWh per stall creates meaningful operating leverage in EVgo model • Higher power chargers and EVs capable of accepting more power • Leading EVgo stalls demonstrate long-term potential of growth runway for broader network • Top 10% of stalls: 26% utilization • Top 20% of stalls: >20% utilization • California network >12% utilization; top metropolitan statistical areas (MSA) >13% • Certain MSAs in Texas, Florida, Nevada, and Connecticut > 10% EVgo Network Throughput Continues to Outpace EV VIO Growth 11 EVgo Network Throughput and US EV VIO Growth Rebased to 100% as of Q1 2022 100% 111% 123% 136% 153% 100% 126% 151% 180% 224% Q1 2022 Q2 2022 Q3 2022 Q4 2022 Q1 2023 US EV VIO EVgo Network Throughput US EV VIO from Experion, Q1 2023 estimate |
|
Adjusted EBITDA** ($78)-($60)M Total Stalls in Operation or Under Construction as of YE 2023 3,400-4,000 Affirming 2023 financial and operational forecast figures: 2023 Guidance 12 *A reconciliation of projected Adjusted EBITDA (Non-GAAP) to net income (loss), the most directly comparable GAAP measure, is not provided because certain measures, including share-based compensation expense, which is excluded from adjusted EBITDA, cannot be reasonably calculated or predicted at this time without unreasonable efforts. For a definition of Adjusted EBITDA and a reconciliation to the most directly comparable GAAP measure, please see “Definitions of Non-GAAP Financial Measures” and “Reconciliations of Non-GAAP Measures” included elsewhere in these materials. Revenue $105-$150M |
|
3 Appendix Reconciliation of Non-GAAP Measures to GAAP, Summary Financials |
|
Revenue Disaggregation 14 *Percentage greater than 999%. Q1'23 vs Q1'22 Charging revenue, retail $ 3,502 $ 4,389 $ 5,176 $ 5,828 $ 6,615 89 % Charging revenue, commercial 709 654 678 1,322 1,715 142 % Charging revenue, OEM 151 189 252 349 552 266 % Regulatory credit sales 1,378 2,128 1,178 968 1,215 (12)% Network revenue, OEM 490 887 448 626 2,699 451 % eXtend revenue 80 131 1,543 16,689 10,292 * Ancillary revenue 1,390 698 1,234 1,521 2,212 59 % Total revenue $ 7,700 $ 9,076 $ 10,509 $ 27,303 $ 25,300 229 % Unaudited, dollars in thousands Q1'22 Q2'22 Q3'22 Q4'22 Q1'23 |
|
Financial Statements: Condensed Consolidated Balance Sheets 15 (in thousands) Assets Current assets Cash, cash equivalents and restricted cash $ 163,512 $ 246,193 Accounts receivable, net of allowance of $782 and $687 as of March 31, 2023 and December 31, 2022, respectively 29,263 11,075 Accounts receivable, capital-build 9,418 8,011 Prepaid expenses 4,077 4,953 Other current assets 10,501 5,252 Total current assets 216,771 275,484 Property, equipment and software, net 367,195 308,112 Operating lease right-of-use assets 54,670 51,856 Restricted cash 300 300 Other assets 2,137 2,308 Intangible assets, net 57,708 60,612 Goodwill 31,052 31,052 Total assets $ 729,833 $ 729,724 Liabilities, redeemable noncontrolling interest and stockholders’ deficit Current liabilities Accounts payable $ 18,640 $ 9,128 Accrued liabilities 40,126 39,233 Operating lease liabilities, current 5,590 4,958 Deferred revenue, current 24,529 16,023 Customer deposits 12,833 17,867 Other current liabilities 415 136 Total current liabilities 102,133 87,345 Operating lease liabilities, noncurrent 48,234 45,689 Earnout liability, at fair value 3,793 1,730 Asset retirement obligations 17,371 15,473 Capital-build liability 28,152 26,157 Deferred revenue, noncurrent 37,175 23,900 Warrant liabilities, at fair value 18,684 12,304 Total liabilities 255,542 212,598 Commitments and contingencies Redeemable noncontrolling interest 1,525,282 875,226 Stockholders’ deficit (1,050,991) (358,100) Total liabilities, redeemable noncontrolling interest and stockholders’ deficit $ 729,833 $ 729,724 March 31, 2023 December 31, (unaudited) 2022 |
|
Financial Statements: Consolidated Statements of Operations 16 *Percentage greater than 999%. (Unaudited, in thousands, except per share data) Change % Revenue $ 25,300 $ 7,700 229 % Cost of revenue 18,917 4,846 290 % Depreciation, net of capital-build amortization 6,342 3,454 84 % Cost of sales 25,259 8,300 204 % Gross profit (loss) 4 1 (600) 107 % General and administrative expenses 37,889 25,428 49 % Depreciation, amortization and accretion 4,784 3,887 23 % Total operating expenses 42,673 29,315 46 % Operating loss (42,632) (29,915) (43)% Interest income 1,998 5 5 * Other income (expense), net 1 (263) 100 % Change in fair value of earnout liability (2,063) (2,264) 9 % Change in fair value of warrant liabilities (6,380) (22,874) 72 % Total other expense, net (6,444) (25,346) 75 % Loss before income tax expense (49,076) (55,261) 11 % Income tax expense (5) (5) — % Net loss (49,081) (55,266) 11 % Less: net loss attributable to redeemable noncontrolling interest (36,005) (40,867) 12 % Net loss attributable to Class A common stockholders $ (13,076) $ (14,399) 9 % Net loss per share to Class A common stockholders, basic and diluted $ (0.18) $ (0.21) 14 % 2023 2022 March 31, Three Months Ended |
|
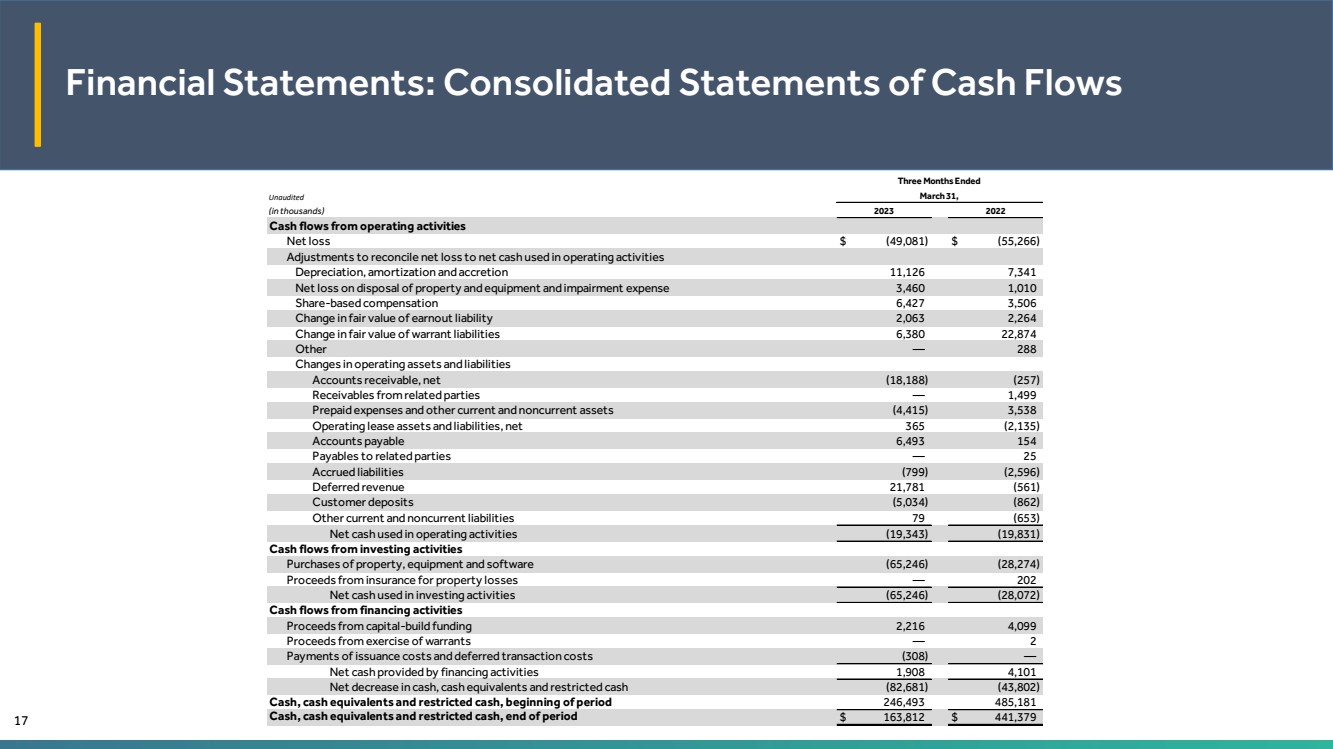
Financial Statements: Consolidated Statements of Cash Flows 17 Unaudited (in thousands) Cash flows from operating activities Net loss $ (49,081) $ (55,266) Adjustments to reconcile net loss to net cash used in operating activities Depreciation, amortization and accretion 11,126 7,341 Net loss on disposal of property and equipment and impairment expense 3,460 1,010 Share-based compensation 6,427 3,506 Change in fair value of earnout liability 2,063 2,264 Change in fair value of warrant liabilities 6,380 22,874 Other — 288 Changes in operating assets and liabilities Accounts receivable, net (18,188) (257) Receivables from related parties — 1,499 Prepaid expenses and other current and noncurrent assets (4,415) 3,538 Operating lease assets and liabilities, net 365 (2,135) Accounts payable 6,493 154 Payables to related parties — 25 Accrued liabilities (799) (2,596) Deferred revenue 21,781 (561) Customer deposits (5,034) (862) Other current and noncurrent liabilities 79 (653) Net cash used in operating activities (19,343) (19,831) Cash flows from investing activities Purchases of property, equipment and software (65,246) (28,274) Proceeds from insurance for property losses — 202 Net cash used in investing activities (65,246) (28,072) Cash flows from financing activities Proceeds from capital-build funding 2,216 4,099 Proceeds from exercise of warrants — 2 Payments of issuance costs and deferred transaction costs (308) — Net cash provided by financing activities 1,908 4,101 Net decrease in cash, cash equivalents and restricted cash (82,681) (43,802) Cash, cash equivalents and restricted cash, beginning of period 246,493 485,181 Cash, cash equivalents and restricted cash, end of period $ 163,812 $ 441,379 Three Months Ended March 31, 2023 2022 |
|
This presentation includes the following non-GAAP financial measures, in each case as defined below: “Adjusted Cost of Sales,” “Adjusted Cost of Sales as a Percentage of Revenue,” “Adjusted Gross Profit (Loss),” “Adjusted Gross Margin,” “Adjusted General and Administrative Expenses,” “Adjusted General and Administrative Expenses as a Percentage of Revenue,” “EBITDA,” “EBITDA Margin,” “Adjusted EBITDA” and “Adjusted EBITDA Margin.” EVgo believes these measures are useful to investors in evaluating EVgo’s performance. In addition, EVgo management uses these measures internally to establish forecasts, budgets, and operational goals to manage and monitor its business. EVgo believes that these measures help to depict a more meaningful representation of the performance of the underlying business, enabling EVgo to evaluate and plan more effectively for the future. EVgo defines Adjusted Cost of Sales as cost of sales before (i) depreciation, net of capital-build amortization, and (ii) share-based compensation. EVgo defines Adjusted Cost of Sales as a Percentage of Revenue as Adjusted Cost of Sales as a percentage of revenue. EVgo defines Adjusted Gross Profit (Loss) as revenue less Adjusted Cost of Sales. EVgo defines Adjusted Gross Margin as Adjusted Gross Profit (Loss) as a percentage of revenue. EVgo defines Adjusted General and Administrative Expenses as general and administrative expenses before (i) share-based compensation, (ii) loss on disposal of property and equipment and impairment expense, (iii) bad debt expense, and (iv) certain other items that management believes are not indicative of EVgo’s ongoing performance. EVgo defines Adjusted General and Administrative Expenses as a Percentage of Revenue as Adjusted General and Administrative Expenses as a percentage of revenue. EVgo defines EBITDA as net income (loss) before (i) depreciation, net of capital-build amortization, (ii) amortization, (iii) accretion, (iv) interest income, and (v) income tax expense. EVgo defines EBITDA Margin as EBITDA as a percentage of revenue. EVgo defines Adjusted EBITDA as EBITDA plus (i) share-based compensation, (ii) loss on disposal of property and equipment and impairment expense, (iii) (gain) loss on investments, (iv) bad debt expense, (v) change in fair value of earnout liability, (vi) change in fair value of warrant liabilities, and (vii) certain other items that management believes are not indicative of EVgo’s ongoing performance. EVgo defines Adjusted EBITDA Margin as Adjusted EBITDA as a percentage of revenue. Adjusted Cost of Sales, Adjusted Cost of Sales as a Percentage of Revenue, Adjusted Gross Profit (Loss), Adjusted Gross Margin, Adjusted General and Administrative Expenses, Adjusted General and Administrative Expenses as a Percentage of Revenue, EBITDA, EBITDA Margin, Adjusted EBITDA and Adjusted EBITDA Margin are not prepared in accordance with GAAP and may be different from non-GAAP financial measures used by other companies. These measures should not be considered as measures of financial performance under GAAP, and the items excluded from or included in these metrics are significant components in understanding and assessing EVgo’s financial performance. These metrics should not be considered as alternatives to net income (loss) or any other performance measures derived in accordance with GAAP. Definitions of Non-GAAP Financial Measures 18 |
|
Reconciliations of Non-GAAP Measures to GAAP 19 *Percentage greater than 999%, bps greater than 9,999 or not meaningful. 1 For the three months ended March 31, 2023, comprised primarily of costs related to the reorganization of Company resources previously announced by the Company on February 23, 2023 and the petition filed by EVgo in the Delaware Court of Chancery in February 2023 seeking validation of EVgo's charter and share structure (the “205 Petition”) , which are not expected to recur. For the three months ended March 31, 2022, comprised primarily of insurance proceeds for property losses. Unaudited, dollars in thousands Change GAAP revenue $ 25,300 $ 7,700 229 % GAAP net loss $ (49,081) $ (55,266) 11 % GAAP net loss margin (194.0%) (717.7%) * bps Adjustments: Depreciation, net of capital-build amortization 6,468 3,517 84 % Amortization 4,119 3,365 22 % Accretion 539 459 17 % Interest income (1,998) (55) * Income tax expense 5 5 — % EBITDA (39,948) (47,975) 17 % EBITDA Margin (157.9%) (623.1%) * bps Adjustments: Share-based compensation 6,427 3,506 83 % Loss on disposal of property and equipment and impairment expense 3,460 1,010 243 % (Gain) loss on investments (1) 255 (100)% Bad debt expense 97 116 (16)% Change in fair value of earnout liability 2,063 2,264 (9)% Change in fair value of warrant liabilities 6,380 22,874 (72)% Other1 1,455 (226) 744 % Adjusted EBITDA $ (20,067) $ (18,176) (10)% Adjusted EBITDA Margin (79.3%) (236.1%) * bps Q1'23 Q1'22 |
|
Reconciliations of Non-GAAP Measures to GAAP 20 Unaudited, dollars in thousands Change GAAP revenue $ 25,300 $ 7,700 229 % GAAP cost of sales 25,259 8,300 204 % GAAP gross profit (loss) $ 41 $ (600) 107 % GAAP cost of sales as a percentage of revenue 99.8% 107.8% (800) bps GAAP gross margin 0.2% (7.8%) 800 bps Depreciation, net of capital-build amortization $ 6,342 $ 3,454 84 % Share-based compensation 22 11 100 % Total adjustments 6,364 3,465 84 % Adjusted Cost of Sales $ 18,895 $ 4,835 291 % Adjusted Cost of Sales as a Percentage of Revenue 74.7% 62.8% 1,190 bps Adjusted Gross Profit $ 6,405 $ 2,865 124 % Adjusted Gross Margin 25.3% 37.2% (1,190) bps Q1'23 Q1'22 Adjustments: |
|
Reconciliations of Non-GAAP Measures to GAAP 21 *Bps greater than 9,999. 1 For the three months ended March 31, 2023, comprised primarily of costs related to the reorganization of Company resources previously announced by the Company on February 23, 2023 and the 205 Petition, which are not expected to recur. For the three months ended March 31, 2022, comprised primarily of insurance proceeds for property losses. Unaudited, dollars in thousands Change GAAP revenue $ 25,300 $ 7,700 229 % GAAP general and administrative expenses $ 37,889 $ 25,428 49 % GAAP general and administrative expenses as a percentage of revenue 149.8% 330.2% * bps Adjustments: Share-based compensation $ 6,405 $ 3,495 83 % Loss on disposal of property and equipment and impairment expense 3,460 1,010 243 % Bad debt expense 97 116 (16)% Other1 1,455 (226) 744 % Total adjustments 11,417 4,395 160 % Adjusted General and Administrative Expenses $ 26,472 $ 21,033 26 % Adjusted General and Administrative Expenses as a Percentage of Revenue 104.6% 273.2% * bps Q1'23 Q1'22 |