UNITED STATES
SECURITIES AND EXCHANGE COMMISSION
Washington, D.C. 20549
|
FORM 8-K |
|
CURRENT REPORT
Pursuant to Section 13 OR 15(d) of the Securities Exchange Act of 1934
Date of Report: February 17, 2023
(Date of earliest event reported)
DEERE & COMPANY
(Exact name of registrant as specified in its charter)
Delaware |
|
1-4121 |
|
36-2382580 |
(State or other jurisdiction of incorporation) |
|
(Commission File Number) |
|
(IRS Employer Identification No.) |
One John Deere Place
Moline, Illinois 61265
(Address of principal executive offices and zip code)
(309) 765-8000
(Registrant’s telephone number, including area code)
___________________________________________________
(Former name or former address, if changed since last report.)
Check the appropriate box below if the Form 8-K filing is intended to simultaneously satisfy the filing obligation of the registrant under any of the following provisions:
☐ Written communications pursuant to Rule 425 under the Securities Act (17 CFR 230.425)
☐ Soliciting material pursuant to Rule 14a-12 under the Exchange Act (17 CFR 240.14a-12)
☐ Pre-commencement communications pursuant to Rule 14d-2(b) under the Exchange Act (17 CFR 240.14d-2(b))
☐ Pre-commencement communications pursuant to Rule 13e-4(c) under the Exchange Act (17 CFR 240.13e-4(c))
SECURITIES REGISTERED PURSUANT TO SECTION 12(b) OF THE ACT:
Title of each class |
|
Trading symbol |
|
Name of each exchange on which registered |
Common stock, $1 par value |
|
DE |
|
New York Stock Exchange |
6.55% Debentures Due 2028 |
|
DE28 |
|
New York Stock Exchange |
Indicate by check mark whether the registrant is an emerging growth company as defined in Rule 405 of the Securities Act of 1933 (§230.405 of this chapter) or Rule 12b-2 of the Securities Exchange Act of 1934 (§240.12b-2 of this chapter).
Emerging growth company ☐
If an emerging growth company, indicate by check mark if the registrant has elected not to use the extended transition period for complying with any new or revised financial accounting standards provided pursuant to Section 13(a) of the Exchange Act. ☐
Items 2.02
and 7.01 Results of Operations and Financial Condition and Regulation FD Disclosure (Furnished
herewith).
Deere & Company’s press release dated February 17, 2023 concerning First Quarter of Fiscal 2023 financial results and supplemental financial information (Exhibit 99.1) is furnished under Form 8-K Items 2.02 and 7.01. The attached schedules of Other Financial Information (Exhibit 99.2) and First Quarter 2023 Earnings Conference Call Information (Exhibit 99.3) are furnished under Form 8-K Items 2.02 and 7.01. The information is not filed for purposes of the Securities Exchange Act of 1934 and is not deemed incorporated by reference by any general statements incorporating by reference this report or future filings into any filings under the Securities Act of 1933 or the Securities Exchange Act of 1934, except to the extent Deere & Company specifically incorporates the information by reference.
Item 9.01Financial Statements and Exhibits.
(d)Exhibits
Number |
Description of Exhibit |
99.1 |
Press Release and Supplemental Financial Information (Furnished herewith) |
99.2 |
|
99.3 |
First Quarter 2023 Earnings Conference Call Information (Furnished herewith) |
104 |
Cover Page Interactive Data File (the cover page XBRL tags are imbedded in the Inline XBRL document) |
2
Signature
Pursuant to the requirements of the Securities Exchange Act of 1934, the Registrant has duly caused this report to be signed on its behalf by the undersigned hereunto duly authorized.
|
DEERE & COMPANY |
|
|
|
|
|
|
|
|
By: |
/s/ Edward R. Berk |
|
|
Edward R. Berk |
|
|
Secretary |
|
|
|
|
|
|
Dated: February 17, 2023 |
|
|
3
Exhibit 99.1
(Furnished herewith)
News Release |
|
|
|
Contact:
Jen Hartmann
Director, Public Relations
HartmannJenniferA@JohnDeere.com
Deere Reports First Quarter Net Income of $1.959 Billion
| ● | Strong execution contributes to 34% net sales gain and higher earnings. |
| ● | Market environment supported by positive fundamentals and healthy demand for farm and construction equipment. |
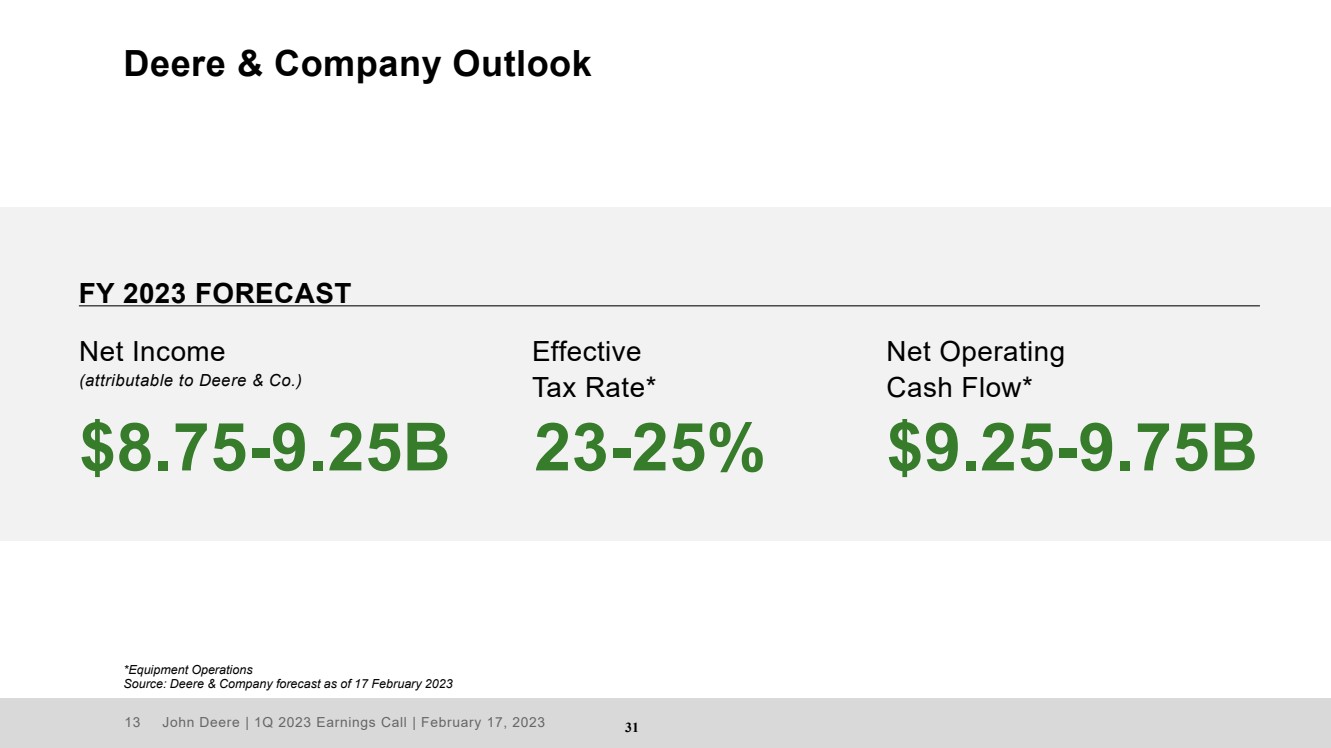
| ● | Full-year net income forecast increased to $8.75 billion to $9.25 billion. |
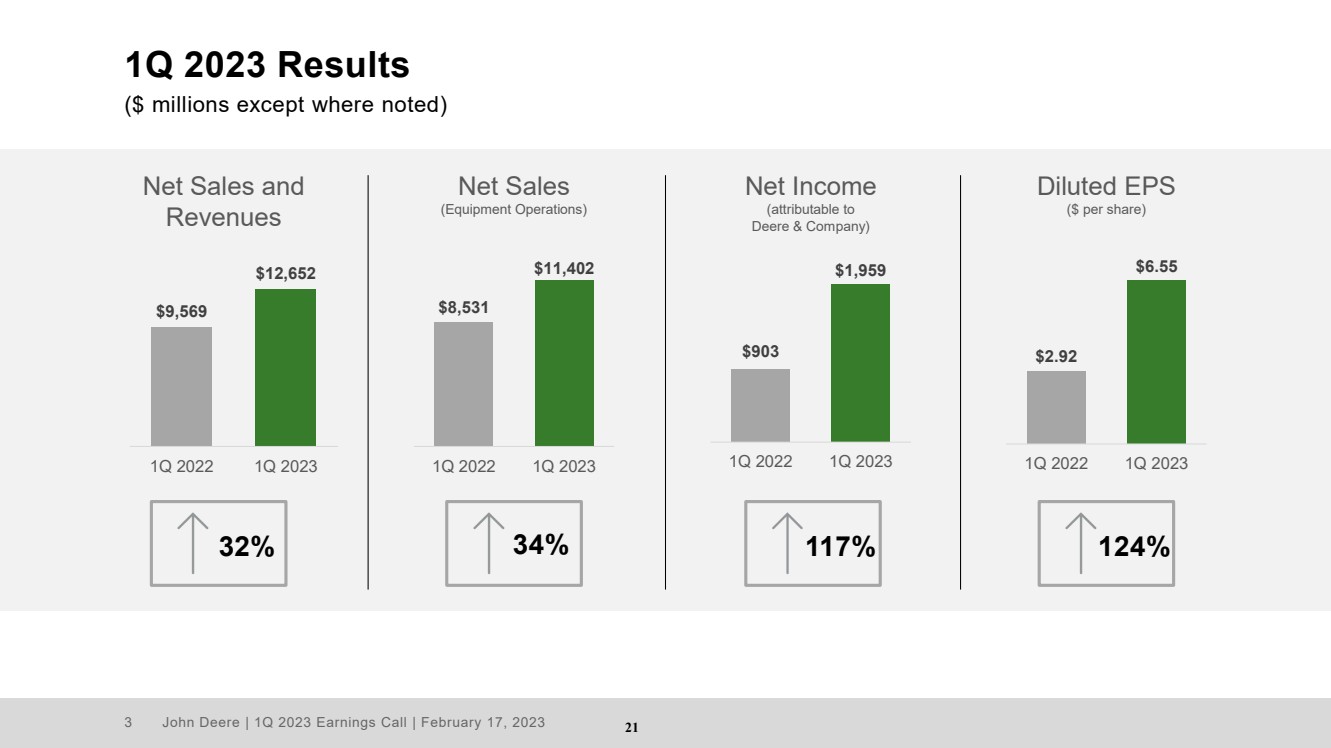
MOLINE, Illinois (February 17, 2023) — Deere & Company reported net income of $1.959 billion for the first quarter ended January 29, 2023, or $6.55 per share, compared with net income of $903 million, or $2.92 per share, for the quarter ended January 30, 2022.
Worldwide net sales and revenues increased 32 percent, to $12.652 billion, in the most recent quarter. Net sales were $11.402 billion for the quarter, compared with $8.531 billion in 2022.
“Deere’s first-quarter performance is a reflection of favorable market fundamentals and healthy demand for our equipment as well as solid execution on the part of our employees, dealers, and suppliers to get products to our customers,” said John C. May, chairman and chief executive officer. “We are, at the same time, benefiting from an improved operating environment, which is contributing to higher levels of production.”
Company Outlook & Summary
Net income attributable to Deere & Company for fiscal 2023 is forecast to be in a range of $8.75 billion to $9.25 billion.
“Deere is looking forward to another strong year on the basis of positive fundamentals, low machine inventories, and a continuation of solid execution,” May said. “We are proud of our recent performance and remain fully committed to helping our customers do their jobs in a more profitable, productive, and sustainable way. We have confidence in our ability to execute on our leap ambitions and run our businesses with real purpose, real technology, and real impact.”
4
Deere & Company |
|
First Quarter |
|
||||||
$ in millions, except per share amounts |
|
2023 |
|
2022 |
|
% Change |
|
||
Net sales and revenues |
|
$ |
12,652 |
|
$ |
9,569 |
|
32% |
|
Net income |
|
$ |
1,959 |
|
$ |
903 |
|
117% |
|
Fully diluted EPS |
|
$ |
6.55 |
|
$ |
2.92 |
|
|
|
Results for the prior period were affected by special items. See Note 1 of the financial statements for further details.
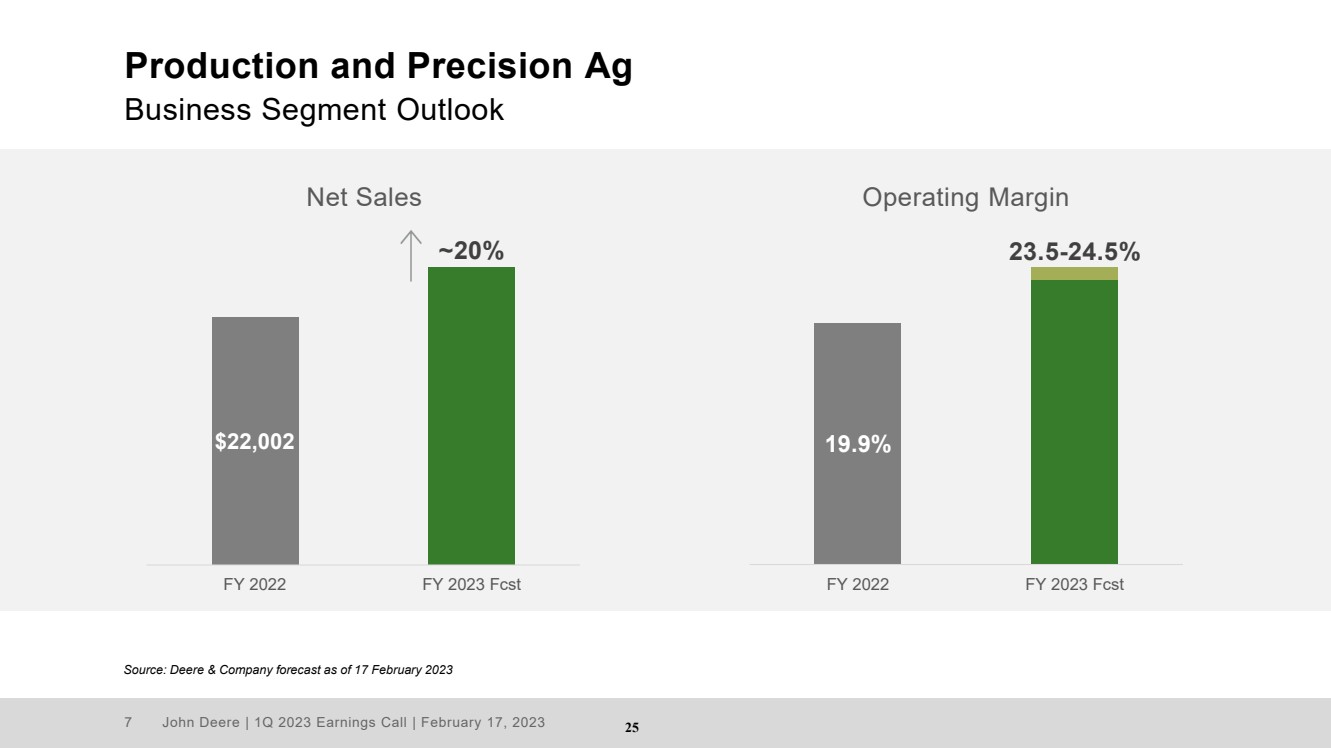
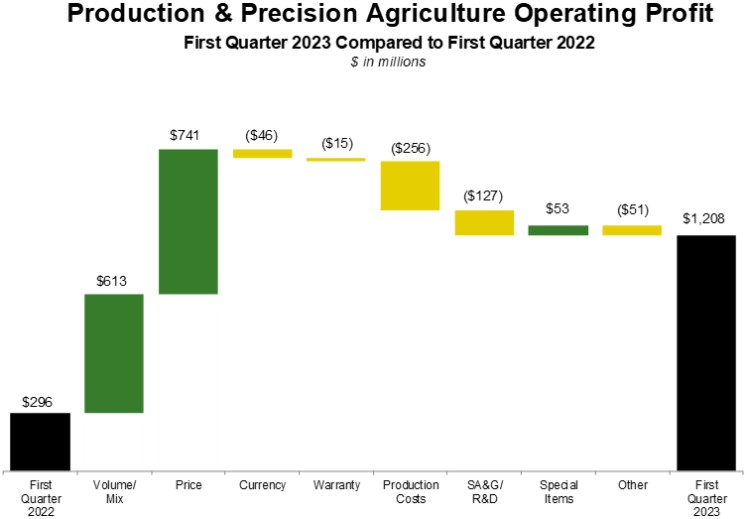
Production & Precision Agriculture |
|
First Quarter |
|
||||||
$ in millions |
|
2023 |
|
2022 |
|
% Change |
|
||
Net sales |
|
$ |
5,198 |
|
$ |
3,356 |
|
55% |
|
Operating profit |
|
$ |
1,208 |
|
$ |
296 |
|
308% |
|
Operating margin |
|
|
23.2% |
|
|
8.8% |
|
|
|
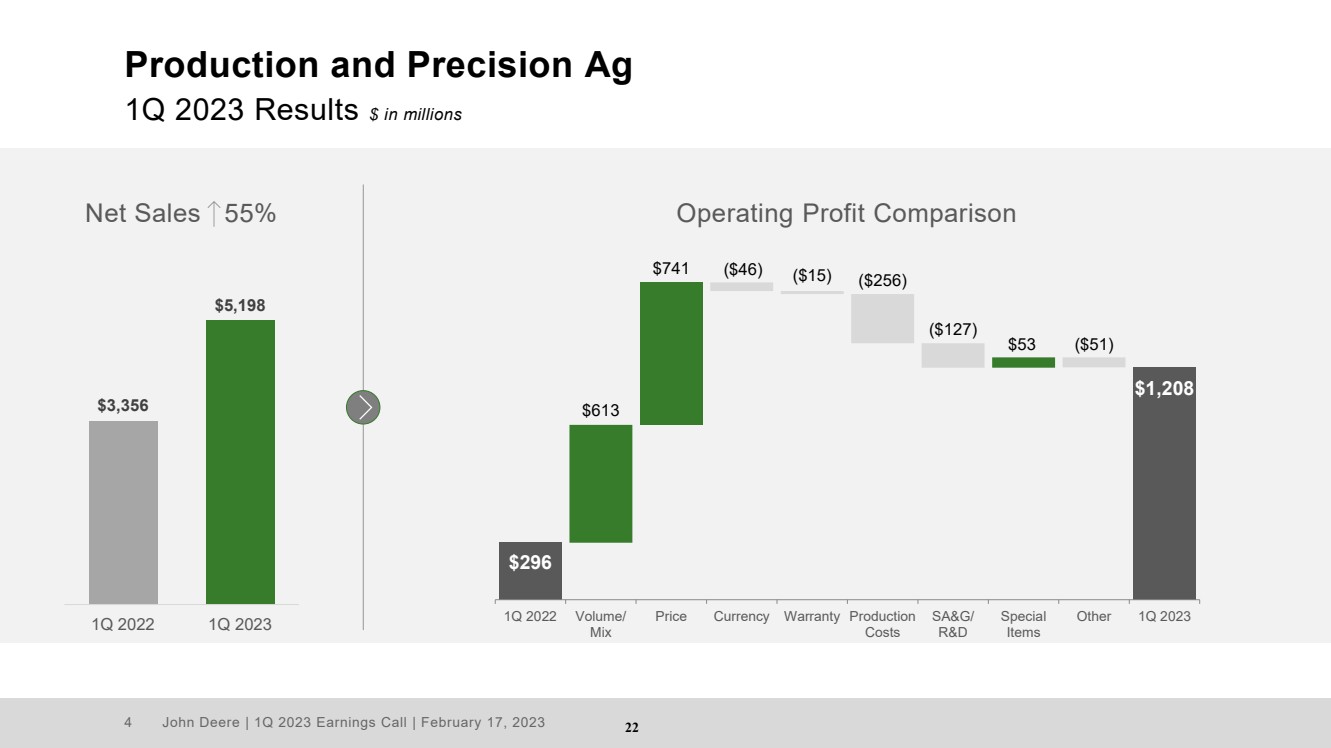
Production and precision agriculture sales increased for the quarter as a result of higher shipment volumes and price realization. Operating profit improved primarily due to price realization and improved shipment volume / mix, partially offset by higher production costs and increased SA&G and R&D expenses. UAW contract-ratification bonus costs affected the prior period.
5
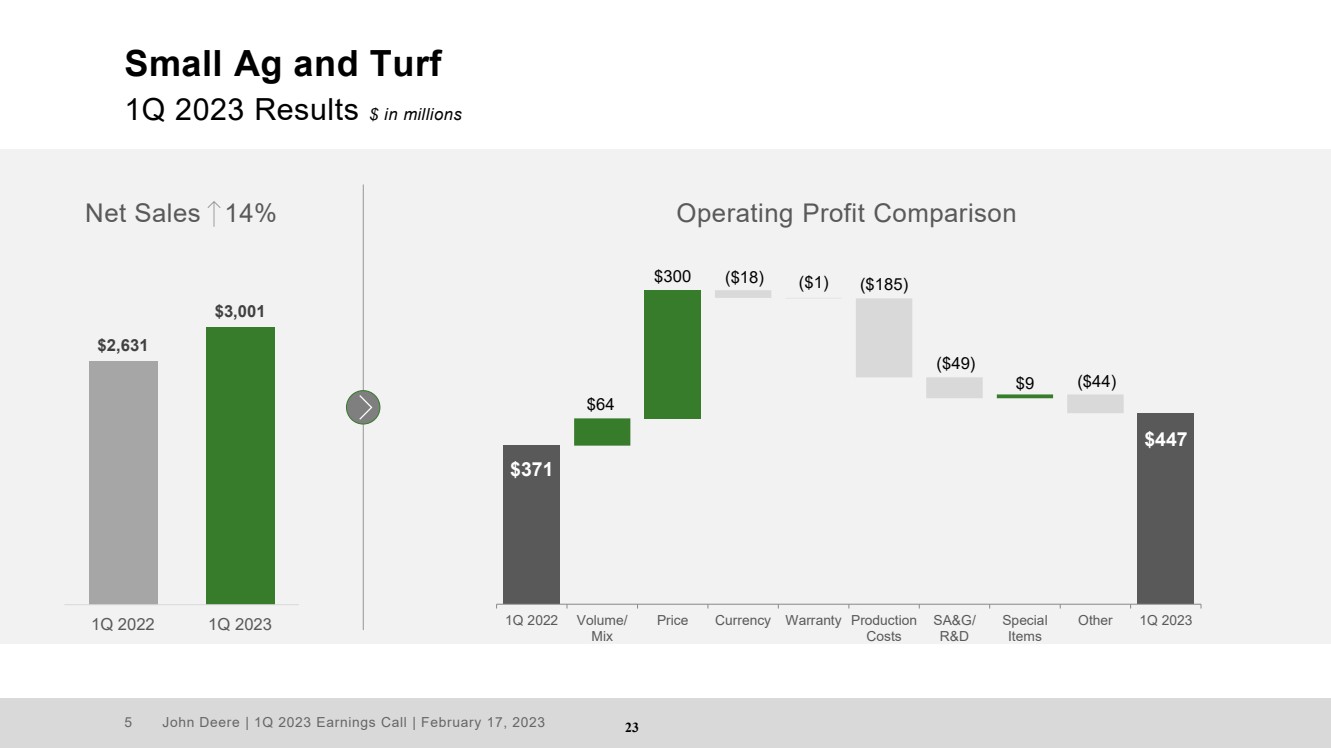
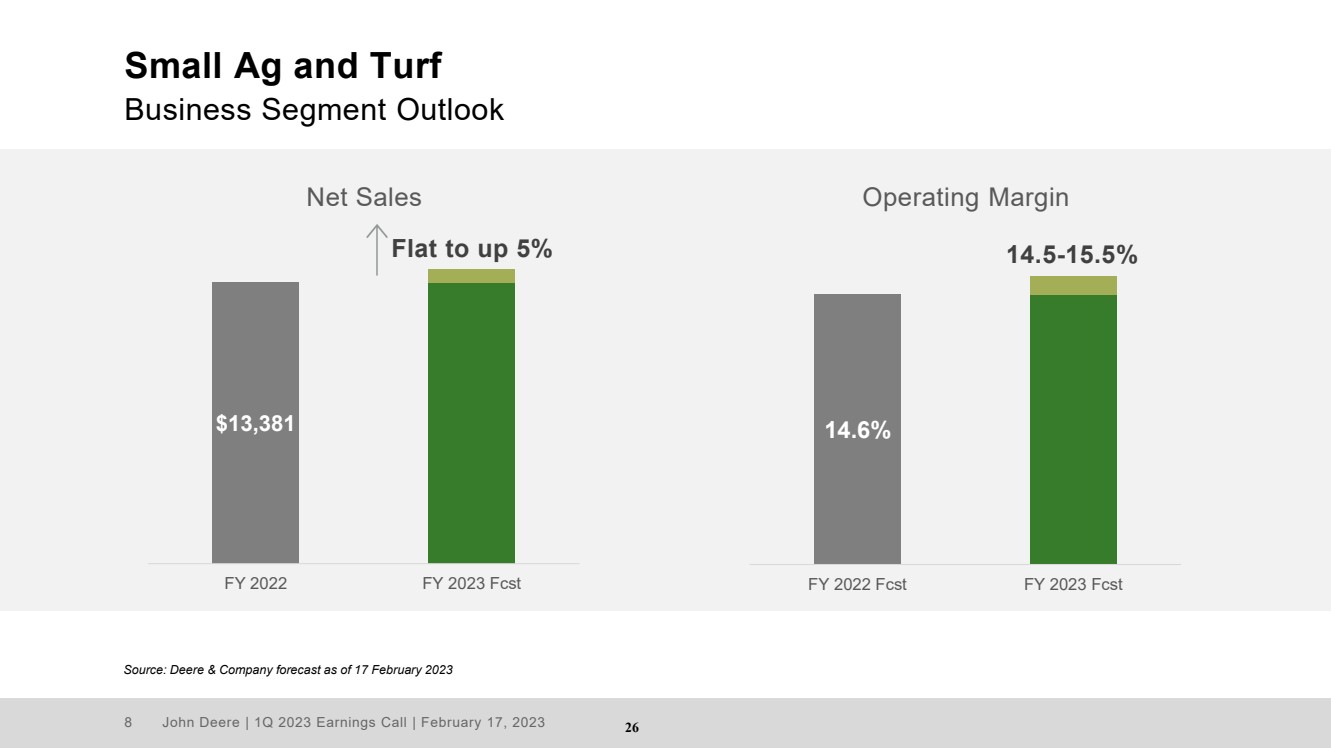
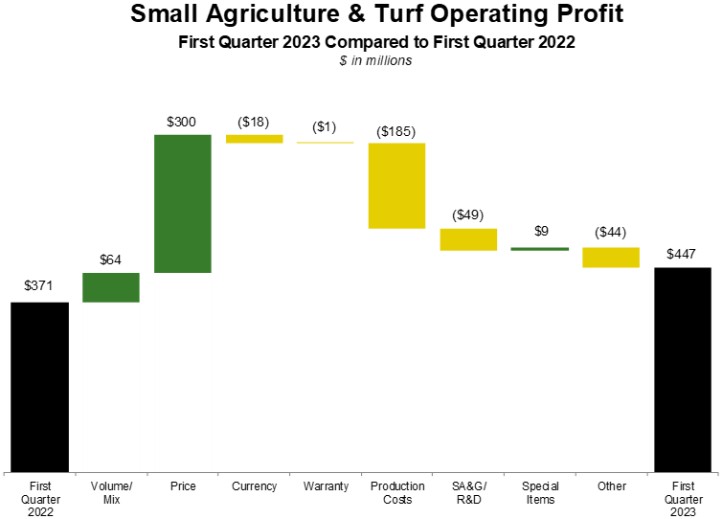
Small Agriculture & Turf |
|
First Quarter |
|
||||||
$ in millions |
|
2023 |
|
2022 |
|
% Change |
|
||
Net sales |
|
$ |
3,001 |
|
$ |
2,631 |
|
14% |
|
Operating profit |
|
$ |
447 |
|
$ |
371 |
|
20% |
|
Operating margin |
|
|
14.9% |
|
|
14.1% |
|
|
|
Small agriculture and turf sales increased for the quarter due to price realization and higher shipment volumes, partially offset by the negative effects of foreign currency translation. Operating profit improved primarily as a result of price realization and improved shipment volumes. These items were partially offset by higher production costs, increased SA&G and R&D expenses, and the unfavorable effects of foreign currency exchange.
6
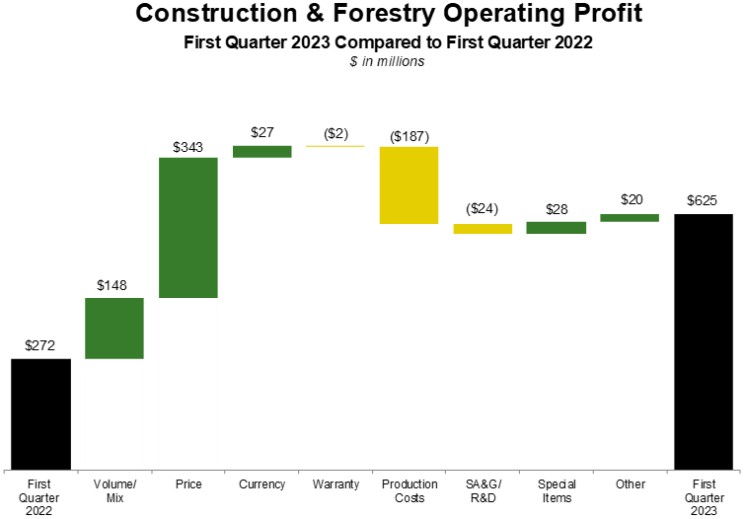
Construction & Forestry |
|
First Quarter |
|
||||||
$ in millions |
|
2023 |
|
2022 |
|
% Change |
|
||
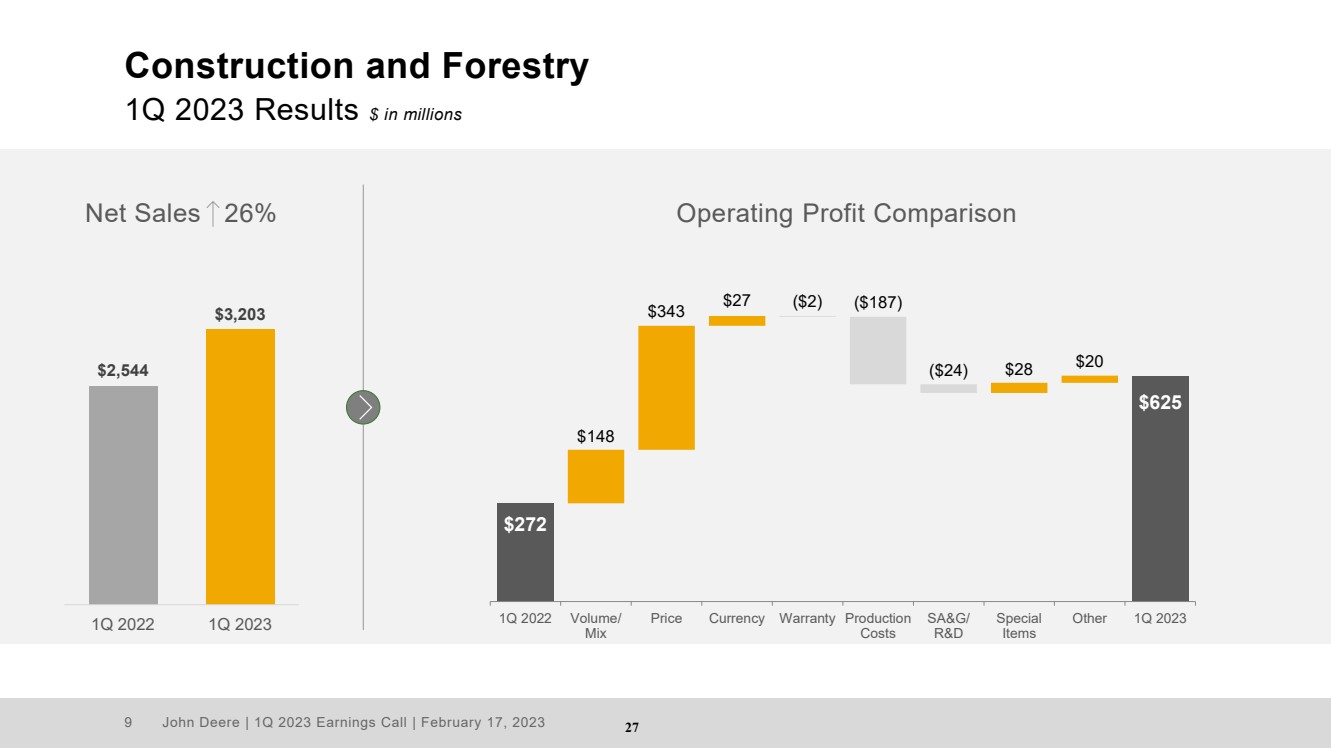
Net sales |
|
$ |
3,203 |
|
$ |
2,544 |
|
26% |
|
Operating profit |
|
$ |
625 |
|
$ |
272 |
|
130% |
|
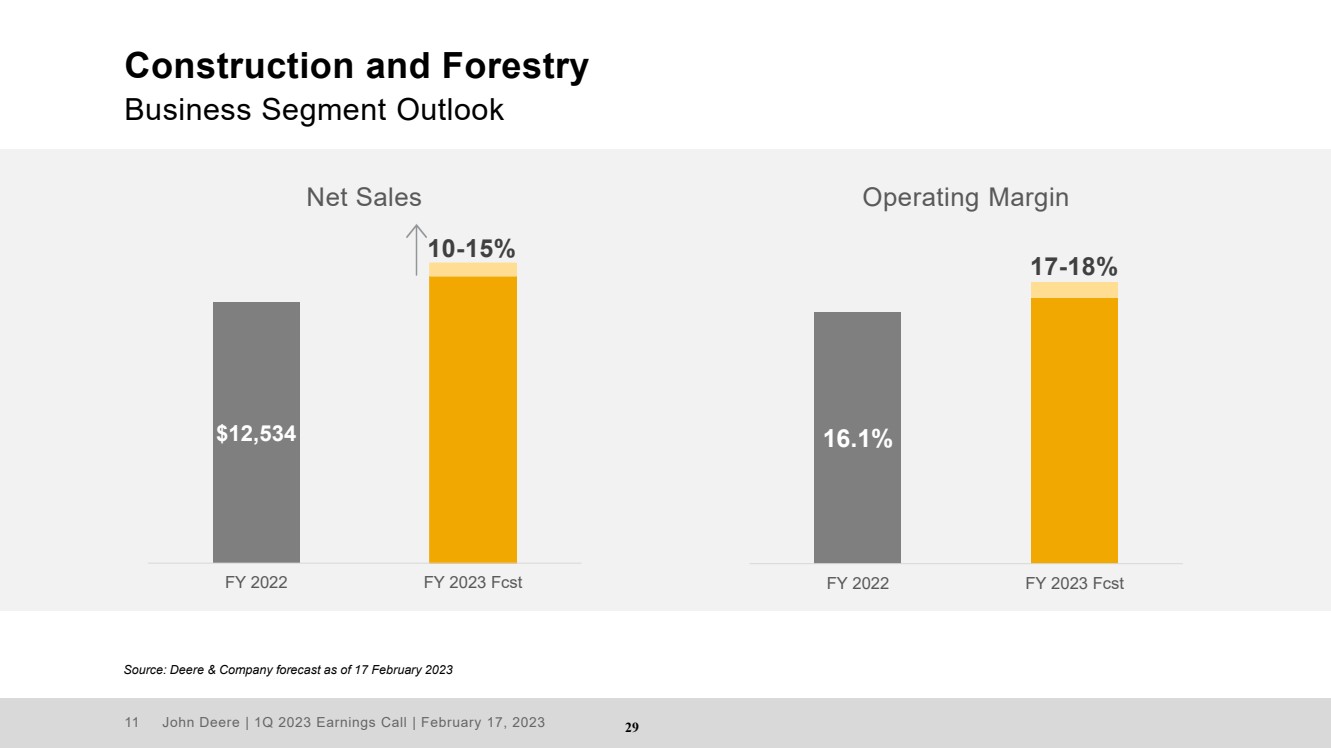
Operating margin |
|
|
19.5% |
|
|
10.7% |
|
|
|
Construction and forestry sales moved higher for the quarter primarily due to higher shipment volumes and price realization, partially offset by the negative effects of foreign currency translation. Operating profit improved due to price realization and improved shipment volumes, partially offset by higher production costs. UAW contract-ratification bonus costs affected the prior period.
7
Financial Services |
|
First Quarter |
|
||||||
$ in millions |
|
2023 |
|
2022 |
|
% Change |
|
||
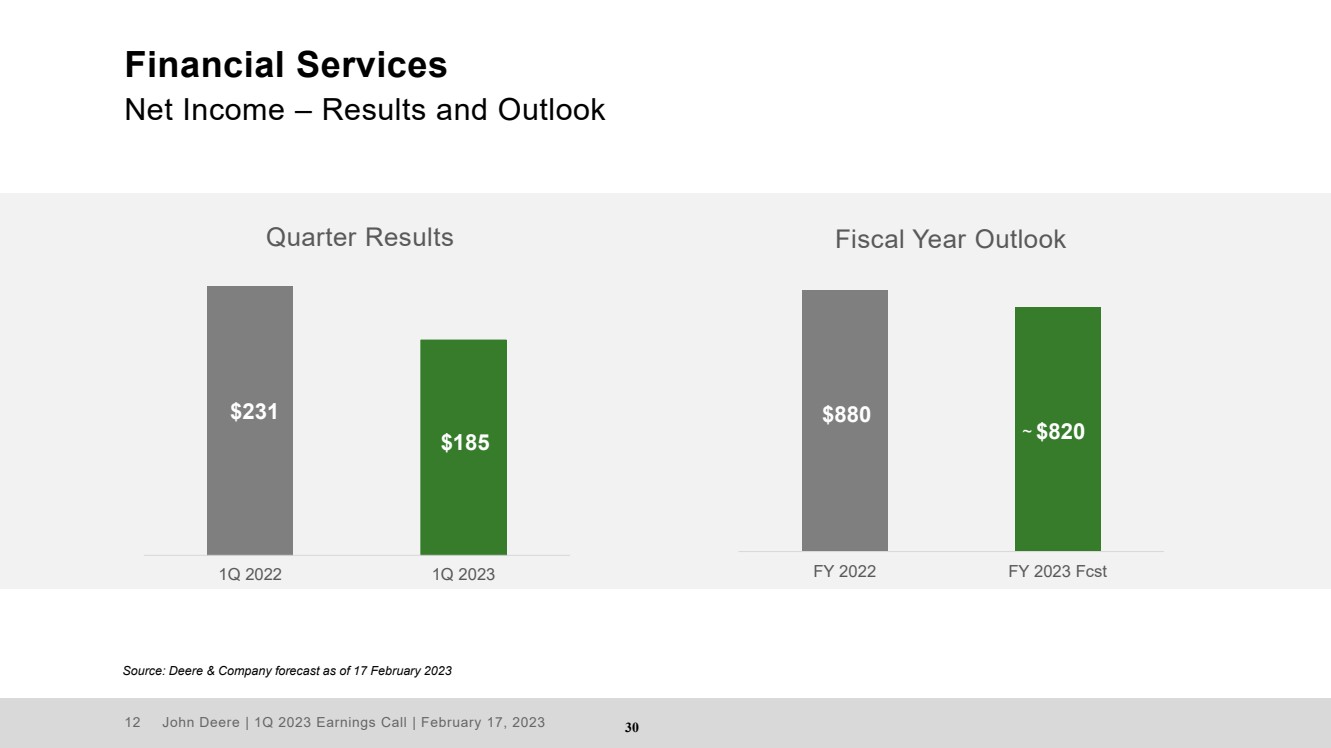
Net income |
|
$ |
185 |
|
$ |
231 |
|
-20% |
|
Financial services net income for the quarter decreased mainly due to less-favorable financing spreads, higher SA&G expenses, and lower gains on operating-lease dispositions, partially offset by income earned on higher average portfolio balances.
Industry Outlook for Fiscal 2023 |
|
|
|
|
|
||
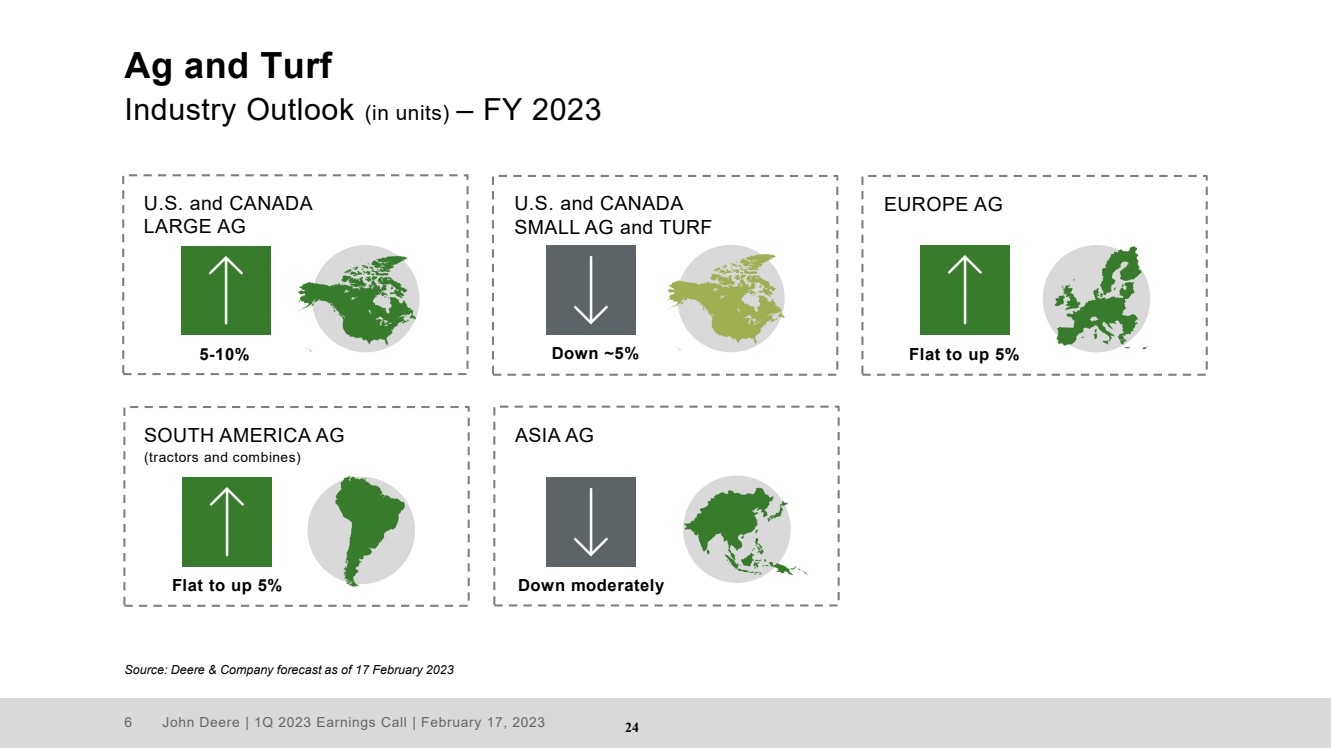
Agriculture & Turf |
|
|
|
|
|
|
|
U.S. & Canada: |
|
|
|
|
|
|
|
Large Ag |
|
|
|
|
|
Up 5 to 10% |
|
Small Ag & Turf |
|
|
|
|
|
Down ~ 5% |
|
Europe |
|
|
|
|
|
Flat to Up 5% |
|
South America (Tractors & Combines) |
|
|
|
|
|
Flat to Up 5% |
|
Asia |
|
|
|
|
|
Down moderately |
|
|
|
|
|
|
|
|
|
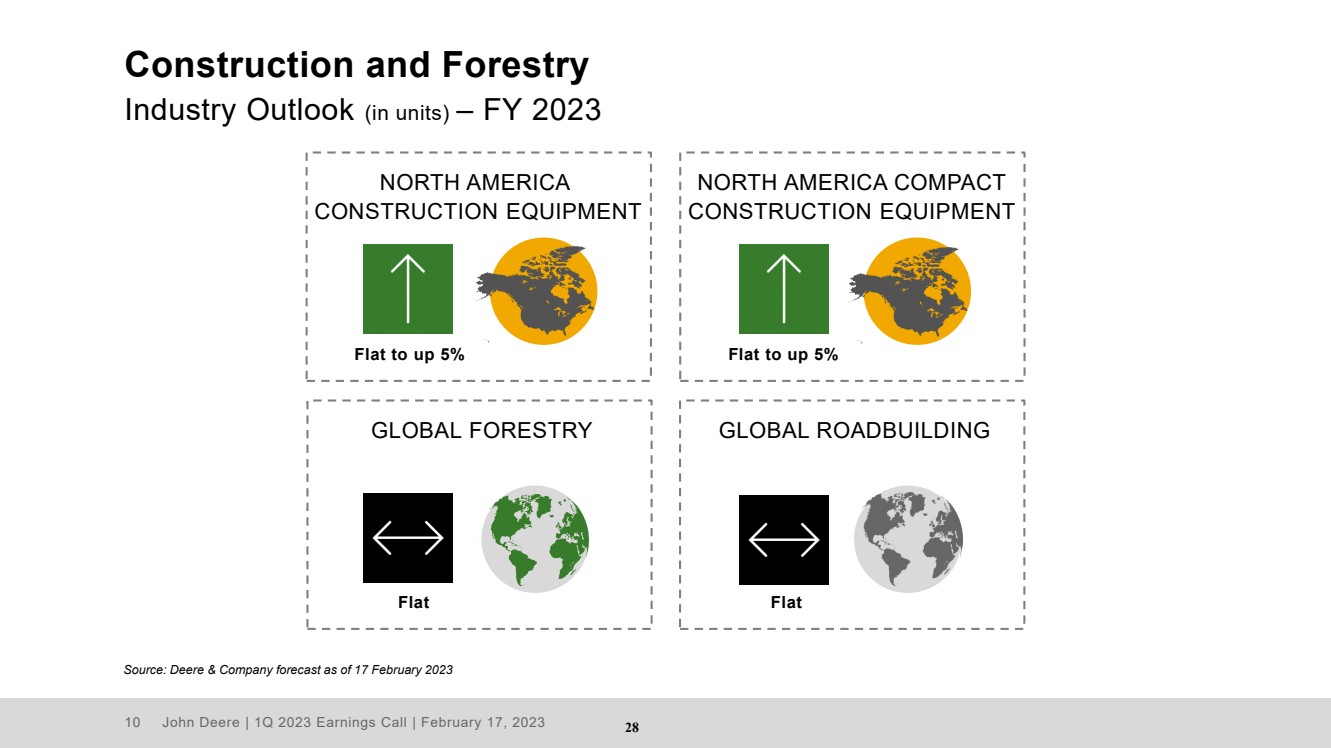
Construction & Forestry |
|
|
|
|
|
|
|
U.S. & Canada: |
|
|
|
|
|
|
|
Construction Equipment |
|
|
|
|
|
Flat to Up 5% |
|
Compact Construction Equipment |
|
|
|
|
|
Flat to Up 5% |
|
Global Forestry |
|
|
|
|
|
Flat |
|
Global Roadbuilding |
|
|
|
|
|
Flat |
|
Deere Segment Outlook for Fiscal 2023 |
|
Currency |
|
Price |
|
||
$ in millions |
|
Net Sales |
|
Translation |
|
Realization |
|
Production & Precision Ag |
|
Up ~ 20% |
|
0% |
|
+14% |
|
Small Ag & Turf |
|
Flat to Up 5% |
|
0% |
|
+8% |
|
Construction & Forestry |
|
Up 10 to 15% |
|
0% |
|
+9% |
|
|
|
|
|
|
|
|
|
Financial Services |
|
Net Income |
|
$ 820 |
|
|
|
Financial Services. Fiscal-year 2023 net income attributable to Deere & Company for the financial services operations is forecast to be $820 million. Results are expected to be lower than fiscal year 2022 due to less-favorable financing spreads, higher SA&G expenses, and lower gains on operating-lease dispositions. These factors are expected to be partially offset by income earned on a higher average portfolio. The outlook decreased from the previous forecast provided on November 23, 2022 due to further compression in financing spreads.
John Deere Capital Corporation
The following is disclosed on behalf of the company’s financial services subsidiary, John Deere Capital Corporation (JDCC), in connection with the disclosure requirements applicable to its periodic issuance of debt securities in the public market.
|
|
First Quarter |
|
||||||
$ in millions |
|
2023 |
|
2022 |
|
% Change |
|
||
Revenue |
|
$ |
821 |
|
$ |
643 |
|
28% |
|
Net income |
|
$ |
147 |
|
$ |
190 |
|
-23% |
|
Ending portfolio balance |
|
$ |
47,227 |
|
$ |
40,353 |
|
17% |
|
Net income for the quarter was lower than the same period in 2022 primarily due to less-favorable financing spreads, higher SA&G expenses, and lower gains on operating-lease dispositions, partially offset by income earned on higher average portfolio balances.
8
FORWARD-LOOKING STATEMENTS
Certain statements contained herein, including in the section entitled “Company Outlook & Summary,” “Industry Outlook,” and “Deere Segment Outlook,” relating to future events, expectations, and trends, constitute “forward-looking statements” as defined in the Private Securities Litigation Reform Act of 1995 and involve factors that are subject to change, assumptions, risks, and uncertainties that could cause actual results to differ materially.
Forward-looking statements are based on currently available information and current assumptions, expectations, and projections about future events and should not be relied upon. Except as required by law, the company expressly disclaims any obligation to update or revise its forward-looking statements. Many factors could cause actual results to differ materially from these forward-looking statements. Among these factors are risks related to:
| ● | changes in U.S. and international laws, regulations, and policies relating to trade, spending, taxing, banking, monetary, environmental (including climate change and engine emission), and farming policies; |
| ● | political, economic, and social instability of the geographies in which the company operates; |
| ● | wars and other conflicts, including the current conflict between Russia and Ukraine, and natural disasters; |
| ● | adverse macroeconomic conditions, including unemployment, inflation, rising interest rates, changes in consumer practices due to slower economic growth or possible recession, and liquidity constraints; |
| ● | growth and sustainability of non-food uses for crops (including ethanol and biodiesel production); |
| ● | the ability to execute business strategies, including the company’s Smart Industrial operating model, Leap Ambitions, and mergers and acquisitions; |
| ● | the ability to understand and meet its customers’ changing expectations and demand for John Deere products; |
| ● | accurately forecasting customer demand for products and services and adequately managing inventory; |
| ● | changes to governmental communications channels (radio frequency technology); |
| ● | gaps or limitations in rural broadband coverage, capacity, and speed needed to support technology solutions; |
| ● | the company’s ability to adapt in highly competitive markets; |
| ● | dealer practices and their ability to manage distribution of John Deere products and support and service precision technology solutions; |
| ● | changes in climate patterns and unfavorable weather events; |
| ● | higher interest rates and currency fluctuations which could adversely affect the U.S. dollar, customer confidence, access to capital, and demand for our products; |
| ● | changes in the company’s credit ratings, and failure to comply with financial covenants in credit agreements could impact access to funding; |
| ● | availability and price of raw materials, components, and whole goods; |
| ● | delays or disruptions in the company’s supply chain; |
| ● | labor relations and contracts, including work stoppages and other disruptions; |
| ● | the ability to attract, develop, engage, and retain qualified personnel; |
| ● | security breaches, cybersecurity attacks, technology failures, and other disruptions to the information technology infrastructure of the company and its products; |
| ● | loss of or challenges to intellectual property rights; |
| ● | compliance with evolving U.S. and foreign laws, including economic sanctions, data privacy, and environmental laws and regulations; |
| ● | legislation introduced or enacted that could affect the company’s business model and intellectual property, such as so-called right to repair or right to modify legislation; |
| ● | investigations, claims, lawsuits, or other legal proceedings; |
| ● | events that damage the company’s reputation or brand; |
| ● | world grain stocks, available farm acres, soil conditions, harvest yields, prices for commodities and livestock, input costs (e.g., fertilizer), and availability of transport for crops; and |
| ● | housing starts and supply, real estate and housing prices, levels of public and non-residential construction, and infrastructure investment. |
Further information concerning the company and its businesses, including factors that could materially affect the company’s financial results, is included in the company’s other filings with the SEC (including, but not limited to, the factors discussed in Item 1A. “Risk Factors” of our Annual Report on Form 10-K and subsequent Quarterly Reports on Form 10-Q).
9
DEERE & COMPANY
FIRST QUARTER 2023 PRESS RELEASE
(In millions of dollars) Unaudited
|
|
Three Months Ended |
|
||||||
|
|
January 29 |
|
January 30 |
|
% |
|
||
|
|
2023 |
|
2022 |
|
Change |
|
||
Net sales and revenues: |
|
|
|
|
|
|
|
|
|
Production & precision ag net sales |
|
$ |
5,198 |
|
$ |
3,356 |
|
+55 |
|
Small ag & turf net sales |
|
|
3,001 |
|
|
2,631 |
|
+14 |
|
Construction & forestry net sales |
|
|
3,203 |
|
|
2,544 |
|
+26 |
|
Financial services revenues |
|
|
1,040 |
|
|
870 |
|
+20 |
|
Other revenues |
|
|
210 |
|
|
168 |
|
+25 |
|
Total net sales and revenues |
|
$ |
12,652 |
|
$ |
9,569 |
|
+32 |
|
|
|
|
|
|
|
|
|
|
|
Operating profit: * |
|
|
|
|
|
|
|
|
|
Production & precision ag |
|
$ |
1,208 |
|
$ |
296 |
|
+308 |
|
Small ag & turf |
|
|
447 |
|
|
371 |
|
+20 |
|
Construction & forestry |
|
|
625 |
|
|
272 |
|
+130 |
|
Financial services |
|
|
238 |
|
|
296 |
|
-20 |
|
Total operating profit |
|
|
2,518 |
|
|
1,235 |
|
+104 |
|
Reconciling items ** |
|
|
(22) |
|
|
(82) |
|
-73 |
|
Income taxes |
|
|
(537) |
|
|
(250) |
|
+115 |
|
Net income attributable to Deere & Company |
|
$ |
1,959 |
|
$ |
903 |
|
+117 |
|
* Operating profit is income from continuing operations before corporate expenses, certain external interest expense, certain foreign exchange gains and losses, and income taxes. Operating profit of the financial services segment includes the effect of interest expense and foreign exchange gains or losses.
** Reconciling items are primarily corporate expenses, certain external interest expense, certain foreign exchange gains and losses, pension and postretirement benefit costs excluding the service cost component, and net income attributable to noncontrolling interests.
10
DEERE & COMPANY
STATEMENTS OF CONSOLIDATED INCOME
For the Three Months Ended January 29, 2023 and January 30, 2022
(In millions of dollars and shares except per share amounts) Unaudited
|
|
2023 |
|
2022 |
||
Net Sales and Revenues |
|
|
|
|
|
|
Net sales |
|
$ |
11,402 |
|
$ |
8,531 |
Finance and interest income |
|
|
994 |
|
|
800 |
Other income |
|
|
256 |
|
|
238 |
Total |
|
|
12,652 |
|
|
9,569 |
|
|
|
|
|
|
|
Costs and Expenses |
|
|
|
|
|
|
Cost of sales |
|
|
7,934 |
|
|
6,695 |
Research and development expenses |
|
|
495 |
|
|
402 |
Selling, administrative and general expenses |
|
|
952 |
|
|
781 |
Interest expense |
|
|
479 |
|
|
229 |
Other operating expenses |
|
|
299 |
|
|
311 |
Total |
|
|
10,159 |
|
|
8,418 |
|
|
|
|
|
|
|
Income of Consolidated Group before Income Taxes |
|
|
2,493 |
|
|
1,151 |
Provision for income taxes |
|
|
537 |
|
|
250 |
|
|
|
|
|
|
|
Income of Consolidated Group |
|
|
1,956 |
|
|
901 |
Equity in income of unconsolidated affiliates |
|
|
1 |
|
|
3 |
|
|
|
|
|
|
|
Net Income |
|
|
1,957 |
|
|
904 |
Less: Net income (loss) attributable to noncontrolling interests |
|
|
(2) |
|
|
1 |
Net Income Attributable to Deere & Company |
|
$ |
1,959 |
|
$ |
903 |
|
|
|
|
|
|
|
Per Share Data |
|
|
|
|
|
|
Basic |
|
$ |
6.58 |
|
$ |
2.94 |
Diluted |
|
$ |
6.55 |
|
$ |
2.92 |
Dividends declared |
|
$ |
1.20 |
|
$ |
1.05 |
Dividends paid |
|
$ |
1.13 |
|
$ |
1.05 |
|
|
|
|
|
|
|
Average Shares Outstanding |
|
|
|
|
|
|
Basic |
|
|
297.6 |
|
|
307.4 |
Diluted |
|
|
299.1 |
|
|
309.4 |
See Condensed Notes to Interim Consolidated Financial Statements.
11
DEERE & COMPANY
CONDENSED CONSOLIDATED BALANCE SHEETS
(In millions of dollars) Unaudited
|
|
January 29 |
|
October 30 |
|
January 30 |
|||
|
|
2023 |
|
2022 |
|
2022 |
|||
Assets |
|
|
|
|
|
|
|
|
|
Cash and cash equivalents |
|
$ |
3,976 |
|
$ |
4,774 |
|
$ |
4,472 |
Marketable securities |
|
|
852 |
|
|
734 |
|
|
735 |
Trade accounts and notes receivable - net |
|
|
7,609 |
|
|
6,410 |
|
|
4,855 |
Financing receivables - net |
|
|
36,882 |
|
|
36,634 |
|
|
33,191 |
Financing receivables securitized - net |
|
|
5,089 |
|
|
5,936 |
|
|
3,516 |
Other receivables |
|
|
1,992 |
|
|
2,492 |
|
|
1,936 |
Equipment on operating leases - net |
|
|
6,502 |
|
|
6,623 |
|
|
6,624 |
Inventories |
|
|
10,056 |
|
|
8,495 |
|
|
7,935 |
Property and equipment - net |
|
|
6,212 |
|
|
6,056 |
|
|
5,665 |
Goodwill |
|
|
3,891 |
|
|
3,687 |
|
|
3,192 |
Other intangible assets - net |
|
|
1,255 |
|
|
1,218 |
|
|
1,209 |
Retirement benefits |
|
|
3,793 |
|
|
3,730 |
|
|
3,158 |
Deferred income taxes |
|
|
914 |
|
|
824 |
|
|
923 |
Other assets |
|
|
2,597 |
|
|
2,417 |
|
|
2,203 |
Total Assets |
|
$ |
91,620 |
|
$ |
90,030 |
|
$ |
79,614 |
|
|
|
|
|
|
|
|
|
|
Liabilities and Stockholders’ Equity |
|
|
|
|
|
|
|
|
|
|
|
|
|
|
|
|
|
|
|
Liabilities |
|
|
|
|
|
|
|
|
|
Short-term borrowings |
|
$ |
14,129 |
|
$ |
12,592 |
|
$ |
10,990 |
Short-term securitization borrowings |
|
|
4,864 |
|
|
5,711 |
|
|
3,482 |
Accounts payable and accrued expenses |
|
|
13,108 |
|
|
14,822 |
|
|
10,651 |
Deferred income taxes |
|
|
519 |
|
|
495 |
|
|
556 |
Long-term borrowings |
|
|
35,071 |
|
|
33,596 |
|
|
32,838 |
Retirement benefits and other liabilities |
|
|
2,493 |
|
|
2,457 |
|
|
3,289 |
Total liabilities |
|
|
70,184 |
|
|
69,673 |
|
|
61,806 |
|
|
|
|
|
|
|
|
|
|
Redeemable noncontrolling interest |
|
|
100 |
|
|
92 |
|
|
|
|
|
|
|
|
|
|
|
|
|
Stockholders’ Equity |
|
|
|
|
|
|
|
|
|
Total Deere & Company stockholders’ equity |
|
|
21,332 |
|
|
20,262 |
|
|
17,804 |
Noncontrolling interests |
|
|
4 |
|
|
3 |
|
|
4 |
Total stockholders’ equity |
|
|
21,336 |
|
|
20,265 |
|
|
17,808 |
Total Liabilities and Stockholders’ Equity |
|
$ |
91,620 |
|
$ |
90,030 |
|
$ |
79,614 |
See Condensed Notes to Interim Consolidated Financial Statements.
12
DEERE & COMPANY
STATEMENTS OF CONSOLIDATED CASH FLOWS
For the Three Months Ended January 29, 2023 and January 30, 2022
(In millions of dollars) Unaudited
|
|
2023 |
|
2022 |
||
Cash Flows from Operating Activities |
|
|
|
|
|
|
Net income |
|
$ |
1,957 |
|
$ |
904 |
Adjustments to reconcile net income to net cash used for operating activities: |
|
|
|
|
|
|
Provision (credit) for credit losses |
|
|
(130) |
|
|
|
Provision for depreciation and amortization |
|
|
494 |
|
|
486 |
Share-based compensation expense |
|
|
23 |
|
|
18 |
Provision (credit) for deferred income taxes |
|
|
(56) |
|
|
210 |
Changes in assets and liabilities: |
|
|
|
|
|
|
Trade, notes, and financing receivables related to sales |
|
|
(1,015) |
|
|
(106) |
Inventories |
|
|
(1,279) |
|
|
(1,297) |
Accounts payable and accrued expenses |
|
|
(1,577) |
|
|
(1,554) |
Accrued income taxes payable/receivable |
|
|
199 |
|
|
(184) |
Retirement benefits |
|
|
(48) |
|
|
(1,010) |
Other |
|
|
186 |
|
|
(20) |
Net cash used for operating activities |
|
|
(1,246) |
|
|
(2,553) |
|
|
|
|
|
|
|
Cash Flows from Investing Activities |
|
|
|
|
|
|
Collections of receivables (excluding receivables related to sales) |
|
|
7,198 |
|
|
6,435 |
Proceeds from sales of equipment on operating leases |
|
|
497 |
|
|
479 |
Cost of receivables acquired (excluding receivables related to sales) |
|
|
(6,322) |
|
|
(5,603) |
Acquisitions of businesses, net of cash acquired |
|
|
|
|
|
(24) |
Purchases of property and equipment |
|
|
(315) |
|
|
(193) |
Cost of equipment on operating leases acquired |
|
|
(497) |
|
|
(391) |
Collateral on derivatives - net |
|
|
345 |
|
|
(13) |
Other |
|
|
(146) |
|
|
(42) |
Net cash provided by investing activities |
|
|
760 |
|
|
648 |
|
|
|
|
|
|
|
Cash Flows from Financing Activities |
|
|
|
|
|
|
Increase (decrease) in total short-term borrowings |
|
|
697 |
|
|
(1,018) |
Proceeds from long-term borrowings |
|
|
2,505 |
|
|
2,353 |
Payments of long-term borrowings |
|
|
(1,925) |
|
|
(1,940) |
Proceeds from issuance of common stock |
|
|
21 |
|
|
11 |
Repurchases of common stock |
|
|
(1,257) |
|
|
(623) |
Dividends paid |
|
|
(341) |
|
|
(327) |
Other |
|
|
(39) |
|
|
(33) |
Net cash used for financing activities |
|
|
(339) |
|
|
(1,577) |
|
|
|
|
|
|
|
Effect of Exchange Rate Changes on Cash, Cash Equivalents, and Restricted Cash |
|
|
62 |
|
|
(74) |
|
|
|
|
|
|
|
Net Decrease in Cash, Cash Equivalents, and Restricted Cash |
|
|
(763) |
|
|
(3,556) |
Cash, Cash Equivalents, and Restricted Cash at Beginning of Period |
|
|
4,941 |
|
|
8,125 |
Cash, Cash Equivalents, and Restricted Cash at End of Period |
|
$ |
4,178 |
|
$ |
4,569 |
See Condensed Notes to Interim Consolidated Financial Statements.
13
DEERE & COMPANY |
|
Condensed Notes to Interim Consolidated Financial Statements |
|
(In millions of dollars) Unaudited |
|
| (1) | In the first quarter of 2022, the company had a one-time payment related to the ratification of the UAW collective bargaining agreement, totaling $90 million. |
|
|
Production & Precision Ag |
|
Small Ag & Turf |
|
Construction & Forestry |
|
Total |
|
||||
UAW ratification bonus – Cost of sales |
|
$ |
53 |
|
$ |
9 |
|
$ |
28 |
|
$ |
90 |
|
| (2) | The calculation of basic net income per share is based on the average number of shares outstanding. The calculation of diluted net income per share recognizes any dilutive effect of share-based compensation. |
| (3) | The consolidated financial statements represent the consolidation of all Deere & Company’s subsidiaries. The supplemental consolidating data is presented for informational purposes. Transactions between the Equipment Operations and Financial Services have been eliminated to arrive at the consolidated financial statements. In the supplemental consolidating data in Note 4 to the financial statements, the “Equipment Operations” represents the enterprise without “Financial Services”, which include the company’s production and precision agriculture operations, small agriculture and turf operations, and construction and forestry operations, and other corporate assets, liabilities, revenues, and expenses not reflected within “Financial Services.” |
14
DEERE & COMPANY
(4) SUPPLEMENTAL CONSOLIDATING DATA
STATEMENTS OF INCOME
For the Three Months Ended January 29, 2023 and January 30, 2022
(In millions of dollars) Unaudited
|
|
EQUIPMENT |
|
FINANCIAL |
|
|
|
|
|
|
||||||||||||||||
|
|
OPERATIONS |
|
SERVICES |
|
ELIMINATIONS |
|
CONSOLIDATED |
|
|
||||||||||||||||
|
|
2023 |
|
2022 |
|
2023 |
|
2022 |
|
2023 |
|
2022 |
|
2023 |
|
2022 |
|
|
||||||||
Net Sales and Revenues |
|
|
|
|
|
|
|
|
|
|
|
|
|
|
|
|
|
|
|
|
|
|
|
|
|
|
Net sales |
|
$ |
11,402 |
|
$ |
8,531 |
|
|
|
|
|
|
|
|
|
|
|
|
|
$ |
11,402 |
|
$ |
8,531 |
|
|
Finance and interest income |
|
|
114 |
|
|
34 |
|
$ |
1,067 |
|
$ |
829 |
|
$ |
(187) |
|
$ |
(63) |
|
|
994 |
|
|
800 |
1 |
|
Other income |
|
|
234 |
|
|
217 |
|
|
177 |
|
|
87 |
|
|
(155) |
|
|
(66) |
|
|
256 |
|
|
238 |
2, 3 |
|
Total |
|
|
11,750 |
|
|
8,782 |
|
|
1,244 |
|
|
916 |
|
|
(342) |
|
|
(129) |
|
|
12,652 |
|
|
9,569 |
|
|
|
|
|
|
|
|
|
|
|
|
|
|
|
|
|
|
|
|
|
|
|
|
|
|
|
|
|
Costs and Expenses |
|
|
|
|
|
|
|
|
|
|
|
|
|
|
|
|
|
|
|
|
|
|
|
|
|
|
Cost of sales |
|
|
7,940 |
|
|
6,696 |
|
|
|
|
|
|
|
|
(6) |
|
|
(1) |
|
|
7,934 |
|
|
6,695 |
4 |
|
Research and development expenses |
|
|
495 |
|
|
402 |
|
|
|
|
|
|
|
|
|
|
|
|
|
|
495 |
|
|
402 |
|
|
Selling, administrative and general expenses |
|
|
783 |
|
|
657 |
|
|
172 |
|
|
126 |
|
|
(3) |
|
|
(2) |
|
|
952 |
|
|
781 |
4 |
|
Interest expense |
|
|
101 |
|
|
90 |
|
|
442 |
|
|
158 |
|
|
(64) |
|
|
(19) |
|
|
479 |
|
|
229 |
5 |
|
Interest compensation to Financial Services |
|
|
123 |
|
|
44 |
|
|
|
|
|
|
|
|
(123) |
|
|
(44) |
|
|
|
|
|
|
5 |
|
Other operating expenses |
|
|
53 |
|
|
39 |
|
|
392 |
|
|
335 |
|
|
(146) |
|
|
(63) |
|
|
299 |
|
|
311 |
6, 7 |
|
Total |
|
|
9,495 |
|
|
7,928 |
|
|
1,006 |
|
|
619 |
|
|
(342) |
|
|
(129) |
|
|
10,159 |
|
|
8,418 |
|
|
|
|
|
|
|
|
|
|
|
|
|
|
|
|
|
|
|
|
|
|
|
|
|
|
|
|
|
Income before Income Taxes |
|
|
2,255 |
|
|
854 |
|
|
238 |
|
|
297 |
|
|
|
|
|
|
|
|
2,493 |
|
|
1,151 |
|
|
Provision for income taxes |
|
|
483 |
|
|
182 |
|
|
54 |
|
|
68 |
|
|
|
|
|
|
|
|
537 |
|
|
250 |
|
|
|
|
|
|
|
|
|
|
|
|
|
|
|
|
|
|
|
|
|
|
|
|
|
|
|
|
|
Income after Income Taxes |
|
|
1,772 |
|
|
672 |
|
|
184 |
|
|
229 |
|
|
|
|
|
|
|
|
1,956 |
|
|
901 |
|
|
Equity in income of unconsolidated affiliates |
|
|
|
|
|
1 |
|
|
1 |
|
|
2 |
|
|
|
|
|
|
|
|
1 |
|
|
3 |
|
|
|
|
|
|
|
|
|
|
|
|
|
|
|
|
|
|
|
|
|
|
|
|
|
|
|
|
|
Net Income |
|
|
1,772 |
|
|
673 |
|
|
185 |
|
|
231 |
|
|
|
|
|
|
|
|
1,957 |
|
|
904 |
|
|
Less: Net income (loss) attributable to noncontrolling interests |
|
|
(2) |
|
|
1 |
|
|
|
|
|
|
|
|
|
|
|
|
|
|
(2) |
|
|
1 |
|
|
Net Income Attributable to Deere & Company |
|
$ |
1,774 |
|
$ |
672 |
|
$ |
185 |
|
$ |
231 |
|
|
|
|
|
|
|
$ |
1,959 |
|
$ |
903 |
|
|
1 Elimination of Financial Services’ interest income earned from Equipment Operations.
2 Elimination of Equipment Operations’ margin from inventory transferred to equipment on operating leases.
3 Elimination of Financial Services’ income related to intercompany guarantees of investments in certain international markets and intercompany service revenue.
4 Elimination of intercompany service fees.
5 Elimination of Equipment Operations’ interest expense to Financial Services.
6 Elimination of Financial Services’ lease depreciation expense related to inventory transferred to equipment on operating leases.
7 Elimination of Equipment Operations’ expense related to intercompany guarantees of investments in certain international markets and intercompany service expenses.
15
DEERE & COMPANY
SUPPLEMENTAL CONSOLIDATING DATA (Continued)
CONDENSED BALANCE SHEETS
(In millions of dollars) Unaudited
|
|
EQUIPMENT |
|
FINANCIAL |
|
|
|
|
|
|
||||||||||||||||||||||||||||
|
|
OPERATIONS |
|
SERVICES |
|
ELIMINATIONS |
|
CONSOLIDATED |
|
|
||||||||||||||||||||||||||||
|
|
Jan 29 |
|
Oct 30 |
|
Jan 30 |
|
Jan 29 |
|
Oct 30 |
|
Jan 30 |
|
Jan 29 |
|
Oct 30 |
|
Jan 30 |
|
Jan 29 |
|
Oct 30 |
|
Jan 30 |
|
|
||||||||||||
|
|
2023 |
|
2022 |
|
2022 |
|
2023 |
|
2022 |
|
2022 |
|
2023 |
|
2022 |
|
2022 |
|
2023 |
|
2022 |
|
2022 |
|
|
||||||||||||
Assets |
|
|
|
|
|
|
|
|
|
|
|
|
|
|
|
|
|
|
|
|
|
|
|
|
|
|
|
|
|
|
|
|
|
|
|
|
|
|
Cash and cash equivalents |
|
$ |
2,665 |
|
$ |
3,767 |
|
$ |
3,596 |
|
$ |
1,311 |
|
$ |
1,007 |
|
$ |
876 |
|
|
|
|
|
|
|
|
|
|
$ |
3,976 |
|
$ |
4,774 |
|
$ |
4,472 |
|
|
Marketable securities |
|
|
18 |
|
|
61 |
|
|
2 |
|
|
834 |
|
|
673 |
|
|
733 |
|
|
|
|
|
|
|
|
|
|
|
852 |
|
|
734 |
|
|
735 |
|
|
Receivables from Financial Services |
|
|
5,348 |
|
|
6,569 |
|
|
5,307 |
|
|
|
|
|
|
|
|
|
|
$ |
(5,348) |
|
$ |
(6,569) |
|
$ |
(5,307) |
|
|
|
|
|
|
|
|
|
8 |
|
Trade accounts and notes receivable - net |
|
|
1,342 |
|
|
1,273 |
|
|
996 |
|
|
7,827 |
|
|
6,434 |
|
|
4,843 |
|
|
(1,560) |
|
|
(1,297) |
|
|
(984) |
|
|
7,609 |
|
|
6,410 |
|
|
4,855 |
9 |
|
Financing receivables - net |
|
|
51 |
|
|
47 |
|
|
56 |
|
|
36,831 |
|
|
36,587 |
|
|
33,135 |
|
|
|
|
|
|
|
|
|
|
|
36,882 |
|
|
36,634 |
|
|
33,191 |
|
|
Financing receivables securitized - net |
|
|
|
|
|
|
|
|
9 |
|
|
5,089 |
|
|
5,936 |
|
|
3,507 |
|
|
|
|
|
|
|
|
|
|
|
5,089 |
|
|
5,936 |
|
|
3,516 |
|
|
Other receivables |
|
|
1,583 |
|
|
1,670 |
|
|
1,818 |
|
|
489 |
|
|
832 |
|
|
153 |
|
|
(80) |
|
|
(10) |
|
|
(35) |
|
|
1,992 |
|
|
2,492 |
|
|
1,936 |
9 |
|
Equipment on operating leases - net |
|
|
|
|
|
|
|
|
|
|
|
6,502 |
|
|
6,623 |
|
|
6,624 |
|
|
|
|
|
|
|
|
|
|
|
6,502 |
|
|
6,623 |
|
|
6,624 |
|
|
Inventories |
|
|
10,056 |
|
|
8,495 |
|
|
7,935 |
|
|
|
|
|
|
|
|
|
|
|
|
|
|
|
|
|
|
|
|
10,056 |
|
|
8,495 |
|
|
7,935 |
|
|
Property and equipment - net |
|
|
6,178 |
|
|
6,021 |
|
|
5,629 |
|
|
34 |
|
|
35 |
|
|
36 |
|
|
|
|
|
|
|
|
|
|
|
6,212 |
|
|
6,056 |
|
|
5,665 |
|
|
Goodwill |
|
|
3,891 |
|
|
3,687 |
|
|
3,192 |
|
|
|
|
|
|
|
|
|
|
|
|
|
|
|
|
|
|
|
|
3,891 |
|
|
3,687 |
|
|
3,192 |
|
|
Other intangible assets - net |
|
|
1,255 |
|
|
1,218 |
|
|
1,209 |
|
|
|
|
|
|
|
|
|
|
|
|
|
|
|
|
|
|
|
|
1,255 |
|
|
1,218 |
|
|
1,209 |
|
|
Retirement benefits |
|
|
3,728 |
|
|
3,666 |
|
|
3,095 |
|
|
67 |
|
|
66 |
|
|
65 |
|
|
(2) |
|
|
(2) |
|
|
(2) |
|
|
3,793 |
|
|
3,730 |
|
|
3,158 |
10 |
|
Deferred income taxes |
|
|
1,015 |
|
|
940 |
|
|
1,095 |
|
|
53 |
|
|
45 |
|
|
50 |
|
|
(154) |
|
|
(161) |
|
|
(222) |
|
|
914 |
|
|
824 |
|
|
923 |
11 |
|
Other assets |
|
|
1,936 |
|
|
1,794 |
|
|
1,730 |
|
|
684 |
|
|
626 |
|
|
477 |
|
|
(23) |
|
|
(3) |
|
|
(4) |
|
|
2,597 |
|
|
2,417 |
|
|
2,203 |
9 |
|
Total Assets |
|
$ |
39,066 |
|
$ |
39,208 |
|
$ |
35,669 |
|
$ |
59,721 |
|
$ |
58,864 |
|
$ |
50,499 |
|
$ |
(7,167) |
|
$ |
(8,042) |
|
$ |
(6,554) |
|
$ |
91,620 |
|
$ |
90,030 |
|
$ |
79,614 |
|
|
|
|
|
|
|
|
|
|
|
|
|
|
|
|
|
|
|
|
|
|
|
|
|
|
|
|
|
|
|
|
|
|
|
|
|
|
|
|
|
Liabilities and Stockholders’ Equity |
|
|
|
|
|
|
|
|
|
|
|
|
|
|
|
|
|
|
|
|
|
|
|
|
|
|
|
|
|
|
|
|
|
|
|
|
|
|
|
|
|
|
|
|
|
|
|
|
|
|
|
|
|
|
|
|
|
|
|
|
|
|
|
|
|
|
|
|
|
|
|
|
|
|
|
|
|
Liabilities |
|
|
|
|
|
|
|
|
|
|
|
|
|
|
|
|
|
|
|
|
|
|
|
|
|
|
|
|
|
|
|
|
|
|
|
|
|
|
Short-term borrowings |
|
$ |
969 |
|
$ |
1,040 |
|
$ |
1,516 |
|
$ |
13,160 |
|
$ |
11,552 |
|
$ |
9,474 |
|
|
|
|
|
|
|
|
|
|
$ |
14,129 |
|
$ |
12,592 |
|
$ |
10,990 |
|
|
Short-term securitization borrowings |
|
|
|
|
|
|
|
|
8 |
|
|
4,864 |
|
|
5,711 |
|
|
3,474 |
|
|
|
|
|
|
|
|
|
|
|
4,864 |
|
|
5,711 |
|
|
3,482 |
|
|
Payables to Equipment Operations |
|
|
|
|
|
|
|
|
|
|
|
5,348 |
|
|
6,569 |
|
|
5,307 |
|
$ |
(5,348) |
|
$ |
(6,569) |
|
$ |
(5,307) |
|
|
|
|
|
|
|
|
|
8 |
|
Accounts payable and accrued expenses |
|
|
11,819 |
|
|
12,962 |
|
|
9,704 |
|
|
2,952 |
|
|
3,170 |
|
|
1,970 |
|
|
(1,663) |
|
|
(1,310) |
|
|
(1,023) |
|
|
13,108 |
|
|
14,822 |
|
|
10,651 |
9 |
|
Deferred income taxes |
|
|
404 |
|
|
380 |
|
|
425 |
|
|
269 |
|
|
276 |
|
|
353 |
|
|
(154) |
|
|
(161) |
|
|
(222) |
|
|
519 |
|
|
495 |
|
|
556 |
11 |
|
Long-term borrowings |
|
|
8,155 |
|
|
7,917 |
|
|
8,760 |
|
|
26,916 |
|
|
25,679 |
|
|
24,078 |
|
|
|
|
|
|
|
|
|
|
|
35,071 |
|
|
33,596 |
|
|
32,838 |
|
|
Retirement benefits and other liabilities |
|
|
2,384 |
|
|
2,351 |
|
|
3,182 |
|
|
111 |
|
|
108 |
|
|
109 |
|
|
(2) |
|
|
(2) |
|
|
(2) |
|
|
2,493 |
|
|
2,457 |
|
|
3,289 |
10 |
|
Total liabilities |
|
|
23,731 |
|
|
24,650 |
|
|
23,595 |
|
|
53,620 |
|
|
53,065 |
|
|
44,765 |
|
|
(7,167) |
|
|
(8,042) |
|
|
(6,554) |
|
|
70,184 |
|
|
69,673 |
|
|
61,806 |
|
|
|
|
|
|
|
|
|
|
|
|
|
|
|
|
|
|
|
|
|
|
|
|
|
|
|
|
|
|
|
|
|
|
|
|
|
|
|
|
|
Redeemable noncontrolling interest |
|
|
100 |
|
|
92 |
|
|
|
|
|
|
|
|
|
|
|
|
|
|
|
|
|
|
|
|
|
|
|
100 |
|
|
92 |
|
|
|
|
|
|
|
|
|
|
|
|
|
|
|
|
|
|
|
|
|
|
|
|
|
|
|
|
|
|
|
|
|
|
|
|
|
|
|
|
|
|
|
|
Stockholders’ Equity |
|
|
|
|
|
|
|
|
|
|
|
|
|
|
|
|
|
|
|
|
|
|
|
|
|
|
|
|
|
|
|
|
|
|
|
|
|
|
Total Deere & Company stockholders’ equity |
|
|
21,332 |
|
|
20,262 |
|
|
17,804 |
|
|
6,101 |
|
|
5,799 |
|
|
5,734 |
|
|
(6,101) |
|
|
(5,799) |
|
|
(5,734) |
|
|
21,332 |
|
|
20,262 |
|
|
17,804 |
12 |
|
Noncontrolling interests |
|
|
4 |
|
|
3 |
|
|
4 |
|
|
|
|
|
|
|
|
|
|
|
|
|
|
|
|
|
|
|
|
4 |
|
|
3 |
|
|
4 |
|
|
Financial Services equity |
|
|
(6,101) |
|
|
(5,799) |
|
|
(5,734) |
|
|
|
|
|
|
|
|
|
|
|
6,101 |
|
|
5,799 |
|
|
5,734 |
|
|
|
|
|
|
|
|
|
12 |
|
Adjusted total stockholders' equity |
|
|
15,235 |
|
|
14,466 |
|
|
12,074 |
|
|
6,101 |
|
|
5,799 |
|
|
5,734 |
|
|
|
|
|
|
|
|
|
|
|
21,336 |
|
|
20,265 |
|
|
17,808 |
|
|
Total Liabilities and Stockholders’ Equity |
|
$ |
39,066 |
|
$ |
39,208 |
|
$ |
35,669 |
|
$ |
59,721 |
|
$ |
58,864 |
|
$ |
50,499 |
|
$ |
(7,167) |
|
$ |
(8,042) |
|
$ |
(6,554) |
|
$ |
91,620 |
|
$ |
90,030 |
|
$ |
79,614 |
|
|
8 Elimination of receivables / payables between Equipment Operations and Financial Services.
9 Primarily reclassification of sales incentive accruals on receivables sold to Financial Services.
10 Reclassification of net pension assets / liabilities.
11 Reclassification of deferred tax assets / liabilities in the same taxing jurisdictions.
12 Elimination of Financial Services’ equity.
16
DEERE & COMPANY
SUPPLEMENTAL CONSOLIDATING DATA (Continued)
STATEMENTS OF CASH FLOWS
For the Three Months Ended January 29, 2023 and January 30, 2022
(In millions of dollars) Unaudited
|
|
EQUIPMENT |
|
FINANCIAL |
|
|
|
|
|
|
||||||||||||||||
|
|
OPERATIONS |
|
SERVICES |
|
ELIMINATIONS |
|
CONSOLIDATED |
|
|
||||||||||||||||
|
|
2023 |
|
2022 |
|
2023 |
|
2022 |
|
2023 |
|
2022 |
|
2023 |
|
2022 |
|
|
||||||||
Cash Flows from Operating Activities |
|
|
|
|
|
|
|
|
|
|
|
|
|
|
|
|
|
|
|
|
|
|
|
|
|
|
Net income |
|
$ |
1,772 |
|
$ |
673 |
|
$ |
185 |
|
$ |
231 |
|
|
|
|
|
|
|
$ |
1,957 |
|
$ |
904 |
|
|
Adjustments to reconcile net income to net cash provided by (used for) operating activities: |
|
|
|
|
|
|
|
|
|
|
|
|
|
|
|
|
|
|
|
|
|
|
|
|
|
|
Provision (credit) for credit losses |
|
|
1 |
|
|
(2) |
|
|
(131) |
|
|
2 |
|
|
|
|
|
|
|
|
(130) |
|
|
|
|
|
Provision for depreciation and amortization |
|
|
279 |
|
|
257 |
|
|
252 |
|
|
266 |
|
$ |
(37) |
|
$ |
(37) |
|
|
494 |
|
|
486 |
13 |
|
Share-based compensation expense |
|
|
|
|
|
|
|
|
|
|
|
|
|
|
23 |
|
|
18 |
|
|
23 |
|
|
18 |
14 |
|
Distributed earnings of Financial Services |
|
|
3 |
|
|
42 |
|
|
|
|
|
|
|
|
(3) |
|
|
(42) |
|
|
|
|
|
|
15 |
|
Provision (credit) for deferred income taxes |
|
|
(39) |
|
|
223 |
|
|
(17) |
|
|
(13) |
|
|
|
|
|
|
|
|
(56) |
|
|
210 |
|
|
Changes in assets and liabilities: |
|
|
|
|
|
|
|
|
|
|
|
|
|
|
|
|
|
|
|
|
|
|
|
|
|
|
Trade, notes, and financing receivables related to sales |
|
|
(23) |
|
|
158 |
|
|
|
|
|
|
|
|
(992) |
|
|
(264) |
|
|
(1,015) |
|
|
(106) |
16, 18, 19 |
|
Inventories |
|
|
(1,254) |
|
|
(1,277) |
|
|
|
|
|
|
|
|
(25) |
|
|
(20) |
|
|
(1,279) |
|
|
(1,297) |
17 |
|
Accounts payable and accrued expenses |
|
|
(1,458) |
|
|
(1,346) |
|
|
145 |
|
|
(66) |
|
|
(264) |
|
|
(142) |
|
|
(1,577) |
|
|
(1,554) |
18 |
|
Accrued income taxes payable/receivable |
|
|
192 |
|
|
(192) |
|
|
7 |
|
|
8 |
|
|
|
|
|
|
|
|
199 |
|
|
(184) |
|
|
Retirement benefits |
|
|
(49) |
|
|
(1,012) |
|
|
1 |
|
|
2 |
|
|
|
|
|
|
|
|
(48) |
|
|
(1,010) |
|
|
Other |
|
|
17 |
|
|
(12) |
|
|
163 |
|
|
(19) |
|
|
6 |
|
|
11 |
|
|
186 |
|
|
(20) |
13, 14, 17 |
|
Net cash provided by (used for) operating activities |
|
|
(559) |
|
|
(2,488) |
|
|
605 |
|
|
411 |
|
|
(1,292) |
|
|
(476) |
|
|
(1,246) |
|
|
(2,553) |
|
|
|
|
|
|
|
|
|
|
|
|
|
|
|
|
|
|
|
|
|
|
|
|
|
|
|
|
|
Cash Flows from Investing Activities |
|
|
|
|
|
|
|
|
|
|
|
|
|
|
|
|
|
|
|
|
|
|
|
|
|
|
Collections of receivables (excluding receivables related to sales) |
|
|
|
|
|
|
|
|
7,495 |
|
|
6,845 |
|
|
(297) |
|
|
(410) |
|
|
7,198 |
|
|
6,435 |
16 |
|
Proceeds from sales of equipment on operating leases |
|
|
|
|
|
|
|
|
497 |
|
|
479 |
|
|
|
|
|
|
|
|
497 |
|
|
479 |
|
|
Cost of receivables acquired (excluding receivables related to sales) |
|
|
|
|
|
|
|
|
(6,375) |
|
|
(5,719) |
|
|
53 |
|
|
116 |
|
|
(6,322) |
|
|
(5,603) |
16 |
|
Acquisitions of businesses, net of cash acquired |
|
|
|
|
|
(24) |
|
|
|
|
|
|
|
|
|
|
|
|
|
|
|
|
|
(24) |
|
|
Purchases of property and equipment |
|
|
(315) |
|
|
(193) |
|
|
|
|
|
|
|
|
|
|
|
|
|
|
(315) |
|
|
(193) |
|
|
Cost of equipment on operating leases acquired |
|
|
|
|
|
|
|
|
(531) |
|
|
(419) |
|
|
34 |
|
|
28 |
|
|
(497) |
|
|
(391) |
17 |
|
Increase in trade and wholesale receivables |
|
|
|
|
|
|
|
|
(1,499) |
|
|
(684) |
|
|
1,499 |
|
|
684 |
|
|
|
|
|
|
16 |
|
Collateral on derivatives - net |
|
|
|
|
|
4 |
|
|
345 |
|
|
(17) |
|
|
|
|
|
|
|
|
345 |
|
|
(13) |
|
|
Other |
|
|
(9) |
|
|
(22) |
|
|
(137) |
|
|
(36) |
|
|
|
|
|
16 |
|
|
(146) |
|
|
(42) |
19 |
|
Net cash provided by (used for) investing activities |
|
|
(324) |
|
|
(235) |
|
|
(205) |
|
|
449 |
|
|
1,289 |
|
|
434 |
|
|
760 |
|
|
648 |
|
|
|
|
|
|
|
|
|
|
|
|
|
|
|
|
|
|
|
|
|
|
|
|
|
|
|
|
|
Cash Flows from Financing Activities |
|
|
|
|
|
|
|
|
|
|
|
|
|
|
|
|
|
|
|
|
|
|
|
|
|
|
Increase (decrease) in total short-term borrowings |
|
|
(136) |
|
|
123 |
|
|
833 |
|
|
(1,141) |
|
|
|
|
|
|
|
|
697 |
|
|
(1,018) |
|
|
Change in intercompany receivables/payables |
|
|
1,469 |
|
|
150 |
|
|
(1,469) |
|
|
(150) |
|
|
|
|
|
|
|
|
|
|
|
|
|
|
Proceeds from long-term borrowings |
|
|
1 |
|
|
18 |
|
|
2,504 |
|
|
2,335 |
|
|
|
|
|
|
|
|
2,505 |
|
|
2,353 |
|
|
Payments of long-term borrowings |
|
|
|
|
|
(124) |
|
|
(1,925) |
|
|
(1,816) |
|
|
|
|
|
|
|
|
(1,925) |
|
|
(1,940) |
|
|
Proceeds from issuance of common stock |
|
|
21 |
|
|
11 |
|
|
|
|
|
|
|
|
|
|
|
|
|
|
21 |
|
|
11 |
|
|
Repurchases of common stock |
|
|
(1,257) |
|
|
(623) |
|
|
|
|
|
|
|
|
|
|
|
|
|
|
(1,257) |
|
|
(623) |
|
|
Dividends paid |
|
|
(341) |
|
|
(327) |
|
|
(3) |
|
|
(42) |
|
|
3 |
|
|
42 |
|
|
(341) |
|
|
(327) |
15 |
|
Other |
|
|
(27) |
|
|
(22) |
|
|
(12) |
|
|
(11) |
|
|
|
|
|
|
|
|
(39) |
|
|
(33) |
|
|
Net cash used for financing activities |
|
|
(270) |
|
|
(794) |
|
|
(72) |
|
|
(825) |
|
|
3 |
|
|
42 |
|
|
(339) |
|
|
(1,577) |
|
|
|
|
|
|
|
|
|
|
|
|
|
|
|
|
|
|
|
|
|
|
|
|
|
|
|
|
|
Effect of Exchange Rate Changes on Cash, Cash Equivalents, and Restricted Cash |
|
|
48 |
|
|
(75) |
|
|
14 |
|
|
1 |
|
|
|
|
|
|
|
|
62 |
|
|
(74) |
|
|
|
|
|
|
|
|
|
|
|
|
|
|
|
|
|
|
|
|
|
|
|
|
|
|
|
|
|
Net Increase (Decrease) in Cash, Cash Equivalents, and Restricted Cash |
|
|
(1,105) |
|
|
(3,592) |
|
|
342 |
|
|
36 |
|
|
|
|
|
|
|
|
(763) |
|
|
(3,556) |
|
|
Cash, Cash Equivalents, and Restricted Cash at Beginning of Period |
|
|
3,781 |
|
|
7,200 |
|
|
1,160 |
|
|
925 |
|
|
|
|
|
|
|
|
4,941 |
|
|
8,125 |
|
|
Cash, Cash Equivalents, and Restricted Cash at End of Period |
|
$ |
2,676 |
|
$ |
3,608 |
|
$ |
1,502 |
|
$ |
961 |
|
|
|
|
|
|
|
$ |
4,178 |
|
$ |
4,569 |
|
|
13 Elimination of depreciation on leases related to inventory transferred to equipment on operating leases.
14 Reclassification of share-based compensation expense.
15 Elimination of dividends from Financial Services to the Equipment Operations, which are included in the Equipment Operations operating activities.
16 Primarily reclassification of receivables related to the sale of equipment.
17 Reclassification of direct lease agreements with retail customers.
18 Reclassification of sales incentive accruals on receivables sold to Financial Services.
19 Elimination and reclassification of the effects of Financial Services partial financing of the construction and forestry retail locations sales and subsequent collection of those amounts.
17
Exhibit 99.2
(Furnished herewith)
DEERE & COMPANY
OTHER FINANCIAL INFORMATION
The company evaluates its business results on the basis of accounting principles generally accepted in the United States. In addition, it uses a metric referred to as Shareholder Value Added (SVA), which management believes is an appropriate measure for the performance of its businesses. SVA is, in effect, the pretax profit left over after subtracting the cost of enterprise capital. The company is aiming for a sustained creation of SVA and is using this metric for various performance goals. Certain compensation is also determined on the basis of performance using this measure. For purposes of determining SVA, each of the equipment segments is assessed a pretax cost of assets, which on an annual basis is approximately 12 percent of the segment’s average identifiable operating assets during the applicable period with inventory at standard cost. Management believes that valuing inventories at standard cost more closely approximates the current cost of inventory and the company’s investment in the asset. The Financial Services segment is assessed an annual pretax cost of approximately 13 percent of the segment's average equity. The cost of assets or equity, as applicable, is deducted from the operating profit or added to the operating loss of each segment to determine the amount of SVA.
|
|
Equipment |
Production & |
Small Ag |
Construction |
||||||||||||||||||||
For the Three Months Ended |
|
Operations |
Precision Ag |
& Turf |
& Forestry |
||||||||||||||||||||
|
|
Jan 29 |
|
Jan 30 |
|
Jan 29 |
|
Jan 30 |
|
Jan 29 |
|
Jan 30 |
|
Jan 29 |
|
Jan 30 |
|
||||||||
Dollars in millions |
|
2023 |
|
2022 |
|
2023 |
|
2022 |
|
2023 |
|
2022 |
|
2023 |
|
2022 |
|
||||||||
Net Sales |
|
$ |
11,402 |
|
$ |
8,531 |
|
$ |
5,198 |
|
$ |
3,356 |
|
$ |
3,001 |
|
$ |
2,631 |
|
$ |
3,203 |
|
$ |
2,544 |
|
Average Identifiable Assets |
|
|
|
|
|
|
|
|
|
|
|
|
|
|
|
|
|
|
|
|
|
|
|
|
|
With Inventories at LIFO |
|
$ |
20,929 |
|
$ |
18,009 |
|
$ |
9,074 |
|
$ |
7,430 |
|
$ |
4,744 |
|
$ |
4,190 |
|
$ |
7,111 |
|
$ |
6,389 |
|
With Inventories at Standard Cost |
|
|
22,976 |
|
|
19,614 |
|
|
10,138 |
|
|
8,234 |
|
|
5,288 |
|
|
4,654 |
|
|
7,550 |
|
|
6,726 |
|
Operating Profit |
|
$ |
2,280 |
|
$ |
939 |
|
$ |
1,208 |
|
$ |
296 |
|
$ |
447 |
|
$ |
371 |
|
$ |
625 |
|
$ |
272 |
|
Percent of Net Sales |
|
|
20.0 |
% |
|
11.0 |
% |
|
23.2 |
% |
|
8.8 |
% |
|
14.9 |
% |
|
14.1 |
% |
|
19.5 |
% |
|
10.7 |
% |
Operating Return on Assets |
|
|
|
|
|
|
|
|
|
|
|
|
|
|
|
|
|
|
|
|
|
|
|
|
|
With Inventories at LIFO |
|
|
10.9 |
% |
|
5.2 |
% |
|
13.3 |
% |
|
4.0 |
% |
|
9.4 |
% |
|
8.9 |
% |
|
8.8 |
% |
|
4.3 |
% |
With Inventories at Standard Cost |
|
|
9.9 |
% |
|
4.8 |
% |
|
11.9 |
% |
|
3.6 |
% |
|
8.5 |
% |
|
8.0 |
% |
|
8.3 |
% |
|
4.0 |
% |
SVA Cost of Assets |
|
$ |
(689) |
|
$ |
(589) |
|
$ |
(304) |
|
$ |
(248) |
|
$ |
(159) |
|
$ |
(139) |
|
$ |
(226) |
|
$ |
(202) |
|
SVA |
|
|
1,591 |
|
|
350 |
|
|
904 |
|
|
48 |
|
|
288 |
|
|
232 |
|
|
399 |
|
|
70 |
|
|
|
|
|
|
|
|
|
|
|
|
|
|
|
|
|
|
|
|
|
|
|
|
|
|
|
|
|
Financial |
|
|
|
|
|
|
|
|
|
|
|
|
|
|
|
|
|
|
|||||
For the Three Months Ended |
|
Services |
|
|
|
|
|
|
|
|
|
|
|
|
|
|
|
|
|
|
|||||
|
|
Jan 29 |
|
Jan 30 |
|
|
|
|
|
|
|
|
|
|
|
|
|
|
|
|
|
|
|
||
Dollars in millions |
|
2023 |
|
2022 |
|
|
|
|
|
|
|
|
|
|
|
|
|
|
|
|
|
|
|
||
Net Income Attributable to Deere & Company |
|
$ |
185 |
|
$ |
231 |
|
|
|
|
|
|
|
|
|
|
|
|
|
|
|
|
|
|
|
Average Equity |
|
|
5,948 |
|
|
5,644 |
|
|
|
|
|
|
|
|
|
|
|
|
|
|
|
|
|
|
|
Return on Equity |
|
|
3.1 |
% |
|
4.1 |
% |
|
|
|
|
|
|
|
|
|
|
|
|
|
|
|
|
|
|
Operating Profit |
|
$ |
238 |
|
$ |
296 |
|
|
|
|
|
|
|
|
|
|
|
|
|
|
|
|
|
|
|
Cost of Equity |
|
|
(192) |
|
|
(180) |
|
|
|
|
|
|
|
|
|
|
|
|
|
|
|
|
|
|
|
SVA |
|
|
46 |
|
|
116 |
|
|
|
|
|
|
|
|
|
|
|
|
|
|
|
|
|
|
|
|
|
|
|
|
|
|
|
|
|
|
|
|
|
|
|
|
|
|
|
|
|
|
|
|
|
18
|
1Q 2023 Earnings Call 17 February 2023 19 Exhibit 99.3 (Furnished herewith) |
|
2 John Deere | 1Q 2023 Earnings Call | February 17, 2023 Safe Harbor Statement and Disclosures The earnings call and accompanying material include “forward-looking statements” within the meaning of the Safe Harbor Provisions of the U.S. Private Securities Litigation Reform Act of 1995 and concern the company’s plans and projections for the future, including estimates and assumptions with respect to economic, political, technological, weather, market acceptance, acquisitions and divestitures of businesses, anticipated transaction costs, the integration of new businesses, anticipated benefits of acquisitions, and other factors that impact our businesses and customers. They also may include financial measures that are not in conformance with accounting principles generally accepted in the United States of America (GAAP). Words such as “forecast,” “guidance,” “projection,” “outlook,” “prospects,” “expected,” “estimated,” “will,” “plan,” “anticipate,” “intend,” “believe,” “likely,” “future,” “may,” or other similar words or phrases often identify forward-looking statements. Actual results may differ materially from those projected in these forward-looking statements based on a number of factors and uncertainties, including those related to the conflict between Russia and Ukraine. Additional information concerning factors that could cause actual results to differ materially is contained in the company’s most recent annual report on Form 10-K and other filings with the U.S. Securities and Exchange Commission, and is incorporated by reference herein. Investors should refer to and consider the incorporated information on risks and uncertainties in addition to the information presented here. The company, except as required by law, undertakes no obligation to update or revise its forward-looking statements whether as a result of new developments or otherwise. The call and accompanying materials are not an offer to sell or a solicitation of offers to buy any of the company’s securities. 20 |
|
3 John Deere | 1Q 2023 Earnings Call | February 17, 2023 1Q 2023 Results ($ millions except where noted) $9,569 $12,652 1Q 2022 1Q 2023 $8,531 $11,402 1Q 2022 1Q 2023 $903 $1,959 1Q 2022 1Q 2023 $2.92 $6.55 1Q 2022 1Q 2023 34% Net Sales and Revenues Net Sales (Equipment Operations) Net Income (attributable to Deere & Company) Diluted EPS ($ per share) 32% 117% 124% 21 |
|
4 John Deere | 1Q 2023 Earnings Call | February 17, 2023 Production and Precision Ag 1Q 2023 Results $ in millions $3,356 $5,198 1Q 2022 1Q 2023 Net Sales 55% Operating Profit Comparison $1,208 $613 $53 ($51) $296 $741 ($46) ($15) ($256) ($127) 1Q 2022 Volume/ Mix Price Currency Warranty Production Costs SA&G/ R&D Special Items Other 1Q 2023 22 |
|
5 John Deere | 1Q 2023 Earnings Call | February 17, 2023 Small Ag and Turf 1Q 2023 Results $ in millions $2,631 $3,001 1Q 2022 1Q 2023 Net Sales 14% Operating Profit Comparison $447 $64 $9 ($44) $371 $300 ($18) ($1) ($185) ($49) 1Q 2022 Volume/ Mix Price Currency Warranty Production Costs SA&G/ R&D Special Items Other 1Q 2023 23 |
|
6 John Deere | 1Q 2023 Earnings Call | February 17, 2023 Ag and Turf Industry Outlook (in units) – FY 2023 Source: Deere & Company forecast as of 17 February 2023 U.S. and CANADA LARGE AG 5-10% EUROPE AG Flat to up 5% SOUTH AMERICA AG (tractors and combines) Flat to up 5% U.S. and CANADA SMALL AG and TURF Down ~5% ASIA AG Down moderately 24 |
|
7 John Deere | 1Q 2023 Earnings Call | February 17, 2023 Production and Precision Ag Business Segment Outlook Source: Deere & Company forecast as of 17 February 2023 19.9% FY 2022 FY 2023 Fcst $22,002 FY 2022 FY 2023 Fcst Net Sales 23.5-24.5% Operating Margin ~20% 25 |
|
8 John Deere | 1Q 2023 Earnings Call | February 17, 2023 $13,381 FY 2022 FY 2023 Fcst Small Ag and Turf Business Segment Outlook Source: Deere & Company forecast as of 17 February 2023 14.6% FY 2022 Fcst FY 2023 Fcst Flat to up 5% 14.5-15.5% Net Sales Operating Margin 26 |
|
9 John Deere | 1Q 2023 Earnings Call | February 17, 2023 Construction and Forestry 1Q 2023 Results $ in millions $2,544 $3,203 1Q 2022 1Q 2023 Net Sales 26% Operating Profit Comparison $625 $148 ($2) ($187) ($24) $28 $272 $343 $27 $20 1Q 2022 Volume/ Mix Price Currency Warranty Production Costs SA&G/ R&D Special Items Other 1Q 2023 27 |
|
10 John Deere | 1Q 2023 Earnings Call | February 17, 2023 Construction and Forestry Industry Outlook (in units) – FY 2023 Source: Deere & Company forecast as of 17 February 2023 NORTH AMERICA COMPACT CONSTRUCTION EQUIPMENT Flat to up 5% GLOBAL FORESTRY Flat NORTH AMERICA CONSTRUCTION EQUIPMENT Flat to up 5% GLOBAL ROADBUILDING Flat 28 |
|
11 John Deere | 1Q 2023 Earnings Call | February 17, 2023 Construction and Forestry Business Segment Outlook Source: Deere & Company forecast as of 17 February 2023 16.1% FY 2022 FY 2023 Fcst $12,534 FY 2022 FY 2023 Fcst 17-18% 10-15% Net Sales Operating Margin 29 |
|
12 John Deere | 1Q 2023 Earnings Call | February 17, 2023 Financial Services Net Income – Results and Outlook Source: Deere & Company forecast as of 17 February 2023 $231 $185 1Q 2022 1Q 2023 Quarter Results Fiscal Year Outlook $880 $820 FY 2022 FY 2023 Fcst ~ 30 |
|
13 John Deere | 1Q 2023 Earnings Call | February 17, 2023 Deere & Company Outlook Effective Tax Rate* Net Income (attributable to Deere & Co.) $8.75-9.25B 23-25% FY 2023 FORECAST Net Operating Cash Flow* $9.25-9.75B *Equipment Operations Source: Deere & Company forecast as of 17 February 2023 31 |
|
14 John Deere | 1Q 2023 Earnings Call | February 17, 2023 Appendix 32 |
|
15 John Deere | 1Q 2023 Earnings Call | February 17, 2023 ($ millions) 1Q 2023 FY 2023 Forecast Cost of Sales (percent of Net Sales) 70% ~69% Selling, Administrative and General Expenses 19% ~16% Research and Development Expenses 23% ~14% Capital Expenditures ~ $1,400 Pension/OPEB Expenses ~ $220 Pension/OPEB Contributions ~ $200 Other Financial Information Equipment Operations Source: Deere & Company forecast as of 17 February 2023 33 |
|
16 John Deere | 1Q 2023 Earnings Call | February 17, 2023 January 2023 Retail Sales (Rolling 3 Months) and Dealer Inventories Retail Sales U.S. and Canada Ag Industry* Deere** 2WD Tractors (< 40 PTO hp) 25% More than the industry 2WD Tractors (40 < 100 PTO hp) 9% In line with the industry 2WD Tractors (100+ PTO hp) 4% More than the industry 4WD Tractors 26% More than the industry Combines 37% More than the industry Deere Dealer Inventories*** U.S. and Canada Ag 2023 2022 2WD Tractors (100+ PTO hp) 25% 15% Combines 16% 7% * As reported by the Association of Equipment Manufacturers ** As reported to the Association of Equipment Manufacturers *** In units as a % of trailing 12 months retail sales, as reported to the Association of Equipment Manufacturers 34 |
|
17 John Deere | 1Q 2023 Earnings Call | February 17, 2023 Retail Sales U.S. and Canada Deere* Selected Turf and Utility Equipment High single digit Construction and Forestry First-in-the-Dirt Settlements Double digits Double digits January 2023 Retail Sales (Rolling 3 Months) Retail Sales Europe Ag Deere* Tractors Single digit Combines Double digits * Based on internal sales reports 35 |
|
18 John Deere | 1Q 2023 Earnings Call | February 17, 2023 Deere Use-of-Cash Priorities SHARE REPURCHASE Manage the balance sheet, including liquidity, to support a rating that provides access to low-cost and readily available short- and long-term funding mechanisms (reflects the strategic nature of our financial services operation) Fund value-creating investments in our businesses Consistently and moderately raise dividend targeting a 25-35% payout ratio of mid-cycle earnings Consider share repurchase as a means to deploy excess cash to shareholders, once above requirements are met COMMITTED TO “A” RATING FUND OPERATING & GROWTH NEEDS COMMON STOCK DIVIDEND CASH FROM OPERATIONS 36 |
|
19 John Deere | 1Q 2023 Earnings Call | February 17, 2023 Sustainability We’re running for a world where people and planet prosper. View the 2022 Sustainability Report at: https://www.deere.com/en/our-company/sustainability/ 37 |
|
20 John Deere | 1Q 2023 Earnings Call | February 17, 2023 Deere & Company’s 2Q 2023 earnings call is scheduled for 9:00 a.m. Central Time on Friday, 19 May 2023. 38 |
|
39 |