UNITED STATES
SECURITIES AND EXCHANGE COMMISSION
Washington, D.C. 20549
FORM 8-K
CURRENT REPORT
Pursuant to Section 13 or 15(d)
of The Securities Exchange Act of 1934
Date of Report (Date of earliest event reported): Februrary 8, 2023
Trinseo PLC
(Exact name of registrant as specified in its charter)
Ireland |
|
001-36473 |
|
N/A |
(State or other jurisdiction |
|
(Commission |
|
(I.R.S. Employer |
440 East Swedesford Road, Suite 301
Wayne, Pennsylvania 19087
(Address of principal executive offices, including zip code)
(610) 240-3200
(Telephone number, including area code)
Check the appropriate box below if the Form 8-K filing is intended to simultaneously satisfy the filing obligation of the registrant under any of the following provisions (see General Instruction A.2. below):
☐ |
Written communications pursuant to Rule 425 under the Securities Act (17 CFR 230.425) |
☐ |
Soliciting material pursuant to Rule 14a-12 under the Exchange Act (17 CFR 240.14a-12) |
☐ |
Pre-commencement communications pursuant to Rule 14d-2(b) under the Exchange Act (17 CFR 240.14d-2(b)) |
☐ |
Pre-commencement communications pursuant to Rule 13e-4(c) under the Exchange Act (17 CFR 240.13e-4(c)) |
Securities registered pursuant to Section 12(b) of the Act:
Title of Each Class |
Trading symbol |
Name of Exchange on which registered |
Ordinary Shares, par value $0.01 per share |
TSE |
New York Stock Exchange |
Indicate by check mark whether the registrant is an emerging growth company as defined in Rule 405 of the Securities Act of 1933 (§230.405 of this chapter) or Rule 12b-2 of the Securities Exchange Act of 1934 (§240.12b-2 of this chapter).
Emerging growth company ☐
If an emerging growth company, indicate by check mark if the registrant has elected not to use the extended transition period for complying with any new or revised financial accounting standards provided pursuant to Section 13(a) of the Exchange Act. ☐
ITEM 2.02 |
Results of Operations and Financial Condition |
On February 8, 2023, Trinseo PLC, a public limited company existing under the laws of Ireland (the “Company”), issued a press release announcing its financial results for the fourth quarter and year ended December 31, 2022. A copy of the press release is furnished as Exhibit 99.1 hereto. The Company intends to hold an investor call and webcast to discuss these results on Thursday, February 9, 2023 at 10 AM Eastern Time. Ahead of this call the Company is also making available on its website an investor presentation, which will be discussed on the call and is furnished as Exhibit 99.2 hereto.
The information contained herein and in the accompanying exhibits shall not be deemed filed for the purposes of Section 18 of the Securities Exchange Act of 1934, as amended, or otherwise subject to the liability of that section, nor shall it be deemed incorporated by reference in any filing under the Securities Act of 1933, as amended, except as shall be expressly set forth by specific reference in such a filing.
ITEM 9.01. |
Financial Statements and Exhibits |
(d) Exhibits
Exhibit |
|
Description |
99.1 |
|
|
99.2 |
|
|
104 |
|
Cover Page Interactive Data File (formatted in Inline XBRL and contained in Exhibit 101) |
SIGNATURES
Pursuant to the requirements of the Securities Exchange Act of 1934, each registrant has duly caused this report to be signed on its behalf by the undersigned hereunto duly authorized.
|
|
TRINSEO PLC |
|
|
|
|
|
|
|
|
|
|
|
By: |
/s/ David Stasse |
|
|
Name: |
David Stasse |
|
|
Title: |
Executive Vice President and Chief Financial Officer |
|
|
|
|
|
Date: Februrary 8, 2023 |
|
|
|
Exhibit 99.1

Contact: | ||
Andy Myers | ||
Tel : +1 610-240-3221 | ||
Email: aemyers@trinseo.com |
Trinseo Reports Fourth Quarter and Full-Year 2022 Financial Results; Provides Full-Year 2023 Guidance
Full-Year 2022 Summary
● |
Net loss from continuing operations of $428 million and diluted EPS from continuing operations of negative $11.91 |
● |
Adjusted EBITDA* of $312 million, including a $21 million favorable impact from net timing, and Adjusted EPS* of negative $0.48 |
● |
Cash from operations of $44 million and capital expenditures of $149 million resulted in Free Cash Flow* of negative $105 million |
| ● | Sales volume and variable margin of products containing recycled materials increased 63% and 69% respectively versus prior year; in 2022 these products represented 1% and 3% of total company sales volume and variable margin, respectively |
Fourth Quarter 2022 Highlights
● |
Net loss from continuing operations of $364 million and diluted EPS from continuing operations of negative $10.42 |
| ● | Adjusted EBITDA* of $6 million, including a $19 million unfavorable impact from net timing and a $15 million negative impact from natural gas hedges established in the second half of the year, and Adjusted Net Loss* of $60 million |
● |
Cash provided by operations of $34 million and capital expenditures of $54 million resulted in Free Cash Flow* of negative $20 million with an $88 million working capital release; results included a $34 million payment for settlement of the European Commission’s 2018 investigation of the Company’s styrene purchasing practices in Europe |
● |
Fourth quarter ending cash of $212 million with approximately $505 million† of additional available liquidity under two undrawn, committed financing facilities |
| ● | Began implementing previously announced asset restructuring initiatives including the closure of the Boehlen, Germany styrene plant and one line at the Stade, Germany polycarbonate plant; expected to result in a $60 million profitability improvement in comparison to the fourth quarter run rate |
|
|
Three Months Ended |
|
Year Ended |
||||||||
|
|
December 31, |
|
December 31, |
||||||||
$millions, except per share data |
|
2022 |
|
2021 |
|
2022 |
|
2021 |
||||
Net Sales |
|
$ |
975 |
|
$ |
1,298 |
|
$ |
4,966 |
|
$ |
4,827 |
Net Income (Loss) from continuing operations |
|
|
(364) |
|
|
1 |
|
|
(428) |
|
|
280 |
Diluted EPS from continuing operations ($) |
|
|
(10.42) |
|
|
0.04 |
|
|
(11.91) |
|
|
7.07 |
Adjusted Net Income (Loss)* |
|
|
(60) |
|
|
33 |
|
|
(17) |
|
|
382 |
Adjusted EPS ($)* |
|
|
(1.72) |
|
|
0.83 |
|
|
(0.48) |
|
|
9.65 |
EBITDA* |
|
|
(322) |
|
|
103 |
|
|
(120) |
|
|
597 |
Adjusted EBITDA* |
|
|
6 |
|
|
133 |
|
|
312 |
|
|
729 |
*For a reconciliation of EBITDA, Adjusted EBITDA, and Adjusted Net Income (Loss), all of which are non-GAAP measures, to Net Income (Loss), as well as a reconciliation of Free Cash Flow and Adjusted EPS, see Notes 2 and 3 to the financial statements included below.
†This amount varies from the Company’s available liquidity stated in its press release announcing preliminary fourth quarter 2022 results, dated January 26, 2023, based on the completion of financial covenant calculations under its debt agreements. The Company had $354.7 million available under its revolving credit facility at the end of fourth quarter 2022 and expects availability under such facility to be approximately $102 million at the end of the first quarter 2023.
WAYNE, Pa — February 8, 2023 — Trinseo (NYSE: TSE), a specialty material solutions provider, today reported its fourth quarter and full-year 2022 financial results. Net sales in the fourth quarter decreased 25% versus prior year due mostly to lower sales volume across all reporting segments caused by continued customer destocking exacerbated by extended year-end shutdowns at many customer sites, Covid-19 impacts in China, and underlying demand weakness stemming from an uncertain economic and geopolitical macroenvironment. Additionally, elevated energy prices in Europe, weak demand in China and easing shipping constraints created a temporary arbitrage window for lower-cost imports from Asia into Europe. This negatively impacted volumes and created margin pressure for globally traded products such as ABS, polycarbonate, MMA and PMMA sheets.
Fourth quarter net loss from continuing operations of $364 million was $365 million below prior year and Adjusted EBITDA of $6 million was $127 million below prior year. Net loss included a non-cash impairment charge of $297 million related to the PMMA business and Aristech Surfaces reporting units goodwill balances. Additional variances were mainly from lower volume and margin caused by weak underlying demand, customer destocking and increased imports from Asia. Results also included a $26 million unfavorable net timing variance as well as a $15 million unfavorable impact from natural gas hedging.
Net sales in the full year increased 3% versus prior year. Higher prices from the passthrough of higher input costs resulted in an 11% increase which was more than offset by a 13% decrease caused by lower volumes, mostly in the second half of the year. Sales grew 8% from portfolio additions including four additional months of the PMMA business and eight additional months of Aristech Surfaces.
Full-year net loss from continuing operations of $428 million, including the fourth quarter non-cash impairment charge of $297 million, was $708 million below prior year and full-year Adjusted EBITDA of $312 million was $417 million below prior year. Significantly elevated energy costs along with the geopolitical conflict in Europe, Covid-19 shutdowns in China and a rapid rise in interest rates in an inflationary environment all combined to adversely impact volume and margin across most products.
Commenting on the Company’s fourth quarter performance, Frank Bozich, President and Chief Executive Officer of Trinseo, said, “During the fourth quarter we observed a similar sequential operating environment including lower global demand and elevated natural gas prices in Europe. However, our results improved sequentially as we made proactive operating decisions that will continue to reduce our exposure to cyclical commodity markets. I want to commend our employees for navigating these challenging business conditions while delivering another exemplary year of EH&S performance as well as staying focused on our growth programs including those in specialty applications and products containing recycled materials.”
Fourth Quarter Results and Commentary by Business Segment
| ● | Engineered Materials net sales of $205 million for the quarter decreased 26% versus prior year and Adjusted EBITDA of negative $5 million was $31 million lower than prior year. Sales volume was lower across all products due to weak underlying demand and continued customer destocking, particularly in building & construction, consumer electronics and wellness applications. In addition, both volume and margins were pressured as elevated natural gas and ammonia prices in Europe and low demand in China created a temporary arbitrage window for lower-cost, standard-grade products from Asia to be more heavily imported into Europe and North America. This predominantly impacted the non-formulated products in the product portfolio including MMA and PMMA sheets. Margins were also negatively impacted by natural gas hedges which led to a $10 million headwind. The integration and synergy realization of the newly acquired businesses remains on schedule and the PMMA business completed its ERP implementation in November which was a major step in exiting the Arkema transition service agreements. |
| ● | Latex Binders net sales of $255 million for the quarter decreased 17% versus prior year. Lower volumes caused a 14% reduction as most products and regions experienced a stepdown in demand. Adjusted EBITDA of $20 million was flat to prior year as lower volume was offset by pricing and fixed cost initiatives. Volume for CASE products declined by 18% in the fourth quarter and by 10% for the full year caused by customer destocking and reduced demand in building & construction applications. Despite a slowdown in 2022, CASE volumes still ended the year 15% higher than 2019 and 9% higher than 2020. |
| ● | Base Plastics net sales of $271 million for the quarter were 28% lower than prior year primarily due to lower volumes for building & construction, industrial and consumer durables applications. Adjusted EBITDA of negative $9 million was $88 million below prior year. Weaker demand led to lower sales volume and also pressured margins in polycarbonate and ABS products. Europe products also faced increased competition from lower-cost imports from Asia. Volumes supporting automotive applications improved modestly versus prior year as production and supply chain constraints eased. Results included a $12 million negative net timing variance versus prior year. |
Starting in 2023, the Base Plastics segment will be renamed to Plastics Solutions to better reflect Trinseo’s strategic focus on providing solutions in areas such as sustainability and material substitution.
| ● | Polystyrene net sales of $216 million for the quarter were 18% below prior year. Lower volume led to an 8% decrease in sales and lower price, primarily from the pass through of lower styrene costs, led to a 10% decrease in sales. Adjusted EBITDA of $12 |
| million was $21 million below prior year as weaker demand in appliance and building & construction applications led to lower volumes and contracted margins. Results included a $5 million negative net timing variance versus prior year. |
| ● | Feedstocks Adjusted EBITDA of negative $16 million was $9 million higher than prior year. Both styrene production plants were idled throughout the quarter due to low styrene demand and elevated natural gas prices in Europe. Results were impacted by a $9 million negative net timing variance versus prior year. During the fourth quarter the Company announced its decision to permanently close the Boehlen, Germany styrene facility. The Terneuzen styrene facility in the Netherlands was restarted in late January due to improving styrene economics. |
| ● | Americas Styrenics Adjusted EBITDA of $18 million for the quarter was $4 million lower than prior year as lower demand was partially offset by higher polystyrene margin. |
2023 Full-Year Outlook
| ● | Full-year 2023 net income from continuing operations of $3 million to $33 million and Adjusted EBITDA of $375 million to $425 million |
| ● | Full-year 2023 cash from operations of approximately $100 million resulting in breakeven Free Cash Flow |
| ● | Full-year 2023 capital spending of approximately $100 million reflects a pause of the legacy ERP upgrade and includes funding for growth and productivity initiatives |
Commenting on the outlook for 2023, Bozich said, “We are expecting underlying demand to remain challenged as we begin 2023 but we are increasingly confident that we will see the end of destocking early in the year. We anticipate first quarter sales volumes will be seasonally stronger than fourth quarter with continued improvement through the year as demand in China recovers and energy prices in Europe moderate which will hinder significant import opportunities from Asia.”
Bozich continued, “During 2023 we’ll focus on completing our asset restructuring initiatives which we expect will improve results in 2023 and position us well when normal order patterns resume. We’ll look to make further progress on our growth platforms including material substitution applications as well as products containing recycled or bio-based materials. Even under a reduced capital expenditure plan, we are able to still fund these programs which delivered solid results in 2022 and will continue our evolution to a specialty material and sustainable solutions provider. We’re confident in the talent of our employees, our ability to generate cash and in our liquidity position to navigate a subdued economic environment while delivering on our transformation strategy.”
Conference Call and Webcast Information
Trinseo will host a conference call to discuss its fourth quarter and full year 2022 financial results on Thursday, Februrary 9, 2023 at 10 a.m. Eastern Time.
Commenting on results will be Frank Bozich, President and Chief Executive Officer, David Stasse, Executive Vice President and Chief Financial Officer, and Andy Myers, Director of Investor Relations.
For those interested in asking questions during the Q&A session, please register using the following link:
| ● | Conference Call Registration |
For those interested in listening only, please register for the webcast using the following link:
| ● | Webcast Registration |
After registering for the conference call, you will receive a confirmation email with a meeting invitation and information for entry. Registration is open through the live call, but it is advised that you register in advance to ensure you are connected for the full call.
Trinseo has posted its fourth quarter and full year 2022 financial results on the Company’s Investor Relations website. The presentation slides will also be made available in the webcast player prior to the conference call. The Company will also furnish copies of the financial results press release and presentation slides to investors by means of a Form 8-K filing with the U.S. Securities and Exchange Commission.
A replay of the conference call and transcript will be archived on the Company’s Investor Relations website shortly following the conference call. The replay will be available until Februrary 9, 2024.
About Trinseo
Trinseo (NYSE: TSE) a specialty material solutions provider, partners with companies to bring ideas to life in an imaginative, smart, and sustainability-focused manner by combining its premier expertise, forward-looking innovations and best-in-class materials to unlock value for companies and consumers. From design to manufacturing, Trinseo taps into decades of experience in diverse material solutions to address customers’ unique challenges in a wide range of industries, including consumer goods, mobility, building and construction, and medical. Trinseo’s approximately 3,400 employees bring endless creativity to reimagining the possibilities with clients all over the world from the company’s locations in North America, Europe, and Asia Pacific. Trinseo reported net sales of approximately $5.0 billion in 2022. Discover more by visiting www.trinseo.com and connecting with Trinseo on LinkedIn, Twitter, Facebook and WeChat.
Use of non-GAAP measures
In addition to using standard measures of performance and liquidity that are recognized in accordance with accounting principles generally accepted in the United States of America (“GAAP”), we use additional measures of income excluding certain GAAP items (“non-GAAP measures”), such as Adjusted Net Income, EBITDA, Adjusted EBITDA and Adjusted EPS and measures of liquidity excluding certain GAAP items, such as Free Cash Flow. We believe these measures are useful for investors and management in evaluating business trends and performance each period. These measures are also used to manage our business and assess current period profitability, as well as to provide an appropriate basis to evaluate the effectiveness of our pricing strategies. Such measures are not recognized in accordance with GAAP and should not be viewed as an alternative to GAAP measures of performance or liquidity, as applicable. The definitions of each of these measures, further discussion of usefulness, and reconciliations of non-GAAP measures to GAAP measures are provided in the Notes to Condensed Consolidated Financial Information presented herein.
Cautionary Note on Forward-Looking Statements
This press release may contain forward-looking statements including, without limitation, statements concerning plans, objectives, goals, projections, forecasts, strategies, future events or performance, and underlying assumptions and other statements, which are not statements of historical facts or guarantees or assurances of future performance. Forward-looking statements may be identified by the use of words like "expect," "anticipate," “believe,” "intend," "forecast," "outlook," "will," "may," "might," "see," "tend," "assume," "potential," "likely," "target," "plan," "contemplate," "seek," "attempt," "should," "could," "would" or expressions of similar meaning. Forward-looking statements reflect management’s evaluation of information currently available and are based on our current expectations and assumptions, our business, the economy and other future conditions. Because forward-looking statements relate to the future, they are subject to inherent uncertainties, risks and changes in circumstances that are difficult to predict. Factors that might cause future results to differ from those expressed by the forward-looking statements include, but are not limited to, our ability to successfully execute our business and transformation strategy; increased costs or disruption in the supply of raw materials; increased energy costs; our ability to successfully generate cost savings and increase profitability through asset restructuring initiatives; compliance with laws and regulations impacting our business; conditions in the global economy and capital markets; and those discussed in our Annual Report on Form 10-K, under Part I, Item 1A —"Risk Factors" and elsewhere in our other reports, filings and furnishings made with the U.S. Securities and Exchange Commission from time to time. As a result of these or other factors, our actual results, performance or achievements may differ materially from those contemplated by the forward-looking statements. Therefore, we caution you against relying on any of these forward-looking statements. The forward-looking statements included in this press release are made only as of the date hereof. We undertake no obligation to publicly update or revise any forward-looking statement as a result of new information, future events or otherwise, except as otherwise required by law.
TRINSEO PLC
Condensed Consolidated Statements of Operations
(In millions, except per share data)
(Unaudited)
|
|
Three Months Ended |
|
Year Ended |
||||||||
|
|
December 31, |
|
December 31, |
||||||||
|
|
2022 |
|
2021 |
|
2022 |
|
2021 |
||||
Net sales |
|
$ |
975.2 |
|
$ |
1,298.5 |
|
$ |
4,965.5 |
|
$ |
4,827.5 |
Cost of sales |
|
|
978.4 |
|
|
1,176.9 |
|
|
4,693.2 |
|
|
4,128.6 |
Gross profit (loss) |
|
|
(3.2) |
|
|
121.6 |
|
|
272.3 |
|
|
698.9 |
Selling, general and administrative expenses |
|
|
136.1 |
|
|
93.1 |
|
|
398.8 |
|
|
323.4 |
Equity in earnings of unconsolidated affiliates |
|
|
18.4 |
|
|
22.5 |
|
|
102.2 |
|
|
92.7 |
Impairment and other charges |
|
|
300.1 |
|
|
3.8 |
|
|
339.6 |
|
|
6.8 |
Operating income (loss) |
|
|
(421.0) |
|
|
47.2 |
|
|
(363.9) |
|
|
461.4 |
Interest expense, net |
|
|
35.3 |
|
|
22.8 |
|
|
112.9 |
|
|
79.4 |
Acquisition purchase price hedge loss |
|
|
— |
|
|
— |
|
|
— |
|
|
22.0 |
Other expense (income), net |
|
|
(9.0) |
|
|
1.0 |
|
|
(7.2) |
|
|
9.5 |
Income (loss) from continuing operations before income taxes |
|
|
(447.3) |
|
|
23.4 |
|
|
(469.6) |
|
|
350.5 |
Provision for (benefit from) income taxes |
|
|
(83.0) |
|
|
22.0 |
|
|
(41.6) |
|
|
70.9 |
Net income (loss) from continuing operations |
|
|
(364.3) |
|
|
1.4 |
|
|
(428.0) |
|
|
279.6 |
Net income (loss) from discontinued operations, net of income taxes |
|
|
(1.0) |
|
|
122.4 |
|
|
(2.9) |
|
|
160.4 |
Net income (loss) |
|
$ |
(365.3) |
|
$ |
123.8 |
|
$ |
(430.9) |
|
$ |
440.0 |
Weighted average shares- basic |
|
|
35.0 |
|
|
38.7 |
|
|
35.9 |
|
|
38.7 |
Net income (loss) per share- basic: |
|
|
|
|
|
|
|
|
|
|
|
|
Continuing operations |
|
$ |
(10.42) |
|
$ |
0.04 |
|
$ |
(11.91) |
|
$ |
7.22 |
Discontinued operations |
|
|
(0.02) |
|
|
3.16 |
|
|
(0.08) |
|
|
4.15 |
Net income (loss) per share- basic |
|
$ |
(10.44) |
|
$ |
3.20 |
|
$ |
(11.99) |
|
$ |
11.37 |
Weighted average shares- diluted |
|
|
35.0 |
|
|
39.5 |
|
|
35.9 |
|
|
39.6 |
Net income (loss) per share- diluted: |
|
|
|
|
|
|
|
|
|
|
|
|
Continuing operations |
|
$ |
(10.42) |
|
$ |
0.04 |
|
$ |
(11.91) |
|
$ |
7.07 |
Discontinued operations |
|
|
(0.02) |
|
|
3.10 |
|
|
(0.08) |
|
|
4.05 |
Net income (loss) per share- diluted |
|
$ |
(10.44) |
|
$ |
3.14 |
|
$ |
(11.99) |
|
$ |
11.12 |
TRINSEO PLC
Condensed Consolidated Balance Sheets
(In millions)
(Unaudited)
|
|
December 31, |
|
December 31, |
||
|
|
2022 |
|
2021 |
||
Assets |
|
|
|
|
|
|
Cash and cash equivalents |
|
$ |
211.7 |
|
$ |
573.0 |
Accounts receivable, net of allowance |
|
|
586.0 |
|
|
740.2 |
Inventories |
|
|
553.6 |
|
|
621.0 |
Other current assets |
|
|
39.4 |
|
|
44.3 |
Investments in unconsolidated affiliates |
|
|
255.1 |
|
|
247.8 |
Property, plant, equipment, goodwill, and other intangible assets, net |
|
|
1,873.5 |
|
|
2,252.9 |
Right-of-use assets - operating, net |
|
|
76.1 |
|
|
85.3 |
Other long-term assets |
|
|
164.8 |
|
|
147.7 |
Total assets |
|
$ |
3,760.2 |
|
$ |
4,712.2 |
Liabilities and shareholders’ equity |
|
|
|
|
|
|
Current liabilities |
|
|
689.4 |
|
|
914.4 |
Long-term debt, net of unamortized deferred financing fees |
|
|
2,301.6 |
|
|
2,305.6 |
Noncurrent lease liabilities - operating |
|
|
60.2 |
|
|
69.2 |
Other noncurrent obligations |
|
|
288.7 |
|
|
409.9 |
Shareholders’ equity |
|
|
420.3 |
|
|
1,013.1 |
Total liabilities and shareholders’ equity |
|
$ |
3,760.2 |
|
$ |
4,712.2 |
TRINSEO PLC
Condensed Consolidated Statements of Cash Flows
(In millions)
(Unaudited)
|
|
Year Ended |
||||
|
|
December 31, |
||||
|
|
2022 |
|
2021 |
||
Cash flows from operating activities |
|
|
|
|
|
|
Cash provided by operating activities - continuing operations |
|
$ |
46.4 |
|
$ |
456.0 |
Cash used in operating activities - discontinued operations |
|
|
(2.9) |
|
|
(3.3) |
Cash provided by operating activities |
|
|
43.5 |
|
|
452.7 |
|
|
|
|
|
|
|
Cash flows from investing activities |
|
|
|
|
|
|
Capital expenditures |
|
|
(148.2) |
|
|
(117.7) |
Cash paid for asset or business acquisitions, net of cash acquired ($1.0 and $12.1) |
|
|
(22.2) |
|
|
(1,804.0) |
Proceeds from the sale of businesses and other assets |
|
|
5.3 |
|
|
0.2 |
Proceeds from (payments for) the settlement of hedging instruments |
|
|
1.9 |
|
|
(14.7) |
Cash used in investing activities - continuing operations |
|
|
(163.2) |
|
|
(1,936.2) |
Cash provided by (used in) investing activities - discontinued operations |
|
|
(0.8) |
|
|
396.5 |
Cash used in investing activities |
|
|
(164.0) |
|
|
(1,539.7) |
|
|
|
|
|
|
|
Cash flows from financing activities |
|
|
|
|
|
|
Deferred financing fees |
|
|
— |
|
|
(35.4) |
Short-term borrowings, net |
|
|
(17.5) |
|
|
(14.6) |
Purchase of treasury shares |
|
|
(151.9) |
|
|
(48.1) |
Dividends paid |
|
|
(47.5) |
|
|
(21.9) |
Proceeds from exercise of option awards |
|
|
3.0 |
|
|
11.0 |
Withholding taxes paid on restricted share units |
|
|
(3.2) |
|
|
(0.9) |
Repurchases and repayments of long-term debt |
|
|
(16.6) |
|
|
(10.7) |
Net proceeds from issuance of 2028 Term Loan B |
|
|
— |
|
|
746.3 |
Net proceeds from issuance of 2029 Senior Notes |
|
|
— |
|
|
450.0 |
Proceeds from Accounts Receivable Securitization Facility |
|
|
— |
|
|
150.0 |
Repayments of Accounts Receivable Securitization Facility |
|
|
— |
|
|
(150.0) |
Cash provided by (used in) by financing activities |
|
|
(233.7) |
|
|
1,075.7 |
Effect of exchange rates on cash |
|
|
(7.1) |
|
|
(4.4) |
Net change in cash, cash equivalents, and restricted cash |
|
|
(361.3) |
|
|
(15.7) |
Cash, cash equivalents, and restricted cash—beginning of period |
|
|
573.0 |
|
|
588.7 |
Cash, cash equivalents, and restricted cash—end of period |
|
$ |
211.7 |
|
$ |
573.0 |
Less: Restricted cash |
|
|
— |
|
|
— |
Cash and cash equivalents—end of period |
|
$ |
211.7 |
|
$ |
573.0 |
TRINSEO PLC
Notes to Condensed Consolidated Financial Information
(Unaudited)
Note 1: Net Sales by Segment
|
|
Three Months Ended |
|
Year Ended |
||||||||
|
|
December 31, |
|
December 31, |
||||||||
(In millions) |
|
2022 |
|
2021 |
|
2022 |
|
2021 |
||||
Engineered Materials |
|
$ |
205.1 |
|
$ |
277.3 |
|
$ |
1,044.4 |
|
$ |
755.0 |
Latex Binders |
|
|
255.2 |
|
|
305.7 |
|
|
1,256.5 |
|
|
1,183.4 |
Base Plastics |
|
|
271.2 |
|
|
378.8 |
|
|
1,323.0 |
|
|
1,497.9 |
Polystyrene |
|
|
215.5 |
|
|
263.8 |
|
|
1,093.1 |
|
|
1,118.8 |
Feedstocks |
|
|
28.2 |
|
|
72.9 |
|
|
248.5 |
|
|
272.4 |
Americas Styrenics* |
|
|
— |
|
|
— |
|
|
— |
|
|
— |
Total Net Sales |
|
$ |
975.2 |
|
$ |
1,298.5 |
|
$ |
4,965.5 |
|
$ |
4,827.5 |
* The results of this segment are comprised entirely of earnings from Americas Styrenics, our 50%-owned equity method investment. As such, we do not separately report net sales of Americas Styrenics within our condensed consolidated statements of operations.
Note 2: Reconciliation of Non-GAAP Performance Measures to Net Income
EBITDA is a non-GAAP financial performance measure, which is defined as income from continuing operations before interest expense, net; income tax provision; depreciation and amortization expense. We refer to EBITDA in making operating decisions because we believe it provides our management as well as our investors with meaningful information regarding the Company’s operational performance. We believe the use of EBITDA as a metric assists our board of directors, management and investors in comparing our operating performance on a consistent basis.
We also present Adjusted EBITDA as a non-GAAP financial performance measure, which we define as income from continuing operations before interest expense, net; income tax provision; depreciation and amortization expense; loss on extinguishment of long-term debt; asset impairment charges; gains or losses on the dispositions of businesses and assets; restructuring charges; acquisition related costs and benefits, and other items. In doing so, we are providing management, investors, and credit rating agencies with an indicator of our ongoing performance and business trends, removing the impact of transactions and events that we would not consider a part of our core operations.
Lastly, we present Adjusted Net Income (Loss) and Adjusted EPS as additional performance measures. Adjusted Net Income (Loss) is calculated as Adjusted EBITDA (defined beginning with net income from continuing operations, above), less interest expense, less the provision for income taxes and depreciation and amortization, tax affected for various discrete items, as appropriate. Adjusted EPS is calculated as Adjusted Net Income (Loss) per weighted average diluted shares outstanding for a given period. We believe that Adjusted Net Income (Loss) and Adjusted EPS provide transparent and useful information to management, investors, analysts and other stakeholders in evaluating and assessing our operating results from period-to-period after removing the impact of certain transactions and activities that affect comparability and that are not considered part of our core operations.
There are limitations to using the financial performance measures noted above. These performance measures are not intended to represent net income or other measures of financial performance. As such, they should not be used as alternatives to net income as indicators of operating performance. Other companies in our industry may define these performance measures differently than we do. As a result, it may be difficult to use these or similarly-named financial measures that other companies may use, to compare the performance of those companies to our performance. We compensate for these limitations by providing reconciliations of these performance measures to our net income, which is determined in accordance with GAAP.
|
|
Three Months Ended |
|
Year Ended |
|
||||||||
|
|
December 31, |
|
December 31, |
|
||||||||
(In millions, except per share data) |
|
2022 |
|
2021 |
|
2022 |
|
2021 |
|
||||
Net income (loss) |
|
$ |
(365.3) |
|
$ |
123.8 |
|
$ |
(430.9) |
|
$ |
440.0 |
|
Net income (loss) from discontinued operations |
|
|
(1.0) |
|
|
122.4 |
|
|
(2.9) |
|
|
160.4 |
|
Net income (loss) from continuing operations |
|
$ |
(364.3) |
|
$ |
1.4 |
|
$ |
(428.0) |
|
$ |
279.6 |
|
Interest expense, net |
|
|
35.3 |
|
|
22.8 |
|
|
112.9 |
|
|
79.4 |
|
Provision for (benefit from) income taxes |
|
|
(83.0) |
|
|
22.0 |
|
|
(41.6) |
|
|
70.9 |
|
Depreciation and amortization |
|
|
89.8 |
|
|
56.4 |
|
|
236.9 |
|
|
167.5 |
|
EBITDA |
|
$ |
(322.2) |
|
$ |
102.6 |
|
$ |
(119.8) |
|
$ |
597.4 |
|
Net gain on disposition of businesses and assets |
|
|
— |
|
|
(0.4) |
|
|
(1.8) |
|
|
(0.6) |
Selling, general, and administrative expenses; Other expense, net |
Restructuring and other charges (a) |
|
|
17.0 |
|
|
2.2 |
|
|
15.9 |
|
|
9.0 |
Selling, general, and administrative expenses |
Acquisition transaction and integration net costs (b) |
|
|
0.4 |
|
|
12.5 |
|
|
6.6 |
|
|
75.3 |
Cost of goods sold; Selling, general, and administrative expenses |
Acquisition purchase price hedge loss (c) |
|
|
— |
|
|
— |
|
|
— |
|
|
22.0 |
Acquisition purchase price hedge (gain) loss |
Asset impairment charges or write-offs (d) |
|
|
2.4 |
|
|
3.8 |
|
|
6.3 |
|
|
6.8 |
Impairment and other charges |
European Commission request for information (e) |
|
|
0.6 |
|
|
— |
|
|
36.2 |
|
|
— |
Impairment and other charges |
Goodwill impairment charge (f) |
|
|
297.1 |
|
|
— |
|
|
297.1 |
|
|
— |
Impairment and other charges |
Other items (g) |
|
|
11.0 |
|
|
12.0 |
|
|
71.2 |
|
|
19.5 |
Selling, general, and administrative expenses; Other expense, net |
Adjusted EBITDA |
|
$ |
6.3 |
|
$ |
132.7 |
|
$ |
311.7 |
|
$ |
729.4 |
|
Adjusted EBITDA to Adjusted Net Income (Loss): |
|
|
|
|
|
|
|
|
|
|
|
|
|
Adjusted EBITDA |
|
|
6.3 |
|
|
132.7 |
|
|
311.7 |
|
|
729.4 |
|
Interest expense, net |
|
|
35.3 |
|
|
22.8 |
|
|
112.9 |
|
|
79.4 |
|
Provision for (benefit from) income taxes - Adjusted (h) |
|
|
(18.8) |
|
|
24.4 |
|
|
22.8 |
|
|
108.7 |
|
Depreciation and amortization - Adjusted (i) |
|
|
49.9 |
|
|
52.9 |
|
|
193.1 |
|
|
159.3 |
|
Adjusted Net Income (Loss) |
|
$ |
(60.1) |
|
$ |
32.6 |
|
$ |
(17.1) |
|
$ |
382.0 |
|
Weighted average shares- diluted |
|
|
35.0 |
|
|
39.5 |
|
|
35.9 |
|
|
39.6 |
|
Adjusted EPS |
|
$ |
(1.72) |
|
$ |
0.83 |
|
$ |
(0.48) |
|
$ |
9.65 |
|
|
|
|
|
|
|
|
|
|
|
|
|
|
|
Adjusted EBITDA by Segment: |
|
|
|
|
|
|
|
|
|
|
|
|
|
Engineered Materials |
|
$ |
(4.6) |
|
$ |
26.3 |
|
$ |
71.6 |
|
$ |
94.8 |
|
Latex Binders |
|
|
20.2 |
|
|
20.3 |
|
|
110.8 |
|
|
106.5 |
|
Base Plastics |
|
|
(8.8) |
|
|
79.1 |
|
|
91.0 |
|
|
314.2 |
|
Polystyrene |
|
|
12.4 |
|
|
33.5 |
|
|
99.3 |
|
|
183.1 |
|
Feedstocks |
|
|
(15.5) |
|
|
(24.7) |
|
|
(75.2) |
|
|
33.7 |
|
Americas Styrenics |
|
|
18.4 |
|
|
22.5 |
|
|
102.2 |
|
|
92.7 |
|
Corporate Unallocated |
|
|
(15.8) |
|
|
(24.3) |
|
|
(88.0) |
|
|
(95.6) |
|
Adjusted EBITDA |
|
$ |
6.3 |
|
$ |
132.7 |
|
$ |
311.7 |
|
$ |
729.4 |
|
| (a) | Restructuring and other charges for the 2022 periods primarily relate to employee termination benefit charges as well as decommissioning and other charges incurred in connection with the Company’s asset restructuring plan. Restructuring and other charges for the 2021 periods primarily relate to employee termination benefit charges as well as contract termination charges incurred in connection with the Company’s transformational and corporate restructuring programs. |
| (b) | Acquisition transaction and integration net costs for the 2022 and 2021 periods primarily relate to expenses incurred for the Company’s acquisition and integration of the PMMA business and Aristech Surfaces Acquisitions. |
| (c) | Acquisition purchase price hedge loss for the 2021 period relates to the change in fair value of the Company’s forward currency hedge arrangement that economically hedges the euro-denominated purchase price of the acquisition of the Arkema PMMA business. |
| (d) | Asset impairment charges for the 2022 and 2021 periods primarily relate to the impairment of the Company’s styrene monomer assets in Boehlen, Germany. |
| (e) | Amounts for the 2022 periods relate to the liability recorded in connection with the European Commission request for information, adjusted for foreign exchange rate impacts, which was subsequently paid in full in December 2022. |
| (f) | Amounts for the 2022 periods relate to the PMMA business and Aristech Surfaces reporting units’ goodwill impairment charge resulting from annual impairment testing. |
| (g) | Other items for the 2022 and 2021 periods primarily relate to fees incurred in conjunction with certain of the Company’s strategic initiatives, as well as costs related to our transition to a new enterprise resource planning system. |
| (h) | Adjusted to remove the tax impact of the items noted within the table above. For the three months and full year periods, the income tax expense (benefit) related to these items was determined utilizing the applicable rates in the taxing jurisdictions in which these adjustments occurred. |
The year ended December 31, 2022 excludes $4.3 million of tax expense, primarily related to the revaluation of the Company’s net deferred tax assets in Switzerland, partially offset by a benefit from the release of a valuation allowance in one of the Company’s subsidiaries in Luxembourg. The three months ended December 31, 2021 excludes $2.5 million of tax expense, primarily related to adjustments in accruals related to outstanding tax audits. The year ended December 31, 2021 excludes $14.1 million of tax benefit, primarily related to the release of a valuation allowance for the Company’s subsidiaries in China.
| (i) | Amounts for the three months and year ended December 31, 2022 exclude accelerated depreciation of $39.9 million and $43.8 million, respectively, and the amounts for the three months and year ended December 31, 2021 exclude accelerated deprecation of $3.7 million and $8.1 million, respectively. These charges for the 2022 periods were primarily related to the shortening of the useful life of certain assets related to the asset restructuring plan. The 2022 and 2021 periods also include charges related to the shortening of the useful life of certain IT assets related to the Company’s transition to a new enterprise resource planning system. |
For the same reasons discussed above, we are providing the following reconciliation of forecasted net income (loss) to forecasted Adjusted EBITDA, Adjusted Net Income (Loss) and Adjusted EPS for the full year ended December 31, 2023. See “Note on Forward-Looking Statements” above for a discussion of the limitations of these forecasts.
|
|
Year Ended |
|
|
December 31, |
(In millions, except per share data) |
|
2023 |
Adjusted EBITDA |
$ |
375 - 425 |
Interest expense, net |
|
(150) |
Provision for income taxes |
|
(22) - (42) |
Depreciation and amortization |
|
(200) |
Reconciling items to Adjusted EBITDA (j) |
|
— |
Net Income from continuing operations |
|
3 - 33 |
Reconciling items to Adjusted Net Income (j) |
|
— |
Adjusted Net Income |
$ |
3 - 33 |
|
|
|
Weighted average shares - diluted (k) |
|
36.5 |
EPS from continuing operations - diluted ($) |
$ |
0.09 - 0.90 |
Adjusted EPS ($) |
$ |
0.09 - 0.90 |
| (j) | Reconciling items to Adjusted EBITDA and Adjusted Net Income (Loss) are not typically forecasted by the Company based on their nature as being primarily driven by transactions that are not part of the core operations of the business and, as a result, cannot be estimated without unreasonable cost or uncertainty. As such, for the forecasted full year ended December 31, 2023, we have not included estimates for these items. |
| (k) | Weighted average shares presented for the purpose of forecasting EPS and Adjusted EPS do not forecast significant future share transactions or events, such as repurchases, significant share-based compensation award grants, and changes in the Company’s share price. These are all factors which could have a significant impact on the calculation of EPS and Adjusted EPS during actual future periods. |
Note 3: Reconciliation of Non-GAAP Liquidity Measures to Cash from Operations
The Company uses certain measures, such as Free Cash Flow as non-GAAP measures, to evaluate and discuss its liquidity position and results. Free Cash Flow is defined as cash from operating activities, less capital expenditures. We believe that Free Cash Flow provides an indicator of the Company’s ongoing ability to generate cash through core operations, as it excludes the cash impacts of various financing transactions as well as cash flows from business combinations that are not considered organic in nature. We also believe that Free Cash Flow provides management and investors with useful analytical indicators of our ability to service our indebtedness, pay dividends (when declared), and meet our ongoing cash obligations.
Free Cash Flow is not intended to represent cash flows from operations as defined by GAAP, and therefore, should not be used as alternatives for that measure. Other companies in our industry may define Free Cash Flow differently than we do. As a result, it may be difficult to use this or similarly-named financial measures that other companies may use, to compare the liquidity and cash generation of those companies to our own. The Company compensates for these limitations by providing the following detail, which is determined in accordance with GAAP.
Free Cash Flow
|
|
Three Months Ended |
|
Year Ended |
||||||||
|
|
December 31, |
|
December 31, |
||||||||
(In millions) |
|
2022 |
|
2021 |
|
2022 |
|
2021 |
||||
Cash provided by operating activities |
|
$ |
34.0 |
|
$ |
214.4 |
|
$ |
43.5 |
|
$ |
452.7 |
Capital expenditures |
|
|
(54.2) |
|
|
(55.4) |
|
|
(149.0) |
|
|
(123.5) |
Free Cash Flow |
|
$ |
(20.2) |
|
$ |
159.0 |
|
$ |
(105.5) |
|
$ |
329.2 |
For the same reasons discussed above, we are providing the following reconciliation of forecasted cash provided by operations and cash used for capital expenditures to forecasted Free Cash Flow for the year ended December 31, 2023. See “Note on Forward-Looking Statements” above for a discussion of the limitations of these forecasts.
|
|
Year Ended |
|
(In millions) |
|
December 31, 2023 |
|
Cash provided by operating activities |
|
$ |
~100 |
Capital expenditures |
|
|
~(100) |
Free Cash Flow |
|
$ |
~0 |
|
™Trademark of Trinseo PLC or its affiliates Fourth Quarter 2022 Financial Results & 2023 Outlook February 8, 2023 |
|
2 Introductions & Disclosure Rules Disclosure Rules Cautionary Note on Forward-Looking Statements.This presentation may contain forward-looking statements including, without limitation, statements concerning plans, objectives, goals, projections, forecasts, strategies, future events or performance, and underlying assumptions and other statements, which are not statements of historical facts or guarantees or assurances of future performance. Forward-looking statements may be identified by the use of words like "expect," "anticipate," “believe,” "intend," "forecast," "outlook," "will," "may," "might," "see," "tend," "assume," "potential," "likely," "target," "plan," "contemplate," "seek," "attempt," "should," "could," "would" or expressions of similar meaning. Forward-looking statements reflect management’s evaluation of information currently available and are based on our current expectations and assumptions regarding our business, the economy and other future conditions. Because forward-looking statements relate to the future, they are subject to inherent uncertainties, risks and changes in circumstances that are difficult to predict. Factors that might cause future results to differ from those expressed by the forward-looking statements include, but are not limited to, our ability to successfully execute our business and transformation strategy; increased costs or disruption in the supply of raw materials; increased energy costs; our ability to successfully generate cost savings and increase profitability through asset restructuring initiatives; compliance with laws and regulations impacting our business; conditions in the global economy and capital markets; and those discussed in our Annual Report on Form 10-K, under Part I, Item 1A —"Risk Factors" and elsewhere in our other reports, filings and furnishings made with the U.S. Securities and Exchange Commission from time to time. As a result of these or other factors, our actual results, performance or achievements may differ materially from those contemplated by the forward-looking statements. Therefore, we caution you against relying on any of these forward-looking statements. The forward-looking statements included in this presentation are made only as of the date hereof. We undertake no obligation to publicly update or revise any forward-looking statement as a result of new information, future events or otherwise, except as otherwise required by law. This presentation contains financial measures that are not in accordance with generally accepted accounting principles in the US (“GAAP”) including EBITDA, Adjusted EBITDA, Adjusted Net Income, Adjusted EPS and Free Cash Flow. We believe these measures provide relevant and meaningful information to investors and lenders about the ongoing operating results and liquidity position of the Company. Such measures when referenced herein should not be viewed as an alternative to GAAP measures of performance or liquidity, as applicable. We have provided a reconciliation of these measures to the most comparable GAAP metric alongside of the respective measure or otherwise in the Appendix section and in the accompanying press release. Introductions • Frank Bozich, President & CEO • David Stasse, Executive Vice President & CFO • Andy Myers, Director of Investor Relations |
|
Summary 2023 Outlook Q4 2022 Results • Q4 cash provided by operations of $34 million led to Free Cash Flow* of negative $20 million - included working capital release of $88 million and $34 million payment for European Commission settlement • 2022 ending cash balance of $212 million with $505 million of additional available liquidity under two undrawn, committed financing facilities Cash Generation & Liquidity • Net income from continuing operations of $3 million to $33 million and Adjusted EBITDA* of $375 million to $425 million • Cash from operations of $100 million and breakeven Free Cash Flow* • Expect sequential improvement in Q1 from seasonality, commercial excellence initiatives, Terneuzen styrene plant reopening and lower expenses from asset restructuring • Progression on asset restructuring including closure of styrene plant in Boehlen, Germany and a polycarbonate production line in Stade, Germany • Focus on growth programs including material substitution applications and sustainable products containing recycled or bio-based materials • Styrenics business separation remains integral part of transformation strategy Key Initiatives • Net loss from continuing operations of $364 million and Adjusted EBITDA* of $6 million; net loss included a non-cash goodwill impairment of $297 million • Limited sequential improvement in macroeconomic conditions; however, Adjusted EBITDA* improved sequentially aided by asset operating decisions • Volumes challenged in most applications but especially in building & construction, wellness and consumer durables and electronics due to economic uncertainty and customer destocking 3 * See Appendix for a reconciliation of non-GAAP measures |
|
2022 In Review • Completed acquisition of plastics collector & recycler Heathland B.V. in January • Announced asset restructuring to improve annual profitability by $60 million versus Q4 2022 run rate • 63% annual volume growth and 69% annual variable margin growth in sustainable products that include recycled materials • Patent filings have more than doubled since 2020, fueling innovation and growth in material substitution products and sustainable and specialty solutions • Completed work to facilitate separation of Styrenics business • Completed ERP implementation for the PMMA business • Released 12th annual Sustainability Report including TCFD framework and new Core Impact Report • Named Chief Commercial Officer, Chief Technology Officer and Chief Sustainability Officer in support of transformation Continued Progress in Evolution as a Provider of Specialty Materials and Sustainable Solutions Against a Challenging Macroeconomic Backdrop 4 |
|
Q4 Sustainability Highlights Ranked #42 by Newsweek in America’s Most Responsible Companies 2023 list New Curtain Coater Launched at Midland Pilot Coater Plant: Allows for increased collaboration with customers to achieve superior performance while offering sustainable attributes of reduced waste and ability to be recycled in traditional paper recycling process Recognized in October as Champion of Board Diversity by Forum of Executive Women for achieving >30% female representation on Trinseo board 5 74% of eligible sites earned the Triple Zero Award for 2022 after achieving zero injuries, spills or process safety incidents |
|
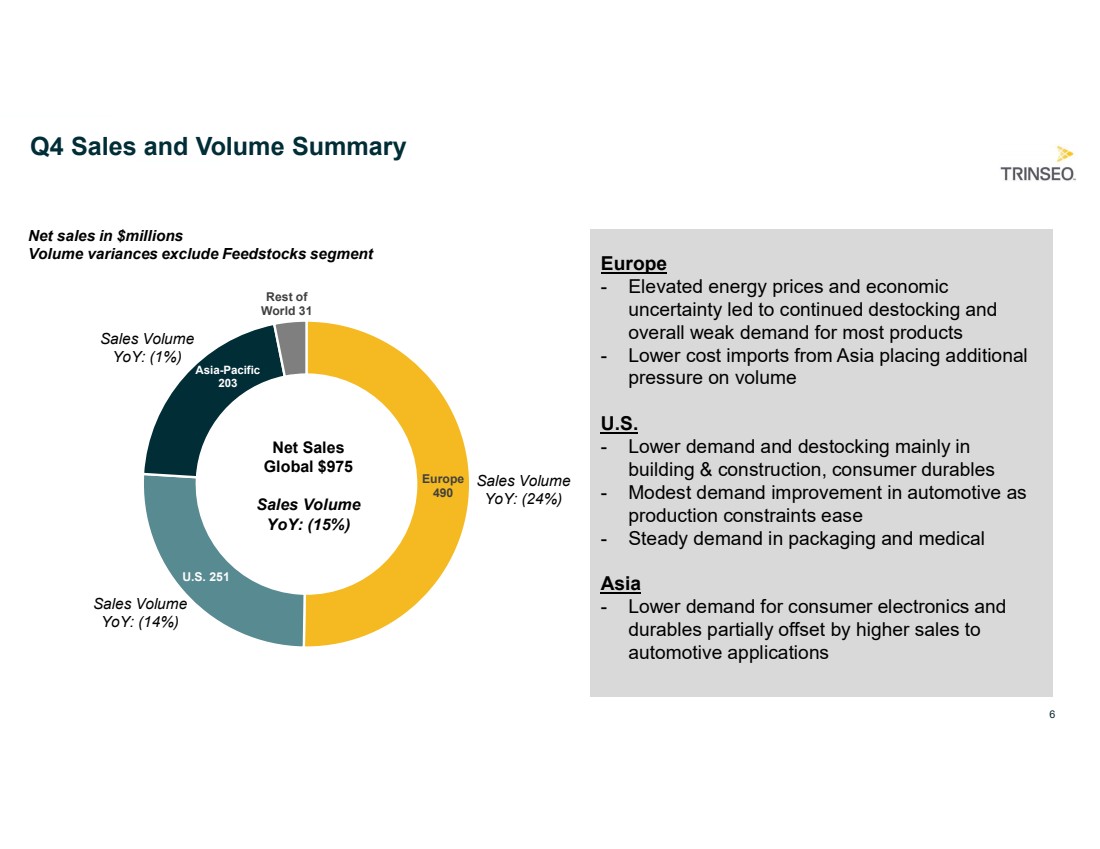
Europe 490 U.S. 251 Asia-Pacific 203 Rest of World 31 Q4 Sales and Volume Summary Europe - Elevated energy prices and economic uncertainty led to continued destocking and overall weak demand for most products - Lower cost imports from Asia placing additional pressure on volume U.S. - Lower demand and destocking mainly in building & construction, consumer durables - Modest demand improvement in automotive as production constraints ease - Steady demand in packaging and medical Asia - Lower demand for consumer electronics and durables partially offset by higher sales to automotive applications Sales Volume YoY: (1%) Sales Volume YoY: (14%) Sales Volume YoY: (24%) Net Sales Global $975 Sales Volume YoY: (15%) Net sales in $millions Volume variances exclude Feedstocks segment 6 |
|
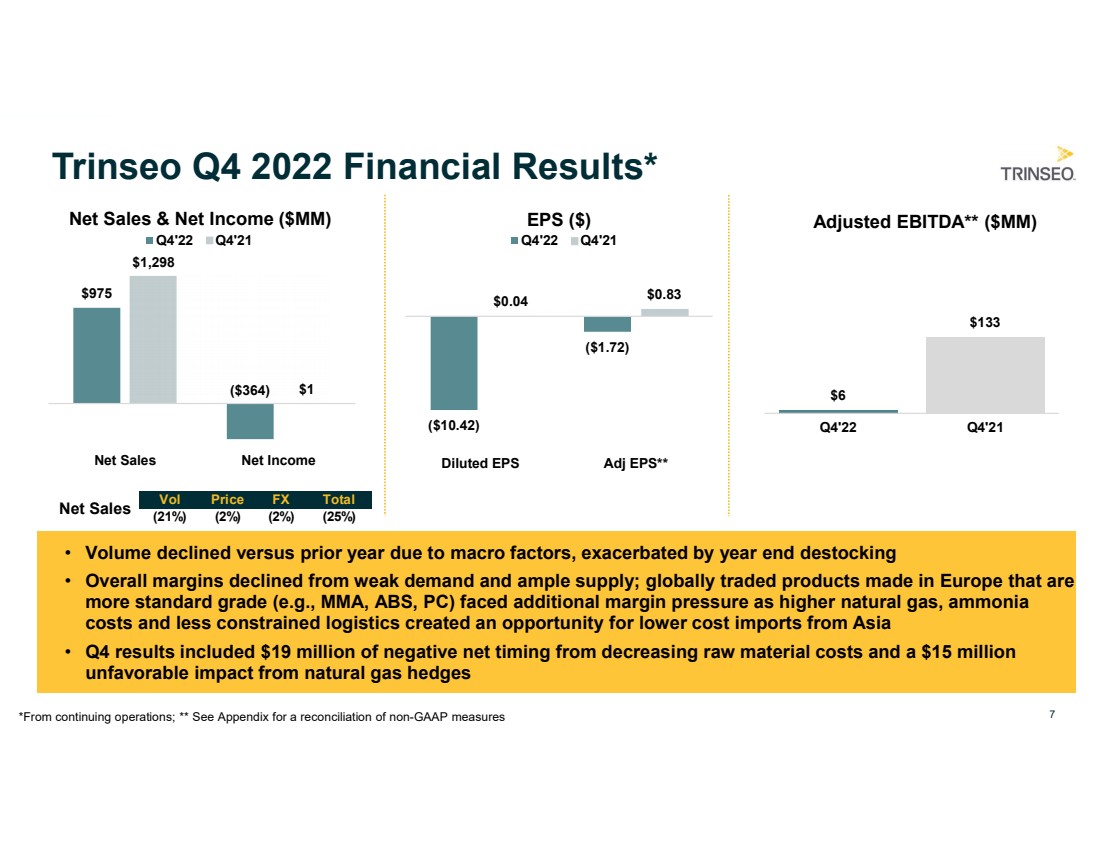
7 Trinseo Q4 2022 Financial Results* *From continuing operations; ** See Appendix for a reconciliation of non-GAAP measures • Volume declined versus prior year due to macro factors, exacerbated by year end destocking • Overall margins declined from weak demand and ample supply; globally traded products made in Europe that are more standard grade (e.g., MMA, ABS, PC) faced additional margin pressure as higher natural gas, ammonia costs and less constrained logistics created an opportunity for lower cost imports from Asia • Q4 results included $19 million of negative net timing from decreasing raw material costs and a $15 million unfavorable impact from natural gas hedges • Volume declined versus prior year due to macro factors, exacerbated by year end destocking • Overall margins declined from weak demand and ample supply; globally traded products made in Europe that are more standard grade (e.g., MMA, ABS, PC) faced additional margin pressure as higher natural gas, ammonia costs and less constrained logistics created an opportunity for lower cost imports from Asia • Q4 results included $19 million of negative net timing from decreasing raw material costs and a $15 million unfavorable impact from natural gas hedges ($10.42) ($1.72) $0.04 $0.83 Diluted EPS Adj EPS** EPS ($) Q4'22 Q4'21 $975 ($364) $1,298 $1 Net Sales Net Income Net Sales & Net Income ($MM) Q4'22 Q4'21 Net Sales $6 $133 Q4'22 Q4'21 Adjusted EBITDA** ($MM) Vol Price FX Total (21%) (2%) (2%) (25%) |
|
8 Engineered Materials • Performance impacted by lower volume and margin from a combination of destocking, lower structural demand and imports of standard-grade products from Asia into Europe and North America as well as a $10 million unfavorable impact from natural gas hedging • Demand impacts most acute in building & construction and wellness applications • Volume and margin resiliency in specialized PMMA resins and PC/ABS compounds • Performance impacted by lower volume and margin from a combination of destocking, lower structural demand and imports of standard-grade products from Asia into Europe and North America as well as a $10 million unfavorable impact from natural gas hedging • Demand impacts most acute in building & construction and wellness applications • Volume and margin resiliency in specialized PMMA resins and PC/ABS compounds $205 $277 Q4'22 Q4'21 Net Sales ($MM) ($5) $26 Q4'22 Q4'21 Adjusted EBITDA ($MM) 41 58 Q4'22 Q4'21 Volume (kt) Vol Price FX Total (29%) 4% (1%) (26%) |
|
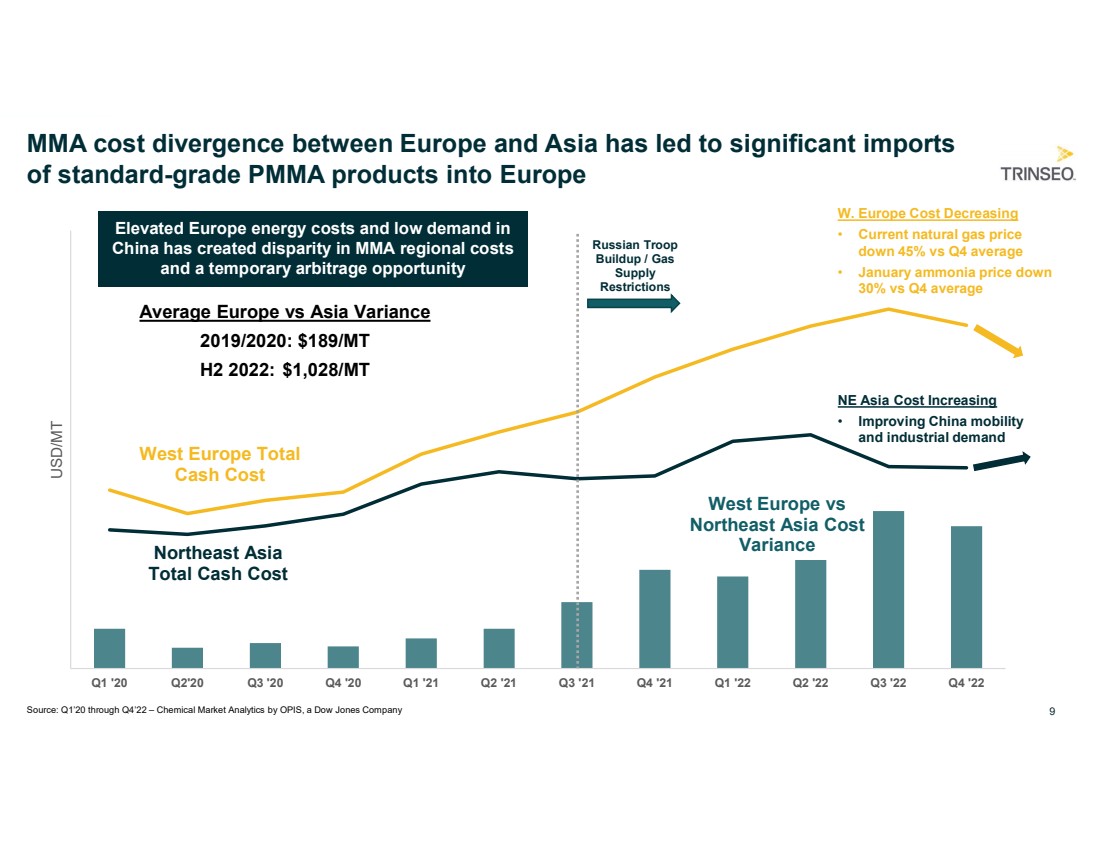
Q1 '20 Q2'20 Q3 '20 Q4 '20 Q1 '21 Q2 '21 Q3 '21 Q4 '21 Q1 '22 Q2 '22 Q3 '22 Q4 '22 USD/MT MMA cost divergence between Europe and Asia has led to significant imports of standard-grade PMMA products into Europe 9 West Europe Total Cash Cost Northeast Asia Total Cash Cost Elevated Europe energy costs and low demand in China has created disparity in MMA regional costs and a temporary arbitrage opportunity Russian Troop Buildup / Gas Supply Restrictions Average Europe vs Asia Variance 2019/2020: $189/MT H2 2022: $1,028/MT West Europe vs Northeast Asia Cost Variance Source: Q1’20 through Q4’22 – Chemical Market Analytics by OPIS, a Dow Jones Company W. Europe Cost Decreasing • Current natural gas price down 45% vs Q4 average • January ammonia price down 30% vs Q4 average NE Asia Cost Increasing • Improving China mobility and industrial demand |
|
10 Engineered Materials Path to Recovery Q4 performance included an unfavorable impact from natural gas hedging ($10 million) and several other factors with recovery expected to occur between Q1 2023 and 2024 Adj EBITDA Impact Anticipated Recovery Destocking: short-term destocking including from declining prices, inventory management and extended year-end customer shutdowns ($10MM) Q2 2023 Asian Arbitrage: elevated natural gas and ammonia prices in Europe, in combination with low demand in China, created a temporary arbitrage window for standard-grade products to be more heavily imported into Europe and North America ($10MM) Q1 - Q4 2023 Structural Market Demand: lower demand in all three regions; most acute in Europe and Asia ($15MM) 2024 |
|
11 Key Indicators for Engineered Materials Recovery 1) Bloomberg 2) Composite rate from Spectron Group, GFI Group Limited, Tradition Financial Services, Bloomberg Commodity Fair Value and ICAP; monthly value taken as daily average 46 48 50 52 54 China PMI €0 €50 €100 €150 €200 €250 TTF Natural Gas Rates (EUR/Mwh)(2) $0 $400 $800 $1,200 $1,600 $2,000 West Europe Ammonia Spot Price (USD/MT)(1) (30)% (15)% 0% 15% 30% China Gasoline Demand YoY %(1) Low China gasoline demand creates significant cost advantage for C4-based MMA producers |
|
12 Latex Binders • Earnings in line as volume decline was offset by fixed cost and commercial excellence actions • Lower volumes in all regions and applications from customer de-stocking and extended shutdowns for year-end and Covid impacts • 2022 CASE volumes declined by 10% versus 2021 from lower demand in building & construction applications; 3-year volume CAGR of +5% • Earnings in line as volume decline was offset by fixed cost and commercial excellence actions • Lower volumes in all regions and applications from customer de-stocking and extended shutdowns for year-end and Covid impacts • 2022 CASE volumes declined by 10% versus 2021 from lower demand in building & construction applications; 3-year volume CAGR of +5% $255 $306 Q4'22 Q4'21 Net Sales ($MM) $20 $20 Q4'22 Q4'21 Adjusted EBITDA ($MM) 117 135 Q4'22 Q4'21 Volume (kt) Vol Price FX Total (14%) 0% (3%) (17%) |
|
13 Base Plastics • Lower volumes caused by destocking and weak demand in building & construction and consumer durables applications partially offset by mild improvement in automotive demand • Margin contraction on weak demand and ample supply including lower-cost imports into Europe from Asia • $12 million negative net timing variance versus prior year • Lower volumes caused by destocking and weak demand in building & construction and consumer durables applications partially offset by mild improvement in automotive demand • Margin contraction on weak demand and ample supply including lower-cost imports into Europe from Asia • $12 million negative net timing variance versus prior year $271 $379 Q4'22 Q4'21 Net Sales ($MM) ($9) $79 Q4'22 Q4'21 Adjusted EBITDA ($MM) 102 128 Q4'22 Q4'21 Volume (kt) Vol Price FX Total (22%) (3%) (4%) (28%) |
|
14 Polystyrene • Lower volume as a result of weaker demand in appliances and building & construction applications • Lower price due mainly to passthrough of raw material costs • Margin contraction from weaker demand and improved supply including new capacity in Asia • $5 million negative net timing variance versus prior year • Lower volume as a result of weaker demand in appliances and building & construction applications • Lower price due mainly to passthrough of raw material costs • Margin contraction from weaker demand and improved supply including new capacity in Asia • $5 million negative net timing variance versus prior year $216 $264 Q4'22 Q4'21 Net Sales ($MM) $12 $33 Q4'22 Q4'21 Adjusted EBITDA ($MM) 134 145 Q4'22 Q4'21 Volume (kt) Vol Price FX Total (8%) (10%) 0% (18%) |
|
15 Feedstocks & Americas Styrenics • Q4 2022 results includes $8 million negative net timing impact from declining raw material costs • Both styrene production plants in Europe were idled during Q4; Boehlen site to be closed permanently • Q4 2022 results includes $8 million negative net timing impact from declining raw material costs • Both styrene production plants in Europe were idled during Q4; Boehlen site to be closed permanently ($16) ($25) Q4'22 Q4'21 Adjusted EBITDA ($MM) FEEDSTOCKS AMERICAS STYRENICS $18 $22 Q4'22 Q4'21 Adjusted EBITDA ($MM) • Lower volumes partially offset by stronger polystyrene margins |
|
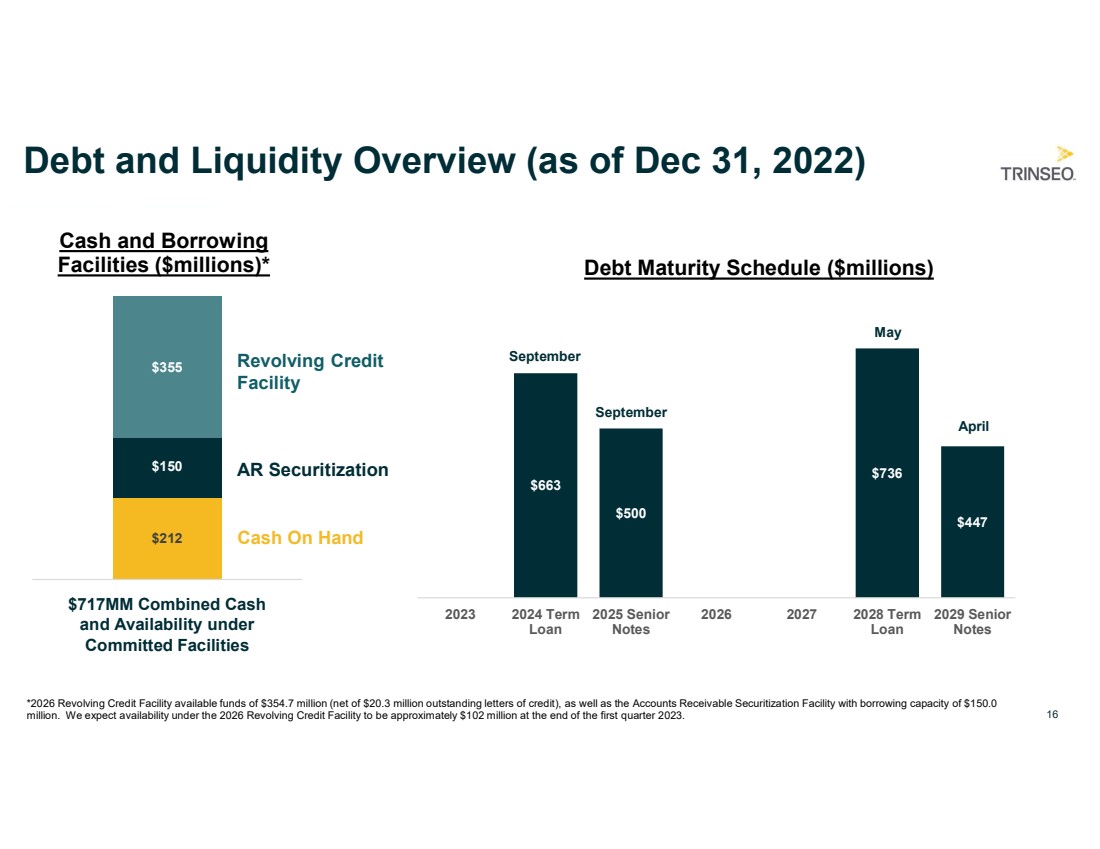
$663 $500 $736 $447 2023 2024 Term Loan 2025 Senior Notes 2026 2027 2028 Term Loan 2029 Senior Notes Debt and Liquidity Overview (as of Dec 31, 2022) 16 $212 $150 $355 Cash and Borrowing Facilities ($millions)* Cash On Hand AR Securitization Revolving Credit Facility *2026 Revolving Credit Facility available funds of $354.7 million (net of $20.3 million outstanding letters of credit), as well as the Accounts Receivable Securitization Facility with borrowing capacity of $150.0 million. We expect availability under the 2026 Revolving Credit Facility to be approximately $102 million at the end of the first quarter 2023. Debt Maturity Schedule ($millions) September September May April $717MM Combined Cash and Availability under Committed Facilities |
|
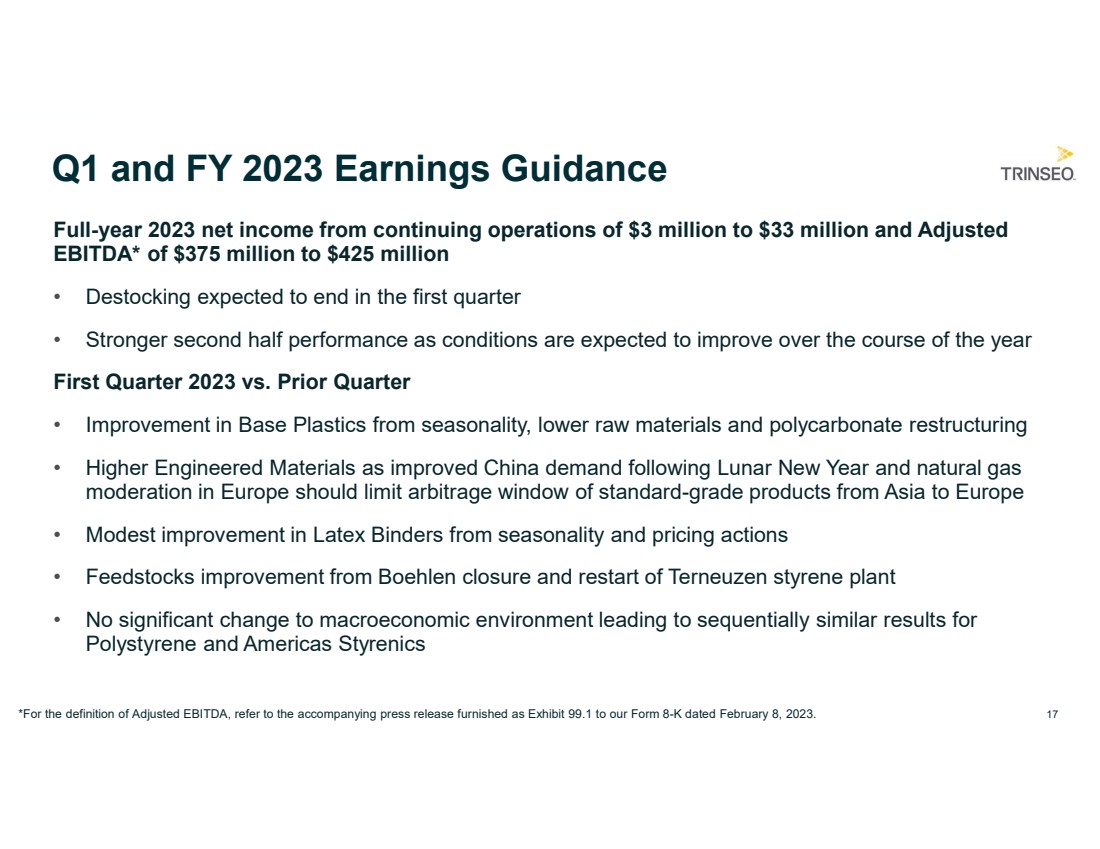
17 Q1 and FY 2023 Earnings Guidance Full-year 2023 net income from continuing operations of $3 million to $33 million and Adjusted EBITDA* of $375 million to $425 million • Destocking expected to end in the first quarter • Stronger second half performance as conditions are expected to improve over the course of the year First Quarter 2023 vs. Prior Quarter • Improvement in Base Plastics from seasonality, lower raw materials and polycarbonate restructuring • Higher Engineered Materials as improved China demand following Lunar New Year and natural gas moderation in Europe should limit arbitrage window of standard-grade products from Asia to Europe • Modest improvement in Latex Binders from seasonality and pricing actions • Feedstocks improvement from Boehlen closure and restart of Terneuzen styrene plant • No significant change to macroeconomic environment leading to sequentially similar results for Polystyrene and Americas Styrenics *For the definition of Adjusted EBITDA, refer to the accompanying press release furnished as Exhibit 99.1 to our Form 8-K dated February 8, 2023. |
|
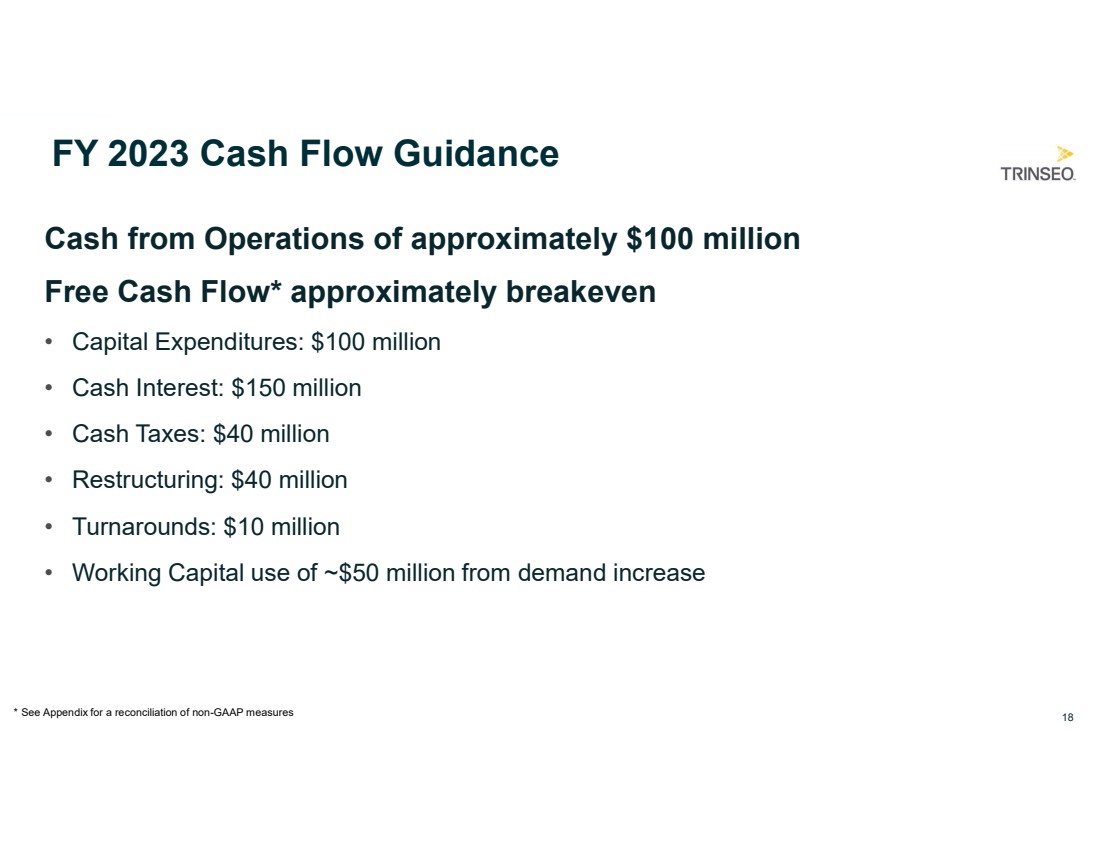
18 FY 2023 Cash Flow Guidance Cash from Operations of approximately $100 million Free Cash Flow* approximately breakeven • Capital Expenditures: $100 million • Cash Interest: $150 million • Cash Taxes: $40 million • Restructuring: $40 million • Turnarounds: $10 million • Working Capital use of ~$50 million from demand increase * See Appendix for a reconciliation of non-GAAP measures |
|
Appendix |
|
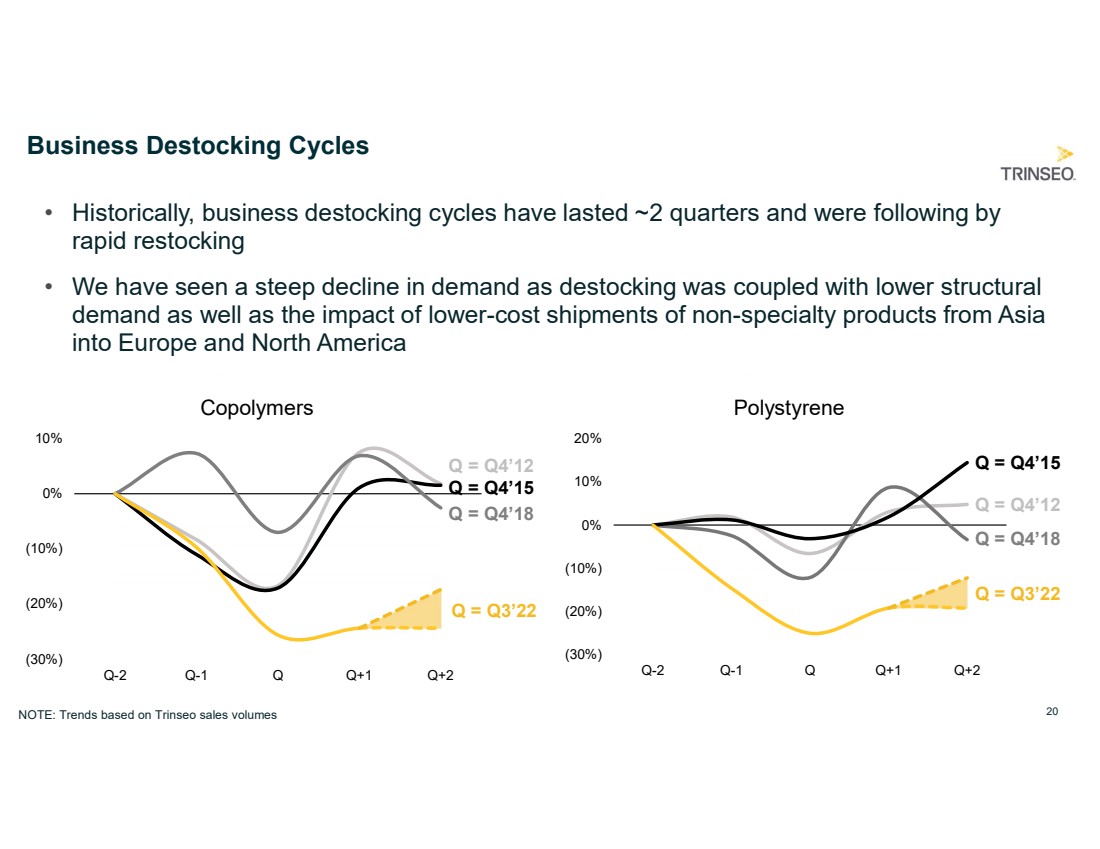
(30%) (20%) (10%) 0% 10% 20% Q-2 Q-1 Q Q+1 Q+2 Polystyrene Business Destocking Cycles 20 (30%) (20%) (10%) 0% 10% Q-2 Q-1 Q Q+1 Q+2 Copolymers Q = Q3’22 Q = Q4’18 Q = Q4’15 Q = Q4’12 Q = Q3’22 Q = Q4’18 Q = Q4’15 Q = Q4’12 • Historically, business destocking cycles have lasted ~2 quarters and were following by rapid restocking • We have seen a steep decline in demand as destocking was coupled with lower structural demand as well as the impact of lower-cost shipments of non-specialty products from Asia into Europe and North America NOTE: Trends based on Trinseo sales volumes |
|
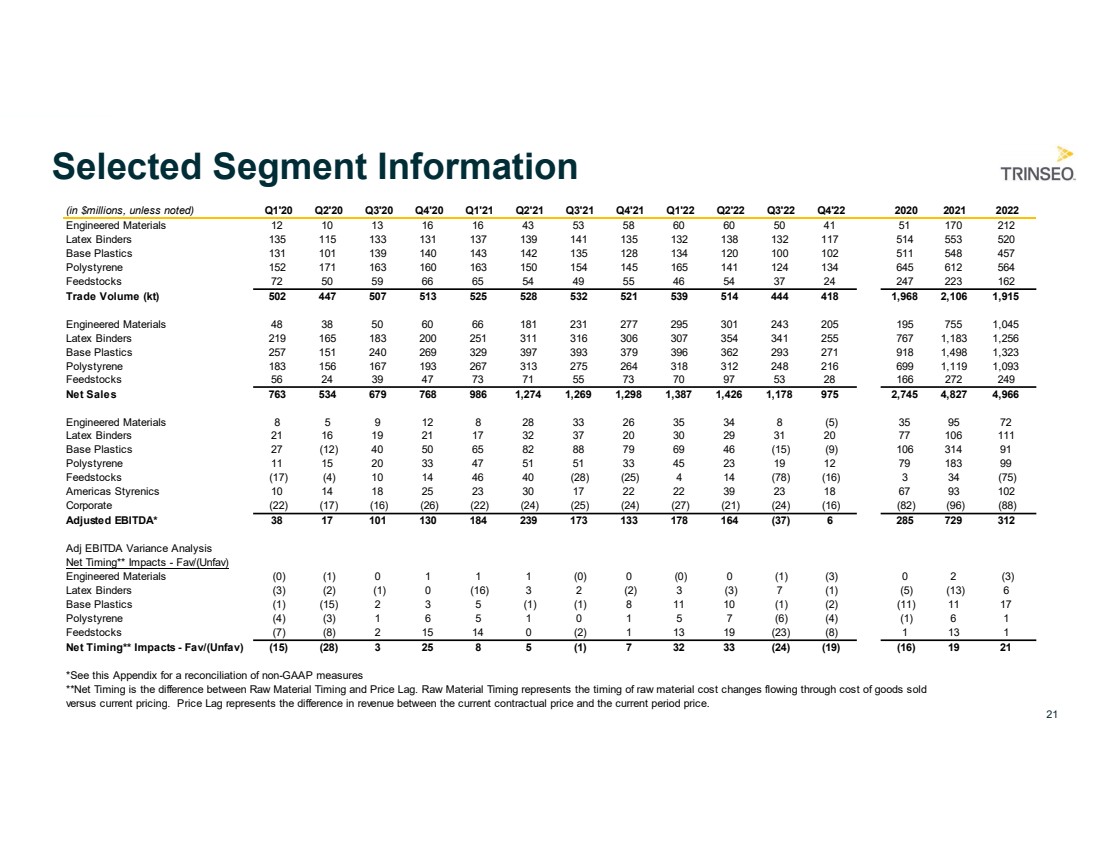
21 Selected Segment Information (in $millions, unless noted) Q1'20 Q2'20 Q3'20 Q4'20 Q1'21 Q2'21 Q3'21 Q4'21 Q1'22 Q2'22 Q3'22 Q4'22 2020 2021 2022 Engineered Materials 12 10 13 16 16 43 53 58 60 60 50 41 51 170 212 Latex Binders 135 115 133 131 137 139 141 135 132 138 132 117 514 553 520 Base Plastics 131 101 139 140 143 142 135 128 134 120 100 102 511 548 457 Polystyrene 152 171 163 160 163 150 154 145 165 141 124 134 645 612 564 Feedstocks 72 50 59 66 65 54 49 55 46 54 37 24 247 223 162 Trade Volume (kt) 502 447 507 513 525 528 532 521 539 514 444 418 1,968 2,106 1,915 Engineered Materials 48 38 50 60 66 181 231 277 295 301 243 205 195 755 1,045 Latex Binders 219 165 183 200 251 311 316 306 307 354 341 255 767 1,183 1,256 Base Plastics 257 151 240 269 329 397 393 379 396 362 293 271 918 1,498 1,323 Polystyrene 183 156 167 193 267 313 275 264 318 312 248 216 699 1,119 1,093 Feedstocks 56 24 39 47 73 71 55 73 70 97 53 28 166 272 249 Net Sales 763 534 679 768 986 1,274 1,269 1,298 1,387 1,426 1,178 975 2,745 4,827 4,966 Engineered Materials 8 5 9 12 8 28 33 26 35 34 8 (5) 35 95 72 Latex Binders 21 16 19 21 17 32 37 20 30 29 31 20 77 106 111 Base Plastics 27 (12) 40 50 65 82 88 79 69 46 (15) (9) 106 314 91 Polystyrene 11 15 20 33 47 51 51 33 45 23 19 12 79 183 99 Feedstocks (17) (4) 10 14 46 40 (28) (25) 4 14 (78) (16) 3 34 (75) Americas Styrenics 10 14 18 25 23 30 17 22 22 39 23 18 67 93 102 Corporate (22) (17) (16) (26) (22) (24) (25) (24) (27) (21) (24) (16) (82) (96) (88) Adjusted EBITDA* 38 17 101 130 184 239 173 133 178 164 (37) 6 285 729 312 Adj EBITDA Variance Analysis Net Timing** Impacts - Fav/(Unfav) Engineered Materials (0) (1) 0 1 1 1 (0) 0 (0) 0 (1) (3) 0 2 (3) Latex Binders (3) (2) (1) 0 (16) 3 2 (2) 3 (3) 7 (1) (5) (13) 6 Base Plastics (1) (15) 2 3 5 (1) (1) 8 11 10 (1) (2) (11) 11 17 Polystyrene (4) (3) 1 6 5 1 0 1 5 7 (6) (4) (1) 6 1 Feedstocks (7) (8) 2 15 14 0 (2) 1 13 19 (23) (8) 1 13 1 Net Timing** Impacts - Fav/(Unfav) (15) (28) 3 25 8 5 (1) 7 32 33 (24) (19) (16) 19 21 *See this Appendix for a reconciliation of non-GAAP measures **Net Timing is the difference between Raw Material Timing and Price Lag. Raw Material Timing represents the timing of raw material cost changes flowing through cost of goods sold versus current pricing. Price Lag represents the difference in revenue between the current contractual price and the current period price. |
|
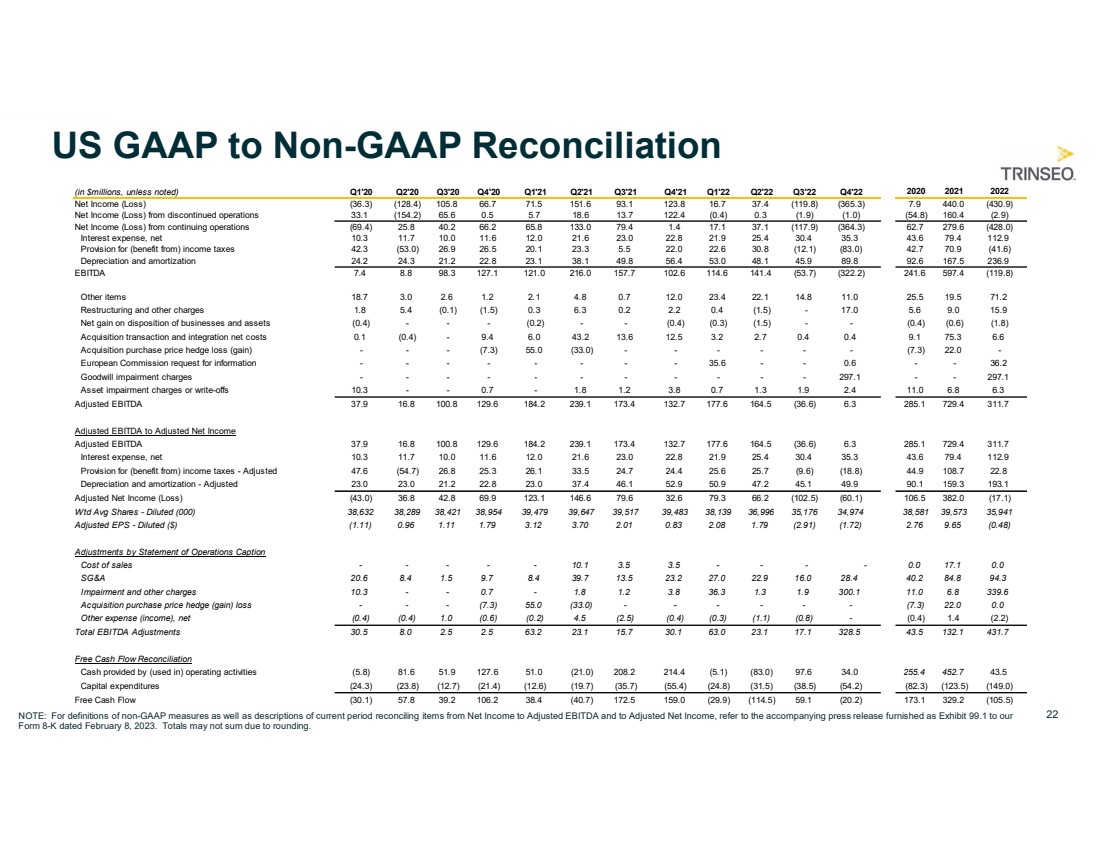
22 US GAAP to Non-GAAP Reconciliation NOTE: For definitions of non-GAAP measures as well as descriptions of current period reconciling items from Net Income to Adjusted EBITDA and to Adjusted Net Income, refer to the accompanying press release furnished as Exhibit 99.1 to our Form 8-K dated February 8, 2023. Totals may not sum due to rounding. (in $millions, unless noted) Q1'20 Q2'20 Q3'20 Q4'20 Q1'21 Q2'21 Q3'21 Q4'21 Q1'22 Q2'22 Q3'22 Q4'22 2020 2021 2022 Net Income (Loss) (36.3) (128.4) 105.8 66.7 71.5 151.6 93.1 123.8 16.7 37.4 (119.8) (365.3) 7.9 440.0 (430.9) Net Income (Loss) from discontinued operations 33.1 (154.2) 65.6 0.5 5.7 18.6 13.7 122.4 (0.4) 0.3 (1.9) (1.0) (54.8) 160.4 (2.9) Net Income (Loss) from continuing operations (69.4) 25.8 40.2 66.2 65.8 133.0 79.4 1.4 17.1 37.1 (117.9) (364.3) 62.7 279.6 (428.0) Interest expense, net 10.3 11.7 10.0 11.6 12.0 21.6 23.0 22.8 21.9 25.4 30.4 35.3 43.6 79.4 112.9 Provision for (benefit from) income taxes 42.3 (53.0) 26.9 26.5 20.1 23.3 5.5 22.0 22.6 30.8 (12.1) (83.0) 42.7 70.9 (41.6) Depreciation and amortization 24.2 24.3 21.2 22.8 23.1 38.1 49.8 56.4 53.0 48.1 45.9 89.8 92.6 167.5 236.9 EBITDA 7.4 8.8 98.3 127.1 121.0 216.0 157.7 102.6 114.6 141.4 (53.7) (322.2) 241.6 597.4 (119.8) Other items 18.7 3.0 2.6 1.2 2.1 4.8 0.7 12.0 23.4 22.1 14.8 11.0 25.5 19.5 71.2 Restructuring and other charges 1.8 5.4 (0.1) (1.5) 0.3 6.3 0.2 2.2 0.4 (1.5) - 17.0 5.6 9.0 15.9 Net gain on disposition of businesses and assets (0.4) - - - (0.2) - - (0.4) (0.3) (1.5) - - (0.4) (0.6) (1.8) Acquisition transaction and integration net costs 0.1 (0.4) - 9.4 6.0 43.2 13.6 12.5 3.2 2.7 0.4 0.4 9.1 75.3 6.6 Acquisition purchase price hedge loss (gain) - - - (7.3) 55.0 (33.0) - - - - - - (7.3) 22.0 - European Commission request for information - - - - - - - - 35.6 - - 0.6 - - 36.2 Goodwill impairment charges - - - - - - - - - - - 297.1 - - 297.1 Asset impairment charges or write-offs 10.3 - - 0.7 - 1.8 1.2 3.8 0.7 1.3 1.9 2.4 11.0 6.8 6.3 Adjusted EBITDA 37.9 16.8 100.8 129.6 184.2 239.1 173.4 132.7 177.6 164.5 (36.6) 6.3 285.1 729.4 311.7 Adjusted EBITDA to Adjusted Net Income Adjusted EBITDA 37.9 16.8 100.8 129.6 184.2 239.1 173.4 132.7 177.6 164.5 (36.6) 6.3 285.1 729.4 311.7 Interest expense, net 10.3 11.7 10.0 11.6 12.0 21.6 23.0 22.8 21.9 25.4 30.4 35.3 43.6 79.4 112.9 Provision for (benefit from) income taxes - Adjusted 47.6 (54.7) 26.8 25.3 26.1 33.5 24.7 24.4 25.6 25.7 (9.6) (18.8) 44.9 108.7 22.8 Depreciation and amortization - Adjusted 23.0 23.0 21.2 22.8 23.0 37.4 46.1 52.9 50.9 47.2 45.1 49.9 90.1 159.3 193.1 Adjusted Net Income (Loss) (43.0) 36.8 42.8 69.9 123.1 146.6 79.6 32.6 79.3 66.2 (102.5) (60.1) 106.5 382.0 (17.1) Wtd Avg Shares - Diluted (000) 38,632 38,289 38,421 38,954 39,479 39,647 39,517 39,483 38,139 36,996 35,176 34,974 38,581 39,573 35,941 Adjusted EPS - Diluted ($) (1.11) 0.96 1.11 1.79 3.12 3.70 2.01 0.83 2.08 1.79 (2.91) (1.72) 2.76 9.65 (0.48) Adjustments by Statement of Operations Caption Cost of sales - - - - - 10.1 3.5 3.5 - - - - 0.0 17.1 0.0 SG&A 20.6 8.4 1.5 9.7 8.4 39.7 13.5 23.2 27.0 22.9 16.0 28.4 40.2 84.8 94.3 Impairment and other charges 10.3 - - 0.7 - 1.8 1.2 3.8 36.3 1.3 1.9 300.1 11.0 6.8 339.6 Acquisition purchase price hedge (gain) loss - - - (7.3) 55.0 (33.0) - - - - - - (7.3) 22.0 0.0 Other expense (income), net (0.4) (0.4) 1.0 (0.6) (0.2) 4.5 (2.5) (0.4) (0.3) (1.1) (0.8) - (0.4) 1.4 (2.2) Total EBITDA Adjustments 30.5 8.0 2.5 2.5 63.2 23.1 15.7 30.1 63.0 23.1 17.1 328.5 43.5 132.1 431.7 Free Cash Flow Reconciliation Cash provided by (used in) operating activities (5.8) 81.6 51.9 127.6 51.0 (21.0) 208.2 214.4 (5.1) (83.0) 97.6 34.0 255.4 452.7 43.5 Capital expenditures (24.3) (23.8) (12.7) (21.4) (12.6) (19.7) (35.7) (55.4) (24.8) (31.5) (38.5) (54.2) (82.3) (123.5) (149.0) Free Cash Flow (30.1) 57.8 39.2 106.2 38.4 (40.7) 172.5 159.0 (29.9) (114.5) 59.1 (20.2) 173.1 329.2 (105.5) |
|
23 US GAAP to Non-GAAP Reconciliation (1) Reconciling items to Adjusted EBITDA and Adjusted Net Income (Loss) are not typically forecasted by the Company based on their nature as being primarily driven by transactions that are not part of the core operations of the business and, as a result, cannot be estimated without unreasonable cost or uncertainty. For potential reconciling items to Adjusted EBITDA and Adjusted Net Income (Loss) during 2023 are not reflected. Profitability Outlook Cash Outlook NOTE: For definitions of non-GAAP measures as well as descriptions of current period reconciling items from Net Income (Loss) to Adjusted EBITDA and to Adjusted Net Income (Loss), refer to the accompanying press release furnished as Exhibit 99.1 to our Form 8-K dated February 8, 2023. Totals may not sum due to rounding. Year Ended (In $millions, unless noted) Dec 31, 2023 Adjusted EBITDA 375 - 425 Interest expense, net (150) Provision for income taxes (22) - (42) Depreciation and amortization (200) Reconciling items to Adjusted EBITDA(1) 0 Net Income (loss) from continuing operations 3 - 33 Reconciling items to Adjusted Net Income (Loss) (1) 0 Adjusted Net Income (Loss) 3 - 33 Weighted avg shares - diluted (MM) 36.5 EPS - diluted ($) 0.09 - 0.90 Adjusted EPS ($) 0.09 - 0.90 Year Ended Dec 31, 2023 Cash From Operations ~100 Capex ~(100) Free Cash Flow ~0 |