UNITED STATES
SECURITIES AND EXCHANGE COMMISSION
Washington, D.C. 20549
FORM 8-K
CURRENT REPORT
Pursuant to Section 13 or 15(d) of the Securities Exchange Act of 1934
Date of Report (Date of earliest event reported): November 2, 2022

TE CONNECTIVITY LTD.
(Exact name of registrant as specified in its charter)
Switzerland |
|
98-0518048 |
(Jurisdiction of Incorporation) |
|
(IRS Employer Identification Number) |
001-33260
(Commission File Number)
Mühlenstrasse 26, CH-8200 Schaffhausen
Switzerland
(Address of Principal Executive Offices, including Zip Code)
+41 (0)52 633 66 61
(Registrant’s telephone number, including Area Code)
Check the appropriate box below if the Form 8-K filing is intended to simultaneously satisfy the filing obligation of the registrant under any of the following provisions (see General Instruction A.2. below):
☐Written communications pursuant to Rule 425 under the Securities Act (17 CFR 230.425)
☐Soliciting material pursuant to Rule 14a-12 under the Exchange Act (17 CFR 240.14a-12)
☐Pre-commencement communications pursuant to Rule 14d-2(b) under the Exchange Act (17 CFR 240.14d-2(b))
☐Pre-commencement communications pursuant to Rule 13e-4(c) under the Exchange Act (17 CFR 240.13e-4(c))
Securities registered pursuant to Section 12(b) of the Act:
Title of each class |
|
Trading symbol |
|
Name of each exchange on which registered |
Common Shares, Par Value CHF 0.57 |
|
TEL |
|
New York Stock Exchange |
Indicate by check mark whether the registrant is an emerging growth company as defined in Rule 405 of the Securities Act of 1933 (§230.405 of this chapter) or Rule 12b-2 of the Securities Exchange Act of 1934 (§240.12b-2 of this chapter).
Emerging growth company ☐
If an emerging growth company, indicate by check mark if the registrant has elected not to use the extended transition period for complying with any new or revised financial accounting standards provided pursuant to Section 13(a) of the Exchange Act. ☐
Item 2.02. Results of Operations and Financial Condition
On November 2, 2022, TE Connectivity Ltd. (the “Company”) issued a press release reporting the Company’s fourth quarter and full year results for fiscal 2022. A copy of the press release is furnished as Exhibit 99.1 to this report and incorporated by reference in this Item 2.02.
Item 7.01. Regulation FD Disclosure
The Company will hold a conference call and webcast on November 2, 2022 (see information in the press release attached hereto as Exhibit 99.1 under “Conference Call and Webcast”). A copy of the slide materials to be discussed at the conference call and webcast is being furnished pursuant to Regulation FD as Exhibit 99.2 and is incorporated herein by reference, and the slide materials also can be accessed at the “Investors” section of the Company’s website (www.te.com).
Item 9.01. Financial Statements and Exhibits
(d) Exhibits
Exhibit |
|
Description |
|
|
|
99.1 |
|
|
|
|
|
99.2 |
|
Presentation - TE Connectivity Q4 2022 Earnings Call (November 2, 2022) |
|
|
|
104 |
|
Cover Page Interactive Data File (embedded within the Inline XBRL document) |
SIGNATURES
Pursuant to the requirements of the Securities Exchange Act of 1934, the Registrant has duly caused this report to be signed on its behalf by the undersigned hereunto duly authorized.
Exhibit 99.1
NEWS RELEASE

te.com
TE Connectivity announces fourth quarter and full year results for fiscal year 2022
Q4 sales and earnings per share exceed expectations with growth across all segments;
Fiscal year sales up 9% with double-digit EPS growth
SCHAFFHAUSEN, Switzerland – Nov. 2, 2022 – TE Connectivity Ltd. (NYSE: TEL) today reported results for the fourth quarter and fiscal year ended Sept. 30, 2022. Financial results include the impact of an additional week in the fourth quarter.
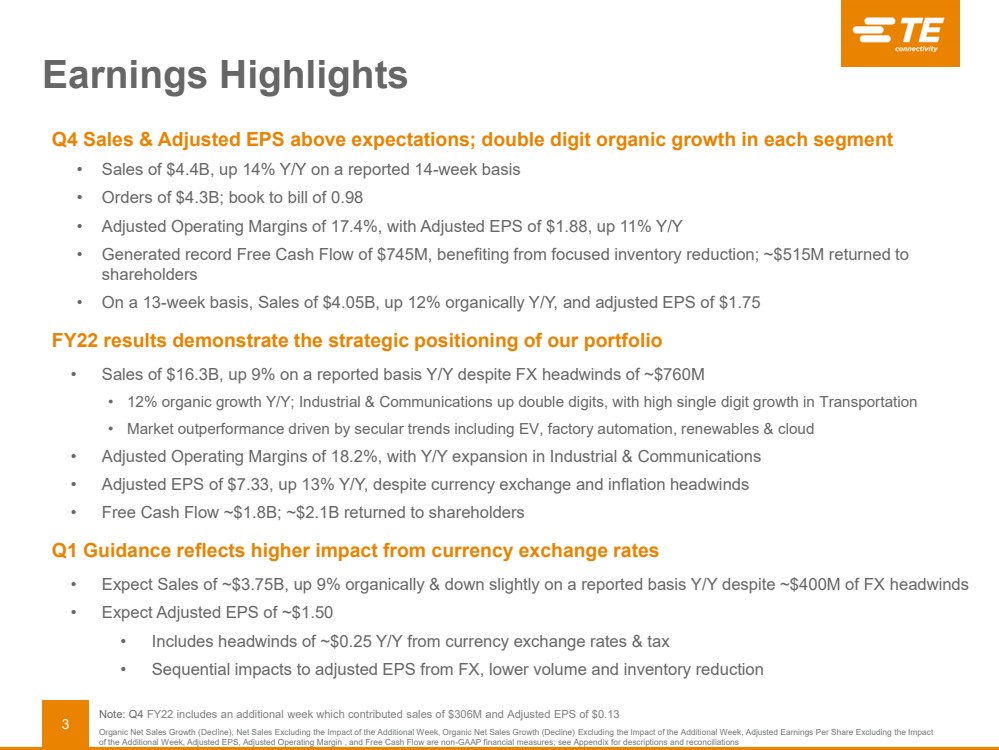
Fourth Quarter Highlights
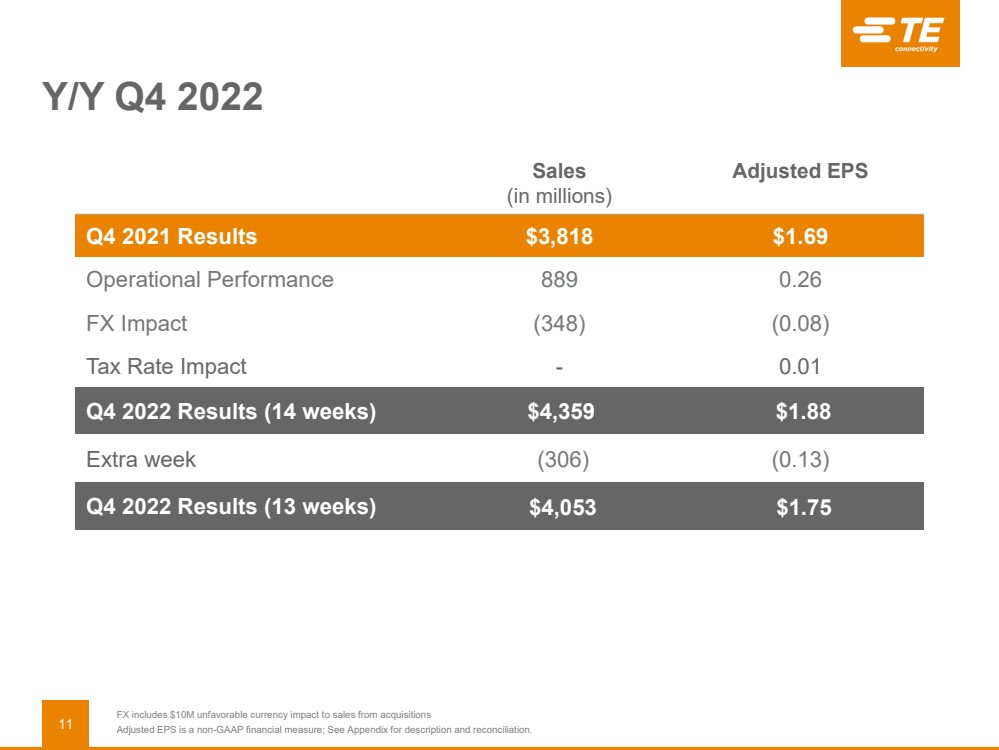
| ● | Net sales were $4.4 billion, up 14% on a reported basis and 21% organically year over year, with growth across all segments. On a comparable 13-week basis, sales were $4.05 billion. |
| ● | GAAP diluted earnings per share (EPS) from continuing operations were $2.21, and adjusted EPS were $1.88, an increase of 11% versus the prior year. |
| ● | Order levels were $4.3B with a book to bill of 0.98. |
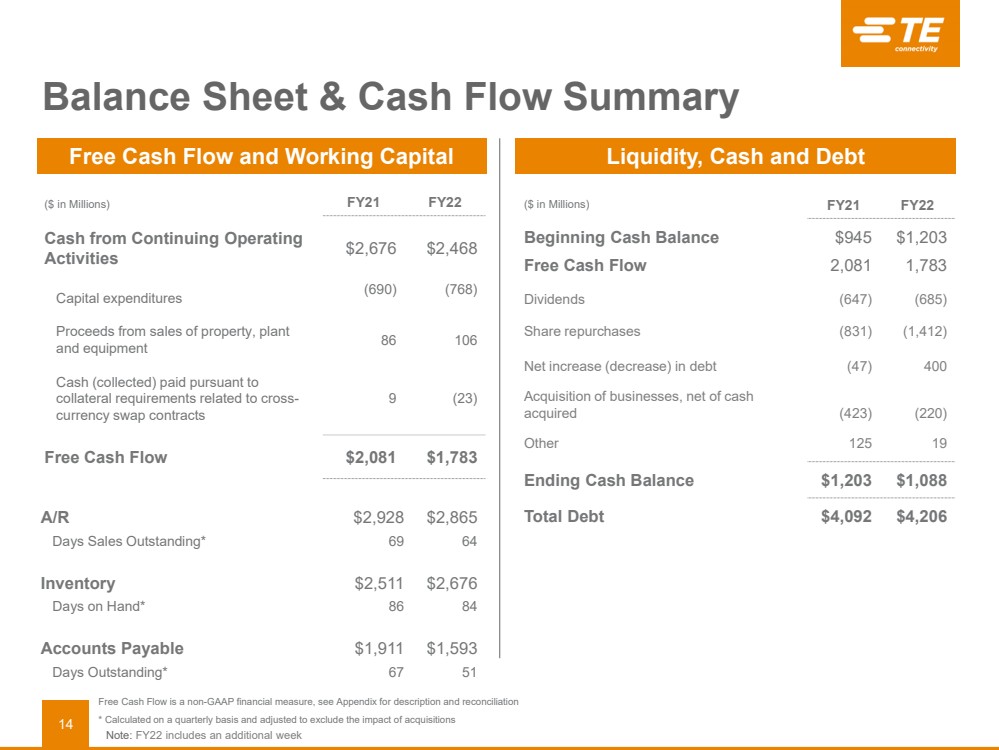
| ● | Record cash flow from operating activities of $944 million and record free cash flow of $745 million, continuing to demonstrate strong cash generation model. |
Full Year Highlights
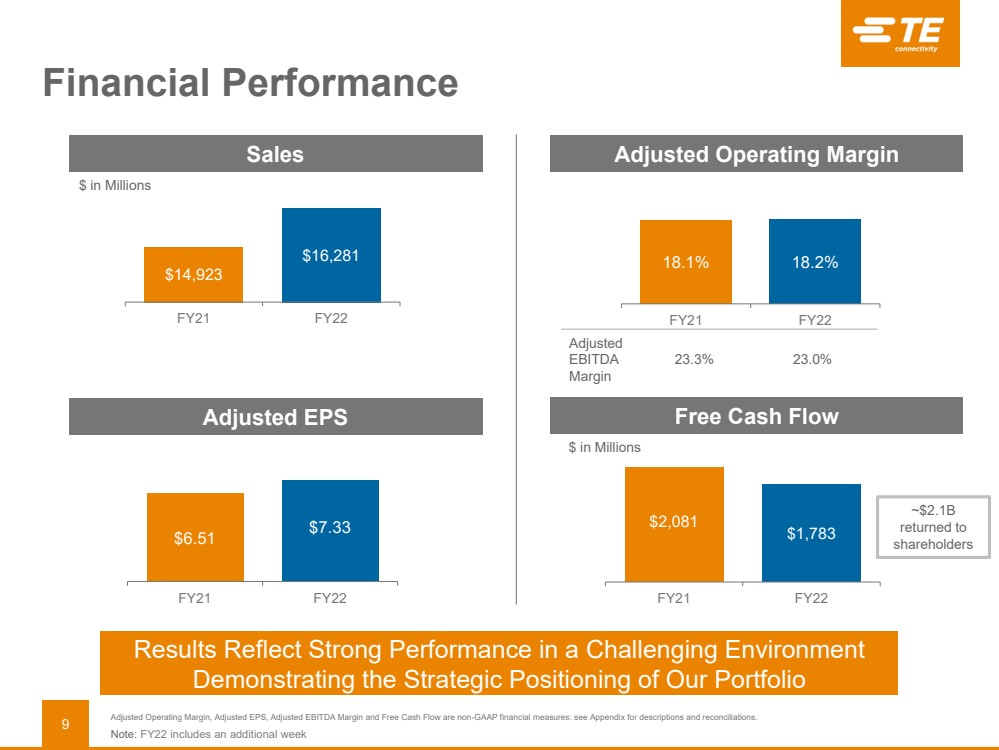
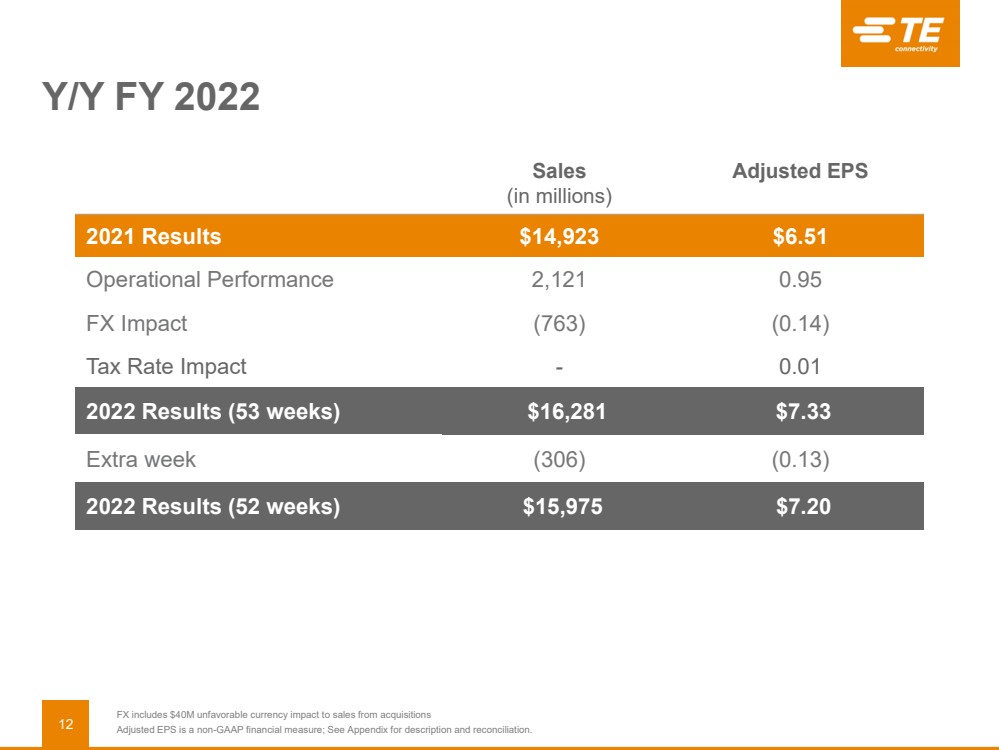
| ● | Net sales were a record at $16.3 billion, up 9% on a reported basis and 12% organically from fiscal year 2021. |
| ● | GAAP EPS from continuing operations were $7.47, up 10% year over year, and adjusted EPS were $7.33, up 13% versus fiscal year 2021, both a company record. |
| ● | Year-over-year margin expansion in Industrial and Communications segments. |
| ● | Cash flow from operating activities was $2.5 billion and free cash flow was $1.8 billion, with approximately $2.1 billion returned to shareholders. |
“Our strong finish and record performance in fiscal 2022 were due to both the strategic positioning of our portfolio and the ability of our global teams to continue executing in a dynamic macro environment. For the full year, we delivered double-digit organic growth, including growth in all segments, as well as double-digit EPS growth,” said TE Connectivity CEO Terrence Curtin. “We remain focused on innovating with our customers around the world to enhance our leadership position in long term growth and sustainability trends including electric vehicles, cloud computing, renewable energy and factory automation applications.

Our order and backlog trends remain favorable, and while we may experience cyclicality in certain markets from broader macro challenges as we enter 2023, we are confident that we are well positioned to capitalize on long-term trends that will drive future growth and value for our owners while creating a safer, sustainable, productive and connected world.”
First Quarter FY23 Outlook
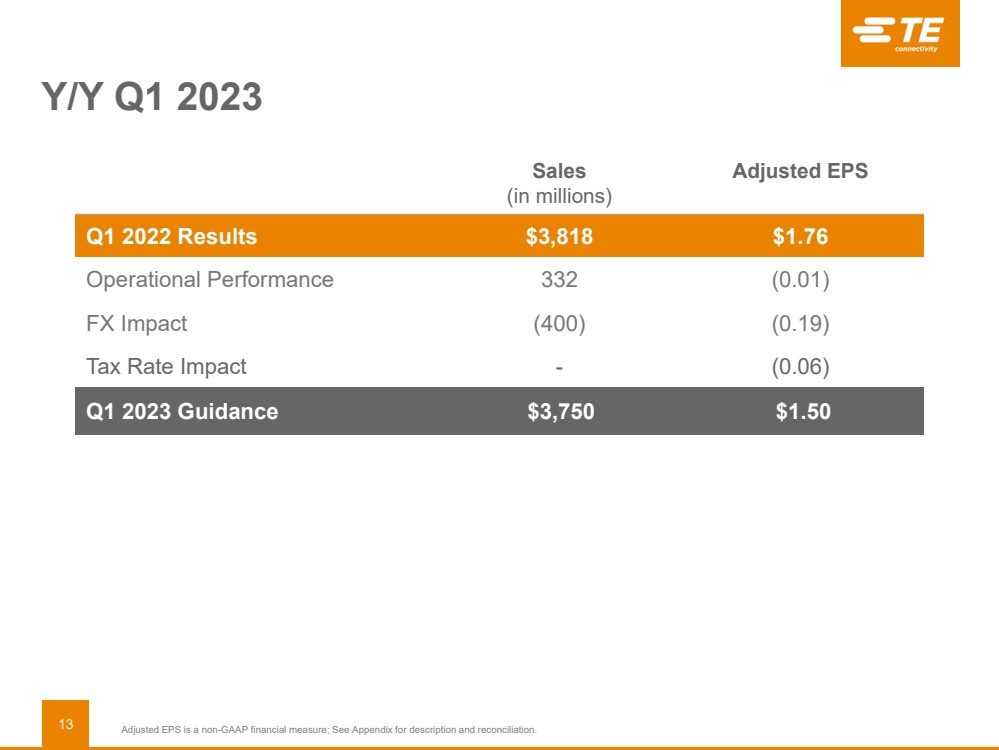
For the first quarter of fiscal 2023, the company expects net sales of approximately $3.75 billion, reflecting a decrease of 2% on a reported basis and an increase of 9% on an organic basis year over year. GAAP EPS from continuing operations are expected to be approximately $1.31, with adjusted EPS of approximately $1.50.
Information about TE Connectivity's use of non-GAAP financial measures is provided below. For reconciliations of these non-GAAP financial measures, see the attached tables.
Conference Call and Webcast
The company will hold a conference call today beginning at 8:30 a.m. ET. The dial-in information is provided here:
| ● | At TE Connectivity's website: investors.te.com |
| ● | By telephone: For both "listen-only" participants and those participants who wish to take part in the question-and-answer portion of the call, the dial-in number in the United States is (888) 330-3417 and for international callers, the dial-in number is (646) 960-0804 |
| ● | A replay of the conference call will be available on TE Connectivity’s investor website at investors.te.com at 11:30 a.m. ET on Nov. 2, 2022. |
About TE Connectivity
TE Connectivity Ltd. (NYSE: TEL) is a global industrial technology leader creating a safer, sustainable, productive, and connected future. Our broad range of connectivity and sensor solutions, proven in the harshest environments, enable advancements in transportation, industrial applications, medical technology, energy, data communications, and the home. With more than 85,000 employees, including over 8,000 engineers, working alongside customers in approximately 140 countries, TE ensures that EVERY CONNECTION COUNTS. Learn more at www.te.com and on LinkedIn, Facebook, WeChat and Twitter.
Non-GAAP Financial Measures
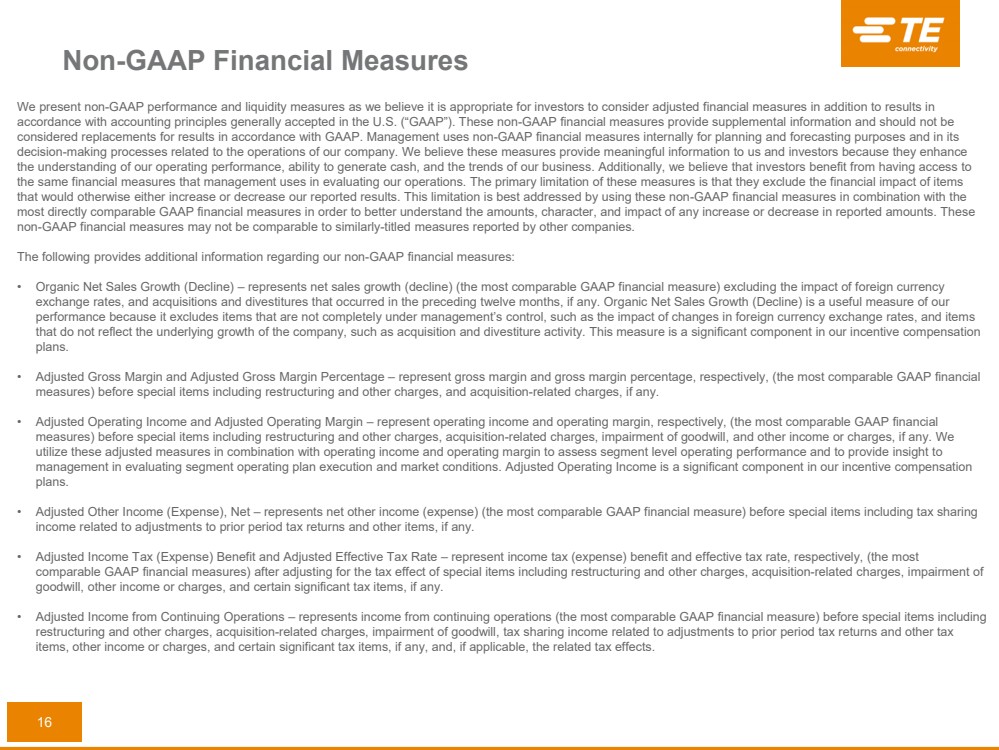
We present non-GAAP performance and liquidity measures as we believe it is appropriate for investors to consider adjusted financial measures in addition to results in accordance with accounting principles generally accepted in the U.S. (“GAAP”). These non-GAAP financial measures provide supplemental information and should not be considered replacements for results in accordance with GAAP. Management uses non-GAAP financial measures internally for planning and forecasting purposes and in its decision-making processes related to the operations of our company. We believe these measures provide meaningful information to us and investors because they enhance the understanding of our operating performance, ability to generate cash, and the trends of our business. Additionally, we believe that investors benefit from having access to the same financial measures that management uses in evaluating our operations. The primary limitation of these measures is that they exclude the financial impact of items that would otherwise either increase or decrease our reported results. This limitation is best addressed by using these non-GAAP financial measures in combination with the most directly comparable GAAP financial measures in order to better understand the amounts, character, and impact of any increase or decrease in reported amounts. These non-GAAP financial measures may not be comparable to similarly-titled measures reported by other companies.
The following provides additional information regarding our non-GAAP financial measures:
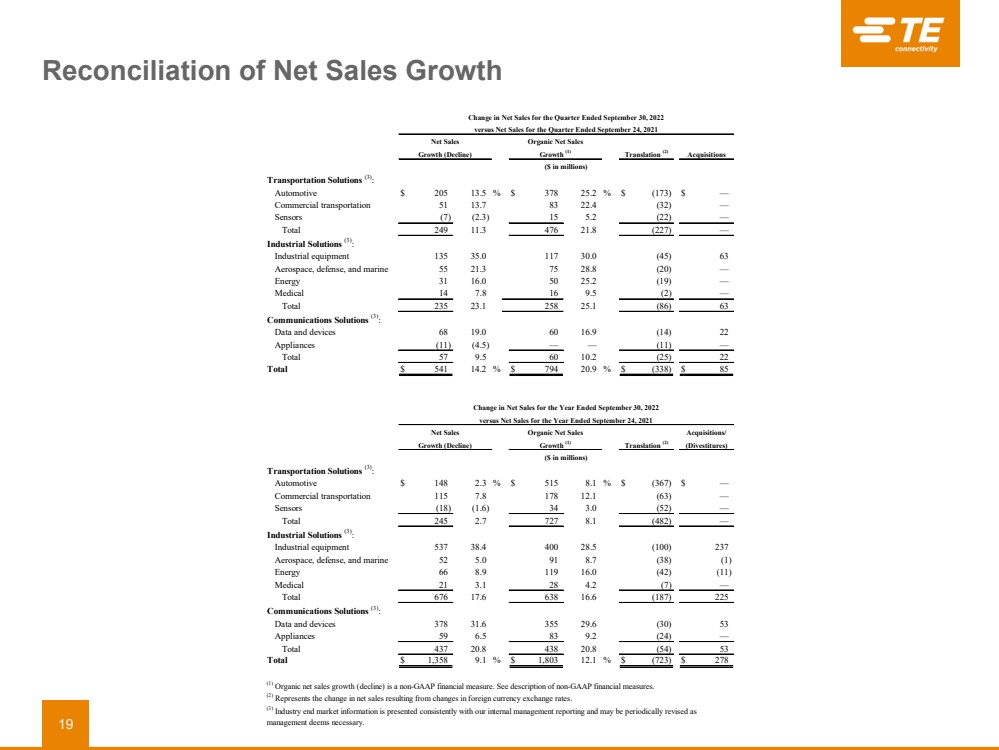
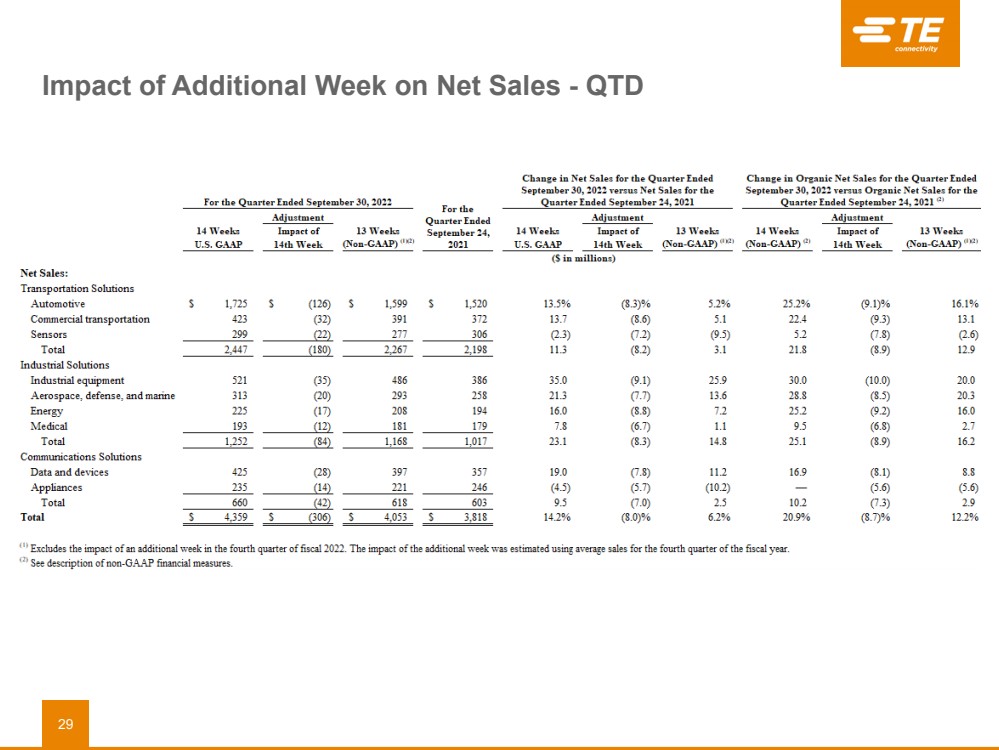
•Organic Net Sales Growth (Decline) – represents net sales growth (decline) (the most comparable GAAP financial measure) excluding the impact of foreign currency exchange rates, and acquisitions and divestitures that occurred in the preceding twelve months, if any. Organic Net Sales Growth (Decline) is a useful measure of our performance because it excludes items that are not completely under management’s control, such as the impact of changes in foreign currency exchange rates, and items that do not reflect the underlying growth of the company, such as acquisition and divestiture activity. This measure is a significant component in our incentive compensation plans.
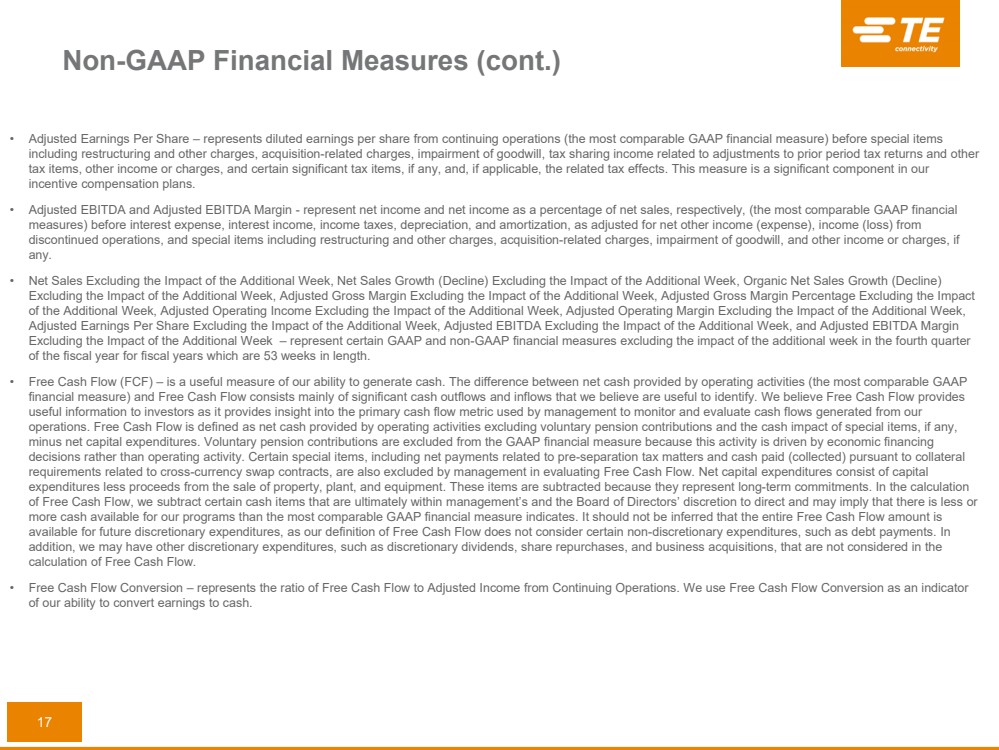
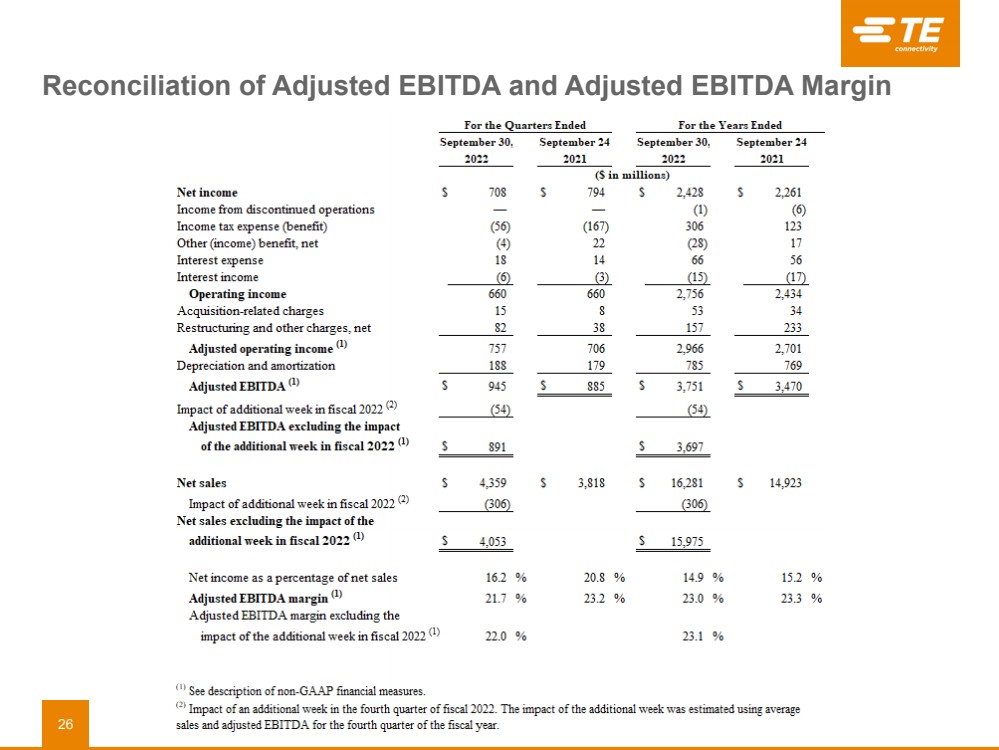
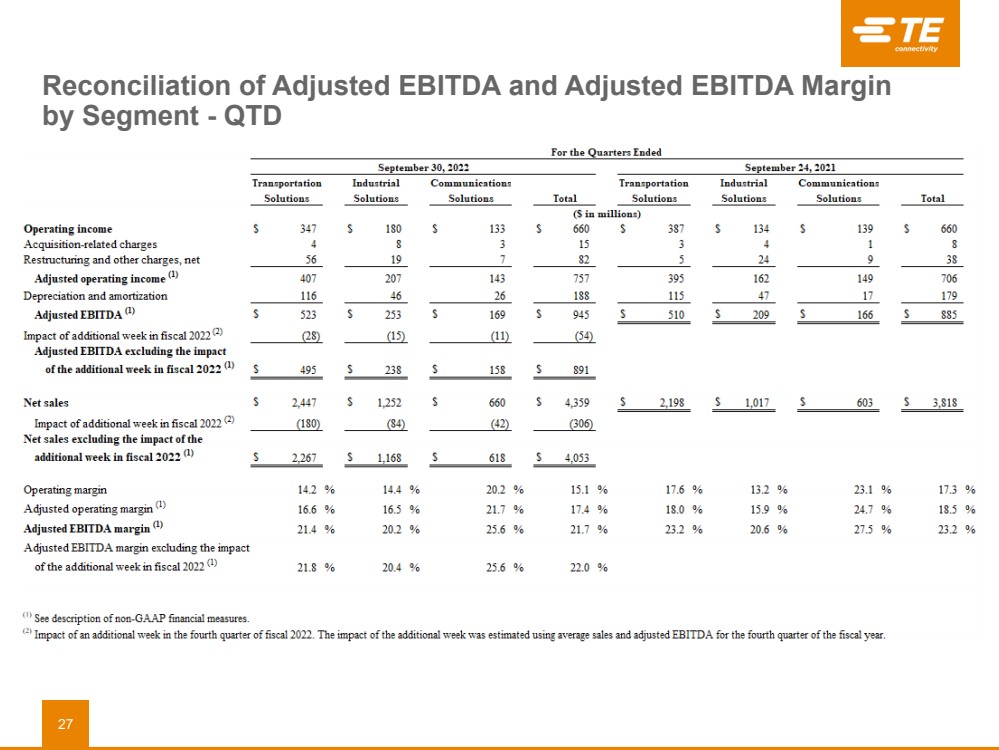
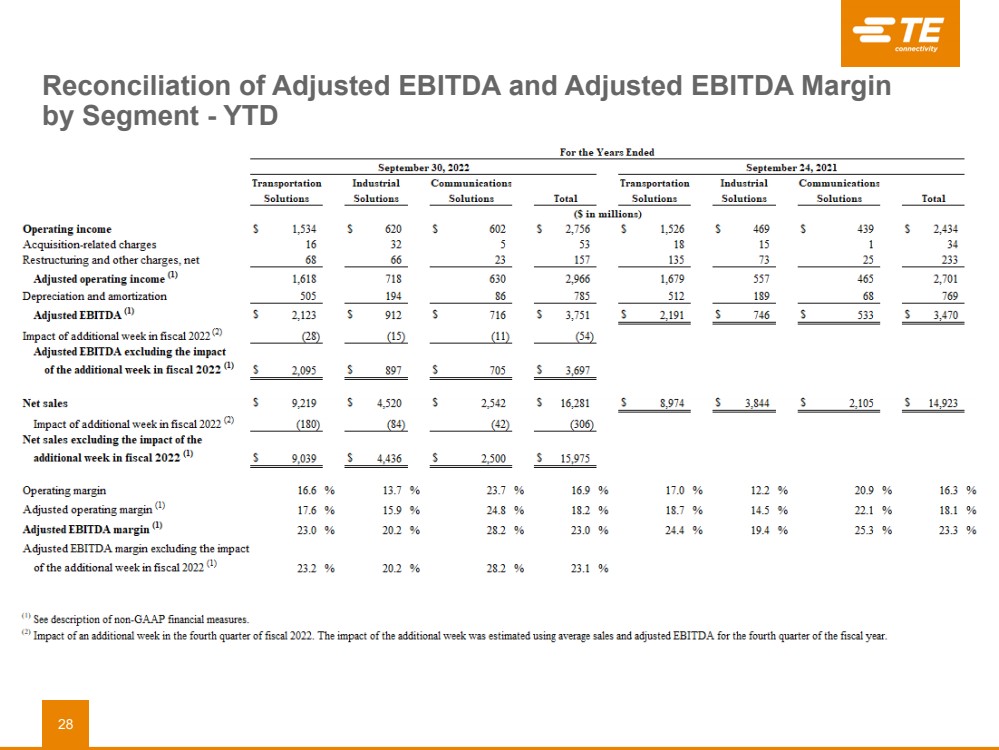
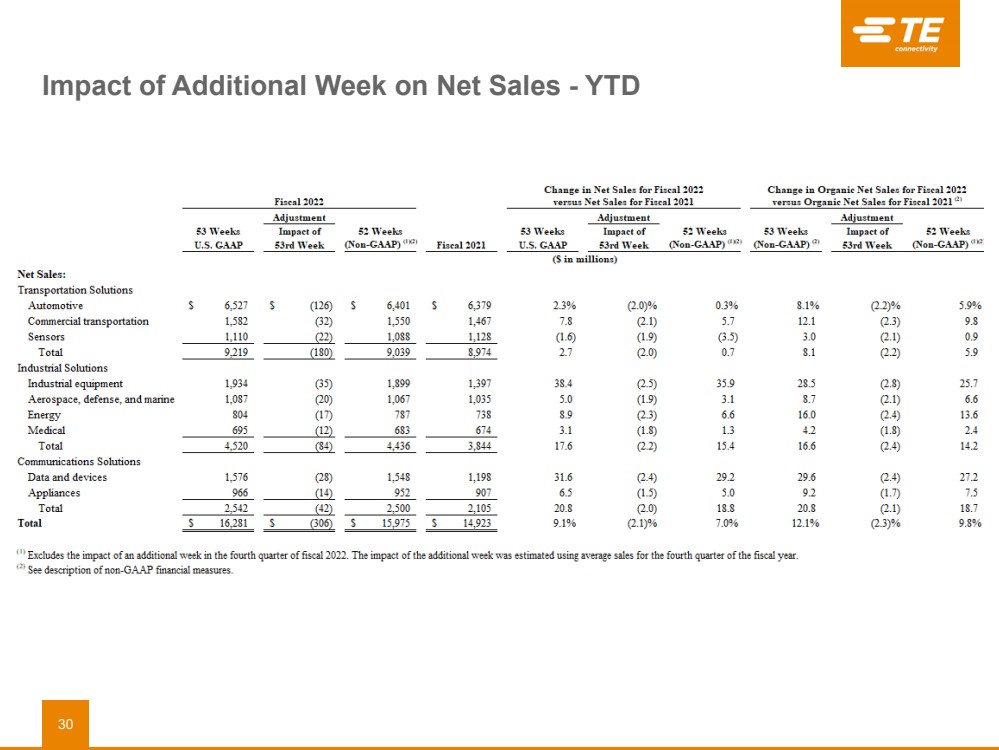
•Net Sales Excluding the Impact of the Additional Week – represents net sales excluding the impact of the additional week in the fourth quarter of the fiscal year for fiscal years which are 53 weeks in length. The impact of the additional week was estimated using average sales for the fourth quarter of the fiscal year.
•Adjusted Operating Income and Adjusted Operating Margin – represent operating income and operating margin, respectively, (the most comparable GAAP financial measures) before special items including restructuring and other charges, acquisition-related charges, impairment of goodwill, and other income or charges, if any. We utilize these adjusted measures in combination with operating income and operating margin to assess segment level operating performance and to provide insight to management in evaluating segment operating plan execution and market conditions. Adjusted Operating Income is a significant component in our incentive compensation plans.
•Adjusted Other Income (Expense), Net – represents net other income (expense) (the most comparable GAAP financial measure) before special items including tax sharing income related to adjustments to prior period tax returns and other items, if any.
•Adjusted Income Tax (Expense) Benefit and Adjusted Effective Tax Rate – represent income tax (expense) benefit and effective tax rate, respectively, (the most comparable GAAP financial measures) after adjusting for the tax effect of special items including restructuring and other charges, acquisition-related charges, impairment of goodwill, other income or charges, and certain significant tax items, if any.
•Adjusted Income from Continuing Operations – represents income from continuing operations (the most comparable GAAP financial measure) before special items including restructuring and other charges, acquisition-related charges, impairment of goodwill, tax sharing income related to adjustments to prior period tax returns and other tax items, other income or charges, and certain significant tax items, if any, and, if applicable, the related tax effects.
•Adjusted Earnings Per Share – represents diluted earnings per share from continuing operations (the most comparable GAAP financial measure) before special items including restructuring and other charges, acquisition-related charges, impairment of goodwill, tax sharing income related to adjustments to prior period tax returns and other tax items, other income or charges, and certain significant tax items, if any, and, if applicable, the related tax effects. This measure is a significant component in our incentive compensation plans.
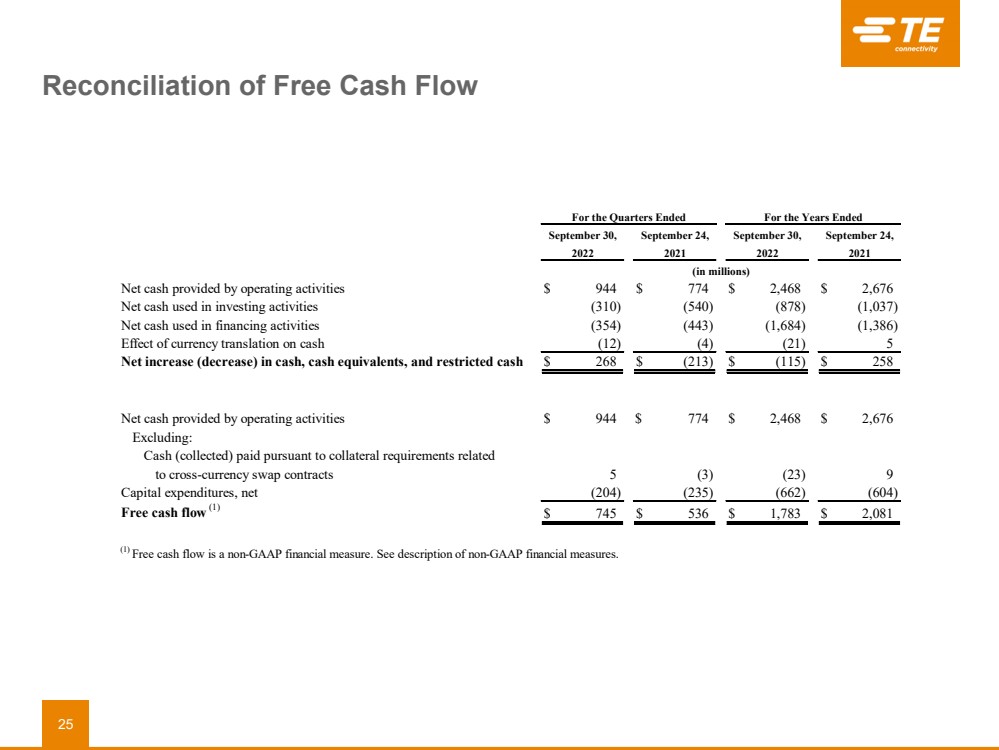
•Free Cash Flow (FCF) – is a useful measure of our ability to generate cash. The difference between net cash provided by operating activities (the most comparable GAAP financial measure) and Free Cash Flow consists mainly of significant cash outflows and inflows that we believe are useful to identify. We believe Free Cash Flow provides useful information to investors as it provides insight into the primary cash flow metric used by management to monitor and evaluate cash flows generated from our operations. Free Cash Flow is defined as net cash provided by operating activities excluding voluntary pension contributions and the cash impact of special items, if any, minus net capital expenditures. Voluntary pension contributions are excluded from the GAAP financial measure because this activity is driven by economic financing decisions rather than operating activity. Certain special items, including net payments related to pre-separation tax matters and cash paid (collected) pursuant to collateral requirements related to cross-currency swap contracts, are also excluded by management in evaluating Free Cash Flow. Net capital expenditures consist of capital expenditures less proceeds from the sale of property, plant, and equipment. These items are subtracted because they represent long-term commitments. In the calculation of Free Cash Flow, we subtract certain cash items that are ultimately within management’s and the Board of Directors’ discretion to direct and may imply that there is less or more cash available for our programs than the most comparable GAAP financial measure indicates. It should not be inferred that the entire Free Cash Flow amount is available for future discretionary expenditures, as our definition of Free Cash Flow does not consider certain non-discretionary expenditures, such as debt payments. In addition, we may have other discretionary expenditures, such as discretionary dividends, share repurchases, and business acquisitions, that are not considered in the calculation of Free Cash Flow.
Forward-Looking Statements
This release contains certain "forward-looking statements" within the meaning of the U.S. Private Securities Litigation Reform Act of 1995. These statements are based on management's current expectations and are subject to risks, uncertainty and changes in circumstances, which may cause actual results, performance, financial condition or achievements to differ materially from anticipated results, performance, financial condition or achievements. All statements contained herein that are not clearly historical in nature are forward-looking and the words "anticipate," "believe," "expect," "estimate," "plan," and similar expressions are generally intended to identify forward-looking statements. We have no intention and are under no obligation to update or alter (and expressly disclaim any such intention or obligation to do so) our forward-looking statements whether as a result of new information, future events or otherwise, except to the extent required by law. The forward-looking statements in this release include statements addressing our future financial condition and operating results, and the impact on our operations resulting from the coronavirus disease 2019 (“COVID-19”).
Examples of factors that could cause actual results to differ materially from those described in the forward-looking statements include, among others, the extent, severity and duration of COVID-19 negatively affecting our business operations; business, economic, competitive and regulatory risks, such as conditions affecting demand for products in the automotive and other industries we serve; competition and pricing pressure; fluctuations in foreign currency exchange rates and commodity prices; natural disasters and political, economic and military instability in countries in which we operate, including continuing military conflict between Russia and Ukraine resulting from Russia’s invasion of Ukraine or escalating tensions in surrounding countries; developments in the credit markets; future goodwill impairment; compliance with current and future environmental and other laws and regulations; and the possible effects on us of changes in tax laws, tax treaties and other legislation, including the effects of Swiss tax reform. In addition, the extent to which COVID-19 will impact our business and our financial results will depend on future developments, which are highly uncertain and cannot be predicted. Such developments may include the geographic spread of the virus, the severity of the virus, the duration of the outbreak, the impact on our suppliers’ and customers’ supply chains, the actions that may be taken by various governmental authorities in response to the outbreak in jurisdictions in which we operate, and the possible impact on the global economy and local economies in which we operate. More detailed information about these and other factors is set forth in TE Connectivity Ltd.'s Annual Report on Form 10-K for the fiscal year ended Sept. 24, 2021 as well as in our Quarterly Reports on Form 10-Q, Current Reports on Form 8-K and other reports filed by us with the U.S. Securities and Exchange Commission.
# # #
Contacts: |
Media Relations: Rachel Quimby TE Connectivity 610-893-9593 Rachel.Quimby@te.com |
Investor Relations: Sujal Shah TE Connectivity 610-893-9790 Sujal.Shah@te.com |
# # #
TE CONNECTIVITY LTD.
CONSOLIDATED STATEMENTS OF OPERATIONS (UNAUDITED)
|
For the Quarters Ended |
|
For the Years Ended |
||||||||
|
September 30, |
|
September 24, |
|
September 30, |
|
September 24, |
||||
|
2022 |
|
2021 |
|
2022 |
|
2021 |
||||
|
(in millions, except per share data) |
||||||||||
Net sales |
$ |
4,359 |
|
$ |
3,818 |
|
$ |
16,281 |
|
$ |
14,923 |
Cost of sales |
|
3,010 |
|
|
2,555 |
|
|
11,037 |
|
|
10,036 |
Gross margin |
|
1,349 |
|
|
1,263 |
|
|
5,244 |
|
|
4,887 |
Selling, general, and administrative expenses |
|
412 |
|
|
384 |
|
|
1,584 |
|
|
1,512 |
Research, development, and engineering expenses |
|
179 |
|
|
173 |
|
|
718 |
|
|
677 |
Acquisition and integration costs |
|
16 |
|
|
8 |
|
|
45 |
|
|
31 |
Restructuring and other charges, net |
|
82 |
|
|
38 |
|
|
141 |
|
|
233 |
Operating income |
|
660 |
|
|
660 |
|
|
2,756 |
|
|
2,434 |
Interest income |
|
6 |
|
|
3 |
|
|
15 |
|
|
17 |
Interest expense |
|
(18) |
|
|
(14) |
|
|
(66) |
|
|
(56) |
Other income (expense), net |
|
4 |
|
|
(22) |
|
|
28 |
|
|
(17) |
Income from continuing operations before income taxes |
|
652 |
|
|
627 |
|
|
2,733 |
|
|
2,378 |
Income tax (expense) benefit |
|
56 |
|
|
167 |
|
|
(306) |
|
|
(123) |
Income from continuing operations |
|
708 |
|
|
794 |
|
|
2,427 |
|
|
2,255 |
Income from discontinued operations, net of income taxes |
|
— |
|
|
— |
|
|
1 |
|
|
6 |
Net income |
$ |
708 |
|
$ |
794 |
|
$ |
2,428 |
|
$ |
2,261 |
|
|
|
|
|
|
|
|
|
|
|
|
Basic earnings per share: |
|
|
|
|
|
|
|
|
|
|
|
Income from continuing operations |
$ |
2.22 |
|
$ |
2.42 |
|
$ |
7.51 |
|
$ |
6.83 |
Income from discontinued operations |
|
— |
|
|
— |
|
|
— |
|
|
0.02 |
Net income |
|
2.22 |
|
|
2.42 |
|
|
7.52 |
|
|
6.85 |
|
|
|
|
|
|
|
|
|
|
|
|
Diluted earnings per share: |
|
|
|
|
|
|
|
|
|
|
|
Income from continuing operations |
$ |
2.21 |
|
$ |
2.40 |
|
$ |
7.47 |
|
$ |
6.77 |
Income from discontinued operations |
|
— |
|
|
— |
|
|
— |
|
|
0.02 |
Net income |
|
2.21 |
|
|
2.40 |
|
|
7.47 |
|
|
6.79 |
|
|
|
|
|
|
|
|
|
|
|
|
Weighted-average number of shares outstanding: |
|
|
|
|
|
|
|
|
|
|
|
Basic |
|
319 |
|
|
328 |
|
|
323 |
|
|
330 |
Diluted |
|
321 |
|
|
331 |
|
|
325 |
|
|
333 |
TE CONNECTIVITY LTD.
CONSOLIDATED BALANCE SHEETS (UNAUDITED)
|
September 30, |
|
September 24, |
||
|
2022 |
|
2021 |
||
|
(in millions, except share data) |
||||
Assets |
|
|
|
|
|
Current assets: |
|
|
|
|
|
Cash and cash equivalents |
$ |
1,088 |
|
$ |
1,203 |
Accounts receivable, net of allowance for doubtful accounts of $45 and $41, respectively |
|
2,865 |
|
|
2,928 |
Inventories |
|
2,676 |
|
|
2,511 |
Prepaid expenses and other current assets |
|
639 |
|
|
621 |
Total current assets |
|
7,268 |
|
|
7,263 |
Property, plant, and equipment, net |
|
3,567 |
|
|
3,778 |
Goodwill |
|
5,258 |
|
|
5,590 |
Intangible assets, net |
|
1,288 |
|
|
1,549 |
Deferred income taxes |
|
2,498 |
|
|
2,499 |
Other assets |
|
903 |
|
|
783 |
Total assets |
$ |
20,782 |
|
$ |
21,462 |
Liabilities, redeemable noncontrolling interests, and shareholders' equity |
|
|
|
|
|
Current liabilities: |
|
|
|
|
|
Short-term debt |
$ |
914 |
|
$ |
503 |
Accounts payable |
|
1,593 |
|
|
1,911 |
Accrued and other current liabilities |
|
2,125 |
|
|
2,242 |
Total current liabilities |
|
4,632 |
|
|
4,656 |
Long-term debt |
|
3,292 |
|
|
3,589 |
Long-term pension and postretirement liabilities |
|
695 |
|
|
1,139 |
Deferred income taxes |
|
244 |
|
|
181 |
Income taxes |
|
304 |
|
|
302 |
Other liabilities |
|
718 |
|
|
847 |
Total liabilities |
|
9,885 |
|
|
10,714 |
Commitments and contingencies |
|
|
|
|
|
Redeemable noncontrolling interests |
|
95 |
|
|
114 |
Shareholders' equity: |
|
|
|
|
|
Common shares, CHF 0.57 par value, 330,830,781 shares authorized and issued, and 336,099,881 shares authorized and issued, respectively |
|
146 |
|
|
148 |
Accumulated earnings |
|
12,832 |
|
|
11,709 |
Treasury shares, at cost, 12,749,540 and 9,060,919 shares, respectively |
|
(1,681) |
|
|
(1,055) |
Accumulated other comprehensive loss |
|
(495) |
|
|
(168) |
Total shareholders' equity |
|
10,802 |
|
|
10,634 |
Total liabilities, redeemable noncontrolling interests, and shareholders' equity |
$ |
20,782 |
|
$ |
21,462 |
TE CONNECTIVITY LTD.
CONSOLIDATED STATEMENTS OF CASH FLOWS (UNAUDITED)
|
For the Quarters Ended |
|
For the Years Ended |
||||||||
|
September 30, |
|
September 24, |
|
September 30, |
|
September 24, |
||||
|
2022 |
|
2021 |
|
2022 |
|
2021 |
||||
|
(in millions) |
||||||||||
Cash flows from operating activities: |
|
|
|
|
|
|
|
|
|
|
|
Net income |
$ |
708 |
|
$ |
794 |
|
$ |
2,428 |
|
$ |
2,261 |
Income from discontinued operations, net of income taxes |
|
— |
|
|
— |
|
|
(1) |
|
|
(6) |
Income from continuing operations |
|
708 |
|
|
794 |
|
|
2,427 |
|
|
2,255 |
Adjustments to reconcile income from continuing operations to net cash provided by operating activities: |
|
|
|
|
|
|
|
|
|
|
|
Depreciation and amortization |
|
188 |
|
|
179 |
|
|
785 |
|
|
769 |
Deferred income taxes |
|
(129) |
|
|
(292) |
|
|
(147) |
|
|
(354) |
Non-cash lease cost |
|
33 |
|
|
30 |
|
|
131 |
|
|
120 |
Provision for losses on accounts receivable and inventories |
|
(9) |
|
|
14 |
|
|
70 |
|
|
46 |
Share-based compensation expense |
|
31 |
|
|
21 |
|
|
119 |
|
|
94 |
Other |
|
42 |
|
|
(16) |
|
|
23 |
|
|
(61) |
Changes in assets and liabilities, net of the effects of acquisitions and divestitures: |
|
|
|
|
|
|
|
|
|
|
|
Accounts receivable, net |
|
308 |
|
|
120 |
|
|
200 |
|
|
(518) |
Inventories |
|
398 |
|
|
(74) |
|
|
(41) |
|
|
(556) |
Prepaid expenses and other current assets |
|
(7) |
|
|
(5) |
|
|
50 |
|
|
(19) |
Accounts payable |
|
(348) |
|
|
(86) |
|
|
(396) |
|
|
560 |
Accrued and other current liabilities |
|
(82) |
|
|
63 |
|
|
(398) |
|
|
173 |
Income taxes |
|
(21) |
|
|
45 |
|
|
32 |
|
|
106 |
Other |
|
(168) |
|
|
(19) |
|
|
(387) |
|
|
61 |
Net cash provided by operating activities |
|
944 |
|
|
774 |
|
|
2,468 |
|
|
2,676 |
Cash flows from investing activities: |
|
|
|
|
|
|
|
|
|
|
|
Capital expenditures |
|
(212) |
|
|
(236) |
|
|
(768) |
|
|
(690) |
Proceeds from sale of property, plant, and equipment |
|
8 |
|
|
1 |
|
|
106 |
|
|
86 |
Acquisition of businesses, net of cash acquired |
|
(104) |
|
|
(297) |
|
|
(220) |
|
|
(423) |
Other |
|
(2) |
|
|
(8) |
|
|
4 |
|
|
(10) |
Net cash used in investing activities |
|
(310) |
|
|
(540) |
|
|
(878) |
|
|
(1,037) |
Cash flows from financing activities: |
|
|
|
|
|
|
|
|
|
|
|
Net increase in commercial paper |
|
133 |
|
|
— |
|
|
370 |
|
|
— |
Proceeds from issuance of debt |
|
— |
|
|
— |
|
|
588 |
|
|
661 |
Repayment of debt |
|
— |
|
|
(2) |
|
|
(558) |
|
|
(708) |
Proceeds from exercise of share options |
|
20 |
|
|
37 |
|
|
54 |
|
|
167 |
Repurchase of common shares |
|
(326) |
|
|
(313) |
|
|
(1,412) |
|
|
(831) |
Payment of common share dividends to shareholders |
|
(179) |
|
|
(164) |
|
|
(685) |
|
|
(647) |
Other |
|
(2) |
|
|
(1) |
|
|
(41) |
|
|
(28) |
Net cash used in financing activities |
|
(354) |
|
|
(443) |
|
|
(1,684) |
|
|
(1,386) |
Effect of currency translation on cash |
|
(12) |
|
|
(4) |
|
|
(21) |
|
|
5 |
Net increase (decrease) in cash, cash equivalents, and restricted cash |
|
268 |
|
|
(213) |
|
|
(115) |
|
|
258 |
Cash, cash equivalents, and restricted cash at beginning of period |
|
820 |
|
|
1,416 |
|
|
1,203 |
|
|
945 |
Cash, cash equivalents, and restricted cash at end of period |
$ |
1,088 |
|
$ |
1,203 |
|
$ |
1,088 |
|
$ |
1,203 |
|
|
|
|
|
|
|
|
|
|
|
|
Supplemental cash flow information: |
|
|
|
|
|
|
|
|
|
|
|
Interest paid on debt, net |
$ |
19 |
|
$ |
18 |
|
$ |
58 |
|
$ |
58 |
Income taxes paid, net of refunds |
|
95 |
|
|
80 |
|
|
421 |
|
|
371 |
TE CONNECTIVITY LTD.
RECONCILIATION OF FREE CASH FLOW (UNAUDITED)
|
For the Quarters Ended |
|
For the Years Ended |
||||||||
|
September 30, |
|
September 24, |
|
September 30, |
|
September 24, |
||||
|
2022 |
|
2021 |
|
2022 |
|
2021 |
||||
|
(in millions) |
||||||||||
Net cash provided by operating activities |
$ |
944 |
|
$ |
774 |
|
$ |
2,468 |
|
$ |
2,676 |
Excluding: |
|
|
|
|
|
|
|
|
|
|
|
Cash (collected) paid pursuant to collateral requirements related to cross-currency swap contracts |
|
5 |
|
|
(3) |
|
|
(23) |
|
|
9 |
Capital expenditures, net |
|
(204) |
|
|
(235) |
|
|
(662) |
|
|
(604) |
Free cash flow (1) |
$ |
745 |
|
$ |
536 |
|
$ |
1,783 |
|
$ |
2,081 |
|
|
|
|
|
|
|
|
|
|
|
|
(1) Free cash flow is a non-GAAP financial measure. See description of non-GAAP financial measures. | |||||||||||
TE CONNECTIVITY LTD.
CONSOLIDATED SEGMENT DATA (UNAUDITED)
|
For the Quarters Ended |
|
|
For the Years Ended |
|
||||||||||||||||||
|
September 30, |
|
|
September 24, |
|
|
September 30, |
|
|
September 24, |
|
||||||||||||
|
2022 |
|
|
2021 |
|
|
2022 |
|
|
2021 |
|
||||||||||||
|
($ in millions) |
|
|||||||||||||||||||||
|
Net Sales |
|
|
|
|
Net Sales |
|
|
|
|
Net Sales |
|
|
|
|
Net Sales |
|
|
|
||||
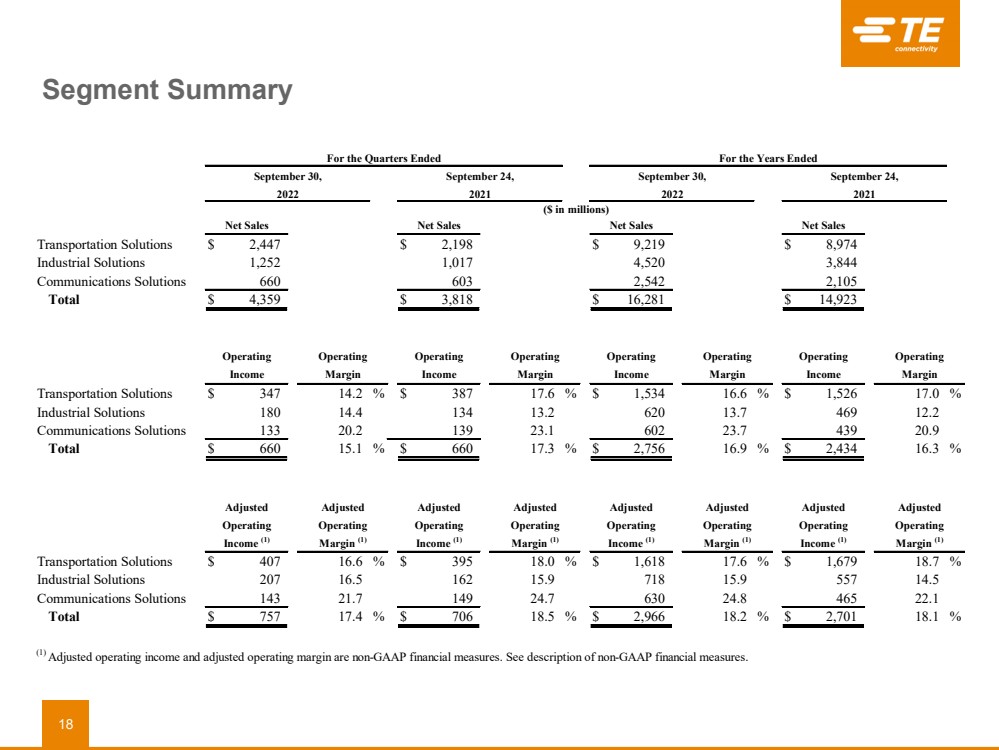
Transportation Solutions |
$ |
2,447 |
|
|
|
|
$ |
2,198 |
|
|
|
|
$ |
9,219 |
|
|
|
|
$ |
8,974 |
|
|
|
Industrial Solutions |
|
1,252 |
|
|
|
|
|
1,017 |
|
|
|
|
|
4,520 |
|
|
|
|
|
3,844 |
|
|
|
Communications Solutions |
|
660 |
|
|
|
|
|
603 |
|
|
|
|
|
2,542 |
|
|
|
|
|
2,105 |
|
|
|
Total |
$ |
4,359 |
|
|
|
|
$ |
3,818 |
|
|
|
|
$ |
16,281 |
|
|
|
|
$ |
14,923 |
|
|
|
|
|
|
|
|
|
|
|
|
|
|
|
|
|
|
|
|
|
|
|
|
|
|
|
|
|
|
|
|
|
|
|
|
|
|
|
|
|
|
|
|
|
|
|
|
|
|
|
|
Operating |
|
Operating |
|
Operating |
|
Operating |
|
Operating |
|
Operating |
|
Operating |
|
Operating |
||||||||
|
Income |
|
Margin |
|
Income |
|
Margin |
|
Income |
|
Margin |
|
Income |
|
Margin |
||||||||
Transportation Solutions |
$ |
347 |
|
14.2 |
% |
|
$ |
387 |
|
17.6 |
% |
|
$ |
1,534 |
|
16.6 |
% |
|
$ |
1,526 |
|
17.0 |
% |
Industrial Solutions |
|
180 |
|
14.4 |
|
|
|
134 |
|
13.2 |
|
|
|
620 |
|
13.7 |
|
|
|
469 |
|
12.2 |
|
Communications Solutions |
|
133 |
|
20.2 |
|
|
|
139 |
|
23.1 |
|
|
|
602 |
|
23.7 |
|
|
|
439 |
|
20.9 |
|
Total |
$ |
660 |
|
15.1 |
% |
|
$ |
660 |
|
17.3 |
% |
|
$ |
2,756 |
|
16.9 |
% |
|
$ |
2,434 |
|
16.3 |
% |
|
|
|
|
|
|
|
|
|
|
|
|
|
|
|
|
|
|
|
|
|
|
|
|
|
|
|
|
|
|
|
|
|
|
|
|
|
|
|
|
|
|
|
|
|
|
|
|
|
Adjusted |
|
Adjusted |
|
Adjusted |
|
Adjusted |
|
Adjusted |
|
Adjusted |
|
Adjusted |
|
Adjusted |
||||||||
|
Operating |
|
Operating |
|
Operating |
|
Operating |
|
Operating |
|
Operating |
|
Operating |
|
Operating |
||||||||
|
Income (1) |
|
Margin (1) |
|
Income (1) |
|
Margin (1) |
|
Income (1) |
|
Margin (1) |
|
Income (1) |
|
Margin (1) |
||||||||
Transportation Solutions |
$ |
407 |
|
16.6 |
% |
|
$ |
395 |
|
18.0 |
% |
|
$ |
1,618 |
|
17.6 |
% |
|
$ |
1,679 |
|
18.7 |
% |
Industrial Solutions |
|
207 |
|
16.5 |
|
|
|
162 |
|
15.9 |
|
|
|
718 |
|
15.9 |
|
|
|
557 |
|
14.5 |
|
Communications Solutions |
|
143 |
|
21.7 |
|
|
|
149 |
|
24.7 |
|
|
|
630 |
|
24.8 |
|
|
|
465 |
|
22.1 |
|
Total |
$ |
757 |
|
17.4 |
% |
|
$ |
706 |
|
18.5 |
% |
|
$ |
2,966 |
|
18.2 |
% |
|
$ |
2,701 |
|
18.1 |
% |
|
|
|
|
|
|
|
|
|
|
|
|
|
|
|
|
|
|
|
|
|
|
|
|
(1) Adjusted operating income and adjusted operating margin are non-GAAP financial measures. See description of non-GAAP financial measures. |
|
||||||||||||||||||||||
TE CONNECTIVITY LTD.
RECONCILIATION OF NET SALES GROWTH (DECLINE) (UNAUDITED)
|
Change in Net Sales for the Quarter Ended September 30, 2022 |
||||||||||||||||
|
versus Net Sales for the Quarter Ended September 24, 2021 |
||||||||||||||||
|
Net Sales |
|
|
Organic Net Sales |
|
|
|
|
|
||||||||
|
Growth (Decline) |
|
|
Growth (1) |
|
|
Translation (2) |
|
Acquisitions |
||||||||
|
($ in millions) |
||||||||||||||||
Transportation Solutions (3): |
|
|
|
|
|
|
|
|
|
|
|
|
|
|
|
|
|
Automotive |
$ |
205 |
|
13.5 |
% |
|
$ |
378 |
|
25.2 |
% |
|
$ |
(173) |
|
$ |
— |
Commercial transportation |
|
51 |
|
13.7 |
|
|
|
83 |
|
22.4 |
|
|
|
(32) |
|
|
— |
Sensors |
|
(7) |
|
(2.3) |
|
|
|
15 |
|
5.2 |
|
|
|
(22) |
|
|
— |
Total |
|
249 |
|
11.3 |
|
|
|
476 |
|
21.8 |
|
|
|
(227) |
|
|
— |
Industrial Solutions (3): |
|
|
|
|
|
|
|
|
|
|
|
|
|
|
|
|
|
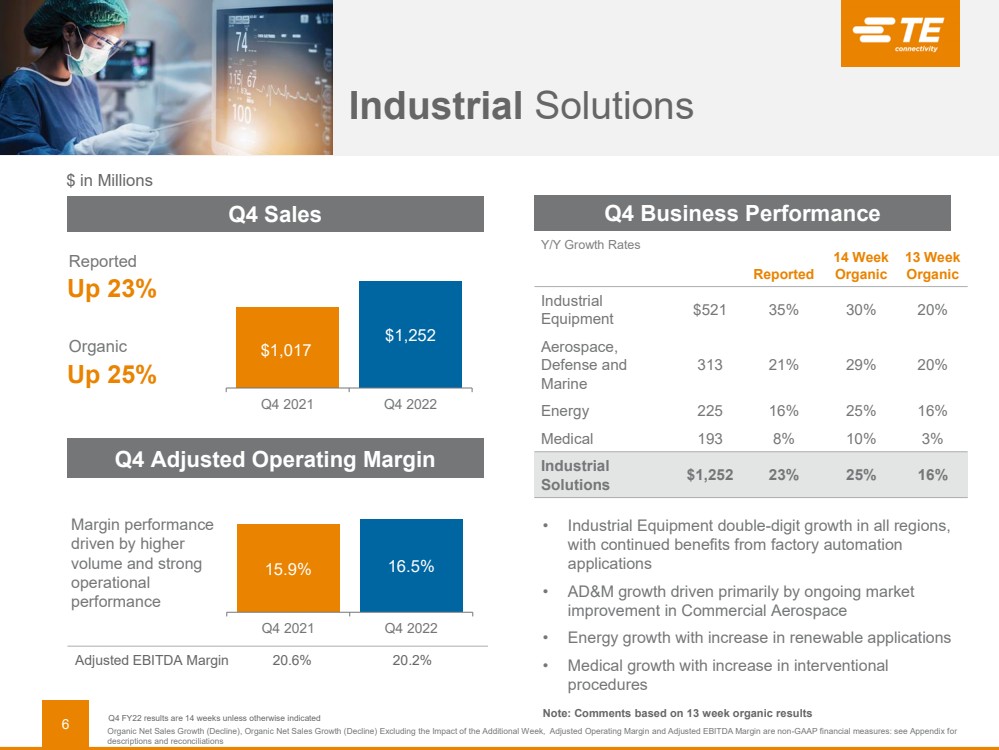
Industrial equipment |
|
135 |
|
35.0 |
|
|
|
117 |
|
30.0 |
|
|
|
(45) |
|
|
63 |
Aerospace, defense, and marine |
|
55 |
|
21.3 |
|
|
|
75 |
|
28.8 |
|
|
|
(20) |
|
|
— |
Energy |
|
31 |
|
16.0 |
|
|
|
50 |
|
25.2 |
|
|
|
(19) |
|
|
— |
Medical |
|
14 |
|
7.8 |
|
|
|
16 |
|
9.5 |
|
|
|
(2) |
|
|
— |
Total |
|
235 |
|
23.1 |
|
|
|
258 |
|
25.1 |
|
|
|
(86) |
|
|
63 |
Communications Solutions (3): |
|
|
|
|
|
|
|
|
|
|
|
|
|
|
|
|
|
Data and devices |
|
68 |
|
19.0 |
|
|
|
60 |
|
16.9 |
|
|
|
(14) |
|
|
22 |
Appliances |
|
(11) |
|
(4.5) |
|
|
|
— |
|
— |
|
|
|
(11) |
|
|
— |
Total |
|
57 |
|
9.5 |
|
|
|
60 |
|
10.2 |
|
|
|
(25) |
|
|
22 |
Total |
$ |
541 |
|
14.2 |
% |
|
$ |
794 |
|
20.9 |
% |
|
$ |
(338) |
|
$ |
85 |
|
Change in Net Sales for the Year Ended September 30, 2022 |
||||||||||||||||
|
versus Net Sales for the Year Ended September 24, 2021 |
||||||||||||||||
|
Net Sales |
|
|
Organic Net Sales |
|
|
|
|
Acquisitions/ |
||||||||
|
Growth (Decline) |
|
|
Growth (1) |
|
|
Translation (2) |
|
(Divestitures) |
||||||||
|
($ in millions) |
||||||||||||||||
Transportation Solutions (3): |
|
|
|
|
|
|
|
|
|
|
|
|
|
|
|
|
|
Automotive |
$ |
148 |
|
2.3 |
% |
|
$ |
515 |
|
8.1 |
% |
|
$ |
(367) |
|
$ |
— |
Commercial transportation |
|
115 |
|
7.8 |
|
|
|
178 |
|
12.1 |
|
|
|
(63) |
|
|
— |
Sensors |
|
(18) |
|
(1.6) |
|
|
|
34 |
|
3.0 |
|
|
|
(52) |
|
|
— |
Total |
|
245 |
|
2.7 |
|
|
|
727 |
|
8.1 |
|
|
|
(482) |
|
|
— |
Industrial Solutions (3): |
|
|
|
|
|
|
|
|
|
|
|
|
|
|
|
|
|
Industrial equipment |
|
537 |
|
38.4 |
|
|
|
400 |
|
28.5 |
|
|
|
(100) |
|
|
237 |
Aerospace, defense, and marine |
|
52 |
|
5.0 |
|
|
|
91 |
|
8.7 |
|
|
|
(38) |
|
|
(1) |
Energy |
|
66 |
|
8.9 |
|
|
|
119 |
|
16.0 |
|
|
|
(42) |
|
|
(11) |
Medical |
|
21 |
|
3.1 |
|
|
|
28 |
|
4.2 |
|
|
|
(7) |
|
|
— |
Total |
|
676 |
|
17.6 |
|
|
|
638 |
|
16.6 |
|
|
|
(187) |
|
|
225 |
Communications Solutions (3): |
|
|
|
|
|
|
|
|
|
|
|
|
|
|
|
|
|
Data and devices |
|
378 |
|
31.6 |
|
|
|
355 |
|
29.6 |
|
|
|
(30) |
|
|
53 |
Appliances |
|
59 |
|
6.5 |
|
|
|
83 |
|
9.2 |
|
|
|
(24) |
|
|
— |
Total |
|
437 |
|
20.8 |
|
|
|
438 |
|
20.8 |
|
|
|
(54) |
|
|
53 |
Total |
$ |
1,358 |
|
9.1 |
% |
|
$ |
1,803 |
|
12.1 |
% |
|
$ |
(723) |
|
$ |
278 |
|
|
|
|
|
|
|
|
|
|
|
|
|
|
|
|
|
|
(1) Organic net sales growth (decline) is a non-GAAP financial measure. See description of non-GAAP financial measures. | |||||||||||||||||
(2) Represents the change in net sales resulting from changes in foreign currency exchange rates. | |||||||||||||||||
(3) Industry end market information is presented consistently with our internal management reporting and may be periodically revised as management deems necessary. | |||||||||||||||||
TE CONNECTIVITY LTD.
RECONCILIATION OF NON-GAAP FINANCIAL MEASURES TO GAAP FINANCIAL MEASURES
For the Quarter Ended September 30, 2022
(UNAUDITED)
|
|
|
|
|
Adjustments |
|
|
|
|
|||||||
|
|
|
|
Acquisition- |
|
Restructuring |
|
|
|
|
|
|||||
|
|
|
|
Related |
|
and Other |
|
|
|
Adjusted |
|
|||||
|
U.S. GAAP |
|
|
Charges (1) |
|
Charges, Net (1) |
|
Tax Items (2) |
|
(Non-GAAP) (3) |
|
|||||
|
($ in millions, except per share data) |
|
||||||||||||||
Operating income: |
|
|
|
|
|
|
|
|
|
|
|
|
|
|
|
|
Transportation Solutions |
$ |
347 |
|
|
$ |
4 |
|
$ |
56 |
|
$ |
— |
|
$ |
407 |
|
Industrial Solutions |
|
180 |
|
|
|
8 |
|
|
19 |
|
|
— |
|
|
207 |
|
Communications Solutions |
|
133 |
|
|
|
3 |
|
|
7 |
|
|
— |
|
|
143 |
|
Total |
$ |
660 |
|
|
$ |
15 |
|
$ |
82 |
|
$ |
— |
|
$ |
757 |
|
|
|
|
|
|
|
|
|
|
|
|
|
|
|
|
|
|
Operating margin |
|
15.1 |
% |
|
|
|
|
|
|
|
|
|
|
|
17.4 |
% |
|
|
|
|
|
|
|
|
|
|
|
|
|
|
|
|
|
Other income, net |
$ |
4 |
|
|
$ |
— |
|
$ |
— |
|
$ |
— |
|
$ |
4 |
|
|
|
|
|
|
|
|
|
|
|
|
|
|
|
|
|
|
Income tax (expense) benefit |
$ |
56 |
|
|
$ |
(3) |
|
$ |
(16) |
|
$ |
(182) |
|
$ |
(145) |
|
|
|
|
|
|
|
|
|
|
|
|
|
|
|
|
|
|
Effective tax rate |
|
(8.6) |
% |
|
|
|
|
|
|
|
|
|
|
|
19.4 |
% |
|
|
|
|
|
|
|
|
|
|
|
|
|
|
|
|
|
Income from continuing operations |
$ |
708 |
|
|
$ |
12 |
|
$ |
66 |
|
$ |
(182) |
|
$ |
604 |
|
|
|
|
|
|
|
|
|
|
|
|
|
|
|
|
|
|
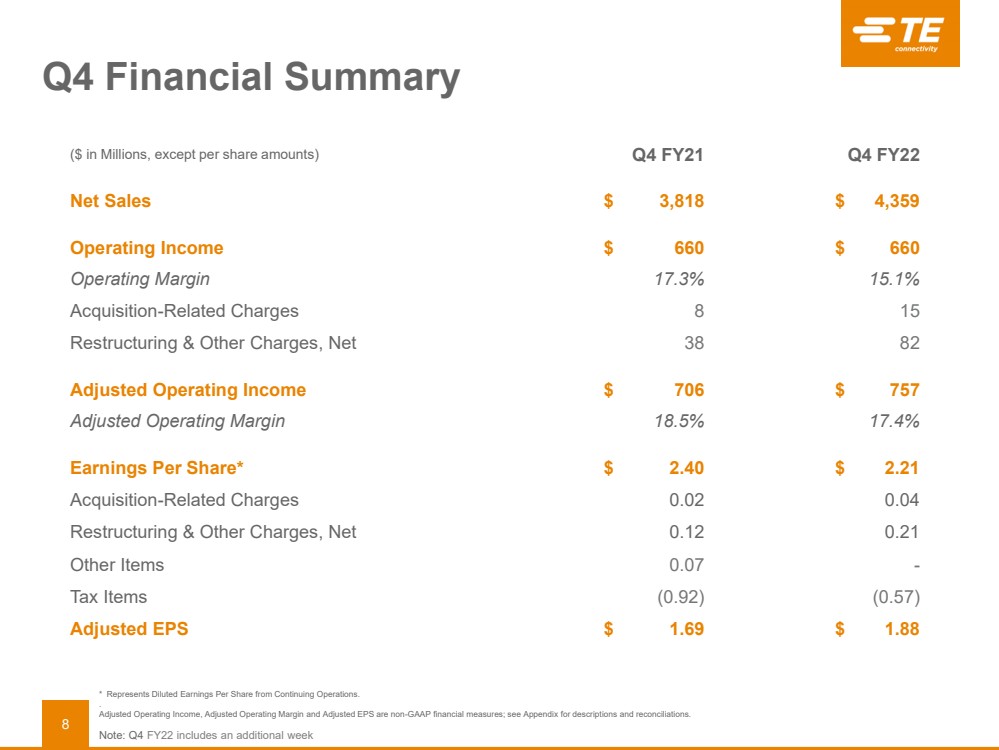
Diluted earnings per share from continuing operations |
$ |
2.21 |
|
|
$ |
0.04 |
|
$ |
0.21 |
|
$ |
(0.57) |
|
$ |
1.88 |
|
|
|
|
|
|
|
|
|
|
|
|
|
|
|
|
|
|
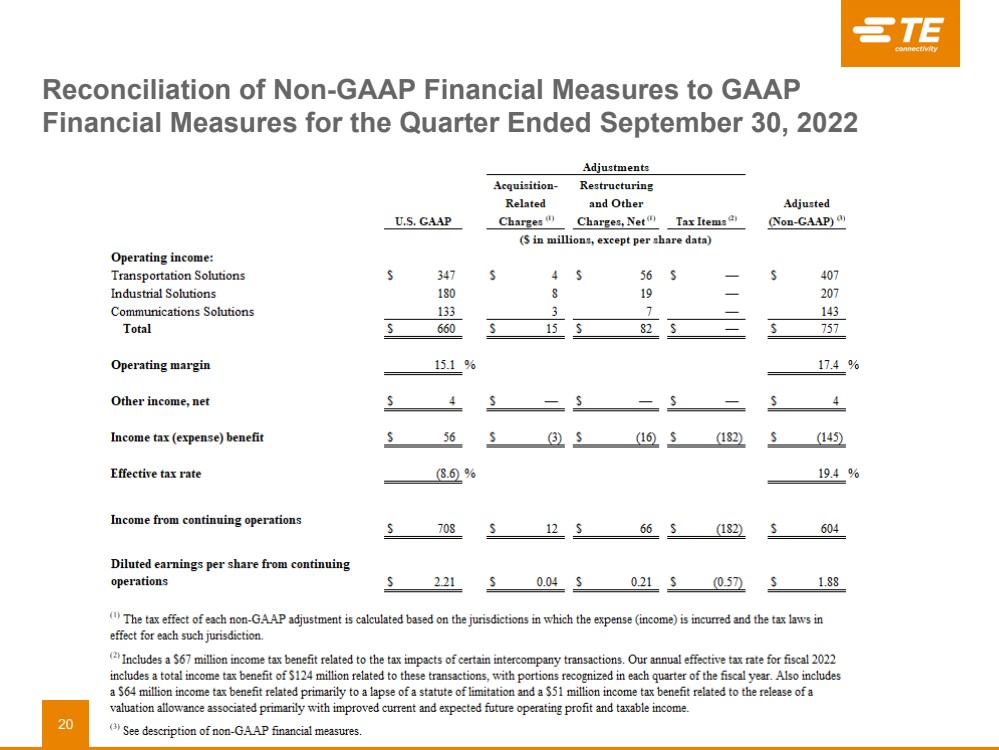
(1) The tax effect of each non-GAAP adjustment is calculated based on the jurisdictions in which the expense (income) is incurred and the tax laws in effect for each such jurisdiction. |
|
|||||||||||||||
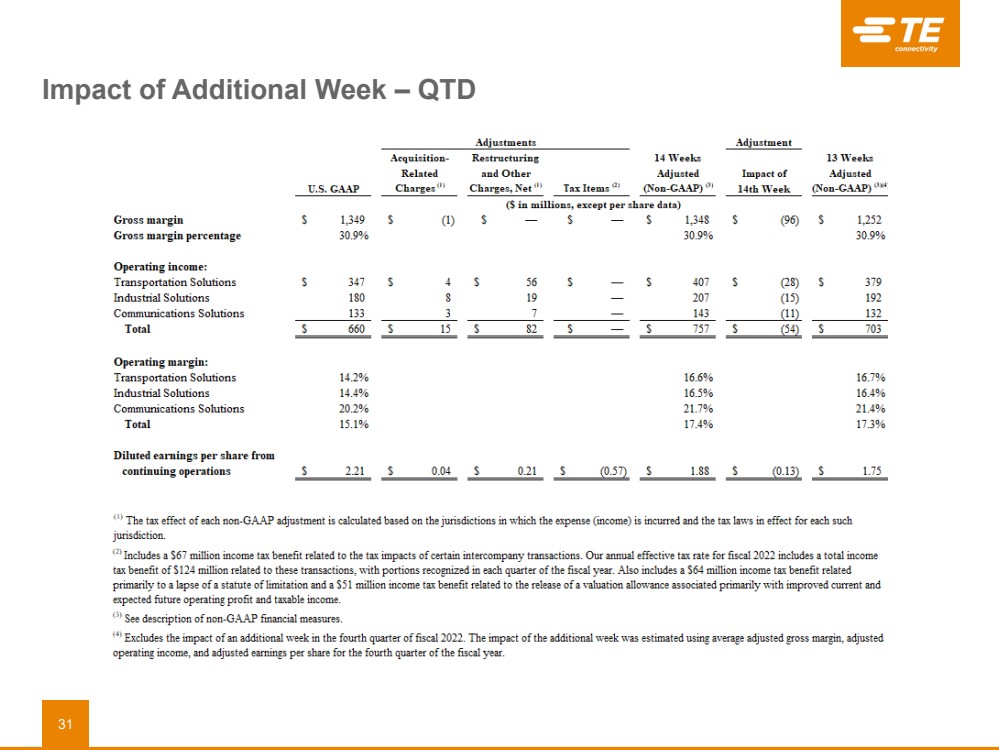
(2) Includes a $67 million income tax benefit related to the tax impacts of certain intercompany transactions. Our annual effective tax rate for fiscal 2022 includes a total income tax benefit of $124 million related to these transactions, with portions recognized in each quarter of the fiscal year. Also includes a $64 million income tax benefit related primarily to a lapse of a statute of limitation and a $51 million income tax benefit related to the release of a valuation allowance associated primarily with improved current and expected future operating profit and taxable income. |
|
|||||||||||||||
(3) See description of non-GAAP financial measures. |
|
|||||||||||||||
TE CONNECTIVITY LTD.
RECONCILIATION OF NON-GAAP FINANCIAL MEASURES TO GAAP FINANCIAL MEASURES
For the Quarter Ended September 24, 2021
(UNAUDITED)
|
|
|
|
|
Adjustments |
|
|
|
|
||||||||||
|
|
|
|
Acquisition- |
|
Restructuring |
|
|
|
|
|
|
|
||||||
|
|
|
|
Related |
|
and Other |
|
|
|
|
|
Adjusted |
|
||||||
|
U.S. GAAP |
|
|
Charges (1) |
|
Charges, Net (1) |
|
Other Items (1)(2) |
|
Tax Items (3) |
|
(Non-GAAP) (4) |
|
||||||
|
($ in millions, except per share data) |
|
|||||||||||||||||
Operating income: |
|
|
|
|
|
|
|
|
|
|
|
|
|
|
|
|
|
|
|
Transportation Solutions |
$ |
387 |
|
|
$ |
3 |
|
$ |
5 |
|
$ |
— |
|
$ |
— |
|
$ |
395 |
|
Industrial Solutions |
|
134 |
|
|
|
4 |
|
|
24 |
|
|
— |
|
|
— |
|
|
162 |
|
Communications Solutions |
|
139 |
|
|
|
1 |
|
|
9 |
|
|
— |
|
|
— |
|
|
149 |
|
Total |
$ |
660 |
|
|
$ |
8 |
|
$ |
38 |
|
$ |
— |
|
$ |
— |
|
$ |
706 |
|
|
|
|
|
|
|
|
|
|
|
|
|
|
|
|
|
|
|
|
|
Operating margin |
|
17.3 |
% |
|
|
|
|
|
|
|
|
|
|
|
|
|
|
18.5 |
% |
|
|
|
|
|
|
|
|
|
|
|
|
|
|
|
|
|
|
|
|
Other income (expense), net |
$ |
(22) |
|
|
$ |
— |
|
$ |
— |
|
$ |
28 |
|
$ |
— |
|
$ |
6 |
|
|
|
|
|
|
|
|
|
|
|
|
|
|
|
|
|
|
|
|
|
Income tax (expense) benefit |
$ |
167 |
|
|
$ |
(1) |
|
$ |
3 |
|
$ |
(6) |
|
$ |
(304) |
|
$ |
(141) |
|
|
|
|
|
|
|
|
|
|
|
|
|
|
|
|
|
|
|
|
|
Effective tax rate |
|
(26.6) |
% |
|
|
|
|
|
|
|
|
|
|
|
|
|
|
20.1 |
% |
|
|
|
|
|
|
|
|
|
|
|
|
|
|
|
|
|
|
|
|
Income from continuing operations |
$ |
794 |
|
|
$ |
7 |
|
$ |
41 |
|
$ |
22 |
|
$ |
(304) |
|
$ |
560 |
|
|
|
|
|
|
|
|
|
|
|
|
|
|
|
|
|
|
|
|
|
Diluted earnings per share from continuing operations |
$ |
2.40 |
|
|
$ |
0.02 |
|
$ |
0.12 |
|
$ |
0.07 |
|
$ |
(0.92) |
|
$ |
1.69 |
|
|
|
|
|
|
|
|
|
|
|
|
|
|
|
|
|
|
|
|
|
(1) The tax effect of each non-GAAP adjustment is calculated based on the jurisdictions in which the expense (income) is incurred and the tax laws in effect for each such jurisdiction. |
|
||||||||||||||||||
(2) Charge related to the transfer of certain U.S. pension plan liabilities to an insurance company through the purchase of a group annuity contract. |
|
||||||||||||||||||
(3) Represents a $327 million income tax benefit for the net reduction in valuation allowances associated primarily with certain tax planning actions as well as improved current and expected future operating profit and taxable income, and $23 million of income tax expense associated with the tax impacts of an intercompany transaction. |
|
||||||||||||||||||
(4) See description of non-GAAP financial measures. |
|
||||||||||||||||||
TE CONNECTIVITY LTD.
RECONCILIATION OF NON-GAAP FINANCIAL MEASURES TO GAAP FINANCIAL MEASURES
For the Year Ended September 30, 2022
(UNAUDITED)
|
|
|
|
|
Adjustments |
|
|
|
|
|||||||
|
|
|
|
Acquisition- |
|
Restructuring |
|
|
|
|
|
|||||
|
|
|
|
Related |
|
and Other |
|
|
|
Adjusted |
|
|||||
|
U.S. GAAP |
|
|
Charges (1) |
|
Charges, Net (1)(2) |
|
Tax Items (3) |
|
(Non-GAAP) (4) |
|
|||||
|
($ in millions, except per share data) |
|
||||||||||||||
Operating income: |
|
|
|
|
|
|
|
|
|
|
|
|
|
|
|
|
Transportation Solutions |
$ |
1,534 |
|
|
$ |
16 |
|
$ |
68 |
|
$ |
— |
|
$ |
1,618 |
|
Industrial Solutions |
|
620 |
|
|
|
32 |
|
|
66 |
|
|
— |
|
|
718 |
|
Communications Solutions |
|
602 |
|
|
|
5 |
|
|
23 |
|
|
— |
|
|
630 |
|
Total |
$ |
2,756 |
|
|
$ |
53 |
|
$ |
157 |
|
$ |
— |
|
$ |
2,966 |
|
|
|
|
|
|
|
|
|
|
|
|
|
|
|
|
|
|
Operating margin |
|
16.9 |
% |
|
|
|
|
|
|
|
|
|
|
|
18.2 |
% |
|
|
|
|
|
|
|
|
|
|
|
|
|
|
|
|
|
Other income, net |
$ |
28 |
|
|
$ |
— |
|
$ |
— |
|
$ |
(11) |
|
$ |
17 |
|
|
|
|
|
|
|
|
|
|
|
|
|
|
|
|
|
|
Income tax expense |
$ |
(306) |
|
|
$ |
(11) |
|
$ |
(34) |
|
$ |
(200) |
|
$ |
(551) |
|
|
|
|
|
|
|
|
|
|
|
|
|
|
|
|
|
|
Effective tax rate |
|
11.2 |
% |
|
|
|
|
|
|
|
|
|
|
|
18.8 |
% |
|
|
|
|
|
|
|
|
|
|
|
|
|
|
|
|
|
Income from continuing operations |
$ |
2,427 |
|
|
$ |
42 |
|
$ |
123 |
|
$ |
(211) |
|
$ |
2,381 |
|
|
|
|
|
|
|
|
|
|
|
|
|
|
|
|
|
|
Diluted earnings per share from continuing operations |
$ |
7.47 |
|
|
$ |
0.13 |
|
$ |
0.38 |
|
$ |
(0.65) |
|
$ |
7.33 |
|
|
|
|
|
|
|
|
|
|
|
|
|
|
|
|
|
|
(1) The tax effect of each non-GAAP adjustment is calculated based on the jurisdictions in which the expense (income) is incurred and the tax laws in effect for each such jurisdiction. |
|
|||||||||||||||
(2) Includes $141 million recorded in net restructuring and other charges and $16 million recorded in cost of sales. |
|
|||||||||||||||
(3) Includes a $124 million income tax benefit related to the tax impacts of certain intercompany transactions, a $64 million income tax benefit related primarily to a lapse of a statute of limitation, and a $51 million income tax benefit related to the release of a valuation allowance associated primarily with improved current and expected future operating profit and taxable income. Also includes $27 million of income tax expense related to the write-down of certain deferred tax assets to the lower corporate tax rate enacted in the canton of Schaffhausen and $12 million of income tax expense related to an income tax audit of an acquired entity, as well as the related impact of $11 million to other income pursuant to the terms of the purchase agreement. |
|
|||||||||||||||
(4) See description of non-GAAP financial measures. |
|
|||||||||||||||
TE CONNECTIVITY LTD.
RECONCILIATION OF NON-GAAP FINANCIAL MEASURES TO GAAP FINANCIAL MEASURES
For the Year Ended September 24, 2021
(UNAUDITED)
|
|
|
|
|
Adjustments |
|
|
|
|
||||||||||
|
|
|
|
Acquisition- |
|
Restructuring |
|
|
|
|
|
|
|
||||||
|
|
|
|
Related |
|
and Other |
|
|
|
|
|
Adjusted |
|
||||||
|
U.S. GAAP |
|
|
Charges (1) |
|
Charges, Net (1) |
|
Other Items (1)(2) |
|
Tax Items (3) |
|
(Non-GAAP) (4) |
|
||||||
|
($ in millions, except per share data) |
|
|||||||||||||||||
Operating income: |
|
|
|
|
|
|
|
|
|
|
|
|
|
|
|
|
|
|
|
Transportation Solutions |
$ |
1,526 |
|
|
$ |
18 |
|
$ |
135 |
|
$ |
— |
|
$ |
— |
|
$ |
1,679 |
|
Industrial Solutions |
|
469 |
|
|
|
15 |
|
|
73 |
|
|
— |
|
|
— |
|
|
557 |
|
Communications Solutions |
|
439 |
|
|
|
1 |
|
|
25 |
|
|
— |
|
|
— |
|
|
465 |
|
Total |
$ |
2,434 |
|
|
$ |
34 |
|
$ |
233 |
|
$ |
— |
|
$ |
— |
|
$ |
2,701 |
|
|
|
|
|
|
|
|
|
|
|
|
|
|
|
|
|
|
|
|
|
Operating margin |
|
16.3 |
% |
|
|
|
|
|
|
|
|
|
|
|
|
|
|
18.1 |
% |
|
|
|
|
|
|
|
|
|
|
|
|
|
|
|
|
|
|
|
|
Other income (expense), net |
$ |
(17) |
|
|
$ |
— |
|
$ |
— |
|
$ |
28 |
|
$ |
— |
|
$ |
11 |
|
|
|
|
|
|
|
|
|
|
|
|
|
|
|
|
|
|
|
|
|
Income tax expense |
$ |
(123) |
|
|
$ |
(7) |
|
$ |
(35) |
|
$ |
(6) |
|
$ |
(333) |
|
$ |
(504) |
|
|
|
|
|
|
|
|
|
|
|
|
|
|
|
|
|
|
|
|
|
Effective tax rate |
|
5.2 |
% |
|
|
|
|
|
|
|
|
|
|
|
|
|
|
18.9 |
% |
|
|
|
|
|
|
|
|
|
|
|
|
|
|
|
|
|
|
|
|
Income from continuing operations |
$ |
2,255 |
|
|
$ |
27 |
|
$ |
198 |
|
$ |
22 |
|
$ |
(333) |
|
$ |
2,169 |
|
|
|
|
|
|
|
|
|
|
|
|
|
|
|
|
|
|
|
|
|
Diluted earnings per share from continuing operations |
$ |
6.77 |
|
|
$ |
0.08 |
|
$ |
0.59 |
|
$ |
0.07 |
|
$ |
(1.00) |
|
$ |
6.51 |
|
|
|
|
|
|
|
|
|
|
|
|
|
|
|
|
|
|
|
|
|
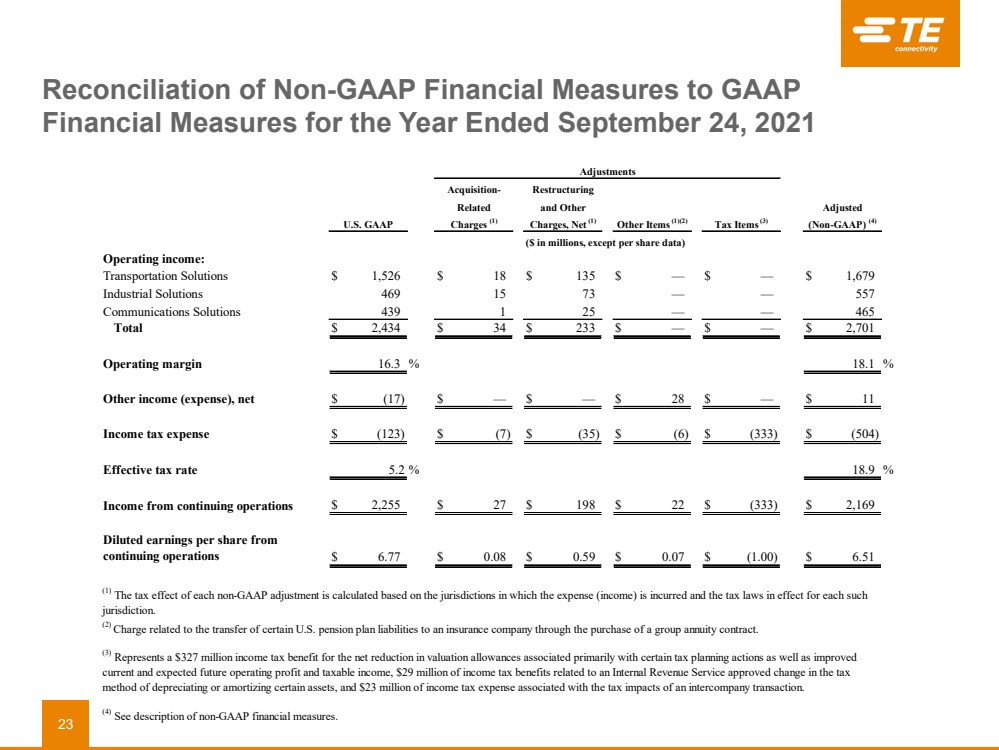
(1) The tax effect of each non-GAAP adjustment is calculated based on the jurisdictions in which the expense (income) is incurred and the tax laws in effect for each such jurisdiction. |
|
||||||||||||||||||
(2) Charge related to the transfer of certain U.S. pension plan liabilities to an insurance company through the purchase of a group annuity contract. |
|
||||||||||||||||||
(3) Represents a $327 million income tax benefit for the net reduction in valuation allowances associated primarily with certain tax planning actions as well as improved current and expected future operating profit and taxable income, $29 million of income tax benefits related to an Internal Revenue Service approved change in the tax method of depreciating or amortizing certain assets, and $23 million of income tax expense associated with the tax impacts of an intercompany transaction. |
|
||||||||||||||||||
(4) See description of non-GAAP financial measures. |
|
||||||||||||||||||
TE CONNECTIVITY LTD.
RECONCILIATION OF NON-GAAP FINANCIAL MEASURES TO GAAP FINANCIAL MEASURES
For the Quarter Ended December 24, 2021
(UNAUDITED)
|
|
|
|
|
Adjustments |
|
|
|
|
|||||||
|
|
|
|
Acquisition- |
|
Restructuring |
|
|
|
|
|
|||||
|
|
|
|
Related |
|
and Other |
|
|
|
Adjusted |
|
|||||
|
U.S. GAAP |
|
|
Charges (1) |
|
Charges, Net (1)(2) |
|
Tax Items (3) |
|
(Non-GAAP) (4) |
|
|||||
|
($ in millions, except per share data) |
|
||||||||||||||
Operating income: |
|
|
|
|
|
|
|
|
|
|
|
|
|
|
|
|
Transportation Solutions |
$ |
395 |
|
|
$ |
3 |
|
$ |
(6) |
|
$ |
— |
|
$ |
392 |
|
Industrial Solutions |
|
123 |
|
|
|
12 |
|
|
22 |
|
|
— |
|
|
157 |
|
Communications Solutions |
|
154 |
|
|
|
1 |
|
|
8 |
|
|
— |
|
|
163 |
|
Total |
$ |
672 |
|
|
$ |
16 |
|
$ |
24 |
|
$ |
— |
|
$ |
712 |
|
|
|
|
|
|
|
|
|
|
|
|
|
|
|
|
|
|
Operating margin |
|
17.6 |
% |
|
|
|
|
|
|
|
|
|
|
|
18.6 |
% |
|
|
|
|
|
|
|
|
|
|
|
|
|
|
|
|
|
Other income, net |
$ |
15 |
|
|
$ |
— |
|
$ |
— |
|
$ |
(11) |
|
$ |
4 |
|
|
|
|
|
|
|
|
|
|
|
|
|
|
|
|
|
|
Income tax expense |
$ |
(110) |
|
|
$ |
(3) |
|
$ |
(7) |
|
$ |
(5) |
|
$ |
(125) |
|
|
|
|
|
|
|
|
|
|
|
|
|
|
|
|
|
|
Effective tax rate |
|
16.2 |
% |
|
|
|
|
|
|
|
|
|
|
|
17.7 |
% |
|
|
|
|
|
|
|
|
|
|
|
|
|
|
|
|
|
Income from continuing operations |
$ |
567 |
|
|
$ |
13 |
|
$ |
17 |
|
$ |
(16) |
|
$ |
581 |
|
|
|
|
|
|
|
|
|
|
|
|
|
|
|
|
|
|
Diluted earnings per share from continuing operations |
$ |
1.72 |
|
|
$ |
0.04 |
|
$ |
0.05 |
|
$ |
(0.05) |
|
$ |
1.76 |
|
|
|
|
|
|
|
|
|
|
|
|
|
|
|
|
|
|
(1) The tax effect of each non-GAAP adjustment is calculated based on the jurisdictions in which the expense (income) is incurred and the tax laws in effect for each such jurisdiction. |
|
|||||||||||||||
(2) Includes $12 million recorded in net restructuring and other charges and $12 million recorded in cost of sales. |
|
|||||||||||||||
(3) Includes a $17 million income tax benefit related to the tax impacts of an intercompany transaction. Our annual effective tax rate for fiscal 2022 includes a total income tax benefit of $124 million related to such transactions. Also includes $12 million of income tax expense related to an income tax audit of an acquired entity, as well as the related impact of $11 million to other income pursuant to the indemnification terms of the purchase agreement. |
|
|||||||||||||||
(4) See description of non-GAAP financial measures. |
|
|||||||||||||||
TE CONNECTIVITY LTD.
IMPACT OF ADDITIONAL WEEK ON NET SALES
(UNAUDITED)
|
|
For the Quarter Ended September 30, 2022 |
|
For the |
|||||||
|
|
|
|
Adjustment |
|
|
|
|
Quarter Ended |
||
|
14 Weeks |
|
Impact of |
|
13 Weeks |
|
September 24, |
||||
|
U.S. GAAP |
|
14th Week |
|
(Non-GAAP) (1)(2) |
|
2021 |
||||
|
|
(in millions) |
|||||||||
|
|
|
|
|
|
|
|
|
|
|
|
Net Sales |
$ |
4,359 |
|
$ |
(306) |
|
$ |
4,053 |
|
$ |
3,818 |
|
|
|
|
|
|
|
|
|
|
|
|
(1) Excludes the impact of an additional week in the fourth quarter of fiscal 2022. The impact of the additional week was estimated using average sales for the fourth quarter of the fiscal year. | |||||||||||
(2) See description of non-GAAP financial measures. | |||||||||||
TE CONNECTIVITY LTD.
RECONCILIATION OF FORWARD-LOOKING NON-GAAP FINANCIAL MEASURES
TO FORWARD-LOOKING GAAP FINANCIAL MEASURES
As of November 2, 2022
(UNAUDITED)
|
Outlook for |
|
|
|
Quarter Ending |
|
|
|
December 30, |
|
|
|
2022 |
|
|
Diluted earnings per share from continuing operations |
$ |
1.31 |
|
Restructuring and other charges, net |
|
0.17 |
|
Acquisition-related charges |
|
0.02 |
|
Adjusted diluted earnings per share from continuing operations (1) |
$ |
1.50 |
|
|
|
. |
|
|
|
|
|
Net sales growth (decline) |
|
(1.8) |
% |
Translation |
|
10.5 |
|
(Acquisitions) divestitures, net |
|
0.1 |
|
Organic net sales growth (1) |
|
8.8 |
% |
|
|
|
|
(1) See description of non-GAAP financial measures. | |||
|
EVERY CONNECTION COUNTS TE Connectivity Fourth Quarter 2022 Earnings November 2, 2022 |
|
Forward - Looking Statements and Non - GAAP Financial Measures 2 Forward - Looking Statements This presentation contains certain "forward - looking statements" within the meaning of the U.S. Private Securities Litigation Ref orm Act of 1995. These statements are based on management's current expectations and are subject to risks, uncertainty and changes in circumstances, which may cause actual results, performance, financial condition or achievements to differ materially from ant ici pated results, performance, financial condition or achievements. All statements contained herein that are not clearly historical in nature a re forward - looking and the words "anticipate," "believe," "expect," "estimate," "plan," and similar expressions are generally intended to identi fy forward - looking statements. We have no intention and are under no obligation to update or alter (and expressly disclaim any such intention or ob ligation to do so) our forward - looking statements whether as a result of new information, future events or otherwise, except to the extent requ ired by law. The forward - looking statements in this presentation include statements addressing our future financial condition and operating r esults, and the impact on our operations resulting from the coronavirus disease 2019 (“COVID - 19”). Examples of factors that could cause actu al results to differ materially from those described in the forward - looking statements include, among others, the extent, severity and dura tion of COVID - 19 negatively affecting our business operations; business, economic, competitive and regulatory risks, such as conditions aff ect ing demand for products in the automotive and other industries we serve; competition and pricing pressure; fluctuations in foreign curre ncy exchange rates and commodity prices; natural disasters and political, economic and military instability in countries in which we opera te, including continuing military conflict between Russia and Ukraine resulting from Russia’s invasion of Ukraine or escalating tensions in su rrounding countries; developments in the credit markets; future goodwill impairment; compliance with current and future environmental a nd other laws and regulations; and the possible effects on us of changes in tax laws, tax treaties and other legislation, including the eff ect s of Swiss tax reform. In addition, the extent to which COVID - 19 will impact our business and our financial results will depend on future devel opments, which are highly uncertain and cannot be predicted. Such developments may include the geographic spread of the virus, the sev eri ty of the virus, the duration of the outbreak, the impact on our suppliers’ and customers’ supply chains, the actions that may be taken by various governmental authorities in response to the outbreak in jurisdictions in which we operate, and the possible impact on the glo bal economy and local economies in which we operate. More detailed information about these and other factors is set forth in TE Connectivity Lt d.'s Annual Report on Form 10 - K for the fiscal year ended Sept. 24, 2021 as well as in our Quarterly Reports on Form 10 - Q, Current Reports o n Form 8 - K and other reports filed by us with the U.S. Securities and Exchange Commission. Non - GAAP Financial Measures Where we have used non - GAAP financial measures, reconciliations to the most comparable GAAP measure are provided, along with a disclosure on the usefulness of the non - GAAP financial measure, in this presentation. |
|
Earnings Highlights Q4 Sales & Adjusted EPS above expectations; double digit organic growth in each segment • Sales of $4.4B, up 14% Y/Y on a reported 14 - week basis • Orders of $4.3B; book to bill of 0.98 • Adjusted Operating Margins of 17.4%, with Adjusted EPS of $1.88, up 11% Y/Y • Generated record Free Cash Flow of $745M, benefiting from focused inventory reduction; ~$515M returned to shareholders • On a 13 - week basis, Sales of $4.05B, up 12% organically Y/Y, and adjusted EPS of $1.75 FY22 results demonstrate the strategic positioning of our portfolio • Sales of $16.3B, up 9% on a reported basis Y/Y despite FX headwinds of ~$760M • 12% organic growth Y/Y; Industrial & Communications up double digits, with high single digit growth in Transportation • Market outperformance driven by secular trends including EV, factory automation, renewables & cloud • Adjusted Operating Margins of 18.2%, with Y/Y expansion in Industrial & Communications • Adjusted EPS of $7.33, up 13% Y/Y, despite currency exchange and inflation headwinds • Free Cash Flow ~$1.8B; ~$2.1B returned to shareholders Q1 Guidance reflects higher impact from currency exchange rates • Expect Sales of ~$3.75B, up 9% organically & down slightly on a reported basis Y/Y despite ~$400M of FX headwinds • Expect Adjusted EPS of ~$1.50 • Includes headwinds of ~$0.25 Y/Y from currency exchange rates & tax • Sequential impacts to adjusted EPS from FX, lower volume and inventory reduction Organic Net Sales Growth (Decline), Net Sales Excluding the Impact of the Additional Week, Organic Net Sales Growth (Decline) Ex cluding the Impact of the Additional Week, Adjusted Earnings Per Share Excluding the Impact of the Additional Week, Adjusted EPS, Adjusted Operating Margin , and Free Cash Flow are non - GAAP financial measures; see Append ix for descriptions and reconciliations 3 Note: Q4 FY22 includes an additional week which contributed sales of $ 306 M and Adjusted EPS of $0.13 |
|
Reported FY21 FY22 FY22 Q4 Y/Y Growth Q4 Q3 Q4 * 13 week Reported 13 week Organic Transportation 2,349 2,303 2,510 (1)% 8% Industrial 1,140 1,320 1,258 4% 4% Communications 647 575 504 (27)% (28)% Total TE 4,136 4,197 4,272 (4)% 1% Book to Bill 1.08 1.02 0.98 Segment Orders Summary ($ in millions) 4 • Strong backlog of $6B, up ~11% Y/Y • Transportation and Industrial book to bill above 1.0, reflecting ongoing strong demand patterns • Communications orders reflect moderation in end markets Orders and Backlog Reflecting Resiliency in Transportation & Industrial and Moderation in Communications * Q4 FY22 includes an additional week |
|
Transportation Solutions $2,198 $2,447 Q4 2021 Q4 2022 • Automotive organic growth across all regions. Continue to increase content per vehicle through our global leadership position in electric vehicles • Commercial Transportation growth driven by North America and Europe. Significant market outperformance in each region for the full year • Sensors organic decline with focused growth offset by portfolio optimization activities Note: Comments based on 13 week organic results Y/Y Growth Rates Reported 14 Week Organic 13 week Organic Automotive $1,725 14% 25% 16% Commercial Transportation 423 14% 22% 13% Sensors 299 (2)% 5% (3)% Transportation Solutions $2,447 11% 22% 13% Q4 Sales Q4 Business Performance Q4 Adjusted Operating Margin $ in Millions Reported Up 11% Organic Up 22% Margins reflecting the timing of pricing actions to offset inflation as well as the impacts from inventory reduction Adjusted EBITDA Margin 23.2% 21.4% 5 Organic Net Sales Growth (Decline), Organic Net Sales Growth (Decline) Excluding the Impact of the Additional Week, Adjusted Ope rating Margin and Adjusted EBITDA Margin are non - GAAP financial measures: see Appendix for descriptions and reconciliations 18.0% 16.6% Q4 2021 Q4 2022 Q4 FY22 results are 14 weeks unless otherwise indicated |
|
Industrial Solutions $1,017 $1,252 Q4 2021 Q4 2022 Y/Y Growth Rates Reported 14 Week Organic 13 Week Organic Industrial Equipment $521 35% 30% 20% Aerospace , Defense and Marine 313 21% 29% 20% Energy 225 16% 25% 16% Medical 193 8% 10% 3% Industrial Solutions $1,252 23% 25% 16% Margin performance driven by higher volume and strong operational performance 15.9% 16.5% Q4 2021 Q4 2022 Adjusted EBITDA Margin 20.6% 20.2% • Industrial Equipment double - digit growth in all regions, with continued benefits from factory automation applications • AD&M growth driven primarily by ongoing market improvement in Commercial Aerospace • Energy growth with increase in renewable applications • Medical growth with increase in interventional procedures Note: Comments based on 13 week organic results $ in Millions Q4 Sales Q4 Business Performance Q4 Adjusted Operating Margin Reported Up 23% Organic Up 25% 6 Organic Net Sales Growth (Decline), Organic Net Sales Growth (Decline) Excluding the Impact of the Additional Week, Adjusted Op erating Margin and Adjusted EBITDA Margin are non - GAAP financial measures: see Appendix for descriptions and reconciliations Q4 FY22 results are 14 weeks unless otherwise indicated |
|
$603 $660 Q4 2021 Q4 2022 Reported Up 10% Organic Up 10% • Dat a & Devices outperformance driven by content growth and share gains in high - speed data and AI applications enabling improved data center energy efficiency • Appliances organic decline reflects moderation in end market Note: Comments based on 13 week organic results 24.7% 21.7% Q4 2021 Q4 2022 Margins impacted by lower sales in Appliances Organic Net Sales Growth (Decline), Organic Net Sales Growth (Decline) Excluding the Impact of the Additional Week, Adjusted Ope rating Margin and Adjusted EBITDA Margin are non - GAAP financial measures: see Appendix for descriptions and reconciliations Communications Solutions Q4 Sales Q4 Adjusted Operating Margin Q4 Business Performance $ in Millions Adjusted EBITDA Margin 27.5% 25.6% 7 Y/Y Growth Rates Reported 14 Week Organic 13 week Organic Data & Devices $425 19% 17% 9% Appliances 235 (5)% 0% (6)% Communications Solutions $660 10% 10% 3% Q4 FY22 results are 14 weeks unless otherwise indicated |
|
Q4 Financial Summary ($ in Millions, except per share amounts) Q4 FY21 Q4 FY22 Net Sales $ 3,818 $ 4,359 Operating Income $ 660 $ 660 Operating Margin 17.3% 15.1% Acquisition - Related Charges 8 15 Restructuring & Other Charges, Net 38 82 Adjusted Operating Income $ 706 $ 757 Adjusted Operating Margin 18.5% 17.4% Earnings Per Share* $ 2.40 $ 2.21 Acquisition - Related Charges 0.02 0.04 Restructuring & Other Charges, Net 0.12 0.21 Other Items 0.07 - Tax Items (0.92) (0.57) Adjusted EPS $ 1.69 $ 1.88 * Represents Diluted Earnings Per Share from Continuing Operations. . Adjusted Operating Income, Adjusted Operating Margin and Adjusted EPS are non - GAAP financial measures; see Appendix for descript ions and reconciliations. 8 Note: Q4 FY22 includes an additional week |
|
Financial Performance $14,923 $16,281 FY21 FY22 $6.51 $7.33 FY21 FY22 Adjusted EBITDA Margin 23.3% 23.0% 18.1% 18.2% FY21 FY22 Adjusted Operating Margin, Adjusted EPS, Adjusted EBITDA Margin and Free Cash Flow are non - GAAP financial measures: see Appendix for descriptions and reconciliations. Sales Adjusted Operating Margin Free Cash Flow Adjusted EPS Results Reflect Strong Performance in a Challenging Environment Demonstrating the Strategic Positioning of Our Portfolio 9 $ in Millions $ in Millions ~$2.1B returned to shareholders $2,081 $1,783 FY21 FY22 Note: FY22 includes an additional week |
|
EVERY CONNECTION COUNTS Additional Information |
|
Y/Y Q4 2022 FX includes $10M unfavorable currency impact to sales from acquisitions Adjusted EPS is a non - GAAP financial measure; See Appendix for description and reconciliation. Sales (in millions) Adjusted EPS Q4 2021 Results $3,818 $1.69 Operational Performance 889 0.26 FX Impact (348) (0.08) Tax Rate Impact - 0.01 Q4 2022 Results (14 weeks) $4,359 $1.88 Extra week ( (306) (0.13) Q4 2022 Results (13 weeks) $4,053 $1.75 11 |
|
Y/Y FY 2022 FX includes $40M unfavorable currency impact to sales from acquisitions Adjusted EPS is a non - GAAP financial measure; See Appendix for description and reconciliation. Sales (in millions) Adjusted EPS 2021 Results $14,923 $6.51 Operational Performance 2,121 0.95 FX Impact (763) (0.14) Tax Rate Impact - 0.01 2022 Results (53 weeks) $16,281 $7.33 Extra week ( 306) (0.13) 2022 Results (52 weeks) $15,975 $7.20 12 |
|
Y/Y Q1 2023 Adjusted EPS is a non - GAAP financial measure; See Appendix for description and reconciliation. Sales (in millions) Adjusted EPS Q1 2022 Results $3,818 $1.76 Operational Performance 332 (0.01) FX Impact (400) (0.19) Tax Rate Impact - (0.06) Q1 2023 Guidance $3,750 $1.50 13 |
|
($ in Millions) FY21 FY22 Beginning Cash Balance $945 $1,203 Free Cash Flow 2,081 1,783 Dividends (647) (685) Share repurchases (831) (1,412) Net increase (decrease) in debt (47) 400 Acquisition of businesses, net of cash acquired (423) (220) Other 125 19 Ending Cash Balance $1,203 $1,088 Total Debt $4,092 $4,206 A/R $2,928 $2,865 Days Sales Outstanding* 69 64 Inventory $2,511 $2,676 Days on Hand* 86 84 Accounts Payable $1,911 $1,593 Days Outstanding* 67 51 Free Cash Flow and Working Capital Liquidity, Cash and Debt ($ in Millions) FY21 FY22 Cash from Continuing Operating Activities $2,676 $2,468 Capital expenditures (690) (768) Proceeds from sales of property, plant and equipment 86 106 Cash (collected) paid pursuant to collateral requirements related to cross - currency swap contracts 9 (23) Free Cash Flow $2,081 $1,783 Free Cash Flow is a non - GAAP financial measure, see Appendix for description and reconciliation * Calculated on a quarterly basis and adjusted to exclude the impact of acquisitions Balance Sheet & Cash Flow Summary 14 Note: FY22 includes an additional week |
|
EVERY CONNECTION COUNTS Appendix |
|
16 Non - GAAP Financial Measures We present non - GAAP performance and liquidity measures as we believe it is appropriate for investors to consider adjusted financ ial measures in addition to results in accordance with accounting principles generally accepted in the U.S. (“GAAP”). These non - GAAP financial measures provide supplem ental information and should not be considered replacements for results in accordance with GAAP. Management uses non - GAAP financial measures internally for planning and forecasting purposes and in its decision - making processes related to the operations of our company. We believe these measures provide meaningful information to us and investors because they enhance the understanding of our operating performance, ability to generate cash, and the trends of our business. Additionally, we be lie ve that investors benefit from having access to the same financial measures that management uses in evaluating our operations. The primary limitation of these measures is th at they exclude the financial impact of items that would otherwise either increase or decrease our reported results. This limitation is best addressed by using these non - GAAP financial measures in combination with the most directly comparable GAAP financial measures in order to better understand the amounts, character, and impact of any incr eas e or decrease in reported amounts. These non - GAAP financial measures may not be comparable to similarly - titled measures reported by other companies. The following provides additional information regarding our non - GAAP financial measures: • Organic Net Sales Growth (Decline) – represents net sales growth (decline) (the most comparable GAAP financial measure) excludin g the impact of foreign currency exchange rates, and acquisitions and divestitures that occurred in the preceding twelve months, if any. Organic Net Sales Gro wth (Decline) is a useful measure of our performance because it excludes items that are not completely under management’s control, such as the impact of changes in fo rei gn currency exchange rates, and items that do not reflect the underlying growth of the company, such as acquisition and divestiture activity. This measure is a sig nif icant component in our incentive compensation plans. • Adjusted Gross Margin and Adjusted Gross Margin Percentage – represent gross margin and gross margin percentage, respectively, ( the most comparable GAAP financial measures) before special items including restructuring and other charges, and acquisition - related charges, if any. • Adjusted Operating Income and Adjusted Operating Margin – represent operating income and operating margin, respectively, (the mo st comparable GAAP financial measures) before special items including restructuring and other charges, acquisition - related charges, impairment of goodwill, a nd other income or charges, if any. We utilize these adjusted measures in combination with operating income and operating margin to assess segment level operating p erf ormance and to provide insight to management in evaluating segment operating plan execution and market conditions. Adjusted Operating Income is a significant c omp onent in our incentive compensation plans. • Adjusted Other Income (Expense), Net – represents net other income (expense) (the most comparable GAAP financial measure) before special items including tax sharing income related to adjustments to prior period tax returns and other items, if any. • Adjusted Income Tax (Expense) Benefit and Adjusted Effective Tax Rate – represent income tax (expense) benefit and effective tax rate, respectively, (the most comparable GAAP financial measures) after adjusting for the tax effect of special items including restructuring and other cha rge s, acquisition - related charges, impairment of goodwill, other income or charges, and certain significant tax items, if any. • Adjusted Income from Continuing Operations – represents income from continuing operations (the most comparable GAAP financial me asure) before special items including restructuring and other charges, acquisition - related charges, impairment of goodwill, tax sharing income related to adjustments to prior period tax returns and other tax items, other income or charges, and certain significant tax items, if any, and, if applicable, the related tax effects. |
|
17 • Adjusted Earnings Per Share – represents diluted earnings per share from continuing operations (the most comparable GAAP financi al measure) before special items including restructuring and other charges, acquisition - related charges, impairment of goodwill, tax sharing income related to ad justments to prior period tax returns and other tax items, other income or charges, and certain significant tax items, if any, and, if applicable, the related tax effects. T his measure is a significant component in our incentive compensation plans. • Adjusted EBITDA and Adjusted EBITDA Margin - represent net income and net income as a percentage of net sales, respectively, (th e most comparable GAAP financial measures) before interest expense, interest income, income taxes, depreciation, and amortization, as adjusted for net other i nco me (expense), income (loss) from discontinued operations, and special items including restructuring and other charges, acquisition - related charges, impairment of goodwill, and other income or charges, if any. • Net Sales Excluding the Impact of the Additional Week, Net Sales Growth (Decline) Excluding the Impact of the Additional Week , O rganic Net Sales Growth (Decline) Excluding the Impact of the Additional Week, Adjusted Gross Margin Excluding the Impact of the Additional Week, Adjusted Gros s M argin Percentage Excluding the Impact of the Additional Week, Adjusted Operating Income Excluding the Impact of the Additional Week, Adjusted Operating Margin Excl udi ng the Impact of the Additional Week, Adjusted Earnings Per Share Excluding the Impact of the Additional Week, Adjusted EBITDA Excluding the Impact of the Addition al Week, and Adjusted EBITDA Margin Excluding the Impact of the Additional Week – represent certain GAAP and non - GAAP financial measures excluding the impact of th e additional week in the fourth quarter of the fiscal year for fiscal years which are 53 weeks in length. • Free Cash Flow (FCF) – is a useful measure of our ability to generate cash. The difference between net cash provided by operatin g activities (the most comparable GAAP financial measure) and Free Cash Flow consists mainly of significant cash outflows and inflows that we believe are useful to ide ntify. We believe Free Cash Flow provides useful information to investors as it provides insight into the primary cash flow metric used by management to monitor and ev alu ate cash flows generated from our operations. Free Cash Flow is defined as net cash provided by operating activities excluding voluntary pension contributions and the cash impact of special items, if any, minus net capital expenditures. Voluntary pension contributions are excluded from the GAAP financial measure because this act ivi ty is driven by economic financing decisions rather than operating activity. Certain special items, including net payments related to pre - separation tax matters an d cash paid (collected) pursuant to collateral requirements related to cross - currency swap contracts, are also excluded by management in evaluating Free Cash Flow. Net capital expenditures consist of capital expenditures less proceeds from the sale of property, plant, and equipment. These items are subtracted because they represent lo ng - term commitments. In the calculation of Free Cash Flow, we subtract certain cash items that are ultimately within management’s and the Board of Directors’ discret ion to direct and may imply that there is less or more cash available for our programs than the most comparable GAAP financial measure indicates. It should not be inferred tha t t he entire Free Cash Flow amount is available for future discretionary expenditures, as our definition of Free Cash Flow does not consider certain non - discretionary expenditures, such as debt payments. In addition, we may have other discretionary expenditures, such as discretionary dividends, share repurchases, and business acqu isi tions, that are not considered in the calculation of Free Cash Flow. • Free Cash Flow Conversion – represents the ratio of Free Cash Flow to Adjusted Income from Continuing Operations. We use Free Ca sh Flow Conversion as an indicator of our ability to convert earnings to cash. Non - GAAP Financial Measures (cont.) |
|
Segment Summary 18 Transportation Solutions $ 2,447 $ 2,198 $ 9,219 $ 8,974 Industrial Solutions 1,252 1,017 4,520 3,844 Communications Solutions 660 603 2,542 2,105 Total $ 4,359 $ 3,818 $ 16,281 $ 14,923 Transportation Solutions $ 347 14.2 % $ 387 17.6 % $ 1,534 16.6 % $ 1,526 17.0 % Industrial Solutions 180 14.4 134 13.2 620 13.7 469 12.2 Communications Solutions 133 20.2 139 23.1 602 23.7 439 20.9 Total $ 660 15.1 % $ 660 17.3 % $ 2,756 16.9 % $ 2,434 16.3 % Transportation Solutions $ 407 16.6 % $ 395 18.0 % $ 1,618 17.6 % $ 1,679 18.7 % Industrial Solutions 207 16.5 162 15.9 718 15.9 557 14.5 Communications Solutions 143 21.7 149 24.7 630 24.8 465 22.1 Total $ 757 17.4 % $ 706 18.5 % $ 2,966 18.2 % $ 2,701 18.1 % Operating Margin Operating Margin Operating Margin Adjusted Operating Margin (1) Adjusted Income (1) (1) Adjusted operating income and adjusted operating margin are non-GAAP financial measures. See description of non-GAAP financial measures. 2022 2021 ($ in millions) Operating Margin (1) Adjusted Operating Margin (1) Adjusted Operating Income (1) Adjusted Operating Adjusted Operating Net Sales Net Sales Net Sales Income (1) Adjusted Operating Income (1) Income Operating Operating Income Operating Income Adjusted Operating Margin (1) Net Sales Operating Income Operating Margin For the Quarters Ended September 30, September 24, September 30, September 24, 2022 For the Years Ended 2021 |
|
Reconciliation of Net Sales Growth 19 Transportation Solutions (3) : Automotive $ 205 13.5 % $ 378 25.2 % $ (173) $ — Commercial transportation 51 13.7 83 22.4 (32) — Sensors (7) (2.3) 15 5.2 (22) — Total 249 11.3 476 21.8 (227) — Industrial Solutions (3) : Industrial equipment 135 35.0 117 30.0 (45) 63 Aerospace, defense, and marine 55 21.3 75 28.8 (20) — Energy 31 16.0 50 25.2 (19) — Medical 14 7.8 16 9.5 (2) — Total 235 23.1 258 25.1 (86) 63 Communications Solutions (3) : Data and devices 68 19.0 60 16.9 (14) 22 Appliances (11) (4.5) — — (11) — Total 57 9.5 60 10.2 (25) 22 Total $ 541 14.2 % $ 794 20.9 % $ (338) $ 85 Transportation Solutions (3) : Automotive $ 148 2.3 % $ 515 8.1 % $ (367) $ — Commercial transportation 115 7.8 178 12.1 (63) — Sensors (18) (1.6) 34 3.0 (52) — Total 245 2.7 727 8.1 (482) — Industrial Solutions (3) : Industrial equipment 537 38.4 400 28.5 (100) 237 Aerospace, defense, and marine 52 5.0 91 8.7 (38) (1) Energy 66 8.9 119 16.0 (42) (11) Medical 21 3.1 28 4.2 (7) — Total 676 17.6 638 16.6 (187) 225 Communications Solutions (3) : Data and devices 378 31.6 355 29.6 (30) 53 Appliances 59 6.5 83 9.2 (24) — Total 437 20.8 438 20.8 (54) 53 Total $ 1,358 9.1 % $ 1,803 12.1 % $ (723) $ 278 ($ in millions) Translation (2) Acquisitions Growth (Decline) Growth (1) Translation (2) (Divestitures) Change in Net Sales for the Year Ended September 30, 2022 versus Net Sales for the Year Ended September 24, 2021 (1) Organic net sales growth (decline) is a non-GAAP financial measure. See description of non-GAAP financial measures. (2) Represents the change in net sales resulting from changes in foreign currency exchange rates. (3) Industry end market information is presented consistently with our internal management reporting and may be periodically revised as management deems necessary. ($ in millions) Net Sales Growth (Decline) Organic Net Sales Growth (1) Change in Net Sales for the Quarter Ended September 30, 2022 versus Net Sales for the Quarter Ended September 24, 2021 Net Sales Organic Net Sales Acquisitions/ |
|
Reconciliation of Non - GAAP Financial Measures to GAAP Financial Measures for the Quarter Ended September 30, 2022 20 |
|
Reconciliation of Non - GAAP Financial Measures to GAAP Financial Measures for the Quarter Ended September 24, 2021 21 Operating income: Transportation Solutions $ 387 $ 3 $ 5 $ — $ — $ 395 Industrial Solutions 134 4 24 — — 162 Communications Solutions 139 1 9 — — 149 Total $ 660 $ 8 $ 38 $ — $ — $ 706 Operating margin 17.3 % 18.5 % Other income (expense), net $ (22) $ — $ — $ 28 $ — $ 6 Income tax (expense) benefit $ 167 $ (1) $ 3 $ (6) $ (304) $ (141) Effective tax rate (26.6) % 20.1 % Income from continuing operations $ 794 $ 7 $ 41 $ 22 $ (304) $ 560 Diluted earnings per share from continuing operations $ 2.40 $ 0.02 $ 0.12 $ 0.07 $ (0.92) $ 1.69 (3) Represents a $327 million income tax benefit for the net reduction in valuation allowances associated primarily with certain tax planning actions as well as improved current and expected future operating profit and taxable income, and $23 million of income tax expense associated with the tax impacts of an intercompany transaction. Other Items (1)(2) ($ in millions, except per share data) (1) The tax effect of each non-GAAP adjustment is calculated based on the jurisdictions in which the expense (income) is incurred and the tax laws in effect for each such jurisdiction. (4) See description of non-GAAP financial measures. U.S. GAAP Charges (1) Charges, Net (1) Tax Items (3) (Non-GAAP) (4) (2) Charge related to the transfer of certain U.S. pension plan liabilities to an insurance company through the purchase of a group annuity contract. Related and Other Adjusted Adjustments Acquisition- Restructuring |
|
Reconciliation of Non - GAAP Financial Measures to GAAP Financial Measures for the Year Ended September 30, 2022 22 |
|
Reconciliation of Non - GAAP Financial Measures to GAAP Financial Measures for the Year Ended September 24, 2021 23 Operating income: Transportation Solutions $ 1,526 $ 18 $ 135 $ — $ — $ 1,679 Industrial Solutions 469 15 73 — — 557 Communications Solutions 439 1 25 — — 465 Total $ 2,434 $ 34 $ 233 $ — $ — $ 2,701 Operating margin 16.3 % 18.1 % Other income (expense), net $ (17) $ — $ — $ 28 $ — $ 11 Income tax expense $ (123) $ (7) $ (35) $ (6) $ (333) $ (504) Effective tax rate 5.2 % 18.9 % Income from continuing operations $ 2,255 $ 27 $ 198 $ 22 $ (333) $ 2,169 Diluted earnings per share from continuing operations $ 6.77 $ 0.08 $ 0.59 $ 0.07 $ (1.00) $ 6.51 Adjustments Acquisition- Restructuring Related and Other (Non-GAAP) (4) Adjusted U.S. GAAP Charges (1) Charges, Net (1) Other Items (1)(2) Tax Items (3) (1) The tax effect of each non-GAAP adjustment is calculated based on the jurisdictions in which the expense (income) is incurred and the tax laws in effect for each such jurisdiction. (2) Charge related to the transfer of certain U.S. pension plan liabilities to an insurance company through the purchase of a group annuity contract. (3) Represents a $327 million income tax benefit for the net reduction in valuation allowances associated primarily with certain tax planning actions as well as improved current and expected future operating profit and taxable income, $29 million of income tax benefits related to an Internal Revenue Service approved change in the tax method of depreciating or amortizing certain assets, and $23 million of income tax expense associated with the tax impacts of an intercompany transaction. (4) See description of non-GAAP financial measures. ($ in millions, except per share data) |
|
Reconciliation of Non - GAAP Financial Measures to GAAP Financial Measures for the Quarter Ended December 24, 2021 24 Operating income: Transportation Solutions $ 395 $ 3 $ (6) $ — $ 392 Industrial Solutions 123 12 22 — 157 Communications Solutions 154 1 8 — 163 Total $ 672 $ 16 $ 24 $ — $ 712 Operating margin 17.6 % 18.6 % Other income, net $ 15 $ — $ — $ (11) $ 4 Income tax expense $ (110) $ (3) $ (7) $ (5) $ (125) Effective tax rate 16.2 % 17.7 % Income from continuing operations $ 567 $ 13 $ 17 $ (16) $ 581 Diluted earnings per share from continuing operations $ 1.72 $ 0.04 $ 0.05 $ (0.05) $ 1.76 Adjustments (4) See description of non-GAAP financial measures. (1) The tax effect of each non-GAAP adjustment is calculated based on the jurisdictions in which the expense (income) is incurred and the tax laws in effect for each such jurisdiction. U.S. GAAP Charges (1) (Non-GAAP) (4) Charges, Net (1)(2) Tax Items (3) ($ in millions, except per share data) (3) Includes a $17 million income tax benefit related to the tax impacts of an intercompany transaction. Our annual effective tax rate for fiscal 2022 includes a total income tax benefit of $124 million related to such transactions. Also includes $12 million of income tax expense related to an income tax audit of an acquired entity, as well as the related impact of $11 million to other income pursuant to the indemnification terms of the purchase agreement. (2) Includes $12 million recorded in net restructuring and other charges and $12 million recorded in cost of sales. and Other Adjusted Related Acquisition- Restructuring |
|
Reconciliation of Free Cash Flow 25 Net cash provided by operating activities $ 944 $ 774 $ 2,468 $ 2,676 Net cash used in investing activities (310) (540) (878) (1,037) Net cash used in financing activities (354) (443) (1,684) (1,386) Effect of currency translation on cash (12) (4) (21) 5 Net increase (decrease) in cash, cash equivalents, and restricted cash $ 268 $ (213) $ (115) $ 258 Net cash provided by operating activities $ 944 $ 774 $ 2,468 $ 2,676 Excluding: Cash (collected) paid pursuant to collateral requirements related to cross-currency swap contracts 5 (3) (23) 9 Capital expenditures, net (204) (235) (662) (604) Free cash flow (1) $ 745 $ 536 $ 1,783 $ 2,081 (1) Free cash flow is a non-GAAP financial measure. See description of non-GAAP financial measures. 2022 2021 2022 2021 (in millions) For the Quarters Ended September 30, September 24, September 30, September 24, For the Years Ended |
|
Reconciliation of Adjusted EBITDA and Adjusted EBITDA Margin 26 |
|
Reconciliation of Adjusted EBITDA and Adjusted EBITDA Margin by Segment - QTD 27 |
|
Reconciliation of Adjusted EBITDA and Adjusted EBITDA Margin by Segment - YTD 28 |
|
Impact of Additional Week on Net Sales - QTD 29 |
|
Impact of Additional Week on Net Sales - YTD 30 |
|
Impact of Additional Week – QTD 31 |
|
Impact of Additional Week – YTD 32 |
|
Reconciliation of Forward - Looking Non - GAAP Financial Measures to Forward - Looking GAAP Financial Measures 33 |