June 30
UNITED STATES
SECURITIES AND EXCHANGE COMMISSION
Washington, D.C. 20549-1004
FORM 8-K
CURRENT REPORT
Pursuant to Section 13 or 15(d) of the Securities Exchange Act of 1934
Date of Report (Date of earliest event reported): July 29, 2022 (July 29, 2022)
ARCBEST CORPORATION
(Exact name of registrant as specified in its charter)
Delaware |
0-19969 |
71-0673405 |
(State or other jurisdiction of incorporation or organization) |
(Commission File Number) |
(IRS Employer Identification No.) |
8401 McClure Drive
Fort Smith, Arkansas 72916
(479) 785-6000
(Address, including zip code, and telephone number, including area code, of
the registrant's principal executive offices)
Securities registered pursuant to Section 12(b) of the Securities Exchange Act of 1934:
Title of each class |
Trading Symbol(s) |
Name of each exchange on which registered |
Common Stock $0.01 Par Value |
ARCB |
Nasdaq |
Check the appropriate box below if the Form 8-K filing is intended to simultaneously satisfy the filing obligation of the registrant under any of the following provisions.
☐ |
Written communication pursuant to Rule 425 under the Securities Act (17 CFR 230.425) |
☐ |
Soliciting material pursuant to Rule 14a-12 under the Exchange Act (17 CFR 240.14a-12) |
☐ |
Pre-commencement communications pursuant to Rule 14d-2(b) under the Exchange Act (17 CFR 240.14d-2(b)) |
☐ |
Pre-commencement communications pursuant to Rule 13e-4(c) under the Exchange Act (17 CFR 240.13e-4(c)) |
Indicate by check mark whether the registrant is an emerging growth company as defined in Rule 405 of the Securities Act of 1933 (§230.405 of this chapter) or Rule 12b-2 of the Securities Exchange Act of 1934 (§240.12b-2 of this chapter).
Emerging growth company☐
If an emerging growth company, indicate by check mark if the registrant has elected not to use the extended transition period for complying with any new or revised financial accounting standards provided pursuant to Section 13(a) of the Exchange Act.☐
ITEM 2.02 – RESULTS OF OPERATIONS AND FINANCIAL CONDITION
On July 29, 2022, ArcBest® (Nasdaq: ARCB) (the “Company”) issued a press release announcing its unaudited second quarter 2022 results. A copy of the press release is furnished as Exhibit 99.1 to this Current Report on Form 8-K and incorporated herein by reference. Additional supplemental information and presentation slides to be used in connection with the scheduled conference call to discuss the second quarter results are furnished as Exhibit 99.2 and Exhibit 99.3 to this Current Report on Form 8-K and incorporated herein by reference.
The Company reports its financial results in accordance with generally accepted accounting principles (“GAAP”). However, management believes that certain non-GAAP financial measures and ratios and other information utilized for internal analysis provide analysts, investors, and others the same information that we use internally for purposes of assessing the Company’s core operating performance and provide meaningful comparisons between current and prior period results, as well as important information regarding performance trends. The use of certain non-GAAP measures improves comparability in analyzing ArcBest’s performance because it removes the impact of items from operating results that, in management’s opinion, do not reflect ArcBest’s core operating performance.
The press release in Exhibit 99.1, the supplemental information in Exhibit 99.2, and the presentation slides in Exhibit 99.3 include certain non-GAAP information. Certain information discussed in the scheduled conference call could also be considered non-GAAP measures. Reconciliations of the non-GAAP measures to the most directly comparable financial measures calculated and presented in accordance with GAAP are included in Exhibit 99.1 herein, including reconciliations of GAAP earnings and earnings per share to non-GAAP financial measures, reconciliations of GAAP to non-GAAP effective tax rates, and calculations of adjusted earnings before interest, taxes, depreciation and amortization (“Adjusted EBITDA”). Reconciliations of non-GAAP measures included in the presentation slides to the most directly comparable GAAP financial measures are also included within Exhibit 99.3 herein.
Management believes EBITDA and Adjusted EBITDA to be relevant and useful information as EBITDA is a standard measure commonly reported and widely used by analysts, investors and others to measure financial performance and ability to service debt obligations. Additionally, Adjusted EBITDA is a primary component of the financial covenants contained in ArcBest’s credit agreement. Other companies may calculate EBITDA and Adjusted EBITDA differently; therefore, ArcBest’s calculation of EBITDA and Adjusted EBITDA may not be comparable to similarly titled measures of other companies. Non-GAAP financial measures should be viewed in addition to, and not as an alternative for, ArcBest’s reported results. These financial measures should not be construed as better measurements than operating income, operating cash flow, net income or earnings per share, as determined under GAAP.
ITEM 9.01 – FINANCIAL STATEMENTS AND EXHIBITS
Exhibit No. |
|
Description of Exhibit |
|
|
|
99.1 |
|
|
99.2 |
|
|
99.3 |
|
|
104 |
|
Cover Page Interactive Data File – The cover page interactive data file does not appear in the Interactive Data File because its XBRL tags are embedded within the Inline XBRL document |
SIGNATURES
Pursuant to the requirements of the Securities Exchange Act of 1934, the registrant has duly caused this report to be signed on its behalf by the undersigned hereunto duly authorized.
|
|
|
ARCBEST CORPORATION |
|
|
|
|
|
|
|
(Registrant) |
|
|
|
|
Date: |
July 29, 2022 |
|
/s/ Michael R. Johns |
|
Michael R. Johns |
||
|
Vice President – General Counsel |
||
|
and Corporate Secretary |
||
Exhibit 99.1
Investor Relations Contact: David Humphrey |
Media Contact: Autumnn Mahar |
Title: Vice President – Investor Relations |
Title: Senior Manager, PR and Social |
Phone: 479-785-6200 |
Phone: 479-494-8221 |
Email: dhumphrey@arcb.com |
Email: amahar@arcb.com |
ArcBest Announces Second Quarter 2022 Results
Record Quarterly Revenue, Operating Income and Net Income Demonstrate ArcBest’s Success Driving Growth and Value Creation
Strategic Growth Initiatives Solidify ArcBest’s Position as a Logistics Leader and Partner of Choice
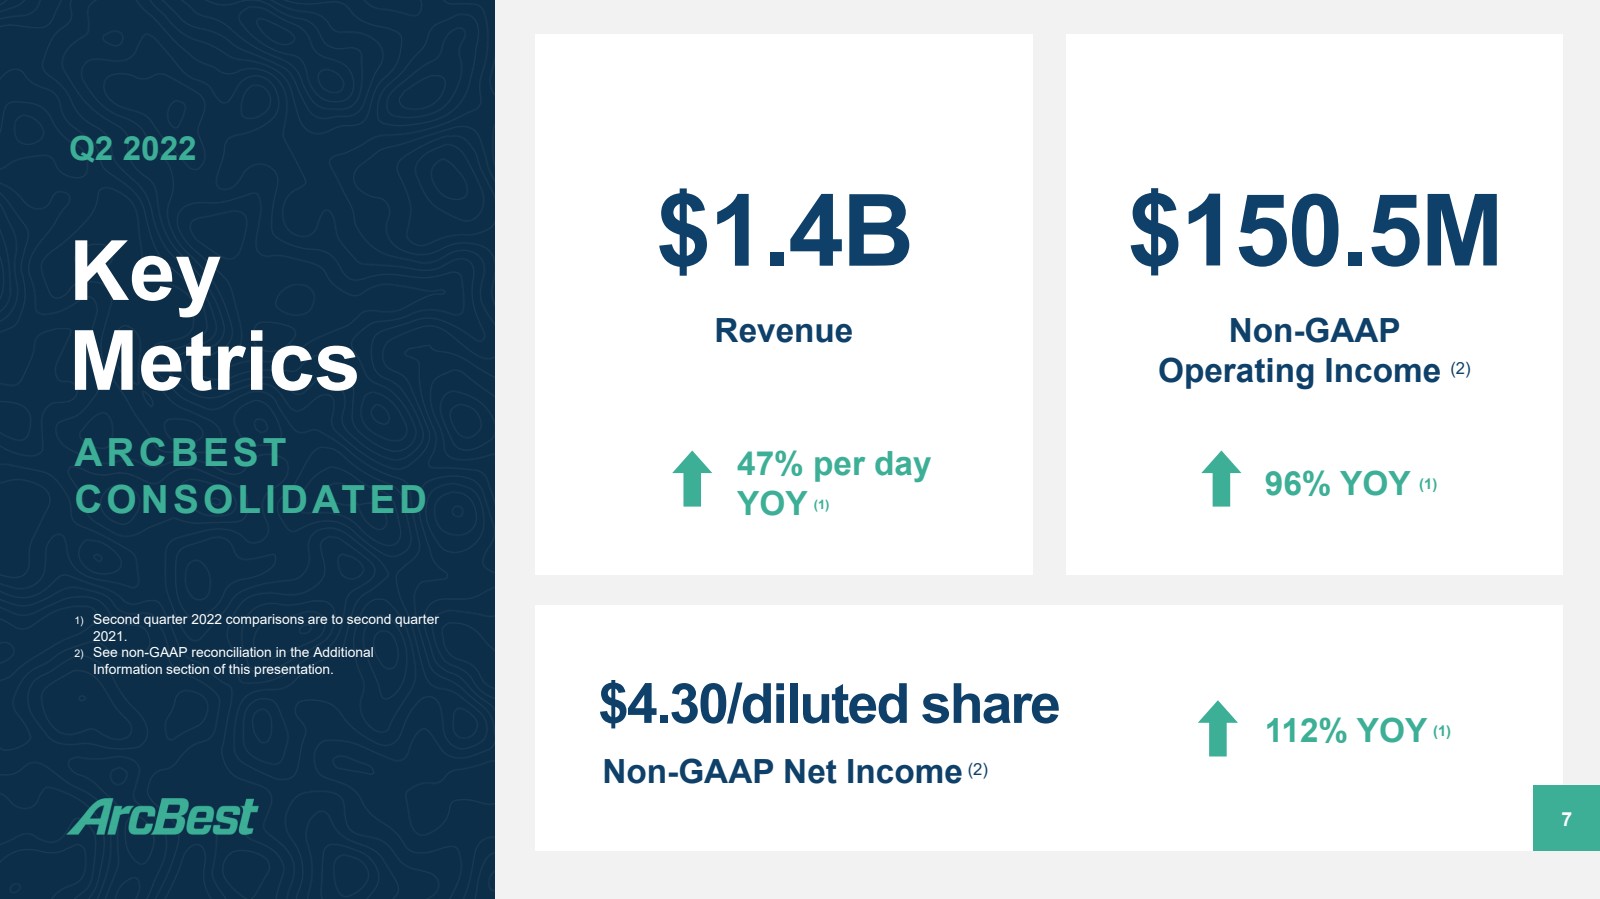
| ● | Second quarter 2022 revenue of $1.4 billion increased 46.8 percent over second quarter 2021. |
| ● | Net income improved to $102.5 million, or $4.00 per diluted share. On a non-GAAP basis, second quarter 2022 net income was $110.0 million, or $4.30 per diluted share. |
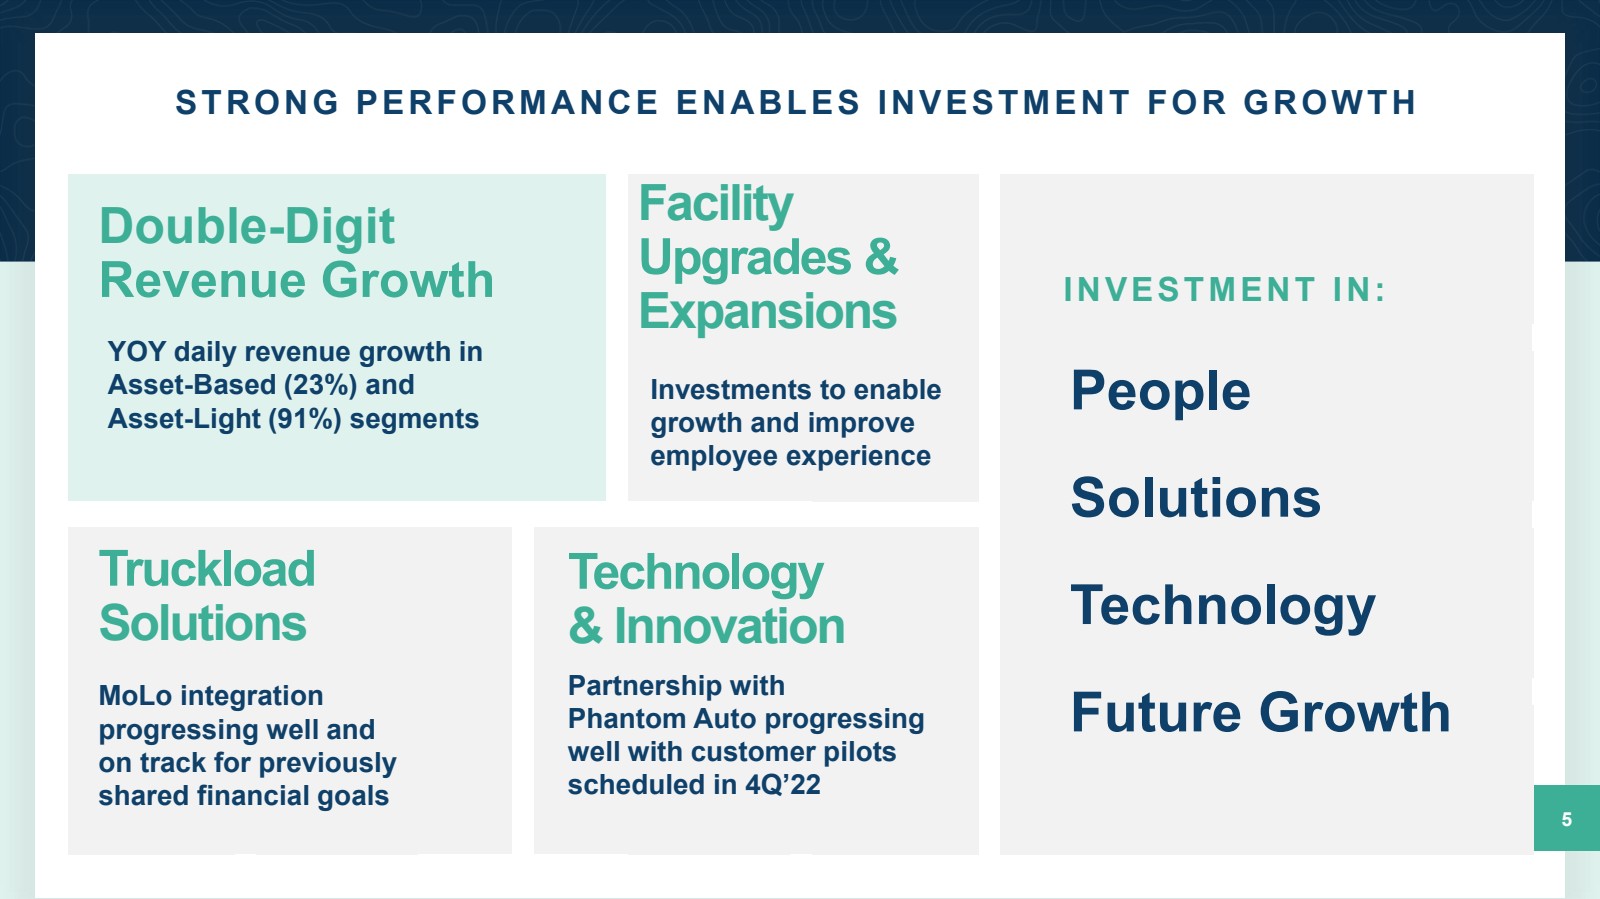
| ● | Innovation investments contributed to revenue growth and improved profitability. |
FORT SMITH, Arkansas, July 29, 2022 — ArcBest® (Nasdaq: ARCB), a leader in supply chain logistics, today reported second quarter 2022 revenue of $1.4 billion, an increase of $444.0 million compared to second quarter 2021. Each operating segment achieved at least double-digit percentage revenue growth over the prior year period. Second quarter 2022 results include the impact of the acquisition of MoLo Solutions, LLC (“MoLo”), which was completed in November 2021.
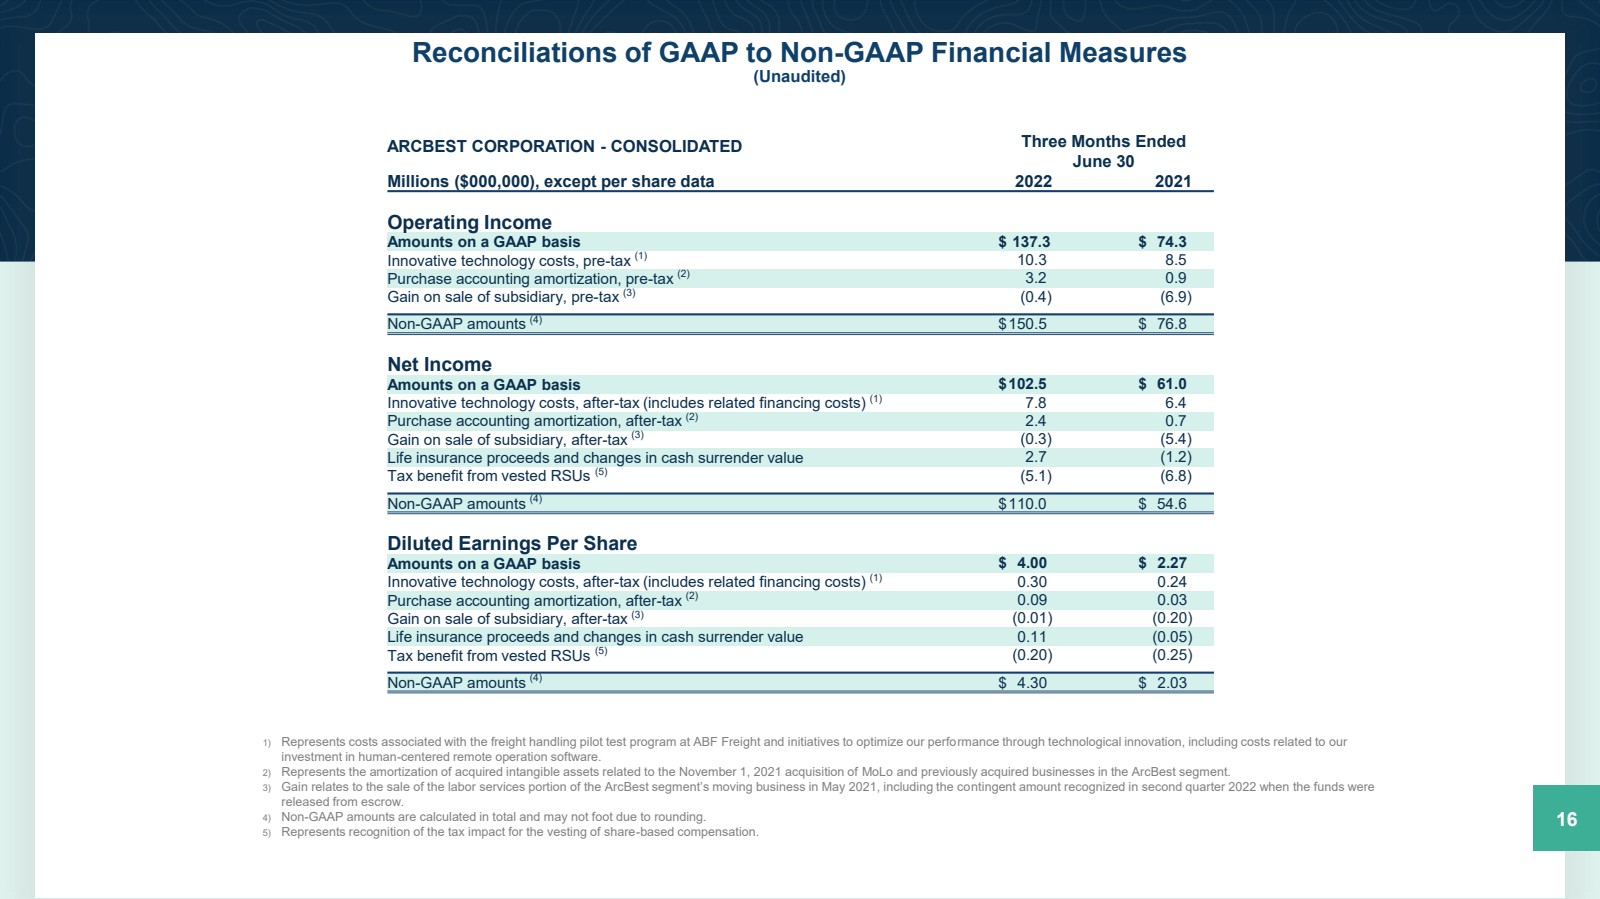
ArcBest’s second quarter 2022 operating income was $137.3 million and net income was $102.5 million, or $4.00 per diluted share, compared to operating income of $74.3 million and net income of $61.0 million, or $2.27 per diluted share, in the second quarter of 2021. The recent quarter’s revenue, operating income and net income totals were the highest of any quarter in ArcBest’s history.
Excluding certain items in both periods as identified in the attached reconciliation tables, second quarter non-GAAP operating income was $150.5 million, compared to $76.8 million in the prior-year period. On a non-GAAP basis, net income was $110.0 million, or $4.30 per diluted share, compared to $54.6 million, or $2.03 per diluted share, in the second quarter of 2021.
“ArcBest’s talented and dedicated team has been successfully executing our strategy, delivering strong financial results and driving value-enhancing growth for the benefit of our shareholders, customers and other stakeholders. The second quarter of 2022 was no exception, as we achieved 47% revenue growth due to increasing demand for our broad offering of transportation and logistics services,” said Judy R. McReynolds, ArcBest chairman, president and CEO. “As our customers’ supply chains become even more complex and economic pressures increase, our strategic focus on technology, innovation and the development of our people positions us to thrive in all environments. By advancing our strategic plan and investing capital back into the business, we continue to differentiate ArcBest and position our company as a logistics leader, our customers' partner of choice, and a consistent generator of superior value for investors.”
1
Second Quarter Results of Operations Comparisons
Asset-Based
Second Quarter 2022 Versus Second Quarter 2021
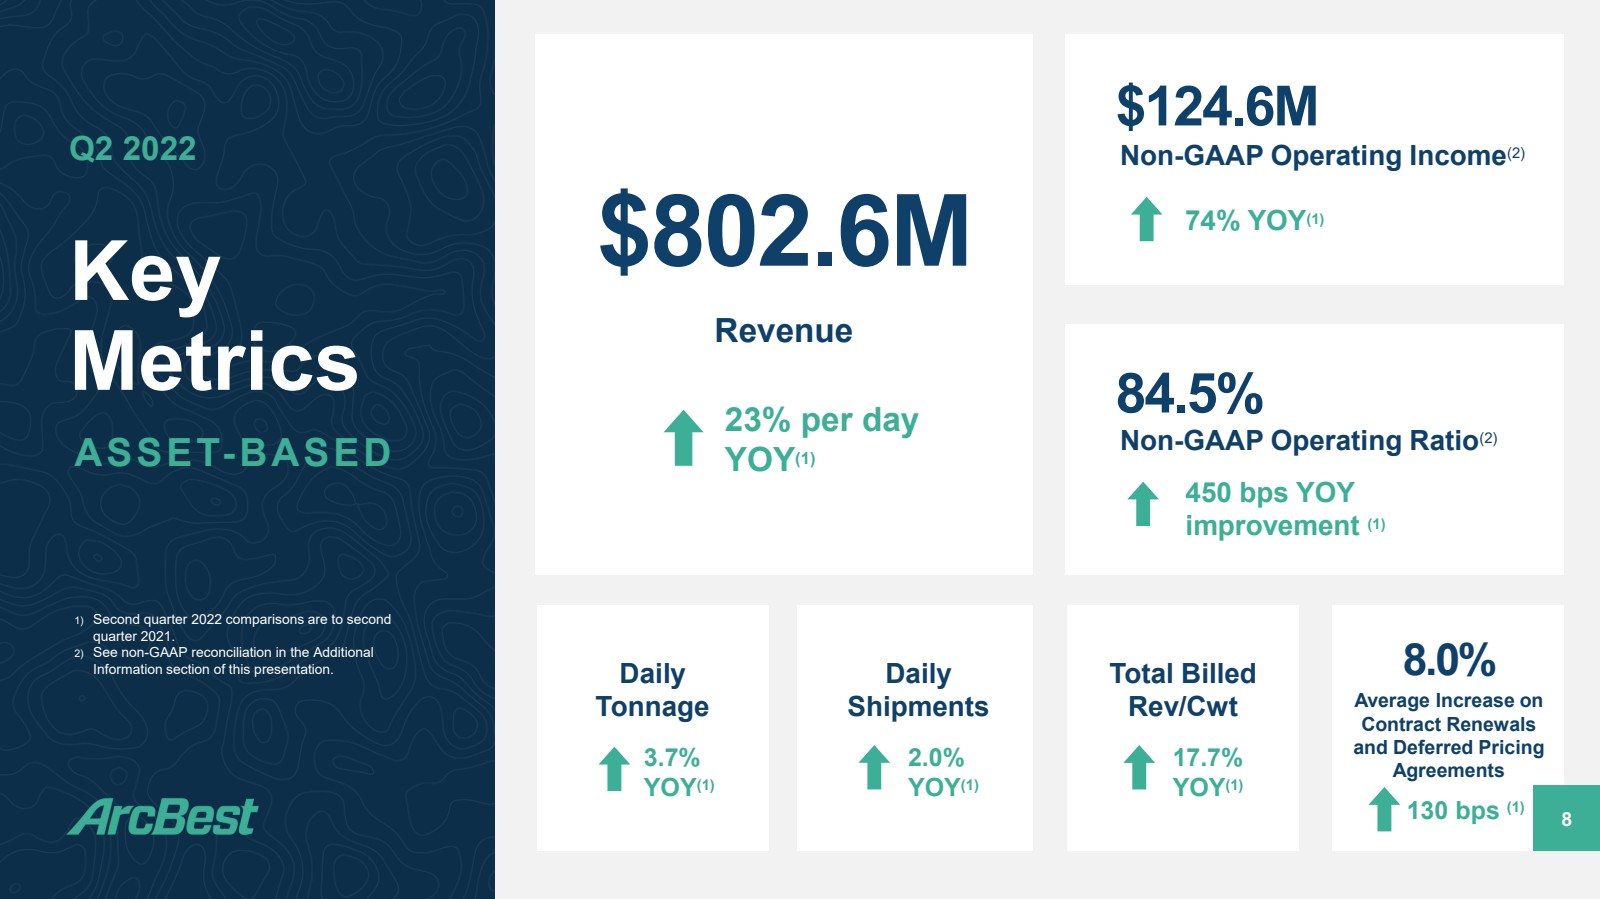
| ● | Revenue of $802.6 million compared to $652.8 million, a per-day increase of 22.9 percent. |
| ● | Total tonnage per day increase of 3.7 percent, including an increase of 0.9 percent in LTL-rated weight per shipment. |
| ● | Total shipments per day increased 2.0 percent. |
| ● | Total billed revenue per hundredweight increased 17.7 percent and was positively impacted by higher fuel surcharges. Revenue per hundredweight on LTL-rated business, excluding fuel surcharge, improved by a percentage in the double digits. |
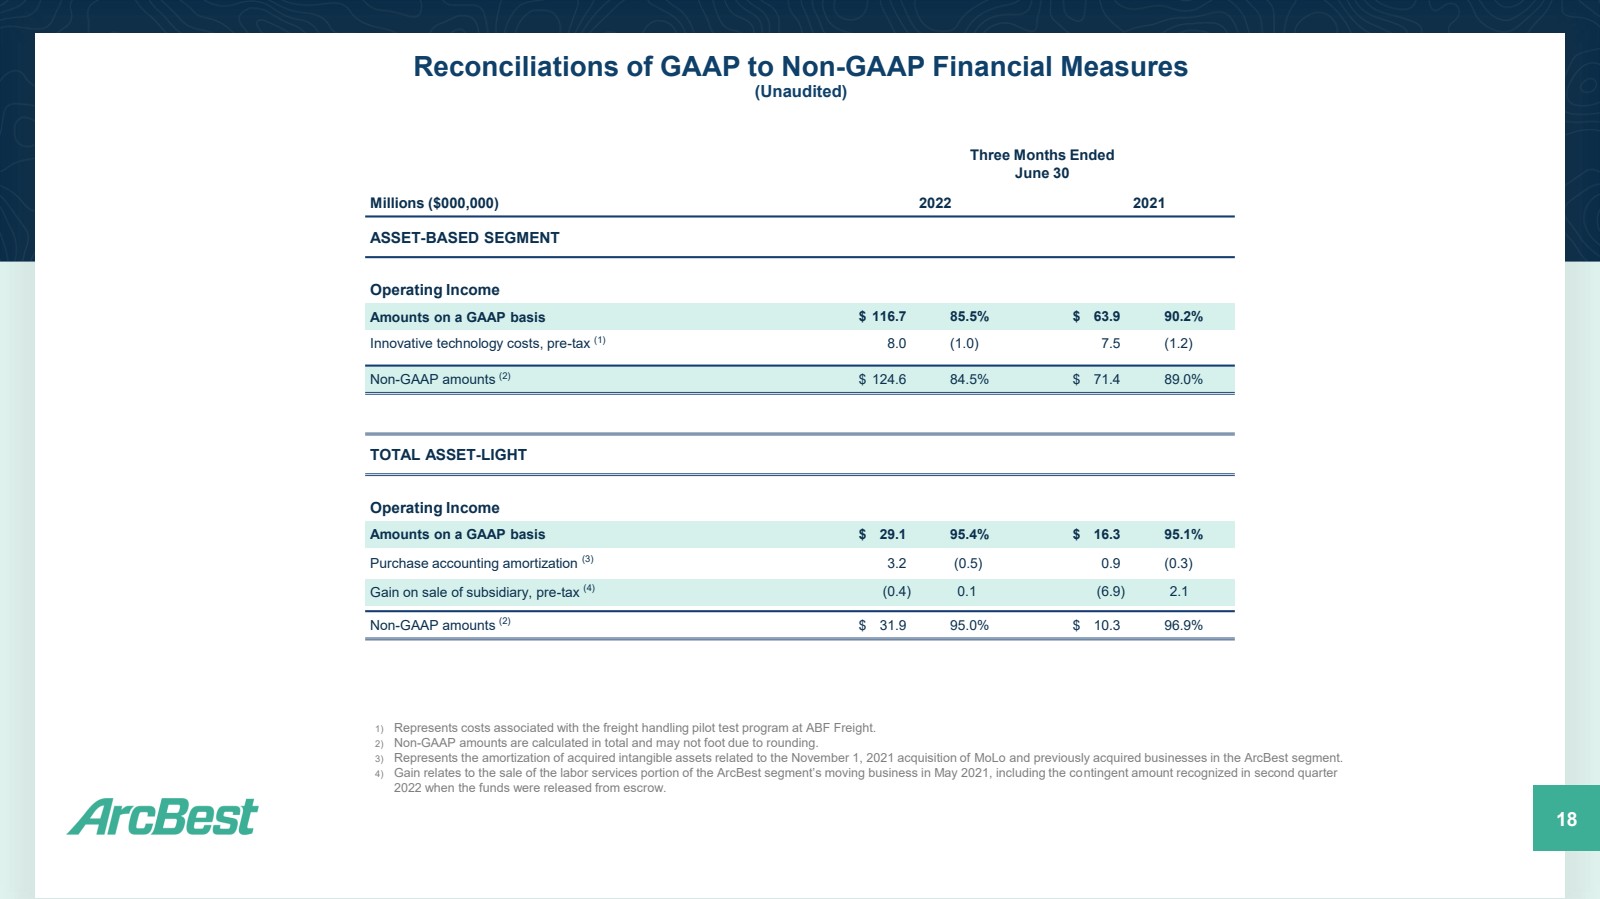
| ● | Operating income of $116.7 million and an operating ratio of 85.5 percent compared to operating income of $63.9 million and an operating ratio of 90.2 percent. On a non-GAAP basis, operating income of $124.6 million and an operating ratio of 84.5 percent compared to operating income of $71.4 million and an operating ratio of 89.0 percent. |
ArcBest’s Asset-Based business delivered strong revenue growth in the second quarter versus the prior year period due in part to a healthy pricing environment, higher fuel surcharges and an increase in ABF Freight’s average weight per shipment. Customer demand drove increases in this year’s freight shipments and tonnage resulting in growth compared to strong, double-digit percent increases in second quarter 2021. Strength in base freight rate pricing continued during the quarter reflecting the value of the logistics solutions ArcBest offers its customers during an ongoing period of supply chain volatility. ArcBest achieved higher second quarter profitability using optimization tools and improved freight data, maintaining more consistent day-to-day business levels while optimizing revenue and managing costs. Hiring initiatives continued at specific service center locations throughout the ABF Freight network and contributed to a net increase in employees.
Asset-Light‡
Second Quarter 2022 Versus Second Quarter 2021 (including the results of MoLo)
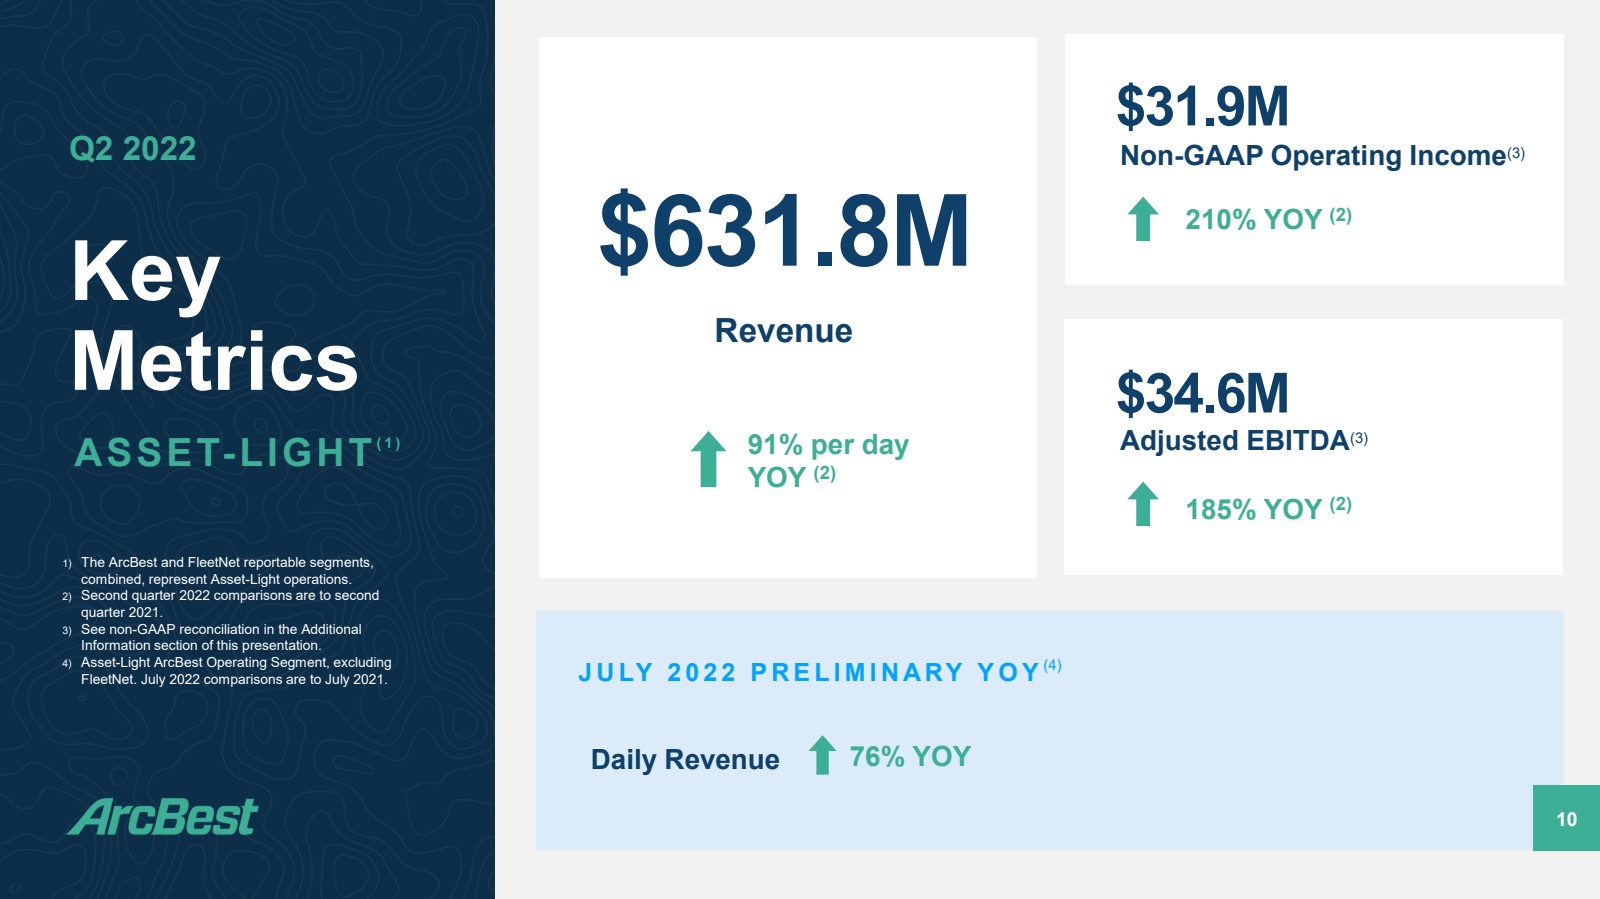
| ● | Revenue of $631.8 million compared to $330.3 million, a per-day increase of 91.3 percent. |
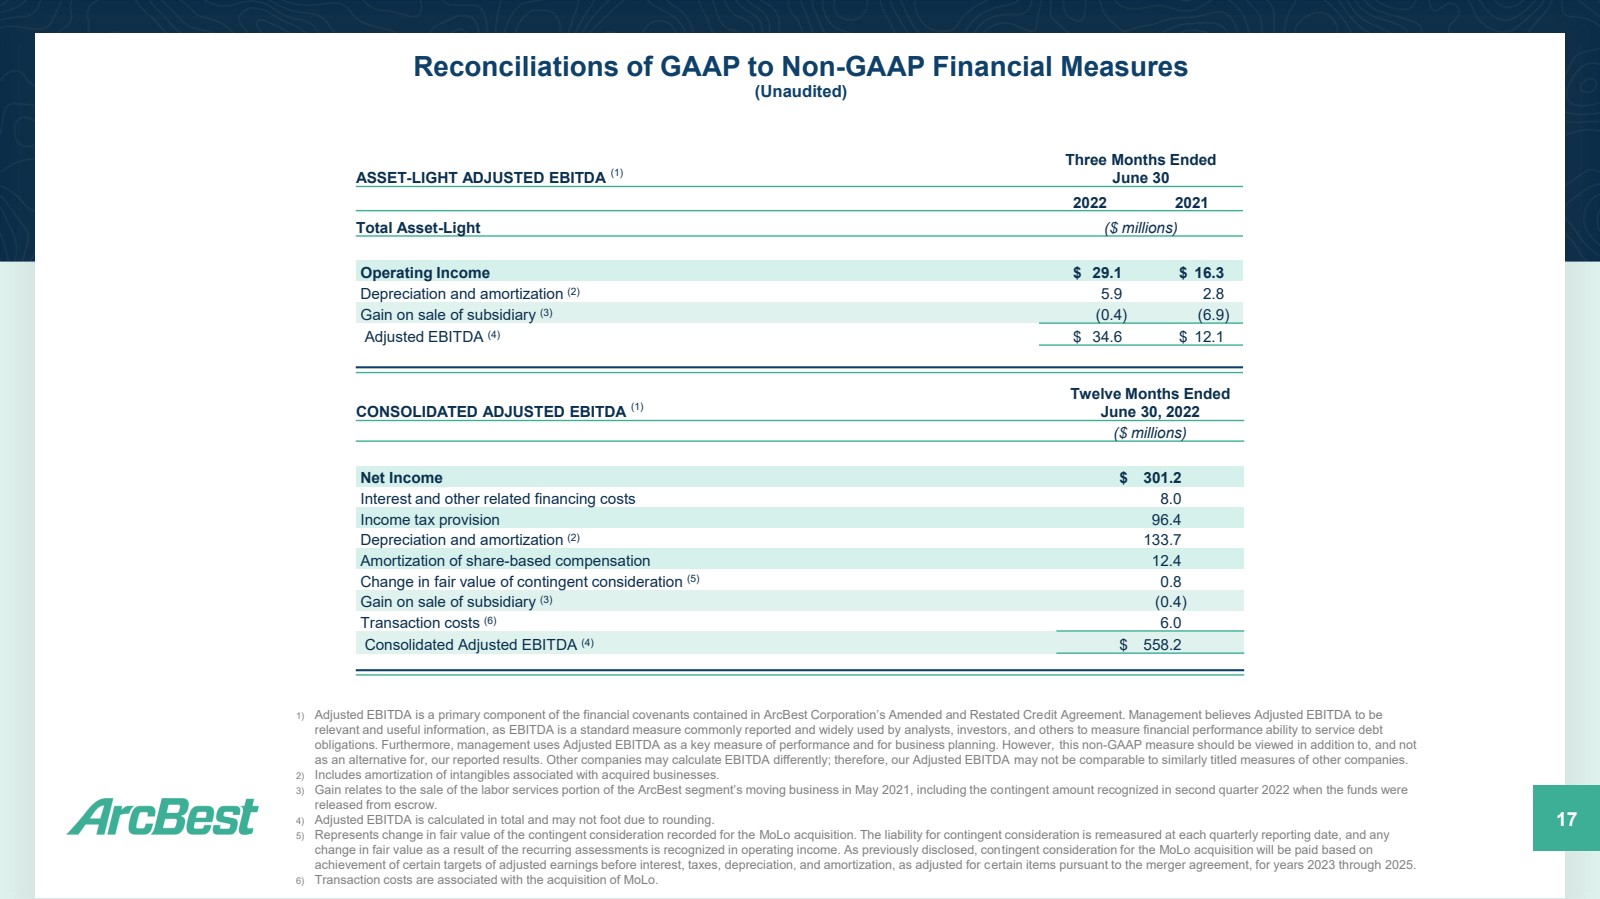
| ● | Operating income of $29.1 million compared to $16.3 million. Prior year operating income included a $6.9 million gain on the sale of the labor services portion of the Asset-Light moving business. On a non-GAAP basis, operating income of $31.9 million compared to $10.3 million. |
| ● | Adjusted earnings before interest, taxes, depreciation and amortization (“Adjusted EBITDA”) of $34.6 million compared to $12.1 million, as detailed in the attached non-GAAP reconciliation tables. |
Higher market rates combined with continued customer demand for our services resulted in strong second quarter revenue growth and another quarter of record profitability in the ArcBest Asset-Light segment. Enhanced revenue and shipment totals versus the same period last year reflect the positive impact of additional truckload brokerage business from MoLo, for which the integration is on schedule. The broad range of ArcBest Asset-Light services offered through managed transportation, dedicated, expedite and international continue to be a great benefit to customers. Each service positively contributed to improved Asset-Light profitability compared to the prior-year period as operating leverage increased due to the revenue growth of the business.
At FleetNet, revenue growth and improved profitability resulted from increases in both total events and revenue per event.
NOTE
‡ - The ArcBest and FleetNet reportable segments, combined, represent Asset-Light operations.
2
Conference Call
ArcBest will host a conference call with company executives to discuss the 2022 second quarter results. The call will be today, Friday, July 29, at 9:30 a.m. EDT (8:30 a.m. CDT). Interested parties are invited to listen by calling (800) 891-8357 or by joining the webcast which can be found on ArcBest’s website at arcb.com. Slides to accompany this call are included in Exhibit 99.3 of the Form 8-K filed on July 29, 2022, will be posted and available to download on the company’s website prior to the scheduled conference time, and will be included in the webcast. Following the call, a recorded playback will be available through the end of the day on September 15, 2022. To listen to the playback, dial (800) 633-8284 or (402) 977-9140 (for international callers). The conference call ID for the playback is 22019591. The conference call and playback can also be accessed, through September 15, 2022, on ArcBest’s website at arcb.com.
About ArcBest
ArcBest® (Nasdaq: ARCB) is a multibillion-dollar integrated logistics company that helps keep the global supply chain moving. Founded in 1923 and now with over 15,000 employees across more than 250 campuses and service centers, the company is a logistics powerhouse, fueled by the simple notion of finding a way to get the job done. Through innovative thinking, agility and trust, ArcBest leverages their full suite of shipping and logistics solutions to meet customers’ critical needs, each and every day. For more information, visit arcb.com.
The following is a “safe harbor” statement under the Private Securities Litigation Reform Act of 1995: Certain statements and information in this press release concerning results for the three months ended June 30, 2022 may constitute “forward-looking statements” within the meaning of the Private Securities Litigation Reform Act of 1995, including, among others, statements regarding (i) our expectations about our intrinsic value or our prospects for growth and value creation and (ii) our financial outlook, position, strategies, goals, and expectations. Terms such as “anticipate,” “believe,” “could,” “estimate,” “expect,” “forecast,” “foresee,” “intend,” “may,” “plan,” “predict,” “project,” “scheduled,” “should,” “would,” and similar expressions and the negatives of such terms are intended to identify forward-looking statements. These statements are based on management’s beliefs, assumptions, and expectations based on currently available information, are not guarantees of future performance, and involve certain risks and uncertainties (some of which are beyond our control). Although we believe that the expectations reflected in these forward-looking statements are reasonable as and when made, we cannot provide assurance that our expectations will prove to be correct. Actual outcomes and results could materially differ from what is expressed, implied, or forecasted in these statements due to a number of factors, including, but not limited to: the effects of widespread outbreak of an illness or disease, including the COVID-19 pandemic, or any other public health crisis, as well as regulatory measures implemented in response to such events; external events which may adversely affect us or the third parties who provide services for us, for which our business continuity plans may not adequately prepare us, including acts of war or terrorism or military conflicts; a failure of our information systems, including disruptions or failures of services essential to our operations or upon which our information technology platforms rely, data breach, and/or cybersecurity incidents; interruption or failure of third-party software or information technology systems or licenses; untimely or ineffective development and implementation of, or failure to realize potential benefits associated with, new or enhanced technology or processes, including the pilot test program at ABF Freight; the loss or reduction of business from large customers; the ability to manage our cost structure, and the timing and performance of growth initiatives; the cost, integration, and performance of any recent or future acquisitions, including the acquisition of MoLo Solutions, LLC, and the inability to realize the anticipated benefits of the acquisition within the expected time period or at all; market fluctuations and interruptions affecting the price of our stock or the price or timing of our share repurchase programs; maintaining our corporate reputation and intellectual property rights; nationwide or global disruption in the supply chain increasing volatility in freight volumes; competitive initiatives and pricing pressures; increased prices for and decreased availability of new revenue equipment, decreases in value of used revenue equipment, and higher costs of equipment-related operating expenses such as maintenance, fuel, and related taxes; availability of fuel, the effect of volatility in fuel prices and the associated changes in fuel surcharges on securing increases in base freight rates, and the inability to collect fuel surcharges; relationships with employees, including unions, and our ability to attract, retain, and develop employees; unfavorable terms of, or the inability to reach agreement on, future collective bargaining agreements or a workforce stoppage by our employees covered under ABF Freight’s collective bargaining agreement; union employee wages and benefits, including changes in required contributions to multiemployer plans; availability and cost of reliable third-party services; our ability to secure independent owner operators and/or operational or regulatory issues related to our use of their services; litigation or claims asserted against us; governmental regulations; environmental laws and regulations, including emissions-control regulations; default on covenants of financing arrangements and the availability and terms of future financing arrangements; self-insurance claims and insurance premium costs; potential impairment of goodwill and intangible assets; general economic conditions and related shifts in market demand that impact the performance and needs of industries we serve and/or limit our customers’ access to adequate financial resources; increasing costs due to inflation; seasonal fluctuations and adverse weather conditions; and other financial, operational, and legal risks and uncertainties detailed from time to time in ArcBest Corporation’s public filings with the Securities and Exchange Commission (the “SEC”).
For additional information regarding known material factors that could cause our actual results to differ from our projected results, please see our filings with the SEC, including our Annual Report on Form 10-K, Quarterly Reports on Form 10-Q, and Current Reports on Form 8-K.
3
Readers are cautioned not to place undue reliance on forward-looking statements, which speak only as of the date hereof. We undertake no obligation to publicly update or revise any forward-looking statements after the date they are made, whether as a result of new information, future events, or otherwise.
Financial Data and Operating Statistics
The following tables show financial data and operating statistics on ArcBest® and its reportable segments.
4
ARCBEST CORPORATION
CONSOLIDATED STATEMENTS OF OPERATIONS
|
|
Three Months Ended |
|
Six Months Ended |
|
||||||||
|
|
June 30 |
|
June 30 |
|
||||||||
|
|
2022 |
|
2021 |
|
2022 |
|
2021 |
|
||||
|
|
(Unaudited) |
|
||||||||||
|
|
($ thousands, except share and per share data) |
|
||||||||||
REVENUES |
|
$ |
1,392,929 |
|
$ |
948,973 |
|
$ |
2,728,003 |
|
$ |
1,778,186 |
|
|
|
|
|
|
|
|
|
|
|
|
|
|
|
OPERATING EXPENSES |
|
|
1,255,583 |
|
|
874,674 |
|
|
2,495,729 |
|
|
1,671,696 |
|
|
|
|
|
|
|
|
|
|
|
|
|
|
|
OPERATING INCOME |
|
|
137,346 |
|
|
74,299 |
|
|
232,274 |
|
|
106,490 |
|
|
|
|
|
|
|
|
|
|
|
|
|
|
|
OTHER INCOME (COSTS) |
|
|
|
|
|
|
|
|
|
|
|
|
|
Interest and dividend income |
|
|
361 |
|
|
322 |
|
|
467 |
|
|
714 |
|
Interest and other related financing costs |
|
|
(1,863) |
|
|
(2,274) |
|
|
(3,802) |
|
|
(4,702) |
|
Other, net |
|
|
(2,807) |
|
|
1,111 |
|
|
(3,633) |
|
|
2,303 |
|
|
|
|
(4,309) |
|
|
(841) |
|
|
(6,968) |
|
|
(1,685) |
|
|
|
|
|
|
|
|
|
|
|
|
|
|
|
INCOME BEFORE INCOME TAXES |
|
|
133,037 |
|
|
73,458 |
|
|
225,306 |
|
|
104,805 |
|
|
|
|
|
|
|
|
|
|
|
|
|
|
|
INCOME TAX PROVISION |
|
|
30,576 |
|
|
12,477 |
|
|
53,276 |
|
|
20,463 |
|
|
|
|
|
|
|
|
|
|
|
|
|
|
|
NET INCOME |
|
$ |
102,461 |
|
$ |
60,981 |
|
$ |
172,030 |
|
$ |
84,342 |
|
|
|
|
|
|
|
|
|
|
|
|
|
|
|
EARNINGS PER COMMON SHARE |
|
|
|
|
|
|
|
|
|
|
|
|
|
Basic |
|
$ |
4.16 |
|
$ |
2.38 |
|
$ |
6.98 |
|
$ |
3.30 |
|
Diluted |
|
$ |
4.00 |
|
$ |
2.27 |
|
$ |
6.68 |
|
$ |
3.13 |
|
|
|
|
|
|
|
|
|
|
|
|
|
|
|
AVERAGE COMMON SHARES OUTSTANDING |
|
|
|
|
|
|
|
|
|
|
|
|
|
Basic |
|
|
24,607,362 |
|
|
25,586,353 |
|
|
24,658,739 |
|
|
25,522,453 |
|
Diluted |
|
|
25,596,031 |
|
|
26,910,796 |
|
|
25,756,314 |
|
|
26,926,133 |
|
5
ARCBEST CORPORATION
CONSOLIDATED BALANCE SHEETS
|
|
June 30 |
|
December 31 |
|
||
|
|
2022 |
|
2021 |
|
||
|
|
(Unaudited) |
|
Note |
|
||
|
|
($ thousands, except share data) |
|
||||
ASSETS |
|
|
|
|
|
|
|
CURRENT ASSETS |
|
|
|
|
|
|
|
Cash and cash equivalents |
|
$ |
127,058 |
|
$ |
76,620 |
|
Short-term investments |
|
|
76,802 |
|
|
48,339 |
|
Accounts receivable, less allowances (2022 - $15,991; 2021 - $13,226) |
|
|
659,672 |
|
|
582,344 |
|
Other accounts receivable, less allowances (2022 - $703; 2021 - $690) |
|
|
18,612 |
|
|
13,094 |
|
Prepaid expenses |
|
|
32,353 |
|
|
40,104 |
|
Prepaid and refundable income taxes |
|
|
10,310 |
|
|
9,654 |
|
Other |
|
|
10,750 |
|
|
5,898 |
|
TOTAL CURRENT ASSETS |
|
|
935,557 |
|
|
776,053 |
|
|
|
|
|
|
|
|
|
PROPERTY, PLANT AND EQUIPMENT |
|
|
|
|
|
|
|
Land and structures |
|
|
356,149 |
|
|
350,694 |
|
Revenue equipment |
|
|
993,008 |
|
|
980,283 |
|
Service, office, and other equipment |
|
|
276,965 |
|
|
251,085 |
|
Software |
|
|
179,195 |
|
|
175,989 |
|
Leasehold improvements |
|
|
20,189 |
|
|
16,931 |
|
|
|
|
1,825,506 |
|
|
1,774,982 |
|
Less allowances for depreciation and amortization |
|
|
1,115,887 |
|
|
1,079,061 |
|
|
|
|
709,619 |
|
|
695,921 |
|
|
|
|
|
|
|
|
|
GOODWILL |
|
|
299,075 |
|
|
300,337 |
|
INTANGIBLE ASSETS, NET |
|
|
120,145 |
|
|
126,580 |
|
OPERATING RIGHT-OF-USE ASSETS |
|
|
124,086 |
|
|
106,686 |
|
DEFERRED INCOME TAXES |
|
|
5,655 |
|
|
5,470 |
|
OTHER LONG-TERM ASSETS |
|
|
99,569 |
|
|
101,629 |
|
TOTAL ASSETS |
|
$ |
2,293,706 |
|
$ |
2,112,676 |
|
|
|
|
|
|
|
|
|
LIABILITIES AND STOCKHOLDERS’ EQUITY |
|
|
|
|
|
|
|
|
|
|
|
|
|
|
|
CURRENT LIABILITIES |
|
|
|
|
|
|
|
Accounts payable |
|
$ |
346,051 |
|
$ |
311,401 |
|
Income taxes payable |
|
|
17,110 |
|
|
12,087 |
|
Accrued expenses |
|
|
304,425 |
|
|
305,851 |
|
Current portion of long-term debt |
|
|
56,049 |
|
|
50,615 |
|
Current portion of operating lease liabilities |
|
|
24,534 |
|
|
22,740 |
|
TOTAL CURRENT LIABILITIES |
|
|
748,169 |
|
|
702,694 |
|
|
|
|
|
|
|
|
|
LONG-TERM DEBT, less current portion |
|
|
169,356 |
|
|
174,917 |
|
OPERATING LEASE LIABILITIES, less current portion |
|
|
104,253 |
|
|
88,835 |
|
POSTRETIREMENT LIABILITIES, less current portion |
|
|
16,694 |
|
|
16,733 |
|
OTHER LONG-TERM LIABILITIES |
|
|
132,930 |
|
|
135,537 |
|
DEFERRED INCOME TAXES |
|
|
59,092 |
|
|
64,893 |
|
|
|
|
|
|
|
|
|
STOCKHOLDERS’ EQUITY |
|
|
|
|
|
|
|
Common stock, $0.01 par value, authorized 70,000,000 shares; |
|
|
296 |
|
|
294 |
|
Additional paid-in capital |
|
|
340,035 |
|
|
318,033 |
|
Retained earnings |
|
|
968,417 |
|
|
801,314 |
|
Treasury stock, at cost, 2022: 5,109,030 shares; 2021: 4,492,514 shares |
|
|
(250,510) |
|
|
(194,273) |
|
Accumulated other comprehensive income |
|
|
4,974 |
|
|
3,699 |
|
TOTAL STOCKHOLDERS’ EQUITY |
|
|
1,063,212 |
|
|
929,067 |
|
TOTAL LIABILITIES AND STOCKHOLDERS' EQUITY |
|
$ |
2,293,706 |
|
$ |
2,112,676 |
|
Note: The balance sheet at December 31, 2021 has been derived from the audited financial statements at that date but does not include all of the information and footnotes required by generally accepted accounting principles for complete financial statements.
6
ARCBEST CORPORATION
CONSOLIDATED STATEMENTS OF CASH FLOWS
|
|
Six Months Ended |
|
||||
|
|
June 30 |
|
||||
|
|
2022 |
|
2021 |
|
||
|
|
Unaudited |
|
||||
|
|
($ thousands) |
|
||||
OPERATING ACTIVITIES |
|
|
|
|
|
|
|
Net income |
|
$ |
172,030 |
|
$ |
84,342 |
|
Adjustments to reconcile net income to net cash provided by operating activities: |
|
|
|
|
|
|
|
Depreciation and amortization |
|
|
63,690 |
|
|
58,709 |
|
Amortization of intangibles |
|
|
6,463 |
|
|
1,927 |
|
Share-based compensation expense |
|
|
6,641 |
|
|
5,678 |
|
Provision for losses on accounts receivable |
|
|
3,583 |
|
|
(334) |
|
Change in deferred income taxes |
|
|
(6,371) |
|
|
(7,612) |
|
Gain on sale of property and equipment |
|
|
(4,073) |
|
|
(8,408) |
|
Gain on sale of subsidiary |
|
|
(402) |
|
|
(6,923) |
|
Changes in operating assets and liabilities: |
|
|
|
|
|
|
|
Receivables |
|
|
(87,092) |
|
|
(37,745) |
|
Prepaid expenses |
|
|
7,477 |
|
|
1,419 |
|
Other assets |
|
|
72 |
|
|
25 |
|
Income taxes |
|
|
4,211 |
|
|
12,275 |
|
Operating right-of-use assets and lease liabilities, net |
|
|
114 |
|
|
761 |
|
Accounts payable, accrued expenses, and other liabilities |
|
|
18,280 |
|
|
41,786 |
|
NET CASH PROVIDED BY OPERATING ACTIVITIES |
|
|
184,623 |
|
|
145,900 |
|
|
|
|
|
|
|
|
|
INVESTING ACTIVITIES |
|
|
|
|
|
|
|
Purchases of property, plant and equipment, net of financings |
|
|
(49,682) |
|
|
(25,395) |
|
Proceeds from sale of property and equipment |
|
|
9,115 |
|
|
10,864 |
|
Proceeds from sale of subsidiary |
|
|
475 |
|
|
9,013 |
|
Purchases of short-term investments |
|
|
(64,330) |
|
|
(43,690) |
|
Proceeds from sale of short-term investments |
|
|
35,840 |
|
|
49,165 |
|
Capitalization of internally developed software |
|
|
(8,541) |
|
|
(9,477) |
|
Business acquisition, net of cash acquired(1) |
|
|
2,279 |
|
|
— |
|
NET CASH USED IN INVESTING ACTIVITIES |
|
|
(74,844) |
|
|
(9,520) |
|
|
|
|
|
|
|
|
|
FINANCING ACTIVITIES |
|
|
|
|
|
|
|
Borrowings under credit facilities |
|
|
58,000 |
|
|
— |
|
Proceeds from notes payable |
|
|
7,280 |
|
|
— |
|
Payments on long-term debt |
|
|
(84,905) |
|
|
(54,643) |
|
Net change in book overdrafts |
|
|
6,085 |
|
|
(922) |
|
Deferred financing costs |
|
|
— |
|
|
(189) |
|
Payment of common stock dividends |
|
|
(4,927) |
|
|
(4,095) |
|
Purchases of treasury stock |
|
|
(31,237) |
|
|
(8,100) |
|
Payments for tax withheld on share-based compensation |
|
|
(9,637) |
|
|
(9,766) |
|
NET CASH USED IN FINANCING ACTIVITIES |
|
|
(59,341) |
|
|
(77,715) |
|
|
|
|
|
|
|
|
|
NET INCREASE IN CASH AND CASH EQUIVALENTS |
|
|
50,438 |
|
|
58,665 |
|
Cash and cash equivalents at beginning of period |
|
|
76,620 |
|
|
303,954 |
|
CASH AND CASH EQUIVALENTS AT END OF PERIOD |
|
$ |
127,058 |
|
$ |
362,619 |
|
|
|
|
|
|
|
|
|
NONCASH INVESTING ACTIVITIES |
|
|
|
|
|
|
|
Equipment financed |
|
$ |
19,498 |
|
$ |
8,138 |
|
Accruals for equipment received |
|
$ |
7,574 |
|
$ |
5,984 |
|
Lease liabilities arising from obtaining right-of-use assets |
|
$ |
30,210 |
|
$ |
6,051 |
|
| 1) | Represents cash received from escrow for post-closing adjustments related to the acquisition of MoLo. |
7
ARCBEST CORPORATION
FINANCIAL STATEMENT OPERATING SEGMENT DATA AND OPERATING RATIOS
|
|
Three Months Ended |
|
|
Six Months Ended |
|
||||||||||||||||||
|
|
June 30 |
|
|
June 30 |
|
||||||||||||||||||
|
|
2022 |
|
|
2021 |
|
|
2022 |
|
|
2021 |
|
||||||||||||
|
|
Unaudited |
|
|||||||||||||||||||||
|
|
($ thousands, except percentages) |
|
|||||||||||||||||||||
REVENUES |
|
|
|
|
|
|
|
|
|
|
|
|
|
|
|
|
|
|
|
|
|
|
|
|
Asset-Based |
|
$ |
802,622 |
|
|
|
|
$ |
652,832 |
|
|
|
|
$ |
1,507,933 |
|
|
|
|
$ |
1,209,124 |
|
|
|
|
|
|
|
|
|
|
|
|
|
|
|
|
|
|
|
|
|
|
|
|
|
|
|
|
ArcBest(1) |
|
|
549,655 |
|
|
|
|
|
270,748 |
|
|
|
|
|
1,144,939 |
|
|
|
|
|
523,084 |
|
|
|
FleetNet |
|
|
82,132 |
|
|
|
|
|
59,547 |
|
|
|
|
|
160,510 |
|
|
|
|
|
118,710 |
|
|
|
Total Asset-Light |
|
|
631,787 |
|
|
|
|
|
330,295 |
|
|
|
|
|
1,305,449 |
|
|
|
|
|
641,794 |
|
|
|
|
|
|
|
|
|
|
|
|
|
|
|
|
|
|
|
|
|
|
|
|
|
|
|
|
Other and eliminations |
|
|
(41,480) |
|
|
|
|
|
(34,154) |
|
|
|
|
|
(85,379) |
|
|
|
|
|
(72,732) |
|
|
|
Total consolidated revenues |
|
$ |
1,392,929 |
|
|
|
|
$ |
948,973 |
|
|
|
|
$ |
2,728,003 |
|
|
|
|
$ |
1,778,186 |
|
|
|
|
|
|
|
|
|
|
|
|
|
|
|
|
|
|
|
|
|
|
|
|
|
|
|
|
OPERATING EXPENSES |
|
|
|
|
|
|
|
|
|
|
|
|
|
|
|
|
|
|
|
|
|
|
|
|
Asset-Based |
|
|
|
|
|
|
|
|
|
|
|
|
|
|
|
|
|
|
|
|
|
|
|
|
Salaries, wages, and benefits |
|
$ |
328,068 |
|
40.9 |
% |
|
$ |
302,370 |
|
46.3 |
% |
|
$ |
641,565 |
|
42.5 |
% |
|
$ |
588,064 |
|
48.6 |
% |
Fuel, supplies, and expenses |
|
|
99,296 |
|
12.4 |
|
|
|
64,689 |
|
9.9 |
|
|
|
184,127 |
|
12.2 |
|
|
|
125,530 |
|
10.4 |
|
Operating taxes and licenses |
|
|
12,823 |
|
1.6 |
|
|
|
12,303 |
|
1.9 |
|
|
|
25,316 |
|
1.7 |
|
|
|
24,551 |
|
2.0 |
|
Insurance |
|
|
12,197 |
|
1.5 |
|
|
|
9,454 |
|
1.4 |
|
|
|
22,628 |
|
1.5 |
|
|
|
18,393 |
|
1.5 |
|
Communications and utilities |
|
|
4,648 |
|
0.6 |
|
|
|
4,663 |
|
0.7 |
|
|
|
9,335 |
|
0.6 |
|
|
|
9,633 |
|
0.8 |
|
Depreciation and amortization |
|
|
24,463 |
|
3.1 |
|
|
|
23,308 |
|
3.6 |
|
|
|
48,768 |
|
3.2 |
|
|
|
46,792 |
|
3.9 |
|
Rents and purchased transportation |
|
|
121,550 |
|
15.1 |
|
|
|
95,082 |
|
14.6 |
|
|
|
224,535 |
|
14.9 |
|
|
|
170,670 |
|
14.1 |
|
Shared services |
|
|
75,584 |
|
9.4 |
|
|
|
69,372 |
|
10.6 |
|
|
|
142,734 |
|
9.6 |
|
|
|
125,238 |
|
10.4 |
|
Gain on sale of property and equipment(2) |
|
|
(1,370) |
|
(0.2) |
|
|
|
71 |
|
— |
|
|
|
(4,065) |
|
(0.3) |
|
|
|
(8,624) |
|
(0.7) |
|
Innovative technology costs(3) |
|
|
7,954 |
|
1.0 |
|
|
|
7,532 |
|
1.2 |
|
|
|
14,914 |
|
1.0 |
|
|
|
14,400 |
|
1.2 |
|
Other |
|
|
753 |
|
0.1 |
|
|
|
77 |
|
— |
|
|
|
1,386 |
|
0.1 |
|
|
|
511 |
|
— |
|
Total Asset-Based |
|
|
685,966 |
|
85.5 |
% |
|
|
588,921 |
|
90.2 |
% |
|
|
1,311,243 |
|
87.0 |
% |
|
|
1,115,158 |
|
92.2 |
% |
|
|
|
|
|
|
|
|
|
|
|
|
|
|
|
|
|
|
|
|
|
|
|
|
|
ArcBest(1) |
|
|
|
|
|
|
|
|
|
|
|
|
|
|
|
|
|
|
|
|
|
|
|
|
Purchased transportation |
|
$ |
448,160 |
|
81.5 |
% |
|
$ |
226,603 |
|
83.7 |
% |
|
$ |
956,540 |
|
83.5 |
% |
|
$ |
437,598 |
|
83.6 |
% |
Supplies and expenses |
|
|
4,263 |
|
0.8 |
|
|
|
2,476 |
|
0.9 |
|
|
|
7,529 |
|
0.7 |
|
|
|
5,044 |
|
1.0 |
|
Depreciation and amortization(4) |
|
|
5,468 |
|
1.0 |
|
|
|
2,366 |
|
0.9 |
|
|
|
10,648 |
|
0.9 |
|
|
|
4,752 |
|
0.9 |
|
Shared services |
|
|
57,986 |
|
10.6 |
|
|
|
29,078 |
|
10.7 |
|
|
|
108,183 |
|
9.5 |
|
|
|
55,150 |
|
10.5 |
|
Gain on sale of subsidiary(5) |
|
|
(402) |
|
(0.1) |
|
|
|
(6,923) |
|
(2.6) |
|
|
|
(402) |
|
— |
|
|
|
(6,923) |
|
(1.3) |
|
Other |
|
|
6,701 |
|
1.2 |
|
|
|
2,021 |
|
0.8 |
|
|
|
13,846 |
|
1.2 |
|
|
|
4,071 |
|
0.8 |
|
|
|
|
522,176 |
|
95.0 |
% |
|
|
255,621 |
|
94.4 |
% |
|
|
1,096,344 |
|
95.8 |
% |
|
|
499,692 |
|
95.5 |
% |
FleetNet |
|
|
80,540 |
|
98.1 |
% |
|
|
58,409 |
|
98.1 |
% |
|
|
157,201 |
|
97.9 |
% |
|
|
116,549 |
|
98.2 |
% |
Total Asset-Light |
|
|
602,716 |
|
|
|
|
|
314,030 |
|
|
|
|
|
1,253,545 |
|
|
|
|
|
616,241 |
|
|
|
|
|
|
|
|
|
|
|
|
|
|
|
|
|
|
|
|
|
|
|
|
|
|
|
|
Other and eliminations(6) |
|
|
(33,099) |
|
|
|
|
|
(28,277) |
|
|
|
|
|
(69,059) |
|
|
|
|
|
(59,703) |
|
|
|
Total consolidated operating expenses |
|
$ |
1,255,583 |
|
90.1 |
% |
|
$ |
874,674 |
|
92.2 |
% |
|
$ |
2,495,729 |
|
91.5 |
% |
|
$ |
1,671,696 |
|
94.0 |
% |
|
|
|
|
|
|
|
|
|
|
|
|
|
|
|
|
|
|
|
|
|
|
|
|
|
OPERATING INCOME |
|
|
|
|
|
|
|
|
|
|
|
|
|
|
|
|
|
|
|
|
|
|
|
|
Asset-Based |
|
$ |
116,656 |
|
|
|
|
$ |
63,911 |
|
|
|
|
$ |
196,690 |
|
|
|
|
$ |
93,966 |
|
|
|
|
|
|
|
|
|
|
|
|
|
|
|
|
|
|
|
|
|
|
|
|
|
|
|
|
ArcBest(1) |
|
|
27,479 |
|
|
|
|
|
15,127 |
|
|
|
|
|
48,595 |
|
|
|
|
|
23,392 |
|
|
|
FleetNet |
|
|
1,592 |
|
|
|
|
|
1,138 |
|
|
|
|
|
3,309 |
|
|
|
|
|
2,161 |
|
|
|
Total Asset-Light |
|
|
29,071 |
|
|
|
|
|
16,265 |
|
|
|
|
|
51,904 |
|
|
|
|
|
25,553 |
|
|
|
|
|
|
|
|
|
|
|
|
|
|
|
|
|
|
|
|
|
|
|
|
|
|
|
|
Other and eliminations(6) |
|
|
(8,381) |
|
|
|
|
|
(5,877) |
|
|
|
|
|
(16,320) |
|
|
|
|
|
(13,029) |
|
|
|
Total consolidated operating income |
|
$ |
137,346 |
|
|
|
|
$ |
74,299 |
|
|
|
|
$ |
232,274 |
|
|
|
|
$ |
106,490 |
|
|
|
| 1) | The 2022 periods include the operations of MoLo, which was acquired on November 1, 2021. |
| 2) | The six months ended June 30, 2021 include an $8.6 million gain on the sale of an unutilized service center property. The 2022 amounts primarily consist of gains on sale of replaced equipment. |
| 3) | Represents costs associated with the freight handling pilot test program at ABF Freight. |
| 4) | Depreciation and amortization includes amortization of intangibles associated with acquired businesses. |
| 5) | Gain relates to the sale of the labor services portion of the ArcBest segment’s moving business in May 2021, including the contingent amount recognized in second quarter 2022 when the funds were released from escrow. |
| 6) | “Other and eliminations” includes corporate costs for certain unallocated shared service costs which are not attributable to any segment, additional investments to offer comprehensive transportation and logistics services across multiple operating segments, and other investments in ArcBest technology and innovations, including innovative technology costs. |
8
ARCBEST CORPORATION
RECONCILIATIONS OF GAAP TO NON-GAAP FINANCIAL MEASURES
Non-GAAP Financial Measures
We report our financial results in accordance with U.S. generally accepted accounting principles (“GAAP”). However, management believes that certain non-GAAP performance measures and ratios utilized for internal analysis provide analysts, investors, and others the same information that we use internally for purposes of assessing our core operating performance and provides meaningful comparisons between current and prior period results, as well as important information regarding performance trends. The use of certain non-GAAP measures improves comparability in analyzing our performance because it removes the impact of items from operating results that, in management's opinion, do not reflect our core operating performance. Other companies may calculate non-GAAP measures differently; therefore, our calculation may not be comparable to similarly titled measures of other companies. Certain information discussed in the scheduled conference call could be considered non-GAAP measures. Non-GAAP financial measures should be viewed in addition to, and not as an alternative for, our reported results. These financial measures should not be construed as better measurements than operating income, operating cash flow, net income or earnings per share, as determined under GAAP.
|
|
Three Months Ended |
|
Six Months Ended |
|||||||||
|
|
June 30 |
|
|
June 30 |
|
|||||||
|
|
2022 |
|
2021 |
|
|
2022 |
|
|
2021 |
|
||
ArcBest Corporation - Consolidated |
|
(Unaudited) |
|
||||||||||
|
|
($ thousands, except per share data) |
|
||||||||||
Operating Income |
|
|
|
|
|
|
|
|
|
|
|
|
|
Amounts on GAAP basis |
|
$ |
137,346 |
|
$ |
74,299 |
|
$ |
232,274 |
|
$ |
106,490 |
|
Innovative technology costs, pre-tax(1) |
|
|
10,341 |
|
|
8,475 |
|
|
20,027 |
|
|
16,142 |
|
Purchase accounting amortization, pre-tax(2) |
|
|
3,214 |
|
|
937 |
|
|
6,427 |
|
|
1,874 |
|
Change in fair value of contingent consideration, pre-tax(3) |
|
|
— |
|
|
— |
|
|
810 |
|
|
— |
|
Gain on sale of subsidiary, pre-tax(4) |
|
|
(402) |
|
|
(6,923) |
|
|
(402) |
|
|
(6,923) |
|
Non-GAAP amounts |
|
$ |
150,499 |
|
$ |
76,788 |
|
$ |
259,136 |
|
$ |
117,583 |
|
|
|
|
|
|
|
|
|
|
|
|
|
|
|
Net Income |
|
|
|
|
|
|
|
|
|
|
|
|
|
Amounts on GAAP basis |
|
$ |
102,461 |
|
$ |
60,981 |
|
$ |
172,030 |
|
$ |
84,342 |
|
Innovative technology costs, after-tax (includes related financing costs)(1) |
|
|
7,789 |
|
|
6,417 |
|
|
15,078 |
|
|
12,241 |
|
Purchase accounting amortization, after-tax(2) |
|
|
2,397 |
|
|
702 |
|
|
4,793 |
|
|
1,404 |
|
Change in fair value of contingent consideration, after-tax(3) |
|
|
— |
|
|
— |
|
|
604 |
|
|
— |
|
Gain on sale of subsidiary, after-tax(4) |
|
|
(317) |
|
|
(5,437) |
|
|
(317) |
|
|
(5,437) |
|
Life insurance proceeds and changes in cash surrender value |
|
|
2,710 |
|
|
(1,248) |
|
|
3,503 |
|
|
(2,514) |
|
Tax benefit from vested RSUs(5) |
|
|
(5,059) |
|
|
(6,796) |
|
|
(5,929) |
|
|
(6,931) |
|
Non-GAAP amounts |
|
$ |
109,981 |
|
$ |
54,619 |
|
$ |
189,762 |
|
$ |
83,105 |
|
|
|
|
|
|
|
|
|
|
|
|
|
|
|
Diluted Earnings Per Share |
|
|
|
|
|
|
|
|
|
|
|
|
|
Amounts on GAAP basis |
|
$ |
4.00 |
|
$ |
2.27 |
|
$ |
6.68 |
|
$ |
3.13 |
|
Innovative technology costs, after-tax (includes related financing costs)(1) |
|
|
0.30 |
|
|
0.24 |
|
|
0.59 |
|
|
0.45 |
|
Purchase accounting amortization, after-tax(2) |
|
|
0.09 |
|
|
0.03 |
|
|
0.19 |
|
|
0.05 |
|
Change in fair value of contingent consideration, after-tax(3) |
|
|
— |
|
|
— |
|
|
0.02 |
|
|
— |
|
Gain on sale of subsidiary, after-tax(4) |
|
|
(0.01) |
|
|
(0.20) |
|
|
(0.01) |
|
|
(0.20) |
|
Life insurance proceeds and changes in cash surrender value |
|
|
0.11 |
|
|
(0.05) |
|
|
0.14 |
|
|
(0.09) |
|
Tax benefit from vested RSUs(5) |
|
|
(0.20) |
|
|
(0.25) |
|
|
(0.23) |
|
|
(0.26) |
|
Non-GAAP amounts(6) |
|
$ |
4.30 |
|
$ |
2.03 |
|
$ |
7.37 |
|
$ |
3.09 |
|
| 1) | Represents costs associated with the freight handling pilot test program at ABF Freight and initiatives to optimize our performance through technological innovation, including costs related to our investment in human-centered remote operation software. |
| 2) | Represents the amortization of acquired intangible assets related to the November 1, 2021 acquisition of MoLo and previously acquired businesses in the ArcBest segment. |
| 3) | Represents change in fair value of the contingent consideration recorded for the MoLo acquisition. The liability for contingent consideration is remeasured at each quarterly reporting date, and any change in fair value as a result of the recurring assessments is recognized in operating income. As previously disclosed, contingent consideration for the MoLo acquisition will be paid based on achievement of certain targets of adjusted earnings before interest, taxes, depreciation, and amortization, as adjusted for certain items pursuant to the merger agreement, for years 2023 through 2025. |
| 4) | Gain relates to the sale of the labor services portion of the ArcBest segment’s moving business in May 2021, including the contingent amount recognized in second quarter 2022 when the funds were released from escrow. |
| 5) | Represents recognition of the tax impact for the vesting of share-based compensation. |
| 6) | Non-GAAP EPS is calculated in total and may not foot due to rounding. |
9
ARCBEST CORPORATION
RECONCILIATIONS OF GAAP TO NON-GAAP FINANCIAL MEASURES – Continued
|
|
Three Months Ended |
|
Six Months Ended |
|
||||||||||||||||||||
|
|
June 30 |
|
June 30 |
|
||||||||||||||||||||
|
|
2022 |
|
2021 |
|
2022 |
|
2021 |
|
||||||||||||||||
Segment Operating Income Reconciliations |
|
(Unaudited) |
|
||||||||||||||||||||||
|
|
($ thousands, except percentages) |
|
||||||||||||||||||||||
Asset-Based Segment |
|
|
|
|
|
||||||||||||||||||||
Operating Income ($) and Operating Ratio (% of revenues) |
|
|
|
|
|
|
|
|
|
|
|
|
|
|
|
||||||||||
Amounts on GAAP basis |
|
$ |
116,656 |
|
85.5 |
% |
|
$ |
63,911 |
|
90.2 |
% |
|
$ |
196,690 |
|
87.0 |
% |
|
$ |
93,966 |
|
92.2 |
% |
|
Innovative technology costs, pre-tax(1) |
|
|
7,954 |
|
(1.0) |
|
|
|
7,532 |
|
(1.2) |
|
|
|
14,914 |
|
(1.0) |
|
|
|
14,400 |
|
(1.2) |
|
|
Non-GAAP amounts |
|
$ |
124,610 |
|
84.5 |
% |
|
$ |
71,443 |
|
89.0 |
% |
|
$ |
211,604 |
|
86.0 |
% |
|
$ |
108,366 |
|
91.0 |
% |
|
|
|
|
|
|
|
||||||||||||||||||||
Asset-Light |
|
|
|
|
|
||||||||||||||||||||
ArcBest Segment |
|
|
|
|
|
||||||||||||||||||||
Operating Income ($) and Operating Ratio (% of revenues) |
|
|
|
|
|
|
|
|
|
|
|
|
|
|
|
||||||||||
Amounts on GAAP basis |
|
$ |
27,479 |
|
95.0 |
% |
|
$ |
15,127 |
|
94.4 |
% |
|
$ |
48,595 |
|
95.8 |
% |
|
$ |
23,392 |
|
95.5 |
% |
|
Purchase accounting amortization, pre-tax(2) |
|
|
3,214 |
|
(0.6) |
|
|
|
937 |
|
(0.3) |
|
|
|
6,427 |
|
(0.6) |
|
|
|
1,874 |
|
(0.4) |
|
|
Change in fair value of contingent consideration, pre-tax(3) |
|
|
— |
|
— |
|
|
|
— |
|
— |
|
|
|
810 |
|
(0.1) |
|
|
|
— |
|
— |
|
|
Gain on sale of subsidiary, pre-tax(4) |
|
|
(402) |
|
0.1 |
|
|
|
(6,923) |
|
2.6 |
|
|
|
(402) |
|
— |
|
|
|
(6,923) |
|
1.3 |
|
|
Non-GAAP amounts |
|
$ |
30,291 |
|
94.5 |
% |
|
$ |
9,141 |
|
96.7 |
% |
|
$ |
55,430 |
|
95.1 |
% |
|
$ |
18,343 |
|
96.4 |
% |
|
|
|
|
|
|
|
||||||||||||||||||||
FleetNet Segment |
|
|
|
|
|
||||||||||||||||||||
Operating Income ($) and Operating Ratio (% of revenues) |
|
|
|
|
|
|
|
|
|
|
|
|
|
|
|
||||||||||
Amounts on GAAP basis |
|
$ |
1,592 |
|
98.1 |
% |
|
$ |
1,138 |
|
98.1 |
% |
|
$ |
3,309 |
|
97.9 |
% |
|
$ |
2,161 |
|
98.2 |
% |
|
|
|
|
|
|
|
||||||||||||||||||||
Total Asset-Light |
|
|
|
|
|
||||||||||||||||||||
Operating Income ($) and Operating Ratio (% of revenues) |
|
|
|
|
|
|
|
|
|
|
|
|
|
|
|
||||||||||
Amounts on GAAP basis |
|
$ |
29,071 |
|
95.4 |
% |
|
$ |
16,265 |
|
95.1 |
% |
|
$ |
51,904 |
|
96.0 |
% |
|
$ |
25,553 |
|
96.0 |
% |
|
Purchase accounting amortization, pre-tax(2) |
|
|
3,214 |
|
(0.5) |
|
|
|
937 |
|
(0.3) |
|
|
|
6,427 |
|
(0.5) |
|
|
|
1,874 |
|
(0.3) |
|
|
Change in fair value of contingent consideration, pre-tax(3) |
|
|
— |
|
— |
|
|
|
— |
|
— |
|
|
|
810 |
|
(0.1) |
|
|
|
— |
|
— |
|
|
Gain on sale of subsidiary, pre-tax(4) |
|
|
(402) |
|
0.1 |
|
|
|
(6,923) |
|
2.1 |
|
|
|
(402) |
|
— |
|
|
|
(6,923) |
|
1.1 |
|
|
Non-GAAP amounts |
|
$ |
31,883 |
|
95.0 |
% |
|
$ |
10,279 |
|
96.9 |
% |
|
$ |
58,739 |
|
95.4 |
% |
|
$ |
20,504 |
|
96.8 |
% |
|
|
|
|
|
|
|
||||||||||||||||||||
Other and Eliminations |
|
|
|
|
|
||||||||||||||||||||
Operating Loss ($) |
|
|
|
|
|
|
|
|
|
|
|
|
|
|
|
||||||||||
Amounts on GAAP basis |
|
$ |
(8,381) |
|
|
|
|
$ |
(5,877) |
|
|
|
|
$ |
(16,320) |
|
|
|
|
$ |
(13,029) |
|
|
|
|
Innovative technology costs, pre-tax(5) |
|
|
2,387 |
|
|
|
|
|
943 |
|
|
|
|
|
5,113 |
|
|
|
|
|
1,742 |
|
|
|
|
Non-GAAP amounts |
|
$ |
(5,994) |
|
|
|
|
$ |
(4,934) |
|
|
|
|
$ |
(11,207) |
|
|
|
|
$ |
(11,287) |
|
|
|
|
| 1) | Represents costs associated with the freight handling pilot test program at ABF Freight. |
| 2) | Represents the amortization of acquired intangible assets related to the November 1, 2021 acquisition of MoLo and previously acquired businesses in the ArcBest segment. |
| 3) | Represents change in fair value of the contingent consideration recorded for the MoLo acquisition, as previously described in the footnotes to the ArcBest Corporation – Consolidated non-GAAP table. |
| 4) | Gain relates to the sale of the labor services portion of the ArcBest segment’s moving business in May 2021, including the contingent amount recognized in second quarter 2022 when the funds were released from escrow. |
| 5) | Represents costs associated with initiative to optimize our performance through technological innovation, including costs related to our investment in human-centered remote operation software, and costs related to the freight handling pilot test program at ABF Freight. |
10
ARCBEST CORPORATION
RECONCILIATIONS OF GAAP TO NON-GAAP FINANCIAL MEASURES – Continued
Effective Tax Rate Reconciliation |
|
|
|
|
|
|
|
|
|
|
|
|
|
|
||||
ArcBest Corporation - Consolidated |
|
|
|
|
|
|
|
|
|
|
|
|
|
|
|
|
|
|
|
|
|
|
|
|
|
|
|
|
|
|
|
|
|
|
|
|
|
(Unaudited) |
|
|
|
|
|
|
|
|
|
|
|
|
|
|
|
|
|
|
($ thousands, except percentages) |
|
Three Months Ended June 30, 2022 |
||||||||||||||||
|
|
|
|
|
Other |
|
Income |
|
Income |
|
|
|
|
|
|
|||
|
|
Operating |
|
Income |
|
Before Income |
|
Tax |
|
Net |
|
|
||||||
|
|
Income |
|
(Costs) |
|
Taxes |
|
Provision |
|
Income |
|
Tax Rate(6) |
||||||
Amounts on GAAP basis |
|
$ |
137,346 |
|
$ |
(4,309) |
|
$ |
133,037 |
|
$ |
30,576 |
|
$ |
102,461 |
|
23.0 |
% |
Innovative technology costs(1) |
|
|
10,341 |
|
|
148 |
|
|
10,489 |
|
|
2,700 |
|
|
7,789 |
|
25.7 |
|
Purchase accounting amortization(2) |
|
|
3,214 |
|
|
— |
|
|
3,214 |
|
|
817 |
|
|
2,397 |
|
25.4 |
|
Change in fair value of contingent consideration(3) |
|
|
— |
|
|
— |
|
|
— |
|
|
— |
|
|
— |
|
— |
|
Gain on sale of subsidiary(4) |
|
|
(402) |
|
|
— |
|
|
(402) |
|
|
(85) |
|
|
(317) |
|
(21.1) |
|
Life insurance proceeds and changes in cash surrender value |
|
|
— |
|
|
2,710 |
|
|
2,710 |
|
|
— |
|
|
2,710 |
|
— |
|
Tax benefit from vested RSUs(5) |
|
|
— |
|
|
— |
|
|
— |
|
|
5,059 |
|
|
(5,059) |
|
— |
|
Non-GAAP amounts |
|
$ |
150,499 |
|
$ |
(1,451) |
|
$ |
149,048 |
|
$ |
39,067 |
|
$ |
109,981 |
|
26.2 |
% |
|
|
Six Months Ended June 30, 2022 |
||||||||||||||||
|
|
|
|
Other |
|
Income |
|
Income |
|
|
|
|
|
|
||||
|
|
Operating |
|
Income |
|
Before Income |
|
Tax |
|
Net |
|
|
||||||
|
|
Income |
|
(Costs) |
|
Taxes |
|
Provision |
|
Income |
|
Tax Rate(6) |
||||||
Amounts on GAAP basis |
|
$ |
232,274 |
|
$ |
(6,968) |
|
$ |
225,306 |
|
$ |
53,276 |
|
$ |
172,030 |
|
23.6 |
% |
Innovative technology costs(1) |
|
|
20,027 |
|
|
277 |
|
|
20,304 |
|
|
5,226 |
|
|
15,078 |
|
25.7 |
|
Purchase accounting amortization(2) |
|
|
6,427 |
|
|
— |
|
|
6,427 |
|
|
1,634 |
|
|
4,793 |
|
25.4 |
|
Change in fair value of contingent consideration(3) |
|
|
810 |
|
|
— |
|
|
810 |
|
|
206 |
|
|
604 |
|
25.4 |
|
Gain on sale of subsidiary(4) |
|
|
(402) |
|
|
— |
|
|
(402) |
|
|
(85) |
|
|
(317) |
|
(21.1) |
|
Life insurance proceeds and changes in cash surrender value |
|
|
— |
|
|
3,503 |
|
|
3,503 |
|
|
— |
|
|
3,503 |
|
— |
|
Tax benefit from vested RSUs(5) |
|
|
— |
|
|
— |
|
|
— |
|
|
5,929 |
|
|
(5,929) |
|
— |
|
Non-GAAP amounts |
|
$ |
259,136 |
|
$ |
(3,188) |
|
$ |
255,948 |
|
$ |
66,186 |
|
$ |
189,762 |
|
25.9 |
% |
|
|
Three Months Ended June 30, 2021 |
||||||||||||||||
|
|
|
|
Other |
|
Income |
|
Income |
|
|
|
|
|
|||||
|
|
Operating |
|
Income |
|
Before Income |
|
Tax |
|
Net |
|
|
||||||
|
|
Income |
|
(Costs) |
|
Taxes |
|
Provision |
|
Income |
|
Tax Rate(6) |
||||||
Amounts on GAAP basis |
|
$ |
74,299 |
|
$ |
(841) |
|
$ |
73,458 |
|
$ |
12,477 |
|
$ |
60,981 |
|
17.0 |
% |
Innovative technology costs(1) |
|
|
8,475 |
|
|
166 |
|
|
8,641 |
|
|
2,224 |
|
|
6,417 |
|
25.7 |
|
Purchase accounting amortization(2) |
|
|
937 |
|
|
— |
|
|
937 |
|
|
235 |
|
|
702 |
|
25.1 |
|
Gain on sale of subsidiary(4) |
|
|
(6,923) |
|
|
— |
|
|
(6,923) |
|
|
(1,486) |
|
|
(5,437) |
|
(21.5) |
|
Life insurance proceeds and changes in cash surrender value |
|
|
— |
|
|
(1,248) |
|
|
(1,248) |
|
|
— |
|
|
(1,248) |
|
— |
|
Tax benefit from vested RSUs(5) |
|
|
— |
|
|
— |
|
|
— |
|
|
6,796 |
|
|
(6,796) |
|
— |
|
Non-GAAP amounts |
|
$ |
76,788 |
|
$ |
(1,923) |
|
$ |
74,865 |
|
$ |
20,246 |
|
$ |
54,619 |
|
27.0 |
% |
|
|
Six Months Ended June 30, 2021 |
||||||||||||||||
|
|
|
|
Other |
|
Income |
|
Income |
|
|
|
|
|
|
||||
|
|
Operating |
|
Income |
|
Before Income |
|
Tax |
|
Net |
|
|
||||||
|
|
Income |
|
(Costs) |
|
Taxes |
|
Provision |
|
Income |
|
Tax Rate(6) |
||||||
Amounts on GAAP basis |
|
$ |
106,490 |
|
$ |
(1,685) |
|
$ |
104,805 |
|
$ |
20,463 |
|
$ |
84,342 |
|
19.5 |
% |
Innovative technology costs(1) |
|
|
16,142 |
|
|
340 |
|
|
16,482 |
|
|
4,241 |
|
|
12,241 |
|
25.7 |
|
Purchase accounting amortization(2) |
|
|
1,874 |
|
|
— |
|
|
1,874 |
|
|
470 |
|
|
1,404 |
|
25.1 |
|
Gain on sale of subsidiary(4) |
|
|
(6,923) |
|
|
— |
|
|
(6,923) |
|
|
(1,486) |
|
|
(5,437) |
|
(21.5) |
|
Life insurance proceeds and changes in cash surrender value |
|
|
— |
|
|
(2,514) |
|
|
(2,514) |
|
|
— |
|
|
(2,514) |
|
— |
|
Tax benefit from vested RSUs(5) |
|
|
— |
|
|
— |
|
|
— |
|
|
6,931 |
|
|
(6,931) |
|
— |
|
Non-GAAP amounts |
|
$ |
117,583 |
|
$ |
(3,859) |
|
$ |
113,724 |
|
$ |
30,619 |
|
$ |
83,105 |
|
26.9 |
% |
| 1) | Represents costs associated with the freight handling pilot test program at ABF Freight and initiatives to optimize our performance through technological innovation, including costs related to our investment in human-centered remote operation software. |
| 2) | Represents the amortization of acquired intangible assets related to the November 1, 2021 acquisition of MoLo and previously acquired businesses in the ArcBest segment. |
| 3) | Represents change in fair value of the contingent consideration recorded for the MoLo acquisition, as previously described in the footnotes to the ArcBest Corporation – Consolidated non-GAAP table. |
| 4) | Gain relates to the sale of the labor services portion of the ArcBest segment’s moving business in May 2021, including the contingent amount recognized in second quarter 2022 when the funds were released from escrow. |
| 5) | Represents recognition of the tax impact for the vesting of share-based compensation. |
| 6) | Tax rate for total “Amounts on GAAP basis” represents the effective tax rate. The tax effects of non-GAAP adjustments are calculated based on the statutory rate applicable to each item based on tax jurisdiction, unless the nature of the item requires the tax effect to be estimated by applying a specific tax treatment. |
11
ARCBEST CORPORATION
RECONCILIATIONS OF GAAP TO NON-GAAP FINANCIAL MEASURES – Continued
Adjusted Earnings Before Interest, Taxes, Depreciation, and Amortization (Adjusted EBITDA)
Management uses Adjusted EBITDA as a key measure of performance and for business planning. The measure is particularly meaningful for analysis of operating performance because it excludes amortization of acquired intangibles and software of the Asset-Light businesses and changes in the fair value of contingent consideration, which are significant expenses resulting from strategic decisions rather than core daily operations. Additionally, Adjusted EBITDA is a primary component of the financial covenants contained in our credit agreement. The calculation of Consolidated Adjusted EBITDA as presented below begins with net income, which is the most directly comparable GAAP measure. The calculation of Asset-Light Adjusted EBITDA as presented below begins with operating income, as other income (costs), income taxes, and net income are reported at the consolidated level and not included in the operating segment financial information evaluated by management to make operating decisions.
|
|
Three Months Ended |
|
Six Months Ended |
|||||||||
|
|
June 30 |
|
|
June 30 |
|
|||||||
|
|
2022 |
|
2021 |
|
2022 |
|
2021 |
|
||||
|
|
(Unaudited) |
|
||||||||||
ArcBest Corporation - Consolidated Adjusted EBITDA |
|
($ thousands) |
|
||||||||||
|
|
|
|||||||||||
Net Income |
|
$ |
102,461 |
|
$ |
60,981 |
|
$ |
172,030 |
|
$ |
84,342 |
|
Interest and other related financing costs |
|
|
1,863 |
|
|
2,274 |
|
|
3,802 |
|
|
4,702 |
|
Income tax provision |
|
|
30,576 |
|
|
12,477 |
|
|
53,276 |
|
|
20,463 |
|
Depreciation and amortization(1) |
|
|
35,330 |
|
|
30,282 |
|
|
70,153 |
|
|
60,636 |
|
Amortization of share-based compensation |
|
|
3,878 |
|
|
3,324 |
|
|
6,641 |
|
|
5,678 |
|
Change in fair value of contingent consideration(2) |
|
|
— |
|
|
— |
|
|
810 |
|
|
— |
|
Gain on sale of subsidiary(3) |
|
|
(402) |
|
|
(6,923) |
|
|
(402) |
|
|
(6,923) |
|
Consolidated Adjusted EBITDA |
|
$ |
173,706 |
|
$ |
102,415 |
|
$ |
306,310 |
|
$ |
168,898 |
|
|
|
Three Months Ended |
|
Six Months Ended |
|
||||||||
|
|
June 30 |
|
June 30 |
|
||||||||
|
|
2022 |
|
2021 |
|
2022 |
|
2021 |
|
||||
Asset-Light Adjusted EBITDA |
|
(Unaudited) |
|
||||||||||
|
|
($ thousands) |
|
||||||||||
|
|
|
|
|
|||||||||
ArcBest |
|
|
|
|
|
|
|
|
|
|
|
|
|
Operating Income |
|
$ |
27,479 |
|
$ |
15,127 |
|
$ |
48,595 |
|
$ |
23,392 |
|
Depreciation and amortization(1) |
|
|
5,468 |
|
|
2,366 |
|
|
10,648 |
|
|
4,752 |
|
Change in fair value of contingent consideration(2) |
|
|
— |
|
|
— |
|
|
810 |
|
|
— |
|
Gain on sale of subsidiary(3) |
|
|
(402) |
|
|
(6,923) |
|
|
(402) |
|
|
(6,923) |
|
Adjusted EBITDA |
|
$ |
32,545 |
|
$ |
10,570 |
|
$ |
59,651 |
|
$ |
21,221 |
|
|
|
|
|
|
|||||||||
FleetNet |
|
|
|
|
|||||||||
Operating Income |
|
$ |
1,592 |
|
$ |
1,138 |
|
$ |
3,309 |
|
$ |
2,161 |
|
Depreciation and amortization(1) |
|
|
446 |
|
|
413 |
|
|
873 |
|
|
828 |
|
Adjusted EBITDA |
|
$ |
2,038 |
|
$ |
1,551 |
|
$ |
4,182 |
|
$ |
2,989 |
|
|
|
|
|
|
|||||||||
Total Asset-Light |
|
|
|
|
|
|
|
|
|
|
|
|
|
Operating Income |
|
$ |
29,071 |
|
$ |
16,265 |
|
$ |
51,904 |
|
$ |
25,553 |
|
Depreciation and amortization(1) |
|
|
5,914 |
|
|
2,779 |
|
|
11,521 |
|
|
5,580 |
|
Change in fair value of contingent consideration(2) |
|
|
— |
|
|
— |
|
|
810 |
|
|
— |
|
Gain on sale of subsidiary(3) |
|
|
(402) |
|
|
(6,923) |
|
|
(402) |
|
|
(6,923) |
|
Adjusted EBITDA |
|
$ |
34,583 |
|
$ |
12,121 |
|
$ |
63,833 |
|
$ |
24,210 |
|
| 1) | Includes amortization of intangibles associated with acquired businesses. |
| 2) | Represents change in fair value of the contingent consideration recorded for the MoLo acquisition, as previously described in the footnotes to the ArcBest Corporation – Consolidated non-GAAP table. |
| 3) | Gain relates to the sale of the labor services portion of the ArcBest segment’s moving business in May 2021, including the contingent amount recognized in second quarter 2022 when the funds were released from escrow. |
12
ARCBEST CORPORATION
OPERATING STATISTICS
|
|
Three Months Ended |
|
Six Months Ended |
|
||||||||||||
|
|
June 30 |
|
June 30 |
|
||||||||||||
|
|
2022 |
|
2021 |
|
% Change |
|
2022 |
|
2021 |
|
% Change |
|
||||
|
|
(Unaudited) |
|
||||||||||||||
Asset-Based |
|
|
|
|
|
|
|
|
|
|
|
|
|
|
|
|
|
|
|
|
|
|
|
|
|
|
|
|
|
|
|
|
|
|
|
Workdays |
|
|
63.5 |
|
|
63.5 |
|
|
|
|
127.0 |
|
|
126.5 |
|
|
|
|
|
|
|
|
|
|
|
|
|
|
|
|
|
|
|
|
|
Billed Revenue(1) / CWT |
|
$ |
45.76 |
|
$ |
38.87 |
|
17.7% |
|
$ |
44.77 |
|
$ |
37.54 |
|
19.3% |
|
|
|
|
|
|
|
|
|
|
|
|
|
|
|
|
|
|
|
Billed Revenue(1) / Shipment |
|
$ |
632.43 |
|
$ |
528.33 |
|
19.7% |
|
$ |
606.14 |
|
$ |
495.76 |
|
22.3% |
|
|
|
|
|
|
|
|
|
|
|
|
|
|
|
|
|
|
|
Shipments |
|
|
1,276,859 |
|
|
1,251,791 |
|
2.0% |
|
|
2,504,083 |
|
|
2,467,207 |
|
1.5% |
|
|
|
|
|
|
|
|
|
|
|
|
|
|
|
|
|
|
|
Shipments / Day |
|
|
20,108 |
|
|
19,713 |
|
2.0% |
|
|
19,717 |
|
|
19,504 |
|
1.1% |
|
|
|
|
|
|
|
|
|
|
|
|
|
|
|
|
|
|
|
Tonnage (Tons) |
|
|
882,367 |
|
|
850,817 |
|
3.7% |
|
|
1,695,097 |
|
|
1,629,232 |
|
4.0% |
|
|
|
|
|
|
|
|
|
|
|
|
|
|
|
|
|
|
|
Tons / Day |
|
|
13,896 |
|
|
13,399 |
|
3.7% |
|
|
13,347 |
|
|
12,879 |
|
3.6% |
|
|
|
|
|
|
|
|
|
|
|
|
|
|
|
|
|
|
|
Pounds / Shipment |
|
|
1,382 |
|
|
1,359 |
|
1.7% |
|
|
1,354 |
|
|
1,321 |
|
2.5% |
|
|
|
|
|
|
|
|
|
|
|
|
|
|
|
|
|
|
|
Average Length of Haul (Miles) |
|
|
1,096 |
|
|
1,107 |
|
(1.0%) |
|
|
1,088 |
|
|
1,099 |
|
(1.0%) |
|
|
|
|
|
|
|
|
|
|
|
|
|
|
|
|
|
|
|
| 1) | Revenue for undelivered freight is deferred for financial statement purposes in accordance with the Asset-Based segment revenue recognition policy. Billed revenue used for calculating revenue per hundredweight measurements has not been adjusted for the portion of revenue deferred for financial statement purposes. |
|
|
Year Over Year % Change |
||||
|
|
Three Months Ended |
Six Months Ended |
|||
|
|
June 30, 2022 |
June 30, 2022 |
|||
|
|
(Unaudited) |
||||
ArcBest(2) |
|
|
|
|
|
|
|
|
|
|
|
|
|
Revenue / Shipment |
|
|
15.2% |
|
|
23.5% |
|
|
|
|
|
|
|
Shipments / Day |
|
|
74.8% |
|
|
79.2% |
| 2) | Statistical data for the three and six months ended June 30, 2022 includes the operations of MoLo, which was acquired on November 1, 2021. Statistical data related to managed transportation solutions transactions is not included in the presentation of operating statistics for the ArcBest segment for the periods presented. |
###
13
Exhibit 99.2
ArcBest® is providing this exhibit as supplemental information to its scheduled conference call and the press release announcing the Company’s unaudited second quarter 2022 results filed as Exhibit 99.1 to the Company’s Current Report on Form 8-K. Certain statements and information in this exhibit may constitute “forward-looking statements” within the meaning of the Private Securities Litigation Reform Act of 1995. Refer to the “Forward-Looking Statements” disclosure at the end of this exhibit.
Non-GAAP Financial Measures
ArcBest reports its financial results in accordance with generally accepted accounting principles (“GAAP”); however, this exhibit includes certain non-GAAP information. Refer to the discussion of non-GAAP information included in Item 2.02 of the Current Report on Form 8-K to which this exhibit is included for further information, including reference to reconciliations of GAAP to non-GAAP financial measures provided by the Company.
Summary Operating and Financial Impacts
ArcBest Consolidated
On a preliminary basis, July 2022 consolidated revenues grew approximately 36% on a per day basis compared to July 2021, reflecting continued customer demand for our logistics solutions and growth in all three operating segments. The consolidated revenue growth in July 2022 benefited from the acquisition of MoLo Solutions, LLC (“MoLo”).
3Q’22 – Projected Other Items
| ● | Projected one-time, non-cash charge for enhancements to nonunion vacation policy effective in third quarter 2022: Approximately $3 million |
| ● | Projected Innovative Technology Costs in “Other and eliminations” related to our freight handling pilot program and human-centered remote and automated operations, in connection with our investment in Phantom Auto (non-GAAP reconciling item): $3 million vs. $1 million in 3Q’21 |
| ● | Loss in “Other and eliminations” (non-GAAP basis which adjusts for Innovative Technology Costs): $5 million vs. $5 million in 3Q’21 |
| ● | Interest Expense, net of Interest Income: $2 million vs. $2 million in 3Q’21 |
FY’22 – Projected Other Items
| ● | Projected Innovative Technology Costs in “Other and eliminations” related to our freight handling pilot program and human-centered remote and automated operations, as recently announced in connection with our investment in Phantom Auto (non-GAAP reconciling item): $12 million vs. $5 million in 2021 |
| ● | Loss in “Other and eliminations” (non-GAAP basis which adjusts for Innovative Technology Costs): $20 million vs. $19 million in 2021 |
| ● | Interest Expense, net of Interest Income: $7 million vs. $8 million in 2021 |
1
ArcBest Consolidated Capital Expenditures
FY’22 – Projected
| ● | Total Net Capital Expenditures, including financed equipment: $240 million to $250 million (from the previous $270 million to $290 million) |
| ● | Includes revenue equipment purchases (majority for Asset-Based) of $115 million |
| ● | Includes real estate expenditures (majority for Asset-Based) of $45 million to $55 million |
| ● | The remaining amount of capital expenditures includes items related to technology and miscellaneous dock equipment upgrades and enhancements |
| ● | Depreciation and amortization costs on property, plant and equipment: $125 million to $130 million |
| ● | Intangible asset amortization, primarily reflecting purchase accounting amortization related to the MoLo acquisition: $13 million |
Asset-Based Segment
2Q’22 Year-over-Year Yield Metrics
| ● | Billed Rev/Cwt on LTL-rated freight, excluding fuel surcharges, increased by a percentage in the double digits |
| ● | Average increase on contract renewals and deferred pricing agreements negotiated during 2Q’22: +8.0% |
Year-over-Year Monthly Total Daily Business Trends
|
|
April 2022 |
|
May 2022 |
|
June 2022 |
|
July 2022(1)(2) |
|
||||
|
|
|
|
|
|
|
|
|
|
|
|
|
|
Billed Revenue/Day(3) |
|
|
+23.5 |
% |
|
+24.0 |
% |
|
+19.1 |
% |
|
+18 |
% |
Total Tons/Day |
|
|
+3.5 |
% |
|
+6.5 |
% |
|
+1.4 |
% |
|
+6 |
% |
Total Shipments/Day |
|
|
+1.5 |
% |
|
+4.4 |
% |
|
+0.3 |
% |
|
Flat |
|
| 1) | Statistics for the full month of July 2022 have not been finalized and are preliminary. |
| 2) | There will be 20.0 workdays in July 2022 and there were 21.0 workdays in July 2021. |
| 3) | Revenue for undelivered freight is deferred for financial statement purposes in accordance with the Asset-Based segment revenue recognition policy. Billed revenue per day has not been adjusted for the portion of revenue deferred for financial statement purposes. |
2
July 2022 Business Update
See tables above for July 2022 revenue, tonnage and shipment metric comparisons.
Statistics for July 2022 have not been finalized. Preliminary Asset-Based financial metrics and business trends for July 2022, compared to the same period last year, are as follows:
| ● | Total Billed Revenue/CWT increased approximately 11% including higher fuel surcharge. |
| ● | Total Billed Revenue/Shipment increased approximately 18%. |
| ● | Total Weight/Shipment increased approximately 6%. |
The July 2022 Asset-Based tonnage and shipment trends, including the increase in weight per shipment, have been impacted by changes in freight profile and business mix as the ABF Freight network continues to be managed with optimization tools and improved freight data. Sequentially, from June to July 2022, the change in total tonnage is running in-line with the historical average sequential change.
Excluding periods impacted by the pandemic, the average sequential change in ArcBest’s Asset-Based operating ratio, in the third quarter versus the second quarter, has been relatively flat.
3Q’22 Other Items
| ● | 64.0 Working Days in both 3Q’22 and 3Q’21 |
| ● | Projected Innovative Technology Costs in our Asset-Based business associated with the freight handling pilot test program at ABF Freight (non-GAAP reconciling item): $8 million vs. $7 million in 3Q’21 |
Asset-Light ArcBest Operating Segment [Excluding FleetNet]
2Q’22 and July 2022 Monthly Total Daily Business Trends
|
|
April 2022(1) |
|
May 2022(1) |
|
June 2022(1) |
|
July 2022(1)(2)(3) |
|
||||
|
|
|
|
|
|
|
|
|
|
|
|
|
|
Revenue/Day (Year-over-Year) |
|
|
+122.2 |
% |
|
+84.0 |
% |
|
+104.4 |
% |
|
+76 |
% |
Purchased Transportation Expense as a % of Revenue |
|
|
81.3 |
% |
|
81.5 |
% |
|
81.8 |
% |
|
83 |
% |
| 1) | Includes revenue of the acquired MoLo business which was effective on November 1, 2021. |
| 2) | Statistics for the full month of July 2022 have not been finalized and are preliminary. |
| 3) | There will be 20.0 workdays in July 2022 and there were 21.0 workdays in July 2021. |
| ● | Comparisons to prior year metrics continue to be affected by the acquired operations of MoLo. |
| ● | Year-over-year growth rates and purchased transportation expense as a percentage of revenue reflect some general weakness in the spot market, combined with business mix changes. |
3
Additional Detailed Information
Asset-Based Segment
Annual Union Profit-Sharing Bonus
As provided in ABF Freight’s current Teamster labor contract, for the full years of 2019 through 2022, ABF Freight’s Teamster employees are eligible for an annual profit-sharing bonus, as shown in the following table. The operating ratio (“OR”) used to calculate the bonus amount is on a GAAP basis. The potential bonus would be based on full-year union employee earnings. While impacted by business and associated labor levels which are subject to change, the estimate of one percent of the annual earnings for the ABF Freight union employees who are eligible for this benefit approximates $5.5 million - $6 million of union bonus expense.
During years in which ArcBest’s internal forecasts indicate an expectation of paying the union bonus, we will accrue for this expense throughout the year, generally in proportion of the quarterly results as a percentage of the annual projection. As we do not provide public updates on our projected operating ratio or our expectations for paying the union bonus, any details of amounts accrued will not be provided. If financial models reflect an operating ratio that meets the payout thresholds shown below, ArcBest encourages analysts to include expenses for the union bonus in quarterly and annual earnings per share projections for the company.
ABF Freight Published Annual OR (GAAP basis) |
Bonus Amount |
95.1 to 96.0 |
1% |
93.1 to 95.0 |
2% |
93.0 and below |
3% |
4
ArcBest Consolidated
Tax Rate
ArcBest’s second quarter 2022 effective GAAP tax rate was 23.0%. The “Effective Tax Rate Reconciliation” table of ArcBest’s second quarter 2022 earnings press release in Exhibit 99.1 shows the reconciliation of GAAP to non-GAAP effective tax rates. The tax rate used to calculate non-GAAP EPS was 26.2% for second quarter 2022. Under the current tax laws, we expect our full year 2022 non-GAAP tax rate to be in a range of 26% to 27%. The effective GAAP tax rate may be impacted by discrete items that could occur during the remainder of the year.
“Other and eliminations” within Operating Income on the Operating Segment Data and Operating Ratios statement
The “Other and eliminations” line includes expenses related to shared services for the delivery of comprehensive transportation and logistics services to ArcBest’s customers, as well as investments in ArcBest technology and innovation. Shared services represent costs incurred to support all segments including sales, yield, customer service, marketing, capacity sourcing functions, human resources, financial services, information technology, legal and other company-wide services. Shared services are primarily allocated to the reporting segments based upon resource utilization-related metrics, such as shipment levels, and therefore fluctuate with business levels. As a result, the loss in “Other and eliminations” tends to be higher in periods when business levels are lower and, consequently, allocations to operating segments are lower, which is typically during the first and fourth quarters of the year; however, our quarterly shipment levels have not been following historical patterns in recent years. Other factors, including the state of the U.S. and global economies, the impact of adverse events or conditions, available capacity in the market, and the impact of yield initiatives may influence quarterly business levels. Furthermore, the acquisition of MoLo resulted in increased ArcBest Asset-Light segment shipment levels for the first and second quarters of 2022, compared to same periods of 2021.
“Other, net” line within Other Income (Costs) on the Consolidated Statements of Operations
The “Other, net” line of ArcBest’s income statement primarily includes the costs associated with postretirement plans and changes in cash surrender value of life insurance. After excluding non-GAAP reconciling items detailed in the table below, ArcBest expects the 2022 non-GAAP “Other, net” expense to approximate the 2021 expense.
Changes in cash surrender value of life insurance included a decrease of $2.7 million in second quarter 2022, compared to an increase of $1.2 million in second quarter 2021. The assets underlying the cash surrender value are invested much like pension plan assets and are impacted by market changes. ArcBest excludes changes in cash surrender value when presenting non-GAAP net income and EPS.
|
|
Three Months Ended |
|
||||
|
|
June 30 |
|
||||
|
|
2022 |
|
2021 |
|
||
|
|
(in millions) |
|
||||
Other, net |
|
|
|
|
|
|
|
Amounts on GAAP basis - income (costs) |
|
$ |
(2.8) |
|
$ |
1.1 |
|
Non-GAAP Adjustments: |
|
|
|
|
|
|
|
Life insurance proceeds and gains in cash surrender value(1) |
|
|
2.7 |
|
|
(1.2) |
|
Non-GAAP amounts - income (costs) |
|
$ |
(0.1) |
|
$ |
(0.1) |
|
| 1) | Amounts in parentheses indicate gains. |
5
Forward-Looking Statements
The following is a “safe harbor” statement under the Private Securities Litigation Reform Act of 1995: Certain statements and information in this exhibit may constitute “forward-looking statements” within the meaning of the Private Securities Litigation Reform Act of 1995, including, among others, statements regarding (i) our expectations about our intrinsic value or our prospects for growth and value creation and (ii) our financial outlook, position, strategies, goals, and expectations. Terms such as “anticipate,” “believe,” “could,” “estimate,” “expect,” “forecast,” “foresee,” “intend,” “may,” “plan,” “predict,” “project,” “scheduled,” “should,” “would,” and similar expressions and the negatives of such terms are intended to identify forward-looking statements. These statements are based on management’s beliefs, assumptions, and expectations based on currently available information, are not guarantees of future performance, and involve certain risks and uncertainties (some of which are beyond our control). Although we believe that the expectations reflected in these forward-looking statements are reasonable as and when made, we cannot provide assurance that our expectations will prove to be correct. Actual outcomes and results could materially differ from what is expressed, implied, or forecasted in these statements due to a number of factors, including, but not limited to: the effects of widespread outbreak of an illness or disease, including the COVID-19 pandemic, or any other public health crisis, as well as regulatory measures implemented in response to such events; external events which may adversely affect us or the third parties who provide services for us, for which our business continuity plans may not adequately prepare us, including acts of war or terrorism or military conflicts; a failure of our information systems, including disruptions or failures of services essential to our operations or upon which our information technology platforms rely, data breach, and/or cybersecurity incidents; interruption or failure of third-party software or information technology systems or licenses; untimely or ineffective development and implementation of, or failure to realize potential benefits associated with, new or enhanced technology or processes, including the pilot test program at ABF Freight; the loss or reduction of business from large customers; the ability to manage our cost structure, and the timing and performance of growth initiatives; the cost, integration, and performance of any recent or future acquisitions, including the acquisition of MoLo Solutions, LLC, and the inability to realize the anticipated benefits of the acquisition within the expected time period or at all; market fluctuations and interruptions affecting the price of our stock or the price or timing of our share repurchase programs; maintaining our corporate reputation and intellectual property rights; nationwide or global disruption in the supply chain increasing volatility in freight volumes; competitive initiatives and pricing pressures; increased prices for and decreased availability of new revenue equipment, decreases in value of used revenue equipment, and higher costs of equipment-related operating expenses such as maintenance, fuel, and related taxes; availability of fuel, the effect of volatility in fuel prices and the associated changes in fuel surcharges on securing increases in base freight rates, and the inability to collect fuel surcharges; relationships with employees, including unions, and our ability to attract, retain, and develop employees; unfavorable terms of, or the inability to reach agreement on, future collective bargaining agreements or a workforce stoppage by our employees covered under ABF Freight’s collective bargaining agreement; union employee wages and benefits, including changes in required contributions to multiemployer plans; availability and cost of reliable third-party services; our ability to secure independent owner operators and/or operational or regulatory issues related to our use of their services; litigation or claims asserted against us; governmental regulations; environmental laws and regulations, including emissions-control regulations; default on covenants of financing arrangements and the availability and terms of future financing arrangements; self-insurance claims and insurance premium costs; potential impairment of goodwill and intangible assets; general economic conditions and related shifts in market demand that impact the performance and needs of industries we serve and/or limit our customers’ access to adequate financial resources; increasing costs due to inflation; seasonal fluctuations and adverse weather conditions; and other financial, operational, and legal risks and uncertainties detailed from time to time in ArcBest Corporation’s public filings with the Securities and Exchange Commission (the “SEC”).
For additional information regarding known material factors that could cause our actual results to differ from our projected results, please see our filings with the SEC, including our Annual Report on Form 10-K, Quarterly Reports on Form 10-Q, and Current Reports on Form 8-K.
Readers are cautioned not to place undue reliance on forward-looking statements, which speak only as of the date hereof. We undertake no obligation to publicly update or revise any forward-looking statements after the date they are made, whether as a result of new information, future events, or otherwise.
6
|
2Q’22 Earnings Presentation |
|
Forward Looking Statements 2 Certain statements and information in this presentation may constitute “forward - looking statements” within the meaning of the Pr ivate Securities Litigation Reform Act of 1995, including, among others, statements regarding ( i ) our expectations about our intrinsic value or our prospects for growth and value creation and (ii) our financial outlook, p osi tion, strategies, goals, and expectations. Terms such as “anticipate,” “believe,” “could,” “estimate,” “expect,” “forecast,” “foresee,” “intend,” “may,” “plan,” “predict,” “project,” “scheduled,” “should,” “ wou ld,” and similar expressions and the negatives of such terms are intended to identify forward - looking statements. These statements are based on management’s beliefs, assumptions, and expectations based on currently avai lab le information, are not guarantees of future performance, and involve certain risks and uncertainties (some of which are beyond our control). Although we believe that the expectations reflected in these for ward - looking statements are reasonable as and when made, we cannot provide assurance that our expectations will prove to be correct. Actual outcomes and results could materially differ from what is ex pre ssed, implied, or forecasted in these statements due to a number of factors, including, but not limited to: the effects of widespread outbreak of an illness or disease, including the COVID - 19 pandemic, or any other p ublic health crisis, as well as regulatory measures implemented in response to such events; external events which may adversely affect us or the third parties who provide services for us, for which our busines s c ontinuity plans may not adequately prepare us, including acts of war or terrorism or military conflicts; a failure of our information systems, including disruptions or failures of services essential to our oper ati ons or upon which our information technology platforms rely, data breach, and/or cybersecurity incidents; interruption or failure of third - party software or information technology systems or licenses; untimely or ineffectiv e development and implementation of, or failure to realize potential benefits associated with, new or enhanced technology or processes, including the pilot test program at ABF Freight; the loss or reduction of business f rom large customers; the ability to manage our cost structure, and the timing and performance of growth initiatives; the cost, integration, and performance of any recent or future acquisitions, including the ac quisition of MoLo Solutions, LLC, and the inability to realize the anticipated benefits of the acquisition within the expected time period or at all; market fluctuations and interruptions affecting the price of our stock or the price or timing of our share repurchase programs; maintaining our corporate reputation and intellectual property rights; nationwide or global disruption in the supply chain increasing volatility in freight volume s; competitive initiatives and pricing pressures; increased prices for and decreased availability of new revenue equipment, decreases in value of used revenue equipment, and higher costs of equipment - related operating expenses su ch as maintenance, fuel, and related taxes; availability of fuel, the effect of volatility in fuel prices and the associated changes in fuel surcharges on securing increases in base freight rates, and the ina bility to collect fuel surcharges; relationships with employees, including unions, and our ability to attract, retain, and develop employees; unfavorable terms of, or the inability to reach agreement on, future colle cti ve bargaining agreements or a workforce stoppage by our employees covered under ABF Freight’s collective bargaining agreement; union employee wages and benefits, including changes in required contributions to mul tiemployer plans; availability and cost of reliable third - party services; our ability to secure independent owner operators and/or operational or regulatory issues related to our use of their services; litigation o r c laims asserted against us; governmental regulations; environmental laws and regulations, including emissions - control regulations; default on covenants of financing arrangements and the availability and terms of future financing arrangements; self - insurance claims and insurance premium costs; potential impairment of goodwill and intangible assets; general economic conditions and related shifts in market demand that impact the pe rformance and needs of industries we serve and/or limit our customers’ access to adequate financial resources; increasing costs due to inflation; seasonal fluctuations and adverse weather conditions; and ot her financial, operational, and legal risks and uncertainties detailed from time to time in ArcBest Corporation’s public filings with the Securities and Exchange Commission (the “SEC”). For additional information regarding known material factors that could cause our actual results to differ from our projected res ults, please see our filings with the SEC, including our Annual Report on Form 10 - K, Quarterly Reports on Form 10 - Q, and Current Reports on Form 8 - K. Readers are cautioned not to place undue reliance on forward - looking statements, which speak only as of the date hereof. We unde rtake no obligation to publicly update or revise any forward - looking statements after the date they are made, whether as a result of new information, future events, or otherwise. |
|
3 Accelerating growth through a customer focus and investment in people, solutions and technology – generating enhanced shareholder value 1 2 3 More Balanced Business Mix Accelerate Asset - Light growth Continue to grow Asset - Based business Optimize Cost Structure Advance adoption of innovative technologies Expand Revenue Opportunities Deepen customer relationships Secure new customers ArcBest Announces Record Second Quarter 2022 Results – Supporting Proven Three - Point Strategy |
|
STRENGTH OF OUR CUSTOMER - FOCUSED STRATEGY 4 Customer Need Our Strength Flexible supply chain solutions Broad suite of logistics solutions with integrated and seamless access to services Strength in Action Someone who knows them and their business Dedicated experts to tackle tough challenges Visibility into their supply chain Proactive communications >75% of revenue comes from customers who are engaged digitally Commitment to sustainability and advancing DE&I Long history of good corporate citizenship and industry - leading ESG • AA MSCI Rating • Bronze EcoVadis Rating • Launched pilot of electric trucks >90% of our Top 50 customers are cross - sold 32% of our accounts were cross - sold (TTM thru June) compared to 17% in 2012 60% of our asset - light customers also use asset - based services Ranked #1 by Mastio for knowledgeable and helpful sales representatives #14 for Employee Training and Development in Training Magazine’s APEX award – 13th consecutive year to be recognized • Forbes Best Employer for Diversity • Comparably Best Large Companies for Women • Signed DOT’s Transportation Leaders Against Human Trafficking pledge |
|
STRONG PERFORMANCE ENABLES INVESTMENT FOR GROWTH 5 INVESTMENT IN: People Solutions Technology Future Growth Double - Digit Revenue Growth YOY daily revenue growth in Asset - Based (23%) and Asset - Light (91%) segments Facility Upgrades & Expansions Investments to enable growth and improve employee experience MoLo integration progressing well and on track for previously shared financial goals Truckload Solutions Technology & Innovation Partnership with Phantom Auto progressing well with customer pilots scheduled in 4Q’22 |
|
STRONG PERFORMANCE ENABLES INVESTMENT FOR GROWTH 6 Customers continue to choose ArcBest as their preferred partner for solving complex logistics challenges... ...and positioning us for the future ...Transforming our business to better align with our customer needs 82% 54% 18% 46% 2012 YTD'22 Asset-Based Asset-Light Asset - Based/Asset - Light Mix Over Time 0% 2% 4% 6% 8% 10% 12% 14% 16% 18% 20% Revenue CAGR (2012 - 2021) ArcBest Asset - Light Market* +17.5% +9.5% >$5B Asset - Light spend among our loyal, non - price sensitive customers • Serve large markets with nearly $500B opportunity • Continue going deeper with customers – cross - sold customers up 20% YoY • Continued focus on reaching $7B - $8B in revenue by 2025 *Market stats derived from Armstrong & Associates, US Department of Commerce and ArcBest management estimates |
|
$1.4B Revenue 47% per day YOY (1) $150.5M Non - GAAP Operating Income (2) 96% YOY (1) $4.30/diluted share Non - GAAP Net Income (2) 112% YOY (1) Key Metrics Q2 2022 7 ARCBEST CONSOLIDATED 1) Second quarter 2022 comparisons are to second quarter 2021. 2) See non - GAAP reconciliation in the Additional Information section of this presentation. |
|
$802.6M Revenue 23% per day YOY (1) $124.6M Non - GAAP Operating Income (2) 74% YOY (1) 84.5% Non - GAAP Operating Ratio (2) 450 bps YOY improvement (1) Daily Tonnage 3.7% YOY (1) Daily Shipments 2.0% YOY (1) Total Billed Rev/Cwt 17.7% YOY (1) 8.0% Average Increase on Contract Renewals and Deferred Pricing Agreements 130 bps (1) Key Metrics Q2 2022 8 ASSET - BASED 1) Second quarter 2022 comparisons are to second quarter 2021. 2) See non - GAAP reconciliation in the Additional Information section of this presentation. |
|
Key Metrics JULY 2022 9 Daily Billed Revenue Total Billed Rev/CWT ASSET - BASED Daily Tonnage Daily Shipments 18% YOY 6% YOY Flat 11% YOY Total Billed Rev/Shipment 18% YOY Total Weight/Shipment 6% YOY JULY 2022 PRELIMINARY (1) 1) July 2022 comparisons are to July 2021. |
|
Key Metrics Q2 2022 10 ASSET - LIGHT (1) JULY 2022 PRELIMINARY YOY (4) Daily Revenue 1) The ArcBest and FleetNet reportable segments, combined, represent Asset - Light operations. 2) Second quarter 2022 comparisons are to second quarter 2021. 3) See non - GAAP reconciliation in the Additional Information section of this presentation. 4) Asset - Light ArcBest Operating Segment, excluding FleetNet . July 2022 comparisons are to July 2021. 76% YOY $631.8M Revenue 91% per day YOY (2) $31.9M Non - GAAP Operating Income (3) 210% YOY (2) $34.6M Adjusted EBITDA (3) 185% YOY (2) |
|
11 INVESTMENTS IN GROWTH AND OPERATING INITIATIVES • Capital investments consistent with organic growth strategy 2022 Projected Net Capital Expenditures: $240M - $250M • Revenue equipment (tractors and trailers), dock equipment and technology to maintain optimal total cost of ownership and increase growth capacity • Multi - year investment plan with Asset - Based network and facility upgrades, expansions, and additions to increase growth capacity, improve energy efficiency and enhance work environment for employees • I nnovation and technology investments, partnerships and pilots for revenue growth and cost optimization • Continuous evaluation of M&A opportunities BALANCED CAPITAL ALLOCATION RETURN OF CAPITAL TO SHAREHOLDERS • Share Repurchase Program: o Repurchased an additional $15M during 2 nd Quarter 2022 o Increased repurchase amount to $75M (1) • Dividend Program: $0.48 per share (annual) (1) 1) As of April 28, 2022 2) Trailing 12 months ending June 30, 2022. 3) As of June 30, 2022. MAINTAIN SOLID FINANCIAL POSITION • TTM EBITDA: $558M (2) • Liquidity: $ 444 M (3) • Net Debt: $ 22 M (3) • Debt Maintenance: 0. 04X Debt (3) (net) to EBITDA (2) Strong balance sheet and free cash flow provide flexibility to invest in the business and increase returns for shareholders |
|
ARCBEST’S CUSTOMER - LED STRATEGY YIELDS RESULTS 12 >5x Revenue per account is over 5X higher on cross - sold accounts >4x Profit per account is over 4X higher on cross - sold accounts 9% Retention rates are 9 percentage points higher on cross - sold accounts >60% Over 60% of our customers who use asset - light services also utilize our asset - based services >75% Over 75% of revenue came from digitally connected customers |
|
Three - Point Strategy Continues to Deliver Shareholder Value & Drive Business Growth 13 1 2 3 More Balanced Business Mix Accelerate Asset - Light growth Continue to grow Asset - Based business Optimize Cost Structure Advance adoption of innovative technologies Expand Revenue Opportunities Deepen customer relationships Secure new customers ✓ ✓ ✓ ENHANCED SHAREHOLDER VALUE |
|
Q & A 14 |
|
15 Note: ArcBest Corporation reports its financial results in accordance with generally accepted accounting principles (“GAAP”) . H owever, management believes that certain non - GAAP performance measures utilized for internal analysis provides analysts, investors, and others the same information that we use internally for purposes of assessing our core operating performance and provides meaningful comp ari sons between current and prior period results, as well as important information regarding performance trends. Accordingly, using t hes e measures improves comparability in analyzing our performance because it removes the impact of items from operating results that, in ma nag ement's opinion, do not reflect our core operating performance. Non - GAAP financial measures should be viewed in addition to, and not as an alternative for, our reported results. These financial measures should not be construed as better measurements than operating income, ope rat ing cash flow, net income or earnings per share, as determined under GAAP. Reconciliations of GAAP to Non - GAAP Financial Measures (Unaudited) ADDITIONAL INFORMATION |
|
Reconciliations of GAAP to Non - GAAP Financial Measures (Unaudited) 16 Three Months Ended June 30 Millions ($000,000), except per share data 2022 2021 Operating Income Amounts on a GAAP basis $ 137.3 $ 74.3 Innovative technology costs, pre - tax (1) 10.3 8.5 Purchase accounting amortization, pre - tax (2) 3.2 0.9 Gain on sale of subsidiary, pre - tax (3) (0.4) (6.9) Non - GAAP amounts (4) $ 150.5 $ 76.8 Net Income Amounts on a GAAP basis $ 102.5 $ 61.0 Innovative technology costs, after - tax (includes related financing costs) (1) 7.8 6.4 Purchase accounting amortization, after - tax (2) 2.4 0.7 Gain on sale of subsidiary, after - tax (3) (0.3) (5.4) Life insurance proceeds and changes in cash surrender value 2.7 (1.2) Tax benefit from vested RSUs (5) (5.1) (6.8) Non - GAAP amounts (4) $ 110.0 $ 54.6 Diluted Earnings Per Share Amounts on a GAAP basis $ 4.00 $ 2.27 Innovative technology costs, after - tax (includes related financing costs) (1) 0.30 0.24 Purchase accounting amortization, after - tax (2) 0.09 0.03 Gain on sale of subsidiary, after - tax (3) (0.01) (0.20) Life insurance proceeds and changes in cash surrender value 0.11 (0.05) Tax benefit from vested RSUs (5) (0.20) (0.25) Non - GAAP amounts (4) $ 4.30 $ 2.03 1) Represents costs associated with the freight handling pilot test program at ABF Freight and initiatives to optimize our perfo rma nce through technological innovation, including costs related to our investment in human - centered remote operation software. 2) Represents the amortization of acquired intangible assets related to the November 1, 2021 acquisition of MoLo and previously acquired businesses in the ArcBest segment. 3) Gain relates to the sale of the labor services portion of the ArcBest segment’s moving business in May 2021, including the co nti ngent amount recognized in second quarter 2022 when the funds were released from escrow. 4) Non - GAAP amounts are calculated in total and may not foot due to rounding. 5) Represents recognition of the tax impact for the vesting of share - based compensation. ARCBEST CORPORATION - CONSOLIDATED |
|
Reconciliations of GAAP to Non - GAAP Financial Measures (Unaudited) 17 1) Adjusted EBITDA is a primary component of the financial covenants contained in ArcBest Corporation’s Amended and Restated Cre dit Agreement. Management believes Adjusted EBITDA to be relevant and useful information, as EBITDA is a standard measure commonly reported and widely used by analysts, investors, an d o thers to measure financial performance ability to service debt obligations. Furthermore, management uses Adjusted EBITDA as a key measure of performance and for business planning. However, th is non - GAAP measure should be viewed in addition to, and not as an alternative for, our reported results. Other companies may calculate EBITDA differently; therefore, our Adjusted EBITDA ma y not be comparable to similarly titled measures of other companies. 2) Includes amortization of intangibles associated with acquired businesses. 3) Gain relates to the sale of the labor services portion of the ArcBest segment’s moving business in May 2021, including the co nti ngent amount recognized in second quarter 2022 when the funds were released from escrow. 4) Adjusted EBITDA is calculated in total and may not foot due to rounding. 5) Represents change in fair value of the contingent consideration recorded for the MoLo acquisition. The liability for contingent consideration is remeasured at each quarterly reporting date, and any change in fair value as a result of the recurring assessments is recognized in operating income. As previously disclosed, con tin gent consideration for the MoLo acquisition will be paid based on achievement of certain targets of adjusted earnings before interest, taxes, depreciation, and amortization, as adjusted for c ert ain items pursuant to the merger agreement, for years 2023 through 2025. 6) Transaction costs are associated with the acquisition of MoLo . ASSET - LIGHT ADJUSTED EBITDA (1) Three Months Ended June 30 2022 2021 Total Asset - Light ($ millions) Operating Income $ 29.1 $ 16.3 Depreciation and amortization (2) 5.9 2.8 Gain on sale of subsidiary (3) (0.4) (6.9) Adjusted EBITDA (4) $ 34.6 $ 12.1 CONSOLIDATED ADJUSTED EBITDA (1) Twelve Months Ended June 30, 2022 ($ millions) Net Income $ 301.2 Interest and other related financing costs 8.0 Income tax provision 96.4 Depreciation and amortization (2) 133.7 Amortization of share - based compensation 12.4 Change in fair value of contingent consideration (5) 0.8 Gain on sale of subsidiary (3) (0.4) Transaction costs (6) 6.0 Consolidated Adjusted EBITDA (4) $ 558.2 |
|
Reconciliations of GAAP to Non - GAAP Financial Measures (Unaudited) 18 Three Months Ended June 30 Millions ($000,000) 2022 2021 ASSET - BASED SEGMENT Operating Income Amounts on a GAAP basis $ 116.7 85.5% $ 63.9 90.2% Innovative technology costs, pre - tax (1) 8.0 (1.0) 7.5 (1.2) Non - GAAP amounts (2) $ 124.6 84.5% $ 71.4 89.0% TOTAL ASSET - LIGHT Operating Income Amounts on a GAAP basis $ 29.1 95.4% $ 16.3 95.1% Purchase accounting amortization (3) 3.2 (0.5) 0.9 (0.3) Gain on sale of subsidiary, pre - tax (4) (0.4) 0.1 (6.9) 2.1 Non - GAAP amounts (2) $ 31.9 95.0% $ 10.3 96.9% 1) Represents costs associated with the freight handling pilot test program at ABF Freight. 2) Non - GAAP amounts are calculated in total and may not foot due to rounding. 3) Represents the amortization of acquired intangible assets related to the November 1, 2021 acquisition of MoLo and previously acquired businesses in the ArcBest segment. 4) Gain relates to the sale of the labor services portion of the ArcBest segment’s moving business in May 2021, including the co nti ngent amount recognized in second quarter 2022 when the funds were released from escrow. |