UNITED STATES
SECURITIES AND EXCHANGE COMMISSION
WASHINGTON, D.C. 20549
FORM 8-K
CURRENT REPORT
PURSUANT TO SECTION 13 OR 15(D) OF
THE SECURITIES EXCHANGE ACT OF 1934
Date of Report (Date of earliest event reported): May 17, 2022
BAR HARBOR BANKSHARES
(Exact Name of Registrant as Specified in its Charter)
Maine |
001-13349 |
01-0393663 |
(State or Other Jurisdiction) |
(Commission File No.) |
(I.R.S. Employer |
|
|
|
PO Box 400 |
|
04609-0400 |
82 Main Street |
|
(Zip Code) |
Bar Harbor, Maine |
|
|
(Address of Principal Executive Offices) |
|
|
Registrant’s telephone number, including area code: (207) 288-3314
Not Applicable
(Former Name or Former Address, if Changed Since Last Report)
Check the appropriate box below if the Form 8-K filing is intended to simultaneously satisfy the filing obligation of the registrant under any of the following provisions (see General Instruction A.2. below):
☐ Written communications pursuant to Rule 425 under the Securities Act (17 CFR 230.425)
☐ Soliciting material pursuant to Rule 14a-12 under the Exchange Act (17 CFR 240.14a-12)
☐ Pre-commencement communications pursuant to Rule 14d-2(b) under the Exchange Act (17 CFR 240.14d-2(b))
☐ Pre-commencement communications pursuant to Rule 13e-4(c) under the Exchange Act (17 CFR 240.13e-4(c)) Securities registered pursuant to Section 12(b) of the Act
|
|
|
Title of each class |
Trading Symbol |
Name of each exchange on which registered |
Common Stock, par value $2.00 per share |
BHB |
NYSE American |
Indicate by check mark whether the registrant is an emerging growth company as defined in Rule 405 of the Securities Act of 1933 (§230.405 of this chapter) or Rule 12b-2 of the Securities Exchange Act of 1934 (§240.12b-2 of this chapter).
Emerging growth company ☐
If an emerging growth company, indicate by check mark if the registrant has elected not to use the extended transition period for complying with any new or revised financial accounting standards provided pursuant to Section 13(a) of the Exchange Act. ☐
Item 7.01 Regulation FD Disclosure
On May 17, 2022, Bar Harbor Bankshares (the “Company”) made available its investor slides that the Company intends to utilize in connection with its annual meeting on May 17, 2022. A copy of the investor presentation is furnished as Exhibit 99.1 to this report and is incorporated by reference herein. The investor presentation is also available on the Company’s website located at www.barharbor.bank/sec-filings.
The information contained in this Item 7.01, including Exhibit 99.1 attached hereto, is intended to be furnished and will not be deemed to be “filed” for any purpose, including for the purposes of Section 18 of the Securities Exchange Act of 1934 or otherwise subject to the liabilities of such section, nor will such information or exhibit be deemed incorporated by reference in any filing under the Securities Act of 1933, as amended, or the Securities Exchange Act of 1934, except as may be expressly set forth by specific reference in such filing.
Item 9.01 Financial Statements and Exhibits
(d) Exhibits.
Exhibit No. |
|
Description |
|
|
|
99.1 |
|
|
104 |
|
Cover Page Interactive Data File – the cover page XBRL tags are embedded within the Inline XBRL document |
SIGNATURES
Pursuant to the requirements of the Securities Exchange Act of 1934, the registrant has duly caused this report to be signed on its behalf by the undersigned, hereunto duly authorized.
|
Bar Harbor Bankshares |
|
|
|
|
May 17, 2022 |
By: |
/s/ Curtis C. Simard |
|
|
Curtis C. Simard |
|
|
President and CEO |
|
|
Legal Disclaimer Forward Looking Statements Certain statements contained in this document that are not historical facts may constitute forward - looking statements within the meaning of Section 27A of the Securities Act of 1933, as amended (“Securities Act”), and Section 21E of the Securities Act of 1934, as a men ded (“Exchange Act”), and are intended to be covered by the safe harbor provisions of the Private Securities Litigation Reform Ac t o f 1995. There are several factors that could cause actual results to differ significantly from expectations described in the forward - looking s tatements, including deterioration in local economies or real estate markets or in the general economy or financial markets, interest ra te volatility, loss of deposits or changes in deposit mix, insufficient wholesale funding sources, competition from an ever - increasing array of financi al service providers, and challenges from expansion, growth and acquisitions. For additional discussion of such factors, please see the Com pany’s most recent reports on Forms 10 - K and 10 - Q filed with the Securities and Exchange Commission and available on the SEC’s website at www.sec.gov . The Company is not undertaking an obligation to update forward - looking statements, even though its situation may change in the future, except as required under federal securities law . Non - GAAP Financial Statements This document contains certain non - GAAP financial measures in addition to results presented in accordance with accounting princi ples generally accepted in the United States of America (“GAAP”). These non - GAAP measures are intended to provide the reader with ad ditional supplemental perspectives on operating results, performance trends, and financial condition. Non - GAAP financial measures are no t a substitute for GAAP measures; they should be read and used in conjunction with the Company’s GAAP financial information. A r eco nciliation of non - GAAP financial measures to GAAP measures is provided in the first quarter of earnings release, which can be found at www.bhbt.com/shareholder - relations. In all cases, it should be understood that non - GAAP measures do not depict amounts that accr ue directly to the benefit of shareholders. An item which management excludes when computing non - GAAP adjusted earnings can be of substantial importance to the Company’s results for any particular quarter or year. The Company’s non - GAAP core earnings inform ation set forth is not necessarily comparable to non - GAAP information which may be presented by other companies. Each non - GAAP measure us ed by the Company in this report as supplemental financial data should be considered in conjunction with the Company’s GAAP fina nci al information . The Company utilizes the non - GAAP measure of core earnings in evaluating operating trends, including components for core revenue and expense. These measures exclude amounts which the Company views as unrelated to its normalized operations, including securit ies gains/losses, acquisition costs, restructuring costs, legal settlements, and system conversion costs. Non - GAAP adjustments are presented net of an adjustment for income tax expense. The Company also calculates core earnings per share based on its measure of core earnings. The Company views these amounts a s important to understanding its operating trends, particularly due to the impact of accounting standards related to acquisitio n a ctivity. Analysts also rely on these measures in estimating and evaluating the Company’s performance. Management also believes that t he computation of non - GAAP core earnings and core earnings per share may facilitate the comparison of the Company to other companie s in the financial services industry. The Company also adjusts certain equity related measures to exclude intangible assets due t o t he importance of these measures to the investment community. 2 |
|
A Bank that Thinks Differently • Employee and customer experience is the foundation of superior performance, which leads to significant financial benefit to shareholders • Geography, heritage and performance are key while being relentlessly committed to a service and sales driven culture with a focus on core business growth • Strong commitment to risk management • Fee income is fundamental to the Company’s profitability through trust and treasury management services, customer derivatives, and secondary market mortgage sales • Investment in process, products, technology, training, leadership and infrastructure • Expansion of the Company’s brand and business to deepen market presence • Opportunity and growth for existing employees while adding catalyst recruits across all levels of the Company 3 Bar Harbor Bank & Trust is the only community Bank headquartered in Northern New England with branches in Maine, New Hampshire and Vermont. The Bank is focused on exceptional commercial, retail and wealth management banking services in over 50 locations. Our business model is balancing earnings with growth by focusing on: |
|
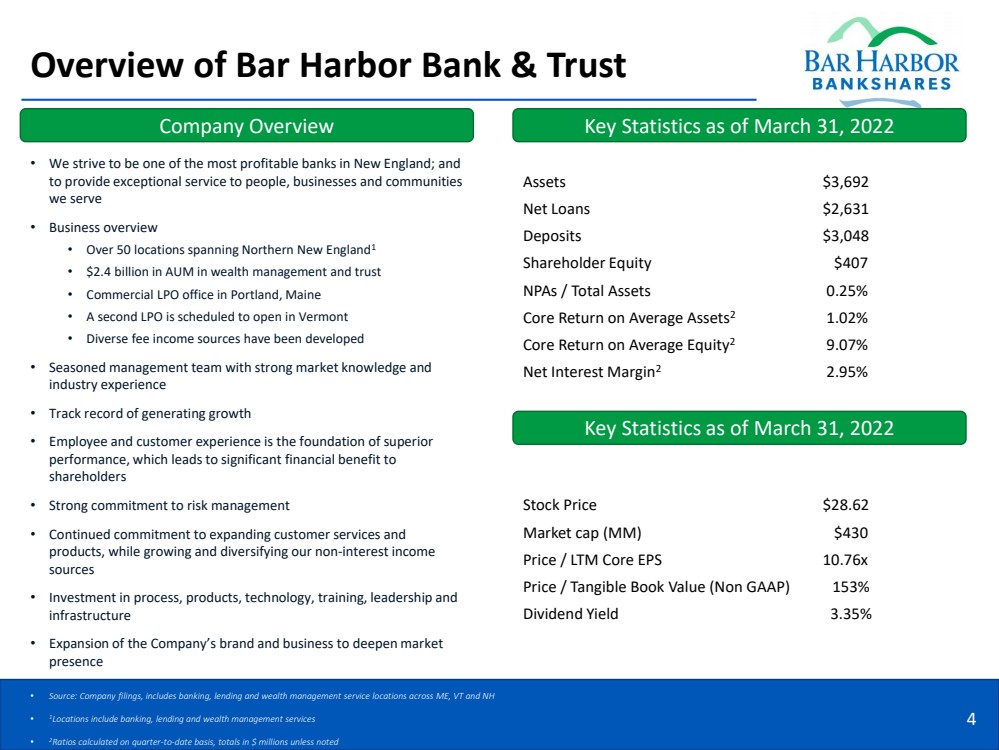
Overview of Bar Harbor Bank & Trust • We strive to be one of the most profitable banks in New England; and to provide exceptional service to people, businesses and communities we serve • Business overview • Over 50 locations spanning Northern New England 1 • $ 2.4 billion in AUM in wealth management and trust • Commercial LPO office in Portland, Maine • A second LPO is scheduled to open in Vermont • Diverse fee income sources have been developed • Seasoned management team with strong market knowledge and industry experience • Track record of generating growth • Employee and customer experience is the foundation of superior performance, which leads to significant financial benefit to shareholders • Strong commitment to risk management • Continued commitment to expanding customer services and products, while growing and diversifying our non - interest income sources • Investment in process, products, technology, training, leadership and infrastructure • Expansion of the Company’s brand and business to deepen market presence 4 • Source: Company filings, includes banking, lending and wealth management service locations across ME, VT and NH • 1 Locations include banking, lending and wealth management services • 2 Ratios calculated on quarter - to - date basis, totals in $ millions unless noted Company Overview Key Statistics as of March 31, 2022 Assets $3,692 Net Loans $ 2,631 Deposits $ 3,048 Shareholder Equity $ 407 NPAs / Total Assets 0.25 % Core Return on Average Assets 2 1.02 % Core Return on Average Equity 2 9.07 % Net Interest Margin 2 2.95 % Stock Price $ 28.62 Market cap (MM ) $430 Price / LTM Core EPS 10.76x Price / Tangible Book Value (Non GAAP) 153 % Dividend Yield 3.35 % Key Statistics as of March 31, 2022 |
|
|
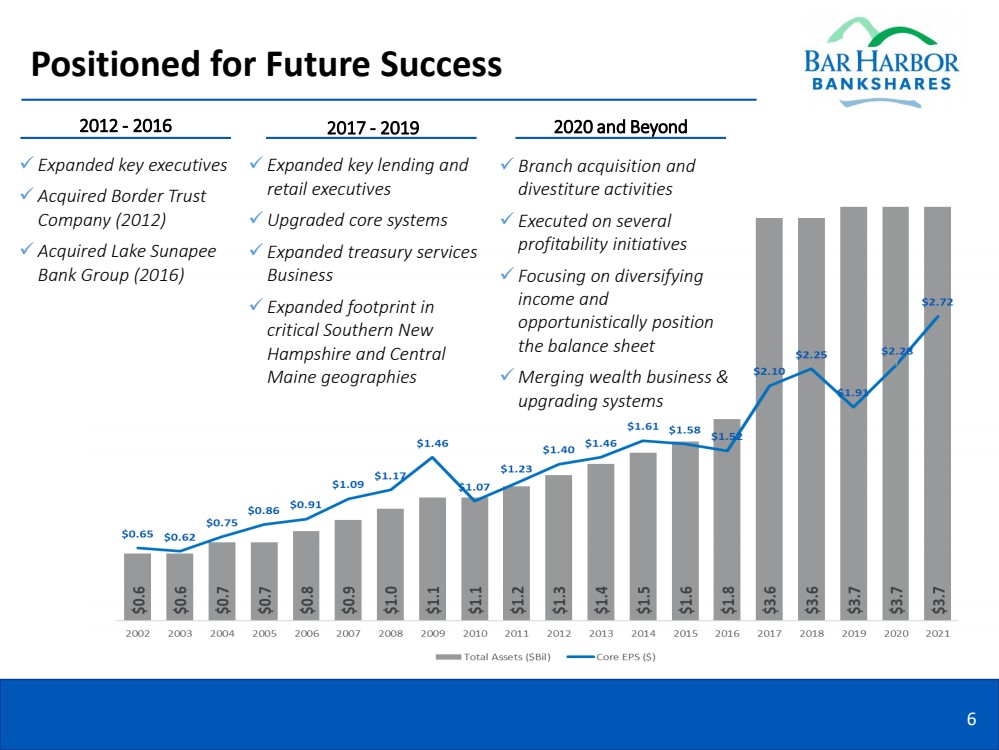
Positioned for Future Success 6 2012 - 2016 ✓ Expanded key executives ✓ Acquired Border Trust Company (2012) ✓ Acquired Lake Sunapee Bank Group (2016) 2017 - 2019 ✓ Expanded key lending and retail executives ✓ Upgraded core systems ✓ Expanded treasury services Business ✓ Expanded footprint in critical Southern New Hampshire and Central Maine geographies 2020 and Beyond ✓ Branch acquisition and divestiture activities ✓ Executed on several profitability initiatives ✓ Focusing on diversifying income and opportunistically position the balance sheet ✓ Merging wealth business & upgrading systems |
|
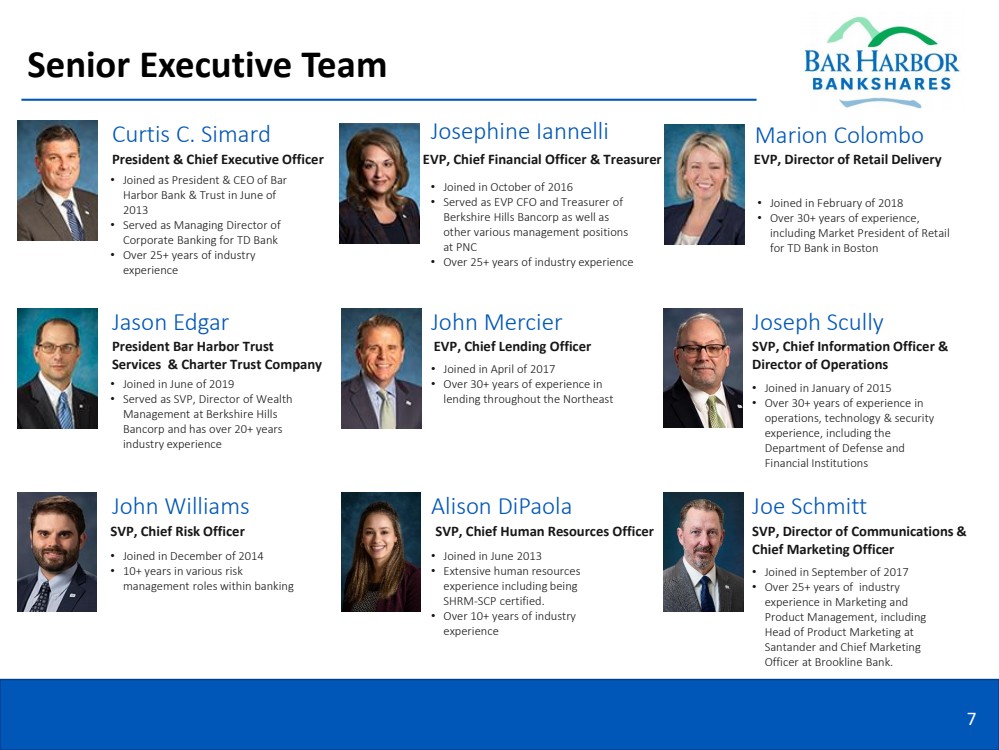
Senior Executive Team Curtis C. Simard President & Chief Executive Officer • Joined as President & CEO of Bar Harbor Bank & Trust in June of 2013 • Served as Managing Director of Corporate Banking for TD Bank • Over 25+ years of industry experience SVP, Chief Human Resources Officer Alison DiPaola • Joined in June 2013 • Extensive human resources experience including being SHRM - SCP certified. • Over 10+ years of industry experience Jason Edgar President Bar Harbor Trust Services & Charter Trust Company • Joined in June of 2019 • Served as SVP, Director of Wealth Management at Berkshire Hills Bancorp and has over 20+ years industry experience Marion Colombo EVP, Director of Retail Delivery • Joined in February of 2018 • Over 30+ years of experience, including Market President of Retail for TD Bank in Boston John Mercier EVP, Chief Lending Officer • Joined in April of 2017 • Over 30+ years of experience in lending throughout the Northeast John Williams SVP, Chief Risk Officer • Joined in December of 2014 • 10+ years in various risk management roles within banking Joseph Scully SVP, Chief Information Officer & Director of Operations • Joined in January of 2015 • Over 30+ years of experience in operations, technology & security experience, including the Department of Defense and Financial Institutions 7 EVP, Chief Financial Officer & Treasurer Josephine Iannelli • Joined in October of 2016 • Served as EVP CFO and Treasurer of Berkshire Hills Bancorp as well as other various management positions at PNC • Over 25+ years of industry experience SVP, Director of Communications & Chief Marketing Officer Joe Schmitt • Joined in September of 2017 • Over 25+ years of industry experience in Marketing and Product Management, including Head of Product Marketing at Santander and Chief Marketing Officer at Brookline Bank . |
|
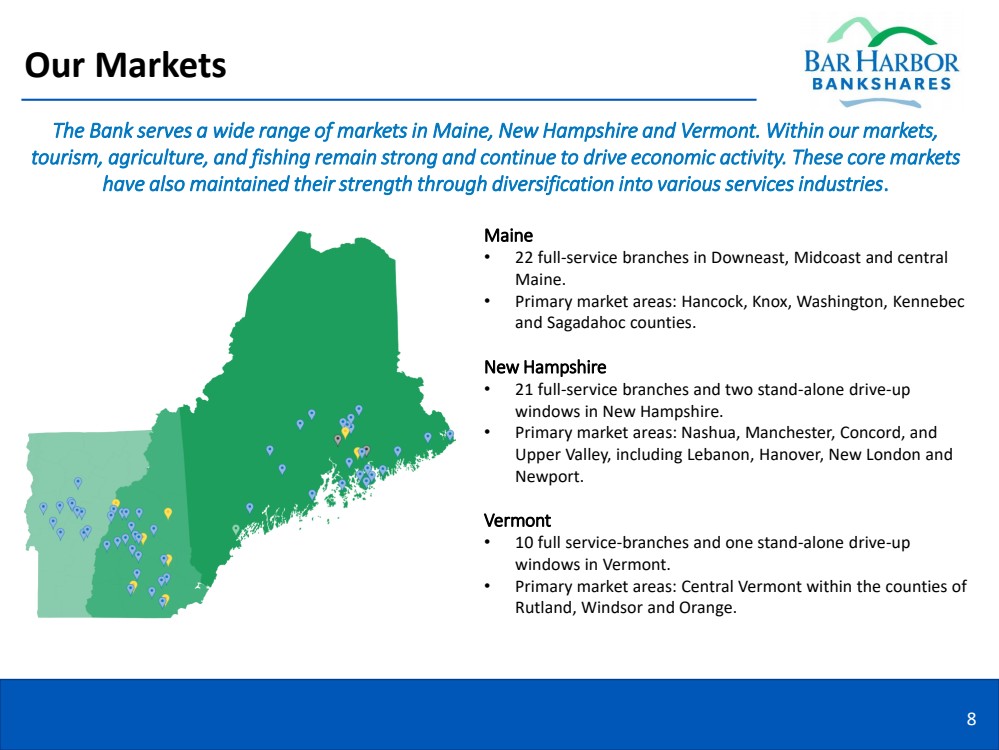
Our Markets The Bank serves a wide range of markets in Maine, New Hampshire and Vermont. Within our markets, tourism, agriculture, and fishing remain strong and continue to drive economic activity. These core markets have also maintained their strength through diversification into various services industries . Maine • 22 full - service branches in D owneast , Midcoast and central Maine . • Primary market areas: Hancock , Knox, Washington, Kennebec and Sagadahoc counties. New Hampshire • 21 full - service branches and two stand - alone drive - up windows in New Hampshire. • Primary market areas: Nashua, Manchester, Concord, and Upper Valley, including Lebanon , Hanover, New London and Newport . Vermont • 10 full service - branches and one stand - alone drive - up windows in Vermont. • Primary market areas: Central Vermont within the counties of Rutland, Windsor and Orange. 8 |
|
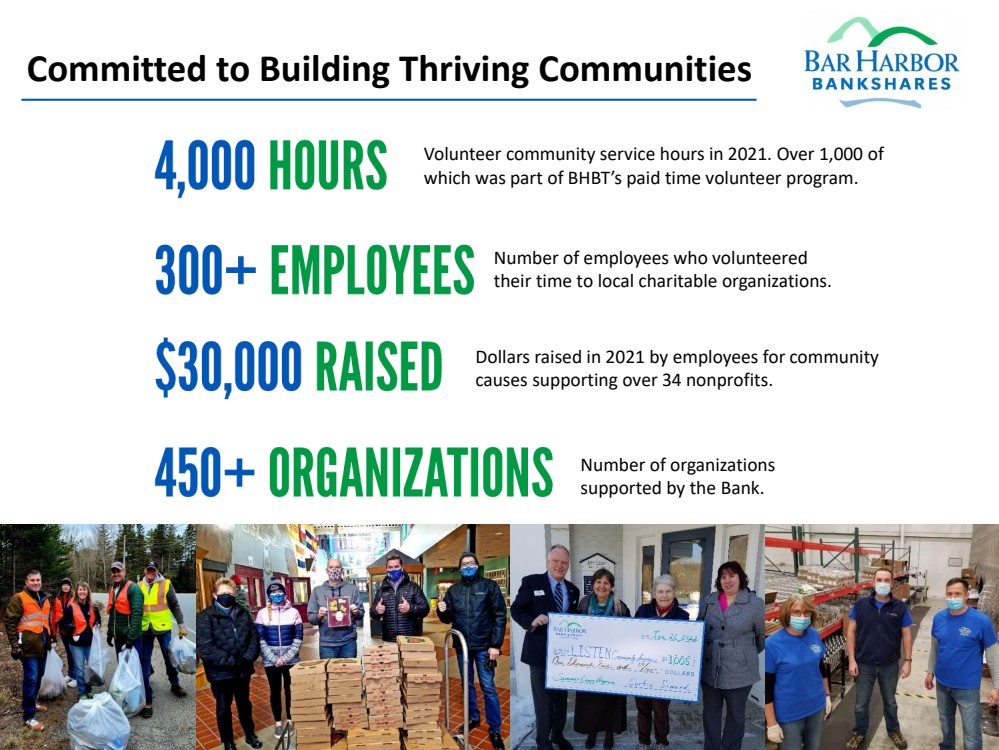
Committed to Building Thriving Communities Volunteer community service hours in 2021. Over 1,000 of which was part of BHBT’s paid time volunteer program . Number of employees who volunteered their time to local charitable organizations. Dollars raised in 2021 by employees for community causes supporting over 34 nonprofits. Number of organizations supported by the Bank. |
|
|
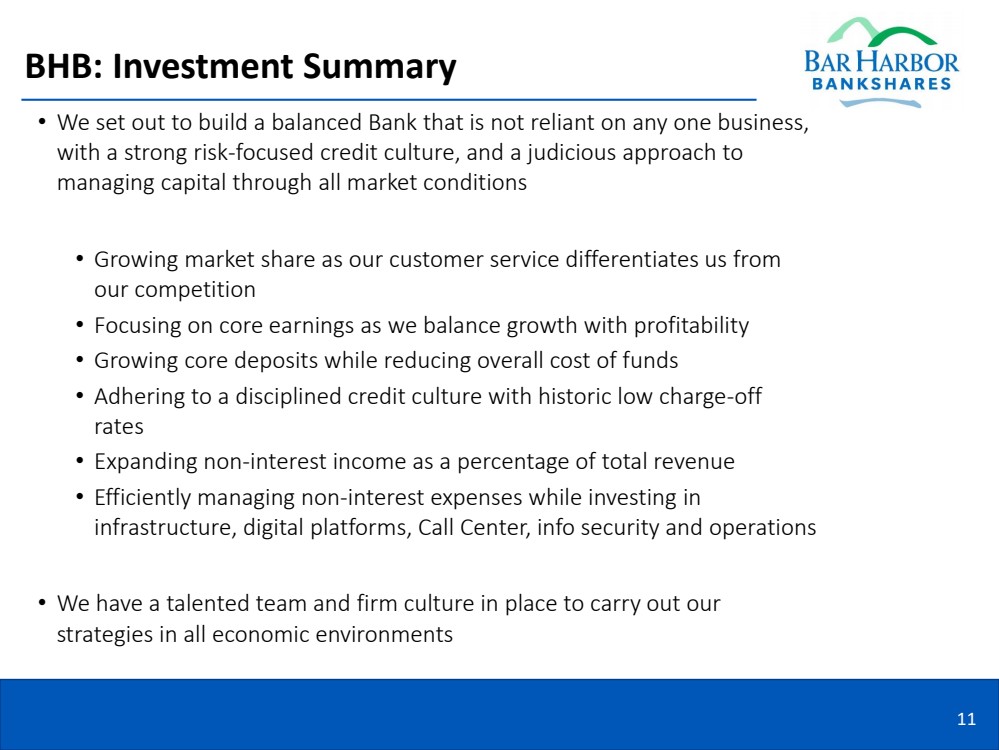
BHB: Investment Summary • W e set out to build a balanced Bank that is not reliant on any one business, with a strong risk - focused credit culture, and a judicious approach to managing capital through all market conditions • Growing market share as our customer service differentiates us from our competition • Focusing on core earnings as we balance growth with profitability • Growing core deposits while reducing overall cost of funds • Adhering to a disciplined credit culture with historic low charge - off rates • Expanding non - interest income as a percentage of total revenue • Efficiently managing non - interest expenses while investing in infrastructure, digital platforms, Call Center, info security and operations • We have a talented team and firm culture in place to carry out our strategies in all economic environments 11 |
|
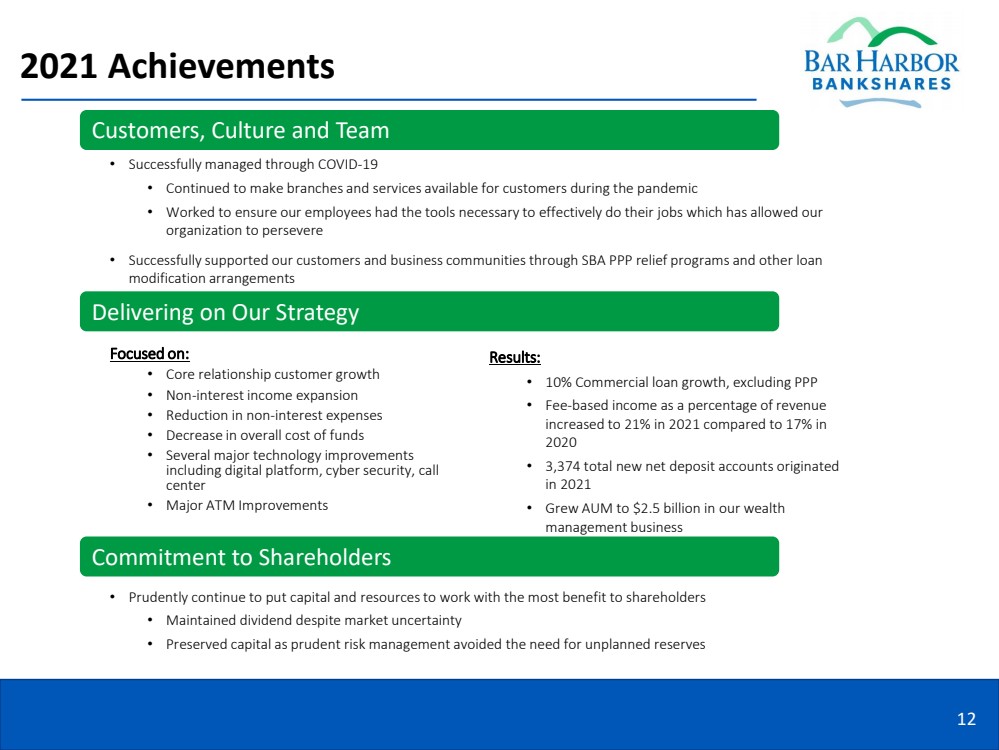
2021 Achievements 12 Customers, Culture and Team Delivering on Our Strategy Commitment to Shareholders • Successfully managed through COVID - 19 • Continued to make branches and services available for customers during the pandemic • Worked to ensure our employees had the tools necessary to effectively do their jobs which has allowed our organization to persevere • Successfully supported our customers and business communities through SBA PPP relief programs and other loan modification arrangements Focused on: • Core relationship customer growth • Non - interest income expansion • Reduction in non - interest expenses • Decrease in overall cost of funds • Several major technology improvements including digital platform, cyber security, call center • Major ATM Improvements • Prudently continue to put capital and resources to work with the most benefit to shareholders • Maintained dividend despite market uncertainty • Preserved capital as prudent risk management avoided the need for unplanned reserves Results: • 10% Commercial loan growth, excluding PPP • Fee - based income as a percentage of revenue increased to 21% in 2021 compared to 1 7% in 2020 • 3,374 total new net deposit accounts originated in 2021 • Grew AUM to $ 2.5 billion in our wealth management business |
|
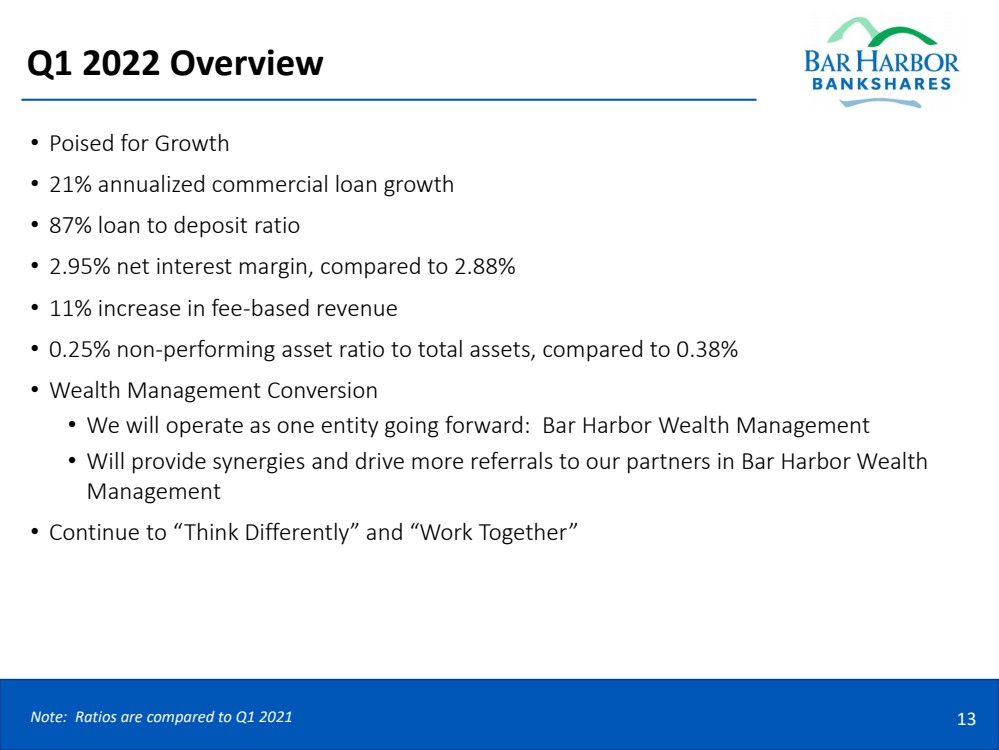
Q1 2022 Overview • Poised for Growth • 21 % annualized commercial loan growth • 8 7 % loan to deposit ratio • 2.95 % net interest margin, compared to 2.88 % • 11 % increase in fee - based revenue • 0.25 % non - performing asset ratio to total assets, compared to 0.38% • Wealth Management Conversion • We will operate as one entity going forward: Bar Harbor Wealth Management • Will provide synergies and drive more referrals to our partners in Bar Harbor Wealth Management • Continue to “Think Differently” and “Work Together” 13 Note: Ratios are compared to Q1 2021 |
|
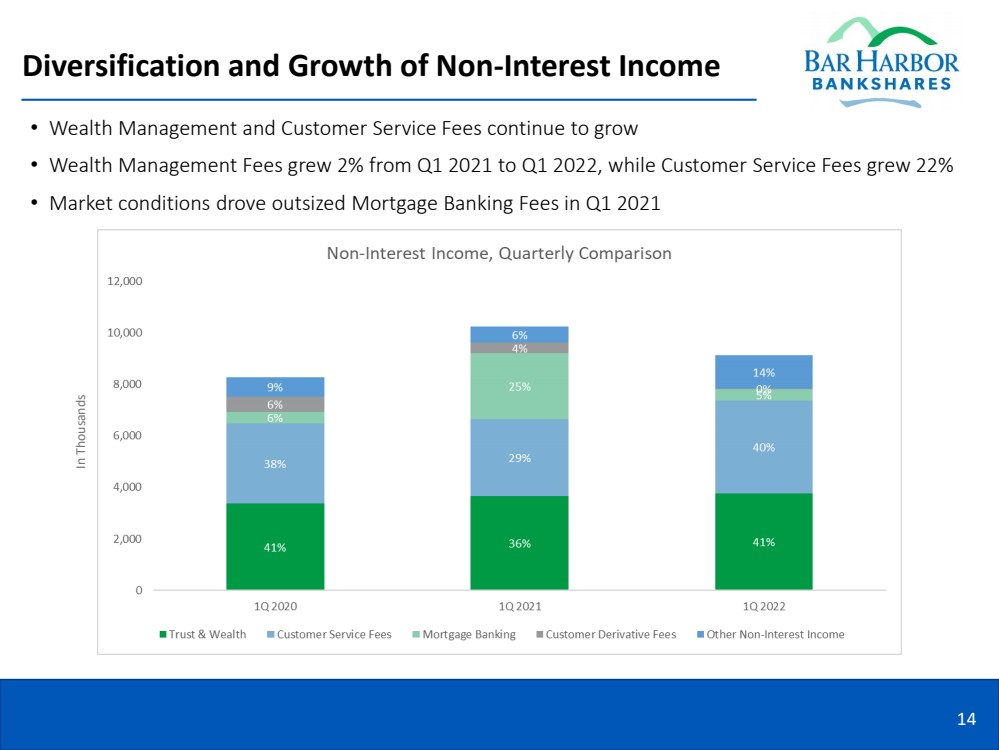
Diversification and Growth of Non‐Interest Income • Wealth Management and Customer Service Fees continue to grow • Wealth Management Fees grew 2 % from Q1 2021 to Q1 2022, while Customer Service Fees grew 22% • Market conditions drove outsized Mortgage Banking Fees in Q1 2021 14 In Thousands |
|
Prudent Balance Sheet Management 15 Liquidity Interest Rate Risk (IRR) Positioning & Modeling Enhancements • Grew total deposits by 5% from Q1 2021 to Q1 2022 • Non - Maturity deposits grew from 78% to 87% of Total Deposits from Q1 2021 to Q1 2022 • Continued reduction in Wholesale Borrowings including Securities sales to prepay FHLB Advances in Q3 and Q4 2021 • The Bank remains relatively asset sensitive • Enhanced and expanded our use of models within the organization, strengthening various ALM assumptions and testing methods |
|
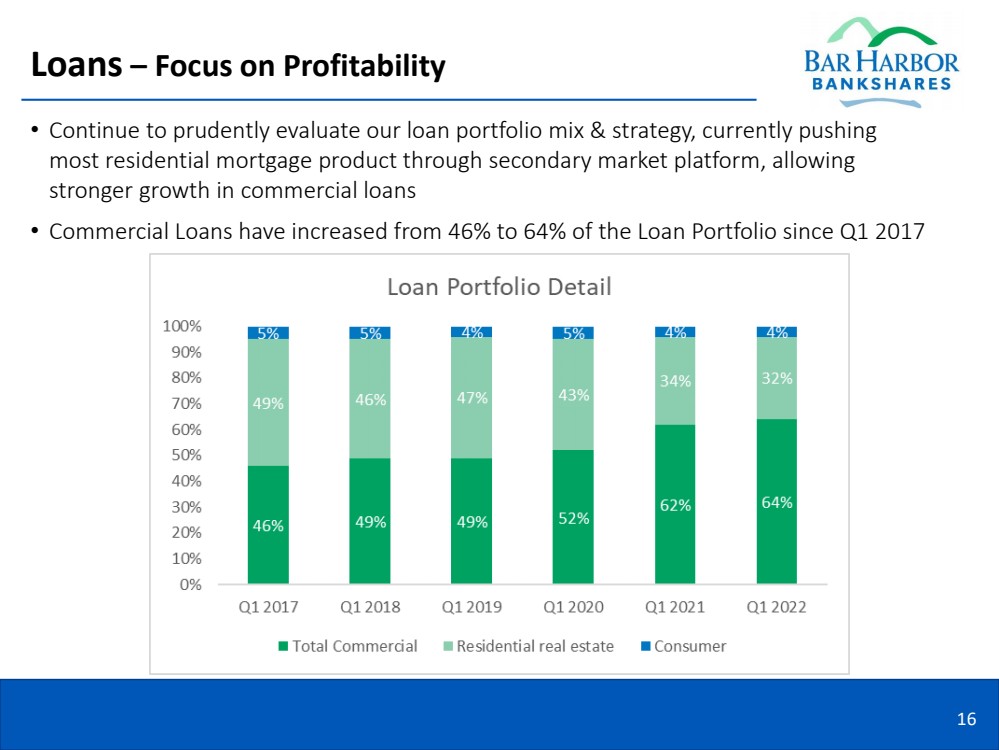
Loans – Focus on Profitability • Continue to prudently evaluate our loan portfolio mix & strategy, currently pushing most residential mortgage product through secondary market platform, allowing stronger growth in commercial loans • Commercial Loans have increased from 46% to 64% of the Loan Portfolio since Q1 2017 16 |
|
SBA PPP Loan Summary • Originated $67.7 million in Round 2 PPP Loans in 2021 • $6 million in income generated in 2021 by the Round 1 & 2 PPP Programs • $7 million in PPP Balances with a Net Fee of $219 thousand remaining at the end of 2021 • Minimal PPP Balances remain as of 3/31/2022 and are expected to be forgiven by the end of Q2 2022 17 |
|
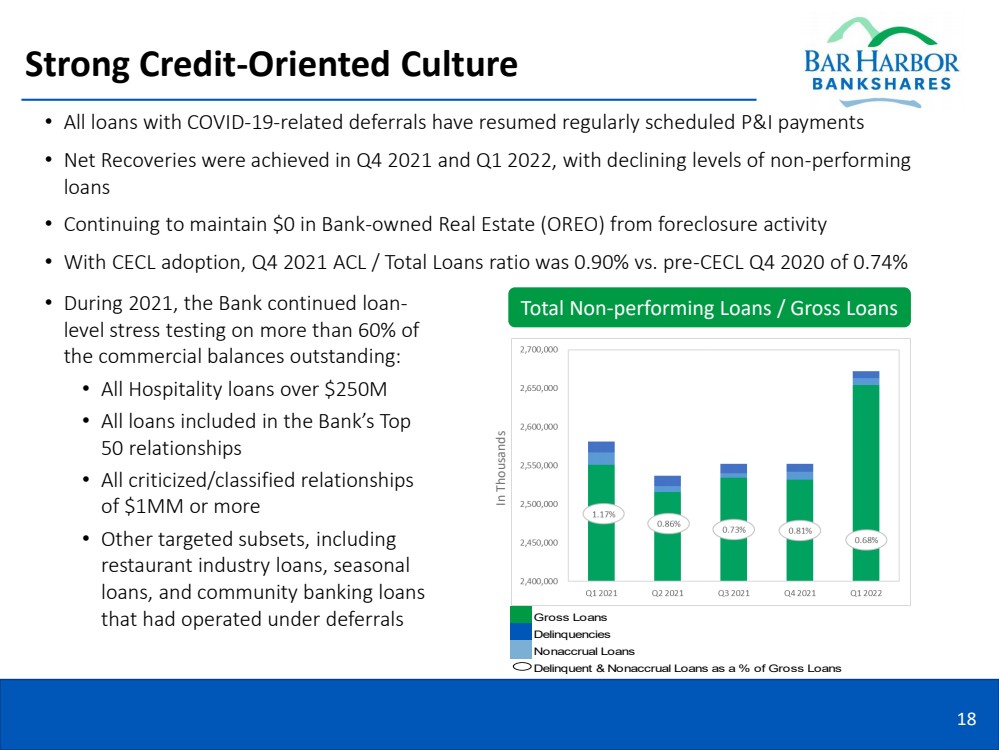
Strong Credit - Oriented Culture • All loans with COVID - 19 - related deferrals have resumed regularly scheduled P&I payments • Net Recoveries were achieved in Q4 2021 and Q1 2022, with declining levels of non - performing loans • Continuing to maintain $0 in Bank - owned Real Estate (OREO) from foreclosure activity • With CECL adoption, Q4 2021 ACL / Total Loans ratio was 0.90% vs. pre - CECL Q4 2020 of 0.74% 18 • During 2021, the Bank continued loan - level stress testing on more than 60% of the commercial balances outstanding: • All Hospitality loans over $250M • All loans included in the Bank’s Top 50 relationships • All criticized/classified relationships of $1MM or more • Other targeted subsets, including restaurant industry loans, seasonal loans, and community banking loans that had operated under deferrals Gross Loans Delinquencies Nonaccrual Loans Delinquent & Nonaccrual Loans as a % of Gross Loans Total Non - performing Loans / Gross Loans In Thousands |
|
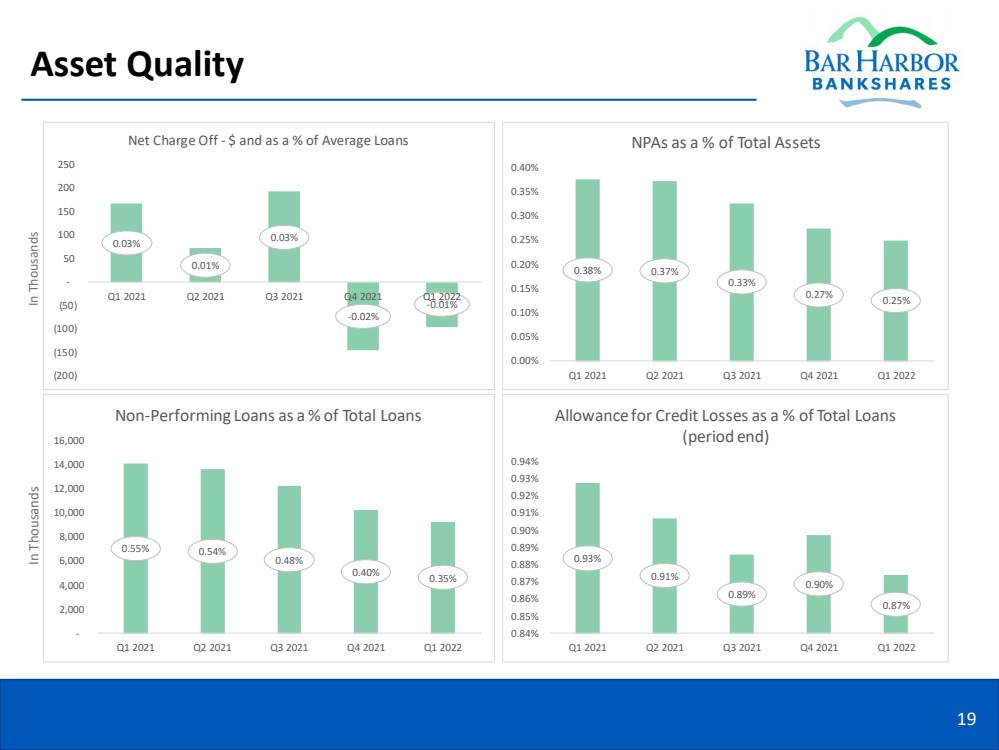
Asset Quality 19 0.03% 0.01% 0.03% - 0.02% - 0.01% (200) (150) (100) (50) - 50 100 150 200 250 Q1 2021 Q2 2021 Q3 2021 Q4 2021 Q1 2022 Net Charge Off - $ and as a % of Average Loans 0.38% 0.37% 0.33% 0.27% 0.25% 0.00% 0.05% 0.10% 0.15% 0.20% 0.25% 0.30% 0.35% 0.40% Q1 2021 Q2 2021 Q3 2021 Q4 2021 Q1 2022 NPAs as a % of Total Assets 0.55% 0.54% 0.48% 0.40% 0.35% - 2,000 4,000 6,000 8,000 10,000 12,000 14,000 16,000 Q1 2021 Q2 2021 Q3 2021 Q4 2021 Q1 2022 Non - Performing Loans as a % of Total Loans 0.93% 0.91% 0.89% 0.90% 0.87% 0.84% 0.85% 0.86% 0.87% 0.88% 0.89% 0.90% 0.91% 0.92% 0.93% 0.94% Q1 2021 Q2 2021 Q3 2021 Q4 2021 Q1 2022 Allowance for Credit Losses as a % of Total Loans (period end) In Thousands In Thousands |
|
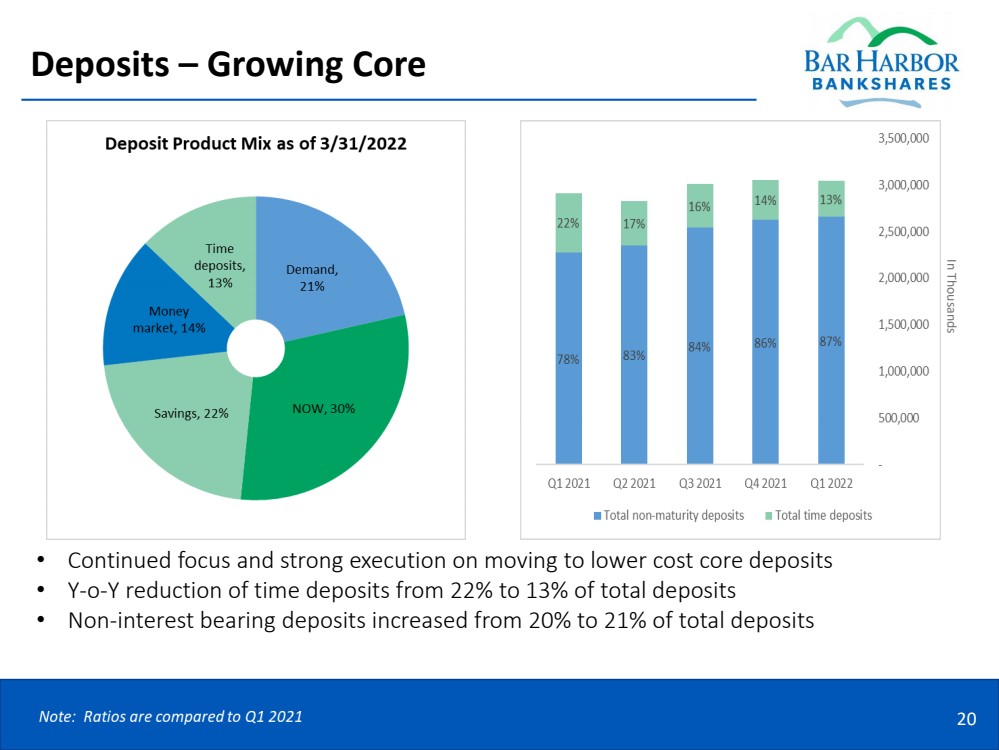
Deposits – Growing Core 20 • Continued focus and strong execution on moving to lower cost core deposits • Y - o - Y reduction of time deposits from 22% to 13% of total deposits • Non - interest bearing deposits increased from 20% to 21% of total deposits In Thousands |
|
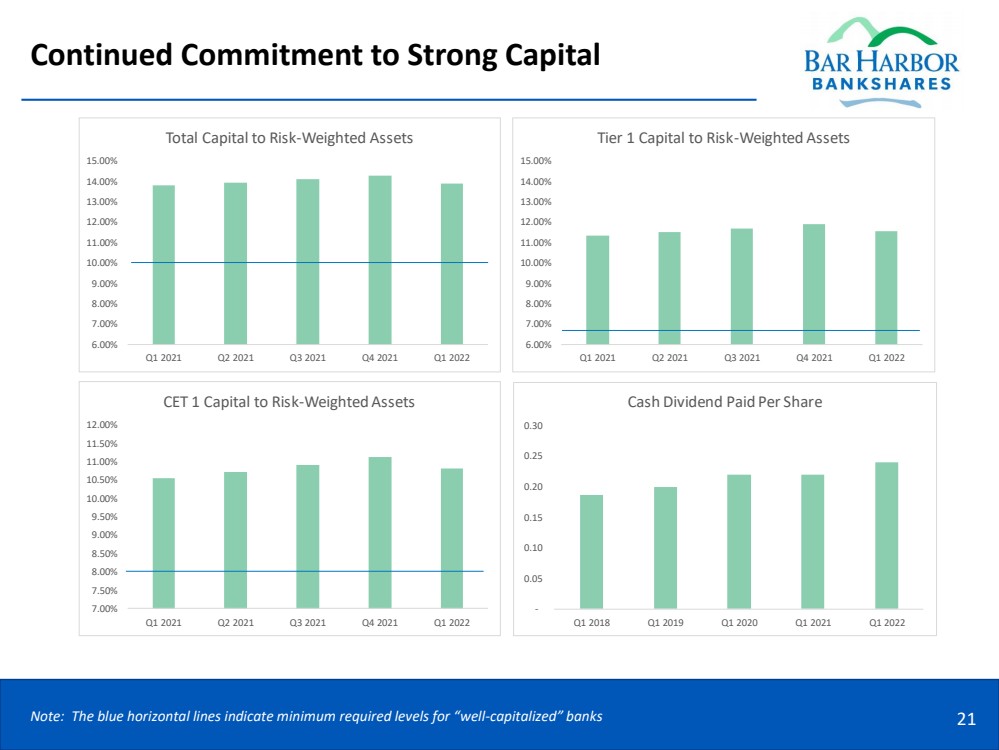
Continued Commitment to Strong Capital 21 Note: The blue horizontal lines indicate minimum required levels for “well - capitalized” banks 6.00% 7.00% 8.00% 9.00% 10.00% 11.00% 12.00% 13.00% 14.00% 15.00% Q1 2021 Q2 2021 Q3 2021 Q4 2021 Q1 2022 Total Capital to Risk - Weighted Assets 7.00% 7.50% 8.00% 8.50% 9.00% 9.50% 10.00% 10.50% 11.00% 11.50% 12.00% Q1 2021 Q2 2021 Q3 2021 Q4 2021 Q1 2022 CET 1 Capital to Risk - Weighted Assets 6.00% 7.00% 8.00% 9.00% 10.00% 11.00% 12.00% 13.00% 14.00% 15.00% Q1 2021 Q2 2021 Q3 2021 Q4 2021 Q1 2022 Tier 1 Capital to Risk - Weighted Assets - 0.05 0.10 0.15 0.20 0.25 0.30 Q1 2018 Q1 2019 Q1 2020 Q1 2021 Q1 2022 Cash Dividend Paid Per Share |
|
Investor Relations Contact Information 22 Facebook @BHBTsocial LinkedIn Bar Harbor Bank & Trust Twitter @barharborbank Connect with us on Social Media Visit our Website www.barharbor.bank/shareholder - relations Contact by Phone (207)288 - 2637 Write to us at Bar Harbor Bankshares Attn: Investor Relations PO Box 400 Bar Harbor, ME 04609 - 0400 Contact by Email investorrelations@barharbor.bank |
|
|
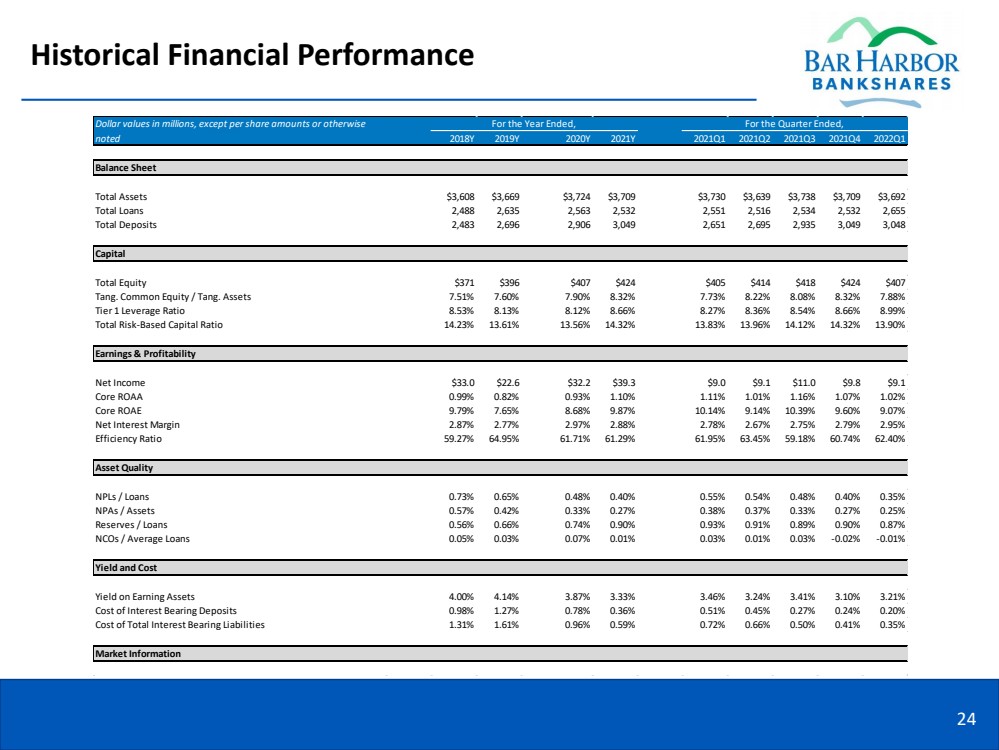
Historical Financial Performance 24 2018Y 2019Y 2020Y 2021Y 2021Q1 2021Q2 2021Q3 2021Q4 2022Q1 Total Assets $3,608 $3,669 $3,724 $3,709 $3,730 $3,639 $3,738 $3,709 $3,692 Total Loans 2,488 2,635 2,563 2,532 2,551 2,516 2,534 2,532 2,655 Total Deposits 2,483 2,696 2,906 3,049 2,651 2,695 2,935 3,049 3,048 Total Equity $371 $396 $407 $424 $405 $414 $418 $424 $407 Tang. Common Equity / Tang. Assets 7.51% 7.60% 7.90% 8.32% 7.73% 8.22% 8.08% 8.32% 7.88% Tier 1 Leverage Ratio 8.53% 8.13% 8.12% 8.66% 8.27% 8.36% 8.54% 8.66% 8.99% Total Risk-Based Capital Ratio 14.23% 13.61% 13.56% 14.32% 13.83% 13.96% 14.12% 14.32% 13.90% Net Income $33.0 $22.6 $32.2 $39.3 $9.0 $9.1 $11.0 $9.8 $9.1 Core ROAA 0.99% 0.82% 0.93% 1.10% 1.11% 1.01% 1.16% 1.07% 1.02% Core ROAE 9.79% 7.65% 8.68% 9.87% 10.14% 9.14% 10.39% 9.60% 9.07% Net Interest Margin 2.87% 2.77% 2.97% 2.88% 2.78% 2.67% 2.75% 2.79% 2.95% Efficiency Ratio 59.27% 64.95% 61.71% 61.29% 61.95% 63.45% 59.18% 60.74% 62.40% NPLs / Loans 0.73% 0.65% 0.48% 0.40% 0.55% 0.54% 0.48% 0.40% 0.35% NPAs / Assets 0.57% 0.42% 0.33% 0.27% 0.38% 0.37% 0.33% 0.27% 0.25% Reserves / Loans 0.56% 0.66% 0.74% 0.90% 0.93% 0.91% 0.89% 0.90% 0.87% NCOs / Average Loans 0.05% 0.03% 0.07% 0.01% 0.03% 0.01% 0.03% -0.02% -0.01% Yield on Earning Assets 4.00% 4.14% 3.87% 3.33% 3.46% 3.24% 3.41% 3.10% 3.21% Cost of Interest Bearing Deposits 0.98% 1.27% 0.78% 0.36% 0.51% 0.45% 0.27% 0.24% 0.20% Cost of Total Interest Bearing Liabilities 1.31% 1.61% 0.96% 0.59% 0.72% 0.66% 0.50% 0.41% 0.35% Asset Quality Yield and Cost Market Information For the Quarter Ended, Dollar values in millions, except per share amounts or otherwise noted For the Year Ended, Balance Sheet Capital Earnings & Profitability |
|
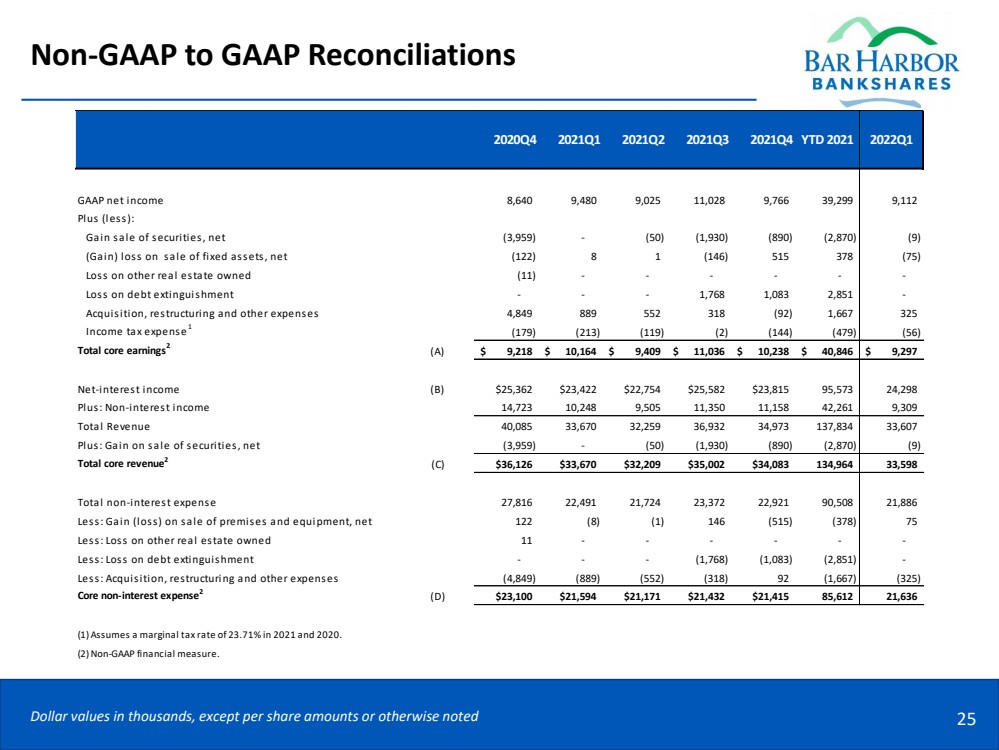
Non‐GAAP to GAAP Reconciliations 25 Dollar values in thousands, except per share amounts or otherwise noted GAAP net income 8,640 9,480 9,025 11,028 9,766 39,299 9,112 Plus (less): Gain sale of securities, net (3,959) - (50) (1,930) (890) (2,870) (9) (Gain) loss on sale of fixed assets, net (122) 8 1 (146) 515 378 (75) Loss on other real estate owned (11) - - - - - - Loss on debt extinguishment - - - 1,768 1,083 2,851 - Acquisition, restructuring and other expenses 4,849 889 552 318 (92) 1,667 325 Income tax expense 1 (179) (213) (119) (2) (144) (479) (56) Total core earnings 2 (A) 9,218 $ 10,164 $ 9,409 $ 11,036 $ 10,238 $ 40,846 $ 9,297 $ Net-interest income (B) $25,362 $23,422 $22,754 $25,582 $23,815 95,573 24,298 Plus: Non-interest income 14,723 10,248 9,505 11,350 11,158 42,261 9,309 Total Revenue 40,085 33,670 32,259 36,932 34,973 137,834 33,607 Plus: Gain on sale of securities, net (3,959) - (50) (1,930) (890) (2,870) (9) Total core revenue 2 (C) $36,126 $33,670 $32,209 $35,002 $34,083 134,964 33,598 Total non-interest expense 27,816 22,491 21,724 23,372 22,921 90,508 21,886 Less: Gain (loss) on sale of premises and equipment, net 122 (8) (1) 146 (515) (378) 75 Less: Loss on other real estate owned 11 - - - - - - Less: Loss on debt extinguishment - - - (1,768) (1,083) (2,851) - Less: Acquisition, restructuring and other expenses (4,849) (889) (552) (318) 92 (1,667) (325) Core non-interest expense 2 (D) $23,100 $21,594 $21,171 $21,432 $21,415 85,612 21,636 (1) Assumes a marginal tax rate of 23.71% in 2021 and 2020. (2) Non-GAAP financial measure. 2022Q1 2020Q4 2021Q1 2021Q2 2021Q3 2021Q4 YTD 2021 |
|
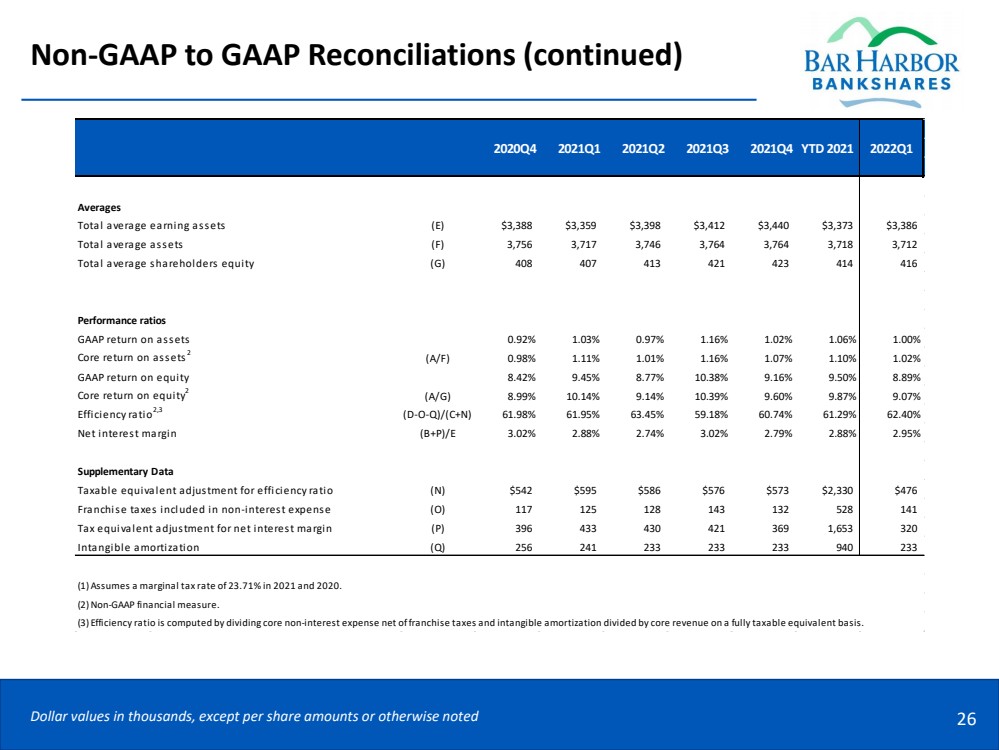
Non‐GAAP to GAAP Reconciliations (continued) 26 Dollar values in thousands, except per share amounts or otherwise noted Averages Total average earning assets (E) $3,388 $3,359 $3,398 $3,412 $3,440 $3,373 $3,386 Total average assets (F) 3,756 3,717 3,746 3,764 3,764 3,718 3,712 Total average shareholders equity (G) 408 407 413 421 423 414 416 Performance ratios GAAP return on assets 0.92% 1.03% 0.97% 1.16% 1.02% 1.06% 1.00% Core return on assets 2 (A/F) 0.98% 1.11% 1.01% 1.16% 1.07% 1.10% 1.02% GAAP return on equity 8.42% 9.45% 8.77% 10.38% 9.16% 9.50% 8.89% Core return on equity 2 (A/G) 8.99% 10.14% 9.14% 10.39% 9.60% 9.87% 9.07% Efficiency ratio 2,3 (D-O-Q)/(C+N) 61.98% 61.95% 63.45% 59.18% 60.74% 61.29% 62.40% Net interest margin (B+P)/E 3.02% 2.88% 2.74% 3.02% 2.79% 2.88% 2.95% Supplementary Data Taxable equivalent adjustment for efficiency ratio (N) $542 $595 $586 $576 $573 $2,330 $476 Franchise taxes included in non-interest expense (O) 117 125 128 143 132 528 141 Tax equivalent adjustment for net interest margin (P) 396 433 430 421 369 1,653 320 Intangible amortization (Q) 256 241 233 233 233 940 233 (1) Assumes a marginal tax rate of 23.71% in 2021 and 2020. (2) Non-GAAP financial measure. (3) Efficiency ratio is computed by dividing core non-interest expense net of franchise taxes and intangible amortization divided by core revenue on a fully taxable equivalent basis. YTD 2021 2020Q4 2021Q1 2021Q2 2021Q3 2021Q4 2022Q1 |
|
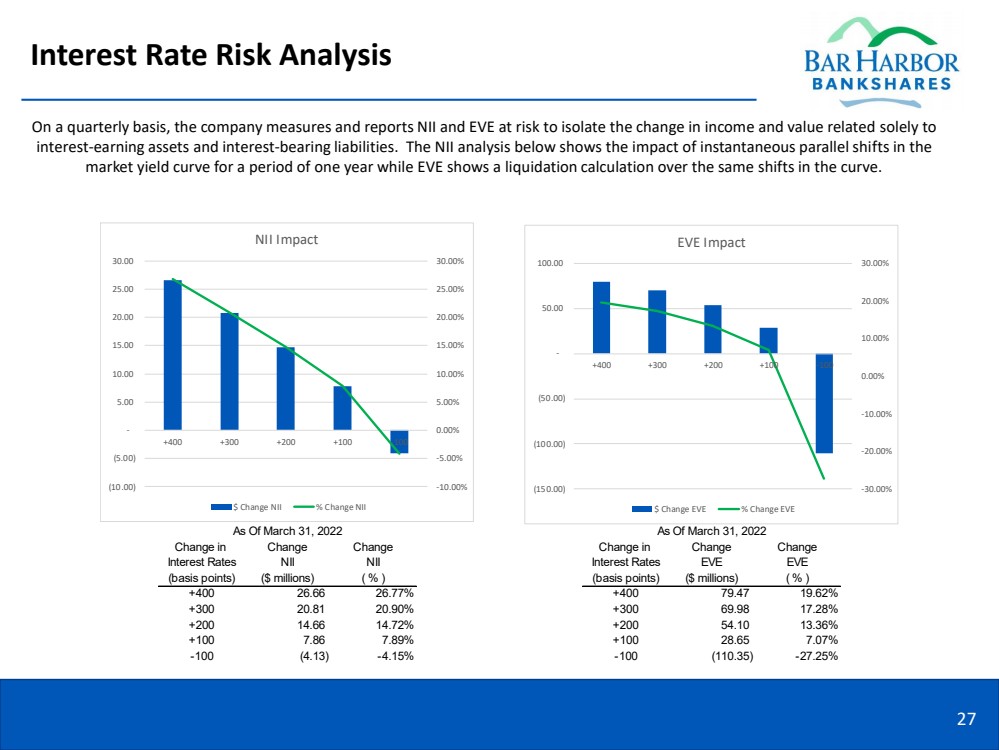
Interest Rate Risk Analysis 27 Change in Change Change Change in Change Change Interest Rates NII NII Interest Rates EVE EVE (basis points) ($ millions) ( % ) (basis points) ($ millions) ( % ) +400 26.66 26.77% +400 79.47 19.62% +300 20.81 20.90% +300 69.98 17.28% +200 14.66 14.72% +200 54.10 13.36% +100 7.86 7.89% +100 28.65 7.07% -100 (4.13) -4.15% -100 (110.35) -27.25% As Of March 31, 2022 As Of March 31, 2022 -10.00% -5.00% 0.00% 5.00% 10.00% 15.00% 20.00% 25.00% 30.00% (10.00) (5.00) - 5.00 10.00 15.00 20.00 25.00 30.00 +400 +300 +200 +100 -100 NII Impact $ Change NII % Change NII -30.00% -20.00% -10.00% 0.00% 10.00% 20.00% 30.00% (150.00) (100.00) (50.00) - 50.00 100.00 +400 +300 +200 +100 -100 EVE Impact $ Change EVE % Change EVE On a quarterly basis, the company measures and reports NII and EVE at risk to isolate the change in income and value related sol ely to interest - earning assets and interest - bearing liabilities. The NII analysis below shows the impact of instantaneous parallel shi fts in the market yield curve for a period of one year while EVE shows a liquidation calculation over the same shifts in the curve. |