Document
Thryv Reports Second Quarter 2026 Results and Launches Thryv Growth Platform
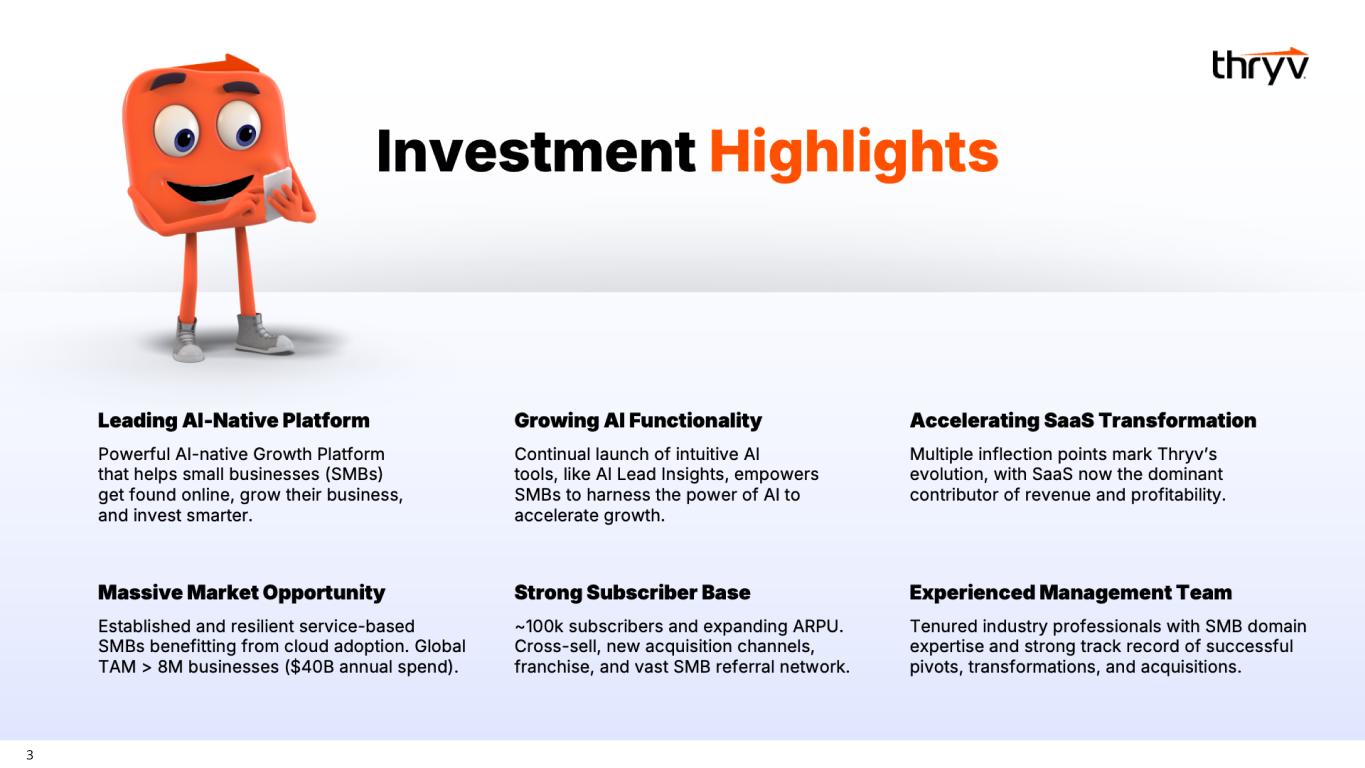
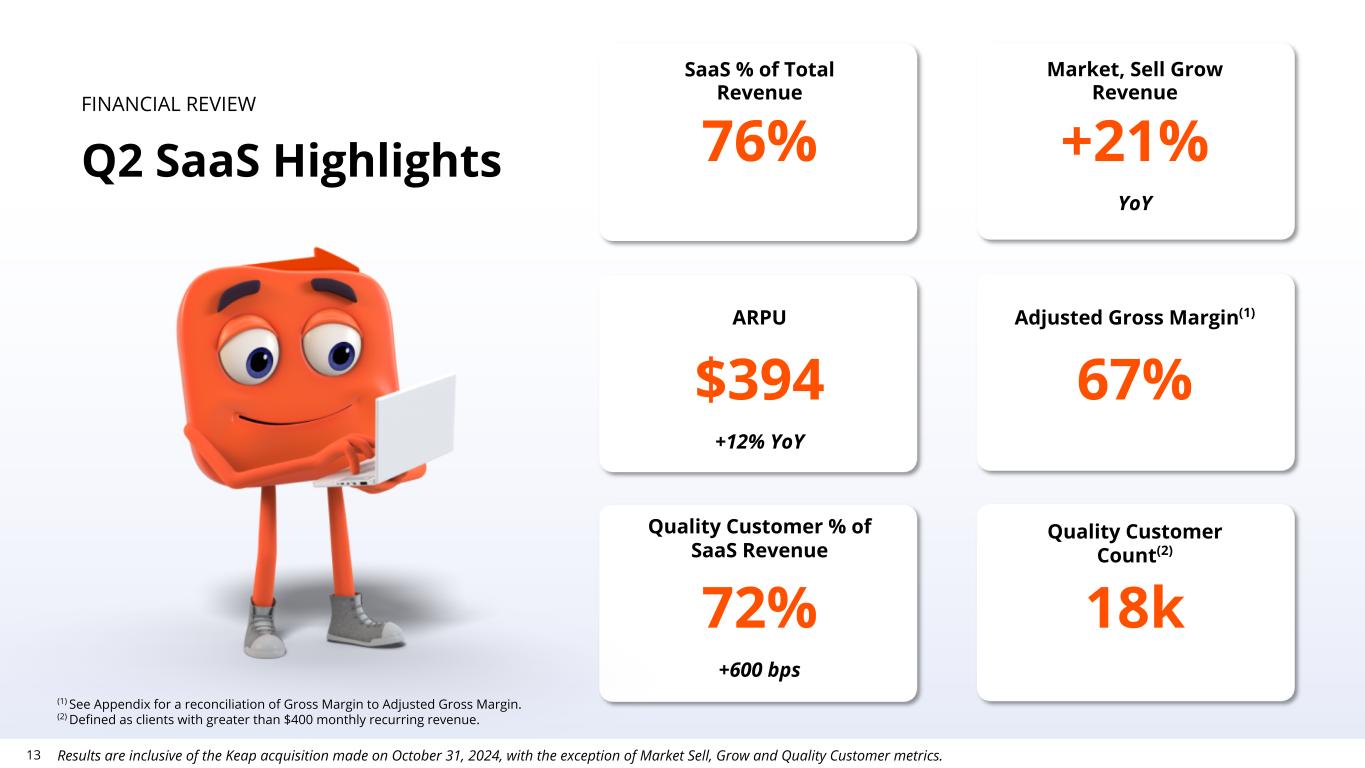
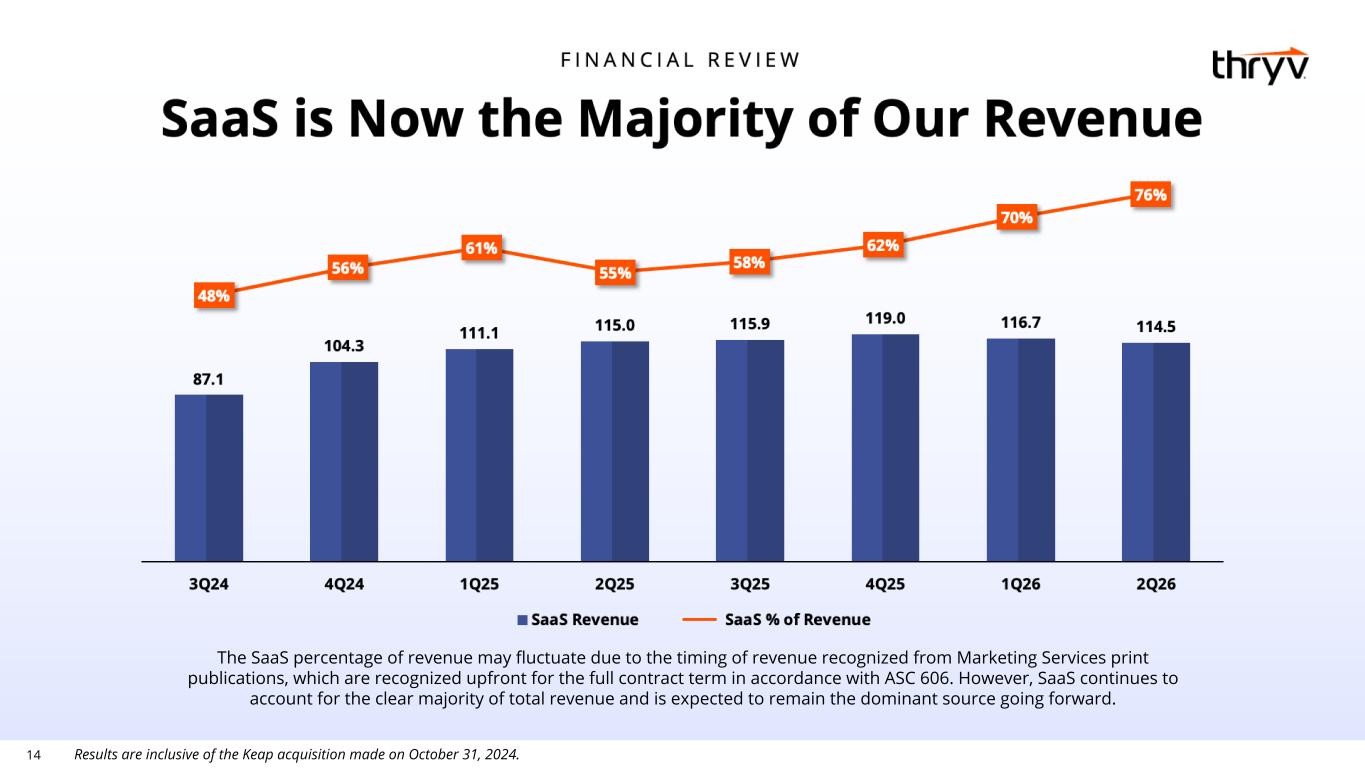
–Q2 SaaS Revenue Grows to 76% of Total Revenue
–Q2 SaaS Monthly ARPU Increases 12% Year-Over-Year to $394
–Company Announces Strategic Restructuring Plan to Improve Operating Efficiencies
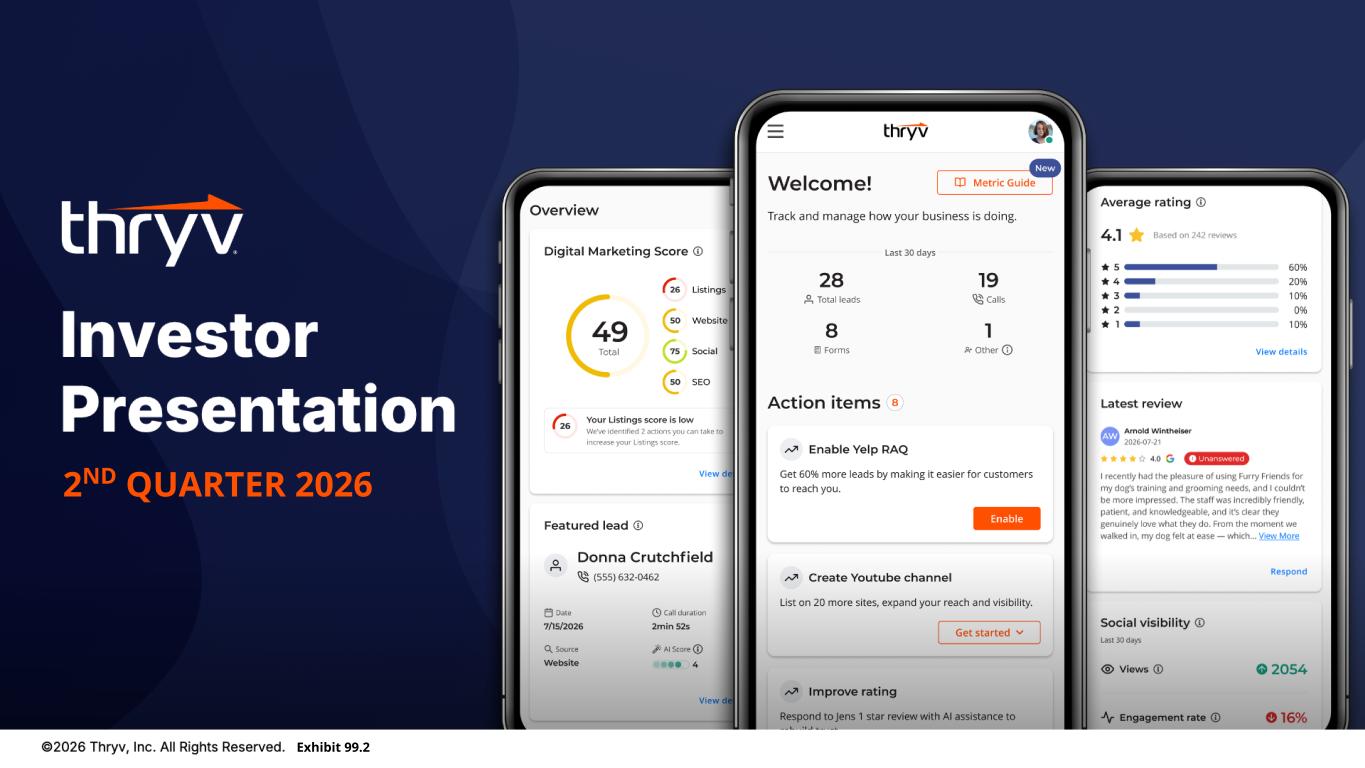
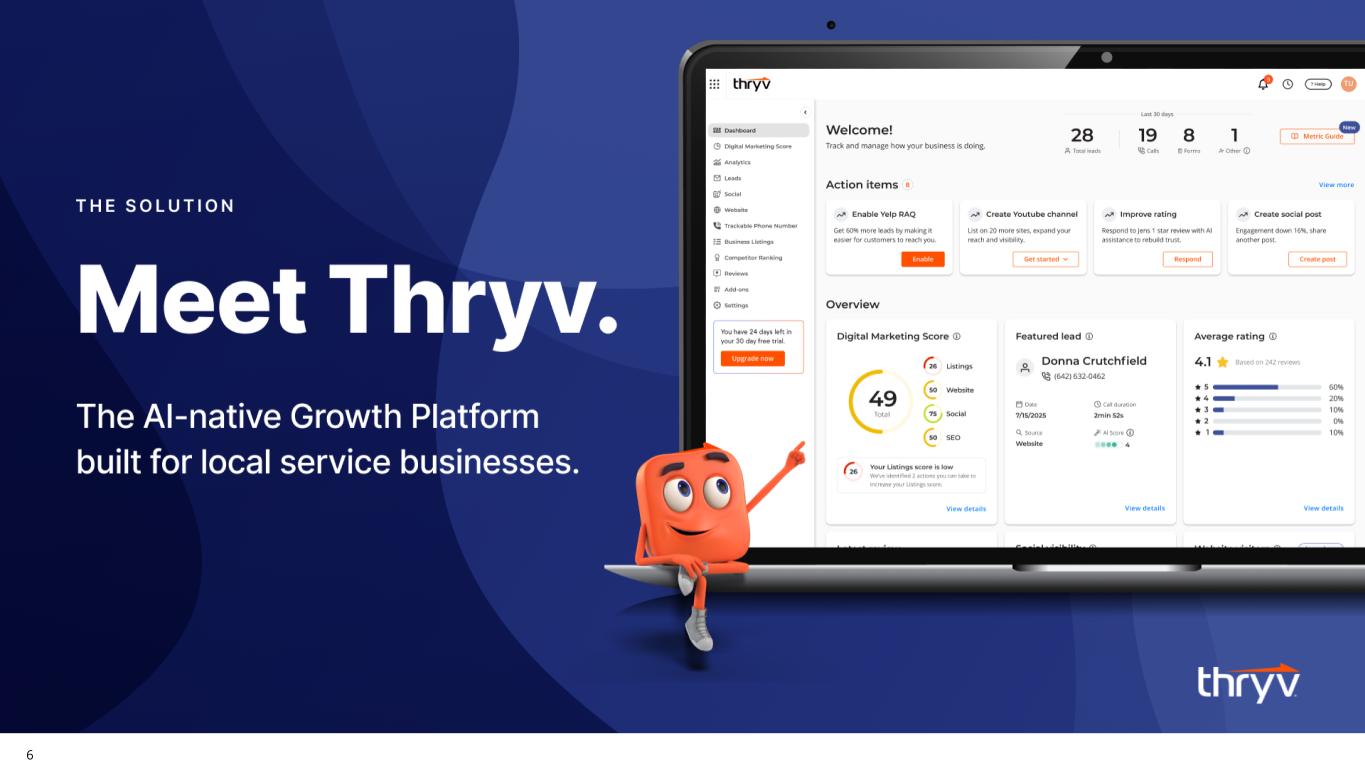
DALLAS, August 4, 2026 – Thryv Holdings, Inc. (NASDAQ:THRY) (“Thryv” or the “Company”), the provider of Thryv®, an AI-native growth platform for local service businesses, reported results for the second quarter of 2026.
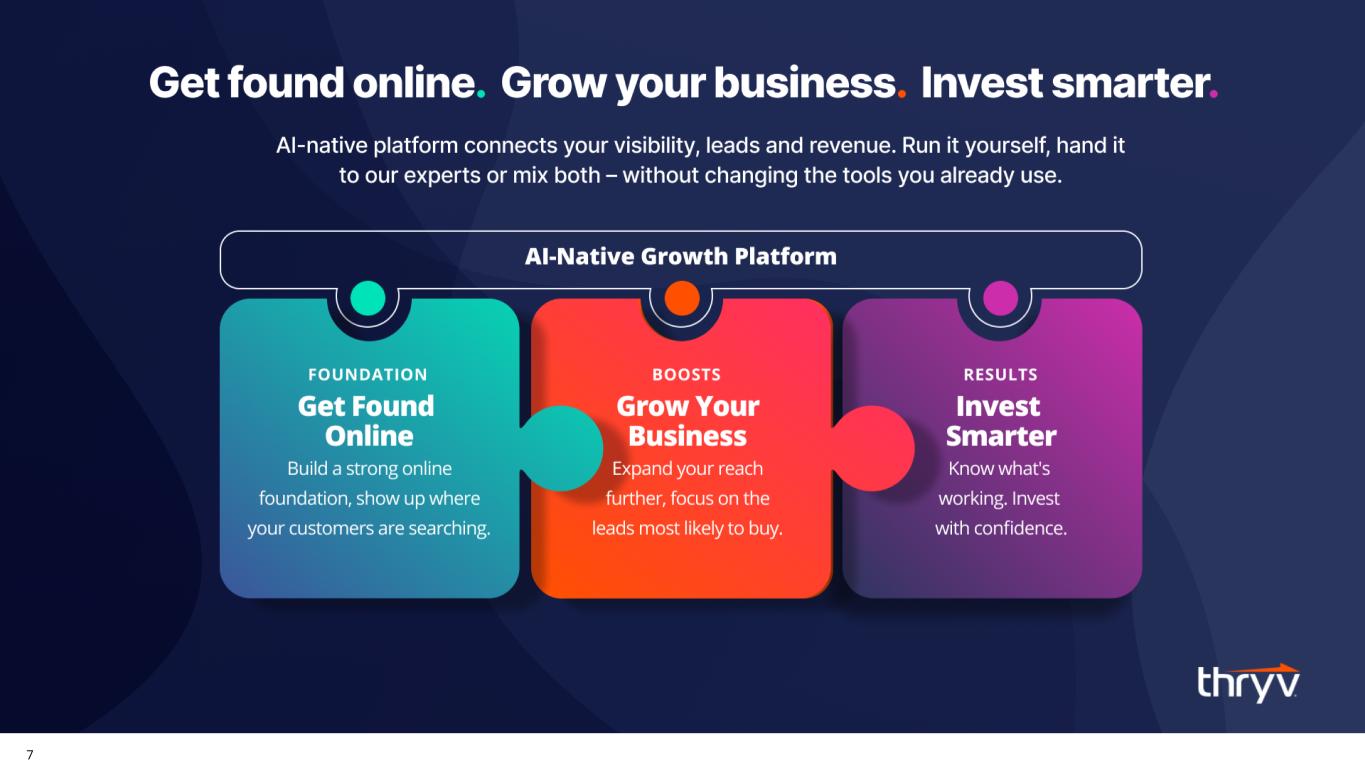
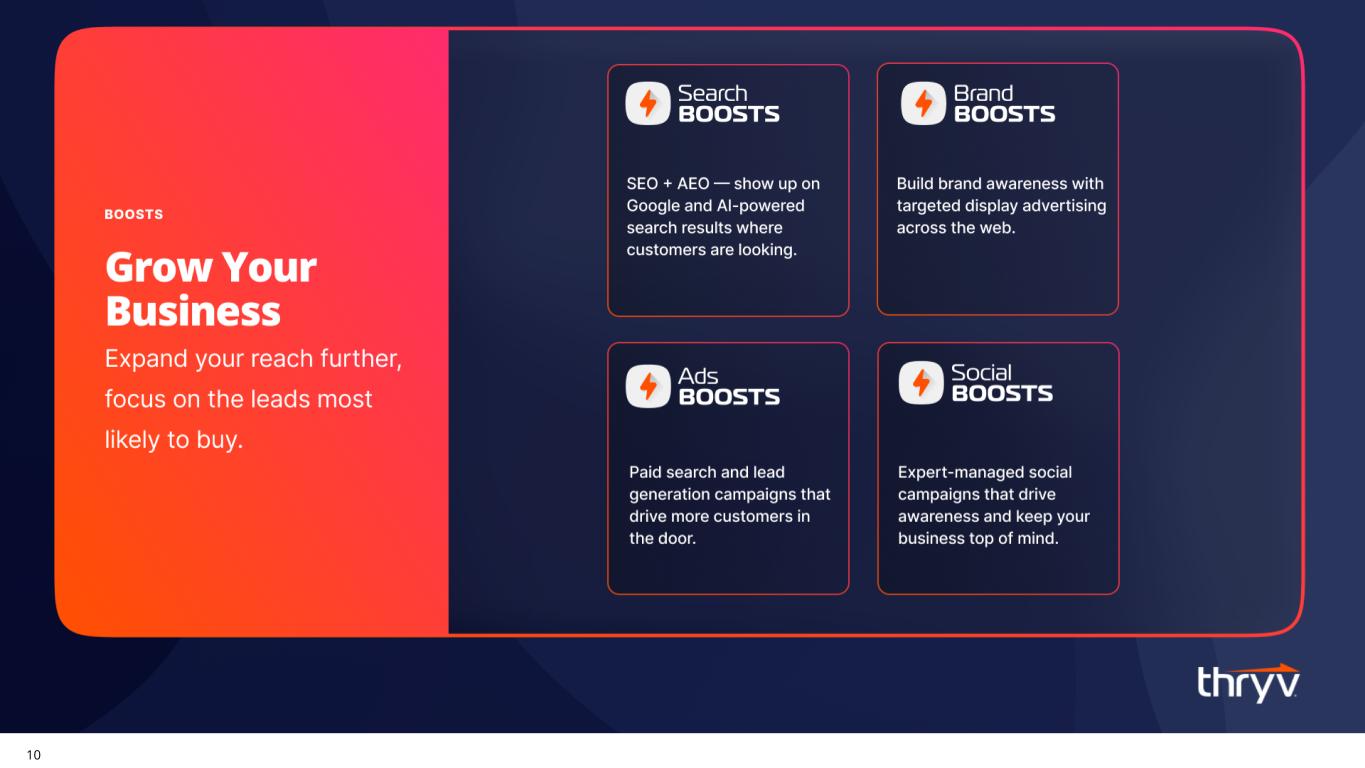
"Our second quarter marked another step forward in the transformation of our business, with SaaS now representing 76% of our revenue and ARPU growing 12% year-over-year," said Joe Walsh, Thryv Chairman and CEO. "Our SaaS profile now reflects our deliberate focus on the newly launched Thryv Growth Platform, the first platform purpose-built for the small business owner with AI running underneath to turn every lead into measurable revenue. We are also announcing a restructuring plan that realigns our cost structure to focus on a SaaS operating model and extend the agentic AI capabilities embedded in Thryv's customer-facing platform. Looking ahead, we remain focused on reaccelerating the growth of our SaaS business. We are announcing today that we have partnered Ooma and plan to establish a strategic partnership with Wix, with a shared focus on helping small businesses succeed."
The Company expects to incur total restructuring and related charges of approximately $20 million to $25 million, approximately 10% of which has already been incurred, with approximately 40% expected to be recognized in the second half of 2026 and the remaining 50% to be recognized in 2027. Cost savings are anticipated to begin in 2027, building to approximately $55 million to $60 million in gross annualized cost savings upon completion.
“We remain focused on optimizing the Thryv Growth Platform, a unified, AI-native growth offering, concentrating investments to scale the business and expand profitability. These initiatives are expected to be accretive to Adjusted EBITDA margins in the future, while strengthening the Company's free cash flow generation,” stated Paul Rouse, Chief Financial Officer.
Second Quarter Financial 2026 Highlights:
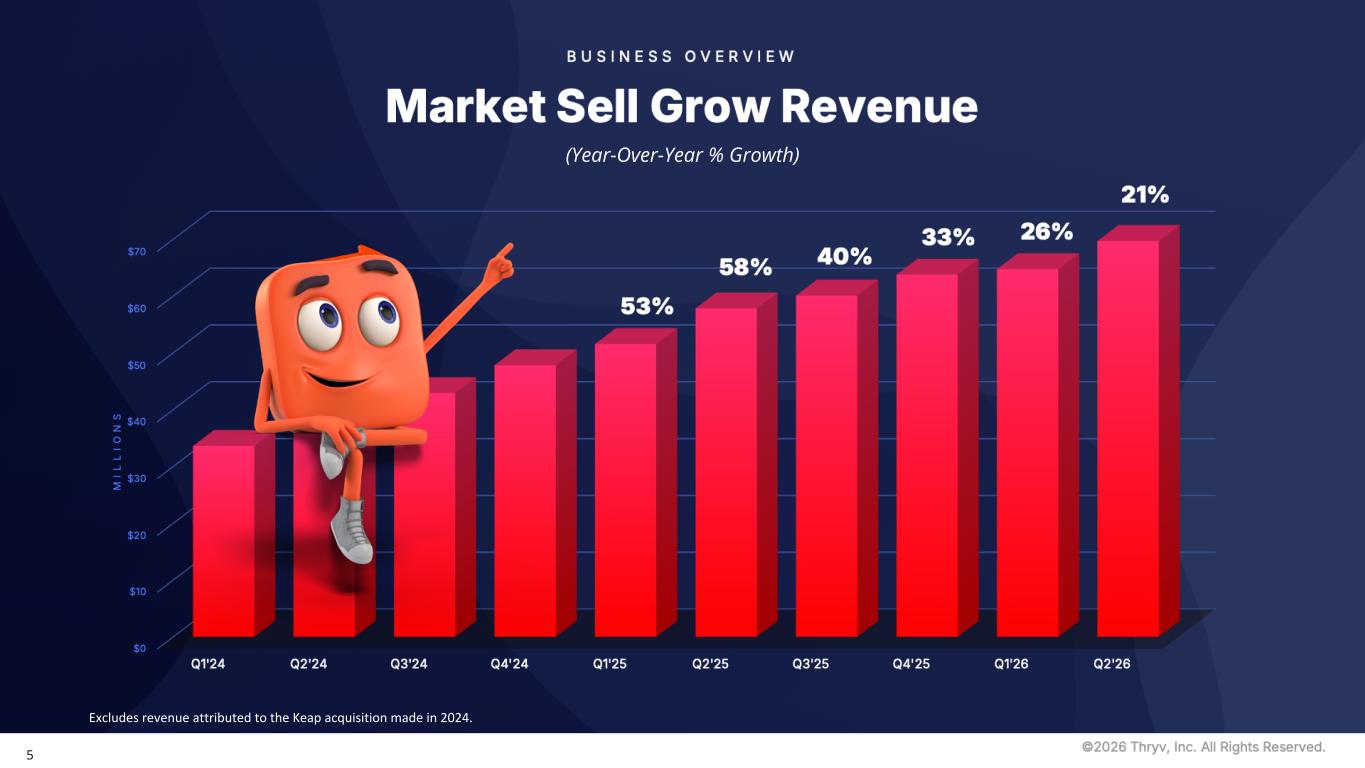
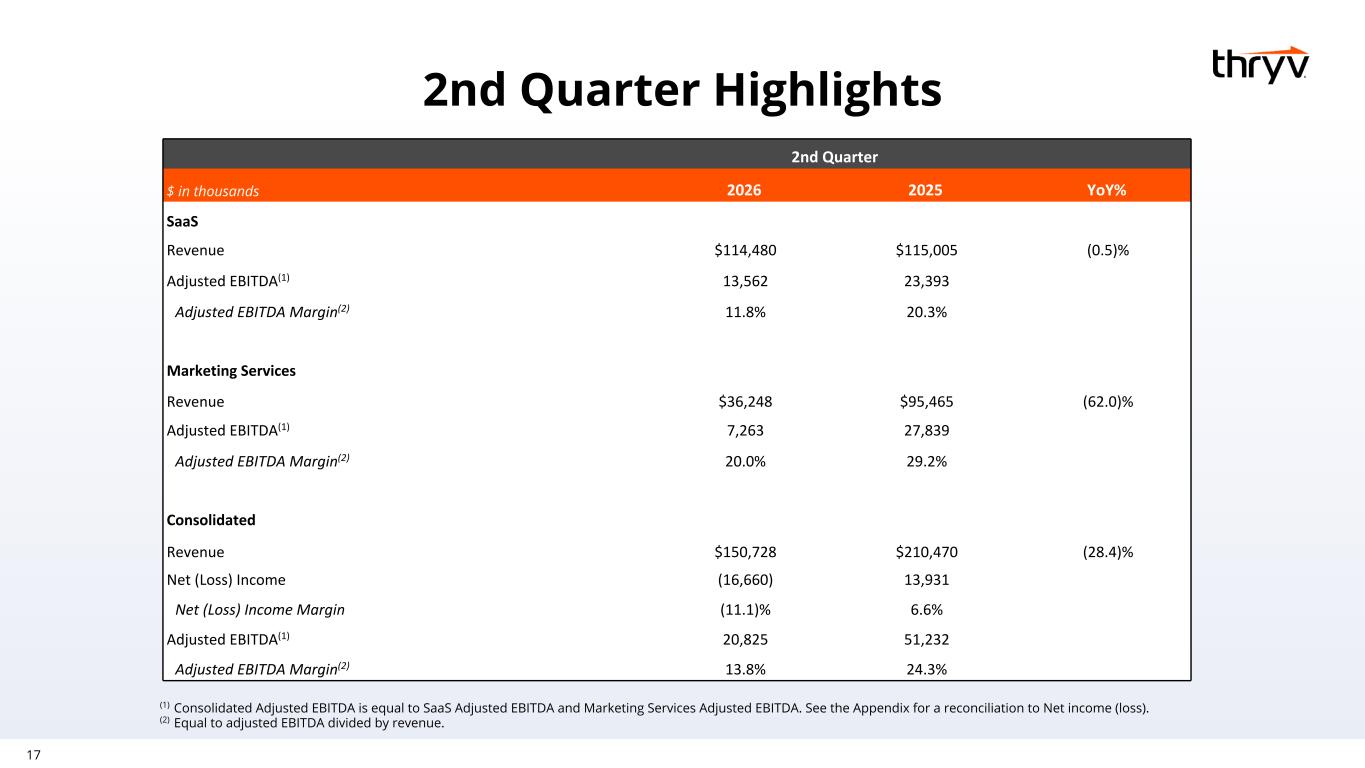
•SaaS revenue was $114.5 million, a decrease of 0.5% year-over-year, of which Market, Sell, Grow initiatives grew 21%1 year-over-year, offset by headwinds in legacy CRM products
•Marketing Services revenue was $36.2 million
•Consolidated total revenue was $150.7 million
•Consolidated net loss was $16.7 million, or $(0.38) per diluted share; compared to net income of $13.9 million, or $0.31 per diluted share, for the second quarter of 2025
•Consolidated Adjusted EBITDA was $20.8 million, representing an Adjusted EBITDA margin of 13.8%
1 Excludes Keap. Market, Sell, Grow initiatives include Marketing Center and additional marketing value-added services.
•SaaS Adjusted EBITDA was $13.6 million, representing an Adjusted EBITDA margin of 11.8%
•Marketing Services Adjusted EBITDA was $7.3 million, representing an Adjusted EBITDA margin of 20.0%
•Consolidated Gross Profit was $94.6 million
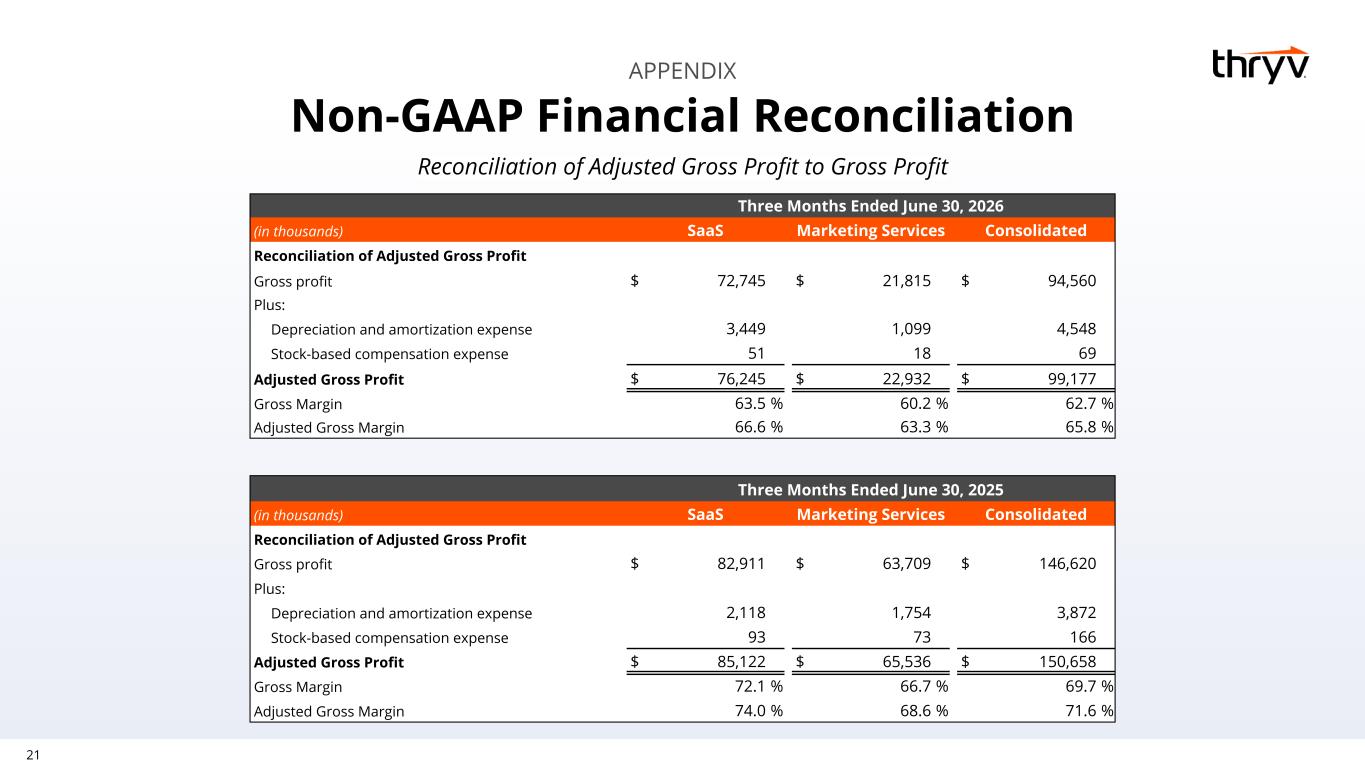
•Consolidated Adjusted Gross Profit2 was $99.2 million
•SaaS Gross Profit was $72.7 million, representing a Gross Margin of 63.5%
•SaaS Adjusted Gross Profit1 was $76.2 million, representing an Adjusted Gross Margin of 66.6%
Recent Business Highlights and Metrics
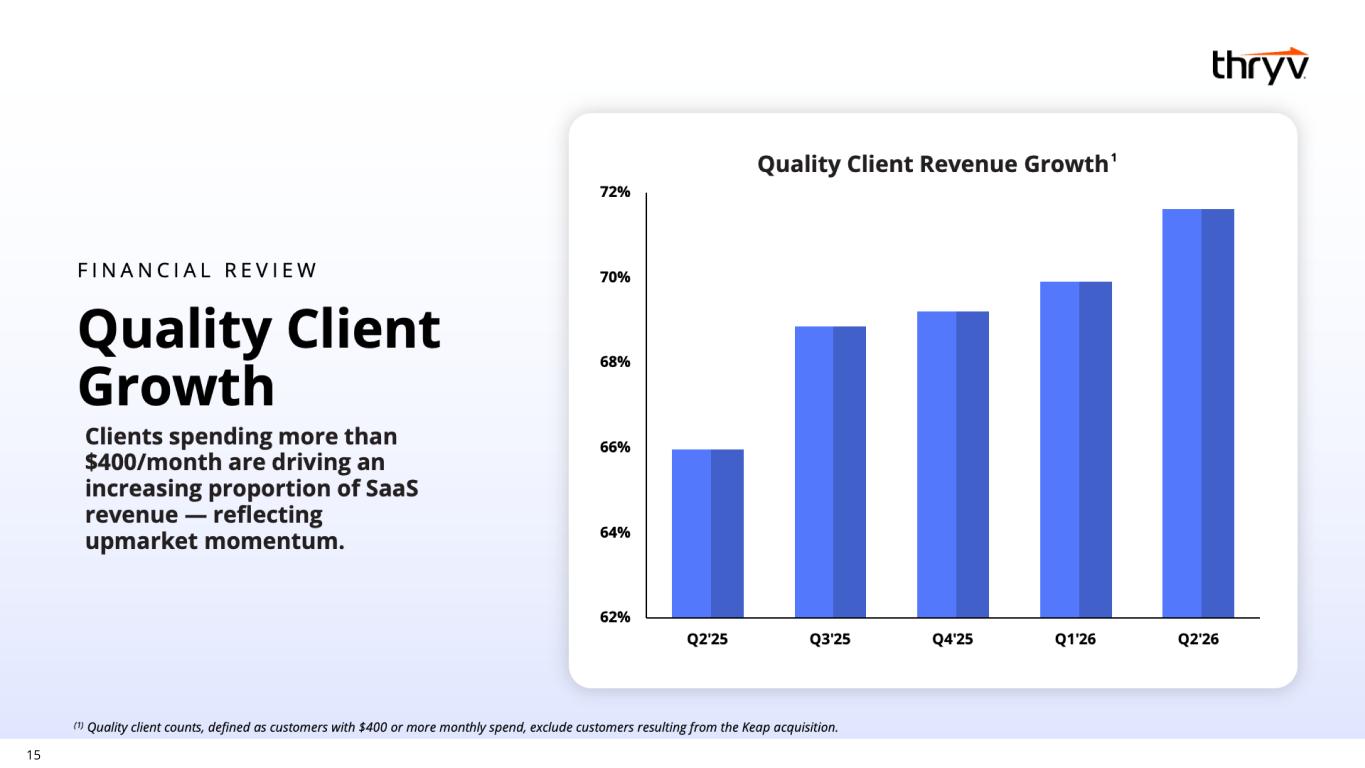
•Quality customers3 (defined as those contributing more than $400 in monthly recurring revenue) accounted for 72% of SaaS revenue3 in the second quarter of 2026
•SaaS clients were 95 thousand at the end of the second quarter of 2026
•Seasoned Net Revenue Retention4 was 90% for the second quarter of 2026
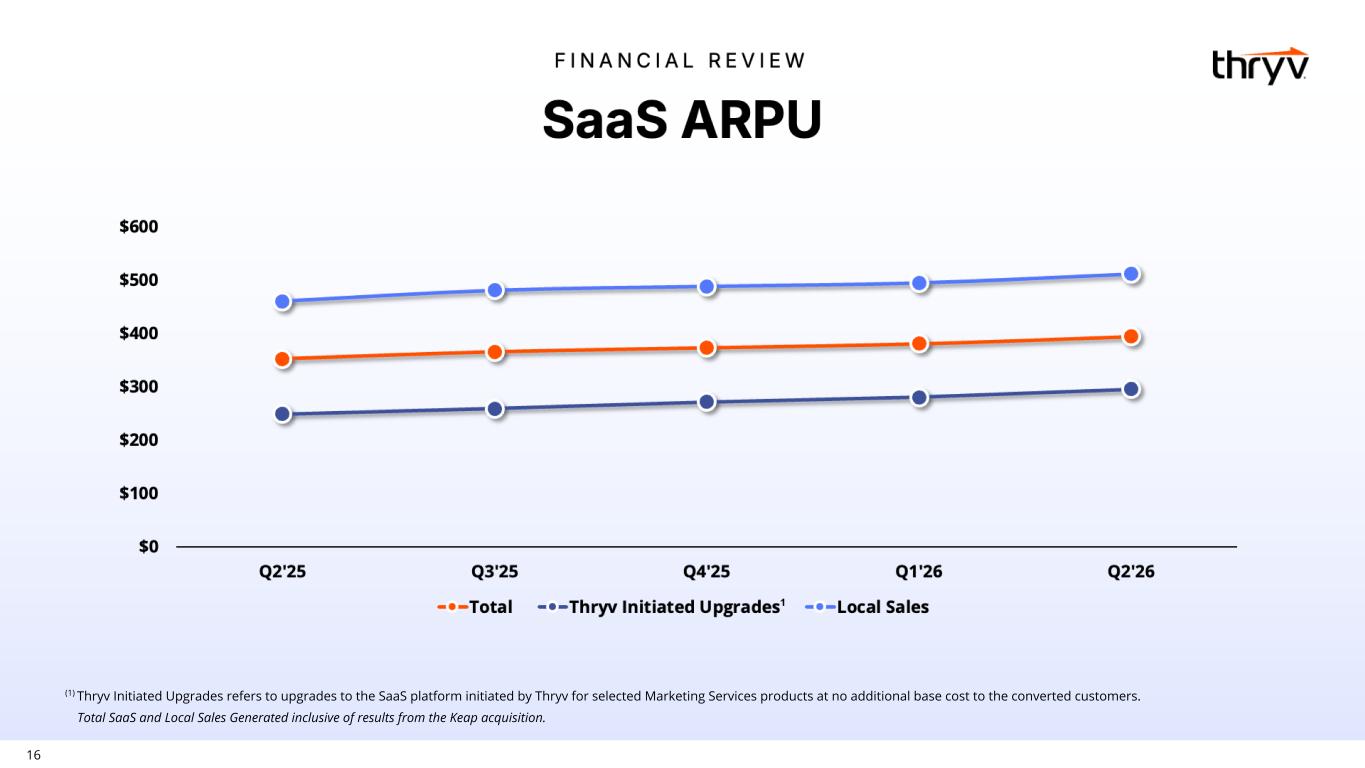
•SaaS monthly Average Revenue per Unit (“ARPU”)5 was $394 for the second quarter of 2026, an increase of 11.9% year-over-year
Outlook
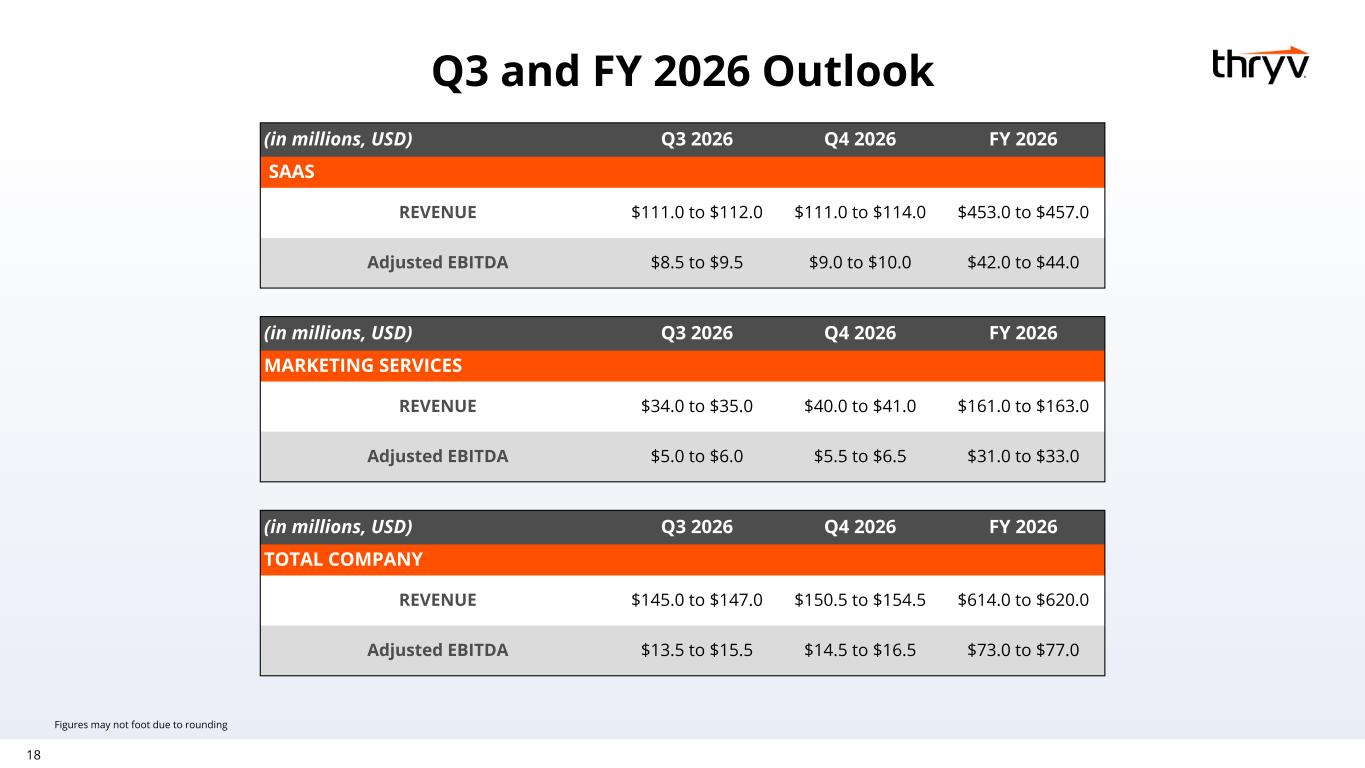
Based on information available as of August 4, 2026, Thryv is issuing guidance6 for the third quarter of 2026 and updating full year 2026 as indicated below:
|
|
|
|
|
|
|
|
|
|
|
|
|
|
|
|
|
|
|
|
|
|
|
|
|
|
|
|
|
3rd Quarter |
|
4th Quarter |
|
Full Year |
| (in millions) |
|
|
|
|
2026 |
|
2026 |
|
2026 |
|
|
|
|
|
|
|
|
|
|
|
|
|
|
|
|
|
|
|
|
| SaaS Revenue |
|
|
|
|
$111.0 - $112.0 |
|
$111.0 - $114.0 |
|
$453.0 - $457.0 |
| SaaS Adjusted EBITDA7 |
|
|
|
|
$8.5 - $9.5 |
|
$9.0 - $10.0 |
|
$42.0 - $44.0 |
|
|
|
|
|
|
|
|
|
|
|
|
|
|
|
|
|
|
|
|
|
|
|
|
|
|
|
|
|
3rd Quarter |
|
4th Quarter |
|
Full Year |
| (in millions) |
|
|
|
|
2026 |
|
2026 |
|
2026 |
| Marketing Services Revenue |
|
|
|
|
$34.0 - $35.0 |
|
$40.0 - $41.0 |
|
$161.0 - $163.0 |
Marketing Services Adjusted EBITDA7
|
|
|
|
|
$5.0 - $6.0 |
|
$5.5 - $6.5 |
|
$31.0 - $33.0 |
2 Defined as Gross profit adjusted to exclude the impact of depreciation and amortization expense and stock-based compensation expense.
3 Excludes customers and revenue attributed to the Keap acquisition.
4 Seasoned NRR is calculated by dividing the revenue of all clients that have had one or more SaaS offerings for at least two years as of the last month of the year or quarter, as applicable, by the same clients' revenue one year ago. For each reporting quarter, the weighted-average monthly NRR from all the months in the quarter are reported. Seasoned NRR excludes clients acquired in the Keap acquisition.
5 Defined as total client billings for a particular month divided by the number of clients that have one or more revenue-generating solutions in that same month. This is a weighted-average calculation and inclusive of the impact from the Keap acquisition.
6 These statements are forward-looking and actual results may materially differ. Refer to the “Forward-Looking Statements” section below for information on the factors that could cause our actual results to materially differ from these forward-looking statements.
7 SaaS Adjusted EBITDA and Marketing Services Adjusted EBITDA are forward-looking non-GAAP financial measurers. We calculate forward-looking non-GAAP financial measures based on internal forecasts that omit certain amounts that would be included in GAAP financial measures. We have not provided quantitative reconciliations of these forward-looking non-GAAP financial measures because the excluded items are not available on a prospective basis without unreasonable effort.
Earnings Conference Call Information
Thryv will host a conference call on Tuesday, August 4, 2026 at 8:30 a.m. (Eastern Time) to discuss the Company's second quarter 2026 results.
To listen to this conference call, please use this link. After registering, a confirmation email will be sent, including access details. We recommend registering a day in advance or at a minimum thirty minutes prior to the start of the call. A live webcast will also be available on the Investor Relations section of the Company's website at investor.thryv.com.
Thryv Holdings, Inc. and Subsidiaries
Consolidated Statements of Operations and Comprehensive (Loss) Income
|
|
|
|
|
|
|
|
|
|
|
|
|
|
|
|
|
|
|
|
|
|
|
|
|
Three Months Ended |
|
Six Months Ended |
|
June 30, |
|
June 30, |
| (in thousands, except share and per share data) |
2026 |
|
2025 |
|
2026 |
|
2025 |
| Revenue |
$ |
150,728 |
|
|
$ |
210,470 |
|
|
$ |
318,412 |
|
|
$ |
391,841 |
|
| Cost of services |
56,168 |
|
|
63,850 |
|
|
114,596 |
|
|
125,933 |
|
| Gross profit |
94,560 |
|
|
146,620 |
|
|
203,816 |
|
|
265,908 |
|
|
|
|
|
|
|
|
|
| Operating expenses: |
|
|
|
|
|
|
|
| Sales and marketing |
47,038 |
|
|
56,063 |
|
|
94,986 |
|
|
115,905 |
|
| Research and development |
7,509 |
|
|
8,661 |
|
|
18,940 |
|
|
18,870 |
|
| General and administrative |
41,156 |
|
|
52,356 |
|
|
86,975 |
|
|
104,627 |
|
|
|
|
|
|
|
|
|
| Total operating expenses |
95,703 |
|
|
117,080 |
|
|
200,901 |
|
|
239,402 |
|
|
|
|
|
|
|
|
|
| Operating (loss) income |
(1,143) |
|
|
29,540 |
|
|
2,915 |
|
|
26,506 |
|
| Other income (expense): |
|
|
|
|
|
|
|
| Interest expense |
(5,035) |
|
|
(5,981) |
|
|
(9,176) |
|
|
(12,048) |
|
| Interest expense, related party |
(2,483) |
|
|
(2,971) |
|
|
(4,949) |
|
|
(5,977) |
|
| Net periodic pension cost |
(357) |
|
|
(778) |
|
|
(702) |
|
|
(1,546) |
|
| Other income |
(446) |
|
|
2,557 |
|
|
987 |
|
|
2,949 |
|
| (Loss) income before income tax expense |
(9,464) |
|
|
22,367 |
|
|
(10,925) |
|
|
9,884 |
|
| Income tax expense |
(7,196) |
|
|
(8,436) |
|
|
(1,193) |
|
|
(5,571) |
|
| Net (loss) income |
$ |
(16,660) |
|
|
$ |
13,931 |
|
|
$ |
(12,118) |
|
|
$ |
4,313 |
|
| Other comprehensive loss: |
|
|
|
|
|
|
|
| Foreign currency translation adjustment, net of tax |
(114) |
|
|
(72) |
|
|
(509) |
|
|
(259) |
|
| Comprehensive (loss) income |
$ |
(16,774) |
|
|
$ |
13,859 |
|
|
$ |
(12,627) |
|
|
$ |
4,054 |
|
|
|
|
|
|
|
|
|
Net (loss) income per common share: |
|
|
|
|
|
|
|
| Basic |
$ |
(0.38) |
|
|
$ |
0.32 |
|
|
$ |
(0.27) |
|
|
$ |
0.10 |
|
| Diluted |
$ |
(0.38) |
|
|
$ |
0.31 |
|
|
$ |
(0.27) |
|
|
$ |
0.10 |
|
|
|
|
|
|
|
|
|
Weighted-average shares used in computing basic and diluted net (loss) income per common share: |
|
|
|
|
|
|
|
| Basic |
44,358,330 |
|
|
43,744,144 |
|
|
44,283,478 |
|
|
43,579,171 |
|
| Diluted |
44,358,330 |
|
|
44,303,331 |
|
|
44,283,478 |
|
|
44,586,162 |
|
Thryv Holdings, Inc. and Subsidiaries
Consolidated Balance Sheets
|
|
|
|
|
|
|
|
|
|
|
|
| (in thousands, except share data) |
June 30, 2026 |
|
December 31, 2025 |
| Assets |
|
|
|
| Current assets |
|
|
|
| Cash and cash equivalents |
$ |
9,136 |
|
|
$ |
10,752 |
|
Accounts receivable, net of allowance of $13,144 in 2026 and $13,830 in 2025 |
127,756 |
|
|
136,394 |
|
Contract assets, net of allowance of $2 in 2026 and $2 in 2025 |
622 |
|
|
411 |
|
| Taxes receivable |
1,172 |
|
|
8,134 |
|
| Deferred costs |
8,243 |
|
|
11,548 |
|
| Prepaid expenses and other current assets |
11,041 |
|
|
11,618 |
|
| Total current assets |
157,970 |
|
|
178,857 |
|
| Fixed assets and capitalized software, net |
49,242 |
|
|
50,885 |
|
| Goodwill |
253,809 |
|
|
253,809 |
|
| Intangible assets, net |
22,979 |
|
|
25,929 |
|
| Deferred tax assets |
137,604 |
|
|
133,221 |
|
| Other assets |
32,528 |
|
|
45,886 |
|
| Total assets |
$ |
654,132 |
|
|
$ |
688,587 |
|
|
|
|
|
| Liabilities and Stockholders' Equity |
|
|
|
| Current liabilities |
|
|
|
| Accounts payable |
$ |
5,509 |
|
|
$ |
9,764 |
|
| Accrued liabilities |
88,753 |
|
|
91,246 |
|
| Current portion of unrecognized tax benefits |
1,847 |
|
|
28,303 |
|
| Contract liabilities |
24,820 |
|
|
28,875 |
|
| Current portion of Term Loan |
21,000 |
|
|
10,500 |
|
| Current portion of Term Loan, related party |
14,000 |
|
|
7,000 |
|
| Other current liabilities |
2,518 |
|
|
3,905 |
|
| Total current liabilities |
158,447 |
|
|
179,593 |
|
| Term Loan, net |
115,886 |
|
|
125,419 |
|
| Term Loan, net, related party |
78,788 |
|
|
85,448 |
|
| ABL Facility |
14,057 |
|
|
25,120 |
|
| Pension obligations, net |
41,425 |
|
|
44,171 |
|
| Other liabilities |
33,967 |
|
|
10,697 |
|
| Total long-term liabilities |
284,123 |
|
|
290,855 |
|
| Commitments and contingencies |
|
|
|
| Stockholders' equity |
|
|
|
Common stock - $0.01 par value, 250,000,000 shares authorized; 72,970,119 shares issued and 44,417,798 shares outstanding at June 30, 2026; and 72,002,129 shares issued and 43,815,268 shares outstanding at December 31, 2025 |
730 |
|
|
720 |
|
| Additional paid-in capital |
1,310,845 |
|
|
1,303,144 |
|
Treasury stock - 28,552,321 shares at June 30, 2026 and 28,186,861 shares at December 31, 2025 |
(499,764) |
|
|
(498,103) |
|
| Accumulated other comprehensive loss |
(16,020) |
|
|
(15,511) |
|
| Accumulated deficit |
(584,229) |
|
|
(572,111) |
|
| Total stockholders' equity |
211,562 |
|
|
218,139 |
|
| Total liabilities and stockholders' equity |
$ |
654,132 |
|
|
$ |
688,587 |
|
Thryv Holdings, Inc. and Subsidiaries
Consolidated Statements of Cash Flows
|
|
|
|
|
|
|
|
|
|
|
|
|
Six Months Ended June 30, |
| (in thousands) |
2026 |
|
2025 |
| Cash Flows from Operating Activities |
|
|
|
| Net (loss) income |
$ |
(12,118) |
|
|
$ |
4,313 |
|
| Adjustments to reconcile net (loss) income to net cash provided by operating activities: |
|
|
|
| Depreciation and amortization |
20,060 |
|
|
21,707 |
|
| Amortization of deferred commissions |
3,046 |
|
|
6,944 |
|
| Amortization of debt issuance costs |
1,465 |
|
|
1,648 |
|
| Deferred income taxes |
(4,116) |
|
|
2,310 |
|
| Provision for credit losses and service credits |
6,734 |
|
|
9,020 |
|
| Stock-based compensation expense |
7,537 |
|
|
13,745 |
|
| Net periodic pension cost |
702 |
|
|
1,546 |
|
|
|
|
|
| Gain on foreign currency exchange rates |
(962) |
|
|
(2,787) |
|
| Other |
2 |
|
|
38 |
|
| Changes in working capital items, excluding acquisitions: |
|
|
|
| Accounts receivable |
24,677 |
|
|
15,392 |
|
|
|
|
|
| Prepaid expenses and other assets |
(389) |
|
|
(16,493) |
|
| Accounts payable and accrued liabilities |
(33,831) |
|
|
(20,515) |
|
| Contract liabilities |
(4,443) |
|
|
(13,748) |
|
| Other liabilities |
18,990 |
|
|
(4,045) |
|
| Net cash provided by operating activities |
27,354 |
|
|
19,075 |
|
|
|
|
|
| Cash Flows from Investing Activities |
|
|
|
| Additions to fixed assets and capitalized software |
(16,121) |
|
|
(14,855) |
|
| Other |
— |
|
|
(143) |
|
|
|
|
|
| Net cash used in investing activities |
(16,121) |
|
|
(14,998) |
|
|
|
|
|
| Cash Flows from Financing Activities |
|
|
|
| Payments of Term Loan |
— |
|
|
(15,750) |
|
| Payments of Term Loan, related party |
— |
|
|
(10,500) |
|
| Proceeds from ABL Facility |
154,389 |
|
|
206,317 |
|
| Payments of ABL Facility |
(165,451) |
|
|
(190,292) |
|
| Principal payments on finance lease obligations |
(436) |
|
|
— |
|
|
|
|
|
|
|
|
|
|
|
|
|
| Other |
(1,486) |
|
|
165 |
|
| Net cash used in financing activities |
(12,984) |
|
|
(10,060) |
|
|
|
|
|
| Effect of exchange rate changes on cash, cash equivalents and restricted cash |
61 |
|
|
592 |
|
| Decrease in cash, cash equivalents and restricted cash |
(1,690) |
|
|
(5,391) |
|
| Cash, cash equivalents and restricted cash, beginning of period |
10,869 |
|
|
17,760 |
|
| Cash, cash equivalents and restricted cash, end of period |
$ |
9,179 |
|
|
$ |
12,369 |
|
|
|
|
|
| Supplemental Information |
|
|
|
| Cash paid for interest |
$ |
13,438 |
|
|
$ |
16,480 |
|
| Cash (received) paid for income taxes, net |
$ |
(3,969) |
|
|
$ |
3,373 |
|
Segment Information
The following tables summarize the operating results of the Company's reportable segments:
|
|
|
|
|
|
|
|
|
|
|
|
|
|
|
|
|
|
|
|
|
|
|
|
|
Three Months Ended June 30, |
|
Change |
| (dollars in thousands) |
2026 |
|
2025 |
|
Amount |
|
% |
| Revenue |
|
|
|
|
|
|
|
| SaaS |
$ |
114,480 |
|
|
$ |
115,005 |
|
|
$ |
(525) |
|
|
(0.5) |
% |
| Marketing Services |
36,248 |
|
|
95,465 |
|
|
(59,217) |
|
|
(62.0) |
% |
| Total Revenue |
$ |
150,728 |
|
|
$ |
210,470 |
|
|
$ |
(59,742) |
|
|
(28.4) |
% |
|
|
|
|
|
|
|
|
| Adjusted EBITDA |
|
|
|
|
|
|
|
| SaaS |
$ |
13,562 |
|
|
$ |
23,393 |
|
|
$ |
(9,831) |
|
|
(42.0) |
% |
| Marketing Services |
7,263 |
|
|
27,839 |
|
|
(20,576) |
|
|
(73.9) |
% |
| Consolidated Adjusted EBITDA8 |
$ |
20,825 |
|
|
$ |
51,232 |
|
|
$ |
(30,407) |
|
|
(59.4) |
% |
|
|
|
|
|
|
|
|
|
|
|
|
|
|
|
|
|
|
|
|
|
|
|
|
|
Six Months Ended June 30, |
|
Change |
| (dollars in thousands) |
2026 |
|
2025 |
|
Amount |
|
% |
| Revenue |
|
|
|
|
|
|
|
| SaaS |
$ |
231,218 |
|
|
$ |
226,134 |
|
|
$ |
5,084 |
|
|
2.2 |
% |
| Marketing Services |
87,194 |
|
|
165,707 |
|
|
(78,513) |
|
|
(47.4) |
% |
| Total Revenue |
$ |
318,412 |
|
|
$ |
391,841 |
|
|
$ |
(73,429) |
|
|
(18.7) |
% |
|
|
|
|
|
|
|
|
| Adjusted EBITDA |
|
|
|
|
|
|
|
| SaaS |
$ |
24,378 |
|
|
$ |
34,208 |
|
|
$ |
(9,830) |
|
|
(28.7) |
% |
| Marketing Services |
20,511 |
|
|
37,925 |
|
|
(17,414) |
|
|
(45.9) |
% |
Consolidated Adjusted EBITDA8
|
$ |
44,889 |
|
|
$ |
72,133 |
|
|
$ |
(27,244) |
|
|
(37.8) |
% |
8 Consolidated Adjusted EBITDA is equal to SaaS Adjusted EBITDA and Marketing Services Adjusted EBITDA. See Non-GAAP Measures below for a reconciliation of Consolidated Adjusted EBITDA to Net income (loss).
Non-GAAP Measures
Our results included in this press release include Adjusted EBITDA, Adjusted EBITDA Margin and Adjusted Gross Profit, which are not presented in accordance with U.S. generally accepted accounting principles (“GAAP”).
We have included Adjusted EBITDA, Adjusted EBITDA Margin, Adjusted Gross Profit because management believes they provide useful information to investors in gaining an overall understanding of our current financial performance and provide consistency and comparability with past financial performance. Specifically, we believe Adjusted EBITDA provides useful information to management and investors by excluding certain non-operating items that we believe are not indicative of our core operating results. In addition, Adjusted EBITDA, Adjusted EBITDA Margin, and Adjusted Gross Profit are used by management for budgeting and forecasting as well as measuring the Company’s performance. We believe Adjusted EBITDA, Adjusted EBITDA Margin, and Adjusted Gross Profit provide investors with the financial measures that closely align with our internal processes.
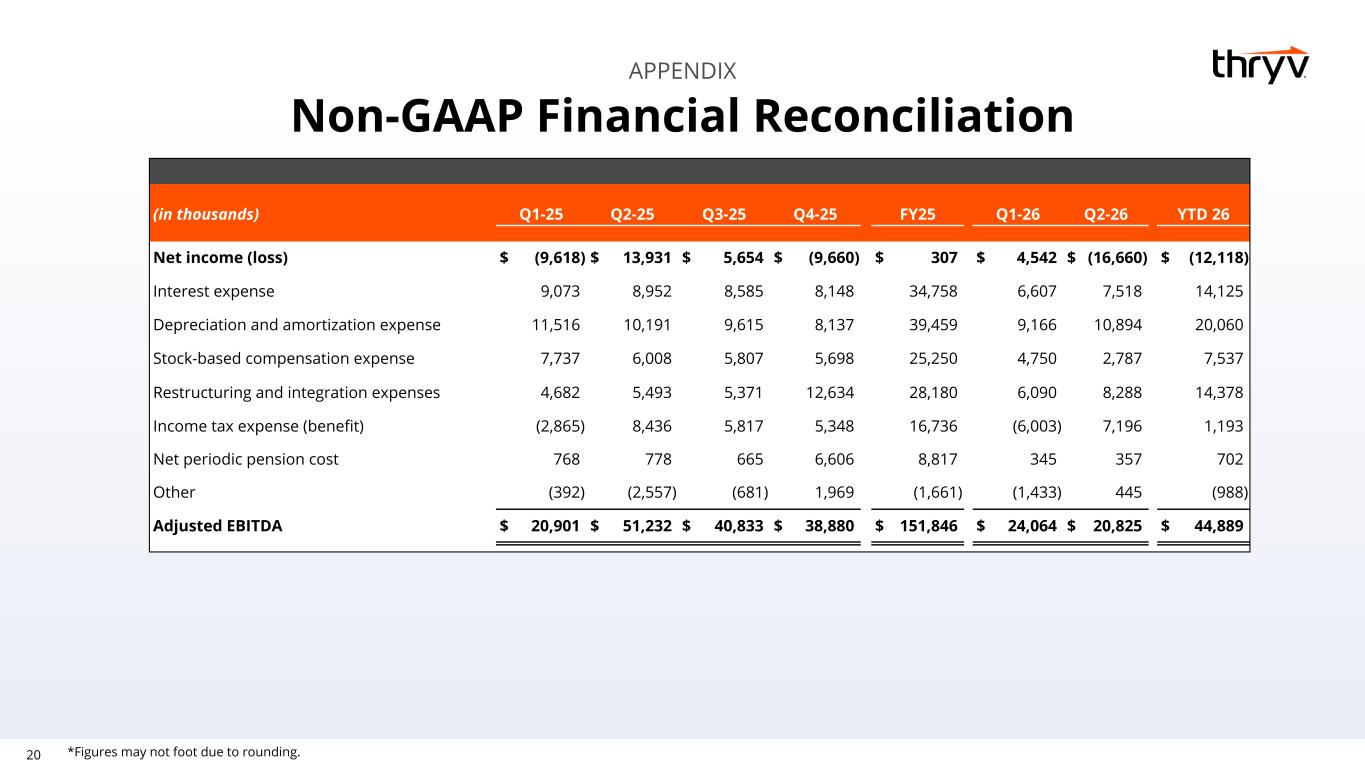
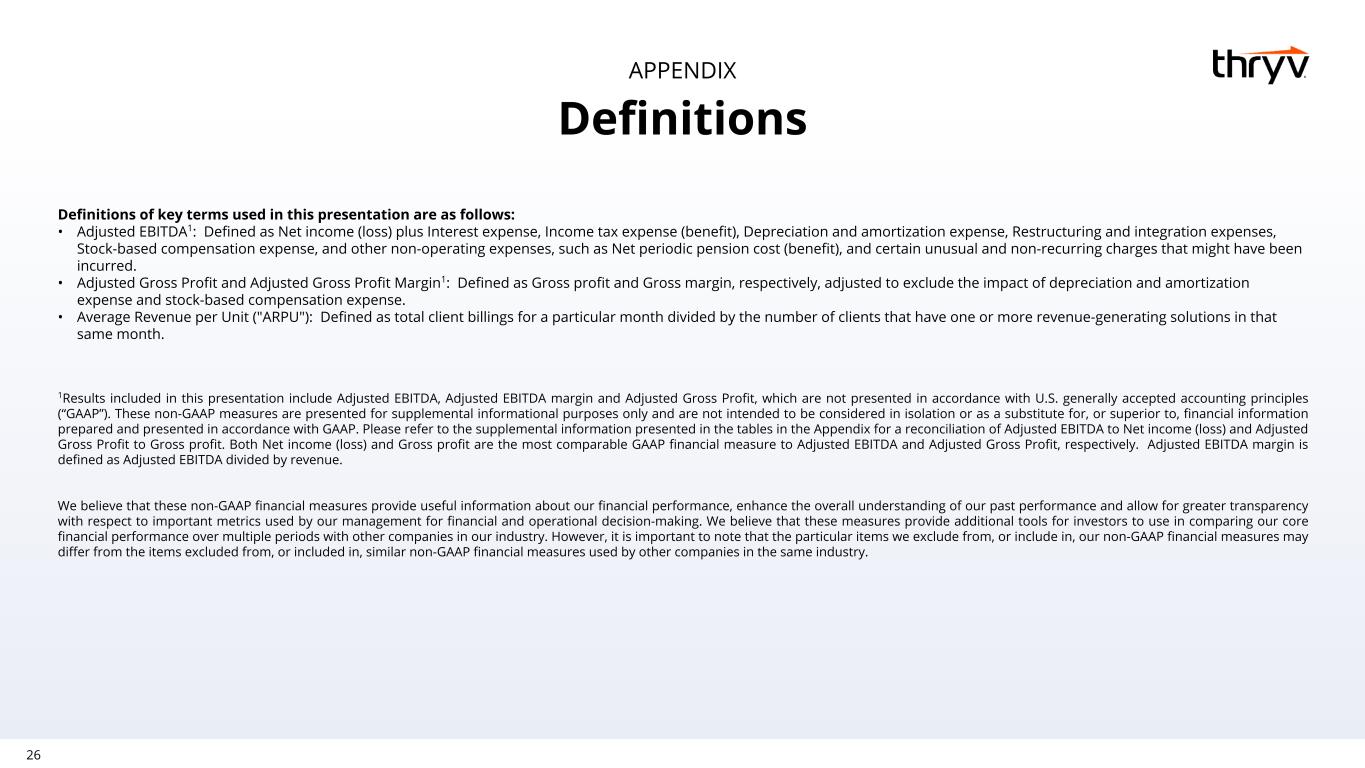
We define Adjusted EBITDA (“Adjusted EBITDA”) as Net income (loss) plus Interest expense, Income tax expense (benefit), Depreciation and amortization expense, Restructuring and integration expenses, Stock-based compensation expense, and non-operating expenses, such as Net periodic pension cost and certain unusual and non-recurring charges that might have been incurred. Adjusted EBITDA should not be considered as an alternative to Net income (loss) as a performance measure. We define Adjusted EBITDA Margin as Adjusted EBITDA divided by revenue. We define Adjusted Gross Profit (“Adjusted Gross Profit”) as Gross profit adjusted to exclude the impact of Depreciation and amortization expense and Stock-based compensation expense.
Non-GAAP financial information has limitations as an analytical tool and is presented for supplemental informational purposes only. Such information should not be considered a substitute for financial information presented in accordance with U.S. GAAP and may be different from similarly-titled non-GAAP measures used by other companies.
The following is a reconciliation of Adjusted EBITDA to its most directly comparable GAAP measure, Net (loss) income:
|
|
|
|
|
|
|
|
|
|
|
|
|
|
|
|
|
|
|
|
|
|
|
|
|
|
|
|
|
|
|
Three Months Ended June 30, |
|
Six Months Ended June 30, |
| (in thousands) |
2026 |
|
2025 |
|
2026 |
|
2025 |
| Reconciliation of Adjusted EBITDA |
|
|
|
|
|
|
|
| Net (loss) income |
$ |
(16,660) |
|
|
$ |
13,931 |
|
|
$ |
(12,118) |
|
|
$ |
4,313 |
|
| Interest expense |
7,518 |
|
|
8,952 |
|
|
14,125 |
|
|
18,025 |
|
| Depreciation and amortization expense |
10,894 |
|
|
10,191 |
|
|
20,060 |
|
|
21,707 |
|
| Stock-based compensation expense |
2,787 |
|
|
6,008 |
|
|
7,537 |
|
|
13,745 |
|
Restructuring and integration expenses (1)
|
8,288 |
|
|
5,493 |
|
|
14,378 |
|
|
10,175 |
|
| Income tax expense (benefit) |
7,196 |
|
|
8,436 |
|
|
1,193 |
|
|
5,571 |
|
Net periodic pension cost (2)
|
357 |
|
|
778 |
|
|
702 |
|
|
1,546 |
|
|
|
|
|
|
|
|
|
Other (3)
|
445 |
|
|
(2,557) |
|
|
(988) |
|
|
(2,949) |
|
| Adjusted EBITDA |
$ |
20,825 |
|
|
$ |
51,232 |
|
|
$ |
44,889 |
|
|
$ |
72,133 |
|
(1)For the three and six months ended June 30, 2026 and 2025, expenses relate to periodic efforts to enhance efficiencies and reduce costs, and include severance benefits, and costs associated with abandoned facilities and system consolidation. For more information on our restructuring and integration expenses, please see our Q2 2026 Quarterly Report on Form 10-Q.
(2)Net periodic pension cost is primarily from our non-contributory defined benefit pension plans that are currently frozen and incur no additional service costs.
(3)Other primarily includes foreign exchange-related (income) expense.
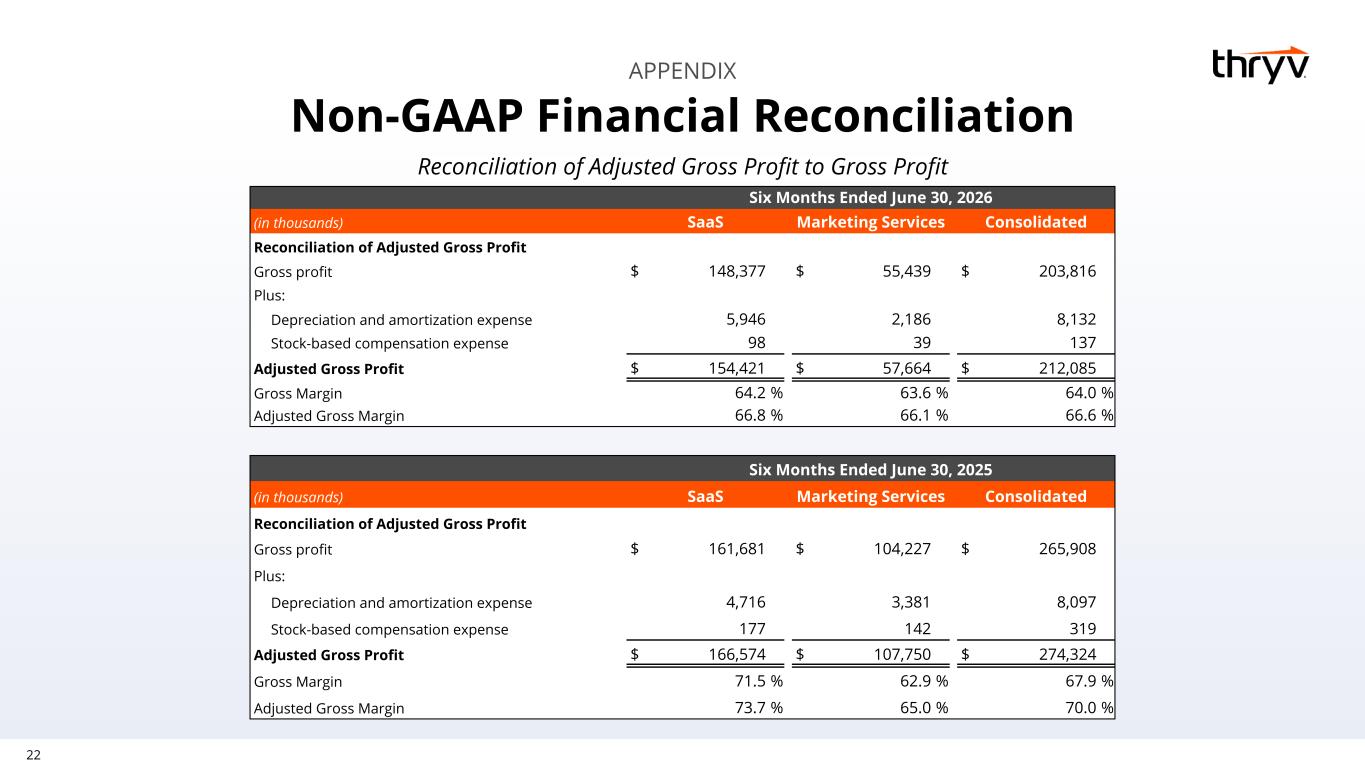
The following tables set forth reconciliations of Adjusted Gross Profit and Adjusted Gross Margin, to their most directly comparable GAAP measures, Gross Profit and Gross Margin:
|
|
|
|
|
|
|
|
|
|
|
|
|
|
|
|
|
|
|
Three Months Ended June 30, 2026 |
| (in thousands) |
SaaS |
|
Marketing Services |
|
Total |
| Reconciliation of Adjusted Gross Profit |
|
|
|
|
|
| Gross Profit |
$ |
72,745 |
|
|
$ |
21,815 |
|
|
$ |
94,560 |
|
| Plus: |
|
|
|
|
|
| Depreciation and amortization expense |
3,449 |
|
|
1,099 |
|
|
4,548 |
|
| Stock-based compensation expense |
51 |
|
|
18 |
|
|
69 |
|
| Adjusted Gross Profit |
$ |
76,245 |
|
|
$ |
22,932 |
|
|
$ |
99,177 |
|
| Gross Margin |
63.5 |
% |
|
60.2 |
% |
|
62.7 |
% |
| Adjusted Gross Margin |
66.6 |
% |
|
63.3 |
% |
|
65.8 |
% |
|
|
|
|
|
|
|
|
|
|
|
|
|
|
|
|
|
|
|
Three Months Ended June 30, 2025 |
| (in thousands) |
SaaS |
|
Marketing Services |
|
Total |
| Reconciliation of Adjusted Gross Profit |
|
|
|
|
|
| Gross Profit |
$ |
82,911 |
|
|
$ |
63,709 |
|
|
$ |
146,620 |
|
| Plus: |
|
|
|
|
|
| Depreciation and amortization expense |
2,118 |
|
|
1,754 |
|
|
3,872 |
|
| Stock-based compensation expense |
93 |
|
|
73 |
|
|
166 |
|
| Adjusted Gross Profit |
$ |
85,122 |
|
|
$ |
65,536 |
|
|
$ |
150,658 |
|
| Gross Margin |
72.1 |
% |
|
66.7 |
% |
|
69.7 |
% |
| Adjusted Gross Margin |
74.0 |
% |
|
68.6 |
% |
|
71.6 |
% |
|
|
|
|
|
|
|
|
|
|
|
|
|
|
|
|
|
|
|
Six Months Ended June 30, 2026 |
| (in thousands) |
SaaS |
|
Marketing Services |
|
Total |
| Reconciliation of Adjusted Gross Profit |
|
|
|
|
|
| Gross Profit |
$ |
148,377 |
|
|
$ |
55,439 |
|
|
$ |
203,816 |
|
| Plus: |
|
|
|
|
|
| Depreciation and amortization expense |
5,946 |
|
|
2,186 |
|
|
8,132 |
|
| Stock-based compensation expense |
98 |
|
|
39 |
|
|
137 |
|
| Adjusted Gross Profit |
$ |
154,421 |
|
|
$ |
57,664 |
|
|
$ |
212,085 |
|
| Gross Margin |
64.2 |
% |
|
63.6 |
% |
|
64.0 |
% |
| Adjusted Gross Margin |
66.8 |
% |
|
66.1 |
% |
|
66.6 |
% |
|
|
|
|
|
|
|
|
|
|
|
|
|
|
|
|
|
|
|
Six Months Ended June 30, 2025 |
| (in thousands) |
SaaS |
|
Marketing Services |
|
Total |
| Reconciliation of Adjusted Gross Profit |
|
|
|
|
|
| Gross Profit |
$ |
161,681 |
|
|
$ |
104,227 |
|
|
$ |
265,908 |
|
| Plus: |
|
|
|
|
|
| Depreciation and amortization expense |
4,716 |
|
|
3,381 |
|
|
8,097 |
|
| Stock-based compensation expense |
177 |
|
|
142 |
|
|
319 |
|
| Adjusted Gross Profit |
$ |
166,574 |
|
|
$ |
107,750 |
|
|
$ |
274,324 |
|
| Gross Margin |
71.5 |
% |
|
62.9 |
% |
|
67.9 |
% |
| Adjusted Gross Margin |
73.7 |
% |
|
65.0 |
% |
|
70.0 |
% |
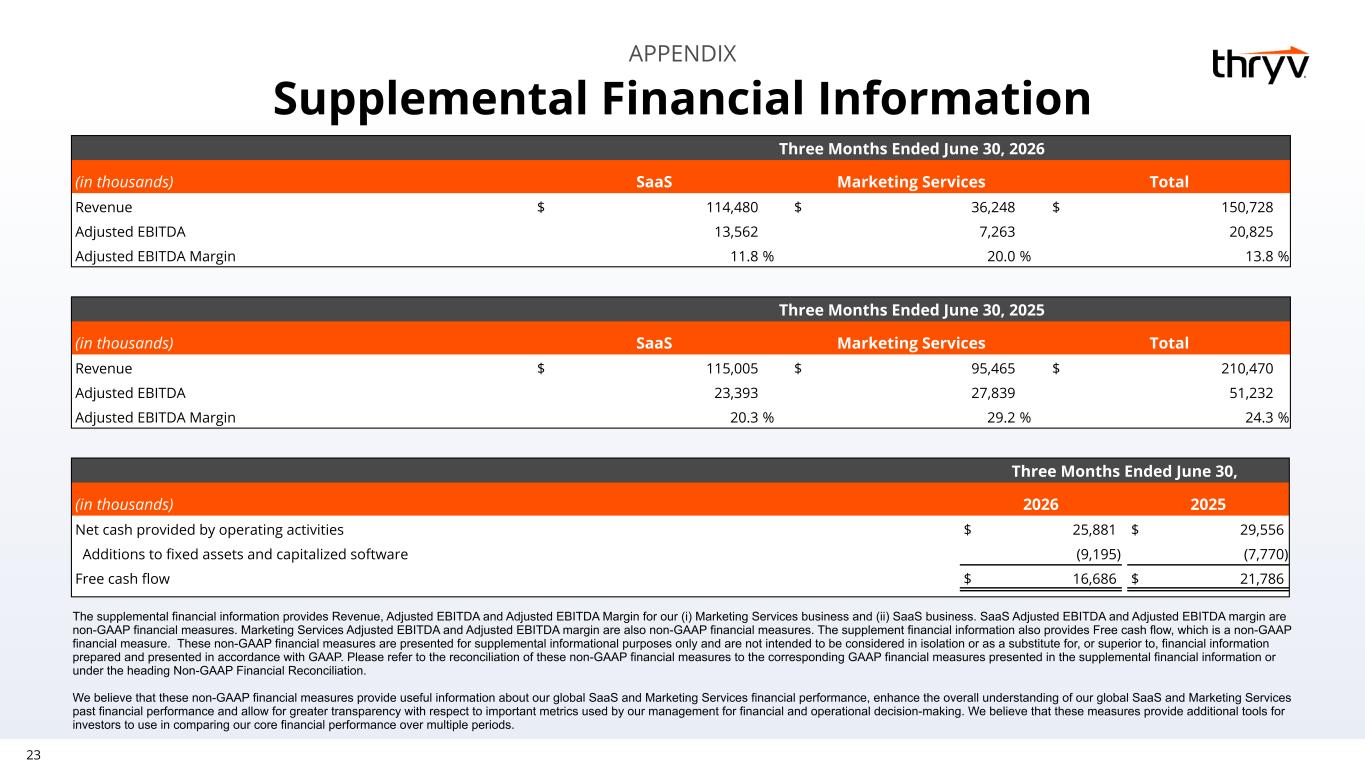
The following table sets forth a reconciliation of Free Cash Flow to its most directly comparable GAAP measure, Net cash provided by operating activities:
|
|
|
|
|
|
|
|
|
|
|
|
|
|
|
|
|
|
|
|
|
|
|
|
|
Three Months Ended June 30, |
|
Six Months Ended June 30, |
| (in thousands) |
2026 |
|
2025 |
|
2026 |
|
2025 |
| Reconciliation of Free Cash Flow |
|
|
|
|
|
|
|
| Net cash provided by operating activities |
$ |
25,881 |
|
|
$ |
29,556 |
|
|
$ |
27,354 |
|
|
$ |
19,075 |
|
| Additions to fixed assets and capitalized software |
(9,195) |
|
|
(7,770) |
|
|
(16,121) |
|
|
(14,855) |
|
| Free Cash Flow |
$ |
16,686 |
|
|
$ |
21,786 |
|
|
$ |
11,233 |
|
|
$ |
4,220 |
|
Supplemental Financial Information
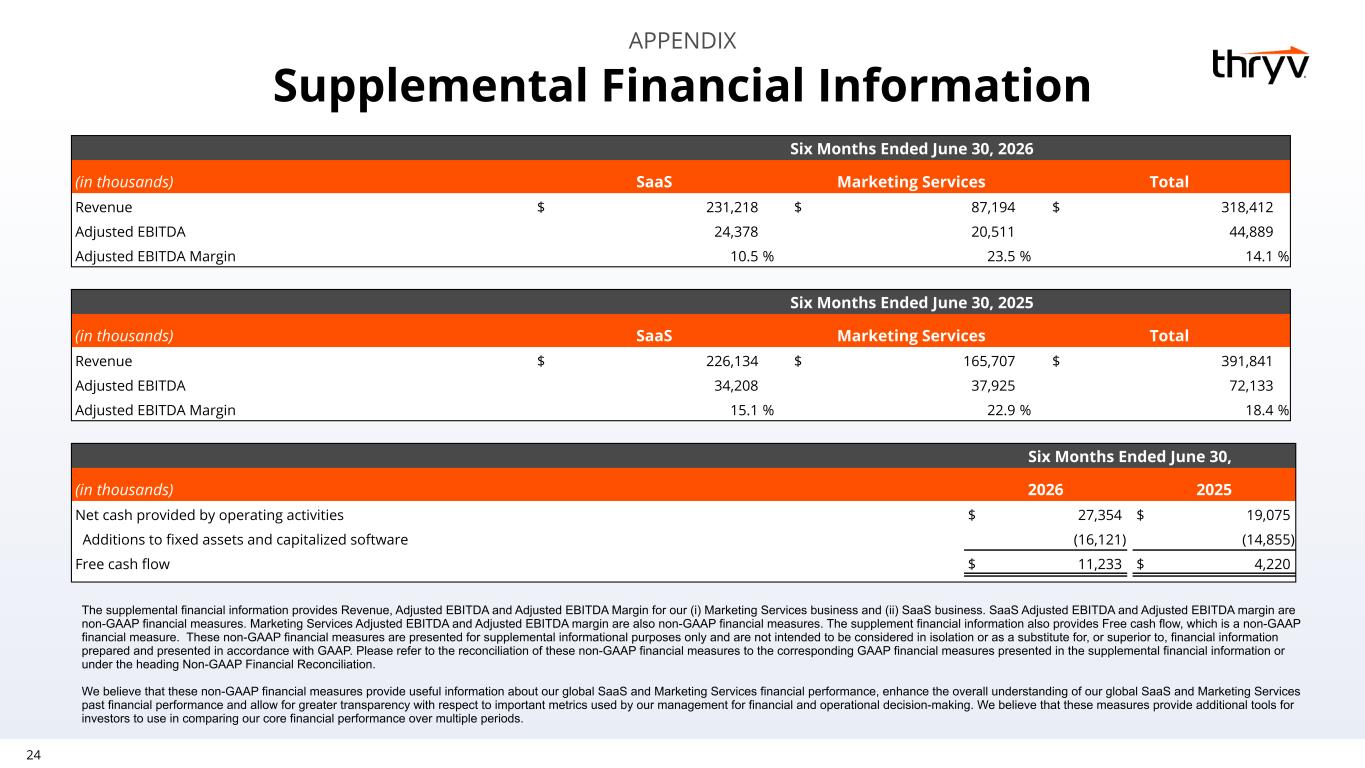
The following supplemental financial information provides Revenue, Net Income (Loss), Net Income (Loss) Margin, Adjusted EBITDA and Adjusted EBITDA Margin by our (i) SaaS business and (ii) Marketing Services business. Total SaaS Adjusted EBITDA and Adjusted EBITDA margin are non-GAAP financial measures. Total Marketing Services Adjusted EBITDA and Adjusted EBITDA margin are also non-GAAP financial measures. These non-GAAP financial measures are presented for supplemental informational purposes only and are not intended to be considered in isolation or as a substitute for, or superior to, financial information prepared and presented in accordance with GAAP.
We believe that these non-GAAP financial measures provide useful information about our global SaaS and Marketing Services financial performance, enhance the overall understanding of our global SaaS and Marketing Services past financial performance and allow for greater transparency with respect to important metrics used by our management for financial and operational decision-making. We believe that these measures provide additional tools for investors to use in comparing our core financial performance over multiple periods.
|
|
|
|
|
|
|
|
|
|
|
|
|
|
|
|
|
|
|
Three Months Ended June 30, 2026 |
| (dollars in thousands) |
SaaS |
|
Marketing Services |
|
Total |
| Revenue |
$ |
114,480 |
|
|
$ |
36,248 |
|
|
$ |
150,728 |
|
| Net Loss |
|
|
|
|
(16,660) |
|
| Net Loss Margin |
|
|
|
|
(11.1) |
% |
| Adjusted EBITDA |
13,562 |
|
|
7,263 |
|
|
20,825 |
|
| Adjusted EBITDA Margin |
11.8 |
% |
|
20.0 |
% |
|
13.8 |
% |
|
|
|
|
|
|
|
|
|
|
|
|
|
|
|
|
|
|
|
Three Months Ended June 30, 2025 |
| (dollars in thousands) |
SaaS |
|
Marketing Services |
|
Total |
| Revenue |
$ |
115,005 |
|
|
$ |
95,465 |
|
|
$ |
210,470 |
|
| Net Income |
|
|
|
|
13,931 |
|
| Net Income Margin |
|
|
|
|
6.6 |
% |
| Adjusted EBITDA |
23,393 |
|
|
27,839 |
|
|
51,232 |
|
| Adjusted EBITDA Margin |
20.3 |
% |
|
29.2 |
% |
|
24.3 |
% |
|
|
|
|
|
|
|
|
|
|
|
|
|
|
|
|
|
|
|
Six Months Ended June 30, 2026 |
| (dollars in thousands) |
SaaS |
|
Marketing Services |
|
Total |
| Revenue |
$ |
231,218 |
|
|
$ |
87,194 |
|
|
$ |
318,412 |
|
| Net Loss |
|
|
|
|
(12,118) |
|
| Net Loss Margin |
|
|
|
|
(3.8) |
% |
| Adjusted EBITDA |
24,378 |
|
|
20,511 |
|
|
44,889 |
|
| Adjusted EBITDA Margin |
10.5 |
% |
|
23.5 |
% |
|
14.1 |
% |
|
|
|
|
|
|
|
|
|
|
|
|
|
|
|
|
|
|
|
Six Months Ended June 30, 2025 |
| (dollars in thousands) |
SaaS |
|
Marketing Services |
|
Total |
| Revenue |
$ |
226,134 |
|
|
$ |
165,707 |
|
|
$ |
391,841 |
|
| Net Income |
|
|
|
|
4,313 |
|
| Net Income Margin |
|
|
|
|
1.1 |
% |
| Adjusted EBITDA |
34,208 |
|
|
37,925 |
|
|
72,133 |
|
| Adjusted EBITDA Margin |
15.1 |
% |
|
22.9 |
% |
|
18.4 |
% |
Forward-Looking Statements
Certain statements contained herein are not historical facts, constitute “forward-looking statements” within the meaning of the Private Securities Litigation Reform Act of 1995 and involve a number of risks and uncertainties. Statements that include the words “may”, “will”, “could”, “should”, “would”, “believe”, “anticipate”, “forecast”, “estimate”, “expect”, “preliminary”, “intend”, “plan”, “target”, “project”, “outlook”, “future”, “forward”, “guidance” and similar statements of a future or forward-looking nature identify forward-looking statements. These statements are not guarantees of future performance. These forward-looking statements are based on our current expectations and beliefs concerning future developments and their potential effect on us. While management believes that these forward-looking statements are reasonable as and when made, there can be no assurance that future developments affecting us will be those that we anticipate. Accordingly, there are or will be important factors that could cause our actual results to differ materially from those indicated in these statements. We believe that these factors include, but are not limited to, the risks related to the following: significant competition for our Marketing Services solutions and SaaS offerings, which include companies that use components of our SaaS offerings provided by third parties; our ability to maintain profitability; our ability to manage our growth effectively; our ability to transition our Marketing Services clients to our Thryv platform, maintain transitioned clients on that platform and sell them additional or upgraded products, sell our platform into new markets or further penetrate existing markets; our ability to maintain our strategic relationships with third-party service providers; internet search engines and portals potentially terminating or materially altering their agreements with us; our ability to keep pace with rapid technological changes and evolving industry standards; our SMBs clients potentially opting not to renew their agreements with us or renewing at lower spend; potential system interruptions or failures, including cybersecurity breaches, identity theft, data loss, unauthorized access to data or other disruptions that could compromise our information; our potential failure to identify suitable acquisition candidates and consummate such acquisitions; our ability to complete acquisitions and the successful integration of such acquisitions, and any failure of an acquired business to achieve its plans and objectives or realize any expected benefit from any such acquisition; the potential loss of one or more key employees or our inability to attract and to retain highly skilled employees; our ability to maintain the compatibility of our Thryv platform with third-party applications; our ability to successfully expand our operations and current offerings into new markets, including internationally, or further penetrate existing markets; our potential failure to provide new or enhanced functionality and features; our potential failure to comply with applicable privacy, security and data laws, regulations and standards; potential changes in regulations governing privacy concerns and laws or other domestic or foreign data protection regulations; our potential failure to meet service level commitments under our client contracts; our potential failure to offer high-quality or technical support services; our Thryv platform and add-ons potentially failing to perform properly; our use of artificial intelligence in our business, and challenges with properly managing its use, could result in reputational harm, competitive harm, and legal liability; the potential impact of future labor negotiations; our ability to protect our intellectual property rights, proprietary technology, information, processes, and know-how; rising inflation and our ability to control costs, including operating expenses; general macro-economic conditions, including a recession or an economic slowdown in the U.S. or internationally; adverse tax laws
or regulations or potential changes to existing tax laws or regulations; costs, liabilities and reputational harm resulting from regulatory investigations, including the subpoena from the Division of Enforcement of the Securities and Exchange Commission (the “SEC”); volatility and weakness in bank and capital markets; and costs, obligations and liabilities incurred as a result of and in connection with being a public company as well as the risks and uncertainties set forth in the Company's most recent Annual Report on Form 10-K filed with the SEC. All subsequent written and oral forward-looking statements attributable to us or persons acting on our behalf are expressly qualified in their entirety by such cautionary statements.
If one or more events related to these or other risks or uncertainties materialize, or if our underlying assumptions prove to be incorrect, actual results may differ materially from what we anticipate. For these reasons, we caution you against relying on forward-looking statements. All forward-looking statements included in this press release are expressly qualified in their entirety by the foregoing cautionary statements. These forward-looking statements speak only as of the date hereof and, other than as required by law, we undertake no obligation to publicly update or revise any forward-looking statements, whether as a result of new information, future events or otherwise.
About Thryv
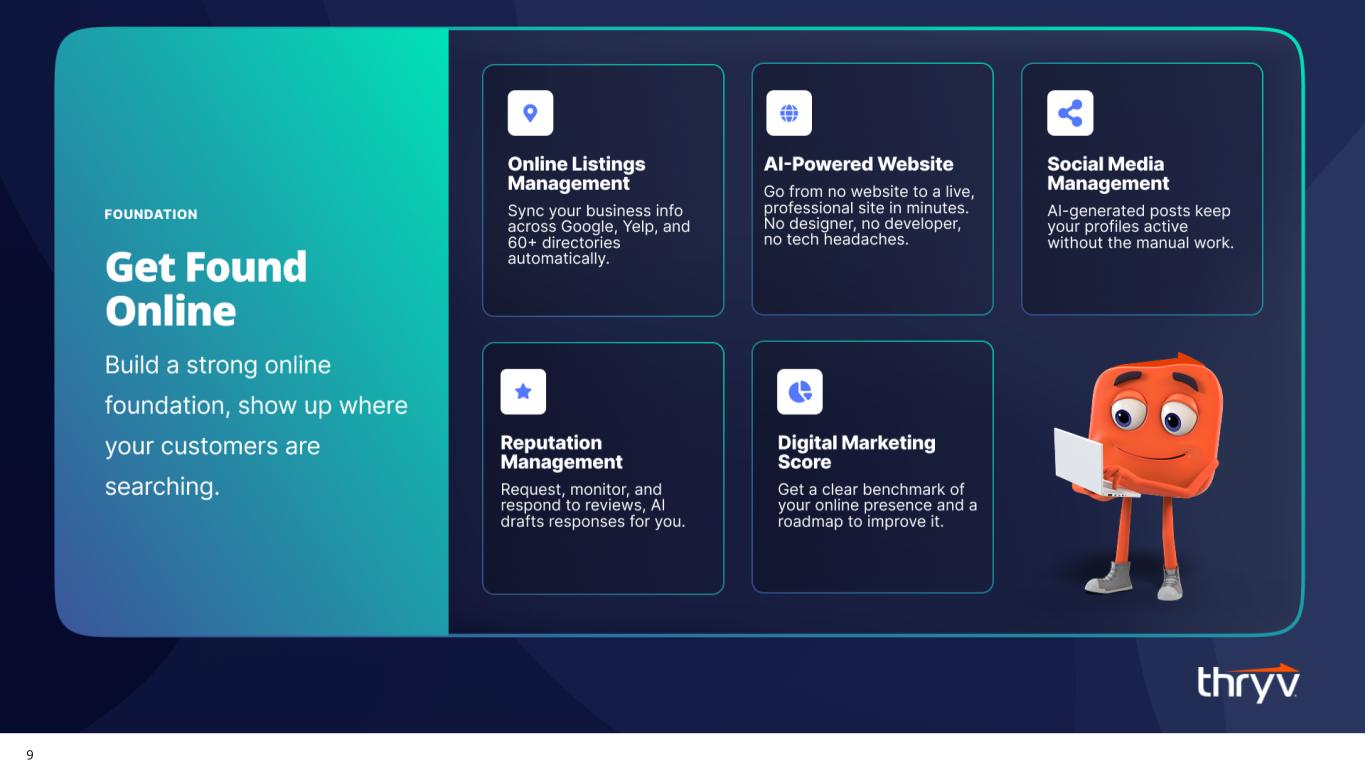
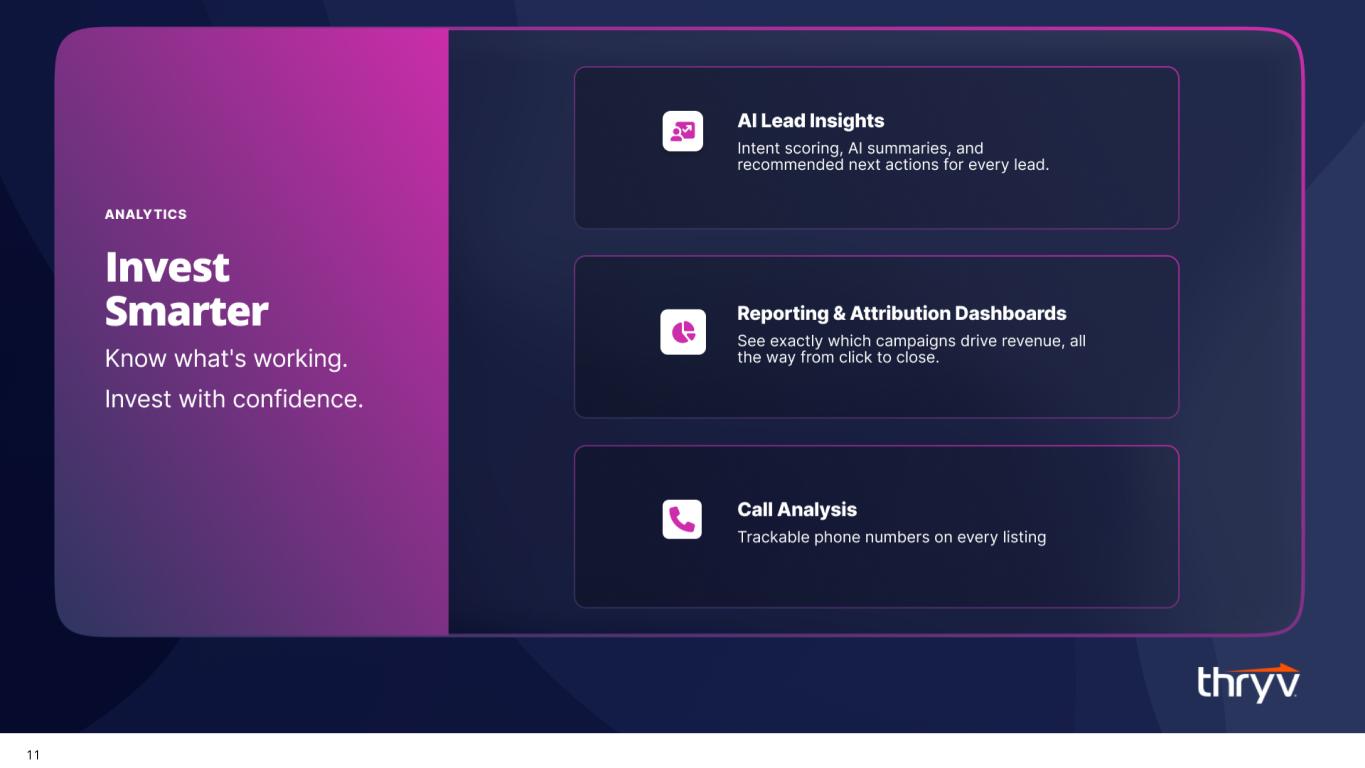
Thryv (NASDAQ: THRY) is an AI-native growth platform that helps small businesses (SMBs) get discovered online, identify their best customer leads, and grow revenue faster with ROI insights. Platform features include AI-powered websites, AI Lead Insights, and integrations with the CRMs service businesses are already using. Thryv makes growth‑focused software accessible to the plumber, salon owner, contractor, lawyer, accountant and more. Approximately 100,000 businesses globally use Thryv software to get found, win customers, and invest smarter. For more information, visit www.thryv.com
Media Contact:
Julie Murphy
Thryv, Inc.
617.967.5426
julie.murphy@thryv.com
Investor Contact:
Cameron Lessard
Thryv, Inc.
cameron.lessard@thryv.com
###
 エドガーで原本を確認する