UNITED STATES
SECURITIES AND EXCHANGE COMMISSION
Washington, D.C. 20549
FORM 6-K
Report of Foreign Issuer
Pursuant To Rule 13a-16 Or 15d-16 of the
Securities Exchange Act of 1934
For the month of May 2025
Commission File Number: 333-251238
|
|
COSAN S.A.
(Exact name of registrant as specified in its charter)
N/A
(Translation of registrant’s name into English)
|
|
Av. Brigadeiro Faria Lima, 4100, – 16th floor
São Paulo, SP 04538-132 Brazil
(Address of principal executive offices)
Indicate by check mark whether the registrant files or will file annual reports under cover of Form 20-F or Form 40‑F:
Form 20-F ☒ Form 40-F ☐
Indicate by check mark if the registrant is submitting the Form 6-K in paper as permitted by Regulation S-T Rule 101(b)(1):
Yes ☐ No ☒
Indicate by check mark if the registrant is submitting the Form 6-K in paper as permitted by Regulation S-T Rule 101(b)(7):
Yes ☐ No ☒
CONTENTS

Report on review of parent company
and consolidated
interim
financial statements
To the Board of Directors and Stockholders
Cosan S.A.
Introduction
We have reviewed the accompanying interim statement of financial position of Cosan S.A. ("Company") as at March 31, 2025 and the related statements of profit or loss, other comprehensive income, changes in equity and cash flows for the quarter then ended, as well as the accompanying consolidated interim statement of financial position of the Company and its subsidiaries ("Consolidated") as at March 31, 2025 and the related consolidated statements of profit or loss, other comprehensive income, changes in equity and cash flows for the quarter then ended, and explanatory notes.
Management is responsible for the preparation and presentation of these parent company and consolidated interim financial statements in accordance with the accounting standard CPC 21, Interim Financial Reporting, of the Brazilian Accounting Pronouncements Committee (CPC), and International Accounting Standard (IAS) 34 - Interim Financial Reporting, of the International Accounting Standards Board (IASB). Our responsibility is to express a conclusion on these interim financial statements based on our review.
Scope of review
We conducted our review in accordance with Brazilian and International Standards on Reviews of Interim Financial Information (NBC TR 2410 - Review of Interim Financial Information Performed by the Independent Auditor of the Entity, and ISRE 2410 - Review of Interim Financial Information Performed by the Independent Auditor of the Entity, respectively). A review of interim financial information consists of making inquiries, primarily of persons responsible for financial and accounting matters, and applying analytical and other review procedures. A review is substantially less in scope than an audit conducted in accordance with Brazilian and International Standards on Auditing and consequently did not enable us to obtain assurance that we would become aware of all significant matters that might be identified in an audit. Accordingly, we do not express an audit opinion.
Conclusion
Based on our review, nothing has come to our attention that causes us to believe that the accompanying parent company and consolidated interim financial statements referred to above are not prepared, in all material respects, in accordance with CPC 21 and IAS 34.
| PricewaterhouseCoopers Auditores Independentes Ltda. | |
| Avenida Brigadeiro Faria Lima, 3732, Edifício B32, 16o, | |
| São Paulo, SP, Brasil, 04538-132 | |
| www.pwc.com.br |
T: +55 (11) 4004-8000 |
Statements of value added
The interim financial statements referred to above include the parent company and consolidated statements of value added for the quarter ended March 31, 2025. These statements are the responsibility of the Company's management and are presented as supplementary information under IAS 34. These statements have been subjected to review procedures performed together with the review of the interim financial statements for the purpose of concluding whether they are reconciled with the interim financial statements and accounting records, as applicable, and if their form and content are in accordance with the criteria defined in the accounting standard CPC 09 - "Statement of Value Added". Based on our review, nothing has come to our attention that causes us to believe that these statements of value added have not been properly prepared, in all material respects, in accordance with the criteria established in this accounting standard, and consistent with the parent company and consolidated interim financial statements taken as a whole.
Audit and review of previous year's figures
The interim financial statements referred to in the first paragraph includes accounting information corresponding to the statements of profit or loss, other comprehensive income, changes in equity, cash flows and value added for the quarter ended March 31, 2024, obtained from the interim financial statements for that quarter, and the statement of financial position ended December 31, 2024, obtained from the financial statements ended December 31, 2024, presented for comparison purposes. The review of the interim financial statements for the quarter ended March 31, 2024 and the audit of the financial statements for the year ended December 31, 2024 were conducted under the responsibility of other independent auditors, who issued review and audit reports dated May 28, 2024 and March 10, 2025, respectively, without qualifications.
São Paulo, May 15, 2025
PricewaterhouseCoopers
Auditores Independentes Ltda.
CRC 2SP000160/O-5
Alessandro Marchesino de Oliveira
Contador CRC 1SP265450/O-8
(In thousands of Reais)
|
|
|
|
Parent Company |
|
Consolidated |
||||
|
|
Note |
|
March 31, 2025 |
|
December 31, 2024 |
|
March 31, 2025 |
|
December 31, 2024 |
|
Assets |
|
|
|
|
|
|
|
|
|
|
Cash and cash equivalents |
5.1 |
|
2,732,522 |
|
2,201,267 |
|
14,809,083 |
|
16,903,542 |
|
Restricted cash |
|
|
— |
|
— |
|
99,653 |
|
28,006 |
|
Marketable securities |
|
|
630,083 |
|
805,335 |
|
2,837,103 |
|
3,272,941 |
|
Trade receivables |
|
|
— |
|
— |
|
4,173,514 |
|
3,730,364 |
|
Derivative financial instruments |
5.3 |
|
13,804 |
|
18,402 |
|
78,582 |
|
905,341 |
|
Inventories |
|
|
— |
|
— |
|
2,041,453 |
|
2,072,905 |
|
Receivables from related parties |
5.4 |
|
147,082 |
|
114,099 |
|
232,553 |
|
197,063 |
|
Income tax receivable |
|
|
656,335 |
|
453,308 |
|
1,069,130 |
|
793,721 |
|
Other current tax receivable |
|
|
5,364 |
|
5,364 |
|
879,293 |
|
886,136 |
|
Dividend receivable |
|
|
14,194 |
|
19,377 |
|
33,621 |
|
153,548 |
|
Reduction of capital receivable |
|
|
— |
|
1,013,714 |
|
— |
|
— |
|
Sectorial financial assets |
|
|
— |
|
— |
|
227,427 |
|
221,947 |
|
Other financial assets |
|
|
— |
|
— |
|
381 |
|
675 |
|
Other current assets |
|
|
62,671 |
|
50,896 |
|
600,566 |
|
629,426 |
|
Current assets |
|
|
4,262,055 |
|
4,681,762 |
|
27,082,359 |
|
29,795,615 |
|
Current assets held for sale |
8 |
|
797,095 |
|
796,211 |
|
970,742 |
|
978,788 |
|
|
|
|
5,059,150 |
|
5,477,973 |
|
28,053,101 |
|
30,774,403 |
|
|
|
|
|
|
|
|
|
|
|
|
Trade receivables |
|
|
— |
|
— |
|
188,568 |
|
265,370 |
|
Marketable securities |
|
|
242,036 |
|
— |
|
343,262 |
|
113,360 |
|
Restricted cash |
|
|
184 |
|
— |
|
186,668 |
|
146,297 |
|
Deferred tax assets |
9 |
|
1,318,408 |
|
1,758,410 |
|
3,759,598 |
|
4,495,296 |
|
Receivables from related parties |
5.4 |
|
199,122 |
|
292,882 |
|
132,110 |
|
202,826 |
|
Income tax receivable |
|
|
— |
|
— |
|
255,817 |
|
264,308 |
|
Other non-current tax receivable |
|
|
35,613 |
|
35,177 |
|
1,371,763 |
|
1,334,553 |
|
Judicial deposits |
10 |
|
419,029 |
|
416,969 |
|
1,085,085 |
|
1,056,690 |
|
Derivative financial instruments |
5.3 |
|
326,451 |
|
1,547,093 |
|
2,012,456 |
|
2,893,987 |
|
Sectorial financial assets |
|
|
— |
|
— |
|
522,427 |
|
509,695 |
|
Other non-current assets |
|
|
55,329 |
|
140,594 |
|
730,757 |
|
739,386 |
|
Other financial assets |
|
|
— |
|
— |
|
4,267 |
|
3,820 |
|
Investments in subsidiaries and associates |
6 |
|
22,796,530 |
|
31,308,696 |
|
1,549,774 |
|
10,678,566 |
|
Investment in joint ventures |
7 |
|
1,078,449 |
|
1,193,072 |
|
9,540,470 |
|
10,545,044 |
|
Property, plant and equipment |
8.1 |
|
38,815 |
|
39,038 |
|
23,760,689 |
|
23,019,016 |
|
Intangible assets and goodwill |
8.2 |
|
10,769 |
|
9,873 |
|
26,590,388 |
|
26,330,785 |
|
Contract assets |
|
|
— |
|
— |
|
978,132 |
|
1,114,830 |
|
Right-of-use assets |
8.3 |
|
18,015 |
|
17,557 |
|
9,596,807 |
|
9,958,751 |
|
Investment property |
|
|
— |
|
— |
|
16,824,078 |
|
16,818,919 |
|
Non-current assets |
|
|
26,538,750 |
|
36,759,361 |
|
99,433,116 |
|
110,491,499 |
|
|
|
|
|
|
|
|
|
|
|
|
Total assets |
|
|
31,597,900 |
|
42,237,334 |
|
127,486,217 |
|
141,265,902 |
Statements of financial position
(In thousands of Reais)
|
|
|
|
Parent Company |
|
Consolidated |
||||
|
|
Note |
|
March 31, 2025 |
|
December 31, 2024 |
|
March 31, 2025 |
|
December 31, 2024 |
|
Liabilities |
|
|
|
|
|
|
|
|
|
|
Loans, borrowings and debentures |
5.2 |
|
360,607 |
|
347,032 |
|
2,628,017 |
|
4,403,148 |
|
Leases |
|
|
10,088 |
|
9,227 |
|
1,024,093 |
|
1,007,533 |
|
Derivative financial instruments |
5.3 |
|
152,414 |
|
1,074,991 |
|
1,820,126 |
|
2,504,117 |
|
Trade payables |
5.5 |
|
1,304 |
|
2,900 |
|
3,886,590 |
|
5,168,593 |
|
Employee benefits payables |
|
|
13,222 |
|
43,356 |
|
498,255 |
|
794,906 |
|
Income tax payables |
|
|
24,188 |
|
18,514 |
|
140,123 |
|
414,823 |
|
Other taxes payable |
|
|
82,333 |
|
78,197 |
|
592,940 |
|
637,842 |
|
Dividends payable |
11 |
|
39 |
|
3,495 |
|
55,086 |
|
96,722 |
|
Reduction of capital payable |
|
|
— |
|
— |
|
— |
|
486,285 |
|
Concessions payable |
|
|
— |
|
— |
|
170,863 |
|
166,273 |
|
Related party payables |
5.4 |
|
126,157 |
|
210,620 |
|
434,093 |
|
416,410 |
|
Sectorial financial liabilities |
|
|
— |
|
— |
|
67,001 |
|
64,718 |
|
Other financial liabilities |
5 |
|
— |
|
— |
|
825,269 |
|
770,103 |
|
Other current liabilities |
|
|
333,881 |
|
298,534 |
|
911,523 |
|
895,223 |
|
Current liabilities |
|
|
1,104,233 |
|
2,086,866 |
|
13,053,979 |
|
17,826,696 |
|
Liabilities related to assets held for sale |
|
|
— |
|
— |
|
86,145 |
|
86,138 |
|
|
|
|
1,104,233 |
|
2,086,866 |
|
13,140,124 |
|
17,912,834 |
|
Loans, borrowings and debentures |
5.2 |
|
15,731,504 |
|
21,003,523 |
|
58,052,637 |
|
62,052,278 |
|
Leases |
|
|
14,590 |
|
15,232 |
|
5,367,814 |
|
5,502,220 |
|
Derivative financial instruments |
5.3 |
|
39,965 |
|
29,883 |
|
559,737 |
|
966,087 |
|
Trade payables |
5.5 |
|
— |
|
— |
|
19,512 |
|
19,256 |
|
Employee benefits payables |
|
|
— |
|
— |
|
25,463 |
|
19,101 |
|
Other taxes payable |
|
|
132,547 |
|
216,203 |
|
160,722 |
|
255,245 |
|
Provision for legal proceedings |
10 |
|
361,210 |
|
308,607 |
|
2,196,218 |
|
2,044,633 |
|
Concessions payable |
|
|
— |
|
— |
|
3,669,664 |
|
3,554,917 |
|
Investments with unsecured liabilities |
6.1 |
|
347,304 |
|
263,722 |
|
— |
|
— |
|
Related party payables |
5.4 |
|
5,611,623 |
|
7,052,404 |
|
1,078 |
|
1,078 |
|
Post-employment benefits |
|
|
289 |
|
279 |
|
558,608 |
|
526,620 |
|
Deferred tax liabilities |
|
|
— |
|
— |
|
6,030,613 |
|
5,973,506 |
|
Sectorial financial liabilities |
|
|
— |
|
— |
|
2,021,410 |
|
1,975,521 |
|
Deferred income |
|
|
— |
|
— |
|
15,962 |
|
16,589 |
|
Other financial liabilities |
|
|
— |
|
— |
|
153,371 |
|
297,736 |
|
Other non-current liabilities |
|
|
362,972 |
|
356,851 |
|
742,306 |
|
749,919 |
|
Non-current liabilities |
|
|
22,602,004 |
|
29,246,704 |
|
79,575,115 |
|
83,954,706 |
|
Total liabilities |
|
|
23,706,237 |
|
31,333,570 |
|
92,715,239 |
|
101,867,540 |
|
|
|
|
|
|
|
|
|
|
|
|
Shareholders' equity |
11 |
|
|
|
|
|
|
|
|
|
Share capital |
|
|
8,832,544 |
|
8,832,544 |
|
8,832,544 |
|
8,832,544 |
|
Treasury shares |
|
|
(84,496) |
|
(50,708) |
|
(84,496) |
|
(50,708) |
|
Additional paid-in capital |
|
|
1,157,267 |
|
2,205,878 |
|
1,157,267 |
|
2,205,878 |
|
Accumulated other comprehensive income |
|
|
424,048 |
|
565,855 |
|
424,048 |
|
565,855 |
|
Profit reserve |
|
|
8,773,990 |
|
8,773,990 |
|
8,773,990 |
|
8,773,990 |
|
Accumulated losses |
|
|
(11,211,690) |
|
(9,423,795) |
|
(11,211,690) |
|
(9,423,795) |
|
|
|
|
|
|
|
|
|
|
|
|
Equity attributable to owners of the Company |
|
|
7,891,663 |
|
10,903,764 |
|
7,891,663 |
|
10,903,764 |
|
Non-controlling interest |
6.2 |
|
— |
|
— |
|
26,879,315 |
|
28,494,598 |
|
Total shareholders' equity |
|
|
7,891,663 |
|
10,903,764 |
|
34,770,978 |
|
39,398,362 |
|
Total liabilities and shareholders' equity |
|
|
31,597,900 |
|
42,237,334 |
|
127,486,217 |
|
141,265,902 |
(In thousands of Reais, except earnings per share)
|
|
|
|
Parent Company |
|
Consolidated |
||||
|
|
|
|
Period of three months ended March 31, |
||||||
|
|
Note |
|
2025 |
|
2024 |
|
2025 |
|
2024 |
|
Net sales |
13 |
|
— |
|
— |
|
9,662,601 |
|
9,842,056 |
|
Cost of sales |
14 |
|
— |
|
— |
|
(6,791,905) |
|
(6,928,437) |
|
Gross profit |
|
|
— |
|
— |
|
2,870,696 |
|
2,913,619 |
|
|
|
|
|
|
|
|
|
|
|
|
Selling expenses |
14 |
|
— |
|
— |
|
(440,056) |
|
(361,404) |
|
General and administrative expenses |
14 |
|
(57,937) |
|
(103,683) |
|
(535,032) |
|
(583,255) |
|
Other operating income (expenses), net |
15 |
|
173,925 |
|
(14,238) |
|
524,130 |
|
761 |
|
Impairment |
15 |
|
— |
|
— |
|
(285,608) |
|
— |
|
Operating expenses |
|
|
115,988 |
|
(117,921) |
|
(736,566) |
|
(943,898) |
|
|
|
|
|
|
|
|
|
|
|
|
Profit (loss) before equity in earnings of investees, finance results and income taxes |
|
|
115,988 |
|
(117,921) |
|
2,134,130 |
|
1,969,721 |
|
|
|
|
|
|
|
|
|
|
|
|
Interest in earnings (losses) of subsidiaries and associates |
6 |
|
(493,236) |
|
824,169 |
|
19,049 |
|
461,423 |
|
Interest in losses of joint ventures |
7 |
|
(128,194) |
|
(45,874) |
|
(1,139,047) |
|
(403,908) |
|
Equity in earnings (losses) of investees |
|
|
(621,430) |
|
778,295 |
|
(1,119,998) |
|
57,515 |
|
|
|
|
|
|
|
|
|
|
|
|
Finance expense |
|
|
(763,961) |
|
(529,536) |
|
(2,713,642) |
|
(1,864,555) |
|
Finance income |
|
|
224,542 |
|
58,182 |
|
1,037,901 |
|
615,101 |
|
Foreign exchange, net |
|
|
1,079,284 |
|
(337,996) |
|
1,793,964 |
|
(531,218) |
|
Net effect of derivatives |
|
|
(1,163,099) |
|
(513,361) |
|
(2,021,218) |
|
1,343 |
|
Finance results, net |
16 |
|
(623,234) |
|
(1,322,711) |
|
(1,902,995) |
|
(1,779,329) |
|
|
|
|
|
|
|
|
|
|
|
|
Profit (loss) before income taxes |
|
|
(1,128,676) |
|
(662,337) |
|
(888,863) |
|
247,907 |
|
|
|
|
|
|
|
|
|
|
|
|
Income taxes |
9 |
|
|
|
|
|
|
|
|
|
Current |
|
|
— |
|
(3,849) |
|
(303,162) |
|
(284,396) |
|
Deferred |
|
|
(659,219) |
|
474,011 |
|
(743,373) |
|
300,033 |
|
|
|
|
(659,219) |
|
470,162 |
|
(1,046,535) |
|
15,637 |
|
Profit (loss) for the period |
|
|
(1,787,895) |
|
(192,175) |
|
(1,935,398) |
|
263,544 |
|
|
|
|
|
|
|
|
|
|
|
|
Profit (loss) attributable to: |
|
|
|
|
|
|
|
|
|
|
Owners of the Company |
|
|
(1,787,895) |
|
(192,175) |
|
(1,787,895) |
|
(192,175) |
|
Non-controlling interest |
|
|
— |
|
— |
|
(147,503) |
|
455,719 |
|
|
|
|
(1,787,895) |
|
(192,175) |
|
(1,935,398) |
|
263,544 |
|
|
|
|
|
|
|
|
|
|
|
|
Losses per share |
12 |
|
|
|
|
|
|
|
|
|
Basic |
|
|
|
|
|
|
(R$0.96) |
|
(R$0.10) |
|
Diluted |
|
|
|
|
|
|
(R$0.96) |
|
(R$0.10) |
The accompanying notes are an integral part of these individual and consolidated interim financial statements.
(In thousands of Reais)
|
|
Parent Company |
|
Consolidated |
||||
|
|
Period of three months ended March 31, |
||||||
|
|
2025 |
|
2024 |
|
2025 |
|
2024 |
|
Profit (loss) for the period |
(1,787,895) |
|
(192,175) |
|
(1,935,398) |
|
263,544 |
|
|
|
|
|
|
|
|
|
|
Other comprehensive income: |
|
|
|
|
|
|
|
|
Items that are or may be reclassified subsequently to profit or loss: |
|
|
|
|
|
|
|
|
Foreign currency translation differences |
(290,696) |
|
62,887 |
|
(290,198) |
|
63,056 |
|
Gain (loss) on cash flow hedge |
162,887 |
|
(32,384) |
|
222,492 |
|
(42,564) |
| Deferred taxes | — | — | (28,025) | — | |||
|
|
(127,809) |
|
30,503 |
|
(95,731) |
|
20,492 |
|
|
|
|
|
|
|
|
|
|
Items that will not be reclassified to profit or loss: |
|
|
|
|
|
|
|
|
Actuarial losses (gains) with defined benefit plan |
(22,497) |
|
14,408 |
|
(59,336) |
|
24,286 |
|
Deferred taxes |
8,499 |
|
— |
|
17,002 |
|
(8,257) |
|
|
(13,998) |
|
14,408 |
|
(42,334) |
|
16,029 |
|
|
|
|
|
|
|
|
|
|
Total comprehensive income for the period |
(1,929,702) |
|
(147,264) |
|
(2,073,463) |
|
300,065 |
|
|
|
|
|
|
|
|
|
|
Comprehensive income (loss) attributable to: |
|
|
|
|
|
|
|
|
Owners of the Company |
(1,929,702) |
|
(147,264) |
|
(1,929,702) |
|
(147,264) |
|
Non-controlling interest |
— |
|
— |
|
(143,761) |
|
447,329 |
|
|
(1,929,702) |
|
(147,264) |
|
(2,073,463) |
|
300,065 |
The accompanying notes are an integral part of these individual and consolidated interim financial statements.
(In thousands of Reais)
|
|
|
|
|
|
|
Capital reserve |
|
|
|
Profit reserve |
|
|
|
|
|
|
|
|||||
|
|
|
Share capital |
|
Treasury shares |
|
Corporate transactions - Law 6404 |
|
Additional paid-in capital |
|
Accumulated other comprehensive income |
|
Legal |
|
Statutory reserve |
|
Accumulated loss |
|
Equity attributable to controlling shareholders |
|
Interest of non-controlling shareholders |
|
Total equity |
|
Balance as of January 1, 2025 |
|
8,832,544 |
|
(50,708) |
|
737 |
|
2,205,141 |
|
565,855 |
|
58,802 |
|
8,715,188 |
|
(9,423,795) |
|
10,903,764 |
|
28,494,598 |
|
39,398,362 |
|
|
|
|
|
|
|
|
|
|
|
|
|
|
|
|
|
|
|
|
|
|
|
|
|
Loss for the period |
|
— |
|
— |
|
— |
|
— |
|
— |
|
— |
|
— |
|
(1,787,895) |
|
(1,787,895) |
|
(147,503) |
|
(1,935,398) |
|
|
|
|
|
|
|
|
|
|
|
|
|
|
|
|
|
|
|
|
|
|
|
|
|
Other comprehensive income |
|
|
|
|
|
|
|
|
|
|
|
|
|
|
|
|
|
|
|
|
|
|
|
Gain from cash flow hedge |
|
— |
|
— |
|
— |
|
— |
|
162,887 |
|
— |
|
— |
|
— |
|
162,887 |
|
31,580 |
|
194,467 |
|
Foreign currency translation differences |
|
— |
|
— |
|
— |
|
— |
|
(290,696) |
|
— |
|
— |
|
— |
|
(290,696) |
|
498 |
|
(290,198) |
|
Actuarial loss on defined benefit plan, net of tax |
|
— |
|
— |
|
— |
|
— |
|
(13,998) |
|
— |
|
— |
|
— |
|
(13,998) |
|
(28,336) |
|
(42,334) |
|
Total comprehensive loss for the period |
|
— |
|
— |
|
— |
|
— |
|
(141,807) |
|
— |
|
— |
|
(1,787,895) |
|
(1,929,702) |
|
(143,761) |
|
(2,073,463) |
|
|
|
|
|
|
|
|
|
|
|
|
|
|
|
|
|
|
|
|
|
|
|
|
|
Transactions with owners of the Company contributions and distributions: |
|
|
|
|
|
|
|
|
|
|
|
|
|
|
|
|
|
|
|
|
|
|
|
Capital increase in subsidiary |
|
— |
|
— |
|
— |
|
(89,084) |
|
— |
|
— |
|
— |
|
— |
|
(89,084) |
|
89,084 |
|
— |
|
Own shares acquired (note 11 (a)) |
|
— |
|
(34,022) |
|
— |
|
— |
|
— |
|
— |
|
— |
|
— |
|
(34,022) |
|
— |
|
(34,022) |
|
Share based payments |
|
— |
|
234 |
|
— |
|
114 |
|
— |
|
— |
|
— |
|
— |
|
348 |
|
6,771 |
|
7,119 |
|
Dividends |
|
— |
|
— |
|
— |
|
— |
|
— |
|
— |
|
— |
|
— |
|
— |
|
(375,782) |
|
(375,782) |
|
Employee share schemes - value of employee services |
|
— |
|
— |
|
— |
|
15,559 |
|
— |
|
— |
|
— |
|
— |
|
15,559 |
|
2,135 |
|
17,694 |
|
Total contributions and distributions |
|
— |
|
(33,788) |
|
— |
|
(73,411) |
|
— |
|
— |
|
— |
|
— |
|
(107,199) |
|
(277,792) |
|
(384,991) |
|
|
|
|
|
|
|
|
|
|
|
|
|
|
|
|
|
|
|
|
|
|
|
|
|
Transactions with owners of the Company: |
|
|
|
|
|
|
|
|
|
|
|
|
|
|
|
|
|
|
|
|
|
|
|
Change of shareholding interest in subsidiary (note 6.1) |
|
— |
|
— |
|
— |
|
(975,200) |
|
— |
|
— |
|
— |
|
— |
|
(975,200) |
|
(1,193,730) |
|
(2,168,930) |
|
Total transactions with owners of the Company |
|
— |
|
— |
|
— |
|
(975,200) |
|
— |
|
— |
|
— |
|
— |
|
(975,200) |
|
(1,193,730) |
|
(2,168,930) |
|
|
|
|
|
|
|
|
|
|
|
|
|
|
|
|
|
|
|
|
|
|
|
|
|
Total transactions with owners of the Company contributions and distributions: |
|
— |
|
(33,788) |
|
— |
|
(1,048,611) |
|
— |
|
— |
|
— |
|
— |
|
(1,082,399) |
|
(1,471,522) |
|
(2,553,921) |
|
|
|
|
|
|
|
|
|
|
|
|
|
|
|
|
|
|
|
|
|
|
|
|
|
Balance as of March 31, 2025 |
|
8,832,544 |
|
(84,496) |
|
737 |
|
1,156,530 |
|
424,048 |
|
58,802 |
|
8,715,188 |
|
(11,211,690) |
|
7,891,663 |
|
26,879,315 |
|
34,770,978 |
The accompanying notes are an integral part of these individual and consolidated interim financial statements.
(In thousands of Reais)
| Capital reserve | Profit reserve | ||||||||||||||||||||||||||||||||||||||
|
|
|
Share capital |
|
Treasury shares |
|
Corporate transactions - Law 6404 |
|
Capital transactions |
|
Accumulated other comprehensive income (loss) |
|
Legal |
|
Statutory reserve |
|
Retained earnings |
|
Accumulated loss |
|
Equity attributable to controlling shareholders |
|
Interest of non-controlling shareholders |
|
Total equity |
|||||||||||||||
|
Balance as of January 1, 2024 |
|
8,682,544 |
|
(93,917) |
|
737 |
|
2,561,227 |
|
314,325 |
|
58,802 |
|
8,610,796 |
|
820,793 |
|
— |
|
20,955,307 |
|
30,025,873 |
|
50,981,180 |
|||||||||||||||
|
Profit (loss) for the period |
|
— |
|
— |
|
— |
|
— |
|
— |
|
— |
|
— |
|
— |
|
(192,175) |
|
(192,175) |
|
455,719 |
|
263,544 |
|||||||||||||||
|
Other comprehensive income |
|
|
|
|
|
|
|
|
|
|
|
|
|
|
|
|
|
|
|
|
|
|
|
|
|||||||||||||||
|
Loss from cash flow hedge |
|
— |
|
— |
|
— |
|
— |
|
(32,384) |
|
— |
|
— |
|
— |
|
— |
|
(32,384) |
|
(10,180) |
|
(42,564) |
|||||||||||||||
|
Foreign currency translation differences |
|
— |
|
— |
|
— |
|
— |
|
62,887 |
|
— |
|
— |
|
— |
|
— |
|
62,887 |
|
169 |
|
63,056 |
|||||||||||||||
|
Actuarial gain on defined benefit plan, net of tax |
|
— |
|
— |
|
— |
|
— |
|
14,408 |
|
— |
|
— |
|
— |
|
— |
|
14,408 |
|
1,621 |
|
16,029 |
|||||||||||||||
|
Total comprehensive income (loss) for the period |
|
— |
|
— |
|
— |
|
— |
|
44,911 |
|
— |
|
— |
|
— |
|
(192,175) |
|
(147,264) |
|
447,329 |
|
300,065 |
|||||||||||||||
|
Transactions with owners of the Company contributions and distributions: |
|
|
|
|
|
|
|
|
|
|
|
|
|
|
|
|
|
|
|
|
|
|
|
|
|||||||||||||||
|
Reduction of capital in subsidiary |
|
— |
|
— |
|
— |
|
— |
|
— |
|
— |
|
— |
|
— |
|
— |
|
— |
|
(20,629) |
|
(20,629) |
|||||||||||||||
|
Share based payments |
|
— |
|
23,097 |
|
— |
|
(66,792) |
|
— |
|
— |
|
— |
|
— |
|
— |
|
(43,695) |
|
— |
|
(43,695) |
|||||||||||||||
|
Dividends |
|
— |
|
— |
|
— |
|
— |
|
— |
|
— |
|
— |
|
— |
|
— |
|
— |
|
(221,019) |
|
(221,019) |
|||||||||||||||
|
Own shares acquired |
|
— |
|
(88,821) |
|
— |
|
— |
|
— |
|
— |
|
— |
|
— |
|
— |
|
(88,821) |
|
— |
|
(88,821) |
|||||||||||||||
|
Loss on distribution of dividends to non-controlling shareholders |
|
— |
|
— |
|
— |
|
(420) |
|
— |
|
— |
|
— |
|
— |
|
— |
|
(420) |
|
(75) |
|
(495) |
|||||||||||||||
|
Employee share schemes - value of employee services |
|
— |
|
— |
|
— |
|
2,390 |
|
— |
|
— |
|
— |
|
— |
|
— |
|
2,390 |
|
12,072 |
|
14,462 |
|||||||||||||||
|
Total contributions and distributions |
|
— |
|
(65,724) |
|
— |
|
(64,822) |
|
— |
|
— |
|
— |
|
— |
|
— |
|
(130,546) |
|
(229,651) |
|
(360,197) |
|||||||||||||||
|
|
|
|
|
|
|
|
|
|
|
|
|
|
|
|
|
|
|
|
|
|
|
|
|
|
|||||||||||||||
|
Transactions with owners of the Company: |
|
|
|
|
|
|
|
|
|
|
|
|
|
|
|
|
|
|
|
|
|
|
|
|
|||||||||||||||
|
Change of shareholding interest in subsidiary |
|
— |
|
— |
|
— |
|
(727) |
|
— |
|
— |
|
— |
|
— |
|
— |
|
(727) |
|
— |
|
(727) |
|||||||||||||||
|
Total transactions with owners of the Company |
|
— |
|
— |
|
— |
|
(727) |
|
— |
|
— |
|
— |
|
— |
|
— |
|
(727) |
|
— |
|
(727) |
|||||||||||||||
|
Total transactions with owners of the Company contributions and distributions: |
|
— |
|
(65,724) |
|
— |
|
(65,549) |
|
— |
|
— |
|
— |
|
— |
|
— |
|
(131,273) |
|
(229,651) |
|
(360,924) |
|||||||||||||||
|
|
|
|
|
|
|
|
|
|
|
|
|
|
|
|
|
|
|
|
|
|
|
|
|
|
|||||||||||||||
|
Balance as of March 31, 2024 |
|
8,682,544 |
|
(159,641) |
|
737 |
|
2,495,678 |
|
359,236 |
|
58,802 |
|
8,610,796 |
|
820,793 |
|
(192,175) |
|
20,676,770 |
|
30,243,551 |
|
50,920,321 |
|||||||||||||||
The accompanying notes are an integral part of these individual and consolidated interim financial statements.
(In thousands of Reais)
| Parent Company |
Consolidated |
||||||||
| Period of three months ended March 31, |
|||||||||
| Note | 2025 | 2024 | 2025 | 2024 | |||||
|
Cash flows from operating activities |
|
|
|
|
|
|
|
|
|
|
Loss (profit) before income taxes |
|
|
(1,128,676) |
|
(662,337) |
|
(888,863) |
|
247,907 |
|
|
|
|
|
|
|
|
|
|
|
|
Adjustments for: |
|
|
|
|
|
|
|
|
|
|
Depreciation and amortization |
14 |
|
4,713 |
|
3,851 |
|
967,894 |
|
907,264 |
|
Loss on disposed assets |
15 |
|
— |
|
— |
|
285,608 |
|
— |
|
Interest in earnings (losses) of subsidiaries and associates |
6 |
|
493,236 |
|
(824,169) |
|
(19,049) |
|
(461,423) |
|
Interest in losses of joint ventures |
7 |
|
128,194 |
|
45,874 |
|
1,139,047 |
|
403,908 |
|
Loss (gain) on disposed assets |
15 |
|
— |
|
7 |
|
(4,194) |
|
8,659 |
|
Share based payment |
17 |
|
6,220 |
|
21,194 |
|
23,892 |
|
47,557 |
|
Provision for legal proceedings |
15 |
|
35,589 |
|
10,842 |
|
84,992 |
|
81,260 |
|
Interest, derivatives, monetary and foreign exchange, net |
|
|
762,997 |
|
1,343,237 |
|
2,397,005 |
|
2,109,721 |
|
Sectorial financial assets and liabilities, net |
|
|
— |
|
— |
|
8,586 |
|
(53,026) |
|
Provisions for employee benefits |
|
|
(579) |
|
6,323 |
|
93,871 |
|
87,258 |
|
Allowance for expected credit losses |
|
|
— |
|
— |
|
11,110 |
|
13,033 |
|
Deferred income |
|
|
— |
|
— |
|
(635) |
|
(650) |
|
Revenue from finance investment |
|
|
(9,143) |
|
— |
|
(9,143) |
|
— |
|
Previously recognized gain in other comprehensive income reclassified to profit or loss upon disposal of investment |
|
|
(206,388) |
|
— |
|
(206,388) |
|
— |
|
Other |
|
|
10 |
|
620 |
|
(88,830) |
|
50,812 |
|
|
|
|
86,173 |
|
(54,558) |
|
3,794,903 |
|
3,442,280 |
|
Variation in: |
|
|
|
|
|
|
|
|
|
|
Trade receivable |
|
|
— |
|
— |
|
(263,936) |
|
(521,801) |
|
Inventories |
|
|
— |
|
— |
|
(99,705) |
|
(125,602) |
|
Other taxes, net |
|
|
2,764 |
|
(7,312) |
|
(138,771) |
|
46,145 |
|
Income tax |
|
|
(26,586) |
|
29,044 |
|
(614,678) |
|
(328,439) |
|
Related parties, net |
|
|
21,633 |
|
(7,751) |
|
(21,353) |
|
126,498 |
|
Trade payables |
|
|
(1,596) |
|
1,427 |
|
(280,419) |
|
(156,761) |
|
Employee benefits |
|
|
(29,555) |
|
(54,135) |
|
(374,402) |
|
(323,520) |
|
Provision for legal proceedings |
|
|
67 |
|
2,008 |
|
(38,754) |
|
(95,857) |
|
Derivatives financial instruments |
|
|
— |
|
— |
|
(5,107) |
|
(4,922) |
|
Other financial liabilities |
|
|
— |
|
— |
|
(53,150) |
|
(51,119) |
|
Judicial deposits |
|
|
(1,561) |
|
(883) |
|
(12,589) |
|
(98,858) |
|
Post-employment benefits obligation |
|
|
— |
|
— |
|
(9,848) |
|
(6,576) |
|
Other assets and liabilities, net |
|
|
(5,646) |
|
40,015 |
|
(152,287) |
|
44,617 |
|
|
|
|
(40,480) |
|
2,413 |
|
(2,064,999) |
|
(1,496,195) |
|
|
|
|
|
|
|
|
|
|
— |
|
Net cash (generated) used in operating activities |
|
|
45,693 |
|
(52,145) |
|
1,729,904 |
|
1,946,085 |
|
|
|
|
|
|
|
|
|
|
|
|
Cash flows from investing activities |
|
|
|
|
|
|
|
|
|
|
Shareholder payments for future capital increases |
|
|
— |
|
(4,070,000) |
|
— |
|
— |
|
Capital contribution to associates |
6 |
|
(331,000) |
|
— |
|
— |
|
— |
|
Capital contribution in joint ventures |
|
|
— |
|
(4,337) |
|
— |
|
(4,337) |
|
Capital reduction in subsidiaries |
|
|
1,013,760 |
|
5,227 |
|
11,000 |
|
— |
|
Purchase of marketable securities |
|
|
193,880 |
|
347,038 |
|
472,358 |
|
(444,102) |
Statement of cash flows
(In thousands of Reais)
| Parent Company |
Consolidated |
||||||||
| Period of three months ended March 31, |
|||||||||
| Note | 2025 | 2024 | 2025 | 2024 | |||||
|
Restricted cash |
|
|
(184) |
|
7,197 |
|
(114,600) |
|
5,508 |
|
Dividends received from associates |
|
|
14,110 |
|
244,324 |
|
4,277 |
|
587,744 |
|
Dividends received from joint venture |
|
|
5,184 |
|
228,342 |
|
45,640 |
|
293,912 |
|
Dividends received from finance investment |
|
|
87,608 |
|
— |
|
87,608 |
|
— |
|
Cash in the incorporation operation |
|
|
10,089 |
|
— |
|
— |
|
— |
|
Acquisition of property, plant and equipment, intangible and contract assets |
|
|
(3,797) |
|
(1,160) |
|
(2,284,909) |
|
(1,535,849) |
|
Proceeds from the sale of investments |
2.1 |
|
8,892,802 |
|
— |
|
8,892,802 |
|
— |
|
Cost of acquiring new business |
6.3 |
|
— |
|
— |
|
(213,086) |
|
— |
|
Receipt of derivative financial instruments, except debt |
|
|
— |
|
— |
|
— |
|
65 |
|
Payment of derivative financial instruments, except debt |
|
|
(981,504) |
|
— |
|
(981,504) |
|
(180) |
|
Related parties |
|
|
25,592 |
|
— |
|
25,592 |
|
— |
|
Cash received on the sale of property, plant and equipment and intangible assets |
|
|
— |
|
— |
|
1,024 |
|
— |
|
Other financial assets |
|
|
— |
|
— |
|
(80) |
|
— |
|
Net cash (generated) used in investing activities |
|
|
8,926,540 |
|
(3,243,369) |
|
5,946,122 |
|
(1,097,239) |
|
|
|
|
|
|
|
|
|
|
|
|
Cash flows from financing activities |
|
|
|
|
|
|
|
|
|
|
Proceeds from loans, borrowings and debentures |
5.2 |
|
2,442,980 |
|
2,980,221 |
|
6,486,495 |
|
7,577,959 |
|
Principal repayment of loans, borrowings and debentures |
5.2 |
|
(7,148,782) |
|
— |
|
(11,504,819) |
|
(4,418,898) |
|
Payment of interest on loans, borrowings and debentures |
5.2 |
|
(459,313) |
|
(262,844) |
|
(1,271,271) |
|
(1,007,511) |
|
Payment of derivative financial instruments |
|
|
(213,110) |
|
(238,456) |
|
(938,580) |
|
(1,378,647) |
|
Proceeds from derivative financial instruments |
|
|
347,361 |
|
13,530 |
|
979,572 |
|
516,758 |
|
Costs of banking operations with derivatives |
|
|
— |
|
— |
|
— |
|
(29,828) |
|
Principal repayment of leases |
|
|
(1,822) |
|
(1,558) |
|
(143,920) |
|
(120,611) |
|
Payment of interest on leases |
|
|
(666) |
|
(828) |
|
(98,596) |
|
(87,946) |
|
Capital reduction |
|
|
— |
|
— |
|
(486,240) |
|
(20,520) |
|
Related parties |
|
|
(1,223,068) |
|
(184,739) |
|
— |
|
— |
|
Payments to redeem the entity’s shares and acquisition of treasury shares |
11 |
|
(34,022) |
|
(91,332) |
|
(34,022) |
|
(91,332) |
|
Acquisition of non-controlling shareholders’ shares |
2.1 |
|
(2,169,000) |
|
— |
|
(2,169,000) |
|
— |
|
Dividends paid |
11 |
|
— |
|
— |
|
(44,032) |
|
(93,851) |
|
Dividends paid for preferred shares |
11 |
|
— |
|
— |
|
(371,000) |
|
— |
|
Gain on derivative banking operations |
|
|
22,100 |
|
— |
|
22,100 |
|
— |
|
Net cash (used in) generated from financing activities |
|
|
(8,437,342) |
|
2,213,994 |
|
(9,573,313) |
|
845,573 |
|
|
|
|
|
|
|
|
|
|
|
|
Increase (decrease) in cash and cash equivalents |
|
|
534,891 |
|
(1,081,520) |
|
(1,897,287) |
|
1,694,419 |
|
|
|
|
|
|
|
|
|
|
|
|
Cash and cash equivalents at the beginning of the period |
|
|
2,201,267 |
|
1,769,976 |
|
16,903,542 |
|
14,658,481 |
|
Effect of foreign exchange rate changes |
|
|
(3,636) |
|
3,272 |
|
(197,172) |
|
45,521 |
|
Cash and cash equivalents at the end of the period |
|
|
2,732,522 |
|
691,728 |
|
14,809,083 |
|
16,398,421 |
|
|
|
|
|
|
|
|
|
|
|
|
Additional information |
|
|
|
|
|
|
|
|
|
|
Income taxes paid |
|
|
— |
|
— |
|
371,123 |
|
251,518 |
The accompanying notes are an integral part of these individual and consolidated interim financial statements.
Statement of cash flows
(In thousands of Reais)
Non-cash transactions:
The Company presents its statements of cash flow using the indirect method. During the period ended March 31, 2025, the Company carried out the following transactions that did not involve cash and, therefore, are not reflected in the parent company and consolidated statement of cash flows:
| (i) | Recognition of right-of-use as a counterpart to the lease liability in the amount of R$135,098 (R$15,775 on March 31, 2024), resulting from the application of inflation indexes and new contracts classified under the leasing rule (Note 8.3). |
| (ii) | Acquisition of property, plant and equipment and intangible assets with payment in installments of R$567,019 (R$696,688 on March 31, 2024). |
| (iii) | The remaining balance of the acquisition of Compagas in the amount of R$613,385, which will be settled by September 2026. |
Disclosure of interest and dividends:
Dividends and interest in shareholders' equity are classified by the Company as cash flow from investing activities. Dividends and interest received or paid are classified as cash flow from financing activities.
(In thousands of Reais)
|
|
Parent Company |
|
Consolidated |
||||
|
|
Period of three months ended March 31, |
||||||
|
|
2025 |
|
2024 |
|
2025 |
|
2024 |
|
Revenue |
|
|
|
|
|
|
|
|
Net sales |
— |
|
— |
|
10,946,098 |
|
11,515,795 |
|
Other income (expenses), net |
218,008 |
|
(1,192) |
|
639,449 |
|
66,357 |
|
Impairment gain (loss) on trade receivables |
— |
|
— |
|
(11,110) |
|
4,832 |
|
|
218,008 |
|
(1,192) |
|
11,574,437 |
|
11,586,984 |
|
Inputs purchased from third parties |
|
|
|
|
|
|
|
|
Cost of goods sold and services rendered |
— |
|
— |
|
6,015,910 |
|
6,410,877 |
|
Materials, energy, third-party services and other |
39,748 |
|
40,493 |
|
484,732 |
|
561,922 |
|
Impairment |
— |
|
— |
|
285,608 |
|
— |
|
|
39,748 |
|
40,493 |
|
6,786,250 |
|
6,972,799 |
|
|
|
|
|
|
|
|
|
|
Gross value added |
178,260 |
|
(41,685) |
|
4,788,187 |
|
4,614,185 |
|
|
|
|
|
|
|
|
|
|
Retention |
|
|
|
|
|
|
|
|
Depreciation and amortization |
4,713 |
|
3,851 |
|
967,894 |
|
907,264 |
|
Net value added |
173,547 |
|
(45,536) |
|
3,820,293 |
|
3,706,921 |
|
|
|
|
|
|
|
|
|
|
Value added transferred in |
|
|
|
|
|
|
|
|
Interest in earnings (losses) of subsidiaries and associates |
(493,236) |
|
824,169 |
|
19,049 |
|
461,423 |
|
Interest in losses of joint ventures |
(128,194) |
|
(45,874) |
|
(1,139,047) |
|
(403,908) |
|
Finance income |
1,303,826 |
|
58,182 |
|
2,831,865 |
|
615,101 |
|
|
682,396 |
|
836,477 |
|
1,711,867 |
|
672,616 |
|
|
|
|
|
|
|
|
|
|
Value added to be distributed |
855,943 |
|
790,941 |
|
5,532,160 |
|
4,379,537 |
|
|
|
|
|
|
|
|
|
|
Distribution of value added |
|
|
|
|
|
|
|
|
Personnel and payroll charges |
45,508 |
|
54,597 |
|
679,116 |
|
629,026 |
|
Direct remuneration |
38,243 |
|
41,097 |
|
577,358 |
|
504,154 |
|
Benefits |
4,530 |
|
3,409 |
|
72,222 |
|
89,653 |
|
FGTS and other |
2,735 |
|
10,091 |
|
29,536 |
|
35,219 |
|
|
|
|
|
|
|
|
|
|
Taxes, fees and contributions |
671,267 |
|
(452,371) |
|
2,130,166 |
|
1,070,957 |
|
Federal |
667,807 |
|
(457,914) |
|
1,411,485 |
|
361,718 |
|
State |
1 |
|
— |
|
683,991 |
|
661,006 |
|
Municipal |
3,459 |
|
5,543 |
|
34,690 |
|
48,233 |
|
|
|
|
|
|
|
|
|
|
Financial expenses and rents |
1,927,063 |
|
1,380,890 |
|
4,658,276 |
|
2,416,010 |
|
Interest and foreign exchange variation |
1,827,712 |
|
1,371,928 |
|
4,275,125 |
|
2,306,059 |
|
Rents |
— |
|
— |
|
19,533 |
|
29,077 |
|
Other |
99,351 |
|
8,962 |
|
363,618 |
|
80,874 |
|
|
|
|
|
|
|
|
|
|
Equity remuneration |
(1,787,895) |
|
(192,175) |
|
(1,935,398) |
|
263,544 |
|
Non-controlling interests |
— |
|
— |
|
(147,503) |
|
455,719 |
|
Retained losses |
(1,787,895) |
|
(192,175) |
|
(1,787,895) |
|
(192,175) |
Notes to the interim Financial Statements
(In thousands of Reais, except when otherwise indicated)
Cosan S.A. (“Cosan” or “the Company”) is a publicly traded company at B3 S.A. - Brasil, Bolsa, Balcão (“B3”) in the special New Market (Novo Mercado) segment under the ticker “CSAN3”. The Company's American Depositary Shares (“ADSs”) are listed on the New York Stock Exchange, or “NYSE”, and are traded under the ticker “CSAN”. Cosan is a corporation (sociedade anônima) of indefinite term incorporated under the laws of Brazil, with its registered office in the city of São Paulo, state of São Paulo (SP). Mr. Rubens Ometto Silveira Mello is the ultimate controlling shareholder of Cosan.
As at March 31, 2025, Cosan Corporate (Cosan’s Corporate segment) is formed of the following entities:
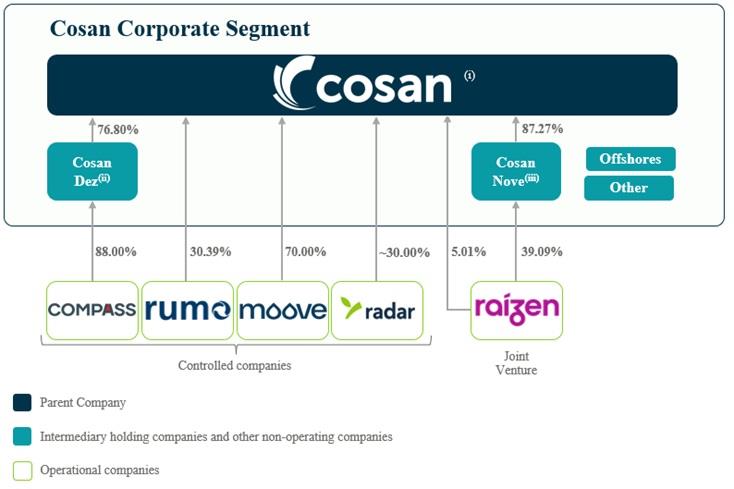
| (i) | Parent company with direct or indirect equity interest in subsidiaries and joint ventures. The main effects on its profit or loss are general and administrative expenses, contingencies, equity income and financial results attributed to loans. |
| (ii) | Bradesco BBI S.A. (“Bradesco”) holds preferred shares corresponding to a 23.20% stake in Cosan Dez Participações S.A. (“Cosan Dez”), which has a direct 88% stake in Compass. |
| (iii) | Itaú Unibanco S.A. (“Itaú”) holds preferred shares corresponding to a 12.73% stake in Cosan Nove Participações S.A. (“Cosan Nove”), which has a direct 39.09% stake in Raízen S.A. (“Raízen”). |
Notes to the interim Financial Statements
(In thousands of Reais, except when otherwise indicated)
Acquisition of DIPI Holdings Ltda by Moove
On September 29, 2024, Cosan Lubrificantes e Especialidades S.A. (“CLE”) entered into a purchase and sale agreement to acquire 100% of the shares of DIPI Holdings Ltda, for the price of R$329,006. The transaction was concluded on January 2, 2025, after all the conditions precedent had been met. The Company made the preliminary recognition of the price allocation, as detailed in Note 6.3.
Incorporation of Cosan Oito S.A.
On January 8, 2025, the Company successfully finalized the merger with Cosan Oito S.A. ("Cosan Oito"), after securing the requisite regulatory approvals. Consequently, all assets, liabilities, and shareholders' equity of Cosan Oito were comprehensively transferred to the Company. See Note 6.1.
Partial disposal of investment in Vale S.A.
On January 16, 2025, the Company sold 173,073,795 Vale S.A. (“Vale”) common shares, representing 4.05% of Vale's share capital, for a net commission of R$8,892,802 (see Note 6.1(b)). After this transaction, the Company kept 4,268,720 Vale common shares, corresponding to 0.10% of the share capital, in the amount of R$ 242,036.
Discontinuation of the operation of the Costa Pinto second generation ethanol (“E2G”) pilot plat
On January 17, 2025, Raízen, jointly controlled by the Company, announced the discontinuation of the recurring operation of Costa Pinto's Second-Generation Ethanol (E2G) pilot plant (Plant 1), located in Piracicaba, São Paulo. The plant, inaugurated in 2015, will operate as a unit dedicated to the testing and future development of biofuel from the harvest starting on April 1, 2025.
The commercial commitments previously linked to Plant 1 will be met by the Bonfim Plant (Plant 2), which is already in operation, and by the Univalem (Plant 3) and Barra (Plant 4) plants, which are in the commissioning phase and will begin operations after obtaining the necessary regulatory authorizations.
Fire incident at Moove’s Industrial Complex
On February 8, 2025, a fire broke out at Moove's Industrial Complex (“CIG”), located in Rio de Janeiro. The incident affected part of the production area and the administrative offices, which were inoperative at the time of the incident, representing 10% of the total area of the complex.
Moove promptly activated all the emergency and risk management protocols to control the incident. The containment measures, implemented through the Moove's contingency plan, were effective in minimizing damage to the structure, the local community and the environment. There were no victims or injuries, and no significant environmental or social impacts were identified.
Bulk lubricant and base oil operations, the tank terminal, maritime operations and pier operations, which account for approximately one third of production, were not affected and continue to operate normally. Moove has begun implementing a continuity plan to re-establish blending and filling operations.
Notes to the interim Financial Statements
(In thousands of Reais, except when otherwise indicated)
a) Operational interruption
The fire has been successfully controlled and is limited to the area where finished lubricant products are manufactured, which remains closed for inspections and assessments. The other operations of the industrial complex (bulk lubricant and base oil operations, tank terminal, marine operations and pier operations) continue to operate, representing between 30% and 35% of total production.
To mitigate the impact of the interruption, Moove implemented the following measures:
(i) Reallocation of blending and filling to other production plants.
(ii) Use of strategic alliance to guarantee product availability and supply chain continuity.
(iii) Production through third-party partners approved.
(iv) Use of safety stock distributed in the distribution center network.
b) Insurance coverage
Moove's global operations have comprehensive insurance coverage, which includes operational risks, business interruption damage, civil liability and environmental liability. The indemnity limit for this incident in the affected region totals approximately R$1,200,000. Moove has begun the process of evaluation and inspection with insurers.
c) Write-off of Assets
Moove will record the write-down of the affected assets in 2025, impacting the balance sheet and the income statement. The loss amount is under review, with the current estimate ranging between R$190,413 and R$285,620 for inventory and fixed asset losses. Of this amount, R$44,756, related to the assets located at the ignition point of the fire, are considered highly probable to be confirmed as lost by March 31, 2025. Estimates of losses related to business interruption are still in the early stages of analysis
Moove has hired a specialized company, knowledgeable about its operations, to conduct a physical inventory of the affected and unaffected assets at the CIG. The objective is to ascertain the actual extent of the loss with greater precision, identify and catalog the affected assets, and measure the impairment losses (cost value less accumulated depreciation), in accordance with CPC 01/IAS 36 – Impairment of Assets. The specialized company will issue a loss assessment report to support the accounting records. As of the date of issuance of these financial statements, the assessment work was not completed due to difficulties in accessing restricted areas and the extent of the work required for events of this magnitude.
Potential corporate reorganization proposal of Rumo Malha Norte
On February 19, 2025, Rumo S.A. (“Rumo”) and Rumo Malha Norte S.A. (“Rumo Malha Norte”) informed their shareholders and the market in general of the approval, by their respective Boards of Directors, of a potential corporate reorganization proposal. The proposal will be submitted for approval by the shareholders of the companies involved at their respective general meetings.
To conduct the negotiation of the exchange ratio in the potential corporate reorganization, special independent committees were set up and their members elected.
If approved, the corporate reorganization will optimize the corporate structure by incorporating the shares of the minority shareholders (0.26% of the share capital) of Rumo Malha Norte into Rumo, converting Rumo Malha Norte into a wholly owned subsidiary of Rumo. The minority shareholders of Rumo Malha Norte who retain their shares until the date of approval of the corporate reorganization by the general meetings of the companies involved will receive common shares in Rumo, in proportion to their holdings in the share capital of Rumo Malha Norte.
Cosan Dez capital reduction
On February 27, 2025, the Company received the amount of R$1,013,760 related to the capital reduction of Cosan Dez, approved at the Extraordinary General Meeting on June 26, 2024.
Redemption of Cosan Nove preferred shares
On March 28, 2025, the Company redeemed 1,087,179,567 preferred shares of Cosan Nove, previously held by Banco Itaú, for the amount of R$ 2,169,000 thousand. After the transaction, the preferred shares were converted into common shares. As a result, the Company's stake in Cosan Nove increased to 87.27% (see Note 6.1).
Notes to the interim Financial Statements
(In thousands of Reais, except when otherwise indicated)
Early redemptions of debentures
On January 22, 2025, the Company requested the optional early redemption of the 1st Series of the 3rd Issue of Simple Debentures, non-convertible into shares, unsecured, with original maturity in 2028, in the total amount of R$750,000 to be increased by the remuneration calculated pro rata temporis from the date of the last payment until the date of the actual payment and the premium.
Early call (Bond 2027)
On January 29, 2025, the Company informed the market that it had exercised the early redemption clause of the 2027 Bond, maturing in January 2027. The full redemption, in the amount of U.S.$392,000 thousand, equivalent to R$2,250,825, was carried out on March 14, 2025, at the face value of the bonds.
Tender offers - Bonds 2029, 2030 and 2031and debentures
During the first quarter of 2025, the Company made partial repurchases of the 5th and 6th issue of Debentures and securities issued by Cosan Luxembourg S.A. (“Cosan Lux”), specifically Bonds 2029, 2030 and 2031, as detailed in the table below:
|
Notes |
Added value of the principal |
Added value paid on repurchase |
Interest paid |
Prize |
Gain/Loss |
|
5.500% Senior notes – 2029 |
1,347,741 |
1,228,072 |
30,487 |
67,135 |
52,534 |
|
7.500% Senior notes – 2030 |
1,568,974 |
1,541,476 |
16,842 |
78,522 |
(51,024) |
|
7.250% Senior notes – 2031 |
1,594,064 |
1,544,299 |
16,798 |
79,604 |
(29,839) |
|
5th and 6th Debentures |
1,152,469 |
1,152,469 |
52,384 |
(17,714) |
(17,714) |
Early redemption
On February 12 and 13, 2025, respectively, the Company settled in advance Loan 4.131 in the amount of U.S.$600,000 thousand, equivalent to R$3,462,660, and Debenture in the amount of U.S.$300,000 thousand, equivalent to R$1,733,640, acquired in February 2024 and December 2023, respectively.
With the early settlement of these debts, the Total Return Swap (“TRS”) and Time Deposit operations were also settled, which had been used to internalize debts.
New debts
|
Segment / Modalities |
Date |
Incidence of interest |
Index |
Objective |
Funding costs |
Value |
Maturity |
|
Cosan Corporate |
|
|
|
|
|
|
|
|
Debenture |
03/12/2025 |
Yearly |
CDI + 0,60% p.a. |
Ordinary Capital management |
(46,633) |
1,500,000 |
01/27/2029 |
|
Debenture |
03/12/2025 |
Yearly |
CDI + 0,70% p.a. |
Ordinary Capital management |
(13,797) |
500,000 |
03/27/2030 |
|
Debenture |
03/12/2025 |
Yearly |
CDI + 1,00% p.a. |
Ordinary Capital management |
(13,721) |
500,000 |
03/27/2032 |
|
Compass |
|
|
|
|
|
|
|
|
Debenture |
01/10/2025 |
Yearly |
DI + spread 0.50% p.a. |
OrdinaryCapital management |
— |
410,000 |
01/07/2027 |
|
Debenture |
02/18/2025 |
Six-monthly |
IPCA + 7.44% p.a. |
Capital management |
(18,546) |
800,000 |
01/15/2033 |
| Loan 4.131 | 03/20/2025 | Yearly | CDI + 0.78% | Investment |
(659) |
350,000 | 03/20/2026 |
| Rumo | |||||||
|
Debenture |
03/28/2025 |
Yearly |
IPCA + 7.47% p.a. |
Ordinary Capital management |
(17,020) |
434,949 |
03/28/2037 |
|
Debenture |
03/28/2025 |
Yearly |
IPCA + 7.53% p.a. |
Ordinary Capital management |
(63,990) |
1,365,051 |
03/28/2040 |
| Moove | |||||||
|
Loan 4.131 |
01/16/2025 |
Yearly |
CDI+0.45% p.a. |
Capital management |
— |
500,000 |
01/18/2028 |
|
18 |
Notes to the interim Financial Statements
(In thousands of Reais, except when otherwise indicated)
The individual and consolidated interim financial statements were prepared and are being presented in accordance with Technical Pronouncement CPC 21 (R1) - Interim Financial Statements, International Accounting Standard (IAS 34) - Interim Financial Reporting, issued by the International Accounting Standards Board (“IASB”), the Brazilian Corporation Law and the rules of the Brazilian Securities Commission (“CVM”) applicable to the preparation of Quarterly Information (“ITR”).
These interim financial statements should be read in conjunction with the Company's annual consolidated financial statements for the fiscal year ended December 31, 2024 (“annual financial statements”). They do not include all the information required for a complete set of financial statements prepared in accordance with accounting practices adopted in Brazil and the International Financial Reporting Standards (“IFRS”). However, selected explanatory notes have been included to clarify events and transactions relevant to an understanding of the changes in the Company's financial position and performance since the last annual financial statements.
The presentation of the Statement of Value-Added Statements (“VAS”), both individual and consolidated, is required by Brazilian corporate law and by the accounting practices adopted in Brazil applicable to publicly traded companies. The DVA was prepared in accordance with the criteria established in Technical Pronouncement CPC 09 - Statement of Value Added. IFRS do not require the presentation of this statement; therefore, it is presented as supplementary information to the individual and consolidated interim financial statements.
These individual and consolidated interim financial statements were prepared using the same basis at preparation and accounting policies adopted in the preparation of the financial statements as of December 31, 2024. All balances have been rounded to the nearest thousand, unless otherwise indicated.
The relevant information specific to the interim financial statements, and only this information, is disclosed and corresponds to the information used by management in the management of the Company.
These interim financial statements were authorized for issue by the Board of Directors on May 15, 2025.
Notes to the interim Financial Statements
(In thousands of Reais, except when otherwise indicated)
The Company's senior management (the Chief Operating Decision Maker) uses segment information to evaluate the performance of operating segments and make resource allocation decisions. This information is prepared on a basis consistent with the accounting policies used in the preparation of the financial statements.
Earnings before interest, taxes, depreciation, and amortization ("EBITDA") are used by the Company to evaluate the performance of its operating segments.
Reported segments:
| (i) | Raízen: operates in the (i) production, commercialization, origination and trading of ethanol, (ii) production and commercialization of bioenergy, (iii) resale and trading of electricity, (iv) production and commercialization of other renewable products (solar energy and biogas), (v) production, commercialization, origination and trading of sugar and (vi) trading and commercialization of fossil fuels, renewable fuels and lubricants through a franchised network of service stations under the Shell brand throughout the country and in Latin America, operating in Argentina and Paraguay. |
| (ii) | Compass: its main activities are: (i) distribution of piped natural gas throughout Brazil to industrial, residential, commercial, automotive, and cogeneration customers; (ii) commercialization of electricity and natural gas; (iii) development of infrastructure projects in a regasification terminal and offshore gas pipeline; |
| (iii) | Moove: operates in the production, formulation and distribution of high-performance lubricants, base oils and specialties with headquarters in Brazil and operates in 11 countries in South America, North America, and Europe. It blends, distributes, and sells products under Mobil and proprietary brands for different end-markets including industrial, commercial and passenger/cargo vehicles. |
| (iv) | Rumo: logistics services for rail transport, port storage and loading of goods, primarily grains and sugar, leasing of locomotives, wagons, and other railroad equipment, as well as operation of containers. |
| (v) | Radar: A reference in agricultural property management, Radar invests in a diversified portfolio with high potential for appreciation, through participation in the companies Radar, Tellus and Janus. |
Reconciliation:
| (i) | Cosan Corporate: represents the reconciliation of Cosan's corporate structure, which is composed of: (i) senior management and corporate teams, which incur general and administrative expenses and other operating expenses (income), including pre-operating investments; (ii) equity income from investments; and (iii) financial income attributable to cash and debts of the parent company, intermediate holding companies (Cosan Nove and Cosan Dez), offshore financial companies and investment in the Climate Tech Fund, a fund managed by Fifth Wall, specializing in technological innovation. |
Although Raízen S.A. is a joint venture registered under the equity method and is not proportionally consolidated, Management continues to review the information by segment. The reconciliation of these segments is presented in the column “Deconsolidation of Joint Venture”
Notes to the interim Financial Statements
(In thousands of Reais, except when otherwise indicated)
|
Period of three months ended March 31, 2025 |
|||||||||||||||||||||||||||||||||||||||||||||||||||||||||||||||||||||||||
|
|
Reported segments |
|
|
|
Reconciliation |
|
Consolidated |
||||||||||||||||||||||||||||||||||||||||||||||||||||||||||||||||||
|
|
Raízen |
|
Compass |
|
Moove |
|
Rumo |
|
Radar |
|
Cosan Corporate |
|
Deconsolidation of Joint Ventures |
|
Elimination Between Segments |
|
|||||||||||||||||||||||||||||||||||||||||||||||||||||||||
|
Statement of profit or loss |
|
|
|
|
|
|
|
|
|
|
|
|
|
|
|
|
|
||||||||||||||||||||||||||||||||||||||||||||||||||||||||
|
Net sales |
57,726,722 |
|
4,209,600 |
|
2,341,582 |
|
2,966,750 |
|
152,078 |
|
48 |
|
(57,726,722) |
|
(7,457) |
|
9,662,601 |
||||||||||||||||||||||||||||||||||||||||||||||||||||||||
|
Cost of sales |
(55,826,827) |
|
(3,395,697) |
|
(1,710,940) |
|
(1,683,563) |
|
(9,162) |
|
— |
|
55,826,827 |
|
7,457 |
|
(6,791,905) |
||||||||||||||||||||||||||||||||||||||||||||||||||||||||
|
Gross profit |
1,899,895 |
|
813,903 |
|
630,642 |
|
1,283,187 |
|
142,916 |
|
48 |
|
(1,899,895) |
|
— |
|
2,870,696 |
||||||||||||||||||||||||||||||||||||||||||||||||||||||||
|
Selling expenses |
(1,767,477) |
|
(53,956) |
|
(371,841) |
|
(14,259) |
|
— |
|
— |
|
1,767,477 |
|
— |
|
(440,056) |
||||||||||||||||||||||||||||||||||||||||||||||||||||||||
|
General and administrative expenses |
(504,617) |
|
(181,465) |
|
(123,242) |
|
(149,241) |
|
(21,875) |
|
(59,209) |
|
504,617 |
|
— |
|
(535,032) |
||||||||||||||||||||||||||||||||||||||||||||||||||||||||
|
Other income (expenses), net |
(28,717) |
|
384,044 |
|
(68) |
|
(317,443) |
|
(1,867) |
|
173,856 |
|
28,717 |
|
— |
|
238,522 |
||||||||||||||||||||||||||||||||||||||||||||||||||||||||
|
Interest in earnings of associates |
(35,548) |
|
25,204 |
|
— |
|
(6,151) |
|
21,618 |
|
369,663 |
|
35,548 |
|
(391,285) |
|
19,049 |
||||||||||||||||||||||||||||||||||||||||||||||||||||||||
|
Interest in earnings of joint ventures |
— |
|
— |
|
— |
|
(3,290) |
|
— |
|
(1,135,757) |
|
— |
|
— |
|
(1,139,047) |
||||||||||||||||||||||||||||||||||||||||||||||||||||||||
|
Financial result |
(1,946,445) |
|
(370,481) |
|
(58,152) |
|
(767,659) |
|
14,022 |
|
(720,725) |
|
1,946,445 |
|
— |
|
(1,902,995) |
||||||||||||||||||||||||||||||||||||||||||||||||||||||||
|
Finance expense |
(2,109,564) |
|
(563,042) |
|
(93,932) |
|
(928,059) |
|
(671) |
|
(1,127,938) |
|
2,109,564 |
|
— |
|
(2,713,642) |
||||||||||||||||||||||||||||||||||||||||||||||||||||||||
|
Finance income |
458,649 |
|
204,674 |
|
36,616 |
|
313,563 |
|
14,693 |
|
468,355 |
|
(458,649) |
|
— |
|
1,037,901 |
||||||||||||||||||||||||||||||||||||||||||||||||||||||||
|
Foreign exchange variation |
1,925,882 |
|
161,376 |
|
69,913 |
|
460,718 |
|
— |
|
1,101,957 |
|
(1,925,882) |
|
— |
|
1,793,964 |
||||||||||||||||||||||||||||||||||||||||||||||||||||||||
|
Net effect of derivatives |
(2,221,412) |
|
(173,489) |
|
(70,749) |
|
(613,881) |
|
— |
|
(1,163,099) |
|
2,221,412 |
|
— |
|
(2,021,218) |
||||||||||||||||||||||||||||||||||||||||||||||||||||||||
|
Income tax |
(173,469) |
|
(196,797) |
|
(47,303) |
|
(122,322) |
|
(20,626) |
|
(659,487) |
|
173,469 |
|
— |
|
(1,046,535) |
||||||||||||||||||||||||||||||||||||||||||||||||||||||||
|
Net profit for the period |
(2,556,378) |
|
420,452 |
|
30,036 |
|
(97,178) |
|
134,188 |
|
(2,031,611) |
|
2,556,378 |
|
(391,285) |
|
(1,935,398) |
||||||||||||||||||||||||||||||||||||||||||||||||||||||||
|
|
|
|
|
|
|
|
|
|
|
|
|
|
|
|
|
|
|
||||||||||||||||||||||||||||||||||||||||||||||||||||||||
|
Profit or loss attributed to: |
|
|
|
|
|
|
|
|
|
|
|
|
|
|
|
|
|
||||||||||||||||||||||||||||||||||||||||||||||||||||||||
|
Owners of the Company |
(2,577,345) |
|
346,486 |
|
21,028 |
|
(30,363) |
|
54,134 |
|
(1,787,895) |
|
2,577,345 |
|
(391,285) |
|
(1,787,895) |
||||||||||||||||||||||||||||||||||||||||||||||||||||||||
|
Non-controlling interest |
20,967 |
|
73,966 |
|
9,008 |
|
(66,815) |
|
80,054 |
|
(243,716) |
|
(20,967) |
|
— |
|
(147,503) |
||||||||||||||||||||||||||||||||||||||||||||||||||||||||
|
|
(2,556,378) |
|
420,452 |
|
30,036 |
|
(97,178) |
|
134,188 |
|
(2,031,611) |
|
2,556,378 |
|
(391,285) |
|
(1,935,398) |
||||||||||||||||||||||||||||||||||||||||||||||||||||||||
|
|
|
|
|
|
|
|
|
|
|
|
|
|
|
|
|
|
|
||||||||||||||||||||||||||||||||||||||||||||||||||||||||
|
Other selected information |
|
|
|
|
|
|
|
|
|
|
|
|
|
|
|
|
|
||||||||||||||||||||||||||||||||||||||||||||||||||||||||
|
Depreciation and amortization |
2,216,529 |
|
309,313 |
|
97,008 |
|
556,776 |
|
68 |
|
4,729 |
|
(2,216,529) |
|
— |
|
967,894 |
||||||||||||||||||||||||||||||||||||||||||||||||||||||||
|
EBITDA |
1,780,065 |
|
1,297,043 |
|
232,499 |
|
1,349,579 |
|
140,860 |
|
(646,670) |
|
(1,780,065) |
|
(391,285) |
|
1,982,026 |
||||||||||||||||||||||||||||||||||||||||||||||||||||||||
|
Additions to fixed assets, intangible assets and contract assets |
4,423,446 |
|
465,701 |
|
45,682 |
|
1,764,569 |
|
5,159 |
|
3,798 |
|
(4,423,446) |
|
— |
|
2,284,909 |
||||||||||||||||||||||||||||||||||||||||||||||||||||||||
|
|
|
|
|
|
|
|
|
|
|
|
|
|
|
|
|
|
— |
||||||||||||||||||||||||||||||||||||||||||||||||||||||||
|
EBITDA reconciliation |
|
|
|
|
|
|
|
|
|
|
|
|
|
|
|
|
— |
||||||||||||||||||||||||||||||||||||||||||||||||||||||||
|
Income for the period |
(2,556,378) |
|
420,452 |
|
30,036 |
|
(97,178) |
|
134,188 |
|
(2,031,611) |
|
2,556,378 |
|
(391,285) |
|
(1,935,398) |
||||||||||||||||||||||||||||||||||||||||||||||||||||||||
|
Income taxes and social contribution |
173,469 |
|
196,797 |
|
47,303 |
|
122,322 |
|
20,626 |
|
659,487 |
|
(173,469) |
|
— |
|
1,046,535 |
||||||||||||||||||||||||||||||||||||||||||||||||||||||||
|
Financial result |
1,946,445 |
|
370,481 |
|
58,152 |
|
767,659 |
|
(14,022) |
|
720,725 |
|
(1,946,445) |
|
— |
|
1,902,995 |
||||||||||||||||||||||||||||||||||||||||||||||||||||||||
|
Depreciation and amortization |
2,216,529 |
|
309,313 |
|
97,008 |
|
556,776 |
|
68 |
|
4,729 |
|
(2,216,529) |
|
— |
|
967,894 |
||||||||||||||||||||||||||||||||||||||||||||||||||||||||
|
EBITDA |
1,780,065 |
|
1,297,043 |
|
232,499 |
|
1,349,579 |
|
140,860 |
|
(646,670) |
|
(1,780,065) |
|
(391,285) |
|
1,982,026 |
||||||||||||||||||||||||||||||||||||||||||||||||||||||||
Notes to the interim Financial Statements
(In thousands of Reais, except when otherwise indicated)
|
Period of three months ended March 31, 2024 |
|||||||||||||||||||||||||||||||||||||||||||||||||||||||||||||||||||||||||
|
|
Reported segments |
|
Reconciliation |
|
Consolidated |
||||||||||||||||||||||||||||||||||||||||||||||||||||||||||||||||||||
|
|
Raízen |
|
Compass |
|
Moove |
|
Rumo |
|
Radar |
|
Cosan Corporate |
|
Deconsolidation of Joint Ventures |
|
Elimination Between Segments |
|
|||||||||||||||||||||||||||||||||||||||||||||||||||||||||
|
Statement of profit or loss |
|
|
|
|
|
|
|
|
|
|
|
|
|
|
|
|
|
||||||||||||||||||||||||||||||||||||||||||||||||||||||||
|
Net sales |
53,657,046 |
|
4,135,168 |
|
2,439,592 |
|
3,146,017 |
|
136,567 |
|
7 |
|
(53,657,046) |
|
(15,295) |
|
9,842,056 |
||||||||||||||||||||||||||||||||||||||||||||||||||||||||
|
Cost of sales |
(49,921,053) |
|
(3,358,766) |
|
(1,758,889) |
|
(1,826,033) |
|
— |
|
(44) |
|
49,921,053 |
|
15,295 |
|
(6,928,437) |
||||||||||||||||||||||||||||||||||||||||||||||||||||||||
|
Gross profit |
3,735,993 |
|
776,402 |
|
680,703 |
|
1,319,984 |
|
136,567 |
|
(37) |
|
(3,735,993) |
|
— |
|
2,913,619 |
||||||||||||||||||||||||||||||||||||||||||||||||||||||||
|
Selling expenses |
(1,579,848) |
|
(43,326) |
|
(306,490) |
|
(11,588) |
|
— |
|
— |
|
1,579,848 |
|
— |
|
(361,404) |
||||||||||||||||||||||||||||||||||||||||||||||||||||||||
|
General and administrative expenses |
(930,404) |
|
(173,833) |
|
(134,169) |
|
(151,817) |
|
(18,385) |
|
(105,051) |
|
930,404 |
|
— |
|
(583,255) |
||||||||||||||||||||||||||||||||||||||||||||||||||||||||
|
Other income (expenses), net |
(45,200) |
|
54,525 |
|
19,290 |
|
(56,651) |
|
(2,166) |
|
(14,237) |
|
45,200 |
|
— |
|
761 |
||||||||||||||||||||||||||||||||||||||||||||||||||||||||
|
Interest in earnings of associates |
(66,352) |
|
29,082 |
|
— |
|
6,466 |
|
19,949 |
|
942,140 |
|
66,352 |
|
(536,214) |
|
461,423 |
||||||||||||||||||||||||||||||||||||||||||||||||||||||||
|
Interest in earnings of joint ventures |
— |
|
— |
|
— |
|
(837) |
|
— |
|
(403,071) |
|
— |
|
— |
|
(403,908) |
||||||||||||||||||||||||||||||||||||||||||||||||||||||||
|
Financial result |
(1,715,131) |
|
(204,019) |
|
1,223 |
|
(621,079) |
|
8,561 |
|
(964,015) |
|
1,715,131 |
|
— |
|
(1,779,329) |
||||||||||||||||||||||||||||||||||||||||||||||||||||||||
|
Finance expense |
(1,245,021) |
|
(403,568) |
|
1,691 |
|
(791,132) |
|
(1,567) |
|
(669,979) |
|
1,245,021 |
|
— |
|
(1,864,555) |
||||||||||||||||||||||||||||||||||||||||||||||||||||||||
|
Finance income |
236,924 |
|
246,942 |
|
22,694 |
|
240,638 |
|
10,128 |
|
94,699 |
|
(236,924) |
|
— |
|
615,101 |
||||||||||||||||||||||||||||||||||||||||||||||||||||||||
|
Foreign exchange variation |
(537,048) |
|
(59,792) |
|
(23,162) |
|
(173,095) |
|
— |
|
(275,169) |
|
537,048 |
|
— |
|
(531,218) |
||||||||||||||||||||||||||||||||||||||||||||||||||||||||
|
Net effect of derivatives |
(169,986) |
|
12,399 |
|
— |
|
102,510 |
|
— |
|
(113,566) |
|
169,986 |
|
— |
|
1,343 |
||||||||||||||||||||||||||||||||||||||||||||||||||||||||
|
Income tax |
(306,554) |
|
(120,728) |
|
(79,901) |
|
(116,141) |
|
(18,480) |
|
350,887 |
|
306,554 |
|
— |
|
15,637 |
||||||||||||||||||||||||||||||||||||||||||||||||||||||||
|
Net profit for the period |
(907,496) |
|
318,103 |
|
180,656 |
|
368,337 |
|
126,046 |
|
(193,384) |
|
907,496 |
|
(536,214) |
|
263,544 |
||||||||||||||||||||||||||||||||||||||||||||||||||||||||
|
|
|
|
|
|
|
|
|
|
|
|
|
|
|
|
|
|
|
||||||||||||||||||||||||||||||||||||||||||||||||||||||||
|
Profit or loss attributed to: |
|
|
|
|
|
|
|
|
|
|
|
|
|
|
|
|
|
||||||||||||||||||||||||||||||||||||||||||||||||||||||||
|
Owners of the Company |
(906,094) |
|
247,480 |
|
126,449 |
|
112,242 |
|
50,042 |
|
(192,174) |
|
906,094 |
|
(536,214) |
|
(192,175) |
||||||||||||||||||||||||||||||||||||||||||||||||||||||||
|
Non-controlling interest |
(1,402) |
|
70,623 |
|
54,207 |
|
256,095 |
|
76,004 |
|
(1,210) |
|
1,402 |
|
— |
|
455,719 |
||||||||||||||||||||||||||||||||||||||||||||||||||||||||
|
|
(907,496) |
|
318,103 |
|
180,656 |
|
368,337 |
|
126,046 |
|
(193,384) |
|
907,496 |
|
(536,214) |
|
263,544 |
||||||||||||||||||||||||||||||||||||||||||||||||||||||||
|
|
|
|
|
|
|
|
|
|
|
|
|
|
|
|
|
|
|
||||||||||||||||||||||||||||||||||||||||||||||||||||||||
|
Other selected information |
|
|
|
|
|
|
|
|
|
|
|
|
|
|
|
|
|
||||||||||||||||||||||||||||||||||||||||||||||||||||||||
|
Depreciation and amortization |
2,765,658 |
|
250,418 |
|
69,606 |
|
583,303 |
|
68 |
|
3,869 |
|
(2,765,658) |
|
— |
|
907,264 |
||||||||||||||||||||||||||||||||||||||||||||||||||||||||
|
EBITDA |
3,879,847 |
|
893,268 |
|
328,940 |
|
1,688,860 |
|
136,033 |
|
423,613 |
|
(3,879,847) |
|
(536,214) |
|
2,934,500 |
||||||||||||||||||||||||||||||||||||||||||||||||||||||||
|
Additions to fixed assets, intangible assets and contract assets |
5,016,672 |
|
531,354 |
|
34,488 |
|
967,106 |
|
1,740 |
|
1,160 |
|
(5,016,672) |
|
— |
|
1,535,848 |
||||||||||||||||||||||||||||||||||||||||||||||||||||||||
|
|
|
|
|
|
|
|
|
|
|
|
|
|
|
|
|
|
|
||||||||||||||||||||||||||||||||||||||||||||||||||||||||
|
EBITDA reconciliation |
|
|
|
|
|
|
|
|
|
|
|
|
|
|
|
|
|
||||||||||||||||||||||||||||||||||||||||||||||||||||||||
|
Income for the period |
(907,496) |
|
318,103 |
|
180,656 |
|
368,337 |
|
126,046 |
|
(193,384) |
|
907,496 |
|
(536,214) |
|
263,544 |
||||||||||||||||||||||||||||||||||||||||||||||||||||||||
|
Income taxes and social contribution |
306,554 |
|
120,728 |
|
79,901 |
|
116,141 |
|
18,480 |
|
(350,887) |
|
(306,554) |
|
— |
|
(15,637) |
||||||||||||||||||||||||||||||||||||||||||||||||||||||||
|
Financial result |
1,715,131 |
|
204,019 |
|
(1,223) |
|
621,079 |
|
(8,561) |
|
964,015 |
|
(1,715,131) |
|
— |
|
1,779,329 |
||||||||||||||||||||||||||||||||||||||||||||||||||||||||
|
Depreciation and amortization |
2,765,658 |
|
250,418 |
|
69,606 |
|
583,303 |
|
68 |
|
3,869 |
|
(2,765,658) |
|
— |
|
907,264 |
||||||||||||||||||||||||||||||||||||||||||||||||||||||||
|
EBITDA |
3,879,847 |
|
893,268 |
|
328,940 |
|
1,688,860 |
|
136,033 |
|
423,613 |
|
(3,879,847) |
|
(536,214) |
|
2,934,500 |
||||||||||||||||||||||||||||||||||||||||||||||||||||||||
Notes to the interim Financial Statements
(In thousands of Reais, except when otherwise indicated)
|
March 31, 2025 |
|||||||||||||||||
|
|
Reported segments |
|
Reconciliation |
|
|||||||||||||
|
|
Raízen |
|
Compass |
|
Moove |
|
Rumo |
|
Radar |
|
Cosan Corporate |
|
Deconsolidation of Joint Venture |
|
Elimination Between Segments |
|
Consolidated |
|
Statement of financial position: |
|
|
|
|
|
|
|
|
|
|
|
|
|
|
|
|
|
|
Cash and cash equivalents |
21,721,394 |
|
3,092,626 |
|
613,928 |
|
7,853,486 |
|
39,997 |
|
3,209,046 |
|
(21,721,394) |
|
— |
|
14,809,083 |
|
Marketable securities |
1,148,076 |
|
804,014 |
|
361,312 |
|
681,178 |
|
331,794 |
|
1,002,067 |
|
(1,148,076) |
|
— |
|
3,180,365 |
|
Trade receivables |
8,351,356 |
|
2,072,727 |
|
1,120,409 |
|
753,328 |
|
415,618 |
|
— |
|
(8,351,356) |
|
— |
|
4,362,082 |
|
Derivative financial instruments |
12,805,150 |
|
170,300 |
|
82,349 |
|
1,498,135 |
|
— |
|
340,254 |
|
(12,805,150) |
|
— |
|
2,091,038 |
|
Inventories |
10,972,184 |
|
262,196 |
|
1,451,105 |
|
328,152 |
|
— |
|
— |
|
(10,972,184) |
|
— |
|
2,041,453 |
|
Sectorial financial assets |
— |
|
749,854 |
|
— |
|
— |
|
— |
|
— |
|
— |
|
— |
|
749,854 |
|
Other financial assets |
89,874 |
|
3,932 |
|
716 |
|
— |
|
— |
|
— |
|
(89,874) |
|
— |
|
4,648 |
|
Other current assets |
9,622,458 |
|
752,671 |
|
316,315 |
|
1,077,479 |
|
52,437 |
|
2,518,051 |
|
(9,622,458) |
|
(831,395) |
|
3,885,558 |
|
Other non-current assets |
15,628,378 |
|
1,773,875 |
|
245,003 |
|
3,551,869 |
|
25,139 |
|
2,072,226 |
|
(15,628,378) |
|
(146,314) |
|
7,521,798 |
|
Investments in subsidiaries and associates |
— |
|
1,294,520 |
|
— |
|
247,822 |
|
92,422 |
|
15,490,638 |
|
— |
|
(15,575,628) |
|
1,549,774 |
|
Investments in joint ventures |
2,033,708 |
|
— |
|
— |
|
52,830 |
|
— |
|
9,487,640 |
|
(2,033,708) |
|
— |
|
9,540,470 |
|
Biological assets |
3,514,712 |
|
— |
|
— |
|
— |
|
— |
|
— |
|
(3,514,712) |
|
— |
|
— |
|
Investment property |
— |
|
— |
|
— |
|
— |
|
16,824,078 |
|
— |
|
— |
|
— |
|
16,824,078 |
|
Contract assets |
2,876,196 |
|
959,977 |
|
18,155 |
|
— |
|
— |
|
— |
|
(2,876,196) |
|
— |
|
978,132 |
|
Right-of-use assets |
9,641,510 |
|
1,557,971 |
|
317,173 |
|
7,700,662 |
|
2,986 |
|
18,015 |
|
(9,641,510) |
|
— |
|
9,596,807 |
|
Property, plant and equipment |
40,363,834 |
|
1,637,114 |
|
914,711 |
|
21,157,337 |
|
15 |
|
51,512 |
|
(40,363,834) |
|
— |
|
23,760,689 |
|
Intangible assets and goodwill |
9,388,616 |
|
16,898,236 |
|
3,161,007 |
|
6,520,377 |
|
— |
|
10,768 |
|
(9,388,616) |
|
— |
|
26,590,388 |
|
Loans, borrowings and debentures |
(57,970,370) |
|
(13,908,996) |
|
(3,893,194) |
|
(20,969,942) |
|
— |
|
(21,908,522) |
|
57,970,370 |
|
— |
|
(60,680,654) |
|
Derivative financial instruments - liabilities |
(11,302,692) |
|
(340,214) |
|
(58,520) |
|
(1,788,750) |
|
— |
|
(192,379) |
|
11,302,692 |
|
— |
|
(2,379,863) |
|
Trade payables |
(21,841,950) |
|
(1,543,939) |
|
(1,386,589) |
|
(953,477) |
|
(20,658) |
|
(1,439) |
|
21,841,950 |
|
— |
|
(3,906,102) |
|
Employee benefits payables |
(1,075,608) |
|
(192,647) |
|
(71,721) |
|
(246,159) |
|
— |
|
(13,191) |
|
1,075,608 |
|
— |
|
(523,718) |
|
Sectorial financial liabilities |
— |
|
(2,088,411) |
|
— |
|
— |
|
— |
|
— |
|
— |
|
— |
|
(2,088,411) |
|
Other current liabilities |
(9,832,462) |
|
(1,242,418) |
|
(365,990) |
|
(1,190,509) |
|
(125,873) |
|
(605,212) |
|
9,832,462 |
|
313,960 |
|
(3,216,042) |
|
Leases |
(10,445,900) |
|
(1,964,767) |
|
(329,218) |
|
(4,070,017) |
|
(3,225) |
|
(24,680) |
|
10,445,900 |
|
— |
|
(6,391,907) |
|
Other non-current liabilities |
(13,542,940) |
|
(3,538,721) |
|
(616,817) |
|
(7,398,455) |
|
(580,514) |
|
(2,057,781) |
|
13,542,940 |
|
663,746 |
|
(13,528,542) |
|
Total assets (net of liabilities) allocated by segment |
22,145,524 |
|
7,209,900 |
|
1,880,134 |
|
14,805,346 |
|
17,054,216 |
|
9,397,013 |
|
(22,145,524) |
|
(15,575,631) |
|
34,770,978 |
|
Total assets |
148,157,446 |
|
32,030,013 |
|
8,602,183 |
|
51,422,655 |
|
17,784,486 |
|
34,200,217 |
|
(148,157,446) |
|
(16,553,337) |
|
127,486,217 |
|
|
|
|
|
|
|
|
|
|
|
|
|
|
|
|
|
|
|
|
Shareholders’ equity attributable to: |
|
|
|
|
|
|
|
|
|
|
|
|
|
|
|
|
|
|
Owners of the Company |
21,558,116 |
|
4,488,988 |
|
1,318,769 |
|
4,437,298 |
|
5,330,576 |
|
7,891,663 |
|
(21,558,116) |
|
(15,575,631) |
|
7,891,663 |
|
Non-controlling interest |
587,408 |
|
2,720,912 |
|
561,365 |
|
10,368,048 |
|
11,723,640 |
|
1,505,350 |
|
(587,408) |
|
— |
|
26,879,315 |
|
Total shareholders’ equity |
22,145,524 |
|
7,209,900 |
|
1,880,134 |
|
14,805,346 |
|
17,054,216 |
|
9,397,013 |
|
(22,145,524) |
|
(15,575,631) |
|
34,770,978 |
Notes to the interim Financial Statements
(In thousands of Reais, except when otherwise indicated)
|
December 31, 2024 |
|||||||||||||||||||||||||||||||||||||||||||||||||||||||||||||||||||||||||
|
|
Reported segments |
Reconciliation |
|
||||||||||||||||||||||||||||||||||||||||||||||||||||||||||||||||||||||
|
|
Raízen |
|
Compass |
|
Moove |
|
Rumo |
|
Radar |
|
Cosan Corporate |
|
Deconsolidation of Joint Venture |
|
Elimination Between Segments |
|
Consolidated |
||||||||||||||||||||||||||||||||||||||||||||||||||||||||
|
Balance sheet items: |
|
|
|
|
|
|
|
|
|
|
|
|
|
|
|
|
|
||||||||||||||||||||||||||||||||||||||||||||||||||||||||
|
Cash and cash equivalents |
9,962,864 |
|
5,271,256 |
|
753,347 |
|
7,461,618 |
|
33,041 |
|
3,384,280 |
|
(9,962,864) |
|
— |
|
16,903,542 |
||||||||||||||||||||||||||||||||||||||||||||||||||||||||
|
Marketable securities |
1,337,706 |
|
1,074,806 |
|
303,492 |
|
812,795 |
|
251,267 |
|
943,941 |
|
(1,337,706) |
|
— |
|
3,386,301 |
||||||||||||||||||||||||||||||||||||||||||||||||||||||||
|
Trade receivables |
11,053,414 |
|
1,804,823 |
|
1,164,422 |
|
583,349 |
|
443,140 |
|
— |
|
(11,053,414) |
|
— |
|
3,995,734 |
||||||||||||||||||||||||||||||||||||||||||||||||||||||||
|
Derivative financial instruments - assets |
17,070,322 |
|
356,589 |
|
151,926 |
|
1,647,977 |
|
— |
|
1,642,836 |
|
(17,070,322) |
|
— |
|
3,799,328 |
||||||||||||||||||||||||||||||||||||||||||||||||||||||||
|
Inventories |
17,435,862 |
|
252,220 |
|
1,538,105 |
|
282,580 |
|
— |
|
— |
|
(17,435,862) |
|
— |
|
2,072,905 |
||||||||||||||||||||||||||||||||||||||||||||||||||||||||
|
Sectorial financial assets |
— |
|
731,642 |
|
— |
|
— |
|
— |
|
— |
|
— |
|
— |
|
731,642 |
||||||||||||||||||||||||||||||||||||||||||||||||||||||||
|
Other financial assets |
87,966 |
|
3,820 |
|
675 |
|
— |
|
— |
|
— |
|
(87,966) |
|
— |
|
4,495 |
||||||||||||||||||||||||||||||||||||||||||||||||||||||||
|
Other current assets |
10,611,882 |
|
592,317 |
|
288,376 |
|
1,040,439 |
|
72,089 |
|
3,786,460 |
|
(10,611,882) |
|
(2,112,993) |
|
3,666,688 |
||||||||||||||||||||||||||||||||||||||||||||||||||||||||
|
Other non-current assets |
15,784,732 |
|
1,810,491 |
|
241,816 |
|
3,421,143 |
|
24,870 |
|
2,901,292 |
|
(15,784,732) |
|
(160,256) |
|
8,239,356 |
||||||||||||||||||||||||||||||||||||||||||||||||||||||||
|
Investments in subsidiaries and associates |
— |
|
1,277,955 |
|
— |
|
280,865 |
|
92,166 |
|
24,235,118 |
|
— |
|
(15,207,538) |
|
10,678,566 |
||||||||||||||||||||||||||||||||||||||||||||||||||||||||
|
Investments in joint ventures |
2,012,536 |
|
— |
|
— |
|
41,121 |
|
— |
|
10,503,923 |
|
(2,012,536) |
|
— |
|
10,545,044 |
||||||||||||||||||||||||||||||||||||||||||||||||||||||||
|
Biological assets |
3,596,878 |
|
— |
|
— |
|
— |
|
— |
|
— |
|
(3,596,878) |
|
— |
|
— |
||||||||||||||||||||||||||||||||||||||||||||||||||||||||
|
Investment property |
— |
|
— |
|
— |
|
— |
|
16,818,919 |
|
— |
|
— |
|
— |
|
16,818,919 |
||||||||||||||||||||||||||||||||||||||||||||||||||||||||
|
Contract assets |
2,806,284 |
|
1,110,463 |
|
4,367 |
|
— |
|
— |
|
— |
|
(2,806,284) |
|
— |
|
1,114,830 |
||||||||||||||||||||||||||||||||||||||||||||||||||||||||
|
Right-of-use assets |
9,549,136 |
|
1,581,601 |
|
316,762 |
|
8,039,779 |
|
3,053 |
|
17,556 |
|
(9,549,136) |
|
— |
|
9,958,751 |
||||||||||||||||||||||||||||||||||||||||||||||||||||||||
|
Property, plant and equipment |
37,503,618 |
|
1,620,505 |
|
911,277 |
|
20,435,467 |
|
17 |
|
51,750 |
|
(37,503,618) |
|
— |
|
23,019,016 |
||||||||||||||||||||||||||||||||||||||||||||||||||||||||
|
Intangible assets and goodwill |
9,472,002 |
|
16,761,631 |
|
3,013,392 |
|
6,545,890 |
|
— |
|
9,872 |
|
(9,472,002) |
|
— |
|
26,330,785 |
||||||||||||||||||||||||||||||||||||||||||||||||||||||||
|
Loans, borrowings and debentures |
(52,781,598) |
|
(14,449,033) |
|
(3,558,575) |
|
(19,123,218) |
|
— |
|
(29,324,600) |
|
52,781,598 |
|
— |
|
(66,455,426) |
||||||||||||||||||||||||||||||||||||||||||||||||||||||||
|
Derivative financial instruments |
(14,464,530) |
|
(389,778) |
|
(57,347) |
|
(1,918,204) |
|
— |
|
(1,104,875) |
|
14,464,530 |
|
— |
|
(3,470,204) |
||||||||||||||||||||||||||||||||||||||||||||||||||||||||
|
Trade payables |
(20,042,646) |
|
(1,650,748) |
|
(1,735,704) |
|
(1,777,918) |
|
(20,549) |
|
(2,930) |
|
20,042,646 |
|
— |
|
(5,187,849) |
||||||||||||||||||||||||||||||||||||||||||||||||||||||||
|
Employee benefits payables |
(1,096,336) |
|
(253,655) |
|
(140,553) |
|
(376,475) |
|
— |
|
(43,324) |
|
1,096,336 |
|
— |
|
(814,007) |
||||||||||||||||||||||||||||||||||||||||||||||||||||||||
|
Sectorial financial liabilities |
— |
|
(2,040,239) |
|
— |
|
— |
|
— |
|
— |
|
— |
|
— |
|
(2,040,239) |
||||||||||||||||||||||||||||||||||||||||||||||||||||||||
|
Other current liabilities |
(9,327,070) |
|
(2,876,023) |
|
(428,437) |
|
(1,252,805) |
|
(135,410) |
|
(905,820) |
|
9,327,070 |
|
1,628,676 |
|
(3,969,819) |
||||||||||||||||||||||||||||||||||||||||||||||||||||||||
|
Leases |
(11,988,100) |
|
(2,122,306) |
|
(327,517) |
|
(4,032,188) |
|
(3,281) |
|
(24,461) |
|
11,988,100 |
|
— |
|
(6,509,753) |
||||||||||||||||||||||||||||||||||||||||||||||||||||||||
|
Other non-current liabilities |
(14,143,270) |
|
(3,735,956) |
|
(548,995) |
|
(7,177,061) |
|
(580,129) |
|
(2,022,675) |
|
14,143,270 |
|
644,573 |
|
(13,420,243) |
||||||||||||||||||||||||||||||||||||||||||||||||||||||||
|
Total assets (net of liabilities) allocated by segment |
24,441,652 |
|
6,732,381 |
|
1,890,829 |
|
14,935,154 |
|
16,999,193 |
|
14,048,343 |
|
(24,441,652) |
|
(15,207,538) |
|
39,398,362 |
||||||||||||||||||||||||||||||||||||||||||||||||||||||||
|
Total assets |
148,285,202 |
|
34,250,119 |
|
8,687,957 |
|
50,593,023 |
|
17,738,562 |
|
47,477,028 |
|
(148,285,202) |
|
(17,480,787) |
|
141,265,902 |
||||||||||||||||||||||||||||||||||||||||||||||||||||||||
|
|
|
|
|
|
|
|
|
|
|
|
|
|
|
|
|
|
|
||||||||||||||||||||||||||||||||||||||||||||||||||||||||
|
Shareholders’ equity attributable to: |
|
|
|
|
|
|
|
|
|
|
|
|
|
|
|
|
|
||||||||||||||||||||||||||||||||||||||||||||||||||||||||
|
Owners of the Company |
23,864,556 |
|
4,091,601 |
|
1,326,385 |
|
4,477,643 |
|
5,311,909 |
|
10,903,764 |
|
(23,864,556) |
|
(15,207,538) |
|
10,903,764 |
||||||||||||||||||||||||||||||||||||||||||||||||||||||||
|
Non-controlling interest |
577,096 |
|
2,640,780 |
|
564,444 |
|
10,457,511 |
|
11,687,284 |
|
3,144,579 |
|
(577,096) |
|
— |
|
28,494,598 |
||||||||||||||||||||||||||||||||||||||||||||||||||||||||
|
Total shareholders’ equity |
24,441,652 |
|
6,732,381 |
|
1,890,829 |
|
14,935,154 |
|
16,999,193 |
|
14,048,343 |
|
(24,441,652) |
|
(15,207,538) |
|
39,398,362 |
||||||||||||||||||||||||||||||||||||||||||||||||||||||||
Notes to the interim Financial Statements
(In thousands of Reais, except when otherwise indicated)
|
|
Period of three months ended March 31, |
||
|
|
2025 |
|
2024 |
|
Reported segment |
|
|
|
|
Raízen |
|
|
|
|
Ethanol |
6,807,576 |
|
5,609,583 |
|
Sugar |
6,562,652 |
|
7,761,595 |
|
Gasoline |
16,819,588 |
|
15,572,382 |
|
Diesel |
23,238,684 |
|
21,612,340 |
|
Cogeneration |
1,637,922 |
|
860,599 |
|
Other |
2,660,300 |
|
2,240,547 |
|
|
57,726,722 |
|
53,657,046 |
|
Compass |
|
|
|
|
Natural gas distribution |
|
|
|
|
Industrial |
2,469,442 |
|
2,800,989 |
|
Residential |
524,343 |
|
458,892 |
|
Cogeneration |
111,346 |
|
138,037 |
|
Automotive |
111,236 |
|
120,383 |
|
Commercial |
210,759 |
|
193,291 |
|
Construction revenue |
304,129 |
|
320,030 |
|
Other |
91,381 |
|
103,546 |
|
|
3,822,636 |
|
4,135,168 |
|
Marketing & services |
|
|
|
|
Gas commercialization |
386,964 |
|
— |
|
|
4,209,600 |
|
4,135,168 |
|
Moove |
|
|
|
|
Finished product |
2,045,129 |
|
2,102,621 |
|
Base oil |
141,743 |
|
168,941 |
|
Services |
154,710 |
|
168,030 |
|
|
2,341,582 |
|
2,439,592 |
|
Rumo |
|
|
|
|
North operations |
2,387,684 |
|
2,434,633 |
|
South operations |
406,410 |
|
563,131 |
|
Container operations |
172,656 |
|
148,253 |
|
|
2,966,750 |
|
3,146,017 |
|
Radar |
|
|
|
|
Lease and sale of land |
152,078 |
|
136,567 |
|
|
152,078 |
|
136,567 |
|
Reconciliation |
|
|
|
|
Cosan Corporate |
48 |
|
7 |
|
|
|
|
|
|
Deconsolidation of joint venture, adjustments and eliminations |
(57,734,179) |
|
(53,672,341) |
|
|
|
|
|
|
Total |
9,662,601 |
|
9,842,056 |
Notes to the interim Financial Statements
(In thousands of Reais, except when otherwise indicated)
|
|
Net sales |
||
|
|
Period of three months ended March 31, |
||
|
|
2025 |
|
2024 |
|
Brazil |
8,166,677 |
|
8,518,307 |
|
Europe (i) |
818,667 |
|
696,739 |
|
Latin America (ii) |
109,769 |
|
56,416 |
|
United States of America |
567,488 |
|
570,594 |
|
Total |
9,662,601 |
|
9,842,056 |
| (i) | England, France, Spain and Portugal. |
| (ii) | Argentina, Bolivia, Uruguay and Paraguay. |
The Company's financial assets and liabilities are stated as classified below:
|
|
|
|
Parent Company |
|
Consolidated |
||||
|
|
Note |
|
March 31, 2025 |
|
December 31, 2024 |
|
March 31, 2025 |
|
December 31, 2024 |
|
Assets |
|
|
|
|
|
|
|
|
|
|
Fair value through profit or loss |
|
|
|
|
|
|
|
|
|
|
Cash and cash equivalents |
5.1 |
|
223,537 |
|
986,278 |
|
746,406 |
|
2,122,442 |
|
Marketable securities |
|
|
872,119 |
|
805,335 |
|
3,180,365 |
|
3,386,301 |
|
Derivative financial instruments |
5.3 |
|
340,255 |
|
1,565,495 |
|
2,091,038 |
|
3,799,328 |
|
Other financial assets |
|
|
— |
|
— |
|
4,648 |
|
4,495 |
|
|
|
|
1,435,911 |
|
3,357,108 |
|
6,022,457 |
|
9,312,566 |
|
Amortized cost |
|
|
|
|
|
|
|
|
|
|
Cash and cash equivalents |
|
|
2,508,985 |
|
1,214,989 |
|
14,062,677 |
|
14,781,100 |
|
Trade receivables |
|
|
— |
|
— |
|
4,362,082 |
|
3,995,734 |
|
Restricted cash |
|
|
184 |
|
— |
|
286,321 |
|
174,303 |
|
Receivables from related parties |
5.4 |
|
346,204 |
|
406,981 |
|
364,663 |
|
399,889 |
|
Sectorial financial assets |
|
|
— |
|
— |
|
749,854 |
|
731,642 |
|
Judicial deposits |
10 |
|
419,029 |
|
416,969 |
|
1,085,085 |
|
1,056,690 |
|
Dividends and interest on equity receivable |
|
|
14,194 |
|
19,377 |
|
33,621 |
|
153,548 |
|
Reduction of capital receivable |
|
|
— |
|
1,013,714 |
|
— |
|
— |
|
|
|
|
3,288,596 |
|
3,072,030 |
|
20,944,303 |
|
21,292,906 |
|
Total |
|
|
4,724,507 |
|
6,429,138 |
|
26,966,760 |
|
30,605,472 |
|
Liabilities |
|
|
|
|
|
|
|
|
|
|
Amortized cost |
|
|
|
|
|
|
|
|
|
|
Loans, borrowings and debentures |
|
|
(16,092,111) |
|
(21,350,555) |
|
(34,212,435) |
|
(38,161,392) |
|
Trade payables |
5.5 |
|
(1,304) |
|
(2,900) |
|
(3,906,102) |
|
(5,187,849) |
|
Consideration payable |
|
|
— |
|
— |
|
(173,746) |
|
(246,256) |
|
Other financial liabilities (i) |
|
|
— |
|
— |
|
(978,640) |
|
(1,067,839) |
|
Leases |
|
|
(24,678) |
|
(24,459) |
|
(6,391,907) |
|
(6,509,753) |
|
Railroad concession payable |
|
|
— |
|
— |
|
(3,840,527) |
|
(3,721,190) |
|
Related parties payable |
5.4 |
|
(5,737,780) |
|
(7,263,024) |
|
(435,171) |
|
(417,488) |
|
Dividends payable |
11 |
|
(39) |
|
(3,495) |
|
(55,086) |
|
(96,722) |
|
Reduction of capital payable |
|
|
— |
|
— |
|
— |
|
(486,285) |
|
Sectorial financial liabilities |
|
|
— |
|
— |
|
(67,001) |
|
(64,718) |
|
Installment of tax debts |
|
|
(135,773) |
|
(219,429) |
|
(154,258) |
|
(254,302) |
|
|
|
|
(21,991,685) |
|
(28,863,862) |
|
(50,214,873) |
|
(56,213,794) |
|
Fair value through profit or loss |
|
|
|
|
|
|
|
|
|
|
Loans, borrowings and debentures |
|
|
— |
|
— |
|
(26,468,219) |
|
(28,294,034) |
|
Derivative financial instruments |
5.3 |
|
(192,379) |
|
(1,104,874) |
|
(2,379,863) |
|
(3,470,204) |
|
|
|
|
(192,379) |
|
(1,104,874) |
|
(28,848,082) |
|
(31,764,238) |
|
Total |
|
|
(22,184,064) |
|
(29,968,736) |
|
(79,062,955) |
|
(87,978,032) |
| (i) | The Company's subsidiaries adopt strategies to optimize working capital efficiency, including extending payment terms with their suppliers and entering into structured payment agreements (commonly referred to reverse factoring or drawn risk) with financial institutions. |
Notes to the interim Financial Statements
(In thousands of Reais, except when otherwise indicated)
|
|
Parent Company |
|
Consolidated |
||||
|
|
March 31, 2025 |
|
December 31, 2024 |
|
March 31, 2025 |
|
December 31, 2024 |
|
Cash and bank accounts |
280 |
|
414 |
|
952,971 |
|
958,738 |
|
Savings account |
45,689 |
|
48,831 |
|
734,502 |
|
485,393 |
|
Financial Investments |
2,686,553 |
|
2,152,022 |
|
13,121,610 |
|
15,459,411 |
|
|
2,732,522 |
|
2,201,267 |
|
14,809,083 |
|
16,903,542 |
Financial investments include the following:
|
|
Parent Company |
|
Consolidated |
||||
|
|
March 31, 2025 |
|
December 31, 2024 |
|
March 31, 2025 |
|
December 31, 2024 |
|
Applications in investment funds |
|
|
|
|
|
|
|
|
Repurchase Agreements |
— |
|
400,251 |
|
392,075 |
|
1,493,278 |
|
Certificate of bank deposits - CDB |
223,537 |
|
586,027 |
|
354,331 |
|
604,398 |
|
Other investments |
— |
|
— |
|
— |
|
24,766 |
|
|
223,537 |
|
986,278 |
|
746,406 |
|
2,122,442 |
|
|
|
|
|
|
|
|
|
|
Applications in banks |
|
|
|
|
|
|
|
|
Repurchase agreements |
— |
|
— |
|
164,488 |
|
236,101 |
|
Certificate of bank deposits - CDB |
2,462,993 |
|
1,165,549 |
|
12,191,250 |
|
12,102,078 |
|
Other |
23 |
|
195 |
|
19,466 |
|
998,790 |
|
|
2,463,016 |
|
1,165,744 |
|
12,375,204 |
|
13,336,969 |
|
|
2,686,553 |
|
2,152,022 |
|
13,121,610 |
|
15,459,411 |
a) Composition
|
|
|
Interest |
|
Parent Company |
||||
|
Description |
|
Average debt index |
|
Average annual interest rate |
|
March 31, 2025 |
|
December 31, 2024 |
|
Debenture |
|
CDI + 1.30% |
|
15.63% |
|
11,191,201 |
|
10,554,301 |
|
Debenture |
|
IPCA + 5.75% |
|
11.53% |
|
435,674 |
|
433,499 |
|
Debenture |
|
Prefixed |
|
7.52% |
|
3,439,505 |
|
5,636,584 |
|
Commercial bank notes |
|
CDI + 1.77% |
|
16.17% |
|
1,025,731 |
|
1,020,037 |
|
Loan 4.131 |
|
Prefixed |
|
|
|
— |
|
3,706,134 |
|
Total |
|
|
|
|
|
16,092,111 |
|
21,350,555 |
|
|
|
|
|
|
|
|
|
|
|
Current |
|
|
|
|
|
360,607 |
|
347,032 |
|
Non-current |
|
|
|
|
|
15,731,504 |
|
21,003,523 |
Notes to the interim Financial Statements
(In thousands of Reais, except when otherwise indicated)
|
|
|
Interest |
|
Consolidated |
||||
|
Description |
|
Average debt index |
|
Average annual interest rate |
|
March 31, 2025 |
|
December 31, 2024 |
|
Cosan Corporate |
|
|
|
|
|
|
|
|
|
Debenture |
|
CDI + 1.30% |
|
15.63% |
|
11,191,201 |
|
10,554,301 |
|
Debenture |
|
IPCA + 5.75% |
|
11.53% |
|
435,674 |
|
433,499 |
|
Commercial bank notes |
|
CDI + 1.77% |
|
16.17% |
|
1,025,731 |
|
1,020,037 |
|
Perpetual Notes |
|
Prefixed |
|
8.25% |
|
2,907,288 |
|
3,135,174 |
|
Senior Notes |
|
Prefixed |
|
6.52% |
|
6,348,627 |
|
14,181,589 |
|
|
|
|
|
|
|
21,908,521 |
|
29,324,600 |
|
Compass |
|
|
|
|
|
|
|
|
|
BNDES |
|
IPCA + 4.63% |
|
10.36% |
|
2,917,700 |
|
3,034,743 |
|
Debenture |
|
CDI + 1.13% |
|
15.43% |
|
5,573,711 |
|
5,378,989 |
|
Loan 4.131 |
|
Prefixed |
|
4.04% |
|
874,686 |
|
2,695,565 |
|
Loan 4.131 |
|
CDI 0.78% |
|
15.04% |
|
350,706 |
|
— |
|
Debenture (Law 12.431) |
|
IPCA + 6.44% |
|
12.27% |
|
3,797,425 |
|
2,956,899 |
|
Debenture |
|
IGPM + 6.10% |
|
15.20% |
|
394,768 |
|
382,837 |
|
|
|
|
|
|
|
13,908,996 |
|
14,449,033 |
|
Moove |
|
|
|
|
|
|
|
|
|
Offshore loan 4.131 |
|
Prefixed |
|
5.50% |
|
14,770 |
|
15,729 |
|
Loan 4.131 |
|
CDI + 0.45% |
|
14.66% |
|
512,809 |
|
— |
|
Acquisition Finance |
|
SOFR + 1.50% |
|
5.70% |
|
2,180,875 |
|
2,346,950 |
|
Working capital |
|
SONIA + 1.30% |
|
5.50% |
|
297,210 |
|
272,318 |
|
Export Credit Note |
|
SOFR + 1.30% |
|
5.50% |
|
300,518 |
|
316,442 |
|
Export Prepayment |
|
SOFR+ 1.40% |
|
5.60% |
|
587,013 |
|
607,136 |
|
|
|
|
|
|
|
3,893,195 |
|
3,558,575 |
|
Rumo |
|
|
|
|
|
|
|
|
|
ACF |
|
IPCA + 6.48% |
|
12.30% |
|
310,078 |
|
299,706 |
|
BNDES |
|
URTJLP + 2.06% |
|
10.12% |
|
1,752,969 |
|
1,861,658 |
|
CCB |
|
IPCA + 0.94% |
|
6.46% |
|
862,873 |
|
874,513 |
|
Debenture |
|
CDI + 0.70% |
|
13.94% |
|
250,187 |
|
— |
|
Debenture (Law 12.431) |
|
IPCA + 5.56% |
|
11.33% |
|
12,677,510 |
|
10,722,182 |
|
Export Credit Agency ("ECA") |
|
Euribor + 0.58% |
|
2.97% |
|
4,497 |
|
38,525 |
|
NCE |
|
|
|
|
|
— |
|
276,661 |
|
Senior Notes |
|
Prefixed |
|
4.73% |
|
5,111,828 |
|
5,049,973 |
|
|
|
|
|
|
|
20,969,942 |
|
19,123,218 |
|
|
|
|
|
|
|
|
|
|
|
Total |
|
|
|
|
|
60,680,654 |
|
66,455,426 |
|
|
|
|
|
|
|
|
|
|
|
Current |
|
|
|
|
|
2,628,017 |
|
4,403,148 |
|
Non current |
|
|
|
|
|
58,052,637 |
|
62,052,278 |
| 28 |
Notes to the interim Financial Statements
(In thousands of Reais, except when otherwise indicated)
b) Changes in loans, borrowings and debentures
|
|
Parent Company |
|
Consolidated |
|
Balance as of January 1, 2025 |
21,350,555 |
|
66,455,426 |
|
Proceeds |
2,442,980 |
|
6,486,495 |
|
Repayment of principal |
(7,148,782) |
|
(11,504,819) |
|
Payment of interest |
(459,313) |
|
(1,271,271) |
|
Payment of interest on work in progress |
— |
|
(26,883) |
|
Acquisition of subsidiaries (Note 6.3) |
— |
|
77,002 |
|
Interest, exchange rate and fair value |
(93,329) |
|
464,704 |
|
Balance as of March 31, 2025 |
16,092,111 |
|
60,680,654 |
c) Offset of assets and liabilities
|
|
Segment |
|
March 31, 2025 |
|
December 31, 2024 |
|
Assets |
|
|
|
|
|
|
Credit Linked Notes |
Rumo |
|
5,802,074 |
|
6,334,168 |
|
Time deposit |
Cosan Corporate |
|
— |
|
3,718,105 |
|
TRS |
Cosan Corporate |
|
3,441,726 |
|
5,640,466 |
|
Total |
|
|
9,243,800 |
|
15,692,739 |
|
|
|
|
|
|
|
|
Liabilities |
|
|
|
|
|
|
NCEs |
Rumo |
|
(5,802,074) |
|
(6,334,168) |
|
Loan 4.131 (i) |
Cosan Corporate |
|
— |
|
(3,718,105) |
|
Debenture |
Cosan Corporate |
|
(3,441,726) |
|
(5,640,466) |
|
Total |
|
|
(9,243,800) |
|
(15,692,739) |
|
Net balance |
|
|
— |
|
— |
| (i) | The balance of Loan 4.131 was settled as mentioned in Note 2.2. |
d) Restrictive Clauses
The Company and its subsidiaries are required to comply with the financial clauses per the terms of the main loan lines both financial and non-financial, as set forth in the loan and financing agreements
As of March 31, 2025, the Company and its subsidiaries were in compliance with all financial and non-financial restrictive covenants. The terms of the loans include cross-default provisions.
Notes to the interim Financial Statements
(In thousands of Reais, except when otherwise indicated)
The Company uses swap instruments, whose fair value is determined from discounted cash flows based on market curves, to hedge the exposure to foreign exchange risk and interest and inflation risk. The consolidated data are presented below:
|
|
Parent Company |
|
Consolidated |
||||||||||||
|
|
Notional |
|
Fair value |
|
Notional |
|
Fair value |
||||||||
|
|
March 31, 2025 |
|
December 31, 2024 |
|
March 31, 2025 |
|
December 31, 2024 |
|
March 31, 2025 |
|
December 31, 2024 |
|
March 31, 2025 |
|
December 31, 2024 |
|
Exchange rate derivatives |
|
|
|
|
|
|
|
|
|
|
|
|
|
|
|
|
Forward agreements |
— |
|
942,987 |
|
— |
|
18,402 |
|
190,813 |
|
1,042,896 |
|
(14,703) |
|
28,392 |
|
FX option agreements |
— |
|
— |
|
— |
|
— |
|
328,500 |
|
411,000 |
|
2,828 |
|
3,096 |
|
|
— |
|
942,987 |
|
— |
|
18,402 |
|
519,313 |
|
1,453,896 |
|
(11,875) |
|
31,488 |
|
Commodity derivatives |
|
|
|
|
|
|
|
|
|
|
|
|
|
|
|
|
Forward contract - NDF |
— |
|
— |
|
— |
|
— |
|
28,985 |
|
21,174 |
|
(3,103) |
|
(7,158) |
|
|
— |
|
— |
|
— |
|
— |
|
28,985 |
|
21,174 |
|
(3,103) |
|
(7,158) |
|
Foreign exchange and interest rate risk |
|
|
|
|
|
|
|
|
|
|
|
|
|
|
|
|
Swap agreements (interest rate) |
350,000 |
|
350,000 |
|
6,974 |
|
(4,705) |
|
6,346,736 |
|
6,453,930 |
|
(240,533) |
|
(364,783) |
|
Swap agreements (interest and FX) |
8,562,589 |
|
13,686,022 |
|
212,842 |
|
1,520,581 |
|
16,396,935 |
|
20,195,459 |
|
133,592 |
|
1,912,553 |
|
Swap agreements (interest and inflation) |
— |
|
— |
|
— |
|
— |
|
14,841,711 |
|
12,247,351 |
|
(94,965) |
|
(246,660) |
|
|
8,912,589 |
|
14,036,022 |
|
219,816 |
|
1,515,876 |
|
37,585,382 |
|
38,896,740 |
|
(201,906) |
|
1,301,110 |
|
Share price risk |
|
|
|
|
|
|
|
|
|
|
|
|
|
|
|
|
Swap agreements - (TRS) |
944,593 |
|
1,817,821 |
|
(144,037) |
|
(1,073,657) |
|
944,593 |
|
1,817,821 |
|
(144,038) |
|
(1,073,657) |
|
Call Spread |
9,510,160 |
|
— |
|
72,097 |
|
— |
|
9,510,160 |
|
4,667,709 |
|
72,097 |
|
77,341 |
|
|
10,454,753 |
|
1,817,821 |
|
(71,940) |
|
(1,073,657) |
|
10,454,753 |
|
6,485,530 |
|
(71,941) |
|
(996,316) |
|
|
|
|
|
|
|
|
|
|
|
|
|
|
|
|
|
|
Total financial instruments |
|
147,876 |
|
460,621 |
|
|
|
|
|
(288,825) |
|
329,124 |
|||
|
Current assets |
|
|
|
|
13,804 |
|
18,402 |
|
|
|
|
|
78,582 |
|
905,341 |
|
Non-current assets |
|
|
|
|
326,451 |
|
1,547,093 |
|
|
|
|
|
2,012,456 |
|
2,893,987 |
|
Current liabilities |
|
|
|
|
(152,414) |
|
(1,074,991) |
|
|
|
|
|
(1,820,126) |
|
(2,504,117) |
|
Non-current liabilities |
|
|
|
|
(39,965) |
|
(29,883) |
|
|
|
|
|
(559,737) |
|
(966,087) |
|
Total |
|
|
|
|
147,876 |
|
460,621 |
|
|
|
|
|
(288,825) |
|
329,124 |
Below, we present the breakdown of the registration value of debt and non-debt derivative financial instruments:
|
|
Parent company |
|
Consolidated |
||||
|
|
March 31, 2025 |
|
December 31, 2024 |
|
March 31, 2025 |
|
December 31, 2024 |
|
Derivative financial instruments |
219,816 |
|
1,534,278 |
|
(201,907) |
|
1,319,512 |
|
Non-derivative financial instruments |
(71,940) |
|
(1,073,657) |
|
(86,918) |
|
(990,388) |
|
|
147,876 |
|
460,621 |
|
(288,825) |
|
329,124 |
Derivatives are only used for economic hedging purposes and not as speculative investments.
Notes to the interim Financial Statements
(In thousands of Reais, except when otherwise indicated)
a) Fair value hedge
The Company, through its subsidiaries, adopts fair value hedge accounting for some of its operations.
There is an economic relationship between the hedged item and the hedging instrument because the terms of the interest and FX rate swap correspond to the terms of the fixed-rate loan, i.e., notional amount, term, and payment. Since the underlying risk of the interest and FX rate swap is identical to the hedged risk component, the Company has established a hedge ratio of 1:1 for its hedging relationships. The Company employs the discounted cash flow method and compares changes in the fair value of the hedging instrument with changes in the fair value of the hedged item attributable to the hedged risk in order to evaluate the effectiveness of the hedge. According to the Company's assessment, the sources of hedge ineffectiveness that are most likely to impact the hedge relationship during its term are: (i) a reduction or change in the hedged item; and (ii) a change in the Company's or the contracted swap counterparty's credit risk. The following amounts were associated with the items designated as hedging instruments:
|
|
|
|
|
|
Registered value |
Accumulated fair value of hedge adjustments |
|||||||||
|
|
Subsidiary |
Index |
Unit |
Notional |
March 31, 2025 |
December 31, 2024 |
March 31, 2025 |
December 31, 2024 |
|||||||
|
FX rate risk hedge |
|
|
|
|
|
|
|
|
|||||||
|
Loans, borrowings and debentures |
|
|
|
|
|
|
|
|
|||||||
|
Designated items |
|
|
|
|
|
|
|
|
|||||||
|
PPE |
Moove |
US$ + 1.40% |
BRL |
(100,000) |
(587,013) |
(620,690) |
(3,313) |
(13,554) |
|||||||
|
NCE |
Moove |
US$ + 1.30% |
BRL |
(50,000) |
(300,518) |
(320,606) |
935 |
(4,164) |
|||||||
|
Senior Notes 2028 |
Rumo |
US$ + 5.30% |
BRL |
(2,791,600) |
(2,513,070) |
(2,631,834) |
(372,643) |
(519,686) |
|||||||
|
Senior Notes 2032 |
Rumo |
US$ + 4.20% |
BRL |
(2,824,075) |
(2,598,757) |
(2,418,140) |
(250,886) |
(687,411) |
|||||||
|
NCE U.S.$ |
Rumo |
SOFR + 1.30% |
BRL |
— |
— |
(25,341) |
— |
(131,663) |
|||||||
|
Total |
|
|
|
(5,765,675) |
(5,999,358) |
(6,016,611) |
(625,907) |
(1,356,478) |
|||||||
|
Interest rate risk hedge |
|
|
|
|
|
|
|
|
|||||||
|
Loans, borrowings and debentures |
|
|
|
|
|
|
|
|
|||||||
|
Designated items |
|
|
|
|
|
|
|
|
|||||||
|
BNDES Projet VIII |
Comgás |
IPCA + 3.25% |
BRL |
(770,832) |
(678,594) |
(678,785) |
99,608 |
100,511 |
|||||||
|
Debenture |
Rumo |
IPCA + 5.56% |
BRL |
(11,989,276) |
(11,750,953) |
(9,719,039) |
(1,852,805) |
(1,851,762) |
|||||||
|
ACF |
Rumo |
IPCA + 6.48% |
BRL |
(312,528) |
(310,078) |
(299,706) |
(13,085) |
(13,635) |
|||||||
|
Finem |
Rumo |
TLP + 2.06% |
BRL |
(21,661) |
(21,912) |
(25,764) |
(2,115) |
(2,212) |
|||||||
|
CCB |
Rumo |
IPCA + 0.94% |
BRL |
(932,077) |
(862,873) |
(874,513) |
(67,815) |
(63,520) |
|||||||
|
Total |
|
|
|
(14,026,374) |
(13,624,410) |
(11,597,807) |
(1,836,212) |
(1,830,618) |
|||||||
Notes to the interim Financial Statements
(In thousands of Reais, except when otherwise indicated)
|
|
|
|
|
|
Registered value |
||||||||||
|
|
|
|
|
|
March 31, 2025 |
December 31, 2024 |
|||||||||
|
|
Subsidiary |
Index |
Unit |
Notional |
Assets |
Liabilities |
Assets |
Liabilities |
|||||||
|
FX rate risk hedge |
|
|
|
|
|
|
|
|
|||||||
|
Derivative financial instruments |
|
|
|
|
|
|
|
|
|||||||
|
PPE |
Moove |
CDI + 0,79% |
BRL |
100,000 |
18,389 |
— |
66,126 |
— |
|||||||
|
NCE |
Moove |
CDI + 0,60% |
BRL |
50,000 |
5,440 |
— |
28,452 |
— |
|||||||
|
Swap Senior Notes 2028 |
Rumo |
US$ + 5,30% |
BRL |
2,791,600 |
2,533,210 |
2,651,325 |
2,657,287 |
2,707,334 |
|||||||
|
Swap Senior Notes 2032 |
Rumo |
US$ + 4,20% |
BRL |
2,824,075 |
2,645,336 |
2,645,207 |
4,039,312 |
3,926,328 |
|||||||
|
Total |
|
|
|
5,765,675 |
5,202,375 |
5,296,532 |
6,791,177 |
6,633,662 |
|||||||
|
Interest rate risk hedge |
|
|
|
|
|
|
|
|
|||||||
|
Derivative financial instruments |
|
|
|
|
|
|
|
|
|||||||
|
BNDES Projet VIII |
Comgás |
99.75% CDI |
BRL |
770,832 |
677,590 |
774,802 |
693,704 |
795,268 |
|||||||
|
Swaps Debentures |
Rumo |
IPCA + 5.56% |
BRL |
11,989,276 |
12,120,960 |
12,352,600 |
10,016,793 |
10,377,790 |
|||||||
|
ACF |
Rumo |
IPCA + 6.48% |
BRL |
312,528 |
315,260 |
327,926 |
304,962 |
318,827 |
|||||||
|
Finem |
Rumo |
TLP + 2.06% |
BRL |
21,661 |
23,043 |
21,768 |
23,552 |
22,614 |
|||||||
|
CCB |
Rumo |
IPCA + 0.94% |
BRL |
932,077 |
871,176 |
936,069 |
882,930 |
946,589 |
|||||||
|
Total |
|
|
|
14,026,374 |
14,008,029 |
14,413,165 |
11,921,941 |
12,461,088 |
|||||||
| 32 |
Notes to the interim Financial Statements
(In thousands of Reais, except when otherwise indicated)
Certain derivative instruments were not designated to documented hedging structures.
The Company chose to designate the hedged liabilities (hedge objects) to be recorded at fair value through profit or loss as below:
|
|
|
|
|
|
Registered Value |
|
Accumulated fair value |
||||
|
|
|
|
Notional |
|
March 31, 2025 |
|
December 31, 2024 |
|
March 31, 2025 |
|
December 31, 2024 |
|
FX rate risk |
|
|
|
|
|
|
|
|
|
|
|
|
Items |
|
|
|
|
|
|
|
|
|
|
|
|
Senior Notes 2027 (Cosan Luxembourg) |
U.S.$ + 7.00% |
|
— |
|
— |
|
(2,475,674) |
|
— |
|
(1,540,318) |
|
Export Credit Agreement (Rumo) |
EUR + 0.58% |
|
(19,027) |
|
(4,497) |
|
(38,525) |
|
(23,024) |
|
(713) |
|
Scotiabank 2022 |
U.S.$ + 2.51% |
|
— |
|
— |
|
(1,245,669) |
|
— |
|
3,580 |
|
Scotiabank 2023 |
U.S.$ + 4.76% |
|
(749,310) |
|
(874,686) |
|
(926,262) |
|
(1,558) |
|
5,920 |
|
BNP Paribas 2024 |
EUR + 5,74% |
|
— |
|
— |
|
(523,634) |
|
— |
|
(19,408) |
|
Total |
|
|
(768,337) |
|
(879,183) |
|
(5,209,764) |
|
(24,582) |
|
(1,550,939) |
|
|
|
|
|
|
|
|
|
|
|
|
|
|
FX rate risk |
|
|
|
|
|
|
|
|
|
|
|
|
Items |
|
|
|
|
|
|
|
|
|
|
|
|
BNDES Projects VI and VII (Comgás) |
IPCA + 4.10% |
|
(95,685) |
|
(83,613) |
|
(88,477) |
|
12,821 |
|
3,288 |
|
BNDES Project VIII (Comgás) |
IPCA + 3.25% |
|
(608,373) |
|
(608,372) |
|
(639,325) |
|
40,335 |
|
39,439 |
|
BNDES Project IX (Comgás) |
IPCA + 5.74% |
|
(565,582) |
|
(566,159) |
|
(554,820) |
|
52,457 |
|
54,110 |
|
BNDES Project IX - Sub A (Comgás) |
IPCA + 5.74% |
|
(306,207) |
|
(293,423) |
|
(287,962) |
|
21,633 |
|
22,242 |
|
BNDES Project IX - Sub A (Comgás) |
IPCA + 5.74% |
|
(196,598) |
|
(188,198) |
|
(184,883) |
|
10,623 |
|
10,864 |
|
BNDES Project IX - Sub B (Comgás) |
IPCA + 6.01% |
|
(315,186) |
|
(301,449) |
|
(295,695) |
|
23,230 |
|
23,999 |
|
Debenture 6th issue - single series (Comgás) |
IPCA + 7.36% |
|
(38,273) |
|
(42,795) |
|
(41,436) |
|
1,017 |
|
718 |
|
Debenture 4th issue - 3rd series (Comgás) |
IPCA + 5.12% |
|
(500,000) |
|
(517,475) |
|
(512,946) |
|
88,700 |
|
88,728 |
|
Debenture 9th issue - 1st series (Comgás) |
IPCA + 5.22% |
|
(500,000) |
|
(470,604) |
|
(466,173) |
|
133,127 |
|
133,379 |
|
Debenture 11th issue - 1st series (Comgás) |
IPCA + 6.38% |
|
(750,000) |
|
(690,997) |
|
(685,420) |
|
72,587 |
|
72,780 |
|
Debenture 9th issue - 2nd series (Comgás) |
IPCA + 6.45% |
|
(750,000) |
|
(665,734) |
|
(662,782) |
|
88,157 |
|
85,912 |
|
Debenture 12th issue - single series (Comgás) |
IPCA + 7.17% |
|
(600,000) |
|
(609,892) |
|
(588,142) |
|
(8,966) |
|
(10,096) |
|
Debenture 2nd issue - single series (Comgás) |
IPCA + 7.44% |
|
(800,000) |
|
(818,277) |
|
— |
|
(18,277) |
|
— |
|
Debenture (Rumo) |
IPCA + 4.68% |
|
(120,000) |
|
(164,881) |
|
(248,085) |
|
(93) |
|
(59,916) |
|
Debenture (Rumo) |
IPCA + 4.50% |
|
(600,000) |
|
(761,675) |
|
(755,061) |
|
(148) |
|
(96,457) |
|
Total |
|
|
(6.745,904) |
|
(6,783,544) |
|
(6,011,207) |
|
571,203 |
|
368,990 |
Notes to the interim Financial Statements
(In thousands of Reais, except when otherwise indicated)
|
|
|
|
|
|
Registered Value |
||
|
|
|
|
Notional |
|
March 31, 2025 |
|
December 31, 2024 |
|
Derivative instruments |
|
|
|
|
|
|
|
|
Swap Senior Notes 2027 (Cosan Luxembourg) |
BRL + 114.48% CDI |
|
— |
|
— |
|
217,523 |
|
FX and interest rate swaps (Rumo) |
BRL + 108% CDI |
|
19,027 |
|
(14,697) |
|
12,253 |
|
Scotiabank 2022 |
CDI + 1.20% |
|
— |
|
— |
|
95,971 |
|
Scotiabank 2023 |
CDI + 1.30% |
|
749,310 |
|
92,571 |
|
169,185 |
|
BNP Paribas 2024 |
CDI + 1.35% |
|
— |
|
— |
|
55,805 |
|
Total derivatives |
|
|
768,337 |
|
77,874 |
|
550,737 |
|
|
|
|
|
|
|
|
|
|
Derivative instruments |
|
|
|
|
|
|
|
|
BNDES Projects VI and VII (Comgás) |
87.50% CDI |
|
95,685 |
|
(2,961) |
|
(3,332) |
|
BNDES Project VIII (Comgás) |
82.94% CDI |
|
608,373 |
|
(38,187) |
|
(39,834) |
|
BNDES Project IX (Comgás) |
98.90% CDI |
|
565,582 |
|
12,091 |
|
1,394 |
|
BNDES Project IX - Sub A (Comgás) |
95.55% CDI |
|
306,207 |
|
(9,205) |
|
(14,383) |
|
BNDES Project IX - Sub A (Comgás) |
92.35% CDI |
|
196,598 |
|
(5,798) |
|
(8,929) |
|
BNDES Project IX - Sub B (Comgás) |
98.49% CDI |
|
315,186 |
|
(10,529) |
|
(15,994) |
|
Debenture 4th issue - 3rd series (Comgás) |
112.49% CDI |
|
38,273 |
|
3,204 |
|
3,203 |
|
Debenture 9th issue - 1st series (Comgás) |
109.20% CDI |
|
500,000 |
|
23,252 |
|
5,192 |
|
Debenture 9th issue - 2nd series (Comgás) |
110.60% CDI |
|
500,000 |
|
(21,212) |
|
(39,535) |
|
Debenture 11th issue - 1st series (Comgás) |
100.45% CDI |
|
750,000 |
|
(52,383) |
|
(71,755) |
|
Debenture 11th issue - 2nd series (Comgás) |
99.70% CDI |
|
750,000 |
|
(68,014) |
|
(84,963) |
|
Debenture 12th issue - single series (Comgás) |
95.66% CDI |
|
600,000 |
|
14,532 |
|
10,424 |
|
Debenture 2nd issue - single series (Comgás) |
97.40% CDI |
|
800,000 |
|
4,915 |
|
— |
|
Debenture (Rumo) |
107.00% CDI |
|
120,000 |
|
43,074 |
|
60,419 |
|
Debenture (Rumo) |
103.00% CDI |
|
600,000 |
|
152,987 |
|
130,505 |
|
Total derivatives |
|
|
6,745,904 |
|
45,766 |
|
(67,588) |
| 34 |
Notes to the interim Financial Statements
(In thousands of Reais, except when otherwise indicated)
c) Cash flow hedge
The indirect subsidiary Edge Comercialização S.A. entered into a natural gas sales contract (Brent risk) with a third party and related party. In order to protect and mitigate the risks arising from fluctuations in natural gas indexes, the subsidiary designated this operation subject to hedge accounting for the respective cash flow protection.
The expected benefits of this contract are: reducing the financial risk associated with fluctuations in natural gas prices, avoiding fluctuations in the financial results of hedging instruments, protecting the subsidiary's margins, maintaining predictability in its costs or revenues and ensuring greater stability in operating results.
The indirect subsidiary TRSP Terminal de Regaseificação de São Paulo (“TRSP”) has adopted a hedge accounting strategy to protect its results from exposure to variability in cash flows arising from the exchange rate effects of highly probable revenues in US dollars projected for a period of 20 years, through non-derivative hedging instruments - lease liabilities in US dollars already contracted.
In order to mitigate the effects of exchange rate volatility on future cash flows, the subsidiary Rumo entered into derivative financial instruments in the form of swap transactions and designated cash flow hedges. The hedge relationship was formally designated and documented at the start of the operation, demonstrating that the hedge is effective in offsetting variations in cash flows attributable to exchange rate risk. The effects of this hedge are recognized in equity, under “Other Comprehensive Income”.
The impacts recognized in the equity of subsidiaries and the estimates of realization in equity are shown below:
|
|
|
|
|
|
Change in fair value used to measure hedge ineffectiveness |
Registered value |
|||||||||
|
|
Subsidiary |
Risk |
Unit |
Notional |
March 31, 2025 |
December 31, 2024 |
March 31, 2025 |
December 31, 2024 |
|||||||
|
Financial instruments |
|
|
|
|
|
|
|
|
|||||||
|
Derivative futures |
Edge |
NDF |
BRL |
127,155 |
(3,195) |
— |
(6,245) |
— |
|||||||
|
Leasing |
TRSP |
FX rate |
BRL |
3,679,794 |
— |
— |
(294,584) |
(446,224) |
|||||||
|
Swap exchange rate and interest |
Rumo |
FX rate |
BRL |
644,164 |
— |
— |
(62,967) |
— |
|||||||
|
Total |
|
|
|
4,451,113 |
(3,195) |
— |
(363,796) |
(446,224) |
|||||||
The effect of cash flow hedge on the income statement and other comprehensive income is shown below:
|
|
|
|
|
|
|
Write-offs |
|
Ineffectiveness |
|
|
|||||
|
|
Subsidiary |
Balance as of January 1, 2025 |
|
Other Comprehensive income |
|
Net sales |
Cost of sales |
|
Cost of sales |
Finance results |
|
Balance as of March 31, 2025 |
|||
|
Financial instruments |
|
|
|
|
|
|
|
|
|
|
|
|
|||
|
Derivative futures |
Edge |
— |
|
(9,441) |
|
— |
1,840 |
|
1,356 |
— |
|
(6,245) |
|||
|
Leasing |
TRSP |
(446,224) |
|
146,851 |
|
4,311 |
— |
|
— |
478 |
|
(294,584) |
|||
|
Swap exchange rate and interest |
Rumo |
— |
|
(62,967) |
|
— |
— |
|
— |
— |
|
(62,967) |
|||
|
|
|
(446,224) |
|
74,443 |
|
4,311 |
1,840 |
|
1,356 |
478 |
|
(363,796) |
|||
| 35 |
Notes to the interim Financial Statements
(In thousands of Reais, except when otherwise indicated)
a) Accounts receivable and payable with related parties:
|
|
Parent Company |
|
Consolidated |
||||
|
|
March 31, 2025 |
|
December 31, 2024 |
|
March 31, 2025 | December 31, 2024 | |
|
Current assets |
|
|
|||||
|
Commercial operations |
|
|
|
||||
|
Raízen S.A. |
10,262 |
5,241 |
69,270 |
72,518 | |||
|
Rumo S.A. |
32,113 |
25,706 |
— |
— | |||
|
CLI Sul S.A. |
10 |
10 |
22,785 |
19,458 | |||
|
Cosan Lubrificantes e Especialidades S.A. |
5,893 |
14,164 |
— |
— | |||
|
Compass Gás e Energia S.A. |
18,329 |
18,561 |
— |
— | |||
|
Termag - Terminal Marítimo de Guarujá S.A. |
— |
— |
14,286 |
14,286 | |||
|
Associação Gestora da Ferrovia Interna do Porto de Santos (AG-FIPS) |
— |
— |
48,109 |
36,985 | |||
|
Other |
2,858 |
2,688 |
4,460 |
6,938 | |||
|
|
69,465 |
|
66,370 |
|
158,910 | 150,185 | |
|
Financial and corporate operations |
|
|
|
||||
|
Raízen S.A. |
17,314 |
45,173 |
17,315 |
45,173 | |||
|
Cosan Lubrificantes e Especialidades S.A. |
5,391 |
— |
— |
— | |||
|
Brado Logística S.A. |
52,356 |
— |
52,356 |
— | |||
|
Cosan Luxembourg S.A. |
2,556 |
2,556 |
— |
— |
|||
|
Other |
— |
— |
3,972 |
1,705 | |||
|
|
77,617 |
|
47,729 |
|
73,643 | 46,878 | |
|
Total current assets |
147,082 |
|
114,099 |
|
232,553 | 197,063 | |
|
|
|
|
|||||
|
Non-current assets |
|
|
|||||
|
Commercial operations |
|
|
|||||
|
Termag - Terminal Marítimo de Guarujá S.A. |
— |
— |
17,857 |
21,438 | |||
|
|
— |
|
— |
|
17,857 | 21,438 | |
|
Financial and corporate operations |
|
|
|
||||
|
Raízen S.A. |
25,649 |
28,864 |
35,718 |
26,920 | |||
|
Cosan Lubrificantes e Especialidades S.A. |
94,938 |
109,550 |
— |
— | |||
|
Ligga S.A. |
78,535 |
154,468 |
78,535 |
154,468 | |||
|
|
199,122 |
|
292,882 |
|
114,253 | 181,388 | |
|
Total non-current assets |
199,122 |
|
292,882 |
|
132,110 | 202,826 | |
|
Related parties receivables |
346,204 |
|
406,981 |
|
364,663 | 399,889 | |
Notes to the interim Financial Statements
(In thousands of Reais, except when otherwise indicated)
| Parent Company | Consolidated |
||||||
| March 31, 2025 | December 31, 2024 | March 31, 2025 | December 31, 2024 | ||||
|
Current liabilities |
|
|
|||||
|
Commercial operations |
|
|
|||||
|
Raízen S.A. |
10,513 |
|
8,176 |
349,606 |
|
303,656 |
|
|
Termag - Terminal Marítimo de Guarujá S.A. |
— |
|
— |
1,305 |
|
8,149 |
|
|
Associação Gestora da Ferrovia Interna do Porto de Santos (AG-FIPS) |
— |
|
— |
20,092 |
|
45,119 |
|
|
Other |
508 |
|
64 |
1,797 |
|
1,932 |
|
|
|
11,021 |
|
8,240 |
372,800 | 358,856 | ||
|
Financial and corporate operations |
|
|
|||||
|
Raízen S.A. |
59,997 |
|
56,478 |
61,293 |
|
57,554 |
|
|
Cosan Overseas Limited |
37,104 |
|
40,012 |
— |
|
— |
|
|
Cosan Luxembourg S.A. |
18,035 |
|
105,890 |
— |
|
— |
|
|
|
115,136 |
|
202,380 |
61,293 | 57,554 | ||
|
Total current liabilities |
126,157 |
|
210,620 |
434,093 | 416,410 | ||
|
Non-current liabilities |
|
|
|||||
|
Financial and corporate operations |
|
|
|||||
|
Cosan Lubrificantes e Especialidades S.A. |
623,444 |
|
591,491 |
— |
|
— |
|
|
Cosan Luxembourg S.A. |
2,095,903 |
|
3,342,012 |
— |
|
— |
|
|
Cosan Overseas Limited |
2,891,198 |
|
3,117,823 |
— |
|
— |
|
|
Raízen S.A. |
1,078 |
|
1,078 |
1,078 |
|
1,078 |
|
|
Total non-current liabilities |
5,611,623 |
|
7,052,404 |
1,078 | 1,078 | ||
|
Payables to related parties |
5,737,780 |
|
7,263,024 |
435,171 | 417,488 | ||
b) Transactions with related parties:
|
|
Parent Company |
Consolidated |
|||||
|
|
Period of three months ended March 31, |
||||||
|
|
2025 |
|
2024 |
|
2025 |
|
2025 |
|
Operating income |
|
|
|
|
|
|
|
|
Raízen S.A. |
— |
|
— |
|
133,069 |
|
255,396 |
|
CLI Sul S.A. |
— |
|
— |
|
3,663 |
|
4,346 |
|
|
— |
|
— |
|
136,732 |
|
259,742 |
|
Purchase of goods / inputs / services |
|
|
|
|
|
|
|
|
Raízen S.A. |
(30) |
|
— |
|
(507,627) |
|
(522,714) |
|
Termag - Terminal Marítimo de Guarujá S.A. |
— |
|
— |
|
(1,250) |
|
— |
|
|
(30) |
|
— |
|
(508,877) |
|
(522,714) |
|
Shared income (expenses) |
|
|
|
|
|
|
|
|
Compass Gás e Energia S.A. |
9,024 |
|
(2) |
|
— |
|
— |
|
Companhia de Gás de São Paulo - COMGÁS |
14 |
|
8,683 |
|
— |
|
— |
|
Comercializadora S/A |
— |
|
14 |
|
— |
|
— |
|
Cosan Lubrificantes e Especialidades S.A. |
3,092 |
|
1,597 |
|
— |
|
— |
|
Raízen S.A. |
481 |
|
(866) |
|
(24,285) |
|
(20,164) |
|
Rumo S.A. |
16,932 |
|
1,484 |
|
— |
|
— |
|
Associação Gestora da Ferrovia Interna do Porto de Santos (AG-FIPS) |
— |
|
— |
|
(25,124) |
|
(25,652) |
|
Other |
2 |
|
(15) |
|
2 |
|
(15) |
|
|
29,545 |
|
10,895 |
|
(49,407) |
|
(45,831) |
|
Finance result |
|
|
|
|
|
|
|
|
Cosan Luxembourg S.A. |
163,816 |
|
(155,597) |
|
— |
|
— |
|
Cosan Overseas Limited |
168,990 |
|
(130,249) |
|
— |
|
— |
|
Raízen S.A. |
(10,507) |
|
— |
|
(10,507) |
|
— |
|
Moove Lubrificantes Limited |
(5) |
|
— |
|
— |
|
— |
|
Aldwych Temple Venture Capital Limited |
5,171 |
|
— |
|
5,171 |
|
— |
|
|
327,465 |
|
(285,846) |
|
(5,336) |
|
— |
|
Total |
356,980 |
|
(274,951) |
|
(426,888) |
|
(308,803) |
Notes to the interim Financial Statements
(In thousands of Reais, except when otherwise indicated)
c) Managers’ and directors’ compensation:
|
|
Parent Company |
|
Consolidated |
||||
|
|
Period of three months ended March 31, |
||||||
|
|
2025 |
|
2024 |
|
2025 |
|
2024 |
|
Short-term benefits to employees and directors |
9,446 |
|
8,725 |
|
39,992 |
|
30,643 |
|
Share-based compensation |
3,351 |
|
13,868 |
|
7,632 |
|
18,915 |
|
Post-employment benefits |
54 |
|
129 |
|
602 |
|
538 |
|
Employment termination benefits |
— |
|
1,645 |
|
— |
|
1,645 |
|
Other long-term benefits |
— |
|
— |
|
486 |
|
890 |
|
|
12,851 |
|
24,367 |
|
48,712 |
|
52,631 |
|
|
Parent Company |
|
Consolidated |
||||
|
|
March 31, 2024 |
|
December 31, 2024 |
|
March 31, 2025 |
|
December 31, 2024 |
|
Material and services suppliers |
1,304 |
|
2,744 |
|
2,713,926 |
|
4,205,516 |
|
Natural gas / transport and logistics suppliers |
— |
|
156 |
|
1,192,176 |
|
982,333 |
|
|
1,304 |
|
2,900 |
|
3,906,102 |
|
5,187,849 |
|
|
|
|
|
|
|
|
|
|
Current |
1,304 |
|
2,900 |
|
3,886,590 |
|
5,168,593 |
|
Non-current |
— |
|
— |
|
19,512 |
|
19,256 |
|
Total |
1,304 |
|
2,900 |
|
3,906,102 |
|
5,187,849 |
All resulting fair value estimates are included in level 2, except for contingent consideration payables for which fair values have been determined using present values and discount rates adjusted for counterparty or own credit risk.
The carrying amounts and fair value of consolidated assets and liabilities are as follows:
|
|
|
|
Carrying amount |
|
Assets and liabilities measured at fair value |
||||||||||||
|
|
|
|
March 31, 2025 |
|
December 31, 2024 |
|
March 31, 2025 |
|
December 31, 2024 |
||||||||
|
|
Note |
|
|
|
|
|
Level 1 |
|
Level 2 |
|
Level 3 |
|
Level 1 |
|
Level 2 |
|
Level 3 |
|
Assets |
|
|
|
|
|
|
|
|
|
|
|
|
|
|
|
|
|
|
Investment funds |
5.1 |
|
746,406 |
|
2,122,442 |
|
— |
|
746,406 |
|
— |
|
— |
|
2,122,442 |
|
— |
|
Marketable securities |
|
|
3,180,365 |
|
3,386,301 |
|
242,036 |
|
2,938,329 |
|
— |
|
— |
|
3,386,301 |
|
— |
|
Other financial assets |
|
|
4,648 |
|
4,495 |
|
4,648 |
|
— |
|
— |
|
4,495 |
|
— |
|
— |
|
Investment properties (i) |
|
|
16,824,078 |
|
16,818,919 |
|
— |
|
— |
|
16,824,078 |
|
— |
|
— |
|
16,818,919 |
|
Derivate financial instruments |
5.3 |
|
2,091,038 |
|
3,799,328 |
|
— |
|
2,091,038 |
|
— |
|
— |
|
3,799,328 |
|
— |
|
Total |
|
|
22,846,535 |
|
26,131,485 |
|
246,684 |
|
5,775,773 |
|
16,824,078 |
|
4,495 |
|
9,308,071 |
|
16,818,919 |
|
Liabilities |
|
|
|
|
|
|
|
|
|
|
|
|
|
|
|
|
|
|
Loans, financing and debentures (ii) |
5.2 |
|
(26,468,219) |
|
(28,294,034) |
|
— |
|
(26,468,219) |
|
— |
|
— |
|
(28,294,034) |
|
— |
|
Derivative financial instruments |
5.3 |
|
(2,379,863) |
|
(3,470,204) |
|
— |
|
(2,379,863) |
|
— |
|
— |
|
(3,470,204) |
|
— |
|
Total |
|
|
(28,848,082) |
|
(31,764,238) |
|
— |
|
(28,848,082) |
|
— |
|
— |
|
(31,764,238) |
|
— |
Notes to the interim Financial Statements
(In thousands of Reais, except when otherwise indicated)
| (i) | The fair value of investment properties was determined using the direct comparative method of market data applied to transactions involving similar properties (type, location, and quality of property) and, to a lesser extent, sales quotes for potential transactions involving comparable assets (level 3). The methodology used to determine fair value incorporates direct comparisons of market information, such as market research, homogenization of values, spot market prices, sales, distances, facilities, access to land, topography and soil, land use (crop type), and rainfall, among other data, in accordance with the standards issued by the Brazilian Association of Technical Standards (Associação Brasileira de Normas Técnicas ("ABNT"). The discount rates used vary between 6.06% p.a. and 10.40% p.a. on March 31, 2025 and December 31, 2024. |
| (ii) | The fair value of loans measured at amortized cost does not differ significantly from their carrying value. |
For debts that have a market value quoted on the Luxembourg Stock Exchange (LuxSE), the fair value measurement is based on the quoted market price as follows:
|
Debt |
|
Company |
|
March 31, 2025 |
|
December 31, 2024 |
|
Senior Notes 2028 |
|
Rumo Luxembourg |
|
98.37% |
|
97.32% |
|
Senior Notes 2032 |
|
Rumo Luxembourg |
|
88.57% |
|
84.30% |
|
Senior Notes 2027 (i) |
|
Cosan Luxembourg S.A. |
|
- |
|
99.63% |
a) Market Risk
Foreign exchange risk
The Company had the following net exposure to foreign exchange variation on assets and liabilities denominated in US Dollars, Euros, and Pound Sterling:
|
|
March 31, 2025 |
|
December 31, 2024 |
|
Cash and cash equivalents |
1,274,128 |
|
1,861,070 |
|
Trade and Other receivables |
17,915 |
|
35,807 |
|
Trade payables |
(492,799) |
|
(691,312) |
|
Loans, borrowings and debentures |
(16,440,689) |
|
(24,263,167) |
|
Leases |
(1,966,115) |
|
(2,121,304) |
|
Consideration payable |
(173,746) |
|
(246,256) |
|
Derivative financial instruments (notional) |
15,256,326 |
|
22,576,441 |
|
Foreign exchange exposure, net |
(2,524,980) |
|
(2,848,721) |
The probable scenario considers the estimated foreign exchange rates, carried out by a specialized third party at the maturity of transactions for companies with real functional currency (positive and negative, before tax effects), as follows:
|
|
|
|
|
|
|
Scenarios |
||||||
|
Instrument |
|
Risk factor |
|
Probable |
|
25% |
|
50% |
|
(25%) |
|
(50%) |
|
Cash and cash equivalents |
|
Low FX rate |
|
869,863 |
|
1,053,329 |
|
1,250.663 |
|
658,663 |
|
461,329 |
|
Trade payables |
|
High FX rate |
|
(88) |
|
(493) |
|
(898) |
|
317 |
|
722 |
|
Derivative financial instruments |
|
Low FX rate |
|
890,672 |
|
1,972,814 |
|
3,020,850 |
|
(123,167) |
|
(1,171,203) |
|
Loans, borrowings and debentures |
|
High FX rate |
|
(1,162,567) |
|
(2,250,605) |
|
(3,576,983) |
|
401,240 |
|
1,727,347 |
|
Leases |
|
High FX rate |
|
(1,978,460) |
|
(2,498,190) |
|
(3,017,919) |
|
(1,458,731) |
|
(939,003) |
|
Consideration payable |
|
High FX rate |
|
(9,968) |
|
(25,099) |
|
(40,230) |
|
5,163 |
|
20,293 |
|
Impacts on profit or loss before tax |
|
|
|
545,197 |
|
547,338 |
|
253,960 |
|
1,133,287 |
|
1,426,392 |
|
Impacts on comprehensive income |
|
|
|
(1,935,745) |
|
(2,295,582) |
|
(2,618,477) |
|
(1,649,802) |
|
(1,326,907) |
Notes to the interim Financial Statements
(In thousands of Reais, except when otherwise indicated)
|
|
|
Exchange rate sensitivity analysis |
||||||||||
|
|
|
March 31, 2025 |
|
Scenarios |
||||||||
|
|
|
|
Probable |
|
25% |
|
50% |
|
(25%) |
|
(50%) |
|
|
U.S.$ |
|
5.7422 |
|
6.0716 |
|
7.5896 |
|
9.1075 |
|
4.5537 |
|
3.0358 |
|
Euro |
|
6.1993 |
|
6.4967 |
|
8.1208 |
|
9.7450 |
|
4.8725 |
|
3.2483 |
|
GBP |
|
7.4046 |
|
7.7717 |
|
9.7146 |
|
11.6576 |
|
5.8288 |
|
3.8859 |
Interest rate risk
Below is a sensitivity analysis of interest rates on loans and financing and financial assets linked to the CDI rate with 25% and 50% pre-tax increases and decreases:
|
|
|
|
|
Scenarios |
||||||
|
Interest rate exposure |
|
Probable |
|
25% |
|
50% |
|
(25%) |
|
(50%) |
|
Cash and cash equivalents |
|
4,558,299 |
|
5,066,459 |
|
5,563,620 |
|
4,073,740 |
|
3,577,375 |
|
Marketable securities |
|
1,544,016 |
|
1,637,413 |
|
1,740,319 |
|
1,431,737 |
|
1,328,899 |
|
Restricted cash |
|
160,567 |
|
170,744 |
|
180,937 |
|
150,389 |
|
140,212 |
|
Lease and concession in installments |
|
(162,246) |
|
(220,356) |
|
(238,447) |
|
(124,156) |
|
(86,143) |
|
Leases liabilities |
|
(1,052,629) |
|
(1,205,703) |
|
(1,357,014) |
|
(901,323) |
|
(748,256) |
|
Derivative financial instruments |
|
(1,948,172) |
|
(2,729,108) |
|
(3,386,075) |
|
(1,253,584) |
|
(397,443) |
|
Loans, borrowings and debentures |
|
(17,660,202) |
|
(19,170,114) |
|
(20,169,284) |
|
(16,703,878) |
|
(15,718,670) |
|
Other financial liabilities |
|
(750,452) |
|
(783,258) |
|
(816,093) |
|
(717,646) |
|
(684,840) |
|
Impacts on the income (loss) before taxes |
|
(15,310,819) |
|
(17,233,923) |
|
(18,482,037) |
|
(14,044,721) |
|
(12,588,866) |
Part of the amount shown under derivative financial instruments corresponds to the Total Return Swap (TRS):
|
|
|
|
|
Scenarios |
||||||
|
Interest rate exposure |
|
Probable |
|
25% |
|
50% |
|
(25%) |
|
(50%) |
|
Derivative financial instruments |
|
(144) |
|
(26) |
|
(32) |
|
(16) |
|
(11) |
The probable scenario considers the estimated interest rate, made by a specialized third party and the Central Bank of Brazil (Banco Central do Brasil or “BACEN”) as follows:
|
|
|
|
|
Scenarios |
||||||
|
|
|
Probable |
|
25% |
|
50% |
|
(25%) |
|
(50%) |
|
SELIC |
|
14.75% |
|
18.44% |
|
22.13% |
|
11.06% |
|
7.38% |
|
CDI |
|
14.65% |
|
18.31% |
|
21.98% |
|
10.99% |
|
7.33% |
|
TJLP462 (TJLP + 1% p.a.) |
|
9.60% |
|
11.75% |
|
13.90% |
|
7.45% |
|
5.30% |
|
TJLP |
|
8.60% |
|
10.75% |
|
12.90% |
|
6.45% |
|
4.30% |
|
IPCA |
|
4.58% |
|
5.73% |
|
6.87% |
|
3.44% |
|
2.29% |
|
IGPM |
|
6.35% |
|
7.94% |
|
9.53% |
|
4.76% |
|
3.18% |
|
Fed Funds |
|
4.00% |
|
5.00% |
|
6.00% |
|
3.00% |
|
2.00% |
|
SOFR |
|
3.88% |
|
4.85% |
|
5.82% |
|
2.91% |
|
1.94% |
Notes to the interim Financial Statements
(In thousands of Reais, except when otherwise indicated)
Price risk
|
|
|
|
|
|
|
Scenarios |
||||||
|
Instrument |
|
Interest |
|
Probable |
|
25% |
|
50% |
|
(25%) |
|
(50%) |
|
Brent Derivatives – options |
|
Price U.S.$ / bbl |
|
(16,856) |
|
32,255 |
|
81,365 |
|
(65,966) |
|
(115,077) |
|
|
|
|
|
Scenarios |
||||||||
|
Instrument |
|
Interest |
|
Probable |
|
25% |
|
50% |
|
(25%) |
|
(50%) |
|
VALE3 (Call Spread) |
|
1.34% |
|
72,097 |
|
292,924 |
|
550,779 |
|
30,284 |
|
4,395 |
Call Option (“Call”)
The Company has a call option which gives it the right to repurchase all the preferred shares of Cosan Nove and Cosan Dez, which may be exercised as of the third year after the execution of the respective agreements in December 2022.
As of March 31, 2025, the Company measured the fair value of the call option and concluded that it is out of price.
Contingent put option
In the shareholders' agreements entered into between the Company and the banks Itaú and Bradesco regarding the issuance of preferred shares, it was defined that both financial institutions have a contingent put option only when the specific adverse material effects provided for in the contract occur, which are under the Company's control and, therefore, do not constitute a financial obligation.
The prices for the exercise of the options are calculated based on the initial amounts adjusted by a weighted average rate of CDI + 0.60% minus the dividends received by non-controlling shareholders in this period, which, on March 31, 2025, is represented by the amounts of R$2,240,312 and R$3,760,860, respectively.
We are exposed to risks linked to CSAN3 share prices. To mitigate such exposures, total return swap derivatives of 106,695,312 shares of CSAN3 were contracted in which the Company receives the variation of the share price and proceeds on the active side and pays CDI + 0.97% on the passive side.
The sensitivity analysis considers the closing share price as shown below:
|
|
|
|
|
Scenarios |
||||||
|
Instrument |
|
Probable |
|
25% |
|
50% |
|
(25%) |
|
(50%) |
|
Net exposure options |
|
(183,515) |
|
197,120 |
|
394,239 |
|
(197,120) |
|
(394,239) |
|
Value of the share (CSAN3) |
|
7.39 |
|
9.24 |
|
11.09 |
|
5.54 |
|
3.70 |
Notes to the interim Financial Statements
(In thousands of Reais, except when otherwise indicated)
b) Credit risk
The Company's regular operations expose it to the risk of default when customers, suppliers, and counterparties are unable to fulfill their financial commitments or other obligations. The credit risk exposure was as follows:
|
|
March 31, 2025 |
|
December 31, 2024 |
|
Cash and cash equivalents |
14,809,083 |
|
16,903,542 |
|
Trade receivables |
4,362,082 |
|
3,995,734 |
|
Marketable securities |
2,938,329 |
|
3,386,301 |
|
Restricted cash |
286,321 |
|
174,303 |
|
Derivative financial instruments |
2,091,038 |
|
3,799,328 |
|
Receivables from related parties |
364,663 |
|
399,889 |
|
Receivable dividends and interest on equity |
33,621 |
|
153,548 |
|
Other financial assets |
4,648 |
|
4,495 |
|
|
24,889,785 |
|
28,817,140 |
The Company is exposed to risks related to its cash management activities and temporary investments.
The credit risk of cash and cash equivalents, marketable securities, restricted cash, and derivative financial instruments is determined by widely accepted market rating instruments and is structured as follows:
|
|
March 31, 2025 |
|
December 31, 204 |
|
AAA |
19,759,567 |
|
22,706,407 |
|
AA |
208,684 |
|
803,935 |
|
A |
— |
|
571,942 |
|
Not rated |
156,520 |
|
181,190 |
|
|
20,124,771 |
|
24,263,474 |
c) Liquidity risk
The Company's financial liabilities (based on contracted undiscounted cash flows) are categorized by maturity dates as follows:
|
|
March 31, 2025 |
|
December 31, 2024 |
||||||||
|
|
Up to 1 year |
|
From 1 to 2 years |
|
From 3 to 5 years |
|
Over 5 years |
|
Total |
|
Total |
|
Loans, borrowings and debentures |
(3,016,608) |
|
(2,864,976) |
|
(24,596,068) |
|
(39,577,990) |
|
(70,055,642) |
|
(64,570,345) |
|
Trade payables |
(3,886,590) |
|
(19,512) |
|
— |
|
— |
|
(3,906,102) |
|
(10,670,813) |
|
Other financial liabilities |
(825,269) |
|
(153,371) |
|
— |
|
— |
|
(978,640) |
|
(770,103) |
|
Installment of tax debts |
(170,781) |
|
(531) |
|
— |
|
(218,882) |
|
(390,194) |
|
(454,885) |
|
Leases |
(827,466) |
|
(660,886) |
|
(848,770) |
|
(16,977,304) |
|
(19,314,426) |
|
(20,948,336) |
|
Lease and concession in installments |
(280,134) |
|
(276,142) |
|
(545,107) |
|
(182,103) |
|
(1,283,486) |
|
(1,281,108) |
|
Payables to related parties |
(434,093) |
|
(1,078) |
|
— |
|
— |
|
(435,171) |
|
(416,410) |
|
Dividends payable |
(55,086) |
|
— |
|
— |
|
— |
|
(55,086) |
|
(96,722) |
|
Consideration payable |
(10,837) |
|
(10,837) |
|
(21,673) |
|
(131,438) |
|
(174,785) |
|
(185,622) |
|
Derivative financial instruments |
(2,468,890) |
|
(2,035,154) |
|
816,131 |
|
10,802,606 |
|
7,114,693 |
|
6,528,439 |
| Sectorial financial liabilities | (67,001) | — | — | — | (67,001) | (64,718) | |||||
|
|
(12,042,755) |
|
(6,022,487) |
|
(25,195,487) |
|
(46,285,111) |
|
(89,545,840) |
|
(92,930,623) |
Notes to the interim Financial Statements
(In thousands of Reais, except when otherwise indicated)
The Company's subsidiaries are listed below:
|
|
|
|
|
|
|
March 31, 2025 |
|
December 31, 2024 |
|
Directly owned subsidiaries excluding treasury shares |
|
|
|
|
Cosan Corporate |
|
|
|
|
Cosan Corretora de Seguros Ltda |
100.00% |
|
100.00% |
|
Cosan Nove Participações S.A. |
87.27% |
|
73.09% |
|
Cosan Luxembourg S.A. (i) |
100.00% |
|
100.00% |
|
Cosan Overseas Limited |
100.00% |
|
100.00% |
|
Pasadena Empreendimentos e Participações S.A. |
100.00% |
|
100.00% |
|
Cosan Limited Partners Brasil Consultoria Ltda. |
98.13% |
|
98.13% |
|
Barrapar Participaçoes Ltda. |
100.00% |
|
100.00% |
|
Aldwych Temple |
100.00% |
|
100.00% |
|
Cosan Global Limited |
100.00% |
|
100.00% |
|
Cosan Dez Participações S.A. |
76.80% |
|
76.80% |
|
Radar |
|
|
|
|
Radar Propriedades Agrícolas S.A. |
50.00% |
|
50.00% |
|
Radar II Propriedades Agrícolas S.A. |
50.00% |
|
50.00% |
|
Nova Agrícola Ponte Alta S.A. |
50.00% |
|
50.00% |
|
Nova Amaralina S.A. Propriedades Agrícolas |
50.00% |
|
50.00% |
|
Nova Santa Bárbara Agrícola S.A. |
50.00% |
|
50.00% |
|
Terras da Ponta Alta S.A. |
50.00% |
|
50.00% |
|
Castanheira Propriedades Agrícolas S.A. |
50.00% |
|
50.00% |
|
Manacá Propriedades Agrícolas S.A. |
50.00% |
|
50.00% |
|
Paineira Propriedades Agrícolas S.A. |
50.00% |
|
50.00% |
|
Tellus Brasil Participações S.A. |
20.00% |
|
20.00% |
|
Janus Brasil Participações S.A. |
20.00% |
|
20.00% |
|
Duguetiapar Empreendimentos e Participações S.A. |
20.00% |
|
20.00% |
|
Gamiovapar Empreendimentos e Participações S.A. |
20.00% |
|
20.00% |
|
Moove |
|
|
|
|
Moove Lubricants Holdings |
70.00% |
|
70.00% |
|
Rumo |
|
|
|
|
Rumo S.A. |
30.39% |
|
30.40% |
| (i) | On March 31, 2025, the subsidiary Cosan Luxembourg S.A. reported an uncovered liability of R$346,975, as detailed below. However, no other events or conditions have been identified that, individually or collectively, may raise significant doubts about its ability to continue as a going concern. The subsidiaries rely on the financial support of the Company. |
Notes to the interim Financial Statements
(In thousands of Reais, except when otherwise indicated)
The following are investments in subsidiaries and affiliates as of March 31, 2025, which are material to the Company:
a) Parent company
|
|
Shares issued by the subsidiary |
|
Shares held by Cosan |
|
Cosan ownership interest |
|
Economic benefit (%) |
|
Cosan Corporate |
|
|
|
|
|
|
|
|
Cosan Corretora de Seguros Ltda. |
5,000 |
|
4,999 |
|
100.00% |
|
100.00% |
|
Cosan Nove Participações S.A. |
7,663,761,736 |
|
6,688,357,663 |
|
87.27% |
|
66.16% |
|
Cosan Luxembourg S.A. |
500,010 |
|
500,010 |
|
100.00% |
|
100.00% |
|
Cosan Overseas Limited |
4,850,000 |
|
4,850,000 |
|
100.00% |
|
100.00% |
|
Pasadena Empreendimentos e Participações S.A. |
41,481,296 |
|
41,481,046 |
|
100.00% |
|
100.00% |
|
Cosan Limited Partners Brasil Consultoria Ltda. |
160,000 |
|
157,000 |
|
98.13% |
|
98.13% |
|
Cosan Global Limited |
1,300 |
|
1,300 |
|
100.00% |
|
100.00% |
|
Cosan Dez Participações S.A. |
3,473,458,688 |
|
2,667,494,859 |
|
76.80% |
|
72.00% |
|
Radar |
|
|
|
|
|
|
|
|
Radar Propriedades Agrícolas S.A. |
737,500 |
|
305,694 |
|
41.45% |
|
41.45% |
|
Radar II Propriedades Agrícolas S.A. |
81,440,221 |
|
40,720,111 |
|
50.00% |
|
50.00% |
|
Nova Agrícola Ponte Alta S.A. |
160,693,378 |
|
66,607,405 |
|
41.45% |
|
41.45% |
|
Nova Amaralina S.A. Propriedades Agrícolas |
30,603,159 |
|
12,685,010 |
|
41.45% |
|
41.45% |
|
Nova Santa Bárbara Agrícola S.A. |
32,336,994 |
|
13,403,684 |
|
41.45% |
|
41.45% |
|
Terras da Ponte Alta S.A. |
16,066,329 |
|
6,659,494 |
|
41.45% |
|
41.45% |
|
Castanheira Propriedades Agrícolas S.A. |
83,850,938 |
|
34,756,214 |
|
41.45% |
|
41.45% |
|
Manacá Propriedades Agrícolas S.A. |
126,200,853 |
|
52,310,254 |
|
41.45% |
|
41.45% |
|
Paineira Propriedade Agrícolas S.A. |
132,667,061 |
|
54,990,497 |
|
41.45% |
|
41.45% |
|
Tellus Brasil Participações S.A. |
106,907,867 |
|
64,243,260 |
|
60.09% |
|
19.57% |
|
Janus Brasil Participações S.A. |
286,370,051 |
|
173,464,883 |
|
60.57% |
|
19.57% |
|
Duguetiapar Empreendimentos e Participações S.A. |
3,573,842 |
|
2,163,979 |
|
60.55% |
|
19.57% |
|
Gamiovapar Empreendimentos e Participações S.A. |
12,132,621 |
|
7,346,670 |
|
60.55% |
|
19.57% |
|
Moove |
|
|
|
|
|
|
|
|
Moove Lubricants Holdings |
34,963,764 |
|
24,474,635 |
|
70.00% |
|
70.00% |
|
Rumo |
|
|
|
|
|
|
|
|
Rumo S.A. |
1,854,868,949 |
|
562,529,490 |
|
30.39% |
|
30.39% |
Notes to the interim Financial Statements
(In thousands of Reais, except when otherwise indicated)
|
|
Balance as of January 1, 2025 |
|
Profit attributable to non-controlling interests |
|
Capital increase |
|
Change of equity interest in subsidiary |
|
Other comprehensive income |
|
Dividends |
|
Purchase of a shareholding |
|
Incorporation of subsidiary |
|
Other |
|
Balance as of March 31, 2025 |
|
Dividend receivable (i) |
|
Cosan Corporate |
|
|
|
|
|
|
|
|
|
|
|
|
|
|
|
|
|
|
|
|
|
|
Cosan Corretora de Seguros Ltda. |
3,333 |
|
126 |
|
— |
|
— |
|
— |
|
— |
|
— |
|
— |
|
— |
|
3,459 |
|
— |
|
Cosan Nove Participações S.A. |
7,153,309 |
|
(666,513) |
|
331,000 |
|
(975,073) |
|
71,615 |
|
— |
|
2,169,000 |
|
— |
|
(83,297) |
|
8,000,041 |
|
— |
|
Cosan Dez Participações S.A. |
3,366,248 |
|
249,973 |
|
— |
|
— |
|
39,092 |
|
— |
|
— |
|
— |
|
— |
|
3,655,313 |
|
11,718 |
|
Pasadena Empreendimentos e Participações S.A. |
(251) |
|
(78) |
|
— |
|
— |
|
— |
|
— |
|
— |
|
— |
|
329 |
|
— |
|
— |
|
Cosan Limited Partners Brasil Consultoria Ltda. |
218 |
|
(354) |
|
— |
|
— |
|
— |
|
— |
|
— |
|
— |
|
— |
|
(136) |
|
— |
|
Cosan Oito S.A. |
9,601,259 |
|
— |
|
— |
|
— |
|
18,322 |
|
— |
|
— |
|
(9,619,581) |
|
— |
|
— |
|
— |
|
Cosan Global |
129,764 |
|
(15,569) |
|
— |
|
— |
|
— |
|
— |
|
— |
|
— |
|
— |
|
114,195 |
|
— |
|
Other |
31,413 |
|
(754) |
|
— |
|
— |
|
(1,243) |
|
— |
|
— |
|
— |
|
— |
|
29,416 |
|
— |
|
Radar |
|
|
|
|
|
|
|
|
|
|
|
|
|
|
|
|
|
|
|
|
|
|
Radar II Propriedades Agrícolas S.A. |
1,241,246 |
|
6,998 |
|
— |
|
— |
|
— |
|
(938) |
|
— |
|
— |
|
— |
|
1,247,306 |
|
— |
|
Radar Propriedades Agrícolas S.A. |
266,250 |
|
74 |
|
— |
|
— |
|
— |
|
— |
|
— |
|
— |
|
— |
|
266,324 |
|
— |
|
Nova Agrícola Ponte Alta S.A. |
455,407 |
|
2,627 |
|
— |
|
— |
|
— |
|
(829) |
|
— |
|
— |
|
— |
|
457,205 |
|
— |
|
Nova Santa Bárbara Agrícola S.A. |
35,942 |
|
458 |
|
— |
|
— |
|
— |
|
— |
|
— |
|
— |
|
— |
|
36,400 |
|
1,960 |
|
Nova Amaralina S.A. Propriedades Agrícolas |
229,289 |
|
1,401 |
|
— |
|
— |
|
— |
|
— |
|
— |
|
— |
|
— |
|
230,690 |
|
133 |
|
Terras da Ponte Alta S.A. |
98,121 |
|
1,459 |
|
— |
|
— |
|
— |
|
— |
|
— |
|
— |
|
— |
|
99,580 |
|
— |
|
Paineira Propriedades Agrícolas S.A. |
231,839 |
|
1,808 |
|
— |
|
— |
|
— |
|
(1,658) |
|
— |
|
— |
|
— |
|
231,989 |
|
— |
|
Manacá Propriedades Agrícolas S.A. |
226,538 |
|
1,750 |
|
— |
|
— |
|
— |
|
(1,036) |
|
— |
|
— |
|
— |
|
227,252 |
|
— |
|
Castanheira Propriedades Agrícolas S.A. |
325,220 |
|
431 |
|
— |
|
— |
|
— |
|
— |
|
— |
|
— |
|
— |
|
325,651 |
|
— |
|
Tellus Brasil Participações S.A. |
767,096 |
|
4,689 |
|
— |
|
— |
|
— |
|
(1,566) |
|
— |
|
— |
|
— |
|
770,219 |
|
5 |
|
Janus Brasil Participações S.A. |
1,198,363 |
|
10,220 |
|
— |
|
— |
|
— |
|
(8,084) |
|
— |
|
— |
|
— |
|
1,200,499 |
|
2 |
|
Duguetiapar Empreendimentos e Participações S.A. |
735 |
|
16 |
|
— |
|
— |
|
— |
|
— |
|
— |
|
— |
|
— |
|
751 |
|
— |
|
Gamiovapar Empreendimentos e Participações S.A. |
143,697 |
|
584 |
|
— |
|
— |
|
— |
|
— |
|
— |
|
— |
|
— |
|
144,281 |
|
— |
|
Moove |
|
|
|
|
|
|
|
|
|
|
|
|
|
|
|
|
|
|
|
|
|
|
Moove Lubricants Holdings |
1,325,556 |
|
21,018 |
|
— |
|
— |
|
(28,203) |
|
— |
|
— |
|
— |
|
— |
|
1,318,371 |
|
368 |
|
Other |
460 |
|
7 |
|
— |
|
— |
|
(44) |
|
— |
|
— |
|
— |
|
— |
|
423 |
|
— |
|
Rumo |
|
|
|
|
|
|
|
|
|
|
|
|
|
|
|
|
|
|
|
|
|
|
Rumo S.A. |
4,477,644 |
|
(30,354) |
|
— |
|
(127) |
|
(12,739) |
|
— |
|
— |
|
— |
|
2,877 |
|
4,437,301 |
|
— |
|
Total investments in subsidiaries |
31,308,696 |
|
(409,983) |
|
331,000 |
|
(975,200) |
|
86,800 |
|
(14,111) |
|
2,169,000 |
|
(9,619,581) |
|
(80,091) |
|
22,796,530 |
|
14,186 |
|
Cosan Corporate |
|
|
|
|
|
|
|
|
|
|
|
|
|
|
|
|
|
|
|
|
|
|
Pasadena Empreendimentos e Participações S.A. |
— |
|
— |
|
— |
|
— |
|
— |
|
— |
|
— |
|
— |
|
(329) |
|
(329) |
|
— |
|
Cosan Luxembourg S.A. |
(263,722) |
|
(83,253) |
|
— |
|
— |
|
— |
|
— |
|
— |
|
— |
|
— |
|
(346,975) |
|
— |
|
Total provision for uncovered liability of subsidiary |
(263,722) |
|
(83,253) |
|
— |
|
— |
|
— |
|
— |
|
— |
|
— |
|
(329) |
|
(347,304) |
|
— |
|
Total |
31,044,974 |
|
(493,236) |
|
331,000 |
|
(975,200) |
|
86,800 |
|
(14,111) |
|
2,169,000 |
|
(9,619,581) |
|
(80,420) |
|
22,449,226 |
|
14,186 |
(i) Dividends receivable by Cosan S.A. from its subsidiaries.
Notes to the interim Financial Statements
(In thousands of Reais, except when otherwise indicated)
(b) Consolidated
|
|
Number of shares of the investee |
Investor's shares |
Equity stake |
||
|
|
|||||
|
Rumo |
|
|
|
||
|
Rhall Terminais Ltda. |
28,580 |
8,574 |
30.00% |
||
|
Termag - Terminal Marítimo de Guarujá S.A. |
500,000 |
99,250 |
20.00% |
||
|
TGG - Terminal de Granéis do Guarujá S.A. |
500,000 |
50,000 |
10.00% |
||
|
CLI Sul S.A. |
543,750,625 |
108,750,125 |
20.00% |
||
|
Terminal Multimodal de Grãos e Fertilizantes S.A. |
60,005,000 |
30,002,500 |
50.00% |
||
|
Compass |
|
|
|
||
|
CEG Rio S.A. |
1,995,022,625 |
746,251,086 |
37.41% |
||
|
Companhia de Gás de Mato Grosso do Sul - Msgás |
61,610,000 |
30,188,900 |
49.00% |
||
|
Companhia de Gás de Santa Catarina - Scgás |
10,749,497 |
4,407,293 |
41.00% |
The significant movements impacting the consolidated balances of the interim financial statements are detailed in the Note 2.1.
|
|
Shares issued by the subsidiary |
|
Shares held by non-controlling shareholders |
|
Non-controlling interest |
|
Radar |
|
|
|
|
|
|
Tellus Brasil Participações S.A. |
106,907,867 |
|
85,526,294 |
|
80.00% |
|
Janus Brasil Participações S.A. |
286,370,051 |
|
229,096,041 |
|
80.00% |
|
Duguetiapar Empreendimentos e Participações S.A. |
3,573,842 |
|
2,859,074 |
|
80.00% |
|
Gamiovapar Empreendimentos e Participações S.A. |
12,132,621 |
|
9,706,097 |
|
80.00% |
|
Radar Propriedades Agrícolas S.A. |
737,500 |
|
368,750 |
|
50.00% |
|
Nova Agrícola Ponte Alta S.A. |
160,693,378 |
|
80,346,689 |
|
50.00% |
|
Terras da Ponte Alta S.A. |
16,066,329 |
|
8,033,165 |
|
50.00% |
|
Nova Santa Bárbara Agrícola S.A. |
32,336,994 |
|
16,168,497 |
|
50.00% |
|
Nova Amaralina S.A. |
30,603,159 |
|
15,301,580 |
|
50.00% |
|
Paineira Propriedades Agrícolas S.A. |
132,667,061 |
|
66,333,531 |
|
50.00% |
|
Manacá Propriedades Agrícolas S.A. |
126,200,853 |
|
63,100,427 |
|
50.00% |
|
Castanheira Propriedades Agrícolas S.A. |
83,850,938 |
|
41,925,469 |
|
50.00% |
|
Radar II Propriedades Agrícolas S.A. |
81,440,221 |
|
40,720,111 |
|
50.00% |
|
Rumo |
|
|
|
|
|
|
Rumo S.A. |
1,854,868,949 |
|
1,287,383,261 |
|
69.61% |
|
Moove |
|
|
|
|
|
|
Moove Lubricants Holdings |
34,963,764 |
|
10,489,129 |
|
30.00% |
|
Cosan Corporate |
|
|
|
|
|
|
Cosan Nove Participações S.A. |
7,663,761,736 |
|
975,404,073 |
|
12.73% |
|
Cosan Limited Partners Brasil Consultoria Ltda. |
160,000 |
|
3,000 |
|
1.88% |
|
Cosan Dez Participações S.A. |
3,473,458,688 |
|
805,963,829 |
|
23.20% |
Notes to the interim Financial Statements
(In thousands of Reais, except when otherwise indicated)
The following table summarizes information relating to each of the Company's subsidiaries that has material non-controlling interests, prior to any intra-group elimination.
|
Balance as of January 1, 2025 |
|
Profit attributable to non-controlling interests |
|
Capital increase |
|
Other comprehensive income |
|
Dividends |
|
Change of equity interest in subsidiary |
|
Other |
|
Balance as of March 31, 2025 |
|
|
Compass |
|
|
|
|
|
|
|
|
|
|
|
|
|
|
|
|
Comgás |
26,637 |
|
2,289 |
|
— |
|
— |
|
— |
|
— |
|
— |
|
28,926 |
|
Commit Gás S.A. |
1,357,447 |
|
24,757 |
|
— |
|
— |
|
— |
|
— |
|
— |
|
1,382,204 |
|
Companhia Paranaense de Gás - COMPAGAS |
460,508 |
|
(306) |
|
— |
|
— |
|
(781) |
|
— |
|
— |
|
459,421 |
|
Biometano Verde Paulínia S.A. |
238,239 |
|
(14) |
|
— |
|
— |
|
— |
|
— |
|
— |
|
238,225 |
|
Compass Gás e Energia |
557,943 |
|
47,247 |
|
— |
|
6,940 |
|
— |
|
— |
|
— |
|
612,130 |
|
Rumo |
|
|
|
|
|
|
|
|
|
|
|
|
|
|
|
|
Rumo S.A. |
10,457,452 |
|
(66,827) |
|
— |
|
(29,235) |
|
(310) |
|
198 |
|
6,771 |
|
10,368,049 |
|
Moove |
|
|
|
|
|
|
|
|
|
|
|
|
|
|
|
|
Moove Lubricants Holdings |
566,991 |
|
9,008 |
|
— |
|
(12,146) |
|
— |
|
— |
|
— |
|
563,853 |
|
Cosan Corporate |
|
|
|
|
|
|
|
|
|
|
|
|
|
|
|
|
Cosan Limited Partners Brasil |
5 |
|
(9) |
|
— |
|
— |
|
— |
|
— |
|
— |
|
(4) |
|
Cosan Nove Participações S.A. |
2,164,445 |
|
(340,915) |
|
89,084 |
|
26,372 |
|
(331,000) |
|
(1,193,928) |
|
2,135 |
|
416,193 |
|
Cosan Dez Participações S.A. |
980,133 |
|
97,212 |
|
— |
|
11,811 |
|
— |
|
— |
|
— |
|
1,089,156 |
|
Radar |
|
|
|
|
|
|
|
|
|
|
|
|
|
|
|
|
Janus Brasil Participações S.A. |
5,051,050 |
|
41,548 |
|
— |
|
— |
|
(32,864) |
|
— |
|
— |
|
5,059,734 |
|
Tellus Brasil Participações S.A. |
3,124,858 |
|
19,062 |
|
— |
|
— |
|
(6,366) |
|
— |
|
— |
|
3,137,554 |
|
Gamiovapar Empreendimentos e Participações S.A. |
591,606 |
|
(2,952) |
|
— |
|
— |
|
— |
|
— |
|
— |
|
588,654 |
|
Duguetiapar Empreendimentos e Participações S.A. |
(2,338) |
|
5,391 |
|
— |
|
— |
|
— |
|
— |
|
— |
|
3,053 |
|
Radar II Propriedades Agrícolas S.A. |
1,176,870 |
|
6,998 |
|
— |
|
— |
|
(938) |
|
— |
|
— |
|
1,182,930 |
|
Radar Propriedades Agrícolas S.A. |
255,348 |
|
74 |
|
— |
|
— |
|
— |
|
— |
|
— |
|
255,422 |
|
Nova Agrícola Ponte Alta S.A. |
430,599 |
|
2,627 |
|
— |
|
— |
|
(829) |
|
— |
|
— |
|
432,397 |
|
Nova Amaralina S.A. Propriedades Agrícolas |
38,998 |
|
1,401 |
|
— |
|
— |
|
— |
|
— |
|
— |
|
40,399 |
|
Nova Santa Bárbara Agrícola S.A. |
205,827 |
|
458 |
|
— |
|
— |
|
— |
|
— |
|
— |
|
206,285 |
|
Terras da Ponte Alta S.A. |
90,250 |
|
1,459 |
|
— |
|
— |
|
— |
|
— |
|
— |
|
91,709 |
|
Paineira Propriedades Agrícolas S.A. |
220,407 |
|
1,808 |
|
— |
|
— |
|
(1,658) |
|
— |
|
— |
|
220,557 |
|
Manacá Propriedades Agrícolas S.A. |
216,478 |
|
1,750 |
|
— |
|
— |
|
(1,036) |
|
— |
|
— |
|
217,192 |
|
Castanheira Propriedades Agrícolas S.A. |
284,845 |
|
431 |
|
— |
|
— |
|
— |
|
— |
|
— |
|
285,276 |
|
|
28,494,598 |
|
(147,503) |
|
89,084 |
|
3,742 |
|
(375,782) |
|
(1,193,730) |
|
8,906 |
|
26,879,315 |
Notes to the interim Financial Statements
(In thousands of Reais, except when otherwise indicated)
DIPI Holding Ltda.
On January 2, 2025, the subsidiary Cosan Lubrificantes e Especialidades S.A. (“CLE”) acquired 100% of the shares of DIPI Holding Ltda. and its subsidiary (“PAX Group”) for the amount of R$329,006. Of this amount, R$232,886 was paid on the transaction date, and the remaining R$96,120 is to be settled in two installments on the first and second anniversaries of the acquisition date. The net cash effect on the consolidated financials from the acquisition was R$213,086, considering the cash acquired from the PAX Group at the acquisition date and amounts owed by former shareholders to the PAX Group.
The first deferred installment is fixed. The second installment is an earn-out and is subject to adjustments based on the change in consolidated EBITDA between the closing date and the respective measurement periods. If the consolidated EBITDA is lower than the base EBITDA adjusted for inflation (based on Brazil’s IPCA index) during the period, the sellers will receive a proportionally reduced amount. Additionally, the second deferred installment may be increased cumulatively under the following conditions: (i) the first deferred installment is subject to a negative adjustment; (ii) the adjustment to the second installment is positive; and (iii) the EBITDA for the first period is equal to or exceeds 70% of the base EBITDA, adjusted for IPCA inflation between the closing and measurement dates, up to a maximum total deferred payment of R$100,000.
The PAX Group, based in Brazil, specializes in the production and sale of greases and lubricating oils, as well as the manufacture of plastic packaging for the lubricants market. The aim of the acquisition was:
As of the acquisition date, the gain on the identifiable assets acquired totaled R$112,966, which was preliminarily allocated as follows:
On the acquisition date, preliminary goodwill of R$236,469 was recognized, representing the expected future economic benefits of the synergies arising from the acquisition. The balance of goodwill on March 31, 2025 is R$236,469, and there have been no significant changes since the acquisition date.
The consolidated income statement includes, since the acquisition date, revenues and net income in the amounts of R$63,392 and R$12,221, respectively, generated by the PAX Group.
Both the fair value and the gross contractual value of the receivables acquired total R$18,455. There are no expected losses due to non-realization of these receivables.
The table below summarizes the values of the assets acquired and liabilities assumed on the acquisition date:
Notes to the interim Financial Statements
(In thousands of Reais, except when otherwise indicated)
|
Transferred consideration |
|
|
|
Cash transfer - on the closing date |
|
232,886 |
|
Remaining installments |
|
96,120 |
|
Transferred consideration |
|
329,006 |
|
|
|
|
|
Identifiable assets acquired and liabilities assumed |
|
|
|
Cash and cash equivalents |
|
2,503 |
|
Trade receivables |
|
18,455 |
|
Inventories |
|
36,576 |
|
Income tax receivable |
|
9,966 |
|
Judicial deposits |
|
79 |
|
Other assets |
|
36,570 |
|
Property, plant and equipment |
|
70,491 |
|
Intangible assets and goodwill |
|
313,378 |
|
Loans, financing and debentures |
|
(77,002) |
|
Trade payables |
|
(6,810) |
|
Employee benefits payables |
|
(12,338) |
|
Other current liabilities |
|
(24,453) |
|
Deferred tax liabilities |
|
(38,409) |
|
Net assets acquired |
|
329,006 |
|
Cash received |
|
(2,503) |
|
Consideration transferred, net of cash |
|
326,503 |
The movements in the investment in subsidiaries jointly in the parent company were as follows:
|
|
Raízen S.A. |
|
Radar Gestão de Invest. S.A. |
|
Total |
|
Shares issued by the joint venture |
10,352,509,484 |
|
24,800,000 |
|
|
|
Shares held by Cosan |
517,625,474 |
|
12,400,000 |
|
|
|
Cosan ownership interest |
5.01% |
|
50.00% |
|
|
|
Balance as of January 1, 2025 |
1,184,466 |
|
8,606 |
|
1,193,072 |
|
Interest in earnings of joint ventures |
(129,096) |
|
902 |
|
(128,194) |
|
Other comprehensive (losses) income |
13,571 |
|
— |
|
13,571 |
|
Balance as of March 31, 2025 |
1,068,941 |
|
9,508 |
|
1,078,449 |
The movements in the investment in subsidiaries together in the consolidated were as follows:
|
|
Raízen S.A. |
|
Terminal Alvorada S.A. |
|
Radar Gestão de Invest. S.A. |
|
Total |
|
Shares issued by the joint venture |
10,352,509,484 |
|
100,197,076 |
|
24,800,000 |
|
|
|
Shares held by Cosan |
4,557,597,117 |
|
50,098,538 |
|
12,400,000 |
|
|
|
|
|
|
|
|
|
|
|
|
Cosan ownership interest |
5.01% |
|
50.00% |
|
50.00% |
|
|
|
Percentage of indirect indirect (Cosan Nove) |
25.86% |
|
— |
|
— |
|
|
|
Total (i) |
30.87% |
|
50.00% |
|
50.00% |
|
|
|
|
|
|
|
|
|
|
|
|
Balance as of January 1, 2025 |
10,495,317 |
|
41,121 |
|
8,606 |
|
10,545,044 |
|
Interest in earnings of joint ventures |
(1,136,658) |
|
(3,291) |
|
902 |
|
(1,139,047) |
|
Other comprehensive (losses) income |
119,473 |
|
— |
|
— |
|
119,473 |
|
Dividends |
— |
|
15,000 |
|
— |
|
15,000 |
|
Balance as of January 1, 2025 |
9,478,132 |
|
52,830 |
|
9,508 |
|
9,540,470 |
Raízen S.A.
The joint venture’s statement of financial position and statement of profit or loss are disclosed in the explanatory note 4 - Information by segment.
As of March 31, 2025, the Company was in compliance with the covenants of the agreement governing the joint venture.
Notes to the interim Financial Statements
(In thousands of Reais, except when otherwise indicated)
|
|
Consolidated |
|
Parent Company |
||||||||||||
|
|
Land, buildings and improvements |
|
Machines, equipment and installations |
|
Wagons and locomotives |
|
Permanent railways |
|
Construction in progress |
|
Other assets |
|
Total |
|
Total |
|
Cost |
|
|
|
|
|
|
|
|
|
|
|
|
|
|
|
|
Balance as of January 1, 2025 |
2,568,098 |
|
3,946,765 |
|
9,176,942 |
|
13,814,183 |
|
7,080,796 |
|
812,698 |
|
37,399,482 |
|
90,929 |
|
Additions |
5,216 |
|
248 |
|
1,094 |
|
— |
|
1,253,085 |
|
398 |
|
1,260,041 |
|
3,090 |
|
Write-offs |
— |
|
(62,596) |
|
(78,104) |
|
(1,108) |
|
(63,155) |
|
(10,069) |
|
(215,032) |
|
— |
|
Transfers |
23,997 |
|
39,552 |
|
1,391,861 |
|
588,820 |
|
(1,491,133) |
|
26,015 |
|
579,112 |
|
(753) |
|
Exchange differences |
(16,471) |
|
(30,469) |
|
— |
|
— |
|
(4,541) |
|
(20,402) |
|
(71,883) |
|
— |
|
Business combination (i) |
47,689 |
|
17,830 |
|
— |
|
— |
|
- |
|
4,972 |
|
70,491 |
|
— |
|
Balance as of March 31, 2025 |
2,628,529 |
|
3,911,300 |
|
10,491,793 |
|
14,401,895 |
|
6,775,052 |
|
813,612 |
|
39,022,211 |
|
93,266 |
|
|
|
|
|
|
|
|
|
|
|
|
|
|
|
|
|
|
Depreciation |
|
|
|
|
|
|
|
|
|
|
|
|
|
|
|
|
Balance as of January 1, 2025 |
(690,143) |
|
(1,318,421) |
|
(4,951,433) |
|
(6,711,147) |
|
(414,892) |
|
(294,430) |
|
(14,380,466) |
|
(51,891) |
|
Additions |
(16,787) |
|
(71,013) |
|
(156,781) |
|
(217,735) |
|
— |
|
(12,659) |
|
(474,975) |
|
(2,560) |
|
Write-offs |
— |
|
62,275 |
|
71,331 |
|
— |
|
— |
|
9,042 |
|
142,648 |
|
— |
|
Transfers |
5 |
|
5,569 |
|
(372,662) |
|
55,882 |
|
— |
|
40 |
|
(311,166) |
|
— |
|
Exchange differences |
4,399 |
|
12,249 |
|
— |
|
— |
|
— |
|
10,881 |
|
27,529 |
|
— |
|
Impairment |
— |
|
— |
|
(107,237) |
|
(157,855) |
|
— |
|
— |
|
(265,092) |
|
— |
|
Balance as of March 31, 2025 |
(702,526) |
|
(1,309,341) |
|
(5,516,782) |
|
(7,030,855) |
|
(414,892) |
|
(287,126) |
|
(15,261,522) |
|
(54,451) |
|
|
|
|
|
|
|
|
|
|
|
|
|
|
|
|
|
|
Balance as of January 1, 2025 |
1,877,955 |
|
2,628,344 |
|
4,225,509 |
|
7,103,036 |
|
6,665,904 |
|
518,268 |
|
23,019,016 |
|
39,038 |
|
Balance as of March 31, 2025 |
1,926,003 |
|
2,601,989 |
|
4,975,011 |
|
7,371,040 |
|
6,360,160 |
|
526,486 |
|
23,760,689 |
|
38,815 |
| (i) | Acquisition of DIPI Holding Ltda, as detailed in Note 6.3. |
Impairment Loss of Rumo Malha Sul Assets
In the second quarter of 2024, the state of Rio Grande do Sul was impacted by extreme weather events. This force majeure event caused damage to the railway infrastructure of Rumo Malha Sul S.A.
During the period ended March 31, 2025, the identified indicators persisted, and Rumo Malha Sul recognized a provision of R$285,608, considering that the assets were destroyed or their use was rendered unfeasible for an indefinite period.
Notes to the interim Financial Statements
(In thousands of Reais, except when otherwise indicated)
|
|
Consolidated |
|
Parent Company |
||||||||||||||
|
|
Goodwill |
|
Concession right |
|
Licenses |
|
Brands and patents |
|
Customer relationships |
|
Other |
|
Supply Agreement |
|
Total |
|
Total |
|
Cost |
|
|
|
|
|
|
|
|
|
|
|
|
|
|
|
|
|
|
Balance as of January 1, 2025 |
1,585,021 |
|
28,907,633 |
|
268,212 |
|
196,070 |
|
3,078,762 |
|
787,743 |
|
574,363 |
|
35,397,804 |
|
26,857 |
|
Additions |
— |
|
— |
|
— |
|
(140) |
|
21,332 |
|
14,301 |
|
— |
|
35,493 |
|
707 |
|
Write-offs |
(4,419) |
|
(101,634) |
|
— |
|
— |
|
— |
|
— |
|
— |
|
(106,053) |
|
— |
|
Transfers (i) |
— |
|
440,868 |
|
— |
|
— |
|
770 |
|
45,022 |
|
— |
|
486,660 |
|
753 |
|
Business combination |
236,470 |
|
— |
|
— |
|
13,254 |
|
63,655 |
|
— |
|
— |
|
313,379 |
|
— |
|
Exchange differences |
(56,972) |
|
(3,832) |
|
(1,544) |
|
(11,824) |
|
(108,608) |
|
(7,170) |
|
— |
|
(189,950) |
|
— |
|
Balance as of March 31, 2025 |
1,760,100 |
|
29,243,035 |
|
266,668 |
|
197,360 |
|
3,055,911 |
|
839,896 |
|
574,363 |
|
35,937,333 |
|
28,317 |
|
Amortization |
|
|
|
|
|
|
|
|
|
|
|
|
|
|
|
|
|
|
Balance as of January 1, 2025 |
— |
|
(6,752,828) |
|
(79,868) |
|
(9,201) |
|
(1,736,395) |
|
(488,727) |
|
— |
|
(9,067,019) |
|
(16,984) |
|
Additions |
— |
|
(269,063) |
|
(1,743) |
|
— |
|
(69,458) |
|
(13,663) |
|
— |
|
(353,927) |
|
(564) |
|
Write-offs |
— |
|
38,133 |
|
— |
|
— |
|
— |
|
— |
|
— |
|
38,133 |
|
— |
|
Exchange differences |
— |
|
3,831 |
|
(408) |
|
— |
|
33,302 |
|
922 |
|
— |
|
37,647 |
|
— |
|
Impairment |
— |
|
— |
|
— |
|
— |
|
— |
|
(1,779) |
|
— |
|
(1,779) |
|
— |
|
Balance as of March 31, 2025 |
— |
|
(6,979,927) |
|
(82,019) |
|
(9,201) |
|
(1,772,551) |
|
(503,247) |
|
— |
|
(9,346,945) |
|
(17,548) |
|
Balance as of January 1, 2025 |
1,585,021 |
|
22,154,805 |
|
188,344 |
|
186,869 |
|
1,342,367 |
|
299,016 |
|
574,363 |
|
26,330,785 |
|
9,873 |
|
Balance as of March 31, 2025 |
1,760,100 |
|
22,263,108 |
|
184,649 |
|
188,159 |
|
1,283,360 |
|
336,649 |
|
574,363 |
|
26,590,388 |
|
10,769 |
| (i) | The amount of the transfers also includes a portion of R$36,789 of intangible assets, which was reclassified to financial assets (R$23,967 in the period ended March 31, 2024). |
| 52 |
Notes to the interim Financial Statements
(In thousands of Reais, except when otherwise indicated)
|
|
Consolidated |
|
Parent company |
||||||||||||||
|
|
Land, buildings and improvements |
|
Machine, equipment, and installations |
|
Wagons and locomotives |
|
Software |
|
Vehicles |
|
Floating storage and regasification |
|
Railway and port infrastructure |
|
Total |
|
Total |
|
Cost |
|
|
|
|
|
|
|
|
|
|
|
|
|
|
|
|
|
|
Balance as of January 1, 2025 |
646,024 |
|
589,214 |
|
957,260 |
|
87,720 |
|
176,697 |
|
1,594,434 |
|
8,980,587 |
|
13,031,936 |
|
44,079 |
|
Additions |
8,577 |
|
8,907 |
|
— |
|
— |
|
60,186 |
|
— |
|
— |
|
77,670 |
|
204 |
|
Contractual readjustments |
5,499 |
|
26,440 |
|
11,048 |
|
259 |
|
(7,034) |
|
— |
|
21,216 |
|
57,428 |
|
1,842 |
|
Write-offs |
(36) |
|
(962) |
|
— |
|
— |
|
(332) |
|
— |
|
— |
|
(1,330) |
|
— |
|
Transfers |
— |
|
— |
|
(686,837) |
|
— |
|
— |
|
— |
|
— |
|
(686,837) |
|
— |
|
Exchange differences |
(20,841) |
|
(1,952) |
|
— |
|
— |
|
(9,772) |
|
— |
|
— |
|
(32,565) |
|
— |
|
Balance as of March 31, 2025 |
639,223 |
|
621,647 |
|
281,471 |
|
87,979 |
|
219,745 |
|
1,594,434 |
|
9,001,803 |
|
12,446,302 |
|
46,125 |
|
|
|
|
|
|
|
|
|
|
|
|
|
|
|
|
|
|
|
|
Amortization |
|
|
|
|
|
|
|
|
|
|
|
|
|
|
|
|
|
|
Balance as of January 1, 2025 |
(321,130) |
|
(209,627) |
|
(505,145) |
|
(29,853) |
|
(54,645) |
|
(116,379) |
|
(1,836,406) |
|
(3,073,185) |
|
(26,522) |
|
Additions |
(23,518) |
|
(17,893) |
|
(4,403) |
|
(1,177) |
|
(12,558) |
|
(19,974) |
|
(64,744) |
|
(144,267) |
|
(1,588) |
|
Write-offs |
181 |
|
896 |
|
— |
|
— |
|
578 |
|
— |
|
— |
|
1,655 |
|
— |
|
Transfers |
— |
|
— |
|
372,463 |
|
— |
|
— |
|
— |
|
— |
|
372,463 |
|
— |
|
Exchange differences |
9,959 |
|
1,188 |
|
— |
|
— |
|
1,428 |
|
— |
|
— |
|
12,575 |
|
— |
|
Impairment |
— |
|
— |
|
— |
|
— |
|
— |
|
— |
|
(18,736) |
|
(18,736) |
|
— |
|
Balance as of March 31, 2025 |
(334,508) |
|
(225,436) |
|
(137,085) |
|
(31,030) |
|
(65,197) |
|
(136,353) |
|
(1,919,886) |
|
(2,849,495) |
|
(28,110) |
|
Balance as of January 1, 2025 |
324,894 |
|
379,587 |
|
452,115 |
|
57,867 |
|
122,052 |
|
1,478,055 |
|
7,144,181 |
|
9,958,751 |
|
17,557 |
|
Balance as of March 31, 2025 |
304,715 |
|
396,211 |
|
144,386 |
|
56,949 |
|
154,548 |
|
1,458,081 |
|
7,081,917 |
|
9,596,807 |
|
18,015 |
| 53 |
Notes to the interim Financial Statements
(In thousands of Reais, except when otherwise indicated)
a) Reconciliation of income tax and social contribution expenses:
|
|
Parent Company |
|
Consolidated |
||||
|
|
Period of three months ended March 31, |
||||||
|
|
2025 |
|
2024 |
|
2025 |
|
2024 |
|
Profit (loss) before taxes |
(1,128,676) |
|
(662,337) |
|
(888,863) |
|
247,907 |
|
Income tax and social contribution at nominal rate (34%) |
383,750 |
|
225,195 |
|
302,213 |
|
(84,288) |
|
Adjustments for calculating the effective rate |
|
|
|
|
|
|
|
|
Interest in earnings of investees (non-taxable income) |
(211,286) |
|
264,620 |
|
(380,799) |
|
22,736 |
|
Differences in tax rates on earnings from operating profit |
— |
|
— |
|
(38,747) |
|
(1,844) |
|
Granted income tax incentive |
— |
|
— |
|
76,708 |
|
91,036 |
|
Interest on shareholders’ equity |
— |
|
— |
|
(2,254) |
|
— |
|
Goodwill amortization effect |
— |
|
— |
|
318 |
|
318 |
|
Non-deductible expenses (donations, gifts, etc.) |
— |
|
— |
|
(6,389) |
|
(1,891) |
|
Tax losses not recorded |
(877,245) |
|
— |
|
(1,058,913) |
|
(67,150) |
|
ICMS benefit - extemporaneous tax credits |
— |
|
— |
|
— |
|
1,010 |
|
ICMS benefit - current year |
— |
|
— |
|
— |
|
5,093 |
|
Provision for non-realization of the benefit of the federative covenant |
— |
|
— |
|
(145) |
|
— |
|
Provision for non-realization of the benefit of the federative covenant - Interest and Fine |
— |
|
— |
|
— |
|
7,646 |
|
Selic on indebtedness |
4,987 |
|
4,044 |
|
11,166 |
|
19,141 |
|
Other |
40,575 |
|
(23,697) |
|
50,307 |
|
23,830 |
|
Income tax and social contribution (current and deferred) |
(659,219) |
|
470,162 |
|
(1,046,535) |
|
15,637 |
|
|
|
|
|
|
|
|
|
|
Effective rate - % |
58.41% |
|
(70.99%) |
|
117.74% |
|
6.31% |
| 54 |
Notes to the interim Financial Statements
(In thousands of Reais, except when otherwise indicated)
b) Deferred income tax assets and liabilities
Presented bellow are the tax effects of temporary differences that give rise to significant parts of the Company's deferred tax assets and liabilities:
|
|
Parent Company |
Consolidated |
|||||
|
|
March 31, 2025 |
|
December 31, 2024 |
|
March 31, 2025 |
|
December 31, 2024 |
|
Deferred tax assets from: |
|
|
|
|
|
|
|
|
Income taxes losses |
— |
|
— |
|
1,757,642 |
|
1,699,262 |
|
Negative base of social contribution |
— |
|
— |
|
584,916 |
|
560,110 |
|
Temporary differences |
|
|
|
|
|
|
|
|
Foreign exchange variation - Loans and borrowings |
1,298,417 |
|
2,159,160 |
|
1,553,682 |
|
2,669,489 |
|
Provision for lawsuits |
82,220 |
|
64,335 |
|
302,036 |
|
272,886 |
|
Impairment provision (Rumo Malha Oeste) |
— |
|
— |
|
37,421 |
|
23,436 |
|
Post-employment benefit obligation |
— |
|
— |
|
129,130 |
|
128,046 |
|
Provisions for uncertain tax credits and tax losses |
— |
|
— |
|
47,823 |
|
44,202 |
|
Provision for non- recoverability of taxes |
2,580 |
|
2,580 |
|
69,888 |
|
70,719 |
|
Share-based payment transactions |
21,450 |
|
19,336 |
|
112,089 |
|
103,454 |
|
Lease |
2,266 |
|
2,347 |
|
258,746 |
|
312,402 |
|
Unrealized loss with derivatives |
251,863 |
|
— |
|
553,468 |
|
390,622 |
|
Provisions for profit sharing |
5,608 |
|
11,212 |
|
44,907 |
|
131,254 |
|
Business Combination - Intangible assets |
— |
|
— |
|
101,036 |
|
124,628 |
|
Business combination – Fixed asset |
— |
|
— |
|
1,925 |
|
1,854 |
|
Other provisions |
146,860 |
|
140,077 |
|
706,613 |
|
682,385 |
|
Deferred tax on pre-operating income |
— |
|
— |
|
76,066 |
|
79,402 |
|
Regulatory asset (liability) |
— |
|
— |
|
8,716 |
|
8,396 |
|
Other |
48,347 |
|
48,365 |
|
284,727 |
|
321,966 |
|
Total |
1,859,611 |
|
2,447,412 |
|
6,630,831 |
|
7,624,513 |
|
Deferred tax liabilities from: |
|
|
|
|
|
|
|
|
Temporary differences |
|
|
|
|
|
|
|
|
Exchange rate variation - Loans and borrowings |
— |
|
— |
|
(351) |
|
(347) |
|
Provision for lawsuits |
— |
|
— |
|
— |
|
(107) |
|
Useful life review |
— |
|
— |
|
(614,190) |
|
(531,081) |
|
Business combination – fixed assets |
— |
|
— |
|
(163,703) |
|
(161,784) |
|
Tax goodwill |
— |
|
— |
|
(629,539) |
|
(645,297) |
|
Unrealized income with derivatives |
— |
|
(156,611) |
|
(311,275) |
|
(369,763) |
|
Fair value adjustment on debt |
— |
|
— |
|
(606,030) |
|
(801,022) |
|
Marketable securities |
(9,287) |
|
— |
|
(9,287) |
|
— |
|
Investment properties |
— |
|
— |
|
(479,882) |
|
(496,395) |
|
Goods intended for sale |
— |
|
— |
|
(698) |
|
(962) |
|
Effects on the formation of joint ventures |
(101,596) |
|
(102,070) |
|
(101,596) |
|
(167,196) |
|
Business Combination – Intangible assets |
— |
|
— |
|
(5,016,172) |
|
(4,990,657) |
|
Post-employment obligations |
— |
|
— |
|
(4,810) |
|
(4,810) |
|
Share-based payment transactions |
— |
|
— |
|
(16,647) |
|
— |
|
Lease |
— |
|
— |
|
(11,239) |
|
(11,557) |
|
Provisions |
(449,153) |
|
(449,153) |
|
(449,153) |
|
(449,153) |
|
Other |
18,833 |
|
18,832 |
|
(487,274) |
|
(472,592) |
|
Total |
(541,203) |
|
(689,002) |
|
(8,901,846) |
|
(9,102,723) |
|
|
|
|
|
|
|
|
|
|
Total deferred taxes recorded |
1,318,408 |
|
1,758,410 |
|
(2,271,015) |
|
(1,478,210) |
|
Deferred tax assets |
1,318,408 |
|
1,758,410 |
|
3,759,598 |
|
4,495,296 |
|
Deferred tax liabilities |
— |
|
— |
|
(6,030,613) |
|
(5,973,506) |
|
Total deferred, net |
1,318,408 |
|
1,758,410 |
|
(2,271,015) |
|
(1,478,210) |
| 55 |
Notes to the interim Financial Statements
(In thousands of Reais, except when otherwise indicated)
c) Changes in deferred tax assets and liabilities:
|
|
Parent Company |
||||||||||
|
|
Unrealized loss with derivatives |
|
Provisions |
|
Leases |
|
Employee benefits |
|
Other |
|
Total |
|
Balance as of January 1, 2025 |
— |
|
206,992 |
|
2,347 |
|
30,548 |
|
2,207,525 |
|
2,447,412 |
|
Credited / charged from income for the period |
251,863 |
|
24,668 |
|
(81) |
|
(3,490) |
|
(18) |
|
272,942 |
|
Foreign exchange differences |
— |
|
— |
|
— |
|
— |
|
(860,743) |
|
(860,743) |
|
Balance as of March 31, 2025 |
251,863 |
|
231,660 |
|
2,266 |
|
27,058 |
|
1,346,764 |
|
1,859,611 |
|
|
Parent Company |
||||||||
|
|
Effects on the formation of joint venture |
|
Unrealized loss with derivatives |
|
Provisions |
|
Other |
|
Total |
|
Balance as of January 1, 2025 |
(102,070) |
|
(156,611) |
|
(449,153) |
|
18,832 |
|
(689,002) |
|
Credited / charged from income for the period |
474 |
|
156,611 |
|
— |
|
(228,503) |
|
(71,418) |
|
Recognized in shareholders' equity |
— |
|
— |
|
— |
|
8,499 |
|
8,499 |
|
Cosan Oito incorporation |
— |
|
— |
|
— |
|
210,718 |
|
210,718 |
|
Balance as of March 31, 2025 |
(101,596) |
|
— |
|
(449,153) |
|
9,546 |
|
(541,203) |
|
|
|
|
|
|
|
|
|
|
|
|
Total deferred taxes recognized |
|
|
|
|
|
|
|
1,318,408 |
|
|
|
Consolidated |
||||||||||||||||
|
|
Tax loss and negative basis |
|
Post-employment obligations |
|
Employee benefits |
|
Provisions |
|
Leases |
|
Unrealized gains on derivatives |
|
Intangible assets |
|
Other |
|
Total |
|
Balance as of January 1, 2025 |
2,259,372 |
|
128,046 |
|
234,708 |
|
1,093,628 |
|
312,402 |
|
390,622 |
|
124,628 |
|
3,081,107 |
|
7,624,513 |
|
Credited / charged from income for the period |
83,186 |
|
1,084 |
|
(77,712) |
|
108,562 |
|
(53,656) |
|
162,846 |
|
(23,592) |
|
(29,161) |
|
171,557 |
|
Recognized in shareholders' equity |
— |
|
— |
|
— |
|
— |
|
— |
|
— |
|
— |
|
(11,023) |
|
(11,023) |
|
Foreign exchange differences |
— |
|
— |
|
— |
|
— |
|
— |
|
— |
|
— |
|
(1,115,807) |
|
(1,115,807) |
|
Business combination |
— |
|
— |
|
— |
|
(38,409) |
|
— |
|
— |
|
— |
|
— |
|
(38,409) |
|
Balance as of March 31, 2025 |
2,342,558 |
|
129,130 |
|
156,996 |
|
1,163,781 |
|
258,746 |
|
553,468 |
|
101,036 |
|
1,925,116 |
|
6,630,831 |
Notes to the interim Financial Statements
(In thousands of Reais, except when otherwise indicated)
|
|
Consolidated |
||||||||||||||||||
|
|
Effects on the formation of joint ventures |
|
Post-employment obligations |
|
Intangible assets |
|
Unrealized gains on derivatives |
|
Property, plant and equipment |
|
Fair value adjustment |
|
Leases |
|
Provisions |
|
Other |
|
Total |
|
Balance as of January 1, 2025 |
(167,196) |
|
(4,810) |
|
(4,990,657) |
|
(369,763) |
|
(531,081) |
|
(801,022) |
|
(11,557) |
|
(449,260) |
|
(1,777,377) |
|
(9,102,723) |
|
Impact on the result for the period |
65,600 |
|
— |
|
(25,515) |
|
58,488 |
|
(83,109) |
|
194,992 |
|
318 |
|
107 |
|
(10,004) |
|
200,877 |
|
Balance as of March 31, 2025 |
(101,596) |
|
(4,810) |
|
(5,016,172) |
|
(311,275) |
|
(614,190) |
|
(606,030) |
|
(11,239) |
|
(449,153) |
|
(1,787,381) |
|
(8,901,846) |
|
|
|
|
|
|
|
|
|
|
|
|
|
|
|
|
|
|
|
|
|
|
Total deferred taxes recorded |
|
|
|
|
|
|
|
|
|
|
|
|
|
|
|
|
|
(2,271,015) |
|
The Company had contingent liabilities and judicial deposits pertaining to:
|
|
Provision for lawsuits |
||||||
|
|
Parent Company |
|
Consolidated |
||||
|
|
March 31, 2025 |
|
December 31, 2024 |
|
March 31, 2025 |
|
December 31, 2024 |
|
Tax |
245,507 |
|
198,385 |
|
802,279 |
|
745,896 |
|
Civil, environmental and regulatory |
66,383 |
|
59,989 |
|
890,170 |
|
818,422 |
|
Labor |
49,320 |
|
50,233 |
|
503,769 |
|
480,315 |
|
Total |
361,210 |
|
308,607 |
|
2,196,218 |
|
2,044,633 |
|
|
Judicial deposit |
||||||
|
|
Parent Company |
|
Consolidated |
||||
|
|
March 31, 2025 |
|
December 31, 2024 |
|
March 31, 2025 |
|
December 31, 2024 |
|
Tax |
395,949 |
|
390,148 |
|
828,550 |
|
801,723 |
|
Civil, environmental and regulatory |
11,363 |
|
14,675 |
|
136,692 |
|
134,058 |
|
Labor |
11,717 |
|
12,146 |
|
119,843 |
|
120,909 |
|
Total |
419,029 |
|
416,969 |
|
1,085,085 |
|
1,056,690 |
Changes in provisions for lawsuits:
|
|
Parent Company |
||||||
|
|
Tax |
|
Civil, environmental, and regulatory |
|
Labor |
|
Total |
|
Balance as of January 1, 2025 |
198,385 |
|
59,989 |
|
50,233 |
|
308,607 |
|
Provisioned in the period |
30,100 |
|
4,371 |
|
601 |
|
35,072 |
|
Write-offs by reversal / payment |
(813) |
|
(901) |
|
(2,227) |
|
(3,941) |
|
Interest (i) |
17,835 |
|
2,924 |
|
713 |
|
21,472 |
|
Balance as of March 31, 2025 |
245,507 |
|
66,383 |
|
49,320 |
|
361,210 |
Notes to the interim Financial Statements
(In thousands of Reais, except when otherwise indicated)
|
|
Consolidated |
||||||
|
|
Tax |
|
Civil, environmental, and regulatory |
|
Labor |
|
Total |
|
Balance as of January 1, 2025 |
745,896 |
|
818,422 |
|
480,315 |
|
2,044,633 |
|
Provisioned in the period |
32,884 |
|
22,701 |
|
37,489 |
|
93,074 |
|
Write-offs by reversal / payment |
(2,134) |
|
(14,816) |
|
(39,560) |
|
(56,510) |
|
Interest (i) |
25,633 |
|
63,863 |
|
25,525 |
|
115,021 |
|
Balance as of March 31, 2025 |
802,279 |
|
890,170 |
|
503,769 |
|
2,196,218 |
(i) Includes write-off of interest due to reversal.
The Company has debts secured by assets or by means of cash deposits, bank guarantees or guarantee insurance.
The Company has probable indemnity lawsuits in addition to those mentioned; as they represent contingent assets, they have not been reported.
a) Probable losses
Tax
The main tax proceedings for which the risk of loss is probable are described below:
|
|
Parent Company |
|
Consolidated |
||||
|
|
March 31, 2025 |
|
December 31, 2024 |
|
March 31, 2025 |
|
December 31, 2024 |
|
Compensation with FINSOCIAL |
— |
|
— |
|
340,505 |
|
337,351 |
|
INSS |
81,700 |
|
80,576 |
|
110,924 |
|
101,399 |
|
ICMS credit |
14,343 |
|
14,217 |
|
64,861 |
|
64,708 |
|
PIS and COFINS (i) |
80,861 |
|
34,073 |
|
81,205 |
|
34,412 |
|
IPI |
58,402 |
|
58,002 |
|
65,439 |
|
64,969 |
|
Other |
10,201 |
|
11,517 |
|
139,345 |
|
143,057 |
|
|
245,507 |
|
198,385 |
|
802,279 |
|
745,896 |
| (i) | Lawsuit filed in the amount of R$46,408, to process a request for refund of IRPJ/CSLL credits for the 2017 calendar year cumulated with the declaration of offsetting of PIS/COFINS debts, as well as future offsets with current federal taxes from the operation, consequently removing the restriction imposed by article 161-A of IN/RFB No. 1,717/2017 to refrain from demanding the debts declared by the company solely because the offset was claimed before the ECF transmission was confirmed. |
Notes to the interim Financial Statements
(In thousands of Reais, except when otherwise indicated)
b) Possible losses
The main lawsuits for which we anticipate a risk of loss as possible are outlined below:
|
|
Parent Company |
|
Consolidated |
||||
|
|
March 31, 2025 |
|
December 31, 2024 |
|
March 31, 2025 |
|
December 31, 2024 |
|
Tax |
3,250,879 |
|
3,324,448 |
|
8,190,560 |
|
8,815,036 |
|
Civil, environmental and regulatory |
1,143,337 |
|
1,111,756 |
|
6,729,481 |
|
6,569,528 |
|
Labor |
9,643 |
|
10,189 |
|
687,920 |
|
690,535 |
|
|
4,403,859 |
|
4,446,393 |
|
15,607,961 |
|
16,075,099 |
Tax
|
|
Parent Company |
|
Consolidated |
||||
|
|
March 31, 2025 |
|
December 31, 2024 |
|
March 31, 2025 |
|
December 31, 2024 |
|
Isolated fine - Federal tax |
— |
|
— |
|
831,964 |
|
847,582 |
|
ICMS -Tax on circulation of goods |
1,163,887 |
|
1,151,523 |
|
2,853,915 |
|
2,996,998 |
|
IRRF |
— |
|
— |
|
880,124 |
|
869,345 |
|
PIS and COFINS |
1,267,038 |
|
1,297,612 |
|
1,920,991 |
|
2,174,274 |
|
MP 470 installment of debts |
256,467 |
|
253,793 |
|
434,879 |
|
430,374 |
|
Stock Grant Plan |
— |
|
— |
|
32,465 |
|
32,087 |
|
IOF on loans |
— |
|
— |
|
50,132 |
|
195,098 |
|
Reward Credit Compensation |
159,095 |
|
157,959 |
|
159,095 |
|
157,959 |
|
IPI - Tax on industrialized products |
160,752 |
|
189,971 |
|
311,649 |
|
333,185 |
|
INSS |
76,523 |
|
76,763 |
|
157,313 |
|
159,983 |
|
IPTU |
— |
|
— |
|
132,567 |
|
128,700 |
|
Financial operations abroad |
— |
|
— |
|
14,086 |
|
13,910 |
|
Other |
167,117 |
|
196,827 |
|
411,380 |
|
475,541 |
|
|
3,250,879 |
|
3,324,448 |
|
8,190,560 |
|
8,815,036 |
The Company maintains discussions of an administrative and judicial nature with the tax authorities in Brazil, related to certain interpretations and tax positions adopted in the calculation of Corporate Income Tax ("IRPJ") and Social Contribution on Net Profit ("CSLL"). The final determination of these issues is uncertain and may be influenced by factors external to the Company, such as changes in case law and amendments to tax laws and regulations. In accordance with IFRIC 23/ICPC 22 - Uncertainty over Income Tax Treatment, the Company evaluates, for each uncertain tax treatment, whether it is probable that the tax authority will accept the treatment used or planned in the tax calculation. Only in cases where the Company concludes that it is unlikely that the tax authority will accept the uncertain tax treatment, the effects of uncertainty are recognized based on the best forecasting method for resolving the issue, whether by the most likely amount or the expected value.
The tax positions adopted by the Company are based on opinions from specialized legal advisors. The Company is subject to review by tax authorities regarding income tax for a period of up to 10 years, depending on the jurisdiction in which it operates.
As of March 31, 2025, the total amount of assessed and disputed values with the tax authorities regarding these matters, for which it is likely that the tax authority will accept the uncertain tax treatment, was R$6,704,852 (R$6,862,000 as of December 31, 2024).
Notes to the interim Financial Statements
(In thousands of Reais, except when otherwise indicated)
Civil, environmental and regulatory
|
|
Parent Company |
|
Consolidated |
||||
|
|
March 31, 2025 |
|
December 31, 2024 |
|
March 31, 2025 |
|
December 31, 2024 |
|
Civil |
1,088,979 |
|
1,059,547 |
|
3,499,221 |
|
3,355,370 |
|
Environmental |
53,672 |
|
51,540 |
|
1,709,237 |
|
1,691,409 |
|
Regulatory |
686 |
|
669 |
|
1,521,023 |
|
1,522,749 |
|
|
1,143,337 |
|
1,111,756 |
|
6,729,481 |
|
6,569,528 |
Labor
|
|
Parent Company |
|
Consolidated |
||||
|
|
March 31, 2025 |
|
December 31, 2024 |
|
March 31, 2025 |
|
December 31, 2024 |
|
Labor claims |
9,643 |
|
10,189 |
|
687,920 |
|
690,535 |
|
|
9,643 |
|
10,189 |
|
687,920 |
|
690,535 |
a) Treasury shares
As of January 14, 2025, the Company repurchased 4,200,000 treasury shares for R$34,022 at an average cost of R$8.10 per share
As of March 31, 2025, the Company had 7,925,940 shares in treasury (3,747,965 shares as of December 31, 2024), whose market price was R$7.39.
b) Payable dividends
|
Change in dividends payable |
|
|
|
|
|
|
|
Parent Company |
|
Consolidated |
|
Balance as of January 1, 2025 |
|
3,495 |
|
96,722 |
|
Declared dividends |
|
— |
|
375,782 |
|
Dividends paid to preferred shareholders |
|
— |
|
(371,000) |
|
Dividends paid |
|
— |
|
(44,032) |
|
Other movements |
|
(3,456) |
|
(2,386) |
|
Balance as of March 31, 2025 |
|
39 |
|
55,086 |
Notes to the interim Financial Statements
(In thousands of Reais, except when otherwise indicated)
The following table presents the calculation of earnings per share (in thousands of reais, except for amounts per share):
|
|
Period of three months ended March 31, |
||
|
|
2025 |
|
2024 |
|
Loss attributable to holders of common shares of the Company used in calculating basic earnings per share |
(1,787,895) |
|
(192,175) |
|
Diluting effect of the share-based plan of subsidiaries |
— |
|
(282) |
|
Loss attributable to holders of common shares of the Company used in the calculation of diluted earnings per share |
(1,787,895) |
|
(192,457) |
|
|
|
|
|
|
Weighted average number of common shares outstanding - basic (in thousands of shares) |
|
|
|
|
Basic |
1,858,633 |
|
1,865,733 |
|
Share repurchases |
(379) |
|
— |
|
Diluted |
1,858,254 |
|
1,865,733 |
|
|
|
|
|
|
Loss per share |
|
|
|
|
Basic |
(R$0.96) |
|
(R$0.10) |
|
Diluted |
(R$0.96) |
|
(R$0.10) |
Diluting instruments
Anti-dilution instruments
Notes to the interim Financial Statements
(In thousands of Reais, except when otherwise indicated)
In the following table presents a breakdown of gross revenue from product and service sales:
|
|
Consolidated |
||
|
|
Period of three months ended March 31, |
||
|
|
2025 |
|
2024 |
|
Gross revenue from the sale of products and services |
11,125,516 |
|
11,293,719 |
|
Construction revenue |
304,129 |
|
320,030 |
|
Indirect taxes and other deductions |
(1,767,044) |
|
(1,771,693) |
|
Net sales |
9,662,601 |
|
9,842,056 |
In the following table, revenue is disaggregated by products and service lines and timing of revenue recognition:
|
|
Period of three months ended March 31, |
||
|
|
2025 |
|
2024 |
|
At a point in time |
|
|
|
|
Natural gas distribution |
3,427,126 |
|
3,711,592 |
|
Lubricants, base oil and other |
2,186,872 |
|
2,271,562 |
|
Lease and sale of property |
152,078 |
|
136,567 |
|
Other |
478,393 |
|
103,553 |
|
|
6,244,469 |
|
6,223,274 |
|
Over time |
|
|
|
|
Railroad transportation services |
2,794,094 |
|
2,997,764 |
|
Container operations |
172,656 |
|
148,253 |
|
Construction revenue |
304,129 |
|
320,030 |
|
Other services |
154,710 |
|
168,030 |
|
|
3,425,589 |
|
3,634,077 |
|
Eliminations |
(7,457) |
|
(15,295) |
|
Total net sales |
9,662,601 |
|
9,842,056 |
Notes to the interim Financial Statements
(In thousands of Reais, except when otherwise indicated)
Expenses are presented in the statement of profit or loss and other comprehensive income by function. The income reconciliation by nature/purpose is as follows:
|
|
Parent Company |
|
Consolidated |
||||
|
|
Period of three months ended March 31, |
||||||
|
|
2025 |
|
2024 |
|
2025 |
|
2024 |
|
Raw materials |
— |
|
— |
|
(1,725,699) |
|
(1,715,162) |
|
Commodity cost (natural gas) |
— |
|
— |
|
(2,790,919) |
|
(2,743,533) |
|
Railroad transport and port elevation expenses |
— |
|
— |
|
(627,753) |
|
(754,724) |
|
Other transport |
— |
|
— |
|
(78,055) |
|
(125,534) |
|
Depreciation and amortization |
(4,713) |
|
(3,851) |
|
(967,894) |
|
(907,264) |
|
Personnel expenses |
(54,097) |
|
(66,845) |
|
(779,127) |
|
(720,468) |
|
Construction cost |
— |
|
— |
|
(304,129) |
|
(320,030) |
|
Expenses with third-party services |
(13,160) |
|
(13,517) |
|
(175,554) |
|
(252,533) |
|
Selling expenses |
(13) |
|
(15) |
|
(102,683) |
|
(9,947) |
|
Cost of properties sold |
— |
|
— |
|
(9,163) |
|
— |
|
Other |
14,046 |
|
(19,455) |
|
(206,017) |
|
(323,901) |
|
|
(57,937) |
|
(103,683) |
|
(7,766,993) |
|
(7,873,096) |
|
|
|
|
|
|
|
|
|
|
Cost of sales |
— |
|
— |
|
(6,791,905) |
|
(6,928,437) |
|
Selling expenses |
— |
|
— |
|
(440,056) |
|
(361,404) |
|
General and administrative expenses |
(57,937) |
|
(103,683) |
|
(535,032) |
|
(583,255) |
|
|
(57,937) |
|
(103,683) |
|
(7,766,993) |
|
(7,873,096) |
Notes to the interim Financial Statements
(In thousands of Reais, except when otherwise indicated)
|
|
Parent Company |
|
Consolidated |
||||
|
|
Period of three months ended March 31, |
||||||
|
|
2025 |
|
2024 |
|
2025 |
|
2024 |
|
Tax credits |
— |
|
— |
|
3,017 |
|
12,525 |
|
Loss on disposals of non-current assets and intangible assets |
— |
|
(7) |
|
4,194 |
|
(8,659) |
|
Result on sale of investments |
206,388 |
|
— |
|
206,388 |
|
— |
|
Net effect of provisions for legal proceedings, legal claims, recoverables and tax installments |
(35,589) |
|
(10,842) |
|
(84,992) |
|
(81,260) |
|
Contractual agreement and others |
— |
|
— |
|
87,487 |
|
— |
|
Result of commercial operations (i) |
— |
|
— |
|
323,598 |
|
— |
|
Other income |
2,849 |
|
1,731 |
|
129,886 |
|
130,546 |
|
Provision for inventory losses and inventory losses |
— |
|
— |
|
— |
|
(26,038) |
|
Net impairment loss (ii) |
— |
|
— |
|
(285,608) |
|
— |
|
Reversal of land sale |
— |
|
— |
|
(8,172) |
|
— |
|
Other |
277 |
|
(5,120) |
|
(137,276) |
|
(26,353) |
|
|
173,925 |
|
(14,238) |
|
238,522 |
|
761 |
| (i) | Refers substantially to the result of certain commercial contracts, carried out by the subsidiary Compass, in the amount of R$306,661 on March 31, 2025 |
| (ii) | The balance includes a provision for the write-off of the residual value of assets impacted by extreme weather events in Rio Grande do Sul, in the amount of R$285,608 at subsidiary Rumo Malha Sul S.A. |
Notes to the interim Financial Statements
(In thousands of Reais, except when otherwise indicated)
The details of financial income and expenses are as follows:
|
|
Parent Company |
|
Consolidated |
||||
|
|
Period of three months ended March 31, |
||||||
|
|
2025 |
|
2024 |
|
2025 |
|
2024 |
|
Cost of gross debt |
|
|
|
|
|
|
|
|
Interest on debt |
(504,981) |
|
(397,186) |
|
(1,733,005) |
|
(1,404,513) |
|
Monetary and exchange rate variation |
652,189 |
|
(154,831) |
|
1,802,738 |
|
(511,848) |
|
Derivatives and fair value measurement |
(1,105,971) |
|
(86,459) |
|
(2,024,379) |
|
444,409 |
|
Amortization of borrowing costs |
(71,011) |
|
(3,244) |
|
(344,843) |
|
(18,673) |
|
Discounts obtained from financial operations(i) |
— |
|
— |
|
195,222 |
|
— |
|
Guarantees and warranties |
— |
|
— |
|
(4,514) |
|
(8,623) |
|
|
(1,029,774) |
|
(641,720) |
|
(2,108,781) |
|
(1,499,248) |
|
Income from financial investments and exchange rate in cash and cash equivalents |
165,328 |
|
37,151 |
|
626,054 |
|
445,338 |
|
Changes in fair value of investments in listed entities |
22,703 |
|
— |
|
22,703 |
|
— |
|
|
188,031 |
|
37,151 |
|
648,757 |
|
445,338 |
|
Cost of debt, net |
(841,743) |
|
(604,569) |
|
(1,460,024) |
|
(1,053,910) |
|
Other charges and monetary variations |
|
|
|
|
|
|
|
|
Interest on other receivables |
26,572 |
|
13,684 |
|
166,693 |
|
117,010 |
|
Monetary variation in leases and concessions agreements |
— |
|
— |
|
(114,204) |
|
(118,805) |
|
Interest on leases |
(662) |
|
(823) |
|
(158,954) |
|
(138,745) |
|
Interest on contingencies and contracts |
(41,418) |
|
(12,765) |
|
(188,403) |
|
(91,727) |
|
Interest on sectoral assets and liabilities |
— |
|
— |
|
(21,657) |
|
(20,759) |
|
Bank charges and other |
(15,321) |
|
(6,650) |
|
(39,956) |
|
(9,216) |
|
Foreign exchange, net |
249,338 |
|
(711,588) |
|
(86,490) |
|
(463,177) |
|
|
218,509 |
|
(718,142) |
|
(442,971) |
|
(725,419) |
|
Financial result, net |
(623,234) |
|
(1,322,711) |
|
(1,902,995) |
|
(1,779,329) |
|
Reconciliation |
|
|
|
|
|
|
|
|
Finance expenses |
(763,961) |
|
(529,536) |
|
(2,713,642) |
|
(1,864,555) |
|
Finance income |
224,542 |
|
58,182 |
|
1,037,901 |
|
615,101 |
|
Exchange variation, net |
1,079,284 |
|
(337,996) |
|
1,793,964 |
|
(531,218) |
|
Derivatives |
(1,163,099) |
|
(513,361) |
|
(2,021,218) |
|
1,343 |
|
Financial result, net |
(623,234) |
|
(1,322,711) |
|
(1,902,995) |
|
(1,779,329) |
| (i) | Discount obtained on the repurchase of the bonds (Note 2.2). |
Notes to the interim Financial Statements
(In thousands of Reais, except when otherwise indicated)
The Company and its subsidiaries have Share-Based Compensation Plans that are payable in shares and cash.
a) Change in outstanding share grants
|
|
Parent company |
|
Consolidated |
|
Balance as of January 1, 2025 |
8,345,147 |
|
16,624,911 |
|
Exercised/cancels/other |
(74,835) |
|
(644,260) |
|
Balance as of March 31, 2025 |
8,270,312 |
|
15,980,651 |
b) Expense recognized in the result
Share-based compensation expenses included in the income statement for the period ended March 31, 2025 were R$23,892 (R$47,557 at March 31, 2024).
Reduction of share capital
On April 30, 2025, at the Ordinary and Extraordinary General Meeting ('OGM'), the Company's shareholders approved a reduction of the Company's share capital in the amount of R$649,805, aiming to absorb the balance of the 'Accumulated Losses' account.
Sale of Leme Mill
On May 12, 2025, the jointly controlled entity Raízen S.A. announced the sale of the Leme Mill, located in the Piracicaba hub, State of São Paulo, with an installed capacity of 1.8 million tons per harvest. The sale value is R$425,000, to be received in cash at the closing of the transaction.
SIGNATURES
Pursuant to the requirements of the Securities Exchange Act of 1934, the registrant has duly caused this report to be signed on its behalf by the undersigned, thereunto duly authorized.
Date: May 15, 2025
|
COSAN S.A. |
||
|
By: |
/s/ Rodrigo Araujo Alves |
|
|
|
Name: Rodrigo Araujo Alves |
|
|
|
Title: Chief Financial Officer |
|
| 67 |