UNITED STATES
SECURITIES AND EXCHANGE COMMISSION
Washington, D.C. 20549
FORM 6-K
Report of Foreign Issuer
Pursuant To Rule 13a-16 Or 15d-16 of the
Securities Exchange Act of 1934
For the month of November 2023
Commission File Number: 333-251238
|
|
COSAN S.A.
(Exact name of registrant as specified in its charter)
N/A
(Translation of registrant’s name into English)
|
|
Av. Brigadeiro Faria Lima, 4100, – 16th floor
São Paulo, SP 04538-132 Brazil
(Address of principal executive offices)
Indicate by check mark whether the registrant files or will file annual reports under cover of Form 20-F or Form 40‑F:
Form 20-F ☒ Form 40-F ☐
Indicate by check mark if the registrant is submitting the Form 6-K in paper as permitted by Regulation S-T Rule 101(b)(1):
Yes ☐ No ☒
Indicate by check mark if the registrant is submitting the Form 6-K in paper as permitted by Regulation S-T Rule 101(b)(7):
Yes ☐ No ☒
CONTENTS
(In thousands of Reais)
|
|
|
|
Parent Company |
|
Consolidated |
||||
|
|
Note |
|
09/30/2023 |
|
12/31/2022 |
|
09/30/2023 |
|
12/31/2022 |
|
Assets |
|
|
|
|
|
|
|
|
|
|
Cash and cash equivalents |
5.2 |
|
2,474,864 |
|
1,348,461 |
|
15,081,373 |
|
13,301,716 |
|
Restricted cash |
5.3 |
|
— |
|
— |
|
7,491 |
|
8,024 |
|
Marketable securities |
5.3 |
|
493,064 |
|
724,050 |
|
4,504,949 |
|
2,422,470 |
|
Trade receivables |
5.7 |
|
— |
|
— |
|
3,580,136 |
|
3,769,908 |
|
Derivative financial instruments |
5.6 |
|
2,718 |
|
— |
|
265,329 |
|
1,086,698 |
|
Inventories |
7 |
|
— |
|
— |
|
1,869,979 |
|
1,869,059 |
|
Receivables from related parties |
5.8 |
|
183,291 |
|
381,547 |
|
264,266 |
|
235,541 |
|
Income tax receivable |
|
|
343,554 |
|
272,130 |
|
801,782 |
|
560,789 |
|
Other current tax receivable |
6 |
|
8,346 |
|
8,366 |
|
585,041 |
|
1,324,203 |
|
Dividend receivable |
17 |
|
143,999 |
|
609,456 |
|
122,970 |
|
161,147 |
|
Sectorial financial assets |
5.10 |
|
— |
|
— |
|
122,346 |
|
148,955 |
|
Other financial assets |
|
|
— |
|
— |
|
717 |
|
88,961 |
|
Other current assets |
|
|
126,280 |
|
119,266 |
|
556,104 |
|
560,080 |
|
|
|
|
3,776,116 |
|
3,463,276 |
|
27,762,483 |
|
25,537,551 |
|
Current assets held for sale |
8 |
|
— |
|
— |
|
368,146 |
|
40,383 |
|
Current assets |
|
|
3,776,116 |
|
3,463,276 |
|
28,130,629 |
|
25,577,934 |
|
|
|
|
|
|
|
|
|
|
|
|
Trade receivables |
5.7 |
|
— |
|
— |
|
118,153 |
|
157,634 |
|
Marketable securities |
5.3 |
|
— |
|
— |
|
14,988,750 |
|
19,677,296 |
|
Restricted cash |
5.3 |
|
151,580 |
|
35,039 |
|
262,827 |
|
131,909 |
|
Deferred tax assets |
15 |
|
2,556,565 |
|
1,857,620 |
|
5,676,890 |
|
4,474,124 |
|
Receivables from related parties |
5.8 |
|
289,572 |
|
355,793 |
|
121,763 |
|
241,001 |
|
Income tax receivable |
|
|
— |
|
— |
|
454,756 |
|
434,886 |
|
Other non-current tax receivable |
6 |
|
33,209 |
|
31,774 |
|
1,146,837 |
|
1,074,923 |
|
Judicial deposits |
16 |
|
397,300 |
|
360,563 |
|
886,682 |
|
814,444 |
|
Derivative financial instruments |
5.6 |
|
674,321 |
|
1,368,809 |
|
3,368,662 |
|
3,065,054 |
|
Sectorial financial assets |
5.10 |
|
— |
|
— |
|
304,897 |
|
193,378 |
|
Other non-current assets |
|
|
69,996 |
|
62,432 |
|
212,752 |
|
201,811 |
|
Other financial assets |
|
|
— |
|
— |
|
2,249 |
|
277 |
|
Investments in subsidiaries and associates |
9.1 |
|
30,678,907 |
|
31,230,371 |
|
2,952,428 |
|
2,913,943 |
|
Investment in joint venture |
10 |
|
1,304,472 |
|
1,266,926 |
|
11,600,582 |
|
11,221,356 |
|
Property, plant and equipment |
11.1 |
|
41,322 |
|
46,044 |
|
20,356,891 |
|
18,948,436 |
|
Intangible assets and goodwill |
11.2 |
|
4,496 |
|
2,247 |
|
22,432,556 |
|
22,121,942 |
|
Contract asset |
11.3 |
|
— |
|
— |
|
1,009,135 |
|
1,118,715 |
|
Right-of-use |
11.4 |
|
23,564 |
|
23,032 |
|
9,599,224 |
|
8,012,869 |
|
Investment properties |
11.5 |
|
— |
|
— |
|
14,227,539 |
|
14,103,060 |
|
Non-current assets |
|
|
36,225,304 |
|
36,640,650 |
|
109,723,573 |
|
108,907,058 |
|
|
|
|
|
|
|
|
|
|
|
|
Total assets |
|
|
40,001,420 |
|
40,103,926 |
|
137,854,202 |
|
134,484,992 |
The accompanying notes are an integral part of these interim financial statements.
Statement of financial position
(In thousands of Reais)
|
|
|
|
Parent Company |
|
Consolidated |
||||
|
|
Note |
|
09/30/2023 |
|
12/31/2022 |
|
09/30/2023 |
|
12/31/2022 |
|
Liabilities |
|
|
|
|
|
|
|
|
|
|
Loans, borrowings and debentures |
5.4 |
|
814,169 |
|
802,549 |
|
5,613,263 |
|
4,542,205 |
|
Leases |
5.5 |
|
8,912 |
|
7,676 |
|
752,230 |
|
550,529 |
|
Derivative financial instruments |
5.6 |
|
97,078 |
|
— |
|
1,100,557 |
|
1,039,357 |
|
Trade payables |
5.9 |
|
2,920 |
|
115,146 |
|
3,610,901 |
|
4,318,362 |
|
Employee benefits payables |
|
|
39,739 |
|
49,301 |
|
699,641 |
|
659,521 |
|
Income tax payables |
15 |
|
2,787 |
|
7,876 |
|
1,950,247 |
|
204,387 |
|
Other taxes payable |
14 |
|
158,155 |
|
141,216 |
|
623,156 |
|
760,041 |
|
Dividends payable |
17 |
|
2,467 |
|
279,979 |
|
146,677 |
|
892,006 |
|
Concessions payable |
13 |
|
— |
|
— |
|
283,667 |
|
256,759 |
|
Related party payables |
5.8 |
|
243,801 |
|
1,237,490 |
|
380,432 |
|
387,736 |
|
Sectorial financial liabilities |
5.10 |
|
— |
|
— |
|
69,228 |
|
67,419 |
|
Other financial liabilities |
5 |
|
— |
|
— |
|
800,996 |
|
924,562 |
|
Deferred revenue |
|
|
— |
|
— |
|
5,381 |
|
5,400 |
|
Other current liabilities |
|
|
577,100 |
|
543,084 |
|
1,323,746 |
|
1,189,929 |
|
Current liabilities |
|
|
1,947,128 |
|
3,184,317 |
|
17,360,122 |
|
15,798,213 |
|
Loans, borrowings and debentures |
5.4 |
|
7,606,213 |
|
4,673,079 |
|
51,300,098 |
|
48,445,011 |
|
Leases |
5.5 |
|
22,023 |
|
22,689 |
|
4,591,072 |
|
2,981,629 |
|
Derivative financial instruments |
5.6 |
|
586,487 |
|
618,947 |
|
2,702,906 |
|
4,251,575 |
|
Trade payables |
5.9 |
|
— |
|
— |
|
65,818 |
|
61,489 |
|
Other taxes payable |
14 |
|
156,304 |
|
148,620 |
|
160,954 |
|
153,688 |
|
Provision for legal proceedings |
16 |
|
363,052 |
|
349,357 |
|
1,802,766 |
|
1,801,186 |
|
Concessions payable |
13 |
|
— |
|
— |
|
3,179,637 |
|
3,094,651 |
|
Investments with unsecured liabilities |
9.1 |
|
102,236 |
|
146,473 |
|
— |
|
— |
|
Related party payables |
5.8 |
|
9,620,826 |
|
9,221,407 |
|
— |
|
— |
|
Post-employment benefit |
23 |
|
325 |
|
312 |
|
597,033 |
|
575,840 |
|
Deferred tax liabilities |
15 |
|
— |
|
— |
|
5,249,457 |
|
5,469,368 |
|
Sectorial financial liabilities |
5.10 |
|
— |
|
— |
|
1,707,039 |
|
1,549,197 |
|
Deferred revenue |
|
|
— |
|
— |
|
28,170 |
|
624,801 |
|
Other financial liabilities |
5 |
|
— |
|
— |
|
— |
|
29,985 |
|
Other non-current liabilities |
|
|
1,115,333 |
|
1,085,558 |
|
1,445,918 |
|
1,478,960 |
|
Non-current liabilities |
|
|
19,572,799 |
|
16,266,442 |
|
72,830,868 |
|
70,517,380 |
|
Total liabilities |
|
|
21,519,927 |
|
19,450,759 |
|
90,190,990 |
|
86,315,593 |
|
Shareholders' equity |
17 |
|
|
|
|
|
|
|
|
|
Share capital |
|
|
8,682,544 |
|
8,402,544 |
|
8,682,544 |
|
8,402,544 |
|
Treasury shares |
|
|
(107,254) |
|
(107,140) |
|
(107,254) |
|
(107,140) |
|
Additional paid-in capital |
|
|
2,579,601 |
|
2,319,928 |
|
2,579,601 |
|
2,319,928 |
|
Accumulated other comprehensive income |
|
|
(74,916) |
|
567,546 |
|
(74,916) |
|
567,546 |
|
Retained earnings |
|
|
8,669,598 |
|
9,470,289 |
|
8,669,598 |
|
9,470,289 |
|
Loss for the period |
|
|
(1,268,080) |
|
— |
|
(1,268,080) |
|
— |
|
Equity attributable to: |
|
|
|
|
|
|
|
|
|
|
Owners of the Company |
|
|
18,481,493 |
|
20,653,167 |
|
18,481,493 |
|
20,653,167 |
|
Non-controlling interests |
9.2 |
|
— |
|
— |
|
29,181,719 |
|
27,516,232 |
|
Total shareholders' equity |
|
|
18,481,493 |
|
20,653,167 |
|
47,663,212 |
|
48,169,399 |
|
Total liabilities and shareholders' equity |
|
|
40,001,420 |
|
40,103,926 |
|
137,854,202 |
|
134,484,992 |
The accompanying notes are an integral part of these interim financial statements.
(In thousands of Reais, except earnings per share)
|
|
|
|
Parent Company |
|
Consolidated |
||||||||||||
|
|
Note |
|
3Q23 |
|
3Q22 |
|
9M23 |
|
9M22 |
|
3Q23 |
|
3Q22 |
|
9M23 |
|
9M22 |
|
Net sales |
19 |
|
— |
|
— |
|
— |
|
— |
|
10,253,570 |
|
11,507,301 |
|
29,895,353 |
|
28,983,273 |
|
Cost of sales |
20 |
|
— |
|
— |
|
— |
|
— |
|
(6,955,078) |
|
(8,698,843) |
|
(21,222,714) |
|
(22,166,959) |
|
Gross profit |
|
|
— |
|
— |
|
— |
|
— |
|
3,298,492 |
|
2,808,458 |
|
8,672,639 |
|
6,816,314 |
|
Selling expenses |
20 |
|
— |
|
— |
|
— |
|
— |
|
(329,465) |
|
(378,616) |
|
(1,010,705) |
|
(816,026) |
|
General and administrative expenses |
20 |
|
(129,518) |
|
(77,575) |
|
(310,858) |
|
(214,121) |
|
(745,800) |
|
(563,979) |
|
(1,889,855) |
|
(1,397,568) |
|
Other incomes (expenses), net |
21 |
|
(40,322) |
|
(27,223) |
|
(43,017) |
|
27,456 |
|
1,403,873 |
|
(63,856) |
|
1,709,720 |
|
(48,472) |
|
Operating expenses |
|
|
(169,840) |
|
(104,798) |
|
(353,875) |
|
(186,665) |
|
328,608 |
|
(1,006,451) |
|
(1,190,840) |
|
(2,262,066) |
|
|
|
|
|
|
|
|
|
|
|
|
|
|
|
|
|
|
|
|
Profit (loss) before equity in earnings of investees finance results and income taxes |
|
|
(169,840) |
|
(104,798) |
|
(353,875) |
|
(186,665) |
|
3,627,100 |
|
1,802,007 |
|
7,481,799 |
|
4,554,248 |
|
|
|
|
|
|
|
|
|
|
|
|
|
|
|
|
|
|
|
|
Interest in earnings of associates |
9.1 |
|
1,288,011 |
|
1,046,594 |
|
(24,028) |
|
2,343,296 |
|
104,237 |
|
254,652 |
|
240,241 |
|
293,545 |
|
Interest in earnings of joint ventures |
10 |
|
(3,544) |
|
(414,887) |
|
154,713 |
|
(153,558) |
|
(29,861) |
|
(414,885) |
|
1,363,556 |
|
(153,558) |
|
Equity in earnings of investees |
|
|
1,284,467 |
|
631,707 |
|
130,685 |
|
2,189,738 |
|
74,376 |
|
(160,233) |
|
1,603,797 |
|
139,987 |
|
|
|
|
|
|
|
|
|
|
|
|
|
|
|
|
|
|
|
|
Finance expenses |
|
|
(504,229) |
|
(508,854) |
|
(1,396,303) |
|
(1,183,257) |
|
(646,254) |
|
(1,199,642) |
|
(10,323,734) |
|
(2,681,384) |
|
Finance income |
|
|
91,269 |
|
71,038 |
|
240,953 |
|
192,710 |
|
722,377 |
|
709,151 |
|
1,951,914 |
|
2,022,664 |
|
Foreign exchange, net |
|
|
(348,799) |
|
(313,494) |
|
361,829 |
|
312,399 |
|
(756,108) |
|
(572,510) |
|
1,379,572 |
|
504,071 |
|
Net effect of derivatives |
|
|
17,777 |
|
(141,076) |
|
(993,863) |
|
(1,810,783) |
|
(794,381) |
|
(291,684) |
|
(394,008) |
|
(3,691,234) |
|
Finance results, net |
22 |
|
(743,982) |
|
(892,386) |
|
(1,787,384) |
|
(2,488,931) |
|
(1,474,366) |
|
(1,354,685) |
|
(7,386,256) |
|
(3,845,883) |
|
|
|
|
|
|
|
|
|
|
|
|
|
|
|
|
|
|
|
|
Profit (loss) before income taxes |
|
|
370,645 |
|
(365,477) |
|
(2,010,574) |
|
(485,858) |
|
2,227,110 |
|
287,089 |
|
1,699,340 |
|
848,352 |
|
|
|
|
|
|
|
|
|
|
|
|
|
|
|
|
|
|
|
|
Income taxes |
15 |
|
— |
|
— |
|
— |
|
— |
|
— |
|
— |
|
— |
|
— |
|
Current |
|
|
— |
|
— |
|
30,562 |
|
— |
|
(576,807) |
|
(378,889) |
|
(2,249,629) |
|
(985,483) |
|
Deferred |
|
|
308,107 |
|
350,591 |
|
711,932 |
|
855,870 |
|
76,704 |
|
532,668 |
|
1,411,823 |
|
1,205,703 |
|
|
|
|
308,107 |
|
350,591 |
|
742,494 |
|
855,870 |
|
(500,103) |
|
153,779 |
|
(837,806) |
|
220,220 |
|
|
|
|
|
|
|
|
|
|
|
|
|
|
|
|
|
|
|
|
Profit (loss) for the period |
|
|
678,752 |
|
(14,886) |
|
(1,268,080) |
|
370,012 |
|
1,727,007 |
|
440,868 |
|
861,534 |
|
1,068,572 |
|
Profit (loss) attributable to: |
|
|
|
|
|
|
|
|
|
|
|
|
|
|
|
|
|
|
Owners of the Company |
|
|
678,752 |
|
(14,886) |
|
(1,268,080) |
|
370,012 |
|
678,752 |
|
(14,886) |
|
(1,268,080) |
|
370,012 |
|
Non-controlling interests |
|
|
— |
|
— |
|
— |
|
— |
|
1,048,255 |
|
455,754 |
|
2,129,614 |
|
698,560 |
|
|
|
|
678,752 |
|
(14,886) |
|
(1,268,080) |
|
370,012 |
|
1,727,007 |
|
440,868 |
|
861,534 |
|
1,068,572 |
|
Earnings per share |
18 |
|
|
|
|
|
|
|
|
|
|
|
|
|
|
|
|
|
Basic |
|
|
|
|
|
|
|
|
|
|
R$0.3635 |
|
(R$0.0080) |
|
(R$0.6793) |
|
R$0.1980 |
|
Diluted |
|
|
|
|
|
|
|
|
|
|
R$0.3633 |
|
(R$0.0082) |
|
(R$0.6844) |
|
R$0.1967 |
The accompanying notes are an integral part of these interim financial statements.
(In thousands of Reais)
|
|
Parent Company |
|
Consolidated |
||||||||||||
|
|
3Q23 |
|
3Q22 |
|
9M23 |
|
9M22 |
|
3Q23 |
|
3Q22 |
|
9M23 |
|
9M22 |
|
Profit (loss) for the period |
678,752 |
|
(14,886) |
|
(1,268,080) |
|
370,012 |
|
1,727,007 |
|
440,868 |
|
861,534 |
|
1,068,572 |
|
Other comprehensive income: |
|
|
|
|
|
|
|
|
|
|
|
|
|
|
|
|
Items that are or may be reclassified subsequently to profit or loss: |
|
|
|
|
|
|
|||||||||
|
Foreign currency translation differences |
(163,848) |
|
300,792 |
|
(584,019) |
|
837,466 |
|
(216,113) |
|
300,837 |
|
(785,812) |
|
787,017 |
|
Gain (loss) on cash flow hedge |
(77,088) |
|
347 |
|
(58,564) |
|
(4,022) |
|
(104,761) |
|
781 |
|
(84,007) |
|
(2,959) |
|
Change in fair value of financial assets, net of taxes |
— |
|
3,470 |
|
— |
|
11,143 |
|
— |
|
6,940 |
|
— |
|
22,286 |
|
|
(240,936) |
|
304,609 |
|
(642,583) |
|
844,587 |
|
(320,874) |
|
308,558 |
|
(869,819) |
|
806,344 |
|
|
|
|
|
|
|
|
|
|
|
|
|
|
|
|
|
|
Items that will not be reclassified to profit or loss: |
|
|
|
|
|
|
|
|
|
|
|
|
|
|
|
|
Actuarial gains (losses) with defined benefit plan, net of taxes |
— |
|
— |
|
121 |
|
17,120 |
|
(23,064) |
|
— |
|
477 |
|
25,939 |
|
Deferred taxes |
— |
|
— |
|
— |
|
— |
|
14,096 |
|
— |
|
(162) |
|
(8,819) |
|
|
— |
|
— |
|
121 |
|
17,120 |
|
(8,968) |
|
— |
|
315 |
|
17,120 |
|
|
|
|
|
|
|
|
|
|
|
|
|
|
|
|
|
|
Total comprehensive income (loss) for the period |
437,816 |
|
289,723 |
|
(1,910,542) |
|
1,231,719 |
|
1,397,165 |
|
749,426 |
|
(7,970) |
|
1,892,036 |
|
|
|
|
|
|
|
|
|
|
|
|
|
|
|
|
|
|
Comprehensive result attributable to: |
|
|
|
|
|
|
|
|
|
|
|
|
|
|
|
|
Owners of the Company |
437,816 |
|
289,723 |
|
(1,910,542) |
|
1,231,719 |
|
437,816 |
|
289,723 |
|
(1,910,542) |
|
1,231,719 |
|
Non-controlling interest |
— |
|
— |
|
— |
|
— |
|
959,349 |
|
459,703 |
|
1,902,572 |
|
660,317 |
|
|
437,816 |
|
289,723 |
|
(1,910,542) |
|
1,231,719 |
|
1,397,165 |
|
749,426 |
|
(7,970) |
|
1,892,036 |
(In thousands of Reais)
|
|
|
|
|
|
|
Capital reserve |
|
|
|
Profit reserve |
|
|
|
|
|
|
|
|||||||
|
|
|
Share capital |
|
Treasury share |
|
Corporate transactions - Law 6404 |
|
Capital transactions |
|
Accumulated other comprehensive loss |
|
Legal |
|
Statutory reserve |
|
Unrealized profit |
|
Accumulated profits |
|
Equity attributable to controlling shareholders |
|
Interest of non-controlling shareholders |
|
Total equity |
|
At January 1, 2023 |
|
8,402,544 |
|
(107,140) |
|
737 |
|
2,319,191 |
|
567,546 |
|
58,802 |
|
9,240,466 |
|
171,021 |
|
— |
|
20,653,167 |
|
27,516,232 |
|
48,169,399 |
|
|
|
|
|
|
|
|
|
|
|
|
|
|
|
|
|
|
|
|
|
|
|
|
|
|
|
Loss for the period |
|
— |
|
— |
|
— |
|
— |
|
— |
|
— |
|
— |
|
— |
|
(1,268,080) |
|
(1,268,080) |
|
2,129,614 |
|
861,534 |
|
|
|
|
|
|
|
|
|
|
|
|
|
|
|
|
|
|
|
|
|
|
|
|
|
|
|
Other comprehensive income (note 17) |
|
|
|
|
|
|
|
|
|
|
|
|
|
|
|
|
|
|
|
|
|
|
|
|
|
Gain from cash flow hedge accounting |
|
— |
|
— |
|
— |
|
— |
|
(58,564) |
|
— |
|
— |
|
— |
|
— |
|
(58,564) |
|
(25,443) |
|
(84,007) |
|
Foreign currency translation differences |
|
— |
|
— |
|
— |
|
— |
|
(584,019) |
|
— |
|
— |
|
— |
|
— |
|
(584,019) |
|
(201,793) |
|
(785,812) |
|
Actuarial gain on defined benefit plan |
|
— |
|
— |
|
— |
|
— |
|
121 |
|
— |
|
— |
|
— |
|
— |
|
121 |
|
194 |
|
315 |
|
Total comprehensive income (loss) for the period |
|
— |
|
— |
|
— |
|
— |
|
(642,462) |
|
— |
|
— |
|
— |
|
(1,268,080) |
|
(1,910,542) |
|
1,902,572 |
|
(7,970) |
|
|
|
|
|
|
|
|
|
|
|
|
|
|
|
|
|
|
|
|
|
|
|
|
|
|
|
Contributions and distributions to owners of the Company: |
|
|
|
|
|
|
|
|
|
|
|
|
|
|
|
|
|
|
|
|
|
|
|
|
|
Capital increase (note 17) |
|
280,000 |
|
— |
|
— |
|
— |
|
— |
|
— |
|
(280,000) |
|
— |
|
— |
|
— |
|
- |
|
— |
|
Funds from capital increase in subsidiary (note 9.2) |
|
— |
|
— |
|
— |
|
— |
|
— |
|
— |
|
— |
|
— |
|
— |
|
— |
|
9,709 |
|
9,709 |
|
Gain (loss) on capital increase in a subsidiary |
|
— |
|
— |
|
— |
|
60,468 |
|
— |
|
— |
|
— |
|
— |
|
— |
|
60,468 |
|
17,947 |
|
78,415 |
|
Share based payments |
|
— |
|
(114) |
|
— |
|
4,593 |
|
— |
|
— |
|
— |
|
— |
|
— |
|
4,479 |
|
(7,819) |
|
(3,340) |
|
Write-off of interest in subsidiary |
|
— |
|
— |
|
— |
|
— |
|
— |
|
— |
|
— |
|
— |
|
— |
|
— |
|
(22,280) |
|
(22,280) |
|
Dividends |
|
— |
|
— |
|
— |
|
— |
|
— |
|
— |
|
(349,670) |
|
(171,021) |
|
— |
|
(520,691) |
|
(462,818) |
|
(983,509) |
|
Employee compensation plan - value of employee services |
|
— |
|
— |
|
— |
|
114,220 |
|
— |
|
— |
|
— |
|
— |
|
— |
|
114,220 |
|
39,667 |
|
153,887 |
|
Total contributions and distributions |
|
280,000 |
|
(114) |
|
— |
|
179,281 |
|
— |
|
— |
|
(629,670) |
|
(171,021) |
|
— |
|
(341,524) |
|
(425,594) |
|
(767,118) |
|
|
|
|
|
|
|
|
|
|
|
|
|
|
|
|
|
|
|
|
|
|
|
|
|
|
|
Transactions with owners of the Company: |
|
|
|
|
|
|
|
|
|
|
|
|
|
|
|
|
|
|
|
|
|
|
|
|
|
Gain on dividends from subsidiary |
|
— |
|
— |
|
— |
|
79,825 |
|
— |
|
— |
|
— |
|
— |
|
— |
|
79,825 |
|
188,509 |
|
268,334 |
|
Change of shareholding interest in subsidiary (note 9.1) |
|
— |
|
— |
|
— |
|
567 |
|
— |
|
— |
|
— |
|
— |
|
— |
|
567 |
|
- |
|
567 |
|
Total transactions with owners of the Company |
|
— |
|
— |
|
— |
|
80,392 |
|
— |
|
— |
|
— |
|
— |
|
— |
|
80,392 |
|
188,509 |
|
268,901 |
|
|
|
|
|
|
|
|
|
|
|
|
|
|
|
|
|
|
|
|
|
|
|
|
|
|
|
Total contributions, distributions and transactions with the Company's shareholders |
|
280,000 |
|
(114) |
|
— |
|
259,673 |
|
— |
|
— |
|
(629,670) |
|
(171,021) |
|
— |
|
(261,132) |
|
(237,085) |
|
(498,217) |
|
|
|
|
|
|
|
|
|
|
|
|
|
|
|
|
|
|
|
|
|
|
|
|
|
|
|
At September 30, 2023 |
|
8,682,544 |
|
(107,254) |
|
737 |
|
2,578,864 |
|
(74,916) |
|
58,802 |
|
8,610,796 |
|
— |
|
(1,268,080) |
|
18,481,493 |
|
29,181,719 |
|
47,663,212 |
The accompanying notes are an integral part of these interim financial statements.
Statement of changes in equity
(In thousands of Reais)
|
|
|
|
|
|
|
Capital reserve |
|
|
|
Profit reserve |
|
|
|
|
|
|
|
|
||||||||
|
|
|
Share capital |
|
Treasury share |
|
Corporate transactions - Law 6404 |
|
Capital transactions |
|
Accumulated other comprehensive loss |
|
Legal |
|
Statutory reserve |
|
Profit to be realized |
|
Retained earnings |
|
Accumulated profits |
|
Equity attributable to controlling shareholders |
|
Non-controlling interest |
|
Total equity |
|
At January 1, 2022 |
|
6,365,853 |
|
(69,064) |
|
737 |
|
(1,690,972) |
|
(521,609) |
|
348,753 |
|
9,872,037 |
|
171,021 |
|
264,181 |
|
— |
|
14,740,937 |
|
14,129,085 |
|
28,870,022 |
|
|
|
|
|
|
|
|
|
|
|
|
|
|
|
|
|
|
|
|
|
|
|
|
|
|
|
|
|
Net income for the period |
|
— |
|
— |
|
— |
|
— |
|
— |
|
— |
|
— |
|
— |
|
— |
|
370,012 |
|
370,012 |
|
698,560 |
|
1,068,572 |
|
|
|
|
|
|
|
|
|
|
|
|
|
|
|
|
|
|
|
|
|
|
|
|
|
|
|
|
|
Other comprehensive income (note 17) |
|
|
|
|
|
|
|
|
|
|
|
|
|
|
|
|
|
|
|
|
|
|
|
|
|
|
|
Gain from cash flow hedge accounting |
|
— |
|
— |
|
— |
|
— |
|
(4,022) |
|
— |
|
— |
|
— |
|
— |
|
— |
|
(4,022) |
|
1,063 |
|
(2,959) |
|
Foreign currency translation differences |
|
— |
|
— |
|
— |
|
— |
|
837,466 |
|
— |
|
— |
|
— |
|
— |
|
— |
|
837,466 |
|
(50,449) |
|
787,017 |
|
Actuarial gain on defined benefit plan |
|
— |
|
— |
|
— |
|
— |
|
17,120 |
|
— |
|
— |
|
— |
|
— |
|
— |
|
17,120 |
|
— |
|
17,120 |
|
Change in fair value of financial assets |
|
— |
|
— |
|
— |
|
— |
|
11,143 |
|
— |
|
— |
|
— |
|
— |
|
— |
|
11,143 |
|
11,143 |
|
22,286 |
|
Total comprehensive income (loss) for the period |
|
— |
|
— |
|
— |
|
— |
|
861,707 |
|
— |
|
— |
|
— |
|
— |
|
370,012 |
|
1,231,719 |
|
660,317 |
|
1,892,036 |
|
|
|
|
|
|
|
|
|
|
|
|
|
|
|
|
|
|
|
|
|
|
|
|
|
|
|
|
|
Transactions with owners of the Company contributions and distributions: |
|
|
|
|
|
|
|
|
|
|
|
|
|
|
|
|
|
|
|
|
|
|
|
|
|
|
|
Capital increase |
|
2,036,691 |
|
— |
|
— |
|
— |
|
— |
|
(348,753) |
|
(1,423,757) |
|
— |
|
(264,181) |
|
— |
|
— |
|
— |
|
— |
|
Share based payments |
|
— |
|
17,190 |
|
— |
|
(19,394) |
|
— |
|
— |
|
— |
|
— |
|
— |
|
— |
|
(2,204) |
|
(7,008) |
|
(9,212) |
|
Dividends |
|
— |
|
— |
|
— |
|
— |
|
— |
|
— |
|
(45,736) |
|
— |
|
— |
|
— |
|
(45,736) |
|
(272,068) |
|
(317,804) |
|
Business combination |
|
— |
|
— |
|
— |
|
— |
|
— |
|
— |
|
— |
|
— |
|
— |
|
— |
|
— |
|
2,924,376 |
|
2,924,376 |
|
Employee compensation plan - value of employee services |
|
— |
|
— |
|
— |
|
41,047 |
|
— |
|
— |
|
— |
|
— |
|
— |
|
— |
|
41,047 |
|
(12,889) |
|
28,158 |
|
Total contributions and distributions |
|
2,036,691 |
|
17,190 |
|
— |
|
21,653 |
|
— |
|
(348,753) |
|
(1,469,493) |
|
— |
|
(264,181) |
|
— |
|
(6,893) |
|
2,632,411 |
|
2,625,518 |
|
|
|
|
|
|
|
|
|
|
|
|
|
|
|
|
|
|
|
|
|
|
|
|
|
|
|
|
|
Changes in interest in subsidiaries: |
|
|
|
|
|
|
|
|
|
|
|
|
|
|
|
|
|
|
|
|
|
|
|
|
|
|
|
Acquisition of non-controlling interest |
|
— |
|
— |
|
— |
|
— |
|
— |
|
— |
|
— |
|
— |
|
— |
|
— |
|
— |
|
(888,450) |
|
(888,450) |
|
Change of shareholding interest in subsidiary |
|
— |
|
— |
|
— |
|
2,789 |
|
— |
|
— |
|
— |
|
— |
|
— |
|
— |
|
2,789 |
|
(68,233) |
|
(65,444) |
|
Total transactions with owners of the Company |
|
— |
|
— |
|
— |
|
2,789 |
|
— |
|
— |
|
— |
|
— |
|
— |
|
— |
|
2,789 |
|
(956,683) |
|
(953,894) |
|
|
|
|
|
|
|
|
|
|
|
|
|
|
|
|
|
|
|
|
|
|
|
|
|
|
|
|
|
Total contributions, distributions and transactions with the Company's shareholders |
|
2,036,691 |
|
17,190 |
|
— |
|
24,442 |
|
— |
|
(348,753) |
|
(1,469,493) |
|
— |
|
(264,181) |
|
— |
|
(4,104) |
|
1,675,728 |
|
1,671,624 |
|
|
|
|
|
|
|
|
|
|
|
|
|
|
|
|
|
|
|
|
|
|
|
|
|
|
|
|
|
At September 30, 2022 |
|
8,402,544 |
|
(51,874) |
|
737 |
|
(1,666,530) |
|
340,098 |
|
— |
|
8,402,544 |
|
171,021 |
|
— |
|
370,012 |
|
15,968,552 |
|
16,465,130 |
|
32,433,682 |
(In thousands of Reais)
|
|
|
|
Parent Company |
Consolidated |
|||||
|
|
Note |
|
9M23 |
|
9M22 |
|
9M23 |
|
9M22 |
|
Cash flows from operating activities |
|
|
|
|
|
|
|
|
|
|
Profit (loss) before income taxes |
|
|
(2,010,574) |
|
(485,858) |
|
1,699,340 |
|
848,352 |
|
|
|
|
|
|
|
|
|
|
|
|
Adjustments for: |
|
|
|
|
|
|
|
|
|
|
Depreciation and amortization |
20 |
|
10,697 |
|
10,461 |
|
2,477,810 |
|
2,162,751 |
|
Interest in earnings of subsidiaries and associates |
9.1 |
|
24,028 |
|
(2,343,296) |
|
(240,241) |
|
(293,545) |
|
Interest in earnings of joint ventures |
10 |
|
(154,713) |
|
153,558 |
|
(1,363,556) |
|
153,558 |
|
Loss (gain) on disposed assets |
21 |
|
(13,563) |
|
1,858 |
|
4,959 |
|
27,343 |
|
Share based payment |
24 |
|
80,296 |
|
34,631 |
|
151,177 |
|
70,455 |
|
Change in fair value of investment properties |
11.5 |
|
— |
|
— |
|
(463,837) |
|
(59,061) |
|
Provision for legal expenses, receivables and tax installments |
21 |
|
56,716 |
|
51,388 |
|
139,301 |
|
237,395 |
|
Interest, derivatives, monetary and foreign exchange variations, net |
|
|
1,847,394 |
|
2,544,778 |
|
8,484,094 |
|
4,833,520 |
|
Bargain purchase gain |
21 |
|
— |
|
(92,946) |
|
— |
|
(92,946) |
|
Sectorial financial assets and liabilities, net |
5.10 |
|
— |
|
— |
|
(2,587) |
|
209,528 |
|
(Gain) loss on energy derivative transactions |
|
|
— |
|
— |
|
— |
|
(181,782) |
|
Provisions for employee benefits |
|
|
31,413 |
|
23,579 |
|
251,637 |
|
274,325 |
|
Allowance for expected credit losses |
|
|
— |
|
— |
|
16,418 |
|
16,262 |
|
Tax credit recovery |
|
|
— |
|
— |
|
(9,106) |
|
(74,330) |
|
Deferred revenue |
|
|
— |
|
— |
|
(596,648) |
|
(4,025) |
|
Revenue from finance investment |
|
|
— |
|
— |
|
(786,443) |
|
— |
|
Other |
|
|
(49,490) |
|
13,043 |
|
174,765 |
|
90,762 |
|
|
|
|
(177,796) |
|
(88,804) |
|
9,937,083 |
|
8,218,562 |
|
Variation in: |
|
|
|
|
|
|
|
|
|
|
Trade receivables |
|
|
— |
|
— |
|
199,656 |
|
(1,042,720) |
|
Inventories |
|
|
— |
|
— |
|
(92,991) |
|
(243,785) |
|
Other taxes, net |
|
|
2,667 |
|
(5,899) |
|
538,549 |
|
554,407 |
|
Income tax |
|
|
76,323 |
|
(6,040) |
|
(861,932) |
|
(889,292) |
|
Related parties, net |
|
|
17,047 |
|
(163,883) |
|
(46,267) |
|
10,275 |
|
Suppliers |
|
|
(112,213) |
|
14,680 |
|
(360,292) |
|
795,022 |
|
Employee benefits payables |
|
|
(40,975) |
|
(32,124) |
|
(295,206) |
|
(214,783) |
|
Provision for legal expenses |
|
|
(17,373) |
|
(5,506) |
|
(284,099) |
|
(220,888) |
|
Derivative financial instruments |
|
|
— |
|
— |
|
19,860 |
|
(21,815) |
|
Other financial liabilities |
|
|
— |
|
— |
|
(210,456) |
|
235,061 |
|
Judicial deposits |
|
|
(33,174) |
|
7,112 |
|
(15,960) |
|
(7,292) |
|
Post-employment benefits obligation |
|
|
— |
|
— |
|
(25,952) |
|
(72,007) |
|
Other assets and liabilities, net |
|
|
19,470 |
|
(4,923) |
|
(213,368) |
|
441,991 |
|
|
|
|
(88,228) |
|
(196,583) |
|
(1,648,458) |
|
(675,826) |
|
|
|
|
|
|
|
|
|
|
— |
|
Net cash (used in) generated from operating activities |
|
|
(266,024) |
|
(285,387) |
|
8,288,625 |
|
7,542,736 |
|
|
|
|
|
|
|
|
|
|
|
|
Cash flows from investing activities |
|
|
|
|
|
|
|
|
|
|
Capital contribution to subsidiaries and associates |
|
|
(296,500) |
|
(6,442,536) |
|
(47,300) |
|
(52,308) |
|
Acquisition of subsidiary, net of acquired cash |
|
|
— |
|
— |
|
— |
|
(5,122,805) |
|
Sale (purchase) of marketable securities |
|
|
277,788 |
|
569,590 |
|
(1,745,814) |
|
(3,059,254) |
|
Restricted cash |
|
|
(116,541) |
|
(2,772) |
|
(133,760) |
|
(36,841) |
|
Dividends received from subsidiaries and associates |
17 |
|
819,331 |
|
97,402 |
|
180,201 |
|
65,928 |
|
Dividends received from joint venture |
17 |
|
58,635 |
|
624,939 |
|
516,268 |
|
624,939 |
|
Dividends received from finance investment |
1.1 |
|
— |
|
— |
|
816,902 |
|
— |
|
Acquisition of instruments designated at fair value |
|
|
— |
|
— |
|
(7,519) |
|
(157,979) |
|
Additions of property, plant and equipment, intangible and contract assets |
|
|
(4,130) |
|
(1,168) |
|
(4,431,547) |
|
(3,246,976) |
|
Proceeds from the sale of investments |
|
|
15,000 |
|
— |
|
(5,926) |
|
726,243 |
Statement of cash flow
(In thousands of Reais)
|
Receipt of derivative financial instruments, except debt |
|
|
162,114 |
|
138,403 |
|
166,390 |
|
138,403 |
|
Payment of derivative financial instruments, except debt |
|
|
(116,303) |
|
(235,290) |
|
(125,435) |
|
(235,290) |
|
Reclassification of assets held for sale |
|
|
— |
|
— |
|
— |
|
(217,119) |
|
Cash received on the sale of property, plant and equipment and intangible assets |
|
|
— |
|
— |
|
1,691 |
|
6,166 |
|
Other |
|
|
— |
|
(300) |
|
— |
|
(435) |
|
Net cash generated from (used in) investing activities |
|
|
799,394 |
|
(5,251,732) |
|
(4,815,849) |
|
(10,567,328) |
|
|
|
|
|
|
|
|
|
|
|
|
Cash flows from financing activities |
|
|
|
|
|
|
|
|
|
|
Loans, borrowings and debentures raised |
5.4 |
|
3,483,102 |
|
9,450,210 |
|
8,357,970 |
|
14,231,104 |
|
Principal repayment of loans, borrowings and debentures |
5.4 |
|
(579,942) |
|
— |
|
(3,562,837) |
|
(6,153,926) |
|
Payment of interest on loans, borrowings and debentures |
5.4 |
|
(659,023) |
|
(653,068) |
|
(2,446,032) |
|
(2,447,313) |
|
Payment of derivative financial instruments |
|
|
(608,433) |
|
(630,908) |
|
(1,831,815) |
|
(1,367,284) |
|
Receipt of derivative financial instruments |
|
|
292,303 |
|
226,684 |
|
407,971 |
|
318,059 |
|
Costs of banking operations with derivatives |
1.1 |
|
— |
|
— |
|
(412,309) |
|
— |
|
Principal repayment of leases |
5.5 |
|
(4,046) |
|
(3,726) |
|
(363,767) |
|
(282,074) |
|
Payment of interest on leases |
5.5 |
|
(2,716) |
|
(2,981) |
|
(144,957) |
|
(155,290) |
|
Funds from capital contributions by non-controlling shareholders |
9.2 |
|
— |
|
— |
|
9,709 |
|
21,626 |
|
Related parties |
|
|
(510,712) |
|
(1,167,462) |
|
— |
|
— |
|
Proceeds from the sale of treasury shares |
|
|
— |
|
— |
|
— |
|
(25,084) |
|
Acquisition of non-controlling shareholders’ shares |
|
|
— |
|
(6,082) |
|
— |
|
(468,221) |
|
Dividends paid |
17 |
|
(798,203) |
|
(799,347) |
|
(1,627,717) |
|
(924,247) |
|
Share options exercised |
|
|
— |
|
— |
|
(13,597) |
|
(15,597) |
|
Net cash generated from (used in) financing activities |
|
|
612,330 |
|
6,413,320 |
|
(1,627,381) |
|
2,731,753 |
|
|
|
|
|
|
|
|
|
|
|
|
Increase (decrease) in cash and cash equivalents |
|
|
1,145,700 |
|
876,201 |
|
1,845,395 |
|
(292,839) |
|
|
|
|
|
|
|
|
|
|
|
|
Cash and cash equivalents at the beginning of the period |
|
|
1,348,461 |
|
1,718,077 |
|
13,301,716 |
|
16,174,130 |
|
Effect of the foreign exchange variation on the cash balance and cash equivalents |
|
|
(19,297) |
|
(192,371) |
|
(65,738) |
|
(394,188) |
|
Cash and cash equivalents at the end of the period |
|
|
2,474,864 |
|
2,401,907 |
|
15,081,373 |
|
15,487,103 |
|
|
|
|
|
|
|
|
|
|
|
|
Additional information |
|
|
|
|
|
|
|
|
|
|
Income taxes paid |
|
|
— |
|
— |
|
63,360 |
|
441,033 |
The accompanying notes are an integral part of these interim financial statements.
Non-cash transactions:
The Company presents its statements of cash flows using the indirect method. During the period ended September 30, 2023, the Company carried out the following transactions that did not involve cash and, therefore, are not reflected in the parent company and consolidated statement of cash flows:
| (i) | Recognition of right-of-use as a counterpart to the lease liability in the amount of R$1,961,656 (R$432,466 on September 30, 2022), resulting from the application of inflation indexes and new contracts classified under the leasing rule (Note 11.4). |
| (ii) | Acquisition of property, plant and equipment and intangible assets with payment in installments R$196,923 (R$39,121 on September 30, 2022). |
| (iii) | Capital increase in subsidiary Cosan Nove Participações S.A. with funds from the balance of accounts receivable from related parties in the amount of R$121,621. |
| (iv) | Partial amortization of Senior Notes 2027 and 2029 in the amount of R$84,585 using the balance of other financial assets. |
Disclosure of interest and dividends:
Dividends and interest on shareholders' equity are classified as cash flow from investing activities by the Company. Dividends and interest received or paid are classified as cash flow from financing activities.
(In thousands of Reais)
|
|
Parent Company |
|
Consolidated |
||||
|
|
9M23 |
|
9M22 |
|
9M23 |
|
9M22 |
|
Revenue |
|
|
|
|
|
|
|
|
Net sales |
— |
|
— |
|
35,198,123 |
|
34,579,820 |
|
Other income (expense), net |
(27,953) |
|
93,038 |
|
1,878,551 |
|
133,421 |
|
Impairment gain (loss) on trade receivables |
— |
|
— |
|
(16,418) |
|
(12,265) |
|
|
(27,953) |
|
93,038 |
|
37,060,256 |
|
34,700,976 |
|
Inputs purchased from third parties |
|
|
|
|
|
|
|
|
Cost of goods sold and services rendered |
— |
|
— |
|
20,264,600 |
|
12,049,413 |
|
Materials, energy, third-party services and other |
89,025 |
|
122,854 |
|
1,476,273 |
|
11,084,735 |
|
|
89,025 |
|
122,854 |
|
21,740,873 |
|
23,134,148 |
|
|
|
|
|
|
|
|
|
|
Gross value added |
(116,978) |
|
(29,816) |
|
15,319,383 |
|
11,566,828 |
|
Retention |
|
|
|
|
|
|
|
|
Depreciation and amortization |
10,697 |
|
10,461 |
|
2,477,810 |
|
2,162,751 |
|
Net value added |
(127,675) |
|
(40,277) |
|
12,841,573 |
|
9,404,077 |
|
|
|
|
|
|
|
|
|
|
Value added transferred in |
|
|
|
|
|
|
|
|
Interest earnings in associates |
(24,028) |
|
2,343,296 |
|
240,241 |
|
293,545 |
|
Interest earnings in joint ventures |
154,713 |
|
(153,558) |
|
1,363,556 |
|
(153,558) |
|
Finance revenue |
240,953 |
|
192,710 |
|
1,951,914 |
|
1,848,093 |
|
|
371,638 |
|
2,382,448 |
|
3,555,711 |
|
1,988,080 |
|
|
|
|
|
|
|
|
|
|
Value added to be distributed |
243,963 |
|
2,342,171 |
|
16,397,284 |
|
11,392,157 |
|
|
|
|
|
|
|
|
|
|
Distribution of value added |
|
|
|
|
|
|
|
|
Personnel and payroll charges |
206,555 |
|
122,500 |
|
1,937,589 |
|
1,604,907 |
|
Direct remuneration |
193,797 |
|
110,729 |
|
1,572,424 |
|
1,298,340 |
|
Benefits |
8,233 |
|
7,012 |
|
286,376 |
|
248,929 |
|
FGTS and other |
4,525 |
|
4,759 |
|
78,789 |
|
57,638 |
|
|
|
|
|
|
|
|
|
|
Taxes, fees and contributions |
(722,849) |
|
(831,982) |
|
4,168,392 |
|
2,823,401 |
|
Federal |
(726,915) |
|
(839,294) |
|
1,960,297 |
|
665,309 |
|
State |
— |
|
— |
|
2,078,368 |
|
1,998,289 |
|
Municipal |
4,066 |
|
7,312 |
|
129,727 |
|
159,803 |
|
|
|
|
|
|
|
|
|
|
Financial expenses and rents |
2,028,337 |
|
2,681,641 |
|
9,429,769 |
|
5,895,277 |
|
Interest and foreign exchange variation |
2,113,122 |
|
2,624,610 |
|
8,828,055 |
|
5,533,078 |
|
Rents |
— |
|
— |
|
107,455 |
|
128,551 |
|
Other |
(84,785) |
|
57,031 |
|
494,259 |
|
233,648 |
|
|
|
|
|
|
|
|
|
|
Equity Remuneration |
(1,268,080) |
|
370,012 |
|
861,534 |
|
1,068,572 |
|
Non-controlling interests |
— |
|
— |
|
2,129,614 |
|
698,560 |
|
Retained profits (loss) |
(1,268,080) |
|
370,012 |
|
(1,268,080) |
|
370,012 |
The accompanying notes are an integral part of these interim financial statements.
Explanatory Notes to the interim Financial Statement
(In thousands of Reais, except when otherwise indicated)
Cosan S.A. (“Cosan” or “the Company”) is a publicly traded company at B3 S.A. - Brasil, Bolsa, Balcão (“B3”) in the special New Market (Novo Mercado) segment under the symbol “CSAN3”. The Company's American Depositary Shares (“ADSs”) are listed on the New York Stock Exchange, or “NYSE”, and are traded under the symbol “CSAN”. Cosan is a corporation (sociedade anônima) of indefinite term incorporated under the laws of Brazil, with its registered office in the city of São Paulo, state of São Paulo. Mr. Rubens Ometto Silveira Mello is the ultimate controlling shareholder of Cosan.
Corporate Cosan (Corporate segment) It is formed by the following entities:
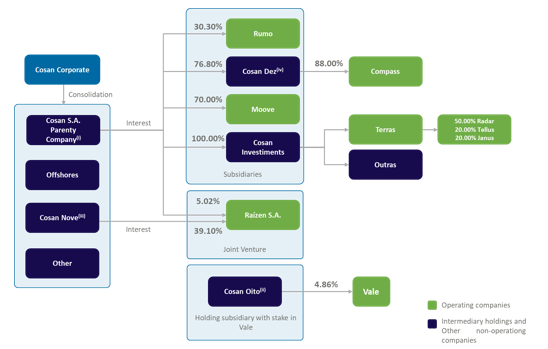
| (i) |
Parent company with direct or indirect equity interest in subsidiaries and joint venture. The main effects on its profit or loss are general and administrative expenses, contingencies, equity income and financial result attributed to loans. |
| (ii) | Cosan Oito is a subsidiary of Cosan S.A, which holds a stake in Vale, together with debt instruments (Resolução 4131) with JP Morgan S.A and Citibank S.A and derivative financial instruments as described in note 1.1 below. |
| (iii) | Cosan Nove has a direct stake in Raízen of 39.15% and preferred shares with Itaú Unibanco S.A. (“Itaú”) which corresponds to an equity interest of 26.90%. |
| (iv) | Cosan Dez has a direct stake in Compass of 88.00% and preferred shares with Bradesco BBI S.A. (“Bradesco”) which corresponds to an equity interest of 23.20%. |
During the fourth quarter of 2022, the subsidiary Cosan Oito S.A. (“Cosan Oito”), completed the transaction related to the acquisition of a non-controlling interest in Vale S.A. (“Vale”) which was divided into: (i) assets acquired; (ii) debt incurred; (iii) structured derivatives; and (iv) issuance of preferred shares.
On April 28, 2023, at Vale's Ordinary General Meeting, the CEO of Cosan S.A., Luis Henrique Cals de Beauclair Guimarães, was elected a member of Vale's Board of Directors, and on May 16, 2023, he was appointed as Committee Coordinator of Capital Allocation and Project and member of the People and Compensation Committee.
| 14 |
Explanatory Notes to the interim Financial Statement
(In thousands of Reais, except when otherwise indicated)
a) Assets acquired
Cosan Oito made the following investments in Vale: (a) acquisition of shares in the spot market and (b) purchase through a private operation with partial protection via derivatives (Collar), as shown in the table below:
|
|
|
Inception date |
|
At September 30, 2023 |
||||
|
Description |
|
% |
|
Amount |
|
% |
|
Amount |
|
Direct shareholding |
|
1.55% |
|
4,918,245 |
|
1.65% |
|
5,056,055 |
|
Equity collar |
|
3.31% |
|
11,117,824 |
|
3.21% |
|
9,836,326 |
|
|
|
4.86% |
|
16,036,069 |
|
4.86% |
|
14,892,381 |
b) Debt incurred and partial advances
The following loans were contracted for the acquisition of assets, together with the banks below:
|
Creditor |
|
Amount |
|
Maturities |
|
Currency (i) |
|
Annual interest rate (i) |
|
JP Morgan S.A. |
|
789,659 |
|
Oct-24 |
|
Euro |
|
2.95% |
|
JP Morgan S.A. |
|
1,825,467 |
|
Oct-25 |
|
Euro |
|
3.20% |
|
JP Morgan S.A. |
|
1,785,329 |
|
Oct-26 |
|
Euro |
|
3.40% |
|
JP Morgan S.A. |
|
741,320 |
|
Oct-27 |
|
Euro |
|
3.56% |
|
Citibank S.A. |
|
526,443 |
|
Oct-24 |
|
Yen |
|
0.25% |
|
Citibank S.A. |
|
1,216,939 |
|
Oct-25 |
|
Yen |
|
0.25% |
|
Citibank S.A. |
|
1,190,274 |
|
Oct-26 |
|
Yen |
|
0.25% |
|
Citibank S.A. |
|
494,199 |
|
Oct-27 |
|
Yen |
|
0.25% |
|
Total |
|
8,569,630 |
|
|
|
|
|
|
| (i) |
Debts were contracted (Resolução 4131) in the currencies specified above with four maturities with pre-fixed amounts and derivative financial instruments were contracted with CDI plus 0.45% equivalent. |
On August 10, 2023, the subsidiary Cosan Oito anticipated the partial settlement of 20% of the first tranche, which represents 15% of the total Collar financing structure related to the stake in Vale, equivalent to 0.10% of the mining company’s total shares in the date. This prepayment totaled R$296,274 in principal plus interest, related to loan 4,131 and dismantling of the foreign exchange derivative. Additionally, we pre-settled VALE3's derivative structure (Collar) in equal proportion, resulting in a financial gain of R$28,961. Finally, the prepayment released 4.5 million Vale shares previously sold on fiduciary basis in this structure. As a result of the operation, the direct participation previously of 1.55%, on June 30, 2023, increased to 1.65%.
On October 6, 2023, as a subsequent event, the subsidiary Cosan Oito anticipated the partial settlement of the remaining 25% of the first tranche of the total Collar Financing structure related to the stake in Vale, equivalent to 0.10% of the total shares. This partial settlement had the following effects: (i) Prepayment of R$300,860 in principal and interest related to loan 4,131 and settlement of foreign exchange derivative; (ii) Early settlement of VALE3's derivative structure (Collar) in equal proportion, resulting in a financial gain of R$28,008 and (iii) Release of 4.5 million Vale shares previously sold on fiduciary basis in this structure. As a result of the operation, the direct participation previously of 1.65%, on September 30, 2023, increased to 1.75%.
| 15 |
Explanatory Notes to the interim Financial Statement
(In thousands of Reais, except when otherwise indicated)
c) Structured derivatives
For protection related to the acquisition of a 3.31% stake, derivatives were contracted consisting of a combination of call and put (Collar). Additionally, the following papers were contracted: (i) forward option (Forward) which grants the right to acquire 1.60% of Vale (optional) and; (ii) Derivatives consisting of a combination of call and put positions (Synthetic Collar).
The collar and synthetic collar derivatives protect the Company from the devaluation of the share’s value below the strikes of the puts, at the same time, they allow Cosan Oito to participate partially in future increases in the share’s value limited to the strikes of the calls.
|
|
|
Inception Date |
|
At September 30, 2023 |
||||
|
Description |
|
% |
|
Amount (paid)/received |
|
% |
|
Fair value |
|
Collar |
|
3.31% |
|
499,197 |
|
3.21% |
|
861,587 |
|
Call Spread |
|
1.60% |
|
(888,612) |
|
1.60% |
|
466,314 |
|
Forward |
|
|
|
(1,134,933) |
|
|
|
(80,476) |
|
Collar sintético |
|
|
|
246,321 |
|
|
|
546,790 |
|
Total |
|
|
|
(389,415) |
|
|
|
1,327,901 |
d) Issuance of preferred shares
Bradesco BBI S.A. (“Bradesco”) and Itaú Unibanco S.A. (“Itaú”) completed investments on December 23 and 28, 2022, acquiring 23.30% and 26.90% of the share capital of the subsidiaries Cosan Dez Participações S.A. ("Cosan Dez") and Cosan Nove Participações S.A. ("Cosan Nove") for R$4,000,000 and R$4,115,000, respectively.
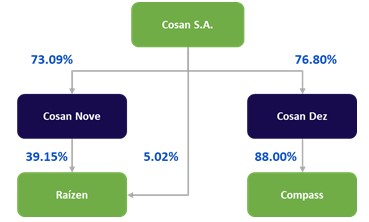
As part of the issuance of preferred shares by Cosan Nove and Cosan Dez, Cosan S.A. contributed its investments in Raízen and Compass Gas and Energy. The structure after the contribution of investments follows as shown:
Disproportionate dividends
The subsidiaries Cosan Nove and Cosan Dez have outstanding preferred shares classified in equity by non-controlling interests. The Company calculates its share of profits or losses after adjusting the dividends on these shares, regardless of whether such dividends have been declared or not. This effectively means that the non-controlling interest, represented by the preferred shares, is receiving a portion of the profit or accrual of interest equivalent to the dividends.
| 16 |
Explanatory Notes to the interim Financial Statement
(In thousands of Reais, except when otherwise indicated)
On September 30, 2023, the equity interest and economic benefit of Cosan S.A. on Cosan Nove and Cosan Dez, considering the disproportionate dividends were as shown below:
|
|
|
% Equity interest |
|
% Economic benefit (i) |
|
Cosan Nove |
|
73.09% |
|
66.16% |
|
Cosan Dez |
|
76.80% |
|
72.00% |
| (i) |
Percentage used to calculate the interest on September 30, 2023. To calculate the dividends of Cosan Nove and Cosan Dez for preferred shareholders, the profits of the respective Companies are used, multiplied by the participation percentages using the percentages defined in the Shareholders’ Agreements. |
Call option
The Company has a call option which gives it the right to repurchase all preferred shares from Cosan Nove and Cosan Dez, which may be exercised from the third year after the signing of the respective agreements in December 2022.
On September 30, 2023, the Company measured the fair value of the call option and concluded that it is out of price.
Contingent sell Option
In the shareholders’ agreements signed between the Company and Itaú and Bradesco referring to the issuance of preferred shares, it was defined that both financial institutions have a contingent call option only when the specific material adverse effects provided for in the contract occur, which are in the control of the Company and, therefore, do not constitute a financial obligation.
The total of investments in preferred shares are calculated based on the initial amounts of R$4,115,000 and R$4,000,000 restated by a weighted average rate of CDI + 1.25% less dividends received by non-controlling shareholders in this period, which, on September 30, 2023, is represented by the amounts of R$4,404,537 and R$4,438,635, respectively.
| 17 |
Explanatory Notes to the interim Financial Statement
(In thousands of Reais, except when otherwise indicated)
e) Summary of the accounting effect of the events mentioned in the previous topics.
Below is a summary of the accounting effect of the events mentioned above:
|
|
Note |
|
Assets acquired |
|
Debt incurred (vi) |
|
Derivates |
|
Dividends receivable, net |
|
Dividends payable |
||||
|
|
|
|
|
Collar (i) |
|
Synthetic Collar (ii) |
|
Foward (ii) |
|
|
|||||
|
At January 1, 2023 |
|
|
19,586,193 |
|
(8,808,673) |
|
(2,840,544) |
|
(1,237,907) |
|
1,954,493 |
|
22,842 |
|
— |
|
- Impacts on the profit or loss |
|
|
|
|
|
|
|
|
|
|
|
|
|
|
|
|
MTM Vale's shares(iii) |
22 |
|
(4,693,812) |
|
— |
|
— |
|
— |
|
— |
|
— |
|
— |
|
Interest and monetary and exchange variation (accrual) |
22 |
|
— |
|
711,919 |
|
— |
|
— |
|
— |
|
— |
|
— |
|
Dividends declared by Vale (vii) |
21 |
|
— |
|
— |
|
— |
|
— |
|
— |
|
762,204 |
|
— |
|
Costs of banking operations with derivatives |
22 |
|
— |
|
— |
|
— |
|
— |
|
— |
|
(380,453) |
|
— |
|
MTM of derivates |
22 |
|
— |
|
(1,844,372) |
|
3,731,092 |
|
1,784,697 |
|
(2,034,969) |
|
— |
|
— |
|
- Impacts on cash flow - (receipt) / payment |
|
|
|
|
|
|
|
|
|
|
|
|
|
|
|
|
Dividends paid to minority shareholders from Cosan Nove |
|
|
— |
|
— |
|
— |
|
— |
|
— |
|
— |
|
123,000 |
|
Dividends (received) from Vale (iv) |
|
|
— |
|
— |
|
— |
|
— |
|
— |
|
(816,902) |
|
— |
|
Costs of banking operations with derivatives (v) |
|
|
— |
|
— |
|
— |
|
— |
|
— |
|
412,309 |
|
— |
|
Partial payment of loans |
2.2 |
|
— |
|
280,744 |
|
— |
|
— |
|
— |
|
— |
|
— |
|
Payment of derivative financial instruments |
2.2 |
|
— |
|
15,530 |
|
— |
|
— |
|
— |
|
— |
|
— |
|
(Receipt) of derivative financial instruments |
2.2 |
|
— |
|
— |
|
(28,961) |
|
— |
|
— |
|
— |
|
— |
|
- Impacts on the balance sheet |
|
|
— |
|
— |
|
— |
|
— |
|
— |
|
— |
|
— |
|
Minority dividends payable referring to structure of issuance of preferred shares |
|
|
— |
|
— |
|
— |
|
— |
|
— |
|
— |
|
(123,000) |
|
At September 30, 2023 |
|
|
14,892,381 |
|
(9,644,852) |
|
861,587 |
|
546,790 |
|
(80,476) |
|
— |
|
— |
| (i) |
Collar contracted to protect 3.21% of the shares acquired. |
| (ii) | Forward and synthetic collar contracted for the right to acquire and protect, respectively, 1.60% of Vale's shares. |
| (iii) | Mark to market consisting of: |
| a) 1.65% interest in shares purchased in cash, totaling R$1,593,578, and | |
| b) 3.21% stake in shares with Collar protection totaling R$3,100,234. | |
| (iv) | The balance received from dividends is composed of R$762,204 referring to the 9-month period ended September 30,2023 and R$54,698 referring to the provisioned amount on December 31, 2022. |
| (v) |
The balance paid for costs of banking operations with derivatives is composed of R$380,453 referring to the 9-month period ended September 30,2023 and R$31,856 referring to the provisioned amount on December 31, 2022. |
| (vi) |
Also includes contracted derivatives (NDF) for exchange rate and interest protection. |
| (vii) |
Vale’s Board of Directors approved, on July 27, 2023, the distribution of interest on own capital in the total gross amount of R$8,276,501, corresponding to the total amount of R$1.917008992 per share, calculated according to the balance sheet of June 30, 2023. |
Explanatory Notes to the interim Financial Statement
(In thousands of Reais, except when otherwise indicated)
SALE OF SHARES OF SINLOG TECNOLOGIA EM LOGÍSTICA S.A.
On March 10, 2023, the Company entered into a share purchase and sale agreement, providing for the sale of its entire equity interest in Sinlog Tecnologia em Logística S.A. The transaction was completed on May 2, 2023, for the amount of R$45,000, divided into three equal installments, the first of which was received on the same date and the remaining installments to be received annually, restated by 100% of the CDI. This operation generated a gain in the Company's profit or loss in the amount of R$14,884, registered in other operating income (expenses), net, explanatory note 21.
ISSUANCE OF SENIOR NOTE 2030
On June 20, 2023, the Company issued an offering of senior notes in the total amount of US$550,000 thousand, equivalent to R$2,668,380, through its wholly owned subsidiary Cosan Luxembourg S.A (“Cosan Luxemburgo”). The issuance of the senior notes took place at an annual interest rate of US$ + 7.50%, maturing in June 2030 and paying interest semi-annually.
ISSUE OF DEBENTURES
On April 20 and June 20, 2023, Cosan issued two debentures, not convertible into shares, in the total principal amount of R$1,000,000 each in a single series that bears interest at a rate equal to DI plus 2.4% p.a. maturing in April and June 2028, respectively, principal due upon maturity and interest paid semiannually.
ADDITION OF RIGHT OF USE – FRSU COMPASS S.A CONTRACT
On July 1, 2023, the subsidiary Compass added the Right of Use to the contract related to the charter of the floating storage and regasification unit (“FRSU”) in the amount of R$1,510,810. The leased asset will be used to receive, store and regasification LNG (“Liquefied Natural Gas”) at the TRSP – LNG Regasification Terminal of São Paulo S.A. (“TRSP”). The term of the contract is 10 years with reasonable certainty of extension for two periods of 5 years, that is, the lease term for this right of use was considered until June 2043.
TREND OFFER SENIOR NOTES 2027
On July 18, 2023, the subsidiary Cosan Luxembourg S.A. concluded the tender-offer of the 2027 senior notes with the repurchase of debt securities in the amount of US$250,000 thousand equivalent to R$1,201,000 in aggregate principal value, with payment of accrued interest of US$8,069 thousand equivalent to R$38,763 and a prize of US$7,500 thousand equivalent to R$36,030.
ISSUE OF DEBENTURES RUMO S.A.
On September 15, 2023, the subsidiary Rumo raised R$1,500,000 with the 17th issuance of simple debentures, not convertible into shares, of the unsecured type, divided into two series, the first of which has an amount of R$750,000, with IPCA+5.76% rate and 6-year term, while the second is R$750,000 with IPCA+6.18% rate and 10-year term. Both series will have semiannual interest payments and 100% principal amortization upon maturity. The funds from this fundraising will be used for investment. These debentures have the same restrictive financial clauses (“financial covenants”) as other debts and ESG commitments, as shown in note 5.1.
Explanatory Notes to the interim Financial Statement
(In thousands of Reais, except when otherwise indicated)
EXPORT CREDIT NOTE - RUMO
On September 15, 2023, the subsidiary On July 7, 2023, the subsidiary Rumo obtained an Export Credit Note (“NCE”), in the amount of R$725.000, equivalent to USD150.000 thousands, with maturity in 18 months, quarterly amortization and cost of SOFR + 1.30%. Along with the debt, a Swap was contracted to transform the cost of debt to 108.9% of the CDI.
REALIZATION OF DEFERRED REVENUE
On July 1, 2022, the indirect subsidiary Compass Comercialização S.A. (“Compass Comercialização”) signed a contractual instrument to cancel Liquefied Natural Gas (“LNG”) with deliveries scheduled for 2023. In return, financial compensation was agreed between the parts whose receipt was initially recorded in Compass Comercialização's balance sheet under deferred revenue. On July 13, 2023, after compliance with all remaining performance obligations, the amount of R$923,214 was recognized under other operating income, with R$845,233 related to the instrument mentioned above and R$77,981 related to the recognition of bonus received
In the note 21:
|
|
Parent Company |
|
Consolidated |
||||||||||||
|
|
3Q23 |
|
3Q22 |
|
9M23 |
|
9M22 |
|
3Q23 |
|
3Q22 |
|
9M23 |
|
9M22 |
|
Gain from bargain purchase |
— |
|
— |
|
— |
|
92,946 |
|
— |
|
— |
|
— |
|
92,946 |
|
Extemporaneous tax credits |
— |
|
— |
|
— |
|
— |
|
6,098 |
|
203 |
|
10,323 |
|
77,926 |
|
Change in fair value of investment properties |
— |
|
— |
|
— |
|
— |
|
372,015 |
|
— |
|
463,837 |
|
59,061 |
|
Loss on disposals of non-current assets and intangible assets |
— |
|
(1,858) |
|
13,563 |
|
(1,858) |
|
(4,182) |
|
(3,354) |
|
(4,959) |
|
(27,343) |
|
Net effect of provisions for legal proceedings |
(13,192) |
|
(24,245) |
|
(56,716) |
|
(51,388) |
|
(60,677) |
|
(86,841) |
|
(139,301) |
|
(237,395) |
|
Settlement of disputes in the renewal process |
— |
|
— |
|
— |
|
— |
|
— |
|
— |
|
— |
|
(32,490) |
|
Dividends |
— |
|
— |
|
— |
|
— |
|
359,452 |
|
— |
|
762,204 |
|
— |
|
Realization of deferred revenue (ii)[DC1] |
— |
|
— |
|
— |
|
— |
|
923,214 |
|
— |
|
923,214 |
|
— |
|
Other income |
4,323 |
|
5,666 |
|
61,730 |
|
14,650 |
|
83,768 |
|
— |
|
125,775 |
|
— |
|
Loss due to reduction in net recoverable value |
— |
|
— |
|
— |
|
— |
|
— |
|
(243) |
|
— |
|
(243) |
|
Other |
(31,453) |
|
(6,786) |
|
(61,594) |
|
(26,894) |
|
(275,815) |
|
26,379 |
|
(431,373) |
|
19,066 |
|
|
(40,322) |
|
(27,223) |
|
(43,017) |
|
27,456 |
|
1,403,873 |
|
(63,856) |
|
1,709,720 |
|
(48,472) |
Explanatory Notes to the interim Financial Statement
(In thousands of Reais, except when otherwise indicated)
INTERNALIZATION OF SENIOR NOTES 2030
On September 29, 2023, the Company internalized the remaining resources arising from the 2030 senior notes, through the issuance of debentures by Cosan S.A., referenced in US dollars in the amount of R$1,491 million (equivalent to US$300,000 thousand), with coupon annual rate of 16.04% p.a. for first interest payment and 8.02% p.a. for the others. In return, Cosan Luxembourg contracted a Total Return Swap (“TRS”) with the same amount and counterparty in US dollars, with semi-annual payment frequency and annual remuneration of 15.52% p.a. for the first interest remuneration and 7.50% p.a. for the others, which has the issue of debentures as its underlying asset. For more information see note 5.4 (e).
RUSSIAN-UKRAINIAN CONFLIT
The conflict between Russia and Ukraine initiated in February 2022 is a far-reaching event in the world economy, thus the Company continues to monitor the possible operational impacts, mainly on its commodities, fertilizers and fuels, and also, impacts on its financial reports. As of the date of issuance of these interim financial statements, we have not experienced significant impacts from this conflict.
These individual and consolidated interim financial statements were prepared and are being presented in accordance with the technical pronouncement CPC 21 (R1) - Interim Statements and with the international standards IAS 34 - Interim Financial Reporting, issued by the International Accounting Standards Board (IASB), and also based on the provisions contained in the Brazilian Corporation Law, and presented in a manner consistent with the rules issued by the Securities and Exchange Commission, applicable to the preparation of quarterly information - ITR. Interim financial statements do not include all information necessary for a complete set of financial statements prepared in accordance with local standards and IFRS. However, specific explanatory notes are included to explain events and transactions that are significant to an understanding of changes in the Group's financial position and performance since the last annual financial statement.
The presentation of Statements of Added Value (DVA), individual and consolidated, is required by Brazilian corporate legislation and by the accounting practices adopted in Brazil applicable to public companies CPC 09 – Statement of Added Value. IFRS standards do not require the presentation of this statement. As a consequence, under IFRS, this statement is presented as supplementary information, without prejudice to the set of interim financial statements.
The information in the explanatory notes that did not undergo significant changes compared to the financial statements as of December 31, 2022, was not presented in full in this quarterly information.
These interim financial statements were prepared following the preparation basis and accounting policies consistent with those adopted in the preparation of the financial statements as of December 31, 2022. All balances have been rounded to the nearest thousand, unless otherwise indicated.
The significant judgments made by Management in applying the Company's accounting policies and the main sources of estimation uncertainty were the same as those described in the last annual financial statements.
The relevant information specific to the interim financial statements, and only them, are being disclosed and correspond to that used by Management in its management.
These interim financial statements were authorized for issuance by the Board of Directors on November 10, 2023.
Explanatory Notes to the interim Financial Statement
(In thousands of Reais, except when otherwise indicated)
The Company's senior management (the Chief Operating Decision Maker) uses segment information to evaluate the performance of operating segments and make resource allocation decisions. Earnings before interest, taxes, depreciation, and amortization ("EBITDA") are used by the Company to evaluate the performance of its operating segments.
Reported segments:
| i. | Raízen: operates in (i) the production, commercialization, origination, and trading of ethanol, (ii) production and commercialization of bioenergy, (iii) resale and trading of electricity, (v) production, marketing, origination and trading of sugar and (iv) distribution and commercialization of fuels and lubricants and operations related to the Shell Select convenience store business and proximity OXXO of the Nós Group, a joint venture with FEMSA Comércio. |
| ii. | Gas and Power: (i) distribution of piped natural gas throughout Brazil to industrial, residential, commercial, automotive, and cogeneration customers; (ii) commercialization of electricity and natural gas; (iii) development of infrastructure projects in a regasification terminal and offshore gas pipeline; and (iv) development of thermal generation projects utilizing natural gas. |
| iii. |
Lubricants: production and distribution of licensed Mobil lubricants in Brazil, Bolivia, Uruguay, Paraguay, Argentina, the United States of American, and the European market. Additionally, under the Comma brand, it manufactures and distributes products for European and Asian markets and corporate activities. |
| iv. |
Logistics: logistics services for rail transport, port storage and loading of goods, primarily grains and sugar, leasing of locomotives, wagons, and other railroad equipment, as well as operation of containers. |
| v. |
Cosan Investments is divided into two reportable components: (i) Land: management of agricultural properties; and (ii) Other Investments: mining projects, and investment in the Climate Tech Fund, a fund managed by Fifth Wall that specializes in technological innovation. |
Reconciliation:
| i. |
Cosan Corporate: Represents Cosan’s corporate structure, which includes expenses with consultancy services, personnel, various legal demands, financial results attributed to debts and equity income results. |
| ii. |
Cosan Oito: Structure designed to carry out the investment made in Vale, containing the shares acquired, the debts contracted, and the derivatives contracted to protect the fluctuations in the share price and the debts contracted. |
Even though Raízen is an equity method joint venture that is not proportionally consolidated, Management continues to review segment-specific data. In the column titled "Deconsolidation of joint venture," the reconciliation between these segments is demonstrated.
The Company reassessed its structure of segments presented as reconciliation items separating the effects of Vale’s operation, called Cosan Oito, considering that the Company’s senior management evaluates its performance separately. With this, the corresponding information from previous years is being represented.
Explanatory Notes to the interim Financial Statement
(In thousands of Reais, except when otherwise indicated)
|
|
3Q23 |
||||||||||||||||||||
|
|
Reported segments |
|
Reconciliation |
|
Consolidated |
||||||||||||||||
|
|
Raízen |
|
Gas and Energy |
|
Lubricants |
|
Logistics |
|
Cosan Investments |
|
Cosan Corporate |
|
Cosan Oito |
|
Deconsolidation of Joint Ventures |
|
Elimination Between Segments |
|
|||
|
|
|
|
|
|
Land |
|
Other Investments |
|
|
|
|
|
|||||||||
|
Result |
|
|
|
|
|
|
|
|
|
|
|
|
|
|
|
|
|
|
|
|
|
|
Gross operating revenue |
62,871,254 |
|
5,420,446 |
|
3,179,287 |
|
3,347,704 |
|
178,926 |
|
— |
|
11 |
|
— |
|
(62,871,254) |
|
(14,205) |
|
12,112,169 |
|
Domestic market (i) |
8,099,884 |
|
5,420,446 |
|
3,044,840 |
|
3,332,135 |
|
178,926 |
|
— |
|
11 |
|
— |
|
(8,099,884) |
|
(14,205) |
|
11,962,153 |
|
Foreign market (i) |
54,771,370 |
|
— |
|
134,447 |
|
15,569 |
|
— |
|
— |
|
— |
|
— |
|
(54,771,370) |
|
— |
|
150,016 |
|
Net operating revenue |
59,444,370 |
|
4,347,452 |
|
2,573,135 |
|
3,175,072 |
|
172,107 |
|
— |
|
9 |
|
— |
|
(59,444,370) |
|
(14,205) |
|
10,253,570 |
|
Cost of goods sold and services provided |
(54,893,366) |
|
(3,387,035) |
|
(1,841,183) |
|
(1,737,523) |
|
(3,542) |
|
— |
|
— |
|
— |
|
54,893,366 |
|
14,205 |
|
(6,955,078) |
|
Gross profit |
4,551,004 |
|
960,417 |
|
731,952 |
|
1,437,549 |
|
168,565 |
|
— |
|
9 |
|
— |
|
(4,551,004) |
|
— |
|
3,298,492 |
|
Selling expenses |
(1,661,014) |
|
(42,066) |
|
(276,197) |
|
(11,202) |
|
— |
|
— |
|
— |
|
— |
|
1,661,014 |
|
— |
|
(329,465) |
|
General and administrative expenses |
(738,916) |
|
(261,719) |
|
(169,947) |
|
(161,082) |
|
(17,153) |
|
(20,079) |
|
(115,780) |
|
(40) |
|
738,916 |
|
— |
|
(745,800) |
|
Other income (expenses), net |
(254,768) |
|
728,571 |
|
2,159 |
|
(46,630) |
|
376,435 |
|
— |
|
(40,323) |
|
383,661 |
|
254,768 |
|
— |
|
1,403,873 |
|
Equity in associates’ earnings |
(62,608) |
|
71,972 |
|
— |
|
32,265 |
|
(4,743) |
|
— |
|
929,045 |
|
— |
|
62,608 |
|
(924,302) |
|
104,237 |
|
Equity income in joint ventures |
— |
|
— |
|
— |
|
1,339 |
|
— |
|
— |
|
(31,200) |
|
— |
|
— |
|
— |
|
(29,861) |
|
Financial result |
(1,706,020) |
|
(175,812) |
|
(80,558) |
|
(677,782) |
|
8,464 |
|
6,684 |
|
(703,771) |
|
148,409 |
|
1,706,020 |
|
— |
|
(1,474,366) |
|
Financial expenses |
(1,276,436) |
|
(215,222) |
|
(73,061) |
|
(377,296) |
|
(1,640) |
|
(32) |
|
(508,886) |
|
529,883 |
|
1,276,436 |
|
— |
|
(646,254) |
|
Financial revenue |
184,928 |
|
244,284 |
|
27,827 |
|
307,116 |
|
10,104 |
|
2,065 |
|
126,938 |
|
4,043 |
|
(184,928) |
|
— |
|
722,377 |
|
Foreign exchange variation |
(410,330) |
|
(71,725) |
|
(34,744) |
|
(218,328) |
|
— |
|
4,651 |
|
(380,897) |
|
(55,065) |
|
410,330 |
|
— |
|
(756,108) |
|
Derivatives |
(204,182) |
|
(133,149) |
|
(580) |
|
(389,274) |
|
— |
|
— |
|
59,074 |
|
(330,452) |
|
204,182 |
|
— |
|
(794,381) |
|
Income tax and social contribution |
(130,424) |
|
(414,918) |
|
(75,580) |
|
(91,843) |
|
(33,434) |
|
(8) |
|
296,282 |
|
(180,602) |
|
130,424 |
|
— |
|
(500,103) |
|
Income for the period |
(2,746) |
|
866,445 |
|
131,829 |
|
482,614 |
|
498,134 |
|
(13,403) |
|
334,262 |
|
351,428 |
|
2,746 |
|
(924,302) |
|
1,727,007 |
|
Result attributed to: |
|
|
|
|
|
|
|
|
|
|
|
|
|
|
|
|
|
|
|
|
|
|
Controlling shareholders |
(50,176) |
|
558,581 |
|
92,303 |
|
146,067 |
|
125,938 |
|
(13,403) |
|
342,140 |
|
351,428 |
|
50,176 |
|
(924,302) |
|
678,752 |
|
Non-controlling shareholders |
47,430 |
|
307,864 |
|
39,526 |
|
336,547 |
|
372,196 |
|
— |
|
(7,878) |
|
— |
|
(47,430) |
|
— |
|
1,048,255 |
|
|
(2,746) |
|
866,445 |
|
131,829 |
|
482,614 |
|
498,134 |
|
(13,403) |
|
334,262 |
|
351,428 |
|
2,746 |
|
(924,302) |
|
1,727,007 |
|
Other selected information |
|
|
|
|
|
|
|
|
|
|
|
|
|
|
|
|
|
|
|
|
|
|
Depreciation and amortization |
2,495,886 |
|
237,610 |
|
63,761 |
|
562,443 |
|
69 |
|
65 |
|
3,685 |
|
— |
|
(2,495,886) |
|
— |
|
867,633 |
|
EBITDA |
4,329,584 |
|
1,694,785 |
|
351,728 |
|
1,814,682 |
|
523,173 |
|
(20,014) |
|
745,436 |
|
383,621 |
|
(4,329,584) |
|
(924,302) |
|
4,569,109 |
|
Additions to fixed assets, intangible assets and contract assets |
2,242,758 |
|
745,849 |
|
40,604 |
|
848,002 |
|
5,487 |
|
8,315 |
|
1,474 |
|
— |
|
(2,242,758) |
|
— |
|
1,649,731 |
|
|
|
|
|
|
|
|
|
|
|
|
|
|
|
|
|
|
|
|
|
|
— |
|
EBITDA reconciliation |
|
|
|
|
|
|
|
|
|
|
|
|
|
|
|
|
|
|
|
|
— |
|
Income for the year |
(2,746) |
|
866,445 |
|
131,829 |
|
482,614 |
|
498,134 |
|
(13,403) |
|
334,262 |
|
351,428 |
|
2,746 |
|
(924,302) |
|
1,727,007 |
|
Income taxes and social contribution |
130,424 |
|
414,918 |
|
75,580 |
|
91,843 |
|
33,434 |
|
8 |
|
(296,282) |
|
180,602 |
|
(130,424) |
|
— |
|
500,103 |
|
Financial result |
1,706,020 |
|
175,812 |
|
80,558 |
|
677,782 |
|
(8,464) |
|
(6,684) |
|
703,771 |
|
(148,409) |
|
(1,706,020) |
|
— |
|
1,474,366 |
|
Depreciation and amortization |
2,495,886 |
|
237,610 |
|
63,761 |
|
562,443 |
|
69 |
|
65 |
|
3,685 |
|
— |
|
(2,495,886) |
|
— |
|
867,633 |
|
EBITDA |
4,329,584 |
|
1,694,785 |
|
351,728 |
|
1,814,682 |
|
523,173 |
|
(20,014) |
|
745,436 |
|
383,621 |
|
(4,329,584) |
|
(924,302) |
|
4,569,109 |
| (i) | Domestic market: sales within each entity's country of residence; Foreign market: export sales. |
Explanatory Notes to the interim Financial Statement
(In thousands of Reais, except when otherwise indicated)
|
|
9M23 |
||||||||||||||||||||
|
|
Reported segments |
|
Reconciliation |
|
Consolidated |
||||||||||||||||
|
|
Raízen |
|
Gas and Energy |
|
Lubricants |
|
Logistics |
|
Cosan Investments |
|
Cosan Corporate |
|
Cosan Oito |
|
Deconsolidation of Joint Ventures |
|
Elimination Between Segments |
|
|||
|
|
|
|
|
|
Land |
|
Other Investments |
|
|
|
|
|
|||||||||
|
Result |
|
|
|
|
|
|
|
|
|
|
|
|
|
|
|
|
|
|
|
|
|
|
Gross operating revenue |
173,290,488 |
|
16,806,710 |
|
9,446,429 |
|
8,788,625 |
|
491,201 |
|
1,678 |
|
557 |
|
— |
|
(173,290,488) |
|
(45,738) |
|
35,489,462 |
|
Domestic market (i) |
86,127,717 |
|
16,806,710 |
|
8,951,695 |
|
8,766,190 |
|
491,201 |
|
1,678 |
|
557 |
|
— |
|
(86,127,717) |
|
(45,738) |
|
34,972,293 |
|
Foreign market (i) |
87,162,771 |
|
— |
|
494,734 |
|
22,435 |
|
— |
|
— |
|
— |
|
— |
|
(87,162,771) |
|
— |
|
517,169 |
|
Net operating revenue |
163,201,592 |
|
13,466,984 |
|
7,677,425 |
|
8,322,012 |
|
472,654 |
|
1,490 |
|
526 |
|
— |
|
(163,201,592) |
|
(45,738) |
|
29,895,353 |
|
Cost of goods sold and services provided |
(148,946,450) |
|
(10,560,705) |
|
(5,627,718) |
|
(5,032,456) |
|
(43,926) |
|
(3,647) |
|
— |
|
— |
|
148,946,450 |
|
45,738 |
|
(21,222,714) |
|
Gross profit |
14,255,142 |
|
2,906,279 |
|
2,049,707 |
|
3,289,556 |
|
428,728 |
|
(2,157) |
|
526 |
|
— |
|
(14,255,142) |
|
— |
|
8,672,639 |
|
Selling expenses |
(4,248,556) |
|
(122,351) |
|
(858,953) |
|
(28,845) |
|
— |
|
(556) |
|
— |
|
— |
|
4,248,556 |
|
— |
|
(1,010,705) |
|
General and administrative expenses |
(2,285,072) |
|
(677,896) |
|
(447,051) |
|
(384,321) |
|
(51,710) |
|
(52,903) |
|
(275,734) |
|
(240) |
|
2,285,072 |
|
— |
|
(1,889,855) |
|
Other income (expenses), net |
1,851,564 |
|
671,538 |
|
(19,995) |
|
(92,031) |
|
456,368 |
|
(17) |
|
(92,556) |
|
786,413 |
|
(1,851,564) |
|
— |
|
1,709,720 |
|
Equity in associates’ earnings |
(175,556) |
|
185,711 |
|
— |
|
54,532 |
|
16,704 |
|
— |
|
258,294 |
|
— |
|
175,556 |
|
(275,000) |
|
240,241 |
|
Equity income in joint ventures |
— |
|
— |
|
— |
|
1,339 |
|
— |
|
— |
|
1,362,217 |
|
— |
|
— |
|
— |
|
1,363,556 |
|
Financial result |
(4,445,220) |
|
(879,789) |
|
(221,923) |
|
(1,961,077) |
|
22,660 |
|
1,655 |
|
(1,790,195) |
|
(2,557,587) |
|
4,445,220 |
|
— |
|
(7,386,256) |
|
Financial expenses |
(4,197,552) |
|
(1,284,754) |
|
(189,998) |
|
(2,451,971) |
|
(5,151) |
|
196 |
|
(1,340,822) |
|
(5,051,234) |
|
4,197,552 |
|
— |
|
(10,323,734) |
|
Financial revenue |
594,358 |
|
671,450 |
|
72,010 |
|
871,155 |
|
27,811 |
|
6,666 |
|
298,489 |
|
4,333 |
|
(594,358) |
|
— |
|
1,951,914 |
|
Foreign exchange variation |
707,620 |
|
81,022 |
|
(66,701) |
|
183,425 |
|
— |
|
(5,207) |
|
334,167 |
|
852,866 |
|
(707,620) |
|
— |
|
1,379,572 |
|
Derivatives |
(1,549,646) |
|
(347,507) |
|
(37,234) |
|
(563,686) |
|
— |
|
— |
|
(1,082,029) |
|
1,636,448 |
|
1,549,646 |
|
— |
|
(394,008) |
|
Income tax and social contribution |
(1,699,110) |
|
(1,665,809) |
|
(432,836) |
|
(158,288) |
|
(71,838) |
|
(8) |
|
751,429 |
|
739,544 |
|
1,699,110 |
|
— |
|
(837,806) |
|
Income for the period |
3,253,192 |
|
417,683 |
|
68,949 |
|
720,865 |
|
800,912 |
|
(53,986) |
|
213,981 |
|
(1,031,870) |
|
(3,253,192) |
|
(275,000) |
|
861,534 |
|
Result attributed to: |
|
|
|
|
|
|
|
|
|
|
|
|
|
|
|
|
|
|
|
|
|
|
Controlling shareholders |
3,104,468 |
|
(198,656) |
|
48,327 |
|
219,070 |
|
221,201 |
|
(52,018) |
|
(199,134) |
|
(1,031,870) |
|
(3,104,468) |
|
(275,000) |
|
(1,268,080) |
|
Non-controlling shareholders |
148,724 |
|
616,339 |
|
20,622 |
|
501,795 |
|
579,711 |
|
(1,968) |
|
413,115 |
|
— |
|
(148,724) |
|
— |
|
2,129,614 |
|
|
3,253,192 |
|
417,683 |
|
68,949 |
|
720,865 |
|
800,912 |
|
(53,986) |
|
213,981 |
|
(1,031,870) |
|
(3,253,192) |
|
(275,000) |
|
861,534 |
|
Other selected information |
|
|
|
|
|
|
|
|
|
|
|
|
|
|
|
|
|
|
|
|
|
|
Depreciation and amortization |
5,863,450 |
|
657,168 |
|
206,009 |
|
1,602,783 |
|
207 |
|
900 |
|
10,743 |
|
— |
|
(5,863,450) |
|
— |
|
2,477,810 |
|
EBITDA |
15,260,972 |
|
3,620,449 |
|
929,717 |
|
4,443,013 |
|
850,297 |
|
(54,733) |
|
1,263,490 |
|
786,173 |
|
(15,260,972) |
|
(275,000) |
|
11,563,406 |
|
Additions to fixed assets, intangible assets and contract assets |
8,328,846 |
|
1,779,497 |
|
118,247 |
|
2,468,609 |
|
31,346 |
|
29,718 |
|
4,130 |
|
— |
|
(8,328,846) |
|
— |
|
4,431,547 |
|
|
|
|
|
|
|
|
|
|
|
|
|
|
|
|
|
|
|
|
|
|
|
|
EBITDA reconciliation |
|
|
|
|
|
|
|
|
|
|
|
|
|
|
|
|
|
|
|
|
|
|
Income for the year |
3,253,192 |
|
417,683 |
|
68,949 |
|
720,865 |
|
800,912 |
|
(53,986) |
|
213,981 |
|
(1,031,870) |
|
(3,253,192) |
|
(275,000) |
|
861,534 |
|
Income taxes and social contribution |
1,699,110 |
|
1,665,809 |
|
432,836 |
|
158,288 |
|
71,838 |
|
8 |
|
(751,429) |
|
(739,544) |
|
(1,699,110) |
|
— |
|
837,806 |
|
Financial result |
4,445,220 |
|
879,789 |
|
221,923 |
|
1,961,077 |
|
(22,660) |
|
(1,655) |
|
1,790,195 |
|
2,557,587 |
|
(4,445,220) |
|
— |
|
7,386,256 |
|
Depreciation and amortization |
5,863,450 |
|
657,168 |
|
206,009 |
|
1,602,783 |
|
207 |
|
900 |
|
10,743 |
|
— |
|
(5,863,450) |
|
— |
|
2,477,810 |
|
EBITDA |
15,260,972 |
|
3,620,449 |
|
929,717 |
|
4,443,013 |
|
850,297 |
|
(54,733) |
|
1,263,490 |
|
786,173 |
|
(15,260,972) |
|
(275,000) |
|
11,563,406 |
| (i) | Domestic market: sales within each entity's country of residence; Foreign market: export sales. |
Explanatory Notes to the interim Financial Statement
(In thousands of Reais, except when otherwise indicated)
|
|
3Q22 (Restated) |
||||||||||||||||||||
|
|
Reported segments |
|
Reconciliation |
|
Consolidated |
||||||||||||||||
|
|
Raízen |
|
Gas and Energy |
|
Lubricants |
|
Logistics |
|
Cosan Investments |
|
Cosan Corporate |
|
Cosan Oito |
|
Deconsolidation of Joint Ventures |
|
Elimination Between Segments |
|
|||
|
|
|
|
|
|
Land |
|
Other Investments |
|
|
|
|
|
|||||||||
|
Result |
|
|
|
|
|
|
|
|
|
|
|
|
|
|
|
|
|
|
|
|
|
|
Gross operating revenue |
67,860,584 |
|
7,345,580 |
|
3,223,327 |
|
3,134,764 |
|
64,874 |
|
4,224 |
|
— |
|
— |
|
(67,860,584) |
|
(17,303) |
|
13,755,466 |
|
Domestic market (i) |
67,860,584 |
|
7,345,580 |
|
3,056,469 |
|
3,045,541 |
|
64,874 |
|
4,224 |
|
— |
|
— |
|
(67,860,584) |
|
(17,303) |
|
13,499,385 |
|
Foreign market (i) |
— |
|
— |
|
166,858 |
|
89,223 |
|
— |
|
— |
|
— |
|
— |
|
— |
|
— |
|
256,081 |
|
Net operating revenue |
64,222,114 |
|
5,844,440 |
|
2,663,381 |
|
2,950,600 |
|
62,506 |
|
3,677 |
|
— |
|
— |
|
(64,222,114) |
|
(17,303) |
|
11,507,301 |
|
Cost of goods sold and services provided |
(62,020,188) |
|
(4,856,992) |
|
(2,025,135) |
|
(1,829,015) |
|
(2,658) |
|
(2,346) |
|
— |
|
— |
|
62,020,188 |
|
17,303 |
|
(8,698,843) |
|
Gross profit |
2,201,926 |
|
987,448 |
|
638,246 |
|
1,121,585 |
|
59,848 |
|
1,331 |
|
— |
|
— |
|
(2,201,926) |
|
— |
|
2,808,458 |
|
Selling expenses |
(1,432,024) |
|
(44,150) |
|
(323,088) |
|
(8,884) |
|
— |
|
(2,494) |
|
— |
|
— |
|
1,432,024 |
|
— |
|
(378,616) |
|
General and administrative expenses |
(574,738) |
|
(235,989) |
|
(109,507) |
|
(121,927) |
|
(9,612) |
|
(16,631) |
|
(70,313) |
|
— |
|
574,738 |
|
— |
|
(563,979) |
|
Other income (expenses), net |
(615,338) |
|
(29,193) |
|
3,212 |
|
(8,905) |
|
(1,867) |
|
(2) |
|
(27,101) |
|
— |
|
615,338 |
|
— |
|
(63,856) |
|
Equity in associates’ earnings |
(39,224) |
|
85,653 |
|
— |
|
11,556 |
|
16,675 |
|
— |
|
855,024 |
|
— |
|
39,224 |
|
(714,256) |
|
254,652 |
|
Equity income in joint ventures |
— |
|
— |
|
— |
|
— |
|
— |
|
— |
|
(414,885) |
|
— |
|
— |
|
— |
|
(414,885) |
|
Financial result |
(1,165,218) |
|
(117,152) |
|
(35,936) |
|
(611,729) |
|
3,202 |
|
8,232 |
|
(883,718) |
|
282,416 |
|
1,165,218 |
|
— |
|
(1,354,685) |
|
Financial expenses |
(864,256) |
|
(308,028) |
|
(38,884) |
|
(354,572) |
|
(131) |
|
2,317 |
|
(494,490) |
|
(5,854) |
|
864,256 |
|
— |
|
(1,199,642) |
|
Financial revenue |
262,070 |
|
23,329 |
|
28,741 |
|
293,564 |
|
3,333 |
|
1,759 |
|
70,155 |
|
288,270 |
|
(262,070) |
|
— |
|
709,151 |
|
Foreign exchange variation |
(481,974) |
|
(64,987) |
|
(23,543) |
|
(173,852) |
|
— |
|
4,156 |
|
(314,284) |
|
— |
|
481,974 |
|
— |
|
(572,510) |
|
Derivatives |
(81,058) |
|
232,534 |
|
(2,250) |
|
(376,869) |
|
— |
|
— |
|
(145,099) |
|
— |
|
81,058 |
|
— |
|
(291,684) |
|
Income tax and social contribution |
655,421 |
|
(80,638) |
|
63,069 |
|
(72,559) |
|
(6,878) |
|
(236) |
|
347,042 |
|
(96,021) |
|
(655,421) |
|
— |
|
153,779 |
|
Income for the period |
(969,195) |
|
565,979 |
|
235,996 |
|
309,137 |
|
61,368 |
|
(9,800) |
|
(193,951) |
|
186,395 |
|
969,195 |
|
(714,256) |
|
440,868 |
|
Result attributed to: |
|
|
|
|
|
|
|
|
|
|
|
|
|
|
|
|
|
|
|
|
|
|
Controlling shareholders |
(915,675) |
|
421,610 |
|
165,215 |
|
93,150 |
|
42,280 |
|
(8,004) |
|
(193,951) |
|
186,395 |
|
915,675 |
|
(721,581) |
|
(14,886) |
|
Non-controlling shareholders |
(53,520) |
|
144,369 |
|
70,781 |
|
215,987 |
|
19,088 |
|
(1,796) |
|
— |
|
— |
|
53,520 |
|
7,325 |
|
455,754 |
|
|
(969,195) |
|
565,979 |
|
235,996 |
|
309,137 |
|
61,368 |
|
(9,800) |
|
(193,951) |
|
186,395 |
|
969,195 |
|
(714,256) |
|
440,868 |
|
Other selected information |
|
|
|
|
|
|
|
|
|
|
|
|
|
|
|
|
|
|
|
|
|
|
Depreciation and amortization |
2,881,156 |
|
202,104 |
|
36,522 |
|
435,812 |
|
57 |
|
1,413 |
|
3,138 |
|
— |
|
(2,881,156) |
|
1 |
|
679,047 |
|
EBITDA |
2,421,758 |
|
965,873 |
|
245,385 |
|
1,429,237 |
|
65,101 |
|
(16,383) |
|
345,863 |
|
— |
|
(2,421,758) |
|
(714,255) |
|
2,320,821 |
|
Additions to fixed assets, intangible assets and contract assets |
1,922,276 |
|
417,825 |
|
42,764 |
|
606,924 |
|
1,517 |
|
6,003 |
|
285 |
|
— |
|
(1,922,276) |
|
— |
|
1,075,318 |
|
|
|
|
|
|
|
|
|
|
|
|
|
|
|
|
|
|
|
|
|
|
— |
|
EBITDA reconciliation |
|
|
|
|
|
|
|
|
|
|
|
|
|
|
|
|
|
|
|
|
— |
|
Income for the year |
(969,195) |
|
565,979 |
|
235,996 |
|
309,137 |
|
61,368 |
|
(9,800) |
|
(193,951) |
|
186,395 |
|
969,195 |
|
(714,256) |
|
440,868 |
|
Income taxes and social contribution |
(655,421) |
|
80,638 |
|
(63,069) |
|
72,559 |
|
6,878 |
|
236 |
|
(347,042) |
|
96,021 |
|
655,421 |
|
— |
|
(153,779) |
|
Financial result |
1,165,218 |
|
117,152 |
|
35,936 |
|
611,729 |
|
(3,202) |
|
(8,232) |
|
883,718 |
|
(282,416) |
|
(1,165,218) |
|
— |
|
1,354,685 |
|
Depreciation and amortization |
2,881,156 |
|
202,104 |
|
36,522 |
|
435,812 |
|
57 |
|
1,413 |
|
3,138 |
|
— |
|
(2,881,156) |
|
1 |
|
679,047 |
|
EBITDA |
2,421,758 |
|
965,873 |
|
245,385 |
|
1,429,237 |
|
65,101 |
|
(16,383) |
|
345,863 |
|
— |
|
(2,421,758) |
|
(714,255) |
|
2,320,821 |
| (i) | Domestic market: sales within each entity's country of residence; Foreign market: export sales. |
Explanatory Notes to the interim Financial Statement
(In thousands of Reais, except when otherwise indicated)
|
|
9M22 (Restated) |
||||||||||||||||||||
|
|
Reported segments |
|
Reconciliation |
|
Consolidated |
||||||||||||||||
|
|
Raízen |
|
Gas and Energy |
|
Lubricants |
|
Logistics |
|
Cosan Investiments |
|
Cosan Corporate |
|
Cosan Oito |
|
Deconsolidation of Joint Ventures |
|
Elimination Between Segments |
|
|||
|
|
|
|
|
|
Land |
|
Other Investments |
|
|
|
|
|
|||||||||
|
Result |
|
|
|
|
|
|
|
|
|
|
|
|
|
|
|
|
|
|
|
|
|
|
Gross operating revenue |
195,375,824 |
|
18,626,438 |
|
7,930,411 |
|
8,075,579 |
|
198,868 |
|
8,839 |
|
— |
|
— |
|
(195,375,824) |
|
(45,600) |
|
34,794,535 |
|
Domestic market (i) |
195,375,824 |
|
18,626,438 |
|
7,432,575 |
|
7,848,049 |
|
198,868 |
|
8,839 |
|
— |
|
— |
|
(195,375,824) |
|
(45,600) |
|
34,069,169 |
|
Foreign market (i) |
— |
|
— |
|
497,836 |
|
227,530 |
|
— |
|
— |
|
— |
|
— |
|
— |
|
— |
|
725,366 |
|
Net operating revenue |
183,941,704 |
|
14,746,639 |
|
6,461,114 |
|
7,621,593 |
|
191,791 |
|
7,736 |
|
— |
|
— |
|
(183,941,704) |
|
(45,600) |
|
28,983,273 |
|
Cost of goods sold and services provided |
(176,745,172) |
|
(12,155,714) |
|
(4,979,370) |
|
(5,060,460) |
|
(10,336) |
|
(6,679) |
|
— |
|
— |
|
176,745,172 |
|
45,600 |
|
(22,166,959) |
|
Gross profit |
7,196,532 |
|
2,590,925 |
|
1,481,744 |
|
2,561,133 |
|
181,455 |
|
1,057 |
|
— |
|
— |
|
(7,196,532) |
|
— |
|
6,816,314 |
|
Selling expenses |
(3,794,044) |
|
(120,754) |
|
(665,993) |
|
(21,915) |
|
— |
|
(7,364) |
|
— |
|
— |
|
3,794,044 |
|
— |
|
(816,026) |
|
General and administrative expenses |
(1,817,722) |
|
(529,382) |
|
(275,186) |
|
(325,481) |
|
(30,107) |
|
(46,980) |
|
(190,432) |
|
— |
|
1,817,722 |
|
— |
|
(1,397,568) |
|
Other income (expenses), net |
255,648 |
|
(60,114) |
|
24,299 |
|
(93,497) |
|
53,264 |
|
(3) |
|
27,579 |
|
— |
|
(255,648) |
|
— |
|
(48,472) |
|
Equity in associates’ earnings |
(99,910) |
|
85,654 |
|
— |
|
26,724 |
|
16,675 |
|
(57) |
|
1,898,204 |
|
— |
|
99,910 |
|
(1,733,655) |
|
293,545 |
|
Equity income in joint ventures |
— |
|
— |
|
— |
|
— |
|
— |
|
— |
|
(153,558) |
|
— |
|
— |
|
— |
|
(153,558) |
|
Financial result |
(2,656,906) |
|
(267,588) |
|
(53,494) |
|
(1,704,015) |
|
1,850 |
|
5,215 |
|
(2,110,267) |
|
282,416 |
|
2,656,906 |
|
— |
|
(3,845,883) |
|
Financial expenses |
(1,638,692) |
|
(959,440) |
|
(59,185) |
|
(880,294) |
|
(260) |
|
5,690 |
|
(782,041) |
|
(5,854) |
|
1,638,692 |
|
— |
|
(2,681,384) |
|
Financial revenue |
597,360 |
|
663,623 |
|
53,326 |
|
810,432 |
|
2,110 |
|
3,813 |
|
201,090 |
|
288,270 |
|
(597,360) |
|
— |
|
2,022,664 |
|
Foreign exchange variation |
417,242 |
|
36,359 |
|
(5,795) |
|
184,526 |
|
— |
|
(4,288) |
|
293,269 |
|
— |
|
(417,242) |
|
— |
|
504,071 |
|
Derivatives |
(2,032,816) |
|
(8,130) |
|
(41,840) |
|
(1,818,679) |
|
— |
|
— |
|
(1,822,585) |
|
— |
|
2,032,816 |
|
— |
|
(3,691,234) |
|
Income tax and social contribution |
774,370 |
|
(237,713) |
|
12,357 |
|
(171,934) |
|
(22,149) |
|
(394) |
|
736,074 |
|
(96,021) |
|
(774,370) |
|
— |
|
220,220 |
|
Income for the period |
(142,032) |
|
1,461,028 |
|
523,727 |
|
271,015 |
|
200,988 |
|
(48,526) |
|
207,600 |
|
186,395 |
|
142,032 |
|
(1,733,655) |
|
1,068,572 |
|
Result attributed to: |
|
|
|
|
|
|
|
|
|
|
|
|
|
|
|
|
|
|
|
|
|
|
Controlling shareholders |
(207,968) |
|
1,104,158 |
|
366,680 |
|
83,206 |
|
128,544 |
|
(42,440) |
|
207,605 |
|
186,395 |
|
207,968 |
|
(1,664,136) |
|
370,012 |
|
Non-controlling shareholders |
65,936 |
|
356,870 |
|
157,047 |
|
187,809 |
|
72,444 |
|
(6,086) |
|
(5) |
|
— |
|
(65,936) |
|
(69,519) |
|
698,560 |
|
|
(142,032) |
|
1,461,028 |
|
523,727 |
|
271,015 |
|
200,988 |
|
(48,526) |
|
207,600 |
|
186,395 |
|
142,032 |
|
(1,733,655) |
|
1,068,572 |
|
Other selected information |
|
|
|
|
|
|
|
|
|
|
|
|
|
|
|
|
|
|
|
|
|
|
Depreciation and amortization |
7,182,686 |
|
580,119 |
|
86,026 |
|
1,482,133 |
|
172 |
|
3,787 |
|
10,514 |
|
— |
|
(7,182,686) |
|
— |
|
2,162,751 |
|
EBITDA |
8,923,190 |
|
2,546,448 |
|
650,890 |
|
3,629,097 |
|
221,459 |
|
(49,560) |
|
1,592,307 |
|
— |
|
(8,923,190) |
|
(1,733,655) |
|
6,856,986 |
|
Additions to fixed assets, intangible assets and contract assets |
6,549,352 |
|
1,179,488 |
|
66,743 |
|
1,977,274 |
|
5,602 |
|
16,701 |
|
1,168 |
|
— |
|
(6,549,352) |
|
— |
|
3,246,976 |
|
|
|
|
|
|
|
|
|
|
|
|
|
|
|
|
|
|
|
|
|
|
— |
|
EBITDA reconciliation |
|
|
|
|
|
|
|
|
|
|
|
|
|
|
|
|
|
|
|
|
— |
|
Income for the year |
(142,032) |
|
1,461,028 |
|
523,727 |
|
271,015 |
|
200,988 |
|
(48,526) |
|
207,600 |
|
186,395 |
|
142,032 |
|
(1,733,655) |
|
1,068,572 |
|
Income taxes and social contribution |
(774,370) |
|
237,713 |
|
(12,357) |
|
171,934 |
|
22,149 |
|
394 |
|
(736,074) |
|
96,021 |
|
774,370 |
|
— |
|
(220,220) |
|
Financial result |
2,656,906 |
|
267,588 |
|
53,494 |
|
1,704,015 |
|
(1,850) |
|
(5,215) |
|
2,110,267 |
|
(282,416) |
|
(2,656,906) |
|
— |
|
3,845,883 |
|
Depreciation and amortization |
7,182,686 |
|
580,119 |
|
86,026 |
|
1,482,133 |
|
172 |
|
3,787 |
|
10,514 |
|
— |
|
(7,182,686) |
|
— |
|
2,162,751 |
|
EBITDA |
8,923,190 |
|
2,546,448 |
|
650,890 |
|
3,629,097 |
|
221,459 |
|
(49,560) |
|
1,592,307 |
|
— |
|
(8,923,190) |
|
(1,733,655) |
|
6,856,986 |
| (i) | Domestic market: sales within each entity's country of residence; Foreign market: export sales. |
Explanatory Notes to the interim Financial Statement
(In thousands of Reais, except when otherwise indicated)
|
|
09/30/2023 |
||||||||||||||||||||
|
|
Reported segments |
|
Reconciliation |
|
|||||||||||||||||
|
|
Raízen |
|
Gas and Energy |
|
Lubricants |
|
Logistics |
|
Cosan Investments |
|
Cosan Corporate |
|
Cosan Oito |
|
Deconsolidation of Joint Ventures |
|
Elimination Between Segments |
|
Consolidated |
||
|
|
|
|
|
|
Lands |
|
Other Investments |
|
|
|
|
|
|||||||||
|
Statement of financial position: |
|
|
|
|
|
|
|
|
|
|
|
|
|
|
|
|
|
|
|
|
|
|
Cash and cash equivalents |
6,583,316 |
|
4,376,990 |
|
791,961 |
|
6,970,324 |
|
30,307 |
|
81,058 |
|
2,816,067 |
|
14,666 |
|
(6,583,316) |
|
— |
|
15,081,373 |
|
Marketable securities |
317,702 |
|
737,398 |
|
103,691 |
|
2,937,452 |
|
219,146 |
|
96,369 |
|
493,087 |
|
14,906,556 |
|
(317,702) |
|
— |
|
19,493,699 |
|
Trade receivables |
11,928,484 |
|
1,681,609 |
|
1,167,843 |
|
644,987 |
|
203,850 |
|
— |
|
— |
|
— |
|
(11,928,484) |
|
— |
|
3,698,289 |
|
Derivative financial instruments - asse |
10,871,218 |
|
334,004 |
|
— |
|
1,295,047 |
|
— |
|
— |
|
677,039 |
|
1,327,901 |
|
(10,871,218) |
|
— |
|
3,633,991 |
|
Inventories |
15,985,712 |
|
312,580 |
|
1,333,274 |
|
224,088 |
|
— |
|
37 |
|
— |
|
— |
|
(15,985,712) |
|
— |
|
1,869,979 |
|
Sectorial financial assets |
— |
|
427,243 |
|
— |
|
— |
|
— |
|
— |
|
— |
|
— |
|
— |
|
— |
|
427,243 |
|
Other financial assets |
103,086 |
|
2,249 |
|
717 |
|
— |
|
— |
|
— |
|
— |
|
— |
|
(103,086) |
|
— |
|
2,966 |
|
Other current assets |
10,628,304 |
|
585,459 |
|
322,707 |
|
676,905 |
|
416,360 |
|
110,856 |
|
1,248,833 |
|
63,536 |
|
(10,628,304) |
|
(718,856) |
|
2,705,800 |
|
Other non-current assets |
14,121,466 |
|
948,004 |
|
195,322 |
|
3,556,105 |
|
22,889 |
|
775 |
|
3,780,757 |
|
517,450 |
|
(14,121,466) |
|
(258,795) |
|
8,762,507 |
|
Investments in associates |
— |
|
2,523,225 |
|
— |
|
422,500 |
|
78,918 |
|
— |
|
15,810,466 |
|
— |
|
— |
|
(15,882,681) |
|
2,952,428 |
|
Investments in joint ventures |
1,317,104 |
|
— |
|
— |
|
48,640 |
|
— |
|
— |
|
11,551,942 |
|
— |
|
(1,317,104) |
|
— |
|
11,600,582 |
|
Biological assets |
3,963,642 |
|
— |
|
— |
|
— |
|
— |
|
— |
|
— |
|
— |
|
(3,963,642) |
|
— |
|
— |
|
investment properties |
— |
|
— |
|
— |
|
— |
|
14,227,539 |
|
— |
|
— |
|
— |
|
— |
|
— |
|
14,227,539 |
|
Contract assets |
3,203,768 |
|
991,460 |
|
17,675 |
|
— |
|
— |
|
— |
|
— |
|
— |
|
(3,203,768) |
|
— |
|
1,009,135 |
|
Right-of-use assets |
9,918,432 |
|
1,576,474 |
|
173,454 |
|
7,822,347 |
|
3,385 |
|
— |
|
23,564 |
|
— |
|
(9,918,432) |
|
— |
|
9,599,224 |
|
Fixed assets |
29,077,776 |
|
1,113,533 |
|
756,253 |
|
18,043,336 |
|
26 |
|
389,624 |
|
54,118 |
|
— |
|
(29,077,776) |
|
1 |
|
20,356,891 |
|
Intangible assets |
9,221,094 |
|
12,561,572 |
|
2,751,402 |
|
6,677,775 |
|
— |
|
437,268 |
|
4,539 |
|
— |
|
(9,221,094) |
|
— |
|
22,432,556 |
|
Loans, financing and debentures |
(36,970,806) |
|
(8,986,877) |
|
(2,510,383) |
|
(19,076,296) |
|
— |
|
— |
|
(17,902,521) |
|
(8,437,284) |
|
36,970,806 |
|
— |
|
(56,913,361) |
|
Derivative financial instruments - liabilities |
(10,614,030) |
|
(364,191) |
|
(12,661) |
|
(1,586,959) |
|
— |
|
— |
|
(632,084) |
|
(1,207,568) |
|
10,614,030 |
|
— |
|
(3,803,463) |
|
Suppliers |
(20,687,578) |
|
(1,460,383) |
|
(1,522,083) |
|
(607,983) |
|
(67,029) |
|
(16,304) |
|
(2,937) |
|
— |
|
20,687,578 |
|
— |
|
(3,676,719) |
|
Employee benefits payables |
(1,039,356) |
|
(235,477) |
|
(135,521) |
|
(286,872) |
|
— |
|
(2,054) |
|
(39,717) |
|
— |
|
1,039,356 |
|
— |
|
(699,641) |
|
Sectorial financial liabilities |
— |
|
(1,776,267) |
|
— |
|
— |
|
— |
|
— |
|
— |
|
— |
|
— |
|
— |
|
(1,776,267) |
|
Other current liabilities |
(8,153,596) |
|
(2,387,289) |
|
(502,825) |
|
(1,690,602) |
|
(355,364) |
|
(2,982) |
|
(864,022) |
|
(44) |
|
8,153,596 |
|
288,826 |
|
(5,514,302) |
|
Lease liabilities |
(11,131,630) |
|
(1,669,205) |
|
(174,256) |
|
(3,465,353) |
|
(3,553) |
|
— |
|
(30,935) |
|
— |
|
11,131,630 |
|
— |
|
(5,343,302) |
|
Other non-current liabilities |
(11,676,302) |
|
(2,672,566) |
|
(624,666) |
|
(6,470,405) |
|
(473,209) |
|
(66,715) |
|
(2,845,262) |
|
— |
|
11,676,302 |
|
688,888 |
|
(12,463,935) |
|
Total assets (net of liabilities) allocated by segment |
26,967,806 |
|
8,619,545 |
|
2,131,904 |
|
16,135,036 |
|
14,303,265 |
|
1,027,932 |
|
14,192,934 |
|
7,185,213 |
|
(26,967,806) |
|
(15,882,617) |
|
47,663,212 |
|
Total assets |
127,241,104 |
|
28,171,800 |
|
7,614,299 |
|
49,319,506 |
|
15,202,420 |
|
1,115,987 |
|
36,460,412 |
|
16,830,109 |
|
(127,241,104) |
|
(16,860,331) |
|
137,854,202 |
|
|
|
|
|
|
|
|
|
|
|
|
|
|
|
|
|
|
|
|
|
|
|
|
Shareholders’ equity attributable to: |
|
|
|
|
|
|
|
|
|
|
|
|
|
|
|
|
|
|
|
|
|
|
Controlling shareholders |
26,967,806 |
|
4,478,243 |
|
1,492,617 |
|
4,842,069 |
|
4,041,762 |
|
1,027,932 |
|
11,296,275 |
|
7,185,213 |
|
(26,967,806) |
|
(15,882,617) |
|
18,481,493 |
|
Non-controlling shareholders |
— |
|
4,141,302 |
|
639,287 |
|
11,292,967 |
|
10,261,503 |
|
— |
|
2,846,659 |
|
— |
|
— |
|
— |
|
29,181,719 |
|
Total shareholders’ equity |
26,967,806 |
|
8,619,545 |
|
2,131,904 |
|
16,135,036 |
|
14,303,265 |
|
1,027,932 |
|
14,142,934 |
|
7,185,213 |
|
(26,967,806) |
|
(15,882,617) |
|
47,663,212 |
Explanatory Notes to the interim Financial Statement
(In thousands of Reais, except when otherwise indicated)
|
12/31/2022 (Restated) |
|||||||||||||||||||||
|
|
Reported segments |
|
Reconciliation |
|
|||||||||||||||||
|
|
Raízen |
|
Gas and Energy |
|
Lubricants |
|
Logistics |
|
Cosan Investments |
|
Cosan Corporate |
|
Cosan Oito |
|
Deconsolidation of Joint Ventures |
|
Elimination Between Segments |
|
Consolidated |
||
|
|
|
|
|
|
Lands |
|
Other Investments |
|
|
|
|
|
|||||||||
|
Balance sheet items: |
|
|
|
|
|
|
|
|
|
|
|
|
|
|
|
|
|
|
|
|
|
|
Cash and cash equivalents |
4,902,800 |
|
3,405,648 |
|
865,370 |
|
7,385,421 |
|
25,582 |
|
110,228 |
|
1,506,334 |
|
3,133 |
|
(4,902,800) |
|
— |
|
13,301,716 |
|
Marketable securities |
126,206 |
|
578,358 |
|
62,919 |
|
840,061 |
|
217,061 |
|
91,103 |
|
724,072 |
|
19,586,192 |
|
(126,206) |
|
— |
|
22,099,766 |
|
Trade receivables |
10,316,720 |
|
1,931,205 |
|
1,101,336 |
|
578,324 |
|
314,834 |
|
1,843 |
|
— |
|
— |
|
(10,316,720) |
|
— |
|
3,927,542 |
|
Derivative financial instruments - assets |
7,023,284 |
|
391,863 |
|
— |
|
874,843 |
|
— |
|
— |
|
1,408,307 |
|
1,476,739 |
|
(7,023,284) |
|
— |
|
4,151,752 |
|
Inventories |
16,043,114 |
|
133,881 |
|
1,509,357 |
|
225,813 |
|
— |
|
8 |
|
— |
|
— |
|
(16,043,114) |
|
— |
|
1,869,059 |
|
Sectorial financial assets |
— |
|
342,333 |
|
— |
|
— |
|
— |
|
— |
|
— |
|
— |
|
— |
|
— |
|
342,333 |
|
Other financial assets |
230,780 |
|
277 |
|
450 |
|
— |
|
— |
|
— |
|
88,511 |
|
— |
|
(230,780) |
|
— |
|
89,238 |
|
Other current assets |
10,285,568 |
|
1,037,587 |
|
405,314 |
|
724,415 |
|
74,623 |
|
110,517 |
|
1,670,894 |
|
34,305 |
|
(10,285,568) |
|
(1,167,488) |
|
2,890,167 |
|
Other non-current assets |
8,938,318 |
|
897,654 |
|
297,616 |
|
3,385,624 |
|
7,643 |
|
900 |
|
2,987,976 |
|
52,206 |
|
(8,938,318) |
|
(266,513) |
|
7,363,106 |
|
Investments in associates |
— |
|
2,525,292 |
|
— |
|
381,469 |
|
74,505 |
|
— |
|
15,751,855 |
|
— |
|
— |
|
(15,819,178) |
|
2,913,943 |
|
Investments in joint ventures |
1,371,430 |
|
— |
|
— |
|
— |
|
— |
|
— |
|
11,221,356 |
|
— |
|
(1,371,430) |
|
— |
|
11,221,356 |
|
Biological assets |
3,254,850 |
|
— |
|
— |
|
— |
|
9,992 |
|
— |
|
— |
|
— |
|
(3,254,850) |
|
— |
|
9,992 |
|
investment properties |
— |
|
— |
|
— |
|
— |
|
14,103,060 |
|
— |
|
— |
|
— |
|
— |
|
— |
|
14,103,060 |
|
Contract assets |
3,297,856 |
|
1,110,335 |
|
8,380 |
|
— |
|
— |
|
— |
|
— |
|
— |
|
(3,297,856) |
|
— |
|
1,118,715 |
|
Right-of-use assets |
9,556,152 |
|
83,059 |
|
170,120 |
|
7,732,284 |
|
3,584 |
|
790 |
|
23,032 |
|
— |
|
(9,556,152) |
|
— |
|
8,012,869 |
|
Fixed assets |
25,210,448 |
|
671,573 |
|
805,377 |
|
17,049,188 |
|
34 |
|
363,374 |
|
58,890 |
|
— |
|
(25,210,448) |
|
— |
|
18,948,436 |
|
Intangible assets |
9,337,192 |
|
12,015,135 |
|
2,854,874 |
|
6,774,306 |
|
— |
|
475,337 |
|
2,290 |
|
— |
|
(9,337,192) |
|
— |
|
22,121,942 |
|
Loans, financing and debentures |
(33,551,302) |
|
(8,278,839) |
|
(2,862,154) |
|
(16,758,088) |
|
— |
|
— |
|
(15,658,188) |
|
(9,429,947) |
|
33,551,302 |
|
— |
|
(52,987,216) |
|
Derivative financial instruments - liabilities |
(4,909,074) |
|
(400,351) |
|
(18,146) |
|
(1,412,945) |
|
— |
|
— |
|
(480,067) |
|
(2,979,423) |
|
4,909,074 |
|
— |
|
(5,290,932) |
|
Suppliers |
(18,789,160) |
|
(1,842,810) |
|
(1,602,936) |
|
(746,433) |
|
(71,684) |
|
(790) |
|
(115,198) |
|
— |
|
18,789,160 |
|
— |
|
(4,379,851) |
|
Employee benefits payables |
(837,208) |
|
(193,585) |
|
(112,590) |
|
(296,833) |
|
— |
|
(7,232) |
|
(49,281) |
|
— |
|
837,208 |
|
— |
|
(659,521) |
|
Sectorial financial liabilities |
— |
|
(1,616,616) |
|
— |
|
— |
|
— |
|
— |
|
— |
|
— |
|
— |
|
— |
|
(1,616,616) |
|
Other current liabilities |
(7,176,122) |
|
(906,844) |
|
(397,704) |
|
(1,786,009) |
|
(905,816) |
|
(3,105) |
|
(1,059,769) |
|
(171,035) |
|
7,176,122 |
|
609,462 |
|
(4,620,820) |
|
Lease liabilities |
(10,568,042) |
|
(76,606) |
|
(166,651) |
|
(3,254,011) |
|
(3,708) |
|
(818) |
|
(30,364) |
|
— |
|
10,568,042 |
|
— |
|
(3,532,158) |
|
Other non-current liabilities |
(7,983,554) |
|
(3,326,667) |
|
(571,672) |
|
(6,286,975) |
|
(465,486) |
|
(66,883) |
|
(3,061,034) |
|
(274,299) |
|
7,983,554 |
|
824,537 |
|
(13,228,479) |
|
Total assets (net of liabilities) allocated by segment |
26,080,256 |
|
8,481,882 |
|
2,349,260 |
|
15,410,454 |
|
13,384,224 |
|
1,075,272 |
|
14,989,616 |
|
8,297,871 |
|
(26,080,256) |
|
(15,819,180) |
|
48,169,399 |
|
Total assets |
109,894,718 |
|
25,124,200 |
|
8,081,113 |
|
45,951,748 |
|
14,830,918 |
|
1,154,100 |
|
35,443,517 |
|
21,152,575 |
|
(109,894,718) |
|
(17,253,179) |
|
134,484,992 |
|
|
|
|
|
|
|
|
|
|
|
|
|
|
|
|
|
|
|
|
|
|
|
|
Shareholders’ equity attributable to: |
|
|
|
|
|
|
|
|
|
|
|
|
|
|
|
|
|
|
|
|
|
|
Controlling shareholders |
26,080,256 |
|
4,310,836 |
|
1,647,259 |
|
4,613,308 |
|
4,187,415 |
|
1,060,360 |
|
12,355,298 |
|
8,297,871 |
|
(26,080,256) |
|
(15,819,180) |
|
20,653,167 |
|
Non-controlling shareholders |
— |
|
4,171,046 |
|
702,001 |
|
10,797,146 |
|
9,196,809 |
|
14,912 |
|
2,634,318 |
|
— |
|
— |
|
— |
|
27,516,232 |
|
Total shareholders’ equity |
26,080,256 |
|
8,481,882 |
|
2,349,260 |
|
15,410,454 |
|
13,384,224 |
|
1,075,272 |
|
14,989,616 |
|
8,297,871 |
|
(26,080,256) |
|
(15,819,180) |
|
48,169,399 |
Explanatory Notes to the interim Financial Statement
(In thousands of Reais, except when otherwise indicated)
4.1 NET SALES BY SEGMENT
|
|
3Q23 |
|
3Q22 |
|
9M23 |
|
9M22 |
|
Reported segment |
|
|
|
|
|
|
|
|
Raízen |
|
|
|
|
|
|
|
|
Ethanol |
5,994,933 |
|
7,353,646 |
|
17,272,964 |
|
21,440,624 |
|
Sugar |
9,320,232 |
|
7,471,952 |
|
20,641,387 |
|
17,124,240 |
|
Gasoline |
16,673,046 |
|
16,063,070 |
|
50,025,976 |
|
50,063,241 |
|
Diesel |
24,280,438 |
|
29,263,615 |
|
65,915,374 |
|
80,920,987 |
|
Cogeneration |
1,077,488 |
|
1,330,872 |
|
2,637,647 |
|
2,827,998 |
|
Other |
2,098,233 |
|
2,738,959 |
|
6,708,244 |
|
11,564,614 |
|
|
59,444,370 |
|
64,222,114 |
|
163,201,592 |
|
183,941,704 |
|
Gas and Energy |
|
|
|
|
|
|
|
|
Natural gas distribution |
|
|
|
|
|
|
|
|
Industrial |
2,705,524 |
|
4,044,571 |
|
8,568,093 |
|
9,914,098 |
|
Residential |
635,259 |
|
603,121 |
|
1,763,062 |
|
1,554,189 |
|
Cogeneration |
149,888 |
|
238,087 |
|
558,556 |
|
712,405 |
|
Automotive |
135,298 |
|
252,155 |
|
451,328 |
|
755,529 |
|
Commercial |
227,867 |
|
210,049 |
|
639,620 |
|
564,430 |
|
Construction revenue |
389,262 |
|
330,300 |
|
1,083,882 |
|
798,360 |
|
Other |
104,354 |
|
105,338 |
|
402,443 |
|
271,784 |
|
|
4,347,452 |
|
5,783,621 |
|
13,466,984 |
|
14,570,795 |
|
|
— |
|
60,819 |
|
— |
|
175,844 |
|
Electricity commercialization |
4,347,452 |
|
5,844,440 |
|
13,466,984 |
|
14,746,639 |
|
|
|
|
|
|
|
|
|
|
Lubricants |
|
|
|
|
|
|
|
|
Finished product |
1,913,252 |
|
2,390,915 |
|
6,396,207 |
|
5,835,194 |
|
Base oil |
214,497 |
|
160,316 |
|
595,342 |
|
410,922 |
|
Services |
445,386 |
|
112,150 |
|
685,876 |
|
214,998 |
|
|
2,573,135 |
|
2,663,381 |
|
7,677,425 |
|
6,461,114 |
|
|
|
|
|
|
|
|
|
|
Logistics |
|
|
|
|
|
|
|
|
North operations |
2,439,718 |
|
2,299,074 |
|
6,349,746 |
|
5,988,513 |
|
South operations |
577,472 |
|
519,477 |
|
1,581,225 |
|
1,301,062 |
|
Container operations |
157,882 |
|
132,049 |
|
391,041 |
|
332,018 |
|
|
3,175,072 |
|
2,950,600 |
|
8,322,012 |
|
7,621,593 |
|
|
|
|
|
|
|
|
|
|
Cosan Investments |
|
|
|
|
|
|
|
|
Lease and sale of lands |
172,107 |
|
62,507 |
|
472,654 |
|
191,791 |
|
Other Investments |
— |
|
3,676 |
|
1,490 |
|
7,736 |
|
|
172,107 |
|
66,183 |
|
474,144 |
|
199,527 |
|
|
|
|
|
|
|
|
|
|
Reconciliation |
|
|
|
|
|
|
|
|
Cosan Corporate |
9 |
|
— |
|
526 |
|
— |
|
|
|
|
|
|
|
|
|
|
Deconsolidated effects and eliminations |
(59,458,575) |
|
(64,239,417) |
|
(163,247,330) |
|
(183,987,304) |
|
Total |
10,253,570 |
|
11,507,301 |
|
29,895,353 |
|
28,983,273 |
Explanatory Notes to the interim Financial Statement
(In thousands of Reais, except when otherwise indicated)
Financial assets and liabilities are stated as classified below:
|
|
|
|
Parent Company |
|
Consolidated |
||||
|
|
Note |
|
09/30/2023 |
|
12/31/2022 |
|
09/30/2023 |
|
12/31/2022 |
|
Assets |
|
|
|
|
|
|
|
|
|
|
Fair value through financial result |
|
|
|
|
|
|
|
|
|
|
Cash and cash equivalents |
5.2 |
|
509,434 |
|
759,965 |
|
2,143,851 |
|
1,134,030 |
|
Marketable securities |
5.3 |
|
493,064 |
|
724,050 |
|
19,493,699 |
|
22,099,766 |
|
Derivative financial instruments |
5.6 |
|
677,039 |
|
1,368,809 |
|
3,633,991 |
|
4,151,752 |
|
Other financial assets |
|
|
— |
|
— |
|
2,966 |
|
89,238 |
|
|
|
|
1,679,537 |
|
2,852,824 |
|
25,274,507 |
|
27,474,786 |
|
Amortized cost |
|
|
|
|
|
|
|
|
|
|
Cash and cash equivalents |
5.2 |
|
1,965,430 |
|
588,496 |
|
12,937,522 |
|
12,167,686 |
|
Trade receivables |
5.7 |
|
— |
|
— |
|
3,698,289 |
|
3,927,542 |
|
Restricted cash |
5.3 |
|
151,580 |
|
35,039 |
|
270,318 |
|
139,933 |
|
Receivables from related parties |
5.8 |
|
472,863 |
|
737,340 |
|
386,029 |
|
476,542 |
|
Sectorial financial assets |
5.10 |
|
— |
|
— |
|
427,243 |
|
342,333 |
|
Dividends and interest on equity receivable |
17 |
|
143,999 |
|
609,456 |
|
122,970 |
|
161,147 |
|
|
|
|
2,733,872 |
|
1,970,331 |
|
17,842,371 |
|
17,215,183 |
|
Total |
|
|
4,413,409 |
|
4,823,155 |
|
43,116,878 |
|
44,689,969 |
|
Liabilities |
|
|
|
|
|
|
|
|
|
|
Amortized cost |
|
|
|
|
|
|
|
|
|
|
Loans, borrowings and debentures |
|
|
(8,420,382) |
|
(5,475,628) |
|
(24,717,617) |
|
(21,620,197) |
|
Trade payables |
5.9 |
|
(2,920) |
|
(115,146) |
|
(3,676,719) |
|
(4,379,851) |
|
Consideration payable |
|
|
— |
|
— |
|
(197,905) |
|
(223,960) |
|
Other financial liabilities |
|
|
— |
|
— |
|
(800,996) |
|
(954,547) |
|
Leases |
5.5 |
|
(30,935) |
|
(30,365) |
|
(5,343,302) |
|
(3,532,158) |
|
Railroad concession payable |
13 |
|
— |
|
— |
|
(3,463,304) |
|
(3,351,410) |
|
Related parties payable |
5.8 |
|
(9,864,627) |
|
(10,458,897) |
|
(380,432) |
|
(387,736) |
|
Dividends payable |
17 |
|
(2,467) |
|
(279,979) |
|
(146,677) |
|
(892,006) |
|
Sectorial financial liabilities |
5.10 |
|
— |
|
— |
|
(1,776,267) |
|
(1,616,616) |
|
Installment of tax debts |
14 |
|
(208,887) |
|
(202,140) |
|
(215,222) |
|
(208,760) |
|
|
|
|
(18,530,218) |
|
(16,562,155) |
|
(40,718,441) |
|
(37,167,241) |
|
Fair value through financial result |
|
|
|
|
|
|
|
|
|
|
Loans, borrowings and debentures |
|
|
— |
|
— |
|
(32,195,744) |
|
(31,367,019) |
|
Derivative financial instruments |
5.6 |
|
(683,565) |
|
(618,947) |
|
(3,803,463) |
|
(5,290,932) |
|
|
|
|
(683,565) |
|
(618,947) |
|
(35,999,207) |
|
(36,657,951) |
|
Total |
|
|
(19,213,783) |
|
(17,181,102) |
|
(76,717,648) |
|
(73,825,192) |
Explanatory Notes to the interim Financial Statement
(In thousands of Reais, except when otherwise indicated)
The information in the table below presents a reconciliation of net debt, a non-GAAP financial measure that is not an accounting measure.
A non-GAAP financial measure is generally defined as one that is intended to measure financial performance but excludes or includes amounts that would not be adjusted for in the most comparable GAAP measure.
Net debt is also used to calculate certain leverage ratios. However, net debt is not an accounting measure in accordance with the IFRS and should not be considered as a substitute for measures of debt determined in accordance with the IFRS and the Brazilian accounting standards.
|
|
|
|
Parent company |
|
Consolidated |
||||
|
|
Note |
|
09/30/2023 |
|
12/31/2022 |
|
09/30/2023 |
|
12/31/2022 |
|
Loans and borrowings |
5.4 |
|
8,420,382 |
|
5,475,628 |
|
56,913,361 |
|
52,987,216 |
|
Derivative financial instruments on Debt (i) |
|
|
(90,552) |
|
(706,733) |
|
69,902 |
|
1,228,928 |
|
|
|
|
8,329,830 |
|
4,768,895 |
|
56,983,263 |
|
54,216,144 |
|
|
|
|
|
|
|
|
|
|
|
|
(-) Cash and cash equivalents |
5.2 |
|
(2,474,864) |
|
(1,348,461) |
|
(15,081,373) |
|
(13,301,716) |
|
(-) Marketable securities |
5.3 |
|
(493,064) |
|
(724,050) |
|
(19,493,699) |
|
(22,099,766) |
|
|
|
|
(2,967,928) |
|
(2,072,511) |
|
(34,575,072) |
|
(35,401,482) |
|
|
|
|
|
|
|
|
|
|
|
|
Net debt |
|
|
5,361,902 |
|
2,696,384 |
|
22,408,191 |
|
18,814,662 |
| (i) | Reconciliation of derivative financial instruments, debt and non-debt related, according to the explanatory notes number 5.6. |
Covenants
The Company and its subsidiaries are required to comply with the following financial clauses per the terms of the main loan lines:
|
Company |
Debt |
Triggers |
Ratios |
|
Cosan Corporate |
|
|
|
|
Cosan S.A. |
* 1th issue debenture |
Net debt (i) / EBITDA (ii) cannot exceed 4.0x |
1.44 |
|
Cosan Luxembourg S.A. |
* Senior Notes 2027 |
Proforma net debt (iv) / pro forma EBITDA (iv) cannot exceed 3.5x |
2.12 |
|
* Senior Notes 2029 |
|||
|
* Senior Notes 2030 |
|||
|
Gas and Energy |
|
|
|
|
Comgás S.A. |
* 4th issue debenture |
Short-term debt / total debt (iii) cannot exceed 0.6x |
0.19 |
|
Comgás S.A. |
* Debenture 4th to 9th issues |
Net debt (i) / EBITDA (ii) cannot exceed 4.0x |
1.37 |
|
* BNDES |
|||
|
* Resolution 4131 |
|||
|
Sulgás |
* BNDES |
Net debt (i) / EBITDA (ii) cannot exceed 3.5x |
0.36 |
|
Short-term debt / Total debt (iii) cannot exceed 0.8x |
0.71 |
||
|
Moove |
|
|
|
|
CLI |
*Syndicated Loan |
Net debt (i) / EBITDA (ii) cannot exceed 3.5x at the end of each quarter |
1.44 |
|
ICSD (x) cannot be less than 2.5x at the end of each quarter |
5.05 |
||
|
Logistics |
|
|
|
|
Rumo S.A. |
* Debenture (11th, 12th, 13th and 14th) (viii) |
ICJ (ix) = EBITDA (ii) / Financial result(v) cannot be less than 2.0x |
3.25 |
|
* ECA |
|||
|
Rumo S.A. |
* NCE |
Net debt (i) / EBITDA (ii) cannot exceed 3.5x |
1.94 |
|
* ECA |
|||
|
Rumo Luxembourg S.à r.l. |
* Senior Notes 2028(vi) |
Net debt (i) / EBITDA (ii) cannot exceed 3.5x |
1.94 |
|
* Senior Notes 2032(vii) |
|||
|
* Debentures(vii) |
|||
|
Brado |
* NCE |
Net debt (i) / EBITDA (ii) cannot exceed 3.3x |
1.45 |
Explanatory Notes to the interim Financial Statement
(In thousands of Reais, except when otherwise indicated)
| (i) | Net debt is composed of current and non-current debt, net cash and cash equivalents and marketable securities. | |
| (ii) | Corresponds to the EBITDA accumulated over the previous twelve months. | |
| (iii) | Total debt is the sum of current and non-current loans, financing and debentures, leasing, as well as current and non-current derivative financial instruments. | |
| (iv) | Net debt and proforma EBITDA, including joint venture financial information. Net Debt and proforma EBITDA are non-GAAP measures. Pro forma EBITDA corresponds to the accumulated period of the last 12 months. | |
| (v) | The financial result of net debt is represented by the cost of net debt. | |
| (vi) | Senior Notes due 2028 was the first Green issuance in the Latin American freight rail sector. The subsidiary Rumo is committed to using the resources to fully or partially finance ongoing and future projects that contribute to the promotion of a resource-efficient, low-carbon transport sector in Brazil. Eligible projects include "acquisition, replacement, and modernization of rolling stock," "Infrastructure for duplication of railway sections, new yards, and yard extensions," and "railway modernization." The subsidiary publishes an annual report detailing the progress of projects, which is available on the investor relations page. | |
| (vii) | Senior Notes due 2032 was an issue of Sustainability-Linked Bonds (SLBs), with the following sustainable targets: reduction of 17.6% by 2026 in greenhouse gas emissions per Ton per useful kilometer (“TKU”) with the base date of December 2020 as the starting point. The subsidiary Rumo is subject to step-up of 25 basis points, which would increase the interest rate to 4.45% p.a., if these targets are not met. | |
| (viii) | The 11th, 12th and 13th issues debentures have a contractual leverage ratio limited to 3.0x. However, they have a prior consent (waiver) that allows the broadcaster to extrapolate this index up to the limit of 3.5x until December 31, 2027. | |
| (ix) | Interest Coverage Ratio (Índice de Cobertura de Juros) (“ICJ”). | |
| (x) | Debt Service Coverage Ratio (Índice de Cobertura do Serviço da Dívida) (“ICSD”). |
Other ESG (Environmental, Social, and Corporate Governance) commitments
Rumo’s Senior Notes 2028 was the first Green issue in the freight railway sector in Latin America. Rumo is committed to using resources to fully or partially finance ongoing and future projects that contribute to the promotion of a low-carbon transport sector with efficient use of resources in Brazil. Eligible projects are distributed in the areas of “Acquisition, replacement and updating of rolling stock”, “Infrastructure for duplication of railway sections, new yards and yard extensions”, and “Railroad modernization”. The company annually issues a report demonstrating the progress of the projects, which can be accessed directly on the investor relations page.
Rumo’s Senior Notes 2032 was an issue in Sustainability-Linked Bonds (SLBs), with the following sustainable goals: 17.6% reduction in tons of direct greenhouse gas emissions per useful kilometer (TKU) by 2026, having 2020 as a reference. The company is subject to a step-up of 25 basis points from July 2027 if it does not reach this target, which would increase the interest rate to 4.45% p.a.
The 2nd Debenture of Malha Paulista is linked to the sustainable goal of reducing greenhouse gas emissions per TKU by 15% by 2023, having as a point the base date of December 2019. The Company will benefit from a step-down of 25 basis points in each series if it reaches this target, which would reduce the rate from 2024 to CDI + 1.54% in the 1st series and IPCA + 4.52% in the 2nd series.
Rumo S.A.’s 17th Debenture is linked to the sustainable goal of reducing (i) 17.6% of tons of direct greenhouse gas emissions per useful kilometer (TKU) by 2026; and (ii) 21.6% until 2030, using 2020 as a reference. The company is subject to a step-up of 25 basis points in both series if it does not reach the targets.
On September 30, 2023, the Company and its subsidiaries were complying with all financial and non-financial covenants.
The terms of the loans include provisions for cross-default.
Explanatory Notes to the interim Financial Statement
(In thousands of Reais, except when otherwise indicated)
|
|
Parent Company |
|
Consolidated |
||||
|
|
09/30/2023 |
|
12/31/2022 |
|
09/30/2023 |
|
12/31/2022 |
|
Cash and bank accounts |
170 |
|
147 |
|
279,321 |
|
307,819 |
|
Savings account |
106,637 |
|
184,386 |
|
553,373 |
|
974,198 |
|
Financial Investments |
2,368,057 |
|
1,163,928 |
|
14,248,679 |
|
12,019,699 |
|
|
2,474,864 |
|
1,348,461 |
|
15,081,373 |
|
13,301,716 |
Financial investments include the following:
|
|
Parent Company |
|
Consolidated |
||||
|
|
09/30/2023 |
|
12/31/2022 |
|
09/30/2023 |
|
12/31/2022 |
|
Bank investments |
|
|
|
|
|
|
|
|
Repurchase Agreements |
509,434 |
|
759,965 |
|
2,143,851 |
|
1,181,280 |
|
Certificate of bank deposits - CDB |
— |
|
— |
|
— |
|
123,052 |
|
|
509,434 |
|
759,965 |
|
2,143,851 |
|
1,304,332 |
|
|
|
|
|
|
|
|
|
|
Repurchase agreements |
1,491,511 |
|
— |
|
1,531,948 |
|
96,841 |
|
Certificate of bank deposits - CDB |
366,943 |
|
403,823 |
|
10,292,556 |
|
10,396,376 |
|
Other |
169 |
|
140 |
|
280,324 |
|
222,150 |
|
|
1,858,623 |
|
403,963 |
|
12,104,828 |
|
10,715,367 |
|
|
2,368,057 |
|
1,163,928 |
|
14,248,679 |
|
12,019,699 |
|
|
Parent Company |
|
Consolidated |
||||
|
|
09/30/2023 |
|
12/31/2022 |
|
09/30/2023 |
|
12/31/2022 |
|
Marketable securities |
|
|
|
|
|
|
|
|
Financial investment in listed entities (i) |
— |
|
— |
|
14,892,381 |
|
19,586,193 |
|
Government securities (ii) |
493,064 |
|
724,050 |
|
4,503,667 |
|
2,421,297 |
|
Certificate of bank deposits |
— |
|
— |
|
1,282 |
|
1,173 |
|
ESG Funds |
— |
|
— |
|
96,369 |
|
91,103 |
|
|
493,064 |
|
724,050 |
|
19,493,699 |
|
22,099,766 |
|
Current |
493,064 |
|
724,050 |
|
4,504,949 |
|
2,422,470 |
|
Non-current |
— |
|
— |
|
14,988,750 |
|
19,677,296 |
|
Total |
493,064 |
|
724,050 |
|
19,493,699 |
|
22,099,766 |
|
Restricted cash |
|
|
|
|
|
|
|
|
Securities pledged as collateral |
151,580 |
|
35,039 |
|
270,318 |
|
139,933 |
|
|
151,580 |
|
35,039 |
|
270,318 |
|
139,933 |
|
Current |
— |
|
— |
|
7,491 |
|
8,024 |
|
Non-current |
151,580 |
|
35,039 |
|
262,827 |
|
131,909 |
|
Total |
151,580 |
|
35,039 |
|
270,318 |
|
139,933 |
Explanatory Notes to the interim Financial Statement
(In thousands of Reais, except when otherwise indicated)
| (i) | Financial investment in Vale S.A. (VALE3) is measured at fair value through profit or loss at the closing price at reporting date. Such investment was classified as non-current as the Company has no intention of selling these shares in the short term, although these shares are extremely liquid and readily convertible into cash. |
| (ii) | The sovereign debt securities declared interest linked to the Special System of Liquidation and Custody (Sistema Especial de Liquidação e Custódia), or “SELIC”, with a yield of approximately 100% of the CDI. |
a)Composition
|
|
|
Interest |
|
Parent Company |
|
|
|
|
||||||
|
Description |
|
Index |
|
Interest Rate |
|
Currency |
|
09/30/2023 |
|
12/31/2022 |
|
Maturity |
|
Objective |
|
No Warranty |
|
|
|
|
|
|
|
|
|
|
|
|
|
|
|
Debentures |
|
CDI + 2.65% |
|
15.64% |
|
Real |
|
1,165,634 |
|
1,819,837 |
|
Aug-25 |
|
Investments |
|
|
|
CDI + 1.65% |
|
14.51% |
|
Real |
|
759,508 |
|
787,519 |
|
Aug-28 |
|
Capital management |
|
|
|
CDI + 1.50% |
|
14.34% |
|
Real |
|
422,503 |
|
407,308 |
|
May-28 |
|
Capital management |
|
|
|
CDI + 1.90% |
|
14.79% |
|
Real |
|
1,163,354 |
|
1,120,577 |
|
May-32 |
|
Capital management |
|
|
|
CDI + 2.00% |
|
14.90% |
|
Real |
|
911,316 |
|
946,379 |
|
Aug-31 |
|
Capital management |
|
|
|
CDI + 2.40% |
|
15.35% |
|
Real |
|
1,059,892 |
|
— |
|
Apr-28 |
|
Capital management |
|
|
|
CDI + 2.40% |
|
15.35% |
|
Real |
|
1,033,522 |
|
— |
|
Jun-28 |
|
Capital management |
|
|
|
IPCA + 5.75% |
|
11.30% |
|
Real |
|
403,590 |
|
394,008 |
|
Aug-31 |
|
Capital management |
|
|
|
8.02% + FX rate |
|
16.04% |
|
Dollar |
|
1,501,063 |
|
— |
|
Jun-30 |
|
Capital management |
|
Total |
|
|
|
|
|
|
|
8,420,382 |
|
5,475,628 |
|
|
|
|
|
Current |
|
|
|
|
|
|
|
814,169 |
|
802,549 |
|
|
|
|
|
Non-current |
|
|
|
|
|
|
|
7,606,213 |
|
4,673,079 |
|
|
|
|
| (i) | The operation has an interest rate for the first interest flow of 16.04% p.a., while for the other flows it will be 8.02% p.a. |
Explanatory Notes to the interim Financial Statement
(In thousands of Reais, except when otherwise indicated)
|
|
|
Interest |
|
Consolidated |
|
|
|
|
|
|
||||||
|
Description |
|
Index |
|
Currency |
|
Annual interest rate |
|
09/30/2023 |
|
12/31/2022 |
|
Maturity |
|
Objective |
|
Segments |
|
With guarantee |
|
|
|
|
|
|
|
|
|
|
|
|
|
|
|
|
|
Resolution 4,131 |
|
|
|
|
|
|
|
|
|
|
|
|
|
|
|
|
|
|
|
Prefixed |
|
Euro |
|
2.95% |
|
563,205 |
|
868,367 |
|
Oct-24 |
|
Investments |
|
Cosan Oito |
|
|
|
Prefixed |
|
Yen |
|
0.25% |
|
491,201 |
|
578,708 |
|
Oct-24 |
|
Investments |
|
Cosan Oito |
|
|
|
Prefixed |
|
Euro |
|
3.20% |
|
1,958,585 |
|
2,009,452 |
|
Oct-25 |
|
Investments |
|
Cosan Oito |
|
|
|
Prefixed |
|
Yen |
|
0.25% |
|
1,135,916 |
|
1,338,697 |
|
Oct-25 |
|
Investments |
|
Cosan Oito |
|
|
|
Prefixed |
|
Euro |
|
3.40% |
|
1,918,981 |
|
1,966,061 |
|
Oct-26 |
|
Investments |
|
Cosan Oito |
|
|
|
Prefixed |
|
Yen |
|
0.25% |
|
1,110,947 |
|
1,309,330 |
|
Oct-26 |
|
Investments |
|
Cosan Oito |
|
|
|
Prefixed |
|
Euro |
|
3.56% |
|
797,599 |
|
816,172 |
|
Oct-27 |
|
Investments |
|
Cosan Oito |
|
|
|
Prefixed |
|
Yen |
|
0.25% |
|
460,850 |
|
543,160 |
|
Oct-27 |
|
Investments |
|
Cosan Oito |
|
BNDES |
|
URTJLP |
|
Real |
|
9.09% |
|
2,317,296 |
|
2,221,900 |
|
Jul-31 |
|
Investments |
|
Logistic |
|
|
|
Prefixed |
|
Real |
|
5.94% |
|
163,977 |
|
280,919 |
|
Dec-24 |
|
Investments |
|
Logistic |
|
|
|
Prefixed |
|
Real |
|
3.50% |
|
116 |
|
378 |
|
Jan-24 |
|
Investments |
|
Logistic |
|
|
|
IPCA + 6,01% |
|
Real |
|
11.58% |
|
301,942 |
|
— |
|
Dec-36 |
|
Investments |
|
Gas and Power |
|
|
|
IPCA + 3.1% |
|
Real |
|
8.67% |
|
1,567,278 |
|
1,653,501 |
|
Jun-34 |
|
Investments |
|
Gas and Power |
|
|
|
IPCA + 4.10% |
|
Real |
|
9.57% |
|
117,434 |
|
131,885 |
|
Apr-29 |
|
Investments |
|
Gas and Power |
|
|
|
IPCA + 5.74% |
|
Real |
|
11.29% |
|
581,791 |
|
544,925 |
|
Dec-36 |
|
Investments |
|
Gas and Power |
|
Export credit note |
|
CDI + 2.25% |
|
Real |
|
16.73% |
|
76,447 |
|
98,003 |
|
Feb-26 |
|
Investments |
|
Logistic |
|
|
|
CDI + 2.25% |
|
Real |
|
16.08% |
|
63,142 |
|
62,760 |
|
May-26 |
|
Investments |
|
Logistic |
|
|
|
CDI + 2.20% |
|
Real |
|
15.80% |
|
30,304 |
|
— |
|
Mar-26 |
|
Capital management |
|
Logistic |
|
|
|
CDI + 2.07% |
|
Real |
|
15.78% |
|
50,423 |
|
50,467 |
|
Mar-25 |
|
Capital management |
|
Logistic |
|
|
|
CDI + 0.80% |
|
Real |
|
13.55% |
|
172,206 |
|
355,770 |
|
Dec-23 |
|
Investments |
|
Logistic |
|
|
|
CDI + 0.80% |
|
Dolar |
|
6.61% |
|
768,650 |
|
— |
|
Jan-25 |
|
Investments |
|
Logistic |
|
Bank credit note |
|
IPCA |
|
Real |
|
6.26% |
|
799,935 |
|
806,028 |
|
Jan-48 |
|
Investments |
|
Logistic |
|
Debentures |
|
CDI + 1.79% |
|
Real |
|
14.67% |
|
782,606 |
|
754,785 |
|
Jun-27 |
|
Investments |
|
Logistic |
|
|
|
CDI + 1.30% |
|
Real |
|
14.11% |
|
788,217 |
|
759,175 |
|
Oct-27 |
|
Investments |
|
Logistic |
|
|
|
IPCA + 4.77% |
|
Real |
|
10.27% |
|
754,870 |
|
632,440 |
|
Jun-31 |
|
Investments |
|
Logistic |
|
Export Credit Agency (“ECA”) |
|
Euribor + 0.58% |
|
Euro |
|
4.52% |
|
48,050 |
|
68,455 |
|
Sep-26 |
|
Investments |
|
Logistic |
|
|
|
IPCA + 4.10% |
|
Real |
|
11.00% |
|
139,031 |
|
73,717 |
|
Jan-30 |
|
Investments |
|
Gas and Power |
|
|
|
|
|
|
|
|
|
17,960,999 |
|
17,925,055 |
|
|
|
|
|
|
|
No Warranty |
|
|
|
|
|
|
|
|
|
|
|
|
|
|
|
|
|
|
|
Prefixed |
|
Libra |
|
1.9% |
|
123,016 |
|
125,707 |
|
Dec-23 |
|
Investments |
|
Lubricants |
|
Resolution 4131 |
|
Prefixed |
|
Dolar |
|
5.5% |
|
38,614 |
|
45,124 |
|
Mar-25 |
|
Investments |
|
Lubricants |
|
|
|
Prefixed |
|
Dolar |
|
3.67% |
|
— |
|
395,285 |
|
May-23 |
|
Investments |
|
Gas and Power |
|
|
|
Prefixed |
|
Dolar |
|
2.13% |
|
955,704 |
|
1,000,957 |
|
Feb-25 |
|
Investments |
|
Gas and Power |
|
|
|
Prefixed |
|
Dolar |
|
4.04% |
|
757,010 |
|
— |
|
May-26 |
|
Investments |
|
Gas and Power |
|
|
|
Prefixed |
|
Dolar |
|
1.36% |
|
369,393 |
|
377,705 |
|
Feb-24 |
|
Investments |
|
Gas and Power |
|
Perpetual Notes |
|
Prefixed |
|
Dolar |
|
8.25% |
|
2,535,358 |
|
2,641,732 |
|
Nov-40 |
|
Acquisition |
|
Cosan Corporate |
|
Senior Notes Due 2027 |
|
Prefixed |
|
Dolar |
|
7.00% |
|
1,965,632 |
|
3,587,265 |
|
Jan-27 |
|
Acquisition |
|
Cosan Corporate |
|
Senior Notes Due 2028 |
|
Prefixed |
|
Dolar |
|
5.25% |
|
2,110,897 |
|
2,196,083 |
|
Jan-28 |
|
Acquisition |
|
Logistic |
|
Senior Notes Due 2029 |
|
Prefixed |
|
Dolar |
|
5.5% |
|
3,698,618 |
|
3,953,564 |
|
Sep-29 |
|
Acquisition |
|
Cosan Corporate |
|
Senior Notes Due 2030 |
|
Prefixed |
|
Dolar |
|
7.50% |
|
2,783,593 |
|
— |
|
Jun-30 |
|
Capital management |
|
Cosan Corporate |
|
Senior Notes Due 2032 |
|
Prefixed |
|
Dolar |
|
4.2% |
|
1,980,850 |
|
2,124,051 |
|
Jan-32 |
|
Acquisition |
|
Logistic |
|
Prepayment |
|
3M Libor + 1.00% |
|
Dolar |
|
1.59% |
|
100,501 |
|
104,667 |
|
Oct-23 |
|
Capital management |
|
Lubricants |
|
|
|
Prepayment |
|
Dolar |
|
1.27% |
|
— |
|
151,871 |
|
Jul-23 |
|
Capital management |
|
Lubricants |
|
Debentures |
|
IPCA + 4.68% |
|
Real |
|
9.6% |
|
385,192 |
|
518,680 |
|
Feb-26 |
|
Investments |
|
Logistic |
|
|
|
IPCA + 4.50% |
|
Real |
|
9.41% |
|
1,548,492 |
|
1,523,382 |
|
Jun-31 |
|
Investments |
|
Logistic |
|
|
|
IPCA + 3.60% |
|
Real |
|
9.55% |
|
404,462 |
|
367,476 |
|
Dec-30 |
|
Capital management |
|
Logistic |
|
|
|
CDI + 2.65% |
|
Real |
|
16.66% |
|
1,165,634 |
|
1,819,837 |
|
Aug-25 |
|
Investments |
|
Cosan Corporate |
|
|
|
IPCA + 6.80% |
|
Real |
|
11.82% |
|
988,324 |
|
893,852 |
|
Apr-30 |
|
Investments |
|
Logistic |
|
|
|
IPCA + 3.90% |
|
Real |
|
8.78% |
|
1,119,027 |
|
1,048,252 |
|
Oct-29 |
|
Investments |
|
Logistic |
|
|
|
IPCA + 5.73% |
|
Real |
|
10.7% |
|
536,695 |
|
537,261 |
|
Oct-33 |
|
Investments |
|
Logistic |
|
|
|
IPCA + 4.00% |
|
Real |
|
8.89% |
|
1,042,253 |
|
941,203 |
|
Dec-35 |
|
Investments |
|
Logistic |
|
|
|
IPCA + 4.54% |
|
Real |
|
9.45% |
|
244,647 |
|
80,987 |
|
Jun-36 |
|
Investments |
|
Logistic |
|
|
|
IPCA + 5.99% |
|
Real |
|
10.97% |
|
467,235 |
|
435,780 |
|
Jun-32 |
|
Investments |
|
Logistic |
|
|
|
IPCA + 5.76% |
|
Real |
|
11.31% |
|
720,457 |
|
— |
|
Aug-29 |
|
Investments |
|
Logistic |
|
|
|
IPCA + 6.18% |
|
Real |
|
11.75% |
|
711,525 |
|
— |
|
May-33 |
|
Investments |
|
Logistic |
|
|
|
IPCA + 5.87% |
|
Real |
|
10.85% |
|
991,169 |
|
907,366 |
|
Dec-23 |
|
Investments |
|
Gas and Power |
|
|
|
IPCA + 4.33% |
|
Real |
|
9.23% |
|
566,905 |
|
523,837 |
|
Oct-24 |
|
Investments |
|
Gas and Power |
|
|
|
IGPM + 6.10% |
|
Real |
|
6.28% |
|
359,455 |
|
372,171 |
|
May-28 |
|
Investments |
|
Gas and Power |
|
|
|
CDI + 1.90% |
|
Real |
|
15.81% |
|
1,163,355 |
|
1,120,577 |
|
May-32 |
|
Investments |
|
Cosan Corporate |
|
|
|
CDI + 1.50% |
|
Real |
|
15.35% |
|
422,503 |
|
407,308 |
|
May-28 |
|
Investments |
|
Cosan Corporate |
|
|
|
CDI + 1.95% |
|
Real |
|
15.87% |
|
711,351 |
|
824,866 |
|
Aug-24 |
|
Investments |
|
Gas and Power |
|
|
|
CDI + 1.45% |
|
Real |
|
15.3% |
|
414,332 |
|
399,616 |
|
Dec-26 |
|
Investments |
|
Gas and Power |
|
|
|
IPCA + 5.12% |
|
Real |
|
10.06% |
|
525,136 |
|
491,153 |
|
Aug-31 |
|
Investments |
|
Gas and Power |
|
|
|
IPCA + 7.36% |
|
Real |
|
13.86% |
|
126,496 |
|
114,014 |
|
Dec-25 |
|
Investments |
|
Gas and Power |
|
|
|
111.60% do CDI |
|
Real |
|
10.17% |
|
502,449 |
|
467,841 |
|
Aug-36 |
|
Investments |
|
Gas and Power |
|
|
|
CDI + 1.65% |
|
Real |
|
15.53% |
|
759,508 |
|
787,519 |
|
Aug-28 |
|
Capital management |
|
Cosan Corporate |
|
|
|
CDI + 2,40% |
|
Real |
|
16.38% |
|
1,059,893 |
|
— |
|
Apr-28 |
|
Capital management |
|
Cosan Corporate |
|
|
|
CDI + 2,40% |
|
Real |
|
16.38% |
|
1,033,523 |
|
— |
|
Jun-28 |
|
Capital management |
|
Cosan Corporate |
|
|
|
CDI + 2.00% |
|
Real |
|
15.92% |
|
911,316 |
|
946,379 |
|
Aug-31 |
|
Capital management |
|
Cosan Corporate |
|
|
|
IPCA + 5.75% |
|
Real |
|
10.72% |
|
403,590 |
|
394,008 |
|
Aug-31 |
|
Capital management |
|
Cosan Corporate |
|
Working capital |
|
CDI + 1.60% |
|
Real |
|
15.47% |
|
— |
|
100,170 |
|
Jun-23 |
|
Capital management |
|
Lubricants |
|
|
|
SOFR + 1.50% |
|
Dolar |
|
1.5% |
|
2,248,252 |
|
2,334,615 |
|
May-27 |
|
Acquisition |
|
Lubricants |
|
|
|
|
|
|
|
|
|
38,952,362 |
|
35,062,161 |
|
|
|
|
|
|
|
|
|
|
|
|
|
|
|
|
|
|
|
|
|
|
|
|
|
Total |
|
|
|
|
|
|
|
56,913,361 |
|
52,987,216 |
|
|
|
|
|
|
|
|
|
|
|
|
|
|
|
|
|
|
|
|
|
|
|
|
|
Current |
|
|
|
|
|
|
|
5,613,263 |
|
4,542,205 |
|
|
|
|
|
|
|
Non-current |
|
|
|
|
|
|
|
51,300,098 |
|
48,445,011 |
|
|
|
|
|
|
Explanatory Notes to the interim Financial Statement
(In thousands of Reais, except when otherwise indicated)
For debts linked to derivatives, the effective rates are shown in the explanatory note 5.6.
To calculate the average rates, on an annual basis, the average annual CDI rate of 13.25% p.a. was considered. (12.44% p.a. on December 31, 2022) and TJLP of 7.21% p.a. (6.79% p.a. on December 31, 2022).
All debts with maturity dates denominate in foreign currency are hedged against foreign exchange risk through derivatives (note 5.6), except for perpetual notes.
b)Movement
|
|
|
Parent Company |
|
Consolidated |
|
Balance as of January 31, 2023 |
|
5,475,628 |
|
52,987,216 |
|
Funding |
|
3,483,102 |
|
8,357,970 |
|
Amortization of principal |
|
(579,942) |
|
(3,562,837) |
|
Interest payment |
|
(659,023) |
|
(2,446,032) |
|
Payment of interest on work in progress |
|
— |
|
(252,229) |
|
Interest, foreign exchange variation and fair value |
|
700,617 |
|
1,829,273 |
|
Balance as of September 30, 2023 |
|
8,420,382 |
|
56,913,361 |
c)Guarantees
The subsidiary Rumo has entered into financing contracts with development banks, intended for investments with a bank guarantee, according to each contract, with an average cost of 0.65% p.a. or by real guarantees (assets) and escrow account. As of September 30, 2023, the balance of bank guarantees contracted was R$3,079,907 (R$3,037,453 as of December 31, 2022).
The subsidiary CLI has a bank guarantee for a loan from Cosan Lubrificantes S.R.L. (“Moove Argentina”), with an average annual cost of 0.18%, and guarantee with top-tier banks for payment to third parties, with an average annual cost of 3.90%. On September 30, 2023, the balance of contracted guarantees was R$37.557 (R$44,813 on December 31, 2022).
The subsidiary Cosan Oito has loans in foreign currency (Resolution 4,131) with top banking institutions, which are guaranteed by 100% of the Vale shares that are in the Collar structure.
d)Available credit line
As of September 30, 2023, the Company had credit lines with banks rated AA, which were not used, in the amount of R$2.055.412 (R$3.052.287 as of December 31, 2022). The use of these lines of credit is subject to certain contractual conditions.
e)Offset of assets and liabilities
In June 2023, the Company, through its subsidiary Cosan Luxembourg S.A. (“Cosan Lux”), carried out an offering of senior notes in the amount of US$550,000 thousand with a coupon of 7.50% and maturing in 2030 (“Senior Notes 2030”).
On September 29, 2023, the Company internalized the remaining resources arising from this debt, through the issuance of debentures by Cosan S.A., referenced in US dollars in the amount of R$1,491 million (equivalent to US$ 300,000 thousand), with coupon annual rate of 16.04% p.a. for first interest payment and 8.02% p.a. for the other. In return, Cosan Luxembourg contracted a Total Return Swap (“TRS”) with the same amount and counterparty in US dollars, with semi-annual payment frequency and annual remuneration of 15.52% p.a. for the first interest remuneration and 7.50% p.a. for the other, which has the 7th issue of debenture as its underlying asset.
Since the Company has the legally enforceable right to offset the amounts and intends to settle them simultaneously, for consolidation purposes the Company offset in the balance sheet the assets relating to the contracting of the TRS with the debt liabilities arising from the debentures, presenting them at net value, as well as their respective impacts on the income statement. Therefore, sensitivity analysis is also not performed as both transactions do not pose any risk to the Company.
Explanatory Notes to the interim Financial Statement
(In thousands of Reais, except when otherwise indicated)
|
|
|
Consolidated |
||||
|
|
|
Gross value |
|
Compensated amount |
|
Net value |
|
TRS (Notional) |
|
1,502,280 |
|
(1,502,280) |
|
— |
|
TRS (Interest) |
|
669 |
|
(669) |
|
— |
|
|
|
1,502,949 |
|
(1,502,949) |
|
— |
|
|
|
|
|
|
|
|
|
Debentures (principal and exchange rate variation) (i) |
|
(1,502,280) |
|
1,502,280 |
|
— |
|
Debentures (interest) |
|
(669) |
|
669 |
|
— |
|
|
|
(1,502,949) |
|
1,502,949 |
|
— |
| (i) | The amounts are equivalent to US$300,000 thousand, with the PTAX conversion rate of September 29,2023 being R$5.0076. |
f)Fair value and exposure to financial risk
The fair value of loans is determined by discounting future cash flows at their implied discount rate. Due to the use of unobservable inputs, including own credit risk, they are classified as fair value at level 2 of the hierarchy (Note 5.11).
Details of the Company's exposure to risks arising from loans are shown in Note 5.12.
The movement in leases for the period ended September 30, 2023 was as follows:
|
|
Parent Company |
|
Consolidated |
|
At January 1, 2023 |
30,365 |
|
3,532,158 |
|
Additions |
— |
|
1,844,244 |
|
Write-offs |
— |
|
(7,141) |
|
Interest |
6,807 |
|
378,246 |
|
Repayment of principal |
(4,046) |
|
(363,767) |
|
Payment of interest |
(2,716) |
|
(144,957) |
|
Contractual adjustment |
525 |
|
104,519 |
|
At September 30, 2023 |
30,935 |
|
5,343,302 |
|
Current |
8,912 |
|
752,230 |
|
Non-current |
22,023 |
|
4,591,072 |
|
|
30,935 |
|
5,343,302 |
The lease agreements have different terms, with the last due date occurring in December 2058. The amounts are updated annually by inflation indexes (such as IGPM and IPCA) or may incur interest calculated based on the TJLP or CDI and some of the contracts have renewal or purchase options that were considered in determining the term and classification as finance lease.
In addition to the amortization and appropriation of interest and exchange variation highlighted in the previous tables, the following impacts on income were recorded for the other lease contracts that were not included in the measurement of lease liabilities.
|
|
3Q23 |
|
3Q22 |
|
9M23 |
|
9M22 |
|
Variable lease payments not included in the measurement of lease liabilities |
8,827 |
|
15,603 |
|
30,536 |
|
40,993 |
|
Expenses relating to short-term leases |
16,437 |
|
3,501 |
|
22,030 |
|
12,041 |
|
Expenses relating to leases of low-value |
804 |
|
244 |
|
1,455 |
|
1,024 |
|
|
26,068 |
|
19,348 |
|
54,021 |
|
54,058 |
Explanatory Notes to the interim Financial Statement
(In thousands of Reais, except when otherwise indicated)
Lease balances recorded by the Company include the Malha Central contract and the renewal amendment to the Malha Paulista contract, which have an identified implicit rate and are therefore readily determinable in such cases. In these cases, the valuation does not generate the distortions in the liabilities and right of use object of CVM Circular Letter 2/2019. This particularity of the Company means that the effects on the balances (of lease liabilities, right of use, financial expenses and depreciation expenses) if the measurement were made by the present value of the expected installments plus projected future inflation, would not are relevant to influence users' decisions and, consequently, to be presented in the interim financial statements.
The Company recorded lease liabilities at the present value of the installments due, that is, including any tax credits to which it will be entitled at the time of the lease payments. The potential PIS / COFINS credit included in liabilities on September 30, 2023, is R$30,091 (R$6,318 on December 31, 2022).
The Company uses swap instruments, whose fair value is determined from discounted cash flows discounted cash flows based on market curves, to hedge the exposure to foreign exchange risk and exposure to foreign exchange risk and interest and inflation risk. The consolidated data are presented below:
|
|
Parent Company |
||||||
|
|
Notional |
|
Fair value |
||||
|
|
09/30/2023 |
|
12/31/2022 |
|
09/30/2023 |
|
12/31/2022 |
|
Interest rate and exchange rate risk |
|
|
|
|
|
|
|
|
Swap agreements (interest) |
9,255,278 |
|
9,255,278 |
|
(19,640) |
|
(195,017) |
|
Swap agreements (interest and FX) |
9,191,985 |
|
7,318,840 |
|
107,474 |
|
901,749 |
|
Forward agreements (interest and FX) |
176,192 |
|
— |
|
2,718 |
|
— |
|
|
18,623,455 |
|
16,574,118 |
|
90,552 |
|
706,732 |
|
Share price risk |
|
|
|
|
|
|
|
|
Swap agreements - Total return swap |
1,755,465 |
|
1,515,827 |
|
(97,078) |
|
43,130 |
|
|
1,755,465 |
|
1,515,827 |
|
(97,078) |
|
43,130 |
|
Total financial instruments |
|
(6,526) |
|
749,862 |
|||
|
Current assets |
|
|
|
|
2,718 |
|
— |
|
Non-current assets |
|
|
|
|
674,321 |
|
1,368,809 |
|
Current liabilities |
|
|
|
|
(97,078) |
|
— |
|
Non-current liabilities |
|
|
|
|
(586,487) |
|
(618,947) |
|
Total |
|
|
|
|
(6,526) |
|
749,862 |
Explanatory Notes to the interim Financial Statement
(In thousands of Reais, except when otherwise indicated)
|
|
Consolidated |
||||||
|
|
Notional |
|
Fair value |
||||
|
|
09/30/2023 |
|
12/31/2022 |
|
09/30/2023 |
|
12/31/2022 |
|
Exchange rate derivatives |
|
|
|
|
|
|
|
|
Forward agreements |
33,378 |
|
53,012 |
|
343 |
|
(485) |
|
FX option agreements |
375,570 |
|
676,214 |
|
23,236 |
|
25,360 |
|
|
408,948 |
|
729,226 |
|
23,579 |
|
24,875 |
|
Commodity derivatives |
|
|
|
|
|
|
|
|
Option agreements |
— |
|
— |
|
558 |
|
21,744 |
|
Forward agreements |
— |
|
— |
|
(26,660) |
|
— |
|
|
— |
|
— |
|
(26,072) |
|
21,744 |
|
Interest rate and exchange rate risk |
|
|
|
|
|
|
|
|
Swap agreements (interest and inflation) |
14,147,554 |
|
10,070,343 |
|
546,339 |
|
(500,444) |
|
Forward agreements (interest and FX) |
12,677,753 |
|
12,811,427 |
|
(1,154,188) |
|
760,152 |
|
Swap agreements (interest rate) |
9,255,278 |
|
9,255,278 |
|
(19,640) |
|
(155,518) |
|
Swap agreements (interest and FX) |
17,370,474 |
|
17,191,070 |
|
(770,313) |
|
790,840 |
|
|
53,451,059 |
|
49,328,118 |
|
(1,397,802) |
|
895,030 |
|
Share price risk |
|
|
|
|
|
|
|
|
Swap agreements - Total return swap |
1,755,465 |
|
1,515,827 |
|
(97,078) |
|
43,130 |
|
Call Spread |
5,594,212 |
|
5,594,212 |
|
(80,476) |
|
1,954,493 |
|
Collar (Vale Shares) |
16,591,538 |
|
16,931,662 |
|
1,408,377 |
|
(4,078,452) |
|
|
23,941,215 |
|
24,041,701 |
|
1,230,823 |
|
(2,080,829) |
|
|
|
|
|
|
|
|
|
|
Total financial instruments |
|
(169,472) |
|
(1,139,180) |
|||
|
Current assets |
|
|
|
|
265,329 |
|
1,086,698 |
|
Non-current assets |
|
|
|
|
3,368,662 |
|
3,065,054 |
|
Current liabilities |
|
|
|
|
(1,100,557) |
|
(1,039,357) |
|
Non-current liabilities |
|
|
|
|
(2,702,906) |
|
(4,251,575) |
|
Total |
|
|
|
|
(169,472) |
|
(1,139,180) |
Explanatory Notes to the interim Financial Statement
(In thousands of Reais, except when otherwise indicated)
Below, we demonstrate the opening value of derivative debt and non-debt derivative financial instruments:
|
|
|
|
Parent company |
|
Consolidated |
||||
|
|
Note |
|
09/30/2023 |
|
12/31/2022 |
|
09/30/2023 |
|
12/31/2022 |
|
Derivative financial instruments |
5.1 |
|
90,552 |
|
706,733 |
|
(6,920) |
|
(1,228,928) |
|
Non-derivative financial instruments |
|
|
(97,078) |
|
43,129 |
|
(99,570) |
|
89,748 |
|
|
|
|
(6,526) |
|
749,862 |
|
(169,472) |
|
(1,139,180) |
Derivatives are only used for economic hedging purposes and not as speculative investments.
a) Fair value hedge
The Company adopts fair value hedge accounting for some of its operations, both the hedging instruments and the hedged items are measured and recognized at fair value through profit or loss.
There is an economic relationship between the hedged item and the hedging instrument as the terms of the interest rate and exchange rate swap correspond to the terms of the fixed rate loan, i.e. notional amount, term and payment. The Company established a 1:1 coverage ratio for the hedging relationships, as the underlying risk of the interest rate and exchange rate swap is identical to the hedged risk component. To test the effectiveness of the hedge, the Company uses the discounted cash flow method and compares changes in the fair value of the hedging instrument with changes in the fair value of the hedged item attributable to the hedged risk. The sources of hedge ineffectiveness that are expected to affect the hedging relationship during its term evaluated by the Company are mainly: (i) reduction or modification of the hedged item; and (ii) a change in the credit risk of the Company or the counterparty of the contracted swaps. The amounts related to the items designated as hedging instruments were as follows:
|
|
|
|
Registered value |
|
Accumulated fair value adjustment |
||||
|
|
Notional |
|
09/30/2023 |
|
12/31/2022 |
|
09/30/2023 |
|
12/31/2022 |
|
FX rate risk hedge |
|
|
|
|
|
|
|
|
|
|
Designated items |
|
|
|
|
|
|
|
|
|
|
Senior notes 2028 (Rumo Luxembourg) |
(2,791,600) |
|
(2,110,897) |
|
(2,196,083) |
|
49,955 |
|
(336,161) |
|
Senior notes 2032 (Rumo Luxembourg) |
(2,259,375) |
|
(1,980,850) |
|
(2,124,051) |
|
(15,702) |
|
(629,220) |
|
NCE USD (Rumo Malha Norte) |
(725,100) |
|
(768,650) |
|
— |
|
5,867 |
|
— |
|
PPE – (Pré pagamento de exportação) 1 (Moove) |
— |
|
— |
|
(156,884) |
|
— |
|
2,389 |
|
PPE – (Pré pagamento de exportação) 2 (Moove) |
(110,400) |
|
(100,501) |
|
(104,667) |
|
(48) |
|
2,624 |
|
Total debt |
(5,886,475) |
|
(4,960,898) |
|
(4,581,685) |
|
40,072 |
|
(960,368) |
|
Derivative financial instruments |
|
|
|
|
|
|
|
|
|
|
Swaps Senior Notes 2028 (Rumo Luxembourg) |
2,791,600 |
|
(424,326) |
|
(418,674) |
|
5,653 |
|
685,200 |
|
Swaps Senior Notes 2032 (Rumo Luxembourg) |
2,259,375 |
|
(233,695) |
|
(128,986) |
|
104,709 |
|
804,558 |
|
Exchange rate and interest swap (Rumo Malha Norte) |
725,100 |
|
20,162 |
|
— |
|
(20,162) |
|
— |
|
SWAP - Export prepayment - PPE 1 (Moove) |
— |
|
— |
|
(11,079) |
|
— |
|
(11,079) |
|
SWAP - Export prepayment - PPE 2 (Moove) |
110,400 |
|
(12,661) |
|
(7,067) |
|
(12,661) |
|
(7,067) |
|
Total derivatives |
5,886,475 |
|
(650,520) |
|
(565,806) |
|
77,539 |
|
1,471,612 |
|
Total |
— |
|
(5,611,418) |
|
(5,147,491) |
|
117,611 |
|
511,244 |
Explanatory Notes to the interim Financial Statement
(In thousands of Reais, except when otherwise indicated)
|
|
|
|
Registered value |
|
Accumulated fair value adjustment |
||||
|
|
Notional |
|
09/30/2023 |
|
12/31/2022 |
|
09/30/2023 |
|
12/31/2022 |
|
Interest rate risk hedge |
|
|
|
|
|
|
|
|
|
|
Designated items |
|
|
|
|
|
|
|
|
|
|
Debenture 5th issue - single series (Comgás) |
(684,501) |
|
(991,169) |
|
(907,366) |
|
(81,846) |
|
(33,892) |
|
BNDES Project VIII (Comgás) |
(1,000,000) |
|
(810,853) |
|
(851,689) |
|
62,644 |
|
70,260 |
|
Debenture (Rumo) |
(7,485,276) |
|
(7,779,631) |
|
(5,755,679) |
|
190,258 |
|
(327,290) |
|
Finem (Rumo) |
(28,808) |
|
(61,620) |
|
(28,115) |
|
601 |
|
(1,644) |
|
CCB (Rumo) |
(814,300) |
|
(799,935) |
|
(785,366) |
|
(2,879) |
|
(4,418) |
|
Total debt |
(10,012,885) |
|
(10,443,208) |
|
(8,328,215) |
|
168,778 |
|
(296,984) |
|
Derivative financial instruments |
|
|
|
|
|
|
|
|
|
|
Debenture 5th issue - single series (Comgás) |
684,501 |
|
235,086 |
|
221,000 |
|
14,086 |
|
1,248 |
|
BNDES Project VIII (Comgás) |
1,000,000 |
|
(70,055) |
|
(90,193) |
|
(9,137) |
|
(61,242) |
|
Swaps Debenture (Rumo) |
7,485,276 |
|
126,932 |
|
(148,662) |
|
(275,594) |
|
72,856 |
|
Finem (Rumo) |
28,808 |
|
1,070 |
|
(558) |
|
(1,628) |
|
558 |
|
CCB (Rumo) |
814,300 |
|
(8,802) |
|
(6,976) |
|
1,826 |
|
6,976 |
|
Derivative total |
10,012,885 |
|
284,231 |
|
(25,389) |
|
(270,447) |
|
20,396 |
|
Total |
— |
|
(10,158,977) |
|
(8,353,604) |
|
(101,669) |
|
(276,588) |
b) Fair value option
Certain derivative instruments were not designated to documented hedging structures.
The Company chose to designate the hedged liabilities (hedge objects) to be recorded at fair value through profit or loss. Considering that derivative instruments are always accounted for at fair value through profit or loss, the accounting effects are the same as those that would be obtained through hedging documentation:
|
|
|
|
|
|
Registered Value |
|
Accumulated fair value |
||||
|
|
|
|
Notional |
|
09/30/2023 |
|
12/31/2022 |
|
09/30/2023 |
|
12/31/2022 |
|
FX rate risk |
|
|
|
|
|
|
|
|
|
|
|
|
Items |
|
|
|
|
|
|
|
|
|
|
|
|
Senior Notes 2027 (Cosan Luxembourg) |
USD+7.0% |
|
(1,962,979) |
|
(1,965,632) |
|
(3,587,265) |
|
579,552 |
|
967,778 |
|
Export Credit Agreement (Rumo) |
EUR + 0.58% |
|
(38,054) |
|
(48,050) |
|
(68,455) |
|
(1,235) |
|
377 |
|
Resolution 4,131 (Rumo) |
USD + 2.20% |
|
— |
|
— |
|
— |
|
— |
|
247 |
|
Resolution 4,131 (Comgás - 2021) |
USD + 1.60% |
|
(407,250) |
|
(369,393) |
|
(377,705) |
|
6,716 |
|
15,545 |
|
Resolution 4,131 (Comgás - 2022) |
USD + 2.51% |
|
(1,097,400) |
|
(955,704) |
|
(1,000,957) |
|
49,199 |
|
51,798 |
|
Resolution 4,131 (Comgás - 2022) |
USD + 4.76% |
|
(749,310) |
|
(757,010) |
|
— |
|
4,503 |
|
— |
|
Resolution 4,131 (Comgás - 2018) |
USD + 4.32% |
|
— |
|
— |
|
(395,285) |
|
— |
|
(2,680) |
|
Total |
|
|
(4,254,993) |
|
(4,095,789) |
|
(5,429,667) |
|
638,735 |
|
1,033,065 |
|
Derivative instruments |
|
|
|
|
|
|
|
|
|
|
|
|
Swap Senior Notes 2027 (Cosan Luxembourg) |
126.85% do CDI |
|
1,962,979 |
|
648,053 |
|
1,285,454 |
|
314,870 |
|
(736,466) |
|
Inflation and interest rate swaps (Rumo) |
108% do CDI |
|
38,054 |
|
9,697 |
|
15,468 |
|
5,772 |
|
15,067 |
|
Inflation and interest rate swaps (Rumo) |
118% do CDI |
|
— |
|
— |
|
— |
|
— |
|
47,527 |
|
Resolution 4,131 (Comgás - 2021) |
CDI + 1.25% |
|
407,250 |
|
(43,567) |
|
(50,245) |
|
(46,039) |
|
(88,612) |
|
Resolution 4,131 (Comgás - 2022) |
CDI + 1.20% |
|
1,097,400 |
|
(164,829) |
|
(160,369) |
|
(137,375) |
|
(217,215) |
|
Resolution 4,131 (Comgás - 2023) |
CDI + 1.30% |
|
749,310 |
|
(28,570) |
|
— |
|
(28,570) |
|
— |
|
Resolution 4,131 (Comgás - 2018) |
107.9% do CDI |
|
— |
|
— |
|
123,760 |
|
(28,050) |
|
(61,685) |
|
Total derivatives |
|
|
4,254,993 |
|
420,784 |
|
1,214,068 |
|
80,608 |
|
(1,041,384) |
|
Total |
|
|
— |
|
(3,675,005) |
|
(4,215,599) |
|
719,343 |
|
(8,319) |
Explanatory Notes to the interim Financial Statement
(In thousands of Reais, except when otherwise indicated)
|
|
|
|
|
|
Registered Value |
|
Accumulated fair value adjustment |
||||
|
|
|
|
Notional |
|
09/30/2023 |
|
12/31/2022 |
|
09/30/2023 |
|
12/31/2022 |
|
FX rate risk |
|
|
|
|
|
|
|
|
|
|
|
|
Items |
|
|
|
|
|
|
|
|
|
|
|
|
Debenture 4rd issue - 3rd series (Comgás) |
IPCA + 7.36% |
|
(114,818) |
|
(126,496) |
|
(114,014) |
|
(11,732) |
|
(114,014) |
|
Debenture 6th issue - single series (Comgás) |
IPCA + 4.33% |
|
(523,993) |
|
(566,905) |
|
(523,837) |
|
(40,744) |
|
(523,837) |
|
Debenture 9rd issue - 1rd series (Comgás) |
IPCA + 5.12% |
|
(500,000) |
|
(525,136) |
|
(491,153) |
|
(15,799) |
|
(6,179) |
|
Debenture 9rd issue - 2rd series (Comgás) |
IPCA + 5.22% |
|
(500,000) |
|
(502,449) |
|
(467,841) |
|
(15,491) |
|
9,737 |
|
BNDES Projects VI and VII (Comgás) |
IPCA + 4.10% |
|
(160,126) |
|
(117,434) |
|
(131,885) |
|
29,656 |
|
(131,885) |
|
BNDES Project VIII (Comgás) |
IPCA + 3.25% |
|
(870,149) |
|
(756,426) |
|
(801,812) |
|
60,301 |
|
(801,812) |
|
BNDES Project IX (Comgás) |
IPCA + 5.74% |
|
(565,582) |
|
(581,791) |
|
(544,925) |
|
(19,707) |
|
(544,925) |
|
Debenture (Rumo) |
IPCA + 4.68% |
|
(300,000) |
|
(385,192) |
|
(518,680) |
|
10,048 |
|
(6,070) |
|
Debenture (Rumo) |
IPCA + 4.50% |
|
(600,000) |
|
(747,419) |
|
(704,954) |
|
21,980 |
|
(34,745) |
|
Total |
|
|
(4,134,668) |
|
(4,309,248) |
|
(4,299,101) |
|
18,512 |
|
(2,153,730) |
|
Derivative instruments |
|
|
|
|
|
|
|
|
|
|
|
|
Debenture 4rd issue - 3rd series (Comgás) |
94.64% CDI |
|
— |
|
— |
|
— |
|
— |
|
(3,900) |
|
Debenture 4rd issue - 3rd series (Comgás) |
112.49% CDI |
|
114,818 |
|
(1,469) |
|
(778) |
|
(691) |
|
(5,096) |
|
Debenture 6th issue - single series (Comgás) |
89.9% CDI |
|
523,993 |
|
(15,961) |
|
(10,419) |
|
(5,542) |
|
(26,161) |
|
Debenture 9rd issue - 1rd series (Comgás) |
109.20% CDI |
|
500,000 |
|
33,166 |
|
(17,705) |
|
7,192 |
|
(37,517) |
|
Debenture 9rd issue - 2rd series (Comgás) |
110.60% CDI |
|
500,000 |
|
11,825 |
|
(40,441) |
|
8,149 |
|
(53,304) |
|
BNDES Projects VI and VII (Comgás) |
87.50% CDI |
|
160,126 |
|
(830) |
|
(2,046) |
|
(628) |
|
(6,923) |
|
BNDES Project VIII (Comgás) |
82.94% CDI |
|
870,149 |
|
(12,252) |
|
(21,039) |
|
(3,533) |
|
(48,613) |
|
BNDES Project IX (Comgás) |
98.9% CDI |
|
565,582 |
|
29,759 |
|
(6,632) |
|
6,768 |
|
(6,632) |
|
Debenture (Rumo) |
107% CDI |
|
300,000 |
|
80,148 |
|
76,194 |
|
(3,954) |
|
(4,819) |
|
Debenture (Rumo) |
103% CDI |
|
600,000 |
|
137,721 |
|
74,092 |
|
(63,629) |
|
8,252 |
|
Total derivatives |
|
|
4,134,668 |
|
262,107 |
|
51,226 |
|
(55,868) |
|
(184,713) |
|
Total |
|
|
— |
|
(4,047,141) |
|
(4,247,875) |
|
(37,356) |
|
(2,338,443) |
c) Cash flow hedge
Compass
Natural gas purchase and sale contracts
The indirect subsidiary Compass Comercialização S.A. entered into natural gas purchase (JKM risk) and sale agreements (BRENT risck) with a third party and related party. In order to protect and mitigate the risks arising from fluctuations in natural gas indexes, the subsidiary designated this operation subject to hedge accounting for the respective cash flow protection.
In this contracting, the expected benefits are: reducing the financial risk associated with fluctuations in natural gas prices, avoiding fluctuations in the financial result of hedge instruments, protecting the subsidiary's margins, as well as maintaining predictability in its costs or revenues, ensuring greater stability in operating results.
Explanatory Notes to the interim Financial Statement
(In thousands of Reais, except when otherwise indicated)
Highly probable revenues in US dollars (Leasing)
The indirect subsidiary TRSP adopted a hedge accounting strategy to protect its results from exposure to variability in cash flows arising from the exchange rate effects of highly probable revenues in US dollars projected for a period of 20 years, through non-derivative hedging instruments – lease liabilities in US dollars already contracted.
Rumo
Investment costs
The subsidiary Rumo S.A contracted certain derivative instruments to protect certain investment costs contracted for the period of 2023 and opted to link the instruments to documented hedge structures.
On September 30, 2023 there was no ineffective portion reclassified to profit or loss. The impacts recognized in the subsidiary's shareholders' equity and the estimated realization in shareholders' equity are shown below:
a) Composition
|
Financial instruments |
|
Subsidiary |
|
Risk |
|
Unit |
|
Notional |
|
Fair value 09/30/2023 |
|
Book value 09/30/2023 |
|
Future |
|
Compass |
|
BRENT |
|
Barrel |
|
368.000 |
|
(26,660) |
|
(26,660) |
|
Leasing |
|
Compass |
|
FX rate |
|
BRL |
|
1,588,268 |
|
(70,248) |
|
(70,248) |
|
NDF (Non deliverable forwards) |
|
Rumo |
|
USD |
|
BRL |
|
23,450 |
|
(819) |
|
(819) |
|
Effect on balance sheet |
|
|
|
|
|
|
|
1,979,718 |
|
(97,727) |
|
(97,727) |
b) Movement
|
Financial instruments |
Comprehensive income (i) |
|
Gains or (losses) realized |
|
Future (BRENT) |
(26,660) |
|
— |
|
Future (JKM) |
— |
|
12,012 |
|
Leasing |
(70,248) |
|
— |
|
NDF (Non deliverable forwards) |
(819) |
|
(1,133) |
|
September 30, 2023 |
(97,727) |
|
10,879 |
(i) Effect of deferred income tax and social contribution is R$33,227.
|
|
Consolidated |
|||
|
|
09/30/2023 |
|
12/31/2022 |
|
|
Domestic market |
3,022,833 |
|
3,085,227 |
|
|
Unbilled receivables (i) |
803,872 |
|
968,147 |
|
|
Foreign market - foreign currency |
31,279 |
|
28,786 |
|
|
|
3,857,984 |
|
4,082,160 |
|
|
Expected credit losses |
(159,695) |
|
(154,618) |
|
|
|
3,698,289 |
|
3,927,542 |
|
|
Current |
3,580,136 |
|
3,769,908 |
|
|
Non-current |
118,153 |
|
157,634 |
|
|
Total |
3,698,289 |
|
3,927,542 |
|
| (i) | Unbilled revenue refers to the portion of the monthly gas supply for which measurement and billing have not been completed. |
Explanatory Notes to the interim Financial Statement
(In thousands of Reais, except when otherwise indicated)
|
|
|
Parent Company |
|
Consolidated |
||||
|
|
|
09/30/2023 |
|
12/31/2022 |
|
09/30/2023 |
|
12/31/2022 |
|
Current assets |
|
|
|
|
|
|
|
|
|
Commercial operations |
|
|
|
|
|
|
|
|
|
Raízen S.A. |
|
4,055 |
|
7,555 |
|
82,571 |
|
79,297 |
|
Rumo S.A. |
|
3,208 |
|
3,045 |
|
— |
|
— |
|
Elevações Portuárias S.A. |
|
— |
|
— |
|
19,937 |
|
5,424 |
|
Cosan Lubrificantes e Especialidades S.A. |
|
1,776 |
|
3,418 |
|
— |
|
— |
|
Aguassanta Participações S.A. |
|
2,198 |
|
2,184 |
|
2,198 |
|
2,184 |
|
Compass Gás e Energia S.A. |
|
1,455 |
|
996 |
|
— |
|
— |
|
Compass Gás e Energia S.A. |
|
104 |
|
— |
|
— |
|
— |
|
Termag - Terminal Marítimo de Guarujá S.A. |
|
— |
|
— |
|
14,286 |
|
14,286 |
|
Other |
|
3,953 |
|
7,269 |
|
1,521 |
|
6,512 |
|
|
|
16,749 |
|
24,467 |
|
120,513 |
|
107,703 |
|
Financial and corporate operations |
|
|
|
|
|
|
|
|
|
Raízen S.A. |
|
31,715 |
|
20,585 |
|
31,715 |
|
20,586 |
|
Cosan Oito S.A. |
|
— |
|
6,742 |
|
— |
|
— |
|
Cosan Nove Participações S.A. (i) |
|
— |
|
121,621 |
|
— |
|
— |
|
Cosan Dez Participações S.A. |
|
111,659 |
|
111,659 |
|
— |
|
— |
|
Ligga S.A. |
|
— |
|
— |
|
107,000 |
|
107,252 |
|
Cosan Lubrificantes e Especialidades S.A. |
|
18,130 |
|
96,473 |
|
— |
|
— |
|
Other |
|
5,038 |
|
— |
|
5,038 |
|
— |
|
|
|
166,542 |
|
357,080 |
|
143,753 |
|
127,838 |
|
Total current assets |
|
183,291 |
|
381,547 |
|
264,266 |
|
235,541 |
|
Non-current assets |
|
|
|
|
|
|
|
|
|
Commercial operations |
|
|
|
|
|
|
|
|
|
Raízen S.A. |
|
— |
|
— |
|
— |
|
47,731 |
|
Termag - Terminal Marítimo de Guarujá S.A. |
|
— |
|
— |
|
38,095 |
|
43,810 |
|
|
|
— |
|
— |
|
38,095 |
|
91,541 |
|
Financial and corporate operations |
|
|
|
|
|
|
|
|
|
Raízen S.A. |
|
88,581 |
|
149,347 |
|
83,668 |
|
149,347 |
|
Cosan Lubrificantes e Especialidades S.A. |
|
200,991 |
|
206,446 |
|
— |
|
— |
|
Other |
|
— |
|
— |
|
— |
|
113 |
|
|
|
289,572 |
|
355,793 |
|
83,668 |
|
149,460 |
|
Total non-current assets |
|
289,572 |
|
355,793 |
|
121,763 |
|
241,001 |
|
Related parties receivables |
|
472,863 |
|
737,340 |
|
386,029 |
|
476,542 |
| (i) | On June 29, 2023, the Minutes of the Ordinary and Extraordinary General Meeting (AGOE) approved the capitalization of the remaining balance of related parties. The subsidiary increased its capital and Cosan S.A transferred the balance from related parties for investment in subsidiaries and associates. |
Explanatory Notes to the interim Financial Statement
(In thousands of Reais, except when otherwise indicated)
|
|
|
Parent Company |
|
Consolidated |
||||
|
|
|
09/30/2023 |
|
12/31/2022 |
|
09/30/2023 |
|
12/31/2022 |
|
Current liabilities |
|
|
|
|
|
|
|
|
|
Commercial operations |
|
|
|
|
|
|
|
|
|
Raízen S.A. |
|
4,181 |
|
6,208 |
|
251,002 |
|
296,051 |
|
Termag - Terminal Marítimo de Guarujá S.A. |
|
— |
|
— |
|
10,500 |
|
— |
|
Aguassanta Participações S.A. |
|
— |
|
— |
|
742 |
|
6,419 |
|
Cosan Lubrificantes e Especialidades S.A. |
|
1,066 |
|
1,855 |
|
— |
|
— |
|
Other |
|
1,477 |
|
3,038 |
|
7,263 |
|
20,569 |
|
|
|
6,724 |
|
11,101 |
|
269,507 |
|
323,039 |
|
Financial and corporate operations |
|
|
|
|
|
|
|
|
|
Raízen S.A. |
|
110,215 |
|
60,866 |
|
110,925 |
|
64,697 |
|
Cosan Overseas Limited |
|
32,357 |
|
33,715 |
|
— |
|
— |
|
Cosan Luxembourg S.A |
|
94,505 |
|
1,085,617 |
|
— |
|
— |
|
Other |
|
— |
|
46,191 |
|
— |
|
— |
|
|
|
237,077 |
|
1,226,389 |
|
110,925 |
|
64,697 |
|
Total current liabilities |
|
243,801 |
|
1,237,490 |
|
380,432 |
|
387,736 |
|
Non-current liabilities |
|
|
|
|
|
|
|
|
|
Financial and corporate operations |
|
|
|
|
|
|
|
|
|
Cosan Lubrificantes e Especialidades S.A. |
|
630,573 |
|
765,148 |
|
— |
|
— |
|
Cosan Luxembourg S.A |
|
6,468,926 |
|
5,829,147 |
|
— |
|
— |
|
Cosan Overseas Limited |
|
2,521,327 |
|
2,627,112 |
|
— |
|
— |
|
Total non-current liabilities |
|
9,620,826 |
|
9,221,407 |
|
— |
|
— |
|
Payables to related parties |
|
9,864,627 |
|
10,458,897 |
|
380,432 |
|
387,736 |
Explanatory Notes to the interim Financial Statement
(In thousands of Reais, except when otherwise indicated)
|
|
Parent Company |
Consolidated |
|||||||||||||
|
|
3Q23 |
|
3Q22 |
|
9M23 |
|
9M22 |
|
3Q23 |
|
3Q22 |
|
9M23 |
|
9M22 |
|
Operating income |
|
|
|
|
|
|
|
|
|
|
|
|
|
|
|
|
Raízen S.A. |
— |
|
— |
|
— |
|
— |
|
244,962 |
|
291,907 |
|
588,746 |
|
703,980 |
|
Raízen International Universal Corporation |
— |
|
— |
|
— |
|
— |
|
1,543 |
|
— |
|
1,743 |
|
— |
|
Elevações Portuárias S.A. |
— |
|
— |
|
— |
|
— |
|
— |
|
— |
|
7,821 |
|
— |
|
Other |
— |
|
— |
|
— |
|
— |
|
— |
|
7,508 |
|
— |
|
8,188 |
|
|
— |
|
— |
|
— |
|
— |
|
246,505 |
|
299,415 |
|
598,310 |
|
712,168 |
|
Purchase of products / inputs / services |
|
|
|
|
|
|
|
|
|
|
|
|
|
|
|
|
Raízen S.A. |
(2) |
|
— |
|
(7) |
|
— |
|
(583,112) |
|
(743,183) |
|
(1,646,546) |
|
(1,907,699) |
|
Elevações Portuárias S.A. |
— |
|
— |
|
— |
|
— |
|
(3,234) |
|
— |
|
(3,234) |
|
— |
|
Other |
— |
|
— |
|
— |
|
— |
|
— |
|
(3,592) |
|
(13,203) |
|
(4,376) |
|
|
(2) |
|
— |
|
(7) |
|
— |
|
(586,346) |
|
(746,775) |
|
(1,662,983) |
|
(1,912,075) |
|
Shared income (expenses) |
|
|
|
|
|
|
|
|
|
|
|
|
|
|
|
|
Aguassanta Participações S.A. |
— |
|
— |
|
— |
|
— |
|
(4) |
|
— |
|
(4) |
|
— |
|
Companhia de Gás de São Paulo - COMGÁS |
— |
|
— |
|
(181) |
|
(1,425) |
|
— |
|
— |
|
— |
|
— |
|
Compass Gás e Energia S.A. |
1,958 |
|
1,632 |
|
5,611 |
|
4,506 |
|
— |
|
— |
|
— |
|
— |
|
Cosan Lubrificantes e Especialidades S.A. |
1,446 |
|
1,072 |
|
3,666 |
|
2,804 |
|
— |
|
— |
|
— |
|
— |
|
Elevações Portuárias S.A. |
— |
|
— |
|
— |
|
— |
|
— |
|
— |
|
20 |
|
— |
|
Other |
(4) |
|
|
|
14 |
|
|
|
|
|
|
|
|
|
|
|
Payly Soluções de Pagamentos S.A. |
— |
|
83 |
|
— |
|
226 |
|
— |
|
— |
|
— |
|
— |
|
Raízen S.A. |
(785) |
|
(808) |
|
(3,699) |
|
(489) |
|
(19,445) |
|
(14,776) |
|
(60,754) |
|
(50,187) |
|
Rumo S.A. |
1,591 |
|
1,155 |
|
4,190 |
|
3,106 |
|
— |
|
— |
|
— |
|
— |
|
Sinlog Tecnologia em Logística S.A. |
— |
|
45 |
|
— |
|
107 |
|
— |
|
— |
|
— |
|
— |
|
Trizy - Sinlog Tec. Em Logistica S.A. |
— |
|
— |
|
129 |
|
— |
|
— |
|
— |
|
— |
|
— |
|
|
4,206 |
|
3,179 |
|
9,730 |
|
8,835 |
|
(19,449) |
|
(14,776) |
|
(60,738) |
|
(50,187) |
|
Financial result |
|
|
|
|
|
|
|
|
|
|
|
|
|
|
|
|
Cosan Luxembourg S.A. |
(350,542) |
|
(207,651) |
|
(59,882) |
|
(52,932) |
|
— |
|
— |
|
— |
|
— |
|
Cosan Overseas Limited |
(146,009) |
|
(140,322) |
|
(46,881) |
|
(72,853) |
|
— |
|
— |
|
— |
|
— |
|
Raízen S.A. |
— |
|
— |
|
— |
|
(106) |
|
— |
|
— |
|
— |
|
(106) |
|
Aldwych Temple Venture Capital Limited |
— |
|
(1,624) |
|
46,191 |
|
1,086 |
|
— |
|
— |
|
— |
|
— |
|
Other |
(1) |
|
2 |
|
(1) |
|
12 |
|
— |
|
1 |
|
— |
|
(33) |
|
|
(496,552) |
|
(349,595) |
|
(60,573) |
|
(124,793) |
|
— |
|
1 |
|
— |
|
(139) |
|
Total |
(492,348) |
|
(346,416) |
|
(50,850) |
|
(115,958) |
|
(359,290) |
|
(462,135) |
|
(1,125,411) |
|
(1,250,233) |
c) Managers’ and directors’ compensation:
The Company has a compensation policy approved by the Board of Directors. Compensation of the Company's key management personnel includes salaries, contributions to a defined post-employment benefit plan and stock-based compensation. On April 27, 2023, the Annual General Meeting approved the global annual compensation of the managers and members of the Fiscal Council for the 2023 fiscal year. We present below the result of the Parent Company on September 30, 2023, as follows:
|
|
3Q23 |
|
3Q22 |
|
9M23 |
|
9M22 |
|
Short-term benefits to employees and managers |
8,390 |
|
12,234 |
|
25,272 |
|
30,155 |
|
Share-based compensation |
31,269 |
|
17,906 |
|
52,742 |
|
44,616 |
|
Post-employment benefits |
137 |
|
116 |
|
389 |
|
345 |
|
|
39,796 |
|
30,256 |
|
78,407 |
|
75,116 |
Explanatory Notes to the interim Financial Statement
(In thousands of Reais, except when otherwise indicated)
|
|
Parent Company |
|
Consolidated |
||||
|
|
09/30/2023 |
|
12/31/2022 |
|
09/30/2023 |
|
12/31/2022 |
|
Material and services suppliers |
2,920 |
|
115,146 |
|
2,526,955 |
|
2,923,486 |
|
Natural gas/ transport and logistics suppliers |
— |
|
— |
|
1,149,764 |
|
1,456,365 |
|
|
2,920 |
|
115,146 |
|
3,676,719 |
|
4,379,851 |
|
Current |
2,920 |
|
115,146 |
|
3,610,901 |
|
4,318,362 |
|
Non-current |
— |
|
— |
|
65,818 |
|
61,489 |
|
Total |
2,920 |
|
115,146 |
|
3,676,719 |
|
4,379,851 |
|
|
Sectorial Assets |
|
Sectorial liabilities |
|
Total |
|
At January 1, 2023 |
342,333 |
|
(1,616,616) |
|
(1,274,283) |
|
Cost of gas |
(52,918) |
|
— |
|
(52,918) |
|
Tax credits |
12,292 |
|
(46,501) |
|
(34,209) |
|
Monetary update |
35,822 |
|
(113,150) |
|
(77,328) |
|
Deferral of IGP-M |
89,714 |
|
— |
|
89,714 |
|
At September 30, 2023 |
427,243 |
|
(1,776,267) |
|
(1,349,024) |
|
Current |
122,346 |
|
(69,228) |
|
53,118 |
|
Non-current |
304,897 |
|
(1,707,039) |
|
(1,402,142) |
|
Total |
427,243 |
|
(1,776,267) |
|
(1,349,024) |
The market value of the debts below is quoted on the Luxembourg Stock Exchange (Note 5.6) and are based on the quoted market price as follows:
|
Debt |
|
Company |
|
09/30/2023 |
|
12/31/2022 |
|
Senior Notes 2028 |
|
Rumo Luxembourg S.à r.l. |
|
92.39% |
|
95.04% |
|
Senior Notes 2032 |
|
Rumo Luxembourg S.à r.l. |
|
78.32% |
|
80.36% |
|
Senior Notes 2030 |
|
Cosan Luxembourg S.A. |
|
99.57% |
|
— |
|
Senior Notes 2029 |
|
Cosan Luxembourg S.A. |
|
91.87% |
|
94.30% |
|
Senior Notes 2027 |
|
Cosan Luxembourg S.A. |
|
99.65% |
|
100.92% |
|
Perpetual Notes |
|
Cosan Overseas Limited |
|
99.82% |
|
98.92% |
All resulting fair value estimates are included in level 2, except for contingent consideration payables for which fair values have been determined using present values and discount rates adjusted for counterparty or own credit risk.
The carrying amounts and fair value of consolidated assets and liabilities are as follows:
Explanatory Notes to the interim Financial Statement
(In thousands of Reais, except when otherwise indicated)
|
|
|
|
Carrying amount |
|
Assets and liabilities measured at fair value |
||||||||||||
|
|
|
|
09/30/2023 |
|
12/31/2022 |
|
09/30/2023 |
|
12/31/2022 |
||||||||
|
|
Note |
|
|
|
|
|
Level 1 |
|
Level 2 |
|
Level 3 |
|
Level 1 |
|
Level 2 |
|
Level 3 |
|
Assets |
|
|
|
|
|
|
|
|
|
|
|
|
|
|
|
|
|
|
Investment funds |
5.2 |
|
2,143,851 |
|
1,304,332 |
|
— |
|
2,143,851 |
|
— |
|
— |
|
1,304,332 |
|
— |
|
Marketable securities |
5.3 |
|
19,493,699 |
|
22,099,766 |
|
14,892,381 |
|
4,601,318 |
|
— |
|
19,586,193 |
|
2,513,573 |
|
— |
|
Other financial assets |
|
|
2,966 |
|
89,238 |
|
2,966 |
|
— |
|
— |
|
89,238 |
|
— |
|
— |
|
Investment properties (i) |
11.5 |
|
14,227,539 |
|
14,103,060 |
|
— |
|
— |
|
14,227,539 |
|
— |
|
— |
|
14,103,060 |
|
Derivate financial instruments |
5.6 |
|
3,633,991 |
|
4,151,752 |
|
— |
|
3,633,991 |
|
— |
|
— |
|
4,151,752 |
|
— |
|
Total |
|
|
39,502,046 |
|
41,748,148 |
|
14,895,347 |
|
10,379,160 |
|
14,227,539 |
|
19,675,431 |
|
7,969,657 |
|
14,103,060 |
|
Liabilities |
|
|
|
|
|
|
|
|
|
|
|
|
|
|
|
|
|
|
Loans, financing and debentures |
5.4 |
|
(56,913,361) |
|
(52,987,216) |
|
— |
|
(52,159,857) |
|
— |
|
— |
|
(45,038,188) |
|
— |
|
Derivative financial instruments |
5.6 |
|
(3,803,463) |
|
(5,290,932) |
|
— |
|
(3,803,463) |
|
— |
|
— |
|
(5,290,932) |
|
— |
|
Total |
|
|
(60,716,824) |
|
(58,278,148) |
|
— |
|
(55,963,320) |
|
— |
|
— |
|
(50,329,120) |
|
— |
| (i) |
The fair value of investment properties was determined using the direct comparative method of market data applied to transactions involving similar properties (type, location, and quality of property) and, to a lesser extent, sales quotes for potential transactions involving comparable assets (level 3). The methodology used to determine fair value incorporates direct comparisons of market information, such as market research, homogenization of values, spot market prices, sales, distances, facilities, access to land, topography and soil, land use (crop type), and rainfall, among other data, in accordance with the standards issued by the Brazilian Association of Technical Standards ("ABNT"). The discount rates used vary between 12.65% p.a. and 13.65% p.a. on September 30, 2023 (11.20% to 13.75% p.a. on December 31, 2022). For fair value assessments of investment properties in the periods between annual assessments, management considers regional market trends presented by the S&P Global Commodity Insights report for the Brazilian rural real estate market. If Management reasonably believes that property values have changed differently from the variation in the S&P Global Commodity Insights report, based on its understanding of current market conditions and evidence of proposals received for the assets, considerations may be made to determine fair value property market. |
Explanatory Notes to the interim Financial Statement
(In thousands of Reais, except when otherwise indicated)
This note describes the group's exposure to financial risks and how these risks may affect future financial performance. To provide more context, current year profit and loss information has been included where applicable:
|
Risk |
Exposure arising from |
Measurement |
Management |
|
Market risk - foreign exchange |
|
|
Foreign currency |
|
Market risk - interest |
Cash and cash equivalents, securities, loans, financing and debentures, leases and derivative financial instruments. |
Sensitivity analysis |
Interest rate swap |
|
Market risk – price |
|
|
|
|
Credit risk |
Cash and cash equivalents, marketable securities, trade receivables, derivatives, receivables from related parties, dividends and investment property |
|
Availability and lines of credit |
|
Liquidity risk |
Loans, financing and debentures, accounts payable to suppliers, other financial liabilities, REFIS, leases, derivatives, payables to related parties and dividends. |
Cash flow forecasting |
Availability and lines of credit |
The Company's Management identifies, evaluates, and hedges financial risks in close collaboration with operating units. The Board of Directors provides written principles for managing global risk in addition to policies covering specific areas such as currency risk, interest rate risk, credit risk, use of derivative and non-derivative financial instruments, and excess investment of liquidity.
When all applicable criteria are satisfied, hedge accounting is used to eliminate the accounting mismatch between the hedging instrument and the hedged item. This will result in the effective recognition of interest expense at a fixed interest rate for hedged floating rate loans and inventory at the fixed foreign exchange rate for purchases hedged against foreign exchange risk.
The Company may opt for formal designation of new debt transactions for which it has swap-type derivative hedging instruments for foreign exchange rate variation and interest, as measured at fair value. The Fair Value Option is intended to eliminate inconsistencies caused by disparities between the measurement credits of certain liabilities and their hedging instruments. Consequently, both swaps and respective debts are now valued at fair value. This option is irrevocable and must be exercised upon the operation's initial accounting entry.
The policy of the company is to maintain a sufficient capital base to foster the confidence of investors, creditors, and the market, and to ensure the business's future growth. Each of its businesses' rate of return on capital is monitored by Management.
An analysis of the risk exposure that Management intends to cover determines the use of financial instruments to protect against these areas of volatility.
Explanatory Notes to the interim Financial Statement
(In thousands of Reais, except when otherwise indicated)
a) Market risk
The objective of market risk management is to manage and control exposures to market risk within acceptable parameters, optimizing returns.
The Company uses derivatives to manage market risks. All these transactions are carried out within the guidelines defined by the Risk Management Committee. Generally, the Company seeks to apply hedge accounting to manage volatility in profit or loss.
(i)Foreign exchange risk
As of September 30,2023 and December 31,2022, the Company had the following net exposure to foreign exchange variation on assets and liabilities denominated in US Dollars, Euros, Yen and Pound Sterling:
|
|
09/30/2023 |
|
12/31/2022 |
|
Cash and cash equivalents |
1,963,666 |
|
1,138,948 |
|
Suppliers |
(414,995) |
|
(97,259) |
|
Loans, financing and debentures |
(28,921,422) |
|
(13,698,102) |
|
Leases |
(83,329) |
|
(94,716) |
|
Consideration payable |
(197,905) |
|
(223,960) |
|
Derivative financial instruments |
14,259,010 |
|
7,728,609 |
|
FX exposure, net |
(13,394,975) |
|
(5,246,480) |
The probable scenario considers the estimated foreign exchange rates, carried out by a specialized third party, at the maturity of transactions for companies with real functional currency (positive and negative, before tax effects), as follows:
|
|
|
|
|
|
|
Scenarios |
||||||
|
Instrument |
|
Risk factor |
|
Probable |
|
25% |
|
50% |
|
(25%) |
|
(50%) |
|
Cash and cash equivalents |
|
Low FX rate |
|
237,834 |
|
735,848 |
|
1,233,862 |
|
(260,181) |
|
(758,195) |
|
Trade payables |
|
High FX rate |
|
(84) |
|
(1,552) |
|
(3,020) |
|
1,384 |
|
2,853 |
|
Derivative financial instruments |
|
Low FX rate |
|
68,871 |
|
4,876,332 |
|
8,952,286 |
|
(3,256,475) |
|
(7,321,426) |
|
Loans, borrowings and debentures |
|
High FX rate |
|
(1,250,220) |
|
(6,752,250) |
|
(13,324,395) |
|
6,505,909 |
|
13,112,580 |
|
Leases |
|
High FX rate |
|
(1,205) |
|
(22,338) |
|
(43,471) |
|
19,929 |
|
41,062 |
|
Consideration payable |
|
High FX rate |
|
(2,861) |
|
(6,495) |
|
(10,129) |
|
773 |
|
4,406 |
|
Impacts on profit or loss before taxes |
|
|
|
(947,665) |
|
(1,170,455) |
|
(3,194,867) |
|
3,011,339 |
|
5,081,280 |
The probable scenario considers the estimated exchange rates, made by a specialized third party, upon maturity of the transactions for the companies with functional currency Reais (positive and negative, before tax effects), as follows:
|
|
|
Exchange rate sensitivity analysis |
||||||||||
|
|
|
09/30/2023 |
|
Scenarios |
||||||||
|
|
|
|
Probable |
|
25% |
|
50% |
|
(25%) |
|
(50%) |
|
|
U.S.$ |
|
5.0076 |
|
5.0800 |
|
6.3500 |
|
7.6200 |
|
3.8100 |
|
2.5400 |
|
Euro |
|
5.3000 |
|
5.8420 |
|
7.3025 |
|
8.7630 |
|
4.3815 |
|
2.9210 |
|
GBP |
|
6.1158 |
|
6.5786 |
|
8.2233 |
|
9.8679 |
|
4.9340 |
|
3.2893 |
|
JPY |
|
0.0335 |
|
0.0379 |
|
0.0474 |
|
0.0569 |
|
0.0284 |
|
0.0190 |
The Company and its subsidiaries monitor fluctuations in variable interest rates related to their financing and use derivative instruments to minimize the risk of fluctuations in variable interest rates.
A sensitivity analysis on interest rates on loans and financing to offset investments in CDI with pre-tax increases and decreases of 25% and 50% is presented below:
Explanatory Notes to the interim Financial Statement
(In thousands of Reais, except when otherwise indicated)
|
|
|
|
|
Scenarios |
||||||
|
Interest rate exposure |
|
Probable |
|
25% |
|
50% |
|
(25%) |
|
(50%) |
|
Cash and cash equivalents |
|
1,604,977 |
|
2,005,728 |
|
2,407,028 |
|
1,203,514 |
|
802,407 |
|
Marketable securities |
|
455,872 |
|
569,840 |
|
683,809 |
|
341,905 |
|
227,937 |
|
Restricted cash |
|
28,233 |
|
35,291 |
|
42,350 |
|
21,175 |
|
14,117 |
|
Lease and concession in installments |
|
(111,247) |
|
(139,058) |
|
(166,870) |
|
(83,435) |
|
(55,623) |
|
Leases liabilities |
|
(434,776) |
|
(434,776) |
|
(434,776) |
|
(434,776) |
|
(434,776) |
|
Derivative financial instruments |
|
(1,108,506) |
|
(3,095,823) |
|
(4,252,704) |
|
(571,918) |
|
800,070 |
|
Loans, financing and debentures |
|
(2,256,786) |
|
(3,181,451) |
|
(3,676,066) |
|
(2,165,338) |
|
(1,662,149) |
|
Other financial liabilities |
|
(82,137) |
|
(100,119) |
|
(118,100) |
|
(64,155) |
|
(46,173) |
|
Impacts on the result before taxes |
|
(1,904,370) |
|
(4,340,368) |
|
(5,515,329) |
|
(1,753,028) |
|
(354,190) |
|
|
|
|
|
|
|
|
|
|
|
|
The probable scenario considers the estimated interest rate, made by a specialized third party and the Central Bank of Brazil (Banco Central do Brasil or “BACEN”) as follows:
|
|
|
|
|
Scenarios |
||||||
|
|
|
Probable |
|
25% |
|
50% |
|
(25%) |
|
(50%) |
|
SELIC |
|
10.75% |
|
13.44% |
|
16.13% |
|
8.06% |
|
5.38% |
|
CDI |
|
10.65% |
|
13.31% |
|
15.98% |
|
7.99% |
|
5.33% |
|
TJLP462 (TJLP + 1% p.a.) |
|
7.00% |
|
8.50% |
|
10.00% |
|
5.50% |
|
4.00% |
|
TJLP |
|
6.00% |
|
7.50% |
|
9.00% |
|
4.50% |
|
3.00% |
|
IPCA |
|
4.38% |
|
5.47% |
|
6.56% |
|
3.28% |
|
2.19% |
|
IGPM |
|
4.64% |
|
5.80% |
|
6.97% |
|
3.48% |
|
2.32% |
|
Fed Funds |
|
4.75% |
|
5.94% |
|
7.13% |
|
3.56% |
|
2.38% |
|
SOFR |
|
4.16% |
|
5.19% |
|
6.23% |
|
3.12% |
|
2.08% |
Natural gas derivative transactions were conducted with bank counterparties and recognized at fair value through profit or loss, based on the difference between the contracted price and the market price of outstanding contracts as of the date of the balance sheet.
These are our open positions in natural gas derivatives:
|
Instrument |
|
Risk factor |
|
Probable |
|
25% |
|
50% |
|
-25% |
|
-50% |
|
Brent derivatives – options |
|
Price variation US$/bbl |
|
(26,448) |
|
(46,929) |
|
(56,554) |
|
14,735 |
|
55,936 |
We are exposed to market risks as a result of the fluctuating prices of certain equity securities and option instruments. Our exposure to changes in the price of equity securities is primarily derived from Vale's common shares purchased on the spot market, which, as of September 30, 2023, represent 1.65% (1.57% on December 31, 2022) of the outstanding shares.
|
Instrument |
|
Probable |
|
25% |
|
50% |
|
(25%) |
|
(50%) |
|
VALE3 |
|
5,363,602 |
|
1,340,900 |
|
2,681,801 |
|
(1,340,900) |
|
(2,681,801) |
|
Share |
|
09/30/2023 |
|
Probable |
|
25% |
|
50% |
|
(25%) |
|
(50%) |
|
VALE3 |
|
67.58 |
|
67.58 |
|
84.48 |
|
101.37 |
|
50.69 |
|
33.79 |
Explanatory Notes to the interim Financial Statement
(In thousands of Reais, except when otherwise indicated)
We use derivative financial instruments called options to limit our exposure to changes in the value of Vale shares. The widely accepted methodology used to calculate the fair value of options is based on the Black & Scholes pricing model. The values calculated in the sensitivity analysis of the framework mentioned reflect the impacts of the intrinsic values of the options as the shares appreciate or depreciate.
|
|
|
|
|
Scenarios |
||||||||
|
Instrument |
|
Interest |
|
Probable |
|
25% |
|
50% |
|
(25%) |
|
(50%) |
|
VALE3 (Collar) |
|
3.21% |
|
10,390,367 |
|
11,017,730 |
|
11,390,629 |
|
9,952,125 |
|
9,477,780 |
|
VALE3 (Call Spread) |
|
1.60% |
|
466,314 |
|
928,068 |
|
897,448 |
|
244,060 |
|
70,794 |
We are exposed to risks linked to CSAN3 share prices. To mitigate such exposures, total return swap derivatives of 96,185,412 shares of CSAN3 were contracted in which the Company receives the variation of the share price and proceeds on the active side and pays CDI + 1.65% on the passive side.
The sensitivity analysis considers the closing share price as shown below:
|
|
|
|
|
Scenarios |
||||||||||||||||||
|
Instrument |
|
Probable |
|
25% |
|
50% |
|
(25%) |
|
(50%) |
||||||||||||
|
Investment value |
|
(116,655) |
|
412,154 |
|
824,309 |
|
(411,674) |
|
(824,309) |
||||||||||||
|
Share value (CSAN3) |
|
17.14 |
|
21.43 |
|
25.71 |
|
12.86 |
|
8.57 |
||||||||||||
b)Credit risk
The Company's regular operations expose it to the risk of default when customers, suppliers, and counterparties are unable to fulfill their financial commitments or other obligations. The Company seeks to mitigate this risk by conducting transactions with a diverse group of counterparties. However, the Company's operations remain susceptible to the unanticipated financial failures of third parties. The credit risk exposure was as follows:
Explanatory Notes to the interim Financial Statement
(In thousands of Reais, except when otherwise indicated)
|
|
09/30/2023 |
|
12/31/2022 |
|
Cash and cash equivalents |
15,081,373 |
|
13,301,716 |
|
Trade receivables |
3,698,289 |
|
3,927,542 |
|
Marketable securities |
4,601,318 |
|
2,513,574 |
|
Restricted cash |
270,318 |
|
139,933 |
|
Derivative financial instruments |
3,633,991 |
|
4,151,752 |
|
Receivables from related parties |
386,029 |
|
476,542 |
|
Receivable dividends and interest on equity |
122,970 |
|
161,147 |
|
Other financial assets |
2,966 |
|
89,238 |
|
|
27,797,254 |
|
24,761,444 |
The Company is exposed to risks related to its cash management activities and temporary investments.
The majority of liquid assets are invested in government bonds and other bank investments. The treasury department manages the credit risk of bank and financial institution balances in accordance with the Company's policy.
The credit risk associated with lease receivables is divided into two customer categories: (i) Level 1 and (ii) Level 2. The majority of subsidiary investment properties are leased to customers classified as Level 1, with no history of late payments or default and a solid financial standing. In order to mitigate the credit risk associated with lease receivables, the Company's policy restricts its exposure to Level 2 customers. The risk associated with accounts receivable related to the sale of investment properties is mitigated by granting land ownership to the customer only after receiving a down payment for the transaction. In addition, the transfer of ownership is contingent upon receipt of all outstanding payments.
Only approved counterparties and within the credit limits assigned to each counterparty may invest surplus funds. Credit limits for counterparties are reviewed annually and may be modified throughout the period. The limits are established to minimize the concentration of risks and, consequently, to mitigate financial loss caused by potential counterparty default. The credit risk of cash and cash equivalents, marketable securities, restricted cash, and derivative financial instruments is determined by widely accepted market rating instruments and is structured as follows:
|
|
09/30/2023 |
|
12/31/2022 |
|
AAA |
22,555,888 |
|
16,769,858 |
|
AA |
885,135 |
|
3,133,455 |
|
A |
101,179 |
|
138,478 |
|
Not rated |
44,798 |
|
65,184 |
|
|
23,587,000 |
|
20,106,975 |
| 53 |
Explanatory Notes to the interim Financial Statement
(In thousands of Reais, except when otherwise indicated)
c)Liquidity risk
The Company's strategy for managing liquidity is to ensure, whenever possible, that it has sufficient liquidity to meet its liabilities when they are due, under normal and stressed conditions, without incurring unacceptable losses or risking reputational harm.
The Company's financial liabilities (based on contracted undiscounted cash flows) are categorized by maturity dates as follows:
|
|
09/30/2023 |
12/31/2022 |
|||||||||
|
|
Up to 1 year |
|
1 - 2 years |
|
2 - 5 years |
|
More than 5 years |
|
Total |
|
Total |
|
Loans, financing and debentures |
(7,212,595) |
|
(6,941,115) |
|
(25,662,944) |
|
(28,534,858) |
|
(68,351,512) |
|
(63,200,127) |
|
Suppliers |
(3,610,901) |
|
(65,818) |
|
— |
|
— |
|
(3,676,719) |
|
(4,379,851) |
|
Other financial liabilities |
(800,996) |
|
— |
|
— |
|
— |
|
(800,996) |
|
(924,562) |
|
Installment of tax debts |
(53,825) |
|
(1,604) |
|
(1,768) |
|
(158,278) |
|
(215,475) |
|
(208,760) |
|
Leases |
(644,550) |
|
(800,554) |
|
(1,222,508) |
|
(18,212,656) |
|
(20,880,268) |
|
(16,436,839) |
|
Lease and concession in installments |
(174,000) |
|
(172,475) |
|
(172,475) |
|
(515,901) |
|
(1,034,851) |
|
(1,137,173) |
|
Payables to related parties |
(380,432) |
|
— |
|
— |
|
— |
|
(380,432) |
|
(387,736) |
|
Dividends payable |
(146,677) |
|
— |
|
— |
|
— |
|
(146,677) |
|
(892,006) |
|
Derivative financial instruments |
(2,261,608) |
|
(947,583) |
|
(283,790) |
|
3,241,063 |
|
(251,918) |
|
(84,126) |
|
|
(15,285,584) |
|
(8,929,149) |
|
(27,343,485) |
|
(44,180,630) |
|
(95,738,848) |
|
(87,651,180) |
d)Capital management risk
The Company's policy is to maintain a solid capital base to foster the confidence of its parent companies, creditors, and the market, and to ensure the business's future growth. Management ensures that the return on capital, which the Company defines as the result of its operating activities divided by its total shareholders' equity, is sufficient for each of its businesses.
Explanatory Notes to the interim Financial Statement
(In thousands of Reais, except when otherwise indicated)
|
|
Parent Company |
|
Consolidated |
||||
|
|
09/30/2023 |
|
12/31/2022 |
|
09/30/2023 |
|
12/31/2022 |
|
COFINS |
3,699 |
|
3,699 |
|
444,568 |
|
975,878 |
|
PIS |
1 |
|
— |
|
106,698 |
|
350,867 |
|
Tax credits |
33,209 |
|
31,774 |
|
33,209 |
|
31,774 |
|
ICMS |
— |
|
— |
|
895,903 |
|
845,450 |
|
ICMS - CIAP |
— |
|
— |
|
163,509 |
|
118,809 |
|
Other |
4,646 |
|
4,667 |
|
87,991 |
|
76,348 |
|
|
41,555 |
|
40,140 |
|
1,731,878 |
|
2,399,126 |
|
|
|
|
|
|
|
|
|
|
Current |
8,346 |
|
8,366 |
|
585,041 |
|
1,324,203 |
|
Non-current |
33,209 |
|
31,774 |
|
1,146,837 |
|
1,074,923 |
|
Total |
41,555 |
|
40,140 |
|
1,731,878 |
|
2,399,126 |
|
|
Consolidated |
||
|
|
09/30/2023 |
|
12/31/2022 |
|
Finished products |
1,330,718 |
|
1,504,134 |
|
Parts and accessories |
183,162 |
|
168,777 |
|
Construction Materials |
295,681 |
|
152,789 |
|
Warehouse and other |
60,417 |
|
43,359 |
|
|
1,869,978 |
|
1,869,059 |
The balances are presented net of a provision of R$52,813 for obsolete inventories on September 30, 2023 (R$38,747 on December 31, 2022).
The balances of assets held for sale are shown below:
|
|
Properties held for sale |
|
At January 1, 2023 |
40,383 |
|
Transfers (i) |
370,705 |
|
Sale of agricultural properties held for sale |
(42,942) |
|
At September 30, 2023 |
368,146 |
| (i) | Transfers from the Investment Properties group, as per Note 11.5, arising from the proposed sale of Fazenda Grão de Ouro, of the subsidiary Tellus Brasil Participações S.A. |
Explanatory Notes to the interim Financial Statement
(In thousands of Reais, except when otherwise indicated)
The Company's subsidiaries and associates are listed below:
|
|
|
|
|
|
|
09/30/2023 |
|
12/31/2022 |
|
Directly owned subsidiaries |
|
|
|
|
Cosan Corporate |
|
|
|
|
Cosan Corretora de Seguros Ltda |
100.00% |
|
100.00% |
|
Cosan Nove Participações S.A. |
73.09% |
|
73.09% |
|
Cosan Luxembourg S.A. (i) |
100.00% |
|
100.00% |
|
Cosan Overseas Limited |
100.00% |
|
100.00% |
|
Pasadena Empreendimentos e Participações S.A. |
100.00% |
|
100.00% |
|
Cosan Limited Partners Brasil Consultoria Ltda. |
97.50% |
|
97.50% |
|
Barrapar Participaçoes Ltda. |
100.00% |
|
100.00% |
|
Aldwych Temple |
100.00% |
|
100.00% |
|
Cosan Oito |
|
|
|
|
Cosan Oito S.A. |
100.00% |
|
100.00% |
|
Gas and Energy |
|
|
|
|
Cosan Dez Participações S.A. |
76.80% |
|
76.80% |
|
Cosan Investiments |
|
|
|
|
Cosan Global Limited |
100.00% |
|
100.00% |
|
Atlântico Participações Ltda. |
100.00% |
|
100.00% |
|
Sinlog Tecnologia em Logística S.A. (ii) |
- |
|
57.48% |
|
Radar Propriedades Agrícolas S.A. |
41.45% |
|
41.45% |
|
Radar II Propriedades Agrícolas S.A. |
50.00% |
|
50.00% |
|
Nova Agrícola Ponte Alta S.A. |
41.45% |
|
41.45% |
|
Nova Amaralina S.A Propriedades Agrícolas |
41.45% |
|
41.45% |
|
Nova Santa Bárbara Agrícola S.A. |
41.45% |
|
41.45% |
|
Terras da Ponta Alta S.A. |
41.45% |
|
41.45% |
|
Castanheira Propriedades Agrícolas S.A. |
41.45% |
|
41.45% |
|
Manacá Propriedades Agrícolas S.A. |
41.45% |
|
41.45% |
|
Paineira Propriedades Agrícolas S.A. |
41.45% |
|
41.45% |
|
Tellus Brasil Participações S.A. |
19.57% |
|
19.57% |
|
Janus Brasil Participações S.A. |
19.57% |
|
19.57% |
|
Duguetiapar Empreendimentos e Participações S.A. |
19.57% |
|
19.57% |
|
Gamiovapar Empreendimentos e Participações S.A. |
19.57% |
|
19.57% |
|
Moove |
|
|
|
|
Cosan Lubes Investments Limited |
70.00% |
|
70.00% |
|
Logistics |
|
|
|
|
Rumo S.A. |
30.38% |
|
30.35% |
| (i) | Despite presenting an unsecured liability amount of R$102,236 on September 30, 2023, as shown below, no other events or conditions were identified that, individually or collectively, may raise relevant doubts as to the ability to maintenance of its operational continuity. Subsidiaries have financial support from the Company. |
| (ii) | Sale of interest completed on May 2, 2023, for the amount of R$45,000. |
Explanatory Notes to the interim Financial Statement
(In thousands of Reais, except when otherwise indicated)
The following are the investments in subsidiaries and affiliates as of September 30, 2023, which are relevant to the Company:
a) Parent company
|
|
Shares issued by the associate |
|
Shares held by Cosan |
|
Cosan ownership interest |
|
Economic benefit (%) |
|
Cosan Corporate |
|
|
|
|
|
|
|
|
Cosan Corretora de Seguros Ltda |
5,000 |
|
4,999 |
|
100.00% |
|
100.00% |
|
Cosan Nove Participações S.A. (i) |
7,663,761,735 |
|
5,601,178,095 |
|
73.09% |
|
66.16% |
|
Cosan Luxembourg S.A. |
500,010 |
|
500,010 |
|
100.00% |
|
100.00% |
|
Cosan Overseas Limited |
4,850,000 |
|
4,850,000 |
|
100.00% |
|
100.00% |
|
Pasadena Empreendimentos e Participações S.A. |
41,481,296 |
|
41,481,046 |
|
100.00% |
|
100.00% |
|
Cosan Limited Partners Brasil Consultoria Ltda |
160,000 |
|
156,000 |
|
97.50% |
|
97.50% |
|
Cosan Oito |
|
|
|
|
|
|
|
|
Cosan Oito S.A. |
7,864,004,999 |
|
7,864,004,999 |
|
100.00% |
|
100.00% |
|
Gas and Energy |
|
|
|
|
|
|
|
|
Cosan Dez Participações S.A. (i) |
3,473,458,687 |
|
2,667,494,858 |
|
76.80% |
|
72.00% |
|
Cosan Investiments |
|
|
|
|
|
|
|
|
Cosan Global Limited |
300 |
|
300 |
|
100.00% |
|
100.00% |
|
Atlântico Participações Ltda. |
928,005,000 |
|
928,004,997 |
|
100.00% |
|
100.00% |
|
Radar Propriedades Agrícolas S.A. |
737,500 |
|
305,694 |
|
41.45% |
|
41.45% |
|
Radar II Propriedades Agrícolas S.A. |
81,440,221 |
|
40,720,111 |
|
50.00% |
|
50.00% |
|
Nova Agrícola Ponte Alta S.A. |
160,693,378 |
|
66,607,405 |
|
41.45% |
|
41.45% |
|
Nova Amaralina S.A Propriedades Agrícolas |
30,603,159 |
|
12,685,010 |
|
41.45% |
|
41.45% |
|
Nova Santa Bárbara Agrícola S.A. |
32,336,994 |
|
13,403,684 |
|
41.45% |
|
41.45% |
|
Terras da Ponte Alta S.A.l |
16,066,329 |
|
6,659,494 |
|
41.45% |
|
41.45% |
|
Castanheira Propriedades Agrícolas S.A. |
83,850,938 |
|
34,756,214 |
|
41.45% |
|
41.45% |
|
Manacá Propriedades Agrícolas S.A. |
128,977,921 |
|
53,461,349 |
|
41.45% |
|
41.45% |
|
Paineira Propriedade Agrícolas S.A. |
132,667,061 |
|
54,990,497 |
|
41.45% |
|
41.45% |
|
Tellus Brasil Participações S.A. |
119,063,044 |
|
71,609,945 |
|
46.58% |
|
19.57% |
|
Janus Brasil Participações S.A. |
286,370,051 |
|
173,464,883 |
|
60.57% |
|
19.57% |
|
Duguetiapar Empreendimentos e Participações S.A. |
3,573,842 |
|
2,163,979 |
|
60.55% |
|
19.57% |
|
Gamiovapar Empreendimentos e Participações S.A. |
12,912,970 |
|
7,819,194 |
|
60.55% |
|
19.57% |
|
Moove |
|
|
|
|
|
|
|
|
Cosan Lubes Investments Limited |
34,963,764 |
|
24,474,635 |
|
70.00% |
|
70.00% |
|
Logistics |
|
|
|
|
|
|
|
|
Rumo S.A. (ii) |
1,854,868,949 |
|
562,529,490 |
|
30.37% |
|
30.37% |
| (i) | The participation related to economic benefit differs from the corporate participation exclusively on account of dividend distribution as explanatory note 1.1. |
| (ii) | On July 19, 2023, the subsidiary Rumo S.A. and the indirect subsidiary Rumo Malha Norte called their respective Extraordinary General Assemblies – AGEs, approving the corporate acts relating to the Corporate Reorganization, as communicated by Rumo S.A to the market on the dates of 20 April, June 2nd and June 19th, 2023. |
Explanatory Notes to the interim Financial Statement
(In thousands of Reais, except when otherwise indicated)
|
|
At January 1, 2023 |
|
Interest in earnings of subsidiaries |
|
Change of equity interest in subsidiary |
|
Other comprehensive income |
|
Dividends |
|
Capital increase |
|
Gain with capital increase in subsidiary |
|
Other |
|
At September 30, 2023 |
|
Dividend receivable (ii) |
|
Logistics |
|
|
|
|
|
|
|
|
|
|
|
|
|
|
|
|
|
|
|
|
Rumo S.A. |
4,613,248 |
|
219,069 |
|
567 |
|
431 |
|
— |
|
3,984 |
|
— |
|
4,832 |
|
4,842,131 |
|
— |
|
Cosan Corporate |
|
|
|
|
|
|
|
|
|
|
|
|
|
|
|
|
|
|
|
|
Cosan Corretora de Seguros Ltda |
244 |
|
498 |
|
— |
|
— |
|
— |
|
— |
|
— |
|
— |
|
742 |
|
— |
|
Cosan Nove Participações S.A. |
7,153,764 |
|
807,672 |
|
— |
|
(363,604) |
|
(88,495) |
|
121,621 |
|
(32,732) |
|
29,750 |
|
7,627,976 |
|
— |
|
Pasadena Empreendimentos e Participações S.A. |
1,486 |
|
(23) |
|
— |
|
— |
|
— |
|
— |
|
— |
|
— |
|
1,463 |
|
— |
|
Cosan Limited Partners Brasil Consultoria Ltda |
346 |
|
(52) |
|
— |
|
— |
|
— |
|
— |
|
— |
|
— |
|
294 |
|
— |
|
Other |
73,565 |
|
(47,430) |
|
— |
|
(612) |
|
— |
|
— |
|
— |
|
— |
|
25,523 |
|
— |
|
Cosan Oito |
|
|
|
|
|
|
|
|
|
|
|
|
|
|
|
|
|
|
|
|
Cosan Oito S.A. |
8,258,622 |
|
(1,089,553) |
|
— |
|
— |
|
(246,384) |
|
296,500 |
|
— |
|
— |
|
7,219,185 |
|
— |
|
Cosan Investiments |
|
|
|
|
|
|
|
|
|
|
|
|
|
|
|
|
|
|
|
|
Atlântico Participações Ltda |
911,342 |
|
(6,575) |
|
— |
|
— |
|
— |
|
— |
|
— |
|
— |
|
904,767 |
|
195 |
|
Cosan Global |
128,868 |
|
(5,705) |
|
— |
|
— |
|
— |
|
— |
|
— |
|
— |
|
123,163 |
|
— |
|
Sinlog Tecnologia em Logística S.A. (i) |
20,155 |
|
(2,661) |
|
— |
|
— |
|
— |
|
— |
|
12,622 |
|
(30,116) |
|
— |
|
— |
|
Radar II Propriedades Agrícolas S.A. |
943,255 |
|
53,950 |
|
— |
|
— |
|
38,665 |
|
— |
|
— |
|
— |
|
1,035,870 |
|
17,135 |
|
Radar Propriedades Agrícolas S.A. |
222,967 |
|
1,217 |
|
— |
|
— |
|
(9,258) |
|
— |
|
— |
|
— |
|
214,926 |
|
— |
|
Nova Agrícola Ponte Alta S.A. |
390,615 |
|
8,773 |
|
— |
|
— |
|
(5,389) |
|
— |
|
— |
|
— |
|
393,999 |
|
24,809 |
|
Nova Santa Bárbara Agrícola S.A. |
31,504 |
|
491 |
|
— |
|
— |
|
(207) |
|
— |
|
— |
|
— |
|
31,788 |
|
1,712 |
|
Nova Amaralina S.A. Propriedades Agrícolas |
192,332 |
|
3,222 |
|
— |
|
— |
|
(2,694) |
|
— |
|
— |
|
— |
|
192,860 |
|
18,694 |
|
Terras da Ponte Alta S.A. |
81,292 |
|
396 |
|
— |
|
— |
|
— |
|
— |
|
— |
|
— |
|
81,688 |
|
7,871 |
|
Paineira Propriedades Agrícolas S.A. |
169,216 |
|
4,483 |
|
— |
|
— |
|
(4,767) |
|
— |
|
— |
|
— |
|
168,932 |
|
11,432 |
|
Manacá Propriedades Agrícolas S.A. |
170,613 |
|
4,512 |
|
— |
|
— |
|
(6,632) |
|
— |
|
— |
|
— |
|
168,493 |
|
10,059 |
|
Castanheira Propriedades Agrícolas S.A. |
251,370 |
|
5,048 |
|
— |
|
— |
|
(8,373) |
|
— |
|
— |
|
— |
|
248,045 |
|
40,375 |
|
Tellus Brasil Participações S.A. |
634,068 |
|
34,752 |
|
— |
|
— |
|
(4,069) |
|
— |
|
— |
|
16,847 |
|
681,598 |
|
— |
|
Janus Brasil Participações S.A. |
884,053 |
|
82,306 |
|
— |
|
— |
|
(10,108) |
|
— |
|
— |
|
29,595 |
|
985,846 |
|
— |
|
Duguetiapar Empreendimentos e Participações S.A. |
18,740 |
|
4,460 |
|
— |
|
— |
|
— |
|
— |
|
— |
|
(2) |
|
23,198 |
|
— |
|
Gamiovapar Empreendimentos e Participações S.A. |
122,561 |
|
887 |
|
— |
|
— |
|
(7,373) |
|
— |
|
— |
|
(71) |
|
116,004 |
|
— |
|
Moove |
|
|
|
|
|
|
|
|
|
|
|
|
|
|
|
|
|
|
|
|
Cosan Lubes Investments Limited |
1,644,170 |
|
50,445 |
|
— |
|
(171,801) |
|
(35,808) |
|
— |
|
— |
|
7,214 |
|
1,494,220 |
|
— |
|
Other |
762 |
|
209 |
|
— |
|
(29) |
|
— |
|
— |
|
— |
|
— |
|
942 |
|
— |
|
Gas and Energy |
|
|
|
|
|
|
|
|
|
|
|
|
|
|
|
|
|
|
|
|
Cosan Dez Participações S.A. |
4,311,213 |
|
(198,656) |
|
— |
|
(39,775) |
|
33,456 |
|
— |
|
— |
|
(10,984) |
|
4,095,254 |
|
11,717 |
|
Total investments in associates |
31,230,371 |
|
(68,265) |
|
567 |
|
(575,390) |
|
(357,436) |
|
422,105 |
|
(20,110) |
|
47,065 |
|
30,678,907 |
|
143,999 |
|
|
|
|
|
|
|
|
|
|
|
|
|
|
|
|
|
|
|
|
|
|
Cosan Corporate |
|
|
|
|
|
|
|
|
|
|
|
|
|
|
|
|
|
|
|
|
Cosan Luxembourg S.A. |
(146,473) |
|
44,237 |
|
— |
|
— |
|
— |
|
— |
|
— |
|
— |
|
(102,236) |
|
— |
|
Total provision for uncovered liability of associates |
(146,473) |
|
44,237 |
|
— |
|
— |
|
— |
|
— |
|
— |
|
— |
|
(102,236) |
|
— |
|
|
|
|
|
|
|
|
|
|
|
|
|
|
|
|
|
|
|
|
|
|
Total |
31,083,898 |
|
(24,028) |
|
567 |
|
(575,390) |
|
(357,436) |
|
422,105 |
|
(20,110) |
|
47,065 |
|
30,576,671 |
|
143,999 |
| (i) | On March 10, 2023, Sinlog Tecnologia was transferred to Logística S.A. for assets held for sale, and consequently their definitive sale as detailed in the explanatory note 2. |
| (ii) | Dividends receivable by Cosan S.A. from its subsidiaries. |
Explanatory Notes to the interim Financial Statement
(In thousands of Reais, except when otherwise indicated)
b) Consolidated
|
|
Shares issued by the associate |
|
Shares held by Cosan |
|
Cosan ownership interest |
|
Logistics |
|
|
|
|
|
|
Rhall Terminais Ltda |
28,580 |
|
8,574 |
|
30.00% |
|
Termag - Terminal Marítimo de Guarujá S.A. |
500,000 |
|
99,246 |
|
19.85% |
|
TGG - Terminal de Granéis do Guarujá S.A. |
79,747,000 |
|
7,914,609 |
|
9.92% |
|
Elevações Portuárias S.A. |
672,397,254 |
|
134,479,451 |
|
20.00% |
|
Terminal XXXIX S.A. |
200,000 |
|
99,246 |
|
49.62% |
|
Gas and Energy |
|
|
|
|
|
|
Gás de Alagoas S.A. – ALGÁS |
810,896,963 |
|
238,728,878 |
|
29.44% |
|
Companhia de Gás do Ceará – Cegás |
39,400,000 |
|
11,599,428 |
|
29.44% |
|
CEG Rio S.A. |
1,995,022,625 |
|
746,251,086 |
|
37.41% |
|
Companhia Paranaense de Gás - Compagás |
33,600,000 |
|
8,232,000 |
|
24.50% |
|
Companhia Potiguar de Gás – Potigas |
4,245,000 |
|
3,523,350 |
|
83.00% |
|
Companhia de Gás de Mato Grosso do Sul - Msgás |
61,610,000 |
|
30,188,900 |
|
49.00% |
|
Companhia de Gás de Santa Catarina - Scgás |
10,749,497 |
|
4,407,293 |
|
41.00% |
|
Sergipe Gás S.A. – SERGÁS |
1,593,656 |
|
661,363 |
|
41.50% |
|
Companhia Pernambucana de Gás - Copergás |
163,485,912 |
|
67,846,653 |
|
41.50% |
|
|
|
|
|
|
|
|
|
At January 1, 2023 |
|
Interest in earnings of subsidiaries |
|
Dividends |
|
Other |
|
At September 30, 2023 |
|
Dividend receivable (i) |
|
Logistics |
|
|
|
|
|
|
|
|
|
|
|
|
Rhall Terminais Ltda |
5,654 |
|
1,148 |
|
(1,200) |
|
— |
|
5,602 |
|
71 |
|
Termag - Terminal Marítimo de Guarujá S.A. |
8,464 |
|
(1,419) |
|
— |
|
— |
|
7,045 |
|
— |
|
TGG - Terminal de Granéis do Guarujá S.A. |
17,468 |
|
6,464 |
|
(8,333) |
|
— |
|
15,599 |
|
275 |
|
Elevações Portuárias S.A. |
296,746 |
|
30,754 |
|
— |
|
— |
|
327,500 |
|
— |
|
Terminal XXXIX S.A. |
53,136 |
|
17,583 |
|
(3,968) |
|
— |
|
66,751 |
|
— |
|
Gas and Energy |
|
|
|
|
|
|
|
|
|
|
|
|
Companhia Paranaense de Gás - Compagás |
424,837 |
|
33,611 |
|
(52,320) |
|
351 |
|
406,479 |
|
31,083 |
|
Companhia Pernambucana de Gás - Copergás |
415,301 |
|
5,921 |
|
(19,238) |
|
— |
|
401,984 |
|
10,279 |
|
Companhia de Gás de Santa Catarina - Scgás |
627,829 |
|
27,988 |
|
(17,079) |
|
— |
|
638,738 |
|
2,960 |
|
Sergipe Gás S.A. - SERGÁS |
69,430 |
|
3,230 |
|
(5,466) |
|
— |
|
67,194 |
|
4,160 |
|
Companhia de Gás do Ceará - Cegás |
184,537 |
|
11,573 |
|
(13,676) |
|
1,446 |
|
183,880 |
|
— |
|
CEG Rio S.A. |
274,480 |
|
62,411 |
|
(48,594) |
|
— |
|
288,297 |
|
54,644 |
|
Companhia de Gás de Mato Grosso do Sul - Msgás |
291,543 |
|
16,283 |
|
(10,969) |
|
— |
|
296,857 |
|
15,248 |
|
Companhia Potiguar de Gás - Potigas |
168,887 |
|
14,371 |
|
(13,118) |
|
— |
|
170,140 |
|
— |
|
Gás de Alagoas S.A. - Algás |
68,448 |
|
10,323 |
|
(8,492) |
|
(623) |
|
69,656 |
|
4,206 |
|
Cosan Corporate |
|
|
|
|
|
|
|
|
|
|
|
|
Other |
7,183 |
|
— |
|
— |
|
(477) |
|
6,706 |
|
44 |
|
|
2,913,943 |
|
240,241 |
|
(202,453) |
|
697 |
|
2,952,428 |
|
122,970 |
| (i) | Dividends receivable by the controlling companies of the subsidiaries disclosed in the table, which are consolidated in Cosan S.A. |
Explanatory Notes to the interim Financial Statement
(In thousands of Reais, except when otherwise indicated)
Below is summarized financial information for each subsidiary that has non-controlling interests that are material to the group. The amounts disclosed for each subsidiary are before intercompany eliminations.
|
|
Shares issued by the subsidiary |
|
Shares held by non-controlling shareholders |
|
Non-controlling interest |
|
Cosan Investments |
|
|
|
|
|
|
Tellus Brasil Participações S.A. |
119,063,044 |
|
52,960,392 |
|
80.43% |
|
Janus Brasil Participações S.A. |
286,370,051 |
|
112,905,168 |
|
80.43% |
|
Duguetiapar Empreendimentos e Participações S.A. |
3,573,842 |
|
1,409,865 |
|
80.43% |
|
Gamiovapar Empreendimentos e Participações S.A. |
12,912,970 |
|
5,093,776 |
|
80.43% |
|
Radar Propriedades Agrícolas S.A. |
737,500 |
|
633,493 |
|
58.55% |
|
Nova Agrícola Ponte Alta S.A. |
160,693,378 |
|
80,346,689 |
|
58.55% |
|
Terras da Ponte Alta S.A. |
16,066,329 |
|
8,033,165 |
|
58.55% |
|
Nova Santa Bárbara Agrícola S.A. |
32,336,994 |
|
16,168,497 |
|
58.55% |
|
Nova Amaralina S.A. |
30,603,159 |
|
15,301,580 |
|
58.55% |
|
Paineira Propriedades Agrícolas S.A. |
132,667,061 |
|
66,333,531 |
|
58.55% |
|
Manacá Propriedades Agrícolas S.A. |
128,977,921 |
|
64,488,961 |
|
58.55% |
|
Castanheira Propriedades Agrícolas S.A. |
83,850,938 |
|
41,925,419 |
|
58.55% |
|
Radar II Propriedades Agrícolas S.A. |
81,440,221 |
|
40,720,111 |
|
50.00% |
|
Logistics |
|
|
|
|
|
|
Rumo S.A. |
1,854,868,949 |
|
1,291,629,301 |
|
69.66% |
|
Moove |
|
|
|
|
|
|
Cosan Lubes Investments Limited |
34,963,764 |
|
10,489,129 |
|
30.00% |
|
Cosan Corporate |
|
|
|
|
|
|
Cosan Nove Participações S.A. |
7,663,761,735 |
|
2,062,583,640 |
|
26.91% |
|
Gas and Energy |
|
|
|
|
|
|
Cosan Dez Participações S.A. |
3,473,458,687 |
|
805,963,829 |
|
23.20% |
The following table summarizes information relating to each of the Company's subsidiaries that has material non-controlling interests, prior to any intra-group elimination.
Explanatory Notes to the interim Financial Statement
(In thousands of Reais, except when otherwise indicated)
|
|
At January 1, 2023 |
|
Interest in earnings of subsidiaries |
|
Capital increase |
|
Gain (loss) with capital increase |
|
Other comprehensive income |
|
Dividends |
|
Other |
|
At September 30, 2023 |
|
Gas and Energy |
|
|
|
|
|
|
|
|
|
|
|
|
|
|
|
|
Comgás |
27,151 |
|
(1,873) |
|
— |
|
— |
|
— |
|
(3,833) |
|
128 |
|
21,573 |
|
Commit Gás S.A. |
2,058,651 |
|
146,526 |
|
— |
|
— |
|
— |
|
(245,000) |
|
172 |
|
1,960,349 |
|
Compass Gás e Energia |
782,583 |
|
33,052 |
|
— |
|
— |
|
(7,481) |
|
— |
|
(1,842) |
|
806,312 |
|
Cosan Dez Participações S.A. |
1,302,661 |
|
438,635 |
|
— |
|
— |
|
(13,023) |
|
— |
|
7,806 |
|
1,736,079 |
|
Logistics |
|
|
|
|
|
|
|
|
|
|
|
|
|
|
|
|
Rumo S.A. |
10,797,146 |
|
501,768 |
|
(12,250) |
|
(2,163) |
|
985 |
|
(1,810) |
|
11,594 |
|
11,295,270 |
|
Moove |
|
|
|
|
|
|
|
|
|
|
|
|
|
|
|
|
Cosan Lubes Investments Limited |
702,001 |
|
21,619 |
|
— |
|
— |
|
(73,629) |
|
(15,346) |
|
3,092 |
|
637,737 |
|
Cosan Corporate |
|
|
|
|
|
|
|
|
|
|
|
|
|
|
|
|
Cosan Limited Partners Brasil |
9 |
|
(1) |
|
— |
|
— |
|
— |
|
— |
|
— |
|
8 |
|
Cosan Nove Participações S.A. |
2,634,310 |
|
413,114 |
|
— |
|
32,732 |
|
(133,894) |
|
(110,566) |
|
10,955 |
|
2,846,651 |
|
Cosan Investments |
|
|
|
|
|
|
|
|
|
|
|
|
|
|
|
|
Sinlog Tecnologia em Logística S.A. |
14,911 |
|
(1,968) |
|
21,959 |
|
(12,622) |
|
— |
|
— |
|
(22,280) |
|
— |
|
Janus Brasil Participações S.A. |
3,773,279 |
|
333,635 |
|
— |
|
— |
|
— |
|
(41,092) |
|
120,253 |
|
4,186,075 |
|
Tellus Brasil Participações S.A. |
2,584,058 |
|
141,278 |
|
— |
|
— |
|
— |
|
(16,542) |
|
68,488 |
|
2,777,282 |
|
Gamiovapar Empreendimentos e Participações S.A. |
505,681 |
|
3,606 |
|
— |
|
— |
|
— |
|
(29,974) |
|
(289) |
|
479,024 |
|
Duguetiapar Empreendimentos e Participações S.A. |
70,857 |
|
18,131 |
|
— |
|
— |
|
— |
|
— |
|
— |
|
88,988 |
|
Radar II Propriedades Agrícolas S.A. |
878,879 |
|
53,950 |
|
— |
|
— |
|
— |
|
38,665 |
|
— |
|
971,494 |
|
Radar Propriedades Agrícolas S.A. |
212,065 |
|
1,217 |
|
— |
|
— |
|
— |
|
(9,258) |
|
— |
|
204,024 |
|
Nova Agrícola Ponte Alta S.A. |
365,807 |
|
8,773 |
|
— |
|
— |
|
— |
|
(5,389) |
|
— |
|
369,191 |
|
Nova Amaralina S.A. Propriedades Agrícolas |
2,041 |
|
3,222 |
|
— |
|
— |
|
— |
|
(2,694) |
|
— |
|
2,569 |
|
Nova Santa Bárbara Agrícola S.A. |
201,389 |
|
491 |
|
— |
|
— |
|
— |
|
(207) |
|
— |
|
201,673 |
|
Terras da Ponte Alta S.A. |
73,421 |
|
396 |
|
— |
|
— |
|
— |
|
— |
|
— |
|
73,817 |
|
Paineira Propriedades Agrícolas S.A. |
157,784 |
|
4,483 |
|
— |
|
— |
|
— |
|
(4,767) |
|
— |
|
157,500 |
|
Manacá Propriedades Agrícolas S.A. |
160,553 |
|
4,512 |
|
— |
|
— |
|
— |
|
(6,632) |
|
— |
|
158,433 |
|
Castanheira Propriedades Agrícolas S.A. |
210,995 |
|
5,048 |
|
— |
|
— |
|
— |
|
(8,373) |
|
— |
|
207,670 |
|
|
27,516,232 |
|
2,129,614 |
|
9,709 |
|
17,947 |
|
(227,042) |
|
(462,818) |
|
198,077 |
|
29,181,719 |
Explanatory Notes to the interim Financial Statement
(In thousands of Reais, except when otherwise indicated)
Changes to the investments in joint venture were as follows:
|
|
Raízen S.A. |
|
Terminal Alvorada S.A. |
|
Total |
|
Shares issued by the joint venture |
10,352,509,484 |
|
100,197,076 |
|
|
|
Shares held by Cosan |
4,557,597,117 |
|
50,098,538 |
|
|
|
|
|
|
|
|
|
|
Cosan ownership interest |
5.02% |
|
50.00% |
|
|
|
Cosan's indirect shareholding |
25.90% |
|
— |
|
|
|
Total(i) |
30.92% |
|
50.00% |
|
|
|
At January 1, 2023 |
11,221,356 |
|
— |
|
11,221,356 |
|
Interest in earnings of joint ventures (ii) |
1,362,215 |
|
1,341 |
|
1,363,556 |
|
Other comprehensive (losses) income |
(515,362) |
|
— |
|
(515,362) |
|
Capital increase (iv) |
— |
|
47,300 |
|
47,300 |
|
Dividends (iii) |
(516,268) |
|
— |
|
(516,268) |
|
At September 30, 2023 |
11,551,941 |
|
48,641 |
|
11,600,582 |
Raízen S.A
| (i) |
The Company's total interest in Raízen S.A. is made up of 5.02% direct participation and 39.15% indirect participation through Cosan Nove. The disclosed percentage of 25.90% refers to the economic benefit calculated by the result of Cosan S.A's participation in its subsidiary Cosan Nove of 66.16% multiplied by the participation of 39.15%. For the Company's consolidated information, direct and indirect interests are added together and the impact relating to the participation of non-controlling shareholders in Cosan Nove is shown in the result line attributed to non-controlling shareholders. |
| (ii) | Raízen measured and recognized on September 30, 2023, PIS and COFINS credits in the consolidated amount of R$3,765,456 relating to Complementary Law 192/22 and R$1,465,726 relating to Complementary Law 194/22, totaling R $5,231,182, which impacted the equity income for the period by R$1,617,481, net of income tax and social contribution. |
| (iii) | Amount proposed and allocated in the period. In the nine-month period ended September 30, 2023, dividends constituted in the period were paid in the amount of R$516,268. |
Terminal Alvorada S.A.
| (iv) |
On July 7, 2023, the subsidiary Rumo S.A contributed R$47,300 to form the joint venture Terminal Alvorada S.A with CHS Agronegócio Indústria e Comércio Ltda “CHS”, whose objective is to transform the CHS road transshipment warehouse in Alvorada (TO) in a road-rail transshipment terminal. |
The joint venture’s statement of financial position and income statement are disclosed in the explanatory note 4 - Information by segment.
As of September 30, 2023, the Company was in compliance with the covenants of the agreement governing the joint venture.
Explanatory Notes to the interim Financial Statement
(In thousands of Reais, except when otherwise indicated)
a) Reconciliation of carrying amount:
|
|
Consolidated |
|
Parent Company |
||||||||||||
|
|
Land, buildings and improvements |
|
Machines, equipment and installations (i) |
|
Wagons and locomotives (i) |
|
Permanent easement |
|
Construction in progress |
|
Other assets |
|
Total |
|
Total |
|
Cost |
|
|
|
|
|
|
|
|
|
|
|
|
|
|
|
|
At January 1, 2023 |
2,135,403 |
|
1,942,798 |
|
7,994,336 |
|
10,416,500 |
|
4,315,087 |
|
720,953 |
|
27,525,077 |
|
82,094 |
|
Additions |
9,093 |
|
16,065 |
|
384 |
|
1,203 |
|
2,765,784 |
|
15,452 |
|
2,807,981 |
|
868 |
|
Write-offs |
(8,967) |
|
(26,215) |
|
(56,014) |
|
(2,295) |
|
(364) |
|
(12,986) |
|
(106,841) |
|
— |
|
Transfers (ii) |
130,633 |
|
130,170 |
|
739,470 |
|
1,950,798 |
|
(2,961,961) |
|
12,269 |
|
1,379 |
|
(28) |
|
Exchange differences |
(7,373) |
|
(14,333) |
|
— |
|
— |
|
(809) |
|
(8,596) |
|
(31,111) |
|
|
|
Assets held for sale |
— |
|
— |
|
— |
|
— |
|
(692) |
|
— |
|
(692) |
|
|
|
At September 30, 2023 |
2,258,789 |
|
2,048,485 |
|
8,678,176 |
|
12,366,206 |
|
4,117,045 |
|
727,092 |
|
30,195,793 |
|
82,934 |
|
|
|
|
|
|
|
|
|
|
|
|
|
|
|
|
|
|
Depreciation |
|
|
|
|
|
|
|
|
|
|
|
|
|
|
|
|
At January 1, 2023 |
(522,048) |
|
(749,237) |
|
(3,357,319) |
|
(3,762,623) |
|
(13,379) |
|
(172,035) |
|
(8,576,641) |
|
(36,050) |
|
Additions |
(57,515) |
|
(137,900) |
|
(455,632) |
|
(585,331) |
|
— |
|
(57,224) |
|
(1,293,602) |
|
(5,562) |
|
Transfers (ii) |
(49,391) |
|
10,013 |
|
(6,496) |
|
(4,829) |
|
— |
|
(45) |
|
(50,748) |
|
— |
|
Write-offs |
2,122 |
|
6,897 |
|
52,044 |
|
21 |
|
— |
|
11,218 |
|
72,302 |
|
— |
|
Exchange differences |
2,475 |
|
3,368 |
|
— |
|
— |
|
— |
|
2,912 |
|
8,755 |
|
— |
|
Assets held for sale |
— |
|
937 |
|
— |
|
— |
|
— |
|
95 |
|
1,032 |
|
— |
|
At September 30, 2023 |
(624,357) |
|
(865,922) |
|
(3,767,403) |
|
(4,352,762) |
|
(13,379) |
|
(215,079) |
|
(9,838,902) |
|
(41,612) |
|
At January 1, 2023 |
1,613,355 |
|
1,193,561 |
|
4,637,017 |
|
6,653,877 |
|
4,301,708 |
|
548,918 |
|
18,948,436 |
|
46,044 |
|
At September 30, 2023 |
1,634,432 |
|
1,182,563 |
|
4,910,773 |
|
8,013,444 |
|
4,103,666 |
|
512,013 |
|
20,356,891 |
|
41,322 |
| (i) | On September 30, 2023, assets, mainly wagons and locomotives, in the amount of R$1,320,979 (R$745,203 on December 31, 2022), were pledged to guarantee bank loans. |
| (ii) | Transfers of property, plant and equipment resulting from capitalization and other reclassifications of those assets. |
b) Capitalization of borrowing costs
In the period ended September 30, 2023, loan costs capitalized in the subsidiary Rumo were R$30,263 (R$63,349 as of September 30, 2022), using an average rate of 12.35% p.a. (12.83% p.a. as of 30 September 2022), while in the subsidiary Compass the capitalized costs were R$79,478 at a weighted average rate of 8.92% p.a. (R$40,196 and 7.67% p.a. in the period ended September 30, 2022).
Explanatory Notes to the interim Financial Statement
(In thousands of Reais, except when otherwise indicated)
|
|
Consolidated |
|
Parent Company |
||||||||||||
|
|
Goodwill |
|
Concession right |
|
Licenses |
|
Brands and patents |
|
Customer relationships |
|
Other |
|
Total |
|
Total |
|
Cost |
|
|
|
|
|
|
|
|
|
|
|
|
|
|
|
|
At January 1, 2023 |
1,460,072 |
|
22,899,744 |
|
639,998 |
|
163,923 |
|
2,688,079 |
|
559,658 |
|
28,411,474 |
|
16,906 |
|
Additions |
4,731 |
|
— |
|
— |
|
— |
|
93,331 |
|
47,697 |
|
145,759 |
|
2,813 |
|
Write-offs |
— |
|
(47,553) |
|
— |
|
— |
|
(41) |
|
(1,904) |
|
(49,498) |
|
— |
|
Transfers (i) |
— |
|
1,117,188 |
|
43,995 |
|
— |
|
(79,334) |
|
(8,021) |
|
1,073,828 |
|
28 |
|
Exchange differences |
(30,195) |
|
— |
|
— |
|
— |
|
(1,819) |
|
(16,145) |
|
(48,159) |
|
— |
|
Assets held for sale |
(26,255) |
|
— |
|
(4,451) |
|
(5,444) |
|
(49,866) |
|
345 |
|
(85,671) |
|
— |
|
At September 30, 2023 |
1,408,353 |
|
23,969,379 |
|
679,542 |
|
158,479 |
|
2,650,350 |
|
581,630 |
|
29,447,733 |
|
19,747 |
|
|
|
|
|
|
|
|
|
|
|
|
|
|
|
|
|
|
Amortization |
|
|
|
|
|
|
|
|
|
|
|
|
|
|
|
|
At January 1, 2023 |
— |
|
(4,652,963) |
|
(19,194) |
|
(9,201) |
|
(1,170,494) |
|
(437,680) |
|
(6,289,532) |
|
(14,659) |
|
Additions |
— |
|
(643,794) |
|
(5,240) |
|
— |
|
(149,807) |
|
(21,233) |
|
(820,074) |
|
(592) |
|
Write-offs |
— |
|
27,297 |
|
— |
|
— |
|
2 |
|
72 |
|
27,371 |
|
— |
|
Transfers (i) |
— |
|
— |
|
(37,209) |
|
— |
|
75,264 |
|
19,873 |
|
57,928 |
|
— |
|
Assets held for sale |
— |
|
— |
|
— |
|
— |
|
1,213 |
|
3,241 |
|
4,454 |
|
— |
|
Exchange differences |
— |
|
— |
|
1,760 |
|
— |
|
4,408 |
|
(1,492) |
|
4,676 |
|
— |
|
At September 30, 2023 |
— |
|
(5,269,460) |
|
(59,883) |
|
(9,201) |
|
(1,239,414) |
|
(437,219) |
|
(7,015,177) |
|
(15,251) |
|
|
|
|
|
|
|
|
|
|
|
|
|
|
|
|
|
|
At January 1, 2023 |
1,460,072 |
|
18,246,781 |
|
620,804 |
|
154,722 |
|
1,517,585 |
|
121,978 |
|
22,121,942 |
|
2,247 |
|
At September 30, 2023 |
1,408,353 |
|
18,699,919 |
|
619,659 |
|
149,278 |
|
1,410,936 |
|
144,411 |
|
22,432,556 |
|
4,496 |
| (i) | The number of transfers also includes a portion of R$120,372 of intangible assets that was reclassified to financial assets (R$25,171, period ended September 30, 2022). |
Explanatory Notes to the interim Financial Statement
(In thousands of Reais, except when otherwise indicated)
a) Amortization methods and useful lives:
|
Intangible assets (except goodwill) |
|
Annual amortization rate |
09/30/2023 |
|
12/31/2022 |
|
|
Concession rights: |
|
|
|
|
|
|
|
Compass (i) |
|
From 3.54% to 4.58% |
12,157,312 |
|
11,614,163 |
|
|
Rumo (ii) |
|
1.59% |
6,542,607 |
|
6,632,618 |
|
|
|
|
|
18,699,919 |
|
18,246,781 |
|
|
Licenses and authorizations |
|
|
|
|
|
|
|
Operating license for port terminal |
|
3.70% |
47,514 |
|
44,305 |
|
|
Moove |
|
5.00% |
135,551 |
|
139,905 |
|
|
Licenses and authorizations (iii) |
|
Indefinity |
436,594 |
|
436,594 |
|
|
|
|
|
619,659 |
|
620,804 |
|
|
Trademarks |
|
|
|
|
|
|
|
Comma |
|
Indefinity |
46,688 |
|
47,929 |
|
|
Petrochoice (iii) |
|
Indefinity |
100,151 |
|
104,354 |
|
|
Tirreno (iii) |
|
Indefinity |
2,439 |
|
2,439 |
|
|
|
|
|
149,278 |
|
154,722 |
|
|
Customers relationship |
|
|
|
|
|
|
|
Compass |
|
20.00% |
285,922 |
|
285,423 |
|
|
Moove (iii) |
|
5% a 30% |
1,125,014 |
|
1,227,588 |
|
|
Other |
|
|
— |
|
4,574 |
|
|
|
|
|
1,410,936 |
|
1,517,585 |
|
|
Other |
|
|
|
|
|
|
|
Software license |
|
20.00% |
73,600 |
|
65,108 |
|
|
Other |
|
20.00% |
70,811 |
|
56,870 |
|
|
|
|
|
144,411 |
|
121,978 |
|
|
|
|
|
|
|
|
|
|
Total |
|
|
21,024,203 |
|
20,661,870 |
| (i) |
Intangible asset of the public gas distribution service concession, which represents the right to charge users for the supply of gas, comprising: (i) the concession rights recognized in the business combination and (ii) the assets of the concession. |
| (ii) |
Refers to Rumo’s railway concession agreement. The amount will be amortized until the end of the concession in 2079. |
| (iii) | Authorization for: (i) installation of port terminal activities; operation of the port facility by the subsidiary TUP Porto São Luís, (ii) lubrication and contamination control solutions, (iii) production and sale of lubricating oils, additives and fluids. |
|
|
Compass |
|
Moove |
|
Total |
|
At January 1, 2023 |
1,110,335 |
|
8,380 |
|
1,118,715 |
|
Additions |
1,083,882 |
|
33,718 |
|
1,117,600 |
|
Write-offs |
— |
|
(24,423) |
|
(24,423) |
|
Transfers to intangible assets (i) |
(1,202,757) |
|
— |
|
(1,202,757) |
|
At September 30, 2023 |
991,460 |
|
17,675 |
|
1,009,135 |
| (i) | The amount of transfers also includes a portion of the intangible asset that was reclassified to a financial asset. |
During the period ended September 30, 2023, through its subsidiaries, R$92,979 were added to internally generated intangible assets (R$79,081 in the period ended September 30, 2022), through the capitalization of labor.
Explanatory Notes to the interim Financial Statement
(In thousands of Reais, except when otherwise indicated)
a) Capitalization of borrowing costs
During the period ended September 30, 2023, the indirect subsidiary Comgás capitalized R$59,385 at a weighted average rate of 12.67% p.a. (R$48,970 at 12.12% p.a. in the period ended September 30, 2022).
During the period ended September 30, 2023, the indirect subsidiary Sulgás capitalized R$518 at a weighted average rate of 5.04% p.a. (there was no capitalization on September 30, 2022).
|
|
Consolidated |
|
Parent company |
||||||||||||||
|
|
Land, buildings and improvements |
|
Machine, equipment, and installations |
|
Wagons and locomotives |
|
Software |
|
Vehicles |
|
Floating storage and regasification |
|
Railway and port infrastructure |
|
Total |
|
Total |
|
Cost |
|
|
|
|
|
|
|
|
|
|
|
|
|
|
|
|
|
|
At January 1, 2023 |
453,718 |
|
268,470 |
|
943,096 |
|
85,949 |
|
34,743 |
|
— |
|
7,961,141 |
|
9,747,117 |
|
37,901 |
|
Additions (i) |
38,832 |
|
233,133 |
|
— |
|
— |
|
20,791 |
|
1,510,810 |
|
45,271 |
|
1,848,837 |
|
— |
|
Contractual readjustments |
9,808 |
|
3,426 |
|
332 |
|
— |
|
— |
|
— |
|
99,253 |
|
112,819 |
|
4,626 |
|
Write-offs |
(18,943) |
|
(6,988) |
|
— |
|
— |
|
(11) |
|
— |
|
— |
|
(25,942) |
|
— |
|
Transfers |
— |
|
34,742 |
|
— |
|
— |
|
— |
|
— |
|
— |
|
34,742 |
|
— |
|
Exchange differences |
(5,827) |
|
(5,534) |
|
— |
|
— |
|
(35) |
|
— |
|
— |
|
(11,396) |
|
— |
|
At September 30, 2023 |
477,588 |
|
527,249 |
|
943,428 |
|
85,949 |
|
55,488 |
|
1,510,810 |
|
8,105,665 |
|
11,706,177 |
|
42,527 |
|
Amortization |
|
|
|
|
|
|
|
|
|
|
|
|
|
|
|
|
|
|
At January 1, 2023 |
(125,497) |
|
(108,651) |
|
(434,208) |
|
(20,974) |
|
(21,723) |
|
— |
|
(1,023,195) |
|
(1,734,248) |
|
(14,869) |
|
Additions |
(53,773) |
|
(33,046) |
|
(25,753) |
|
(3,285) |
|
(9,983) |
|
— |
|
(240,279) |
|
(366,119) |
|
(4,093) |
|
Write-offs |
6,243 |
|
1,077 |
|
— |
|
— |
|
— |
|
(18,885) |
|
— |
|
(11,565) |
|
— |
|
Exchange differences |
1,311 |
|
3,571 |
|
— |
|
— |
|
97 |
|
— |
|
— |
|
4,979 |
|
— |
|
At September 30, 2023 |
(171,716) |
|
(137,049) |
|
(459,961) |
|
(24,259) |
|
(31,609) |
|
(18,885) |
|
(1,263,474) |
|
(2,106,953) |
|
(18,962) |
|
|
|
|
|
|
|
|
|
|
|
|
|
|
|
|
|
|
|
|
At January 1, 2023 |
328,221 |
|
159,819 |
|
508,888 |
|
64,975 |
|
13,020 |
|
— |
|
6,937,946 |
|
8,012,869 |
|
23,032 |
|
At September 30, 2023 |
305,872 |
|
390,200 |
|
483,467 |
|
61,690 |
|
23,879 |
|
1,491,925 |
|
6,842,191 |
|
9,599,224 |
|
23,565 |
| (i) | The addition of the period is mainly composed of the contract related to the charter of the floating storage and regasification unit (“FRSU”) according to note 2. |
Explanatory Notes to the interim Financial Statement
(In thousands of Reais, except when otherwise indicated)
|
|
Investment properties |
|
At January 1, 2023 |
14,103,060 |
|
Change in the fair value of investment properties |
463,837 |
|
Additions |
31,347 |
|
Transfers (i) |
(370,705) |
|
At September 30, 2023 |
14,227,539 |
| (i) | Transfers to the group of properties held for sale as explanatory note 8, arising from the proposed sale of Fazenda Grão de Ouro, of the subsidiary Tellus Brasil Participações S.A. |
Considering the current gas supply contracts, the subsidiaries has a financial commitment that totaled an estimated present value of R$ 46,070,691, the amount of which includes the minimum volume established in the contract, both in commodities and in transportation, with a term until December 2034.
The sub-concession agreements for which Rumo, through its subsidiaries, generally include commitments to execute investments with certain characteristics during the term of the agreement. We can highlight:
(i) Capacity increase in Rumo Malha Paulista and reduction of urban conflicts, estimated by the agency at R$ 6,100,000.
(ii) Investments in Rumo Malha Central at R$ 645,573.
The movement in leases for the period ended September 30, 2023 was as follows:
|
|
09/30/2023 |
|
12/31/2022 |
|
Court discussion: |
|
|
|
|
Rumo Malha Oeste S.A. |
2,147,108 |
|
1,957,149 |
|
|
2,147,108 |
|
1,957,149 |
|
|
|
|
|
|
Railroad concession: |
|
|
|
|
Rumo Malha Paulista S.A. |
1,034,852 |
|
1,138,076 |
|
|
1,034,852 |
|
1,138,076 |
|
|
|
|
|
|
Concessions and grants: |
|
|
|
|
Rumo Malha Sul S.A. |
76,621 |
|
81,112 |
|
Rumo Malha Paulista S.A. |
181,326 |
|
156,497 |
|
Rumo Malha Central S.A. |
23,397 |
|
18,576 |
|
|
281,344 |
|
256,185 |
|
|
|
|
|
|
Total |
3,463,304 |
|
3,351,410 |
|
|
|
|
|
|
Current |
283,667 |
|
256,759 |
|
Non-current |
3,179,637 |
|
3,094,651 |
|
|
3,463,304 |
|
3,351,410 |
Explanatory Notes to the interim Financial Statement
(In thousands of Reais, except when otherwise indicated)
Leases and grants under IFRS16
|
|
9/30/2023 |
|
12/31/2022 |
|
Leases: |
|
|
|
|
Rumo Malha Sul S.A. |
483,460 |
|
542,996 |
|
Rumo Malha Paulista S.A. |
439,100 |
|
539,900 |
|
Rumo Malha Oeste S.A. |
141,421 |
|
185,324 |
|
Portofer Transporte Ferroviário Ltda. |
7,942 |
|
11,658 |
|
|
1,071,923 |
|
1,279,878 |
|
|
|
|
|
|
Grants: |
|
|
|
|
Rumo Malha Paulista S.A. (renewal) |
897,209 |
|
732,727 |
|
Rumo Malha Central S.A. |
918,980 |
|
792,374 |
|
|
1,816,189 |
|
1,525,101 |
|
|
|
|
|
|
Total |
2,888,112 |
|
2,804,979 |
|
|
|
|
|
|
Current |
362,295 |
|
350,719 |
|
Non-current |
2,525,817 |
|
2,454,260 |
|
|
2,888,112 |
|
2,804,979 |
|
|
Parent Company |
|
Consolidated |
||||
|
|
09/30/2023 |
|
12/31/2022 |
|
09/30/2023 |
|
12/31/2022 |
|
Tax debts installments |
208,887 |
|
202,140 |
|
215,222 |
|
208,760 |
|
ICMS |
30 |
|
43 |
|
207,169 |
|
271,688 |
|
COFINS |
46,976 |
|
48,982 |
|
147,637 |
|
246,501 |
|
PIS |
1,667 |
|
2,579 |
|
23,053 |
|
43,524 |
|
Social Security charges |
55,294 |
|
29,416 |
|
76,248 |
|
42,186 |
|
IRRF |
— |
|
— |
|
8,615 |
|
14,553 |
|
Other |
1,605 |
|
6,676 |
|
106,166 |
|
86,517 |
|
|
|
|
|
|
|
|
|
|
|
314,459 |
|
289,836 |
|
784,110 |
|
913,729 |
|
|
|
|
|
|
|
|
|
|
Current |
158,155 |
|
141,216 |
|
623,156 |
|
760,041 |
|
Non-current |
156,304 |
|
148,620 |
|
160,954 |
|
153,688 |
|
Total |
314,459 |
|
289,836 |
|
784,110 |
|
913,729 |
Explanatory Notes to the interim Financial Statement
(In thousands of Reais, except when otherwise indicated)
a) Reconciliation of income tax and social contribution expenses:
|
|
|
Parent Company |
|
Consolidated |
||||||||||||
|
|
|
3T23 |
|
3T22 |
|
9M23 |
|
9M22 |
|
3T23 |
|
3T22 |
|
9M23 |
|
9M22 |
|
Income before income tax and social contribution |
|
370,645 |
|
(365,477) |
|
(2,010,574) |
|
(485,858) |
|
2,227,110 |
|
287,089 |
|
1,699,340 |
|
848,352 |
|
Income tax and social contribution at nominal rate (34%) |
|
(126,019) |
|
124,262 |
|
683,595 |
|
165,192 |
|
(757,217) |
|
(97,610) |
|
(577,776) |
|
(288,440) |
|
Adjustments for calculating the effective rate |
|
|
|
|
|
|
|
|
|
|
|
|
|
|
|
|
|
Equity income |
|
436,719 |
|
224,493 |
|
44,433 |
|
764,019 |
|
30,593 |
|
(41,111) |
|
519,405 |
|
70,761 |
|
Result of companies abroad |
|
(7,909) |
|
(25,270) |
|
(19,560) |
|
(31,281) |
|
(10,004) |
|
(28,496) |
|
(38,418) |
|
(19,371) |
|
Operating profit |
|
— |
|
— |
|
— |
|
— |
|
81,144 |
|
56,629 |
|
182,890 |
|
151,589 |
|
Interest on equity |
|
— |
|
(15,975) |
|
— |
|
(66,544) |
|
8 |
|
13,067 |
|
(1,312) |
|
(28,846) |
|
Permanent differences (donations, gifts, etc.) |
|
— |
|
— |
|
— |
|
— |
|
(3,187) |
|
(2,026) |
|
(8,170) |
|
(5,710) |
|
Unrecognized tax losses and temporary differences |
|
— |
|
— |
|
— |
|
— |
|
(12,304) |
|
2,931 |
|
(127,632) |
|
(215,192) |
|
ICMS benefit - extemporaneous |
|
— |
|
— |
|
— |
|
— |
|
(1,827) |
|
98,772 |
|
4,295 |
|
274,584 |
|
ICMS benefit - current year |
|
— |
|
— |
|
— |
|
— |
|
— |
|
66,809 |
|
68,409 |
|
169,878 |
|
Dividend income (i) |
|
— |
|
— |
|
— |
|
— |
|
— |
|
— |
|
136,936 |
|
— |
|
Provision for non-realization of the benefit of the covenant Federative (ii) |
|
— |
|
— |
|
— |
|
— |
|
— |
|
— |
|
(1,171,810) |
|
— |
|
Provision for non-realization of the benefit of the covenant Federal - Interest and Fine (ii) |
|
— |
|
— |
|
— |
|
— |
|
(10,067) |
|
— |
|
(152,357) |
|
— |
|
Selic on indebtedness |
|
4,849 |
|
6,871 |
|
14,350 |
|
11,652 |
|
14,417 |
|
20,137 |
|
68,283 |
|
10,498 |
|
Rate differential (iv) |
|
— |
|
— |
|
— |
|
— |
|
150,046 |
|
— |
|
219,960 |
|
16,715 |
|
Benefit Membership Program Zero Litigation (iii) |
|
— |
|
— |
|
19,710 |
|
— |
|
— |
|
— |
|
23,276 |
|
— |
|
Other |
|
467 |
|
36,210 |
|
(34) |
|
12,832 |
|
18,295 |
|
64,677 |
|
16,215 |
|
83,754 |
|
Income tax and social contribution (current and deferred) |
|
308,107 |
|
350,591 |
|
742,494 |
|
855,870 |
|
(500,103) |
|
153,779 |
|
(837,806) |
|
220,220 |
|
|
|
|
|
|
|
|
|
|
|
|
|
|
|
|
|
|
|
Effective rate - % |
|
83,13% |
|
(95,93%) |
|
(36,93%) |
|
(176,16%) |
|
(22,46%) |
|
53,56% |
|
(49,30%) |
|
25,96% |
Explanatory Notes to the interim Financial Statement
(In thousands of Reais, except when otherwise indicated)
| (i) | Refers to dividends received from Vale S.A. |
| (ii) | As of the 1st quarter of 2021, the Company, through its subsidiaries Comgás and Moove, began to calculate and use current and extemporaneous credits arising from the non-taxation of the benefit of reducing the ICMS calculation base. The subsidiary Comgás takes advantage of the reduction of the ICMS calculation base in the State of São Paulo, whose effective rate is reduced from 18% to the interval between 12 and 15.6% pursuant to art. 8 of Annex II of the ICMS Regulation, approved by State Decree No. 45,490 (“RICMS/SP”), as amended by State Decrees No. 62,399/2016 and 67,383/2022. The subsidiary Moove, on the other hand, makes use of ICMS deferrals provided for by art. 44, Book IV of the RICMS/RJ1 and by art. 1 of Decree 44,637/2014, in the domestic acquisition and import of base oil, an input for the production of lubricating oil. |
| These credits were used by the subsidiary based on its best understanding of the subject, substantiated by the opinion of its external legal advisors, which took into account all applicable case law, including the understanding signed in November 2017 by the 1st Section of the STJ regarding the application of the thesis of the federative pact, which began to be applied in repeated judgments of the 1st Panel of the STJ. On March 8, 2022, there was a decision on the subject in the 1st Panel of the STJ, favorable to the taxpayer, involving tax benefit of ICMS deferral, obtained by contract. On April 5, 2022, the 2nd Panel of the STJ ruled against the taxpayer, in a case involving a reduction in the ICMS tax base. After said divergence, the matter was set for judgment by the 1st Section of the STJ on April 26, 2023. Although a preliminary decision was issued by the STF determining the suspension of the effectiveness of the STJ judgment of April 26, the session took place and the ministers unanimously decided against the taxpayers and the thesis defended by the subsidiary. On May 4, 2023, the preliminary injunction was reconsidered by the Minister of the STF who granted it, after the decision of the STJ passed to be effective from April 26, 2023. Despite (i) the history of divergence between the 1st and 2nd Panels of the STJ, (ii) the fact that the STJ judgment has not yet been published, (iii) the possibility of opposing motions for clarification of the judgment, including to safeguard past taxable events, and also (iv) the possibility of discussing the topic before the STF, the subsidiary's administrators, with the data and facts existing at the time, observing the technical interpretation that governs the treatment of uncertainties regarding taxes on profit (ICPC22 and IFRIC 23), decided for the constitution of provision on March 31, 2023 due to the unfavorable decision with confirmation of present obligation at the end of the accounting period. The provision was constituted in the total restated amount of R$1,619,919 (R$1,171,810 of principal recorded under current income tax and R$448,109 of interest and fine recorded under financial result), in addition to R$114,891 of income tax and deferred social contribution, which includes the assessments received for the years 2015, 2016, 2017 and 2018, and the other credits used in the following years until September 30, 2023, plus the respective legal charges. | |
| (iii) | Adherence to the Tax Litigation Reduction Program ("Zero Litigation"), (Joint Ordinance PGFN/RFB No. 01/2023), as defined in art. 11 § 12 of Law 13,988/2020, which establishes the requirements and conditions for transactions resolving litigation with the Public Treasury. |
| (iv) | Difference in rate between the nominal rate of 34% and the effective rate applicable to entities that calculate the tax under the presumed profit regime. |
The balance of income tax and social contribution in current liabilities, in the amount of R$1,950,247 (R$204,387 as of December 31, 2022), refers mainly to the liability related to the federative pact benefit in the amount of R$1,619,919.
b) Deferred income tax assets and liabilities
Below are presented the tax effects of temporary differences that give rise to significant parts of the company's deferred tax assets and liabilities:
Explanatory Notes to the interim Financial Statement
(In thousands of Reais, except when otherwise indicated)
|
|
|
Parent Company |
|
Consolidated |
||||
|
|
|
09/30/2023 |
|
12/31/2022 |
|
09/30/2023 |
|
12/31/2022 |
|
Deferred tax assets from: |
|
|
|
|
|
|
|
|
|
Income taxes losses |
|
1,156,889 |
|
697,179 |
|
2,745,242 |
|
2,244,654 |
|
Negative base of social contribution |
|
417,015 |
|
251,519 |
|
944,698 |
|
809,556 |
|
Temporary differences |
|
|
|
|
|
|
|
|
|
Foreign exchange variation - Loans and financing |
|
1,177,609 |
|
1,299,577 |
|
1,281,276 |
|
1,701,529 |
|
Provision for lawsuits |
|
82,846 |
|
78,190 |
|
219,918 |
|
204,303 |
|
Impairment provision (Rumo Malha Oeste) |
|
— |
|
— |
|
29,340 |
|
34,469 |
|
Post-employment benefit obligation |
|
— |
|
— |
|
157,063 |
|
152,373 |
|
Provisions for uncertain tax credits and tax losses |
|
— |
|
— |
|
33,398 |
|
31,880 |
|
Provision for non-occurrence of taxes |
|
6,985 |
|
6,985 |
|
69,327 |
|
70,815 |
|
Share-based payment transactions |
|
54,147 |
|
26,846 |
|
136,814 |
|
82,480 |
|
Lease |
|
2,506 |
|
2,493 |
|
186,846 |
|
167,962 |
|
Unrealized loss with derivatives |
|
2,219 |
|
— |
|
493,311 |
|
674,554 |
|
Provisions for profit sharing |
|
24,806 |
|
18,322 |
|
108,614 |
|
124,833 |
|
Business Combination - Intangible |
|
— |
|
— |
|
123,290 |
|
119,060 |
|
Business combination - fixed assets |
|
— |
|
— |
|
27,739 |
|
36,535 |
|
Securities |
|
— |
|
— |
|
388,852 |
|
— |
|
Selic on indebtedness |
|
— |
|
77,645 |
|
— |
|
100,264 |
|
Other provisions |
|
137,415 |
|
196,671 |
|
670,688 |
|
581,059 |
|
Deferred on pre-operating income |
|
— |
|
— |
|
70,265 |
|
14,009 |
|
Regulatory asset (liability) |
|
— |
|
— |
|
6,414 |
|
4,843 |
|
Other (i) |
|
48,470 |
|
1,607 |
|
387,423 |
|
488,299 |
|
Total |
|
3,110,907 |
|
2,657,034 |
|
8,080,518 |
|
7,643,477 |
|
|
|
|
|
|
|
|
|
|
|
Deferred tax liabilities from: |
|
|
|
|
|
|
|
|
|
Temporary differences |
|
|
|
|
|
|
|
|
|
Exchange rate variation - Loans and financing |
|
— |
|
— |
|
(142,266) |
|
— |
|
Useful life review |
|
— |
|
— |
|
(442,215) |
|
(401,926) |
|
Business combination - fixed assets |
|
— |
|
— |
|
(167,380) |
|
(76,263) |
|
Tax goodwill |
|
— |
|
— |
|
(615,944) |
|
(359,100) |
|
Unrealized income with derivatives |
|
— |
|
(249,206) |
|
(250,075) |
|
(226,243) |
|
Fair value adjustment on debt |
|
— |
|
— |
|
(472,379) |
|
(548,726) |
|
Marketable securities |
|
— |
|
— |
|
— |
|
(1,150,916) |
|
Investment properties |
|
— |
|
— |
|
(402,214) |
|
(391,382) |
|
Capitalized interest |
|
— |
|
— |
|
— |
|
(108,616) |
|
Effects on the formation of joint ventures |
|
(104,462) |
|
(106,254) |
|
(104,462) |
|
(106,254) |
|
Business Combination - Intangible |
|
— |
|
— |
|
(4,412,820) |
|
(4,486,211) |
|
Post-employment obligations |
|
— |
|
— |
|
(4,594) |
|
(4,594) |
|
Lease |
|
— |
|
495 |
|
(12,255) |
|
(11,797) |
|
Provisions |
|
— |
|
815 |
|
(19,422) |
|
(79,092) |
|
Other (ii) |
|
(449,880) |
|
(445,264) |
|
(607,059) |
|
(687,601) |
|
Total |
|
(554,342) |
|
(799,414) |
|
(7,653,085) |
|
(8,638,721) |
|
Total deferred taxes recorded |
|
2,556,565 |
|
1,857,620 |
|
427,433 |
|
(995,244) |
|
Deferred tax assets |
|
2,556,565 |
|
1,857,620 |
|
5,676,890 |
|
4,474,124 |
|
Deferred tax liabilities |
|
— |
|
— |
|
(5,249,457) |
|
(5,469,368) |
|
Total deferred, net |
|
2,556,565 |
|
1,857,620 |
|
427,433 |
|
(995,244) |
| (i) | Refers mainly to deferred expenses at Rumo Malha Central R$96,252 and Rumo Malha Norte R$49,084. | |
| (ii) | Refers mainly to the tax loss recognized in the capital contribution in a controlled company. |
Explanatory Notes to the interim Financial Statement
(In thousands of Reais, except when otherwise indicated)
Deferred income tax and social contribution inactivated
As of September 30, 2023, the balance of inactivated income tax and social contribution is R$2,522,627 and refers mainly to tax losses and temporary differences of the subsidiary Rumo S.A, of the indirect subsidiaries Rumo Malha Sul and Rumo Malha Oeste, which under current conditions do not meet the requirements for the accounting of said deferred income tax and social contribution asset due to the lack of predictability of future generation of tax profits.
c) Changes in deferred tax assets and liabilities:
|
ASSETS |
Parent Company |
||||||||||||
|
|
Tax loss and negative base |
|
Employee benefits |
|
Unrealized loss with derivatives |
|
Provisions |
|
Leases |
|
Others |
|
Total |
|
At January 1, 2023 |
948,698 |
|
45,168 |
|
— |
|
281,846 |
|
2,493 |
|
1,378,829 |
|
2,657,034 |
|
Credited / charged from income for the period |
625,206 |
|
33,785 |
|
2,219 |
|
(54,600) |
|
13 |
|
(30,781) |
|
575,842 |
|
Foreign exchange differences |
— |
|
— |
|
— |
|
— |
|
— |
|
(121,969) |
|
(121,969) |
|
At September 30, 2023 |
1,573,904 |
|
78,953 |
|
2,219 |
|
227,246 |
|
2,506 |
|
1,226,079 |
|
3,110,907 |
|
|
Parent Company |
||||||
|
|
Effects on the formation of joint venture |
|
Unrealized income with derivatives |
|
Other |
|
Total |
|
At January 1, 2023 |
(106,254) |
|
(249,206) |
|
(443,954) |
|
(799,414) |
|
Credited / charged from income for the period |
1,792 |
|
249,206 |
|
7,061 |
|
258,059 |
|
Recognized in shareholders' equity |
— |
|
— |
|
(12,987) |
|
(12,987) |
|
At September 30, 2023 |
(104,462) |
|
— |
|
(449,880) |
|
(554,342) |
|
|
|
|
|
|
|
|
|
|
Total deferred taxes recognized |
|
|
|
|
|
2,556,565 |
|
Explanatory Notes to the interim Financial Statement
(In thousands of Reais, except when otherwise indicated)
Assets:
|
|
Consolidated |
||||||||||||||||
|
|
Tax loss and negative basis |
|
Post-employment obligations |
|
Employee benefits |
|
Provisions |
|
Leases |
|
Unrealized gains on derivatives |
|
Intangible assets |
|
Other |
|
Total |
|
At January 1, 2023 |
3,054,210 |
|
152,373 |
|
207,313 |
|
922,526 |
|
167,962 |
|
674,554 |
|
119,060 |
|
2,345,479 |
|
7,643,477 |
|
Credited / charged from income for the period |
635,730 |
|
4,690 |
|
38,115 |
|
100,145 |
|
18,884 |
|
(181,243) |
|
4,230 |
|
236,743 |
|
857,294 |
|
Foreign exchange differences |
— |
|
— |
|
— |
|
— |
|
— |
|
— |
|
— |
|
(420,253) |
|
(420,253) |
|
At September 30, 2023 |
3,689,940 |
|
157,063 |
|
245,428 |
|
1,022,671 |
|
186,846 |
|
493,311 |
|
123,290 |
|
2,161,969 |
|
8,080,518 |
|
|
Consolidated |
||||||||||||||||||
|
|
Effects on the formation of joint ventures |
|
Post-employment obligations |
|
Intangible assets |
|
Unrealized gains on derivatives |
|
Property, plant and equipment |
|
Fair value adjustment |
|
Leases |
|
Provisions |
|
Other |
|
Total |
|
At January 1, 2023 |
(106,254) |
|
(4,594) |
|
(4,486,211) |
|
(226,243) |
|
(401,926) |
|
(548,726) |
|
(11,797) |
|
(79,092) |
|
(2,773,878) |
|
(8,638,721) |
|
Credited / charged from income for the period |
1,792 |
|
— |
|
73,391 |
|
(9,810) |
|
(40,289) |
|
76,347 |
|
(458) |
|
59,670 |
|
814,139 |
|
974,782 |
|
Recognized in shareholders' equity |
— |
|
— |
|
— |
|
(14,022) |
|
— |
|
— |
|
— |
|
— |
|
24,876 |
|
10,854 |
|
At September 30, 2023 |
(104,462) |
|
(4,594) |
|
(4,412,820) |
|
(250,075) |
|
(442,215) |
|
(472,379) |
|
(12,255) |
|
(19,422) |
|
(1,934,863) |
|
(7,653,085) |
|
|
|
|
|
|
|
|
|
|
|
|
|
|
|
|
|
|
|
|
|
|
Total deferred taxes recorded |
|
|
|
|
|
|
|
|
|
|
|
|
|
|
|
|
|
|
427,433 |
Explanatory Notes to the interim Financial Statement
(In thousands of Reais, except when otherwise indicated)
As of September 30, 2023 and December 31, 2022, the Corporation had contingent liabilities and judicial deposits pertaining to:
|
|
Provision for lawsuits |
||||||
|
|
Parent Company |
|
Consolidated |
||||
|
|
09/30/2023 |
|
12/31/2022 |
|
09/30/2023 |
|
12/31/2022 |
|
Tax |
236,747 |
|
227,481 |
|
769,045 |
|
747,647 |
|
Civil, environmental and regulatory |
69,755 |
|
53,835 |
|
640,099 |
|
662,052 |
|
Labor |
56,550 |
|
68,041 |
|
393,622 |
|
391,487 |
|
|
363,052 |
|
349,357 |
|
1,802,766 |
|
1,801,186 |
|
|
Judicial deposit |
||||||
|
|
Parent Company |
|
Consolidated |
||||
|
|
09/30/2023 |
|
12/31/2022 |
|
09/30/2023 |
|
12/31/2022 |
|
Tax |
367,680 |
|
327,354 |
|
644,135 |
|
585,988 |
|
Civil, environmental and regulatory |
15,586 |
|
15,644 |
|
112,494 |
|
92,411 |
|
Labor |
14,034 |
|
17,565 |
|
130,053 |
|
136,045 |
|
|
397,300 |
|
360,563 |
|
886,682 |
|
814,444 |
Changes in provisions for lawsuits:
|
|
Parent Company |
||||||
|
|
Tax |
|
Civil, environmental, and regulatory |
|
Labor |
|
Total |
|
At January 1, 2023 |
227,481 |
|
53,835 |
|
68,041 |
|
349,357 |
|
Provisioned in the year |
3,124 |
|
26,934 |
|
1,593 |
|
31,651 |
|
Write-offs by reversal / payment |
(3,179) |
|
(19,277) |
|
(12,771) |
|
(35,227) |
|
Interest (i) |
9,321 |
|
8,263 |
|
(313) |
|
17,271 |
|
At September 30, 2023 |
236,747 |
|
69,755 |
|
56,550 |
|
363,052 |
|
|
|
|
|
|
|
|
|
|
|
Consolidated |
||||||
|
|
Tax |
|
Civil, environmental, and regulatory |
|
Labor |
|
Total |
|
At January 1, 2023 |
747,647 |
|
662,052 |
|
391,487 |
|
1,801,186 |
|
Provisioned in the year |
19,739 |
|
85,687 |
|
86,125 |
|
191,551 |
|
Write-offs by reversal / payment |
(22,891) |
|
(116,053) |
|
(125,600) |
|
(264,544) |
|
Transfer |
— |
|
3,793 |
|
607 |
|
4,400 |
|
Interest (i) |
24,550 |
|
4,620 |
|
41,003 |
|
70,173 |
|
At September 30, 2023 |
769,045 |
|
640,099 |
|
393,622 |
|
1,802,766 |
(i) Includes write-off of interest due to reversal.
The Company has debts secured by assets or by means of cash deposits, bank guarantees or guarantee insurance.
The Company has probable indemnity lawsuits in addition to those mentioned, and as they represent contingent assets, they were not reported.
Explanatory Notes to the interim Financial Statement
(In thousands of Reais, except when otherwise indicated)
a) Probable losses
Tax: The main tax proceedings for which the risk of loss is probable are described below:
|
|
Parent Company |
|
Consolidated |
||||
|
|
09/30/2023 |
|
12/31/2022 |
|
09/30/2023 |
|
12/31/2022 |
|
Compensation with FINSOCIAL |
— |
|
— |
|
323,109 |
|
312,721 |
|
INSS |
76,133 |
|
72,389 |
|
104,558 |
|
98,657 |
|
ICMS credit |
66,507 |
|
63,093 |
|
138,203 |
|
125,723 |
|
PIS and COFINS |
32,456 |
|
27,954 |
|
33,075 |
|
30,446 |
|
IPI |
56,243 |
|
54,430 |
|
62,894 |
|
60,852 |
|
IRPJ and CSLL |
1,093 |
|
1,065 |
|
9,351 |
|
11,676 |
|
Other |
4,315 |
|
8,550 |
|
97,855 |
|
107,572 |
|
|
236,747 |
|
227,481 |
|
769,045 |
|
747,647 |
b) Possible losses
The main lawsuits for which we anticipate a risk of loss as possible are outlined below:
|
|
Parent Company |
|
Consolidated |
||||
|
|
09/30/2023 |
|
12/31/2022 |
|
09/30/2023 |
|
12/31/2022 |
|
Tax |
5,098,395 |
|
5,034,867 |
|
15,883,897 |
|
16,079,589 |
|
Civil, environmental and regulatory |
1,032,311 |
|
1,015,125 |
|
6,971,849 |
|
6,597,105 |
|
Labor |
20,774 |
|
23,972 |
|
811,720 |
|
782,080 |
|
|
6,151,480 |
|
6,073,964 |
|
23,667,466 |
|
23,458,774 |
Explanatory Notes to the interim Financial Statement
(In thousands of Reais, except when otherwise indicated)
Tax:
|
|
Parent Company |
|
Consolidated |
||||
|
|
09/30/2023 |
|
12/31/2022 |
|
09/30/2023 |
|
12/31/2022 |
|
Isolated fine - Federal tax |
— |
|
— |
|
793,215 |
|
762,613 |
|
IRPJ/CSLL (i) (ii) |
1,378,077 |
|
1,296,481 |
|
6,350,229 |
|
6,297,550 |
|
ICMS -Tax on circulation of goods |
1,270,835 |
|
1,264,685 |
|
3,081,719 |
|
2,987,853 |
|
IRRF |
1,414 |
|
1,389 |
|
1,214,976 |
|
1,366,268 |
|
PIS and COFINS |
1,275,123 |
|
1,322,277 |
|
2,250,042 |
|
2,556,050 |
|
MP 470 installment of debts |
248,446 |
|
246,000 |
|
395,837 |
|
388,166 |
|
Stock Grant Plan |
— |
|
— |
|
71,887 |
|
68,846 |
|
IOF on loans |
— |
|
— |
|
151,457 |
|
149,323 |
|
Reward Credit Compensation |
142,269 |
|
138,753 |
|
142,269 |
|
138,753 |
|
IPI - Tax on industrialized products |
231,783 |
|
227,184 |
|
370,639 |
|
374,274 |
|
INSS |
78,642 |
|
90,049 |
|
154,628 |
|
161,037 |
|
Other |
471,806 |
|
448,049 |
|
906,999 |
|
828,856 |
|
|
5,098,395 |
|
5,034,867 |
|
15,883,897 |
|
16,079,589 |
| (i) |
Assessment notice drawn up by the Federal Revenue of Brazil against Cosan Lubrificantes e Especialidades S.A. in the amount of R$104,926 referring to the collection of IRPJ and CSL, due to the disallowance of goodwill expenses amortized in 2017 and 2018. An objection was filed demonstrating the legality of the operation, considering the legal, commercial and economic factors that demonstrate the objective commercial and economic substance of the operation, which was carried out between independent parties and with effective payment of the price. |
| (ii) |
End of the administrative discussion and start of the judicial discussion regarding the official assessment of IRPJ and CSLL resulting from the disallowance of goodwill expenses amortized in 2009 to 2011. Addition of R$109,429 due to the registration of the debt in overdue debt. |
With the exception of the effect indicated in note 15.a, item (ii), we did not identify other effects of IFRIC 23 / ICPC 22 - Uncertainty regarding the Treatment of Taxes on Income that could significantly affect the accounting policies of the Company and its subsidiaries and these statements intermediary financial institutions..
Civil, environmental and regulatory:
|
|
Parent Company |
|
Consolidated |
||||
|
|
09/30/2023 |
|
12/31/2022 |
|
09/30/2023 |
|
12/31/2022 |
|
Civil |
971,918 |
|
972,966 |
|
3,128,803 |
|
3,336,284 |
|
Environmental |
59,656 |
|
42,159 |
|
2,285,923 |
|
1,764,671 |
|
Regulatory |
737 |
|
— |
|
1,557,123 |
|
1,496,150 |
|
|
1,032,311 |
|
1,015,125 |
|
6,971,849 |
|
6,597,105 |
Explanatory Notes to the interim Financial Statement
(In thousands of Reais, except when otherwise indicated)
a) Share capital
The subscribed capital on September 30, 2023 is R$8,682,544 (R$8,402,544 on December 31, 2022), fully paid in, represented by 1,874,070,932 registered, book-entry common shares with no par value. According to the statute, the authorized share capital can be increased up to the limit of R$9,000,000.
On April 27, 2023, the Extraordinary General Meeting approved the increase in the Company's share capital, in the amount of R$280,000, distribution of dividends of R$628,979, allocations of the legal reserve of R$58,802 and statutory reserve in the amount of R$488,252.
As of September 30, 2023, the Company's share capital consists of the following:
|
|
|
Ordinary actions |
||
|
Shareholding structure |
|
Amount |
|
% |
|
Controlling shareholders |
|
672,312,942 |
|
35.87% |
|
Administrators |
|
25,753,354 |
|
1.37% |
|
Free float |
|
1,169,433,764 |
|
62.41% |
|
|
|
|
|
|
|
Outstanding shares |
|
1,867,500,060 |
|
99.65% |
|
|
|
|
|
|
|
Treasury stock |
|
6,570,872 |
|
0.35% |
|
|
|
|
|
|
|
Total |
|
1,874,070,932 |
|
100.00% |
b) Treasury shares
On August 14, 2023, the Company's Board of Directors approved the new Share Buyback Program of up to 116,000,000 common shares, representing 9.93% of the total shares available on the market, with a term of up to 18 months. The repurchased shares may be used to meet obligations arising from potential exercises of share-based compensation plans, holding in treasury, disposal or cancellations in accordance with applicable legislation.
On September 30, 2023, the Company had 6,570,872 shares in treasury (7,432,832 shares on December 31, 2022), whose market price was R$17.14.
Explanatory Notes to the interim Financial Statement
(In thousands of Reais, except when otherwise indicated)
c) Dividends
|
Parent Company |
|
Investments in associates (i) |
|
Investments in joint venture |
|
Total |
|
At January 1, 2023 |
|
609,456 |
|
— |
|
609,456 |
|
Complementary Dividends |
|
357,436 |
|
58,635 |
|
416,071 |
|
Other movements |
|
(3,562) |
|
— |
|
(3,562) |
|
Dividends received |
|
(819,331) |
|
(58,635) |
|
(877,966) |
|
At September 30, 2023 |
|
143,999 |
|
— |
|
143,999 |
(i) See composition of the balance in note 9.1.a.
|
Consolidated |
|
Investments in associates (ii) |
|
Investments in joint venture |
|
Total |
|
At January 1, 2023 |
|
161,147 |
|
— |
|
161,147 |
|
Complementary Dividends |
|
202,453 |
|
516,268 |
|
718,721 |
|
Other movements |
|
(60,429) |
|
— |
|
(60,429) |
|
Dividends received |
|
(180,201) |
|
(516,268) |
|
(696,469) |
|
At September 30, 2023 |
|
122,970 |
|
— |
|
122,970 |
(ii) See composition of the balance in note 9.1.b.
|
|
|
Parent Company |
|
Consolidated |
|
At January 1, 2023 |
|
279,979 |
|
892,006 |
|
Complementary Dividends |
|
520,691 |
|
882,388 |
|
Dividends paid |
|
(798,203) |
|
(1,627,717) |
|
At September 30, 2023 |
|
2,467 |
|
146,677 |
Explanatory Notes to the interim Financial Statement
(In thousands of Reais, except when otherwise indicated)
d) Other comprehensive income
|
|
|
12/31/2022 |
|
Comprehensive (loss) income |
|
09/30/2023 |
|
Cash flow hedge result |
|
(1,361,895) |
|
(84,007) |
|
(1,445,902) |
|
Exchange rate differences on conversion of operations abroad |
|
2,010,914 |
|
(785,812) |
|
1,225,102 |
|
Actuarial losses of defined benefit plan |
|
(219,663) |
|
477 |
|
(219,186) |
|
Deferred tax on actuarial losses of defined benefit plan |
|
74,685 |
|
(162) |
|
74,523 |
|
Loss on measurement of derivative financial instrument |
|
(45,631) |
|
— |
|
(45,631) |
|
Change in the fair value of a financial asset |
|
77,152 |
|
— |
|
77,152 |
|
Deferred income tax on financial asset |
|
(26,232) |
|
— |
|
(26,232) |
|
Total |
|
509,330 |
|
(869,504) |
|
(360,174) |
|
|
|
|
|
|
|
|
|
Attributable to: |
|
|
|
|
|
|
|
Controlling shareholders |
|
567,546 |
|
(642,462) |
|
(74,916) |
|
Non-controlling shareholders |
|
(58,216) |
|
(227,042) |
|
(285,258) |
|
|
|
12/31/2021 |
|
Comprehensive (loss) income |
|
09/30/2022 |
|
Cash flow hedge result |
|
(1,362,618) |
|
(2,959) |
|
(1,365,577) |
|
Exchange rate differences on conversion of operations abroad |
|
1,093,366 |
|
787,017 |
|
1,880,383 |
|
Actuarial losses of defined benefit plan |
|
(299,993) |
|
25,939 |
|
(274,054) |
|
Deferred tax on actuarial losses of defined benefit plan |
|
101,997 |
|
(8,819) |
|
93,178 |
|
Loss on measurement of derivative financial instrument |
|
(45,631) |
|
— |
|
(45,631) |
|
Change in the fair value of a financial asset |
|
43,220 |
|
33,767 |
|
76,987 |
|
Deferred income tax on financial asset |
|
(14,695) |
|
(11,481) |
|
(26,176) |
|
Total |
|
(484,354) |
|
823,464 |
|
339,110 |
|
|
|
|
|
|
|
|
|
Attributable to: |
|
|
|
|
|
|
|
Owners of the Company |
|
(521,609) |
|
861,707 |
|
340,098 |
|
Non-controlling interests |
|
37,255 |
|
(38,243) |
|
(988) |
Basic earnings per share is calculated by dividing net income by the weighted average number of common shares outstanding during the period. Earnings per share after potentially dilutive instruments is computed by adjusting earnings and the number of shares for the impact of potentially dilutive instruments.
Explanatory Notes to the interim Financial Statement
(In thousands of Reais, except when otherwise indicated)
The following table presents the calculation of earnings per share (in thousands of reais, except for amounts per share):
|
|
3Q23 |
|
3Q22 |
|
9M23 |
|
9M22 |
|
(Loss) income attributable to holders of common shares of Company used in calculating basic earnings per share |
678,752 |
|
(14,886) |
|
(1,268,080) |
|
370,012 |
|
Diluting effect of the share-based plan of subsidiaries |
(374) |
|
(261) |
|
(566) |
|
(232) |
|
Dilutive effect - Brado Logística |
— |
|
(146) |
|
— |
|
(1,019) |
|
(Loss) income attributable to holders of common shares of Company used in the calculation of diluted earnings per share |
678,378 |
|
(15,293) |
|
(1,268,646) |
|
368,761 |
|
|
|
|
|
|
|
|
|
|
Weighted average number of common shares outstanding - basic (in thousands of shares) |
|
|
|
|
|
|
|
|
Basic |
1,867,217 |
|
1,868,618 |
|
1,866,823 |
|
1,868,913 |
|
Dilutive effect of the share-based plan |
— |
|
4,855 |
|
— |
|
5,720 |
|
Share repurchases |
— |
|
— |
|
(13,244) |
|
— |
|
|
|
|
|
|
|
|
|
|
Diluted |
1,867,217 |
|
1,873,473 |
|
1,853,579 |
|
1,874,633 |
|
|
|
|
|
|
|
|
|
|
Earnings per share |
|
|
|
|
|
|
|
|
Basic |
0.3635 |
|
(0.0080) |
|
(0.6793) |
|
0.1980 |
|
Diluted |
0.3633 |
|
(0.0082) |
|
(0.6844) |
|
0.1967 |
Diluting instruments
The Company and its subsidiaries have two categories of possible dilutive effects: stock grants and put options. For stock grants, a calculation is performed to determine the impact of dilution on the profit attributable to the Parent Company's shareholders as a result of the exercise of stock grants in subsidiaries. It is assumed that the put option was converted into common stock, and the profit attributable to the Parent Company's shareholders is adjusted accordingly.
In the period ended September 30, 2023, 10,243,716 shares related to the Company's share repurchase plan were considered in the analysis of diluted earnings per share as they increase loss per share.
Anti-dilution instruments
In the period ended September 30, 2023, 7,162,640 shares related to the Company's stock option plan were not considered in the diluted earnings per share analysis as they would have an anti-dilutive effect.
Explanatory Notes to the interim Financial Statement
(In thousands of Reais, except when otherwise indicated)
The following is an analysis of the Company’s and its subsidiaries net sales for the period:
|
|
Consolidated |
||||||
|
|
3Q23 |
|
3Q22 |
|
9M23 |
|
9M22 |
|
Gross revenue from the sale of products and services |
11,722,907 |
|
13,425,167 |
|
34,405,580 |
|
33,996,175 |
|
Construction revenue |
389,262 |
|
330,300 |
|
1,083,882 |
|
798,360 |
|
Indirect taxes and other deductions |
(1,858,599) |
|
(2,248,166) |
|
(5,594,109) |
|
(5,811,262) |
|
Net sales |
10,253,570 |
|
11,507,301 |
|
29,895,353 |
|
28,983,273 |
In the following table, revenue is disaggregated by products and service lines and timing of revenue recognition:
|
|
Consolidated |
||||||
|
|
3Q23 |
|
3Q22 |
|
9M23 |
|
9M22 |
|
At a point in time |
|
|
|
|
|
|
|
|
Natural gas distribution |
3,853,836 |
|
5,347,983 |
|
11,980,659 |
|
13,500,651 |
|
Electricity trading |
— |
|
60,819 |
|
— |
|
175,844 |
|
Lubricants and base oil |
2,127,749 |
|
2,551,231 |
|
6,991,549 |
|
6,246,116 |
|
Other |
276,470 |
|
171,521 |
|
877,113 |
|
471,311 |
|
|
6,258,055 |
|
8,131,554 |
|
19,849,321 |
|
20,393,922 |
|
Over time |
|
|
|
|
|
|
|
|
Railroad transportation services |
3,017,190 |
|
2,818,551 |
|
7,930,971 |
|
7,289,575 |
|
Container operations |
157,882 |
|
132,049 |
|
391,041 |
|
332,018 |
|
Construction revenue |
389,262 |
|
330,300 |
|
1,083,882 |
|
798,360 |
|
Services rendered |
445,386 |
|
112,150 |
|
685,876 |
|
214,998 |
|
|
4,009,720 |
|
3,393,050 |
|
10,091,770 |
|
8,634,951 |
|
|
|
|
|
|
|
|
|
|
Eliminations |
(14,205) |
|
(17,303) |
|
(45,738) |
|
(45,600) |
|
|
|
|
|
|
|
|
|
|
Total net sales |
10,253,570 |
|
11,507,301 |
|
29,895,353 |
|
28,983,273 |
Seasonality of operations
The Company's segments “Gas and Power” and “Logistics” segments are subject to fluctuations due to the seasonality of operations, as shown below:
Gas and Power
Activities in the natural gas commercialization and distribution segment are subject to seasonality. While the months from December to March are marked by a drop in gas consumption, between the months of April and November there is a significant increase in consumption, due to the winter season and the acceleration of industrial production.
Logistics
Rumo's activities are subject to the natural seasonality of agricultural commodities. Most of the soybean crop exports take place between January and August, while the transportation of the corn crop (mainly for export) is concentrated between May and December. These fluctuations have a significant impact on the demand for transporting these commodities. For this reason, Rumo normally has a higher volume transported in the second and third quarters of each year, and a lower volume transported in the off-season, that is, in the first and fourth quarters of each year.
Explanatory Notes to the interim Financial Statement
(In thousands of Reais, except when otherwise indicated)
The costs and expenses are presented in the statement of profit and loss by function. The reconciliation of costs and expenses by nature/purpose is as follows:
|
|
Parent Company |
|
Consolidated |
||||||||||||
|
|
3Q23 |
|
3Q22 |
|
9M23 |
|
9M22 |
|
3Q23 |
|
3Q22 |
|
9M23 |
|
9M22 |
|
Raw materials |
— |
|
— |
|
— |
|
— |
|
(1,808,847) |
|
(1,851,478) |
|
(5,490,005) |
|
(4,737,400) |
|
Gas and transportation cost |
— |
|
— |
|
— |
|
— |
|
(2,775,672) |
|
(4,262,079) |
|
(8,826,771) |
|
(10,584,177) |
|
Electricity purchased for resale |
— |
|
— |
|
— |
|
— |
|
— |
|
(65,906) |
|
— |
|
(196,912) |
|
Railroad transport and port elevation expenses |
— |
|
— |
|
— |
|
— |
|
(710,041) |
|
(972,498) |
|
(2,066,335) |
|
(2,398,659) |
|
Other transport |
— |
|
— |
|
— |
|
— |
|
(138,880) |
|
(40,142) |
|
(426,994) |
|
(85,715) |
|
Depreciation and amortization |
(3,670) |
|
(3,123) |
|
(10,697) |
|
(10,461) |
|
(867,633) |
|
(679,047) |
|
(2,477,810) |
|
(2,162,751) |
|
Personnel expenses |
(96,189) |
|
(51,960) |
|
(222,137) |
|
(141,043) |
|
(791,638) |
|
(725,931) |
|
(2,148,200) |
|
(1,792,263) |
|
Construction cost |
— |
|
— |
|
— |
|
— |
|
(389,262) |
|
(330,300) |
|
(1,083,882) |
|
(798,360) |
|
Expenses with third-party services |
(13,008) |
|
(6,699) |
|
(26,847) |
|
(18,497) |
|
(308,648) |
|
(227,749) |
|
(681,287) |
|
(623,282) |
|
Business expenses |
(7) |
|
— |
|
(11) |
|
— |
|
(8,517) |
|
(11,075) |
|
(28,653) |
|
(29,373) |
|
Other expenses |
(16,644) |
|
(15,793) |
|
(51,166) |
|
(44,120) |
|
(231,205) |
|
(475,233) |
|
(893,337) |
|
(971,661) |
|
|
(129,518) |
|
(77,575) |
|
(310,858) |
|
(214,121) |
|
(8,030,343) |
|
(9,641,438) |
|
(24,123,274) |
|
(24,380,553) |
|
|
|
|
|
|
|
|
|
|
|
|
|
|
|
|
|
|
Cost of goods sold and services rendered |
— |
|
— |
|
— |
|
— |
|
(6,955,078) |
|
(8,698,843) |
|
(21,222,714) |
|
(22,166,959) |
|
Selling expenses |
— |
|
— |
|
— |
|
— |
|
(329,465) |
|
(378,616) |
|
(1,010,705) |
|
(816,026) |
|
General and administrative expenses |
(129,518) |
|
(77,575) |
|
(310,858) |
|
(214,121) |
|
(745,800) |
|
(563,979) |
|
(1,889,855) |
|
(1,397,568) |
|
|
(129,518) |
|
(77,575) |
|
(310,858) |
|
(214,121) |
|
(8,030,343) |
|
(9,641,438) |
|
(24,123,274) |
|
(24,380,553) |
|
|
Parent Company |
|
Consolidated |
||||||||||||
|
|
3Q23 |
|
3Q22 |
|
9M23 |
|
9M22 |
|
3Q23 |
|
3Q22 |
|
9M23 |
|
9M22 |
|
Gain from bargain purchase |
— |
|
— |
|
— |
|
92,946 |
|
— |
|
— |
|
— |
|
92,946 |
|
Extemporaneous tax credits |
— |
|
— |
|
— |
|
— |
|
6,098 |
|
203 |
|
10,323 |
|
77,926 |
|
Change in fair value of investment properties |
— |
|
— |
|
— |
|
— |
|
372,015 |
|
— |
|
463,837 |
|
59,061 |
|
Loss on disposals of non-current assets and intangible assets |
— |
|
(1,858) |
|
13,563 |
|
(1,858) |
|
(4,182) |
|
(3,354) |
|
(4,959) |
|
(27,343) |
|
Net effect of provisions for legal proceedings |
(13,192) |
|
(24,245) |
|
(56,716) |
|
(51,388) |
|
(60,677) |
|
(86,841) |
|
(139,301) |
|
(237,395) |
|
Settlement of disputes in the renewal process |
— |
|
— |
|
— |
|
— |
|
— |
|
— |
|
— |
|
(32,490) |
|
Dividends |
— |
|
— |
|
— |
|
— |
|
359,452 |
|
— |
|
762,204 |
|
— |
|
Realization of deferred revenue |
— |
|
— |
|
— |
|
— |
|
923,214 |
|
— |
|
923,214 |
|
— |
|
Other income |
4,323 |
|
5,666 |
|
61,730 |
|
14,650 |
|
83,768 |
|
— |
|
125,775 |
|
— |
|
Loss due to reduction in net recoverable value |
— |
|
— |
|
— |
|
— |
|
— |
|
(243) |
|
— |
|
(243) |
|
Other |
(31,453) |
|
(6,786) |
|
(61,594) |
|
(26,894) |
|
(275,815) |
|
26,379 |
|
(431,373) |
|
19,066 |
|
|
(40,322) |
|
(27,223) |
|
(43,017) |
|
27,456 |
|
1,403,873 |
|
(63,856) |
|
1,709,720 |
|
(48,472) |
| (i) | Includes the gain relating to the sale of SINLOG TECNOLOGIA EM LOGÍSTICA S.A in the amount of R$14,884 as per note 2.1. |
| (ii) | As mentioned in note 2 |
Explanatory Notes to the interim Financial Statement
(In thousands of Reais, except when otherwise indicated)
|
|
Parent Company |
|
Consolidated |
||||||||||||
|
|
3Q23 |
|
3Q22 |
|
9M23 |
|
9M22 |
|
3Q23 |
|
3Q22 |
|
9M23 |
|
9M22 |
|
Gross debt cost |
|
|
|
|
|
|
|
|
|
|
|
|
|
|
|
|
Interest and monetary variation (i) |
(266,346) |
|
(162,306) |
|
(687,981) |
|
(571,477) |
|
(965,027) |
|
(904,309) |
|
(3,235,041) |
|
(3,096,742) |
|
Net foreign exchange variation on debts (i) |
(11,767) |
|
(124,422) |
|
(11,767) |
|
135,445 |
|
(769,553) |
|
(421,131) |
|
1,425,218 |
|
768,909 |
|
Financial result with derivatives and fair value (ii) (iii) |
(32,592) |
|
(174,081) |
|
(963,447) |
|
(1,589,928) |
|
(622,049) |
|
(253,386) |
|
(795,799) |
|
(1,486,926) |
|
Amortization of borrowing costs |
(2,580) |
|
(23,718) |
|
(6,805) |
|
(32,189) |
|
(16,422) |
|
(16,327) |
|
(45,798) |
|
(181,851) |
|
Guarantees and warranties |
— |
|
— |
|
— |
|
— |
|
(9,263) |
|
(9,554) |
|
(29,204) |
|
(32,230) |
|
|
(313,285) |
|
(484,527) |
|
(1,670,000) |
|
(2,058,149) |
|
(2,382,314) |
|
(1,604,707) |
|
(2,680,624) |
|
(4,028,840) |
|
Income from financial investments and exchange rate variation in cash and cash equivalents |
71,133 |
|
48,374 |
|
167,838 |
|
151,408 |
|
572,200 |
|
477,467 |
|
1,503,376 |
|
1,309,639 |
|
Changes in fair value of investments in listed entities (iv) |
— |
|
— |
|
— |
|
— |
|
740,432 |
|
283,366 |
|
(4,528,730) |
|
283,366 |
|
|
71,133 |
|
48,374 |
|
167,838 |
|
151,408 |
|
1,312,632 |
|
760,833 |
|
(3,025,354) |
|
1,593,005 |
|
|
|
|
|
|
|
|
|
|
|
|
|
|
|
|
|
|
Cost of debt, net |
(242,152) |
|
(436,153) |
|
(1,502,162) |
|
(1,906,741) |
|
(1,069,682) |
|
(843,874) |
|
(5,705,978) |
|
(2,435,835) |
|
|
|
|
|
|
|
|
|
|
|
|
|
|
|
|
|
|
Other charges and monetary variations |
|
|
|
|
|
|
|
|
|
|
|
|
|
|
|
|
Interest on other receivables |
14,662 |
|
16,354 |
|
37,300 |
|
34,942 |
|
111,197 |
|
105,922 |
|
335,987 |
|
261,372 |
|
Update of other financial assets |
169 |
|
2,060 |
|
1,777 |
|
(1,006) |
|
169 |
|
17,010 |
|
1,777 |
|
(1,006) |
|
Monetary variation on leases and concessions agreements |
— |
|
— |
|
— |
|
— |
|
(121,207) |
|
(118,199) |
|
(399,066) |
|
(299,122) |
|
Interest on leases |
(913) |
|
(917) |
|
(2,707) |
|
(2,906) |
|
(129,426) |
|
(89,233) |
|
(308,888) |
|
(288,221) |
|
Interest on shareholders’ equity |
— |
|
(4,346) |
|
(39,534) |
|
(6,401) |
|
— |
|
— |
|
(43,175) |
|
— |
|
Interest on contingencies and contracts |
(60,244) |
|
(38,095) |
|
(147,914) |
|
(78,250) |
|
(240,748) |
|
(104,331) |
|
(933,857) |
|
(307,387) |
|
Interest on sectoral assets and liabilities |
— |
|
— |
|
— |
|
— |
|
(24,359) |
|
(10,413) |
|
(66,057) |
|
(21,964) |
|
Bank charges and other |
(7,236) |
|
(114,172) |
|
(25,847) |
|
(137,033) |
|
(35,416) |
|
(124,393) |
|
(82,838) |
|
(125,050) |
|
Foreign exchange, net |
(448,268) |
|
(317,117) |
|
(108,297) |
|
(391,536) |
|
35,106 |
|
(187,174) |
|
(184,161) |
|
(628,670) |
|
|
(501,830) |
|
(456,233) |
|
(285,222) |
|
(582,190) |
|
(404,684) |
|
(510,811) |
|
(1,680,278) |
|
(1,410,048) |
|
Financial result, net |
(743,982) |
|
(892,386) |
|
(1,787,384) |
|
(2,488,931) |
|
(1,474,366) |
|
(1,354,685) |
|
(7,386,256) |
|
(3,845,883) |
|
|
|
|
|
|
|
|
|
|
|
|
|
|
|
|
|
|
Reconciliation |
|
|
|
|
|
|
|
|
|
|
|
|
|
|
|
|
Financial expenses |
(504,229) |
|
(508,854) |
|
(1,396,303) |
|
(1,183,257) |
|
(646,254) |
|
(1,199,642) |
|
(10,323,734) |
|
(2,681,384) |
|
Financial income |
91,269 |
|
71,038 |
|
240,953 |
|
192,710 |
|
722,377 |
|
709,151 |
|
1,951,914 |
|
2,022,664 |
|
Exchange variation |
(348,799) |
|
(313,494) |
|
361,829 |
|
312,399 |
|
(756,108) |
|
(572,510) |
|
1,379,572 |
|
504,071 |
|
Net effect of derivatives |
17,777 |
|
(141,076) |
|
(993,863) |
|
(1,810,783) |
|
(794,381) |
|
(291,684) |
|
(394,008) |
|
(3,691,234) |
|
Financial result, net |
(743,982) |
|
(892,386) |
|
(1,787,384) |
|
(2,488,931) |
|
(1,474,366) |
|
(1,354,685) |
|
(7,386,256) |
|
(3,845,883) |
| (i) |
September 30, 2023, the amount of interest for monetary variation and exchange variation of debts linked to the purchase of assets from Vale was R$711,919. |
| (ii) |
September 30, 2023, the cost of banking operations with derivatives was R$380,453. |
| (iii) |
September 30, 2023, the result with derivatives and fair value of the securities linked to the protection of the investment in Vale shares was R$1,636,448. |
| (iv) |
The gross balance of the financial investment’s accrual in listed entities without effects of PIS and COFINS in the nine months ended on September 30, 2023, is R$4,693,812. |
Explanatory Notes to the interim Financial Statement
(In thousands of Reais, except when otherwise indicated)
|
|
Consolidated |
||
|
|
09/30/2023 |
|
12/31/2022 |
|
Defined contribution |
|
|
|
|
Future II |
256 |
|
332 |
|
Defined benefit |
|
|
|
|
Future |
134,826 |
|
127,351 |
|
Health Insurance |
461,951 |
|
448,157 |
|
|
596,777 |
|
575,508 |
|
|
597,033 |
|
575,840 |
The Company and its subsidiaries have Share-Based Plans that are settled in shares and cash. As of September 30, 2023, the Group has the following share-based payment arrangements:
Grants made in 2023
In the period ended of September 30, 2023, the following Grant Program was established:
|
Program |
Conditions for vesting |
|
|
Cosan Partners 2023. |
Grants January 30, 2023. The incentive program is conditioned on length of service (service condition) and performance targets (performance conditions). Of the program's total shares, 60% are related to length of service for a period of 3 years, with shares being granted annually. The remainder, equivalent to 40% of the program, are related to performance goals, requiring the achievement of specific metrics that can vary between 0% and 110% (to calculate the fair value, reaching 100% was considered), these actions will have a specific base weight in accordance with the target established by the Board of Directors. Grant March 28, 2023. The incentive program is conditioned on length of service (service condition) and performance targets (performance conditions). Of the program's total shares, 49% are related to length of service for a period of 3 years, with shares being granted annually. The remainder, equivalent to 51% of the program, are related to performance goals, requiring the achievement of specific metrics that can vary between 0% and 110%. The total value of shares granted in the two plans is 12,472,325. |
Explanatory Notes to the interim Financial Statement
(In thousands of Reais, except when otherwise indicated)
|
Cosan Invest. |
Grant July 31, 2023. The incentive program is conditioned on length of service (service condition) and performance targets (performance conditions). Of the program's total shares, 41% are related to length of service for a period of 3 years, with shares being granted annually. The remainder, equivalent to 59% of the program, are related to performance goals, requiring the achievement of specific metrics that can vary between 50% and 150%. |
|
|
SOP Moove. |
Grant July 1, 2023. The incentive program is conditioned on length of service (service condition) and linked to the occurrence of a liquidity event defined in the program (performance conditions). The options granted to participants may only be exercised after they become vested options, and the maximum period for exercising the Options will be 6 (six) years from the date of grant. The exercise price of the options covered by this Program is R$50.05 for Model A options, R$106.28 for Model B options and R$135.05 for Models C and D options (“Exercise Price”) and must be paid in cash, simultaneously with the formalization of the subscription or purchase. To measure fair value, the binomial model is used with premises such as price of the base asset, distribution of dividends (0% dividend yield), exercise price according to each Model within the program, expected average exit rate, risk-free rate, volatility and effect of lock-up linked to the exercise of options. |
Explanatory Notes to the interim Financial Statement
(In thousands of Reais, except when otherwise indicated)
|
Award Type / Award Date |
|
Company |
|
Life expectancy (years) |
|
Grants under plans |
|
Exercised / Canceled / Transferred |
|
Available |
|
Fair value as of grant date - R$ |
|
Share grant program |
|
|
|
|
|
|
|
|
|
|
||
|
31/07/2018 |
|
Cosan S.A. |
|
— |
|
842,408 |
|
(842,408) |
|
— |
|
9.65 |
|
31/07/2019 |
|
Cosan S.A. |
|
60 |
|
229,020 |
|
(22,283) |
|
206,737 |
|
12.46 |
|
31/07/2020 |
|
Cosan S.A. |
|
60 |
|
68,972 |
|
(6,704) |
|
62,268 |
|
20.93 |
|
7/31/2021 - Invest I |
|
Cosan S.A. |
|
36 |
|
424,839 |
|
— |
|
424,839 |
|
24.38 |
|
9/10/2021 - Invest II |
|
Cosan S.A. |
|
48 |
|
5,283,275 |
|
(1,981,231) |
|
3,302,044 |
|
22.24 |
|
10/11/2021 - Invest III |
|
Cosan S.A. |
|
60 |
|
809,944 |
|
— |
|
809,944 |
|
23.20 |
|
7/31/2022 - Invest I |
|
Cosan S.A. |
|
36 |
|
846,506 |
|
— |
|
846,506 |
|
18.74 |
|
11/22/2022 - Invests Partners |
|
Cosan S.A. |
|
60 |
|
377,173 |
|
— |
|
377,173 |
|
17.14 |
|
1/30/2023 - Invest Partners |
|
Cosan S.A. |
|
36 |
|
12,472,325 |
|
— |
|
12,472,325 |
|
15.26 |
|
7/31/2023 - Invest Cosan I - Regular |
|
Cosan S.A. |
|
36 |
|
1,047,845 |
|
— |
|
1,047,845 |
|
17.53 |
|
|
|
|
|
|
|
22,402,307 |
|
(2,852,626) |
|
19,549,681 |
|
|
|
7/31/2019 |
|
Comgás |
|
48 |
|
83,683 |
|
(83,683) |
|
— |
|
79.00 |
|
|
|
|
|
|
|
|
|
|
|
|
|
|
|
7/01/2023 - Program SOP A |
|
Moove |
|
72 |
|
699,276 |
|
— |
|
699,276 |
|
142.62 |
|
7/01/2023 - Program SOP B |
|
Moove |
|
72 |
|
279,710 |
|
— |
|
279,710 |
|
88.32 |
|
7/01/2023 - Program SOP C |
|
Moove |
|
72 |
|
223,768 |
|
— |
|
223,768 |
|
76.54 |
|
7/01/2023 - Program SOP D |
|
Moove |
|
72 |
|
139,855 |
|
— |
|
139,855 |
|
71.45 |
|
|
|
|
|
|
|
1,342,609 |
|
— |
|
1,342,609 |
|
|
|
|
|
|
|
|
|
|
|
|
|
|
|
|
|
01/08/2018 |
|
Rumo S.A. |
|
60 |
|
1,149,544 |
|
(1,149,544) |
|
— |
|
13.94 |
|
15/08/2019 |
|
Rumo S.A. |
|
60 |
|
843,152 |
|
(267,977) |
|
575,175 |
|
22.17 |
|
11/11/2020 |
|
Rumo S.A. |
|
60 |
|
776,142 |
|
(238,437) |
|
537,705 |
|
20.01 |
|
05/05/2021 |
|
Rumo S.A. |
|
60 |
|
1,481,000 |
|
(977,523) |
|
503,477 |
|
20.84 |
|
15/09/2021 |
|
Rumo S.A. |
|
36 |
|
1,560,393 |
|
(175,636) |
|
1,384,757 |
|
18.19 |
|
01/09/2022 |
|
Rumo S.A. |
|
36 |
|
1,781,640 |
|
(35,513) |
|
1,746,127 |
|
20.36 |
|
01/09/2022 |
|
Rumo S.A. |
|
— |
|
146,909 |
|
(146,909) |
|
— |
|
20.36 |
|
01/09/2023 |
|
Rumo S.A. |
|
36 |
|
1,724,867 |
|
— |
|
1,724,867 |
|
21.86 |
|
|
|
|
|
|
|
9,463,647 |
|
(2,991,539) |
|
6,472,108 |
|
|
|
Share-based compensation plan (settled in cash) |
|
|
|
|
|
|
|
|
||||
|
07/31/2019 - Invest I |
|
Moove |
|
60 |
|
132,670 |
|
(26,285) |
|
106,385 |
|
50.79 |
|
07/31/2020 - Invest II |
|
Moove |
|
60 |
|
106,952 |
|
(17,210) |
|
89,742 |
|
61.89 |
|
07/31/2021 - Invest III |
|
Moove |
|
36 |
|
80,729 |
|
(13,141) |
|
67,588 |
|
102.73 |
|
07/31/2022 - Invest IV |
|
Moove |
|
36 |
|
77,188 |
|
(3,000) |
|
74,188 |
|
135.05 |
|
07/31/2023 - Invest V |
|
Moove |
|
36 |
|
82,234 |
|
— |
|
82,234 |
|
150.98 |
|
07/31/2022 - Special Program |
|
Moove |
|
48 |
|
615,362 |
|
(615,362) |
|
— |
|
50.05 |
|
01/08/2021 |
|
Compass Gás e Energia |
|
24 |
|
29,492 |
|
(29,492) |
|
— |
|
25.46 |
|
01/08/2021 |
|
Compass Comercialização |
|
36 |
|
34,054 |
|
(6,001) |
|
28,053 |
|
25.46 |
|
01/08/2021 |
|
Compass Gás e Energia |
|
36 |
|
164,657 |
|
— |
|
164,657 |
|
25.46 |
|
01/08/2021 |
|
Compass Gás e Energia |
|
36 |
|
36,251 |
|
— |
|
36,251 |
|
25.46 |
|
01/11/2021 |
|
Compass Gás e Energia |
|
32 |
|
185,649 |
|
— |
|
185,649 |
|
25.46 |
|
01/11/2021 |
|
Compass Gás e Energia |
|
32 |
|
1,589,245 |
|
(17,873) |
|
1,571,372 |
|
25.46 |
|
01/02/2022 |
|
Compass Gás e Energia |
|
29 |
|
87,021 |
|
— |
|
87,021 |
|
25.59 |
|
01/08/2022 |
|
Compass Gás e Energia |
|
36 |
|
808,938 |
|
— |
|
808,938 |
|
25.59 |
|
01/08/2022 |
|
Compass |
|
36 |
|
29,828 |
|
(6,460) |
|
23,368 |
|
25.59 |
|
01/08/2022 |
|
TRSP |
|
36 |
|
30,598 |
|
— |
|
30,598 |
|
25.59 |
|
01/08/2023 |
|
Compass Gás e Energia |
|
36 |
|
234,741 |
|
— |
|
234,741 |
|
34.12 |
|
01/08/2023 |
|
Compass |
|
36 |
|
24,862 |
|
— |
|
24,862 |
|
34.12 |
|
01/08/2023 |
|
TRSP |
|
36 |
|
22,187 |
|
— |
|
22,187 |
|
34.12 |
|
|
|
|
|
|
|
4,372,658 |
|
(734,824) |
|
3,637,834 |
|
|
|
Total |
|
|
|
|
|
37,664,904 |
|
(6,662,672) |
|
31,002,232 |
|
|
Explanatory Notes to the interim Financial Statement
(In thousands of Reais, except when otherwise indicated)
a) Reconciliation of outstanding share grants
The change in outstanding share grants is as follows:
|
|
|
Parent company |
|
Consolidated |
|
At January 1, 2023 |
|
7,426,957 |
|
17,876,508 |
|
Granted |
|
13,520,170 |
|
16,951,670 |
|
Exercised/cancels/other |
|
(1,397,446) |
|
(3,825,946) |
|
At September 30, 2023 |
|
19,549,681 |
|
31,002,232 |
b) Fair value measurement
The weighted average fair value of the shares granted during the period ended September 30, 2023, and the year ended December 31, 2022 as well as the key assumptions used to apply the Black and Scholes and Binominal model were as follows:
|
|
|
Average market price on the grant date |
|
Interest rate |
|
Volatility |
|
Cosan S.A |
09/30/2023 |
16.02 |
|
N/A |
|
N/A |
|
12/31/2023 |
17.14 |
|
6.82% |
|
36.50% |
|
|
|
|
|
|
|
|
|
|
Compass |
09/30/2023 |
41.46 |
|
N/A |
|
N/A |
|
12/31/2023 |
29.20 |
|
N/A |
|
N/A |
|
|
|
|
|
|
|
|
|
|
Comgás |
09/30/2023 |
79.00 |
|
N/A |
|
N/A |
|
12/31/2023 |
79.00 |
|
N/A |
|
N/A |
|
|
|
|
|
|
|
|
|
|
TRSP |
09/30/2023 |
41.46 |
|
N/A |
|
N/A |
|
12/31/2023 |
29.20 |
|
N/A |
|
N/A |
|
|
|
|
|
|
|
|
|
|
Rumo |
09/30/2023 |
21.87 |
|
10.41% |
|
25.84% |
|
12/31/2023 |
20.56 |
|
11.53% |
|
27.70% |
|
|
|
|
|
|
|
|
|
|
Moove |
09/30/2023 |
105.98 |
|
4.05% |
|
42.85% |
c) Expense recognized in profit or loss
Share-based compensation expenses included in profit or loss for the periods ended September 30, 2023, and 2022 were R$151,177 and R$ 50,996, respectively.
Explanatory Notes to the interim Financial Statement
(In thousands of Reais, except when otherwise indicated)
PARTIAL COMMIT SPIN-OFF
On October 9, 2023, the Extraordinary General Meeting of the indirect subsidiary Commit Gás S.A. (“Commit”) approved the partial spin-off of Commit into a new company, to be called Norgás S.A. (“Norgás”). The spun-off portion is made up of shares representing the equity interest held by Commit in Companhia de Gás do Ceará (“CEGÁS”), Companhia Potiguar de Gás (“POTIGÁS”), Gás de Alagoas S.A. (“ALGÁS”), Sergipe Gás S.A. ( “SERGÁS”) and Companhia Pernambucana de Gás (“COPERGÁS”). The indirect subsidiary Compass Gás e Energia holds a 51% shareholding in Norgás, the same percentage it holds in Commit, therefore Compass Gás e Energia's shareholding in the companies mentioned above does not change.
The occurrence of this event reinforces the strategy of the subsidiary Compass of selling its stake in Norgás, and as a result, on the same date these investments for balance sheet purposes were classified as 'asset held for sale' and for income statement purposes they were classified as 'discontinued operation', in accordance with the requirements contained in Technical pronouncement CPC 31 – Non-Current Assets Held for Sale and Discontinued Operations.
ACQUISITION OF 51% SHAREHOLDING IN BIOMETANO VERDE PAULÍNIA S.A.
On October 20, 2023, the indirect subsidiary Compass Comercialização concluded the acquisition of control of 51% of the equity interest in Biometano Verde Paulínia S.A. (“BVP”). BVP is a privately held company based in Brazil whose activities will involve the purification and treatment of Biogas and the production, movement and sale of Biomethane. Compass Comercialização carried out the acquisition in line with the objective of expanding the Marketing & Services segment, offering increasingly complete solutions to its customers towards a safe and efficient energy transition.
The cash disbursement in the context of the acquisition, up to the date of issue of these interim financial statements, was R$235,000, of which R$100,000 was via capital contribution and R$135,000 paid in a single installment to the former controlling shareholders. The subsidiary Compass hired external consultants to assess the financial impacts of this transaction, which is ongoing on the date of publication of these interim financial statements.
DISTRIBUTION OF DIVIDENDS AND INTEREST ON VALE’S EQUITY
On October 26, 2023, Vale's Board of Directors approved shareholder remuneration in the amount of R$10,033 million. Of this amount, R$6,738 million refers to dividends corresponding to the total value of R$1.565890809 per share and R$3,295 million refers to interest on equity (“JCP”) corresponding to the total value of R$0.765770758 per share as interest on equity.
MOOVE CORPORATE REORGANIZATION
During the third quarter of 2023, the Management of the subsidiary Moove approved the carrying out of a corporate reorganization consisting of the creation of a new entity in the Cayman Islands, Moove Lubricants Holdings – “MLH”, and the subsequent transfer of all assets of the Moove Group's current holding company, Cosan Lubes Investments – “CLI”, for the new entity. The new entity will become the holding company of the Moove Group and CLI will be liquidated. The reorganization is expected to be carried out during the fourth quarter of 2023.
Explanatory Notes to the interim Financial Statement
(In thousands of Reais, except when otherwise indicated)
2nd ISSUE OF DEBENTURES LINKED TO ENVIRONMENTAL, SOCIAL AND GOVERNANCE (“ESG”) GOALS
On November 1, 2023, the subsidiary Compass issued simple, non-convertible debentures, in the amount of R$1,736,385 with semi-annual remuneration equivalent to CDI + 1.55% p.a. and maturities on November 1, 2029 (50%) and November 1, 2030. The resources obtained from the issue will be used for investments and reinforcement of working capital.
This 2nd issue of debentures is linked to ESG Targets of:
| (i) |
Biomethane distributed volume (thousands of m³): Increase the daily volume distributed by 50 times in 2022 until 2027, reaching 0.25mln/m³ day; |
| (i) |
(Diversity in Leadership Positions: Reach 47% of people in leadership composed of Diversity Groups by 2027. |
The Compass subsidiary will undergo a step-up of 12.5 basis points for each target that is not achieved, which would increase the rate from April 2028 (verification date) to up to CDI + 1.85% p.a.
COMPASS DIVIDENDS
On November 8, 2023, the Board of Directors of the subsidiary Compass deliberated and approved the distribution of interim dividends in the amount of R$1,000,000; being part of the previous year's profit reserves account (R$724,565); and part of the net profit for the year incurred until September 2023 (R$275,435).
EIGHTH ISSUE OF COSAN DEBENTURES
On November 8, 2023, the Board of Directors of Cosan S.A. approved the public offering of the 8th issue of simple debentures, under a firm placement guarantee regime, not convertible into shares, unsecured, in a single series. The issuance will be in the total amount of R$ 1,250,000.00, with semi-annual interest accruing at a rate equal to DI plus a spread of 1.80% p.a. and with principal due on January 21, 2031, with partial straight-line amortization on January 21, 2030 and on the maturity date. The net resources obtained from the Issue will be used for the ordinary management of the Company's business.
SHARE PURCHASE PLAN – RUMO
On November 9, 2023, the Board of Directors of the subsidiary Rumo approved the share buyback program. The approved Program aims to acquire shares issued by Rumo itself to maintain such shares acquired in treasury, cancel or sell them, or subsequently sell the shares on the market. The shares repurchased and held in treasury may, at the discretion of Rumo’s management, be used to fulfill obligations arising from share plans relating to the retention of executives, in the manner approved by the shareholders meeting at the General Meeting and by the Board of Directors.
The maximum period for carrying out acquisitions of Rumo shares under the Buyback Program will be 18 months, starting on November 10, 2023 and ending on May 10, 2025. Within this period, the repurchase limit of the Company will be 4,461,504 shares.
SIGNATURES
Pursuant to the requirements of the Securities Exchange Act of 1934, the registrant has duly caused this report to be signed on its behalf by the undersigned, thereunto duly authorized.
Date: November 13, 2023
|
COSAN S.A. |
||
|
By: |
/s/ Ricardo Lewin |
|
|
|
Name: Ricardo Lewin |
|
|
|
Title: Chief Financial Officer |
|
| 90 |