UNITED STATES
SECURITIES AND EXCHANGE COMMISSION
Washington, D.C. 20549
FORM 6-K
Report of Foreign Issuer
Pursuant To Rule 13a-16 Or 15d-16 of the
Securities Exchange Act of 1934
For the month of May 2023
Commission File Number: 333-251238
|
|
COSAN S.A.
(Exact name of registrant as specified in its charter)
N/A
(Translation of registrant’s name into English)
|
|
Av. Brigadeiro Faria Lima, 4100, – 16th floor
São Paulo, SP 04538-132 Brazil
(Address of principal executive offices)
Indicate by check mark whether the registrant files or will file annual reports under cover of Form 20-F or Form 40‑F:
Form 20-F ☒ Form 40-F ☐
Indicate by check mark if the registrant is submitting the Form 6-K in paper as permitted by Regulation S-T Rule 101(b)(1):
Yes ☐ No ☒
Indicate by check mark if the registrant is submitting the Form 6-K in paper as permitted by Regulation S-T Rule 101(b)(7):
Yes ☐ No ☒
Earnings Release Cosan S.A. 1st Quarter of 2023
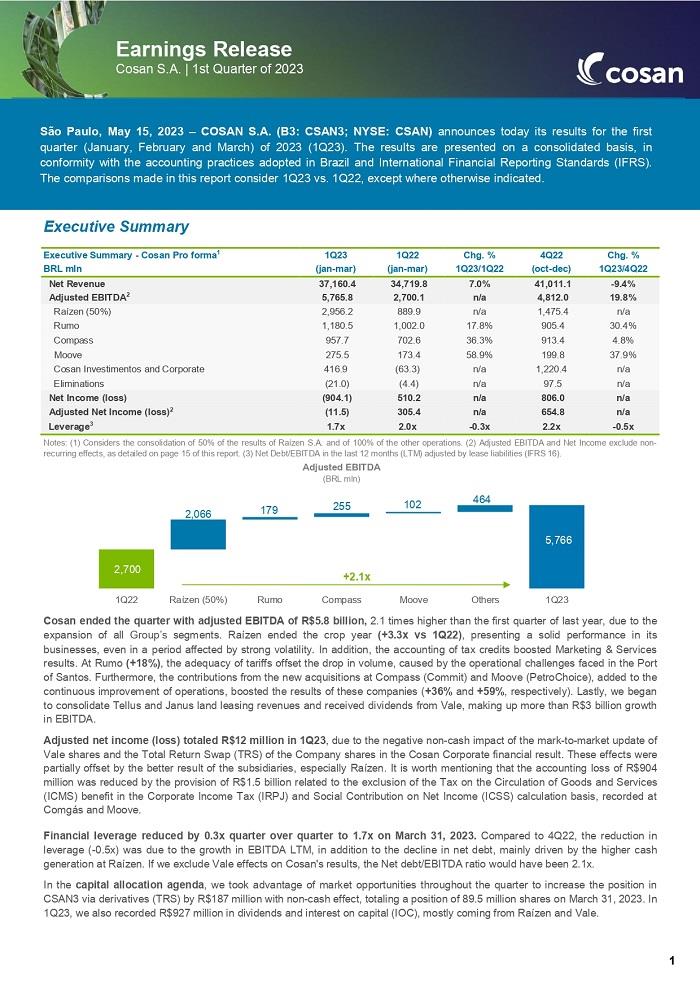
São Paulo, May 15, 2023 – COSAN S.A. (B3: CSAN3; NYSE: CSAN) announces today its results for the first quarter (January, February and March) of 2023 (1Q23). The results are presented on a consolidated basis, in conformity with the accounting practices adopted in Brazil and International Financial Reporting Standards (IFRS). The comparisons made in this report consider 1Q23 vs. 1Q22, except where otherwise indicated.Executive Summary Executive Summary - Cosan Pro forma1 1Q23 1Q22 Chg. % 4Q22 Chg. % BRL mln (jan-mar) (jan-mar) 1Q23/1Q22 (oct-dec) 1Q23/4Q22 Net Revenue 37,160.4 34,719.8 7.0% 41,011.1 -9.4% Adjusted EBITDA2 5,765.8 2,700.1 n/a 4,812.0 19.8% Raízen (50%) 2,956.2 889.9 n/a 1,475.4 n/a Rumo 1,180.5 1,002.0 17.8% 905.4 30.4% Compass 957.7 702.6 36.3% 913.4 4.8% Moove 275.5 173.4 58.9% 199.8 37.9% Cosan Investimentos and Corporate 416.9 (63.3) n/a 1,220.4 n/a Eliminations (21.0) (4.4) n/a 97.5 n/a Net Income (loss) (904.1) 510.2 n/a 806.0 n/a Adjusted Net Income (loss)2 (11.5) 305.4 n/a 654.8 n/a Leverage3 1.7x 2.0x -0.3x 2.2x -0.5x Notes: (1) Considers the consolidation of 50% of the results of Raízen S.A. and of 100% of the other operations. (2) Adjusted EBITDA and Net Income exclude non-recurring effects, as detailed on page 15 of this report. (3) Net Debt/EBITDA in the last 12 months (LTM) adjusted by lease liabilities (IFRS 16). Cosan ended the quarter with adjusted EBITDA of R$5.8 billion, 2.1 times higher than the first quarter of last year, due to the expansion of all Group’s segments. Raízen ended the crop year (+3.3x vs 1Q22), presenting a solid performance in its businesses, even in a period affected by strong volatility. In addition, the accounting of tax credits boosted Marketing & Services results. At Rumo (+18%), the adequacy of tariffs offset the drop in volume, caused by the operational challenges faced in the Port of Santos. Furthermore, the contributions from the new acquisitions at Compass (Commit) and Moove (PetroChoice), added to the continuous improvement of operations, boosted the results of these companies (+36% and +59%, respectively). Lastly, we began to consolidate Tellus and Janus land leasing revenues and received dividends from Vale, making up more than R$3 billion growth in EBITDA. Adjusted net income (loss) totaled R$12 million in 1Q23, due to the negative non-cash impact of the mark-to-market update of Vale shares and the Total Return Swap (TRS) of the Company shares in the Cosan Corporate financial result. These effects were partially offset by the better result of the subsidiaries, especially Raízen. It is worth mentioning that the accounting loss of R$904 million was reduced by the provision of R$1.5 billion related to the exclusion of the Tax on the Circulation of Goods and Services (ICMS) benefit in the Corporate Income Tax (IRPJ) and Social Contribution on Net Income (ICSS) calculation basis, recorded at Comgás and Moove. Financial leverage reduced by 0.3x quarter over quarter to 1.7x on March 31, 2023. Compared to 4Q22, the reduction in leverage (-0.5x) was due to the growth in EBITDA LTM, in addition to the decline in net debt, mainly driven by the higher cash generation at Raízen. If we exclude Vale effects on Cosan's results, the Net debt/EBITDA ratio would have been 2.1x. In the capital allocation agenda, we took advantage of market opportunities throughout the quarter to increase the position in CSAN3 via derivatives (TRS) by R$187 million with non-cash effect, totaling a position of 89.5 million shares on March 31, 2023. In 1Q23, we also recorded R$927 million in dividends and interest on capital (IOC), mostly coming from Raízen and Vale.
A. Results by Business Unit The business units comprising Cosan’s portfolio and a brief description of their market segments follow. Raízen: A joint venture created by Cosan and Shell in 2011. With an integrated and unique ecosystem, Raízen operates from the production and processing of sugarcane to the production and marketing of sugar and renewable energy, including even the distribution of fuels and operations in the convenience and proximity store segment. Since August 2021, Raízen’s shares are listed on the São Paulo Stock Exchange (B3) under the ticker "RAIZ4." The Renewables business comprises the production, sourcing, marketing and trading of ethanol; production and marketing of bioenergy; resale and trading of electricity; and production and marketing of other renewable products (solar power and biogas). Meanwhile, the Sugar business involves the production, sourcing, marketing and trading of sugar. Marketing & Services encompasses the distribution of fuel and lubricants and the convenience and proximity store operations in Brazil, Argentina and Paraguay, under the Shell brand. In Brazil, we operate in the proximity segment under the brands Shell Select and OXXO, in partnership with FEMSA Comércio, through the JV Nós Group. In Argentina, the segment also includes oil refining. The Financial Statements and Earnings Release of Raízen are available at: ri.raizen.com.br. Rumo: Brazil’s largest independent rail logistics operator, connecting the country’s main agricultural commodity producing regions to the country’s main ports. It also operates in port loading and goods storage at terminals. Through Brado, Rumo also offers container operations serving both the domestic and international markets. Rumo has been listed under the ticker "RAIL3" since 2015 on the Novo Mercado, the listing segment of the São Paulo Stock Exchange (B3) with the highest corporate governance standards. The Financial Statements and Earnings Release of Rumo are available at: ri.rumolog.com. Compass: Based on all the experience accumulated in managing Comgás, Compass was launched in 2020, with the purpose of creating options for an increasingly less regulated natural gas market. It offers client-centered services and solutions to expand access to natural gas safely, efficiently and competitively, which contributes to energy safety, economic development and expansion of Brazil’s infrastructure. The natural gas distribution segment has the largest piped gas distributor in Brazil, Comgás; and Commit, a joint venture with the Japanese conglomerate Mitsui, which has interests in 11 concessionaires in different states, including Sulgás and Gasbrasiliano. Compass’ portfolio also includes projects in the Natural Gas and Energy sectors, such as the São Paulo LNG Regasification Terminal (TRSP), among others. The Financial Statements and Earnings Release of Compass are available at: compassbr.com. Moove: A reference in lubricants, Moove produces and distributes products under the Mobil and Comma brands, with operations in Brazil and other countries in South America (Argentina, Bolivia, Uruguay and Paraguay), as well as in Europe (United Kingdom, Spain, Portugal and France) and the United States. It markets lubricants and other products for applications in the automotive and industrial segments, and also is an importer and distributor of base oils in the Brazilian market. Cosan Investimentos: The Company’s vehicle for new businesses and innovation, with investments in projects adjacent to its current portfolio. The following assets are part of Cosan Investimentos’ current portfolio: Land – segment of agricultural land management companies, with interest held in Radar, Tellus and Janus; the Port of São Luís, in Maranhão; and investments in the Climate Tech Fund and Ventures SPV, both managed by Fifth Wall, one of the largest venture capital firms specializing in technological innovation. Cosan Corporate: Segment representing Cosan’s corporate structure, which includes expenses with consulting services, personnel and various lawsuits. The Corporate segment also includes the investment in Vale, a Brazilian company that operates in 20 countries in the segments of mining, logistics - with rail, ports, terminals and infrastructure - energy and steel, as well as other investments.
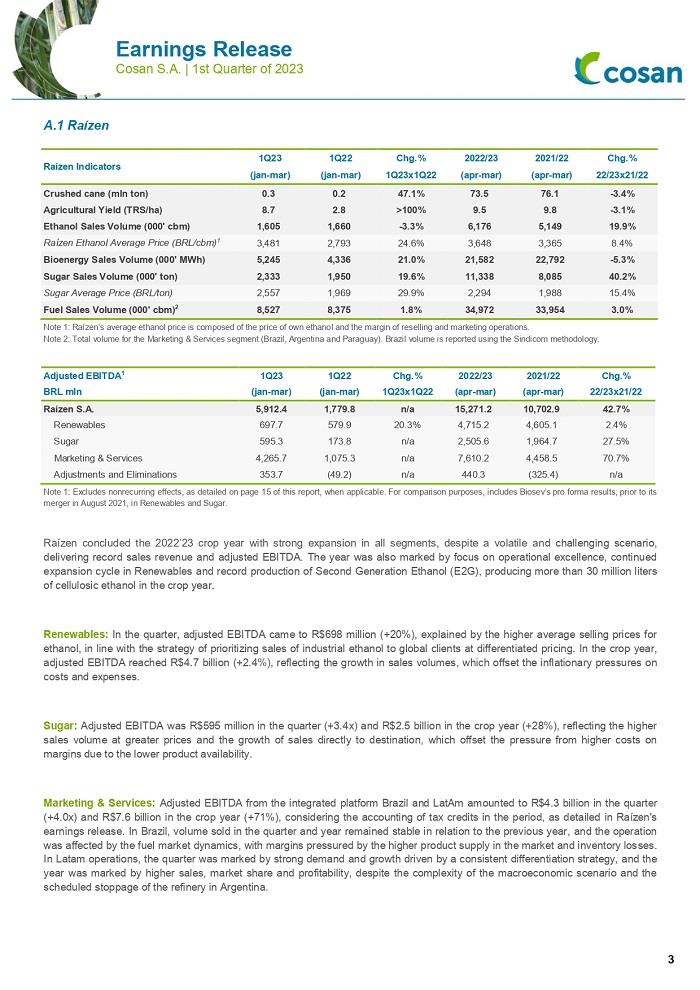
A.1 Raízen Raízen Indicators 1Q23 1Q22 Chg.% 2022/23 2021/22 Chg.% (jan-mar) (jan-mar) 1Q23x1Q22 (apr-mar) (apr-mar) 22/23x21/22 Crushed cane (mln ton) 0.3 0.2 47.1% 73.5 76.1 -3.4% Agricultural Yield (TRS/ha) 8.7 2.8 >100% 9.5 9.8 -3.1% Ethanol Sales Volume (000' cbm) 1,605 1,660 -3.3% 6,176 5,149 19.9% Raízen Ethanol Average Price (BRL/cbm)1 3,481 2,793 24.6% 3,648 3,365 8.4% Bioenergy Sales Volume (000' MWh) 5,245 4,336 21.0% 21,582 22,792 -5.3% Sugar Sales Volume (000' ton) 2,333 1,950 19.6% 11,338 8,085 40.2% Sugar Average Price (BRL/ton) 2,557 1,969 29.9% 2,294 1,988 15.4% Fuel Sales Volume (000' cbm)2 8,527 8,375 1.8% 34,972 33,954 3.0% Note 1: Raízen’s average ethanol price is composed of the price of own ethanol and the margin of reselling and marketing operations. Note 2: Total volume for the Marketing & Services segment (Brazil, Argentina and Paraguay). Brazil volume is reported using the Sindicom methodology. Adjusted EBITDA1 1Q23 1Q22 Chg.% 2022/23 2021/22 Chg.% BRL mln (jan-mar) (jan-mar) 1Q23x1Q22 (apr-mar) (apr-mar) 22/23x21/22 Raízen S.A. 5,912.4 1,779.8 n/a 15,271.2 10,702.9 42.7% Renewables 697.7 579.9 20.3% 4,715.2 4,605.1 2.4% Sugar 595.3 173.8 n/a 2,505.6 1,964.7 27.5% Marketing & Services 4,265.7 1,075.3 n/a 7,610.2 4,458.5 70.7% Adjustments and Eliminations 353.7 (49.2) n/a 440.3 (325.4) n/a Note 1: Excludes nonrecurring effects, as detailed on page 15 of this report, when applicable. For comparison purposes, includes Biosev’s pro forma results, prior to its merger in August 2021, in Renewables and Sugar. Raízen concluded the 2022’23 crop year with strong expansion in all segments, despite a volatile and challenging scenario, delivering record sales revenue and adjusted EBITDA. The year was also marked by focus on operational excellence, continued expansion cycle in Renewables and record production of Second Generation Ethanol (E2G), producing more than 30 million liters of cellulosic ethanol in the crop year. Renewables: In the quarter, adjusted EBITDA came to R$698 million (+20%), explained by the higher average selling prices for ethanol, in line with the strategy of prioritizing sales of industrial ethanol to global clients at differentiated pricing. In the crop year, adjusted EBITDA reached R$4.7 billion (+2.4%), reflecting the growth in sales volumes, which offset the inflationary pressures on costs and expenses. Sugar: Adjusted EBITDA was R$595 million in the quarter (+3.4x) and R$2.5 billion in the crop year (+28%), reflecting the higher sales volume at greater prices and the growth of sales directly to destination, which offset the pressure from higher costs on margins due to the lower product availability. Marketing & Services: Adjusted EBITDA from the integrated platform Brazil and LatAm amounted to R$4.3 billion in the quarter (+4.0x) and R$7.6 billion in the crop year (+71%), considering the accounting of tax credits in the period, as detailed in Raízen's earnings release. In Brazil, volume sold in the quarter and year remained stable in relation to the previous year, and the operation was affected by the fuel market dynamics, with margins pressured by the higher product supply in the market and inventory losses. In Latam operations, the quarter was marked by strong demand and growth driven by a consistent differentiation strategy, and the year was marked by higher sales, market share and profitability, despite the complexity of the macroeconomic scenario and the scheduled stoppage of the refinery in Argentina.
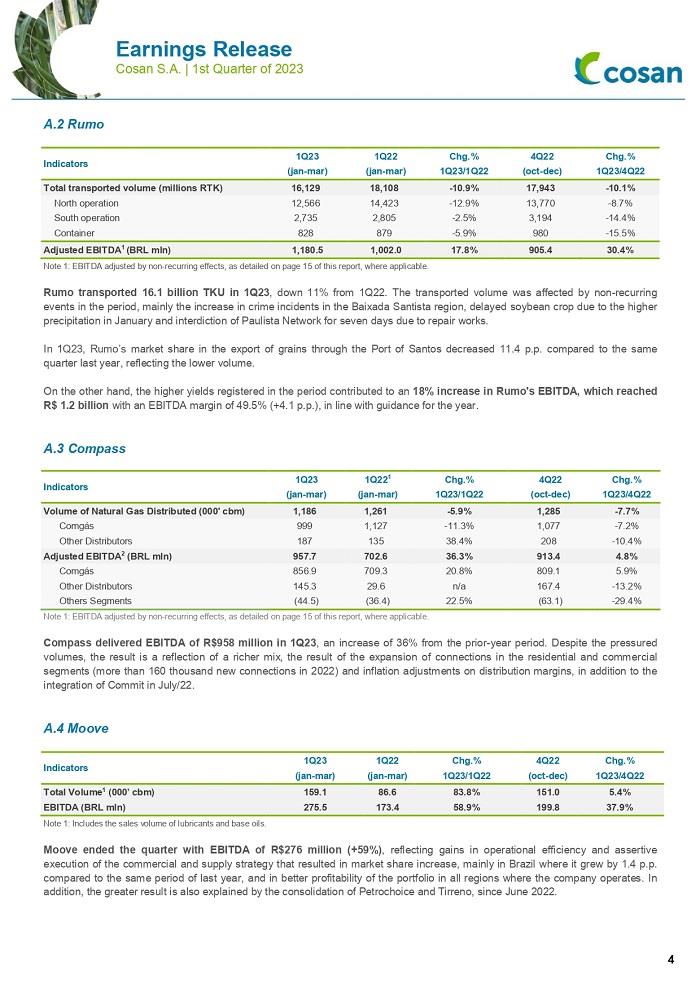
A.2 Rumo Indicators 1Q23 1Q22 Chg.% 4Q22 Chg.% (jan-mar) (jan-mar) 1Q23/1Q22 (oct-dec) 1Q23/4Q22 Total transported volume (millions RTK) 16,129 18,108 -10.9% 17,943 -10.1% North operation 12,566 14,423 -12.9% 13,770 -8.7% South operation 2,735 2,805 -2.5% 3,194 -14.4% Container 828 879 -5.9% 980 -15.5% Adjusted EBITDA1 (BRL mln) 1,180.5 1,002.0 17.8% 905.4 30.4% Note 1: EBITDA adjusted by non-recurring effects, as detailed on page 15 of this report, where applicable. Rumo transported 16.1 billion TKU in 1Q23, down 11% from 1Q22. The transported volume was affected by non-recurring events in the period, mainly the increase in crime incidents in the Baixada Santista region, delayed soybean crop due to the higher precipitation in January and interdiction of Paulista Network for seven days due to repair works. In 1Q23, Rumo’s market share in the export of grains through the Port of Santos decreased 11.4 p.p. compared to the same quarter last year, reflecting the lower volume. On the other hand, the higher yields registered in the period contributed to an 18% increase in Rumo's EBITDA, which reached R$ 1.2 billion with an EBITDA margin of 49.5% (+4.1 p.p.), in line with guidance for the year. A.3 Compass Indicators 1Q23 1Q221 Chg.% 4Q22 Chg.% (jan-mar) (jan-mar) 1Q23/1Q22 (oct-dec) 1Q23/4Q22 Volume of Natural Gas Distributed (000' cbm) 1,186 1,261 -5.9% 1,285 -7.7% Comgás 999 1,127 -11.3% 1,077 -7.2% Other Distributors 187 135 38.4% 208 -10.4% Adjusted EBITDA2 (BRL mln) 957.7 702.6 36.3% 913.4 4.8% Comgás 856.9 709.3 20.8% 809.1 5.9% Other Distributors 145.3 29.6 n/a 167.4 -13.2% Others Segments (44.5) (36.4) 22.5% (63.1) -29.4% Note 1: EBITDA adjusted by non-recurring effects, as detailed on page 15 of this report, where applicable. Compass delivered EBITDA of R$958 million in 1Q23, an increase of 36% from the prior-year period. Despite the pressured volumes, the result is a reflection of a richer mix, the result of the expansion of connections in the residential and commercial segments (more than 160 thousand new connections in 2022) and inflation adjustments on distribution margins, in addition to the integration of Commit in July/22. A.4 Moove Indicators 1Q23 1Q22 Chg.% 4Q22 Chg.% (jan-mar) (jan-mar) 1Q23/1Q22 (oct-dec) 1Q23/4Q22 Total Volume1 (000’ cbm) 159.1 86.6 83.8% 151.0 5.4% EBITDA (BRL mln) 275.5 173.4 58.9% 199.8 37.9% Note 1: Includes the sales volume of lubricants and base oils. Moove ended the quarter with EBITDA of R$276 million (+59%), reflecting gains in operational efficiency and assertive execution of the commercial and supply strategy that resulted in market share increase, mainly in Brazil where it grew by 1.4 p.p. compared to the same period of last year, and in better profitability of the portfolio in all regions where the company operates. In addition, the greater result is also explained by the consolidation of Petrochoice and Tirreno, since June 2022.
A.5 Cosan Investimentos EBITDA 1Q23 1Q22 Chg.% 4Q22 Chg.% BRL mln (jan-mar) (jan-mar) 1Q23/1Q22 (oct-dec) 1Q23/4Q22 Land (Radar, Tellus and Janus) 137.9 35.2 n/a 1,330.8 -89.6% Others1 (19.7) (16.8) 17.1% (22.7) -13.1% Total EBITDA 118.2 18.4 n/a 1,308.2 -91.0% Note 1: Includes results of the Port of São Luís, Climate Tech Fund and Trizy. In 1Q23, Cosan Investimentos delivered EBITDA of R$118 million, with the main component the Land segment, represented by the result of the lease of agricultural properties. The EBITDA expansion in the period reflects the consolidation of the first full quarter of Tellus and Janus. A.5.1 Land Location Area (ha) Useful area (ha) Southeast 167,741.2 126,427.6 Northeast 101,996.1 67,648.0 Midwest 45,396.1 31,953.4 North 2,960.2 1,551.9 Total 318,093.6 227,580.9 The Land portfolio, including Radar, Tellus and Janus agricultural properties ended the quarter with 318.1 thousand hectares of own land in eight Brazilian states, with total market value of R$13.9 billion, and R$ 4.2 billion adjusting for Cosan’s stake. Once a year, in the fourth quarter, the fair market value is determined by the technical opinion of several consulting companies, and the difference is recorded in the results. The main crops are Sugarcane and Grains and Fibers, which account for 64% and 34%, respectively, of the portfolio market value, and ~100% of the portfolio is leased to major agricultural operators in Brazil. Income Statement for the Period 1Q23 1Q22 Chg.% 4Q22 Chg.% BRL mln (jan-mar) (jan-mar) 1Q23x1Q22 (oct-dec) 1Q23x4Q22 Net Revenue 136.8 48.9 n/a 642.8 -78.7% Cost of Goods and Services Sold - - n/a (549.9) -100.0% Gross profit 136.8 48.9 n/a 92.9 47.2% Selling, general & administrative expenses (18.0) (10.5) 70.6% (15.4) 16.4% Other net operating income (expenses) (2.0) (3.2) -35.5% 1,249.2 n/a Equity Pick-up 21.0 0.0 n/a 4.1 n/a Depreciation & amortization 0.1 0.1 19.9% 0.1 6.0% EBITDA 137.9 35.2 n/a 1,330.8 -89.6% Financial results 6.2 4.8 29.3% 2.3 n/a Expenses with income and social contribution taxes (17.9) (6.1) n/a (52.8) -66.1% Net income 126.1 33.8 n/a 1,280.3 -90.1%
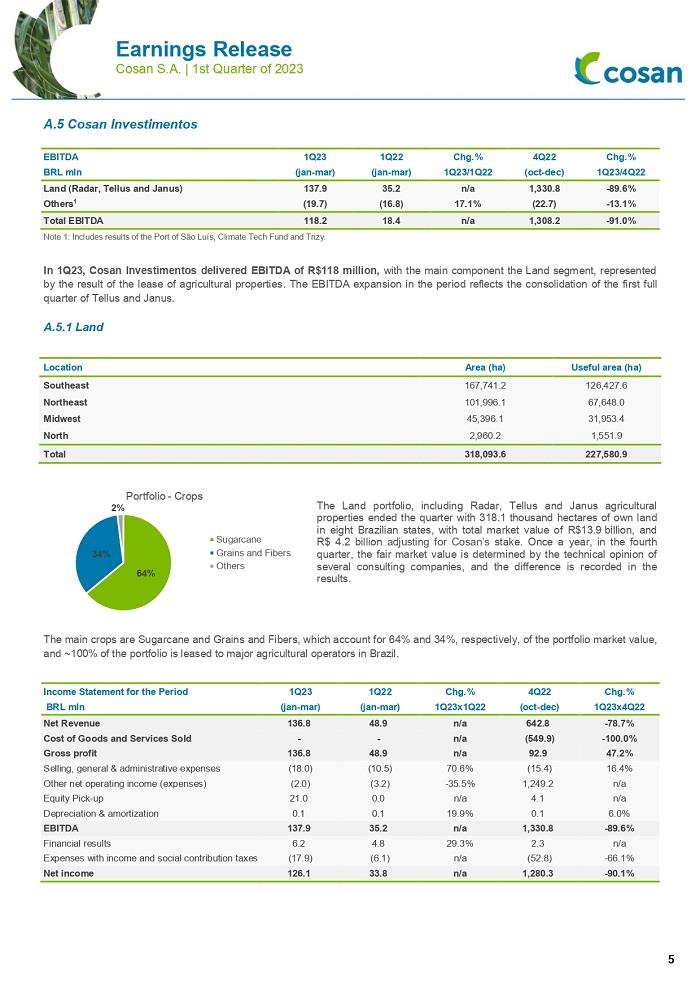
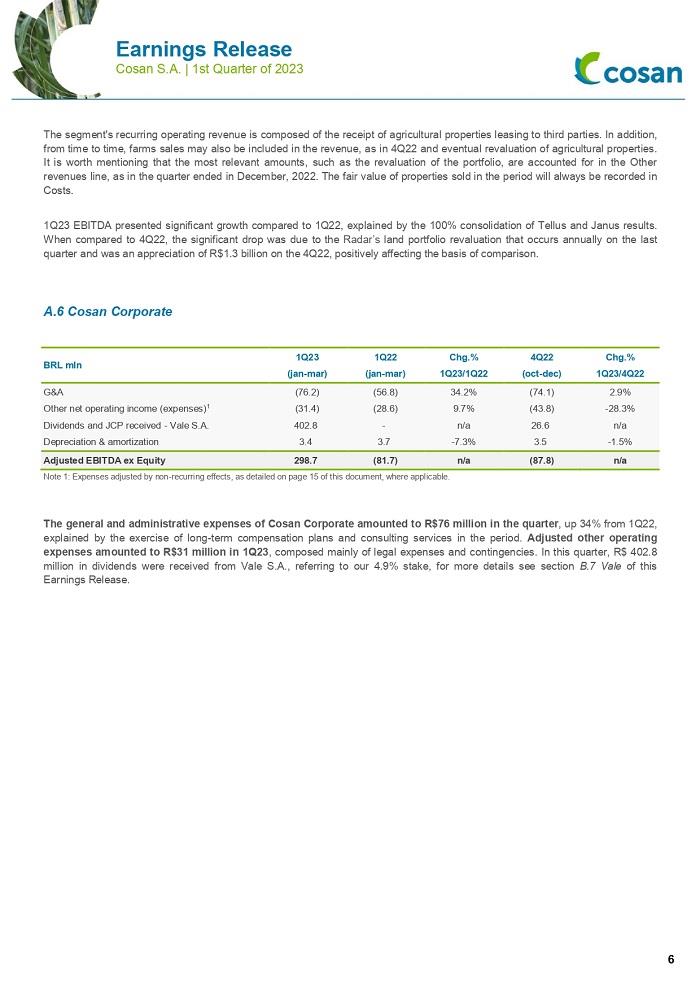
The segment's recurring operating revenue is composed of the receipt of agricultural properties leasing to third parties. In addition, from time to time, farms sales may also be included in the revenue, as in 4Q22 and eventual revaluation of agricultural properties. It is worth mentioning that the most relevant amounts, such as the revaluation of the portfolio, are accounted for in the Other revenues line, as in the quarter ended in December, 2022. The fair value of properties sold in the period will always be recorded in Costs. 1Q23 EBITDA presented significant growth compared to 1Q22, explained by the 100% consolidation of Tellus and Janus results. When compared to 4Q22, the significant drop was due to the Radar’s land portfolio revaluation that occurs annually on the last quarter and was an appreciation of R$1.3 billion on the 4Q22, positively affecting the basis of comparison. A.6 Cosan Corporate BRL mln 1Q23 1Q22 Chg.% 4Q22 Chg.% (jan-mar) (jan-mar) 1Q23/1Q22 (oct-dec) 1Q23/4Q22 G&A (76.2) (56.8) 34.2% (74.1) 2.9% Other net operating income (expenses)1 (31.4) (28.6) 9.7% (43.8) -28.3% Dividends and JCP received - Vale S.A. 402.8 - n/a 26.6 n/a Depreciation & amortization 3.4 3.7 -7.3% 3.5 -1.5% Adjusted EBITDA ex Equity 298.7 (81.7) n/a (87.8) n/a Note 1: Expenses adjusted by non-recurring effects, as detailed on page 15 of this document, where applicable. The general and administrative expenses of Cosan Corporate amounted to R$76 million in the quarter, up 34% from 1Q22, explained by the exercise of long-term compensation plans and consulting services in the period. Adjusted other operating expenses amounted to R$31 million in 1Q23, composed mainly of legal expenses and contingencies. In this quarter, R$ 402.8 million in dividends were received from Vale S.A., referring to our 4.9% stake, for more details see section B.7 Vale of this Earnings Release.
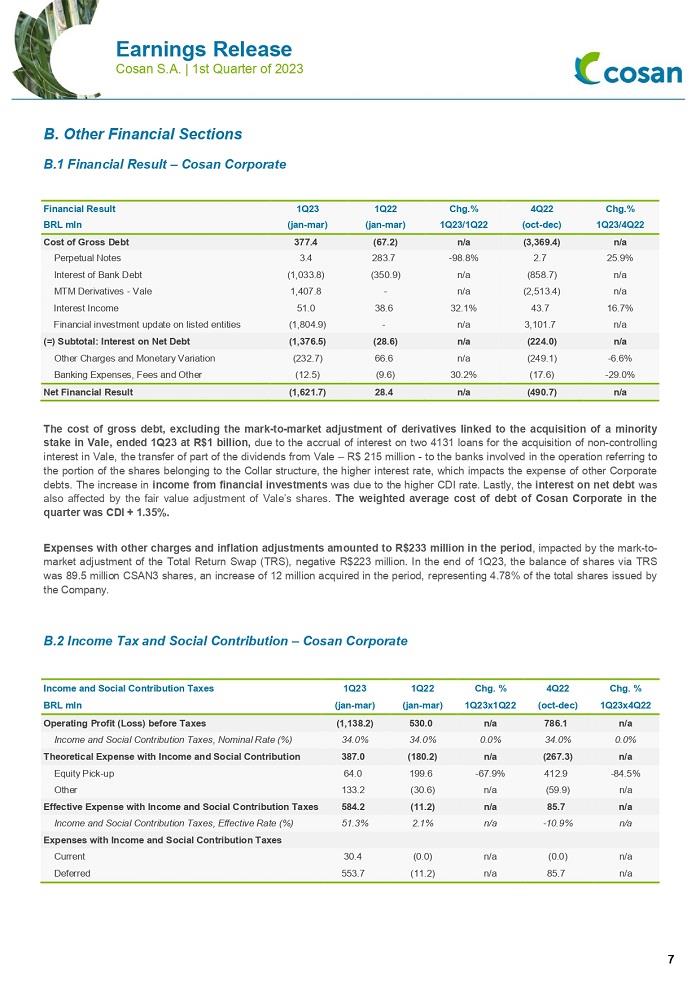
B. Other Financial Sections B.1 Financial Result – Cosan Corporate Financial Result 1Q23 1Q22 Chg.% 4Q22 Chg.% BRL mln (jan-mar) (jan-mar) 1Q23/1Q22 (oct-dec) 1Q23/4Q22 Cost of Gross Debt 377.4 (67.2) n/a (3,369.4) n/a Perpetual Notes 3.4 283.7 -98.8% 2.7 25.9% Interest of Bank Debt (1,033.8) (350.9) n/a (858.7) n/a MTM Derivatives - Vale 1,407.8 - n/a (2,513.4) n/a Interest Income 51.0 38.6 32.1% 43.7 16.7% Financial investment update on listed entities (1,804.9) - n/a 3,101.7 n/a (=) Subtotal: Interest on Net Debt (1,376.5) (28.6) n/a (224.0) n/a Other Charges and Monetary Variation (232.7) 66.6 n/a (249.1) -6.6% Banking Expenses, Fees and Other (12.5) (9.6) 30.2% (17.6) -29.0% Net Financial Result (1,621.7) 28.4 n/a (490.7) n/a The cost of gross debt, excluding the mark-to-market adjustment of derivatives linked to the acquisition of a minority stake in Vale, ended 1Q23 at R$1 billion, due to the accrual of interest on two 4131 loans for the acquisition of non-controlling interest in Vale, the transfer of part of the dividends from Vale – R$ 215 million - to the banks involved in the operation referring to the portion of the shares belonging to the Collar structure, the higher interest rate, which impacts the expense of other Corporate debts. The increase in income from financial investments was due to the higher CDI rate. Lastly, the interest on net debt was also affected by the fair value adjustment of Vale’s shares. The weighted average cost of debt of Cosan Corporate in the quarter was CDI + 1.35%. Expenses with other charges and inflation adjustments amounted to R$233 million in the period, impacted by the mark-to-market adjustment of the Total Return Swap (TRS), negative R$223 million. In the end of 1Q23, the balance of shares via TRS was 89.5 million CSAN3 shares, an increase of 12 million acquired in the period, representing 4.78% of the total shares issued by the Company. B.2 Income Tax and Social Contribution – Cosan Corporate Income and Social Contribution Taxes 1Q23 1Q22 Chg. % 4Q22 Chg. % BRL mln (jan-mar) (jan-mar) 1Q23x1Q22 (oct-dec) 1Q23x4Q22 Operating Profit (Loss) before Taxes (1,138.2) 530.0 n/a 786.1 n/a Income and Social Contribution Taxes, Nominal Rate (%) 34.0% 34.0% 0.0% 34.0% 0.0% Theoretical Expense with Income and Social Contribution 387.0 (180.2) n/a (267.3) n/a Equity Pick-up 64.0 199.6 -67.9% 412.9 -84.5% Other 133.2 (30.6) n/a (59.9) n/a Effective Expense with Income and Social Contribution Taxes 584.2 (11.2) n/a 85.7 n/a Income and Social Contribution Taxes, Effective Rate (%) 51.3% 2.1% n/a -10.9% n/a Expenses with Income and Social Contribution Taxes Current 30.4 (0.0) n/a (0.0) n/a Deferred 553.7 (11.2) n/a 85.7 n/a
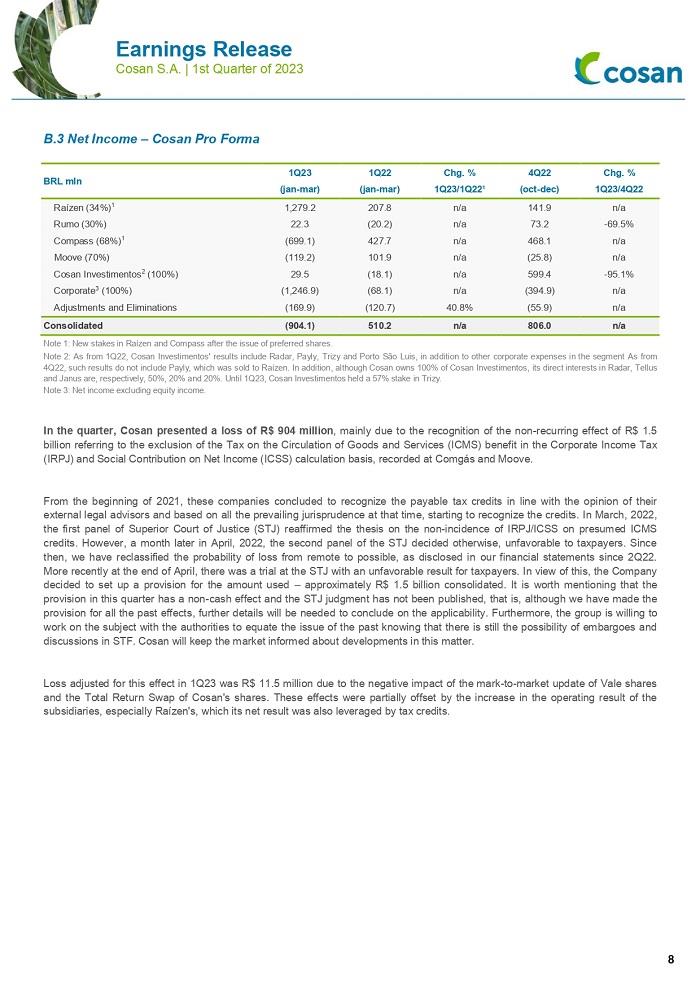
B.3 Net Income – Cosan Pro Forma BRL mln 1Q23 1Q22 Chg. % 4Q22 Chg. % (jan-mar) (jan-mar) 1Q23/1Q22¹ (oct-dec) 1Q23/4Q22 Raízen (34%)1 1,279.2 207.8 n/a 141.9 n/a Rumo (30%) 22.3 (20.2) n/a 73.2 -69.5% Compass (68%)1 (699.1) 427.7 n/a 468.1 n/a Moove (70%) (119.2) 101.9 n/a (25.8) n/a Cosan Investimentos2 (100%) 29.5 (18.1) n/a 599.4 -95.1% Corporate3 (100%) (1,246.9) (68.1) n/a (394.9) n/a Adjustments and Eliminations (169.9) (120.7) 40.8% (55.9) n/a Consolidated (904.1) 510.2 n/a 806.0 n/a Note 1: New stakes in Raízen and Compass after the issue of preferred shares. Note 2: As from 1Q22, Cosan Investimentos' results include Radar, Payly, Trizy and Porto São Luis, in addition to other corporate expenses in the segment As from 4Q22, such results do not include Payly, which was sold to Raízen. In addition, although Cosan owns 100% of Cosan Investimentos, its direct interests in Radar, Tellus and Janus are, respectively, 50%, 20% and 20%. Until 1Q23, Cosan Investimentos held a 57% stake in Trizy. Note 3: Net income excluding equity income. In the quarter, Cosan presented a loss of R$ 904 million, mainly due to the recognition of the non-recurring effect of R$ 1.5 billion referring to the exclusion of the Tax on the Circulation of Goods and Services (ICMS) benefit in the Corporate Income Tax (IRPJ) and Social Contribution on Net Income (ICSS) calculation basis, recorded at Comgás and Moove. From the beginning of 2021, these companies concluded to recognize the payable tax credits in line with the opinion of their external legal advisors and based on all the prevailing jurisprudence at that time, starting to recognize the credits. In March, 2022, the first panel of Superior Court of Justice (STJ) reaffirmed the thesis on the non-incidence of IRPJ/ICSS on presumed ICMS credits. However, a month later in April, 2022, the second panel of the STJ decided otherwise, unfavorable to taxpayers. Since then, we have reclassified the probability of loss from remote to possible, as disclosed in our financial statements since 2Q22. More recently at the end of April, there was a trial at the STJ with an unfavorable result for taxpayers. In view of this, the Company decided to set up a provision for the amount used – approximately R$ 1.5 billion consolidated. It is worth mentioning that the provision in this quarter has a non-cash effect and the STJ judgment has not been published, that is, although we have made the provision for all the past effects, further details will be needed to conclude on the applicability. Furthermore, the group is willing to work on the subject with the authorities to equate the issue of the past knowing that there is still the possibility of embargoes and discussions in STF. Cosan will keep the market informed about developments in this matter. Loss adjusted for this effect in 1Q23 was R$ 11.5 million due to the negative impact of the mark-to-market update of Vale shares and the Total Return Swap of Cosan's shares. These effects were partially offset by the increase in the operating result of the subsidiaries, especially Raízen's, which its net result was also leveraged by tax credits.
B.4 Investments – Cosan Pro Forma1 BRL mln1 Q23 1Q22 Chg. % 4Q22 Chg. % (jan-mar) (jan-mar) 1Q23/1Q22 (oct-dec) 1Q23/4Q22 Raízen2 (50%) 2,149.8 1,540.2 39.6% 1,544.6 39.2% Rumo 927.9 692.0 34.1% 740.5 25.3% Compass2 527.0 370.8 42.1% 479.7 9.9% Others3 53.2 12.8 n/a 64.2 -17.1% Consolidated 3,657.9 2,615.8 39.8% 2,829.0 29.3% Note 1: Pro forma investments accounted for on a cash basis, i.e. considering 50% of Raízen, and excluding M&A. Note 2: Includes investments in assets originating from contracts with clients. At Raízen, excludes business acquisitions and additions to investments in subsidiaries. Note 3: Sum of the investments of Moove, Cosan Investimentos and Cosan Corporate. In the quarter, Cosan’s consolidated pro forma investments totaled R$3.7 billion (+40%), due to the expenditures at Raízen (+40%), allocated mainly to the expansion of the Renewables business, with five E2G plants under construction and investments in Power, in addition to the sugarcane productivity recovery journey. At Rumo, the 34% increase in 1Q23 was in line with the plan for the period, due to the phasing of investments last year (recurring CAPEX), the cash effect of construction works in 4Q22 and the initial expenditures with the Extension project in Mato Grosso. At Compass, the 42% increase reflected investments for construction of the São Paulo Regasification Terminal (TRSP) and the natural gas distribution subsidiaries, in line with the tariff business plan. B.5 Debt and Leverage Ratio - Cosan Pro Forma1 Loans and Financing 1Q23 BRL mln Rumo Compass Moove Parent Company Others Corporate Cosan Consolidated Raízen 50% Cosan Pro forma Opening balance of net debt2 9,070.7 4,349.9 1,952.0 2,696.4 745.6 18,814.7 14,052.5 32,867.2 Cash, cash equivalents and marketable securities 8,225.5 3,984.0 928.3 2,072.5 20,191.2 35,401.5 2,456.2 37,857.7 Opening balance of gross debt2 17,296.2 8,333.9 2,880.3 4,768.9 20,936.8 54,216.1 16,508.7 70,724.9 Cash items (868.8) (9.7) (54.7) (572.5) (279.3) (1,785.0) (2,222.3) (4,007.3) Funding 77.7 294.4 0.0 - - 372.1 1,611.5 1,983.6 Payment of principal (384.4) (44.8) (5.1) - - (434.3) (3,494.0) (3,928.3) Payment of interest (272.7) (99.8) (41.2) (277.8) (279.3) (970.8) (339.8) (1,310.6) Derivatives (289.4) (159.5) (8.4) (294.7) - (752.0) - (752.0) Noncash items 603.4 277.7 (11.8) 463.1 (1,076.1) 256.2 349.7 605.9 Provision for interest (accrual) 224.6 123.8 41.5 194.8 214.4 799.2 286.8 1,086.0 Monetary variation and MTM adjustment of debt 420.6 144.4 (69.5) 10.6 (21.6) 484.5 106.4 590.9 Exchange variation, net of derivatives (41.8) 9.4 16.1 257.7 (1,268.9) (1,027.5) (43.5) (1,071.0) Closing balance of gross debt2 17,030.8 8,601.9 2,813.8 4,659.5 19,581.4 52,687.3 14,636.2 67,323.5 Cash, cash equivalents and marketable securities 7,211.5 4,395.1 905.5 1,286.7 18,634.5 32,433.2 4,371.1 36,804.3 Closing balance of net debt2 9,819.3 4,206.9 1,908.2 3,372.8 946.9 20,254.1 10,265.1 30,519.2 Leasing (IFRS 16) 3,051.2 78.5 162.3 32.3 3.7 3,328.0 5,407.2 8,735.3 Net bank debt 12,870.5 4,285.4 2,070.5 3,405.1 950.6 23,582.1 15,672.3 39,254.5 Note 1: Pro forma vision, i.e., includes 50% of Raízen’s results. Note 2: Debt excludes: (i) PESA at Raízen S.A. and (ii) lease liabilities (IFRS 16).
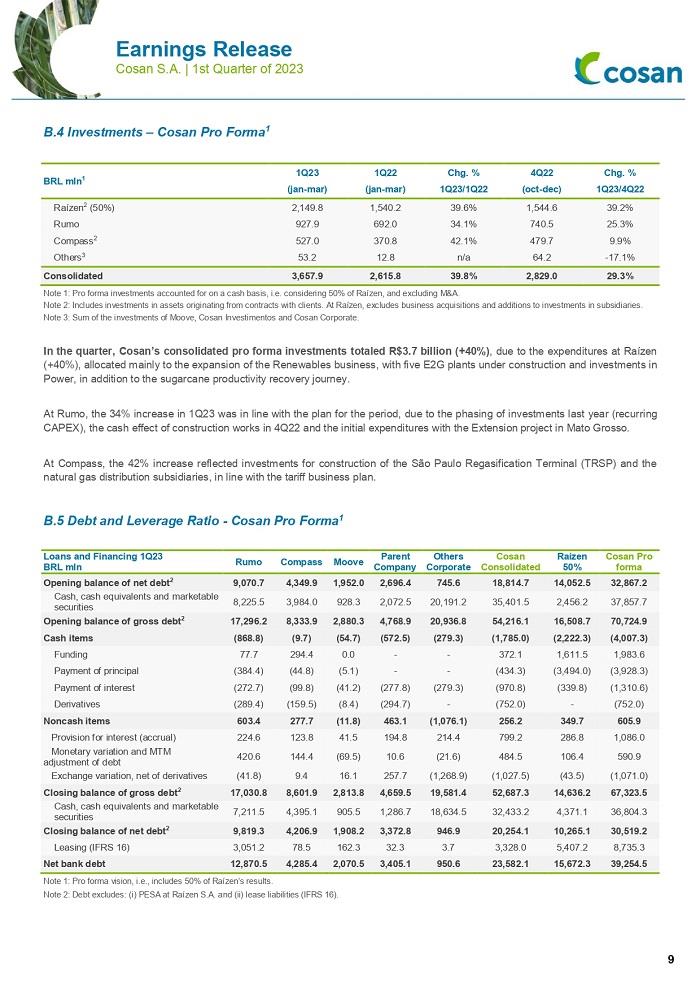
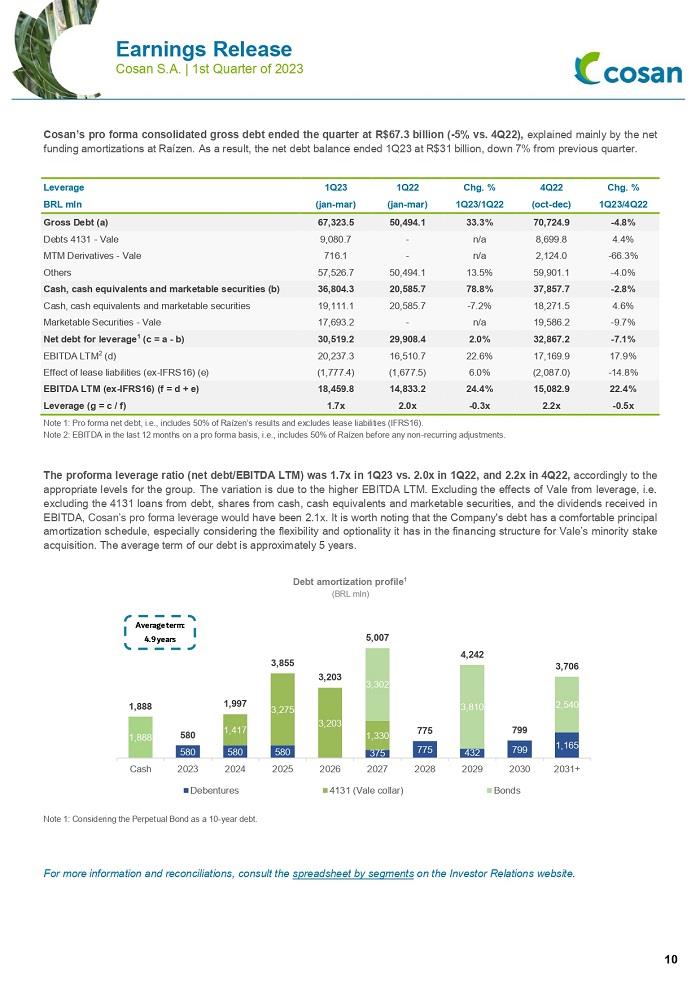
Cosan’s pro forma consolidated gross debt ended the quarter at R$67.3 billion (-5% vs. 4Q22), explained mainly by the net funding amortizations at Raízen. As a result, the net debt balance ended 1Q23 at R$31 billion, down 7% from previous quarter. Leverage 1Q23 1Q22 Chg. % 4Q22 Chg. % BRL mln (jan-mar) (jan-mar) 1Q23/1Q22 (oct-dec) 1Q23/4Q22 Gross Debt (a) 67,323.5 50,494.1 33.3% 70,724.9 -4.8% Debts 4131 - Vale 9,080.7 - n/a 8,699.8 4.4% MTM Derivatives - Vale 716.1 - n/a 2,124.0 -66.3% Others 57,526.7 50,494.1 13.5% 59,901.1 -4.0% Cash, cash equivalents and marketable securities (b) 36,804.3 20,585.7 78.8% 37,857.7 -2.8% Cash, cash equivalents and marketable securities 19,111.1 20,585.7 -7.2% 18,271.5 4.6% Marketable Securities - Vale 17,693.2 - n/a 19,586.2 -9.7% Net debt for leverage1 (c = a - b) 30,519.2 29,908.4 2.0% 32,867.2 -7.1% EBITDA LTM2 (d) 20,237.3 16,510.7 22.6% 17,169.9 17.9% Effect of lease liabilities (ex-IFRS16) (e) (1,777.4) (1,677.5) 6.0% (2,087.0) -14.8% EBITDA LTM (ex-IFRS16) (f = d + e) 18,459.8 14,833.2 24.4% 15,082.9 22.4% Leverage (g = c / f) 1.7x 2.0x -0.3x 2.2x -0.5x Note 1: Pro forma net debt, i.e., includes 50% of Raízen’s results and excludes lease liabilities (IFRS16). Note 2: EBITDA in the last 12 months on a pro forma basis, i.e., includes 50% of Raízen before any non-recurring adjustments. The proforma leverage ratio (net debt/EBITDA LTM) was 1.7x in 1Q23 vs. 2.0x in 1Q22, and 2.2x in 4Q22, accordingly to the appropriate levels for the group. The variation is due to the higher EBITDA LTM. Excluding the effects of Vale from leverage, i.e. excluding the 4131 loans from debt, shares from cash, cash equivalents and marketable securities, and the dividends received in EBITDA, Cosan’s pro forma leverage would have been 2.1x. It is worth noting that the Company's debt has a comfortable principal amortization schedule, especially considering the flexibility and optionality it has in the financing structure for Vale’s minority stake acquisition. The average term of our debt is approximately 5 years. Note 1: Considering the Perpetual Bond as a 10-year debt. For more information and reconciliations, consult the spreadsheet by segments on the Investor Relations website.
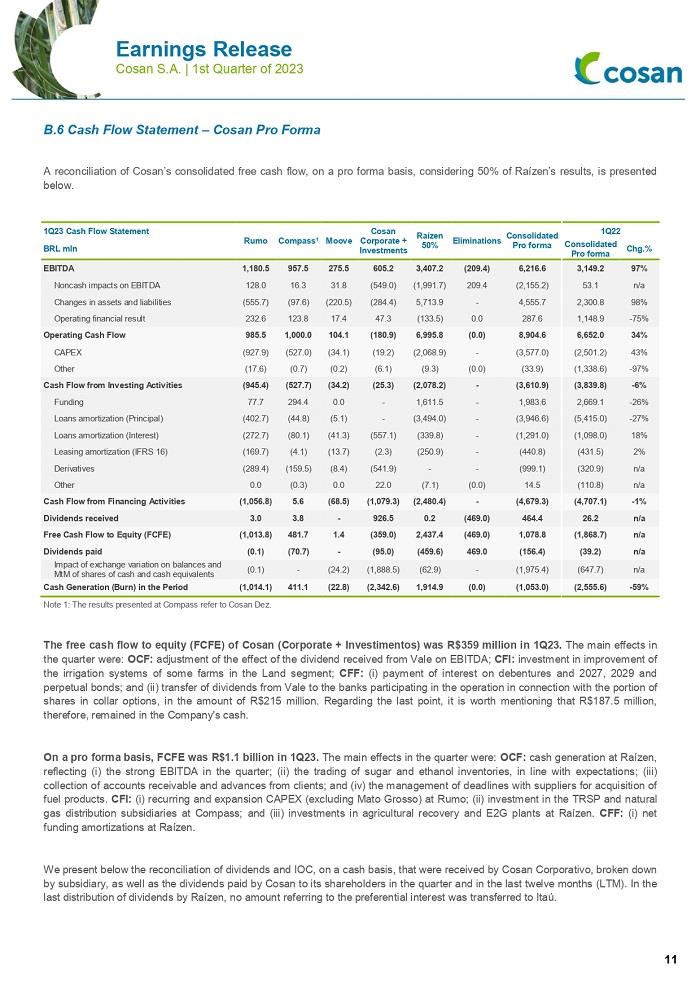
B.6 Cash Flow Statement – Cosan Pro Forma A reconciliation of Cosan’s consolidated free cash flow, on a pro forma basis, considering 50% of Raízen’s results, is presented below. 1Q23 Cash Flow Statement Rumo Compass1 Moove Cosan Corporate + Investments Raízen 50% Eliminations Consolidated Pro forma 1Q22 BRL mln Consolidated Pro forma Chg.% EBITDA 1,180.5 957.5 275.5 605.2 3,407.2 (209.4) 6,216.6 3,149.2 97% Noncash impacts on EBITDA 128.0 16.3 31.8 (549.0) (1,991.7) 209.4 (2,155.2) 53.1 n/a Changes in assets and liabilities (555.7) (97.6) (220.5) (284.4) 5,713.9 - 4,555.7 2,300.8 98% Operating financial result 232.6 123.8 17.4 47.3 (133.5) 0.0 287.6 1,148.9 -75% Operating Cash Flow 985.5 1,000.0 104.1 (180.9) 6,995.8 (0.0) 8,904.6 6,652.0 34% CAPEX (927.9) (527.0) (34.1) (19.2) (2,068.9) - (3,577.0) (2,501.2) 43% Other (17.6) (0.7) (0.2) (6.1) (9.3) (0.0) (33.9) (1,338.6) -97% Cash Flow from Investing Activities (945.4) (527.7) (34.2) (25.3) (2,078.2) - (3,610.9) (3,839.8) -6% Funding 77.7 294.4 0.0 - 1,611.5 - 1,983.6 2,669.1 -26% Loans amortization (Principal) (402.7) (44.8) (5.1) - (3,494.0) - (3,946.6) (5,415.0) -27% Loans amortization (Interest) (272.7) (80.1) (41.3) (557.1) (339.8) - (1,291.0) (1,098.0) 18% Leasing amortization (IFRS 16) (169.7) (4.1) (13.7) (2.3) (250.9) - (440.8) (431.5) 2% Derivatives (289.4) (159.5) (8.4) (541.9) - - (999.1) (320.9) n/a Other 0.0 (0.3) 0.0 22.0 (7.1) (0.0) 14.5 (110.8) n/a Cash Flow from Financing Activities (1,056.8) 5.6 (68.5) (1,079.3) (2,480.4) - (4,679.3) (4,707.1) -1% Dividends received 3.0 3.8 - 926.5 0.2 (469.0) 464.4 26.2 n/a Free Cash Flow to Equity (FCFE) (1,013.8) 481.7 1.4 (359.0) 2,437.4 (469.0) 1,078.8 (1,868.7) n/a Dividends paid (0.1) (70.7) - (95.0) (459.6) 469.0 (156.4) (39.2) n/a Impact of exchange variation on balances and MtM of shares of cash and cash equivalents (0.1) - (24.2) (1,888.5) (62.9) - (1,975.4) (647.7) n/a Cash Generation (Burn) in the Period (1,014.1) 411.1 (22.8) (2,342.6) 1,914.9 (0.0) (1,053.0) (2,555.6) -59% Note 1: The results presented at Compass refer to Cosan Dez. The free cash flow to equity (FCFE) of Cosan (Corporate + Investimentos) was R$359 million in 1Q23. The main effects in the quarter were: OCF: adjustment of the effect of the dividend received from Vale on EBITDA; CFI: investment in improvement of the irrigation systems of some farms in the Land segment; CFF: (i) payment of interest on debentures and 2027, 2029 and perpetual bonds; and (ii) transfer of dividends from Vale to the banks participating in the operation in connection with the portion of shares in collar options, in the amount of R$215 million. Regarding the last point, it is worth mentioning that R$187.5 million, therefore, remained in the Company's cash. On a pro forma basis, FCFE was R$1.1 billion in 1Q23. The main effects in the quarter were: OCF: cash generation at Raízen, reflecting (i) the strong EBITDA in the quarter; (ii) the trading of sugar and ethanol inventories, in line with expectations; (iii) collection of accounts receivable and advances from clients; and (iv) the management of deadlines with suppliers for acquisition of fuel products. CFI: (i) recurring and expansion CAPEX (excluding Mato Grosso) at Rumo; (ii) investment in the TRSP and natural gas distribution subsidiaries at Compass; and (iii) investments in agricultural recovery and E2G plants at Raízen. CFF: (i) net funding amortizations at Raízen. We present below the reconciliation of dividends and IOC, on a cash basis, that were received by Cosan Corporativo, broken down by subsidiary, as well as the dividends paid by Cosan to its shareholders in the quarter and in the last twelve months (LTM). In the last distribution of dividends by Raízen, no amount referring to the preferential interest was transferred to Itaú.
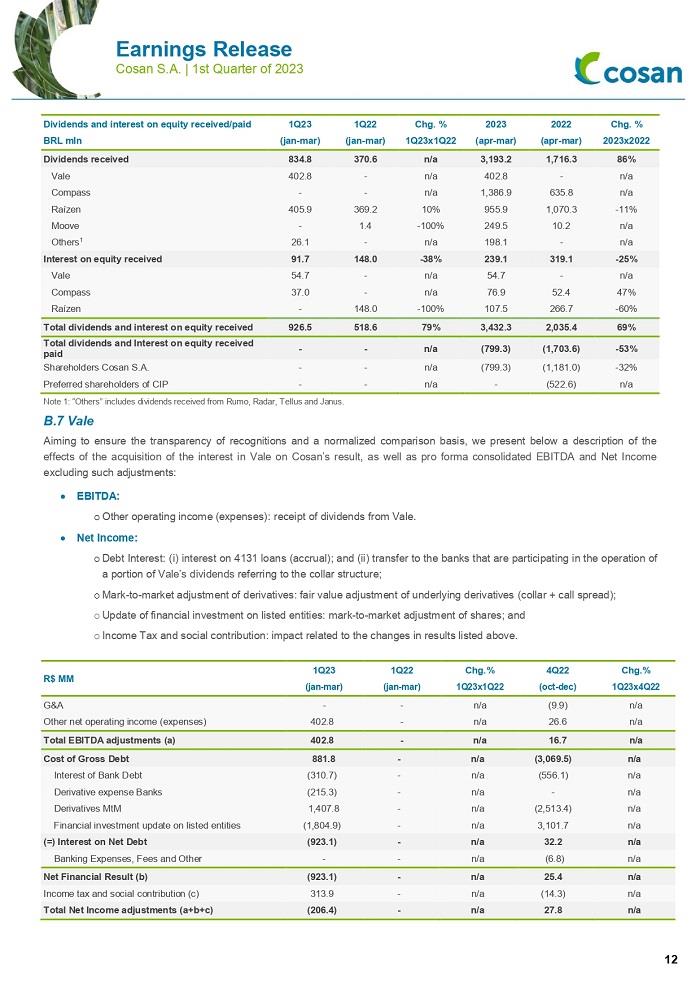
Dividends and interest on equity received/paid 1Q23 1Q22 Chg. % 2023 2022 Chg. % BRL mln (jan-mar) (jan-mar) 1Q23x1Q22 (apr-mar) (apr-mar) 2023x2022 Dividends received 834.8 370.6 n/a 3,193.2 1,716.3 86% Vale 402.8 - n/a 402.8 - n/a Compass - - n/a 1,386.9 635.8 n/a Raízen 405.9 369.2 10% 955.9 1,070.3 -11% Moove - 1.4 -100% 249.5 10.2 n/a Others1 26.1 - n/a 198.1 - n/a Interest on equity received 91.7 148.0 -38% 239.1 319.1 -25% Vale 54.7 - n/a 54.7 - n/a Compass 37.0 - n/a 76.9 52.4 47% Raízen - 148.0 -100% 107.5 266.7 -60% Total dividends and interest on equity received 926.5 518.6 79% 3,432.3 2,035.4 69% Total dividends and Interest on equity received paid - - n/a (799.3) (1,703.6) -53% Shareholders Cosan S.A. - - n/a (799.3) (1,181.0) -32% Preferred shareholders of CIP - - n/a - (522.6) n/a Note 1: “Others” includes dividends received from Rumo, Radar, Tellus and Janus. B.7 Vale Aiming to ensure the transparency of recognitions and a normalized comparison basis, we present below a description of the effects of the acquisition of the interest in Vale on Cosan’s result, as well as pro forma consolidated EBITDA and Net Income excluding such adjustments: • EBITDA: o Other operating income (expenses): receipt of dividends from Vale. • Net Income: o Debt Interest: (i) interest on 4131 loans (accrual); and (ii) transfer to the banks that are participating in the operation of a portion of Vale’s dividends referring to the collar structure; o Mark-to-market adjustment of derivatives: fair value adjustment of underlying derivatives (collar + call spread); o Update of financial investment on listed entities: mark-to-market adjustment of shares; and o Income Tax and social contribution: impact related to the changes in results listed above. R$ MM 1Q23 1Q22 Chg.% 4Q22 Chg.% (jan-mar) (jan-mar) 1Q23x1Q22 (oct-dec) 1Q23x4Q22 G&A - - n/a (9.9) n/a Other net operating income (expenses) 402.8 - n/a 26.6 n/a Total EBITDA adjustments (a) 402.8 - n/a 16.7 n/a Cost of Gross Debt 881.8 - n/a (3,069.5) n/a Interest of Bank Debt (310.7) - n/a (556.1) n/a Derivative expense Banks (215.3) - n/a - n/a Derivatives MtM 1,407.8 - n/a (2,513.4) n/a Financial investment update on listed entities (1,804.9) - n/a 3,101.7 n/a (=) Interest on Net Debt (923.1) - n/a 32.2 n/a Banking Expenses, Fees and Other - - n/a (6.8) n/a Net Financial Result (b) (923.1) - n/a 25.4 n/a Income tax and social contribution (c) 313.9 - n/a (14.3) n/a Total Net Income adjustments (a+b+c) (206.4) - n/a 27.8 n/a
C. Cosan - Consolidated Results C.1 Cosan Consolidated Accounting The following table shows the results for 1Q23 by business unit, as detailed above, and on a consolidated basis. All information reflects the consolidation of 100% of subsidiaries’ results, irrespective of Cosan’s interest, since the Company holds a controlling interest in these companies (IFRS 10 – for more information, see Note 9.1 to the Financial Statements for 1Q23). Note that Cosan Corporate is a reconciliation comprising Cosan Parent Company and its financial subsidiaries outside Brazil. The following table reflects the information provided in the Financial Statements of the Company. For the purpose of reconciliation of EBITDA and consolidation, in the “Cosan Consolidated Accounting” column, “Adjustments and Deductions” reflect the deductions of operations among all the businesses controlled by Cosan. Results by Business Unit Parent Company (a) Others Corporate (b) Cosan Corporate (a+b) Cosan Investimentos Rumo Compass Moove Adjustments and Elimination Cosan Consolidated Accounting 1Q23 Net Revenue (0.0) 0.0 0.0 138.3 2,383.8 4,535.0 2,587.2 (13.0) 9,631.3 Cost of Goods and Services Sold - - - (3.6) (1,603.6) (3,594.6) (1,943.6) 13.0 (7,132.5) Gross Profit (0.0) 0.0 0.0 134.6 780.2 940.4 643.5 0.0 2,498.8 Gross Margin (%) n/a n/a n/a 97.4% 32.7% 20.7% 24.9% 0.0% 25.9% Selling Expenses - - - (0.6) (8.5) (38.9) (291.7) 0.0 (339.7) General and Administrative Expenses (86.6) 10.4 (76.2) (35.7) (102.9) (197.3) (137.6) (0.0) (549.8) Other Operating Income (Expenses) 18.2 353.2 371.4 (2.1) 9.0 (5.7) (10.7) (0.0) 361.9 Equity Pick-up (452.7) 641.0 188.3 21.0 0.8 52.1 (0.0) 921.0 1,183.4 Depreciation and Amortization 3.4 0.0 3.4 0.8 502.0 206.9 72.1 (0.0) 785.2 EBITDA (517.7) 1,004.7 487.0 118.2 1,180.5 957.5 275.5 921.0 3,939.8 EBITDA Margin (%) n/a n/a n/a 85.5% 49.5% 21.1% 10.7% n/a 40.9% Adjusted EBITDA (517.7) 1,004.7 487.0 118.2 1,180.5 957.5 275.5 921.0 3,939.8 Adjusted EBITDA Margin (%) n/a n/a n/a 85.5% 49.5% 21.1% 10.7% n/a 40.9% Financial Result (626.0) (995.8) (1,621.7) 5.5 (607.4) (465.4) (80.1) (0.0) (2,769.1) Income and Social Contribution Taxes 243.0 341.2 584.2 (17.9) (0.1) (1,076.6) (293.8) - (804.2) Non-controlling Interest - (504.6) (504.6) (75.4) (48.8) 92.3 51.1 0.0 (485.4) Net (loss) Income (904.1) (154.6) (1,058.6) 29.5 22.3 (699.1) (119.2) 921.0 (904.1) The Cosan Consolidated Accounting result reflects the sum of all results of all entities that Cosan controls, as from the acquisition date of the controlling interest. In addition, transactions and balances between companies of the Group are excluded, in accordance with the accounting policy detailed in Note 9.1 to the financial statements for the year 2022.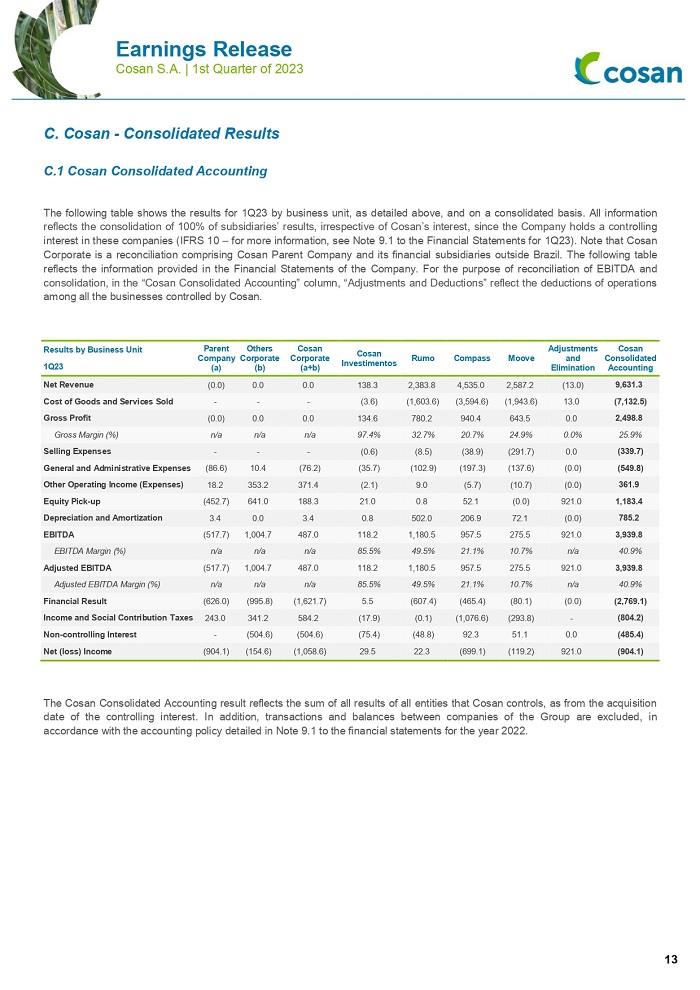
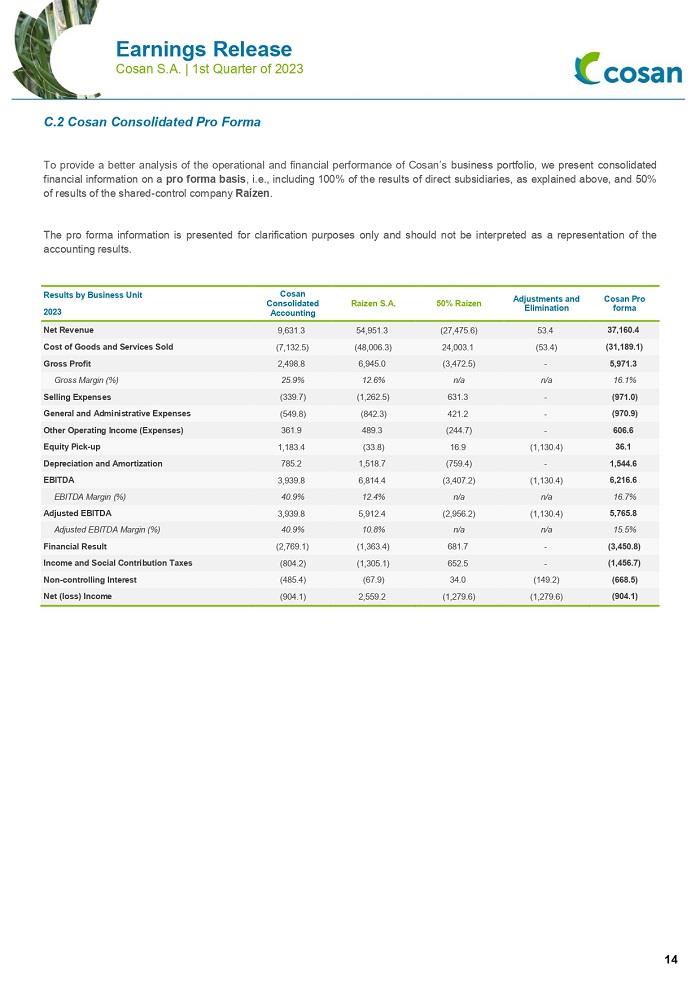
C.2 Cosan Consolidated Pro Forma To provide a better analysis of the operational and financial performance of Cosan’s business portfolio, we present consolidated financial information on a pro forma basis, i.e., including 100% of the results of direct subsidiaries, as explained above, and 50% of results of the shared-control company Raízen. The pro forma information is presented for clarification purposes only and should not be interpreted as a representation of the accounting results. Results by Business Unit Cosan Consolidated Accounting Raízen S.A. 50% Raízen Adjustments and Elimination Cosan Pro forma 2023 Net Revenue 9,631.3 54,951.3 (27,475.6) 53.4 37,160.4 Cost of Goods and Services Sold (7,132.5) (48,006.3) 24,003.1 (53.4) (31,189.1) Gross Profit 2,498.8 6,945.0 (3,472.5) - 5,971.3 Gross Margin (%) 25.9% 12.6% n/a n/a 16.1% Selling Expenses (339.7) (1,262.5) 631.3 - (971.0) General and Administrative Expenses (549.8) (842.3) 421.2 - (970.9) Other Operating Income (Expenses) 361.9 489.3 (244.7) - 606.6 Equity Pick-up 1,183.4 (33.8) 16.9 (1,130.4) 36.1 Depreciation and Amortization 785.2 1,518.7 (759.4) - 1,544.6 EBITDA 3,939.8 6,814.4 (3,407.2) (1,130.4) 6,216.6 EBITDA Margin (%) 40.9% 12.4% n/a n/a 16.7% Adjusted EBITDA 3,939.8 5,912.4 (2,956.2) (1,130.4) 5,765.8 Adjusted EBITDA Margin (%) 40.9% 10.8% n/a n/a 15.5% Financial Result (2,769.1) (1,363.4) 681.7 - (3,450.8) Income and Social Contribution Taxes (804.2) (1,305.1) 652.5 - (1,456.7) Non-controlling Interest (485.4) (67.9) 34.0 (149.2) (668.5) Net (loss) Income (904.1) 2,559.2 (1,279.6) (1,279.6) (904.1)
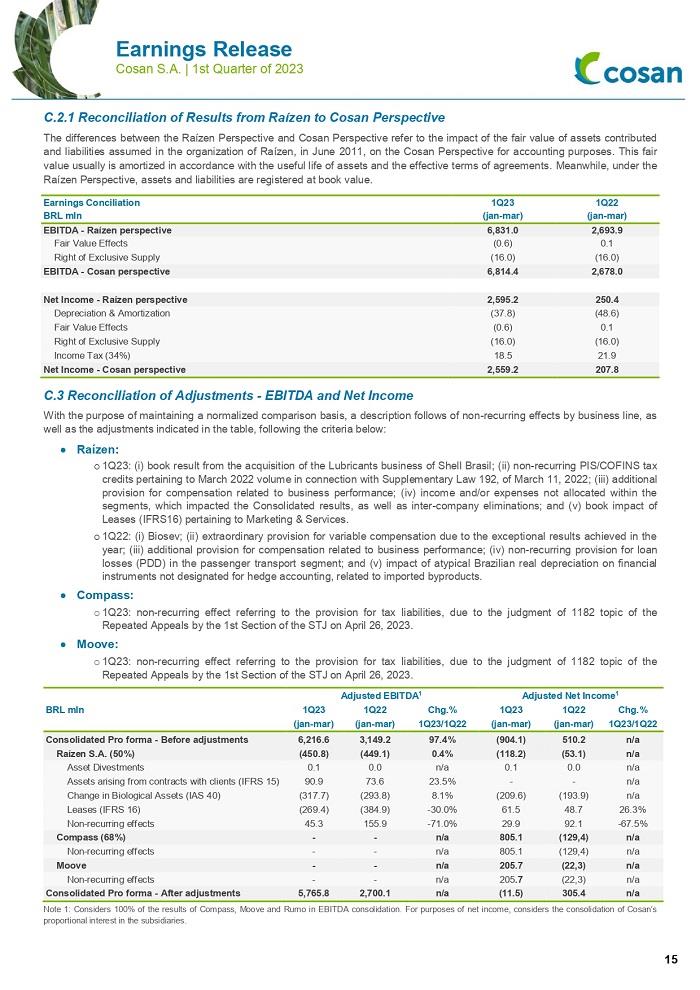
C.2.1 Reconciliation of Results from Raízen to Cosan Perspective The differences between the Raízen Perspective and Cosan Perspective refer to the impact of the fair value of assets contributed and liabilities assumed in the organization of Raízen, in June 2011, on the Cosan Perspective for accounting purposes. This fair value usually is amortized in accordance with the useful life of assets and the effective terms of agreements. Meanwhile, under the Raízen Perspective, assets and liabilities are registered at book value. Earnings Conciliation 1Q23 1Q22 BRL mln (jan-mar) (jan-mar) EBITDA - Raízen perspective 6,831.0 2,693.9 Fair Value Effects (0.6) 0.1 Right of Exclusive Supply (16.0) (16.0) EBITDA - Cosan perspective 6,814.4 2,678.0 Net Income - Raízen perspective 2,595.2 250.4 Depreciation & Amortization (37.8) (48.6) Fair Value Effects (0.6) 0.1 Right of Exclusive Supply (16.0) (16.0) Income Tax (34%) 18.5 21.9 Net Income - Cosan perspective 2,559.2 207.8 C.3 Reconciliation of Adjustments - EBITDA and Net Income With the purpose of maintaining a normalized comparison basis, a description follows of non-recurring effects by business line, as well as the adjustments indicated in the table, following the criteria below: • Raízen: o 1Q23: (i) book result from the acquisition of the Lubricants business of Shell Brasil; (ii) non-recurring PIS/COFINS tax credits pertaining to March 2022 volume in connection with Supplementary Law 192, of March 11, 2022; (iii) additional provision for compensation related to business performance; (iv) income and/or expenses not allocated within the segments, which impacted the Consolidated results, as well as inter-company eliminations; and (v) book impact of Leases (IFRS16) pertaining to Marketing & Services. o 1Q22: (i) Biosev; (ii) extraordinary provision for variable compensation due to the exceptional results achieved in the year; (iii) additional provision for compensation related to business performance; (iv) non-recurring provision for loan losses (PDD) in the passenger transport segment; and (v) impact of atypical Brazilian real depreciation on financial instruments not designated for hedge accounting, related to imported byproducts. • Compass: o 1Q23: non-recurring effect referring to the provision for tax liabilities, due to the judgment of 1182 topic of the Repeated Appeals by the 1st Section of the STJ on April 26, 2023. • Moove: o 1Q23: non-recurring effect referring to the provision for tax liabilities, due to the judgment of 1182 topic of the Repeated Appeals by the 1st Section of the STJ on April 26, 2023. Adjusted EBITDA1 Adjusted Net Income1 BRL mln 1Q23 1Q22 Chg.% 1Q23 1Q22 Chg.% (jan-mar) (jan-mar) 1Q23/1Q22 (jan-mar) (jan-mar) 1Q23/1Q22 Consolidated Pro forma - Before adjustments 6,216.6 3,149.2 97.4% (904.1) 510.2 n/a Raízen S.A. (50%) (450.8) (449.1) 0.4% (118.2) (53.1) n/a Asset Divestments 0.1 0.0 n/a 0.1 0.0 n/a Assets arising from contracts with clients (IFRS 15) 90.9 73.6 23.5% - - n/a Change in Biological Assets (IAS 40) (317.7) (293.8) 8.1% (209.6) (193.9) n/a Leases (IFRS 16) (269.4) (384.9) -30.0% 61.5 48.7 26.3% Non-recurring effects 45.3 155.9 -71.0% 29.9 92.1 -67.5% Compass (68%) - - n/a 805.1 (129,4) n/a Non-recurring effects - - n/a 805.1 (129,4) n/a Moove - - n/a 205.7 (22,3) n/a Non-recurring effects - - n/a 205.7 (22,3) n/a Consolidated Pro forma - After adjustments 5,765.8 2,700.1 n/a (11.5) 305.4 n/a Note 1: Considers 100% of the results of Compass, Moove and Rumo in EBITDA consolidation. For purposes of net income, considers the consolidation of Cosan’s proportional interest in the subsidiaries.
D. ESG Highlights and Relevant Matters ESG 100% Transparency Movement - Global Compact In March, Cosan signed a letter affirming its commitment to 100% Transparency Movement, an initiative of the UN Global Compact - Network Brazil that strives to engage companies in combating corruption to achieve the Sustainable Development Goals (SDGs) of the 2030 Agenda, reinforcing the Company’s positioning of adopting the best corporate governance practices in addition to legal obligations. Publication of Sustainability Report at Compass and Rumo In March, Compass disclosed its third Annual Sustainability Report since its foundation, in 2020. The report features various achievements of Compass in 2022, including the revision of its ESG strategy, definition of public commitments to be met by 2030, as well as advances such as the reduction of scope 1 and 2 emissions by 38% and the milestone of 36% of leadership positions held by women in the company. Still in March, Rumo also disclosed its report, featuring highlights such as the expansion of energy efficiency in rail transportation and mitigation of climate change-related impacts, as well as safe railroad operations – the company was among the best American Class One railroads and has the lowest accident rate in its history. Below we present the principal matters announced up to the publication of this document. Sale of Trizy In March, the Company entered into a share purchase and sale agreement for the sale of 100% of its interest in Trizy. The transaction was concluded on May 02, 2023. Issue of Debentures by Cosan In April, the Board of Directors approved the 5th issue of unsecured, non-convertible debentures in a single series, by the Company, in the aggregate amount of R$1.0 billion. The issue was settled on April 28. Form 20-F In April, Cosan filed its annual report Form 20-F (2022) with the U.S. Securities and Exchange Commission (SEC). The document is available on the Company’s website (https://www.cosan.com.br/en/cvm-and-sec-publications/registration-reference-and-20-f-form/). Dividend Distribution In April, the Shareholders Meeting approved the distribution of dividends in the total amount of R$800 million, corresponding to R$0.42857979 per common share, to be paid on May 31, 2022. Election of the Board of Directors and Fiscal Council In April, the Shareholders Meeting elected the following members to Cosan’s Board of Directors (BoD), to serve in the next two-year period: Rubens Ometto as chairman of the BoD; Luis Henrique Guimarães as vice chairman; as non-independent members: Burkhard Otto Cordes, Marcelo Eduardo Martins and Pedro Isamu Mizutani; and as independent members: Ana Paula Pessoa, Dan Ioschpe, José Alexandre Scheinkman, Silvia Brasil Coutinho and Vasco Augusto Pinto da Fonseca Dias Júnior. The change in the composition of the Board, now with 50% of independent members, two of them women, reinforces Cosan’s governance and is aligned with its agenda. The Shareholders Meeting also elected the members of the Fiscal Council for the next year. Election of member to the Board of Directors of Vale In April, the CEO of the Company, Luis Henrique Guimarães, was elected independent member of the Board of Directors of Vale at its Annual Shareholders Meeting.
E. Financial Statements We present below the Financial Statements (Income Statement and Balance Sheet) from the perspectives of Cosan S.A. Consolidated and Cosan S.A. Pro Forma. To access the separate Financial Statements for each business, as well as operational data and information, please consult the spreadsheet by segments available on the Company’s Investor Relations website. E.1 Cosan S.A. Consolidated Income Statement for the Period 1Q23 1Q22 Chg.% 4Q22 Chg.% BRL mln (jan-mar) (jan-mar) 1Q23/1Q22 (oct-dec) 1Q23/4Q22 Net Revenue 9,631.3 7,904.9 21.8% 10,754.1 -10.4% Cost of Goods and Services Sold (7,132.5) (6,189.2) 15.2% (8,586.2) -16.9% Gross profit 2,498.8 1,715.7 45.6% 2,167.9 15.3% Selling, general & administrative expenses (889.5) (562.2) 58.2% (1,039.0) -14.4% Other net operating income (expenses) 361.9 (100.7) n/a 1,800.7 -79.9% Financial results (2,769.1) (522.0) n/a (1,312.1) n/a Equity Pick-up 1,183.4 94.2 n/a 236.6 n/a Expenses with income and social contribution taxes (804.2) (49.1) n/a (101.8) n/a Non-controlling interest (485.4) (65.6) n/a (946.3) -48.7% Net income (loss) (904.1) 510.2 n/a 806.0 n/a Balance Sheet 1Q23 4Q22 BRL mln 03/31/23 12/31/23 Cash and cash equivalents 11,385 13,302 Marketable Securities 20,957 22,009 Trade accounts receivable 3,806 3,770 Inventories 1,917 1,869 Derivative financial instruments 3,405 4,152 Other current assets 3,195 3,128 Other non-current assets 16,803 17,165 Investments 14,595 14,135 Investment properties 14,047 13,875 Biological assets 10 10 Property, plant, and equipment 19,418 18,948 Intangible assets 22,415 22,122 Total assets 131,954 134,485 Loans and borrowings 52,619 52,987 Financial instruments and derivatives 3,629 5,291 Trade accounts payable 3,778 4,318 Payroll 448 660 Other current liabilities 6,955 5,239 Other non-current liabilities 17,033 17,821 Shareholders' Equity 47,493 48,169 Total liabilities 131,954 134,485 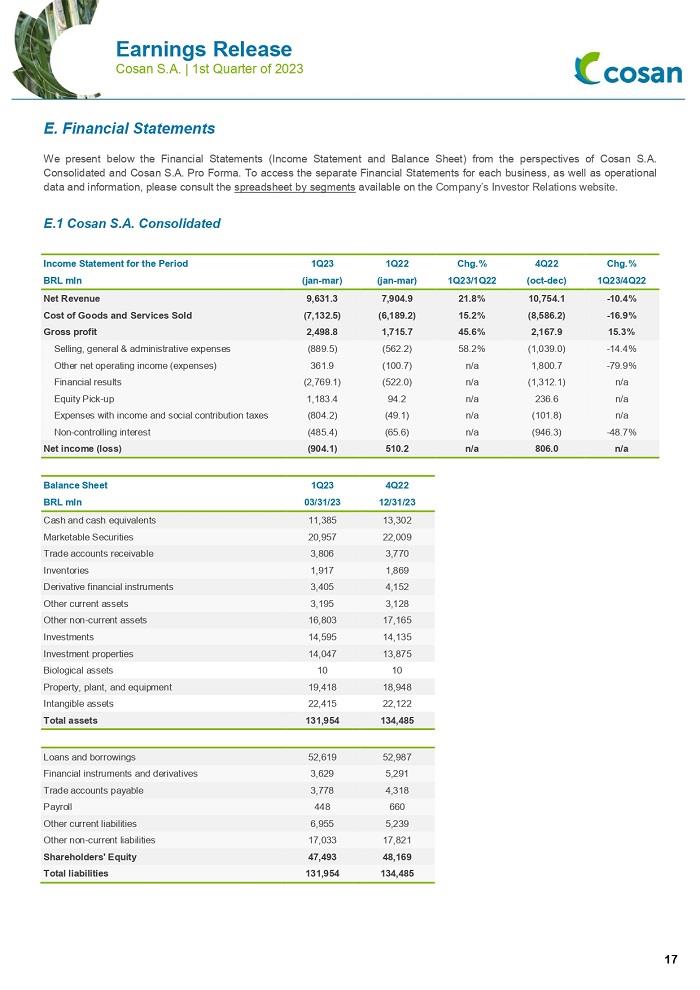
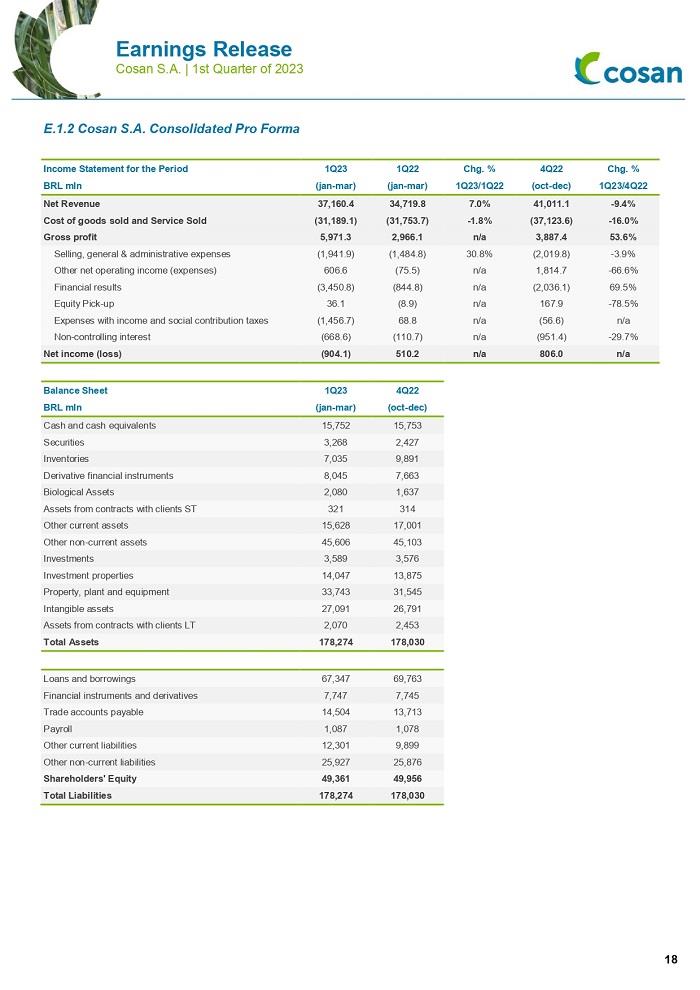
E.1.2 Cosan S.A. Consolidated Pro Forma Income Statement for the Period 1Q23 1Q22 Chg. % 4Q22 Chg. % BRL mln (jan-mar) (jan-mar) 1Q23/1Q22 (oct-dec) 1Q23/4Q22 Net Revenue 37,160.4 34,719.8 7.0% 41,011.1 -9.4% Cost of goods sold and Service Sold (31,189.1) (31,753.7) -1.8% (37,123.6) -16.0% Gross profit 5,971.3 2,966.1 n/a 3,887.4 53.6% Selling, general & administrative expenses (1,941.9) (1,484.8) 30.8% (2,019.8) -3.9% Other net operating income (expenses) 606.6 (75.5) n/a 1,814.7 -66.6% Financial results (3,450.8) (844.8) n/a (2,036.1) 69.5% Equity Pick-up 36.1 (8.9) n/a 167.9 -78.5% Expenses with income and social contribution taxes (1,456.7) 68.8 n/a (56.6) n/a Non-controlling interest (668.6) (110.7) n/a (951.4) -29.7% Net income (loss) (904.1) 510.2 n/a 806.0 n/a Balance Sheet 1Q23 4Q22 BRL mln (jan-mar) (oct-dec) Cash and cash equivalents 15,752 15,753 Securities 3,268 2,427 Inventories 7,035 9,891 Derivative financial instruments 8,045 7,663 Biological Assets 2,080 1,637 Assets from contracts with clients ST 321 314 Other current assets 15,628 17,001 Other non-current assets 45,606 45,103 Investments 3,589 3,576 Investment properties 14,047 13,875 Property, plant and equipment 33,743 31,545 Intangible assets 27,091 26,791 Assets from contracts with clients LT 2,070 2,453 Total Assets 178,274 178,030 Loans and borrowings 67,347 69,763 Financial instruments and derivatives 7,747 7,745 Trade accounts payable 14,504 13,713 Payroll 1,087 1,078 Other current liabilities 12,301 9,899 Other non-current liabilities 25,927 25,876 Shareholders' Equity 49,361 49,956 Total Liabilities 178,274 178,030
1Q23 CONFERENCE CALL Portuguese (with simultaneous translation to English) May 16, 2023 (Tuesday) TIME 10 a.m. (Brasília) | 09 a.m. (New York) Webcast PT/EN: click here BR: + 55 (11) 4632 2237 USA: +1 (386) 347 5053 TEAM: Ricardo Lewin – Chief Financial and Investor Relations Officer Ana Luísa Perina – IR Head Camila Amorim - Coordinator Paula Macedo – Coordinator Eduardo Kitagawa – Analyst Helena Fukuda – Analyst INVESTOR RELATIONS E-mail: ri@cosan.com Website: cosan.com.br Telephone: +55 11 3897-9797
SIGNATURES
Pursuant to the requirements of the Securities Exchange Act of 1934, the registrant has duly caused this report to be signed on its behalf by the undersigned, thereunto duly authorized.
Date: May 16, 2023
|
|
COSAN S.A. |
|
|
|
By: |
/s/ Ricardo Lewin |
|
|
|
Name: Ricardo Lewin |
|
|
|
Title: Chief Financial Officer |