UNITED STATES
SECURITIES AND EXCHANGE COMMISSION
Washington, D.C. 20549
FORM 8-K
CURRENT REPORT
Pursuant to Section 13 or 15(d)
of the Securities Exchange Act of 1934
December 4, 2025
Date of Report
(Date of Earliest Event Reported)
WSFS Financial Corporation
(Exact Name of Registrant as Specified in its Charter)
| Delaware | 001-35638 | 22-2866913 | ||
| (State or Other Jurisdiction of Incorporation) |
(SEC Commission File Number) |
(IRS Employer Identification Number) |
500 Delaware Ave,
Wilmington, Delaware, 19801
(Address of Principal Executive Offices) (Zip Code)
Registrant’s Telephone Number, including Area Code: (302) 792-6000
Not Applicable
(Former Name or Former Address, if Changed Since Last Report)
Check the appropriate box below if the Form 8-K filing is intended to simultaneously satisfy the filing obligation of the registrant under any of the following provisions:
| ☐ | Written communication pursuant to Rule 425 under the Securities Act (17 CFR 230.425) |
| ☐ | Soliciting material pursuant to Rule 14a-12 under the Exchange Act (17 CFR 240.14a-12) |
| ☐ | Pre-commencement communications pursuant to Rule 14d-2(b) under the Exchange Act (17 CFR 240.14d-2(b)) |
| ☐ | Pre-commencement communications pursuant to Rule 13e-4(c) under the Exchange Act (17 CFR 240.13e-4(c)) |
Securities registered pursuant to Section 12(b) of the Act:
| Title of each class | Trading Symbol(s) | Name of each exchange on which registered |
| Common Stock, par value $0.01 per share | WSFS | Nasdaq Global Select Market |
Indicate by check mark whether the registrant is an emerging growth company as defined in Rule 405 of the Securities Act of 1933 (17 CFR 230.405) or Rule 12b-2 of the Securities Exchange Act of 1934 (17 CFR 240.12b-2).
Emerging growth company ☐
If an emerging growth company, indicate by check mark if the registrant has elected not to use the extended transition period for complying with any new or revised financial accounting standards provided pursuant to Section 13(a) of the Exchange Act. ☐
| Item 7.01 | Regulation FD Disclosures. |
The attached presentation contains information that the members of WSFS Financial Corporation (the “Registrant”) management will use during visits with investors, analysts, and other interested parties to assist their understanding of the Registrant from time to time throughout the fourth quarter of 2025. Other presentations and related materials will be made available as they are presented during the year.
A copy of the presentation is attached as Exhibit 99.1 to this Current Report on Form 8-K and is being furnished under Item 7.01 hereof and shall not be deemed “filed” for purposes of Section 18 of the Securities Exchange Act of 1934, as amended (the “Exchange Act”), or otherwise subject to the liabilities of that section, and such information shall not be deemed incorporated by reference into any filing under the Securities Act of 1933, as amended, or the Exchange Act, except as shall be expressly set forth by specific reference in such filing.
| Item 9.01 | Financial Statements and Other Exhibits. |
(d) Exhibits.
| Number | Description |
| 99.1 | Investor Presentation, dated December 4, 2025 |
| 104 | Cover Page Interactive Data File (embedded within the Inline XBRL document) |
SIGNATURE
Pursuant to the requirements of the Securities Exchange Act of 1934, the registrant has duly caused this report to be signed on its behalf by the undersigned hereunto duly authorized.
| WSFS Financial Corporation | ||
| Date: December 4, 2025 | By: | /s/ David Burg |
| David Burg Executive Vice President, Chief Financial Officer |
||
Exhibit 99.1
WSFS Financial Corporation Fixed Income Presentation December 2025
2 Forward Looking Statements & Non - GAAP Disclaimers Trade names, trademarks and service marks of other companies appearing in this presentation are the property of their respective holders . Forward Looking Statements: This presentation contains estimates, predictions, opinions, projections and other "forward - looking statements" as that phrase is defined in the Private Securities Litigation Reform Act of 1995. Such statements include, without limitation, references to WSFS Financial Corporation’s (“the Company”) predictions or expectations of future business or financial performance as well as its goals and objectives for future operations, financial and business trends, business prospects, and management's outlook or expectations for earnings, revenues, expenses, capital levels, liquidity levels, asset quality or other future financial or business performance, strategies or expectations. The words “believe,” “expect,” “anticipate,” “plan,” “estimate,” “target,” “project” and similar expressions, among others, generally identify forward - looking statements. Such forward - looking statements are based on various assumptions (some of which may be beyond the Company's control) and are subject to significant risks and uncertainties (which change over time) and other factors, including, but not limited to, volatile market conditions and uncertain economic trends in the United States generally and in financial markets, particularly in the markets in which the Company operates and in which its loans are concentrated, including potential recessionary and other unfavorable conditions and trends related to housing markets, costs of living, unemployment levels, trade, monetary and fiscal policies, interest rates, supply chain issues, inflation, economic growth, the uncertain effects of geopolitical instability, armed conflicts, public health crises, inflation, interest rates and actions taken in response thereto on our business, results of operations, capital and liquidity, which could cause actual results to differ materially from those currently anticipated. Such risks and uncertainties are discussed in detail in the Company’s Form 10 - K for the year ended December 31, 2024, Form 10 - Q for the quarter ended March 31, 2025, Form 10 - Q for the quarter ended June 30, 2025, and Form 10 - Q for the quarter ended September 30, 2025, and other documents filed by the Company with the Securities and Exchange Commission from time to time. We caution readers not to place undue reliance on any such forward - looking statements, which speak only as of the date on which they are made, and the Company disclaims any duty to revise or update any forward - looking statement, whether written or oral, that may be made from time to time by or on behalf of the Company for any reason, except as specifically required by law. As used in this presentation, the terms "WSFS", "the Company", "registrant", "we", "us", and "our" mean WSFS Financial Corporation and its subsidiaries, on a consolidated basis, unless the context indicates otherwise. Non - GAAP Financial Measures: This presentation contains financial measures determined by methods other than in accordance with accounting principles generally accepted in the United States (“GAAP”). The Company’s management believes that these non - GAAP financial measures provide a greater understanding of ongoing operations, enhance comparability of results of operations with prior periods and show the effects of significant gains and charges in the periods presented. The Company’s management believes these non - GAAP financial measures are useful measures for management and investors to analyze the Company’s financial performance without the impact of unusual items or events that may obscure trends in the Company’s underlying performance. You should not rely on these non - GAAP financial measures as a substitute for, or as superior to, GAAP results. For a reconciliation of these non - GAAP financial measures to their most directly comparable GAAP measures, see the Appendix.

3 Page 4 WSFS Franchise and Growth Strategy Page 11 Financial Highlights and Trends Page 19 Capital, Liquidity, and Interest Coverage Page 24 Asset Quality and ACL Overview Page 28 Select Lines of Business Page 34 Appendix: Reconciliation of Non - GAAP Financial Measures Table of Contents WSFS Franchise and Growth Strategy
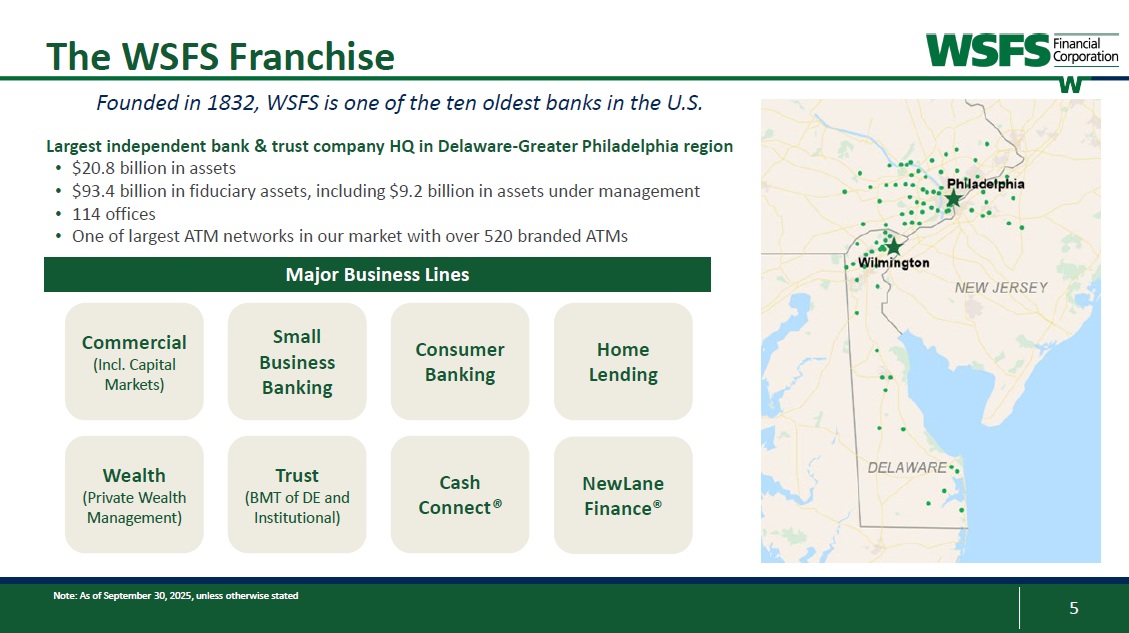
5 Note: As of September 30, 2025, unless otherwise stated The WSFS Franchise Commercial (Incl. Capital Markets) Small Business Banking Wealth (Private Wealth Management) Trust (BMT of DE and Institutional) Cash Connect ® Major Business Lines Founded in 1832, WSFS is one of the ten oldest banks in the U.S. Largest independent bank & trust company HQ in Delaware - Greater Philadelphia region • $20.8 billion in assets • $93.4 billion in fiduciary assets, including $9.2 billion in assets under management • 114 offices • One of largest ATM networks in our market with over 520 branded ATMs Consumer Banking NewLane Finance® Home Lending 6 WSFS Key Strengths Focused on long-term sustainable top-quintile financial performance 1 This is a non-GAAP financial measure and should be considered along with results prepared in accordance with GAAP, and not as a substitute for GAAP results.
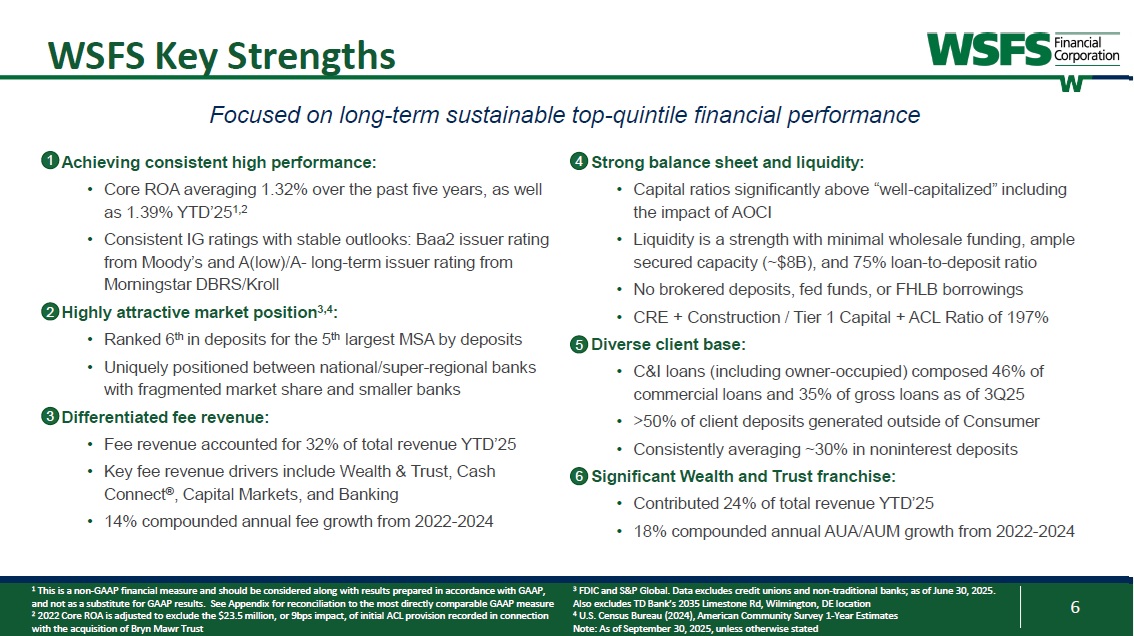
See Appendix for reconciliation to the most directly comparable GAAP measure 2 2022 Core ROA is adjusted to exclude the $23.5 million, or 9bps impact, of initial ACL provision recorded in connection with the acquisition of Bryn Mawr Trust Strong balance sheet and liquidity: • Capital ratios significantly above “well-capitalized” including the impact of AOCI • Liquidity is a strength with minimal wholesale funding, ample secured capacity (~$8B), and 75% loan-to-deposit ratio • No brokered deposits, fed funds, or FHLB borrowings • CRE + Construction / Tier 1 Capital + ACL Ratio of 197% Diverse client base: • C&I loans (including owner-occupied) composed 46% of commercial loans and 35% of gross loans as of 3Q25 • >50% of client deposits generated outside of Consumer • Consistently averaging ~30% in noninterest deposits Significant Wealth and Trust franchise: • Contributed 24% of total revenue YTD’25 • 18% compounded annual AUA/AUM growth from 2022-2024 Achieving consistent high performance: • Core ROA averaging 1.32% over the past five years, as well as 1.39% YTD’251,2 • Consistent IG ratings with stable outlooks: Baa2 issuer rating from Moody’s and A(low)/A- long-term issuer rating from Morningstar DBRS/Kroll Highly attractive market position3,4: • Ranked 6th in deposits for the 5th largest MSA by deposits • Uniquely positioned between national/super-regional banks with fragmented market share and smaller banks Differentiated fee revenue: • Fee revenue accounted for 32% of total revenue YTD’25 • Key fee revenue drivers include Wealth & Trust, Cash Connect®, Capital Markets, and Banking • 14% compounded annual fee growth from 2022-2024 1 2 3 4 5 6 3 FDIC and S&P Global. Data excludes credit unions and non-traditional banks; as of June 30, 2025. Also excludes TD Bank’s 2035 Limestone Rd, Wilmington, DE location 4 U.S. Census Bureau (2024), American Community Survey 1-Year Estimates Note: As of September 30, 2025, unless otherwise stated 7 1 KRX represents the KBW Nasdaq Regional Bank Index 2 This is a non-GAAP financial measure and should be considered along with results prepared in accordance with GAAP, and not as a substitute for GAAP results.
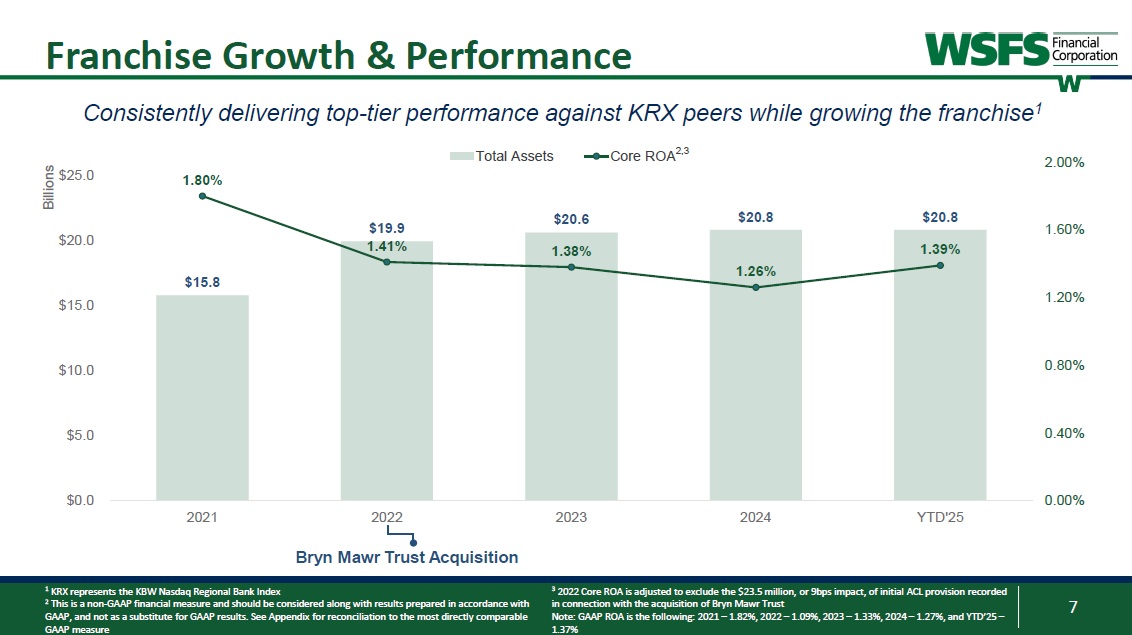
See Appendix for reconciliation to the most directly comparable GAAP measure Franchise Growth & Performance Consistently delivering top-tier performance against KRX peers while growing the franchise1 $15.8 $19.9 $20.6 $20.8 $20.8 1.80% 1.41% 1.38% 1.26% 1.39% 0.00% 0.40% 0.80% 1.20% 1.60% 2.00% $0.0 $5.0 $10.0 $15.0 $20.0 $25.0 2021 2022 2023 2024 YTD'25 Billions Total Assets Core ROA Bryn Mawr Trust Acquisition 2,3 3 2022 Core ROA is adjusted to exclude the $23.5 million, or 9bps impact, of initial ACL provision recorded in connection with the acquisition of Bryn Mawr Trust Note: GAAP ROA is the following: 2021 – 1.82%, 2022 – 1.09%, 2023 – 1.33%, 2024 – 1.27%, and YTD’25 – 1.37% 8 Unique Market Position Largest locally headquartered bank and wealth franchise in the Greater Philadelphia and Delaware region 1 FDIC and S&P Global.
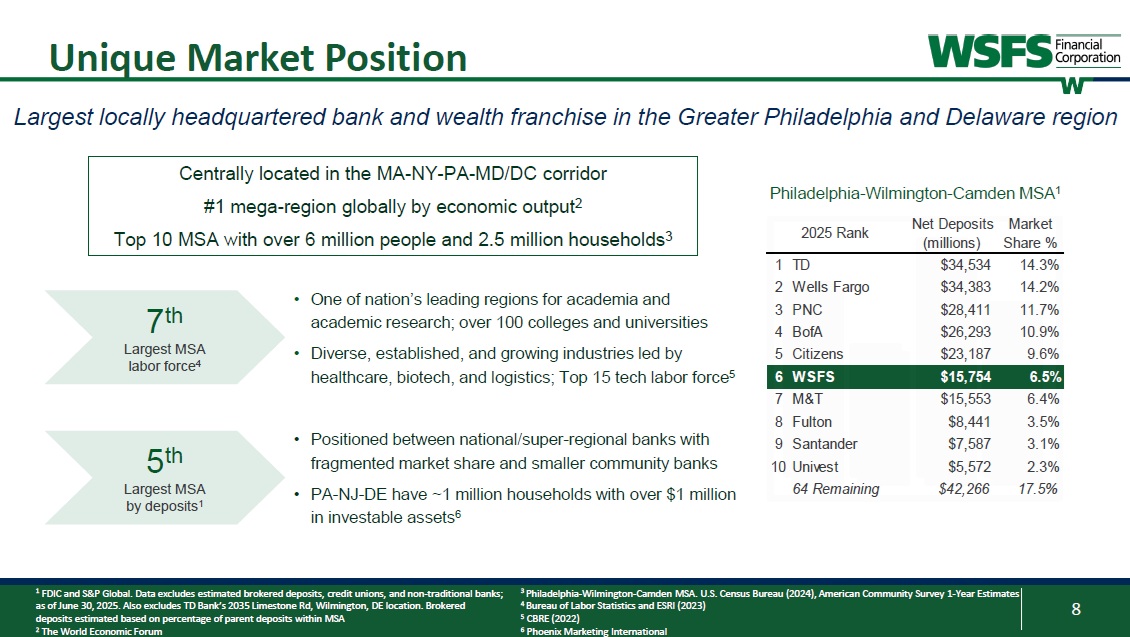
Data excludes estimated brokered deposits, credit unions, and non - traditional banks; as of June 30, 2025. Also excludes TD Bank’s 2035 Limestone Rd, Wilmington, DE location. Brokered deposits estimated based on percentage of parent deposits within MSA 2 The World Economic Forum 3 Philadelphia - Wilmington - Camden MSA. U.S.
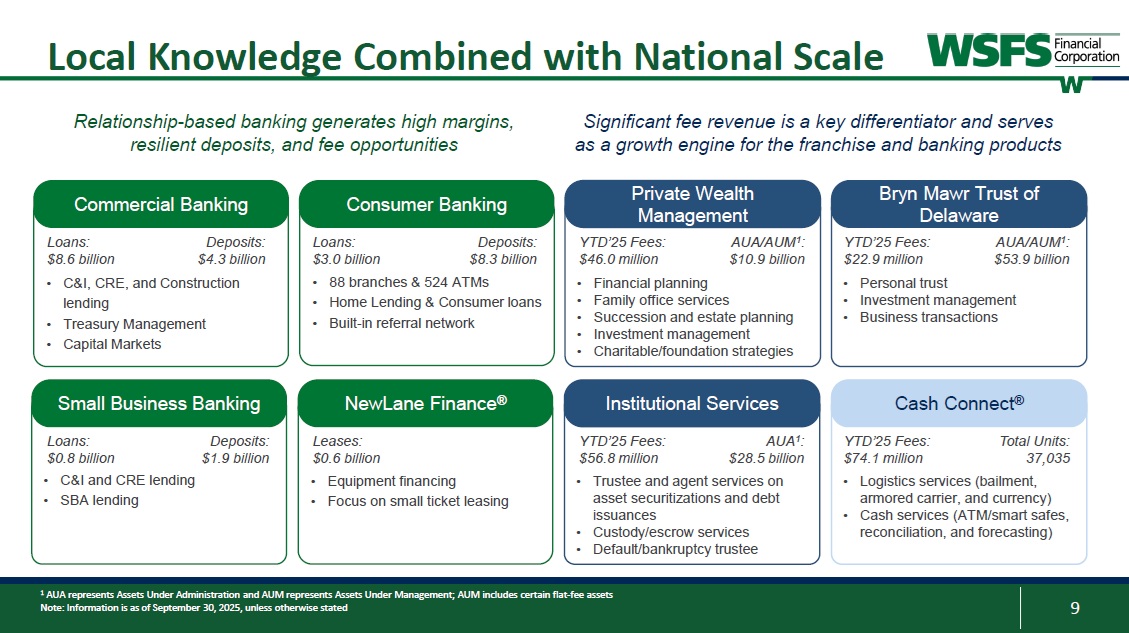
Census Bureau (2024), American Community Survey 1 - Year Estimates 4 Bureau of Labor Statistics and ESRI (2023) 5 CBRE (2022) 6 Phoenix Marketing International Centrally located in the MA - NY - PA - MD/DC corridor #1 mega - region globally by economic output 2 Top 10 MSA with over 6 million people and 2.5 million households 3 7 th Largest MSA labor force 4 5 th Largest MSA by deposits 1 • One of nation’s leading regions for academia and • Positioned between national/super - regional banks with fragmented market share and smaller community banks • PA - NJ - DE have ~1 million households with over $1 million in investable assets 6 Philadelphia - Wilmington - Camden MSA 1 Net Deposits (millions) Market Share % TD $34,534 14.3% 1 14.2% $34,383 2 Wells Fargo 11.7% $28,411 3 PNC 10.9% $26,293 BofA 4 academic research; over 100 colleges and universities 9.6% $23,187 Citizens 5 • Diverse, established, and growing industries led by 6.5% $15,754 WSFS 6 healthcare, biotech, and logistics; Top 15 tech labor force 5 6.4% $15,553 M&T 7 3.5% $8,441 Fulton 8 3.1% $7,587 9 Santander 2.3% $5,572 10 Univest 17.5% $42,266 64 Remaining 2025 Rank 9 • Logistics services (bailment, armored carrier, and currency) • Cash services (ATM/smart safes, reconciliation, and forecasting) • Trustee and agent services on asset securitizations and debt issuances • Custody/escrow services • Default/bankruptcy trustee Local Knowledge Combined with National Scale 1 AUA represents Assets Under Administration and AUM represents Assets Under Management; AUM includes certain flat - fee assets Note: Information is as of September 30, 2025, unless otherwise stated • 88 branches & 524 ATMs • Home Lending & Consumer loans • Built - in referral network • Financial planning • Family office services • Succession and estate planning • Investment management • Charitable/foundation strategies • Personal trust • Investment management • Business transactions • C&I, CRE, and Construction lending • Treasury Management • Capital Markets Private Wealth Management Institutional Services Bryn Mawr Trust of Delaware Cash Connect ® Consumer Banking Commercial Banking Small Business Banking Loans: $0.8 billion • C&I and CRE lending • SBA lending NewLane Finance ® Leases: $0.6 billion • Equipment financing • Focus on small ticket leasing YTD’25 Fees: $46.0 million AUA/AUM 1 : $10.9 billion YTD’25 Fees: $22.9 million AUA/AUM 1 : $53.9 billion YTD’25 Fees: $56.8 million AUA 1 : $28.5 billion YTD’25 Fees: $74.1 million Total Units: 37,035 Relationship - based banking generates high margins, resilient deposits, and fee opportunities Significant fee revenue is a key differentiator and serves as a growth engine for the franchise and banking products Loans: $3.0 billion Loans: $8.6 billion Deposits: $4.3 billion Deposits: $1.9 billion Deposits: $8.3 billion 10 Focused on Relationship - Banking 1 Consumer Banking client deposits 2 Medallia; as of September 30, 2025.
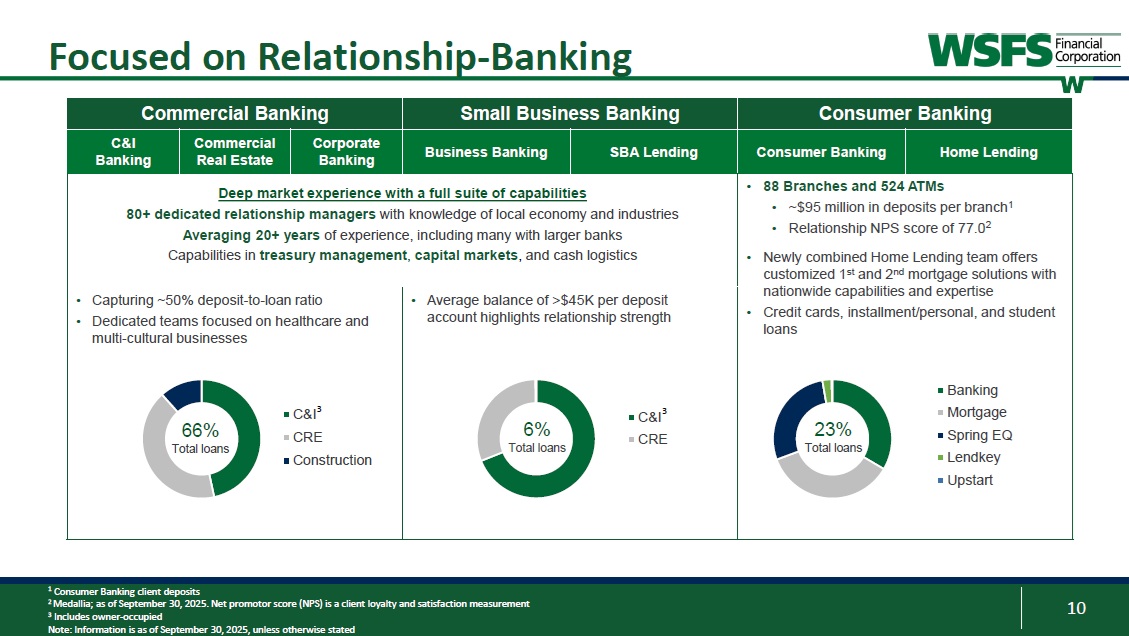
Net promotor score (NPS) is a client loyalty and satisfaction measurement 3 Includes owner - occupied Note: Information is as of September 30, 2025, unless otherwise stated Consumer Banking Small Business Banking Commercial Banking Home Lending Consumer Banking SBA Lending Business Banking Corporate Banking Commercial Real Estate C&I Banking • 88 Branches and 524 ATMs • ~$95 million in deposits per branch 1 • Relationship NPS score of 77.0 2 • Newly combined Home Lending team offers customized 1 st and 2 nd mortgage solutions with nationwide capabilities and expertise • Credit cards, installment/personal, and student loans Banking Mortgage 23% Spring EQ Total loans Lendkey Upstart Deep market experience with a full suite of capabilities 80+ dedicated relationship managers with knowledge of local economy and industries Averaging 20+ years of experience, including many with larger banks Capabilities in treasury management , capital markets , and cash logistics • Average balance of >$45K per deposit account highlights relationship strength C&I 3 6% CRE Total loans • Capturing ~50% deposit - to - loan ratio • Dedicated teams focused on healthcare and multi - cultural businesses C&I 3 66% CRE Total loans Construction 12 $3.27 $3.79 +16% $1.50 $4.00 $1.20 $3.20 $0.90 $2.40 $0.00 $0.80 $1.60 YTD'24 YTD'25 YTD Core EPS 1 3Q25 Financial Highlights 1 These are non - GAAP financial measures and should be considered along with results prepared in accordance with GAAP, and not as a substitute for GAAP results.
Financial Highlights and Trends
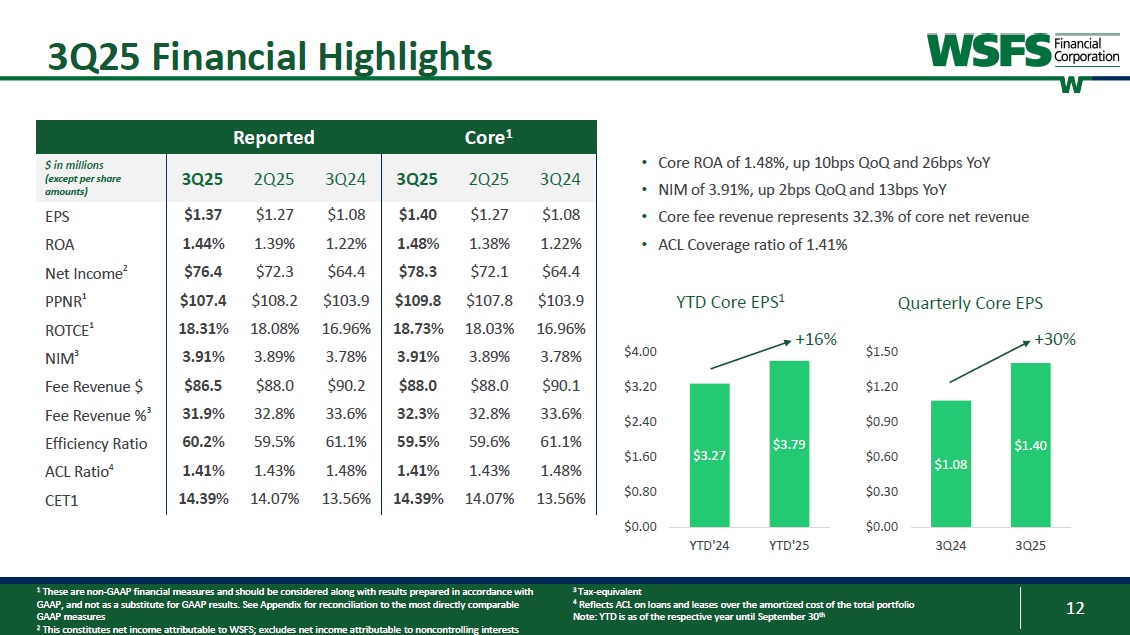
See Appendix for reconciliation to the most directly comparable GAAP measures 2 This constitutes net income attributable to WSFS; excludes net income attributable to noncontrolling interests 3 Tax - equivalent 4 Reflects ACL on loans and leases over the amortized cost of the total portfolio Note: YTD is as of the respective year until September 30 th Core 1 Reported 3Q24 2Q25 3Q25 3Q24 2Q25 3Q25 $ in millions (except per share amounts) $1.08 $1.27 $1.40 $1.08 $1.27 $1.37 EPS 1.22% 1.38% 1.48% 1.22% 1.39% 1.44% ROA $64.4 $72.1 $78.3 $64.4 $72.3 $76.4 Net Income 2 $103.9 $107.8 $109.8 $103.9 $108.2 $107.4 PPNR 1 16.96% 18.03% 18.73% 16.96% 18.08% 18.31% ROTCE 1 3.78% 3.89% 3.91% 3.78% 3.89% 3.91% NIM 3 $90.1 $88.0 $88.0 $90.2 $88.0 $86.5 Fee Revenue $ 33.6% 32.8% 32.3% 33.6% 32.8% 31.9% Fee Revenue % 3 61.1% 59.6% 59.5% 61.1% 59.5% 60.2% Efficiency Ratio 1.48% 1.43% 1.41% 1.48% 1.43% 1.41% ACL Ratio 4 13.56% 14.07% 14.39% 13.56% 14.07% 14.39% CET1 $1.08 $1.40 $0.00 $0.30 $0.60 3Q24 3Q25 Quarterly Core EPS • Core ROA of 1.48%, up 10bps QoQ and 26bps YoY • NIM of 3.91%, up 2bps QoQ and 13bps YoY • Core fee revenue represents 32.3% of core net revenue • ACL Coverage ratio of 1.41% +30% 13 Year - To - Date Performance Highlights 1 S&P Global; data for KBW Nasdaq Regional Banking Index (KRX) peers pulled as of November 15, 2025 2 Core Fee Revenue %, Core Efficiency %, Core ROA %, and Core ROTCE are non - GAAP financial measures and should be considered along with results prepared in accordance with GAAP, and not as a substitute for GAAP results.
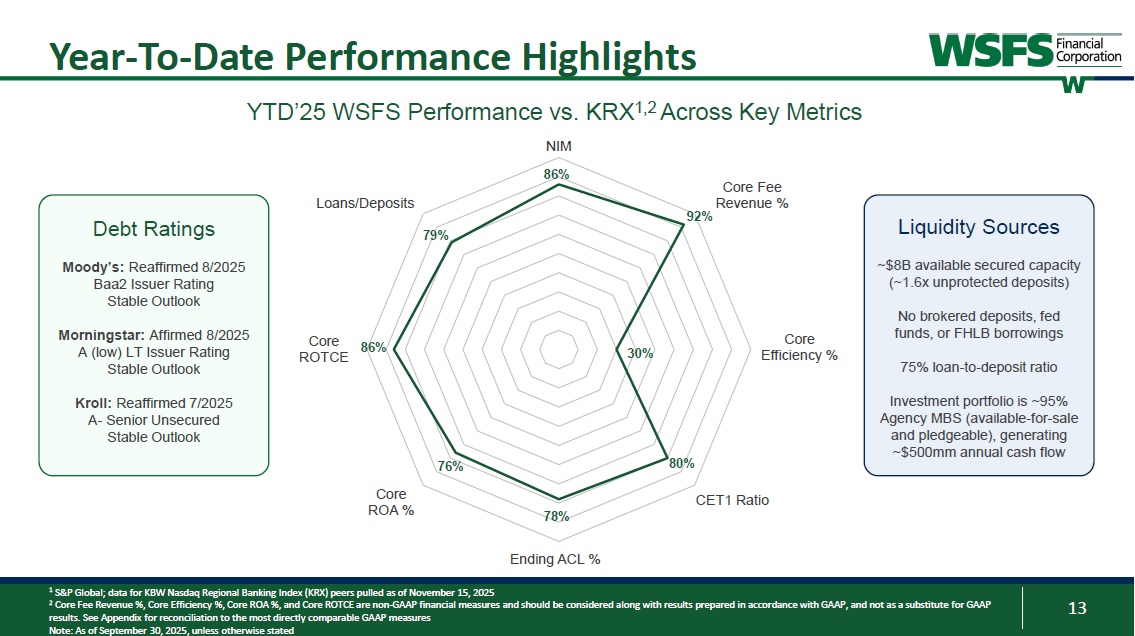
See Appendix for reconciliation to the most directly comparable GAAP measures Note: As of September 30, 2025, unless otherwise stated Core Efficiency % CET1 Ratio Ending ACL % Core ROA % Core ROTCE 92% 79% 78% 76% 86% 30% 80% YTD’25 WSFS Performance vs. KRX 1,2 Across Key Metrics NIM 86% Core Fee Loans/Deposits Revenue % Debt Ratings Moody’s: Reaffirmed 8/2025 Baa2 Issuer Rating Stable Outlook Morningstar: Affirmed 8/2025 A (low) LT Issuer Rating Stable Outlook Kroll: Reaffirmed 7/2025 A - Senior Unsecured Stable Outlook Liquidity Sources ~$8B available secured capacity (~1.6x unprotected deposits) No brokered deposits, fed funds, or FHLB borrowings 75% loan - to - deposit ratio Investment portfolio is ~95% Agency MBS (available - for - sale and pledgeable), generating ~$500mm annual cash flow 14 Core ROTCE1 Net Interest Margin Core ROA1,2 Core Fee Income %1,3 Core Metrics – 5 Year Trend 1.80% 1.41% 1.38% 1.26% 1.39% 0.0% 0.4% 0.8% 1.2% 1.6% 2.0% 2021 2022 2023 2024 YTD'25 29.4% 27.9% 28.0% 32.2% 32.2% 24.0% 26.0% 28.0% 30.0% 32.0% 34.0% 2021 2022 2023 2024 YTD'25 3.23% 3.71% 4.11% 3.82% 3.89% 0.0% 1.0% 2.0% 3.0% 4.0% 5.0% 2021 2022 2023 2024 YTD'25 21.33% 20.37% 22.48% 17.83% 17.92% 1.4% 6.4% 11.4% 16.4% 21.4% 26.4% 2021 2022 2023 2024 YTD'25 1 These are non-GAAP financial measures and should be considered along with results prepared in accordance with GAAP, and not as a substitute for GAAP results.
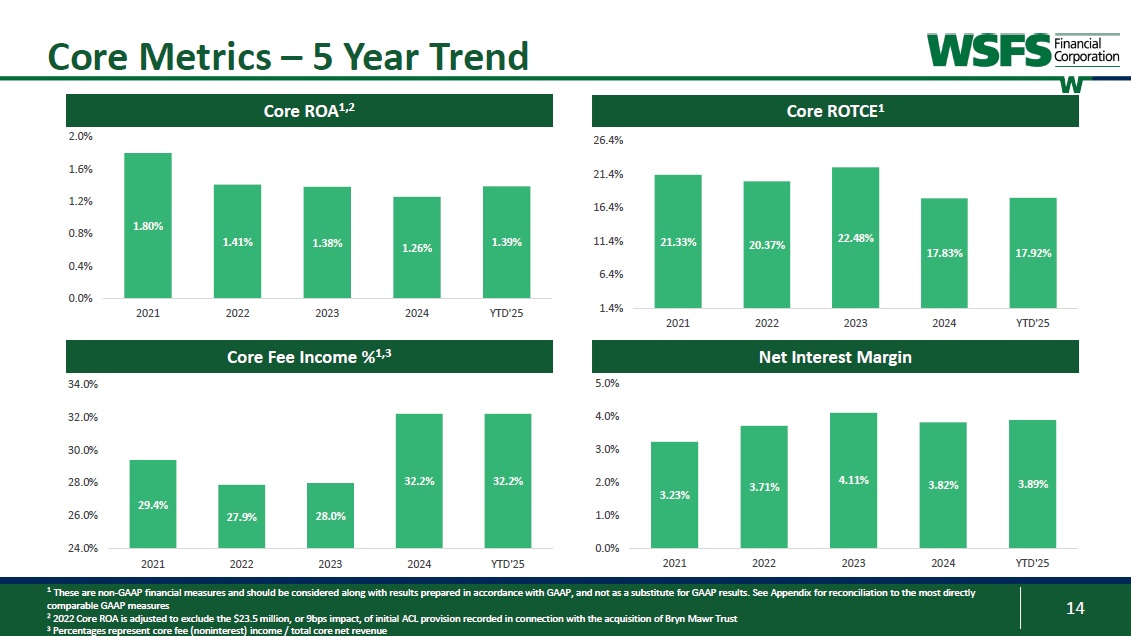
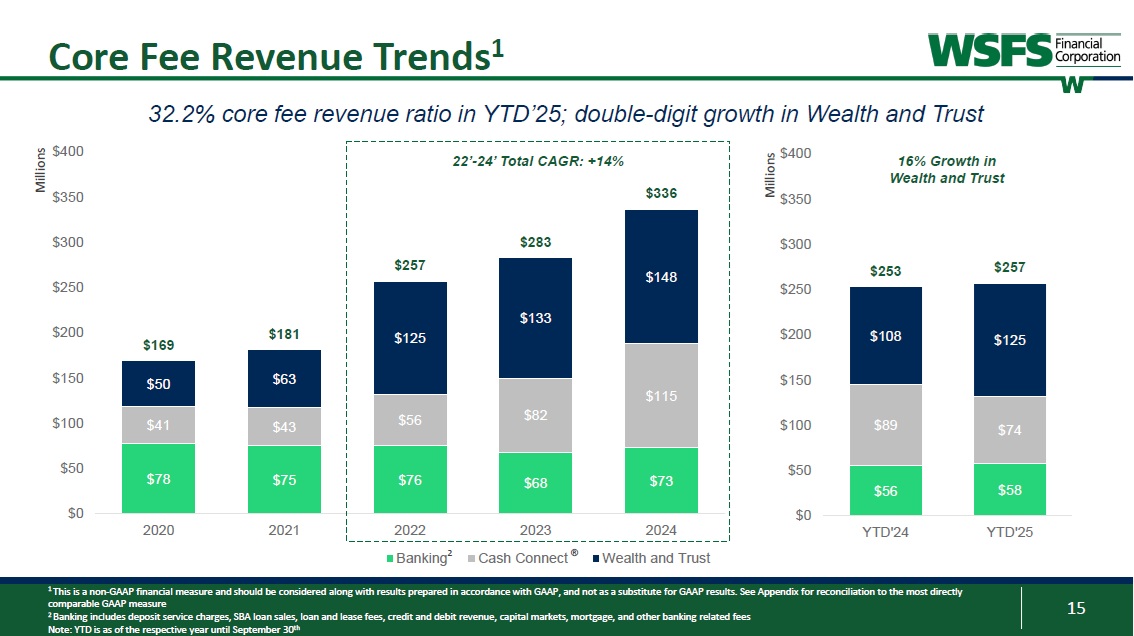
See Appendix for reconciliation to the most directly comparable GAAP measures 2 2022 Core ROA is adjusted to exclude the $23.5 million, or 9bps impact, of initial ACL provision recorded in connection with the acquisition of Bryn Mawr Trust 3 Percentages represent core fee (noninterest) income / total core net revenue 15 $56 $58 $89 $74 $108 $125 $253 $257 $0 $50 $100 $150 $200 $250 $300 $350 $400 YTD'24 YTD'25 Core Fee Revenue Trends 1 32.2% core fee revenue ratio in YTD’25; double - digit growth in Wealth and Trust $78 $75 $76 $68 $73 $41 $43 $56 $82 $115 $50 $63 $125 $133 $148 $169 $181 $257 $283 $336 $0 $50 $100 $150 $200 $250 $300 $350 $400 2020 2021 2022 2023 2024 Banking 2 Cash Connect ® Wealth and Trust 1 This is a non - GAAP financial measure and should be considered along with results prepared in accordance with GAAP, and not as a substitute for GAAP results.
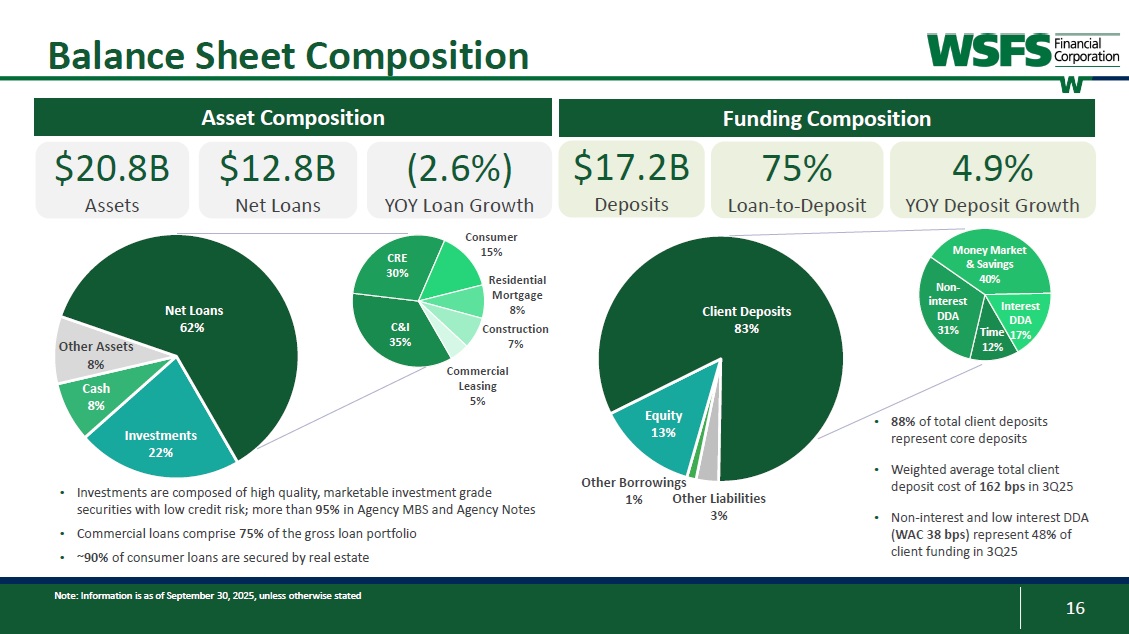
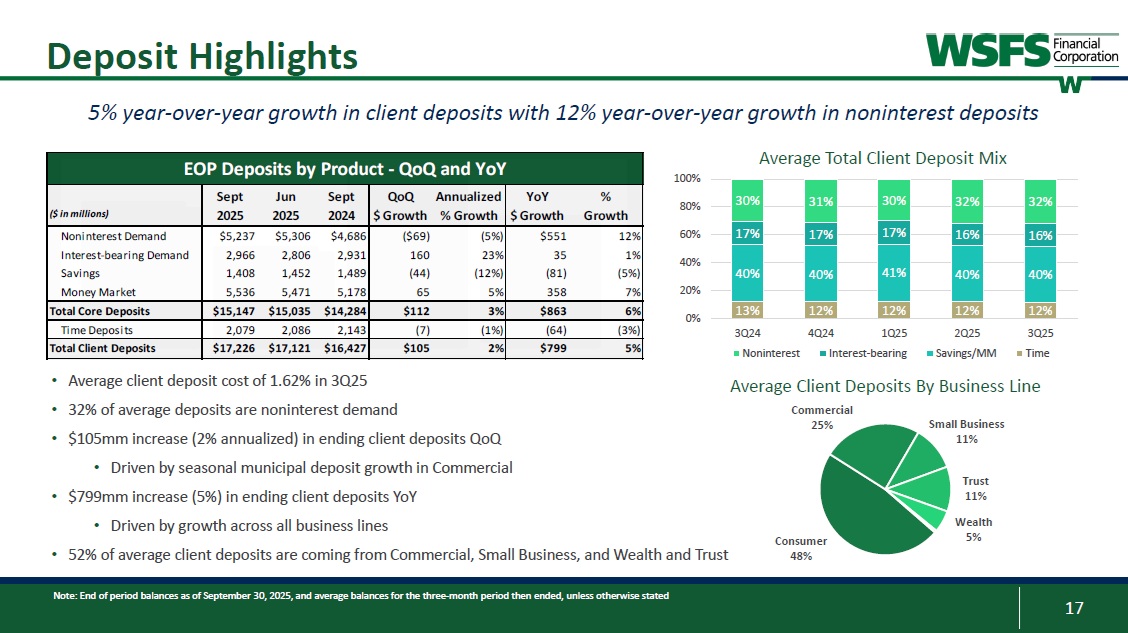
See Appendix for reconciliation to the most directly comparable GAAP measure 2 Banking includes deposit service charges, SBA loan sales, loan and lease fees, credit and debit revenue, capital markets, mortgage, and other banking related fees Note: YTD is as of the respective year until September 30 th 22’ - 24’ Total CAGR: +14% Millions Millions 16% Growth in Wealth and Trust 16 Non - interest DDA 31% Money Market & Savings 40% Interest DDA Time 17% 12% Balance Sheet Composition C&I 35% CRE 30% Consumer 15% Residential Mortgage 8% Construction 7% Commercial Leasing 5% Investments 22% Other Assets 8% Cash 8% Net Loans 62% • Investments are composed of high quality, marketable investment grade securities with low credit risk; more than 95% in Agency MBS and Agency Notes • Commercial loans comprise 75% of the gross loan portfolio • ~90% of consumer loans are secured by real estate Equity 13% Client Deposits 83% • 88% of total client deposits represent core deposits • Weighted average total client deposit cost of 162 bps in 3Q25 • Non - interest and low interest DDA ( WAC 38 bps ) represent 48 % of client funding in 3Q25 $20.8B Assets $12.8B Net Loans Asset Composition (2.6%) YOY Loan Growth Funding Composition $17.2B Deposits 75% Loan - to - Deposit 4.9% YOY Deposit Growth Other Borrowings 1% Other Liabilities 3% Note: Information is as of September 30, 2025, unless otherwise stated 17 Deposit Highlights • Average client deposit cost of 1.62% in 3Q25 • 32% of average deposits are noninterest demand • $105mm increase (2% annualized) in ending client deposits QoQ • Driven by seasonal municipal deposit growth in Commercial • $799mm increase (5%) in ending client deposits YoY • Driven by growth across all business lines • 52% of average client deposits are coming from Commercial, Small Business, and Wealth and Trust 5% year - over - year growth in client deposits with 12% year - over - year growth in noninterest deposits Average Total Client Deposit Mix Consumer 48% 25% Small Business 11% Average Client Deposits By Business Line Commercial Trust 11% Wealth 5% 32% 32% 30% 31% 30% 16% 16% 17% 17% 17% 40% 40% 41% 40% 40% 12% 12% 12% 12% 13% 0% 100% 80% 60% 40% 20% 3Q24 Noninterest 4Q24 1Q25 Interest - bearing 2Q25 Savings/MM 3Q25 Time EOP Deposits by Product - QoQ and YoY % Growth YoY $ Growth Annualized % Growth QoQ $ Growth Sept 2024 Jun 2025 Sept 2025 ($ in millions) 12% $551 (5%) ($69) $4,686 $5,306 $5,237 Noninterest Demand 1% 35 23% 160 2,931 2,806 2,966 Interest - bearing Demand (5%) (81) (12%) (44) 1,489 1,452 1,408 Savings 7% 358 5% 65 5,178 5,471 5,536 Money Market 6% $863 3% $112 $14,284 $15,035 $15,147 Total Core Deposits (3%) (64) (1%) (7) 2,143 2,086 2,079 Time Deposits 5% $799 2% $105 $16,427 $17,121 $17,226 Total Client Deposits Note: End of period balances as of September 30, 2025, and average balances for the three - month period then ended, unless otherwise stated
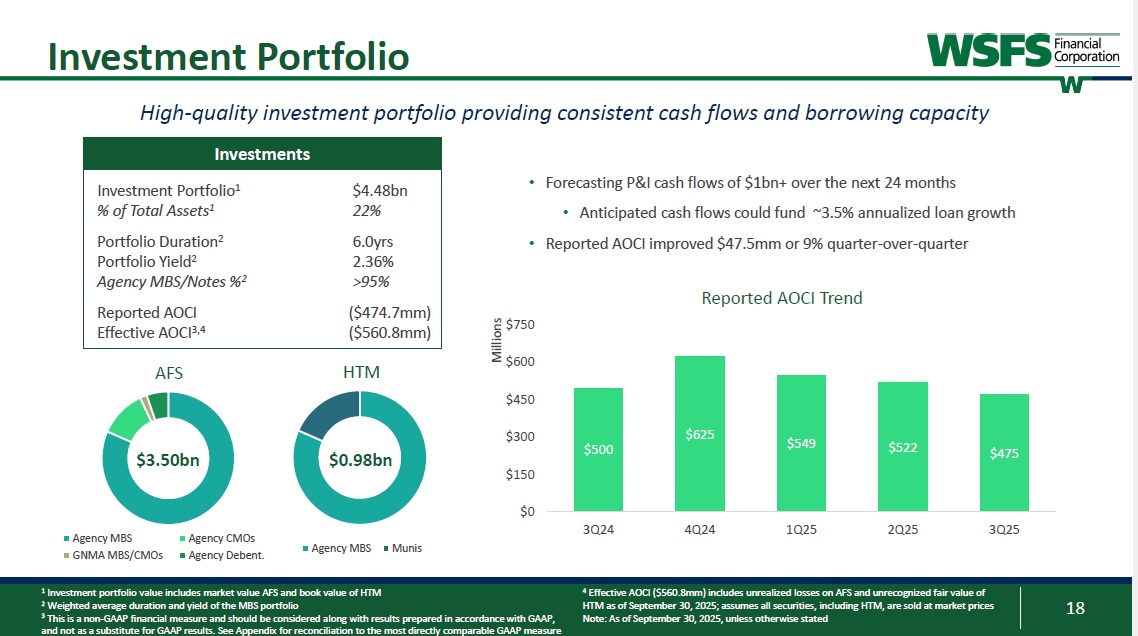
18 Investment Portfolio 1 Investment portfolio value includes market value AFS and book value of HTM 2 Weighted average duration and yield of the MBS portfolio 3 This is a non - GAAP financial measure and should be considered along with results prepared in accordance with GAAP, and not as a substitute for GAAP results. See Appendix for reconciliation to the most directly comparable GAAP measure Investments $4.48bn Investment Portfolio 1 22% % of Total Assets 1 6.0yrs Portfolio Duration 2 2.36% Portfolio Yield 2 >95% Agency MBS/Notes % 2 ($474.7mm) Reported AOCI ($560.8mm) Effective AOCI 3,4 AFS Agency MBS GNMA MBS/CMOs Agency CMOs Agency Debent. HTM Agency MBS Munis $3.50bn $0.98bn $500 $625 $549 $522 $475 $0 $150 $300 $450 $600 3Q24 4Q24 1Q25 2Q25 3Q25 Millions High - quality investment portfolio providing consistent cash flows and borrowing capacity • Forecasting P&I cash flows of $1bn+ over the next 24 months • Anticipated cash flows could fund ~3.5% annualized loan growth • Reported AOCI improved $47.5mm or 9% quarter - over - quarter Reported AOCI Trend $750 4 Effective AOCI ($560.8mm) includes unrealized losses on AFS and unrecognized fair value of HTM as of September 30, 2025; assumes all securities, including HTM, are sold at market prices Note: As of September 30, 2025, unless otherwise stated Capital, Liquidity, and Interest Coverage

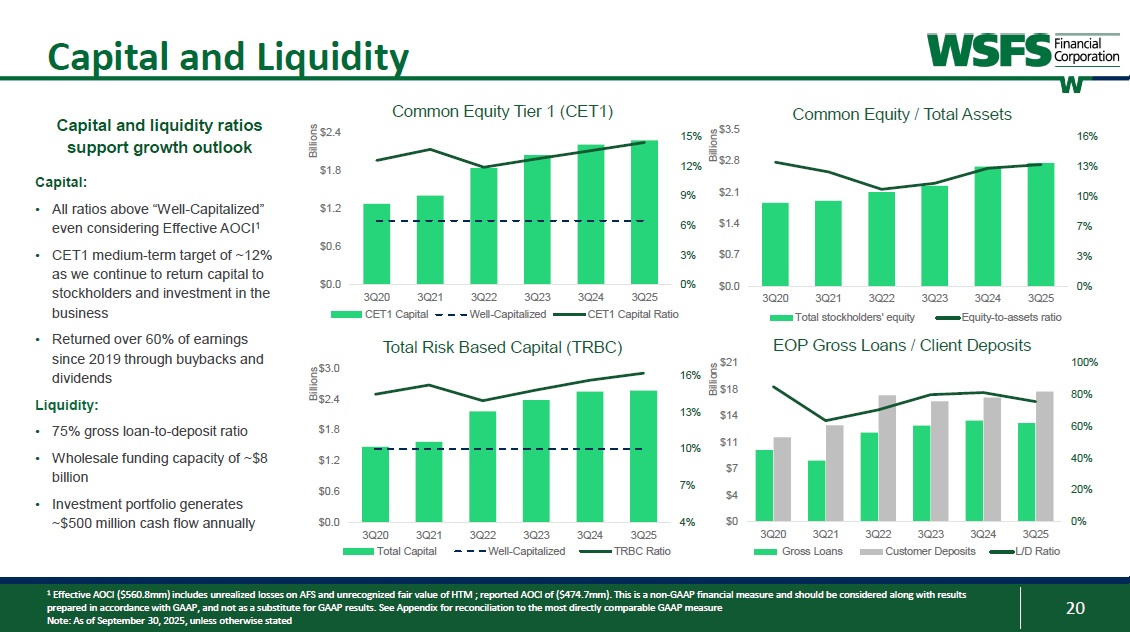
20 Capital and Liquidity 0% 3% 6% 9% 12% 15% $0.0 $0.6 $1.2 $1.8 $2.4 3Q20 3Q21 3Q22 3Q23 3Q24 3Q25 Billions CET1 Capital Well-Capitalized CET1 Capital Ratio 0% 20% 40% 60% 80% 100% $0 $4 $7 $11 $14 $18 $21 3Q20 3Q21 3Q22 3Q23 3Q24 3Q25 Billions Gross Loans Customer Deposits L/D Ratio 4% 7% 10% 13% 16% $0.0 $0.6 $1.2 $1.8 $2.4 $3.0 3Q20 3Q21 3Q22 3Q23 3Q24 3Q25 Billions Total Capital Well-Capitalized TRBC Ratio 0% 3% 7% 10% 13% 16% $0.0 $0.7 $1.4 $2.1 $2.8 $3.5 3Q20 3Q21 3Q22 3Q23 3Q24 3Q25 Billions Total stockholders' equity Equity-to-assets ratio EOP Gross Loans / Client Deposits Common Equity Tier 1 (CET1) Common Equity / Total Assets Total Risk Based Capital (TRBC) Capital and liquidity ratios support growth outlook Capital: • All ratios above “Well-Capitalized” even considering Effective AOCI1 • CET1 medium-term target of ~12% as we continue to return capital to stockholders and investment in the business • Returned over 60% of earnings since 2019 through buybacks and dividends Liquidity: • 75% gross loan-to-deposit ratio • Wholesale funding capacity of ~$8 billion • Investment portfolio generates ~$500 million cash flow annually 1 Effective AOCI ($560.8mm) includes unrealized losses on AFS and unrecognized fair value of HTM ; reported AOCI of ($474.7mm). This is a non-GAAP financial measure and should be considered along with results prepared in accordance with GAAP, and not as a substitute for GAAP results.
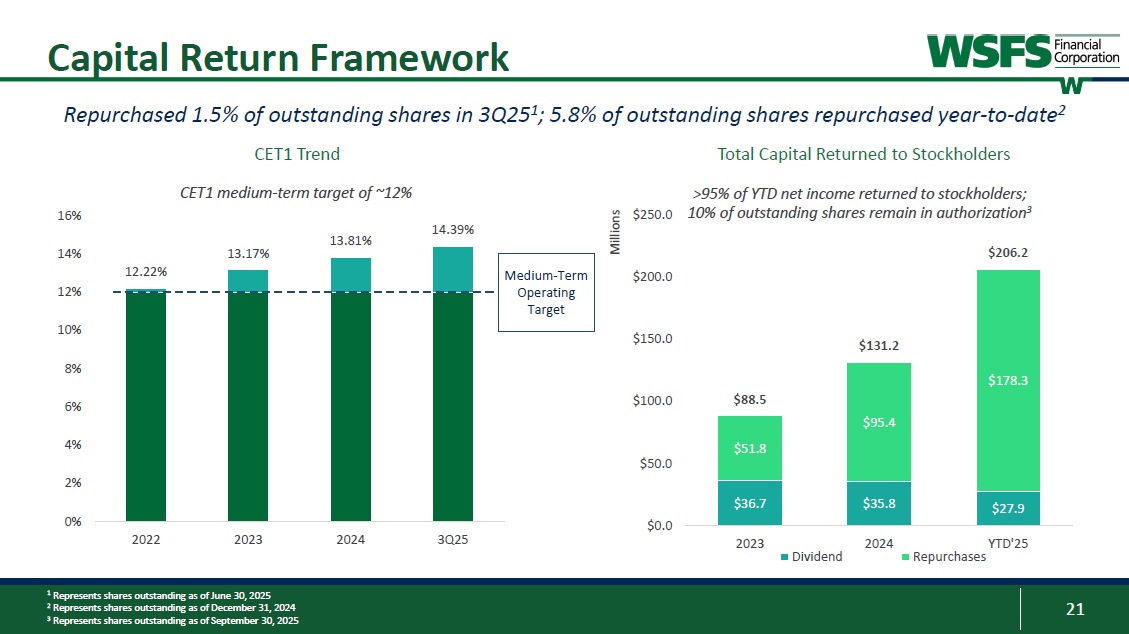
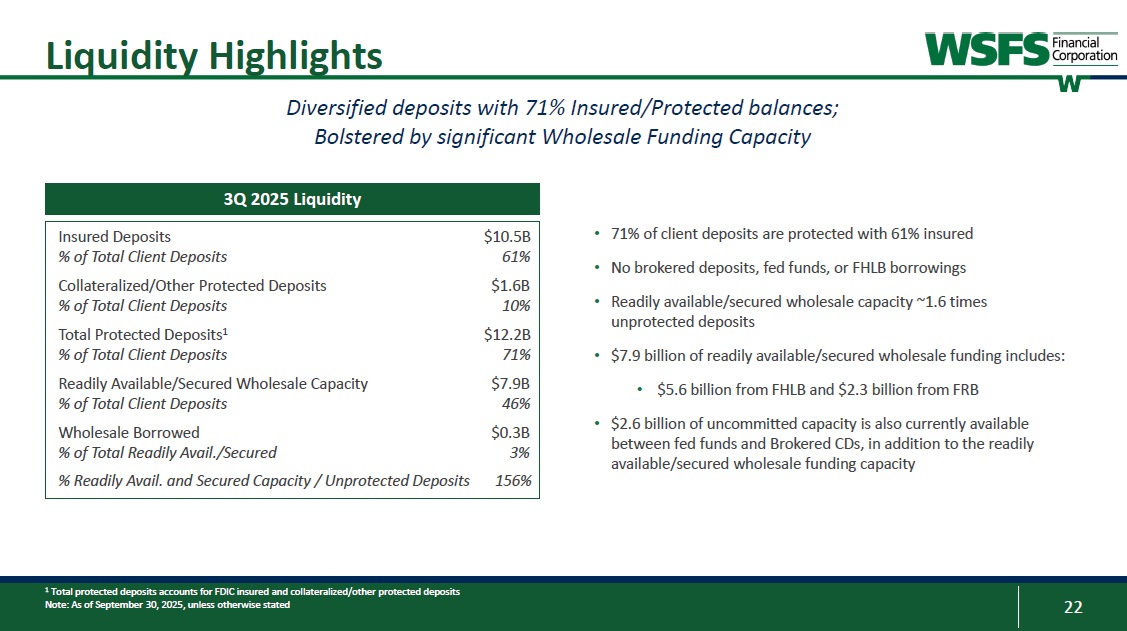
See Appendix for reconciliation to the most directly comparable GAAP measure Note: As of September 30, 2025, unless otherwise stated 21 >95% of YTD net income returned to stockholders; 10% of outstanding shares remain in authorization 3 $36.7 $35.8 $27.9 $51.8 $95.4 $178.3 $88.5 $131.2 $206.2 $0.0 $50.0 $100.0 $150.0 $200.0 $250.0 2023 2024 YTD'25 Millions Dividend Repurchases Medium - Term Operating Target 12.22% 13.17% 13.81% 14.39% 0% 2% 4% 6% 8% 10% 12% 14% 16% 2022 2023 2024 3Q25 Capital Return Framework Repurchased 1.5% of outstanding shares in 3Q25 1 ; 5.8% of outstanding shares repurchased year - to - date 2 CET1 Trend Total Capital Returned to Stockholders 1 Represents shares outstanding as of June 30, 2025 2 Represents shares outstanding as of December 31, 2024 3 Represents shares outstanding as of September 30, 2025 CET1 medium - term target of ~12% 22 Liquidity Highlights Diversified deposits with 71% Insured/Protected balances; Bolstered by significant Wholesale Funding Capacity 1 Total protected deposits accounts for FDIC insured and collateralized/other protected deposits Note: As of September 30, 2025, unless otherwise stated • 71% of client deposits are protected with 61% insured • No brokered deposits, fed funds, or FHLB borrowings • Readily available/secured wholesale capacity ~1.6 times unprotected deposits • $7.9 billion of readily available/secured wholesale funding includes: • $5.6 billion from FHLB and $2.3 billion from FRB • $ 2 . 6 billion of uncommitted capacity is also currently available between fed funds and Brokered CDs, in addition to the readily available/secured wholesale funding capacity $10.5B Insured Deposits 61% % of Total Client Deposits $1.6B Collateralized/Other Protected Deposits 10% % of Total Client Deposits $12.2B Total Protected Deposits 1 71% % of Total Client Deposits $7.9B Readily Available/Secured Wholesale Capacity 46% % of Total Client Deposits $0.3B Wholesale Borrowed 3% % of Total Readily Avail./Secured 156% % Readily Avail. and Secured Capacity / Unprotected Deposits 3Q 2025 Liquidity 23 Interest Coverage Interest Coverage 1 This is a non - GAAP financial measure and should be considered along with results prepared in accordance with GAAP, and not as a substitute for GAAP results.
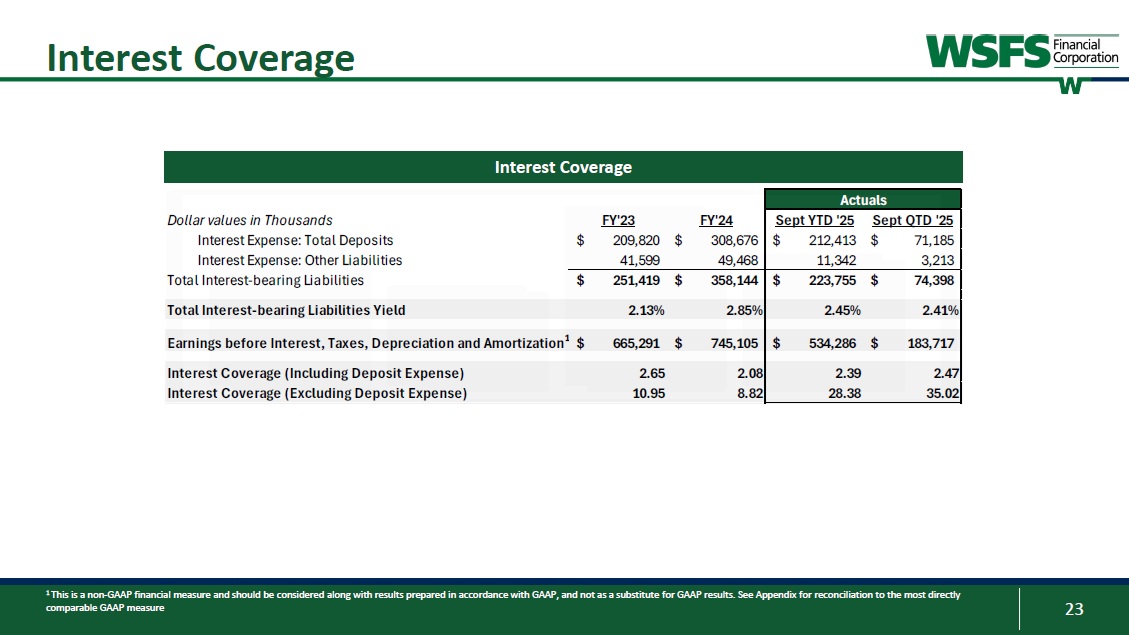
See Appendix for reconciliation to the most directly comparable GAAP measure Dollar values in Thousands Interest Expense: Total Deposits Interest Expense: Other Liabilities Total Interest - bearing Liabilities Total Interest - bearing Liabilities Yield Earnings before Interest, Taxes, Depreciation and Amortization 1 Interest Coverage (Including Deposit Expense) Interest Coverage (Excluding Deposit Expense) Actuals Sept QTD '25 Sept YTD '25 FY'24 FY'23 $ 71,185 $ 212,413 $ 308,676 $ 209,820 3,213 11,342 49,468 41,599 $ 74,398 $ 223,755 $ 358,144 $ 251,419 2.41% 2.45% 2.85% 2.13% $ 183,717 $ 534,286 $ 745,105 $ 665,291 2.47 2.39 2.08 2.65 35.02 28.38 8.82 10.95 Asset Quality and ACL Overview
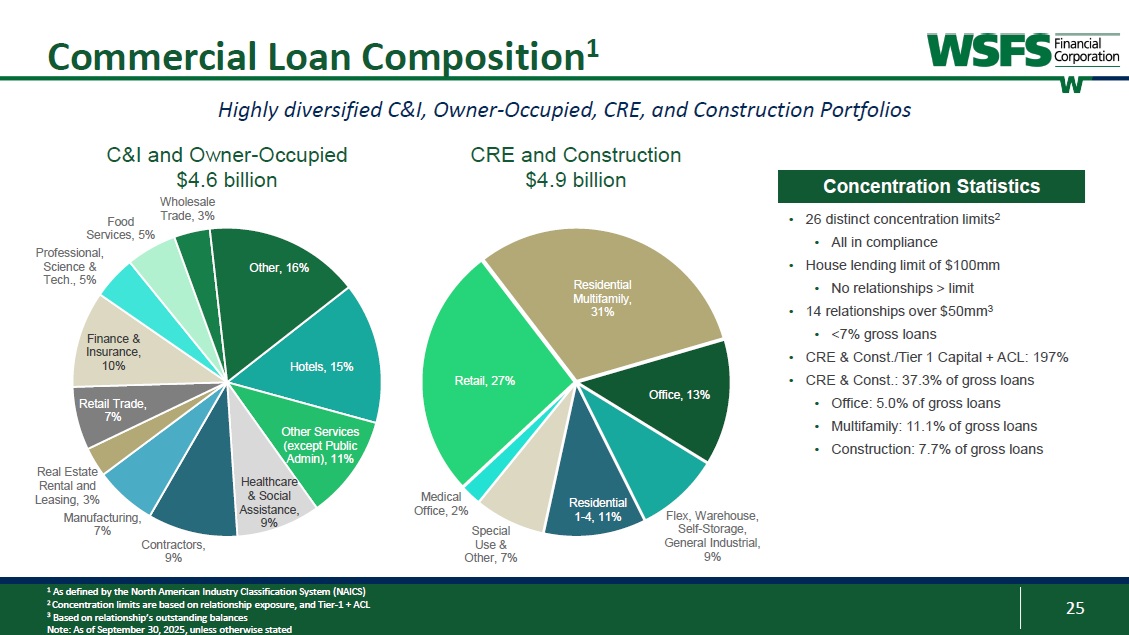
25 Commercial Loan Composition 1 1 As defined by the North American Industry Classification System (NAICS) 2 Concentration limits are based on relationship exposure, and Tier - 1 + ACL 3 Based on relationship’s outstanding balances Note: As of September 30, 2025, unless otherwise stated Highly diversified C&I, Owner - Occupied, CRE, and Construction Portfolios C&I and Owner - Occupied $4.6 billion Wholesale CRE and Construction $4.9 billion Hotels, 15% Other Services (except Public Admin), 11 % Healthcare & Social Assistance, 9% Real Estate Rental and Leasing, 3 % Manufacturing, 7% Contractors, 9% Retail Trade, 7% Finance & Insurance, 10% Food Services, 5% Professional, Science & Tech., 5% Trade, 3% Other, 16% Retail, 27% Residential Multifamily, 31% Office, 13% Flex, Warehouse, Self - Storage, General Industrial, 9% Residential 1 - 4, 11% Special Use & Other, 7% Medical Office, 2% • 26 distinct concentration limits 2 • All in compliance • House lending limit of $100mm • No relationships > limit • 14 relationships over $50mm 3 • <7% gross loans • CRE & Const./Tier 1 Capital + ACL: 197% • CRE & Const.: 37.3% of gross loans • Office: 5.0% of gross loans • Multifamily: 11.1% of gross loans • Construction: 7.7% of gross loans Concentration Statistics 26 $50 $77 $85 $87 $55 $84 $29 $43 $54 $35 $14 $16 $20 $17 $15 $148 $122 $148 $158 $105 1.11% 0.92% 1.13% 1.22% 0.81% 0.00% 0.30% 0.60% 0.90% 1.20% $0 $50 $100 $150 $200 $250 3Q24 4Q24 1Q25 2Q25 3Q25 Millions Non-accruing Accruing Govt.
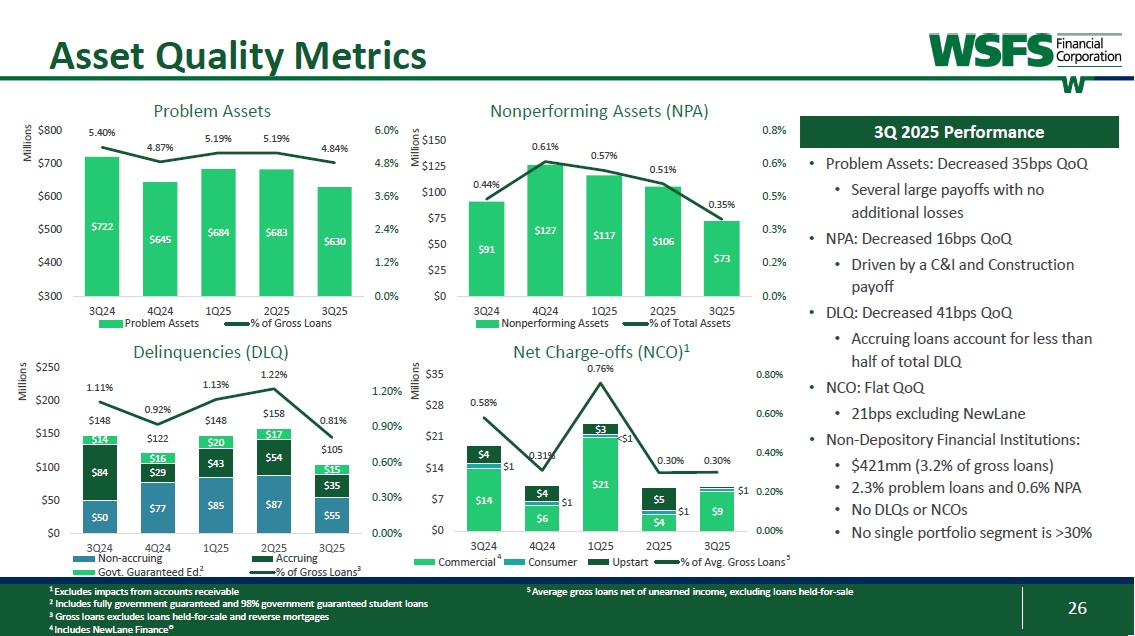
Guaranteed Ed. % of Gross Loans Asset Quality Metrics Problem Assets Nonperforming Assets (NPA) Delinquencies (DLQ) Net Charge-offs (NCO)1 $722 $645 $684 $683 $630 5.40% 4.87% 5.19% 5.19% 4.84% 0.0% 1.2% 2.4% 3.6% 4.8% 6.0% $300 $400 $500 $600 $700 $800 3Q24 4Q24 1Q25 2Q25 3Q25 Millions Problem Assets % of Gross Loans $14 $6 $21 $4 $9 $1 $1 $1 $1 $4 $4 $3 $5 0.58% 0.31% 0.76% 0.30% 0.30% 0.00% 0.20% 0.40% 0.60% 0.80% $0 $7 $14 $21 $28 $35 3Q24 4Q24 1Q25 2Q25 3Q25 Millions Commercial Consumer Upstart % of Avg.
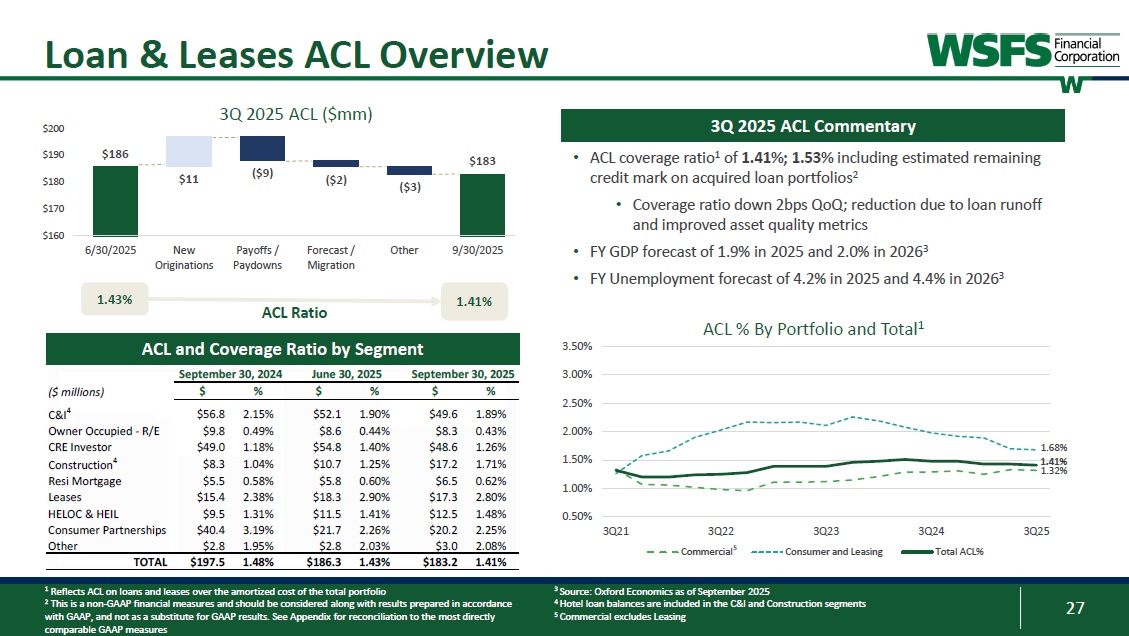
Gross Loans $91 $127 $117 $106 $73 0.44% 0.61% 0.57% 0.51% 0.35% 0.0% 0.2% 0.3% 0.5% 0.6% 0.8% $0 $25 $50 $75 $100 $125 $150 3Q24 4Q24 1Q25 2Q25 3Q25 Millions Nonperforming Assets % of Total Assets • Problem Assets: Decreased 35bps QoQ • Several large payoffs with no additional losses • NPA: Decreased 16bps QoQ • Driven by a C&I and Construction payoff • DLQ: Decreased 41bps QoQ • Accruing loans account for less than half of total DLQ • NCO: Flat QoQ • 21bps excluding NewLane • Non-Depository Financial Institutions: • $421mm (3.2% of gross loans) • 2.3% problem loans and 0.6% NPA • No DLQs or NCOs • No single portfolio segment is >30% 3Q 2025 Performance 1 Excludes impacts from accounts receivable 2 Includes fully government guaranteed and 98% government guaranteed student loans 3 Gross loans excludes loans held-for-sale and reverse mortgages 4 Includes NewLane Finance® 4 5 2 <$1 5 Average gross loans net of unearned income, excluding loans held-for-sale 3 27 $160 $170 $180 $190 3Q 2025 ACL ($mm) $200 6/30/2025 New Originations Payoffs / Paydowns Forecast / Migration Other 9/30/2025 ACL Ratio $183 Loan & Leases ACL Overview ACL and Coverage Ratio by Segment 3Q 2025 ACL Commentary 1.41% • ACL coverage ratio 1 of 1.41%; 1.53% including estimated remaining credit mark on acquired loan portfolios 2 • Coverage ratio down 2bps QoQ; reduction due to loan runoff and improved asset quality metrics • FY GDP forecast of 1.9% in 2025 and 2.0% in 2026 3 • FY Unemployment forecast of 4.2% in 2025 and 4.4% in 2026 3 1.43% 1.32% 1.68% 1.41% 1.00% 2.50% 3.00% 3.50% ACL % By Portfolio and Total 1 3 Source: Oxford Economics as of September 2025 4 Hotel loan balances are included in the C&I and Construction segments 5 Commercial excludes Leasing 1.89% $49.6 1.90% $52.1 2.15% $56.8 C&I 4 2.00% 0.43% $8.3 0.44% $8.6 0.49% $9.8 Owner Occupied - R/E 1.26% $48.6 1.40% $54.8 1.18% $49.0 CRE Investor 1.50% 1.71% $17.2 1.25% $10.7 1.04% $8.3 Construction 4 $186 $11 ($9) ($2) ($3) Resi Mortgage $5.5 0.58% $5.8 0.60% $6.5 0.62% 2.80% $17.3 2.90% $18.3 2.38% $15.4 Leases 0.50% 1.48% $12.5 1.41% $11.5 1.31% $9.5 HELOC & HEIL 3Q25 3Q24 3Q23 3Q22 3Q21 2.25% $20.2 2.26% $21.7 3.19% $40.4 Consumer Partnerships Total ACL% Consumer and Leasing Commercial 5 2.08% $3.0 2.03% $2.8 1.95% $2.8 Other TOTAL $197.5 1.48% $186.3 1.43% $183.2 1.41% 1 Reflects ACL on loans and leases over the amortized cost of the total portfolio 2 This is a non - GAAP financial measures and should be considered along with results prepared in accordance with GAAP, and not as a substitute for GAAP results.

Select Lines of Business
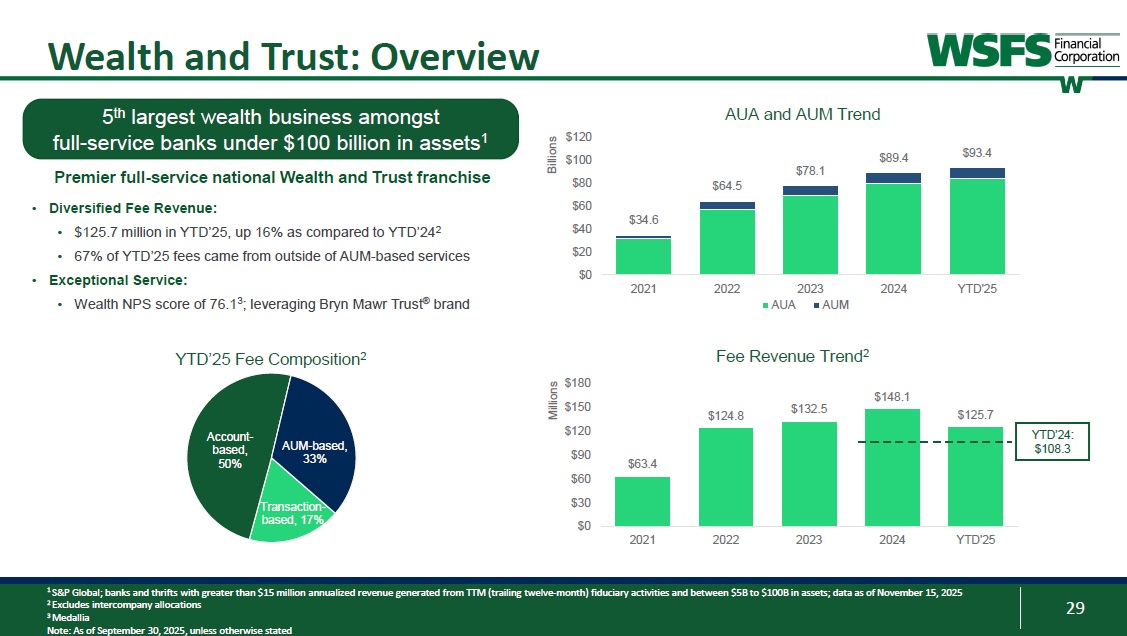
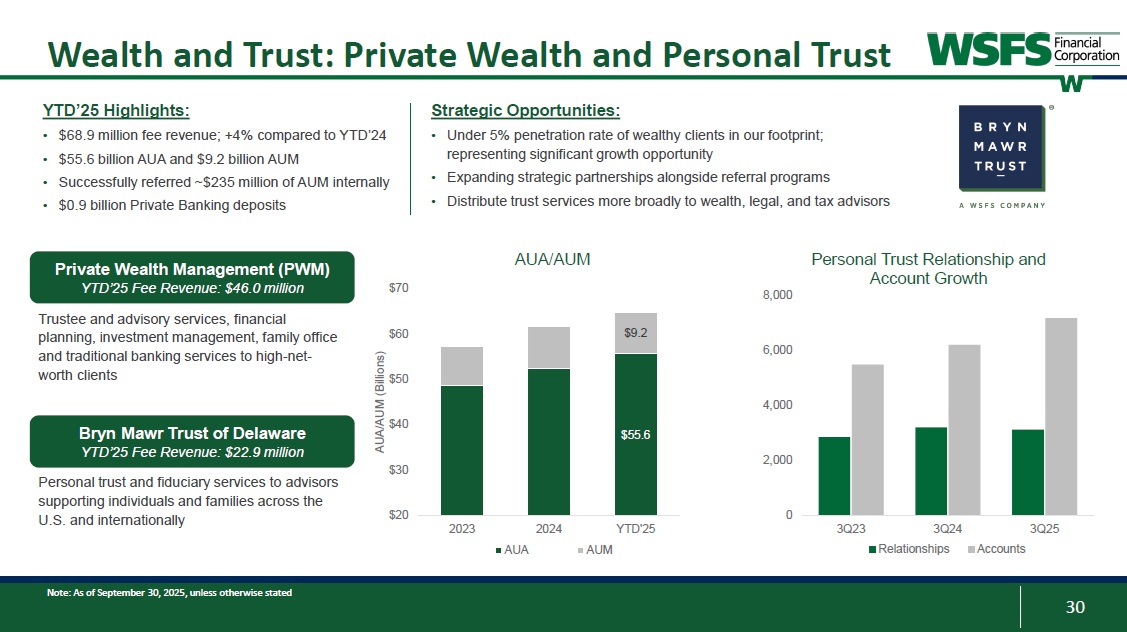
See Appendix for reconciliation to the most directly comparable GAAP measures September 30, 2024 June 30, 2025 September 30, 2025 ($ millions) $ % $ % $ % 29 Wealth and Trust: Overview 1 S&P Global; banks and thrifts with greater than $15 million annualized revenue generated from TTM (trailing twelve-month) fiduciary activities and between $5B to $100B in assets; data as of November 15, 2025 2 Excludes intercompany allocations 3 Medallia Note: As of September 30, 2025, unless otherwise stated $34.6 $64.5 $78.1 $89.4 $93.4 $0 $20 $40 $60 $80 $100 $120 2021 2022 2023 2024 YTD'25 Billions AUA AUM AUA and AUM Trend Premier full-service national Wealth and Trust franchise • Diversified Fee Revenue: • $125.7 million in YTD’25, up 16% as compared to YTD’242 • 67% of YTD’25 fees came from outside of AUM-based services • Exceptional Service: • Wealth NPS score of 76.13; leveraging Bryn Mawr Trust® brand 5th largest wealth business amongst full-service banks under $100 billion in assets1 Transactionbased, 17% Accountbased, 50% AUM-based, 33% YTD’25 Fee Composition2 $63.4 $124.8 $132.5 $148.1 $125.7 $0 $30 $60 $90 $120 $150 $180 2021 2022 2023 2024 YTD'25 Millions Fee Revenue Trend2 YTD’24: $108.3 30 Wealth and Trust: Private Wealth and Personal Trust 0 2,000 4,000 6,000 8,000 3Q23 3Q24 Relationships 3Q25 Personal Trust Relationship and Account Growth Accounts Private Wealth Management (PWM) YTD’25 Fee Revenue: $46.0 million Bryn Mawr Trust of Delaware YTD’25 Fee Revenue: $22.9 million Trustee and advisory services, financial planning, investment management, family office and traditional banking services to high - net - worth clients Personal trust and fiduciary services to advisors supporting individuals and families across the U.S. and internationally • $68.9 million fee revenue; +4% compared to YTD’24 • $55.6 billion AUA and $9.2 billion AUM • Successfully referred ~$235 million of AUM internally • $0.9 billion Private Banking deposits YTD’25 Highlights: Strategic Opportunities: • Under 5% penetration rate of wealthy clients in our footprint; representing significant growth opportunity • Expanding strategic partnerships alongside referral programs • Distribute trust services more broadly to wealth, legal, and tax advisors $55.6 $9.2 $20 $30 $40 $50 $60 $70 2023 2024 YTD'25 AUA/AUM (Billions) AUA/AUM AUA AUM Note: As of September 30, 2025, unless otherwise stated
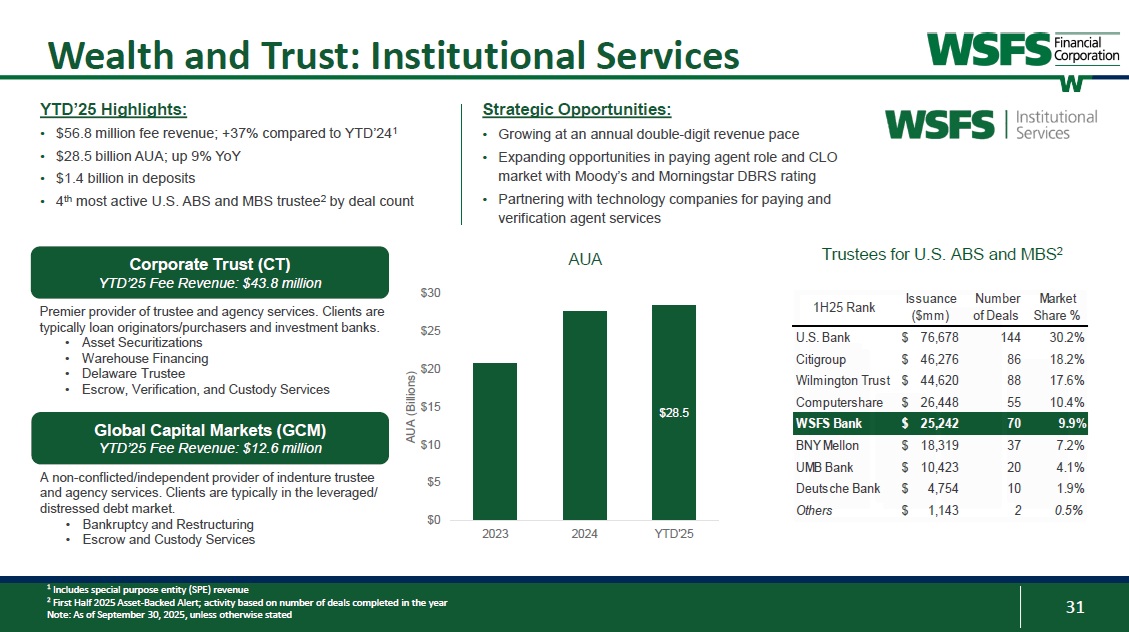
31 Wealth and Trust: Institutional Services 1 Includes special purpose entity (SPE) revenue 2 First Half 2025 Asset - Backed Alert; activity based on number of deals completed in the year Note: As of September 30, 2025, unless otherwise stated Trustees for U.S. ABS and MBS 2 30.2% 144 $ 76,678 U.S. Bank 18.2% 86 $ 46,276 Citigroup 17.6% 88 $ 44,620 Wilmington Trust 10.4% 55 $ 26,448 Computershare 9.9% 70 $ 25,242 WSFS Bank 7.2% 37 $ 18,319 BNY Mellon 4.1% 20 $ 10,423 UMB Bank 1.9% 10 $ 4,754 Deutsche Bank 0.5% 2 $ 1,143 Others Issuance ($mm) Number of Deals Market Share % 1H25 Rank • $56.8 million fee revenue; +37% compared to YTD’24 1 • $28.5 billion AUA; up 9% YoY • $1.4 billion in deposits • 4 th most active U.S. ABS and MBS trustee 2 by deal count YTD’25 Highlights: Strategic Opportunities: Global Capital Markets (GCM) YTD’25 Fee Revenue: $12.6 million A non - conflicted/independent provider of indenture trustee and agency services . Clients are typically in the leveraged/ distressed debt market . • Bankruptcy and Restructuring • Escrow and Custody Services Corporate Trust (CT) YTD’25 Fee Revenue: $43.8 million Premier provider of trustee and agency services. Clients are typically loan originators/purchasers and investment banks.
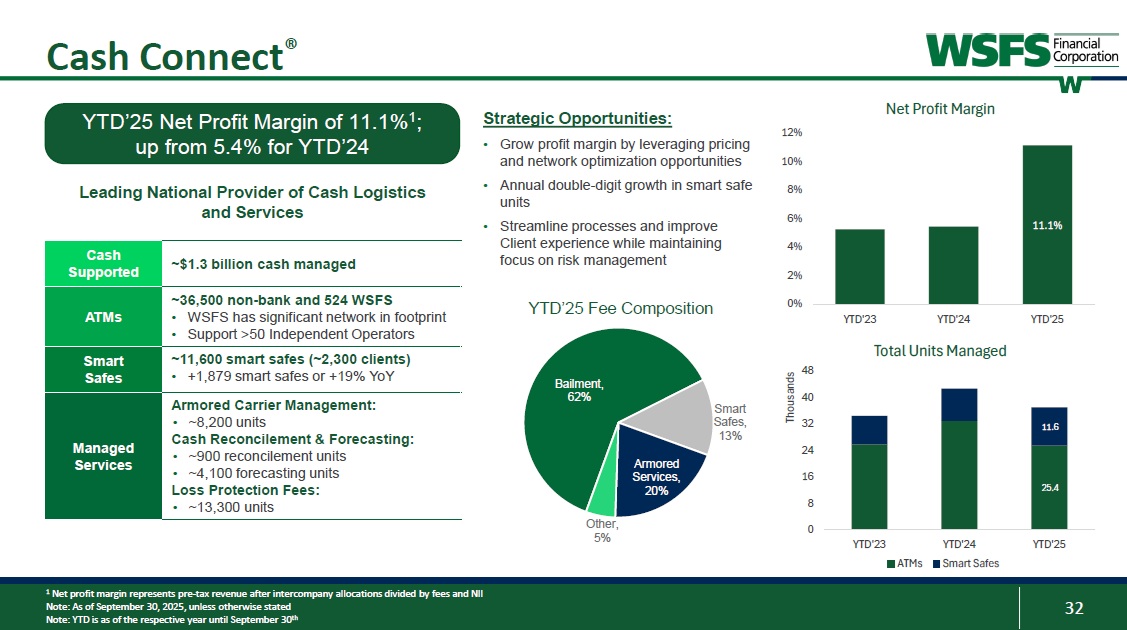
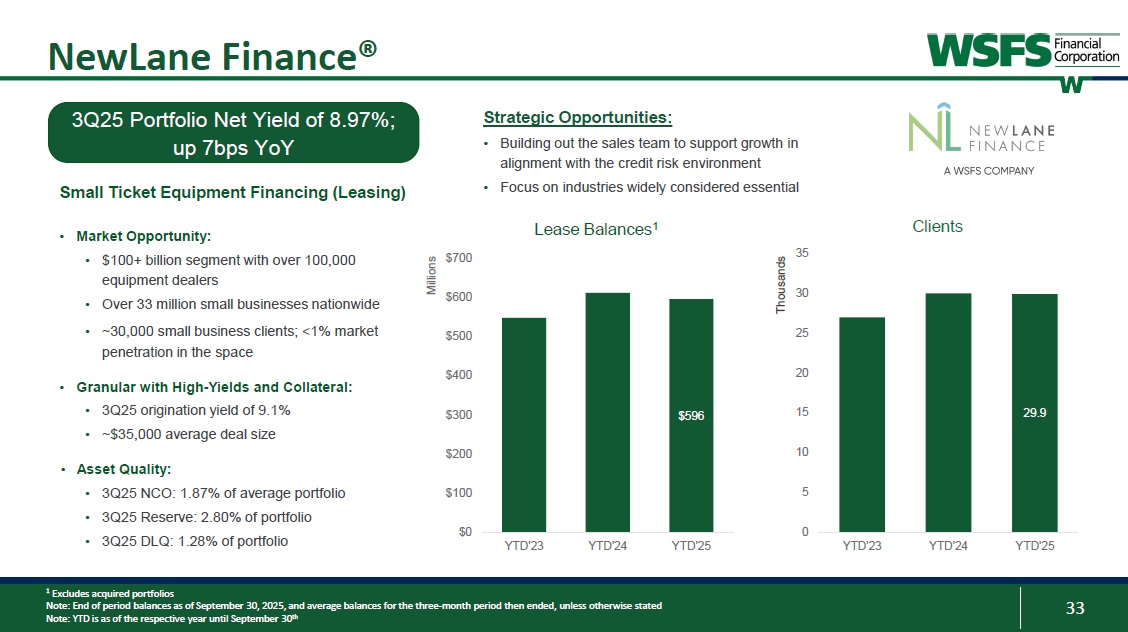
• Asset Securitizations • Warehouse Financing • Delaware Trustee • Escrow, Verification, and Custody Services • Growing at an annual double - digit revenue pace • Expanding opportunities in paying agent role and CLO market with Moody’s and Morningstar DBRS rating • Partnering with technology companies for paying and verification agent services $28.5 $0 $5 $10 $15 $20 $25 $30 2023 2024 YTD'25 AUA (Billions) AUA 32 Cash Connect ® ~$1.3 billion cash managed Cash Supported ~36,500 non - bank and 524 WSFS • WSFS has significant network in footprint • Support >50 Independent Operators ATMs ~11,600 smart safes (~2,300 clients) • +1,879 smart safes or +19% YoY Smart Safes Armored Carrier Management: • ~8,200 units Cash Reconcilement & Forecasting: • ~900 reconcilement units • ~4,100 forecasting units Loss Protection Fees: • ~13,300 units Managed Services YTD’25 Net Profit Margin of 11.1% 1 ; up from 5.4% for YTD’24 Leading National Provider of Cash Logistics and Services Bailment, 62% Smart Safes, 13 % Armored Services, 20% Other, 5% Strategic Opportunities: • Grow profit margin by leveraging pricing and network optimization opportunities • Annual double - digit growth in smart safe units • Streamline processes and improve Client experience while maintaining focus on risk management 1 Net profit margin represents pre - tax revenue after intercompany allocations divided by fees and NII Note: As of September 30, 2025, unless otherwise stated Note: YTD is as of the respective year until September 30 th 11.1% 0% 2% 4% 6% 8% 10% 12% YTD'23 YTD'24 Total Units Managed YTD'25 Net Profit Margin 25.4 11.6 32 24 16 8 0 48 40 YTD'23 YTD'24 Smart Safes YTD'25 Thousands ATMs YTD’25 Fee Composition 33 NewLane Finance® 1 Excludes acquired portfolios Note: End of period balances as of September 30, 2025, and average balances for the three - month period then ended, unless otherwise stated Note: YTD is as of the respective year until September 30 th Strategic Opportunities: • Building out the sales team to support growth in alignment with the credit risk environment • Focus on industries widely considered essential Small Ticket Equipment Financing (Leasing) • Market Opportunity: • $100+ billion segment with over 100,000 equipment dealers • Over 33 million small businesses nationwide • ~30,000 small business clients; <1% market penetration in the space • Granular with High - Yields and Collateral: • 3Q25 origination yield of 9.1% • ~$35,000 average deal size • Asset Quality: • 3Q25 NCO: 1.87% of average portfolio • 3Q25 Reserve: 2.80% of portfolio • 3Q25 DLQ: 1.28% of portfolio 29.9 0 5 10 15 20 25 30 35 YTD'23 YTD'24 YTD'25 Thousands Clients $596 $0 $100 $200 $300 $400 $500 $600 $700 YTD'23 YTD'24 YTD'25 Millions Lease Balances 1 3Q25 Portfolio Net Yield of 8.97%; up 7bps YoY
34 Appendix: Reconciliation of Non-GAAP Financial Measures 3355 Appendix: Non-GAAP Financial Measures This presentation contains financial measures determined by methods other than in accordance with accounting principles generally accepted in the United States (GAAP).
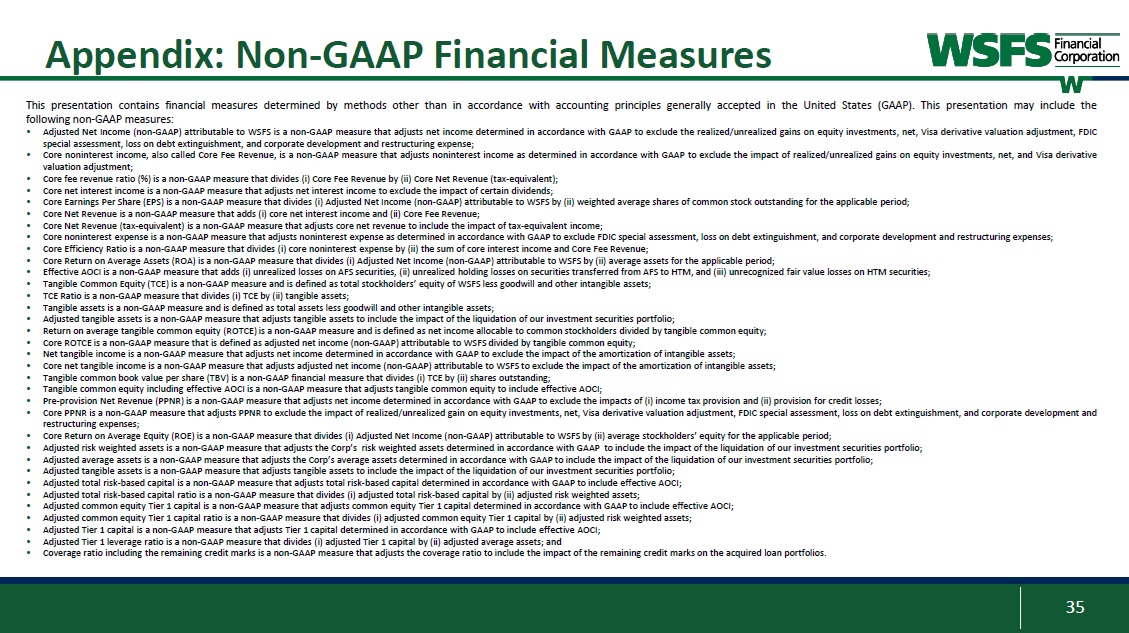
This presentation may include the following non-GAAP measures: • Adjusted Net Income (non-GAAP) attributable to WSFS is a non-GAAP measure that adjusts net income determined in accordance with GAAP to exclude the realized/unrealized gains on equity investments, net, Visa derivative valuation adjustment, FDIC special assessment, loss on debt extinguishment, and corporate development and restructuring expense; • Core noninterest income, also called Core Fee Revenue, is a non-GAAP measure that adjusts noninterest income as determined in accordance with GAAP to exclude the impact of realized/unrealized gains on equity investments, net, and Visa derivative valuation adjustment; • Core fee revenue ratio (%) is a non-GAAP measure that divides (i) Core Fee Revenue by (ii) Core Net Revenue (tax-equivalent); • Core net interest income is a non-GAAP measure that adjusts net interest income to exclude the impact of certain dividends; • Core Earnings Per Share (EPS) is a non-GAAP measure that divides (i) Adjusted Net Income (non-GAAP) attributable toWSFS by (ii) weighted average shares of common stock outstanding for the applicable period; • Core Net Revenue is a non-GAAP measure that adds (i) core net interest income and (ii) Core Fee Revenue; • Core Net Revenue (tax-equivalent) is a non-GAAP measure that adjusts core net revenue to include the impact of tax-equivalent income; • Core noninterest expense is a non-GAAP measure that adjusts noninterest expense as determined in accordance with GAAP to exclude FDIC special assessment, loss on debt extinguishment, and corporate development and restructuring expenses; • Core Efficiency Ratio is a non-GAAP measure that divides (i) core noninterest expense by (ii) the sum of core interest income and Core Fee Revenue; • Core Return on Average Assets (ROA) is a non-GAAP measure that divides (i) Adjusted Net Income (non-GAAP) attributable toWSFS by (ii) average assets for the applicable period; • Effective AOCI is a non-GAAP measure that adds (i) unrealized losses on AFS securities, (ii) unrealized holding losses on securities transferred from AFS to HTM, and (iii) unrecognized fair value losses on HTM securities; • Tangible Common Equity (TCE) is a non-GAAP measure and is defined as total stockholders’ equity of WSFS less goodwill and other intangible assets; • TCE Ratio is a non-GAAP measure that divides (i) TCE by (ii) tangible assets; • Tangible assets is a non-GAAP measure and is defined as total assets less goodwill and other intangible assets; • Adjusted tangible assets is a non-GAAP measure that adjusts tangible assets to include the impact of the liquidation of our investment securities portfolio; • Return on average tangible common equity (ROTCE) is a non-GAAP measure and is defined as net income allocable to common stockholders divided by tangible common equity; • Core ROTCE is a non-GAAP measure that is defined as adjusted net income (non-GAAP) attributable toWSFS divided by tangible common equity; • Net tangible income is a non-GAAP measure that adjusts net income determined in accordance with GAAP to exclude the impact of the amortization of intangible assets; • Core net tangible income is a non-GAAP measure that adjusts adjusted net income (non-GAAP) attributable toWSFS to exclude the impact of the amortization of intangible assets; • Tangible common book value per share (TBV) is a non-GAAP financial measure that divides (i) TCE by (ii) shares outstanding; • Tangible common equity including effective AOCI is a non-GAAP measure that adjusts tangible common equity to include effective AOCI; • Pre-provision Net Revenue (PPNR) is a non-GAAP measure that adjusts net income determined in accordance with GAAP to exclude the impacts of (i) income tax provision and (ii) provision for credit losses; • Core PPNR is a non-GAAP measure that adjusts PPNR to exclude the impact of realized/unrealized gain on equity investments, net, Visa derivative valuation adjustment, FDIC special assessment, loss on debt extinguishment, and corporate development and restructuring expenses; • Core Return on Average Equity (ROE) is a non-GAAP measure that divides (i) Adjusted Net Income (non-GAAP) attributable toWSFS by (ii) average stockholders’ equity for the applicable period; • Adjusted risk weighted assets is a non-GAAP measure that adjusts the Corp’s risk weighted assets determined in accordance with GAAP to include the impact of the liquidation of our investment securities portfolio; • Adjusted average assets is a non-GAAP measure that adjusts the Corp’s average assets determined in accordance with GAAP to include the impact of the liquidation of our investment securities portfolio; • Adjusted tangible assets is a non-GAAP measure that adjusts tangible assets to include the impact of the liquidation of our investment securities portfolio; • Adjusted total risk-based capital is a non-GAAP measure that adjusts total risk-based capital determined in accordance with GAAP to include effective AOCI; • Adjusted total risk-based capital ratio is a non-GAAP measure that divides (i) adjusted total risk-based capital by (ii) adjusted risk weighted assets; • Adjusted common equity Tier 1 capital is a non-GAAP measure that adjusts common equity Tier 1 capital determined in accordance with GAAP to include effective AOCI; • Adjusted common equity Tier 1 capital ratio is a non-GAAP measure that divides (i) adjusted common equity Tier 1 capital by (ii) adjusted risk weighted assets; • Adjusted Tier 1 capital is a non-GAAP measure that adjusts Tier 1 capital determined in accordance with GAAP to include effective AOCI; • Adjusted Tier 1 leverage ratio is a non-GAAP measure that divides (i) adjusted Tier 1 capital by (ii) adjusted average assets; and • Coverage ratio including the remaining credit marks is a non-GAAP measure that adjusts the coverage ratio to include the impact of the remaining credit marks on the acquired loan portfolios..
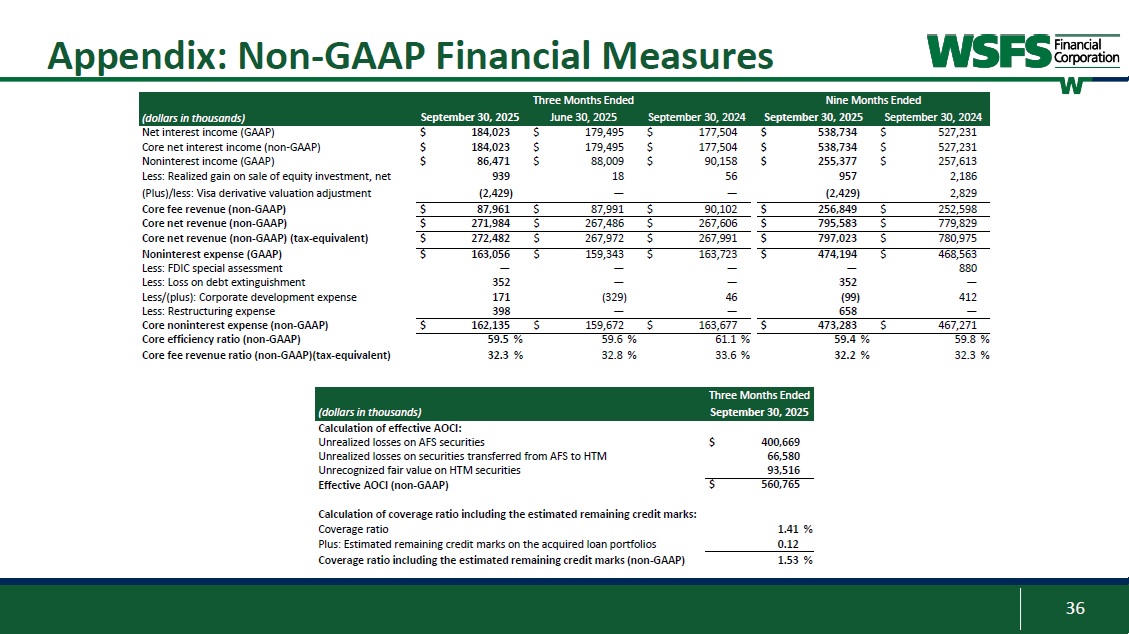
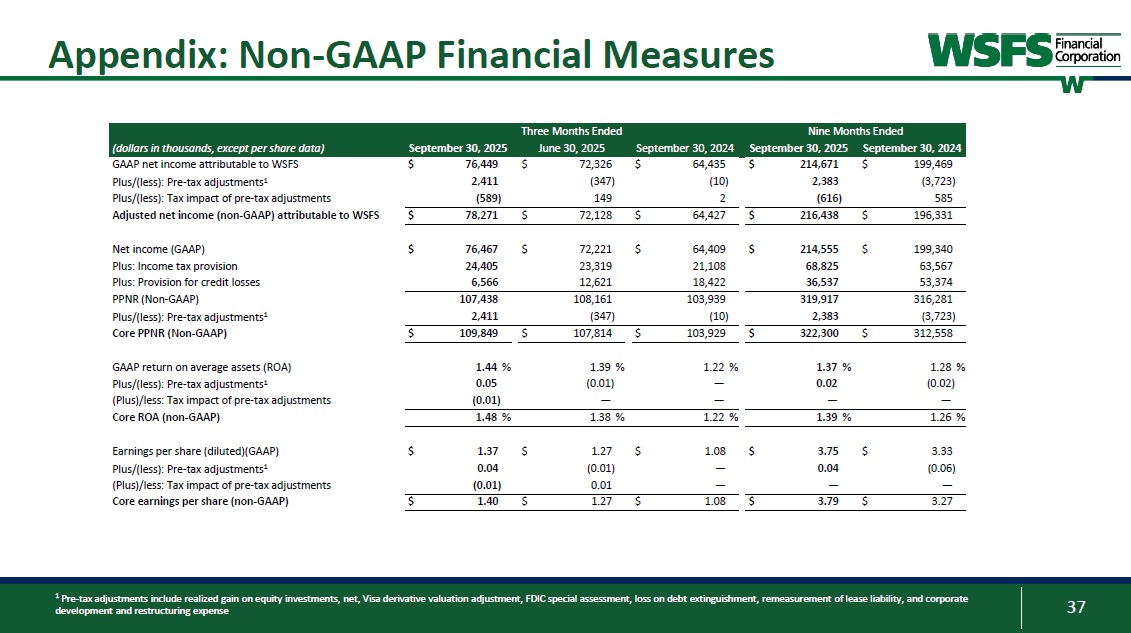
3366 Appendix: Non-GAAP Financial Measures Three Months Ended Nine Months Ended (dollars in thousands) September 30, 2025 June 30, 2025 September 30, 2024 September 30, 2025 September 30, 2024 Net interest income (GAAP) $ 184,023 $ 179,495 $ 177,504 $ 538,734 $ 527,231 Core net interest income (non-GAAP) $ 184,023 $ 179,495 $ 177,504 $ 538,734 $ 527,231 Noninterest income (GAAP) $ 86,471 $ 88,009 $ 90,158 $ 255,377 $ 257,613 Less: Realized gain on sale of equity investment, net 939 18 56 957 2,186 (Plus)/less: Visa derivative valuation adjustment (2,429) — — (2,429) 2,829 Core fee revenue (non-GAAP) $ 87,961 $ 87,991 $ 90,102 $ 256,849 $ 252,598 Core net revenue (non-GAAP) $ 271,984 $ 267,486 $ 267,606 $ 795,583 $ 779,829 Core net revenue (non-GAAP) (tax-equivalent) $ 272,482 $ 267,972 $ 267,991 $ 797,023 $ 780,975 Noninterest expense (GAAP) $ 163,056 $ 159,343 $ 163,723 $ 474,194 $ 468,563 Less: FDIC special assessment — — — — 880 Less: Loss on debt extinguishment 352 — — 352 — Less/(plus): Corporate development expense 171 (329) 46 (99) 412 Less: Restructuring expense 398 — — 658 — Core noninterest expense (non-GAAP) $ 162,135 $ 159,672 $ 163,677 $ 473,283 $ 467,271 Core efficiency ratio (non-GAAP) 59.5 % 59.6 % 61.1 % 59.4 % 59.8 % Core fee revenue ratio (non-GAAP)(tax-equivalent) 32.3 % 32.8 % 33.6 % 32.2 % 32.3 % Three Months Ended (dollars in thousands) September 30, 2025 Calculation of effective AOCI: Unrealized losses on AFS securities $ 400,669 Unrealized losses on securities transferred from AFS to HTM 66,580 Unrecognized fair value on HTM securities 93,516 Effective AOCI (non-GAAP) $ 560,765 Calculation of coverage ratio including the estimated remaining credit marks: Coverage ratio 1.41 % Plus: Estimated remaining credit marks on the acquired loan portfolios 0.12 Coverage ratio including the estimated remaining credit marks (non-GAAP) 1.53 % 3377 Appendix: Non-GAAP Financial Measures Three Months Ended Nine Months Ended (dollars in thousands, except per share data) September 30, 2025 June 30, 2025 September 30, 2024 September 30, 2025 September 30, 2024 GAAP net income attributable to WSFS $ 76,449 $ 72,326 $ 64,435 $ 214,671 $ 199,469 Plus/(less): Pre-tax adjustments1 2,411 (347) (10) 2,383 (3,723) Plus/(less): Tax impact of pre-tax adjustments (589) 149 2 (616) 585 Adjusted net income (non-GAAP) attributable to WSFS $ 78,271 $ 72,128 $ 64,427 $ 216,438 $ 196,331 Net income (GAAP) $ 76,467 $ 72,221 $ 64,409 $ 214,555 $ 199,340 Plus: Income tax provision 24,405 23,319 21,108 68,825 63,567 Plus: Provision for credit losses 6,566 12,621 18,422 36,537 53,374 PPNR (Non-GAAP) 107,438 108,161 103,939 319,917 316,281 Plus/(less): Pre-tax adjustments1 2,411 (347) (10) 2,383 (3,723) Core PPNR (Non-GAAP) $ 109,849 $ 107,814 $ 103,929 $ 322,300 $ 312,558 GAAP return on average assets (ROA) 1.44 % 1.39 % 1.22 % 1.37 % 1.28 % Plus/(less): Pre-tax adjustments1 0.05 (0.01) — 0.02 (0.02) (Plus)/less: Tax impact of pre-tax adjustments (0.01) — — — — Core ROA (non-GAAP) 1.48 % 1.38 % 1.22 % 1.39 % 1.26 % Earnings per share (diluted)(GAAP) $ 1.37 $ 1.27 $ 1.08 $ 3.75 $ 3.33 Plus/(less): Pre-tax adjustments1 0.04 (0.01) — 0.04 (0.06) (Plus)/less: Tax impact of pre-tax adjustments (0.01) 0.01 — — — Core earnings per share (non-GAAP) $ 1.40 $ 1.27 $ 1.08 $ 3.79 $ 3.27 1 Pre-tax adjustments include realized gain on equity investments, net, Visa derivative valuation adjustment, FDIC special assessment, loss on debt extinguishment, remeasurement of lease liability, and corporate development and restructuring expense
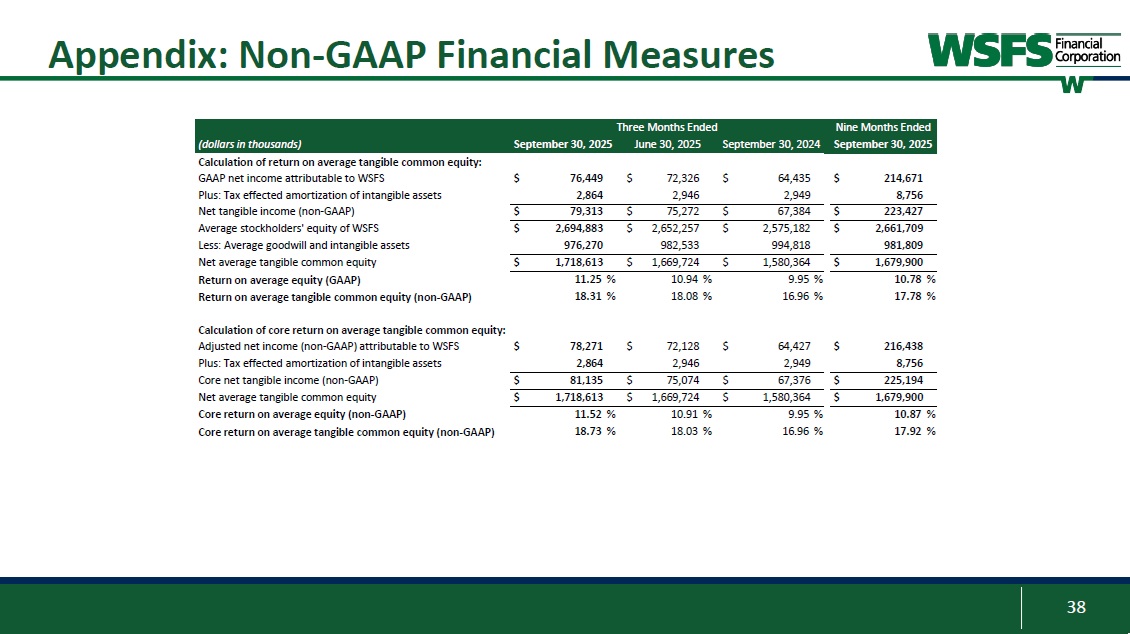
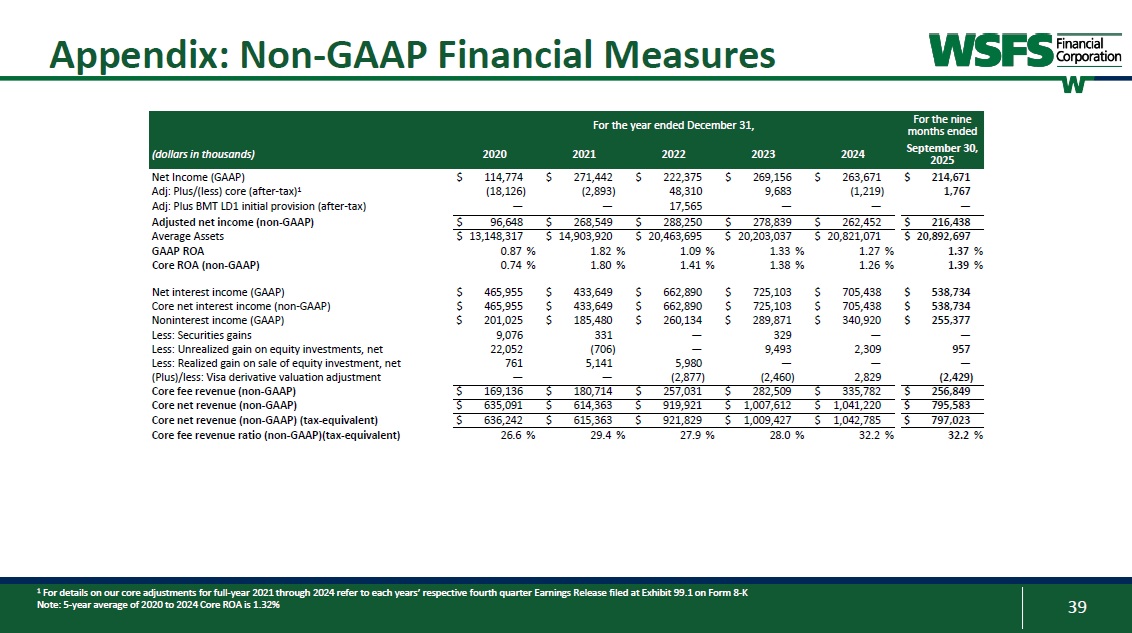
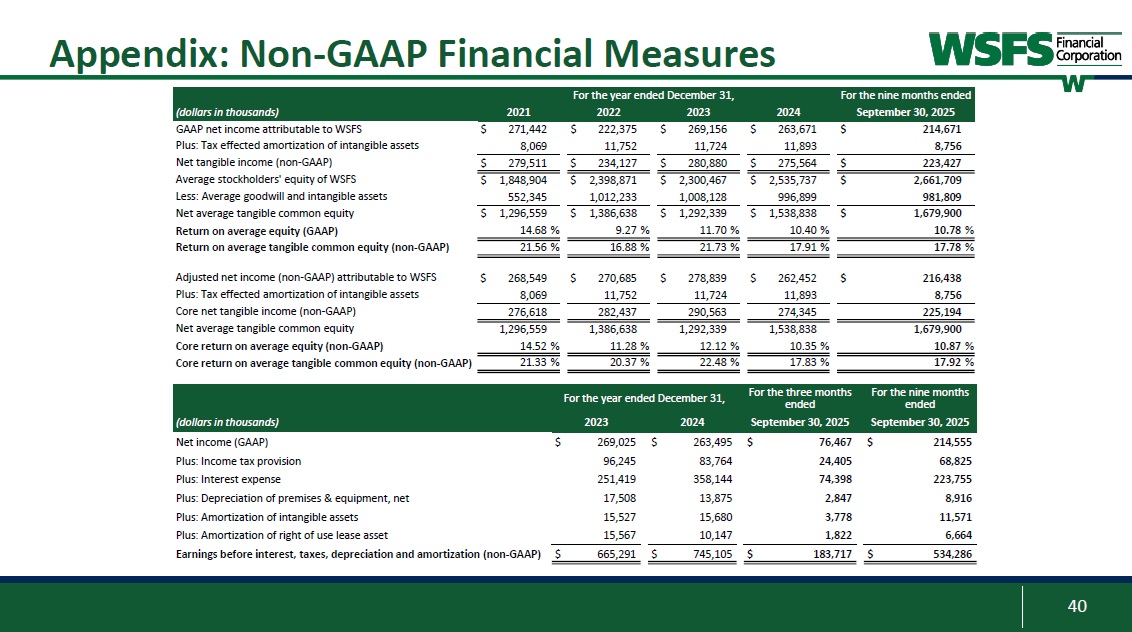
3388 Appendix: Non-GAAP Financial Measures Three Months Ended Nine Months Ended (dollars in thousands) September 30, 2025 June 30, 2025 September 30, 2024 September 30, 2025 Calculation of return on average tangible common equity: GAAP net income attributable to WSFS $ 76,449 $ 72,326 $ 64,435 $ 214,671 Plus: Tax effected amortization of intangible assets 2,864 2,946 2,949 8,756 Net tangible income (non-GAAP) $ 79,313 $ 75,272 $ 67,384 $ 223,427 Average stockholders' equity of WSFS $ 2,694,883 $ 2,652,257 $ 2,575,182 $ 2,661,709 Less: Average goodwill and intangible assets 976,270 982,533 994,818 981,809 Net average tangible common equity $ 1,718,613 $ 1,669,724 $ 1,580,364 $ 1,679,900 Return on average equity (GAAP) 11.25 % 10.94 % 9.95 % 10.78 % Return on average tangible common equity (non-GAAP) 18.31 % 18.08 % 16.96 % 17.78 % Calculation of core return on average tangible common equity: Adjusted net income (non-GAAP) attributable to WSFS $ 78,271 $ 72,128 $ 64,427 $ 216,438 Plus: Tax effected amortization of intangible assets 2,864 2,946 2,949 8,756 Core net tangible income (non-GAAP) $ 81,135 $ 75,074 $ 67,376 $ 225,194 Net average tangible common equity $ 1,718,613 $ 1,669,724 $ 1,580,364 $ 1,679,900 Core return on average equity (non-GAAP) 11.52 % 10.91 % 9.95 % 10.87 % Core return on average tangible common equity (non-GAAP) 18.73 % 18.03 % 16.96 % 17.92 % 3399 Appendix: Non-GAAP Financial Measures For the year ended December 31, For the nine months ended (dollars in thousands) 2020 2021 2022 2023 2024 September 30, 2025 Net Income (GAAP) $ 114,774 $ 271,442 $ 222,375 $ 269,156 $ 263,671 $ 214,671 Adj: Plus/(less) core (after-tax)1 (18,126) (2,893) 48,310 9,683 (1,219) 1,767 Adj: Plus BMT LD1 initial provision (after-tax) — — 17,565 — — — Adjusted net income (non-GAAP) $ 96,648 $ 268,549 $ 288,250 $ 278,839 $ 262,452 $ 216,438 Average Assets $ 13,148,317 $ 14,903,920 $ 20,463,695 $ 20,203,037 $ 20,821,071 $ 20,892,697 GAAP ROA 0.87 % 1.82 % 1.09 % 1.33 % 1.27 % 1.37 % Core ROA (non-GAAP) 0.74 % 1.80 % 1.41 % 1.38 % 1.26 % 1.39 % Net interest income (GAAP) $ 465,955 $ 433,649 $ 662,890 $ 725,103 $ 705,438 $ 538,734 Core net interest income (non-GAAP) $ 465,955 $ 433,649 $ 662,890 $ 725,103 $ 705,438 $ 538,734 Noninterest income (GAAP) $ 201,025 $ 185,480 $ 260,134 $ 289,871 $ 340,920 $ 255,377 Less: Securities gains 9,076 331 — 329 — — Less: Unrealized gain on equity investments, net 22,052 (706) — 9,493 2,309 957 Less: Realized gain on sale of equity investment, net 761 5,141 5,980 — — — (Plus)/less: Visa derivative valuation adjustment — — (2,877) (2,460) 2,829 (2,429) Core fee revenue (non-GAAP) $ 169,136 $ 180,714 $ 257,031 $ 282,509 $ 335,782 $ 256,849 Core net revenue (non-GAAP) $ 635,091 $ 614,363 $ 919,921 $ 1,007,612 $ 1,041,220 $ 795,583 Core net revenue (non-GAAP) (tax-equivalent) $ 636,242 $ 615,363 $ 921,829 $ 1,009,427 $ 1,042,785 $ 797,023 Core fee revenue ratio (non-GAAP)(tax-equivalent) 26.6 % 29.4 % 27.9 % 28.0 % 32.2 % 32.2 % 1 For details on our core adjustments for full-year 2021 through 2024 refer to each years’ respective fourth quarter Earnings Release filed at Exhibit 99.1 on Form 8-K Note: 5-year average of 2020 to 2024 Core ROA is 1.32% 40 Appendix: Non-GAAP Financial Measures For the year ended December 31, For the nine months ended (dollars in thousands) 2021 2022 2023 2024 September 30, 2025 GAAP net income attributable to WSFS $ 271,442 $ 222,375 $ 269,156 $ 263,671 $ 214,671 Plus: Tax effected amortization of intangible assets 8,069 11,752 11,724 11,893 8,756 Net tangible income (non-GAAP) $ 279,511 $ 234,127 $ 280,880 $ 275,564 $ 223,427 Average stockholders' equity of WSFS $ 1,848,904 $ 2,398,871 $ 2,300,467 $ 2,535,737 $ 2,661,709 Less: Average goodwill and intangible assets 552,345 1,012,233 1,008,128 996,899 981,809 Net average tangible common equity $ 1,296,559 $ 1,386,638 $ 1,292,339 $ 1,538,838 $ 1,679,900 Return on average equity (GAAP) 14.68 % 9.27 % 11.70 % 10.40 % 10.78 % Return on average tangible common equity (non-GAAP) 21.56 % 16.88 % 21.73 % 17.91 % 17.78 % Adjusted net income (non-GAAP) attributable to WSFS $ 268,549 $ 270,685 $ 278,839 $ 262,452 $ 216,438 Plus: Tax effected amortization of intangible assets 8,069 11,752 11,724 11,893 8,756 Core net tangible income (non-GAAP) 276,618 282,437 290,563 274,345 225,194 Net average tangible common equity 1,296,559 1,386,638 1,292,339 1,538,838 1,679,900 Core return on average equity (non-GAAP) 14.52 % 11.28 % 12.12 % 10.35 % 10.87 % Core return on average tangible common equity (non-GAAP) 21.33 % 20.37 % 22.48 % 17.83 % 17.92 % For the year ended December 31, For the three months ended For the nine months ended (dollars in thousands) 2023 2024 September 30, 2025 September 30, 2025 Net income (GAAP) $ 269,025 $ 263,495 $ 76,467 $ 214,555 Plus: Income tax provision 96,245 83,764 24,405 68,825 Plus: Interest expense 251,419 358,144 74,398 223,755 Plus: Depreciation of premises & equipment, net 17,508 13,875 2,847 8,916 Plus: Amortization of intangible assets 15,527 15,680 3,778 11,571 Plus: Amortization of right of use lease asset 15,567 10,147 1,822 6,664 Earnings before interest, taxes, depreciation and amortization (non-GAAP) $ 665,291 $ 745,105 $ 183,717 $ 534,286