| Maryland | 001-36105 | 37-1645259 | ||||||||||||
| (State or other Jurisdiction of Incorporation) |
(Commission
File Number)
|
(I.R.S. Employer Identification No.) |
||||||||||||
| Delaware | 001-36106 | 45-4685158 | ||||||||||||
| (State or other Jurisdiction of Incorporation) |
(Commission
File Number)
|
(I.R.S. Employer Identification No.) |
||||||||||||
|
111 West 33rd Street,
|
12th Floor | |||||||
| New York, | New York | 10120 | ||||||
| (Address of Principal Executive Offices) | (Zip Code) | |||||||
☐ |
Written communications pursuant to Rule 425 under the Securities Act (17 CFR 230.425) | ||||
☐ |
Soliciting material pursuant to Rule 14a-12 under the Exchange Act (17 CFR 240.14a-12) | ||||
☐ |
Pre-commencement communications pursuant to Rule 14d-2(b) under the Exchange Act (17 CFR 240.14d-2(b)) | ||||
☐ |
Pre-commencement communications pursuant to Rule 13e-4(c) under the Exchange Act (17 CFR 240.13e-4(c)) | ||||
| Title of each class |
Trading
Symbol(s)
|
Name of each exchange
on which registered
|
||||||||||||
| Empire State Realty Trust, Inc. | ||||||||||||||
| Class A Common Stock, par value $0.01 per share | ESRT | The New York Stock Exchange | ||||||||||||
| Empire State Realty OP, L.P. | ||||||||||||||
| Series ES Operating Partnership Units | ESBA | NYSE Arca, Inc. | ||||||||||||
| Series 60 Operating Partnership Units | OGCP | NYSE Arca, Inc. | ||||||||||||
| Series 250 Operating Partnership Units | FISK | NYSE Arca, Inc. | ||||||||||||
| Item 2.02. | Results of Operations and Financial Condition. | ||||
| Item 7.01. | Regulation FD Disclosure | ||||
| Exhibit No. | Description | ||||
| 104 | Cover Page Interactive File (the cover page tags are embedded within the Inline XBRL document). | ||||
|
Date: July 23, 2025
|
EMPIRE STATE REALTY TRUST, INC. (Registrant)
By: /s/ Stephen V. Horn
Name: Stephen V. Horn
Title: Executive Vice President, Chief Financial Officer & Chief Accounting Officer
|
||||
|
Date: July 23, 2025
|
EMPIRE STATE REALTY OP, L.P.
(Registrant)
By: Empire State Realty Trust, Inc., as general partner
By: /s/ Stephen V. Horn
Name: Stephen V. Horn
Title: Executive Vice President, Chief Financial Officer & Chief Accounting Officer
|
||||

June 30, 20251 |
March 31, 20251 |
June 30, 20241 |
||||||||||||
Percent occupied: |
||||||||||||||
Total commercial portfolio |
89.0% | 87.9% | 88.9% | |||||||||||
Total office |
88.9% | 87.5% | 88.6% | |||||||||||
Manhattan office |
89.5% | 88.1% | 89.3% | |||||||||||
| Total retail | 89.9% | 91.2% | 92.3% | |||||||||||
Percent leased (includes signed leases not commenced): | ||||||||||||||
Total commercial portfolio |
92.9% | 92.5% | 93.1% | |||||||||||
Total office |
93.1% | 92.3% | 93.0% | |||||||||||
Manhattan office |
93.8% | 93.0% | 93.8% | |||||||||||
| Total retail | 90.7% | 94.1% | 93.5% | |||||||||||
Total multifamily portfolio |
98.6% | 99.0% | 97.9% | |||||||||||
Total Portfolio |
Leases executed |
Square
footage executed
|
Average cash rent psf – leases executed |
% of new cash rent over / under previously escalated rents |
||||||||||
Office |
18 | 221,776 | 71.21 | 12.1 | % | |||||||||
Retail |
4 | 10,332 | 268.92 | (15.0) | % | |||||||||
Total Overall |
22 | 232,108 | 80.01 | 7.0 | % | |||||||||
Manhattan Office Portfolio |
Leases executed |
Square
footage executed
|
Average cash rent psf – leases executed |
% of new cash rent over / under previously escalated rents |
||||||||||
New Office |
16 | 202,499 | 72.28 | 14.5 | % | |||||||||
Renewal Office |
2 | 19,277 | 59.97 | (11.2) | % | |||||||||
Total Office |
18 | 221,776 | 71.21 | 12.1 | % | |||||||||
Key Assumptions |
2025 Updated Guidance (July 2025) |
2025 Initial Guidance (Feb 2025) |
Comments |
||||||||
Earnings |
|||||||||||
Core FFO Per Fully Diluted Share |
$0.83 to $0.86 |
$0.86 to $0.89 |
•2025 includes ~$0.05 from multifamily assets |
||||||||
Commercial Property Drivers |
|||||||||||
Commercial Occupancy at year-end |
89% to 91% |
89% to 91% | |||||||||
|
SS Property Cash NOI
(excluding lease termination fees)
|
–2.0% to +1.5% |
–2.0% to +1.5% |
•Assumes positive revenue y/y growth
•Assumes a ~2.0 to 4.0% y/y increase in operating expenses and real estate taxes
•2025 SS NOI y/y growth is expected to range from ~0.5 to 4.0% relative to 2024 excluding one-time items
|
||||||||
Observatory Drivers |
|||||||||||
Observatory NOI |
$90M to $94M |
$97M to $102M |
•Reflects average quarterly expenses of ~$9 to 10M |
||||||||
Low |
High |
|||||||
| Net Income (Loss) Attributable to Common Stockholders and the Operating Partnership | $0.22 | $0.25 | ||||||
Add: |
||||||||
Impairment Charge |
0.00 | 0.00 | ||||||
Real Estate Depreciation & Amortization |
0.65 | 0.65 | ||||||
Less: |
||||||||
Private Perpetual Distributions |
0.02 | 0.02 | ||||||
Gain on Disposal of Real Estate, net |
0.05 | 0.05 | ||||||
FFO Attributable to Common Stockholders and the Operating Partnership |
$0.80 | $0.83 | ||||||
Add: |
||||||||
Amortization of Below Market Ground Lease |
0.03 | 0.03 | ||||||
Core FFO Attributable to Common Stockholders and the Operating Partnership |
$0.83 | $0.86 | ||||||


Empire State Realty Trust, Inc. | |||||||||||
Condensed Consolidated Statements of Operations | |||||||||||
|
(unaudited and amounts in thousands, except per share data)
| |||||||||||
| Three Months Ended June 30, | |||||||||||
| 2025 | 2024 | ||||||||||
Revenues |
|||||||||||
Rental revenue |
$ | 153,540 | $ | 152,470 | |||||||
Observatory revenue |
33,899 | 34,124 | |||||||||
Lease termination fees |
464 | — | |||||||||
Third-party management and other fees |
408 | 376 | |||||||||
Other revenue and fees |
2,939 | 2,573 | |||||||||
Total revenues |
191,250 | 189,543 | |||||||||
Operating expenses |
|||||||||||
Property operating expenses |
44,880 | 41,516 | |||||||||
Ground rent expenses |
2,332 | 2,332 | |||||||||
General and administrative expenses |
18,685 | 18,020 | |||||||||
Observatory expenses |
9,822 | 8,958 | |||||||||
Real estate taxes |
32,607 | 31,883 | |||||||||
Depreciation and amortization |
47,802 | 47,473 | |||||||||
Total operating expenses |
156,128 | 150,182 | |||||||||
Total operating income |
35,122 | 39,361 | |||||||||
Other income (expense): |
|||||||||||
Interest income |
1,867 | 5,092 | |||||||||
Interest expense |
(25,126) | (25,323) | |||||||||
Interest expense associated with property in receivership |
— | (628) | |||||||||
Gain on disposition of property |
— | 10,803 | |||||||||
Income before income taxes |
11,863 | 29,305 | |||||||||
Income tax expense |
(478) | (750) | |||||||||
Net income |
11,385 | 28,555 | |||||||||
Net income attributable to non-controlling interests: |
|||||||||||
Non-controlling interest in the Operating Partnership |
(3,815) | (10,433) | |||||||||
Preferred unit distributions |
(1,051) | (1,051) | |||||||||
Net income attributable to common stockholders |
$ | 6,519 | $ | 17,071 | |||||||
Total weighted average shares |
|||||||||||
Basic |
168,368 | 164,277 | |||||||||
Diluted |
269,951 | 268,716 | |||||||||
Earnings per share attributable to common stockholders |
|||||||||||
Basic |
$ | 0.04 | $ | 0.10 | |||||||
Diluted |
$ | 0.04 | $ | 0.10 | |||||||
Empire State Realty Trust, Inc. | |||||||||||
Condensed Consolidated Statements of Operations | |||||||||||
|
(unaudited and amounts in thousands, except per share data)
| |||||||||||
| Six Months Ended June 30, | |||||||||||
| 2025 | 2024 | ||||||||||
Revenues |
|||||||||||
Rental revenue |
$ | 308,082 | $ | 306,352 | |||||||
Observatory revenue |
57,060 | 58,720 | |||||||||
Lease termination fees |
464 | — | |||||||||
Third-party management and other fees |
839 | 641 | |||||||||
Other revenue and fees |
4,871 | 5,009 | |||||||||
Total revenues |
371,316 | 370,722 | |||||||||
Operating expenses |
|||||||||||
Property operating expenses |
89,940 | 86,576 | |||||||||
Ground rent expenses |
4,663 | 4,663 | |||||||||
General and administrative expenses |
35,625 | 33,992 | |||||||||
Observatory expenses |
17,940 | 17,389 | |||||||||
Real estate taxes |
65,657 | 64,124 | |||||||||
Depreciation and amortization |
96,581 | 93,554 | |||||||||
Total operating expenses |
310,406 | 300,298 | |||||||||
Total operating income |
60,910 | 70,424 | |||||||||
Other income (expense): |
|||||||||||
Interest income |
5,653 | 9,270 | |||||||||
Interest expense |
(52,064) | (50,451) | |||||||||
Interest expense associated with property in receivership |
(647) | (628) | |||||||||
Loss on early extinguishment of debt |
— | (553) | |||||||||
Gain on disposition of property |
13,170 | 10,803 | |||||||||
Income before income taxes |
27,022 | 38,865 | |||||||||
Income tax (expense) benefit |
141 | (95) | |||||||||
Net income |
27,163 | 38,770 | |||||||||
Net income attributable to non-controlling interests: |
|||||||||||
Non-controlling interest in the Operating Partnership |
(9,323) | (13,933) | |||||||||
Non-controlling interests in other partnerships |
— | (4) | |||||||||
Preferred unit distributions |
(2,101) | (2,101) | |||||||||
Net income attributable to common stockholders |
$ | 15,739 | $ | 22,732 | |||||||
Total weighted average shares |
|||||||||||
Basic |
167,644 | 163,988 | |||||||||
Diluted |
269,739 | 268,105 | |||||||||
Earnings per share attributable to common stockholders |
|||||||||||
Basic |
$ | 0.09 | $ | 0.14 | |||||||
Diluted |
$ | 0.09 | $ | 0.14 | |||||||
Empire State Realty Trust, Inc. | |||||||||||
Reconciliation of Net Income to Funds From Operations (“FFO”), | |||||||||||
Modified Funds From Operations (“Modified FFO”) and Core Funds From Operations (“Core FFO”) | |||||||||||
(unaudited and amounts in thousands, except per share data) | |||||||||||
| Three Months Ended June 30, | |||||||||||
| 2025 | 2024 | ||||||||||
Net income |
$ | 11,385 | $ | 28,555 | |||||||
Preferred unit distributions |
(1,051) | (1,051) | |||||||||
Real estate depreciation and amortization |
46,921 | 46,398 | |||||||||
Gain on disposition of property |
— | (10,803) | |||||||||
FFO attributable to common stockholders and Operating Partnership units |
57,255 | 63,099 | |||||||||
Amortization of below-market ground leases |
1,958 | 1,958 | |||||||||
Modified FFO attributable to common stockholders and Operating Partnership units |
59,213 | 65,057 | |||||||||
Interest expense associated with property in receivership |
— | 628 | |||||||||
Core FFO attributable to common stockholders and Operating Partnership units |
$ | 59,213 | $ | 65,685 | |||||||
Total weighted average shares and Operating Partnership units |
|||||||||||
Basic |
266,899 | 264,676 | |||||||||
Diluted |
269,951 | 268,716 | |||||||||
FFO per share |
|||||||||||
Basic |
$ | 0.21 | $ | 0.24 | |||||||
Diluted |
$ | 0.21 | $ | 0.23 | |||||||
Modified FFO per share |
|||||||||||
Basic |
$ | 0.22 | $ | 0.25 | |||||||
Diluted |
$ | 0.22 | $ | 0.24 | |||||||
Core FFO per share |
|||||||||||
Basic |
$ | 0.22 | $ | 0.25 | |||||||
Diluted |
$ | 0.22 | $ | 0.24 | |||||||
Empire State Realty Trust, Inc. | |||||||||||
Reconciliation of Net Income to Funds From Operations (“FFO”), | |||||||||||
Modified Funds From Operations (“Modified FFO”) and Core Funds From Operations (“Core FFO”) | |||||||||||
(unaudited and amounts in thousands, except per share data) | |||||||||||
| Six Months Ended June 30, | |||||||||||
| 2025 | 2024 | ||||||||||
Net income |
$ | 27,163 | $ | 38,770 | |||||||
Non-controlling interests in other partnerships |
— | (4) | |||||||||
Preferred unit distributions |
(2,101) | (2,101) | |||||||||
Real estate depreciation and amortization |
94,792 | 91,255 | |||||||||
Gain on disposition of property |
(13,170) | (10,803) | |||||||||
FFO attributable to common stockholders and Operating Partnership units |
106,684 | 117,117 | |||||||||
Amortization of below-market ground leases |
3,916 | 3,916 | |||||||||
Modified FFO attributable to common stockholders and Operating Partnership units |
110,600 | 121,033 | |||||||||
Interest expense associated with property in receivership |
647 | 628 | |||||||||
| Loss on early extinguishment of debt | — | 553 | |||||||||
Core FFO attributable to common stockholders and Operating Partnership units |
$ | 111,247 | $ | 122,214 | |||||||
Total weighted average shares and Operating Partnership units |
|||||||||||
Basic |
266,985 | 264,619 | |||||||||
Diluted |
269,739 | 268,105 | |||||||||
FFO per share |
|||||||||||
Basic |
$ | 0.40 | $ | 0.44 | |||||||
Diluted |
$ | 0.40 | $ | 0.44 | |||||||
Modified FFO per share |
|||||||||||
Basic |
$ | 0.41 | $ | 0.46 | |||||||
Diluted |
$ | 0.41 | $ | 0.45 | |||||||
Core FFO per share |
|||||||||||
Basic |
$ | 0.42 | $ | 0.46 | |||||||
Diluted |
$ | 0.41 | $ | 0.46 | |||||||
Empire State Realty Trust, Inc. | |||||||||||
Condensed Consolidated Balance Sheets | |||||||||||
(unaudited and amounts in thousands) | |||||||||||
| June 30, 2025 | December 31, 2024 | ||||||||||
Assets |
|||||||||||
Commercial real estate properties, at cost |
$ | 3,903,950 | $ | 3,786,653 | |||||||
Less: accumulated depreciation |
(1,341,144) | (1,274,193) | |||||||||
Commercial real estate properties, net |
2,562,806 | 2,512,460 | |||||||||
Contract asset2 |
— | 170,419 | |||||||||
Cash and cash equivalents |
94,643 | 385,465 | |||||||||
Restricted cash |
42,084 | 43,837 | |||||||||
Tenant and other receivables |
28,124 | 31,427 | |||||||||
Deferred rent receivables |
255,272 | 247,754 | |||||||||
Prepaid expenses and other assets |
85,083 | 101,852 | |||||||||
Deferred costs, net |
181,694 | 183,987 | |||||||||
Acquired below market ground leases, net |
309,495 | 313,410 | |||||||||
Right of use assets |
28,070 | 28,197 | |||||||||
Goodwill |
491,479 | 491,479 | |||||||||
Total assets |
$ | 4,078,750 | $ | 4,510,287 | |||||||
Liabilities and equity |
|||||||||||
Mortgage notes payable, net |
$ | 691,440 | $ | 692,176 | |||||||
Senior unsecured notes, net |
1,097,355 | 1,197,061 | |||||||||
Unsecured term loan facility, net |
268,883 | 268,731 | |||||||||
Unsecured revolving credit facility |
— | 120,000 | |||||||||
Debt associated with property in receivership |
— | 177,667 | |||||||||
Accrued interest associated with property in receivership |
— | 5,433 | |||||||||
Accounts payable and accrued expenses |
104,315 | 132,016 | |||||||||
Acquired below market leases, net |
17,081 | 19,497 | |||||||||
Ground lease liabilities |
28,070 | 28,197 | |||||||||
Deferred revenue and other liabilities |
55,343 | 62,639 | |||||||||
Tenants’ security deposits |
27,015 | 24,908 | |||||||||
Total liabilities |
2,289,502 | 2,728,325 | |||||||||
Total equity |
1,789,248 | 1,781,962 | |||||||||
Total liabilities and equity |
$ | 4,078,750 | $ | 4,510,287 | |||||||

 |
|||||
Second Quarter 2025 | |||||
| Table of Content | Page | ||||
| Summary | |||||
| Supplemental Definitions | |||||
| Company Profile | |||||
| Condensed Consolidated Balance Sheets | |||||
| Condensed Consolidated Statements of Operations | |||||
| FFO, Modified FFO, Core FFO, FAD and EBITDA | |||||
| Highlights | |||||
| Selected Property Data | |||||
| Property Summary Net Operating Income | |||||
| Same Store Net Operating Income | |||||
| Leasing Activity | |||||
| Commercial Property Detail | |||||
| Portfolio Expirations and Vacates Summary | |||||
| Tenant Lease Expirations | |||||
| Largest Tenants and Portfolio Tenant Diversification by Industry | |||||
| Initial Cash Rent Contributing to Cash NOI, Capital Expenditures and Redevelopment Program | |||||
| Observatory Summary | |||||
| Financial information | |||||
| Consolidated Debt Analysis | |||||
| Debt Summary | |||||
| Debt Detail | |||||
| Debt Maturities | |||||
| Ground Leases | |||||
|
|||||
Second Quarter 2025 | |||||
| Supplemental Definitions | |||||
|
|||||
Second Quarter 2025 | |||||
| Supplemental Definitions | |||||
|
|||||
Second Quarter 2025 | |||||
| COMPANY PROFILE | ||||||||
| BROAD OF DIRECTORS | |||||
| Anthony E. Malkin | Chairman and Chief Executive Officer | ||||
| Steven J. Gilbert | Director, Lead Independent Director, Chair of the Compensation Committee | ||||
| S. Michael Giliberto | Director, Chair of the Audit Committee | ||||
| Patricia S. Han | Director | ||||
| Grant H. Hill | Director | ||||
| R. Paige Hood | Director, Chair of the Finance Committee | ||||
| George L. W. Malkin | Director | ||||
| James D. Robinson IV | Director, Chair of the Nominating and Corporate Governance Committee | ||||
| Christina Van Tassell | Director | ||||
| Hannah Yang | Director | ||||
| EXECUTIVE MANAGEMENT | |||||
| Anthony E. Malkin | Chairman and Chief Executive Officer | ||||
| Christina Chiu | President | ||||
| Thomas P. Durels | Executive Vice President, Real Estate | ||||
| Steve Horn | Executive Vice President, Chief Financial Officer & Chief Accounting Officer | ||||
| COMPANY INFORMATION | ||||||||
| Corporate Headquarters | Investor Relations | New York Stock Exchange | ||||||
| 111 West 33rd Street, 12th Floor | IR@esrtreit.com | Trading Symbol: ESRT |
||||||
| New York, NY 10120 | ||||||||
| www.esrtreit.com | ||||||||
| (212) 687-8700 | ||||||||
| RESEARCH COVERAGE | |||||||||||
| Bank of America Merrill Lynch | Jeff Spector | (646) 855-1363 | jeff.spector@bofa.com | ||||||||
| BMO Capital Markets Corp. | John Kim | (212) 885-4115 | jp.kim@bmo.com | ||||||||
| BTIG | Thomas Catherwood | (212) 738-6140 | tcatherwood@btig.com | ||||||||
| Citi | Seth Bergey | (212) 816-2066 | seth.bergey@citi.com | ||||||||
| Evercore ISI | Steve Sakwa | (212) 446-9462 | steve.sakwa@evercoreisi.com | ||||||||
| Green Street Advisors | Dylan Burzinski | (949) 640-8780 | dburzinski@greenstreetadvisors.com | ||||||||
| KeyBanc Capital Markets | Todd Thomas | (917) 368-2286 | tthomas@key.com | ||||||||
| Wells Fargo Securities, LLC | Blaine Heck | (443) 263-6529 | blaine.heck@wellsfargo.com | ||||||||
| Wolfe Research | Ally Yaseen | (646) 582-9253 | ayaseen@wolferesearch.com | ||||||||
|
Second Quarter 2025 |
||||
| Condensed Consolidated Balance Sheet | |||||
| (unaudited and dollars in thousands) | |||||
| Assets | June 30, 2025 |
March 31, 2025 |
December 31, 2024 |
September 30, 2024 |
June 30, 2024 |
||||||||||||||||||||||||
| Commercial real estate properties, at cost | $ | 3,903,950 | $ | 3,825,422 | $ | 3,786,653 | $ | 3,667,687 | $ | 3,503,302 | |||||||||||||||||||
| Less: accumulated depreciation | (1,341,144) | (1,306,924) | (1,274,193) | (1,241,454) | (1,206,039) | ||||||||||||||||||||||||
| Commercial real estate properties, net | 2,562,806 | 2,518,498 | 2,512,460 | 2,426,233 | 2,297,263 | ||||||||||||||||||||||||
Contract asset(1) |
— | — | 170,419 | 168,687 | 166,955 | ||||||||||||||||||||||||
| Cash and cash equivalents | 94,643 | 187,823 | 385,465 | 421,896 | 535,533 | ||||||||||||||||||||||||
| Restricted cash | 42,084 | 49,589 | 43,837 | 48,023 | 41,015 | ||||||||||||||||||||||||
| Tenant and other receivables | 28,124 | 29,071 | 31,427 | 34,068 | 34,665 | ||||||||||||||||||||||||
| Deferred rent receivables | 255,272 | 252,299 | 247,754 | 244,448 | 242,940 | ||||||||||||||||||||||||
| Prepaid expenses and other assets | 85,083 | 64,233 | 101,852 | 81,758 | 105,438 | ||||||||||||||||||||||||
| Deferred costs, net | 181,694 | 181,802 | 183,987 | 176,720 | 172,318 | ||||||||||||||||||||||||
| Acquired below-market ground leases, net | 309,495 | 311,452 | 313,410 | 315,368 | 317,326 | ||||||||||||||||||||||||
| Right of use assets | 28,070 | 28,134 | 28,197 | 28,257 | 28,318 | ||||||||||||||||||||||||
| Goodwill | 491,479 | 491,479 | 491,479 | 491,479 | 491,479 | ||||||||||||||||||||||||
| Total assets | $ | 4,078,750 | $ | 4,114,380 | $ | 4,510,287 | $ | 4,436,937 | $ | 4,433,250 | |||||||||||||||||||
| Liabilities and Equity | |||||||||||||||||||||||||||||
| Mortgage notes payable, net | $ | 691,440 | $ | 691,816 | $ | 692,176 | $ | 692,989 | $ | 700,348 | |||||||||||||||||||
| Senior unsecured notes, net | 1,097,355 | 1,097,212 | 1,197,061 | 1,196,911 | 1,196,831 | ||||||||||||||||||||||||
| Unsecured term loan facility, net | 268,883 | 268,807 | 268,731 | 268,655 | 268,580 | ||||||||||||||||||||||||
| Unsecured revolving credit facility | — | — | 120,000 | 120,000 | 120,000 | ||||||||||||||||||||||||
| Debt associated with property in receivership | — | — | 177,667 | 177,667 | 177,667 | ||||||||||||||||||||||||
| Accrued interest associated with property in receivership | — | — | 5,433 | 3,511 | 1,589 | ||||||||||||||||||||||||
| Accounts payable and accrued expenses | 104,315 | 135,298 | 132,016 | 81,443 | 90,908 | ||||||||||||||||||||||||
| Acquired below-market leases, net | 17,081 | 18,306 | 19,497 | 14,702 | 11,872 | ||||||||||||||||||||||||
| Ground lease liabilities | 28,070 | 28,134 | 28,197 | 28,257 | 28,318 | ||||||||||||||||||||||||
| Deferred revenue and other liabilities | 55,343 | 61,888 | 62,639 | 70,766 | 61,890 | ||||||||||||||||||||||||
| Tenants' security deposits | 27,015 | 27,044 | 24,908 | 24,715 | 24,031 | ||||||||||||||||||||||||
| Total liabilities | 2,289,502 | 2,328,505 | 2,728,325 | 2,679,616 | 2,682,034 | ||||||||||||||||||||||||
| Total equity | 1,789,248 | 1,785,875 | 1,781,962 | 1,757,321 | 1,751,216 | ||||||||||||||||||||||||
| Total liabilities and equity | $ | 4,078,750 | $ | 4,114,380 | $ | 4,510,287 | $ | 4,436,937 | $ | 4,433,250 | |||||||||||||||||||
|
Second Quarter 2025 |
||||
| Condensed Consolidated Statements of Operations | |||||
| (unaudited and in thousands, except per share amounts) | |||||
| Three Months Ended | |||||||||||||||||||||||||||||
| June 30, 2025 |
March 31, 2025 |
December 31, 2024 |
September 30, 2024 |
June 30, 2024 |
|||||||||||||||||||||||||
| Revenues | |||||||||||||||||||||||||||||
Rental revenue (1) |
$ | 153,540 | $ | 154,542 | $ | 155,127 | $ | 153,117 | $ | 152,470 | |||||||||||||||||||
| Observatory revenue | 33,899 | 23,161 | 38,275 | 39,382 | 34,124 | ||||||||||||||||||||||||
| Lease termination fees | 464 | — | — | 4,771 | — | ||||||||||||||||||||||||
| Third-party management and other fees | 408 | 431 | 258 | 271 | 376 | ||||||||||||||||||||||||
| Other revenue and fees | 2,939 | 1,932 | 3,942 | 2,058 | 2,573 | ||||||||||||||||||||||||
| Total revenues | 191,250 | 180,066 | 197,602 | 199,599 | 189,543 | ||||||||||||||||||||||||
| Operating expenses | |||||||||||||||||||||||||||||
| Property operating expenses | 44,880 | 45,060 | 46,645 | 45,954 | 41,516 | ||||||||||||||||||||||||
| Ground rent expenses | 2,332 | 2,331 | 2,332 | 2,331 | 2,332 | ||||||||||||||||||||||||
| General and administrative expenses | 18,685 | 16,940 | 17,870 | 18,372 | 18,020 | ||||||||||||||||||||||||
| Observatory expenses | 9,822 | 8,118 | 9,730 | 9,715 | 8,958 | ||||||||||||||||||||||||
| Real estate taxes | 32,607 | 33,050 | 32,720 | 31,982 | 31,883 | ||||||||||||||||||||||||
| Depreciation and amortization | 47,802 | 48,779 | 45,365 | 45,899 | 47,473 | ||||||||||||||||||||||||
| Total operating expenses | 156,128 | 154,278 | 154,662 | 154,253 | 150,182 | ||||||||||||||||||||||||
| Total operating income | 35,122 | 25,788 | 42,940 | 45,346 | 39,361 | ||||||||||||||||||||||||
| Other income (expense) | |||||||||||||||||||||||||||||
| Interest income | 1,867 | 3,786 | 5,068 | 6,960 | 5,092 | ||||||||||||||||||||||||
| Interest expense | (25,126) | (26,938) | (27,380) | (27,408) | (25,323) | ||||||||||||||||||||||||
| Interest expense associated with property in receivership | — | (647) | (1,921) | (1,922) | (628) | ||||||||||||||||||||||||
| Gain on disposition of property | — | 13,170 | 1,237 | 1,262 | 10,803 | ||||||||||||||||||||||||
| Income before income taxes | 11,863 | 15,159 | 19,944 | 24,238 | 29,305 | ||||||||||||||||||||||||
| Income tax (expense) benefit | (478) | 619 | (1,151) | (1,442) | (750) | ||||||||||||||||||||||||
| Net income | 11,385 | 15,778 | 18,793 | 22,796 | 28,555 | ||||||||||||||||||||||||
| Net income attributable to noncontrolling interests: | |||||||||||||||||||||||||||||
| Non-controlling interests in the Operating Partnership | (3,815) | (5,508) | (6,575) | (8,205) | (10,433) | ||||||||||||||||||||||||
| Private perpetual preferred unit distributions | (1,051) | (1,050) | (1,050) | (1,050) | (1,051) | ||||||||||||||||||||||||
| Net income attributable to common stockholders | $ | 6,519 | $ | 9,220 | $ | 11,168 | $ | 13,541 | $ | 17,071 | |||||||||||||||||||
| Weighted average common shares outstanding | |||||||||||||||||||||||||||||
| Basic | 168,368 | 167,181 | 166,671 | 164,880 | 164,277 | ||||||||||||||||||||||||
| Diluted | 269,951 | 269,529 | 270,251 | 269,613 | 268,716 | ||||||||||||||||||||||||
| Earnings per share attributable to common stockholders | |||||||||||||||||||||||||||||
| Basic | $ | 0.04 | $ | 0.06 | $ | 0.07 | $ | 0.08 | $ | 0.10 | |||||||||||||||||||
| Diluted | $ | 0.04 | $ | 0.05 | $ | 0.07 | $ | 0.08 | $ | 0.10 | |||||||||||||||||||
| Dividends per share | $ | 0.035 | $ | 0.035 | $ | 0.035 | $ | 0.035 | $ | 0.035 | |||||||||||||||||||
| Three Months Ended | |||||||||||||||||||||||||||||
| Rental Revenue | June 30, 2025 |
March 31, 2025 |
December 31, 2024 |
September 30, 2024 |
June 30, 2024 |
||||||||||||||||||||||||
| Base rent | $ | 133,987 | $ | 136,096 | $ | 135,629 | $ | 132,492 | $ | 136,328 | |||||||||||||||||||
| Billed tenant expense reimbursement | 19,553 | 18,446 | 19,498 | 20,625 | 16,142 | ||||||||||||||||||||||||
| Total rental revenue | $ | 153,540 | $ | 154,542 | $ | 155,127 | $ | 153,117 | $ | 152,470 | |||||||||||||||||||
|
Second Quarter 2025 |
||||
| FFO, Modified FFO, Core FFO, Core FAD and EBITDA | |||||
| (unaudited and in thousands, except per share amounts) | |||||
| Three Months Ended | |||||||||||||||||||||||||||||
| Reconciliation of Net Income to FFO, Modified FFO, and Core FFO | June 30, 2025 |
March 31, 2025 |
December 31, 2024 |
September 30, 2024 |
June 30, 2024 |
||||||||||||||||||||||||
| Net Income | $ | 11,385 | $ | 15,778 | $ | 18,793 | $ | 22,796 | $ | 28,555 | |||||||||||||||||||
| Preferred unit distributions | (1,051) | (1,050) | (1,050) | (1,050) | (1,051) | ||||||||||||||||||||||||
| Real estate depreciation and amortization | 46,921 | 47,871 | 44,386 | 44,871 | 46,398 | ||||||||||||||||||||||||
| Gain on disposition of property | — | (13,170) | (1,237) | (1,262) | (10,803) | ||||||||||||||||||||||||
| FFO attributable to common stockholders and the Operating Partnership | 57,255 | 49,429 | 60,892 | 65,355 | 63,099 | ||||||||||||||||||||||||
| Amortization of below-market ground lease | 1,958 | 1,958 | 1,958 | 1,958 | 1,958 | ||||||||||||||||||||||||
| Modified FFO attributable to common stockholders and the Operating Partnership | 59,213 | 51,387 | 62,850 | 67,313 | 65,057 | ||||||||||||||||||||||||
| Interest expense associated with property in receivership | — | 647 | 1,921 | 1,922 | 628 | ||||||||||||||||||||||||
| Core FFO attributable to common stockholders and the Operating Partnership | $ | 59,213 | $ | 52,034 | $ | 64,771 | $ | 69,235 | $ | 65,685 | |||||||||||||||||||
| Total weighted average shares and Operating Partnership units | |||||||||||||||||||||||||||||
| Basic | 266,899 | 267,073 | 264,798 | 264,787 | 264,676 | ||||||||||||||||||||||||
| Diluted | 269,951 | 269,529 | 270,251 | 269,613 | 268,716 | ||||||||||||||||||||||||
| FFO attributable to common stockholders and the Operating Partnership per share and unit | |||||||||||||||||||||||||||||
| Basic | $ | 0.21 | $ | 0.19 | $ | 0.23 | $ | 0.25 | $ | 0.24 | |||||||||||||||||||
| Diluted | $ | 0.21 | $ | 0.18 | $ | 0.23 | $ | 0.24 | $ | 0.23 | |||||||||||||||||||
| Modified FFO attributable to common stockholders and the Operating Partnership per share and unit | |||||||||||||||||||||||||||||
| Basic | $ | 0.22 | $ | 0.19 | $ | 0.24 | $ | 0.25 | $ | 0.25 | |||||||||||||||||||
| Diluted | $ | 0.22 | $ | 0.19 | $ | 0.23 | $ | 0.25 | $ | 0.24 | |||||||||||||||||||
| Core FFO attributable to common stockholders and the Operating Partnership per share and unit | |||||||||||||||||||||||||||||
| Basic | $ | 0.22 | $ | 0.19 | $ | 0.24 | $ | 0.26 | $ | 0.25 | |||||||||||||||||||
| Diluted | $ | 0.22 | $ | 0.19 | $ | 0.24 | $ | 0.26 | $ | 0.24 | |||||||||||||||||||
| Reconciliation of Core FFO to Core FAD | |||||||||||||||||||||||||||||
| Core FFO | $ | 59,213 | $ | 52,034 | $ | 64,771 | $ | 69,235 | $ | 65,685 | |||||||||||||||||||
| Add: | |||||||||||||||||||||||||||||
| Amortization of deferred financing costs | 1,080 | 1,094 | 1,099 | 1,110 | 1,050 | ||||||||||||||||||||||||
| Non-real estate depreciation and amortization | 880 | 908 | 979 | 1,029 | 1,074 | ||||||||||||||||||||||||
| Amortization of non-cash compensation expense | 6,900 | 4,980 | 6,107 | 5,752 | 6,388 | ||||||||||||||||||||||||
| Amortization of loss on interest rate derivative | 1,386 | 1,386 | 1,386 | 1,386 | 1,480 | ||||||||||||||||||||||||
| Deduct: | |||||||||||||||||||||||||||||
| Straight-line rental revenues, above/below market rent, and other non-cash adjustments | (4,913) | (6,407) | (5,044) | (3,082) | (2,744) | ||||||||||||||||||||||||
| Corporate capital expenditures | (234) | (83) | (226) | (121) | (157) | ||||||||||||||||||||||||
| Tenant improvements - second generation | (36,890) | (39,304) | (45,969) | (17,149) | (25,087) | ||||||||||||||||||||||||
| Building improvements - second generation | (7,868) | (5,770) | (9,377) | (7,838) | (11,362) | ||||||||||||||||||||||||
| Leasing commissions - second generation | (7,605) | (7,629) | (10,769) | (3,753) | (3,807) | ||||||||||||||||||||||||
| Core FAD | $ | 11,949 | $ | 1,209 | $ | 2,957 | $ | 46,569 | $ | 32,521 | |||||||||||||||||||
| Reconciliation of Net Income to EBITDA and Adjusted EBITDA | |||||||||||||||||||||||||||||
| Net income | $ | 11,385 | $ | 15,778 | $ | 18,793 | $ | 22,796 | $ | 28,555 | |||||||||||||||||||
| Interest expense | 25,126 | 26,938 | 27,380 | 27,408 | 25,323 | ||||||||||||||||||||||||
| Interest expense associated with property in receivership | — | 647 | 1,921 | 1,922 | 628 | ||||||||||||||||||||||||
| Income tax expense (benefit) | 478 | (619) | 1,151 | 1,442 | 750 | ||||||||||||||||||||||||
| Depreciation and amortization | 47,802 | 48,779 | 45,365 | 45,899 | 47,473 | ||||||||||||||||||||||||
| EBITDA | 84,791 | 91,523 | 94,610 | 99,467 | 102,729 | ||||||||||||||||||||||||
| Gain on disposition of property | — | (13,170) | (1,237) | (1,262) | (10,803) | ||||||||||||||||||||||||
| Adjusted EBITDA | $ | 84,791 | $ | 78,353 | $ | 93,373 | $ | 98,205 | $ | 91,926 | |||||||||||||||||||
|
Second Quarter 2025 |
||||
| Highlights | |||||
| (unaudited and dollars and shares in thousands, except per share amounts) | |||||
| Three Months Ended | |||||||||||||||||||||||||||||
| Office and Retail Metrics: | June 30, 2025 |
March 31, 2025 |
December 31, 2024 |
September 30, 2024 |
June 30, 2024 |
||||||||||||||||||||||||
| Total rentable square footage | 8,626,395 | 8,617,292 | 8,616,284 | 8,592,481 | 8,549,496 | ||||||||||||||||||||||||
Percent occupied (1) |
89.0 | % | 87.9 | % | 88.6 | % | 89.1 | % | 88.9 | % | |||||||||||||||||||
Percent leased (2) |
92.9 | % | 92.5 | % | 93.5 | % | 93.4 | % | 93.1 | % | |||||||||||||||||||
| Same Store Property Cash Net Operating Income (NOI) - excluding lease termination fees: | |||||||||||||||||||||||||||||
| Manhattan office portfolio | $ | 63,589 | $ | 61,548 | $ | 64,110 | $ | 65,069 | $ | 67,165 | |||||||||||||||||||
| Greater New York office portfolio | 1,393 | 1,584 | 1,769 | 1,651 | 1,825 | ||||||||||||||||||||||||
| Retail portfolio | 2,298 | 2,433 | 2,472 | 2,431 | 2,517 | ||||||||||||||||||||||||
| Total Same Store Property Cash NOI | $ | 67,280 | $ | 65,565 | $ | 68,351 | $ | 69,151 | $ | 71,507 | |||||||||||||||||||
| Multifamily Metrics: | |||||||||||||||||||||||||||||
| Multifamily Cash NOI | $ | 5,173 | $ | 4,643 | $ | 4,168 | $ | 4,506 | $ | 4,533 | |||||||||||||||||||
| Total number of units | 743 | 732 | 732 | 732 | 727 | ||||||||||||||||||||||||
| Percent occupied | 98.6 | % | 99.0 | % | 98.5 | % | 96.8 | % | 97.9 | % | |||||||||||||||||||
| Observatory Metrics: | |||||||||||||||||||||||||||||
| Observatory NOI | $ | 24,077 | $ | 15,043 | $ | 28,545 | $ | 29,667 | $ | 25,166 | |||||||||||||||||||
Number of visitors (3) |
629,000 | 428,000 | 718,000 | 727,000 | 648,000 | ||||||||||||||||||||||||
| Change in visitors year-over-year | (2.9) | % | (11.8) | % | 1.0 | % | (2.2) | % | (2.7) | % | |||||||||||||||||||
| Ratios: | |||||||||||||||||||||||||||||
Debt to Total Market Capitalization (4) |
46.9 | % | 47.8 | % | 44.0 | % | 42.3 | % | 46.4 | % | |||||||||||||||||||
Net Debt to Total Market Capitalization (4) |
45.8 | % | 45.4 | % | 39.5 | % | 37.5 | % | 39.9 | % | |||||||||||||||||||
|
Debt and Perpetual Preferred Units to
Total Market Capitalization (4)
|
49.0 | % | 49.8 | % | 45.7 | % | 44.0 | % | 48.2 | % | |||||||||||||||||||
|
Net Debt and Perpetual Preferred Units to
Total Market Capitalization (4)
|
47.8 | % | 47.5 | % | 41.4 | % | 39.3 | % | 41.9 | % | |||||||||||||||||||
Debt to Adjusted EBITDA (5) |
5.8x | 5.8x | 6.4x | 6.4x | 6.6x | ||||||||||||||||||||||||
Net Debt to Adjusted EBITDA (5) |
5.6x | 5.2x | 5.3x | 5.2x | 5.1x | ||||||||||||||||||||||||
Core FFO Payout Ratio (6) |
16 | % | 19 | % | 15 | % | 14 | % | 15 | % | |||||||||||||||||||
| Core FAD Payout Ratio | 82 | % | 805 | % | 324 | % | 21 | % | 30 | % | |||||||||||||||||||
| Core FFO per share - diluted | $ | 0.22 | $ | 0.19 | $ | 0.24 | $ | 0.26 | $ | 0.24 | |||||||||||||||||||
| Diluted weighted average shares | 269,951 | 269,529 | 270,251 | 269,613 | 268,716 | ||||||||||||||||||||||||
| Class A common stock price at quarter end | $ | 8.09 | $ | 7.82 | $ | 10.32 | $ | 11.08 | $ | 9.38 | |||||||||||||||||||
| Dividends declared and paid per share | $ | 0.035 | $ | 0.035 | $ | 0.035 | $ | 0.035 | $ | 0.035 | |||||||||||||||||||
| Dividends per share - annualized | $ | 0.14 | $ | 0.14 | $ | 0.14 | $ | 0.14 | $ | 0.14 | |||||||||||||||||||
Dividend yield (7) |
1.7 | % | 1.8 | % | 1.4 | % | 1.3 | % | 1.5 | % | |||||||||||||||||||
| Series 2014 Private Perpetual Preferred Units outstanding ($16.62 liquidation value) |
1,560 | 1,560 | 1,560 | 1,560 | 1,560 | ||||||||||||||||||||||||
| Series 2019 Private Perpetual Preferred Units outstanding ($13.52 liquidation value) |
4,664 | 4,664 | 4,664 | 4,664 | 4,664 | ||||||||||||||||||||||||
| Class A common stock | 168,301 | 167,094 | 166,405 | 165,507 | 164,483 | ||||||||||||||||||||||||
Class B common stock (8) |
975 | 976 | 978 | 981 | 982 | ||||||||||||||||||||||||
| Operating partnership units | 109,308 | 110,662 | 106,768 | 107,664 | 108,713 | ||||||||||||||||||||||||
|
Total common stock and operating partnership units
outstanding (9)
|
278,584 | 278,732 | 274,151 | 274,152 | 274,178 | ||||||||||||||||||||||||
|
Second Quarter 2025 |
||||
| Property Summary - Same Store NOI | |||||
| (unaudited and dollars in thousands) | |||||
| Three Months Ended | Six Months Ended | ||||||||||||||||||||||||||||||||||||||||
| June 30, 2025 |
March 31, 2025 |
December 31, 2024 |
September 30, 2024 |
June 30, 2024 |
June 30, 2025 |
June 30, 2024 |
|||||||||||||||||||||||||||||||||||
Same Store Portfolio(1) |
|||||||||||||||||||||||||||||||||||||||||
| Revenues | $ | 143,776 | $ | 143,916 | $ | 146,969 | $ | 145,501 | $ | 140,763 | $ | 287,692 | $ | 280,910 | |||||||||||||||||||||||||||
| Operating expenses | (74,612) | (74,891) | (76,317) | (75,596) | (68,762) | (149,503) | (140,248) | ||||||||||||||||||||||||||||||||||
| Same store property NOI | 69,164 | 69,025 | 70,652 | 69,905 | 72,001 | 138,189 | 140,662 | ||||||||||||||||||||||||||||||||||
| Straight-line rent | (3,213) | (4,831) | (3,782) | (2,184) | (1,887) | (8,044) | (5,105) | ||||||||||||||||||||||||||||||||||
| Above/below-market rent revenue amortization | (629) | (587) | (477) | (528) | (565) | (1,216) | (1,130) | ||||||||||||||||||||||||||||||||||
| Below-market ground lease amortization | 1,958 | 1,958 | 1,958 | 1,958 | 1,958 | 3,916 | 3,916 | ||||||||||||||||||||||||||||||||||
| Total same store property cash NOI - excluding lease termination fees | $ | 67,280 | $ | 65,565 | $ | 68,351 | $ | 69,151 | $ | 71,507 | $ | 132,845 | $ | 138,343 | |||||||||||||||||||||||||||
| Percent change over prior year | (5.9) | % | (1.9) | % | (2.9) | % | 5.2 | % | 7.4 | % | (4.0) | % | 9.7 | % | |||||||||||||||||||||||||||
| Total same store property cash NOI - excluding lease termination fees | $ | 67,280 | $ | 65,565 | $ | 68,351 | $ | 69,151 | $ | 71,507 | $ | 132,845 | $ | 138,343 | |||||||||||||||||||||||||||
| Lease termination fees | 464 | — | — | 4,771 | — | 464 | — | ||||||||||||||||||||||||||||||||||
| Total same store property cash NOI | $ | 67,744 | $ | 65,565 | $ | 68,351 | $ | 73,922 | $ | 71,507 | $ | 133,309 | $ | 138,343 | |||||||||||||||||||||||||||
Same Store Manhattan Office(1),(2) |
|||||||||||||||||||||||||||||||||||||||||
| Revenues | $ | 136,543 | $ | 136,408 | $ | 139,380 | $ | 138,060 | $ | 133,180 | $ | 272,951 | $ | 267,099 | |||||||||||||||||||||||||||
| Operating expenses | (71,336) | (71,598) | (73,062) | (72,287) | (65,473) | (142,934) | (133,646) | ||||||||||||||||||||||||||||||||||
| Same store property NOI | 65,207 | 64,810 | 66,318 | 65,773 | 67,707 | 130,017 | 133,453 | ||||||||||||||||||||||||||||||||||
| Straight-line rent | (2,947) | (4,633) | (3,689) | (2,134) | (1,935) | (7,580) | (5,163) | ||||||||||||||||||||||||||||||||||
| Above/below-market rent revenue amortization | (629) | (587) | (477) | (528) | (565) | (1,216) | (1,130) | ||||||||||||||||||||||||||||||||||
| Below-market ground lease amortization | 1,958 | 1,958 | 1,958 | 1,958 | 1,958 | 3,916 | 3,916 | ||||||||||||||||||||||||||||||||||
| Total same store property cash NOI - excluding lease termination fees | 63,589 | 61,548 | 64,110 | 65,069 | 67,165 | 125,137 | 131,076 | ||||||||||||||||||||||||||||||||||
| Lease termination fees | 464 | — | — | 4,771 | — | 464 | — | ||||||||||||||||||||||||||||||||||
| Total same store property cash NOI | $ | 64,053 | $ | 61,548 | $ | 64,110 | $ | 69,840 | $ | 67,165 | $ | 125,601 | $ | 131,076 | |||||||||||||||||||||||||||
Same Store Greater New York Metropolitan Area Office(1) |
|||||||||||||||||||||||||||||||||||||||||
| Revenues | $ | 2,985 | $ | 3,154 | $ | 3,213 | $ | 3,060 | $ | 3,319 | $ | 6,139 | $ | 6,163 | |||||||||||||||||||||||||||
| Operating expenses | (1,551) | (1,606) | (1,572) | (1,612) | (1,656) | (3,157) | (3,250) | ||||||||||||||||||||||||||||||||||
| Same store property NOI | 1,434 | 1,548 | 1,641 | 1,448 | 1,663 | 2,982 | 2,913 | ||||||||||||||||||||||||||||||||||
| Straight-line rent | (41) | 36 | 128 | 203 | 162 | (5) | 295 | ||||||||||||||||||||||||||||||||||
| Above/below-market rent revenue amortization | — | — | — | — | — | — | — | ||||||||||||||||||||||||||||||||||
| Below-market ground lease amortization | — | — | — | — | — | — | — | ||||||||||||||||||||||||||||||||||
| Total same store property cash NOI - excluding lease termination fees | 1,393 | 1,584 | 1,769 | 1,651 | 1,825 | 2,977 | 3,208 | ||||||||||||||||||||||||||||||||||
| Lease termination fees | — | — | — | — | — | — | — | ||||||||||||||||||||||||||||||||||
| Total same store property cash NOI | $ | 1,393 | $ | 1,584 | $ | 1,769 | $ | 1,651 | $ | 1,825 | $ | 2,977 | $ | 3,208 | |||||||||||||||||||||||||||
Same Store Retail(1) |
|||||||||||||||||||||||||||||||||||||||||
| Revenues | $ | 4,248 | $ | 4,354 | $ | 4,376 | $ | 4,381 | $ | 4,264 | $ | 8,602 | $ | 7,648 | |||||||||||||||||||||||||||
| Operating expenses | (1,725) | (1,687) | (1,683) | (1,697) | (1,633) | (3,412) | (3,352) | ||||||||||||||||||||||||||||||||||
| Same store property NOI | 2,523 | 2,667 | 2,693 | 2,684 | 2,631 | 5,190 | 4,296 | ||||||||||||||||||||||||||||||||||
| Straight-line rent | (225) | (234) | (221) | (253) | (114) | (459) | (237) | ||||||||||||||||||||||||||||||||||
| Above/below-market rent revenue amortization | — | — | — | — | — | — | — | ||||||||||||||||||||||||||||||||||
| Below-market ground lease amortization | — | — | — | — | — | — | — | ||||||||||||||||||||||||||||||||||
| Total same store property cash NOI - excluding lease termination fees | 2,298 | 2,433 | 2,472 | 2,431 | 2,517 | 4,731 | 4,059 | ||||||||||||||||||||||||||||||||||
| Lease termination fees | — | — | — | — | — | — | — | ||||||||||||||||||||||||||||||||||
| Total same store property cash NOI | $ | 2,298 | $ | 2,433 | $ | 2,472 | $ | 2,431 | $ | 2,517 | $ | 4,731 | $ | 4,059 | |||||||||||||||||||||||||||
|
Second Quarter 2025 |
||||
| Same Store NOI | |||||
| (unaudited and dollars in thousands) | |||||
| Three Months Ended | Six Months Ended | ||||||||||||||||||||||||||||||||||||||||
| Reconciliation of Net Income to Cash NOI and Same Store Cash NOI | June 30, 2025 |
March 31, 2025 |
December 31, 2024 |
September 30, 2024 |
June 30, 2024 |
June 30, 2025 |
June 30, 2024 |
||||||||||||||||||||||||||||||||||
| Net income | $ | 11,385 | $ | 15,778 | $ | 18,793 | $ | 22,796 | $ | 28,555 | $ | 27,163 | $ | 38,770 | |||||||||||||||||||||||||||
| Add: | |||||||||||||||||||||||||||||||||||||||||
| General and administrative expenses | 18,685 | 16,940 | 17,870 | 18,372 | 18,020 | 35,625 | 33,992 | ||||||||||||||||||||||||||||||||||
| Depreciation and amortization | 47,802 | 48,779 | 45,365 | 45,899 | 47,473 | 96,581 | 93,554 | ||||||||||||||||||||||||||||||||||
| Interest expense | 25,126 | 26,938 | 27,380 | 27,408 | 25,323 | 52,064 | 50,451 | ||||||||||||||||||||||||||||||||||
| Interest expense associated with property in receivership | — | 647 | 1,921 | 1,922 | 628 | 647 | 628 | ||||||||||||||||||||||||||||||||||
| Loss on early extinguishment of debt | — | — | — | — | — | — | 553 | ||||||||||||||||||||||||||||||||||
| Income tax expense (benefit) | 478 | (619) | 1,151 | 1,442 | 750 | (141) | 95 | ||||||||||||||||||||||||||||||||||
| Less: | |||||||||||||||||||||||||||||||||||||||||
| Gain on disposition of property | — | (13,170) | (1,237) | (1,262) | (10,803) | (13,170) | (10,803) | ||||||||||||||||||||||||||||||||||
| Third-party management and other fees | (408) | (431) | (258) | (271) | (376) | (839) | (641) | ||||||||||||||||||||||||||||||||||
| Interest income | (1,867) | (3,786) | (5,068) | (6,960) | (5,092) | (5,653) | (9,270) | ||||||||||||||||||||||||||||||||||
| Net operating income | 101,201 | 91,076 | 105,917 | 109,346 | 104,478 | 192,277 | 197,329 | ||||||||||||||||||||||||||||||||||
| Straight-line rent | (3,748) | (5,283) | (4,045) | (2,277) | (1,900) | (9,031) | (4,961) | ||||||||||||||||||||||||||||||||||
| Above/below-market rent revenue amortization | (840) | (798) | (674) | (476) | (513) | (1,638) | (1,027) | ||||||||||||||||||||||||||||||||||
| Below-market ground lease amortization | 1,958 | 1,958 | 1,958 | 1,958 | 1,958 | 3,916 | 3,916 | ||||||||||||||||||||||||||||||||||
| Total cash NOI - including Observatory and lease termination fees | 98,571 | 86,953 | 103,156 | 108,551 | 104,023 | 185,524 | 195,257 | ||||||||||||||||||||||||||||||||||
| Less: Observatory NOI | (24,077) | (15,043) | (28,545) | (29,667) | (25,166) | (39,120) | (41,331) | ||||||||||||||||||||||||||||||||||
| Less: cash NOI from non-Same Store properties | (6,750) | (6,345) | (6,260) | (4,962) | (7,350) | (13,095) | (15,583) | ||||||||||||||||||||||||||||||||||
| Total Same Store property cash NOI - including lease termination fees | 67,744 | 65,565 | 68,351 | 73,922 | 71,507 | 133,309 | 138,343 | ||||||||||||||||||||||||||||||||||
| Less: Lease termination fees | (464) | — | — | (4,771) | — | (464) | — | ||||||||||||||||||||||||||||||||||
| Total Same Store property cash NOI - excluding Observatory and lease termination fees | $ | 67,280 | $ | 65,565 | $ | 68,351 | $ | 69,151 | $ | 71,507 | $ | 132,845 | $ | 138,343 | |||||||||||||||||||||||||||
| Multifamily NOI | |||||||||||||||||||||||||||||||||||||||||
| Revenues | $ | 9,846 | $ | 9,646 | $ | 9,322 | $ | 9,140 | $ | 9,161 | $ | 19,492 | $ | 17,633 | |||||||||||||||||||||||||||
| Operating expenses | (4,665) | (4,993) | (5,145) | (4,623) | (4,578) | (9,658) | (8,787) | ||||||||||||||||||||||||||||||||||
| NOI | 5,181 | 4,653 | 4,177 | 4,517 | 4,583 | 9,834 | 8,846 | ||||||||||||||||||||||||||||||||||
| Straight-line rent | (67) | (67) | (67) | (69) | (109) | (134) | (211) | ||||||||||||||||||||||||||||||||||
| Above/below-market rent revenue amortization | 59 | 57 | 58 | 58 | 59 | 116 | 115 | ||||||||||||||||||||||||||||||||||
| Cash NOI | $ | 5,173 | $ | 4,643 | $ | 4,168 | $ | 4,506 | $ | 4,533 | $ | 9,816 | $ | 8,750 | |||||||||||||||||||||||||||
|
Second Quarter 2025 |
||||
| Property Summary - Leasing Activity by Quarter | |||||
| (unaudited) | |||||
| Three Months Ended | |||||||||||||||||||||||||||||
| June 30, 2025 |
March 31, 2025 |
December 31, 2024 |
September 30, 2024 |
June 30, 2024 |
|||||||||||||||||||||||||
Total Office and Retail Portfolio(1) |
|||||||||||||||||||||||||||||
| Total leases executed | 22 | 20 | 20 | 31 | 35 | ||||||||||||||||||||||||
| Weighted average lease term | 9.9 years | 8.4 years | 8.0 years | 7.0 years | 7.0 years | ||||||||||||||||||||||||
| Average free rent period | 7.6 months | 7.8 months | 5.7 months | 5.2 months | 7.4 months | ||||||||||||||||||||||||
| Office | |||||||||||||||||||||||||||||
| Total square footage executed | 221,776 | 229,367 | 378,913 | 291,418 | 262,991 | ||||||||||||||||||||||||
| Average starting cash rent psf - leases executed | $ | 71.21 | $ | 66.43 | $ | 78.40 | $ | 70.11 | $ | 66.60 | |||||||||||||||||||
| Previously escalated cash rents psf | $ | 63.50 | $ | 60.63 | $ | 71.03 | $ | 68.34 | $ | 65.31 | |||||||||||||||||||
| Percentage of new cash rent over previously escalated rents | 12.1 | % | 9.6 | % | 10.4 | % | 2.6 | % | 2.0 | % | |||||||||||||||||||
| Retail | |||||||||||||||||||||||||||||
| Total square footage executed | 10,332 | 1,181 | — | 12,792 | 8,990 | ||||||||||||||||||||||||
| Average starting cash rent psf - leases executed | $ | 268.92 | $ | 193.00 | $ | — | $ | 203.88 | $ | 91.14 | |||||||||||||||||||
| Previously escalated cash rents psf | $ | 316.28 | $ | 183.74 | $ | — | $ | 332.35 | $ | 75.03 | |||||||||||||||||||
| Percentage of new cash rent over previously escalated rents | (15.0) | % | 5.0 | % | — | (38.7) | % | 21.5 | % | ||||||||||||||||||||
| Total Office and Retail Portfolio | |||||||||||||||||||||||||||||
| Total square footage executed | 232,108 | 230,548 | 378,913 | 304,210 | 271,981 | ||||||||||||||||||||||||
| Average starting cash rent psf - leases executed | $ | 80.01 | $ | 67.08 | $ | 78.40 | $ | 75.74 | $ | 67.41 | |||||||||||||||||||
| Previously escalated cash rents psf | $ | 74.75 | $ | 61.27 | $ | 71.03 | $ | 79.44 | $ | 65.63 | |||||||||||||||||||
| Percentage of new cash rent over previously escalated rents | 7.0 | % | 9.5 | % | 10.4 | % | (4.7) | % | 2.7 | % | |||||||||||||||||||
| Leasing commission costs per square foot | $ | 31.62 | $ | 22.39 | $ | 21.73 | $ | 19.67 | $ | 18.87 | |||||||||||||||||||
| Tenant improvement costs per square foot | 86.85 | 47.92 | 49.46 | 42.90 | 65.69 | ||||||||||||||||||||||||
Total LC and TI per square foot(2) |
$ | 118.47 | $ | 70.31 | $ | 71.19 | $ | 62.57 | $ | 84.56 | |||||||||||||||||||
| Total LC and TI per square foot per year of weighted average lease term | $ | 11.93 | $ | 8.34 | $ | 8.89 | $ | 8.94 | $ | 12.14 | |||||||||||||||||||
Occupancy(3) |
89.0 | % | 87.9 | % | 88.6 | % | 89.1 | % | 88.9 | % | |||||||||||||||||||
| Manhattan Office Portfolio | |||||||||||||||||||||||||||||
| Total leases executed | 18 | 18 | 18 | 25 | 31 | ||||||||||||||||||||||||
| Office - New Leases | |||||||||||||||||||||||||||||
| Total square footage executed | 202,499 | 43,184 | 184,258 | 130,688 | 162,655 | ||||||||||||||||||||||||
| Average starting cash rent psf - leases executed | $ | 72.28 | $ | 69.13 | $ | 71.07 | $ | 66.07 | $ | 67.44 | |||||||||||||||||||
| Previously escalated cash rents psf | $ | 63.11 | $ | 66.77 | $ | 59.54 | $ | 63.21 | $ | 64.36 | |||||||||||||||||||
| Percentage of new cash rent over previously escalated rents | 14.5 | % | 3.5 | % | 19.4 | % | 4.5 | % | 4.8 | % | |||||||||||||||||||
Office - Renewal Leases(1) |
|||||||||||||||||||||||||||||
| Current Renewals | 19,277 | 177,328 | 10,178 | 53,622 | 43,895 | ||||||||||||||||||||||||
| Early Renewals | — | — | 172,286 | 105,019 | 54,761 | ||||||||||||||||||||||||
| Total square footage executed | 19,277 | 177,328 | 182,464 | 158,641 | 98,656 | ||||||||||||||||||||||||
| Average starting cash rent psf - leases executed | $ | 59.97 | $ | 66.62 | $ | 86.98 | $ | 73.11 | $ | 65.50 | |||||||||||||||||||
| Previously escalated cash rents psf | $ | 67.51 | $ | 59.35 | $ | 83.14 | $ | 72.24 | $ | 67.09 | |||||||||||||||||||
| Percentage of new cash rent over previously escalated rents | (11.2) | % | 12.3 | % | 4.6 | % | 1.2 | % | (2.4) | % | |||||||||||||||||||
| Total Manhattan Office Portfolio | |||||||||||||||||||||||||||||
| Total square footage executed | 221,776 | 220,512 | 366,722 | 289,329 | 261,311 | ||||||||||||||||||||||||
| Average starting cash rent psf - leases executed | $ | 71.21 | $ | 67.11 | $ | 78.99 | $ | 69.93 | $ | 66.71 | |||||||||||||||||||
| Previously escalated cash rents psf | $ | 63.50 | $ | 60.80 | $ | 71.28 | $ | 68.16 | $ | 65.40 | |||||||||||||||||||
| Percentage of new cash rent over previously escalated rents | 12.1 | % | 10.4 | % | 10.8 | % | 2.6 | % | 2.0 | % | |||||||||||||||||||
| Leasing commission costs per square foot | $ | 28.97 | $ | 22.47 | $ | 21.85 | $ | 17.40 | $ | 18.13 | |||||||||||||||||||
| Tenant improvement costs per square foot | 89.60 | 49.50 | 47.96 | 42.82 | 68.02 | ||||||||||||||||||||||||
Total LC and TI per square foot(2) |
$ | 118.57 | $ | 71.97 | $ | 69.81 | $ | 60.22 | $ | 86.15 | |||||||||||||||||||
| Total LC and TI per square foot per year of weighted average lease term | $ | 11.79 | $ | 8.41 | $ | 8.66 | $ | 8.67 | $ | 12.49 | |||||||||||||||||||
Occupancy(3) |
89.5 | % | 88.1 | % | 89.0 | % | 89.6 | % | 89.3 | % | |||||||||||||||||||
|
Second Quarter 2025 |
||||
| Property Summary - Leasing Activity by Quarter - (Continued) | |||||
| (unaudited) | |||||
| Three Months Ended | |||||||||||||||||||||||||||||
| June 30, 2025 |
March 31, 2025 |
December 31, 2024 |
September 30, 2024 |
June 30, 2024 |
|||||||||||||||||||||||||
| Retail Portfolio | |||||||||||||||||||||||||||||
| Total leases executed | 4 | 1 | — | 5 | 3 | ||||||||||||||||||||||||
| Total square footage executed | 10,332 | 1,181 | — | 12,792 | 8,990 | ||||||||||||||||||||||||
| Average starting cash rent psf - leases executed | $ | 268.92 | $ | 193.00 | $ | — | $ | 203.88 | $ | 91.14 | |||||||||||||||||||
| Previously escalated cash rents psf | $ | 316.28 | $ | 183.74 | $ | — | $ | 332.35 | $ | 75.03 | |||||||||||||||||||
| Percentage of new cash rent over previously escalated rents | (15.0) | % | 5.0 | % | — | (38.7) | % | 21.5 | % | ||||||||||||||||||||
| Leasing commission costs per square foot | $ | 88.59 | $ | 63.04 | $ | — | $ | 74.25 | $ | 41.87 | |||||||||||||||||||
| Tenant improvement costs per square foot | 27.88 | — | — | 51.72 | 9.45 | ||||||||||||||||||||||||
Total LC and TI per square foot(2) |
$ | 116.47 | $ | 63.04 | $ | — | $ | 125.97 | $ | 51.32 | |||||||||||||||||||
| Total LC and TI per square foot per year of weighted average lease term | $ | 16.15 | $ | 6.25 | $ | — | $ | 14.73 | $ | 5.33 | |||||||||||||||||||
Occupancy(3) |
89.9 | % | 91.2 | % | 90.4 | % | 91.1 | % | 92.3 | % | |||||||||||||||||||
| Multifamily Portfolio | |||||||||||||||||||||||||||||
| Percent occupied | 98.6 | % | 99.0 | % | 98.5 | % | 96.8 | % | 97.9 | % | |||||||||||||||||||
| Total number of units | 743 | 732 | 732 | 732 | 727 | ||||||||||||||||||||||||
|
Second Quarter 2025 |
||||
| Commercial Property Detail | |||||
| (unaudited) | |||||
| Property Name | Location or Sub-Market | Rentable Square Feet (1) |
Percent Occupied (2),(3) |
Percent Leased (3),(4) |
Annualized Rent (5) |
Annualized Rent per Occupied Square Foot (6) |
Number of Leases (7) |
||||||||||||||||||||||||||||||||||
| Office - Manhattan | |||||||||||||||||||||||||||||||||||||||||
| The Empire State Building | Penn Station -Times Sq. South | 2,711,344 | 92.2 | % | 96.6 | % | $ | 170,956,876 | $ | 69.05 | 148 | ||||||||||||||||||||||||||||||
| One Grand Central Place | Grand Central | 1,224,683 | 87.2 | % | 93.3 | % | 68,905,466 | 64.59 | 128 | ||||||||||||||||||||||||||||||||
1400 Broadway (8) |
Penn Station -Times Sq. South | 917,281 | 87.0 | % | 94.5 | % | 50,618,224 | 63.42 | 18 | ||||||||||||||||||||||||||||||||
111 West 33rd Street (9) |
Penn Station -Times Sq. South | 639,595 | 92.6 | % | 94.3 | % | 41,656,476 | 70.32 | 21 | ||||||||||||||||||||||||||||||||
| 250 West 57th Street | Columbus Circle - West Side | 476,831 | 81.6 | % | 82.9 | % | 27,777,535 | 71.46 | 29 | ||||||||||||||||||||||||||||||||
| 1359 Broadway | Penn Station -Times Sq. South | 456,634 | 89.3 | % | 92.4 | % | 24,325,517 | 59.71 | 28 | ||||||||||||||||||||||||||||||||
| 501 Seventh Avenue | Penn Station -Times Sq. South | 455,432 | 90.2 | % | 90.2 | % | 22,742,723 | 55.41 | 16 | ||||||||||||||||||||||||||||||||
1350 Broadway (10) |
Penn Station -Times Sq. South | 383,588 | 88.0 | % | 97.0 | % | 21,435,654 | 63.63 | 47 | ||||||||||||||||||||||||||||||||
| 1333 Broadway | Penn Station -Times Sq. South | 297,126 | 89.8 | % | 89.8 | % | 15,494,116 | 58.09 | 11 | ||||||||||||||||||||||||||||||||
| Office - Manhattan | 7,562,514 | 89.5 | % | 93.8 | % | 443,912,587 | 65.83 | 446 | |||||||||||||||||||||||||||||||||
| Office - Greater New York Metropolitan Area | |||||||||||||||||||||||||||||||||||||||||
| Metro Center | Stamford, CT | 282,176 | 74.1 | % | 74.1 | % | 12,148,780 | 58.12 | 21 | ||||||||||||||||||||||||||||||||
| Office - Greater New York Metropolitan Area | 282,176 | 74.1 | % | 74.1 | % | 12,148,780 | 58.12 | 21 | |||||||||||||||||||||||||||||||||
| Total/Weighted Average Office Properties | 7,844,690 | 88.9 | % | 93.1 | % | 456,061,367 | 65.60 | 467 | |||||||||||||||||||||||||||||||||
| Retail Properties | |||||||||||||||||||||||||||||||||||||||||
| North Sixth Street Collection | Williamsburg - Brooklyn | 102,191 | 78.0 | % | 78.0 | % | 11,195,391 | 140.50 | 16 | ||||||||||||||||||||||||||||||||
112 West 34th Street (9) |
Penn Station -Times Sq. South | 93,057 | 100.0 | % | 100.0 | % | 25,108,425 | 269.82 | 4 | ||||||||||||||||||||||||||||||||
| The Empire State Building | Penn Station -Times Sq. South | 88,445 | 78.7 | % | 78.7 | % | 8,039,762 | 115.45 | 12 | ||||||||||||||||||||||||||||||||
| One Grand Central Place | Grand Central | 70,810 | 79.6 | % | 79.6 | % | 6,947,677 | 123.23 | 11 | ||||||||||||||||||||||||||||||||
| 1333 Broadway | Penn Station -Times Sq. South | 67,001 | 100.0 | % | 100.0 | % | 10,297,889 | 153.70 | 4 | ||||||||||||||||||||||||||||||||
| 250 West 57th Street | Columbus Circle - West Side | 63,443 | 93.2 | % | 93.2 | % | 8,580,632 | 145.19 | 6 | ||||||||||||||||||||||||||||||||
| 10 Union Square | Union Square | 58,049 | 88.2 | % | 88.2 | % | 7,983,831 | 155.91 | 8 | ||||||||||||||||||||||||||||||||
| 1542 Third Avenue | Upper East Side | 56,211 | 95.0 | % | 100.0 | % | 2,517,661 | 47.16 | 3 | ||||||||||||||||||||||||||||||||
| 1010 Third Avenue | Upper East Side | 38,235 | 100.0 | % | 100.0 | % | 3,498,187 | 91.49 | 2 | ||||||||||||||||||||||||||||||||
| 1359 Broadway | Penn Station -Times Sq. South | 29,247 | 99.4 | % | 99.4 | % | 2,220,926 | 76.37 | 5 | ||||||||||||||||||||||||||||||||
| 501 Seventh Avenue | Penn Station -Times Sq. South | 27,213 | 78.9 | % | 89.4 | % | 1,442,201 | 67.20 | 7 | ||||||||||||||||||||||||||||||||
| 77 West 55th Street | Midtown | 25,388 | 100.0 | % | 100.0 | % | 2,124,815 | 83.69 | 3 | ||||||||||||||||||||||||||||||||
1350 Broadway (10) |
Penn Station -Times Sq. South | 19,511 | 100.0 | % | 100.0 | % | 4,137,484 | 212.06 | 6 | ||||||||||||||||||||||||||||||||
1400 Broadway (8) |
Penn Station -Times Sq. South | 17,017 | 82.2 | % | 82.2 | % | 1,753,002 | 125.39 | 6 | ||||||||||||||||||||||||||||||||
| 561 10th Avenue | Hudson Yards | 11,822 | 100.0 | % | 100.0 | % | 1,618,381 | 136.90 | 2 | ||||||||||||||||||||||||||||||||
| 298 Mulberry Street | NoHo | 10,365 | 100.0 | % | 100.0 | % | 1,981,662 | 191.19 | 1 | ||||||||||||||||||||||||||||||||
| 345 East 94th Street | Upper East Side | 3,700 | 100.0 | % | 100.0 | % | 261,661 | 70.72 | 1 | ||||||||||||||||||||||||||||||||
| Total/Weighted Average Retail Properties | 781,705 | 89.9 | % | 90.7 | % | 99,709,587 | 141.83 | 97 | |||||||||||||||||||||||||||||||||
| Portfolio Total | 8,626,395 | 89.0 | % | 92.9 | % | $ | 555,770,954 | $ | 72.60 | 564 | |||||||||||||||||||||||||||||||
|
Second Quarter 2025 |
||||
| Total Portfolio Expirations and Vacates Summary | |||||
| (unaudited and in square feet) | |||||
| Actual | Forecast (1) |
Forecast (1) |
|||||||||||||||||||||||||||||||||
| Three Months Ended | |||||||||||||||||||||||||||||||||||
Total Office and Retail Portfolio (2) |
March 31, 2025 |
June 30, 2025 |
September 30, 2025 |
December 31, 2025 |
July to Dec. 2025 | Full Year 2026 | |||||||||||||||||||||||||||||
| Total expirations | 164,025 | 79,269 | 60,286 | 197,267 | 257,553 | 510,412 | |||||||||||||||||||||||||||||
| Less: broadcasting | — | — | (1,417) | — | (1,417) | — | |||||||||||||||||||||||||||||
| Office and retail expirations | 164,025 | 79,269 | 58,869 | 197,267 | 256,136 | 510,412 | |||||||||||||||||||||||||||||
Renewals & relocations (3) |
31,205 | 8,483 | 15,635 | 14,461 | 30,096 | 119,513 | |||||||||||||||||||||||||||||
New leases (4) |
50,486 | 21,120 | — | 126,391 | 126,391 | 19,463 | |||||||||||||||||||||||||||||
Vacates (5) |
82,334 | 49,666 | 40,918 | 50,035 | 90,953 | 229,314 | |||||||||||||||||||||||||||||
Unknown (6) |
— | — | 2,316 | 6,380 | 8,696 | 142,122 | |||||||||||||||||||||||||||||
| Total Office and Retail Portfolio expirations and vacates | 164,025 | 79,269 | 58,869 | 197,267 | 256,136 | 510,412 | |||||||||||||||||||||||||||||
| Manhattan Office Portfolio | |||||||||||||||||||||||||||||||||||
| Total expirations | 147,055 | 77,329 | 55,207 | 195,800 | 251,007 | 416,307 | |||||||||||||||||||||||||||||
| Less: broadcasting | — | — | (1,417) | — | (1,417) | — | |||||||||||||||||||||||||||||
| Office and retail expirations | 147,055 | 77,329 | 53,790 | 195,800 | 249,590 | 416,307 | |||||||||||||||||||||||||||||
Renewals & relocations (3) |
16,775 | 8,483 | 15,635 | 14,461 | 30,096 | 117,842 | |||||||||||||||||||||||||||||
New leases (4) |
50,486 | 21,120 | — | 126,391 | 126,391 | 19,463 | |||||||||||||||||||||||||||||
Vacates (5) |
79,794 | 47,726 | 35,839 | 48,921 | 84,760 | 212,716 | |||||||||||||||||||||||||||||
Unknown (6) |
— | — | 2,316 | 6,027 | 8,343 | 66,286 | |||||||||||||||||||||||||||||
| Total expirations and vacates | 147,055 | 77,329 | 53,790 | 195,800 | 249,590 | 416,307 | |||||||||||||||||||||||||||||
| Greater New York Metropolitan Area Office Portfolio | |||||||||||||||||||||||||||||||||||
| Office expirations | 2,540 | — | 5,079 | — | 5,079 | 23,268 | |||||||||||||||||||||||||||||
Renewals & relocations (3) |
— | — | — | — | — | — | |||||||||||||||||||||||||||||
New leases (4) |
— | — | — | — | — | — | |||||||||||||||||||||||||||||
Vacates (5) |
2,540 | — | 5,079 | — | 5,079 | — | |||||||||||||||||||||||||||||
Unknown (6) |
— | — | — | — | — | 23,268 | |||||||||||||||||||||||||||||
| Total expirations and vacates | 2,540 | — | 5,079 | — | 5,079 | 23,268 | |||||||||||||||||||||||||||||
| Retail Portfolio | |||||||||||||||||||||||||||||||||||
| Office expirations | 14,430 | 1,940 | — | 1,467 | 1,467 | 70,837 | |||||||||||||||||||||||||||||
Renewals & relocations (3) |
14,430 | — | — | — | — | 1,671 | |||||||||||||||||||||||||||||
New leases (4) |
— | — | — | — | — | — | |||||||||||||||||||||||||||||
Vacates (5) |
— | 1,940 | — | 1,114 | 1,114 | 16,598 | |||||||||||||||||||||||||||||
Unknown (6) |
— | — | — | 353 | 353 | 52,568 | |||||||||||||||||||||||||||||
| Total expirations and vacates | 14,430 | 1,940 | — | 1,467 | 1,467 | 70,837 | |||||||||||||||||||||||||||||
|
Second Quarter 2025 |
||||
| Tenant Lease Expirations | |||||
| (unaudited) | |||||
| Total Office and Retail Lease Expirations | Number of Leases Expiring(1) |
Rentable Square Feet Expiring(2) |
Percent of Portfolio Rentable Square Feet Expiring | Annualized Rent(3) |
Percent of Annualized Rent | Annualized Rent Per Rentable Square Foot | |||||||||||||||||||||||||||||
| Available | — | 642,124 | 7.4 | % | $ | — | — | % | $ | — | |||||||||||||||||||||||||
| Signed leases not commenced | 21 | 328,609 | 3.8 | % | — | — | % | — | |||||||||||||||||||||||||||
2Q 2025(4) |
6 | 45,336 | 0.5 | % | 2,812,089 | 0.5 | % | 62.03 | |||||||||||||||||||||||||||
| 3Q 2025 | 14 | 59,360 | 0.7 | % | 3,802,172 | 0.7 | % | 64.05 | |||||||||||||||||||||||||||
| 4Q 2025 | 19 | 197,267 | 2.3 | % | 12,995,985 | 2.3 | % | 65.88 | |||||||||||||||||||||||||||
| Total 2025 | 39 | 301,963 | 3.5 | % | 19,610,246 | 3.5 | % | 64.94 | |||||||||||||||||||||||||||
| 1Q 2026 | 15 | 148,843 | 1.7 | % | 9,365,060 | 1.7 | % | 62.92 | |||||||||||||||||||||||||||
| 2Q 2026 | 7 | 26,719 | 0.3 | % | 1,846,306 | 0.3 | % | 69.10 | |||||||||||||||||||||||||||
| 3Q 2026 | 18 | 107,713 | 1.2 | % | 6,691,424 | 1.2 | % | 62.12 | |||||||||||||||||||||||||||
| 4Q 2026 | 22 | 227,137 | 2.6 | % | 12,259,510 | 2.2 | % | 53.97 | |||||||||||||||||||||||||||
| Total 2026 | 62 | 510,412 | 5.8 | % | 30,162,300 | 5.4 | % | 59.09 | |||||||||||||||||||||||||||
| 2027 | 87 | 707,724 | 8.2 | % | 47,867,236 | 8.6 | % | 67.64 | |||||||||||||||||||||||||||
| 2028 | 63 | 873,723 | 10.1 | % | 52,913,755 | 9.5 | % | 60.56 | |||||||||||||||||||||||||||
| 2029 | 66 | 795,575 | 9.2 | % | 68,365,795 | 12.3 | % | 85.93 | |||||||||||||||||||||||||||
| 2030 | 60 | 777,381 | 9.0 | % | 58,892,496 | 10.6 | % | 75.76 | |||||||||||||||||||||||||||
| 2031 | 35 | 240,815 | 2.8 | % | 27,161,717 | 4.9 | % | 112.79 | |||||||||||||||||||||||||||
| 2032 | 31 | 388,724 | 4.5 | % | 29,292,989 | 5.3 | % | 75.36 | |||||||||||||||||||||||||||
| 2033 | 34 | 306,026 | 3.5 | % | 23,515,571 | 4.2 | % | 76.84 | |||||||||||||||||||||||||||
| 2034 | 22 | 361,995 | 4.2 | % | 27,256,503 | 4.9 | % | 75.30 | |||||||||||||||||||||||||||
| 2035 | 23 | 461,318 | 5.3 | % | 32,068,550 | 5.8 | % | 69.52 | |||||||||||||||||||||||||||
| Thereafter | 42 | 1,930,006 | 22.7 | % | 138,663,796 | 25.0 | % | 71.85 | |||||||||||||||||||||||||||
| Total | 585 | 8,626,395 | 100.0 | % | $ | 555,770,954 | 100.0 | % | $ | 72.60 | |||||||||||||||||||||||||
Manhattan Office Properties(5) |
|||||||||||||||||||||||||||||||||||
| Available | — | 495,958 | 6.6 | % | $ | — | — | % | $ | — | |||||||||||||||||||||||||
| Signed leases not commenced | 19 | 322,924 | 4.3 | % | — | — | % | — | |||||||||||||||||||||||||||
2Q 2025(4) |
5 | 43,396 | 0.6 | % | 2,564,393 | 0.6 | % | 59.09 | |||||||||||||||||||||||||||
| 3Q 2025 | 13 | 54,281 | 0.7 | % | 3,510,274 | 0.8 | % | 64.67 | |||||||||||||||||||||||||||
| 4Q 2025 | 17 | 195,800 | 2.6 | % | 12,881,357 | 2.9 | % | 65.79 | |||||||||||||||||||||||||||
| Total 2025 | 35 | 293,477 | 3.9 | % | 18,956,024 | 4.3 | % | 64.59 | |||||||||||||||||||||||||||
| 1Q 2026 | 13 | 139,705 | 1.8 | % | 8,703,399 | 2.0 | % | 62.30 | |||||||||||||||||||||||||||
| 2Q 2026 | 7 | 26,719 | 0.4 | % | 1,846,306 | 0.4 | % | 69.10 | |||||||||||||||||||||||||||
| 3Q 2026 | 14 | 72,794 | 1.0 | % | 4,468,416 | 1.0 | % | 61.38 | |||||||||||||||||||||||||||
| 4Q 2026 | 20 | 177,089 | 2.3 | % | 11,075,014 | 2.5 | % | 62.54 | |||||||||||||||||||||||||||
| Total 2026 | 54 | 416,307 | 5.5 | % | 26,093,135 | 5.9 | % | 62.68 | |||||||||||||||||||||||||||
| 2027 | 77 | 626,173 | 8.3 | % | 38,399,735 | 8.7 | % | 61.32 | |||||||||||||||||||||||||||
| 2028 | 58 | 854,533 | 11.3 | % | 50,714,632 | 11.4 | % | 59.35 | |||||||||||||||||||||||||||
| 2029 | 51 | 648,524 | 8.6 | % | 42,748,001 | 9.6 | % | 65.92 | |||||||||||||||||||||||||||
| 2030 | 43 | 657,412 | 8.7 | % | 44,481,444 | 10.0 | % | 67.66 | |||||||||||||||||||||||||||
| 2031 | 23 | 151,071 | 2.0 | % | 11,204,439 | 2.5 | % | 74.17 | |||||||||||||||||||||||||||
| 2032 | 23 | 344,120 | 4.6 | % | 25,144,502 | 5.7 | % | 73.07 | |||||||||||||||||||||||||||
| 2033 | 19 | 198,333 | 2.6 | % | 13,053,369 | 2.9 | % | 65.82 | |||||||||||||||||||||||||||
| 2034 | 16 | 337,787 | 4.5 | % | 23,828,011 | 5.4 | % | 70.54 | |||||||||||||||||||||||||||
| 2035 | 18 | 446,299 | 5.9 | % | 30,558,955 | 6.9 | % | 68.47 | |||||||||||||||||||||||||||
| Thereafter | 29 | 1,769,596 | 23.2 | % | 118,730,340 | 26.7 | % | 67.09 | |||||||||||||||||||||||||||
| Total Manhattan office properties | 465 | 7,562,514 | 100.0 | % | $ | 443,912,587 | 100.0 | % | $ | 65.83 | |||||||||||||||||||||||||
|
Second Quarter 2025 |
||||
| Tenant Lease Expirations | |||||
| (unaudited) | |||||
|
Greater New York Metropolitan
Area Office Portfolio
|
Number of Leases Expiring(1) |
Rentable Square Feet Expiring(2) |
Percent of Portfolio Rentable Square Feet Expiring | Annualized Rent(3) |
Percent of Annualized Rent | Annualized Rent Per Rentable Square Foot | |||||||||||||||||||||||||||||
| Available | — | 73,147 | 25.9 | % | $ | — | — | % | $ | — | |||||||||||||||||||||||||
| Signed leases not commenced | — | — | — | % | — | — | % | — | |||||||||||||||||||||||||||
2Q 2025(4) |
— | — | — | % | — | — | % | — | |||||||||||||||||||||||||||
| 3Q 2025 | 1 | 5,079 | 1.8 | % | 291,898 | 2.4 | % | 57.47 | |||||||||||||||||||||||||||
| 4Q 2025 | — | — | — | % | — | — | % | — | |||||||||||||||||||||||||||
| Total 2025 | 1 | 5,079 | 1.8 | % | 291,898 | 2.4 | % | 57.47 | |||||||||||||||||||||||||||
| 1Q 2026 | — | — | — | % | — | — | % | — | |||||||||||||||||||||||||||
| 2Q 2026 | — | — | — | % | — | — | % | — | |||||||||||||||||||||||||||
| 3Q 2026 | 1 | 23,268 | 8.2 | % | 1,448,235 | 11.9 | % | 62.24 | |||||||||||||||||||||||||||
| 4Q 2026 | — | — | — | % | — | — | % | — | |||||||||||||||||||||||||||
| Total 2026 | 1 | 23,268 | 8.2 | % | 1,448,235 | 11.9 | % | 62.24 | |||||||||||||||||||||||||||
| 2027 | 4 | 21,546 | 7.6 | % | 1,264,659 | 10.4 | % | 58.70 | |||||||||||||||||||||||||||
| 2028 | 2 | 11,480 | 4.1 | % | 658,539 | 5.4 | % | 57.36 | |||||||||||||||||||||||||||
| 2029 | 3 | 12,208 | 4.3 | % | 720,869 | 5.9 | % | 59.05 | |||||||||||||||||||||||||||
| 2030 | 5 | 42,827 | 15.2 | % | 2,516,457 | 20.7 | % | 58.76 | |||||||||||||||||||||||||||
| 2031 | 1 | 15,030 | 5.3 | % | 879,672 | 7.2 | % | 58.53 | |||||||||||||||||||||||||||
2032(6) |
2 | 7,281 | 2.6 | % | 381,961 | 3.1 | % | 52.46 | |||||||||||||||||||||||||||
| 2033 | 1 | 63,173 | 22.4 | % | 3,618,934 | 29.8 | % | 57.29 | |||||||||||||||||||||||||||
| 2034 | — | — | — | % | — | — | % | — | |||||||||||||||||||||||||||
| 2035 | 1 | 7,137 | 2.6 | % | 367,556 | 3.2 | % | 51.50 | |||||||||||||||||||||||||||
| Thereafter | — | — | — | % | — | — | % | — | |||||||||||||||||||||||||||
| Total greater New York metropolitan area office portfolio | 21 | 282,176 | 100.0 | % | $ | 12,148,780 | 100.0 | % | $ | 58.12 | |||||||||||||||||||||||||
| Retail Properties | |||||||||||||||||||||||||||||||||||
| Available | — | 73,019 | 9.3 | % | $ | — | — | % | $ | — | |||||||||||||||||||||||||
| Signed leases not commenced | 2 | 5,685 | 0.7 | % | — | — | % | — | |||||||||||||||||||||||||||
2Q 2025(4) |
1 | 1,940 | 0.2 | % | 247,696 | 0.2 | % | 127.68 | |||||||||||||||||||||||||||
| 3Q 2025 | — | — | — | % | — | — | % | — | |||||||||||||||||||||||||||
| 4Q 2025 | 2 | 1,467 | 0.2 | % | 114,628 | 0.1 | % | 78.14 | |||||||||||||||||||||||||||
| Total 2025 | 3 | 3,407 | 0.4 | % | 362,324 | 0.3 | % | 106.35 | |||||||||||||||||||||||||||
| 1Q 2026 | 2 | 9,138 | 1.2 | % | 661,661 | 0.7 | % | 72.41 | |||||||||||||||||||||||||||
| 2Q 2026 | — | — | — | % | — | — | % | — | |||||||||||||||||||||||||||
| 3Q 2026 | 3 | 11,651 | 1.5 | % | 774,773 | 0.8 | % | 66.50 | |||||||||||||||||||||||||||
| 4Q 2026 | 2 | 50,048 | 6.4 | % | 1,184,496 | 1.2 | % | 23.67 | |||||||||||||||||||||||||||
| Total 2026 | 7 | 70,837 | 9.1 | % | 2,620,930 | 2.7 | % | 37.00 | |||||||||||||||||||||||||||
| 2027 | 6 | 60,005 | 7.7 | % | 8,202,842 | 8.2 | % | 136.70 | |||||||||||||||||||||||||||
| 2028 | 3 | 7,710 | 1.0 | % | 1,540,584 | 1.5 | % | 199.82 | |||||||||||||||||||||||||||
| 2029 | 12 | 134,843 | 17.2 | % | 24,896,925 | 25.0 | % | 184.64 | |||||||||||||||||||||||||||
| 2030 | 12 | 77,142 | 9.9 | % | 11,894,595 | 11.9 | % | 154.19 | |||||||||||||||||||||||||||
| 2031 | 11 | 74,714 | 9.6 | % | 15,077,606 | 15.1 | % | 201.80 | |||||||||||||||||||||||||||
| 2032 | 6 | 37,323 | 4.8 | % | 3,766,526 | 3.8 | % | 100.92 | |||||||||||||||||||||||||||
| 2033 | 14 | 44,520 | 5.7 | % | 6,843,268 | 6.9 | % | 153.71 | |||||||||||||||||||||||||||
| 2034 | 6 | 24,208 | 3.1 | % | 3,428,492 | 3.4 | % | 141.63 | |||||||||||||||||||||||||||
| 2035 | 4 | 7,882 | 1.0 | % | 1,142,039 | 1.1 | % | 144.89 | |||||||||||||||||||||||||||
| Thereafter | 13 | 160,410 | 20.5 | % | 19,933,456 | 20.1 | % | 124.27 | |||||||||||||||||||||||||||
| Total retail properties | 99 | 781,705 | 100.0 | % | $ | 99,709,587 | 100.0 | % | $ | 141.83 | |||||||||||||||||||||||||
|
Second Quarter 2025 |
||||
| 20 Largest Tenants and Portfolio Tenant Diversification by Industry | |||||
| (unaudited) | |||||
| 20 Largest Tenants | Property | Lease Expiration(1) |
Weighted Average Remaining Lease Term(2) |
Total Occupied Square Feet(3) |
Percent of Portfolio Rentable Square Feet(4) |
Annualized Rent(5) |
Percent of Portfolio Annualized Rent(6) |
|||||||||||||||||||||||||||||||||||||
| 1. | Empire State Building | Feb. 2026 - Aug. 2036 | 10.3 years | 423,544 | 4.97 | % | $ | 31,010,761 | 5.58 | % | ||||||||||||||||||||||||||||||||||
| 2. | Flagstar Bank | 1400 Broadway | Aug. 2039 | 14.2 years | 313,109 | 3.68 | % | 19,600,190 | 3.53 | % | ||||||||||||||||||||||||||||||||||
| 3. | Centric Brands Inc. | Empire State Building | Oct. 2028 | 3.3 years | 252,929 | 2.97 | % | 14,255,159 | 2.56 | % | ||||||||||||||||||||||||||||||||||
| 4. | PVH Corp. | 501 Seventh Avenue | Jan. 2026 - Oct. 2028 | 2.7 years | 237,281 | 2.79 | % | 13,507,462 | 2.43 | % | ||||||||||||||||||||||||||||||||||
| 5. | Institutional Capital Network, Inc. | One Grand Central Place | Nov. 2027 - Dec. 2041 | 15.6 years | 154,050 | 1.81 | % | 11,012,076 | 1.98 | % | ||||||||||||||||||||||||||||||||||
| 6. | Sephora USA, Inc. | 112 West 34th Street | Jan. 2029 | 3.6 years | 11,334 | 0.13 | % | 10,563,141 | 1.90 | % | ||||||||||||||||||||||||||||||||||
| 7. | Target Corporation | 112 West 34th St., 10 Union Sq. | Jan. 2038 | 12.6 years | 81,340 | 0.95 | % | 9,543,763 | 1.72 | % | ||||||||||||||||||||||||||||||||||
| 8. | Macy's | 111 West 33rd Street | May 2030 | 4.9 years | 131,117 | 1.54 | % | 9,520,794 | 1.71 | % | ||||||||||||||||||||||||||||||||||
| 9. | Coty Inc. | Empire State Building | Jan. 2030 | 4.6 years | 157,892 | 1.85 | % | 9,339,709 | 1.68 | % | ||||||||||||||||||||||||||||||||||
| 10. | URBAN OUTFITTERS | 1333 Broadway | Sep. 2029 | 4.3 years | 56,730 | 0.67 | % | 8,287,997 | 1.49 | % | ||||||||||||||||||||||||||||||||||
| 11. | Li & Fung | 1359 Broadway, ESB | Oct. 2027 - Oct. 2028 | 3.0 years | 149,061 | 1.75 | % | 8,173,187 | 1.47 | % | ||||||||||||||||||||||||||||||||||
| 12. | Foot Locker, Inc. | 112 West 34th Street | Sep. 2031 | 6.3 years | 34,192 | 0.40 | % | 7,834,994 | 1.41 | % | ||||||||||||||||||||||||||||||||||
| 13. | FDIC | Empire State Building | Dec. 2025 | 0.5 years | 119,226 | 1.40 | % | 7,751,788 | 1.39 | % | ||||||||||||||||||||||||||||||||||
| 14. | Shutterstock, Inc. | Empire State Building | Apr. 2029 | 3.8 years | 108,937 | 1.28 | % | 7,558,689 | 1.36 | % | ||||||||||||||||||||||||||||||||||
| 15. | Fragomen | 1400 Broadway | Feb. 2035 | 9.7 years | 107,680 | 1.26 | % | 7,118,080 | 1.28 | % | ||||||||||||||||||||||||||||||||||
| 16. | The Michael J. Fox Foundation | 111 West 33rd Street | Nov. 2029 | 4.4 years | 86,492 | 1.02 | % | 6,549,061 | 1.18 | % | ||||||||||||||||||||||||||||||||||
| 17. | ASCAP | 250 West 57th Street | Aug. 2034 | 9.2 years | 87,943 | 1.03 | % | 6,476,281 | 1.17 | % | ||||||||||||||||||||||||||||||||||
| 18. | Burlington Merchandising Corporation | 1400 Broadway | Jan. 2038 | 12.6 years | 102,898 | 1.21 | % | 6,463,891 | 1.16 | % | ||||||||||||||||||||||||||||||||||
| 19. | HNTB Corporation | Empire State Building | Sep. 2034 | 9.3 years | 78,361 | 0.92 | % | 5,639,656 | 1.01 | % | ||||||||||||||||||||||||||||||||||
| 20. | Kohl's Department Stores, Inc. | 1400 Broadway | May 2029 | 3.9 years | 91,775 | 1.08 | % | 5,181,788 | 0.93 | % | ||||||||||||||||||||||||||||||||||
| Total | 2,785,891 | 32.71 | % | $ | 205,388,467 | 36.94 | % | |||||||||||||||||||||||||||||||||||||
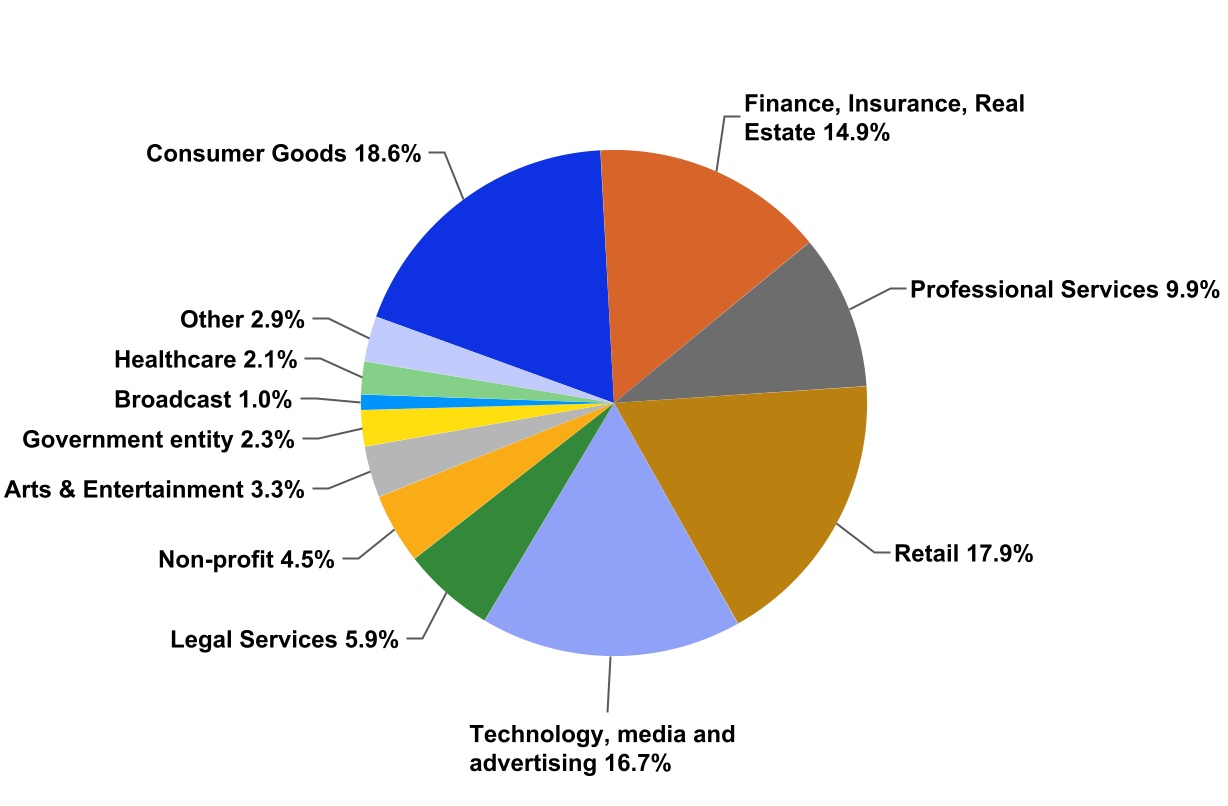
|
Second Quarter 2025 |
||||
| Initial Cash Rent Contributing to Cash NOI, Capital Expenditures and Redevelopment Program | |||||
| (unaudited and dollars in thousands) | |||||
| Square | Initial Annual | Initial Cash Rent Contributing to Cash NOI in the Following Years | ||||||||||||||||||||||||||||||||||||||||||
| Expected Cash Commencement | Feet | Cash Rent | 2025 | 2026 | 2027 | 2028 | 2029 | |||||||||||||||||||||||||||||||||||||
| Third quarter 2025 | 141,538 | $ | 9,501 | $ | 3,152 | $ | 9,501 | $ | 9,501 | $ | 9,243 | $ | 8,999 | |||||||||||||||||||||||||||||||
| Fourth quarter 2025 | 127,907 | 9,136 | 1,450 | 9,136 | 9,136 | 9,136 | 9,136 | |||||||||||||||||||||||||||||||||||||
| First quarter 2026 | 41,873 | 3,784 | — | 3,351 | 3,784 | 3,784 | 3,784 | |||||||||||||||||||||||||||||||||||||
| Second quarter 2026 | 182,828 | 13,664 | — | 8,552 | 13,664 | 13,664 | 13,664 | |||||||||||||||||||||||||||||||||||||
| Third quarter 2026 | 67,304 | 3,994 | — | 1,569 | 3,994 | 3,994 | 3,994 | |||||||||||||||||||||||||||||||||||||
| Fourth quarter 2026 | 119,981 | 7,507 | — | 1,006 | 7,507 | 7,507 | 7,507 | |||||||||||||||||||||||||||||||||||||
| First quarter 2027 | 106,746 | 8,563 | — | — | 7,892 | 8,563 | 8,563 | |||||||||||||||||||||||||||||||||||||
| Second quarter 2027 | 51,726 | 3,799 | — | — | 2,791 | 3,799 | 3,799 | |||||||||||||||||||||||||||||||||||||
| Fourth quarter 2027 | 13,943 | 1,115 | — | — | 279 | 1,115 | 1,115 | |||||||||||||||||||||||||||||||||||||
| First quarter 2028 | 34,162 | 2,462 | — | — | — | 2,350 | 2,462 | |||||||||||||||||||||||||||||||||||||
| Third quarter 2028 | 24,212 | 1,453 | — | — | — | 482 | 1,453 | |||||||||||||||||||||||||||||||||||||
| First quarter 2029 | 39,610 | 3,094 | — | — | — | — | 2,585 | |||||||||||||||||||||||||||||||||||||
| Second quarter 2029 | 25,212 | 1,575 | — | — | — | — | 920 | |||||||||||||||||||||||||||||||||||||
| 977,042 | $ | 69,647 | $ | 4,602 | $ | 33,115 | $ | 58,548 | $ | 63,637 | $ | 67,981 | ||||||||||||||||||||||||||||||||
| Incremental Annual | Initial Annual | Initial Cash Rent Contributing to Cash NOI in the Following Years | ||||||||||||||||||||||||||||||||||||||||||
| 2Q 2025 | Cash Rent (1) |
Cash Rent | 2025 | 2026 | 2027 | 2028 | 2029 | |||||||||||||||||||||||||||||||||||||
| Commenced leases in free rent period | $ | 21,939 | $ | 37,527 | $ | 4,136 | $ | 28,089 | $ | 37,527 | $ | 37,270 | $ | 37,026 | ||||||||||||||||||||||||||||||
| Signed leases not commenced | 25,007 | 32,120 | 466 | 5,026 | 21,021 | 26,367 | 30,955 | |||||||||||||||||||||||||||||||||||||
| $ | 46,946 | $ | 69,647 | $ | 4,602 | $ | 33,115 | $ | 58,548 | $ | 63,637 | $ | 67,981 | |||||||||||||||||||||||||||||||
| Three Months Ended | |||||||||||||||||||||||||||||
| Capital expenditures | June 30, 2025 |
March 31, 2025 |
December 31, 2024 |
September 30, 2024 |
June 30, 2024 |
||||||||||||||||||||||||
| Tenant improvements - first generation | $ | 39 | $ | 174 | $ | 2,744 | $ | — | $ | — | |||||||||||||||||||
Tenant improvements - second generation (2) |
36,890 | 39,304 | 45,969 | 17,149 | 25,087 | ||||||||||||||||||||||||
| Leasing commissions - first generation | — | — | 98 | 138 | 129 | ||||||||||||||||||||||||
| Leasing commissions - second generation | 7,605 | 7,629 | 10,769 | 3,753 | 3,807 | ||||||||||||||||||||||||
| Building improvements - first generation | 236 | — | 180 | 128 | — | ||||||||||||||||||||||||
| Building improvements - second generation | 7,868 | 5,770 | 9,377 | 7,838 | 11,362 | ||||||||||||||||||||||||
| Non-recurring capital improvements | 8,934 | 2,910 | 14,420 | 2,825 | 5,979 | ||||||||||||||||||||||||
| Total | $ | 61,572 | $ | 55,787 | $ | 83,557 | $ | 31,831 | $ | 46,364 | |||||||||||||||||||
|
Second Quarter 2025 |
||||
| Observatory Summary | |||||
| (unaudited and dollars in thousands) | |||||
| Twelve Months to Date | Three Months Ended | |||||||||||||||||||||||||||||||||||||
| Observatory NOI | June 30, 2025 |
March 31, 2025 |
December 31, 2024 |
September 30, 2024 |
June 30, 2024 |
|||||||||||||||||||||||||||||||||
Observatory revenue (1) |
$ | 134,717 | $ | 33,899 | $ | 23,161 | $ | 38,275 | $ | 39,382 | $ | 34,124 | ||||||||||||||||||||||||||
| Observatory expenses | 37,385 | 9,822 | 8,118 | 9,730 | 9,715 | 8,958 | ||||||||||||||||||||||||||||||||
| NOI | 97,332 | 24,077 | 15,043 | 28,545 | 29,667 | 25,166 | ||||||||||||||||||||||||||||||||
Intercompany rent expense (2) |
82,256 | 20,666 | 15,160 | 22,969 | 23,461 | 20,980 | ||||||||||||||||||||||||||||||||
| NOI after intercompany rent | $ | 15,076 | $ | 3,411 | $ | (117) | $ | 5,576 | $ | 6,206 | $ | 4,186 | ||||||||||||||||||||||||||
| Observatory Metrics | ||||||||||||||||||||||||||||||||||||||
Number of visitors (3) |
629,000 | 428,000 | 718,000 | 727,000 | 648,000 | |||||||||||||||||||||||||||||||||
| Change in visitors year over year | (2.9) | % | (11.8) | % | 1.0 | % | (2.2) | % | (2.7) | % | ||||||||||||||||||||||||||||
Number of bad weather days ("BWD") (4) |
21 | 13 | 8 | 8 | 8 | |||||||||||||||||||||||||||||||||
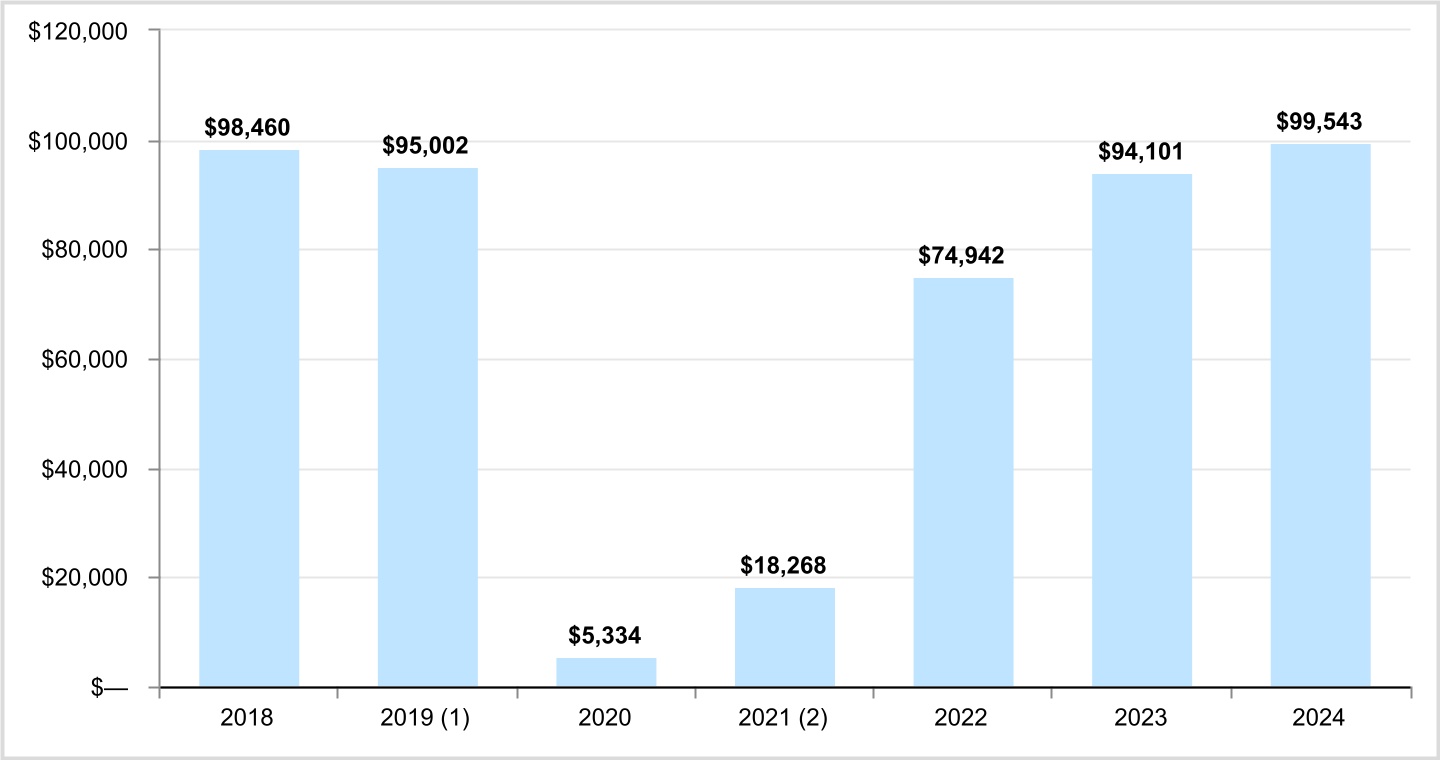
|
Second Quarter 2025 |
||||
| Debt Summary | |||||
| (unaudited and dollars in thousands) | |||||
| June 30, 2025 | ||||||||||||||||||||
| Weighted Average | ||||||||||||||||||||
| Debt Summary | Balance | Interest Rate (1) |
Maturity (Years) | |||||||||||||||||
| Mortgage debt | $ | 702,478 | 3.64 | % | 5.8 | |||||||||||||||
| Senior unsecured notes | 1,100,000 | 4.76 | % | 5.2 | ||||||||||||||||
Unsecured term loan facilities (2) |
270,000 | 4.43 | % | 2.3 | ||||||||||||||||
| Total fixed rate debt | 2,072,478 | 4.34 | % | 5.0 | ||||||||||||||||
Unsecured term loan facilities (3) |
— | — | — | |||||||||||||||||
| Unsecured revolving credit facility | — | — | — | |||||||||||||||||
| Total variable rate debt | — | — | — | |||||||||||||||||
| Total debt | 2,072,478 | 4.34 | % | 5.0 | ||||||||||||||||
| Deferred financing costs, net | (9,007) | |||||||||||||||||||
| Debt discount | (5,793) | |||||||||||||||||||
| Total | $ | 2,057,678 | ||||||||||||||||||
| Available Capacity | Facility | Outstanding at June 30, 2025 |
Letters of Credit | Available Capacity | ||||||||||||||||||||||||||||||||||
Unsecured revolving credit facility (4) |
$ | 620,000 | $ | — | $ | — | $ | 620,000 | ||||||||||||||||||||||||||||||
| Covenant Summary | Required | Current Quarter | In Compliance | |||||||||||||||||||||||||||||
Maximum Total Leverage (5) |
< 60% | 32.7 | % | Yes | ||||||||||||||||||||||||||||
Maximum Secured Leverage (6) |
< 40% | 11.6 | % | Yes | ||||||||||||||||||||||||||||
| Minimum Fixed Charge Coverage | > 1.50x | 3.1x | Yes | |||||||||||||||||||||||||||||
| Minimum Unencumbered Interest Coverage | > 1.75x | 5.0x | Yes | |||||||||||||||||||||||||||||
Maximum Unsecured Leverage (7) |
< 60% | 25.1 | % | Yes | ||||||||||||||||||||||||||||
|
Second Quarter 2025 |
||||
| Debt Detail | |||||
| (unaudited and dollars in thousands) | |||||
| Stated Interest Rate (%) |
Principal Balance | Maturity Date |
Amortization | |||||||||||||||||||||||
| 10 Union Square | 3.70 | % | $ | 50,000 | 4/1/2026 | Interest only | ||||||||||||||||||||
| 1542 Third Avenue | 4.29 | % | 30,000 | 5/1/2027 | Interest only | |||||||||||||||||||||
| 1010 Third Avenue & 77 West 55th St. | 4.01 | % | 33,580 | 1/5/2028 | 30 years | |||||||||||||||||||||
| Metro Center | 3.59 | % | 71,600 | 11/5/2029 | Interest only | |||||||||||||||||||||
| 250 West 57th Street | 2.83 | % | 180,000 | 12/1/2030 | Interest only | |||||||||||||||||||||
| 1333 Broadway | 4.21 | % | 160,000 | 2/5/2033 | Interest only | |||||||||||||||||||||
| 345 East 94th Street - Series A | 70% of SOFR plus 0.95% | 43,600 | 11/1/2030 | Interest only | ||||||||||||||||||||||
| 345 East 94th Street - Series B | SOFR plus 2.24% | 6,106 | 11/1/2030 | 30 years | ||||||||||||||||||||||
| 561 10th Avenue - Series A | 70% of SOFR plus 1.07% | 114,500 | 11/1/2033 | Interest only | ||||||||||||||||||||||
| 561 10th Avenue - Series B | SOFR plus 2.45% | 13,092 | 11/1/2033 | 30 years | ||||||||||||||||||||||
| Total fixed rate mortgage debt | 702,478 | |||||||||||||||||||||||||
| Unsecured term loan facility | SOFR plus 1.50% | 175,000 | 12/31/2026 | Interest only | ||||||||||||||||||||||
| Unsecured term loan facility | SOFR plus 1.50% | 95,000 | 3/8/2029 | Interest only | ||||||||||||||||||||||
| Unsecured revolving credit facility | SOFR plus 1.30% | — | 3/8/2029 | Interest only | ||||||||||||||||||||||
| Senior unsecured notes: | ||||||||||||||||||||||||||
| Series B | 4.09 | % | 125,000 | 3/27/2027 | Interest only | |||||||||||||||||||||
| Series C | 4.18 | % | 125,000 | 3/27/2030 | Interest only | |||||||||||||||||||||
| Series D | 4.08 | % | 115,000 | 1/22/2028 | Interest only | |||||||||||||||||||||
| Series E | 4.26 | % | 160,000 | 3/22/2030 | Interest only | |||||||||||||||||||||
| Series F | 4.44 | % | 175,000 | 3/22/2033 | Interest only | |||||||||||||||||||||
| Series G | 3.61 | % | 100,000 | 3/17/2032 | Interest only | |||||||||||||||||||||
| Series H | 3.73 | % | 75,000 | 3/17/2035 | Interest only | |||||||||||||||||||||
| Series I | 7.20 | % | 155,000 | 6/17/2029 | Interest only | |||||||||||||||||||||
| Series J | 7.32 | % | 45,000 | 6/17/2031 | Interest only | |||||||||||||||||||||
| Series K | 7.41 | % | 25,000 | 6/17/2034 | Interest only | |||||||||||||||||||||
| Total / weighted average debt | 4.34 | % | 2,072,478 | |||||||||||||||||||||||
| Deferred financing costs, net | (9,007) | |||||||||||||||||||||||||
| Debt discount | (5,793) | |||||||||||||||||||||||||
| Total | $ | 2,057,678 | ||||||||||||||||||||||||
|
Second Quarter 2025 |
||||
| Debt Maturities and Ground Lease Commitments | |||||
| (unaudited and dollars in thousands) | |||||
| Year | Maturities (1) |
Amortization | Total | Percentage of Total Debt | Weighted Average Interest Rate of Maturing Debt | |||||||||||||||||||||||||||
| 2025 | $ | — | $ | 1,868 | $ | 1,868 | 0.1 | % | N/A | |||||||||||||||||||||||
| 2026 | 225,000 | 3,957 | 228,957 | 11.1 | % | 4.06 | % | |||||||||||||||||||||||||
| 2027 | 155,000 | 4,276 | 159,276 | 7.7 | % | 4.13 | % | |||||||||||||||||||||||||
| 2028 | 146,091 | 3,555 | 149,646 | 7.2 | % | 4.06 | % | |||||||||||||||||||||||||
| 2029 | 321,600 | 3,890 | 325,490 | 15.7 | % | 5.72 | % | |||||||||||||||||||||||||
| 2030 | 508,600 | 4,511 | 513,111 | 24.8 | % | 3.67 | % | |||||||||||||||||||||||||
| 2031 | 45,000 | 3,283 | 48,283 | 2.3 | % | 7.32 | % | |||||||||||||||||||||||||
| 2032 | 100,000 | 3,591 | 103,591 | 5.0 | % | 3.61 | % | |||||||||||||||||||||||||
| 2033 | 439,007 | 3,249 | 442,256 | 21.3 | % | 4.20 | % | |||||||||||||||||||||||||
| 2034 | 25,000 | — | 25,000 | 1.2 | % | 7.41 | % | |||||||||||||||||||||||||
| 2035 | 75,000 | — | 75,000 | 3.6 | % | 3.73 | % | |||||||||||||||||||||||||
| Total debt | $ | 2,040,298 | $ | 32,180 | 2,072,478 | 100.0 | % | 4.34 | % | |||||||||||||||||||||||
| Deferred financing costs, net | (9,007) | |||||||||||||||||||||||||||||||
| Debt discount | (5,793) | |||||||||||||||||||||||||||||||
| Total | $ | 2,057,678 | ||||||||||||||||||||||||||||||
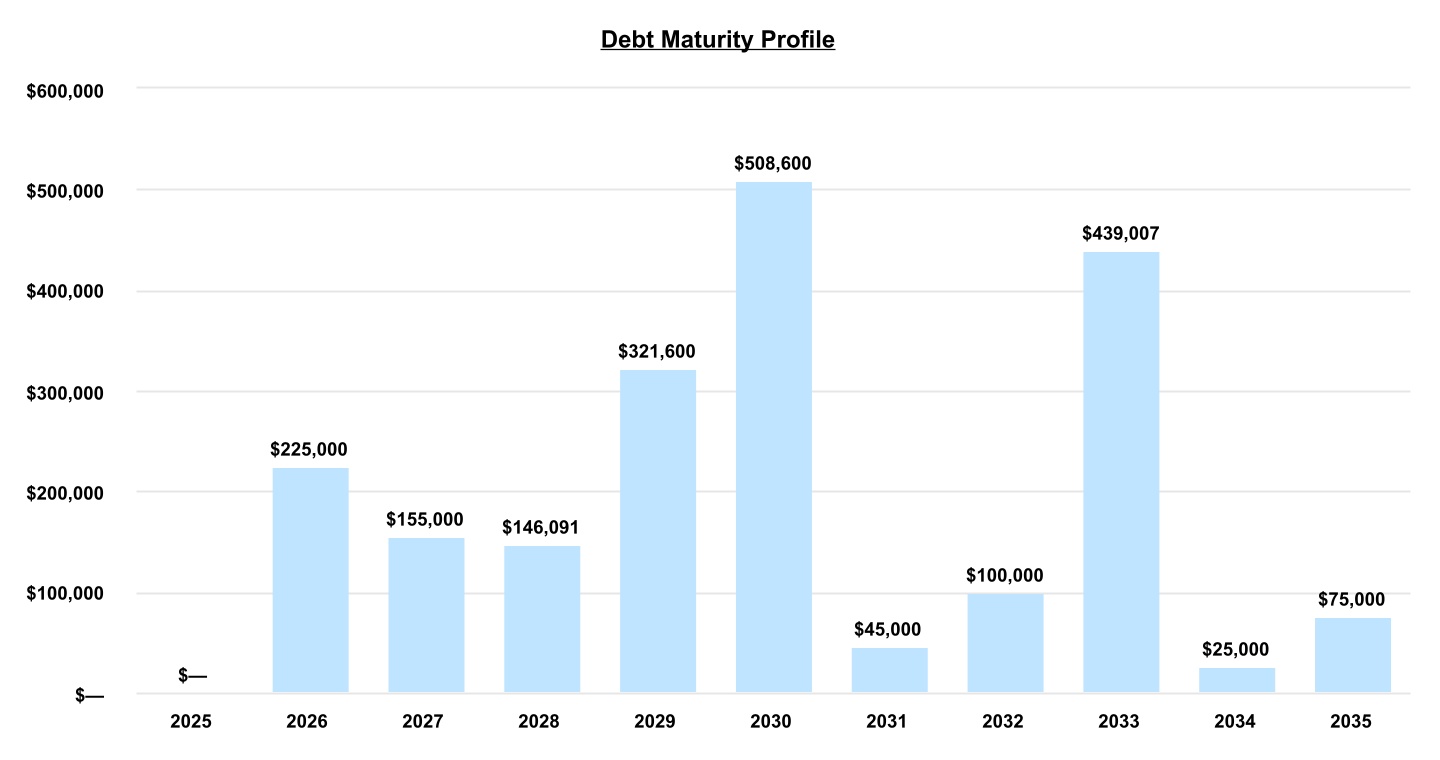
Ground Lease Commitments (2) |
||||||||||||||||||||||||||||||||
| Year | 1350 Broadway (3) |
1400 Broadway (4) |
111 West 33rd Street (5) |
Total | ||||||||||||||||||||||||||||
| 2025 | $ | 54 | $ | 338 | $ | 368 | $ | 760 | ||||||||||||||||||||||||
| 2026 | 93 | 675 | 735 | 1,503 | ||||||||||||||||||||||||||||
| 2027 | 72 | 675 | 735 | 1,482 | ||||||||||||||||||||||||||||
| 2028 | 72 | 675 | 735 | 1,482 | ||||||||||||||||||||||||||||
| 2029 | 72 | 675 | 735 | 1,482 | ||||||||||||||||||||||||||||
| Thereafter | 1,482 | 22,950 | 34,851 | 59,283 | ||||||||||||||||||||||||||||
| $ | 1,845 | $ | 25,988 | $ | 38,159 | $ | 65,992 | |||||||||||||||||||||||||